 Deutsch
 English
 Español
 Français
 Italiano
 Nederlands
 Polski
 Português
 Русский
 Türkçe
 Svenska
 Chinese
 Magyar
Análisis del XMG Fusion 15 (Early 24): Un portátil RTX 4070 compacto para jugadores y creadores

El XMG Fusion 15 (Early 24) -un portátil de 15,3 pulgadas para jugadores y creadores- está basado en un barebone (GM5IX7A) del fabricante Tongfang. Raptor Lake, Ada Lovelace y 32 GB de RAM equipan el portátil para streaming, renderizado y juegos. La variante actual puede adquirirse por unos 2.500 dólares. Entre los competidores se encuentran dispositivos como el Aorus 16X (2024), Alienware m16 R2, HP Omen Transcend 16 y el Lenovo Legion Pro 5 16IRX9.
Posibles contendientes en la comparación
Valoración | Fecha | Modelo | Peso | Altura | Tamaño | Resolución | Best Price |
|---|---|---|---|---|---|---|---|
| 88.9 % | 05/2024 | SCHENKER XMG Fusion 15 (Early 24) i9-14900HX, NVIDIA GeForce RTX 4070 Laptop GPU | 2.1 kg | 21.9 mm | 15.30" | 2560x1600 | |
| 87.4 % | 04/2024 | Aorus 16X 2024 i9-14900HX, NVIDIA GeForce RTX 4070 Laptop GPU | 2.3 kg | 20 mm | 16.00" | 2560x1600 | |
| 90.2 % | 03/2024 | Alienware m16 R2 Ultra 7 155H, NVIDIA GeForce RTX 4070 Laptop GPU | 2.5 kg | 23.5 mm | 16.00" | 2560x1600 | |
| 88.4 % | 02/2024 | HP Omen Transcend 16-u1095ng i9-14900HX, NVIDIA GeForce RTX 4070 Laptop GPU | 2.3 kg | 20 mm | 16.00" | 2560x1600 | |
| 89.3 % | 04/2024 | Lenovo Legion Pro 5 16IRX9 i9-14900HX, NVIDIA GeForce RTX 4070 Laptop GPU | 2.5 kg | 26.95 mm | 16.00" | 2560x1600 |
Maletín - El portátil XMG con maletín de aluminio
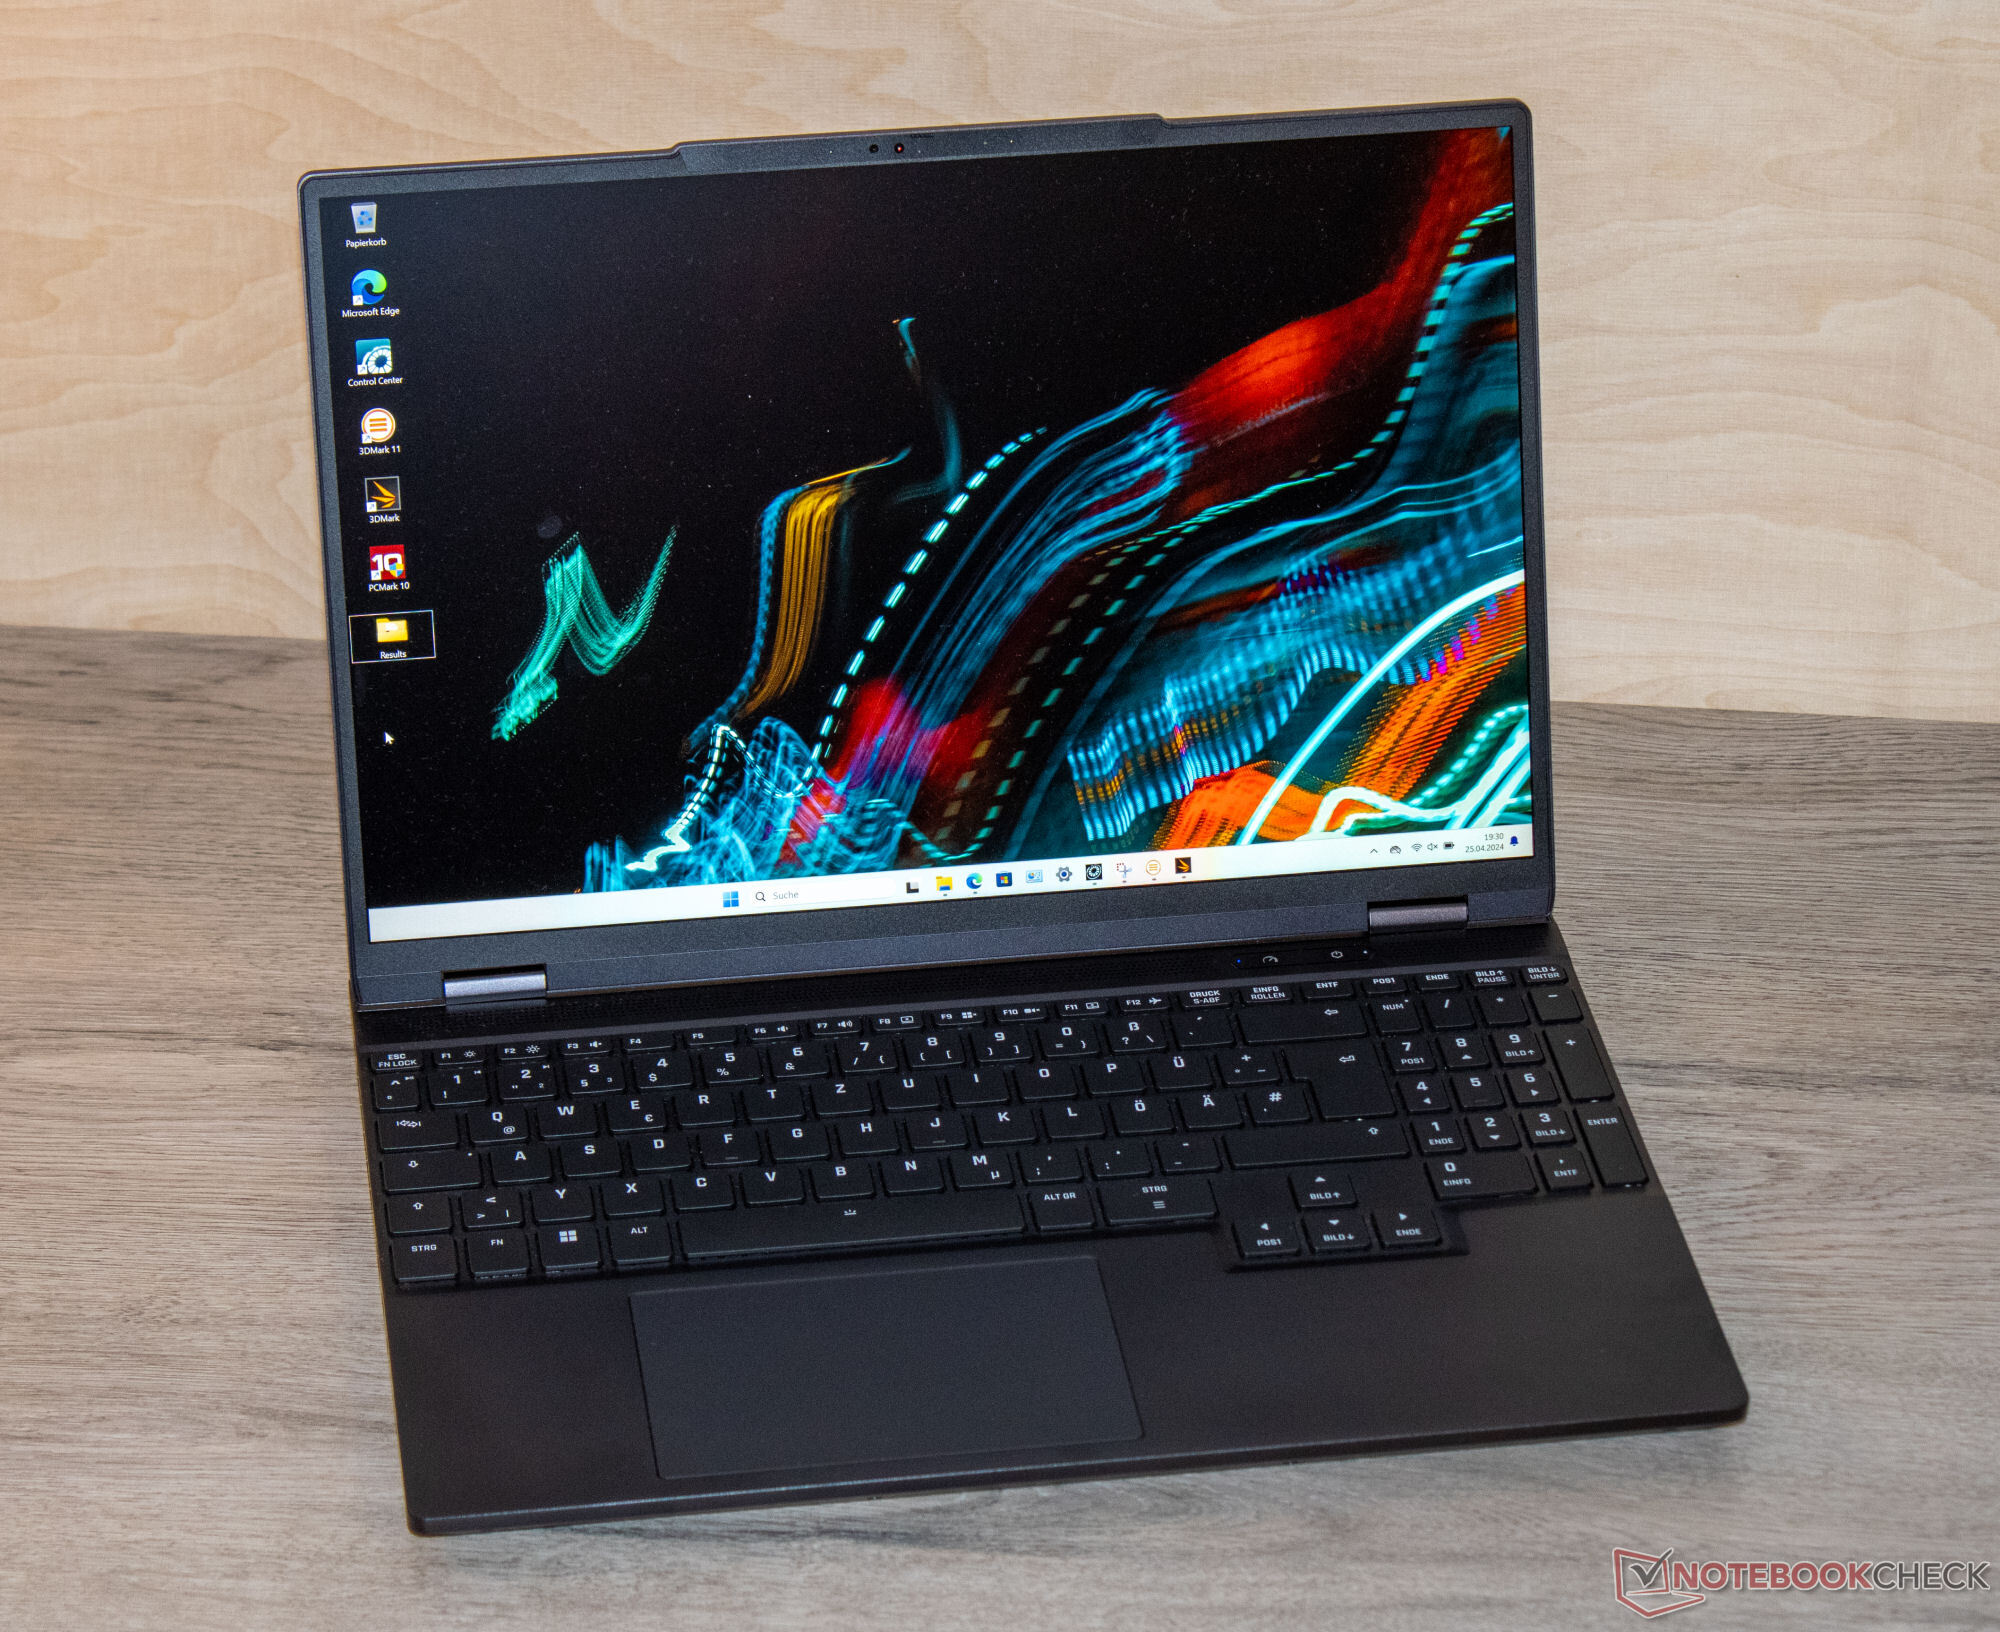
Schenker ha optado por una elegante carcasa de aluminio negro mate con superficies lisas. El portátil no presenta ningún elemento de diseño llamativo ni tiras LED -sólo la retroiluminación de su teclado (RGB) le da un poco de color al dispositivo. El portátil apenas destacaría en entornos profesionales.
No observamos ningún saliente de material y todos los huecos se alinean perfectamente. La unidad base y la tapa pueden torcerse ligeramente, pero no es nada fuera de lo normal. Al presionar la parte posterior de la tapa no se produce ningún cambio de imagen. Las rígidas bisagras permiten un ángulo de apertura máximo de 180 grados. Es posible abrirla con una sola mano.


No es ninguna sorpresa: Dentro del campo de la comparación, el Fusion es el dispositivo más compacto: cuenta con la pantalla más pequeña. Al mismo tiempo, también es el más ligero de todos.
Conectividad - El Fusion 15 con Thunderbolt 4
La Fusion cuenta con tres puertos USB-A (USB 3.2 Gen 1) y dos puertos USB-C (1x USB 3.2 Gen 1, 1x Thunderbolt 4). El puerto TB4 admite Power Delivery y puede emitir una señal DisplayPort. En total, el portátil tiene dos salidas de vídeo (1x HDMI, 1x DP). Una toma de audio y un puerto Gigabit Ethernet completan sus opciones de conectividad. Sus salidas de vídeo y la conexión de alimentación se encuentran en la parte posterior del dispositivo. Los cables correspondientes salen por la parte trasera, por lo que no le estorbarán.


Lector de tarjetas SD
Con velocidades de transferencia de 81 MB/s (transferencia de 250 imágenes jpg, cada una de 5 MB de tamaño) y 82 MB/s (copia de grandes bloques de datos), el lector de tarjetas SD (tarjeta de referencia: AV PRO microSD 128 GB V60) es de velocidad media. La competencia ofrece en gran medida lectores más rápidos.
| SD Card Reader | |
| average JPG Copy Test (av. of 3 runs) | |
| Aorus 16X 2024 (AV PRO microSD 128 GB V60) | |
| Average of class Gaming (19 - 202, n=96, last 2 years) | |
| SCHENKER XMG Fusion 15 (Early 24) (AV PRO microSD 128 GB V60) | |
| Alienware m16 R2 (AV PRO microSD 128 GB V60) | |
| maximum AS SSD Seq Read Test (1GB) | |
| Alienware m16 R2 (AV PRO microSD 128 GB V60) | |
| Aorus 16X 2024 (AV PRO microSD 128 GB V60) | |
| Average of class Gaming (25.8 - 269, n=91, last 2 years) | |
| SCHENKER XMG Fusion 15 (Early 24) (AV PRO microSD 128 GB V60) | |
Comunicación
El Fusion utiliza un chip WiFi 6E (Intel AX211) que, en el mejor de los casos (sin dispositivos WiFi en las proximidades, corta distancia entre el portátil y el servidor), alcanza muy buenas velocidades de transmisión de datos. De las conexiones por cable se encarga un controlador Gigabit Ethernet (YT6801) de Motorcomm, un fabricante con el que no nos habíamos encontrado antes.
Cámara web
Su cámara web (2,1 MP) es de calidad media. Falla en lo que se refiere a la precisión del color: Con una desviación de unos 9, no alcanza el valor objetivo (DeltaE<3). No obstante, es compatible con Windows Hello. Además, está equipado con una cubierta mecánica.

 NVIDIA GeForce RTX 4070 Laptop GPU, i9-14900HX, Samsung 990 Pro 1 TB")
 NVIDIA GeForce RTX 4070 Laptop GPU, i9-14900HX, Samsung 990 Pro 1 TB")
Accesorios
El portátil se entrega con una memoria USB (controlador, manuales), pegatinas y una alfombrilla de ratón.
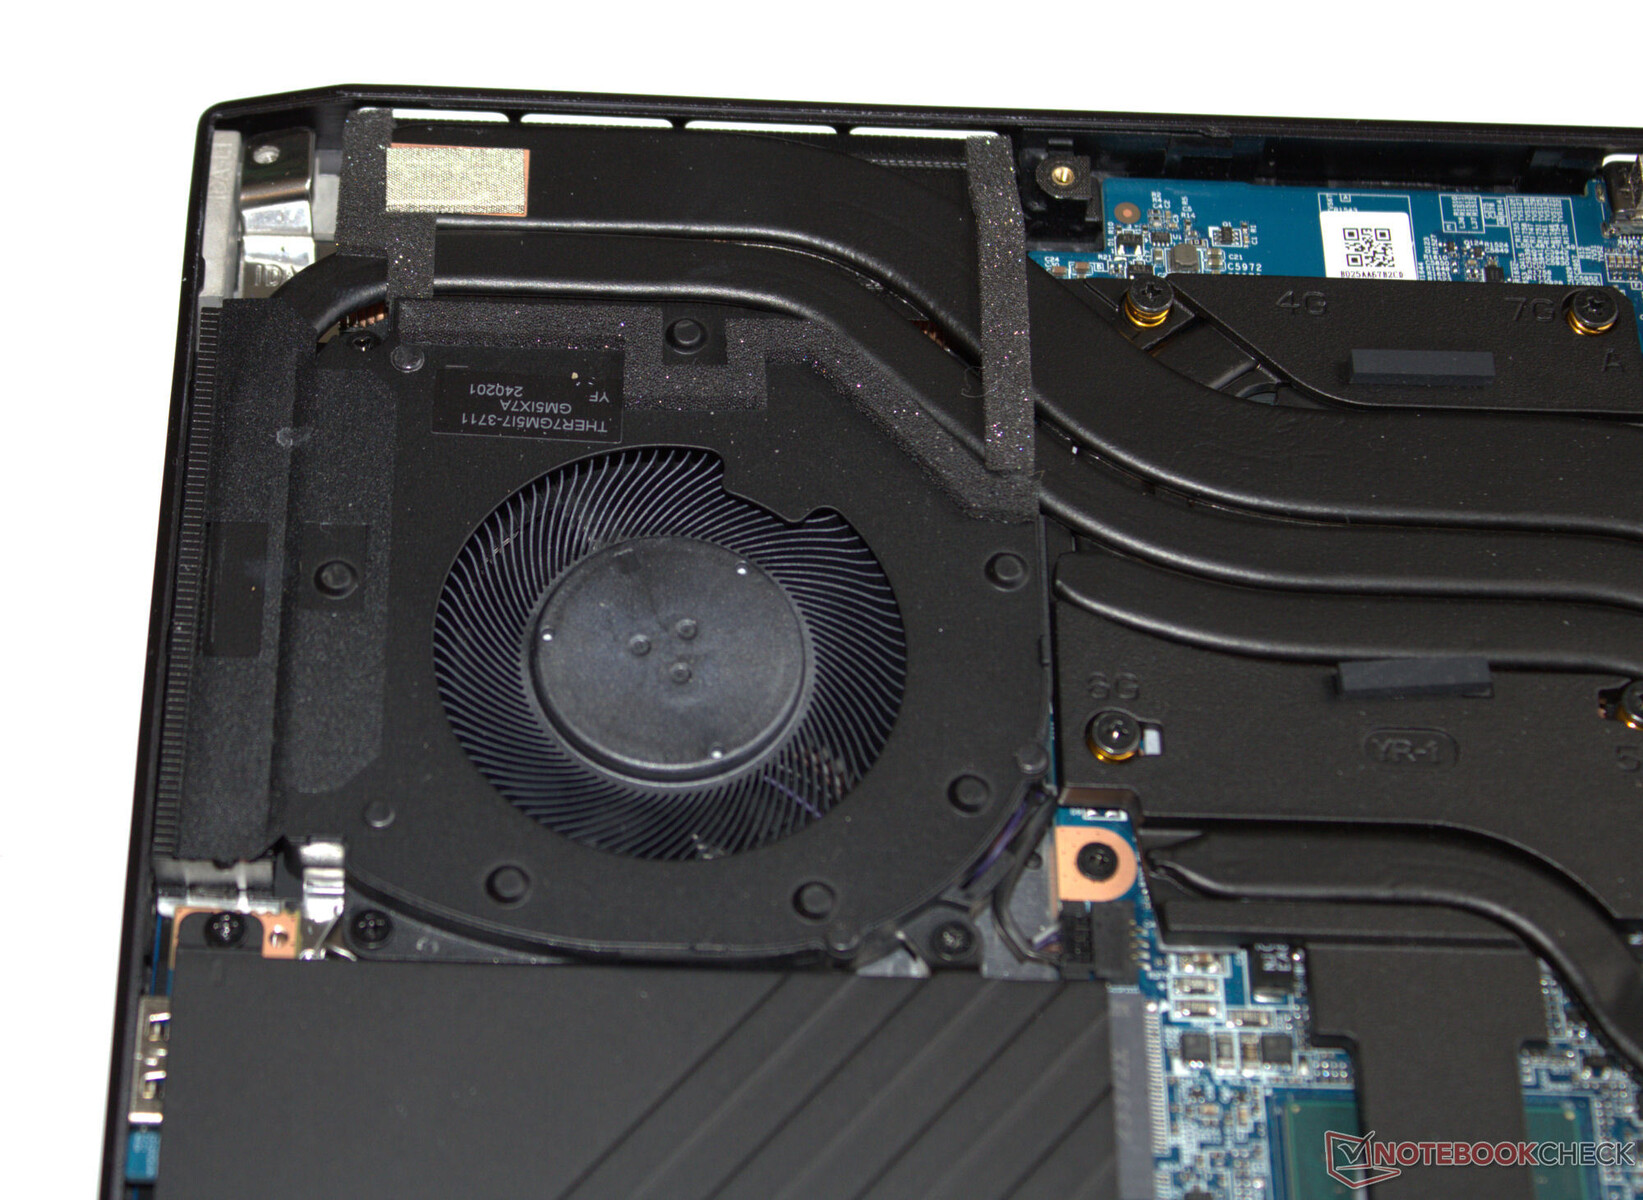
Mantenimiento
Después de retirar todos los tornillos de la parte inferior del dispositivo, la parte inferior de la carcasa se puede retirar con bastante facilidad; puede que sólo necesite una púa o una espátula plana para ayudarle en esta tarea. A continuación, puede acceder a los bancos de RAM (ambos ocupados), la SSD (PCIe 4, M.2-2280), la segunda ranura SSD (PCIe 4, M.2-2280), el módulo WLAN, los ventiladores, la batería de la BIOS y la batería del portátil.


Garantía
El aparato está cubierto por una garantía básica de dos años, que incluye el servicio de recogida y un servicio de reparación rápida de 6 meses (reparación en 48 horas). Puede ampliar esta garantía a 36 meses previo pago.
Dispositivos de entrada - Retroiluminación RGB de una tecla
Teclado
Las teclas del teclado chiclet (retroiluminación RGB de cuatro niveles) presentan una elevación media y un punto de presión claro. Su resistencia podría ser un poco más nítida, pero esto es cuestión de gustos. El teclado cede mínimamente al escribir, pero no resultó molesto durante nuestra prueba. Positivo: Las cuatro teclas de flecha no sólo tienen un tamaño completo, sino que están separadas del resto de teclas.
Panel táctil
Un clickpad multitáctil (aprox. 12,3 x 7,8 cm) sustituye la necesidad de un ratón y su superficie lisa facilita el deslizamiento de los dedos. Presenta una elevación corta y un punto de presión claro.

Pantalla - Panel brillante con cobertura sRGB
Schenker ha equipado el Fusion con una pantalla de 15,3 pulgadas (2.560 x 1.600 píxeles) con una relación de aspecto de 16:10. El panel mate de 240 Hz cuenta con Adaptive Sync, sin parpadeo PWM, tiempos de respuesta cortos y un gran brillo. No hay pantallas alternativas disponibles.

| |||||||||||||||||||||||||
iluminación: 89 %
Brillo con batería: 491 cd/m²
Contraste: 1045:1 (Negro: 0.47 cd/m²)
ΔE Color 2.16 | 0.5-29.43 Ø5, calibrated: 1.14
ΔE Greyscale 3.3 | 0.57-98 Ø5.3
75% AdobeRGB 1998 (Argyll 2.2.0 3D)
100% sRGB (Argyll 2.2.0 3D)
73.5% Display P3 (Argyll 2.2.0 3D)
Gamma: 2.204
| SCHENKER XMG Fusion 15 (Early 24) BOE NJ NE153QDM-NZ1, IPS, 2560x1600, 15.30 | Aorus 16X 2024 BOE CQ NE160QDM-NY1, IPS, 2560x1600, 16.00 | Alienware m16 R2 BOE NE16NYH, IPS, 2560x1600, 16.00 | HP Omen Transcend 16-u1095ng ATNA60DL02-0 (SDC41A4), OLED, 2560x1600, 16.00 | Lenovo Legion Pro 5 16IRX9 BOE NE160QDM-NYC, IPS, 2560x1600, 16.00 | |
|---|---|---|---|---|---|
| Display | -7% | -3% | 22% | -5% | |
| Display P3 Coverage | 73.5 | 67.2 -9% | 71 -3% | 99.8 36% | 69.3 -6% |
| sRGB Coverage | 100 | 96.7 -3% | 100 0% | 100 0% | 99.4 -1% |
| AdobeRGB 1998 Coverage | 75 | 69.3 -8% | 71.4 -5% | 97 29% | 70.1 -7% |
| Response Times | -27% | -41% | 96% | -105% | |
| Response Time Grey 50% / Grey 80% * | 5 ? | 7.5 ? -50% | 5.7 ? -14% | 0.2 ? 96% | 11.9 ? -138% |
| Response Time Black / White * | 5.2 ? | 5.4 ? -4% | 8.7 ? -67% | 0.2 ? 96% | 8.9 ? -71% |
| PWM Frequency | 120 ? | ||||
| Screen | -1% | 11% | 182% | 17% | |
| Brightness middle | 491 | 542 10% | 345.8 -30% | 390 -21% | 384 -22% |
| Brightness | 460 | 504 10% | 337 -27% | 392 -15% | 366 -20% |
| Brightness Distribution | 89 | 86 -3% | 87 -2% | 98 10% | 91 2% |
| Black Level * | 0.47 | 0.45 4% | 0.3 36% | 0.02 96% | 0.35 26% |
| Contrast | 1045 | 1204 15% | 1153 10% | 19500 1766% | 1097 5% |
| Colorchecker dE 2000 * | 2.16 | 2.73 -26% | 1.99 8% | 1.94 10% | 0.97 55% |
| Colorchecker dE 2000 max. * | 4.44 | 5.29 -19% | 3.52 21% | 4.26 4% | 3.57 20% |
| Colorchecker dE 2000 calibrated * | 1.14 | 1.32 -16% | 0.62 46% | 4.21 -269% | 0.77 32% |
| Greyscale dE 2000 * | 3.3 | 2.9 12% | 2.1 36% | 1.5 55% | 1.5 55% |
| Gamma | 2.204 100% | 2.192 100% | 2.32 95% | 2.221 99% | 2.24 98% |
| CCT | 6286 103% | 6173 105% | 6369 102% | 6395 102% | 6709 97% |
| Media total (Programa/Opciones) | -12% /
-6% | -11% /
1% | 100% /
135% | -31% /
-5% |
* ... más pequeño es mejor
La pantalla ya mostraba una buena representación del color nada más sacarla de la caja: Con una desviación de alrededor de 2,2, se ha alcanzado el valor objetivo (DeltaE < 3). Calibrar la pantalla reduce su desviación a 1,14 y da como resultado unos tonos grises más equilibrados. El panel es capaz de cubrir completamente el espacio de color sRGB pero no los espacios de color AdobeRGB o DCI P3. Esto no es diferente en la mayoría de las pantallas de sus competidores.


Tiempos de respuesta del display
| ↔ Tiempo de respuesta de Negro a Blanco | ||
|---|---|---|
| 5.2 ms ... subida ↗ y bajada ↘ combinada | ↗ 1.5 ms subida |  |
| ↘ 3.7 ms bajada | ||
| La pantalla mostró tiempos de respuesta muy rápidos en nuestros tests y debería ser adecuada para juegos frenéticos. En comparación, todos los dispositivos de prueba van de ##min### (mínimo) a 240 (máximo) ms. » 12 % de todos los dispositivos son mejores. Esto quiere decir que el tiempo de respuesta medido es mejor que la media (21.4 ms) de todos los dispositivos testados. | ||
| ↔ Tiempo de respuesta 50% Gris a 80% Gris | ||
| 5 ms ... subida ↗ y bajada ↘ combinada | ↗ 2.3 ms subida |  |
| ↘ 2.7 ms bajada | ||
| La pantalla mostró tiempos de respuesta muy rápidos en nuestros tests y debería ser adecuada para juegos frenéticos. En comparación, todos los dispositivos de prueba van de ##min### (mínimo) a 636 (máximo) ms. » 12 % de todos los dispositivos son mejores. Esto quiere decir que el tiempo de respuesta medido es mejor que la media (33.7 ms) de todos los dispositivos testados. | ||
Parpadeo de Pantalla / PWM (Pulse-Width Modulation)
| Parpadeo de Pantalla / PWM no detectado |  | ||
Comparación: 53 % de todos los dispositivos testados no usaron PWM para atenuar el display. Si se usó, medimos una media de 17803 (mínimo: 5 - máxmo: 3846000) Hz. | |||
El panel IPS del dispositivo, con un ángulo de visión estable, sigue siendo legible desde cualquier ángulo. En el exterior, podrá leer en la pantalla siempre que el sol no brille demasiado.


Rendimiento - Raptor Lake y Ada Lovelace impulsan el portátil
El potente y compacto XMG Fusion 15 (Early 24) está dirigido a jugadores y creadores. Raptor Lake y Ada Lovelace proporcionan el rendimiento necesario. El portátil puede configurarse individualmente a través de la tienda en línea Schenker. La variante actual cuesta unos 2.500 dólares. Los modelos más baratos parten de unos 1.700 dólares.


Condiciones de prueba
El portátil ofrece tres modos de rendimiento específicos del fabricante (véase la tabla), entre los que se puede cambiar rápidamente mediante un botón independiente (junto al botón de encendido). Se pueden crear perfiles individuales utilizando el software Control Center preinstalado. Por ejemplo, se pueden ajustar los límites de potencia de la CPU, el TGP de la GPU y/o los límites superiores de temperatura del dispositivo.
Durante nuestra prueba se utilizaron los modos Enthusiast (pruebas de rendimiento) y Balanced (pruebas de batería). El modo GPU se ajustó a Híbrido (= Optimus).
| Entusiasta | Sobrealimentación | Equilibrada | |
|---|---|---|---|
| Límite de potencia 1 (HWInfo) | 160 vatios | 160 vatios | 160 vatios |
| Límite de potencia 2 (HWInfo) | 170 vatios | 170 vatios | 170 vatios |
| Ruido (Witcher 3) | 51 dB(A) | 53 dB(A) | 39 dB(A) |
| Rendimiento (Witcher 3) | 128 fps | 130 fps | 14-128 fps |


Subvoltaje
El procesador puede funcionar con tensiones inferiores a las previstas por el fabricante (undervolting). Como resultado, se reduce el consumo de energía del dispositivo y las emisiones de calor. Pero tenga cuidado: Bajar demasiado el voltaje puede dar lugar a un sistema inestable o defectuoso. En este caso, los cambios deben invertirse: el undervolting debe realizarse bajo su propia responsabilidad.


Procesador
El Core i9-14900HX (Raptor Lake) de 24 núcleos de CPU (8P + 16E = 32 hilos) alcanzan velocidades de reloj máximas de 5,8 GHz (P) y 4,1 GHz (E). La carga multihilo permanente (CB15 Loop) da lugar a velocidades de reloj estables: el nivel depende del modo de alimentación seleccionado.
Enthusiast ofrece valores de referencia por debajo de la media de la CPU, mientras que Overboost los eleva significativamente por encima de la media; esto se aplica principalmente al rendimiento multihilo del portátil. Su rendimiento monohilo se sitúa en un nivel alto y muy similar cuando se utilizan los tres perfiles.
Encontrará más información sobre el Core i9 en nuestro artículo de análisisAnálisis de la actualización Intel Raptor Lake-HX: Core i9-14900HX con más rendimiento de un solo núcleo .


Cinebench R15 Multi continuous test


| CPU Performance Rating - Percent | |
| SCHENKER XMG Fusion 15 (Early 24) | |
| Lenovo Legion Pro 5 16IRX9 | |
| Average Intel Core i9-14900HX | |
| Aorus 16X 2024 | |
| SCHENKER XMG Fusion 15 (Early 24) | |
| HP Omen Transcend 16-u1095ng | |
| Average of class Gaming | |
| Alienware m16 R2 -1! | |
| Cinebench R23 | |
| Multi Core | |
| SCHENKER XMG Fusion 15 (Early 24) (Overboost) | |
| Lenovo Legion Pro 5 16IRX9 | |
| Average Intel Core i9-14900HX (20702 - 32996, n=23) | |
| Aorus 16X 2024 | |
| SCHENKER XMG Fusion 15 (Early 24) | |
| HP Omen Transcend 16-u1095ng | |
| Average of class Gaming (2435 - 34613, n=222, last 2 years) | |
| Alienware m16 R2 | |
| Single Core | |
| SCHENKER XMG Fusion 15 (Early 24) (Overboost) | |
| Aorus 16X 2024 | |
| HP Omen Transcend 16-u1095ng | |
| Average Intel Core i9-14900HX (2043 - 2235, n=23) | |
| Lenovo Legion Pro 5 16IRX9 | |
| SCHENKER XMG Fusion 15 (Early 24) | |
| Average of class Gaming (527 - 2235, n=220, last 2 years) | |
| Alienware m16 R2 | |
| Cinebench R20 | |
| CPU (Multi Core) | |
| SCHENKER XMG Fusion 15 (Early 24) (Overboost) | |
| Lenovo Legion Pro 5 16IRX9 | |
| Average Intel Core i9-14900HX (8427 - 12419, n=23) | |
| Aorus 16X 2024 | |
| SCHENKER XMG Fusion 15 (Early 24) | |
| HP Omen Transcend 16-u1095ng | |
| Average of class Gaming (930 - 13769, n=220, last 2 years) | |
| Alienware m16 R2 | |
| CPU (Single Core) | |
| SCHENKER XMG Fusion 15 (Early 24) (Overboost) | |
| Aorus 16X 2024 | |
| HP Omen Transcend 16-u1095ng | |
| Average Intel Core i9-14900HX (779 - 859, n=23) | |
| Lenovo Legion Pro 5 16IRX9 | |
| SCHENKER XMG Fusion 15 (Early 24) | |
| Average of class Gaming (169 - 855, n=220, last 2 years) | |
| Alienware m16 R2 | |
| Cinebench R15 | |
| CPU Multi 64Bit | |
| Lenovo Legion Pro 5 16IRX9 | |
| SCHENKER XMG Fusion 15 (Early 24) (Overboost) | |
| Average Intel Core i9-14900HX (3263 - 4875, n=23) | |
| Aorus 16X 2024 | |
| HP Omen Transcend 16-u1095ng | |
| SCHENKER XMG Fusion 15 (Early 24) | |
| Average of class Gaming (400 - 5663, n=225, last 2 years) | |
| Alienware m16 R2 | |
| CPU Single 64Bit | |
| Aorus 16X 2024 | |
| SCHENKER XMG Fusion 15 (Early 24) (Overboost) | |
| Average Intel Core i9-14900HX (287 - 320, n=23) | |
| Lenovo Legion Pro 5 16IRX9 | |
| HP Omen Transcend 16-u1095ng | |
| SCHENKER XMG Fusion 15 (Early 24) | |
| Average of class Gaming (79.2 - 318, n=224, last 2 years) | |
| Alienware m16 R2 | |
| Blender - v2.79 BMW27 CPU | |
| Average of class Gaming (87 - 1259, n=217, last 2 years) | |
| HP Omen Transcend 16-u1095ng | |
| SCHENKER XMG Fusion 15 (Early 24) | |
| Aorus 16X 2024 | |
| Average Intel Core i9-14900HX (102 - 164, n=23) | |
| Lenovo Legion Pro 5 16IRX9 | |
| SCHENKER XMG Fusion 15 (Early 24) (Overboost) | |
| 7-Zip 18.03 | |
| 7z b 4 | |
| SCHENKER XMG Fusion 15 (Early 24) (Overboost) | |
| Lenovo Legion Pro 5 16IRX9 | |
| Average Intel Core i9-14900HX (87555 - 127108, n=23) | |
| Aorus 16X 2024 | |
| SCHENKER XMG Fusion 15 (Early 24) | |
| HP Omen Transcend 16-u1095ng | |
| Average of class Gaming (11386 - 140932, n=219, last 2 years) | |
| Alienware m16 R2 | |
| 7z b 4 -mmt1 | |
| SCHENKER XMG Fusion 15 (Early 24) | |
| SCHENKER XMG Fusion 15 (Early 24) (Overboost) | |
| Aorus 16X 2024 | |
| HP Omen Transcend 16-u1095ng | |
| Average Intel Core i9-14900HX (6206 - 7508, n=23) | |
| Lenovo Legion Pro 5 16IRX9 | |
| Average of class Gaming (2685 - 7581, n=219, last 2 years) | |
| Alienware m16 R2 | |
| Geekbench 6.2 | |
| Multi-Core | |
| Lenovo Legion Pro 5 16IRX9 (6.2.1) | |
| SCHENKER XMG Fusion 15 (Early 24) (6.2.1, Overboost) | |
| Average Intel Core i9-14900HX (15849 - 18643, n=23) | |
| Aorus 16X 2024 (6.2.1) | |
| SCHENKER XMG Fusion 15 (Early 24) (6.2.1) | |
| HP Omen Transcend 16-u1095ng (6.2.1) | |
| Average of class Gaming (5340 - 18590, n=79, last 2 years) | |
| Alienware m16 R2 (6.2.1) | |
| Single-Core | |
| SCHENKER XMG Fusion 15 (Early 24) (6.2.1) | |
| Aorus 16X 2024 (6.2.1) | |
| SCHENKER XMG Fusion 15 (Early 24) (6.2.1, Overboost) | |
| Average Intel Core i9-14900HX (2800 - 3095, n=23) | |
| Lenovo Legion Pro 5 16IRX9 (6.2.1) | |
| HP Omen Transcend 16-u1095ng (6.2.1) | |
| Average of class Gaming (1599 - 3095, n=79, last 2 years) | |
| Alienware m16 R2 (6.2.1) | |
| Geekbench 5.5 | |
| Multi-Core | |
| Lenovo Legion Pro 5 16IRX9 | |
| SCHENKER XMG Fusion 15 (Early 24) (Overboost) | |
| Aorus 16X 2024 | |
| Average Intel Core i9-14900HX (8618 - 21606, n=23) | |
| HP Omen Transcend 16-u1095ng | |
| SCHENKER XMG Fusion 15 (Early 24) | |
| Average of class Gaming (1946 - 22200, n=224, last 2 years) | |
| Alienware m16 R2 | |
| Single-Core | |
| Aorus 16X 2024 | |
| SCHENKER XMG Fusion 15 (Early 24) (Overboost) | |
| SCHENKER XMG Fusion 15 (Early 24) | |
| Average Intel Core i9-14900HX (1669 - 2210, n=23) | |
| HP Omen Transcend 16-u1095ng | |
| Lenovo Legion Pro 5 16IRX9 | |
| Average of class Gaming (158 - 2210, n=224, last 2 years) | |
| Alienware m16 R2 | |
| HWBOT x265 Benchmark v2.2 - 4k Preset | |
| SCHENKER XMG Fusion 15 (Early 24) (Overboost) | |
| Lenovo Legion Pro 5 16IRX9 | |
| Average Intel Core i9-14900HX (22.7 - 34.4, n=23) | |
| Aorus 16X 2024 | |
| SCHENKER XMG Fusion 15 (Early 24) | |
| HP Omen Transcend 16-u1095ng | |
| Average of class Gaming (3 - 37.6, n=220, last 2 years) | |
| Alienware m16 R2 | |
| LibreOffice - 20 Documents To PDF | |
| HP Omen Transcend 16-u1095ng (6.3.4.2) | |
| Alienware m16 R2 (6.3.4.2) | |
| Average of class Gaming (32.8 - 332, n=216, last 2 years) | |
| Average Intel Core i9-14900HX (33.9 - 85.1, n=23) | |
| Lenovo Legion Pro 5 16IRX9 (6.3.4.2) | |
| SCHENKER XMG Fusion 15 (Early 24) (6.3.4.2) | |
| Aorus 16X 2024 (6.3.4.2) | |
| SCHENKER XMG Fusion 15 (Early 24) (6.3.4.2, Overboost) | |
| R Benchmark 2.5 - Overall mean | |
| Alienware m16 R2 | |
| Average of class Gaming (0.3609 - 4.47, n=219, last 2 years) | |
| HP Omen Transcend 16-u1095ng | |
| Lenovo Legion Pro 5 16IRX9 | |
| Average Intel Core i9-14900HX (0.3609 - 0.4225, n=23) | |
| Aorus 16X 2024 | |
| SCHENKER XMG Fusion 15 (Early 24) (Overboost) | |
| SCHENKER XMG Fusion 15 (Early 24) | |
* ... más pequeño es mejor
AIDA64: FP32 Ray-Trace | FPU Julia | CPU SHA3 | CPU Queen | FPU SinJulia | FPU Mandel | CPU AES | CPU ZLib | FP64 Ray-Trace | CPU PhotoWorxx
| Performance Rating | |
| SCHENKER XMG Fusion 15 (Early 24) | |
| Lenovo Legion Pro 5 16IRX9 | |
| Average Intel Core i9-14900HX | |
| Aorus 16X 2024 | |
| SCHENKER XMG Fusion 15 (Early 24) | |
| Average of class Gaming | |
| HP Omen Transcend 16-u1095ng | |
| Alienware m16 R2 | |
| AIDA64 / FP32 Ray-Trace | |
| SCHENKER XMG Fusion 15 (Early 24) (v6.92.6600, Overboost) | |
| Average Intel Core i9-14900HX (17244 - 29351, n=22) | |
| Lenovo Legion Pro 5 16IRX9 (v6.92.6600) | |
| Aorus 16X 2024 (v6.92.6600) | |
| SCHENKER XMG Fusion 15 (Early 24) (v6.92.6600) | |
| Average of class Gaming (3069 - 60169, n=215, last 2 years) | |
| Alienware m16 R2 (v6.92.6600) | |
| HP Omen Transcend 16-u1095ng (v6.92.6600) | |
| AIDA64 / FPU Julia | |
| SCHENKER XMG Fusion 15 (Early 24) (v6.92.6600, Overboost) | |
| Lenovo Legion Pro 5 16IRX9 (v6.92.6600) | |
| Average Intel Core i9-14900HX (88537 - 148888, n=22) | |
| Aorus 16X 2024 (v6.92.6600) | |
| SCHENKER XMG Fusion 15 (Early 24) (v6.92.6600) | |
| Average of class Gaming (18567 - 252486, n=215, last 2 years) | |
| Alienware m16 R2 (v6.92.6600) | |
| HP Omen Transcend 16-u1095ng (v6.92.6600) | |
| AIDA64 / CPU SHA3 | |
| SCHENKER XMG Fusion 15 (Early 24) (v6.92.6600, Overboost) | |
| Lenovo Legion Pro 5 16IRX9 (v6.92.6600) | |
| Average Intel Core i9-14900HX (4267 - 7229, n=22) | |
| Aorus 16X 2024 (v6.92.6600) | |
| SCHENKER XMG Fusion 15 (Early 24) (v6.92.6600) | |
| Average of class Gaming (629 - 10389, n=215, last 2 years) | |
| HP Omen Transcend 16-u1095ng (v6.92.6600) | |
| Alienware m16 R2 (v6.92.6600) | |
| AIDA64 / CPU Queen | |
| Lenovo Legion Pro 5 16IRX9 (v6.92.6600) | |
| SCHENKER XMG Fusion 15 (Early 24) (v6.92.6600, Overboost) | |
| Aorus 16X 2024 (v6.92.6600) | |
| Average Intel Core i9-14900HX (118405 - 148773, n=22) | |
| SCHENKER XMG Fusion 15 (Early 24) (v6.92.6600) | |
| HP Omen Transcend 16-u1095ng (v6.92.6600) | |
| Average of class Gaming (15371 - 200651, n=215, last 2 years) | |
| Alienware m16 R2 (v6.92.6600) | |
| AIDA64 / FPU SinJulia | |
| SCHENKER XMG Fusion 15 (Early 24) (v6.92.6600, Overboost) | |
| Lenovo Legion Pro 5 16IRX9 (v6.92.6600) | |
| Average Intel Core i9-14900HX (12217 - 18256, n=22) | |
| Aorus 16X 2024 (v6.92.6600) | |
| SCHENKER XMG Fusion 15 (Early 24) (v6.92.6600) | |
| Average of class Gaming (2137 - 32988, n=215, last 2 years) | |
| HP Omen Transcend 16-u1095ng (v6.92.6600) | |
| Alienware m16 R2 (v6.92.6600) | |
| AIDA64 / FPU Mandel | |
| SCHENKER XMG Fusion 15 (Early 24) (v6.92.6600, Overboost) | |
| Lenovo Legion Pro 5 16IRX9 (v6.92.6600) | |
| Average Intel Core i9-14900HX (43302 - 72594, n=22) | |
| Aorus 16X 2024 (v6.92.6600) | |
| SCHENKER XMG Fusion 15 (Early 24) (v6.92.6600) | |
| Average of class Gaming (10291 - 134044, n=215, last 2 years) | |
| Alienware m16 R2 (v6.92.6600) | |
| HP Omen Transcend 16-u1095ng (v6.92.6600) | |
| AIDA64 / CPU AES | |
| SCHENKER XMG Fusion 15 (Early 24) (v6.92.6600, Overboost) | |
| SCHENKER XMG Fusion 15 (Early 24) (v6.92.6600) | |
| Average Intel Core i9-14900HX (86964 - 241777, n=22) | |
| Lenovo Legion Pro 5 16IRX9 (v6.92.6600) | |
| Aorus 16X 2024 (v6.92.6600) | |
| Average of class Gaming (19065 - 328679, n=215, last 2 years) | |
| HP Omen Transcend 16-u1095ng (v6.92.6600) | |
| Alienware m16 R2 (v6.92.6600) | |
| AIDA64 / CPU ZLib | |
| SCHENKER XMG Fusion 15 (Early 24) (v6.92.6600, Overboost) | |
| Lenovo Legion Pro 5 16IRX9 (v6.92.6600) | |
| Average Intel Core i9-14900HX (1265 - 2149, n=22) | |
| Aorus 16X 2024 (v6.92.6600) | |
| SCHENKER XMG Fusion 15 (Early 24) (v6.92.6600) | |
| HP Omen Transcend 16-u1095ng (v6.92.6600) | |
| Average of class Gaming (150.9 - 2409, n=215, last 2 years) | |
| Alienware m16 R2 (v6.92.6600) | |
| AIDA64 / FP64 Ray-Trace | |
| SCHENKER XMG Fusion 15 (Early 24) (v6.92.6600, Overboost) | |
| Lenovo Legion Pro 5 16IRX9 (v6.92.6600) | |
| Average Intel Core i9-14900HX (9170 - 16128, n=22) | |
| Aorus 16X 2024 (v6.92.6600) | |
| SCHENKER XMG Fusion 15 (Early 24) (v6.92.6600) | |
| Average of class Gaming (1518 - 31796, n=215, last 2 years) | |
| Alienware m16 R2 (v6.92.6600) | |
| HP Omen Transcend 16-u1095ng (v6.92.6600) | |
| AIDA64 / CPU PhotoWorxx | |
| Lenovo Legion Pro 5 16IRX9 (v6.92.6600) | |
| HP Omen Transcend 16-u1095ng (v6.92.6600) | |
| Aorus 16X 2024 (v6.92.6600) | |
| Average Intel Core i9-14900HX (33960 - 51118, n=22) | |
| SCHENKER XMG Fusion 15 (Early 24) (v6.92.6600, Overboost) | |
| SCHENKER XMG Fusion 15 (Early 24) (v6.92.6600) | |
| Alienware m16 R2 (v6.92.6600) | |
| Average of class Gaming (10805 - 60161, n=216, last 2 years) | |
Rendimiento del sistema
A este sistema de funcionamiento fluido no le falta potencia de cálculo. Los juegos, el streaming y el renderizado no suponen ningún reto importante para el portátil. Las tasas de transferencia de la RAM se sitúan dentro de un nivel normal para una RAM DDR5-5600. Sus resultados en PCMark también fueron buenos.

CrossMark: Overall | Productivity | Creativity | Responsiveness
WebXPRT 3: Overall
WebXPRT 4: Overall
Mozilla Kraken 1.1: Total
| PCMark 10 / Score | |
| Lenovo Legion Pro 5 16IRX9 | |
| SCHENKER XMG Fusion 15 (Early 24) | |
| Aorus 16X 2024 | |
| Average Intel Core i9-14900HX, NVIDIA GeForce RTX 4070 Laptop GPU (7866 - 8550, n=5) | |
| HP Omen Transcend 16-u1095ng | |
| Alienware m16 R2 | |
| Average of class Gaming (5235 - 9852, n=191, last 2 years) | |
| PCMark 10 / Essentials | |
| SCHENKER XMG Fusion 15 (Early 24) | |
| Lenovo Legion Pro 5 16IRX9 | |
| Average Intel Core i9-14900HX, NVIDIA GeForce RTX 4070 Laptop GPU (10621 - 11815, n=5) | |
| Aorus 16X 2024 | |
| Average of class Gaming (8300 - 12334, n=190, last 2 years) | |
| HP Omen Transcend 16-u1095ng | |
| Alienware m16 R2 | |
| PCMark 10 / Productivity | |
| Aorus 16X 2024 | |
| SCHENKER XMG Fusion 15 (Early 24) | |
| Average Intel Core i9-14900HX, NVIDIA GeForce RTX 4070 Laptop GPU (9701 - 11103, n=5) | |
| HP Omen Transcend 16-u1095ng | |
| Lenovo Legion Pro 5 16IRX9 | |
| Average of class Gaming (6662 - 11833, n=190, last 2 years) | |
| Alienware m16 R2 | |
| PCMark 10 / Digital Content Creation | |
| Lenovo Legion Pro 5 16IRX9 | |
| Average Intel Core i9-14900HX, NVIDIA GeForce RTX 4070 Laptop GPU (12114 - 14827, n=5) | |
| SCHENKER XMG Fusion 15 (Early 24) | |
| Aorus 16X 2024 | |
| Alienware m16 R2 | |
| HP Omen Transcend 16-u1095ng | |
| Average of class Gaming (6462 - 18475, n=190, last 2 years) | |
| CrossMark / Overall | |
| Aorus 16X 2024 | |
| Average Intel Core i9-14900HX, NVIDIA GeForce RTX 4070 Laptop GPU (2002 - 2312, n=4) | |
| SCHENKER XMG Fusion 15 (Early 24) | |
| Lenovo Legion Pro 5 16IRX9 | |
| Average of class Gaming (1247 - 2334, n=164, last 2 years) | |
| Alienware m16 R2 | |
| CrossMark / Productivity | |
| Aorus 16X 2024 | |
| SCHENKER XMG Fusion 15 (Early 24) | |
| Average Intel Core i9-14900HX, NVIDIA GeForce RTX 4070 Laptop GPU (1827 - 2191, n=4) | |
| Lenovo Legion Pro 5 16IRX9 | |
| Average of class Gaming (1299 - 2204, n=164, last 2 years) | |
| Alienware m16 R2 | |
| CrossMark / Creativity | |
| Aorus 16X 2024 | |
| Average Intel Core i9-14900HX, NVIDIA GeForce RTX 4070 Laptop GPU (2287 - 2458, n=4) | |
| SCHENKER XMG Fusion 15 (Early 24) | |
| Lenovo Legion Pro 5 16IRX9 | |
| Average of class Gaming (1275 - 2514, n=164, last 2 years) | |
| Alienware m16 R2 | |
| CrossMark / Responsiveness | |
| Aorus 16X 2024 | |
| Average Intel Core i9-14900HX, NVIDIA GeForce RTX 4070 Laptop GPU (1769 - 2330, n=4) | |
| SCHENKER XMG Fusion 15 (Early 24) | |
| Lenovo Legion Pro 5 16IRX9 | |
| Average of class Gaming (1030 - 2330, n=164, last 2 years) | |
| Alienware m16 R2 | |
| WebXPRT 3 / Overall | |
| HP Omen Transcend 16-u1095ng | |
| SCHENKER XMG Fusion 15 (Early 24) | |
| Average Intel Core i9-14900HX, NVIDIA GeForce RTX 4070 Laptop GPU (322 - 342, n=5) | |
| Aorus 16X 2024 | |
| Lenovo Legion Pro 5 16IRX9 | |
| Average of class Gaming (215 - 480, n=189, last 2 years) | |
| Alienware m16 R2 | |
| WebXPRT 4 / Overall | |
| SCHENKER XMG Fusion 15 (Early 24) | |
| Average Intel Core i9-14900HX, NVIDIA GeForce RTX 4070 Laptop GPU (291 - 301, n=3) | |
| Lenovo Legion Pro 5 16IRX9 | |
| Average of class Gaming (157.9 - 328, n=164, last 2 years) | |
| Alienware m16 R2 | |
| Mozilla Kraken 1.1 / Total | |
| Alienware m16 R2 | |
| Average of class Gaming (421 - 824, n=202, last 2 years) | |
| Lenovo Legion Pro 5 16IRX9 | |
| Average Intel Core i9-14900HX, NVIDIA GeForce RTX 4070 Laptop GPU (431 - 449, n=5) | |
| HP Omen Transcend 16-u1095ng | |
| Aorus 16X 2024 | |
| SCHENKER XMG Fusion 15 (Early 24) | |
* ... más pequeño es mejor
| PCMark 10 Score | 8522 puntos | |
ayuda | ||
| AIDA64 / Memory Copy | |
| Lenovo Legion Pro 5 16IRX9 | |
| Aorus 16X 2024 | |
| HP Omen Transcend 16-u1095ng | |
| SCHENKER XMG Fusion 15 (Early 24) | |
| Average Intel Core i9-14900HX (56992 - 83392, n=22) | |
| Alienware m16 R2 | |
| Average of class Gaming (21842 - 92565, n=215, last 2 years) | |
| AIDA64 / Memory Read | |
| Aorus 16X 2024 | |
| Lenovo Legion Pro 5 16IRX9 | |
| SCHENKER XMG Fusion 15 (Early 24) | |
| HP Omen Transcend 16-u1095ng | |
| Average Intel Core i9-14900HX (54443 - 87507, n=22) | |
| Alienware m16 R2 | |
| Average of class Gaming (24879 - 90647, n=215, last 2 years) | |
| AIDA64 / Memory Write | |
| HP Omen Transcend 16-u1095ng | |
| Aorus 16X 2024 | |
| Lenovo Legion Pro 5 16IRX9 | |
| Average Intel Core i9-14900HX (51387 - 78199, n=22) | |
| SCHENKER XMG Fusion 15 (Early 24) | |
| Alienware m16 R2 | |
| Average of class Gaming (21619 - 103259, n=215, last 2 years) | |
| AIDA64 / Memory Latency | |
| Alienware m16 R2 | |
| Average of class Gaming (59.5 - 152.5, n=211, last 2 years) | |
| HP Omen Transcend 16-u1095ng | |
| Average Intel Core i9-14900HX (79.7 - 105, n=22) | |
| Lenovo Legion Pro 5 16IRX9 | |
| SCHENKER XMG Fusion 15 (Early 24) | |
| Aorus 16X 2024 | |
* ... más pequeño es mejor
Latencias del CPD
La prueba de monitorización de latencia estandarizada (navegación por la web, reproducción de vídeo 4k, Prime95 a alta carga) reveló algunas anomalías. El sistema no parece adecuado para la edición de vídeo y audio en tiempo real. Futuras actualizaciones del software podrían suponer mejoras o incluso deterioros.


| DPC Latencies / LatencyMon - interrupt to process latency (max), Web, Youtube, Prime95 | |
| Alienware m16 R2 | |
| HP Omen Transcend 16-u1095ng | |
| Aorus 16X 2024 | |
| Lenovo Legion Pro 5 16IRX9 | |
| SCHENKER XMG Fusion 15 (Early 24) | |
* ... más pequeño es mejor
Dispositivos de almacenamiento
La Fusion puede alojar un total de dos unidades SSD PCIe-4 de formato M.2-2280. Soporta RAID-0/1. La unidad SSD Samsung (1 TB) de nuestro dispositivo de prueba ofreció una excelente velocidad de datos. Positivo: No notamos ningún estrangulamiento térmico.


* ... más pequeño es mejor
Reading continuous performance: DiskSpd Read Loop, Queue Depth 8
Tarjeta gráfica
Schenker ha permitido que la GeForce RTX 4070 un TGP máximo de 140 vatios (115 vatios + 25 vatios Dynamic Boost)-más no es recomendado por Nvidia. La GPU tiene acceso a 8 GB de VRAM (GDDR6), un poco escasa para las exigencias actuales. Las pruebas de rendimiento ofrecieron resultados por encima de la media de la RTX-4070(Enthusiast) y Overboost sólo supuso una pequeña ventaja. El cambio entre la dGPU y Optimus requiere un reinicio.


| 3DMark Performance Rating - Percent | |
| SCHENKER XMG Fusion 15 (Early 24) | |
| Lenovo Legion Pro 5 16IRX9 | |
| SCHENKER XMG Fusion 15 (Early 24) | |
| Alienware m16 R2 | |
| Average of class Gaming | |
| Aorus 16X 2024 | |
| Average NVIDIA GeForce RTX 4070 Laptop GPU | |
| HP Omen Transcend 16-u1095ng | |
| 3DMark 11 - 1280x720 Performance GPU | |
| SCHENKER XMG Fusion 15 (Early 24) (Overboost) | |
| SCHENKER XMG Fusion 15 (Early 24) | |
| Lenovo Legion Pro 5 16IRX9 | |
| Alienware m16 R2 | |
| Aorus 16X 2024 | |
| Average of class Gaming (1029 - 72070, n=219, last 2 years) | |
| Average NVIDIA GeForce RTX 4070 Laptop GPU (24229 - 46434, n=50) | |
| HP Omen Transcend 16-u1095ng | |
| 3DMark | |
| 1920x1080 Fire Strike Graphics | |
| SCHENKER XMG Fusion 15 (Early 24) (Overboost) | |
| SCHENKER XMG Fusion 15 (Early 24) | |
| Lenovo Legion Pro 5 16IRX9 | |
| Alienware m16 R2 | |
| Average of class Gaming (781 - 53059, n=224, last 2 years) | |
| Average NVIDIA GeForce RTX 4070 Laptop GPU (16212 - 33451, n=50) | |
| Aorus 16X 2024 | |
| HP Omen Transcend 16-u1095ng | |
| 2560x1440 Time Spy Graphics | |
| SCHENKER XMG Fusion 15 (Early 24) (Overboost) | |
| Lenovo Legion Pro 5 16IRX9 | |
| Alienware m16 R2 | |
| SCHENKER XMG Fusion 15 (Early 24) | |
| Average of class Gaming (224 - 22547, n=221, last 2 years) | |
| Aorus 16X 2024 | |
| Average NVIDIA GeForce RTX 4070 Laptop GPU (6241 - 13391, n=49) | |
| HP Omen Transcend 16-u1095ng | |
| 3DMark 06 Standard Score | 63892 puntos | |
| 3DMark 11 Performance | 36008 puntos | |
| 3DMark Fire Strike Score | 26661 puntos | |
| 3DMark Time Spy Score | 13067 puntos | |
ayuda | ||
| Geekbench 5.5 | |
| OpenCL Score | |
| SCHENKER XMG Fusion 15 (Early 24) | |
| SCHENKER XMG Fusion 15 (Early 24) (Overboost) | |
| Aorus 16X 2024 | |
| Average of class Gaming (5039 - 226512, n=223, last 2 years) | |
| HP Omen Transcend 16-u1095ng | |
| Lenovo Legion Pro 5 16IRX9 | |
| Average NVIDIA GeForce RTX 4070 Laptop GPU (17391 - 129366, n=49) | |
| Alienware m16 R2 | |
| Vulkan Score | |
| SCHENKER XMG Fusion 15 (Early 24) (Overboost) | |
| Aorus 16X 2024 | |
| SCHENKER XMG Fusion 15 (Early 24) | |
| Alienware m16 R2 | |
| Lenovo Legion Pro 5 16IRX9 | |
| Average of class Gaming (1952 - 160279, n=219, last 2 years) | |
| Average NVIDIA GeForce RTX 4070 Laptop GPU (4898 - 93339, n=48) | |
| Geekbench 6.2 | |
| GPU OpenCL | |
| SCHENKER XMG Fusion 15 (Early 24) (6.2.1) | |
| SCHENKER XMG Fusion 15 (Early 24) (6.2.1, Overboost) | |
| HP Omen Transcend 16-u1095ng (6.2.1) | |
| Aorus 16X 2024 (6.2.1) | |
| Average of class Gaming (4321 - 207373, n=79, last 2 years) | |
| Average NVIDIA GeForce RTX 4070 Laptop GPU (101474 - 129836, n=26) | |
| Lenovo Legion Pro 5 16IRX9 (6.2.1) | |
| Alienware m16 R2 (6.2.1) | |
| GPU Vulkan | |
| SCHENKER XMG Fusion 15 (Early 24) (6.2.1, Overboost) | |
| Alienware m16 R2 (6.2.1) | |
| Lenovo Legion Pro 5 16IRX9 (6.2.1) | |
| SCHENKER XMG Fusion 15 (Early 24) (6.2.1) | |
| Aorus 16X 2024 (6.2.1) | |
| Average of class Gaming (4286 - 196201, n=76, last 2 years) | |
| Average NVIDIA GeForce RTX 4070 Laptop GPU (9035 - 120033, n=24) | |
| V-Ray 5 Benchmark | |
| GPU RTX | |
| Average of class Gaming (171 - 3824, n=122, last 2 years) | |
| Lenovo Legion Pro 5 16IRX9 (5.0.1) | |
| SCHENKER XMG Fusion 15 (Early 24) (5.0.1, Overboost) | |
| SCHENKER XMG Fusion 15 (Early 24) (5.0.1) | |
| Alienware m16 R2 (5.0.1) | |
| Aorus 16X 2024 (5.0.1) | |
| Average NVIDIA GeForce RTX 4070 Laptop GPU (171 - 1872, n=28) | |
| GPU CUDA | |
| Average of class Gaming (120 - 2797, n=126, last 2 years) | |
| Lenovo Legion Pro 5 16IRX9 (5.0.1) | |
| SCHENKER XMG Fusion 15 (Early 24) (5.0.1, Overboost) | |
| SCHENKER XMG Fusion 15 (Early 24) (5.0.1) | |
| Alienware m16 R2 (5.0.1) | |
| Aorus 16X 2024 (5.0.1) | |
| Average NVIDIA GeForce RTX 4070 Laptop GPU (120 - 1333, n=28) | |
| CPU | |
| SCHENKER XMG Fusion 15 (Early 24) (5.0.1, Overboost) | |
| Lenovo Legion Pro 5 16IRX9 (5.0.1) | |
| Aorus 16X 2024 (5.0.1) | |
| SCHENKER XMG Fusion 15 (Early 24) (5.0.1) | |
| Average NVIDIA GeForce RTX 4070 Laptop GPU (10005 - 20388, n=27) | |
| Average of class Gaming (1690 - 26944, n=136, last 2 years) | |
| Alienware m16 R2 (5.0.1) | |
| V-Ray Benchmark Next 4.10 | |
| GPU | |
| Lenovo Legion Pro 5 16IRX9 (v4.10.07 ) | |
| SCHENKER XMG Fusion 15 (Early 24) (v4.10.07, Overboost) | |
| Average of class Gaming (54 - 1334, n=177, last 2 years) | |
| Average NVIDIA GeForce RTX 4070 Laptop GPU (500 - 686, n=35) | |
| SCHENKER XMG Fusion 15 (Early 24) (v4.10.07 ) | |
| HP Omen Transcend 16-u1095ng (v4.10.07 ) | |
| Aorus 16X 2024 (v4.10.07 ) | |
| CPU | |
| SCHENKER XMG Fusion 15 (Early 24) (v4.10.07, Overboost) | |
| Lenovo Legion Pro 5 16IRX9 (v4.10.07 ) | |
| Aorus 16X 2024 (v4.10.07 ) | |
| SCHENKER XMG Fusion 15 (Early 24) (v4.10.07 ) | |
| HP Omen Transcend 16-u1095ng (v4.10.07 ) | |
| Average NVIDIA GeForce RTX 4070 Laptop GPU (12638 - 35173, n=35) | |
| Average of class Gaming (2741 - 37629, n=177, last 2 years) | |
* ... más pequeño es mejor
Rendimiento en juegos
El hardware está pensado para juegos QHD con ajustes de altos a máximos. Utilizando DLSS 3 y la Generación de fotogramas, podría jugar a resoluciones más altas y ajustes máximos, incluido el trazado de rayos, pero sólo con juegos compatibles con estas funciones. Observamos velocidades de fotogramas superiores a la media de la RTX-4070(Enthusiast) y el Overboost se tradujo en una pequeña ventaja.
| Performance Rating - Percent | |
| SCHENKER XMG Fusion 15 (Early 24) | |
| Lenovo Legion Pro 5 16IRX9 | |
| SCHENKER XMG Fusion 15 (Early 24) | |
| Aorus 16X 2024 | |
| Alienware m16 R2 -1! | |
| HP Omen Transcend 16-u1095ng | |
| Average NVIDIA GeForce RTX 4070 Laptop GPU | |
| Average of class Gaming | |
| The Witcher 3 - 1920x1080 Ultra Graphics & Postprocessing (HBAO+) | |
| Lenovo Legion Pro 5 16IRX9 | |
| SCHENKER XMG Fusion 15 (Early 24) (Overboost) | |
| SCHENKER XMG Fusion 15 (Early 24) | |
| Aorus 16X 2024 | |
| Alienware m16 R2 | |
| Average of class Gaming (8.61 - 216, n=215, last 2 years) | |
| HP Omen Transcend 16-u1095ng | |
| Average NVIDIA GeForce RTX 4070 Laptop GPU (69.8 - 133.7, n=52) | |
| GTA V - 1920x1080 Highest Settings possible AA:4xMSAA + FX AF:16x | |
| SCHENKER XMG Fusion 15 (Early 24) (Overboost) | |
| SCHENKER XMG Fusion 15 (Early 24) | |
| Lenovo Legion Pro 5 16IRX9 | |
| HP Omen Transcend 16-u1095ng | |
| Average NVIDIA GeForce RTX 4070 Laptop GPU (63.5 - 140.5, n=44) | |
| Average of class Gaming (6.38 - 167.7, n=207, last 2 years) | |
| Aorus 16X 2024 | |
| Final Fantasy XV Benchmark - 1920x1080 High Quality | |
| SCHENKER XMG Fusion 15 (Early 24) (1.3, Overboost) | |
| Lenovo Legion Pro 5 16IRX9 (1.3) | |
| SCHENKER XMG Fusion 15 (Early 24) (1.3) | |
| Alienware m16 R2 (1.3) | |
| Average NVIDIA GeForce RTX 4070 Laptop GPU (66 - 131.9, n=47) | |
| Average of class Gaming (9.13 - 194.9, n=217, last 2 years) | |
| Aorus 16X 2024 (1.3) | |
| HP Omen Transcend 16-u1095ng (1.3) | |
| Strange Brigade - 1920x1080 ultra AA:ultra AF:16 | |
| Lenovo Legion Pro 5 16IRX9 (1.47.22.14 D3D12) | |
| SCHENKER XMG Fusion 15 (Early 24) (1.47.22.14 D3D12, Overboost) | |
| Alienware m16 R2 (1.47.22.14 D3D12) | |
| SCHENKER XMG Fusion 15 (Early 24) (1.47.22.14 D3D12) | |
| Average of class Gaming (14.6 - 421, n=214, last 2 years) | |
| Aorus 16X 2024 (1.47.22.14 D3D12) | |
| Average NVIDIA GeForce RTX 4070 Laptop GPU (117.7 - 234, n=47) | |
| HP Omen Transcend 16-u1095ng (1.47.22.14 D3D12) | |
| Dota 2 Reborn - 1920x1080 ultra (3/3) best looking | |
| SCHENKER XMG Fusion 15 (Early 24) (Overboost) | |
| Lenovo Legion Pro 5 16IRX9 | |
| SCHENKER XMG Fusion 15 (Early 24) | |
| Aorus 16X 2024 | |
| HP Omen Transcend 16-u1095ng | |
| Average NVIDIA GeForce RTX 4070 Laptop GPU (89.7 - 187.5, n=48) | |
| Average of class Gaming (26.9 - 220, n=226, last 2 years) | |
| Alienware m16 R2 | |
| X-Plane 11.11 - 1920x1080 high (fps_test=3) | |
| SCHENKER XMG Fusion 15 (Early 24) (Overboost) | |
| Lenovo Legion Pro 5 16IRX9 | |
| SCHENKER XMG Fusion 15 (Early 24) | |
| Aorus 16X 2024 | |
| HP Omen Transcend 16-u1095ng | |
| Average NVIDIA GeForce RTX 4070 Laptop GPU (72.2 - 144.4, n=50) | |
| Average of class Gaming (12.4 - 166.2, n=232, last 2 years) | |
| Alienware m16 R2 | |
| Alone in the Dark | |
| 1920x1080 Cinematic Preset | |
| SCHENKER XMG Fusion 15 (Early 24) | |
| Aorus 16X 2024 | |
| Average NVIDIA GeForce RTX 4070 Laptop GPU (114 - 126, n=3) | |
| Average of class Gaming (13.6 - 176.4, n=4, last 2 years) | |
| 2560x1440 Cinematic Preset | |
| Average of class Gaming (64.7 - 91.6, n=3, last 2 years) | |
| SCHENKER XMG Fusion 15 (Early 24) | |
| Average NVIDIA GeForce RTX 4070 Laptop GPU (64.7 - 76.6, n=3) | |
| Aorus 16X 2024 | |
| The Witcher 3 v4.00 | |
| 1920x1080 Ultra Preset / On AA:FX | |
| Average of class Gaming (25.7 - 150, n=17, last 2 years) | |
| SCHENKER XMG Fusion 15 (Early 24) | |
| Average NVIDIA GeForce RTX 4070 Laptop GPU (85 - 86.5, n=2) | |
| 1920x1080 RT Ultra Preset / On AA:FX | |
| Average of class Gaming (12.9 - 66, n=11, last 2 years) | |
| SCHENKER XMG Fusion 15 (Early 24) | |
| Average NVIDIA GeForce RTX 4070 Laptop GPU (36 - 40.4, n=2) | |
Para comprobar si sus tasas de imágenes por segundo se mantienen estables durante un periodo de tiempo prolongado, dejamos correr el juego The Witcher 3 durante unos 60 minutos en Full HD y con los ajustes al máximo. No movimos el personaje del juego. No notamos un desplome en la velocidad de fotogramas, sin embargo, se redujeron en un tanto por ciento después de unos 50 minutos(Enthusiast). Con el perfil Overboost activado, este comportamiento no se produjo.
Witcher 3 FPS diagram


| bajo | medio | alto | ultra | QHD | |
| GTA V (2015) | 187.8 | 187 | 186.4 | 137.6 | 98.2 |
| The Witcher 3 (2015) | 603.3 | 418.4 | 246.2 | 128 | 92.2 |
| Dota 2 Reborn (2015) | 234 | 207 | 196.5 | 182.1 | |
| Final Fantasy XV Benchmark (2018) | 226 | 175.5 | 124.6 | 90.5 | |
| X-Plane 11.11 (2018) | 205 | 173.3 | 136.9 | ||
| Far Cry 5 (2018) | 204 | 176 | 166 | 157 | 124 |
| Strange Brigade (2018) | 558 | 313 | 245 | 214 | 139.2 |
| The Witcher 3 v4.00 (2023) | 271 | 215 | 176.2 | 86.5 | |
| Baldur's Gate 3 (2023) | 157.2 | 121.2 | 106.1 | 105 | 82.1 |
| Cyberpunk 2077 2.0 Phantom Liberty (2023) | 156.6 | 124.5 | 103.6 | 87 | 52.6 |
| Alan Wake 2 (2023) | 74.3 | 71.4 | 70.1 | 42.8 | |
| Alone in the Dark (2024) | 222 | 209 | 196.5 | 126 | 76.6 |
| Dragon's Dogma 2 (2024) | 83.9 | 80 | 61.3 |
Emisiones - El portátil Schenker se calienta bastante
Emisiones sonoras
En el uso diario y en ralentí, el portátil funciona de forma muy silenciosa. Aunque los ventiladores están permanentemente activados (se pueden desactivar a través de la BIOS), sólo se oyen en entornos muy silenciosos. Bajo carga, las cosas cambian rápidamente: Observamos emisiones nasales de hasta 53 dB(A)(Enthusiast). El modo Overboost dio lugar a valores aún más elevados. El aparato funciona considerablemente más silencioso cuando se utiliza el modo Equilibrado, acosta de algunas prestaciones.
Ruido
| Ocioso |
| 27 / 28 / 33 dB(A) |
| Carga |
| 52 / 53 dB(A) |
 | ||
30 dB silencioso 40 dB(A) audible 50 dB(A) ruidosamente alto |
||
min: | ||
| SCHENKER XMG Fusion 15 (Early 24) i9-14900HX, NVIDIA GeForce RTX 4070 Laptop GPU | Aorus 16X 2024 i9-14900HX, NVIDIA GeForce RTX 4070 Laptop GPU | Alienware m16 R2 Ultra 7 155H, NVIDIA GeForce RTX 4070 Laptop GPU | HP Omen Transcend 16-u1095ng i9-14900HX, NVIDIA GeForce RTX 4070 Laptop GPU | Lenovo Legion Pro 5 16IRX9 i9-14900HX, NVIDIA GeForce RTX 4070 Laptop GPU | |
|---|---|---|---|---|---|
| Noise | -5% | 8% | 5% | 6% | |
| off / environment * | 25 | 26 -4% | 24.7 1% | 24 4% | 23.9 4% |
| Idle Minimum * | 27 | 26 4% | 25.3 6% | 29 -7% | 24.3 10% |
| Idle Average * | 28 | 32 -14% | 25.3 10% | 30 -7% | 24.3 13% |
| Idle Maximum * | 33 | 38 -15% | 25.3 23% | 31 6% | 28.9 12% |
| Load Average * | 52 | 54 -4% | 31.7 39% | 45 13% | 45.8 12% |
| Witcher 3 ultra * | 51 | 50 2% | 53.8 -5% | 44 14% | 51 -0% |
| Load Maximum * | 53 | 55 -4% | 62 -17% | 47 11% | 56.6 -7% |
* ... más pequeño es mejor
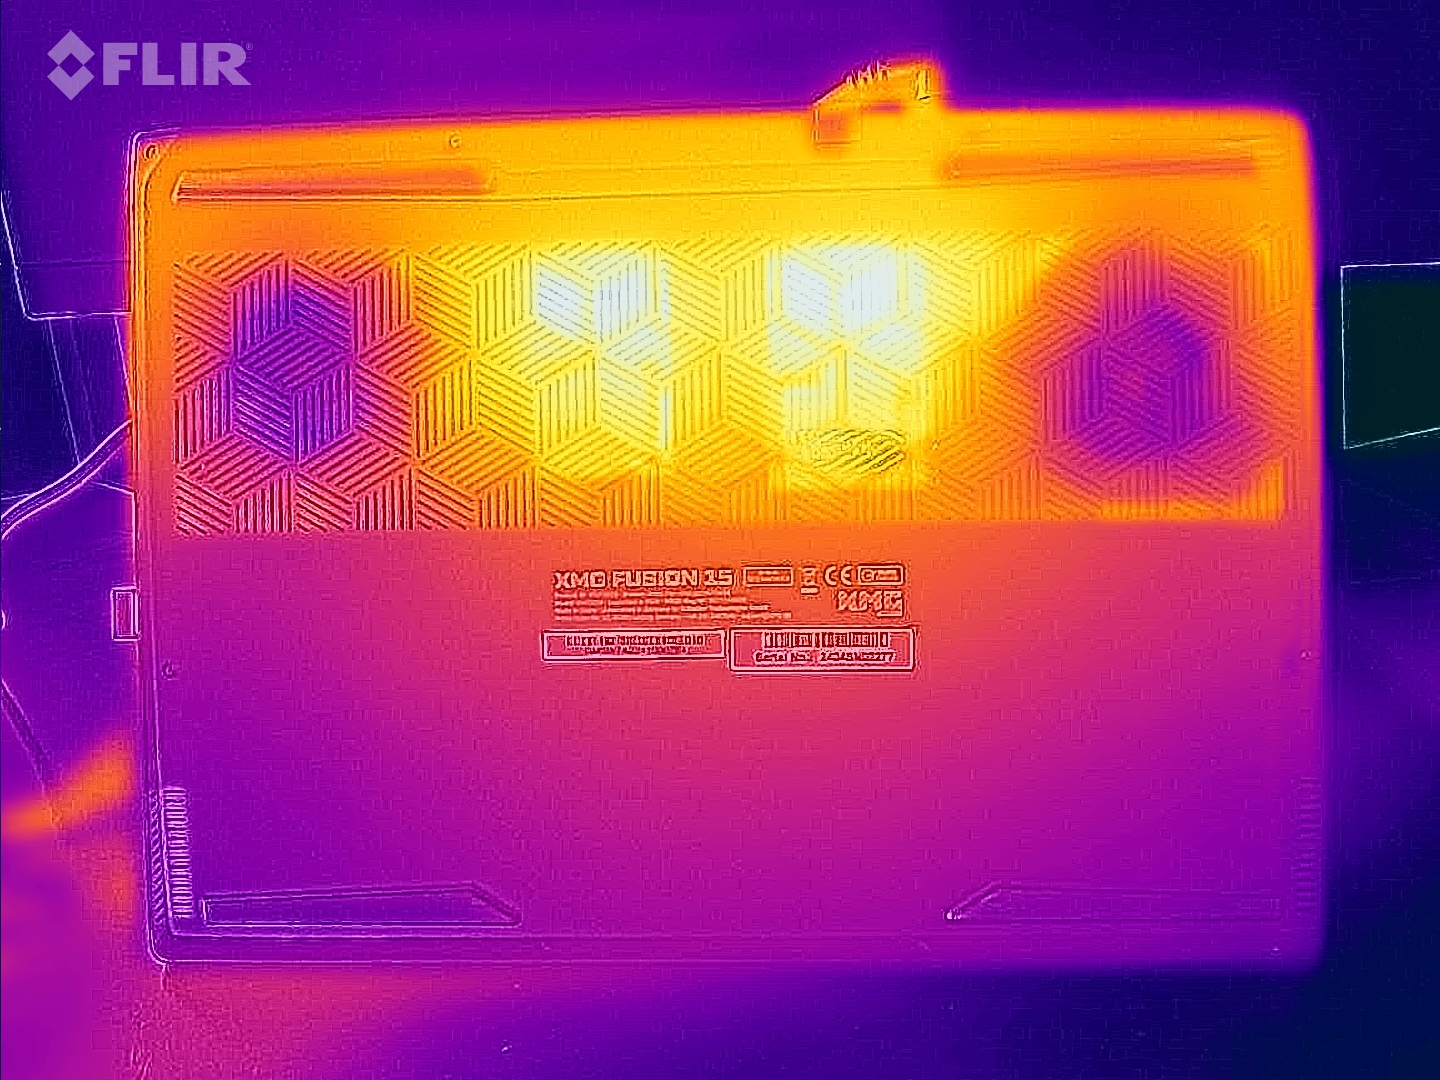
Temperatura
La prueba de estrés y Witcher 3 test hicieron que el portátil se calentara considerablemente. En ocasiones, alcanzó valores dentro de la franja superior de los 50 grados centígrados. En el uso diario (oficina, Internet), los valores se mantienen generalmente dentro de la zona verde.
(-) The maximum temperature on the upper side is 48 °C / 118 F, compared to the average of 40.4 °C / 105 F, ranging from 21.2 to 68.8 °C for the class Gaming.
(-) The bottom heats up to a maximum of 56 °C / 133 F, compared to the average of 43.2 °C / 110 F
(+) In idle usage, the average temperature for the upper side is 26.6 °C / 80 F, compared to the device average of 33.8 °C / 93 F.
(-) Playing The Witcher 3, the average temperature for the upper side is 40.4 °C / 105 F, compared to the device average of 33.8 °C / 93 F.
(+) The palmrests and touchpad are reaching skin temperature as a maximum (34 °C / 93.2 F) and are therefore not hot.
(-) The average temperature of the palmrest area of similar devices was 28.9 °C / 84 F (-5.1 °C / -9.2 F).
| SCHENKER XMG Fusion 15 (Early 24) Intel Core i9-14900HX, NVIDIA GeForce RTX 4070 Laptop GPU | Aorus 16X 2024 Intel Core i9-14900HX, NVIDIA GeForce RTX 4070 Laptop GPU | Alienware m16 R2 Intel Core Ultra 7 155H, NVIDIA GeForce RTX 4070 Laptop GPU | HP Omen Transcend 16-u1095ng Intel Core i9-14900HX, NVIDIA GeForce RTX 4070 Laptop GPU | Lenovo Legion Pro 5 16IRX9 Intel Core i9-14900HX, NVIDIA GeForce RTX 4070 Laptop GPU | |
|---|---|---|---|---|---|
| Heat | -5% | -14% | -6% | -8% | |
| Maximum Upper Side * | 48 | 41 15% | 44.8 7% | 49 -2% | 43.8 9% |
| Maximum Bottom * | 56 | 41 27% | 48 14% | 63 -13% | 55.4 1% |
| Idle Upper Side * | 28 | 37 -32% | 37.2 -33% | 30 -7% | 32.8 -17% |
| Idle Bottom * | 29 | 38 -31% | 42 -45% | 29 -0% | 36 -24% |
* ... más pequeño es mejor
Prueba de esfuerzo
El escenario extremo simulado por la prueba de estrés (Prime95 y Furmark en funcionamiento continuo) comprueba la estabilidad del sistema a plena carga. El reloj de la CPU se hundió lenta y continuamente desde valores ligeramente superiores a la velocidad de reloj base hasta valores inferiores. El núcleo gráfico funcionó a altas velocidades en todo momento.


Altavoces
Los altavoces estéreo del portátil producen un sonido decente, pero carecen de graves. Se podría conseguir una mejor experiencia de sonido conectando unos auriculares o unos altavoces externos.
SCHENKER XMG Fusion 15 (Early 24) audio analysis
(+) | speakers can play relatively loud (85 dB)
Bass 100 - 315 Hz
(-) | nearly no bass - on average 15.8% lower than median
(±) | linearity of bass is average (12.5% delta to prev. frequency)
Mids 400 - 2000 Hz
(+) | balanced mids - only 4.4% away from median
(+) | mids are linear (5.9% delta to prev. frequency)
Highs 2 - 16 kHz
(+) | balanced highs - only 2% away from median
(+) | highs are linear (4.8% delta to prev. frequency)
Overall 100 - 16.000 Hz
(+) | overall sound is linear (11.5% difference to median)
Compared to same class
» 9% of all tested devices in this class were better, 2% similar, 89% worse
» The best had a delta of 6%, average was 18%, worst was 132%
Compared to all devices tested
» 6% of all tested devices were better, 2% similar, 93% worse
» The best had a delta of 4%, average was 25%, worst was 134%
Aorus 16X 2024 audio analysis
(+) | speakers can play relatively loud (85 dB)
Bass 100 - 315 Hz
(±) | reduced bass - on average 8.5% lower than median
(±) | linearity of bass is average (8.3% delta to prev. frequency)
Mids 400 - 2000 Hz
(+) | balanced mids - only 3.1% away from median
(+) | mids are linear (5.8% delta to prev. frequency)
Highs 2 - 16 kHz
(+) | balanced highs - only 2.5% away from median
(±) | linearity of highs is average (7% delta to prev. frequency)
Overall 100 - 16.000 Hz
(+) | overall sound is linear (8.4% difference to median)
Compared to same class
» 1% of all tested devices in this class were better, 1% similar, 98% worse
» The best had a delta of 6%, average was 18%, worst was 132%
Compared to all devices tested
» 1% of all tested devices were better, 0% similar, 98% worse
» The best had a delta of 4%, average was 25%, worst was 134%
Gestión de la energía - La Fusion 15 ofrece tiempos de ejecución muy buenos
Consumo de energía
Su requerimiento de energía es en gran medida normal para el hardware instalado. Excepción: A pesar de tener la batería completamente cargada, medimos un valor de consumo de energía de unos 20 vatios con el portátil apagado. Es probable que se trate de un error. Las pruebas Witcher 3 test y la prueba de estrés se ejecutaron con valores de consumo de energía ligeramente descendentes. La fuente de alimentación (280 vatios) es suficiente en potencia.
| Ocioso | |
| Carga |
|
| SCHENKER XMG Fusion 15 (Early 24) i9-14900HX, NVIDIA GeForce RTX 4070 Laptop GPU | Aorus 16X 2024 i9-14900HX, NVIDIA GeForce RTX 4070 Laptop GPU | Alienware m16 R2 Ultra 7 155H, NVIDIA GeForce RTX 4070 Laptop GPU | HP Omen Transcend 16-u1095ng i9-14900HX, NVIDIA GeForce RTX 4070 Laptop GPU | Average of class Gaming | |
|---|---|---|---|---|---|
| Power Consumption | -21% | -3% | -10% | -23% | |
| Idle Minimum * | 8 | 13 -63% | 8.1 -1% | 10 -25% | 13.9 ? -74% |
| Idle Average * | 14 | 18 -29% | 13 7% | 18 -29% | 19.3 ? -38% |
| Idle Maximum * | 26 | 35 -35% | 40.3 -55% | 32 -23% | 27.2 ? -5% |
| Load Average * | 118 | 138 -17% | 79 33% | 128 -8% | 110.6 ? 6% |
| Witcher 3 ultra * | 192.7 | 172.6 10% | 188.1 2% | 148.4 23% | |
| Load Maximum * | 244 | 222 9% | 254.9 -4% | 242 1% | 251 ? -3% |
* ... más pequeño es mejor
Power consumption Witcher 3 / stress test
Power consumption with external monitor
Tiempos de ejecución
Durante nuestra prueba WiFi (carga de sitios web a través de un script) y la prueba de vídeo (cortometraje Big Buck Bunny (codificación H.264, FHD) en bucle), medimos tiempos de ejecución de 8:00 horas y 10:02 horas respectivamente. Se trata de valores muy buenos.

| SCHENKER XMG Fusion 15 (Early 24) i9-14900HX, NVIDIA GeForce RTX 4070 Laptop GPU, 99.8 Wh | Aorus 16X 2024 i9-14900HX, NVIDIA GeForce RTX 4070 Laptop GPU, 99 Wh | Alienware m16 R2 Ultra 7 155H, NVIDIA GeForce RTX 4070 Laptop GPU, 90 Wh | HP Omen Transcend 16-u1095ng i9-14900HX, NVIDIA GeForce RTX 4070 Laptop GPU, 97 Wh | Lenovo Legion Pro 5 16IRX9 i9-14900HX, NVIDIA GeForce RTX 4070 Laptop GPU, 80 Wh | Average of class Gaming | |
|---|---|---|---|---|---|---|
| Duración de Batería | -17% | -26% | -39% | -52% | -36% | |
| Reader / Idle | 911 | 753 -17% | 758 -17% | 403 -56% | 545 ? -40% | |
| H.264 | 602 | 541 -10% | 397 ? -34% | |||
| WiFi v1.3 | 480 | 481 0% | 483 1% | 292 -39% | 290 -40% | 369 ? -23% |
| Load | 164 | 100 -39% | 60 -63% | 65 -60% | 84.8 ? -48% |
Pro
Contra
Veredicto - Portátil, potente, perseverante

Las dimensiones compactas y el bajo peso (aprox. 2,1 kg) no se producen a costa de reducir el rendimiento del hardware. El Core i9 y el procesador GeForce RTX 4070 son capaces de trabajar con frecuencias de reloj consistentemente altas. La fusión de rendimiento y portabilidad del portátil puede calificarse de éxito.
El XMG Fusion 15 (Early 24)-un portátil potente y portátil para jugadores y creadores.
El portátil se calienta bastante bajo carga y, al hacerlo, produce bastante ruido. Las emisiones más moderadas requieren sacrificar algo de potencia de cálculo. Su pantalla de 15,3 pulgadas (2.560 x 1.600 píxeles, IPS, 240 Hz, Adaptive Sync) con una relación de aspecto 16:10 es impresionante en general. Su alto brillo es digno de mención.
Una carga completa (99,8 Wh) es suficiente para una autonomía práctica de unas 8 - 10 horas, valores muy buenos. Positivo: La batería puede cargarse a través de una fuente de alimentación USB-C (mín. 100 vatios, 20 V) -el puerto TB4 del portátil es compatible con Power Delivery. Como resultado, no tiene por qué llevar consigo todo el tiempo la fuente de alimentación propietaria (280 vatios).
Una alternativa podría ser el Aorus 16X (2024). Este portátil ofrece una potencia de cálculo comparable, así como una autonomía similarmente buena.
Precio y disponibilidad
El XMG Fusion 15 (Early 24) puede configurarse y encargarse directamente a través de la tienda en línea de Schenker. El dispositivo de prueba actual cuesta unos 2.500 dólares. Los precios comienzan a partir de unos 1.700 dólares.
SCHENKER XMG Fusion 15 (Early 24)
-
05/01/2024 v7
Sascha Mölck
Transparency
The present review sample was made available to the author as a loan by the manufacturer or a shop for the purposes of review. The lender had no influence on this review, nor did the manufacturer receive a copy of this review before publication. There was no obligation to publish this review.
Pricecompare

