 Deutsch
 English
 Español
 Français
 Italiano
 Nederlands
 Polski
 Português
 Русский
 Türkçe
 Svenska
 Chinese
 Magyar
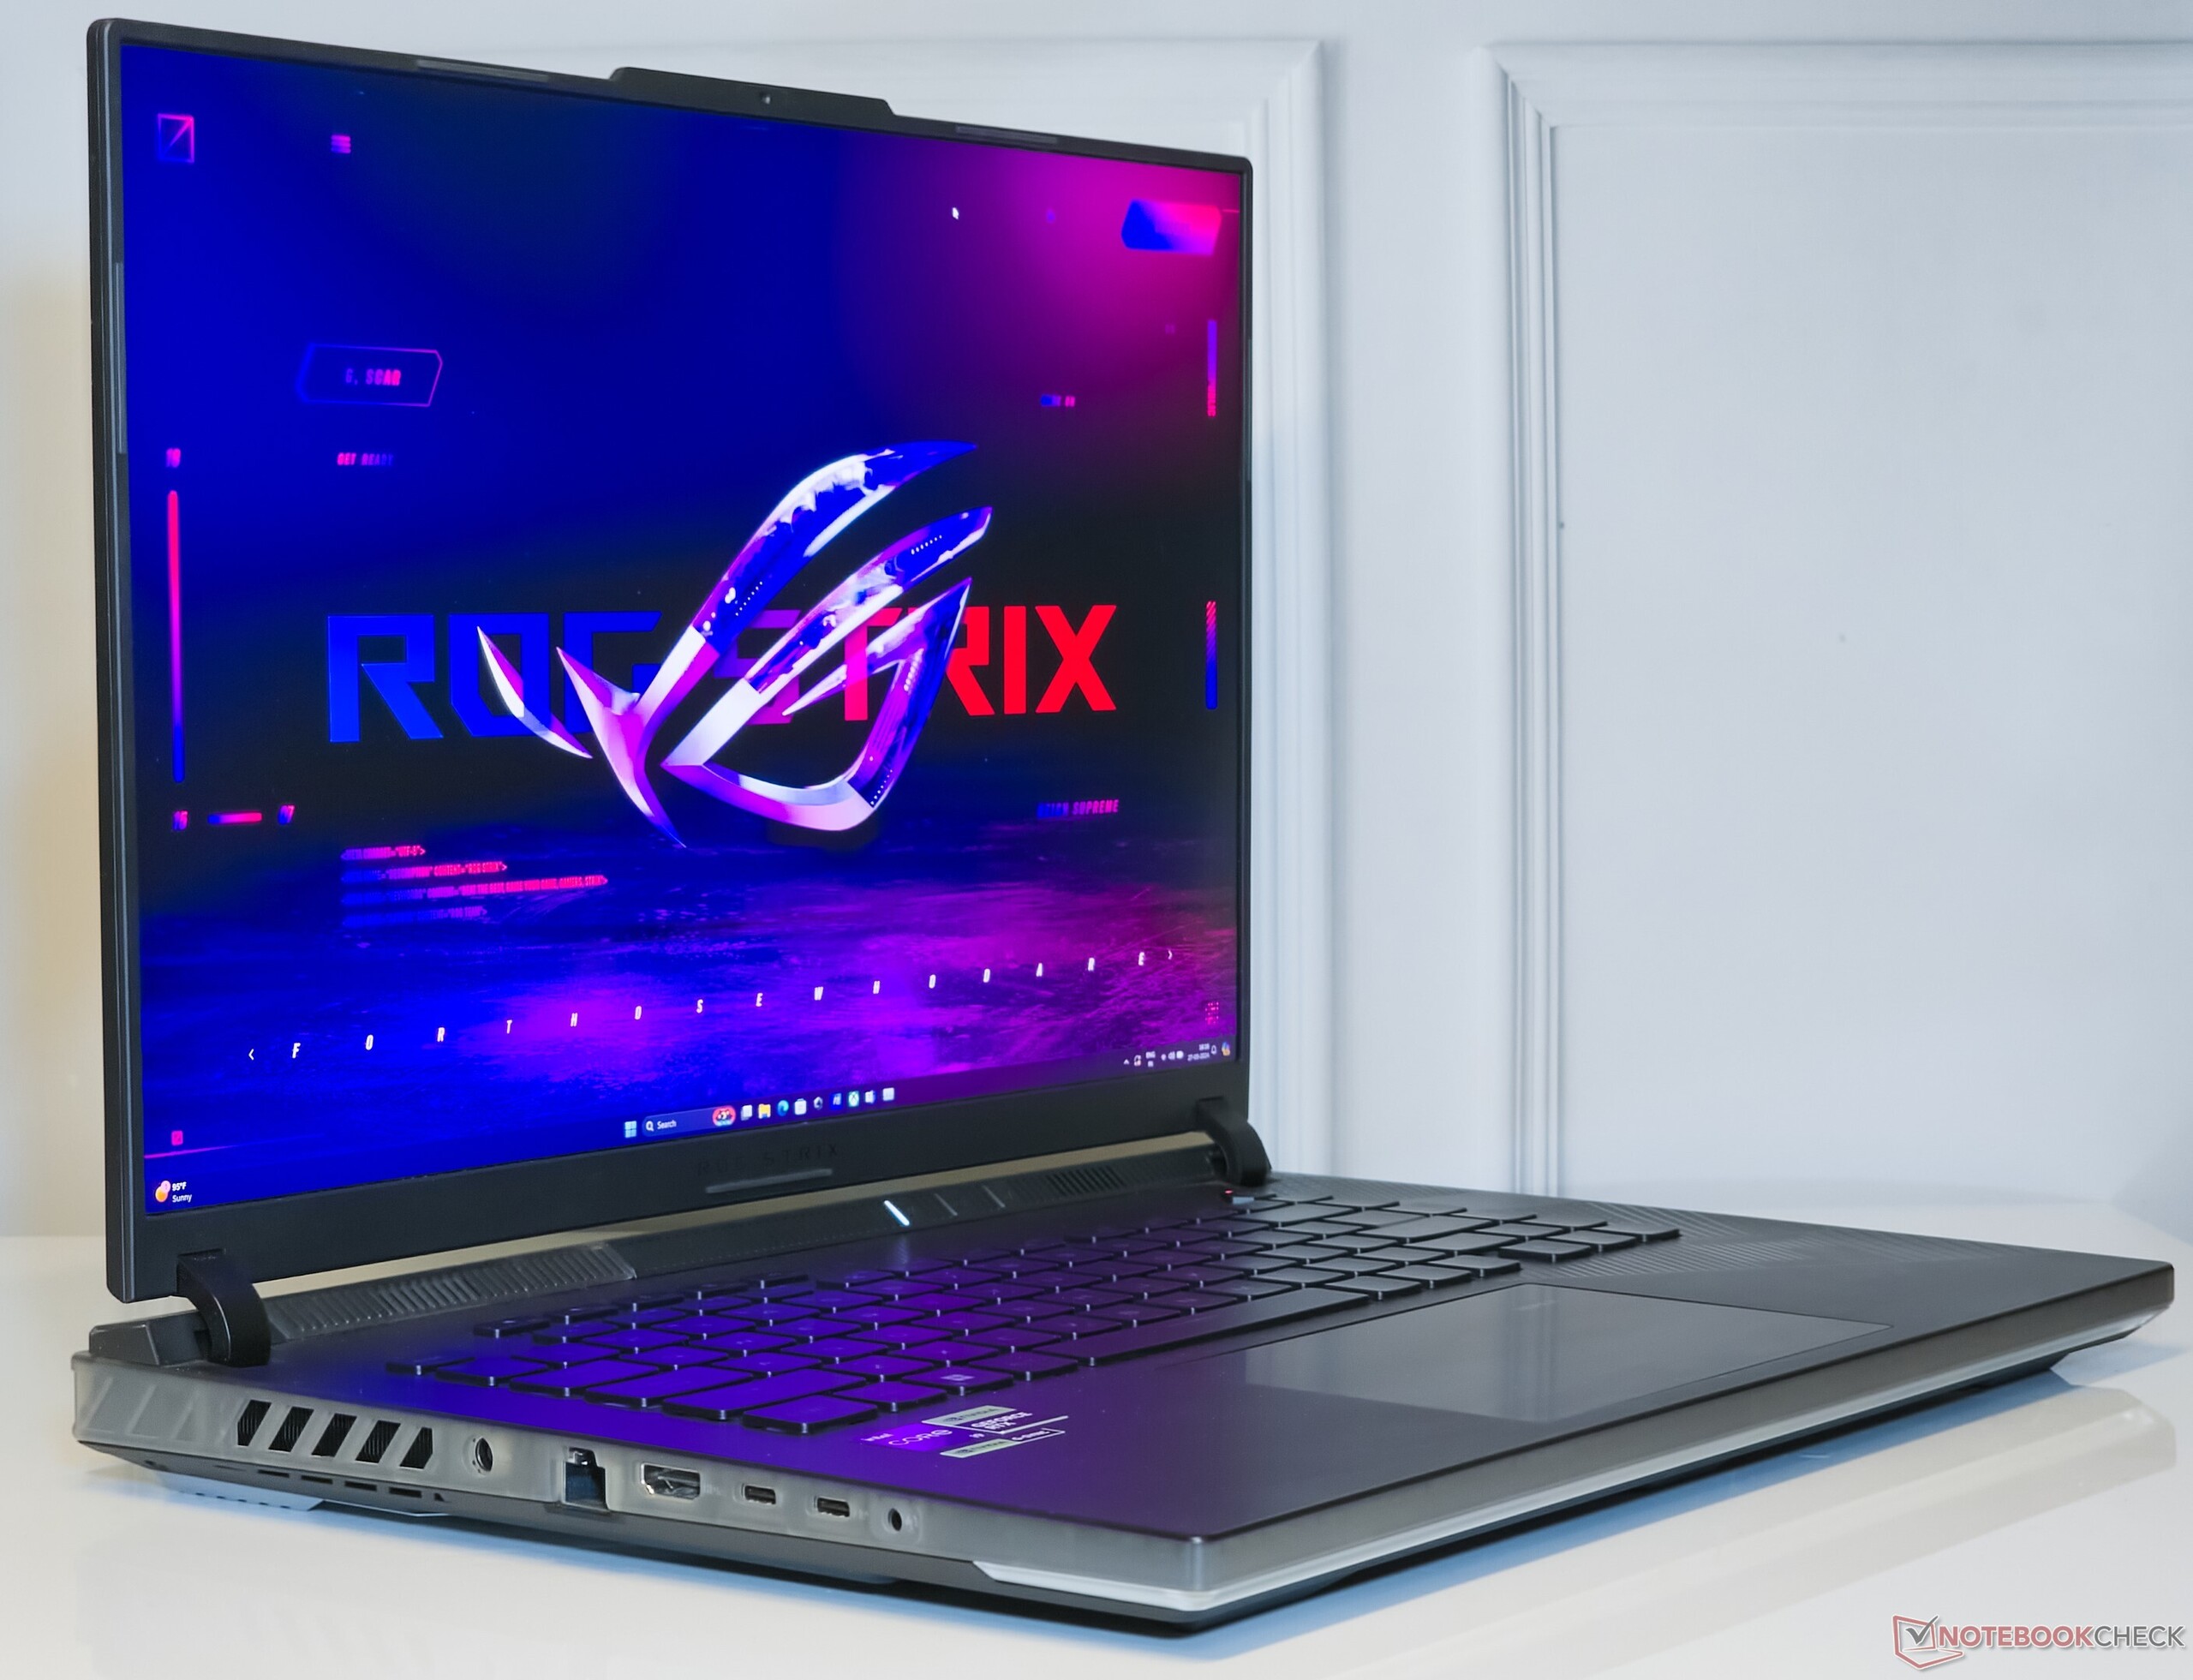
Análisis del portátil Asus ROG Strix Scar 16 (2024): Rendimiento ardiente y brillo mini LED con un precio a la altura
")
Asus ha actualizado toda su gama de portátiles en el CES 2024. Entre las variantes para juegos del 2024, hemos revisado el ROG Zephyrus G14, ROG Zephyrus G16y ROG Strix Scar 18 hasta ahora. Hoy, echamos un vistazo al nuevo ROG Strix Scar 16.
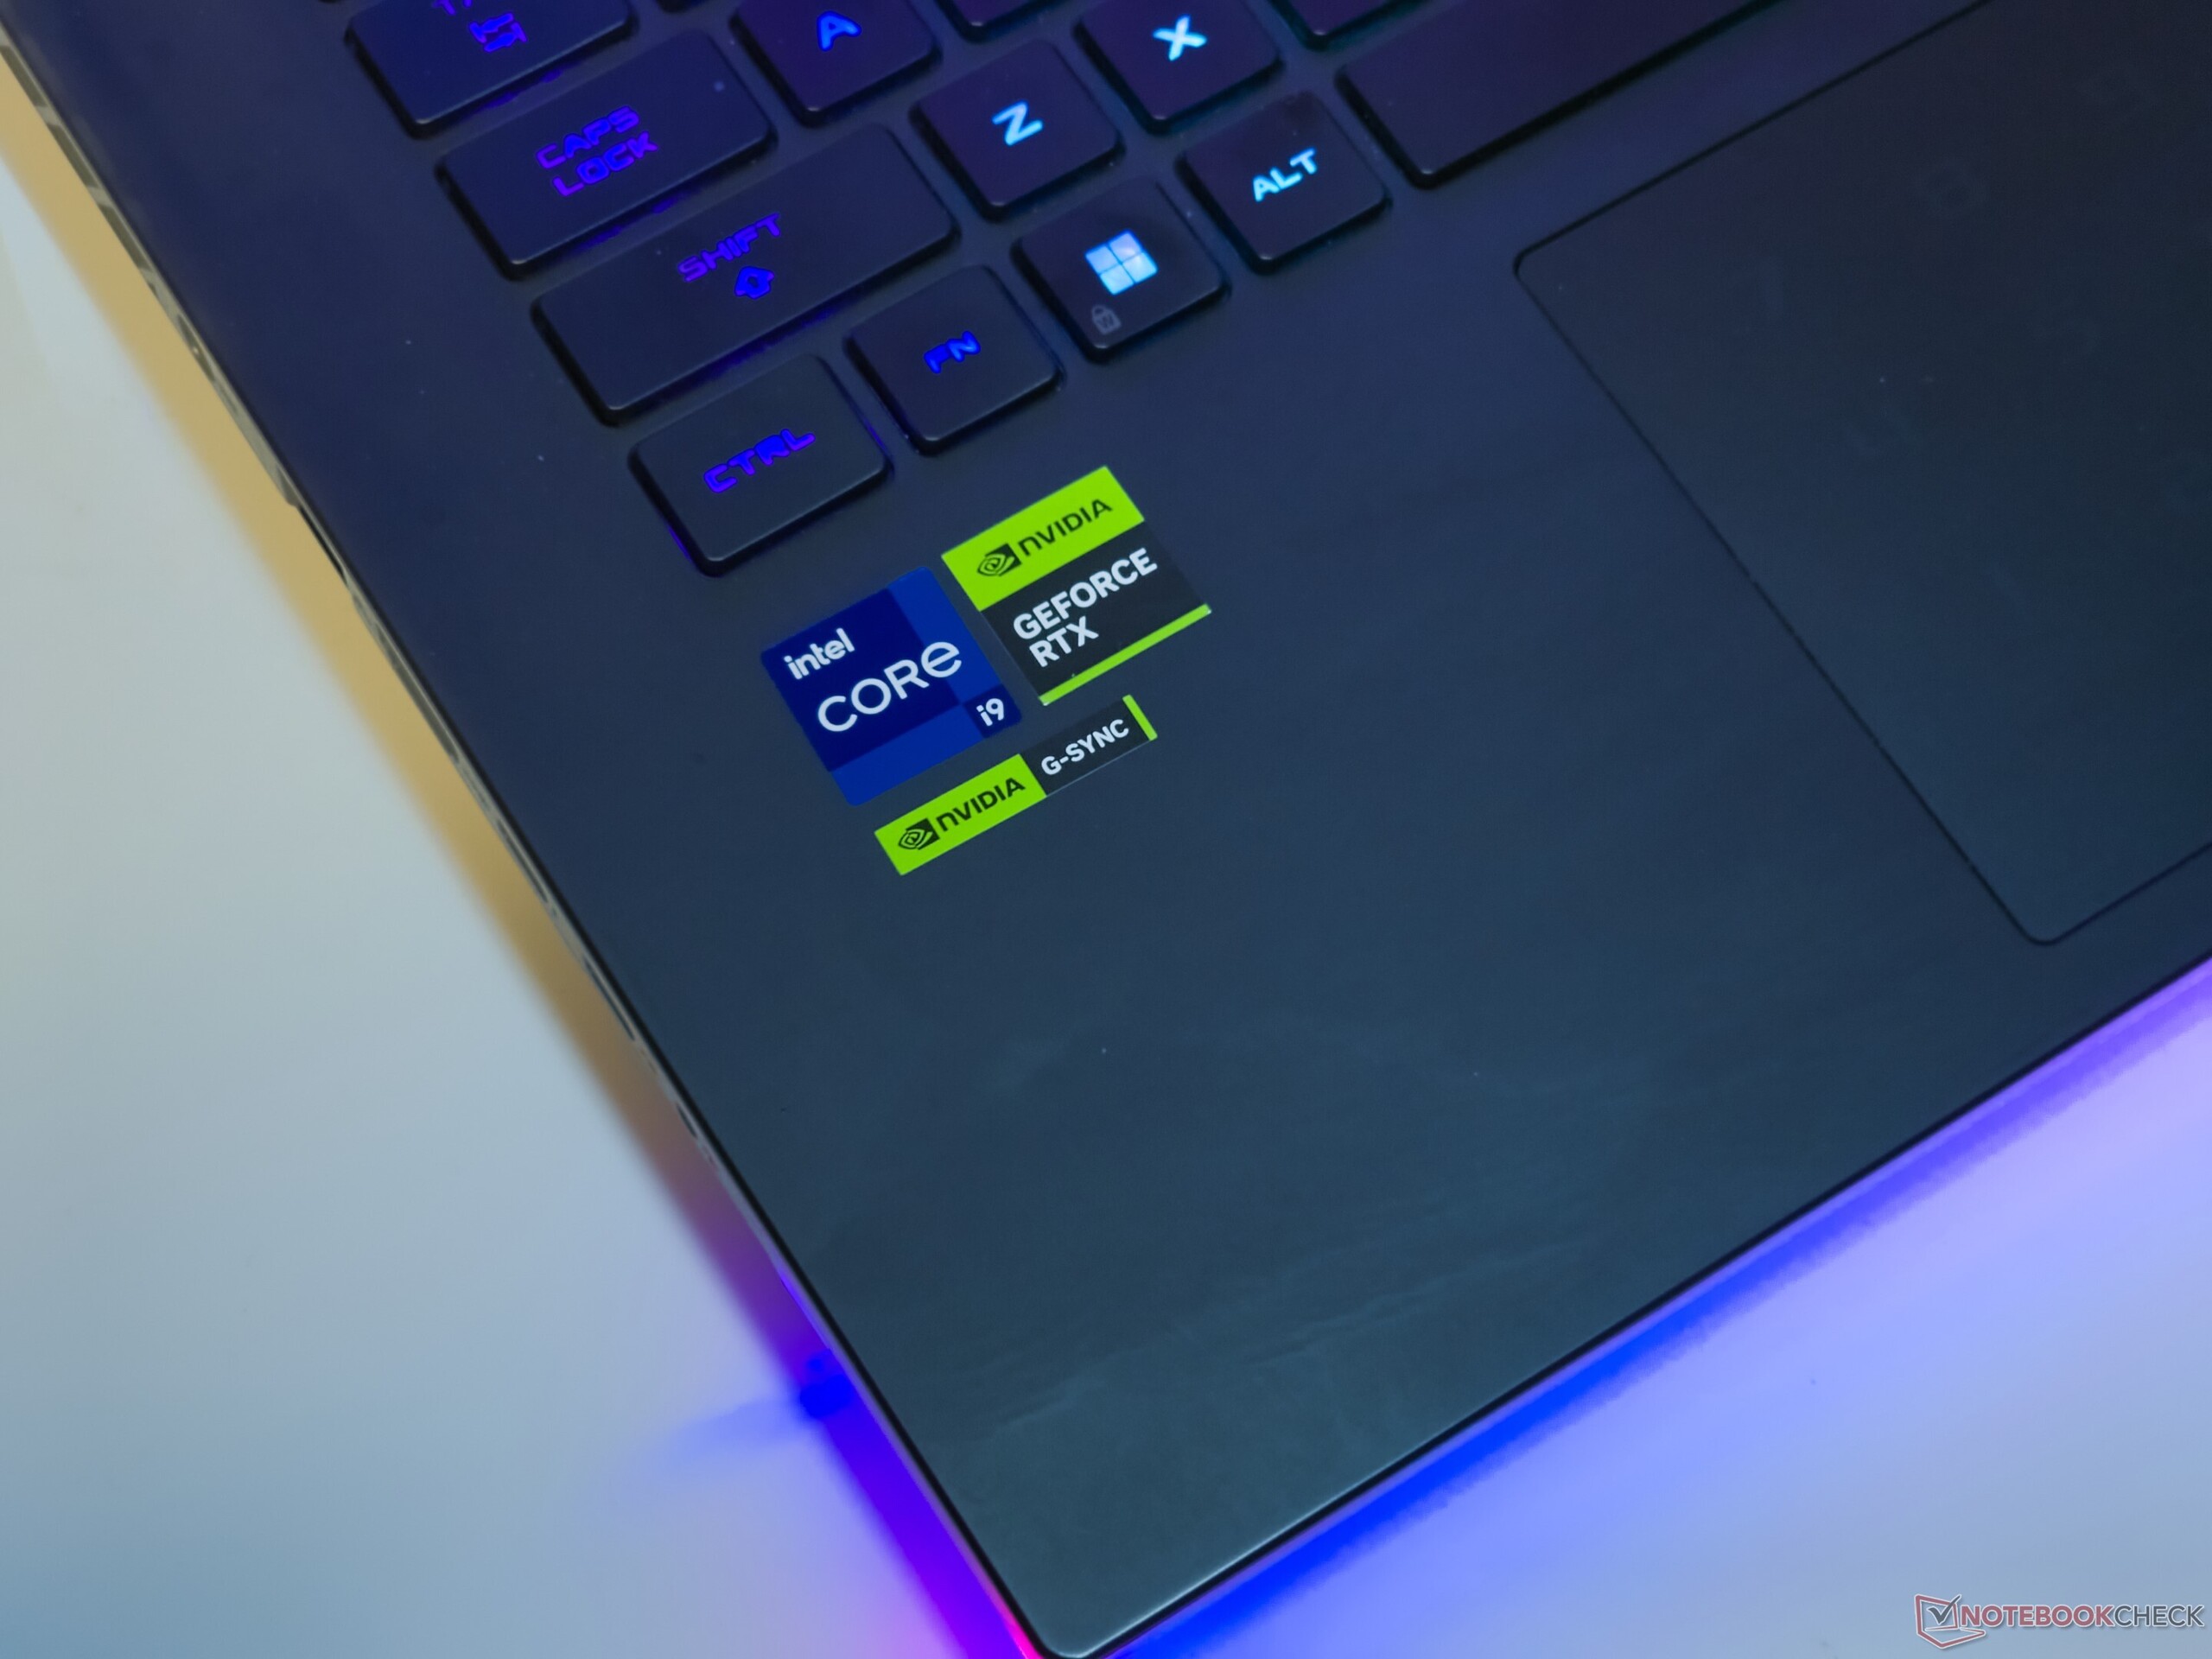
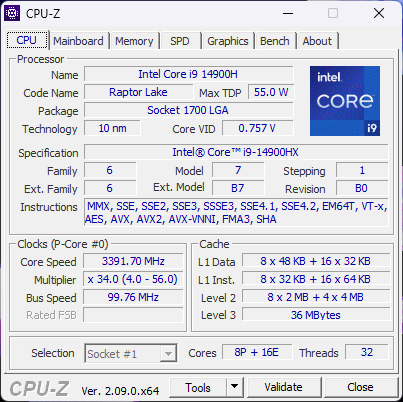
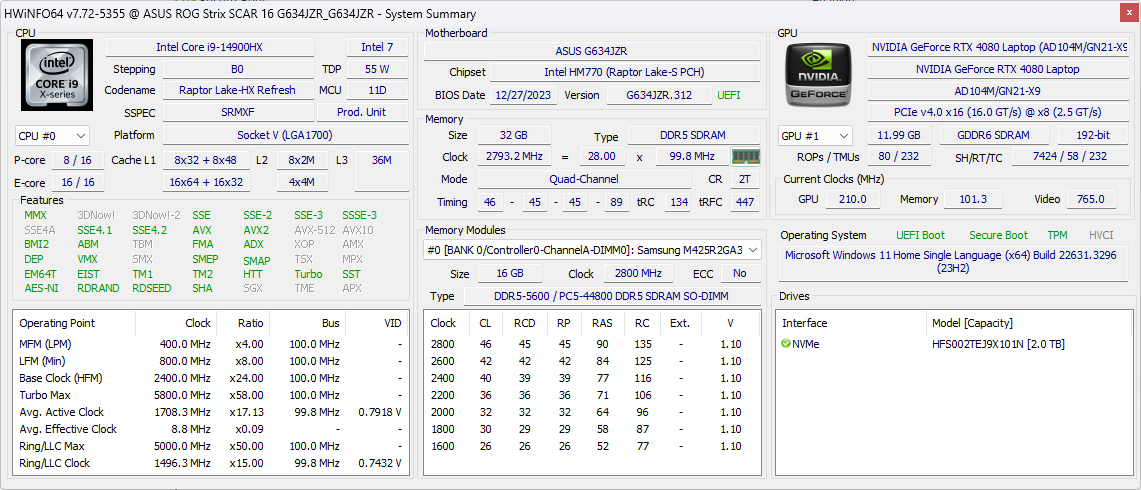
El ROG Strix Scar 16 está dirigido a los jugadores de gama alta y cuenta con el hardware necesario para arrancar. Nuestro dispositivo de prueba se basa en el Intel Core i9-14900HX Raptor Lake-HX complementado por un procesador de 175 W GPU Nvidia GeForce RTX 4080 para portátiles.
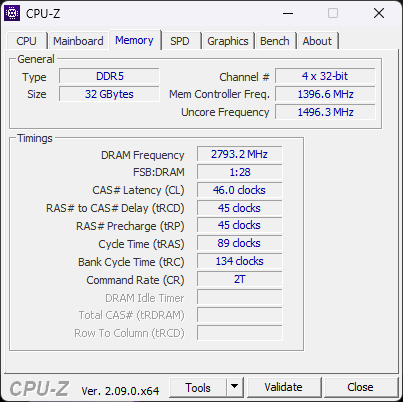
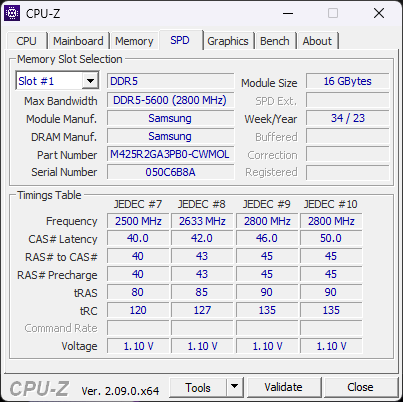
Otras especificaciones dignas de baba incluyen 32 GB de RAM DDR5-5600, una unidad SSD NVMe de 2 TB y una pantalla mini-LED G-Sync QHD+ de 240 Hz que, en conjunto, no tienen reparos en hacerle un agujero en la cartera de ₹2.89.990 (~3.473 dólares).
Posibles contendientes en la comparación
Valoración | Fecha | Modelo | Peso | Altura | Tamaño | Resolución | Best Price |
|---|---|---|---|---|---|---|---|
| 87.6 % | 04/2024 | Asus ROG Strix Scar 16 G634JZR i9-14900HX, NVIDIA GeForce RTX 4080 Laptop GPU | 2.7 kg | 30.4 mm | 16.00" | 2560x1600 | |
| 87.2 % | 08/2023 | Asus ROG Strix Scar 17 G733PYV-LL053X R9 7945HX3D, NVIDIA GeForce RTX 4090 Laptop GPU | 2.9 kg | 28.3 mm | 17.30" | 2560x1440 | |
| 88.4 % | 03/2023 | Asus ROG Strix G16 G614JZ i9-13980HX, NVIDIA GeForce RTX 4080 Laptop GPU | 2.4 kg | 30.4 mm | 16.00" | 2560x1600 | |
| 89.5 % | 03/2024 | Lenovo Legion Pro 7 16IRX9H i9-14900HX, NVIDIA GeForce RTX 4080 Laptop GPU | 2.7 kg | 21.95 mm | 16.00" | 2560x1600 | |
| 86.7 % | 02/2024 | HP Omen 16 (2024) i9-14900HX, NVIDIA GeForce RTX 4080 Laptop GPU | 2.4 kg | 23.5 mm | 16.10" | 2560x1440 | |
| 88 % | 02/2024 | MSI Vector 16 HX A14V i9-14900HX, NVIDIA GeForce RTX 4080 Laptop GPU | 2.7 kg | 28.55 mm | 16.00" | 2560x1600 | |
| 90.2 % | 03/2024 | Alienware m16 R2 Ultra 7 155H, NVIDIA GeForce RTX 4070 Laptop GPU | 2.5 kg | 23.5 mm | 16.00" | 2560x1600 |
Chasis: Principalmente de plástico con un asomo translúcido
La ROG Strix Scar 16 de este año luce un lenguaje de diseño familiar como ya hemos visto antes con la 2022 Scar 15 pero ahora es 350 g más pesada, inclinando la balanza a 2,65 kg.
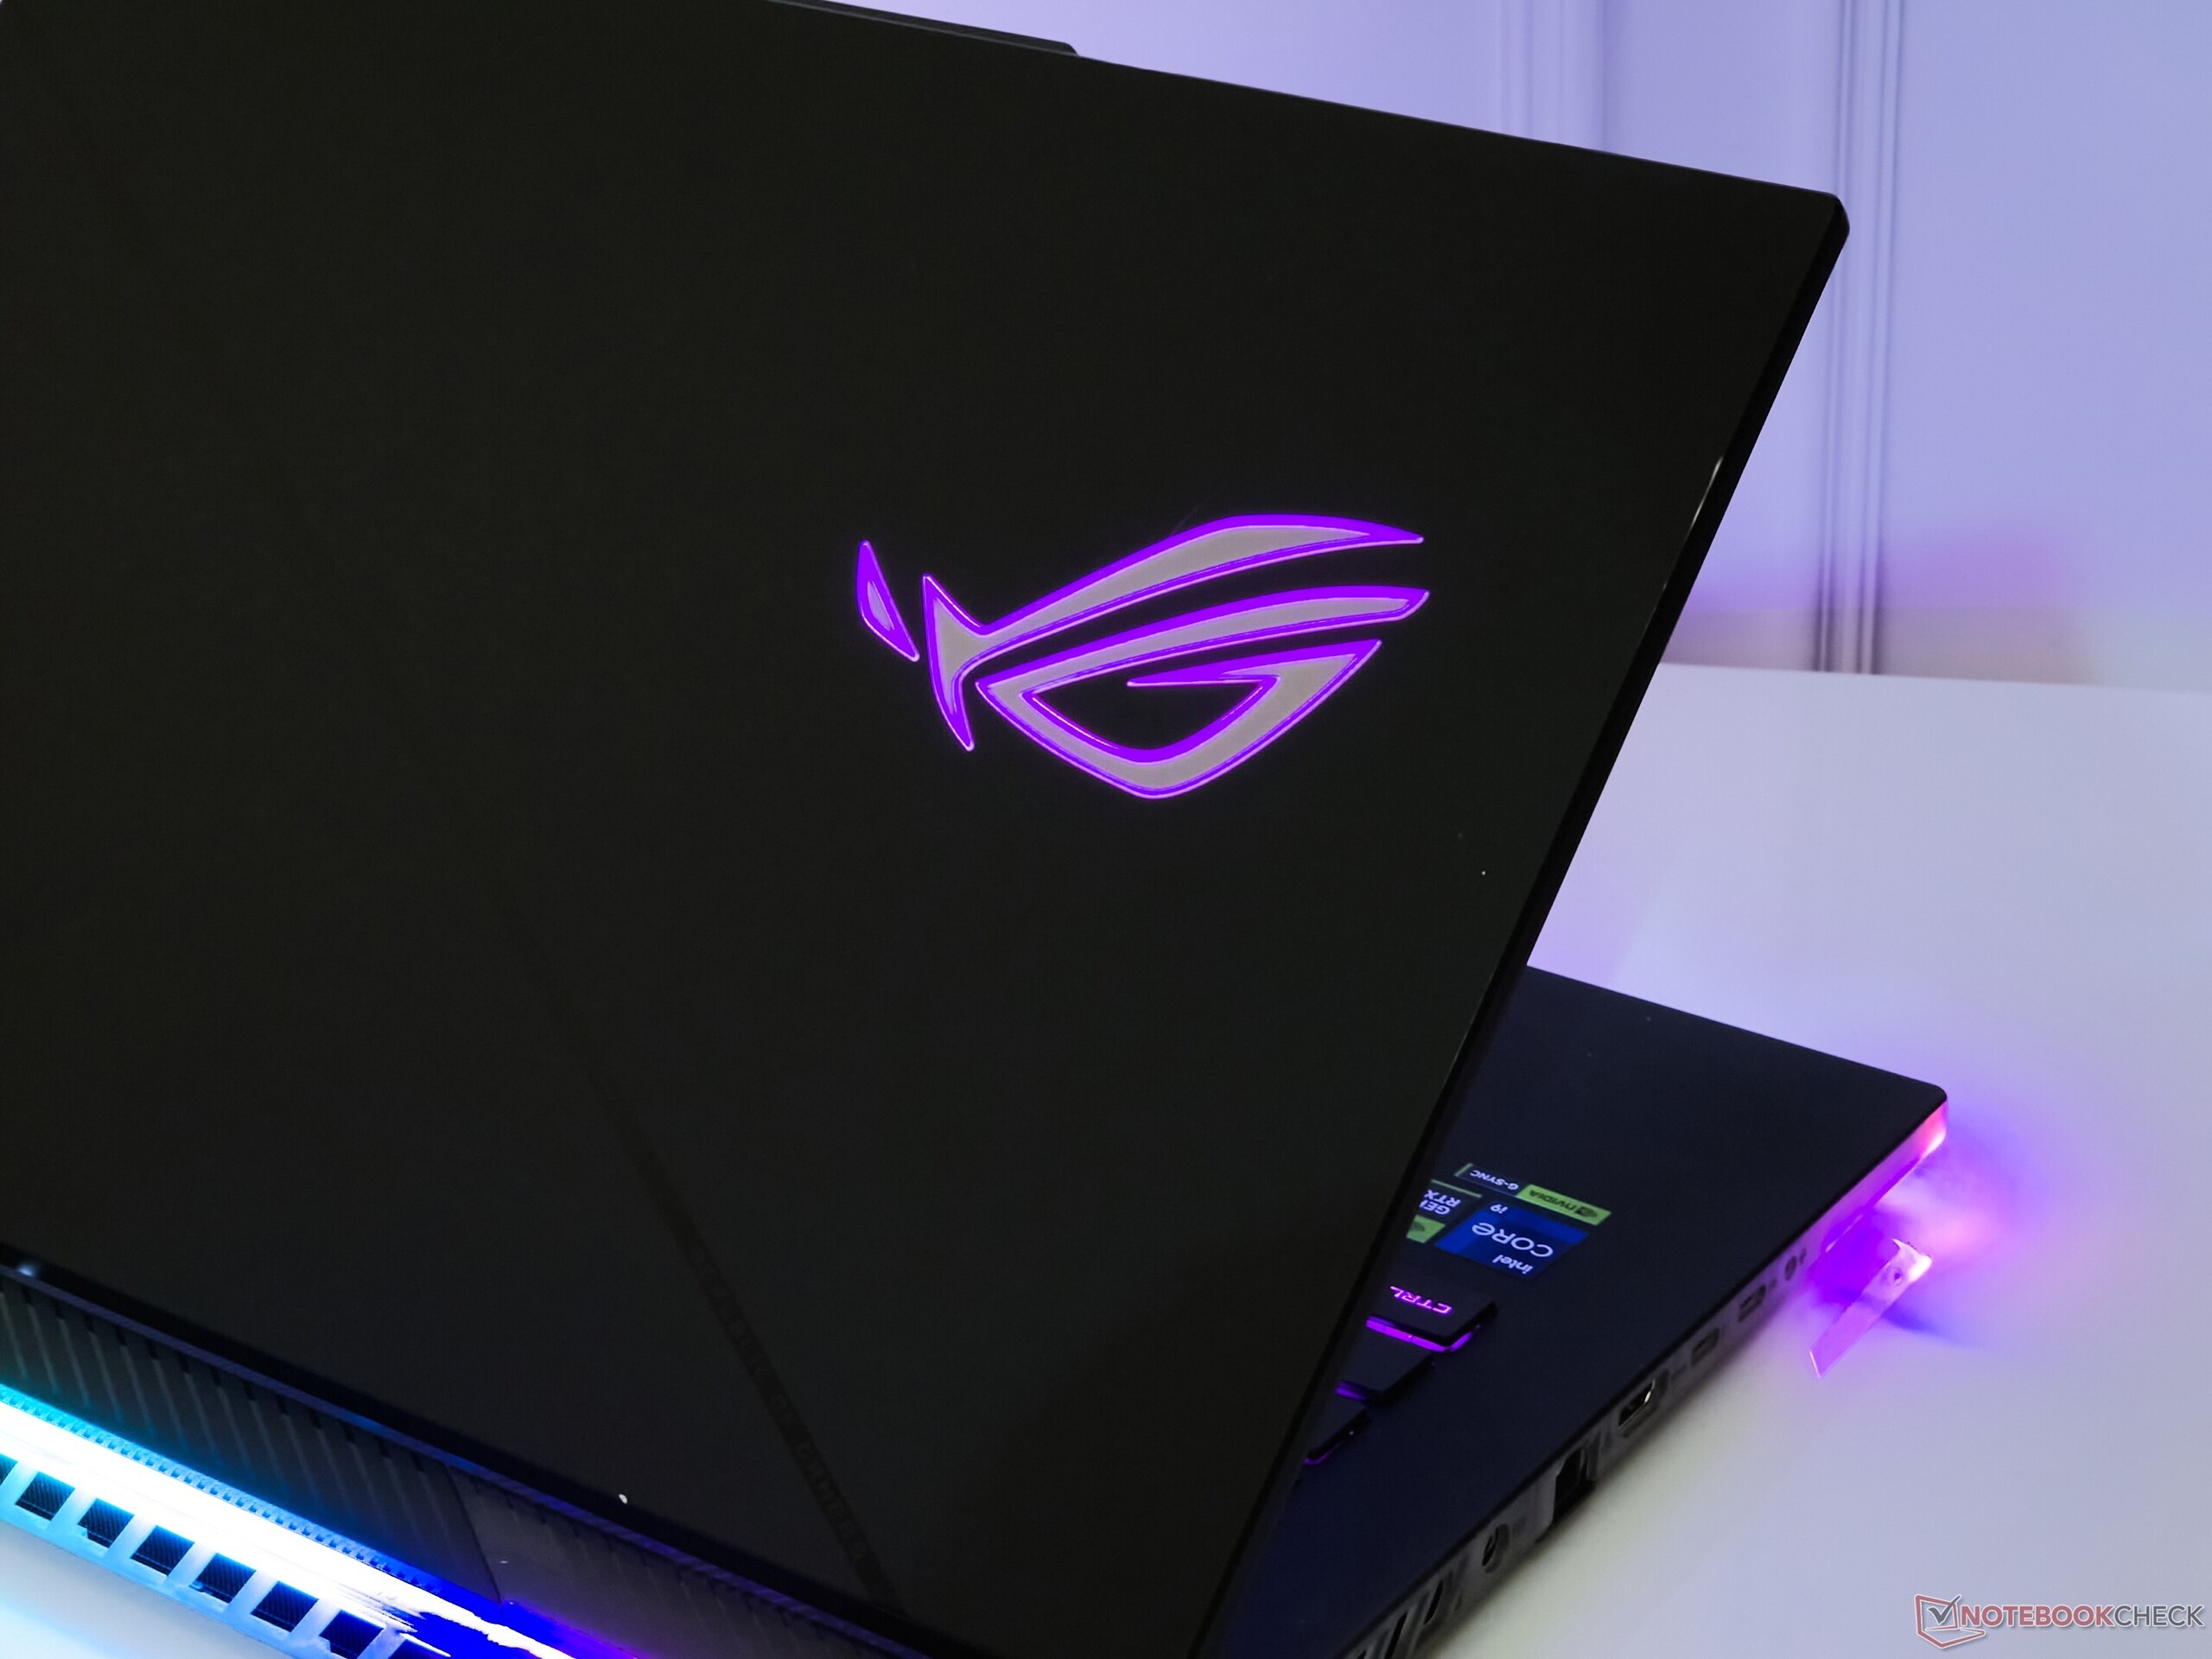
El chasis no se flexiona a pesar de ser una construcción de plástico. La tapa de aluminio con acabado mate también parece bastante robusta con bisagras estables.
La tapa puede abrirse con un solo dedo sin que el portátil se deslice sobre el escritorio, lo que se evita además con la base de goma.
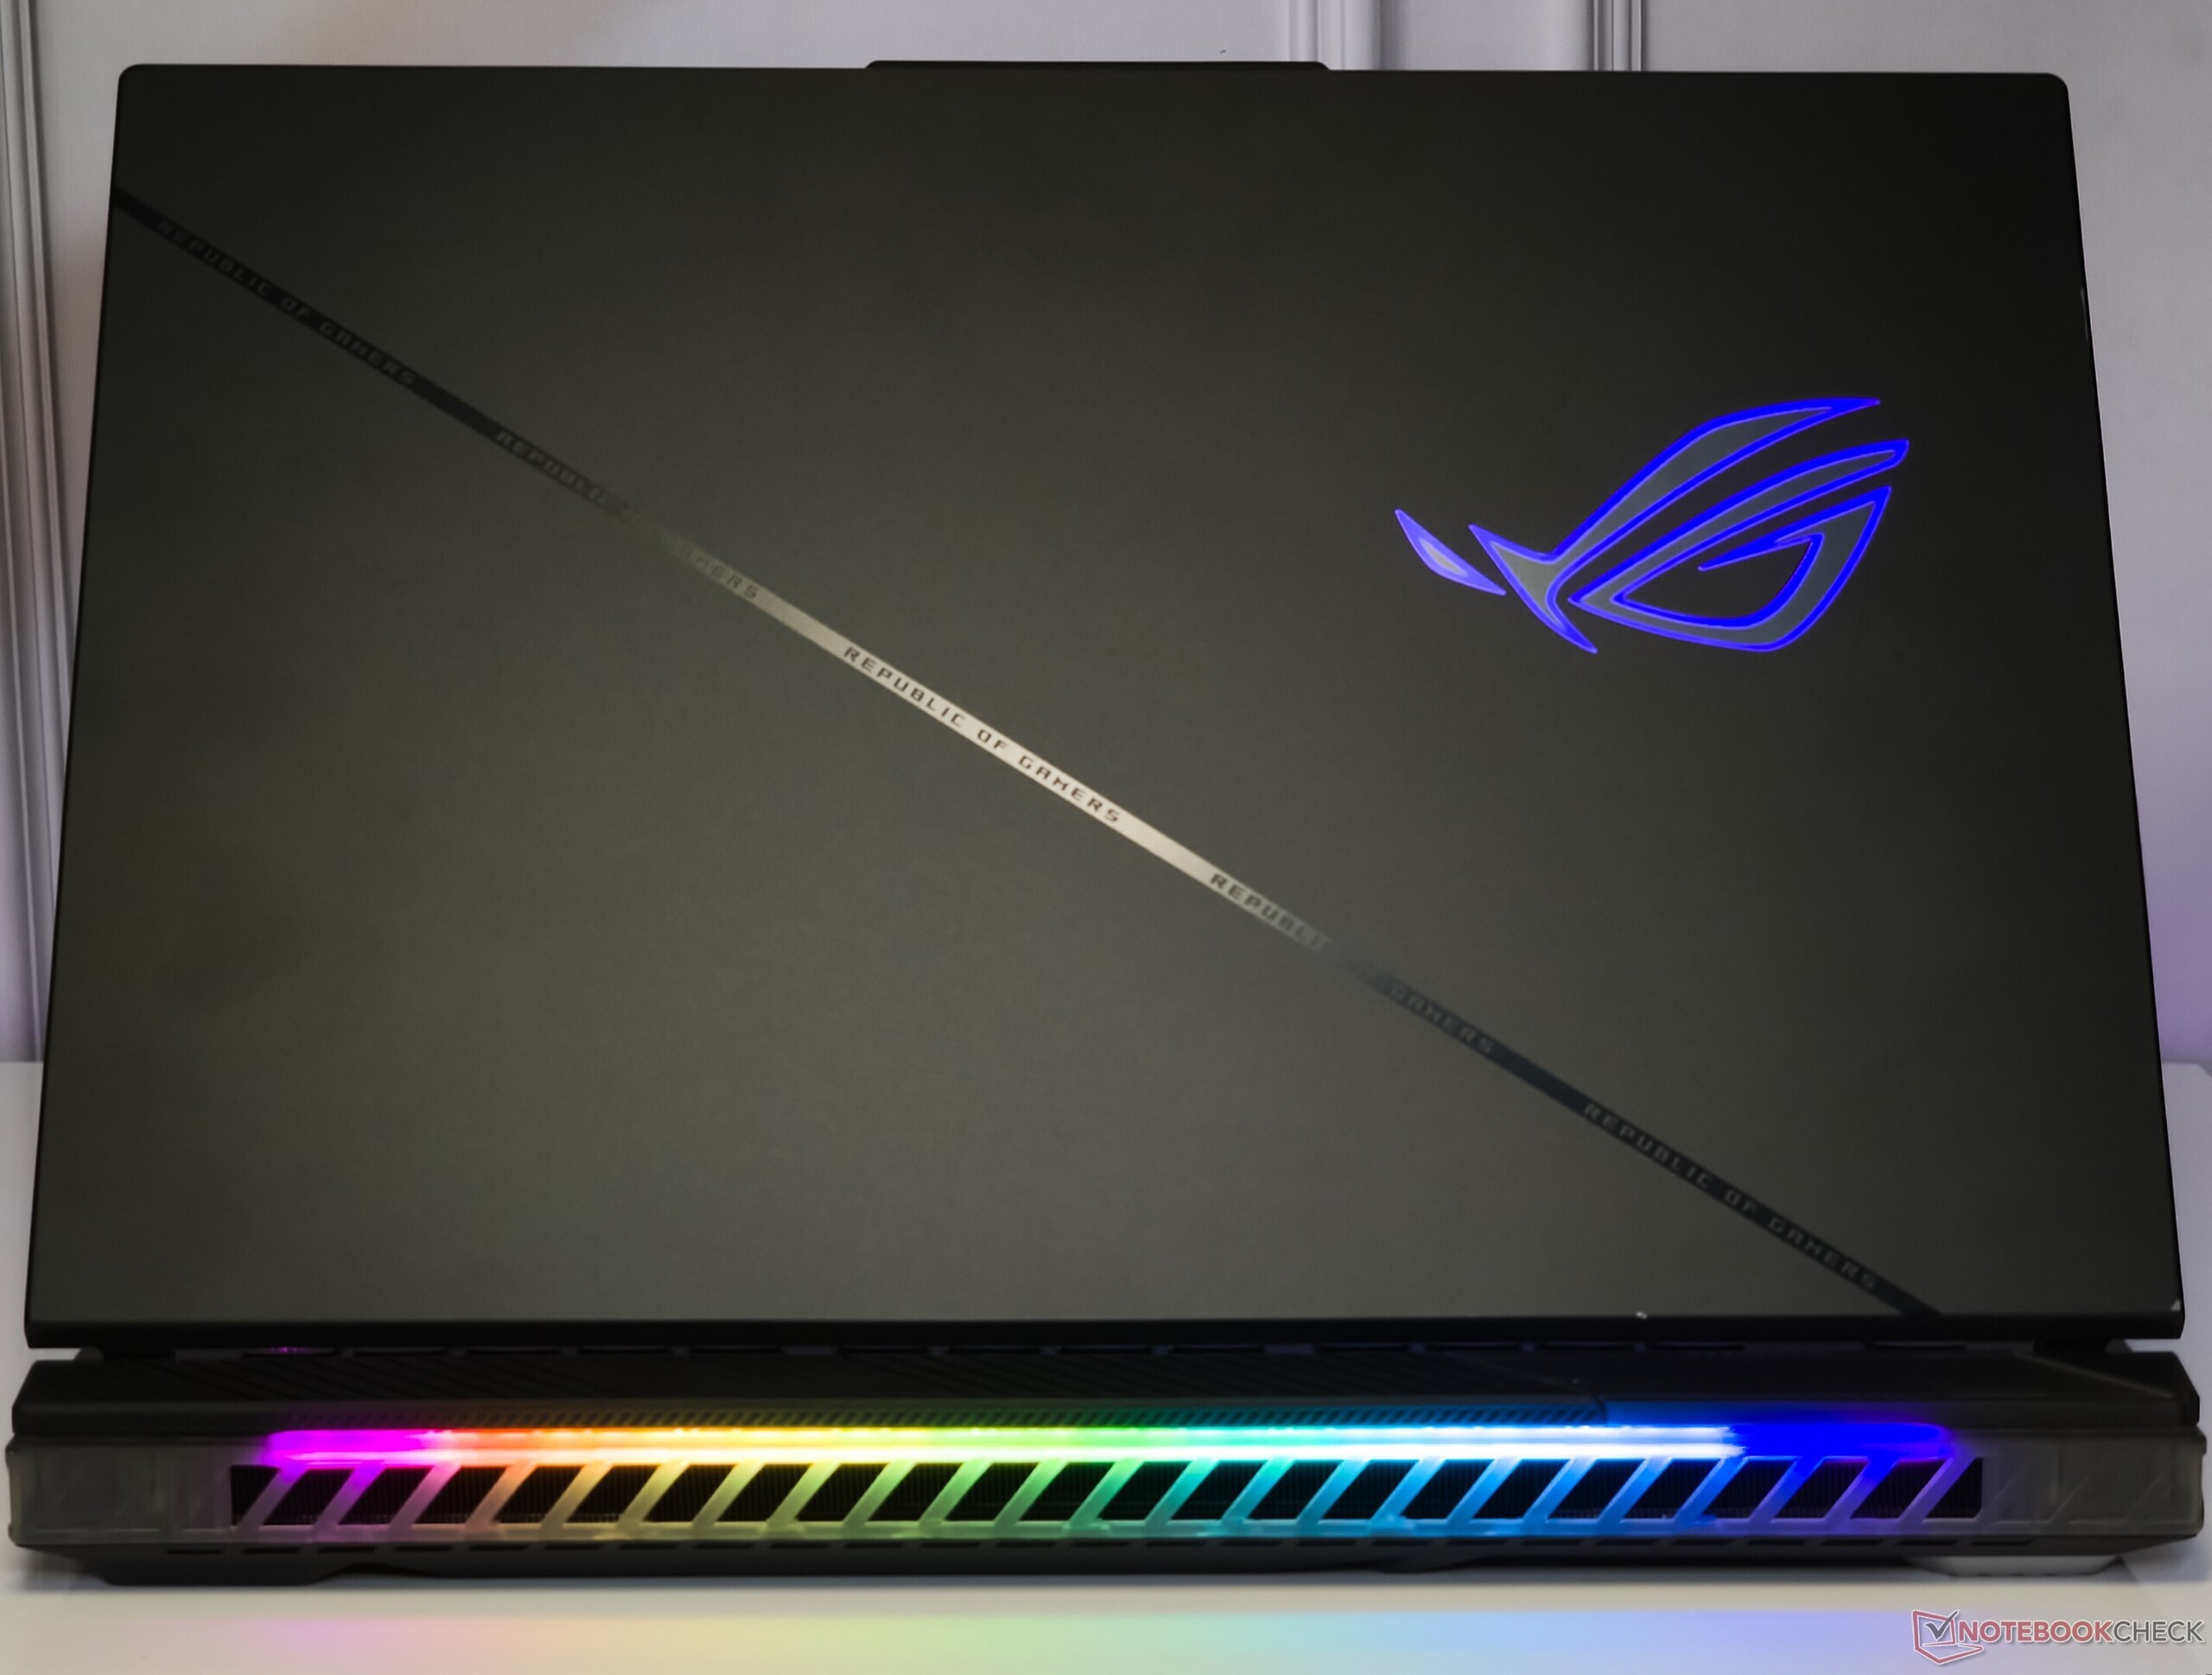
Los conocedores de la serie Scar notarán que la cubierta del teclado ya no luce la franja diagonal blanca con el logotipo ROG.
La parte superior de la cubierta del teclado sigue siendo translúcida como antes, ofreciendo una mirada furtiva a las partes internas debajo. Sin embargo, Asus ha hecho poco para que la cubierta sea resistente a las huellas dactilares y a la grasa.
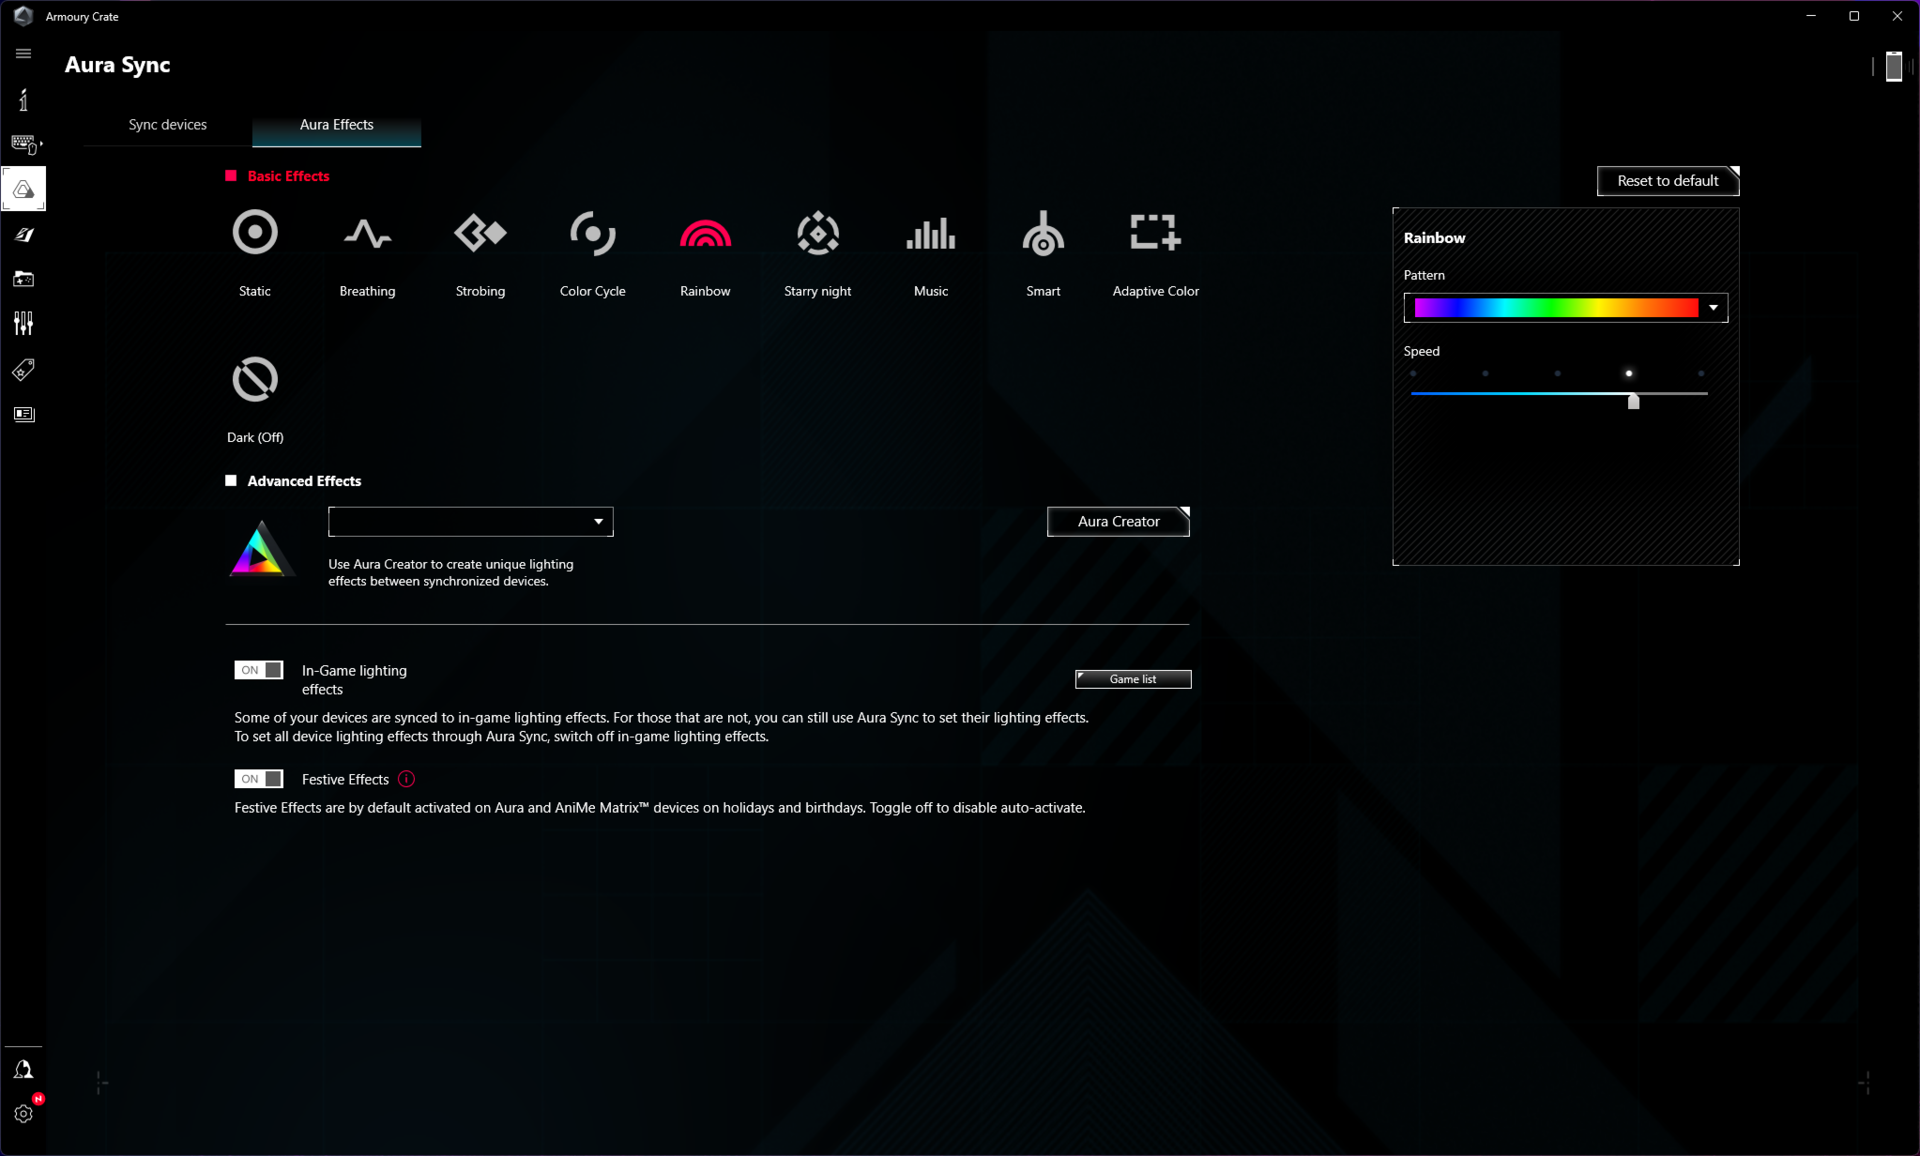
El teclado del Scar 16, la base, la parte trasera y el logotipo de ROG en la bondad de RGB que puede ser controlado y personalizado a través de Armory Crate. Sin embargo, no hay forma aparente de iluminar individualmente estas áreas - es todo RGB o nada.
Fiel a la ética de la cicatriz, Asus le permite diseñar e imprimir en 3D ROG Armor caps para darle un toque de personalización.
Conectividad: Wi-Fi 5 mediocre y alimentación USB de 100 W
El ROG Strix Scar 16 utiliza la misma disposición de puertos y funcionalidad que la iteración del año pasado. Asus ya no ofrece el ROG Keystone, que ha sido durante mucho tiempo una característica definitoria de la serie Scar, a pesar de su dudosa utilidad.
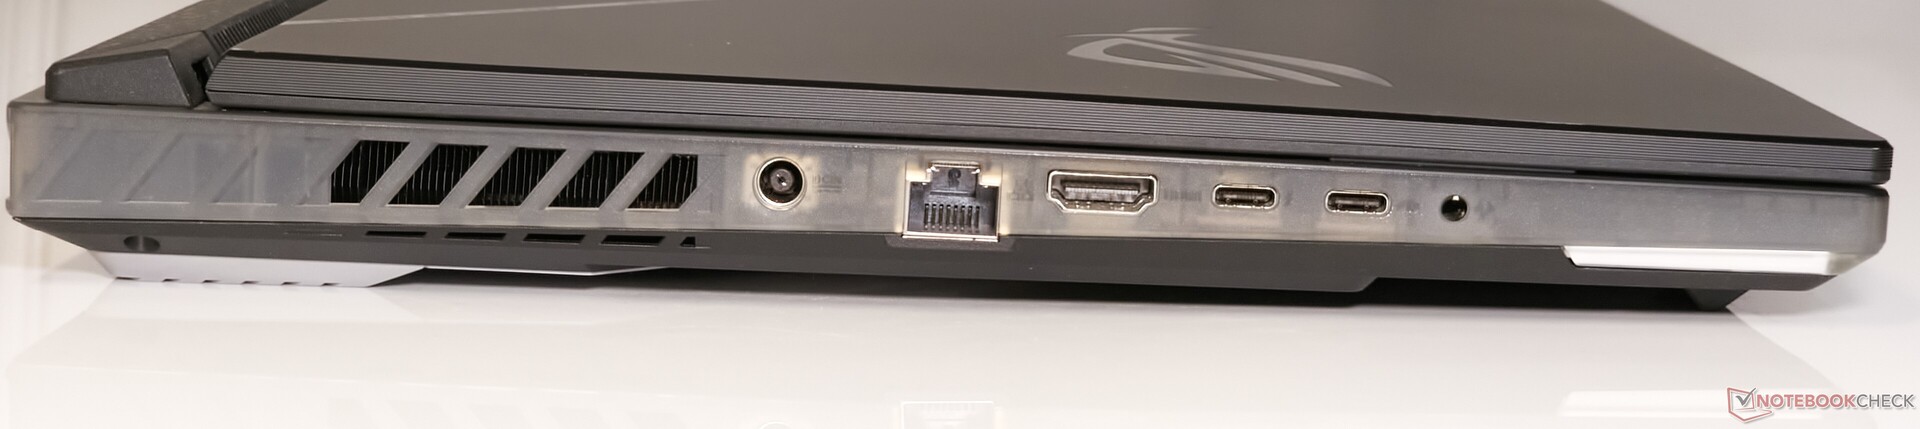
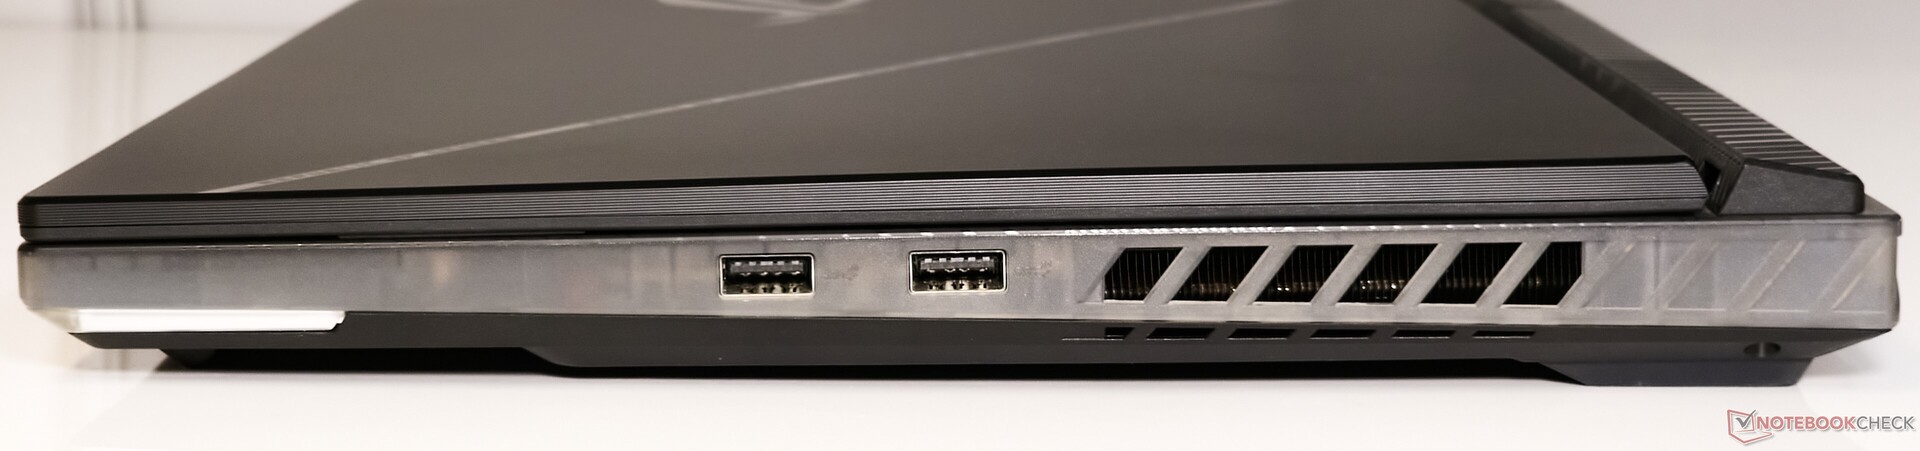
La distribución de puertos es desigual. Con la excepción de dos puertos USB 3.2 Gen2 Tipo-A en el lado derecho, todos los puertos adicionales están situados a la izquierda. Sin embargo, los puertos están cómodamente espaciados y no suponen ningún obstáculo a la hora de conectar varios periféricos.
Hay dos puertos USB Tipo-C, uno de los cuales es Thunderbolt 4. El puerto Thunderbolt 4 permite la salida DisplayPort 1.4 pero no la carga. El puerto USB 3.2 Gen2 Tipo-C, por otro lado, no sólo ofrece salida DisplayPort sino también una entrega de potencia de 100 W.
La parte trasera está totalmente reservada para alojar el aparato de refrigeración y, como tal, carece de puertos.
Comunicación
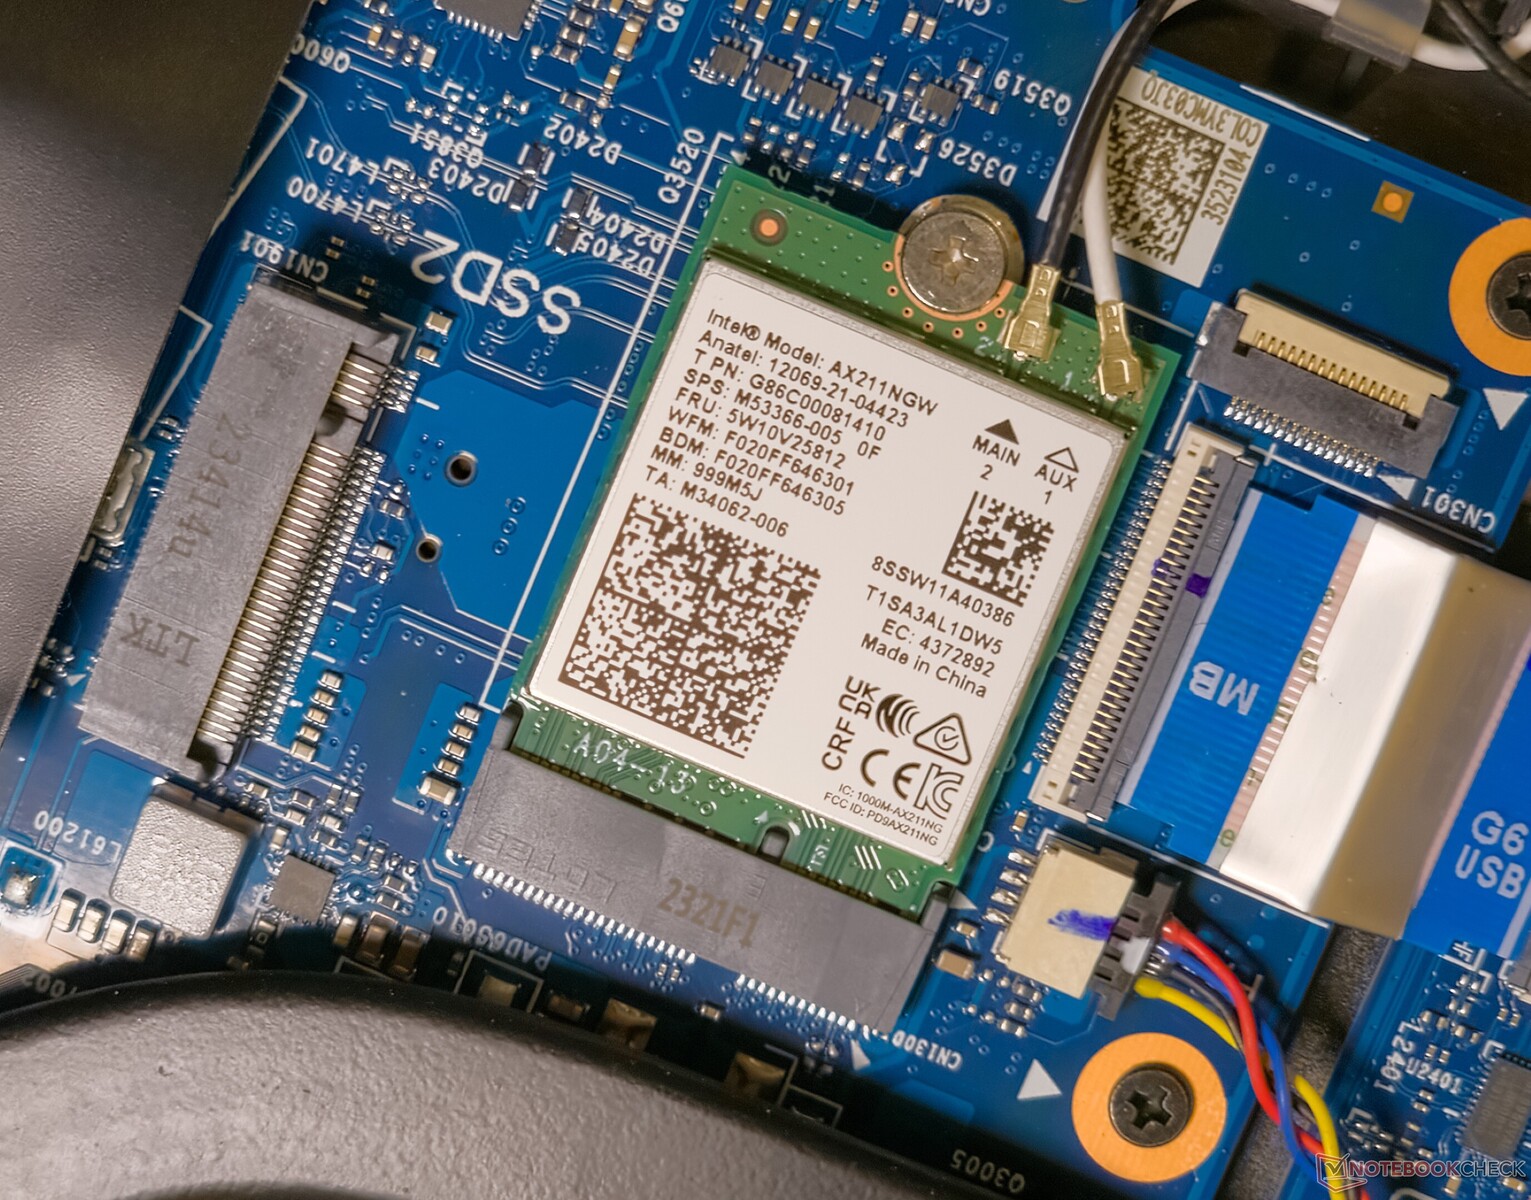
Los portátiles de 2024 se están apuntando poco a poco a la moda del Wi-Fi 7, aunque la compatibilidad con el estándar sólo está previsto que llegue cuando Windows 11 24H2 comience a desplegarse a finales de este año. El Scar 16, por tanto, se conforma con el chip Intel Wi-Fi AX211 normal.
Las pruebas del Scar 16 con nuestro router de referencia Asus ROG Rapture GT-AXE11000 revelaron un rendimiento relativamente inferior en la banda Wi-Fi 5 en comparación con la competencia. Sin embargo, el rendimiento es bastante estable sin grandes caídas de velocidad.
El rendimiento en Wi-Fi 6E fue notablemente mejor con velocidades de transmisión y recepción de hasta 1,5 Gbps y 1,74 Gbps, respectivamente, pero observamos una ralentización momentánea durante la prueba de transmisión.
| Networking / iperf3 transmit AXE11000 | |
| Asus ROG Strix G16 G614JZ | |
| HP Omen 16 (2024) | |
| Lenovo Legion Pro 7 16IRX9H | |
| Average of class Gaming (469 - 1793, n=152, last 2 years) | |
| Average Intel Wi-Fi 6E AX211 (464 - 1861, n=188) | |
| Alienware m16 R2 | |
| MSI Vector 16 HX A14V | |
| Asus ROG Strix Scar 16 G634JZR | |
| Networking / iperf3 receive AXE11000 | |
| HP Omen 16 (2024) | |
| Lenovo Legion Pro 7 16IRX9H | |
| Asus ROG Strix G16 G614JZ | |
| Average of class Gaming (685 - 1890, n=158, last 2 years) | |
| Average Intel Wi-Fi 6E AX211 (582 - 1890, n=188) | |
| MSI Vector 16 HX A14V | |
| Alienware m16 R2 | |
| Asus ROG Strix Scar 16 G634JZR | |
| Networking / iperf3 transmit AXE11000 6GHz | |
| Asus ROG Strix Scar 16 G634JZR | |
| Average of class Gaming (648 - 1878, n=77, last 2 years) | |
| MSI Vector 16 HX A14V | |
| Alienware m16 R2 | |
| Average Intel Wi-Fi 6E AX211 (632 - 1851, n=174) | |
| Networking / iperf3 receive AXE11000 6GHz | |
| Asus ROG Strix Scar 16 G634JZR | |
| Average of class Gaming (853 - 1857, n=79, last 2 years) | |
| Average Intel Wi-Fi 6E AX211 (883 - 1857, n=173) | |
| Alienware m16 R2 | |
| MSI Vector 16 HX A14V | |
Cámara web
A diferencia del Scar 15 que incluía una webcam externa ROG Eye 1080p como accesorio inbox, el Scar 16 se conforma con un sensor convencional integrado de 720p.
La calidad de imagen no es excepcional bajo ningún concepto, pero le permite realizar una o dos videollamadas ocasionales. Observamos grandes desviaciones de color en los tonos azules, y la nitidez general no parece adecuada.


Seguridad
El Scar 16 carece de cualquier forma de autenticación biométrica. Dispone de un módulo TPM 2.0 para cumplir los requisitos de Windows 11.
Accesorios y garantía
En la caja se incluye un gorro de armadura personalizable. No hay más accesorios aparte de éste.
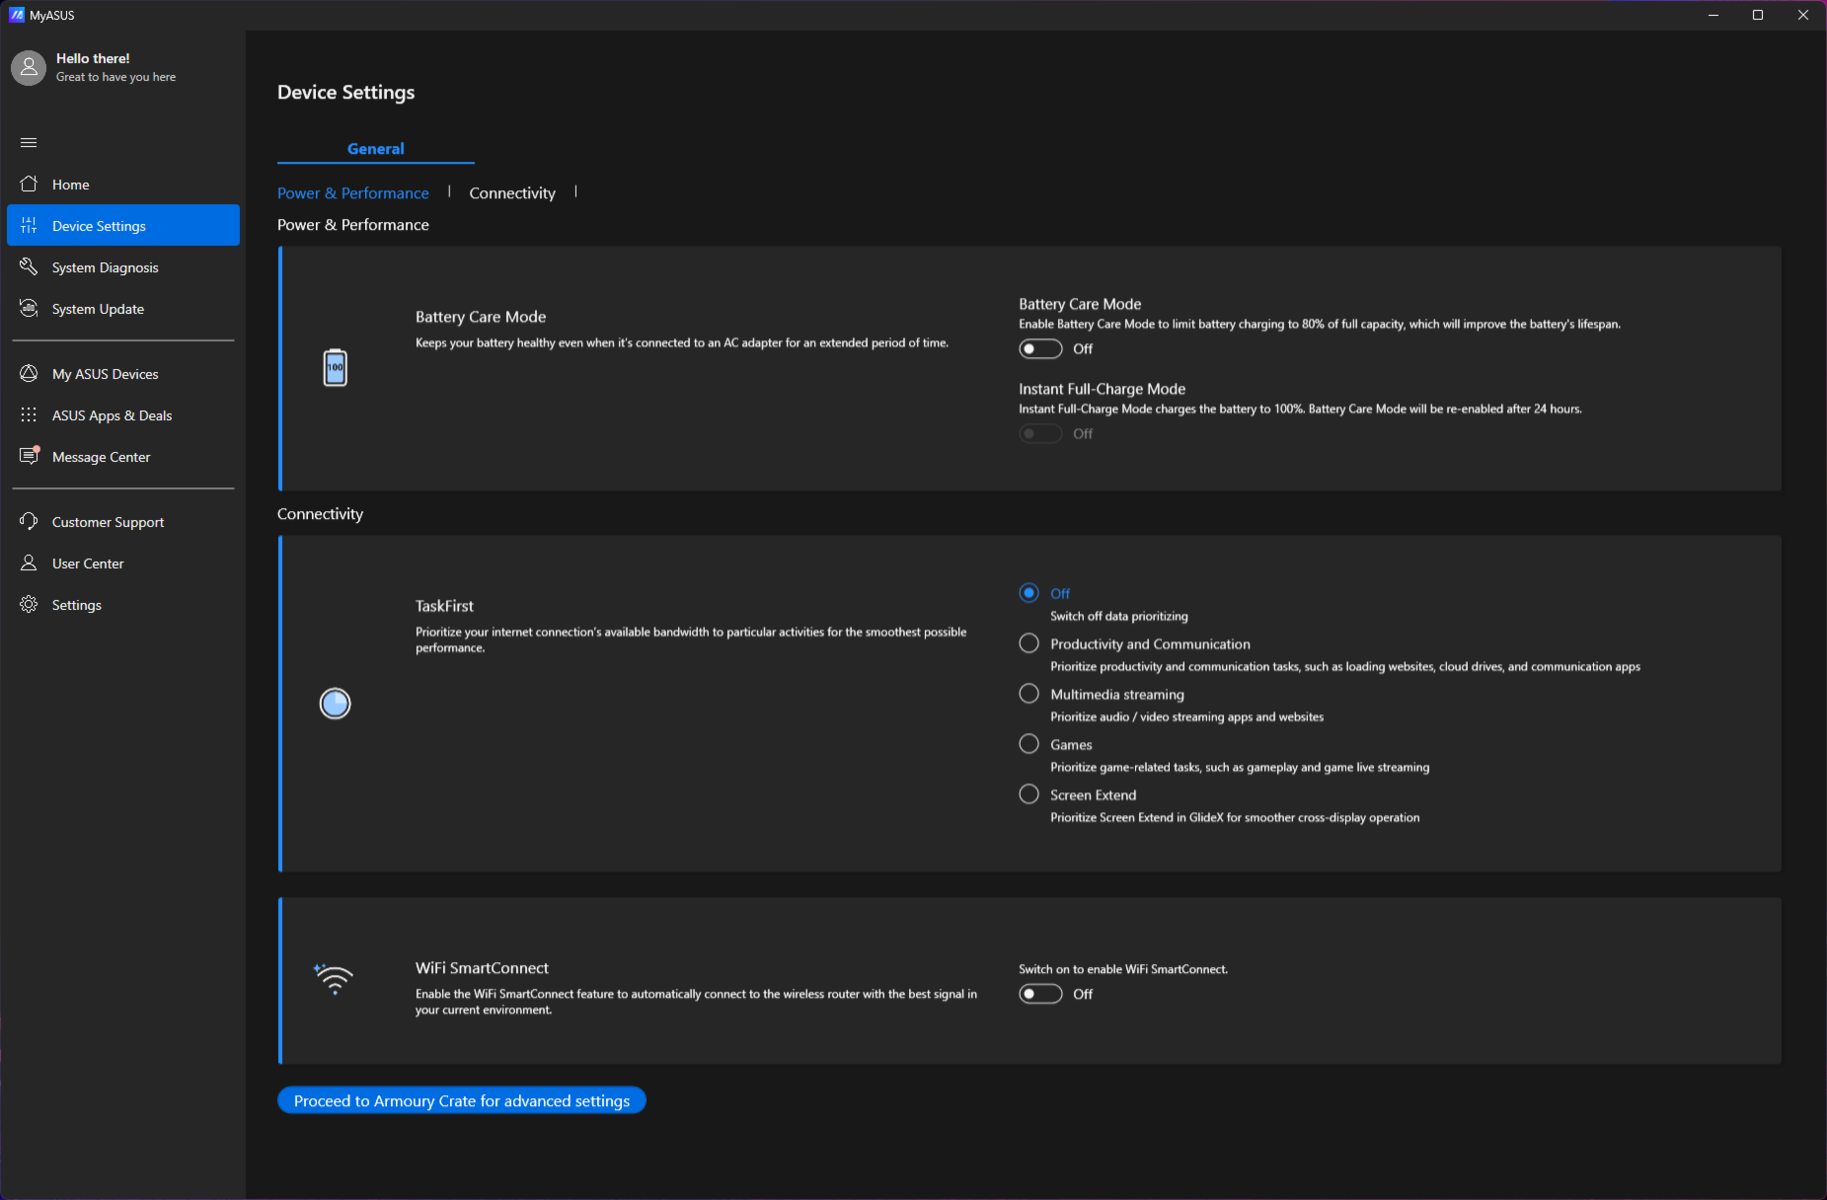
Asus ofrece una garantía estándar de un año para el Scar 16 en la India. Se pueden adquirir extensiones de garantía a través de la aplicación MyAsus preinstalada en los 180 días posteriores a la compra.
Los compradores también pueden elegir entre varias opciones de garantía https://asuspromo.in/terms que van desde los ₹999 (U$12) para una extensión de un año hasta los ₹4.999 (U$60) que incluyen una extensión de dos años y tres años de protección contra daños accidentales.
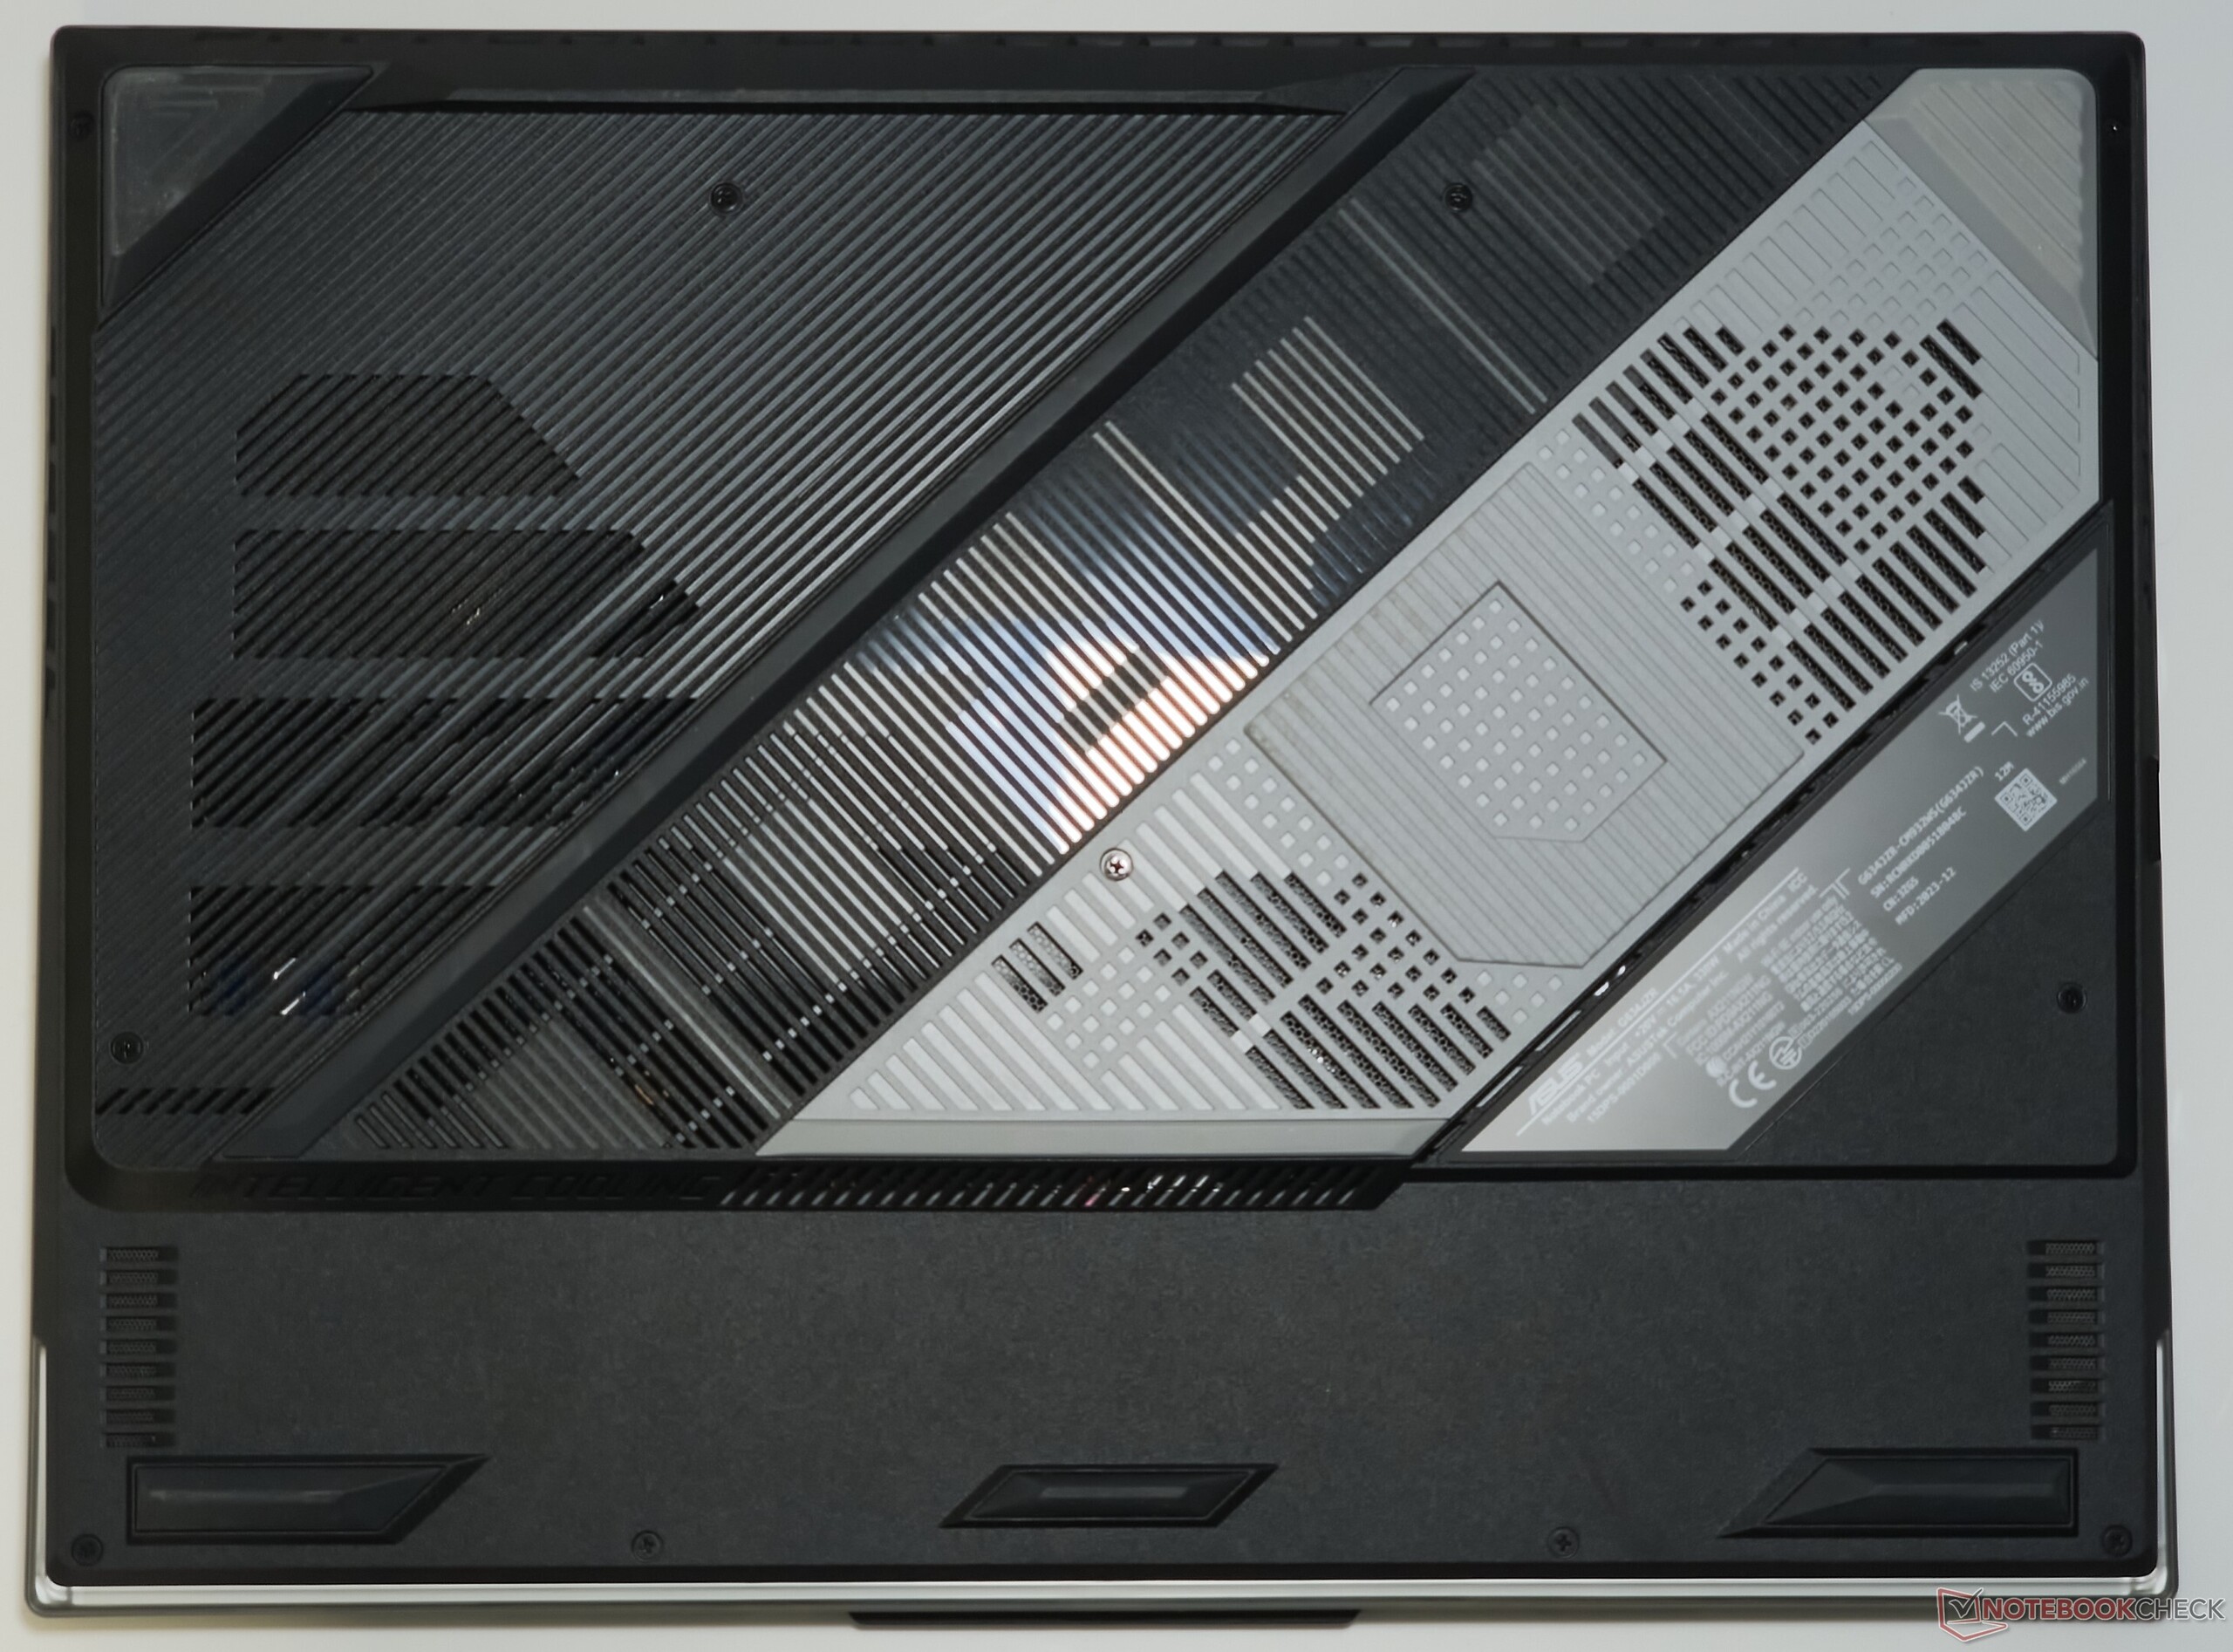
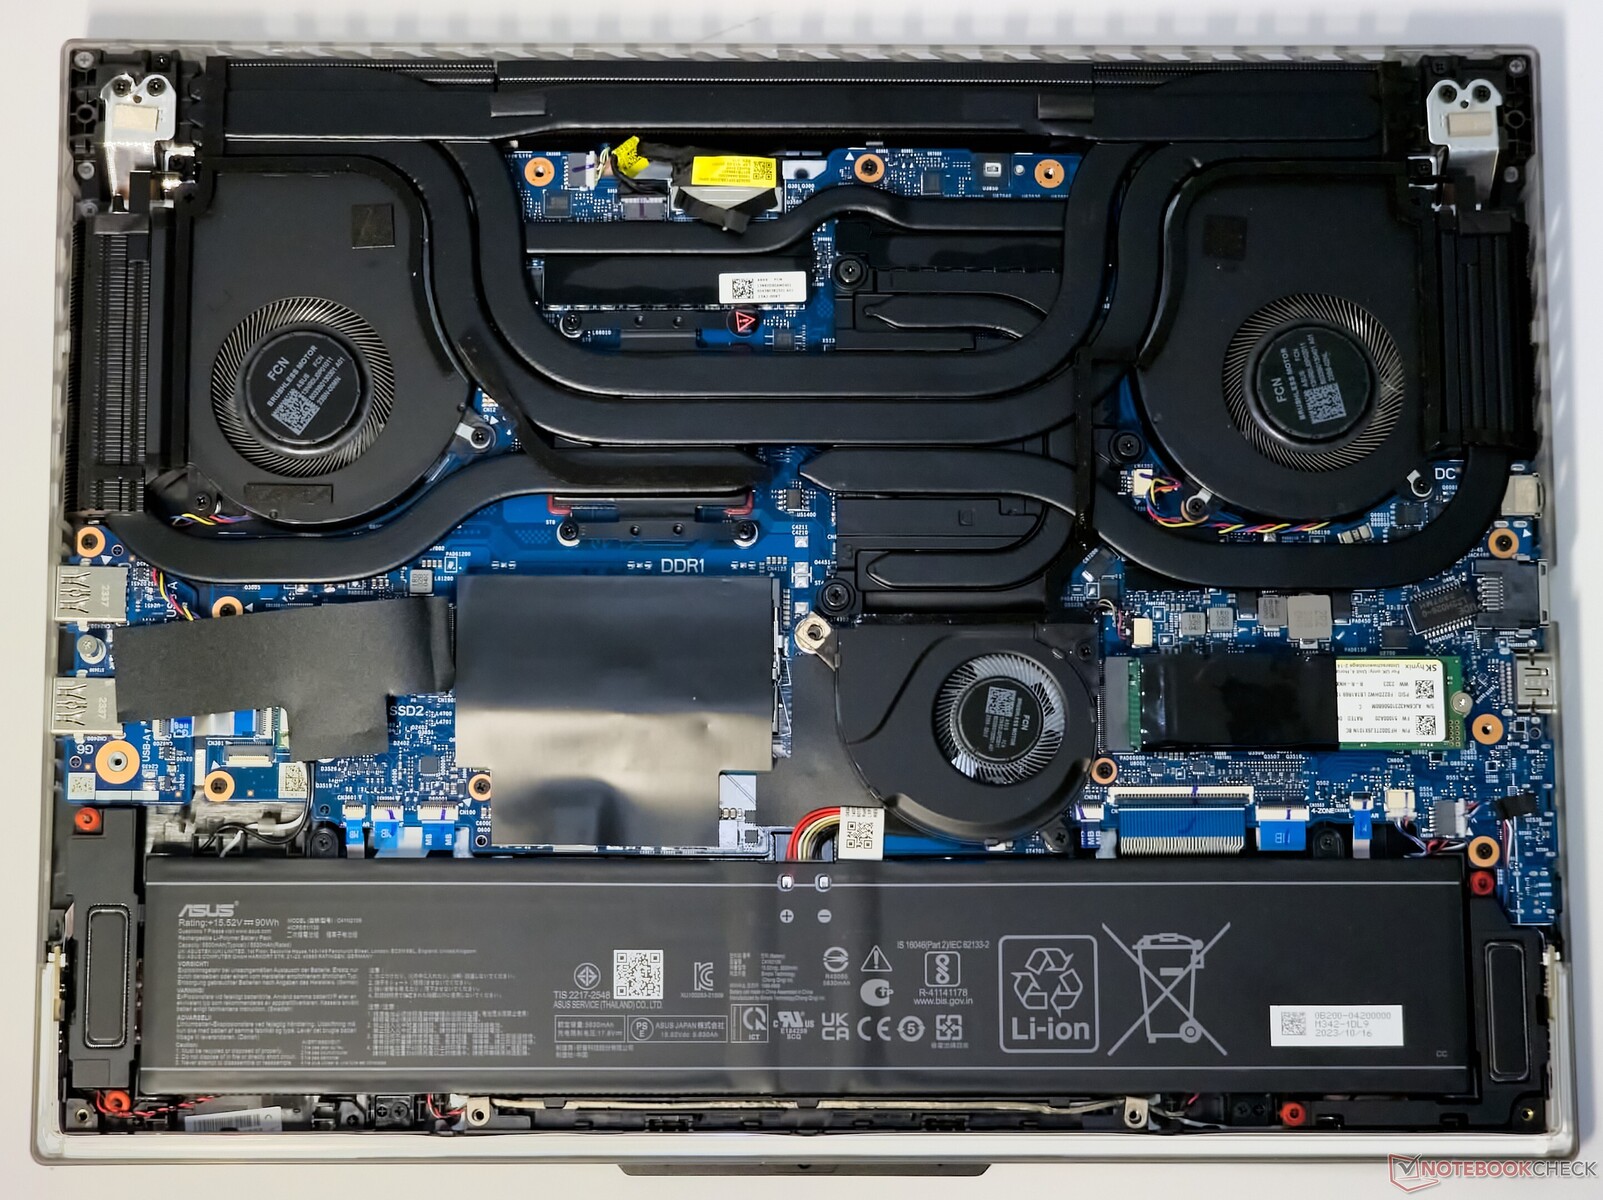
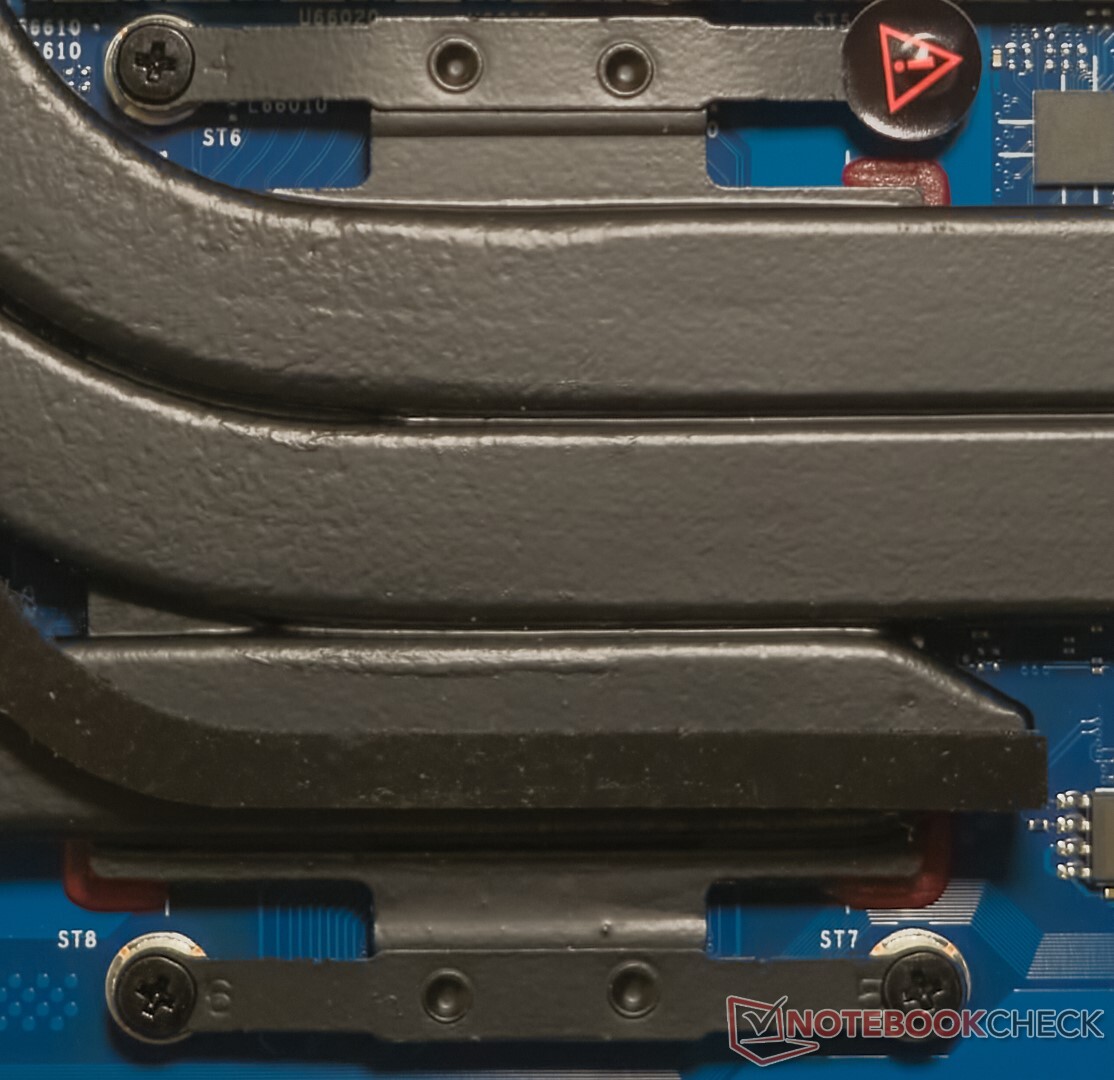
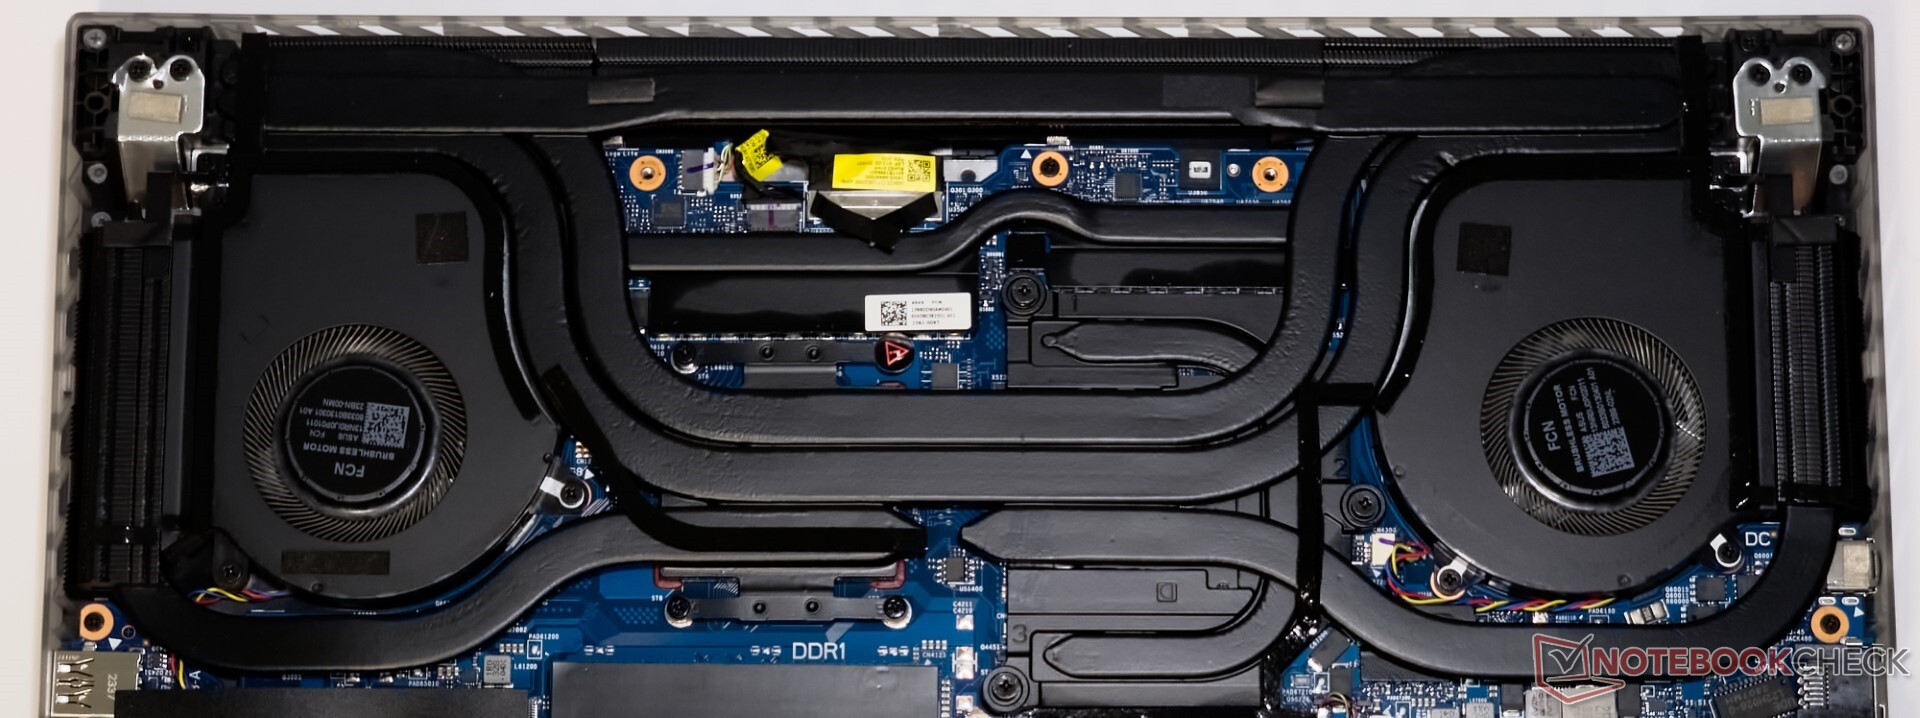
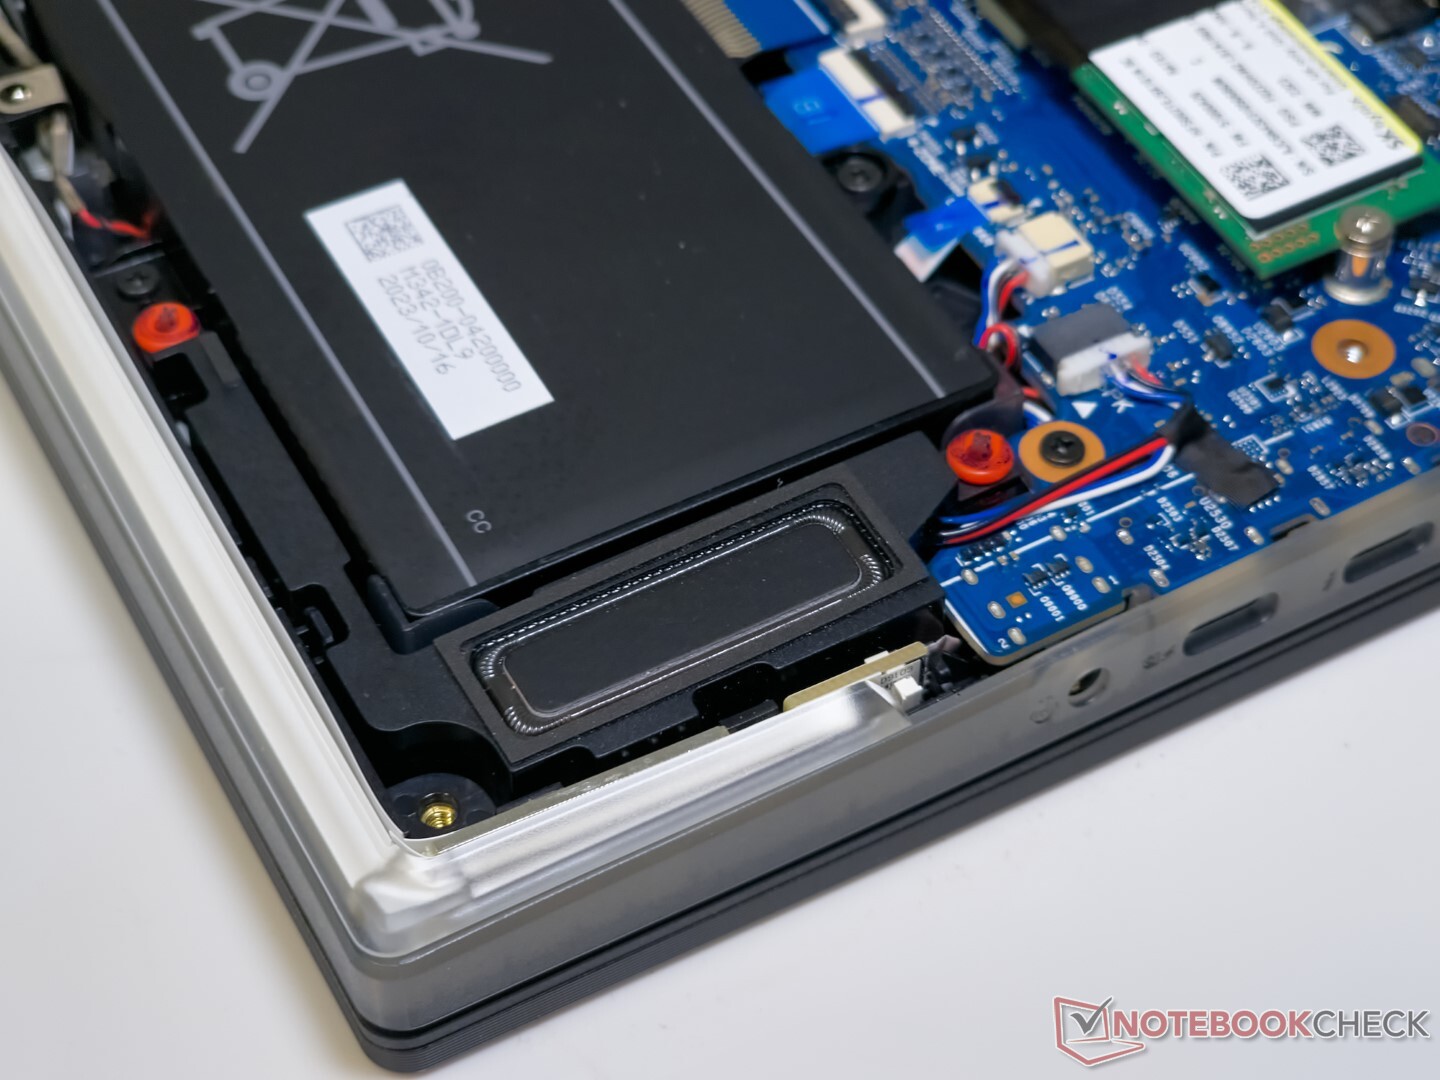
Mantenimiento
Al retirar los 11 tornillos PH0 y hacer palanca para abrir el panel trasero, queda al descubierto la ajetreada distribución interna del Scar 16. Un sensor óptico en la placa base actúa como medida de seguridad, impidiendo que el portátil se encienda o apagándolo si ya está encendido cuando se retira el panel inferior. Para arrancar de nuevo, es necesario volver a colocar el panel inferior y conectar el portátil al adaptador de corriente.
La tira de LED RGB ya no forma parte del panel trasero, así que adiós a las preocupaciones de que los frágiles cables de cinta se rompan al hacer palanca para abrir la cubierta.
La memoria RAM, la unidad SSD y la tarjeta WLAN se pueden intercambiar por actualizaciones si es necesario. La batería también se puede desenroscar y sustituir.
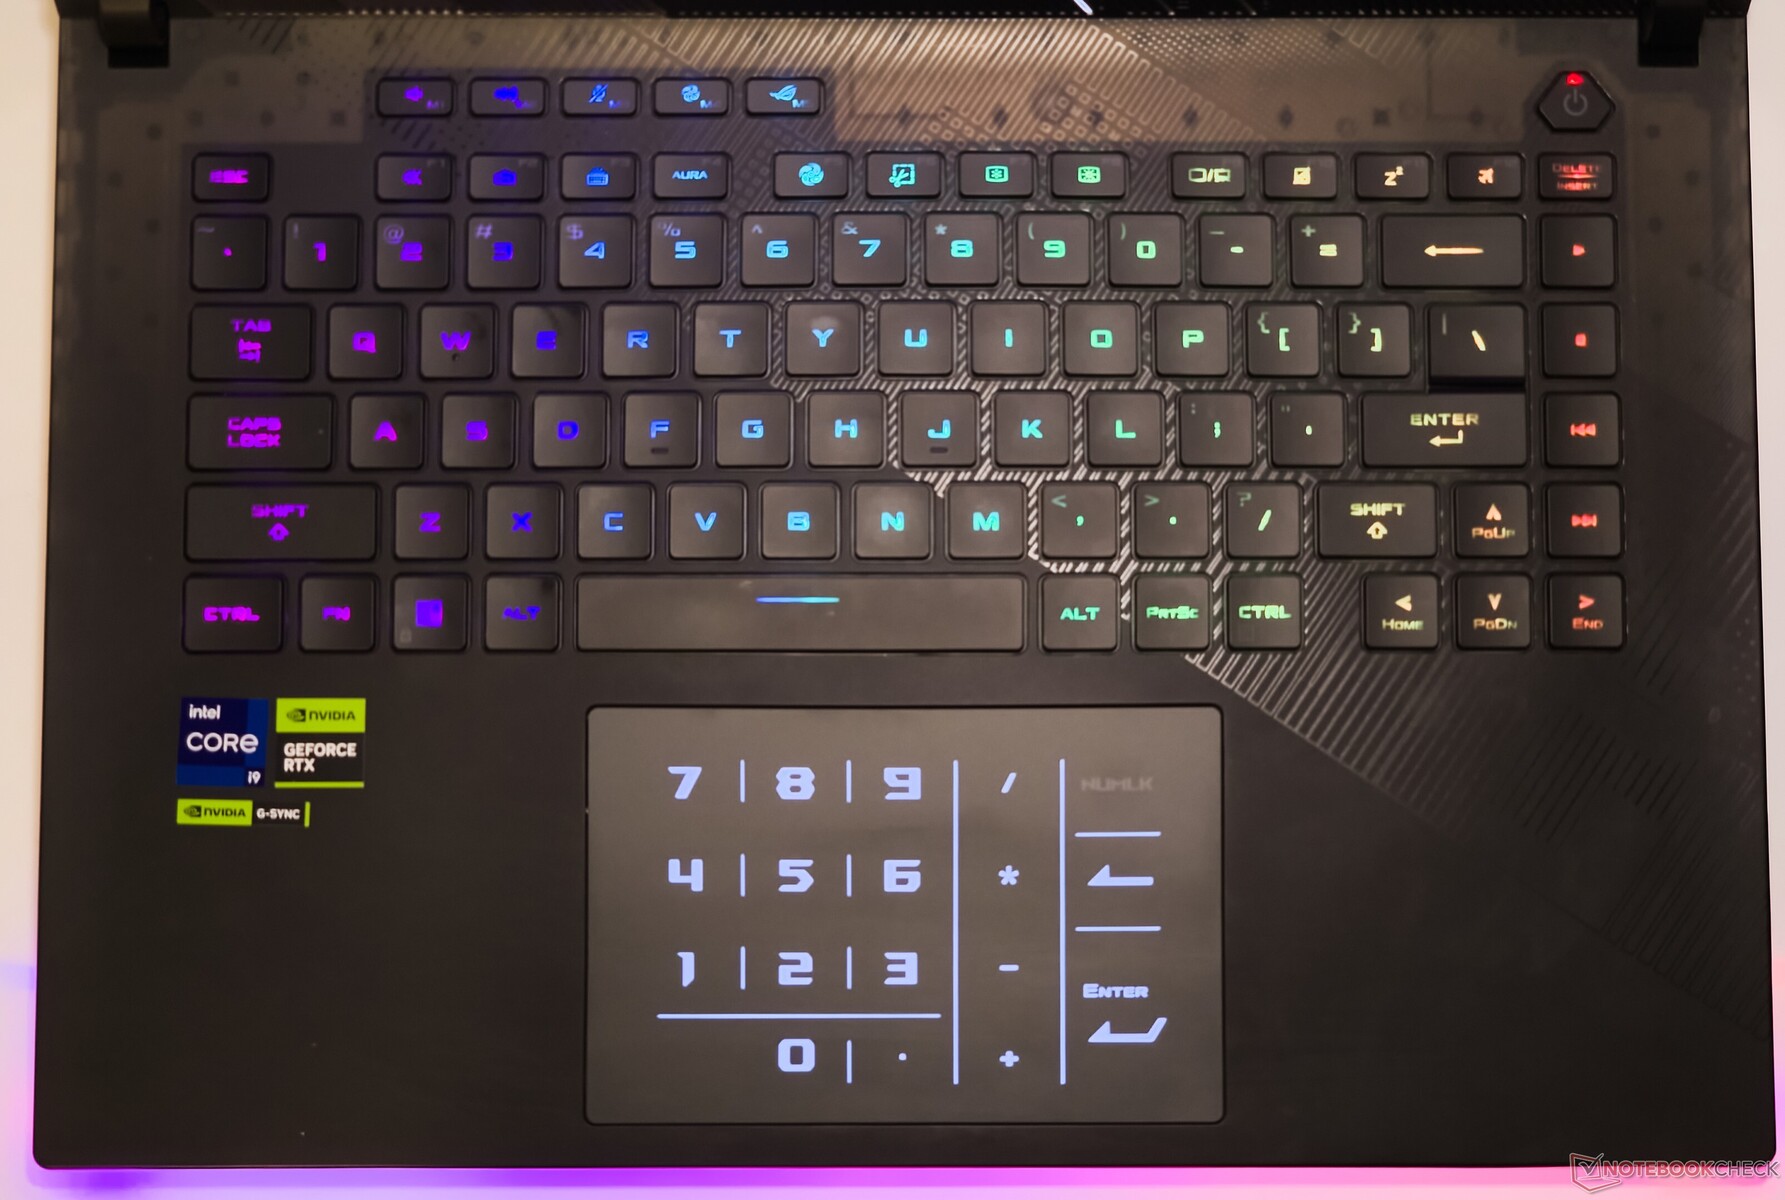
Dispositivos de entrada: Práctico teclado numérico virtual pero F1-F12 permanece sin iluminar
Teclado
El teclado del Scar 16 ofrece una buena experiencia de escritura en general, pero la respuesta podría haber sido más nítida. Aquellos que vengan de un portátil ROG que no sea Asus pueden tardar algún tiempo en adaptarse a la corta tecla Shift derecha y a la disposición vertical de las teclas multimedia hacia la derecha.
Como es habitual en los portátiles ROG, la fila superior permite programar funciones macro a través de Armory Crate. Es encomiable que Asus proporcione teclas de flecha de tamaño completo. Hay teclas dedicadas para cambiar entre los preajustes de iluminación RGB y los perfiles de rendimiento.
El RGB por tecla se puede personalizar a través de Armory Crate. Sin embargo, las teclas F1-F12 siguen permaneciendo en la oscuridad.
Panel táctil
El touchpad de 8,5 cm x 13 cm ofrece una experiencia de deslizamiento suave con soporte para los gestos de Windows Precision. El touchpad ofrece una buena tactilidad y los clics son sensibles en las esquinas.
Un botón de bloqueo numérico suave en la parte superior derecha del touchpad lanza un teclado numérico virtual para aquellas necesidades de cálculo numérico. Puede activarse accidentalmente al deslizar el dedo, pero no suele entorpecer el uso normal.
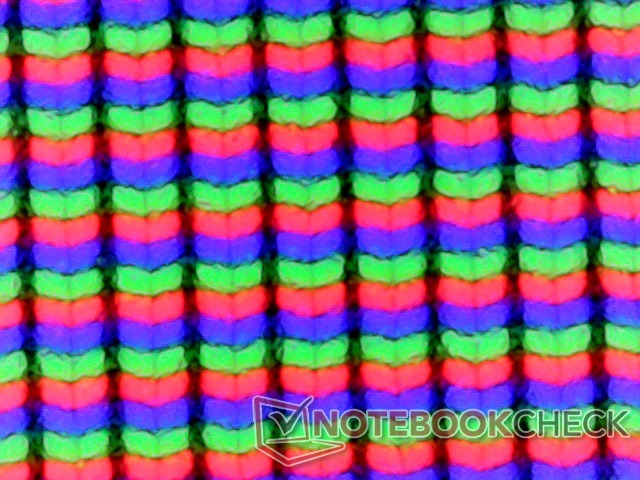
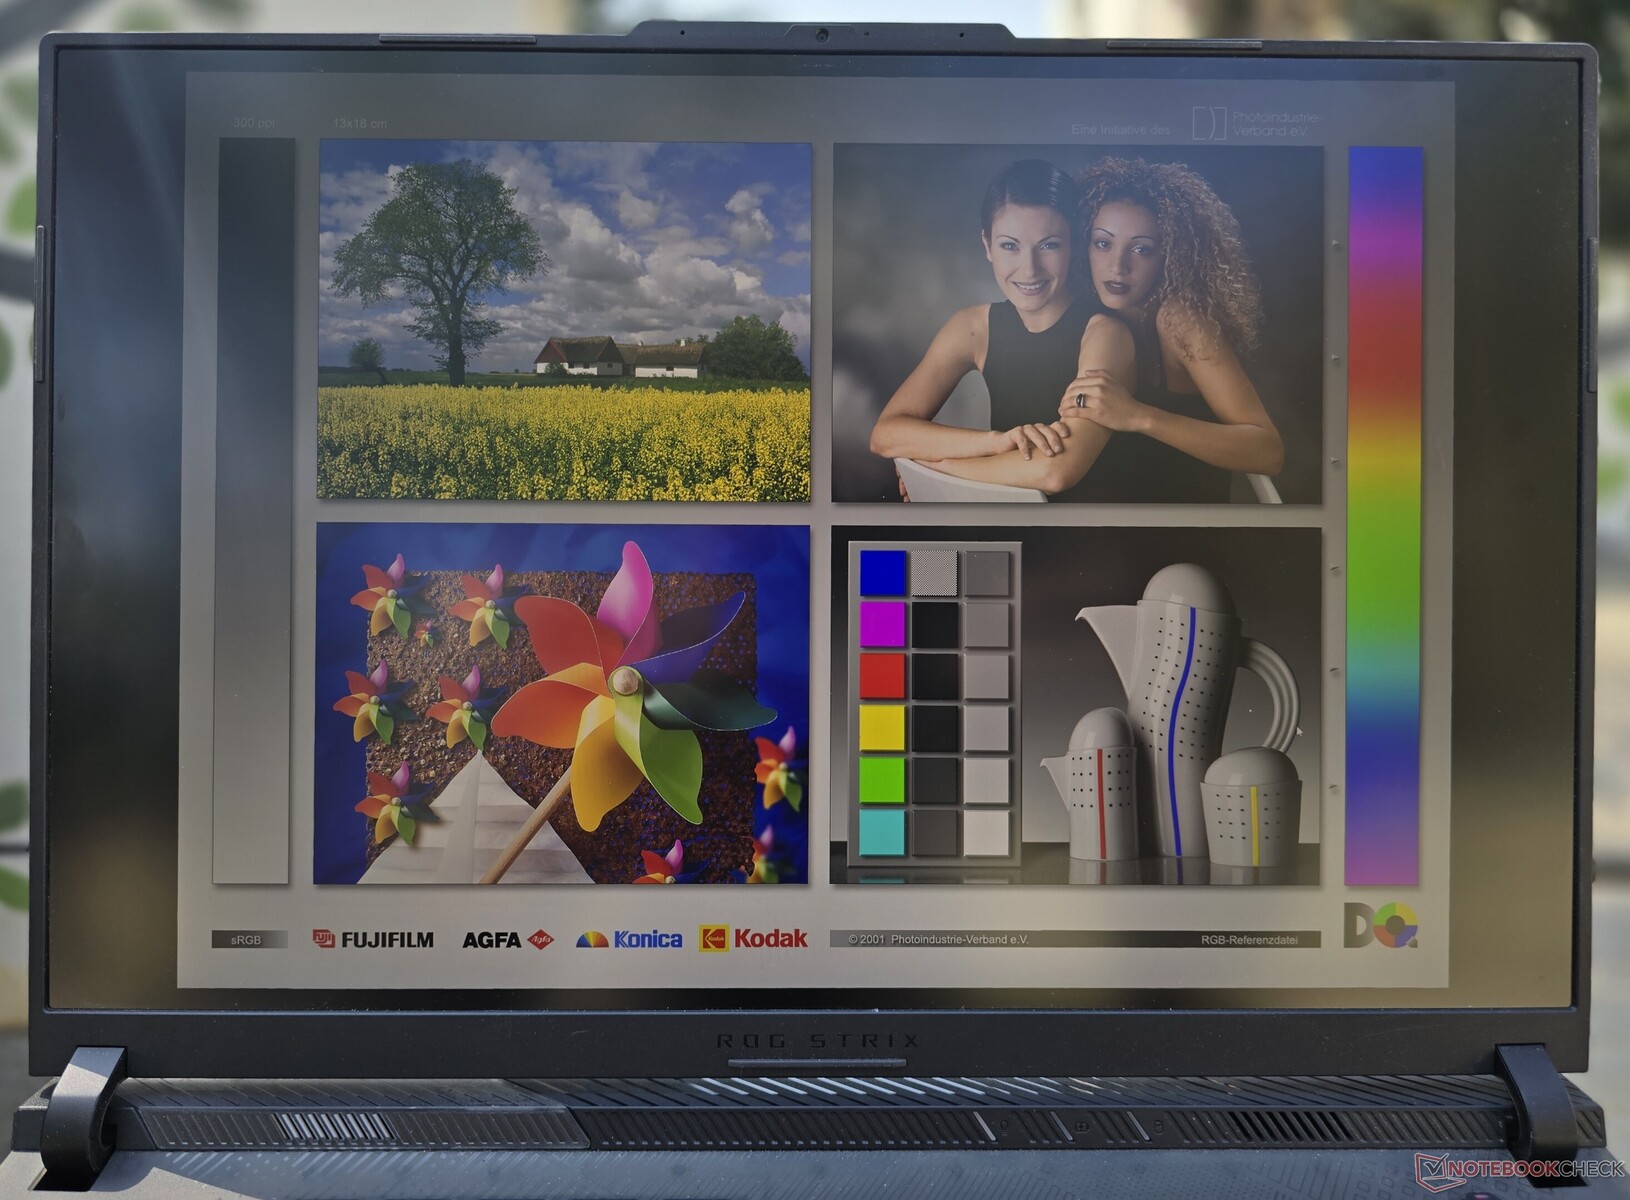
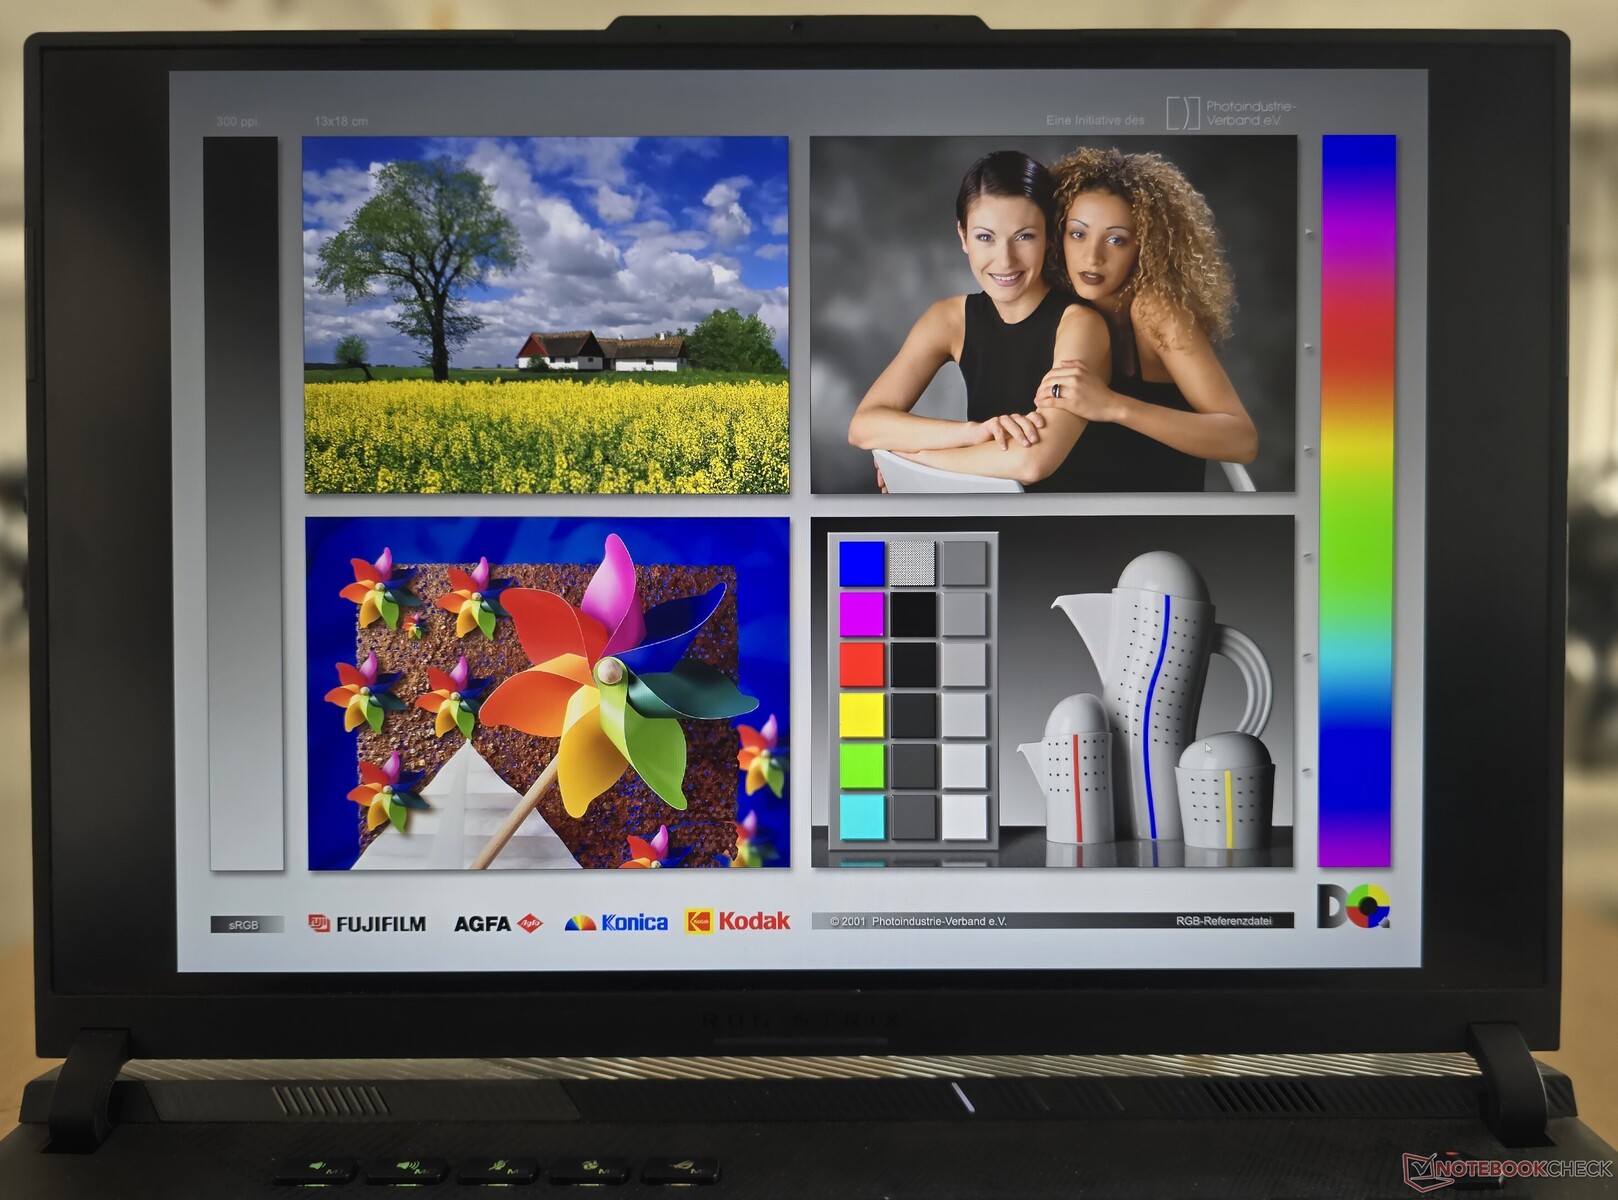
Pantalla: panel QHD+ G-Sync HDR de 240 Hz con PWM alto
El ROG Strix Scar 16 viene equipado con un panel mini LED "Nebula HDR" de 2560 x 1600 16:10 que Asus especifica que tiene 2.048 zonas de atenuación. La pantalla de 240 Hz es compatible con HDR10, Dolby Vision, Nvidia G-Sync y también está validada por Pantone.
Armory Crate permite alternar entre retroiluminación monozona y multizona. La primera es el modo de funcionamiento por defecto y permite una iluminación más uniforme para flujos de trabajo con colores precisos.
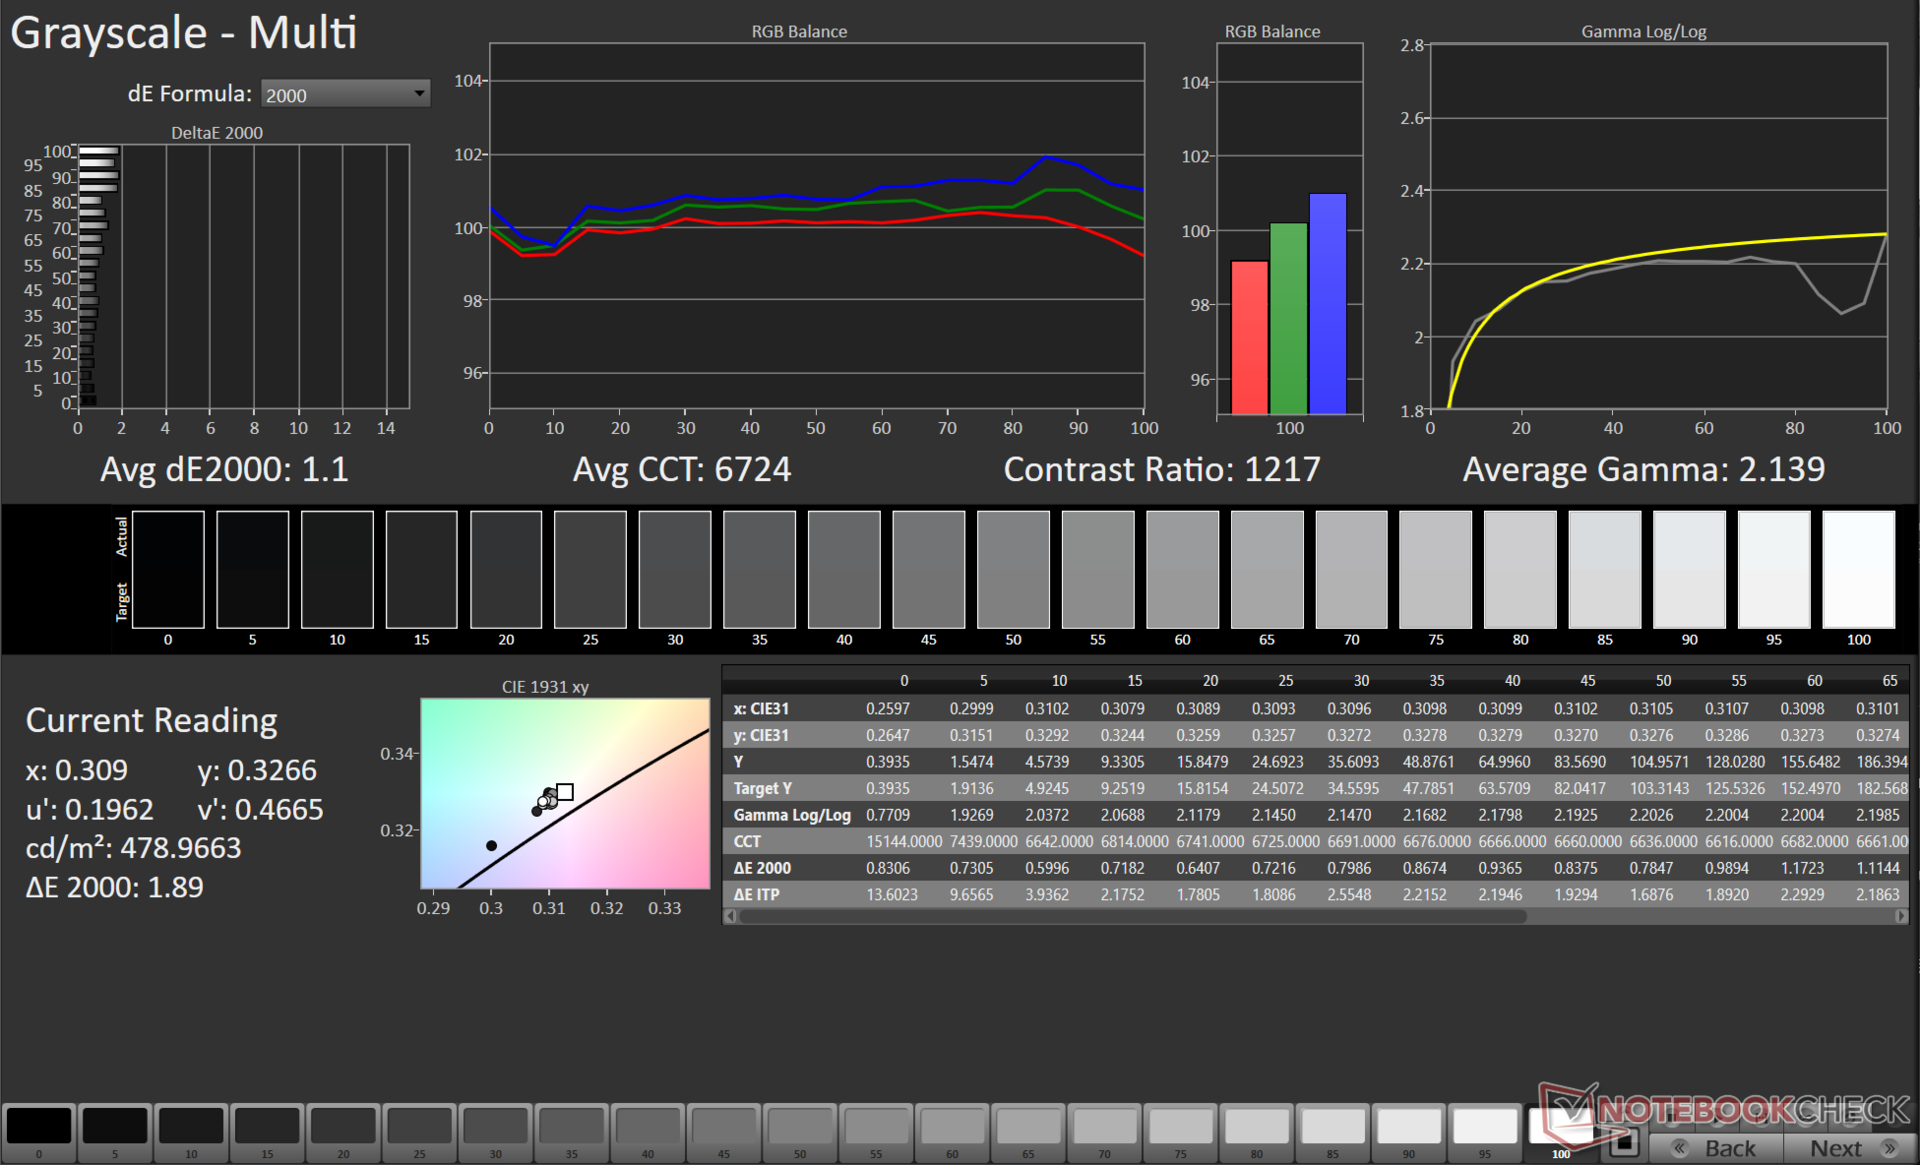
En este modo, la pantalla del Scar 16 mostró una buena distribución del brillo del 94% en nuestras mediciones SDR, con un brillo máximo de 503 nits. Medimos una relación de contraste de 1.225:1, que está bien, pero querrá activar el interruptor multizona si necesita negros aún más profundos.
Consulte nuestro Análisis del ROG Scar 18 (2024) que luce un panel mini LED Nebula HDR similar para conocer el tipo de valores que cabe esperar con la retroiluminación multizona.
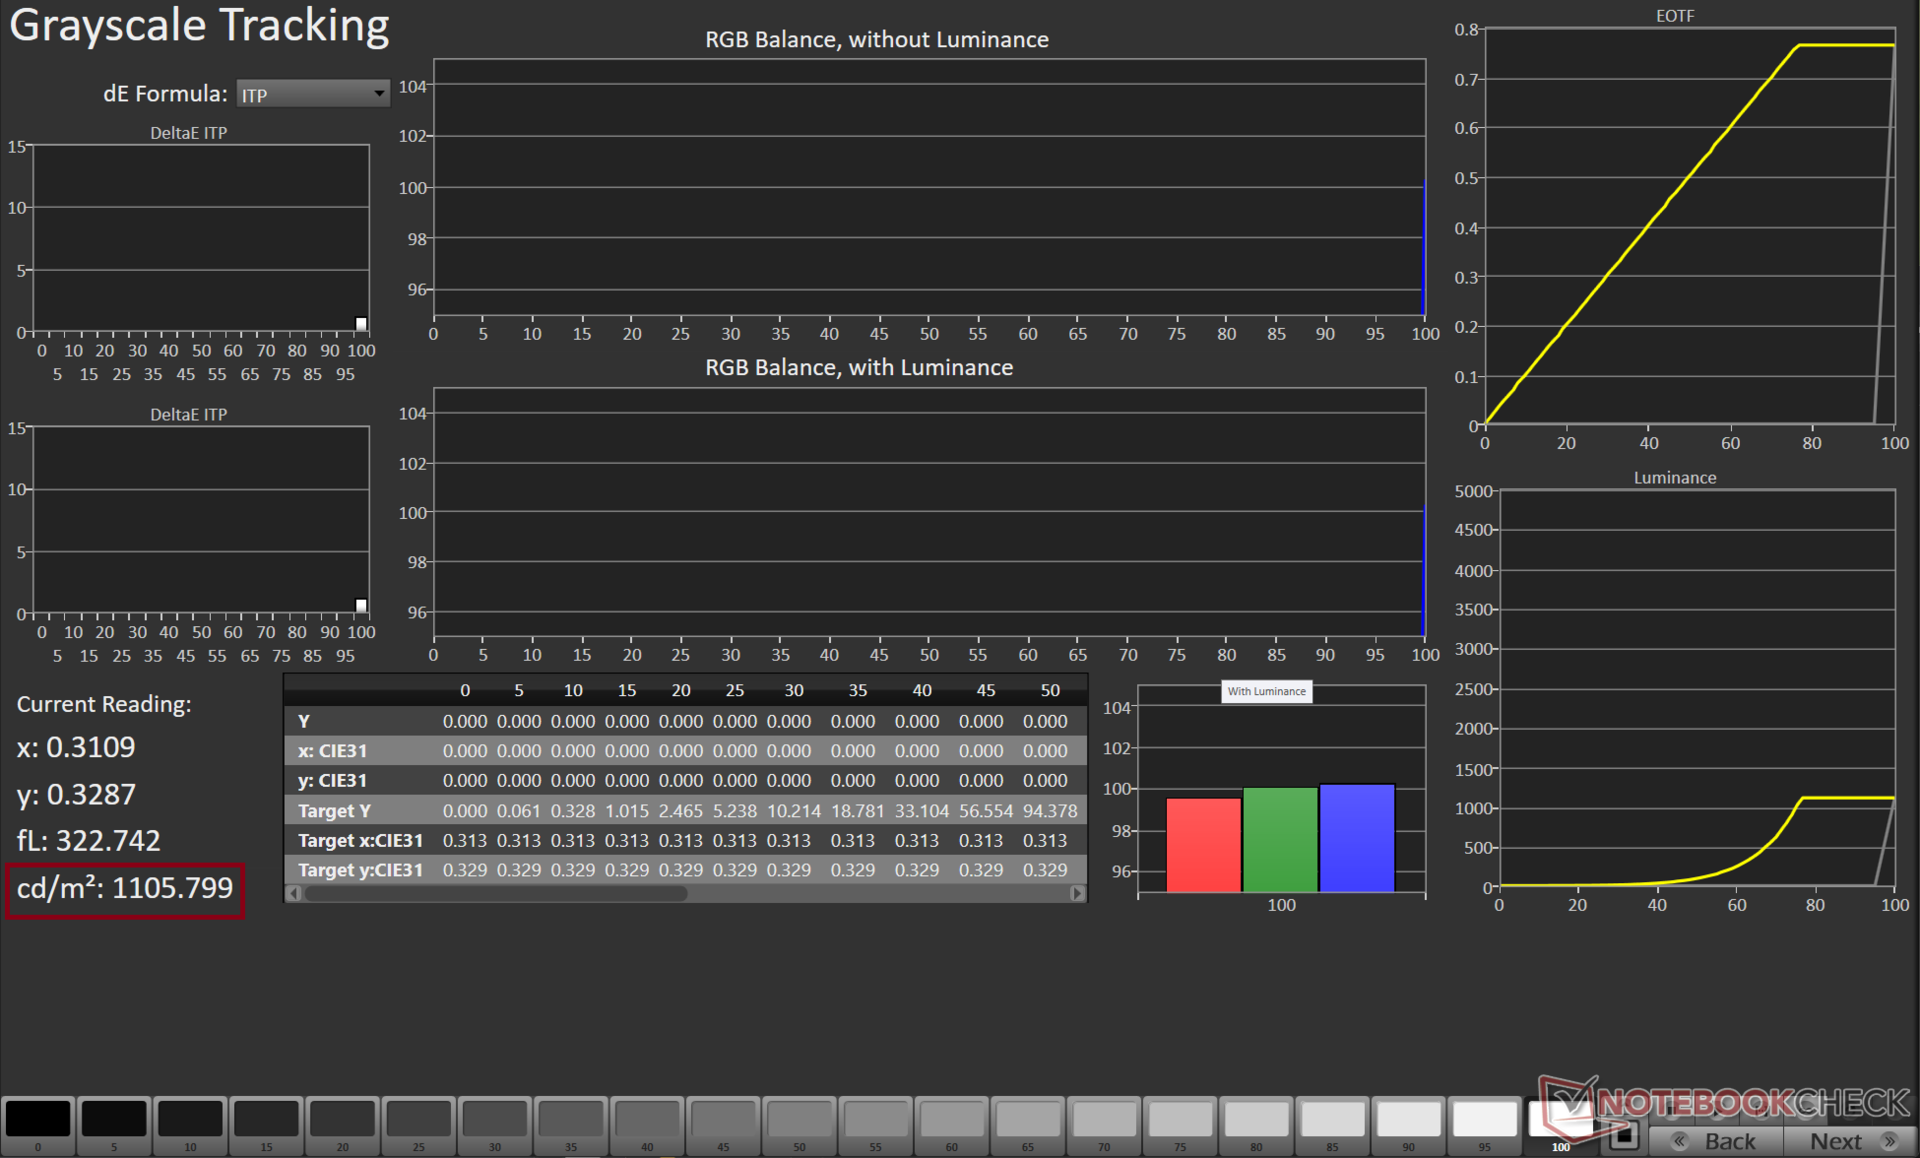
Asus anuncia 1.100 nits de brillo máximo HDR, y descubrimos que esta afirmación era cierta cuando se midió con un tamaño de ventana del 49%.
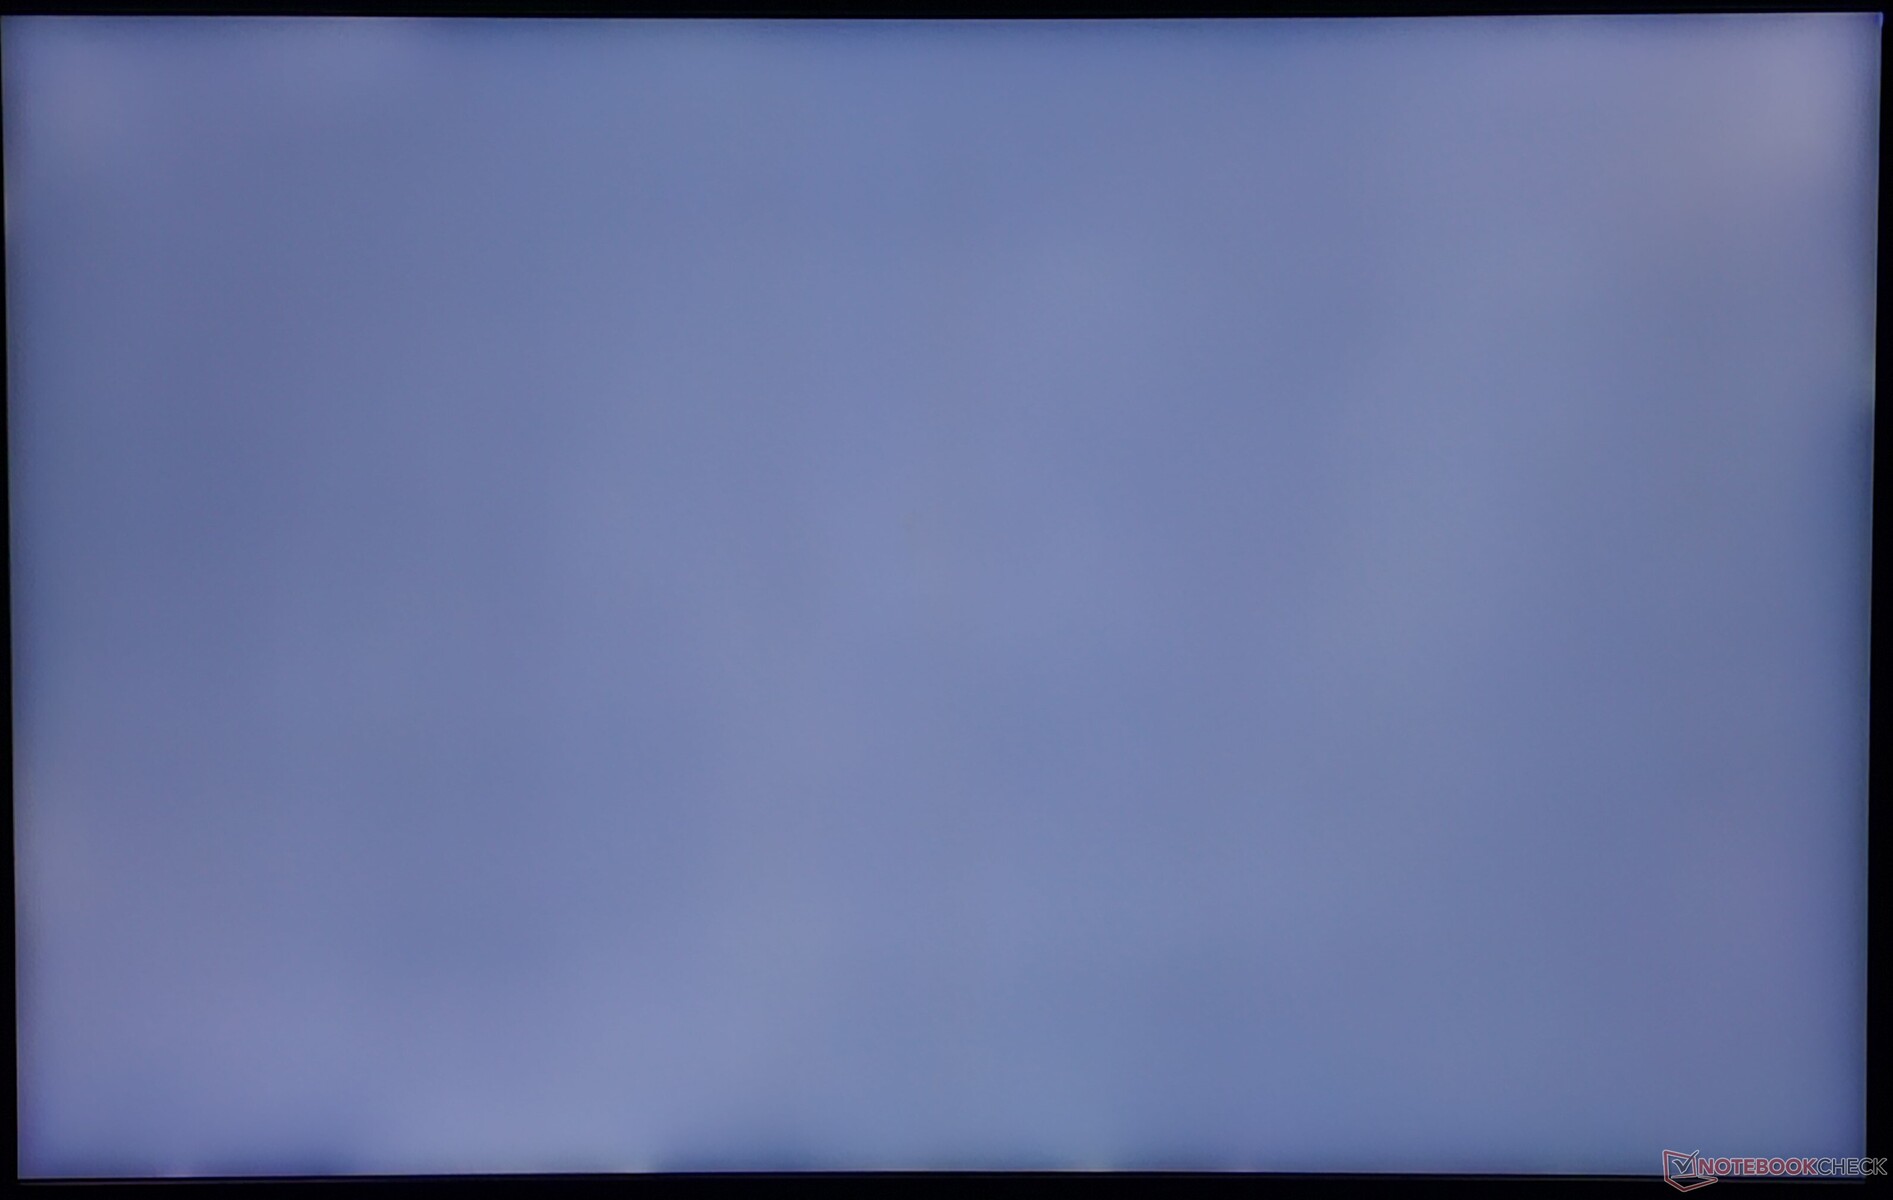
El sangrado de la retroiluminación sólo se aprecia mínimamente a lo largo del marco inferior de la pantalla.
| |||||||||||||||||||||||||
iluminación: 94 %
Brillo con batería: 291 cd/m²
Contraste: 1225:1 (Negro: 0.4 cd/m²)
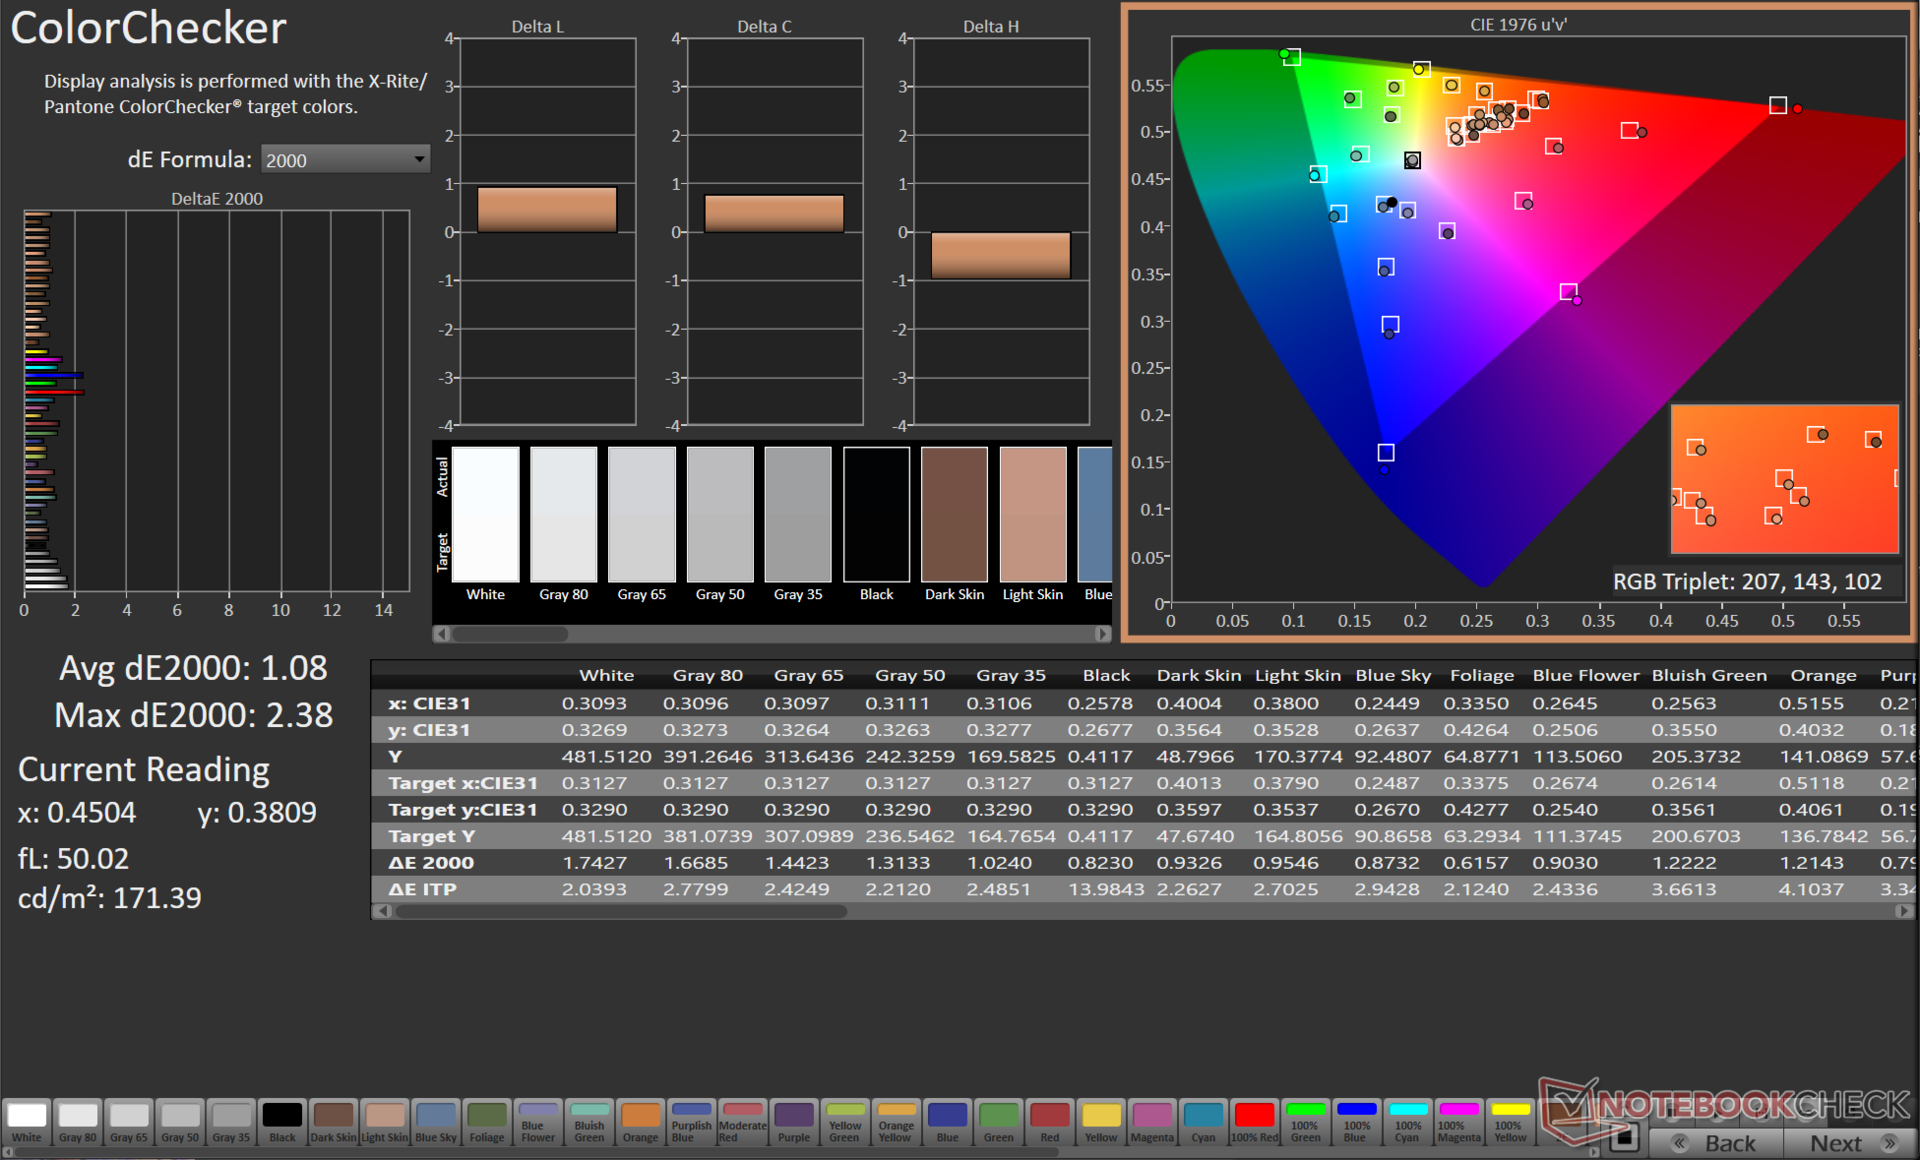
ΔE Color 1.08 | 0.5-29.43 Ø5, calibrated: 0.9
ΔE Greyscale 1.1 | 0.57-98 Ø5.3
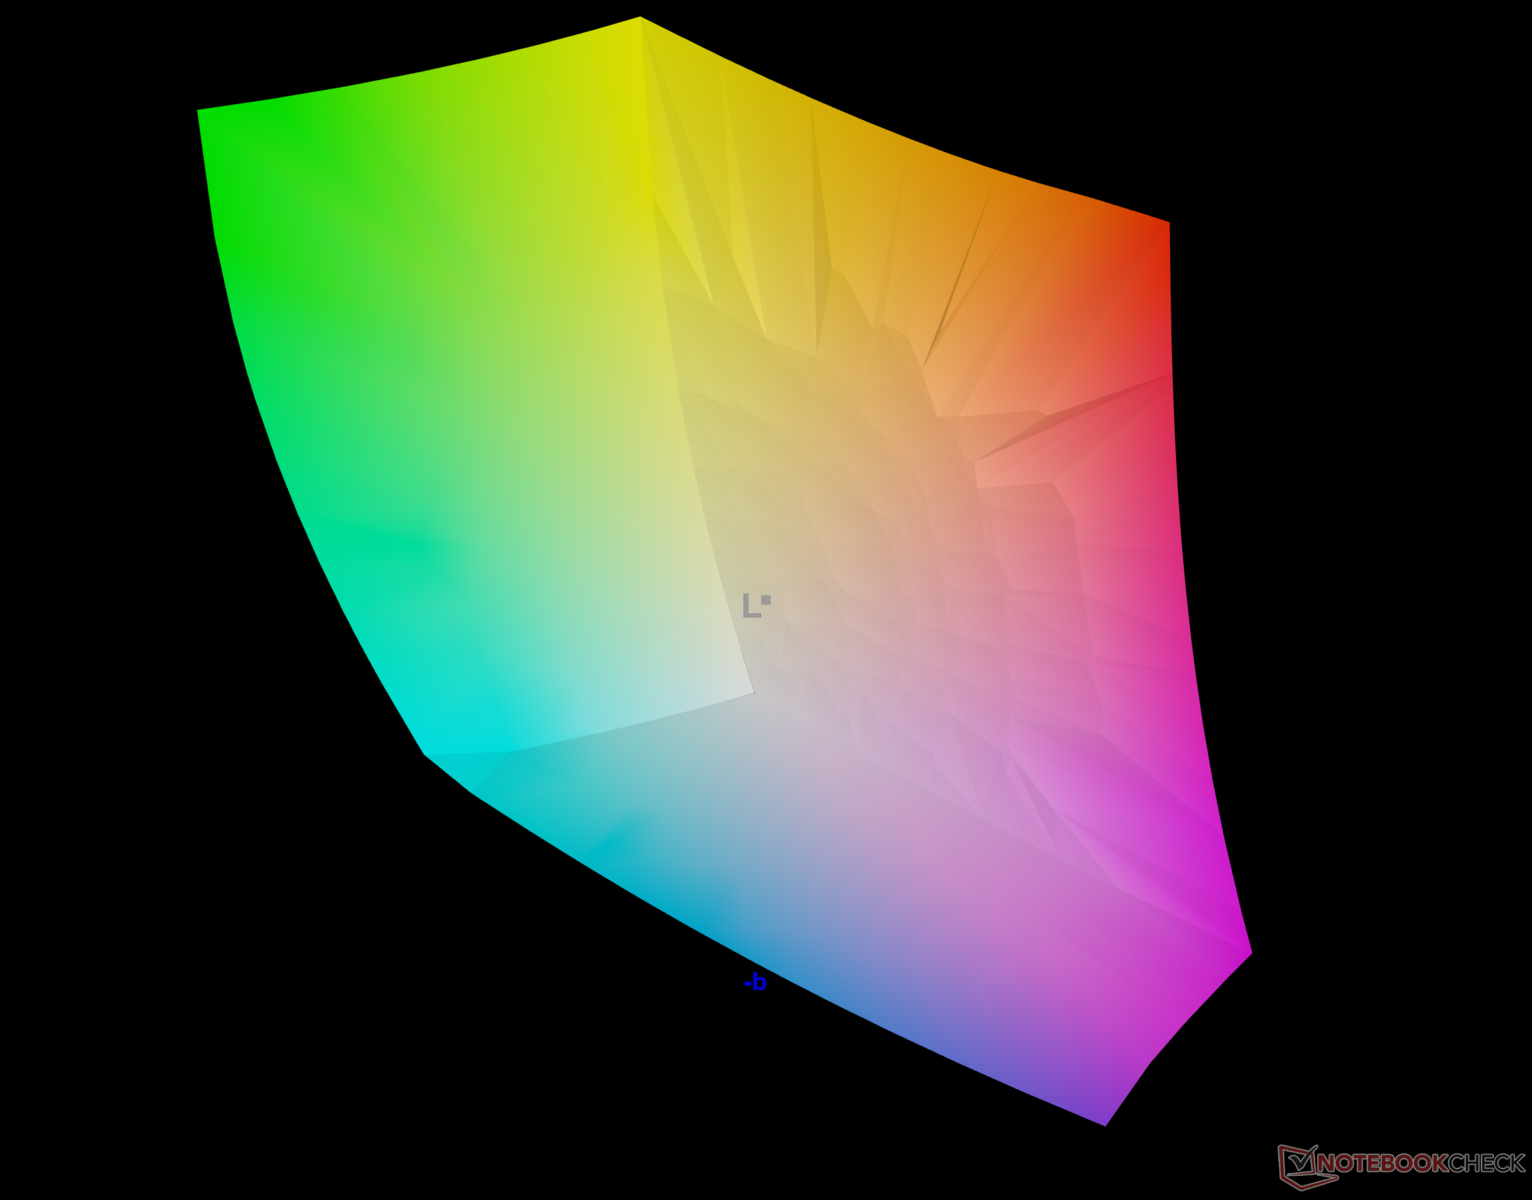
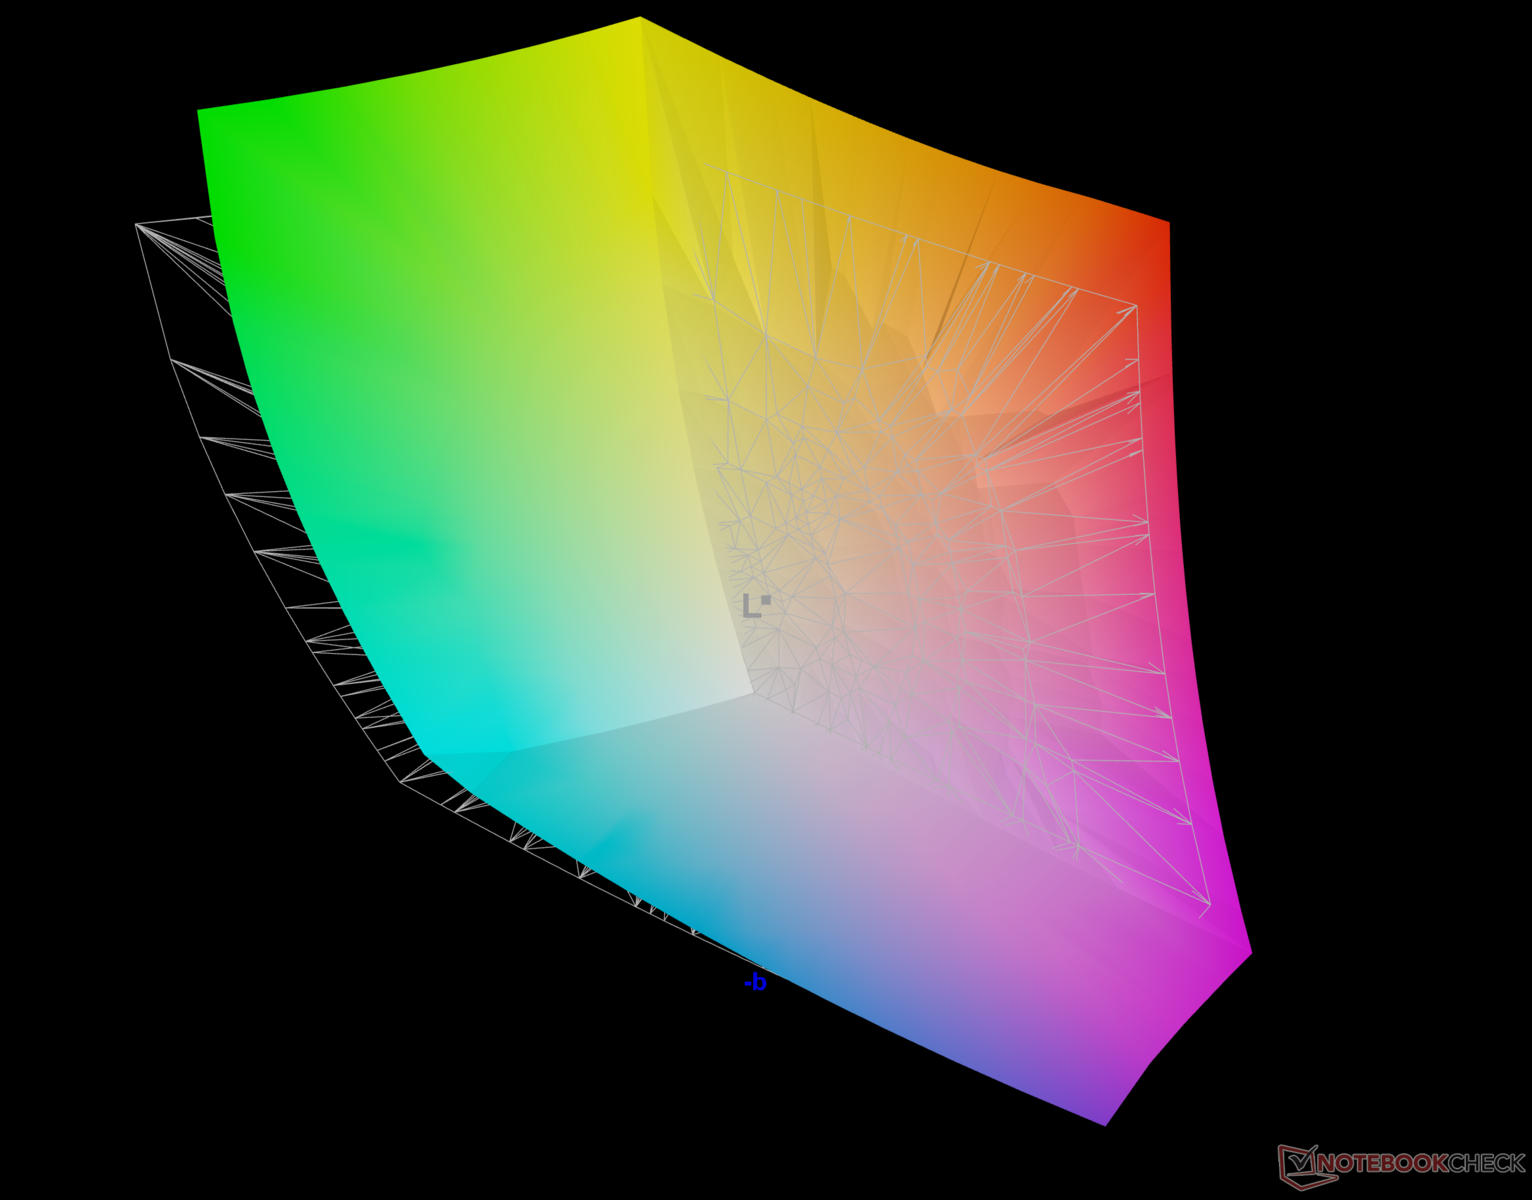
90.8% AdobeRGB 1998 (Argyll 2.2.0 3D)
100% sRGB (Argyll 2.2.0 3D)
99.8% Display P3 (Argyll 2.2.0 3D)
Gamma: 2.13
| Asus ROG Strix Scar 16 G634JZR BOE NE160QDM-NM7, Mini LED, 2560x1600, 16.00 | Asus ROG Strix G16 G614JZ TL160ADMP03-0, IPS, 2560x1600, 16.00 | Lenovo Legion Pro 7 16IRX9H BOE CQ NE16QDM-NZB, IPS, 2560x1600, 16.00 | HP Omen 16 (2024) BOE BOE0B7D, IPS, 2560x1440, 16.10 | MSI Vector 16 HX A14V Chi Mei N160GME-GTB, IPS, 2560x1600, 16.00 | Alienware m16 R2 BOE NE16NYH, IPS, 2560x1600, 16.00 | |
|---|---|---|---|---|---|---|
| Display | -3% | -2% | -18% | -3% | -17% | |
| Display P3 Coverage | 99.8 | 97 -3% | 98.5 -1% | 68.6 -31% | 95.4 -4% | 71 -29% |
| sRGB Coverage | 100 | 99.9 0% | 99.9 0% | 98.6 -1% | 99.7 0% | 100 0% |
| AdobeRGB 1998 Coverage | 90.8 | 84.9 -6% | 86.7 -5% | 70.6 -22% | 85.4 -6% | 71.4 -21% |
| Response Times | 18% | -54% | -86% | -12% | 1% | |
| Response Time Grey 50% / Grey 80% * | 5 ? | 5.1 ? -2% | 12.6 ? -152% | 14.1 ? -182% | 5.7 ? -14% | 5.7 ? -14% |
| Response Time Black / White * | 10.4 ? | 6.6 ? 37% | 5.8 ? 44% | 9.3 ? 11% | 11.4 ? -10% | 8.7 ? 16% |
| PWM Frequency | 2040 ? | |||||
| Screen | -34% | -1% | -46% | -70% | -27% | |
| Brightness middle | 490 | 470 -4% | 487 -1% | 292 -40% | 557.2 14% | 345.8 -29% |
| Brightness | 487 | 459 -6% | 460 -6% | 291 -40% | 506 4% | 337 -31% |
| Brightness Distribution | 94 | 93 -1% | 88 -6% | 85 -10% | 83 -12% | 87 -7% |
| Black Level * | 0.4 | 0.42 -5% | 0.42 -5% | 0.24 40% | 0.41 -3% | 0.3 25% |
| Contrast | 1225 | 1119 -9% | 1160 -5% | 1217 -1% | 1359 11% | 1153 -6% |
| Colorchecker dE 2000 * | 1.08 | 1.86 -72% | 1.12 -4% | 2.36 -119% | 2.91 -169% | 1.99 -84% |
| Colorchecker dE 2000 max. * | 2.38 | 3.87 -63% | 2.26 5% | 4.08 -71% | 5.94 -150% | 3.52 -48% |
| Colorchecker dE 2000 calibrated * | 0.9 | 0.93 -3% | 0.54 40% | 0.93 -3% | 1.63 -81% | 0.62 31% |
| Greyscale dE 2000 * | 1.1 | 2.7 -145% | 1.4 -27% | 3 -173% | 3.8 -245% | 2.1 -91% |
| Gamma | 2.13 103% | 2.246 98% | 2.242 98% | 2.101 105% | 2.23 99% | 2.32 95% |
| CCT | 6724 97% | 6711 97% | 6809 95% | 5976 109% | 6408 101% | 6369 102% |
| Media total (Programa/Opciones) | -6% /
-20% | -19% /
-9% | -50% /
-46% | -28% /
-48% | -14% /
-21% |
* ... más pequeño es mejor
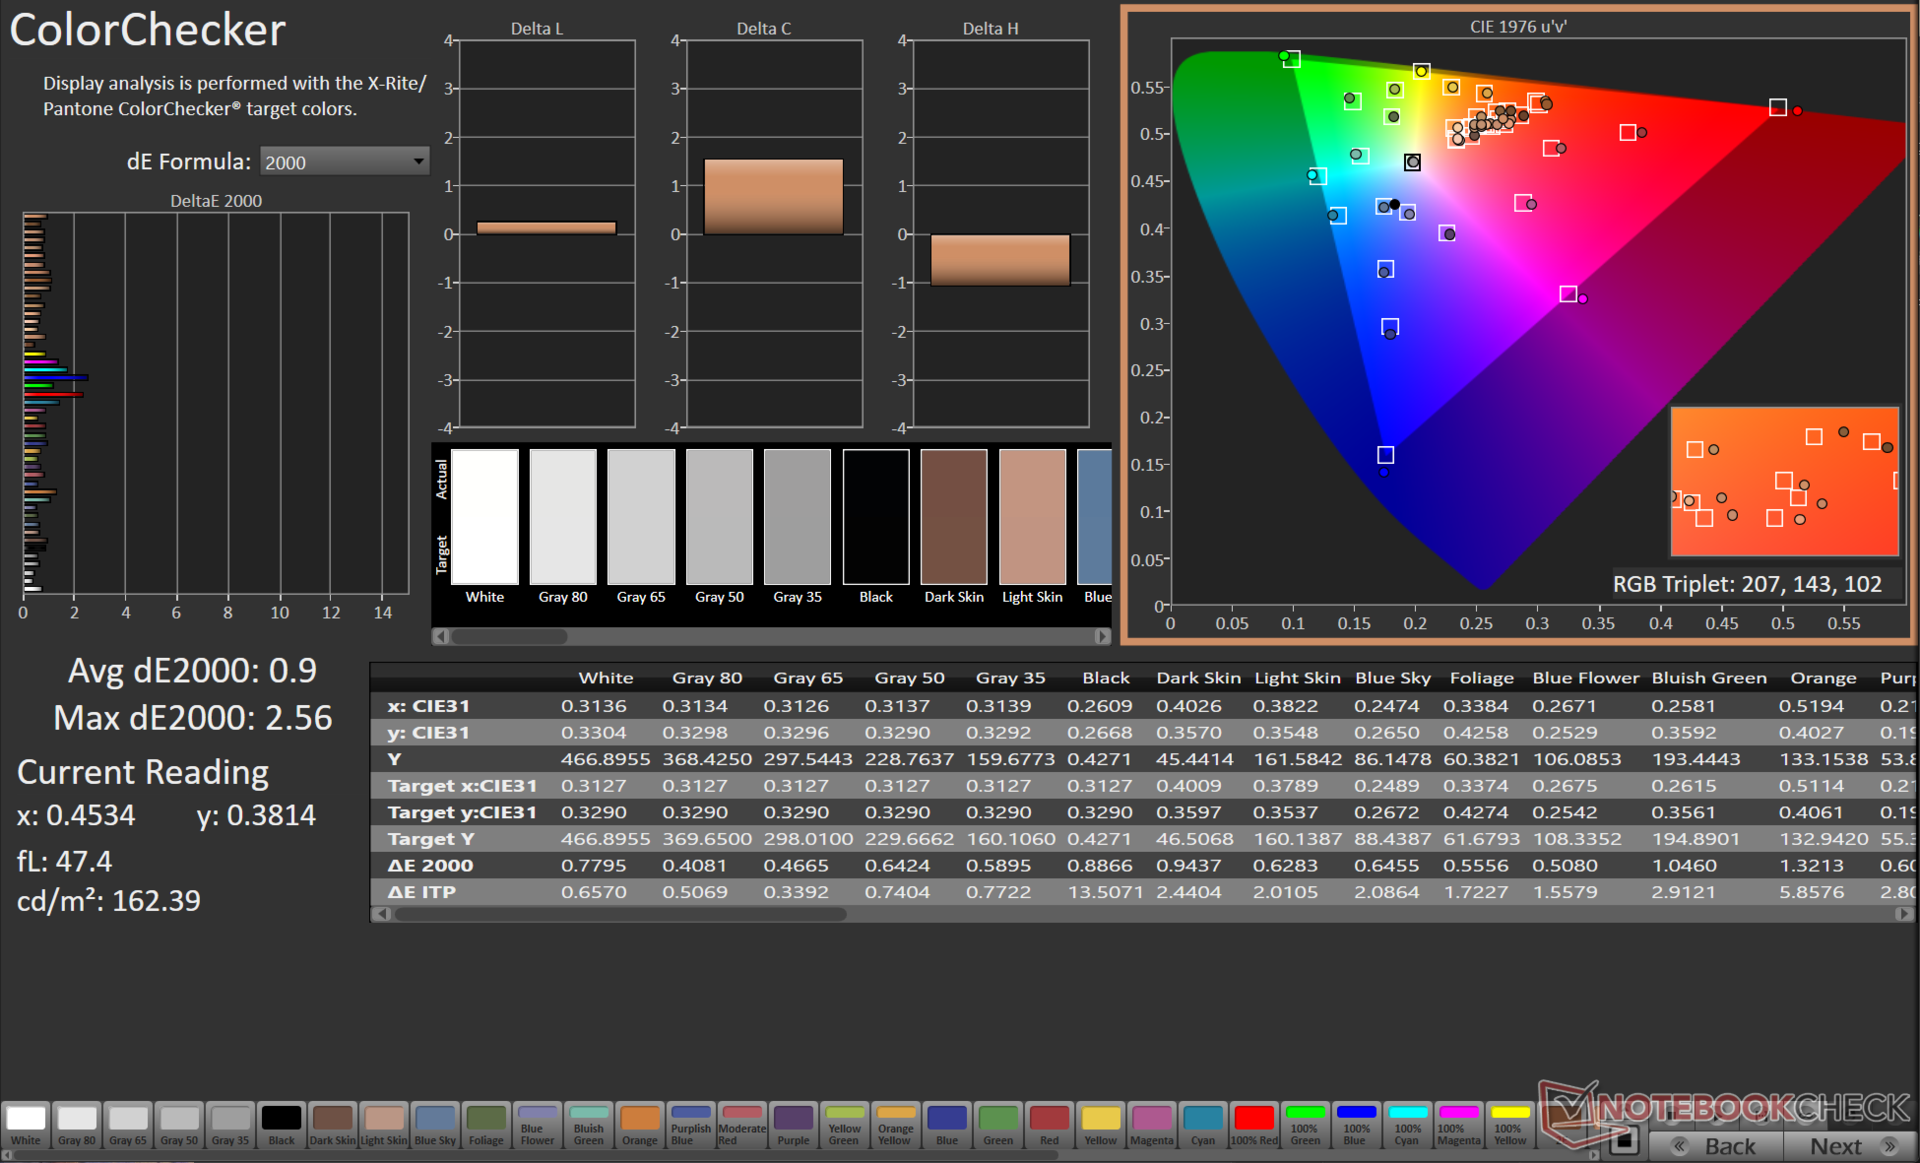
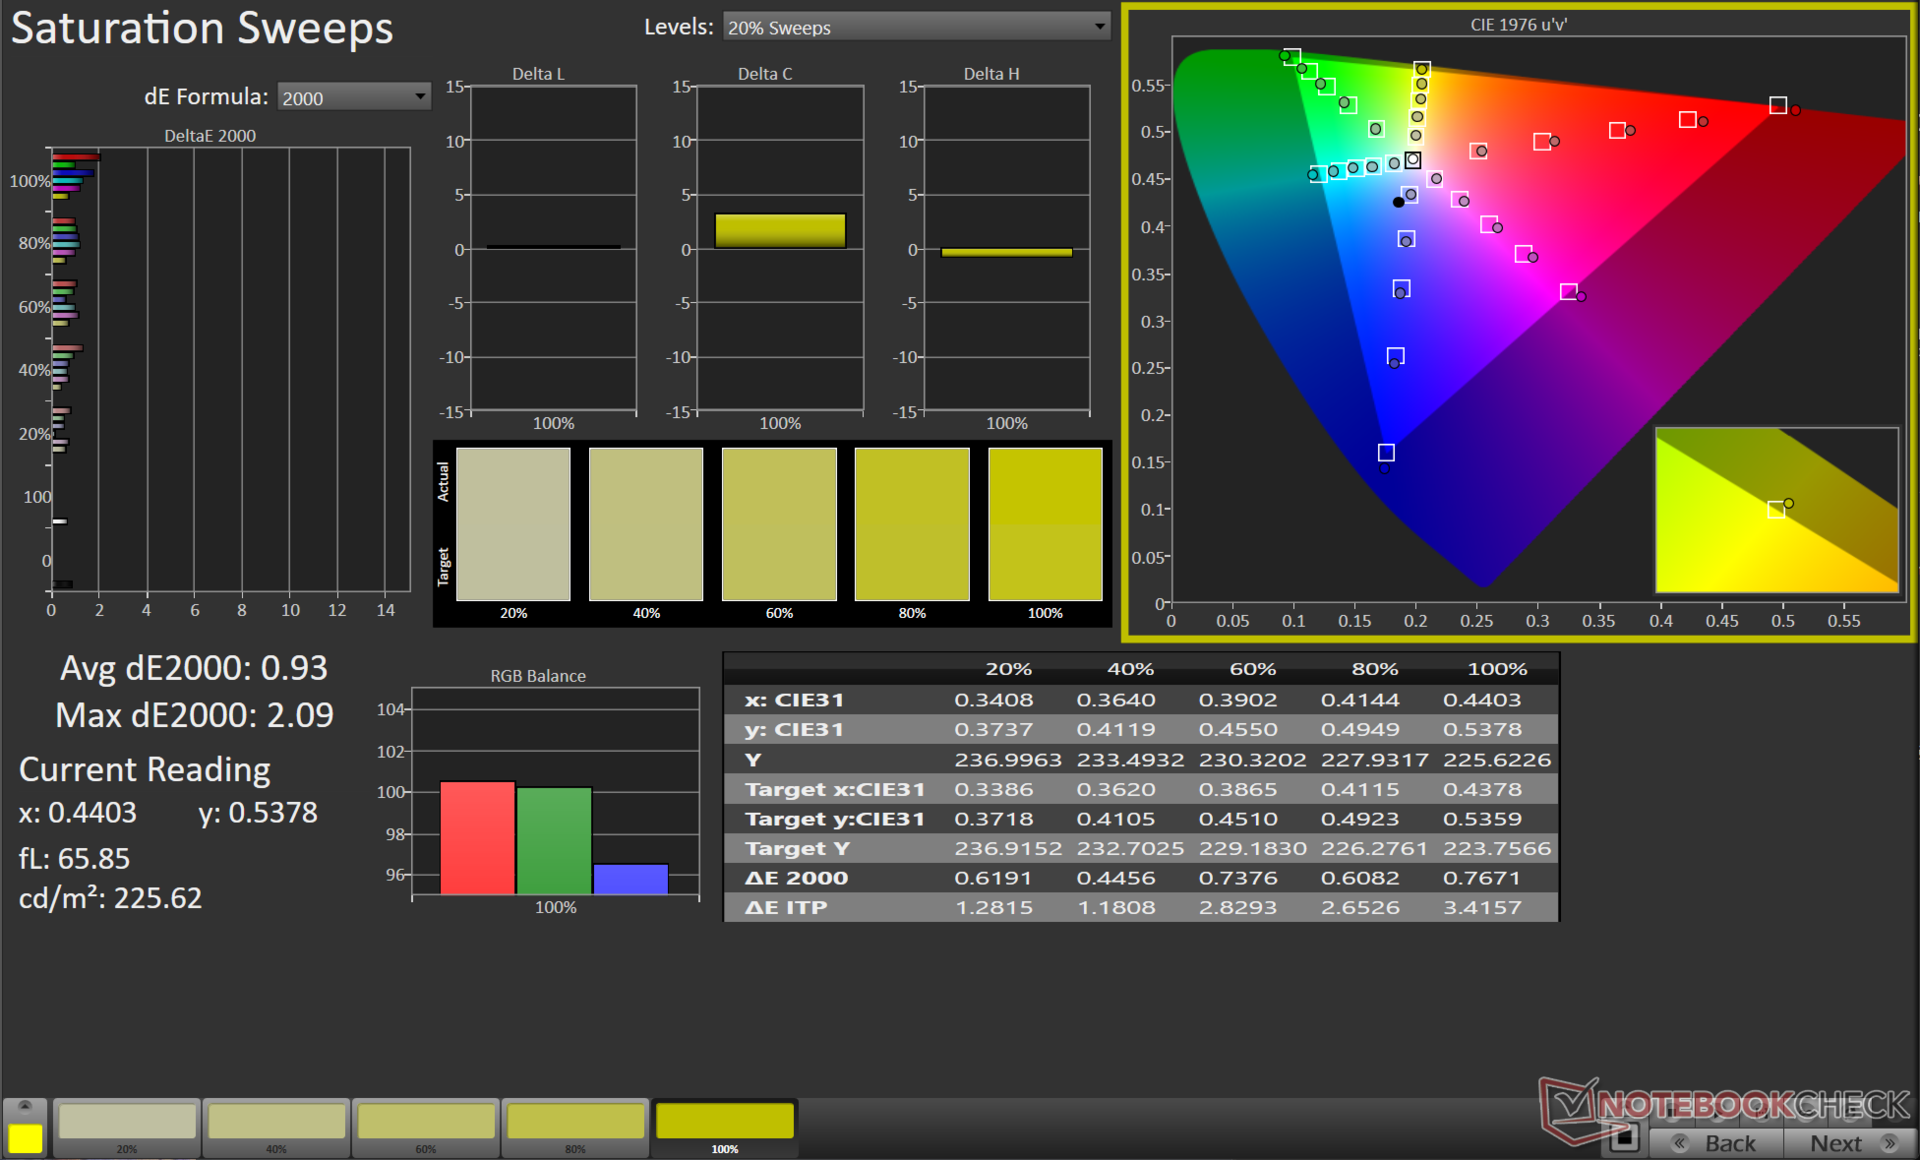
La pantalla de la Scar 16 cubre completamente los espacios de color sRGB y Display P3. La cobertura Adobe RGB también es buena con casi un 91%, lo que hace que la Scar 16 sea muy adecuada tanto para el consumo de medios como para los flujos de trabajo de creación de contenidos.

La pantalla de la Scar 16 está bien calibrada de fábrica con unos valores medios de escala de grises y ColorChecker Delta E 2000 de 1,1 y 1,08, respectivamente.
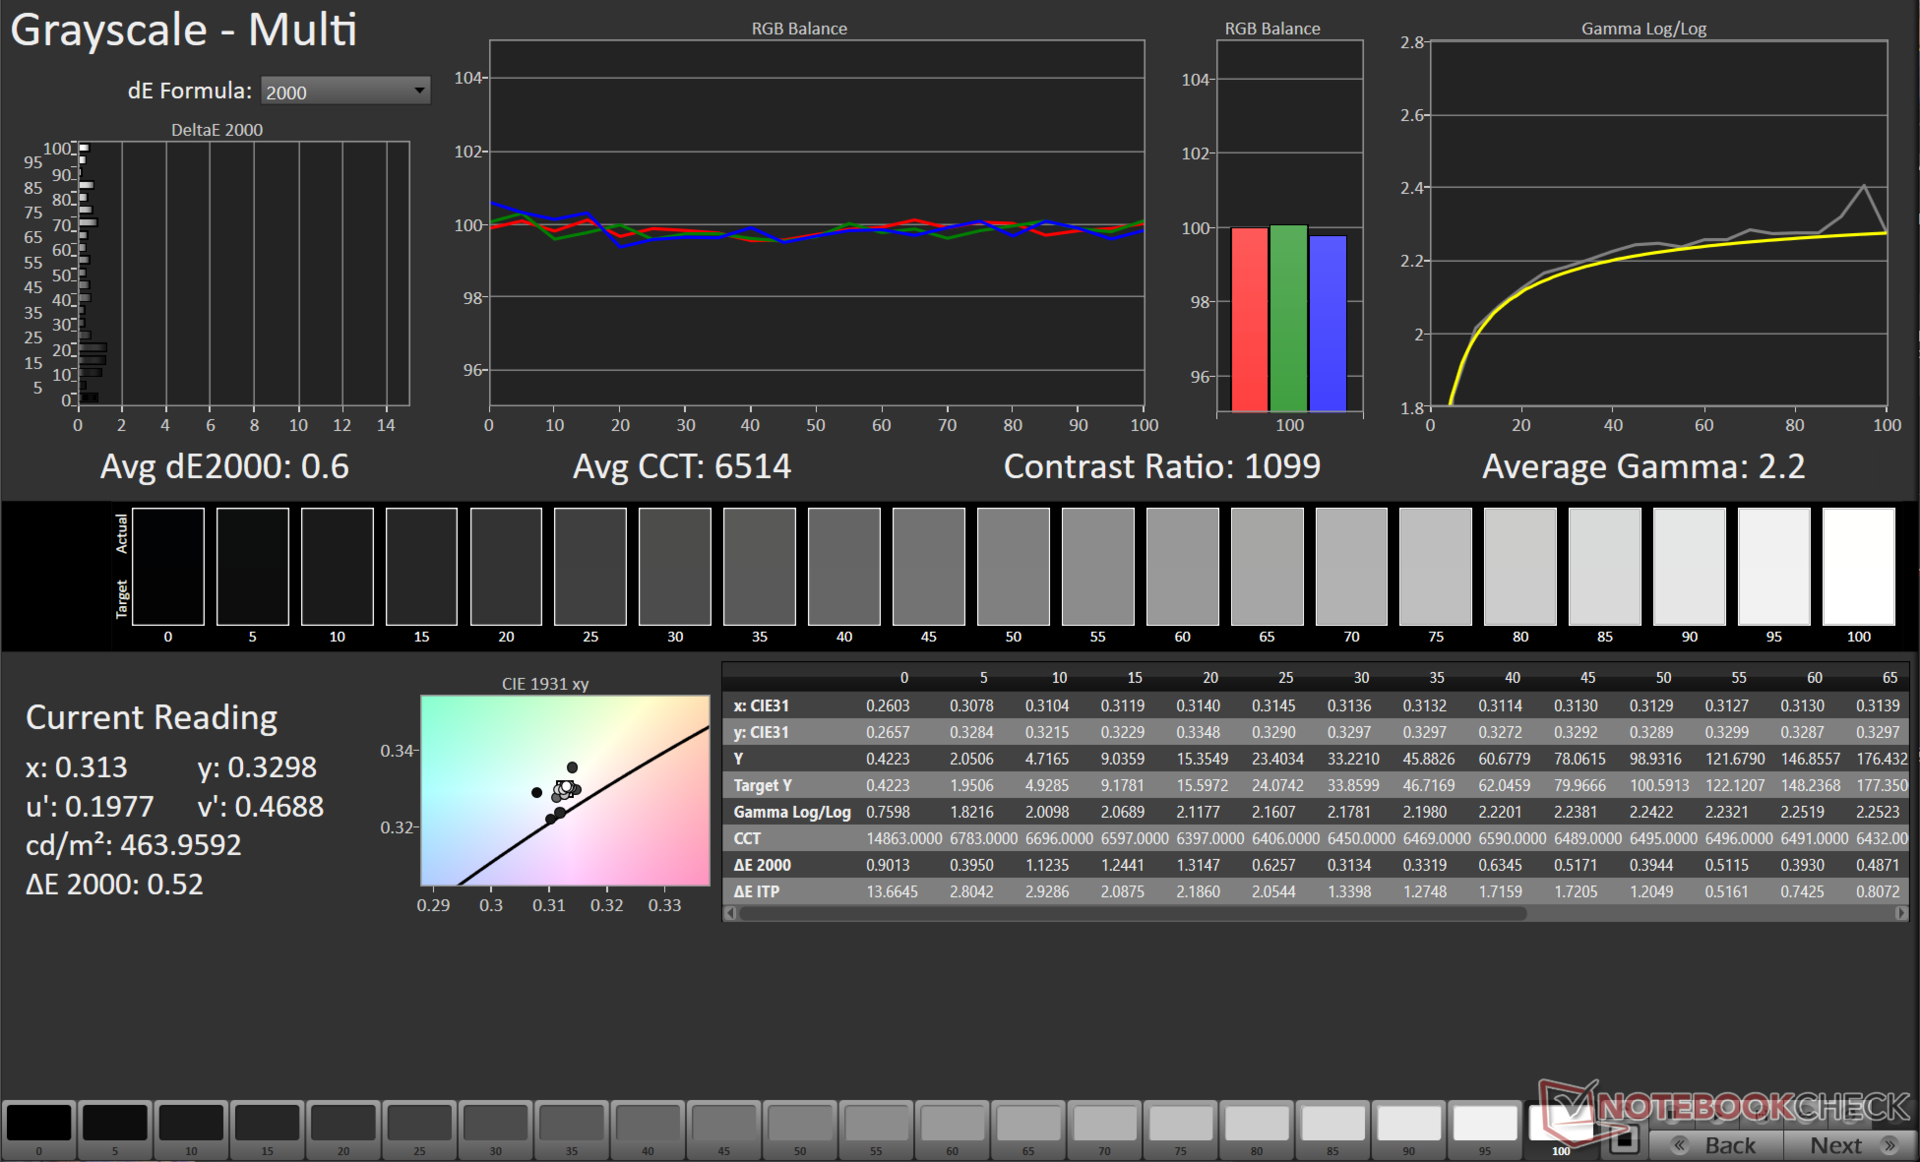
Nuestra rutina de calibración en el espacio de color Display P3 con el espectrofotómetro X-Rite i1Basic Pro 3 y el software Calman Ultimate de Portrait Displays ajusta aún más estos valores correspondientes a 0,6 y 0,9.

Tiempos de respuesta del display
| ↔ Tiempo de respuesta de Negro a Blanco | ||
|---|---|---|
| 10.4 ms ... subida ↗ y bajada ↘ combinada | ↗ 3 ms subida | 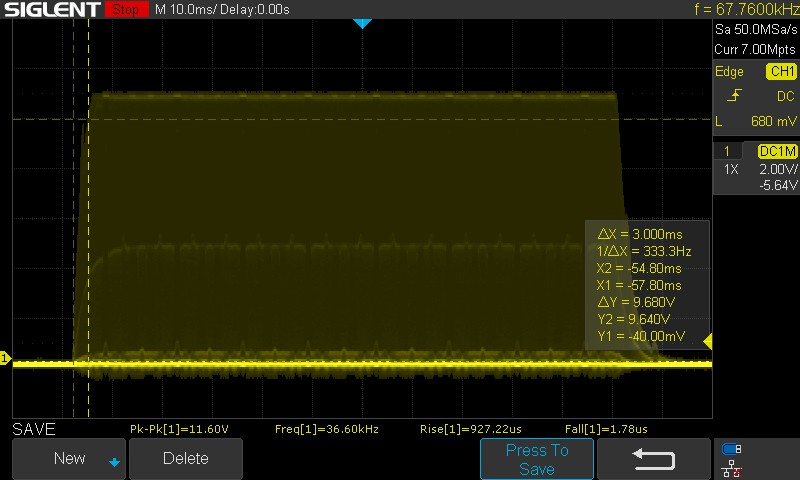  |
| ↘ 7.4 ms bajada | ||
| La pantalla mostró buenos tiempos de respuesta en nuestros tests pero podría ser demasiado lenta para los jugones competitivos. En comparación, todos los dispositivos de prueba van de ##min### (mínimo) a 240 (máximo) ms. » 23 % de todos los dispositivos son mejores. Esto quiere decir que el tiempo de respuesta medido es mejor que la media (21.5 ms) de todos los dispositivos testados. | ||
| ↔ Tiempo de respuesta 50% Gris a 80% Gris | ||
| 5 ms ... subida ↗ y bajada ↘ combinada | ↗ 2 ms subida | 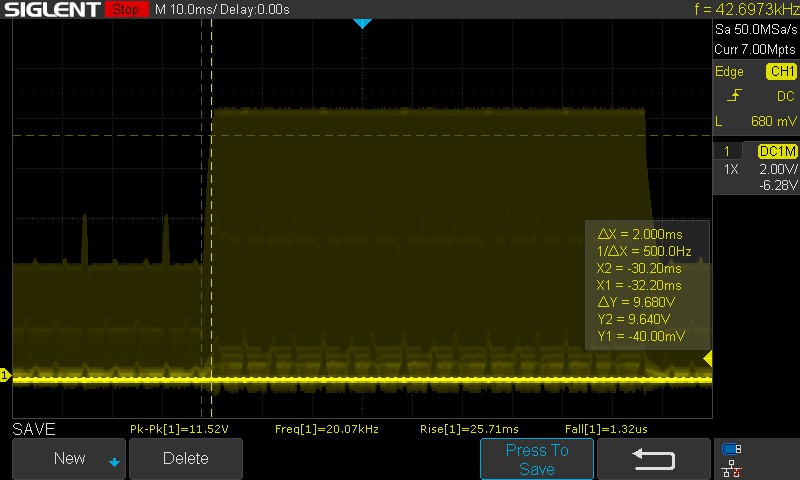 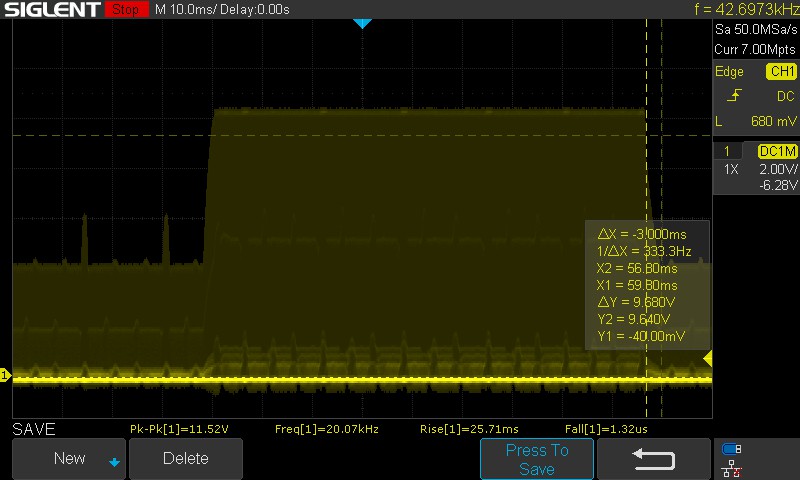 |
| ↘ 3 ms bajada | ||
| La pantalla mostró tiempos de respuesta muy rápidos en nuestros tests y debería ser adecuada para juegos frenéticos. En comparación, todos los dispositivos de prueba van de ##min### (mínimo) a 636 (máximo) ms. » 12 % de todos los dispositivos son mejores. Esto quiere decir que el tiempo de respuesta medido es mejor que la media (33.7 ms) de todos los dispositivos testados. | ||
Tuvimos que estimar manualmente los tiempos de respuesta debido al PWM de fondo con el mini panel LED. Los tiempos de respuesta estimados parecen decentes para un portátil de juegos.
Asus anuncia un tiempo de respuesta de 3 ms, pero medimos 5 ms con transiciones del 50% de gris al 80% de gris. No se ofrece una opción de sobremodulación del panel.
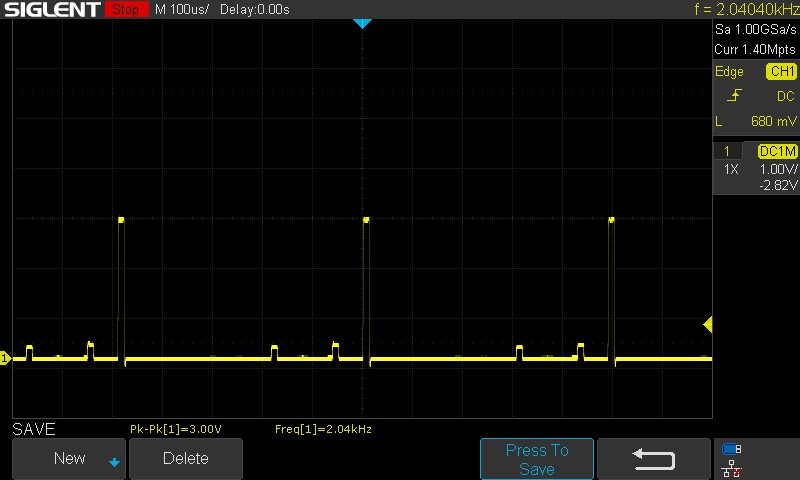
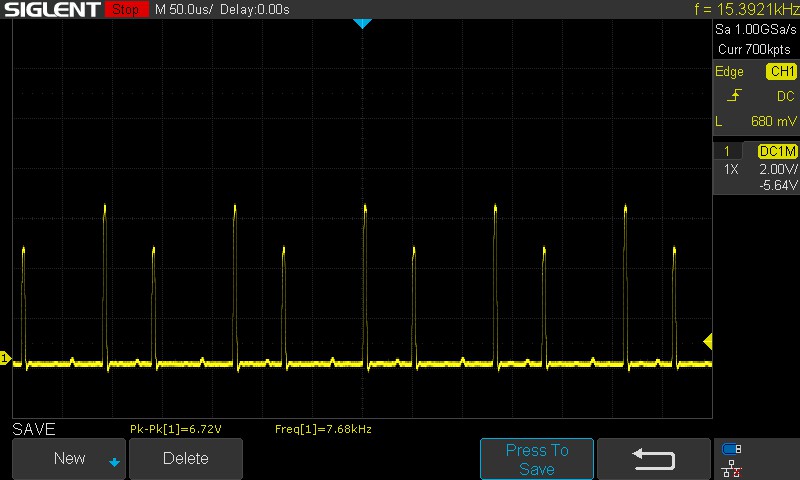
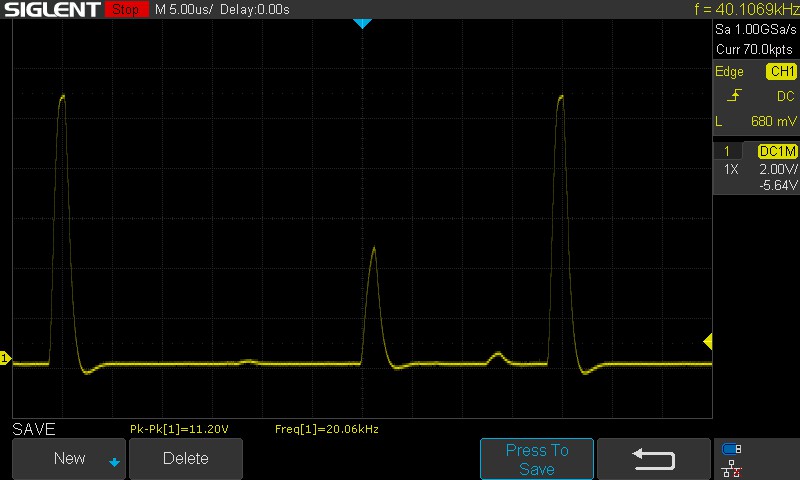
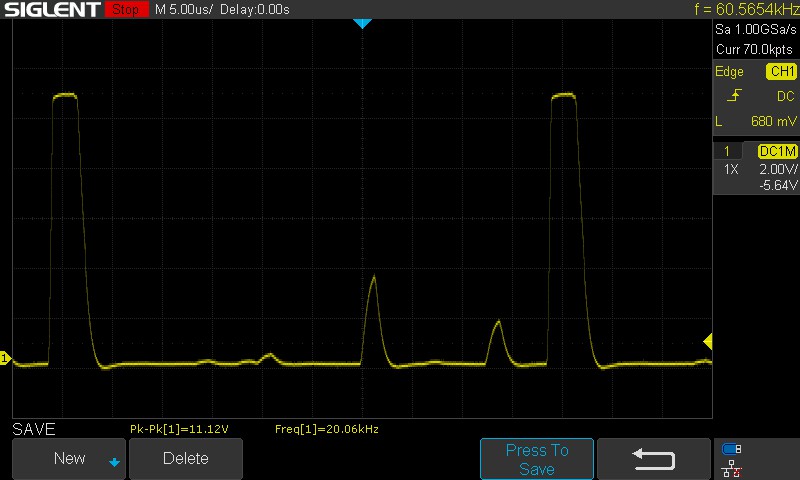
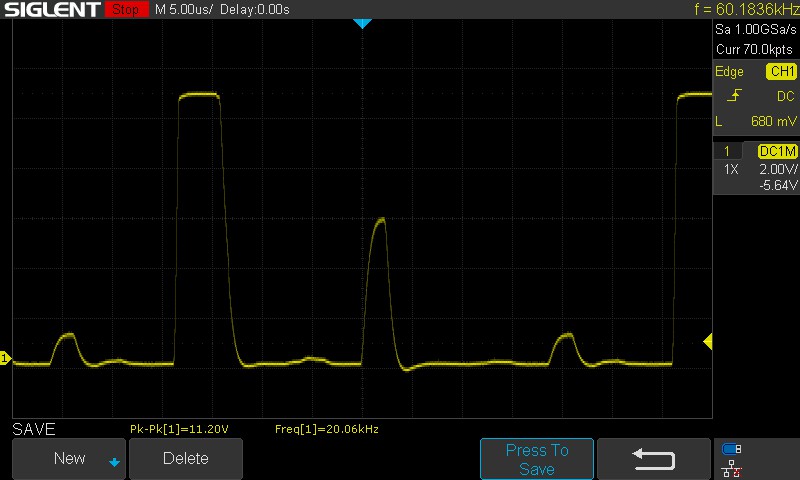
Parpadeo de Pantalla / PWM (Pulse-Width Modulation)
| Parpadeo de Pantalla / PWM detectado | 2040 Hz | ≤ 10 % de brillo | 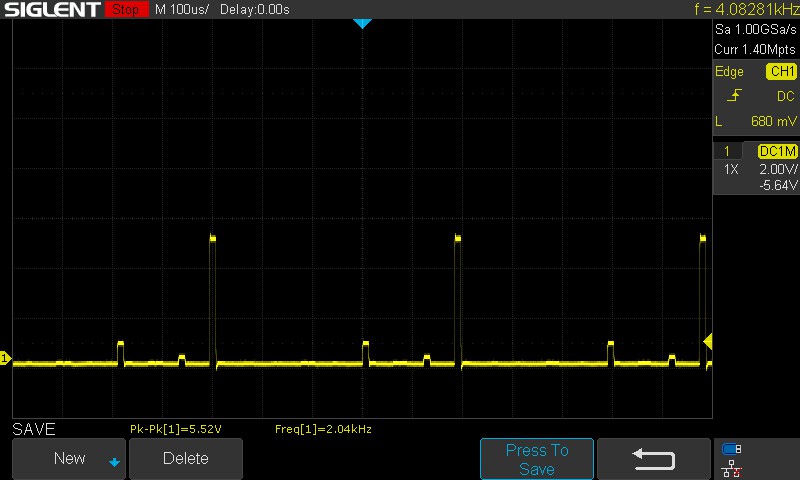 |
La retroiluminación del display parpadea a 2040 Hz (seguramente usa PWM - Pulse-Width Modulation) a un brillo del 10 % e inferior. Sobre este nivel de brillo no debería darse parpadeo / PWM. La frecuencia de 2040 Hz es bastante alta, por lo que la mayoría de gente sensible al parpadeo no debería ver parpadeo o tener fatiga visual. Comparación: 53 % de todos los dispositivos testados no usaron PWM para atenuar el display. Si se usó, medimos una media de 17908 (mínimo: 5 - máxmo: 3846000) Hz. | |||
Registramos una frecuencia PWM de 2,04 kHZ con el deslizador de brillo de Windows ajustado al 10%. Del 50% al 100% de brillo, este valor aumenta a 20,06 kHz. Los valores medidos son bastante elevados y, por tanto, no deberían plantear problemas de fatiga visual incluso con niveles de brillo más bajos.
Consulte nuestro artículo, "Por qué el PWM es un dolor de cabeza" para obtener más información. También tenemos una Página de clasificación PWM que enumera las mediciones de frecuencia de todos los dispositivos revisados.

La visualización en exteriores es generalmente buena, pero un sol deslumbrante puede presentar problemas con la legibilidad del contenido en pantalla. Los ángulos de visión son bastante estables, sin pérdida perceptible de brillo o información de color en los extremos.

Rendimiento: Core i9-14900HX muestra modestas ganancias sobre Core i9-13980HX
Asus ofrece el ROG Strix Scar 16 en dos configuraciones, ambas con Intel Core i9-14900HX de Intel. Las SKU solo difieren en la GPU, con opciones entre la Nvidia GeForce RTX 4080 y la GPU RTX 4090 para portátiless.
Condiciones de prueba
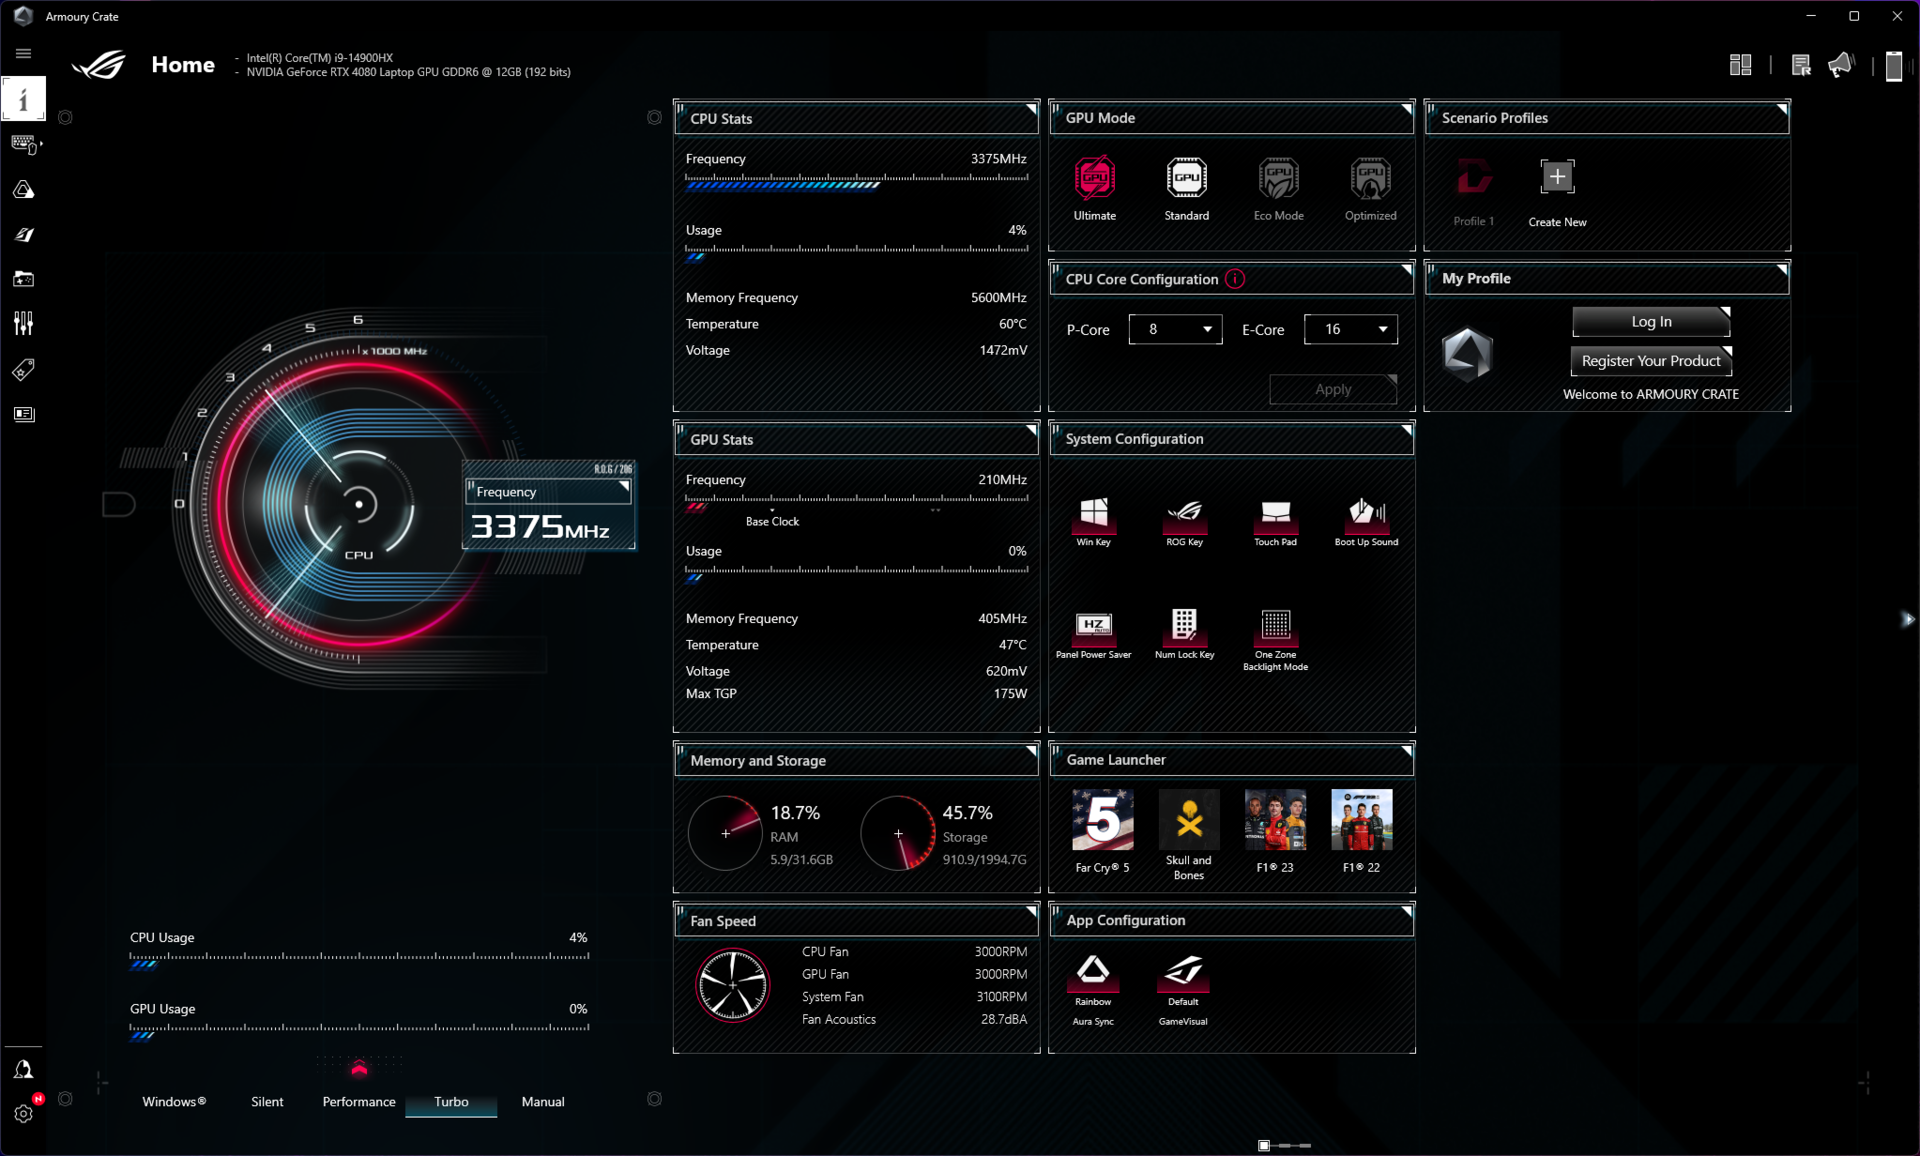
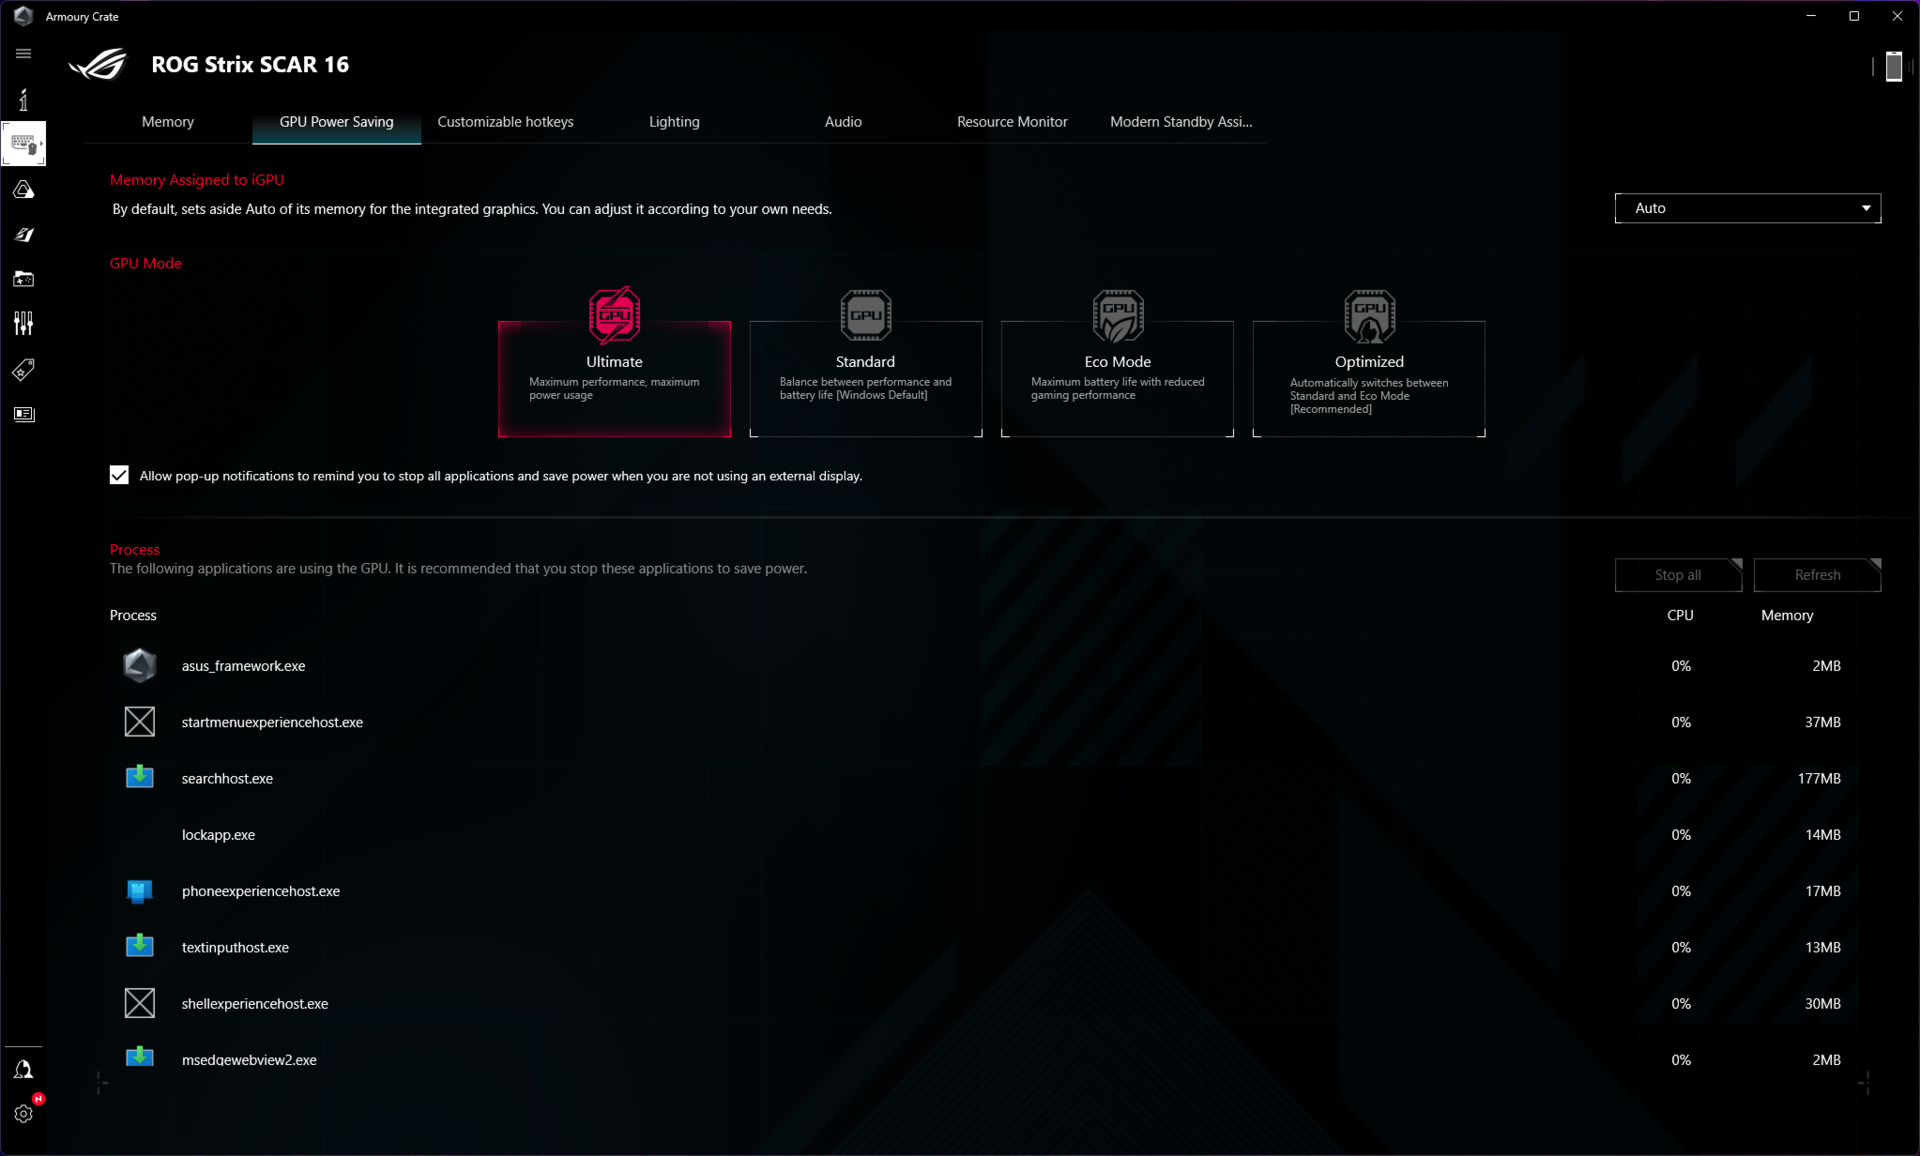
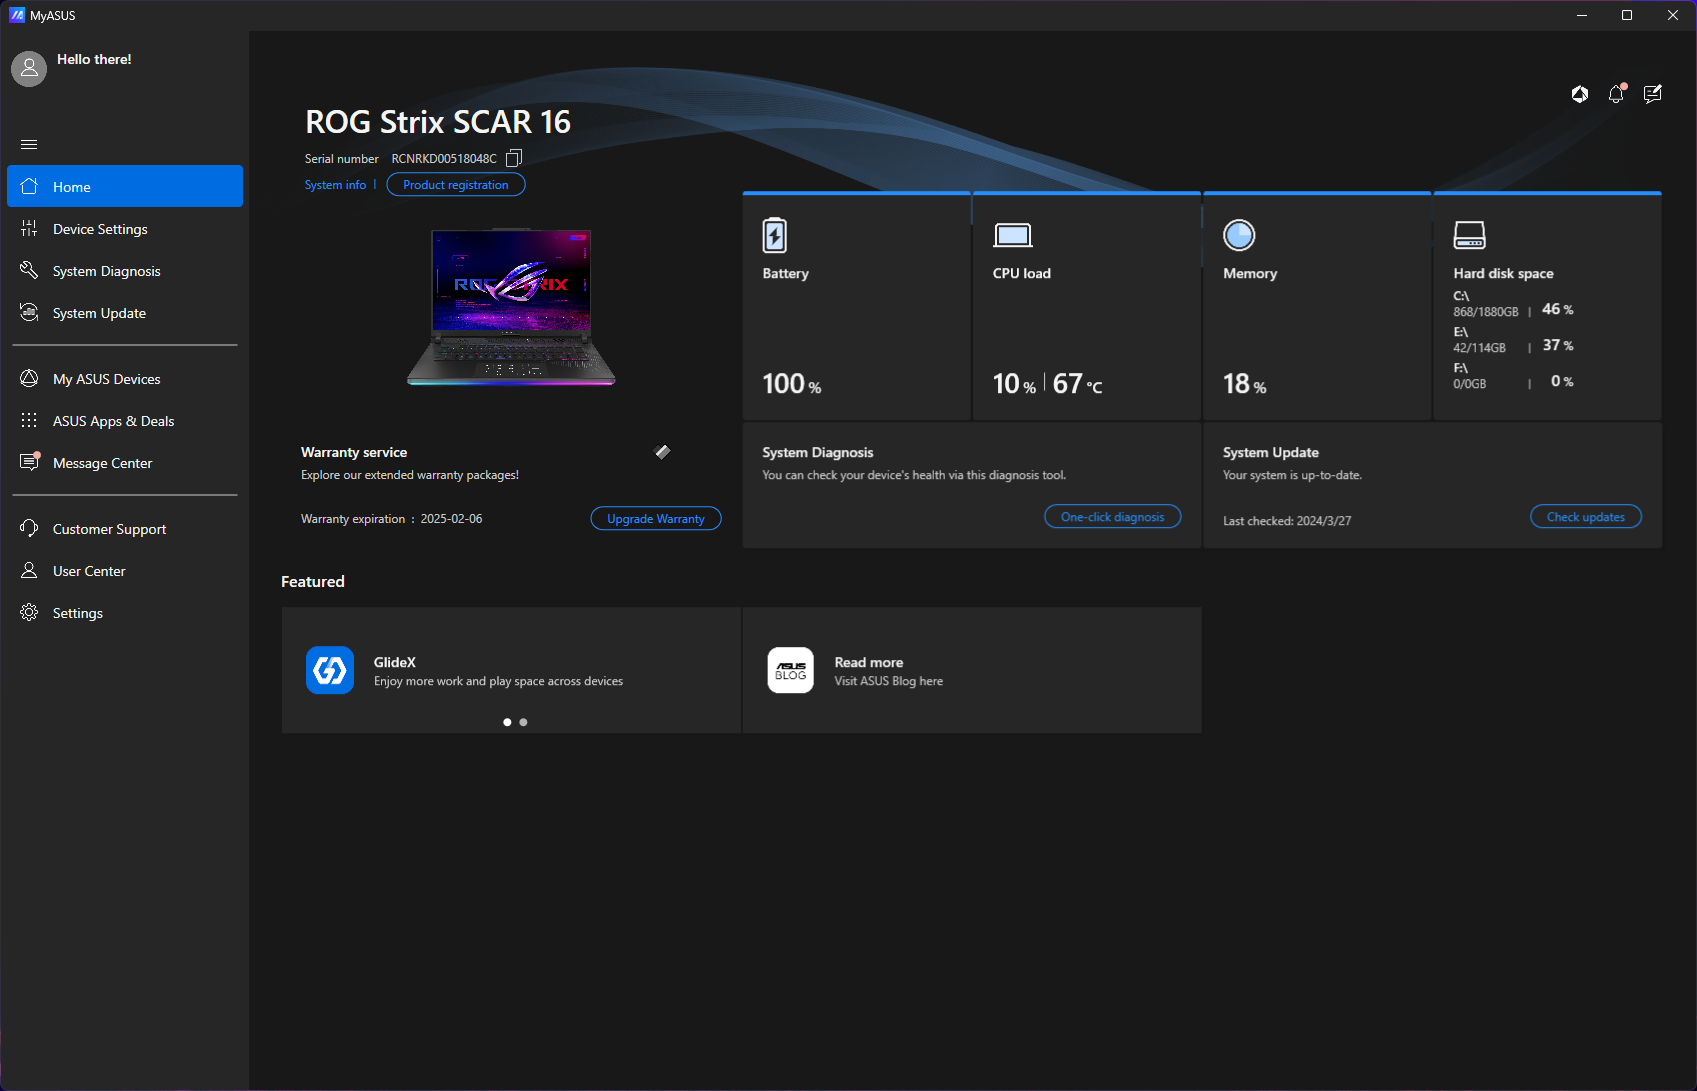
El ajuste del rendimiento puede realizarse a través de Armory Crate. Asus también incluye la aplicación MyAsus que ofrece funciones auxiliares como actualizaciones del sistema, diagnósticos, etc.
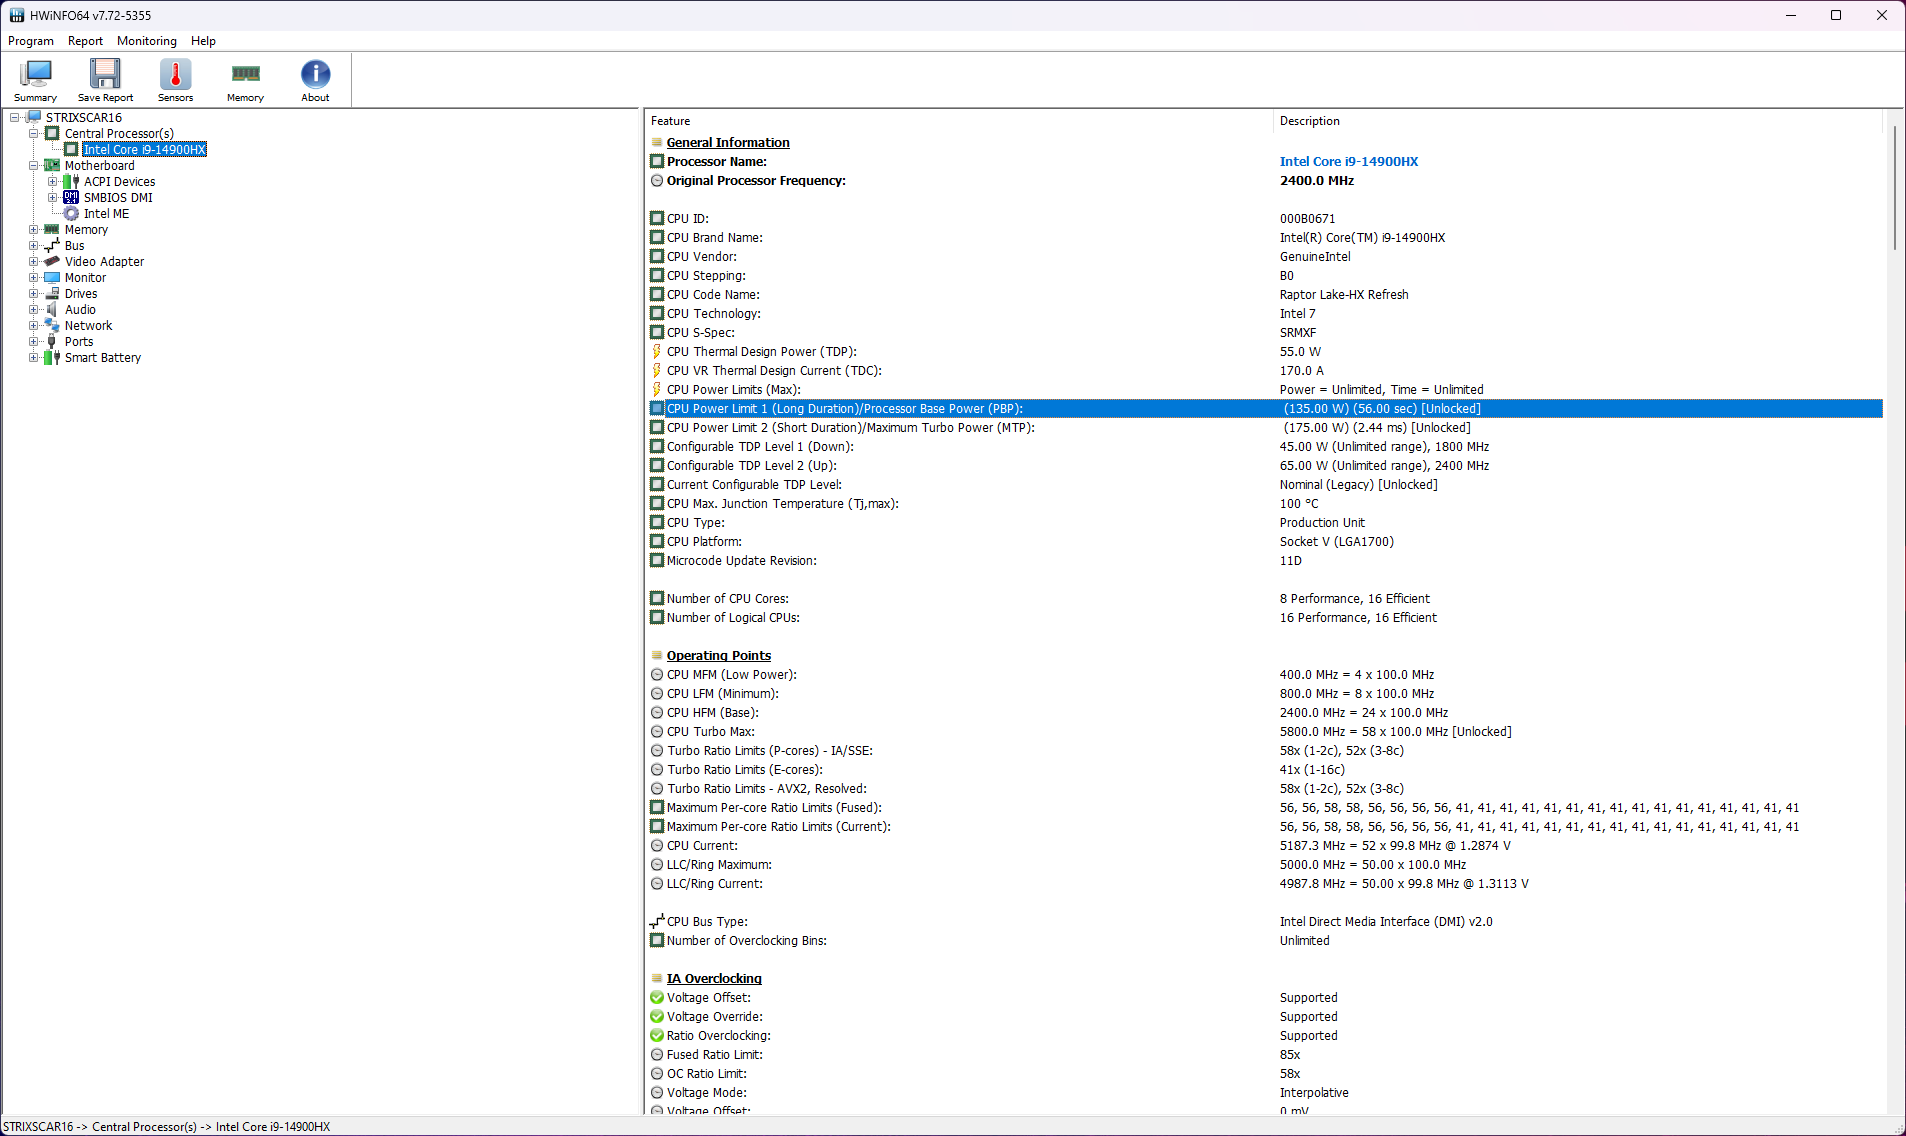
El Scar 16 ofrece tres perfiles de energía principales para elegir: Silencioso, Rendimiento y Turbo. También es posible utilizar los planes de energía de Windows en lugar de los disponibles en Armory Crate. Además, hay un modo Manual que permite configurar hasta un PL1 de 140 W.
| Modo de rendimiento | PL1 (PBP) / Tau | PL2 (MTP) / Tau | Cinebench R15 Puntuación múltiple | Cinebench R15 Puntuación múltiple (30 bucles) |
|---|---|---|---|---|
| Silencioso | 70 W / 56 s | 100 W / 2,44 ms | 3904 (-15,14%) | 3435 (-20,98%) |
| Rendimiento | 107 W / 56 s | 120 W / 2,44 ms | 4208 (-8,54%) | 4182 (-3,79%) |
| Turbo | 135 W / 56 s | 175 W / 2,44 ms | 4601 (100%) | 4347 (100%) |
Nvidia Advanced Optimus es compatible, pero Asus también incluye un modo MUX de hardware. Realizamos todas las pruebas de rendimiento en el modo Turbo con MUX configurado para la dGPU RTX 4080.
Las pruebas de batería se realizaron en el modo Silencioso con MSHybrid activado.
Procesador
El Core i9-14900HX es bastante parecido al Core i9-13980HX con 24 núcleos (8P + 16E) y 32 hilos pero con un aumento de 5,8 GHz.
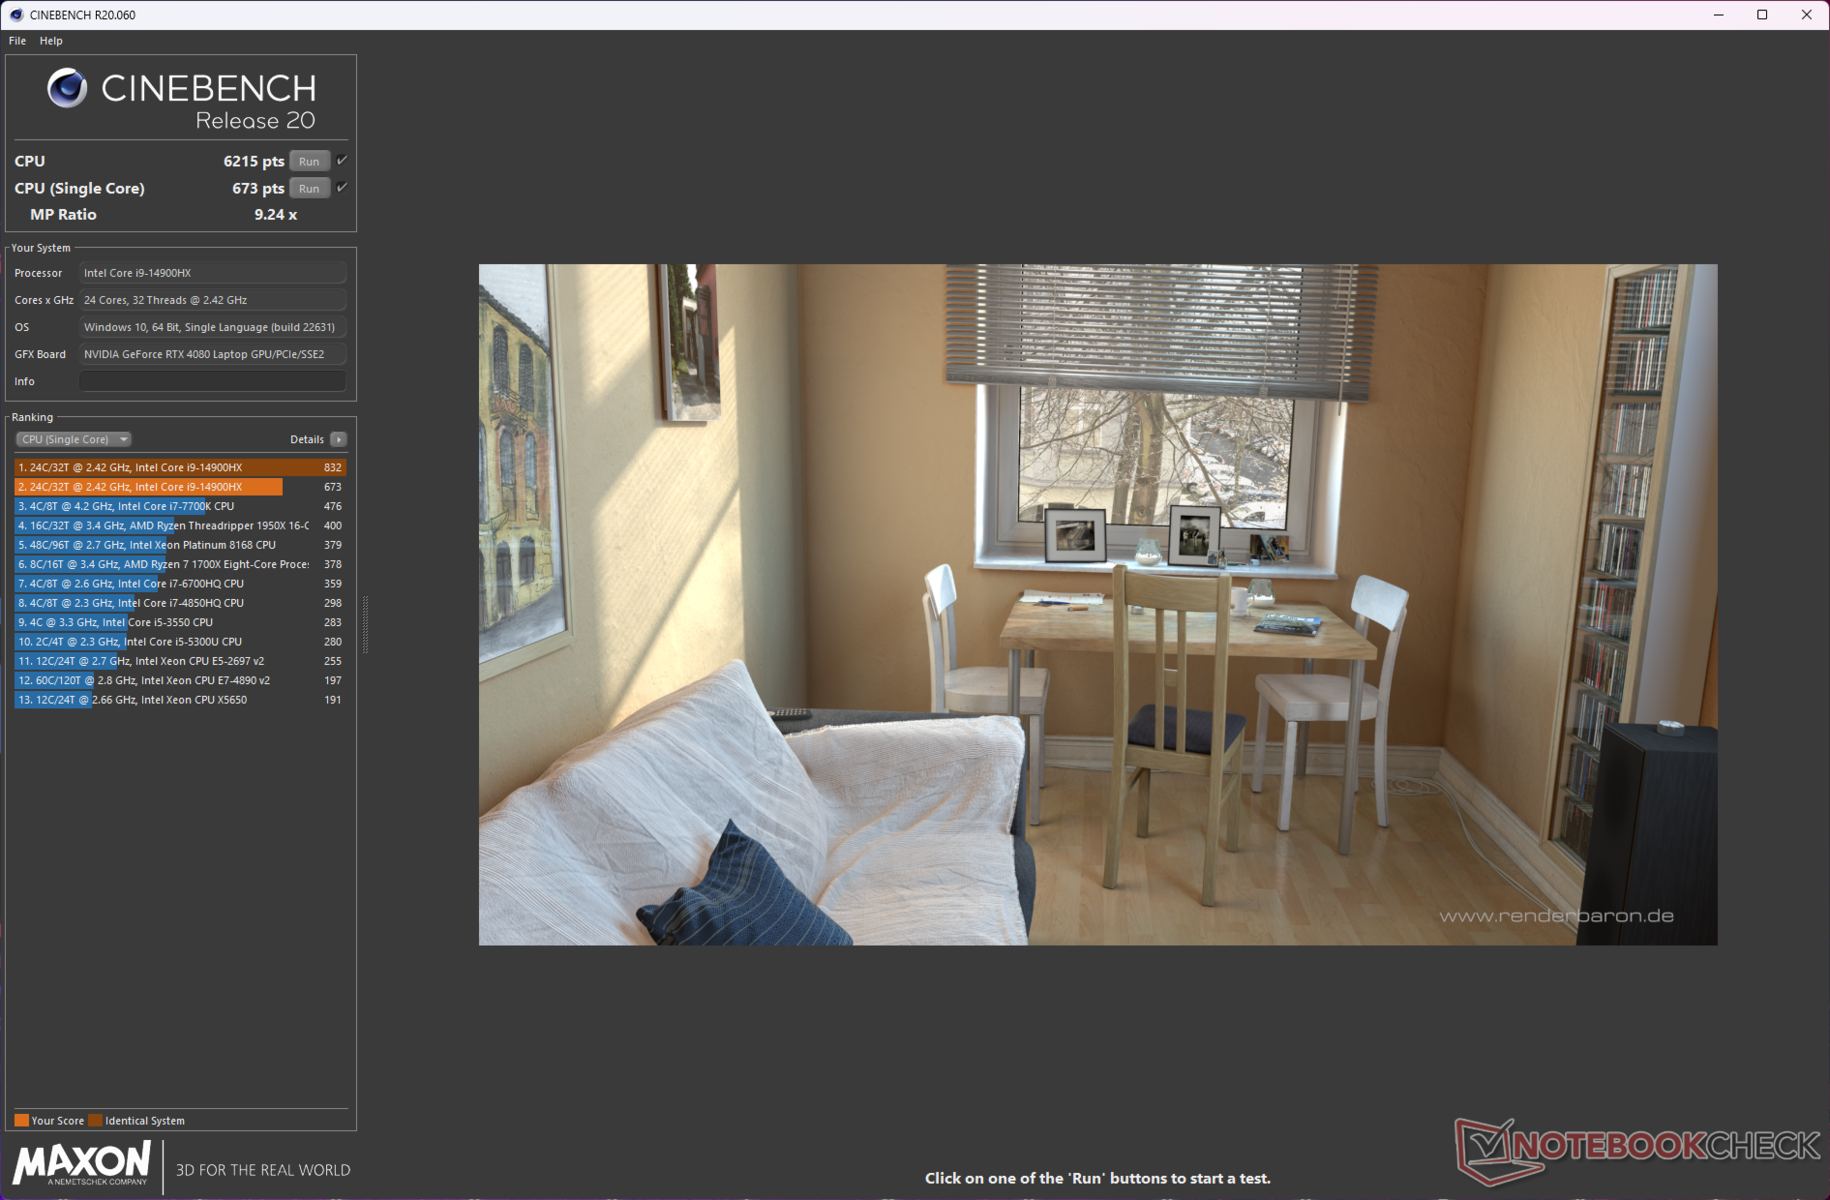
El Raptor Lake-HX de 14ª generación no es una mejora importante y el aumento de rendimiento respecto a un Core i9-13980HX está dentro del margen de error. En comparación, el rendimiento de un solo núcleo del Scar 16 está a la par con otros portátiles Core i9-14900HX.
Sin embargo, el MSI Vector 16 HX con la misma CPU tiene una ventaja perceptible en multinúcleo debido al mayor PL2 de 184 W. Por el contrario, el HP Omen 16's Core i9-14900HX con un PL2 de 130 W queda por detrás del Scar 16 en estas pruebas.
Cinebench R15 Multi Loop
Cinebench R23: Multi Core | Single Core
Cinebench R20: CPU (Multi Core) | CPU (Single Core)
Cinebench R15: CPU Multi 64Bit | CPU Single 64Bit
Blender: v2.79 BMW27 CPU
7-Zip 18.03: 7z b 4 | 7z b 4 -mmt1
Geekbench 6.2: Multi-Core | Single-Core
Geekbench 5.5: Multi-Core | Single-Core
HWBOT x265 Benchmark v2.2: 4k Preset
LibreOffice : 20 Documents To PDF
R Benchmark 2.5: Overall mean
| CPU Performance Rating | |
| Lenovo Legion Pro 7 16IRX9H | |
| Asus ROG Strix Scar 17 G733PYV-LL053X | |
| Asus ROG Strix Scar 16 G634JZR | |
| MSI Vector 16 HX A14V | |
| Average Intel Core i9-14900HX | |
| Asus ROG Strix G16 G614JZ -2! | |
| HP Omen 16 (2024) | |
| Average of class Gaming | |
| Alienware m16 R2 -1! | |
| Cinebench R23 / Multi Core | |
| MSI Vector 16 HX A14V | |
| Asus ROG Strix Scar 17 G733PYV-LL053X | |
| Lenovo Legion Pro 7 16IRX9H | |
| Asus ROG Strix Scar 16 G634JZR | |
| Asus ROG Strix G16 G614JZ | |
| Average Intel Core i9-14900HX (20702 - 32996, n=23) | |
| HP Omen 16 (2024) | |
| Average of class Gaming (2435 - 34613, n=232, last 2 years) | |
| Alienware m16 R2 | |
| Cinebench R23 / Single Core | |
| Lenovo Legion Pro 7 16IRX9H | |
| HP Omen 16 (2024) | |
| MSI Vector 16 HX A14V | |
| Asus ROG Strix Scar 16 G634JZR | |
| Average Intel Core i9-14900HX (2043 - 2235, n=23) | |
| Asus ROG Strix G16 G614JZ | |
| Asus ROG Strix Scar 17 G733PYV-LL053X | |
| Average of class Gaming (527 - 2235, n=230, last 2 years) | |
| Alienware m16 R2 | |
| Cinebench R20 / CPU (Multi Core) | |
| Asus ROG Strix Scar 17 G733PYV-LL053X | |
| Lenovo Legion Pro 7 16IRX9H | |
| MSI Vector 16 HX A14V | |
| Asus ROG Strix Scar 16 G634JZR | |
| Asus ROG Strix G16 G614JZ | |
| Average Intel Core i9-14900HX (8427 - 12419, n=23) | |
| HP Omen 16 (2024) | |
| Average of class Gaming (930 - 13769, n=230, last 2 years) | |
| Alienware m16 R2 | |
| Cinebench R20 / CPU (Single Core) | |
| HP Omen 16 (2024) | |
| Asus ROG Strix Scar 16 G634JZR | |
| MSI Vector 16 HX A14V | |
| Average Intel Core i9-14900HX (779 - 859, n=23) | |
| Lenovo Legion Pro 7 16IRX9H | |
| Asus ROG Strix G16 G614JZ | |
| Asus ROG Strix Scar 17 G733PYV-LL053X | |
| Average of class Gaming (169 - 855, n=230, last 2 years) | |
| Alienware m16 R2 | |
| Cinebench R15 / CPU Multi 64Bit | |
| Asus ROG Strix Scar 17 G733PYV-LL053X | |
| Asus ROG Strix Scar 16 G634JZR | |
| Asus ROG Strix G16 G614JZ | |
| Asus ROG Strix G16 G614JZ | |
| Lenovo Legion Pro 7 16IRX9H | |
| MSI Vector 16 HX A14V | |
| Average Intel Core i9-14900HX (3263 - 4875, n=23) | |
| HP Omen 16 (2024) | |
| Average of class Gaming (400 - 5663, n=234, last 2 years) | |
| Alienware m16 R2 | |
| Cinebench R15 / CPU Single 64Bit | |
| Asus ROG Strix Scar 16 G634JZR | |
| Lenovo Legion Pro 7 16IRX9H | |
| Asus ROG Strix Scar 17 G733PYV-LL053X | |
| HP Omen 16 (2024) | |
| Average Intel Core i9-14900HX (287 - 320, n=23) | |
| MSI Vector 16 HX A14V | |
| Asus ROG Strix G16 G614JZ | |
| Asus ROG Strix G16 G614JZ | |
| Average of class Gaming (79.2 - 318, n=233, last 2 years) | |
| Alienware m16 R2 | |
| Blender / v2.79 BMW27 CPU | |
| Average of class Gaming (87 - 1259, n=228, last 2 years) | |
| HP Omen 16 (2024) | |
| Average Intel Core i9-14900HX (102 - 164, n=23) | |
| Asus ROG Strix Scar 16 G634JZR | |
| Asus ROG Strix G16 G614JZ | |
| Lenovo Legion Pro 7 16IRX9H | |
| MSI Vector 16 HX A14V | |
| Asus ROG Strix Scar 17 G733PYV-LL053X | |
| 7-Zip 18.03 / 7z b 4 | |
| Asus ROG Strix Scar 17 G733PYV-LL053X | |
| Lenovo Legion Pro 7 16IRX9H | |
| MSI Vector 16 HX A14V | |
| Asus ROG Strix Scar 16 G634JZR | |
| Asus ROG Strix G16 G614JZ | |
| Average Intel Core i9-14900HX (87555 - 127108, n=23) | |
| HP Omen 16 (2024) | |
| Average of class Gaming (11386 - 140932, n=229, last 2 years) | |
| Alienware m16 R2 | |
| 7-Zip 18.03 / 7z b 4 -mmt1 | |
| Asus ROG Strix Scar 17 G733PYV-LL053X | |
| Asus ROG Strix Scar 16 G634JZR | |
| Lenovo Legion Pro 7 16IRX9H | |
| HP Omen 16 (2024) | |
| MSI Vector 16 HX A14V | |
| Average Intel Core i9-14900HX (6206 - 7508, n=23) | |
| Asus ROG Strix G16 G614JZ | |
| Average of class Gaming (2685 - 7581, n=229, last 2 years) | |
| Alienware m16 R2 | |
| Geekbench 6.2 / Multi-Core | |
| Asus ROG Strix Scar 16 G634JZR | |
| Lenovo Legion Pro 7 16IRX9H | |
| MSI Vector 16 HX A14V | |
| Average Intel Core i9-14900HX (15849 - 18643, n=23) | |
| Asus ROG Strix Scar 17 G733PYV-LL053X | |
| HP Omen 16 (2024) | |
| Average of class Gaming (5340 - 18590, n=76, last 2 years) | |
| Alienware m16 R2 | |
| Geekbench 6.2 / Single-Core | |
| HP Omen 16 (2024) | |
| Lenovo Legion Pro 7 16IRX9H | |
| Asus ROG Strix Scar 16 G634JZR | |
| MSI Vector 16 HX A14V | |
| Average Intel Core i9-14900HX (2800 - 3095, n=23) | |
| Asus ROG Strix Scar 17 G733PYV-LL053X | |
| Average of class Gaming (1599 - 3095, n=76, last 2 years) | |
| Alienware m16 R2 | |
| Geekbench 5.5 / Multi-Core | |
| Asus ROG Strix Scar 16 G634JZR | |
| MSI Vector 16 HX A14V | |
| Lenovo Legion Pro 7 16IRX9H | |
| Asus ROG Strix Scar 17 G733PYV-LL053X | |
| Average Intel Core i9-14900HX (8618 - 21606, n=23) | |
| Asus ROG Strix G16 G614JZ | |
| HP Omen 16 (2024) | |
| Average of class Gaming (1946 - 22200, n=234, last 2 years) | |
| Alienware m16 R2 | |
| Geekbench 5.5 / Single-Core | |
| Asus ROG Strix Scar 16 G634JZR | |
| HP Omen 16 (2024) | |
| Asus ROG Strix Scar 17 G733PYV-LL053X | |
| MSI Vector 16 HX A14V | |
| Lenovo Legion Pro 7 16IRX9H | |
| Average Intel Core i9-14900HX (1669 - 2210, n=23) | |
| Asus ROG Strix G16 G614JZ | |
| Average of class Gaming (158 - 2210, n=234, last 2 years) | |
| Alienware m16 R2 | |
| HWBOT x265 Benchmark v2.2 / 4k Preset | |
| Asus ROG Strix Scar 17 G733PYV-LL053X | |
| Lenovo Legion Pro 7 16IRX9H | |
| MSI Vector 16 HX A14V | |
| Asus ROG Strix Scar 16 G634JZR | |
| Asus ROG Strix G16 G614JZ | |
| Average Intel Core i9-14900HX (22.7 - 34.4, n=23) | |
| HP Omen 16 (2024) | |
| Average of class Gaming (3 - 37.6, n=232, last 2 years) | |
| Alienware m16 R2 | |
| LibreOffice / 20 Documents To PDF | |
| Alienware m16 R2 | |
| Average of class Gaming (32.8 - 332, n=226, last 2 years) | |
| Asus ROG Strix Scar 16 G634JZR | |
| Asus ROG Strix G16 G614JZ | |
| MSI Vector 16 HX A14V | |
| HP Omen 16 (2024) | |
| Average Intel Core i9-14900HX (33.9 - 85.1, n=23) | |
| Asus ROG Strix Scar 17 G733PYV-LL053X | |
| Lenovo Legion Pro 7 16IRX9H | |
| R Benchmark 2.5 / Overall mean | |
| Alienware m16 R2 | |
| Average of class Gaming (0.3609 - 4.47, n=229, last 2 years) | |
| Asus ROG Strix Scar 17 G733PYV-LL053X | |
| Asus ROG Strix G16 G614JZ | |
| Lenovo Legion Pro 7 16IRX9H | |
| MSI Vector 16 HX A14V | |
| Average Intel Core i9-14900HX (0.3609 - 0.4225, n=23) | |
| HP Omen 16 (2024) | |
| Asus ROG Strix Scar 16 G634JZR | |
* ... más pequeño es mejor
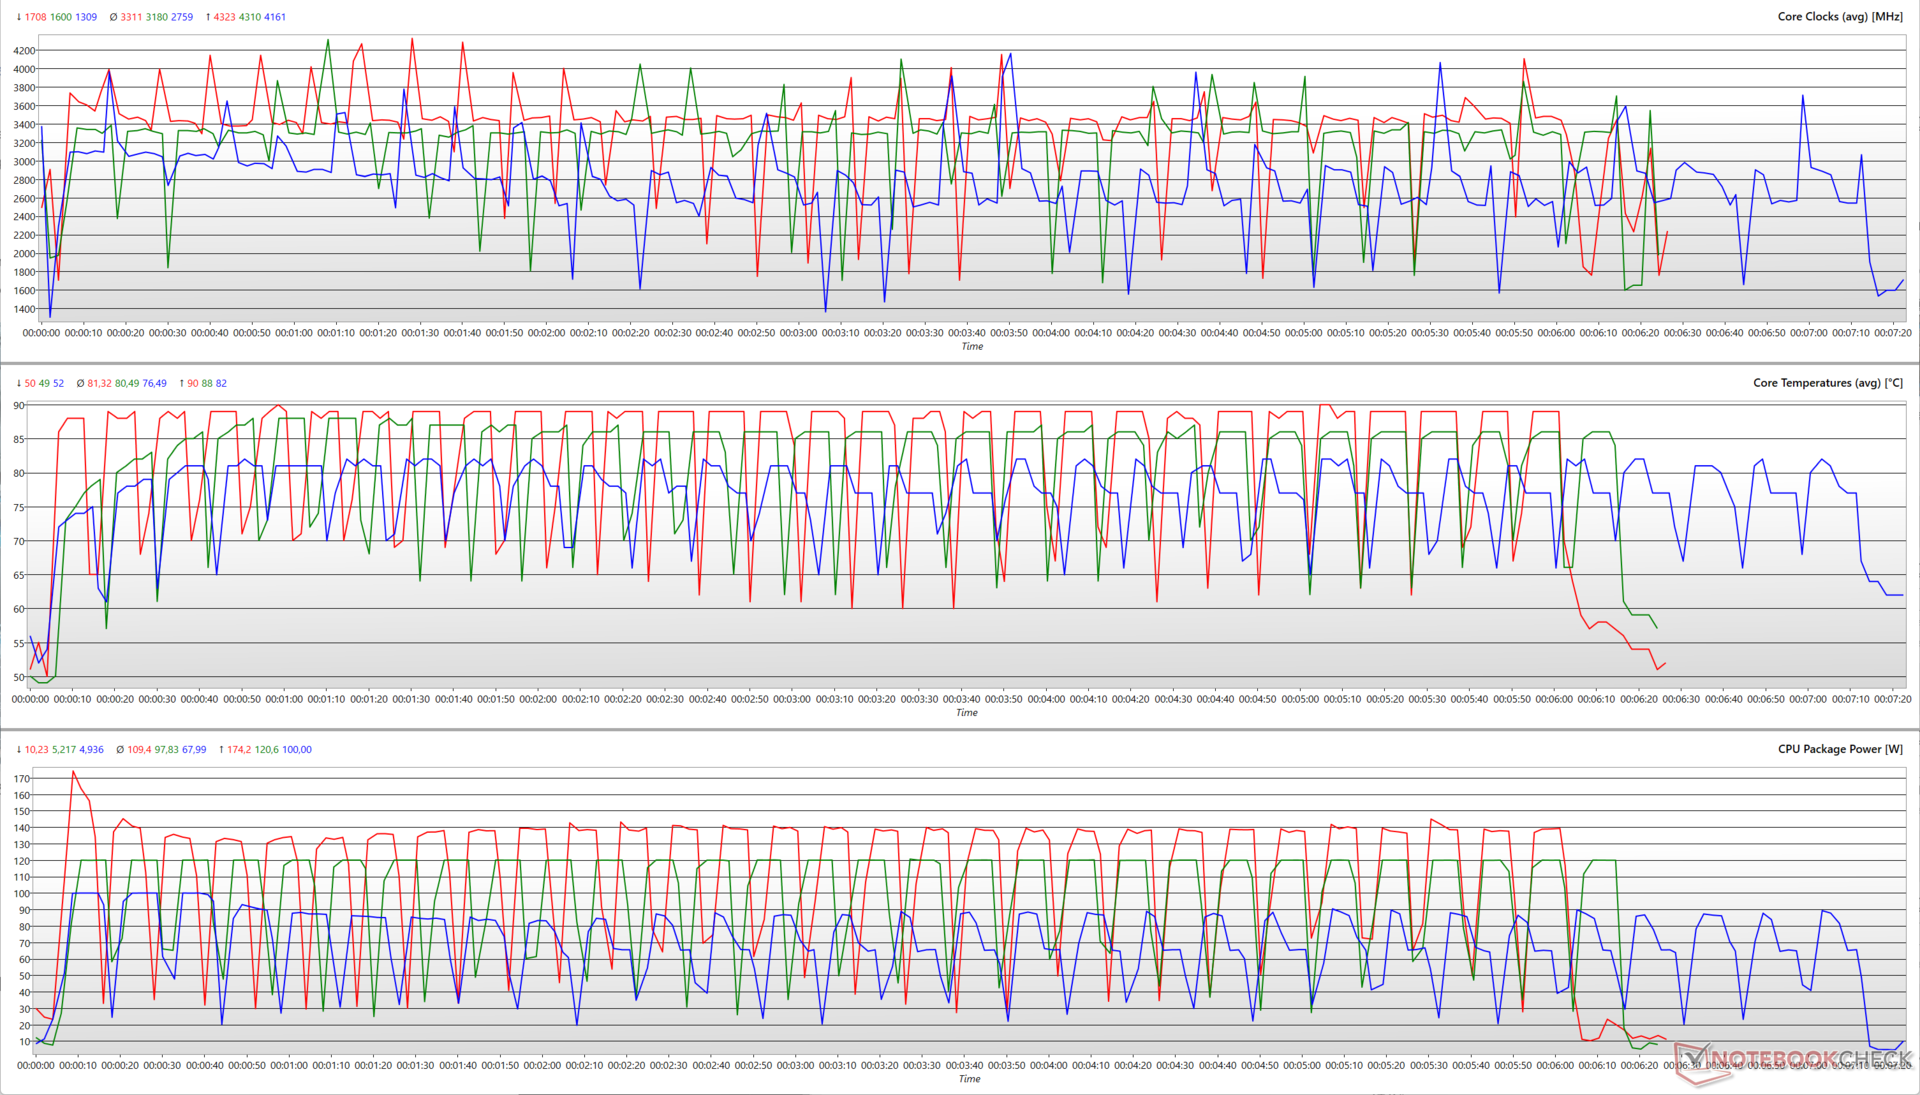
La ejecución de Cinebench R15 multi-core durante 30 bucles muestra que el Core i9-14900HX es capaz de utilizar todo el límite PL2 permitido en cada modo. En el perfil Turbo, el Core i9-14900HX es capaz de alcanzar un impulso de 4,3 GHz a 174 W antes de establecerse en un promedio de relojes de 3,3 GHz a 109 W de media.
Sin embargo, la CPU es capaz de alcanzar un reloj similar a 120 W también en el modo Rendimiento mientras que los relojes medios rondan los 3,18 GHz a 97,8 W de potencia media del paquete.
El modo Silencioso ve un consumo medio del paquete de 68 W para unos relojes medios de 2,76 GHz. La CPU es capaz de alcanzar aumentos máximos de 4,16 GHz a 100 W en este modo.
Los resultados de Cinebench R20 sobre la energía de la batería caen un 19,78% y un 46,44% en mononúcleo y multinúcleo, respectivamente.
AIDA64: FP32 Ray-Trace | FPU Julia | CPU SHA3 | CPU Queen | FPU SinJulia | FPU Mandel | CPU AES | CPU ZLib | FP64 Ray-Trace | CPU PhotoWorxx
| Performance Rating | |
| Asus ROG Strix Scar 17 G733PYV-LL053X | |
| MSI Vector 16 HX A14V | |
| Lenovo Legion Pro 7 16IRX9H | |
| Asus ROG Strix Scar 16 G634JZR | |
| Asus ROG Strix G16 G614JZ | |
| Average Intel Core i9-14900HX | |
| HP Omen 16 (2024) | |
| Average of class Gaming | |
| Alienware m16 R2 | |
| AIDA64 / FP32 Ray-Trace | |
| Asus ROG Strix Scar 17 G733PYV-LL053X | |
| MSI Vector 16 HX A14V | |
| Lenovo Legion Pro 7 16IRX9H | |
| Asus ROG Strix G16 G614JZ | |
| Asus ROG Strix Scar 16 G634JZR | |
| Average Intel Core i9-14900HX (17244 - 29351, n=22) | |
| Average of class Gaming (3069 - 60169, n=225, last 2 years) | |
| Alienware m16 R2 | |
| HP Omen 16 (2024) | |
| AIDA64 / FPU Julia | |
| Asus ROG Strix Scar 17 G733PYV-LL053X | |
| MSI Vector 16 HX A14V | |
| Lenovo Legion Pro 7 16IRX9H | |
| Asus ROG Strix G16 G614JZ | |
| Average Intel Core i9-14900HX (88537 - 148888, n=22) | |
| Asus ROG Strix Scar 16 G634JZR | |
| Average of class Gaming (18567 - 252486, n=225, last 2 years) | |
| Alienware m16 R2 | |
| HP Omen 16 (2024) | |
| AIDA64 / CPU SHA3 | |
| Asus ROG Strix Scar 17 G733PYV-LL053X | |
| Lenovo Legion Pro 7 16IRX9H | |
| MSI Vector 16 HX A14V | |
| Asus ROG Strix Scar 16 G634JZR | |
| Asus ROG Strix G16 G614JZ | |
| Average Intel Core i9-14900HX (4267 - 7229, n=22) | |
| HP Omen 16 (2024) | |
| Average of class Gaming (629 - 10389, n=225, last 2 years) | |
| Alienware m16 R2 | |
| AIDA64 / CPU Queen | |
| Asus ROG Strix Scar 17 G733PYV-LL053X | |
| Asus ROG Strix Scar 16 G634JZR | |
| Lenovo Legion Pro 7 16IRX9H | |
| Asus ROG Strix G16 G614JZ | |
| MSI Vector 16 HX A14V | |
| Average Intel Core i9-14900HX (118405 - 148773, n=22) | |
| HP Omen 16 (2024) | |
| Average of class Gaming (15371 - 200651, n=225, last 2 years) | |
| Alienware m16 R2 | |
| AIDA64 / FPU SinJulia | |
| Asus ROG Strix Scar 17 G733PYV-LL053X | |
| Asus ROG Strix G16 G614JZ | |
| Lenovo Legion Pro 7 16IRX9H | |
| MSI Vector 16 HX A14V | |
| Asus ROG Strix Scar 16 G634JZR | |
| Average Intel Core i9-14900HX (12217 - 18256, n=22) | |
| HP Omen 16 (2024) | |
| Average of class Gaming (2137 - 32988, n=225, last 2 years) | |
| Alienware m16 R2 | |
| AIDA64 / FPU Mandel | |
| Asus ROG Strix Scar 17 G733PYV-LL053X | |
| MSI Vector 16 HX A14V | |
| Lenovo Legion Pro 7 16IRX9H | |
| Asus ROG Strix G16 G614JZ | |
| Asus ROG Strix Scar 16 G634JZR | |
| Average Intel Core i9-14900HX (43302 - 72594, n=22) | |
| Average of class Gaming (10291 - 134044, n=225, last 2 years) | |
| Alienware m16 R2 | |
| HP Omen 16 (2024) | |
| AIDA64 / CPU AES | |
| Asus ROG Strix Scar 17 G733PYV-LL053X | |
| Asus ROG Strix Scar 16 G634JZR | |
| Average Intel Core i9-14900HX (86964 - 241777, n=22) | |
| Lenovo Legion Pro 7 16IRX9H | |
| MSI Vector 16 HX A14V | |
| Asus ROG Strix G16 G614JZ | |
| Average of class Gaming (19065 - 328679, n=225, last 2 years) | |
| HP Omen 16 (2024) | |
| Alienware m16 R2 | |
| AIDA64 / CPU ZLib | |
| Lenovo Legion Pro 7 16IRX9H | |
| MSI Vector 16 HX A14V | |
| Asus ROG Strix Scar 17 G733PYV-LL053X | |
| Asus ROG Strix G16 G614JZ | |
| Asus ROG Strix Scar 16 G634JZR | |
| Average Intel Core i9-14900HX (1265 - 2149, n=22) | |
| HP Omen 16 (2024) | |
| Average of class Gaming (150.9 - 2409, n=225, last 2 years) | |
| Alienware m16 R2 | |
| AIDA64 / FP64 Ray-Trace | |
| Asus ROG Strix Scar 17 G733PYV-LL053X | |
| MSI Vector 16 HX A14V | |
| Lenovo Legion Pro 7 16IRX9H | |
| Asus ROG Strix G16 G614JZ | |
| Asus ROG Strix Scar 16 G634JZR | |
| Average Intel Core i9-14900HX (9170 - 16128, n=22) | |
| Average of class Gaming (1518 - 31796, n=225, last 2 years) | |
| Alienware m16 R2 | |
| HP Omen 16 (2024) | |
| AIDA64 / CPU PhotoWorxx | |
| Asus ROG Strix Scar 16 G634JZR | |
| HP Omen 16 (2024) | |
| MSI Vector 16 HX A14V | |
| Average Intel Core i9-14900HX (33960 - 51118, n=22) | |
| Lenovo Legion Pro 7 16IRX9H | |
| Alienware m16 R2 | |
| Asus ROG Strix G16 G614JZ | |
| Average of class Gaming (10805 - 60161, n=226, last 2 years) | |
| Asus ROG Strix Scar 17 G733PYV-LL053X | |
Encontrará más información y comparaciones de rendimiento en nuestra página dedicada Intel Core i9-14900HX dedicada.
Rendimiento del sistema
El Scar 16 se queda algo rezagado con respecto al Lenovo Legion Pro 7 en las pruebas PCMark 10 y CrossMark. Dicho esto, el portátil responde bastante bien para las tareas cotidianas, y no hay demasiadas cargas de trabajo que puedan atascar su rendimiento.
CrossMark: Overall | Productivity | Creativity | Responsiveness
AIDA64: Memory Copy | Memory Read | Memory Write | Memory Latency
WebXPRT 3: Overall
WebXPRT 4: Overall
Mozilla Kraken 1.1: Total
| PCMark 10 / Score | |
| Asus ROG Strix Scar 17 G733PYV-LL053X | |
| Lenovo Legion Pro 7 16IRX9H | |
| HP Omen 16 (2024) | |
| MSI Vector 16 HX A14V | |
| Average Intel Core i9-14900HX, NVIDIA GeForce RTX 4080 Laptop GPU (7703 - 8923, n=4) | |
| Alienware m16 R2 | |
| Asus ROG Strix Scar 16 G634JZR | |
| Average of class Gaming (5235 - 9852, n=198, last 2 years) | |
| Asus ROG Strix G16 G614JZ | |
| PCMark 10 / Essentials | |
| Asus ROG Strix G16 G614JZ | |
| Lenovo Legion Pro 7 16IRX9H | |
| Asus ROG Strix Scar 16 G634JZR | |
| Asus ROG Strix Scar 17 G733PYV-LL053X | |
| Average Intel Core i9-14900HX, NVIDIA GeForce RTX 4080 Laptop GPU (11255 - 11706, n=4) | |
| MSI Vector 16 HX A14V | |
| HP Omen 16 (2024) | |
| Average of class Gaming (8300 - 12334, n=197, last 2 years) | |
| Alienware m16 R2 | |
| PCMark 10 / Productivity | |
| HP Omen 16 (2024) | |
| Lenovo Legion Pro 7 16IRX9H | |
| Asus ROG Strix Scar 17 G733PYV-LL053X | |
| MSI Vector 16 HX A14V | |
| Average Intel Core i9-14900HX, NVIDIA GeForce RTX 4080 Laptop GPU (6662 - 11410, n=4) | |
| Average of class Gaming (6662 - 11833, n=197, last 2 years) | |
| Alienware m16 R2 | |
| Asus ROG Strix G16 G614JZ | |
| Asus ROG Strix Scar 16 G634JZR | |
| PCMark 10 / Digital Content Creation | |
| Asus ROG Strix Scar 17 G733PYV-LL053X | |
| Asus ROG Strix Scar 16 G634JZR | |
| MSI Vector 16 HX A14V | |
| Average Intel Core i9-14900HX, NVIDIA GeForce RTX 4080 Laptop GPU (14466 - 16027, n=4) | |
| HP Omen 16 (2024) | |
| Lenovo Legion Pro 7 16IRX9H | |
| Alienware m16 R2 | |
| Average of class Gaming (6462 - 18475, n=197, last 2 years) | |
| Asus ROG Strix G16 G614JZ | |
| CrossMark / Overall | |
| Lenovo Legion Pro 7 16IRX9H | |
| HP Omen 16 (2024) | |
| Average Intel Core i9-14900HX, NVIDIA GeForce RTX 4080 Laptop GPU (2037 - 2334, n=4) | |
| MSI Vector 16 HX A14V | |
| Asus ROG Strix G16 G614JZ | |
| Asus ROG Strix Scar 17 G733PYV-LL053X | |
| Asus ROG Strix Scar 16 G634JZR | |
| Average of class Gaming (1247 - 2334, n=171, last 2 years) | |
| Alienware m16 R2 | |
| CrossMark / Productivity | |
| Lenovo Legion Pro 7 16IRX9H | |
| HP Omen 16 (2024) | |
| Average Intel Core i9-14900HX, NVIDIA GeForce RTX 4080 Laptop GPU (1874 - 2204, n=4) | |
| Asus ROG Strix G16 G614JZ | |
| MSI Vector 16 HX A14V | |
| Asus ROG Strix Scar 17 G733PYV-LL053X | |
| Asus ROG Strix Scar 16 G634JZR | |
| Average of class Gaming (1299 - 2204, n=171, last 2 years) | |
| Alienware m16 R2 | |
| CrossMark / Creativity | |
| Lenovo Legion Pro 7 16IRX9H | |
| MSI Vector 16 HX A14V | |
| Asus ROG Strix Scar 17 G733PYV-LL053X | |
| Average Intel Core i9-14900HX, NVIDIA GeForce RTX 4080 Laptop GPU (2327 - 2500, n=4) | |
| Asus ROG Strix G16 G614JZ | |
| HP Omen 16 (2024) | |
| Asus ROG Strix Scar 16 G634JZR | |
| Average of class Gaming (1275 - 2514, n=171, last 2 years) | |
| Alienware m16 R2 | |
| CrossMark / Responsiveness | |
| Lenovo Legion Pro 7 16IRX9H | |
| HP Omen 16 (2024) | |
| Average Intel Core i9-14900HX, NVIDIA GeForce RTX 4080 Laptop GPU (1756 - 2254, n=4) | |
| Asus ROG Strix G16 G614JZ | |
| MSI Vector 16 HX A14V | |
| Asus ROG Strix Scar 16 G634JZR | |
| Average of class Gaming (1030 - 2330, n=171, last 2 years) | |
| Asus ROG Strix Scar 17 G733PYV-LL053X | |
| Alienware m16 R2 | |
| AIDA64 / Memory Copy | |
| HP Omen 16 (2024) | |
| Asus ROG Strix Scar 16 G634JZR | |
| Average Intel Core i9-14900HX, NVIDIA GeForce RTX 4080 Laptop GPU (78053 - 79244, n=5) | |
| Lenovo Legion Pro 7 16IRX9H | |
| MSI Vector 16 HX A14V | |
| Alienware m16 R2 | |
| Asus ROG Strix G16 G614JZ | |
| Average of class Gaming (21842 - 92565, n=225, last 2 years) | |
| Asus ROG Strix Scar 17 G733PYV-LL053X | |
| AIDA64 / Memory Read | |
| Asus ROG Strix Scar 16 G634JZR | |
| HP Omen 16 (2024) | |
| Average Intel Core i9-14900HX, NVIDIA GeForce RTX 4080 Laptop GPU (85898 - 87507, n=5) | |
| Lenovo Legion Pro 7 16IRX9H | |
| MSI Vector 16 HX A14V | |
| Alienware m16 R2 | |
| Asus ROG Strix G16 G614JZ | |
| Average of class Gaming (24879 - 90647, n=225, last 2 years) | |
| Asus ROG Strix Scar 17 G733PYV-LL053X | |
| AIDA64 / Memory Write | |
| HP Omen 16 (2024) | |
| Asus ROG Strix Scar 16 G634JZR | |
| MSI Vector 16 HX A14V | |
| Average Intel Core i9-14900HX, NVIDIA GeForce RTX 4080 Laptop GPU (71763 - 77715, n=5) | |
| Lenovo Legion Pro 7 16IRX9H | |
| Alienware m16 R2 | |
| Average of class Gaming (21619 - 103259, n=225, last 2 years) | |
| Asus ROG Strix G16 G614JZ | |
| Asus ROG Strix Scar 17 G733PYV-LL053X | |
| AIDA64 / Memory Latency | |
| Alienware m16 R2 | |
| Asus ROG Strix Scar 17 G733PYV-LL053X | |
| Asus ROG Strix G16 G614JZ | |
| Average of class Gaming (59.5 - 152.5, n=222, last 2 years) | |
| HP Omen 16 (2024) | |
| Average Intel Core i9-14900HX, NVIDIA GeForce RTX 4080 Laptop GPU (79.7 - 84.6, n=5) | |
| MSI Vector 16 HX A14V | |
| Asus ROG Strix Scar 16 G634JZR | |
| Lenovo Legion Pro 7 16IRX9H | |
| WebXPRT 3 / Overall | |
| Asus ROG Strix Scar 17 G733PYV-LL053X | |
| Lenovo Legion Pro 7 16IRX9H | |
| Asus ROG Strix G16 G614JZ | |
| Average Intel Core i9-14900HX, NVIDIA GeForce RTX 4080 Laptop GPU (310 - 345, n=4) | |
| HP Omen 16 (2024) | |
| MSI Vector 16 HX A14V | |
| Asus ROG Strix Scar 16 G634JZR | |
| Average of class Gaming (215 - 480, n=194, last 2 years) | |
| Alienware m16 R2 | |
| WebXPRT 4 / Overall | |
| Asus ROG Strix Scar 17 G733PYV-LL053X | |
| Lenovo Legion Pro 7 16IRX9H | |
| Asus ROG Strix G16 G614JZ | |
| HP Omen 16 (2024) | |
| Asus ROG Strix Scar 16 G634JZR | |
| Average Intel Core i9-14900HX, NVIDIA GeForce RTX 4080 Laptop GPU (300 - 316, n=4) | |
| MSI Vector 16 HX A14V | |
| Average of class Gaming (157.9 - 328, n=163, last 2 years) | |
| Alienware m16 R2 | |
| Mozilla Kraken 1.1 / Total | |
| Alienware m16 R2 | |
| Average of class Gaming (421 - 824, n=209, last 2 years) | |
| Asus ROG Strix G16 G614JZ | |
| MSI Vector 16 HX A14V | |
| Asus ROG Strix Scar 16 G634JZR | |
| Average Intel Core i9-14900HX, NVIDIA GeForce RTX 4080 Laptop GPU (437 - 443, n=4) | |
| Lenovo Legion Pro 7 16IRX9H | |
| HP Omen 16 (2024) | |
| Asus ROG Strix Scar 17 G733PYV-LL053X | |
* ... más pequeño es mejor
| PCMark 8 Home Score Accelerated v2 | 5883 puntos | |
| PCMark 10 Score | 7703 puntos | |
ayuda | ||
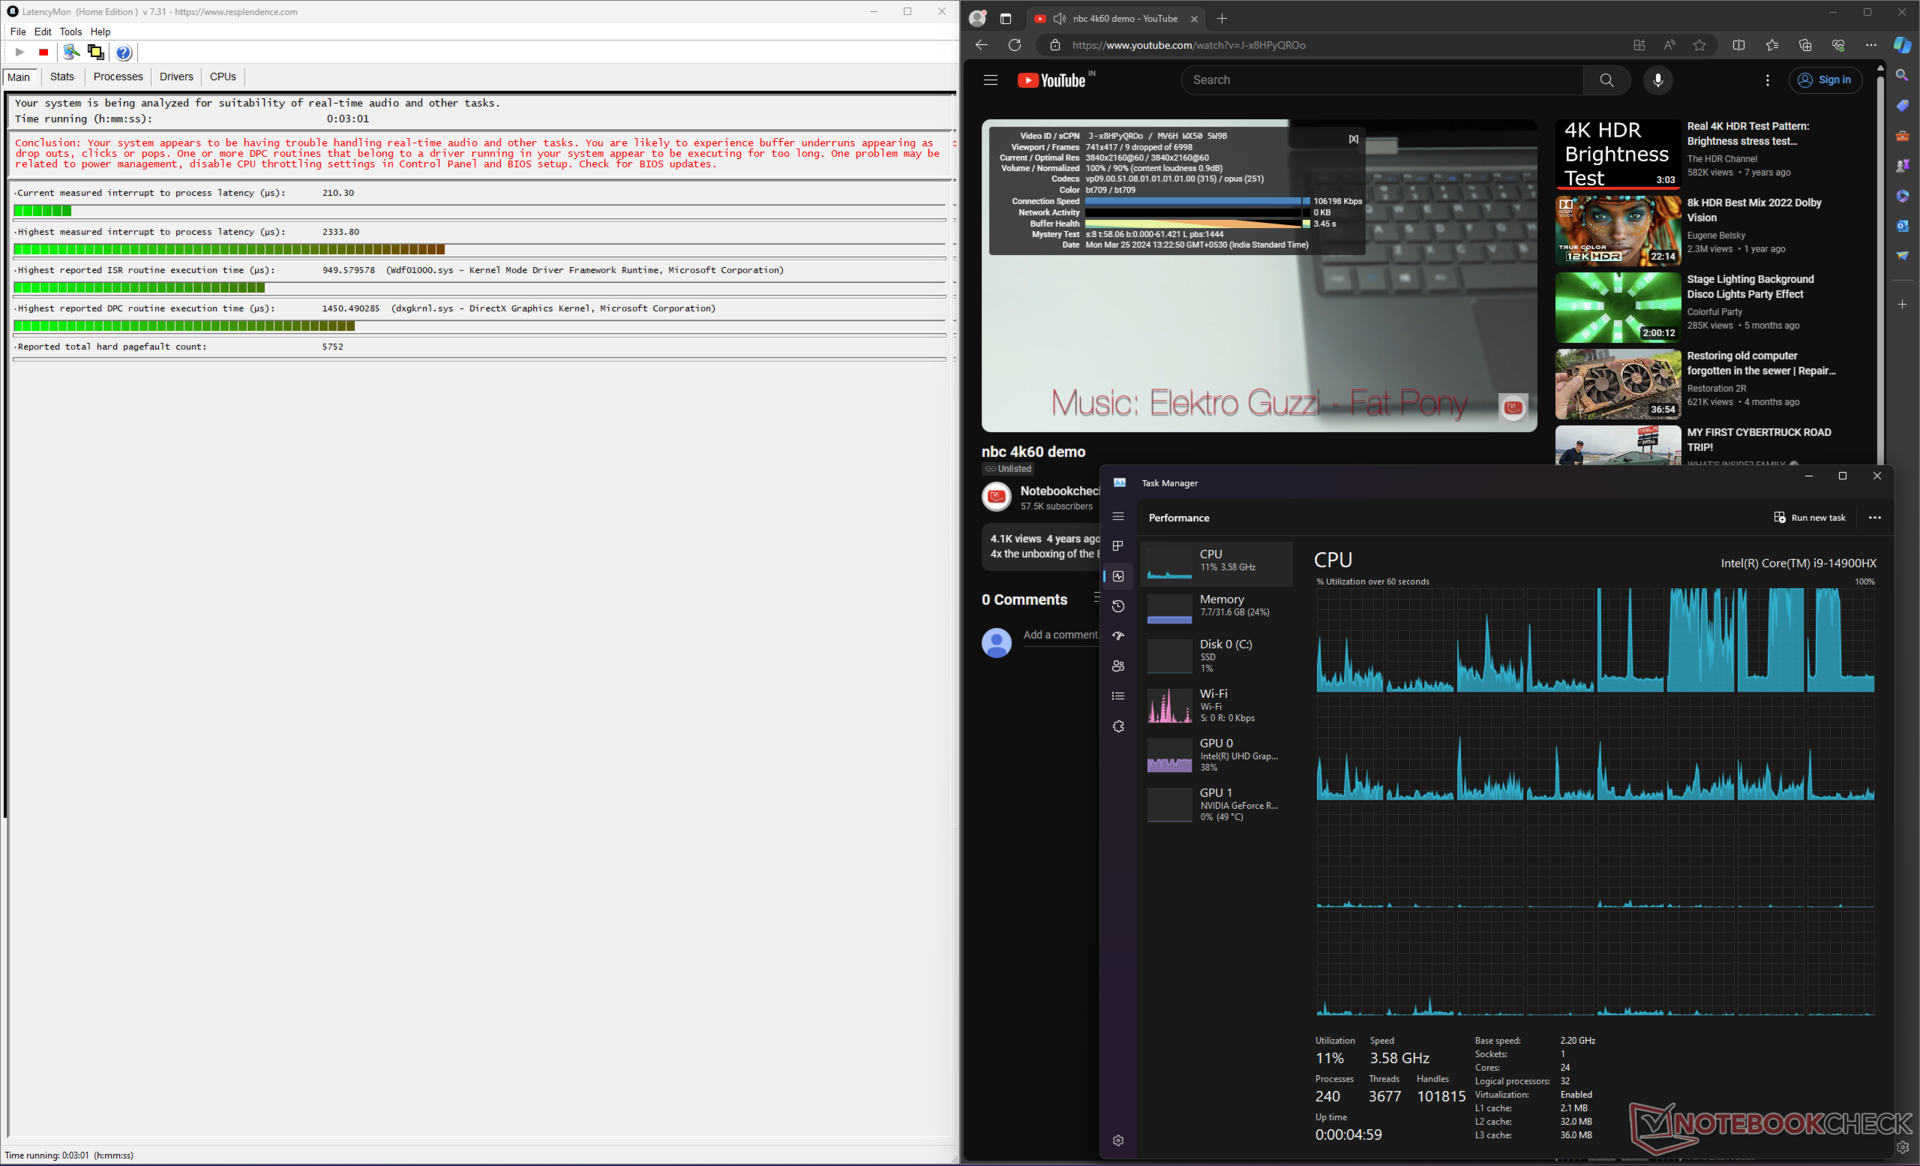
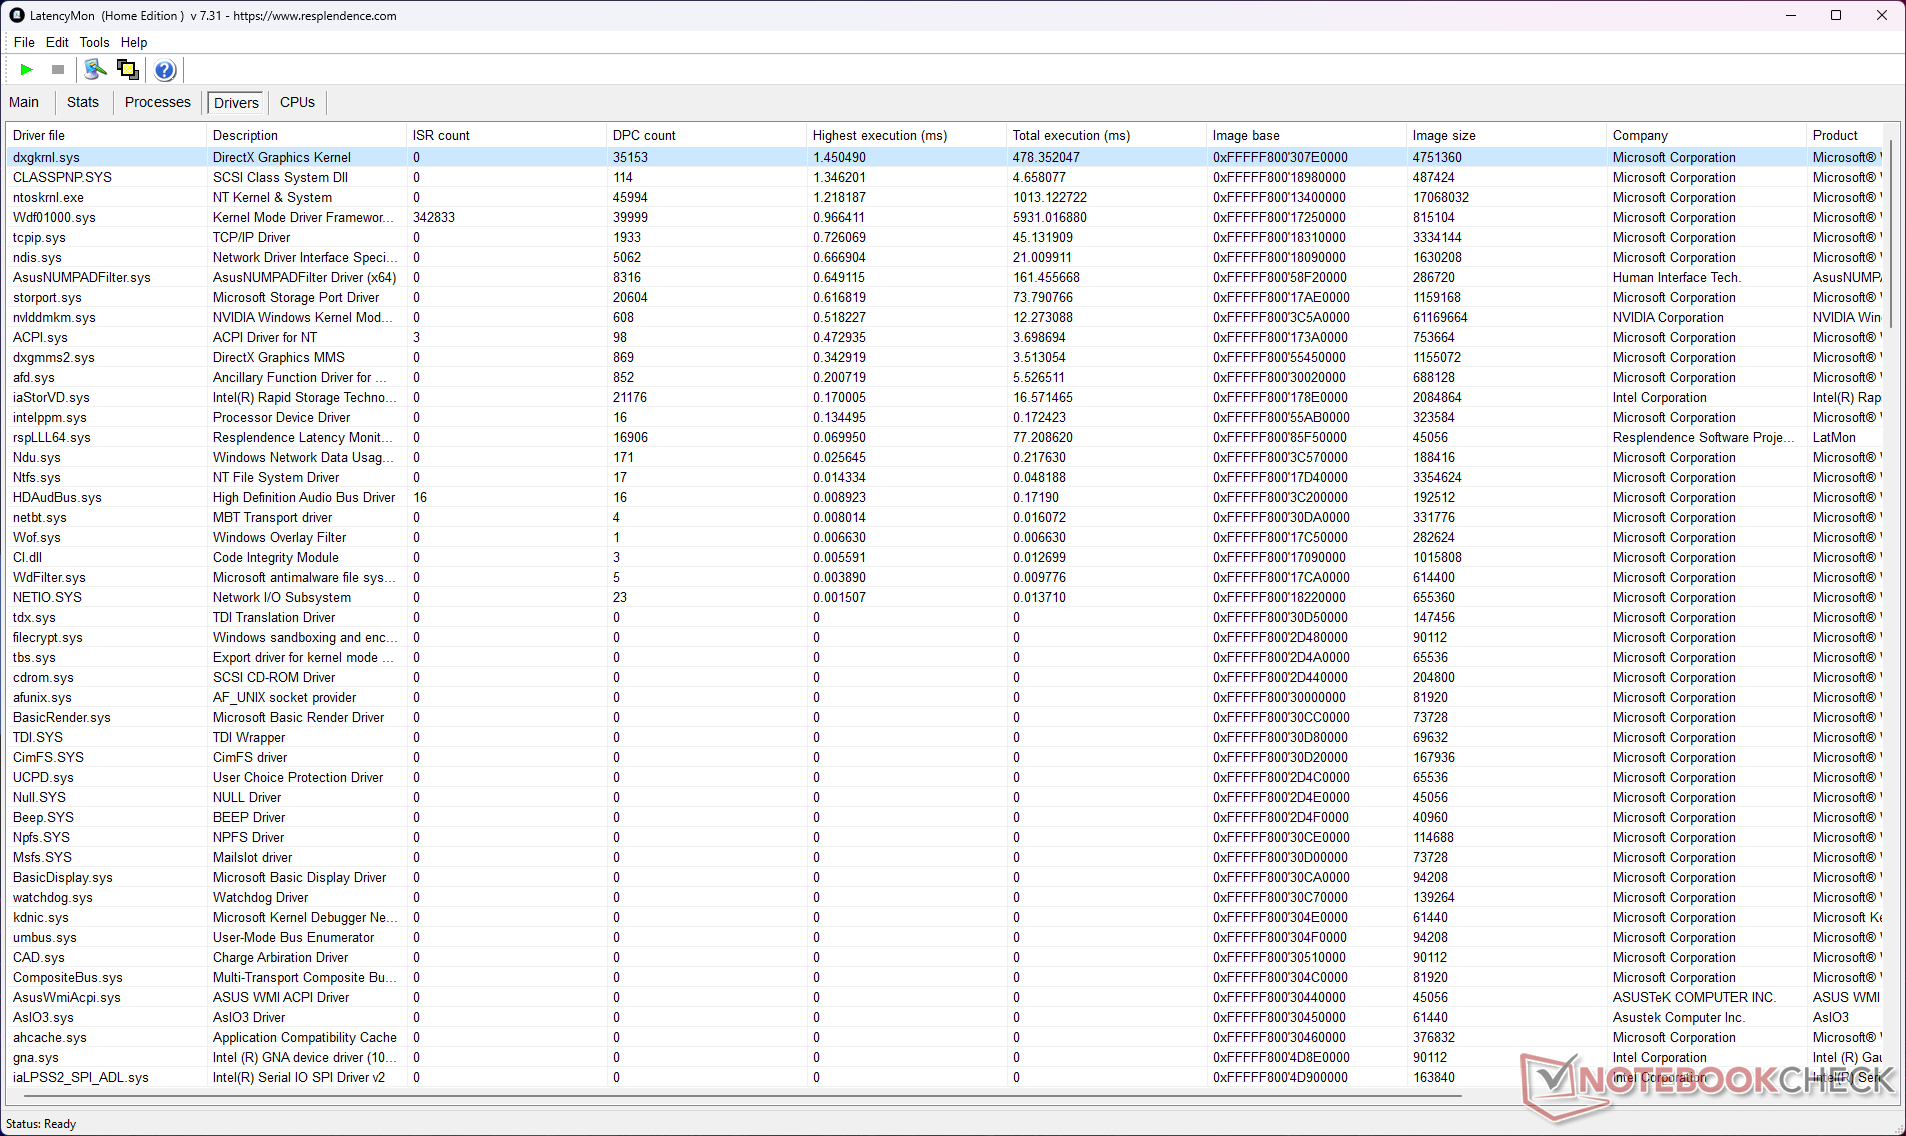
Latencia del CPD
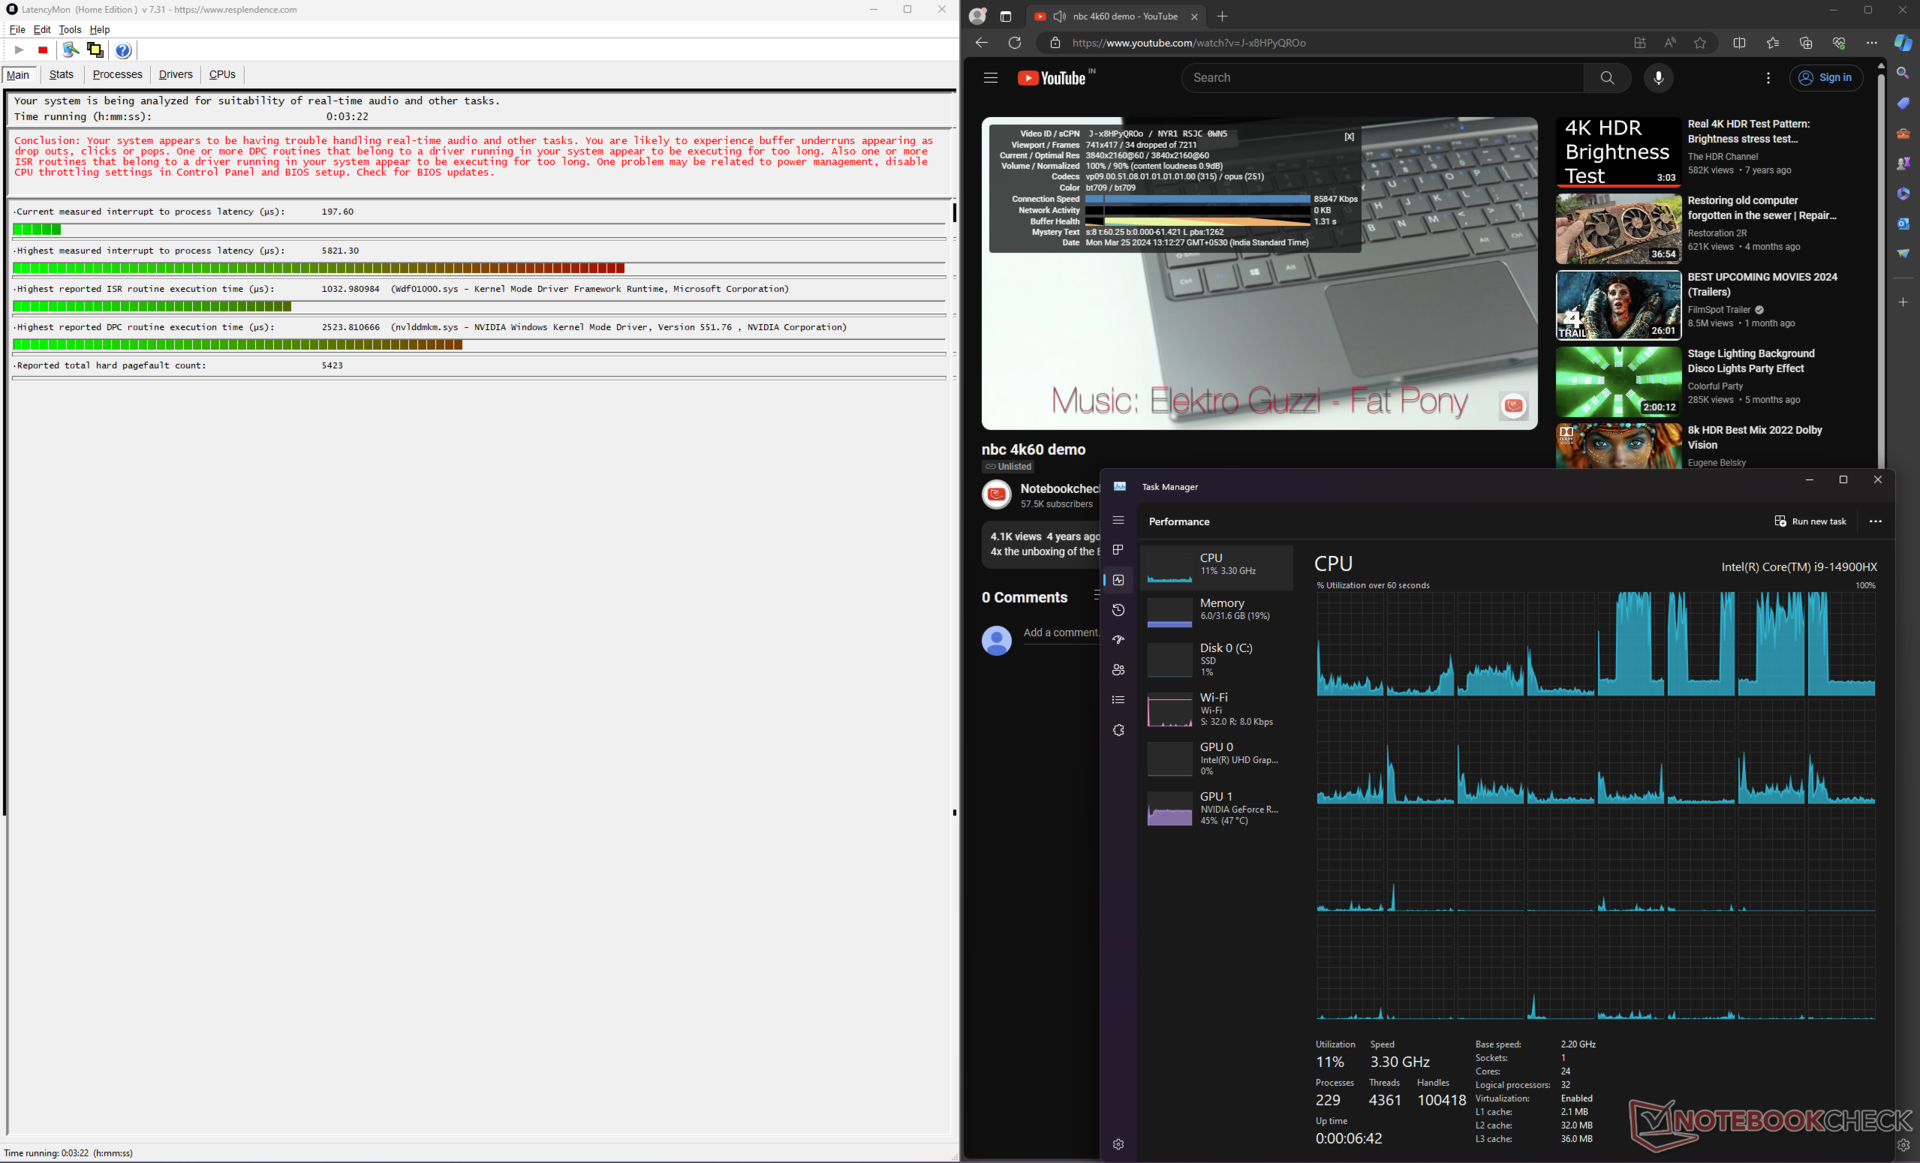
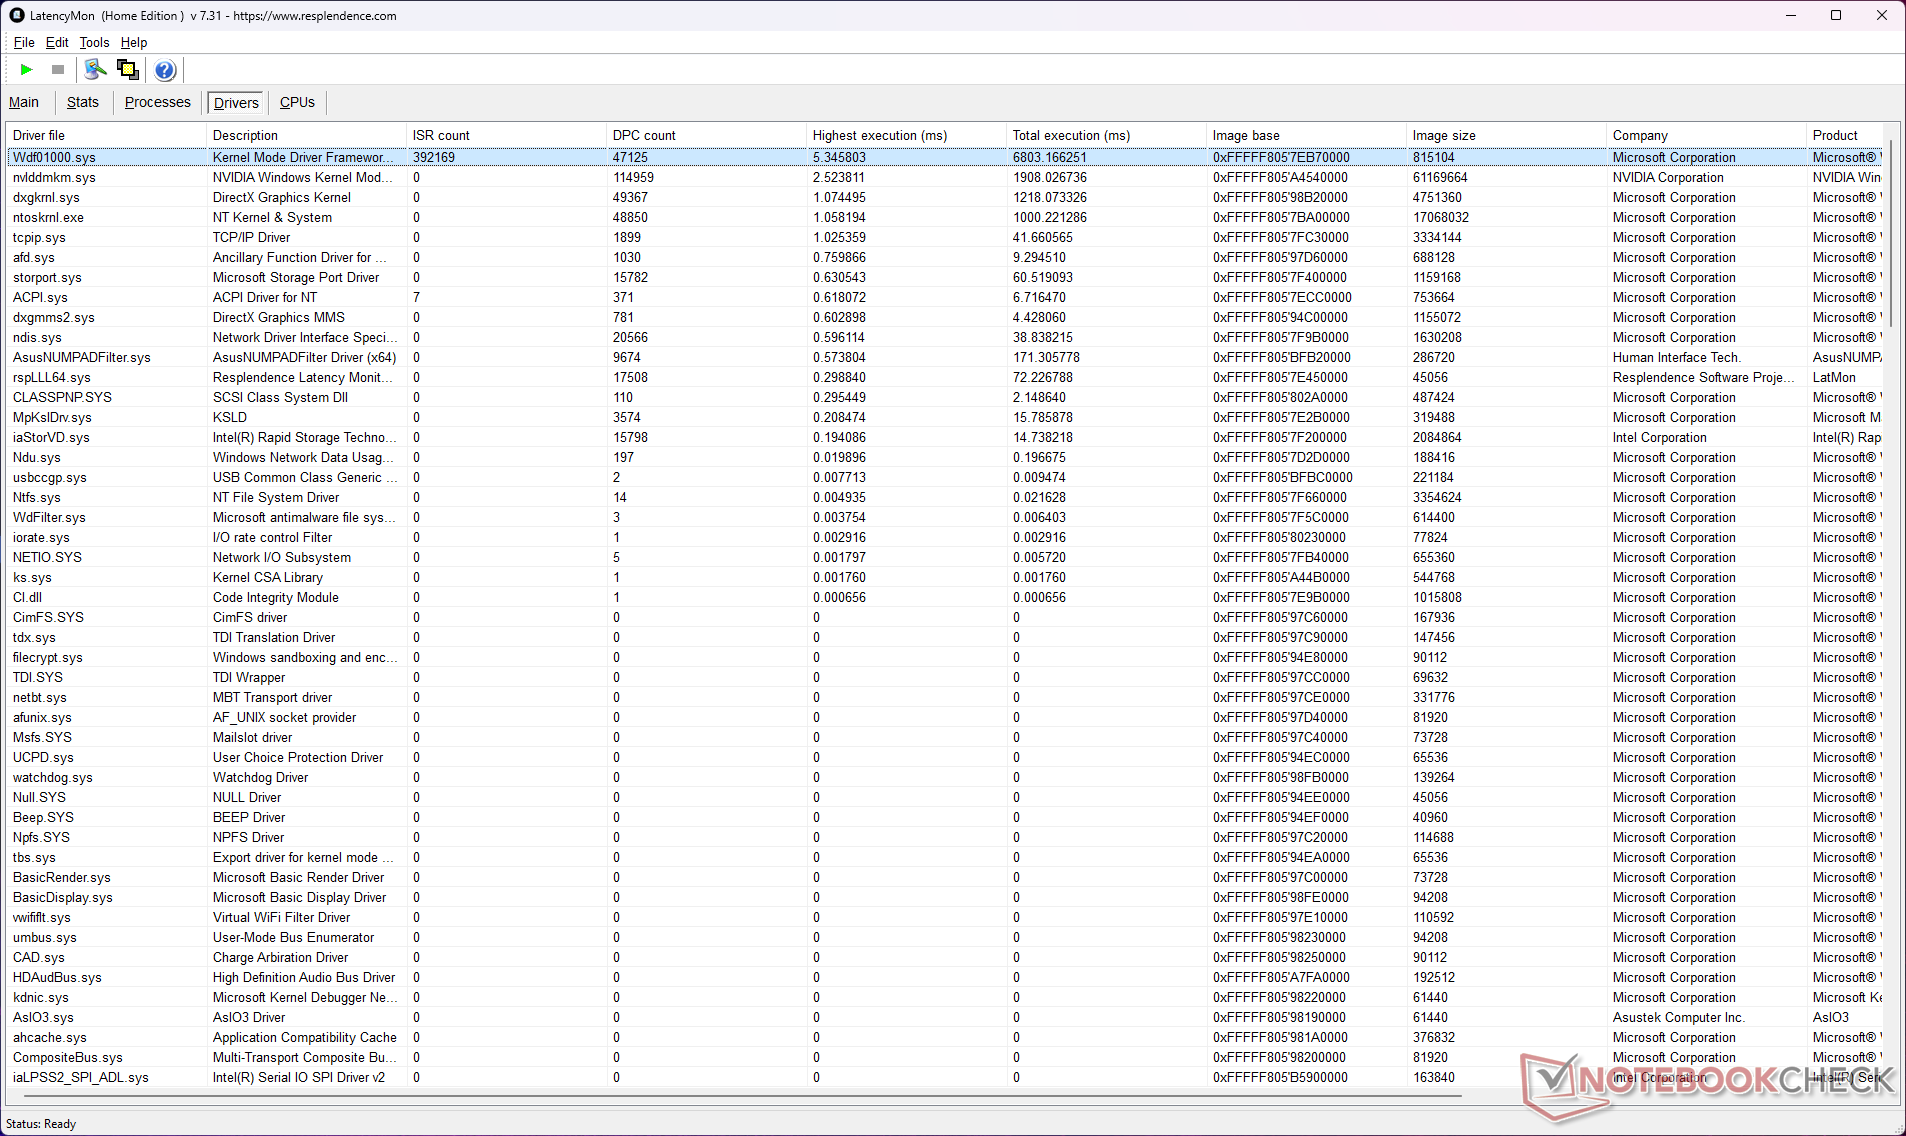
La latencia del DPC es mayor con la MUX de la dGPU activada. El cambio a la iGPU reduce la latencia de 5821,30 µs a 2333,80 µs, que sigue siendo un valor elevado. Esto puede plantear problemas si se dedica a flujos de trabajo de edición de audio o vídeo en tiempo real.
| DPC Latencies / LatencyMon - interrupt to process latency (max), Web, Youtube, Prime95 | |
| Asus ROG Strix Scar 16 G634JZR | |
| Asus ROG Strix G16 G614JZ | |
| Alienware m16 R2 | |
| MSI Vector 16 HX A14V | |
| Lenovo Legion Pro 7 16IRX9H | |
| HP Omen 16 (2024) | |
| Asus ROG Strix Scar 17 G733PYV-LL053X | |
* ... más pequeño es mejor
Nuestra Clasificación de la latencia del CPD proporciona una visión general de las latencias medidas en los dispositivos revisados.
Dispositivos de almacenamiento
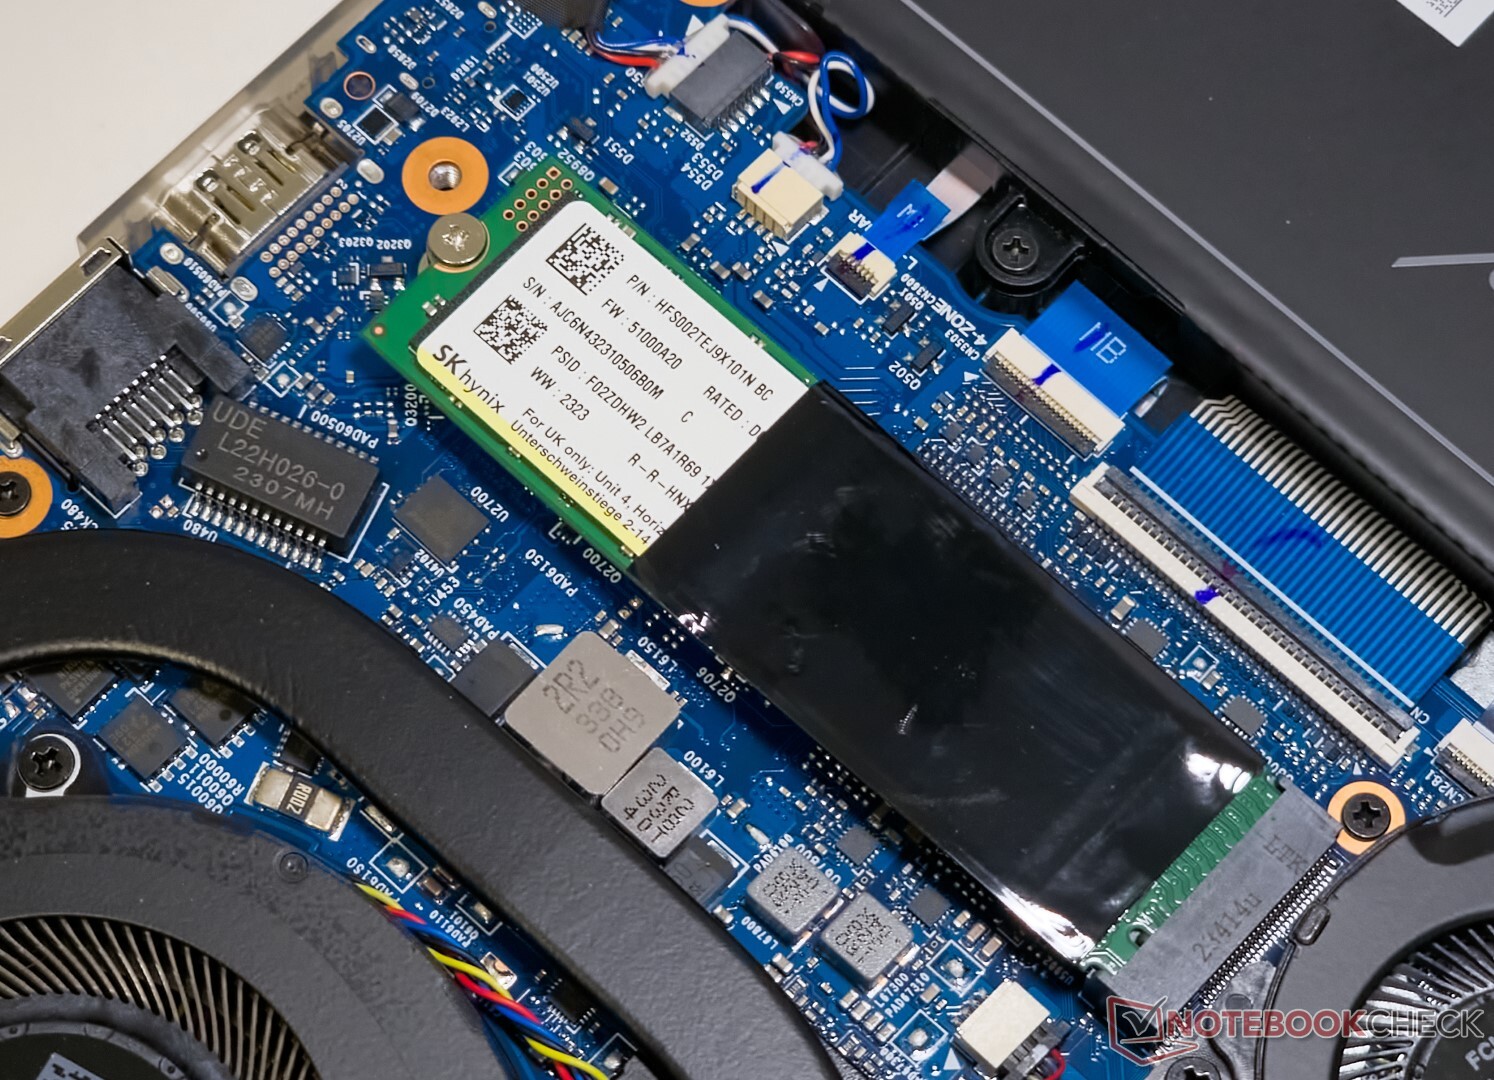
Nuestra unidad Scar 16 venía equipada con una unidad SSD NVMe PCIe Gen 4 de 2 TB Sk hynix PC801.
El rendimiento de la SSD recibe una paliza en las lecturas secuenciales y en varias pruebas 4k, pero el rendimiento acumulado está al alcance del Alienware m16 R2samsung PM9A1.
Se puede añadir almacenamiento adicional a través de una ranura de expansión para otra SSD M.2. Sin embargo, no hay ninguna disposición para instalar unidades SATA de 2,5 pulgadas.

* ... más pequeño es mejor
Estrangulamiento de disco: Bucle de lectura DiskSpd, profundidad de cola 8
El rendimiento de la unidad cae después de la 14ª ejecución durante una prueba de bucle de lectura DiskSpd con una profundidad de cola de 8, pero permanece estable a partir de ahí.
Encontrará más comparaciones de rendimiento de almacenamiento en nuestros Puntos de referencia de SSD y HDD página.
Rendimiento de la GPU
El Scar 16 está equipado con una GPU Nvidia GeForce RTX 4080 de 175 W para portátiles. El rendimiento general en 3DMark es comparable al de otros portátiles que incorporan esta tarjeta, aunque queda por detrás del Lenovo Legion Pro 7 en un 6%.
El HP Omen 16 con una GPU RTX 4080 de 140 W para portátiles sufre un retroceso mayor de lo esperado del 24% frente al Strix Scar 16 en rendimiento 3DMark acumulado.
La RTX 4080 de la Scar 16 la sitúa justo por detrás de la Asus ROG Strix Scar 17 con una GPU RTX 4090 Laptop en Blender Classroom Optix, aunque por un margen del 15% - esto aumenta al 18% en Blender Classroom CUDA.
La CPU de Blender Classroom, por otro lado, ve que el Core i9-14900HX del Scar 16 está a la par con el del Legion Pro 7 y el Vector 16 HX, pero el Scar 17 de AMD Ryzen 9 7945HX3D es capaz de terminar el render un 20% más rápido.
| 3DMark 11 Performance | 42772 puntos | |
| 3DMark Ice Storm Standard Score | 284572 puntos | |
| 3DMark Cloud Gate Standard Score | 64579 puntos | |
| 3DMark Fire Strike Score | 32183 puntos | |
| 3DMark Fire Strike Extreme Score | 21288 puntos | |
| 3DMark Time Spy Score | 18822 puntos | |
ayuda | ||
| Blender / v3.3 Classroom OPTIX/RTX | |
| Average of class Gaming (9 - 142, n=182, last 2 years) | |
| Alienware m16 R2 | |
| HP Omen 16 (2024) | |
| Average NVIDIA GeForce RTX 4080 Laptop GPU (13 - 20, n=18) | |
| Asus ROG Strix G16 G614JZ | |
| MSI Vector 16 HX A14V | |
| Lenovo Legion Pro 7 16IRX9H | |
| Asus ROG Strix Scar 16 G634JZR | |
| Asus ROG Strix Scar 17 G733PYV-LL053X | |
| Blender / v3.3 Classroom CUDA | |
| Average of class Gaming (16 - 175, n=189, last 2 years) | |
| Alienware m16 R2 | |
| HP Omen 16 (2024) | |
| Average NVIDIA GeForce RTX 4080 Laptop GPU (21 - 28, n=19) | |
| Asus ROG Strix G16 G614JZ | |
| MSI Vector 16 HX A14V | |
| Asus ROG Strix Scar 16 G634JZR | |
| Lenovo Legion Pro 7 16IRX9H | |
| Asus ROG Strix Scar 17 G733PYV-LL053X | |
| Blender / v3.3 Classroom CPU | |
| Average of class Gaming (138 - 962, n=201, last 2 years) | |
| Alienware m16 R2 | |
| HP Omen 16 (2024) | |
| Average NVIDIA GeForce RTX 4080 Laptop GPU (177 - 337, n=19) | |
| Asus ROG Strix G16 G614JZ | |
| Asus ROG Strix Scar 16 G634JZR | |
| Lenovo Legion Pro 7 16IRX9H | |
| MSI Vector 16 HX A14V | |
| Asus ROG Strix Scar 17 G733PYV-LL053X | |
* ... más pequeño es mejor
Rendimiento en juegos
La diferencia de rendimiento entre la Legion Pro 7 y la Strix Scar 16 desaparece en el rendimiento acumulado en juegos a 1080p Ultra.
El Scar 16 puede superar fácilmente la marca de los 100 fps en 1440p Ultra con títulos más antiguos. El portátil puede manejar la mayoría de los juegos AAA modernos a 60 fps en esta resolución, y puede lograr velocidades de fotogramas aún más altas con una mano de upscalers.
| The Witcher 3 - 1920x1080 Ultra Graphics & Postprocessing (HBAO+) | |
| Asus ROG Strix Scar 17 G733PYV-LL053X | |
| Lenovo Legion Pro 7 16IRX9H | |
| Asus ROG Strix Scar 16 G634JZR | |
| MSI Vector 16 HX A14V | |
| Asus ROG Strix G16 G614JZ | |
| HP Omen 16 (2024) | |
| Alienware m16 R2 | |
| Average of class Gaming (8.61 - 216, n=227, last 2 years) | |
| GTA V - 1920x1080 Highest Settings possible AA:4xMSAA + FX AF:16x | |
| Asus ROG Strix Scar 17 G733PYV-LL053X | |
| Lenovo Legion Pro 7 16IRX9H | |
| Asus ROG Strix G16 G614JZ | |
| Asus ROG Strix Scar 16 G634JZR | |
| MSI Vector 16 HX A14V | |
| HP Omen 16 (2024) | |
| Average of class Gaming (6.38 - 167.7, n=218, last 2 years) | |
La tabla de FPS de Witcher 3
El enorme sistema de refrigeración de la Scar 16 es capaz de garantizar un rendimiento de juego relativamente libre de estrangulamientos. No observamos ninguna caída drástica de fotogramas mientras estresábamos con La Witcher 3 a 1080p Ultra.
| bajo | medio | alto | ultra | QHD | |
| GTA V (2015) | 187.3 | 187.1 | 182.6 | 139 | 130.1 |
| The Witcher 3 (2015) | 581 | 513 | 365 | 185.6 | 140.1 |
| Dota 2 Reborn (2015) | 247 | 216 | 192.7 | 177.4 | |
| Final Fantasy XV Benchmark (2018) | 228 | 207 | 178 | 138.1 | |
| X-Plane 11.11 (2018) | 211 | 184.3 | 141.3 | ||
| Far Cry 5 (2018) | 183 | 168 | 164 | 157 | 157 |
| Strange Brigade (2018) | 499 | 402 | 373 | 337 | 240 |
| F1 22 (2022) | 323 | 334 | 287 | 117.1 | 76.6 |
| F1 23 (2023) | 310 | 326 | 295 | 111.3 | 70 |
| Cyberpunk 2077 2.0 Phantom Liberty (2023) | 170.4 | 159.8 | 141.3 | 123.1 | 77.6 |
| Avatar Frontiers of Pandora (2023) | 141.4 | 131.6 | 115.2 | 88.3 | 59.3 |
| Skull & Bones (2024) | 155 | 168 | 144 | 115 | 91 |
Consulte nuestro dedicado GPU Nvidia GeForce RTX 4080 para portátiles para ver más pruebas de rendimiento y juegos.
Emisiones: Altas temperaturas superficiales y ruido a pesar de 3 ventiladores y 7 heatpipes
Ruido del sistema
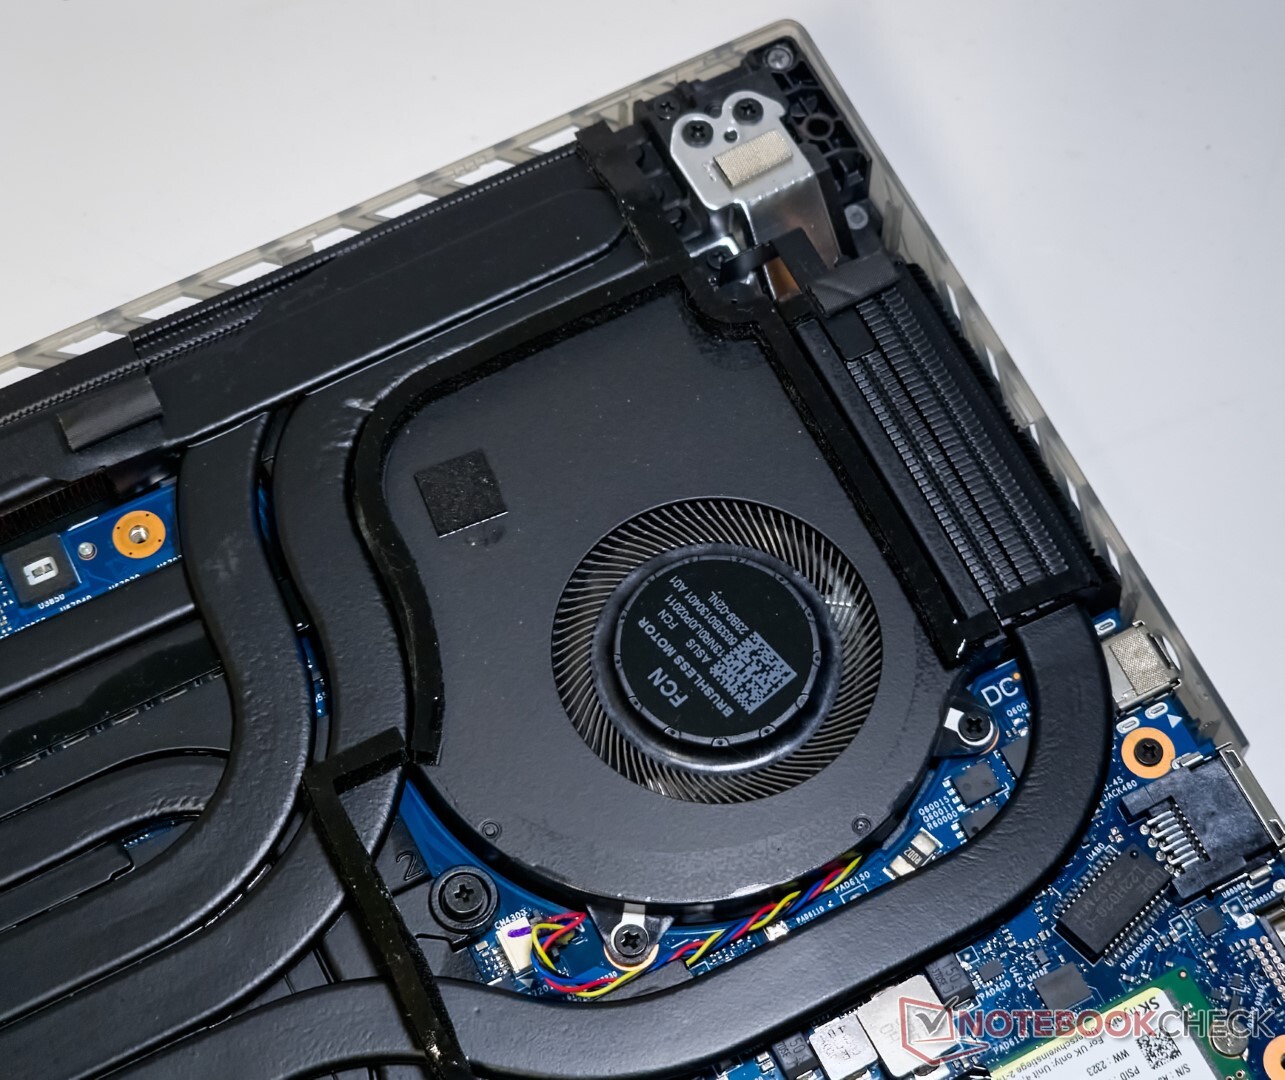
Asus, curiosamente, incluye un tercer ventilador en la VRAM además de los conectados a la CPU y la GPU.
El Scar 16 no parece imponer límites estrictos a las emisiones de ruido en cada perfil de potencia. Como resultado, las emisiones de ruido del ventilador en el modo Turbo pueden alcanzar los 58 db(A) bajo carga máxima.
El modo Rendimiento también produce emisiones de ruido elevadas. El modo Silencioso es comparativamente más tolerable, pero a costa de una notable caída en el rendimiento de juego.
Dicho esto, los ventiladores están completamente apagados en el modo Silencioso cuando está en reposo y durante cargas de trabajo menos intensivas como Office o la navegación web casual.
Ruido
| Ocioso |
| 29.75 / 29.75 / 29.75 dB(A) |
| Carga |
| 54.85 / 58 dB(A) |
 | ||
30 dB silencioso 40 dB(A) audible 50 dB(A) ruidosamente alto |
||
min: | ||
| Modo de rendimiento | Al ralentí dB(A) | Carga media dB(A) | Carga máxima dB(A) | El Witcher 3 1080p Ultra dB(A) |
|---|---|---|---|---|
| Silencioso | 21,07 | 37,50 | 46,56 | 46,32 / 133 fps |
| Rendimiento | 21,07 | 54,03 | 54,02 | 54,08 / 174 fps |
| Turbo | 29.75 | 54.85 | 58 | 57.75 / 177 fps |
| Asus ROG Strix Scar 16 G634JZR i9-14900HX, NVIDIA GeForce RTX 4080 Laptop GPU | Asus ROG Strix Scar 17 G733PYV-LL053X R9 7945HX3D, NVIDIA GeForce RTX 4090 Laptop GPU | Asus ROG Strix G16 G614JZ i9-13980HX, NVIDIA GeForce RTX 4080 Laptop GPU | Lenovo Legion Pro 7 16IRX9H i9-14900HX, NVIDIA GeForce RTX 4080 Laptop GPU | HP Omen 16 (2024) i9-14900HX, NVIDIA GeForce RTX 4080 Laptop GPU | MSI Vector 16 HX A14V i9-14900HX, NVIDIA GeForce RTX 4080 Laptop GPU | Alienware m16 R2 Ultra 7 155H, NVIDIA GeForce RTX 4070 Laptop GPU | |
|---|---|---|---|---|---|---|---|
| Noise | 3% | 5% | -4% | 5% | -8% | 10% | |
| off / environment * | 21.07 | 23 -9% | 25 -19% | 24 -14% | 25 -19% | 23.2 -10% | 24.7 -17% |
| Idle Minimum * | 29.75 | 23 23% | 26 13% | 25 16% | 29 3% | 33.5 -13% | 25.3 15% |
| Idle Average * | 29.75 | 27.7 7% | 28 6% | 30 -1% | 30 -1% | 33.5 -13% | 25.3 15% |
| Idle Maximum * | 29.75 | 34.7 -17% | 30 -1% | 45 -51% | 31 -4% | 33.5 -13% | 25.3 15% |
| Load Average * | 54.85 | 53.4 3% | 48 12% | 50 9% | 46 16% | 52.1 5% | 31.7 42% |
| Witcher 3 ultra * | 57.8 | 53.4 8% | 49 15% | 54 7% | 47 19% | 62 -7% | 53.8 7% |
| Load Maximum * | 58 | 53.4 8% | 52 10% | 56 3% | 47 19% | 62 -7% | 62 -7% |
* ... más pequeño es mejor
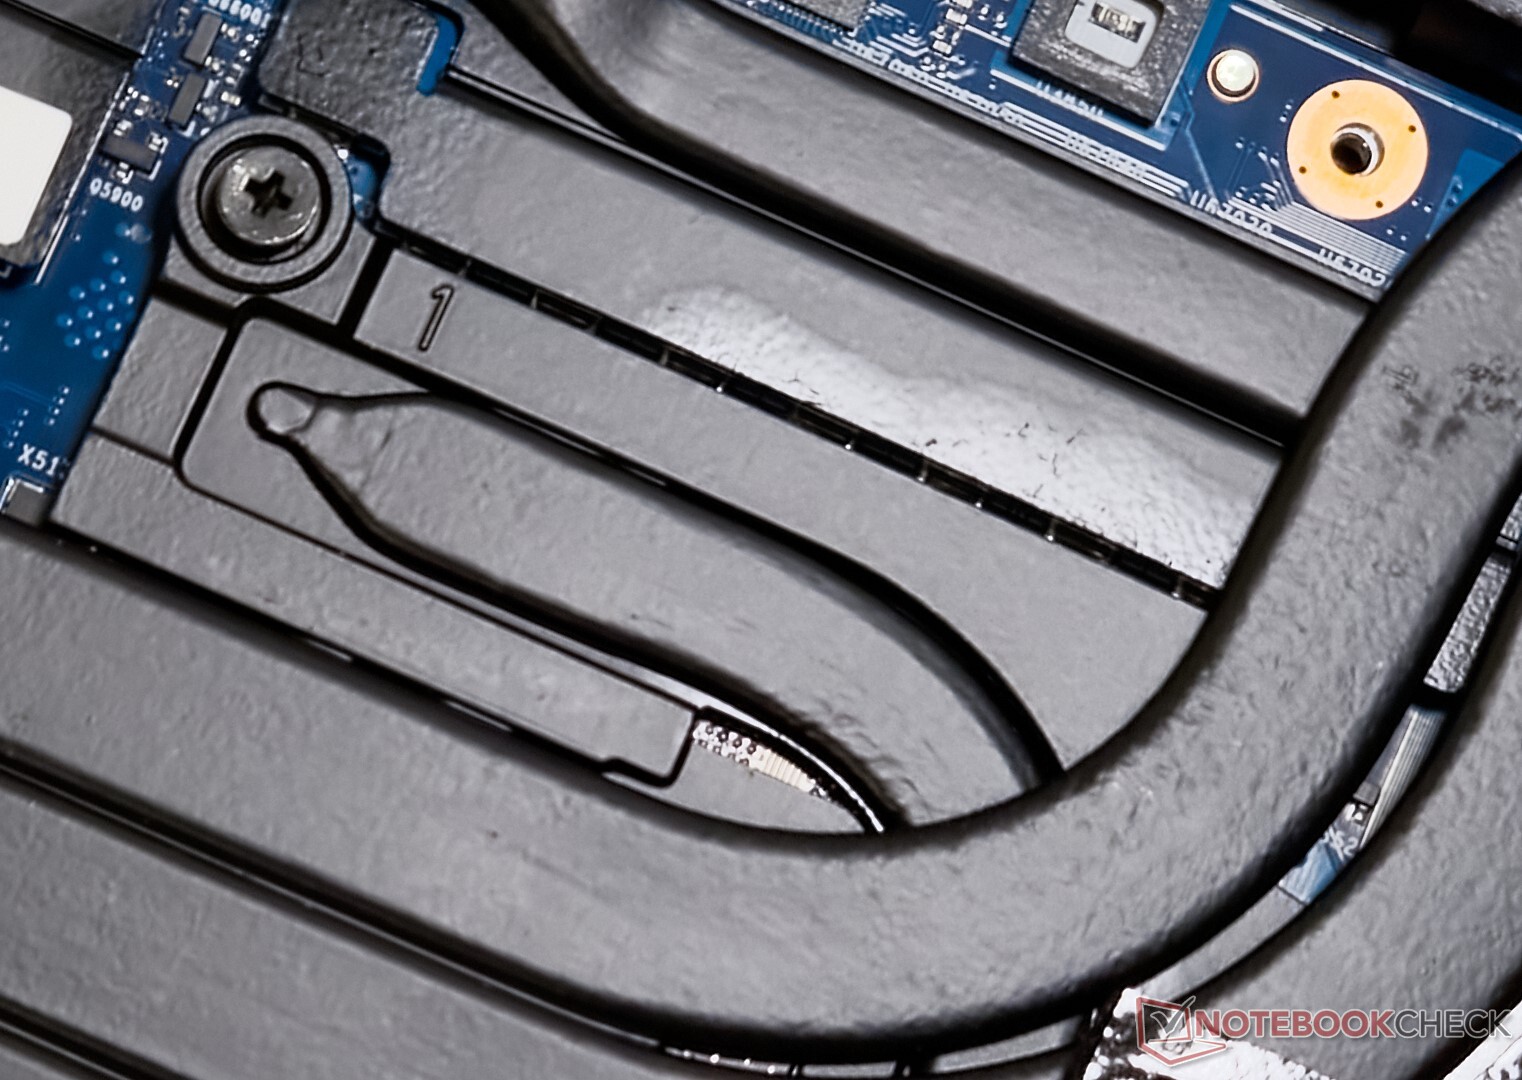
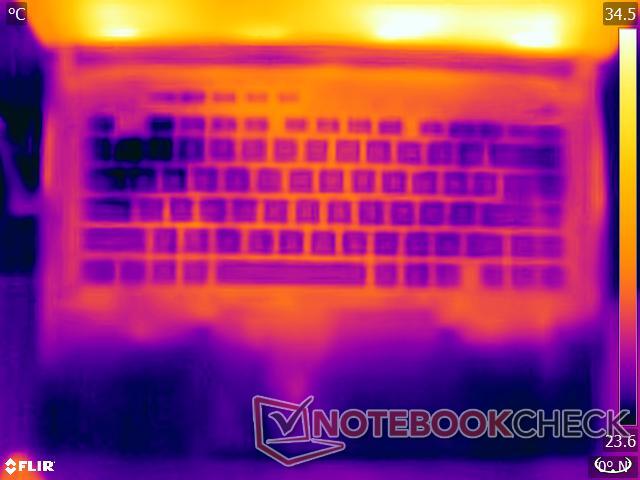
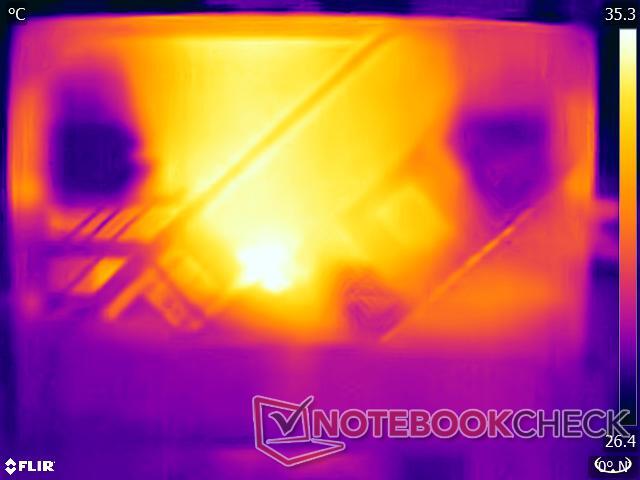
Temperatura
La ROG Strix Scar 16 está equipada con siete heatpipes y un sistema de refrigeración de triple ventilador. En esta ocasión, Asus ha apostado por el metal líquido Conductonaut Extreme tanto para la CPU como para la GPU.
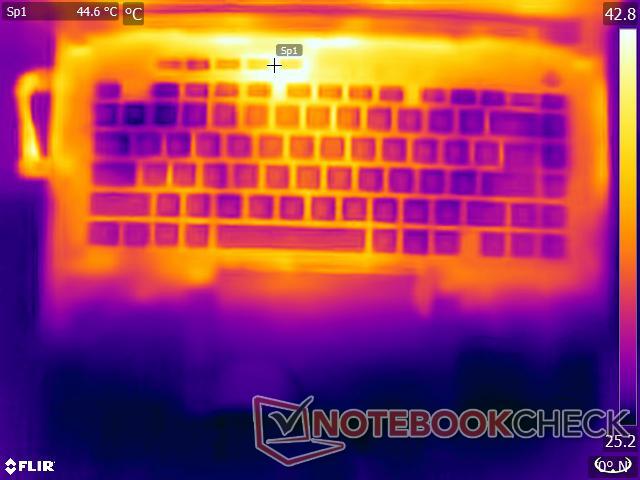
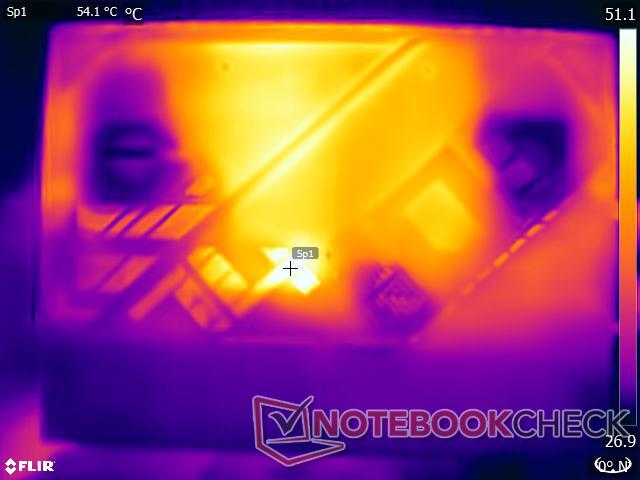
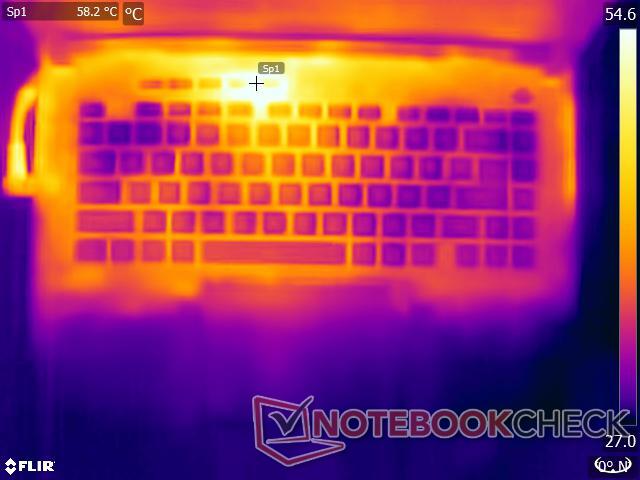
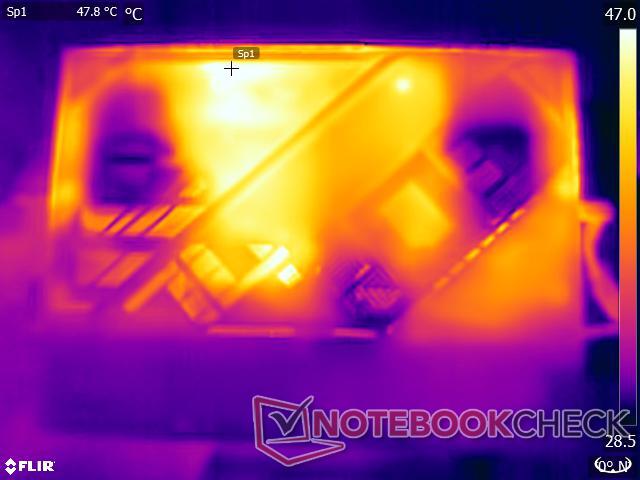
Aunque el robusto aparato de refrigeración y la presencia de rejillas de ventilación de escape en tres lados ayudan a una refrigeración eficaz de los componentes, también provocan una mayor disipación del calor, como demuestran las elevadas lecturas de temperatura de la superficie bajo carga.
Observamos algunos puntos calientes por encima de la marca de 55 °C en la parte superior durante las pruebas de estrés con The Witcher 3 a 1080p Ultra.
En términos prácticos, dado su peso y temperaturas superficiales, el Scar 16 sirve mejor como máquina de escritorio. Dicho esto, el portátil no debería causar mucha incomodidad mientras se utiliza sobre el regazo en el perfil Silencioso, siempre que no se someta a cargas de trabajo pesadas.
(-) The maximum temperature on the upper side is 47.8 °C / 118 F, compared to the average of 40.4 °C / 105 F, ranging from 21.2 to 68.8 °C for the class Gaming.
(-) The bottom heats up to a maximum of 52.2 °C / 126 F, compared to the average of 43.2 °C / 110 F
(+) In idle usage, the average temperature for the upper side is 30.9 °C / 88 F, compared to the device average of 33.8 °C / 93 F.
(-) Playing The Witcher 3, the average temperature for the upper side is 42.9 °C / 109 F, compared to the device average of 33.8 °C / 93 F.
(±) The palmrests and touchpad can get very hot to the touch with a maximum of 39.2 °C / 102.6 F.
(-) The average temperature of the palmrest area of similar devices was 28.9 °C / 84 F (-10.3 °C / -18.6 F).
| Asus ROG Strix Scar 16 G634JZR i9-14900HX, NVIDIA GeForce RTX 4080 Laptop GPU | Asus ROG Strix Scar 17 G733PYV-LL053X R9 7945HX3D, NVIDIA GeForce RTX 4090 Laptop GPU | Asus ROG Strix G16 G614JZ i9-13980HX, NVIDIA GeForce RTX 4080 Laptop GPU | Lenovo Legion Pro 7 16IRX9H i9-14900HX, NVIDIA GeForce RTX 4080 Laptop GPU | HP Omen 16 (2024) i9-14900HX, NVIDIA GeForce RTX 4080 Laptop GPU | MSI Vector 16 HX A14V i9-14900HX, NVIDIA GeForce RTX 4080 Laptop GPU | Alienware m16 R2 Ultra 7 155H, NVIDIA GeForce RTX 4070 Laptop GPU | |
|---|---|---|---|---|---|---|---|
| Heat | 15% | -2% | -5% | 9% | 23% | -7% | |
| Maximum Upper Side * | 47.8 | 40.1 16% | 54 -13% | 46 4% | 47 2% | 36.4 24% | 44.8 6% |
| Maximum Bottom * | 52.2 | 46.7 11% | 55 -5% | 49 6% | 57 -9% | 35.6 32% | 48 8% |
| Idle Upper Side * | 32.4 | 26.5 18% | 29 10% | 38 -17% | 25 23% | 26.6 18% | 37.2 -15% |
| Idle Bottom * | 33 | 27.7 16% | 33 -0% | 37 -12% | 26 21% | 27 18% | 42 -27% |
* ... más pequeño es mejor
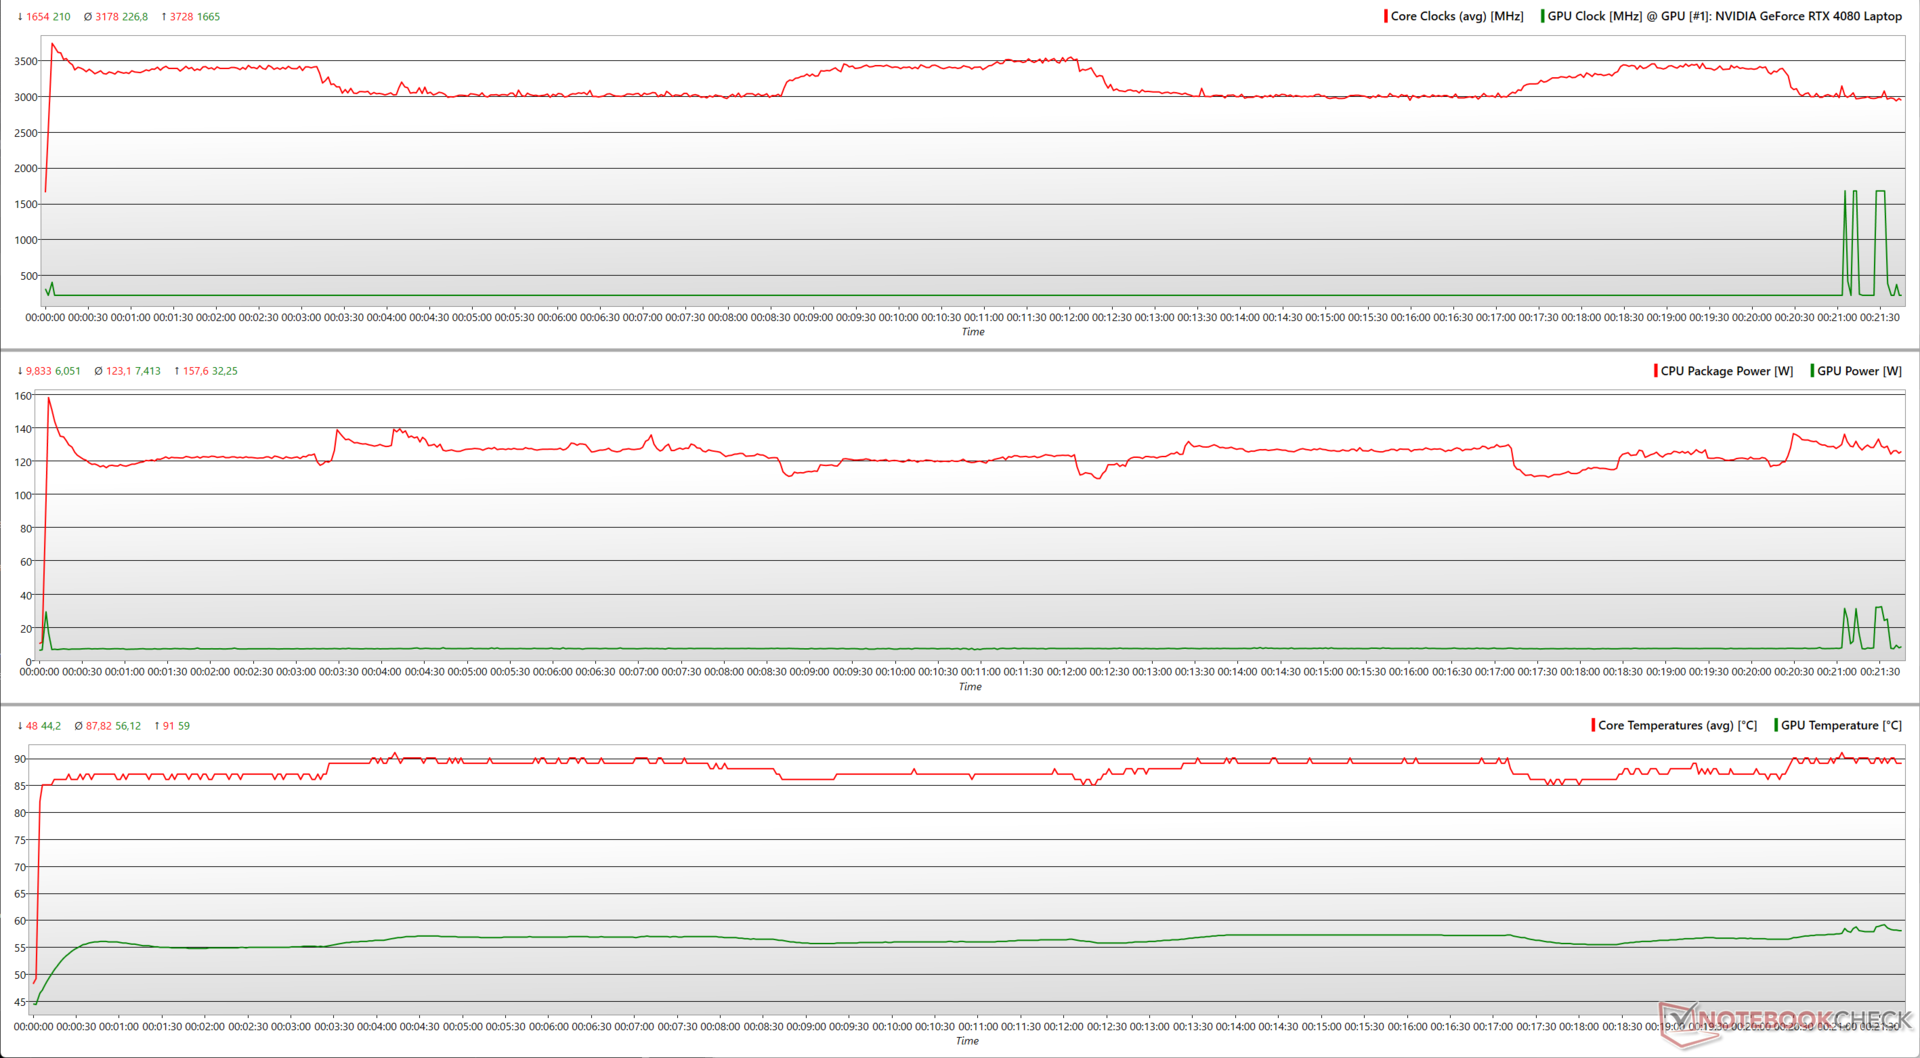
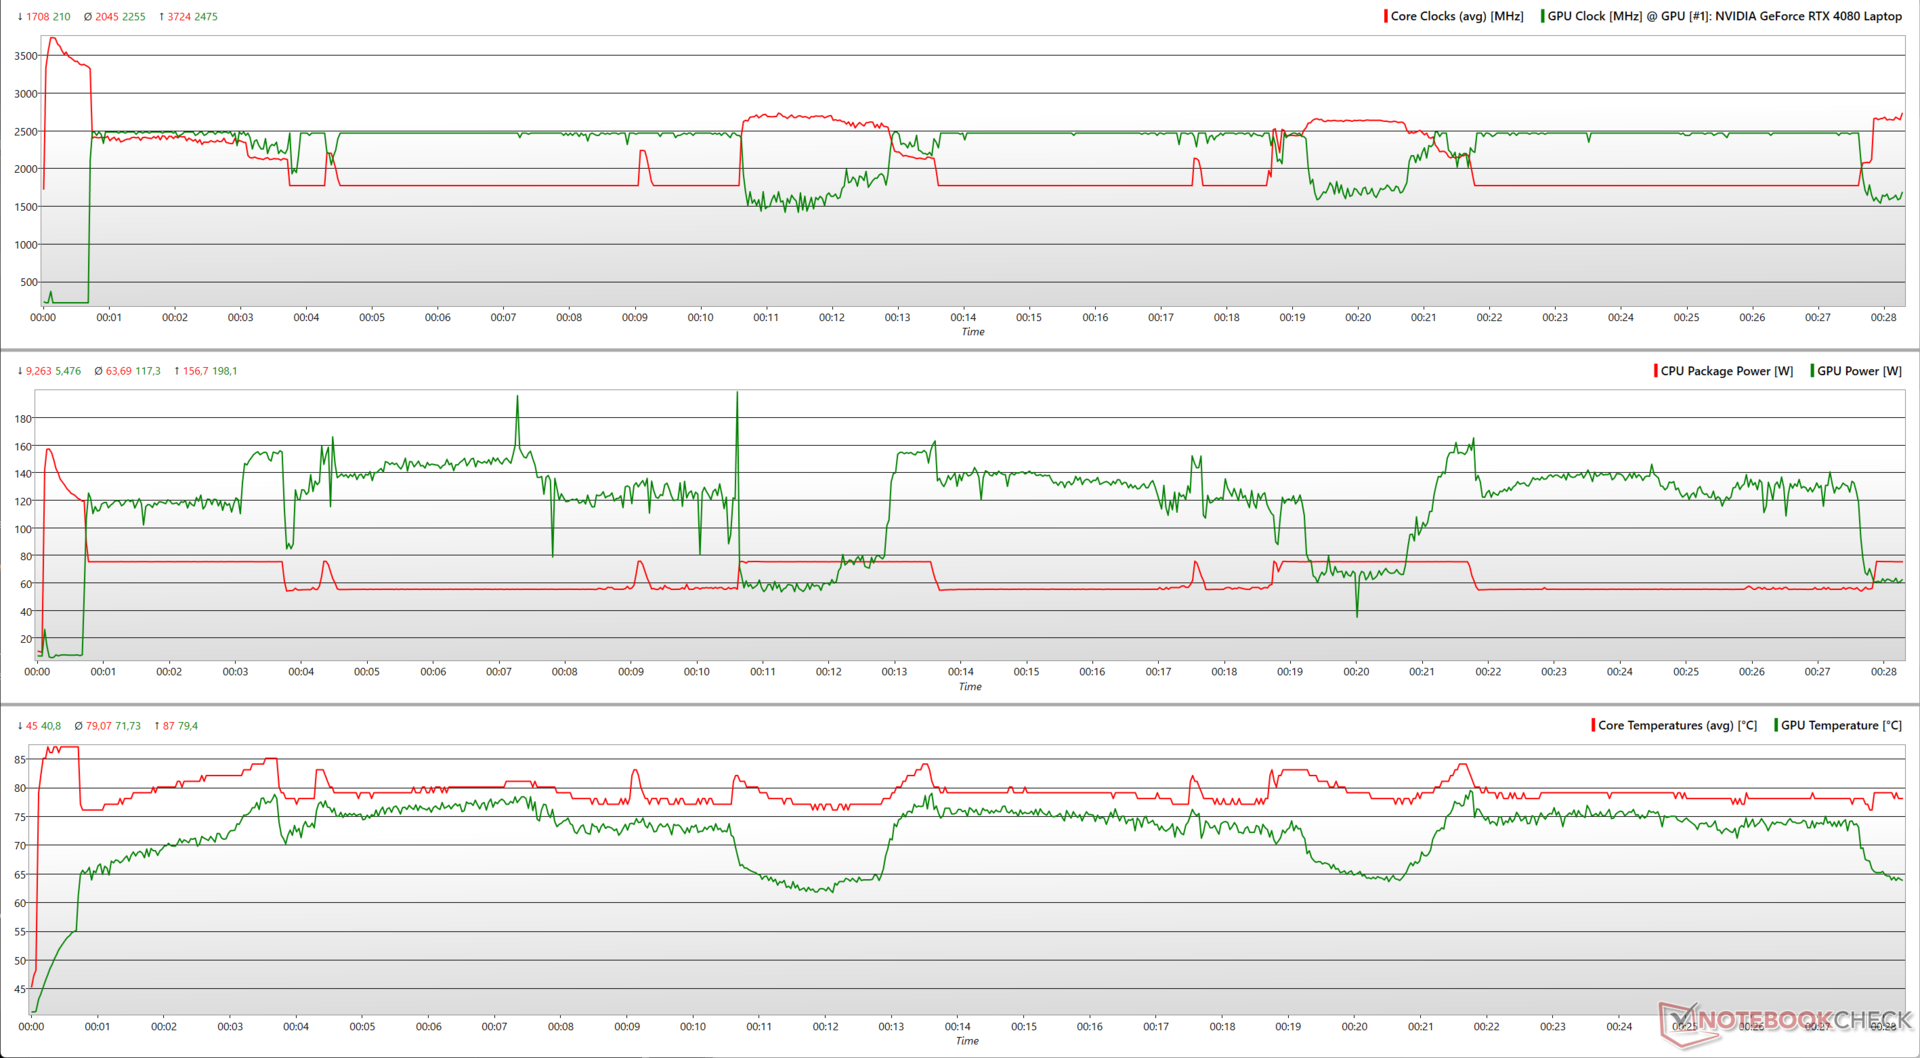
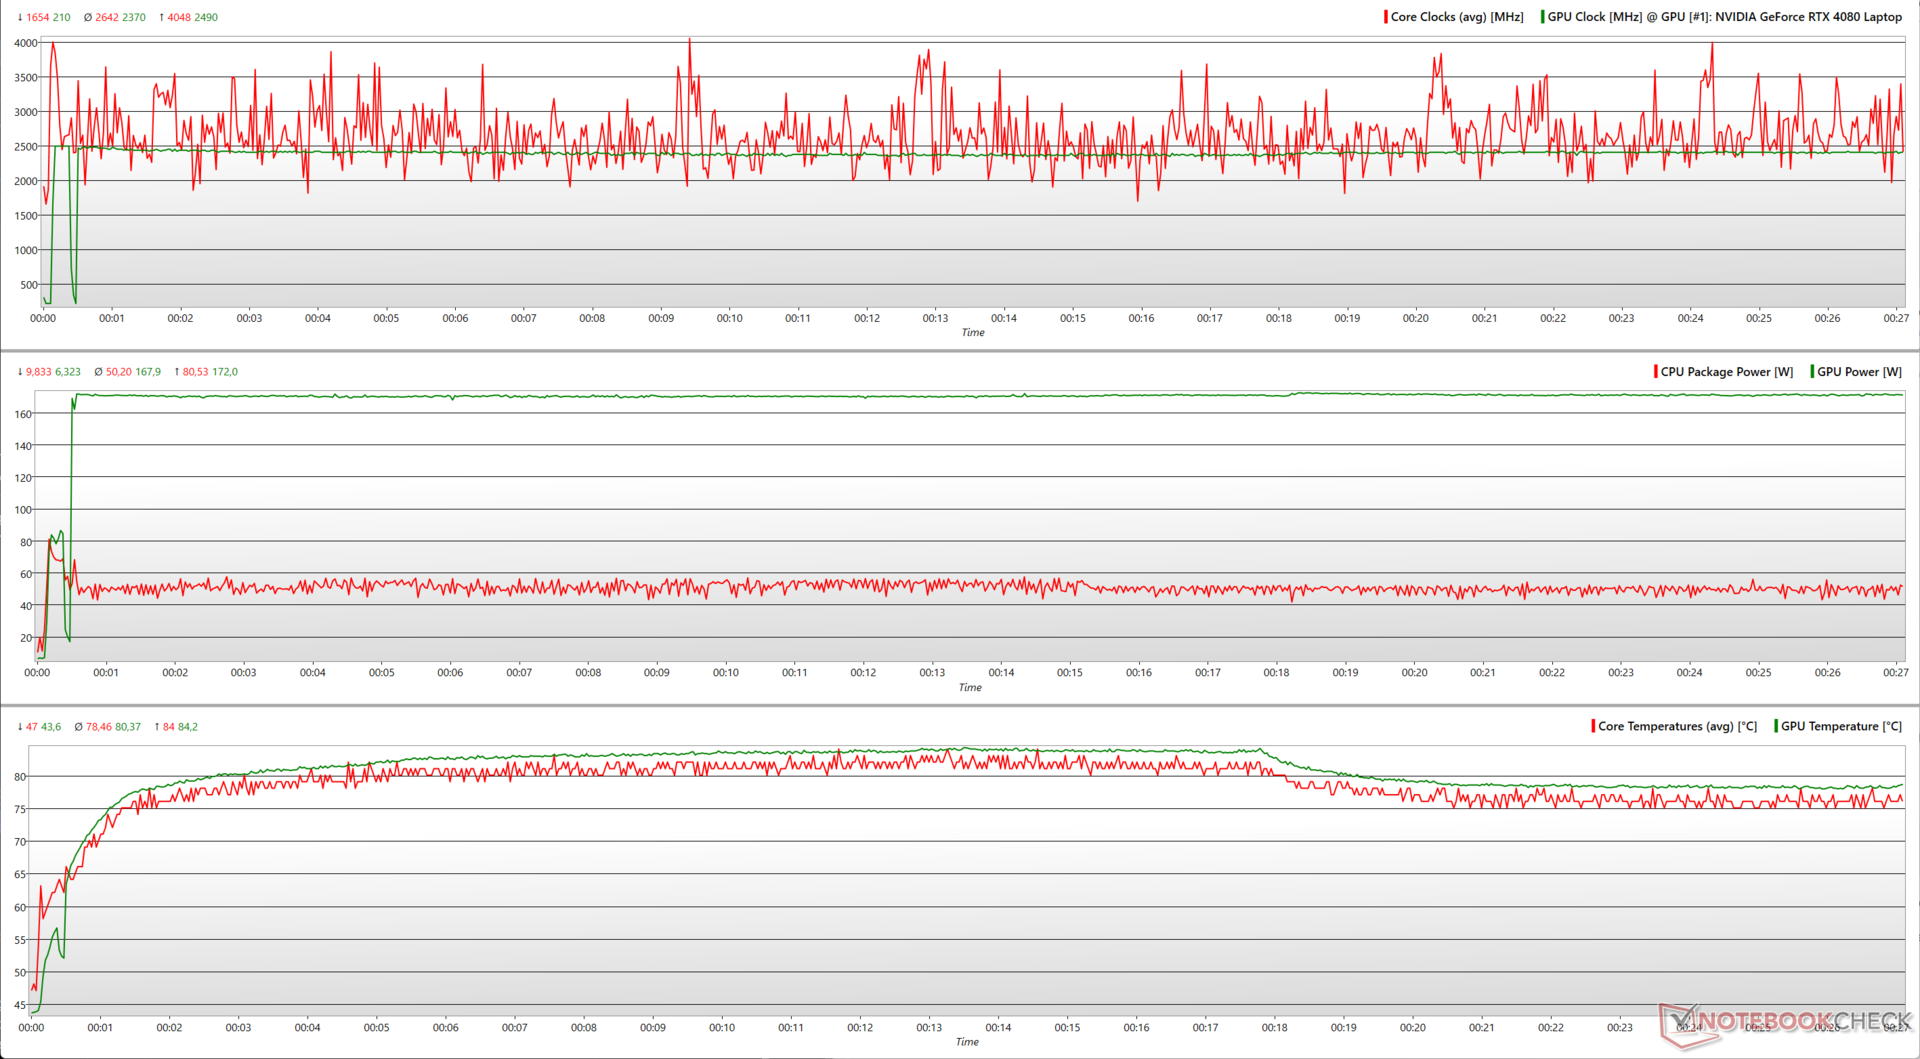
Prueba de estrés
Estresando el Scar 16 sólo con grandes FFTs en Prime95 el Core i9-14900HX utiliza hasta 158 W con picos de reloj a 3,7 GHz, pero esto no puede mantenerse durante mucho tiempo. La frecuencia cae a ~3 GHz cuando las temperaturas de los núcleos alcanzan la marca de los 90 °C. Los núcleos consiguen un respiro y son capaces de aumentar hasta los 3,5 GHz cuando las temperaturas caen hasta los ~87 °C.
En FurMark (1280 x 720, sin AA), la RTX 4080 del Scar 16 consume unos momentáneos 198 W. El portátil puede utilizar una potencia total combinada de 181 W de media tanto con la CPU como con la GPU.
Sin embargo, observamos una lucha por la potencia, ya que la CPU necesitaba bajar el consumo para que la GPU subiera más y viceversa.
| Prueba de estrés | Relojdela CPU (GHz) | Reloj de la GPU (MHz) | Temperatura media dela CPU (°C) | Temperatura media de la GPU (°C) |
| Sistema en reposo | 1,6 | 210 | 41 | 37,5 |
| Prime95 | 3,0 | 210 | 87 | 56 |
| Prime95 + FurMark | 2,7 | 1.500 | 78 | 70,4 |
| El Witcher 3 1080p Ultra | 2,4 | 2.460 | 78 | 80,2 |
Estresando la Scar 16 con The Witcher 3 a 1080p Ultra presenta un comportamiento más real. El Core i9-14900HX puede alcanzar aumentos de 4 GHz en ocasiones mientras consume 81 W. La RTX 4080, por otro lado, funciona a unos 2.500 MHz bien sostenidos mientras utiliza unos consistentes ~170 W.
Altavoces
El Scar 16 utiliza una matriz de cuatro altavoces con dos tweeters cerca de la base de la tapa y dos woofers que disparan hacia abajo. Asus especifica la compatibilidad con Hi-Res Audio y Dolby Atmos.
La sonoridad de 79 db(A) es suficiente para una habitación de tamaño medio. La respuesta de graves es pasable pero podría haber sido mejor teniendo en cuenta la presencia de woofers dedicados. Los medios y agudos se reproducen bastante bien.
La presencia de una toma de audio combo de 3,5 mm y Bluetooth 5.3 significa que los usuarios pueden conectar dispositivos de audio externos mucho más capaces.
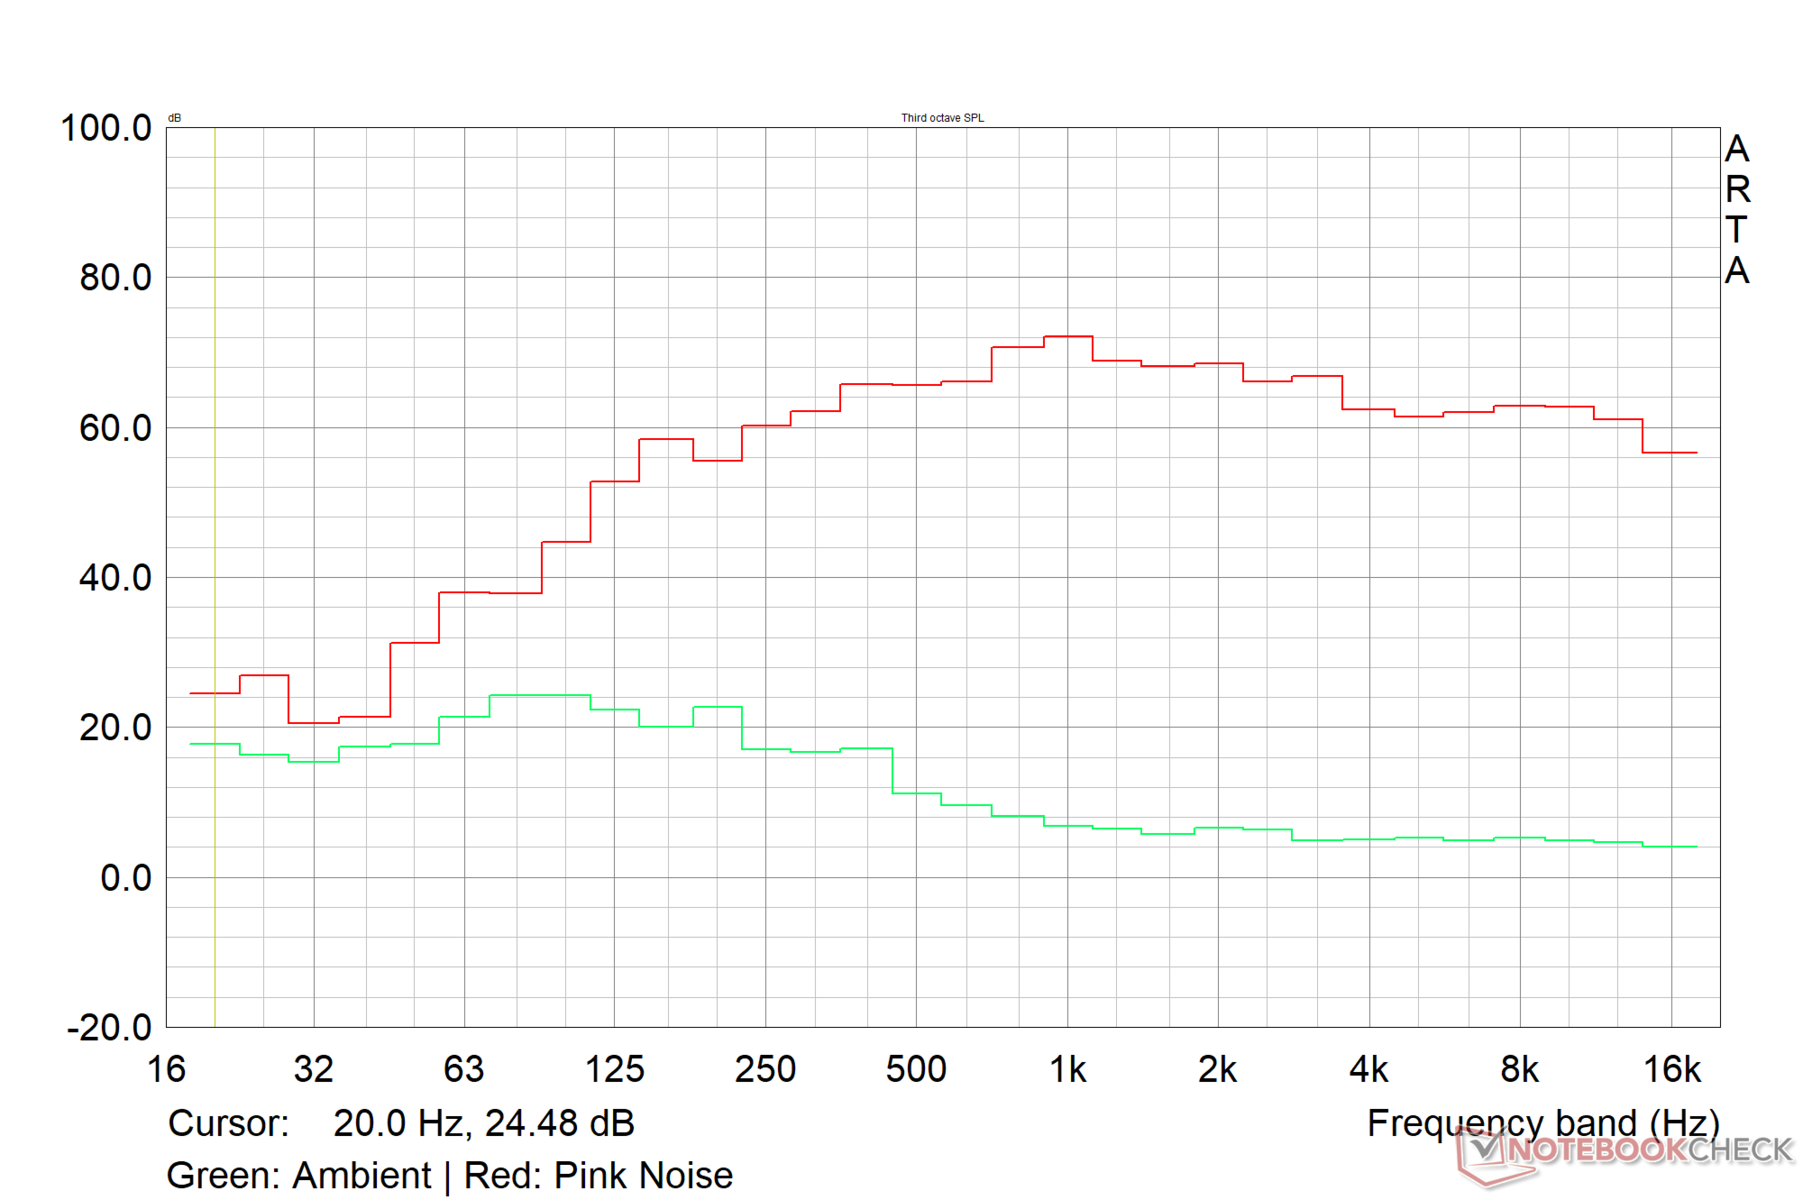
Asus ROG Strix Scar 16 G634JZR audio analysis
(±) | speaker loudness is average but good (79 dB)
Bass 100 - 315 Hz
(±) | reduced bass - on average 7.1% lower than median
(±) | linearity of bass is average (9% delta to prev. frequency)
Mids 400 - 2000 Hz
(±) | higher mids - on average 5.5% higher than median
(+) | mids are linear (3.3% delta to prev. frequency)
Highs 2 - 16 kHz
(+) | balanced highs - only 1.4% away from median
(+) | highs are linear (2.6% delta to prev. frequency)
Overall 100 - 16.000 Hz
(+) | overall sound is linear (9.8% difference to median)
Compared to same class
» 4% of all tested devices in this class were better, 2% similar, 95% worse
» The best had a delta of 6%, average was 18%, worst was 132%
Compared to all devices tested
» 3% of all tested devices were better, 1% similar, 96% worse
» The best had a delta of 4%, average was 25%, worst was 134%
Apple MacBook Pro 16 2021 M1 Pro audio analysis
(+) | speakers can play relatively loud (84.7 dB)
Bass 100 - 315 Hz
(+) | good bass - only 3.8% away from median
(+) | bass is linear (5.2% delta to prev. frequency)
Mids 400 - 2000 Hz
(+) | balanced mids - only 1.3% away from median
(+) | mids are linear (2.1% delta to prev. frequency)
Highs 2 - 16 kHz
(+) | balanced highs - only 1.9% away from median
(+) | highs are linear (2.7% delta to prev. frequency)
Overall 100 - 16.000 Hz
(+) | overall sound is linear (4.6% difference to median)
Compared to same class
» 0% of all tested devices in this class were better, 0% similar, 100% worse
» The best had a delta of 5%, average was 18%, worst was 45%
Compared to all devices tested
» 0% of all tested devices were better, 0% similar, 100% worse
» The best had a delta of 4%, average was 25%, worst was 134%
Gestión de la energía: En las líneas esperadas para el hardware a bordo
Consumo de energía
El Scar 16 consume algo más de energía en comparación con el ROG Strix G16 con un Core i9-13980HX. El Omen 16 con una configuración similar es aproximadamente un 8% más económico que el Scar 16 en general debido a su CPU y GPU de menor vataje.
El Vector 16 HX tiene un consumo idéntico bajo carga, aunque muestra un consumo en reposo considerablemente mayor.
El adaptador de corriente de 330 W suministrado puede mantener el portátil adecuadamente alimentado bajo carga máxima.
| Off / Standby | |
| Ocioso | |
| Carga |
|
| Asus ROG Strix Scar 16 G634JZR i9-14900HX, NVIDIA GeForce RTX 4080 Laptop GPU, Mini LED, 2560x1600, 16.00 | Asus ROG Strix Scar 17 G733PYV-LL053X R9 7945HX3D, NVIDIA GeForce RTX 4090 Laptop GPU, IPS, 2560x1440, 17.30 | Asus ROG Strix G16 G614JZ i9-13980HX, NVIDIA GeForce RTX 4080 Laptop GPU, IPS, 2560x1600, 16.00 | Lenovo Legion Pro 7 16IRX9H i9-14900HX, NVIDIA GeForce RTX 4080 Laptop GPU, IPS, 2560x1600, 16.00 | HP Omen 16 (2024) i9-14900HX, NVIDIA GeForce RTX 4080 Laptop GPU, IPS, 2560x1440, 16.10 | MSI Vector 16 HX A14V i9-14900HX, NVIDIA GeForce RTX 4080 Laptop GPU, IPS, 2560x1600, 16.00 | Alienware m16 R2 Ultra 7 155H, NVIDIA GeForce RTX 4070 Laptop GPU, IPS, 2560x1600, 16.00 | Average NVIDIA GeForce RTX 4080 Laptop GPU | Average of class Gaming | |
|---|---|---|---|---|---|---|---|---|---|
| Power Consumption | -8% | 3% | -20% | 8% | -16% | 16% | -18% | -3% | |
| Idle Minimum * | 10.71 | 15.4 -44% | 10 7% | 16 -49% | 9 16% | 15.8 -48% | 8.1 24% | 16.2 ? -51% | 13.9 ? -30% |
| Idle Average * | 14.75 | 21.6 -46% | 16 -8% | 21 -42% | 16 -8% | 23.3 -58% | 13 12% | 21.4 ? -45% | 19.2 ? -30% |
| Idle Maximum * | 30 | 22.2 26% | 27 10% | 36 -20% | 35 -17% | 30 -0% | 40.3 -34% | 33.7 ? -12% | 27 ? 10% |
| Load Average * | 135 | 116.7 14% | 129 4% | 132 2% | 129 4% | 123.9 8% | 79 41% | 118.8 ? 12% | 111.4 ? 17% |
| Witcher 3 ultra * | 286 | 262 8% | 247 14% | 267 7% | 150.8 47% | 285 -0% | 188.1 34% | ||
| Load Maximum * | 307 | 327.1 -7% | 342 -11% | 360 -17% | 285 7% | 306 -0% | 254.9 17% | 293 ? 5% | 251 ? 18% |
* ... más pequeño es mejor
Power Consumption: The Witcher 3 / Stress test
Power Consumption: External monitor
Duración de las pilas
En el perfil Silencioso con MSHybrid activado y una frecuencia de actualización de 60 Hz, el Scar 16 dura hasta 7:14 horas en nuestra prueba estandarizada de navegación web Wi-Fi a 150 nits de brillo. Esto aumenta a 7,5 horas en la prueba de bucle H.264 1080p al mismo nivel de brillo con todas las radios apagadas.
Jugar durante largas horas con batería con el Scar 16 es una quimera ya que el portátil apenas dura una hora jugando a The Witcher 3 1080p Ultra a 150 nits.
| Asus ROG Strix Scar 16 G634JZR i9-14900HX, NVIDIA GeForce RTX 4080 Laptop GPU, 90 Wh | Asus ROG Strix Scar 17 G733PYV-LL053X R9 7945HX3D, NVIDIA GeForce RTX 4090 Laptop GPU, 90 Wh | Asus ROG Strix G16 G614JZ i9-13980HX, NVIDIA GeForce RTX 4080 Laptop GPU, 90 Wh | Lenovo Legion Pro 7 16IRX9H i9-14900HX, NVIDIA GeForce RTX 4080 Laptop GPU, 99.9 Wh | HP Omen 16 (2024) i9-14900HX, NVIDIA GeForce RTX 4080 Laptop GPU, 83 Wh | MSI Vector 16 HX A14V i9-14900HX, NVIDIA GeForce RTX 4080 Laptop GPU, 90 Wh | Alienware m16 R2 Ultra 7 155H, NVIDIA GeForce RTX 4070 Laptop GPU, 90 Wh | Average of class Gaming | |
|---|---|---|---|---|---|---|---|---|
| Duración de Batería | -20% | 31% | -14% | -19% | 21% | 15% | 20% | |
| H.264 | 451 | 302 -33% | 400 ? -11% | |||||
| WiFi v1.3 | 434 | 287 -34% | 583 34% | 373 -14% | 352 -19% | 332 -24% | 483 11% | 367 ? -15% |
| Witcher 3 ultra | 57 | 80.6 ? 41% | ||||||
| Load | 51 | 55 8% | 65 27% | 84 65% | 60 18% | 84.3 ? 65% | ||
| Reader / Idle | 641 | 758 | 543 ? |
Pro
Contra
Veredicto: La habitual actualización iterativa para jugadores entusiastas
Asus se ciñe a la fórmula probada que distingue a la Scar 16 de la competencia. En ese sentido, el Asus ROG Strix Scar 16 de este año es sólo una actualización evolutiva pero no revolucionaria con respecto a la generación anterior.
Asus ofrece una pantalla mini LED G-Sync HDR de primera calidad con el Scar 16. La pantalla de alta frecuencia PWM de 240 Hz presenta unas características de color excelentes y es perfectamente adecuada también para flujos de trabajo con colores críticos, aunque en el modo de retroiluminación de una sola zona. Por desgracia, esto no está bien documentado.
El Asus ROG Strix Scar 16 cumple casi todos los requisitos que se esperan de un portátil de juego para entusiastas de 16 pulgadas en 2024. Sus compañeros, sin embargo, ofrecen características y rendimiento similares por un precio de venta más bajo.
En cuanto al rendimiento, el ROG Strix Scar 16 está a la altura de otros portátiles con Core i9-14900HX y RTX 4080.
Los ajustes de refrigeración de Asus permiten al Scar 16 hacer uso de una potencia combinada de 180 W tanto de la CPU como de la GPU bajo carga. Sin embargo, llevar el portátil tan lejos resulta inevitablemente en altas temperaturas superficiales y emisiones de ruido del ventilador.
Algunos reparos que nos gustaría que se resolvieran incluyen un mejor rendimiento del Wi-Fi 5 y una distribución de puertos más equitativa a ambos lados. Además, incluir una webcam 1080p en este modelo no debería ser demasiado exigente para Asus en 2024.
Si está buscando una potencia de 16 pulgadas para juegos con unos ₹3,00,00 (~US$3.000) de sobra, el Asus ROG Strix Scar 16 encaja casi a la perfección. Sin embargo, no es la ganga más ideal.
El Lenovo Legion Pro 7 tiene un perfil más delgado, una batería más grande (con menor autonomía) y una webcam 1080p muy superior, al tiempo que rinde ligeramente mejor en el lado de la CPU.
El MSI Vector 16 HX, aunque carece de algunos de los adornos RGB y G-Sync añadidos, tiene un precio algo inferior e iguala el rendimiento del Scar 16 en la mayoría de los aspectos.
Precio y disponibilidad
En la India, el Asus ROG Strix Scar 16 (2024) con una RTX 4080 tiene un precio oficial de ₹2.89.990 pero actualmente se vende por ₹3.04.490 en Amazon India mientras que la versión RTX 4090 está disponible por el precio designado de ₹3.29.990.
La ROG Strix Scar 16 (2024) probada con un SSD de 1 TB y RTX 4080 se puede conseguir por 2.900 dólares en Amazon EE.UU. y Best Buy EE.UU. mientras que la variante RTX 4090 le costará 3.625 dólares.
Asus ROG Strix Scar 16 G634JZR
-
04/22/2024 v7
Vaidyanathan Subramaniam
Transparency
The present review sample was made available to the author as a loan by the manufacturer or a shop for the purposes of review. The lender had no influence on this review, nor did the manufacturer receive a copy of this review before publication. There was no obligation to publish this review.
Pricecompare

