 Deutsch
 English
 Español
 Français
 Italiano
 Nederlands
 Polski
 Português
 Русский
 Türkçe
 Svenska
 Chinese
 Magyar
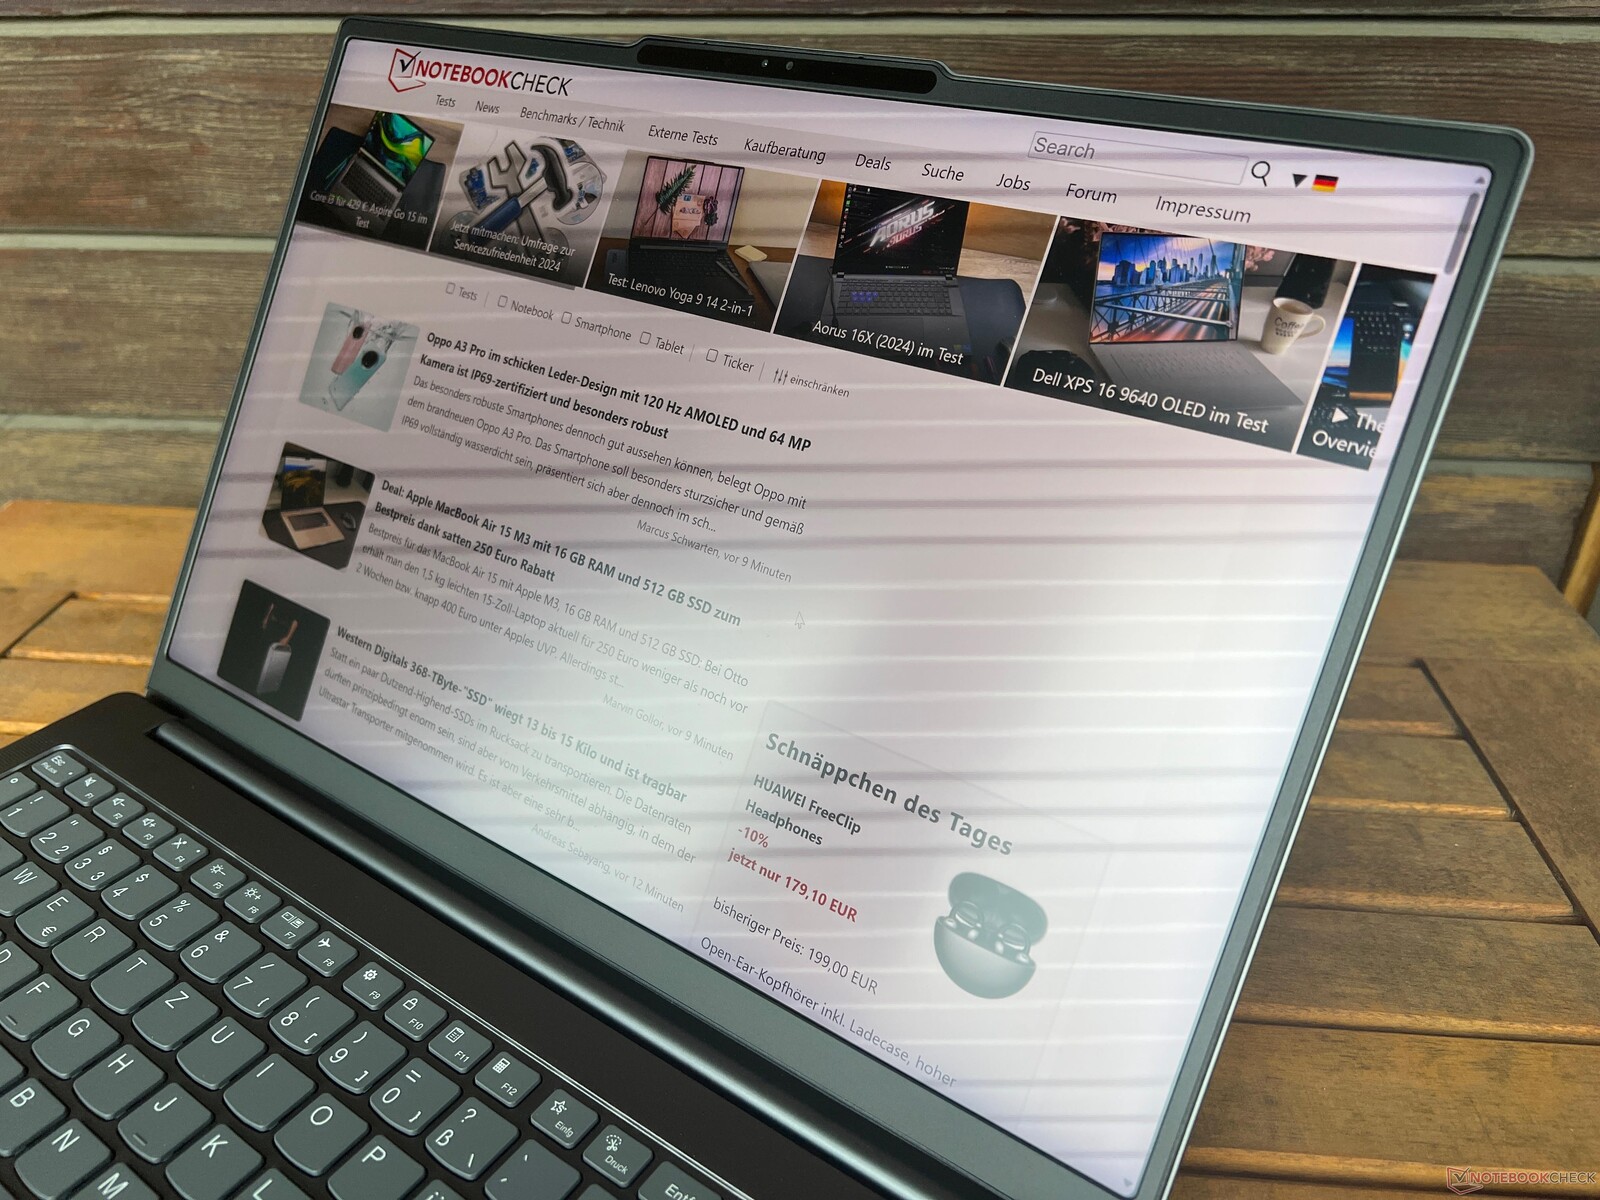
Análisis del portátil Lenovo Yoga Pro 9i 16 G9: MiniLED con 1200 nits y Core Ultra 9
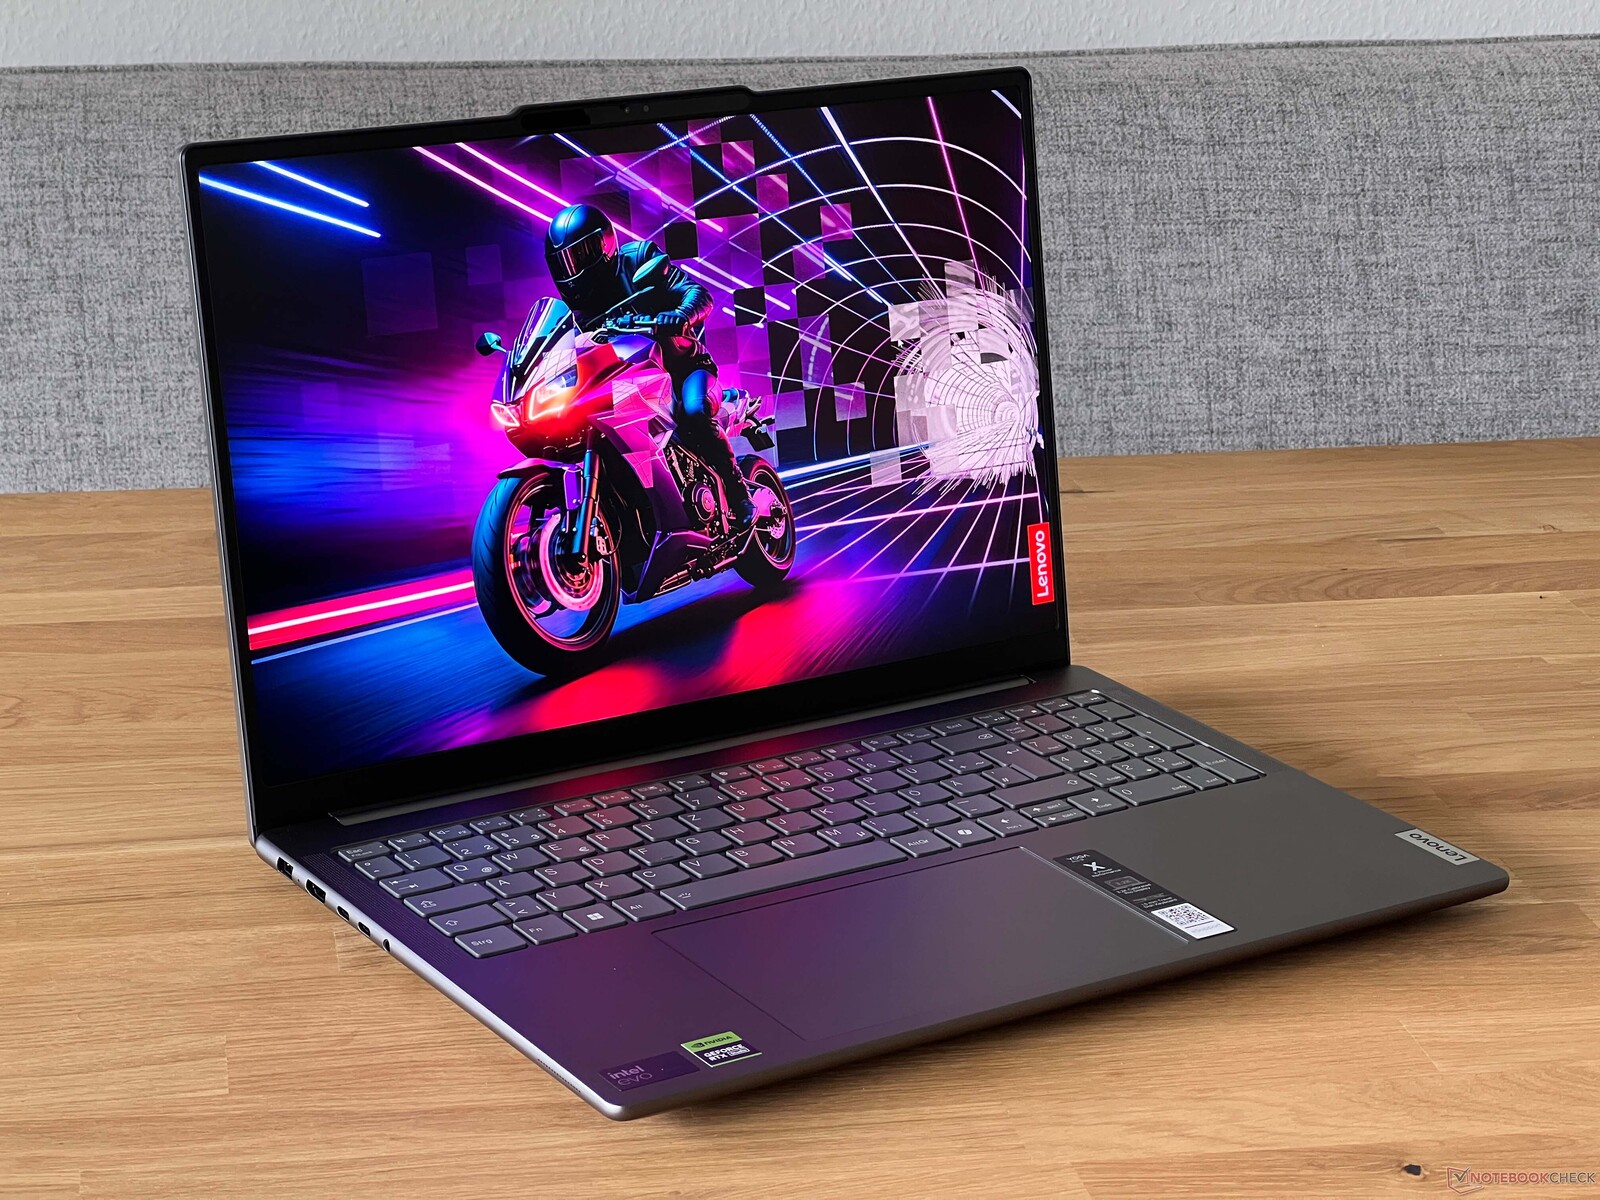
El Yoga Pro 9i 16 es el mejor portátil multimedia de consumo de Lenovo. Con su panel mini LED de alta resolución y su buen rendimiento, fue uno de los mejores dispositivos multimedia en 2023. Para el nuevo modelo G9, ha habido algunos cambios, incluyendo un procesador Meteor Lake actualizado de Intel y el cambio de un mini panel LED reflectante a uno mate, que puede llegar a ser extremadamente brillante con hasta 1200 nits. Las tarjetas gráficas son los modelos GeForce RTX 4000 hasta la RTX 4070 portátil con un TGP de 100 vatios.
Nuestro dispositivo de prueba (con el número de modelo 83DN006HGE) es la variante de gama alta por 2700 euros (unos 2875 dólares) y contiene el Core Ultra 9 185H y GeForce RTX 4070 portátil así como 32 GB de RAM, una unidad SSD de 1 TB y el brillante panel mini LED. El modelo más débil con el Core Ultra 7 155H y GeForce Portátil RTX 4060 está disponible por 2300 euros (2450 dólares), pero el resto del hardware es idéntico.
Posibles contendientes en la comparación
Valoración | Fecha | Modelo | Peso | Altura | Tamaño | Resolución | Best Price |
|---|---|---|---|---|---|---|---|
| 88.7 % | 04/2024 | Lenovo Yoga Pro 9 16IMH9 Ultra 9 185H, NVIDIA GeForce RTX 4070 Laptop GPU | 2.1 kg | 18.3 mm | 16.00" | 3200x2000 | |
| 88.6 % | 04/2024 | Dell XPS 16 9640 Ultra 7 155H, NVIDIA GeForce RTX 4070 Laptop GPU | 2.3 kg | 18.7 mm | 16.30" | 3840x2400 | |
| 90 % | 03/2024 | Honor MagicBook Pro 16 2024 Ultra 7 155H, NVIDIA GeForce RTX 4060 Laptop GPU | 1.9 kg | 17.9 mm | 16.00" | 3072x1920 | |
| 90.4 % | 03/2024 | Samsung Galaxy Book4 Ultra Ultra 7 155H, NVIDIA GeForce RTX 4050 Laptop GPU | 1.8 kg | 17 mm | 16.00" | 2880x1800 | |
| 89.6 % | 01/2024 | Framework Laptop 16 R9 7940HS, Radeon RX 7700S | 2.4 kg | 20.95 mm | 16.00" | 2560x1600 | |
| 88.6 % | 07/2023 | SCHENKER VISION 16 Pro (M23) i7-13700H, NVIDIA GeForce RTX 4070 Laptop GPU | 1.6 kg | 17.1 mm | 16.00" | 2560x1600 |
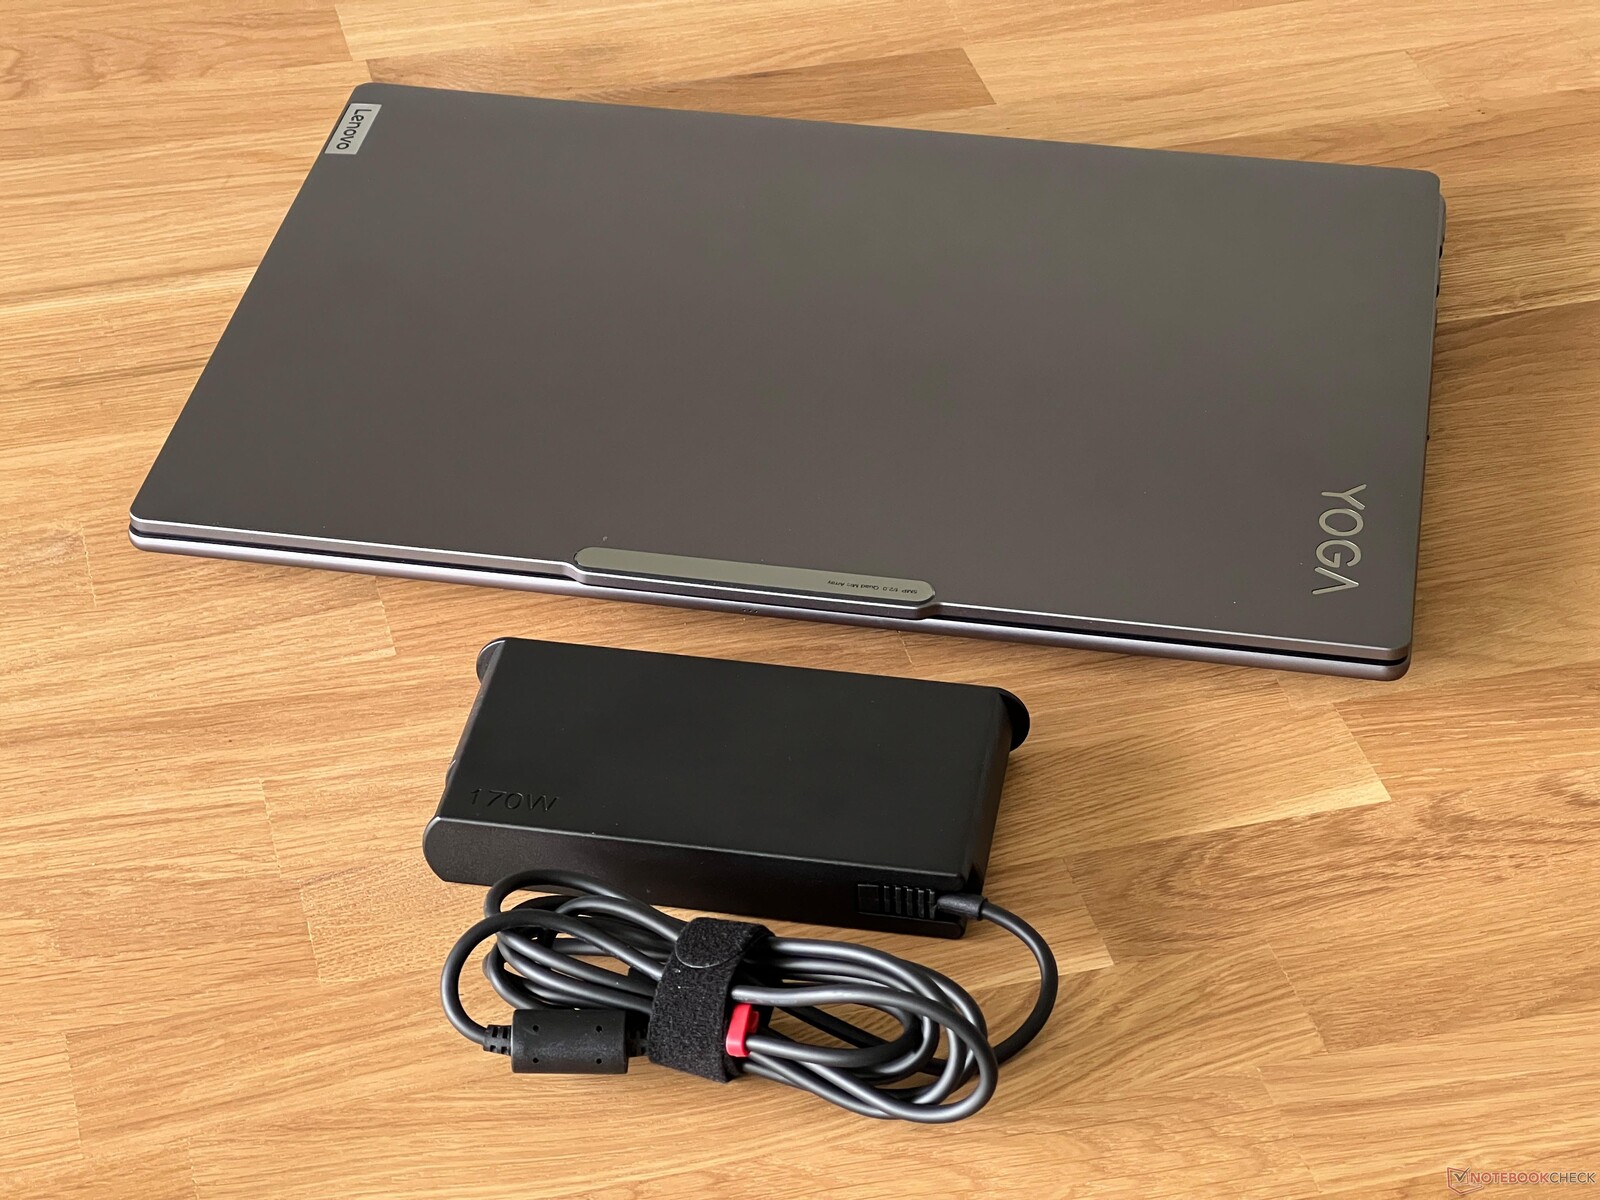
Carcasa - Aluminio y placa base delgada
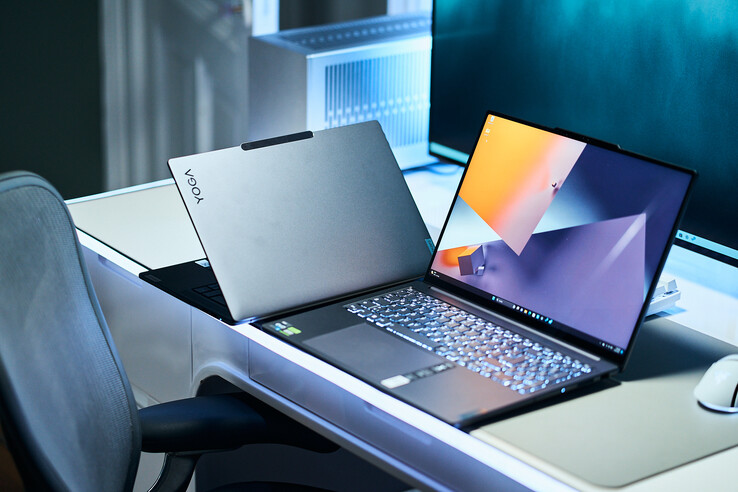
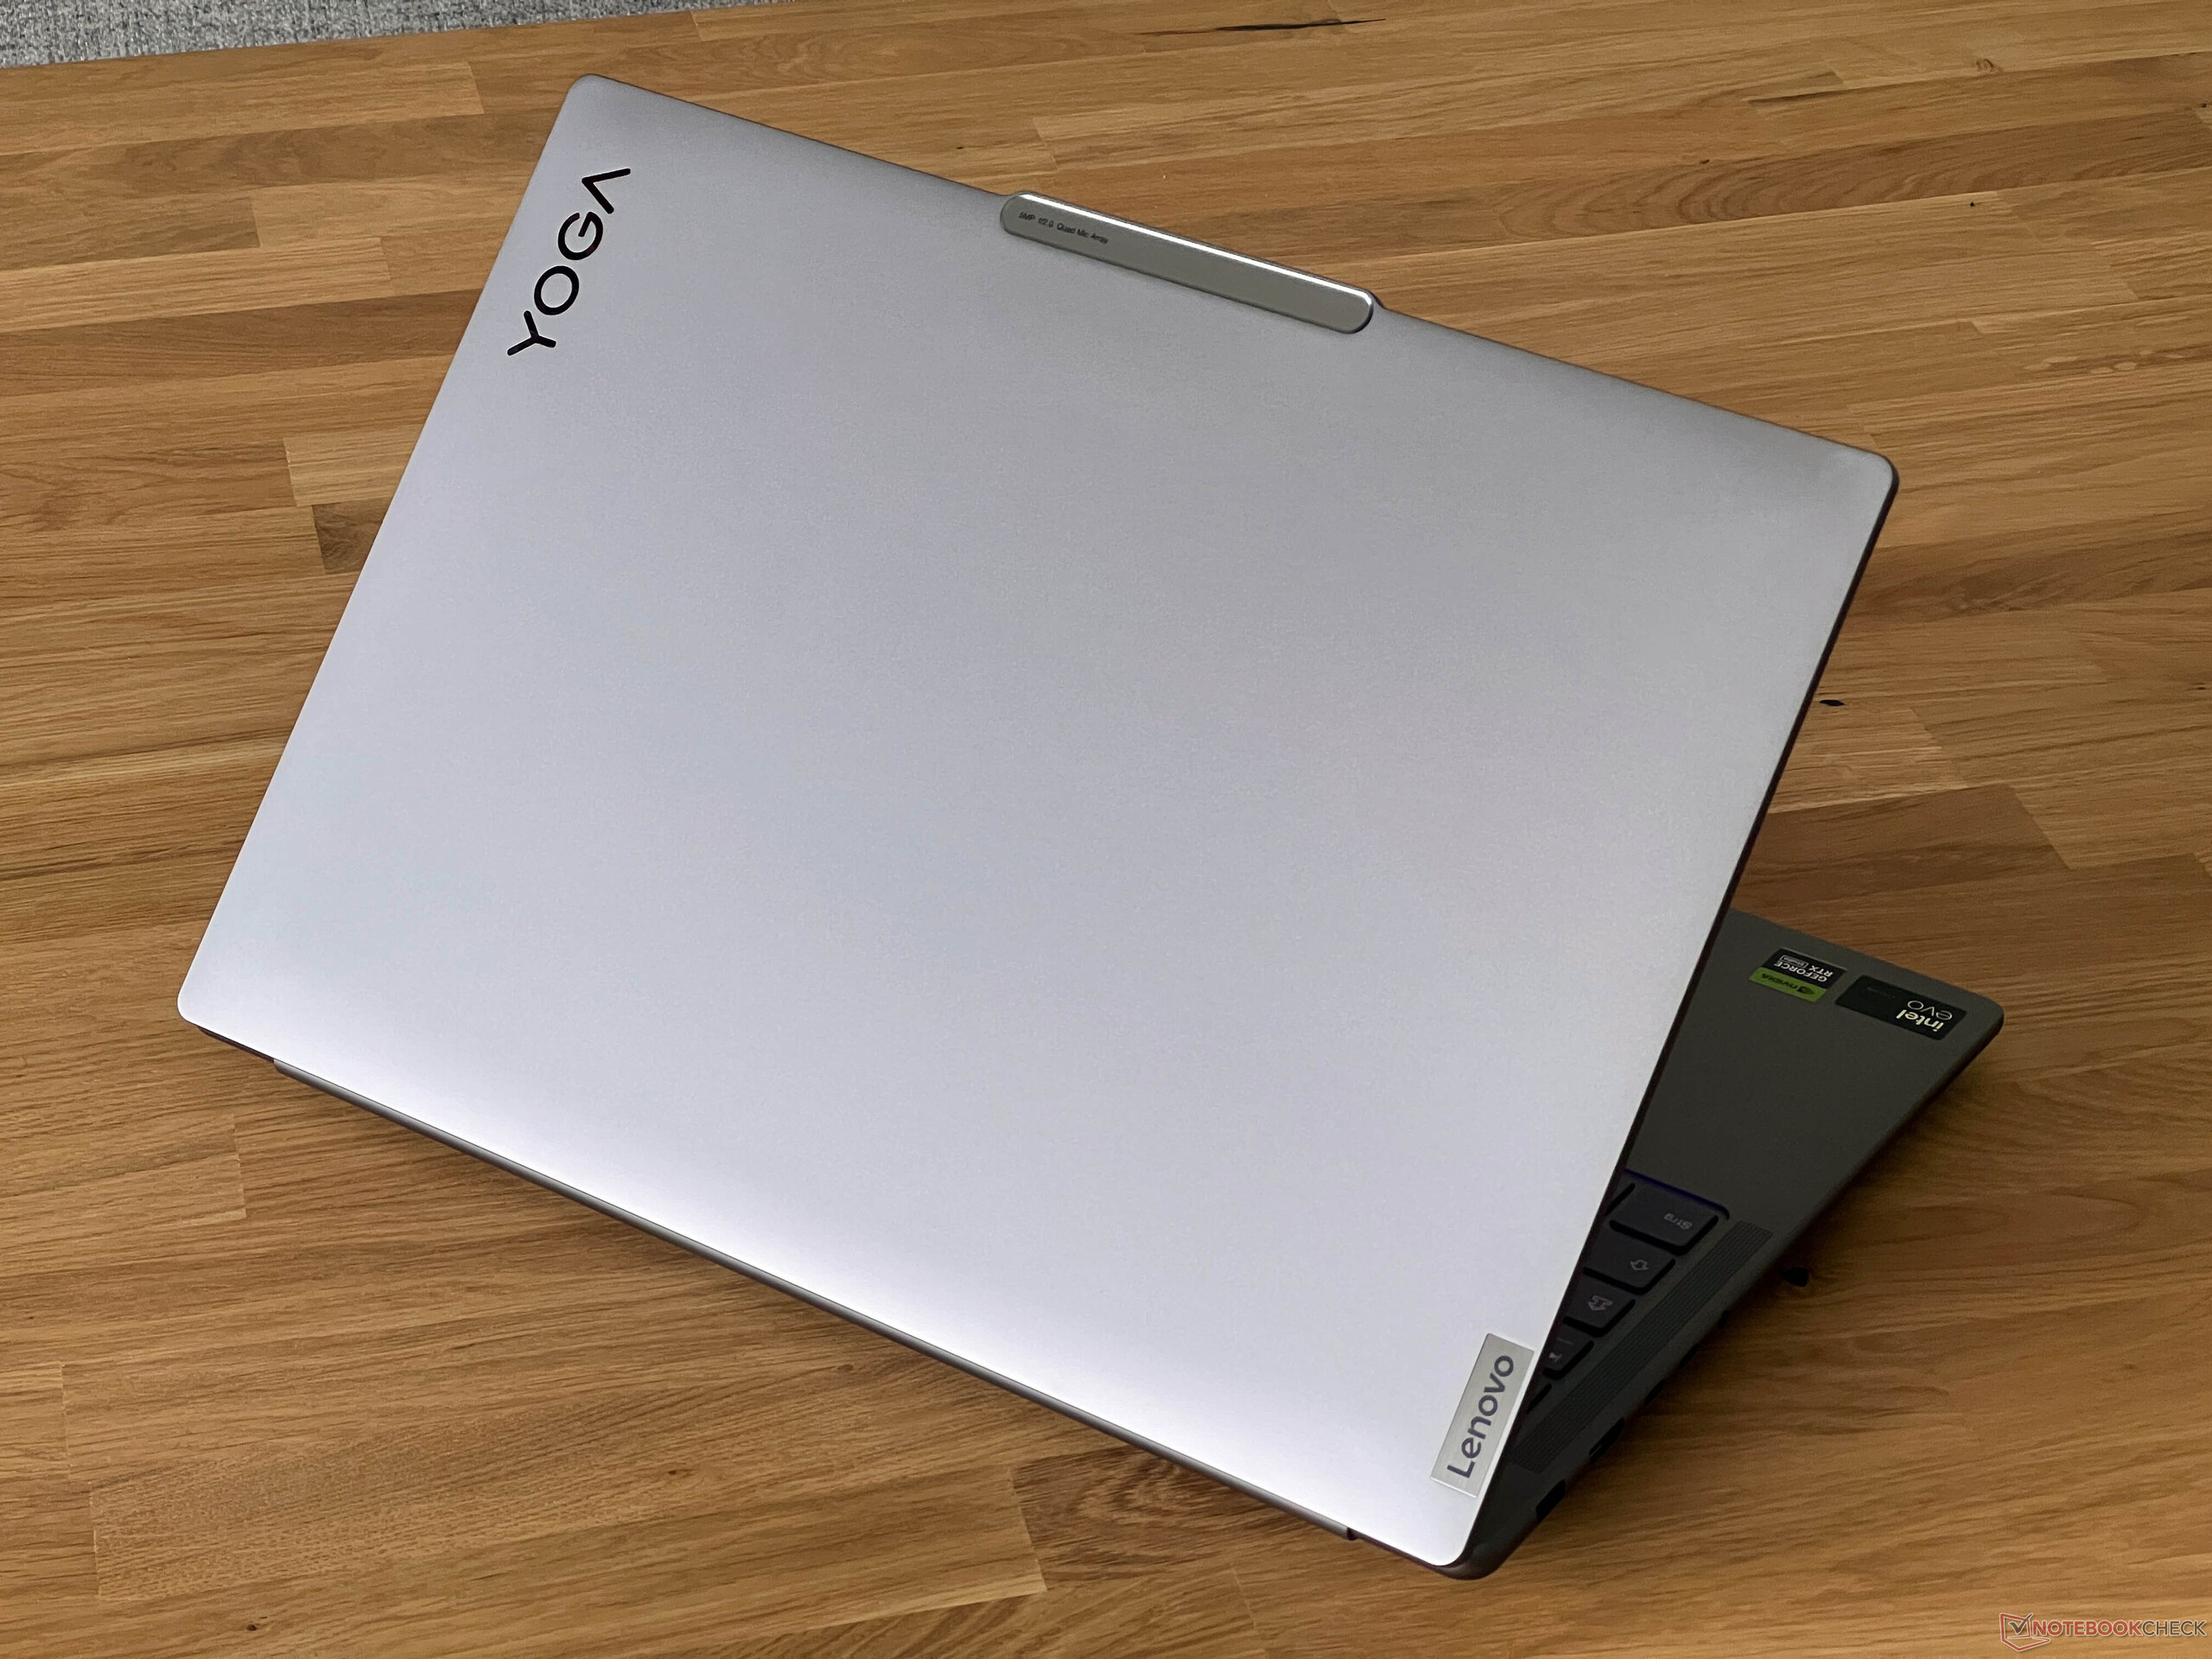
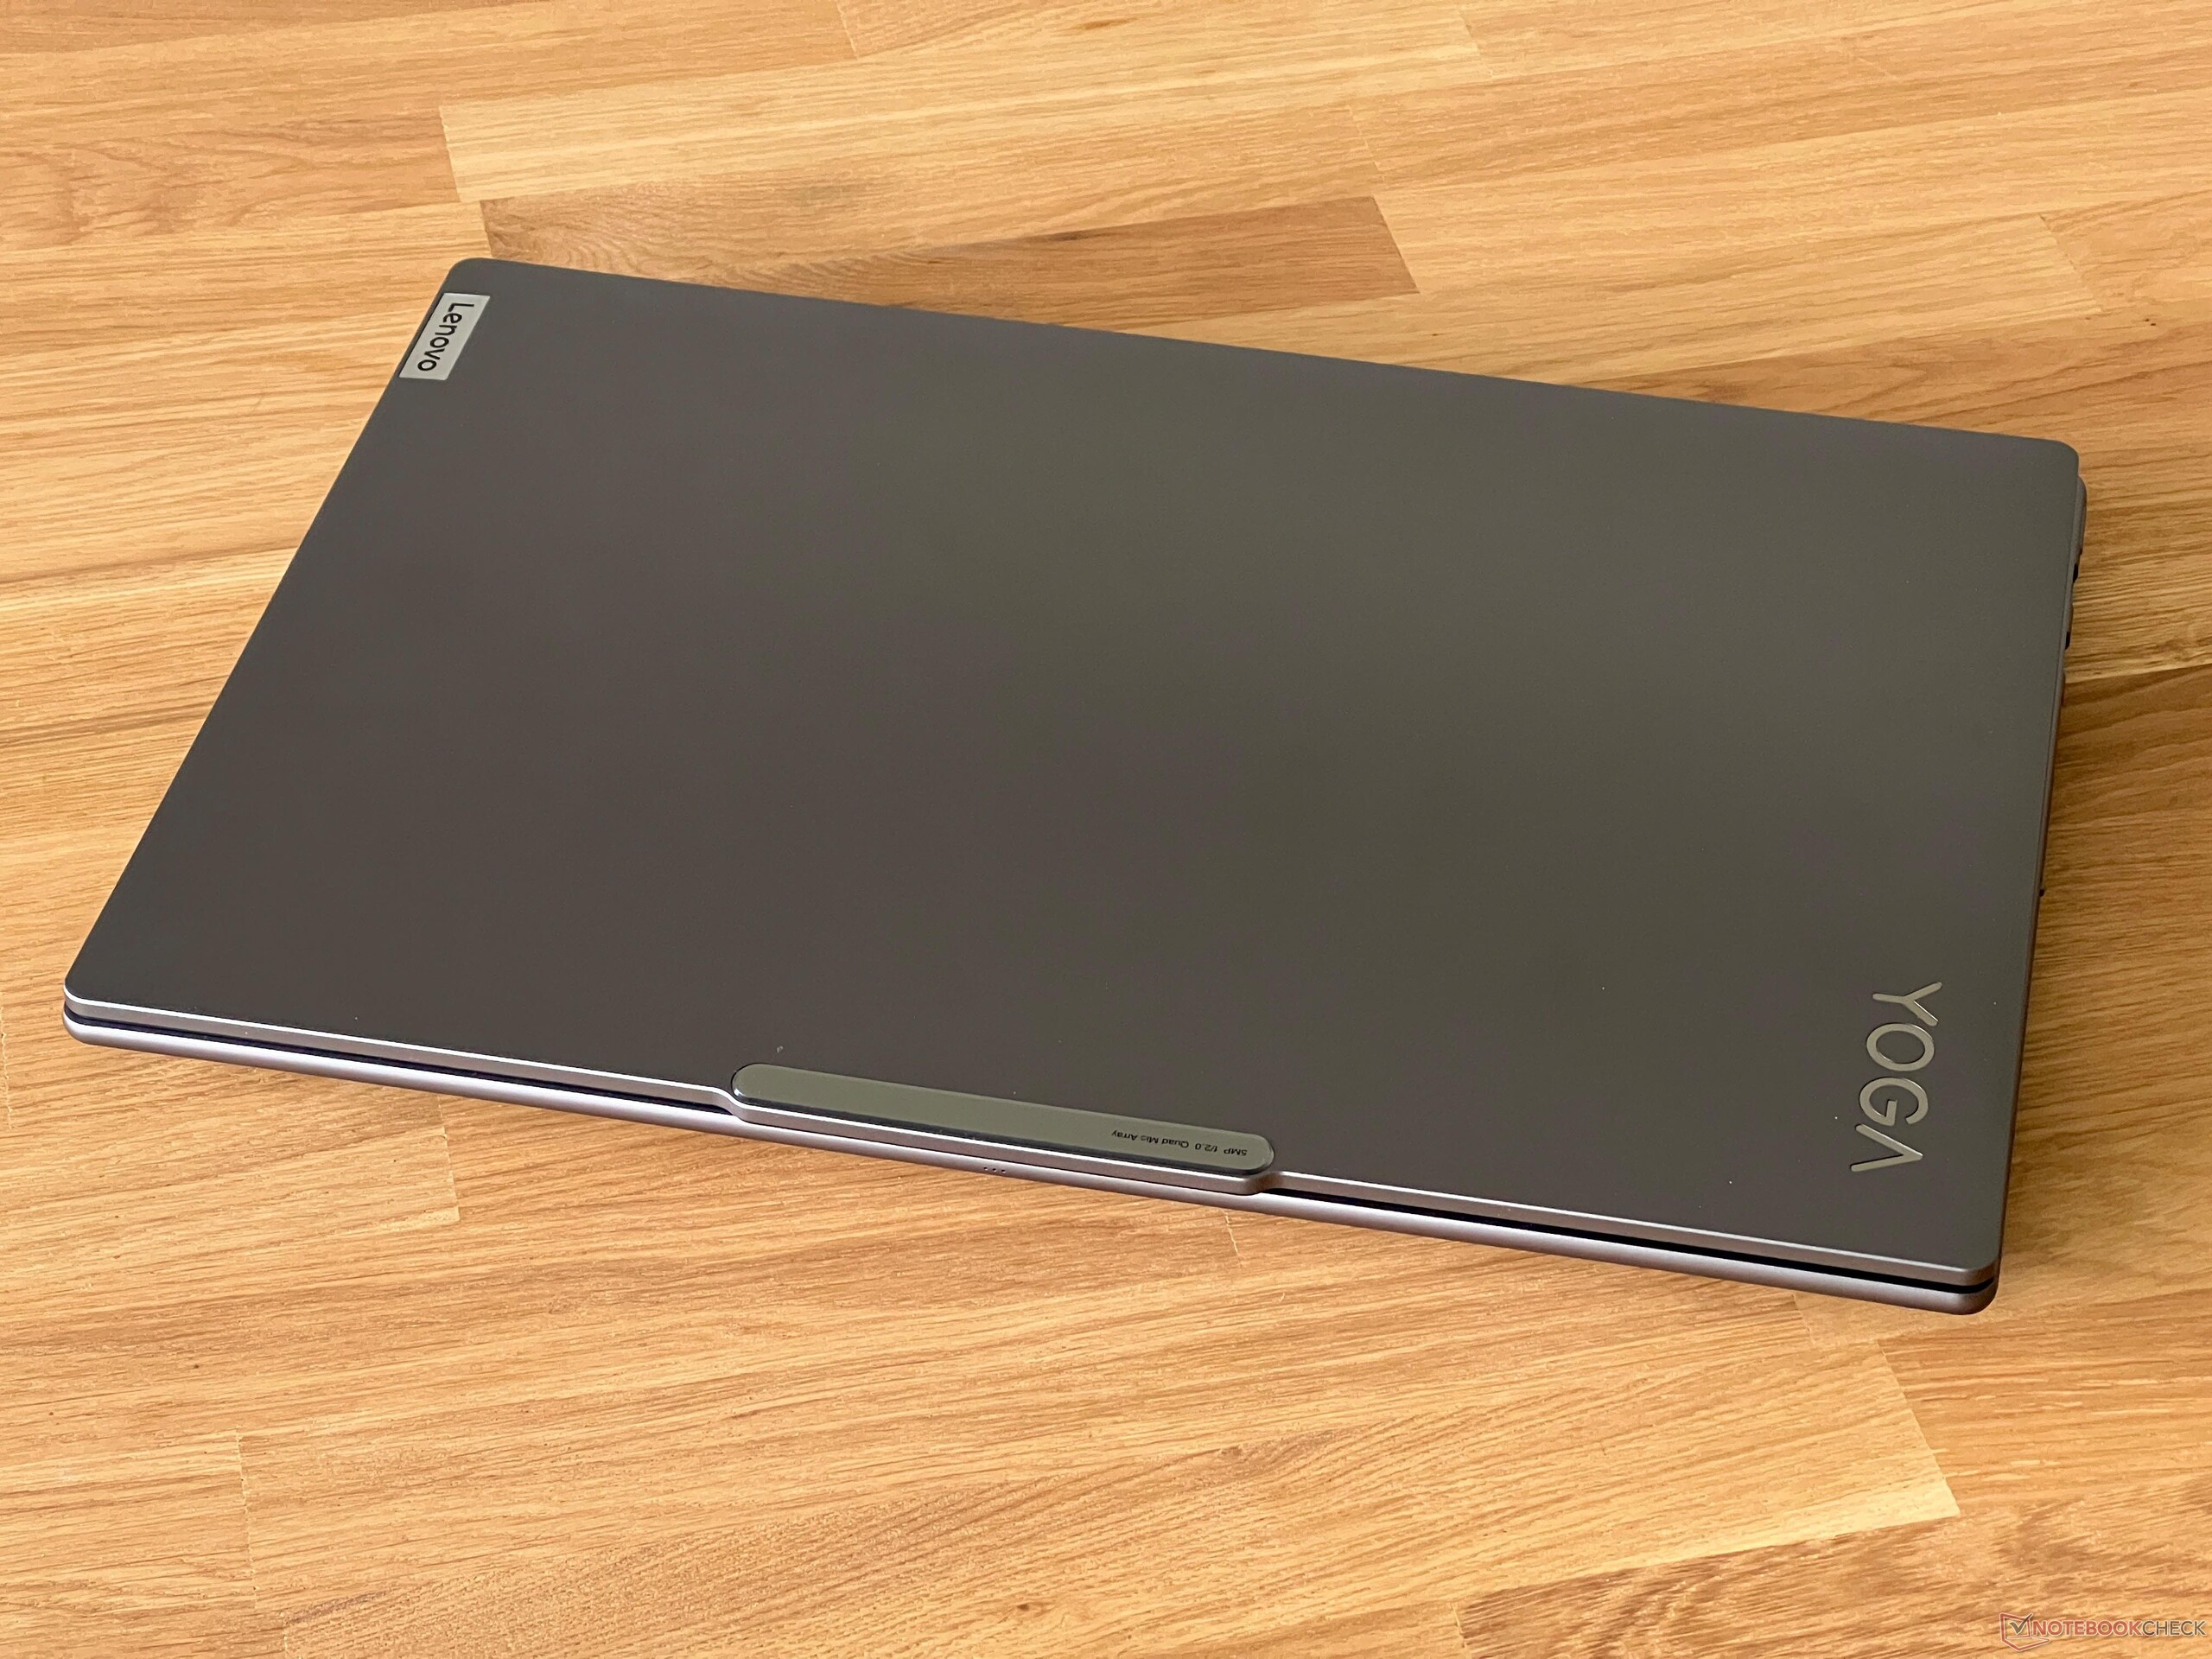
El diseño de la caja no ha cambiado con respecto al modelo antiguo y la carcasa de aluminio en gris oscuro (alternativamente en turquesa) tiene buen aspecto, pero no hay mucha diferencia visual con el IdeaPad Pro 16 actual. El diseño parece moderno; sólo la gran joroba de la cámara perturba un poco la impresión.
En términos de calidad, el dispositivo de prueba da una buena impresión en general. Sólo la placa base, aún muy delgada, emite ruidos chirriantes ocasionales. Sin embargo, la propia unidad base es muy estable y sólo la zona central cede ligeramente cuando se somete a presión. La tapa de la pantalla es un poco más flexible, pero no pudimos provocar ninguna distorsión de la imagen. Las bisagras están bien ajustadas y el ángulo máximo de apertura es de 180 grados.
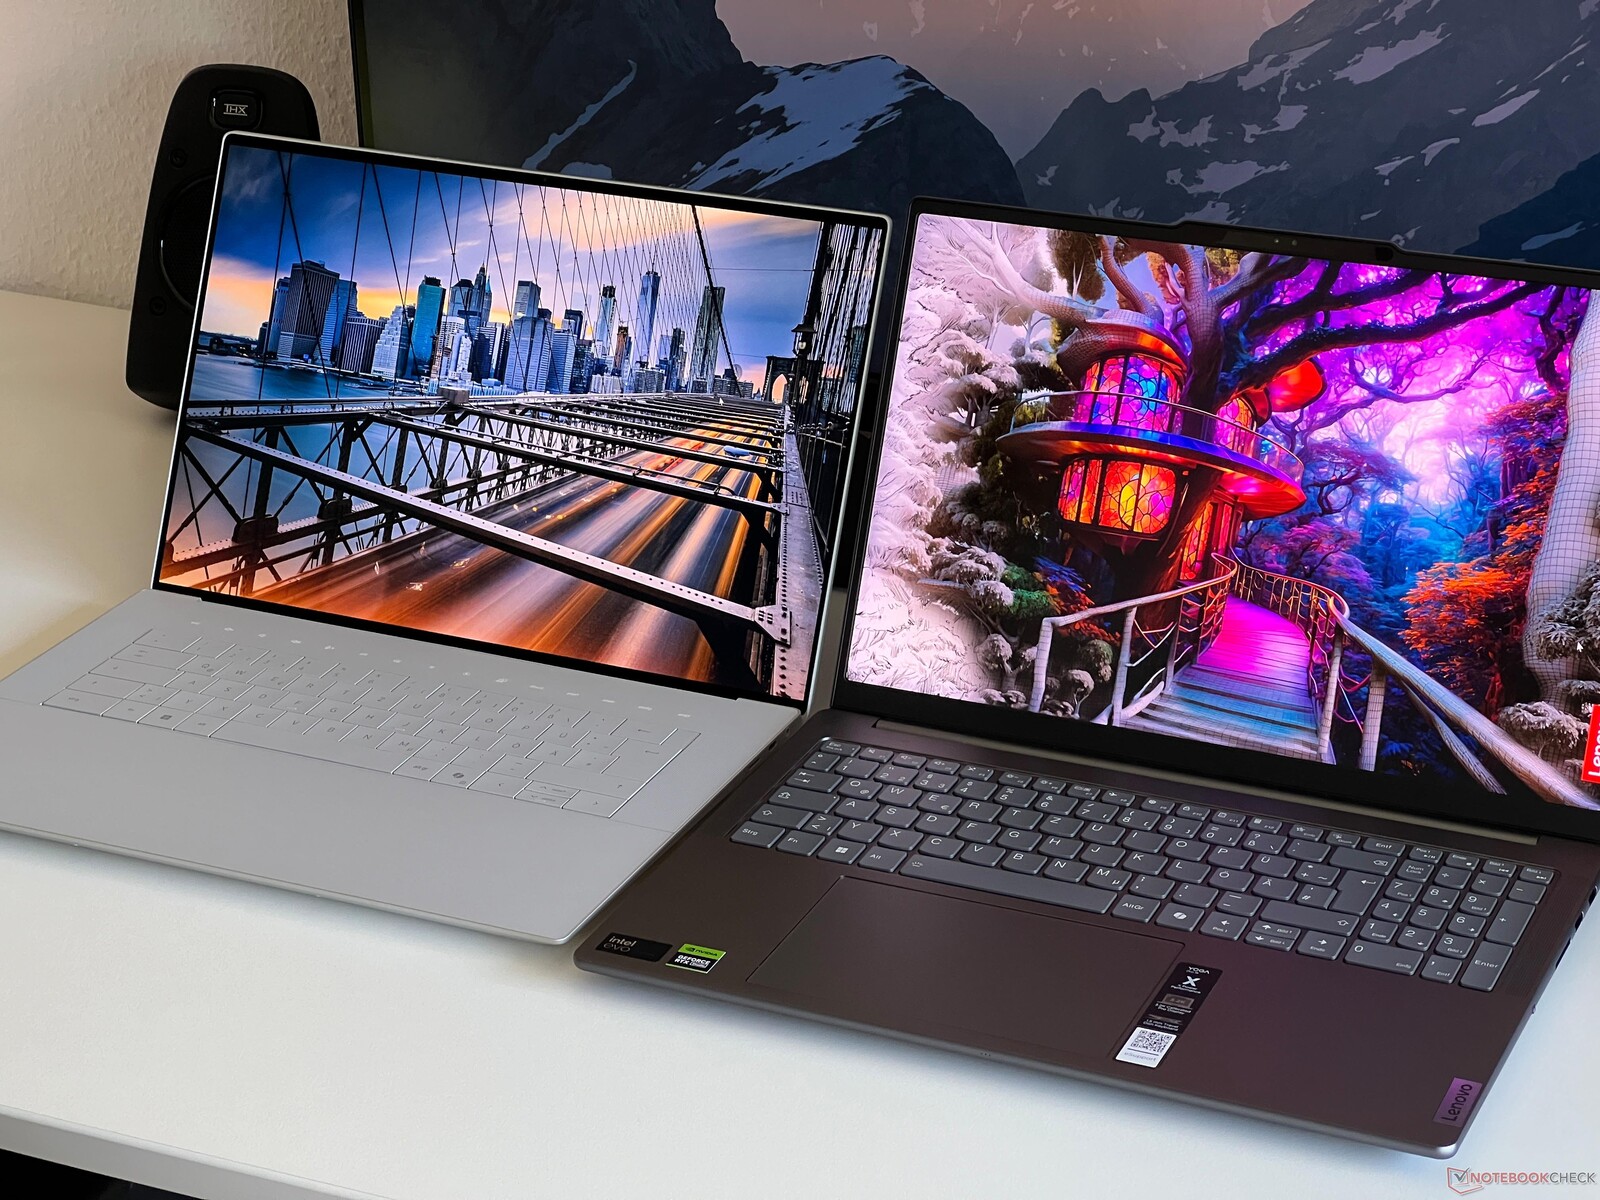
Con un peso de poco más de 2 kg, el Yoga Pro se sitúa en el medio campo, pero ocupa un espacio ligeramente mayor que el nuevo Dell XPS 16por ejemplo. La fuente de alimentación de 170 vatios pesa 566 gramos.
Equipamiento - Thunderbolt 4 y HDMI 2.1
Mientras que el modelo del año pasado aún tenía limitaciones con el puerto HDMI, ahora incorpora un moderno puerto HDMI 2.1. También dispone de Thunderbolt 4 y suficientes puertos USB. Todas las salidas de vídeo se conectan a través de la iGPU, por lo que la GPU GeForce no tiene que funcionar todo el tiempo cuando se utiliza un monitor externo, lo que reduce el consumo de energía.
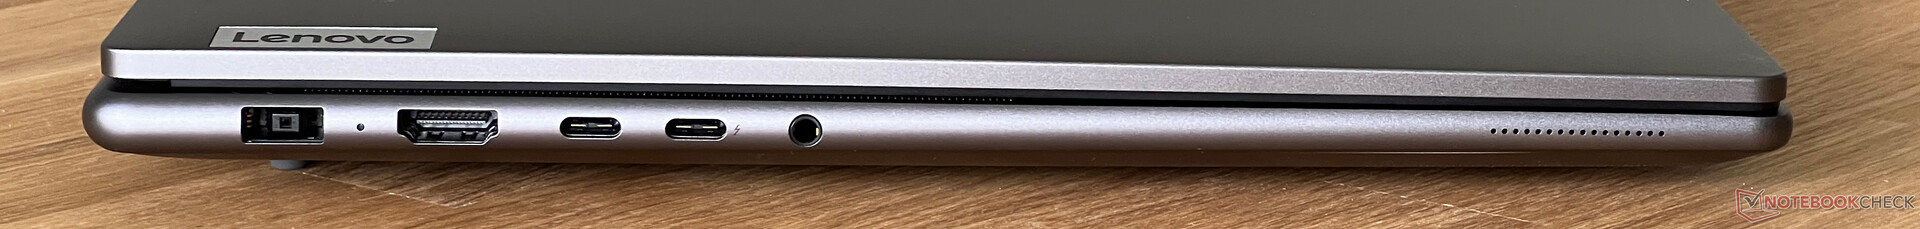
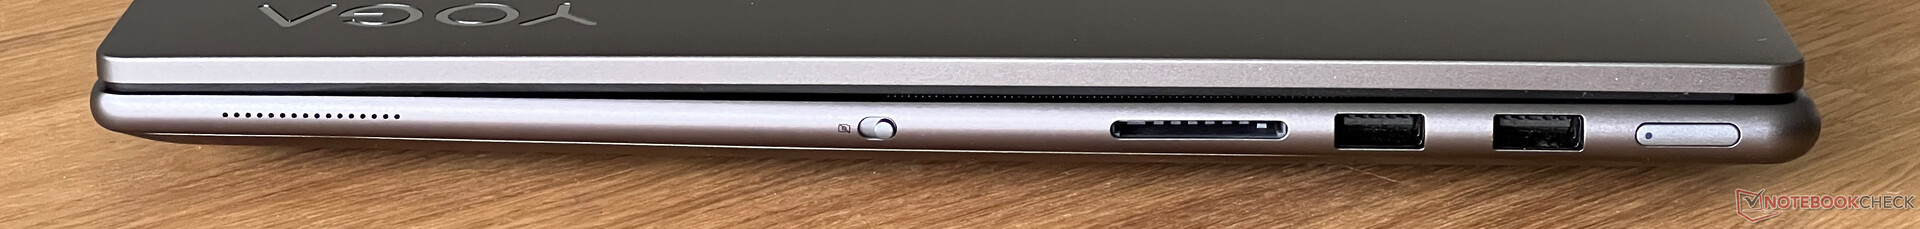
Lector de tarjetas SD
El lector de tarjetas del lado derecho ofrece una velocidad de transferencia media de 80-90 MB/s en combinación con nuestra tarjeta de referencia (Angelbird AV Pro V60). Las tarjetas insertadas sobresalen aproximadamente 1,5 cm de la carcasa.
| SD Card Reader | |
| average JPG Copy Test (av. of 3 runs) | |
| Dell XPS 16 9640 (Angelbird AV Pro V60) | |
| Average of class Multimedia (17.6 - 205, n=67, last 2 years) | |
| Samsung Galaxy Book4 Ultra (Angelbird AV Pro V60) | |
| Lenovo Yoga Pro 9 16IMH9 (Angelbird AV Pro V60) | |
| Lenovo Yoga Pro 9 16-IRP G8 (Angelibird AV Pro V60) | |
| SCHENKER VISION 16 Pro (M23) (Angelbird AV Pro V60) | |
| maximum AS SSD Seq Read Test (1GB) | |
| Dell XPS 16 9640 (Angelbird AV Pro V60) | |
| Average of class Multimedia (16.8 - 266, n=63, last 2 years) | |
| Lenovo Yoga Pro 9 16IMH9 (Angelbird AV Pro V60) | |
| Samsung Galaxy Book4 Ultra (Angelbird AV Pro V60) | |
| Lenovo Yoga Pro 9 16-IRP G8 (Angelibird AV Pro V60) | |
| SCHENKER VISION 16 Pro (M23) (Angelbird AV Pro V60) | |
Comunicación
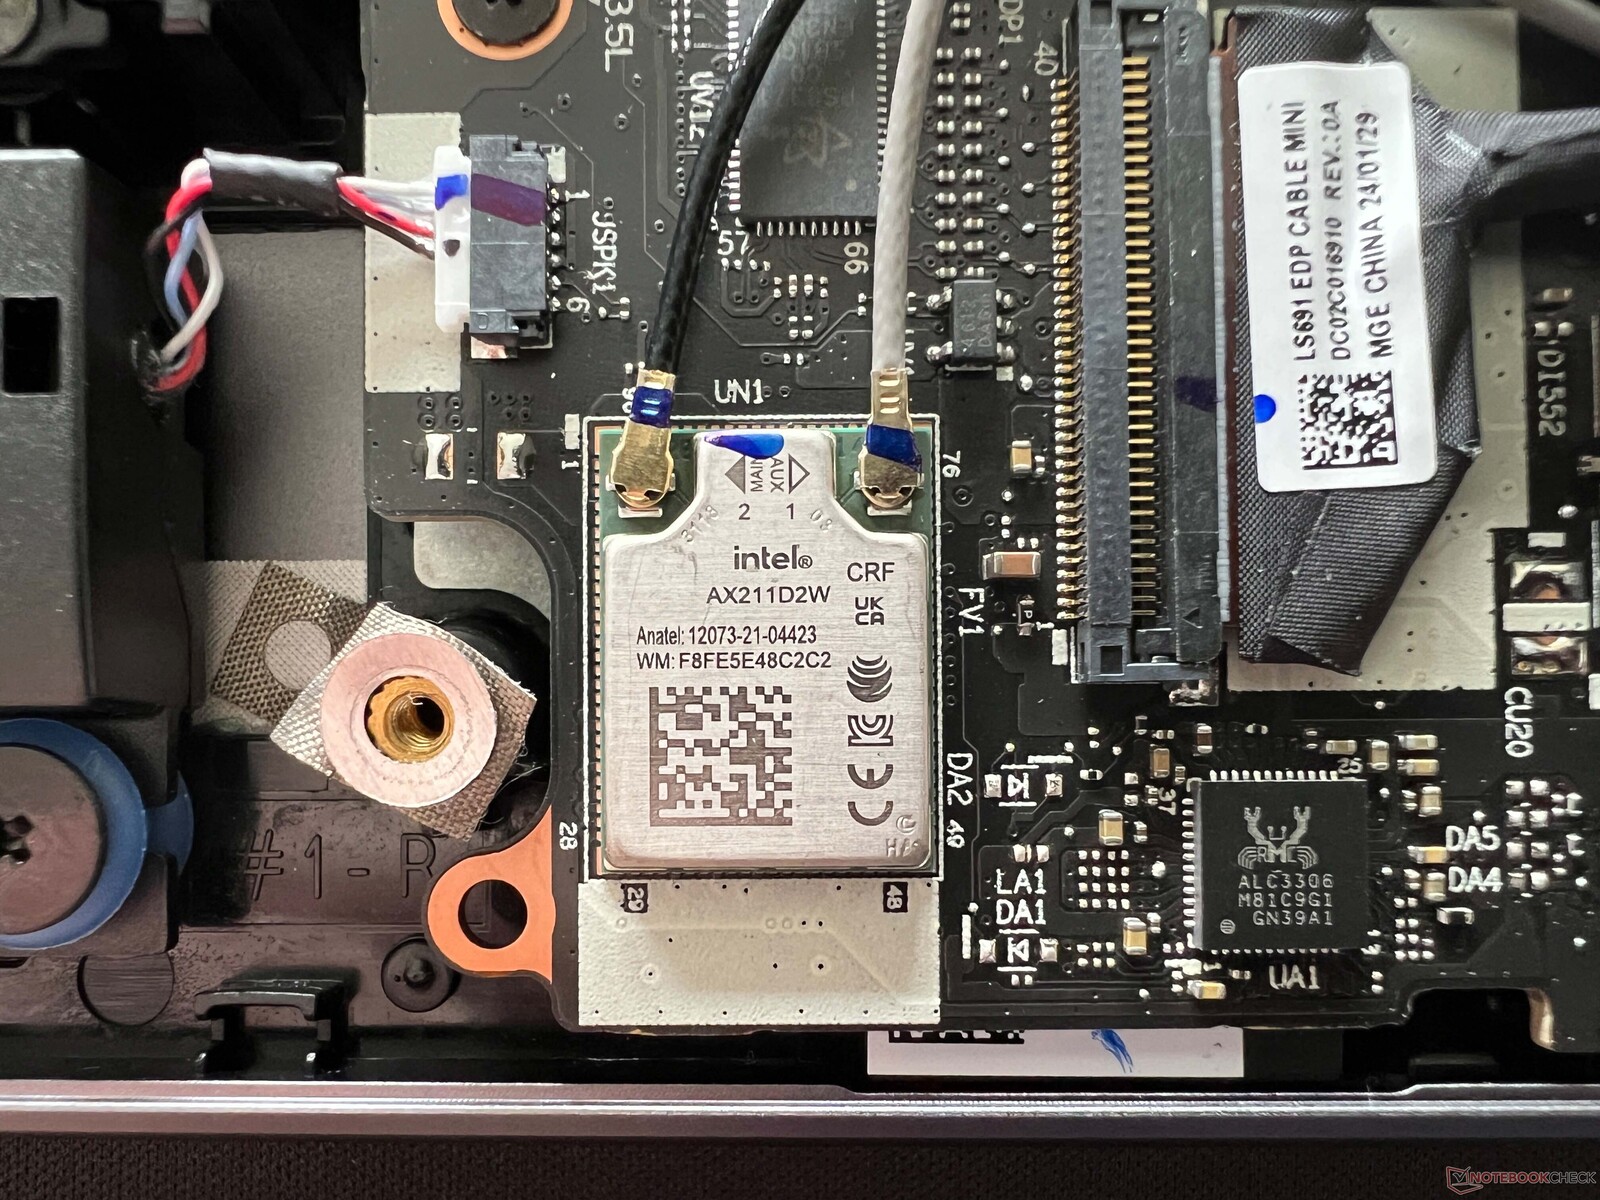
El módulo WLAN AX211 de Intel está soldado y es compatible con WiFi 6E, así como con Bluetooth 5.3. No tuvimos problemas con la estabilidad de la WLAN en nuestras pruebas y las velocidades de transferencia fueron muy buenas en general junto con nuestro router de referencia de Asus. Lenovo no incluye un módulo WiFi 7.
| Networking | |
| Lenovo Yoga Pro 9 16IMH9 | |
| iperf3 transmit AXE11000 |
|
| iperf3 receive AXE11000 |
|
| Dell XPS 16 9640 | |
| iperf3 transmit AXE11000 |
|
| iperf3 receive AXE11000 |
|
| Honor MagicBook Pro 16 2024 | |
| iperf3 transmit AXE11000 |
|
| iperf3 receive AXE11000 |
|
| Samsung Galaxy Book4 Ultra | |
| iperf3 transmit AXE11000 |
|
| iperf3 receive AXE11000 |
|
| Framework Laptop 16 | |
| iperf3 transmit AXE11000 |
|
| iperf3 receive AXE11000 |
|
| iperf3 transmit AXE11000 6GHz |
|
| iperf3 receive AXE11000 6GHz |
|
| SCHENKER VISION 16 Pro (M23) | |
| iperf3 transmit AXE11000 |
|
| iperf3 receive AXE11000 |
|
| Lenovo Yoga Pro 9 16-IRP G8 | |
| iperf3 transmit AXE11000 |
|
| iperf3 receive AXE11000 |
|
Cámara web
La cámara de 5 MP ofrece una calidad de imagen decente y también hay un sensor de infrarrojos para el reconocimiento facial a través de Windows Hello. Junto con la NPU del procesador, ciertos efectos de estudio (desenfoque, seguimiento de la cabeza, etc.) están disponibles directamente en Windows e independientemente de la aplicación. La webcam dispone de un obturador electrónico con un botón en el lado derecho de la carcasa.


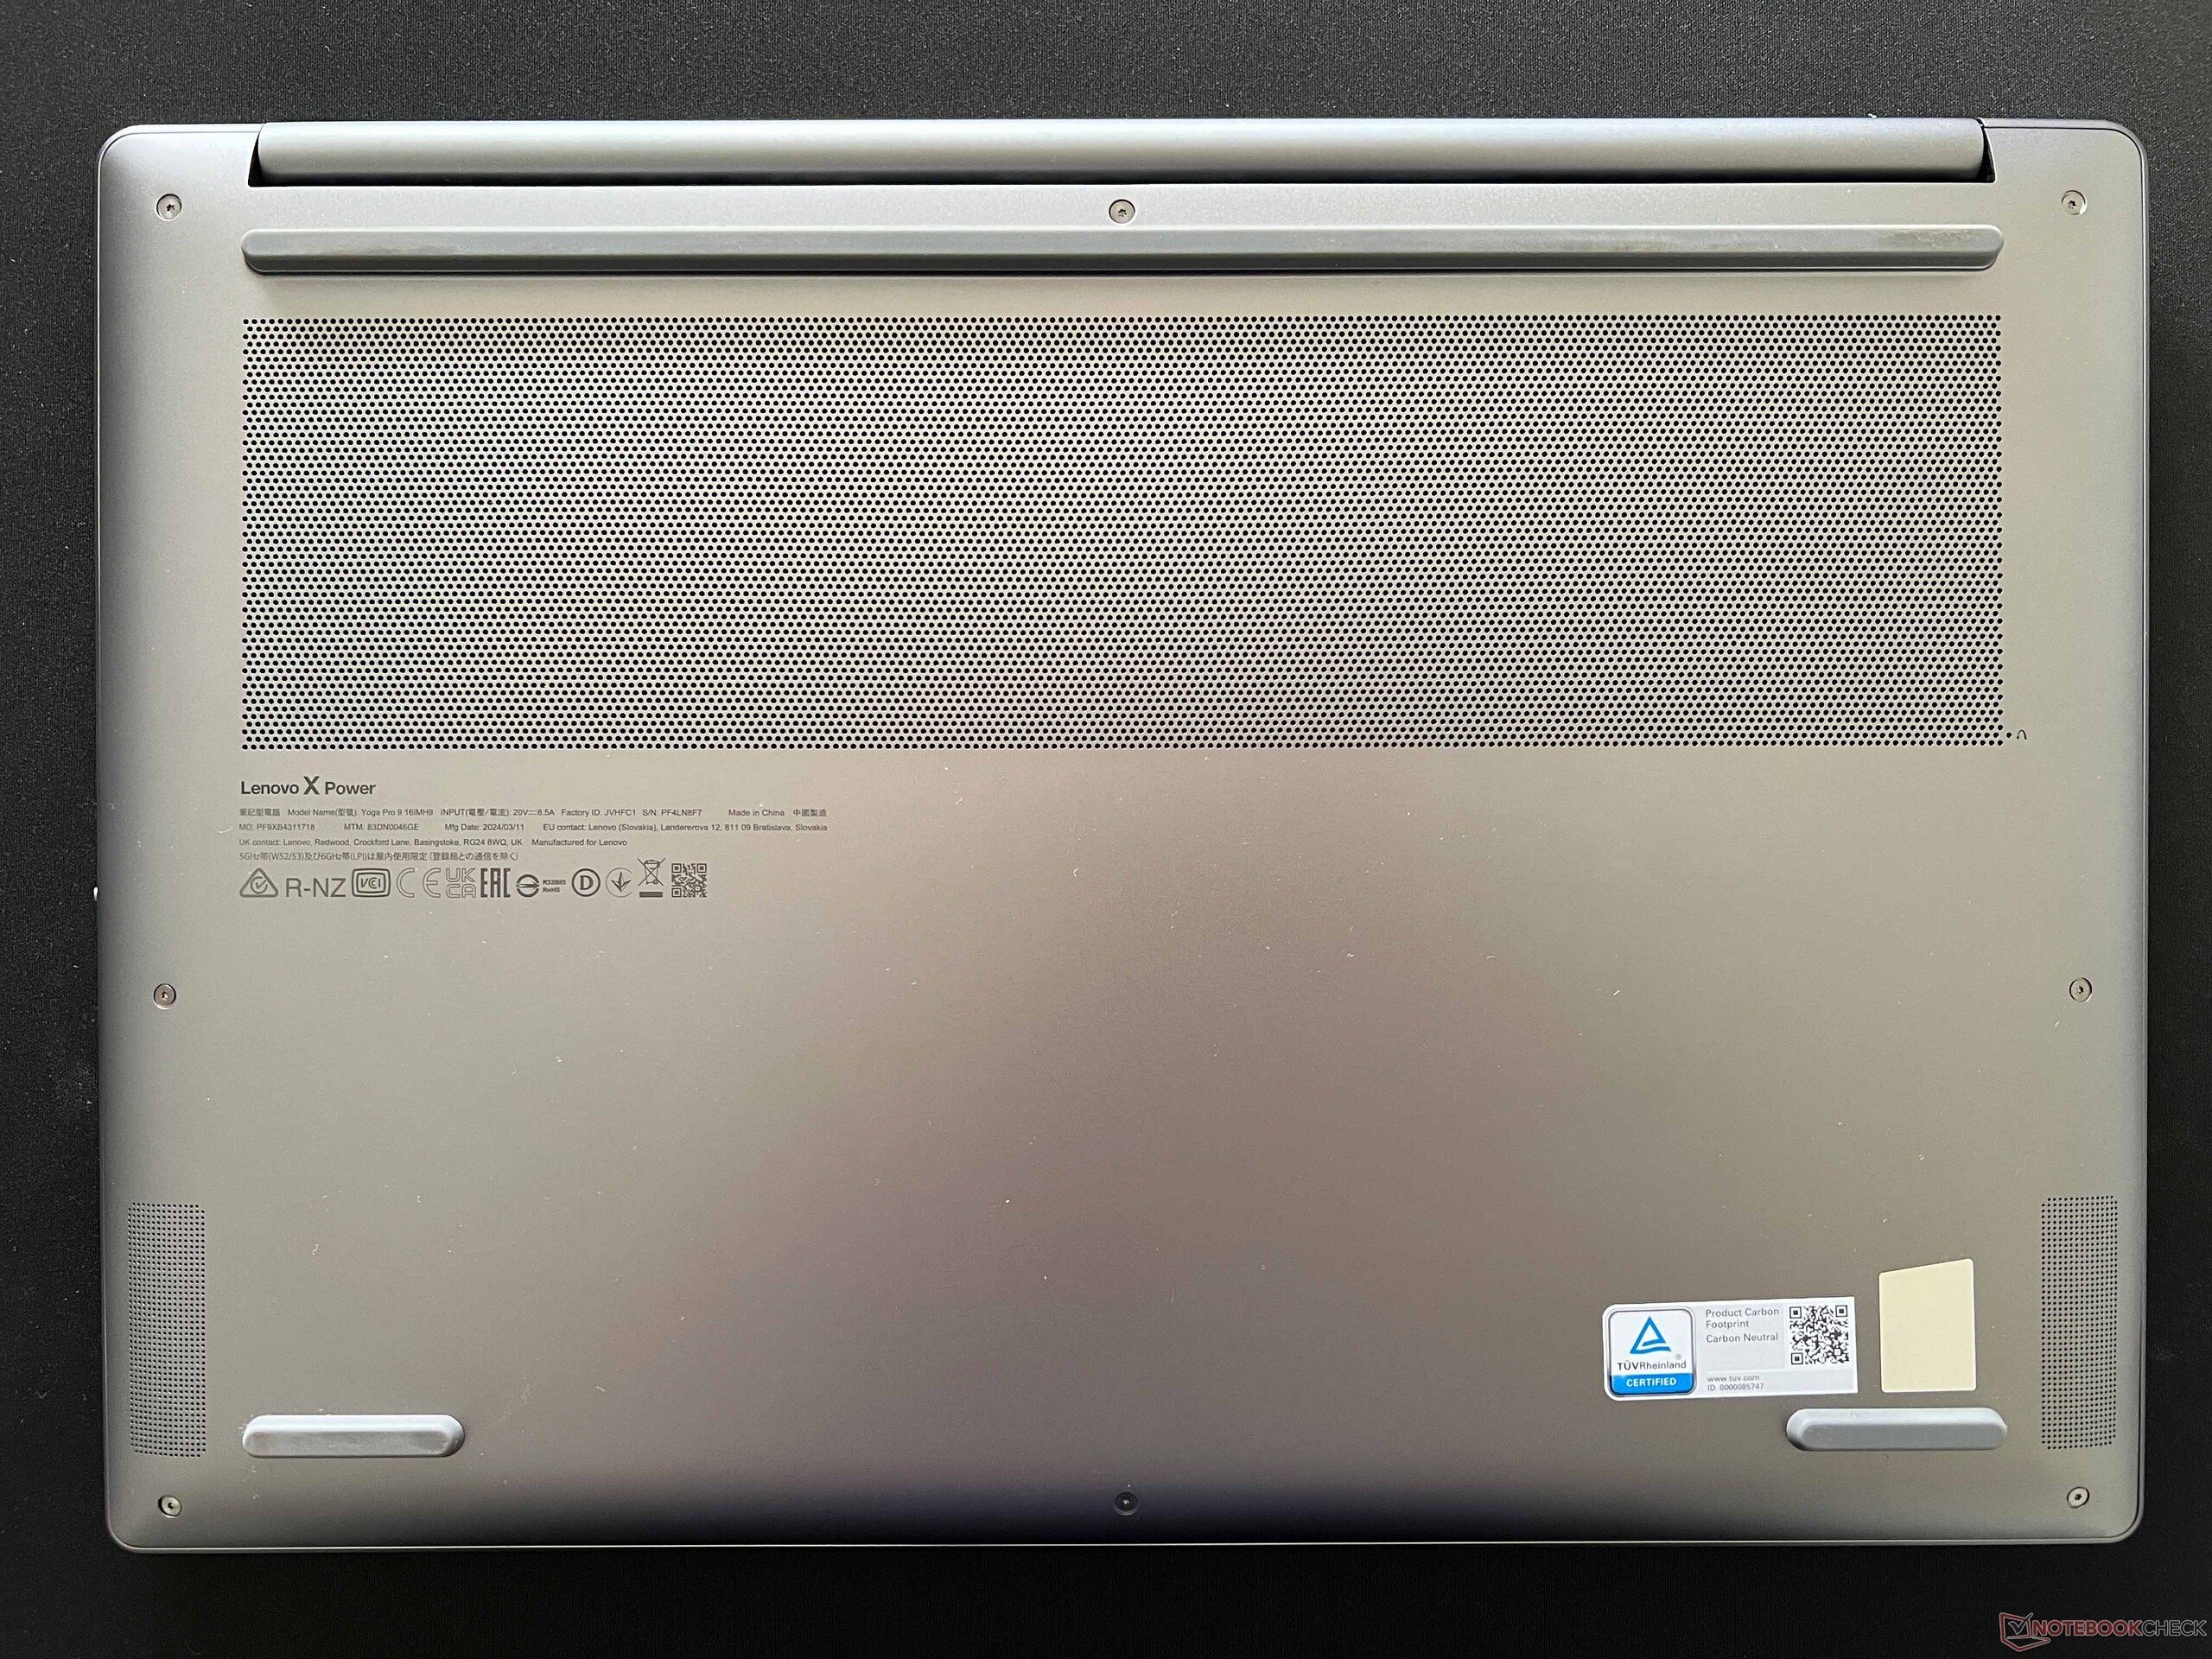
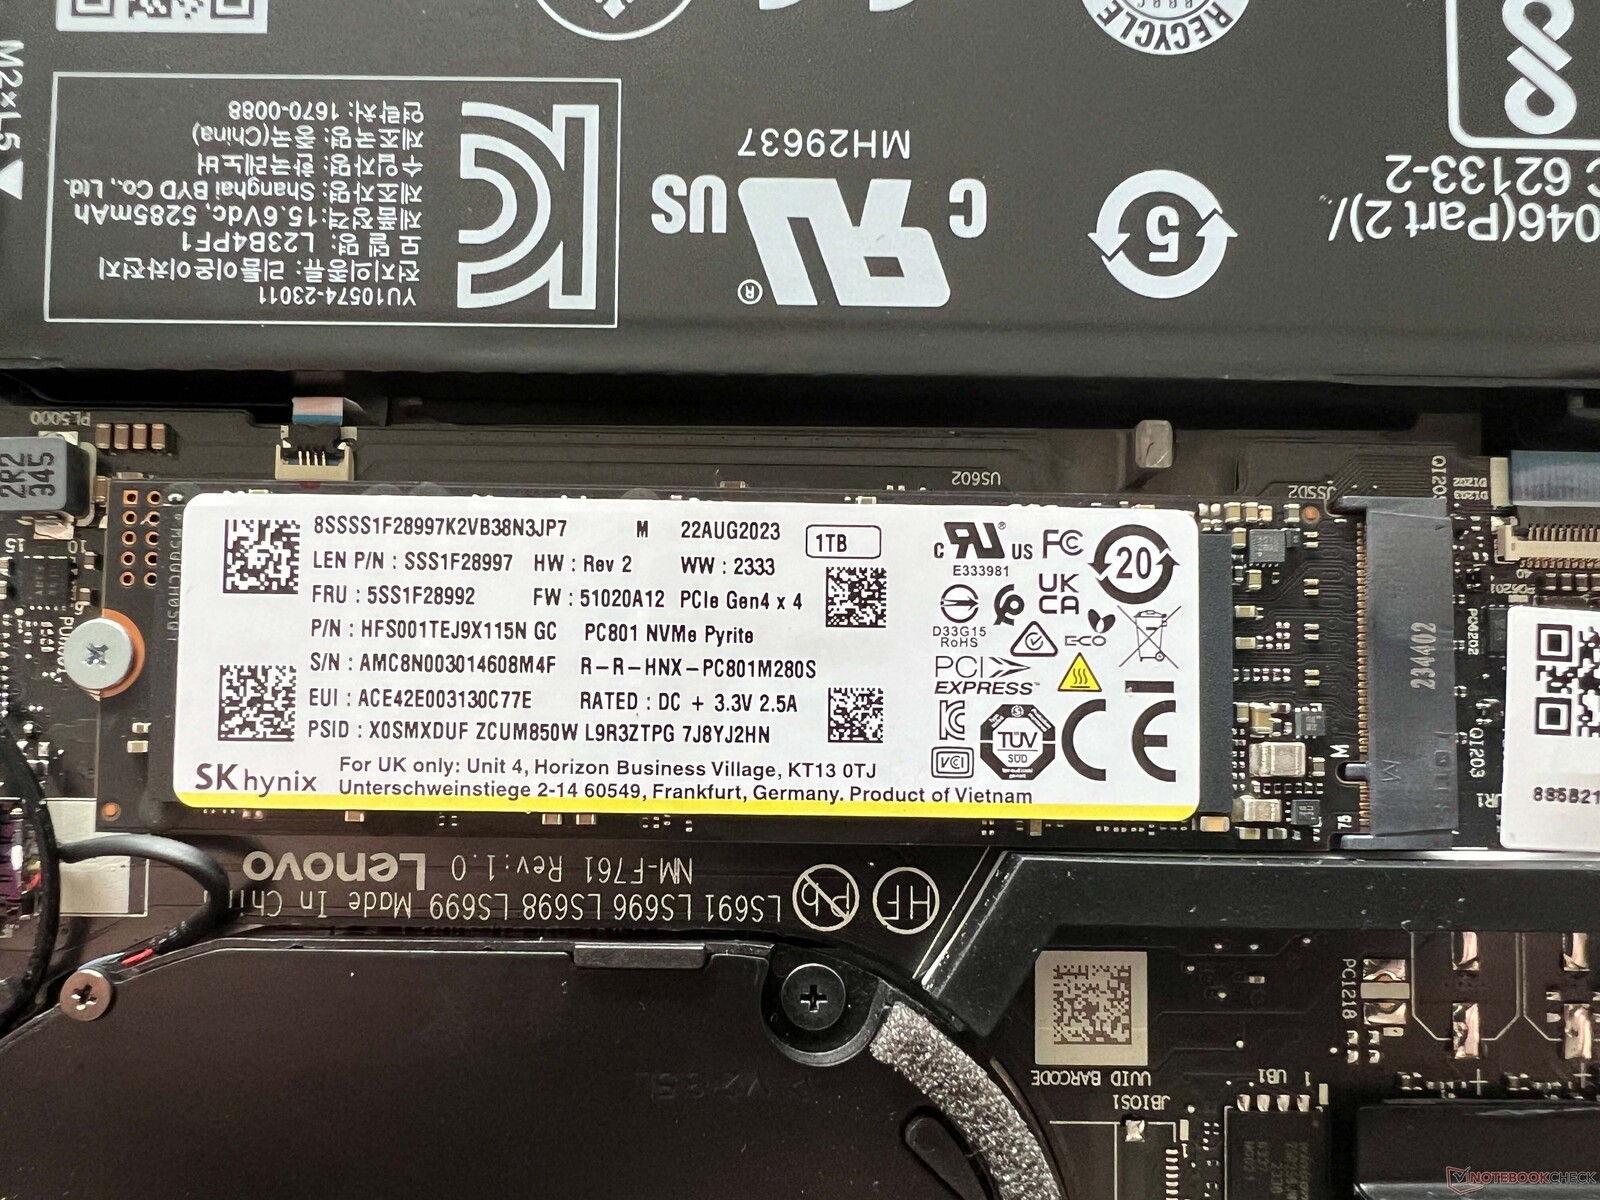
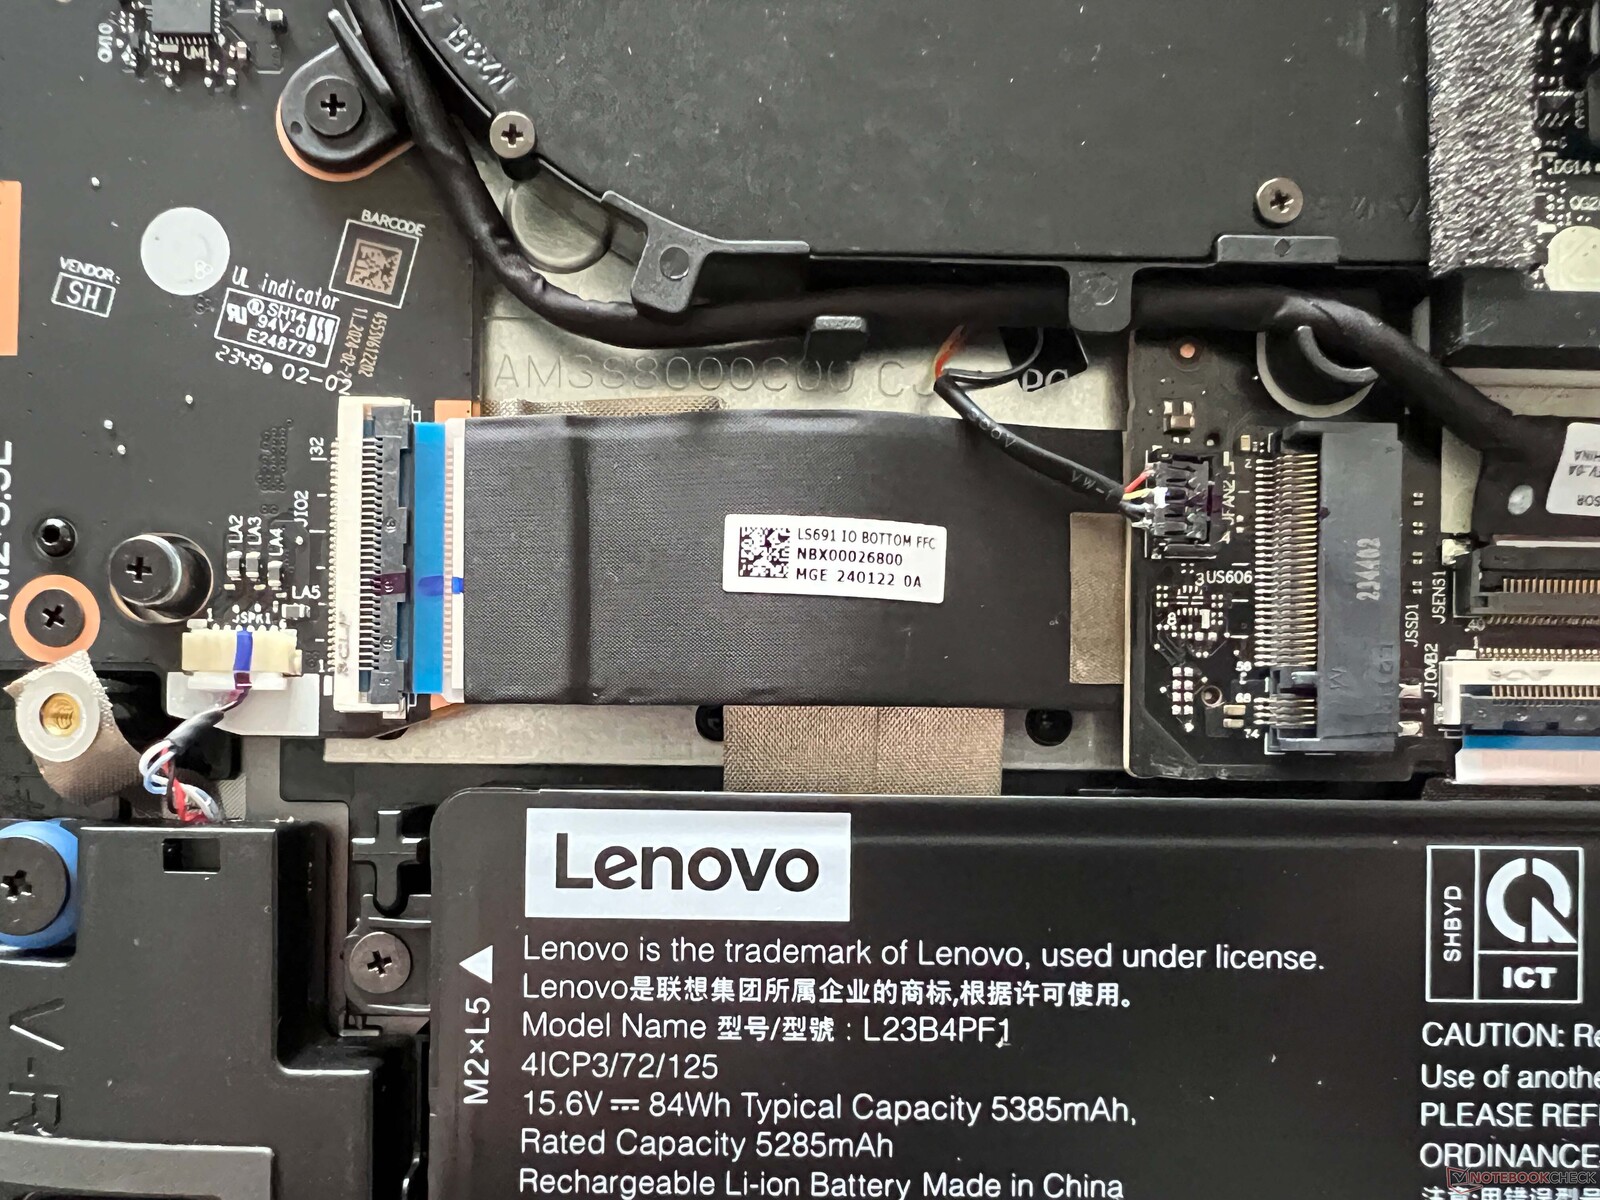
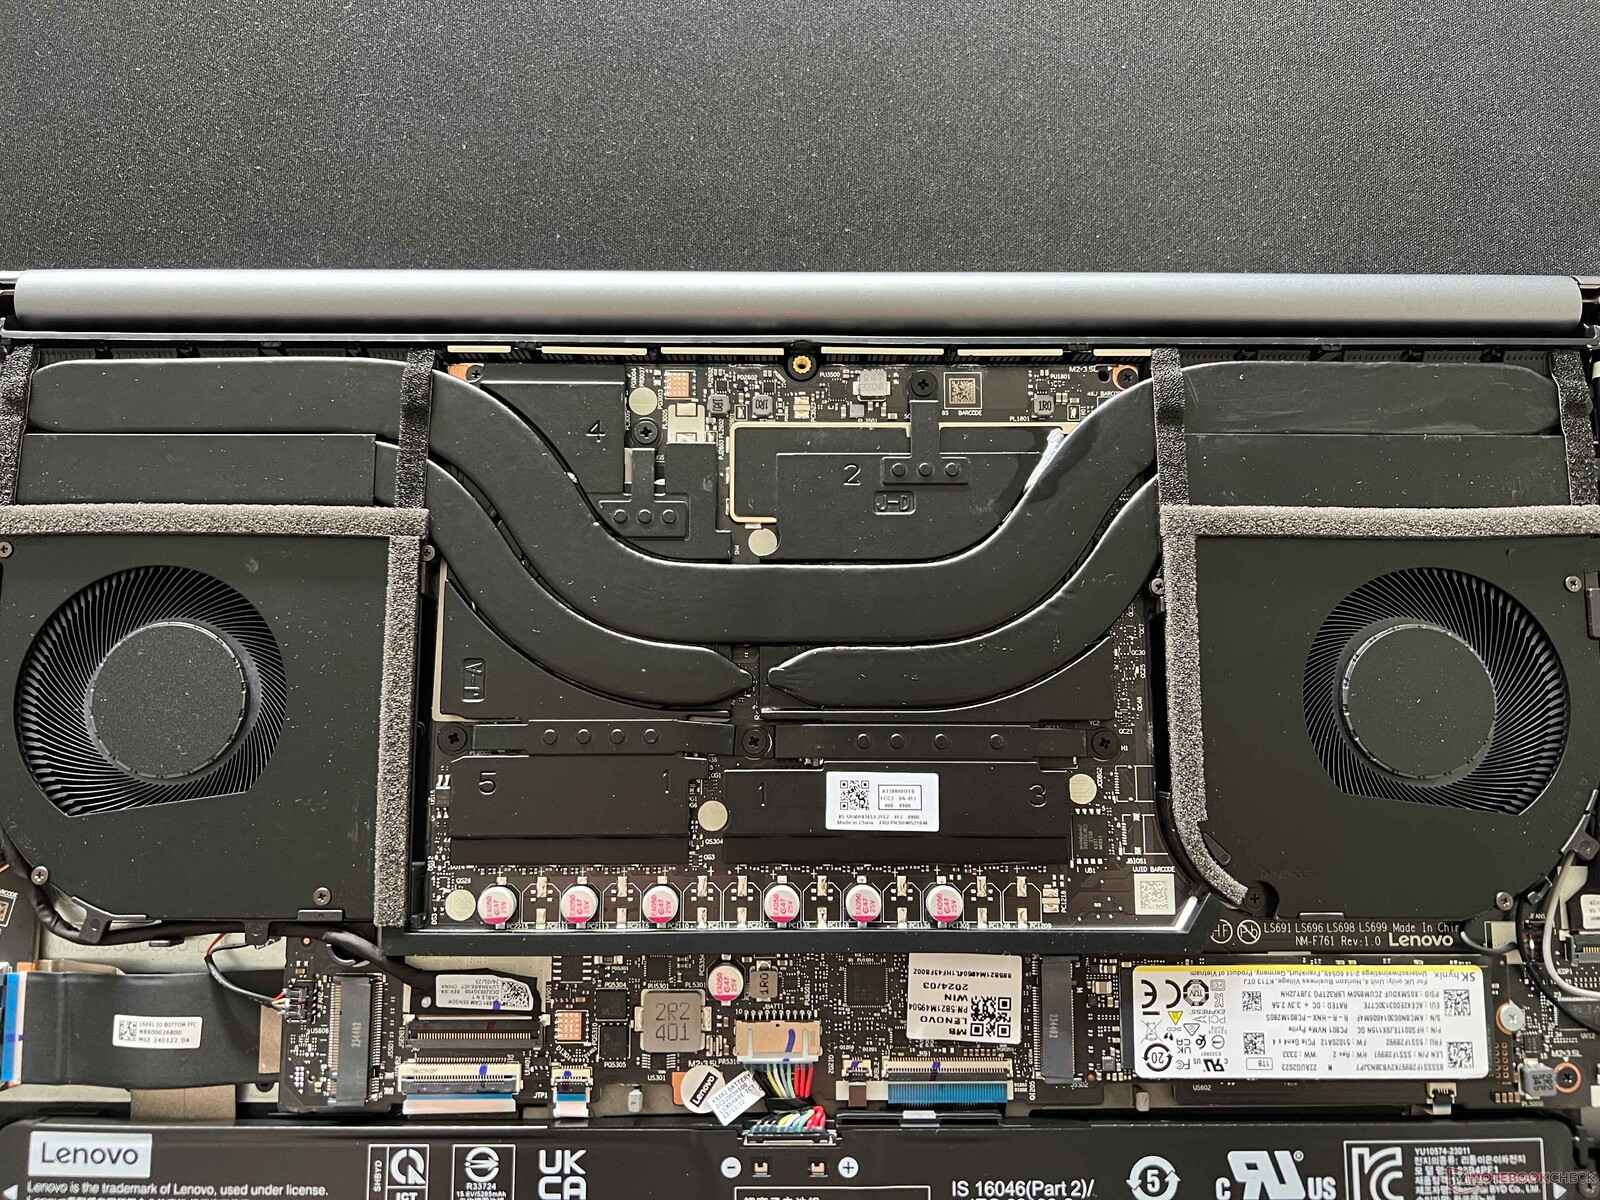
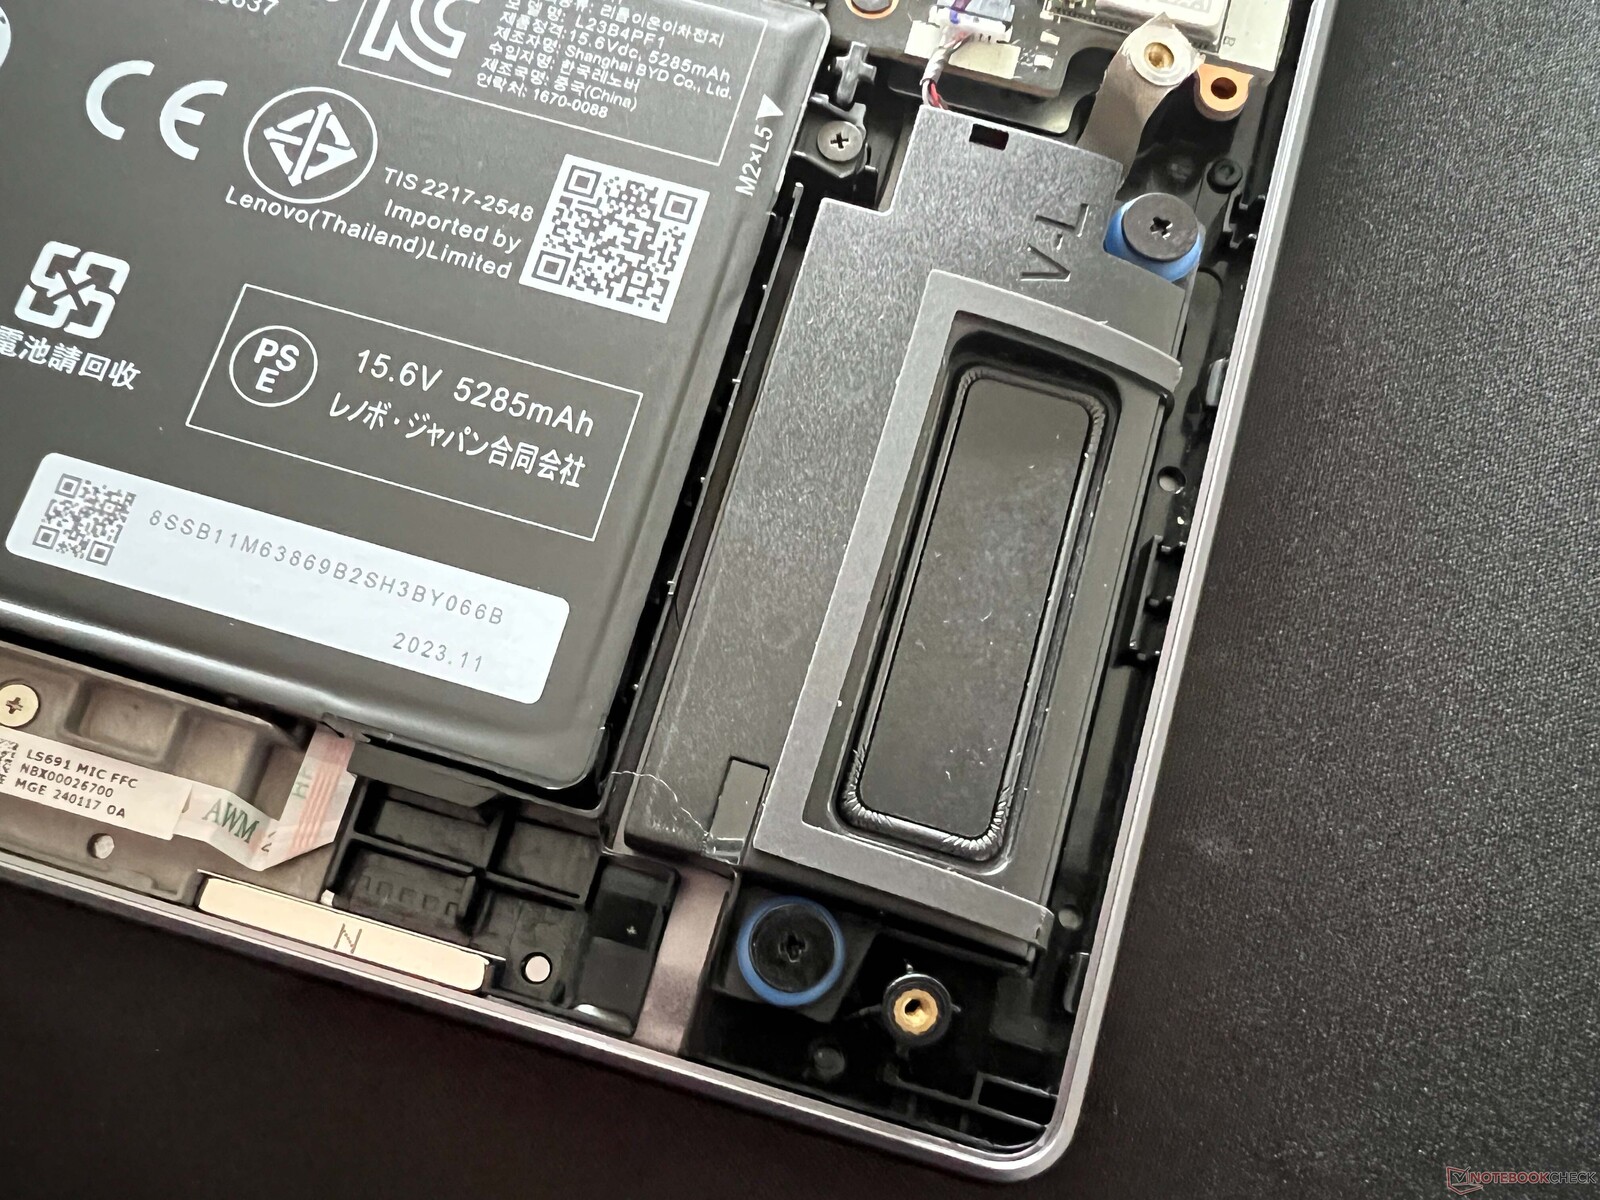
Mantenimiento
La cubierta inferior está fijada con tornillos Torx (T5) y es fácil de quitar. En el interior, la disposición ha cambiado con respecto al modelo antiguo, en parte para dejar espacio para una batería más grande. La RAM y el módulo WLAN siguen estando soldados. Sigue habiendo dos ranuras para SSD M.2 2280 y puede tanto limpiar los ventiladores como sustituir la batería (si es necesario).

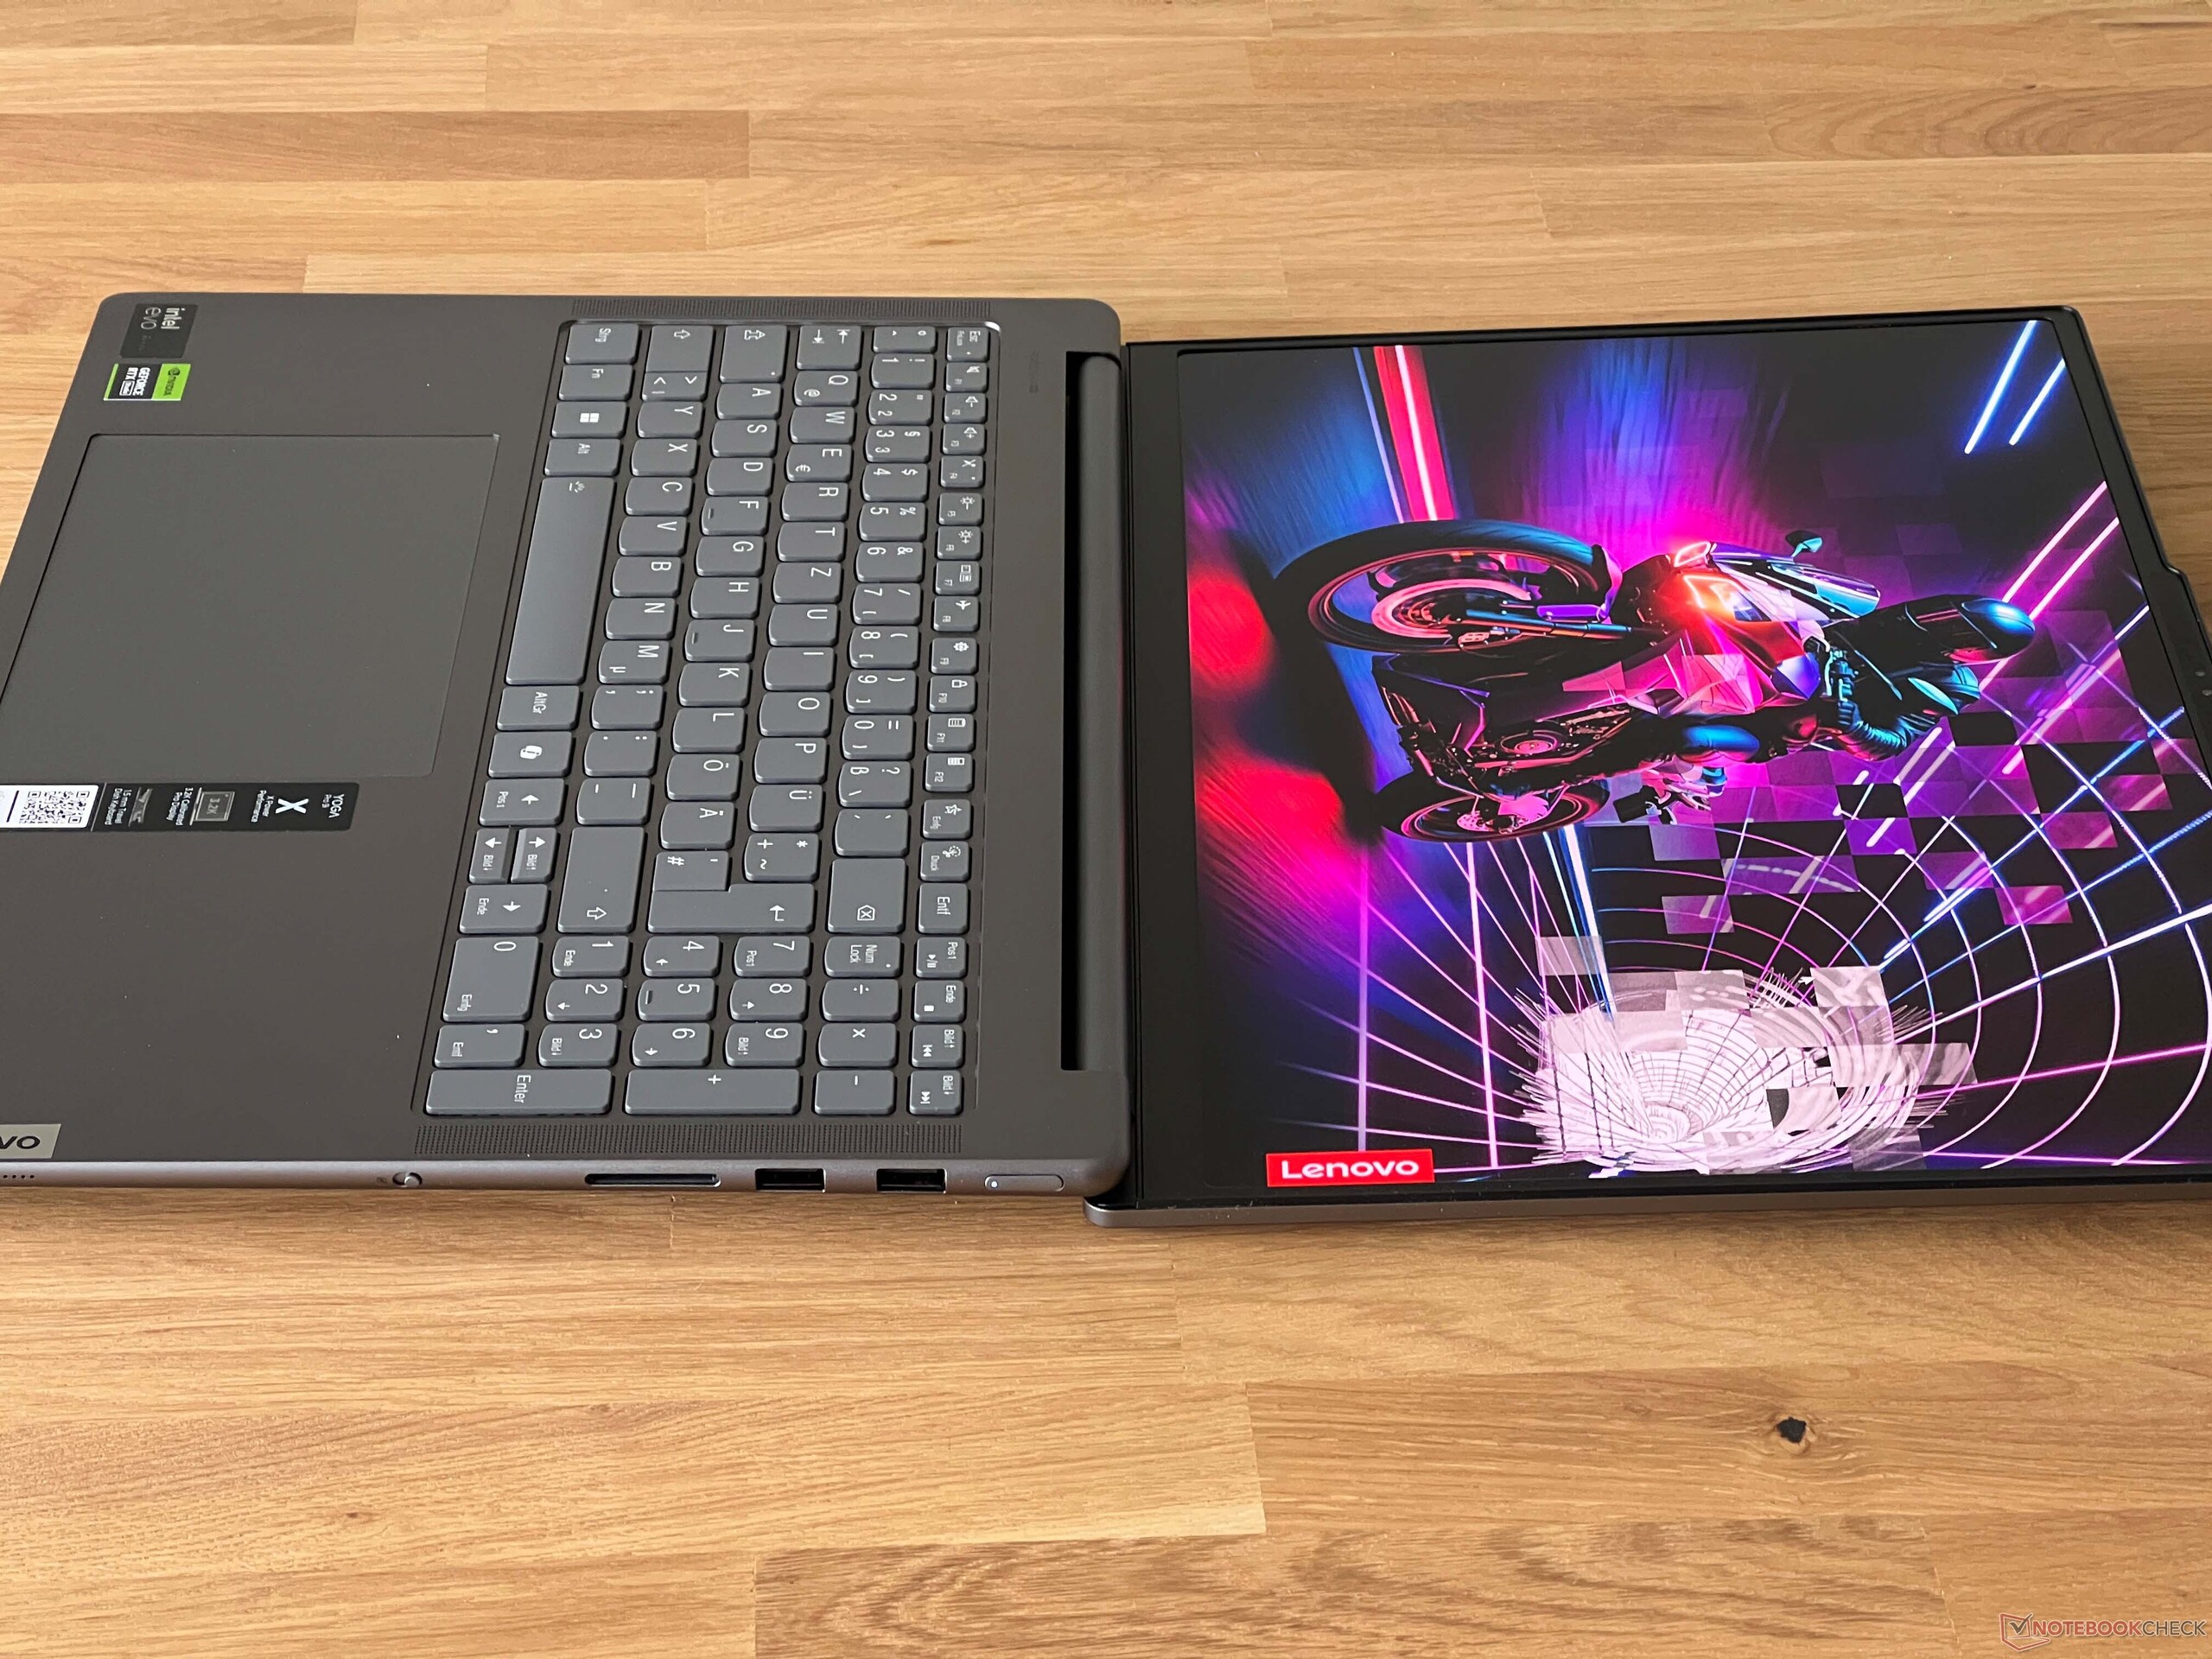
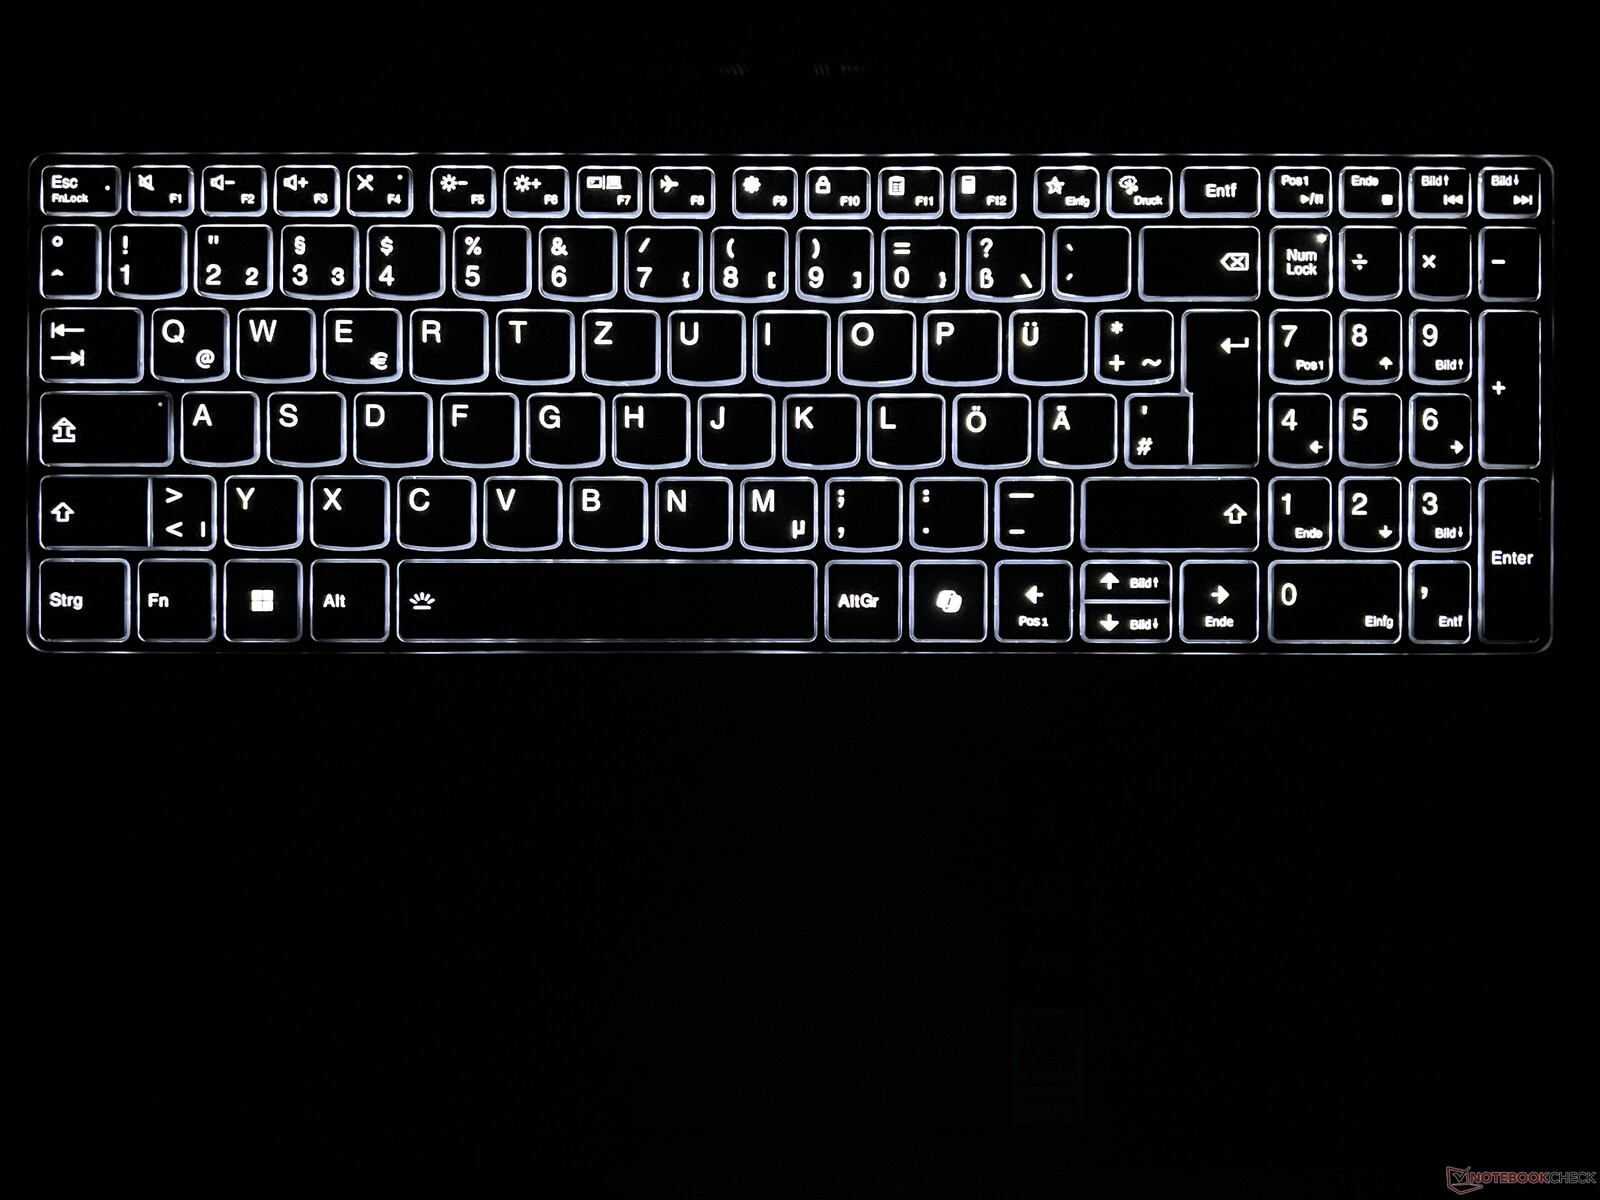
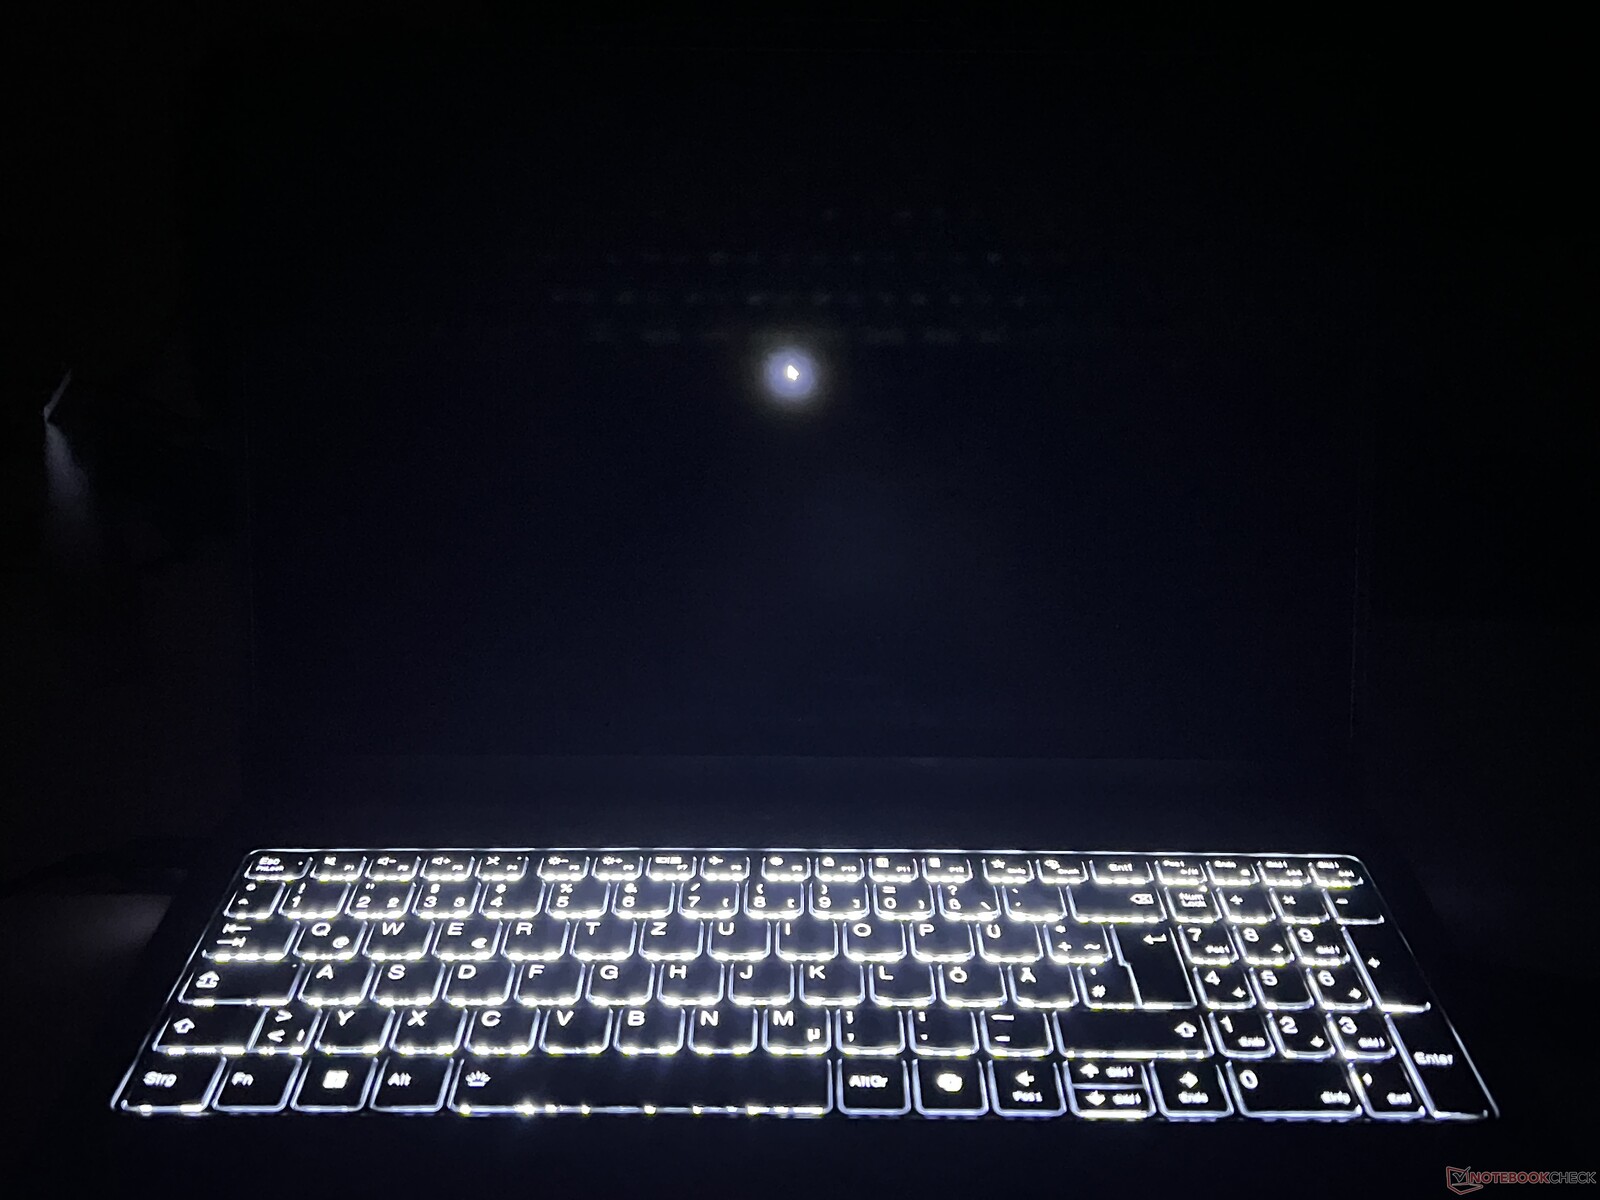
Dispositivos de entrada - carrera de 1,5 mm y teclado numérico
Los dispositivos de entrada permanecen sin cambios, aparte de la nueva tecla Copilot (en lugar de la tecla Ctrl derecha). El cómodo teclado ofrece un recorrido suficientemente largo (1,5 mm) y se pueden escribir textos largos sin problemas. La iluminación blanca de dos niveles se activa automáticamente mediante un sensor.
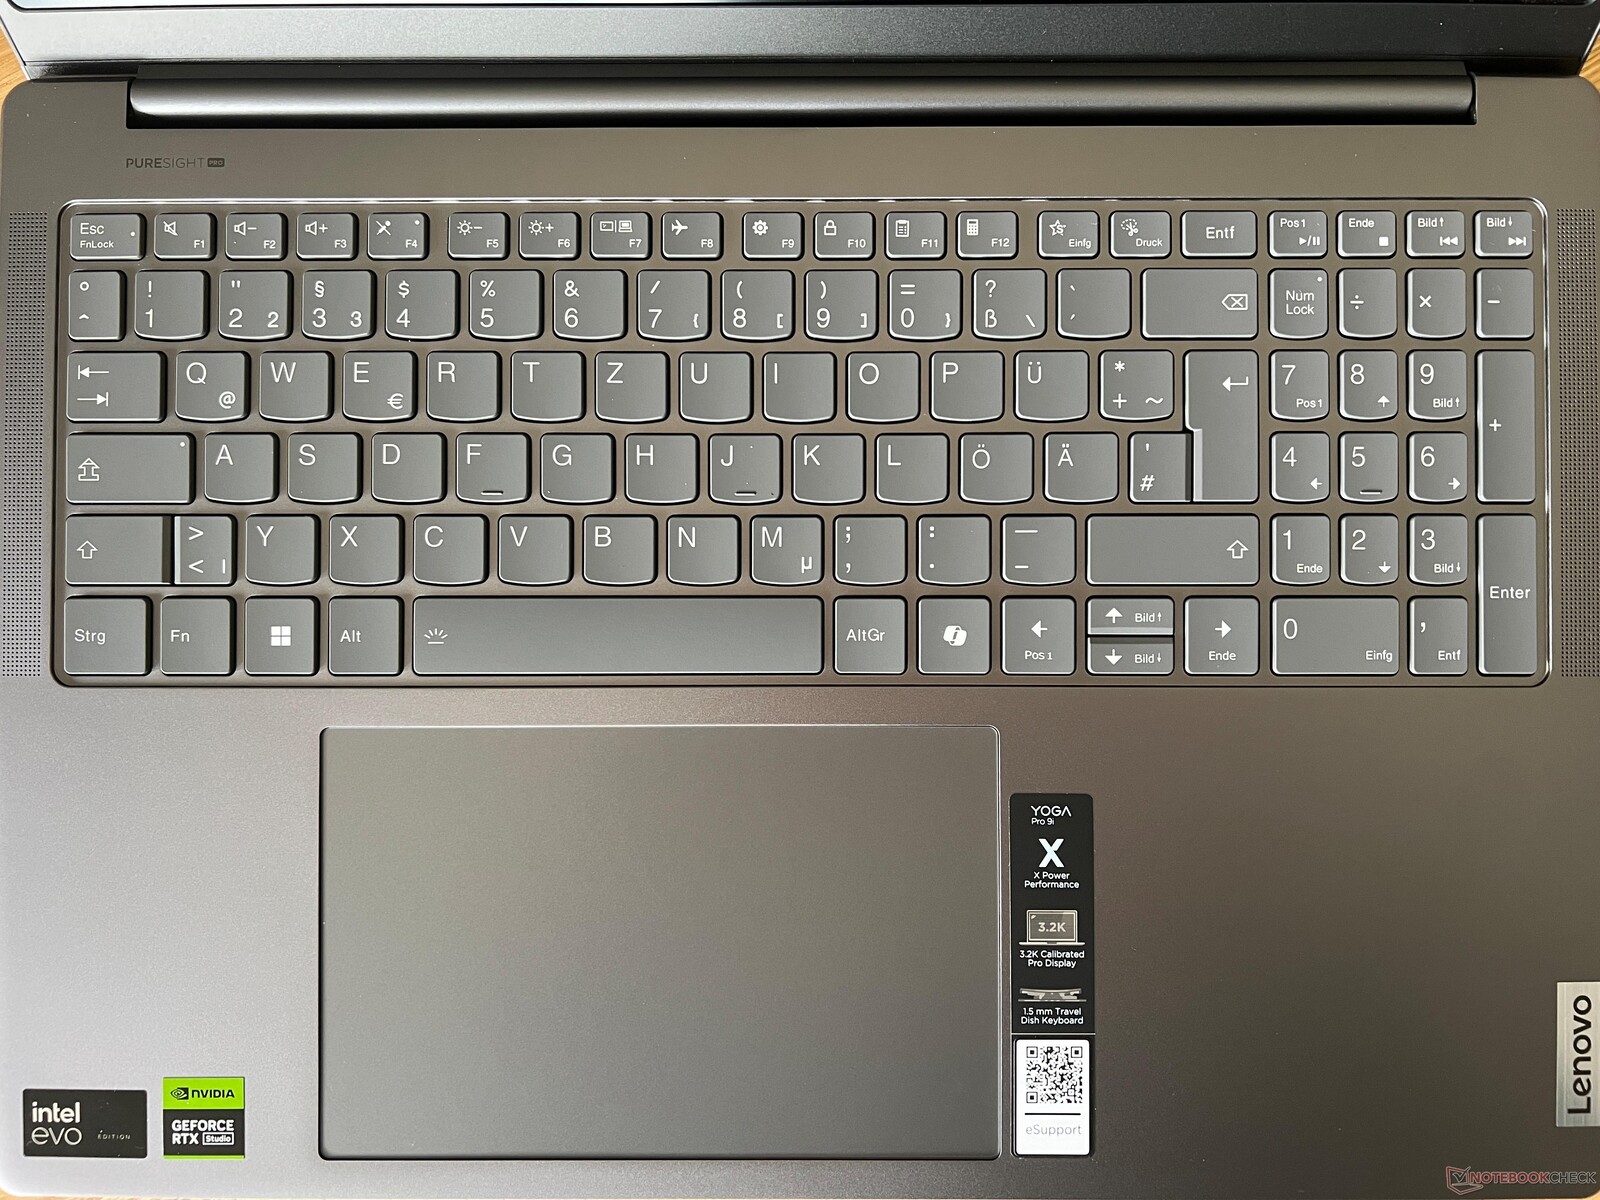
El tamaño del clickpad se mantiene sin cambios en 15 x 9,5 cm, pero Lenovo parece haber tenido en cuenta nuestras críticas y ha revisado la mecánica. Mientras que los clics del modelo antiguo sonaban fuertes y baratos, ahora los ruidos de los clics están mucho más amortiguados y dan una impresión de gran calidad. Como siempre, las propiedades de deslizamiento son excelentes. En general, no hay absolutamente ningún problema con la usabilidad del clickpad.
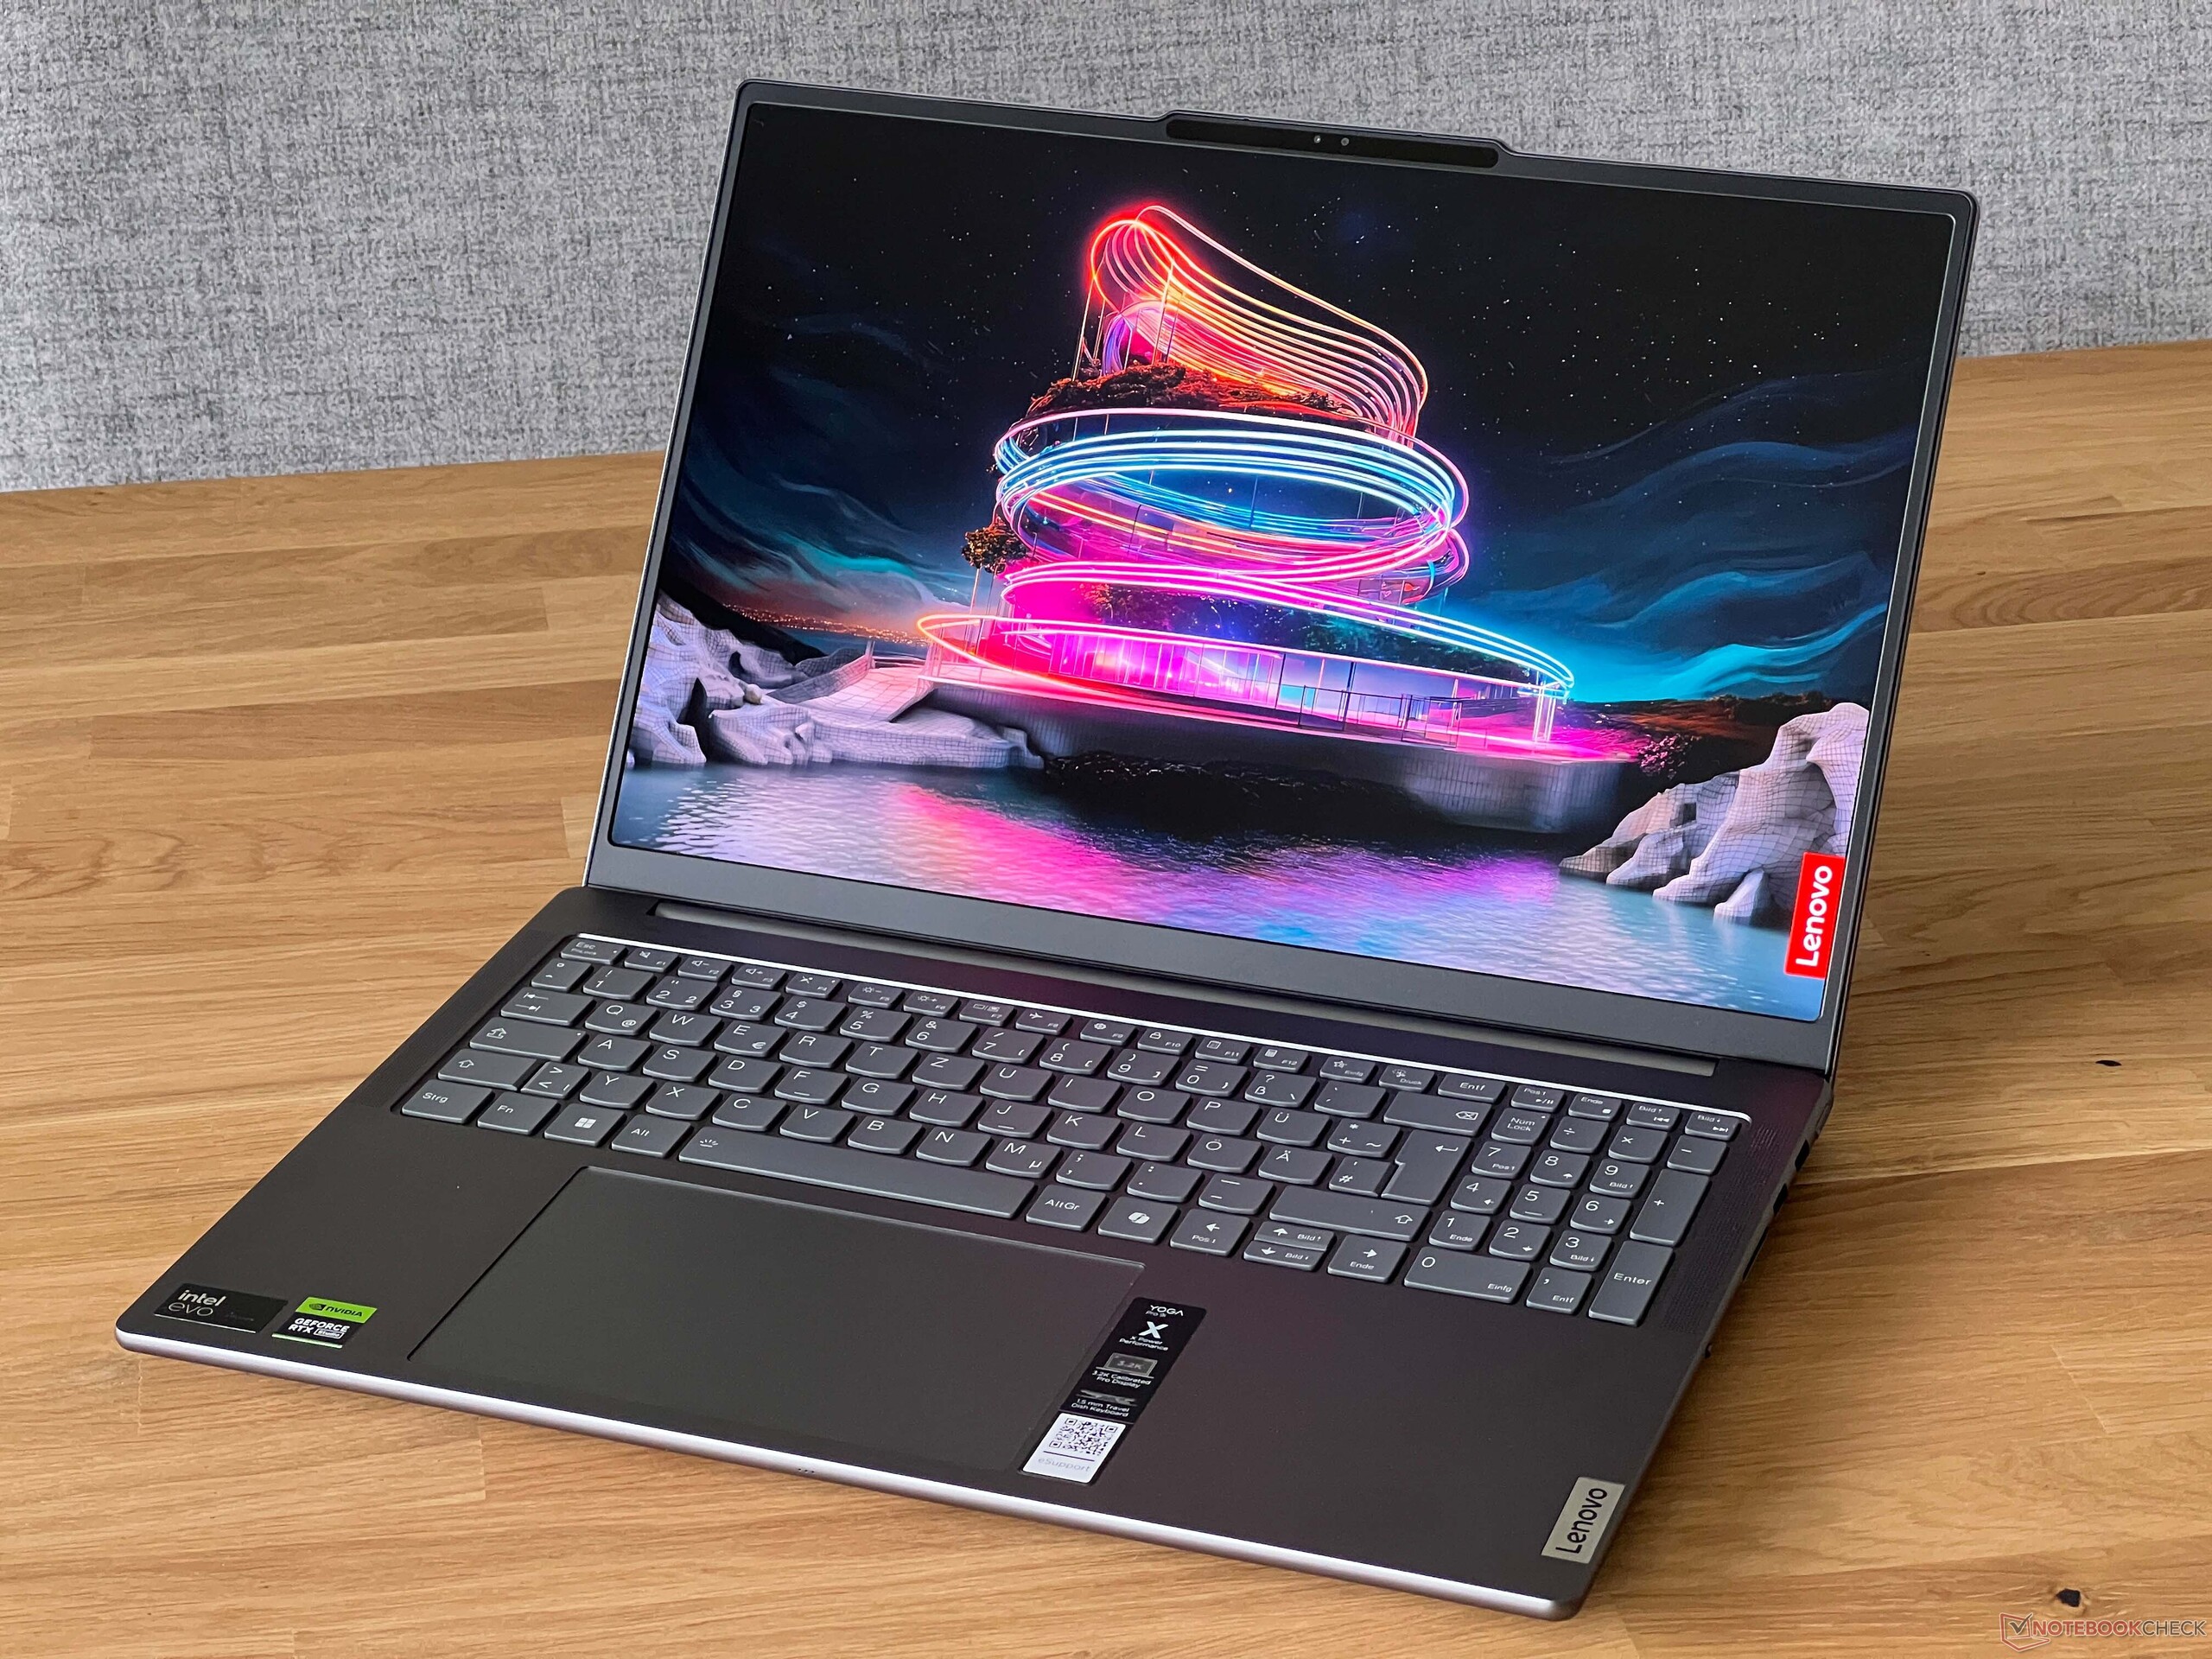
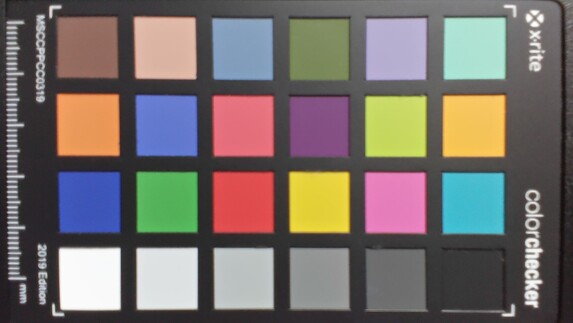
Pantalla - Mini panel LED mate
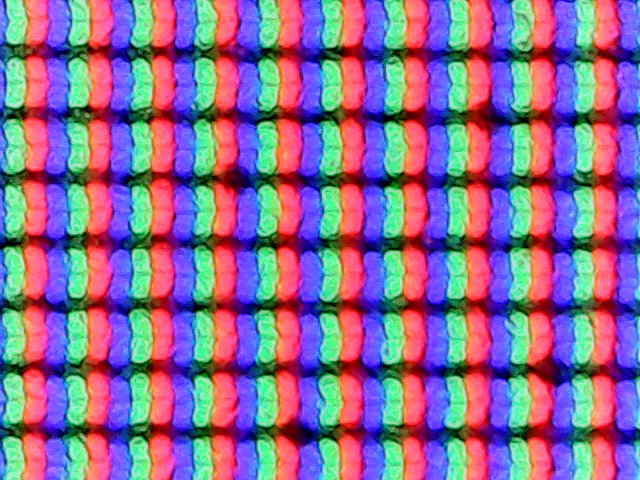
Lenovo ofrece varios paneles para el Yoga Pro 9i 16 G9 y nuestro dispositivo de prueba tiene la pantalla mini-LED mate con una resolución de 3200 x 2000. La variante brillante y táctil, que probamos en el predecesorsigue estando disponible. Los movimientos son muy fluidos gracias a la alta frecuencia de actualización y los colores aparecen muy vivos. Incluso las superficies brillantes no aparecen granuladas a pesar de la pantalla mate. El mini panel LED parpadea a una frecuencia constante de 4800 Hz, lo que no debería ser un problema para la gran mayoría de los usuarios. Los tiempos de respuesta son ligeramente más lentos que los del modelo antiguo, pero no se observaron imágenes fantasma en el uso cotidiano.
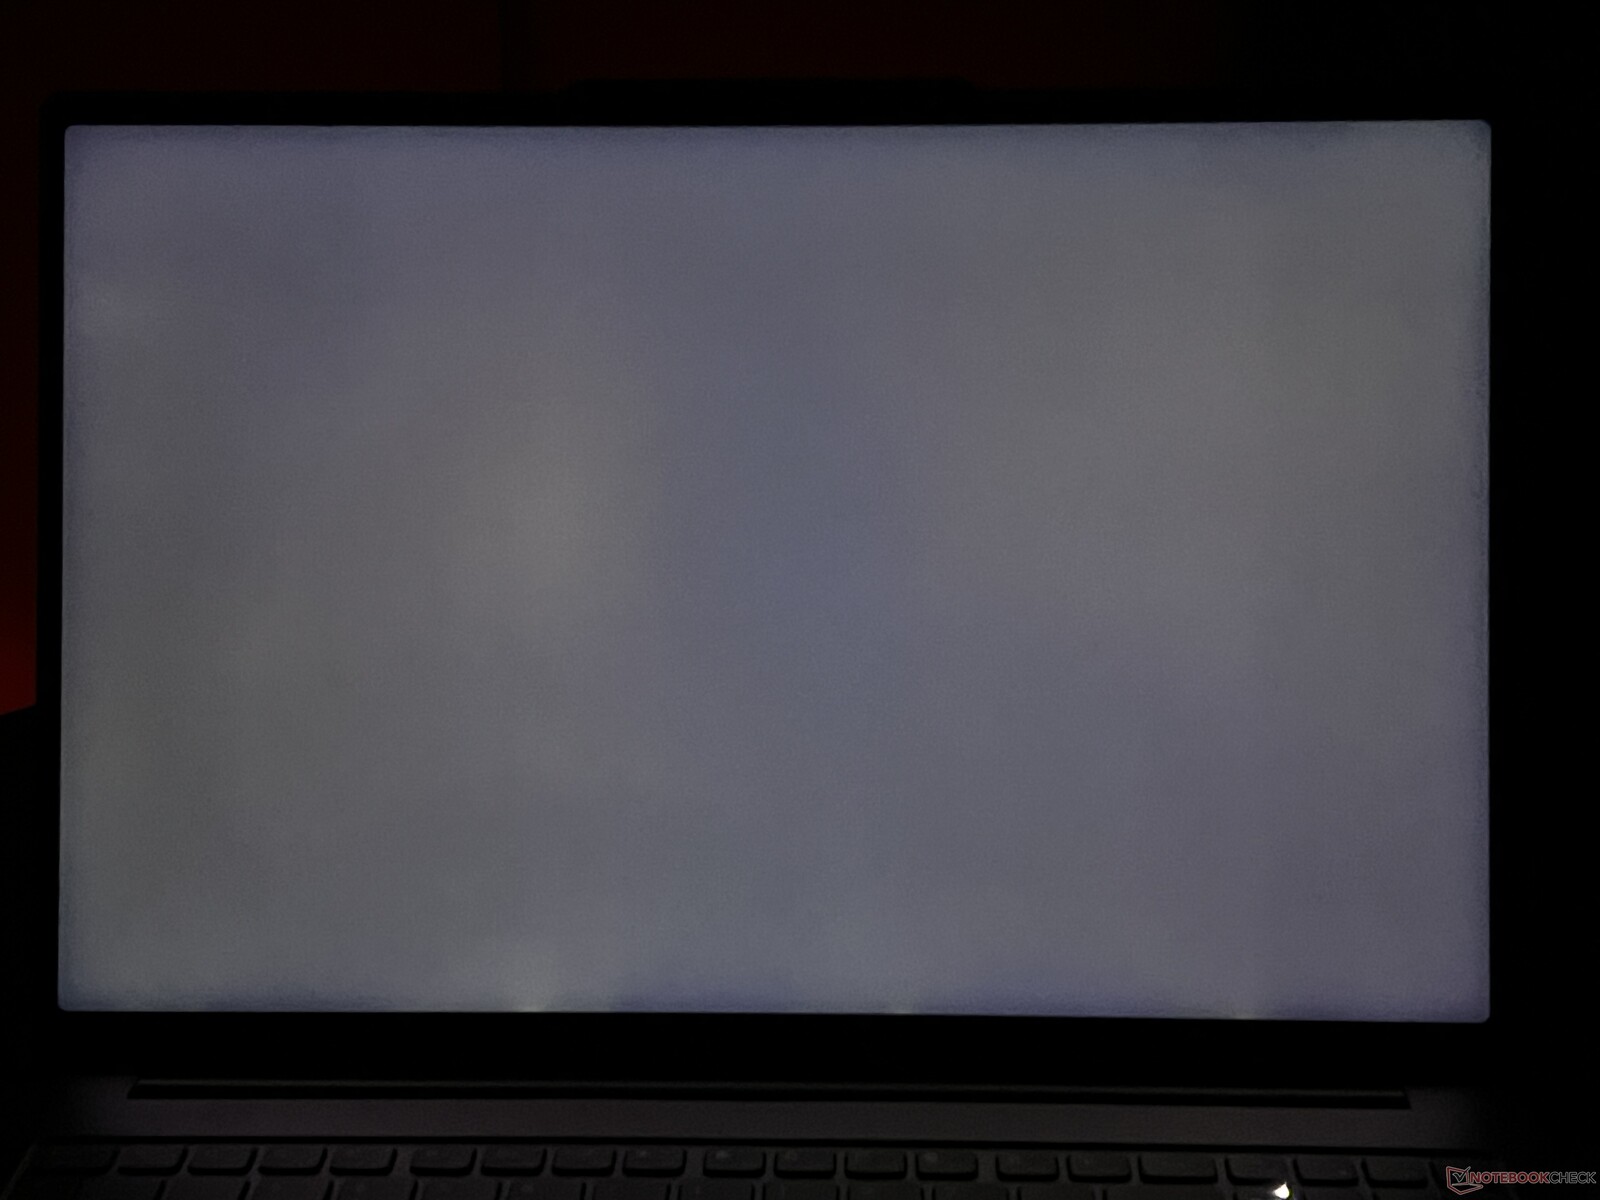
El panel mini LED se comporta de forma diferente a lo que cabría esperar. En modo SDR, el panel funciona como una pantalla IPS normal y aquí el negro no es completamente negro. El brillo medio es de unos muy buenos 670 cd/m² y el nivel de negro es bajo, de 0,22 cd/m², lo que da como resultado una relación de contraste máxima de algo menos de 3000:1.
Sólo cuando se activa el modo HDR, el panel pasa a la atenuación local y el negro es ahora realmente negro, aunque también hay efectos de halo visibles con objetos brillantes sobre fondos oscuros. El brillo HDR máximo es de 1230 cd/m², tanto en secciones de imagen pequeñas como en una imagen casi completamente blanca. Esto es ejemplar, pero la implementación HDR de Windows sigue siendo problemática: el modo HDR tiene que activarse manualmente y no es adecuado para un funcionamiento continuo, ya que el contenido SDR normal (como el escritorio de Windows) aparece entonces significativamente más pálido que en el modo SDR.
| |||||||||||||||||||||||||
iluminación: 93 %
Brillo con batería: 651 cd/m²
Contraste: 2959:1 (Negro: 0.22 cd/m²)
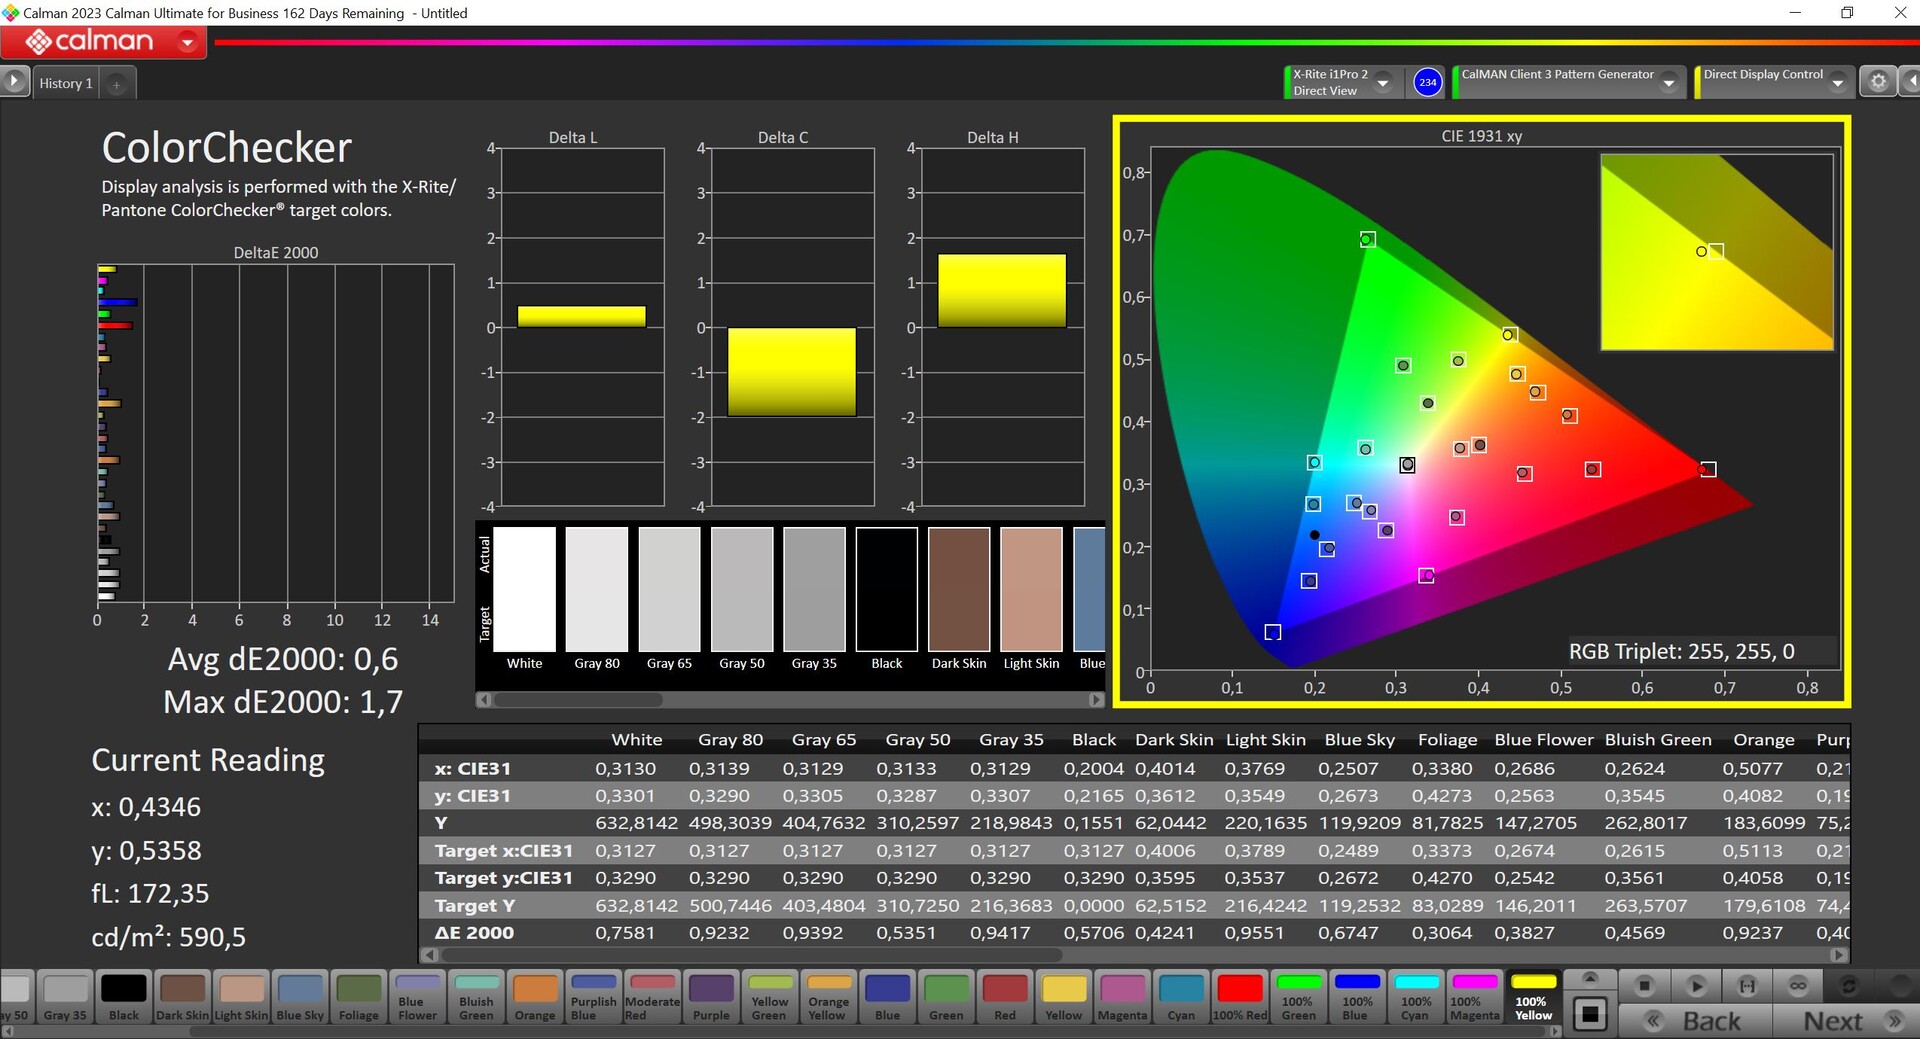
ΔE Color 1.9 | 0.5-29.43 Ø5, calibrated: 0.6
ΔE Greyscale 3 | 0.57-98 Ø5.3
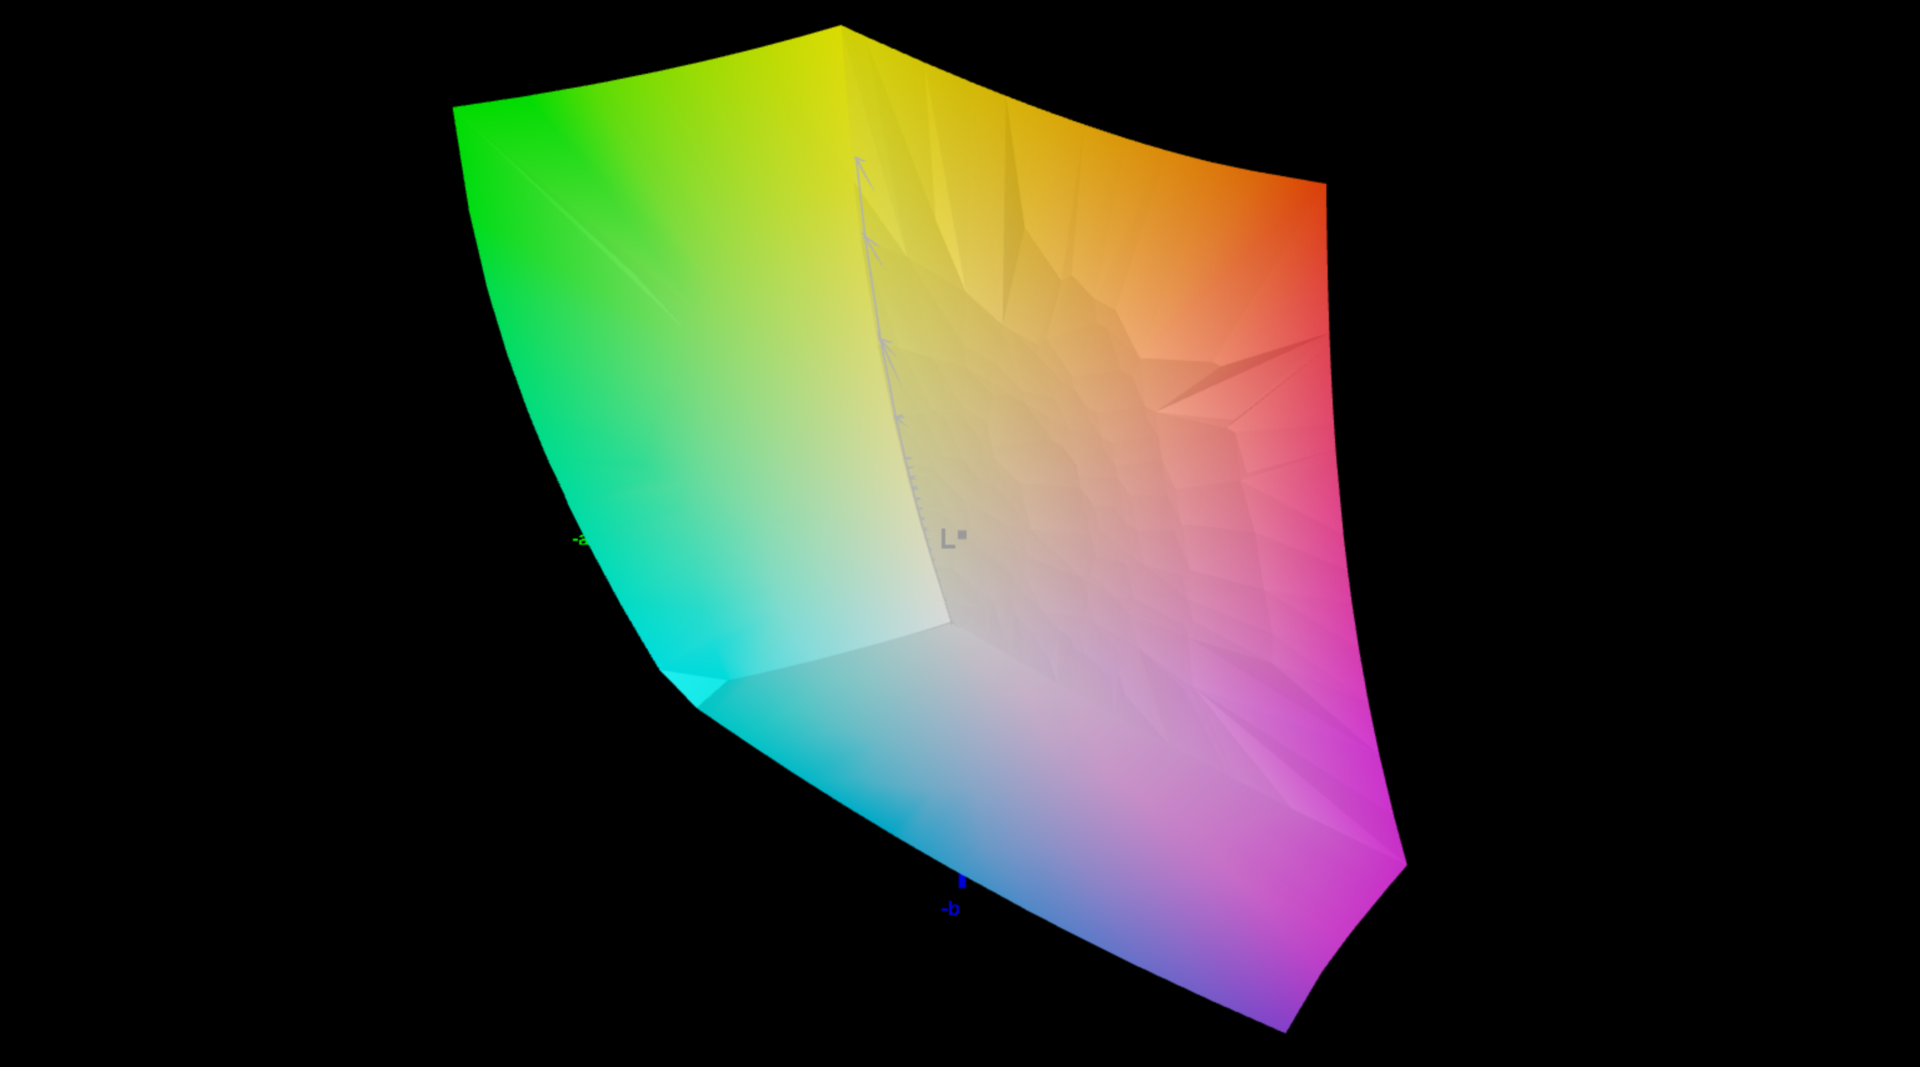
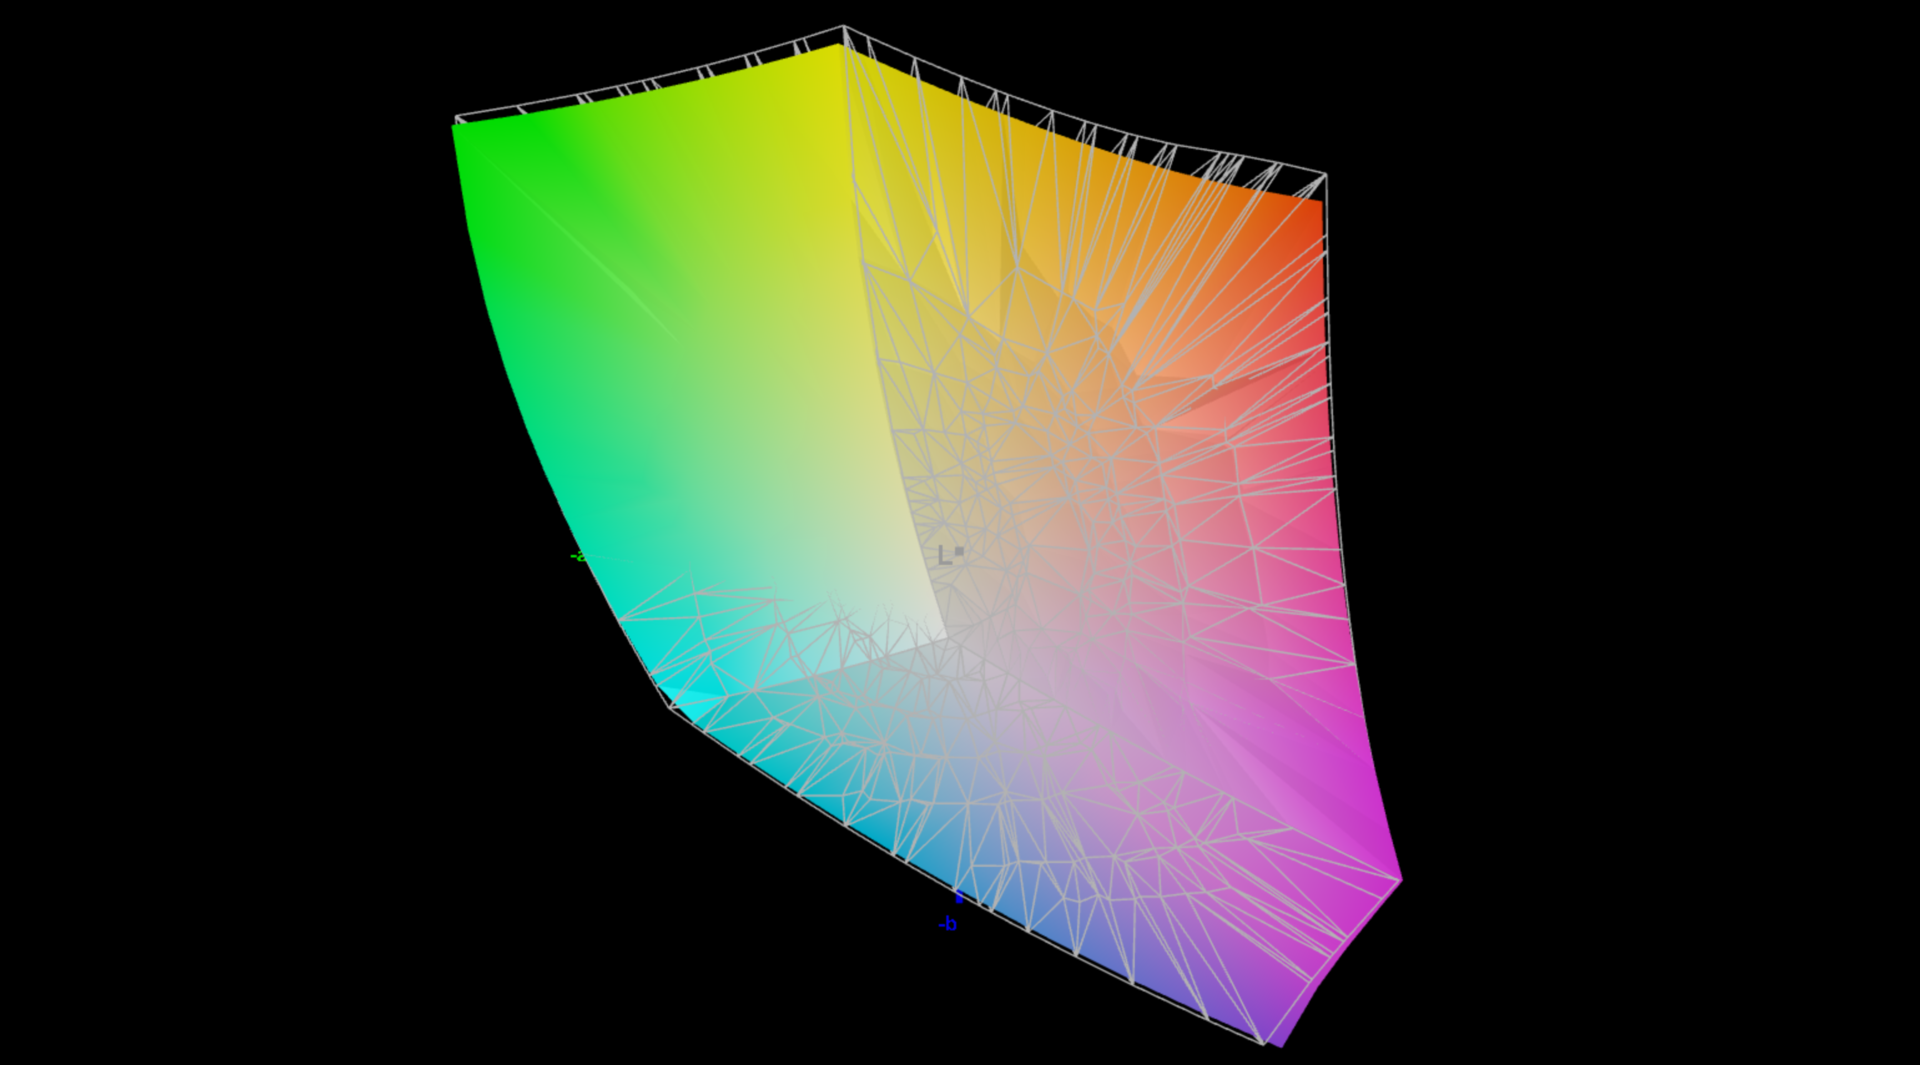
86.6% AdobeRGB 1998 (Argyll 2.2.0 3D)
99.9% sRGB (Argyll 2.2.0 3D)
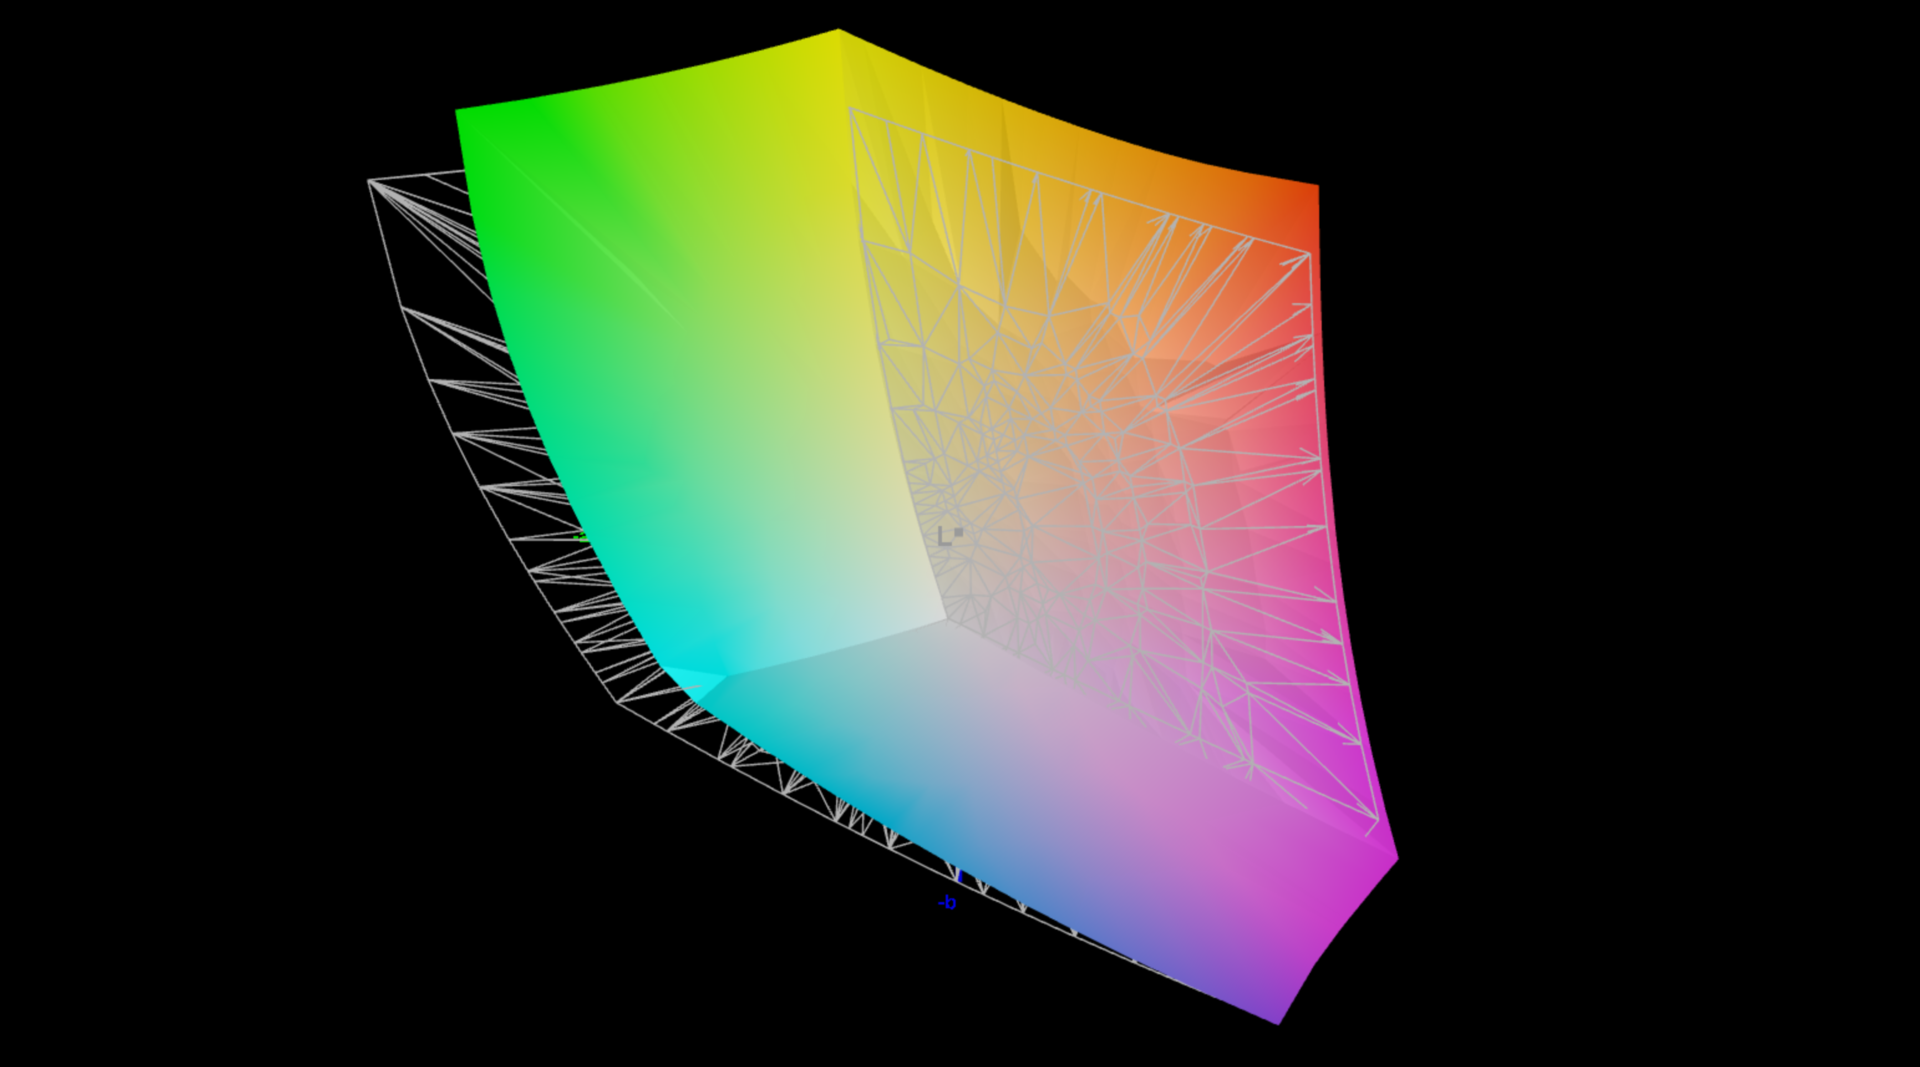
97% Display P3 (Argyll 2.2.0 3D)
Gamma: 2.18
| Lenovo Yoga Pro 9 16IMH9 LEN160-3.2K, Mini-LED, 3200x2000, 16.00 | Dell XPS 16 9640 SDC4196, OLED, 3840x2400, 16.30 | Honor MagicBook Pro 16 2024 TL160MDMP01, IPS, 3072x1920, 16.00 | Samsung Galaxy Book4 Ultra ATNA60CL07-0, OLED, 2880x1800, 16.00 | Framework Laptop 16 2560x1600, 16.00 | SCHENKER VISION 16 Pro (M23) NE160QDM-NZ1, IPS, 2560x1600, 16.00 | Lenovo Yoga Pro 9 16-IRP G8 LEN160-3.2K, Mini-LED, 3200x2000, 16.00 | |
|---|---|---|---|---|---|---|---|
| Display | 1% | 2% | 1% | 0% | -16% | 3% | |
| Display P3 Coverage | 97 | 98.3 1% | 98.8 2% | 98.6 2% | 97.7 1% | 68.8 -29% | 97 0% |
| sRGB Coverage | 99.9 | 100 0% | 100 0% | 99.9 0% | 99.7 0% | 98.8 -1% | 99.8 0% |
| AdobeRGB 1998 Coverage | 86.6 | 87.8 1% | 89.1 3% | 88.5 2% | 87 0% | 70 -19% | 95.1 10% |
| Response Times | 33% | 70% | 33% | 34% | 45% | 34% | |
| Response Time Grey 50% / Grey 80% * | 22.2 ? | 0.82 ? 96% | 6.3 ? 72% | 0.54 ? 98% | 14.6 ? 34% | 13.7 ? 38% | 14 ? 37% |
| Response Time Black / White * | 17 ? | 0.85 ? 95% | 5.6 ? 67% | 0.69 ? 96% | 11.3 ? 34% | 8.1 ? 52% | 9.2 ? 46% |
| PWM Frequency | 4840 ? | 360 ? -93% | 240 ? -95% | 5800 ? 20% | |||
| Screen | -11% | -30% | 3% | -23% | -57% | 11% | |
| Brightness middle | 651 | 366 -44% | 551 -15% | 390 -40% | 504.8 -22% | 384 -41% | 539 -17% |
| Brightness | 673 | 367 -45% | 524 -22% | 393 -42% | 490 -27% | 371 -45% | 546 -19% |
| Brightness Distribution | 93 | 96 3% | 91 -2% | 98 5% | 84 -10% | 88 -5% | 96 3% |
| Black Level * | 0.22 | 0.52 -136% | 0.41 -86% | 0.3 -36% | 0.18 18% | ||
| Contrast | 2959 | 1060 -64% | 1231 -58% | 1280 -57% | 2994 1% | ||
| Colorchecker dE 2000 * | 1.9 | 1.3 32% | 1.7 11% | 1.4 26% | 1.23 35% | 3.4 -79% | 1.4 26% |
| Colorchecker dE 2000 max. * | 4.2 | 3.6 14% | 4.1 2% | 2.7 36% | 3.74 11% | 9.2 -119% | 2.1 50% |
| Colorchecker dE 2000 calibrated * | 0.6 | 1 -67% | 1 -67% | 1.1 -83% | 1.3 -117% | ||
| Greyscale dE 2000 * | 3 | 2.2 27% | 2.4 20% | 2.1 30% | 2 33% | 3.4 -13% | 2.2 27% |
| Gamma | 2.18 101% | 2.14 103% | 2.2 100% | 2.27 97% | 2.22 99% | 2.16 102% | 2.19 100% |
| CCT | 6738 96% | 6680 97% | 6842 95% | 6431 101% | 6670 97% | 7462 87% | 6479 100% |
| Media total (Programa/Opciones) | 8% /
2% | 14% /
-9% | 12% /
10% | 4% /
-10% | -9% /
-34% | 16% /
14% |
* ... más pequeño es mejor
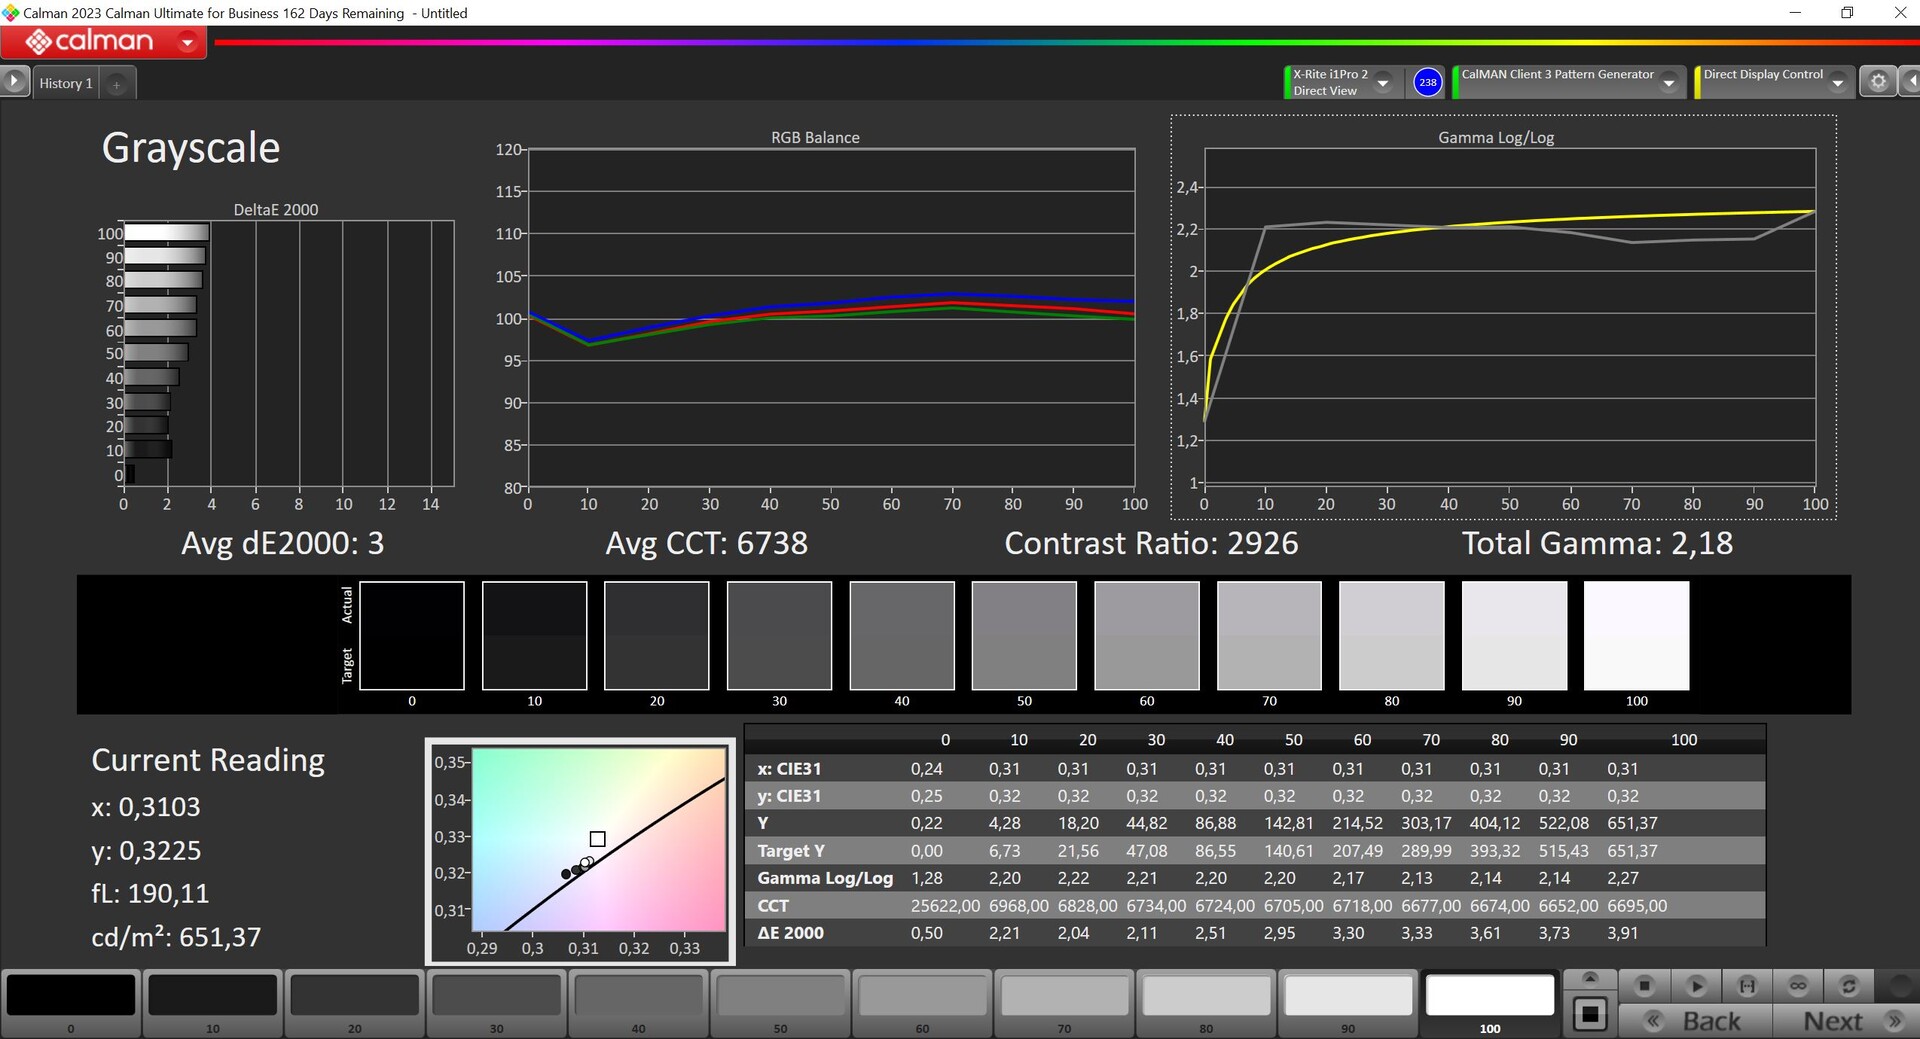
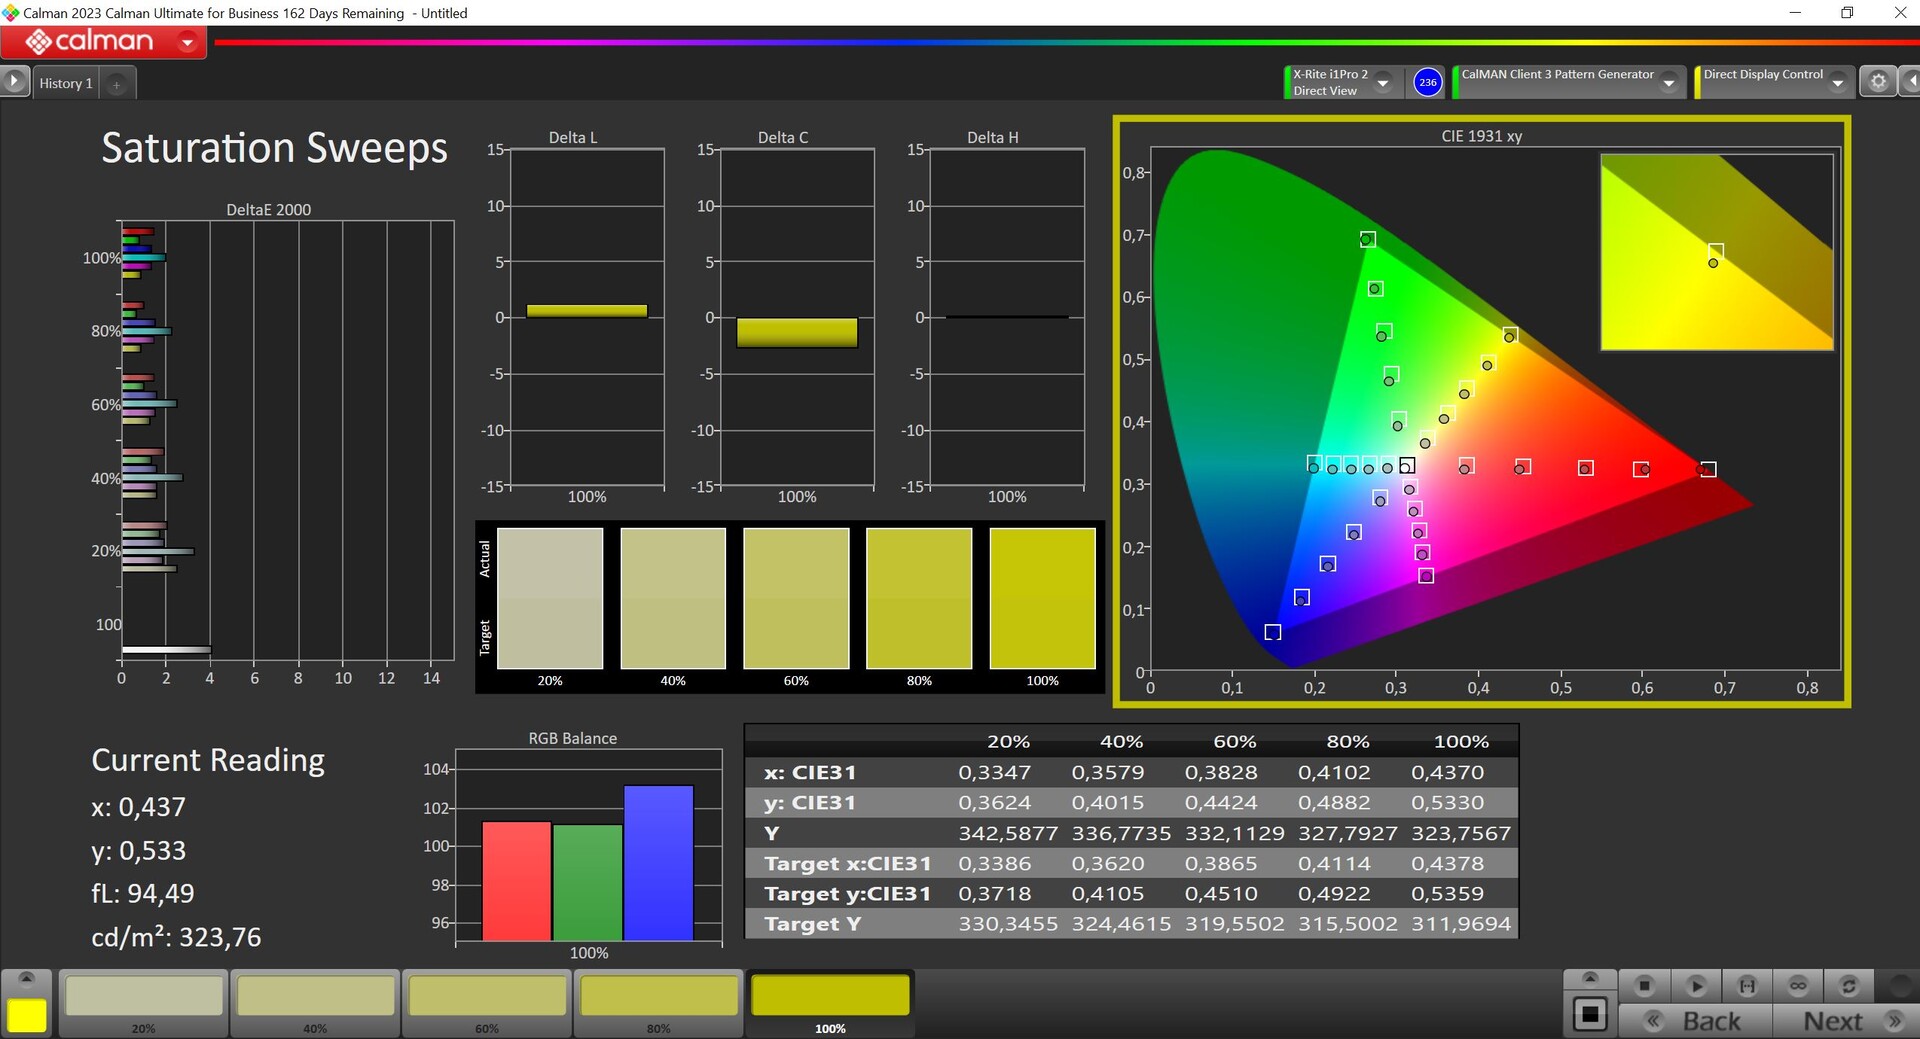
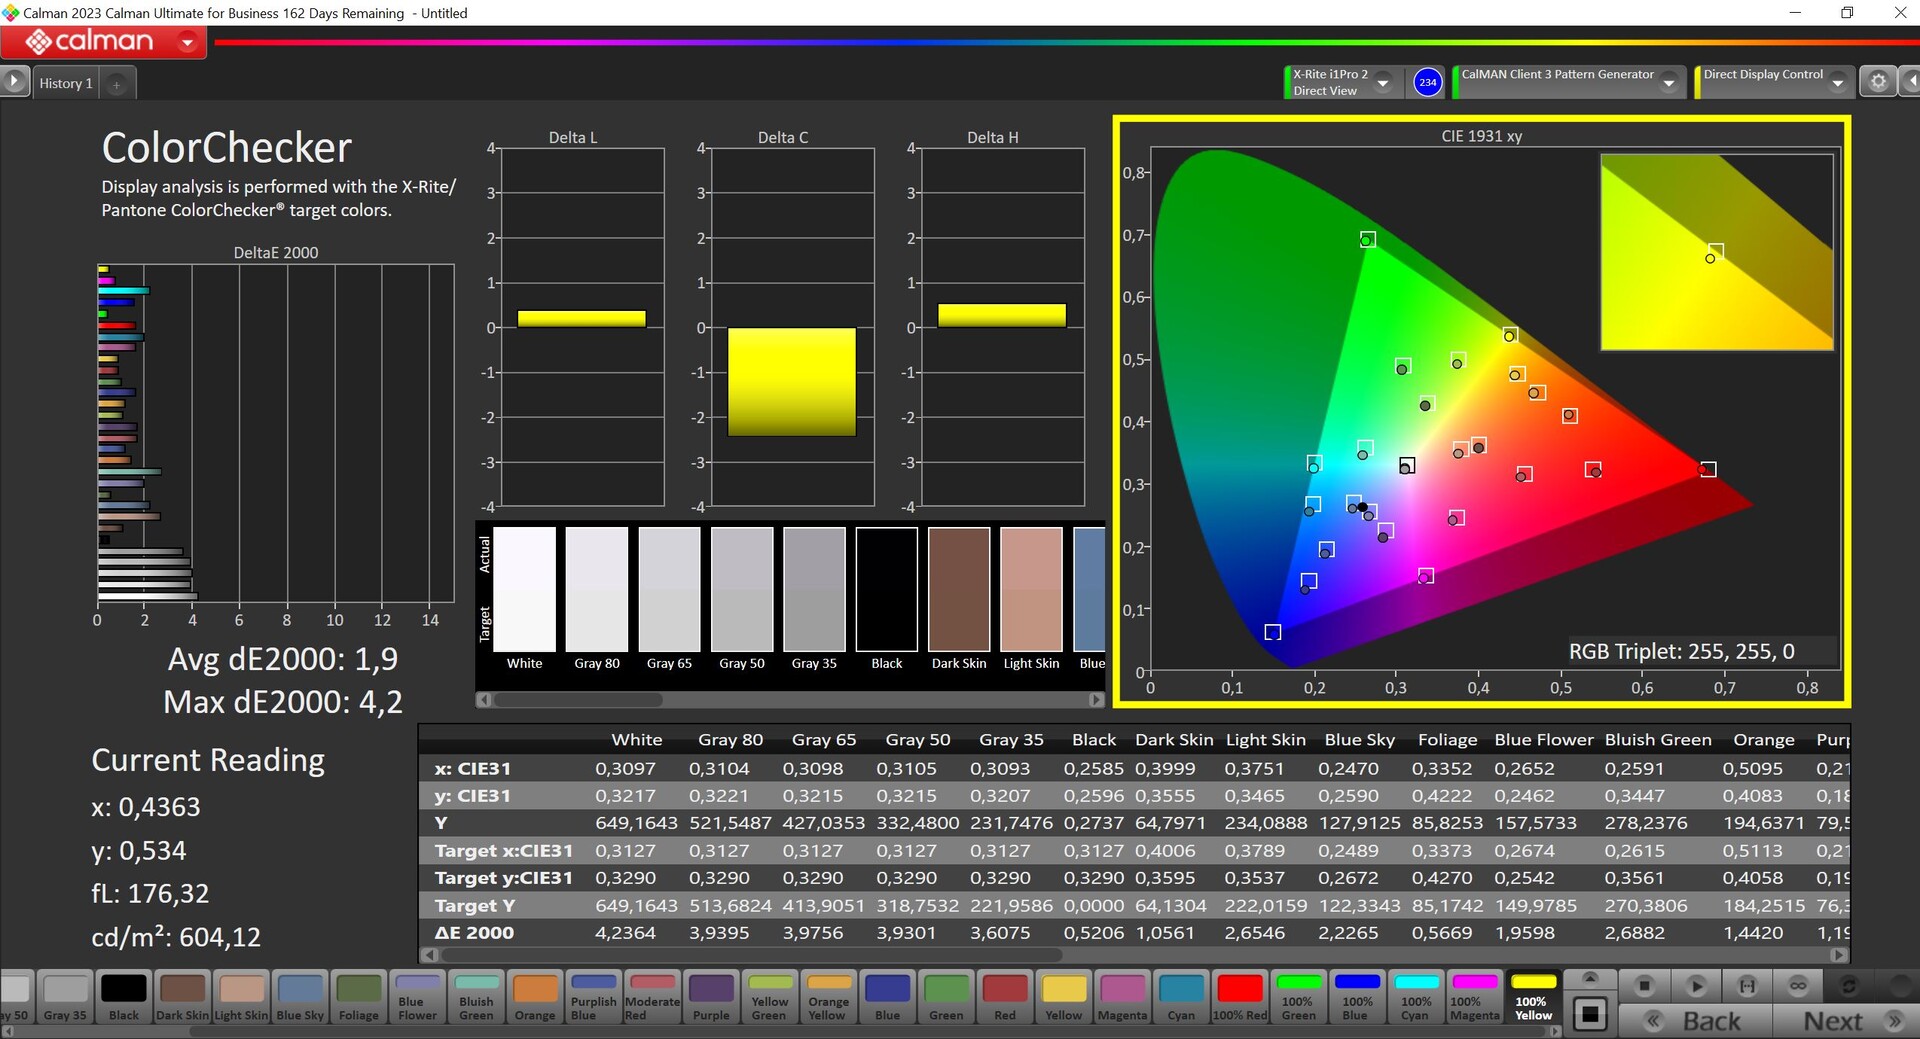
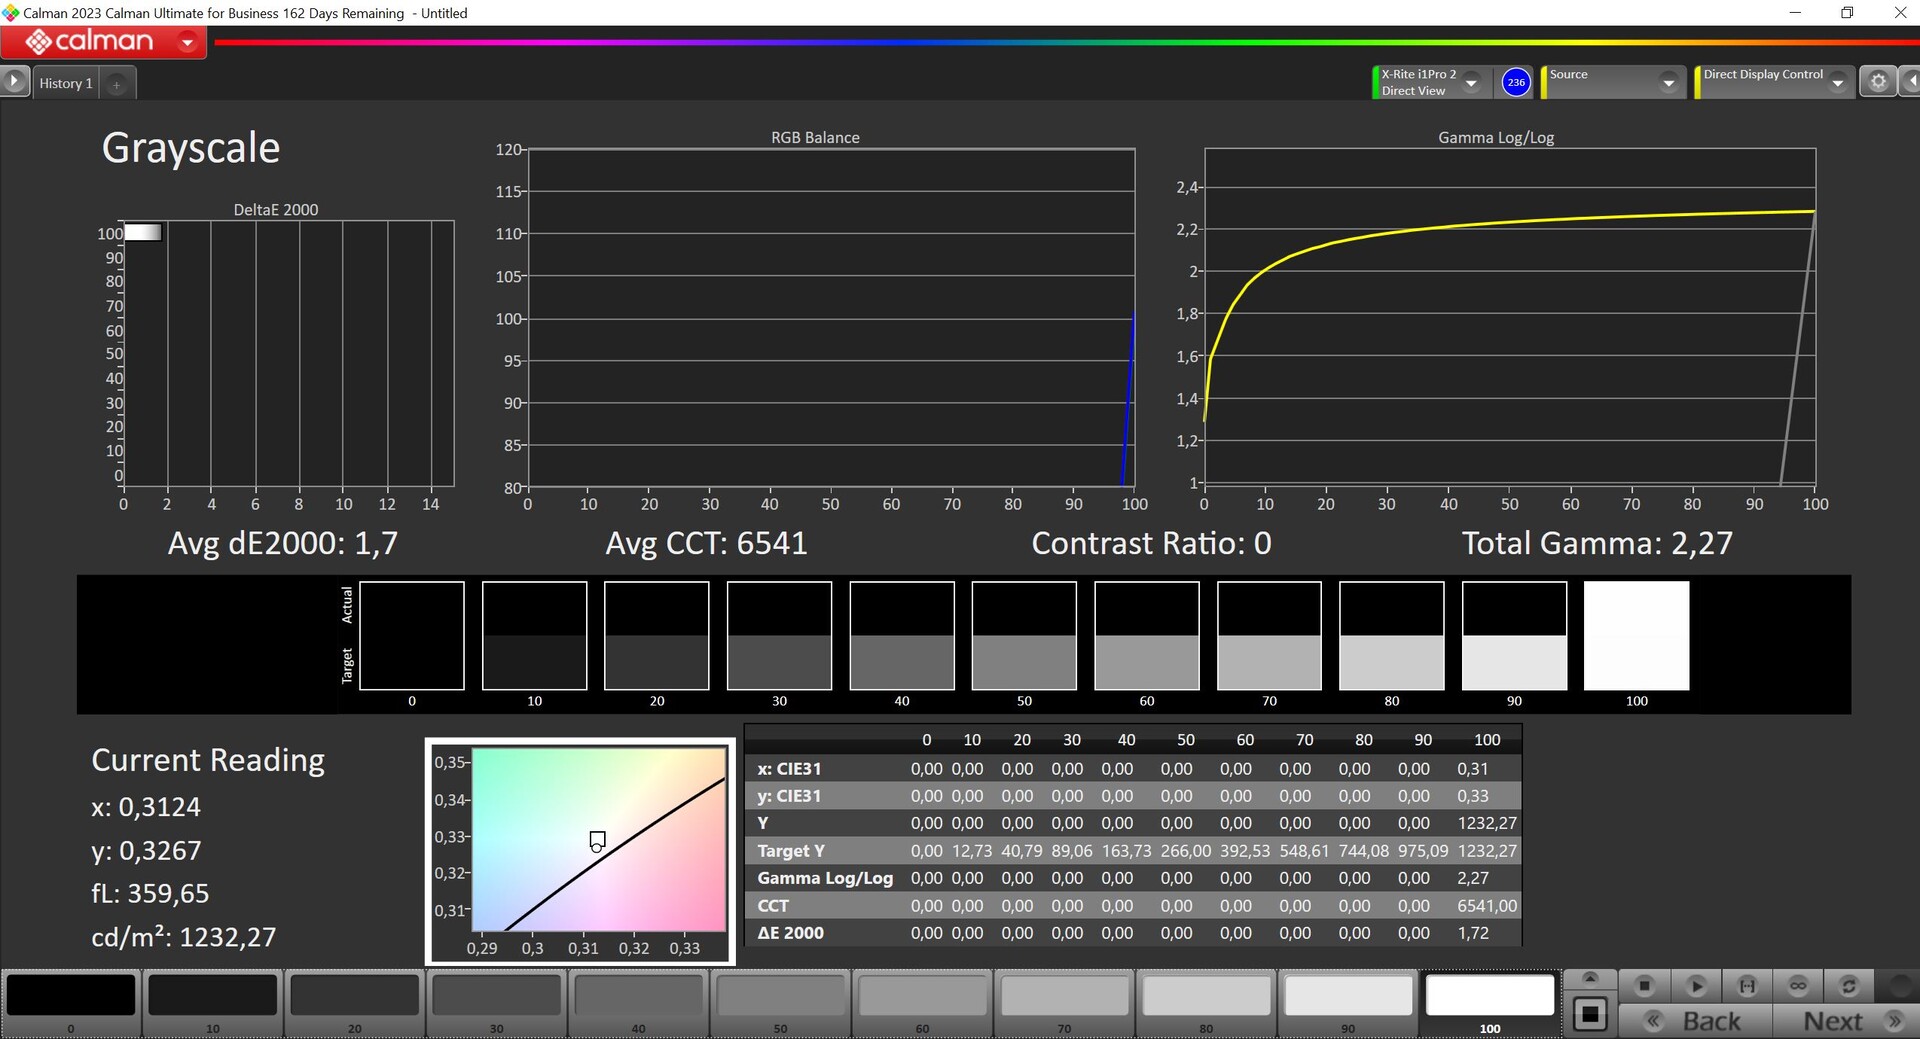
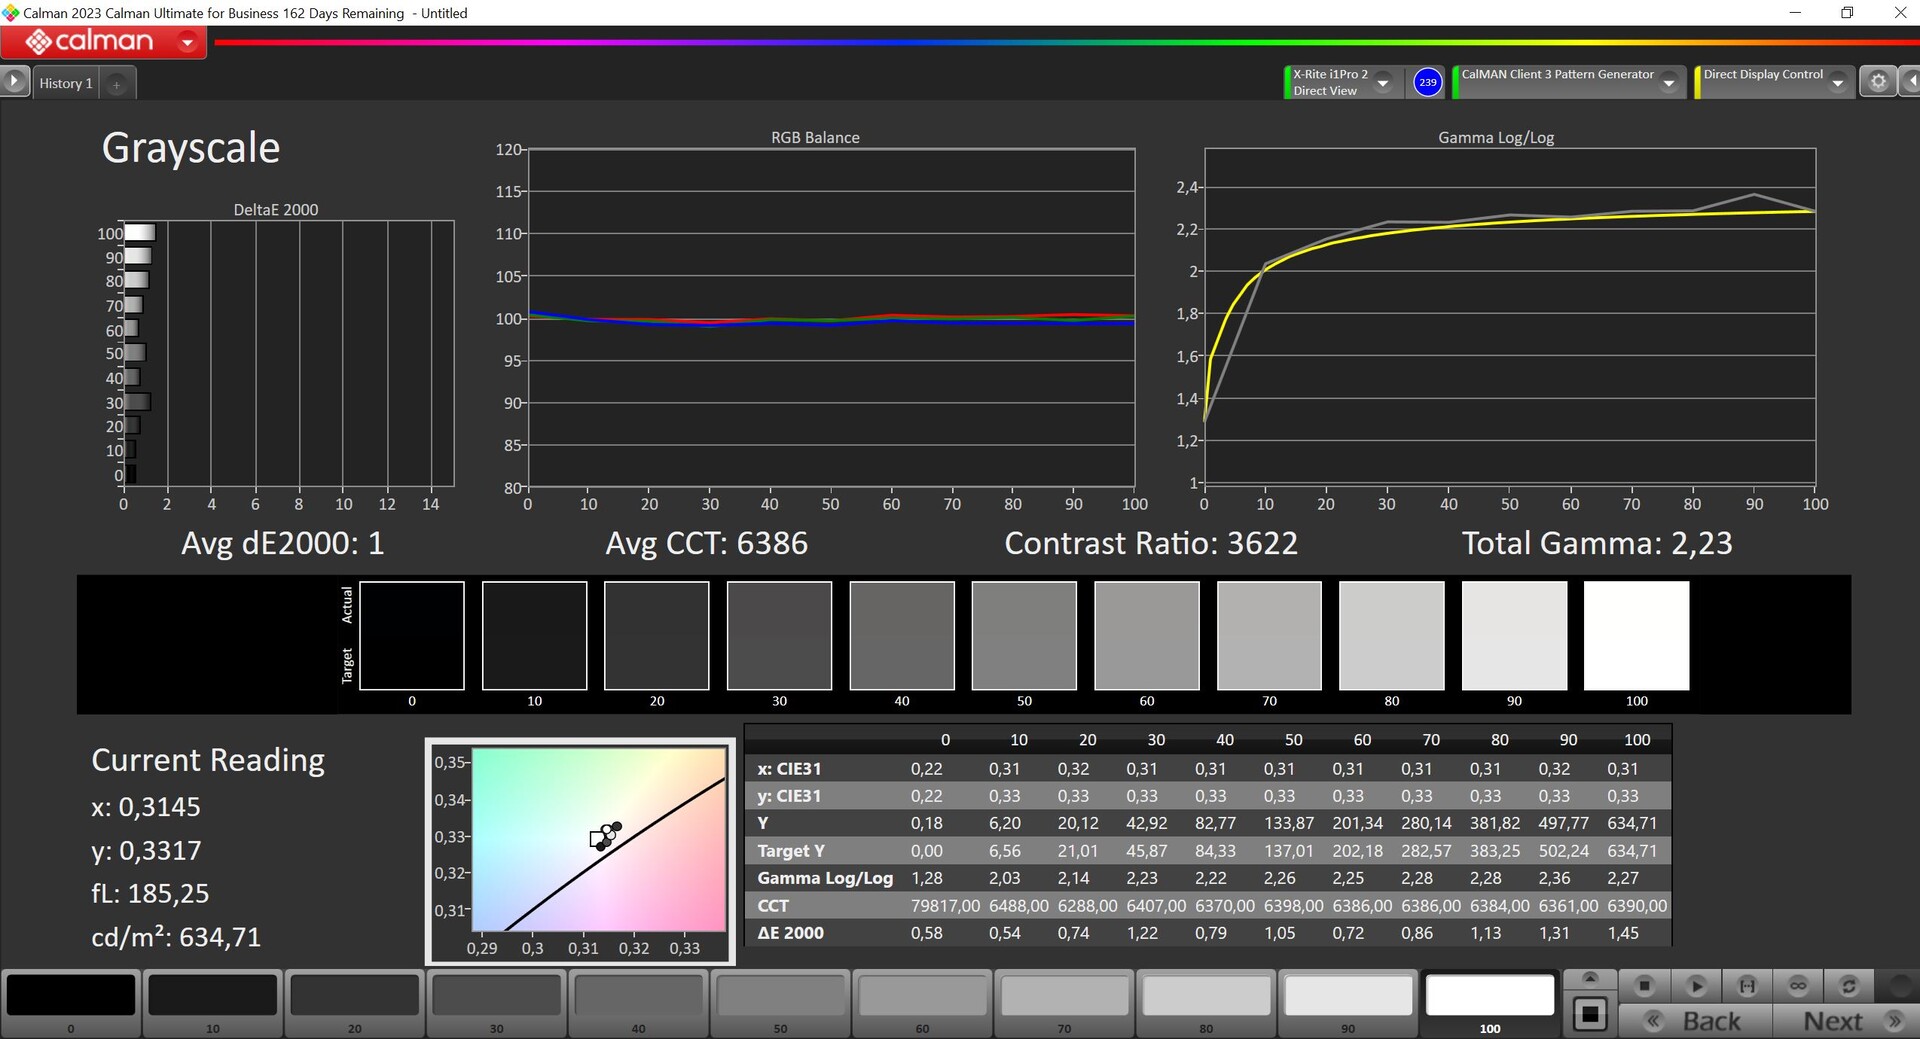
Analizamos el panel utilizando el software profesional CalMAN (X-Rite i1 Pro 2) y nos sorprendió que el software Lenovo Vantage ya no proporciona perfiles de color para los diferentes espacios de color. Lenovo sigue anunciando AdobeRGB, pero el único perfil disponible es el espacio de color P3. La razón de esta restricción no está clara, pero es definitivamente molesta. La pantalla ya es bastante decente fuera de la caja, pero hemos sido capaces de mejorar significativamente la calidad de imagen con nuestra propia calibración (perfil disponible para su descarga gratuita arriba).

Tiempos de respuesta del display
| ↔ Tiempo de respuesta de Negro a Blanco | ||
|---|---|---|
| 17 ms ... subida ↗ y bajada ↘ combinada | ↗ 8.2 ms subida | 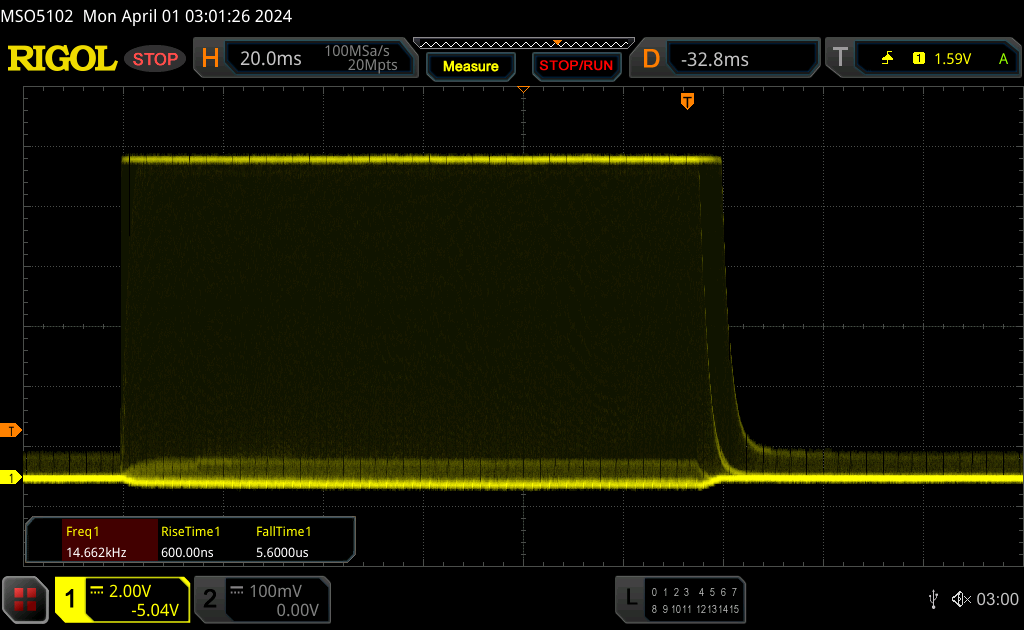 |
| ↘ 8.8 ms bajada | ||
| La pantalla mostró buenos tiempos de respuesta en nuestros tests pero podría ser demasiado lenta para los jugones competitivos. En comparación, todos los dispositivos de prueba van de ##min### (mínimo) a 240 (máximo) ms. » 33 % de todos los dispositivos son mejores. Esto quiere decir que el tiempo de respuesta medido es mejor que la media (21.5 ms) de todos los dispositivos testados. | ||
| ↔ Tiempo de respuesta 50% Gris a 80% Gris | ||
| 22.2 ms ... subida ↗ y bajada ↘ combinada | ↗ 9.6 ms subida | 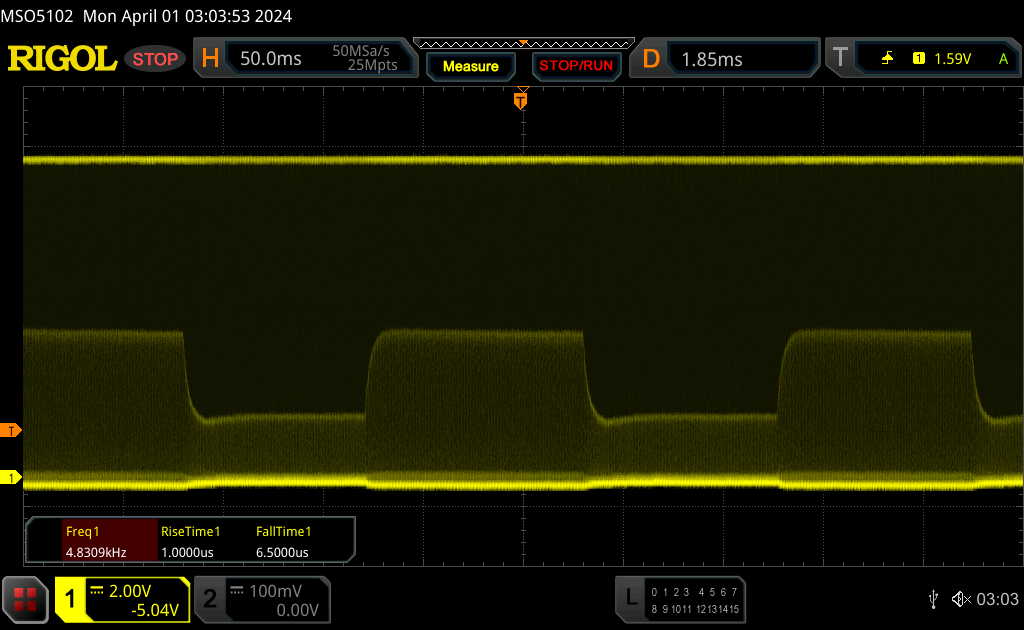 |
| ↘ 12.6 ms bajada | ||
| La pantalla mostró buenos tiempos de respuesta en nuestros tests pero podría ser demasiado lenta para los jugones competitivos. En comparación, todos los dispositivos de prueba van de ##min### (mínimo) a 636 (máximo) ms. » 28 % de todos los dispositivos son mejores. Esto quiere decir que el tiempo de respuesta medido es mejor que la media (33.7 ms) de todos los dispositivos testados. | ||
Parpadeo de Pantalla / PWM (Pulse-Width Modulation)
| Parpadeo de Pantalla / PWM detectado | 4840 Hz | ≤ 100 % de brillo | 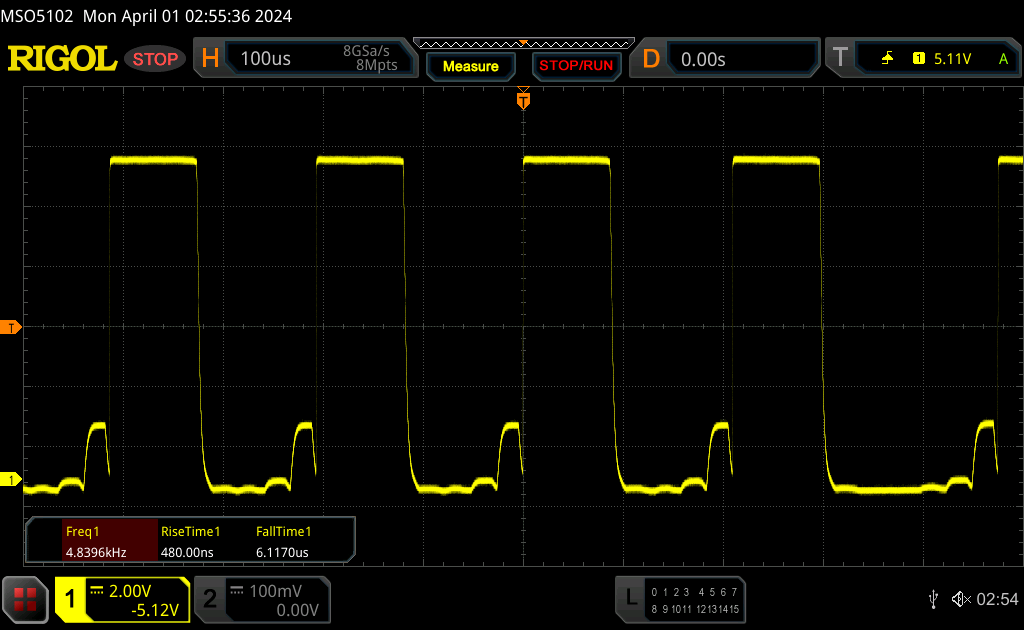 |
La retroiluminación del display parpadea a 4840 Hz (seguramente usa PWM - Pulse-Width Modulation) a un brillo del 100 % e inferior. Sobre este nivel de brillo no debería darse parpadeo / PWM. La frecuencia de 4840 Hz es bastante alta, por lo que la mayoría de gente sensible al parpadeo no debería ver parpadeo o tener fatiga visual. Comparación: 53 % de todos los dispositivos testados no usaron PWM para atenuar el display. Si se usó, medimos una media de 17898 (mínimo: 5 - máxmo: 3846000) Hz. | |||
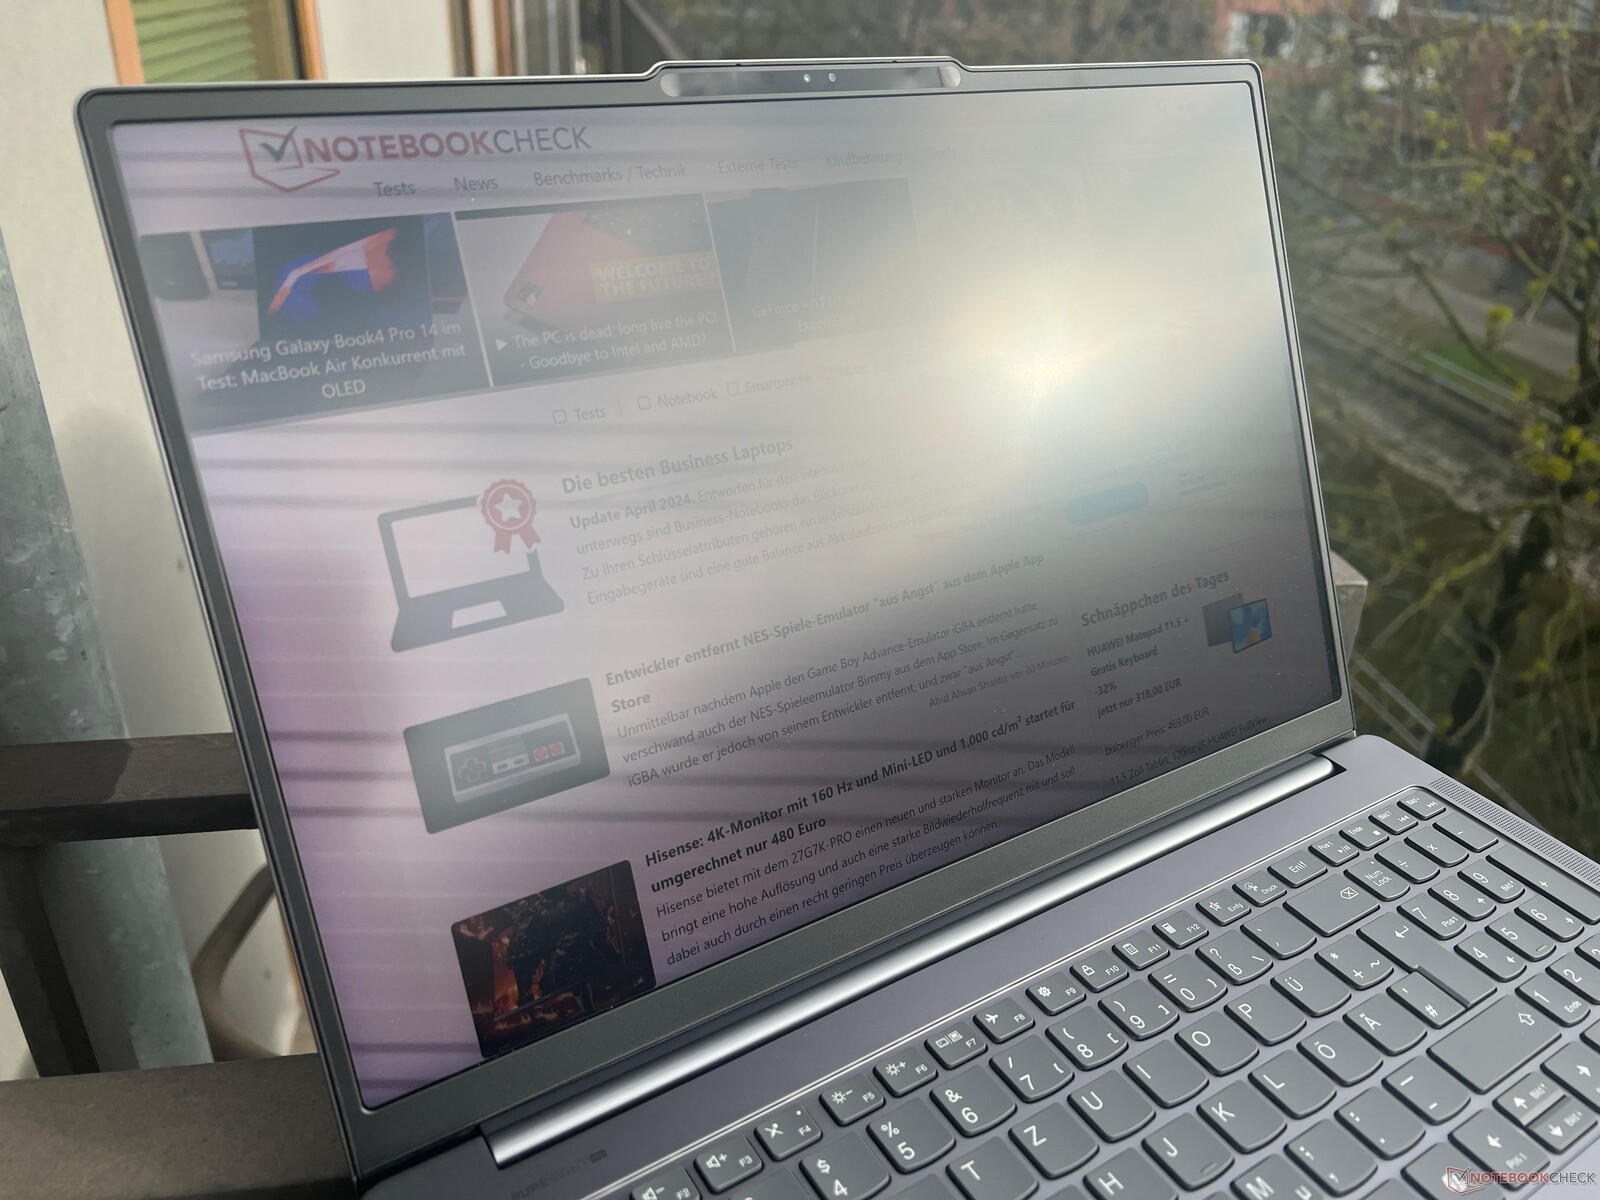
Naturalmente, la versión mate del mini panel LED se comporta mejor en exteriores que la pantalla táctil reflectante. Si se evitan los reflejos de las fuentes de luz directa, el dispositivo también puede utilizarse en entornos muy luminosos sin problemas. La estabilidad del ángulo de visión tampoco es motivo de crítica.

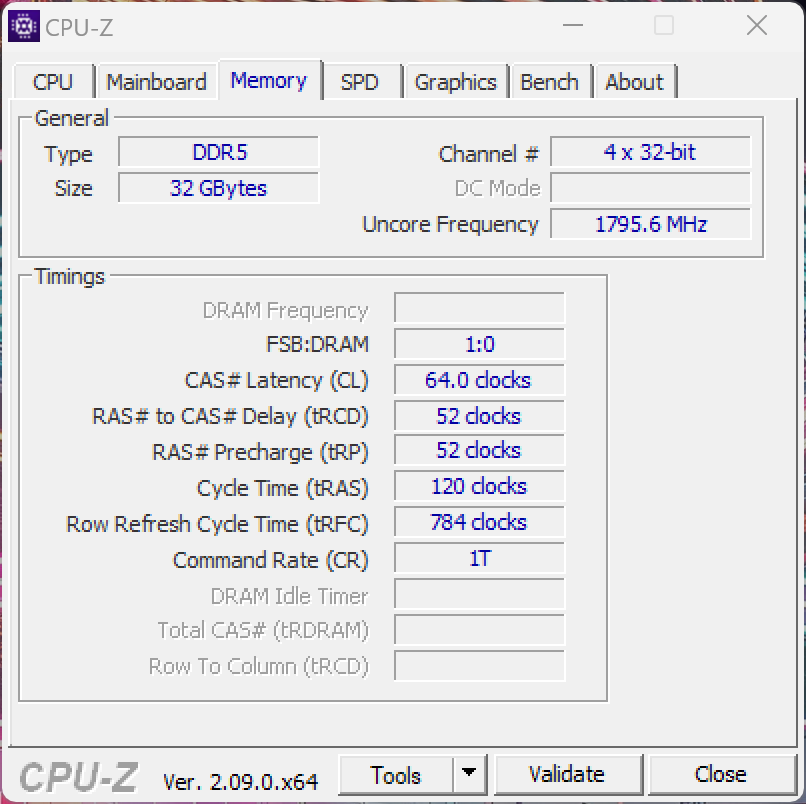
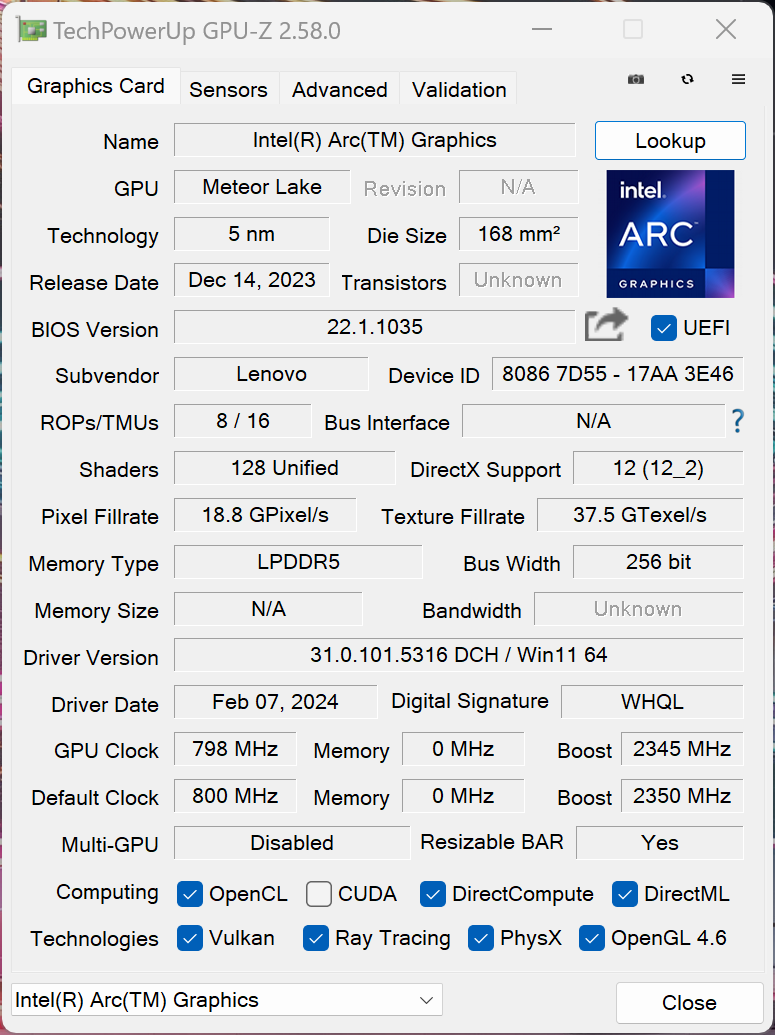
Rendimiento - Portátil RTX 4070 con Advanced Optimus
Lenovo ofrece el Yoga Pro 9i 16 G9 exclusivamente con los nuevos procesadores Meteor Lake de Intel (Core Ultra 7 o 9) y las dos GeForce RTX 4060/4070 para portátiles modelos. viene de serie con 32 GB de RAM (LPDDR5x-7467), pero la cantidad de RAM se puede duplicar hasta 64 GB por 130 EUR (unos 140 USD) si se elige el procesador Core Ultra 9 185H.
Condiciones de prueba
Lenovo ofrece varios perfiles de energía y hemos resumido los valores TDP/TGP correspondientes en la siguiente tabla. Realizamos los benchmarks y las mediciones en modo Rendimiento .
| Perfil energético | Carga de la CPU | CB R23 Multi | Carga de la GPU | Time Spy Gráficos | Cyberpunk 2077 QHD Ultra |
volumen máx. del ventilador |
|---|---|---|---|---|---|---|
| Batería | 40 -> 30 vatios | 12.824 puntos | 22 vatios | 2.655 puntos | 10,3 FPS | 30,9 dB(A) |
| Auto | 78 -> 65 vatios | 18.849 puntos | 65 vatios | 10.032 puntos | 38,6 FPS | 44,9 dB(A) |
| Rendimiento | 115 -> 80 vatios | puntos | 100 vatios | 12.181 puntos | 47,8 FPS | 53,9 dB(A) |
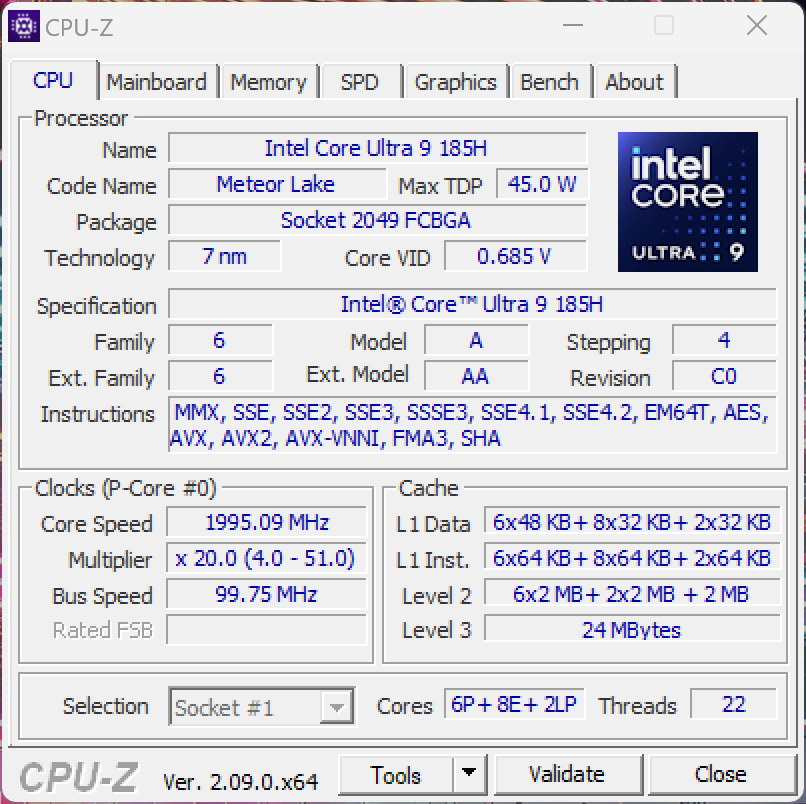
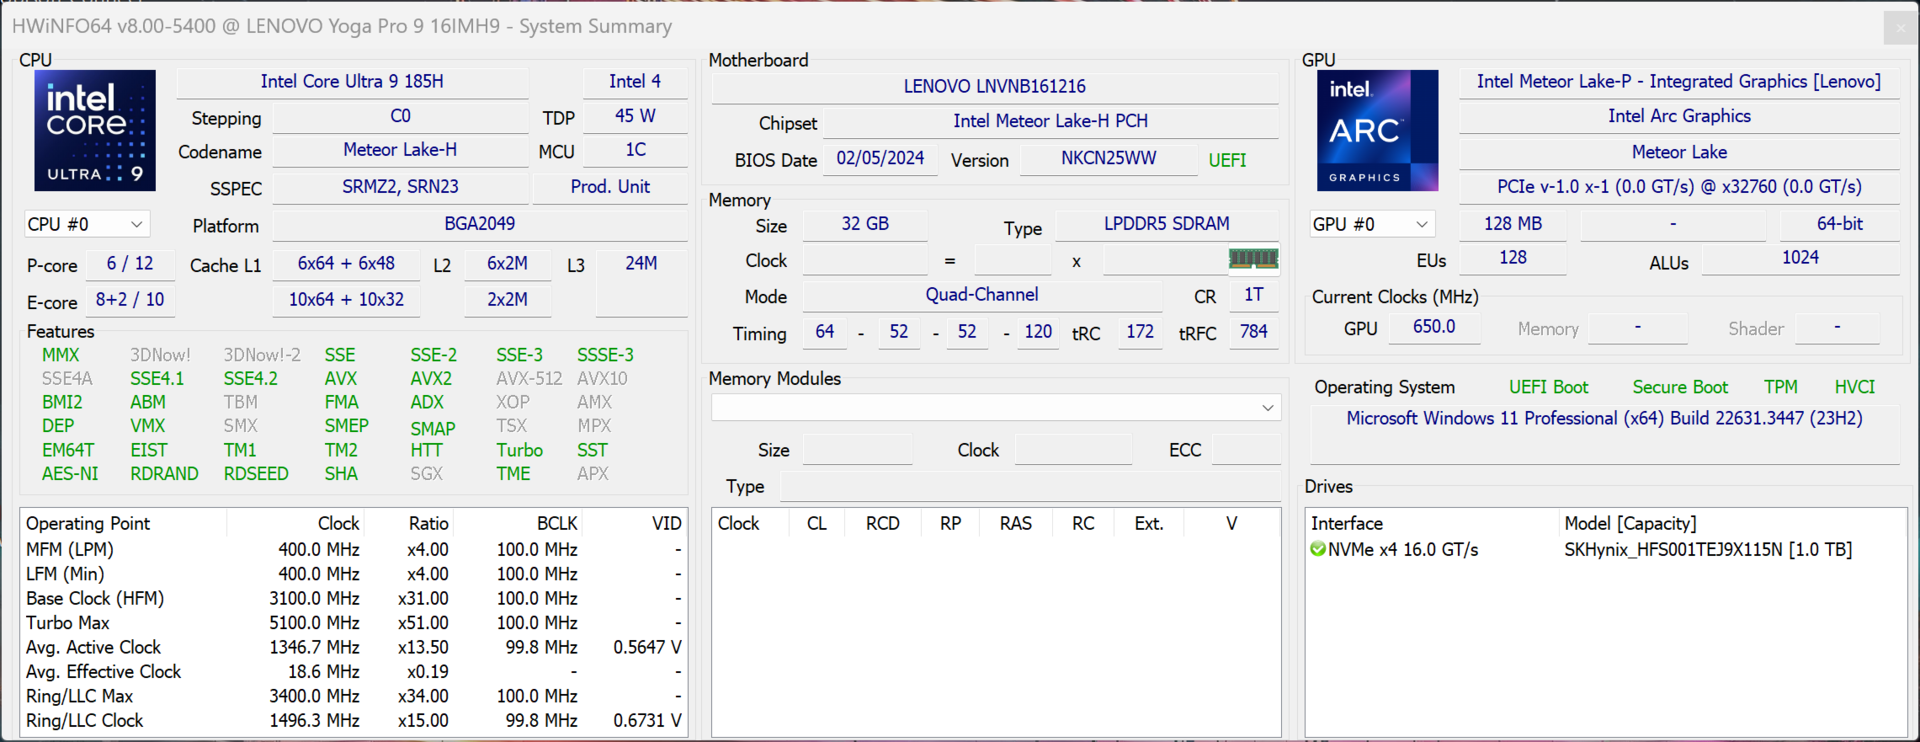
Procesador - Core Ultra 9 185H
El Core Ultra 9 185H es el sucesor del Core i9-13900H y ofrece 16 núcleos (22 hilos). En comparación con el Core Ultra 7 155H el 185H alcanza una velocidad de reloj máxima superior de hasta 5,1 GHz. Gracias a los altos límites de potencia, el rendimiento es muy bueno, pero también se puede ver que el rendimiento multinúcleo es sólo marginalmente mejor que el de los antiguos chips Raptor Lake. De media, el Core Ultra 9 sólo supera en un 2% al Core i7-13705H de su predecesor en todas las pruebas comparativas de CPU. El rendimiento también se mantiene muy estable bajo carga sostenida.
En modo batería, el procesador puede consumir un máximo de 80 vatios, por lo que el rendimiento aquí es solo ligeramente inferior al del funcionamiento en red. Encontrará más pruebas de rendimiento de la CPU en nuestra sección de tecnología.
Cinebench R15 Multi Sustained Load
Cinebench R23: Multi Core | Single Core
Cinebench R20: CPU (Multi Core) | CPU (Single Core)
Cinebench R15: CPU Multi 64Bit | CPU Single 64Bit
Blender: v2.79 BMW27 CPU
7-Zip 18.03: 7z b 4 | 7z b 4 -mmt1
Geekbench 6.2: Multi-Core | Single-Core
Geekbench 5.5: Multi-Core | Single-Core
HWBOT x265 Benchmark v2.2: 4k Preset
LibreOffice : 20 Documents To PDF
R Benchmark 2.5: Overall mean
| CPU Performance Rating | |
| Lenovo Yoga Pro 9 16IMH9 | |
| Lenovo Yoga Pro 9 16-IRP G8 | |
| Framework Laptop 16 | |
| Honor MagicBook Pro 16 2024 | |
| Dell XPS 16 9640 | |
| Average Intel Core Ultra 9 185H | |
| Samsung Galaxy Book4 Ultra | |
| SCHENKER VISION 16 Pro (M23) -2! | |
| Average of class Multimedia | |
| Cinebench R23 / Multi Core | |
| Lenovo Yoga Pro 9 16IMH9 | |
| Lenovo Yoga Pro 9 16-IRP G8 | |
| Honor MagicBook Pro 16 2024 | |
| Dell XPS 16 9640 | |
| Average Intel Core Ultra 9 185H (12688 - 19851, n=4) | |
| Framework Laptop 16 | |
| Samsung Galaxy Book4 Ultra | |
| SCHENKER VISION 16 Pro (M23) | |
| Average of class Multimedia (4624 - 30789, n=102, last 2 years) | |
| Cinebench R23 / Single Core | |
| Lenovo Yoga Pro 9 16IMH9 | |
| SCHENKER VISION 16 Pro (M23) | |
| Lenovo Yoga Pro 9 16-IRP G8 | |
| Average Intel Core Ultra 9 185H (1770 - 1906, n=4) | |
| Dell XPS 16 9640 | |
| Samsung Galaxy Book4 Ultra | |
| Honor MagicBook Pro 16 2024 | |
| Framework Laptop 16 | |
| Average of class Multimedia (878 - 2110, n=100, last 2 years) | |
| Cinebench R20 / CPU (Multi Core) | |
| Lenovo Yoga Pro 9 16IMH9 | |
| Lenovo Yoga Pro 9 16-IRP G8 | |
| Honor MagicBook Pro 16 2024 | |
| Dell XPS 16 9640 | |
| Average Intel Core Ultra 9 185H (4843 - 7651, n=4) | |
| Framework Laptop 16 | |
| Samsung Galaxy Book4 Ultra | |
| SCHENKER VISION 16 Pro (M23) | |
| Average of class Multimedia (1783 - 11768, n=98, last 2 years) | |
| Cinebench R20 / CPU (Single Core) | |
| Lenovo Yoga Pro 9 16IMH9 | |
| Lenovo Yoga Pro 9 16-IRP G8 | |
| SCHENKER VISION 16 Pro (M23) | |
| Average Intel Core Ultra 9 185H (680 - 735, n=4) | |
| Samsung Galaxy Book4 Ultra | |
| Honor MagicBook Pro 16 2024 | |
| Framework Laptop 16 | |
| Dell XPS 16 9640 | |
| Average of class Multimedia (341 - 812, n=98, last 2 years) | |
| Cinebench R15 / CPU Multi 64Bit | |
| Lenovo Yoga Pro 9 16IMH9 | |
| Lenovo Yoga Pro 9 16-IRP G8 | |
| Honor MagicBook Pro 16 2024 | |
| Dell XPS 16 9640 | |
| Framework Laptop 16 | |
| Samsung Galaxy Book4 Ultra | |
| Average Intel Core Ultra 9 185H (1582 - 3165, n=6) | |
| Average of class Multimedia (785 - 4703, n=107, last 2 years) | |
| SCHENKER VISION 16 Pro (M23) | |
| Cinebench R15 / CPU Single 64Bit | |
| Lenovo Yoga Pro 9 16IMH9 | |
| Framework Laptop 16 | |
| SCHENKER VISION 16 Pro (M23) | |
| Lenovo Yoga Pro 9 16-IRP G8 | |
| Honor MagicBook Pro 16 2024 | |
| Average Intel Core Ultra 9 185H (257 - 280, n=4) | |
| Dell XPS 16 9640 | |
| Samsung Galaxy Book4 Ultra | |
| Average of class Multimedia (142.6 - 308, n=100, last 2 years) | |
| Blender / v2.79 BMW27 CPU | |
| Average of class Multimedia (107 - 662, n=96, last 2 years) | |
| SCHENKER VISION 16 Pro (M23) | |
| Samsung Galaxy Book4 Ultra | |
| Average Intel Core Ultra 9 185H (163 - 285, n=4) | |
| Framework Laptop 16 | |
| Honor MagicBook Pro 16 2024 | |
| Dell XPS 16 9640 | |
| Lenovo Yoga Pro 9 16-IRP G8 | |
| Lenovo Yoga Pro 9 16IMH9 | |
| 7-Zip 18.03 / 7z b 4 | |
| Lenovo Yoga Pro 9 16-IRP G8 | |
| Lenovo Yoga Pro 9 16IMH9 | |
| Framework Laptop 16 | |
| Dell XPS 16 9640 | |
| Honor MagicBook Pro 16 2024 | |
| Average Intel Core Ultra 9 185H (52522 - 76331, n=4) | |
| Samsung Galaxy Book4 Ultra | |
| SCHENKER VISION 16 Pro (M23) | |
| Average of class Multimedia (20166 - 119900, n=91, last 2 years) | |
| 7-Zip 18.03 / 7z b 4 -mmt1 | |
| Framework Laptop 16 | |
| SCHENKER VISION 16 Pro (M23) | |
| Lenovo Yoga Pro 9 16-IRP G8 | |
| Lenovo Yoga Pro 9 16IMH9 | |
| Average of class Multimedia (3398 - 7163, n=91, last 2 years) | |
| Samsung Galaxy Book4 Ultra | |
| Honor MagicBook Pro 16 2024 | |
| Dell XPS 16 9640 | |
| Average Intel Core Ultra 9 185H (4981 - 5781, n=4) | |
| Geekbench 6.2 / Multi-Core | |
| Lenovo Yoga Pro 9 16-IRP G8 | |
| Lenovo Yoga Pro 9 16IMH9 | |
| Average Intel Core Ultra 9 185H (13351 - 14160, n=4) | |
| Dell XPS 16 9640 | |
| Average of class Multimedia (8656 - 21264, n=31, last 2 years) | |
| Framework Laptop 16 | |
| Honor MagicBook Pro 16 2024 | |
| Samsung Galaxy Book4 Ultra | |
| Geekbench 6.2 / Single-Core | |
| Framework Laptop 16 | |
| Average of class Multimedia (2320 - 3157, n=31, last 2 years) | |
| Lenovo Yoga Pro 9 16-IRP G8 | |
| Lenovo Yoga Pro 9 16IMH9 | |
| Average Intel Core Ultra 9 185H (2384 - 2570, n=4) | |
| Honor MagicBook Pro 16 2024 | |
| Samsung Galaxy Book4 Ultra | |
| Dell XPS 16 9640 | |
| Geekbench 5.5 / Multi-Core | |
| Lenovo Yoga Pro 9 16-IRP G8 | |
| Lenovo Yoga Pro 9 16IMH9 | |
| Dell XPS 16 9640 | |
| Honor MagicBook Pro 16 2024 | |
| Average Intel Core Ultra 9 185H (10441 - 14230, n=4) | |
| Samsung Galaxy Book4 Ultra | |
| Framework Laptop 16 | |
| SCHENKER VISION 16 Pro (M23) | |
| Average of class Multimedia (3828 - 23059, n=101, last 2 years) | |
| Geekbench 5.5 / Single-Core | |
| Framework Laptop 16 | |
| Lenovo Yoga Pro 9 16IMH9 | |
| SCHENKER VISION 16 Pro (M23) | |
| Average Intel Core Ultra 9 185H (1759 - 1902, n=4) | |
| Samsung Galaxy Book4 Ultra | |
| Honor MagicBook Pro 16 2024 | |
| Lenovo Yoga Pro 9 16-IRP G8 | |
| Dell XPS 16 9640 | |
| Average of class Multimedia (926 - 2342, n=101, last 2 years) | |
| HWBOT x265 Benchmark v2.2 / 4k Preset | |
| Lenovo Yoga Pro 9 16IMH9 | |
| Lenovo Yoga Pro 9 16-IRP G8 | |
| Framework Laptop 16 | |
| Dell XPS 16 9640 | |
| Honor MagicBook Pro 16 2024 | |
| Average Intel Core Ultra 9 185H (14.1 - 22.7, n=4) | |
| Samsung Galaxy Book4 Ultra | |
| SCHENKER VISION 16 Pro (M23) | |
| Average of class Multimedia (4.99 - 30.5, n=89, last 2 years) | |
| LibreOffice / 20 Documents To PDF | |
| Average of class Multimedia (6.7 - 84.9, n=93, last 2 years) | |
| Lenovo Yoga Pro 9 16-IRP G8 | |
| SCHENKER VISION 16 Pro (M23) | |
| Honor MagicBook Pro 16 2024 | |
| Samsung Galaxy Book4 Ultra | |
| Dell XPS 16 9640 | |
| Framework Laptop 16 | |
| Average Intel Core Ultra 9 185H (39.7 - 44.6, n=4) | |
| Lenovo Yoga Pro 9 16IMH9 | |
| R Benchmark 2.5 / Overall mean | |
| Dell XPS 16 9640 | |
| Average of class Multimedia (0.3826 - 0.723, n=91, last 2 years) | |
| Samsung Galaxy Book4 Ultra | |
| Honor MagicBook Pro 16 2024 | |
| Average Intel Core Ultra 9 185H (0.4457 - 0.4757, n=4) | |
| Lenovo Yoga Pro 9 16-IRP G8 | |
| Framework Laptop 16 | |
| Lenovo Yoga Pro 9 16IMH9 | |
| SCHENKER VISION 16 Pro (M23) | |
* ... más pequeño es mejor
AIDA64: FP32 Ray-Trace | FPU Julia | CPU SHA3 | CPU Queen | FPU SinJulia | FPU Mandel | CPU AES | CPU ZLib | FP64 Ray-Trace | CPU PhotoWorxx
| Performance Rating | |
| Framework Laptop 16 | |
| Lenovo Yoga Pro 9 16IMH9 | |
| Honor MagicBook Pro 16 2024 | |
| Lenovo Yoga Pro 9 16-IRP G8 | |
| Dell XPS 16 9640 | |
| Average Intel Core Ultra 9 185H | |
| Samsung Galaxy Book4 Ultra | |
| SCHENKER VISION 16 Pro (M23) | |
| Average of class Multimedia | |
| AIDA64 / FP32 Ray-Trace | |
| Framework Laptop 16 | |
| Lenovo Yoga Pro 9 16IMH9 | |
| Lenovo Yoga Pro 9 16-IRP G8 | |
| Honor MagicBook Pro 16 2024 | |
| Dell XPS 16 9640 | |
| Average Intel Core Ultra 9 185H (9220 - 18502, n=4) | |
| Samsung Galaxy Book4 Ultra | |
| SCHENKER VISION 16 Pro (M23) | |
| Average of class Multimedia (3804 - 27411, n=89, last 2 years) | |
| AIDA64 / FPU Julia | |
| Framework Laptop 16 | |
| Lenovo Yoga Pro 9 16IMH9 | |
| Honor MagicBook Pro 16 2024 | |
| Lenovo Yoga Pro 9 16-IRP G8 | |
| Dell XPS 16 9640 | |
| Average Intel Core Ultra 9 185H (48865 - 95213, n=4) | |
| Samsung Galaxy Book4 Ultra | |
| SCHENKER VISION 16 Pro (M23) | |
| Average of class Multimedia (16379 - 136048, n=89, last 2 years) | |
| AIDA64 / CPU SHA3 | |
| Framework Laptop 16 | |
| Honor MagicBook Pro 16 2024 | |
| Lenovo Yoga Pro 9 16IMH9 | |
| Lenovo Yoga Pro 9 16-IRP G8 | |
| Dell XPS 16 9640 | |
| Average Intel Core Ultra 9 185H (2394 - 4382, n=4) | |
| Samsung Galaxy Book4 Ultra | |
| SCHENKER VISION 16 Pro (M23) | |
| Average of class Multimedia (1099 - 6681, n=89, last 2 years) | |
| AIDA64 / CPU Queen | |
| Framework Laptop 16 | |
| Lenovo Yoga Pro 9 16-IRP G8 | |
| SCHENKER VISION 16 Pro (M23) | |
| Lenovo Yoga Pro 9 16IMH9 | |
| Average of class Multimedia (21547 - 134321, n=89, last 2 years) | |
| Dell XPS 16 9640 | |
| Average Intel Core Ultra 9 185H (66785 - 94589, n=4) | |
| Samsung Galaxy Book4 Ultra | |
| Honor MagicBook Pro 16 2024 | |
| AIDA64 / FPU SinJulia | |
| Framework Laptop 16 | |
| Lenovo Yoga Pro 9 16IMH9 | |
| Lenovo Yoga Pro 9 16-IRP G8 | |
| Honor MagicBook Pro 16 2024 | |
| Dell XPS 16 9640 | |
| Average Intel Core Ultra 9 185H (7255 - 11392, n=4) | |
| Samsung Galaxy Book4 Ultra | |
| Average of class Multimedia (3099 - 15484, n=89, last 2 years) | |
| SCHENKER VISION 16 Pro (M23) | |
| AIDA64 / FPU Mandel | |
| Framework Laptop 16 | |
| Lenovo Yoga Pro 9 16IMH9 | |
| Dell XPS 16 9640 | |
| Honor MagicBook Pro 16 2024 | |
| Lenovo Yoga Pro 9 16-IRP G8 | |
| Average Intel Core Ultra 9 185H (24004 - 47315, n=4) | |
| Samsung Galaxy Book4 Ultra | |
| Average of class Multimedia (9602 - 68591, n=89, last 2 years) | |
| SCHENKER VISION 16 Pro (M23) | |
| AIDA64 / CPU AES | |
| Framework Laptop 16 | |
| Honor MagicBook Pro 16 2024 | |
| Lenovo Yoga Pro 9 16IMH9 | |
| Lenovo Yoga Pro 9 16-IRP G8 | |
| Dell XPS 16 9640 | |
| Average Intel Core Ultra 9 185H (53116 - 94250, n=4) | |
| Average of class Multimedia (23702 - 169946, n=89, last 2 years) | |
| Samsung Galaxy Book4 Ultra | |
| SCHENKER VISION 16 Pro (M23) | |
| AIDA64 / CPU ZLib | |
| Lenovo Yoga Pro 9 16IMH9 | |
| Honor MagicBook Pro 16 2024 | |
| Lenovo Yoga Pro 9 16-IRP G8 | |
| Dell XPS 16 9640 | |
| Average Intel Core Ultra 9 185H (678 - 1341, n=4) | |
| Samsung Galaxy Book4 Ultra | |
| SCHENKER VISION 16 Pro (M23) | |
| Average of class Multimedia (302 - 1901, n=89, last 2 years) | |
| Framework Laptop 16 | |
| AIDA64 / FP64 Ray-Trace | |
| Framework Laptop 16 | |
| Lenovo Yoga Pro 9 16IMH9 | |
| Lenovo Yoga Pro 9 16-IRP G8 | |
| Dell XPS 16 9640 | |
| Honor MagicBook Pro 16 2024 | |
| Average Intel Core Ultra 9 185H (4428 - 9768, n=4) | |
| SCHENKER VISION 16 Pro (M23) | |
| Samsung Galaxy Book4 Ultra | |
| Average of class Multimedia (1996 - 14590, n=89, last 2 years) | |
| AIDA64 / CPU PhotoWorxx | |
| Lenovo Yoga Pro 9 16IMH9 | |
| Lenovo Yoga Pro 9 16-IRP G8 | |
| Dell XPS 16 9640 | |
| Average Intel Core Ultra 9 185H (50237 - 53918, n=4) | |
| Samsung Galaxy Book4 Ultra | |
| Honor MagicBook Pro 16 2024 | |
| SCHENKER VISION 16 Pro (M23) | |
| Framework Laptop 16 | |
| Average of class Multimedia (7419 - 53918, n=89, last 2 years) | |
Rendimiento del sistema
Los resultados en los benchmarks sintéticos son buenos y el Yoga Pro 9i 16 es un dispositivo muy rápido en el uso diario. Sólo hay un breve retraso al cambiar a la tarjeta gráfica dedicada, pero esto es normal en los dispositivos con Advanced Optimus. No se detectaron otros problemas durante las pruebas de rendimiento del sistema.
CrossMark: Overall | Productivity | Creativity | Responsiveness
WebXPRT 3: Overall
WebXPRT 4: Overall
Mozilla Kraken 1.1: Total
| PCMark 10 / Score | |
| Framework Laptop 16 | |
| Lenovo Yoga Pro 9 16IMH9 | |
| Average Intel Core Ultra 9 185H, NVIDIA GeForce RTX 4070 Laptop GPU () | |
| SCHENKER VISION 16 Pro (M23) | |
| Lenovo Yoga Pro 9 16-IRP G8 | |
| Dell XPS 16 9640 | |
| Samsung Galaxy Book4 Ultra | |
| Honor MagicBook Pro 16 2024 | |
| Average of class Multimedia (4635 - 8670, n=86, last 2 years) | |
| PCMark 10 / Essentials | |
| Framework Laptop 16 | |
| Lenovo Yoga Pro 9 16IMH9 | |
| Average Intel Core Ultra 9 185H, NVIDIA GeForce RTX 4070 Laptop GPU () | |
| Lenovo Yoga Pro 9 16-IRP G8 | |
| SCHENKER VISION 16 Pro (M23) | |
| Average of class Multimedia (8480 - 12420, n=86, last 2 years) | |
| Samsung Galaxy Book4 Ultra | |
| Dell XPS 16 9640 | |
| Honor MagicBook Pro 16 2024 | |
| PCMark 10 / Productivity | |
| Framework Laptop 16 | |
| SCHENKER VISION 16 Pro (M23) | |
| Dell XPS 16 9640 | |
| Samsung Galaxy Book4 Ultra | |
| Lenovo Yoga Pro 9 16IMH9 | |
| Average Intel Core Ultra 9 185H, NVIDIA GeForce RTX 4070 Laptop GPU () | |
| Lenovo Yoga Pro 9 16-IRP G8 | |
| Average of class Multimedia (5845 - 11186, n=86, last 2 years) | |
| Honor MagicBook Pro 16 2024 | |
| PCMark 10 / Digital Content Creation | |
| Framework Laptop 16 | |
| Lenovo Yoga Pro 9 16IMH9 | |
| Average Intel Core Ultra 9 185H, NVIDIA GeForce RTX 4070 Laptop GPU () | |
| Lenovo Yoga Pro 9 16-IRP G8 | |
| SCHENKER VISION 16 Pro (M23) | |
| Honor MagicBook Pro 16 2024 | |
| Dell XPS 16 9640 | |
| Samsung Galaxy Book4 Ultra | |
| Average of class Multimedia (4688 - 13548, n=86, last 2 years) | |
| CrossMark / Overall | |
| SCHENKER VISION 16 Pro (M23) | |
| Dell XPS 16 9640 | |
| Lenovo Yoga Pro 9 16-IRP G8 | |
| Samsung Galaxy Book4 Ultra | |
| Honor MagicBook Pro 16 2024 | |
| Lenovo Yoga Pro 9 16IMH9 | |
| Average Intel Core Ultra 9 185H, NVIDIA GeForce RTX 4070 Laptop GPU () | |
| Average of class Multimedia (1009 - 2146, n=92, last 2 years) | |
| Framework Laptop 16 | |
| CrossMark / Productivity | |
| SCHENKER VISION 16 Pro (M23) | |
| Dell XPS 16 9640 | |
| Lenovo Yoga Pro 9 16-IRP G8 | |
| Honor MagicBook Pro 16 2024 | |
| Samsung Galaxy Book4 Ultra | |
| Average of class Multimedia (971 - 2064, n=92, last 2 years) | |
| Lenovo Yoga Pro 9 16IMH9 | |
| Average Intel Core Ultra 9 185H, NVIDIA GeForce RTX 4070 Laptop GPU () | |
| Framework Laptop 16 | |
| CrossMark / Creativity | |
| Lenovo Yoga Pro 9 16-IRP G8 | |
| Dell XPS 16 9640 | |
| SCHENKER VISION 16 Pro (M23) | |
| Lenovo Yoga Pro 9 16IMH9 | |
| Average Intel Core Ultra 9 185H, NVIDIA GeForce RTX 4070 Laptop GPU () | |
| Samsung Galaxy Book4 Ultra | |
| Average of class Multimedia (1054 - 2865, n=92, last 2 years) | |
| Framework Laptop 16 | |
| Honor MagicBook Pro 16 2024 | |
| CrossMark / Responsiveness | |
| SCHENKER VISION 16 Pro (M23) | |
| Dell XPS 16 9640 | |
| Honor MagicBook Pro 16 2024 | |
| Lenovo Yoga Pro 9 16-IRP G8 | |
| Samsung Galaxy Book4 Ultra | |
| Average of class Multimedia (926 - 2171, n=92, last 2 years) | |
| Framework Laptop 16 | |
| Lenovo Yoga Pro 9 16IMH9 | |
| Average Intel Core Ultra 9 185H, NVIDIA GeForce RTX 4070 Laptop GPU () | |
| WebXPRT 3 / Overall | |
| Framework Laptop 16 | |
| SCHENKER VISION 16 Pro (M23) | |
| Lenovo Yoga Pro 9 16-IRP G8 | |
| Lenovo Yoga Pro 9 16IMH9 | |
| Average Intel Core Ultra 9 185H, NVIDIA GeForce RTX 4070 Laptop GPU () | |
| Average of class Multimedia (171.4 - 432, n=94, last 2 years) | |
| Honor MagicBook Pro 16 2024 | |
| Dell XPS 16 9640 | |
| Samsung Galaxy Book4 Ultra | |
| WebXPRT 4 / Overall | |
| SCHENKER VISION 16 Pro (M23) | |
| Lenovo Yoga Pro 9 16IMH9 | |
| Average Intel Core Ultra 9 185H, NVIDIA GeForce RTX 4070 Laptop GPU () | |
| Framework Laptop 16 | |
| Lenovo Yoga Pro 9 16-IRP G8 | |
| Honor MagicBook Pro 16 2024 | |
| Samsung Galaxy Book4 Ultra | |
| Dell XPS 16 9640 | |
| Average of class Multimedia (133.2 - 348, n=71, last 2 years) | |
| Mozilla Kraken 1.1 / Total | |
| Average of class Multimedia (363 - 1016, n=96, last 2 years) | |
| Honor MagicBook Pro 16 2024 | |
| Lenovo Yoga Pro 9 16-IRP G8 | |
| SCHENKER VISION 16 Pro (M23) | |
| Lenovo Yoga Pro 9 16IMH9 | |
| Average Intel Core Ultra 9 185H, NVIDIA GeForce RTX 4070 Laptop GPU () | |
| Framework Laptop 16 | |
| Samsung Galaxy Book4 Ultra | |
* ... más pequeño es mejor
| PCMark 10 Score | 7547 puntos | |
ayuda | ||
| AIDA64 / Memory Copy | |
| Lenovo Yoga Pro 9 16IMH9 | |
| Average Intel Core Ultra 9 185H (91178 - 95718, n=4) | |
| Dell XPS 16 9640 | |
| Samsung Galaxy Book4 Ultra | |
| Honor MagicBook Pro 16 2024 | |
| Framework Laptop 16 | |
| Lenovo Yoga Pro 9 16-IRP G8 | |
| SCHENKER VISION 16 Pro (M23) | |
| Average of class Multimedia (20513 - 94254, n=89, last 2 years) | |
| AIDA64 / Memory Read | |
| Samsung Galaxy Book4 Ultra | |
| Lenovo Yoga Pro 9 16IMH9 | |
| Average Intel Core Ultra 9 185H (83175 - 87768, n=4) | |
| Dell XPS 16 9640 | |
| Lenovo Yoga Pro 9 16-IRP G8 | |
| Honor MagicBook Pro 16 2024 | |
| SCHENKER VISION 16 Pro (M23) | |
| Framework Laptop 16 | |
| Average of class Multimedia (22917 - 90142, n=89, last 2 years) | |
| AIDA64 / Memory Write | |
| Lenovo Yoga Pro 9 16-IRP G8 | |
| Framework Laptop 16 | |
| Average Intel Core Ultra 9 185H (73682 - 93871, n=4) | |
| Honor MagicBook Pro 16 2024 | |
| Samsung Galaxy Book4 Ultra | |
| Lenovo Yoga Pro 9 16IMH9 | |
| Dell XPS 16 9640 | |
| SCHENKER VISION 16 Pro (M23) | |
| Average of class Multimedia (20226 - 95196, n=89, last 2 years) | |
| AIDA64 / Memory Latency | |
| Honor MagicBook Pro 16 2024 | |
| Samsung Galaxy Book4 Ultra | |
| Average Intel Core Ultra 9 185H (129.6 - 144.5, n=4) | |
| Dell XPS 16 9640 | |
| Lenovo Yoga Pro 9 16IMH9 | |
| Lenovo Yoga Pro 9 16-IRP G8 | |
| Average of class Multimedia (75 - 346, n=88, last 2 years) | |
| Framework Laptop 16 | |
| SCHENKER VISION 16 Pro (M23) | |
* ... más pequeño es mejor
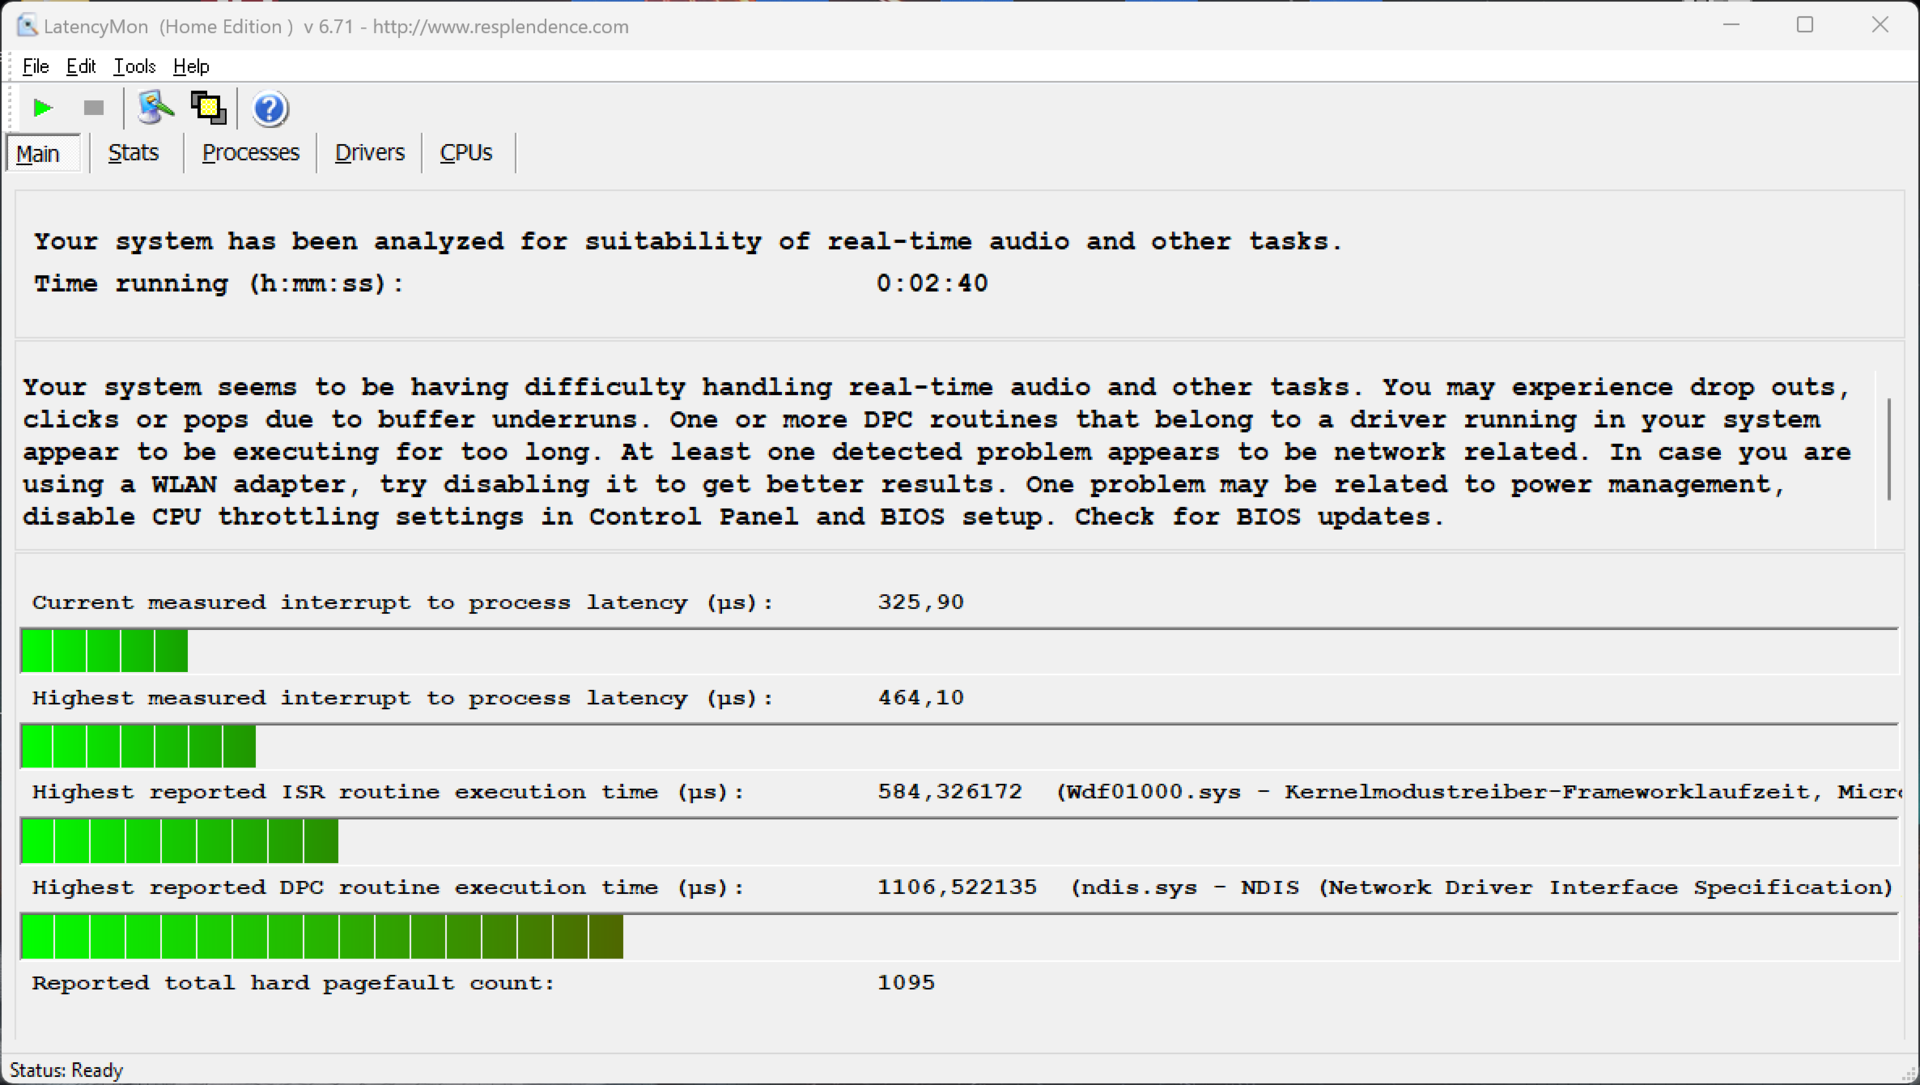
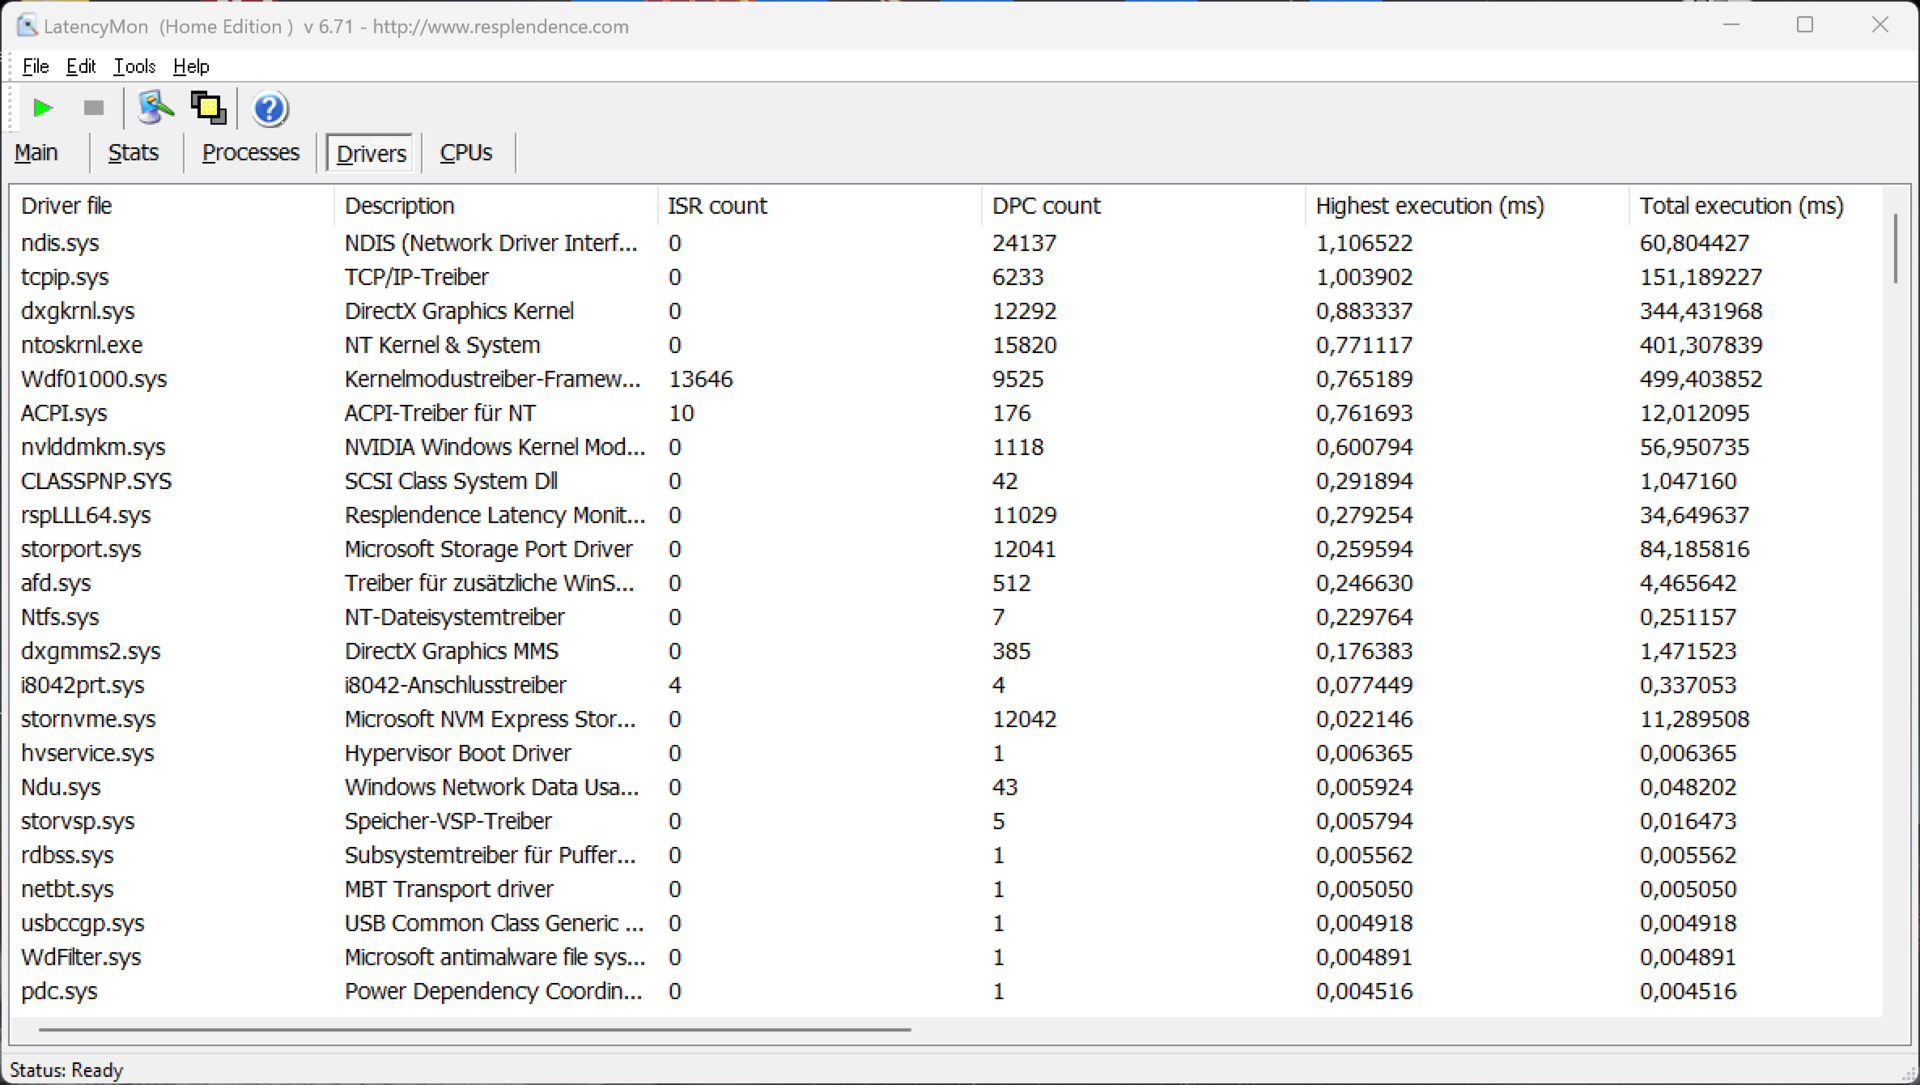
Latencia del CPD
En nuestra prueba de latencia estandarizada (navegación web, reproducción 4K de YouTube, carga de la CPU), nuestro dispositivo de prueba con su versión actual de BIOS no tiene problemas para ejecutar aplicaciones de audio en tiempo real. Aunque un controlador lucha un poco, el importante valor "interrupt-to-process-latency" es muy bajo.
| DPC Latencies / LatencyMon - interrupt to process latency (max), Web, Youtube, Prime95 | |
| Lenovo Yoga Pro 9 16-IRP G8 | |
| Honor MagicBook Pro 16 2024 | |
| Framework Laptop 16 | |
| Dell XPS 16 9640 | |
| SCHENKER VISION 16 Pro (M23) | |
| Samsung Galaxy Book4 Ultra | |
| Lenovo Yoga Pro 9 16IMH9 | |
* ... más pequeño es mejor
Dispositivos de almacenamiento
Lenovo instaló una unidad SSD PCIe 4.0 de 1 TB de SK Hynix en nuestro dispositivo de prueba, de la que 877 GB están disponibles al arrancar por primera vez. Los resultados del benchmark son sólo medios, pero esto no será un problema en el uso diario. Al menos el rendimiento se mantiene estable bajo carga sostenida. El Yoga Pro también ofrece una segunda ranura para una SSD PCIe 4.0. Encontrará más pruebas de rendimiento SSD aquí.

* ... más pequeño es mejor
Sustained Read Performance: DiskSpd Read Loop, Queue Depth 8
Tarjeta gráfica
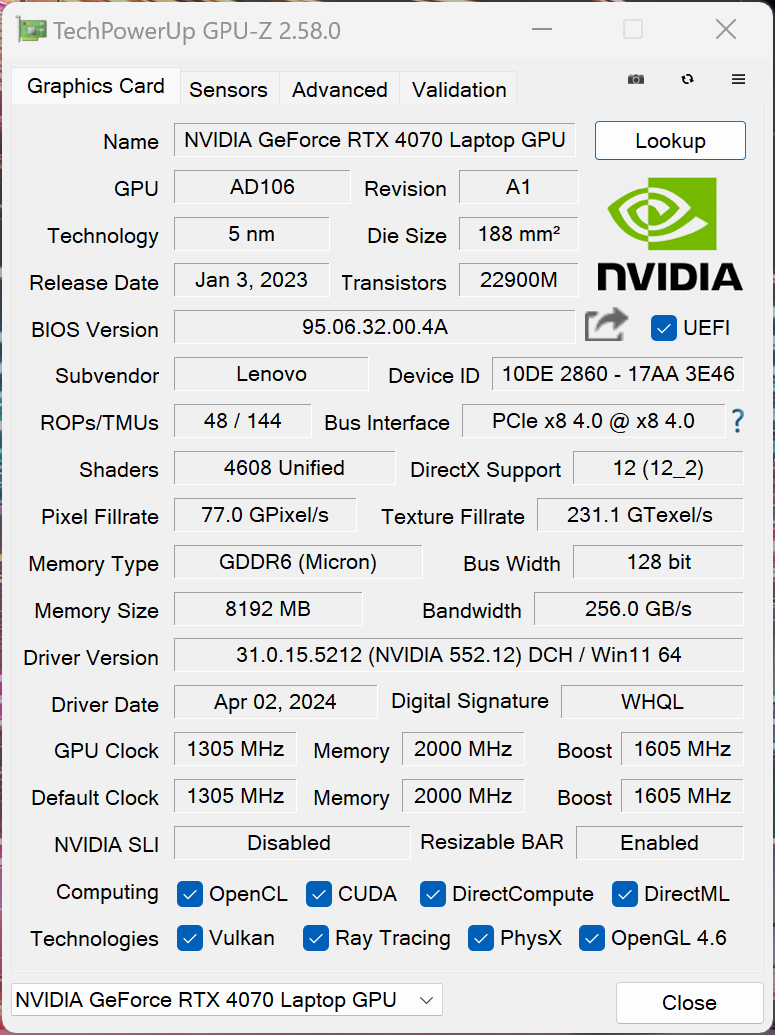
Nada ha cambiado en términos de tarjetas gráficas dedicadas, ya que el Yoga Pro sigue estando disponible con la Nvidia GeForce RTX 4060 portátil o RTX 4070 Portátil. Sin embargo, ahora se integra Advanced Optimus para la conmutación de gráficos, lo que no ocurría en el modelo antiguo. El portátil RTX 4070, más rápido y con un TGP de 100 vatios, está instalado en nuestro dispositivo de pruebas y los resultados del benchmark son muy buenos en general. La tarjeta gráfica también se puede overclockear opcionalmente.
El Yoga también obtiene buenos resultados en los benchmarks de juegos e incluso se puede jugar a títulos modernos al máximo detalle en resolución QHD sin problemas, y el rendimiento se mantiene completamente estable durante largas sesiones de juego.
En modo batería, la tarjeta gráfica dispone de un máximo de 65 vatios, por lo que el rendimiento aquí es alrededor de un 18% inferior. Encontrará más pruebas comparativas de la GPU en nuestra sección de tecnología.
| 3DMark 11 Performance | 34118 puntos | |
| 3DMark Fire Strike Score | 26981 puntos | |
| 3DMark Time Spy Score | 12105 puntos | |
ayuda | ||
| Blender / v3.3 Classroom OPTIX/RTX | |
| Average of class Multimedia (19 - 99, n=45, last 2 years) | |
| Samsung Galaxy Book4 Ultra | |
| Lenovo Yoga Pro 9 16-IRP G8 | |
| SCHENKER VISION 16 Pro (M23) | |
| Honor MagicBook Pro 16 2024 | |
| Average NVIDIA GeForce RTX 4070 Laptop GPU (18 - 28, n=49) | |
| Dell XPS 16 9640 | |
| Lenovo Yoga Pro 9 16IMH9 | |
| Blender / v3.3 Classroom CUDA | |
| Average of class Multimedia (32 - 152, n=47, last 2 years) | |
| Samsung Galaxy Book4 Ultra | |
| Lenovo Yoga Pro 9 16-IRP G8 | |
| Honor MagicBook Pro 16 2024 | |
| Average NVIDIA GeForce RTX 4070 Laptop GPU (32 - 142, n=52) | |
| Dell XPS 16 9640 | |
| SCHENKER VISION 16 Pro (M23) | |
| Lenovo Yoga Pro 9 16IMH9 | |
| Blender / v3.3 Classroom CPU | |
| Average of class Multimedia (190 - 1374, n=84, last 2 years) | |
| SCHENKER VISION 16 Pro (M23) | |
| Samsung Galaxy Book4 Ultra | |
| Honor MagicBook Pro 16 2024 | |
| Framework Laptop 16 | |
| Lenovo Yoga Pro 9 16-IRP G8 | |
| Dell XPS 16 9640 | |
| Average NVIDIA GeForce RTX 4070 Laptop GPU (158 - 428, n=49) | |
| Lenovo Yoga Pro 9 16IMH9 | |
* ... más pequeño es mejor
| The Witcher 3 - 1920x1080 Ultra Graphics & Postprocessing (HBAO+) | |
| Lenovo Yoga Pro 9 16IMH9 | |
| SCHENKER VISION 16 Pro (M23) | |
| Lenovo Yoga Pro 9 16-IRP G8 | |
| Dell XPS 16 9640 | |
| Framework Laptop 16 | |
| Honor MagicBook Pro 16 2024 | |
| Samsung Galaxy Book4 Ultra | |
| Average of class Multimedia (8 - 143.2, n=100, last 2 years) | |
| GTA V - 1920x1080 Highest Settings possible AA:4xMSAA + FX AF:16x | |
| Lenovo Yoga Pro 9 16IMH9 | |
| Lenovo Yoga Pro 9 16-IRP G8 | |
| Dell XPS 16 9640 | |
| Honor MagicBook Pro 16 2024 | |
| SCHENKER VISION 16 Pro (M23) | |
| Framework Laptop 16 | |
| Samsung Galaxy Book4 Ultra | |
| Average of class Multimedia (4.24 - 123, n=89, last 2 years) | |
| Horizon Forbidden West | |
| 1920x1080 Very High Preset AA:T | |
| Average NVIDIA GeForce RTX 4070 Laptop GPU (53.2 - 76.7, n=6) | |
| Lenovo Yoga Pro 9 16IMH9 | |
| Average of class Multimedia (53.2 - 65.4, n=2, last 2 years) | |
| Dell XPS 16 9640 | |
| 2560x1440 Very High Preset AA:T | |
| Lenovo Yoga Pro 9 16IMH9 | |
| Average NVIDIA GeForce RTX 4070 Laptop GPU (40.3 - 59.1, n=6) | |
| Average of class Multimedia (40.3 - 56.1, n=2, last 2 years) | |
| Dell XPS 16 9640 | |
Witcher 3 FPS chart
| bajo | medio | alto | ultra | QHD | |
| GTA V (2015) | 171.4 | 110.9 | 90.4 | ||
| The Witcher 3 (2015) | 242 | 107.8 | 89 | ||
| Dota 2 Reborn (2015) | 171.7 | 155.7 | 148.1 | 139 | |
| Final Fantasy XV Benchmark (2018) | 189.6 | 156.2 | 115.7 | 85.6 | |
| X-Plane 11.11 (2018) | 133.9 | 118.7 | 90.5 | ||
| Far Cry 5 (2018) | 156 | 133 | 130 | 116 | 109 |
| Strange Brigade (2018) | 418 | 300 | 244 | 213 | 139 |
| F1 23 (2023) | 229 | 239 | 209 | 68.9 | 44 |
| Baldur's Gate 3 (2023) | 166.3 | 136.6 | 119.9 | 117.7 | 79.8 |
| Cyberpunk 2077 2.0 Phantom Liberty (2023) | 129.6 | 106.8 | 90.5 | 76.9 | 47.8 |
| Horizon Forbidden West (2024) | 110.5 | 104.2 | 75.4 | 65.4 | 56.1 |
Emisiones - Ventiladores ruidosos, altavoces superiores
Ruido
En modo ralentí y con poca carga, los ventiladores permanecen desactivados o apenas se oyen en la mayoría de los casos. Bajo carga, sin embargo, se vuelven rápidamente ruidosos, tanto en modo automático como en modo de rendimiento . Hemos resumido los resultados para los distintos perfiles de energía en la siguiente tabla. En modo batería, el aparato sigue siendo muy silencioso en todo momento, pero el rendimiento se reduce enormemente y ya no es suficiente para jugar. No se detectaron ruidos electrónicos como el zumbido de la bobina en nuestro dispositivo de prueba
| Perfil energético | 3DMark 06 | Witcher 3 | Cyberpunk 2077 | Prueba de estrés |
|---|---|---|---|---|
| Batería | 29,5 dB(A) | 29,5 dB(A) | 29,5 dB(A) | 30,9 dB(A) |
| Auto | 44,9 dB(A) | 44,9 dB(A) | 44,9 dB(A) | 44,9 dB(A) |
| Rendimiento | 48,1 dB(A) | 49,7 dB(A) | 49,7 dB(A) | 53,9 dB(A) |
Ruido
| Ocioso |
| 24.3 / 24.3 / 25.8 dB(A) |
| Carga |
| 48.1 / 53.9 dB(A) |
 | ||
30 dB silencioso 40 dB(A) audible 50 dB(A) ruidosamente alto |
||
min: | ||
| Lenovo Yoga Pro 9 16IMH9 NVIDIA GeForce RTX 4070 Laptop GPU, Ultra 9 185H, SK Hynix HFS001TEJ9X115N | Dell XPS 16 9640 NVIDIA GeForce RTX 4070 Laptop GPU, Ultra 7 155H, Kioxia XG8 KXG80ZNV1T02 | Honor MagicBook Pro 16 2024 NVIDIA GeForce RTX 4060 Laptop GPU, Ultra 7 155H, WD PC SN740 SDDPNQD-1T00 | Samsung Galaxy Book4 Ultra NVIDIA GeForce RTX 4050 Laptop GPU, Ultra 7 155H, Samsung PM9A1 MZVL2512HCJQ | Framework Laptop 16 Radeon RX 7700S, R9 7940HS, WDC PC SN810 1TB | SCHENKER VISION 16 Pro (M23) NVIDIA GeForce RTX 4070 Laptop GPU, i7-13700H, Samsung 990 Pro 1 TB | Lenovo Yoga Pro 9 16-IRP G8 NVIDIA GeForce RTX 4060 Laptop GPU, i7-13705H, Samsung PM9A1 MZVL21T0HCLR | |
|---|---|---|---|---|---|---|---|
| Noise | 2% | 10% | 9% | 7% | -7% | -0% | |
| off / environment * | 24.3 | 24.5 -1% | 24 1% | 24.2 -0% | 23.8 2% | 25.9 -7% | 24.7 -2% |
| Idle Minimum * | 24.3 | 24.5 -1% | 24 1% | 24.2 -0% | 23.9 2% | 25.9 -7% | 24.7 -2% |
| Idle Average * | 24.3 | 24.5 -1% | 24 1% | 24.2 -0% | 23.9 2% | 25.9 -7% | 26.2 -8% |
| Idle Maximum * | 25.8 | 27.5 -7% | 27.2 -5% | 24.2 6% | 23.9 7% | 32 -24% | 26.2 -2% |
| Load Average * | 48.1 | 39.6 18% | 29 40% | 37.9 21% | 28.5 41% | 47.2 2% | 39.7 17% |
| Witcher 3 ultra * | 49.7 | 49.7 -0% | 42.1 15% | 41.7 16% | 51.9 -4% | 53.1 -7% | 53.2 -7% |
| Load Maximum * | 53.9 | 49.7 8% | 45 17% | 41.7 23% | 53.7 -0% | 53.1 1% | 53.2 1% |
* ... más pequeño es mejor
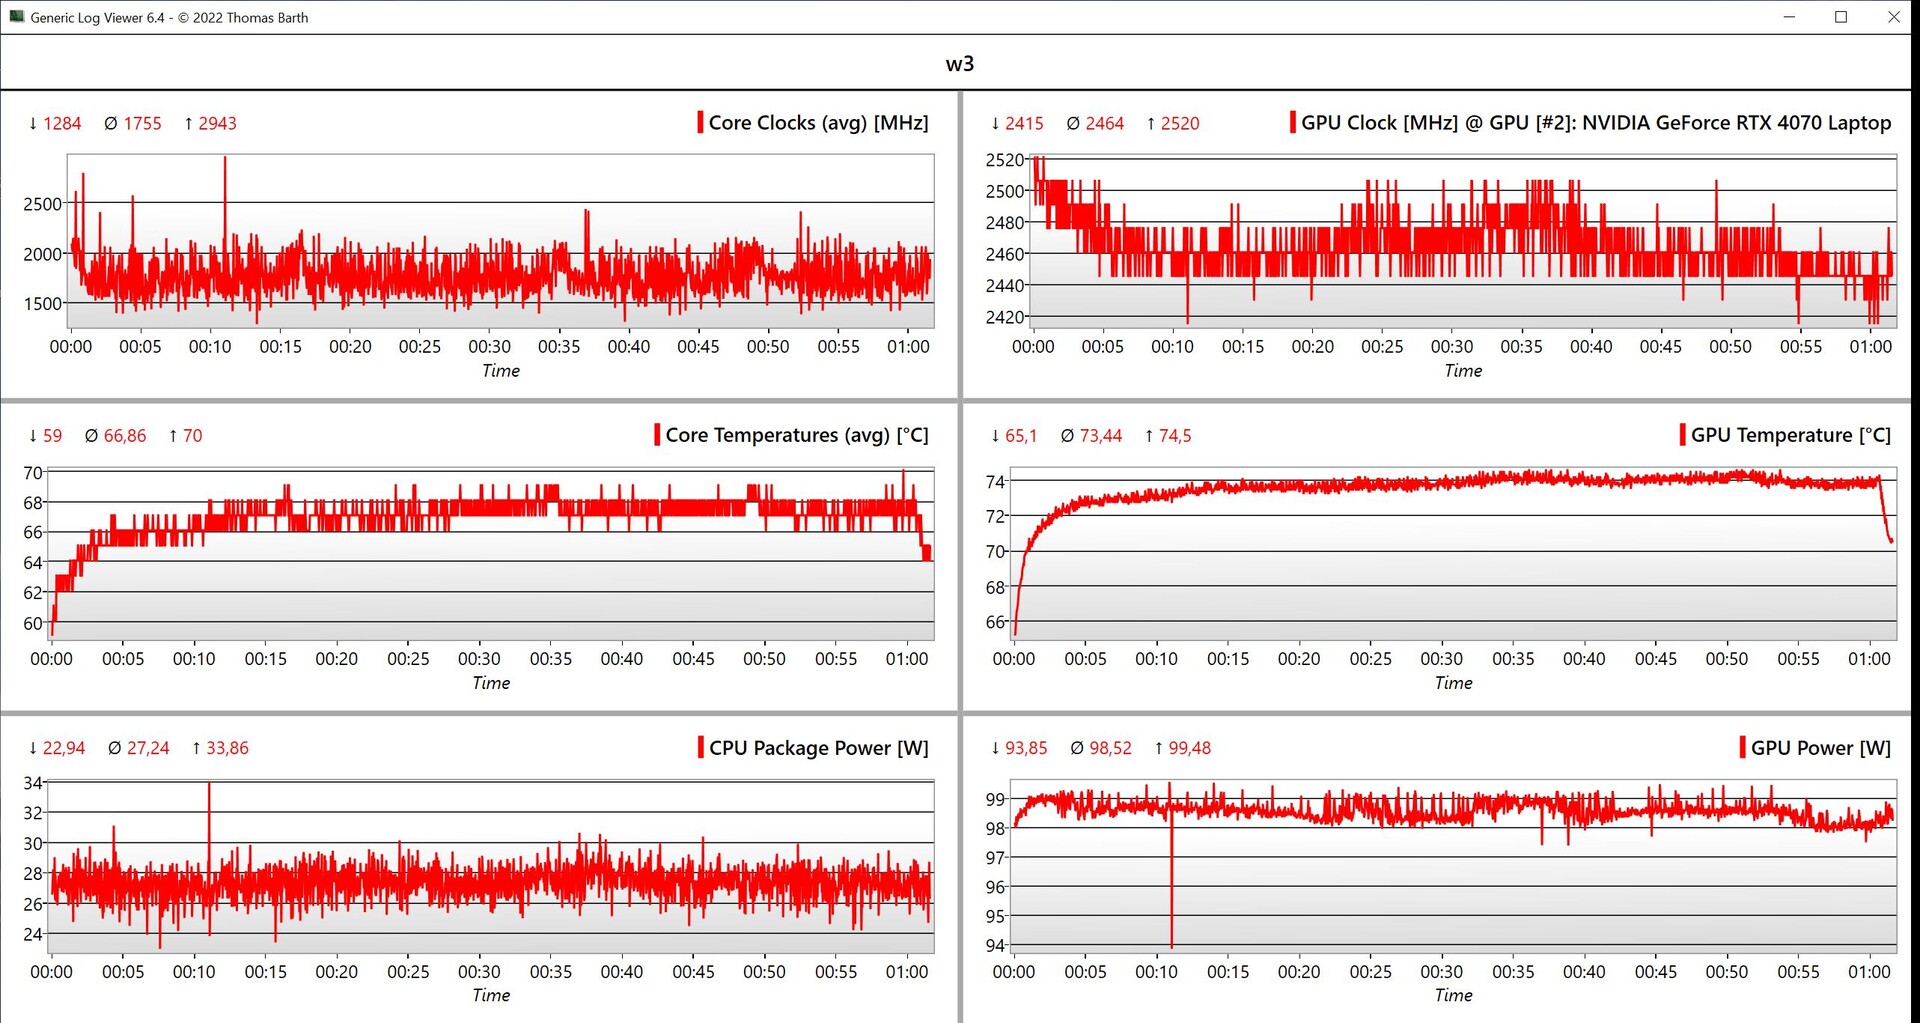
Temperatura
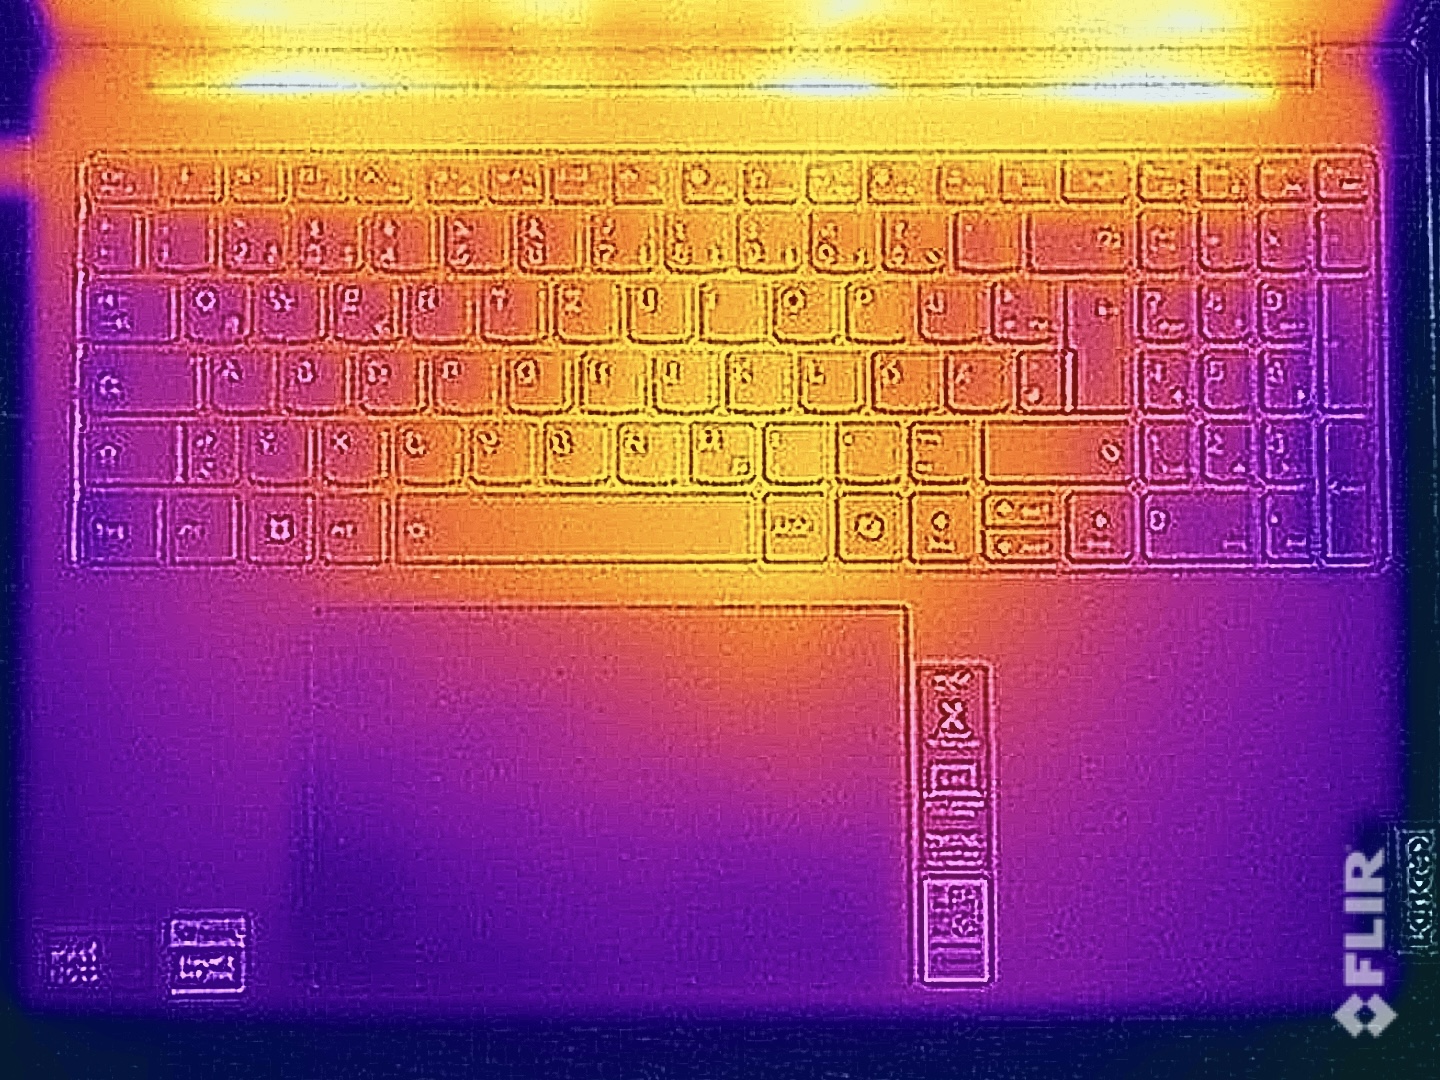
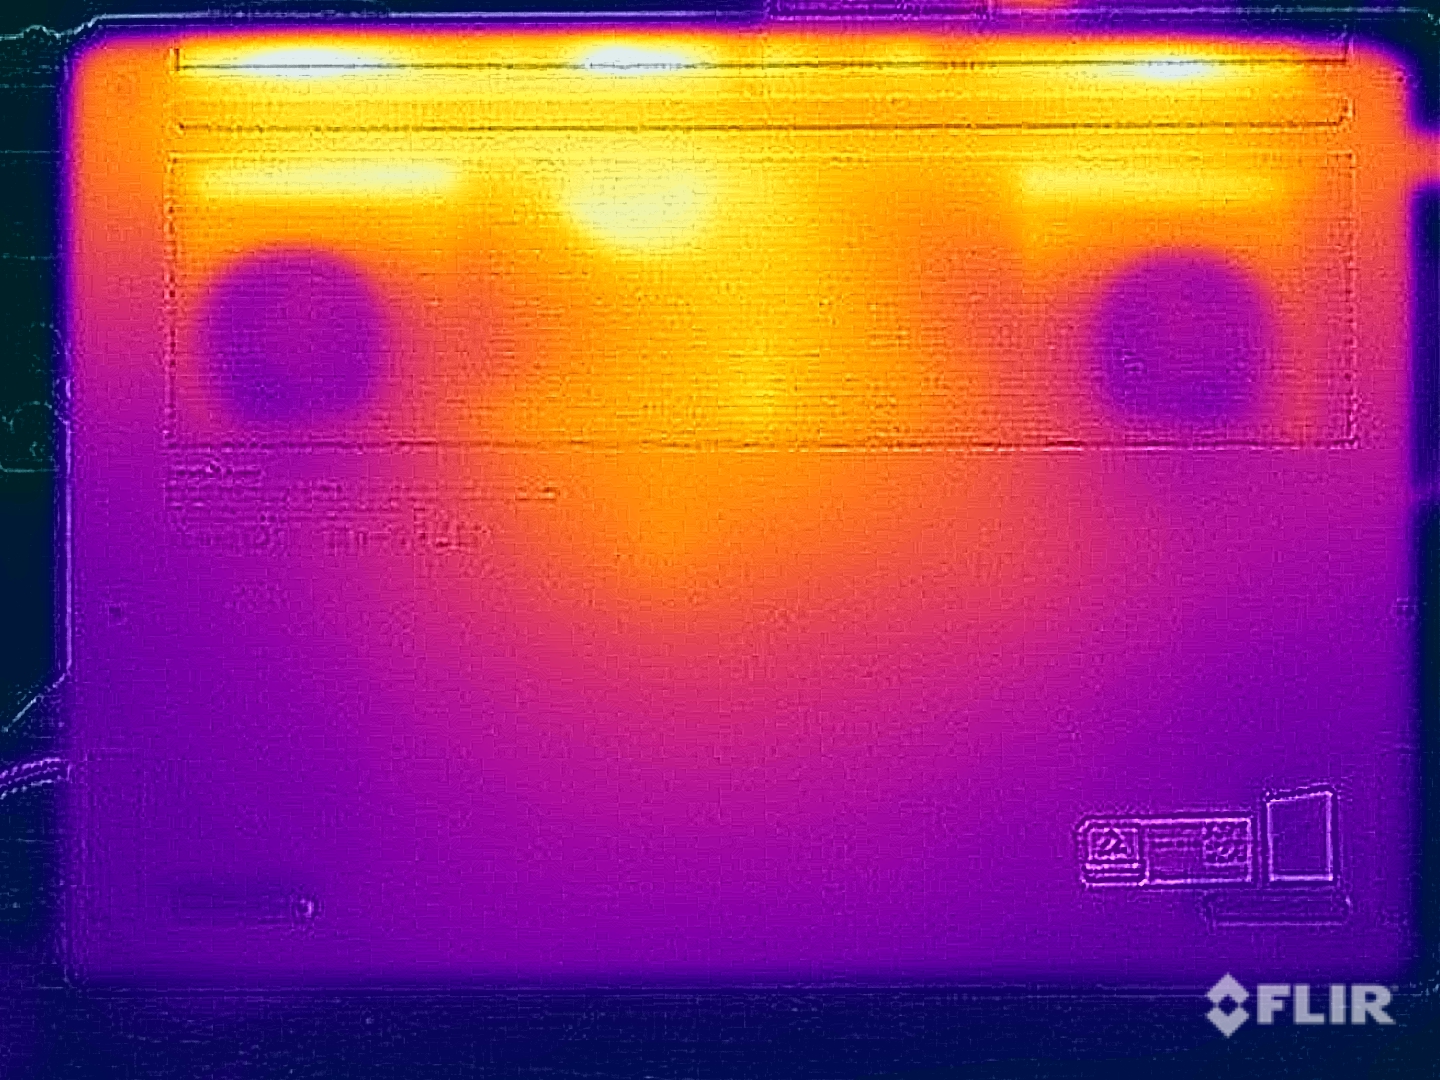
El chasis permanece agradablemente frío durante las tareas sencillas y la temperatura máxima también es ligeramente inferior bajo carga. No obstante, es probable que los usuarios noten el punto caliente por encima de los 45 °C en la parte inferior, por lo que no se recomienda colocar el dispositivo sobre los muslos. Tanto el teclado como la unidad base permanecen significativamente más fríos. En la prueba de estrés con carga combinada de CPU/GPU, la tarjeta gráfica funciona constantemente a unos 87 vatios y el procesador a 42 vatios. Se trata de un rendimiento sólido en general.
(±) The maximum temperature on the upper side is 41.7 °C / 107 F, compared to the average of 36.9 °C / 98 F, ranging from 21.1 to 71 °C for the class Multimedia.
(-) The bottom heats up to a maximum of 46.3 °C / 115 F, compared to the average of 39.1 °C / 102 F
(+) In idle usage, the average temperature for the upper side is 25.5 °C / 78 F, compared to the device average of 31.2 °C / 88 F.
(±) Playing The Witcher 3, the average temperature for the upper side is 35.4 °C / 96 F, compared to the device average of 31.2 °C / 88 F.
(+) The palmrests and touchpad are cooler than skin temperature with a maximum of 31 °C / 87.8 F and are therefore cool to the touch.
(-) The average temperature of the palmrest area of similar devices was 28.8 °C / 83.8 F (-2.2 °C / -4 F).
| Lenovo Yoga Pro 9 16IMH9 Intel Core Ultra 9 185H, NVIDIA GeForce RTX 4070 Laptop GPU | Dell XPS 16 9640 Intel Core Ultra 7 155H, NVIDIA GeForce RTX 4070 Laptop GPU | Honor MagicBook Pro 16 2024 Intel Core Ultra 7 155H, NVIDIA GeForce RTX 4060 Laptop GPU | Samsung Galaxy Book4 Ultra Intel Core Ultra 7 155H, NVIDIA GeForce RTX 4050 Laptop GPU | Framework Laptop 16 AMD Ryzen 9 7940HS, AMD Radeon RX 7700S | SCHENKER VISION 16 Pro (M23) Intel Core i7-13700H, NVIDIA GeForce RTX 4070 Laptop GPU | Lenovo Yoga Pro 9 16-IRP G8 Intel Core i7-13705H, NVIDIA GeForce RTX 4060 Laptop GPU | |
|---|---|---|---|---|---|---|---|
| Heat | 4% | 9% | 10% | -3% | -7% | -3% | |
| Maximum Upper Side * | 41.7 | 39.4 6% | 39.7 5% | 38.5 8% | 42.4 -2% | 46.7 -12% | 41.6 -0% |
| Maximum Bottom * | 46.3 | 36.9 20% | 42.9 7% | 41.2 11% | 40.8 12% | 54.1 -17% | 50 -8% |
| Idle Upper Side * | 26.2 | 28.2 -8% | 23.7 10% | 23.5 10% | 31.4 -20% | 26.5 -1% | 26.8 -2% |
| Idle Bottom * | 27.2 | 27.4 -1% | 23.5 14% | 24.1 11% | 27.8 -2% | 26.8 1% | 27.9 -3% |
* ... más pequeño es mejor
Altavoces
El sistema de sonido con los 6 módulos sigue siendo uno de los mejores modelos del segmento multimedia y supera a muchos de sus competidores. Puede prescindir de los altavoces externos en muchos casos, pero no se beneficiará de los altavoces cuando juegue debido a los ruidosos ventiladores. En este caso se recomiendan unos auriculares.
Lenovo Yoga Pro 9 16IMH9 audio analysis
(+) | speakers can play relatively loud (84.5 dB)
Bass 100 - 315 Hz
(±) | reduced bass - on average 7% lower than median
(±) | linearity of bass is average (7.2% delta to prev. frequency)
Mids 400 - 2000 Hz
(+) | balanced mids - only 3.9% away from median
(+) | mids are linear (4.5% delta to prev. frequency)
Highs 2 - 16 kHz
(+) | balanced highs - only 2.8% away from median
(+) | highs are linear (3.2% delta to prev. frequency)
Overall 100 - 16.000 Hz
(+) | overall sound is linear (8.8% difference to median)
Compared to same class
» 7% of all tested devices in this class were better, 1% similar, 92% worse
» The best had a delta of 5%, average was 18%, worst was 45%
Compared to all devices tested
» 2% of all tested devices were better, 1% similar, 98% worse
» The best had a delta of 4%, average was 25%, worst was 134%
Dell XPS 16 9640 audio analysis
(+) | speakers can play relatively loud (83.4 dB)
Bass 100 - 315 Hz
(±) | reduced bass - on average 11.2% lower than median
(±) | linearity of bass is average (8.9% delta to prev. frequency)
Mids 400 - 2000 Hz
(+) | balanced mids - only 4.5% away from median
(+) | mids are linear (3% delta to prev. frequency)
Highs 2 - 16 kHz
(+) | balanced highs - only 1.4% away from median
(+) | highs are linear (2% delta to prev. frequency)
Overall 100 - 16.000 Hz
(+) | overall sound is linear (10% difference to median)
Compared to same class
» 8% of all tested devices in this class were better, 1% similar, 91% worse
» The best had a delta of 5%, average was 18%, worst was 45%
Compared to all devices tested
» 3% of all tested devices were better, 1% similar, 96% worse
» The best had a delta of 4%, average was 25%, worst was 134%
Honor MagicBook Pro 16 2024 audio analysis
(±) | speaker loudness is average but good (81.3 dB)
Bass 100 - 315 Hz
(±) | reduced bass - on average 6.8% lower than median
(±) | linearity of bass is average (9% delta to prev. frequency)
Mids 400 - 2000 Hz
(+) | balanced mids - only 2.1% away from median
(+) | mids are linear (5.2% delta to prev. frequency)
Highs 2 - 16 kHz
(+) | balanced highs - only 2.1% away from median
(+) | highs are linear (6.5% delta to prev. frequency)
Overall 100 - 16.000 Hz
(+) | overall sound is linear (8.7% difference to median)
Compared to same class
» 7% of all tested devices in this class were better, 1% similar, 92% worse
» The best had a delta of 5%, average was 18%, worst was 45%
Compared to all devices tested
» 2% of all tested devices were better, 0% similar, 98% worse
» The best had a delta of 4%, average was 25%, worst was 134%
Samsung Galaxy Book4 Ultra audio analysis
(+) | speakers can play relatively loud (85 dB)
Bass 100 - 315 Hz
(±) | reduced bass - on average 14.4% lower than median
(±) | linearity of bass is average (11.3% delta to prev. frequency)
Mids 400 - 2000 Hz
(+) | balanced mids - only 3.4% away from median
(+) | mids are linear (3.4% delta to prev. frequency)
Highs 2 - 16 kHz
(+) | balanced highs - only 3% away from median
(+) | highs are linear (5.6% delta to prev. frequency)
Overall 100 - 16.000 Hz
(+) | overall sound is linear (11.5% difference to median)
Compared to same class
» 11% of all tested devices in this class were better, 4% similar, 85% worse
» The best had a delta of 5%, average was 18%, worst was 45%
Compared to all devices tested
» 6% of all tested devices were better, 2% similar, 93% worse
» The best had a delta of 4%, average was 25%, worst was 134%
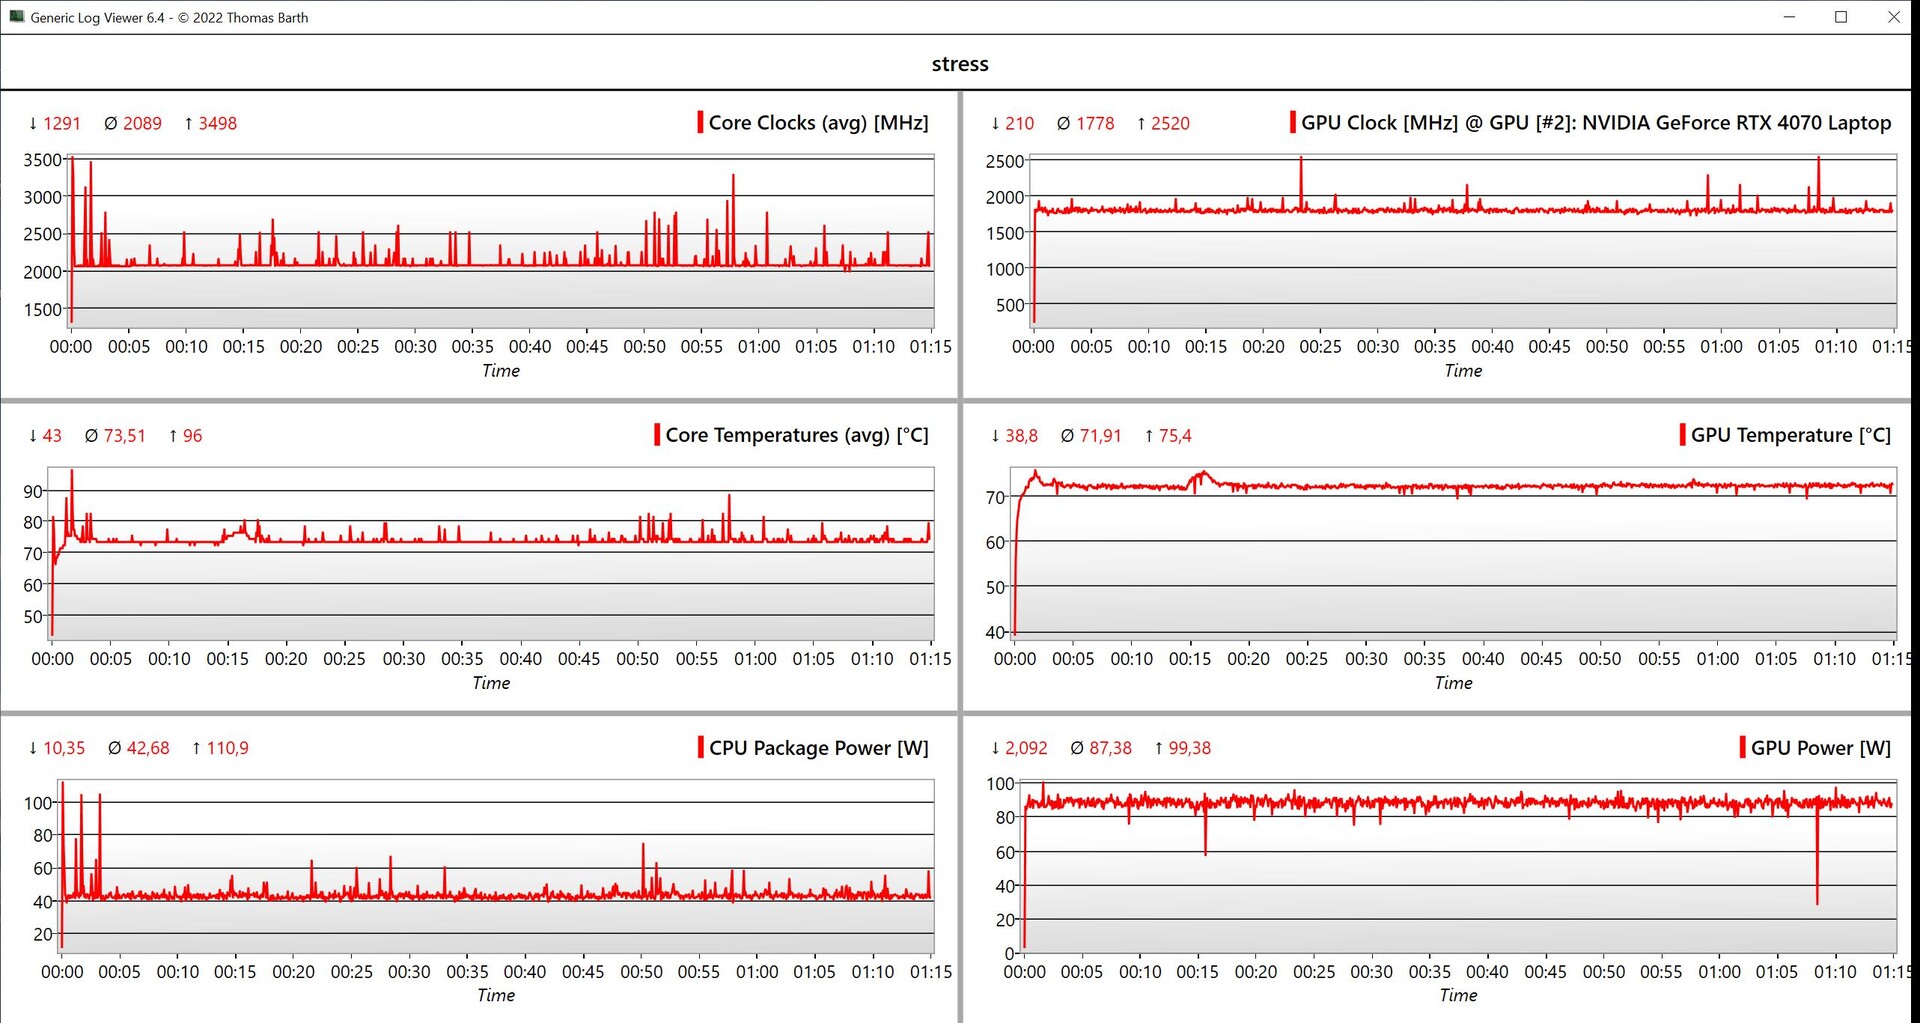
Gestión de la energía - Batería más grande, mayor autonomía
Consumo de energía
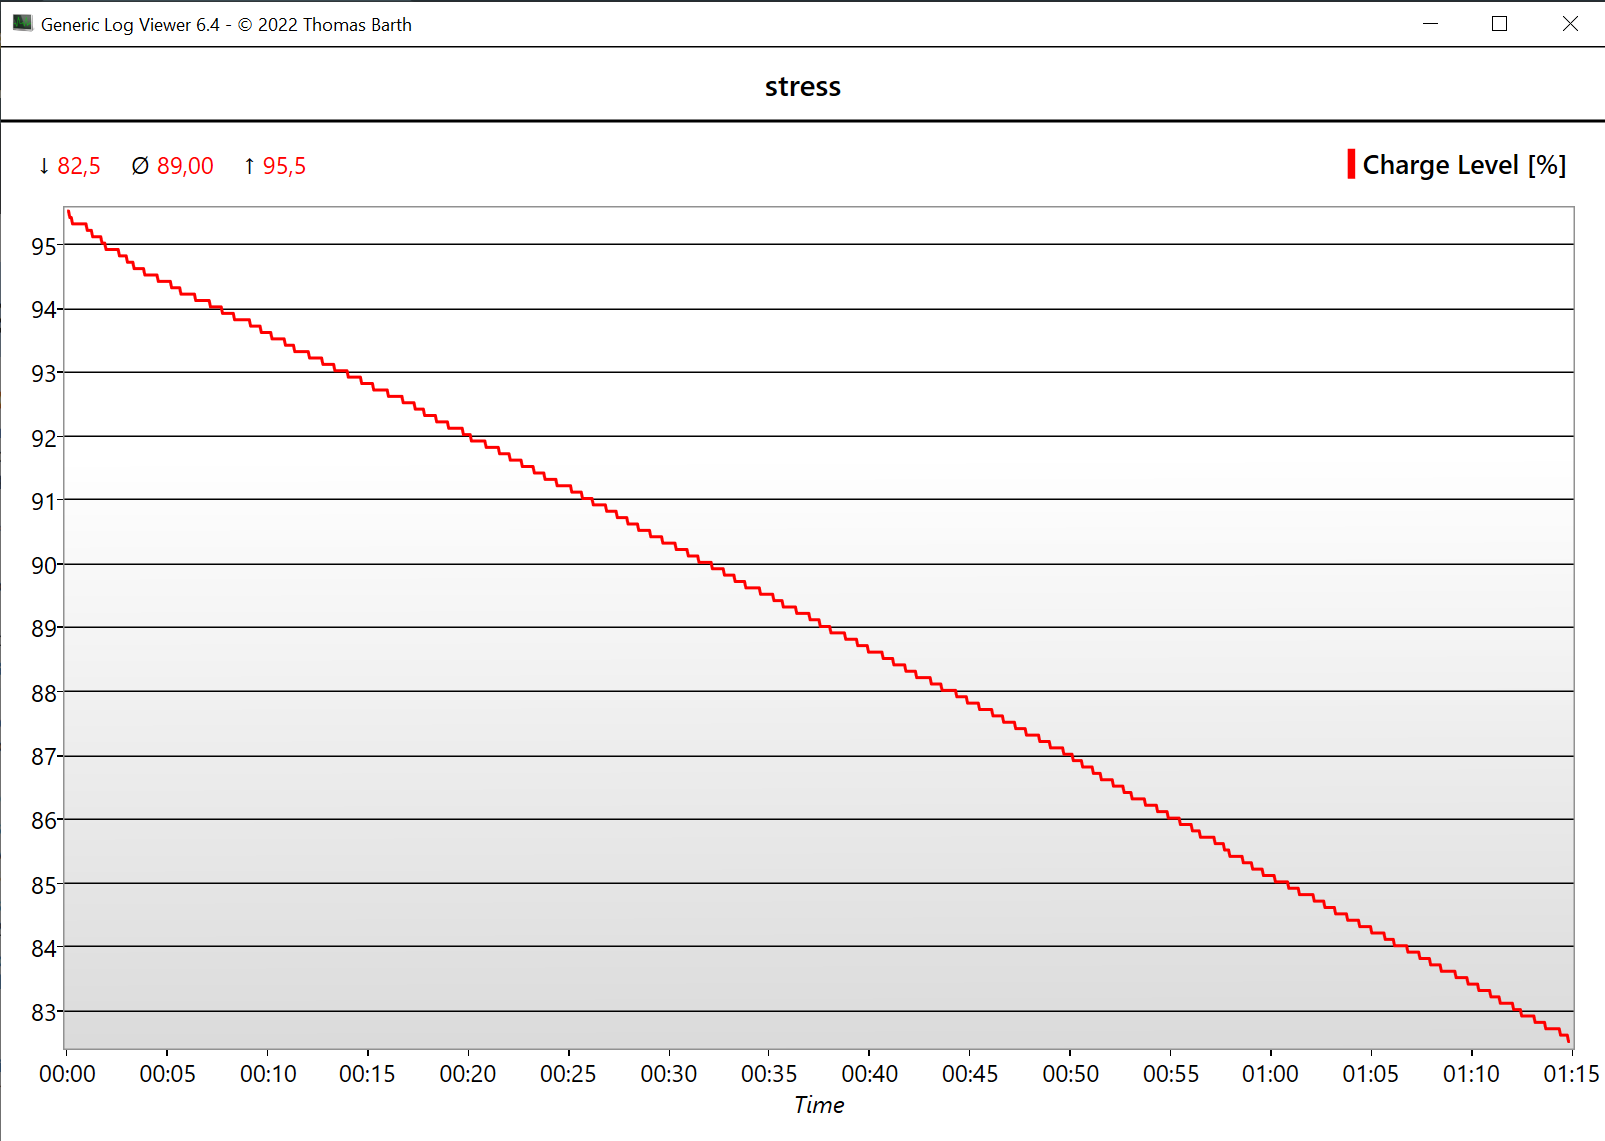
No hay cambios significativos en las mediciones de consumo en comparación con el predecesor. Sin embargo, aquí hay otro problema: la fuente de alimentación de 170 vatios suministrada no cubre suficientemente el consumo máximo y el aparato tiene que recurrir a la batería. Y no sólo brevemente, sino de forma constante, lo que puede verse claramente en el siguiente gráfico. Durante la prueba de estrés, la capacidad de la batería cae un 12% en 75 minutos. Aunque nuestra prueba de estrés es el peor escenario y no todos los clientes utilizarán el modo Rendimiento , esto es claramente un problema y Lenovo está recortando aquí. El Yoga Pro 9i 16 debería haber sido entregado con al menos una fuente de alimentación de 200 vatios.
| Off / Standby | |
| Ocioso | |
| Carga |
|
| Lenovo Yoga Pro 9 16IMH9 Ultra 9 185H, NVIDIA GeForce RTX 4070 Laptop GPU, SK Hynix HFS001TEJ9X115N, Mini-LED, 3200x2000, 16.00 | Dell XPS 16 9640 Ultra 7 155H, NVIDIA GeForce RTX 4070 Laptop GPU, Kioxia XG8 KXG80ZNV1T02, OLED, 3840x2400, 16.30 | Honor MagicBook Pro 16 2024 Ultra 7 155H, NVIDIA GeForce RTX 4060 Laptop GPU, WD PC SN740 SDDPNQD-1T00, IPS, 3072x1920, 16.00 | Samsung Galaxy Book4 Ultra Ultra 7 155H, NVIDIA GeForce RTX 4050 Laptop GPU, Samsung PM9A1 MZVL2512HCJQ, OLED, 2880x1800, 16.00 | Framework Laptop 16 R9 7940HS, Radeon RX 7700S, WDC PC SN810 1TB, , 2560x1600, 16.00 | SCHENKER VISION 16 Pro (M23) i7-13700H, NVIDIA GeForce RTX 4070 Laptop GPU, Samsung 990 Pro 1 TB, IPS, 2560x1600, 16.00 | Lenovo Yoga Pro 9 16-IRP G8 i7-13705H, NVIDIA GeForce RTX 4060 Laptop GPU, Samsung PM9A1 MZVL21T0HCLR, Mini-LED, 3200x2000, 16.00 | Average NVIDIA GeForce RTX 4070 Laptop GPU | Average of class Multimedia | |
|---|---|---|---|---|---|---|---|---|---|
| Power Consumption | 32% | 21% | 47% | 8% | 22% | -1% | -6% | 32% | |
| Idle Minimum * | 10.3 | 7.7 25% | 5.2 50% | 4.8 53% | 9.5 8% | 8.6 17% | 10.9 -6% | 12.1 ? -17% | 7.25 ? 30% |
| Idle Average * | 21.9 | 10.3 53% | 14.4 34% | 7.5 66% | 17 22% | 12 45% | 22.6 -3% | 16.9 ? 23% | 11.8 ? 46% |
| Idle Maximum * | 22.4 | 10.6 53% | 15.4 31% | 7.9 65% | 17.2 23% | 12.4 45% | 23.5 -5% | 24.1 ? -8% | 14.5 ? 35% |
| Load Average * | 96.9 | 76.5 21% | 105.4 -9% | 79.3 18% | 96.2 1% | 80 17% | 84.6 13% | 99.5 ? -3% | 77.6 ? 20% |
| Witcher 3 ultra * | 159.6 | 126.4 21% | 107.6 33% | 79.2 50% | 171.9 -8% | 147.7 7% | 159.5 -0% | ||
| Load Maximum * | 173.8 | 138.5 20% | 195.2 -12% | 125 28% | 175.7 -1% | 173.1 -0% | 177.3 -2% | 220 ? -27% | 120.8 ? 30% |
* ... más pequeño es mejor
Power consumption Witcher 3 / Stress test
Power consumption with an external monitor
Duración de las pilas
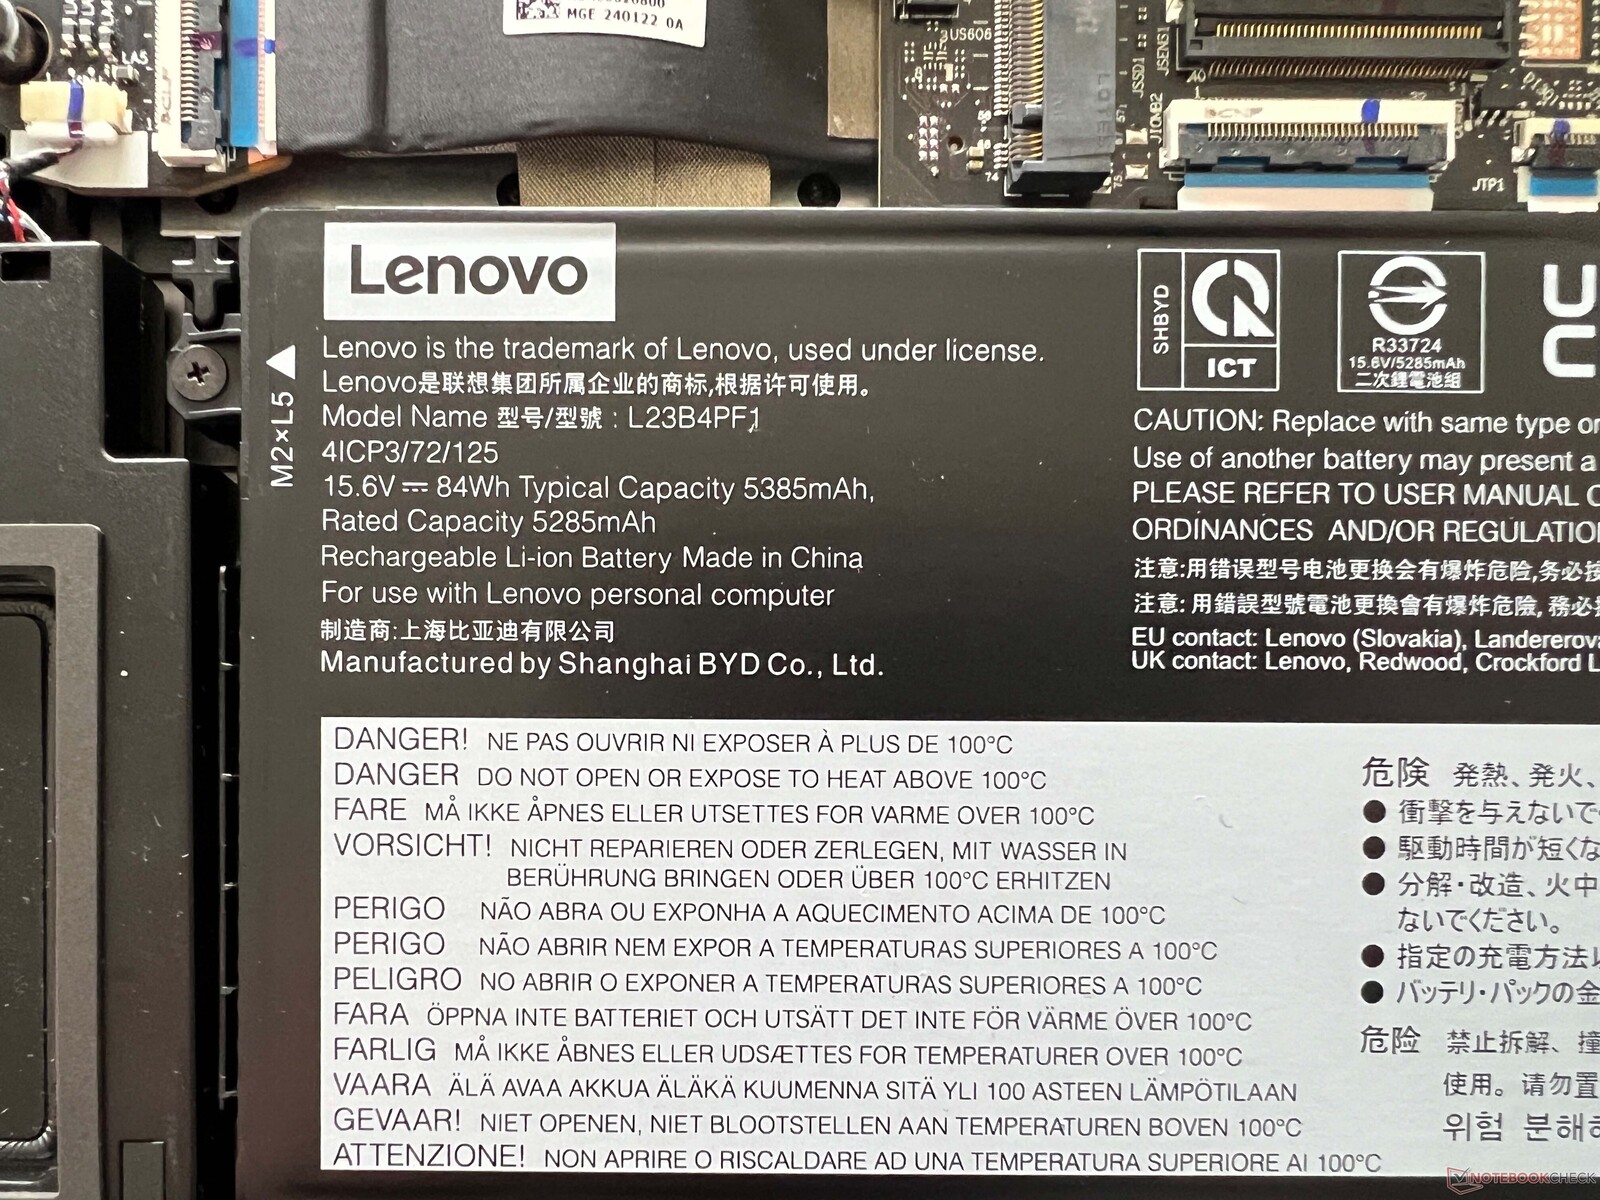
La duración de la batería no era uno de los puntos fuertes del modelo anterior, lo que también se debía a la pantalla muy brillante. Por ello, Lenovo ha aumentado la capacidad de la batería de 75 a 84 vatios para su nuevo modelo G9, lo que ha mejorado la autonomía. Con un brillo ajustado de 150 cd/m² en particular, el nuevo Yoga rinde mejor, aunque los competidores a menudo siguen teniendo ventaja. En la prueba WLAN, hemos medido 8:46 horas a 60 Hz (~7,5 horas a 165 Hz), pero sólo 4,5 horas a pleno brillo SDR y 60 Hz (4:10 horas a 165 Hz). En la prueba de vídeo, alcanza unas muy buenas 11,5 horas, pero un vídeo HDR a pleno brillo dura sólo 2:40 horas y a plena carga termina tras 73 minutos. Una carga completa tarda 96 minutos con el aparato encendido.
| Lenovo Yoga Pro 9 16IMH9 Ultra 9 185H, NVIDIA GeForce RTX 4070 Laptop GPU, 84 Wh | Dell XPS 16 9640 Ultra 7 155H, NVIDIA GeForce RTX 4070 Laptop GPU, 99.5 Wh | Honor MagicBook Pro 16 2024 Ultra 7 155H, NVIDIA GeForce RTX 4060 Laptop GPU, 75 Wh | Samsung Galaxy Book4 Ultra Ultra 7 155H, NVIDIA GeForce RTX 4050 Laptop GPU, 76 Wh | Framework Laptop 16 R9 7940HS, Radeon RX 7700S, 85 Wh | SCHENKER VISION 16 Pro (M23) i7-13700H, NVIDIA GeForce RTX 4070 Laptop GPU, 80 Wh | Lenovo Yoga Pro 9 16-IRP G8 i7-13705H, NVIDIA GeForce RTX 4060 Laptop GPU, 75 Wh | Average of class Multimedia | |
|---|---|---|---|---|---|---|---|---|
| Duración de Batería | 27% | 11% | 29% | 15% | -13% | -34% | 15% | |
| H.264 | 692 | 988 43% | 784 13% | 1076 55% | 470 -32% | 449 -35% | 714 ? 3% | |
| WiFi v1.3 | 526 | 629 20% | 734 40% | 656 25% | 548 4% | 467 -11% | 385 -27% | 574 ? 9% |
| Load | 73 | 87 19% | 58 -21% | 78 7% | 92 26% | 77 5% | 44 -40% | 97.3 ? 33% |
Pro
Contra
Veredicto - Yoga Pro 9i 16 G9 no sólo con mejoras

Lenovo ha mejorado su portátil multimedia Yoga Pro 9i 16 G9 en varias áreas. Se ha instalado un moderno puerto HDMI, Advanced Optimus está a bordo y se ha mejorado la mecánica del ClickPad. Además, la batería es ahora más grande y la autonomía ligeramente mejor, pero si pone al máximo el brillo del mini panel LED, no espere milagros.
En términos de rendimiento, el Yoga sigue rindiendo muy bien, pero el nuevo Core Ultra 9 185H no ofrece ninguna ventaja real de rendimiento sobre los antiguos chips Raptor Lake. El rendimiento en juegos es sólido y la pantalla mini-LED mate se ve muy bien, especialmente con contenidos HDR. El problema, sin embargo, es que Lenovo ya no ofrece perfiles de color para sRGB y AdobeRGB, como ocurría con el modelo antiguo.
Lenovo vuelve a ofrecer un muy buen portátil multimedia en el Yoga Pro 9 16 G9 con componentes rápidos y un panel mini LED extremadamente brillante. Sin embargo, también hay desventajas como los ruidosos ventiladores, la fuente de alimentación más bien débil y la corta duración de la batería cuando el brillo de la pantalla está al máximo.
La refrigeración sigue siendo muy ruidosa bajo carga y la inadecuada fuente de alimentación también es problemática, ya que el Yoga tiene que recurrir constantemente a la batería bajo carga prolongada. Con todo, sin embargo, los aspectos positivos superan a los negativos y el Yoga apenas tiene competidores en el segmento Windows en lo que respecta a su panel mini-LED. Los paneles OLED no son ni de lejos tan brillantes, pero la deficiente implementación de HDR de Windows sigue siendo un problema. No obstante, el Yoga Pro sigue superando claramente a otros competidores multimedia como el nuevo Dell XPS 16 9640, especialmente en términos de rendimiento.
Precio y disponibilidad
El nuevo Yoga Pro 9 16 G9 puede configurarse y encargarse directamente a Lenovo, con el modelo base a partir de algo menos de 1.500 dólares.
Lenovo Yoga Pro 9 16IMH9
-
04/20/2024 v7
Andreas Osthoff
Transparency
The present review sample was made available to the author as a loan by the manufacturer or a shop for the purposes of review. The lender had no influence on this review, nor did the manufacturer receive a copy of this review before publication. There was no obligation to publish this review.
Pricecompare

