Notebookcheck Logo

Reseña del GMK NucBox M6: Un mini PC equilibrado por menos de 300 dólares
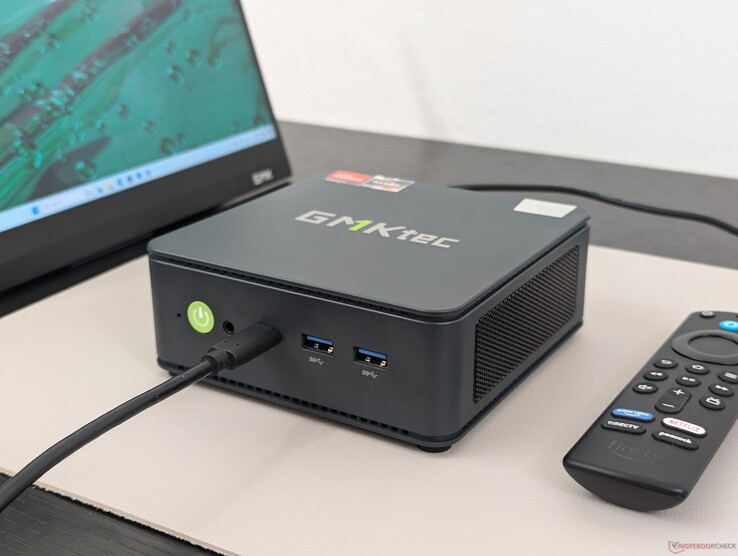
Zen 3+ de gama media por poco dinero.

No necesita lo último y lo mejor para la mayoría de los HTPC. La CPU AMD Ryzen de hace dos años es suficiente para las tareas comunes y cuesta la mitad que las opciones Zen 4.
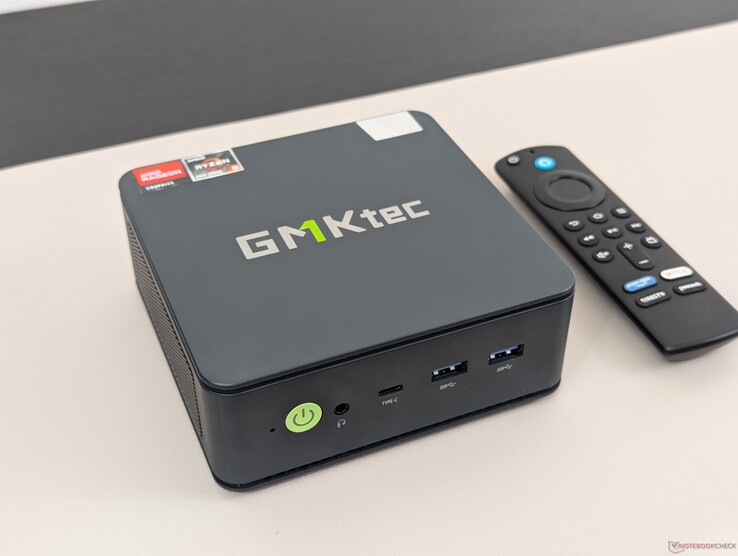
GMKtec NucBox M6
GMKtec NucBox M6

La NucBox M6 es la versión más rápida de la NucBox M5. GMK ha cambiado el Ryzen 7 5700U de la serie U en el M5 por el más reciente Ryzen 5 6600H de la serie H en el M6. Por lo demás, el diseño del chasis y las características físicas no han cambiado, por lo que recomendamos consultar nuestro análisis sobre el M5 para saber más sobre la serie.

Nuestra configuración de revisión se vende por 300 dólares completa con 16 GB de RAM, 512 GB de SSD y Windows 11 Pro. El precio de salida puede ser incluso más bajo, de sólo 230 dólares para un kit barebones. Todas las SKU vienen con la misma opción de color negro y procesador Ryzen 5 6600H.

Entre los competidores del NucBox M6 se incluyen otros mini PC asequibles como el Beelink SER5, Maxtang MTN-FP750o el Geekom Mini IT12.

Más reseñas de GMK:

medio (64%) GMK NucBox M6 AMD Ryzen 5 6600HAMD Radeon 660M Mini PC - 07/04/2024 - v8
Dispositivo de pruebas cortesía de GMKtec
Download your licensed rating image as PNG / SVG
GMK NucBox M6
Procesador
AMD Ryzen 5 6600H 6 x 3.3 - 4.5 GHz, 54 W PL2 / Short Burst, 50 W PL1 / Sustained, Rembrandt-H (Zen 3+)
Adaptador gráfico
AMD Radeon 660M, Núcleo: 1900 MHz, DDR5, 32.0.11021.1011
Memoría
32 GB 
, DDR5, 4800 MHz, Dual-Channel, 2x SODIMM
Placa base
AMD Promontory/Bixby FCH
Disco duro
AirDisk APF 10-512G, 512 GB 
Tarjeta de sonido
AMD Zen - Audio Processor - HD Audio Controller
Conexiones
1 USB 2.0, 3 USB 3.0, USB-C Power Delivery (PD), 1 HDMI, 2 DisplayPort, Audio Conexiones: 3.5 mm combo
Equipamento de red
Realtek RTL8125 2.5GBe Family Ethernet Controller (10/100/1000/2500MBit/s), MediaTek Wi-Fi 6E MT7922 160MHz Wireless LAN Card (a/b/g/n = Wi-Fi 4/ac = Wi-Fi 5/ax = Wi-Fi 6/ Wi-Fi 6E 6 GHz), Bluetooth 5.2
Tamaño
Alto x ancho x profundidad (en mm): 48 x 128 x 127
Sistema Operativo
Microsoft Windows 11 Pro
Características adicionales
12 Meses Garantía
Peso
526 g, Suministro de Electricidad: 507 g
Precio
300 USD
Nota: El fabricante puede utilizar componentes de diferentes proveedores, incluidos paneles de visualización, unidades o lápices de memoria con especificaciones similares.


Posibles contendientes en la comparación

Valoración
Versión
Fecha
Modelo
Peso
Altura
Tamaño
Resolución
Precio
63.6 %v8
07/2024
GMK NucBox M6
R5 6600H, Radeon 660M
526 g48 mmx
78.9 %
v7 (old)
v7 (old)
04/2024
GMK NucBox M5
R7 5700U, Vega 8
505 g48 mmx
83.6 %
v7 (old)
v7 (old)
04/2024
GMK NucBox K6
R7 7840HS, Radeon 780M
514 g47 mmx
84.5 %
v7 (old)
v7 (old)
05/2024
BOSGAME M1
R7 7840HS, Radeon 780M
766 g51 mmx
82.1 %
v7 (old)
v7 (old)
11/2023
Beelink SER5
R5 5560U, Vega 6
439 g42 mmx
80.8 %
v7 (old)
v7 (old)
04/2023
Intel NUC 13 Pro Kit NUC13ANK
i7-1360P, Iris Xe G7 96EUs
538 g37 mmx

Nota: Hemos actualizado nuestro sistema de evaluación y los resultados de la versión 8 no se pueden comparar con los de la versión 7. Más información aquí verfügbar.

Nota: Recientemente hemos actualizado nuestro sistema de clasificación y los resultados de la versión 8 no son comparables con los de la versión 7. Encontrará más información aquí .

Comparación de tamaños

136 mm 132 mm 51 mm 766 g129 mm 127 mm 48 mm 505 g128 mm 127 mm 48 mm 526 g128 mm 126 mm 47 mm 514 g126 mm 113 mm 42 mm 439 g117 mm 112 mm 37 mm 538 g210 mm 148 mm 1 mm 2.9 g

Conectividad

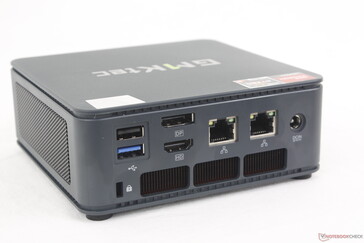
Aunque las opciones de puerto son idénticas a las de la NucBox M5, es importante señalar que la M6 no soporta USB4 a pesar del marketing del fabricante. El Administrador de dispositivos sólo lista soporte USB 3.2 y no USB4. Afortunadamente, Power Delivery y DisplayPort a través de USB-C siguen siendo compatibles.

Frontal: Botón de encendido, auriculares de 3,5 mm, USB-C 3.2 con Power Delivery + DisplayPort, 2x USB-A 3.2 Gen. 2
Parte trasera: 2x USB-A 2.0, DisplayPort (4K144), HDMI 2.0 (4K60), 2x RJ-45 (2,5 Gbps), adaptador de CA, bloqueo Kensington

Comunicación

Nuestras pruebas WiFi muestran que el rendimiento es más rápido en Wi-Fi 6 que en Wi-Fi 6E, incluso después de múltiples reintentos. Las velocidades de Wi-Fi 6E son anormalmente lentas lo que sugiere posibles problemas de antena con el módulo MediaTek MT7922 de nuestra unidad de pruebas.

Networking
iperf3 transmit AXE11000
GMK NucBox M6
MediaTek Wi-Fi 6E MT7922 160MHz Wireless LAN Card
1531 (1372min - 1639max) MBit/s
BOSGAME M1
MediaTek Wi-Fi 6E MT7922 160MHz Wireless LAN Card
1470 (1310min - 1625max) MBit/s -4%
GMK NucBox M5
MediaTek RZ616
1335 (782min - 1633max) MBit/s -13%
Beelink SER5
Intel Wi-Fi 6 AX200
1278 (649min - 1345max) MBit/s -17%
Intel NUC 13 Pro Kit NUC13ANK
Intel Wi-Fi 6E AX211
833 (805min - 866max) MBit/s -46%
GMK NucBox K6
MediaTek RZ616
634 (574min - 685max) MBit/s -59%
iperf3 receive AXE11000
BOSGAME M1
MediaTek Wi-Fi 6E MT7922 160MHz Wireless LAN Card
1479 (1255min - 1539max) MBit/s +2%
GMK NucBox M6
MediaTek Wi-Fi 6E MT7922 160MHz Wireless LAN Card
1449 (1247min - 1560max) MBit/s
Beelink SER5
Intel Wi-Fi 6 AX200
1411 (1230min - 1580max) MBit/s -3%
GMK NucBox M5
MediaTek RZ616
1264 (1077min - 1480max) MBit/s -13%
GMK NucBox K6
MediaTek RZ616
1222 (1074min - 1368max) MBit/s -16%
Intel NUC 13 Pro Kit NUC13ANK
Intel Wi-Fi 6E AX211
939 (921min - 952max) MBit/s -35%
iperf3 transmit AXE11000 6GHz
Intel NUC 13 Pro Kit NUC13ANK
Intel Wi-Fi 6E AX211
1445 (736min - 1476max) MBit/s +267%
GMK NucBox M5
MediaTek RZ616
1437 (695min - 1546max) MBit/s +265%
BOSGAME M1
MediaTek Wi-Fi 6E MT7922 160MHz Wireless LAN Card
1324 (1090min - 1580max) MBit/s +236%
GMK NucBox K6
MediaTek RZ616
432 (212min - 471max) MBit/s +10%
GMK NucBox M6
MediaTek Wi-Fi 6E MT7922 160MHz Wireless LAN Card
394 (359min - 432max) MBit/s
iperf3 receive AXE11000 6GHz
Intel NUC 13 Pro Kit NUC13ANK
Intel Wi-Fi 6E AX211
1668 (1467min - 1725max) MBit/s +144%
GMK NucBox M5
MediaTek RZ616
1347 (1315min - 1439max) MBit/s +97%
BOSGAME M1
MediaTek Wi-Fi 6E MT7922 160MHz Wireless LAN Card
1321 (1233min - 1393max) MBit/s +93%
GMK NucBox K6
MediaTek RZ616
984 (937min - 1048max) MBit/s +44%
GMK NucBox M6
MediaTek Wi-Fi 6E MT7922 160MHz Wireless LAN Card
684 (650min - 718max) MBit/s
0501001502002503003504004505005506006507007508008509009501000105011001150120012501300135014001450150015501600Tooltip
GMK NucBox M6; iperf3 transmit AXE11000 6GHz; iperf 3.1.3: Ø394 (359-432)
GMK NucBox M6; iperf3 receive AXE11000 6GHz; iperf 3.1.3: Ø684 (650-718)
GMK NucBox M6; iperf3 transmit AXE11000; iperf 3.1.3: Ø1531 (1372-1639)
GMK NucBox M6; iperf3 receive AXE11000; iperf 3.1.3: Ø1449 (1247-1560)

Mantenimiento

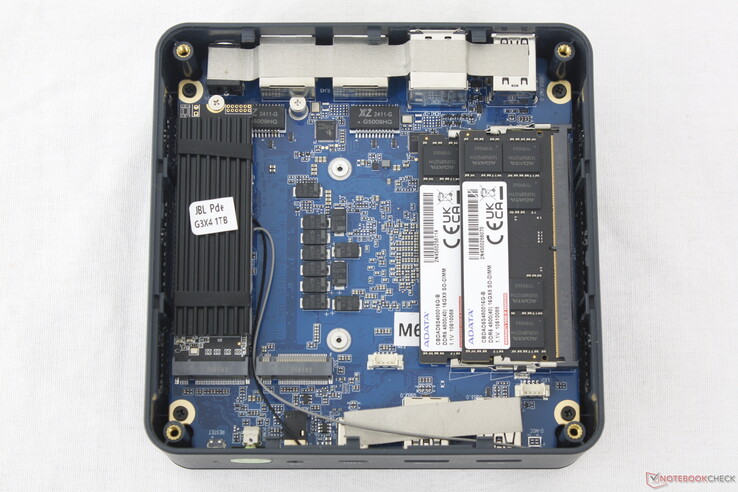
El panel superior sólo requiere un destornillador Phillips para extraerlo y facilitar el mantenimiento.

NucBox M6
NucBox M6
NucBox M5 para comparar

Accesorios y garantía

La caja de venta incluye un soporte VESA extraíble y un cable HDMI, además de los manuales habituales y el adaptador de CA. Tenga en cuenta que también pueden utilizarse adaptadores de CA USB-C de otros fabricantes si cumplen los requisitos de alimentación del mini PC.

Se aplica la habitual garantía limitada de un año del fabricante si se adquiere en EE.UU.

Rendimiento - Buena CPU por el precio


Condiciones de prueba

Pusimos Windows en modo Rendimiento antes de ejecutar las pruebas comparativas que se indican a continuación.

Procesador

Para un procesador de gama media a partir de 2022, el Ryzen 5 6600H sigue ofreciendo un buen rendimiento con resultados multihilo entre los del competidor Core i5-12450H y Core i5-12500H. Los usuarios que no puedan decidirse entre el NucBox M5 o M6 descubrirán que el Ryzen 5 6600H es más rápido que el Ryzen 7 5700U en aproximadamente un 60 por ciento.

Cinebench R15 Multi Loop

0130260390520650780910104011701300143015601690182019502080221023402470Tooltip
GMK NucBox M6 AMD Ryzen 5 6600H: Ø1720 (1708.16-1737.02)
GMK NucBox M5 AMD Ryzen 7 5700U: Ø1108 (1041.59-1129.53)
GMK NucBox K6 AMD Ryzen 7 7840HS: Ø2520 (2510.2-2537.27)
BOSGAME M1 AMD Ryzen 7 7840HS: Ø2554 (2501.09-2597.23)
Beelink SER5 AMD Ryzen 5 5560U: Ø1274 (1263.74-1280.29)
Intel NUC 13 Pro Kit NUC13ANK Intel Core i7-1360P: Ø1825 (1794.93-2181.38)
CPU Performance Rating: Percent
Cinebench R23: Multi Core | Single Core
Cinebench R20: CPU (Multi Core) | CPU (Single Core)
Cinebench R15: CPU Multi 64Bit | CPU Single 64Bit
Blender: v2.79 BMW27 CPU
7-Zip 18.03: 7z b 4 | 7z b 4 -mmt1
Geekbench 6.3: Multi-Core | Single-Core
Geekbench 5.5: Multi-Core | Single-Core
HWBOT x265 Benchmark v2.2: 4k Preset
LibreOffice : 20 Documents To PDF
R Benchmark 2.5: Overall mean
CPU Performance Rating
Minisforum AtomMan X7 Ti
Intel Core Ultra 9 185H
85.7 pt
Aoostar GEM12
AMD Ryzen 7 8845HS
84.8 pt
BOSGAME M1
AMD Ryzen 7 7840HS
84.3 pt
Acemagic F2A
Intel Core Ultra 7 155H
83.3 pt
HP Elite Mini 800 G9-5M9T9EA
Intel Core i5-13500
75.5 pt
Geekom GT13 Pro
Intel Core i9-13900H
75.2 pt
Intel NUC 13 Pro Kit NUC13ANK -2!
Intel Core i7-1360P
72.9 pt
Geekom XT12 Pro
Intel Core i9-12900H
70.9 pt
Aorus 15 YE5-54DEB34SH
Intel Core i5-12500H
70.5 pt
Aoostar GEM10
AMD Ryzen 7 6800H
67.5 pt
GMK NucBox M6
AMD Ryzen 5 6600H
63 pt
Maxtang MTN-FP750
AMD Ryzen 7 7735HS
62.5 pt
Medio AMD Ryzen 5 6600H
 
60.8 pt
Geekom Mini IT12
Intel Core i5-12450H
58.7 pt
Acemagic AD15
Intel Core i5-11500B
56.7 pt
GMK NucBox M5
AMD Ryzen 7 5700U
44.9 pt
Intel NUC11TNKi5 -2!
Intel Core i5-1135G7
39.2 pt
Cinebench R23 / Multi Core
Acemagic F2A
Intel Core Ultra 7 155H
18497 Points +78%
Minisforum AtomMan X7 Ti
Intel Core Ultra 9 185H
18016 Points +73%
Aoostar GEM12
AMD Ryzen 7 8845HS
16130 Points +55%
BOSGAME M1
AMD Ryzen 7 7840HS
16123 (15200.9min - 16122.9max) Points +55%
HP Elite Mini 800 G9-5M9T9EA
Intel Core i5-13500
14573 Points +40%
Aorus 15 YE5-54DEB34SH
Intel Core i5-12500H
13451 Points +29%
Aoostar GEM10
AMD Ryzen 7 6800H
13117 Points +26%
Geekom GT13 Pro
Intel Core i9-13900H
13015 Points +25%
Intel NUC 13 Pro Kit NUC13ANK
Intel Core i7-1360P
12637 Points +21%
Maxtang MTN-FP750
AMD Ryzen 7 7735HS
11072 Points +6%
Geekom XT12 Pro
Intel Core i9-12900H
11036 Points +6%
Medio AMD Ryzen 5 6600H
  (10226 - 10717, n=3)
10454 Points 0%
GMK NucBox M6
AMD Ryzen 5 6600H
10418 (10142.8min - 10418max) Points
Geekom Mini IT12
Intel Core i5-12450H
8511 Points -18%
Acemagic AD15
Intel Core i5-11500B
8318 Points -20%
GMK NucBox M5
AMD Ryzen 7 5700U
6649 (6519.7min - 6648.75max) Points -36%
Intel NUC11TNKi5
Intel Core i5-1135G7
5098 (4930.91min - 5098.17max) Points -51%
Cinebench R23 / Single Core
Intel NUC 13 Pro Kit NUC13ANK
Intel Core i7-1360P
1909 Points +28%
Minisforum AtomMan X7 Ti
Intel Core Ultra 9 185H
1851 Points +25%
Geekom XT12 Pro
Intel Core i9-12900H
1824 Points +23%
Aoostar GEM12
AMD Ryzen 7 8845HS
1783 Points +20%
HP Elite Mini 800 G9-5M9T9EA
Intel Core i5-13500
1780 Points +20%
Acemagic F2A
Intel Core Ultra 7 155H
1771 Points +19%
BOSGAME M1
AMD Ryzen 7 7840HS
1718 Points +16%
Geekom GT13 Pro
Intel Core i9-13900H
1715 Points +15%
Aorus 15 YE5-54DEB34SH
Intel Core i5-12500H
1696 Points +14%
Geekom Mini IT12
Intel Core i5-12450H
1663 Points +12%
Maxtang MTN-FP750
AMD Ryzen 7 7735HS
1543 Points +4%
Aoostar GEM10
AMD Ryzen 7 6800H
1542 Points +4%
GMK NucBox M6
AMD Ryzen 5 6600H
1486 Points
Acemagic AD15
Intel Core i5-11500B
1484 Points 0%
Medio AMD Ryzen 5 6600H
  (1458 - 1486, n=3)
1467 Points -1%
Intel NUC11TNKi5
Intel Core i5-1135G7
1369 Points -8%
GMK NucBox M5
AMD Ryzen 7 5700U
1267 Points -15%
Cinebench R20 / CPU (Multi Core)
Minisforum AtomMan X7 Ti
Intel Core Ultra 9 185H
7196 Points +75%
Acemagic F2A
Intel Core Ultra 7 155H
7188 Points +75%
BOSGAME M1
AMD Ryzen 7 7840HS
6349 Points +55%
Aoostar GEM12
AMD Ryzen 7 8845HS
6346 Points +55%
HP Elite Mini 800 G9-5M9T9EA
Intel Core i5-13500
5633 Points +37%
Aoostar GEM10
AMD Ryzen 7 6800H
5216 Points +27%
Aorus 15 YE5-54DEB34SH
Intel Core i5-12500H
5054 Points +23%
Geekom GT13 Pro
Intel Core i9-13900H
5013 Points +22%
Intel NUC 13 Pro Kit NUC13ANK
Intel Core i7-1360P
4887 Points +19%
Maxtang MTN-FP750
AMD Ryzen 7 7735HS
4339 Points +6%
Geekom XT12 Pro
Intel Core i9-12900H
4294 Points +5%
GMK NucBox M6
AMD Ryzen 5 6600H
4106 Points
Medio AMD Ryzen 5 6600H
  (3965 - 4141, n=3)
4071 Points -1%
Geekom Mini IT12
Intel Core i5-12450H
3270 Points -20%
Acemagic AD15
Intel Core i5-11500B
3236 Points -21%
GMK NucBox M5
AMD Ryzen 7 5700U
2580 Points -37%
Intel NUC11TNKi5
Intel Core i5-1135G7
1974 Points -52%
Cinebench R20 / CPU (Single Core)
Intel NUC 13 Pro Kit NUC13ANK
Intel Core i7-1360P
736 Points +26%
Minisforum AtomMan X7 Ti
Intel Core Ultra 9 185H
715 Points +22%
Geekom XT12 Pro
Intel Core i9-12900H
701 Points +20%
Aoostar GEM12
AMD Ryzen 7 8845HS
691 Points +18%
HP Elite Mini 800 G9-5M9T9EA
Intel Core i5-13500
685 Points +17%
BOSGAME M1
AMD Ryzen 7 7840HS
682 Points +17%
Acemagic F2A
Intel Core Ultra 7 155H
679 Points +16%
Geekom GT13 Pro
Intel Core i9-13900H
659 Points +13%
Aorus 15 YE5-54DEB34SH
Intel Core i5-12500H
653 Points +12%
Geekom Mini IT12
Intel Core i5-12450H
642 Points +10%
Maxtang MTN-FP750
AMD Ryzen 7 7735HS
604 Points +3%
Aoostar GEM10
AMD Ryzen 7 6800H
598 Points +2%
GMK NucBox M6
AMD Ryzen 5 6600H
584 Points
Medio AMD Ryzen 5 6600H
  (564 - 584, n=3)
574 Points -2%
Acemagic AD15
Intel Core i5-11500B
566 Points -3%
Intel NUC11TNKi5
Intel Core i5-1135G7
503 Points -14%
GMK NucBox M5
AMD Ryzen 7 5700U
495 Points -15%
Cinebench R15 / CPU Multi 64Bit
Minisforum AtomMan X7 Ti
Intel Core Ultra 9 185H
2746 Points +58%
Acemagic F2A
Intel Core Ultra 7 155H
2738 Points +58%
BOSGAME M1
AMD Ryzen 7 7840HS
2597 (2501.09min - 2597.23max) Points +50%
Aoostar GEM12
AMD Ryzen 7 8845HS
2537 Points +46%
HP Elite Mini 800 G9-5M9T9EA
Intel Core i5-13500
2405 Points +38%
Aorus 15 YE5-54DEB34SH
Intel Core i5-12500H
2283 (1991.44min - 2282.84max) Points +31%
Geekom GT13 Pro
Intel Core i9-13900H
2260 Points +30%
Geekom XT12 Pro
Intel Core i9-12900H
2121 Points +22%
Aoostar GEM10
AMD Ryzen 7 6800H
2117 Points +22%
Intel NUC 13 Pro Kit NUC13ANK
Intel Core i7-1360P
2030 Points +17%
Maxtang MTN-FP750
AMD Ryzen 7 7735HS
1795 Points +3%
GMK NucBox M6
AMD Ryzen 5 6600H
1737 (1708.16min - 1737.02max) Points
Medio AMD Ryzen 5 6600H
  (1626 - 1740, n=3)
1701 Points -2%
Acemagic AD15
Intel Core i5-11500B
1322 Points -24%
Geekom Mini IT12
Intel Core i5-12450H
1321 Points -24%
GMK NucBox M5
AMD Ryzen 7 5700U
1130 (1041.59min - 1129.53max) Points -35%
Intel NUC11TNKi5
Intel Core i5-1135G7
794 (772.57min - 794.38max) Points -54%
Cinebench R15 / CPU Single 64Bit
Aoostar GEM12
AMD Ryzen 7 8845HS
279 Points +15%
BOSGAME M1
AMD Ryzen 7 7840HS
275 Points +13%
Intel NUC 13 Pro Kit NUC13ANK
Intel Core i7-1360P
271 Points +12%
Minisforum AtomMan X7 Ti
Intel Core Ultra 9 185H
268 Points +10%
Acemagic F2A
Intel Core Ultra 7 155H
258 Points +6%
HP Elite Mini 800 G9-5M9T9EA
Intel Core i5-13500
256 Points +5%
Geekom XT12 Pro
Intel Core i9-12900H
251 Points +3%
Aorus 15 YE5-54DEB34SH
Intel Core i5-12500H
249 Points +2%
Maxtang MTN-FP750
AMD Ryzen 7 7735HS
245 Points +1%
Geekom GT13 Pro
Intel Core i9-13900H
245 Points +1%
GMK NucBox M6
AMD Ryzen 5 6600H
243 Points
Aoostar GEM10
AMD Ryzen 7 6800H
240 Points -1%
Geekom Mini IT12
Intel Core i5-12450H
239 Points -2%
Medio AMD Ryzen 5 6600H
  (231 - 243, n=3)
237 Points -2%
Acemagic AD15
Intel Core i5-11500B
223 Points -8%
Intel NUC11TNKi5
Intel Core i5-1135G7
201 Points -17%
GMK NucBox M5
AMD Ryzen 7 5700U
188.1 Points -23%
Blender / v2.79 BMW27 CPU
Intel NUC11TNKi5
Intel Core i5-1135G7
600 Seconds * -105%
GMK NucBox M5
AMD Ryzen 7 5700U
427 Seconds * -46%
Geekom Mini IT12
Intel Core i5-12450H
385 Seconds * -31%
Acemagic AD15
Intel Core i5-11500B
379 Seconds * -29%
Medio AMD Ryzen 5 6600H
  (291 - 306, n=3)
297 Seconds * -1%
Geekom XT12 Pro
Intel Core i9-12900H
296 Seconds * -1%
GMK NucBox M6
AMD Ryzen 5 6600H
293 Seconds *
Maxtang MTN-FP750
AMD Ryzen 7 7735HS
279 Seconds * +5%
Intel NUC 13 Pro Kit NUC13ANK
Intel Core i7-1360P
275 Seconds * +6%
Geekom GT13 Pro
Intel Core i9-13900H
262 Seconds * +11%
Aoostar GEM10
AMD Ryzen 7 6800H
259 Seconds * +12%
Aorus 15 YE5-54DEB34SH
Intel Core i5-12500H
246 Seconds * +16%
HP Elite Mini 800 G9-5M9T9EA
Intel Core i5-13500
223 Seconds * +24%
Aoostar GEM12
AMD Ryzen 7 8845HS
197 Seconds * +33%
BOSGAME M1
AMD Ryzen 7 7840HS
196 Seconds * +33%
Acemagic F2A
Intel Core Ultra 7 155H
178 Seconds * +39%
Minisforum AtomMan X7 Ti
Intel Core Ultra 9 185H
171 Seconds * +42%
7-Zip 18.03 / 7z b 4
Minisforum AtomMan X7 Ti
Intel Core Ultra 9 185H
71934 MIPS +46%
Aoostar GEM12
AMD Ryzen 7 8845HS
70733 MIPS +43%
BOSGAME M1
AMD Ryzen 7 7840HS
70417 MIPS +43%
Acemagic F2A
Intel Core Ultra 7 155H
66438 MIPS +35%
HP Elite Mini 800 G9-5M9T9EA
Intel Core i5-13500
55528 MIPS +13%
Aoostar GEM10
AMD Ryzen 7 6800H
55067 MIPS +12%
Intel NUC 13 Pro Kit NUC13ANK
Intel Core i7-1360P
52959 MIPS +7%
Aorus 15 YE5-54DEB34SH
Intel Core i5-12500H
52924 MIPS +7%
Geekom GT13 Pro
Intel Core i9-13900H
52479 MIPS +6%
GMK NucBox M6
AMD Ryzen 5 6600H
49353 MIPS
Maxtang MTN-FP750
AMD Ryzen 7 7735HS
48327 MIPS -2%
Geekom XT12 Pro
Intel Core i9-12900H
47146 MIPS -4%
Medio AMD Ryzen 5 6600H
  (39886 - 49353, n=3)
45692 MIPS -7%
Acemagic AD15
Intel Core i5-11500B
36194 MIPS -27%
Geekom Mini IT12
Intel Core i5-12450H
35191 MIPS -29%
GMK NucBox M5
AMD Ryzen 7 5700U
34172 MIPS -31%
Intel NUC11TNKi5
Intel Core i5-1135G7
23280 MIPS -53%
7-Zip 18.03 / 7z b 4 -mmt1
Aoostar GEM12
AMD Ryzen 7 8845HS
6644 MIPS +16%
BOSGAME M1
AMD Ryzen 7 7840HS
6602 MIPS +15%
Geekom GT13 Pro
Intel Core i9-13900H
6321 MIPS +11%
Intel NUC 13 Pro Kit NUC13ANK
Intel Core i7-1360P
5961 MIPS +4%
HP Elite Mini 800 G9-5M9T9EA
Intel Core i5-13500
5887 MIPS +3%
Geekom XT12 Pro
Intel Core i9-12900H
5881 MIPS +3%
Maxtang MTN-FP750
AMD Ryzen 7 7735HS
5796 MIPS +1%
GMK NucBox M6
AMD Ryzen 5 6600H
5720 MIPS
Medio AMD Ryzen 5 6600H
  (5466 - 5720, n=3)
5580 MIPS -2%
Minisforum AtomMan X7 Ti
Intel Core Ultra 9 185H
5560 MIPS -3%
Aoostar GEM10
AMD Ryzen 7 6800H
5521 MIPS -3%
Acemagic AD15
Intel Core i5-11500B
5498 MIPS -4%
Acemagic F2A
Intel Core Ultra 7 155H
5485 MIPS -4%
Aorus 15 YE5-54DEB34SH
Intel Core i5-12500H
5418 MIPS -5%
Geekom Mini IT12
Intel Core i5-12450H
5386 MIPS -6%
Intel NUC11TNKi5
Intel Core i5-1135G7
4738 MIPS -17%
GMK NucBox M5
AMD Ryzen 7 5700U
4599 MIPS -20%
Geekbench 6.3 / Multi-Core
Minisforum AtomMan X7 Ti
Intel Core Ultra 9 185H
13356 Points +45%
BOSGAME M1
AMD Ryzen 7 7840HS
13326 Points +44%
Aoostar GEM12
AMD Ryzen 7 8845HS
13318 Points +44%
Acemagic F2A
Intel Core Ultra 7 155H
12385 Points +34%
Geekom GT13 Pro
Intel Core i9-13900H
11358 Points +23%
Aorus 15 YE5-54DEB34SH
Intel Core i5-12500H
11069 Points +20%
HP Elite Mini 800 G9-5M9T9EA
Intel Core i5-13500
10348 Points +12%
Geekom XT12 Pro
Intel Core i9-12900H
10233 Points +11%
Aoostar GEM10
AMD Ryzen 7 6800H
9527 Points +3%
GMK NucBox M6
AMD Ryzen 5 6600H
9240 Points
Medio AMD Ryzen 5 6600H
  ()
9240 Points 0%
Geekom Mini IT12
Intel Core i5-12450H
8828 Points -4%
Acemagic AD15
Intel Core i5-11500B
8148 Points -12%
Maxtang MTN-FP750
AMD Ryzen 7 7735HS
7854 Points -15%
GMK NucBox M5
AMD Ryzen 7 5700U
6260 Points -32%
Geekbench 6.3 / Single-Core
Aoostar GEM12
AMD Ryzen 7 8845HS
2667 Points +31%
BOSGAME M1
AMD Ryzen 7 7840HS
2640 Points +29%
Geekom GT13 Pro
Intel Core i9-13900H
2580 Points +26%
Minisforum AtomMan X7 Ti
Intel Core Ultra 9 185H
2492 Points +22%
HP Elite Mini 800 G9-5M9T9EA
Intel Core i5-13500
2483 Points +22%
Geekom XT12 Pro
Intel Core i9-12900H
2464 Points +21%
Acemagic F2A
Intel Core Ultra 7 155H
2410 Points +18%
Aorus 15 YE5-54DEB34SH
Intel Core i5-12500H
2320 Points +14%
Geekom Mini IT12
Intel Core i5-12450H
2286 Points +12%
Acemagic AD15
Intel Core i5-11500B
2173 Points +6%
Maxtang MTN-FP750
AMD Ryzen 7 7735HS
2072 Points +1%
Aoostar GEM10
AMD Ryzen 7 6800H
2049 Points 0%
GMK NucBox M6
AMD Ryzen 5 6600H
2042 Points
Medio AMD Ryzen 5 6600H
  ()
2042 Points 0%
GMK NucBox M5
AMD Ryzen 7 5700U
1625 Points -20%
Geekbench 5.5 / Multi-Core
Minisforum AtomMan X7 Ti
Intel Core Ultra 9 185H
13392 Points +63%
Acemagic F2A
Intel Core Ultra 7 155H
12662 Points +55%
Aoostar GEM12
AMD Ryzen 7 8845HS
12143 Points +48%
BOSGAME M1
AMD Ryzen 7 7840HS
12116 Points +48%
Geekom GT13 Pro
Intel Core i9-13900H
11283 Points +38%
Intel NUC 13 Pro Kit NUC13ANK
Intel Core i7-1360P
10574 Points +29%
Aorus 15 YE5-54DEB34SH
Intel Core i5-12500H
10560 Points +29%
HP Elite Mini 800 G9-5M9T9EA
Intel Core i5-13500
10322 Points +26%
Geekom XT12 Pro
Intel Core i9-12900H
10028 Points +22%
Aoostar GEM10
AMD Ryzen 7 6800H
8898 Points +9%
GMK NucBox M6
AMD Ryzen 5 6600H
8195 Points
Geekom Mini IT12
Intel Core i5-12450H
8066 Points -2%
Medio AMD Ryzen 5 6600H
  (6403 - 8195, n=3)
7442 Points -9%
Maxtang MTN-FP750
AMD Ryzen 7 7735HS
7368 Points -10%
Acemagic AD15
Intel Core i5-11500B
7132 Points -13%
GMK NucBox M5
AMD Ryzen 7 5700U
5593 Points -32%
Intel NUC11TNKi5
Intel Core i5-1135G7
4593 Points -44%
Geekbench 5.5 / Single-Core
Aoostar GEM12
AMD Ryzen 7 8845HS
1958 Points +29%
BOSGAME M1
AMD Ryzen 7 7840HS
1928 Points +27%
Minisforum AtomMan X7 Ti
Intel Core Ultra 9 185H
1856 Points +23%
Intel NUC 13 Pro Kit NUC13ANK
Intel Core i7-1360P
1850 Points +22%
Geekom GT13 Pro
Intel Core i9-13900H
1841 Points +22%
HP Elite Mini 800 G9-5M9T9EA
Intel Core i5-13500
1805 Points +19%
Geekom XT12 Pro
Intel Core i9-12900H
1790 Points +18%
Acemagic F2A
Intel Core Ultra 7 155H
1746 Points +15%
Geekom Mini IT12
Intel Core i5-12450H
1636 Points +8%
Aorus 15 YE5-54DEB34SH
Intel Core i5-12500H
1626 Points +7%
Acemagic AD15
Intel Core i5-11500B
1566 Points +4%
Aoostar GEM10
AMD Ryzen 7 6800H
1552 Points +3%
Maxtang MTN-FP750
AMD Ryzen 7 7735HS
1534 Points +1%
GMK NucBox M6
AMD Ryzen 5 6600H
1513 Points
Medio AMD Ryzen 5 6600H
  (1446 - 1513, n=3)
1478 Points -2%
Intel NUC11TNKi5
Intel Core i5-1135G7
1396 Points -8%
GMK NucBox M5
AMD Ryzen 7 5700U
1203 Points -20%
HWBOT x265 Benchmark v2.2 / 4k Preset
Minisforum AtomMan X7 Ti
Intel Core Ultra 9 185H
20.9 fps +50%
Aoostar GEM12
AMD Ryzen 7 8845HS
20.5 fps +47%
BOSGAME M1
AMD Ryzen 7 7840HS
20.3 fps +46%
Acemagic F2A
Intel Core Ultra 7 155H
19.6 fps +41%
HP Elite Mini 800 G9-5M9T9EA
Intel Core i5-13500
16.3 fps +17%
Aorus 15 YE5-54DEB34SH
Intel Core i5-12500H
15.1 fps +9%
Aoostar GEM10
AMD Ryzen 7 6800H
14.9 fps +7%
Intel NUC 13 Pro Kit NUC13ANK
Intel Core i7-1360P
14.2 fps +2%
Geekom GT13 Pro
Intel Core i9-13900H
14.1 fps +1%
GMK NucBox M6
AMD Ryzen 5 6600H
13.9 fps
Medio AMD Ryzen 5 6600H
  (11.5 - 14.2, n=3)
13.2 fps -5%
Maxtang MTN-FP750
AMD Ryzen 7 7735HS
12.7 fps -9%
Geekom XT12 Pro
Intel Core i9-12900H
12.3 fps -12%
Geekom Mini IT12
Intel Core i5-12450H
10.4 fps -25%
Acemagic AD15
Intel Core i5-11500B
10.3 fps -26%
GMK NucBox M5
AMD Ryzen 7 5700U
8.44 fps -39%
Intel NUC11TNKi5
Intel Core i5-1135G7
6.63 fps -52%
LibreOffice / 20 Documents To PDF
Aorus 15 YE5-54DEB34SH
Intel Core i5-12500H
58.5 s * -12%
GMK NucBox M5
AMD Ryzen 7 5700U
58 s * -11%
Medio AMD Ryzen 5 6600H
  (52.4 - 60, n=3)
56.9 s * -9%
Maxtang MTN-FP750
AMD Ryzen 7 7735HS
54.8 s * -5%
Geekom Mini IT12
Intel Core i5-12450H
53.2 s * -2%
HP Elite Mini 800 G9-5M9T9EA
Intel Core i5-13500
52.5 s * -0%
GMK NucBox M6
AMD Ryzen 5 6600H
52.4 s *
Intel NUC11TNKi5
Intel Core i5-1135G7
51.3 s * +2%
Aoostar GEM10
AMD Ryzen 7 6800H
51.2 s * +2%
Minisforum AtomMan X7 Ti
Intel Core Ultra 9 185H
49.5 s * +6%
Aoostar GEM12
AMD Ryzen 7 8845HS
47.5 s * +9%
BOSGAME M1
AMD Ryzen 7 7840HS
47.4 s * +10%
Acemagic F2A
Intel Core Ultra 7 155H
44.5 s * +15%
Intel NUC 13 Pro Kit NUC13ANK
Intel Core i7-1360P
43.7 s * +17%
Acemagic AD15
Intel Core i5-11500B
41.2 s * +21%
Geekom XT12 Pro
Intel Core i9-12900H
39.6 s * +24%
Geekom GT13 Pro
Intel Core i9-13900H
39.4 s * +25%
R Benchmark 2.5 / Overall mean
Intel NUC11TNKi5
Intel Core i5-1135G7
0.622 sec * -25%
GMK NucBox M5
AMD Ryzen 7 5700U
0.584 sec * -17%
Acemagic AD15
Intel Core i5-11500B
0.561 sec * -12%
Aorus 15 YE5-54DEB34SH
Intel Core i5-12500H
0.519 sec * -4%
Aoostar GEM10
AMD Ryzen 7 6800H
0.515 sec * -3%
Medio AMD Ryzen 5 6600H
  (0.4995 - 0.532, n=3)
0.511 sec * -2%
Maxtang MTN-FP750
AMD Ryzen 7 7735HS
0.507 sec * -2%
Geekom Mini IT12
Intel Core i5-12450H
0.505 sec * -1%
GMK NucBox M6
AMD Ryzen 5 6600H
0.4995 sec *
Acemagic F2A
Intel Core Ultra 7 155H
0.4652 sec * +7%
Geekom XT12 Pro
Intel Core i9-12900H
0.4632 sec * +7%
Minisforum AtomMan X7 Ti
Intel Core Ultra 9 185H
0.4627 sec * +7%
HP Elite Mini 800 G9-5M9T9EA
Intel Core i5-13500
0.4469 sec * +11%
Intel NUC 13 Pro Kit NUC13ANK
Intel Core i7-1360P
0.445 sec * +11%
BOSGAME M1
AMD Ryzen 7 7840HS
0.4418 sec * +12%
Geekom GT13 Pro
Intel Core i9-13900H
0.4395 sec * +12%
Aoostar GEM12
AMD Ryzen 7 8845HS
0.4392 sec * +12%
CPU Performance Rating: Percent
Cinebench R23: Multi Core | Single Core
Cinebench R20: CPU (Multi Core) | CPU (Single Core)
Cinebench R15: CPU Multi 64Bit | CPU Single 64Bit
Blender: v2.79 BMW27 CPU
7-Zip 18.03: 7z b 4 | 7z b 4 -mmt1
Geekbench 6.3: Multi-Core | Single-Core
Geekbench 5.5: Multi-Core | Single-Core
HWBOT x265 Benchmark v2.2: 4k Preset
LibreOffice : 20 Documents To PDF
R Benchmark 2.5: Overall mean

* ... más pequeño es mejor

Cinebench R15 CPU Multi 64Bit
1737 Points
Cinebench R15 OpenGL 64Bit
154.4 fps
Cinebench R15 Ref. Match 64Bit
97.9 %
Cinebench R15 CPU Single 64Bit
243 Points
Cinebench R20 CPU (Multi Core)
4106 Points
Cinebench R20 CPU (Single Core)
584 Points
Cinebench R23 Single Core
1486 Points
Cinebench R23 Multi Core
10418 Points
ayuda
Performance Rating
BOSGAME M1
AMD Ryzen 7 7840HS, Radeon 780M
100 pt
GMK NucBox K6
AMD Ryzen 7 7840HS, Radeon 780M
97.7 pt
GMK NucBox M6
AMD Ryzen 5 6600H, Radeon 660M
62.2 pt
Medio AMD Ryzen 5 6600H
 
60.6 pt
Intel NUC 13 Pro Kit NUC13ANK
Intel Core i7-1360P, Iris Xe G7 96EUs
56.7 pt
Beelink SER5
AMD Ryzen 5 5560U, Vega 6
46.4 pt
GMK NucBox M5
AMD Ryzen 7 5700U, Vega 8
43.2 pt
AIDA64 / FP32 Ray-Trace
BOSGAME M1
AMD Ryzen 7 7840HS, Radeon 780M
26022 KRay/s +112%
GMK NucBox K6
AMD Ryzen 7 7840HS, Radeon 780M
25360 KRay/s +107%
Medio AMD Ryzen 5 6600H
  (12156 - 12871, n=3)
12434 KRay/s +1%
GMK NucBox M6
AMD Ryzen 5 6600H, Radeon 660M
12274 KRay/s
Intel NUC 13 Pro Kit NUC13ANK
Intel Core i7-1360P, Iris Xe G7 96EUs
11040 KRay/s -10%
Beelink SER5
AMD Ryzen 5 5560U, Vega 6
8895 KRay/s -28%
GMK NucBox M5
AMD Ryzen 7 5700U, Vega 8
7345 KRay/s -40%
AIDA64 / FPU Julia
BOSGAME M1
AMD Ryzen 7 7840HS, Radeon 780M
110752 Points +44%
GMK NucBox K6
AMD Ryzen 7 7840HS, Radeon 780M
107805 Points +40%
GMK NucBox M6
AMD Ryzen 5 6600H, Radeon 660M
76931 Points
Medio AMD Ryzen 5 6600H
  (75025 - 78277, n=3)
76744 Points 0%
Beelink SER5
AMD Ryzen 5 5560U, Vega 6
56914 Points -26%
Intel NUC 13 Pro Kit NUC13ANK
Intel Core i7-1360P, Iris Xe G7 96EUs
55557 Points -28%
GMK NucBox M5
AMD Ryzen 7 5700U, Vega 8
45926 Points -40%
AIDA64 / CPU SHA3
BOSGAME M1
AMD Ryzen 7 7840HS, Radeon 780M
4854 MB/s +83%
GMK NucBox K6
AMD Ryzen 7 7840HS, Radeon 780M
4763 MB/s +80%
Intel NUC 13 Pro Kit NUC13ANK
Intel Core i7-1360P, Iris Xe G7 96EUs
2728 MB/s +3%
GMK NucBox M6
AMD Ryzen 5 6600H, Radeon 660M
2650 MB/s
Medio AMD Ryzen 5 6600H
  (2606 - 2689, n=3)
2648 MB/s 0%
Beelink SER5
AMD Ryzen 5 5560U, Vega 6
1943 MB/s -27%
GMK NucBox M5
AMD Ryzen 7 5700U, Vega 8
1503 MB/s -43%
AIDA64 / CPU Queen
BOSGAME M1
AMD Ryzen 7 7840HS, Radeon 780M
117809 Points +43%
GMK NucBox K6
AMD Ryzen 7 7840HS, Radeon 780M
111803 Points +36%
Intel NUC 13 Pro Kit NUC13ANK
Intel Core i7-1360P, Iris Xe G7 96EUs
86691 Points +6%
GMK NucBox M6
AMD Ryzen 5 6600H, Radeon 660M
82119 Points
Medio AMD Ryzen 5 6600H
  (78765 - 82119, n=3)
80152 Points -2%
GMK NucBox M5
AMD Ryzen 7 5700U, Vega 8
68805 Points -16%
Beelink SER5
AMD Ryzen 5 5560U, Vega 6
67352 Points -18%
AIDA64 / FPU SinJulia
BOSGAME M1
AMD Ryzen 7 7840HS, Radeon 780M
14915 Points +53%
GMK NucBox K6
AMD Ryzen 7 7840HS, Radeon 780M
14721 Points +51%
GMK NucBox M5
AMD Ryzen 7 5700U, Vega 8
9992 Points +3%
GMK NucBox M6
AMD Ryzen 5 6600H, Radeon 660M
9739 Points
Medio AMD Ryzen 5 6600H
  (9184 - 9739, n=3)
9426 Points -3%
Beelink SER5
AMD Ryzen 5 5560U, Vega 6
8505 Points -13%
Intel NUC 13 Pro Kit NUC13ANK
Intel Core i7-1360P, Iris Xe G7 96EUs
7269 Points -25%
AIDA64 / FPU Mandel
BOSGAME M1
AMD Ryzen 7 7840HS, Radeon 780M
59072 Points +39%
GMK NucBox K6
AMD Ryzen 7 7840HS, Radeon 780M
57534 Points +36%
GMK NucBox M6
AMD Ryzen 5 6600H, Radeon 660M
42406 Points
Medio AMD Ryzen 5 6600H
  (41153 - 43222, n=3)
42260 Points 0%
Beelink SER5
AMD Ryzen 5 5560U, Vega 6
31339 Points -26%
Intel NUC 13 Pro Kit NUC13ANK
Intel Core i7-1360P, Iris Xe G7 96EUs
27772 Points -35%
GMK NucBox M5
AMD Ryzen 7 5700U, Vega 8
24053 Points -43%
AIDA64 / CPU AES
BOSGAME M1
AMD Ryzen 7 7840HS, Radeon 780M
166944 MB/s +60%
GMK NucBox K6
AMD Ryzen 7 7840HS, Radeon 780M
164041 MB/s +58%
GMK NucBox M6
AMD Ryzen 5 6600H, Radeon 660M
104138 MB/s
Medio AMD Ryzen 5 6600H
  (100609 - 104138, n=3)
102594 MB/s -1%
Intel NUC 13 Pro Kit NUC13ANK
Intel Core i7-1360P, Iris Xe G7 96EUs
99244 MB/s -5%
Beelink SER5
AMD Ryzen 5 5560U, Vega 6
78948 MB/s -24%
GMK NucBox M5
AMD Ryzen 7 5700U, Vega 8
46218 MB/s -56%
AIDA64 / CPU ZLib
BOSGAME M1
AMD Ryzen 7 7840HS, Radeon 780M
1051 MB/s +59%
GMK NucBox K6
AMD Ryzen 7 7840HS, Radeon 780M
1031 MB/s +56%
Intel NUC 13 Pro Kit NUC13ANK
Intel Core i7-1360P, Iris Xe G7 96EUs
807 MB/s +22%
GMK NucBox M6
AMD Ryzen 5 6600H, Radeon 660M
660 MB/s
Medio AMD Ryzen 5 6600H
  (634 - 660, n=3)
649 MB/s -2%
GMK NucBox M5
AMD Ryzen 7 5700U, Vega 8
513 MB/s -22%
Beelink SER5
AMD Ryzen 5 5560U, Vega 6
509 MB/s -23%
AIDA64 / FP64 Ray-Trace
BOSGAME M1
AMD Ryzen 7 7840HS, Radeon 780M
13897 KRay/s +111%
GMK NucBox K6
AMD Ryzen 7 7840HS, Radeon 780M
13642 KRay/s +107%
Medio AMD Ryzen 5 6600H
  (6545 - 6911, n=3)
6681 KRay/s +1%
GMK NucBox M6
AMD Ryzen 5 6600H, Radeon 660M
6588 KRay/s
Intel NUC 13 Pro Kit NUC13ANK
Intel Core i7-1360P, Iris Xe G7 96EUs
5920 KRay/s -10%
Beelink SER5
AMD Ryzen 5 5560U, Vega 6
4540 KRay/s -31%
GMK NucBox M5
AMD Ryzen 7 5700U, Vega 8
3892 KRay/s -41%
AIDA64 / CPU PhotoWorxx
BOSGAME M1
AMD Ryzen 7 7840HS, Radeon 780M
41516 MPixel/s +40%
GMK NucBox K6
AMD Ryzen 7 7840HS, Radeon 780M
40760 MPixel/s +38%
GMK NucBox M6
AMD Ryzen 5 6600H, Radeon 660M
29621 MPixel/s
Intel NUC 13 Pro Kit NUC13ANK
Intel Core i7-1360P, Iris Xe G7 96EUs
29108 MPixel/s -2%
GMK NucBox M5
AMD Ryzen 7 5700U, Vega 8
25066 MPixel/s -15%
Medio AMD Ryzen 5 6600H
  (16218 - 29621, n=3)
24848 MPixel/s -16%
Beelink SER5
AMD Ryzen 5 5560U, Vega 6
17917 MPixel/s -40%

Prueba de estrés

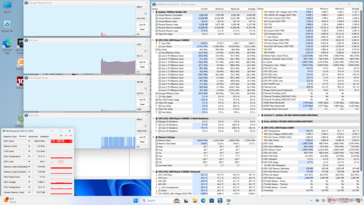
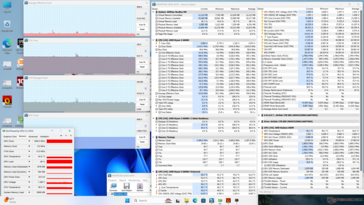
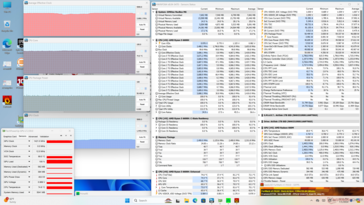
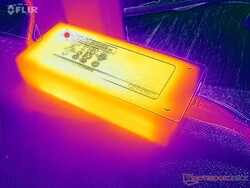
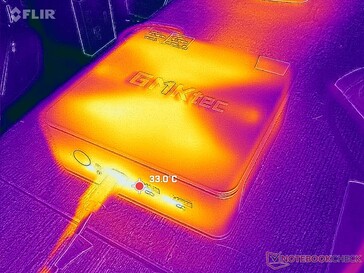
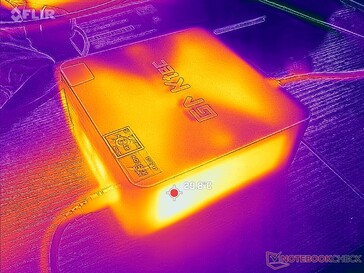
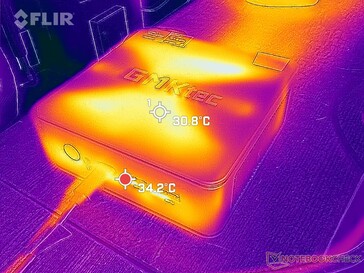
La CPU aumentaba a 4,1 GHz, 54 W y 78 C cuando ejecutaba el estrés Prime95 antes de caer rápidamente y estabilizarse en 3,9 GHz y 50 W sólo unos segundos después. Aunque el rendimiento máximo del Turbo Core no es indefinido, la caída es sorprendentemente marginal.

La temperatura del núcleo se estabilizaría en sólo 64 C cuando se ejecuta Witcher 3 cargas típicas de juego, lo que es comparable a la del más lento NucBox M5.

Sistema inactivo
Sistema inactivo
Witcher 3 estrés
Witcher 3 estrés
Prime95 estrés
Prime95 estrés
Prime95+Tensión FurMark
Reloj medio de la CPU (GHz) Reloj de la GPU (MHz) Temperatura media de la CPU (°C)
Sistema en reposo -- -- 40
Prime95 Estrés ~3,9 -- 80
Estrés Prime95+ FurMark ~3,7 1421 75
Witcher 3 Estrés ~0,3 1900 54

Rendimiento del sistema

PCMark 10 Estándar. Las puntuaciones medias se sitúan entre los mini PCs que funcionan con CPUs Zen 4 más rápidas y CPUs Zen 2 más lentas, como era de esperar
PCMark 10 / Score
GMK NucBox K6
Radeon 780M, R7 7840HS, MasonSemi 1TB MC7000
7529 Points +21%
BOSGAME M1
Radeon 780M, R7 7840HS
7198 Points +16%
Intel NUC 13 Pro Kit NUC13ANK
Iris Xe G7 96EUs, i7-1360P, Samsung PM9A1 MZVL2512HCJQ
6281 Points +1%
GMK NucBox M6
Radeon 660M, R5 6600H, AirDisk APF 10-512G
6220 Points
Medio AMD Ryzen 5 6600H, AMD Radeon 660M
  ()
6220 Points 0%
Beelink SER5
Vega 6, R5 5560U, Crucial P3 Plus CT1000P3PSSD8
5453 Points -12%
GMK NucBox M5
Vega 8, R7 5700U, Lexar 1024GB LNM6A1X001T-HNNNG
5293 Points -15%
PCMark 10 / Essentials
Intel NUC 13 Pro Kit NUC13ANK
Iris Xe G7 96EUs, i7-1360P, Samsung PM9A1 MZVL2512HCJQ
11596 Points +12%
GMK NucBox K6
Radeon 780M, R7 7840HS, MasonSemi 1TB MC7000
11214 Points +8%
BOSGAME M1
Radeon 780M, R7 7840HS
11211 Points +8%
GMK NucBox M6
Radeon 660M, R5 6600H, AirDisk APF 10-512G
10360 Points
Medio AMD Ryzen 5 6600H, AMD Radeon 660M
  ()
10360 Points 0%
GMK NucBox M5
Vega 8, R7 5700U, Lexar 1024GB LNM6A1X001T-HNNNG
9554 Points -8%
Beelink SER5
Vega 6, R5 5560U, Crucial P3 Plus CT1000P3PSSD8
9440 Points -9%
PCMark 10 / Productivity
GMK NucBox K6
Radeon 780M, R7 7840HS, MasonSemi 1TB MC7000
10591 Points +17%
BOSGAME M1
Radeon 780M, R7 7840HS
9075 Points 0%
GMK NucBox M6
Radeon 660M, R5 6600H, AirDisk APF 10-512G
9059 Points
Medio AMD Ryzen 5 6600H, AMD Radeon 660M
  ()
9059 Points 0%
Beelink SER5
Vega 6, R5 5560U, Crucial P3 Plus CT1000P3PSSD8
8901 Points -2%
GMK NucBox M5
Vega 8, R7 5700U, Lexar 1024GB LNM6A1X001T-HNNNG
8457 Points -7%
Intel NUC 13 Pro Kit NUC13ANK
Iris Xe G7 96EUs, i7-1360P, Samsung PM9A1 MZVL2512HCJQ
7893 Points -13%
PCMark 10 / Digital Content Creation
BOSGAME M1
Radeon 780M, R7 7840HS
9948 Points +43%
GMK NucBox K6
Radeon 780M, R7 7840HS, MasonSemi 1TB MC7000
9752 Points +40%
Intel NUC 13 Pro Kit NUC13ANK
Iris Xe G7 96EUs, i7-1360P, Samsung PM9A1 MZVL2512HCJQ
7348 Points +6%
GMK NucBox M6
Radeon 660M, R5 6600H, AirDisk APF 10-512G
6959 Points
Medio AMD Ryzen 5 6600H, AMD Radeon 660M
  ()
6959 Points 0%
Beelink SER5
Vega 6, R5 5560U, Crucial P3 Plus CT1000P3PSSD8
5238 Points -25%
GMK NucBox M5
Vega 8, R7 5700U, Lexar 1024GB LNM6A1X001T-HNNNG
4982 Points -28%
CrossMark / Overall
BOSGAME M1
Radeon 780M, R7 7840HS
1891 Points +24%
GMK NucBox K6
Radeon 780M, R7 7840HS, MasonSemi 1TB MC7000
1873 Points +23%
Intel NUC 13 Pro Kit NUC13ANK
Iris Xe G7 96EUs, i7-1360P, Samsung PM9A1 MZVL2512HCJQ
1810 Points +19%
GMK NucBox M6
Radeon 660M, R5 6600H, AirDisk APF 10-512G
1521 Points
Medio AMD Ryzen 5 6600H, AMD Radeon 660M
  ()
1521 Points 0%
Beelink SER5
Vega 6, R5 5560U, Crucial P3 Plus CT1000P3PSSD8
1196 Points -21%
GMK NucBox M5
Vega 8, R7 5700U, Lexar 1024GB LNM6A1X001T-HNNNG
1087 Points -29%
CrossMark / Productivity
BOSGAME M1
Radeon 780M, R7 7840HS
1823 Points +20%
GMK NucBox K6
Radeon 780M, R7 7840HS, MasonSemi 1TB MC7000
1816 Points +20%
Intel NUC 13 Pro Kit NUC13ANK
Iris Xe G7 96EUs, i7-1360P, Samsung PM9A1 MZVL2512HCJQ
1740 Points +15%
GMK NucBox M6
Radeon 660M, R5 6600H, AirDisk APF 10-512G
1517 Points
Medio AMD Ryzen 5 6600H, AMD Radeon 660M
  ()
1517 Points 0%
Beelink SER5
Vega 6, R5 5560U, Crucial P3 Plus CT1000P3PSSD8
1259 Points -17%
GMK NucBox M5
Vega 8, R7 5700U, Lexar 1024GB LNM6A1X001T-HNNNG
1133 Points -25%
CrossMark / Creativity
BOSGAME M1
Radeon 780M, R7 7840HS
2013 Points +28%
GMK NucBox K6
Radeon 780M, R7 7840HS, MasonSemi 1TB MC7000
1994 Points +27%
Intel NUC 13 Pro Kit NUC13ANK
Iris Xe G7 96EUs, i7-1360P, Samsung PM9A1 MZVL2512HCJQ
1970 Points +26%
GMK NucBox M6
Radeon 660M, R5 6600H, AirDisk APF 10-512G
1567 Points
Medio AMD Ryzen 5 6600H, AMD Radeon 660M
  ()
1567 Points 0%
Beelink SER5
Vega 6, R5 5560U, Crucial P3 Plus CT1000P3PSSD8
1153 Points -26%
GMK NucBox M5
Vega 8, R7 5700U, Lexar 1024GB LNM6A1X001T-HNNNG
1042 Points -34%
CrossMark / Responsiveness
BOSGAME M1
Radeon 780M, R7 7840HS
1749 Points +24%
GMK NucBox K6
Radeon 780M, R7 7840HS, MasonSemi 1TB MC7000
1706 Points +21%
Intel NUC 13 Pro Kit NUC13ANK
Iris Xe G7 96EUs, i7-1360P, Samsung PM9A1 MZVL2512HCJQ
1578 Points +12%
GMK NucBox M6
Radeon 660M, R5 6600H, AirDisk APF 10-512G
1407 Points
Medio AMD Ryzen 5 6600H, AMD Radeon 660M
  ()
1407 Points 0%
Beelink SER5
Vega 6, R5 5560U, Crucial P3 Plus CT1000P3PSSD8
1144 Points -19%
GMK NucBox M5
Vega 8, R7 5700U, Lexar 1024GB LNM6A1X001T-HNNNG
1091 Points -22%
WebXPRT 3 / Overall
GMK NucBox K6
Radeon 780M, R7 7840HS, MasonSemi 1TB MC7000
328 Points +34%
BOSGAME M1
Radeon 780M, R7 7840HS
319 Points +31%
Intel NUC 13 Pro Kit NUC13ANK
Iris Xe G7 96EUs, i7-1360P, Samsung PM9A1 MZVL2512HCJQ
305 Points +25%
Beelink SER5
Vega 6, R5 5560U, Crucial P3 Plus CT1000P3PSSD8
250 Points +2%
GMK NucBox M6
Radeon 660M, R5 6600H, AirDisk APF 10-512G
244 Points
Medio AMD Ryzen 5 6600H, AMD Radeon 660M
  ()
244 Points 0%
GMK NucBox M5
Vega 8, R7 5700U, Lexar 1024GB LNM6A1X001T-HNNNG
214 Points -12%
WebXPRT 4 / Overall
Intel NUC 13 Pro Kit NUC13ANK
Iris Xe G7 96EUs, i7-1360P, Samsung PM9A1 MZVL2512HCJQ
266 Points +38%
GMK NucBox K6
Radeon 780M, R7 7840HS, MasonSemi 1TB MC7000
266 Points +38%
BOSGAME M1
Radeon 780M, R7 7840HS
258 Points +33%
GMK NucBox M6
Radeon 660M, R5 6600H, AirDisk APF 10-512G
193.4 Points
Medio AMD Ryzen 5 6600H, AMD Radeon 660M
  ()
193.4 Points 0%
Beelink SER5
Vega 6, R5 5560U, Crucial P3 Plus CT1000P3PSSD8
192.4 Points -1%
GMK NucBox M5
Vega 8, R7 5700U, Lexar 1024GB LNM6A1X001T-HNNNG
158.5 Points -18%
Mozilla Kraken 1.1 / Total
GMK NucBox M5
Vega 8, R7 5700U, Lexar 1024GB LNM6A1X001T-HNNNG
802 ms * -33%
Beelink SER5
Vega 6, R5 5560U, Crucial P3 Plus CT1000P3PSSD8
702 ms * -16%
GMK NucBox M6
Radeon 660M, R5 6600H, AirDisk APF 10-512G
604 ms *
Medio AMD Ryzen 5 6600H, AMD Radeon 660M
  ()
604 ms * -0%
GMK NucBox K6
Radeon 780M, R7 7840HS, MasonSemi 1TB MC7000
534 ms * +12%
BOSGAME M1
Radeon 780M, R7 7840HS
526 ms * +13%
Intel NUC 13 Pro Kit NUC13ANK
Iris Xe G7 96EUs, i7-1360P, Samsung PM9A1 MZVL2512HCJQ
494 ms * +18%

* ... más pequeño es mejor

PCMark 10 Score
6220 puntos
ayuda
AIDA64 / Memory Copy
BOSGAME M1
AMD Ryzen 7 7840HS, Radeon 780M
69508 MB/s +37%
GMK NucBox K6
AMD Ryzen 7 7840HS, Radeon 780M
69281 MB/s +36%
GMK NucBox M6
AMD Ryzen 5 6600H, Radeon 660M
50886 MB/s
Intel NUC 13 Pro Kit NUC13ANK
Intel Core i7-1360P, Iris Xe G7 96EUs
44892 MB/s -12%
Medio AMD Ryzen 5 6600H
  (28335 - 50886, n=3)
42594 MB/s -16%
GMK NucBox M5
AMD Ryzen 7 5700U, Vega 8
39126 MB/s -23%
Beelink SER5
AMD Ryzen 5 5560U, Vega 6
38690 MB/s -24%
AIDA64 / Memory Read
BOSGAME M1
AMD Ryzen 7 7840HS, Radeon 780M
61765 MB/s +20%
GMK NucBox K6
AMD Ryzen 7 7840HS, Radeon 780M
61708 MB/s +19%
GMK NucBox M6
AMD Ryzen 5 6600H, Radeon 660M
51684 MB/s
GMK NucBox M5
AMD Ryzen 7 5700U, Vega 8
46813 MB/s -9%
Intel NUC 13 Pro Kit NUC13ANK
Intel Core i7-1360P, Iris Xe G7 96EUs
45196 MB/s -13%
Medio AMD Ryzen 5 6600H
  (34300 - 51684, n=3)
45152 MB/s -13%
Beelink SER5
AMD Ryzen 5 5560U, Vega 6
39794 MB/s -23%
AIDA64 / Memory Write
BOSGAME M1
AMD Ryzen 7 7840HS, Radeon 780M
86719 MB/s +57%
GMK NucBox K6
AMD Ryzen 7 7840HS, Radeon 780M
86528 MB/s +57%
GMK NucBox M6
AMD Ryzen 5 6600H, Radeon 660M
55160 MB/s
Medio AMD Ryzen 5 6600H
  (31788 - 55160, n=3)
47364 MB/s -14%
GMK NucBox M5
AMD Ryzen 7 5700U, Vega 8
47048 MB/s -15%
Intel NUC 13 Pro Kit NUC13ANK
Intel Core i7-1360P, Iris Xe G7 96EUs
46179 MB/s -16%
Beelink SER5
AMD Ryzen 5 5560U, Vega 6
41162 MB/s -25%
AIDA64 / Memory Latency
GMK NucBox M5
AMD Ryzen 7 5700U, Vega 8
100.1 ns * -17%
Intel NUC 13 Pro Kit NUC13ANK
Intel Core i7-1360P, Iris Xe G7 96EUs
96.1 ns * -12%
Beelink SER5
AMD Ryzen 5 5560U, Vega 6
93.1 ns * -9%
BOSGAME M1
AMD Ryzen 7 7840HS, Radeon 780M
89.8 ns * -5%
GMK NucBox K6
AMD Ryzen 7 7840HS, Radeon 780M
88.1 ns * -3%
GMK NucBox M6
AMD Ryzen 5 6600H, Radeon 660M
85.8 ns *
Medio AMD Ryzen 5 6600H
  (81.7 - 89.8, n=3)
85.8 ns * -0%

* ... más pequeño es mejor

Latencia del CPD

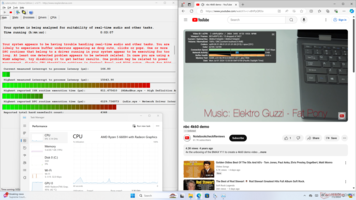
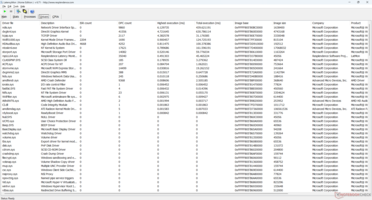
LatencyMon revela importantes problemas de CPD al abrir varias pestañas del navegador de nuestra página de inicio, incluso tras múltiples repeticiones de las pruebas. la reproducción de vídeo 4K a 60 FPS también es problemática, con 15 fotogramas caídos registrados en un periodo de 60 segundos. Estos problemas persistirían a pesar de actualizar tanto los controladores de Windows como los de AMD a sus últimas versiones respectivas en el momento de la revisión.

LatencyMon
LatencyMon
Lista de conductores
DPC Latencies / LatencyMon - interrupt to process latency (max), Web, Youtube, Prime95
GMK NucBox M6
Radeon 660M, R5 6600H, AirDisk APF 10-512G
15043.9 μs *
GMK NucBox K6
Radeon 780M, R7 7840HS, MasonSemi 1TB MC7000
10561.5 μs * +30%
GMK NucBox M5
Vega 8, R7 5700U, Lexar 1024GB LNM6A1X001T-HNNNG
2146.9 μs * +86%
BOSGAME M1
Radeon 780M, R7 7840HS
1179.5 μs * +92%
Intel NUC 13 Pro Kit NUC13ANK
Iris Xe G7 96EUs, i7-1360P, Samsung PM9A1 MZVL2512HCJQ
1087 μs * +93%
Beelink SER5
Vega 6, R5 5560U, Crucial P3 Plus CT1000P3PSSD8
364.6 μs * +98%

* ... más pequeño es mejor

Dispositivos de almacenamiento

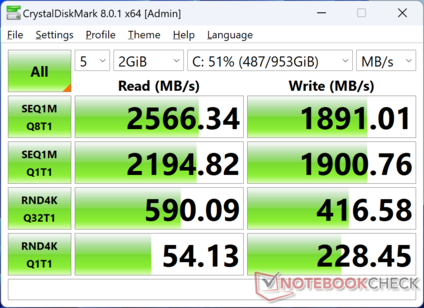
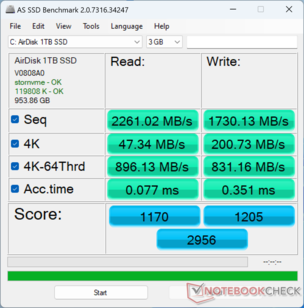
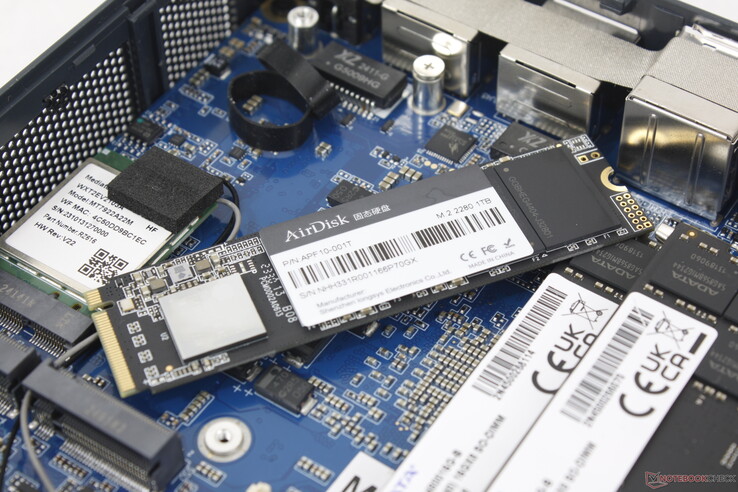
El sistema se entrega con una SSD PCIe3 x4 NVMe de AirDisk en lugar de la unidad PCIe4 más común, probablemente para ahorrar costes. La SSD de gama media ofrece una velocidad de lectura estable de 2600 MB/s que es suficiente teniendo en cuenta la CPU con la que se empareja.

MDL 8
MDL 8
AS SSD
AS SSD
SSD M.2 con el disipador de calor retirado. El sistema viene con un solo disipador de calor a pesar de que puede soportar hasta dos SSD M.2
AirDisk APF 10-512G
CDM 5/6 Read Seq Q32T1: 2547 MB/s
CDM 5/6 Write Seq Q32T1: 1852 MB/s
CDM 5/6 Read 4K Q32T1: 595 MB/s
CDM 5/6 Write 4K Q32T1: 425.3 MB/s
CDM 5 Read Seq: 2192 MB/s
CDM 5 Write Seq: 1856 MB/s
CDM 5/6 Read 4K: 54.06 MB/s
CDM 5/6 Write 4K: 223 MB/s
Drive Performance Rating - Percent
GMK NucBox K6
MasonSemi 1TB MC7000
88.3 pt
Intel NUC 13 Pro Kit NUC13ANK
Samsung PM9A1 MZVL2512HCJQ
70 pt
Beelink SER5
Crucial P3 Plus CT1000P3PSSD8
58.5 pt
BOSGAME M1
 
58.1 pt
GMK NucBox M5
Lexar 1024GB LNM6A1X001T-HNNNG
49.9 pt
GMK NucBox M6
AirDisk APF 10-512G
42 pt
DiskSpd
seq read
GMK NucBox K6
MasonSemi 1TB MC7000
3703 (3243.89min - 3702.94max) MB/s +75%
Intel NUC 13 Pro Kit NUC13ANK
Samsung PM9A1 MZVL2512HCJQ
3375 (3310.44min - 3375.33max) MB/s +60%
Beelink SER5
Crucial P3 Plus CT1000P3PSSD8
2615 (2607.21min - 2614.94max) MB/s +24%
GMK NucBox M5
Lexar 1024GB LNM6A1X001T-HNNNG
2560 (2546.51min - 2560.12max) MB/s +21%
BOSGAME M1
 
2533 (2518.88min - 2532.52max) MB/s +20%
GMK NucBox M6
AirDisk APF 10-512G
2113 (2099.24min - 2112.85max) MB/s
seq write
GMK NucBox K6
MasonSemi 1TB MC7000
5595 (1443.73min - 5595.13max) MB/s +202%
Intel NUC 13 Pro Kit NUC13ANK
Samsung PM9A1 MZVL2512HCJQ
3360 (1416.73min - 3360.47max) MB/s +81%
BOSGAME M1
 
3176 (2921.36min - 3176.08max) MB/s +71%
Beelink SER5
Crucial P3 Plus CT1000P3PSSD8
2878 (2868.83min - 2877.62max) MB/s +55%
GMK NucBox M5
Lexar 1024GB LNM6A1X001T-HNNNG
2752 (2706.58min - 2751.67max) MB/s +49%
GMK NucBox M6
AirDisk APF 10-512G
1852 (1762.49min - 1851.99max) MB/s
seq q8 t1 read
GMK NucBox K6
MasonSemi 1TB MC7000
7069 (6459.52min - 7068.99max) MB/s +179%
Intel NUC 13 Pro Kit NUC13ANK
Samsung PM9A1 MZVL2512HCJQ
6729 (6134.8min - 6728.5max) MB/s +165%
BOSGAME M1
 
4109 (3651.18min - 4108.53max) MB/s +62%
Beelink SER5
Crucial P3 Plus CT1000P3PSSD8
3673 (3327.76min - 3673.17max) MB/s +45%
GMK NucBox M5
Lexar 1024GB LNM6A1X001T-HNNNG
3536 (3096.86min - 3536.22max) MB/s +39%
GMK NucBox M6
AirDisk APF 10-512G
2536 (2272.68min - 2536.26max) MB/s
seq q8 t1 write
GMK NucBox K6
MasonSemi 1TB MC7000
6669 (1251.16min - 6668.61max) MB/s +262%
Beelink SER5
Crucial P3 Plus CT1000P3PSSD8
3220 (3120.61min - 3219.7max) MB/s +75%
BOSGAME M1
 
3187 (3142.8min - 3187.38max) MB/s +73%
GMK NucBox M5
Lexar 1024GB LNM6A1X001T-HNNNG
3126 (3077.57min - 3126.22max) MB/s +70%
Intel NUC 13 Pro Kit NUC13ANK
Samsung PM9A1 MZVL2512HCJQ
2830 (1138.15min - 2830.32max) MB/s +54%
GMK NucBox M6
AirDisk APF 10-512G
1842 (1840.35min - 1842.35max) MB/s
4k q1 t1 read
GMK NucBox K6
MasonSemi 1TB MC7000
71 (70.41min - 71.02max) MB/s +30%
BOSGAME M1
 
64.4 (64.2min - 64.35max) MB/s +18%
GMK NucBox M5
Lexar 1024GB LNM6A1X001T-HNNNG
62.7 (54.67min - 62.69max) MB/s +14%
GMK NucBox M6
AirDisk APF 10-512G
54.8 (52.56min - 54.76max) MB/s
Beelink SER5
Crucial P3 Plus CT1000P3PSSD8
52.5 (52.31min - 52.46max) MB/s -4%
Intel NUC 13 Pro Kit NUC13ANK
Samsung PM9A1 MZVL2512HCJQ
51.8 (51.62min - 51.84max) MB/s -5%
4k q1 t1 write
BOSGAME M1
 
261 (258.95min - 260.75max) MB/s +14%
GMK NucBox K6
MasonSemi 1TB MC7000
239 (237.67min - 239.17max) MB/s +5%
GMK NucBox M6
AirDisk APF 10-512G
228 (215.43min - 228.32max) MB/s
Intel NUC 13 Pro Kit NUC13ANK
Samsung PM9A1 MZVL2512HCJQ
177.7 (176.17min - 177.7max) MB/s -22%
GMK NucBox M5
Lexar 1024GB LNM6A1X001T-HNNNG
175.4 (153.43min - 175.39max) MB/s -23%
Beelink SER5
Crucial P3 Plus CT1000P3PSSD8
173.4 (172.45min - 173.36max) MB/s -24%
4k q32 t16 read
Beelink SER5
Crucial P3 Plus CT1000P3PSSD8
2781 (2776.44min - 2781.48max) MB/s +187%
GMK NucBox K6
MasonSemi 1TB MC7000
2463 (2040.37min - 2463.15max) MB/s +154%
GMK NucBox M5
Lexar 1024GB LNM6A1X001T-HNNNG
2315 (2310.04min - 2315.42max) MB/s +139%
Intel NUC 13 Pro Kit NUC13ANK
Samsung PM9A1 MZVL2512HCJQ
1225 (1194.7min - 1224.8max) MB/s +27%
GMK NucBox M6
AirDisk APF 10-512G
968 (965.06min - 967.94max) MB/s
BOSGAME M1
 
791 (751.42min - 791.35max) MB/s -18%
4k q32 t16 write
GMK NucBox K6
MasonSemi 1TB MC7000
3983 (3232.63min - 3982.67max) MB/s +401%
BOSGAME M1
 
3112 (3068.44min - 3111.56max) MB/s +291%
Beelink SER5
Crucial P3 Plus CT1000P3PSSD8
2218 (2164.78min - 2217.8max) MB/s +179%
GMK NucBox M5
Lexar 1024GB LNM6A1X001T-HNNNG
1400 (948.76min - 1400.43max) MB/s +76%
GMK NucBox M6
AirDisk APF 10-512G
795 (753.98min - 794.81max) MB/s
Intel NUC 13 Pro Kit NUC13ANK
Samsung PM9A1 MZVL2512HCJQ
626 (605.6min - 625.63max) MB/s -21%
AS SSD
Score Total
GMK NucBox K6
MasonSemi 1TB MC7000
7918 Points +168%
Intel NUC 13 Pro Kit NUC13ANK
Samsung PM9A1 MZVL2512HCJQ
6005 Points +103%
Beelink SER5
Crucial P3 Plus CT1000P3PSSD8
4696 Points +59%
BOSGAME M1
 
4263 Points +44%
GMK NucBox M5
Lexar 1024GB LNM6A1X001T-HNNNG
3786 Points +28%
GMK NucBox M6
AirDisk APF 10-512G
2956 Points
Score Read
GMK NucBox K6
MasonSemi 1TB MC7000
3258 Points +178%
Beelink SER5
Crucial P3 Plus CT1000P3PSSD8
1701 Points +45%
Intel NUC 13 Pro Kit NUC13ANK
Samsung PM9A1 MZVL2512HCJQ
1673 Points +43%
GMK NucBox M5
Lexar 1024GB LNM6A1X001T-HNNNG
1433 Points +22%
GMK NucBox M6
AirDisk APF 10-512G
1170 Points
BOSGAME M1
 
1146 Points -2%
Score Write
Intel NUC 13 Pro Kit NUC13ANK
Samsung PM9A1 MZVL2512HCJQ
3574 Points +197%
GMK NucBox K6
MasonSemi 1TB MC7000
3000 Points +149%
BOSGAME M1
 
2547 Points +111%
Beelink SER5
Crucial P3 Plus CT1000P3PSSD8
2136 Points +77%
GMK NucBox M5
Lexar 1024GB LNM6A1X001T-HNNNG
1626 Points +35%
GMK NucBox M6
AirDisk APF 10-512G
1205 Points
Seq Read
GMK NucBox K6
MasonSemi 1TB MC7000
5825.09 MB/s +158%
Intel NUC 13 Pro Kit NUC13ANK
Samsung PM9A1 MZVL2512HCJQ
4767 MB/s +111%
BOSGAME M1
 
3438.69 MB/s +52%
Beelink SER5
Crucial P3 Plus CT1000P3PSSD8
3157.87 MB/s +40%
GMK NucBox M5
Lexar 1024GB LNM6A1X001T-HNNNG
3028.67 MB/s +34%
GMK NucBox M6
AirDisk APF 10-512G
2261.02 MB/s
Seq Write
GMK NucBox K6
MasonSemi 1TB MC7000
5783.3 MB/s +234%
BOSGAME M1
 
2877.44 MB/s +66%
Beelink SER5
Crucial P3 Plus CT1000P3PSSD8
2830.61 MB/s +64%
GMK NucBox M5
Lexar 1024GB LNM6A1X001T-HNNNG
2729.51 MB/s +58%
Intel NUC 13 Pro Kit NUC13ANK
Samsung PM9A1 MZVL2512HCJQ
2442 MB/s +41%
GMK NucBox M6
AirDisk APF 10-512G
1730.13 MB/s
4K Read
Intel NUC 13 Pro Kit NUC13ANK
Samsung PM9A1 MZVL2512HCJQ
78.3 MB/s +65%
GMK NucBox K6
MasonSemi 1TB MC7000
65.5 MB/s +38%
GMK NucBox M5
Lexar 1024GB LNM6A1X001T-HNNNG
50 MB/s +6%
Beelink SER5
Crucial P3 Plus CT1000P3PSSD8
49.71 MB/s +5%
BOSGAME M1
 
48.27 MB/s +2%
GMK NucBox M6
AirDisk APF 10-512G
47.34 MB/s
4K Write
Intel NUC 13 Pro Kit NUC13ANK
Samsung PM9A1 MZVL2512HCJQ
209 MB/s +4%
GMK NucBox M6
AirDisk APF 10-512G
200.73 MB/s
GMK NucBox K6
MasonSemi 1TB MC7000
190.06 MB/s -5%
Beelink SER5
Crucial P3 Plus CT1000P3PSSD8
143.94 MB/s -28%
GMK NucBox M5
Lexar 1024GB LNM6A1X001T-HNNNG
126.66 MB/s -37%
BOSGAME M1
 
114.69 MB/s -43%
4K-64 Read
GMK NucBox K6
MasonSemi 1TB MC7000
2610.4 MB/s +191%
Beelink SER5
Crucial P3 Plus CT1000P3PSSD8
1335.88 MB/s +49%
Intel NUC 13 Pro Kit NUC13ANK
Samsung PM9A1 MZVL2512HCJQ
1118 MB/s +25%
GMK NucBox M5
Lexar 1024GB LNM6A1X001T-HNNNG
1080.06 MB/s +21%
GMK NucBox M6
AirDisk APF 10-512G
896.13 MB/s
BOSGAME M1
 
754.28 MB/s -16%
4K-64 Write
Intel NUC 13 Pro Kit NUC13ANK
Samsung PM9A1 MZVL2512HCJQ
3120 MB/s +275%
GMK NucBox K6
MasonSemi 1TB MC7000
2231.47 MB/s +168%
BOSGAME M1
 
2144.62 MB/s +158%
Beelink SER5
Crucial P3 Plus CT1000P3PSSD8
1708.89 MB/s +106%
GMK NucBox M5
Lexar 1024GB LNM6A1X001T-HNNNG
1226.59 MB/s +48%
GMK NucBox M6
AirDisk APF 10-512G
831.16 MB/s
Access Time Read
Beelink SER5
Crucial P3 Plus CT1000P3PSSD8
0.094 ms * -22%
BOSGAME M1
 
0.088 ms * -14%
GMK NucBox K6
MasonSemi 1TB MC7000
0.079 ms * -3%
GMK NucBox M5
Lexar 1024GB LNM6A1X001T-HNNNG
0.077 ms * -0%
GMK NucBox M6
AirDisk APF 10-512G
0.077 ms *
Intel NUC 13 Pro Kit NUC13ANK
Samsung PM9A1 MZVL2512HCJQ
0.045 ms * +42%
Access Time Write
GMK NucBox M5
Lexar 1024GB LNM6A1X001T-HNNNG
0.408 ms * -16%
GMK NucBox M6
AirDisk APF 10-512G
0.351 ms *
GMK NucBox K6
MasonSemi 1TB MC7000
0.196 ms * +44%
Beelink SER5
Crucial P3 Plus CT1000P3PSSD8
0.077 ms * +78%
BOSGAME M1
 
0.058 ms * +83%
Intel NUC 13 Pro Kit NUC13ANK
Samsung PM9A1 MZVL2512HCJQ
0.02 ms * +94%

* ... más pequeño es mejor

Disk Throttling: DiskSpd Read Loop, Queue Depth 8

0130260390520650780910104011701300143015601690182019502080221023402470Tooltip
GMK NucBox M6; diskspd 2.0.17 f: Ø2502 (2251.92-2522.24)

Rendimiento de la GPU - La Radeon 660M lucha en la mayoría de los juegos

La Radeon 660M es aproximadamente un 35 por ciento más lenta que la Radeon 680M para estar aproximadamente a la par con las más comunes Iris Xe 96 UE. Aunque no es especialmente adecuada para la mayoría de los juegos, es al menos un salto respetable sobre la Radeon RX Vega 8 en procesadores Zen de generaciones anteriores.

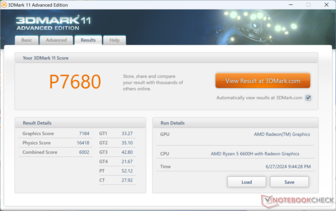
3DMark 11
3DMark 11
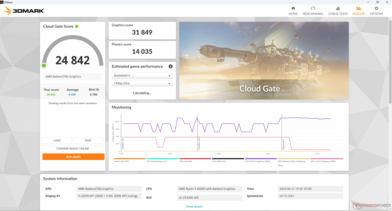
Cloud Gate
Cloud Gate
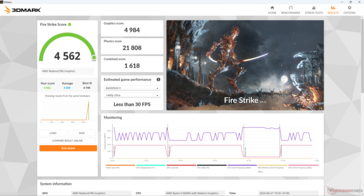
Fire Strike
Fire Strike
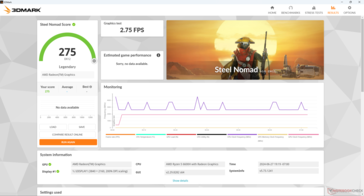
Nómada de acero
Nómada de acero
3DMark Performance Rating - Percent
BOSGAME M1
AMD Radeon 780M, AMD Ryzen 7 7840HS
99.8 pt
Aoostar GEM12
AMD Radeon 780M, AMD Ryzen 7 8845HS
90.2 pt
Acemagic F2A
Intel Arc 8-Core iGPU, Intel Core Ultra 7 155H
88.5 pt
Minisforum AtomMan X7 Ti
Intel Arc 8-Core iGPU, Intel Core Ultra 9 185H
85 pt
Aoostar GEM10
AMD Radeon 680M, AMD Ryzen 7 6800H
82.7 pt
Geekom GT13 Pro
Intel Iris Xe Graphics G7 96EUs, Intel Core i9-13900H
58.2 pt
Geekom XT12 Pro
Intel Iris Xe Graphics G7 96EUs, Intel Core i9-12900H
54.1 pt
GMK NucBox M6
AMD Radeon 660M, AMD Ryzen 5 6600H
53.8 pt
Intel NUC 13 Pro Kit NUC13ANK
Intel Iris Xe Graphics G7 96EUs, Intel Core i7-1360P
53.2 pt
Medio AMD Radeon 660M
 
49.2 pt
Maxtang MTN-FP750
AMD Radeon 680M, AMD Ryzen 7 7735HS
46.9 pt
GMK NucBox M5
AMD Radeon RX Vega 8 (Ryzen 4000/5000), AMD Ryzen 7 5700U
40.5 pt
Intel NUC11TNKi5
Intel Iris Xe Graphics G7 80EUs, Intel Core i5-1135G7
35.1 pt
HP Elite Mini 800 G9-5M9T9EA
Intel UHD Graphics 770, Intel Core i5-13500
26.8 pt
Acemagic AD15
Intel UHD Graphics Xe 32EUs (Tiger Lake-H), Intel Core i5-11500B
24.5 pt
3DMark 11 - 1280x720 Performance GPU
BOSGAME M1
AMD Radeon 780M, AMD Ryzen 7 7840HS
14249 Points +98%
Aoostar GEM12
AMD Radeon 780M, AMD Ryzen 7 8845HS
13410 Points +87%
Acemagic F2A
Intel Arc 8-Core iGPU, Intel Core Ultra 7 155H
12085 Points +68%
Minisforum AtomMan X7 Ti
Intel Arc 8-Core iGPU, Intel Core Ultra 9 185H
11691 Points +63%
Aoostar GEM10
AMD Radeon 680M, AMD Ryzen 7 6800H
11668 Points +62%
Geekom GT13 Pro
Intel Iris Xe Graphics G7 96EUs, Intel Core i9-13900H
7424 Points +3%
GMK NucBox M6
AMD Radeon 660M, AMD Ryzen 5 6600H
7184 Points
Intel NUC 13 Pro Kit NUC13ANK
Intel Iris Xe Graphics G7 96EUs, Intel Core i7-1360P
7143 Points -1%
Geekom XT12 Pro
Intel Iris Xe Graphics G7 96EUs, Intel Core i9-12900H
6975 Points -3%
Maxtang MTN-FP750
AMD Radeon 680M, AMD Ryzen 7 7735HS
6858 Points -5%
Medio AMD Radeon 660M
  (4636 - 7184, n=9)
6332 Points -12%
GMK NucBox M5
AMD Radeon RX Vega 8 (Ryzen 4000/5000), AMD Ryzen 7 5700U
5388 Points -25%
Intel NUC11TNKi5
Intel Iris Xe Graphics G7 80EUs, Intel Core i5-1135G7
5221 Points -27%
HP Elite Mini 800 G9-5M9T9EA
Intel UHD Graphics 770, Intel Core i5-13500
3428 Points -52%
Acemagic AD15
Intel UHD Graphics Xe 32EUs (Tiger Lake-H), Intel Core i5-11500B
3065 Points -57%
3DMark
1280x720 Cloud Gate Standard Graphics
BOSGAME M1
AMD Radeon 780M, AMD Ryzen 7 7840HS
53972 Points +69%
Aoostar GEM12
AMD Radeon 780M, AMD Ryzen 7 8845HS
46987 Points +48%
Aoostar GEM10
AMD Radeon 680M, AMD Ryzen 7 6800H
45116 Points +42%
Acemagic F2A
Intel Arc 8-Core iGPU, Intel Core Ultra 7 155H
44014 Points +38%
Minisforum AtomMan X7 Ti
Intel Arc 8-Core iGPU, Intel Core Ultra 9 185H
38976 Points +22%
Geekom GT13 Pro
Intel Iris Xe Graphics G7 96EUs, Intel Core i9-13900H
33541 Points +5%
GMK NucBox M6
AMD Radeon 660M, AMD Ryzen 5 6600H
31849 Points
Geekom XT12 Pro
Intel Iris Xe Graphics G7 96EUs, Intel Core i9-12900H
30564 Points -4%
Medio AMD Radeon 660M
  (21857 - 33949, n=8)
30318 Points -5%
Intel NUC 13 Pro Kit NUC13ANK
Intel Iris Xe Graphics G7 96EUs, Intel Core i7-1360P
27511 Points -14%
GMK NucBox M5
AMD Radeon RX Vega 8 (Ryzen 4000/5000), AMD Ryzen 7 5700U
25003 Points -21%
Maxtang MTN-FP750
AMD Radeon 680M, AMD Ryzen 7 7735HS
24634 Points -23%
Intel NUC11TNKi5
Intel Iris Xe Graphics G7 80EUs, Intel Core i5-1135G7
19330 Points -39%
HP Elite Mini 800 G9-5M9T9EA
Intel UHD Graphics 770, Intel Core i5-13500
16288 Points -49%
Acemagic AD15
Intel UHD Graphics Xe 32EUs (Tiger Lake-H), Intel Core i5-11500B
15716 Points -51%
1920x1080 Fire Strike Graphics
BOSGAME M1
AMD Radeon 780M, AMD Ryzen 7 7840HS
8816 Points +77%
Aoostar GEM12
AMD Radeon 780M, AMD Ryzen 7 8845HS
8007 Points +61%
Acemagic F2A
Intel Arc 8-Core iGPU, Intel Core Ultra 7 155H
7710 Points +55%
Aoostar GEM10
AMD Radeon 680M, AMD Ryzen 7 6800H
7653 Points +54%
Minisforum AtomMan X7 Ti
Intel Arc 8-Core iGPU, Intel Core Ultra 9 185H
7599 Points +52%
Geekom GT13 Pro
Intel Iris Xe Graphics G7 96EUs, Intel Core i9-13900H
5812 Points +17%
Geekom XT12 Pro
Intel Iris Xe Graphics G7 96EUs, Intel Core i9-12900H
5421 Points +9%
Intel NUC 13 Pro Kit NUC13ANK
Intel Iris Xe Graphics G7 96EUs, Intel Core i7-1360P
5229 Points +5%
GMK NucBox M6
AMD Radeon 660M, AMD Ryzen 5 6600H
4984 Points
Medio AMD Radeon 660M
  (3447 - 4993, n=9)
4521 Points -9%
Maxtang MTN-FP750
AMD Radeon 680M, AMD Ryzen 7 7735HS
4424 Points -11%
GMK NucBox M5
AMD Radeon RX Vega 8 (Ryzen 4000/5000), AMD Ryzen 7 5700U
3653 Points -27%
Intel NUC11TNKi5
Intel Iris Xe Graphics G7 80EUs, Intel Core i5-1135G7
3152 Points -37%
HP Elite Mini 800 G9-5M9T9EA
Intel UHD Graphics 770, Intel Core i5-13500
2643 Points -47%
Acemagic AD15
Intel UHD Graphics Xe 32EUs (Tiger Lake-H), Intel Core i5-11500B
2363 Points -53%
2560x1440 Time Spy Graphics
Acemagic F2A
Intel Arc 8-Core iGPU, Intel Core Ultra 7 155H
3205 Points +103%
Minisforum AtomMan X7 Ti
Intel Arc 8-Core iGPU, Intel Core Ultra 9 185H
3193 Points +102%
BOSGAME M1
AMD Radeon 780M, AMD Ryzen 7 7840HS
3178 Points +101%
Aoostar GEM12
AMD Radeon 780M, AMD Ryzen 7 8845HS
2846 Points +80%
Aoostar GEM10
AMD Radeon 680M, AMD Ryzen 7 6800H
2518 Points +59%
Geekom GT13 Pro
Intel Iris Xe Graphics G7 96EUs, Intel Core i9-13900H
1690 Points +7%
Intel NUC 13 Pro Kit NUC13ANK
Intel Iris Xe Graphics G7 96EUs, Intel Core i7-1360P
1673 Points +6%
GMK NucBox M6
AMD Radeon 660M, AMD Ryzen 5 6600H
1582 Points
Geekom XT12 Pro
Intel Iris Xe Graphics G7 96EUs, Intel Core i9-12900H
1581 Points 0%
Medio AMD Radeon 660M
  (1016 - 1588, n=9)
1442 Points -9%
Maxtang MTN-FP750
AMD Radeon 680M, AMD Ryzen 7 7735HS
1399 Points -12%
GMK NucBox M5
AMD Radeon RX Vega 8 (Ryzen 4000/5000), AMD Ryzen 7 5700U
1162 Points -27%
Intel NUC11TNKi5
Intel Iris Xe Graphics G7 80EUs, Intel Core i5-1135G7
1031 Points -35%
HP Elite Mini 800 G9-5M9T9EA
Intel UHD Graphics 770, Intel Core i5-13500
739 Points -53%
Acemagic AD15
Intel UHD Graphics Xe 32EUs (Tiger Lake-H), Intel Core i5-11500B
658 Points -58%
3DMark 11 Performance
7680 puntos
3DMark Cloud Gate Standard Score
24842 puntos
3DMark Fire Strike Score
4562 puntos
3DMark Time Spy Score
1793 puntos
3DMark Steel Nomad Score
275 puntos
ayuda
Blender
v3.3 Classroom HIP/AMD
Medio AMD Radeon 660M
  (438 - 755, n=7)
561 Seconds *
Maxtang MTN-FP750
AMD Radeon 680M, AMD Ryzen 7 7735HS
458 Seconds *
Aoostar GEM10
AMD Radeon 680M, AMD Ryzen 7 6800H
306 Seconds *
v3.3 Classroom CPU
GMK NucBox M5
AMD Radeon RX Vega 8 (Ryzen 4000/5000), AMD Ryzen 7 5700U
758 Seconds * -53%
Acemagic AD15
Intel UHD Graphics Xe 32EUs (Tiger Lake-H), Intel Core i5-11500B
673 Seconds * -35%
Medio AMD Radeon 660M
  (323 - 968, n=9)
662 Seconds * -33%
Geekom XT12 Pro
Intel Iris Xe Graphics G7 96EUs, Intel Core i9-12900H
536 Seconds * -8%
GMK NucBox M6
AMD Radeon 660M, AMD Ryzen 5 6600H
497 Seconds *
Geekom GT13 Pro
Intel Iris Xe Graphics G7 96EUs, Intel Core i9-13900H
467 Seconds * +6%
Intel NUC 13 Pro Kit NUC13ANK
Intel Iris Xe Graphics G7 96EUs, Intel Core i7-1360P
464 Seconds * +7%
Maxtang MTN-FP750
AMD Radeon 680M, AMD Ryzen 7 7735HS
460 Seconds * +7%
Aoostar GEM10
AMD Radeon 680M, AMD Ryzen 7 6800H
438 Seconds * +12%
HP Elite Mini 800 G9-5M9T9EA
Intel UHD Graphics 770, Intel Core i5-13500
399 Seconds * +20%
Aoostar GEM12
AMD Radeon 780M, AMD Ryzen 7 8845HS
320 Seconds * +36%
BOSGAME M1
AMD Radeon 780M, AMD Ryzen 7 7840HS
319 Seconds * +36%
Acemagic F2A
Intel Arc 8-Core iGPU, Intel Core Ultra 7 155H
301 Seconds * +39%
Minisforum AtomMan X7 Ti
Intel Arc 8-Core iGPU, Intel Core Ultra 9 185H
294 Seconds * +41%
v3.3 Classroom oneAPI/Intel
Minisforum AtomMan X7 Ti
Intel Arc 8-Core iGPU, Intel Core Ultra 9 185H
254 Seconds *

* ... más pequeño es mejor

Performance Rating - Percent
BOSGAME M1
AMD Ryzen 7 7840HS, AMD Radeon 780M
99.6 pt
GMK NucBox K6
AMD Ryzen 7 7840HS, AMD Radeon 780M
96.2 pt
GMK NucBox M6
AMD Ryzen 5 6600H, AMD Radeon 660M
62 pt
Intel NUC 13 Pro Kit NUC13ANK -2!
Intel Core i7-1360P, Intel Iris Xe Graphics G7 96EUs
52.2 pt
GMK NucBox M5
AMD Ryzen 7 5700U, AMD Radeon RX Vega 8 (Ryzen 4000/5000)
46.4 pt
Beelink SER5
AMD Ryzen 5 5560U, AMD Radeon RX Vega 6 (Ryzen 4000/5000)
42.3 pt
The Witcher 3 - 1920x1080 Ultra Graphics & Postprocessing (HBAO+)
BOSGAME M1
AMD Ryzen 7 7840HS, AMD Radeon 780M
33.3 (29min) fps +87%
GMK NucBox K6
AMD Ryzen 7 7840HS, AMD Radeon 780M
30.8 (27min) fps +73%
GMK NucBox M6
AMD Ryzen 5 6600H, AMD Radeon 660M
17.8 (15min) fps
Intel NUC 13 Pro Kit NUC13ANK
Intel Core i7-1360P, Intel Iris Xe Graphics G7 96EUs
16.3 fps -8%
GMK NucBox M5
AMD Ryzen 7 5700U, AMD Radeon RX Vega 8 (Ryzen 4000/5000)
13.7 (12min) fps -23%
Beelink SER5
AMD Ryzen 5 5560U, AMD Radeon RX Vega 6 (Ryzen 4000/5000)
11.8 (11min) fps -34%
Final Fantasy XV Benchmark - 1920x1080 High Quality
BOSGAME M1
AMD Ryzen 7 7840HS, AMD Radeon 780M
30.8 fps +72%
GMK NucBox K6
AMD Ryzen 7 7840HS, AMD Radeon 780M
29.3 fps +64%
GMK NucBox M6
AMD Ryzen 5 6600H, AMD Radeon 660M
17.9 fps
GMK NucBox M5
AMD Ryzen 7 5700U, AMD Radeon RX Vega 8 (Ryzen 4000/5000)
13.1 fps -27%
Beelink SER5
AMD Ryzen 5 5560U, AMD Radeon RX Vega 6 (Ryzen 4000/5000)
11.5 fps -36%
Strange Brigade - 1920x1080 ultra AA:ultra AF:16
BOSGAME M1
AMD Ryzen 7 7840HS, AMD Radeon 780M
52.1 (5.2min, 33.8P1) fps +76%
GMK NucBox K6
AMD Ryzen 7 7840HS, AMD Radeon 780M
48.8 (11.1min, 31.1P1) fps +65%
GMK NucBox M6
AMD Ryzen 5 6600H, AMD Radeon 660M
29.6 (21min, 24.7P1) fps
Intel NUC 13 Pro Kit NUC13ANK
Intel Core i7-1360P, Intel Iris Xe Graphics G7 96EUs
25.2 (5.1min, 6.91P1) fps -15%
GMK NucBox M5
AMD Ryzen 7 5700U, AMD Radeon RX Vega 8 (Ryzen 4000/5000)
22.7 (11.3min, 12.5P1) fps -23%
Beelink SER5
AMD Ryzen 5 5560U, AMD Radeon RX Vega 6 (Ryzen 4000/5000)
20.5 (12.2min, 14.6P1) fps -31%
Dota 2 Reborn - 1920x1080 ultra (3/3) best looking
BOSGAME M1
AMD Ryzen 7 7840HS, AMD Radeon 780M
88.5 (78.9min) fps +46%
GMK NucBox K6
AMD Ryzen 7 7840HS, AMD Radeon 780M
87.4 (16.1min) fps +44%
Intel NUC 13 Pro Kit NUC13ANK
Intel Core i7-1360P, Intel Iris Xe Graphics G7 96EUs
61.6 (54.6min) fps +1%
GMK NucBox M6
AMD Ryzen 5 6600H, AMD Radeon 660M
60.8 (54.4min) fps
GMK NucBox M5
AMD Ryzen 7 5700U, AMD Radeon RX Vega 8 (Ryzen 4000/5000)
47.6 (40.4min) fps -22%
Beelink SER5
AMD Ryzen 5 5560U, AMD Radeon RX Vega 6 (Ryzen 4000/5000)
45.4 (42.4min) fps -25%
X-Plane 11.11 - 1920x1080 high (fps_test=3)
GMK NucBox K6
AMD Ryzen 7 7840HS, AMD Radeon 780M
39.7 fps +20%
BOSGAME M1
AMD Ryzen 7 7840HS, AMD Radeon 780M
38.7 fps +17%
GMK NucBox M6
AMD Ryzen 5 6600H, AMD Radeon 660M
33.2 fps
GMK NucBox M5
AMD Ryzen 7 5700U, AMD Radeon RX Vega 8 (Ryzen 4000/5000)
25.1 fps -24%
Beelink SER5
AMD Ryzen 5 5560U, AMD Radeon RX Vega 6 (Ryzen 4000/5000)
24.2 fps -27%
Tiny Tina's Wonderlands - 1920x1080 Badass Preset (DX12)
BOSGAME M1
AMD Ryzen 7 7840HS, AMD Radeon 780M
30.3 fps +94%
GMK NucBox K6
AMD Ryzen 7 7840HS, AMD Radeon 780M
29.5 fps +89%
GMK NucBox M6
AMD Ryzen 5 6600H, AMD Radeon 660M
15.6 fps
Intel NUC 13 Pro Kit NUC13ANK
Intel Core i7-1360P, Intel Iris Xe Graphics G7 96EUs
12.7 fps -19%
GMK NucBox M5
AMD Ryzen 7 5700U, AMD Radeon RX Vega 8 (Ryzen 4000/5000)
10.3 fps -34%
Beelink SER5
AMD Ryzen 5 5560U, AMD Radeon RX Vega 6 (Ryzen 4000/5000)
8.9 fps -43%
The Witcher 3
1024x768 Low Graphics & Postprocessing
BOSGAME M1
AMD Ryzen 7 7840HS, AMD Radeon 780M
160.7 (126min) fps +64%
GMK NucBox K6
AMD Ryzen 7 7840HS, AMD Radeon 780M
155.1 (145min) fps +58%
Intel NUC 13 Pro Kit NUC13ANK
Intel Core i7-1360P, Intel Iris Xe Graphics G7 96EUs
101.7 fps +4%
GMK NucBox M6
AMD Ryzen 5 6600H, AMD Radeon 660M
98.2 (84min) fps
Medio AMD Radeon 660M
  (61.7 - 98.2, n=7)
84.2 fps -14%
GMK NucBox M5
AMD Ryzen 7 5700U, AMD Radeon RX Vega 8 (Ryzen 4000/5000)
67.6 (60min) fps -31%
Beelink SER5
AMD Ryzen 5 5560U, AMD Radeon RX Vega 6 (Ryzen 4000/5000)
58.8 (52min) fps -40%
1366x768 Medium Graphics & Postprocessing
BOSGAME M1
AMD Ryzen 7 7840HS, AMD Radeon 780M
103.8 (96min) fps +97%
GMK NucBox K6
AMD Ryzen 7 7840HS, AMD Radeon 780M
99 (72min) fps +88%
GMK NucBox M6
AMD Ryzen 5 6600H, AMD Radeon 660M
52.6 (38min) fps
Medio AMD Radeon 660M
  (40.2 - 58.5, n=6)
49.4 fps -6%
GMK NucBox M5
AMD Ryzen 7 5700U, AMD Radeon RX Vega 8 (Ryzen 4000/5000)
43.3 (38min) fps -18%
Beelink SER5
AMD Ryzen 5 5560U, AMD Radeon RX Vega 6 (Ryzen 4000/5000)
39 (36min) fps -26%
1920x1080 High Graphics & Postprocessing (Nvidia HairWorks Off)
BOSGAME M1
AMD Ryzen 7 7840HS, AMD Radeon 780M
52.2 (48min) fps +103%
GMK NucBox K6
AMD Ryzen 7 7840HS, AMD Radeon 780M
50.9 (45min) fps +98%
Intel NUC 13 Pro Kit NUC13ANK
Intel Core i7-1360P, Intel Iris Xe Graphics G7 96EUs
31.1 fps +21%
GMK NucBox M6
AMD Ryzen 5 6600H, AMD Radeon 660M
25.7 (24min) fps
Medio AMD Radeon 660M
  (18.5 - 28.6, n=7)
24.3 fps -5%
GMK NucBox M5
AMD Ryzen 7 5700U, AMD Radeon RX Vega 8 (Ryzen 4000/5000)
22 (20min) fps -14%
Beelink SER5
AMD Ryzen 5 5560U, AMD Radeon RX Vega 6 (Ryzen 4000/5000)
18.8 (17min) fps -27%
1920x1080 Ultra Graphics & Postprocessing (HBAO+)
BOSGAME M1
AMD Ryzen 7 7840HS, AMD Radeon 780M
33.3 (29min) fps +87%
GMK NucBox K6
AMD Ryzen 7 7840HS, AMD Radeon 780M
30.8 (27min) fps +73%
GMK NucBox M6
AMD Ryzen 5 6600H, AMD Radeon 660M
17.8 (15min) fps
Intel NUC 13 Pro Kit NUC13ANK
Intel Core i7-1360P, Intel Iris Xe Graphics G7 96EUs
16.3 fps -8%
Medio AMD Radeon 660M
  (12.3 - 17.9, n=7)
15.5 fps -13%
GMK NucBox M5
AMD Ryzen 7 5700U, AMD Radeon RX Vega 8 (Ryzen 4000/5000)
13.7 (12min) fps -23%
Beelink SER5
AMD Ryzen 5 5560U, AMD Radeon RX Vega 6 (Ryzen 4000/5000)
11.8 (11min) fps -34%
Far Cry 5
1280x720 Low Preset AA:T
BOSGAME M1
AMD Ryzen 7 7840HS, AMD Radeon 780M
88 (77min) fps +24%
GMK NucBox K6
AMD Ryzen 7 7840HS, AMD Radeon 780M
86 (75min) fps +21%
GMK NucBox M6
AMD Ryzen 5 6600H, AMD Radeon 660M
71 (62min) fps
Medio AMD Radeon 660M
  (38 - 71, n=6)
58.3 fps -18%
Intel NUC 13 Pro Kit NUC13ANK
Intel Core i7-1360P, Intel Iris Xe Graphics G7 96EUs
46 (37min) fps -35%
Beelink SER5
AMD Ryzen 5 5560U, AMD Radeon RX Vega 6 (Ryzen 4000/5000)
46 (41min) fps -35%
GMK NucBox M5
AMD Ryzen 7 5700U, AMD Radeon RX Vega 8 (Ryzen 4000/5000)
42 (36min) fps -41%
1920x1080 Medium Preset AA:T
BOSGAME M1
AMD Ryzen 7 7840HS, AMD Radeon 780M
54 (48min) fps +64%
GMK NucBox K6
AMD Ryzen 7 7840HS, AMD Radeon 780M
49 (44min) fps +48%
GMK NucBox M6
AMD Ryzen 5 6600H, AMD Radeon 660M
33 (29min) fps
Medio AMD Radeon 660M
  (18 - 33, n=6)
27.8 fps -16%
Intel NUC 13 Pro Kit NUC13ANK
Intel Core i7-1360P, Intel Iris Xe Graphics G7 96EUs
26 (24min) fps -21%
Beelink SER5
AMD Ryzen 5 5560U, AMD Radeon RX Vega 6 (Ryzen 4000/5000)
21 (18min) fps -36%
GMK NucBox M5
AMD Ryzen 7 5700U, AMD Radeon RX Vega 8 (Ryzen 4000/5000)
20 (17min) fps -39%
1920x1080 High Preset AA:T
BOSGAME M1
AMD Ryzen 7 7840HS, AMD Radeon 780M
49 (43min) fps +63%
GMK NucBox K6
AMD Ryzen 7 7840HS, AMD Radeon 780M
45 (41min) fps +50%
GMK NucBox M6
AMD Ryzen 5 6600H, AMD Radeon 660M
30 (26min) fps
Intel NUC 13 Pro Kit NUC13ANK
Intel Core i7-1360P, Intel Iris Xe Graphics G7 96EUs
25 (22min) fps -17%
Medio AMD Radeon 660M
  (16 - 30, n=6)
25 fps -17%
Beelink SER5
AMD Ryzen 5 5560U, AMD Radeon RX Vega 6 (Ryzen 4000/5000)
19 (17min) fps -37%
GMK NucBox M5
AMD Ryzen 7 5700U, AMD Radeon RX Vega 8 (Ryzen 4000/5000)
19 (16min) fps -37%
1920x1080 Ultra Preset AA:T
BOSGAME M1
AMD Ryzen 7 7840HS, AMD Radeon 780M
47 (41min) fps +74%
GMK NucBox K6
AMD Ryzen 7 7840HS, AMD Radeon 780M
43 (38min) fps +59%
GMK NucBox M6
AMD Ryzen 5 6600H, AMD Radeon 660M
27 (20min) fps
Medio AMD Radeon 660M
  (16 - 27, n=5)
23.2 fps -14%
Intel NUC 13 Pro Kit NUC13ANK
Intel Core i7-1360P, Intel Iris Xe Graphics G7 96EUs
23 (21min) fps -15%
Beelink SER5
AMD Ryzen 5 5560U, AMD Radeon RX Vega 6 (Ryzen 4000/5000)
18 (16min) fps -33%
GMK NucBox M5
AMD Ryzen 7 5700U, AMD Radeon RX Vega 8 (Ryzen 4000/5000)
17 (15min) fps -37%
Final Fantasy XV Benchmark
1280x720 Lite Quality
BOSGAME M1
AMD Ryzen 7 7840HS, AMD Radeon 780M
84.5 fps +75%
GMK NucBox K6
AMD Ryzen 7 7840HS, AMD Radeon 780M
80.8 fps +67%
GMK NucBox M6
AMD Ryzen 5 6600H, AMD Radeon 660M
48.3 fps
Medio AMD Radeon 660M
  (33.1 - 53.4, n=9)
43.9 fps -9%
GMK NucBox M5
AMD Ryzen 7 5700U, AMD Radeon RX Vega 8 (Ryzen 4000/5000)
35.2 fps -27%
Beelink SER5
AMD Ryzen 5 5560U, AMD Radeon RX Vega 6 (Ryzen 4000/5000)
32.2 fps -33%
1920x1080 Standard Quality
BOSGAME M1
AMD Ryzen 7 7840HS, AMD Radeon 780M
40.9 fps +66%
GMK NucBox K6
AMD Ryzen 7 7840HS, AMD Radeon 780M
39.3 fps +59%
GMK NucBox M6
AMD Ryzen 5 6600H, AMD Radeon 660M
24.7 fps
Medio AMD Radeon 660M
  (16 - 24.7, n=9)
21.2 fps -14%
GMK NucBox M5
AMD Ryzen 7 5700U, AMD Radeon RX Vega 8 (Ryzen 4000/5000)
18 fps -27%
Beelink SER5
AMD Ryzen 5 5560U, AMD Radeon RX Vega 6 (Ryzen 4000/5000)
16.1 fps -35%
1920x1080 High Quality
BOSGAME M1
AMD Ryzen 7 7840HS, AMD Radeon 780M
30.8 fps +72%
GMK NucBox K6
AMD Ryzen 7 7840HS, AMD Radeon 780M
29.3 fps +64%
GMK NucBox M6
AMD Ryzen 5 6600H, AMD Radeon 660M
17.9 fps
Medio AMD Radeon 660M
  (11.1 - 17.9, n=9)
15.2 fps -15%
GMK NucBox M5
AMD Ryzen 7 5700U, AMD Radeon RX Vega 8 (Ryzen 4000/5000)
13.1 fps -27%
Beelink SER5
AMD Ryzen 5 5560U, AMD Radeon RX Vega 6 (Ryzen 4000/5000)
11.5 fps -36%
Cyberpunk 2077 2.1 Phantom Liberty
1280x720 Low Preset (FSR off)
BOSGAME M1
AMD Ryzen 7 7840HS, AMD Radeon 780M
80.6 (51.6min) fps
GMK NucBox K6
AMD Ryzen 7 7840HS, AMD Radeon 780M
77.4 (28.7min) fps
Medio AMD Radeon 660M
  ()
27.5 fps
GMK NucBox M5
AMD Ryzen 7 5700U, AMD Radeon RX Vega 8 (Ryzen 4000/5000)
24.4 (12.7min) fps
1920x1080 Low Preset (FSR off)
BOSGAME M1
AMD Ryzen 7 7840HS, AMD Radeon 780M
47.9 (37.5min) fps +97%
GMK NucBox K6
AMD Ryzen 7 7840HS, AMD Radeon 780M
46.3 (32.3min) fps +91%
GMK NucBox M6
AMD Ryzen 5 6600H, AMD Radeon 660M
24.3 (20.5min) fps
Medio AMD Radeon 660M
  (14.9 - 24.3, n=3)
20.7 fps -15%
GMK NucBox M5
AMD Ryzen 7 5700U, AMD Radeon RX Vega 8 (Ryzen 4000/5000)
13.8 (6.57min) fps -43%
1920x1080 Medium Preset (FSR off)
BOSGAME M1
AMD Ryzen 7 7840HS, AMD Radeon 780M
37.5 (30.6min) fps +107%
GMK NucBox K6
AMD Ryzen 7 7840HS, AMD Radeon 780M
35.2 (10.9min) fps +94%
GMK NucBox M6
AMD Ryzen 5 6600H, AMD Radeon 660M
18.1 (15.7min) fps
Medio AMD Radeon 660M
  (11.5 - 18.1, n=3)
15.7 fps -13%
GMK NucBox M5
AMD Ryzen 7 5700U, AMD Radeon RX Vega 8 (Ryzen 4000/5000)
10.9 (8.08min) fps -40%
1920x1080 High Preset (FSR off)
BOSGAME M1
AMD Ryzen 7 7840HS, AMD Radeon 780M
29.6 (23.3min) fps +155%
GMK NucBox K6
AMD Ryzen 7 7840HS, AMD Radeon 780M
27.7 (9.25min) fps +139%
GMK NucBox M6
AMD Ryzen 5 6600H, AMD Radeon 660M
11.6 (10min) fps
Medio AMD Radeon 660M
  (8.85 - 13.2, n=4)
11.2 fps -3%
GMK NucBox M5
AMD Ryzen 7 5700U, AMD Radeon RX Vega 8 (Ryzen 4000/5000)
9.17 (6.25min) fps -21%
1920x1080 Ultra Preset (FSR off)
BOSGAME M1
AMD Ryzen 7 7840HS, AMD Radeon 780M
25.8 (19.9min) fps
GMK NucBox K6
AMD Ryzen 7 7840HS, AMD Radeon 780M
24.5 (9.31min) fps
Medio AMD Radeon 660M
  (7.77 - 11.2, n=2)
9.49 fps
Strange Brigade
1280x720 lowest AF:1
BOSGAME M1
AMD Ryzen 7 7840HS, AMD Radeon 780M
175.9 (26.4min, 151.8P1) fps +46%
GMK NucBox K6
AMD Ryzen 7 7840HS, AMD Radeon 780M
167.7 (34.3min, 142.9P1) fps +40%
GMK NucBox M6
AMD Ryzen 5 6600H, AMD Radeon 660M
120.2 (78.3min, 104.5P1) fps
Medio AMD Radeon 660M
  (70.2 - 120.7, n=8)
107.5 fps -11%
Intel NUC 13 Pro Kit NUC13ANK
Intel Core i7-1360P, Intel Iris Xe Graphics G7 96EUs
95.4 (19.5min, 37.2P1) fps -21%
GMK NucBox M5
AMD Ryzen 7 5700U, AMD Radeon RX Vega 8 (Ryzen 4000/5000)
79.8 (20.7min, 69.9P1) fps -34%
Beelink SER5
AMD Ryzen 5 5560U, AMD Radeon RX Vega 6 (Ryzen 4000/5000)
78.9 (56.9min, 66.5P1) fps -34%
1920x1080 medium AA:medium AF:4
BOSGAME M1
AMD Ryzen 7 7840HS, AMD Radeon 780M
70.9 (5min, 61.9P1) fps +65%
GMK NucBox K6
AMD Ryzen 7 7840HS, AMD Radeon 780M
67.9 (43.7min, 58.3P1) fps +58%
GMK NucBox M6
AMD Ryzen 5 6600H, AMD Radeon 660M
43 (36.6min, 37.4P1) fps
Medio AMD Radeon 660M
  (26.8 - 44.5, n=8)
39.7 fps -8%
Intel NUC 13 Pro Kit NUC13ANK
Intel Core i7-1360P, Intel Iris Xe Graphics G7 96EUs
37.3 (12min, 16.1P1) fps -13%
GMK NucBox M5
AMD Ryzen 7 5700U, AMD Radeon RX Vega 8 (Ryzen 4000/5000)
32.4 (15.3min, 28.3P1) fps -25%
Beelink SER5
AMD Ryzen 5 5560U, AMD Radeon RX Vega 6 (Ryzen 4000/5000)
30.3 (25.6min, 27.4P1) fps -30%
1920x1080 high AA:high AF:8
BOSGAME M1
AMD Ryzen 7 7840HS, AMD Radeon 780M
60.6 (32.5min, 47.4P1) fps +69%
GMK NucBox K6
AMD Ryzen 7 7840HS, AMD Radeon 780M
57.9 (7min, 45P1) fps +61%
GMK NucBox M6
AMD Ryzen 5 6600H, AMD Radeon 660M
35.9 (28.5min, 29.1P1) fps
Medio AMD Radeon 660M
  (21.4 - 35.9, n=8)
31.9 fps -11%
Intel NUC 13 Pro Kit NUC13ANK
Intel Core i7-1360P, Intel Iris Xe Graphics G7 96EUs
31 (8.5min, 12P1) fps -14%
GMK NucBox M5
AMD Ryzen 7 5700U, AMD Radeon RX Vega 8 (Ryzen 4000/5000)
26.8 (14.8min, 19.1P1) fps -25%
Beelink SER5
AMD Ryzen 5 5560U, AMD Radeon RX Vega 6 (Ryzen 4000/5000)
24.6 (19.8min, 20.3P1) fps -31%
1920x1080 ultra AA:ultra AF:16
BOSGAME M1
AMD Ryzen 7 7840HS, AMD Radeon 780M
52.1 (5.2min, 33.8P1) fps +76%
GMK NucBox K6
AMD Ryzen 7 7840HS, AMD Radeon 780M
48.8 (11.1min, 31.1P1) fps +65%
GMK NucBox M6
AMD Ryzen 5 6600H, AMD Radeon 660M
29.6 (21min, 24.7P1) fps
Medio AMD Radeon 660M
  (18.4 - 29.7, n=8)
26.5 fps -10%
Intel NUC 13 Pro Kit NUC13ANK
Intel Core i7-1360P, Intel Iris Xe Graphics G7 96EUs
25.2 (5.1min, 6.91P1) fps -15%
GMK NucBox M5
AMD Ryzen 7 5700U, AMD Radeon RX Vega 8 (Ryzen 4000/5000)
22.7 (11.3min, 12.5P1) fps -23%
Beelink SER5
AMD Ryzen 5 5560U, AMD Radeon RX Vega 6 (Ryzen 4000/5000)
20.5 (12.2min, 14.6P1) fps -31%
Tiny Tina's Wonderlands
1280x720 Lowest Preset (DX12)
BOSGAME M1
AMD Ryzen 7 7840HS, AMD Radeon 780M
142.1 fps +76%
GMK NucBox K6
AMD Ryzen 7 7840HS, AMD Radeon 780M
139 fps +72%
GMK NucBox M6
AMD Ryzen 5 6600H, AMD Radeon 660M
80.8 fps
Medio AMD Radeon 660M
  (56.3 - 80.8, n=2)
68.6 fps -15%
Intel NUC 13 Pro Kit NUC13ANK
Intel Core i7-1360P, Intel Iris Xe Graphics G7 96EUs
59.8 fps -26%
GMK NucBox M5
AMD Ryzen 7 5700U, AMD Radeon RX Vega 8 (Ryzen 4000/5000)
54.5 fps -33%
Beelink SER5
AMD Ryzen 5 5560U, AMD Radeon RX Vega 6 (Ryzen 4000/5000)
54 fps -33%
1920x1080 Low Preset (DX12)
BOSGAME M1
AMD Ryzen 7 7840HS, AMD Radeon 780M
77.7 fps +94%
GMK NucBox K6
AMD Ryzen 7 7840HS, AMD Radeon 780M
74.6 fps +87%
GMK NucBox M6
AMD Ryzen 5 6600H, AMD Radeon 660M
40 fps
Medio AMD Radeon 660M
  (26.9 - 40, n=3)
33.7 fps -16%
Intel NUC 13 Pro Kit NUC13ANK
Intel Core i7-1360P, Intel Iris Xe Graphics G7 96EUs
32.5 fps -19%
GMK NucBox M5
AMD Ryzen 7 5700U, AMD Radeon RX Vega 8 (Ryzen 4000/5000)
27.3 fps -32%
Beelink SER5
AMD Ryzen 5 5560U, AMD Radeon RX Vega 6 (Ryzen 4000/5000)
25.6 fps -36%
1920x1080 Medium Preset (DX12)
BOSGAME M1
AMD Ryzen 7 7840HS, AMD Radeon 780M
55.9 fps +79%
GMK NucBox K6
AMD Ryzen 7 7840HS, AMD Radeon 780M
52.2 fps +67%
GMK NucBox M6
AMD Ryzen 5 6600H, AMD Radeon 660M
31.3 fps
Medio AMD Radeon 660M
  (19.7 - 31.3, n=3)
26 fps -17%
Intel NUC 13 Pro Kit NUC13ANK
Intel Core i7-1360P, Intel Iris Xe Graphics G7 96EUs
25.2 fps -19%
GMK NucBox M5
AMD Ryzen 7 5700U, AMD Radeon RX Vega 8 (Ryzen 4000/5000)
21.5 fps -31%
Beelink SER5
AMD Ryzen 5 5560U, AMD Radeon RX Vega 6 (Ryzen 4000/5000)
19.5 fps -38%
1920x1080 High Preset (DX12)
BOSGAME M1
AMD Ryzen 7 7840HS, AMD Radeon 780M
37.9 fps +85%
GMK NucBox K6
AMD Ryzen 7 7840HS, AMD Radeon 780M
36.6 fps +79%
GMK NucBox M6
AMD Ryzen 5 6600H, AMD Radeon 660M
20.5 fps
Medio AMD Radeon 660M
  (12.6 - 20.5, n=3)
16.9 fps -18%
Intel NUC 13 Pro Kit NUC13ANK
Intel Core i7-1360P, Intel Iris Xe Graphics G7 96EUs
16.1 fps -21%
GMK NucBox M5
AMD Ryzen 7 5700U, AMD Radeon RX Vega 8 (Ryzen 4000/5000)
13.8 fps -33%
Beelink SER5
AMD Ryzen 5 5560U, AMD Radeon RX Vega 6 (Ryzen 4000/5000)
12.1 fps -41%
1920x1080 Badass Preset (DX12)
BOSGAME M1
AMD Ryzen 7 7840HS, AMD Radeon 780M
30.3 fps +94%
GMK NucBox K6
AMD Ryzen 7 7840HS, AMD Radeon 780M
29.5 fps +89%
GMK NucBox M6
AMD Ryzen 5 6600H, AMD Radeon 660M
15.6 fps
Intel NUC 13 Pro Kit NUC13ANK
Intel Core i7-1360P, Intel Iris Xe Graphics G7 96EUs
12.7 fps -19%
Medio AMD Radeon 660M
  (9.57 - 15.6, n=2)
12.6 fps -19%
GMK NucBox M5
AMD Ryzen 7 5700U, AMD Radeon RX Vega 8 (Ryzen 4000/5000)
10.3 fps -34%
Beelink SER5
AMD Ryzen 5 5560U, AMD Radeon RX Vega 6 (Ryzen 4000/5000)
8.9 fps -43%
Dota 2 Reborn
1280x720 min (0/3) fastest
GMK NucBox K6
AMD Ryzen 7 7840HS, AMD Radeon 780M
161.2 (11.9min) fps +11%
BOSGAME M1
AMD Ryzen 7 7840HS, AMD Radeon 780M
159.5 (137.7min) fps +10%
GMK NucBox M6
AMD Ryzen 5 6600H, AMD Radeon 660M
144.9 (123.5min) fps
Intel NUC 13 Pro Kit NUC13ANK
Intel Core i7-1360P, Intel Iris Xe Graphics G7 96EUs
123.8 (98min) fps -15%
Medio AMD Radeon 660M
  (93.7 - 144.9, n=9)
114.7 fps -21%
Beelink SER5
AMD Ryzen 5 5560U, AMD Radeon RX Vega 6 (Ryzen 4000/5000)
110.7 (97.6min) fps -24%
GMK NucBox M5
AMD Ryzen 7 5700U, AMD Radeon RX Vega 8 (Ryzen 4000/5000)
99.7 (85.3min) fps -31%
1366x768 med (1/3)
BOSGAME M1
AMD Ryzen 7 7840HS, AMD Radeon 780M
126.5 (104.4min) fps +17%
GMK NucBox K6
AMD Ryzen 7 7840HS, AMD Radeon 780M
124.8 (104.5min) fps +16%
GMK NucBox M6
AMD Ryzen 5 6600H, AMD Radeon 660M
107.9 (92.8min) fps
Intel NUC 13 Pro Kit NUC13ANK
Intel Core i7-1360P, Intel Iris Xe Graphics G7 96EUs
93.9 (77.2min) fps -13%
Beelink SER5
AMD Ryzen 5 5560U, AMD Radeon RX Vega 6 (Ryzen 4000/5000)
90.8 (71min) fps -16%
Medio AMD Radeon 660M
  (72.2 - 107.9, n=9)
90.7 fps -16%
GMK NucBox M5
AMD Ryzen 7 5700U, AMD Radeon RX Vega 8 (Ryzen 4000/5000)
80.6 (61.8min) fps -25%
1920x1080 high (2/3)
BOSGAME M1
AMD Ryzen 7 7840HS, AMD Radeon 780M
98.8 (88.1min) fps +41%
GMK NucBox K6
AMD Ryzen 7 7840HS, AMD Radeon 780M
96.8 (17.4min) fps +38%
GMK NucBox M6
AMD Ryzen 5 6600H, AMD Radeon 660M
70 (63.6min) fps
Intel NUC 13 Pro Kit NUC13ANK
Intel Core i7-1360P, Intel Iris Xe Graphics G7 96EUs
67.6 (59.9min) fps -3%
Medio AMD Radeon 660M
  (37.4 - 70, n=9)
56.6 fps -19%
GMK NucBox M5
AMD Ryzen 7 5700U, AMD Radeon RX Vega 8 (Ryzen 4000/5000)
50.5 (43.1min) fps -28%
Beelink SER5
AMD Ryzen 5 5560U, AMD Radeon RX Vega 6 (Ryzen 4000/5000)
48.7 (44.8min) fps -30%
1920x1080 ultra (3/3) best looking
BOSGAME M1
AMD Ryzen 7 7840HS, AMD Radeon 780M
88.5 (78.9min) fps +46%
GMK NucBox K6
AMD Ryzen 7 7840HS, AMD Radeon 780M
87.4 (16.1min) fps +44%
Intel NUC 13 Pro Kit NUC13ANK
Intel Core i7-1360P, Intel Iris Xe Graphics G7 96EUs
61.6 (54.6min) fps +1%
GMK NucBox M6
AMD Ryzen 5 6600H, AMD Radeon 660M
60.8 (54.4min) fps
Medio AMD Radeon 660M
  (32.8 - 60.8, n=9)
48.8 fps -20%
GMK NucBox M5
AMD Ryzen 7 5700U, AMD Radeon RX Vega 8 (Ryzen 4000/5000)
47.6 (40.4min) fps -22%
Beelink SER5
AMD Ryzen 5 5560U, AMD Radeon RX Vega 6 (Ryzen 4000/5000)
45.4 (42.4min) fps -25%
F1 22
1280x720 Ultra Low Preset AA:T AF:16x
BOSGAME M1
AMD Ryzen 7 7840HS, AMD Radeon 780M
186.7 (148min, 125P1) fps +74%
GMK NucBox K6
AMD Ryzen 7 7840HS, AMD Radeon 780M
170 (137min, 113P1) fps +58%
GMK NucBox M6
AMD Ryzen 5 6600H, AMD Radeon 660M
107.3 (86min, 79P1) fps
Medio AMD Radeon 660M
  (72.1 - 107.3, n=3)
88.8 fps -17%
Intel NUC 13 Pro Kit NUC13ANK
Intel Core i7-1360P, Intel Iris Xe Graphics G7 96EUs
80 (64min, 64P1) fps -25%
GMK NucBox M5
AMD Ryzen 7 5700U, AMD Radeon RX Vega 8 (Ryzen 4000/5000)
64.5 (55min, 54P1) fps -40%
Beelink SER5
AMD Ryzen 5 5560U, AMD Radeon RX Vega 6 (Ryzen 4000/5000)
61.5 (52min, 51P1) fps -43%
1920x1080 Low Preset AA:T AF:16x
BOSGAME M1
AMD Ryzen 7 7840HS, AMD Radeon 780M
109.9 (95min, 85P1) fps +89%
GMK NucBox K6
AMD Ryzen 7 7840HS, AMD Radeon 780M
99.8 (12min, 70P1) fps +71%
GMK NucBox M6
AMD Ryzen 5 6600H, AMD Radeon 660M
58.3 (43min, 42P1) fps
Medio AMD Radeon 660M
  (42.4 - 58.3, n=4)
48.4 fps -17%
Intel NUC 13 Pro Kit NUC13ANK
Intel Core i7-1360P, Intel Iris Xe Graphics G7 96EUs
48 (40min, 40P1) fps -18%
GMK NucBox M5
AMD Ryzen 7 5700U, AMD Radeon RX Vega 8 (Ryzen 4000/5000)
35.7 (31min, 27P1) fps -39%
Beelink SER5
AMD Ryzen 5 5560U, AMD Radeon RX Vega 6 (Ryzen 4000/5000)
32.4 (28min, 26P1) fps -44%
1920x1080 Medium Preset AA:T AF:16x
BOSGAME M1
AMD Ryzen 7 7840HS, AMD Radeon 780M
95 (81min, 76P1) fps +82%
GMK NucBox K6
AMD Ryzen 7 7840HS, AMD Radeon 780M
85.9 (67min, 59P1) fps +64%
GMK NucBox M6
AMD Ryzen 5 6600H, AMD Radeon 660M
52.3 (41min, 39P1) fps
Intel NUC 13 Pro Kit NUC13ANK
Intel Core i7-1360P, Intel Iris Xe Graphics G7 96EUs
44.3 (36min, 36P1) fps -15%
Medio AMD Radeon 660M
  (37 - 52.3, n=4)
42.9 fps -18%
GMK NucBox M5
AMD Ryzen 7 5700U, AMD Radeon RX Vega 8 (Ryzen 4000/5000)
32.3 (28min, 25P1) fps -38%
Beelink SER5
AMD Ryzen 5 5560U, AMD Radeon RX Vega 6 (Ryzen 4000/5000)
28.6 (25min, 24P1) fps -45%
1920x1080 High Preset AA:T AF:16x
BOSGAME M1
AMD Ryzen 7 7840HS, AMD Radeon 780M
70.6 (60min, 59P1) fps +90%
GMK NucBox K6
AMD Ryzen 7 7840HS, AMD Radeon 780M
66.7 (53min, 36P1) fps +79%
GMK NucBox M6
AMD Ryzen 5 6600H, AMD Radeon 660M
37.2 (31min, 29P1) fps
Intel NUC 13 Pro Kit NUC13ANK
Intel Core i7-1360P, Intel Iris Xe Graphics G7 96EUs
31.2 (27min, 26P1) fps -16%
Medio AMD Radeon 660M
  (26.2 - 37.2, n=4)
29.7 fps -20%
GMK NucBox M5
AMD Ryzen 7 5700U, AMD Radeon RX Vega 8 (Ryzen 4000/5000)
23.8 (20min, 18P1) fps -36%
Beelink SER5
AMD Ryzen 5 5560U, AMD Radeon RX Vega 6 (Ryzen 4000/5000)
21.6 (18min, 18P1) fps -42%
1920x1080 Ultra High Preset AA:T AF:16x
Intel NUC 13 Pro Kit NUC13ANK
Intel Core i7-1360P, Intel Iris Xe Graphics G7 96EUs
24 fps +185%
BOSGAME M1
AMD Ryzen 7 7840HS, AMD Radeon 780M
19.2 (14min, 14P1) fps +128%
GMK NucBox K6
AMD Ryzen 7 7840HS, AMD Radeon 780M
18.4 (12min, 12P1) fps +118%
GMK NucBox M5
AMD Ryzen 7 5700U, AMD Radeon RX Vega 8 (Ryzen 4000/5000)
16.8 (13min, 13P1) fps +99%
Beelink SER5
AMD Ryzen 5 5560U, AMD Radeon RX Vega 6 (Ryzen 4000/5000)
15.3 (13min, 13P1) fps +81%
GMK NucBox M6
AMD Ryzen 5 6600H, AMD Radeon 660M
8.43 (6min, 6P1) fps
Medio AMD Radeon 660M
  (5.13 - 8.43, n=3)
6.49 fps -23%
Baldur's Gate 3
1280x720 Low Preset
BOSGAME M1
AMD Ryzen 7 7840HS, AMD Radeon 780M
64.7 fps +73%
GMK NucBox M6
AMD Ryzen 5 6600H, AMD Radeon 660M
37.3 fps
Medio AMD Radeon 660M
  (26.6 - 37.3, n=2)
32 fps -14%
GMK NucBox M5
AMD Ryzen 7 5700U, AMD Radeon RX Vega 8 (Ryzen 4000/5000)
22.5 fps -40%
1920x1080 Low Preset
BOSGAME M1
AMD Ryzen 7 7840HS, AMD Radeon 780M
43.9 fps +92%
GMK NucBox K6
AMD Ryzen 7 7840HS, AMD Radeon 780M
40.5 fps +77%
GMK NucBox M6
AMD Ryzen 5 6600H, AMD Radeon 660M
22.9 fps
Medio AMD Radeon 660M
  (16.5 - 22.9, n=3)
20.5 fps -10%
GMK NucBox M5
AMD Ryzen 7 5700U, AMD Radeon RX Vega 8 (Ryzen 4000/5000)
14.2 fps -38%
1920x1080 Medium Preset
BOSGAME M1
AMD Ryzen 7 7840HS, AMD Radeon 780M
36.8 fps +144%
GMK NucBox K6
AMD Ryzen 7 7840HS, AMD Radeon 780M
33.7 fps +123%
GMK NucBox M6
AMD Ryzen 5 6600H, AMD Radeon 660M
15.1 fps
Medio AMD Radeon 660M
  (12.8 - 15.1, n=3)
14 fps -7%
1920x1080 High Preset
BOSGAME M1
AMD Ryzen 7 7840HS, AMD Radeon 780M
29.9 fps +125%
GMK NucBox K6
AMD Ryzen 7 7840HS, AMD Radeon 780M
28.1 fps +111%
GMK NucBox M6
AMD Ryzen 5 6600H, AMD Radeon 660M
13.3 fps
Medio AMD Radeon 660M
  (10.3 - 13.3, n=3)
12.2 fps -8%
1920x1080 Ultra Preset
BOSGAME M1
AMD Ryzen 7 7840HS, AMD Radeon 780M
29.2 fps +132%
GMK NucBox K6
AMD Ryzen 7 7840HS, AMD Radeon 780M
27 fps +114%
GMK NucBox M6
AMD Ryzen 5 6600H, AMD Radeon 660M
12.6 fps
Medio AMD Radeon 660M
  (9.97 - 12.6, n=3)
11.5 fps -9%
X-Plane 11.11
1280x720 low (fps_test=1)
GMK NucBox K6
AMD Ryzen 7 7840HS, AMD Radeon 780M
65.9 fps +27%
BOSGAME M1
AMD Ryzen 7 7840HS, AMD Radeon 780M
64.2 fps +24%
GMK NucBox M6
AMD Ryzen 5 6600H, AMD Radeon 660M
51.8 fps
Medio AMD Radeon 660M
  (34.8 - 51.8, n=9)
44.1 fps -15%
GMK NucBox M5
AMD Ryzen 7 5700U, AMD Radeon RX Vega 8 (Ryzen 4000/5000)
40.4 fps -22%
Beelink SER5
AMD Ryzen 5 5560U, AMD Radeon RX Vega 6 (Ryzen 4000/5000)
38 fps -27%
1920x1080 med (fps_test=2)
GMK NucBox K6
AMD Ryzen 7 7840HS, AMD Radeon 780M
47.3 fps +23%
BOSGAME M1
AMD Ryzen 7 7840HS, AMD Radeon 780M
46.3 fps +20%
GMK NucBox M6
AMD Ryzen 5 6600H, AMD Radeon 660M
38.5 fps
Medio AMD Radeon 660M
  (24.2 - 38.5, n=9)
31.9 fps -17%
Beelink SER5
AMD Ryzen 5 5560U, AMD Radeon RX Vega 6 (Ryzen 4000/5000)
27.4 fps -29%
GMK NucBox M5
AMD Ryzen 7 5700U, AMD Radeon RX Vega 8 (Ryzen 4000/5000)
27.3 fps -29%
1920x1080 high (fps_test=3)
GMK NucBox K6
AMD Ryzen 7 7840HS, AMD Radeon 780M
39.7 fps +20%
BOSGAME M1
AMD Ryzen 7 7840HS, AMD Radeon 780M
38.7 fps +17%
GMK NucBox M6
AMD Ryzen 5 6600H, AMD Radeon 660M
33.2 fps
Medio AMD Radeon 660M
  (22.1 - 33.8, n=9)
28.2 fps -15%
GMK NucBox M5
AMD Ryzen 7 5700U, AMD Radeon RX Vega 8 (Ryzen 4000/5000)
25.1 fps -24%
Beelink SER5
AMD Ryzen 5 5560U, AMD Radeon RX Vega 6 (Ryzen 4000/5000)
24.2 fps -27%

El ralentí encendido Witcher 3 revela problemas para mantener constantes las velocidades de fotogramas, lo que sugiere una mala gestión de las actividades en segundo plano o unos controladores deficientes. Como muestra nuestro gráfico siguiente, las velocidades de fotogramas caían bruscamente en ocasiones de ~30 FPS a ~24 FPS sin motivo aparente, cuando deberían mantenerse estables en todo momento.

Witcher 3 FPS Chart

051015202530Tooltip
GMK NucBox M6: Ø29.3 (23-32)
bajomedioaltoultra
The Witcher 3 (2015) 98.2 52.6 25.7 17.8
Dota 2 Reborn (2015) 144.9 107.9 70 60.8
Final Fantasy XV Benchmark (2018) 48.3 24.7 17.9
X-Plane 11.11 (2018) 51.8 38.5 33.2
Far Cry 5 (2018) 71 33 30 27
Strange Brigade (2018) 120.2 43 35.9 29.6
Tiny Tina's Wonderlands (2022) 40 31.3 20.5 15.6
F1 22 (2022) 58.3 52.3 37.2 8.43
Baldur's Gate 3 (2023) 22.9 15.1 13.3 12.6
Cyberpunk 2077 2.1 Phantom Liberty (2023) 24.3 18.1 11.6

Emisiones

Ruido del sistema

El ruido del ventilador es más fuerte que el que registramos en la NucBox M5. Si tenemos en cuenta que la M6 utiliza una CPU más exigente sin cambios en la solución de refrigeración, el ruido más alto no es ninguna sorpresa. Incluso cargas medias como 3DMark 06 pueden hacer que el ventilador alcance su máximo de RPM a los 30 segundos de la prueba en comparación con los sólo 37 dB(A) de la más lenta M5. Las pulsaciones del ventilador son

Perfil de ruido del ventilador (Blanco: Fondo, Rojo: Sistema en reposo, Azul: 3DMark 06, Naranja: Cyberpunk 2077 estrés, Verde: Prime95+estrés FurMark)

Ruido

Ocioso
31.9 / 32 / 33.8 dB(A)
Carga
48.5 / 48.5 dB(A)
  red to green bar
 
 
30 dB
silencioso
40 dB(A)
audible
50 dB(A)
ruidosamente alto
 
min: dark, med: mid, max: light   Earthworks M23R, Arta (15 cm de distancia)   ruido ambiental: 24.2 dB(A)
dB(A) 0102030405060708090Deep BassMiddle BassHigh BassLower RangeMidsHigher MidsLower HighsMid HighsUpper HighsSuper Highs2033.835.135.135.238.12525.723.623.923.624.23125.723.723.823.527.64022.325.223.624.224.75025.831.320.524.725.16331.43026.825.9308027.729.326.226.727.510028.429.122.625.927.712525.726.219.220.125.516026.627.216.616.526.620026.727.519.619.827.825028.729.220.716.628.931530.23022.820.430.340029.329.9201729.550029.730.520.714.931.263031.130.719.912.531.880032.532.120.711.832.910003534.721.110.135.3125040.539.9219.640.216003939.122.810.139.4200038.538.923.61038.7250038.73918.510.338.73150383817.910.737.740003635.814.711.235.7500035.235.119.211.335.2630034.234.115.411.63480002828.213.611.627.91000023.123.212.411.622.81250018.618.71211.618.51600016.316.711.410.815.6SPL48.548.531.924.248.5N661.50.66median 30.2median 30.5median 19.6median 11.6median 31.2Delta4.44.133.24.4hearing rangehide median Fan NoiseGMK NucBox M6
GMK NucBox M6
Radeon 660M, R5 6600H, AirDisk APF 10-512G
GMK NucBox M5
Vega 8, R7 5700U, Lexar 1024GB LNM6A1X001T-HNNNG
GMK NucBox K6
Radeon 780M, R7 7840HS, MasonSemi 1TB MC7000
BOSGAME M1
Radeon 780M, R7 7840HS
Beelink SER5
Vega 6, R5 5560U, Crucial P3 Plus CT1000P3PSSD8
Intel NUC 13 Pro Kit NUC13ANK
Iris Xe G7 96EUs, i7-1360P, Samsung PM9A1 MZVL2512HCJQ
Noise
9%
3%
8%
28%
4%
apagado / medio ambiente *
24.2
23.4
3%
23.2
4%
23.2
4%
23.7
2%
29.8
-23%
Idle Minimum *
31.9
33.8
-6%
31.3
2%
32
-0%
23.9
25%
30.2
5%
Idle Average *
32
33.8
-6%
31.3
2%
32
-0%
23.9
25%
31.1
3%
Idle Maximum *
33.8
33.8
-0%
33.4
1%
32
5%
23.9
29%
31.9
6%
Load Average *
48.5
36.5
25%
47.5
2%
38.7
20%
28
42%
40
18%
Witcher 3 ultra *
48.5
36.8
24%
43.6
10%
41.7
14%
27.6
43%
Load Maximum *
48.5
36.9
24%
47.7
2%
42
13%
32.8
32%
40.5
16%

* ... más pequeño es mejor

Temperatura

El adaptador de CA alcanza más de 37 C cuando funciona con cargas exigentes

Las temperaturas de la superficie nunca son incómodamente cálidas. A diferencia de algunos modelos de Beelink, la NucBox M6 no tiene rejillas en la superficie superior, ya que en su lugar extrae el aire fresco a través de estrechas rendijas a lo largo del perímetro. Colocar la unidad verticalmente es seguro aunque algunas rejillas de ventilación quedarán bloqueadas.

Sistema inactivo (frontal)
Sistema inactivo (trasero)
Prime95+Tensión FurMark (frente)
Prime95+Tensión FurMark (trasera)

Gestión de la energía - Mayor rendimiento, mayor consumo

Consumo de energía

El sistema es mucho más exigente que el NucBox M5 debido al cambio a una CPU de la serie H. Ejecutar Witcher 3por ejemplo, demandaría un 75 por ciento más de potencia mientras que Prime95 demandaría más de 2,5 veces la potencia. El Ryzen 5 6600H es ciertamente más rápido que el Ryzen 7 5700U en la NucBox M5, pero el rendimiento por vatio sigue favoreciendo a la M5 por amplios márgenes.

Somos capaces de registrar un consumo máximo de 85 W desde el adaptador de CA de 120 W de tamaño medio (~14,5 x 6,4 x 3,2 cm) cuando la CPU está totalmente estresada. Tenga en cuenta que este adaptador es mayor que el adaptador de CA de 65 W que se suministra con la NucBox M5 debido al procesador más exigente de la NucBox M6.

consumo 3DMark 06
consumo 3DMark 06
Witcher 3 1080p Ultra consumo
El consumo al iniciar el estrés Prime95 se disparaba a 83 W durante unos 10 segundos antes de caer ligeramente a 79 W
Prime95+FurMark tensión iniciada en la marca 10s
Consumo de corriente
Off / Standbydarklight 1.2 / 1.5 Watt
Ociosodarkmidlight 7.9 / 8 / 8.3 Watt
Carga midlight 61.5 / 84.6 Watt
 color bar
Clave: min: dark, med: mid, max: light        Metrahit Energy
GMK NucBox M6
R5 6600H, Radeon 660M, AirDisk APF 10-512G, , x,
GMK NucBox M5
R7 5700U, Vega 8, Lexar 1024GB LNM6A1X001T-HNNNG, , x,
GMK NucBox K6
R7 7840HS, Radeon 780M, MasonSemi 1TB MC7000, , x,
BOSGAME M1
R7 7840HS, Radeon 780M, , , x,
Beelink SER5
R5 5560U, Vega 6, Crucial P3 Plus CT1000P3PSSD8, , x,
Intel NUC 13 Pro Kit NUC13ANK
i7-1360P, Iris Xe G7 96EUs, Samsung PM9A1 MZVL2512HCJQ, , x,
Power Consumption
39%
-8%
-15%
43%
0%
Idle Minimum *
7.9
5.9
25%
6.7
15%
7.3
8%
4.4
44%
5.1
35%
Idle Average *
8
6.2
22%
7
12%
7.3
9%
5
37%
5.8
27%
Idle Maximum *
8.3
6.4
23%
7.6
8%
8.4
-1%
5.3
36%
10.2
-23%
Load Average *
61.5
28.2
54%
74.3
-21%
72.7
-18%
29.8
52%
68.1
-11%
Witcher 3 ultra *
47.3
27.5
42%
75
-59%
80.5
-70%
28.8
39%
Load Maximum *
84.6
29.5
65%
85.7
-1%
99.1
-17%
40.4
52%
108.3
-28%

* ... más pequeño es mejor

Power Consumption Witcher 3 / Stresstest

05101520253035404550556065707580Tooltip
GMK NucBox M6 R5 6600H, Radeon 660M; Witcher 3 ultra: Ø47.3 (45.7-49.8)
GMK NucBox M5 R7 5700U, Vega 8; Witcher 3 ultra: Ø27.5 (26.7-28.1)
GMK NucBox M6 R5 6600H, Radeon 660M; 1280x720 Prime95 28.10 and Furmark 1.25: Ø80 (77.6-84.6)
GMK NucBox M5 R7 5700U, Vega 8; 1280x720 Prime95 28.10 and Furmark 1.25: Ø27.7 (27.4-29.5)

Power Consumption external Monitor

05101520253035404550556065707580Tooltip
GMK NucBox M6 R5 6600H, Radeon 660M; Prime95 V2810 Stress (external Monitor): Ø78.3 (76.1-82.8)
GMK NucBox M5 R7 5700U, Vega 8; Prime95 V2810 Stress (external Monitor): Ø27.6 (27.3-28)
GMK NucBox M6 R5 6600H, Radeon 660M; Cinebench R15 Multi (external Monitor): Ø75.1 (57.8-78.5)
GMK NucBox M5 R7 5700U, Vega 8; Cinebench R15 Multi (external Monitor): Ø25.6 (25-25.9)
GMK NucBox M6 R5 6600H, Radeon 660M; 1280x720 FurMark 1.19 GPU Stress Test (external Monitor): Ø54.7 (52.9-56.1)
GMK NucBox M5 R7 5700U, Vega 8; 1280x720 FurMark 1.19 GPU Stress Test (external Monitor): Ø30.1 (29.6-30.5)
GMK NucBox M6 R5 6600H, Radeon 660M; 1920x1080 The Witcher 3 ultra (external Monitor): Ø47.3 (45.7-49.8)
GMK NucBox M5 R7 5700U, Vega 8; 1920x1080 The Witcher 3 ultra (external Monitor): Ø27.5 (26.7-28.1)
GMK NucBox M6 R5 6600H, Radeon 660M; Idle 1min (external Monitor): Ø8.08 (7.75-13.6)
GMK NucBox M5 R7 5700U, Vega 8; Idle 1min (external Monitor): Ø6.26 (6.02-7.71)

Pro

+ admite 2 unidades SSD M.2 + 2 módulos RAM DDR5
+ pequeño y compacto
+ fácil mantenimiento
+ económico

Contra

- Problemas de DPC con reproducción imperfecta de vídeo 4K60
- sólo un puerto USB-C sin soporte USB4
- muy ruidoso bajo carga
- iGPU envejecida

Veredicto - Gran valor por el precio y el tamaño

En revisión: GMKtec NucBox M6

Al igual que el resto de la línea, el NucBox M6 lo deja fuera del parque cuando se trata de rendimiento por dólar. El Ryzen 5 6600H corre vueltas alrededor de cualquier Core i3 o Celeron opción comúnmente encontrados en el rango de precios por debajo de $ 300. Los usuarios de HTPC que quieran maximizar el rendimiento sin arruinarse tendrán que considerar el NucBox M5.

El GMKtec NucBox M6 es todo valor sin conformarse con las CPU más lentas de la serie U de las familias Core i3 o Celeron. El ruido del ventilador, sin embargo, puede estar en el lado más ruidoso para un mini PC.

Hay algunos inconvenientes, como la falta de compatibilidad con USB4 y el mayor ruido del ventilador asociado a la CPU más rápida de la serie H. La compatibilidad con Wi-Fi 6E, aunque es agradable de tener, puede mostrar problemas de rendimiento y lo mismo puede decirse cuando se reproducen contenidos de vídeo 4K a 60 FPS. Estos últimos problemas en particular pueden mostrar una falta de cuidado a los detalles más pequeños del modelo. Para el público objetivo de usuarios domésticos y tareas básicas de streaming HTPC, sin embargo, la mayoría será más probable que note el ruido del ventilador que cualquier otra cosa.

Precio y disponibilidad

El NucBox M6 ya está a la venta directamente desde el fabricante por 230 dólares como kit básico o por 300 dólares con 16 GB de RAM, 512 GB de SSD y Windows 11 Pro. El modelo también está disponible en Amazon por precios de salida más altos.

Nota: Hemos actualizado nuestro sistema de evaluación y los resultados de la versión 8 no se pueden comparar con los de la versión 7. Más información aquí verfügbar.

Nota: Recientemente hemos actualizado nuestro sistema de clasificación y los resultados de la versión 8 no son comparables con los de la versión 7. Encontrará más información aquí .

GMK NucBox M6 - 07/04/2024 v8
Allen Ngo

Acabado
82 / 98 → 84%
Conectividad
56 / 81 → 69%
Peso
83%
Rendimiento de juegos
32 / 80 → 40%
Rendimiento de la Aplicación
78 / 92 → 85%
Ruido
69%
Médio
43%
64%
Mini PC - media ponderada
CO2 Emissions
No Data
Materials
0%
Packaging
0%
Power Use
69.8%
Repairability
40%
Software Updates
22.3%
Recycle Logo Total Sustainability Score: 22%

Transparencia

La selección de los dispositivos que se van a reseñar corre a cargo de nuestro equipo editorial. La muestra de prueba fue proporcionada al autor en calidad de préstamo por el fabricante o el minorista a los efectos de esta reseña. El prestamista no tuvo ninguna influencia en esta reseña, ni el fabricante recibió una copia de la misma antes de su publicación. No había ninguna obligación de publicar esta reseña. Nunca aceptamos compensaciones o pagos a cambio de nuestras reseñas. Como empresa de medios independiente, Notebookcheck no está sujeta a la autoridad de fabricantes, minoristas o editores.

Así es como prueba Notebookcheck

Cada año, Notebookcheck revisa de forma independiente cientos de portátiles y smartphones utilizando procedimientos estandarizados para asegurar que todos los resultados son comparables. Hemos desarrollado continuamente nuestros métodos de prueba durante unos 20 años y hemos establecido los estándares de la industria en el proceso. En nuestros laboratorios de pruebas, técnicos y editores experimentados utilizan equipos de medición de alta calidad. Estas pruebas implican un proceso de validación en varias fases. Nuestro complejo sistema de clasificación se basa en cientos de mediciones y puntos de referencia bien fundamentados, lo que mantiene la objetividad.

Price comparison

Please share our article, every link counts!
Mail Logo
> Análisis y pruebas de ordenadores portátiles y móviles teléfonos > Análisis > Reseña del GMK NucBox M6: Un mini PC equilibrado por menos de 300 dólares
Allen Ngo, 2024-07- 7 (Update: 2024-07- 7)