Notebookcheck Logo

Análisis del Razer Blade 18 2024: El primer portátil del mercado con mini-LED y Thunderbolt 5

La hoja más brillante con diferencia. Razer ha subido aún más la apuesta este año con opciones de pantalla mini-LED 2K de 300 Hz y 4K IPS de 200 Hz, además de la ya impresionante GPU GeForce RTX 4090 de 175 W. El panel mini-LED HDR1000 en particular convierte al Blade 18 en un coloso multimedia en lo que se refiere a juegos y reproducción de vídeo.

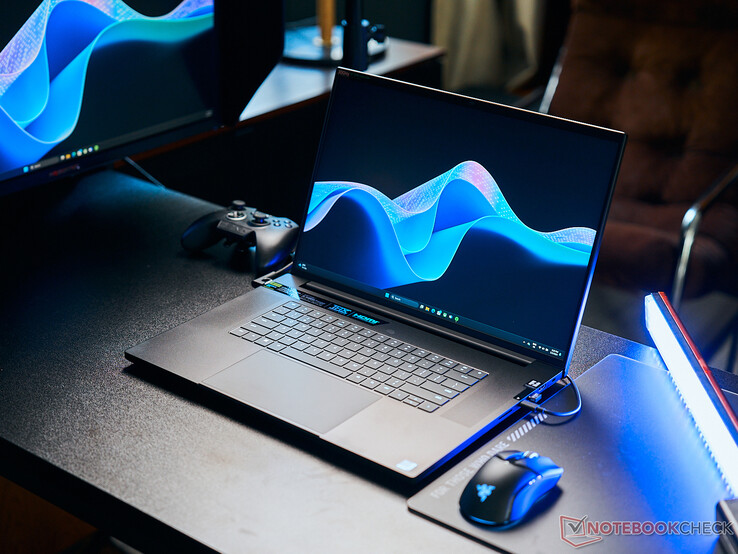
El Razer Blade 18 debutó en 2023 con un diseño fuertemente inspirado en el vetusto Blade 17. Para 2024, la última revisión utiliza el mismo diseño de chasis que el año anterior pero con características adicionales de alto nivel para atraer a los cazadores de rendimiento y entusiastas. Estas nuevas opciones incluyen una CPU Core i9-14900HX Raptor Lake, conectividad Thunderbolt 5 y una pantalla IPS 4K 16:10 200 Hz opcional. Estas dos últimas en particular debutan primero en el sistema Razer antes de aparecer eventualmente en otros fabricantes.

Nuestra configuración en revisión viene con la GPU GeForce RTX 4090 de 175 W, una SSD de 2 TB y una pantalla Mini-LED de 2560 x 1600 300 Hz por aproximadamente 4500 USD. Otras SKU se envían con la GeForce RTX 4070/4080 o la mencionada pantalla IPS 4K 200 Hz, pero todas las configuraciones por el momento vienen con la misma CPU Core i9-14900HX. El color alternativo Mercury White sólo está disponible con configuraciones selectas.

Hay un pequeño puñado de competidores del Blade 18 incluyendo el MSI Titan 18, Asus ROG Strix Scar 18, Acer Predator Helios 18o el enorme Alienware m18 R2.

Más reseñas de Razer:

Razer Blade 18 2024 RZ09-0509
Procesador
Intel Core i9-14900HX 24 x 1.6 - 5.8 GHz, 138 W PL2 / Short Burst, 117 W PL1 / Sustained, Raptor Lake-HX Refresh
Adaptador gráfico
NVIDIA GeForce RTX 4090 Laptop GPU - 16 GB VRAM, Núcleo: 1455 MHz, Memoría: 2250 MHz, 175 W TDP, GDDR6, 552.22, Optimus
Memoría
32 GB 
, Samsung DDR5-5600, 46-45-45-89, Dual-Channel
pantalla
18.00 pulgadas 16:10, 2560 x 1600 pixels 168 PPI, BOE NE180QDM-NM1, Mini-LED, lustroso: no, HDR, 300 Hz
Placa base
Intel HM770 (Raptor Lake-S PCH)
Tarjeta de sonido
Intel Raptor Lake-S PCH - cAVS
Conexiones
5 USB 3.1 Gen2, 1 Thunderbolt, USB-C Power Delivery (PD), 1 HDMI, 2 DisplayPort, 1 Kensington Lock, Audio Conexiones: 3.5 mm headset, Card Reader: SD
Equipamento de red
Realtek RTL8125 2.5GBe Family Ethernet Controller (10/100/1000/2500MBit/s), Intel Wi-Fi 7 BE200 320MHz (a/b/g/n = Wi-Fi 4/ac = Wi-Fi 5/ax = Wi-Fi 6/ Wi-Fi 6E 6 GHz be = Wi-Fi 7), Bluetooth 5.4
Tamaño
Alto x ancho x profundidad (en mm): 21.9 x 399.9 x 275.4
Battería
91.7 Wh Litio-Polimero
Sistema Operativo
Microsoft Windows 11 Home
Camera
Webcam: 1080p30
Primary Camera: 5 MPix
Características adicionales
Altavoces: 2x tweeters, 4x subwoofers, Teclado: Chiclet, Luz de Teclado: si, Razer Synapse, 12 Meses Garantía
Peso
3.134 kg, Suministro de Electricidad: 931 g
Precio
4500 USD
Note: The manufacturer may use components from different suppliers including display panels, drives or memory sticks with similar specifications.


Posibles contendientes en la comparación

Valoración
Fecha
Modelo
Peso
Altura
Tamaño
Resolución
Best Price
90.5 %
05/2024
Razer Blade 18 2024 RZ09-0509
i9-14900HX, NVIDIA GeForce RTX 4090 Laptop GPU
3.1 kg21.9 mm18.00"2560x1600
89.5 %
03/2024
Alienware m18 R2
i9-14900HX, NVIDIA GeForce RTX 4090 Laptop GPU
4 kg26.7 mm18.00"2560x1600
87.2 %
08/2023
Asus ROG Strix Scar 17 G733PYV-LL053X
R9 7945HX3D, NVIDIA GeForce RTX 4090 Laptop GPU
2.9 kg28.3 mm17.30"2560x1440
88.8 %
01/2024
MSI Titan 18 HX A14VIG
i9-14900HX, NVIDIA GeForce RTX 4090 Laptop GPU
3.6 kg32.1 mm18.00"3840x2400
88.3 %
02/2024
Asus ROG Strix Scar 18 G834JYR (2024)
i9-14900HX, NVIDIA GeForce RTX 4090 Laptop GPU
3.1 kg30.8 mm18.00"2560x1600
91.1 %
02/2024
Razer Blade 16 2024, RTX 4090
i9-14900HX, NVIDIA GeForce RTX 4090 Laptop GPU
2.5 kg22 mm16.00"2560x1600

Case - Tan afilado como siempre

Recomendamos consultar nuestra reseña sobre la Blade 18 2023 para saber más sobre las características físicas del modelo, ya que todos nuestros comentarios siguen siendo válidos para la versión 2024. Aunque no hay cambios en el teclado ni en el chasis que permitan diferenciar los dos años, sí hay un pequeño añadido que ayuda a distinguirlos visualmente; el modelo 2024 incluye ahora un deslizador manual para la cámara web, mientras que el modelo 2023 no lo tenía.

Comparación de tamaños

410.3 mm 319.9 mm 26.7 mm 4 kg404 mm 307.5 mm 32.1 mm 3.6 kg399 mm 294 mm 30.8 mm 3.1 kg395 mm 282.1 mm 28.3 mm 2.9 kg399.9 mm 275.4 mm 21.9 mm 3.1 kg355 mm 244 mm 22 mm 2.5 kg297 mm 210 mm 1 mm 5.7 g

Conectividad - A prueba de futuro con Thunderbolt 5

Demostración de Blade 18 en la GDC2024 conectada a varios accesorios, incluida una pantalla externa de 5K con TB 5
El adaptador de CA propietario de 330 W sigue siendo necesario cuando se juega, ya que la carga USB-C está limitada a 100 W

El puerto Thunderbolt 4 se ha actualizado a Thunderbolt 5 para el modelo 2024. Tenga en cuenta que esto sólo se aplica al puerto Tipo-C a lo largo del borde derecho, por lo que el puerto Tipo-C a lo largo del borde izquierdo sigue estando limitado a la conectividad USB 3.2 Gen. 2. En comparación con Thunderbolt 4, Thunderbolt 5 soporta el doble de ancho de banda (80 Gbps frente a 40 Gbps) con carriles adicionales reservados para dispositivos externos más exigentes como las eGPU.

La especificación Thunderbolt 5 también admite una carga descendente de hasta 240 W. En el Blade 18, sin embargo, la carga USB-C sigue estando limitada a 100 W o menos de un tercio del adaptador de CA de 330 W del cañón principal. Para ser justos, ningún portátil en el momento de escribir estas líneas admite la carga USB-C completa de 240 W, ya que se requieren ajustes de hardware adicionales para explotar al máximo la nueva especificación.

Frontal: Sin puertos
Derecha: Lector de tarjetas SD, USB-C 3.2 Gen. 2 con Thunderbolt 5 + Power Delivery + DisplayPort 1.4, USB-A 3.2 Gen. 2, HDMI 2.1, bloqueo Kensington
Trasera: Sin puertos
Izquierda: adaptador de CA, RJ-45 a 2,5 Gbps, 2x USB-A 3.2 Gen. 2, USB-C con Power Delivery + DisplayPort 1.4, auriculares de 3,5 mm

Lector de tarjetas SD

SD Card Reader
average JPG Copy Test (av. of 3 runs)
Alienware m18 R2
Intel Core i9-14900HX (Toshiba Exceria Pro SDXC 64 GB UHS-II)
190.3 MB/s +1%
Razer Blade 18 2024 RZ09-0509
Intel Core i9-14900HX (Toshiba Exceria Pro SDXC 64 GB UHS-II)
188.25 MB/s
Razer Blade 16 2024, RTX 4090
Intel Core i9-14900HX
171 (169.48min - 194.55max) MB/s -9%
MSI Titan 18 HX A14VIG
Intel Core i9-14900HX (Toshiba Exceria Pro SDXC 64 GB UHS-II)
83.8 MB/s -55%
maximum AS SSD Seq Read Test (1GB)
Razer Blade 18 2024 RZ09-0509
Intel Core i9-14900HX (Toshiba Exceria Pro SDXC 64 GB UHS-II)
220.56 MB/s
Alienware m18 R2
Intel Core i9-14900HX (Toshiba Exceria Pro SDXC 64 GB UHS-II)
219.7 MB/s 0%
Razer Blade 16 2024, RTX 4090
Intel Core i9-14900HX
181.81 MB/s -18%
MSI Titan 18 HX A14VIG
Intel Core i9-14900HX (Toshiba Exceria Pro SDXC 64 GB UHS-II)
91.5 MB/s -59%

Comunicación

La WLAN se ha actualizado con el Intel BE200 para que sea compatible tanto con Bluetooth 5.4 como con Wi-Fi 7. Sin embargo, la gran mayoría de los usuarios aún no disponen de routers Wi-Fi 7, por lo que sólo unos pocos elegidos notarán mejoras en el rendimiento por ahora.

Networking
iperf3 transmit AXE11000
Razer Blade 16 2024, RTX 4090
Intel Killer Wi-Fi 7 BE1750W 320 MHz (BE200NGW)
1577 (796min - 1617max) MBit/s +38%
Razer Blade 18 2024 RZ09-0509
Intel Wi-Fi 7 BE200 320MHz
1143 (813min - 1407max) MBit/s
MSI Titan 18 HX A14VIG
Intel Killer Wi-Fi 7 BE1750x BE200NGW
1011 (514min - 1160max) MBit/s -12%
Asus ROG Strix Scar 18 G834JYR (2024)
Intel Wi-Fi 6E AX211
968 (656min - 1200max) MBit/s -15%
Alienware m18 R2
Intel Killer Wi-Fi 7 BE1750x BE200NGW
791 (736min - 894max) MBit/s -31%
iperf3 receive AXE11000
Asus ROG Strix Scar 18 G834JYR (2024)
Intel Wi-Fi 6E AX211
1681 (1662min - 1704max) MBit/s +15%
Razer Blade 16 2024, RTX 4090
Intel Killer Wi-Fi 7 BE1750W 320 MHz (BE200NGW)
1604 (1554min - 1623max) MBit/s +10%
Razer Blade 18 2024 RZ09-0509
Intel Wi-Fi 7 BE200 320MHz
1459 (1375min - 1525max) MBit/s
Alienware m18 R2
Intel Killer Wi-Fi 7 BE1750x BE200NGW
1381 (1277min - 1427max) MBit/s -5%
MSI Titan 18 HX A14VIG
Intel Killer Wi-Fi 7 BE1750x BE200NGW
1116 (932min - 1352max) MBit/s -24%
iperf3 transmit AXE11000 6GHz
Razer Blade 16 2024, RTX 4090
Intel Killer Wi-Fi 7 BE1750W 320 MHz (BE200NGW)
1538 (784min - 1597max) MBit/s +28%
Razer Blade 18 2024 RZ09-0509
Intel Wi-Fi 7 BE200 320MHz
1199 (1057min - 1319max) MBit/s
MSI Titan 18 HX A14VIG
Intel Killer Wi-Fi 7 BE1750x BE200NGW
1096 (900min - 1242max) MBit/s -9%
Alienware m18 R2
Intel Killer Wi-Fi 7 BE1750x BE200NGW
648 (595min - 759max) MBit/s -46%
iperf3 receive AXE11000 6GHz
Razer Blade 16 2024, RTX 4090
Intel Killer Wi-Fi 7 BE1750W 320 MHz (BE200NGW)
1518 (762min - 1536max) MBit/s +15%
MSI Titan 18 HX A14VIG
Intel Killer Wi-Fi 7 BE1750x BE200NGW
1379 (709min - 1426max) MBit/s +5%
Razer Blade 18 2024 RZ09-0509
Intel Wi-Fi 7 BE200 320MHz
1315 (1269min - 1369max) MBit/s
Alienware m18 R2
Intel Killer Wi-Fi 7 BE1750x BE200NGW
1292 (1215min - 1327max) MBit/s -2%
05010015020025030035040045050055060065070075080085090095010001050110011501200125013001350Tooltip
Razer Blade 18 2024 RZ09-0509; iperf3 transmit AXE11000 6GHz; iperf 3.1.3: Ø1199 (1057-1319)
Razer Blade 18 2024 RZ09-0509; iperf3 receive AXE11000 6GHz; iperf 3.1.3: Ø1315 (1269-1369)

Cámara web

La webcam de 5 MP + IR no ha cambiado aparte del nuevo control deslizante del obturador para mayor privacidad. Curiosamente, este es el único portátil para juegos de 18 pulgadas con una webcam de 5 MP como el Titan HX de la competencia, Alienware m18 R2y el ROG Strix Scar 18 vienen con cámaras de sólo 1 MP a 2 MP en comparación.

ColorChecker
13.5 ∆E
13.4 ∆E
18.4 ∆E
20 ∆E
17 ∆E
14.1 ∆E
11.9 ∆E
17.5 ∆E
16.7 ∆E
15 ∆E
15.5 ∆E
15.2 ∆E
9.4 ∆E
15.3 ∆E
21.9 ∆E
14.1 ∆E
17.5 ∆E
14.8 ∆E
2.3 ∆E
11.8 ∆E
14.4 ∆E
14.3 ∆E
11.9 ∆E
1.4 ∆E
ColorChecker Razer Blade 18 2024 RZ09-0509: 14.07 ∆E min: 1.43 - max: 21.9 ∆E

Mantenimiento

El modelo 2024 incorpora altavoces ligeramente más grandes cerca de las esquinas delanteras. Por lo demás, no hay diferencias notables en comparación con la versión 2023.

Cuchilla 18 2024
Cuchilla 18 2024
Cuchilla 18 2023 para comparar

Pantalla - QHD+ 300 Hz Mini-LED

Matriz de subpíxeles RGB mate. La pantalla es ligeramente más granulada que la mayoría de las alternativas brillantes

El panel QHD+ de 240 Hz del Blade 18 2023 ha sido sustituido este año por dos nuevas opciones:

  • QHD+ (2560 x 1600), 300 Hz, Mini-LED, HDR1000
  • 4K UHD+ (3840 x 2400), 200 Hz, IPS, HDR400

Ambos paneles ofrecen G-Sync, calibración de fábrica, colores DCI-P3 completos y rápidos tiempos de respuesta de <3 ms para ser aptos tanto para juegos hardcore como para la mayoría de las tareas de edición. Nuestra unidad de prueba específica se ha configurado con la opción en negrita. Tenga en cuenta que este panel BOE NE180QDM-NM1 exacto también se puede encontrar en el ROG Strix Scar 18 lo que significa que los portátiles Razer y Asus pueden ofrecer experiencias de visualización comparables.

En comparación con IPS y OLED, mini-LED proporciona niveles de negro más profundos que IPS y blancos más brillantes que OLED para cumplir mejor con los requisitos HDR. Por ejemplo, los portátiles con paneles IPS u OLED de gama alta suelen cubrir HDR400 o HDR500, mientras que los mini-LED suelen satisfacer HDR1000 para una reproducción multimedia más vibrante. El brillo máximo de nuestra unidad Blade 18 puede alcanzar los 1227 nits cuando tanto el HDR como la atenuación local están activados, en comparación con sólo 712 nits cuando el HDR está activado pero con la atenuación local desactivada. Por lo demás, el brillo se limita a ~600 nits en modo SDR, que sigue siendo mucho más brillante que la mayoría de los portátiles para juegos.

Configuración de pantallaModo SDR con atenuación local desactivadaModo SDR con atenuación local activadaModo HDR con atenuación local desactivadaModo HDR con atenuación local activada
Brillo máximo (nits)6056027121227


Pantalla totalmente negra en modo SDR con atenuación local desactivada. Sangrado presente aunque relativamente uniforme
Pantalla totalmente negra en modo HDR con atenuación local activada. La pantalla se vuelve completamente negra para obtener ratios de contraste similares a los de OLED

Los niveles de negro y, por tanto, el contraste también se ven afectados por la atenuación local. Somos capaces de medir un nivel de negro de 0,62 nits con la atenuación local desactivada frente a 0,22 nits con la atenuación local activada para unos niveles de contraste mucho más altos, especialmente cuando el HDR está activado. La atenuación local puede no ser necesaria o incluso recomendable para fines de navegación o edición debido a su inherente efecto "halo", pero vale la pena activarla para vídeos HDR y juegos donde el inconveniente es menos perceptible.

Tenga en cuenta que la frecuencia de actualización del panel admite hasta 300 Hz sólo en el modo dGPU, ya que en el modo Optimus está limitada a 240 Hz. Una frecuencia de actualización dinámica de hasta 60 Hz sólo se admite en el modo Optimus.

600.6
cd/m²
605.5
cd/m²
602.3
cd/m²
601.8
cd/m²
605.4
cd/m²
588
cd/m²
605
cd/m²
603.5
cd/m²
586.6
cd/m²
Temperatura del cuarto
BOE NE180QDM-NM1 tested with X-Rite i1Pro 2
Máximo: 605.5 cd/m² (Nits) Médio: 599.9 cd/m² Minimum: 0.62 cd/m²
iluminación: 97 %
Brillo con batería: 605.4 cd/m²
Contraste: 976:1 (Negro: 0.62 cd/m²)
ΔE Color 1.53 | 0.5-29.43 Ø5
ΔE Greyscale 2.6 | 0.57-98 Ø5.3
86.9% AdobeRGB 1998 (Argyll 2.2.0 3D)
100% sRGB (Argyll 2.2.0 3D)
99% Display P3 (Argyll 2.2.0 3D)
Gamma: 2.22
Razer Blade 18 2024 RZ09-0509
BOE NE180QDM-NM1, Mini-LED, 2560x1600, 18.00
Razer Blade 18 RTX 4070
AU Optronics B180QAN01.0, IPS, 2560x1600, 18.00
Alienware m18 R2
BOE NE18NZ1, IPS, 2560x1600, 18.00
MSI Titan 18 HX A14VIG
AU Optronics B180ZAN01.0, Mini-LED, 3840x2400, 18.00
Asus ROG Strix Scar 18 G834JYR (2024)
BOE NE180QDM-NM1, Mini LED, 2560x1600, 18.00
Display
-1%
0%
-1%
2%
Display P3 Coverage
99
96.9
-2%
97.8
-1%
98.1
-1%
99.9
1%
sRGB Coverage
100
99.8
0%
99.5
0%
99.8
0%
100
0%
AdobeRGB 1998 Coverage
86.9
85.3
-2%
88.9
2%
86.2
-1%
90
4%
Response Times
44%
28%
-196%
-37%
Response Time Grey 50% / Grey 80% *
7.6 ?(3.6, 4)
4.2 ?(2.1, 2.1)
45%
5.3 ?(2.2, 3.1)
30%
8.6 ?(4.2, 4.4)
-13%
12 ?(8, 4)
-58%
Response Time Black / White *
14 ?(6.6, 7.4)
8 ?(3.8, 4.2)
43%
10.4 ?(4.8, 5.6)
26%
81.8 ?(76, 5.8)
-484%
10.7 ?(7.6, 3.1)
24%
PWM Frequency
26444 ?(100)
2592 ?(100)
-90%
5733 ?(94)
-78%
Screen
-20%
-26%
-45%
202%
Brightness middle
605.4
549.6
-9%
271.8
-55%
467.5
-23%
937
55%
Brightness
600
524
-13%
275
-54%
459
-23%
934
56%
Brightness Distribution
97
89
-8%
78
-20%
90
-7%
89
-8%
Black Level *
0.62
0.53
15%
0.27
56%
0.066
89%
Contrast
976
1037
6%
1007
3%
14197
1355%
Colorchecker dE 2000 *
1.53
3.32
-117%
2.48
-62%
3.77
-146%
1.52
1%
Colorchecker dE 2000 max. *
4.15
6.63
-60%
5.59
-35%
6.12
-47%
2.82
32%
Greyscale dE 2000 *
2.6
2
23%
3.7
-42%
3.2
-23%
1.7
35%
Gamma
2.22 99%
2.29 96%
2.2 100%
2.43 91%
2.042 108%
CCT
6843 95%
6319 103%
6355 102%
6478 100%
6578 99%
Colorchecker dE 2000 calibrated *
2.7
0.56
2.94
1.21
Media total (Programa/Opciones)
8% / -6%
1% / -12%
-81% / -72%
56% / 108%

* ... más pequeño es mejor

frente a sRGB
frente a sRGB
frente a P3
frente a P3

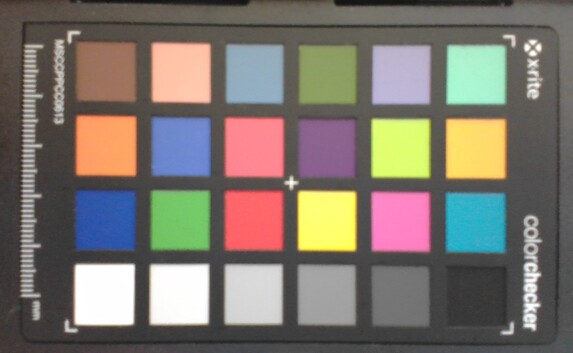
El estándar P3 está totalmente representado como se anuncia. Los colores, sin embargo, cambian de forma molesta al cambiar entre los modos Optimus y dGPU. Los colores sRGB son precisos con unos valores medios DeltaE de escala de grises y ColorChecker de sólo 2,6 y 1,53, respectivamente, pero los colores P3 son más imprecisos incluso cuando se ajusta al modo P3. La temperatura de color, por ejemplo, se calienta automáticamente a 5600K cuando se ajusta a P3. Es posible que exista un error en la forma en que se representan los colores P3 al cambiar entre los distintos modos de la GPU.

Escala de grises (vs. sRGB)
Barridos de saturación (frente a sRGB)
ColorChecker (frente a sRGB)
Escala de grises (vs. P3)
Barridos de saturación (vs. P3)
ColorChecker (vs. P3)

Tiempos de respuesta del display

Los tiempos de respuesta del display muestran lo rápido que puede cambiar la pantalla de un color al siguiente. Tiempos lentos de respuesta pueden llevar a imágenes persistentes alrededor de objetos en movimiento o a displays borrosos. Particularmente los aficionados a los juegos 3D frenéticos deberían usar una pantalla con tiempos de respuesta rápidos.
       Tiempo de respuesta de Negro a Blanco
14 ms ... subida ↗ y bajada ↘ combinada↗ 6.6 ms subida
↘ 7.4 ms bajada
La pantalla mostró buenos tiempos de respuesta en nuestros tests pero podría ser demasiado lenta para los jugones competitivos.
En comparación, todos los dispositivos de prueba van de ##min### (mínimo) a 240 (máximo) ms. » 29 % de todos los dispositivos son mejores.
Esto quiere decir que el tiempo de respuesta medido es mejor que la media (21.4 ms) de todos los dispositivos testados.
       Tiempo de respuesta 50% Gris a 80% Gris
7.6 ms ... subida ↗ y bajada ↘ combinada↗ 3.6 ms subida
↘ 4 ms bajada
La pantalla mostró tiempos de respuesta muy rápidos en nuestros tests y debería ser adecuada para juegos frenéticos.
En comparación, todos los dispositivos de prueba van de ##min### (mínimo) a 636 (máximo) ms. » 15 % de todos los dispositivos son mejores.
Esto quiere decir que el tiempo de respuesta medido es mejor que la media (33.7 ms) de todos los dispositivos testados.

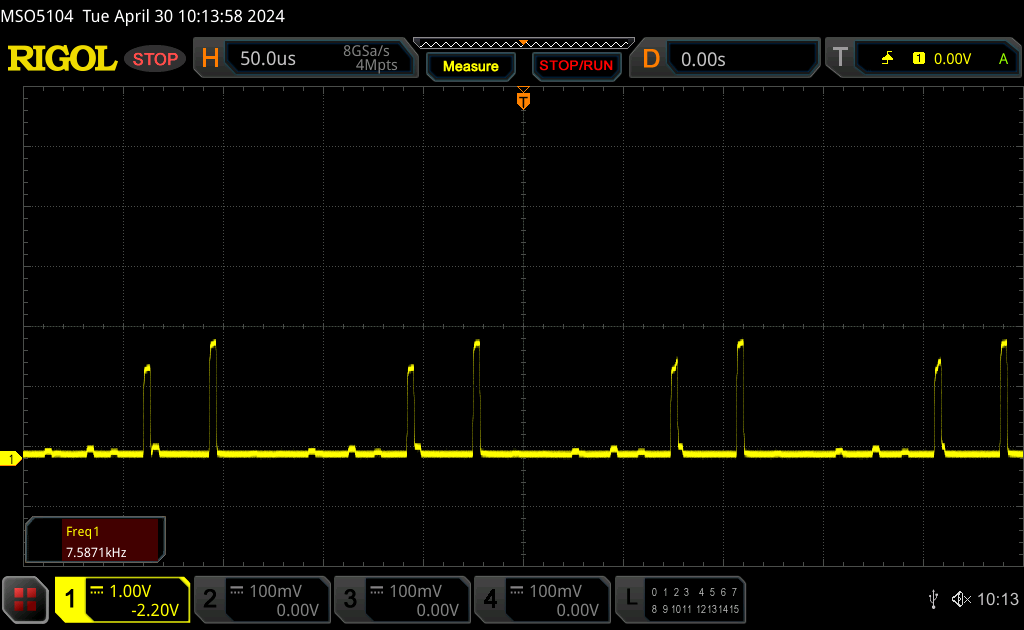
Parpadeo de Pantalla / PWM (Pulse-Width Modulation)

Para atenuar el brillo de pantalla algunos portátiles están encendiendo y apagando la retroiluminación muy rápidamente. Esto se hace a una frecuencia que no debiera detectarse a simple vista. Si la frecuencia es demasiado lenta, la gente sensible podría experimentar problemas visuales, dolores de cabeza e incluso ver parpadeos.
Parpadeo de Pantalla / PWM detectado 26444 Hz ≤ 100 % de brillo

La retroiluminación del display parpadea a 26444 Hz (seguramente usa PWM - Pulse-Width Modulation) a un brillo del 100 % e inferior. Sobre este nivel de brillo no debería darse parpadeo / PWM.

La frecuencia de 26444 Hz es bastante alta, por lo que la mayoría de gente sensible al parpadeo no debería ver parpadeo o tener fatiga visual.

Comparación: 53 % de todos los dispositivos testados no usaron PWM para atenuar el display. Si se usó, medimos una media de 17803 (mínimo: 5 - máxmo: 3846000) Hz.

El parpadeo está presente al igual que en otros portátiles con opciones mini-LED. Sin embargo, su frecuencia es extremadamente alta y, por tanto, es menos probable que cause fatiga visual a los usuarios sensibles. La intensidad del parpadeo también parece disminuir significativamente una vez que los niveles de brillo se reducen a <50%, por lo que unos niveles de brillo más bajos pueden no ser una mala idea.

0 por ciento de luminosidad
25% de luminosidad
25% de luminosidad
50% de luminosidad
50% de luminosidad
75% de luminosidad
75% de luminosidad
100% de luminosidad
100% de luminosidad

La visibilidad en exteriores es decente a la sombra, sobre todo porque el revestimiento mate minimiza los reflejos. No obstante, debe evitarse la luz solar directa para una experiencia visual óptima.

Al aire libre bajo la luz del sol
Al aire libre y a la sombra
Al aire libre bajo la luz del sol
Los amplios ángulos de visión mini-LED no presentan la degradación del contraste de IPS ni el efecto arco iris de OLED para unos colores más estables

Rendimiento - Igual que antaño


Condiciones de prueba

Razer sigue actualizando Synapse con funciones adicionales y casillas para mejorar la personalización. Las novedades de este año son el modo Turbo, el modo Max Fan y funciones de pantalla integradas como perfiles de color y teclas de acceso rápido para ajustar la frecuencia de actualización. Tenga en cuenta que el nuevo modo Turbo es esencialmente equivalente al modo Personalizado, como mostrarán nuestras pruebas a continuación. Razer afirma que añadieron el modo Turbo para facilitar a los usuarios la selección del "mejor" modo para jugar, pero creemos que esto puede tener el efecto contrario, ya que ahora hay demasiados modos confusos entre los que elegir. Todas nuestras pruebas a continuación se realizaron en modo Personalizado con la CPU y la GPU configuradas en Boost y Alto, respectivamente, a menos que se indique lo contrario.

Tal vez la característica más importante a tener en cuenta es el conmutador de atenuación local en la pestaña Pantalla. Curiosamente, Razer tiene esto desactivado por defecto a pesar de que la atenuación local es uno de los puntos clave de venta de mini-LED. Alternar esta característica puede afectar en gran medida los niveles de brillo en el modo HDR como se señaló anteriormente.

Pantalla de perfil de potencia con modo personalizado, modo ventilador máximo, modo turbo y más
Submenú de overclocking de la CPU
Ficha de pantalla con perfiles de color, frecuencias de actualización y funciones de atenuación local
Ajustes de audio
Ajustes de audio

Procesador

Mientras que el salto del 12º gen Core i9-12900HX al 13º gen Core i9-13900HX supondría un aumento del rendimiento del 25 al 30 por ciento, el salto del Core i9-13900HX de 13ª generación al Core i9-14900HX es esencialmente una línea plana. Los resultados de las pruebas comparativas entre nuestros modelos Blade 18 2023 y 2024 estarían dentro de un margen de 5 puntos porcentuales entre sí tanto en cargas de trabajo monohilo como multihilo. El i9-14900HX se describe informalmente como un rebrand del i9-13900HX y nuestras cifras así lo reflejan.

Perfil de potenciaPuntuación CineBench R23 xT (Puntos)Nivel de potencia sostenida de la CPU (W)Cyberpunk 2077 QHD Ultra (FPS)
Equilibrado1426955 -> 4565.13
Turbo27029135 -> 12584.69
Custom c/ Max Ventilador Encendido27167135 -> 12585.46

Curiosamente, los resultados de la CPU de nuestro sistema Razer serían ligera pero consistentemente más lentos que la mayoría de los demás portátiles para juegos con la misma CPU, como el Alienware m18 R2 o el MSI Titan 18 HX. Sospechamos que esto se hizo a propósito para permitir un mayor margen de overclocking a través del software Synapse. El rendimiento Turbo Boost de la CPU y los niveles de TDP están ligados a los diferentes perfiles de potencia como se muestra en la tabla anterior.

Cinebench R15 Multi Loop

02805608401120140016801960224025202800308033603640392042004480476050405320Tooltip
Razer Blade 18 2024 RZ09-0509 Intel Core i9-14900HX: Ø4163 (3956.09-4227.88)
Alienware m18 R2 Intel Core i9-14900HX: Ø4743 (4458.81-4807.11)
Asus ROG Strix Scar 17 G733PYV-LL053X AMD Ryzen 9 7945HX3D: Ø5282 (5177.32-5599.89)
MSI Titan 18 HX A14VIG Intel Core i9-14900HX: Ø4753 (4700.35-4782.4)
Asus ROG Strix Scar 18 G834JYR (2024) Intel Core i9-14900HX: Ø4024 (3961.18-4098.11)
Razer Blade 16 2024, RTX 4090 Intel Core i9-14900HX: Ø4396 (4349.72-4455.83)
CPU Performance Rating: Percent
Cinebench R23: Multi Core | Single Core
Cinebench R20: CPU (Multi Core) | CPU (Single Core)
Cinebench R15: CPU Multi 64Bit | CPU Single 64Bit
Blender: v2.79 BMW27 CPU
7-Zip 18.03: 7z b 4 | 7z b 4 -mmt1
Geekbench 6.2: Multi-Core | Single-Core
Geekbench 5.5: Multi-Core | Single-Core
HWBOT x265 Benchmark v2.2: 4k Preset
LibreOffice : 20 Documents To PDF
R Benchmark 2.5: Overall mean
CPU Performance Rating
Alienware m18 R1 AMD
AMD Ryzen 9 7945HX
84.3 pt
Asus ROG Strix Scar 17 G733PYV-LL053X
AMD Ryzen 9 7945HX3D
84.2 pt
Alienware m18 R2
Intel Core i9-14900HX
83.4 pt
Alienware m18 R1 -2!
Intel Core i9-13980HX
80.7 pt
MSI Titan 18 HX A14VIG
Intel Core i9-14900HX
79.9 pt
Average Intel Core i9-14900HX
 
79.2 pt
Razer Blade 16 2024, RTX 4090
Intel Core i9-14900HX
79 pt
Asus ROG Strix Scar 18 G834JYR (2024)
Intel Core i9-14900HX
78.8 pt
Razer Blade 18 RTX 4070 -2!
Intel Core i9-13950HX
76.1 pt
Razer Blade 18 2024 RZ09-0509
Intel Core i9-14900HX
75.9 pt
MSI Titan GT77 12UHS -2!
Intel Core i9-12900HX
65.4 pt
Asus TUF Gaming A17 FA707XI-NS94
AMD Ryzen 9 7940HS
60 pt
MSI Pulse 17 B13VGK
Intel Core i7-13700H
55.2 pt
Acer Nitro 17 AN17-41-R9LN
AMD Ryzen 7 7735HS
46.8 pt
Cinebench R23 / Multi Core
Alienware m18 R1 AMD
AMD Ryzen 9 7945HX
34613 (33896.2min - 34613.2max) Points +25%
Asus ROG Strix Scar 17 G733PYV-LL053X
AMD Ryzen 9 7945HX3D
32782 Points +19%
Alienware m18 R1
Intel Core i9-13980HX
32601 (28888.6min - 32601.4max) Points +18%
MSI Titan 18 HX A14VIG
Intel Core i9-14900HX
32428 (29693.8min - 32428.3max) Points +17%
Alienware m18 R2
Intel Core i9-14900HX
31391 (28656min - 31390.7max) Points +14%
Average Intel Core i9-14900HX
  (20702 - 32996, n=23)
28967 Points +5%
Razer Blade 16 2024, RTX 4090
Intel Core i9-14900HX
28867 Points +4%
Razer Blade 18 RTX 4070
Intel Core i9-13950HX
28681 (25585.5min - 28680.9max) Points +4%
Asus ROG Strix Scar 18 G834JYR (2024)
Intel Core i9-14900HX
28516 Points +3%
Razer Blade 18 2024 RZ09-0509
Intel Core i9-14900HX
27657 (23328.1min - 27657.5max) Points
MSI Titan GT77 12UHS
Intel Core i9-12900HX
22982 Points -17%
MSI Pulse 17 B13VGK
Intel Core i7-13700H
18304 Points -34%
Asus TUF Gaming A17 FA707XI-NS94
AMD Ryzen 9 7940HS
17623 (17398.8min - 17622.8max) Points -36%
Acer Nitro 17 AN17-41-R9LN
AMD Ryzen 7 7735HS
14087 Points -49%
Cinebench R23 / Single Core
Alienware m18 R2
Intel Core i9-14900HX
2235 Points +7%
Asus ROG Strix Scar 18 G834JYR (2024)
Intel Core i9-14900HX
2177 Points +4%
Average Intel Core i9-14900HX
  (2043 - 2235, n=23)
2175 Points +4%
MSI Titan 18 HX A14VIG
Intel Core i9-14900HX
2143 Points +3%
Razer Blade 16 2024, RTX 4090
Intel Core i9-14900HX
2117 Points +1%
Alienware m18 R1
Intel Core i9-13980HX
2106 Points +1%
Razer Blade 18 2024 RZ09-0509
Intel Core i9-14900HX
2088 Points
Razer Blade 18 RTX 4070
Intel Core i9-13950HX
2076 Points -1%
Alienware m18 R1 AMD
AMD Ryzen 9 7945HX
1948 Points -7%
Asus ROG Strix Scar 17 G733PYV-LL053X
AMD Ryzen 9 7945HX3D
1935 Points -7%
MSI Titan GT77 12UHS
Intel Core i9-12900HX
1913 Points -8%
Asus TUF Gaming A17 FA707XI-NS94
AMD Ryzen 9 7940HS
1832 Points -12%
MSI Pulse 17 B13VGK
Intel Core i7-13700H
1694 Points -19%
Acer Nitro 17 AN17-41-R9LN
AMD Ryzen 7 7735HS
1569 Points -25%
Cinebench R20 / CPU (Multi Core)
Alienware m18 R1 AMD
AMD Ryzen 9 7945HX
13308 Points +22%
Asus ROG Strix Scar 17 G733PYV-LL053X
AMD Ryzen 9 7945HX3D
13033 Points +20%
Alienware m18 R1
Intel Core i9-13980HX
12423 Points +14%
MSI Titan 18 HX A14VIG
Intel Core i9-14900HX
12103 Points +11%
Alienware m18 R2
Intel Core i9-14900HX
11816 Points +9%
Average Intel Core i9-14900HX
  (8427 - 12419, n=23)
11018 Points +1%
Razer Blade 16 2024, RTX 4090
Intel Core i9-14900HX
10968 Points +1%
Razer Blade 18 RTX 4070
Intel Core i9-13950HX
10919 Points 0%
Razer Blade 18 2024 RZ09-0509
Intel Core i9-14900HX
10871 Points
Asus ROG Strix Scar 18 G834JYR (2024)
Intel Core i9-14900HX
10787 Points -1%
MSI Titan GT77 12UHS
Intel Core i9-12900HX
8667 Points -20%
MSI Pulse 17 B13VGK
Intel Core i7-13700H
7190 Points -34%
Asus TUF Gaming A17 FA707XI-NS94
AMD Ryzen 9 7940HS
6894 Points -37%
Acer Nitro 17 AN17-41-R9LN
AMD Ryzen 7 7735HS
5408 Points -50%
Cinebench R20 / CPU (Single Core)
Alienware m18 R2
Intel Core i9-14900HX
853 Points +5%
Asus ROG Strix Scar 18 G834JYR (2024)
Intel Core i9-14900HX
833 Points +2%
Average Intel Core i9-14900HX
  (779 - 859, n=23)
833 Points +2%
MSI Titan 18 HX A14VIG
Intel Core i9-14900HX
823 Points +1%
Razer Blade 18 2024 RZ09-0509
Intel Core i9-14900HX
814 Points
Razer Blade 16 2024, RTX 4090
Intel Core i9-14900HX
810 Points 0%
Alienware m18 R1
Intel Core i9-13980HX
807 Points -1%
Razer Blade 18 RTX 4070
Intel Core i9-13950HX
797 Points -2%
Asus ROG Strix Scar 17 G733PYV-LL053X
AMD Ryzen 9 7945HX3D
755 Points -7%
Alienware m18 R1 AMD
AMD Ryzen 9 7945HX
747 Points -8%
MSI Titan GT77 12UHS
Intel Core i9-12900HX
738 Points -9%
Asus TUF Gaming A17 FA707XI-NS94
AMD Ryzen 9 7940HS
714 Points -12%
MSI Pulse 17 B13VGK
Intel Core i7-13700H
663 Points -19%
Acer Nitro 17 AN17-41-R9LN
AMD Ryzen 7 7735HS
611 Points -25%
Cinebench R15 / CPU Multi 64Bit
Asus ROG Strix Scar 17 G733PYV-LL053X
AMD Ryzen 9 7945HX3D
5600 (5177.32min - 5599.89max) Points +32%
Alienware m18 R1 AMD
AMD Ryzen 9 7945HX
5541 (5377.07min - 5540.93max) Points +31%
Alienware m18 R1
Intel Core i9-13980HX
4989 (4579.8min - 4989.4max) Points +18%
Alienware m18 R2
Intel Core i9-14900HX
4807 (4458.81min - 4807.11max) Points +14%
MSI Titan 18 HX A14VIG
Intel Core i9-14900HX
4782 (4700.35min - 4782.4max) Points +13%
Razer Blade 18 RTX 4070
Intel Core i9-13950HX
4481 Points +6%
Razer Blade 16 2024, RTX 4090
Intel Core i9-14900HX
4456 (4349.72min - 4455.83max) Points +5%
Average Intel Core i9-14900HX
  (3263 - 4875, n=23)
4406 Points +4%
Razer Blade 18 2024 RZ09-0509
Intel Core i9-14900HX
4228 (3956.09min - 4227.88max) Points
Asus ROG Strix Scar 18 G834JYR (2024)
Intel Core i9-14900HX
4098 Points -3%
MSI Titan GT77 12UHS
Intel Core i9-12900HX
3570 (3259.45min - 3569.52max) Points -16%
MSI Pulse 17 B13VGK
Intel Core i7-13700H
2869 (2748.57min - 2868.62max) Points -32%
Asus TUF Gaming A17 FA707XI-NS94
AMD Ryzen 9 7940HS
2817 (2741.98min - 2817.3max) Points -33%
Acer Nitro 17 AN17-41-R9LN
AMD Ryzen 7 7735HS
2296 (2231.27min - 2296.34max) Points -46%
Cinebench R15 / CPU Single 64Bit
Alienware m18 R2
Intel Core i9-14900HX
318 Points +5%
Asus ROG Strix Scar 17 G733PYV-LL053X
AMD Ryzen 9 7945HX3D
311 Points +2%
Razer Blade 16 2024, RTX 4090
Intel Core i9-14900HX
311 Points +2%
Alienware m18 R1 AMD
AMD Ryzen 9 7945HX
309 Points +2%
Average Intel Core i9-14900HX
  (287 - 320, n=23)
309 Points +2%
Razer Blade 18 2024 RZ09-0509
Intel Core i9-14900HX
304 Points
Alienware m18 R1
Intel Core i9-13980HX
303 Points 0%
Asus ROG Strix Scar 18 G834JYR (2024)
Intel Core i9-14900HX
302 Points -1%
MSI Titan 18 HX A14VIG
Intel Core i9-14900HX
300 Points -1%
Razer Blade 18 RTX 4070
Intel Core i9-13950HX
297 Points -2%
Asus TUF Gaming A17 FA707XI-NS94
AMD Ryzen 9 7940HS
287 Points -6%
MSI Titan GT77 12UHS
Intel Core i9-12900HX
278 Points -9%
Acer Nitro 17 AN17-41-R9LN
AMD Ryzen 7 7735HS
251 Points -17%
MSI Pulse 17 B13VGK
Intel Core i7-13700H
250 Points -18%
Blender / v2.79 BMW27 CPU
Acer Nitro 17 AN17-41-R9LN
AMD Ryzen 7 7735HS
222 Seconds * -90%
Asus TUF Gaming A17 FA707XI-NS94
AMD Ryzen 9 7940HS
183 Seconds * -56%
MSI Pulse 17 B13VGK
Intel Core i7-13700H
173 Seconds * -48%
MSI Titan GT77 12UHS
Intel Core i9-12900HX
147 Seconds * -26%
Average Intel Core i9-14900HX
  (102 - 164, n=23)
118.9 Seconds * -2%
Asus ROG Strix Scar 18 G834JYR (2024)
Intel Core i9-14900HX
118 Seconds * -1%
Razer Blade 18 2024 RZ09-0509
Intel Core i9-14900HX
117 Seconds *
Razer Blade 16 2024, RTX 4090
Intel Core i9-14900HX
113 Seconds * +3%
Razer Blade 18 RTX 4070
Intel Core i9-13950HX
111 Seconds * +5%
MSI Titan 18 HX A14VIG
Intel Core i9-14900HX
104 Seconds * +11%
Alienware m18 R2
Intel Core i9-14900HX
102 Seconds * +13%
Alienware m18 R1
Intel Core i9-13980HX
97 Seconds * +17%
Asus ROG Strix Scar 17 G733PYV-LL053X
AMD Ryzen 9 7945HX3D
95 Seconds * +19%
Alienware m18 R1 AMD
AMD Ryzen 9 7945HX
87 Seconds * +26%
7-Zip 18.03 / 7z b 4
Alienware m18 R1 AMD
AMD Ryzen 9 7945HX
140493 MIPS +31%
Asus ROG Strix Scar 17 G733PYV-LL053X
AMD Ryzen 9 7945HX3D
136201 MIPS +27%
Alienware m18 R1
Intel Core i9-13980HX
129804 MIPS +21%
Alienware m18 R2
Intel Core i9-14900HX
122772 MIPS +14%
MSI Titan 18 HX A14VIG
Intel Core i9-14900HX
121266 MIPS +13%
Razer Blade 18 RTX 4070
Intel Core i9-13950HX
116665 MIPS +8%
Razer Blade 16 2024, RTX 4090
Intel Core i9-14900HX
115695 MIPS +8%
Asus ROG Strix Scar 18 G834JYR (2024)
Intel Core i9-14900HX
114546 MIPS +7%
Average Intel Core i9-14900HX
  (87555 - 127108, n=23)
112774 MIPS +5%
Razer Blade 18 2024 RZ09-0509
Intel Core i9-14900HX
107527 MIPS
MSI Titan GT77 12UHS
Intel Core i9-12900HX
86234 MIPS -20%
MSI Pulse 17 B13VGK
Intel Core i7-13700H
74965 MIPS -30%
Asus TUF Gaming A17 FA707XI-NS94
AMD Ryzen 9 7940HS
72749 MIPS -32%
Acer Nitro 17 AN17-41-R9LN
AMD Ryzen 7 7735HS
61495 MIPS -43%
7-Zip 18.03 / 7z b 4 -mmt1
Asus ROG Strix Scar 17 G733PYV-LL053X
AMD Ryzen 9 7945HX3D
7573 MIPS +17%
Alienware m18 R1 AMD
AMD Ryzen 9 7945HX
7381 MIPS +14%
Asus ROG Strix Scar 18 G834JYR (2024)
Intel Core i9-14900HX
7172 MIPS +10%
Average Intel Core i9-14900HX
  (6206 - 7508, n=23)
7105 MIPS +9%
Alienware m18 R2
Intel Core i9-14900HX
7103 MIPS +9%
Razer Blade 16 2024, RTX 4090
Intel Core i9-14900HX
7018 MIPS +8%
Alienware m18 R1
Intel Core i9-13980HX
6889 MIPS +6%
Razer Blade 18 RTX 4070
Intel Core i9-13950HX
6880 MIPS +6%
Asus TUF Gaming A17 FA707XI-NS94
AMD Ryzen 9 7940HS
6642 MIPS +2%
MSI Titan 18 HX A14VIG
Intel Core i9-14900HX
6504 MIPS 0%
Razer Blade 18 2024 RZ09-0509
Intel Core i9-14900HX
6497 MIPS
MSI Titan GT77 12UHS
Intel Core i9-12900HX
6256 MIPS -4%
Acer Nitro 17 AN17-41-R9LN
AMD Ryzen 7 7735HS
5797 MIPS -11%
MSI Pulse 17 B13VGK
Intel Core i7-13700H
5461 MIPS -16%
Geekbench 6.2 / Multi-Core
Alienware m18 R2
Intel Core i9-14900HX
18233 Points +6%
Asus ROG Strix Scar 18 G834JYR (2024)
Intel Core i9-14900HX
17695 Points +3%
Average Intel Core i9-14900HX
  (15849 - 18643, n=23)
17564 Points +2%
Razer Blade 16 2024, RTX 4090
Intel Core i9-14900HX
17559 Points +2%
Razer Blade 18 2024 RZ09-0509
Intel Core i9-14900HX
17231 Points
Asus ROG Strix Scar 17 G733PYV-LL053X
AMD Ryzen 9 7945HX3D
16957 Points -2%
MSI Titan 18 HX A14VIG
Intel Core i9-14900HX
16652 Points -3%
Alienware m18 R1 AMD
AMD Ryzen 9 7945HX
16316 Points -5%
MSI Pulse 17 B13VGK
Intel Core i7-13700H
12989 Points -25%
Asus TUF Gaming A17 FA707XI-NS94
AMD Ryzen 9 7940HS
12447 Points -28%
Acer Nitro 17 AN17-41-R9LN
AMD Ryzen 7 7735HS
10348 Points -40%
Geekbench 6.2 / Single-Core
Alienware m18 R2
Intel Core i9-14900HX
3057 Points +8%
Asus ROG Strix Scar 18 G834JYR (2024)
Intel Core i9-14900HX
2999 Points +6%
Average Intel Core i9-14900HX
  (2800 - 3095, n=23)
2995 Points +5%
Razer Blade 16 2024, RTX 4090
Intel Core i9-14900HX
2964 Points +4%
Asus ROG Strix Scar 17 G733PYV-LL053X
AMD Ryzen 9 7945HX3D
2916 Points +3%
Alienware m18 R1 AMD
AMD Ryzen 9 7945HX
2876 Points +1%
MSI Titan 18 HX A14VIG
Intel Core i9-14900HX
2843 Points 0%
Razer Blade 18 2024 RZ09-0509
Intel Core i9-14900HX
2842 Points
Asus TUF Gaming A17 FA707XI-NS94
AMD Ryzen 9 7940HS
2730 Points -4%
MSI Pulse 17 B13VGK
Intel Core i7-13700H
2316 Points -19%
Acer Nitro 17 AN17-41-R9LN
AMD Ryzen 7 7735HS
2115 Points -26%
Geekbench 5.5 / Multi-Core
Alienware m18 R1
Intel Core i9-13980HX
22200 Points +15%
Alienware m18 R2
Intel Core i9-14900HX
21284 Points +10%
Razer Blade 18 RTX 4070
Intel Core i9-13950HX
20036 Points +4%
Asus ROG Strix Scar 18 G834JYR (2024)
Intel Core i9-14900HX
19975 Points +3%
Asus ROG Strix Scar 17 G733PYV-LL053X
AMD Ryzen 9 7945HX3D
19875 Points +3%
Alienware m18 R1 AMD
AMD Ryzen 9 7945HX
19802 Points +3%
Average Intel Core i9-14900HX
  (8618 - 21606, n=23)
19446 Points +1%
Razer Blade 16 2024, RTX 4090
Intel Core i9-14900HX
19372 Points 0%
Razer Blade 18 2024 RZ09-0509
Intel Core i9-14900HX
19310 Points
MSI Titan 18 HX A14VIG
Intel Core i9-14900HX
19137 Points -1%
MSI Titan GT77 12UHS
Intel Core i9-12900HX
16250 Points -16%
MSI Pulse 17 B13VGK
Intel Core i7-13700H
13257 Points -31%
Asus TUF Gaming A17 FA707XI-NS94
AMD Ryzen 9 7940HS
11399 Points -41%
Acer Nitro 17 AN17-41-R9LN
AMD Ryzen 7 7735HS
9694 Points -50%
Geekbench 5.5 / Single-Core
Alienware m18 R2
Intel Core i9-14900HX
2193 Points +9%
Asus ROG Strix Scar 17 G733PYV-LL053X
AMD Ryzen 9 7945HX3D
2133 Points +6%
Razer Blade 16 2024, RTX 4090
Intel Core i9-14900HX
2131 Points +6%
Alienware m18 R1 AMD
AMD Ryzen 9 7945HX
2124 Points +5%
Asus ROG Strix Scar 18 G834JYR (2024)
Intel Core i9-14900HX
2118 Points +5%
Average Intel Core i9-14900HX
  (1669 - 2210, n=23)
2102 Points +4%
MSI Titan 18 HX A14VIG
Intel Core i9-14900HX
2098 Points +4%
Alienware m18 R1
Intel Core i9-13980HX
2062 Points +2%
Razer Blade 18 RTX 4070
Intel Core i9-13950HX
2035 Points +1%
Razer Blade 18 2024 RZ09-0509
Intel Core i9-14900HX
2015 Points
Asus TUF Gaming A17 FA707XI-NS94
AMD Ryzen 9 7940HS
2014 Points 0%
MSI Titan GT77 12UHS
Intel Core i9-12900HX
1923 Points -5%
MSI Pulse 17 B13VGK
Intel Core i7-13700H
1704 Points -15%
Acer Nitro 17 AN17-41-R9LN
AMD Ryzen 7 7735HS
1554 Points -23%
HWBOT x265 Benchmark v2.2 / 4k Preset
Alienware m18 R1 AMD
AMD Ryzen 9 7945HX
37.5 fps +35%
Asus ROG Strix Scar 17 G733PYV-LL053X
AMD Ryzen 9 7945HX3D
36.4 fps +31%
Alienware m18 R1
Intel Core i9-13980HX
33.1 fps +19%
Alienware m18 R2
Intel Core i9-14900HX
32.1 fps +16%
Razer Blade 18 RTX 4070
Intel Core i9-13950HX
31 fps +12%
MSI Titan 18 HX A14VIG
Intel Core i9-14900HX
30.9 fps +12%
Razer Blade 16 2024, RTX 4090
Intel Core i9-14900HX
30.1 fps +9%
Average Intel Core i9-14900HX
  (22.7 - 34.4, n=23)
29.6 fps +7%
Asus ROG Strix Scar 18 G834JYR (2024)
Intel Core i9-14900HX
29.2 fps +5%
Razer Blade 18 2024 RZ09-0509
Intel Core i9-14900HX
27.7 fps
MSI Titan GT77 12UHS
Intel Core i9-12900HX
25.6 fps -8%
Asus TUF Gaming A17 FA707XI-NS94
AMD Ryzen 9 7940HS
21.8 fps -21%
MSI Pulse 17 B13VGK
Intel Core i7-13700H
21.2 fps -23%
Acer Nitro 17 AN17-41-R9LN
AMD Ryzen 7 7735HS
17 fps -39%
LibreOffice / 20 Documents To PDF
Acer Nitro 17 AN17-41-R9LN
AMD Ryzen 7 7735HS
63.8 s * -32%
MSI Pulse 17 B13VGK
Intel Core i7-13700H
62.4 s * -29%
Asus TUF Gaming A17 FA707XI-NS94
AMD Ryzen 9 7940HS
49.4 s * -2%
Razer Blade 18 2024 RZ09-0509
Intel Core i9-14900HX
48.5 s *
Razer Blade 16 2024, RTX 4090
Intel Core i9-14900HX
47.5 s * +2%
Alienware m18 R1
Intel Core i9-13980HX
46.7 s * +4%
MSI Titan 18 HX A14VIG
Intel Core i9-14900HX
46.2 s * +5%
Alienware m18 R2
Intel Core i9-14900HX
44.8 s * +8%
Average Intel Core i9-14900HX
  (33.9 - 85.1, n=23)
44.6 s * +8%
Asus ROG Strix Scar 18 G834JYR (2024)
Intel Core i9-14900HX
43.8 s * +10%
Razer Blade 18 RTX 4070
Intel Core i9-13950HX
43.4 s * +11%
Alienware m18 R1 AMD
AMD Ryzen 9 7945HX
41.8 s * +14%
MSI Titan GT77 12UHS
Intel Core i9-12900HX
39 s * +20%
Asus ROG Strix Scar 17 G733PYV-LL053X
AMD Ryzen 9 7945HX3D
39 s * +20%
R Benchmark 2.5 / Overall mean
Acer Nitro 17 AN17-41-R9LN
AMD Ryzen 7 7735HS
0.4911 sec * -25%
MSI Pulse 17 B13VGK
Intel Core i7-13700H
0.4809 sec * -22%
Asus TUF Gaming A17 FA707XI-NS94
AMD Ryzen 9 7940HS
0.4278 sec * -9%
MSI Titan GT77 12UHS
Intel Core i9-12900HX
0.4194 sec * -7%
Alienware m18 R1 AMD
AMD Ryzen 9 7945HX
0.4145 sec * -5%
Asus ROG Strix Scar 17 G733PYV-LL053X
AMD Ryzen 9 7945HX3D
0.4127 sec * -5%
Razer Blade 18 RTX 4070
Intel Core i9-13950HX
0.3955 sec * -0%
Asus ROG Strix Scar 18 G834JYR (2024)
Intel Core i9-14900HX
0.3944 sec * -0%
Razer Blade 18 2024 RZ09-0509
Intel Core i9-14900HX
0.3937 sec *
Alienware m18 R1
Intel Core i9-13980HX
0.3931 sec * -0%
MSI Titan 18 HX A14VIG
Intel Core i9-14900HX
0.3919 sec * -0%
Average Intel Core i9-14900HX
  (0.3609 - 0.4225, n=23)
0.3818 sec * +3%
Razer Blade 16 2024, RTX 4090
Intel Core i9-14900HX
0.3789 sec * +4%
Alienware m18 R2
Intel Core i9-14900HX
0.3767 sec * +4%
CPU Performance Rating: Percent
Cinebench R23: Multi Core | Single Core
Cinebench R20: CPU (Multi Core) | CPU (Single Core)
Cinebench R15: CPU Multi 64Bit | CPU Single 64Bit
Blender: v2.79 BMW27 CPU
7-Zip 18.03: 7z b 4 | 7z b 4 -mmt1
Geekbench 6.2: Multi-Core | Single-Core
Geekbench 5.5: Multi-Core | Single-Core
HWBOT x265 Benchmark v2.2: 4k Preset
LibreOffice : 20 Documents To PDF
R Benchmark 2.5: Overall mean

* ... más pequeño es mejor

Cinebench R15 CPU Multi 64Bit
4228 Points
Cinebench R15 OpenGL 64Bit
271 fps
Cinebench R15 Ref. Match 64Bit
99.6 %
Cinebench R15 CPU Single 64Bit
304 Points
ayuda
Performance Rating
Asus ROG Strix Scar 17 G733PYV-LL053X
AMD Ryzen 9 7945HX3D, NVIDIA GeForce RTX 4090 Laptop GPU
96.8 pt
Alienware m18 R2
Intel Core i9-14900HX, NVIDIA GeForce RTX 4090 Laptop GPU
67.8 pt
MSI Titan 18 HX A14VIG
Intel Core i9-14900HX, NVIDIA GeForce RTX 4090 Laptop GPU
66.8 pt
Razer Blade 16 2024, RTX 4090
Intel Core i9-14900HX, NVIDIA GeForce RTX 4090 Laptop GPU
62.6 pt
Asus ROG Strix Scar 18 G834JYR (2024)
Intel Core i9-14900HX, NVIDIA GeForce RTX 4090 Laptop GPU
62.4 pt
Average Intel Core i9-14900HX
 
61.8 pt
Razer Blade 18 2024 RZ09-0509
Intel Core i9-14900HX, NVIDIA GeForce RTX 4090 Laptop GPU
61.1 pt
Average of class Gaming
 
47 pt
AIDA64 / FP32 Ray-Trace
Asus ROG Strix Scar 17 G733PYV-LL053X
AMD Ryzen 9 7945HX3D, NVIDIA GeForce RTX 4090 Laptop GPU
53908 KRay/s +115%
MSI Titan 18 HX A14VIG
Intel Core i9-14900HX, NVIDIA GeForce RTX 4090 Laptop GPU
29351 KRay/s +17%
Alienware m18 R2
Intel Core i9-14900HX, NVIDIA GeForce RTX 4090 Laptop GPU
29280 KRay/s +17%
Razer Blade 16 2024, RTX 4090
Intel Core i9-14900HX, NVIDIA GeForce RTX 4090 Laptop GPU
25682 KRay/s +2%
Asus ROG Strix Scar 18 G834JYR (2024)
Intel Core i9-14900HX, NVIDIA GeForce RTX 4090 Laptop GPU
25444 KRay/s +1%
Average Intel Core i9-14900HX
  (17244 - 29351, n=22)
25121 KRay/s 0%
Razer Blade 18 2024 RZ09-0509
Intel Core i9-14900HX, NVIDIA GeForce RTX 4090 Laptop GPU
25098 KRay/s
Average of class Gaming
  (3069 - 60169, n=215, last 2 years)
19200 KRay/s -23%
AIDA64 / FPU Julia
Asus ROG Strix Scar 17 G733PYV-LL053X
AMD Ryzen 9 7945HX3D, NVIDIA GeForce RTX 4090 Laptop GPU
222115 Points +73%
MSI Titan 18 HX A14VIG
Intel Core i9-14900HX, NVIDIA GeForce RTX 4090 Laptop GPU
148888 Points +16%
Alienware m18 R2
Intel Core i9-14900HX, NVIDIA GeForce RTX 4090 Laptop GPU
142791 Points +11%
Asus ROG Strix Scar 18 G834JYR (2024)
Intel Core i9-14900HX, NVIDIA GeForce RTX 4090 Laptop GPU
128826 Points 0%
Razer Blade 18 2024 RZ09-0509
Intel Core i9-14900HX, NVIDIA GeForce RTX 4090 Laptop GPU
128369 Points
Razer Blade 16 2024, RTX 4090
Intel Core i9-14900HX, NVIDIA GeForce RTX 4090 Laptop GPU
127908 Points 0%
Average Intel Core i9-14900HX
  (88537 - 148888, n=22)
125646 Points -2%
Average of class Gaming
  (18567 - 252486, n=215, last 2 years)
96286 Points -25%
AIDA64 / CPU SHA3
Asus ROG Strix Scar 17 G733PYV-LL053X
AMD Ryzen 9 7945HX3D, NVIDIA GeForce RTX 4090 Laptop GPU
9582 MB/s +56%
MSI Titan 18 HX A14VIG
Intel Core i9-14900HX, NVIDIA GeForce RTX 4090 Laptop GPU
7229 MB/s +17%
Alienware m18 R2
Intel Core i9-14900HX, NVIDIA GeForce RTX 4090 Laptop GPU
7095 MB/s +15%
Asus ROG Strix Scar 18 G834JYR (2024)
Intel Core i9-14900HX, NVIDIA GeForce RTX 4090 Laptop GPU
6204 MB/s +1%
Average Intel Core i9-14900HX
  (4267 - 7229, n=22)
6189 MB/s 0%
Razer Blade 16 2024, RTX 4090
Intel Core i9-14900HX, NVIDIA GeForce RTX 4090 Laptop GPU
6188 MB/s 0%
Razer Blade 18 2024 RZ09-0509
Intel Core i9-14900HX, NVIDIA GeForce RTX 4090 Laptop GPU
6159 MB/s
Average of class Gaming
  (629 - 10389, n=215, last 2 years)
4422 MB/s -28%
AIDA64 / CPU Queen
Asus ROG Strix Scar 17 G733PYV-LL053X
AMD Ryzen 9 7945HX3D, NVIDIA GeForce RTX 4090 Laptop GPU
181270 Points +33%
MSI Titan 18 HX A14VIG
Intel Core i9-14900HX, NVIDIA GeForce RTX 4090 Laptop GPU
148773 Points +9%
Asus ROG Strix Scar 18 G834JYR (2024)
Intel Core i9-14900HX, NVIDIA GeForce RTX 4090 Laptop GPU
141681 Points +4%
Alienware m18 R2
Intel Core i9-14900HX, NVIDIA GeForce RTX 4090 Laptop GPU
139323 Points +2%
Average Intel Core i9-14900HX
  (118405 - 148773, n=22)
138500 Points +1%
Razer Blade 16 2024, RTX 4090
Intel Core i9-14900HX, NVIDIA GeForce RTX 4090 Laptop GPU
138473 Points +1%
Razer Blade 18 2024 RZ09-0509
Intel Core i9-14900HX, NVIDIA GeForce RTX 4090 Laptop GPU
136621 Points
Average of class Gaming
  (15371 - 200651, n=215, last 2 years)
110711 Points -19%
AIDA64 / FPU SinJulia
Asus ROG Strix Scar 17 G733PYV-LL053X
AMD Ryzen 9 7945HX3D, NVIDIA GeForce RTX 4090 Laptop GPU
29487 Points +90%
MSI Titan 18 HX A14VIG
Intel Core i9-14900HX, NVIDIA GeForce RTX 4090 Laptop GPU
18256 Points +18%
Alienware m18 R2
Intel Core i9-14900HX, NVIDIA GeForce RTX 4090 Laptop GPU
16279 Points +5%
Asus ROG Strix Scar 18 G834JYR (2024)
Intel Core i9-14900HX, NVIDIA GeForce RTX 4090 Laptop GPU
16121 Points +4%
Razer Blade 16 2024, RTX 4090
Intel Core i9-14900HX, NVIDIA GeForce RTX 4090 Laptop GPU
15857 Points +2%
Razer Blade 18 2024 RZ09-0509
Intel Core i9-14900HX, NVIDIA GeForce RTX 4090 Laptop GPU
15500 Points
Average Intel Core i9-14900HX
  (12217 - 18256, n=22)
15333 Points -1%
Average of class Gaming
  (2137 - 32988, n=215, last 2 years)
12335 Points -20%
AIDA64 / FPU Mandel
Asus ROG Strix Scar 17 G733PYV-LL053X
AMD Ryzen 9 7945HX3D, NVIDIA GeForce RTX 4090 Laptop GPU
118813 Points +89%
Alienware m18 R2
Intel Core i9-14900HX, NVIDIA GeForce RTX 4090 Laptop GPU
72594 Points +15%
MSI Titan 18 HX A14VIG
Intel Core i9-14900HX, NVIDIA GeForce RTX 4090 Laptop GPU
72355 Points +15%
Razer Blade 16 2024, RTX 4090
Intel Core i9-14900HX, NVIDIA GeForce RTX 4090 Laptop GPU
64134 Points +2%
Asus ROG Strix Scar 18 G834JYR (2024)
Intel Core i9-14900HX, NVIDIA GeForce RTX 4090 Laptop GPU
63748 Points +1%
Razer Blade 18 2024 RZ09-0509
Intel Core i9-14900HX, NVIDIA GeForce RTX 4090 Laptop GPU
62867 Points
Average Intel Core i9-14900HX
  (43302 - 72594, n=22)
61661 Points -2%
Average of class Gaming
  (10291 - 134044, n=215, last 2 years)
48960 Points -22%
AIDA64 / CPU AES
Asus ROG Strix Scar 17 G733PYV-LL053X
AMD Ryzen 9 7945HX3D, NVIDIA GeForce RTX 4090 Laptop GPU
328679 MB/s +179%
MSI Titan 18 HX A14VIG
Intel Core i9-14900HX, NVIDIA GeForce RTX 4090 Laptop GPU
138830 MB/s +18%
Average Intel Core i9-14900HX
  (86964 - 241777, n=22)
138443 MB/s +17%
Alienware m18 R2
Intel Core i9-14900HX, NVIDIA GeForce RTX 4090 Laptop GPU
134675 MB/s +14%
Razer Blade 16 2024, RTX 4090
Intel Core i9-14900HX, NVIDIA GeForce RTX 4090 Laptop GPU
122937 MB/s +4%
Asus ROG Strix Scar 18 G834JYR (2024)
Intel Core i9-14900HX, NVIDIA GeForce RTX 4090 Laptop GPU
122250 MB/s +4%
Razer Blade 18 2024 RZ09-0509
Intel Core i9-14900HX, NVIDIA GeForce RTX 4090 Laptop GPU
117887 MB/s
Average of class Gaming
  (19065 - 328679, n=215, last 2 years)
108576 MB/s -8%
AIDA64 / CPU ZLib
MSI Titan 18 HX A14VIG
Intel Core i9-14900HX, NVIDIA GeForce RTX 4090 Laptop GPU
2149 MB/s +20%
Alienware m18 R2
Intel Core i9-14900HX, NVIDIA GeForce RTX 4090 Laptop GPU
2053 MB/s +14%
Asus ROG Strix Scar 17 G733PYV-LL053X
AMD Ryzen 9 7945HX3D, NVIDIA GeForce RTX 4090 Laptop GPU
2043 MB/s +14%
Razer Blade 16 2024, RTX 4090
Intel Core i9-14900HX, NVIDIA GeForce RTX 4090 Laptop GPU
1863 MB/s +4%
Average Intel Core i9-14900HX
  (1265 - 2149, n=22)
1802 MB/s 0%
Razer Blade 18 2024 RZ09-0509
Intel Core i9-14900HX, NVIDIA GeForce RTX 4090 Laptop GPU
1794 MB/s
Asus ROG Strix Scar 18 G834JYR (2024)
Intel Core i9-14900HX, NVIDIA GeForce RTX 4090 Laptop GPU
1789 MB/s 0%
Average of class Gaming
  (150.9 - 2409, n=215, last 2 years)
1231 MB/s -31%
AIDA64 / FP64 Ray-Trace
Asus ROG Strix Scar 17 G733PYV-LL053X
AMD Ryzen 9 7945HX3D, NVIDIA GeForce RTX 4090 Laptop GPU
29140 KRay/s +113%
Alienware m18 R2
Intel Core i9-14900HX, NVIDIA GeForce RTX 4090 Laptop GPU
16128 KRay/s +18%
MSI Titan 18 HX A14VIG
Intel Core i9-14900HX, NVIDIA GeForce RTX 4090 Laptop GPU
16104 KRay/s +18%
Razer Blade 16 2024, RTX 4090
Intel Core i9-14900HX, NVIDIA GeForce RTX 4090 Laptop GPU
13993 KRay/s +2%
Razer Blade 18 2024 RZ09-0509
Intel Core i9-14900HX, NVIDIA GeForce RTX 4090 Laptop GPU
13680 KRay/s
Asus ROG Strix Scar 18 G834JYR (2024)
Intel Core i9-14900HX, NVIDIA GeForce RTX 4090 Laptop GPU
13608 KRay/s -1%
Average Intel Core i9-14900HX
  (9170 - 16128, n=22)
13530 KRay/s -1%
Average of class Gaming
  (1518 - 31796, n=215, last 2 years)
10376 KRay/s -24%
AIDA64 / CPU PhotoWorxx
Alienware m18 R2
Intel Core i9-14900HX, NVIDIA GeForce RTX 4090 Laptop GPU
49716 MPixel/s +5%
Asus ROG Strix Scar 18 G834JYR (2024)
Intel Core i9-14900HX, NVIDIA GeForce RTX 4090 Laptop GPU
49710 MPixel/s +5%
Razer Blade 16 2024, RTX 4090
Intel Core i9-14900HX, NVIDIA GeForce RTX 4090 Laptop GPU
49616 MPixel/s +5%
Average Intel Core i9-14900HX
  (33960 - 51118, n=22)
48315 MPixel/s +2%
Razer Blade 18 2024 RZ09-0509
Intel Core i9-14900HX, NVIDIA GeForce RTX 4090 Laptop GPU
47472 MPixel/s
Average of class Gaming
  (10805 - 60161, n=216, last 2 years)
37419 MPixel/s -21%
Asus ROG Strix Scar 17 G733PYV-LL053X
AMD Ryzen 9 7945HX3D, NVIDIA GeForce RTX 4090 Laptop GPU
36406 MPixel/s -23%
MSI Titan 18 HX A14VIG
Intel Core i9-14900HX, NVIDIA GeForce RTX 4090 Laptop GPU
33960 MPixel/s -28%

Prueba de estrés

Sistema inactivo
Sistema inactivo

El consumo de energía de la CPU cuando se ejecuta Prime95 se estabilizaría en torno a 117 W para estar muy cerca de lo que registramos en el Blade 18 del año pasado en 114 W. Cuando se combina con sus números de rendimiento casi idénticos como se señaló en la sección anterior, esto cimienta aún más el hecho de que la serie de actualización Raptor Lake-HX más reciente ofrece poco o ningún beneficio sobre el antiguo Core i9-13950HX.

Ejecutando Witcher 3 para representar cargas típicas de juego no muestra grandes diferencias de rendimiento entre Max Fan activado o Max Fan desactivado, ya que el consumo de energía de la placa GPU se mantendría casi igual a 172 W constantes. Pasar al modo Turbo reduce el consumo de energía de la GPU en apenas unos vatios hasta ser indiscernible en la práctica. Las temperaturas de la CPU y la GPU se estabilizarían en 80 C y 74 C, respectivamente, en comparación con los 87 C y 64 C del Alienware m18 R2, mucho más pesado y ligeramente más rápido.

Prime95 stress (Perfil personalizado, CPU Boost, GPU High, Max Fan on)
Prime95+FurMark stress (Perfil personalizado, CPU Boost, GPU High, Max Fan on)
Witcher 3 estrés (perfil equilibrado)
Witcher 3 estrés (perfil Turbo)
Witcher 3 estrés (perfil personalizado, CPU Boost, GPU High, Max Fan off)
Witcher 3 estrés (perfil personalizado, CPU Boost, GPU High, ventilador Max activado)
Reloj medio efectivo de la CPU (GHz) Reloj de la GPU (MHz) Temperatura media de la CPU (°C) Temperatura media de la GPU (°C) Consumo de energía de la placa GPU
Sistema en reposo -- -- 54 44 --
Prime95 Stress 2.8 -- 78 54 --
Estrés Prime95+ FurMark 1.8 1515 - 2340 70 62 42 - 181
Witcher 3 Tensión (modo personalizado conventilador máximo encendido) ~0,6 2145 81 70 172
Witcher 3 Tensión (modo personalizado con ventilador máximoapagado) ~0,5 2160 80 74 172
Witcher 3 Estrés (ModoTurbo) ~0,5 2100 80 74 165
Witcher 3 Estrés (modoequilibrado) ~0,4 1740 79 71 127

Rendimiento del sistema

Las puntuaciones en PCMark están a la par con otros portátiles para juegos con CPU Raptor Lake-HX similares y GPU GeForce RTX 4090, incluidos los sistemas con el core i9-13900HX más antiguos. La velocidad de la RAM no ha cambiado con respecto al modelo 2023.

Nos encontramos con un par de errores al poner el sistema en modo de reposo. El sistema seguía funcionando muy caliente en modo de reposo cuando se configuraba en modo dGPU. Si se configuraba en modo Optimus, el sistema parecía entrar en modo Reposo con normalidad. La pantalla a veces se congelaba durante varios segundos al despertar del modo de suspensión también.

Mientras tanto, los problemas de G-Sync que experimentamos en el modelo 2023 no están presentes en nuestra unidad 2024.

PCMark 10 Estándar
PCMark 10 Estándar
PCMark 10 / Score
Alienware m18 R2
NVIDIA GeForce RTX 4090 Laptop GPU, i9-14900HX, SK Hynix PC811 HFS002TEM9X152N
9234 Points +5%
Asus ROG Strix Scar 17 G733PYV-LL053X
NVIDIA GeForce RTX 4090 Laptop GPU, R9 7945HX3D, SK hynix PC801 HFS001TEJ9X101N
9117 Points +4%
MSI Titan 18 HX A14VIG
NVIDIA GeForce RTX 4090 Laptop GPU, i9-14900HX, 2x Samsung PM9A1a MZVL22T0HDLB (RAID 0)
8968 Points +2%
Razer Blade 18 2024 RZ09-0509
NVIDIA GeForce RTX 4090 Laptop GPU, i9-14900HX
8805 Points
Asus ROG Strix Scar 18 G834JYR (2024)
NVIDIA GeForce RTX 4090 Laptop GPU, i9-14900HX, Samsung PM9A1a MZVL22T0HDLB
8801 Points 0%
Average Intel Core i9-14900HX, NVIDIA GeForce RTX 4090 Laptop GPU
  (8230 - 9234, n=8)
8743 Points -1%
Razer Blade 16 2024, RTX 4090
NVIDIA GeForce RTX 4090 Laptop GPU, i9-14900HX, Samsung PM9A1 MZVL22T0HBLB
8401 Points -5%
PCMark 10 / Essentials
MSI Titan 18 HX A14VIG
NVIDIA GeForce RTX 4090 Laptop GPU, i9-14900HX, 2x Samsung PM9A1a MZVL22T0HDLB (RAID 0)
11628 Points +2%
Asus ROG Strix Scar 17 G733PYV-LL053X
NVIDIA GeForce RTX 4090 Laptop GPU, R9 7945HX3D, SK hynix PC801 HFS001TEJ9X101N
11561 Points +2%
Alienware m18 R2
NVIDIA GeForce RTX 4090 Laptop GPU, i9-14900HX, SK Hynix PC811 HFS002TEM9X152N
11415 Points 0%
Asus ROG Strix Scar 18 G834JYR (2024)
NVIDIA GeForce RTX 4090 Laptop GPU, i9-14900HX, Samsung PM9A1a MZVL22T0HDLB
11394 Points 0%
Razer Blade 18 2024 RZ09-0509
NVIDIA GeForce RTX 4090 Laptop GPU, i9-14900HX
11378 Points
Average Intel Core i9-14900HX, NVIDIA GeForce RTX 4090 Laptop GPU
  (10871 - 11628, n=8)
11217 Points -1%
Razer Blade 16 2024, RTX 4090
NVIDIA GeForce RTX 4090 Laptop GPU, i9-14900HX, Samsung PM9A1 MZVL22T0HBLB
10915 Points -4%
PCMark 10 / Productivity
Alienware m18 R2
NVIDIA GeForce RTX 4090 Laptop GPU, i9-14900HX, SK Hynix PC811 HFS002TEM9X152N
11415 Points +12%
Razer Blade 16 2024, RTX 4090
NVIDIA GeForce RTX 4090 Laptop GPU, i9-14900HX, Samsung PM9A1 MZVL22T0HBLB
11150 Points +9%
Asus ROG Strix Scar 17 G733PYV-LL053X
NVIDIA GeForce RTX 4090 Laptop GPU, R9 7945HX3D, SK hynix PC801 HFS001TEJ9X101N
10881 Points +7%
Average Intel Core i9-14900HX, NVIDIA GeForce RTX 4090 Laptop GPU
  (9951 - 11759, n=8)
10735 Points +5%
Asus ROG Strix Scar 18 G834JYR (2024)
NVIDIA GeForce RTX 4090 Laptop GPU, i9-14900HX, Samsung PM9A1a MZVL22T0HDLB
10528 Points +3%
MSI Titan 18 HX A14VIG
NVIDIA GeForce RTX 4090 Laptop GPU, i9-14900HX, 2x Samsung PM9A1a MZVL22T0HDLB (RAID 0)
10225 Points 0%
Razer Blade 18 2024 RZ09-0509
NVIDIA GeForce RTX 4090 Laptop GPU, i9-14900HX
10186 Points
PCMark 10 / Digital Content Creation
MSI Titan 18 HX A14VIG
NVIDIA GeForce RTX 4090 Laptop GPU, i9-14900HX, 2x Samsung PM9A1a MZVL22T0HDLB (RAID 0)
16462 Points +3%
Alienware m18 R2
NVIDIA GeForce RTX 4090 Laptop GPU, i9-14900HX, SK Hynix PC811 HFS002TEM9X152N
16398 Points +3%
Asus ROG Strix Scar 17 G733PYV-LL053X
NVIDIA GeForce RTX 4090 Laptop GPU, R9 7945HX3D, SK hynix PC801 HFS001TEJ9X101N
16348 Points +2%
Razer Blade 18 2024 RZ09-0509
NVIDIA GeForce RTX 4090 Laptop GPU, i9-14900HX
15985 Points
Asus ROG Strix Scar 18 G834JYR (2024)
NVIDIA GeForce RTX 4090 Laptop GPU, i9-14900HX, Samsung PM9A1a MZVL22T0HDLB
15421 Points -4%
Average Intel Core i9-14900HX, NVIDIA GeForce RTX 4090 Laptop GPU
  (13219 - 16462, n=8)
15105 Points -6%
Razer Blade 16 2024, RTX 4090
NVIDIA GeForce RTX 4090 Laptop GPU, i9-14900HX, Samsung PM9A1 MZVL22T0HBLB
13219 Points -17%
CrossMark / Overall
Asus ROG Strix Scar 18 G834JYR (2024)
NVIDIA GeForce RTX 4090 Laptop GPU, i9-14900HX, Samsung PM9A1a MZVL22T0HDLB
2208 Points +8%
Razer Blade 16 2024, RTX 4090
NVIDIA GeForce RTX 4090 Laptop GPU, i9-14900HX, Samsung PM9A1 MZVL22T0HBLB
2149 Points +5%
Average Intel Core i9-14900HX, NVIDIA GeForce RTX 4090 Laptop GPU
  (1877 - 2238, n=8)
2114 Points +3%
Asus ROG Strix Scar 17 G733PYV-LL053X
NVIDIA GeForce RTX 4090 Laptop GPU, R9 7945HX3D, SK hynix PC801 HFS001TEJ9X101N
2086 Points +2%
Alienware m18 R2
NVIDIA GeForce RTX 4090 Laptop GPU, i9-14900HX, SK Hynix PC811 HFS002TEM9X152N
2073 Points +1%
Razer Blade 18 2024 RZ09-0509
NVIDIA GeForce RTX 4090 Laptop GPU, i9-14900HX
2048 Points
MSI Titan 18 HX A14VIG
NVIDIA GeForce RTX 4090 Laptop GPU, i9-14900HX, 2x Samsung PM9A1a MZVL22T0HDLB (RAID 0)
1877 Points -8%
CrossMark / Productivity
Asus ROG Strix Scar 18 G834JYR (2024)
NVIDIA GeForce RTX 4090 Laptop GPU, i9-14900HX, Samsung PM9A1a MZVL22T0HDLB
2055 Points +8%
Razer Blade 16 2024, RTX 4090
NVIDIA GeForce RTX 4090 Laptop GPU, i9-14900HX, Samsung PM9A1 MZVL22T0HBLB
2007 Points +6%
Average Intel Core i9-14900HX, NVIDIA GeForce RTX 4090 Laptop GPU
  (1738 - 2113, n=8)
1970 Points +4%
Asus ROG Strix Scar 17 G733PYV-LL053X
NVIDIA GeForce RTX 4090 Laptop GPU, R9 7945HX3D, SK hynix PC801 HFS001TEJ9X101N
1948 Points +2%
Razer Blade 18 2024 RZ09-0509
NVIDIA GeForce RTX 4090 Laptop GPU, i9-14900HX
1902 Points
Alienware m18 R2
NVIDIA GeForce RTX 4090 Laptop GPU, i9-14900HX, SK Hynix PC811 HFS002TEM9X152N
1881 Points -1%
MSI Titan 18 HX A14VIG
NVIDIA GeForce RTX 4090 Laptop GPU, i9-14900HX, 2x Samsung PM9A1a MZVL22T0HDLB (RAID 0)
1738 Points -9%
CrossMark / Creativity
Asus ROG Strix Scar 18 G834JYR (2024)
NVIDIA GeForce RTX 4090 Laptop GPU, i9-14900HX, Samsung PM9A1a MZVL22T0HDLB
2478 Points +7%
Razer Blade 16 2024, RTX 4090
NVIDIA GeForce RTX 4090 Laptop GPU, i9-14900HX, Samsung PM9A1 MZVL22T0HBLB
2418 Points +4%
Asus ROG Strix Scar 17 G733PYV-LL053X
NVIDIA GeForce RTX 4090 Laptop GPU, R9 7945HX3D, SK hynix PC801 HFS001TEJ9X101N
2415 Points +4%
Alienware m18 R2
NVIDIA GeForce RTX 4090 Laptop GPU, i9-14900HX, SK Hynix PC811 HFS002TEM9X152N
2393 Points +3%
Average Intel Core i9-14900HX, NVIDIA GeForce RTX 4090 Laptop GPU
  (2195 - 2543, n=8)
2376 Points +3%
Razer Blade 18 2024 RZ09-0509
NVIDIA GeForce RTX 4090 Laptop GPU, i9-14900HX
2316 Points
MSI Titan 18 HX A14VIG
NVIDIA GeForce RTX 4090 Laptop GPU, i9-14900HX, 2x Samsung PM9A1a MZVL22T0HDLB (RAID 0)
2195 Points -5%
CrossMark / Responsiveness
Asus ROG Strix Scar 18 G834JYR (2024)
NVIDIA GeForce RTX 4090 Laptop GPU, i9-14900HX, Samsung PM9A1a MZVL22T0HDLB
1944 Points +10%
Razer Blade 16 2024, RTX 4090
NVIDIA GeForce RTX 4090 Laptop GPU, i9-14900HX, Samsung PM9A1 MZVL22T0HBLB
1851 Points +5%
Average Intel Core i9-14900HX, NVIDIA GeForce RTX 4090 Laptop GPU
  (1478 - 2327, n=8)
1851 Points +5%
Alienware m18 R2
NVIDIA GeForce RTX 4090 Laptop GPU, i9-14900HX, SK Hynix PC811 HFS002TEM9X152N
1806 Points +2%
Razer Blade 18 2024 RZ09-0509
NVIDIA GeForce RTX 4090 Laptop GPU, i9-14900HX
1765 Points
Asus ROG Strix Scar 17 G733PYV-LL053X
NVIDIA GeForce RTX 4090 Laptop GPU, R9 7945HX3D, SK hynix PC801 HFS001TEJ9X101N
1649 Points -7%
MSI Titan 18 HX A14VIG
NVIDIA GeForce RTX 4090 Laptop GPU, i9-14900HX, 2x Samsung PM9A1a MZVL22T0HDLB (RAID 0)
1478 Points -16%
WebXPRT 3 / Overall
Asus ROG Strix Scar 17 G733PYV-LL053X
NVIDIA GeForce RTX 4090 Laptop GPU, R9 7945HX3D, SK hynix PC801 HFS001TEJ9X101N
480 Points +42%
Razer Blade 18 2024 RZ09-0509
NVIDIA GeForce RTX 4090 Laptop GPU, i9-14900HX
339 Points
Razer Blade 16 2024, RTX 4090
NVIDIA GeForce RTX 4090 Laptop GPU, i9-14900HX, Samsung PM9A1 MZVL22T0HBLB
330 Points -3%
Average Intel Core i9-14900HX, NVIDIA GeForce RTX 4090 Laptop GPU
  (322 - 339, n=7)
329 Points -3%
MSI Titan 18 HX A14VIG
NVIDIA GeForce RTX 4090 Laptop GPU, i9-14900HX, 2x Samsung PM9A1a MZVL22T0HDLB (RAID 0)
327 Points -4%
Alienware m18 R2
NVIDIA GeForce RTX 4090 Laptop GPU, i9-14900HX, SK Hynix PC811 HFS002TEM9X152N
326 Points -4%
Asus ROG Strix Scar 18 G834JYR (2024)
NVIDIA GeForce RTX 4090 Laptop GPU, i9-14900HX, Samsung PM9A1a MZVL22T0HDLB
322 Points -5%
WebXPRT 4 / Overall
Asus ROG Strix Scar 17 G733PYV-LL053X
NVIDIA GeForce RTX 4090 Laptop GPU, R9 7945HX3D, SK hynix PC801 HFS001TEJ9X101N
328 Points
Alienware m18 R2
NVIDIA GeForce RTX 4090 Laptop GPU, i9-14900HX, SK Hynix PC811 HFS002TEM9X152N
309 Points
Asus ROG Strix Scar 18 G834JYR (2024)
NVIDIA GeForce RTX 4090 Laptop GPU, i9-14900HX, Samsung PM9A1a MZVL22T0HDLB
304 Points
Average Intel Core i9-14900HX, NVIDIA GeForce RTX 4090 Laptop GPU
  (287 - 309, n=5)
301 Points
MSI Titan 18 HX A14VIG
NVIDIA GeForce RTX 4090 Laptop GPU, i9-14900HX, 2x Samsung PM9A1a MZVL22T0HDLB (RAID 0)
287 Points
Mozilla Kraken 1.1 / Total
MSI Titan 18 HX A14VIG
NVIDIA GeForce RTX 4090 Laptop GPU, i9-14900HX, 2x Samsung PM9A1a MZVL22T0HDLB (RAID 0)
452 ms * -1%
Razer Blade 16 2024, RTX 4090
NVIDIA GeForce RTX 4090 Laptop GPU, i9-14900HX, Samsung PM9A1 MZVL22T0HBLB
450 ms * -0%
Asus ROG Strix Scar 18 G834JYR (2024)
NVIDIA GeForce RTX 4090 Laptop GPU, i9-14900HX, Samsung PM9A1a MZVL22T0HDLB
449 ms * -0%
Razer Blade 18 2024 RZ09-0509
NVIDIA GeForce RTX 4090 Laptop GPU, i9-14900HX
449 ms *
Average Intel Core i9-14900HX, NVIDIA GeForce RTX 4090 Laptop GPU
  (430 - 467, n=8)
447 ms * -0%
Alienware m18 R2
NVIDIA GeForce RTX 4090 Laptop GPU, i9-14900HX, SK Hynix PC811 HFS002TEM9X152N
430 ms * +4%
Asus ROG Strix Scar 17 G733PYV-LL053X
NVIDIA GeForce RTX 4090 Laptop GPU, R9 7945HX3D, SK hynix PC801 HFS001TEJ9X101N
421.3 ms * +6%

* ... más pequeño es mejor

PCMark 10 Score
8805 puntos
ayuda
AIDA64 / Memory Copy
Asus ROG Strix Scar 18 G834JYR (2024)
Intel Core i9-14900HX, NVIDIA GeForce RTX 4090 Laptop GPU
83392 MB/s +9%
Alienware m18 R2
Intel Core i9-14900HX, NVIDIA GeForce RTX 4090 Laptop GPU
79243 MB/s +4%
Razer Blade 16 2024, RTX 4090
Intel Core i9-14900HX, NVIDIA GeForce RTX 4090 Laptop GPU
78799 MB/s +3%
Average Intel Core i9-14900HX
  (56992 - 83392, n=22)
77573 MB/s +2%
Razer Blade 18 RTX 4070
Intel Core i9-13950HX, NVIDIA GeForce RTX 4070 Laptop GPU
77096 MB/s +1%
Razer Blade 18 2024 RZ09-0509
Intel Core i9-14900HX, NVIDIA GeForce RTX 4090 Laptop GPU
76268 MB/s
MSI Titan 18 HX A14VIG
Intel Core i9-14900HX, NVIDIA GeForce RTX 4090 Laptop GPU
56992 MB/s -25%
Asus ROG Strix Scar 17 G733PYV-LL053X
AMD Ryzen 9 7945HX3D, NVIDIA GeForce RTX 4090 Laptop GPU
50335 MB/s -34%
AIDA64 / Memory Read
Asus ROG Strix Scar 18 G834JYR (2024)
Intel Core i9-14900HX, NVIDIA GeForce RTX 4090 Laptop GPU
86788 MB/s +5%
Razer Blade 16 2024, RTX 4090
Intel Core i9-14900HX, NVIDIA GeForce RTX 4090 Laptop GPU
86387 MB/s +4%
Razer Blade 18 RTX 4070
Intel Core i9-13950HX, NVIDIA GeForce RTX 4070 Laptop GPU
86207 MB/s +4%
Alienware m18 R2
Intel Core i9-14900HX, NVIDIA GeForce RTX 4090 Laptop GPU
85791 MB/s +3%
Average Intel Core i9-14900HX
  (54443 - 87507, n=22)
84273 MB/s +2%
Razer Blade 18 2024 RZ09-0509
Intel Core i9-14900HX, NVIDIA GeForce RTX 4090 Laptop GPU
82992 MB/s
Asus ROG Strix Scar 17 G733PYV-LL053X
AMD Ryzen 9 7945HX3D, NVIDIA GeForce RTX 4090 Laptop GPU
59921 MB/s -28%
MSI Titan 18 HX A14VIG
Intel Core i9-14900HX, NVIDIA GeForce RTX 4090 Laptop GPU
54443 MB/s -34%
AIDA64 / Memory Write
Asus ROG Strix Scar 18 G834JYR (2024)
Intel Core i9-14900HX, NVIDIA GeForce RTX 4090 Laptop GPU
77534 MB/s +14%
Alienware m18 R2
Intel Core i9-14900HX, NVIDIA GeForce RTX 4090 Laptop GPU
77089 MB/s +14%
Razer Blade 18 RTX 4070
Intel Core i9-13950HX, NVIDIA GeForce RTX 4070 Laptop GPU
75814 MB/s +12%
Razer Blade 16 2024, RTX 4090
Intel Core i9-14900HX, NVIDIA GeForce RTX 4090 Laptop GPU
75421 MB/s +11%
Average Intel Core i9-14900HX
  (51387 - 78199, n=22)
74508 MB/s +10%
Razer Blade 18 2024 RZ09-0509
Intel Core i9-14900HX, NVIDIA GeForce RTX 4090 Laptop GPU
67801 MB/s
Asus ROG Strix Scar 17 G733PYV-LL053X
AMD Ryzen 9 7945HX3D, NVIDIA GeForce RTX 4090 Laptop GPU
58774 MB/s -13%
MSI Titan 18 HX A14VIG
Intel Core i9-14900HX, NVIDIA GeForce RTX 4090 Laptop GPU
51387 MB/s -24%
AIDA64 / Memory Latency
MSI Titan 18 HX A14VIG
Intel Core i9-14900HX, NVIDIA GeForce RTX 4090 Laptop GPU
105 ns * -20%
Asus ROG Strix Scar 17 G733PYV-LL053X
AMD Ryzen 9 7945HX3D, NVIDIA GeForce RTX 4090 Laptop GPU
88.6 ns * -1%
Razer Blade 18 2024 RZ09-0509
Intel Core i9-14900HX, NVIDIA GeForce RTX 4090 Laptop GPU
87.6 ns *
Alienware m18 R2
Intel Core i9-14900HX, NVIDIA GeForce RTX 4090 Laptop GPU
86.4 ns * +1%
Razer Blade 18 RTX 4070
Intel Core i9-13950HX, NVIDIA GeForce RTX 4070 Laptop GPU
84.5 ns * +4%
Average Intel Core i9-14900HX
  (79.7 - 105, n=22)
84.1 ns * +4%
Razer Blade 16 2024, RTX 4090
Intel Core i9-14900HX, NVIDIA GeForce RTX 4090 Laptop GPU
83.4 ns * +5%
Asus ROG Strix Scar 18 G834JYR (2024)
Intel Core i9-14900HX, NVIDIA GeForce RTX 4090 Laptop GPU
82.8 ns * +5%

* ... más pequeño es mejor

Latencia del CPD

LatencyMon sólo revela problemas menores de CPD al abrir varias pestañas del navegador de nuestra página principal. la reproducción de vídeo 4K60 también es perfecta sin que se registre ninguna caída de fotogramas, salvo el único fotograma al tomar la captura de pantalla.

LatencyMon
LatencyMon
Lista de conductores
DPC Latencies / LatencyMon - interrupt to process latency (max), Web, Youtube, Prime95
Alienware m18 R2
NVIDIA GeForce RTX 4090 Laptop GPU, i9-14900HX, SK Hynix PC811 HFS002TEM9X152N
2815.1 μs * -90%
MSI Titan 18 HX A14VIG
NVIDIA GeForce RTX 4090 Laptop GPU, i9-14900HX, 2x Samsung PM9A1a MZVL22T0HDLB (RAID 0)
2384.5 μs * -61%
Razer Blade 18 2024 RZ09-0509
NVIDIA GeForce RTX 4090 Laptop GPU, i9-14900HX
1479.7 μs *
Razer Blade 16 2024, RTX 4090
NVIDIA GeForce RTX 4090 Laptop GPU, i9-14900HX, Samsung PM9A1 MZVL22T0HBLB
1389.7 μs * +6%
Asus ROG Strix Scar 18 G834JYR (2024)
NVIDIA GeForce RTX 4090 Laptop GPU, i9-14900HX, Samsung PM9A1a MZVL22T0HDLB
1117.4 μs * +24%
Asus ROG Strix Scar 17 G733PYV-LL053X
NVIDIA GeForce RTX 4090 Laptop GPU, R9 7945HX3D, SK hynix PC801 HFS001TEJ9X101N
1100.8 μs * +26%

* ... más pequeño es mejor

Dispositivos de almacenamiento

Tanto nuestras unidades 2023 como 2024 Blade 18 vienen con Micron CA6 SSD NVMe, mientras que la mayoría de los otros modelos Blade vienen con unidades Samsung en su lugar. Las velocidades de lectura y escritura de bloques 4K más pequeños pueden estar en el lado lento, pero por lo demás no presenta problemas de estrangulamiento del rendimiento.

Las opciones de SSD PCIe5 no están disponibles probablemente debido a los costes y al suministro limitado.

AS SSD
AS SSD
MDL 8
MDL 8
CDM 5/6 Read Seq Q32T1: 6905 MB/s
CDM 5/6 Write Seq Q32T1: 4883 MB/s
CDM 5/6 Read 4K Q32T1: 438 MB/s
CDM 5/6 Write 4K Q32T1: 405.9 MB/s
CDM 5 Read Seq: 3709 MB/s
CDM 5 Write Seq: 3438 MB/s
CDM 5/6 Read 4K: 65.54 MB/s
CDM 5/6 Write 4K: 157.3 MB/s
Drive Performance Rating - Percent
Alienware m18 R2
SK Hynix PC811 HFS002TEM9X152N
83.6 pt
Asus ROG Strix Scar 18 G834JYR (2024)
Samsung PM9A1a MZVL22T0HDLB
69.7 pt
Razer Blade 18 RTX 4070
SSSTC CA6-8D1024
66 pt
Razer Blade 16 2024, RTX 4090
Samsung PM9A1 MZVL22T0HBLB
63.2 pt
MSI Titan 18 HX A14VIG
2x Samsung PM9A1a MZVL22T0HDLB (RAID 0)
62.7 pt
Asus ROG Strix Scar 17 G733PYV-LL053X
SK hynix PC801 HFS001TEJ9X101N
50.3 pt
Razer Blade 18 2024 RZ09-0509
 
50.2 pt
DiskSpd
seq read
Alienware m18 R2
SK Hynix PC811 HFS002TEM9X152N
5588 (5540.05min - 5587.65max) MB/s +57%
MSI Titan 18 HX A14VIG
2x Samsung PM9A1a MZVL22T0HDLB (RAID 0)
5424 (5395.57min - 5423.86max) MB/s +52%
Asus ROG Strix Scar 18 G834JYR (2024)
Samsung PM9A1a MZVL22T0HDLB
3908 (3887.48min - 3908.2max) MB/s +10%
Razer Blade 18 RTX 4070
SSSTC CA6-8D1024
3889 (3873.65min - 3888.73max) MB/s +9%
Razer Blade 16 2024, RTX 4090
Samsung PM9A1 MZVL22T0HBLB
3795 (3693.04min - 3794.8max) MB/s +7%
Razer Blade 18 2024 RZ09-0509
 
3560 (3002.28min - 3559.93max) MB/s
Asus ROG Strix Scar 17 G733PYV-LL053X
SK hynix PC801 HFS001TEJ9X101N
2570 (2552.37min - 2570.06max) MB/s -28%
seq write
MSI Titan 18 HX A14VIG
2x Samsung PM9A1a MZVL22T0HDLB (RAID 0)
7291 (7191.64min - 7291.38max) MB/s +117%
Alienware m18 R2
SK Hynix PC811 HFS002TEM9X152N
5153 (5139.7min - 5152.91max) MB/s +53%
Asus ROG Strix Scar 18 G834JYR (2024)
Samsung PM9A1a MZVL22T0HDLB
4335 (4306.29min - 4335.44max) MB/s +29%
Razer Blade 18 RTX 4070
SSSTC CA6-8D1024
3798 (3750.39min - 3798.15max) MB/s +13%
Razer Blade 16 2024, RTX 4090
Samsung PM9A1 MZVL22T0HBLB
3794 (3745.51min - 3793.5max) MB/s +13%
Razer Blade 18 2024 RZ09-0509
 
3367 (3255.82min - 3366.95max) MB/s
Asus ROG Strix Scar 17 G733PYV-LL053X
SK hynix PC801 HFS001TEJ9X101N
1690 (1454.82min - 1690.3max) MB/s -50%
seq q8 t1 read
MSI Titan 18 HX A14VIG
2x Samsung PM9A1a MZVL22T0HDLB (RAID 0)
13588 (10727.3min - 13588.3max) MB/s +100%
Alienware m18 R2
SK Hynix PC811 HFS002TEM9X152N
7110 (6256.85min - 7110.18max) MB/s +5%
Asus ROG Strix Scar 18 G834JYR (2024)
Samsung PM9A1a MZVL22T0HDLB
7084 (6413.06min - 7083.97max) MB/s +4%
Asus ROG Strix Scar 17 G733PYV-LL053X
SK hynix PC801 HFS001TEJ9X101N
6971 (6127.67min - 6971.35max) MB/s +3%
Razer Blade 18 RTX 4070
SSSTC CA6-8D1024
6810 (6260.27min - 6809.87max) MB/s 0%
Razer Blade 18 2024 RZ09-0509
 
6797 (5573.18min - 6797.33max) MB/s
Razer Blade 16 2024, RTX 4090
Samsung PM9A1 MZVL22T0HBLB
6673 (5801.28min - 6672.72max) MB/s -2%
seq q8 t1 write
MSI Titan 18 HX A14VIG
2x Samsung PM9A1a MZVL22T0HDLB (RAID 0)
10571 (10519.3min - 10571.3max) MB/s +116%
Alienware m18 R2
SK Hynix PC811 HFS002TEM9X152N
6779 (6710.47min - 6778.83max) MB/s +38%
Asus ROG Strix Scar 18 G834JYR (2024)
Samsung PM9A1a MZVL22T0HDLB
5255 (5183.65min - 5254.62max) MB/s +7%
Razer Blade 16 2024, RTX 4090
Samsung PM9A1 MZVL22T0HBLB
4936 (4909.47min - 4936.28max) MB/s +1%
Razer Blade 18 2024 RZ09-0509
 
4902 (4309.42min - 4901.73max) MB/s
Razer Blade 18 RTX 4070
SSSTC CA6-8D1024
4426 (4263.58min - 4426.04max) MB/s -10%
Asus ROG Strix Scar 17 G733PYV-LL053X
SK hynix PC801 HFS001TEJ9X101N
2382 (920.86min - 2382.42max) MB/s -51%
4k q1 t1 read
Asus ROG Strix Scar 18 G834JYR (2024)
Samsung PM9A1a MZVL22T0HDLB
80.7 (80.11min - 80.66max) MB/s +31%
Alienware m18 R2
SK Hynix PC811 HFS002TEM9X152N
75.4 (73.49min - 75.43max) MB/s +22%
Razer Blade 18 RTX 4070
SSSTC CA6-8D1024
74.5 (73.46min - 74.52max) MB/s +21%
Razer Blade 16 2024, RTX 4090
Samsung PM9A1 MZVL22T0HBLB
71.4 (66.19min - 71.35max) MB/s +16%
MSI Titan 18 HX A14VIG
2x Samsung PM9A1a MZVL22T0HDLB (RAID 0)
69.6 (68.6min - 69.57max) MB/s +13%
Razer Blade 18 2024 RZ09-0509
 
61.8 (61.2min - 61.81max) MB/s
Asus ROG Strix Scar 17 G733PYV-LL053X
SK hynix PC801 HFS001TEJ9X101N
54.3 (54.23min - 54.34max) MB/s -12%
4k q1 t1 write
Alienware m18 R2
SK Hynix PC811 HFS002TEM9X152N
300 (297.27min - 299.6max) MB/s +83%
Razer Blade 18 RTX 4070
SSSTC CA6-8D1024
280 (267.82min - 279.79max) MB/s +71%
Asus ROG Strix Scar 18 G834JYR (2024)
Samsung PM9A1a MZVL22T0HDLB
230 (219.52min - 229.87max) MB/s +40%
Razer Blade 16 2024, RTX 4090
Samsung PM9A1 MZVL22T0HBLB
205 (202.97min - 204.75max) MB/s +25%
Asus ROG Strix Scar 17 G733PYV-LL053X
SK hynix PC801 HFS001TEJ9X101N
183.8 (182.06min - 183.78max) MB/s +12%
Razer Blade 18 2024 RZ09-0509
 
164 (110.95min - 164max) MB/s
MSI Titan 18 HX A14VIG
2x Samsung PM9A1a MZVL22T0HDLB (RAID 0)
152.1 (149.74min - 152.09max) MB/s -7%
4k q32 t16 read
Alienware m18 R2
SK Hynix PC811 HFS002TEM9X152N
6067 (5596.15min - 6066.73max) MB/s +504%
Asus ROG Strix Scar 18 G834JYR (2024)
Samsung PM9A1a MZVL22T0HDLB
3732 (3273.44min - 3732.1max) MB/s +271%
Razer Blade 16 2024, RTX 4090
Samsung PM9A1 MZVL22T0HBLB
3726 (3704.12min - 3725.6max) MB/s +271%
Razer Blade 18 RTX 4070
SSSTC CA6-8D1024
3203 (3180.36min - 3203.41max) MB/s +219%
MSI Titan 18 HX A14VIG
2x Samsung PM9A1a MZVL22T0HDLB (RAID 0)
1623 (1464.8min - 1623.24max) MB/s +61%
Asus ROG Strix Scar 17 G733PYV-LL053X
SK hynix PC801 HFS001TEJ9X101N
1331 (1250.04min - 1330.81max) MB/s +32%
Razer Blade 18 2024 RZ09-0509
 
1005 (964.75min - 1004.59max) MB/s
4k q32 t16 write
Alienware m18 R2
SK Hynix PC811 HFS002TEM9X152N
4176 (3805.57min - 4175.9max) MB/s +845%
Razer Blade 16 2024, RTX 4090
Samsung PM9A1 MZVL22T0HBLB
3548 (3533.85min - 3548.33max) MB/s +703%
Asus ROG Strix Scar 18 G834JYR (2024)
Samsung PM9A1a MZVL22T0HDLB
2900 MB/s +556%
Razer Blade 18 RTX 4070
SSSTC CA6-8D1024
2209 (1041.25min - 2208.74max) MB/s +400%
MSI Titan 18 HX A14VIG
2x Samsung PM9A1a MZVL22T0HDLB (RAID 0)
1377 (1306.51min - 1377.05max) MB/s +212%
Asus ROG Strix Scar 17 G733PYV-LL053X
SK hynix PC801 HFS001TEJ9X101N
730 (694.74min - 729.67max) MB/s +65%
Razer Blade 18 2024 RZ09-0509
 
442 (336.87min - 441.83max) MB/s
AS SSD
Score Total
Alienware m18 R2
SK Hynix PC811 HFS002TEM9X152N
10655 Points +116%
Asus ROG Strix Scar 18 G834JYR (2024)
Samsung PM9A1a MZVL22T0HDLB
8367 Points +70%
Razer Blade 18 RTX 4070
SSSTC CA6-8D1024
7745 Points +57%
Razer Blade 16 2024, RTX 4090
Samsung PM9A1 MZVL22T0HBLB
7040 Points +43%
Asus ROG Strix Scar 17 G733PYV-LL053X
SK hynix PC801 HFS001TEJ9X101N
6546 Points +33%
MSI Titan 18 HX A14VIG
2x Samsung PM9A1a MZVL22T0HDLB (RAID 0)
5369 Points +9%
Razer Blade 18 2024 RZ09-0509
 
4927 Points
Score Read
Alienware m18 R2
SK Hynix PC811 HFS002TEM9X152N
3753 Points +125%
Razer Blade 18 RTX 4070
SSSTC CA6-8D1024
3490 Points +109%
Asus ROG Strix Scar 18 G834JYR (2024)
Samsung PM9A1a MZVL22T0HDLB
3272 Points +96%
Razer Blade 16 2024, RTX 4090
Samsung PM9A1 MZVL22T0HBLB
2848 Points +71%
MSI Titan 18 HX A14VIG
2x Samsung PM9A1a MZVL22T0HDLB (RAID 0)
2194 Points +32%
Asus ROG Strix Scar 17 G733PYV-LL053X
SK hynix PC801 HFS001TEJ9X101N
1689 Points +1%
Razer Blade 18 2024 RZ09-0509
 
1667 Points
Score Write
Alienware m18 R2
SK Hynix PC811 HFS002TEM9X152N
4993 Points +98%
Asus ROG Strix Scar 17 G733PYV-LL053X
SK hynix PC801 HFS001TEJ9X101N
4073 Points +62%
Asus ROG Strix Scar 18 G834JYR (2024)
Samsung PM9A1a MZVL22T0HDLB
3490 Points +39%
Razer Blade 16 2024, RTX 4090
Samsung PM9A1 MZVL22T0HBLB
2766 Points +10%
Razer Blade 18 RTX 4070
SSSTC CA6-8D1024
2566 Points +2%
Razer Blade 18 2024 RZ09-0509
 
2518 Points
MSI Titan 18 HX A14VIG
2x Samsung PM9A1a MZVL22T0HDLB (RAID 0)
2092 Points -17%
Seq Read
MSI Titan 18 HX A14VIG
2x Samsung PM9A1a MZVL22T0HDLB (RAID 0)
9576.8 MB/s +75%
Alienware m18 R2
SK Hynix PC811 HFS002TEM9X152N
5916.27 MB/s +8%
Razer Blade 18 RTX 4070
SSSTC CA6-8D1024
5770.79 MB/s +5%
Asus ROG Strix Scar 17 G733PYV-LL053X
SK hynix PC801 HFS001TEJ9X101N
5739 MB/s +5%
Asus ROG Strix Scar 18 G834JYR (2024)
Samsung PM9A1a MZVL22T0HDLB
5636.54 MB/s +3%
Razer Blade 18 2024 RZ09-0509
 
5476.6 MB/s
Razer Blade 16 2024, RTX 4090
Samsung PM9A1 MZVL22T0HBLB
4371 MB/s -20%
Seq Write
MSI Titan 18 HX A14VIG
2x Samsung PM9A1a MZVL22T0HDLB (RAID 0)
8685.54 MB/s +190%
Alienware m18 R2
SK Hynix PC811 HFS002TEM9X152N
5929.42 MB/s +98%
Asus ROG Strix Scar 18 G834JYR (2024)
Samsung PM9A1a MZVL22T0HDLB
4294.95 MB/s +43%
Asus ROG Strix Scar 17 G733PYV-LL053X
SK hynix PC801 HFS001TEJ9X101N
3972 MB/s +33%
Razer Blade 18 RTX 4070
SSSTC CA6-8D1024
3951.34 MB/s +32%
Razer Blade 16 2024, RTX 4090
Samsung PM9A1 MZVL22T0HBLB
3791 MB/s +27%
Razer Blade 18 2024 RZ09-0509
 
2995.22 MB/s
4K Read
Asus ROG Strix Scar 18 G834JYR (2024)
Samsung PM9A1a MZVL22T0HDLB
75.56 MB/s +15%
Razer Blade 18 RTX 4070
SSSTC CA6-8D1024
69.72 MB/s +6%
Razer Blade 18 2024 RZ09-0509
 
65.49 MB/s
Alienware m18 R2
SK Hynix PC811 HFS002TEM9X152N
64.97 MB/s -1%
MSI Titan 18 HX A14VIG
2x Samsung PM9A1a MZVL22T0HDLB (RAID 0)
63.69 MB/s -3%
Razer Blade 16 2024, RTX 4090
Samsung PM9A1 MZVL22T0HBLB
61.1 MB/s -7%
Asus ROG Strix Scar 17 G733PYV-LL053X
SK hynix PC801 HFS001TEJ9X101N
56 MB/s -14%
4K Write
Razer Blade 18 RTX 4070
SSSTC CA6-8D1024
241.69 MB/s +10%
Alienware m18 R2
SK Hynix PC811 HFS002TEM9X152N
238.28 MB/s +9%
Razer Blade 18 2024 RZ09-0509
 
219.58 MB/s
Asus ROG Strix Scar 18 G834JYR (2024)
Samsung PM9A1a MZVL22T0HDLB
207.25 MB/s -6%
Asus ROG Strix Scar 17 G733PYV-LL053X
SK hynix PC801 HFS001TEJ9X101N
192.1 MB/s -13%
Razer Blade 16 2024, RTX 4090
Samsung PM9A1 MZVL22T0HBLB
160.6 MB/s -27%
MSI Titan 18 HX A14VIG
2x Samsung PM9A1a MZVL22T0HDLB (RAID 0)
134.66 MB/s -39%
4K-64 Read
Alienware m18 R2
SK Hynix PC811 HFS002TEM9X152N
3096 MB/s +194%
Razer Blade 18 RTX 4070
SSSTC CA6-8D1024
2843.31 MB/s +170%
Asus ROG Strix Scar 18 G834JYR (2024)
Samsung PM9A1a MZVL22T0HDLB
2636.61 MB/s +150%
Razer Blade 16 2024, RTX 4090
Samsung PM9A1 MZVL22T0HBLB
2350 MB/s +123%
MSI Titan 18 HX A14VIG
2x Samsung PM9A1a MZVL22T0HDLB (RAID 0)
1172.14 MB/s +11%
Asus ROG Strix Scar 17 G733PYV-LL053X
SK hynix PC801 HFS001TEJ9X101N
1059 MB/s 0%
Razer Blade 18 2024 RZ09-0509
 
1053.83 MB/s
4K-64 Write
Alienware m18 R2
SK Hynix PC811 HFS002TEM9X152N
4161.9 MB/s +108%
Asus ROG Strix Scar 17 G733PYV-LL053X
SK hynix PC801 HFS001TEJ9X101N
3484 MB/s +74%
Asus ROG Strix Scar 18 G834JYR (2024)
Samsung PM9A1a MZVL22T0HDLB
2866.57 MB/s +43%
Razer Blade 16 2024, RTX 4090
Samsung PM9A1 MZVL22T0HBLB
2226 MB/s +11%
Razer Blade 18 2024 RZ09-0509
 
1998.53 MB/s
Razer Blade 18 RTX 4070
SSSTC CA6-8D1024
1929.02 MB/s -3%
MSI Titan 18 HX A14VIG
2x Samsung PM9A1a MZVL22T0HDLB (RAID 0)
1088.59 MB/s -46%
Access Time Read
Asus ROG Strix Scar 17 G733PYV-LL053X
SK hynix PC801 HFS001TEJ9X101N
0.062 ms * -148%
Asus ROG Strix Scar 18 G834JYR (2024)
Samsung PM9A1a MZVL22T0HDLB
0.046 ms * -84%
MSI Titan 18 HX A14VIG
2x Samsung PM9A1a MZVL22T0HDLB (RAID 0)
0.036 ms * -44%
Razer Blade 16 2024, RTX 4090
Samsung PM9A1 MZVL22T0HBLB
0.033 ms * -32%
Alienware m18 R2
SK Hynix PC811 HFS002TEM9X152N
0.029 ms * -16%
Razer Blade 18 RTX 4070
SSSTC CA6-8D1024
0.026 ms * -4%
Razer Blade 18 2024 RZ09-0509
 
0.025 ms *
Access Time Write
MSI Titan 18 HX A14VIG
2x Samsung PM9A1a MZVL22T0HDLB (RAID 0)
0.091 ms * -60%
Razer Blade 18 2024 RZ09-0509
 
0.057 ms *
Razer Blade 18 RTX 4070
SSSTC CA6-8D1024
0.056 ms * +2%
Alienware m18 R2
SK Hynix PC811 HFS002TEM9X152N
0.055 ms * +4%
Razer Blade 16 2024, RTX 4090
Samsung PM9A1 MZVL22T0HBLB
0.025 ms * +56%
Asus ROG Strix Scar 18 G834JYR (2024)
Samsung PM9A1a MZVL22T0HDLB
0.022 ms * +61%
Asus ROG Strix Scar 17 G733PYV-LL053X
SK hynix PC801 HFS001TEJ9X101N
0.019 ms * +67%

* ... más pequeño es mejor

Disk Throttling: DiskSpd Read Loop, Queue Depth 8

035070010501400175021002450280031503500385042004550490052505600595063006650Tooltip
Razer Blade 18 2024 RZ09-0509  ; diskspd 2.0.17 f: Ø6880 (5682.4-6917.67)
Razer Blade 18 RTX 4070 SSSTC CA6-8D1024: Ø6845 (5855.67-6875.3)

Rendimiento en juegos - RTX 4090 por segundo año consecutivo

Rendimiento gráfico bruto de la GeForce RTX 4090 móvil es esencialmente idéntico al de la Blade 16 que también cuenta con gráficos TGP de 175 W. Por lo tanto, el Blade 18 no ejecutará los juegos notablemente más rápido que su homólogo más pequeño. El downgrade a la RTX 4080 o 4070 se espera que afecte al rendimiento en aproximadamente un 10 por ciento y entre un 35 y un 40 por ciento, respectivamente. La MSI Titan 18 HX puede ejecutar la misma GPU ligeramente más rápido que la Razer, pero también es significativamente más grande y pesada.

Tenga en cuenta que el modo Max Fan tiene un impacto mínimo o nulo en el rendimiento del sistema, como se muestra en nuestra tabla de resultados Fire Strike que aparece a continuación. Por tanto, no es necesario activar el modo Max Fan para sacar el máximo partido a la GPU. Ni siquiera el modo Turbo parece tener un impacto significativo en el rendimiento cuando se juega.

Perfil de potenciaPuntuación de gráficosPuntuación físicaPuntuación combinada
Perfil personalizado con ventilador máximo activado447023888712094
Perfil personalizado con ventilador máximo apagado44397 (-1%)35809 (-8%)12595 (-0%)
Modo Turbo44111 (-1%)33180 (-15%)13065 (-0%)
Modo equilibrado36832 (-18%)25159 (-35%)6109 (-49%)
Batería18581 (-58%)23066 (-41%)5093 (-58%)

Se admite Optimus avanzado para alternar entre los modos dGPU y Optimus. Sin embargo, no hay modo sólo iGPU para un ahorro de energía adicional a diferencia de en los recientes Portátiles Alienware.

Fire Strike (Modo personalizado con el ventilador máximo apagado)
Fire Strike (Modo turbo)
Fire Strike Ultra
Fire Strike Ultra
Vía rápida
Vía rápida
Time Spy
Time Spy
 
3DMark Performance Rating - Percent
AMD Ryzen 7 7800X3D
NVIDIA GeForce RTX 4090, AMD Ryzen 7 7800X3D
100 pt
Alienware m18 R1
NVIDIA GeForce RTX 4090 Laptop GPU, Intel Core i9-13980HX
59.6 pt
MSI Titan 18 HX A14VIG
NVIDIA GeForce RTX 4090 Laptop GPU, Intel Core i9-14900HX
59 pt
Alienware m18 R2
NVIDIA GeForce RTX 4090 Laptop GPU, Intel Core i9-14900HX
58.3 pt
Asus ROG Strix Scar 17 G733PYV-LL053X
NVIDIA GeForce RTX 4090 Laptop GPU, AMD Ryzen 9 7945HX3D
58.1 pt
Razer Blade 16 2024, RTX 4090 -2!
NVIDIA GeForce RTX 4090 Laptop GPU, Intel Core i9-14900HX
57.9 pt
Razer Blade 18 2024 RZ09-0509
NVIDIA GeForce RTX 4090 Laptop GPU, Intel Core i9-14900HX
56.9 pt
Average NVIDIA GeForce RTX 4090 Laptop GPU
 
56.3 pt
Asus ROG Strix Scar 18 G834JYR (2024)
NVIDIA GeForce RTX 4090 Laptop GPU, Intel Core i9-14900HX
53.6 pt
Alienware m18 R1 AMD -1!
AMD Radeon RX 7900M, AMD Ryzen 9 7945HX
53.5 pt
Razer Blade 16 Early 2023
NVIDIA GeForce RTX 4080 Laptop GPU, Intel Core i9-13950HX
48.9 pt
Razer Blade 18 RTX 4070
NVIDIA GeForce RTX 4070 Laptop GPU, Intel Core i9-13950HX
31.9 pt
3DMark 11 - 1280x720 Performance GPU
AMD Ryzen 7 7800X3D
NVIDIA GeForce RTX 4090, AMD Ryzen 7 7800X3D
114641 Points +77%
Alienware m18 R1
NVIDIA GeForce RTX 4090 Laptop GPU, Intel Core i9-13980HX
71383 Points +10%
Alienware m18 R2
NVIDIA GeForce RTX 4090 Laptop GPU, Intel Core i9-14900HX
69254 Points +7%
Razer Blade 16 2024, RTX 4090
NVIDIA GeForce RTX 4090 Laptop GPU, Intel Core i9-14900HX
65956 Points +2%
Average NVIDIA GeForce RTX 4090 Laptop GPU
  (56764 - 73027, n=37)
65184 Points 0%
Razer Blade 18 2024 RZ09-0509
NVIDIA GeForce RTX 4090 Laptop GPU, Intel Core i9-14900HX
64952 Points
Asus ROG Strix Scar 17 G733PYV-LL053X
NVIDIA GeForce RTX 4090 Laptop GPU, AMD Ryzen 9 7945HX3D
64166 Points -1%
MSI Titan 18 HX A14VIG
NVIDIA GeForce RTX 4090 Laptop GPU, Intel Core i9-14900HX
63978 Points -1%
Asus ROG Strix Scar 18 G834JYR (2024)
NVIDIA GeForce RTX 4090 Laptop GPU, Intel Core i9-14900HX
61833 Points -5%
Alienware m18 R1 AMD
AMD Radeon RX 7900M, AMD Ryzen 9 7945HX
59943 Points -8%
Razer Blade 16 Early 2023
NVIDIA GeForce RTX 4080 Laptop GPU, Intel Core i9-13950HX
56565 Points -13%
Razer Blade 18 RTX 4070
NVIDIA GeForce RTX 4070 Laptop GPU, Intel Core i9-13950HX
39733 Points -39%
3DMark
1920x1080 Fire Strike Graphics
AMD Ryzen 7 7800X3D
NVIDIA GeForce RTX 4090, AMD Ryzen 7 7800X3D
73447 Points +64%
MSI Titan 18 HX A14VIG
NVIDIA GeForce RTX 4090 Laptop GPU, Intel Core i9-14900HX
50532 Points +13%
Alienware m18 R1 AMD
AMD Radeon RX 7900M, AMD Ryzen 9 7945HX
50241 Points +12%
Asus ROG Strix Scar 17 G733PYV-LL053X
NVIDIA GeForce RTX 4090 Laptop GPU, AMD Ryzen 9 7945HX3D
49422 Points +11%
Alienware m18 R1
NVIDIA GeForce RTX 4090 Laptop GPU, Intel Core i9-13980HX
46998 Points +5%
Razer Blade 16 2024, RTX 4090
NVIDIA GeForce RTX 4090 Laptop GPU, Intel Core i9-14900HX
46527 Points +4%
Average NVIDIA GeForce RTX 4090 Laptop GPU
  (41210 - 53059, n=34)
46447 Points +4%
Razer Blade 18 2024 RZ09-0509
NVIDIA GeForce RTX 4090 Laptop GPU, Intel Core i9-14900HX
44702 Points
Alienware m18 R2
NVIDIA GeForce RTX 4090 Laptop GPU, Intel Core i9-14900HX
44492 Points 0%
Asus ROG Strix Scar 18 G834JYR (2024)
NVIDIA GeForce RTX 4090 Laptop GPU, Intel Core i9-14900HX
43477 Points -3%
Razer Blade 16 Early 2023
NVIDIA GeForce RTX 4080 Laptop GPU, Intel Core i9-13950HX
40570 Points -9%
Razer Blade 18 RTX 4070
NVIDIA GeForce RTX 4070 Laptop GPU, Intel Core i9-13950HX
28743 Points -36%
2560x1440 Time Spy Graphics
AMD Ryzen 7 7800X3D
NVIDIA GeForce RTX 4090, AMD Ryzen 7 7800X3D
37664 Points +77%
Alienware m18 R1
NVIDIA GeForce RTX 4090 Laptop GPU, Intel Core i9-13980HX
22547 Points +6%
Alienware m18 R2
NVIDIA GeForce RTX 4090 Laptop GPU, Intel Core i9-14900HX
22290 Points +5%
MSI Titan 18 HX A14VIG
NVIDIA GeForce RTX 4090 Laptop GPU, Intel Core i9-14900HX
22256 Points +5%
Asus ROG Strix Scar 17 G733PYV-LL053X
NVIDIA GeForce RTX 4090 Laptop GPU, AMD Ryzen 9 7945HX3D
21353 Points +1%
Razer Blade 18 2024 RZ09-0509
NVIDIA GeForce RTX 4090 Laptop GPU, Intel Core i9-14900HX
21246 Points
Average NVIDIA GeForce RTX 4090 Laptop GPU
  (17620 - 23292, n=36)
21024 Points -1%
Asus ROG Strix Scar 18 G834JYR (2024)
NVIDIA GeForce RTX 4090 Laptop GPU, Intel Core i9-14900HX
20070 Points -6%
Razer Blade 16 2024, RTX 4090
NVIDIA GeForce RTX 4090 Laptop GPU, Intel Core i9-14900HX
19878 Points -6%
Alienware m18 R1 AMD
AMD Radeon RX 7900M, AMD Ryzen 9 7945HX
19434 Points -9%
Razer Blade 16 Early 2023
NVIDIA GeForce RTX 4080 Laptop GPU, Intel Core i9-13950HX
18441 Points -13%
Razer Blade 18 RTX 4070
NVIDIA GeForce RTX 4070 Laptop GPU, Intel Core i9-13950HX
11683 Points -45%
2560x1440 Speed Way Score
AMD Ryzen 7 7800X3D
NVIDIA GeForce RTX 4090, AMD Ryzen 7 7800X3D
10133 Points +77%
Alienware m18 R1
NVIDIA GeForce RTX 4090 Laptop GPU, Intel Core i9-13980HX
5794 Points +1%
Alienware m18 R2
NVIDIA GeForce RTX 4090 Laptop GPU, Intel Core i9-14900HX
5784 Points +1%
Razer Blade 18 2024 RZ09-0509
NVIDIA GeForce RTX 4090 Laptop GPU, Intel Core i9-14900HX
5736 Points
MSI Titan 18 HX A14VIG
NVIDIA GeForce RTX 4090 Laptop GPU, Intel Core i9-14900HX
5726 Points 0%
Asus ROG Strix Scar 17 G733PYV-LL053X
NVIDIA GeForce RTX 4090 Laptop GPU, AMD Ryzen 9 7945HX3D
5712 Points 0%
Average NVIDIA GeForce RTX 4090 Laptop GPU
  (4401 - 5940, n=26)
5496 Points -4%
Asus ROG Strix Scar 18 G834JYR (2024)
NVIDIA GeForce RTX 4090 Laptop GPU, Intel Core i9-14900HX
5319 Points -7%
Razer Blade 16 Early 2023
NVIDIA GeForce RTX 4080 Laptop GPU, Intel Core i9-13950HX
4642 Points -19%
Razer Blade 18 RTX 4070
NVIDIA GeForce RTX 4070 Laptop GPU, Intel Core i9-13950HX
2789 Points -51%
2560x1440 Port Royal Graphics
AMD Ryzen 7 7800X3D
NVIDIA GeForce RTX 4090, AMD Ryzen 7 7800X3D
25924 Points +86%
Alienware m18 R1
NVIDIA GeForce RTX 4090 Laptop GPU, Intel Core i9-13980HX
14225 Points +2%
MSI Titan 18 HX A14VIG
NVIDIA GeForce RTX 4090 Laptop GPU, Intel Core i9-14900HX
14201 Points +2%
Alienware m18 R2
NVIDIA GeForce RTX 4090 Laptop GPU, Intel Core i9-14900HX
14069 Points +1%
Asus ROG Strix Scar 17 G733PYV-LL053X
NVIDIA GeForce RTX 4090 Laptop GPU, AMD Ryzen 9 7945HX3D
14057 Points +1%
Razer Blade 18 2024 RZ09-0509
NVIDIA GeForce RTX 4090 Laptop GPU, Intel Core i9-14900HX
13936 Points
Average NVIDIA GeForce RTX 4090 Laptop GPU
  (10798 - 14457, n=27)
13342 Points -4%
Asus ROG Strix Scar 18 G834JYR (2024)
NVIDIA GeForce RTX 4090 Laptop GPU, Intel Core i9-14900HX
12677 Points -9%
Razer Blade 16 Early 2023
NVIDIA GeForce RTX 4080 Laptop GPU, Intel Core i9-13950HX
11665 Points -16%
Alienware m18 R1 AMD
AMD Radeon RX 7900M, AMD Ryzen 9 7945HX
10814 Points -22%
Razer Blade 18 RTX 4070
NVIDIA GeForce RTX 4070 Laptop GPU, Intel Core i9-13950HX
7078 Points -49%
3DMark 11 Performance
45938 puntos
3DMark Fire Strike Score
34597 puntos
3DMark Time Spy Score
20561 puntos
ayuda
Blender
v3.3 Classroom OPTIX/RTX
Razer Blade 18 2024 RZ09-0509
NVIDIA GeForce RTX 4090 Laptop GPU, Intel Core i9-14900HX
14 Seconds *
Asus ROG Strix Scar 18 G834JYR (2024)
NVIDIA GeForce RTX 4090 Laptop GPU, Intel Core i9-14900HX
12 Seconds * +14%
Razer Blade 16 2024, RTX 4090
NVIDIA GeForce RTX 4090 Laptop GPU, Intel Core i9-14900HX
12 Seconds * +14%
Alienware m18 R2
NVIDIA GeForce RTX 4090 Laptop GPU, Intel Core i9-14900HX
12 Seconds * +14%
Average NVIDIA GeForce RTX 4090 Laptop GPU
  (9 - 19, n=34)
12 Seconds * +14%
Asus ROG Strix Scar 17 G733PYV-LL053X
NVIDIA GeForce RTX 4090 Laptop GPU, AMD Ryzen 9 7945HX3D
11 Seconds * +21%
MSI Titan 18 HX A14VIG
NVIDIA GeForce RTX 4090 Laptop GPU, Intel Core i9-14900HX
10 Seconds * +29%
v3.3 Classroom CUDA
Razer Blade 18 2024 RZ09-0509
NVIDIA GeForce RTX 4090 Laptop GPU, Intel Core i9-14900HX
19 Seconds *
Average NVIDIA GeForce RTX 4090 Laptop GPU
  (16 - 24, n=34)
18.4 Seconds * +3%
Asus ROG Strix Scar 17 G733PYV-LL053X
NVIDIA GeForce RTX 4090 Laptop GPU, AMD Ryzen 9 7945HX3D
18 Seconds * +5%
MSI Titan 18 HX A14VIG
NVIDIA GeForce RTX 4090 Laptop GPU, Intel Core i9-14900HX
18 Seconds * +5%
Razer Blade 16 2024, RTX 4090
NVIDIA GeForce RTX 4090 Laptop GPU, Intel Core i9-14900HX
18 Seconds * +5%
Alienware m18 R2
NVIDIA GeForce RTX 4090 Laptop GPU, Intel Core i9-14900HX
18 Seconds * +5%
Asus ROG Strix Scar 18 G834JYR (2024)
NVIDIA GeForce RTX 4090 Laptop GPU, Intel Core i9-14900HX
17 Seconds * +11%
v3.3 Classroom CPU
Asus ROG Strix Scar 18 G834JYR (2024)
NVIDIA GeForce RTX 4090 Laptop GPU, Intel Core i9-14900HX
209 Seconds * -1%
Razer Blade 18 2024 RZ09-0509
NVIDIA GeForce RTX 4090 Laptop GPU, Intel Core i9-14900HX
207 Seconds *
Razer Blade 16 2024, RTX 4090
NVIDIA GeForce RTX 4090 Laptop GPU, Intel Core i9-14900HX
202 Seconds * +2%
Average NVIDIA GeForce RTX 4090 Laptop GPU
  (144 - 287, n=34)
197.8 Seconds * +4%
Alienware m18 R2
NVIDIA GeForce RTX 4090 Laptop GPU, Intel Core i9-14900HX
180 Seconds * +13%
MSI Titan 18 HX A14VIG
NVIDIA GeForce RTX 4090 Laptop GPU, Intel Core i9-14900HX
179 Seconds * +14%
Asus ROG Strix Scar 17 G733PYV-LL053X
NVIDIA GeForce RTX 4090 Laptop GPU, AMD Ryzen 9 7945HX3D
150 Seconds * +28%

* ... más pequeño es mejor

Performance Rating - Percent
Asus ROG Strix Scar 17 G733PYV-LL053X
AMD Ryzen 9 7945HX3D, NVIDIA GeForce RTX 4090 Laptop GPU
98.5 pt
Alienware m18 R2
Intel Core i9-14900HX, NVIDIA GeForce RTX 4090 Laptop GPU
88.3 pt
MSI Titan 18 HX A14VIG
Intel Core i9-14900HX, NVIDIA GeForce RTX 4090 Laptop GPU
87.5 pt
Razer Blade 16 2024, RTX 4090
Intel Core i9-14900HX, NVIDIA GeForce RTX 4090 Laptop GPU
84.6 pt
Asus ROG Strix Scar 18 G834JYR (2024)
Intel Core i9-14900HX, NVIDIA GeForce RTX 4090 Laptop GPU
81.9 pt
Razer Blade 18 2024 RZ09-0509
Intel Core i9-14900HX, NVIDIA GeForce RTX 4090 Laptop GPU
79.7 pt
Average of class Gaming
 
59.3 pt
The Witcher 3 - 1920x1080 Ultra Graphics & Postprocessing (HBAO+)
MSI Titan 18 HX A14VIG
Intel Core i9-14900HX, NVIDIA GeForce RTX 4090 Laptop GPU
211.2 (165min) fps +9%
Asus ROG Strix Scar 17 G733PYV-LL053X
AMD Ryzen 9 7945HX3D, NVIDIA GeForce RTX 4090 Laptop GPU
207 fps +7%
Alienware m18 R2
Intel Core i9-14900HX, NVIDIA GeForce RTX 4090 Laptop GPU
205.7 (193min) fps +7%
Razer Blade 16 2024, RTX 4090
Intel Core i9-14900HX, NVIDIA GeForce RTX 4090 Laptop GPU
200 fps +4%
Razer Blade 18 2024 RZ09-0509
Intel Core i9-14900HX, NVIDIA GeForce RTX 4090 Laptop GPU
193 (53.6P0.1, 119.7P1) fps
Asus ROG Strix Scar 18 G834JYR (2024)
Intel Core i9-14900HX, NVIDIA GeForce RTX 4090 Laptop GPU
189.4 (165min) fps -2%
Average of class Gaming
  (8.61 - 216, n=215, last 2 years)
118.4 fps -39%
GTA V - 1920x1080 Highest Settings possible AA:4xMSAA + FX AF:16x
Asus ROG Strix Scar 17 G733PYV-LL053X
AMD Ryzen 9 7945HX3D, NVIDIA GeForce RTX 4090 Laptop GPU
167.7 (1.87min, 111.1P1) fps +29%
MSI Titan 18 HX A14VIG
Intel Core i9-14900HX, NVIDIA GeForce RTX 4090 Laptop GPU
139.2 (3.73min, 90.9P1) fps +7%
Razer Blade 16 2024, RTX 4090
Intel Core i9-14900HX, NVIDIA GeForce RTX 4090 Laptop GPU
138.1 (4.19min, 83.3P1) fps +6%
Alienware m18 R2
Intel Core i9-14900HX, NVIDIA GeForce RTX 4090 Laptop GPU
137 (7.81min, 83.3P1) fps +6%
Asus ROG Strix Scar 18 G834JYR (2024)
Intel Core i9-14900HX, NVIDIA GeForce RTX 4090 Laptop GPU
136 (8.67min, 100P1) fps +5%
Razer Blade 18 2024 RZ09-0509
Intel Core i9-14900HX, NVIDIA GeForce RTX 4090 Laptop GPU
129.8 (16.1min, 90.9P1) fps
Average of class Gaming
  (6.38 - 167.7, n=207, last 2 years)
108 fps -17%
Final Fantasy XV Benchmark - 1920x1080 High Quality
Alienware m18 R2
Intel Core i9-14900HX, NVIDIA GeForce RTX 4090 Laptop GPU
193.2 fps +23%
MSI Titan 18 HX A14VIG
Intel Core i9-14900HX, NVIDIA GeForce RTX 4090 Laptop GPU
184 fps +17%
Asus ROG Strix Scar 17 G733PYV-LL053X
AMD Ryzen 9 7945HX3D, NVIDIA GeForce RTX 4090 Laptop GPU
180 fps +15%
Asus ROG Strix Scar 18 G834JYR (2024)
Intel Core i9-14900HX, NVIDIA GeForce RTX 4090 Laptop GPU
166.1 fps +6%
Razer Blade 18 2024 RZ09-0509
Intel Core i9-14900HX, NVIDIA GeForce RTX 4090 Laptop GPU
156.9 fps
Razer Blade 16 2024, RTX 4090
Intel Core i9-14900HX, NVIDIA GeForce RTX 4090 Laptop GPU
137.5 fps -12%
Average of class Gaming
  (9.13 - 194.9, n=217, last 2 years)
112.3 fps -28%
Strange Brigade - 1920x1080 ultra AA:ultra AF:16
Asus ROG Strix Scar 17 G733PYV-LL053X
AMD Ryzen 9 7945HX3D, NVIDIA GeForce RTX 4090 Laptop GPU
420 (64.7min, 302P1) fps +29%
MSI Titan 18 HX A14VIG
Intel Core i9-14900HX, NVIDIA GeForce RTX 4090 Laptop GPU
385 (27.2min, 274P1) fps +18%
Alienware m18 R2
Intel Core i9-14900HX, NVIDIA GeForce RTX 4090 Laptop GPU
369 (31.4min, 266P1) fps +14%
Razer Blade 16 2024, RTX 4090
Intel Core i9-14900HX, NVIDIA GeForce RTX 4090 Laptop GPU
359.8 (30.2min, 253P1) fps +11%
Asus ROG Strix Scar 18 G834JYR (2024)
Intel Core i9-14900HX, NVIDIA GeForce RTX 4090 Laptop GPU
331 (34.1min, 238P1) fps +2%
Razer Blade 18 2024 RZ09-0509
Intel Core i9-14900HX, NVIDIA GeForce RTX 4090 Laptop GPU
325 (49.1min, 213P1) fps
Average of class Gaming
  (14.6 - 421, n=214, last 2 years)
210 fps -35%
Dota 2 Reborn - 1920x1080 ultra (3/3) best looking
Asus ROG Strix Scar 17 G733PYV-LL053X
AMD Ryzen 9 7945HX3D, NVIDIA GeForce RTX 4090 Laptop GPU
220 (175min) fps +34%
Razer Blade 16 2024, RTX 4090
Intel Core i9-14900HX, NVIDIA GeForce RTX 4090 Laptop GPU
188.1 (155.2min) fps +15%
MSI Titan 18 HX A14VIG
Intel Core i9-14900HX, NVIDIA GeForce RTX 4090 Laptop GPU
174.5 (151.1min) fps +6%
Alienware m18 R2
Intel Core i9-14900HX, NVIDIA GeForce RTX 4090 Laptop GPU
171.8 (143.6min) fps +5%
Razer Blade 18 2024 RZ09-0509
Intel Core i9-14900HX, NVIDIA GeForce RTX 4090 Laptop GPU
164 (140min) fps
Asus ROG Strix Scar 18 G834JYR (2024)
Intel Core i9-14900HX, NVIDIA GeForce RTX 4090 Laptop GPU
161.3 (135.6min) fps -2%
Average of class Gaming
  (26.9 - 220, n=226, last 2 years)
144.1 fps -12%
X-Plane 11.11 - 1920x1080 high (fps_test=3)
Asus ROG Strix Scar 17 G733PYV-LL053X
AMD Ryzen 9 7945HX3D, NVIDIA GeForce RTX 4090 Laptop GPU
166.2 fps +31%
Razer Blade 16 2024, RTX 4090
Intel Core i9-14900HX, NVIDIA GeForce RTX 4090 Laptop GPU
146.2 fps +15%
Alienware m18 R2
Intel Core i9-14900HX, NVIDIA GeForce RTX 4090 Laptop GPU
140.6 fps +11%
Asus ROG Strix Scar 18 G834JYR (2024)
Intel Core i9-14900HX, NVIDIA GeForce RTX 4090 Laptop GPU
136.8 fps +8%
Razer Blade 18 2024 RZ09-0509
Intel Core i9-14900HX, NVIDIA GeForce RTX 4090 Laptop GPU
127.2 fps
MSI Titan 18 HX A14VIG
Intel Core i9-14900HX, NVIDIA GeForce RTX 4090 Laptop GPU
126.1 fps -1%
Average of class Gaming
  (12.4 - 166.2, n=232, last 2 years)
102.9 fps -19%
Call of Duty Modern Warfare 3 2023
3840x2160 Extreme Preset
Alienware m18 R2
Intel Core i9-14900HX, NVIDIA GeForce RTX 4090 Laptop GPU
106 fps +22%
Average NVIDIA GeForce RTX 4090 Laptop GPU
  (87 - 106, n=4)
94.3 fps +8%
Razer Blade 16 2024, RTX 4090
Intel Core i9-14900HX, NVIDIA GeForce RTX 4090 Laptop GPU
91 fps +5%
Razer Blade 18 2024 RZ09-0509
Intel Core i9-14900HX, NVIDIA GeForce RTX 4090 Laptop GPU
87 fps
Average of class Gaming
  (27 - 106, n=5, last 2 years)
72.2 fps -17%
2560x1440 Extreme Preset
Asus ROG Strix Scar 18 G834JYR (2024)
Intel Core i9-14900HX, NVIDIA GeForce RTX 4090 Laptop GPU
162 (119min) fps +23%
Alienware m18 R2
Intel Core i9-14900HX, NVIDIA GeForce RTX 4090 Laptop GPU
160 fps +21%
Average NVIDIA GeForce RTX 4090 Laptop GPU
  (123 - 162, n=6)
142.8 fps +8%
Razer Blade 16 2024, RTX 4090
Intel Core i9-14900HX, NVIDIA GeForce RTX 4090 Laptop GPU
138 fps +5%
Razer Blade 18 2024 RZ09-0509
Intel Core i9-14900HX, NVIDIA GeForce RTX 4090 Laptop GPU
132 fps
Average of class Gaming
  (48 - 162, n=11, last 2 years)
98.4 fps -25%
1920x1080 Extreme Preset
Alienware m18 R2
Intel Core i9-14900HX, NVIDIA GeForce RTX 4090 Laptop GPU
205 fps +18%
Average NVIDIA GeForce RTX 4090 Laptop GPU
  (162 - 205, n=6)
179.7 fps +3%
Razer Blade 16 2024, RTX 4090
Intel Core i9-14900HX, NVIDIA GeForce RTX 4090 Laptop GPU
179 fps +3%
Razer Blade 18 2024 RZ09-0509
Intel Core i9-14900HX, NVIDIA GeForce RTX 4090 Laptop GPU
174 fps
Asus ROG Strix Scar 18 G834JYR (2024)
Intel Core i9-14900HX, NVIDIA GeForce RTX 4090 Laptop GPU
162 (119min) fps -7%
Average of class Gaming
  (41 - 205, n=13, last 2 years)
115.8 fps -33%
Cyberpunk 2077 2.0 Phantom Liberty
3840x2160 Ultra Preset (FSR off)
MSI Titan 18 HX A14VIG
Intel Core i9-14900HX, NVIDIA GeForce RTX 4090 Laptop GPU
43.9 (27.1min) fps +17%
Average NVIDIA GeForce RTX 4090 Laptop GPU
  (37.4 - 50.6, n=7)
43.6 fps +17%
Alienware m18 R2
Intel Core i9-14900HX, NVIDIA GeForce RTX 4090 Laptop GPU
43.4 (30.4min) fps +16%
Razer Blade 16 2024, RTX 4090
Intel Core i9-14900HX, NVIDIA GeForce RTX 4090 Laptop GPU
39.61 fps +6%
Razer Blade 18 2024 RZ09-0509
Intel Core i9-14900HX, NVIDIA GeForce RTX 4090 Laptop GPU
37.38 (31.36min) fps
Average of class Gaming
  (13.8 - 50.6, n=15, last 2 years)
32.1 fps -14%
2560x1440 Ultra Preset (FSR off)
MSI Titan 18 HX A14VIG
Intel Core i9-14900HX, NVIDIA GeForce RTX 4090 Laptop GPU
94.5 (50.3min) fps +13%
Alienware m18 R2
Intel Core i9-14900HX, NVIDIA GeForce RTX 4090 Laptop GPU
94.1 (57.3min) fps +13%
Asus ROG Strix Scar 17 G733PYV-LL053X
AMD Ryzen 9 7945HX3D, NVIDIA GeForce RTX 4090 Laptop GPU
93.4 fps +12%
Average NVIDIA GeForce RTX 4090 Laptop GPU
  (83.4 - 103.9, n=13)
91.4 fps +10%
Asus ROG Strix Scar 18 G834JYR (2024)
Intel Core i9-14900HX, NVIDIA GeForce RTX 4090 Laptop GPU
83.8 (35.1min) fps +1%
Razer Blade 16 2024, RTX 4090
Intel Core i9-14900HX, NVIDIA GeForce RTX 4090 Laptop GPU
83.39 (67.14min) fps 0%
Razer Blade 18 2024 RZ09-0509
Intel Core i9-14900HX, NVIDIA GeForce RTX 4090 Laptop GPU
83.38 (67.53min) fps
Average of class Gaming
  (32.9 - 103.9, n=38, last 2 years)
66.5 fps -20%
1920x1080 Ultra Preset (FSR off)
Asus ROG Strix Scar 17 G733PYV-LL053X
AMD Ryzen 9 7945HX3D, NVIDIA GeForce RTX 4090 Laptop GPU
142.8 fps +41%
Alienware m18 R2
Intel Core i9-14900HX, NVIDIA GeForce RTX 4090 Laptop GPU
133.9 (67.5min) fps +32%
MSI Titan 18 HX A14VIG
Intel Core i9-14900HX, NVIDIA GeForce RTX 4090 Laptop GPU
129.8 (26.2min) fps +28%
Average NVIDIA GeForce RTX 4090 Laptop GPU
  (95.4 - 144.7, n=13)
122.7 fps +21%
Asus ROG Strix Scar 18 G834JYR (2024)
Intel Core i9-14900HX, NVIDIA GeForce RTX 4090 Laptop GPU
112.1 (42.7min) fps +11%
Razer Blade 18 2024 RZ09-0509
Intel Core i9-14900HX, NVIDIA GeForce RTX 4090 Laptop GPU
101.25 (77.2min) fps
Razer Blade 16 2024, RTX 4090
Intel Core i9-14900HX, NVIDIA GeForce RTX 4090 Laptop GPU
95.35 (70.51min) fps -6%
Average of class Gaming
  (6.76 - 144.7, n=47, last 2 years)
89.2 fps -12%
Baldur's Gate 3
3840x2160 Ultra Preset
Alienware m18 R2
Intel Core i9-14900HX, NVIDIA GeForce RTX 4090 Laptop GPU
81.7 fps +16%
MSI Titan 18 HX A14VIG
Intel Core i9-14900HX, NVIDIA GeForce RTX 4090 Laptop GPU
80.8 fps +15%
Average NVIDIA GeForce RTX 4090 Laptop GPU
  (66 - 81.7, n=5)
74.9 fps +6%
Razer Blade 18 2024 RZ09-0509
Intel Core i9-14900HX, NVIDIA GeForce RTX 4090 Laptop GPU
70.5 (39.1P0.1, 55.6P1) fps
Average of class Gaming
  (22.9 - 81.7, n=12, last 2 years)
54.6 fps -23%
2560x1440 Ultra Preset
MSI Titan 18 HX A14VIG
Intel Core i9-14900HX, NVIDIA GeForce RTX 4090 Laptop GPU
155.2 fps +30%
Alienware m18 R2
Intel Core i9-14900HX, NVIDIA GeForce RTX 4090 Laptop GPU
151.6 fps +27%
Average NVIDIA GeForce RTX 4090 Laptop GPU
  (119.2 - 155.2, n=5)
141.7 fps +19%
Razer Blade 18 2024 RZ09-0509
Intel Core i9-14900HX, NVIDIA GeForce RTX 4090 Laptop GPU
119.2 (40.8P0.1, 73.2P1) fps
Average of class Gaming
  (44 - 155.2, n=19, last 2 years)
89 fps -25%
1920x1080 Ultra Preset
MSI Titan 18 HX A14VIG
Intel Core i9-14900HX, NVIDIA GeForce RTX 4090 Laptop GPU
207.7 fps +29%
Alienware m18 R2
Intel Core i9-14900HX, NVIDIA GeForce RTX 4090 Laptop GPU
202 fps +26%
Average NVIDIA GeForce RTX 4090 Laptop GPU
  (160.5 - 208, n=5)
189.5 fps +18%
Razer Blade 18 2024 RZ09-0509
Intel Core i9-14900HX, NVIDIA GeForce RTX 4090 Laptop GPU
160.5 (65P0.1, 99.5P1) fps
Average of class Gaming
  (34.5 - 208, n=26, last 2 years)
106.1 fps -34%
Alan Wake 2
3840x2160 High Preset
Alienware m18 R2
Intel Core i9-14900HX, NVIDIA GeForce RTX 4090 Laptop GPU
45.2 fps +7%
Average NVIDIA GeForce RTX 4090 Laptop GPU
  (41.6 - 46.9, n=4)
44 fps +4%
Razer Blade 18 2024 RZ09-0509
Intel Core i9-14900HX, NVIDIA GeForce RTX 4090 Laptop GPU
42.3 (21.9P0.1, 33.4P1) fps
Razer Blade 16 2024, RTX 4090
Intel Core i9-14900HX, NVIDIA GeForce RTX 4090 Laptop GPU
41.6 (20P0.1, 31.8P1) fps -2%
Average of class Gaming
  (12.3 - 45.2, n=6, last 2 years)
35.6 fps -16%
2560x1440 High Preset
Alienware m18 R2
Intel Core i9-14900HX, NVIDIA GeForce RTX 4090 Laptop GPU
83.1 fps +5%
Average NVIDIA GeForce RTX 4090 Laptop GPU
  (78.4 - 85.5, n=5)
82 fps +3%
Razer Blade 18 2024 RZ09-0509
Intel Core i9-14900HX, NVIDIA GeForce RTX 4090 Laptop GPU
79.4 (33.5P0.1, 57.9P1) fps
Razer Blade 16 2024, RTX 4090
Intel Core i9-14900HX, NVIDIA GeForce RTX 4090 Laptop GPU
78.4 (17P0.1, 52.8P1) fps -1%
Average of class Gaming
  (22.5 - 83.7, n=12, last 2 years)
59.9 fps -25%
1920x1080 High Preset
Average NVIDIA GeForce RTX 4090 Laptop GPU
  (108.6 - 124.7, n=5)
117.1 fps +3%
Alienware m18 R2
Intel Core i9-14900HX, NVIDIA GeForce RTX 4090 Laptop GPU
116.9 fps +2%
Razer Blade 18 2024 RZ09-0509
Intel Core i9-14900HX, NVIDIA GeForce RTX 4090 Laptop GPU
114.1 (56.8P0.1, 81.7P1) fps
Razer Blade 16 2024, RTX 4090
Intel Core i9-14900HX, NVIDIA GeForce RTX 4090 Laptop GPU
108.6 (26.3P0.1, 67P1) fps -5%
Average of class Gaming
  (17.1 - 121.1, n=17, last 2 years)
67.7 fps -41%

Witcher 3 FPS Chart

0153045607590105120135150165180195Tooltip
Razer Blade 18 2024 RZ09-0509 i9-14900HX, NVIDIA GeForce RTX 4090 Laptop GPU: Ø191.2 (168-206)
bajo medio alto ultraQHD4K DLSS4K
GTA V (2015) 129.8 126.6 165.4
The Witcher 3 (2015) 193 154.6 149.8
Dota 2 Reborn (2015) 213 191.8 180.5 164 147
Final Fantasy XV Benchmark (2018) 156.9 139.1 87.3
X-Plane 11.11 (2018) 183.8 158.2 127.2 107.2
Strange Brigade (2018) 325 268 149.2
F1 23 (2023) 110.9 73.1 37.1
Baldur's Gate 3 (2023) 160.5 119.2 94.4 70.5
Cyberpunk 2077 2.0 Phantom Liberty (2023) 101.25 83.38 54.59 37.38
Assassin's Creed Mirage (2023) 124 114 98 73
Alan Wake 2 (2023) 114.1 79.4 60.8 42.3
Call of Duty Modern Warfare 3 2023 (2023) 174 132 92 87

Emisiones - Fuerte sólo cuando sea necesario

Ruido del sistema

El ruido de los ventiladores es en general más fuerte que el que registramos en nuestra 2023 Blade 18 debido en gran parte a las diferencias de configuración de nuestra GPU. Los ventiladores pulsaban con más frecuencia entre 24 y 29 dB(A) incluso cuando estaban configurados en modo Equilibrado y Optimus. Esto es lo suficientemente fuerte como para ser perceptible pero nunca molesto.

Tal vez lo más importante para los jugadores, el ruido de los ventiladores puede ser muy diferente dependiendo de la configuración del perfil de potencia. Cuando se ejecuta Witcher 3 con el modo Max Fan activo, por ejemplo, el ruido del ventilador puede llegar a 61 dB(A) en comparación con sólo 54 dB(A) con el modo Max Fan desactivado. Dado que no hay diferencias de rendimiento entre Max Fan activado y desactivado con los ajustes de fábrica, recomendamos jugar con Max Fan desactivado para mantener bajos los niveles de ruido. El ruido del ventilador en modo Turbo sería idéntico al de Max Fan apagado, lo que concuerda con nuestros resultados de rendimiento anteriores.

Cuando se compara con los competidores, el Blade 18 es comparable si no ligeramente más ruidoso que el Alienware m18 R2 o el ROG Strix Scar 18 que funcionan con la misma GPU GeForce RTX 4090. Se recomienda el uso de auriculares cuando los niveles del ventilador alcanzan >50 dB(A), especialmente en juegos en los que los pasos y otras pequeñas señales de audio son vitales para la jugabilidad.

Perfil de ruido del ventilador (Blanco: Fondo, Rojo: Sistema en reposo, Azul: 3DMark 06, Naranja: Witcher 3 verde: Prime95+FurMark estrés)

Ruido

Ocioso
23.9 / 28.2 / 29 dB(A)
Carga
36.8 / 61.1 dB(A)
  red to green bar
 
 
30 dB
silencioso
40 dB(A)
audible
50 dB(A)
ruidosamente alto
 
min: dark, med: mid, max: light   Earthworks M23R, Arta (15 cm de distancia)   environment noise: 23.4 dB(A)
dB(A) 0102030405060708090Deep BassMiddle BassHigh BassLower RangeMidsHigher MidsLower HighsMid HighsUpper HighsSuper Highs2036.237.639.835.432.836.2252827.52827.323.1283127.626.728.123.723.627.64028.525.92522.62328.55029.927.729.628.327.229.96329.529.224.223.625.129.58032.32923.923.52332.310032.728.921.222.721.532.712532.328.218.917.91732.316035.630.421.918.118.235.620035.429.926.822.716.935.425036.831.621.222.41536.831538.533.121.517.515.538.540040.434.721.917.813.140.450042.837.72618.412.442.863042.437.623.918.411.642.480044.739.525.820.912.344.7100045.840.426.219.210.245.8125047.441.226.618.79.947.4160050.344.129.520.19.550.3200050.444.428.416.89.950.4250051.144.725.514.810.251.1315051.744.722.713.810.651.740005144.420.312.610.951500050.339.716.712.311.650.3630049.238.815.212.111.549.2800046.636.71311.911.546.61000044.73412.71211.644.71250041.33012.511.811.541.31600037.82611.911.210.837.8SPL61.154.136.82923.461.1N14.492.31.10.514.4median 44.7median 37.6median 21.9median 17.8median 11.6median 44.7Delta6.35.753.92.46.3hearing rangehide median Fan NoiseRazer Blade 18 2024 RZ09-0509
Razer Blade 18 2024 RZ09-0509
NVIDIA GeForce RTX 4090 Laptop GPU, i9-14900HX
Razer Blade 18 RTX 4070
NVIDIA GeForce RTX 4070 Laptop GPU, i9-13950HX, SSSTC CA6-8D1024
Alienware m18 R2
NVIDIA GeForce RTX 4090 Laptop GPU, i9-14900HX, SK Hynix PC811 HFS002TEM9X152N
MSI Titan 18 HX A14VIG
NVIDIA GeForce RTX 4090 Laptop GPU, i9-14900HX, 2x Samsung PM9A1a MZVL22T0HDLB (RAID 0)
Asus ROG Strix Scar 18 G834JYR (2024)
NVIDIA GeForce RTX 4090 Laptop GPU, i9-14900HX, Samsung PM9A1a MZVL22T0HDLB
Razer Blade 16 2024, RTX 4090
NVIDIA GeForce RTX 4090 Laptop GPU, i9-14900HX, Samsung PM9A1 MZVL22T0HBLB
Noise
7%
3%
1%
-5%
6%
off / environment *
23.4
23.5
-0%
23.6
-1%
22.8
3%
24
-3%
23
2%
Idle Minimum *
23.9
23.8
-0%
23.8
-0%
23.8
-0%
27
-13%
23
4%
Idle Average *
28.2
23.8
16%
26.1
7%
23.8
16%
28
1%
23
18%
Idle Maximum *
29
26.8
8%
31.5
-9%
28
3%
32
-10%
27.66
5%
Load Average *
36.8
37.3
-1%
31.5
14%
38
-3%
50
-36%
43.76
-19%
Witcher 3 ultra *
54.1
48
11%
52.1
4%
57.3
-6%
50
8%
46.81
13%
Load Maximum *
61.1
53.5
12%
56.6
7%
62.8
-3%
52
15%
50.37
18%

* ... más pequeño es mejor

Temperatura

Las temperaturas de la superficie al jugar son notablemente más cálidas que las que registramos en nuestra unidad 2023, pero esto se debe de nuevo principalmente a las diferencias de GPU en nuestras configuraciones. Razer no ha realizado cambios en la solución de refrigeración subyacente.

Los ladrillos de potencia Razer siguen siendo de los más pequeños y a la vez más calientes del mercado. Por ejemplo, nuestro adaptador alcanzaba más de 63 C cuando jugábamos, frente a los apenas 54 C del adaptador Alienware m18 R2. Las temperaturas más cálidas son por diseño cuando se trata de cargadores GaN.

Escape trasero
Escape trasero
El adaptador de CA puede alcanzar más de 63 C cuando se ejecutan cargas exigentes como juegos
 38.2 °C43.2 °C37.2 °C 
 34.8 °C41.2 °C33.4 °C 
 35.4 °C36.2 °C33.2 °C 
Máximo: 43.2 °C
Médio: 37 °C
33.6 °C42.6 °C35.6 °C
36.4 °C38.8 °C37 °C
33.6 °C34.8 °C35.4 °C
Máximo: 42.6 °C
Médio: 36.4 °C
Conector de corriente  51.4 °C | Temperatura del cuarto 20 °C | Fluke 62 Mini IR Thermometer
(±) The average temperature for the upper side under maximal load is 37 °C / 99 F, compared to the average of 33.8 °C / 93 F for the devices in the class Gaming.
(±) The maximum temperature on the upper side is 43.2 °C / 110 F, compared to the average of 40.4 °C / 105 F, ranging from 21.2 to 68.8 °C for the class Gaming.
(±) The bottom heats up to a maximum of 42.6 °C / 109 F, compared to the average of 43.2 °C / 110 F
(+) In idle usage, the average temperature for the upper side is 31.3 °C / 88 F, compared to the device average of 33.8 °C / 93 F.
(±) Playing The Witcher 3, the average temperature for the upper side is 34.9 °C / 95 F, compared to the device average of 33.8 °C / 93 F.
(±) The palmrests and touchpad can get very hot to the touch with a maximum of 36.2 °C / 97.2 F.
(-) The average temperature of the palmrest area of similar devices was 28.9 °C / 84 F (-7.3 °C / -13.2 F).
Sistema inactivo (arriba)
Sistema inactivo (abajo)
Witcher 3 estrés (arriba)
Witcher 3 tensión (abajo)
Tensión Prime95+FurMark (arriba)
Tensión Prime95+FurMark (abajo)
Razer Blade 18 2024 RZ09-0509
Intel Core i9-14900HX, NVIDIA GeForce RTX 4090 Laptop GPU
Razer Blade 18 RTX 4070
Intel Core i9-13950HX, NVIDIA GeForce RTX 4070 Laptop GPU
Alienware m18 R2
Intel Core i9-14900HX, NVIDIA GeForce RTX 4090 Laptop GPU
MSI Titan 18 HX A14VIG
Intel Core i9-14900HX, NVIDIA GeForce RTX 4090 Laptop GPU
Asus ROG Strix Scar 18 G834JYR (2024)
Intel Core i9-14900HX, NVIDIA GeForce RTX 4090 Laptop GPU
Razer Blade 16 2024, RTX 4090
Intel Core i9-14900HX, NVIDIA GeForce RTX 4090 Laptop GPU
Heat
12%
-4%
7%
3%
7%
Maximum Upper Side *
43.2
39.2
9%
41.2
5%
37.8
12%
49
-13%
45
-4%
Maximum Bottom *
42.6
35.6
16%
34.6
19%
37.6
12%
47
-10%
45
-6%
Idle Upper Side *
36
31.8
12%
42.8
-19%
34.8
3%
29
19%
29
19%
Idle Bottom *
36.4
33.2
9%
43.6
-20%
36
1%
31
15%
30
18%

* ... más pequeño es mejor

Altavoces

El volumen máximo es de algo más de 85 dB(A) para ser casi idéntico al que registramos en el modelo 2023 a pesar de los cambios físicos en los altavoces mencionados anteriormente
dB(A) 0102030405060708090Deep BassMiddle BassHigh BassLower RangeMidsHigher MidsLower HighsMid HighsUpper HighsSuper Highs2033.935.433.92526.127.326.1312523.725402622.6265036.128.336.1634623.6468055.223.555.210058.222.758.212561.917.961.916070.218.170.22007122.77125075.322.475.33157617.57640075.517.875.550076.818.476.863074.918.474.980074.520.974.510006319.263125072.118.772.1160076.220.176.2200074.916.874.925007614.876315070.813.870.8400070.512.670.550007112.371630069.912.169.9800065.611.965.61000063.21263.21250062.911.862.91600057.911.257.9SPL85.22985.2N70.21.170.2median 71median 17.8median 71Delta4.53.94.526.325.821.422.12624.925.127.622.532.523.448.72655.818.860.922.167.2267019.372.317.674.217.774.319.575.31571.711.871.311.27410.574.21072.710.17210.67210.97511.374.811.671.71269.71269.612.371.112.669.61270.111.269.824.784.70.666.6median 12median 71.73.42.2hearing rangehide median Pink NoiseRazer Blade 18 2024 RZ09-0509Apple MacBook Pro 16 2021 M1 Pro
Diagrama de frecuencia en comparación (¡las casillas de verificación se pueden marcar y desmarcar!)
Razer Blade 18 2024 RZ09-0509 audio analysis

(+) | speakers can play relatively loud (85.2 dB)
Bass 100 - 315 Hz
(±) | reduced bass - on average 5.3% lower than median
(+) | bass is linear (6.5% delta to prev. frequency)
Mids 400 - 2000 Hz
(+) | balanced mids - only 4.5% away from median
(±) | linearity of mids is average (7.1% delta to prev. frequency)
Highs 2 - 16 kHz
(+) | balanced highs - only 2.9% away from median
(+) | highs are linear (4% delta to prev. frequency)
Overall 100 - 16.000 Hz
(+) | overall sound is linear (9.3% difference to median)
Compared to same class
» 2% of all tested devices in this class were better, 2% similar, 96% worse
» The best had a delta of 6%, average was 18%, worst was 132%
Compared to all devices tested
» 2% of all tested devices were better, 1% similar, 97% worse
» The best had a delta of 4%, average was 25%, worst was 134%

Apple MacBook Pro 16 2021 M1 Pro audio analysis

(+) | speakers can play relatively loud (84.7 dB)
Bass 100 - 315 Hz
(+) | good bass - only 3.8% away from median
(+) | bass is linear (5.2% delta to prev. frequency)
Mids 400 - 2000 Hz
(+) | balanced mids - only 1.3% away from median
(+) | mids are linear (2.1% delta to prev. frequency)
Highs 2 - 16 kHz
(+) | balanced highs - only 1.9% away from median
(+) | highs are linear (2.7% delta to prev. frequency)
Overall 100 - 16.000 Hz
(+) | overall sound is linear (4.6% difference to median)
Compared to same class
» 0% of all tested devices in this class were better, 0% similar, 100% worse
» The best had a delta of 5%, average was 18%, worst was 45%
Compared to all devices tested
» 0% of all tested devices were better, 0% similar, 100% worse
» The best had a delta of 4%, average was 25%, worst was 134%

Gestión de la energía

Consumo de energía

El consumo es superior en todos los casos, como era de esperar, debido a las diferencias de pantalla y GPU entre nuestras unidades de prueba 2023 y 2024. El modo Optimus, con el brillo al mínimo y una frecuencia de refresco de 60 Hz, consume aproximadamente 25 W, mientras que el modo dGPU, con el brillo al máximo y una frecuencia de refresco de 300 Hz, consume el doble.

La ejecución de Witcher 3 exige unos 70 W más a nuestra unidad de pruebas 2024 con RTX 4090 que a nuestra unidad 2023 con RTX 4070 en condiciones similares. Como resultado, las configuraciones RTX 4070 de gama baja se suministran con un adaptador GaN más pequeño de 280 W, mientras que las configuraciones RTX 4080/4090 se suministran con el adaptador GaN ligeramente más grande de 330 W (~18 x 7,5 x 2,5 cm frente a ~16,3 x 7 x 2,5 cm)

Consumo de corriente
Off / Standbydarklight 0.08 / 0.1 Watt
Ociosodarkmidlight 25.4 / 37.7 / 57.9 Watt
Carga midlight 128.4 / 297.9 Watt
 color bar
Clave: min: dark, med: mid, max: light        Metrahit Energy
Currently we use the Metrahit Energy, a professional single phase power quality and energy measurement digital multimeter, for our measurements. Find out more about it here. All of our test methods can be found here.
Razer Blade 18 2024 RZ09-0509
i9-14900HX, NVIDIA GeForce RTX 4090 Laptop GPU, , Mini-LED, 2560x1600, 18.00
Razer Blade 18 RTX 4070
i9-13950HX, NVIDIA GeForce RTX 4070 Laptop GPU, SSSTC CA6-8D1024, IPS, 2560x1600, 18.00
Alienware m18 R2
i9-14900HX, NVIDIA GeForce RTX 4090 Laptop GPU, SK Hynix PC811 HFS002TEM9X152N, IPS, 2560x1600, 18.00
MSI Titan 18 HX A14VIG
i9-14900HX, NVIDIA GeForce RTX 4090 Laptop GPU, 2x Samsung PM9A1a MZVL22T0HDLB (RAID 0), Mini-LED, 3840x2400, 18.00
Asus ROG Strix Scar 18 G834JYR (2024)
i9-14900HX, NVIDIA GeForce RTX 4090 Laptop GPU, Samsung PM9A1a MZVL22T0HDLB, Mini LED, 2560x1600, 18.00
Power Consumption
10%
3%
26%
Idle Minimum *
25.4
24.5
4%
13.2
48%
14
45%
Idle Average *
37.7
34.1
10%
25.4
33%
17
55%
Idle Maximum *
57.9
47.7
18%
53.5
8%
24
59%
Load Average *
128.4
140
-9%
151.4
-18%
143
-11%
Witcher 3 ultra *
273.1
202
26%
336
-23%
251
8%
Load Maximum *
297.9
261
12%
395.2
-33%
302
-1%

* ... más pequeño es mejor

Duración de las pilas

Los tiempos de ejecución son más o menos los mismos que antes, si no ligeramente superiores en unos 20 minutos. Tenga en cuenta que nuestra prueba WLAN ya tiene en cuenta el modo Optimus y la tasa de refresco más lenta de 60 Hz, lo que significa que la duración de la batería sería aún menor en el modo dGPU con la atenuación local y las altas tasas de refresco activas.

No es realista esperar una larga duración de una potencia para juegos de 18 pulgadas, pero competidores como la ROG Strix Scar 18 o el Alienware m18 R2 siguen ganando al Razer en este aspecto.

Tiempo de Ejecución de la Batería
Ocioso (sin WLAN, min brillo)
6h 35min
WiFi Websurfing
4h 23min
Carga (máximo brillo)
0h 58min
Razer Blade 18 2024 RZ09-0509
i9-14900HX, NVIDIA GeForce RTX 4090 Laptop GPU, 91.7 Wh
Razer Blade 18 RTX 4070
i9-13950HX, NVIDIA GeForce RTX 4070 Laptop GPU, 91.7 Wh
Alienware m18 R2
i9-14900HX, NVIDIA GeForce RTX 4090 Laptop GPU, 97 Wh
MSI Titan 18 HX A14VIG
i9-14900HX, NVIDIA GeForce RTX 4090 Laptop GPU, 99.9 Wh
Asus ROG Strix Scar 18 G834JYR (2024)
i9-14900HX, NVIDIA GeForce RTX 4090 Laptop GPU, 90 Wh
Razer Blade 16 2024, RTX 4090
i9-14900HX, NVIDIA GeForce RTX 4090 Laptop GPU, 95.2 Wh
Duración de Batería
12%
10%
3%
54%
31%
Reader / Idle
395
420
6%
353
-11%
612
55%
WiFi v1.3
263
240
-9%
290
10%
252
-4%
461
75%
329
25%
Load
58
80
38%
72
24%
77
33%
79
36%
H.264
447
456

Pro

+ por fin un obturador de privacidad para la webcam
+ vívida pantalla mini-LED HDR1000
+ gráfica TGP de plena potencia de 175 W
+ Compatibilidad con Thunderbolt 5
+ Compatibilidad con Wi-Fi 7

Contra

- rendimiento esencialmente idéntico al 2023 Blade 18
- ninguna mejora importante en la duración de la batería
- el nuevo modo "Turbo" parece superfluo
- sin OLED ni mini-LED 4K
- sin modo sólo iGPU

Veredicto - Todo sobre esas nuevas opciones de visualización

En revisión: Razer Blade 18 2024

Sin nuevas GPU Nvidia que incorporar este año y sin ganancias reales de la nueva serie de actualización Raptor Lake-HX, Razer tuvo que buscar en otra parte para hacer que el Blade 18 2024 fuera más atractivo que su predecesor 2023, visualmente idéntico. En este caso, el último modelo incluye nuevas opciones de pantalla junto a la compatibilidad con Thunderbolt 5 para ser uno de los primeros portátiles para juegos del mercado tanto con mini-LED como con Thunderbolt de nueva generación. Otras actualizaciones menores como el Wi-Fi 7 y el obturador de la webcam son bienvenidas, pero no dejan de ser mejoras menores. Los jugadores que no estén enamorados de estas características específicas deberían considerar en su lugar el 2023 Blade 18 que puede ofrecer el mismo rendimiento de juego y experiencia de usuario por cientos de dólares menos.

Thunderbolt 5, mini-LED y Wi-Fi 7 ayudan a distinguir el Blade 18 2024 del de antaño. Los cazadores de rendimiento, sin embargo, no encontrarán grandes diferencias entre los modelos 2023 y 2024.

En cuanto al mini-LED en portátiles, el panel está en su mejor momento con el HDR y la atenuación local activos para los juegos y vídeos compatibles. De lo contrario, tendrá que activar y desactivar continuamente la atenuación local en función de sus cargas de trabajo para evitar el efecto halo. Si planea utilizar el Blade 18 principalmente para juegos y multimedia, entonces la pantalla mini-LED 2K podría ser la opción óptima. Por el contrario, los usuarios que rara vez activan el HDR y quieren el Blade 18 principalmente para fines profesionales como la creación de contenidos, la edición o el trabajo CAD deberían considerar la configuración IPS 4K de mayor resolución que combina bien con el gran tamaño de la pantalla de 18 pulgadas. Razer tiene ambas caras de la moneda cubiertas en este sentido.

Por último, vale la pena mencionar que 4K mini-LED está disponible en el MSI Titan 18 mientras que falta en el Razer. La contrapartida es que el sistema MSI no es compatible con G-Sync y, por tanto, no hay un panel mini-LED "definitivo" de 18 pulgadas por el momento.

Precio y disponibilidad

Amazon ya está enviando nuestra configuración mini-LED por 4500 USD. Como alternativa, los usuarios pueden comprar directamente a Razer con más opciones de configuración entre los modelos 2023 y 2024.

Razer Blade 18 2024 RZ09-0509 - 05/05/2024 v7
Allen Ngo

Acabado
91 / 98 → 92%
Teclado
83%
Ratón
89%
Conectividad
0 / 80 → 0%
Peso
56 / 10-66 → 81%
Battería
60 / 95 → 63%
Pantalla
93%
Rendimiento de juegos
100%
Rendimiento de la Aplicación
97%
Temperatura
87 / 95 → 92%
Ruido
73 / 90 → 81%
Audio
89%
Cámara
48 / 85 → 56%
Médio
80%
91%
Gaming - media ponderada

Transparency

The present review sample was made available to the author as a loan by the manufacturer or a shop for the purposes of review. The lender had no influence on this review, nor did the manufacturer receive a copy of this review before publication. There was no obligation to publish this review.

Pricecompare

Please share our article, every link counts!
> Análisis y pruebas de ordenadores portátiles y móviles teléfonos > Análisis > Análisis del Razer Blade 18 2024: El primer portátil del mercado con mini-LED y Thunderbolt 5
Allen Ngo, 2024-05- 7 (Update: 2024-05- 7)