


Análisis del Dell Pro 13 Premium: El portátil de negocios casi perfecto
El portátil "Promium".
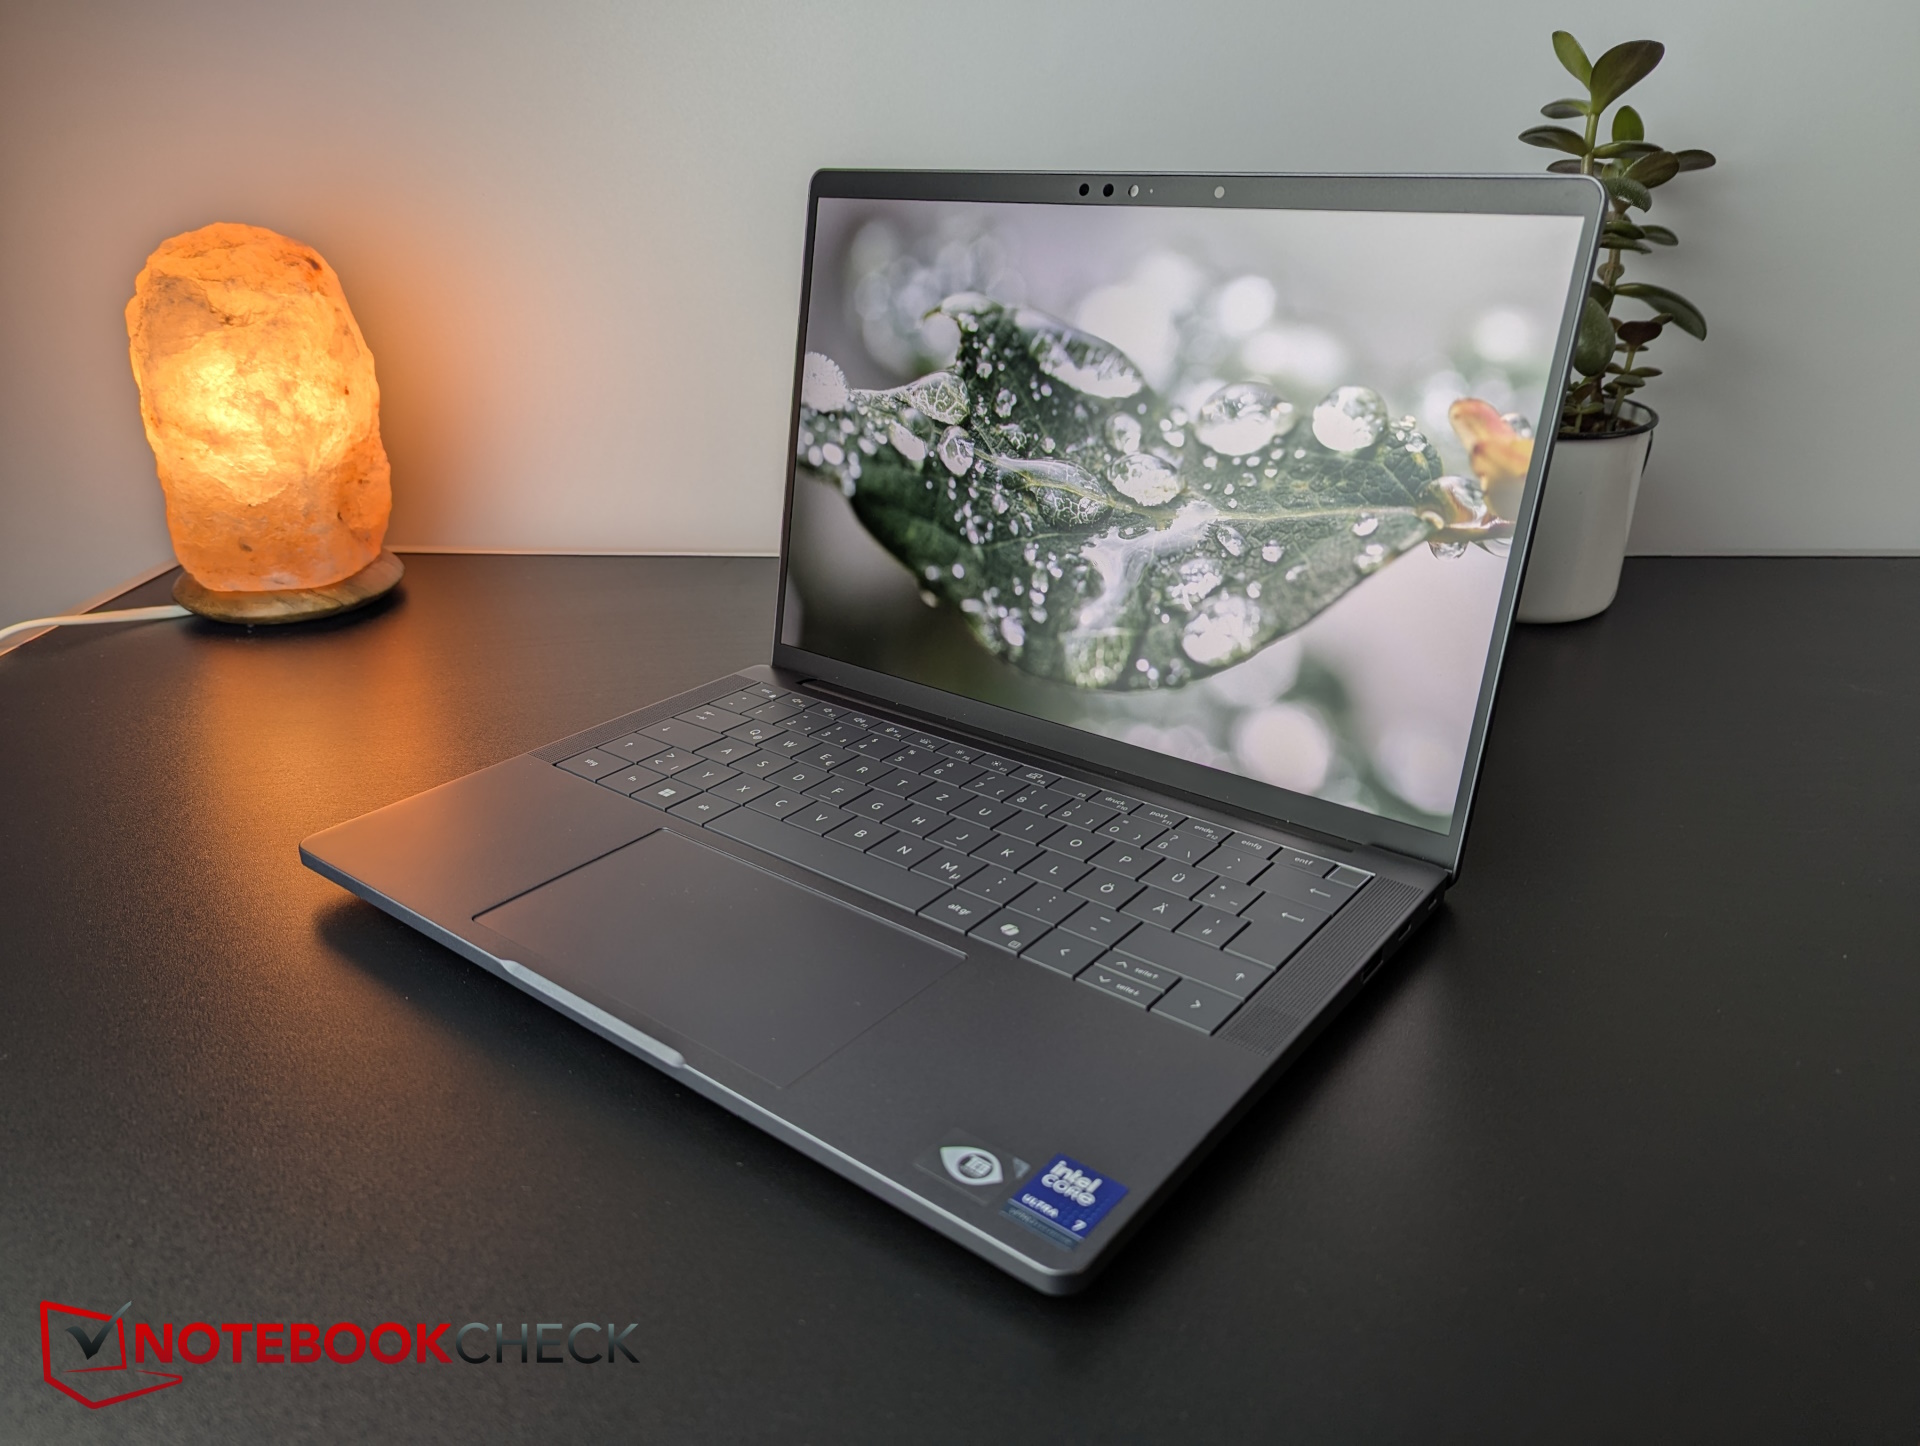
Aprovechamos la oportunidad para revisar el portátil empresarial de 13 pulgadas de la línea de productos Dell. Dirigido a usuarios empresariales exigentes y diseñado para atraer a los empresarios con sus modernos puertos, el Dell Pro 13 Premium cuenta con un chasis de magnesio robusto pero ligero, AI y también disfruta de una autonomía de batería muy larga.Christian Hintze, 👁 Christian Hintze (traducido por DeepL / Ninh Duy) Publicado 🇺🇸 🇩🇪 ...
Veredicto - Un portátil empresarial casi completo
El Dell Pro 13 Premium es un gran portátil de empresa sin apenas puntos débiles pero con un montón de características positivas que le hacen merecedor de nuestro premio. Los empleados de empresa y otros compradores potenciales obtienen un portátil compacto, pequeño, ligero, económico, con una autonomía extremadamente larga (¡24 horas!) y potente con un chasis de magnesio de alta calidad, una cámara web de 8 MP de alta resolución e interfaces modernas como Thunderbolt 4 dual y Wi-Fi 7. Además, el portátil se mantiene siempre frío en prácticamente cualquier situación.
Sin embargo, eso tiene un coste, ya que el portátil tiene un precio de nada menos que ¡entre 1.900 y 2.500 dólares! Teniendo esto en cuenta, la coja SSD M.2 2230 es casi una barbaridad, pero en situaciones cotidianas, apenas notará la diferencia. Las únicas áreas en las que se requieren mejoras son el nombre y la capacidad de actualización.
Pro
Contra
Precio y disponibilidad
Nuestro modelo de análisis viene con una pantalla FHD+ y cuesta alrededor de 2.100 dólares en la tienda online de Dell.
- $29.99Smatree Hard EVA Protective Sleeve Compatible for 13.3 inch Dell Pro 13 Premium (PA13250), for 13 inch DELL Latitude 7350/7320 Detachable, for 12 inch DELL Latitude 7230 Rugged Extreme Tablet (X8016)
- $49.99Smatree 13 inch Laptop Sleeve for DELL Pro 13 Premium PA13250, Protective Laptop Case with Accessory Pocket, YKK Zipper, Patented Shockproof Design (E431)
Posibles contendientes en la comparación
Imagen | Modelo | Precio | Peso | Altura | Pantalla |
|---|---|---|---|---|---|
1. 89.9%  | Dell Pro 13 Premium PA13250 Intel Core Ultra 7 268V ⎘ Intel Arc Graphics 140V ⎘ 32 GB Memoría, 1024 GB SSD | Amazon: 1. $39.99 Smatree Hard Shell Laptop Ca... 2. $29.99 Smatree Hard EVA Protective ... 3. $49.99 Smatree 13 inch Laptop Sleev... Precio de catálogo: 2700 Euro | 1.1 kg | 17.2 mm | 13.30" 1920x1200 170 PPI IPS |
2. 85%  | MSI Prestige 13 AI Plus Evo A2VMG Intel Core Ultra 7 258V ⎘ Intel Arc Graphics 140V ⎘ 32 GB Memoría | Amazon: $1,349.99 Precio de catálogo: 1400 USD | 970 g | 16.9 mm | 13.30" 2880x1800 255 PPI OLED |
3. 85.1%  | Lenovo ThinkPad X13 2-in-1 Gen 5 Intel Core Ultra 7 165U ⎘ Intel Graphics 4-Core iGPU (Arc) ⎘ 32 GB Memoría, 1000 GB SSD | Amazon: $1,601.95 Precio de catálogo: 2107.23 Euro | 1.3 kg | 16.4 mm | 13.30" 1920x1200 170 PPI IPS |
4. 84%  | Framework Laptop 13.5 Core Ultra 7 155H Intel Core Ultra 7 155H ⎘ Intel Arc 8-Core iGPU ⎘ 32 GB Memoría | Precio de catálogo: 1500 USD | 1.4 kg | 15.85 mm | 13.50" 2880x1920 256 PPI IPS |
5. 85.3%  | Dell XPS 13 9350 Intel Core Ultra 7 256V ⎘ Intel Arc Graphics 140V ⎘ 16 GB Memoría, 512 GB SSD | Amazon: 1. $1,499.99 2025 Latest Dell XPS 13 9350... 2. $1,699.00 NewDell XPS 13 9350 Powerful... 3. $1,599.99 Dell XPS 13 9340 Business La... Precio de catálogo: 1400 USD | 1.2 kg | 15.3 mm | 13.40" 1920x1200 169 PPI IPS |
6. 80.7%  | Microsoft Surface Pro Copilot+ Qualcomm Snapdragon X Plus X1P-64-100 ⎘ Qualcomm SD X Adreno X1-85 3.8 TFLOPS ⎘ 16 GB Memoría, 256 GB SSD | Amazon: $1,079.99 Precio de catálogo: 1199€ | 872 g | 9.3 mm | 13.00" 2880x1920 266 PPI IPS |
Índice
- Veredicto - Un portátil empresarial casi completo
- Especificaciones
- Carcasa y características - Este Dell viene con una webcam de 8 MP
- Dispositivos de entrada - El 13 Premium tiene un panel táctil para conferencias
- Pantalla - Un panel de oficina de alto contraste con opciones adicionales
- Rendimiento - Un potente Arco de 140V
- Emisiones y energía - El Dell Pro es económico
- Valoración general de Notebookcheck
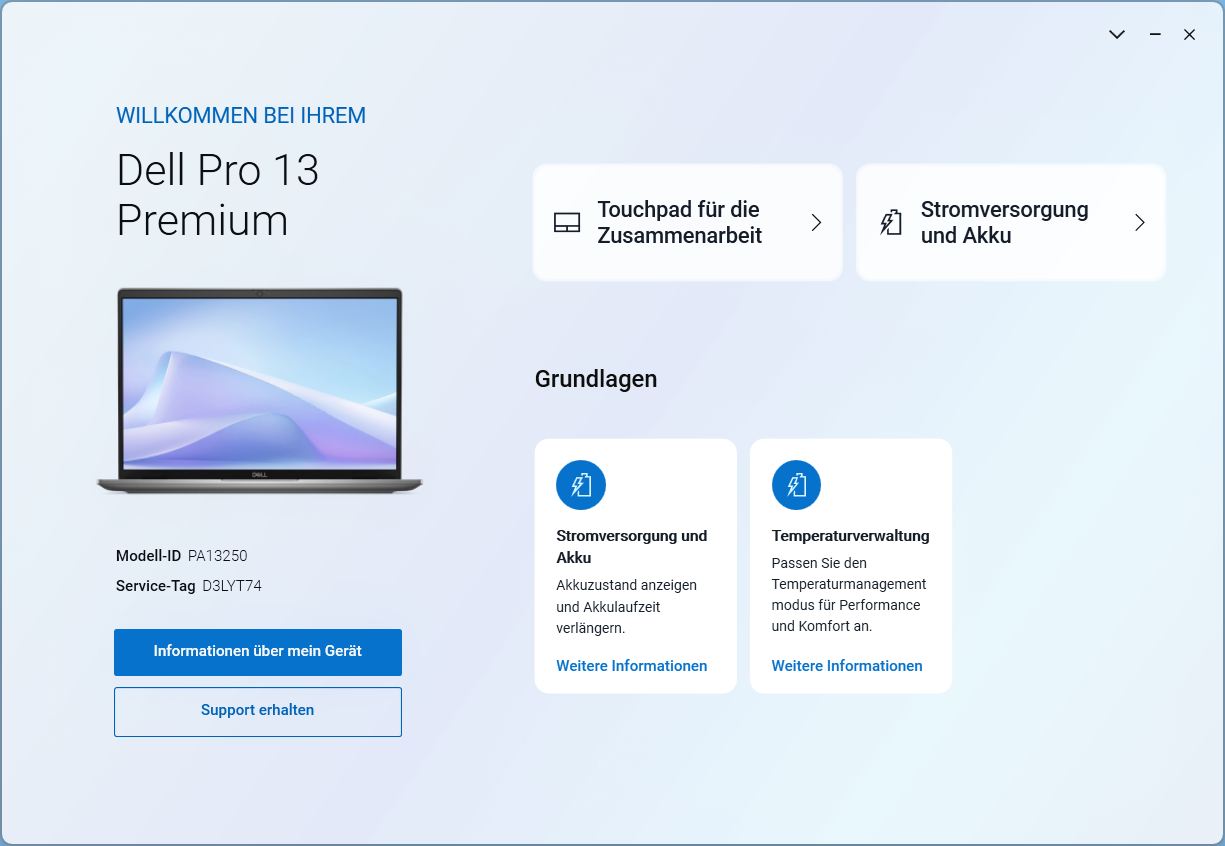
Dell ha cambiado recientemente su esquema de nomenclatura. Con la serie Pro, Dell se dirige al usuario empresarial típico, sustituyendo esencialmente a la anterior serie Latitude. Premium es sinónimo de los mejores materiales y características, y nuestro modelo actual de 13 pulgadas viene con puertos modernos, amplia seguridad, mucha IA, un robusto chasis de magnesio y, a pesar de ello, inclina la balanza con poco más de 1 kg. Entonces, ¿es éste el portátil premium para los usuarios de empresa?
Especificaciones
Carcasa y características - Este Dell viene con una webcam de 8 MP
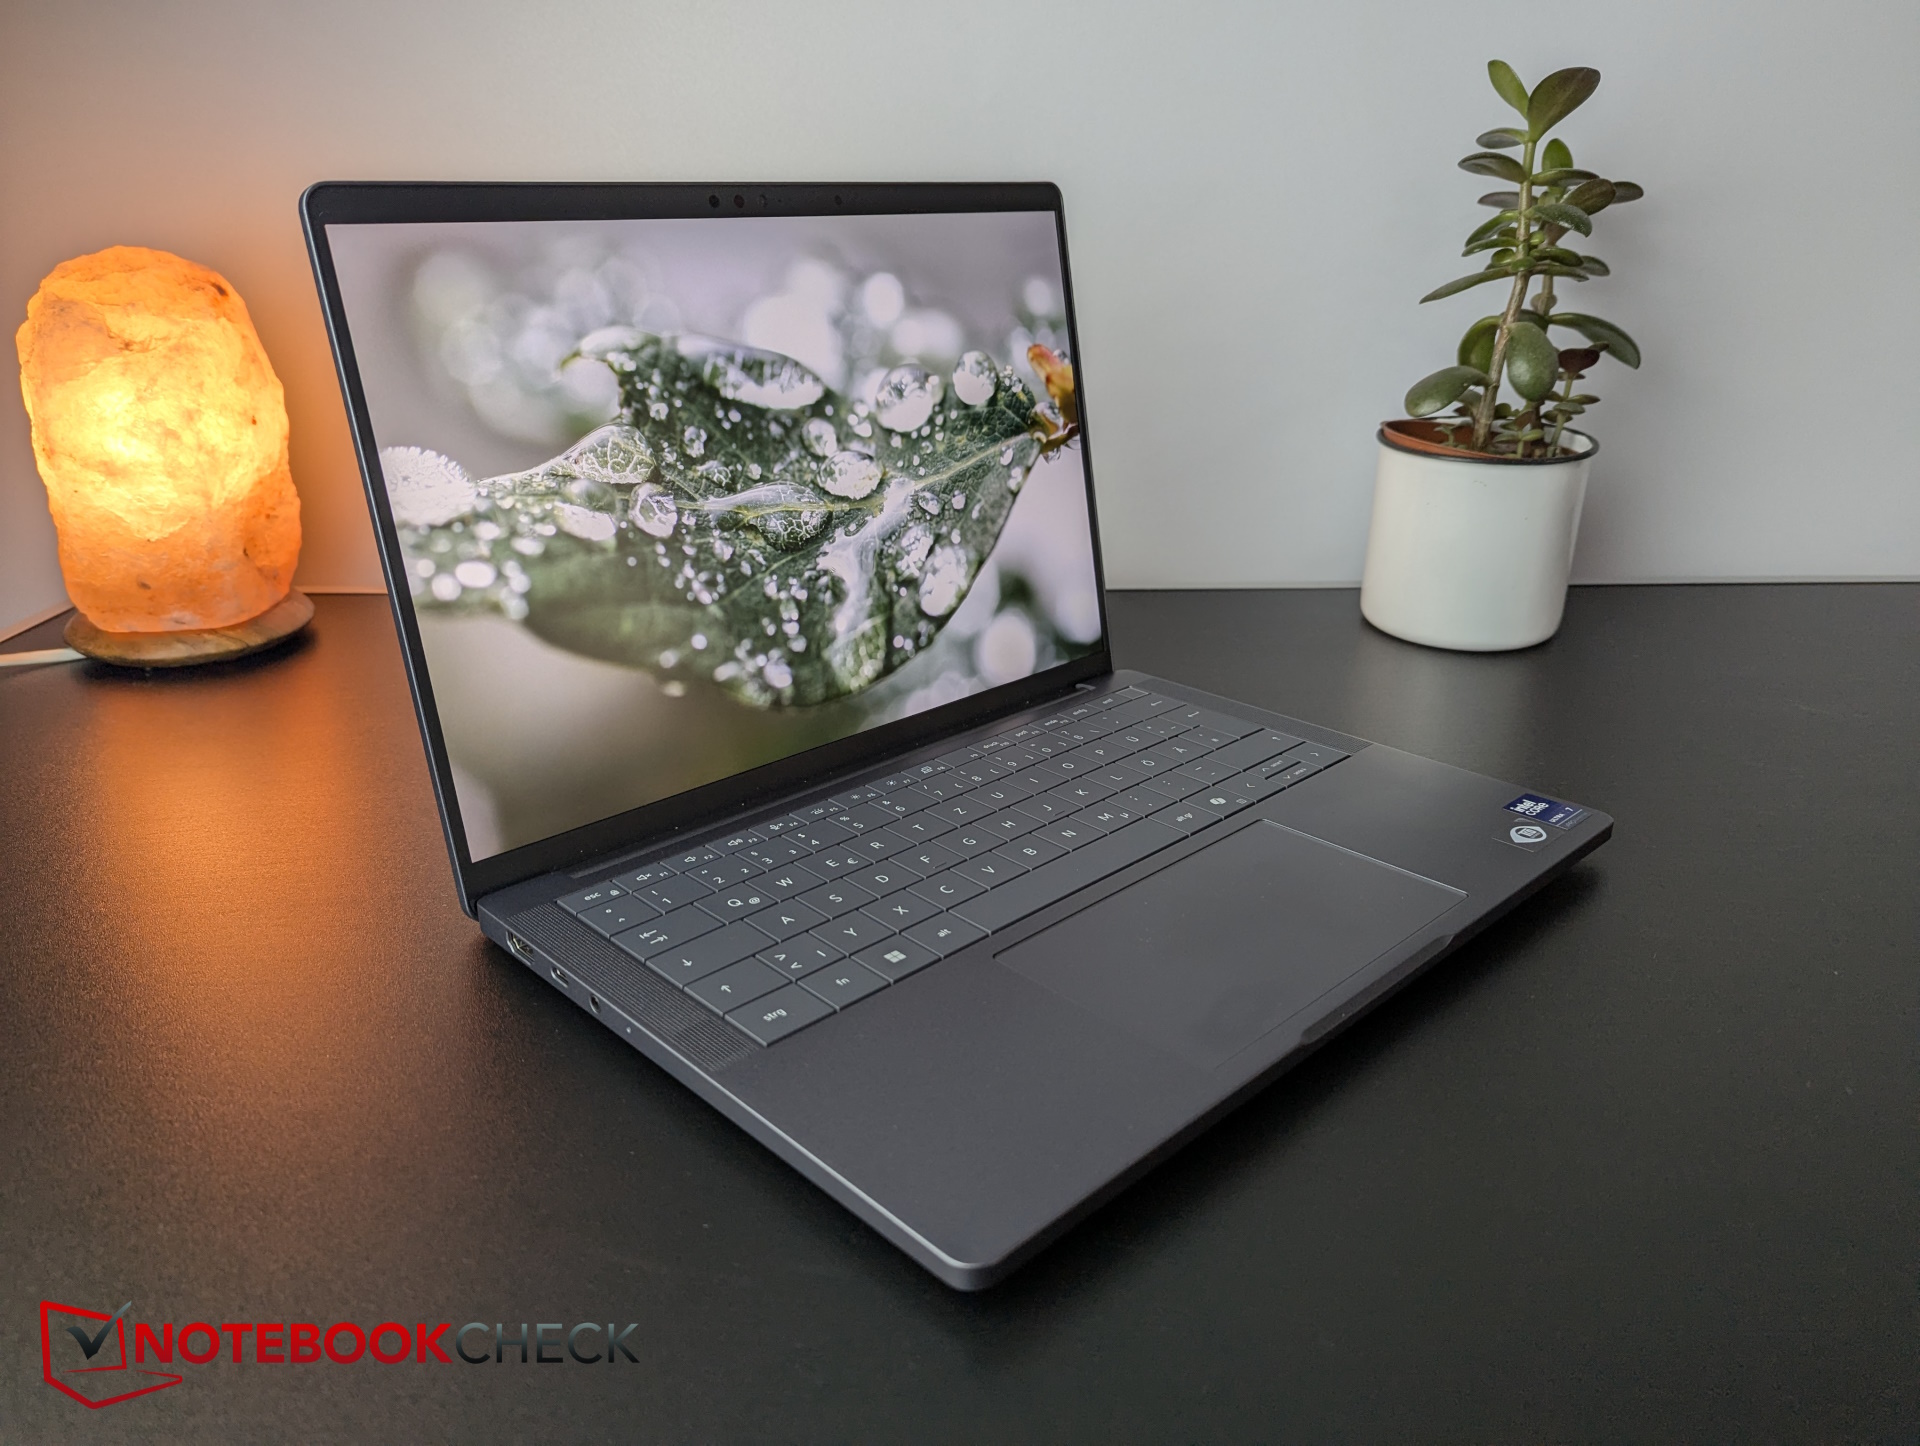
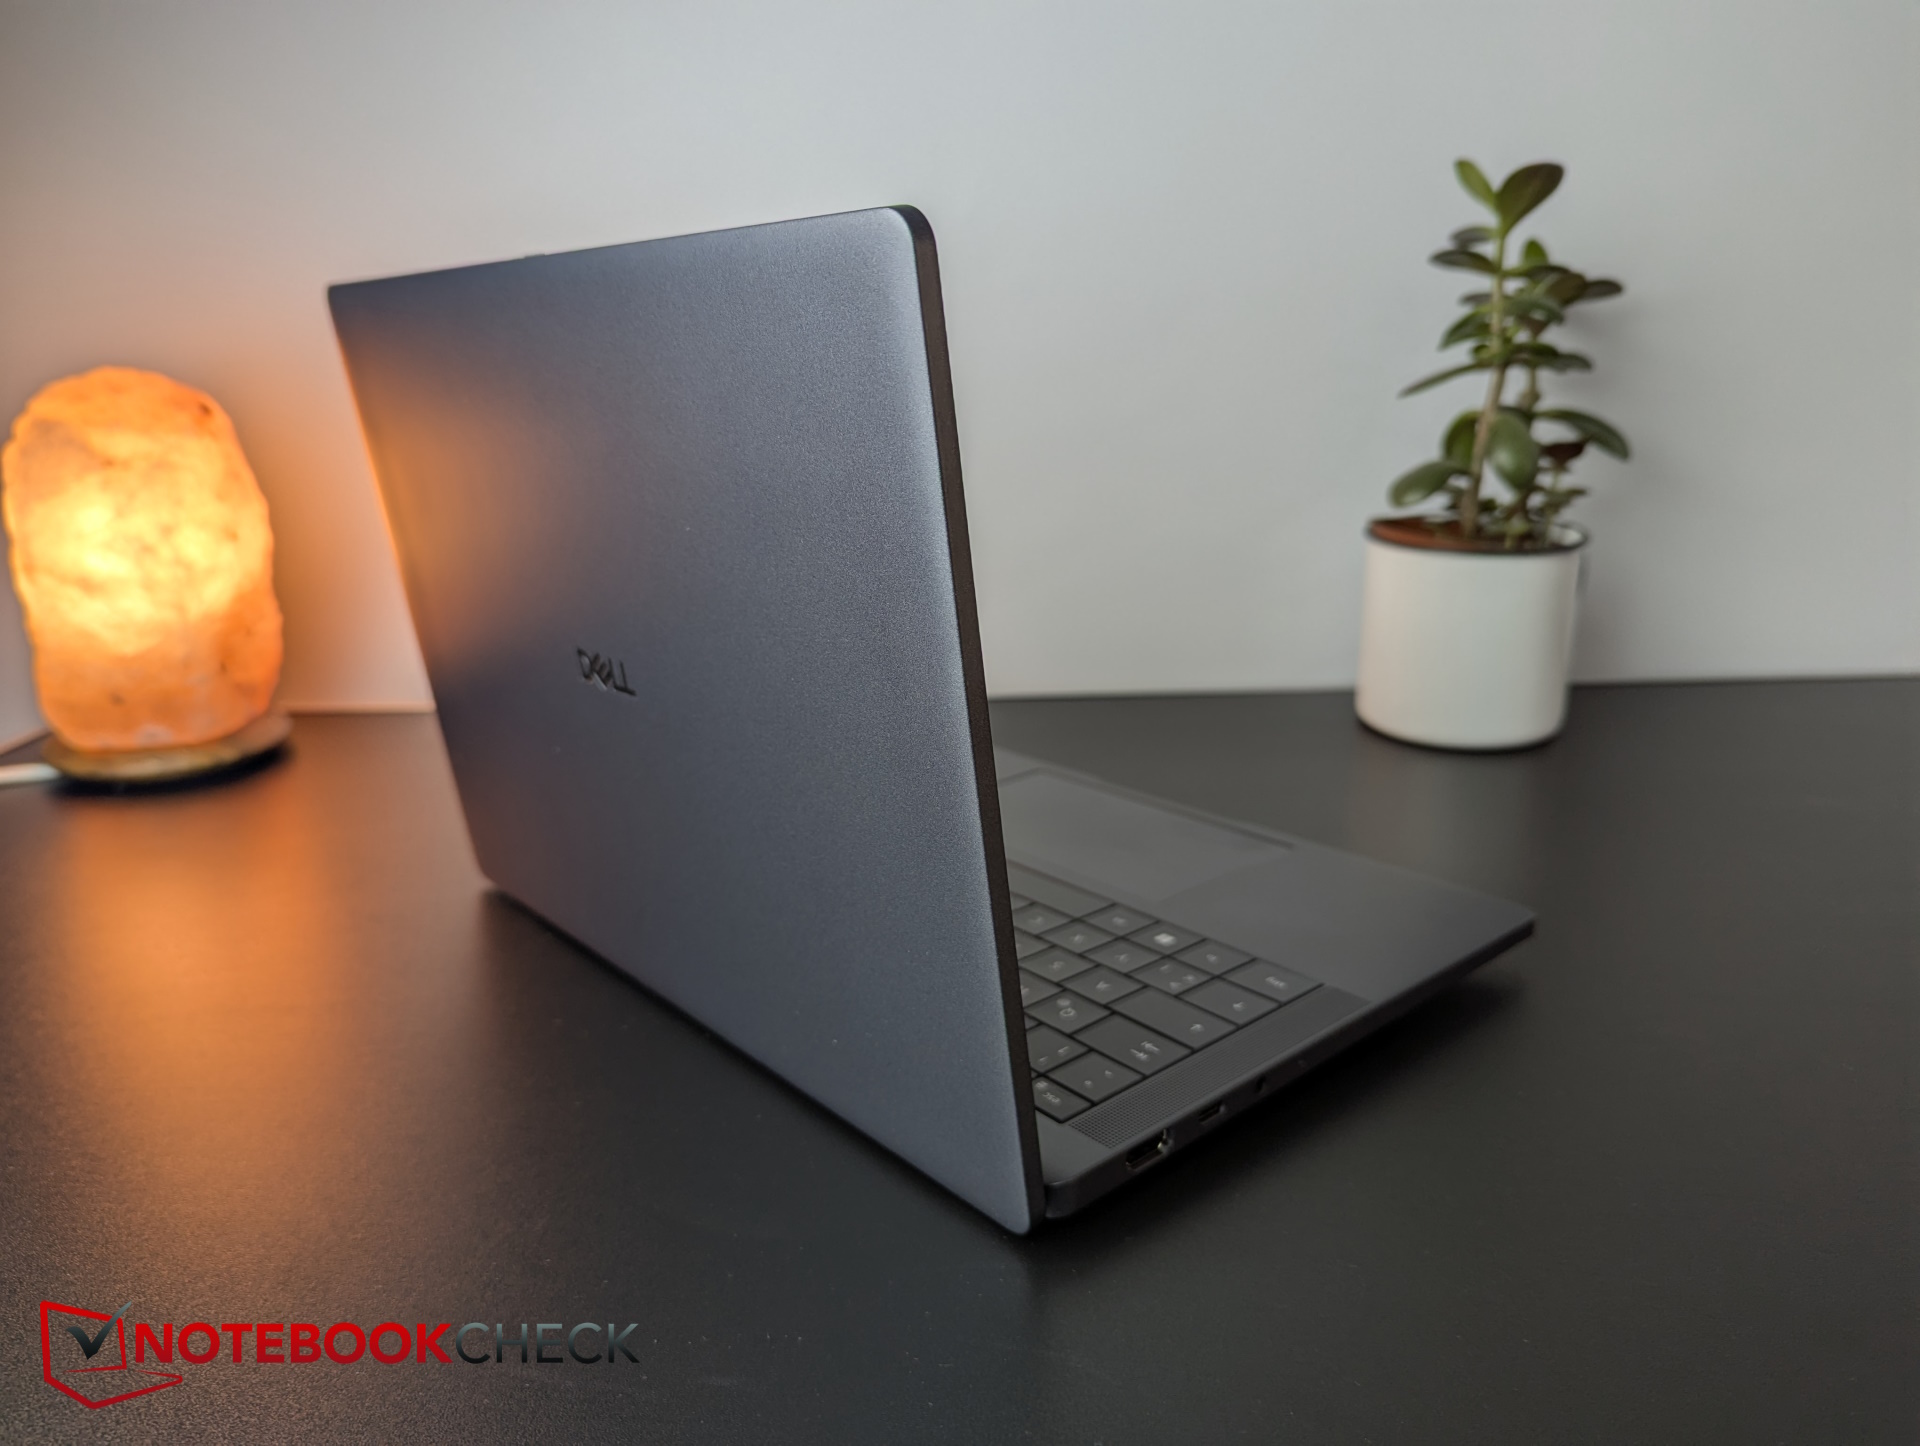
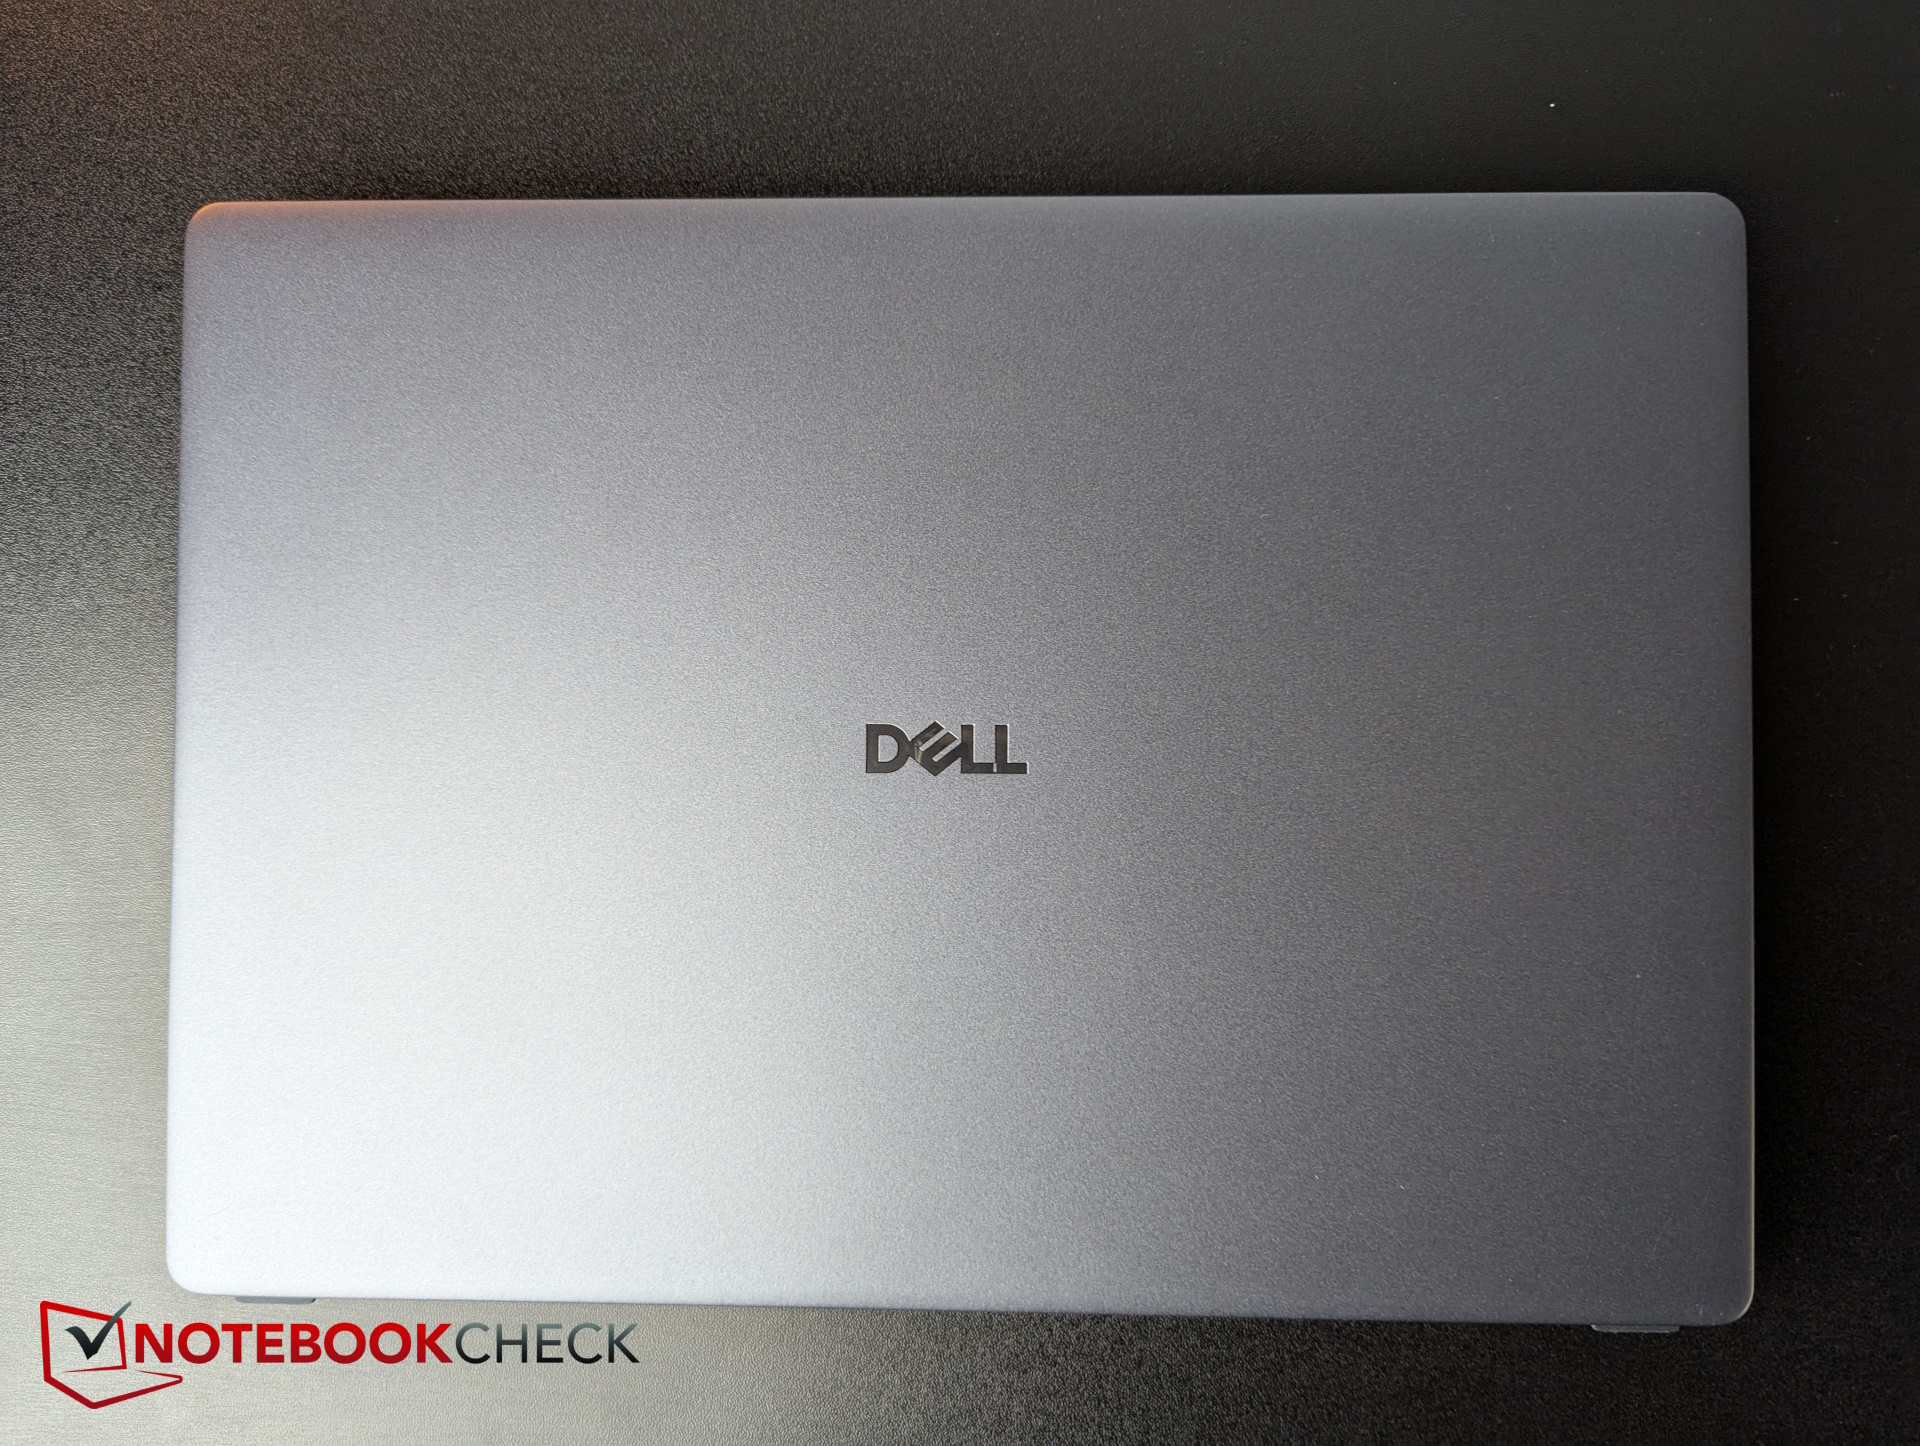
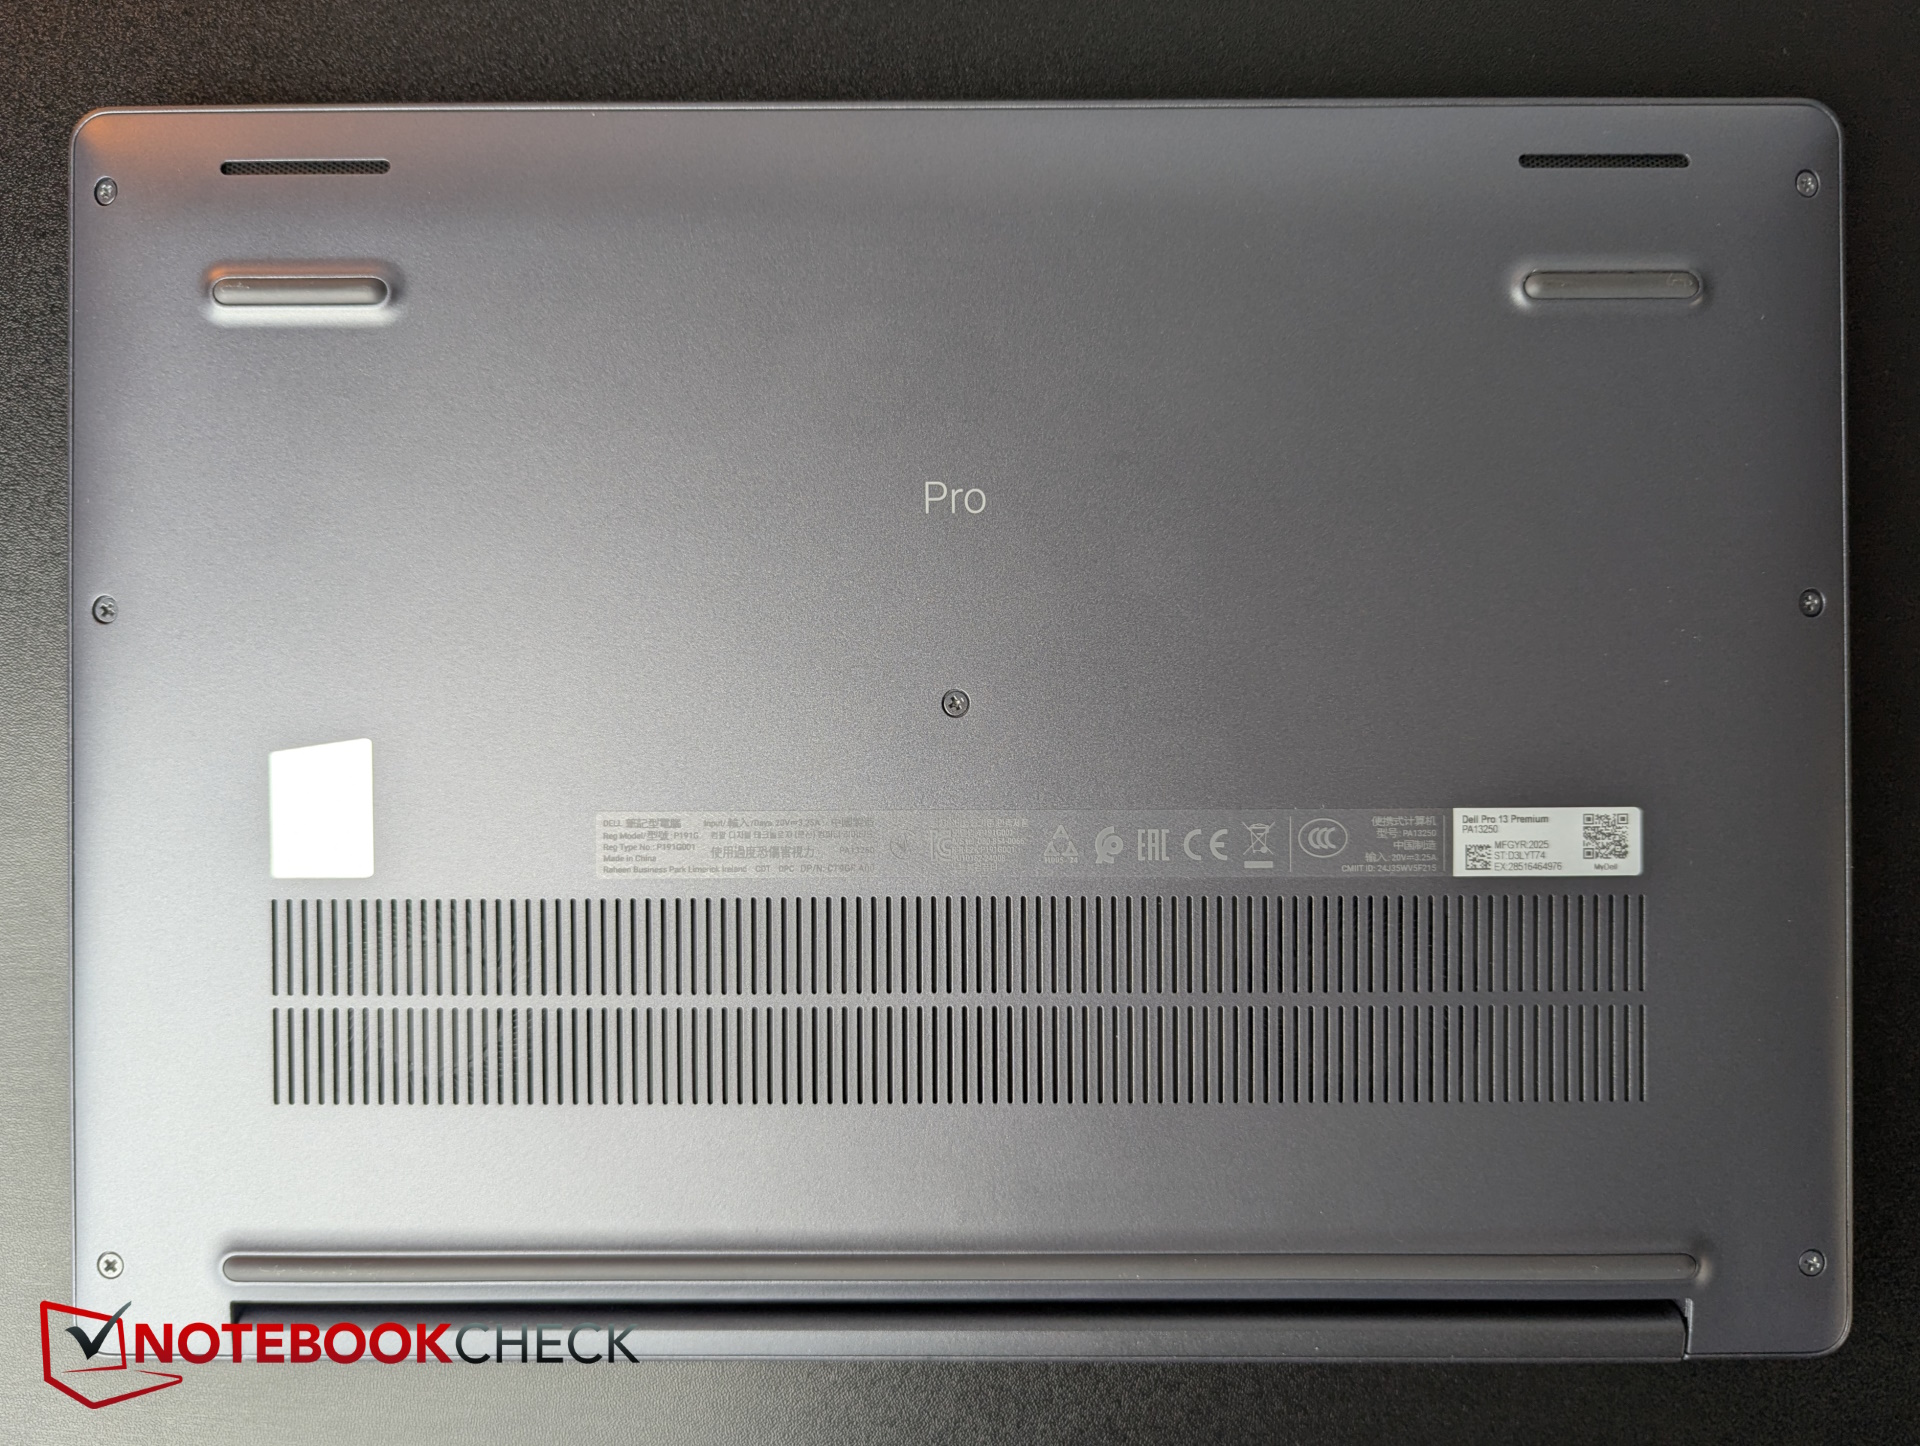
La carcasa de color gris oscuro está fabricada en un 90 por ciento de magnesio reciclado. Esto hace que la unidad base y la tapa de 180 grados sean muy estables, y no detectamos ningún chirrido al girar el dispositivo. El diseño parece extremadamente compacto y sencillo a la par que elegante.
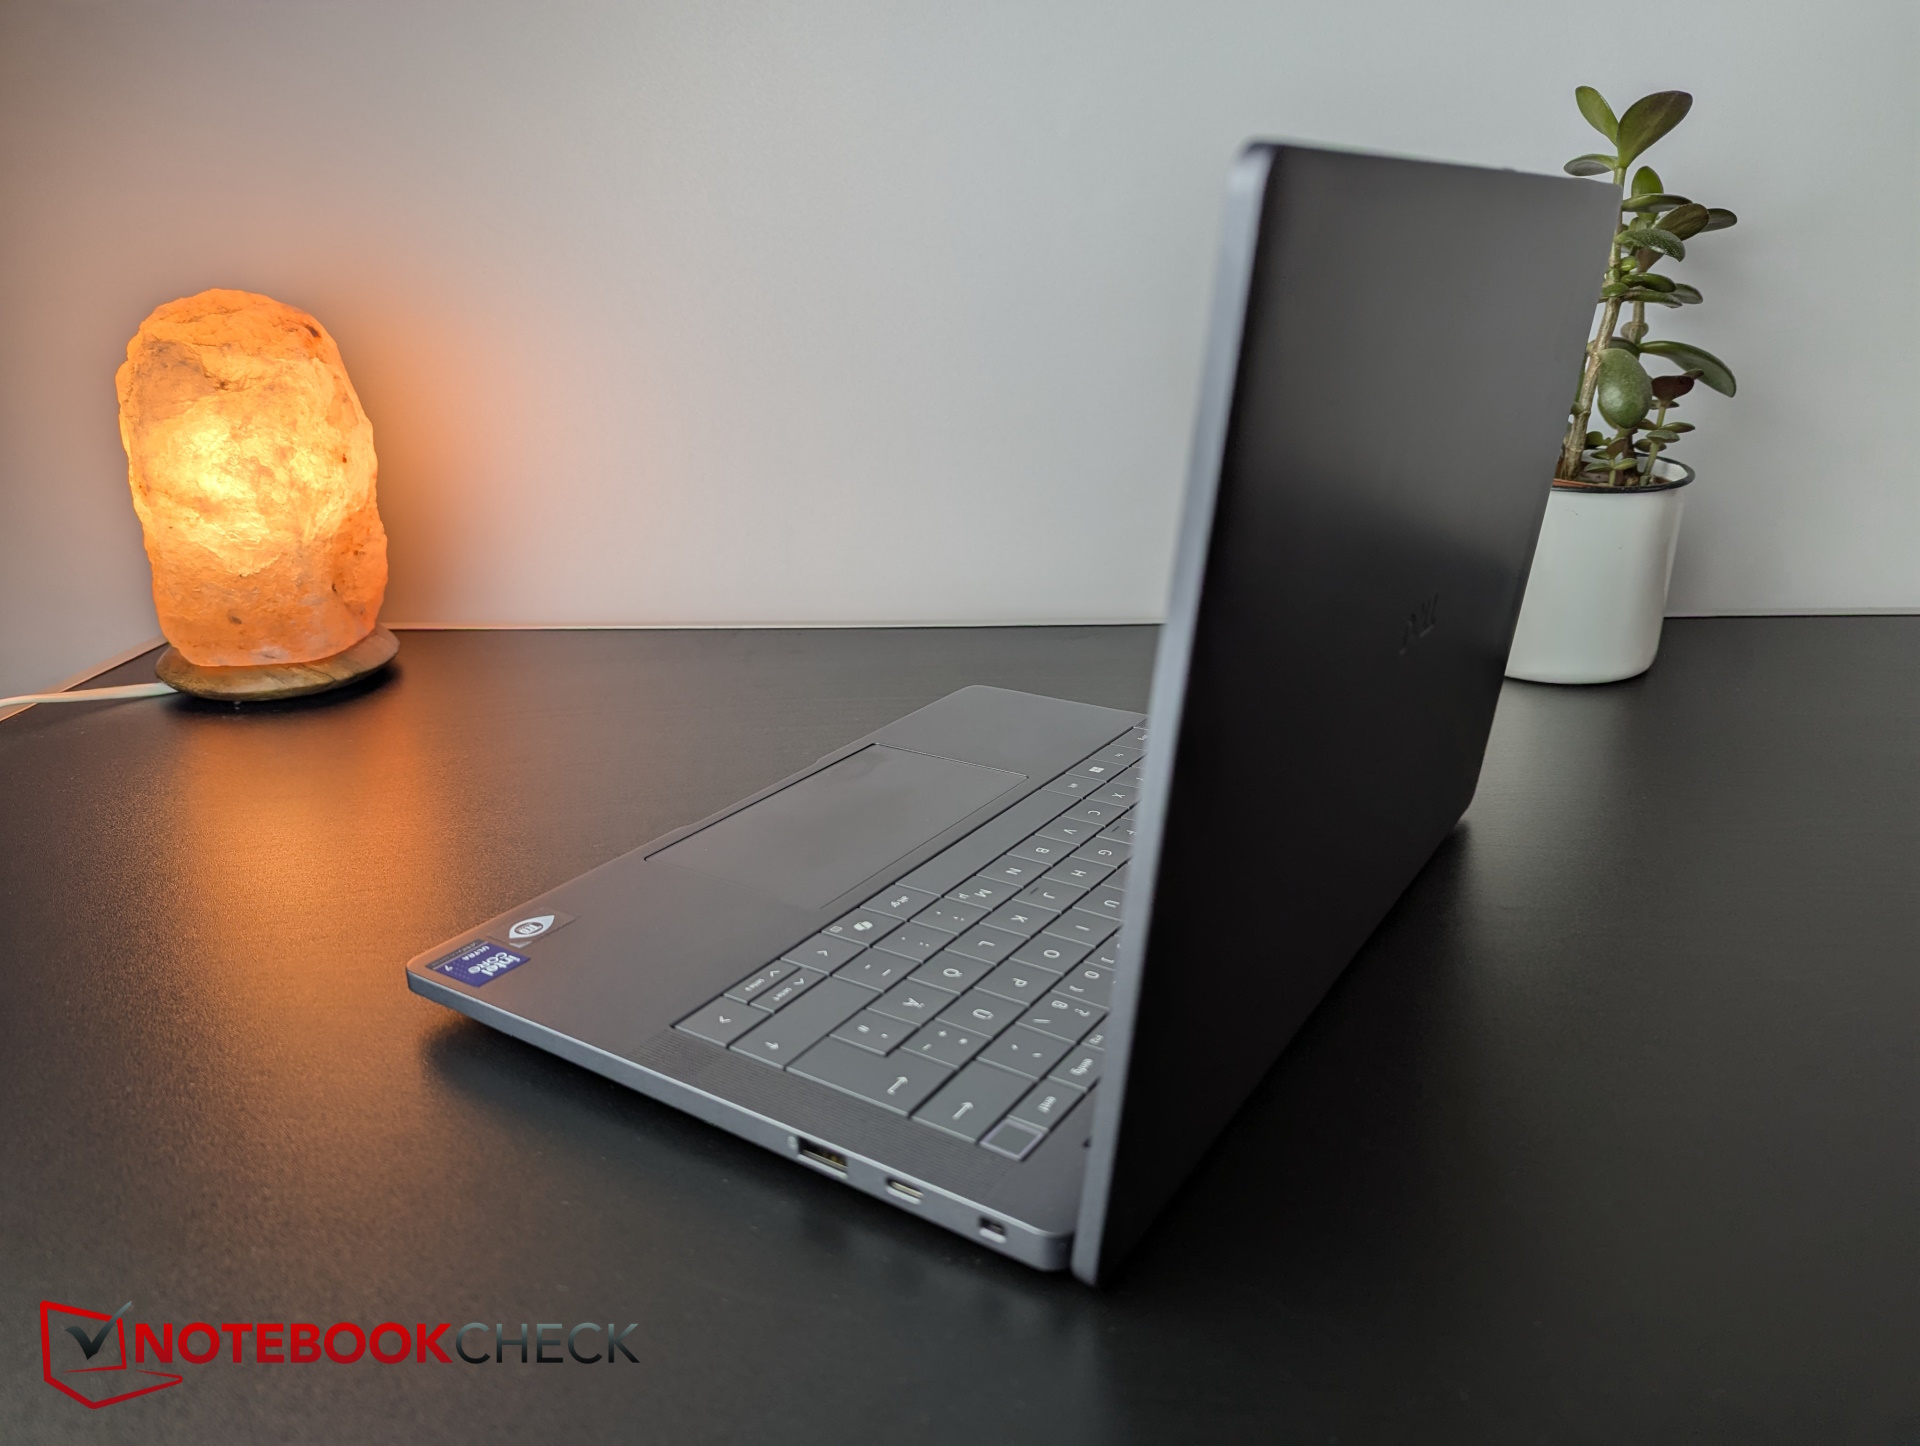
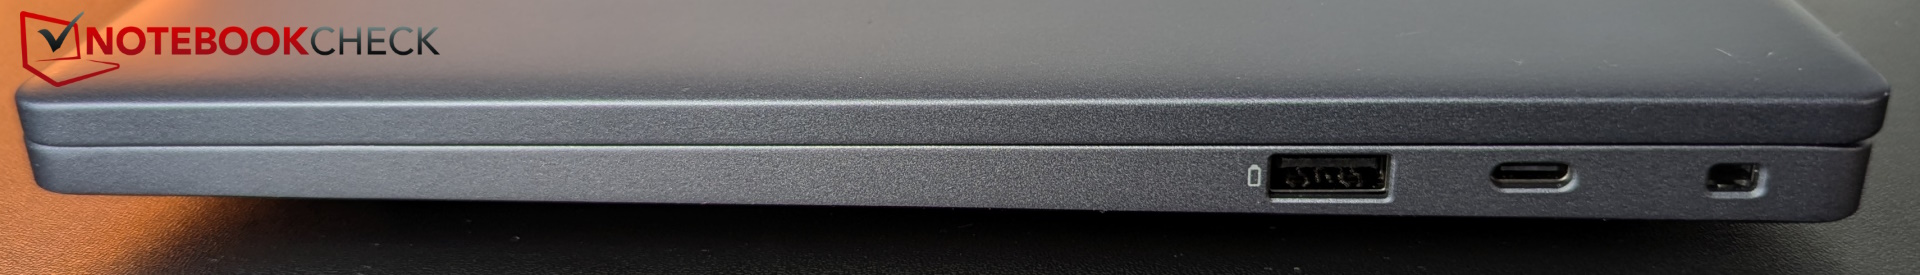
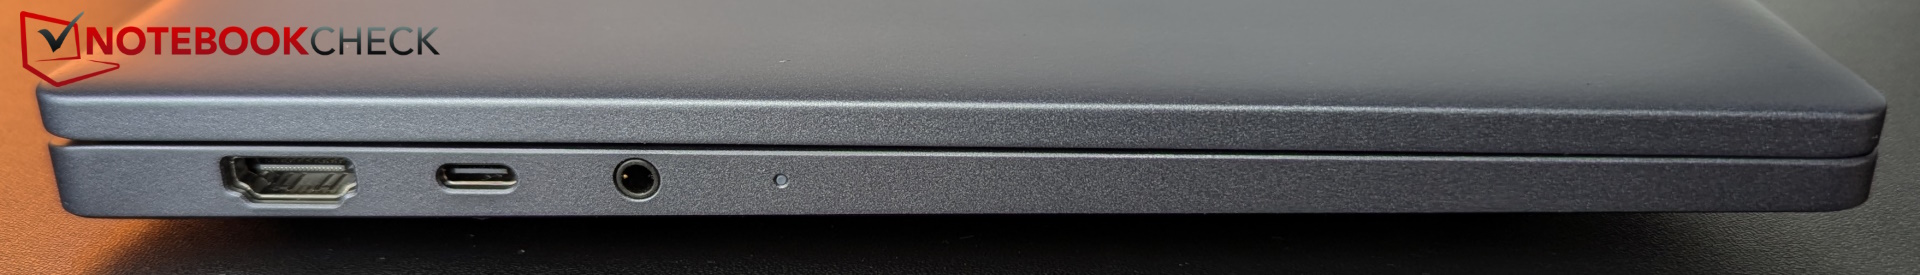
El Pro 13 Premium cuenta con dos puertos Thunderbolt 4, uno a cada lado, y un puerto HDMI de tamaño completo. Hay un sensor de huellas dactilares integrado en el botón de encendido. No hay lector de tarjetas ni puerto LAN dedicado. Sin embargo, Dell ofrece Wi-Fi 7. Una ranura para tarjeta SIM es opcional.
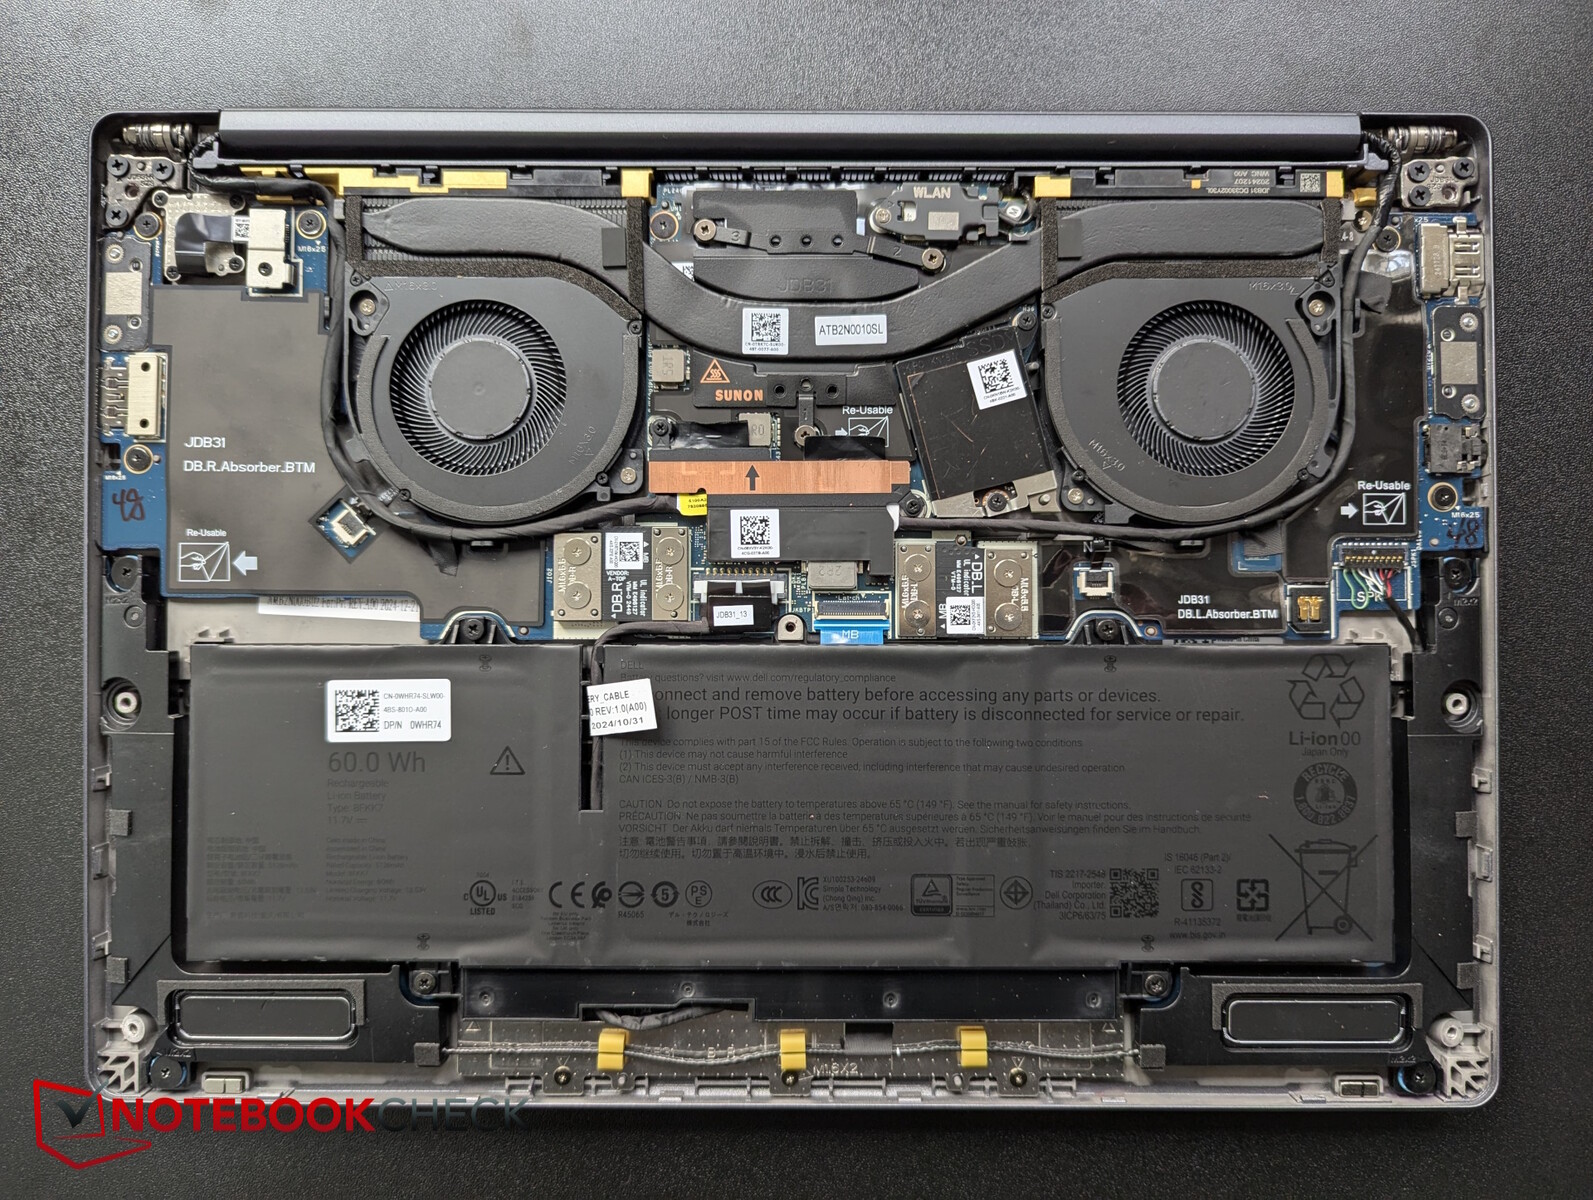
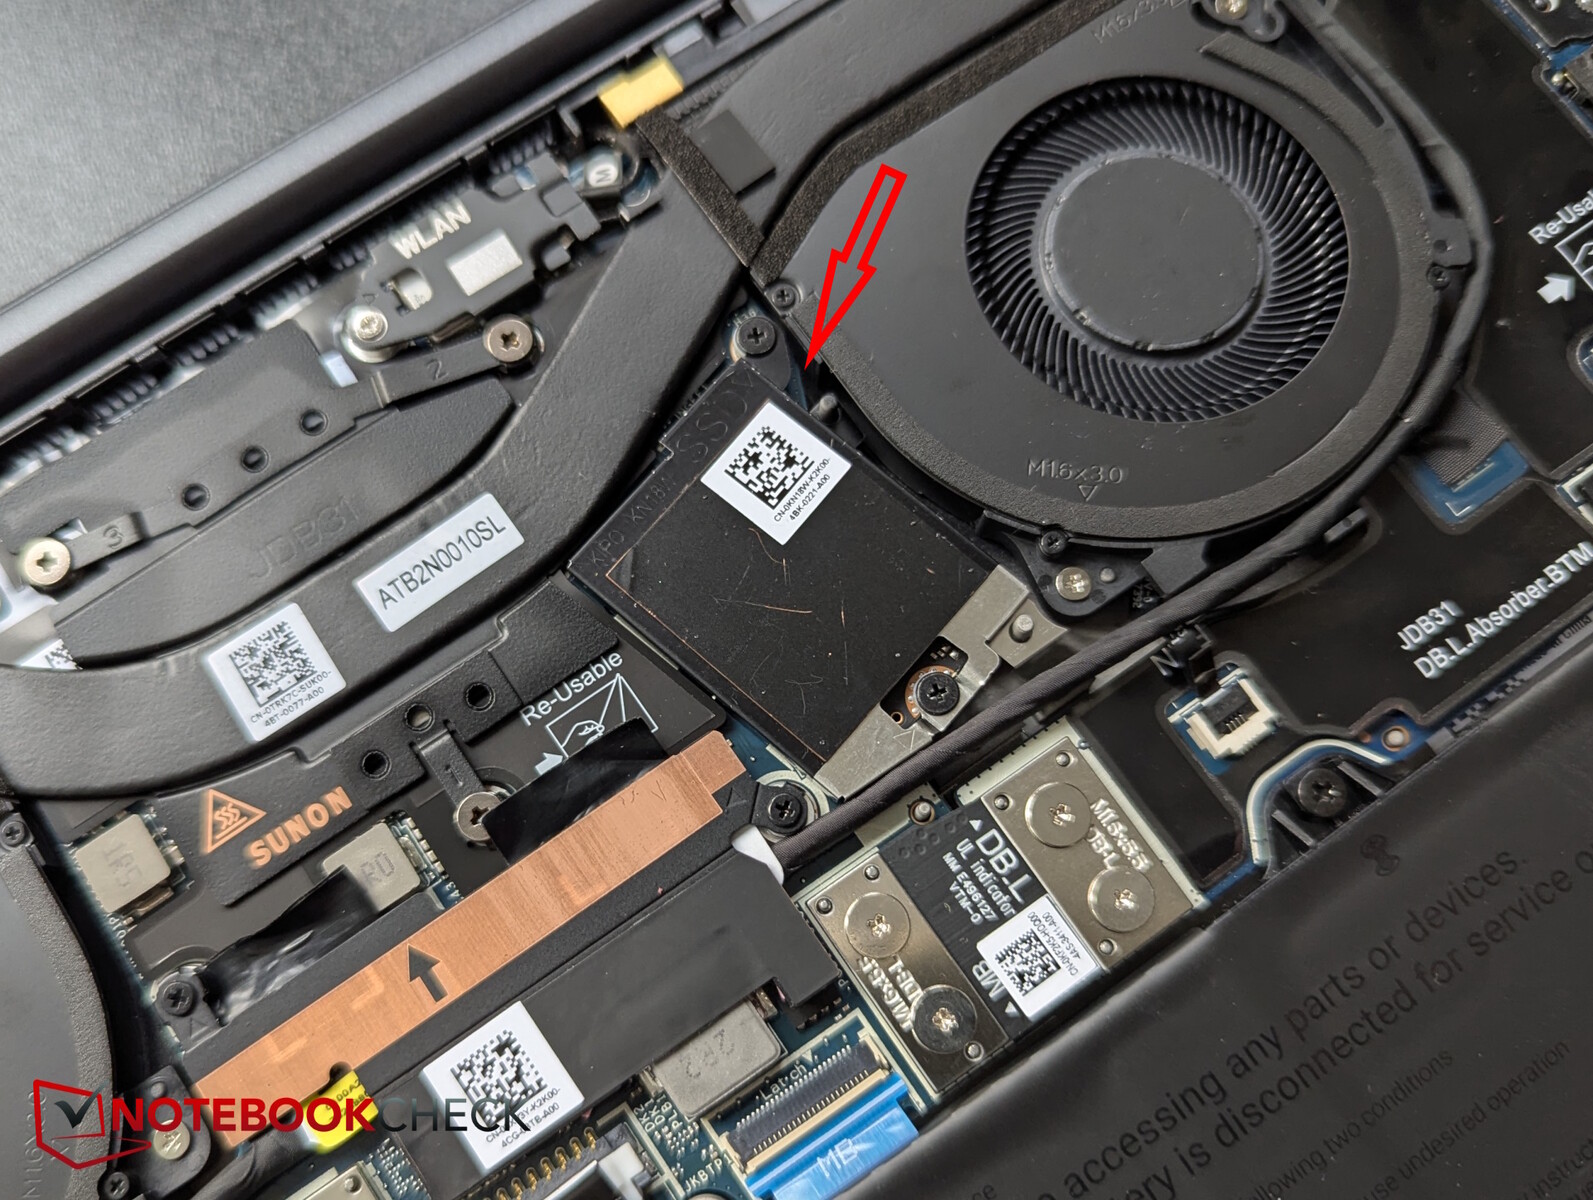
El portátil profesional es relativamente fácil de abrir con los tornillos Phillips que quedan en la placa base. Sin embargo, la RAM y el módulo Wi-Fi están instalados permanentemente en el interior, y la unidad SSD es sólo del pequeño formato M.2 2230 y carece de una segunda ranura.
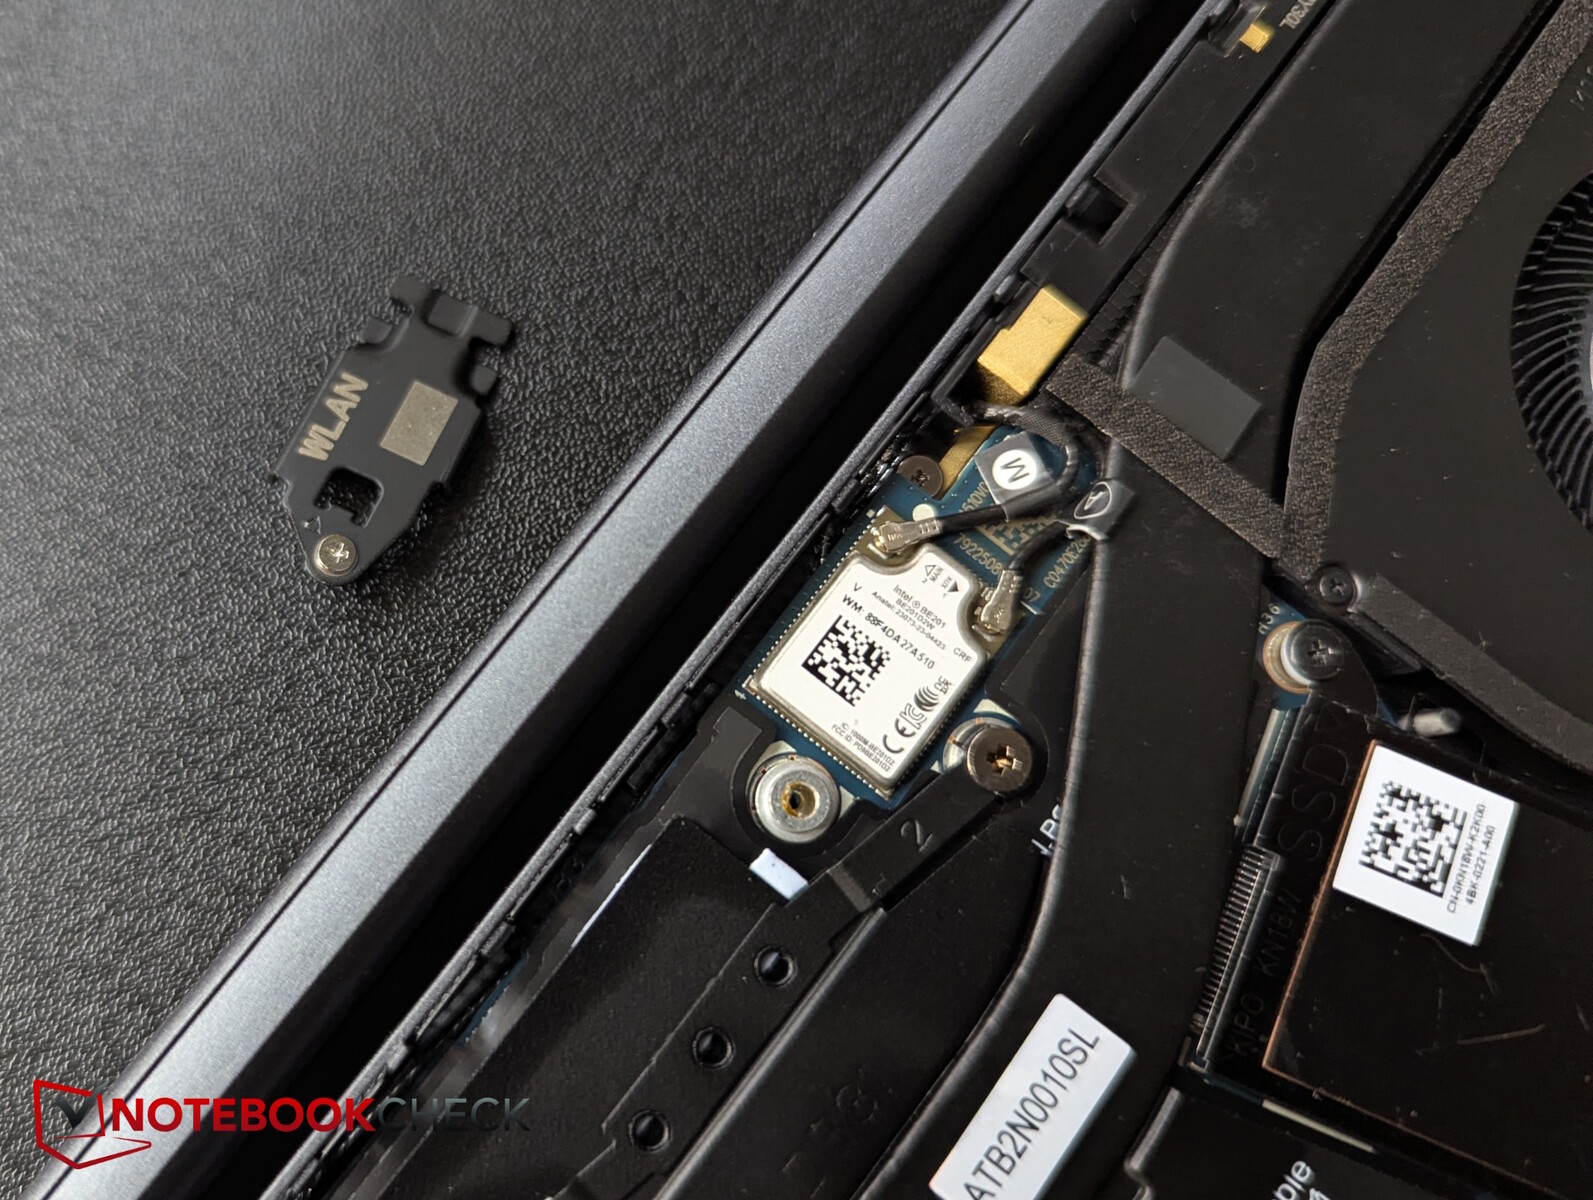

Con 8 MP, la webcam IR tiene una resolución inusualmente alta. Esto confiere a las imágenes de prueba una buena nitidez, pero las desviaciones de color son de medias a altas, especialmente en la gama de verdes. El módulo WiFi 7 ofrece velocidades de transferencia consistentemente altas.


Sostenibilidad
Según Asus, el Pro 13 Premium cuenta con la certificación ENERGY STAR, el registro EPEAT Gold y el sello Climate+. También cumple con la última certificación TCO Generation 9 de consumo energético y reparabilidad.
Los materiales utilizados incluyen plástico PCR, magnesio reciclado, plástico de base biológica y cobalto reciclado, y el embalaje está fabricado con materiales 100% reciclados o renovables, que son principalmente cartón.
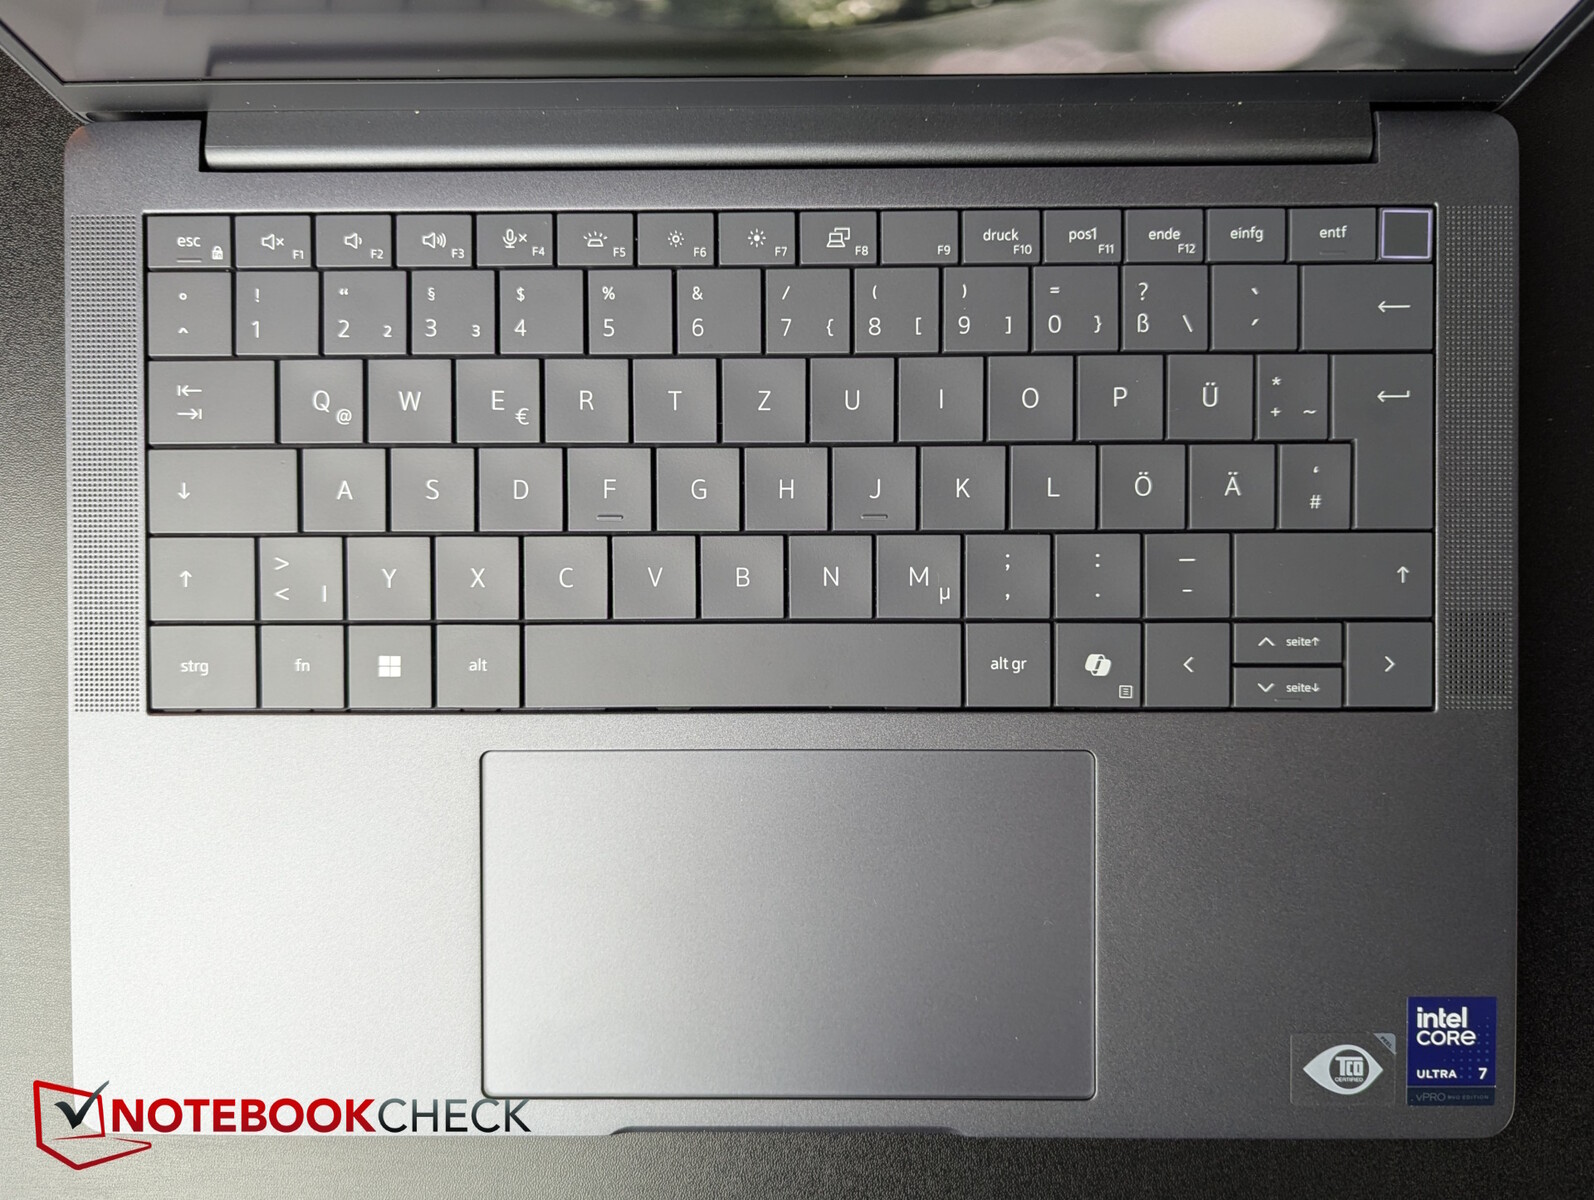
Dispositivos de entrada - El 13 Premium tiene un panel táctil para conferencias
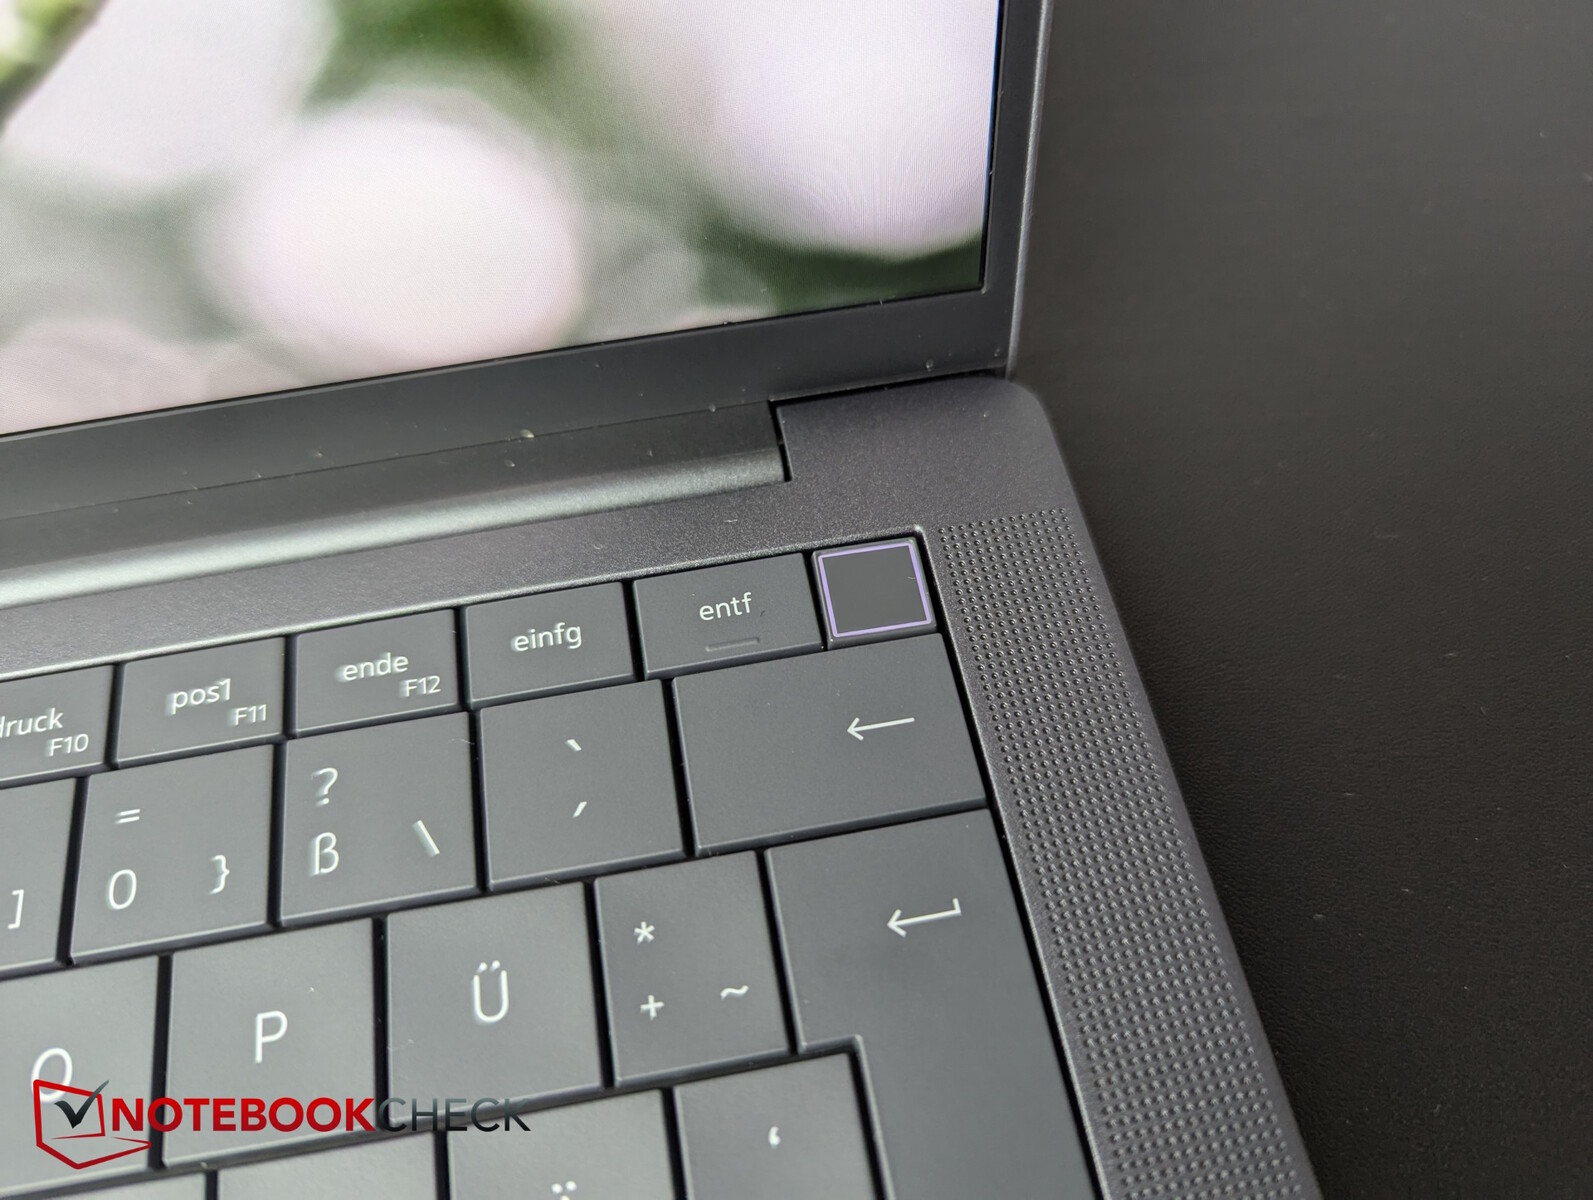
El Dell ofrece una disposición muy despejada y compacta con teclas grandes (aprox. 1,7 cm), sin espacios entre ellas, y las teclas de flecha verticales tienen la mitad de altura. El botón de encendido integrado en el teclado en la parte superior derecha también alberga un sensor de huellas dactilares.
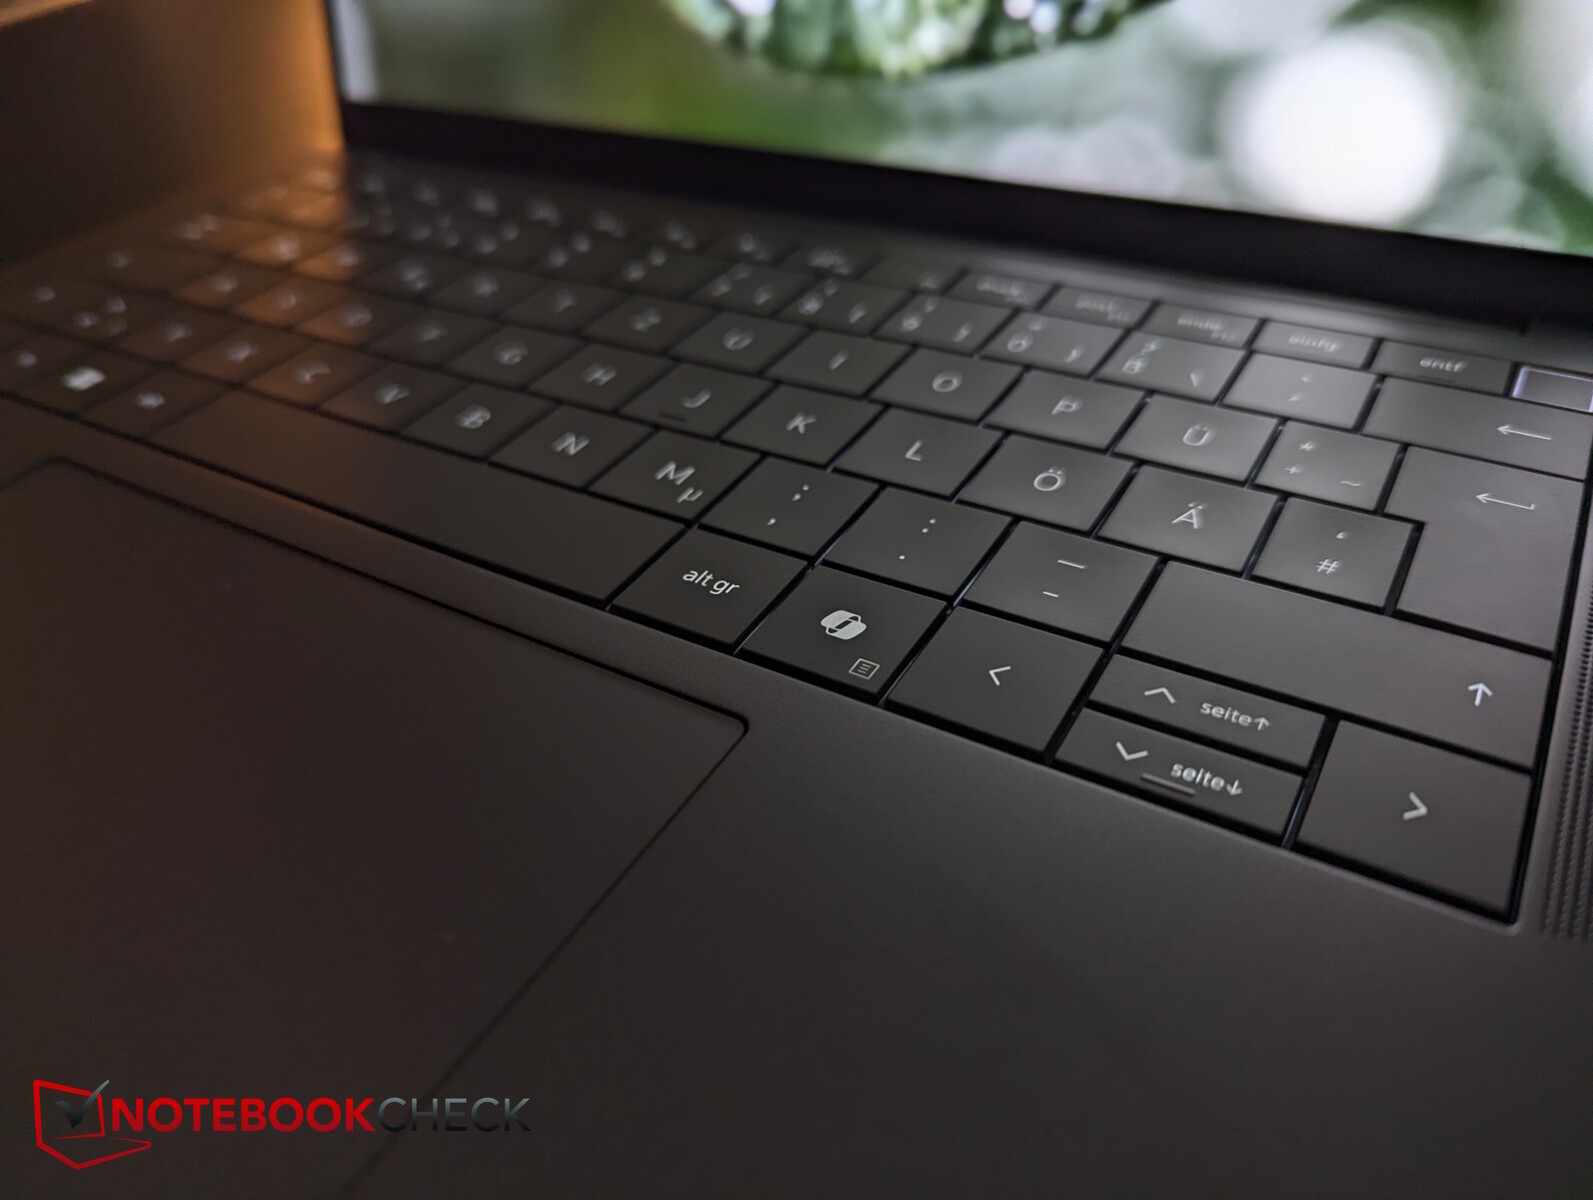
Las teclas poseen un recorrido entre superficial y medio, pero una respuesta tangible. Esto permite al usuario escribir con rapidez, y el ruido de pulsación es más que moderado. Se dice que el consumo de energía de la retroiluminación de dos etapas se ha reducido hasta en un 75% gracias a los mini LED.
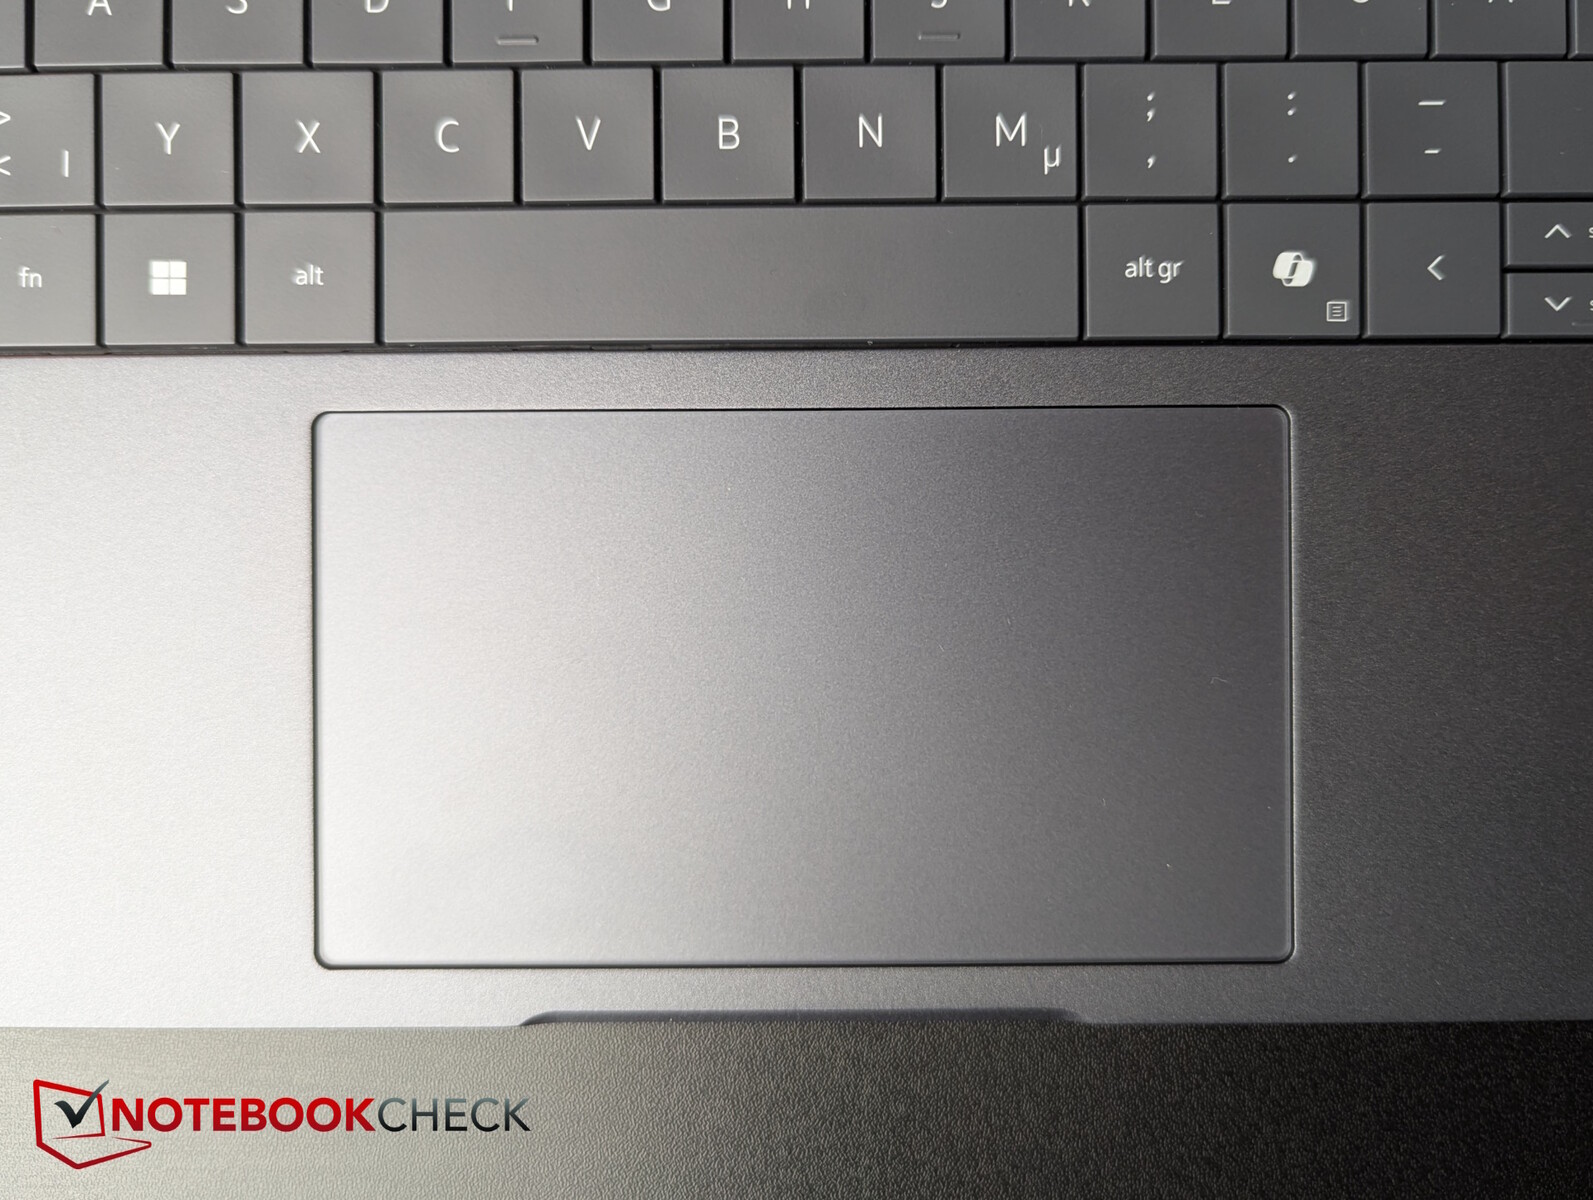
El panel táctil mide aproximadamente 12,5 x 7,1 cm, y su característica más destacada es la inclusión de teclas especiales para el videochat en la fila superior (cámara encendida/apagada, pantalla compartida, chat, micrófono encendido/apagado). Los símbolos táctiles sólo son visibles durante las llamadas Zoom o Microsoft Teams. La superficie es muy suave, pero si se acaba de lavar las manos o tiene los dedos ligeramente húmedos por cualquier otro motivo, tartamudeará considerablemente. Los silenciosos clics de los botones integrados del ratón proporcionan una respuesta agradable y se activan de forma fiable.
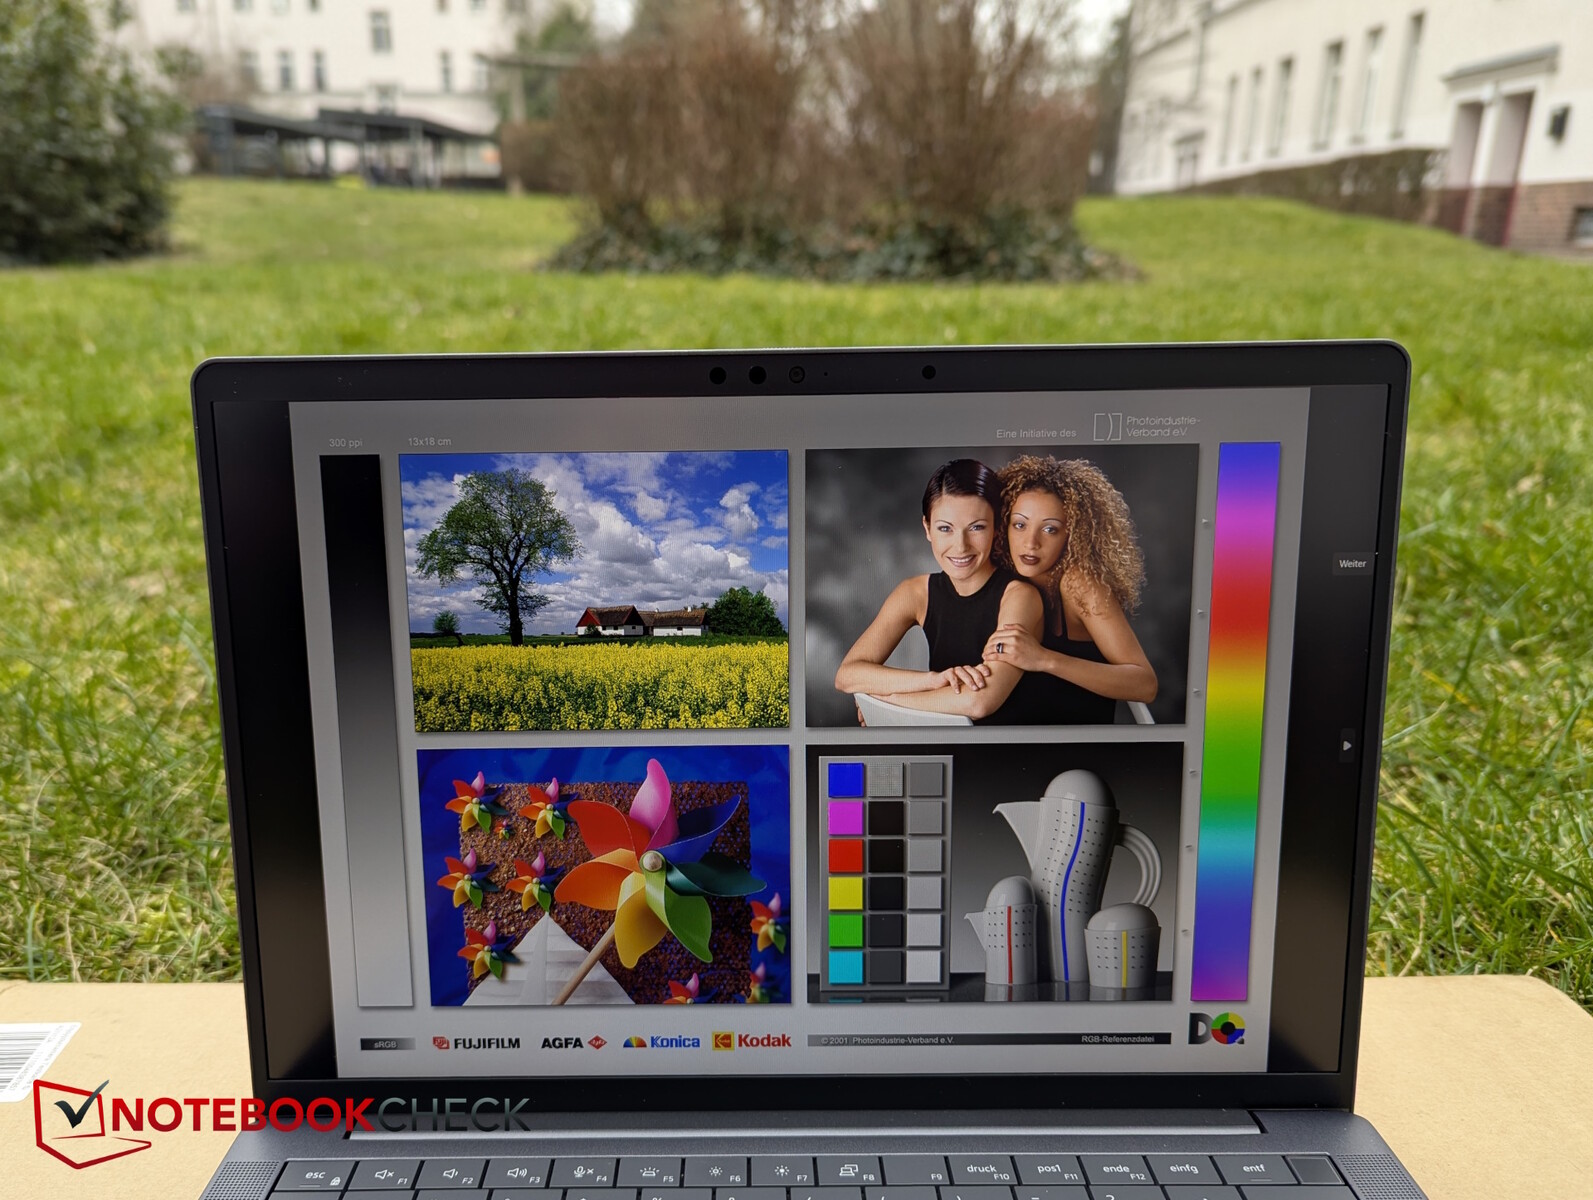
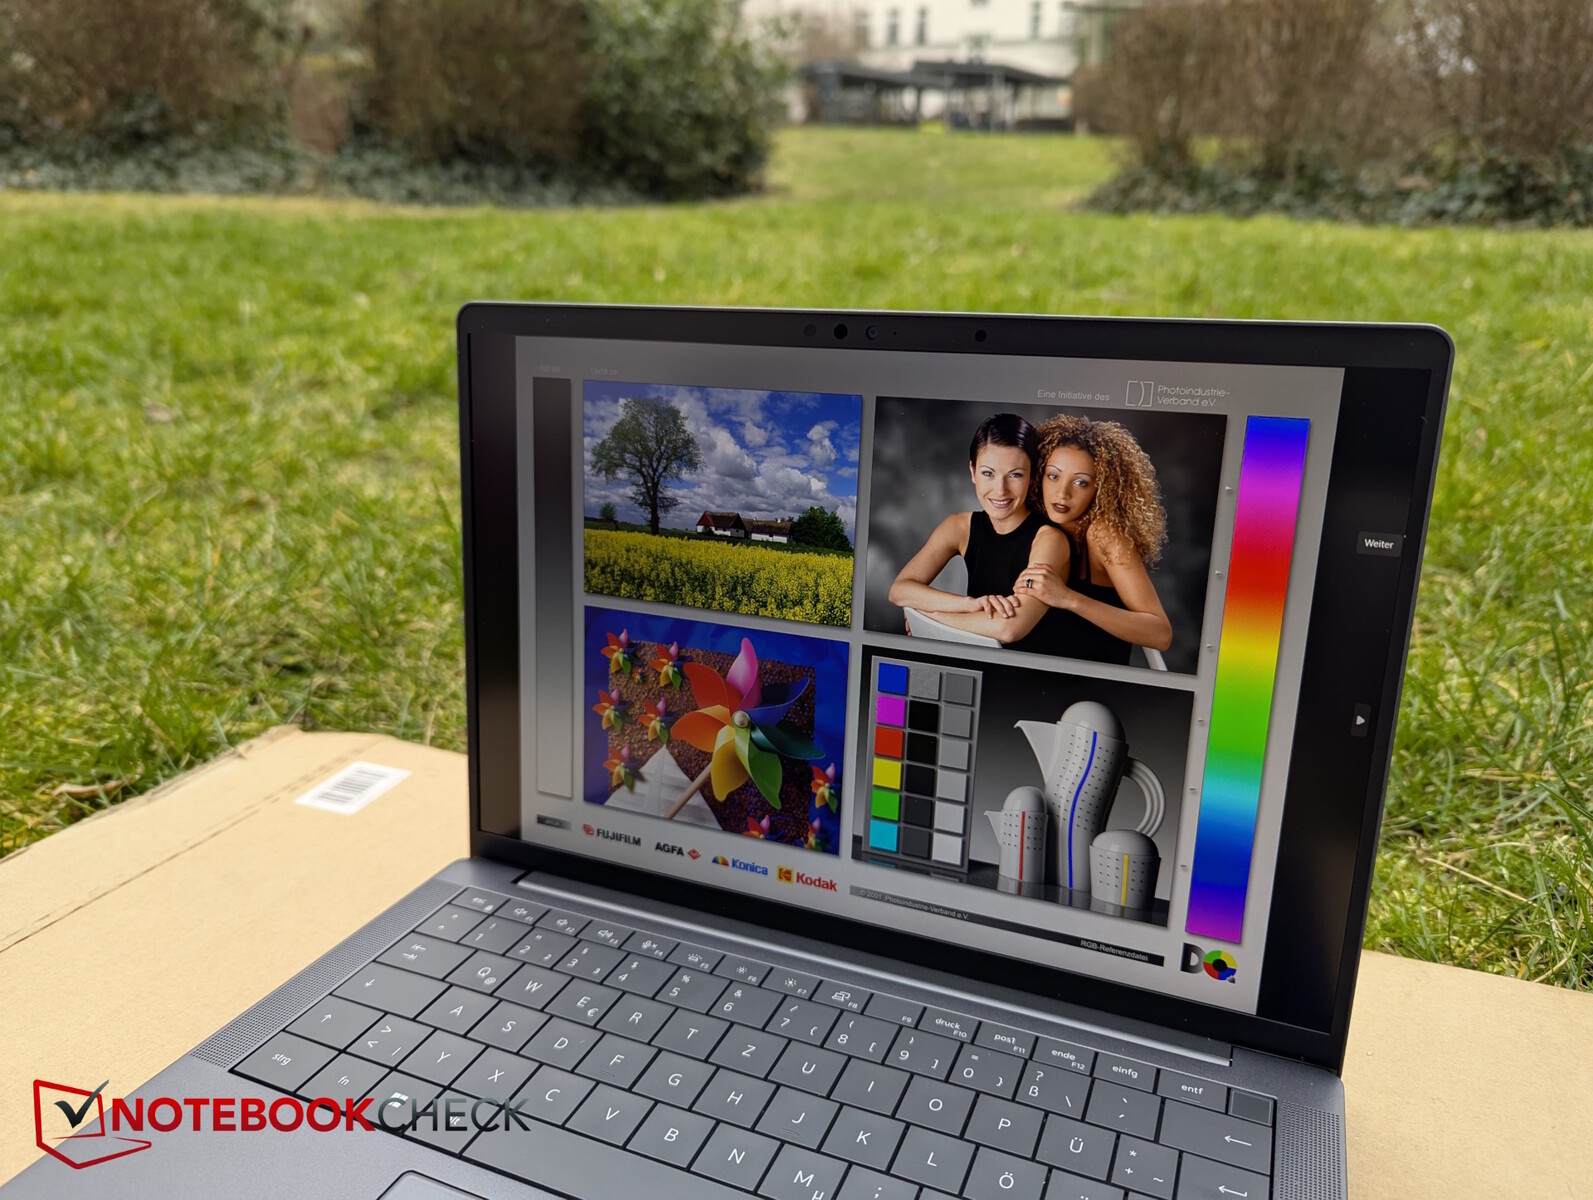
Pantalla - Un panel de oficina de alto contraste con opciones adicionales
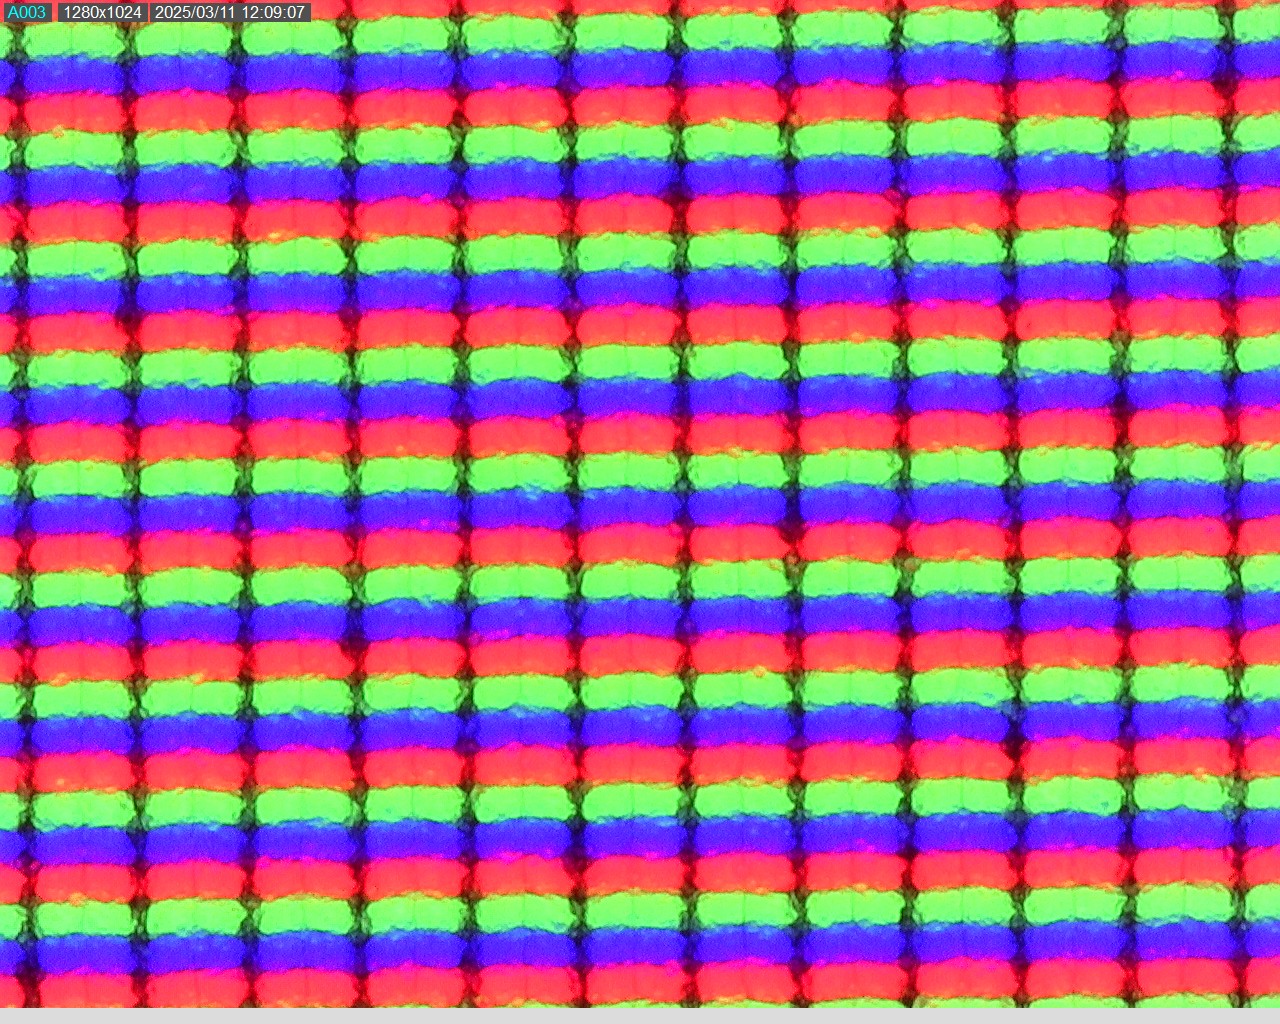
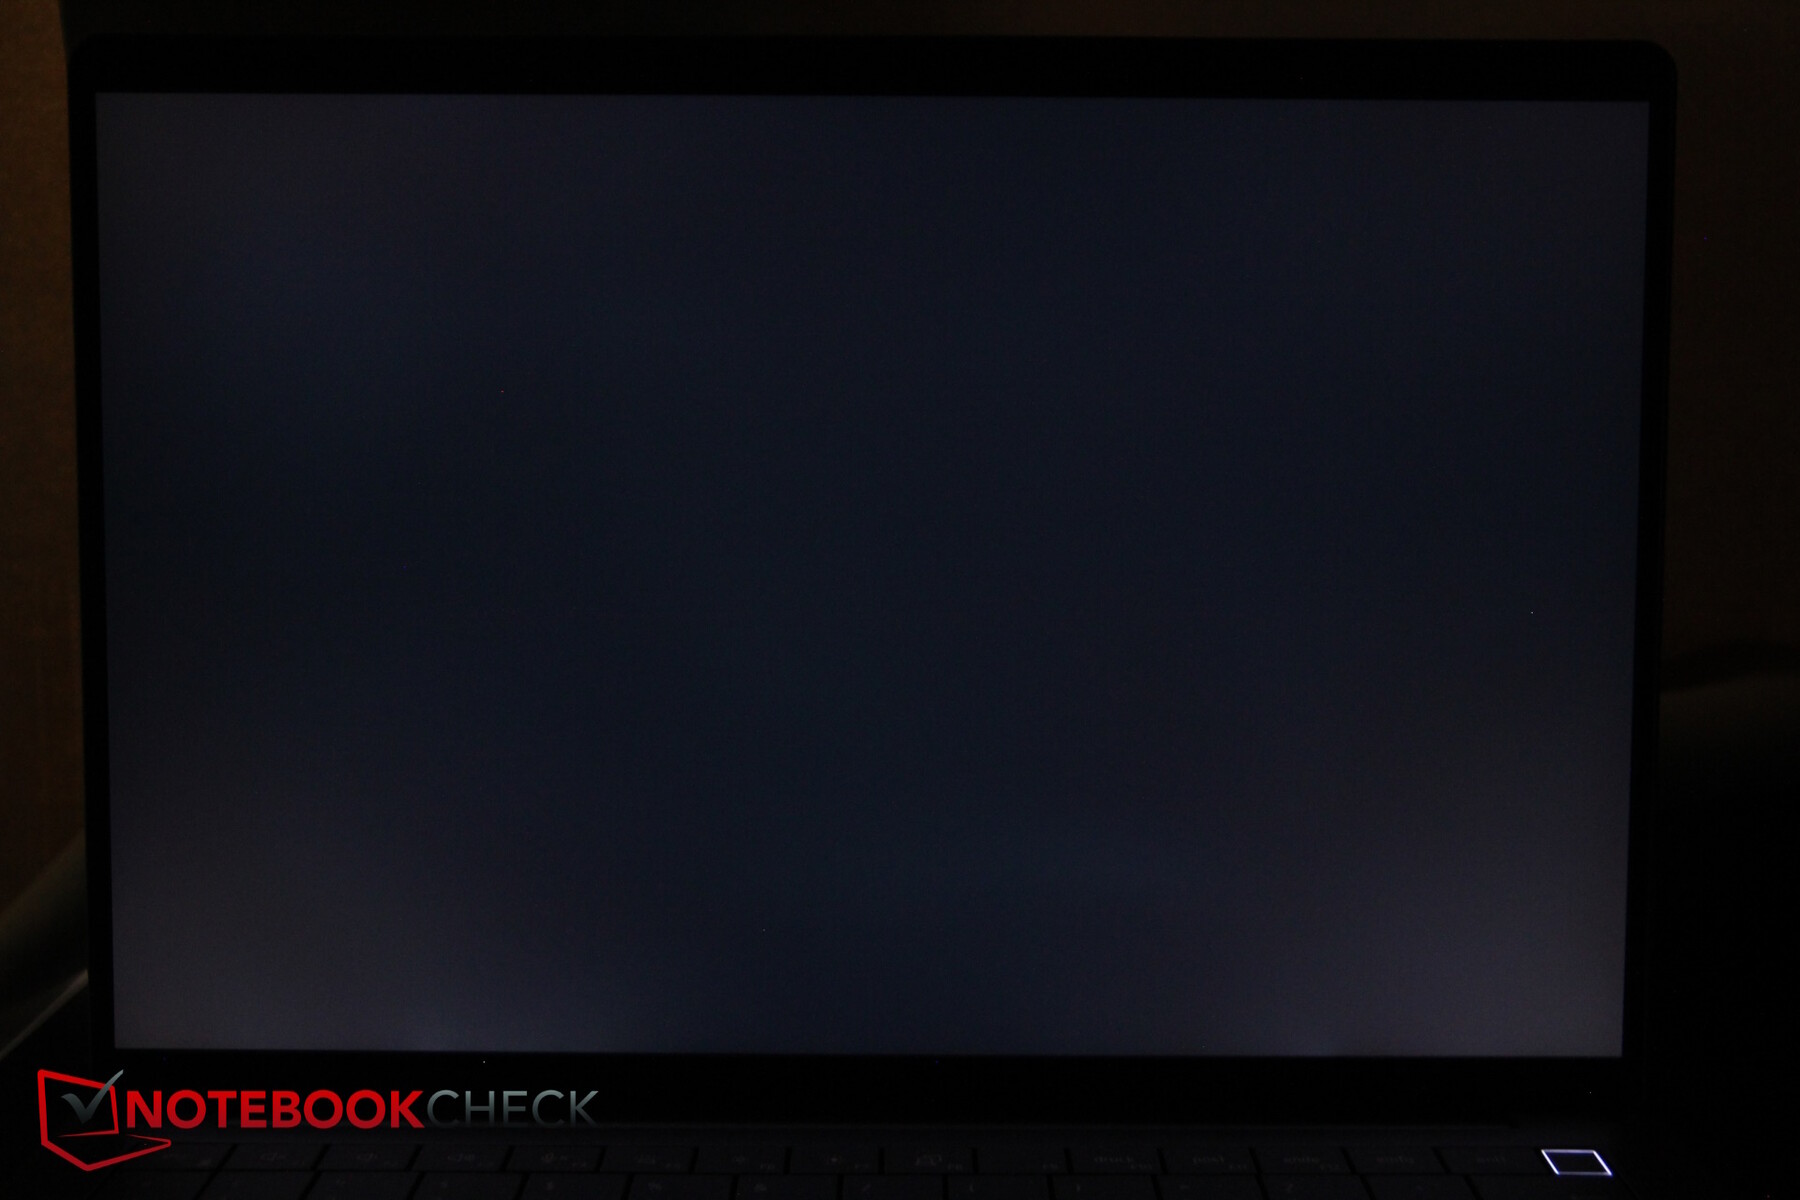
Hay varias opciones de pantalla, pero lo que vemos aquí es una pantalla mate, con relación de aspecto 16:10, de 1.920 x 1.200 píxeles, con un brillo oficial de 400 nits y sin entrada táctil. También hay una versión de 300 nits, así como la opción superior, que tiene una resolución de 2.560 x 1.600 píxeles, 500 nits y funcionalidad táctil. Dell destaca que todas sus pantallas son especialmente eficientes desde el punto de vista energético.
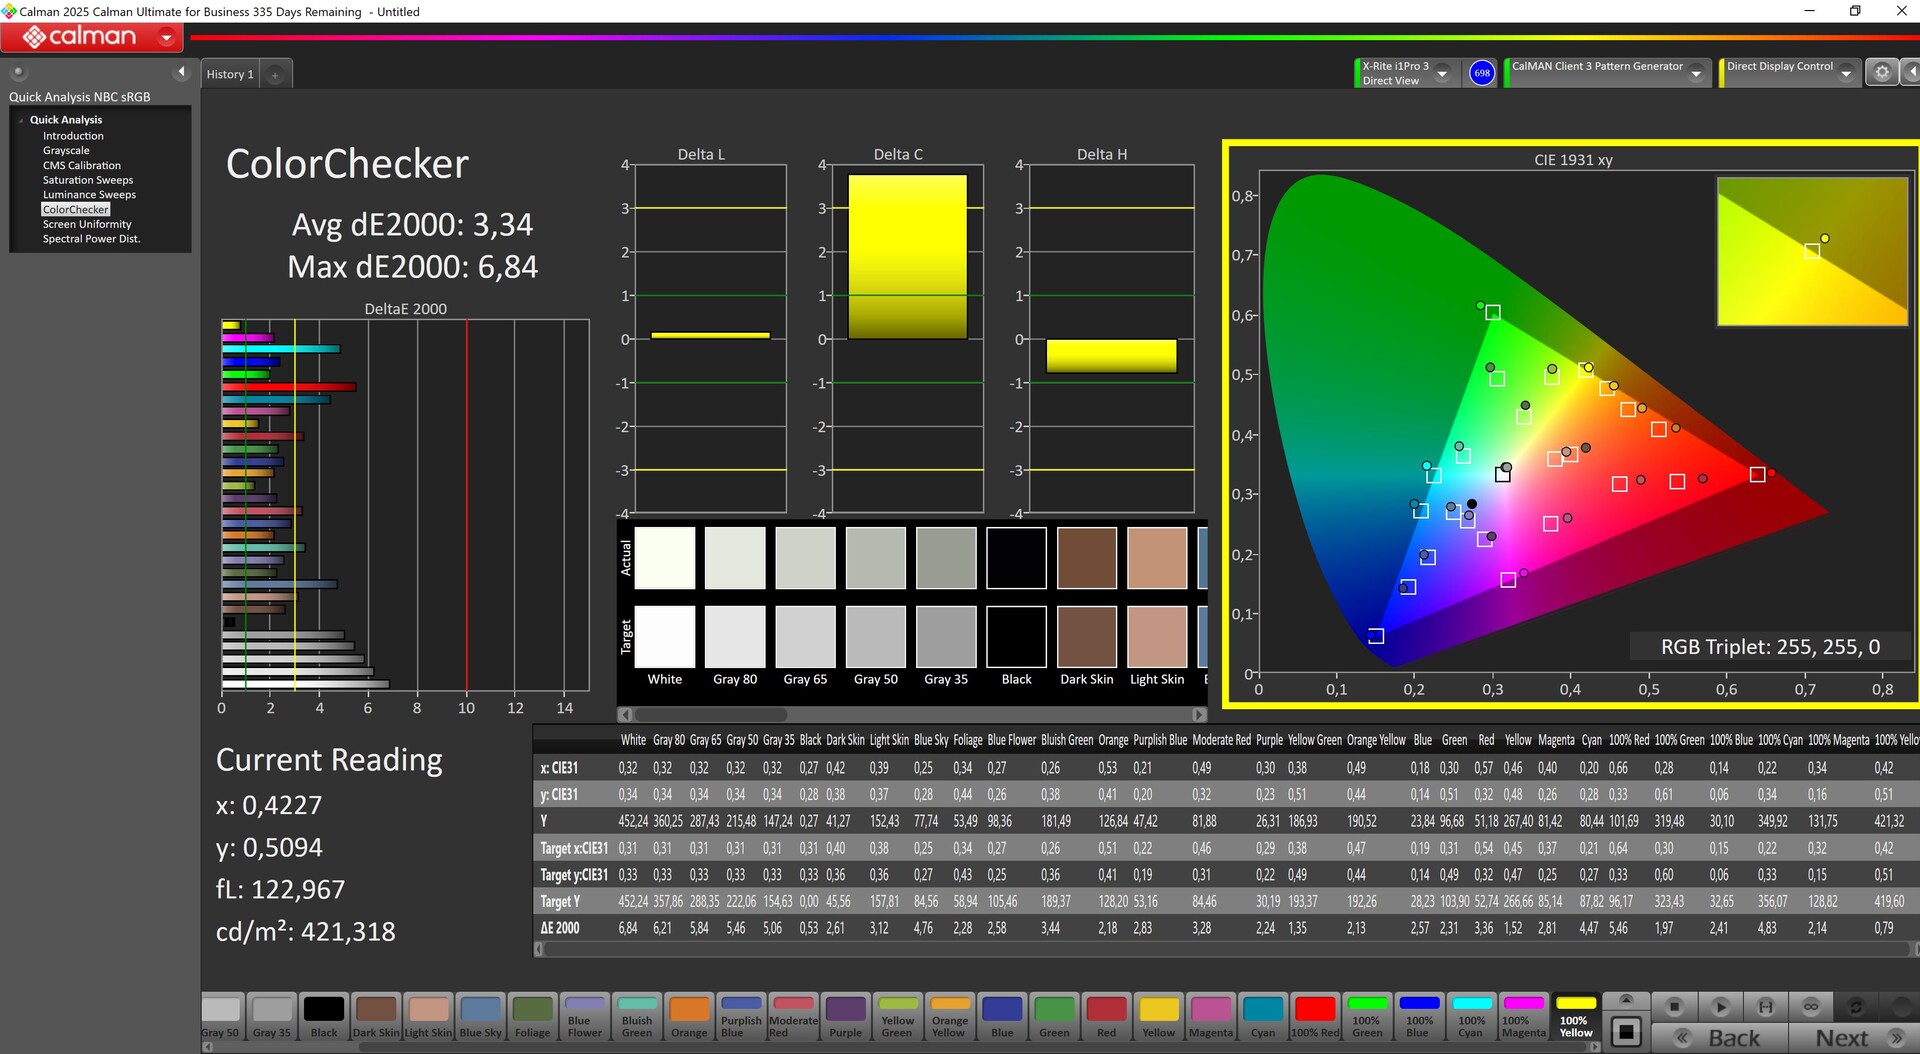
Medimos un brillo medio bien iluminado de 460 nits. El contraste también es más que decente, gracias al nivel de negro relativamente bajo. AdobeRGB y Display P3 se cubren en torno al 75 por ciento, y sRGB casi por completo.
Los tiempos de respuesta, sin embargo, son bastante lentos, y el panel sólo admite 60 Hz.
| |||||||||||||||||||||||||
iluminación: 89 %
Brillo con batería: 456 cd/m²
Contraste: 1983:1 (Negro: 0.23 cd/m²)
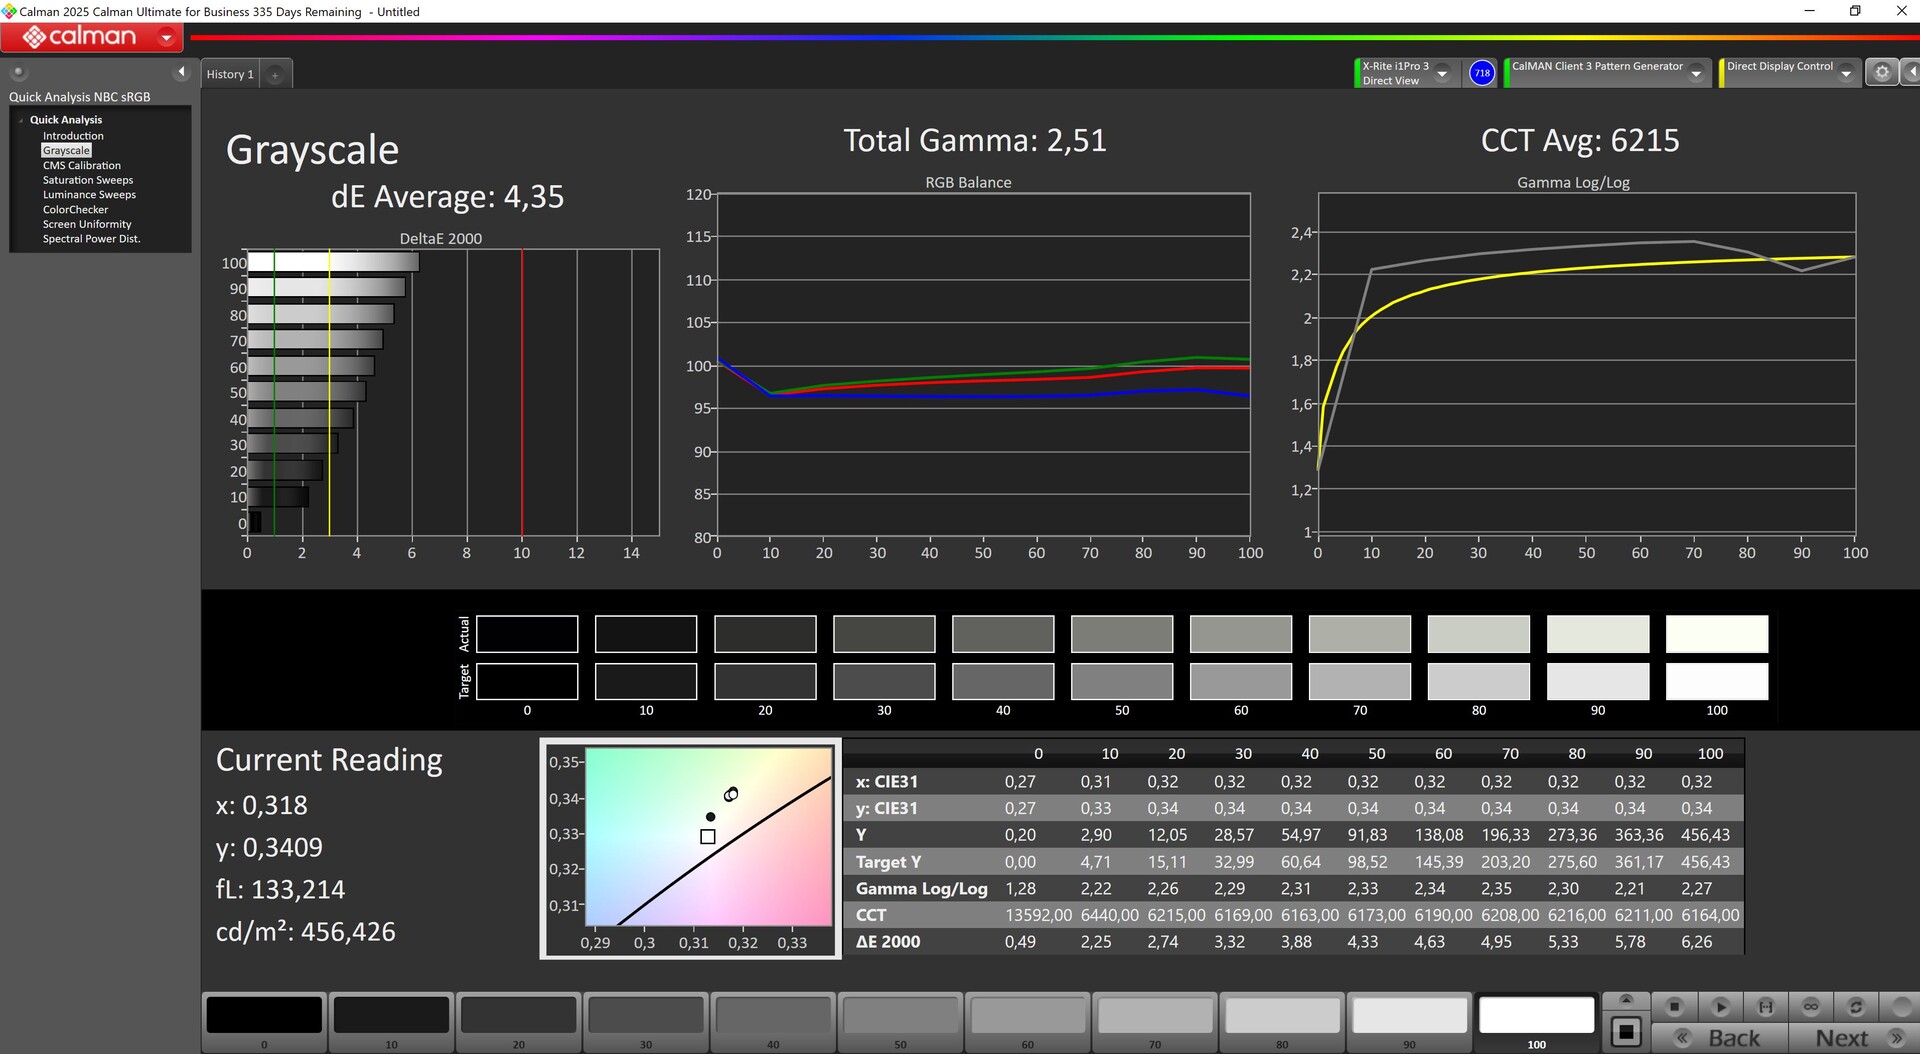
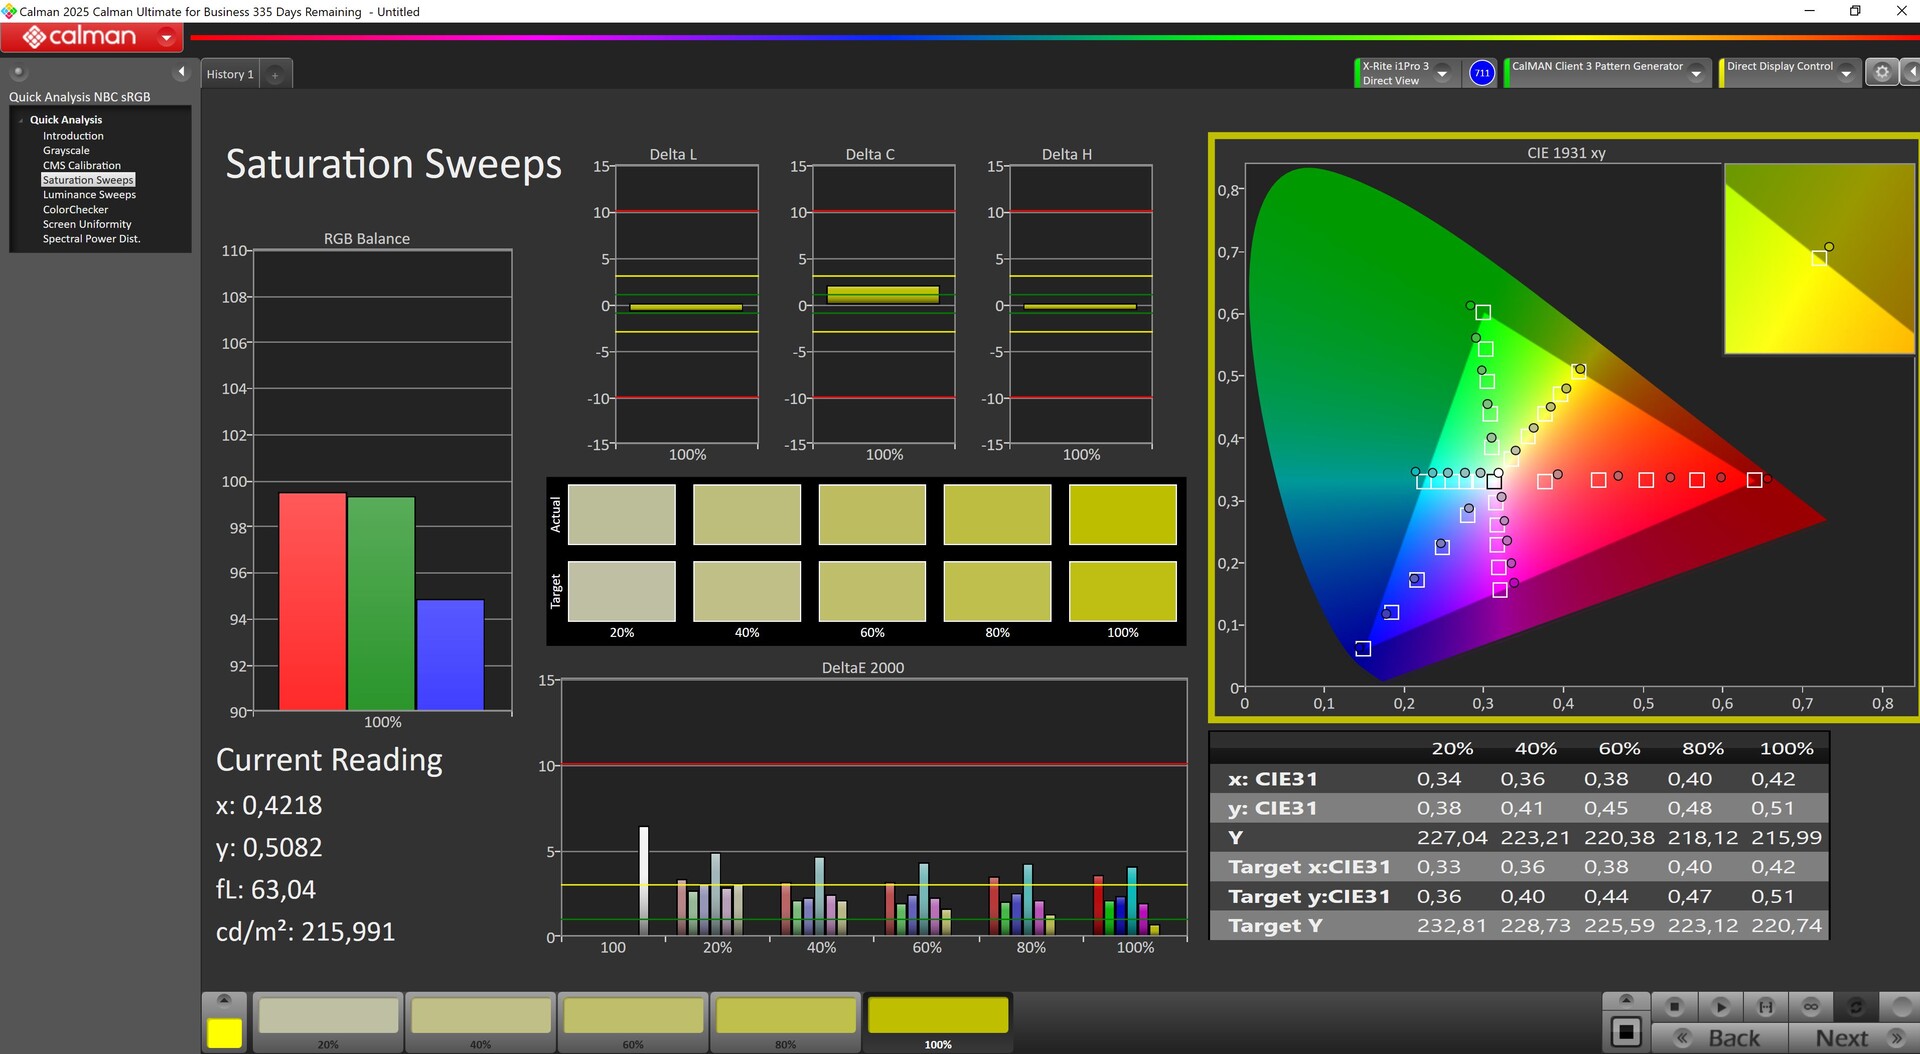
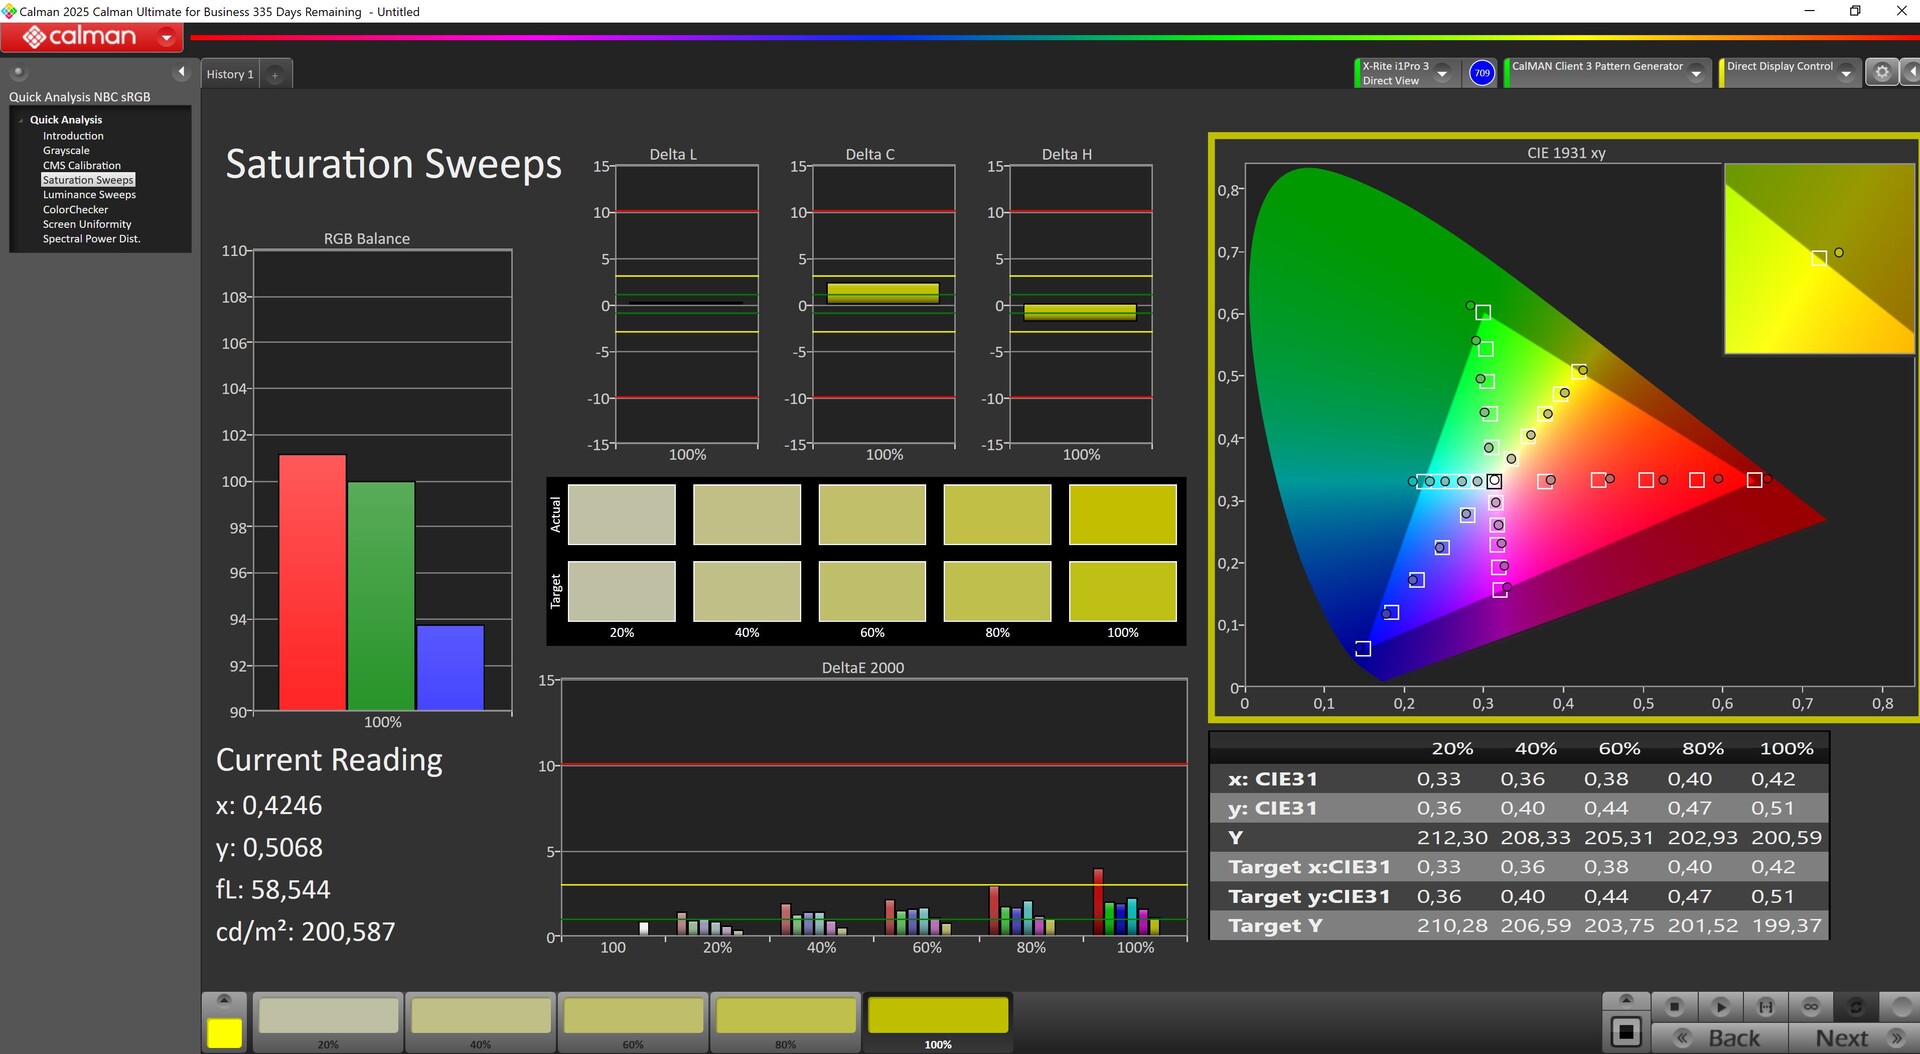
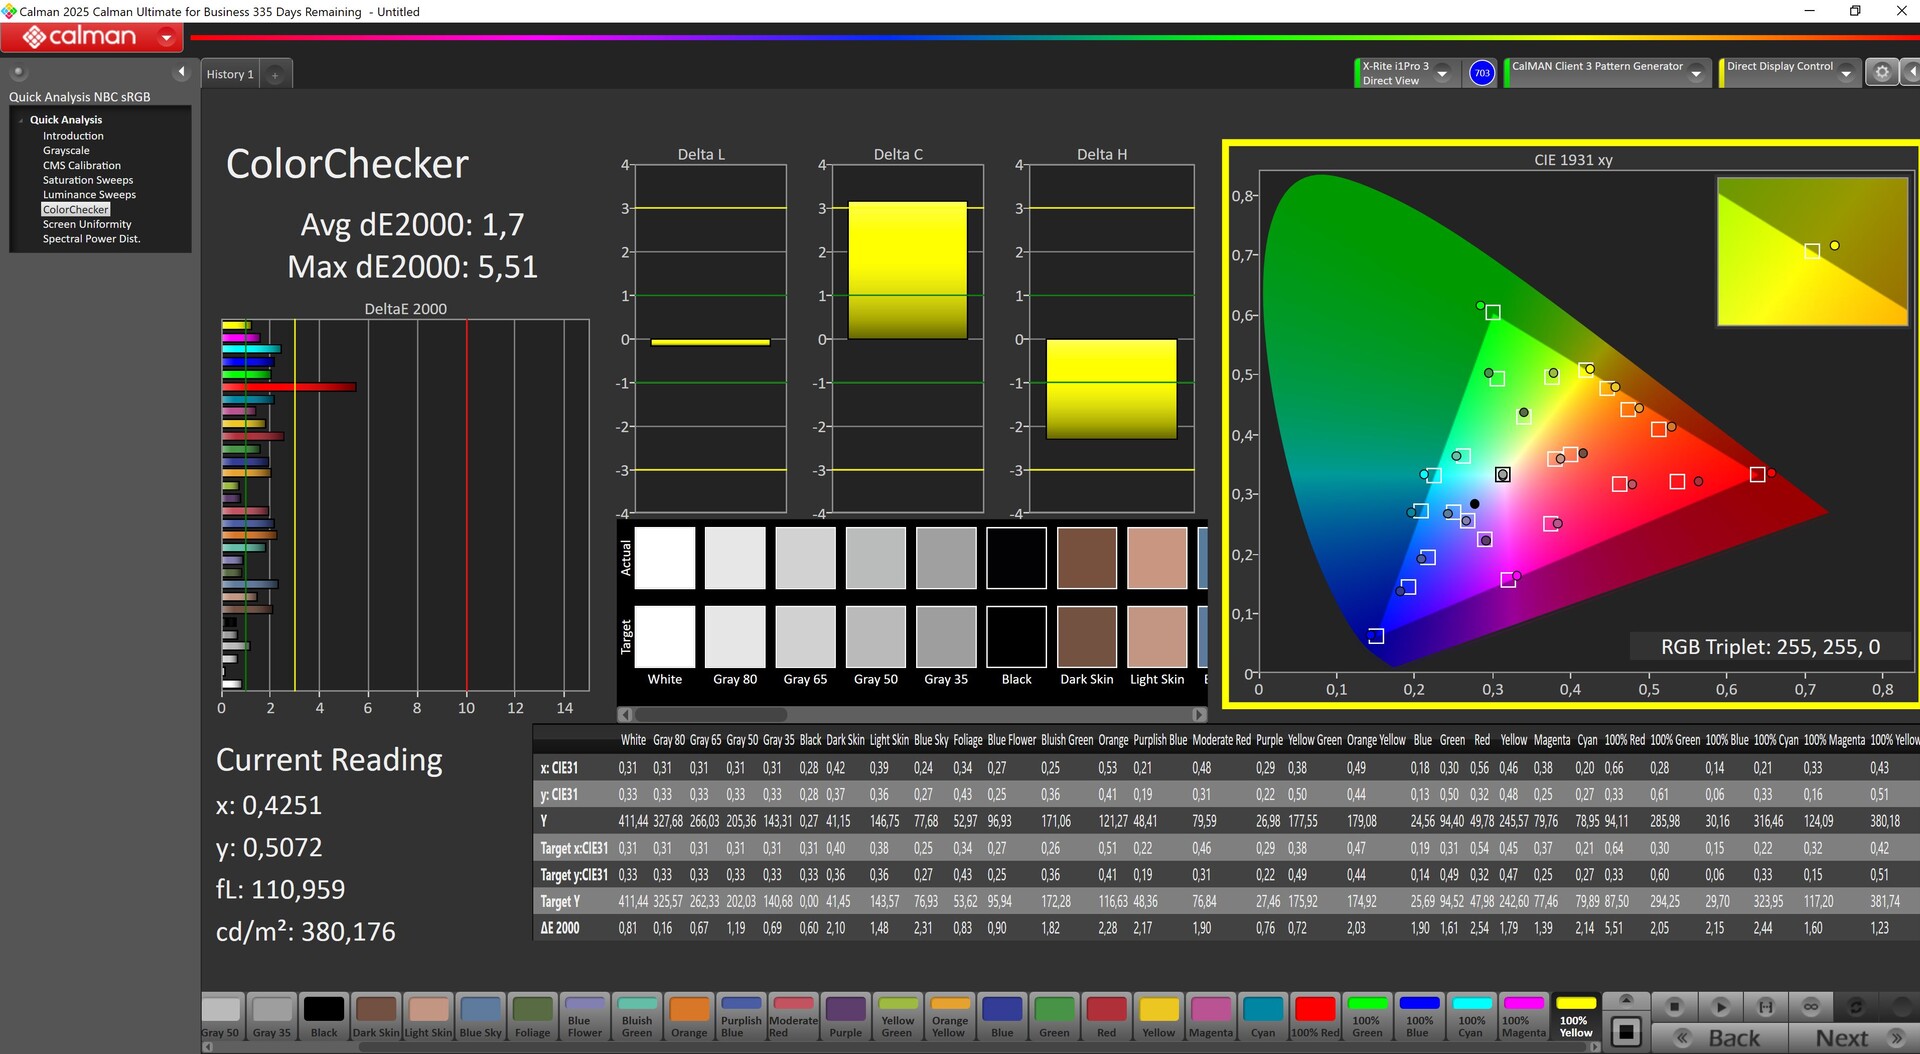
ΔE Color 3.3 | 0.5-29.43 Ø4.87, calibrated: 1.7
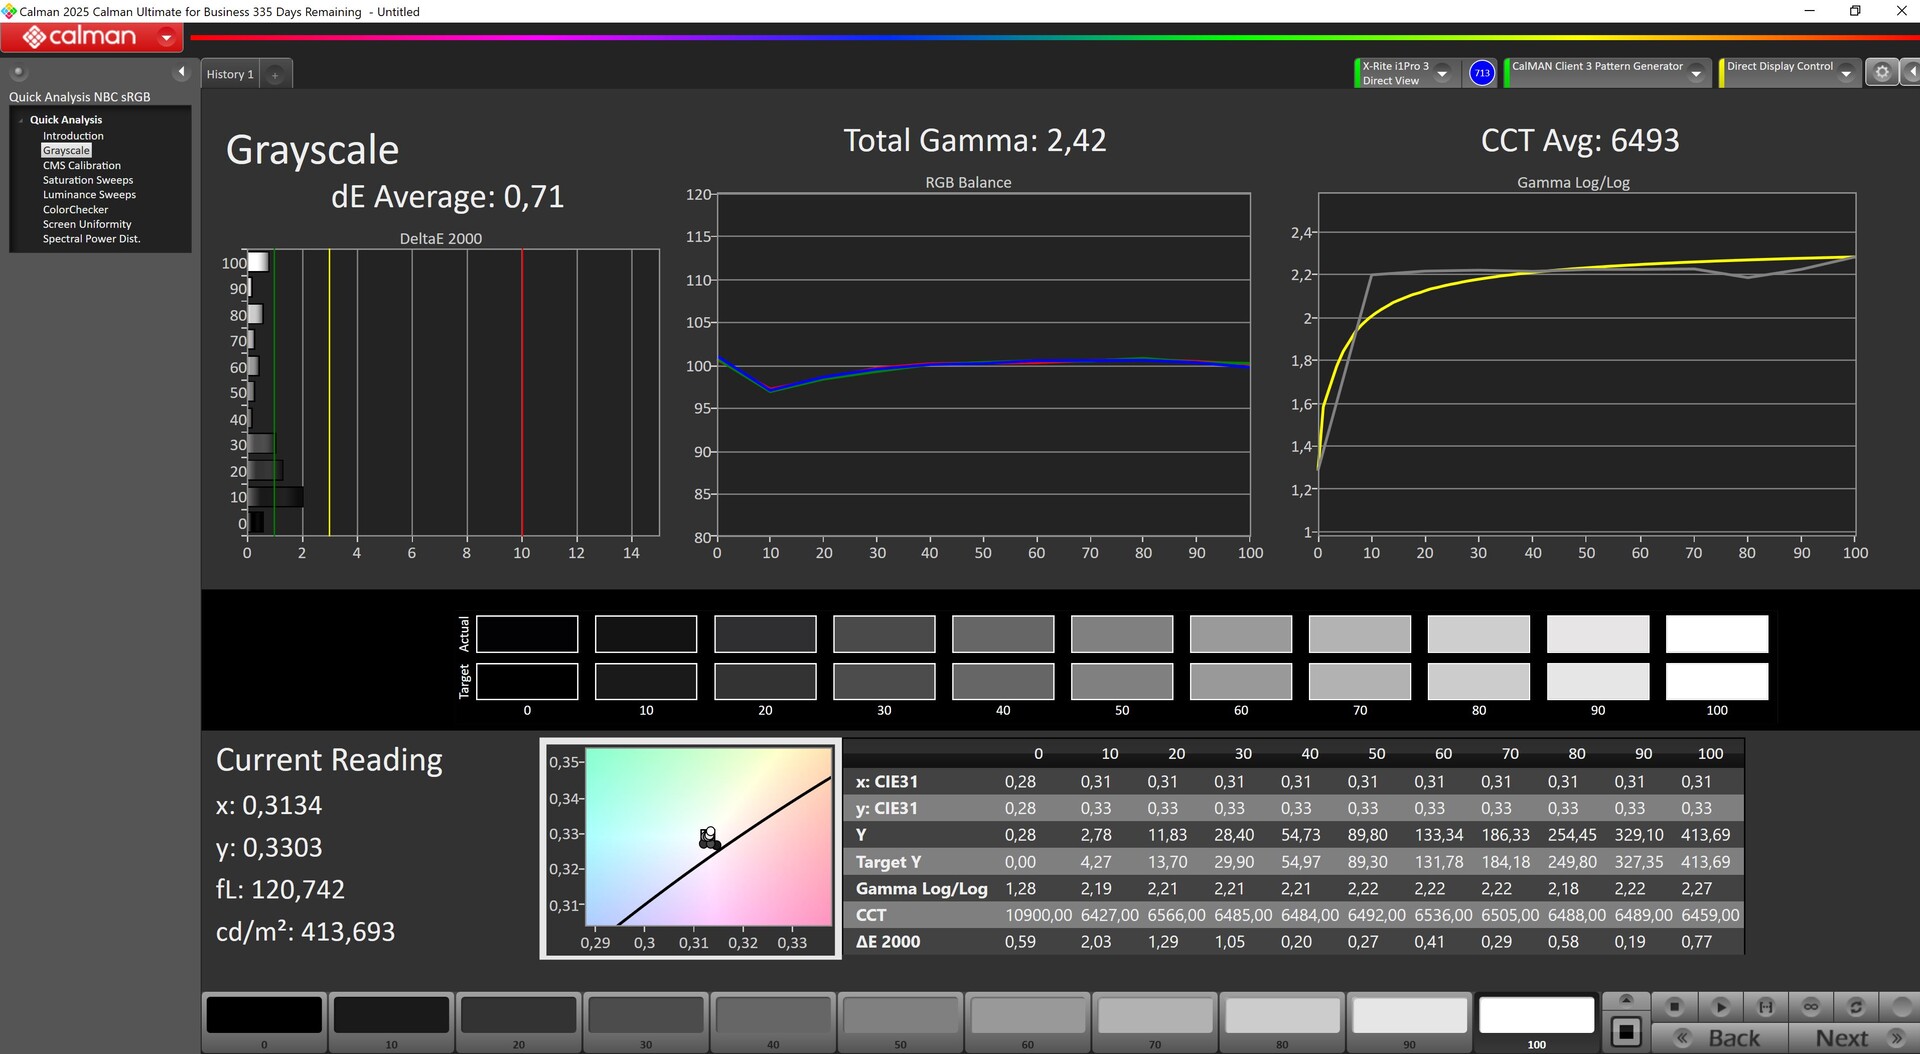
ΔE Greyscale 4.35 | 0.5-98 Ø5.1
75.9% AdobeRGB 1998 (Argyll 2.2.0 3D)
99.1% sRGB (Argyll 2.2.0 3D)
74.3% Display P3 (Argyll 2.2.0 3D)
Gamma: 2.51
| Dell Pro 13 Premium PA13250 B133UAN (AUOBEB0), IPS, 1920x1200, 13.3", 60 Hz | MSI Prestige 13 AI Plus Evo A2VMG ATNA33AA07-0, OLED, 2880x1800, 13.3", 60 Hz | Lenovo ThinkPad X13 2-in-1 Gen 5 Lenovo B133UAN01.2, IPS, 1920x1200, 13.3", 60 Hz | Framework Laptop 13.5 Core Ultra 7 155H BOE NE135A1M-NY1, IPS, 2880x1920, 13.5", 120 Hz | Dell XPS 13 9350 LG Philips 134WU2, IPS, 1920x1200, 13.4", 120 Hz | Microsoft Surface Pro Copilot+ LP129WT342166, IPS, 2880x1920, 13", 120 Hz | |
|---|---|---|---|---|---|---|
| Display | 20% | -4% | -2% | -6% | 6% | |
| Display P3 Coverage | 74.3 | 99.9 34% | 71.1 -4% | 72.8 -2% | 67.3 -9% | 83.4 12% |
| sRGB Coverage | 99.1 | 100 1% | 97.1 -2% | 98.6 -1% | 99 0% | 99.7 1% |
| AdobeRGB 1998 Coverage | 75.9 | 95.8 26% | 71.7 -6% | 72.9 -4% | 68.6 -10% | 79.4 5% |
| Response Times | 94% | -9% | 16% | 16% | 29% | |
| Response Time Grey 50% / Grey 80% * | 52.8 ? | 1.94 ? 96% | 50.2 ? 5% | 41.9 ? 21% | 37.3 ? 29% | 39.6 ? 25% |
| Response Time Black / White * | 26.4 ? | 2.02 ? 92% | 32.6 ? -23% | 23.7 ? 10% | 25.9 ? 2% | 18 ? 32% |
| PWM Frequency | 60 ? | |||||
| Screen | 17% | -9% | -11% | 31% | 4% | |
| Brightness middle | 456 | 382.4 -16% | 334 -27% | 498.5 9% | 462.8 1% | 585 28% |
| Brightness | 460 | 383 -17% | 308 -33% | 464 1% | 435 -5% | 574 25% |
| Brightness Distribution | 89 | 99 11% | 86 -3% | 86 -3% | 87 -2% | 89 0% |
| Black Level * | 0.23 | 0.37 -61% | 0.36 -57% | 0.19 17% | 0.56 -143% | |
| Contrast | 1983 | 903 -54% | 1385 -30% | 2436 23% | 1045 -47% | |
| Colorchecker dE 2000 * | 3.3 | 3.84 -16% | 2.36 28% | 4.27 -29% | 1.92 42% | 1.3 61% |
| Colorchecker dE 2000 max. * | 6.47 | 6.66 -3% | 4.93 24% | 7.08 -9% | 3.45 47% | 3 54% |
| Colorchecker dE 2000 calibrated * | 1.7 | 0.41 76% | 1.25 26% | 1.26 26% | 0.48 72% | |
| Greyscale dE 2000 * | 4.35 | 0.7 84% | 3.38 22% | 4.7 -8% | 0.6 86% | 2 54% |
| Gamma | 2.51 88% | 2.23 99% | 2.38 92% | 2.09 105% | 2.19 100% | 2.18 101% |
| CCT | 6215 105% | 6475 100% | 6352 102% | 7417 88% | 6539 99% | 6914 94% |
| Media total (Programa/Opciones) | 44% /
31% | -7% /
-8% | 1% /
-5% | 14% /
21% | 13% /
8% |
* ... más pequeño es mejor
Al sacarlo de la caja, el panel no está especialmente bien calibrado, y aunque nuestra calibración manual consiguió mejorar los valores DeltaE tanto en la escala de grises como en ColorChecker, seguía habiendo un valor atípico en la zona roja.
Tiempos de respuesta del display
| ↔ Tiempo de respuesta de Negro a Blanco | ||
|---|---|---|
| 26.4 ms ... subida ↗ y bajada ↘ combinada | ↗ 12.2 ms subida | 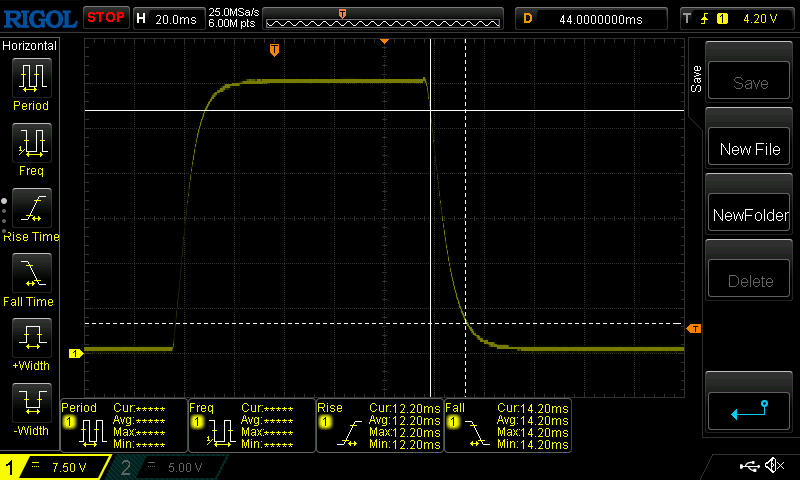 |
| ↘ 14.2 ms bajada | ||
| La pantalla mostró tiempos de respuesta relativamente lentos en nuestros tests pero podría ser demasiado lenta para los jugones. En comparación, todos los dispositivos de prueba van de ##min### (mínimo) a 240 (máximo) ms. » 63 % de todos los dispositivos son mejores. Eso quiere decir que el tiempo de respuesta es peor que la media (20.8 ms) de todos los dispositivos testados. | ||
| ↔ Tiempo de respuesta 50% Gris a 80% Gris | ||
| 52.8 ms ... subida ↗ y bajada ↘ combinada | ↗ 23.4 ms subida | 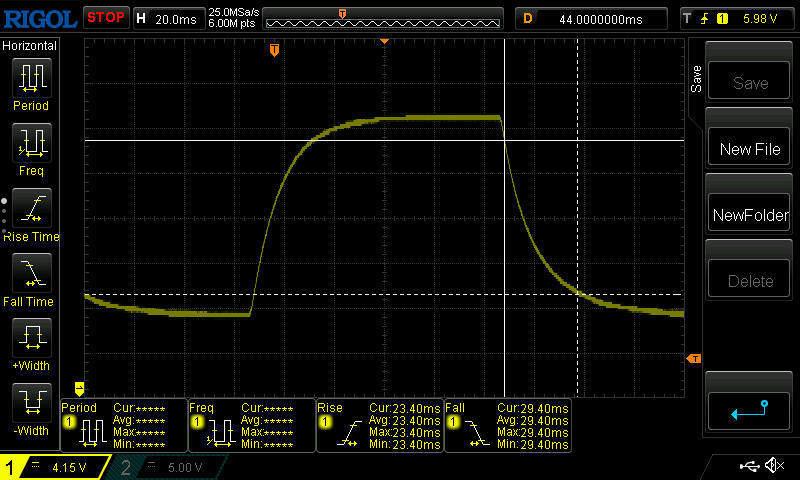 |
| ↘ 29.4 ms bajada | ||
| La pantalla mostró tiempos de respuesta lentos en nuestros tests y podría ser demasiado lenta para los jugones. En comparación, todos los dispositivos de prueba van de ##min### (mínimo) a 636 (máximo) ms. » 89 % de todos los dispositivos son mejores. Eso quiere decir que el tiempo de respuesta es peor que la media (32.5 ms) de todos los dispositivos testados. | ||
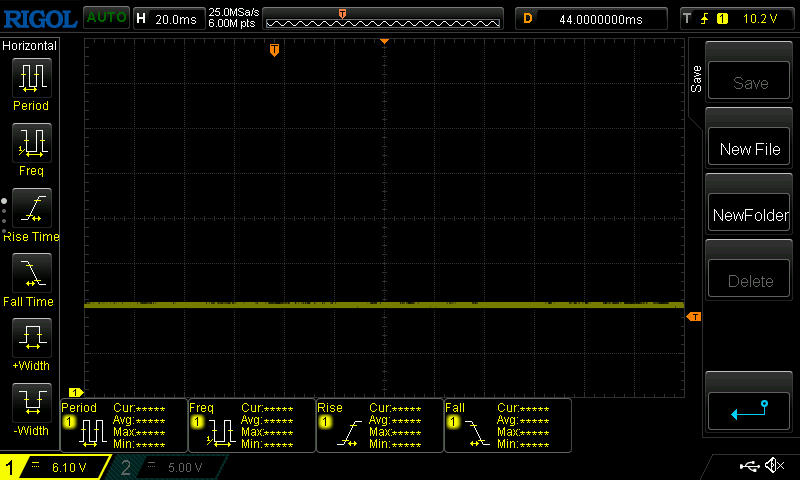
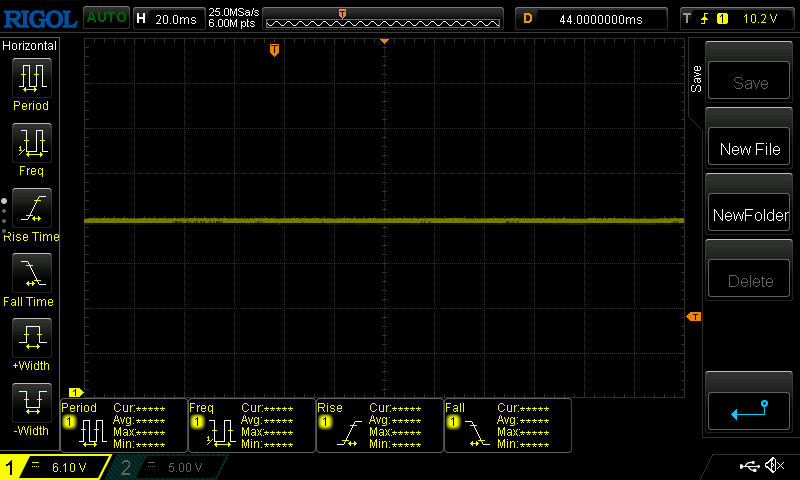
Parpadeo de Pantalla / PWM (Pulse-Width Modulation)
| Parpadeo de Pantalla / PWM no detectado |  | ||
Comparación: 53 % de todos los dispositivos testados no usaron PWM para atenuar el display. Si se usó, medimos una media de 8516 (mínimo: 5 - máxmo: 343500) Hz. | |||

En exteriores, el buen brillo y contraste, la superficie mate, así como la buena estabilidad del ángulo de visión contribuyen a garantizar en gran medida un funcionamiento sin problemas.

Rendimiento - Un potente Arco de 140V
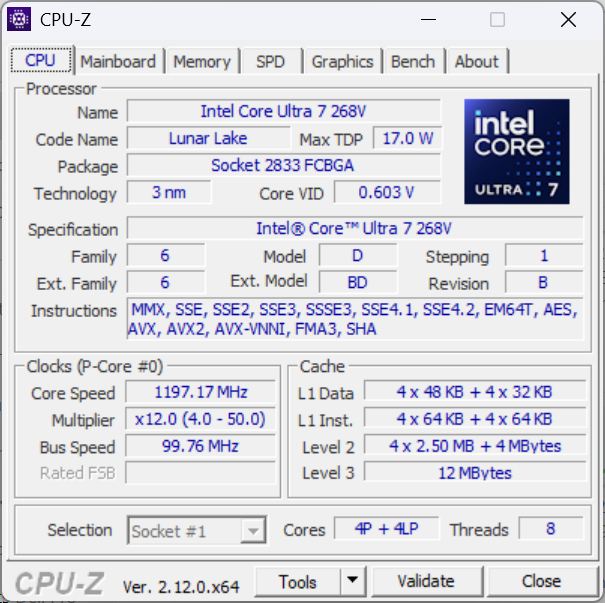
El corazón palpitante es el nuevo Intel Core Ultra 7 268V que también viene con 32 GB de RAM integrada. Alternativamente, existe una versión con un más débil Core Ultra 5 236V y 16 GB de RAM. El almacenamiento también está disponible en varias configuraciones (256 GB, 512 GB, 1 TB). El Dell Pro 13 Premium está claramente dirigido a los usuarios empresariales móviles.

Condiciones de la prueba
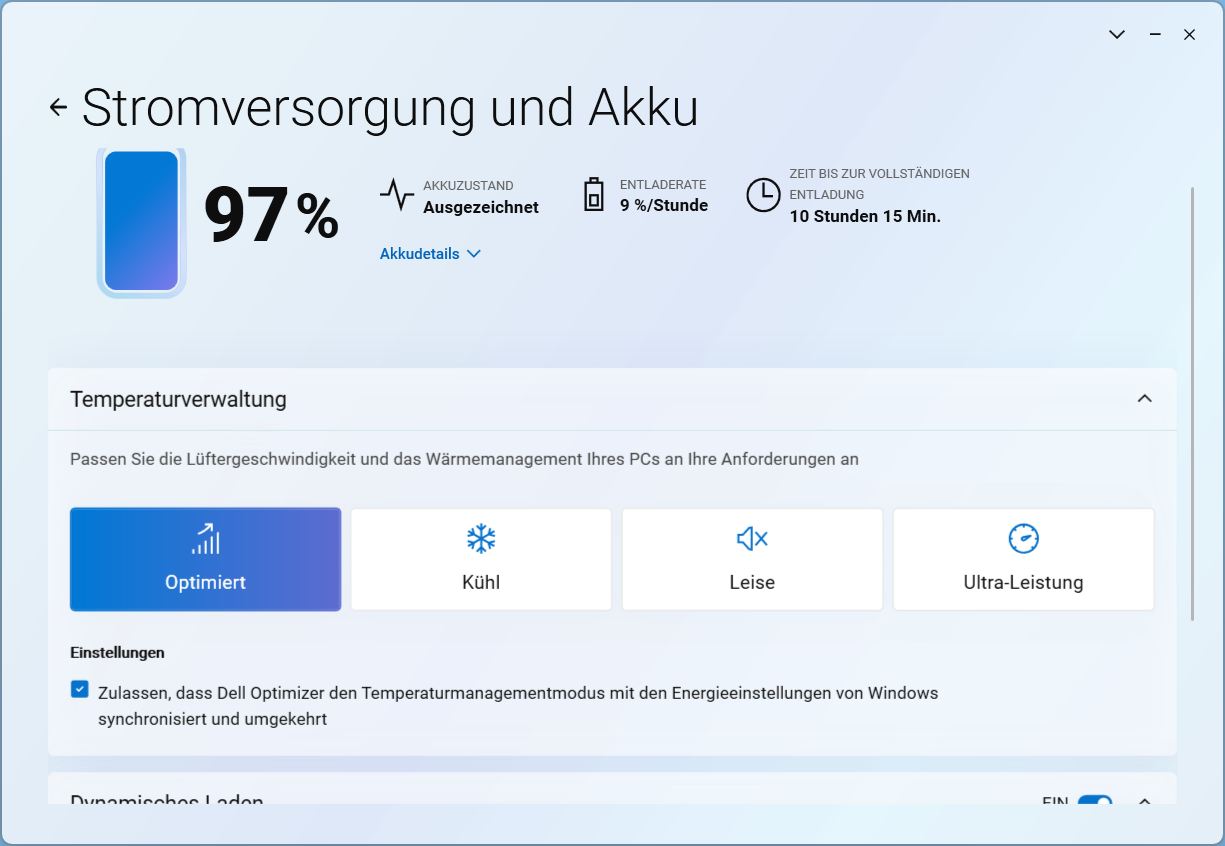
Dell Optimizer hace las veces de centro de control, ofreciendo ajustes del ventilador que afectan al rendimiento y algunas otras opciones. Para nuestros benchmarks, lo dejamos con el modo "Optimizado" preseleccionado.

Procesador
El Intel Core Ultra 7 268V es uno de los modelos de gama más alta de la familia Lunar Lake de bajo consumo energético. Sus cuatro núcleos E y sus cuatro núcleos P van de 2,2 GHz a 5,0 GHz y también cuentan con una NPU de 48 TOPS.
Su rendimiento mononúcleo fue particularmente impresionante en todas las pruebas que realizamos. En las pruebas comparativas multinúcleo, la CPU del Dell Pro 13 es algo decepcionante, quedando a menudo ligeramente por detrás de la competencia, algunos con procesadores nominalmente más débiles. En modo batería, se pierde alrededor de un 16 por ciento de rendimiento.
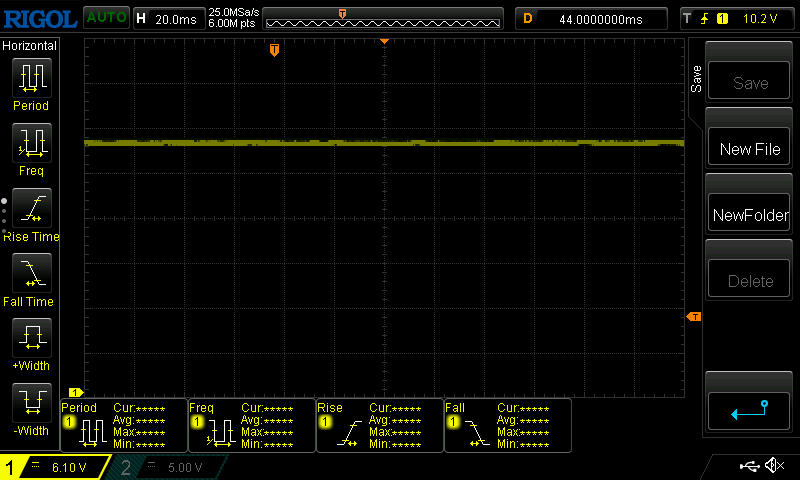
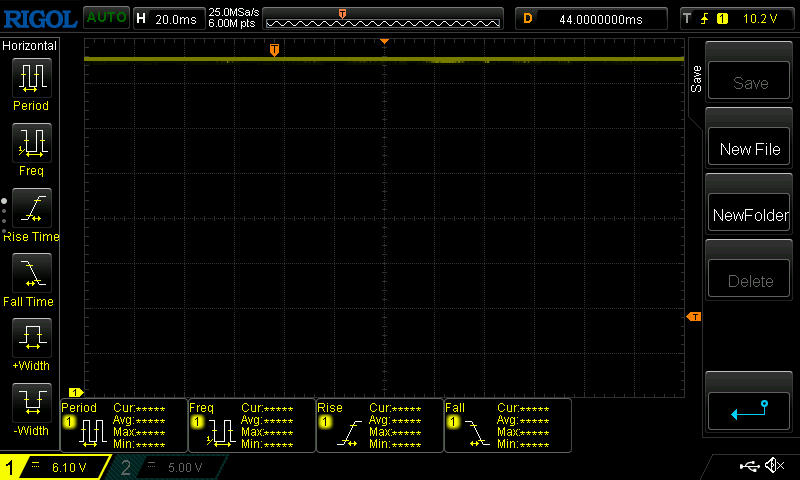
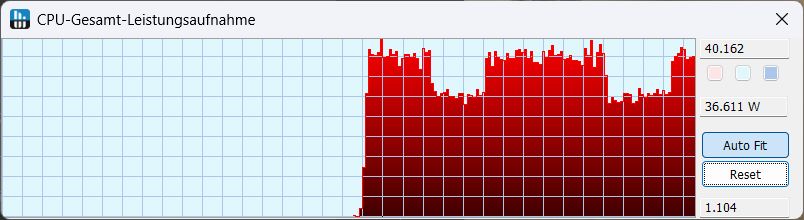
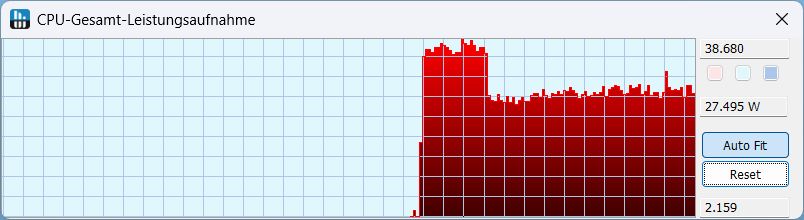
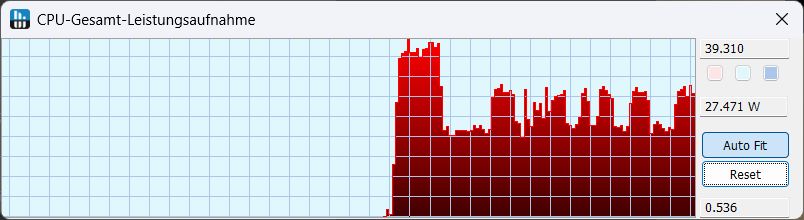
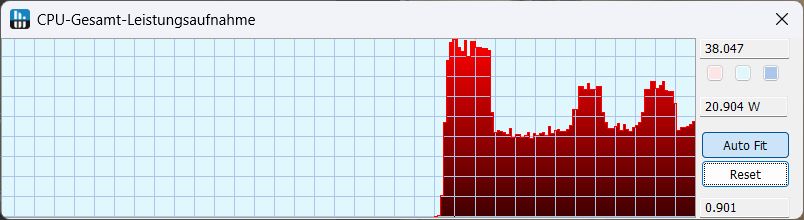
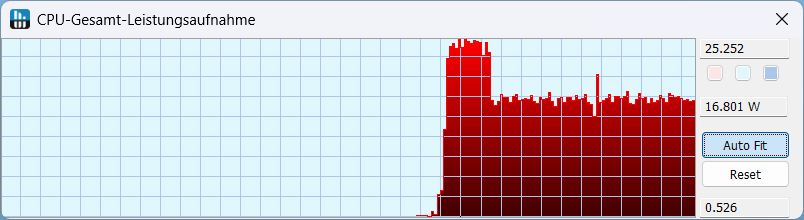
En el bucle Cinebench R15, el rendimiento cayó alrededor de un 28 por ciento (¡!) en las tres primeras ejecuciones y se mantuvo constante a partir de entonces. En el modo optimizado estándar, el consumo de energía se situó inicialmente en torno a los 38 W y luego bajó a 27 W. Las imágenes de la derecha muestran el comportamiento del consumo de energía en Cinebench R23, en función del modo de ventilador.
Cinebench R15 Multi Continuous Test
Cinebench R23: Multi Core | Single Core
Cinebench R20: CPU (Multi Core) | CPU (Single Core)
Cinebench R15: CPU Multi 64Bit | CPU Single 64Bit
Blender: v2.79 BMW27 CPU
7-Zip 18.03: 7z b 4 | 7z b 4 -mmt1
Geekbench 6.4: Multi-Core | Single-Core
Geekbench 5.5: Multi-Core | Single-Core
HWBOT x265 Benchmark v2.2: 4k Preset
LibreOffice : 20 Documents To PDF
R Benchmark 2.5: Overall mean
| CPU Performance Rating | |
| Framework Laptop 13.5 Core Ultra 7 155H | |
| MSI Prestige 13 AI Plus Evo A2VMG | |
| Dell XPS 13 9350 | |
| Medio Intel Core Ultra 7 268V | |
| Media de la clase Subnotebook | |
| Dell Pro 13 Premium PA13250 | |
| Lenovo ThinkPad X13 2-in-1 Gen 5 | |
| Microsoft Surface Pro Copilot+ -2! | |
| Cinebench R23 / Multi Core | |
| Framework Laptop 13.5 Core Ultra 7 155H | |
| Media de la clase Subnotebook (1555 - 21812, n=76, últimos 2 años) | |
| MSI Prestige 13 AI Plus Evo A2VMG | |
| Dell XPS 13 9350 | |
| Medio Intel Core Ultra 7 268V (9835 - 10535, n=2) | |
| Dell Pro 13 Premium PA13250 | |
| Microsoft Surface Pro Copilot+ | |
| Lenovo ThinkPad X13 2-in-1 Gen 5 | |
| Cinebench R23 / Single Core | |
| Dell Pro 13 Premium PA13250 | |
| Medio Intel Core Ultra 7 268V (1910 - 1985, n=2) | |
| Dell XPS 13 9350 | |
| MSI Prestige 13 AI Plus Evo A2VMG | |
| Framework Laptop 13.5 Core Ultra 7 155H | |
| Media de la clase Subnotebook (358 - 2165, n=76, últimos 2 años) | |
| Lenovo ThinkPad X13 2-in-1 Gen 5 | |
| Microsoft Surface Pro Copilot+ | |
| Cinebench R20 / CPU (Multi Core) | |
| Framework Laptop 13.5 Core Ultra 7 155H | |
| Media de la clase Subnotebook (579 - 8541, n=71, últimos 2 años) | |
| MSI Prestige 13 AI Plus Evo A2VMG | |
| Dell XPS 13 9350 | |
| Medio Intel Core Ultra 7 268V (3811 - 4129, n=2) | |
| Dell Pro 13 Premium PA13250 | |
| Lenovo ThinkPad X13 2-in-1 Gen 5 | |
| Microsoft Surface Pro Copilot+ | |
| Cinebench R20 / CPU (Single Core) | |
| Dell Pro 13 Premium PA13250 | |
| Medio Intel Core Ultra 7 268V (736 - 764, n=2) | |
| Dell XPS 13 9350 | |
| MSI Prestige 13 AI Plus Evo A2VMG | |
| Framework Laptop 13.5 Core Ultra 7 155H | |
| Media de la clase Subnotebook (128 - 826, n=71, últimos 2 años) | |
| Lenovo ThinkPad X13 2-in-1 Gen 5 | |
| Microsoft Surface Pro Copilot+ | |
| Cinebench R15 / CPU Multi 64Bit | |
| Framework Laptop 13.5 Core Ultra 7 155H | |
| Microsoft Surface Pro Copilot+ | |
| Media de la clase Subnotebook (327 - 3345, n=77, últimos 2 años) | |
| MSI Prestige 13 AI Plus Evo A2VMG | |
| Medio Intel Core Ultra 7 268V (1601 - 1616, n=2) | |
| Dell Pro 13 Premium PA13250 | |
| Dell XPS 13 9350 | |
| Lenovo ThinkPad X13 2-in-1 Gen 5 | |
| Cinebench R15 / CPU Single 64Bit | |
| Dell Pro 13 Premium PA13250 | |
| Medio Intel Core Ultra 7 268V (287 - 302, n=2) | |
| Dell XPS 13 9350 | |
| MSI Prestige 13 AI Plus Evo A2VMG | |
| Framework Laptop 13.5 Core Ultra 7 155H | |
| Media de la clase Subnotebook (72.4 - 322, n=72, últimos 2 años) | |
| Lenovo ThinkPad X13 2-in-1 Gen 5 | |
| Microsoft Surface Pro Copilot+ | |
| Blender / v2.79 BMW27 CPU | |
| Dell Pro 13 Premium PA13250 | |
| Microsoft Surface Pro Copilot+ | |
| Lenovo ThinkPad X13 2-in-1 Gen 5 | |
| Media de la clase Subnotebook (159 - 2271, n=75, últimos 2 años) | |
| Medio Intel Core Ultra 7 268V (337 - 410, n=2) | |
| Dell XPS 13 9350 | |
| MSI Prestige 13 AI Plus Evo A2VMG | |
| Framework Laptop 13.5 Core Ultra 7 155H | |
| 7-Zip 18.03 / 7z b 4 | |
| Framework Laptop 13.5 Core Ultra 7 155H | |
| Media de la clase Subnotebook (11668 - 77867, n=67, últimos 2 años) | |
| Microsoft Surface Pro Copilot+ | |
| Dell XPS 13 9350 | |
| MSI Prestige 13 AI Plus Evo A2VMG | |
| Medio Intel Core Ultra 7 268V (32797 - 35687, n=2) | |
| Dell Pro 13 Premium PA13250 | |
| Lenovo ThinkPad X13 2-in-1 Gen 5 | |
| 7-Zip 18.03 / 7z b 4 -mmt1 | |
| Medio Intel Core Ultra 7 268V (5884 - 6021, n=2) | |
| Dell Pro 13 Premium PA13250 | |
| Dell XPS 13 9350 | |
| MSI Prestige 13 AI Plus Evo A2VMG | |
| Media de la clase Subnotebook (2643 - 6442, n=69, últimos 2 años) | |
| Framework Laptop 13.5 Core Ultra 7 155H | |
| Microsoft Surface Pro Copilot+ | |
| Lenovo ThinkPad X13 2-in-1 Gen 5 | |
| Geekbench 6.4 / Multi-Core | |
| Microsoft Surface Pro Copilot+ | |
| Framework Laptop 13.5 Core Ultra 7 155H | |
| Media de la clase Subnotebook (2244 - 17489, n=72, últimos 2 años) | |
| MSI Prestige 13 AI Plus Evo A2VMG | |
| Dell XPS 13 9350 | |
| Medio Intel Core Ultra 7 268V (10589 - 11279, n=3) | |
| Dell Pro 13 Premium PA13250 | |
| Lenovo ThinkPad X13 2-in-1 Gen 5 | |
| Geekbench 6.4 / Single-Core | |
| Dell Pro 13 Premium PA13250 | |
| Dell XPS 13 9350 | |
| Medio Intel Core Ultra 7 268V (2583 - 2871, n=3) | |
| MSI Prestige 13 AI Plus Evo A2VMG | |
| Media de la clase Subnotebook (960 - 3655, n=67, últimos 2 años) | |
| Microsoft Surface Pro Copilot+ | |
| Framework Laptop 13.5 Core Ultra 7 155H | |
| Lenovo ThinkPad X13 2-in-1 Gen 5 | |
| Lenovo ThinkPad X13 2-in-1 Gen 5 | |
| Geekbench 5.5 / Multi-Core | |
| Framework Laptop 13.5 Core Ultra 7 155H | |
| Media de la clase Subnotebook (2557 - 17218, n=68, últimos 2 años) | |
| Medio Intel Core Ultra 7 268V (9491 - 9801, n=3) | |
| MSI Prestige 13 AI Plus Evo A2VMG | |
| Dell Pro 13 Premium PA13250 | |
| Dell XPS 13 9350 | |
| Lenovo ThinkPad X13 2-in-1 Gen 5 | |
| Geekbench 5.5 / Single-Core | |
| Medio Intel Core Ultra 7 268V (2008 - 2091, n=3) | |
| Dell XPS 13 9350 | |
| Dell Pro 13 Premium PA13250 | |
| MSI Prestige 13 AI Plus Evo A2VMG | |
| Media de la clase Subnotebook (726 - 2350, n=68, últimos 2 años) | |
| Framework Laptop 13.5 Core Ultra 7 155H | |
| Lenovo ThinkPad X13 2-in-1 Gen 5 | |
| HWBOT x265 Benchmark v2.2 / 4k Preset | |
| MSI Prestige 13 AI Plus Evo A2VMG | |
| Framework Laptop 13.5 Core Ultra 7 155H | |
| Dell XPS 13 9350 | |
| Media de la clase Subnotebook (0.97 - 25.1, n=70, últimos 2 años) | |
| Medio Intel Core Ultra 7 268V (10.4 - 12.9, n=2) | |
| Dell Pro 13 Premium PA13250 | |
| Lenovo ThinkPad X13 2-in-1 Gen 5 | |
| Microsoft Surface Pro Copilot+ | |
| LibreOffice / 20 Documents To PDF | |
| Dell Pro 13 Premium PA13250 | |
| Microsoft Surface Pro Copilot+ | |
| Lenovo ThinkPad X13 2-in-1 Gen 5 | |
| Media de la clase Subnotebook (38.5 - 220, n=68, últimos 2 años) | |
| Medio Intel Core Ultra 7 268V (48 - 60.8, n=2) | |
| Dell XPS 13 9350 | |
| MSI Prestige 13 AI Plus Evo A2VMG | |
| Framework Laptop 13.5 Core Ultra 7 155H | |
| R Benchmark 2.5 / Overall mean | |
| Microsoft Surface Pro Copilot+ | |
| Lenovo ThinkPad X13 2-in-1 Gen 5 | |
| Media de la clase Subnotebook (0.403 - 1.456, n=70, últimos 2 años) | |
| Framework Laptop 13.5 Core Ultra 7 155H | |
| MSI Prestige 13 AI Plus Evo A2VMG | |
| Dell XPS 13 9350 | |
| Medio Intel Core Ultra 7 268V (0.4344 - 0.4565, n=2) | |
| Dell Pro 13 Premium PA13250 | |
* ... más pequeño es mejor
AIDA64: FP32 Ray-Trace | FPU Julia | CPU SHA3 | CPU Queen | FPU SinJulia | FPU Mandel | CPU AES | CPU ZLib | FP64 Ray-Trace | CPU PhotoWorxx
| Performance Rating | |
| Framework Laptop 13.5 Core Ultra 7 155H | |
| Media de la clase Subnotebook | |
| MSI Prestige 13 AI Plus Evo A2VMG | |
| Dell XPS 13 9350 | |
| Medio Intel Core Ultra 7 268V | |
| Dell Pro 13 Premium PA13250 | |
| Lenovo ThinkPad X13 2-in-1 Gen 5 | |
| Microsoft Surface Pro Copilot+ | |
| AIDA64 / FP32 Ray-Trace | |
| Media de la clase Subnotebook (1135 - 32888, n=70, últimos 2 años) | |
| MSI Prestige 13 AI Plus Evo A2VMG | |
| Dell XPS 13 9350 | |
| Framework Laptop 13.5 Core Ultra 7 155H | |
| Medio Intel Core Ultra 7 268V (10556 - 11547, n=2) | |
| Dell Pro 13 Premium PA13250 | |
| Microsoft Surface Pro Copilot+ | |
| Lenovo ThinkPad X13 2-in-1 Gen 5 | |
| AIDA64 / FPU Julia | |
| MSI Prestige 13 AI Plus Evo A2VMG | |
| Dell XPS 13 9350 | |
| Framework Laptop 13.5 Core Ultra 7 155H | |
| Media de la clase Subnotebook (5218 - 123315, n=70, últimos 2 años) | |
| Medio Intel Core Ultra 7 268V (47659 - 56299, n=2) | |
| Dell Pro 13 Premium PA13250 | |
| Lenovo ThinkPad X13 2-in-1 Gen 5 | |
| Microsoft Surface Pro Copilot+ | |
| AIDA64 / CPU SHA3 | |
| Media de la clase Subnotebook (444 - 5287, n=70, últimos 2 años) | |
| MSI Prestige 13 AI Plus Evo A2VMG | |
| Framework Laptop 13.5 Core Ultra 7 155H | |
| Dell XPS 13 9350 | |
| Medio Intel Core Ultra 7 268V (2117 - 2538, n=2) | |
| Dell Pro 13 Premium PA13250 | |
| Lenovo ThinkPad X13 2-in-1 Gen 5 | |
| Microsoft Surface Pro Copilot+ | |
| AIDA64 / CPU Queen | |
| Framework Laptop 13.5 Core Ultra 7 155H | |
| Media de la clase Subnotebook (10579 - 115682, n=70, últimos 2 años) | |
| Microsoft Surface Pro Copilot+ | |
| MSI Prestige 13 AI Plus Evo A2VMG | |
| Dell Pro 13 Premium PA13250 | |
| Medio Intel Core Ultra 7 268V (49645 - 49759, n=2) | |
| Dell XPS 13 9350 | |
| Lenovo ThinkPad X13 2-in-1 Gen 5 | |
| AIDA64 / FPU SinJulia | |
| Framework Laptop 13.5 Core Ultra 7 155H | |
| Media de la clase Subnotebook (744 - 18418, n=70, últimos 2 años) | |
| Lenovo ThinkPad X13 2-in-1 Gen 5 | |
| Dell XPS 13 9350 | |
| MSI Prestige 13 AI Plus Evo A2VMG | |
| Medio Intel Core Ultra 7 268V (4353 - 4426, n=2) | |
| Dell Pro 13 Premium PA13250 | |
| Microsoft Surface Pro Copilot+ | |
| AIDA64 / FPU Mandel | |
| MSI Prestige 13 AI Plus Evo A2VMG | |
| Dell XPS 13 9350 | |
| Media de la clase Subnotebook (3341 - 65433, n=70, últimos 2 años) | |
| Framework Laptop 13.5 Core Ultra 7 155H | |
| Medio Intel Core Ultra 7 268V (25929 - 29637, n=2) | |
| Dell Pro 13 Premium PA13250 | |
| Lenovo ThinkPad X13 2-in-1 Gen 5 | |
| Microsoft Surface Pro Copilot+ | |
| AIDA64 / CPU AES | |
| Framework Laptop 13.5 Core Ultra 7 155H | |
| Microsoft Surface Pro Copilot+ | |
| Media de la clase Subnotebook (638 - 161430, n=70, últimos 2 años) | |
| Dell XPS 13 9350 | |
| MSI Prestige 13 AI Plus Evo A2VMG | |
| Lenovo ThinkPad X13 2-in-1 Gen 5 | |
| Medio Intel Core Ultra 7 268V (33196 - 38706, n=2) | |
| Dell Pro 13 Premium PA13250 | |
| AIDA64 / CPU ZLib | |
| Framework Laptop 13.5 Core Ultra 7 155H | |
| Media de la clase Subnotebook (164.9 - 1379, n=70, últimos 2 años) | |
| Microsoft Surface Pro Copilot+ | |
| MSI Prestige 13 AI Plus Evo A2VMG | |
| Dell XPS 13 9350 | |
| Lenovo ThinkPad X13 2-in-1 Gen 5 | |
| Medio Intel Core Ultra 7 268V (441 - 583, n=2) | |
| Dell Pro 13 Premium PA13250 | |
| AIDA64 / FP64 Ray-Trace | |
| MSI Prestige 13 AI Plus Evo A2VMG | |
| Media de la clase Subnotebook (610 - 17495, n=70, últimos 2 años) | |
| Dell XPS 13 9350 | |
| Medio Intel Core Ultra 7 268V (5938 - 6214, n=2) | |
| Framework Laptop 13.5 Core Ultra 7 155H | |
| Dell Pro 13 Premium PA13250 | |
| Lenovo ThinkPad X13 2-in-1 Gen 5 | |
| Microsoft Surface Pro Copilot+ | |
| AIDA64 / CPU PhotoWorxx | |
| MSI Prestige 13 AI Plus Evo A2VMG | |
| Dell XPS 13 9350 | |
| Medio Intel Core Ultra 7 268V (46733 - 53540, n=2) | |
| Dell Pro 13 Premium PA13250 | |
| Framework Laptop 13.5 Core Ultra 7 155H | |
| Media de la clase Subnotebook (6569 - 64588, n=70, últimos 2 años) | |
| Lenovo ThinkPad X13 2-in-1 Gen 5 | |
| Microsoft Surface Pro Copilot+ | |
Rendimiento del sistema
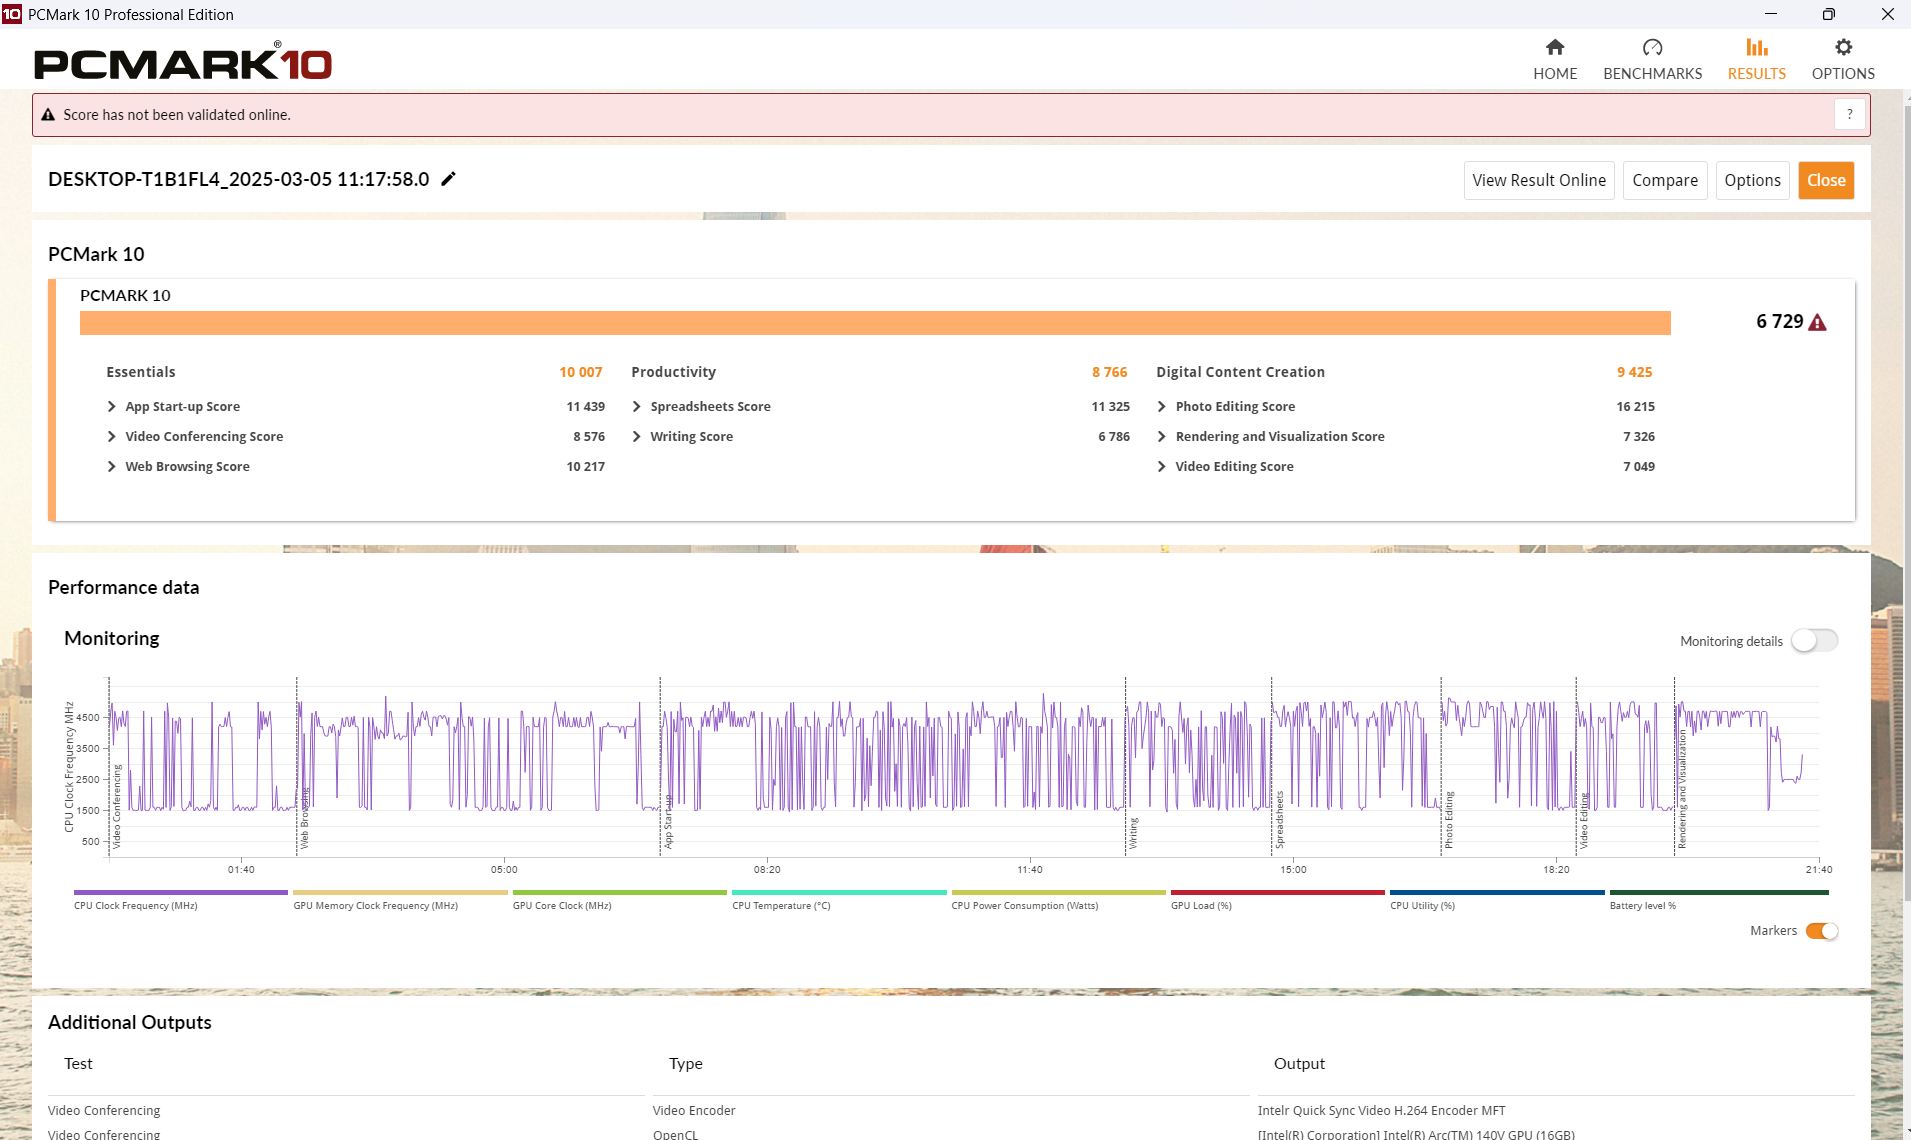
En PCMark 10 y CrossMark, los dispositivos de la comparación están cerca unos de otros, pero tanto en esta área como en las pruebas web, nuestro Dell Pro se sitúa más en el medio que apuntando al primer puesto.
CrossMark: Overall | Productivity | Creativity | Responsiveness
WebXPRT 3: Overall
WebXPRT 4: Overall
Mozilla Kraken 1.1: Total
| PCMark 10 / Score | |
| Medio Intel Core Ultra 7 268V, Intel Arc Graphics 140V (6729 - 7236, n=2) | |
| Dell XPS 13 9350 | |
| Framework Laptop 13.5 Core Ultra 7 155H | |
| MSI Prestige 13 AI Plus Evo A2VMG | |
| Dell Pro 13 Premium PA13250 | |
| Media de la clase Subnotebook (4993 - 7788, n=59, últimos 2 años) | |
| Lenovo ThinkPad X13 2-in-1 Gen 5 | |
| PCMark 10 / Essentials | |
| Lenovo ThinkPad X13 2-in-1 Gen 5 | |
| Framework Laptop 13.5 Core Ultra 7 155H | |
| Media de la clase Subnotebook (9363 - 11331, n=59, últimos 2 años) | |
| Medio Intel Core Ultra 7 268V, Intel Arc Graphics 140V (10007 - 10701, n=2) | |
| MSI Prestige 13 AI Plus Evo A2VMG | |
| Dell Pro 13 Premium PA13250 | |
| Dell XPS 13 9350 | |
| PCMark 10 / Productivity | |
| Dell XPS 13 9350 | |
| Medio Intel Core Ultra 7 268V, Intel Arc Graphics 140V (8766 - 9217, n=2) | |
| Dell Pro 13 Premium PA13250 | |
| Framework Laptop 13.5 Core Ultra 7 155H | |
| Media de la clase Subnotebook (5435 - 10623, n=59, últimos 2 años) | |
| MSI Prestige 13 AI Plus Evo A2VMG | |
| Lenovo ThinkPad X13 2-in-1 Gen 5 | |
| PCMark 10 / Digital Content Creation | |
| MSI Prestige 13 AI Plus Evo A2VMG | |
| Medio Intel Core Ultra 7 268V, Intel Arc Graphics 140V (9425 - 10427, n=2) | |
| Dell XPS 13 9350 | |
| Framework Laptop 13.5 Core Ultra 7 155H | |
| Dell Pro 13 Premium PA13250 | |
| Media de la clase Subnotebook (5305 - 12442, n=59, últimos 2 años) | |
| Lenovo ThinkPad X13 2-in-1 Gen 5 | |
| CrossMark / Overall | |
| Dell XPS 13 9350 | |
| MSI Prestige 13 AI Plus Evo A2VMG | |
| Medio Intel Core Ultra 7 268V, Intel Arc Graphics 140V (1643 - 1738, n=2) | |
| Framework Laptop 13.5 Core Ultra 7 155H | |
| Dell Pro 13 Premium PA13250 | |
| Media de la clase Subnotebook (365 - 2018, n=68, últimos 2 años) | |
| Lenovo ThinkPad X13 2-in-1 Gen 5 | |
| Microsoft Surface Pro Copilot+ | |
| CrossMark / Productivity | |
| Dell XPS 13 9350 | |
| MSI Prestige 13 AI Plus Evo A2VMG | |
| Medio Intel Core Ultra 7 268V, Intel Arc Graphics 140V (1577 - 1680, n=2) | |
| Framework Laptop 13.5 Core Ultra 7 155H | |
| Dell Pro 13 Premium PA13250 | |
| Lenovo ThinkPad X13 2-in-1 Gen 5 | |
| Media de la clase Subnotebook (364 - 1875, n=68, últimos 2 años) | |
| Microsoft Surface Pro Copilot+ | |
| CrossMark / Creativity | |
| MSI Prestige 13 AI Plus Evo A2VMG | |
| Dell XPS 13 9350 | |
| Medio Intel Core Ultra 7 268V, Intel Arc Graphics 140V (1866 - 1976, n=2) | |
| Framework Laptop 13.5 Core Ultra 7 155H | |
| Dell Pro 13 Premium PA13250 | |
| Media de la clase Subnotebook (372 - 2396, n=68, últimos 2 años) | |
| Lenovo ThinkPad X13 2-in-1 Gen 5 | |
| Microsoft Surface Pro Copilot+ | |
| CrossMark / Responsiveness | |
| Lenovo ThinkPad X13 2-in-1 Gen 5 | |
| Framework Laptop 13.5 Core Ultra 7 155H | |
| Dell XPS 13 9350 | |
| Media de la clase Subnotebook (312 - 1899, n=68, últimos 2 años) | |
| MSI Prestige 13 AI Plus Evo A2VMG | |
| Medio Intel Core Ultra 7 268V, Intel Arc Graphics 140V (1267 - 1311, n=2) | |
| Dell Pro 13 Premium PA13250 | |
| Microsoft Surface Pro Copilot+ | |
| WebXPRT 3 / Overall | |
| Microsoft Surface Pro Copilot+ | |
| Media de la clase Subnotebook (156 - 479, n=67, últimos 2 años) | |
| Dell XPS 13 9350 | |
| MSI Prestige 13 AI Plus Evo A2VMG | |
| Framework Laptop 13.5 Core Ultra 7 155H | |
| Medio Intel Core Ultra 7 268V, Intel Arc Graphics 140V (266 - 310, n=2) | |
| Dell Pro 13 Premium PA13250 | |
| Lenovo ThinkPad X13 2-in-1 Gen 5 | |
| WebXPRT 4 / Overall | |
| MSI Prestige 13 AI Plus Evo A2VMG | |
| Dell XPS 13 9350 | |
| Medio Intel Core Ultra 7 268V, Intel Arc Graphics 140V (245 - 287, n=2) | |
| Media de la clase Subnotebook (132 - 348, n=68, últimos 2 años) | |
| Microsoft Surface Pro Copilot+ | |
| Framework Laptop 13.5 Core Ultra 7 155H | |
| Dell Pro 13 Premium PA13250 | |
| Lenovo ThinkPad X13 2-in-1 Gen 5 | |
| Mozilla Kraken 1.1 / Total | |
| Lenovo ThinkPad X13 2-in-1 Gen 5 | |
| Framework Laptop 13.5 Core Ultra 7 155H | |
| Media de la clase Subnotebook (278 - 1104, n=76, últimos 2 años) | |
| Dell Pro 13 Premium PA13250 | |
| Medio Intel Core Ultra 7 268V, Intel Arc Graphics 140V (475 - 476, n=2) | |
| MSI Prestige 13 AI Plus Evo A2VMG | |
| Dell XPS 13 9350 | |
| Microsoft Surface Pro Copilot+ | |
* ... más pequeño es mejor
| PCMark 10 Score | 6729 puntos | |
ayuda | ||
| AIDA64 / Memory Copy | |
| MSI Prestige 13 AI Plus Evo A2VMG | |
| Medio Intel Core Ultra 7 268V (100445 - 107108, n=2) | |
| Dell XPS 13 9350 | |
| Dell Pro 13 Premium PA13250 | |
| Media de la clase Subnotebook (14554 - 109035, n=70, últimos 2 años) | |
| Framework Laptop 13.5 Core Ultra 7 155H | |
| Lenovo ThinkPad X13 2-in-1 Gen 5 | |
| Microsoft Surface Pro Copilot+ | |
| AIDA64 / Memory Read | |
| Microsoft Surface Pro Copilot+ | |
| Dell XPS 13 9350 | |
| MSI Prestige 13 AI Plus Evo A2VMG | |
| Medio Intel Core Ultra 7 268V (82511 - 88341, n=2) | |
| Dell Pro 13 Premium PA13250 | |
| Framework Laptop 13.5 Core Ultra 7 155H | |
| Media de la clase Subnotebook (15948 - 122210, n=70, últimos 2 años) | |
| Lenovo ThinkPad X13 2-in-1 Gen 5 | |
| AIDA64 / Memory Write | |
| MSI Prestige 13 AI Plus Evo A2VMG | |
| Medio Intel Core Ultra 7 268V (115959 - 117888, n=2) | |
| Dell Pro 13 Premium PA13250 | |
| Dell XPS 13 9350 | |
| Media de la clase Subnotebook (15709 - 117898, n=70, últimos 2 años) | |
| Framework Laptop 13.5 Core Ultra 7 155H | |
| Lenovo ThinkPad X13 2-in-1 Gen 5 | |
| Microsoft Surface Pro Copilot+ | |
| AIDA64 / Memory Latency | |
| Lenovo ThinkPad X13 2-in-1 Gen 5 | |
| Framework Laptop 13.5 Core Ultra 7 155H | |
| Media de la clase Subnotebook (7.2 - 187.8, n=69, últimos 2 años) | |
| Dell Pro 13 Premium PA13250 | |
| MSI Prestige 13 AI Plus Evo A2VMG | |
| Dell XPS 13 9350 | |
| Medio Intel Core Ultra 7 268V (97.4 - 101.2, n=2) | |
| Microsoft Surface Pro Copilot+ | |
* ... más pequeño es mejor
Latencias del CPD
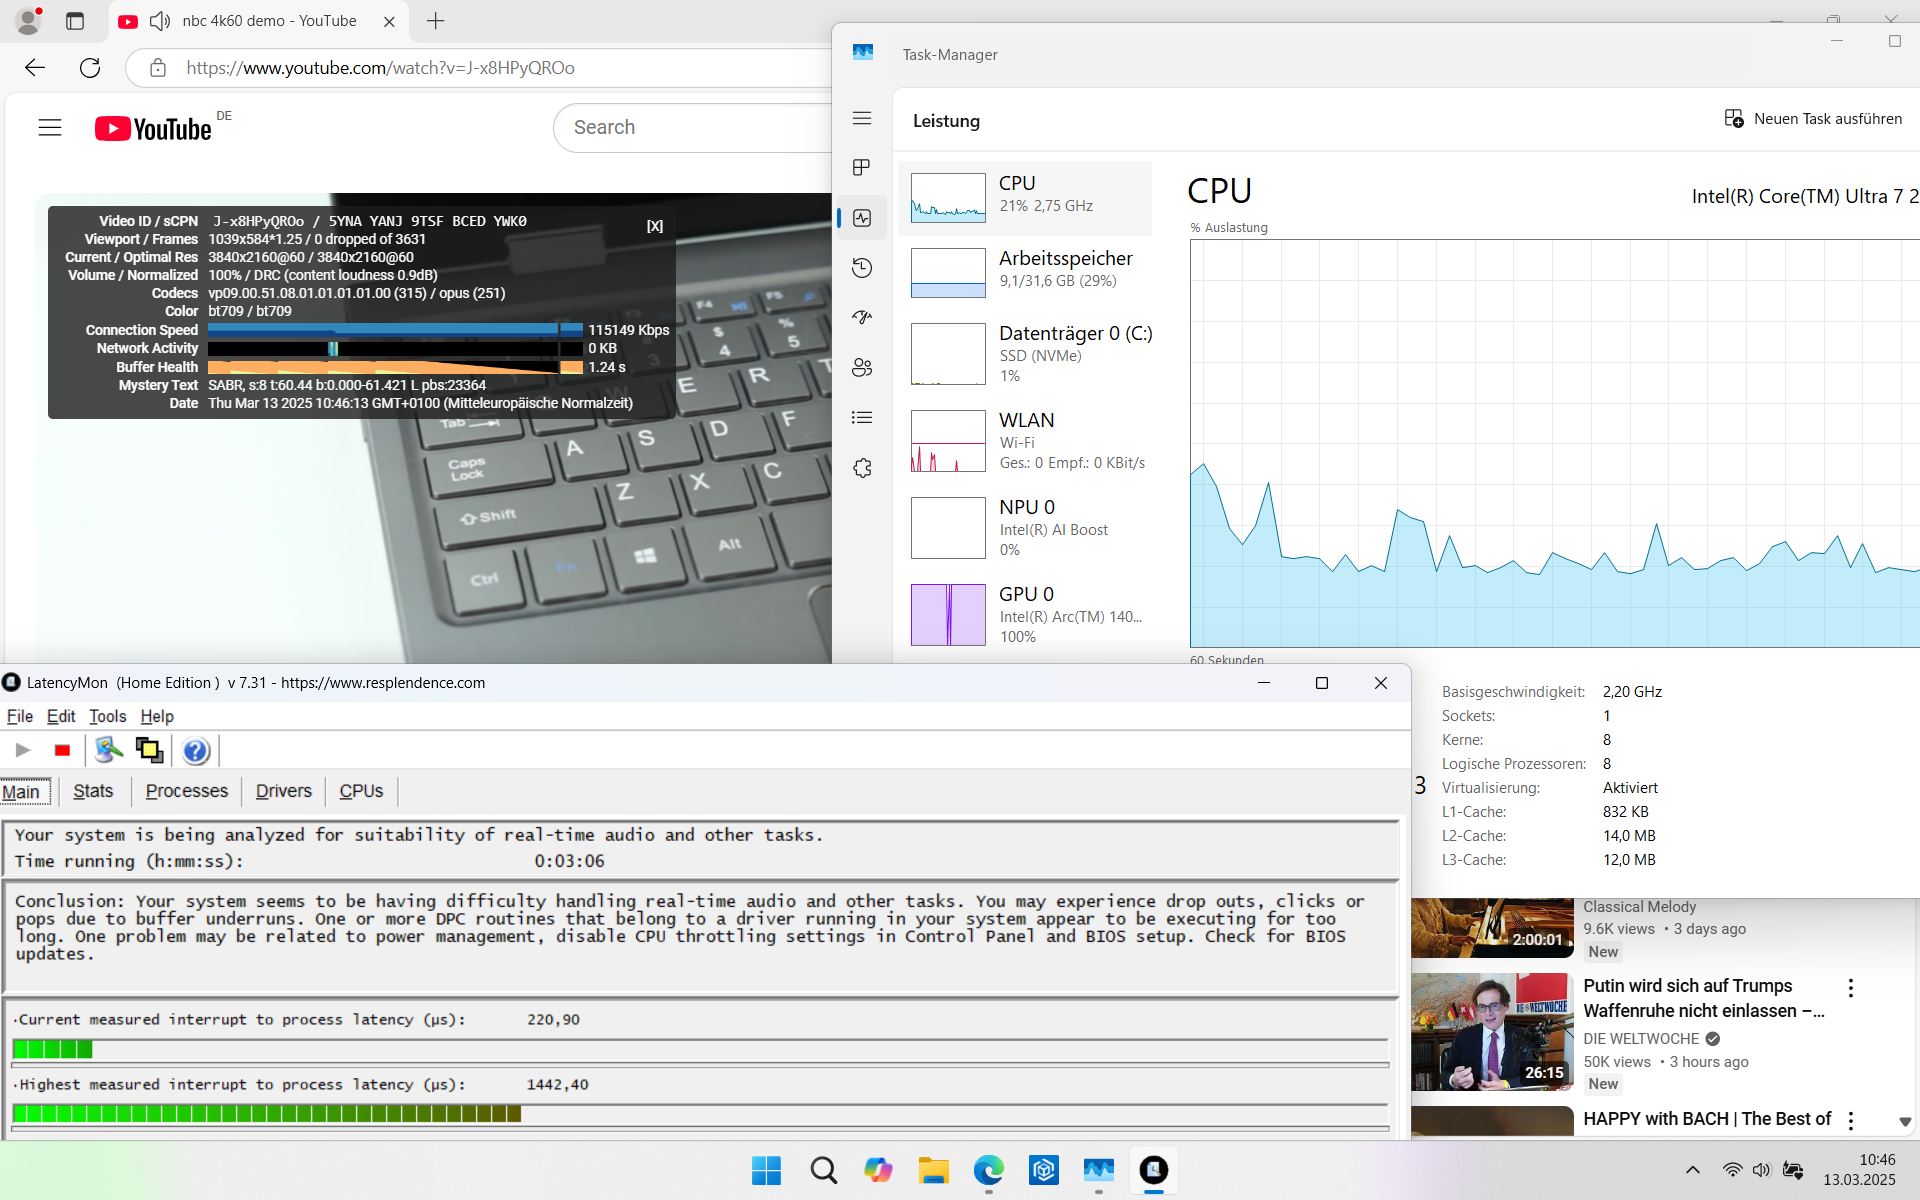
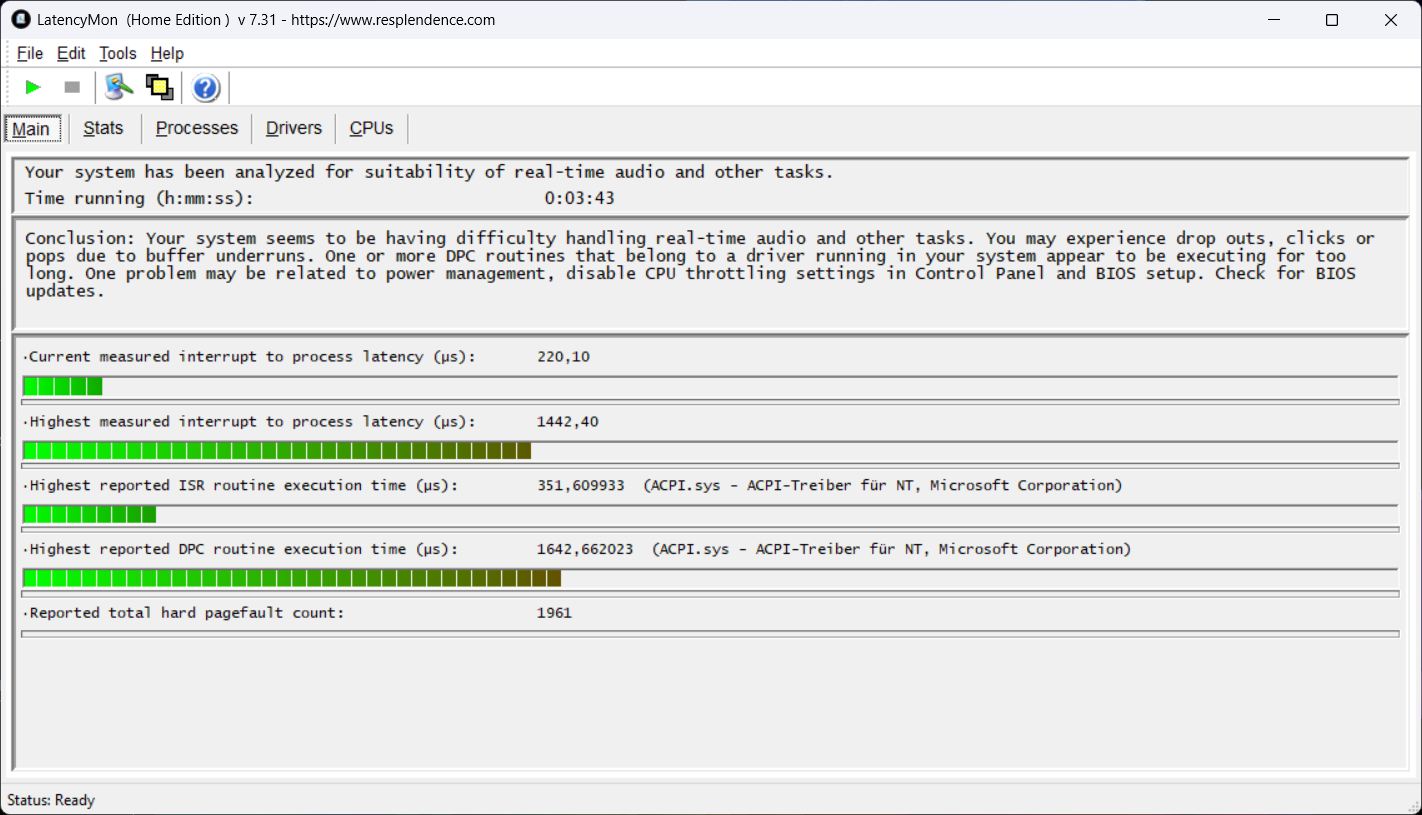
Los primeros problemas graves de latencia asomaron la cabeza al abrir varias pestañas del navegador. La latencia aumentó al reproducir nuestro vídeo 4K/60fps de YouTube, que afortunadamente seguía ejecutándose sin perder ningún fotograma. El valor final es un poco demasiado alto para nosotros.
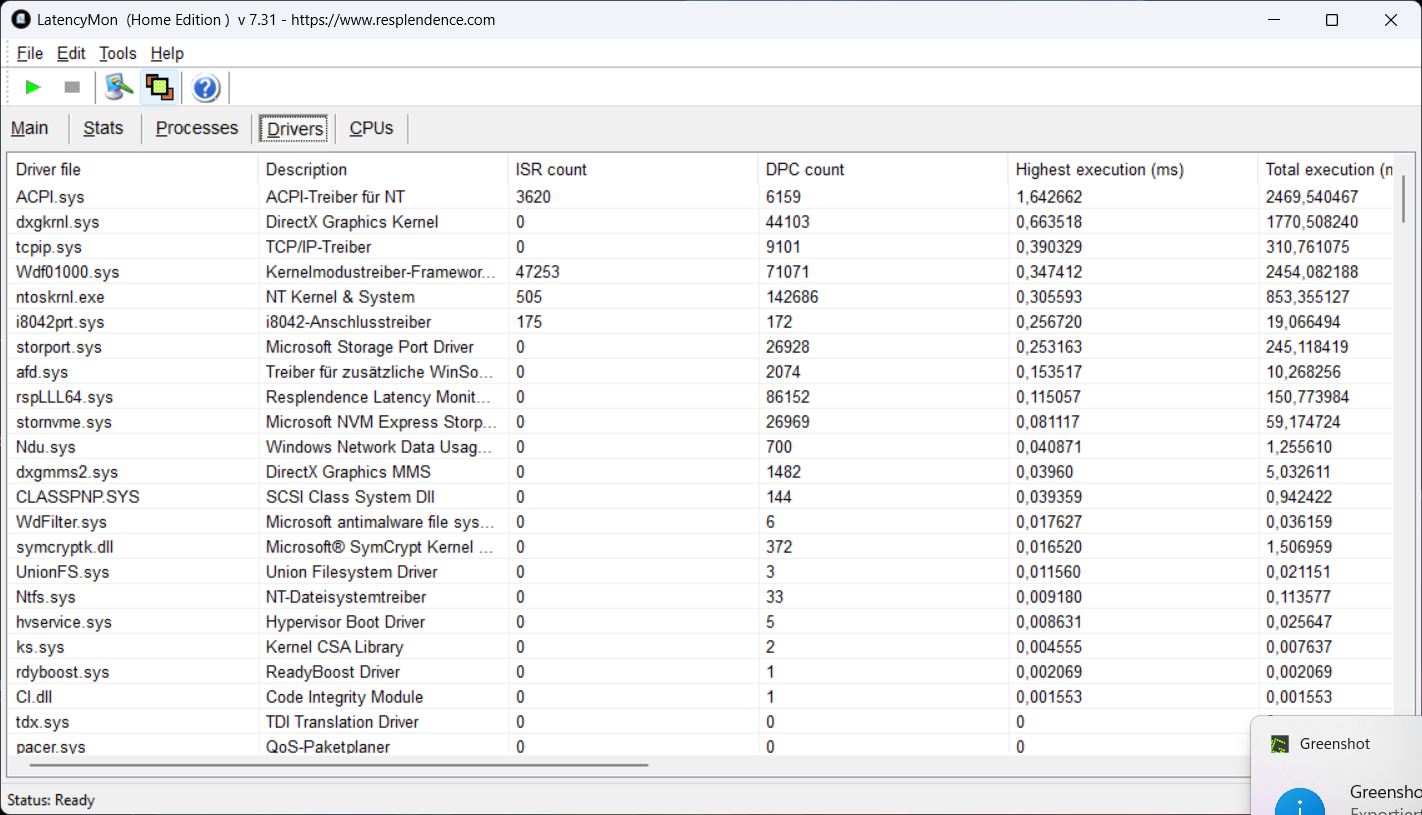
| DPC Latencies / LatencyMon - interrupt to process latency (max), Web, Youtube, Prime95 | |
| Dell Pro 13 Premium PA13250 | |
| Lenovo ThinkPad X13 2-in-1 Gen 5 | |
| MSI Prestige 13 AI Plus Evo A2VMG | |
| Framework Laptop 13.5 Core Ultra 7 155H | |
* ... más pequeño es mejor
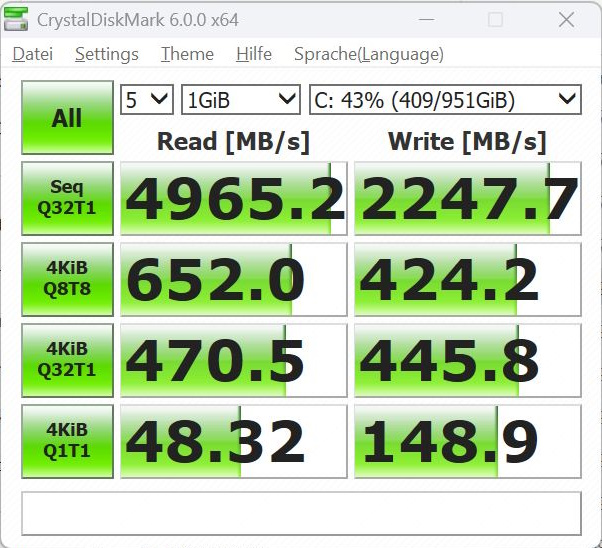
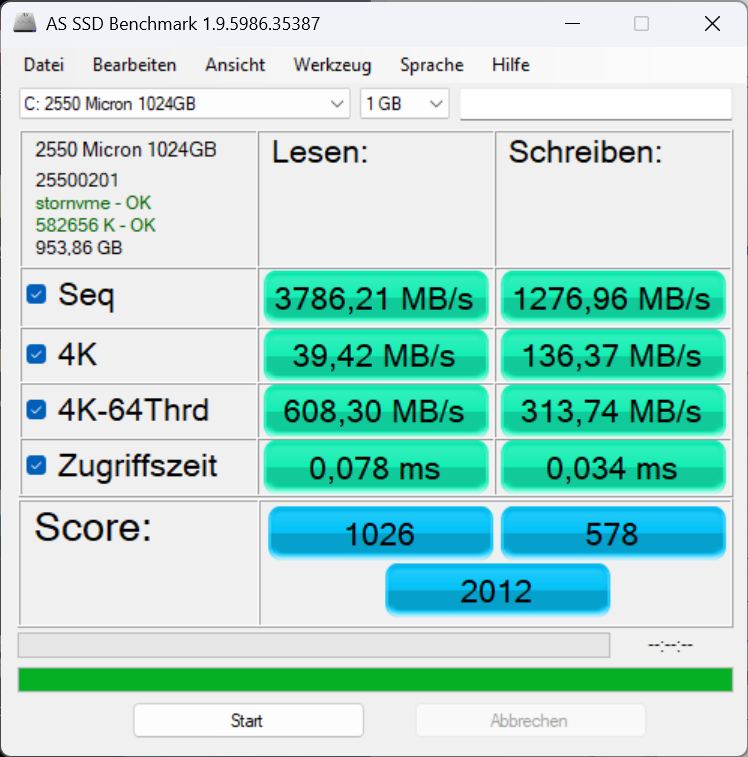
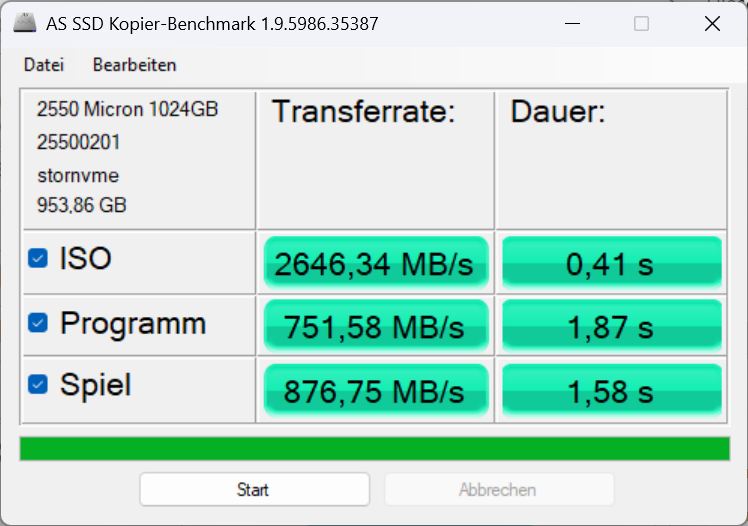
Almacenamiento masivo
El almacenamiento viene en forma de un Micron 2550 de 1 TB, aunque dependiendo de la configuración, también hay disponibles modelos de 512 GB. En general, la unidad es decepcionante en cuanto a su velocidad, pero el rendimiento se mantiene bastante constante a lo largo del tiempo.

* ... más pequeño es mejor
Continuous Performance Read: DiskSpd Read Loop, Queue Depth 8
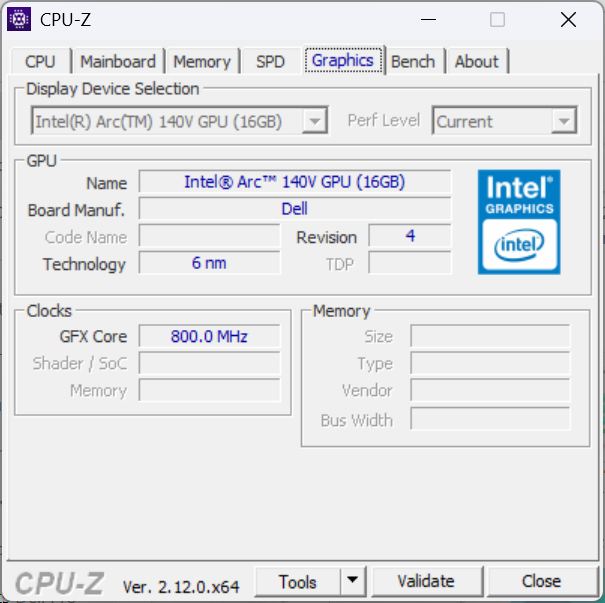
Tarjeta gráfica
El Gráficos Intel Arc 140V iGPU Es una tarjeta gráfica integrada relativamente rápida. En las pruebas comparativas sintéticas 3DMark, su rendimiento estuvo a la altura o ligeramente por encima de nuestras expectativas. No notamos ninguna degradación del rendimiento en un bucle de Fire Strike funcionando con energía de la batería.
También tuvo un rendimiento impresionante al jugar, con casi todos los juegos funcionando a Full HD y detalles medios por encima de 30 fps, y en algunos casos, incluso fue suficiente para detalles altos. La tasa de fotogramas de 30 minutos en Cyberpunk 2077 se mostró muy consistente.

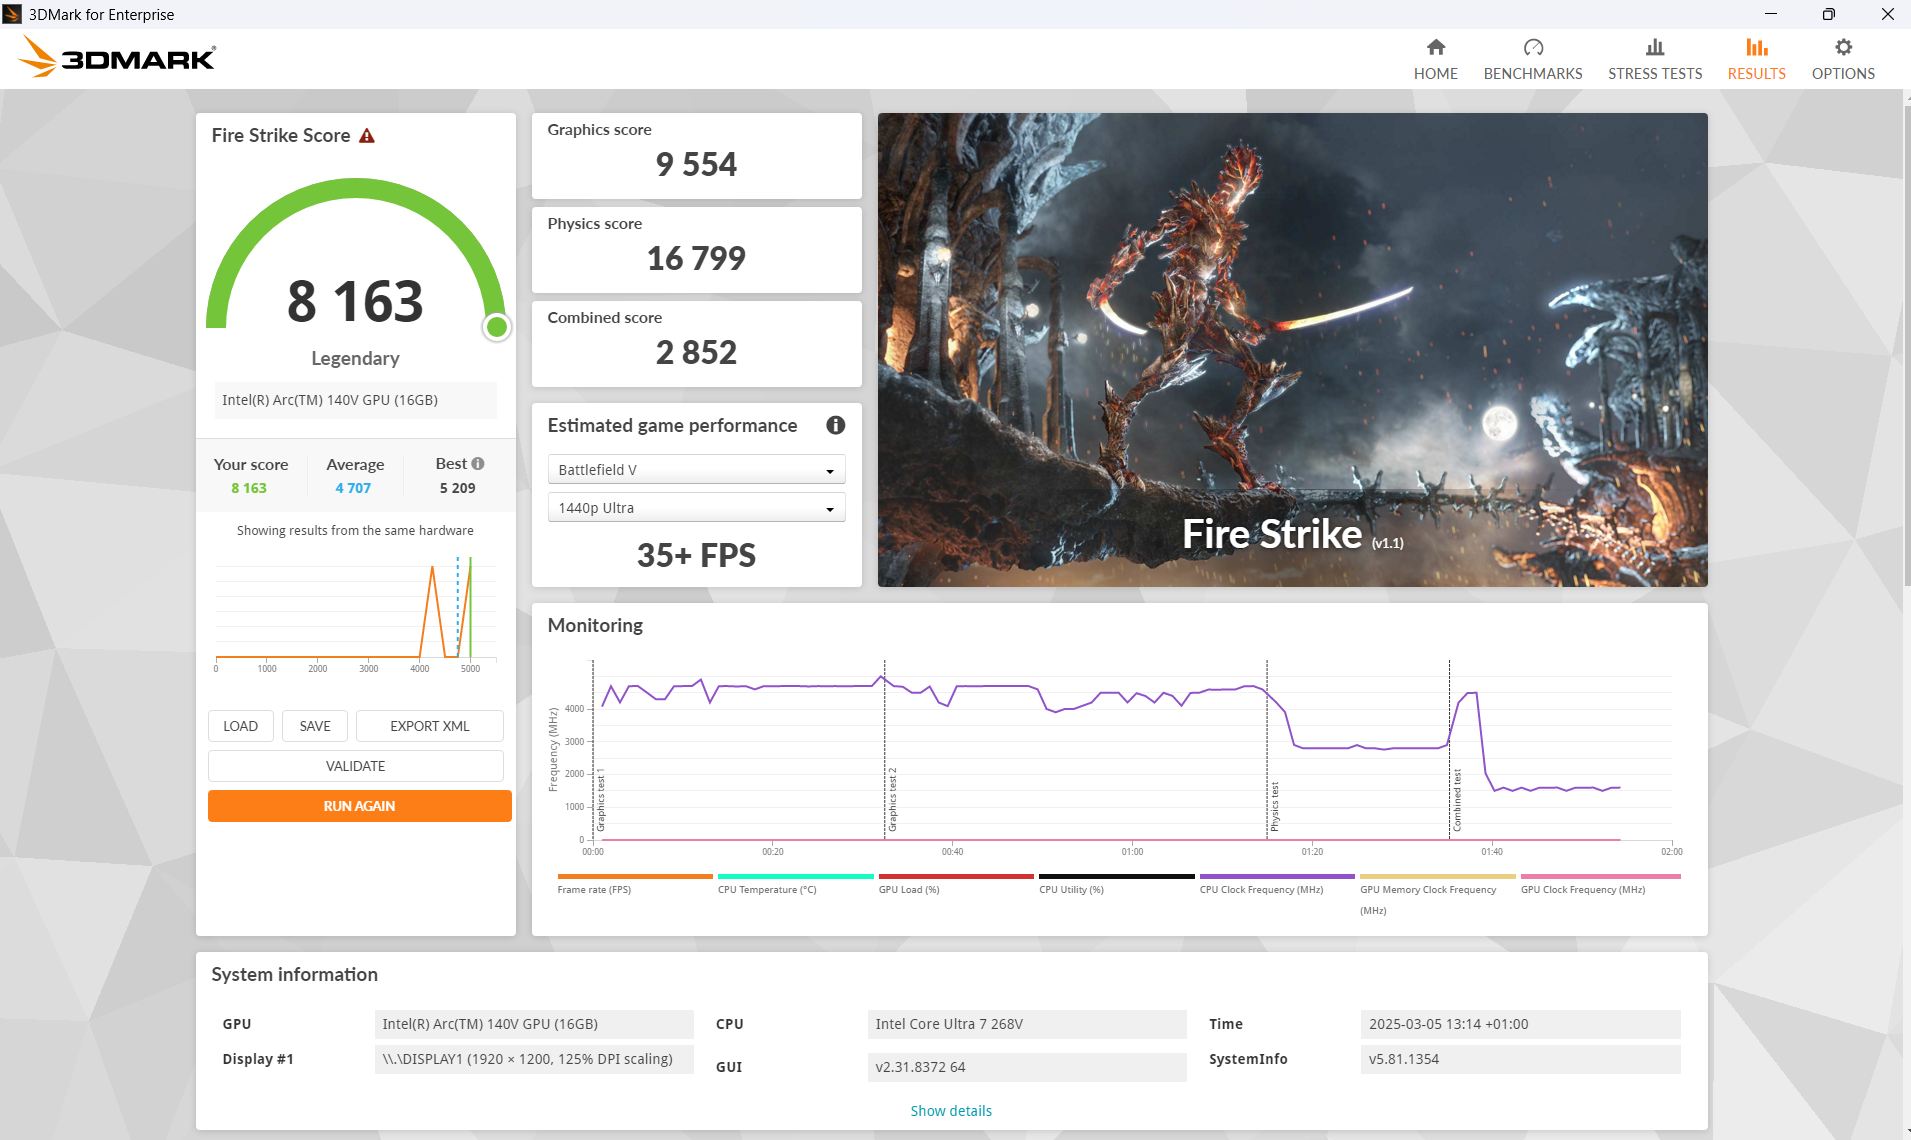
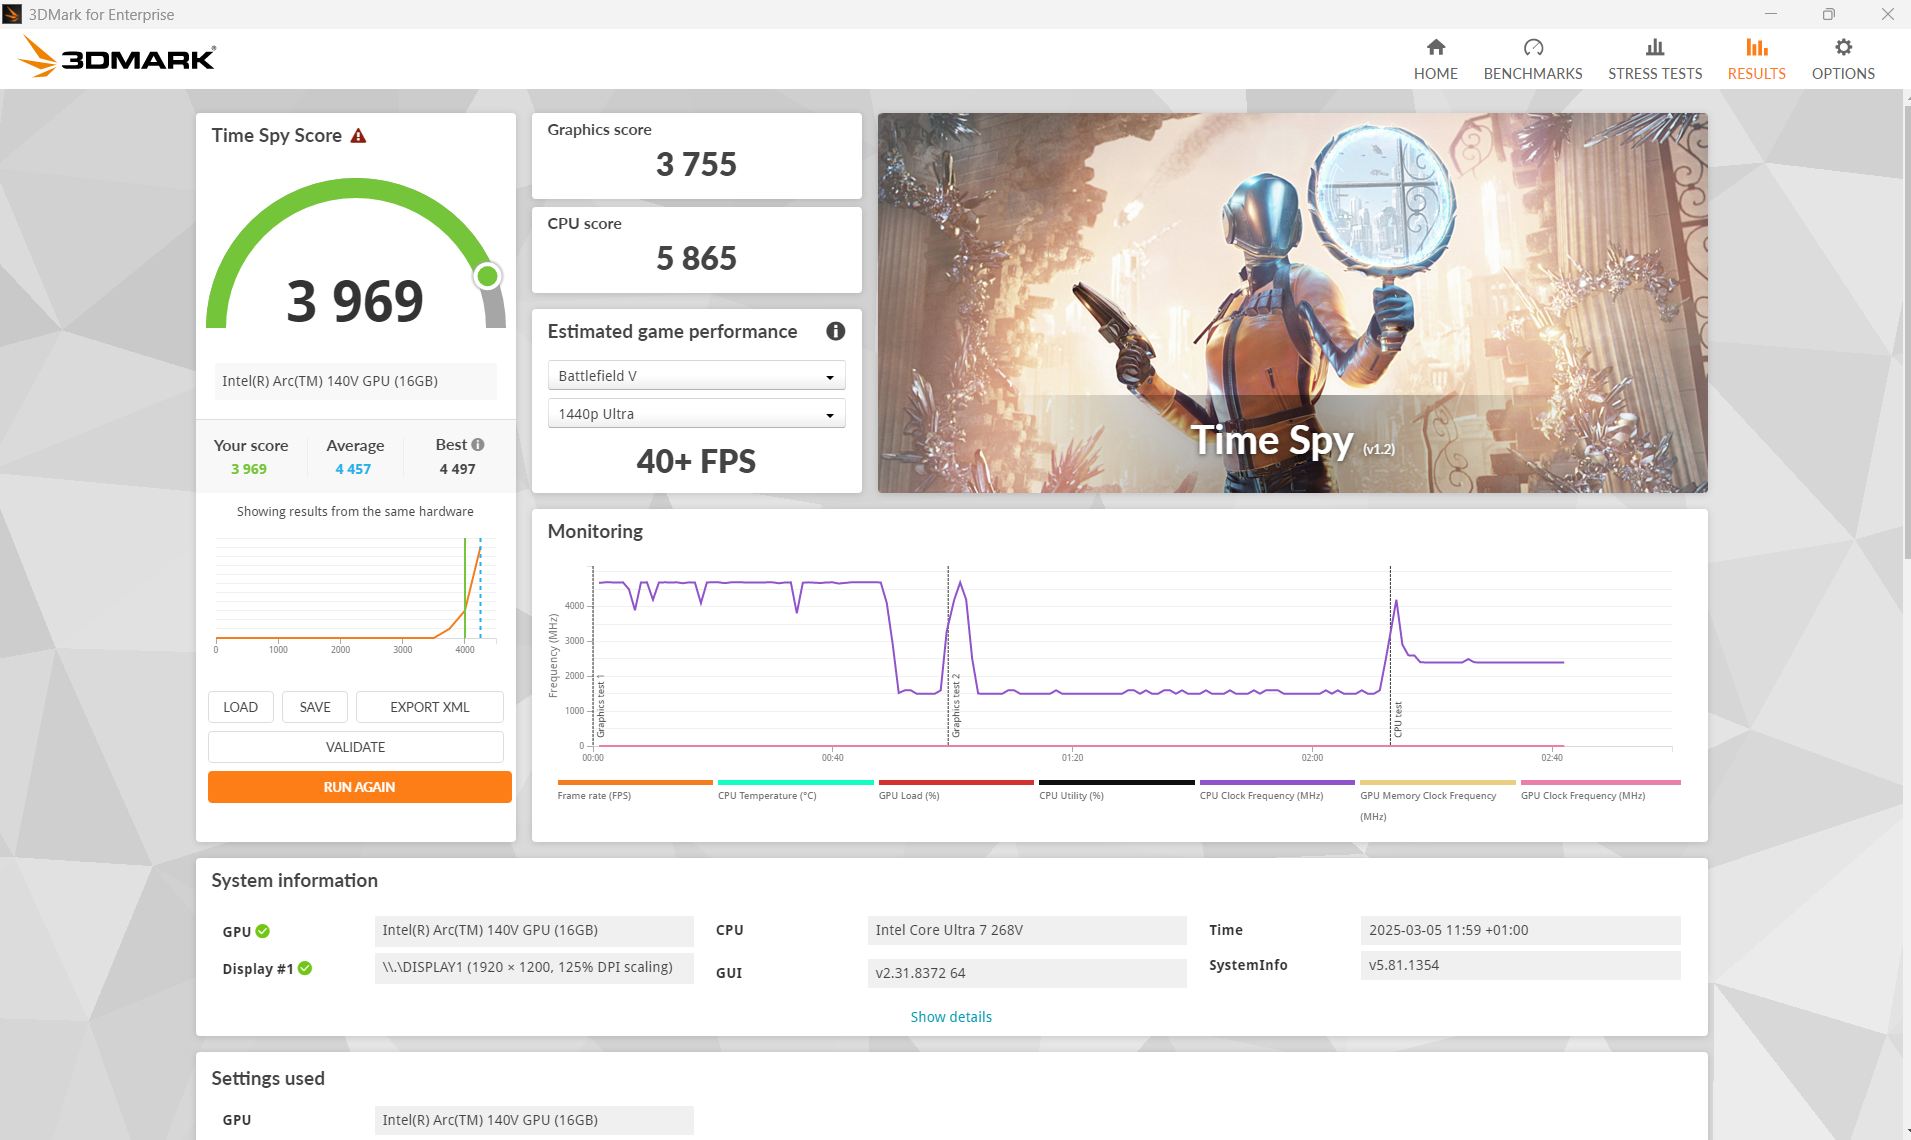
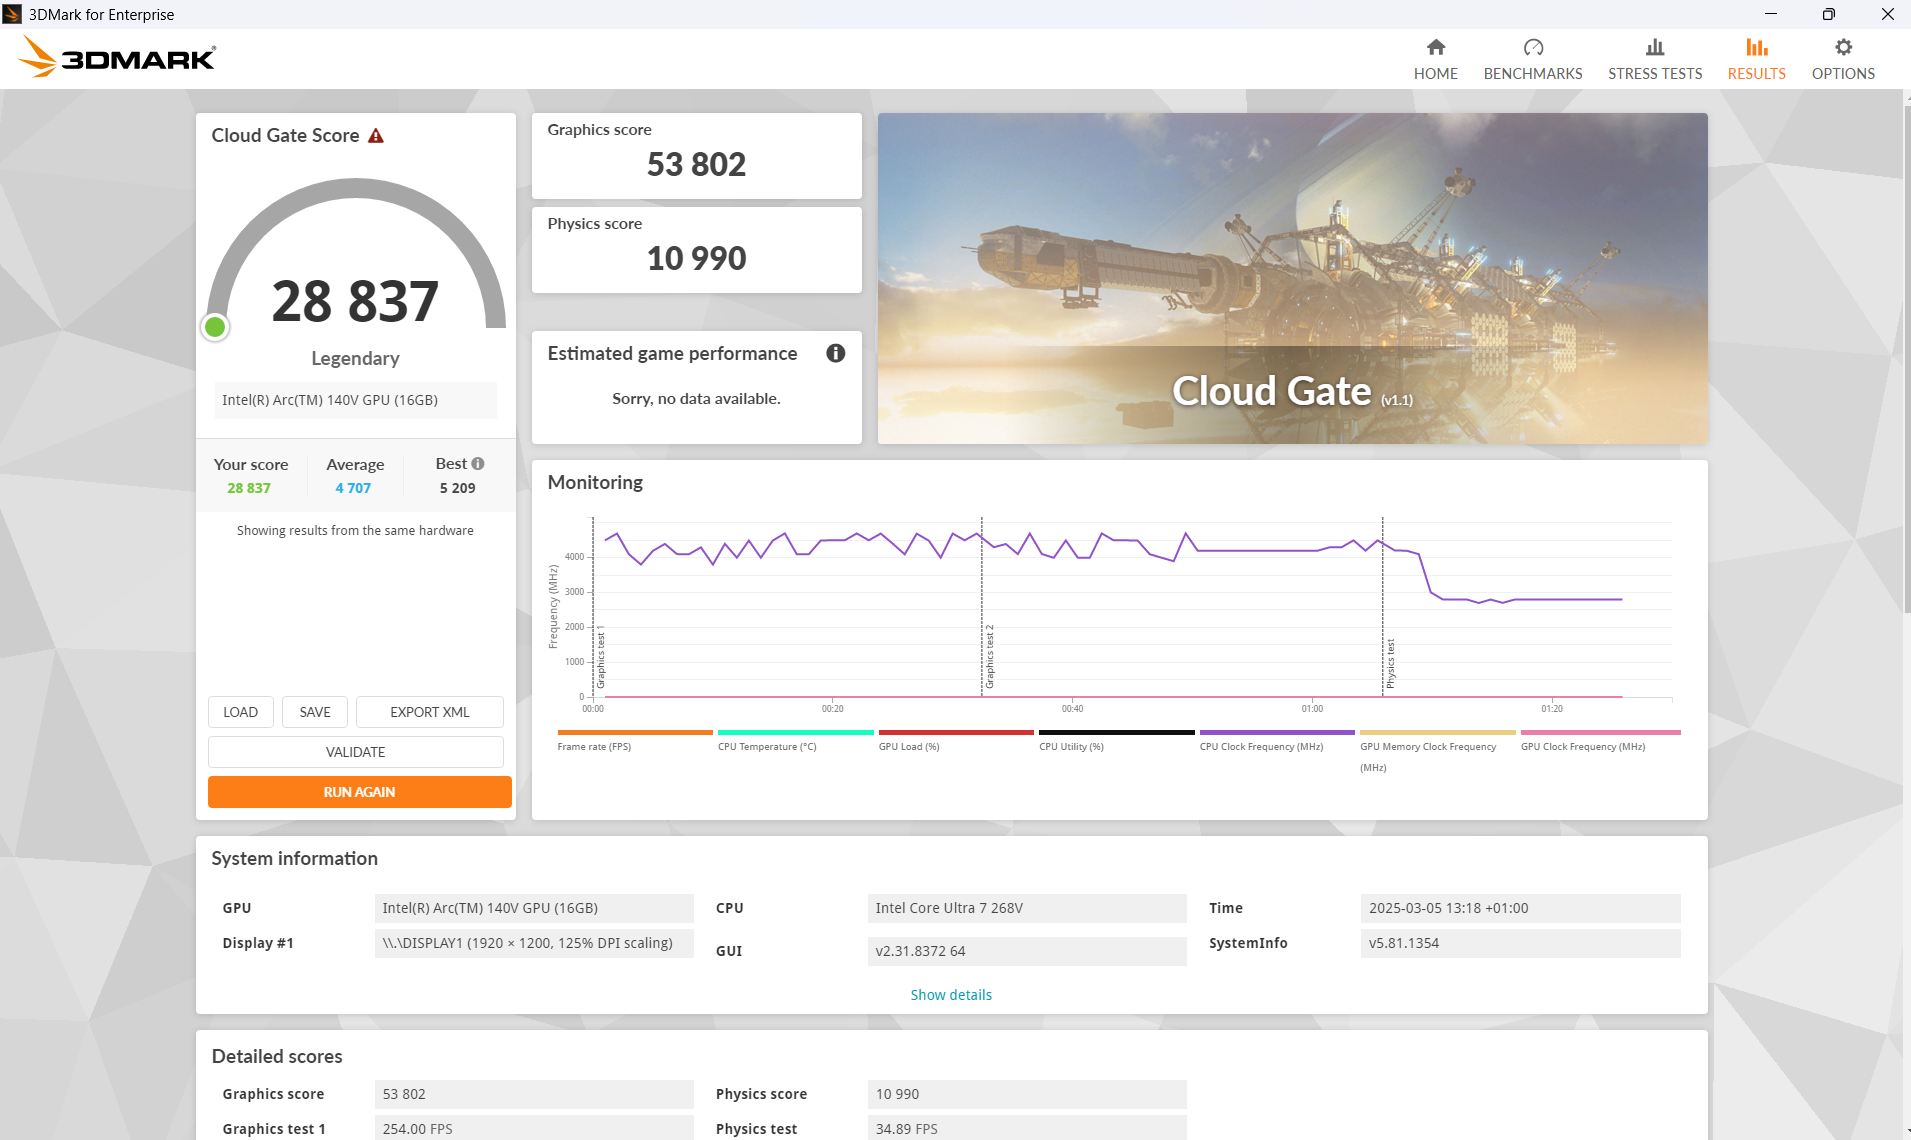
| 3DMark 11 Performance | 10860 puntos | |
| 3DMark Cloud Gate Standard Score | 28837 puntos | |
| 3DMark Fire Strike Score | 8163 puntos | |
| 3DMark Time Spy Score | 3969 puntos | |
ayuda | ||
* ... más pequeño es mejor
| Cyberpunk 2077 2.2 Phantom Liberty - 1920x1080 Ultra Preset (FSR off) | |
| MSI Prestige 13 AI Plus Evo A2VMG | |
| Dell Pro 13 Premium PA13250 | |
| Framework Laptop 13.5 Core Ultra 7 155H | |
| Media de la clase Subnotebook (8.48 - 31.4, n=47, últimos 2 años) | |
| Dell XPS 13 9350 | |
| Microsoft Surface Pro Copilot+ | |
| Lenovo ThinkPad X13 2-in-1 Gen 5 | |
| GTA V - 1920x1080 Highest Settings possible AA:4xMSAA + FX AF:16x | |
| MSI Prestige 13 AI Plus Evo A2VMG | |
| Dell Pro 13 Premium PA13250 | |
| Dell XPS 13 9350 | |
| Microsoft Surface Pro Copilot+ | |
| Media de la clase Subnotebook (7.81 - 53, n=67, últimos 2 años) | |
| Framework Laptop 13.5 Core Ultra 7 155H | |
| Lenovo ThinkPad X13 2-in-1 Gen 5 | |
Cyberpunk 2077 ultra FPS diagram
| bajo | medio | alto | ultra | |
|---|---|---|---|---|
| GTA V (2015) | 153.4 | 140 | 26.3 | |
| Dota 2 Reborn (2015) | 107.5 | 101.7 | 87.8 | 71.2 |
| Final Fantasy XV Benchmark (2018) | 74.9 | 42.3 | 29.1 | |
| X-Plane 11.11 (2018) | 48.1 | 36.7 | 32.7 | |
| Strange Brigade (2018) | 223 | 83.3 | 69.5 | 57.8 |
| Baldur's Gate 3 (2023) | 45.5 | 35.7 | 31.3 | 30.8 |
| Cyberpunk 2077 2.2 Phantom Liberty (2023) | 43.5 | 35.4 | 28.6 | 28.1 |
Emisiones y energía - El Dell Pro es económico
Emisiones sonoras
Los ventiladores suelen ser silenciosos cuando funcionan en vacío. Mientras jugábamos con carga máxima, medimos un máximo de 42 dB, pero en realidad, era más bajo (incluso en las pruebas de estrés) y a menudo sólo alcanzaba los 36 ó 37 dB.
Ruido
| Ocioso |
| 23 / 23 / 23 dB(A) |
| Carga |
| 37 / 42.74 dB(A) |
 | ||
30 dB silencioso 40 dB(A) audible 50 dB(A) ruidosamente alto |
||
min: | ||
| Dell Pro 13 Premium PA13250 Arc 140V, Core Ultra 7 268V, Micron 2550 1TB | MSI Prestige 13 AI Plus Evo A2VMG Arc 140V, Core Ultra 7 258V | Lenovo ThinkPad X13 2-in-1 Gen 5 Graphics 4-Core, Ultra 7 165U, Lenovo UMIS RPETJ1T24MHP2QDQ | Framework Laptop 13.5 Core Ultra 7 155H Arc 8-Core, Ultra 7 155H | Dell XPS 13 9350 Arc 140V, Core Ultra 7 256V, Micron 2550 512GB | Microsoft Surface Pro Copilot+ Adreno X1-85 3.8 TFLOPS, SD X Plus X1P-64-100, Samsung PM9B1 256GB MZ9L4256HCJQ | |
|---|---|---|---|---|---|---|
| Noise | -8% | 4% | -7% | 3% | 2% | |
| apagado / medio ambiente * | 23 | 24.1 -5% | 23 -0% | 24 -4% | 24.1 -5% | 23.8 -3% |
| Idle Minimum * | 23 | 24.8 -8% | 23 -0% | 24.1 -5% | 24.4 -6% | 23.8 -3% |
| Idle Average * | 23 | 24.8 -8% | 23 -0% | 25.1 -9% | 24.4 -6% | 23.8 -3% |
| Idle Maximum * | 23 | 26.7 -16% | 23 -0% | 27 -17% | 24.4 -6% | 23.8 -3% |
| Load Average * | 37 | 36.8 1% | 34.44 7% | 38.4 -4% | 26.2 29% | 23.8 36% |
| Cyberpunk 2077 ultra * | 42.74 | 44.5 -4% | 38.28 10% | 43.7 -2% | 34.2 20% | 44.7 -5% |
| Load Maximum * | 42.74 | 50.8 -19% | 39.04 9% | 45.8 -7% | 45.2 -6% | 44.7 -5% |
* ... más pequeño es mejor
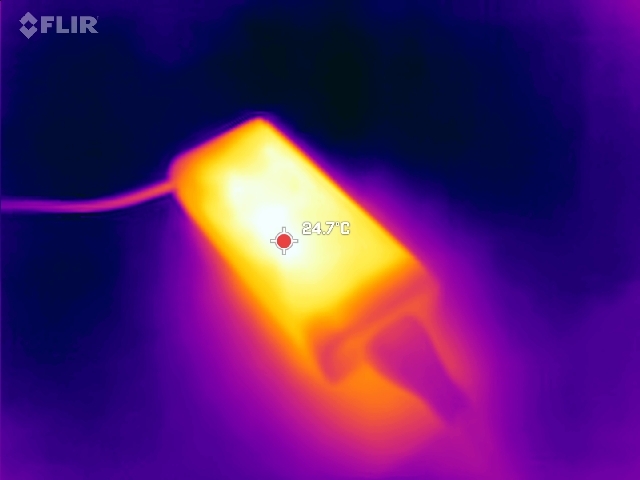
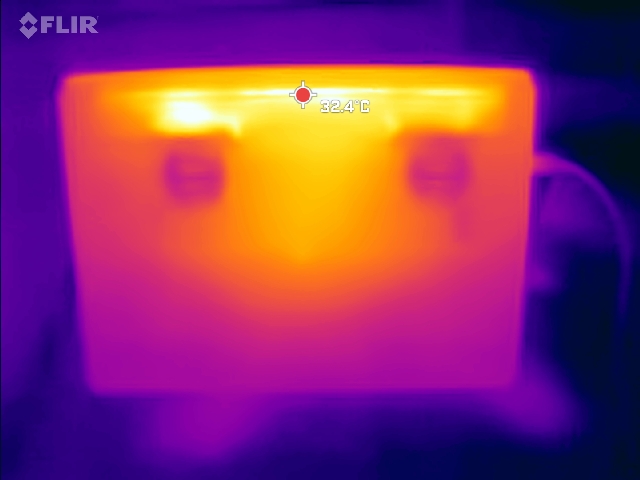
Temperatura
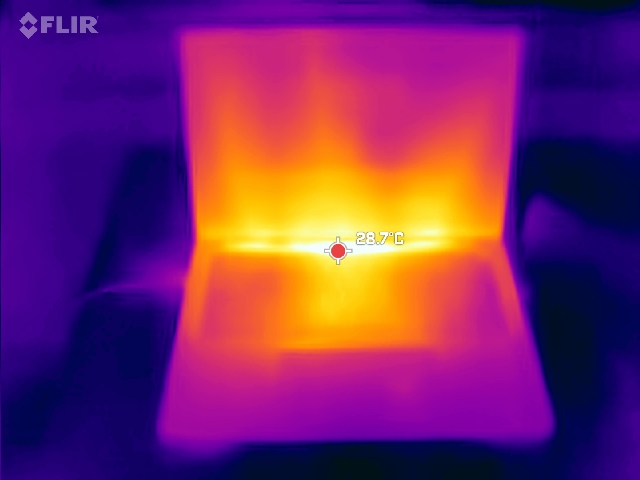
A diferencia de muchos competidores de oficina y empresariales de este tamaño, el Dell Pro 13 Premium utiliza dos ventiladores en lugar de uno solo, y esto es algo que repercute positivamente en las temperaturas de la superficie. Los juegos se calientan más que en nuestra prueba de estrés, pero incluso aquí, medimos puntos calientes de sólo 37°C. Ambos lados del portátil se refrigeran por igual en lugar de un solo lado como ocurre con algunos competidores.
(+) La temperatura máxima en la parte superior es de 31 °C / 88 F, frente a la media de 35.9 °C / 97 F, que oscila entre 21.4 y 59 °C para la clase Subnotebook.
(+) El fondo se calienta hasta un máximo de 31 °C / 88 F, frente a la media de 39.3 °C / 103 F
(+) En reposo, la temperatura media de la parte superior es de 22.3 °C / 72# F, frente a la media del dispositivo de 30.8 °C / 87 F.
(+) 3: The average temperature for the upper side is 28.8 °C / 84 F, compared to the average of 30.8 °C / 87 F for the class Subnotebook.
(+) El reposamanos y el panel táctil están a una temperatura inferior a la de la piel, con un máximo de 26 °C / 78.8 F y, por tanto, son fríos al tacto.
(+) La temperatura media de la zona del reposamanos de dispositivos similares fue de 28.2 °C / 82.8 F (+2.2 °C / 4 F).
| Dell Pro 13 Premium PA13250 Intel Core Ultra 7 268V, Intel Arc Graphics 140V | MSI Prestige 13 AI Plus Evo A2VMG Intel Core Ultra 7 258V, Intel Arc Graphics 140V | Lenovo ThinkPad X13 2-in-1 Gen 5 Intel Core Ultra 7 165U, Intel Graphics 4-Core iGPU (Arc) | Framework Laptop 13.5 Core Ultra 7 155H Intel Core Ultra 7 155H, Intel Arc 8-Core iGPU | Dell XPS 13 9350 Intel Core Ultra 7 256V, Intel Arc Graphics 140V | Microsoft Surface Pro Copilot+ Qualcomm Snapdragon X Plus X1P-64-100, Qualcomm SD X Adreno X1-85 3.8 TFLOPS | |
|---|---|---|---|---|---|---|
| Heat | -23% | -52% | -29% | -12% | -25% | |
| Maximum Upper Side * | 31 | 43.4 -40% | 60 -94% | 42.8 -38% | 34.8 -12% | 43.9 -42% |
| Maximum Bottom * | 31 | 42.4 -37% | 57 -84% | 45.2 -46% | 37.4 -21% | 44.9 -45% |
| Idle Upper Side * | 24 | 25.4 -6% | 27 -13% | 27.2 -13% | 25.4 -6% | 26.2 -9% |
| Idle Bottom * | 24 | 25.6 -7% | 28 -17% | 28.6 -19% | 26.2 -9% | 24.6 -3% |
* ... más pequeño es mejor
Altavoces
Para ser un portátil tan pequeño, los altavoces consiguen incluso superar a algunos modelos mucho más grandes. Los medios están equilibrados, pero aún les faltan graves. Dispone de una entrada de audio jack para conectar dispositivos externos.
Dell Pro 13 Premium PA13250 análisis de audio
(+) | los altavoces pueden reproducir a un volumen relativamente alto (#87.49 dB)
Graves 100 - 315 Hz
(-) | casi sin bajos - de media 15.9% inferior a la mediana
(±) | la linealidad de los graves es media (8.3% delta a frecuencia anterior)
Medios 400 - 2000 Hz
(+) | medios equilibrados - a sólo 2.9% de la mediana
(+) | los medios son lineales (4.7% delta a la frecuencia anterior)
Altos 2 - 16 kHz
(±) | máximos reducidos - de media 5.2% inferior a la mediana
(±) | la linealidad de los máximos es media (7.1% delta a frecuencia anterior)
Total 100 - 16.000 Hz
(+) | el sonido global es lineal (12.2% de diferencia con la mediana)
En comparación con la misma clase
» 14% de todos los dispositivos probados de esta clase eran mejores, 4% similares, 82% peores
» El mejor tuvo un delta de 5%, la media fue 19%, el peor fue ###max##%
En comparación con todos los dispositivos probados
» 8% de todos los dispositivos probados eran mejores, 2% similares, 89% peores
» El mejor tuvo un delta de 4%, la media fue 24%, el peor fue ###max##%
MSI Prestige 13 AI Plus Evo A2VMG análisis de audio
(+) | los altavoces pueden reproducir a un volumen relativamente alto (#84.5 dB)
Graves 100 - 315 Hz
(-) | casi sin bajos - de media 19.4% inferior a la mediana
(±) | la linealidad de los graves es media (9.6% delta a frecuencia anterior)
Medios 400 - 2000 Hz
(±) | medias más altas - de media 6.4% más altas que la mediana
(+) | los medios son lineales (5.1% delta a la frecuencia anterior)
Altos 2 - 16 kHz
(±) | máximos más altos - de media 6.1% más altos que la mediana
(+) | los máximos son lineales (4.6% delta a la frecuencia anterior)
Total 100 - 16.000 Hz
(±) | la linealidad del sonido global es media (18.2% de diferencia con la mediana)
En comparación con la misma clase
» 50% de todos los dispositivos probados de esta clase eran mejores, 7% similares, 43% peores
» El mejor tuvo un delta de 5%, la media fue 19%, el peor fue ###max##%
En comparación con todos los dispositivos probados
» 36% de todos los dispositivos probados eran mejores, 8% similares, 56% peores
» El mejor tuvo un delta de 4%, la media fue 24%, el peor fue ###max##%
Consumo de energía
Gracias al SoC Lunar Lake, el Dell Pro 13 es muy económico. Sólo consume de 2 a 4,75 W en reposo, y medimos sólo 38 W al ejecutar Cyberpunk 2077. Sólo el Dell XPS 13 9350, con su CPU Lunar Lake ligeramente más débil, es más económico, y todos los demás competidores consumen más
| Off / Standby | |
| Ocioso | |
| Carga |
|
Clave:
min: | |
| Dell Pro 13 Premium PA13250 Core Ultra 7 268V, Arc 140V | MSI Prestige 13 AI Plus Evo A2VMG Core Ultra 7 258V, Arc 140V | Lenovo ThinkPad X13 2-in-1 Gen 5 Ultra 7 165U, Graphics 4-Core | Framework Laptop 13.5 Core Ultra 7 155H Ultra 7 155H, Arc 8-Core | Dell XPS 13 9350 Core Ultra 7 256V, Arc 140V | Microsoft Surface Pro Copilot+ SD X Plus X1P-64-100, Adreno X1-85 3.8 TFLOPS | Media de la clase Subnotebook | |
|---|---|---|---|---|---|---|---|
| Power Consumption | -39% | -19% | -26% | 7% | -23% | -62% | |
| Idle Minimum * | 2 | 3.5 -75% | 3.2 -60% | 2.5 -25% | 1.3 35% | 1.9 5% | 4.3 ? -115% |
| Idle Average * | 4.3 | 5.9 -37% | 6.1 -42% | 5.2 -21% | 2.5 42% | 9.2 -114% | 7.33 ? -70% |
| Idle Maximum * | 4.75 | 10 -111% | 6.7 -41% | 5.8 -22% | 4.1 14% | 9.5 -100% | 9.07 ? -91% |
| Load Average * | 40 | 38.7 3% | 44.2 -11% | 47.5 -19% | 40.1 -0% | 29.6 26% | 45.2 ? -13% |
| Cyberpunk 2077 ultra * | 36.4 | 46.3 -27% | 25.2 31% | 54.5 -50% | 46.1 -27% | 39.5 -9% | |
| Cyberpunk 2077 ultra external monitor * | 38 | 45.6 -20% | 38.5 -1% | 52.4 -38% | 43.1 -13% | 37.4 2% | |
| Load Maximum * | 57 | 61.5 -8% | 62.5 -10% | 61.5 -8% | 57.3 -1% | 40.7 29% | 69 ? -21% |
* ... más pequeño es mejor
Power consumption Cyberpunk / stress test
Power consumption with an external monitor
Duración de las pilas
Gracias a su bajo consumo, la duración de la batería es excelente. Registramos casi 24 horas en las pruebas de Wi-Fi y vídeo, ¡un resultado fantástico! La batería de 60 W es más bien de gama media en cuanto a su capacidad. El XPS 13 sólo pierde marginalmente debido a su batería ligeramente más pequeña (55 Wh).
| Dell Pro 13 Premium PA13250 Core Ultra 7 268V, Arc 140V, 60 Wh | MSI Prestige 13 AI Plus Evo A2VMG Core Ultra 7 258V, Arc 140V, 75 Wh | Lenovo ThinkPad X13 2-in-1 Gen 5 Ultra 7 165U, Graphics 4-Core, 54.7 Wh | Framework Laptop 13.5 Core Ultra 7 155H Ultra 7 155H, Arc 8-Core, 61 Wh | Dell XPS 13 9350 Core Ultra 7 256V, Arc 140V, 55 Wh | Microsoft Surface Pro Copilot+ SD X Plus X1P-64-100, Adreno X1-85 3.8 TFLOPS, 47 Wh | Media de la clase Subnotebook | |
|---|---|---|---|---|---|---|---|
| Duración de Batería | -44% | -50% | -52% | -15% | -48% | -36% | |
| H.264 | 1425 | 731 -49% | 841 -41% | 961 ? -33% | |||
| WiFi v1.3 | 1440 | 804 -44% | 739 -49% | 630 -56% | 1236 -14% | 662 -54% | 757 ? -47% |
| Load | 170 | 84 -51% | 90 -47% | 142 -16% | 89 -48% | 121.3 ? -29% | |
| Reader / Idle | 2296 | 3407 | 1882 ? |
Valoración general de Notebookcheck
El Dell Pro 13 Premium es casi todo lo que se puede esperar de un portátil profesional: Es bastante pequeño, ligero, económico, tiene una gran duración de batería y aún así ofrece un rendimiento de alto nivel. Aparte de su elevado precio, no hay prácticamente ninguna queja real que se pueda tener.
Dell Pro 13 Premium PA13250
- 03/14/2025 v8
Christian Hintze
 Total Sustainability Score:
 Transparencia
La selección de los dispositivos que se van a reseñar corre a cargo de nuestro equipo editorial. La muestra de prueba fue proporcionada al autor en calidad de préstamo por el fabricante o el minorista a los efectos de esta reseña. El prestamista no tuvo ninguna influencia en esta reseña, ni el fabricante recibió una copia de la misma antes de su publicación. No había ninguna obligación de publicar esta reseña. Nunca aceptamos compensaciones o pagos a cambio de nuestras reseñas. Como empresa de medios independiente, Notebookcheck no está sujeta a la autoridad de fabricantes, minoristas o editores.
Así es como prueba Notebookcheck
Cada año, Notebookcheck revisa de forma independiente cientos de portátiles y smartphones utilizando procedimientos estandarizados para asegurar que todos los resultados son comparables. Hemos desarrollado continuamente nuestros métodos de prueba durante unos 20 años y hemos establecido los estándares de la industria en el proceso. En nuestros laboratorios de pruebas, técnicos y editores experimentados utilizan equipos de medición de alta calidad. Estas pruebas implican un proceso de validación en varias fases. Nuestro complejo sistema de clasificación se basa en cientos de mediciones y puntos de referencia bien fundamentados, lo que mantiene la objetividad.
