
Análisis del Lenovo Yoga Pro 7 14: el portátil multimedia con OLED de 120 Hz y una RTX 4050
Aumento del rendimiento de la GPU.
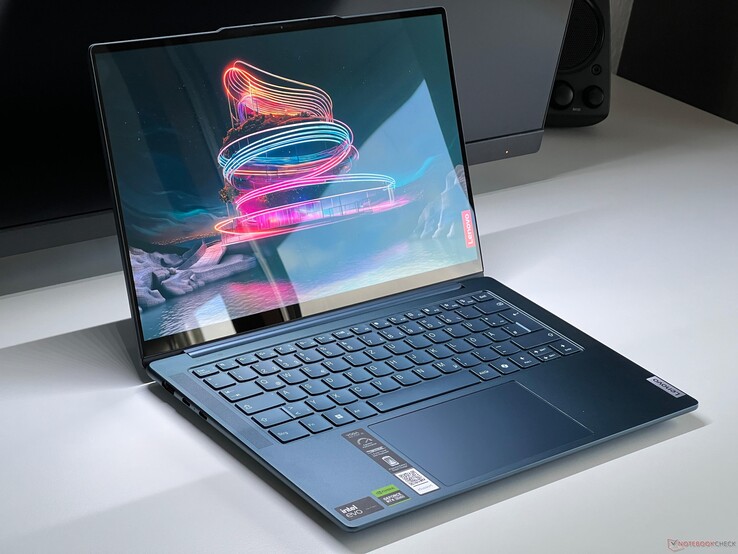
El Yoga Pro 7 14 de Lenovo es un rápido portátil multimedia que puede equiparse opcionalmente con GPU dedicadas GeForce. Hemos probado la versión con el Core Ultra 7 155H de Meteor Lake, 32 GB de RAM, OLED de 120 Hz y el portátil Nvidia GeForce RTX 4050.Andreas Osthoff, 👁 Andreas Osthoff (traducido por DeepL / Ninh Duy) Publicado 🇺🇸 🇩🇪 ...
Veredicto - El Yoga Pro 7 14 presume de un mejor rendimiento de la GPU gracias a su portátil RTX 4050
El Lenovo Yoga Pro 7 14 es un buen portátil multimedia y su GeForce RTX 4050 dedicada duplica el rendimiento gráfico de las configuraciones iGPU. Su desarrollo de rendimiento con un TGP máximo de 60 vatios es decente y el rendimiento del procesador Core Ultra 7 155H del portátil es igualmente bueno (70 vatios). Sin embargo, sus elevados límites de potencia dan lugar a ventiladores ruidosos y su comparación con la variante AMD muestra que el Ryzen AI 9 365 ofrece ligeramente más rendimiento con menos potencia. Como resultado, la combinación AMD/Nvidia sería en realidad la mejor opción.
La carcasa del Yoga -incluidos sus puertos- es impresionante y su teclado es súper cómodo. Además, cuenta con buenos altavoces. La pantalla OLED de 120 Hz opcional ofrece una gran calidad de imagen y Lenovo proporciona perfiles precisos para P3 y sRGB. Sin embargo, el panel también es bastante reflectante y observamos un parpadeo PWM constante a 240 Hz.
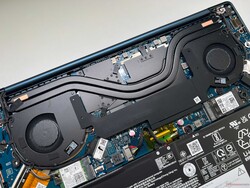
Además de los ruidosos ventiladores, los puntos débiles del portátil incluyen sus tiempos de ejecución, que por desgracia son mediocres en el mejor de los casos. Además, su fuente de alimentación no es de tamaño suficiente. Con una carga muy elevada, hay que recurrir a la batería para cubrir el consumo de energía del dispositivo. Esto es innecesario y, desde luego, no es nada bueno para la batería. Lenovo debería haber incluido una fuente de alimentación de 130 vatios. Por no mencionar que su RAM no se puede actualizar y que sólo se puede instalar una SSD M.2-2242 compacta debido a la GPU dedicada.
Pro
Contra
Precio y disponibilidad
Nuestro dispositivo de prueba exacto no está actualmente disponible para su compra en línea en los Estados Unidos, sin embargo, puede ver y comprar otras versiones del portátil en el sitio web de Lenovo.
Posibles contendientes en la comparación
Imagen | Modelo | Precio | Peso | Altura | Pantalla |
|---|---|---|---|---|---|
| Lenovo Yoga Pro 7 14IMH9, RTX 4050 Intel Core Ultra 7 155H ⎘ NVIDIA GeForce RTX 4050 Laptop GPU ⎘ 32 GB Memoría, 1024 GB SSD | Amazon: 1. $1,149.00 Lenovo Yoga Pro 7 14AHP9 202... 2. $799.98 Lenovo Yoga 7 7i 2-in-1 Lapt... 3. $899.99 Lenovo - Yoga 7 2-in-1 14" 2... Precio de catálogo: 1699€ | 1.6 kg | 16.6 mm | 14.50" 2880x1800 234 PPI OLED | |
| SCHENKER Key 14 (M24) Intel Core Ultra 7 155H ⎘ NVIDIA GeForce RTX 4060 Laptop GPU ⎘ 32 GB Memoría, 1024 GB SSD | Amazon: 1. $68.99 PowerHOOD 20V AC/DC Adapter ... Precio de catálogo: 1890€ | 1.7 kg | 19.9 mm | 14.00" 2880x1800 243 PPI IPS | |
| Dell XPS 14 2024 OLED Intel Core Ultra 7 155H ⎘ NVIDIA GeForce RTX 4050 Laptop GPU ⎘ 32 GB Memoría, 1024 GB SSD | Amazon: $1,175.00 Precio de catálogo: 2949€ | 1.8 kg | 19 mm | 14.50" 3200x2000 260 PPI OLED | |
| HP OmniBook Ultra 14 AMD Ryzen AI 9 HX 375 ⎘ AMD Radeon 890M ⎘ 32 GB Memoría, 2048 GB SSD | Amazon: Precio de catálogo: 1030 USD | 1.5 kg | 16.5 mm | 14.00" 2240x1400 189 PPI IPS | |
| SCHENKER Vision 14 M23 RTX 3050 Intel Core i7-13700H ⎘ NVIDIA GeForce RTX 3050 6GB Laptop GPU ⎘ 32 GB Memoría, 1024 GB SSD | Amazon: 1. $125.00 14.0" 2880(RGB)*1800 LCD Scr... 2. $132.99 14.0" 2880(RGB)*1800 90Hz ED... 3. $45.99 19V 6.32A 120W Charger for M... Precio de catálogo: 1985€ | 1.3 kg | 16.6 mm | 14.00" 2880x1800 243 PPI IPS | |
| Lenovo Yoga Pro 7 14IMH9 Intel Core Ultra 7 155H ⎘ Intel Arc 8-Core iGPU ⎘ 32 GB Memoría, 1024 GB SSD | Amazon: 1. $969.99 Lenovo Yoga Pro 7 14AHP9-202... 2. $53.99 RUNMEIJIA Laptop Case Cover ... 3. $2,049.00 Lenovo Yoga Pro 9i 16"" Lapt... Precio de catálogo: 1300 EUR | 1.6 kg | 16.6 mm | 14.50" 3072x1920 250 PPI IPS |
Índice
- Veredicto - El Yoga Pro 7 14 presume de un mejor rendimiento de la GPU gracias a su portátil RTX 4050
- Especificaciones
- Estuche y conectividad
- Dispositivos de entrada - Recorrido de tecla de 1,5 mm
- Pantalla - 2.8K OLED a 120 Hz
- Rendimiento - Lago Meteoro-H
- Emisiones y energía
- Valoración total de Notebookcheck
Lenovo ofrece su Yoga Pro 7 14 en varias configuraciones y ya hemos probado la AMD Zen5 y Intel (cada uno con tarjetas gráficas integradas), por ejemplo. Sin embargo, también hay disponibles variantes más potentes (especialmente en lo que respecta a la GPU) con hasta la RTX 4060 Laptop. Nuestro dispositivo de prueba actual por un MRSP de poco más de 1.700 dólares viene con el procesador Meteor Lake Core Ultra 7 155H, 32 GB de RAM, una pantalla OLED de 2,8K a 120 Hz y la tarjeta gráfica dedicada Portátil Nvidia GeForce RTX 4050.
Especificaciones
Top 10 Análisis
» Top 10 Portátiles Multimedia
» Top 10 Portátiles de Juego
» Top 10 Portátiles de Juego ligeros
» Top 10 Portátiles Asequibles de Oficina/Empresa
» Top 10 Portátiles de Juego Ligeros
» Top 10 Portátiles de Oficina/Empresa Premium
» Top 10 Estaciones de Trabajo
» Top 10 Subportátiles
» Top 10 Ultrabooks
» Top 10 Convertibles
» Top 10 Tablets
» Top 10 Tablets Windows
» Top 10 Tablets de menos de 250 Euros
» Top 10 Phablets (>5.5")
» Top 10 Smartphones
» Top 10 Smartphones (≤5")
» Top 10 Smartphones de menos de 300 Euros
» Top 10 Smartphones de menos de 120 Euros
» Top 10 Portátiles de menos de 1000 Euros
» Top 10 Portátiles de menos de 500 Euros
» Top 10 Portátiles de menos de 300 Euros
» Los Mejores Displays de Portátiles Analizados por Notebookcheck
Estuche y conectividad
En general, el diseño de la carcasa de nuestro dispositivo de prueba es prácticamente el mismo que el del AMD Zen5 o la versión Intel que ya probamos, pero en lugar de la variante de color Tidal Gray, presenta el colorway Tidal Teal, es decir, una carcasa turquesa. La estabilidad y la calidad de construcción de la carcasa metálica no dan lugar a críticas y sus superficies no son especialmente susceptibles a las marcas de huellas dactilares. En comparación con otros portátiles de Lenovo, la joroba de la cámara es muy discreta e incluso resulta bastante útil si desea abrir la tapa, lo que puede hacerse fácilmente con una sola mano.
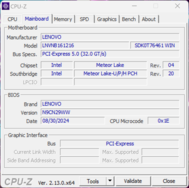
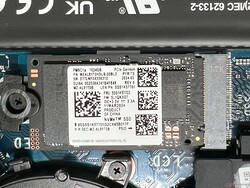
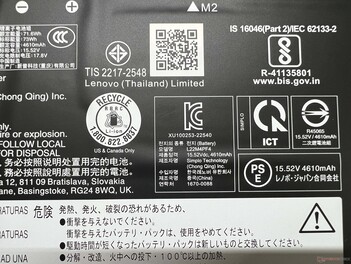
La RAM está soldada, por lo que las opciones de mantenimiento se limitan al módulo WLAN, la SSD compacta M.2-2242 (M.2-2280 para las versiones iGPU) y la limpieza de los ventiladores. La batería atornillada también puede sustituirse en caso necesario. Todos los puertos importantes están a bordo (incluido Thunderbolt 4) y la webcam 1080p (que incluye un sensor IR y un obturador electrónico) es compatible con Windows Studio Effects. El módulo Wi-Fi cumple con el estándar Wi-Fi 6E y alcanzó altas tasas de transferencia durante nuestra prueba; sin embargo, el portátil no dispone de lector de tarjetas.
| Networking | |
| Lenovo Yoga Pro 7 14IMH9, RTX 4050 | |
| iperf3 transmit AXE11000 | |
| iperf3 receive AXE11000 | |
| SCHENKER Key 14 (M24) | |
| iperf3 transmit AXE11000 | |
| iperf3 receive AXE11000 | |
| Dell XPS 14 2024 OLED | |
| iperf3 transmit AXE11000 | |
| iperf3 receive AXE11000 | |
| HP OmniBook Ultra 14 | |
| iperf3 transmit AXE11000 | |
| iperf3 receive AXE11000 | |
| iperf3 transmit AXE11000 6GHz | |
| iperf3 receive AXE11000 6GHz | |
| Lenovo Yoga Pro 7 14IMH9 | |
| iperf3 transmit AXE11000 | |
| iperf3 receive AXE11000 | |

Sostenibilidad
Lenovo no ha facilitado ninguna información sobre la huella deCO2 de la producción del Yoga Pro 7 14, pero el dispositivo cuenta al menos con las certificaciones EPEAT Gold y Energy Star. Su embalaje está completamente libre de plástico y se ha utilizado un 50% de aluminio reciclado tanto para la unidad base como para la tapa de la pantalla.
Dispositivos de entrada - Recorrido de tecla de 1,5 mm
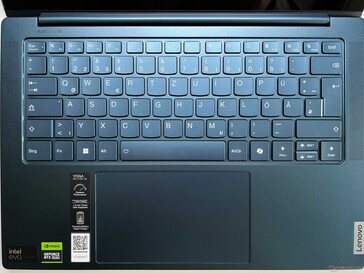
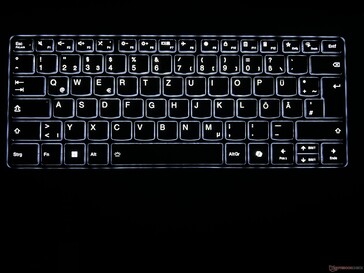
El teclado del portátil resulta cómodo para escribir gracias a su recorrido de 1,5 mm y a su respuesta precisa. Sin embargo, las teclas más grandes en particular son bastante ruidosas. A pesar de su esquema de color azul, la visibilidad de las teclas es buena y la retroiluminación blanca de dos niveles -que también puede activarse automáticamente mediante un sensor- ayuda en entornos oscuros. En principio, el ClickPad funciona muy bien, pero los clics mecánicos de la zona inferior son muy ruidosos, lo que da la impresión de ser barato.
Pantalla - 2.8K OLED a 120 Hz
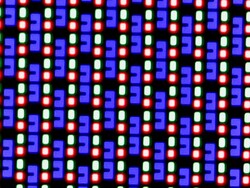
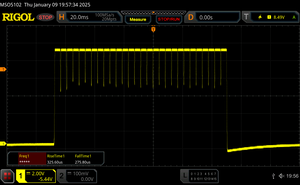
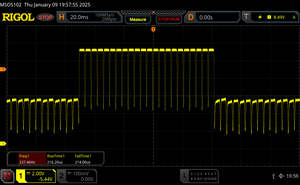
La pantalla OLED de 14,5 pulgadas de nuestro dispositivo de pruebas (2.880 x 1.800 píxeles, 16:10) presume de una calidad de imagen subjetiva muy buena y ya no tiene los mismos problemas de efecto de trama que las anteriores OLED 2,8K de Lenovo. Su frecuencia de actualización es de 120 Hz y los movimientos se ven súper suaves; además, sus tiempos de respuesta son extremadamente rápidos. No hay sangrado de retroiluminación en los paneles OLED, pero sí un parpadeo PWM constante a 240 Hz. Ni su brillo ni su temperatura de color se pueden ajustar automáticamente a la luz ambiente. No dispone de pantalla táctil.
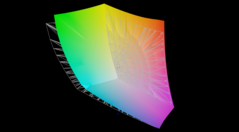
En modo SDR, su brillo ronda los 400 cd/m² y, junto con su bajo nivel de negro, resulta en una relación de contraste extremadamente alta. En modo HDR, medimos un brillo máximo de 650 cd/m² al mostrar una pequeña sección de imagen y de 520 cd/m² al mostrar una imagen casi completamente blanca. Hay que tener en cuenta, sin embargo, que el modo HDR tiene que activarse manualmente y que entonces los perfiles de color dejan de funcionar.
| |||||||||||||||||||||||||
iluminación: 98 %
Brillo con batería: 398 cd/m²
Contraste: ∞:1 (Negro: 0 cd/m²)
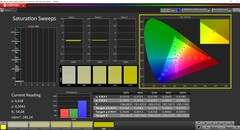
ΔE Color 1.4 | 0.5-29.43 Ø4.87
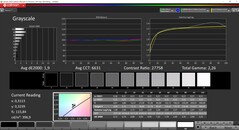
ΔE Greyscale 1.8 | 0.5-98 Ø5.1
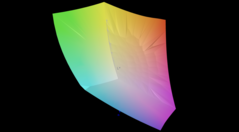
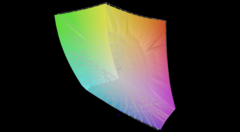
88.8% AdobeRGB 1998 (Argyll 2.2.0 3D)
99.9% sRGB (Argyll 2.2.0 3D)
98% Display P3 (Argyll 2.2.0 3D)
Gamma: 2.27
| Lenovo Yoga Pro 7 14IMH9, RTX 4050 LEN145WQ+, OLED, 2880x1800, 14.5", 120 Hz | SCHENKER Key 14 (M24) TL140ADXP24-0, IPS, 2880x1800, 14", 120 Hz | Dell XPS 14 2024 OLED SDC41A2, OLED, 3200x2000, 14.5", 120 Hz | HP OmniBook Ultra 14 BOE0C9E, IPS, 2240x1400, 14", 60 Hz | Lenovo Yoga Pro 7 14IMH9 Lenovo LEN145-3K (LEN8AAF), IPS, 3072x1920, 14.5", 120 Hz | SCHENKER Vision 14 2023 CSOT T3 MNE007ZA1-3, IPS, 2880x1800, 14", 90 Hz | |
|---|---|---|---|---|---|---|
| Display | -16% | -0% | -18% | -1% | -13% | |
| Display P3 Coverage | 98 | 70.3 -28% | 98.5 1% | 67.1 -32% | 98.4 0% | 74.7 -24% |
| sRGB Coverage | 99.9 | 97.4 -3% | 100 0% | 99 -1% | 100 0% | 99.6 0% |
| AdobeRGB 1998 Coverage | 88.8 | 72.4 -18% | 87.2 -2% | 68.9 -22% | 86.9 -2% | 75.8 -15% |
| Response Times | -6393% | 4% | -6370% | -5046% | -4907% | |
| Response Time Grey 50% / Grey 80% * | 0.43 ? | 38.5 ? -8853% | 0.7 ? -63% | 35.9 ? -8249% | 34.1 ? -7830% | 32.2 ? -7388% |
| Response Time Black / White * | 0.61 ? | 24.6 ? -3933% | 0.77 ? -26% | 28 ? -4490% | 14.4 ? -2261% | 15.4 ? -2425% |
| PWM Frequency | 240 ? | 480 100% | ||||
| Screen | -17% | -13% | -19% | 20% | -8% | |
| Brightness middle | 398 | 325 -18% | 351 -12% | 359.5 -10% | 464 17% | 402 1% |
| Brightness | 402 | 317 -21% | 353 -12% | 361 -10% | 456 13% | 371 -8% |
| Brightness Distribution | 98 | 94 -4% | 97 -1% | 92 -6% | 90 -8% | 86 -12% |
| Black Level * | 0.12 | 0.27 | 0.36 | 0.27 | ||
| Colorchecker dE 2000 * | 1.4 | 1.8 -29% | 1.7 -21% | 1.64 -17% | 0.9 36% | 1.8 -29% |
| Colorchecker dE 2000 max. * | 3.7 | 3.4 8% | 2.2 41% | 4.68 -26% | 2.32 37% | 3.6 3% |
| Greyscale dE 2000 * | 1.8 | 2.5 -39% | 3.1 -72% | 2.6 -44% | 1.4 22% | 1.8 -0% |
| Gamma | 2.27 97% | 2.15 102% | 2.12 104% | 2.22 99% | 2.218 99% | 2.27 97% |
| CCT | 6609 98% | 7017 93% | 6616 98% | 6388 102% | 6669 97% | 6695 97% |
| Contrast | 2708 | 1331 | 1289 | 1489 | ||
| Colorchecker dE 2000 calibrated * | 1.4 | 0.8 | 0.97 | 0.35 | 1.5 | |
| Media total (Programa/Opciones) | -2142% /
-1176% | -3% /
-6% | -2136% /
-1173% | -1676% /
-907% | -1643% /
-900% |
* ... más pequeño es mejor
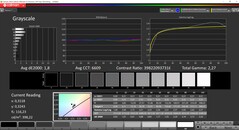
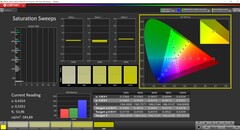
Analizamos el panel utilizando el software profesional CalMAN. Lenovo ofrece varios perfiles en la aplicación Vantage y la pantalla ya es bastante impresionante con el perfil P3 seleccionado. No observamos valores atípicos por encima de la importante desviación de 3 ni en la escala de grises ni en los colores, y tampoco encontrará un tinte de color. Los usuarios también tienen a su disposición un perfil sRGB preciso. Tanto el espacio de color P3 como el sRGB están totalmente cubiertos. No pudimos mejorar más la pantalla mediante nuestra propia calibración.
Tiempos de respuesta del display
| ↔ Tiempo de respuesta de Negro a Blanco | ||
|---|---|---|
| 0.61 ms ... subida ↗ y bajada ↘ combinada | ↗ 0.33 ms subida | |
| ↘ 0.28 ms bajada | ||
| La pantalla mostró tiempos de respuesta muy rápidos en nuestros tests y debería ser adecuada para juegos frenéticos. En comparación, todos los dispositivos de prueba van de ##min### (mínimo) a 240 (máximo) ms. » 1 % de todos los dispositivos son mejores. Esto quiere decir que el tiempo de respuesta medido es mejor que la media (20.8 ms) de todos los dispositivos testados. | ||
| ↔ Tiempo de respuesta 50% Gris a 80% Gris | ||
| 0.43 ms ... subida ↗ y bajada ↘ combinada | ↗ 0.22 ms subida | |
| ↘ 0.21 ms bajada | ||
| La pantalla mostró tiempos de respuesta muy rápidos en nuestros tests y debería ser adecuada para juegos frenéticos. En comparación, todos los dispositivos de prueba van de ##min### (mínimo) a 636 (máximo) ms. » 0 % de todos los dispositivos son mejores. Esto quiere decir que el tiempo de respuesta medido es mejor que la media (32.5 ms) de todos los dispositivos testados. | ||
Parpadeo de Pantalla / PWM (Pulse-Width Modulation)
| Parpadeo de Pantalla / PWM detectado | 240 Hz Amplitude: 50 % | ≤ 100 % de brillo | |
La retroiluminación del display parpadea a 240 Hz (seguramente usa PWM - Pulse-Width Modulation) a un brillo del 100 % e inferior. Sobre este nivel de brillo no debería darse parpadeo / PWM. La frecuencia de 240 Hz es relativamente baja, por lo que la gente sensible debería ver parpadeos y padecer fatiga visual por la pantalla (usado al brillo indicado a continuación). Comparación: 53 % de todos los dispositivos testados no usaron PWM para atenuar el display. Si se usó, medimos una media de 8516 (mínimo: 5 - máxmo: 343500) Hz. | |||
Rendimiento - Lago Meteoro-H
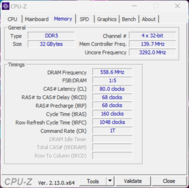
Nuestro dispositivo de prueba está equipado con 32 GB de RAM LPDDR5x-7467, que debería ser suficiente para la mayoría de los usuarios. Sin embargo, no hay opción de ampliarla.
Condiciones de prueba
Lenovo ofrece varios perfiles de energía entre los que se puede cambiar mediante el software Vantage o la combinación de teclas Fn+Q. Realizamos las siguientes pruebas de rendimiento y mediciones utilizando el modo de rendimiento máximo para aprovechar todo el rendimiento de la CPU y la GPU.
| Modo de energía | TDP de la CPU | CB R23 Multi | TGP de la GPU | Time Spy Gráficos | emisiones máximas de ruido del ventilador |
|---|---|---|---|---|---|
| Modo de ahorro de batería | 50/15 vatios | 12.648 puntos | 13 vatios | 1.251 puntos | 29,8 dB(A) |
| Modo de ahorro de batería adaptable (Auto) | 70/65 vatios | 17.539 puntos | 50 vatios | 6.461 puntos | 45 dB(A) |
| Rendimiento | 75/70 vatios | 18.184 puntos | 60 vatios | 7.342 puntos | 49,1 dB(A) |
Procesador
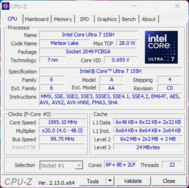
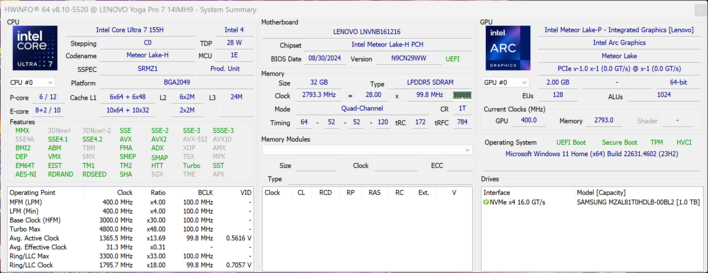
El Intel Core Ultra 7 155H de la generación Meteor Lake se utiliza como procesador del portátil. Tiene un total de 16 núcleos (22 hilos) y puede funcionar en un rango de 28-115 vatios. Durante nuestra prueba, el Yoga Pro 7 14 consumió un máximo de 75 vatios, que luego se estabilizó en 70 vatios. Como resultado, su rendimiento multinúcleo fue bueno y estable en general, aunque el Ryzen AI 9 365 logró resultados aún mejores con un consumo ligeramente inferior (60/54 vatios). Además, su rendimiento se mantuvo estable en modo batería. Encontrará más pruebas comparativas de CPU en nuestra sección de tecnología.
Cinebench R15 Multi continuous test
Cinebench R23: Multi Core | Single Core
Cinebench R20: CPU (Multi Core) | CPU (Single Core)
Cinebench R15: CPU Multi 64Bit | CPU Single 64Bit
Blender: v2.79 BMW27 CPU
7-Zip 18.03: 7z b 4 | 7z b 4 -mmt1
Geekbench 6.4: Multi-Core | Single-Core
Geekbench 5.5: Multi-Core | Single-Core
HWBOT x265 Benchmark v2.2: 4k Preset
LibreOffice : 20 Documents To PDF
R Benchmark 2.5: Overall mean
| CPU Performance Rating | |
| HP OmniBook Ultra 14 | |
| Lenovo Yoga Pro 7 14ASP G9 | |
| Lenovo Yoga Pro 7 14IMH9, RTX 4050 | |
| Media de la clase Multimedia | |
| SCHENKER Key 14 (M24) | |
| Lenovo Yoga Pro 7 14IMH9 | |
| Dell XPS 14 2024 OLED | |
| Medio Intel Core Ultra 7 155H | |
| SCHENKER Vision 14 M23 RTX 3050 | |
| Cinebench R23 / Multi Core | |
| HP OmniBook Ultra 14 | |
| Lenovo Yoga Pro 7 14ASP G9 | |
| Lenovo Yoga Pro 7 14IMH9, RTX 4050 | |
| Media de la clase Multimedia (4861 - 30789, n=96, últimos 2 años) | |
| SCHENKER Key 14 (M24) | |
| Medio Intel Core Ultra 7 155H (9769 - 19007, n=52) | |
| Lenovo Yoga Pro 7 14IMH9 | |
| Dell XPS 14 2024 OLED | |
| SCHENKER Vision 14 M23 RTX 3050 | |
| Cinebench R23 / Single Core | |
| Lenovo Yoga Pro 7 14ASP G9 | |
| HP OmniBook Ultra 14 | |
| SCHENKER Vision 14 M23 RTX 3050 | |
| Media de la clase Multimedia (878 - 2290, n=87, últimos 2 años) | |
| Lenovo Yoga Pro 7 14IMH9, RTX 4050 | |
| Dell XPS 14 2024 OLED | |
| Medio Intel Core Ultra 7 155H (1496 - 1815, n=52) | |
| SCHENKER Key 14 (M24) | |
| Lenovo Yoga Pro 7 14IMH9 | |
| Cinebench R20 / CPU (Multi Core) | |
| HP OmniBook Ultra 14 | |
| Lenovo Yoga Pro 7 14ASP G9 | |
| Lenovo Yoga Pro 7 14IMH9, RTX 4050 | |
| Dell XPS 14 2024 OLED | |
| SCHENKER Key 14 (M24) | |
| Media de la clase Multimedia (1887 - 11924, n=80, últimos 2 años) | |
| Medio Intel Core Ultra 7 155H (3798 - 7409, n=50) | |
| Lenovo Yoga Pro 7 14IMH9 | |
| SCHENKER Vision 14 M23 RTX 3050 | |
| Cinebench R20 / CPU (Single Core) | |
| Lenovo Yoga Pro 7 14ASP G9 | |
| HP OmniBook Ultra 14 | |
| SCHENKER Vision 14 M23 RTX 3050 | |
| Lenovo Yoga Pro 7 14IMH9, RTX 4050 | |
| Media de la clase Multimedia (341 - 853, n=80, últimos 2 años) | |
| Dell XPS 14 2024 OLED | |
| Lenovo Yoga Pro 7 14IMH9 | |
| Medio Intel Core Ultra 7 155H (601 - 696, n=50) | |
| SCHENKER Key 14 (M24) | |
| Cinebench R15 / CPU Multi 64Bit | |
| HP OmniBook Ultra 14 | |
| Lenovo Yoga Pro 7 14ASP G9 | |
| Lenovo Yoga Pro 7 14IMH9, RTX 4050 | |
| Dell XPS 14 2024 OLED | |
| Lenovo Yoga Pro 7 14IMH9 | |
| Media de la clase Multimedia (856 - 5224, n=87, últimos 2 años) | |
| SCHENKER Key 14 (M24) | |
| Medio Intel Core Ultra 7 155H (1932 - 2880, n=56) | |
| SCHENKER Vision 14 M23 RTX 3050 | |
| Cinebench R15 / CPU Single 64Bit | |
| Lenovo Yoga Pro 7 14ASP G9 | |
| HP OmniBook Ultra 14 | |
| SCHENKER Vision 14 M23 RTX 3050 | |
| Lenovo Yoga Pro 7 14IMH9 | |
| Media de la clase Multimedia (99.6 - 323, n=82, últimos 2 años) | |
| Lenovo Yoga Pro 7 14IMH9, RTX 4050 | |
| Dell XPS 14 2024 OLED | |
| Medio Intel Core Ultra 7 155H (99.6 - 268, n=52) | |
| SCHENKER Key 14 (M24) | |
| Blender / v2.79 BMW27 CPU | |
| Dell XPS 14 2024 OLED | |
| SCHENKER Vision 14 M23 RTX 3050 | |
| Media de la clase Multimedia (100 - 557, n=80, últimos 2 años) | |
| Medio Intel Core Ultra 7 155H (175 - 381, n=47) | |
| SCHENKER Key 14 (M24) | |
| Lenovo Yoga Pro 7 14IMH9 | |
| Lenovo Yoga Pro 7 14ASP G9 | |
| Lenovo Yoga Pro 7 14IMH9, RTX 4050 | |
| HP OmniBook Ultra 14 | |
| 7-Zip 18.03 / 7z b 4 | |
| HP OmniBook Ultra 14 | |
| Lenovo Yoga Pro 7 14IMH9, RTX 4050 | |
| Lenovo Yoga Pro 7 14ASP G9 | |
| Lenovo Yoga Pro 7 14IMH9 | |
| SCHENKER Key 14 (M24) | |
| Media de la clase Multimedia (29095 - 130368, n=75, últimos 2 años) | |
| Medio Intel Core Ultra 7 155H (41739 - 70254, n=50) | |
| SCHENKER Vision 14 M23 RTX 3050 | |
| Dell XPS 14 2024 OLED | |
| 7-Zip 18.03 / 7z b 4 -mmt1 | |
| SCHENKER Vision 14 M23 RTX 3050 | |
| Lenovo Yoga Pro 7 14ASP G9 | |
| HP OmniBook Ultra 14 | |
| Media de la clase Multimedia (3398 - 7545, n=75, últimos 2 años) | |
| Lenovo Yoga Pro 7 14IMH9, RTX 4050 | |
| Lenovo Yoga Pro 7 14IMH9 | |
| SCHENKER Key 14 (M24) | |
| Dell XPS 14 2024 OLED | |
| Medio Intel Core Ultra 7 155H (4594 - 5621, n=50) | |
| Geekbench 6.4 / Multi-Core | |
| HP OmniBook Ultra 14 | |
| Lenovo Yoga Pro 7 14ASP G9 | |
| Media de la clase Multimedia (4983 - 25760, n=77, últimos 2 años) | |
| Lenovo Yoga Pro 7 14IMH9, RTX 4050 | |
| Dell XPS 14 2024 OLED | |
| Lenovo Yoga Pro 7 14IMH9 | |
| SCHENKER Key 14 (M24) | |
| Medio Intel Core Ultra 7 155H (7732 - 13656, n=55) | |
| SCHENKER Vision 14 M23 RTX 3050 | |
| Geekbench 6.4 / Single-Core | |
| HP OmniBook Ultra 14 | |
| Lenovo Yoga Pro 7 14ASP G9 | |
| Media de la clase Multimedia (1534 - 3927, n=73, últimos 2 años) | |
| SCHENKER Vision 14 M23 RTX 3050 | |
| Dell XPS 14 2024 OLED | |
| Lenovo Yoga Pro 7 14IMH9, RTX 4050 | |
| Lenovo Yoga Pro 7 14IMH9 | |
| Medio Intel Core Ultra 7 155H (1901 - 2473, n=52) | |
| SCHENKER Key 14 (M24) | |
| Geekbench 5.5 / Multi-Core | |
| HP OmniBook Ultra 14 | |
| Lenovo Yoga Pro 7 14IMH9, RTX 4050 | |
| Lenovo Yoga Pro 7 14ASP G9 | |
| Dell XPS 14 2024 OLED | |
| Lenovo Yoga Pro 7 14IMH9 | |
| SCHENKER Key 14 (M24) | |
| Media de la clase Multimedia (4652 - 23059, n=79, últimos 2 años) | |
| Medio Intel Core Ultra 7 155H (10017 - 13556, n=52) | |
| SCHENKER Vision 14 M23 RTX 3050 | |
| Geekbench 5.5 / Single-Core | |
| HP OmniBook Ultra 14 | |
| Lenovo Yoga Pro 7 14ASP G9 | |
| SCHENKER Vision 14 M23 RTX 3050 | |
| Media de la clase Multimedia (891 - 2555, n=79, últimos 2 años) | |
| Lenovo Yoga Pro 7 14IMH9 | |
| Lenovo Yoga Pro 7 14IMH9, RTX 4050 | |
| Dell XPS 14 2024 OLED | |
| Medio Intel Core Ultra 7 155H (1462 - 1824, n=52) | |
| SCHENKER Key 14 (M24) | |
| HWBOT x265 Benchmark v2.2 / 4k Preset | |
| HP OmniBook Ultra 14 | |
| Lenovo Yoga Pro 7 14IMH9, RTX 4050 | |
| Lenovo Yoga Pro 7 14ASP G9 | |
| Lenovo Yoga Pro 7 14IMH9 | |
| Media de la clase Multimedia (5.26 - 34.3, n=74, últimos 2 años) | |
| Medio Intel Core Ultra 7 155H (9.93 - 21.2, n=50) | |
| Dell XPS 14 2024 OLED | |
| SCHENKER Key 14 (M24) | |
| SCHENKER Vision 14 M23 RTX 3050 | |
| LibreOffice / 20 Documents To PDF | |
| Lenovo Yoga Pro 7 14IMH9 | |
| SCHENKER Vision 14 M23 RTX 3050 | |
| Lenovo Yoga Pro 7 14ASP G9 | |
| Media de la clase Multimedia (23.9 - 146.7, n=76, últimos 2 años) | |
| Dell XPS 14 2024 OLED | |
| Medio Intel Core Ultra 7 155H (37.5 - 79.2, n=49) | |
| Lenovo Yoga Pro 7 14IMH9, RTX 4050 | |
| HP OmniBook Ultra 14 | |
| SCHENKER Key 14 (M24) | |
| R Benchmark 2.5 / Overall mean | |
| Lenovo Yoga Pro 7 14IMH9 | |
| SCHENKER Key 14 (M24) | |
| Medio Intel Core Ultra 7 155H (0.4457 - 0.53, n=49) | |
| Media de la clase Multimedia (0.3604 - 0.947, n=74, últimos 2 años) | |
| Dell XPS 14 2024 OLED | |
| Lenovo Yoga Pro 7 14IMH9, RTX 4050 | |
| SCHENKER Vision 14 M23 RTX 3050 | |
| HP OmniBook Ultra 14 | |
| Lenovo Yoga Pro 7 14ASP G9 | |
* ... más pequeño es mejor
AIDA64: FP32 Ray-Trace | FPU Julia | CPU SHA3 | CPU Queen | FPU SinJulia | FPU Mandel | CPU AES | CPU ZLib | FP64 Ray-Trace | CPU PhotoWorxx
| Performance Rating | |
| HP OmniBook Ultra 14 | |
| Lenovo Yoga Pro 7 14IMH9, RTX 4050 | |
| Lenovo Yoga Pro 7 14IMH9 | |
| Media de la clase Multimedia | |
| SCHENKER Key 14 (M24) | |
| Medio Intel Core Ultra 7 155H | |
| Dell XPS 14 2024 OLED | |
| SCHENKER Vision 14 M23 RTX 3050 | |
| AIDA64 / FP32 Ray-Trace | |
| HP OmniBook Ultra 14 | |
| Lenovo Yoga Pro 7 14IMH9, RTX 4050 | |
| Lenovo Yoga Pro 7 14IMH9 | |
| Media de la clase Multimedia (5121 - 50388, n=73, últimos 2 años) | |
| SCHENKER Key 14 (M24) | |
| Medio Intel Core Ultra 7 155H (6670 - 18470, n=50) | |
| SCHENKER Vision 14 M23 RTX 3050 | |
| Dell XPS 14 2024 OLED | |
| AIDA64 / FPU Julia | |
| HP OmniBook Ultra 14 | |
| Lenovo Yoga Pro 7 14IMH9, RTX 4050 | |
| Lenovo Yoga Pro 7 14IMH9 | |
| Media de la clase Multimedia (14528 - 201874, n=74, últimos 2 años) | |
| SCHENKER Key 14 (M24) | |
| Medio Intel Core Ultra 7 155H (40905 - 93181, n=50) | |
| SCHENKER Vision 14 M23 RTX 3050 | |
| Dell XPS 14 2024 OLED | |
| AIDA64 / CPU SHA3 | |
| HP OmniBook Ultra 14 | |
| Lenovo Yoga Pro 7 14IMH9, RTX 4050 | |
| Lenovo Yoga Pro 7 14IMH9 | |
| Media de la clase Multimedia (1188 - 8623, n=74, últimos 2 años) | |
| SCHENKER Key 14 (M24) | |
| Medio Intel Core Ultra 7 155H (1940 - 4436, n=50) | |
| Dell XPS 14 2024 OLED | |
| SCHENKER Vision 14 M23 RTX 3050 | |
| AIDA64 / CPU Queen | |
| HP OmniBook Ultra 14 | |
| Media de la clase Multimedia (21547 - 181505, n=74, últimos 2 años) | |
| SCHENKER Vision 14 M23 RTX 3050 | |
| SCHENKER Key 14 (M24) | |
| Lenovo Yoga Pro 7 14IMH9 | |
| Lenovo Yoga Pro 7 14IMH9, RTX 4050 | |
| Dell XPS 14 2024 OLED | |
| Medio Intel Core Ultra 7 155H (64698 - 94181, n=50) | |
| AIDA64 / FPU SinJulia | |
| HP OmniBook Ultra 14 | |
| Lenovo Yoga Pro 7 14IMH9, RTX 4050 | |
| Lenovo Yoga Pro 7 14IMH9 | |
| Media de la clase Multimedia (1240 - 28794, n=74, últimos 2 años) | |
| SCHENKER Key 14 (M24) | |
| Medio Intel Core Ultra 7 155H (5639 - 10647, n=50) | |
| Dell XPS 14 2024 OLED | |
| SCHENKER Vision 14 M23 RTX 3050 | |
| AIDA64 / FPU Mandel | |
| HP OmniBook Ultra 14 | |
| Lenovo Yoga Pro 7 14IMH9, RTX 4050 | |
| Lenovo Yoga Pro 7 14IMH9 | |
| Media de la clase Multimedia (9903 - 105740, n=73, últimos 2 años) | |
| SCHENKER Key 14 (M24) | |
| Medio Intel Core Ultra 7 155H (18236 - 47685, n=50) | |
| SCHENKER Vision 14 M23 RTX 3050 | |
| Dell XPS 14 2024 OLED | |
| AIDA64 / CPU AES | |
| Lenovo Yoga Pro 7 14IMH9, RTX 4050 | |
| Medio Intel Core Ultra 7 155H (45713 - 152179, n=50) | |
| HP OmniBook Ultra 14 | |
| Lenovo Yoga Pro 7 14IMH9 | |
| Media de la clase Multimedia (26066 - 169946, n=74, últimos 2 años) | |
| SCHENKER Key 14 (M24) | |
| Dell XPS 14 2024 OLED | |
| SCHENKER Vision 14 M23 RTX 3050 | |
| AIDA64 / CPU ZLib | |
| HP OmniBook Ultra 14 | |
| Lenovo Yoga Pro 7 14IMH9, RTX 4050 | |
| Lenovo Yoga Pro 7 14IMH9 | |
| SCHENKER Key 14 (M24) | |
| Media de la clase Multimedia (440 - 2022, n=74, últimos 2 años) | |
| Medio Intel Core Ultra 7 155H (557 - 1250, n=50) | |
| Dell XPS 14 2024 OLED | |
| SCHENKER Vision 14 M23 RTX 3050 | |
| AIDA64 / FP64 Ray-Trace | |
| HP OmniBook Ultra 14 | |
| Lenovo Yoga Pro 7 14IMH9, RTX 4050 | |
| Media de la clase Multimedia (2759 - 26875, n=74, últimos 2 años) | |
| Lenovo Yoga Pro 7 14IMH9 | |
| SCHENKER Key 14 (M24) | |
| SCHENKER Vision 14 M23 RTX 3050 | |
| Medio Intel Core Ultra 7 155H (3569 - 9802, n=50) | |
| Dell XPS 14 2024 OLED | |
| AIDA64 / CPU PhotoWorxx | |
| Lenovo Yoga Pro 7 14IMH9, RTX 4050 | |
| Lenovo Yoga Pro 7 14IMH9 | |
| Dell XPS 14 2024 OLED | |
| HP OmniBook Ultra 14 | |
| SCHENKER Key 14 (M24) | |
| Medio Intel Core Ultra 7 155H (32719 - 54223, n=50) | |
| SCHENKER Vision 14 M23 RTX 3050 | |
| Media de la clase Multimedia (12860 - 58844, n=74, últimos 2 años) | |
Rendimiento del sistema
El Yoga funcionó muy bien durante los benchmarks del sistema y es un dispositivo que responde bien durante el uso diario. No hubo problemas con la estabilidad del sistema en nuestro dispositivo de prueba.
CrossMark: Overall | Productivity | Creativity | Responsiveness
WebXPRT 3: Overall
WebXPRT 4: Overall
Mozilla Kraken 1.1: Total
| PCMark 10 / Score | |
| HP OmniBook Ultra 14 | |
| Lenovo Yoga Pro 7 14IMH9, RTX 4050 | |
| Lenovo Yoga Pro 7 14IMH9 | |
| Media de la clase Multimedia (4325 - 8670, n=70, últimos 2 años) | |
| Medio Intel Core Ultra 7 155H, NVIDIA GeForce RTX 4050 Laptop GPU (6537 - 6973, n=5) | |
| SCHENKER Key 14 (M24) | |
| Dell XPS 14 2024 OLED | |
| SCHENKER Vision 14 M23 RTX 3050 | |
| PCMark 10 / Essentials | |
| HP OmniBook Ultra 14 | |
| Lenovo Yoga Pro 7 14IMH9 | |
| Media de la clase Multimedia (8025 - 12420, n=70, últimos 2 años) | |
| Lenovo Yoga Pro 7 14IMH9, RTX 4050 | |
| Medio Intel Core Ultra 7 155H, NVIDIA GeForce RTX 4050 Laptop GPU (9463 - 10446, n=5) | |
| SCHENKER Key 14 (M24) | |
| Dell XPS 14 2024 OLED | |
| SCHENKER Vision 14 M23 RTX 3050 | |
| PCMark 10 / Productivity | |
| HP OmniBook Ultra 14 | |
| Lenovo Yoga Pro 7 14IMH9, RTX 4050 | |
| Medio Intel Core Ultra 7 155H, NVIDIA GeForce RTX 4050 Laptop GPU (8769 - 9272, n=5) | |
| Media de la clase Multimedia (6089 - 10615, n=70, últimos 2 años) | |
| SCHENKER Vision 14 M23 RTX 3050 | |
| Dell XPS 14 2024 OLED | |
| Lenovo Yoga Pro 7 14IMH9 | |
| SCHENKER Key 14 (M24) | |
| PCMark 10 / Digital Content Creation | |
| HP OmniBook Ultra 14 | |
| SCHENKER Key 14 (M24) | |
| Lenovo Yoga Pro 7 14IMH9 | |
| Lenovo Yoga Pro 7 14IMH9, RTX 4050 | |
| Medio Intel Core Ultra 7 155H, NVIDIA GeForce RTX 4050 Laptop GPU (8602 - 10622, n=5) | |
| Media de la clase Multimedia (3651 - 13548, n=70, últimos 2 años) | |
| Dell XPS 14 2024 OLED | |
| SCHENKER Vision 14 M23 RTX 3050 | |
| CrossMark / Overall | |
| SCHENKER Key 14 (M24) | |
| Media de la clase Multimedia (866 - 2255, n=81, últimos 2 años) | |
| HP OmniBook Ultra 14 | |
| Dell XPS 14 2024 OLED | |
| Medio Intel Core Ultra 7 155H, NVIDIA GeForce RTX 4050 Laptop GPU (1552 - 1740, n=5) | |
| Lenovo Yoga Pro 7 14IMH9, RTX 4050 | |
| SCHENKER Vision 14 M23 RTX 3050 | |
| CrossMark / Productivity | |
| SCHENKER Key 14 (M24) | |
| Media de la clase Multimedia (913 - 2050, n=81, últimos 2 años) | |
| HP OmniBook Ultra 14 | |
| Dell XPS 14 2024 OLED | |
| Medio Intel Core Ultra 7 155H, NVIDIA GeForce RTX 4050 Laptop GPU (1459 - 1659, n=5) | |
| Lenovo Yoga Pro 7 14IMH9, RTX 4050 | |
| SCHENKER Vision 14 M23 RTX 3050 | |
| CrossMark / Creativity | |
| Media de la clase Multimedia (907 - 2795, n=81, últimos 2 años) | |
| HP OmniBook Ultra 14 | |
| Dell XPS 14 2024 OLED | |
| Medio Intel Core Ultra 7 155H, NVIDIA GeForce RTX 4050 Laptop GPU (1811 - 1943, n=5) | |
| SCHENKER Key 14 (M24) | |
| Lenovo Yoga Pro 7 14IMH9, RTX 4050 | |
| SCHENKER Vision 14 M23 RTX 3050 | |
| CrossMark / Responsiveness | |
| SCHENKER Key 14 (M24) | |
| HP OmniBook Ultra 14 | |
| Media de la clase Multimedia (605 - 2094, n=81, últimos 2 años) | |
| Dell XPS 14 2024 OLED | |
| Medio Intel Core Ultra 7 155H, NVIDIA GeForce RTX 4050 Laptop GPU (1167 - 1467, n=5) | |
| SCHENKER Vision 14 M23 RTX 3050 | |
| Lenovo Yoga Pro 7 14IMH9, RTX 4050 | |
| WebXPRT 3 / Overall | |
| HP OmniBook Ultra 14 | |
| Media de la clase Multimedia (136.4 - 545, n=81, últimos 2 años) | |
| SCHENKER Vision 14 M23 RTX 3050 | |
| Lenovo Yoga Pro 7 14IMH9, RTX 4050 | |
| Dell XPS 14 2024 OLED | |
| SCHENKER Key 14 (M24) | |
| Lenovo Yoga Pro 7 14IMH9 | |
| Medio Intel Core Ultra 7 155H, NVIDIA GeForce RTX 4050 Laptop GPU (262 - 285, n=5) | |
| WebXPRT 4 / Overall | |
| SCHENKER Vision 14 M23 RTX 3050 | |
| HP OmniBook Ultra 14 | |
| Media de la clase Multimedia (133.2 - 353, n=75, últimos 2 años) | |
| Lenovo Yoga Pro 7 14IMH9, RTX 4050 | |
| Dell XPS 14 2024 OLED | |
| Medio Intel Core Ultra 7 155H, NVIDIA GeForce RTX 4050 Laptop GPU (247 - 260, n=5) | |
| SCHENKER Key 14 (M24) | |
| Mozilla Kraken 1.1 / Total | |
| SCHENKER Key 14 (M24) | |
| Lenovo Yoga Pro 7 14IMH9 | |
| Lenovo Yoga Pro 7 14IMH9, RTX 4050 | |
| Dell XPS 14 2024 OLED | |
| Medio Intel Core Ultra 7 155H, NVIDIA GeForce RTX 4050 Laptop GPU (416 - 561, n=5) | |
| SCHENKER Vision 14 M23 RTX 3050 | |
| Media de la clase Multimedia (254 - 1016, n=86, últimos 2 años) | |
| HP OmniBook Ultra 14 | |
* ... más pequeño es mejor
| PCMark 10 Score | 6941 puntos | |
ayuda | ||
| AIDA64 / Memory Copy | |
| Lenovo Yoga Pro 7 14IMH9, RTX 4050 | |
| Lenovo Yoga Pro 7 14IMH9 | |
| Dell XPS 14 2024 OLED | |
| HP OmniBook Ultra 14 | |
| Medio Intel Core Ultra 7 155H (62397 - 96791, n=50) | |
| SCHENKER Key 14 (M24) | |
| Media de la clase Multimedia (21158 - 104459, n=74, últimos 2 años) | |
| SCHENKER Vision 14 M23 RTX 3050 | |
| AIDA64 / Memory Read | |
| HP OmniBook Ultra 14 | |
| Lenovo Yoga Pro 7 14IMH9, RTX 4050 | |
| Dell XPS 14 2024 OLED | |
| Lenovo Yoga Pro 7 14IMH9 | |
| SCHENKER Key 14 (M24) | |
| Medio Intel Core Ultra 7 155H (60544 - 90647, n=50) | |
| Media de la clase Multimedia (24312 - 125604, n=74, últimos 2 años) | |
| SCHENKER Vision 14 M23 RTX 3050 | |
| AIDA64 / Memory Write | |
| HP OmniBook Ultra 14 | |
| SCHENKER Key 14 (M24) | |
| Dell XPS 14 2024 OLED | |
| Lenovo Yoga Pro 7 14IMH9, RTX 4050 | |
| Lenovo Yoga Pro 7 14IMH9 | |
| Medio Intel Core Ultra 7 155H (58692 - 93451, n=50) | |
| Media de la clase Multimedia (23679 - 117933, n=74, últimos 2 años) | |
| SCHENKER Vision 14 M23 RTX 3050 | |
| AIDA64 / Memory Latency | |
| Lenovo Yoga Pro 7 14IMH9 | |
| Medio Intel Core Ultra 7 155H (116.2 - 233, n=50) | |
| Dell XPS 14 2024 OLED | |
| Lenovo Yoga Pro 7 14IMH9, RTX 4050 | |
| HP OmniBook Ultra 14 | |
| SCHENKER Key 14 (M24) | |
| Media de la clase Multimedia (7 - 346, n=74, últimos 2 años) | |
| SCHENKER Vision 14 M23 RTX 3050 | |
* ... más pequeño es mejor
Latencias del CPD
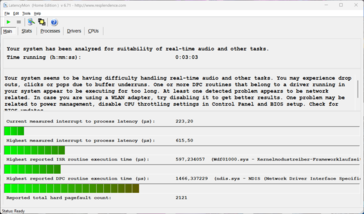
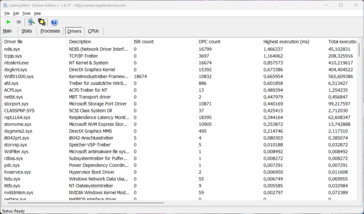
En nuestra prueba de latencia estandarizada (navegación por Internet, reproducción 4K de YouTube, carga de la CPU), nuestro dispositivo de prueba con la versión actual de la BIOS no mostró ningún problema. Uno de los controladores sí falló un poco, pero el importante valor "interrupt-to-process-latency" fue bajo.
| DPC Latencies / LatencyMon - interrupt to process latency (max), Web, Youtube, Prime95 | |
| Dell XPS 14 2024 OLED | |
| SCHENKER Vision 14 M23 RTX 3050 | |
| Lenovo Yoga Pro 7 14IMH9 | |
| Lenovo Yoga Pro 7 14IMH9, RTX 4050 | |
| SCHENKER Key 14 (M24) | |
* ... más pequeño es mejor
Dispositivo de almacenamiento
Como se ha descrito anteriormente, las configuraciones del Yoga Pro 7 14 con una GPU dedicada están limitadas a una SSD M.2-2242 compacta. Una versión de 1 TB de la Samsung PM9C1a está instalada en nuestro dispositivo de prueba, y las tasas de transferencia de la SSD PCIe 4.0 que medimos fueron decentes. Su rendimiento fluctuó ligeramente bajo carga constante, pero esto no causó ningún problema. Encontrará más pruebas comparativas de SSD aquí.
* ... más pequeño es mejor
Reading continuous performance: DiskSpd Read Loop, Queue Depth 8
Tarjeta gráfica
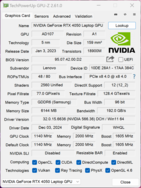
Además de los gráficos Intel Arc integrados en el procesador, nuestro dispositivo de prueba utiliza los gráficos dedicados de Portátil Nvidia GeForce RTX 4050 con 6 GB de VRAM, con conmutación de gráficos mediante la tecnología Optimus. El TGP máximo del portátil 4050 es de 60 vatios (45 vatios + 15 vatios de Dynamic Boost), por lo que no se puede aprovechar todo el rendimiento del portátil 4050. Durante las pruebas comparativas de gráficos sintéticos, se duplicó el rendimiento de ambos modelos de iGPU del Yoga Pro 7 14. El Portátil RTX 4050 dentro del Dell XPS 14 (30 vatios TGP) fue significativamente más lento, mientras que el Portátil RTX 4060 en el Schenker Key 14 (100 vatios TGP) fue más rápido.
Estos resultados se confirmaron durante las pruebas de juego reales y el Yoga Pro 7 14 hizo frente a los juegos actuales con detalles altos y en resolución Full HD. En resolución QHD, sin embargo, las cosas se pusieron un poco más difíciles. En general, sin embargo, logró resultados sólidos. Su GPU y su rendimiento en juegos se mantienen constantes bajo carga permanente. En modo batería, el consumo de energía de la GPU se limita a 45 vatios, lo que conlleva una reducción del rendimiento de alrededor del 12%. Encontrará más pruebas comparativas de la GPU aquí.
| 3DMark 11 Performance | 24470 puntos | |
| 3DMark Fire Strike Score | 17998 puntos | |
| 3DMark Time Spy Score | 7757 puntos | |
| 3DMark Steel Nomad Score | 1561 puntos | |
| 3DMark Steel Nomad Light Score | 7254 puntos | |
ayuda | ||
| Blender / v3.3 Classroom OPTIX/RTX | |
| SCHENKER Vision 14 M23 RTX 3050 | |
| Media de la clase Multimedia (19 - 105, n=39, últimos 2 años) | |
| Dell XPS 14 2024 OLED | |
| Lenovo Yoga Pro 7 14IMH9, RTX 4050 | |
| Medio NVIDIA GeForce RTX 4050 Laptop GPU (25 - 37, n=39) | |
| SCHENKER Key 14 (M24) | |
| Blender / v3.3 Classroom CUDA | |
| SCHENKER Vision 14 M23 RTX 3050 | |
| Dell XPS 14 2024 OLED | |
| Media de la clase Multimedia (32 - 164, n=39, últimos 2 años) | |
| Medio NVIDIA GeForce RTX 4050 Laptop GPU (47 - 175, n=40) | |
| Lenovo Yoga Pro 7 14IMH9, RTX 4050 | |
| SCHENKER Key 14 (M24) | |
| Blender / v3.3 Classroom CPU | |
| Dell XPS 14 2024 OLED | |
| SCHENKER Vision 14 M23 RTX 3050 | |
| Media de la clase Multimedia (160 - 1042, n=80, últimos 2 años) | |
| Medio NVIDIA GeForce RTX 4050 Laptop GPU (243 - 907, n=40) | |
| SCHENKER Key 14 (M24) | |
| Lenovo Yoga Pro 7 14IMH9 | |
| Lenovo Yoga Pro 7 14IMH9, RTX 4050 | |
| HP OmniBook Ultra 14 | |
* ... más pequeño es mejor
| Cyberpunk 2077 2.2 Phantom Liberty - 1920x1080 Ultra Preset (FSR off) | |
| SCHENKER Key 14 (M24) | |
| Lenovo Yoga Pro 7 14IMH9, RTX 4050 | |
| Dell XPS 14 2024 OLED | |
| Media de la clase Multimedia (8.26 - 86, n=63, últimos 2 años) | |
| SCHENKER Vision 14 M23 RTX 3050 | |
| HP OmniBook Ultra 14 | |
| Lenovo Yoga Pro 7 14ASP G9 | |
| GTA V - 1920x1080 Highest Settings possible AA:4xMSAA + FX AF:16x | |
| Lenovo Yoga Pro 7 14IMH9, RTX 4050 | |
| SCHENKER Key 14 (M24) | |
| Dell XPS 14 2024 OLED | |
| Media de la clase Multimedia (9.38 - 141.6, n=77, últimos 2 años) | |
| SCHENKER Vision 14 M23 RTX 3050 | |
| Lenovo Yoga Pro 7 14ASP G9 | |
| HP OmniBook Ultra 14 | |
| Lenovo Yoga Pro 7 14IMH9 | |
Cyberpunk 2077 ultra FPS diagram
| bajo | medio | alto | ultra | QHD | |
|---|---|---|---|---|---|
| GTA V (2015) | 133.5 | 84.9 | 63.7 | ||
| Dota 2 Reborn (2015) | 163.1 | 148.7 | 143.9 | 133.8 | |
| Final Fantasy XV Benchmark (2018) | 156 | 99 | 71.9 | 52.6 | |
| X-Plane 11.11 (2018) | 127.9 | 113.6 | 89.9 | ||
| Strange Brigade (2018) | 385 | 178 | 146 | 129 | 86 |
| Baldur's Gate 3 (2023) | 95.9 | 74.4 | 53.3 | 49.8 | 35.7 |
| Cyberpunk 2077 2.2 Phantom Liberty (2023) | 88.9 | 70.5 | 59.3 | 50.8 | 31.4 |
Emisiones y energía
Emisiones sonoras
En general, los dos ventiladores de la unidad de refrigeración permanecen silenciosos o hacen poco ruido (~30 dB(A)) en ralentí y con poca carga. Sin embargo, en cuanto el procesador o la tarjeta gráfica están bajo carga, rápidamente se hace claramente audible debido a los altos límites de potencia. Medimos 49,1 dB(A) tanto al jugar como durante nuestra prueba de estrés, lo que puede resultar molesto a largo plazo. En modo adaptativo(Auto), notamos 45 dB(A), que sigue siendo muy audible. Nos hubiera gustado una dispersión algo más amplia y un resultado en torno a los 40 dB(A). Sólo en el modo de ahorro de batería se vuelve significativamente más silencioso, donde puede esperar un máximo de 29,8 dB(A), pero entonces el rendimiento del portátil también se reduce significativamente y los juegos, por ejemplo, ya no son posibles. No había otros ruidos electrónicos procedentes de nuestro dispositivo de prueba.
Ruido
| Ocioso |
| 25.4 / 25.4 / 29.8 dB(A) |
| Carga |
| 39.3 / 49.1 dB(A) |
 | ||
30 dB silencioso 40 dB(A) audible 50 dB(A) ruidosamente alto |
||
min: | ||
| Lenovo Yoga Pro 7 14IMH9, RTX 4050 NVIDIA GeForce RTX 4050 Laptop GPU, Ultra 7 155H, Samsung PM9C1a MZAL81T0HDLB | SCHENKER Key 14 (M24) NVIDIA GeForce RTX 4060 Laptop GPU, Ultra 7 155H, Samsung 990 Pro 1 TB | Dell XPS 14 2024 OLED NVIDIA GeForce RTX 4050 Laptop GPU, Ultra 7 155H, Samsung PM9A1 MZVL21T0HCLR | HP OmniBook Ultra 14 Radeon 890M, Ryzen AI 9 HX 375, SK hynix PC801 HFS002TEJ9X101N | SCHENKER Vision 14 M23 RTX 3050 GeForce RTX 3050 6GB Laptop GPU, i7-13700H, Samsung 990 Pro 1 TB | Lenovo Yoga Pro 7 14IMH9 Arc 8-Core, Ultra 7 155H, SK Hynix HFS001TEJ9X115N | Lenovo Yoga Pro 7 14ASP G9 Radeon 880M, Ryzen AI 9 365, Micron 2550 1TB MTFDKCD1T0TGE | |
|---|---|---|---|---|---|---|---|
| Noise | -10% | 4% | 10% | 4% | 5% | 9% | |
| apagado / medio ambiente * | 25.4 | 25.5 -0% | 24.3 4% | 23.8 6% | 23.5 7% | 24 6% | 23.8 6% |
| Idle Minimum * | 25.4 | 25.5 -0% | 24.3 4% | 24.9 2% | 23.5 7% | 25 2% | 23.8 6% |
| Idle Average * | 25.4 | 26.5 -4% | 26.5 -4% | 24.9 2% | 23.5 7% | 27 -6% | 23.8 6% |
| Idle Maximum * | 29.8 | 30.3 -2% | 28.5 4% | 24.9 16% | 26 13% | 30 -1% | 23.8 20% |
| Load Average * | 39.3 | 49.3 -25% | 37 6% | 32.9 16% | 43.6 -11% | 36 8% | 44.6 -13% |
| Cyberpunk 2077 ultra * | 49.1 | 57.8 -18% | 40.9 17% | 35.9 27% | |||
| Load Maximum * | 49.1 | 57.8 -18% | 43.3 12% | 43 12% | 49.1 -0% | 38 23% | 44.6 9% |
| Witcher 3 ultra * | 39.1 | 48.7 | 38 |
* ... más pequeño es mejor
Temperatura
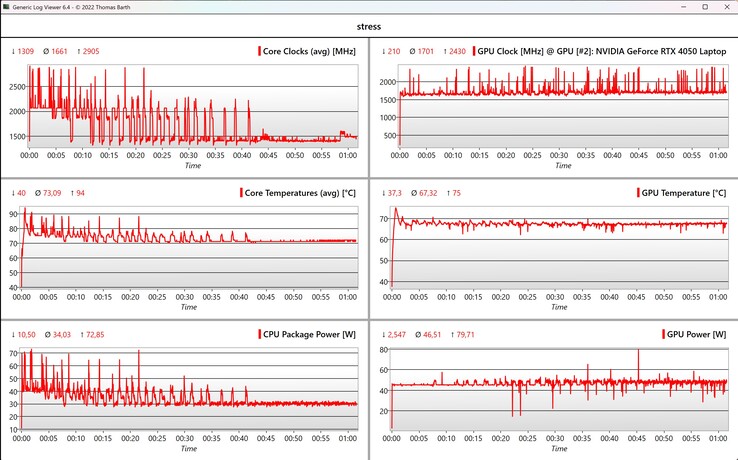
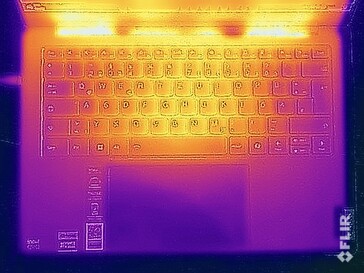
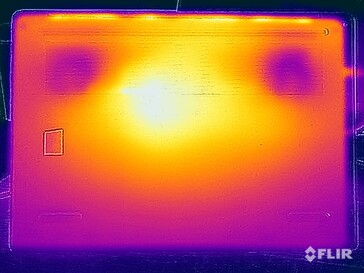
Lenovo tiene las temperaturas de la superficie del portátil bien controladas, ya que medimos un máximo de 43 °C incluso a plena carga. Como resultado, puede colocar el Yoga sobre sus muslos en estas maletas. Toda la carcasa se mantiene agradable y fresca bajo carga baja. Durante la prueba de estrés, la GPU funcionó a 45 vatios, mientras que el procesador fluctuó inicialmente un poco y finalmente se estableció en 30 vatios durante el transcurso de la prueba de estrés.
(±) La temperatura máxima en la parte superior es de 42.4 °C / 108 F, frente a la media de 36.9 °C / 98 F, que oscila entre 21.1 y 71 °C para la clase Multimedia.
(±) El fondo se calienta hasta un máximo de 43.3 °C / 110 F, frente a la media de 39.2 °C / 103 F
(+) En reposo, la temperatura media de la parte superior es de 26.9 °C / 80# F, frente a la media del dispositivo de 31.3 °C / 88 F.
(-) 3: The average temperature for the upper side is 38.2 °C / 101 F, compared to the average of 31.3 °C / 88 F for the class Multimedia.
(+) El reposamanos y el panel táctil están a una temperatura inferior a la de la piel, con un máximo de 30.5 °C / 86.9 F y, por tanto, son fríos al tacto.
(±) La temperatura media de la zona del reposamanos de dispositivos similares fue de 28.8 °C / 83.8 F (-1.7 °C / -3.1 F).
| Lenovo Yoga Pro 7 14IMH9, RTX 4050 Intel Core Ultra 7 155H, NVIDIA GeForce RTX 4050 Laptop GPU | SCHENKER Key 14 (M24) Intel Core Ultra 7 155H, NVIDIA GeForce RTX 4060 Laptop GPU | Dell XPS 14 2024 OLED Intel Core Ultra 7 155H, NVIDIA GeForce RTX 4050 Laptop GPU | HP OmniBook Ultra 14 AMD Ryzen AI 9 HX 375, AMD Radeon 890M | SCHENKER Vision 14 M23 RTX 3050 Intel Core i7-13700H, NVIDIA GeForce RTX 3050 6GB Laptop GPU | Lenovo Yoga Pro 7 14IMH9 Intel Core Ultra 7 155H, Intel Arc 8-Core iGPU | |
|---|---|---|---|---|---|---|
| Heat | -20% | 2% | -7% | -9% | 4% | |
| Maximum Upper Side * | 42.4 | 43.1 -2% | 40.5 4% | 40.4 5% | 48.5 -14% | 43 -1% |
| Maximum Bottom * | 43.3 | 51.3 -18% | 42.6 2% | 43.6 -1% | 52.8 -22% | 42 3% |
| Idle Upper Side * | 27.5 | 33.2 -21% | 26.9 2% | 31 -13% | 27.6 -0% | 25 9% |
| Idle Bottom * | 27.6 | 38.3 -39% | 27.8 -1% | 32.2 -17% | 27 2% | 26 6% |
* ... más pequeño es mejor
Altavoces
Lenovo Yoga Pro 7 14IMH9, RTX 4050 análisis de audio
(+) | los altavoces pueden reproducir a un volumen relativamente alto (#83.1 dB)
Graves 100 - 315 Hz
(±) | lubina reducida - en promedio 12.1% inferior a la mediana
(±) | la linealidad de los graves es media (12.1% delta a frecuencia anterior)
Medios 400 - 2000 Hz
(+) | medios equilibrados - a sólo 3.2% de la mediana
(+) | los medios son lineales (5.7% delta a la frecuencia anterior)
Altos 2 - 16 kHz
(+) | máximos equilibrados - a sólo 3% de la mediana
(+) | los máximos son lineales (3.8% delta a la frecuencia anterior)
Total 100 - 16.000 Hz
(+) | el sonido global es lineal (10.8% de diferencia con la mediana)
En comparación con la misma clase
» 11% de todos los dispositivos probados de esta clase eran mejores, 2% similares, 87% peores
» El mejor tuvo un delta de 5%, la media fue 18%, el peor fue ###max##%
En comparación con todos los dispositivos probados
» 5% de todos los dispositivos probados eran mejores, 1% similares, 94% peores
» El mejor tuvo un delta de 4%, la media fue 24%, el peor fue ###max##%
SCHENKER Key 14 (M24) análisis de audio
(±) | la sonoridad del altavoz es media pero buena (81.5 dB)
Graves 100 - 315 Hz
(-) | casi sin bajos - de media 29.9% inferior a la mediana
(±) | la linealidad de los graves es media (7.9% delta a frecuencia anterior)
Medios 400 - 2000 Hz
(±) | medias más altas - de media 5.3% más altas que la mediana
(+) | los medios son lineales (5.9% delta a la frecuencia anterior)
Altos 2 - 16 kHz
(+) | máximos equilibrados - a sólo 2.1% de la mediana
(+) | los máximos son lineales (2.8% delta a la frecuencia anterior)
Total 100 - 16.000 Hz
(±) | la linealidad del sonido global es media (20.9% de diferencia con la mediana)
En comparación con la misma clase
» 70% de todos los dispositivos probados de esta clase eran mejores, 8% similares, 22% peores
» El mejor tuvo un delta de 5%, la media fue 18%, el peor fue ###max##%
En comparación con todos los dispositivos probados
» 54% de todos los dispositivos probados eran mejores, 8% similares, 38% peores
» El mejor tuvo un delta de 4%, la media fue 24%, el peor fue ###max##%
Dell XPS 14 2024 OLED análisis de audio
(+) | los altavoces pueden reproducir a un volumen relativamente alto (#82.8 dB)
Graves 100 - 315 Hz
(±) | lubina reducida - en promedio 9.9% inferior a la mediana
(±) | la linealidad de los graves es media (10.1% delta a frecuencia anterior)
Medios 400 - 2000 Hz
(+) | medios equilibrados - a sólo 4.4% de la mediana
(+) | los medios son lineales (3.8% delta a la frecuencia anterior)
Altos 2 - 16 kHz
(+) | máximos equilibrados - a sólo 2.3% de la mediana
(±) | la linealidad de los máximos es media (7% delta a frecuencia anterior)
Total 100 - 16.000 Hz
(+) | el sonido global es lineal (11% de diferencia con la mediana)
En comparación con la misma clase
» 12% de todos los dispositivos probados de esta clase eran mejores, 3% similares, 85% peores
» El mejor tuvo un delta de 5%, la media fue 18%, el peor fue ###max##%
En comparación con todos los dispositivos probados
» 5% de todos los dispositivos probados eran mejores, 2% similares, 93% peores
» El mejor tuvo un delta de 4%, la media fue 24%, el peor fue ###max##%
HP OmniBook Ultra 14 análisis de audio
(+) | los altavoces pueden reproducir a un volumen relativamente alto (#88.8 dB)
Graves 100 - 315 Hz
(±) | lubina reducida - en promedio 9.9% inferior a la mediana
(±) | la linealidad de los graves es media (9.5% delta a frecuencia anterior)
Medios 400 - 2000 Hz
(+) | medios equilibrados - a sólo 4% de la mediana
(+) | los medios son lineales (4.3% delta a la frecuencia anterior)
Altos 2 - 16 kHz
(+) | máximos equilibrados - a sólo 2.7% de la mediana
(+) | los máximos son lineales (3.6% delta a la frecuencia anterior)
Total 100 - 16.000 Hz
(+) | el sonido global es lineal (9.2% de diferencia con la mediana)
En comparación con la misma clase
» 3% de todos los dispositivos probados de esta clase eran mejores, 1% similares, 96% peores
» El mejor tuvo un delta de 5%, la media fue 19%, el peor fue ###max##%
En comparación con todos los dispositivos probados
» 3% de todos los dispositivos probados eran mejores, 1% similares, 97% peores
» El mejor tuvo un delta de 4%, la media fue 24%, el peor fue ###max##%
Consumo de energía
Sus valores de consumo en reposo son bastante bajos, pero el problema se hace patente rápidamente bajo carga. La fuente de alimentación de 100 vatios suministrada no es suficiente para cubrir el consumo del portátil a plena carga. Medimos algo menos de 111 vatios durante la prueba de estrés y alrededor de 105 vatios durante el resto de la prueba. Como resultado, la batería se descargó durante la prueba de estrés; alrededor de un 9% por hora. Incluso durante los picos de carga cortos, la batería siempre tiene que descargarse brevemente. Se trata de una medida de ahorro innecesaria y Lenovo debería haber suministrado la versión dGPU con una fuente de alimentación de 130 vatios.
| Off / Standby | |
| Ocioso | |
| Carga |
|
Clave:
min: | |
| Lenovo Yoga Pro 7 14IMH9, RTX 4050 NVIDIA GeForce RTX 4050 Laptop GPU, Ultra 7 155H, Samsung PM9C1a MZAL81T0HDLB | SCHENKER Key 14 (M24) NVIDIA GeForce RTX 4060 Laptop GPU, Ultra 7 155H, Samsung 990 Pro 1 TB | Dell XPS 14 2024 OLED NVIDIA GeForce RTX 4050 Laptop GPU, Ultra 7 155H, Samsung PM9A1 MZVL21T0HCLR | HP OmniBook Ultra 14 Radeon 890M, Ryzen AI 9 HX 375, SK hynix PC801 HFS002TEJ9X101N | SCHENKER Vision 14 M23 RTX 3050 GeForce RTX 3050 6GB Laptop GPU, i7-13700H, Samsung 990 Pro 1 TB | Lenovo Yoga Pro 7 14IMH9 Arc 8-Core, Ultra 7 155H, SK Hynix HFS001TEJ9X115N | |
|---|---|---|---|---|---|---|
| Power Consumption | -46% | -22% | 31% | -5% | 8% | |
| Idle Minimum * | 4.9 | 5.8 -18% | 8.1 -65% | 2.7 45% | 5.2 -6% | 4 18% |
| Idle Average * | 6.9 | 10.8 -57% | 9.9 -43% | 5.4 22% | 7.8 -13% | 5.5 20% |
| Idle Maximum * | 9.3 | 11.1 -19% | 10.4 -12% | 5.5 41% | 9 3% | 11.8 -27% |
| Load Average * | 79.7 | 87.4 -10% | 75.6 5% | 67.4 15% | 78.6 1% | 66 17% |
| Cyberpunk 2077 ultra * | 97.5 | 175.3 -80% | 67.9 30% | |||
| Cyberpunk 2077 ultra external monitor * | 96.1 | 169.1 -76% | 67.8 29% | |||
| Load Maximum * | 110.9 | 183 -65% | 107.1 3% | 68.3 38% | 121.2 -9% | 100 10% |
| Witcher 3 ultra * | 65.6 | 86.8 | 55 |
* ... más pequeño es mejor
Power consumption Cyberpunk / stress test
Power consumption with external monitor
Tiempos de ejecución
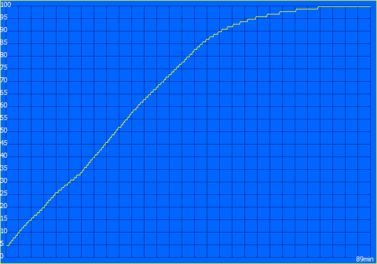
Su batería de 73 Wh sólo permite una autonomía media en general. Durante la prueba WLAN a 150 cd/m² (corresponde al 69% del brillo SDR máximo de nuestro dispositivo de prueba) y 60 Hz, duró unas 8 horas (o 7 horas a 120 Hz) y 6:17 horas a brillo SDR máximo (o 05:40 horas a 120 Hz). En la prueba de vídeo a 150 cd/m², el resultado fue mejor, ya que el dispositivo duró más de 13 horas.
| Lenovo Yoga Pro 7 14IMH9, RTX 4050 Ultra 7 155H, NVIDIA GeForce RTX 4050 Laptop GPU, 73 Wh | SCHENKER Key 14 (M24) Ultra 7 155H, NVIDIA GeForce RTX 4060 Laptop GPU, 80 Wh | Dell XPS 14 2024 OLED Ultra 7 155H, NVIDIA GeForce RTX 4050 Laptop GPU, 69.5 Wh | HP OmniBook Ultra 14 Ryzen AI 9 HX 375, Radeon 890M, 68 Wh | SCHENKER Vision 14 M23 RTX 3050 i7-13700H, GeForce RTX 3050 6GB Laptop GPU, 99 Wh | Lenovo Yoga Pro 7 14IMH9 Ultra 7 155H, Arc 8-Core, 73 Wh | Lenovo Yoga Pro 7 14ASP G9 Ryzen AI 9 365, Radeon 880M, 73 Wh | Media de la clase Multimedia | |
|---|---|---|---|---|---|---|---|---|
| Duración de Batería | -5% | -12% | 18% | 52% | 43% | -2% | 18% | |
| H.264 | 794 | 635 -20% | 649 -18% | 864 ? 9% | ||||
| WiFi v1.3 | 477 | 454 -5% | 465 -3% | 661 39% | 723 52% | 680 43% | 527 10% | 645 ? 35% |
| Load | 91 | 79 -13% | 88 -3% | 93 2% | 99 ? 9% |
Valoración total de Notebookcheck
Lenovo Yoga Pro 7 14IMH9, RTX 4050
- 01/10/2025 v8
Andreas Osthoff
Transparencia
La selección de los dispositivos que se van a reseñar corre a cargo de nuestro equipo editorial. La muestra de prueba fue proporcionada al autor en calidad de préstamo por el fabricante o el minorista a los efectos de esta reseña. El prestamista no tuvo ninguna influencia en esta reseña, ni el fabricante recibió una copia de la misma antes de su publicación. No había ninguna obligación de publicar esta reseña. Nunca aceptamos compensaciones o pagos a cambio de nuestras reseñas. Como empresa de medios independiente, Notebookcheck no está sujeta a la autoridad de fabricantes, minoristas o editores.
Así es como prueba Notebookcheck
Cada año, Notebookcheck revisa de forma independiente cientos de portátiles y smartphones utilizando procedimientos estandarizados para asegurar que todos los resultados son comparables. Hemos desarrollado continuamente nuestros métodos de prueba durante unos 20 años y hemos establecido los estándares de la industria en el proceso. En nuestros laboratorios de pruebas, técnicos y editores experimentados utilizan equipos de medición de alta calidad. Estas pruebas implican un proceso de validación en varias fases. Nuestro complejo sistema de clasificación se basa en cientos de mediciones y puntos de referencia bien fundamentados, lo que mantiene la objetividad.












 Total Sustainability Score:


