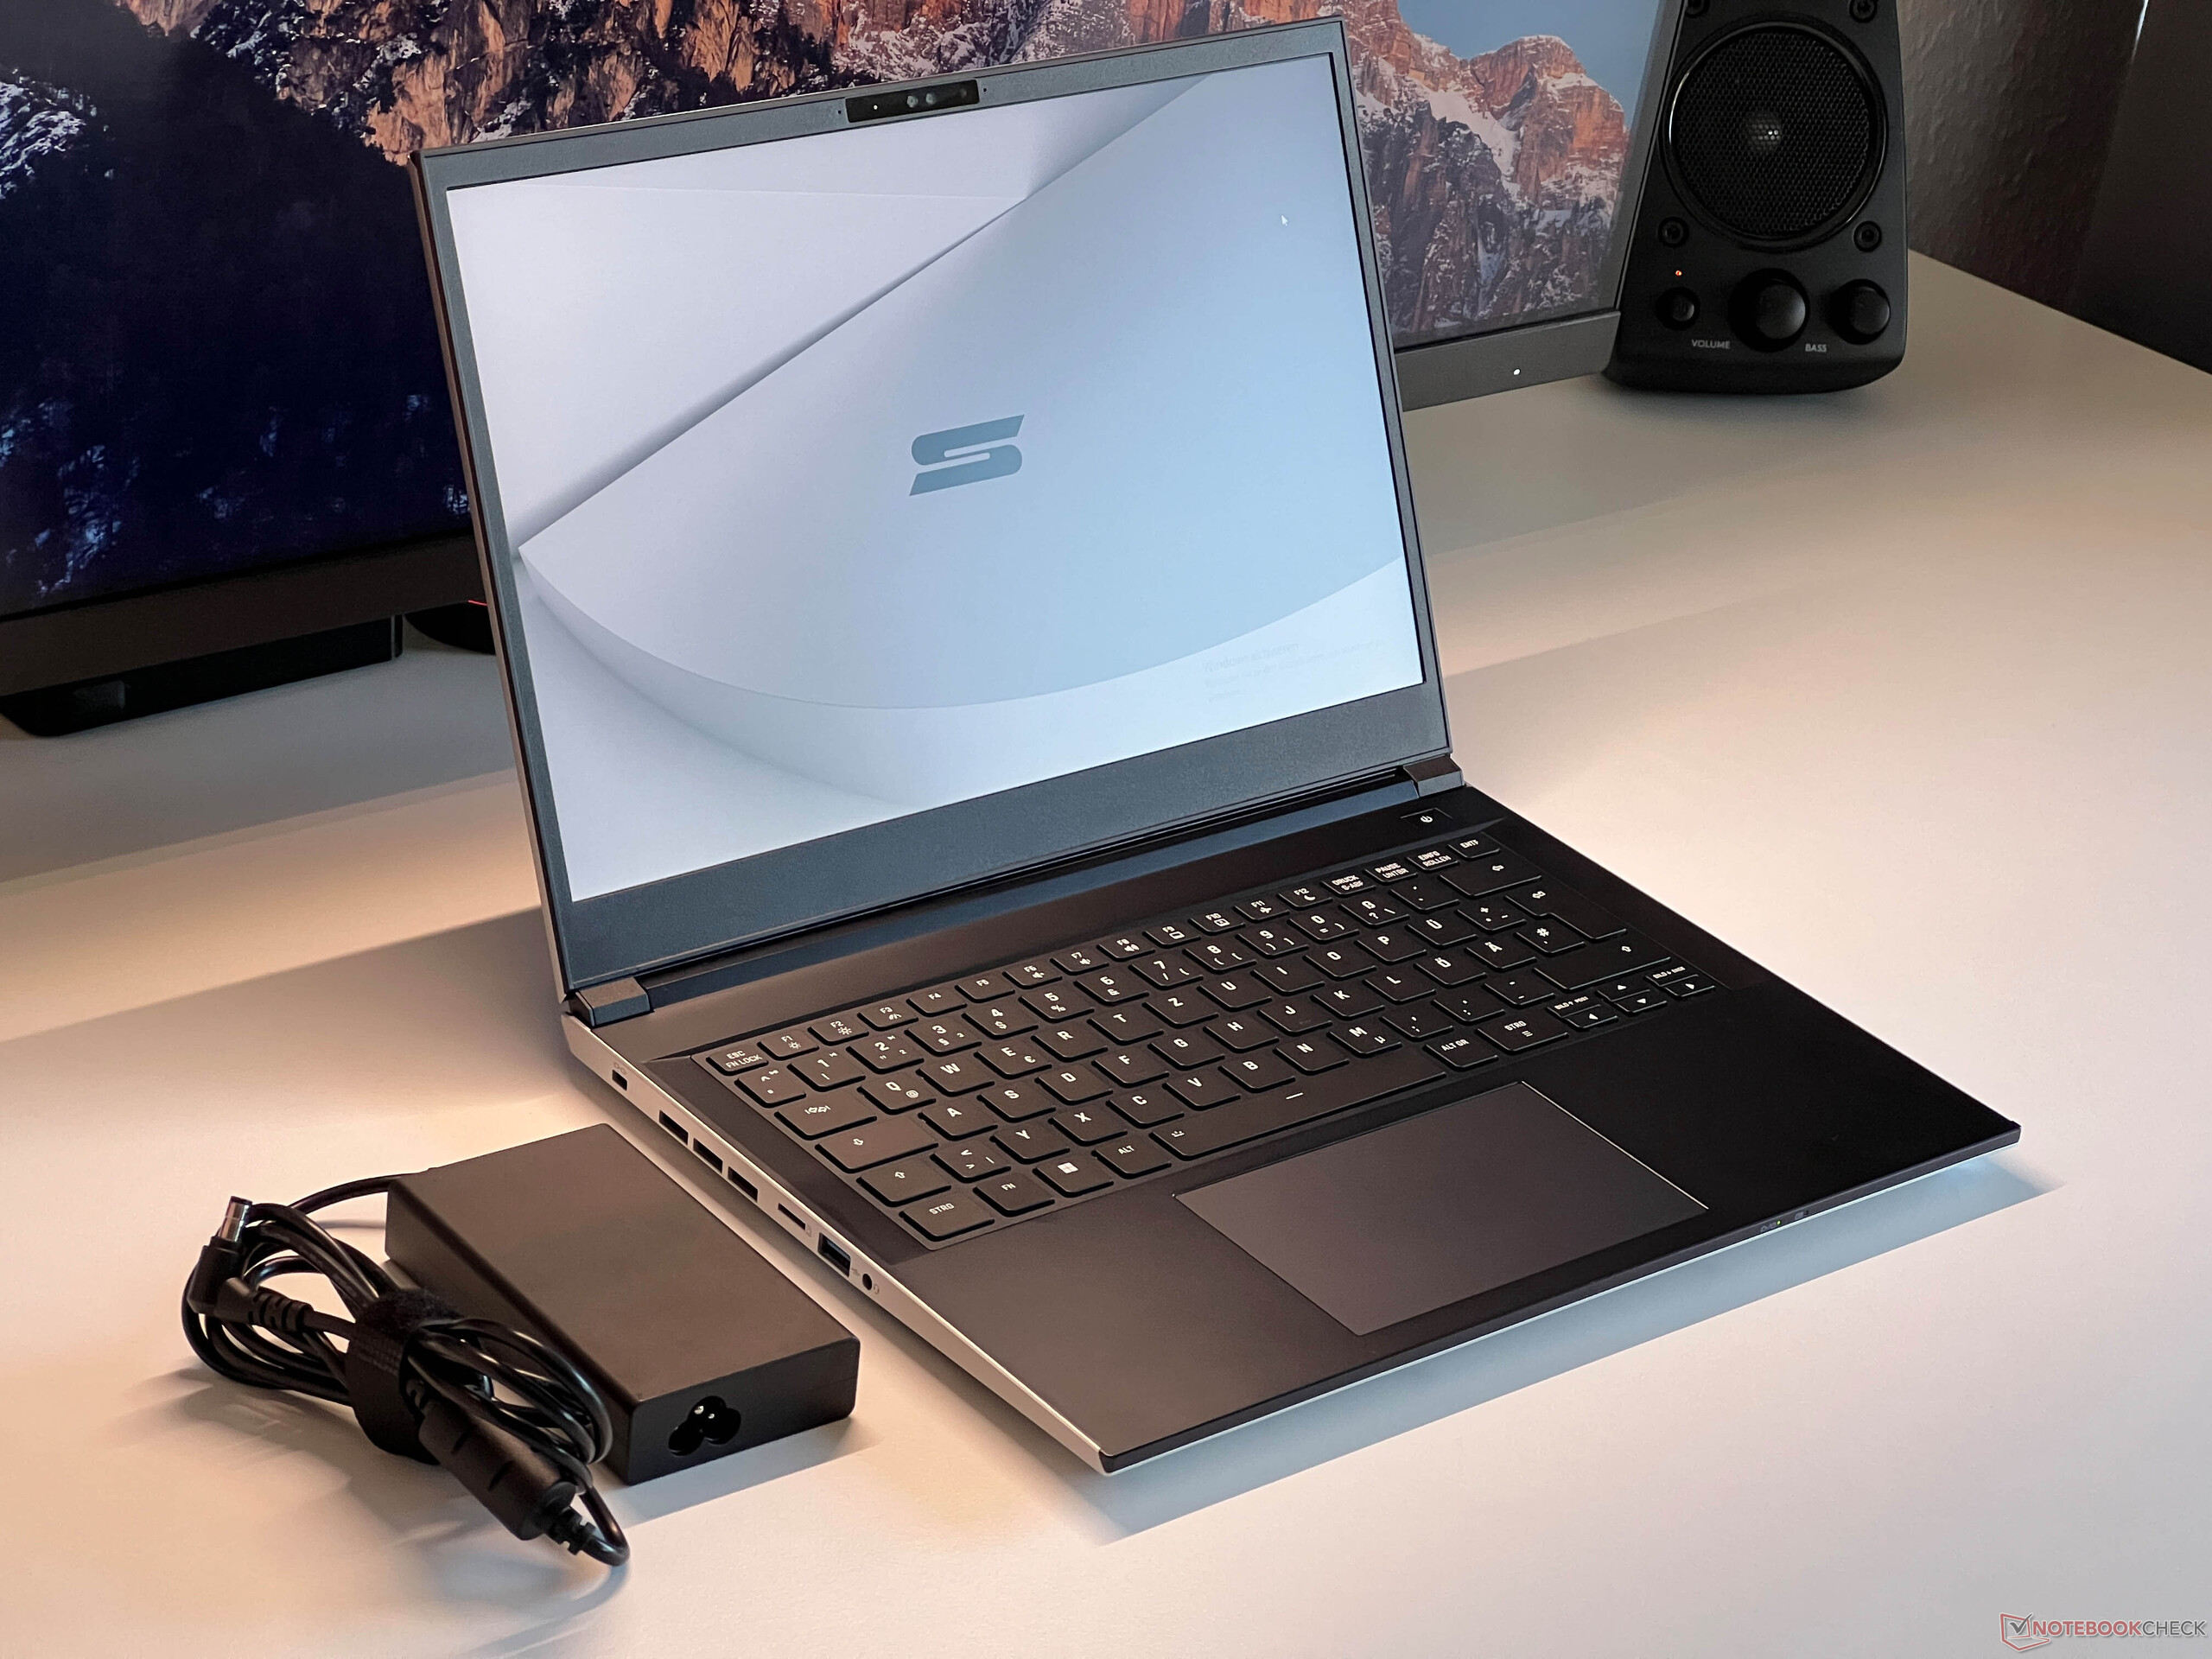
Análisis del Schenker Key 14: 100 W RTX 4060 en un portátil multimedia compacto
Pequeña pero potente.
Con el Key 14, Schenker incorpora a su gama un portátil compacto de 14 pulgadas que incorpora una pantalla precalibrada de 120 Hz y una selección de rápidas tarjetas gráficas dedicadas de Nvidia. Probamos la SKU construida en torno a la GeForce RTX 4060 portátil con un TGP de 100 vatios.Andreas Osthoff, 👁 Andreas Osthoff (traducido por DeepL / Ninh Duy) Publicado 🇺🇸 🇩🇪 ...
Veredicto - Key 14 ofrece buenas prestaciones y opciones de mantenimiento, pero también tiene puntos débiles
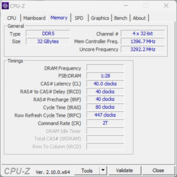
El Schenker Key 14 es un rápido portátil multimedia de 14 pulgadas disponible con variantes de 100 vatios de la GeForce RTX 4060 o alternativamente RTX 4070. La memoria RAM es ampliable y admite un máximo de 96 GB. El rendimiento general es bueno y se mantiene estable incluso bajo carga continua, aunque los dos ventiladores pueden llegar a ser bastante ruidosos durante un uso intensivo. En cuanto a la conectividad, admite todos los estándares esenciales, incluidos Thunderbolt 4, un puerto Gigabit Ethernet y un módulo Wi-Fi 7 opcional.
En muchos otros aspectos, sin embargo, el Key es bastante mediocre. Aunque su carcasa es robusta y está bien hecha, el marco de plástico rugoso alrededor de la pantalla parece algo fuera de lugar. El teclado es cómodo pero podría beneficiarse de un poco más de recorrido de las teclas, y la duración de la batería no va a batir nuevos récords a corto plazo. La pantalla IPS mate de 120 Hz sin parpadeos ofrece una buena calidad de imagen en general, pero su brillo es inferior a lo que ofrece la competencia, alcanzando poco más de 300 nits.
En Alemania, el Key 14 parte de los 1.699 euros (~1.780 dólares) con la RTX 4060, y hay muchas SKU en oferta, así como muchas opciones de actualización, lo que es un claro punto a favor. En cuanto a otras opciones, por 1.799 euros se puede adquirir un Asus Zephyrus G14 con la RTX 4060, que ofrece un mejor paquete global pero está limitado a 16 GB de RAM soldada. El XPS 14 de Dell se queda atrás con su RTX 4050 más lenta y sus limitadas opciones de conectividad. El Asus TUF Gaming 14 destaca con su procesador AMD más rápido, pero tampoco está totalmente libre de problemas. Entre ellos, la memoria soldada y las altas emisiones.
Pro
Contra
Precio y disponibilidad
En Alemania, la Key 14 (M24) puede configurarse y encargarse a Bestware a partir de 1.699 euros.
Posibles contendientes en la comparación
Imagen | Modelo | Precio | Peso | Altura | Pantalla |
|---|---|---|---|---|---|
| SCHENKER Key 14 (M24) Intel Core Ultra 7 155H ⎘ NVIDIA GeForce RTX 4060 Laptop GPU ⎘ 32 GB Memoría, 1024 GB SSD | Amazon: 1. $68.99 PowerHOOD 20V AC/DC Adapter ... Precio de catálogo: 1890€ | 1.7 kg | 19.9 mm | 14.00" 2880x1800 243 PPI IPS | |
| Asus TUF Gaming A14 FA401WV-WB94 AMD Ryzen AI 9 HX 370 ⎘ NVIDIA GeForce RTX 4060 Laptop GPU ⎘ 16 GB Memoría, 1024 GB SSD | Amazon: Precio de catálogo: 1500 USD | 1.5 kg | 19.9 mm | 14.00" 2560x1600 216 PPI IPS | |
| Dell XPS 14 2024 OLED Intel Core Ultra 7 155H ⎘ NVIDIA GeForce RTX 4050 Laptop GPU ⎘ 32 GB Memoría, 1024 GB SSD | Amazon: $1,175.00 Precio de catálogo: 2949€ | 1.8 kg | 19 mm | 14.50" 3200x2000 260 PPI OLED | |
| Asus ROG Zephyrus G14 2024 GA403U AMD Ryzen 9 8945HS ⎘ NVIDIA GeForce RTX 4070 Laptop GPU ⎘ 32 GB Memoría, 1024 GB SSD | Amazon: 1. $72.99 180W 20V 9A Charger ADP-180T... 2. $72.99 180W Rectangle Conn Charger ... 3. $89.99 Slim 200W 180W Charger for A... Precio de catálogo: 2499€ | 1.5 kg | 16.3 mm | 14.00" 2880x1800 243 PPI OLED | |
| Acer Nitro 14 AN14-41-R3MX AMD Ryzen 5 8645HS ⎘ NVIDIA GeForce RTX 4060 Laptop GPU ⎘ 16 GB Memoría, 512 GB SSD | Amazon: $1,249.99 Precio de catálogo: 1450 Euro | 2 kg | 22.84 mm | 14.50" 2560x1600 208 PPI IPS |
Índice
- Veredicto - Key 14 ofrece buenas prestaciones y opciones de mantenimiento, pero también tiene puntos débiles
- Especificaciones
- Caja y conectividad
- Dispositivos de entrada - Teclado cómodo
- Pantalla - IPS con 120 Hz y calibración
- Rendimiento - Core Ultra acoplado a hasta 96 GB de RAM
- Emisiones. Potencia
- Valoración de Notebookcheck
El Key 14 de Schenker es un potente portátil multimedia que incorpora un procesador Intel Meteor Lake emparejado con una GPU dedicada GeForce RTX 4060 Laptop o incluso una GPU RTX 4070 Laptop. El modelo base con la RTX 4060 cuesta a partir de 1.699 euros e incluye una pantalla IPS de alta resolución de 120 Hz. Nuestra configuración de prueba, que cuenta con 32 GB de RAM, una unidad SSD de 1 TB, el módulo Wi-Fi 7 opcional y tres años de garantía, tiene un precio aproximado de 1.900 euros. Además, recibimos la variante dotada de RTX 4070 para ejecutar algunos puntos de referencia y pruebas de juegos.
Especificaciones
Top 10 Análisis
» Top 10 Portátiles Multimedia
» Top 10 Portátiles de Juego
» Top 10 Portátiles de Juego ligeros
» Top 10 Portátiles Asequibles de Oficina/Empresa
» Top 10 Portátiles de Juego Ligeros
» Top 10 Portátiles de Oficina/Empresa Premium
» Top 10 Estaciones de Trabajo
» Top 10 Subportátiles
» Top 10 Ultrabooks
» Top 10 Convertibles
» Top 10 Tablets
» Top 10 Tablets Windows
» Top 10 Tablets de menos de 250 Euros
» Top 10 Phablets (>5.5")
» Top 10 Smartphones
» Top 10 Smartphones (≤5")
» Top 10 Smartphones de menos de 300 Euros
» Top 10 Smartphones de menos de 120 Euros
» Top 10 Portátiles de menos de 1000 Euros
» Top 10 Portátiles de menos de 500 Euros
» Top 10 Portátiles de menos de 300 Euros
» Los Mejores Displays de Portátiles Analizados por Notebookcheck
Caja y conectividad
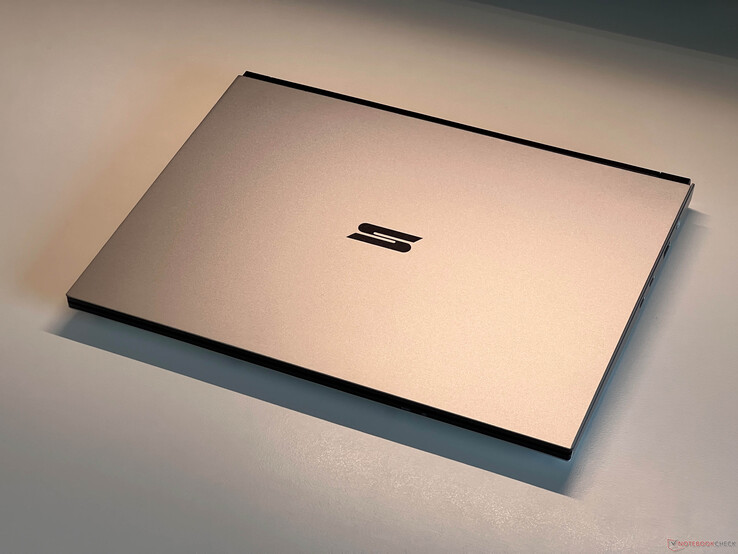
Con su diseño negro y plateado, la Key 14 tiene un aspecto sutil y profesional que se integra sin esfuerzo en los entornos de trabajo. La tapa y la base (ambas de aluminio) no son imanes para las huellas dactilares, pero el reposamanos de plástico oscuro que tiene un tacto algo gomoso sí requiere una limpieza regular. El bisel de la pantalla está hecho de un plástico más rugoso, lo que le da un aspecto ligeramente barato. Además, los biseles de la pantalla son relativamente anchos para un dispositivo moderno (especialmente en la parte superior e inferior). Tanto la calidad de construcción como la estabilidad son buenas, con una flexión mínima en la parte superior de la unidad base y sin crujidos al intentar girarla. La parte de la pantalla del portátil es algo más flexible, aunque no conseguimos que apareciera ninguna distorsión de la imagen. Las bisagras están bien afinadas, ofreciendo suficiente resistencia (mejor que el Vision 14), pero el ángulo máximo de apertura está limitado a sólo 130 grados.
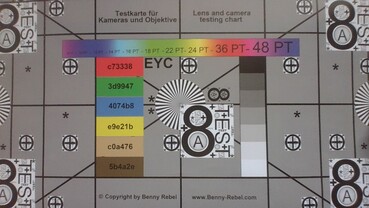
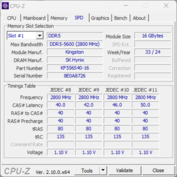
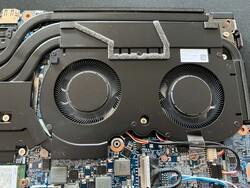
La cubierta inferior se puede retirar, lo que permite acceder a los ventiladores, la batería, la SSD M.2 2280, el módulo WLAN soldado y las dos ranuras de RAM. Esta es una clara ventaja del Schenker frente a muchos competidores, ya que permite ampliar sin problemas la memoria RAM hasta 96 GB. Nuestra SKU está equipada con el módulo opcional Intel Wi-Fi 7 que ofrece velocidades de transferencia significativamente superiores a las alternativas Wi-Fi 6 cuando se empareja con un router compatible. Registramos velocidades de entre 2,6 y 4,1 Gbit/s, una mejora sustancial respecto a los ~1,7 Gbit/s logrados con Wi-Fi 6. La cámara web Full HD hace su trabajo y también es compatible con el reconocimiento facial a través de Windows Hello.
El Key 14 sobresale en conectividad, ofreciendo todos los estándares esenciales, incluyendo Thunderbolt 4, HDMI 2.1 e incluso un puerto Gigabit Ethernet, una característica cada vez más rara en esta clase de tamaño. La distribución de los puertos está bien pensada, y el Key también admite la carga a través de USB-C a una potencia de hasta 100 vatios.
Con un peso de 1,75 kg y una altura de algo menos de 2 cm, la Key 14 se sitúa en el medio de su grupo de comparación. El adaptador de corriente de 180 vatios incluido inclina la balanza hasta los 430 gramos.
| SD Card Reader | |
| average JPG Copy Test (av. of 3 runs) | |
| Asus ROG Zephyrus G14 2024 GA403U (Angelbird AV Pro V60) | |
| Dell XPS 14 2024 OLED (Angelbird AV Pro V60) | |
| Media de la clase Multimedia (18.4 - 201, n=56, últimos 2 años) | |
| SCHENKER Key 14 (M24) (Angelbird AV Pro V60) | |
| Asus TUF Gaming A14 FA401WV-WB94 (Angelbird AV Pro V60) | |
| Acer Nitro 14 AN14-41-R3MX (AV PRO microSD 128 GB V60) | |
| maximum AS SSD Seq Read Test (1GB) | |
| Asus TUF Gaming A14 FA401WV-WB94 (Angelbird AV Pro V60) | |
| Dell XPS 14 2024 OLED (Angelbird AV Pro V60) | |
| Asus ROG Zephyrus G14 2024 GA403U (Angelbird AV Pro V60) | |
| Media de la clase Multimedia (25.8 - 266, n=56, últimos 2 años) | |
| SCHENKER Key 14 (M24) (Angelbird AV Pro V60) | |
| Acer Nitro 14 AN14-41-R3MX (AV PRO microSD 128 GB V60) | |
| Networking | |
| SCHENKER Key 14 (M24) | |
| iperf3 transmit AXE11000 | |
| iperf3 receive AXE11000 | |
| iperf3 transmit GT-BE19000 WiFi7 | |
| iperf3 receive GT-BE19000 WiFi7 | |
| Asus TUF Gaming A14 FA401WV-WB94 | |
| iperf3 transmit AXE11000 | |
| iperf3 receive AXE11000 | |
| iperf3 transmit AXE11000 6GHz | |
| iperf3 receive AXE11000 6GHz | |
| Dell XPS 14 2024 OLED | |
| iperf3 transmit AXE11000 | |
| iperf3 receive AXE11000 | |
| Asus ROG Zephyrus G14 2024 GA403U | |
| iperf3 transmit AXE11000 | |
| iperf3 receive AXE11000 | |
| Acer Nitro 14 AN14-41-R3MX | |
| iperf3 transmit AXE11000 | |
| iperf3 receive AXE11000 | |
| iperf3 transmit AXE11000 6GHz | |
| iperf3 receive AXE11000 6GHz | |

Sostenibilidad
Schenker Technologies no facilita información sobre la huella de CO² de la Key 14. El embalaje se compone principalmente de materiales reciclables, lo que es una ventaja.
Dispositivos de entrada - Teclado cómodo
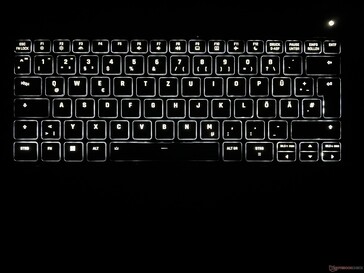
El teclado de color negro cuenta con retroiluminación blanca y teclas relativamente pequeñas de 15 x 15 mm con un generoso espacio entre ellas. Aunque el recorrido de las teclas es bastante limitado, el teclado es cómodo de usar en general gracias a lo precisas y relativamente silenciosas que suelen ser las pulsaciones. Puede que le cueste un poco acostumbrarse a las pequeñas teclas de flecha. Las teclas dedicadas Re Pág y Av Pág son una adición útil.
El clickpad del portátil es suficientemente grande, de 12,1 x 7,3 cm, y cumple el estándar Precision de Microsoft. Ofrece buenas propiedades de deslizamiento y funciona bien en el uso diario. La zona inferior del pad se puede pulsar mecánicamente, lo que produce un ruido bastante fuerte.
Pantalla - IPS con 120 Hz y calibración
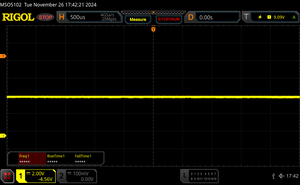
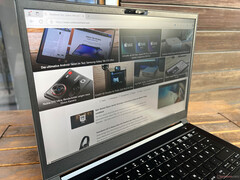
La pantalla IPS mate de 14 pulgadas ofrece imágenes nítidas gracias a su alta resolución de 2.880 x 1.800 píxeles (relación de aspecto 16:10). Su reproducción del color es totalmente aceptable, a pesar de la falta del brillo que tienen los paneles OLED. Aquí tampoco hay parpadeo PWM.
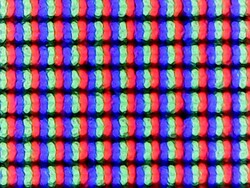
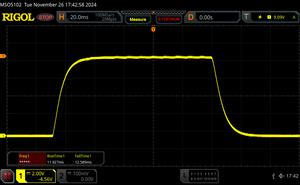
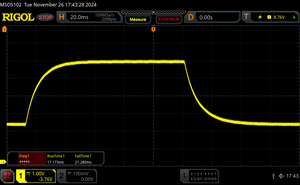
Las zonas brillantes aparecen ligeramente granuladas en una inspección más cercana, lo que no es realmente perceptible en el uso diario. La frecuencia de refresco de 120 Hz permite un movimiento fluido, y los tiempos de respuesta también son buenos. Pueden apreciarse ligeros halos en los bordes cuando la pantalla muestra una imagen oscura. No hay problemas con la estabilidad del ángulo de visión.
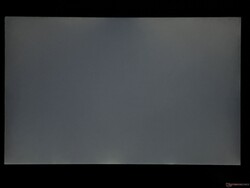
El fabricante especifica un brillo de 300 cd/m², que el panel de nuestro aparato de pruebas supera realmente con una media de 317 cd/m². Su nivel de negro es muy bajo, lo que se traduce en una elevada relación de contraste máxima. En interiores, el brillo decente combinado con la superficie mate permite interactuar con la pantalla sin esfuerzo; sin embargo, la competencia ofrece niveles de brillo más altos. La Key sería mucho más adecuada para su uso en exteriores si tuviera una pantalla más brillante.
| |||||||||||||||||||||||||
iluminación: 94 %
Brillo con batería: 325 cd/m²
Contraste: 2708:1 (Negro: 0.12 cd/m²)
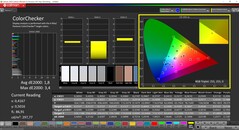
ΔE Color 1.8 | 0.5-29.43 Ø4.87, calibrated: 1.4
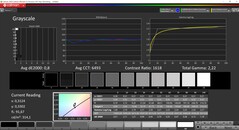
ΔE Greyscale 2.5 | 0.5-98 Ø5.1
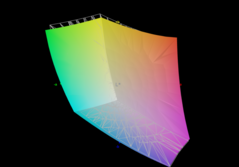
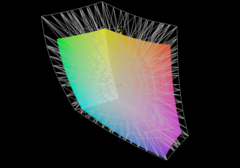
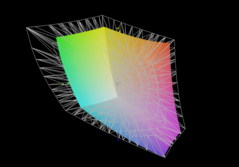
72.4% AdobeRGB 1998 (Argyll 2.2.0 3D)
97.4% sRGB (Argyll 2.2.0 3D)
70.3% Display P3 (Argyll 2.2.0 3D)
Gamma: 2.15
| SCHENKER Key 14 (M24) TL140ADXP24-0, IPS, 2880x1800, 14", 120 Hz | Asus TUF Gaming A14 FA401WV-WB94 BOE NE140QDM-NX7, IPS, 2560x1600, 14", 165 Hz | Dell XPS 14 2024 OLED SDC41A2, OLED, 3200x2000, 14.5", 120 Hz | Asus ROG Zephyrus G14 2024 GA403U ATNA40CU05-0, OLED, 2880x1800, 14", 120 Hz | Acer Nitro 14 AN14-41-R3MX AU Optronics B145QAN01.J, IPS, 2560x1600, 14.5", 120 Hz | |
|---|---|---|---|---|---|
| Display | -6% | 21% | 23% | 2% | |
| Display P3 Coverage | 70.3 | 65.1 -7% | 98.5 40% | 99.6 42% | 72.7 3% |
| sRGB Coverage | 97.4 | 94 -3% | 100 3% | 100 3% | 97.6 0% |
| AdobeRGB 1998 Coverage | 72.4 | 65.6 -9% | 87.2 20% | 89.9 24% | 74.7 3% |
| Response Times | 72% | 98% | 98% | 41% | |
| Response Time Grey 50% / Grey 80% * | 38.5 ? | 10.7 ? 72% | 0.7 ? 98% | 0.62 ? 98% | 22.3 ? 42% |
| Response Time Black / White * | 24.6 ? | 7.1 ? 71% | 0.77 ? 97% | 0.68 ? 97% | 14.8 ? 40% |
| PWM Frequency | 480 | 960 ? | |||
| Screen | -53% | 12% | 225% | -86% | |
| Brightness middle | 325 | 455.8 40% | 351 8% | 423 30% | 415 28% |
| Brightness | 317 | 436 38% | 353 11% | 424 34% | 395 25% |
| Brightness Distribution | 94 | 93 -1% | 97 3% | 98 4% | 89 -5% |
| Black Level * | 0.12 | 0.38 -217% | 0.01 92% | 0.34 -183% | |
| Contrast | 2708 | 1199 -56% | 42300 1462% | 1221 -55% | |
| Colorchecker dE 2000 * | 1.8 | 3.39 -88% | 1.7 6% | 0.7 61% | 4.5 -150% |
| Colorchecker dE 2000 max. * | 3.4 | 7.3 -115% | 2.2 35% | 1.8 47% | 10.7 -215% |
| Colorchecker dE 2000 calibrated * | 1.4 | 1.67 -19% | 0.8 43% | 1.8 -29% | |
| Greyscale dE 2000 * | 2.5 | 3.9 -56% | 3.1 -24% | 0.8 68% | 7.2 -188% |
| Gamma | 2.15 102% | 2.17 101% | 2.12 104% | 2.18 101% | 2.15 102% |
| CCT | 7017 93% | 7340 89% | 6616 98% | 6505 100% | 6541 99% |
| Media total (Programa/Opciones) | 4% /
-25% | 44% /
28% | 115% /
159% | -14% /
-49% |
* ... más pequeño es mejor
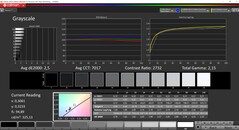
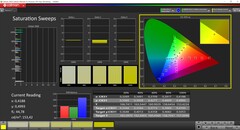
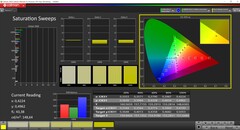
Medimos los parámetros del panel con el software profesional CalMAN utilizando el perfil predeterminado. La prueba de escala de grises revela un ligero tinte azulado y una temperatura de color ligeramente demasiado fría. Para los colores, sin embargo, las desviaciones respecto a los colores de referencia sRGB están por debajo del umbral de 3, lo que significa que se muestran de forma suficientemente natural.
Con nuestro perfil de calibración aplicado (el archivo está disponible para su descarga gratuita más arriba), se aprecian algunas ligeras mejoras en la escala de grises y en los colores. En cualquier caso, el panel cubre el espectro sRGB en su totalidad, lo que significa que la edición de imágenes no supone ningún problema con el Schenker.
Tiempos de respuesta del display
| ↔ Tiempo de respuesta de Negro a Blanco | ||
|---|---|---|
| 24.6 ms ... subida ↗ y bajada ↘ combinada | ↗ 11.9 ms subida | |
| ↘ 12.6 ms bajada | ||
| La pantalla mostró buenos tiempos de respuesta en nuestros tests pero podría ser demasiado lenta para los jugones competitivos. En comparación, todos los dispositivos de prueba van de ##min### (mínimo) a 240 (máximo) ms. » 55 % de todos los dispositivos son mejores. Eso quiere decir que el tiempo de respuesta es peor que la media (20.8 ms) de todos los dispositivos testados. | ||
| ↔ Tiempo de respuesta 50% Gris a 80% Gris | ||
| 38.5 ms ... subida ↗ y bajada ↘ combinada | ↗ 17.2 ms subida | |
| ↘ 21.3 ms bajada | ||
| La pantalla mostró tiempos de respuesta lentos en nuestros tests y podría ser demasiado lenta para los jugones. En comparación, todos los dispositivos de prueba van de ##min### (mínimo) a 636 (máximo) ms. » 55 % de todos los dispositivos son mejores. Eso quiere decir que el tiempo de respuesta es peor que la media (32.5 ms) de todos los dispositivos testados. | ||
Parpadeo de Pantalla / PWM (Pulse-Width Modulation)
| Parpadeo de Pantalla / PWM no detectado | |||
Comparación: 53 % de todos los dispositivos testados no usaron PWM para atenuar el display. Si se usó, medimos una media de 8516 (mínimo: 5 - máxmo: 343500) Hz. | |||
Rendimiento - Core Ultra acoplado a hasta 96 GB de RAM
Condiciones de prueba
El Key 14 viene con el último Command Center 3.0, que ofrece una gama de ajustes y tres perfiles de energía: Silencio, Entretenimiento y Rendimiento. Cada perfil tiene varios subperfiles, y también existe la opción de ajustar manualmente las curvas de los ventiladores. Para alcanzar el objetivo de potencia máxima de la GPU de 100 vatios, debe utilizarse el perfil Rendimiento con el subperfil Turbo, que es el que activamos para las pruebas de rendimiento que se muestran a continuación.
Procesador
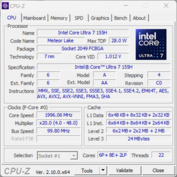
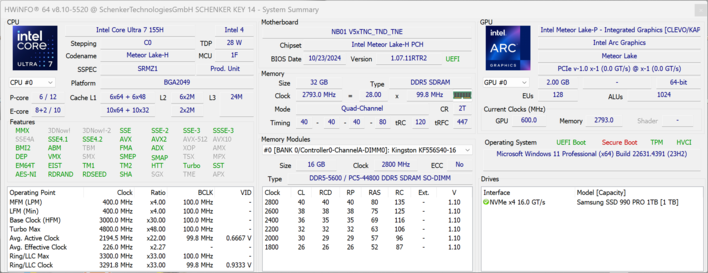
El procesador utilizado es el Core Ultra 7 155H de la generación Meteor Lake. Schenker permite que consuma hasta 65 vatios; la cifra acaba estabilizándose en 54 vatios. Como resultado, el rendimiento del procesador es relativamente constante aquí, incluso bajo carga sostenida.
Dicho esto, la competencia creada en torno a las CPU Ryzen de AMD ofrece un mayor rendimiento multinúcleo, siendo el Ryzen AI 9 HX 370 notablemente más rápido que el Core Ultra 7.
En batería, el procesador consume un máximo de 45 vatios para estabilizarse en 40 vatios un tiempo después. Esto se traduce en una reducción del rendimiento de alrededor del 14% en las pruebas multinúcleo en comparación con el funcionamiento en red. Encontrará más pruebas de rendimiento de la CPU disponibles en nuestra sección técnica.
Cinebench R15 Multi loop
Cinebench R23: Multi Core | Single Core
Cinebench R20: CPU (Multi Core) | CPU (Single Core)
Cinebench R15: CPU Multi 64Bit | CPU Single 64Bit
Blender: v2.79 BMW27 CPU
7-Zip 18.03: 7z b 4 | 7z b 4 -mmt1
Geekbench 6.4: Multi-Core | Single-Core
Geekbench 5.5: Multi-Core | Single-Core
HWBOT x265 Benchmark v2.2: 4k Preset
LibreOffice : 20 Documents To PDF
R Benchmark 2.5: Overall mean
| CPU Performance Rating | |
| Asus TUF Gaming A14 FA401WV-WB94 | |
| Asus ROG Zephyrus G14 2024 GA403U | |
| Media de la clase Multimedia | |
| SCHENKER Key 14 (M24) | |
| Dell XPS 14 2024 OLED | |
| Acer Nitro 14 AN14-41-R3MX | |
| Medio Intel Core Ultra 7 155H | |
| Cinebench R23 / Multi Core | |
| Asus TUF Gaming A14 FA401WV-WB94 | |
| Asus ROG Zephyrus G14 2024 GA403U | |
| Media de la clase Multimedia (4861 - 30789, n=96, últimos 2 años) | |
| SCHENKER Key 14 (M24) | |
| Medio Intel Core Ultra 7 155H (9769 - 19007, n=52) | |
| Dell XPS 14 2024 OLED | |
| Acer Nitro 14 AN14-41-R3MX | |
| Cinebench R23 / Single Core | |
| Asus TUF Gaming A14 FA401WV-WB94 | |
| Media de la clase Multimedia (878 - 2290, n=87, últimos 2 años) | |
| Asus ROG Zephyrus G14 2024 GA403U | |
| Dell XPS 14 2024 OLED | |
| Medio Intel Core Ultra 7 155H (1496 - 1815, n=52) | |
| Acer Nitro 14 AN14-41-R3MX | |
| SCHENKER Key 14 (M24) | |
| Cinebench R20 / CPU (Multi Core) | |
| Asus TUF Gaming A14 FA401WV-WB94 | |
| Asus ROG Zephyrus G14 2024 GA403U | |
| Dell XPS 14 2024 OLED | |
| SCHENKER Key 14 (M24) | |
| Media de la clase Multimedia (1887 - 11924, n=80, últimos 2 años) | |
| Medio Intel Core Ultra 7 155H (3798 - 7409, n=50) | |
| Acer Nitro 14 AN14-41-R3MX | |
| Cinebench R20 / CPU (Single Core) | |
| Asus TUF Gaming A14 FA401WV-WB94 | |
| Asus ROG Zephyrus G14 2024 GA403U | |
| Media de la clase Multimedia (341 - 853, n=80, últimos 2 años) | |
| Dell XPS 14 2024 OLED | |
| Acer Nitro 14 AN14-41-R3MX | |
| Medio Intel Core Ultra 7 155H (601 - 696, n=50) | |
| SCHENKER Key 14 (M24) | |
| Cinebench R15 / CPU Multi 64Bit | |
| Asus TUF Gaming A14 FA401WV-WB94 | |
| Asus ROG Zephyrus G14 2024 GA403U | |
| Dell XPS 14 2024 OLED | |
| Media de la clase Multimedia (856 - 5224, n=87, últimos 2 años) | |
| SCHENKER Key 14 (M24) | |
| Medio Intel Core Ultra 7 155H (1932 - 2880, n=56) | |
| Acer Nitro 14 AN14-41-R3MX | |
| Cinebench R15 / CPU Single 64Bit | |
| Asus TUF Gaming A14 FA401WV-WB94 | |
| Asus ROG Zephyrus G14 2024 GA403U | |
| Acer Nitro 14 AN14-41-R3MX | |
| Media de la clase Multimedia (99.6 - 323, n=82, últimos 2 años) | |
| Dell XPS 14 2024 OLED | |
| Medio Intel Core Ultra 7 155H (99.6 - 268, n=52) | |
| SCHENKER Key 14 (M24) | |
| Blender / v2.79 BMW27 CPU | |
| Dell XPS 14 2024 OLED | |
| Media de la clase Multimedia (100 - 557, n=80, últimos 2 años) | |
| Acer Nitro 14 AN14-41-R3MX | |
| Medio Intel Core Ultra 7 155H (175 - 381, n=47) | |
| SCHENKER Key 14 (M24) | |
| Asus ROG Zephyrus G14 2024 GA403U | |
| Asus TUF Gaming A14 FA401WV-WB94 | |
| 7-Zip 18.03 / 7z b 4 | |
| Asus TUF Gaming A14 FA401WV-WB94 | |
| Asus ROG Zephyrus G14 2024 GA403U | |
| SCHENKER Key 14 (M24) | |
| Media de la clase Multimedia (29095 - 130368, n=75, últimos 2 años) | |
| Medio Intel Core Ultra 7 155H (41739 - 70254, n=50) | |
| Acer Nitro 14 AN14-41-R3MX | |
| Dell XPS 14 2024 OLED | |
| 7-Zip 18.03 / 7z b 4 -mmt1 | |
| Acer Nitro 14 AN14-41-R3MX | |
| Asus TUF Gaming A14 FA401WV-WB94 | |
| Asus ROG Zephyrus G14 2024 GA403U | |
| Media de la clase Multimedia (3398 - 7545, n=75, últimos 2 años) | |
| SCHENKER Key 14 (M24) | |
| Dell XPS 14 2024 OLED | |
| Medio Intel Core Ultra 7 155H (4594 - 5621, n=50) | |
| Geekbench 6.4 / Multi-Core | |
| Asus TUF Gaming A14 FA401WV-WB94 | |
| Media de la clase Multimedia (4983 - 25760, n=77, últimos 2 años) | |
| Dell XPS 14 2024 OLED | |
| Asus ROG Zephyrus G14 2024 GA403U | |
| SCHENKER Key 14 (M24) | |
| Medio Intel Core Ultra 7 155H (7732 - 13656, n=55) | |
| Acer Nitro 14 AN14-41-R3MX | |
| Geekbench 6.4 / Single-Core | |
| Asus TUF Gaming A14 FA401WV-WB94 | |
| Media de la clase Multimedia (1534 - 3927, n=73, últimos 2 años) | |
| Asus ROG Zephyrus G14 2024 GA403U | |
| Acer Nitro 14 AN14-41-R3MX | |
| Dell XPS 14 2024 OLED | |
| Medio Intel Core Ultra 7 155H (1901 - 2473, n=52) | |
| SCHENKER Key 14 (M24) | |
| Geekbench 5.5 / Multi-Core | |
| Asus TUF Gaming A14 FA401WV-WB94 | |
| Dell XPS 14 2024 OLED | |
| SCHENKER Key 14 (M24) | |
| Media de la clase Multimedia (4652 - 23059, n=79, últimos 2 años) | |
| Medio Intel Core Ultra 7 155H (10017 - 13556, n=52) | |
| Asus ROG Zephyrus G14 2024 GA403U | |
| Acer Nitro 14 AN14-41-R3MX | |
| Geekbench 5.5 / Single-Core | |
| Asus TUF Gaming A14 FA401WV-WB94 | |
| Acer Nitro 14 AN14-41-R3MX | |
| Media de la clase Multimedia (891 - 2555, n=79, últimos 2 años) | |
| Asus ROG Zephyrus G14 2024 GA403U | |
| Dell XPS 14 2024 OLED | |
| Medio Intel Core Ultra 7 155H (1462 - 1824, n=52) | |
| SCHENKER Key 14 (M24) | |
| HWBOT x265 Benchmark v2.2 / 4k Preset | |
| Asus TUF Gaming A14 FA401WV-WB94 | |
| Asus ROG Zephyrus G14 2024 GA403U | |
| Acer Nitro 14 AN14-41-R3MX | |
| Media de la clase Multimedia (5.26 - 34.3, n=74, últimos 2 años) | |
| Medio Intel Core Ultra 7 155H (9.93 - 21.2, n=50) | |
| Dell XPS 14 2024 OLED | |
| SCHENKER Key 14 (M24) | |
| LibreOffice / 20 Documents To PDF | |
| Asus ROG Zephyrus G14 2024 GA403U | |
| Asus TUF Gaming A14 FA401WV-WB94 | |
| Media de la clase Multimedia (23.9 - 146.7, n=76, últimos 2 años) | |
| Dell XPS 14 2024 OLED | |
| Medio Intel Core Ultra 7 155H (37.5 - 79.2, n=49) | |
| Acer Nitro 14 AN14-41-R3MX | |
| SCHENKER Key 14 (M24) | |
| R Benchmark 2.5 / Overall mean | |
| SCHENKER Key 14 (M24) | |
| Medio Intel Core Ultra 7 155H (0.4457 - 0.53, n=49) | |
| Media de la clase Multimedia (0.3604 - 0.947, n=74, últimos 2 años) | |
| Dell XPS 14 2024 OLED | |
| Acer Nitro 14 AN14-41-R3MX | |
| Asus ROG Zephyrus G14 2024 GA403U | |
| Asus TUF Gaming A14 FA401WV-WB94 | |
* ... más pequeño es mejor
AIDA64: FP32 Ray-Trace | FPU Julia | CPU SHA3 | CPU Queen | FPU SinJulia | FPU Mandel | CPU AES | CPU ZLib | FP64 Ray-Trace | CPU PhotoWorxx
| Performance Rating | |
| Asus TUF Gaming A14 FA401WV-WB94 | |
| Asus ROG Zephyrus G14 2024 GA403U | |
| Acer Nitro 14 AN14-41-R3MX | |
| Media de la clase Multimedia | |
| SCHENKER Key 14 (M24) | |
| Medio Intel Core Ultra 7 155H | |
| Dell XPS 14 2024 OLED | |
| AIDA64 / FP32 Ray-Trace | |
| Asus TUF Gaming A14 FA401WV-WB94 | |
| Asus ROG Zephyrus G14 2024 GA403U | |
| Acer Nitro 14 AN14-41-R3MX | |
| Media de la clase Multimedia (5121 - 50388, n=73, últimos 2 años) | |
| SCHENKER Key 14 (M24) | |
| Medio Intel Core Ultra 7 155H (6670 - 18470, n=50) | |
| Dell XPS 14 2024 OLED | |
| AIDA64 / FPU Julia | |
| Asus TUF Gaming A14 FA401WV-WB94 | |
| Asus ROG Zephyrus G14 2024 GA403U | |
| Acer Nitro 14 AN14-41-R3MX | |
| Media de la clase Multimedia (14528 - 201874, n=74, últimos 2 años) | |
| SCHENKER Key 14 (M24) | |
| Medio Intel Core Ultra 7 155H (40905 - 93181, n=50) | |
| Dell XPS 14 2024 OLED | |
| AIDA64 / CPU SHA3 | |
| Asus TUF Gaming A14 FA401WV-WB94 | |
| Asus ROG Zephyrus G14 2024 GA403U | |
| Acer Nitro 14 AN14-41-R3MX | |
| Media de la clase Multimedia (1188 - 8623, n=74, últimos 2 años) | |
| SCHENKER Key 14 (M24) | |
| Medio Intel Core Ultra 7 155H (1940 - 4436, n=50) | |
| Dell XPS 14 2024 OLED | |
| AIDA64 / CPU Queen | |
| Asus ROG Zephyrus G14 2024 GA403U | |
| Acer Nitro 14 AN14-41-R3MX | |
| Asus TUF Gaming A14 FA401WV-WB94 | |
| Media de la clase Multimedia (21547 - 181505, n=74, últimos 2 años) | |
| SCHENKER Key 14 (M24) | |
| Dell XPS 14 2024 OLED | |
| Medio Intel Core Ultra 7 155H (64698 - 94181, n=50) | |
| AIDA64 / FPU SinJulia | |
| Asus TUF Gaming A14 FA401WV-WB94 | |
| Asus ROG Zephyrus G14 2024 GA403U | |
| Acer Nitro 14 AN14-41-R3MX | |
| Media de la clase Multimedia (1240 - 28794, n=74, últimos 2 años) | |
| SCHENKER Key 14 (M24) | |
| Medio Intel Core Ultra 7 155H (5639 - 10647, n=50) | |
| Dell XPS 14 2024 OLED | |
| AIDA64 / FPU Mandel | |
| Asus TUF Gaming A14 FA401WV-WB94 | |
| Asus ROG Zephyrus G14 2024 GA403U | |
| Acer Nitro 14 AN14-41-R3MX | |
| Media de la clase Multimedia (9903 - 105740, n=73, últimos 2 años) | |
| SCHENKER Key 14 (M24) | |
| Medio Intel Core Ultra 7 155H (18236 - 47685, n=50) | |
| Dell XPS 14 2024 OLED | |
| AIDA64 / CPU AES | |
| Asus ROG Zephyrus G14 2024 GA403U | |
| Asus TUF Gaming A14 FA401WV-WB94 | |
| Medio Intel Core Ultra 7 155H (45713 - 152179, n=50) | |
| Media de la clase Multimedia (26066 - 169946, n=74, últimos 2 años) | |
| SCHENKER Key 14 (M24) | |
| Dell XPS 14 2024 OLED | |
| Acer Nitro 14 AN14-41-R3MX | |
| AIDA64 / CPU ZLib | |
| Asus TUF Gaming A14 FA401WV-WB94 | |
| Asus ROG Zephyrus G14 2024 GA403U | |
| SCHENKER Key 14 (M24) | |
| Media de la clase Multimedia (440 - 2022, n=74, últimos 2 años) | |
| Medio Intel Core Ultra 7 155H (557 - 1250, n=50) | |
| Dell XPS 14 2024 OLED | |
| Acer Nitro 14 AN14-41-R3MX | |
| AIDA64 / FP64 Ray-Trace | |
| Asus TUF Gaming A14 FA401WV-WB94 | |
| Asus ROG Zephyrus G14 2024 GA403U | |
| Acer Nitro 14 AN14-41-R3MX | |
| Media de la clase Multimedia (2759 - 26875, n=74, últimos 2 años) | |
| SCHENKER Key 14 (M24) | |
| Medio Intel Core Ultra 7 155H (3569 - 9802, n=50) | |
| Dell XPS 14 2024 OLED | |
| AIDA64 / CPU PhotoWorxx | |
| Dell XPS 14 2024 OLED | |
| SCHENKER Key 14 (M24) | |
| Medio Intel Core Ultra 7 155H (32719 - 54223, n=50) | |
| Media de la clase Multimedia (12860 - 58844, n=74, últimos 2 años) | |
| Asus ROG Zephyrus G14 2024 GA403U | |
| Asus TUF Gaming A14 FA401WV-WB94 | |
| Acer Nitro 14 AN14-41-R3MX | |
Rendimiento del sistema
La Key 14 es bastante sensible en el uso diario, con pruebas de rendimiento sintéticas que confirman más o menos nuestra impresión subjetiva. Tampoco experimentamos problemas de ningún tipo durante nuestro tiempo con la unidad de muestra.
CrossMark: Overall | Productivity | Creativity | Responsiveness
WebXPRT 3: Overall
WebXPRT 4: Overall
Mozilla Kraken 1.1: Total
| PCMark 10 / Score | |
| Asus TUF Gaming A14 FA401WV-WB94 | |
| Acer Nitro 14 AN14-41-R3MX | |
| Asus ROG Zephyrus G14 2024 GA403U | |
| Medio Intel Core Ultra 7 155H, NVIDIA GeForce RTX 4060 Laptop GPU (6751 - 7370, n=5) | |
| Media de la clase Multimedia (4325 - 8670, n=70, últimos 2 años) | |
| SCHENKER Key 14 (M24) | |
| Dell XPS 14 2024 OLED | |
| PCMark 10 / Essentials | |
| Media de la clase Multimedia (8025 - 12420, n=70, últimos 2 años) | |
| Asus TUF Gaming A14 FA401WV-WB94 | |
| SCHENKER Key 14 (M24) | |
| Dell XPS 14 2024 OLED | |
| Medio Intel Core Ultra 7 155H, NVIDIA GeForce RTX 4060 Laptop GPU (9476 - 10446, n=5) | |
| Asus ROG Zephyrus G14 2024 GA403U | |
| Acer Nitro 14 AN14-41-R3MX | |
| PCMark 10 / Productivity | |
| Acer Nitro 14 AN14-41-R3MX | |
| Asus TUF Gaming A14 FA401WV-WB94 | |
| Asus ROG Zephyrus G14 2024 GA403U | |
| Media de la clase Multimedia (6089 - 10615, n=70, últimos 2 años) | |
| Dell XPS 14 2024 OLED | |
| Medio Intel Core Ultra 7 155H, NVIDIA GeForce RTX 4060 Laptop GPU (8079 - 9477, n=5) | |
| SCHENKER Key 14 (M24) | |
| PCMark 10 / Digital Content Creation | |
| Asus TUF Gaming A14 FA401WV-WB94 | |
| Asus ROG Zephyrus G14 2024 GA403U | |
| Acer Nitro 14 AN14-41-R3MX | |
| Medio Intel Core Ultra 7 155H, NVIDIA GeForce RTX 4060 Laptop GPU (9811 - 11620, n=5) | |
| SCHENKER Key 14 (M24) | |
| Media de la clase Multimedia (3651 - 13548, n=70, últimos 2 años) | |
| Dell XPS 14 2024 OLED | |
| CrossMark / Overall | |
| Asus ROG Zephyrus G14 2024 GA403U | |
| Acer Nitro 14 AN14-41-R3MX | |
| SCHENKER Key 14 (M24) | |
| Media de la clase Multimedia (866 - 2255, n=81, últimos 2 años) | |
| Asus TUF Gaming A14 FA401WV-WB94 | |
| Dell XPS 14 2024 OLED | |
| Medio Intel Core Ultra 7 155H, NVIDIA GeForce RTX 4060 Laptop GPU (1540 - 1746, n=5) | |
| CrossMark / Productivity | |
| Acer Nitro 14 AN14-41-R3MX | |
| Asus ROG Zephyrus G14 2024 GA403U | |
| SCHENKER Key 14 (M24) | |
| Media de la clase Multimedia (913 - 2050, n=81, últimos 2 años) | |
| Medio Intel Core Ultra 7 155H, NVIDIA GeForce RTX 4060 Laptop GPU (1436 - 1684, n=5) | |
| Dell XPS 14 2024 OLED | |
| Asus TUF Gaming A14 FA401WV-WB94 | |
| CrossMark / Creativity | |
| Asus TUF Gaming A14 FA401WV-WB94 | |
| Asus ROG Zephyrus G14 2024 GA403U | |
| Media de la clase Multimedia (907 - 2795, n=81, últimos 2 años) | |
| Dell XPS 14 2024 OLED | |
| Medio Intel Core Ultra 7 155H, NVIDIA GeForce RTX 4060 Laptop GPU (1811 - 1929, n=5) | |
| SCHENKER Key 14 (M24) | |
| Acer Nitro 14 AN14-41-R3MX | |
| CrossMark / Responsiveness | |
| Acer Nitro 14 AN14-41-R3MX | |
| SCHENKER Key 14 (M24) | |
| Asus ROG Zephyrus G14 2024 GA403U | |
| Media de la clase Multimedia (605 - 2094, n=81, últimos 2 años) | |
| Medio Intel Core Ultra 7 155H, NVIDIA GeForce RTX 4060 Laptop GPU (1165 - 1631, n=5) | |
| Dell XPS 14 2024 OLED | |
| Asus TUF Gaming A14 FA401WV-WB94 | |
| WebXPRT 3 / Overall | |
| Media de la clase Multimedia (136.4 - 545, n=81, últimos 2 años) | |
| Asus ROG Zephyrus G14 2024 GA403U | |
| Acer Nitro 14 AN14-41-R3MX | |
| Asus TUF Gaming A14 FA401WV-WB94 | |
| Medio Intel Core Ultra 7 155H, NVIDIA GeForce RTX 4060 Laptop GPU (274 - 290, n=5) | |
| Dell XPS 14 2024 OLED | |
| SCHENKER Key 14 (M24) | |
| WebXPRT 4 / Overall | |
| Media de la clase Multimedia (133.2 - 353, n=75, últimos 2 años) | |
| Dell XPS 14 2024 OLED | |
| Asus TUF Gaming A14 FA401WV-WB94 | |
| Medio Intel Core Ultra 7 155H, NVIDIA GeForce RTX 4060 Laptop GPU (236 - 262, n=5) | |
| Asus ROG Zephyrus G14 2024 GA403U | |
| Acer Nitro 14 AN14-41-R3MX | |
| SCHENKER Key 14 (M24) | |
| Mozilla Kraken 1.1 / Total | |
| SCHENKER Key 14 (M24) | |
| Medio Intel Core Ultra 7 155H, NVIDIA GeForce RTX 4060 Laptop GPU (519 - 585, n=5) | |
| Acer Nitro 14 AN14-41-R3MX | |
| Dell XPS 14 2024 OLED | |
| Asus ROG Zephyrus G14 2024 GA403U | |
| Media de la clase Multimedia (254 - 1016, n=86, últimos 2 años) | |
| Asus TUF Gaming A14 FA401WV-WB94 | |
* ... más pequeño es mejor
| PCMark 10 Score | 6751 puntos | |
ayuda | ||
| AIDA64 / Memory Copy | |
| Dell XPS 14 2024 OLED | |
| Asus TUF Gaming A14 FA401WV-WB94 | |
| Medio Intel Core Ultra 7 155H (62397 - 96791, n=50) | |
| SCHENKER Key 14 (M24) | |
| Media de la clase Multimedia (21158 - 104459, n=74, últimos 2 años) | |
| Acer Nitro 14 AN14-41-R3MX | |
| Asus ROG Zephyrus G14 2024 GA403U | |
| AIDA64 / Memory Read | |
| Asus TUF Gaming A14 FA401WV-WB94 | |
| Dell XPS 14 2024 OLED | |
| SCHENKER Key 14 (M24) | |
| Medio Intel Core Ultra 7 155H (60544 - 90647, n=50) | |
| Media de la clase Multimedia (24312 - 125604, n=74, últimos 2 años) | |
| Acer Nitro 14 AN14-41-R3MX | |
| Asus ROG Zephyrus G14 2024 GA403U | |
| AIDA64 / Memory Write | |
| Asus TUF Gaming A14 FA401WV-WB94 | |
| Asus ROG Zephyrus G14 2024 GA403U | |
| Acer Nitro 14 AN14-41-R3MX | |
| SCHENKER Key 14 (M24) | |
| Dell XPS 14 2024 OLED | |
| Medio Intel Core Ultra 7 155H (58692 - 93451, n=50) | |
| Media de la clase Multimedia (23679 - 117933, n=74, últimos 2 años) | |
| AIDA64 / Memory Latency | |
| Medio Intel Core Ultra 7 155H (116.2 - 233, n=50) | |
| Dell XPS 14 2024 OLED | |
| Asus TUF Gaming A14 FA401WV-WB94 | |
| SCHENKER Key 14 (M24) | |
| Asus ROG Zephyrus G14 2024 GA403U | |
| Media de la clase Multimedia (7 - 346, n=74, últimos 2 años) | |
| Acer Nitro 14 AN14-41-R3MX | |
* ... más pequeño es mejor
Latencias del CPD
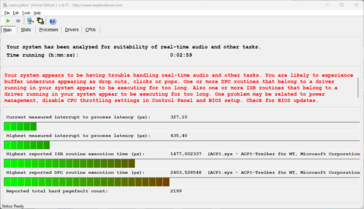
En nuestra prueba de latencia estandarizada (navegación por Internet, reproducción 4K de YouTube, carga de la CPU con Prime95), uno de los controladores dio algún problema, pero el importante valor de "latencia de interrupción a proceso" siguió siendo muy bajo. Por lo tanto, no debería haber problemas al trabajar con audio o vídeo en tiempo real.
| DPC Latencies / LatencyMon - interrupt to process latency (max), Web, Youtube, Prime95 | |
| Dell XPS 14 2024 OLED | |
| Acer Nitro 14 AN14-41-R3MX | |
| Asus ROG Zephyrus G14 2024 GA403U | |
| SCHENKER Key 14 (M24) | |
* ... más pequeño es mejor
Dispositivos de almacenamiento
El Key 14 se puede tener con varias unidades SSD PCIe 4 M.2 2280. El dispositivo de prueba está equipado con una unidad SSD Samsung 990 Pro de 1 TB, que es 64 euros más cara en comparación con la opción básica Samsung 980 de 500 GB.
La SSD ofrece unas tasas de transferencia excelentes sin caídas de rendimiento incluso bajo carga sostenida. Tras la configuración inicial, dispone de aproximadamente 890 GB. Encontrará más información en Las pruebas de rendimiento de la SSD se pueden encontrar aquí.
* ... más pequeño es mejor
Disk throttling: DiskSpd Read Loop, Queue Depth 8
Rendimiento de la GPU
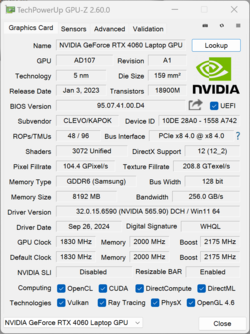
La Key 14 está disponible con las GPU para portátiles GeForce RTX 4060 o GeForce RTX 4070. Esta última encarece el conjunto en 295 euros. En ambos casos, el objetivo de potencia máxima TGP está fijado en 100 vatios (75 W TGP + 25 W Dynamic Boost) y hay 8 GB de VRAM. GeForce La certificación RTX Studio también está a bordo. Un interruptor MUX está presente.
Tuvimos la oportunidad de ejecutar pruebas sintéticas y de juegos en ambas variantes. El portátil RTX 4070 es aproximadamente un 16% más rápido en los puntos de referencia sintéticos, pero sólo un 7% más rápido en los juegos probados. El rendimiento del portátil RTX 4060 es suficiente para ejecutar sin problemas los 2024 juegos en Full HD con los ajustes máximos y se mantiene estable incluso con cargas de trabajo prolongadas.
En batería, la GPU está limitada a un máximo de 40 vatios, lo que se traduce en una caída del rendimiento de alrededor del 30%. Encontrará más pruebas comparativas de la GPU disponibles aquí.
| 3DMark Performance Rating - Percent | |
| SCHENKER Key 14 (M24) | |
| Acer Nitro 14 AN14-41-R3MX | |
| Asus ROG Zephyrus G14 2024 GA403U | |
| Asus TUF Gaming A14 FA401WV-WB94 | |
| SCHENKER Key 14 (M24) | |
| Medio NVIDIA GeForce RTX 4060 Laptop GPU | |
| Media de la clase Multimedia | |
| Dell XPS 14 2024 OLED | |
| 3DMark 11 - 1280x720 Performance GPU | |
| SCHENKER Key 14 (M24) | |
| Acer Nitro 14 AN14-41-R3MX | |
| Asus ROG Zephyrus G14 2024 GA403U | |
| Asus TUF Gaming A14 FA401WV-WB94 | |
| SCHENKER Key 14 (M24) | |
| Medio NVIDIA GeForce RTX 4060 Laptop GPU (28136 - 38912, n=57) | |
| Media de la clase Multimedia (3765 - 60250, n=74, últimos 2 años) | |
| Dell XPS 14 2024 OLED | |
| 3DMark 11 Performance | 28106 puntos | |
| 3DMark Fire Strike Score | 18863 puntos | |
| 3DMark Time Spy Score | 10037 puntos | |
| 3DMark Steel Nomad Score | 2236 puntos | |
| 3DMark Steel Nomad Light Score | 9967 puntos | |
ayuda | ||
| Blender / v3.3 Classroom OPTIX/RTX | |
| Media de la clase Multimedia (19 - 105, n=39, últimos 2 años) | |
| Dell XPS 14 2024 OLED | |
| Asus ROG Zephyrus G14 2024 GA403U | |
| Medio NVIDIA GeForce RTX 4060 Laptop GPU (19 - 28, n=53) | |
| Asus TUF Gaming A14 FA401WV-WB94 | |
| Acer Nitro 14 AN14-41-R3MX | |
| SCHENKER Key 14 (M24) | |
| SCHENKER Key 14 (M24) | |
| Blender / v3.3 Classroom CUDA | |
| Dell XPS 14 2024 OLED | |
| Media de la clase Multimedia (32 - 164, n=39, últimos 2 años) | |
| Medio NVIDIA GeForce RTX 4060 Laptop GPU (39 - 53, n=53) | |
| SCHENKER Key 14 (M24) | |
| Asus TUF Gaming A14 FA401WV-WB94 | |
| Acer Nitro 14 AN14-41-R3MX | |
| Asus ROG Zephyrus G14 2024 GA403U | |
| SCHENKER Key 14 (M24) | |
| Blender / v3.3 Classroom CPU | |
| Dell XPS 14 2024 OLED | |
| Media de la clase Multimedia (160 - 1042, n=80, últimos 2 años) | |
| Acer Nitro 14 AN14-41-R3MX | |
| SCHENKER Key 14 (M24) | |
| SCHENKER Key 14 (M24) | |
| Asus ROG Zephyrus G14 2024 GA403U | |
| Medio NVIDIA GeForce RTX 4060 Laptop GPU (189 - 452, n=53) | |
| Asus TUF Gaming A14 FA401WV-WB94 | |
* ... más pequeño es mejor
| Performance Rating - Percent | |
| Acer Nitro 14 AN14-41-R3MX | |
| Asus TUF Gaming A14 FA401WV-WB94 | |
| Asus ROG Zephyrus G14 2024 GA403U -1! | |
| SCHENKER Key 14 (M24) | |
| SCHENKER Key 14 (M24) | |
| Dell XPS 14 2024 OLED | |
| Media de la clase Multimedia | |
| Cyberpunk 2077 2.2 Phantom Liberty - 1920x1080 Ultra Preset (FSR off) | |
| Acer Nitro 14 AN14-41-R3MX | |
| Asus ROG Zephyrus G14 2024 GA403U | |
| Asus TUF Gaming A14 FA401WV-WB94 | |
| SCHENKER Key 14 (M24) | |
| SCHENKER Key 14 (M24) | |
| Dell XPS 14 2024 OLED | |
| Media de la clase Multimedia (8.26 - 86, n=63, últimos 2 años) | |
| Baldur's Gate 3 - 1920x1080 Ultra Preset | |
| Acer Nitro 14 AN14-41-R3MX | |
| Asus TUF Gaming A14 FA401WV-WB94 | |
| SCHENKER Key 14 (M24) | |
| SCHENKER Key 14 (M24) | |
| Dell XPS 14 2024 OLED | |
| Media de la clase Multimedia (9.1 - 117.7, n=51, últimos 2 años) | |
| GTA V - 1920x1080 Highest Settings possible AA:4xMSAA + FX AF:16x | |
| Asus TUF Gaming A14 FA401WV-WB94 | |
| Acer Nitro 14 AN14-41-R3MX | |
| Asus ROG Zephyrus G14 2024 GA403U | |
| SCHENKER Key 14 (M24) | |
| SCHENKER Key 14 (M24) | |
| Dell XPS 14 2024 OLED | |
| Media de la clase Multimedia (9.38 - 141.6, n=77, últimos 2 años) | |
| Final Fantasy XV Benchmark - 1920x1080 High Quality | |
| Acer Nitro 14 AN14-41-R3MX | |
| SCHENKER Key 14 (M24) | |
| Asus ROG Zephyrus G14 2024 GA403U | |
| Asus TUF Gaming A14 FA401WV-WB94 | |
| SCHENKER Key 14 (M24) | |
| Dell XPS 14 2024 OLED | |
| Media de la clase Multimedia (7.61 - 141.8, n=78, últimos 2 años) | |
| Strange Brigade - 1920x1080 ultra AA:ultra AF:16 | |
| SCHENKER Key 14 (M24) | |
| Asus TUF Gaming A14 FA401WV-WB94 | |
| Acer Nitro 14 AN14-41-R3MX | |
| Asus ROG Zephyrus G14 2024 GA403U | |
| SCHENKER Key 14 (M24) | |
| Dell XPS 14 2024 OLED | |
| Media de la clase Multimedia (13.3 - 233, n=78, últimos 2 años) | |
| Dota 2 Reborn - 1920x1080 ultra (3/3) best looking | |
| Asus TUF Gaming A14 FA401WV-WB94 | |
| SCHENKER Key 14 (M24) | |
| SCHENKER Key 14 (M24) | |
| Asus ROG Zephyrus G14 2024 GA403U | |
| Acer Nitro 14 AN14-41-R3MX | |
| Dell XPS 14 2024 OLED | |
| Media de la clase Multimedia (29 - 179.9, n=79, últimos 2 años) | |
| X-Plane 11.11 - 1920x1080 high (fps_test=3) | |
| SCHENKER Key 14 (M24) | |
| SCHENKER Key 14 (M24) | |
| Asus ROG Zephyrus G14 2024 GA403U | |
| Dell XPS 14 2024 OLED | |
| Acer Nitro 14 AN14-41-R3MX | |
| Asus TUF Gaming A14 FA401WV-WB94 | |
| Media de la clase Multimedia (16.9 - 141.1, n=76, últimos 2 años) | |
Cyberpunk 2077 Ultra fps chart
| bajo | medio | alto | ultra | QHD | |
|---|---|---|---|---|---|
| GTA V (2015) | 167 | 158.8 | 141.1 | 79.7 | 72.3 |
| Dota 2 Reborn (2015) | 167.5 | 141.1 | 136.5 | 122.6 | |
| Final Fantasy XV Benchmark (2018) | 156.8 | 121.1 | 94 | 72.4 | |
| X-Plane 11.11 (2018) | 123.1 | 103.2 | 84.6 | ||
| Far Cry 5 (2018) | 130 | 116 | 112 | 106 | |
| Strange Brigade (2018) | 341 | 255 | 214 | 186 | 125 |
| Baldur's Gate 3 (2023) | 124.5 | 104.2 | 77.6 | 66.9 | 50.8 |
| Cyberpunk 2077 2.2 Phantom Liberty (2023) | 109.6 | 79.3 | 70.5 | 56.4 | 41.5 |
| F1 24 (2024) | 182.8 | 182.9 | 162.8 | 52.3 | 24.3 |
Emisiones. Potencia
Emisiones sonoras
La llave utiliza dos ventiladores para deshacerse del calor no deseado. El ruido producido varía significativamente en función del perfil de potencia. En los modos Entretenimiento y Rendimiento, los ventiladores se activan rápidamente incluso durante tareas mundanas, lo que puede resultar algo molesto. Bajo carga, el sistema es bastante ruidoso, alcanzando los 57,8 dB(A) en el modo Rendimiento (Turbo) durante los juegos y las pruebas de estrés. Es de 55,9 dB(a) para Rendimiento (Automático) y 51,6 dB(A) para Entretenimiento, lo que sigue estando en el lado más ruidoso. Por lo tanto, se recomienda el uso de auriculares. La activación del modo Silencioso hace que la solución de refrigeración actúe de forma mucho más silenciosa con 30,3 dB(A), incluso durante las pruebas de estrés.
No somos capaces de oír otros ruidos como el quejido de la bobina.
Ruido
| Ocioso |
| 25.5 / 26.5 / 30.3 dB(A) |
| Carga |
| 49.3 / 57.8 dB(A) |
 | ||
30 dB silencioso 40 dB(A) audible 50 dB(A) ruidosamente alto |
||
min: | ||
| SCHENKER Key 14 (M24) NVIDIA GeForce RTX 4060 Laptop GPU, Ultra 7 155H, Samsung 990 Pro 1 TB | Asus TUF Gaming A14 FA401WV-WB94 NVIDIA GeForce RTX 4060 Laptop GPU, Ryzen AI 9 HX 370, WD PC SN560 SDDPNQE-1T00 | Dell XPS 14 2024 OLED NVIDIA GeForce RTX 4050 Laptop GPU, Ultra 7 155H, Samsung PM9A1 MZVL21T0HCLR | Asus ROG Zephyrus G14 2024 GA403U NVIDIA GeForce RTX 4070 Laptop GPU, R9 8945HS, WD PC SN560 SDDPNQE-1T00 | Acer Nitro 14 AN14-41-R3MX NVIDIA GeForce RTX 4060 Laptop GPU, R5 8645HS, Micron 3500 MTFDKBA512TGD | |
|---|---|---|---|---|---|
| Noise | 9% | 11% | 12% | 10% | |
| apagado / medio ambiente * | 25.5 | 22.9 10% | 24.3 5% | 23.9 6% | 24.3 5% |
| Idle Minimum * | 25.5 | 22.9 10% | 24.3 5% | 23.9 6% | 24.3 5% |
| Idle Average * | 26.5 | 28.3 -7% | 26.5 -0% | 23.9 10% | 24.3 8% |
| Idle Maximum * | 30.3 | 28.8 5% | 28.5 6% | 23.9 21% | 24.3 20% |
| Load Average * | 49.3 | 37.3 24% | 37 25% | 46.2 6% | 33.1 33% |
| Cyberpunk 2077 ultra * | 57.8 | 50.6 12% | 57.1 1% | ||
| Load Maximum * | 57.8 | 50.6 12% | 43.3 25% | 46.2 20% | 57 1% |
| Witcher 3 ultra * | 39.1 | 46.2 |
* ... más pequeño es mejor
Temperatura
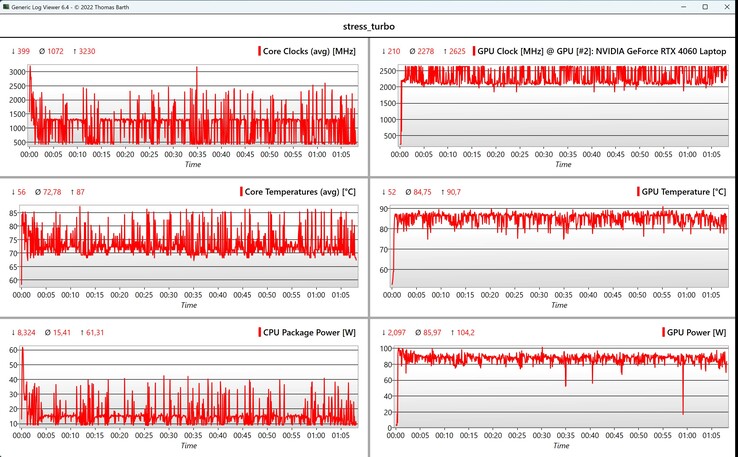
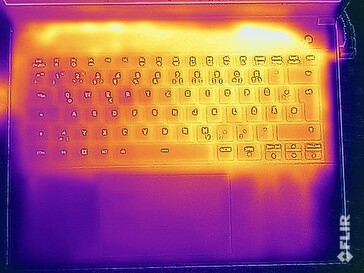
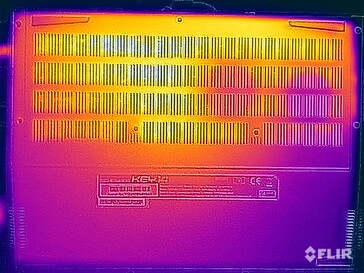
Las temperaturas no son un problema cuando se realizan tareas sencillas, pero bajo carga, la zona trasera de la parte inferior se calienta mucho (más de 50°C) y no es el único sector que se calienta. Es mejor no colocar el sistema sobre los muslos. Durante nuestras pruebas de estrés (Prime95 + FurMark), tanto las velocidades de reloj del procesador como las de la tarjeta gráfica y las cifras de consumo de energía fluctúan ligeramente, siendo la GPU la que se lleva una parte mucho mayor del presupuesto total de energía. El consumo medio del procesador es de ~15 vatios, mientras que la dGPU se come la friolera de 85 vatios.
(±) La temperatura máxima en la parte superior es de 43.1 °C / 110 F, frente a la media de 36.9 °C / 98 F, que oscila entre 21.1 y 71 °C para la clase Multimedia.
(-) El fondo se calienta hasta un máximo de 51.3 °C / 124 F, frente a la media de 39.2 °C / 103 F
(+) En reposo, la temperatura media de la parte superior es de 30.4 °C / 87# F, frente a la media del dispositivo de 31.3 °C / 88 F.
(±) 3: The average temperature for the upper side is 37.3 °C / 99 F, compared to the average of 31.3 °C / 88 F for the class Multimedia.
(+) El reposamanos y el panel táctil están a una temperatura inferior a la de la piel, con un máximo de 31 °C / 87.8 F y, por tanto, son fríos al tacto.
(-) La temperatura media de la zona del reposamanos de dispositivos similares fue de 28.8 °C / 83.8 F (-2.2 °C / -4 F).
| SCHENKER Key 14 (M24) Intel Core Ultra 7 155H, NVIDIA GeForce RTX 4060 Laptop GPU | Asus TUF Gaming A14 FA401WV-WB94 AMD Ryzen AI 9 HX 370, NVIDIA GeForce RTX 4060 Laptop GPU | Dell XPS 14 2024 OLED Intel Core Ultra 7 155H, NVIDIA GeForce RTX 4050 Laptop GPU | Asus ROG Zephyrus G14 2024 GA403U AMD Ryzen 9 8945HS, NVIDIA GeForce RTX 4070 Laptop GPU | Acer Nitro 14 AN14-41-R3MX AMD Ryzen 5 8645HS, NVIDIA GeForce RTX 4060 Laptop GPU | |
|---|---|---|---|---|---|
| Heat | 6% | 17% | 12% | 9% | |
| Maximum Upper Side * | 43.1 | 49.8 -16% | 40.5 6% | 46.6 -8% | 43.5 -1% |
| Maximum Bottom * | 51.3 | 46 10% | 42.6 17% | 47.8 7% | 46.3 10% |
| Idle Upper Side * | 33.2 | 30.2 9% | 26.9 19% | 26.7 20% | 30.4 8% |
| Idle Bottom * | 38.3 | 29.8 22% | 27.8 27% | 27.8 27% | 31.3 18% |
* ... más pequeño es mejor
Altavoces
Los altavoces estéreo suenan algo metálico y no son especialmente impresionantes. Aunque la reproducción de voz se beneficia de unos agudos claros, se recomiendan altavoces externos o auriculares para reproducir música o contenidos de vídeo.
SCHENKER Key 14 (M24) análisis de audio
(±) | la sonoridad del altavoz es media pero buena (81.5 dB)
Graves 100 - 315 Hz
(-) | casi sin bajos - de media 29.9% inferior a la mediana
(±) | la linealidad de los graves es media (7.9% delta a frecuencia anterior)
Medios 400 - 2000 Hz
(±) | medias más altas - de media 5.3% más altas que la mediana
(+) | los medios son lineales (5.9% delta a la frecuencia anterior)
Altos 2 - 16 kHz
(+) | máximos equilibrados - a sólo 2.1% de la mediana
(+) | los máximos son lineales (2.8% delta a la frecuencia anterior)
Total 100 - 16.000 Hz
(±) | la linealidad del sonido global es media (20.9% de diferencia con la mediana)
En comparación con la misma clase
» 70% de todos los dispositivos probados de esta clase eran mejores, 8% similares, 22% peores
» El mejor tuvo un delta de 5%, la media fue 18%, el peor fue ###max##%
En comparación con todos los dispositivos probados
» 54% de todos los dispositivos probados eran mejores, 8% similares, 38% peores
» El mejor tuvo un delta de 4%, la media fue 24%, el peor fue ###max##%
Asus TUF Gaming A14 FA401WV-WB94 análisis de audio
(±) | la sonoridad del altavoz es media pero buena (75.2 dB)
Graves 100 - 315 Hz
(±) | lubina reducida - en promedio 8.4% inferior a la mediana
(±) | la linealidad de los graves es media (9.7% delta a frecuencia anterior)
Medios 400 - 2000 Hz
(±) | medias más altas - de media 10% más altas que la mediana
(+) | los medios son lineales (4.2% delta a la frecuencia anterior)
Altos 2 - 16 kHz
(+) | máximos equilibrados - a sólo 3.8% de la mediana
(+) | los máximos son lineales (6.7% delta a la frecuencia anterior)
Total 100 - 16.000 Hz
(±) | la linealidad del sonido global es media (19.2% de diferencia con la mediana)
En comparación con la misma clase
» 63% de todos los dispositivos probados de esta clase eran mejores, 7% similares, 30% peores
» El mejor tuvo un delta de 6%, la media fue 18%, el peor fue ###max##%
En comparación con todos los dispositivos probados
» 43% de todos los dispositivos probados eran mejores, 7% similares, 49% peores
» El mejor tuvo un delta de 4%, la media fue 24%, el peor fue ###max##%
Dell XPS 14 2024 OLED análisis de audio
(+) | los altavoces pueden reproducir a un volumen relativamente alto (#82.8 dB)
Graves 100 - 315 Hz
(±) | lubina reducida - en promedio 9.9% inferior a la mediana
(±) | la linealidad de los graves es media (10.1% delta a frecuencia anterior)
Medios 400 - 2000 Hz
(+) | medios equilibrados - a sólo 4.4% de la mediana
(+) | los medios son lineales (3.8% delta a la frecuencia anterior)
Altos 2 - 16 kHz
(+) | máximos equilibrados - a sólo 2.3% de la mediana
(±) | la linealidad de los máximos es media (7% delta a frecuencia anterior)
Total 100 - 16.000 Hz
(+) | el sonido global es lineal (11% de diferencia con la mediana)
En comparación con la misma clase
» 12% de todos los dispositivos probados de esta clase eran mejores, 3% similares, 85% peores
» El mejor tuvo un delta de 5%, la media fue 18%, el peor fue ###max##%
En comparación con todos los dispositivos probados
» 5% de todos los dispositivos probados eran mejores, 2% similares, 93% peores
» El mejor tuvo un delta de 4%, la media fue 24%, el peor fue ###max##%
Asus ROG Zephyrus G14 2024 GA403U análisis de audio
(+) | los altavoces pueden reproducir a un volumen relativamente alto (#84.7 dB)
Graves 100 - 315 Hz
(+) | buen bajo - sólo 3.5% lejos de la mediana
(±) | la linealidad de los graves es media (7.3% delta a frecuencia anterior)
Medios 400 - 2000 Hz
(+) | medios equilibrados - a sólo 3.8% de la mediana
(+) | los medios son lineales (3.6% delta a la frecuencia anterior)
Altos 2 - 16 kHz
(+) | máximos equilibrados - a sólo 1.4% de la mediana
(+) | los máximos son lineales (3.5% delta a la frecuencia anterior)
Total 100 - 16.000 Hz
(+) | el sonido global es lineal (5.8% de diferencia con la mediana)
En comparación con la misma clase
» 0% de todos los dispositivos probados de esta clase eran mejores, 0% similares, 100% peores
» El mejor tuvo un delta de 6%, la media fue 18%, el peor fue ###max##%
En comparación con todos los dispositivos probados
» 0% de todos los dispositivos probados eran mejores, 0% similares, 100% peores
» El mejor tuvo un delta de 4%, la media fue 24%, el peor fue ###max##%
Acer Nitro 14 AN14-41-R3MX análisis de audio
(±) | la sonoridad del altavoz es media pero buena (79.6 dB)
Graves 100 - 315 Hz
(-) | casi sin bajos - de media 23.5% inferior a la mediana
(±) | la linealidad de los graves es media (10.2% delta a frecuencia anterior)
Medios 400 - 2000 Hz
(+) | medios equilibrados - a sólo 2.7% de la mediana
(±) | la linealidad de los medios es media (7.9% delta respecto a la frecuencia anterior)
Altos 2 - 16 kHz
(±) | máximos más altos - de media 5.3% más altos que la mediana
(±) | la linealidad de los máximos es media (9.4% delta a frecuencia anterior)
Total 100 - 16.000 Hz
(±) | la linealidad del sonido global es media (20% de diferencia con la mediana)
En comparación con la misma clase
» 68% de todos los dispositivos probados de esta clase eran mejores, 7% similares, 25% peores
» El mejor tuvo un delta de 6%, la media fue 18%, el peor fue ###max##%
En comparación con todos los dispositivos probados
» 48% de todos los dispositivos probados eran mejores, 8% similares, 43% peores
» El mejor tuvo un delta de 4%, la media fue 24%, el peor fue ###max##%
Consumo de energía
Su consumo máximo en reposo es de unos 11 vatios, mientras que el consumo en juegos oscila entre 160 y 180 vatios. En la prueba de estrés, medimos inicialmente un máximo de 183 vatios, pero éste descendió rápidamente y se estabilizó en torno a los 125 a 140 vatios. Por tanto, la fuente de alimentación de 180 vatios incluida tiene un tamaño adecuado.
| Off / Standby | |
| Ocioso | |
| Carga |
|
Clave:
min: | |
Power consumption in Cyberpunk 2077 (gaming stress test)
Power consumption with ext. monitor connected
Duración de las pilas
La batería de 80 Wh sólo proporciona una autonomía media. En nuestra prueba de navegación por Internet vía Wi-Fi con un brillo de 150 cd/m² (corresponde a un ajuste del 70%), el Schenker duró unas 7,5 horas.
Valoración de Notebookcheck
SCHENKER Key 14 (M24)
- 12/15/2024 v8
Andreas Osthoff
Transparencia
La selección de los dispositivos que se van a reseñar corre a cargo de nuestro equipo editorial. La muestra de prueba fue proporcionada al autor en calidad de préstamo por el fabricante o el minorista a los efectos de esta reseña. El prestamista no tuvo ninguna influencia en esta reseña, ni el fabricante recibió una copia de la misma antes de su publicación. No había ninguna obligación de publicar esta reseña. Nunca aceptamos compensaciones o pagos a cambio de nuestras reseñas. Como empresa de medios independiente, Notebookcheck no está sujeta a la autoridad de fabricantes, minoristas o editores.
Así es como prueba Notebookcheck
Cada año, Notebookcheck revisa de forma independiente cientos de portátiles y smartphones utilizando procedimientos estandarizados para asegurar que todos los resultados son comparables. Hemos desarrollado continuamente nuestros métodos de prueba durante unos 20 años y hemos establecido los estándares de la industria en el proceso. En nuestros laboratorios de pruebas, técnicos y editores experimentados utilizan equipos de medición de alta calidad. Estas pruebas implican un proceso de validación en varias fases. Nuestro complejo sistema de clasificación se basa en cientos de mediciones y puntos de referencia bien fundamentados, lo que mantiene la objetividad.













 Total Sustainability Score:


