Análisis del portátil Tulpar T7 V20.6 (Tongfang GM7PG0R): Actualmente uno de los más baratos para jugadores con RTX 4060
La empresa originalmente turca -que técnicamente opera bajo el nombre de Monster Notebook- cambió su nombre de marca a Tulpar Notebook para el mercado europeo en 2022. Tulpar tiene su sede DACH en el centro de Berlín, en la Alexanderplatz, donde podrá probar varios productos y llevar su dispositivo al servicio técnico -de esto último hablaremos más adelante-.
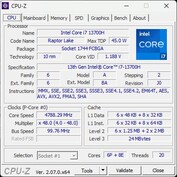
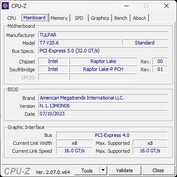
Los portátiles de Tulpar han despertado un interés creciente últimamente, lo que significa que por fin tenemos la oportunidad de probar nuestro primer portátil Tulpar. "La serie A incluye modelos básicos más asequibles para jugadores ocasionales. La serie T está dirigida a jugadores frecuentes con altas exigencias", dice la página web del fabricante. Estamos probando el T7, un modelo para jugadores frecuentes con altas exigencias, pero aunque las "series A y T de portátiles se diseñaron de acuerdo con los últimos estándares tecnológicos", actualmente sólo hay dos modelos del T6 con la última CPU Gen14 de Intel. Nuestro T7 sigue equipado con un i7-13700H de la última generación de Intel. Además, hay una RTX 4060 dentro de la carcasa Tonfang GM7PG0R.
El atractivo actual de un portátil Tulpar es sobre todo su bajo precio. ¿Bajo precio? En el sitio web, el modelo con 1 TB de almacenamiento cuesta alrededor de ¡1.800 dólares! Pero al mismo tiempo, también puede conseguir el portátil T7 en ciertos minoristas en línea que piden mucho menos por él.
Cada vez se lanzan menos portátiles de 17 pulgadas este año debido al auge de los modelos de 18 pulgadas. Como resultado, compararemos el T7 con otros gamers económicos y de gama media del año pasado como el XMG Apex 17, Acer Nitro 17, Medion Erazer Defender P40 y el MSI Katana 17. Además, lanzaremos el 16 pulgadas Lenovo Legion 5i 16 G9 con una CPU actual al ruedo para ver hasta dónde puede llegar la última tecnología.
Posibles contendientes en la comparación
Valoración | Fecha | Modelo | Peso | Altura | Tamaño | Resolución | Precio |
|---|---|---|---|---|---|---|---|
| 86.3 % v7 (old) | 05/2024 | Tulpar T7 V20.6 i7-13700H, NVIDIA GeForce RTX 4060 Laptop GPU | 2.6 kg | 30.05 mm | 17.30" | 1920x1080 | |
| 87.1 % v7 (old) | 10/2023 | SCHENKER XMG Apex 17 (Late 23) R7 7840HS, NVIDIA GeForce RTX 4060 Laptop GPU | 2.5 kg | 24.9 mm | 17.30" | 2560x1440 | |
| 87.2 % v7 (old) | 07/2023 | Acer Nitro 17 AN17-51-71ER i7-13700H, NVIDIA GeForce RTX 4060 Laptop GPU | 3 kg | 30.3 mm | 17.30" | 2560x1440 | |
| 84.6 % v7 (old) | 05/2023 | Medion Erazer Defender P40 i7-13700HX, NVIDIA GeForce RTX 4060 Laptop GPU | 2.9 kg | 33 mm | 17.30" | 2560x1440 | |
| 82.1 % v7 (old) | 02/2023 | MSI Katana 17 B13VFK i7-13620H, NVIDIA GeForce RTX 4060 Laptop GPU | 2.8 kg | 25.2 mm | 17.30" | 1920x1080 | |
| 89.1 % v7 (old) | 02/2024 | Lenovo Legion 5 16IRX G9 i7-14650HX, NVIDIA GeForce RTX 4060 Laptop GPU | 2.4 kg | 25.2 mm | 16.00" | 2560x1600 |
Caso - Un Tongfang con un ojo verde de jugador
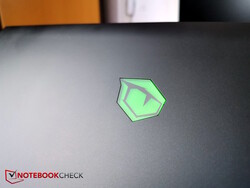
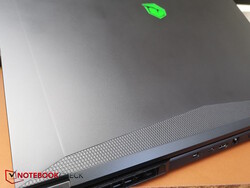
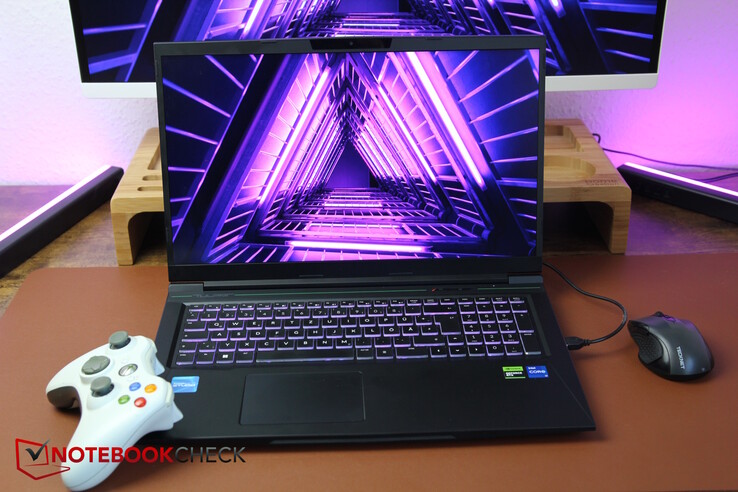
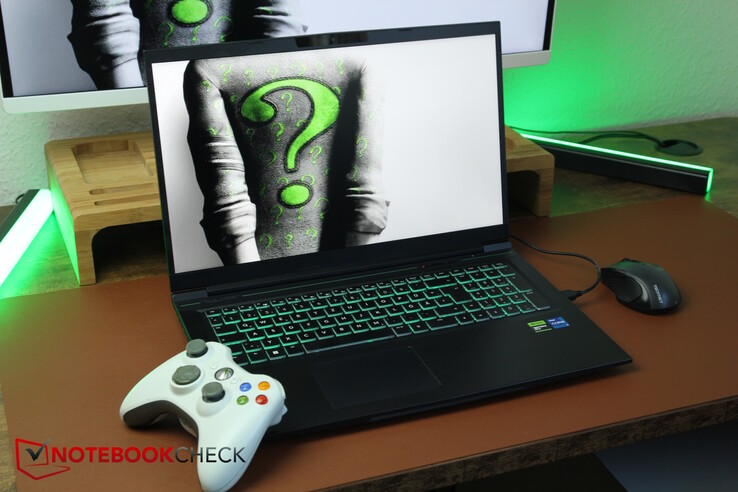
La carcasa de Tongfang está fabricada completamente en plástico negro. El logotipo verde en la parte frontal, la tira ancha con un patrón de panal de abeja debajo y la marca Tulpar con una franja verde en la base sobre el teclado aportan acentos al dispositivo. La superficie ligeramente texturizada atrae la grasa y las huellas dactilares.
En nuestras pruebas de torsión, la base pudo doblarse con bastante facilidad y los bordes laterales en particular hicieron ruidos de crujido más fuertes. Aparte de eso, la base es suficientemente estable, y lo mismo puede decirse de la pantalla. Las bisagras sujetan bien la pantalla, pero no pueden evitar cierto balanceo al ajustar su ángulo de apertura. Este último es de unos 145 grados.
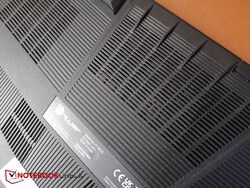
Sólo notamos algunas pequeñas holguras a lo largo del borde frontal, donde la base se une a la placa inferior y ésta está ligeramente curvada. La parte inferior está fabricada con un plástico ligeramente más blando y éste puede presionarse fácilmente contra los elementos de refrigeración internos -especialmente los tubos de calor- desde el exterior, en las rejillas de aire en particular, que son aún más blandas debido a sus hendiduras. Sin embargo, esto no debería ocurrir normalmente gracias a las cuatro patas de goma.
En conjunto, su calidad de construcción está bien, pero sin duda hay aparatos más estables y de mejor calidad en el mercado.
Top 10 Análisis
» Top 10 Portátiles Multimedia
» Top 10 Portátiles de Juego
» Top 10 Portátiles de Juego ligeros
» Top 10 Portátiles Asequibles de Oficina/Empresa
» Top 10 Portátiles de Juego Ligeros
» Top 10 Portátiles de Oficina/Empresa Premium
» Top 10 Estaciones de Trabajo
» Top 10 Subportátiles
» Top 10 Ultrabooks
» Top 10 Convertibles
» Top 10 Tablets
» Top 10 Tablets Windows
» Top 10 Tablets de menos de 250 Euros
» Top 10 Phablets (>5.5")
» Top 10 Smartphones
» Top 10 Smartphones (≤5")
» Top 10 Smartphones de menos de 300 Euros
» Top 10 Smartphones de menos de 120 Euros
» Top 10 Portátiles de menos de 1000 Euros
» Top 10 Portátiles de menos de 500 Euros
» Top 10 Portátiles de menos de 300 Euros
» Los Mejores Displays de Portátiles Analizados por Notebookcheck
Dentro del campo de la comparación, la T7 tiene un tamaño y un peso medios. Tiene aproximadamente el mismo tamaño que la Medion o la XMG, mientras que la Nitro y la Katana son más grandes. Su peso de 2,6 kg sólo es superado por poco por la Schenker, mientras que el resto de los aparatos de la comparación son más pesados, especialmente la Nitro, que pesa alrededor de 3 kg.
Con un grosor máximo de 30 mm, el T7 no parece terriblemente delgado, pero el Acer Nitro es igual de grueso y el Medion tiene incluso 3 mm más en sus costillas (de refrigeración), sobre todo porque el T7 es más delgado que su valor máximo especificado en la mayoría de los lugares. El Katana y el XMG son más delgados.
Conectividad - Sin Thunderbolt, pero con USB 2.0
El Tulpar gamer cuenta con todas las opciones de conectividad más necesarias y un gran punto positivo es su puerto MiniDP dedicado en la parte trasera, que podría ser especialmente importante para los cascos de realidad virtual. Por su parte, su puerto USB-C lamentablemente no es compatible con Thunderbolt y uno de sus tres puertos USB-A (izquierda) sigue siendo de tipo 2.0. Aun así, al menos cuenta con un lector de tarjetas SD de tamaño completo y dos puertos de audio independientes.
Su disposición está bien, al menos las conexiones están bien distribuidas a ambos lados y en la parte trasera. Sobre todo, los cables potencialmente rígidos y gruesos -como los de LAN, HDMI, MiniDP y alimentación- salen por la parte trasera, por lo que sólo tendrá que ocuparse de los dispositivos USB en los laterales. En el lateral derecho, los dos puertos USB-A podrían estar un poco más separados, pero por lo demás, la distribución del portátil es buena.
Lector de tarjetas SD
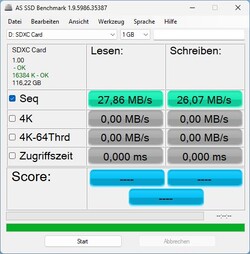
Nos gusta que el portátil esté equipado con un lector de tarjetas SD de tamaño completo. Menos impresionante es lo lentas que son las velocidades del lector de tarjetas. No hay mecanismo de enganche y las tarjetas sobresalen hasta la mitad.
Medimos velocidades de lectura y escritura secuenciales de sólo unos 27 MB/s, lo que no está en absoluto a la altura de nuestra tarjeta de referencia AV PRO MicroSD 128 GB V60. Copiar 1 GB de material de imagen de la tarjeta al escritorio lleva la friolera de ¡48 segundos! La competencia es mucho más rápida, aunque la Legion 5 y la XMG no son decisivas.
| SD Card Reader | |
| average JPG Copy Test (av. of 3 runs) | |
| Media de la clase Gaming (19 - 197.3, n=68, últimos 2 años) | |
| Medion Erazer Defender P40 (AV PRO microSD 128 GB V60) | |
| Acer Nitro 17 AN17-51-71ER | |
| SCHENKER XMG Apex 17 (Late 23) (AV PRO microSD 128 GB V60) | |
| Lenovo Legion 5 16IRX G9 | |
| Tulpar T7 V20.6 | |
| maximum AS SSD Seq Read Test (1GB) | |
| Media de la clase Gaming (25.8 - 263, n=67, últimos 2 años) | |
| Medion Erazer Defender P40 (AV PRO microSD 128 GB V60) | |
| Acer Nitro 17 AN17-51-71ER | |
| SCHENKER XMG Apex 17 (Late 23) (AV PRO microSD 128 GB V60) | |
| Lenovo Legion 5 16IRX G9 | |
| Tulpar T7 V20.6 | |
Comunicación
Cámara web
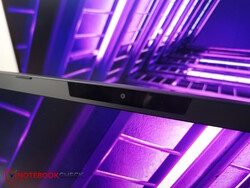
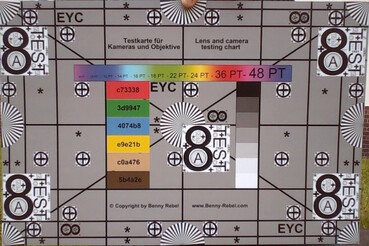
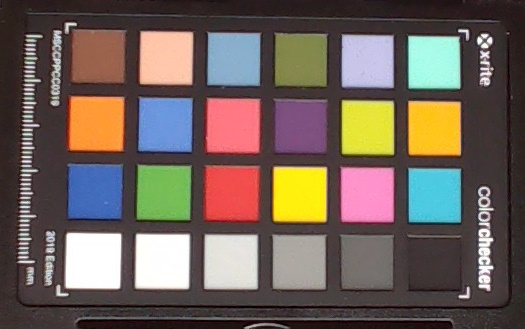
Mientras que al menos el XMG y el Legion 5 ya cuentan con cámaras web Full HD, el Tulpar, al igual que los demás competidores, sigue disponiendo de una cámara de 720p.
Ésta también tiene que lidiar con unas desviaciones de color bastante elevadas y una nitidez deficiente, lo que hace que no transmita una imagen muy agradable del usuario.
Seguridad
Dispone de una ranura Kensington y el TPM está integrado en la CPU Intel. No hay características de seguridad adicionales, como un sensor de huellas dactilares o una cubierta para la cámara web como mínimo.
Accesorios y garantía
El asequible portátil Tulpar no incluye ningún accesorio adicional. Sin embargo, existe la promesa de un mantenimiento anual gratuito de por vida, además de una garantía legal de 12 meses. Esto incluye la limpieza de los ventiladores, la sustitución de la pasta térmica de la CPU y la GPU y la eliminación del polvo de la carcasa. Pero tenga cuidado: Si el cliente hace algo por su cuenta (por ejemplo, cambiar la pasta térmica), el mantenimiento gratuito caduca, así que lo mejor es leer los términos y condiciones exactos en el sitio web de Tulpar.
Mantenimiento
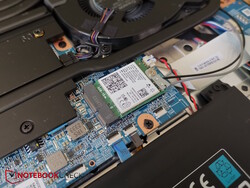
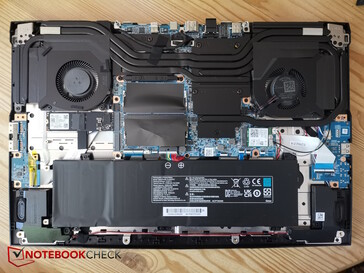
La parte inferior de la caja está sujeta por 10 tornillos Phillips de la misma longitud y muchos clips de plástico. Como resultado, debe tener cuidado al hacer palanca pero, en general, es bastante fácil de abrir. No hay tornillos ocultos.
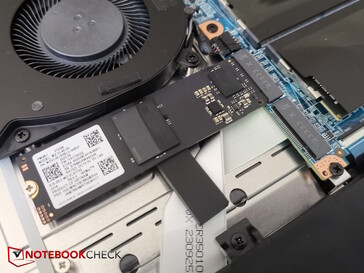
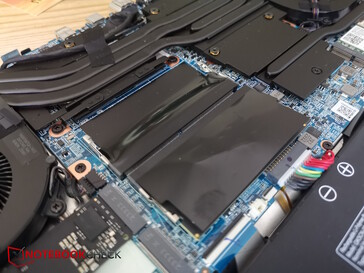
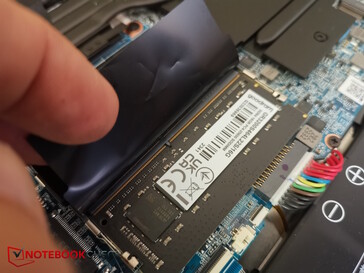
En el interior, tendrá acceso al sistema de refrigeración, las dos ranuras para RAM (sólo una ocupada), las dos ranuras para SSD M.2 (una libre), el módulo Wi-Fi y la batería.
Dispositivos de entrada - El teclado es mejor de lo esperado
Teclado
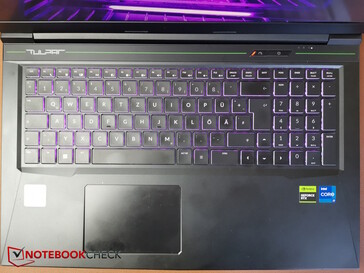
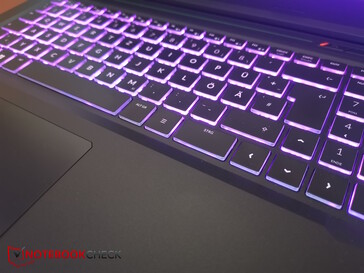
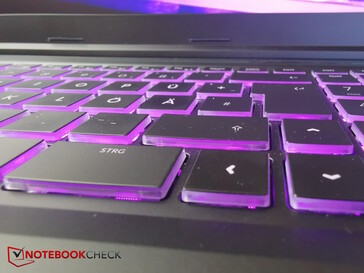
El teclado tiene una disposición estándar; todo está repartido en seis filas y nada se desvía hacia la parte superior o inferior del dispositivo. Hay un teclado numérico en el lado derecho. La base del teclado retroiluminado de tres niveles (1 zona) está ligeramente rebajada y las teclas miden 1,5 x 1,5 cm de tamaño. Su recorrido de presión es ligeramente más largo y suave que en muchos otros portátiles, pero su respuesta es suficientemente nítida. Como resultado, el teclado se siente menos plano que algunos de sus competidores y escribir en él es bastante cómodo y rápido. El ruido de tecleo es de moderado a medio alto y el etiquetado de las teclas es fácil de leer.
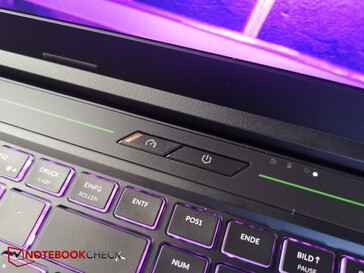
Hay un botón de encendido separado por encima del resto del teclado y junto a él hay otro botón para cambiar entre los perfiles de rendimiento. Lamentablemente, tienen nombres diferentes a los que aparecen en el Centro de Control, pero controlan exactamente estos. Office es equilibrado, gaming es enthusiast y turbo se llama en realidad overboost. Un pequeño LED en el botón muestra qué modo está en uso (apagado = oficina, naranja = juegos, naranja más claro = turbo).
Panel táctil
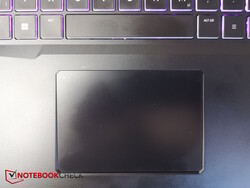
El Tulpar está claramente comercializado hacia los jugadores, y su panel táctil relativamente pequeño (aprox. 10,6 x 7,35 cm) lo hace evidente, a pesar de que el portátil es un modelo de 17 pulgadas. El teclado numérico no está totalmente centrado, sino que se sitúa ligeramente a la izquierda, lo que significa que está justo debajo de la barra espaciadora.
Su superficie sólo es agradable y suave en condiciones óptimas-en otras palabras, en cuanto sus manos están un poco húmedas, se enganchan en su superficie. Puede (des)activar el touchpad dando un doble toque en la parte superior izquierda y un pequeño LED muestra su estado actual.
Sus ruidos de clic son un poco más fuertes y no dan al dispositivo una sensación de gran calidad, pero están bien. En conjunto, el touchpad responde muy bien, ofreciendo un rendimiento total sólido. De todos modos, es probable que los jugadores busquen un ratón.
Pantalla - Decente Full HD de 2019
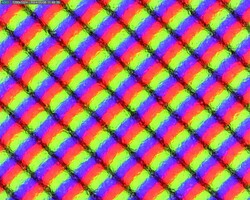
La pantalla IPS Full HD mate de Chi Mei es una vieja conocida, ya que también se encuentra en varios portátiles más baratos de la serie G de MSI, incluido el MSI GP75 Leopard 9SD (2019) que probamos anteriormente, así como el MSI GT76 9SG (2019) y el MSI GE75 9SG. Por supuesto, la edad no es realmente un signo de calidad en este caso. A excepción del Katana, ninguno de los competidores apuesta por Full HD en 17 pulgadas, sino por pantallas de mayor resolución con 2.560 x 1.440 píxeles.
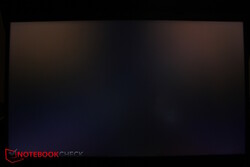
Aun así, el panel no es necesariamente malo. Su brillo medio de unos 350 nits está bien, pero a su iluminación le vendría bien ser más uniforme. A su vez, su contraste es superior al de los dispositivos de la comparación gracias a su valor de negro, que está bien para un dispositivo económico. El sangrado de la retroiluminación es apenas perceptible y no debería molestarle.
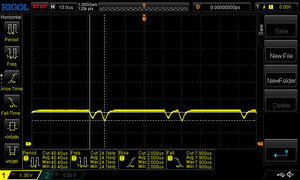
Sin embargo, la pantalla parpadea a niveles de brillo inferiores al 25% a una frecuencia alta de 25 kHz a 42 kHz, lo que significa que incluso los usuarios sensibles apenas deberían tener problemas con ella. Sus tiempos de respuesta son de aproximadamente 11 (negro a blanco) a 15 ms (gris a gris).
| |||||||||||||||||||||||||
iluminación: 83 %
Brillo con batería: 373 cd/m²
Contraste: 1639:1 (Negro: 0.23 cd/m²)
ΔE Color 0.83 | 0.5-29.43 Ø4.87, calibrated: 0.83
ΔE Greyscale 0.9 | 0.5-98 Ø5.1
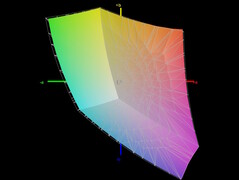
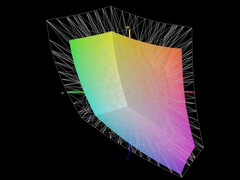
66.1% AdobeRGB 1998 (Argyll 2.2.0 3D)
96.2% sRGB (Argyll 2.2.0 3D)
64.2% Display P3 (Argyll 2.2.0 3D)
Gamma: 2.36
| Tulpar T7 V20.6 Chi Mei CMN175C (CMN N173HCE-G33), IPS, 1920x1080, 17.3" | SCHENKER XMG Apex 17 (Late 23) BOE CQ NE173QHM-NZ3, IPS, 2560x1440, 17.3" | Acer Nitro 17 AN17-51-71ER BOE0B7C NE173QHM-NY6, , 2560x1440, 17.3" | Medion Erazer Defender P40 BOE CQ NE173QHM-NZ3, IPS, 2560x1440, 17.3" | MSI Katana 17 B13VFK B173HAN04.9, IPS LED, 1920x1080, 17.3" | Lenovo Legion 5 16IRX G9 NE160QDM-NZ3, IPS, 2560x1600, 16" | |
|---|---|---|---|---|---|---|
| Display | 4% | 29% | 5% | -36% | 10% | |
| Display P3 Coverage | 64.2 | 68.1 6% | 98.3 53% | 68.3 6% | 40.8 -36% | 72.4 13% |
| sRGB Coverage | 96.2 | 97.7 2% | 100 4% | 98.1 2% | 61 -37% | 100 4% |
| AdobeRGB 1998 Coverage | 66.1 | 69.5 5% | 85.7 30% | 69.8 6% | 42.2 -36% | 74.1 12% |
| Response Times | 19% | 14% | 12% | -129% | 19% | |
| Response Time Grey 50% / Grey 80% * | 14.7 ? | 13.5 ? 8% | 14.8 ? -1% | 14.6 ? 1% | 33 ? -124% | 12.5 ? 15% |
| Response Time Black / White * | 11.1 ? | 7.9 ? 29% | 8 ? 28% | 8.7 ? 22% | 26 ? -134% | 8.7 ? 22% |
| PWM Frequency | 25000 | |||||
| Screen | -55% | -153% | -32% | -222% | -9% | |
| Brightness middle | 377 | 403 7% | 361 -4% | 364 -3% | 267 -29% | 526 40% |
| Brightness | 353 | 381 8% | 326 -8% | 343 -3% | 256 -27% | 500 42% |
| Brightness Distribution | 83 | 90 8% | 87 5% | 86 4% | 93 12% | 87 5% |
| Black Level * | 0.23 | 0.37 -61% | 0.6 -161% | 0.28 -22% | 0.21 9% | 0.33 -43% |
| Contrast | 1639 | 1089 -34% | 602 -63% | 1300 -21% | 1271 -22% | 1594 -3% |
| Colorchecker dE 2000 * | 0.83 | 2.22 -167% | 3.83 -361% | 1.67 -101% | 4.7 -466% | 1.2 -45% |
| Colorchecker dE 2000 max. * | 1.92 | 3.76 -96% | 5.71 -197% | 2.78 -45% | 20.4 -963% | 2.1 -9% |
| Colorchecker dE 2000 calibrated * | 0.83 | 1.22 -47% | 3.48 -319% | 1.14 -37% | 4.5 -442% | 1 -20% |
| Greyscale dE 2000 * | 0.9 | 1.9 -111% | 3.29 -266% | 1.4 -56% | 1.5 -67% | 1.3 -44% |
| Gamma | 2.36 93% | 2.046 108% | 2.29 96% | 2.091 105% | 2.12 104% | 2.23 99% |
| CCT | 6471 100% | 6656 98% | 6679 97% | 6568 99% | 6552 99% | 6391 102% |
| Media total (Programa/Opciones) | -11% /
-32% | -37% /
-90% | -5% /
-18% | -129% /
-169% | 7% /
-1% |
* ... más pequeño es mejor
El panel está asombrosamente bien calibrado nada más sacarlo de la caja, especialmente dentro de esta categoría de precio. Sus valores medios de escala de grises y ColorChecker DeltaE son de sólo 0,9 y 0,83 (medidos con respecto a sRGB), por lo que los usuarios no necesitarán calibrar más la pantalla.
Tiempos de respuesta del display
| ↔ Tiempo de respuesta de Negro a Blanco | ||
|---|---|---|
| 11.1 ms ... subida ↗ y bajada ↘ combinada | ↗ 5.7 ms subida | |
| ↘ 5.4 ms bajada | ||
| La pantalla mostró buenos tiempos de respuesta en nuestros tests pero podría ser demasiado lenta para los jugones competitivos. En comparación, todos los dispositivos de prueba van de ##min### (mínimo) a 240 (máximo) ms. » 27 % de todos los dispositivos son mejores. Esto quiere decir que el tiempo de respuesta medido es mejor que la media (20.8 ms) de todos los dispositivos testados. | ||
| ↔ Tiempo de respuesta 50% Gris a 80% Gris | ||
| 14.7 ms ... subida ↗ y bajada ↘ combinada | ↗ 6.8 ms subida | |
| ↘ 7.9 ms bajada | ||
| La pantalla mostró buenos tiempos de respuesta en nuestros tests pero podría ser demasiado lenta para los jugones competitivos. En comparación, todos los dispositivos de prueba van de ##min### (mínimo) a 636 (máximo) ms. » 26 % de todos los dispositivos son mejores. Esto quiere decir que el tiempo de respuesta medido es mejor que la media (32.5 ms) de todos los dispositivos testados. | ||
Parpadeo de Pantalla / PWM (Pulse-Width Modulation)
| Parpadeo de Pantalla / PWM detectado | 25000 Hz Amplitude: 27 % | ||
La retroiluminación del display parpadea a 25000 Hz (seguramente usa PWM - Pulse-Width Modulation) . La frecuencia de 25000 Hz es bastante alta, por lo que la mayoría de gente sensible al parpadeo no debería ver parpadeo o tener fatiga visual. Comparación: 53 % de todos los dispositivos testados no usaron PWM para atenuar el display. Si se usó, medimos una media de 8516 (mínimo: 5 - máxmo: 343500) Hz. | |||
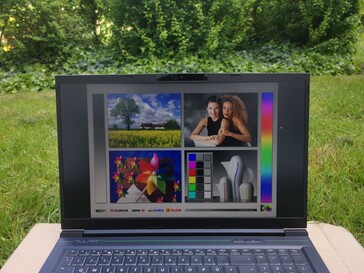
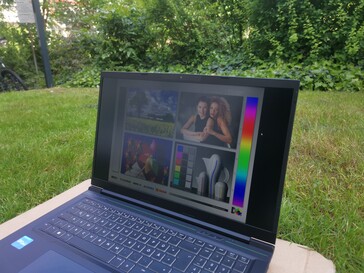
En exteriores, la superficie mate de la pantalla evita la mayoría de los reflejos. A la sombra, puede trabajar bien mirando directamente a la T7-su brillo de 350 nits es suficiente para poder hacerlo. Sólo debe evitar la luz solar directa y los ángulos de visión oblicuos.
Rendimiento: Intel Gen13 no es una noticia antigua
Hay varias configuraciones disponibles del Tulpar T7, todas ellas con la RTX 4060. Nuestro T7 20.6 está equipado con la CPU Raptor Lake i7-13700H, mientras que los modelos en torno al T7 20.7 siguen utilizando una CPU Alder Lake de 12ª generación, a pesar del "número" supuestamente superior en el nombre. También hay diferentes configuraciones de RAM y SSD, que suelen ir seguidas de un número, por ejemplo el T7 20.6.1 (1 TB SSD) frente al T7 20.2 (500 GB SSD) -ambos modelos tienen 32 GB de RAM. La configuración de memoria y almacenamiento de nuestro dispositivo de prueba (16 GB de RAM y 500 GB de SSD) no se puede encontrar en el sitio web de Tulpar ni en los portales de comparación.
El Tulpar T7 está claramente dirigido a los jugadores con un presupuesto más ajustado. Su CPU Intel Gen13 y su RTX 4060 prometen un buen rendimiento en juegos a un precio bajo. A los creadores, en cambio, no se dirige directamente por su evidente diseño gamer, carcasa gruesa, touchpad pequeño y pantalla decente que no es la más adecuada para la edición.
Condiciones de prueba
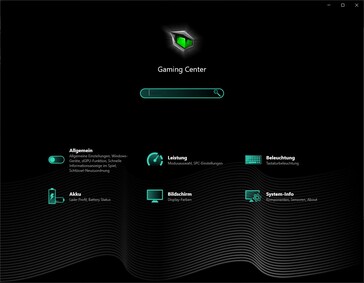
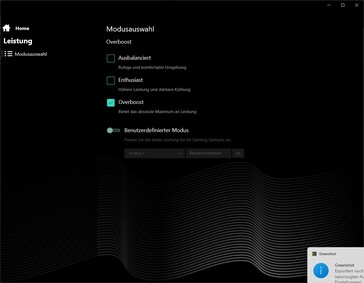
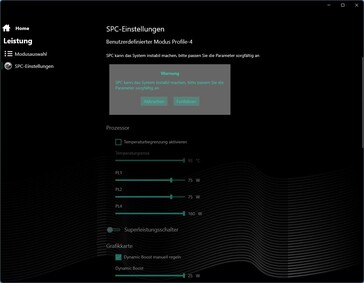
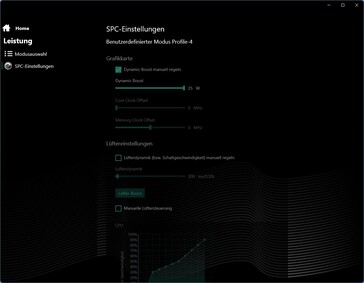
Tulpar se basa en un Centro de Control genérico, ligeramente adaptado, cuyo diseño es exactamente el mismo que el utilizado en los modelos XMG de Schenker y algunos otros. Es sencillo pero claro y ofrece varias opciones de ajuste.
La pestaña de rendimiento ofrece tres perfiles predeterminados(equilibrado, entusiasta, overboost), así como un modo manual con todo tipo de opciones de personalización. Llevamos a cabo nuestras pruebas comparativas de rendimiento utilizando el modo overboost a menos que se indique lo contrario.
Además de los perfiles de rendimiento, también hay un interruptor MUX, ajustes generales, opciones de pantalla, ajustes de iluminación del teclado y ajustes de la batería.
Unas palabras sobre el modo de batería: Aunque, por supuesto, el rendimiento del portátil se reduce considerablemente, el modo de alimentación configurado no cambia visualmente, por lo que si ha activado previamente el modo overboost y desenchufa el cable de alimentación, éste seguirá activo en el Centro de control. Esto sugiere que también tiene la posibilidad de elegir entre varios modos de potencia cuando se encuentre lejos de una toma de corriente. Sin embargo, lo más probable es que no sea así, ya que los resultados de nuestro modo de batería fueron siempre los mismos (dentro de la tolerancia), independientemente del modo de alimentación seleccionado.
Procesador
El Intel Gen13 Core i7-13700H CPU, que se encontraba en muchos ordenadores para juegos de los principales fabricantes el año pasado, se utiliza en este portátil para juegos. La última Gen14 sólo está disponible actualmente en la serie T6 de Tulpar. Sin embargo, como la Gen14 apenas ofrece ventajas en cuanto a velocidad, es probable que la ventaja de los portátiles más recientes sea pequeña en el mejor de los casos.
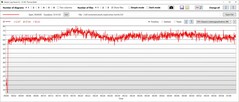
Nuestro Tulpar se comportó bien durante el bucle Cinebench R15, ofreciendo un rendimiento elevado y -sobre todo- muy constante, sin caídas tras las primeras ejecuciones. En overboost, pidió un TDP bastante constante de 95 a 96 vatios, en modo entusiasta seguía siendo de 82 vatios y en modo equilibrado notamos sólo 48 vatios. En modo batería, se pone automáticamente en equilibrado. Aquí, el rendimiento de la CPU cae alrededor de un 27%.
En general y en todas las pruebas comparativas, el T7 estuvo más o menos al mismo nivel de rendimiento que el portátil medio equipado con la misma CPU en nuestra base de datos. Fue incluso más rápido en muchas pruebas, pero sus puntuaciones inusualmente bajas en Geekbench multihilo estropean ligeramente su puntuación global. En las pruebas Cinebench, fue alrededor de un 11% más rápido que el i7-13700H medio.
Esto lo sitúa justo en el medio de los dispositivos de comparación en términos de rendimiento -sólo el Legion 5 fue notablemente más rápido, y todos los demás competidores estuvieron a unos pocos puntos porcentuales de nuestro dispositivo de prueba.
Sus puntuaciones multinúcleo inusualmente bajas en las pruebas Geekbench son bastante interesantes. Sus puntuaciones se mantuvieron muy bajas incluso después de varias repeticiones(overboost, dGPU y modo híbrido probados). En las pruebas Cinebench, sin embargo, sus puntuaciones multihilo fueron de normales a buenas.
| Perfil de rendimiento/valor de medición | CB15 puntuación múltiple | TDP (en vatios) |
|---|---|---|
| Turbo | 2.763 | 95 |
| Entusiasta | 2.538 | 82 |
| Equilibrada | 1.990 | 48 |
| Batería | 1.760 | 35 |
Cinebench R15 Multi continuous test
Cinebench R23: Multi Core | Single Core
Cinebench R20: CPU (Multi Core) | CPU (Single Core)
Cinebench R15: CPU Multi 64Bit | CPU Single 64Bit
Blender: v2.79 BMW27 CPU
7-Zip 18.03: 7z b 4 | 7z b 4 -mmt1
Geekbench 6.4: Multi-Core | Single-Core
Geekbench 5.5: Multi-Core | Single-Core
HWBOT x265 Benchmark v2.2: 4k Preset
LibreOffice : 20 Documents To PDF
R Benchmark 2.5: Overall mean
| CPU Performance Rating | |
| Lenovo Legion 5 16IRX G9 | |
| Media de la clase Gaming | |
| SCHENKER XMG Apex 17 (Late 23) | |
| Medion Erazer Defender P40 -2! | |
| Tulpar T7 V20.6 | |
| Medio Intel Core i7-13700H | |
| Acer Nitro 17 AN17-51-71ER -2! | |
| MSI Katana 17 B13VFK -2! | |
| Cinebench R23 / Multi Core | |
| Lenovo Legion 5 16IRX G9 | |
| Media de la clase Gaming (5668 - 39652, n=151, últimos 2 años) | |
| Medion Erazer Defender P40 | |
| Acer Nitro 17 AN17-51-71ER | |
| Tulpar T7 V20.6 | |
| SCHENKER XMG Apex 17 (Late 23) | |
| MSI Katana 17 B13VFK | |
| Medio Intel Core i7-13700H (5890 - 20034, n=29) | |
| Cinebench R23 / Single Core | |
| Lenovo Legion 5 16IRX G9 | |
| Tulpar T7 V20.6 | |
| Media de la clase Gaming (1136 - 2252, n=151, últimos 2 años) | |
| MSI Katana 17 B13VFK | |
| Medio Intel Core i7-13700H (1323 - 1914, n=29) | |
| SCHENKER XMG Apex 17 (Late 23) | |
| Medion Erazer Defender P40 | |
| Acer Nitro 17 AN17-51-71ER | |
| Cinebench R20 / CPU (Multi Core) | |
| Lenovo Legion 5 16IRX G9 | |
| Media de la clase Gaming (2179 - 15517, n=151, últimos 2 años) | |
| Medion Erazer Defender P40 | |
| Acer Nitro 17 AN17-51-71ER | |
| Tulpar T7 V20.6 | |
| SCHENKER XMG Apex 17 (Late 23) | |
| MSI Katana 17 B13VFK | |
| Medio Intel Core i7-13700H (2322 - 7674, n=29) | |
| Cinebench R20 / CPU (Single Core) | |
| Lenovo Legion 5 16IRX G9 | |
| Tulpar T7 V20.6 | |
| Media de la clase Gaming (439 - 866, n=151, últimos 2 años) | |
| Medio Intel Core i7-13700H (508 - 741, n=29) | |
| MSI Katana 17 B13VFK | |
| SCHENKER XMG Apex 17 (Late 23) | |
| Medion Erazer Defender P40 | |
| Acer Nitro 17 AN17-51-71ER | |
| Cinebench R15 / CPU Multi 64Bit | |
| Lenovo Legion 5 16IRX G9 | |
| Media de la clase Gaming (905 - 6074, n=154, últimos 2 años) | |
| Medion Erazer Defender P40 | |
| Acer Nitro 17 AN17-51-71ER | |
| Tulpar T7 V20.6 | |
| SCHENKER XMG Apex 17 (Late 23) | |
| Medio Intel Core i7-13700H (905 - 2982, n=29) | |
| MSI Katana 17 B13VFK | |
| Cinebench R15 / CPU Single 64Bit | |
| Lenovo Legion 5 16IRX G9 | |
| Tulpar T7 V20.6 | |
| Media de la clase Gaming (191.9 - 343, n=151, últimos 2 años) | |
| SCHENKER XMG Apex 17 (Late 23) | |
| Medio Intel Core i7-13700H (213 - 278, n=29) | |
| MSI Katana 17 B13VFK | |
| Medion Erazer Defender P40 | |
| Acer Nitro 17 AN17-51-71ER | |
| Blender / v2.79 BMW27 CPU | |
| Medio Intel Core i7-13700H (169 - 555, n=29) | |
| MSI Katana 17 B13VFK | |
| SCHENKER XMG Apex 17 (Late 23) | |
| Medion Erazer Defender P40 | |
| Acer Nitro 17 AN17-51-71ER | |
| Media de la clase Gaming (81 - 555, n=144, últimos 2 años) | |
| Tulpar T7 V20.6 | |
| Lenovo Legion 5 16IRX G9 | |
| 7-Zip 18.03 / 7z b 4 | |
| Lenovo Legion 5 16IRX G9 | |
| Media de la clase Gaming (23795 - 144064, n=149, últimos 2 años) | |
| Medion Erazer Defender P40 | |
| Acer Nitro 17 AN17-51-71ER | |
| SCHENKER XMG Apex 17 (Late 23) | |
| MSI Katana 17 B13VFK | |
| Medio Intel Core i7-13700H (27322 - 76344, n=29) | |
| Tulpar T7 V20.6 | |
| 7-Zip 18.03 / 7z b 4 -mmt1 | |
| SCHENKER XMG Apex 17 (Late 23) | |
| Lenovo Legion 5 16IRX G9 | |
| Media de la clase Gaming (4199 - 7573, n=149, últimos 2 años) | |
| Tulpar T7 V20.6 | |
| Medio Intel Core i7-13700H (4825 - 6238, n=29) | |
| MSI Katana 17 B13VFK | |
| Medion Erazer Defender P40 | |
| Acer Nitro 17 AN17-51-71ER | |
| Geekbench 6.4 / Multi-Core | |
| Lenovo Legion 5 16IRX G9 | |
| Media de la clase Gaming (5340 - 21668, n=119, últimos 2 años) | |
| SCHENKER XMG Apex 17 (Late 23) | |
| Medio Intel Core i7-13700H (8415 - 13832, n=13) | |
| Tulpar T7 V20.6 | |
| Geekbench 6.4 / Single-Core | |
| Lenovo Legion 5 16IRX G9 | |
| SCHENKER XMG Apex 17 (Late 23) | |
| Media de la clase Gaming (1490 - 3219, n=119, últimos 2 años) | |
| Tulpar T7 V20.6 | |
| Medio Intel Core i7-13700H (2316 - 2639, n=13) | |
| Geekbench 5.5 / Multi-Core | |
| Lenovo Legion 5 16IRX G9 | |
| Media de la clase Gaming (4557 - 25855, n=148, últimos 2 años) | |
| Medion Erazer Defender P40 | |
| Acer Nitro 17 AN17-51-71ER | |
| SCHENKER XMG Apex 17 (Late 23) | |
| Medio Intel Core i7-13700H (6165 - 14215, n=29) | |
| MSI Katana 17 B13VFK | |
| Tulpar T7 V20.6 | |
| Geekbench 5.5 / Single-Core | |
| SCHENKER XMG Apex 17 (Late 23) | |
| Lenovo Legion 5 16IRX G9 | |
| Media de la clase Gaming (986 - 2423, n=148, últimos 2 años) | |
| Medio Intel Core i7-13700H (1362 - 1919, n=29) | |
| MSI Katana 17 B13VFK | |
| Tulpar T7 V20.6 | |
| Medion Erazer Defender P40 | |
| Acer Nitro 17 AN17-51-71ER | |
| HWBOT x265 Benchmark v2.2 / 4k Preset | |
| Lenovo Legion 5 16IRX G9 | |
| Media de la clase Gaming (6.72 - 42.9, n=148, últimos 2 años) | |
| Medion Erazer Defender P40 | |
| SCHENKER XMG Apex 17 (Late 23) | |
| Acer Nitro 17 AN17-51-71ER | |
| Tulpar T7 V20.6 | |
| MSI Katana 17 B13VFK | |
| Medio Intel Core i7-13700H (6.72 - 21.2, n=29) | |
| LibreOffice / 20 Documents To PDF | |
| MSI Katana 17 B13VFK | |
| Acer Nitro 17 AN17-51-71ER | |
| Tulpar T7 V20.6 | |
| Medion Erazer Defender P40 | |
| Medio Intel Core i7-13700H (31.3 - 62.4, n=29) | |
| Media de la clase Gaming (19 - 96.6, n=147, últimos 2 años) | |
| SCHENKER XMG Apex 17 (Late 23) | |
| Lenovo Legion 5 16IRX G9 | |
| R Benchmark 2.5 / Overall mean | |
| Acer Nitro 17 AN17-51-71ER | |
| Medion Erazer Defender P40 | |
| Medio Intel Core i7-13700H (0.4308 - 0.607, n=29) | |
| Tulpar T7 V20.6 | |
| MSI Katana 17 B13VFK | |
| Media de la clase Gaming (0.3609 - 0.759, n=150, últimos 2 años) | |
| SCHENKER XMG Apex 17 (Late 23) | |
| Lenovo Legion 5 16IRX G9 | |
* ... más pequeño es mejor
AIDA64: FP32 Ray-Trace | FPU Julia | CPU SHA3 | CPU Queen | FPU SinJulia | FPU Mandel | CPU AES | CPU ZLib | FP64 Ray-Trace | CPU PhotoWorxx
| Performance Rating | |
| SCHENKER XMG Apex 17 (Late 23) | |
| Media de la clase Gaming | |
| Acer Nitro 17 AN17-51-71ER | |
| Lenovo Legion 5 16IRX G9 | |
| Tulpar T7 V20.6 | |
| Medion Erazer Defender P40 | |
| Medio Intel Core i7-13700H | |
| MSI Katana 17 B13VFK | |
| AIDA64 / FP32 Ray-Trace | |
| SCHENKER XMG Apex 17 (Late 23) | |
| Media de la clase Gaming (4986 - 81639, n=147, últimos 2 años) | |
| Lenovo Legion 5 16IRX G9 | |
| Acer Nitro 17 AN17-51-71ER | |
| Tulpar T7 V20.6 | |
| Medion Erazer Defender P40 | |
| Medio Intel Core i7-13700H (4986 - 18908, n=29) | |
| MSI Katana 17 B13VFK | |
| AIDA64 / FPU Julia | |
| SCHENKER XMG Apex 17 (Late 23) | |
| Media de la clase Gaming (25360 - 252486, n=147, últimos 2 años) | |
| Lenovo Legion 5 16IRX G9 | |
| Tulpar T7 V20.6 | |
| Acer Nitro 17 AN17-51-71ER | |
| Medion Erazer Defender P40 | |
| Medio Intel Core i7-13700H (25360 - 92359, n=29) | |
| MSI Katana 17 B13VFK | |
| AIDA64 / CPU SHA3 | |
| Media de la clase Gaming (1339 - 10389, n=147, últimos 2 años) | |
| SCHENKER XMG Apex 17 (Late 23) | |
| Acer Nitro 17 AN17-51-71ER | |
| Lenovo Legion 5 16IRX G9 | |
| Tulpar T7 V20.6 | |
| Medion Erazer Defender P40 | |
| Medio Intel Core i7-13700H (1339 - 4224, n=29) | |
| MSI Katana 17 B13VFK | |
| AIDA64 / CPU Queen | |
| SCHENKER XMG Apex 17 (Late 23) | |
| Media de la clase Gaming (50699 - 200651, n=147, últimos 2 años) | |
| Medion Erazer Defender P40 | |
| Tulpar T7 V20.6 | |
| Lenovo Legion 5 16IRX G9 | |
| Acer Nitro 17 AN17-51-71ER | |
| Medio Intel Core i7-13700H (59324 - 107159, n=29) | |
| MSI Katana 17 B13VFK | |
| AIDA64 / FPU SinJulia | |
| SCHENKER XMG Apex 17 (Late 23) | |
| Media de la clase Gaming (4800 - 32988, n=147, últimos 2 años) | |
| Lenovo Legion 5 16IRX G9 | |
| Tulpar T7 V20.6 | |
| Acer Nitro 17 AN17-51-71ER | |
| Medion Erazer Defender P40 | |
| Medio Intel Core i7-13700H (4800 - 11050, n=29) | |
| MSI Katana 17 B13VFK | |
| AIDA64 / FPU Mandel | |
| SCHENKER XMG Apex 17 (Late 23) | |
| Media de la clase Gaming (12321 - 134044, n=147, últimos 2 años) | |
| Lenovo Legion 5 16IRX G9 | |
| Acer Nitro 17 AN17-51-71ER | |
| Tulpar T7 V20.6 | |
| Medion Erazer Defender P40 | |
| Medio Intel Core i7-13700H (12321 - 45118, n=29) | |
| MSI Katana 17 B13VFK | |
| AIDA64 / CPU AES | |
| SCHENKER XMG Apex 17 (Late 23) | |
| Acer Nitro 17 AN17-51-71ER | |
| Media de la clase Gaming (19065 - 328679, n=147, últimos 2 años) | |
| Lenovo Legion 5 16IRX G9 | |
| Tulpar T7 V20.6 | |
| Medio Intel Core i7-13700H (28769 - 151254, n=29) | |
| Medion Erazer Defender P40 | |
| MSI Katana 17 B13VFK | |
| AIDA64 / CPU ZLib | |
| Media de la clase Gaming (373 - 2531, n=147, últimos 2 años) | |
| Lenovo Legion 5 16IRX G9 | |
| Acer Nitro 17 AN17-51-71ER | |
| Tulpar T7 V20.6 | |
| SCHENKER XMG Apex 17 (Late 23) | |
| Medion Erazer Defender P40 | |
| Medio Intel Core i7-13700H (389 - 1215, n=29) | |
| MSI Katana 17 B13VFK | |
| AIDA64 / FP64 Ray-Trace | |
| SCHENKER XMG Apex 17 (Late 23) | |
| Media de la clase Gaming (2540 - 43430, n=147, últimos 2 años) | |
| Lenovo Legion 5 16IRX G9 | |
| Acer Nitro 17 AN17-51-71ER | |
| Tulpar T7 V20.6 | |
| Medion Erazer Defender P40 | |
| Medio Intel Core i7-13700H (2540 - 10135, n=29) | |
| MSI Katana 17 B13VFK | |
| AIDA64 / CPU PhotoWorxx | |
| Media de la clase Gaming (10805 - 60161, n=147, últimos 2 años) | |
| Medio Intel Core i7-13700H (12872 - 52727, n=29) | |
| Acer Nitro 17 AN17-51-71ER | |
| SCHENKER XMG Apex 17 (Late 23) | |
| Medion Erazer Defender P40 | |
| MSI Katana 17 B13VFK | |
| Lenovo Legion 5 16IRX G9 | |
| Tulpar T7 V20.6 | |
Rendimiento del sistema
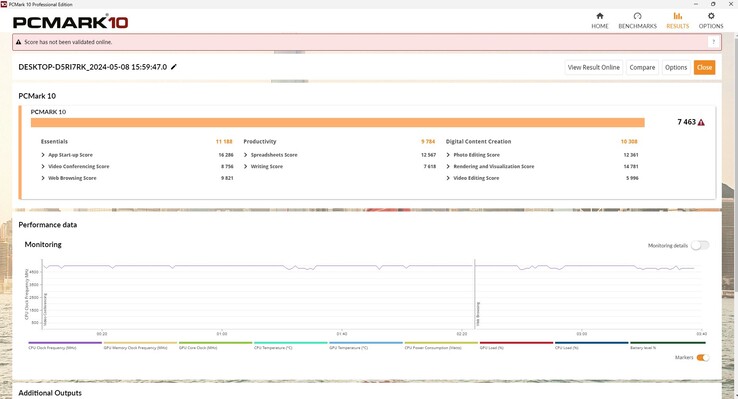
En lo que respecta al rendimiento del sistema, el T7 se sitúa en la zona media alta. En PCMark 10, alcanzó el nivel medio exacto para esta combinación de hardware. Sus resultados en CrossMark están un poco en el lado bajo.
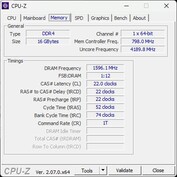
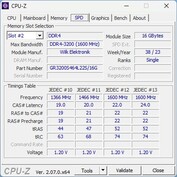
No es lo mejor que sólo esté ocupada una ranura de RAM, al menos en nuestra configuración del T7. La prueba de memoria AIDA a continuación muestra la desventaja de la RAM de un solo canal. Para doble canal, tendría que insertar otra barra, ya que una ranura sigue libre.
CrossMark: Overall | Productivity | Creativity | Responsiveness
WebXPRT 3: Overall
WebXPRT 4: Overall
Mozilla Kraken 1.1: Total
| PCMark 10 / Score | |
| SCHENKER XMG Apex 17 (Late 23) | |
| Media de la clase Gaming (5776 - 9852, n=133, últimos 2 años) | |
| Lenovo Legion 5 16IRX G9 | |
| Tulpar T7 V20.6 | |
| Medio Intel Core i7-13700H, NVIDIA GeForce RTX 4060 Laptop GPU (7157 - 7661, n=5) | |
| MSI Katana 17 B13VFK | |
| Acer Nitro 17 AN17-51-71ER | |
| Medion Erazer Defender P40 | |
| PCMark 10 / Essentials | |
| Tulpar T7 V20.6 | |
| MSI Katana 17 B13VFK | |
| Lenovo Legion 5 16IRX G9 | |
| Medio Intel Core i7-13700H, NVIDIA GeForce RTX 4060 Laptop GPU (10179 - 11200, n=5) | |
| Media de la clase Gaming (9057 - 12600, n=133, últimos 2 años) | |
| SCHENKER XMG Apex 17 (Late 23) | |
| Acer Nitro 17 AN17-51-71ER | |
| Medion Erazer Defender P40 | |
| PCMark 10 / Productivity | |
| SCHENKER XMG Apex 17 (Late 23) | |
| Media de la clase Gaming (6662 - 14612, n=133, últimos 2 años) | |
| Tulpar T7 V20.6 | |
| Medion Erazer Defender P40 | |
| Medio Intel Core i7-13700H, NVIDIA GeForce RTX 4060 Laptop GPU (8238 - 10249, n=5) | |
| MSI Katana 17 B13VFK | |
| Lenovo Legion 5 16IRX G9 | |
| Acer Nitro 17 AN17-51-71ER | |
| PCMark 10 / Digital Content Creation | |
| Media de la clase Gaming (6807 - 18475, n=133, últimos 2 años) | |
| SCHENKER XMG Apex 17 (Late 23) | |
| Lenovo Legion 5 16IRX G9 | |
| Acer Nitro 17 AN17-51-71ER | |
| Medio Intel Core i7-13700H, NVIDIA GeForce RTX 4060 Laptop GPU (10308 - 11862, n=5) | |
| Tulpar T7 V20.6 | |
| MSI Katana 17 B13VFK | |
| Medion Erazer Defender P40 | |
| CrossMark / Overall | |
| Lenovo Legion 5 16IRX G9 | |
| Media de la clase Gaming (1247 - 2344, n=114, últimos 2 años) | |
| MSI Katana 17 B13VFK | |
| SCHENKER XMG Apex 17 (Late 23) | |
| Medion Erazer Defender P40 | |
| Tulpar T7 V20.6 | |
| Medio Intel Core i7-13700H, NVIDIA GeForce RTX 4060 Laptop GPU (1629 - 1849, n=5) | |
| Acer Nitro 17 AN17-51-71ER | |
| CrossMark / Productivity | |
| Lenovo Legion 5 16IRX G9 | |
| Media de la clase Gaming (1299 - 2204, n=114, últimos 2 años) | |
| MSI Katana 17 B13VFK | |
| SCHENKER XMG Apex 17 (Late 23) | |
| Tulpar T7 V20.6 | |
| Medion Erazer Defender P40 | |
| Medio Intel Core i7-13700H, NVIDIA GeForce RTX 4060 Laptop GPU (1561 - 1743, n=5) | |
| Acer Nitro 17 AN17-51-71ER | |
| CrossMark / Creativity | |
| Lenovo Legion 5 16IRX G9 | |
| Media de la clase Gaming (1275 - 2660, n=114, últimos 2 años) | |
| MSI Katana 17 B13VFK | |
| Medion Erazer Defender P40 | |
| SCHENKER XMG Apex 17 (Late 23) | |
| Medio Intel Core i7-13700H, NVIDIA GeForce RTX 4060 Laptop GPU (1691 - 2064, n=5) | |
| Tulpar T7 V20.6 | |
| Acer Nitro 17 AN17-51-71ER | |
| CrossMark / Responsiveness | |
| Lenovo Legion 5 16IRX G9 | |
| MSI Katana 17 B13VFK | |
| Media de la clase Gaming (1030 - 2330, n=114, últimos 2 años) | |
| SCHENKER XMG Apex 17 (Late 23) | |
| Acer Nitro 17 AN17-51-71ER | |
| Medion Erazer Defender P40 | |
| Medio Intel Core i7-13700H, NVIDIA GeForce RTX 4060 Laptop GPU (1381 - 1656, n=5) | |
| Tulpar T7 V20.6 | |
| WebXPRT 3 / Overall | |
| Lenovo Legion 5 16IRX G9 | |
| SCHENKER XMG Apex 17 (Late 23) | |
| Media de la clase Gaming (215 - 480, n=127, últimos 2 años) | |
| Tulpar T7 V20.6 | |
| MSI Katana 17 B13VFK | |
| Medion Erazer Defender P40 | |
| Medio Intel Core i7-13700H, NVIDIA GeForce RTX 4060 Laptop GPU (215 - 314, n=4) | |
| Acer Nitro 17 AN17-51-71ER | |
| WebXPRT 4 / Overall | |
| Lenovo Legion 5 16IRX G9 | |
| Tulpar T7 V20.6 | |
| MSI Katana 17 B13VFK | |
| Media de la clase Gaming (176.4 - 335, n=115, últimos 2 años) | |
| Medio Intel Core i7-13700H, NVIDIA GeForce RTX 4060 Laptop GPU (228 - 274, n=4) | |
| Medion Erazer Defender P40 | |
| SCHENKER XMG Apex 17 (Late 23) | |
| Acer Nitro 17 AN17-51-71ER | |
| Mozilla Kraken 1.1 / Total | |
| Acer Nitro 17 AN17-51-71ER | |
| Medion Erazer Defender P40 | |
| MSI Katana 17 B13VFK | |
| SCHENKER XMG Apex 17 (Late 23) | |
| Medio Intel Core i7-13700H, NVIDIA GeForce RTX 4060 Laptop GPU (495 - 570, n=4) | |
| Media de la clase Gaming (409 - 674, n=139, últimos 2 años) | |
| Tulpar T7 V20.6 | |
| Lenovo Legion 5 16IRX G9 | |
* ... más pequeño es mejor
| PCMark 10 Score | 7463 puntos | |
ayuda | ||
| AIDA64 / Memory Copy | |
| SCHENKER XMG Apex 17 (Late 23) | |
| Media de la clase Gaming (21750 - 97515, n=147, últimos 2 años) | |
| Medio Intel Core i7-13700H (24334 - 78081, n=29) | |
| Lenovo Legion 5 16IRX G9 | |
| Acer Nitro 17 AN17-51-71ER | |
| Medion Erazer Defender P40 | |
| MSI Katana 17 B13VFK | |
| Tulpar T7 V20.6 | |
| AIDA64 / Memory Read | |
| Lenovo Legion 5 16IRX G9 | |
| Media de la clase Gaming (22956 - 102937, n=147, últimos 2 años) | |
| Medion Erazer Defender P40 | |
| Acer Nitro 17 AN17-51-71ER | |
| Medio Intel Core i7-13700H (23681 - 79656, n=29) | |
| SCHENKER XMG Apex 17 (Late 23) | |
| MSI Katana 17 B13VFK | |
| Tulpar T7 V20.6 | |
| AIDA64 / Memory Write | |
| SCHENKER XMG Apex 17 (Late 23) | |
| Media de la clase Gaming (22297 - 108954, n=147, últimos 2 años) | |
| Medio Intel Core i7-13700H (22986 - 99898, n=29) | |
| Acer Nitro 17 AN17-51-71ER | |
| Medion Erazer Defender P40 | |
| Lenovo Legion 5 16IRX G9 | |
| MSI Katana 17 B13VFK | |
| Tulpar T7 V20.6 | |
| AIDA64 / Memory Latency | |
| Acer Nitro 17 AN17-51-71ER | |
| MSI Katana 17 B13VFK | |
| Media de la clase Gaming (59.5 - 259, n=147, últimos 2 años) | |
| Medio Intel Core i7-13700H (82.4 - 136.8, n=29) | |
| Medion Erazer Defender P40 | |
| Lenovo Legion 5 16IRX G9 | |
| Tulpar T7 V20.6 | |
| SCHENKER XMG Apex 17 (Late 23) | |
* ... más pequeño es mejor
Latencias del CPD
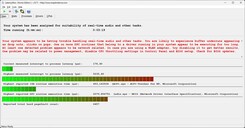
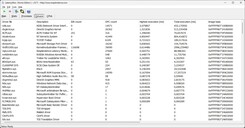
Por desgracia, ya notamos los primeros problemas de latencia al mover la ventana del software LatencyMon. Abrir el navegador aumentó aún más el valor de latencia, mientras que abrir varias pestañas después no lo hizo. Hasta este punto, el valor de alrededor de 500 μs que medimos sigue estando dentro de un rango tolerable.
Sin embargo, al reproducir nuestro vídeo 4K/60fps de YouTube, ¡el valor de retardo subió a más de 5.000 μs! No obstante, no se produjeron caídas de fotogramas. Sin embargo, el valor sigue siendo claramente demasiado alto.
| DPC Latencies / LatencyMon - interrupt to process latency (max), Web, Youtube, Prime95 | |
| Tulpar T7 V20.6 | |
| Medion Erazer Defender P40 | |
| MSI Katana 17 B13VFK | |
| Lenovo Legion 5 16IRX G9 | |
| Acer Nitro 17 AN17-51-71ER | |
| SCHENKER XMG Apex 17 (Late 23) | |
* ... más pequeño es mejor
Dispositivos de almacenamiento
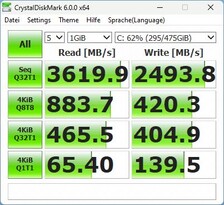
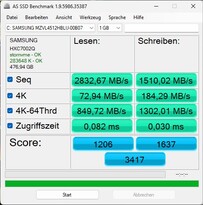
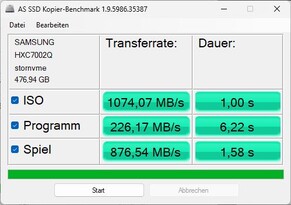
La unidad SSD NVMe de Samsung instalada con solo 500 GB de almacenamiento es un poco más antigua y, como resultado, no es especialmente rápida, también porque rinde ligeramente menos dentro del T7. La competencia es claramente más rápida en este aspecto. Definitivamente, debería optar por una configuración T7 con 1 TB de almacenamiento. Sin embargo, no hay por qué preocuparse, ya que su velocidad debería ser suficiente para el trabajo diario y los juegos, y además rindió ligeramente mejor en la prueba Crystaldiskmark. Después de todo, su rendimiento se mantuvo constante durante un periodo de tiempo más largo.
* ... más pequeño es mejor
Reading continuous performance: DiskSpd Read Loop, Queue Depth 8
Tarjeta gráfica
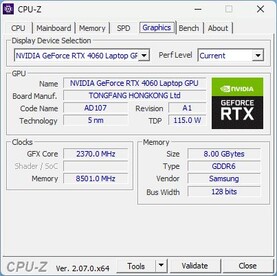
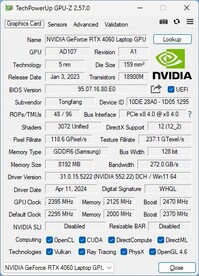
Todos los modelos T7 están equipados con una Nvidia Geforce RTX 4060. Tulpar no ha proporcionado ninguna información sobre su rendimiento, pero el panel de control de Nvidia indica 140 vatios. La RTX 4060 debería poder ejecutar casi todos los juegos actuales en Full HD con detalles medios a altos, lo que es compatible con la pantalla instalada.
En las pruebas sintéticas 3DMark, su rendimiento 3D fue muy bueno y aproximadamente un 10% mejor que el de un portátil medio con la misma GPU.
Una ejecución repetida de Fire Strike en modo batería dio como resultado una pérdida de rendimiento 3D de alrededor del 85 por ciento, ¡lo que supone una caída enorme! Aparentemente, aquí sólo actúa la GPU integrada. Si se desactiva Optimus (sólo está activa la dGPU), su puntuación aumenta significativamente y su pérdida de rendimiento se minimiza entonces a alrededor del 56 por ciento.
| 3DMark 11 Performance | 28054 puntos | |
| 3DMark Cloud Gate Standard Score | 60984 puntos | |
| 3DMark Fire Strike Score | 24884 puntos | |
| 3DMark Time Spy Score | 10324 puntos | |
ayuda | ||
* ... más pequeño es mejor
Rendimiento en juegos
Desgraciadamente, el portátil Tulpar no pudo mantener sus buenos resultados en 3DMark en la comparación de juegos, ya que a menudo perdió frente a la competencia y acabó en la parte baja de la clasificación. El XMG estuvo a un nivel similar, pero muchos de sus competidores fueron un 10% más rápidos.
Al ejecutar el juego actual Skull & Bones, el T7 aún alcanza una media jugable de 65 fps en Full HD y con detalles ultra.
| Performance Rating - Percent | |
| Lenovo Legion 5 16IRX G9 | |
| Media de la clase Gaming | |
| MSI Katana 17 B13VFK | |
| Acer Nitro 17 AN17-51-71ER | |
| Medion Erazer Defender P40 | |
| SCHENKER XMG Apex 17 (Late 23) -1! | |
| Tulpar T7 V20.6 | |
| The Witcher 3 - 1920x1080 Ultra Graphics & Postprocessing (HBAO+) | |
| Media de la clase Gaming (18.4 - 214, n=119, últimos 2 años) | |
| Acer Nitro 17 AN17-51-71ER | |
| MSI Katana 17 B13VFK | |
| SCHENKER XMG Apex 17 (Late 23) | |
| Medion Erazer Defender P40 | |
| Tulpar T7 V20.6 | |
| Lenovo Legion 5 16IRX G9 | |
| GTA V - 1920x1080 Highest Settings possible AA:4xMSAA + FX AF:16x | |
| Lenovo Legion 5 16IRX G9 | |
| Acer Nitro 17 AN17-51-71ER | |
| Medion Erazer Defender P40 | |
| MSI Katana 17 B13VFK | |
| Media de la clase Gaming (12.1 - 168.2, n=132, últimos 2 años) | |
| Tulpar T7 V20.6 | |
| Final Fantasy XV Benchmark - 1920x1080 High Quality | |
| Media de la clase Gaming (19.2 - 201, n=144, últimos 2 años) | |
| Lenovo Legion 5 16IRX G9 | |
| SCHENKER XMG Apex 17 (Late 23) | |
| Acer Nitro 17 AN17-51-71ER | |
| Medion Erazer Defender P40 | |
| MSI Katana 17 B13VFK | |
| Tulpar T7 V20.6 | |
| Strange Brigade - 1920x1080 ultra AA:ultra AF:16 | |
| Media de la clase Gaming (38.9 - 420, n=140, últimos 2 años) | |
| Lenovo Legion 5 16IRX G9 | |
| Tulpar T7 V20.6 | |
| Acer Nitro 17 AN17-51-71ER | |
| SCHENKER XMG Apex 17 (Late 23) | |
| Medion Erazer Defender P40 | |
| MSI Katana 17 B13VFK | |
| Dota 2 Reborn - 1920x1080 ultra (3/3) best looking | |
| Lenovo Legion 5 16IRX G9 | |
| MSI Katana 17 B13VFK | |
| Media de la clase Gaming (65.1 - 220, n=148, últimos 2 años) | |
| Medion Erazer Defender P40 | |
| SCHENKER XMG Apex 17 (Late 23) | |
| Acer Nitro 17 AN17-51-71ER | |
| Tulpar T7 V20.6 | |
El Witcher 3 gráfico sigue la curva habitual día/noche y, por lo demás, su rendimiento es muy constante. El T7 no es tan rápido como algunos de sus competidores, pero la diferencia no es demasiado grande.
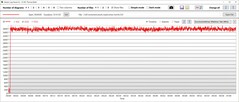
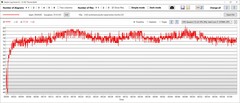
La velocidad de reloj de su GPU es constante, en torno a los 2,6 GHz, mientras que la de su memoria es de 2,1 GHz. La GPU se calienta hasta los 72 °C y hasta un máximo de 75,5 °C. El consumo de la tarjeta gráfica es de unos 97 vatios, lo que aún está lejos de los 140 vatios posibles.
En modo entusiasta, su velocidad de reloj desciende entre 100 y 150 MHz, pero su evolución térmica es similar. Su consumo ronda los 94 vatios.
| Modo de rendimiento/valor de medición | Witcher 3 fps | Reloj de la GPU (en GHz) | Temperatura de la GPU (en °C) | Consumo de energía de la GPU (en vatios) |
|---|---|---|---|---|
| Overboost | 97 | 2,6 | 73 | 97 |
| Entusiasta | 90 | 2,45 | 72 | 94 |
| Equilibrada | 64 | 1,7 | 57 | 49 |
Witcher 3 FPS diagram
| bajo | medio | alto | ultra | |
|---|---|---|---|---|
| GTA V (2015) | 178.3 | 172.1 | 163 | 97.8 |
| The Witcher 3 (2015) | 339 | 287 | 198 | 99.6 |
| Dota 2 Reborn (2015) | 148 | 130 | 124 | 115 |
| Final Fantasy XV Benchmark (2018) | 149.5 | 125.8 | 93.3 | |
| X-Plane 11.11 (2018) | 141.69 | 126.82 | 99.32 | |
| Far Cry 5 (2018) | 135 | 113 | 109 | 103 |
| Strange Brigade (2018) | 432 | 291 | 230 | 198.7 |
| Skull & Bones (2024) | 82 | 82 | 78 | 65 |
Emisiones - Valores moderados
Emisiones sonoras
Cuando está en ralentí en el sobremesa, los ventiladores del portátil suelen estar apagados. Esto también se aplica al modo de sobremarcha, pero al utilizarlo, los ventiladores a veces se aceleran brevemente hasta los 40 dB. Esto último también puede conseguirse al realizar tareas menos exigentes fuera del modo inactivo.
En la prueba 3DMark06, el ruido de los ventiladores aumentó lentamente hasta alcanzar los 40 dB. Sin embargo, volvieron a hacerse más silenciosos en el transcurso de la prueba y, al final, los ventiladores zumbaron a unos 38 dB bastante constantes. Por tanto, los 40 dB que medimos deben entenderse más bien como el valor máximo de los ventiladores bajo carga media.
Durante The Witcher 3, los ventiladores oscilaron constantemente entre unos 47,5 dB y algo menos de 50 dB. Estos son valores típicos para un jugador, pero los competidores representados en esta prueba son incluso más ruidosos cuando juegan. En general, el T7 rinde bastante bien en términos de ruido, pero no puede alcanzar el rendimiento de los otros dispositivos de la comparación.
Ruido
| Ocioso |
| 23 / 23 / 30.84 dB(A) |
| Carga |
| 40.14 / 50.69 dB(A) |
 | ||
30 dB silencioso 40 dB(A) audible 50 dB(A) ruidosamente alto |
||
min: | ||
| Tulpar T7 V20.6 NVIDIA GeForce RTX 4060 Laptop GPU, i7-13700H, Samsung PM9B1 512GB MZVL4512HBLU | SCHENKER XMG Apex 17 (Late 23) NVIDIA GeForce RTX 4060 Laptop GPU, R7 7840HS, Samsung 990 Pro 1 TB | Acer Nitro 17 AN17-51-71ER NVIDIA GeForce RTX 4060 Laptop GPU, i7-13700H, Samsung PM9A1 MZVL21T0HCLR | Medion Erazer Defender P40 NVIDIA GeForce RTX 4060 Laptop GPU, i7-13700HX, Phison PS5021-E21 1TB | MSI Katana 17 B13VFK NVIDIA GeForce RTX 4060 Laptop GPU, i7-13620H, Micron 2400 MTFDKBA1T0QFM | Lenovo Legion 5 16IRX G9 NVIDIA GeForce RTX 4060 Laptop GPU, i7-14650HX, Samsung PM9A1 MZVL21T0HCLR | |
|---|---|---|---|---|---|---|
| Noise | -6% | -3% | -16% | -14% | -9% | |
| apagado / medio ambiente * | 23 | 24 -4% | 24 -4% | 25 -9% | 24.5 -7% | 24 -4% |
| Idle Minimum * | 23 | 25 -9% | 24 -4% | 26 -13% | 24.5 -7% | 24 -4% |
| Idle Average * | 23 | 29 -26% | 24 -4% | 27 -17% | 24.5 -7% | 28.8 -25% |
| Idle Maximum * | 30.84 | 33 -7% | 32.32 -5% | 32 -4% | 40 -30% | 32 -4% |
| Load Average * | 40.14 | 37 8% | 35.18 12% | 53 -32% | 48.3 -20% | 45.5 -13% |
| Witcher 3 ultra * | 50.69 | 50 1% | 54.78 -8% | 56 -10% | 56 -10% | 53.1 -5% |
| Load Maximum * | 50.69 | 54 -7% | 54.78 -8% | 64 -26% | 59.1 -17% | 55.7 -10% |
* ... más pequeño es mejor
Temperatura
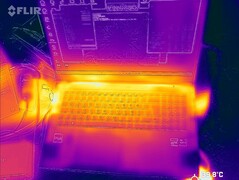
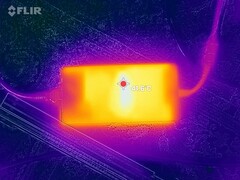
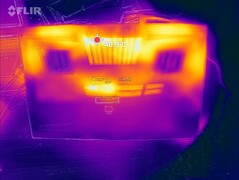
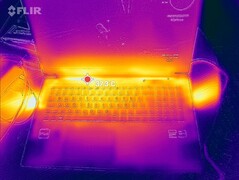
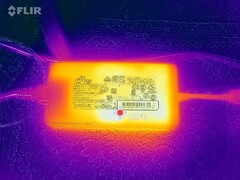
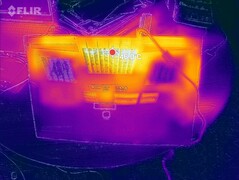
Las temperaturas superficiales del T7 también se mantuvieron moderadas, con sus puntos calientes calentándose sólo hasta 44 °C durante la prueba de estrés.
Cuando ejecutamos la misma prueba de estrés en modo equilibrado, medimos temperaturas superficiales medias de sólo 32 °C en la parte superior y 33 °C en la inferior.
(+) La temperatura máxima en la parte superior es de 38 °C / 100 F, frente a la media de 40.4 °C / 105 F, que oscila entre 21.2 y 68.8 °C para la clase Gaming.
(±) El fondo se calienta hasta un máximo de 44 °C / 111 F, frente a la media de 43.2 °C / 110 F
(+) En reposo, la temperatura media de la parte superior es de 30 °C / 86# F, frente a la media del dispositivo de 33.9 °C / 93 F.
(±) Jugando a The Witcher 3, la temperatura media de la parte superior es de 34.3 °C / 94 F, frente a la media del dispositivo de 33.9 °C / 93 F.
(+) Los reposamanos y el panel táctil alcanzan como máximo la temperatura de la piel (35 °C / 95 F) y, por tanto, no están calientes.
(-) La temperatura media de la zona del reposamanos de dispositivos similares fue de 28.9 °C / 84 F (-6.1 °C / -11 F).
| Tulpar T7 V20.6 Intel Core i7-13700H, NVIDIA GeForce RTX 4060 Laptop GPU | SCHENKER XMG Apex 17 (Late 23) AMD Ryzen 7 7840HS, NVIDIA GeForce RTX 4060 Laptop GPU | Acer Nitro 17 AN17-51-71ER Intel Core i7-13700H, NVIDIA GeForce RTX 4060 Laptop GPU | Medion Erazer Defender P40 Intel Core i7-13700HX, NVIDIA GeForce RTX 4060 Laptop GPU | MSI Katana 17 B13VFK Intel Core i7-13620H, NVIDIA GeForce RTX 4060 Laptop GPU | Lenovo Legion 5 16IRX G9 Intel Core i7-14650HX, NVIDIA GeForce RTX 4060 Laptop GPU | |
|---|---|---|---|---|---|---|
| Heat | -16% | -11% | 2% | -4% | -2% | |
| Maximum Upper Side * | 38 | 51 -34% | 46 -21% | 42 -11% | 41.6 -9% | 40.4 -6% |
| Maximum Bottom * | 44 | 54 -23% | 51 -16% | 45 -2% | 43.1 2% | 43.8 -0% |
| Idle Upper Side * | 32 | 33 -3% | 34 -6% | 28 12% | 32 -0% | 30.3 5% |
| Idle Bottom * | 33 | 34 -3% | 33 -0% | 30 9% | 35.8 -8% | 35.3 -7% |
* ... más pequeño es mejor
Prueba de esfuerzo
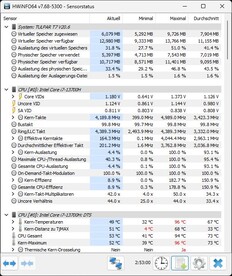
En la prueba de estrés, los núcleos aceleraron a unos 3,5 - 3,7 GHz al principio y se mantuvieron en este rango hasta el final de la prueba de una hora. La temperatura media de sus núcleos fue de 78 °C, y no se calentó más de 85 °C. El consumo de energía de la CPU fluctuó entre 60 y 80 vatios, con una media de 67 vatios.
| Reloj de la CPU (GHz) | Reloj de la GPU (MHz) | Temperatura media dela CPU (°C) | Temperatura media de la GPU (°C) | |
| Sistema en reposo | 4,2 | / | 41 | / |
| Prime95 + FurMark estrés | 3,5 | 1.264 | 80 | 54 |
| Witcher 3 estrés | 0,64 | 2.600 | 77 | 71 |
Altavoces
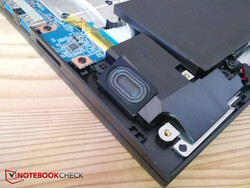
Los altavoces estéreo están alojados en las esquinas frontales del portátil; son bastante pequeños e irradian hacia abajo. En consecuencia, podrían ser más ruidosos y les faltan graves. Al menos, los medios y los agudos están equilibrados.
Dispone de una entrada de micrófono y una salida de auriculares -ambas de 3,5 mm- para conectar dispositivos de audio analógicos.
Tulpar T7 V20.6 análisis de audio
(±) | la sonoridad del altavoz es media pero buena (78.88 dB)
Graves 100 - 315 Hz
(-) | casi sin bajos - de media 20.7% inferior a la mediana
(±) | la linealidad de los graves es media (12% delta a frecuencia anterior)
Medios 400 - 2000 Hz
(+) | medios equilibrados - a sólo 4.8% de la mediana
(+) | los medios son lineales (6.5% delta a la frecuencia anterior)
Altos 2 - 16 kHz
(+) | máximos equilibrados - a sólo 2.7% de la mediana
(+) | los máximos son lineales (5.7% delta a la frecuencia anterior)
Total 100 - 16.000 Hz
(±) | la linealidad del sonido global es media (17% de diferencia con la mediana)
En comparación con la misma clase
» 43% de todos los dispositivos probados de esta clase eran mejores, 12% similares, 45% peores
» El mejor tuvo un delta de 6%, la media fue 18%, el peor fue ###max##%
En comparación con todos los dispositivos probados
» 28% de todos los dispositivos probados eran mejores, 8% similares, 64% peores
» El mejor tuvo un delta de 4%, la media fue 24%, el peor fue ###max##%
Lenovo Legion 5 16IRX G9 análisis de audio
(+) | los altavoces pueden reproducir a un volumen relativamente alto (#84.4 dB)
Graves 100 - 315 Hz
(-) | casi sin bajos - de media 25.7% inferior a la mediana
(±) | la linealidad de los graves es media (8.3% delta a frecuencia anterior)
Medios 400 - 2000 Hz
(+) | medios equilibrados - a sólo 4.3% de la mediana
(+) | los medios son lineales (5.2% delta a la frecuencia anterior)
Altos 2 - 16 kHz
(+) | máximos equilibrados - a sólo 1.9% de la mediana
(+) | los máximos son lineales (2.1% delta a la frecuencia anterior)
Total 100 - 16.000 Hz
(±) | la linealidad del sonido global es media (16.1% de diferencia con la mediana)
En comparación con la misma clase
» 37% de todos los dispositivos probados de esta clase eran mejores, 7% similares, 56% peores
» El mejor tuvo un delta de 6%, la media fue 18%, el peor fue ###max##%
En comparación con todos los dispositivos probados
» 23% de todos los dispositivos probados eran mejores, 5% similares, 72% peores
» El mejor tuvo un delta de 4%, la media fue 24%, el peor fue ###max##%
Gestión de la energía - La eficiencia del año pasado
Consumo de energía
El T7 no es especialmente frugal. Ya hay competidores más frugales cuando el portátil está en reposo, aunque la diferencia no sea demasiado grande. Cuando funciona El Witcher 3, su consumo es demasiado alto, especialmente si se tiene en cuenta su rendimiento ligeramente bajo. Aunque el Medion y el Lenovo consumen un poco más, el XMG y el Acer son un poco más frugales a la vez que ofrecen un rendimiento ligeramente superior.
Si conecta un monitor externo a través de HDMI, la dGPU del portátil se activa, lo que hace que su consumo en reposo aumente unos 5 vatios, por ejemplo (véase el gráfico siguiente).
| Off / Standby | |
| Ocioso | |
| Carga |
|
Clave:
min: | |
| Tulpar T7 V20.6 i7-13700H, NVIDIA GeForce RTX 4060 Laptop GPU, Samsung PM9B1 512GB MZVL4512HBLU, IPS, 1920x1080, 17.3" | SCHENKER XMG Apex 17 (Late 23) R7 7840HS, NVIDIA GeForce RTX 4060 Laptop GPU, Samsung 990 Pro 1 TB, IPS, 2560x1440, 17.3" | Acer Nitro 17 AN17-51-71ER i7-13700H, NVIDIA GeForce RTX 4060 Laptop GPU, Samsung PM9A1 MZVL21T0HCLR, , 2560x1440, 17.3" | Medion Erazer Defender P40 i7-13700HX, NVIDIA GeForce RTX 4060 Laptop GPU, Phison PS5021-E21 1TB, IPS, 2560x1440, 17.3" | MSI Katana 17 B13VFK i7-13620H, NVIDIA GeForce RTX 4060 Laptop GPU, Micron 2400 MTFDKBA1T0QFM, IPS LED, 1920x1080, 17.3" | Lenovo Legion 5 16IRX G9 i7-14650HX, NVIDIA GeForce RTX 4060 Laptop GPU, Samsung PM9A1 MZVL21T0HCLR, IPS, 2560x1600, 16" | Medio NVIDIA GeForce RTX 4060 Laptop GPU | Media de la clase Gaming | |
|---|---|---|---|---|---|---|---|---|
| Power Consumption | 16% | 9% | -2% | 3% | -21% | -5% | -24% | |
| Idle Minimum * | 12 | 9 25% | 8.3 31% | 8 33% | 12.2 -2% | 15.4 -28% | 11.5 ? 4% | 13.4 ? -12% |
| Idle Average * | 17 | 12 29% | 13.5 21% | 12 29% | 14.9 12% | 19.7 -16% | 16 ? 6% | 18.9 ? -11% |
| Idle Maximum * | 17.5 | 14 20% | 14.8 15% | 18 -3% | 15.8 10% | 20.7 -18% | 20.3 ? -16% | 26.3 ? -50% |
| Load Average * | 78.5 | 67 15% | 77 2% | 101 -29% | 85.22 -9% | 102.6 -31% | 92.9 ? -18% | 102.7 ? -31% |
| Witcher 3 ultra * | 169 | 147.6 13% | 154 9% | 180.8 -7% | 151.1 11% | 191.3 -13% | ||
| Load Maximum * | 209 | 223 -7% | 263 -26% | 284 -36% | 212.8 -2% | 246.6 -18% | 210 ? -0% | 244 ? -17% |
* ... más pequeño es mejor
Power consumption Witcher 3 / stress test
Power consumption with external monitor
Tiempos de ejecución
Tulpar ha instalado una batería de 62 Wh en la carcasa de 17 pulgadas. Con respecto al tamaño del portátil, no es mucho para un jugador y se nota claramente que el fabricante ha ahorrado un poco de dinero, aunque el XMG Apex está equipado con la misma y el MSI Katana incluso tiene que conformarse con sólo 54 Wh. Los otros tres competidores están equipados con baterías más grandes que oscilan entre los 73 y los 90 Wh.
Como resultado, el T7 logró tiempos de funcionamiento de alrededor de 3,5 horas durante la prueba WLAN y la prueba de vídeo con un brillo reducido de 150 nits. Sólo el Katana lo hizo peor aquí, mientras que el resto de los dispositivos de la comparación aguantaron mucho más en ocasiones, por ejemplo el Apex a pesar de estar equipado con una batería del mismo tamaño. Esto se debe quizás a que tiene mejores medidas de ahorro de energía.
| Tulpar T7 V20.6 i7-13700H, NVIDIA GeForce RTX 4060 Laptop GPU, 62.32 Wh | SCHENKER XMG Apex 17 (Late 23) R7 7840HS, NVIDIA GeForce RTX 4060 Laptop GPU, 62.32 Wh | Acer Nitro 17 AN17-51-71ER i7-13700H, NVIDIA GeForce RTX 4060 Laptop GPU, 90 Wh | Medion Erazer Defender P40 i7-13700HX, NVIDIA GeForce RTX 4060 Laptop GPU, 73 Wh | MSI Katana 17 B13VFK i7-13620H, NVIDIA GeForce RTX 4060 Laptop GPU, 53.5 Wh | Lenovo Legion 5 16IRX G9 i7-14650HX, NVIDIA GeForce RTX 4060 Laptop GPU, 80 Wh | Media de la clase Gaming | |
|---|---|---|---|---|---|---|---|
| Duración de Batería | 45% | 111% | 38% | -26% | 74% | 60% | |
| H.264 | 222 | 411 85% | 413 86% | 339 53% | 576 159% | 447 ? 101% | |
| WiFi v1.3 | 209 | 306 46% | 494 136% | 373 78% | 176 -16% | 444 112% | 387 ? 85% |
| Load | 90 | 93 3% | 76 -16% | 58 -36% | 46 -49% | 84.5 ? -6% | |
| Reader / Idle | 469 | 528 | 585 ? | ||||
| Witcher 3 ultra | 151 | 74.7 ? |
Pro
Contra
Veredicto - Asequible, sólido, ¡pero el núcleo de la competencia!
Aparte de su atractivo precio actual, nos gusta especialmente el teclado de la Tulpar T7, su rápida conexión WLAN y, por supuesto, su mantenimiento de por vida, anual y gratuito. Además, el T7 se mantiene bastante fresco bajo tensión.
Sin embargo, esto último tiene su precio, ya que, por desgracia, el asequible gamer no aprovecha toda su potencia al jugar. Por supuesto, se le puede perdonar a un portátil para juegos económico una webcam débil o que no sea compatible con Thunderbolt. Pero a cambio, debería cumplir en su disciplina principal, es decir, el juego. Y el portátil Tulpar simplemente no lo hace. El hecho de que el fabricante nos enviara una configuración con 16 GB de RAM de un solo canal, aunque hay varias SKU con 32 GB (¿esperamos que de doble canal?), ha tenido desgraciadamente un efecto negativo en nuestros resultados de las pruebas comparativas. Como resultado, el T7 va por detrás de la competencia cuando se trata de juegos, aunque ciertamente no debería. La duración de su batería también podría decepcionar a algunos usuarios, aunque quizá no sea demasiado importante para un jugador de 17 pulgadas.
El Tulpar T7 es un portátil para juegos asequible con una generosa promesa de servicio gratuito anual de por vida. Sólo debe asegurarse de seleccionar una configuración con RAM de doble canal porque, de lo contrario, su rendimiento no podrá seguir el ritmo de la competencia.
Si sólo tiene en cuenta su PVPR, hay muchas alternativas. Sin embargo, el T7 con una RTX 4060 está disponible actualmente a un precio especialmente bajo, por debajo de los 1.000 dólares en algunos casos. Si está dispuesto a gastar más, entonces el Lenovo Legion 5 puede ser una alternativa mejor en muchos aspectos.
Precio y disponibilidad
Actualmente, el Tulpar T7 aún no está disponible en EE UU. Al parecer, el fabricante tiene previsto lanzar sus productos en Estados Unidos a finales de este año.
Tulpar T7 V20.6
- 05/24/2024 v7 (old)
Christian Hintze
Transparencia
La selección de los dispositivos que se van a reseñar corre a cargo de nuestro equipo editorial. La muestra de prueba fue proporcionada al autor en calidad de préstamo por el fabricante o el minorista a los efectos de esta reseña. El prestamista no tuvo ninguna influencia en esta reseña, ni el fabricante recibió una copia de la misma antes de su publicación. No había ninguna obligación de publicar esta reseña. Nunca aceptamos compensaciones o pagos a cambio de nuestras reseñas. Como empresa de medios independiente, Notebookcheck no está sujeta a la autoridad de fabricantes, minoristas o editores.
Así es como prueba Notebookcheck
Cada año, Notebookcheck revisa de forma independiente cientos de portátiles y smartphones utilizando procedimientos estandarizados para asegurar que todos los resultados son comparables. Hemos desarrollado continuamente nuestros métodos de prueba durante unos 20 años y hemos establecido los estándares de la industria en el proceso. En nuestros laboratorios de pruebas, técnicos y editores experimentados utilizan equipos de medición de alta calidad. Estas pruebas implican un proceso de validación en varias fases. Nuestro complejo sistema de clasificación se basa en cientos de mediciones y puntos de referencia bien fundamentados, lo que mantiene la objetividad.


