Notebookcheck Logo
Teaser

Reseña del Asus NUC 14 Pro: Mini PC NUC con Intel Core Ultra 5 125H, rápida iGPU Intel Arc y 2x Thunderbolt 4

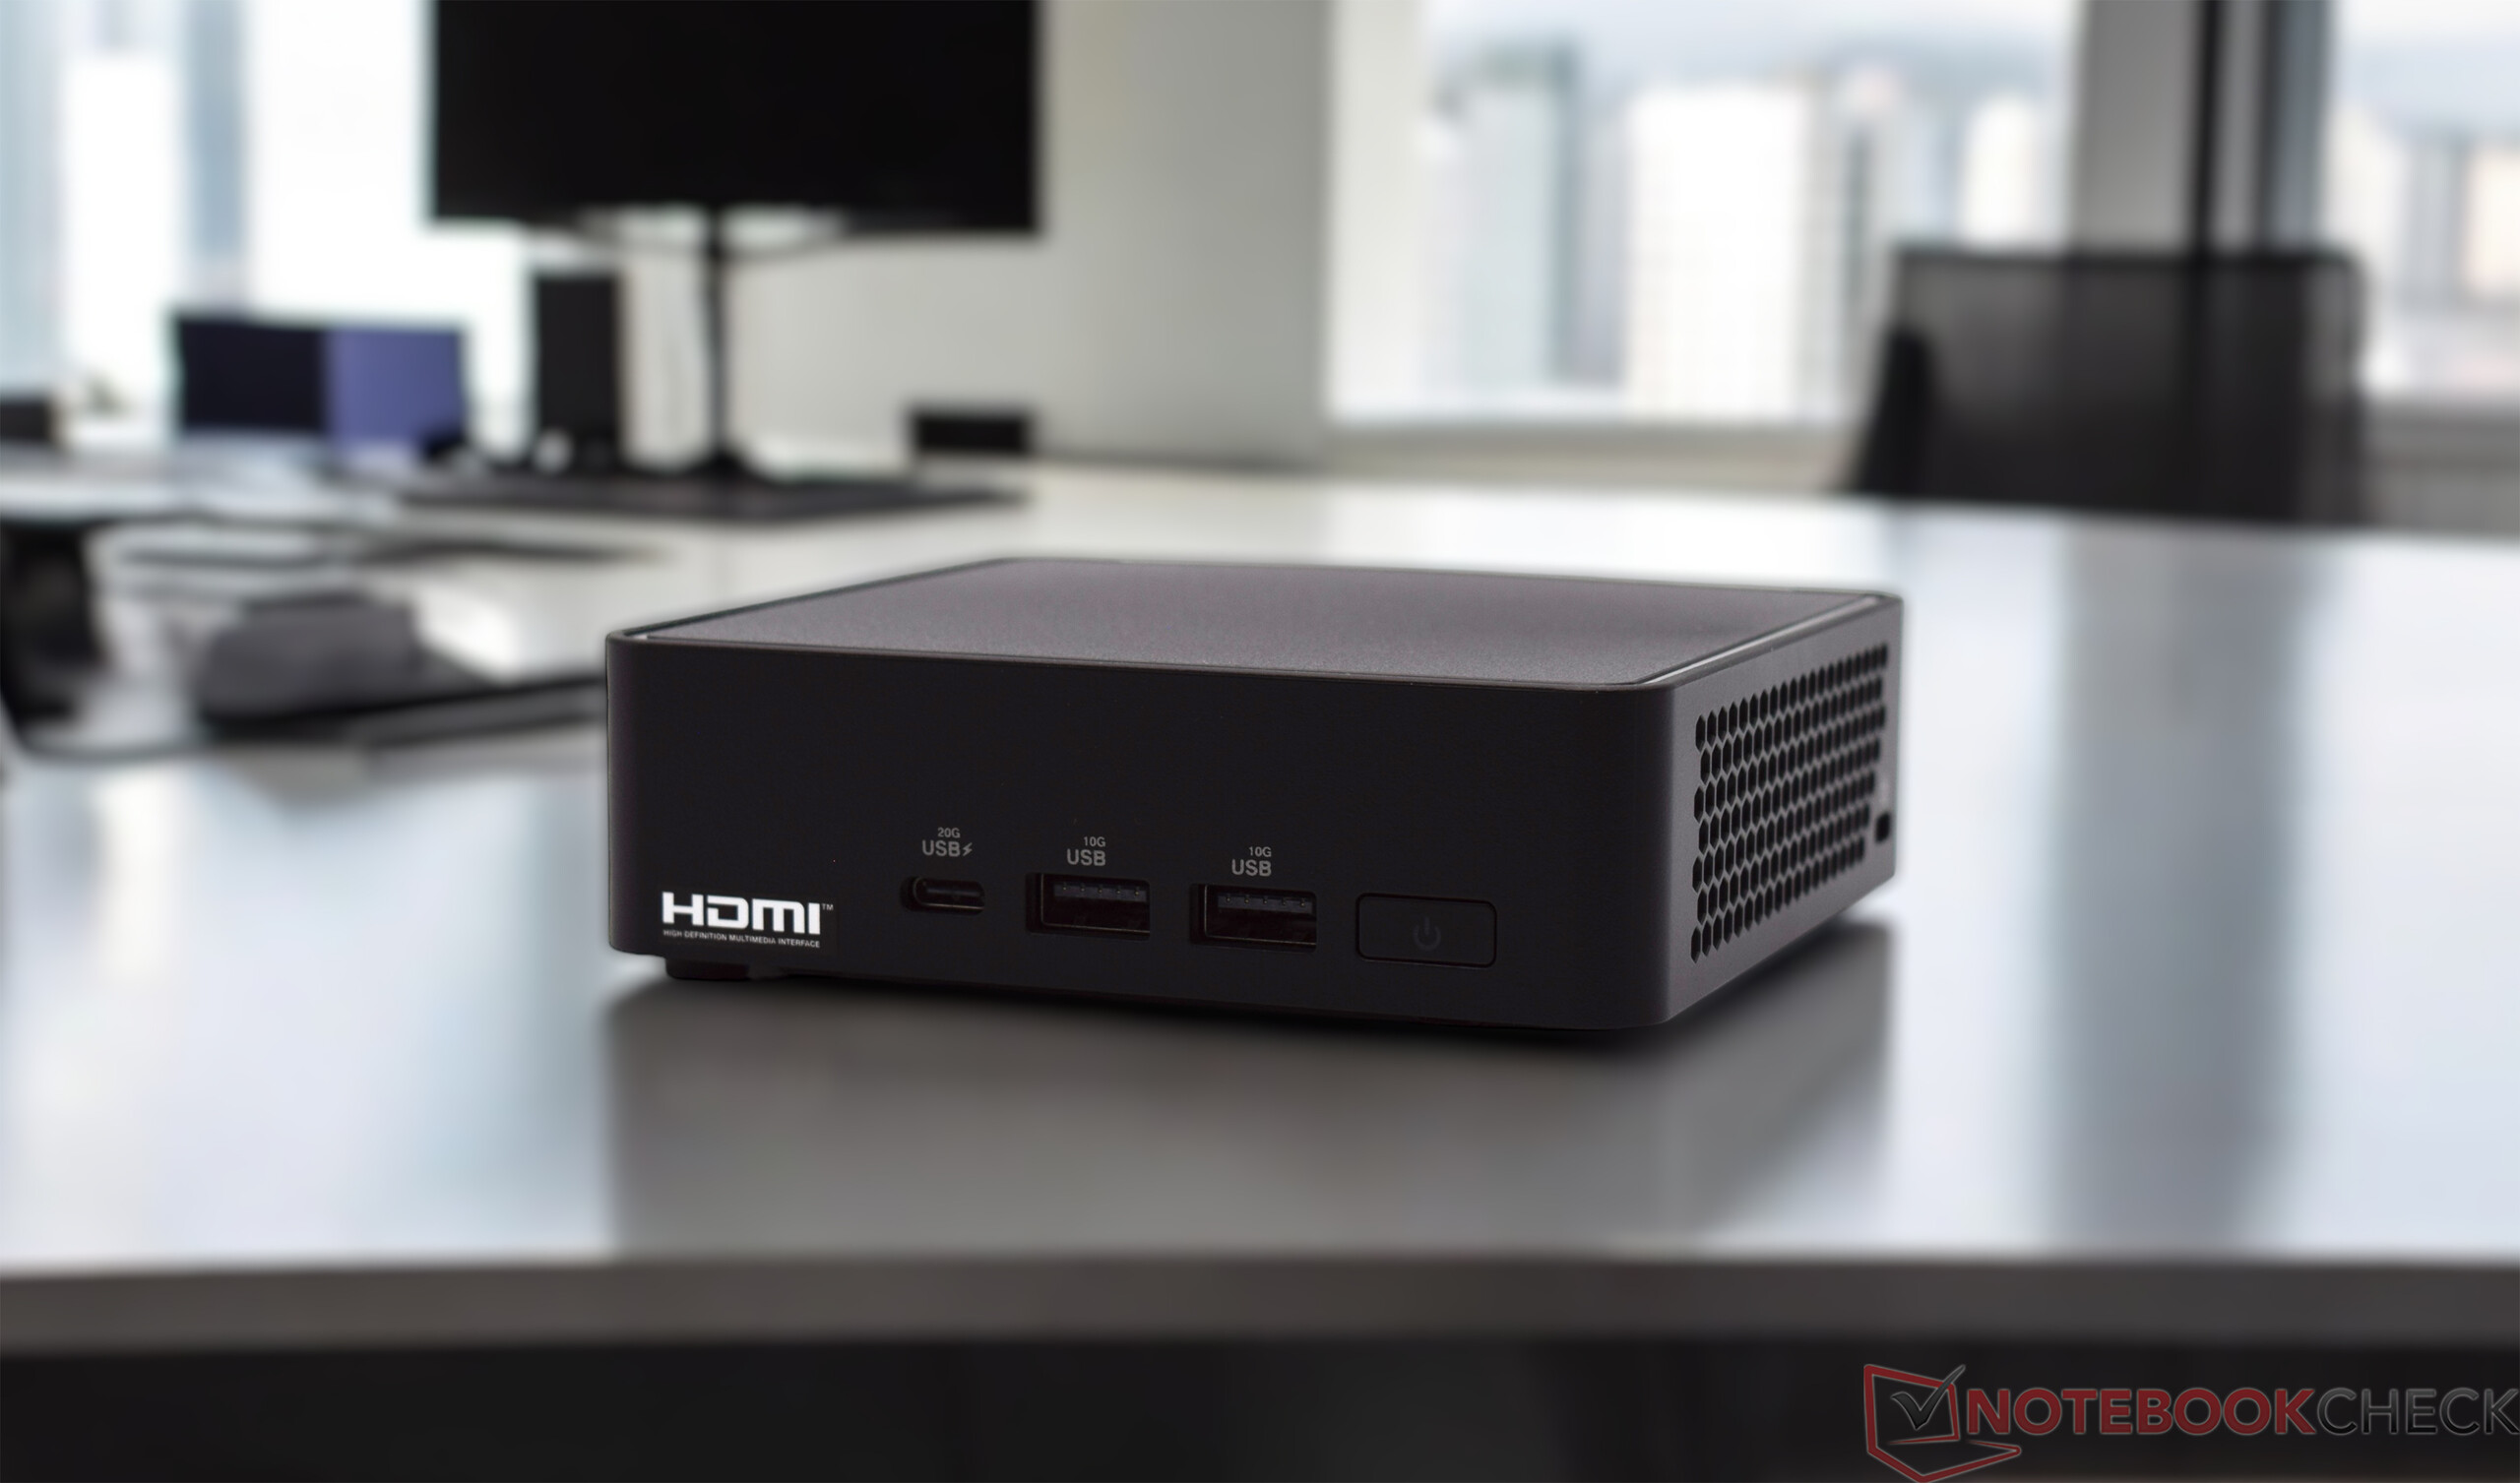
¡No es un punto culminante visual! Asus se ha hecho con la división NUC de Intel y ahora ofrece los populares mini PC con los procesadores Meteor Lake de Intel. Esto no sólo proporciona a los pequeños ordenadores de sobremesa más potencia de CPU, sino que también puede aumentar significativamente el rendimiento 3D gracias a la iGPU revisada. Hemos probado el Asus NUC 14 Pro con Intel Core Ultra 5 125H en detalle y evaluado el rendimiento basándonos en numerosas mediciones y pruebas comparativas.
Sebastian Bade, 👁 Sebastian Bade (traducido por DeepL / Ninh Duy) Published 🇺🇸 🇩🇪 ...
Mini PC Desktop Intel 3D Printing Meteor Lake Thunderbolt

La serie NUC (Next Unit of Computing), lanzada en su día por Intel, ha pasado a manos de Asus. Asus ofrece ahora los modelos conocidos con el mismo estilo, aunque también se están introduciendo dispositivos más nuevos. Basados en Intel Meteor Lake, los equipos informáticos compactos reciben más potencia y, sobre todo, se benefician de la iGPU revisada con arquitectura Arc. El Asus NUC 14 Pro está disponible con diferentes procesadores y, como es habitual, en una versión plana y ligeramente más gruesa, que ofrece espacio adicional para una unidad de 2,5 pulgadas. Probamos el Asus NUC 14 Pro en la opción delgada con un Intel Core Ultra 5 125H. El dispositivo nos llegó como barebone, lo que significa que tuvimos que instalar la RAM y la SSD antes de realizar las pruebas. El sistema operativo tampoco está incluido en el volumen de suministro. Tiene que poner algo más de 500 euros sobre la mesa para nuestra muestra de prueba. En comparación con sus competidores, es mucho si se tiene en cuenta que hay costes adicionales debido a la opción barebone. En comparación con las otras marcas, Asus es más conocida y ofrece mejor soporte.

Los competidores con los que enfrentamos al Asus NUC 14 Pro se enumeran en la tabla siguiente.

Asus NUC 14 Pro
Procesador
Intel Core Ultra 5 125H 14 x 3.6 - 4.5 GHz, 64 W PL2 / Short Burst, 64 W PL1 / Sustained, Meteor Lake-H
Adaptador gráfico
Intel Arc 7-Core iGPU, Núcleo: 2200 MHz, 32.0.101.5762 DCH
Placa base
Intel Meteor Lake-U/P/H PCH
Disco duro
Kingston KC3000 2048G SKC3000D2048G, 2048 GB 
, 1750 GB libre
Tarjeta de sonido
Intel Meteor Lake-U/P/H PCH - cAVS (Audio, Voice, Speech)
Conexiones
1 USB 2.0, 3 USB 3.0, 1 USB 3.2 Gen 2x2 20Gbps, 2 USB 4.0 40 Gbps, 2 Thunderbolt, USB-C Power Delivery (PD), 2 HDMI, 2 DisplayPort, 1 Kensington Lock
Equipamento de red
Intel Ethernet Controller I226-V (10/2500MBit/s), Intel Wi-Fi 6E AX211 (a/b/g/h/n = Wi-Fi 4/ac = Wi-Fi 5/ax = Wi-Fi 6/ Wi-Fi 6E 6 GHz), Bluetooth 5.3
Tamaño
Alto x ancho x profundidad (en mm): 37 x 117 x 112
Características adicionales
120W power adapter, VESA-Mount, 36 Meses Garantía
Peso
525 g, Suministro de Electricidad: 238 g
Precio
500 EUR
Note: The manufacturer may use components from different suppliers including display panels, drives or memory sticks with similar specifications.


Posibles contendientes en la comparación

Valoración
Version
Fecha
Modelo
Peso
Altura
Best Price
74.7 %v8
08/2024
Asus NUC 14 Pro
Ultra 5 125H, Arc 7-Core
525 g37 mm
78 %v8
07/2024
Geekom AE7
R9 7940HS, Radeon 780M
578 g49.2 mm
74.5 %v8
07/2024
Minisforum UH125 Pro
Ultra 5 125H, Arc 7-Core
797 g49 mm
73.7 %v8
Aoostar GEM10
R7 6800H, Radeon 680M
525 g60 mm
83.4 %v7 (old)
04/2024
Acemagic F2A
Ultra 7 155H, Arc 8-Core
768 g57 mm
81.2 %v7 (old)
10/2023
Geekom A5
R7 5800H, Vega 8
555 g49.2 mm

Nota: Hemos actualizado nuestro sistema de clasificación y los resultados de la versión 8 no son comparables con los de la versión 7 disponibles aquí.

Caja - La carcasa de plástico negro cubre la jaula metálica

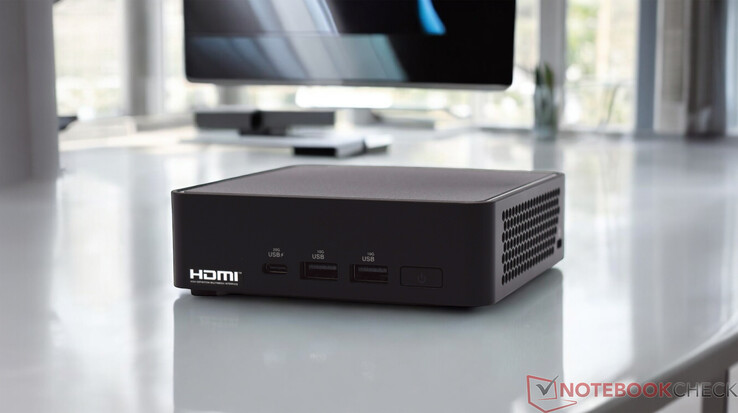
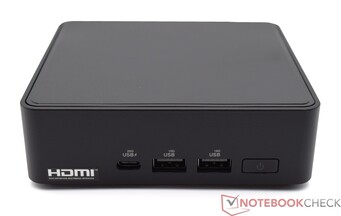
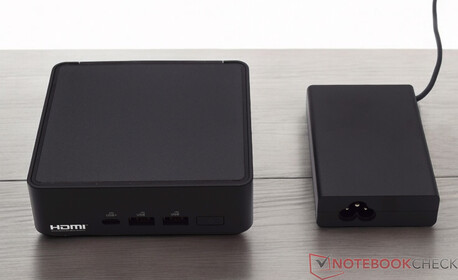
Visualmente, el Asus NUC 14 Pro recuerda al Kit Intel NUC 12 Pro aunque el diseño ha sido ligeramente revisado. Sin embargo, la elección de materiales es la misma. El concepto básico tampoco ha cambiado, ya que el plástico negro oculta un robusto marco metálico. Desde el punto de vista háptico, el Asus NUC 14 Pro es inferior a los Mini PC, que apuestan por una carcasa de aluminio. Como atractivo visual, el dispositivo de Asus tampoco convence si esto es importante para usted. Sin embargo, la mano de obra no ofrece ningún motivo de crítica. La parte inferior, por otra parte, ha sido rediseñada e incluye un cierre mecánico para abrir el dispositivo sin herramientas. La versión delgada, que probamos aquí, tiene un diseño muy plano con una altura de 37 milímetros. Con una huella casi cuadrada de 11,7 x 11,2 centímetros, el dispositivo ocupa poco espacio en el escritorio. El soporte VESA suministrado también permite montarlo sobre un monitor.

Comparación de tamaños

146 mm 146 mm 57 mm 768 g145 mm 145 mm 49 mm 797 g107 mm 107 mm 60 mm 525 g117 mm 112 mm 49.2 mm 578 g117 mm 112 mm 49.2 mm 555 g117 mm 112 mm 37 mm 525 g210 mm 148 mm 1 mm 2.9 g

Equipamiento

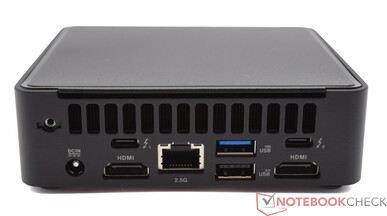
El mini PC Asus NUC 14 Pro ofrece muchas interfaces a pesar de su diseño compacto. Dispone de un total de seis puertos USB, cuatro de los cuales son tomas de tipo A ampliamente utilizadas, y otros dos son tomas de tipo C. Estos últimos también ofrecen compatibilidad total con Thunderbolt. Esto diferencia al Asus NUC 14 Pro de otros mini PC, que a menudo sólo ofrecen puertos USB 4 sencillos o puertos Tipo-C convencionales. También hay dos puertos HDMI y una conexión de red 2,5G.

Frontal: 1x USB 3.2 Gen2x2 Tipo-C, 2 x USB 3.2 Gen2 Tipo-A
Panel trasero: Conector de alimentación, 2x Thunderbold (Tipo C), 1x USB 3.2, 1x USB 2.0, LAN 2.5G, 2x HDMI 2.1

Comunicación

Módulo WLAN
Módulo WLAN

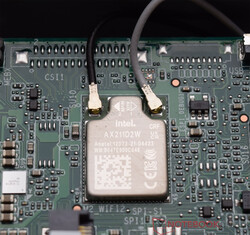
Asus equipa el NUC 14 Pro con el módulo Intel Wi-Fi 6E AX211, que ofrece unos resultados excelentes en la prueba. En combinación con el router ASUS ROG Rapture GT-AXE11000, documentamos resultados sistemáticamente mejores que con los dispositivos de comparación.

Networking
iperf3 receive AXE11000 6GHz
Acemagic F2A
Intel Wi-Fi 7 BE200 320MHz
1770 (1584min - 1790max) MBit/s +2%
Minisforum UH125 Pro
Intel Wi-Fi 6E AX210
1755 (1737min - 1766max) MBit/s +2%
Asus NUC 14 Pro
Intel Wi-Fi 6E AX211
1729 (1594min - 1755max) MBit/s
Geekom AE7
MediaTek Wi-Fi 6E MT7922 160MHz Wireless LAN Card
1528 (1495min - 1552max) MBit/s -12%
Average Intel Wi-Fi 6E AX211
  (700 - 1857, n=199)
1490 MBit/s -14%
Average of class Mini PC
  (684 - 1771, n=54, last 2 years)
1355 MBit/s -22%
iperf3 transmit AXE11000 6GHz
Geekom AE7
MediaTek Wi-Fi 6E MT7922 160MHz Wireless LAN Card
1699 (1590min - 1792max) MBit/s +23%
Acemagic F2A
Intel Wi-Fi 7 BE200 320MHz
1615 (767min - 1670max) MBit/s +17%
Minisforum UH125 Pro
Intel Wi-Fi 6E AX210
1605 (1238min - 1652max) MBit/s +16%
Asus NUC 14 Pro
Intel Wi-Fi 6E AX211
1379 (1299min - 1425max) MBit/s
Average Intel Wi-Fi 6E AX211
  (632 - 1851, n=200)
1368 MBit/s -1%
Average of class Mini PC
  (394 - 1800, n=55, last 2 years)
1290 MBit/s -6%
iperf3 receive AXE11000
Average Intel Wi-Fi 6E AX211
  (582 - 1890, n=226)
1389 MBit/s +1%
Asus NUC 14 Pro
Intel Wi-Fi 6E AX211
1379 (1016min - 1613max) MBit/s
Geekom A5
Realtek RTL8852BE
946 (856min - 970max) MBit/s -31%
Minisforum UH125 Pro
Intel Wi-Fi 6E AX210
936 (907min - 946max) MBit/s -32%
Average of class Mini PC
  (192.9 - 1796, n=108, last 2 years)
933 MBit/s -32%
Acemagic F2A
Intel Wi-Fi 7 BE200 320MHz
838 (728min - 926max) MBit/s -39%
Geekom AE7
MediaTek Wi-Fi 6E MT7922 160MHz Wireless LAN Card
707 (631min - 811max) MBit/s -49%
Aoostar GEM10
Intel Wi-Fi 6 AX200
451 (228min - 466max) MBit/s -67%
iperf3 transmit AXE11000
Asus NUC 14 Pro
Intel Wi-Fi 6E AX211
1331 (1187min - 1442max) MBit/s
Average Intel Wi-Fi 6E AX211
  (464 - 1861, n=226)
1244 MBit/s -7%
Average of class Mini PC
  (184.1 - 1776, n=108, last 2 years)
860 MBit/s -35%
Geekom A5
Realtek RTL8852BE
834 (730min - 861max) MBit/s -37%
Minisforum UH125 Pro
Intel Wi-Fi 6E AX210
758 (727min - 793max) MBit/s -43%
Acemagic F2A
Intel Wi-Fi 7 BE200 320MHz
709 (369min - 977max) MBit/s -47%
Geekom AE7
MediaTek Wi-Fi 6E MT7922 160MHz Wireless LAN Card
573 (145min - 972max) MBit/s -57%
Aoostar GEM10
Intel Wi-Fi 6 AX200
429 (325min - 510max) MBit/s -68%
0501001502002503003504004505005506006507007508008509009501000105011001150120012501300135014001450150015501600165017001750Tooltip
Asus NUC 14 Pro Intel Wi-Fi 6E AX211; iperf3 transmit AXE11000 6GHz; iperf 3.1.3: Ø1379 (1299-1425)
Geekom AE7 MediaTek Wi-Fi 6E MT7922 160MHz Wireless LAN Card; iperf3 transmit AXE11000 6GHz; iperf 3.1.3: Ø1700 (1590-1792)
Minisforum UH125 Pro Intel Wi-Fi 6E AX210; iperf3 transmit AXE11000 6GHz; iperf 3.1.3: Ø1605 (1238-1652)
Acemagic F2A Intel Wi-Fi 7 BE200 320MHz; iperf3 transmit AXE11000 6GHz; iperf 3.1.3: Ø1590 (767-1670)
Asus NUC 14 Pro Intel Wi-Fi 6E AX211; iperf3 receive AXE11000 6GHz; iperf 3.1.3: Ø1728 (1594-1755)
Geekom AE7 MediaTek Wi-Fi 6E MT7922 160MHz Wireless LAN Card; iperf3 receive AXE11000 6GHz; iperf 3.1.3: Ø1527 (1495-1552)
Minisforum UH125 Pro Intel Wi-Fi 6E AX210; iperf3 receive AXE11000 6GHz; iperf 3.1.3: Ø1755 (1737-1766)
Acemagic F2A Intel Wi-Fi 7 BE200 320MHz; iperf3 receive AXE11000 6GHz; iperf 3.1.3: Ø1769 (1584-1790)
Asus NUC 14 Pro Intel Wi-Fi 6E AX211; iperf3 receive AXE11000; iperf 3.1.3: Ø1379 (1016-1613)
Geekom AE7 MediaTek Wi-Fi 6E MT7922 160MHz Wireless LAN Card; iperf3 receive AXE11000; iperf 3.1.3: Ø707 (631-811)
Minisforum UH125 Pro Intel Wi-Fi 6E AX210; iperf3 receive AXE11000; iperf 3.1.3: Ø935 (907-946)
Acemagic F2A Intel Wi-Fi 7 BE200 320MHz; iperf3 receive AXE11000; iperf 3.1.3: Ø838 (728-926)
Asus NUC 14 Pro Intel Wi-Fi 6E AX211; iperf3 transmit AXE11000; iperf 3.1.3: Ø1331 (1187-1442)
Geekom AE7 MediaTek Wi-Fi 6E MT7922 160MHz Wireless LAN Card; iperf3 transmit AXE11000; iperf 3.1.3: Ø558 (145-972)
Minisforum UH125 Pro Intel Wi-Fi 6E AX210; iperf3 transmit AXE11000; iperf 3.1.3: Ø758 (727-793)
Acemagic F2A Intel Wi-Fi 7 BE200 320MHz; iperf3 transmit AXE11000; iperf 3.1.3: Ø695 (369-977)

Accesorios

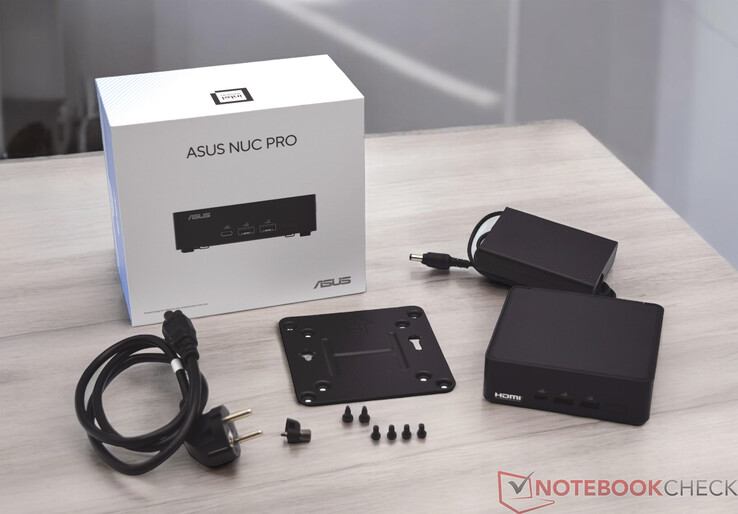
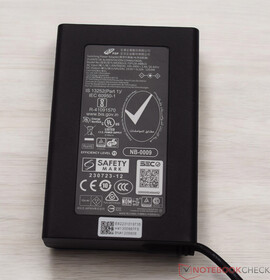
El Asus NUC 14 Pro viene con una fuente de alimentación de 120 vatios y un soporte VESA con material de montaje. El fabricante no incluye ningún otro accesorio como teclado o ratón.

Volumen de suministro del Asus NUC 14 Pro

Mantenimiento

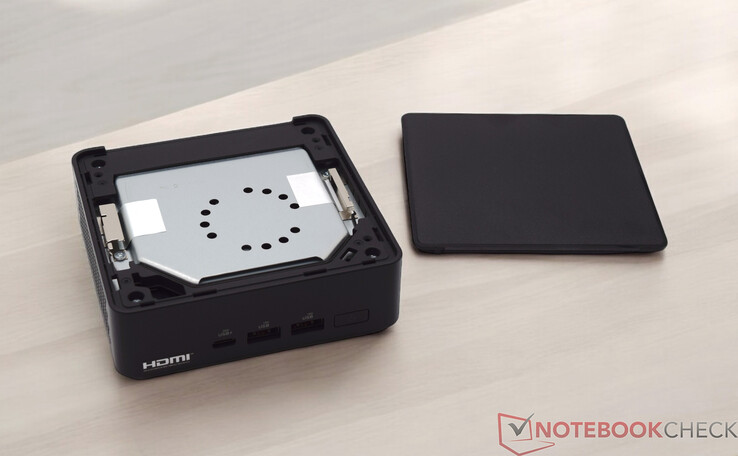
Recibimos el Asus NUC 14 Pro en la versión barebone, lo que significa que la RAM, el SSD y el sistema operativo no están incluidos en el volumen de suministro. Por ello, es importante que el usuario pueda abrir fácilmente el dispositivo para instalar por sí mismo los componentes que faltan. En el caso del Asus NUC 14 Pro, la placa base puede extraerse fácilmente y sin herramientas. El fabricante ha integrado un pequeño pestillo mecánico que lo hace posible: La RAM y la SSD pueden instalarse rápidamente y, a continuación, el mini PC está listo para el primer arranque. Se pueden instalar dos unidades SSD en el dispositivo y se proporcionan dos ranuras SO-DIMM para la RAM. Para un funcionamiento óptimo, ambas ranuras SO-DIMM deben estar ocupadas.

Asus NUC 14 Pro sin tapa de carcasa
Asus NUC 14 Pro con la parte inferior abierta
Placa de circuito con unidad de refrigeración
Asus NUC 14 Pro desmontado
Asus NUC 14 Pro sin carcasa de plástico
Cubierta de plástico vacía

Sostenibilidad

El Asus NUC 14 Pro es un mini PC muy compacto, que presenta ventajas significativas en términos de consumo de energía en comparación con un PC de sobremesa convencional. El dispositivo se entrega en una pequeña caja, que no es excesivamente grande. El mini PC en sí está fabricado principalmente en metal y plástico. No sabemos si en el proceso de producción se utilizan materiales especialmente reciclados. Asus recibe elogios por el periodo de garantía de tres años.

Rendimiento

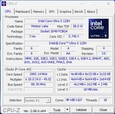
El Intel Core Ultra 5 125H es un sólido pero potente SoC de gama media de la serie Meteor Lake de Intel. El gran número de núcleos de computación física que trae consigo el SoC garantiza en última instancia un buen rendimiento multihilo. El SoC Meteor Lake también cuenta con una iGPU revisada, que ofrece un rendimiento notablemente superior al de las anticuadas iGPU Intel Iris Xe de la serie predecesora basadas en la arquitectura Arc. El Asus NUC 14 Pro también está disponible con un Intel Core 3 100U ligeramente más débil, así como con una variante ligeramente más potente con el SoC Intel Core Ultra 7.

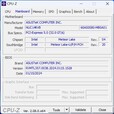
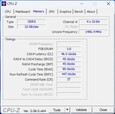
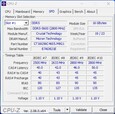
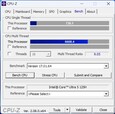
CPU-Z
CPU-Z
CPU-Z
CPU-Z
CPU-Z
CPU-Z
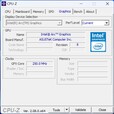
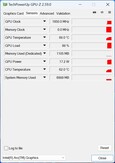
GPU-Z
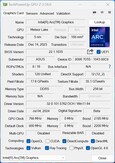
GPU-Z
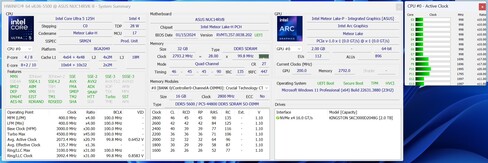
HWiNFO

Condiciones de la prueba

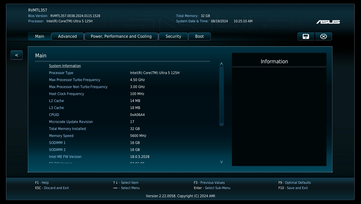
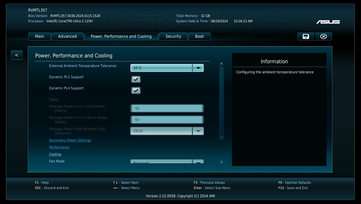
Realizamos todas las pruebas de rendimiento con el perfil de energía Equilibrado. No modificamos el rendimiento del SoC y lo dejamos en su estado predeterminado según los ajustes de la BIOS (Equilibrado). Los ajustes de la BIOS son muy amplios. En comparación con los mini PC de Geekom, Minisforum o Acemagic, Asus está claramente por delante en este aspecto. Además del consumo de energía de la CPU, se pueden desactivar incluso puertos USB individuales.

Procesador

En nuestro caso, el Asus NUC 14 Pro está alimentado por un Intel Core Ultra 5 125H. 14 núcleos con un total de 18 hilos garantizan una alta velocidad de trabajo, lo que sitúa a nuestra muestra de prueba en un buen tercer puesto. El límite de potencia del procesador es de 64 vatios y se alcanza repetidamente durante periodos cortos. En escenarios de carga más largos, el SoC sólo se ralentiza debido a temperaturas excesivas. Estas superan entonces los 100 °C bajo carga y no son infrecuentes. Asus no parece ralentizar más el SoC Intel en este caso, ya que el SoC está especificado con una temperatura máxima de funcionamiento de 110 °C según las especificaciones. Una comparación directa con el Minisforum UH125 Pro la gana nuestra muestra de prueba de Asus. En las pruebas individuales, el Asus NUC 14 Pro tiene una ligera ventaja con un rendimiento de un solo núcleo consistentemente mejor.

Para más comparaciones y pruebas comparativas, consulte nuestra Tabla comparativa de CPU.

Cinebench R15
Cinebench R15
Cinebench R20
Cinebench R20
Cinebench R23
Cinebench R23
Cinebench 2024
Cinebench 2024
Performance Rating - Percent
Geekom AE7
AMD Ryzen 9 7940HS
58.2 pt
Acemagic F2A
Intel Core Ultra 7 155H
56.4 pt
Asus NUC 14 Pro
Intel Core Ultra 5 125H
51.9 pt
Aoostar GEM10
AMD Ryzen 7 6800H
51.3 pt
Minisforum UH125 Pro
Intel Core Ultra 5 125H
51.1 pt
Geekom A5
AMD Ryzen 7 5800H
49.5 pt
Cinebench 2024
CPU Multi Core
Acemagic F2A
Intel Core Ultra 7 155H
1022 Points +25%
Geekom AE7
AMD Ryzen 9 7940HS
946 Points +16%
Asus NUC 14 Pro
Intel Core Ultra 5 125H
815 Points
Minisforum UH125 Pro
Intel Core Ultra 5 125H
814 Points 0%
Aoostar GEM10
AMD Ryzen 7 6800H
709 Points -13%
Geekom A5
AMD Ryzen 7 5800H
618 Points -24%
CPU Single Core
Geekom AE7
AMD Ryzen 9 7940HS
108 Points +6%
Acemagic F2A
Intel Core Ultra 7 155H
106 Points +4%
Asus NUC 14 Pro
Intel Core Ultra 5 125H
102 Points
Minisforum UH125 Pro
Intel Core Ultra 5 125H
97 Points -5%
Aoostar GEM10
AMD Ryzen 7 6800H
88 Points -14%
Geekom A5
AMD Ryzen 7 5800H
86 Points -16%
Cinebench R23
Multi Core
Acemagic F2A
Intel Core Ultra 7 155H
18497 Points +27%
Geekom AE7
AMD Ryzen 9 7940HS
16099 Points +11%
Minisforum UH125 Pro
Intel Core Ultra 5 125H
14564 Points 0%
Asus NUC 14 Pro
Intel Core Ultra 5 125H
14516 Points
Aoostar GEM10
AMD Ryzen 7 6800H
13117 Points -10%
Geekom A5
AMD Ryzen 7 5800H
10819 Points -25%
Single Core
Geekom AE7
AMD Ryzen 9 7940HS
1788 Points +4%
Acemagic F2A
Intel Core Ultra 7 155H
1771 Points +3%
Asus NUC 14 Pro
Intel Core Ultra 5 125H
1721 Points
Minisforum UH125 Pro
Intel Core Ultra 5 125H
1640 Points -5%
Aoostar GEM10
AMD Ryzen 7 6800H
1542 Points -10%
Geekom A5
AMD Ryzen 7 5800H
1405 Points -18%
Cinebench R20
CPU (Single Core)
Geekom AE7
AMD Ryzen 9 7940HS
700 Points +13%
Acemagic F2A
Intel Core Ultra 7 155H
679 Points +9%
Minisforum UH125 Pro
Intel Core Ultra 5 125H
629 Points +1%
Asus NUC 14 Pro
Intel Core Ultra 5 125H
622 Points
Aoostar GEM10
AMD Ryzen 7 6800H
598 Points -4%
Geekom A5
AMD Ryzen 7 5800H
551 Points -11%
CPU (Multi Core)
Acemagic F2A
Intel Core Ultra 7 155H
7188 Points +28%
Geekom AE7
AMD Ryzen 9 7940HS
6321 Points +13%
Minisforum UH125 Pro
Intel Core Ultra 5 125H
5618 Points 0%
Asus NUC 14 Pro
Intel Core Ultra 5 125H
5617 Points
Aoostar GEM10
AMD Ryzen 7 6800H
5216 Points -7%
Geekom A5
AMD Ryzen 7 5800H
4229 Points -25%
Cinebench R15
CPU Single 64Bit
Geekom AE7
AMD Ryzen 9 7940HS
281 Points +13%
Acemagic F2A
Intel Core Ultra 7 155H
258 Points +4%
Asus NUC 14 Pro
Intel Core Ultra 5 125H
248 Points
Aoostar GEM10
AMD Ryzen 7 6800H
240 Points -3%
Minisforum UH125 Pro
Intel Core Ultra 5 125H
235 Points -5%
Geekom A5
AMD Ryzen 7 5800H
227 Points -8%
CPU Multi 64Bit
Acemagic F2A
Intel Core Ultra 7 155H
2738 Points +28%
Geekom AE7
AMD Ryzen 9 7940HS
2544 Points +19%
Minisforum UH125 Pro
Intel Core Ultra 5 125H
2245 Points +5%
Asus NUC 14 Pro
Intel Core Ultra 5 125H
2141 Points
Aoostar GEM10
AMD Ryzen 7 6800H
2117 Points -1%
Geekom A5
AMD Ryzen 7 5800H
1773 Points -17%
Cinebench R11.5
CPU Single 64Bit
Geekom AE7
AMD Ryzen 9 7940HS
3.38 Points +12%
Acemagic F2A
Intel Core Ultra 7 155H
3.13 Points +3%
Asus NUC 14 Pro
Intel Core Ultra 5 125H
3.03 Points
Aoostar GEM10
AMD Ryzen 7 6800H
2.86 Points -6%
Minisforum UH125 Pro
Intel Core Ultra 5 125H
2.86 Points -6%
Geekom A5
AMD Ryzen 7 5800H
2.69 Points -11%
CPU Multi 64Bit
Acemagic F2A
Intel Core Ultra 7 155H
33.49 Points +24%
Geekom AE7
AMD Ryzen 9 7940HS
30.49 Points +13%
Minisforum UH125 Pro
Intel Core Ultra 5 125H
27.02 Points 0%
Asus NUC 14 Pro
Intel Core Ultra 5 125H
26.92 Points
Aoostar GEM10
AMD Ryzen 7 6800H
24.57 Points -9%
Geekom A5
AMD Ryzen 7 5800H
21.25 Points -21%
Cinebench R10
Rendering Single CPUs 64Bit
Geekom AE7
AMD Ryzen 9 7940HS
14232 Points +7%
Acemagic F2A
Intel Core Ultra 7 155H
13938 Points +5%
Asus NUC 14 Pro
Intel Core Ultra 5 125H
13281 Points
Minisforum UH125 Pro
Intel Core Ultra 5 125H
12858 Points -3%
Aoostar GEM10
AMD Ryzen 7 6800H
12142 Points -9%
Geekom A5
AMD Ryzen 7 5800H
11378 Points -14%
Rendering Multiple CPUs 64Bit
Acemagic F2A
Intel Core Ultra 7 155H
95005 Points +21%
Geekom AE7
AMD Ryzen 9 7940HS
87296 Points +11%
Minisforum UH125 Pro
Intel Core Ultra 5 125H
78817 Points 0%
Asus NUC 14 Pro
Intel Core Ultra 5 125H
78788 Points
Aoostar GEM10
AMD Ryzen 7 6800H
70792 Points -10%
Geekom A5
AMD Ryzen 7 5800H
62312 Points -21%
Blender - v2.79 BMW27 CPU
Geekom A5
AMD Ryzen 7 5800H
293 Seconds * -29%
Aoostar GEM10
AMD Ryzen 7 6800H
259 Seconds * -14%
Minisforum UH125 Pro
Intel Core Ultra 5 125H
230 Seconds * -1%
Asus NUC 14 Pro
Intel Core Ultra 5 125H
228 Seconds *
Geekom AE7
AMD Ryzen 9 7940HS
197 Seconds * +14%
Acemagic F2A
Intel Core Ultra 7 155H
178 Seconds * +22%
wPrime 2.10
32m
Minisforum UH125 Pro
Intel Core Ultra 5 125H
4.48 s * -9%
Asus NUC 14 Pro
Intel Core Ultra 5 125H
4.107 s *
Geekom A5
AMD Ryzen 7 5800H
3.93 s * +4%
Aoostar GEM10
AMD Ryzen 7 6800H
3.55 s * +14%
Acemagic F2A
Intel Core Ultra 7 155H
3.523 s * +14%
Geekom AE7
AMD Ryzen 9 7940HS
2.699 s * +34%
1024m
Minisforum UH125 Pro
Intel Core Ultra 5 125H
246.982 s * -66%
Asus NUC 14 Pro
Intel Core Ultra 5 125H
148.994 s *
Acemagic F2A
Intel Core Ultra 7 155H
139.617 s * +6%
Geekom A5
AMD Ryzen 7 5800H
111.714 s * +25%
Aoostar GEM10
AMD Ryzen 7 6800H
97.298 s * +35%
Geekom AE7
AMD Ryzen 9 7940HS
96.95 s * +35%
X264 HD Benchmark 4.0
Pass 1
Acemagic F2A
Intel Core Ultra 7 155H
325 (323min - 328max) fps +5%
Asus NUC 14 Pro
Intel Core Ultra 5 125H
308.5 (306min - 311max) fps
Minisforum UH125 Pro
Intel Core Ultra 5 125H
304.5 (304min - 306max) fps -1%
Geekom AE7
AMD Ryzen 9 7940HS
288 (287min - 289max) fps -7%
Aoostar GEM10
AMD Ryzen 7 6800H
251.5 (250min - 256max) fps -18%
Geekom A5
AMD Ryzen 7 5800H
244 (242min - 246max) fps -21%
Pass 2
Acemagic F2A
Intel Core Ultra 7 155H
154.15 (153.8min - 154.3max) fps +17%
Geekom AE7
AMD Ryzen 9 7940HS
144.15 (143.5min - 146.6max) fps +9%
Minisforum UH125 Pro
Intel Core Ultra 5 125H
134 (133.7min - 134.5max) fps +1%
Asus NUC 14 Pro
Intel Core Ultra 5 125H
132.3 (129.2min - 135max) fps
Aoostar GEM10
AMD Ryzen 7 6800H
122.2 (120.3min - 126.1max) fps -8%
Geekom A5
AMD Ryzen 7 5800H
104.65 (104.1min - 106.9max) fps -21%
WinRAR - Result
Acemagic F2A
Intel Core Ultra 7 155H
7723 KB/s +22%
Geekom AE7
AMD Ryzen 9 7940HS
7580 KB/s +20%
Geekom A5
AMD Ryzen 7 5800H
7042 KB/s +12%
Asus NUC 14 Pro
Intel Core Ultra 5 125H
6315 KB/s
Aoostar GEM10
AMD Ryzen 7 6800H
5890 KB/s -7%
Minisforum UH125 Pro
Intel Core Ultra 5 125H
5594 KB/s -11%
TrueCrypt
AES Mean 100MB
Geekom AE7
AMD Ryzen 9 7940HS
15.2 GB/s +73%
Aoostar GEM10
AMD Ryzen 7 6800H
13.5 GB/s +53%
Geekom A5
AMD Ryzen 7 5800H
11.5 GB/s +31%
Acemagic F2A
Intel Core Ultra 7 155H
10.6 GB/s +20%
Minisforum UH125 Pro
Intel Core Ultra 5 125H
9 GB/s +2%
Asus NUC 14 Pro
Intel Core Ultra 5 125H
8.8 GB/s
Twofish Mean 100MB
Geekom AE7
AMD Ryzen 9 7940HS
2.1 GB/s +50%
Aoostar GEM10
AMD Ryzen 7 6800H
1.8 GB/s +29%
Acemagic F2A
Intel Core Ultra 7 155H
1.7 GB/s +21%
Geekom A5
AMD Ryzen 7 5800H
1.6 GB/s +14%
Minisforum UH125 Pro
Intel Core Ultra 5 125H
1.4 GB/s 0%
Asus NUC 14 Pro
Intel Core Ultra 5 125H
1.4 GB/s
Serpent Mean 100MB
Geekom AE7
AMD Ryzen 9 7940HS
1.4 GB/s +61%
Aoostar GEM10
AMD Ryzen 7 6800H
1.2 GB/s +38%
Geekom A5
AMD Ryzen 7 5800H
1 GB/s +15%
Acemagic F2A
Intel Core Ultra 7 155H
1 GB/s +15%
Asus NUC 14 Pro
Intel Core Ultra 5 125H
0.869 GB/s
Minisforum UH125 Pro
Intel Core Ultra 5 125H
0.854 GB/s -2%
Geekbench 5.5
Multi-Core
Acemagic F2A
Intel Core Ultra 7 155H
12662 Points +17%
Geekom AE7
AMD Ryzen 9 7940HS
12228 Points +13%
Asus NUC 14 Pro
Intel Core Ultra 5 125H
10856 Points
Minisforum UH125 Pro
Intel Core Ultra 5 125H
10788 Points -1%
Aoostar GEM10
AMD Ryzen 7 6800H
8898 Points -18%
Geekom A5
AMD Ryzen 7 5800H
8823 Points -19%
Single-Core
Geekom AE7
AMD Ryzen 9 7940HS
1986 Points +18%
Acemagic F2A
Intel Core Ultra 7 155H
1746 Points +4%
Asus NUC 14 Pro
Intel Core Ultra 5 125H
1685 Points
Minisforum UH125 Pro
Intel Core Ultra 5 125H
1593 Points -5%
Aoostar GEM10
AMD Ryzen 7 6800H
1552 Points -8%
Geekom A5
AMD Ryzen 7 5800H
1494 Points -11%
Geekbench 5.0
5.0 Multi-Core
Acemagic F2A
Intel Core Ultra 7 155H
12438 Points +16%
Geekom AE7
AMD Ryzen 9 7940HS
12141 Points +13%
Asus NUC 14 Pro
Intel Core Ultra 5 125H
10747 Points
Minisforum UH125 Pro
Intel Core Ultra 5 125H
10676 Points -1%
Aoostar GEM10
AMD Ryzen 7 6800H
8868 Points -17%
Geekom A5
AMD Ryzen 7 5800H
8568 Points -20%
5.0 Single-Core
Geekom AE7
AMD Ryzen 9 7940HS
1905 Points +15%
Acemagic F2A
Intel Core Ultra 7 155H
1708 Points +3%
Asus NUC 14 Pro
Intel Core Ultra 5 125H
1659 Points
Minisforum UH125 Pro
Intel Core Ultra 5 125H
1596 Points -4%
Aoostar GEM10
AMD Ryzen 7 6800H
1509 Points -9%
Geekom A5
AMD Ryzen 7 5800H
1421 Points -14%
Geekbench 4.4
64 Bit Single-Core Score
Geekom AE7
AMD Ryzen 9 7940HS
8125 Points +17%
Asus NUC 14 Pro
Intel Core Ultra 5 125H
6964 Points
Acemagic F2A
Intel Core Ultra 7 155H
6927 Points -1%
Minisforum UH125 Pro
Intel Core Ultra 5 125H
6734 Points -3%
Aoostar GEM10
AMD Ryzen 7 6800H
6341 Points -9%
Geekom A5
AMD Ryzen 7 5800H
6295 Points -10%
64 Bit Multi-Core Score
Geekom AE7
AMD Ryzen 9 7940HS
49341 Points +27%
Acemagic F2A
Intel Core Ultra 7 155H
45250 Points +17%
Asus NUC 14 Pro
Intel Core Ultra 5 125H
38793 Points
Minisforum UH125 Pro
Intel Core Ultra 5 125H
38648 Points 0%
Aoostar GEM10
AMD Ryzen 7 6800H
35898 Points -7%
Geekom A5
AMD Ryzen 7 5800H
34200 Points -12%
3DMark 11 - 1280x720 Performance Physics
Geekom AE7
AMD Ryzen 9 7940HS
22237 Points +26%
Acemagic F2A
Intel Core Ultra 7 155H
20846 Points +18%
Asus NUC 14 Pro
Intel Core Ultra 5 125H
17624 Points
Minisforum UH125 Pro
Intel Core Ultra 5 125H
17138 Points -3%
Geekom A5
AMD Ryzen 7 5800H
16933 Points -4%
Aoostar GEM10
AMD Ryzen 7 6800H
16034 Points -9%
7-Zip 18.03
7z b 4
Geekom AE7
AMD Ryzen 9 7940HS
71631 MIPS
Acemagic F2A
Intel Core Ultra 7 155H
66438 MIPS
Aoostar GEM10
AMD Ryzen 7 6800H
55067 MIPS
Geekom A5
AMD Ryzen 7 5800H
53954 MIPS
Minisforum UH125 Pro
Intel Core Ultra 5 125H
0 MIPS
Asus NUC 14 Pro
Intel Core Ultra 5 125H
0 MIPS
7z b 4 -mmt1
Geekom AE7
AMD Ryzen 9 7940HS
6661 MIPS +30%
Aoostar GEM10
AMD Ryzen 7 6800H
5521 MIPS +7%
Geekom A5
AMD Ryzen 7 5800H
5486 MIPS +7%
Acemagic F2A
Intel Core Ultra 7 155H
5485 MIPS +7%
Asus NUC 14 Pro
Intel Core Ultra 5 125H
5136 MIPS
Minisforum UH125 Pro
Intel Core Ultra 5 125H
4699 MIPS -9%
HWBOT x265 Benchmark v2.2 - 4k Preset
Geekom AE7
AMD Ryzen 9 7940HS
20.9 fps +33%
Acemagic F2A
Intel Core Ultra 7 155H
19.6 fps +25%
Minisforum UH125 Pro
Intel Core Ultra 5 125H
16.7 fps +6%
Asus NUC 14 Pro
Intel Core Ultra 5 125H
15.7 fps
Aoostar GEM10
AMD Ryzen 7 6800H
14.9 fps -5%
Geekom A5
AMD Ryzen 7 5800H
13.3 fps -15%
R Benchmark 2.5 - Overall mean
Geekom A5
AMD Ryzen 7 5800H
0.523 sec * -5%
Aoostar GEM10
AMD Ryzen 7 6800H
0.515 sec * -3%
Minisforum UH125 Pro
Intel Core Ultra 5 125H
0.513 sec * -3%
Asus NUC 14 Pro
Intel Core Ultra 5 125H
0.4982 sec *
Acemagic F2A
Intel Core Ultra 7 155H
0.4652 sec * +7%
Geekom AE7
AMD Ryzen 9 7940HS
0.4346 sec * +13%
LibreOffice - 20 Documents To PDF
Minisforum UH125 Pro
Intel Core Ultra 5 125H
70.9 s * -27%
Asus NUC 14 Pro
Intel Core Ultra 5 125H
55.7 s *
Geekom A5
AMD Ryzen 7 5800H
54.3 s * +3%
Geekom AE7
AMD Ryzen 9 7940HS
53.7 s * +4%
Aoostar GEM10
AMD Ryzen 7 6800H
51.2 s * +8%
Acemagic F2A
Intel Core Ultra 7 155H
44.5 s * +20%
WebXPRT 3 - Overall
Geekom AE7
AMD Ryzen 9 7940HS
323 Points +27%
Acemagic F2A
Intel Core Ultra 7 155H
276 Points +9%
Aoostar GEM10
AMD Ryzen 7 6800H
275 Points +8%
Geekom A5
AMD Ryzen 7 5800H
269 Points +6%
Minisforum UH125 Pro
Intel Core Ultra 5 125H
254 Points 0%
Asus NUC 14 Pro
Intel Core Ultra 5 125H
254 Points
Mozilla Kraken 1.1 - Total
Geekom A5
AMD Ryzen 7 5800H
653 ms * -15%
Minisforum UH125 Pro
Intel Core Ultra 5 125H
595 ms * -5%
Aoostar GEM10
AMD Ryzen 7 6800H
591 ms * -4%
Asus NUC 14 Pro
Intel Core Ultra 5 125H
567 ms *
Acemagic F2A
Intel Core Ultra 7 155H
535 ms * +6%
Geekom AE7
AMD Ryzen 9 7940HS
510 ms * +10%
3DMark
1920x1080 Fire Strike Physics
Geekom AE7
AMD Ryzen 9 7940HS
26617 Points +16%
Acemagic F2A
Intel Core Ultra 7 155H
25043 Points +10%
Aoostar GEM10
AMD Ryzen 7 6800H
23807 Points +4%
Asus NUC 14 Pro
Intel Core Ultra 5 125H
22863 Points
Geekom A5
AMD Ryzen 7 5800H
22433 Points -2%
Minisforum UH125 Pro
Intel Core Ultra 5 125H
21391 Points -6%
2560x1440 Time Spy CPU
Geekom AE7
AMD Ryzen 9 7940HS
11049 Points +27%
Acemagic F2A
Intel Core Ultra 7 155H
10014 Points +15%
Minisforum UH125 Pro
Intel Core Ultra 5 125H
9182 Points +5%
Asus NUC 14 Pro
Intel Core Ultra 5 125H
8719 Points
Geekom A5
AMD Ryzen 7 5800H
8481 Points -3%
Aoostar GEM10
AMD Ryzen 7 6800H
8128 Points -7%
Super Pi mod 1.5 XS 1M - 1M
Geekom A5
AMD Ryzen 7 5800H
9.415 s * -26%
Aoostar GEM10
AMD Ryzen 7 6800H
7.839 s * -5%
Minisforum UH125 Pro
Intel Core Ultra 5 125H
7.744 s * -4%
Asus NUC 14 Pro
Intel Core Ultra 5 125H
7.444 s *
Acemagic F2A
Intel Core Ultra 7 155H
7.168 s * +4%
Geekom AE7
AMD Ryzen 9 7940HS
7.158 s * +4%
Super Pi mod 1.5 XS 2M - 2M
Geekom A5
AMD Ryzen 7 5800H
20.257 s * -23%
Aoostar GEM10
AMD Ryzen 7 6800H
19.101 s * -16%
Geekom AE7
AMD Ryzen 9 7940HS
17.904 s * -9%
Minisforum UH125 Pro
Intel Core Ultra 5 125H
16.967 s * -3%
Asus NUC 14 Pro
Intel Core Ultra 5 125H
16.446 s *
Acemagic F2A
Intel Core Ultra 7 155H
16.125 s * +2%
Super Pi Mod 1.5 XS 32M - 32M
Aoostar GEM10
AMD Ryzen 7 6800H
694.152 s * -76%
Geekom AE7
AMD Ryzen 9 7940HS
653.976 s * -66%
Geekom A5
AMD Ryzen 7 5800H
472.992 s * -20%
Minisforum UH125 Pro
Intel Core Ultra 5 125H
423.565 s * -7%
Acemagic F2A
Intel Core Ultra 7 155H
394.754 s * -0%
Asus NUC 14 Pro
Intel Core Ultra 5 125H
394.697 s *
Affinity Photo 2 - Combined (Multi CPU)
Acemagic F2A
Intel Core Ultra 7 155H
770 Points +30%
Geekom AE7
AMD Ryzen 9 7940HS
623 Points +5%
Minisforum UH125 Pro
Intel Core Ultra 5 125H
615 Points +4%
Asus NUC 14 Pro
Intel Core Ultra 5 125H
594 Points
Aoostar GEM10
AMD Ryzen 7 6800H
513 Points -14%
Geekom A5
AMD Ryzen 7 5800H
439 Points -26%

* ... más pequeño es mejor

Cinebench R10 Rendering Single 32Bit
9561
Cinebench R10 Shading 64Bit
16957 Points
Cinebench R10 Rendering Multiple CPUs 64Bit
78788 Points
Cinebench R10 Rendering Single CPUs 64Bit
13281 Points
Cinebench R10 Shading 32Bit
16752
Cinebench R10 Rendering Multiple CPUs 32Bit
53390
Cinebench R11.5 CPU Multi 32Bit
24.31 Points
Cinebench R11.5 OpenGL 32Bit
101.29 fps
Cinebench R11.5 CPU Single 64Bit
3.03 Points
Cinebench R11.5 CPU Multi 64Bit
26.92 Points
Cinebench R11.5 OpenGL 64Bit
97.61 fps
Cinebench R11.5 CPU Single 32Bit
2.66 Points
Cinebench R15 CPU Single 64Bit
248 Points
Cinebench R15 Ref. Match 64Bit
97.8 %
Cinebench R15 OpenGL 64Bit
145.06 fps
Cinebench R15 CPU Multi 64Bit
2141 Points
ayuda
Performance Rating
Geekom AE7
AMD Ryzen 9 7940HS, Radeon 780M
97.2 pt
Acemagic F2A
Intel Core Ultra 7 155H, Arc 8-Core
77.3 pt
Aoostar GEM10
AMD Ryzen 7 6800H, Radeon 680M
67.4 pt
Minisforum UH125 Pro
Intel Core Ultra 5 125H, Arc 7-Core
63.1 pt
Asus NUC 14 Pro
Intel Core Ultra 5 125H, Arc 7-Core
62.4 pt
Geekom A5
AMD Ryzen 7 5800H, Vega 8
61.4 pt
Average of class Mini PC
 
52.7 pt
AIDA64 / FP32 Ray-Trace
Geekom AE7
AMD Ryzen 9 7940HS, Radeon 780M
26514 KRay/s +99%
Acemagic F2A
Intel Core Ultra 7 155H, Arc 8-Core
17544 KRay/s +31%
Aoostar GEM10
AMD Ryzen 7 6800H, Radeon 680M
13726 KRay/s +3%
Minisforum UH125 Pro
Intel Core Ultra 5 125H, Arc 7-Core
13639 KRay/s +2%
Asus NUC 14 Pro
Intel Core Ultra 5 125H, Arc 7-Core
13347 KRay/s
Geekom A5
AMD Ryzen 7 5800H, Vega 8
12468 KRay/s -7%
Average of class Mini PC
  (561 - 51004, n=121, last 2 years)
11617 KRay/s -13%
AIDA64 / FPU Julia
Geekom AE7
AMD Ryzen 9 7940HS, Radeon 780M
112419 Points +64%
Acemagic F2A
Intel Core Ultra 7 155H, Arc 8-Core
88829 Points +30%
Aoostar GEM10
AMD Ryzen 7 6800H, Radeon 680M
86223 Points +26%
Geekom A5
AMD Ryzen 7 5800H, Vega 8
77847 Points +14%
Minisforum UH125 Pro
Intel Core Ultra 5 125H, Arc 7-Core
70880 Points +3%
Asus NUC 14 Pro
Intel Core Ultra 5 125H, Arc 7-Core
68551 Points
Average of class Mini PC
  (3604 - 214250, n=121, last 2 years)
59588 Points -13%
AIDA64 / CPU SHA3
Geekom AE7
AMD Ryzen 9 7940HS, Radeon 780M
4898 MB/s +47%
Acemagic F2A
Intel Core Ultra 7 155H, Arc 8-Core
4246 MB/s +28%
Minisforum UH125 Pro
Intel Core Ultra 5 125H, Arc 7-Core
3404 MB/s +2%
Asus NUC 14 Pro
Intel Core Ultra 5 125H, Arc 7-Core
3323 MB/s
Aoostar GEM10
AMD Ryzen 7 6800H, Radeon 680M
2953 MB/s -11%
Geekom A5
AMD Ryzen 7 5800H, Vega 8
2707 MB/s -19%
Average of class Mini PC
  (225 - 9399, n=121, last 2 years)
2617 MB/s -21%
AIDA64 / CPU Queen
Geekom AE7
AMD Ryzen 9 7940HS, Radeon 780M
119250 Points +49%
Aoostar GEM10
AMD Ryzen 7 6800H, Radeon 680M
98582 Points +23%
Geekom A5
AMD Ryzen 7 5800H, Vega 8
91846 Points +15%
Acemagic F2A
Intel Core Ultra 7 155H, Arc 8-Core
89748 Points +12%
Asus NUC 14 Pro
Intel Core Ultra 5 125H, Arc 7-Core
79866 Points
Minisforum UH125 Pro
Intel Core Ultra 5 125H, Arc 7-Core
78098 Points -2%
Average of class Mini PC
  (8172 - 184747, n=121, last 2 years)
76050 Points -5%
AIDA64 / FPU SinJulia
Geekom AE7
AMD Ryzen 9 7940HS, Radeon 780M
14976 Points +91%
Aoostar GEM10
AMD Ryzen 7 6800H, Radeon 680M
12159 Points +55%
Geekom A5
AMD Ryzen 7 5800H, Vega 8
10972 Points +40%
Acemagic F2A
Intel Core Ultra 7 155H, Arc 8-Core
10247 Points +31%
Average of class Mini PC
  (408 - 29064, n=121, last 2 years)
8128 Points +4%
Asus NUC 14 Pro
Intel Core Ultra 5 125H, Arc 7-Core
7851 Points
Minisforum UH125 Pro
Intel Core Ultra 5 125H, Arc 7-Core
7842 Points 0%
AIDA64 / FPU Mandel
Geekom AE7
AMD Ryzen 9 7940HS, Radeon 780M
60098 Points +76%
Aoostar GEM10
AMD Ryzen 7 6800H, Radeon 680M
47463 Points +39%
Acemagic F2A
Intel Core Ultra 7 155H, Arc 8-Core
45718 Points +34%
Geekom A5
AMD Ryzen 7 5800H, Vega 8
42543 Points +24%
Minisforum UH125 Pro
Intel Core Ultra 5 125H, Arc 7-Core
35321 Points +3%
Asus NUC 14 Pro
Intel Core Ultra 5 125H, Arc 7-Core
34225 Points
Average of class Mini PC
  (1958 - 113499, n=121, last 2 years)
31212 Points -9%
AIDA64 / CPU AES
Geekom AE7
AMD Ryzen 9 7940HS, Radeon 780M
167583 MB/s +161%
Acemagic F2A
Intel Core Ultra 7 155H, Arc 8-Core
144741 MB/s +126%
Aoostar GEM10
AMD Ryzen 7 6800H, Radeon 680M
119681 MB/s +87%
Geekom A5
AMD Ryzen 7 5800H, Vega 8
108262 MB/s +69%
Average of class Mini PC
  (3691 - 325960, n=121, last 2 years)
83023 MB/s +30%
Minisforum UH125 Pro
Intel Core Ultra 5 125H, Arc 7-Core
65304 MB/s +2%
Asus NUC 14 Pro
Intel Core Ultra 5 125H, Arc 7-Core
64107 MB/s
AIDA64 / CPU ZLib
Acemagic F2A
Intel Core Ultra 7 155H, Arc 8-Core
1183 MB/s +22%
Geekom AE7
AMD Ryzen 9 7940HS, Radeon 780M
1015 MB/s +5%
Minisforum UH125 Pro
Intel Core Ultra 5 125H, Arc 7-Core
994 MB/s +3%
Asus NUC 14 Pro
Intel Core Ultra 5 125H, Arc 7-Core
969 MB/s
Aoostar GEM10
AMD Ryzen 7 6800H, Radeon 680M
757 MB/s -22%
Geekom A5
AMD Ryzen 7 5800H, Vega 8
700 MB/s -28%
Average of class Mini PC
  (74.8 - 2039, n=121, last 2 years)
673 MB/s -31%
AIDA64 / FP64 Ray-Trace
Geekom AE7
AMD Ryzen 9 7940HS, Radeon 780M
14162 KRay/s +109%
Acemagic F2A
Intel Core Ultra 7 155H, Arc 8-Core
9284 KRay/s +37%
Aoostar GEM10
AMD Ryzen 7 6800H, Radeon 680M
7279 KRay/s +7%
Minisforum UH125 Pro
Intel Core Ultra 5 125H, Arc 7-Core
7221 KRay/s +6%
Asus NUC 14 Pro
Intel Core Ultra 5 125H, Arc 7-Core
6786 KRay/s
Geekom A5
AMD Ryzen 7 5800H, Vega 8
6380 KRay/s -6%
Average of class Mini PC
  (308 - 26952, n=121, last 2 years)
6213 KRay/s -8%
AIDA64 / CPU PhotoWorxx
Asus NUC 14 Pro
Intel Core Ultra 5 125H, Arc 7-Core
47377 MPixel/s
Minisforum UH125 Pro
Intel Core Ultra 5 125H, Arc 7-Core
45789 MPixel/s -3%
Geekom AE7
AMD Ryzen 9 7940HS, Radeon 780M
40690 MPixel/s -14%
Acemagic F2A
Intel Core Ultra 7 155H, Arc 8-Core
33092 MPixel/s -30%
Average of class Mini PC
  (4408 - 50500, n=121, last 2 years)
26668 MPixel/s -44%
Aoostar GEM10
AMD Ryzen 7 6800H, Radeon 680M
26496 MPixel/s -44%
Geekom A5
AMD Ryzen 7 5800H, Vega 8
25113 MPixel/s -47%

Cinebench R15 Bucle múltiple

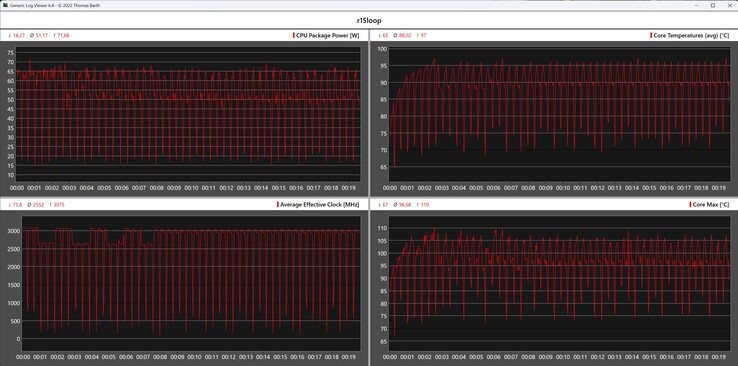
Lamentablemente, el Asus NUC 14 Pro no puede mantener su rendimiento ligeramente superior de la CPU en el bucle continuo de Cinebench R15 en comparación con el Minisforum UH125 Pro. El aumento de la temperatura de la CPU provoca repetidamente caídas de rendimiento a corto plazo, por lo que los resultados no son muy consistentes. Con una media de 2.021 puntos, el Asus NUC 14 Pro no puede superar al Minisforum UH125 Pro.

Métricas de la CPU durante el bucle Cinebench R15
01452904355807258701015116013051450159517401885203021752320246526102755Tooltip
Asus NUC 14 Pro Intel Core Ultra 5 125H, Intel Core Ultra 5 125H: Ø2021 (1900.15-2203.13)
Geekom AE7 AMD Ryzen 9 7940HS, AMD Ryzen 9 7940HS: Ø2563 (2486.79-2630.54)
Minisforum UH125 Pro Intel Core Ultra 5 125H, Intel Core Ultra 5 125H: Ø2186 (2040.4-2248.33)
Aoostar GEM10 AMD Ryzen 7 6800H, AMD Ryzen 7 6800H: Ø1983 (1919.75-2106.82)
Acemagic F2A Intel Core Ultra 7 155H, Intel Core Ultra 7 155H: Ø2759 (2690.7-2800.92)
Geekom A5 AMD Ryzen 7 5800H, AMD Ryzen 7 5800H: Ø1715 (1692.05-1838.74)

Rendimiento del sistema

El rendimiento del sistema refleja exactamente lo que es posible con el Intel Core Ultra 5 125H. Basado en el mismo SoC, el Minisforum UH125 Pro es el principal competidor y ofrece un rendimiento similar al del Asus NUC 14 Pro. Subjetivamente, el Asus NUC 14 Pro ofrece un excelente rendimiento en el día a día y nuestra muestra de prueba puede asegurar el segundo puesto en las pruebas de RAM.

PCMark 10 / Score
Geekom AE7, AMD Ryzen 9 7940HS
AMD Radeon 780M, Wodposit NVMe SSD 1024 GB
7520 Points +20%
Acemagic F2A, Intel Core Ultra 7 155H
Intel Arc 8-Core iGPU, Kingston OM8SEP1024Q-A0
7120 Points +13%
Aoostar GEM10, AMD Ryzen 7 6800H
AMD Radeon 680M, BIWIN CE980Y28900-1TB
6749 Points +7%
Asus NUC 14 Pro, Intel Core Ultra 5 125H
Intel Arc 7-Core iGPU, Kingston KC3000 2048G SKC3000D2048G
6282 Points
Minisforum UH125 Pro, Intel Core Ultra 5 125H
Intel Arc 7-Core iGPU, Kingston OM8PGP41024Q-A0
6194 Points -1%
Geekom A5, AMD Ryzen 7 5800H
AMD Radeon RX Vega 8 (Ryzen 4000/5000), Lexar NM620 512GB
6149 Points -2%
PCMark 10 / Essentials
Acemagic F2A, Intel Core Ultra 7 155H
Intel Arc 8-Core iGPU, Kingston OM8SEP1024Q-A0
11125 Points +11%
Geekom AE7, AMD Ryzen 9 7940HS
AMD Radeon 780M, Wodposit NVMe SSD 1024 GB
11058 Points +10%
Aoostar GEM10, AMD Ryzen 7 6800H
AMD Radeon 680M, BIWIN CE980Y28900-1TB
10522 Points +5%
Geekom A5, AMD Ryzen 7 5800H
AMD Radeon RX Vega 8 (Ryzen 4000/5000), Lexar NM620 512GB
10356 Points +3%
Asus NUC 14 Pro, Intel Core Ultra 5 125H
Intel Arc 7-Core iGPU, Kingston KC3000 2048G SKC3000D2048G
10050 Points
Minisforum UH125 Pro, Intel Core Ultra 5 125H
Intel Arc 7-Core iGPU, Kingston OM8PGP41024Q-A0
9427 Points -6%
PCMark 10 / Productivity
Geekom AE7, AMD Ryzen 9 7940HS
AMD Radeon 780M, Wodposit NVMe SSD 1024 GB
10717 Points +52%
Aoostar GEM10, AMD Ryzen 7 6800H
AMD Radeon 680M, BIWIN CE980Y28900-1TB
9367 Points +33%
Geekom A5, AMD Ryzen 7 5800H
AMD Radeon RX Vega 8 (Ryzen 4000/5000), Lexar NM620 512GB
9311 Points +32%
Acemagic F2A, Intel Core Ultra 7 155H
Intel Arc 8-Core iGPU, Kingston OM8SEP1024Q-A0
8901 Points +26%
Minisforum UH125 Pro, Intel Core Ultra 5 125H
Intel Arc 7-Core iGPU, Kingston OM8PGP41024Q-A0
7715 Points +10%
Asus NUC 14 Pro, Intel Core Ultra 5 125H
Intel Arc 7-Core iGPU, Kingston KC3000 2048G SKC3000D2048G
7042 Points
CrossMark / Overall
Geekom AE7, AMD Ryzen 9 7940HS
AMD Radeon 780M, Wodposit NVMe SSD 1024 GB
1813 Points +19%
Acemagic F2A, Intel Core Ultra 7 155H
Intel Arc 8-Core iGPU, Kingston OM8SEP1024Q-A0
1802 Points +18%
Aoostar GEM10, AMD Ryzen 7 6800H
AMD Radeon 680M, BIWIN CE980Y28900-1TB
1648 Points +8%
Minisforum UH125 Pro, Intel Core Ultra 5 125H
Intel Arc 7-Core iGPU, Kingston OM8PGP41024Q-A0
1533 Points +1%
Asus NUC 14 Pro, Intel Core Ultra 5 125H
Intel Arc 7-Core iGPU, Kingston KC3000 2048G SKC3000D2048G
1522 Points
Geekom A5, AMD Ryzen 7 5800H
AMD Radeon RX Vega 8 (Ryzen 4000/5000), Lexar NM620 512GB
1429 Points -6%
CrossMark / Responsiveness
Acemagic F2A, Intel Core Ultra 7 155H
Intel Arc 8-Core iGPU, Kingston OM8SEP1024Q-A0
1700 Points +45%
Aoostar GEM10, AMD Ryzen 7 6800H
AMD Radeon 680M, BIWIN CE980Y28900-1TB
1566 Points +34%
Geekom AE7, AMD Ryzen 9 7940HS
AMD Radeon 780M, Wodposit NVMe SSD 1024 GB
1527 Points +30%
Minisforum UH125 Pro, Intel Core Ultra 5 125H
Intel Arc 7-Core iGPU, Kingston OM8PGP41024Q-A0
1332 Points +14%
Geekom A5, AMD Ryzen 7 5800H
AMD Radeon RX Vega 8 (Ryzen 4000/5000), Lexar NM620 512GB
1233 Points +5%
Asus NUC 14 Pro, Intel Core Ultra 5 125H
Intel Arc 7-Core iGPU, Kingston KC3000 2048G SKC3000D2048G
1171 Points
CrossMark / Creativity
Geekom AE7, AMD Ryzen 9 7940HS
AMD Radeon 780M, Wodposit NVMe SSD 1024 GB
2011 Points +14%
Acemagic F2A, Intel Core Ultra 7 155H
Intel Arc 8-Core iGPU, Kingston OM8SEP1024Q-A0
1929 Points +9%
Asus NUC 14 Pro, Intel Core Ultra 5 125H
Intel Arc 7-Core iGPU, Kingston KC3000 2048G SKC3000D2048G
1765 Points
Aoostar GEM10, AMD Ryzen 7 6800H
AMD Radeon 680M, BIWIN CE980Y28900-1TB
1696 Points -4%
Minisforum UH125 Pro, Intel Core Ultra 5 125H
Intel Arc 7-Core iGPU, Kingston OM8PGP41024Q-A0
1683 Points -5%
Geekom A5, AMD Ryzen 7 5800H
AMD Radeon RX Vega 8 (Ryzen 4000/5000), Lexar NM620 512GB
1523 Points -14%
CrossMark / Productivity
Geekom AE7, AMD Ryzen 9 7940HS
AMD Radeon 780M, Wodposit NVMe SSD 1024 GB
1731 Points +21%
Acemagic F2A, Intel Core Ultra 7 155H
Intel Arc 8-Core iGPU, Kingston OM8SEP1024Q-A0
1717 Points +20%
Aoostar GEM10, AMD Ryzen 7 6800H
AMD Radeon 680M, BIWIN CE980Y28900-1TB
1629 Points +14%
Minisforum UH125 Pro, Intel Core Ultra 5 125H
Intel Arc 7-Core iGPU, Kingston OM8PGP41024Q-A0
1463 Points +2%
Asus NUC 14 Pro, Intel Core Ultra 5 125H
Intel Arc 7-Core iGPU, Kingston KC3000 2048G SKC3000D2048G
1432 Points
Geekom A5, AMD Ryzen 7 5800H
AMD Radeon RX Vega 8 (Ryzen 4000/5000), Lexar NM620 512GB
1408 Points -2%
AIDA64 / Memory Copy
Minisforum UH125 Pro
Intel Core Ultra 5 125H, Arc 7-Core
69592 MB/s 0%
Asus NUC 14 Pro
Intel Core Ultra 5 125H, Arc 7-Core
69264 MB/s
Geekom AE7
AMD Ryzen 9 7940HS, Radeon 780M
68449 MB/s -1%
Acemagic F2A
Intel Core Ultra 7 155H, Arc 8-Core
62397 MB/s -10%
Aoostar GEM10
AMD Ryzen 7 6800H, Radeon 680M
50829 MB/s -27%
Average of class Mini PC
  (6481 - 76462, n=121, last 2 years)
45817 MB/s -34%
Geekom A5
AMD Ryzen 7 5800H, Vega 8
43870 MB/s -37%
AIDA64 / Memory Read
Asus NUC 14 Pro
Intel Core Ultra 5 125H, Arc 7-Core
74415 MB/s
Minisforum UH125 Pro
Intel Core Ultra 5 125H, Arc 7-Core
72711 MB/s -2%
Acemagic F2A
Intel Core Ultra 7 155H, Arc 8-Core
64323 MB/s -14%
Geekom AE7
AMD Ryzen 9 7940HS, Radeon 780M
61836 MB/s -17%
Average of class Mini PC
  (6914 - 83287, n=121, last 2 years)
46245 MB/s -38%
Geekom A5
AMD Ryzen 7 5800H, Vega 8
46241 MB/s -38%
Aoostar GEM10
AMD Ryzen 7 6800H, Radeon 680M
43828 MB/s -41%
AIDA64 / Memory Write
Geekom AE7
AMD Ryzen 9 7940HS, Radeon 780M
87118 MB/s +20%
Asus NUC 14 Pro
Intel Core Ultra 5 125H, Arc 7-Core
72443 MB/s
Minisforum UH125 Pro
Intel Core Ultra 5 125H, Arc 7-Core
71514 MB/s -1%
Acemagic F2A
Intel Core Ultra 7 155H, Arc 8-Core
65057 MB/s -10%
Aoostar GEM10
AMD Ryzen 7 6800H, Radeon 680M
51116 MB/s -29%
Average of class Mini PC
  (6862 - 89318, n=121, last 2 years)
49957 MB/s -31%
Geekom A5
AMD Ryzen 7 5800H, Vega 8
46407 MB/s -36%
AIDA64 / Memory Latency
Minisforum UH125 Pro
Intel Core Ultra 5 125H, Arc 7-Core
184.8 ns * -45%
Acemagic F2A
Intel Core Ultra 7 155H, Arc 8-Core
149 ns * -17%
Asus NUC 14 Pro
Intel Core Ultra 5 125H, Arc 7-Core
127.3 ns *
Aoostar GEM10
AMD Ryzen 7 6800H, Radeon 680M
104.1 ns * +18%
Geekom AE7
AMD Ryzen 9 7940HS, Radeon 780M
90 ns * +29%
Average of class Mini PC
  (44.9 - 184.8, n=121, last 2 years)
89.9 ns * +29%
Geekom A5
AMD Ryzen 7 5800H, Vega 8
81.4 ns * +36%

* ... más pequeño es mejor

UL Procyon AI Inference for Windows
Overall Score Integer NPU
Asus NUC 14 Pro
Intel Core Ultra 5 125H, Arc 7-Core
508 Points
Minisforum UH125 Pro
Intel Core Ultra 5 125H, Arc 7-Core
501 Points -1%
Acemagic F2A
Intel Core Ultra 7 155H, Arc 8-Core
499 Points -2%
Overall Score Integer GPU
Asus NUC 14 Pro
Intel Core Ultra 5 125H, Arc 7-Core
741 Points
Acemagic F2A
Intel Core Ultra 7 155H, Arc 8-Core
684 Points -8%
Minisforum UH125 Pro
Intel Core Ultra 5 125H, Arc 7-Core
547 Points -26%

Latencias del CPD

Las latencias DPC del Asus NUC 14 Pro no son convincentes. Incluso al navegar simplemente por Internet, vemos valores elevados, que se deterioran aún más al reproducir el vídeo de prueba 4K. Futuras actualizaciones de la BIOS o de los controladores podrían garantizar mejoras aquí en el futuro.

Latencia máxima al abrir varias pestañas del navegador
Latencia máxima al reproducir material de vídeo 4K
Latencia máxima tras diez segundos de Prime95
Conductores clasificados por el mayor tiempo de ejecución
DPC Latencies / LatencyMon - interrupt to process latency (max), Web, Youtube, Prime95
Asus NUC 14 Pro
Arc 7-Core, Ultra 5 125H, Kingston KC3000 2048G SKC3000D2048G
2776 μs *
Acemagic F2A
Arc 8-Core, Ultra 7 155H, Kingston OM8SEP1024Q-A0
2724 μs * +2%
Geekom AE7
Radeon 780M, R9 7940HS, Wodposit NVMe SSD 1024 GB
2198.8 μs * +21%
Minisforum UH125 Pro
Arc 7-Core, Ultra 5 125H, Kingston OM8PGP41024Q-A0
1438 μs * +48%
Geekom A5
Vega 8, R7 5800H, Lexar NM620 512GB
1310.5 μs * +53%
Aoostar GEM10
Radeon 680M, R7 6800H, BIWIN CE980Y28900-1TB
962.8 μs * +65%

* ... más pequeño es mejor

Almacenamiento masivo

SSD de prueba de Kingston

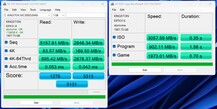
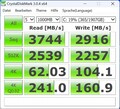
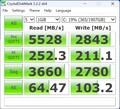
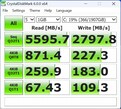
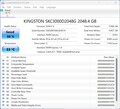
Equipamos el dispositivo de prueba con una unidad SSD Kingston KC3000. El rendimiento teórico de la SSD no puede alcanzarse en la práctica. No obstante, registramos unos resultados comparativamente buenos, lo que supuso un buen tercer puesto en la clasificación general. En la prueba de estrés se aprecian ligeros problemas: En combinación con la Kingston SC3000 utilizada, el rendimiento de lectura no puede mantenerse permanentemente al mismo nivel.

Para más comparaciones y pruebas comparativas, consulte nuestra tabla comparativa Laptop SSD & HDD Benchmarks .

AS SSD
AS SSD
MDL 3
MDL 3
MDL 5
MDL 5
MDL 6
MDL 6
CDI
CDI
Kingston KC3000 2048G SKC3000D2048G
Sequential Read: 3744 MB/s
Sequential Write: 2916 MB/s
512K Read: 2539 MB/s
512K Write: 2257 MB/s
4K Read: 62.03 MB/s
4K Write: 104.1 MB/s
4K QD32 Read: 241 MB/s
4K QD32 Write: 160.9 MB/s
Drive Performance Rating - Percent
Aoostar GEM10
BIWIN CE980Y28900-1TB
86.9 pt
Geekom AE7
Wodposit NVMe SSD 1024 GB
76.3 pt
Asus NUC 14 Pro
Kingston KC3000 2048G SKC3000D2048G
70.7 pt
Minisforum UH125 Pro
Kingston OM8PGP41024Q-A0
59.8 pt
Acemagic F2A
Kingston OM8SEP1024Q-A0
59.2 pt
Geekom A5
Lexar NM620 512GB
59 pt
Average of class Mini PC
 
56.1 pt
DiskSpd
seq read
Aoostar GEM10
BIWIN CE980Y28900-1TB
4000 (3961.36min - 3999.66max) MB/s +8%
Asus NUC 14 Pro
Kingston KC3000 2048G SKC3000D2048G
3706 (3594.04min - 3706.37max) MB/s
Geekom AE7
Wodposit NVMe SSD 1024 GB
2411 (2346.63min - 2410.89max) MB/s -35%
Geekom A5
Lexar NM620 512GB
2371 (2315.68min - 2370.91max) MB/s -36%
Minisforum UH125 Pro
Kingston OM8PGP41024Q-A0
2351 (2320.68min - 2350.61max) MB/s -37%
Average of class Mini PC
  (233 - 4357, n=120, last 2 years)
2199 MB/s -41%
Acemagic F2A
Kingston OM8SEP1024Q-A0
1674 (1242.56min - 1673.54max) MB/s -55%
seq write
Aoostar GEM10
BIWIN CE980Y28900-1TB
4553 (4417.86min - 4552.92max) MB/s +55%
Geekom AE7
Wodposit NVMe SSD 1024 GB
3650 (3239.07min - 3649.71max) MB/s +25%
Minisforum UH125 Pro
Kingston OM8PGP41024Q-A0
3331 (3244.92min - 3330.75max) MB/s +14%
Asus NUC 14 Pro
Kingston KC3000 2048G SKC3000D2048G
2928 (1958.53min - 2927.62max) MB/s
Geekom A5
Lexar NM620 512GB
2668 (292.6min - 2668max) MB/s -9%
Average of class Mini PC
  (222 - 5595, n=120, last 2 years)
2309 MB/s -21%
Acemagic F2A
Kingston OM8SEP1024Q-A0
1348 (1117.85min - 1347.87max) MB/s -54%
seq q8 t1 read
Asus NUC 14 Pro
Kingston KC3000 2048G SKC3000D2048G
7110 (6058.21min - 7110.02max) MB/s
Geekom AE7
Wodposit NVMe SSD 1024 GB
4939 (4360.49min - 4938.56max) MB/s -31%
Aoostar GEM10
BIWIN CE980Y28900-1TB
4878 (4476.29min - 4877.98max) MB/s -31%
Minisforum UH125 Pro
Kingston OM8PGP41024Q-A0
4802 (4169.19min - 4801.68max) MB/s -32%
Average of class Mini PC
  (236 - 8430, n=120, last 2 years)
3524 MB/s -50%
Geekom A5
Lexar NM620 512GB
3444 (2979.63min - 3443.98max) MB/s -52%
Acemagic F2A
Kingston OM8SEP1024Q-A0
3194 (2810.81min - 3194.17max) MB/s -55%
seq q8 t1 write
Asus NUC 14 Pro
Kingston KC3000 2048G SKC3000D2048G
4712 (3064.99min - 4711.88max) MB/s
Aoostar GEM10
BIWIN CE980Y28900-1TB
4505 (4403.81min - 4505.09max) MB/s -4%
Geekom AE7
Wodposit NVMe SSD 1024 GB
4273 (4238.26min - 4272.58max) MB/s -9%
Minisforum UH125 Pro
Kingston OM8PGP41024Q-A0
3902 (3839.68min - 3901.75max) MB/s -17%
Geekom A5
Lexar NM620 512GB
3117 (3075.4min - 3117.21max) MB/s -34%
Average of class Mini PC
  (228 - 6669, n=120, last 2 years)
2587 MB/s -45%
Acemagic F2A
Kingston OM8SEP1024Q-A0
2212 (1222.43min - 2212.27max) MB/s -53%
4k q1 t1 read
Aoostar GEM10
BIWIN CE980Y28900-1TB
61.7 (61.26min - 61.71max) MB/s +16%
Minisforum UH125 Pro
Kingston OM8PGP41024Q-A0
60 (58.44min - 60.02max) MB/s +12%
Geekom A5
Lexar NM620 512GB
54.5 (37.15min - 54.54max) MB/s +2%
Average of class Mini PC
  (5.67 - 86.6, n=120, last 2 years)
53.6 MB/s 0%
Asus NUC 14 Pro
Kingston KC3000 2048G SKC3000D2048G
53.4 (49.89min - 53.35max) MB/s
Geekom AE7
Wodposit NVMe SSD 1024 GB
48.1 (43.1min - 48.11max) MB/s -10%
Acemagic F2A
Kingston OM8SEP1024Q-A0
47.3 (47.07min - 47.31max) MB/s -11%
4k q1 t1 write
Aoostar GEM10
BIWIN CE980Y28900-1TB
235 (230.8min - 235.02max) MB/s +183%
Average of class Mini PC
  (22 - 435, n=120, last 2 years)
189.9 MB/s +129%
Acemagic F2A
Kingston OM8SEP1024Q-A0
187.2 (181.54min - 187.2max) MB/s +125%
Geekom AE7
Wodposit NVMe SSD 1024 GB
184.8 (177.47min - 184.84max) MB/s +122%
Geekom A5
Lexar NM620 512GB
148.4 (147.43min - 148.38max) MB/s +79%
Minisforum UH125 Pro
Kingston OM8PGP41024Q-A0
136.8 (131.56min - 136.81max) MB/s +65%
Asus NUC 14 Pro
Kingston KC3000 2048G SKC3000D2048G
83.1 (75.3min - 83.11max) MB/s
4k q32 t16 read
Aoostar GEM10
BIWIN CE980Y28900-1TB
2004 (2002.37min - 2004.23max) MB/s +174%
Geekom A5
Lexar NM620 512GB
1960 MB/s +168%
Acemagic F2A
Kingston OM8SEP1024Q-A0
1824 (1239.47min - 1824.09max) MB/s +150%
Geekom AE7
Wodposit NVMe SSD 1024 GB
1580 (1549.8min - 1579.65max) MB/s +116%
Average of class Mini PC
  (26.1 - 4158, n=120, last 2 years)
1256 MB/s +72%
Asus NUC 14 Pro
Kingston KC3000 2048G SKC3000D2048G
731 (660.89min - 731.29max) MB/s
Minisforum UH125 Pro
Kingston OM8PGP41024Q-A0
698 (691.89min - 697.84max) MB/s -5%
4k q32 t16 write
Aoostar GEM10
BIWIN CE980Y28900-1TB
2681 (2560.18min - 2680.76max) MB/s +1336%
Acemagic F2A
Kingston OM8SEP1024Q-A0
1434 (1410.26min - 1433.71max) MB/s +668%
Geekom A5
Lexar NM620 512GB
1370 (84.65min - 1370.23max) MB/s +634%
Average of class Mini PC
  (30.2 - 4288, n=120, last 2 years)
1201 MB/s +543%
Geekom AE7
Wodposit NVMe SSD 1024 GB
627 (618.33min - 627.08max) MB/s +236%
Minisforum UH125 Pro
Kingston OM8PGP41024Q-A0
311 (252.72min - 310.91max) MB/s +67%
Asus NUC 14 Pro
Kingston KC3000 2048G SKC3000D2048G
186.7 (155.05min - 186.74max) MB/s
AS SSD
Score Total
Geekom AE7
Wodposit NVMe SSD 1024 GB
6354 Points +24%
Aoostar GEM10
BIWIN CE980Y28900-1TB
6147 Points +20%
Asus NUC 14 Pro
Kingston KC3000 2048G SKC3000D2048G
5131 Points
Acemagic F2A
Kingston OM8SEP1024Q-A0
4412 Points -14%
Geekom A5
Lexar NM620 512GB
4006 Points -22%
Average of class Mini PC
  (151.3 - 10021, n=118, last 2 years)
3898 Points -24%
Minisforum UH125 Pro
Kingston OM8PGP41024Q-A0
3878 Points -24%
Score Read
Aoostar GEM10
BIWIN CE980Y28900-1TB
2109 Points +65%
Geekom AE7
Wodposit NVMe SSD 1024 GB
1757 Points +38%
Acemagic F2A
Kingston OM8SEP1024Q-A0
1561 Points +22%
Geekom A5
Lexar NM620 512GB
1502 Points +18%
Average of class Mini PC
  (61 - 3741, n=118, last 2 years)
1454 Points +14%
Asus NUC 14 Pro
Kingston KC3000 2048G SKC3000D2048G
1275 Points
Minisforum UH125 Pro
Kingston OM8PGP41024Q-A0
1096 Points -14%
Score Write
Geekom AE7
Wodposit NVMe SSD 1024 GB
3759 Points +13%
Asus NUC 14 Pro
Kingston KC3000 2048G SKC3000D2048G
3313 Points
Aoostar GEM10
BIWIN CE980Y28900-1TB
2964 Points -11%
Minisforum UH125 Pro
Kingston OM8PGP41024Q-A0
2306 Points -30%
Acemagic F2A
Kingston OM8SEP1024Q-A0
2082 Points -37%
Average of class Mini PC
  (88 - 4371, n=118, last 2 years)
1751 Points -47%
Geekom A5
Lexar NM620 512GB
1739 Points -48%
Seq Read
Asus NUC 14 Pro
Kingston KC3000 2048G SKC3000D2048G
5158 MB/s
Aoostar GEM10
BIWIN CE980Y28900-1TB
4264 MB/s -17%
Geekom AE7
Wodposit NVMe SSD 1024 GB
3891 MB/s -25%
Minisforum UH125 Pro
Kingston OM8PGP41024Q-A0
3808 MB/s -26%
Average of class Mini PC
  (291 - 6620, n=118, last 2 years)
3037 MB/s -41%
Geekom A5
Lexar NM620 512GB
3020 MB/s -41%
Acemagic F2A
Kingston OM8SEP1024Q-A0
3010 MB/s -42%
Seq Write
Aoostar GEM10
BIWIN CE980Y28900-1TB
3970 MB/s +50%
Geekom A5
Lexar NM620 512GB
2714 MB/s +3%
Asus NUC 14 Pro
Kingston KC3000 2048G SKC3000D2048G
2646 MB/s
Geekom AE7
Wodposit NVMe SSD 1024 GB
2526 MB/s -5%
Acemagic F2A
Kingston OM8SEP1024Q-A0
2369 MB/s -10%
Average of class Mini PC
  (240 - 5783, n=118, last 2 years)
2097 MB/s -21%
Minisforum UH125 Pro
Kingston OM8PGP41024Q-A0
1787 MB/s -32%
4K Read
Aoostar GEM10
BIWIN CE980Y28900-1TB
68.4 MB/s +8%
Asus NUC 14 Pro
Kingston KC3000 2048G SKC3000D2048G
63.6 MB/s
Geekom A5
Lexar NM620 512GB
57.7 MB/s -9%
Average of class Mini PC
  (6.08 - 104.3, n=118, last 2 years)
57.5 MB/s -10%
Minisforum UH125 Pro
Kingston OM8PGP41024Q-A0
57.3 MB/s -10%
Geekom AE7
Wodposit NVMe SSD 1024 GB
55.2 MB/s -13%
Acemagic F2A
Kingston OM8SEP1024Q-A0
41.8 MB/s -34%
4K Write
Acemagic F2A
Kingston OM8SEP1024Q-A0
196.9 MB/s +16%
Aoostar GEM10
BIWIN CE980Y28900-1TB
196.5 MB/s +16%
Geekom AE7
Wodposit NVMe SSD 1024 GB
195.5 MB/s +15%
Minisforum UH125 Pro
Kingston OM8PGP41024Q-A0
182.1 MB/s +7%
Average of class Mini PC
  (30.9 - 366, n=118, last 2 years)
173 MB/s +2%
Asus NUC 14 Pro
Kingston KC3000 2048G SKC3000D2048G
169.5 MB/s
Geekom A5
Lexar NM620 512GB
125.5 MB/s -26%
4K-64 Read
Aoostar GEM10
BIWIN CE980Y28900-1TB
1614 MB/s +132%
Geekom AE7
Wodposit NVMe SSD 1024 GB
1313 MB/s +89%
Acemagic F2A
Kingston OM8SEP1024Q-A0
1218 MB/s +75%
Geekom A5
Lexar NM620 512GB
1143 MB/s +64%
Average of class Mini PC
  (23.4 - 3220, n=118, last 2 years)
1093 MB/s +57%
Asus NUC 14 Pro
Kingston KC3000 2048G SKC3000D2048G
695 MB/s
Minisforum UH125 Pro
Kingston OM8PGP41024Q-A0
658 MB/s -5%
4K-64 Write
Geekom AE7
Wodposit NVMe SSD 1024 GB
3311 MB/s +15%
Asus NUC 14 Pro
Kingston KC3000 2048G SKC3000D2048G
2878 MB/s
Aoostar GEM10
BIWIN CE980Y28900-1TB
2370 MB/s -18%
Minisforum UH125 Pro
Kingston OM8PGP41024Q-A0
1945 MB/s -32%
Acemagic F2A
Kingston OM8SEP1024Q-A0
1649 MB/s -43%
Average of class Mini PC
  (32.8 - 3731, n=118, last 2 years)
1368 MB/s -52%
Geekom A5
Lexar NM620 512GB
1342 MB/s -53%
Access Time Read
Average of class Mini PC
  (0.022 - 0.489, n=118, last 2 years)
0.1022 ms * -93%
Minisforum UH125 Pro
Kingston OM8PGP41024Q-A0
0.101 ms * -91%
Aoostar GEM10
BIWIN CE980Y28900-1TB
0.098 ms * -85%
Geekom A5
Lexar NM620 512GB
0.08 ms * -51%
Geekom AE7
Wodposit NVMe SSD 1024 GB
0.077 ms * -45%
Asus NUC 14 Pro
Kingston KC3000 2048G SKC3000D2048G
0.053 ms *
Acemagic F2A
Kingston OM8SEP1024Q-A0
0.046 ms * +13%
Access Time Write
Geekom A5
Lexar NM620 512GB
0.13 ms * -202%
Acemagic F2A
Kingston OM8SEP1024Q-A0
0.126 ms * -193%
Average of class Mini PC
  (0.016 - 0.765, n=118, last 2 years)
0.1145 ms * -166%
Aoostar GEM10
BIWIN CE980Y28900-1TB
0.061 ms * -42%
Asus NUC 14 Pro
Kingston KC3000 2048G SKC3000D2048G
0.043 ms *
Minisforum UH125 Pro
Kingston OM8PGP41024Q-A0
0.024 ms * +44%
Geekom AE7
Wodposit NVMe SSD 1024 GB
0.023 ms * +47%

* ... más pequeño es mejor

Continuous read: DiskSpd Read Loop, Queue Depth 8

036072010801440180021602520288032403600396043204680504054005760612064806840Tooltip
Asus NUC 14 Pro Kingston KC3000 2048G SKC3000D2048G; diskspd 2.0.17 f: Ø6306 (1073.74-7111.48)
Geekom AE7 Wodposit NVMe SSD 1024 GB; diskspd 2.0.17 f: Ø4932 (4634.29-4944.25)
Minisforum UH125 Pro Kingston OM8PGP41024Q-A0; diskspd 2.0.17 f: Ø4790 (4223.81-4803.95)
Aoostar GEM10 BIWIN CE980Y28900-1TB; diskspd 2.0.17 f: Ø4833 (4418.07-4847.99)
Acemagic F2A Kingston OM8SEP1024Q-A0; diskspd 2.0.17 f: Ø1320 (771.89-3141.95)
Geekom A5 Lexar NM620 512GB: Ø3437 (3126.47-3454.22)

Tarjeta gráfica

El rendimiento 3D del Asus NUC 14 Pro es notablemente mejor que el del antiguo Intel Iris Xe G7 con 96 UE debido a la arquitectura Intel Arc revisada. Sin embargo, el Intel Arc de 7 núcleos iGPU no puede seguir el ritmo de la AMD Radeon 780M. No obstante, el Asus NUC 14 Pro ofrece un rendimiento sobresaliente, ya que nuestra muestra de prueba gana la comparación con el Acemagic F2A en varias pruebas.

Encontrará más comparaciones y pruebas comparativas en nuestra tabla comparativa de GPU Tarjetas gráficas moviles - lista de Benchmarks (nueva) .

3DMark Performance Rating - Percent
Geekom AE7
AMD Radeon 780M, AMD Ryzen 9 7940HS
97.6 pt
Asus NUC 14 Pro
Intel Arc 7-Core iGPU, Intel Core Ultra 5 125H
93 pt
Acemagic F2A
Intel Arc 8-Core iGPU, Intel Core Ultra 7 155H
92.9 pt
Aoostar GEM10
AMD Radeon 680M, AMD Ryzen 7 6800H
84.6 pt
Minisforum UH125 Pro
Intel Arc 7-Core iGPU, Intel Core Ultra 5 125H
81.8 pt
Geekom A5
AMD Radeon RX Vega 8 (Ryzen 4000/5000), AMD Ryzen 7 5800H
49.9 pt
3DMark 11 - 1280x720 Performance GPU
Geekom AE7
AMD Radeon 780M, AMD Ryzen 9 7940HS
13824 Points +17%
Acemagic F2A
Intel Arc 8-Core iGPU, Intel Core Ultra 7 155H
12085 Points +3%
Asus NUC 14 Pro
Intel Arc 7-Core iGPU, Intel Core Ultra 5 125H
11785 Points
Aoostar GEM10
AMD Radeon 680M, AMD Ryzen 7 6800H
11668 Points -1%
Minisforum UH125 Pro
Intel Arc 7-Core iGPU, Intel Core Ultra 5 125H
10303 Points -13%
Geekom A5
AMD Radeon RX Vega 8 (Ryzen 4000/5000), AMD Ryzen 7 5800H
7101 Points -40%
3DMark
2560x1440 Time Spy Graphics
Acemagic F2A
Intel Arc 8-Core iGPU, Intel Core Ultra 7 155H
3205 Points 0%
Asus NUC 14 Pro
Intel Arc 7-Core iGPU, Intel Core Ultra 5 125H
3205 Points
Geekom AE7
AMD Radeon 780M, AMD Ryzen 9 7940HS
2970 Points -7%
Minisforum UH125 Pro
Intel Arc 7-Core iGPU, Intel Core Ultra 5 125H
2796 Points -13%
Aoostar GEM10
AMD Radeon 680M, AMD Ryzen 7 6800H
2518 Points -21%
Geekom A5
AMD Radeon RX Vega 8 (Ryzen 4000/5000), AMD Ryzen 7 5800H
1418 Points -56%
1920x1080 Fire Strike Graphics
Geekom AE7
AMD Radeon 780M, AMD Ryzen 9 7940HS
8437 Points +7%
Asus NUC 14 Pro
Intel Arc 7-Core iGPU, Intel Core Ultra 5 125H
7900 Points
Acemagic F2A
Intel Arc 8-Core iGPU, Intel Core Ultra 7 155H
7710 Points -2%
Aoostar GEM10
AMD Radeon 680M, AMD Ryzen 7 6800H
7653 Points -3%
Minisforum UH125 Pro
Intel Arc 7-Core iGPU, Intel Core Ultra 5 125H
7047 Points -11%
Geekom A5
AMD Radeon RX Vega 8 (Ryzen 4000/5000), AMD Ryzen 7 5800H
4567 Points -42%
Unigine Heaven 4.0
Extreme Preset OpenGL
Aoostar GEM10
AMD Radeon 680M, AMD Ryzen 7 6800H
37 fps +11%
Asus NUC 14 Pro
Intel Arc 7-Core iGPU, Intel Core Ultra 5 125H
33.3 fps
Geekom AE7
AMD Radeon 780M, AMD Ryzen 9 7940HS
33.2 fps 0%
Acemagic F2A
Intel Arc 8-Core iGPU, Intel Core Ultra 7 155H
31.6 fps -5%
Minisforum UH125 Pro
Intel Arc 7-Core iGPU, Intel Core Ultra 5 125H
29.6 fps -11%
Geekom A5
AMD Radeon RX Vega 8 (Ryzen 4000/5000), AMD Ryzen 7 5800H
22.8 fps -32%
Extreme Preset DX11
Geekom AE7
AMD Radeon 780M, AMD Ryzen 9 7940HS
36.1 fps +5%
Aoostar GEM10
AMD Radeon 680M, AMD Ryzen 7 6800H
34.7 fps +1%
Asus NUC 14 Pro
Intel Arc 7-Core iGPU, Intel Core Ultra 5 125H
34.5 fps
Acemagic F2A
Intel Arc 8-Core iGPU, Intel Core Ultra 7 155H
32.7 fps -5%
Minisforum UH125 Pro
Intel Arc 7-Core iGPU, Intel Core Ultra 5 125H
31.5 fps -9%
Geekom A5
AMD Radeon RX Vega 8 (Ryzen 4000/5000), AMD Ryzen 7 5800H
22 fps -36%
Unigine Valley 1.0
1920x1080 Extreme HD DirectX AA:x8
Geekom AE7
AMD Radeon 780M, AMD Ryzen 9 7940HS
24.5 fps +30%
Aoostar GEM10
AMD Radeon 680M, AMD Ryzen 7 6800H
23.7 fps +26%
Asus NUC 14 Pro
Intel Arc 7-Core iGPU, Intel Core Ultra 5 125H
18.8 fps
Acemagic F2A
Intel Arc 8-Core iGPU, Intel Core Ultra 7 155H
17.1 fps -9%
Minisforum UH125 Pro
Intel Arc 7-Core iGPU, Intel Core Ultra 5 125H
16.9 fps -10%
Geekom A5
AMD Radeon RX Vega 8 (Ryzen 4000/5000), AMD Ryzen 7 5800H
14.2 fps -24%
1920x1080 Extreme HD Preset OpenGL AA:x8
Aoostar GEM10
AMD Radeon 680M, AMD Ryzen 7 6800H
25.5 fps +26%
Asus NUC 14 Pro
Intel Arc 7-Core iGPU, Intel Core Ultra 5 125H
20.2 fps
Geekom AE7
AMD Radeon 780M, AMD Ryzen 9 7940HS
19.2 fps -5%
Acemagic F2A
Intel Arc 8-Core iGPU, Intel Core Ultra 7 155H
18.3 fps -9%
Minisforum UH125 Pro
Intel Arc 7-Core iGPU, Intel Core Ultra 5 125H
18.3 fps -9%
Geekom A5
AMD Radeon RX Vega 8 (Ryzen 4000/5000), AMD Ryzen 7 5800H
14.7 fps -27%
Unigine Superposition
1280x720 720p Low
Geekom AE7
AMD Radeon 780M, AMD Ryzen 9 7940HS
12146 Points +12%
Aoostar GEM10
AMD Radeon 680M, AMD Ryzen 7 6800H
11940 Points +10%
Asus NUC 14 Pro
Intel Arc 7-Core iGPU, Intel Core Ultra 5 125H
10872 Points
Acemagic F2A
Intel Arc 8-Core iGPU, Intel Core Ultra 7 155H
10491 Points -4%
Minisforum UH125 Pro
Intel Arc 7-Core iGPU, Intel Core Ultra 5 125H
10026 Points -8%
Geekom A5
AMD Radeon RX Vega 8 (Ryzen 4000/5000), AMD Ryzen 7 5800H
7952 Points -27%
1920x1080 1080p High
Geekom AE7
AMD Radeon 780M, AMD Ryzen 9 7940HS
3698 Points +2%
Asus NUC 14 Pro
Intel Arc 7-Core iGPU, Intel Core Ultra 5 125H
3609 Points
Acemagic F2A
Intel Arc 8-Core iGPU, Intel Core Ultra 7 155H
3391 Points -6%
Aoostar GEM10
AMD Radeon 680M, AMD Ryzen 7 6800H
3380 Points -6%
Minisforum UH125 Pro
Intel Arc 7-Core iGPU, Intel Core Ultra 5 125H
3066 Points -15%
Geekom A5
AMD Radeon RX Vega 8 (Ryzen 4000/5000), AMD Ryzen 7 5800H
1949 Points -46%
1920x1080 1080p Extreme
Asus NUC 14 Pro
Intel Arc 7-Core iGPU, Intel Core Ultra 5 125H
1981 Points
Acemagic F2A
Intel Arc 8-Core iGPU, Intel Core Ultra 7 155H
1920 Points -3%
Geekom AE7
AMD Radeon 780M, AMD Ryzen 9 7940HS
1803 Points -9%
Minisforum UH125 Pro
Intel Arc 7-Core iGPU, Intel Core Ultra 5 125H
1686 Points -15%
Aoostar GEM10
AMD Radeon 680M, AMD Ryzen 7 6800H
1424 Points -28%
Geekom A5
AMD Radeon RX Vega 8 (Ryzen 4000/5000), AMD Ryzen 7 5800H
914 Points -54%
ComputeMark v2.1
1024x600 Normal, Score
Geekom AE7
AMD Radeon 780M, AMD Ryzen 9 7940HS
9806 Points +46%
Acemagic F2A
Intel Arc 8-Core iGPU, Intel Core Ultra 7 155H
7480 Points +12%
Aoostar GEM10
AMD Radeon 680M, AMD Ryzen 7 6800H
6763 Points +1%
Asus NUC 14 Pro
Intel Arc 7-Core iGPU, Intel Core Ultra 5 125H
6698 Points
Minisforum UH125 Pro
Intel Arc 7-Core iGPU, Intel Core Ultra 5 125H
5613 Points -16%
Geekom A5
AMD Radeon RX Vega 8 (Ryzen 4000/5000), AMD Ryzen 7 5800H
4020 Points -40%
1024x600 Normal, Fluid 3DTex
Asus NUC 14 Pro
Intel Arc 7-Core iGPU, Intel Core Ultra 5 125H
490 Points
Geekom AE7
AMD Radeon 780M, AMD Ryzen 9 7940HS
481 Points -2%
Minisforum UH125 Pro
Intel Arc 7-Core iGPU, Intel Core Ultra 5 125H
471 Points -4%
Acemagic F2A
Intel Arc 8-Core iGPU, Intel Core Ultra 7 155H
427 Points -13%
Aoostar GEM10
AMD Radeon 680M, AMD Ryzen 7 6800H
427 Points -13%
Geekom A5
AMD Radeon RX Vega 8 (Ryzen 4000/5000), AMD Ryzen 7 5800H
296 Points -40%
1024x600 Normal, Fluid 2DTexArr
Geekom AE7
AMD Radeon 780M, AMD Ryzen 9 7940HS
486 Points +3%
Asus NUC 14 Pro
Intel Arc 7-Core iGPU, Intel Core Ultra 5 125H
472 Points
Aoostar GEM10
AMD Radeon 680M, AMD Ryzen 7 6800H
468 Points -1%
Minisforum UH125 Pro
Intel Arc 7-Core iGPU, Intel Core Ultra 5 125H
439 Points -7%
Acemagic F2A
Intel Arc 8-Core iGPU, Intel Core Ultra 7 155H
422 Points -11%
Geekom A5
AMD Radeon RX Vega 8 (Ryzen 4000/5000), AMD Ryzen 7 5800H
280 Points -41%
1024x600 Normal, Mandel Vector
Geekom AE7
AMD Radeon 780M, AMD Ryzen 9 7940HS
2560 Points +49%
Acemagic F2A
Intel Arc 8-Core iGPU, Intel Core Ultra 7 155H
1961 Points +14%
Aoostar GEM10
AMD Radeon 680M, AMD Ryzen 7 6800H
1900 Points +11%
Asus NUC 14 Pro
Intel Arc 7-Core iGPU, Intel Core Ultra 5 125H
1715 Points
Minisforum UH125 Pro
Intel Arc 7-Core iGPU, Intel Core Ultra 5 125H
1447 Points -16%
Geekom A5
AMD Radeon RX Vega 8 (Ryzen 4000/5000), AMD Ryzen 7 5800H
1236 Points -28%
1024x600 Normal, Mandel Scalar
Geekom AE7
AMD Radeon 780M, AMD Ryzen 9 7940HS
2614 Points +92%
Aoostar GEM10
AMD Radeon 680M, AMD Ryzen 7 6800H
1812 Points +33%
Acemagic F2A
Intel Arc 8-Core iGPU, Intel Core Ultra 7 155H
1594 Points +17%
Asus NUC 14 Pro
Intel Arc 7-Core iGPU, Intel Core Ultra 5 125H
1360 Points
Minisforum UH125 Pro
Intel Arc 7-Core iGPU, Intel Core Ultra 5 125H
1112 Points -18%
Geekom A5
AMD Radeon RX Vega 8 (Ryzen 4000/5000), AMD Ryzen 7 5800H
1062 Points -22%
1024x600 Normal, QJuliaRayTrace
Geekom AE7
AMD Radeon 780M, AMD Ryzen 9 7940HS
3665 Points +38%
Acemagic F2A
Intel Arc 8-Core iGPU, Intel Core Ultra 7 155H
3076 Points +16%
Asus NUC 14 Pro
Intel Arc 7-Core iGPU, Intel Core Ultra 5 125H
2662 Points
Aoostar GEM10
AMD Radeon 680M, AMD Ryzen 7 6800H
2157 Points -19%
Minisforum UH125 Pro
Intel Arc 7-Core iGPU, Intel Core Ultra 5 125H
2143 Points -19%
Geekom A5
AMD Radeon RX Vega 8 (Ryzen 4000/5000), AMD Ryzen 7 5800H
1145 Points -57%
LuxMark v2.0 64Bit
Room GPUs-only
Geekom AE7
AMD Radeon 780M, AMD Ryzen 9 7940HS
1025 Samples/s +28%
Asus NUC 14 Pro
Intel Arc 7-Core iGPU, Intel Core Ultra 5 125H
801 Samples/s
Minisforum UH125 Pro
Intel Arc 7-Core iGPU, Intel Core Ultra 5 125H
710 Samples/s -11%
Aoostar GEM10
AMD Radeon 680M, AMD Ryzen 7 6800H
567 Samples/s -29%
Acemagic F2A
Intel Arc 8-Core iGPU, Intel Core Ultra 7 155H
549 Samples/s -31%
Sala GPUs-only
Asus NUC 14 Pro
Intel Arc 7-Core iGPU, Intel Core Ultra 5 125H
2807 Samples/s
Minisforum UH125 Pro
Intel Arc 7-Core iGPU, Intel Core Ultra 5 125H
2517 Samples/s -10%
Acemagic F2A
Intel Arc 8-Core iGPU, Intel Core Ultra 7 155H
2319 Samples/s -17%
Geekom AE7
AMD Radeon 780M, AMD Ryzen 9 7940HS
2312 Samples/s -18%
Aoostar GEM10
AMD Radeon 680M, AMD Ryzen 7 6800H
1288 Samples/s -54%
Affinity Photo 2 - Combined (Single / Multi GPU)
Minisforum UH125 Pro
Intel Arc 7-Core iGPU, Intel Core Ultra 5 125H
5244 Points +3%
Asus NUC 14 Pro
Intel Arc 7-Core iGPU, Intel Core Ultra 5 125H
5105 Points
Acemagic F2A
Intel Arc 8-Core iGPU, Intel Core Ultra 7 155H
4928 Points -3%
Aoostar GEM10
AMD Radeon 680M, AMD Ryzen 7 6800H
2339 Points -54%
Geekom AE7
AMD Radeon 780M, AMD Ryzen 9 7940HS
1889 Points -63%
Geekom A5
AMD Radeon RX Vega 8 (Ryzen 4000/5000), AMD Ryzen 7 5800H
1683 Points -67%
Asus NUC 14 Pro, Intel Arc 7-Core iGPU
Ultra 5 125H
Geekom AE7, AMD Radeon 780M
R9 7940HS
Minisforum UH125 Pro, Intel Arc 7-Core iGPU
Ultra 5 125H
Aoostar GEM10, AMD Radeon 680M
R7 6800H
Acemagic F2A, Intel Arc 8-Core iGPU
Ultra 7 155H
Geekom A5, AMD Radeon RX Vega 8 (Ryzen 4000/5000)
R7 5800H
Average of class Mini PC
 
SPECviewperf 2020
236%
-8%
217%
1%
83%
165%
3840x2160 Medical (medical-03)
5.87
12.7
116%
4.8
-18%
10.7
82%
5.05
-14%
4.82
-18%
3840x2160 Energy (energy-03)
3.81
14.4
278%
3.38
-11%
10.6
178%
4.61
21%
5.33
40%
3840x2160 Creo (creo-03)
15.3
30.2
97%
15.4
1%
32
109%
17.9
17%
19.1
25%
3840x2160 CATIA (catia-06)
10.4
23.7
128%
9.7
-7%
22.8
119%
10
-4%
13.1
26%
3840x2160 3ds Max (3dsmax-07)
14.5
20.7
43%
13.2
-9%
18.9
30%
12.9
-11%
11.3
-22%
3840x2160 Siemens NX (snx-04)
5.82
61.3
953%
5.54
-5%
61.4
955%
5.7
-2%
38
553%
3840x2160 Maya (maya-06)
34.7
47.4
37%
32.8
-5%
49.7
43%
35.4
2%
25.8
-26%
3DMark 05 Standard
48550 puntos
3DMark 06 Standard Score
40475 puntos
3DMark Vantage P Result
39395 puntos
3DMark 11 Performance
11870 puntos
3DMark Ice Storm Standard Score
126152 puntos
3DMark Cloud Gate Standard Score
29960 puntos
3DMark Fire Strike Score
7302 puntos
3DMark Fire Strike Extreme Score
3819 puntos
3DMark Time Spy Score
3540 puntos
3DMark Steel Nomad Score
699 puntos
3DMark Steel Nomad Light Score
2798 puntos
ayuda

Rendimiento en juegos

El Asus NUC 14 Pro sólo es adecuado para juegos modernos de forma limitada. Sin embargo, en comparación con la antigua Intel Iris Xe G7 con 96 UE, el rendimiento en juegos puede mejorar notablemente. Intel pierde el duelo con la iGPU de AMD más claramente que en las pruebas sintéticas en términos de rendimiento 3D. Para clasificar mejor el rendimiento de la iGPU, nos remitimos a nuestra Lista de juegos para GPU.

GTA V
1024x768 Lowest Settings possible
Geekom AE7
Radeon 780M, R9 7940HS, Wodposit NVMe SSD 1024 GB
168 (6.33min, 125P1) fps +7%
Acemagic F2A
Arc 8-Core, Ultra 7 155H, Kingston OM8SEP1024Q-A0
161 (4.76min, 100P1) fps +3%
Asus NUC 14 Pro
Arc 7-Core, Ultra 5 125H, Kingston KC3000 2048G SKC3000D2048G
156.3 (4.92min, 90.9P1) fps
Aoostar GEM10
Radeon 680M, R7 6800H, BIWIN CE980Y28900-1TB
145.3 (5.31min, 100P1) fps -7%
Geekom A5
Vega 8, R7 5800H, Lexar NM620 512GB
140.1 (17.4min, 90.9P1) fps -10%
Minisforum UH125 Pro
Arc 7-Core, Ultra 5 125H, Kingston OM8PGP41024Q-A0
132.4 (4.93min, 90.9P1) fps -15%
1920x1080 High/On (Advanced Graphics Off) AA:2xMSAA + FX AF:8x
Geekom AE7
Radeon 780M, R9 7940HS, Wodposit NVMe SSD 1024 GB
65.1 (2.93min, 29.4P1) fps +63%
Aoostar GEM10
Radeon 680M, R7 6800H, BIWIN CE980Y28900-1TB
53.9 (3.82min, 38.5P1) fps +35%
Asus NUC 14 Pro
Arc 7-Core, Ultra 5 125H, Kingston KC3000 2048G SKC3000D2048G
39.9 (3.1min, 29.4P1) fps
Minisforum UH125 Pro
Arc 7-Core, Ultra 5 125H, Kingston OM8PGP41024Q-A0
38.9 (3.15min, 28.6P1) fps -3%
Geekom A5
Vega 8, R7 5800H, Lexar NM620 512GB
35.1 (10.8min, 25.6P1) fps -12%
Acemagic F2A
Arc 8-Core, Ultra 7 155H, Kingston OM8SEP1024Q-A0
31.3 (2.94min, 22.7P1) fps -22%
Dota 2 Reborn
1280x720 min (0/3) fastest
Geekom AE7
Radeon 780M, R9 7940HS, Wodposit NVMe SSD 1024 GB
163 (143.1min) fps +68%
Geekom A5
Vega 8, R7 5800H, Lexar NM620 512GB
129.5 (112.6min) fps +33%
Aoostar GEM10
Radeon 680M, R7 6800H, BIWIN CE980Y28900-1TB
124 (8.9min) fps +28%
Acemagic F2A
Arc 8-Core, Ultra 7 155H, Kingston OM8SEP1024Q-A0
103.2 (59.8min) fps +6%
Asus NUC 14 Pro
Arc 7-Core, Ultra 5 125H, Kingston KC3000 2048G SKC3000D2048G
97.1 (61.8min) fps
Minisforum UH125 Pro
Arc 7-Core, Ultra 5 125H, Kingston OM8PGP41024Q-A0
95.5 (63.7min) fps -2%
1920x1080 high (2/3)
Geekom AE7
Radeon 780M, R9 7940HS, Wodposit NVMe SSD 1024 GB
89.8 (75.7min) fps +18%
Aoostar GEM10
Radeon 680M, R7 6800H, BIWIN CE980Y28900-1TB
81.6 (72.3min) fps +8%
Acemagic F2A
Arc 8-Core, Ultra 7 155H, Kingston OM8SEP1024Q-A0
77.3 (52.5min) fps +2%
Asus NUC 14 Pro
Arc 7-Core, Ultra 5 125H, Kingston KC3000 2048G SKC3000D2048G
75.9 (45.7min) fps
Minisforum UH125 Pro
Arc 7-Core, Ultra 5 125H, Kingston OM8PGP41024Q-A0
73.6 (47.5min) fps -3%
Geekom A5
Vega 8, R7 5800H, Lexar NM620 512GB
67.7 (59.9min) fps -11%
Cyberpunk 2077 2.1 Phantom Liberty
1920x1080 Low Preset (FSR off)
Geekom AE7
Radeon 780M, R9 7940HS, Wodposit NVMe SSD 1024 GB
45 (38min) fps +50%
Aoostar GEM10
Radeon 680M, R7 6800H, BIWIN CE980Y28900-1TB
34.8 (29.9min) fps +16%
Asus NUC 14 Pro
Arc 7-Core, Ultra 5 125H, Kingston KC3000 2048G SKC3000D2048G
30.1 (25.8min) fps
Acemagic F2A
Arc 8-Core, Ultra 7 155H, Kingston OM8SEP1024Q-A0
29.5 (24.1min) fps -2%
Minisforum UH125 Pro
Arc 7-Core, Ultra 5 125H, Kingston OM8PGP41024Q-A0
29.5 (25.4min) fps -2%
1920x1080 High Preset (FSR off)
Geekom AE7
Radeon 780M, R9 7940HS, Wodposit NVMe SSD 1024 GB
27.4 (23.1min) fps +26%
Asus NUC 14 Pro
Arc 7-Core, Ultra 5 125H, Kingston KC3000 2048G SKC3000D2048G
21.7 (18.8min) fps
Aoostar GEM10
Radeon 680M, R7 6800H, BIWIN CE980Y28900-1TB
21.3 (18.4min) fps -2%
Minisforum UH125 Pro
Arc 7-Core, Ultra 5 125H, Kingston OM8PGP41024Q-A0
20.6 (17.9min) fps -5%
Acemagic F2A
Arc 8-Core, Ultra 7 155H, Kingston OM8SEP1024Q-A0
20.4 (13.8min) fps -6%
Baldur's Gate 3
1280x720 Low Preset
Geekom AE7
Radeon 780M, R9 7940HS, Wodposit NVMe SSD 1024 GB
67.4 (22.7min, 28.3P0.1, 43.6P1) fps +34%
Asus NUC 14 Pro
Arc 7-Core, Ultra 5 125H, Kingston KC3000 2048G SKC3000D2048G
50.2 (27.7min, 29.7P0.1, 32.6P1) fps
Aoostar GEM10
Radeon 680M, R7 6800H, BIWIN CE980Y28900-1TB
48.9 (16.6min, 29.1P0.1, 36.8P1) fps -3%
Minisforum UH125 Pro
Arc 7-Core, Ultra 5 125H, Kingston OM8PGP41024Q-A0
45 (14.9min, 19.4P0.1, 29P1) fps -10%
1920x1080 High Preset
Geekom AE7
Radeon 780M, R9 7940HS, Wodposit NVMe SSD 1024 GB
25.7 (11min, 11.5P0.1, 14.5P1) fps +15%
Aoostar GEM10
Radeon 680M, R7 6800H, BIWIN CE980Y28900-1TB
23.3 (16.6min, 16.7P0.1, 18.3P1) fps +4%
Asus NUC 14 Pro
Arc 7-Core, Ultra 5 125H, Kingston KC3000 2048G SKC3000D2048G
22.4 (14min, 14.2P0.1, 15.3P1) fps
Minisforum UH125 Pro
Arc 7-Core, Ultra 5 125H, Kingston OM8PGP41024Q-A0
19.5 (9.2min, 10.4P0.1, 12.7P1) fps -13%
F1 24
1920x1080 Low Preset AA:T AF:16x
Geekom AE7
Radeon 780M, R9 7940HS, Wodposit NVMe SSD 1024 GB
94.8 (81min, 64P1) fps +43%
Asus NUC 14 Pro
Arc 7-Core, Ultra 5 125H, Kingston KC3000 2048G SKC3000D2048G
66.2 (56min, 54P1) fps
Minisforum UH125 Pro
Arc 7-Core, Ultra 5 125H, Kingston OM8PGP41024Q-A0
64.3 (55min, 53P1) fps -3%
1920x1080 High Preset AA:T AF:16x
Geekom AE7
Radeon 780M, R9 7940HS, Wodposit NVMe SSD 1024 GB
59.5 (50min, 41P1) fps +37%
Asus NUC 14 Pro
Arc 7-Core, Ultra 5 125H, Kingston KC3000 2048G SKC3000D2048G
43.4 (34min, 35P1) fps
Minisforum UH125 Pro
Arc 7-Core, Ultra 5 125H, Kingston OM8PGP41024Q-A0
41.7 (34min, 34P1) fps -4%

FPS chart

05101520Tooltip
Asus NUC 14 Pro Ultra 5 125H, Arc 7-Core: Ø18.5 (12.6-20.7)
bajo medio alto ultra
GTA V (2015) 156.3 148.8 39.9 16.6
Dota 2 Reborn (2015) 97.1 79.2 75.9 72.9
Final Fantasy XV Benchmark (2018) 60.6 35.4 25.3
X-Plane 11.11 (2018) 47.5 38.5 32.9
Baldur's Gate 3 (2023) 33.5 25.9 22.4 21.5
Cyberpunk 2077 2.1 Phantom Liberty (2023) 30.1 25.2 21.7 19.6
F1 24 (2024) 66.2 57.6 43.4

Comprobación del rendimiento del Asus NUC 14 Pro con una Nvidia GeForce RTX 3060 Ti

El rendimiento 3D puede mejorarse notablemente con una tarjeta gráfica externa. Sin embargo, los aceleradores 3D externos sólo pueden conectarse a través de USB-C. Sin influir en la valoración general, realizamos algunas pruebas en combinación con el Razer Core X y una tarjeta gráfica Nvidia GeForce RTX 3060 Ti. Observamos sistemáticamente una mejora en el rendimiento 3D, e incluso los juegos modernos pueden ejecutarse ahora sin problemas. En comparación con el Minisforum UH125 Proel Asus NUC 14 Pro ofrece un rendimiento idéntico.

Performance Rating - Percent
Geekom XT13 Pro (Nvidia GeForce RTX 3060 Ti FE)
Intel Core i9-13900H
99.2 pt
Geekom AX8 Pro (Nvidia GeForce RTX 3060 Ti FE)
AMD Ryzen 9 8945HS
98.6 pt
Asus NUC 14 Pro (Nvidia GeForce RTX 3060 Ti FE)
Intel Core Ultra 5 125H
97.4 pt
Minisforum UH125 Pro (Nvidia GeForce RTX 3060 Ti FE)
Intel Core Ultra 5 125H
96.8 pt
3DMark 11 - 1280x720 Performance GPU
Geekom AX8 Pro (Nvidia GeForce RTX 3060 Ti FE)
AMD Ryzen 9 8945HS
34907 Points +196%
Geekom XT13 Pro (Nvidia GeForce RTX 3060 Ti FE)
Intel Core i9-13900H
33454 Points +184%
Minisforum UH125 Pro (Nvidia GeForce RTX 3060 Ti FE)
Intel Core Ultra 5 125H
32085 Points +172%
Asus NUC 14 Pro (Nvidia GeForce RTX 3060 Ti FE)
Intel Core Ultra 5 125H
31917 Points +171%

11785 Points
3DMark
2560x1440 Time Spy Graphics
Geekom AX8 Pro (Nvidia GeForce RTX 3060 Ti FE)
AMD Ryzen 9 8945HS
11180 Points +249%
Geekom XT13 Pro (Nvidia GeForce RTX 3060 Ti FE)
Intel Core i9-13900H
11118 Points +247%
Minisforum UH125 Pro (Nvidia GeForce RTX 3060 Ti FE)
Intel Core Ultra 5 125H
10935 Points +241%
Asus NUC 14 Pro (Nvidia GeForce RTX 3060 Ti FE)
Intel Core Ultra 5 125H
10932 Points +241%

3205 Points
1920x1080 Fire Strike Graphics
Geekom AX8 Pro (Nvidia GeForce RTX 3060 Ti FE)
AMD Ryzen 9 8945HS
25665 Points +225%
Geekom XT13 Pro (Nvidia GeForce RTX 3060 Ti FE)
Intel Core i9-13900H
25415 Points +222%
Minisforum UH125 Pro (Nvidia GeForce RTX 3060 Ti FE)
Intel Core Ultra 5 125H
24809 Points +214%
Asus NUC 14 Pro (Nvidia GeForce RTX 3060 Ti FE)
Intel Core Ultra 5 125H
24767 Points +214%

7900 Points
3840x2160 Fire Strike Ultra Graphics
Geekom AX8 Pro (Nvidia GeForce RTX 3060 Ti FE)
AMD Ryzen 9 8945HS
7103 Points +274%
Geekom XT13 Pro (Nvidia GeForce RTX 3060 Ti FE)
Intel Core i9-13900H
7046 Points +271%
Asus NUC 14 Pro (Nvidia GeForce RTX 3060 Ti FE)
Intel Core Ultra 5 125H
7024 Points +270%
Minisforum UH125 Pro (Nvidia GeForce RTX 3060 Ti FE)
Intel Core Ultra 5 125H
6997 Points +268%

1899 Points
Unigine Superposition
1280x720 720p Low
Geekom AX8 Pro (Nvidia GeForce RTX 3060 Ti FE)
AMD Ryzen 9 8945HS
33452 Points +208%
Geekom XT13 Pro (Nvidia GeForce RTX 3060 Ti FE)
Intel Core i9-13900H
31986 Points +194%
Asus NUC 14 Pro (Nvidia GeForce RTX 3060 Ti FE)
Intel Core Ultra 5 125H
27554 Points +153%
Minisforum UH125 Pro (Nvidia GeForce RTX 3060 Ti FE)
Intel Core Ultra 5 125H
25121 Points +131%

10872 Points
1920x1080 1080p High
Geekom AX8 Pro (Nvidia GeForce RTX 3060 Ti FE)
AMD Ryzen 9 8945HS
15070 Points +318%
Geekom XT13 Pro (Nvidia GeForce RTX 3060 Ti FE)
Intel Core i9-13900H
14959 Points +314%
Asus NUC 14 Pro (Nvidia GeForce RTX 3060 Ti FE)
Intel Core Ultra 5 125H
14910 Points +313%
Minisforum UH125 Pro (Nvidia GeForce RTX 3060 Ti FE)
Intel Core Ultra 5 125H
14859 Points +312%

3609 Points
1920x1080 1080p Extreme
Geekom AX8 Pro (Nvidia GeForce RTX 3060 Ti FE)
AMD Ryzen 9 8945HS
7117 Points +259%
Asus NUC 14 Pro (Nvidia GeForce RTX 3060 Ti FE)
Intel Core Ultra 5 125H
7111 Points +259%
Geekom XT13 Pro (Nvidia GeForce RTX 3060 Ti FE)
Intel Core i9-13900H
7098 Points +258%
Minisforum UH125 Pro (Nvidia GeForce RTX 3060 Ti FE)
Intel Core Ultra 5 125H
7064 Points +257%

1981 Points
3840x2160 4k Optimized
Geekom XT13 Pro (Nvidia GeForce RTX 3060 Ti FE)
Intel Core i9-13900H
9315 Points
Asus NUC 14 Pro (Nvidia GeForce RTX 3060 Ti FE)
Intel Core Ultra 5 125H
9243 Points
Geekom AX8 Pro (Nvidia GeForce RTX 3060 Ti FE)
AMD Ryzen 9 8945HS
9206 Points
Minisforum UH125 Pro (Nvidia GeForce RTX 3060 Ti FE)
Intel Core Ultra 5 125H
9188 Points
7680x4320 8k Optimized
Geekom XT13 Pro (Nvidia GeForce RTX 3060 Ti FE)
Intel Core i9-13900H
4061 Points
Geekom AX8 Pro (Nvidia GeForce RTX 3060 Ti FE)
AMD Ryzen 9 8945HS
4047 Points
Minisforum UH125 Pro (Nvidia GeForce RTX 3060 Ti FE)
Intel Core Ultra 5 125H
4016 Points
Asus NUC 14 Pro (Nvidia GeForce RTX 3060 Ti FE)
Intel Core Ultra 5 125H
4013 Points
Unigine Valley 1.0
1920x1080 Extreme HD DirectX AA:x8
Geekom XT13 Pro (Nvidia GeForce RTX 3060 Ti FE)
Intel Core i9-13900H
142.2 fps +656%
Geekom AX8 Pro (Nvidia GeForce RTX 3060 Ti FE)
AMD Ryzen 9 8945HS
141.7 fps +654%
Asus NUC 14 Pro (Nvidia GeForce RTX 3060 Ti FE)
Intel Core Ultra 5 125H
137.3 fps +630%
Minisforum UH125 Pro (Nvidia GeForce RTX 3060 Ti FE)
Intel Core Ultra 5 125H
135.9 fps +623%

18.8 fps
1920x1080 Extreme HD Preset OpenGL AA:x8
Geekom XT13 Pro (Nvidia GeForce RTX 3060 Ti FE)
Intel Core i9-13900H
137.6 fps +581%
Geekom AX8 Pro (Nvidia GeForce RTX 3060 Ti FE)
AMD Ryzen 9 8945HS
137.6 fps +581%
Asus NUC 14 Pro (Nvidia GeForce RTX 3060 Ti FE)
Intel Core Ultra 5 125H
133.8 fps +562%
Minisforum UH125 Pro (Nvidia GeForce RTX 3060 Ti FE)
Intel Core Ultra 5 125H
133.5 fps +561%

20.2 fps
Unigine Heaven 4.0
Extreme Preset OpenGL
Geekom AX8 Pro (Nvidia GeForce RTX 3060 Ti FE)
AMD Ryzen 9 8945HS
174.9 fps +425%
Geekom XT13 Pro (Nvidia GeForce RTX 3060 Ti FE)
Intel Core i9-13900H
173.5 fps +421%
Asus NUC 14 Pro (Nvidia GeForce RTX 3060 Ti FE)
Intel Core Ultra 5 125H
172.4 fps +418%
Minisforum UH125 Pro (Nvidia GeForce RTX 3060 Ti FE)
Intel Core Ultra 5 125H
172.3 fps +417%

33.3 fps
Extreme Preset DX11
Geekom XT13 Pro (Nvidia GeForce RTX 3060 Ti FE)
Intel Core i9-13900H
164.2 fps +376%
Geekom AX8 Pro (Nvidia GeForce RTX 3060 Ti FE)
AMD Ryzen 9 8945HS
163.2 fps +373%
Minisforum UH125 Pro (Nvidia GeForce RTX 3060 Ti FE)
Intel Core Ultra 5 125H
158.8 fps +360%
Asus NUC 14 Pro (Nvidia GeForce RTX 3060 Ti FE)
Intel Core Ultra 5 125H
158.7 fps +360%

34.5 fps
ComputeMark v2.1
1024x600 Normal, Score
Geekom XT13 Pro (Nvidia GeForce RTX 3060 Ti FE)
Intel Core i9-13900H
27843 Points +316%
Asus NUC 14 Pro (Nvidia GeForce RTX 3060 Ti FE)
Intel Core Ultra 5 125H
27843 Points +316%
Minisforum UH125 Pro (Nvidia GeForce RTX 3060 Ti FE)
Intel Core Ultra 5 125H
27669 Points +313%
Geekom AX8 Pro (Nvidia GeForce RTX 3060 Ti FE)
AMD Ryzen 9 8945HS
26591 Points +297%

6698 Points
1024x600 Normal, Fluid 3DTex
Minisforum UH125 Pro (Nvidia GeForce RTX 3060 Ti FE)
Intel Core Ultra 5 125H
2708 Points +453%
Geekom AX8 Pro (Nvidia GeForce RTX 3060 Ti FE)
AMD Ryzen 9 8945HS
2683 Points +448%
Geekom XT13 Pro (Nvidia GeForce RTX 3060 Ti FE)
Intel Core i9-13900H
2681 Points +447%
Asus NUC 14 Pro (Nvidia GeForce RTX 3060 Ti FE)
Intel Core Ultra 5 125H
2681 Points +447%

490 Points
1024x600 Normal, Fluid 2DTexArr
Minisforum UH125 Pro (Nvidia GeForce RTX 3060 Ti FE)
Intel Core Ultra 5 125H
2641 Points +460%
Geekom AX8 Pro (Nvidia GeForce RTX 3060 Ti FE)
AMD Ryzen 9 8945HS
2618 Points +455%
Geekom XT13 Pro (Nvidia GeForce RTX 3060 Ti FE)
Intel Core i9-13900H
2614 Points +454%
Asus NUC 14 Pro (Nvidia GeForce RTX 3060 Ti FE)
Intel Core Ultra 5 125H
2614 Points +454%

472 Points
1024x600 Normal, Mandel Vector
Geekom XT13 Pro (Nvidia GeForce RTX 3060 Ti FE)
Intel Core i9-13900H
5726 Points +234%
Asus NUC 14 Pro (Nvidia GeForce RTX 3060 Ti FE)
Intel Core Ultra 5 125H
5726 Points +234%
Minisforum UH125 Pro (Nvidia GeForce RTX 3060 Ti FE)
Intel Core Ultra 5 125H
5652 Points +230%
Geekom AX8 Pro (Nvidia GeForce RTX 3060 Ti FE)
AMD Ryzen 9 8945HS
5358 Points +212%

1715 Points
1024x600 Normal, Mandel Scalar
Geekom XT13 Pro (Nvidia GeForce RTX 3060 Ti FE)
Intel Core i9-13900H
6275 Points +361%
Asus NUC 14 Pro (Nvidia GeForce RTX 3060 Ti FE)
Intel Core Ultra 5 125H
6275 Points +361%
Minisforum UH125 Pro (Nvidia GeForce RTX 3060 Ti FE)
Intel Core Ultra 5 125H
6223 Points +358%
Geekom AX8 Pro (Nvidia GeForce RTX 3060 Ti FE)
AMD Ryzen 9 8945HS
5949 Points +337%

1360 Points
1024x600 Normal, QJuliaRayTrace
Geekom XT13 Pro (Nvidia GeForce RTX 3060 Ti FE)
Intel Core i9-13900H
10548 Points +296%
Asus NUC 14 Pro (Nvidia GeForce RTX 3060 Ti FE)
Intel Core Ultra 5 125H
10548 Points +296%
Minisforum UH125 Pro (Nvidia GeForce RTX 3060 Ti FE)
Intel Core Ultra 5 125H
10445 Points +292%
Geekom AX8 Pro (Nvidia GeForce RTX 3060 Ti FE)
AMD Ryzen 9 8945HS
9982 Points +275%

2662 Points
Performance Rating - Percent
Geekom AX8 Pro (Nvidia GeForce RTX 3060 Ti FE)
AMD Ryzen 9 8945HS
99.5 pt
Geekom XT13 Pro (Nvidia GeForce RTX 3060 Ti FE)
Intel Core i9-13900H
94.6 pt
Minisforum UH125 Pro (Nvidia GeForce RTX 3060 Ti FE)
Intel Core Ultra 5 125H
88.3 pt
Asus NUC 14 Pro (Nvidia GeForce RTX 3060 Ti FE)
Intel Core Ultra 5 125H
88 pt
Cyberpunk 2077 2.1 Phantom Liberty
1280x720 Low Preset (FSR off)
Geekom AX8 Pro (Nvidia GeForce RTX 3060 Ti FE)
AMD Ryzen 9 8945HS
103.1 (80.9min - 132.1max) fps +123%
Geekom XT13 Pro (Nvidia GeForce RTX 3060 Ti FE)
Intel Core i9-13900H
88.7 (68min - 118.2max) fps +92%
Asus NUC 14 Pro (Nvidia GeForce RTX 3060 Ti FE)
Intel Core Ultra 5 125H
72.4 (53.9min - 101max) fps +56%
Minisforum UH125 Pro (Nvidia GeForce RTX 3060 Ti FE)
Intel Core Ultra 5 125H
70.2 (53.5min - 91.7max) fps +52%

46.3 (39.2min - 54.8max) fps
1920x1080 Medium Preset (FSR off)
Geekom AX8 Pro (Nvidia GeForce RTX 3060 Ti FE)
AMD Ryzen 9 8945HS
81.5 (65.7min - 103.4max) fps +223%
Geekom XT13 Pro (Nvidia GeForce RTX 3060 Ti FE)
Intel Core i9-13900H
81.4 (65.1min - 102max) fps +223%
Minisforum UH125 Pro (Nvidia GeForce RTX 3060 Ti FE)
Intel Core Ultra 5 125H
72.2 (55.8min - 97.4max) fps +187%
Asus NUC 14 Pro (Nvidia GeForce RTX 3060 Ti FE)
Intel Core Ultra 5 125H
69.8 (50min - 99.9max) fps +177%

25.2 (22.3min - 29max) fps
1920x1080 Ultra Preset (FSR off)
Geekom XT13 Pro (Nvidia GeForce RTX 3060 Ti FE)
Intel Core i9-13900H
64.4 (49.9min - 85.5max) fps +229%
Geekom AX8 Pro (Nvidia GeForce RTX 3060 Ti FE)
AMD Ryzen 9 8945HS
64.3 (50.9min - 85.8max) fps +228%
Minisforum UH125 Pro (Nvidia GeForce RTX 3060 Ti FE)
Intel Core Ultra 5 125H
60.8 (43.6min - 87max) fps +210%
Asus NUC 14 Pro (Nvidia GeForce RTX 3060 Ti FE)
Intel Core Ultra 5 125H
58.3 (36.6min - 87.8max) fps +197%

19.6 (16.7min - 23.6max) fps
Baldur's Gate 3
1920x1080 Low Preset
Geekom XT13 Pro (Nvidia GeForce RTX 3060 Ti FE)
Intel Core i9-13900H
113 (47.4min, 65.4P0.1, 77.5P1 - 215max) fps +237%
Asus NUC 14 Pro (Nvidia GeForce RTX 3060 Ti FE)
Intel Core Ultra 5 125H
111.6 (57.7min, 64.3P0.1, 75.6P1 - 248max) fps +233%
Geekom AX8 Pro (Nvidia GeForce RTX 3060 Ti FE)
AMD Ryzen 9 8945HS
110.9 (57.4min, 66.9P0.1, 76.7P1 - 233max) fps +231%
Minisforum UH125 Pro (Nvidia GeForce RTX 3060 Ti FE)
Intel Core Ultra 5 125H
109.5 (51.8min, 62.3P0.1, 74.4P1 - 198.7max) fps +227%

33.5 (20.9min, 21P0.1, 23.4P1 - 64.9max) fps
1920x1080 Medium Preset
Geekom XT13 Pro (Nvidia GeForce RTX 3060 Ti FE)
Intel Core i9-13900H
91.3 (51.4min, 53.4P0.1, 61.1P1 - 196.3max) fps +253%
Geekom AX8 Pro (Nvidia GeForce RTX 3060 Ti FE)
AMD Ryzen 9 8945HS
89.4 (43.6min, 53.5P0.1, 60P1 - 201max) fps +245%
Minisforum UH125 Pro (Nvidia GeForce RTX 3060 Ti FE)
Intel Core Ultra 5 125H
87.3 (36.9min, 43.6P0.1, 57.2P1 - 191.9max) fps +237%
Asus NUC 14 Pro (Nvidia GeForce RTX 3060 Ti FE)
Intel Core Ultra 5 125H
86 (30.5min, 43.2P0.1, 55.8P1 - 194.6max) fps +232%

25.9 (5.81min, 8.8P0.1, 15.9P1 - 97.2max) fps
1920x1080 Ultra Preset
Geekom XT13 Pro (Nvidia GeForce RTX 3060 Ti FE)
Intel Core i9-13900H
78.5 (46.2min, 47P0.1, 53.1P1 - 179.1max) fps +265%
Geekom AX8 Pro (Nvidia GeForce RTX 3060 Ti FE)
AMD Ryzen 9 8945HS
78.2 (23.4min, 47.3P0.1, 51.1P1 - 216max) fps +264%
Minisforum UH125 Pro (Nvidia GeForce RTX 3060 Ti FE)
Intel Core Ultra 5 125H
76.3 (41.3min, 43.7P0.1, 50P1 - 176.1max) fps +255%
Asus NUC 14 Pro (Nvidia GeForce RTX 3060 Ti FE)
Intel Core Ultra 5 125H
72.1 (20.2min, 24.7P0.1, 31.8P1 - 189.9max) fps +235%

21.5 (13.6min, 13.7P0.1, 14.1P1 - 66max) fps
F1 24
1920x1080 Low Preset AA:T AF:16x
Geekom AX8 Pro (Nvidia GeForce RTX 3060 Ti FE)
AMD Ryzen 9 8945HS
86.5 (48min, 51P1 - 108max) fps +31%
Geekom XT13 Pro (Nvidia GeForce RTX 3060 Ti FE)
Intel Core i9-13900H
76.9 (42min, 44P1 - 96max) fps +16%
Asus NUC 14 Pro (Nvidia GeForce RTX 3060 Ti FE)
Intel Core Ultra 5 125H
75.3 (42min, 44P1 - 92max) fps +14%
Minisforum UH125 Pro (Nvidia GeForce RTX 3060 Ti FE)
Intel Core Ultra 5 125H
72.6 (41min, 43P1 - 87max) fps +10%

66.2 (56min, 54P1 - 77max) fps
1920x1080 Medium Preset AA:T AF:16x
Geekom AX8 Pro (Nvidia GeForce RTX 3060 Ti FE)
AMD Ryzen 9 8945HS
82.3 (47min, 49P1 - 97max) fps +43%
Geekom XT13 Pro (Nvidia GeForce RTX 3060 Ti FE)
Intel Core i9-13900H
73.1 (42min, 43P1 - 86max) fps +27%
Asus NUC 14 Pro (Nvidia GeForce RTX 3060 Ti FE)
Intel Core Ultra 5 125H
71.7 (41min, 43P1 - 84max) fps +24%
Minisforum UH125 Pro (Nvidia GeForce RTX 3060 Ti FE)
Intel Core Ultra 5 125H
70 (41min, 42P1 - 81max) fps +22%

57.6 (47min, 46P1 - 68max) fps
1920x1080 High Preset AA:T AF:16x
Geekom AX8 Pro (Nvidia GeForce RTX 3060 Ti FE)
AMD Ryzen 9 8945HS
68.7 (40min, 40P1 - 82max) fps +58%
Geekom XT13 Pro (Nvidia GeForce RTX 3060 Ti FE)
Intel Core i9-13900H
60.5 (35min, 37P1 - 74max) fps +39%
Asus NUC 14 Pro (Nvidia GeForce RTX 3060 Ti FE)
Intel Core Ultra 5 125H
59.5 (35min, 35P1 - 72max) fps +37%
Minisforum UH125 Pro (Nvidia GeForce RTX 3060 Ti FE)
Intel Core Ultra 5 125H
58.2 (34min, 36P1 - 71max) fps +34%

43.4 (34min, 35P1 - 51max) fps
Asus NUC 14 Pro (Nvidia GeForce RTX 3060 Ti FE),
Ultra 5 125H
Minisforum UH125 Pro (Nvidia GeForce RTX 3060 Ti FE),
Ultra 5 125H
Geekom AX8 Pro (Nvidia GeForce RTX 3060 Ti FE),
R9 8945HS
Geekom XT13 Pro (Nvidia GeForce RTX 3060 Ti FE),
i9-13900H
Average of class Mini PC
 
SPECviewperf 2020
290%
126%
304%
300%
165%
3840x2160 Medical (medical-03)
13
121%
10.9
86%
13
121%
13
121%
3840x2160 Energy (energy-03)
20.9
449%
17.8
367%
21
451%
20.9
449%
3840x2160 Creo (creo-03)
68.3
346%
26.6
74%
77.2
405%
74.2
385%
3840x2160 CATIA (catia-06)
37.3
259%
23.6
127%
39.2
277%
39.4
279%
3840x2160 3ds Max (3dsmax-07)
46.5
221%
28.7
98%
46.1
218%
47.2
226%
3840x2160 Siemens NX (snx-04)
16.2
178%
11.4
96%
16.7
187%
16.5
184%
3840x2160 Maya (maya-06)
193
456%
47.5
37%
198
471%
194
459%
bajo medio alto ultraQHD4K
GTA V (2015) 178.7 174 162.9 100.6 90 102.6
Dota 2 Reborn (2015) 159 138.8 131 122.6 104.3
Final Fantasy XV Benchmark (2018) 163.8 141 97.3 75.6 47.4
X-Plane 11.11 (2018) 119.6 107.5 83.7 71.7
Baldur's Gate 3 (2023) 111.6 86 72.8 72.1 57.5 36.4
Cyberpunk 2077 2.1 Phantom Liberty (2023) 72.4 69.8 63.7 58.3 43.5 22.2
F1 24 (2024) 75.3 71.7 59.5 41.1 35.7 16.9

Emisiones

Emisiones sonoras

El Asus NUC 14 Pro es muy silencioso la mayor parte del tiempo. Sin embargo, el ventilador también funciona en modo inactivo, por lo que el funcionamiento no es silencioso. Bajo carga media, registramos un nivel de presión sonora de 42,4 dB(A). El Minisforum UH125 Pro y el Aoostar GEM10 están aproximadamente al mismo nivel. A carga máxima, nuestra muestra de prueba alcanza los 47,8 dB(A). Esto significa que el Asus NUC 14 Pro es claramente audible, aunque la percepción subjetiva del nivel de ruido es algo inferior.

Ruido

Ocioso
26 / 26.2 / 26.2 dB(A)
Carga
42.4 / 47.8 dB(A)
  red to green bar
 
 
30 dB
silencioso
40 dB(A)
audible
50 dB(A)
ruidosamente alto
 
min: dark, med: mid, max: light   Earthworks M23R (15 cm de distancia)   environment noise: 24 dB(A)
dB(A) 0102030405060708090Deep BassMiddle BassHigh BassLower RangeMidsHigher MidsLower HighsMid HighsUpper HighsSuper Highs2035.53536.236.836.335.435.52533.235.836.532.935.733.733.23133.435.235.835.937.534.333.44029.224.131.53126.726.629.25032.727.625.426.326.327.732.76330.524.124.125.924.327.730.58023.518.318.920.415.120.523.510020.820.717.91817.822.520.812522.319.218.514.813.816.822.316021.219.611.610.911.315.321.220023.921.111.812.211.912.723.925027.322.512.31211.210.927.331526.223.816.916.517.39.326.240027.523.813.313.312.69.327.55002925.313.713.213.38.72963031.227.71312.512.38.931.280034.130.315.215.615.39.334.1100037.432.81514.914.79.837.412503632.312.812.812.410.936160038.734.411.912.3121138.7200040.733.812.312.512.511.740.7250039.233.113.213.613.112.439.2315035.528.913.413.513.313.235.5400033.826.214.214.114.113.833.8500030.524.314.314.314.41430.5630029.223.11514.814.814.929.2800022.117.515.114.91514.922.11000019.417.815.315.215.214.919.4125002424.217.617.717.716.2241600014.915.114.214.214.314.314.9SPL47.842.426.226.22624.947.8N5.43.60.70.70.70.65.4median 29median 24.2median 14.2median 14.1median 13.8median 12.7median 29Delta6.75.31.21.21.42.26.7hearing rangehide median Fan NoiseAsus NUC 14 Pro
Asus NUC 14 Pro
Ultra 5 125H, Arc 7-Core
Geekom AE7
R9 7940HS, Radeon 780M
Minisforum UH125 Pro
Ultra 5 125H, Arc 7-Core
Aoostar GEM10
R7 6800H, Radeon 680M
Acemagic F2A
Ultra 7 155H, Arc 8-Core
Geekom A5
R7 5800H, Vega 8
Noise
-4%
-12%
-13%
-2%
-7%
off / environment *
24
24.4
-2%
24.8
-3%
24.3
-1%
24.9
-4%
25
-4%
Idle Minimum *
26
24.9
4%
35
-35%
36.5
-40%
25.4
2%
28.2
-8%
Idle Average *
26.2
25
5%
35
-34%
36.6
-40%
25.7
2%
28.2
-8%
Idle Maximum *
26.2
25
5%
35
-34%
36.6
-40%
25.7
2%
28.2
-8%
Load Average *
42.4
52
-23%
42.2
-0%
41.7
2%
47.8
-13%
47.8
-13%
Cyberpunk 2077 ultra *
47.7
52
-9%
40.8
14%
40.3
16%
Load Maximum *
47.8
51.4
-8%
43.9
8%
40.8
15%
49
-3%
47.4
1%
Witcher 3 ultra *
40.18
45.23

* ... más pequeño es mejor

Temperatura

La carcasa del Asus NUC 14 Pro se calienta considerablemente en algunos lugares bajo carga. Registramos un máximo de 55,1 °C en la parte superior. No hay anomalías apreciables en modo inactivo. Alcanzamos fácilmente valores superiores a los 100 °C para el SoC en la prueba de estrés. Según Intel, el Intel Core Ultra 5 125H está diseñado para una temperatura de funcionamiento de hasta 110 °C. Lo conseguimos en la prueba de estrés, aunque el consumo de energía se redujo a unos 50 vatios como resultado. El sistema de refrigeración no es capaz de disipar permanentemente los 64 vatios definidos como PL1 y PL2.

Prueba de esfuerzo Prime95, en solitario
Prueba de esfuerzo FurMark, en solitario
Prime95 y prueba de esfuerzo FurMark
Asus NUC 14 Pro durante la prueba de estrés (lado superior)
Prueba de resistencia del Asus NUC 14 Pro (parte inferior)
Asus NUC 14 Pro durante la prueba de estrés (parte inferior abierta)
Prueba de estrés del Asus NUC 14 Pro (parte trasera)
Carga Máx.
 38.3 °C50.5 °C55.1 °C 
 34.9 °C39.3 °C32.9 °C 
 35.1 °C35.9 °C30.5 °C 
Máximo: 55.1 °C
Médio: 39.2 °C
36.6 °C38.2 °C39.3 °C
33.6 °C36.1 °C37.7 °C
31.1 °C32.7 °C36.6 °C
Máximo: 39.3 °C
Médio: 35.8 °C
Conector de corriente  45.4 °C | Temperatura del cuarto 21.4 °C | Fluke t3000FC (calibrated)
(-) The average temperature for the upper side under maximal load is 39.2 °C / 103 F, compared to the average of 31.9 °C / 89 F for the devices in the class Mini PC.
(-) The maximum temperature on the upper side is 55.1 °C / 131 F, compared to the average of 35.6 °C / 96 F, ranging from 24 to 69.5 °C for the class Mini PC.
(+) The bottom heats up to a maximum of 39.3 °C / 103 F, compared to the average of 36.1 °C / 97 F
(+) In idle usage, the average temperature for the upper side is 30.8 °C / 87 F, compared to the device average of 31.9 °C / 89 F.

Consumo de energía

Asus tiene el consumo de energía del NUC 14 Pro relativamente bajo control. Bajo carga media, nuestra muestra de prueba sólo requiere 55,5 vatios, que es un poco más que el Miniforum UH125 Pro. La razón es el límite de potencia ligeramente superior que Asus impone al SoC. Registramos brevemente 103,3 vatios, a los que la fuente de alimentación de 120 vatios hace frente fácilmente.

Asus NUC 14 Pro con fuente de alimentación (19 V; 6,32 A)
Fuente de alimentación (19 V; 6,32 A)
Consumo de corriente
Off / Standbydarklight 0.48 / 1 Watt
Ociosodarkmidlight 5.1 / 6.4 / 14.7 Watt
Carga midlight 55.5 / 103.3 Watt
 color bar
Clave: min: dark, med: mid, max: light        Metrahit Energy
Currently we use the Metrahit Energy, a professional single phase power quality and energy measurement digital multimeter, for our measurements. Find out more about it here. All of our test methods can be found here.
Asus NUC 14 Pro
Ultra 5 125H, Arc 7-Core
Geekom AE7
R9 7940HS, Radeon 780M
Minisforum UH125 Pro
Ultra 5 125H, Arc 7-Core
Aoostar GEM10
R7 6800H, Radeon 680M
Acemagic F2A
Ultra 7 155H, Arc 8-Core
Geekom A5
R7 5800H, Vega 8
Average Intel Arc 7-Core iGPU
 
Average of class Mini PC
 
Power Consumption
3%
-38%
-11%
-29%
-3%
-1%
-34%
Idle Minimum *
5.1
4.5
12%
11.9
-133%
7.3
-43%
9.1
-78%
6.9
-35%
6.08 ?(3 - 11.9, n=5)
-19%
Idle Average *
6.4
4.7
27%
14.6
-128%
8.7
-36%
10.3
-61%
7.9
-23%
8.62 ?(6.3 - 14.6, n=5)
-35%
Idle Maximum *
14.7
8.1
45%
15.4
-5%
10.4
29%
14.4
2%
8.9
39%
12.3 ?(6.5 - 16, n=5)
16%
Load Average *
55.5
81.8
-47%
48.3
13%
67.2
-21%
54.9
1%
60.8
-10%
Cyberpunk 2077 ultra external monitor *
59.1
71.2
-20%
52.7
11%
58.8
1%
Load Maximum *
103.3
100.3
3%
89.8
13%
101.6
2%
110.4
-7%
89.7
13%

* ... más pequeño es mejor

Efficiency

Performance Rating - Percent
Geekom AE7
AMD Ryzen 9 7940HS, Radeon 780M
96.2 pt
Minisforum UH125 Pro
Intel Core Ultra 5 125H, Arc 7-Core
80.9 pt
Asus NUC 14 Pro
Intel Core Ultra 5 125H, Arc 7-Core
80.4 pt
Acemagic F2A
Intel Core Ultra 7 155H, Arc 8-Core
78.5 pt
Power Consumption
Cinebench R23 Multi Power Efficiency - external Monitor
Geekom AE7
AMD Ryzen 9 7940HS, Radeon 780M
238 Points per Watt +45%
Acemagic F2A
Intel Core Ultra 7 155H, Arc 8-Core
183.7 Points per Watt +12%
Minisforum UH125 Pro
Intel Core Ultra 5 125H, Arc 7-Core
181.1 Points per Watt +11%
Asus NUC 14 Pro
Intel Core Ultra 5 125H, Arc 7-Core
163.7 Points per Watt
Cinebench R23 Single Power Efficiency - external Monitor
Asus NUC 14 Pro
Intel Core Ultra 5 125H, Arc 7-Core
69.4 Points per Watt
Geekom AE7
AMD Ryzen 9 7940HS, Radeon 780M
61.4 Points per Watt -12%
Minisforum UH125 Pro
Intel Core Ultra 5 125H, Arc 7-Core
57.1 Points per Watt -18%
Acemagic F2A
Intel Core Ultra 7 155H, Arc 8-Core
54.2 Points per Watt -22%
Cinebench R15 Multi Efficiency (external Monitor)
Geekom AE7
AMD Ryzen 9 7940HS, Radeon 780M
33.2 Points per Watt +38%
Minisforum UH125 Pro
Intel Core Ultra 5 125H, Arc 7-Core
28 Points per Watt +17%
Acemagic F2A
Intel Core Ultra 7 155H, Arc 8-Core
26.6 Points per Watt +11%
Asus NUC 14 Pro
Intel Core Ultra 5 125H, Arc 7-Core
24 Points per Watt

Power consumtion with the external monitor

0102030405060708090100Tooltip
Asus NUC 14 Pro Ultra 5 125H, Arc 7-Core; Idle 1min (external Monitor): Ø6.48 (4.52-12)
Minisforum UH125 Pro Ultra 5 125H, Arc 7-Core; Idle 1min (external Monitor): Ø14.4 (13.7-16.8)
Aoostar GEM10 R7 6800H, Radeon 680M; Idle 1min (external Monitor): Ø9.01 (8.45-10.4)
Aoostar GEM10 R7 6800H, Radeon 680M; 1920x1080 The Witcher 3 ultra (external Monitor): Ø63.2 (61.3-86)
Asus NUC 14 Pro Ultra 5 125H, Arc 7-Core; 1280x720 Prime95 28.10 and Furmark 1.25: Ø90.8 (85.1-98.5)
Minisforum UH125 Pro Ultra 5 125H, Arc 7-Core; 1280x720 Prime95 28.10 and Furmark 1.25: Ø82.9 (81.3-87.6)
Aoostar GEM10 R7 6800H, Radeon 680M; 1280x720 Prime95 28.10 and Furmark 1.25: Ø87.3 (85-101.6)
Asus NUC 14 Pro Ultra 5 125H, Arc 7-Core; Cyberpunk 2077 FHD ultra no FSR - external Monitor: Ø59.1 (55.8-67.9)
Minisforum UH125 Pro Ultra 5 125H, Arc 7-Core; Cyberpunk 2077 FHD ultra no FSR - external Monitor: Ø52.7 (51.9-55.2)
Aoostar GEM10 R7 6800H, Radeon 680M; Cyberpunk 2077 FHD ultra no FSR - external Monitor: Ø58.8 (56.1-62.3)
Asus NUC 14 Pro Ultra 5 125H, Arc 7-Core; 3DMark06 Return To Proxycon: Ø55.5 (51.2-61.4)
Minisforum UH125 Pro Ultra 5 125H, Arc 7-Core; 3DMark06 Return To Proxycon: Ø48.4 (45.1-51.5)
Aoostar GEM10 R7 6800H, Radeon 680M; 3DMark06 Return To Proxycon: Ø67.2 (55.9-76)

Power consumtion with the external monitor

0102030405060708090100Tooltip
Asus NUC 14 Pro Ultra 5 125H, Arc 7-Core; Prime95 V2810 Stress (external Monitor): Ø90.6 (79.2-103.3)
Minisforum UH125 Pro Ultra 5 125H, Arc 7-Core; Prime95 V2810 Stress (external Monitor): Ø83 (67.7-89.8)
Aoostar GEM10 R7 6800H, Radeon 680M; Prime95 V2810 Stress (external Monitor): Ø76.4 (71.4-100.8)
Asus NUC 14 Pro Ultra 5 125H, Arc 7-Core; Cinebench R15 Multi (external Monitor): Ø89.2 (88-90.9)
Minisforum UH125 Pro Ultra 5 125H, Arc 7-Core; Cinebench R15 Multi (external Monitor): Ø80.3 (80-81.4)
Aoostar GEM10 R7 6800H, Radeon 680M; Cinebench R15 Multi (external Monitor): Ø87.9 (81.6-97.1)
Asus NUC 14 Pro Ultra 5 125H, Arc 7-Core; Cinebench R23 Single (external Monitor): Ø24.8 (20.8-58)
Minisforum UH125 Pro Ultra 5 125H, Arc 7-Core; Cinebench R23 Single (external Monitor): Ø28.7 (27-62.8)
Aoostar GEM10 R7 6800H, Radeon 680M; Cinebench R23 Single (external Monitor): Ø30.1 (28.4-45.5)
Asus NUC 14 Pro Ultra 5 125H, Arc 7-Core; Cinebench R23 Multi (external Monitor): Ø88.7 (86.9-91.6)
Minisforum UH125 Pro Ultra 5 125H, Arc 7-Core; Cinebench R23 Multi (external Monitor): Ø80.4 (79.8-81.1)
Aoostar GEM10 R7 6800H, Radeon 680M; Cinebench R23 Multi (external Monitor): Ø78.2 (71.1-95.8)
Asus NUC 14 Pro Ultra 5 125H, Arc 7-Core; 1280x720 FurMark 1.19 GPU Stress Test (external Monitor): Ø56.9 (53.6-63.3)
Minisforum UH125 Pro Ultra 5 125H, Arc 7-Core; 1280x720 FurMark 1.19 GPU Stress Test (external Monitor): Ø48 (46.2-53.5)
Aoostar GEM10 R7 6800H, Radeon 680M; 1280x720 FurMark 1.19 GPU Stress Test (external Monitor): Ø76.4 (69.1-84.4)

Pro

+ carcasa robusta y compacta
+ soC moderno con núcleos P y E
+ buen rendimiento del sistema
+ fácil de abrir (sin herramientas)
+ 2x Thunderbolt
+ wLAN rápida
+ muchos ajustes BIOS
+ 36 meses de garantía

Contra

- audible bajo carga
- altas latencias del CPD
- La unidad de refrigeración alcanza rápidamente su límite

Veredicto - Mini PC para empresas con amplias opciones de BIOS

Reseña del Asus NUC 14 Pro: proporcionado por Asus Alemania

Los conocidos mini PC NUC, que en su día fueron comercializados directamente por Intel, tienen ahora la misma continuación por parte de Asus. Basados en los procesadores Meteor Lake, los PC compactos obtienen un notable aumento de rendimiento en términos de rendimiento 3D.

No ha cambiado mucho el diseño en comparación con los conocidos mini PC NUC. Sería deseable una carcasa totalmente metálica, ya que el Asus NUC 14 Pro es inferior a algunos de sus competidores en este aspecto. En términos de dimensiones, el mini PC es más pequeño que muchos otros dispositivos. Por desgracia, este diseño conlleva un compromiso que todos los fabricantes tienen que hacer. El rendimiento del SoC debe disiparse de forma fiable. En realidad, el Asus NUC 14 Pro lo consigue bastante bien si no hay cargas continuas. Asus empuja el límite de temperatura del Intel Core Ultra 5 125H lo que sin duda hará sudar a algunos usuarios. En principio, los procesadores están diseñados para estos rangos de temperatura. Mientras tanto, la BIOS ofrece muchas opciones que también influyen en el límite de temperatura del procesador. Aquí se puede fijar un límite manualmente. Sin embargo, entonces debe esperarse un rendimiento ligeramente inferior. Hay que destacar positivamente la excelente conectividad: muchos puertos USB y dos puertos Thunderbolt 4 están a bordo. También se incluyen Wi-Fi rápido y LAN 2,5G.

El Asus NUC 14 Pro es un potente mini PC NUC. La conectividad es mejor que la de la mayoría de sus competidores y las amplias opciones de la BIOS son también un verdadero argumento de venta.

El precio del Asus NUC 14 Pro no es totalmente fuera de lo común. A 510 euros, el dispositivo barebone no es ciertamente una ganga. Sin embargo, sus competidores pueden costar fácilmente más de 700 euros incluyendo SSD, RAM y sistema operativo. En cuanto a la relación calidad-precio, el Aoostar GEM10 ya está disponible por 459 dólares estadounidenses.

Nota: Recientemente hemos actualizado nuestro sistema de clasificación y los resultados de la versión 8 no son comparables con los de la versión 7. Encontrará más información aquí.

Precio y disponibilidad

El Asus NUC 14 Pro está disponible en varias configuraciones. El mini PC con Intel Core Ultra 5 125H está disponible actualmente por 500 euros. Nuestro dispositivo de prueba aparece en Alternate y Notebooksbilliger. La opción Tall con el mismo SoC ofrece espacio adicional para un soporte de datos de 2,5 pulgadas y también puede encargarse en Alternate o Notebooksbilliger. El precio aquí ronda los 520 euros.

Asus NUC 14 Pro - 08/26/2024 v8
Sebastian Bade

Acabado
81 / 98 → 83%
Conectividad
58 / 81 → 71%
Peso
83%
Rendimiento de juegos
47 / 80 → 59%
Rendimiento de la Aplicación
80 / 92 → 87%
Workstation
28%
AI Performance
77%
Temperatura
87%
Ruido
80%
Médio
54%
75%
Mini PC - media ponderada
CO2 Emissions
No Data
Materials
25%
Packaging
25%
Power Use
77.5%
Repairability
30%
Software Updates
50%
Total Sustainability Score: 34.6%

Transparency

The present review sample was made available to the author as a loan by the manufacturer or a shop for the purposes of review. The lender had no influence on this review, nor did the manufacturer receive a copy of this review before publication. There was no obligation to publish this review.

Price comparison

Please share our article, every link counts!
> Análisis y pruebas de ordenadores portátiles y móviles teléfonos > Análisis > Reseña del Asus NUC 14 Pro: Mini PC NUC con Intel Core Ultra 5 125H, rápida iGPU Intel Arc y 2x Thunderbolt 4
Sebastian Bade, 2024-08-30 (Update: 2024-08-30)