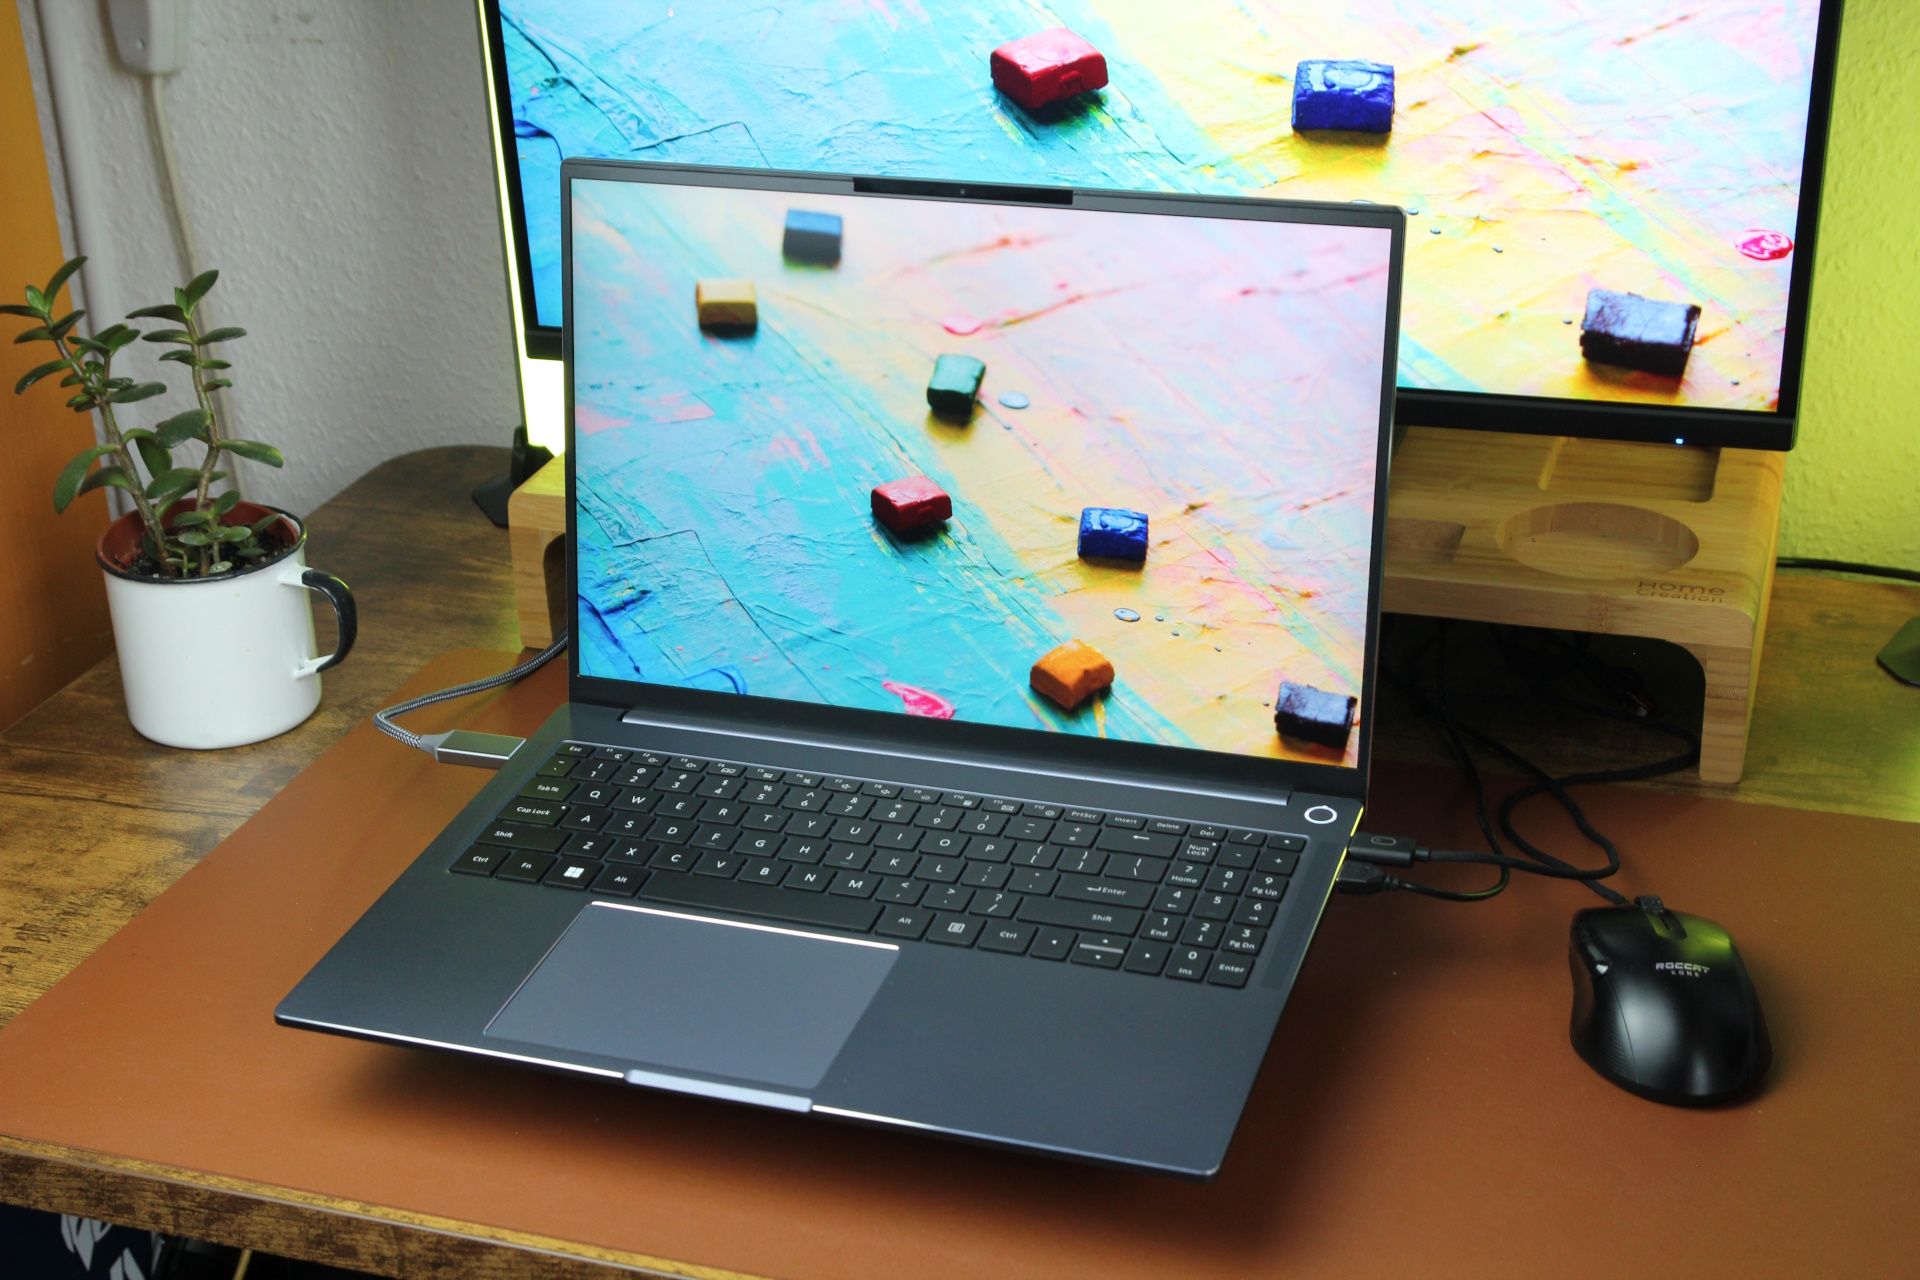
Reseña del portátil Ninkear A16 Pro: Asequible, potente y silencioso durante su uso
Aún mejor con AMD.
El Ninkear A16 Pro es un portátil chino sorprendentemente bueno equipado con el AMD Ryzen 7 8845HS, 32 GB de RAM y una unidad SSD de 1 TB por unos 840 dólares. Con sus buenas prestaciones, supera a su modelo hermano, el N16 Pro, e incluso se acerca al Xiaomi RedmiBook Pro 16. Descubrimos exactamente cómo de cerca durante nuestra prueba.Christian Hintze, 👁 Christian Hintze (traducido por DeepL / Ninh Duy) Publicado 🇺🇸 🇩🇪 ...
Veredicto - Mucho bueno, casi nada malo
Con el lanzamiento del A16 Pro, Ninkear ha demostrado una vez más que puede ofrecer una alternativa asequible y de alta calidad a los modelos de las marcas establecidas. Aunque no podemos decir nada sobre su funcionamiento a largo plazo, la A16 Pro nos impresionó durante nuestra prueba por su carcasa metálica, su bonita pantalla, su rendimiento bueno y sobre todo constante (incluso cuando funciona con batería), y su funcionamiento silencioso por relativamente poco dinero. Definitivamente se sitúa por delante de su modelo hermano -el N16 Pro- en términos de rendimiento.
Se le restan puntos por su débil webcam de 720p, y su clickpad muy ruidoso y de aspecto algo barato desmerece la por lo demás buena experiencia de usuario de sus dispositivos de entrada. Pero son debilidades perdonables. A pesar de su gran batería, nos sorprendió la escasa duración del portátil, aunque el fabricante ha declarado una autonomía de al menos 10 horas. Además, sin duda aún hay margen de mejora en lo que respecta a la optimización del software. A sus puertos USB también les vendría bien ser un poco más modernos.
Pro
Contra
Precio y disponibilidad
En el momento de escribir estas líneas, el Ninkear A16 no está disponible para su compra en Estados Unidos, pero si se encuentra en Europa, puede adquirirlo a través de nuestro prestamista Geekmaxi. Actualmente cuesta 779 euros (unos 842 dólares).
Posibles contendientes en la comparación
Imagen | Modelo | Geizhals | Peso | Altura | Pantalla |
|---|---|---|---|---|---|
| Ninkear A16 Pro AMD Ryzen 7 8845HS ⎘ AMD Radeon 780M ⎘ 32 GB Memoría, 1000 GB SSD | Listenpreis 799 Euro Geizhals Suche | 1.8 kg | 24 mm | 16.00" 2560x1600 189 PPI IPS | |
| Ninkear N16-Pro-32+1TB Intel Core i7-13620H ⎘ Intel UHD Graphics 64EUs (Alder Lake 12th Gen) ⎘ 32 GB Memoría, 1024 GB SSD | Listenpreis 800 Euro Geizhals Suche | 1.8 kg | 22 mm | 16.00" 2560x1600 189 PPI IPS | |
| Xiaomi RedmiBook Pro 16 2024 Intel Core Ultra 7 155H ⎘ Intel Arc 8-Core iGPU ⎘ 32 GB Memoría, 1024 GB SSD | Listenpreis 957€ | 1.9 kg | 15.9 mm | 16.00" 3072x1920 226 PPI IPS | |
| Acer Aspire 16 A16-51GM-77G2 Intel Core 7 150U ⎘ NVIDIA GeForce RTX 2050 Mobile ⎘ 16 GB Memoría, 1024 GB SSD | 1.9 kg | 21 mm | 16.00" 1920x1200 142 PPI IPS | ||
| Lenovo IdeaPad Slim 5 16IRU9 Intel Core 7 150U ⎘ Intel Iris Xe Graphics G7 96EUs ⎘ 16 GB Memoría | Listenpreis 800 USD Geizhals Suche | 1.8 kg | 16.9 mm | 16.00" 1920x1200 142 PPI IPS | |
| Medion S10 OLED Intel Core Ultra 7 155H ⎘ Intel Arc 8-Core iGPU ⎘ 16 GB Memoría, 1024 GB SSD | 1.6 kg | 17.8 mm | 16.00" 3840x2400 283 PPI OLED |
Índice
- Veredicto - Mucho bueno, casi nada malo
- Especificaciones
- Carcasa y conectividad - Muchas incógnitas en el A16 Pro
- Dispositivos de entrada - Buen teclado, teclas táctiles ruidosas
- Pantalla - Ninkear con 1.600p, 400 nits y 120 Hz
- Rendimiento - El A16 Pro con AMD Hawk Point
- Emisiones y potencia - El Ninkear silencioso y fresco
- Valoración total de Notebookcheck
Top 10 Análisis
» Top 10 Portátiles Multimedia
» Top 10 Portátiles de Juego
» Top 10 Portátiles de Juego ligeros
» Top 10 Portátiles Asequibles de Oficina/Empresa
» Top 10 Portátiles de Juego Ligeros
» Top 10 Portátiles de Oficina/Empresa Premium
» Top 10 Estaciones de Trabajo
» Top 10 Subportátiles
» Top 10 Ultrabooks
» Top 10 Convertibles
» Top 10 Tablets
» Top 10 Tablets Windows
» Top 10 Tablets de menos de 250 Euros
» Top 10 Phablets (>5.5")
» Top 10 Smartphones
» Top 10 Smartphones (≤5")
» Top 10 Smartphones de menos de 300 Euros
» Top 10 Smartphones de menos de 120 Euros
» Top 10 Portátiles de menos de 1000 Euros
» Top 10 Portátiles de menos de 500 Euros
» Top 10 Portátiles de menos de 300 Euros
» Los Mejores Displays de Portátiles Analizados por Notebookcheck
En los últimos tiempos, los portátiles Ninkear nos han sorprendido. El A15 Plus y el N16 Pro del Lejano Oriente lo hicieron bastante bien en nuestras pruebas, así que ahora ha llegado el momento de probar el A16 Pro. Destacan su carcasa metálica y, sobre todo, su pantalla de 16 pulgadas con una resolución de 2.560 x 1.600 píxeles. A diferencia del N16 Pro con una CPU Intel, este modelo lleva un procesador AMD Hawk Point y una GPU Radeon integrada. Cuesta algo más de 800 dólares. Hemos comprobado lo buena que es su pantalla multimedia y lo completo que es su paquete ofimático.
Especificaciones
Carcasa y conectividad - Muchas incógnitas en el A16 Pro
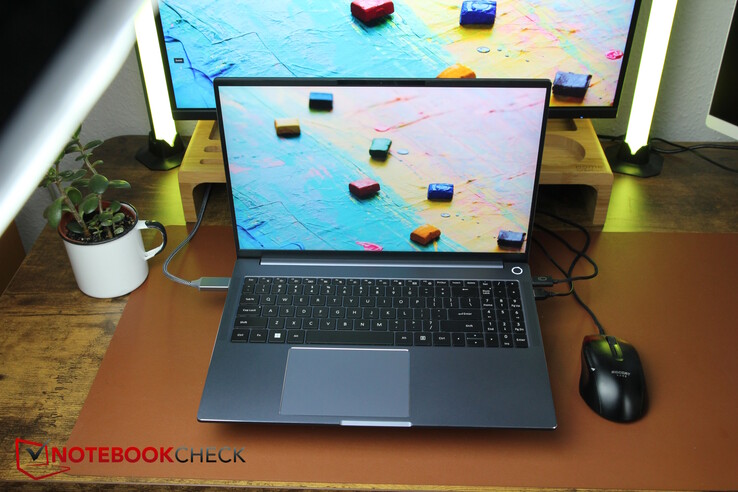
A pesar de que existen algunas similitudes, nuestro A16 Pro también parece bastante diferente del N16 Pro por fuera. Ninkear ha apostado por aún más metal y menos plástico para su A16 Pro. Como todo es de color azul metálico, el A16 Pro parece como si hubiera sido fundido a partir de un único molde. Por desgracia, la tapa de la pantalla cruje y se agrieta considerablemente al retorcerla. La base, en cambio, es muy estable.
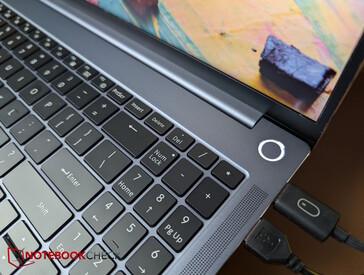
En general, su diseño luce muy bien, con "Ninkear" en letras negras en una de las esquinas superiores de la tapa. Por lo demás, el portátil brilla por su elegancia azul y su sencillez. La pantalla puede abrirse 180 grados, pero la bisagra, por desgracia, no agarra con suficiente firmeza. Las salidas de aire están ocultas tras la larga bisagra, y hay un sensor de huellas dactilares integrado en el botón de encendido.
Los accesorios son dignos de elogio: Además de los adhesivos para el teclado en diferentes idiomas, los usuarios también reciben un ratón USB y una alfombrilla para el ratón.
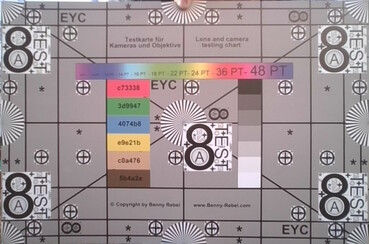
Por desgracia, su webcam sólo tiene una resolución de 720p y adolece de altas desviaciones de color y baja nitidez. Sólo es compatible con Wi-Fi 6 sin el sufijo E, por lo que se echa en falta la rápida red de 6 GHz, y sus velocidades de transferencia en la red de 5 GHz son más bien medias.
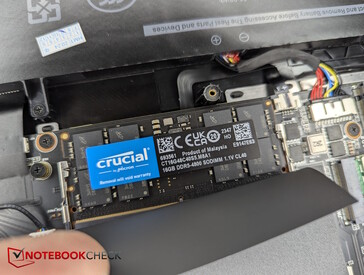
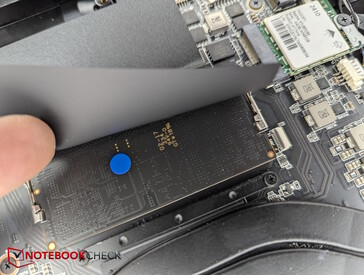
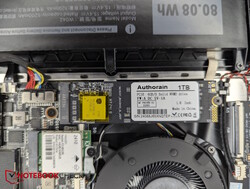
Para abrir el aparato, basta con retirar 13 tornillos Phillips. Parece que apenas hay abrazaderas en la placa base, por lo que se desprende inmediatamente. En el interior, puede acceder entonces a todos los componentes importantes, como la SSD, la RAM, la batería, el módulo Wi-Fi y el sistema de refrigeración. Hay una segunda ranura M.2 para SSD.
Conectividad
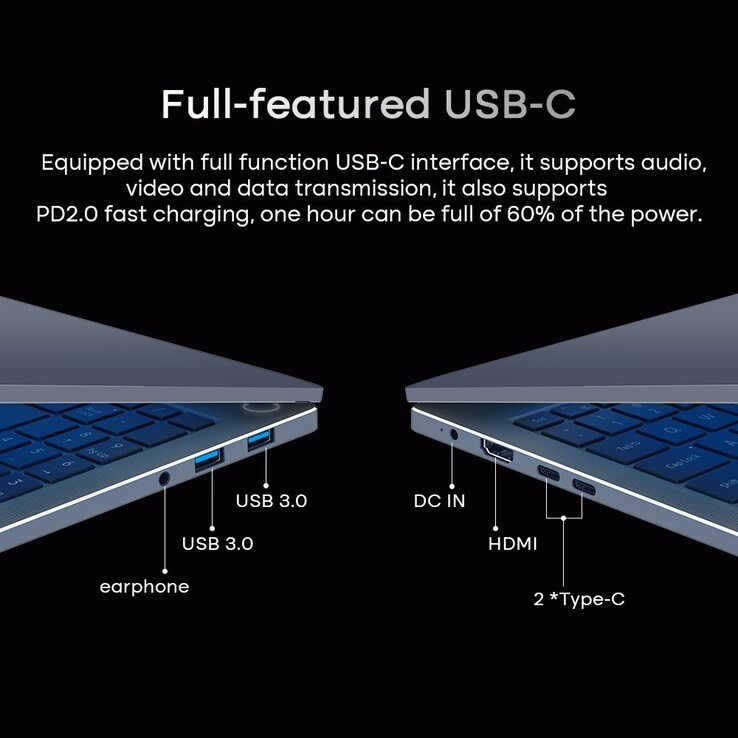
Por desgracia, el portátil no es compatible con Thunderbolt y el fabricante no parece querer dar más detalles sobre los dos puertos USB-C -¿o qué significa exactamente USB-C con todas las funciones?
| Networking | |
| iperf3 transmit AXE11000 | |
| Ninkear N16-Pro-32+1TB | |
| Medion S10 OLED | |
| Media de la clase Office (47.8 - 1793, n=87, últimos 2 años) | |
| Acer Aspire 16 A16-51GM-77G2 | |
| Lenovo IdeaPad Slim 5 16IRU9 | |
| Ninkear A16 Pro | |
| Medio Realtek RTL8852BE (536 - 926, n=52) | |
| Xiaomi RedmiBook Pro 16 2024 | |
| iperf3 receive AXE11000 | |
| Ninkear N16-Pro-32+1TB | |
| Medion S10 OLED | |
| Media de la clase Office (104.2 - 1775, n=87, últimos 2 años) | |
| Xiaomi RedmiBook Pro 16 2024 | |
| Ninkear A16 Pro | |
| Acer Aspire 16 A16-51GM-77G2 | |
| Medio Realtek RTL8852BE (455 - 985, n=53) | |
| Lenovo IdeaPad Slim 5 16IRU9 | |
| iperf3 transmit AXE11000 6GHz | |
| Acer Aspire 16 A16-51GM-77G2 | |
| Media de la clase Office (385 - 1961, n=51, últimos 2 años) | |
| iperf3 receive AXE11000 6GHz | |
| Media de la clase Office (1065 - 1790, n=51, últimos 2 años) | |
| Acer Aspire 16 A16-51GM-77G2 | |
Sostenibilidad
El portátil se entrega en dos cajas de cartón, una dentro de la otra. En el interior, sin embargo, el embalaje y los materiales de protección consisten en mucho plástico. El fabricante no ha facilitado ninguna información sobre las emisionesde CO2 durante la producción.
Dispositivos de entrada - Buen teclado, teclas táctiles ruidosas
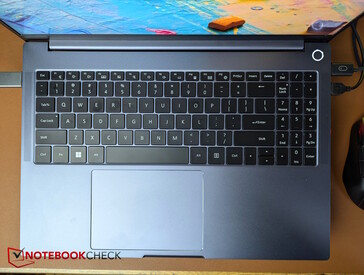
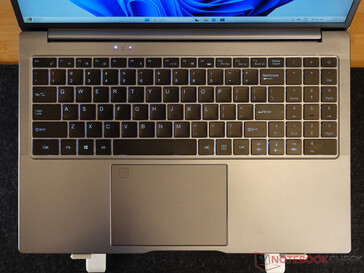
La disposición del teclado es muy ordenada y difiere de la del N16 Pro. En el lado derecho, un teclado numérico con teclas pequeñas está encajado junto a otras teclas bastante grandes. Por desgracia, las teclas de flecha verticales están reducidas a la mitad en altura. El portátil viene con una distribución de teclado americana de serie, sin embargo, los hablantes de otros idiomas no deben preocuparse, ya que el fabricante incluye etiquetas adhesivas para varios idiomas más.
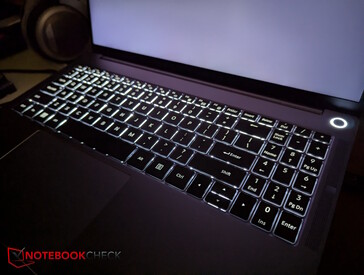
La sensación al escribir en el teclado es sorprendentemente buena: aunque su recorrido es bajo, la respuesta que proporciona es notable y los chasquidos son bastante silenciosos, siendo sólo la barra espaciadora notablemente más ruidosa. Una retroiluminación blanca de dos niveles proporciona apoyo en la oscuridad.
El gran touchpad (aprox. 12,8 x 9 cm) es fácil de deslizar el dedo y realizar gestos. Sólo los botones integrados del ratón parecen un poco baratos con sus ruidosos clics y son, por tanto, menos agradables de usar, aunque la respuesta es buena y se dispara con fiabilidad.
Pantalla - Ninkear con 1.600p, 400 nits y 120 Hz
Cuando se trata de la pantalla IPS mate instalada, incluso Hwinfo tiene que pasar ("desconocida") -una búsqueda a través del ID de hardware (CSO1623) indica que es un panel de Lenovo, pero esto tampoco arrojó resultados definitivos. Tiene una resolución de 2.560 x 1.600 píxeles, y debería cubrir completamente el sRGB, tener un alto contraste y funcionar a 120 Hz.
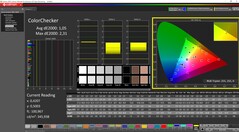
Medimos un brillo medio de algo menos de 400 nits, y su iluminación es de un buen 91%. Su nivel de negro es demasiado alto en sus ajustes de fábrica y el contraste sufre como resultado. Cuando se calibra, el nivel de negro de la pantalla baja y el contraste sube a más de 1.200:1.
| |||||||||||||||||||||||||
iluminación: 91 %
Brillo con batería: 393.5 cd/m²
Contraste: 895:1 (Negro: 0.44 cd/m²)
ΔE Color 2.32 | 0.5-29.43 Ø4.87, calibrated: 1.05
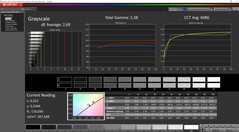
ΔE Greyscale 2.69 | 0.5-98 Ø5.1
71.1% AdobeRGB 1998 (Argyll 2.2.0 3D)
97.6% sRGB (Argyll 2.2.0 3D)
68.7% Display P3 (Argyll 2.2.0 3D)
Gamma: 2.38
| Ninkear A16 Pro cso1623, IPS, 2560x1600, 16", 120 Hz | Ninkear N16-Pro-32+1TB BOE0A40 (NE160QDM-NY1), IPS, 2560x1600, 16", 165 Hz | Xiaomi RedmiBook Pro 16 2024 TL160MDMP03_0, IPS, 3072x1920, 16", 165 Hz | Acer Aspire 16 A16-51GM-77G2 N160JCA-EEK (Chi Mei CMN163D), IPS, 1920x1200, 16", 60 Hz | Lenovo IdeaPad Slim 5 16IRU9 LEN160WUXGA, IPS, 1920x1200, 16", 60 Hz | Medion S10 OLED Samsung SDC4174, OLED, 3840x2400, 16", 60 Hz | |
|---|---|---|---|---|---|---|
| Display | 2% | 24% | -37% | -39% | 29% | |
| Display P3 Coverage | 68.7 | 70.2 2% | 98.8 44% | 42.3 -38% | 41.5 -40% | 99.9 45% |
| sRGB Coverage | 97.6 | 99.5 2% | 100 2% | 63.6 -35% | 61.2 -37% | 100 2% |
| AdobeRGB 1998 Coverage | 71.1 | 72.5 2% | 89.9 26% | 43.7 -39% | 42.9 -40% | 98.6 39% |
| Response Times | 18% | -85% | -94% | -31% | 89% | |
| Response Time Grey 50% / Grey 80% * | 16.4 ? | 14 ? 15% | 39.2 ? -139% | 31.4 ? -91% | 20.7 ? -26% | 1.7 ? 90% |
| Response Time Black / White * | 11.2 ? | 9 ? 20% | 14.6 ? -30% | 22 ? -96% | 15.1 ? -35% | 1.4 ? 87% |
| PWM Frequency | 60 ? | |||||
| Screen | 23% | -1% | -67% | -114% | 371% | |
| Brightness middle | 393.6 | 397 1% | 520 32% | 352 -11% | 313.3 -20% | 307 -22% |
| Brightness | 398 | 396 -1% | 510 28% | 324 -19% | 308 -23% | 307 -23% |
| Brightness Distribution | 91 | 89 -2% | 93 2% | 86 -5% | 91 0% | 96 5% |
| Black Level * | 0.44 | 0.35 20% | 0.35 20% | 0.27 39% | 0.37 16% | 0.01 98% |
| Contrast | 895 | 1134 27% | 1486 66% | 1304 46% | 847 -5% | 30700 3330% |
| Colorchecker dE 2000 * | 2.32 | 1.15 50% | 2.9 -25% | 4.41 -90% | 8.42 -263% | 2.1 9% |
| Colorchecker dE 2000 max. * | 3.72 | 2.08 44% | 6.2 -67% | 15.04 -304% | 19.09 -413% | 4.87 -31% |
| Colorchecker dE 2000 calibrated * | 1.05 | 0.81 23% | 1.1 -5% | 3.52 -235% | 2.16 -106% | 2.08 -98% |
| Greyscale dE 2000 * | 2.69 | 1.4 48% | 4.3 -60% | 3.32 -23% | 8.3 -209% | 0.9 67% |
| Gamma | 2.38 92% | 2.142 103% | 2.19 100% | 2.44 90% | 2.83 78% | 2.197 100% |
| CCT | 6086 107% | 7422 88% | 7122 91% | 6296 103% | 6513 100% | |
| Media total (Programa/Opciones) | 14% /
18% | -21% /
-8% | -66% /
-64% | -61% /
-86% | 163% /
257% |
* ... más pequeño es mejor
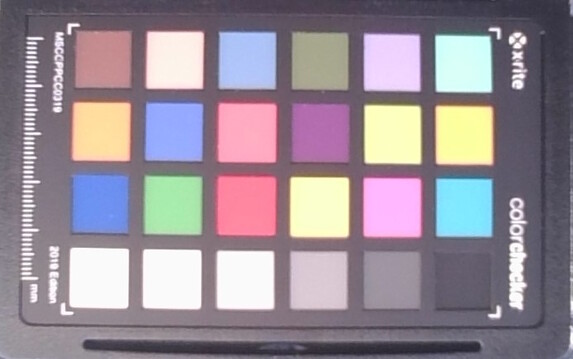
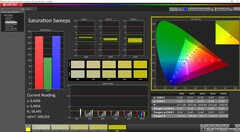
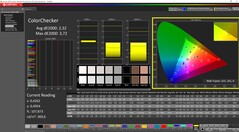
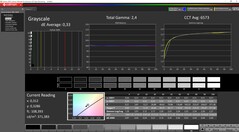
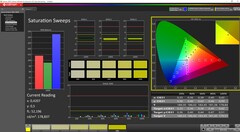
Nada más sacarlo de la caja, las desviaciones de color del panel y, sobre todo, su nivel de negro son demasiado altos. La calibración manual con nuestro colorímetro Xrite y el software Calman es una magnífica forma de reducir los valores DeltaE, y entonces el nivel de negro también desciende. Nuestro perfil icc puede descargarse gratuitamente más arriba. Por desgracia, el panel más que decente sólo cubre sRGB.
Tiempos de respuesta del display
| ↔ Tiempo de respuesta de Negro a Blanco | ||
|---|---|---|
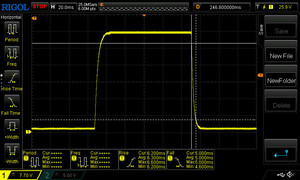
| 11.2 ms ... subida ↗ y bajada ↘ combinada | ↗ 6.2 ms subida | |
| ↘ 5 ms bajada | ||
| La pantalla mostró buenos tiempos de respuesta en nuestros tests pero podría ser demasiado lenta para los jugones competitivos. En comparación, todos los dispositivos de prueba van de ##min### (mínimo) a 240 (máximo) ms. » 27 % de todos los dispositivos son mejores. Esto quiere decir que el tiempo de respuesta medido es mejor que la media (20.8 ms) de todos los dispositivos testados. | ||
| ↔ Tiempo de respuesta 50% Gris a 80% Gris | ||
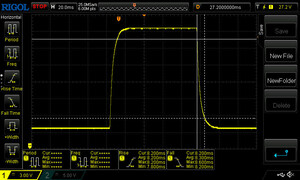
| 16.4 ms ... subida ↗ y bajada ↘ combinada | ↗ 8.2 ms subida | |
| ↘ 8.2 ms bajada | ||
| La pantalla mostró buenos tiempos de respuesta en nuestros tests pero podría ser demasiado lenta para los jugones competitivos. En comparación, todos los dispositivos de prueba van de ##min### (mínimo) a 636 (máximo) ms. » 28 % de todos los dispositivos son mejores. Esto quiere decir que el tiempo de respuesta medido es mejor que la media (32.5 ms) de todos los dispositivos testados. | ||
Parpadeo de Pantalla / PWM (Pulse-Width Modulation)
| Parpadeo de Pantalla / PWM no detectado | |||
Comparación: 53 % de todos los dispositivos testados no usaron PWM para atenuar el display. Si se usó, medimos una media de 8516 (mínimo: 5 - máxmo: 343500) Hz. | |||
Rendimiento - El A16 Pro con AMD Hawk Point
El Ninkear A16 Pro sólo está disponible en una configuración, concretamente con un AMD Ryzen 7 8845HS incluyendo su Radeon 780M integrada, unos generosos 32 GB de RAM y una unidad SSD de 1 TB. Esto hace que el portátil de 16 pulgadas sea especialmente adecuado para uso ofimático y algunas tareas multimedia. Gracias a la NPU integrada, también puede manejar aplicaciones de IA, aunque los últimos modelos son aún más potentes en este sentido.
Condiciones de prueba
El A16 Pro no tiene sus propios perfiles de rendimiento preestablecidos ni una aplicación del Centro de Control. Por lo tanto, configuramos los perfiles de energía de Windows en "rendimiento" para nuestros puntos de referencia de rendimiento y en "ahorro de energía" durante las pruebas de batería.
Procesador
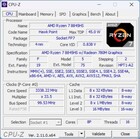
El AMD Ryzen 7 8845HS de la serie Hawk Point está clasificado como uno de los procesadores para portátiles de gama más alta, tiene 8 núcleos y puede procesar 16 hilos simultáneamente, con velocidades de reloj que oscilan entre 3,8 y 5,1 GHz. La NPU integrada para aplicaciones locales de IA alcanza hasta 16 TOPS, y toda la CPU gestiona hasta 38 TOPS.
Nuestra prueba de resistencia Cinebench R15 confirmó que la CPU tiene un rendimiento muy constante sin ninguna caída en el rendimiento. El Ryzen rindió exactamente al nivel de un Intel Ultra 7 155H en el Medion S10 -el mismo procesador en el Xiaomi RedmiBook Pro 16 fue sólo ligeramente más rápido al principio, pero esto se igualó cuando llegó al rendimiento continuo.
En todas las pruebas de CPU, el Ryzen 7 rindió ligeramente por debajo de nuestras expectativas, pero aún así ocupó el segundo lugar en nuestra comparación por detrás del RedmiBook, e incluso se situó por delante del Medion y de todos los demás competidores.
Para nuestro deleite, el A16 Pro no pierde nada de su rendimiento en modo batería, como demostró una nueva ejecución de Cinebench R15.
Cinebench R15 Multi continuous test
Cinebench R23: Multi Core | Single Core
Cinebench R20: CPU (Multi Core) | CPU (Single Core)
Cinebench R15: CPU Multi 64Bit | CPU Single 64Bit
Blender: v2.79 BMW27 CPU
7-Zip 18.03: 7z b 4 | 7z b 4 -mmt1
Geekbench 6.4: Multi-Core | Single-Core
Geekbench 5.5: Multi-Core | Single-Core
HWBOT x265 Benchmark v2.2: 4k Preset
LibreOffice : 20 Documents To PDF
R Benchmark 2.5: Overall mean
| CPU Performance Rating | |
| Xiaomi RedmiBook Pro 16 2024 | |
| Medio AMD Ryzen 7 8845HS | |
| Ninkear A16 Pro | |
| Medion S10 OLED | |
| Ninkear N16-Pro-32+1TB | |
| Acer Aspire 16 A16-51GM-77G2 | |
| Lenovo IdeaPad Slim 5 16IRU9 | |
| Media de la clase Office | |
| Cinebench R23 / Multi Core | |
| Xiaomi RedmiBook Pro 16 2024 | |
| Medio AMD Ryzen 7 8845HS (14895 - 18037, n=12) | |
| Medion S10 OLED | |
| Ninkear A16 Pro | |
| Ninkear N16-Pro-32+1TB | |
| Media de la clase Office (1577 - 20399, n=90, últimos 2 años) | |
| Lenovo IdeaPad Slim 5 16IRU9 | |
| Acer Aspire 16 A16-51GM-77G2 | |
| Cinebench R23 / Single Core | |
| Acer Aspire 16 A16-51GM-77G2 | |
| Lenovo IdeaPad Slim 5 16IRU9 | |
| Ninkear N16-Pro-32+1TB | |
| Medion S10 OLED | |
| Xiaomi RedmiBook Pro 16 2024 | |
| Medio AMD Ryzen 7 8845HS (1623 - 1783, n=12) | |
| Ninkear A16 Pro | |
| Media de la clase Office (618 - 1995, n=90, últimos 2 años) | |
| Cinebench R20 / CPU (Multi Core) | |
| Xiaomi RedmiBook Pro 16 2024 | |
| Medio AMD Ryzen 7 8845HS (5808 - 7026, n=12) | |
| Medion S10 OLED | |
| Ninkear A16 Pro | |
| Ninkear N16-Pro-32+1TB | |
| Media de la clase Office (590 - 8086, n=88, últimos 2 años) | |
| Lenovo IdeaPad Slim 5 16IRU9 | |
| Acer Aspire 16 A16-51GM-77G2 | |
| Cinebench R20 / CPU (Single Core) | |
| Acer Aspire 16 A16-51GM-77G2 | |
| Ninkear N16-Pro-32+1TB | |
| Lenovo IdeaPad Slim 5 16IRU9 | |
| Medion S10 OLED | |
| Medio AMD Ryzen 7 8845HS (673 - 698, n=12) | |
| Ninkear A16 Pro | |
| Xiaomi RedmiBook Pro 16 2024 | |
| Media de la clase Office (229 - 766, n=88, últimos 2 años) | |
| Cinebench R15 / CPU Multi 64Bit | |
| Xiaomi RedmiBook Pro 16 2024 | |
| Medio AMD Ryzen 7 8845HS (2342 - 2908, n=12) | |
| Medion S10 OLED | |
| Ninkear A16 Pro | |
| Ninkear N16-Pro-32+1TB | |
| Media de la clase Office (246 - 3132, n=92, últimos 2 años) | |
| Acer Aspire 16 A16-51GM-77G2 | |
| Lenovo IdeaPad Slim 5 16IRU9 | |
| Cinebench R15 / CPU Single 64Bit | |
| Acer Aspire 16 A16-51GM-77G2 | |
| Medio AMD Ryzen 7 8845HS (269 - 283, n=12) | |
| Ninkear A16 Pro | |
| Ninkear N16-Pro-32+1TB | |
| Medion S10 OLED | |
| Xiaomi RedmiBook Pro 16 2024 | |
| Lenovo IdeaPad Slim 5 16IRU9 | |
| Media de la clase Office (98 - 294, n=90, últimos 2 años) | |
| Blender / v2.79 BMW27 CPU | |
| Media de la clase Office (163 - 1956, n=91, últimos 2 años) | |
| Lenovo IdeaPad Slim 5 16IRU9 | |
| Acer Aspire 16 A16-51GM-77G2 | |
| Ninkear N16-Pro-32+1TB | |
| Ninkear A16 Pro | |
| Medion S10 OLED | |
| Medio AMD Ryzen 7 8845HS (179 - 216, n=12) | |
| Xiaomi RedmiBook Pro 16 2024 | |
| 7-Zip 18.03 / 7z b 4 | |
| Xiaomi RedmiBook Pro 16 2024 | |
| Medio AMD Ryzen 7 8845HS (62669 - 74664, n=12) | |
| Ninkear A16 Pro | |
| Medion S10 OLED | |
| Ninkear N16-Pro-32+1TB | |
| Media de la clase Office (7532 - 76886, n=92, últimos 2 años) | |
| Lenovo IdeaPad Slim 5 16IRU9 | |
| Acer Aspire 16 A16-51GM-77G2 | |
| 7-Zip 18.03 / 7z b 4 -mmt1 | |
| Ninkear N16-Pro-32+1TB | |
| Medio AMD Ryzen 7 8845HS (5197 - 6714, n=12) | |
| Acer Aspire 16 A16-51GM-77G2 | |
| Lenovo IdeaPad Slim 5 16IRU9 | |
| Ninkear A16 Pro | |
| Medion S10 OLED | |
| Xiaomi RedmiBook Pro 16 2024 | |
| Media de la clase Office (2972 - 6687, n=91, últimos 2 años) | |
| Geekbench 6.4 / Multi-Core | |
| Xiaomi RedmiBook Pro 16 2024 | |
| Ninkear A16 Pro | |
| Medio AMD Ryzen 7 8845HS (11073 - 14014, n=16) | |
| Medion S10 OLED | |
| Acer Aspire 16 A16-51GM-77G2 | |
| Lenovo IdeaPad Slim 5 16IRU9 | |
| Ninkear N16-Pro-32+1TB | |
| Media de la clase Office (662 - 14767, n=85, últimos 2 años) | |
| Geekbench 6.4 / Single-Core | |
| Acer Aspire 16 A16-51GM-77G2 | |
| Lenovo IdeaPad Slim 5 16IRU9 | |
| Medio AMD Ryzen 7 8845HS (2510 - 2698, n=14) | |
| Ninkear A16 Pro | |
| Ninkear N16-Pro-32+1TB | |
| Medion S10 OLED | |
| Xiaomi RedmiBook Pro 16 2024 | |
| Media de la clase Office (457 - 2871, n=84, últimos 2 años) | |
| Geekbench 5.5 / Multi-Core | |
| Xiaomi RedmiBook Pro 16 2024 | |
| Medio AMD Ryzen 7 8845HS (11256 - 12726, n=13) | |
| Ninkear A16 Pro | |
| Medion S10 OLED | |
| Ninkear N16-Pro-32+1TB | |
| Acer Aspire 16 A16-51GM-77G2 | |
| Lenovo IdeaPad Slim 5 16IRU9 | |
| Media de la clase Office (1018 - 14192, n=91, últimos 2 años) | |
| Geekbench 5.5 / Single-Core | |
| Acer Aspire 16 A16-51GM-77G2 | |
| Medio AMD Ryzen 7 8845HS (1765 - 2004, n=13) | |
| Lenovo IdeaPad Slim 5 16IRU9 | |
| Ninkear N16-Pro-32+1TB | |
| Ninkear A16 Pro | |
| Xiaomi RedmiBook Pro 16 2024 | |
| Medion S10 OLED | |
| Media de la clase Office (510 - 2096, n=92, últimos 2 años) | |
| HWBOT x265 Benchmark v2.2 / 4k Preset | |
| Medio AMD Ryzen 7 8845HS (18.6 - 22.7, n=12) | |
| Xiaomi RedmiBook Pro 16 2024 | |
| Ninkear A16 Pro | |
| Medion S10 OLED | |
| Ninkear N16-Pro-32+1TB | |
| Media de la clase Office (1.72 - 22.4, n=89, últimos 2 años) | |
| Lenovo IdeaPad Slim 5 16IRU9 | |
| Acer Aspire 16 A16-51GM-77G2 | |
| LibreOffice / 20 Documents To PDF | |
| Media de la clase Office (31.3 - 129.6, n=89, últimos 2 años) | |
| Ninkear A16 Pro | |
| Medio AMD Ryzen 7 8845HS (44.4 - 77, n=12) | |
| Medion S10 OLED | |
| Xiaomi RedmiBook Pro 16 2024 | |
| Ninkear N16-Pro-32+1TB | |
| Lenovo IdeaPad Slim 5 16IRU9 | |
| Acer Aspire 16 A16-51GM-77G2 | |
| R Benchmark 2.5 / Overall mean | |
| Media de la clase Office (0.4098 - 1.135, n=88, últimos 2 años) | |
| Ninkear A16 Pro | |
| Xiaomi RedmiBook Pro 16 2024 | |
| Medion S10 OLED | |
| Medio AMD Ryzen 7 8845HS (0.4304 - 0.4935, n=12) | |
| Ninkear N16-Pro-32+1TB | |
| Lenovo IdeaPad Slim 5 16IRU9 | |
| Acer Aspire 16 A16-51GM-77G2 | |
* ... más pequeño es mejor
AIDA64: FP32 Ray-Trace | FPU Julia | CPU SHA3 | CPU Queen | FPU SinJulia | FPU Mandel | CPU AES | CPU ZLib | FP64 Ray-Trace | CPU PhotoWorxx
| Performance Rating | |
| Medio AMD Ryzen 7 8845HS | |
| Ninkear A16 Pro | |
| Xiaomi RedmiBook Pro 16 2024 | |
| Medion S10 OLED | |
| Ninkear N16-Pro-32+1TB | |
| Media de la clase Office | |
| Lenovo IdeaPad Slim 5 16IRU9 | |
| Acer Aspire 16 A16-51GM-77G2 | |
| AIDA64 / FP32 Ray-Trace | |
| Medio AMD Ryzen 7 8845HS (23708 - 29544, n=12) | |
| Ninkear A16 Pro | |
| Medion S10 OLED | |
| Xiaomi RedmiBook Pro 16 2024 | |
| Ninkear N16-Pro-32+1TB | |
| Media de la clase Office (763 - 31245, n=90, últimos 2 años) | |
| Lenovo IdeaPad Slim 5 16IRU9 | |
| Acer Aspire 16 A16-51GM-77G2 | |
| AIDA64 / FPU Julia | |
| Medio AMD Ryzen 7 8845HS (99659 - 125873, n=12) | |
| Ninkear A16 Pro | |
| Xiaomi RedmiBook Pro 16 2024 | |
| Medion S10 OLED | |
| Ninkear N16-Pro-32+1TB | |
| Media de la clase Office (4113 - 125394, n=90, últimos 2 años) | |
| Lenovo IdeaPad Slim 5 16IRU9 | |
| Acer Aspire 16 A16-51GM-77G2 | |
| AIDA64 / CPU SHA3 | |
| Medio AMD Ryzen 7 8845HS (4332 - 5180, n=12) | |
| Ninkear A16 Pro | |
| Xiaomi RedmiBook Pro 16 2024 | |
| Medion S10 OLED | |
| Media de la clase Office (287 - 5398, n=90, últimos 2 años) | |
| Ninkear N16-Pro-32+1TB | |
| Lenovo IdeaPad Slim 5 16IRU9 | |
| Acer Aspire 16 A16-51GM-77G2 | |
| AIDA64 / CPU Queen | |
| Medio AMD Ryzen 7 8845HS (109458 - 124695, n=12) | |
| Ninkear A16 Pro | |
| Xiaomi RedmiBook Pro 16 2024 | |
| Medion S10 OLED | |
| Media de la clase Office (8185 - 115197, n=90, últimos 2 años) | |
| Acer Aspire 16 A16-51GM-77G2 | |
| Lenovo IdeaPad Slim 5 16IRU9 | |
| Ninkear N16-Pro-32+1TB | |
| AIDA64 / FPU SinJulia | |
| Medio AMD Ryzen 7 8845HS (14062 - 15519, n=12) | |
| Ninkear A16 Pro | |
| Xiaomi RedmiBook Pro 16 2024 | |
| Medion S10 OLED | |
| Media de la clase Office (404 - 18321, n=90, últimos 2 años) | |
| Ninkear N16-Pro-32+1TB | |
| Acer Aspire 16 A16-51GM-77G2 | |
| Lenovo IdeaPad Slim 5 16IRU9 | |
| AIDA64 / FPU Mandel | |
| Medio AMD Ryzen 7 8845HS (53436 - 67367, n=12) | |
| Ninkear A16 Pro | |
| Medion S10 OLED | |
| Xiaomi RedmiBook Pro 16 2024 | |
| Media de la clase Office (2075 - 66922, n=90, últimos 2 años) | |
| Ninkear N16-Pro-32+1TB | |
| Lenovo IdeaPad Slim 5 16IRU9 | |
| Acer Aspire 16 A16-51GM-77G2 | |
| AIDA64 / CPU AES | |
| Ninkear A16 Pro | |
| Medio AMD Ryzen 7 8845HS (64515 - 172642, n=12) | |
| Ninkear N16-Pro-32+1TB | |
| Xiaomi RedmiBook Pro 16 2024 | |
| Medion S10 OLED | |
| Media de la clase Office (7254 - 155900, n=90, últimos 2 años) | |
| Lenovo IdeaPad Slim 5 16IRU9 | |
| Acer Aspire 16 A16-51GM-77G2 | |
| AIDA64 / CPU ZLib | |
| Xiaomi RedmiBook Pro 16 2024 | |
| Medion S10 OLED | |
| Medio AMD Ryzen 7 8845HS (627 - 1080, n=12) | |
| Ninkear A16 Pro | |
| Ninkear N16-Pro-32+1TB | |
| Media de la clase Office (78 - 1366, n=90, últimos 2 años) | |
| Lenovo IdeaPad Slim 5 16IRU9 | |
| Acer Aspire 16 A16-51GM-77G2 | |
| AIDA64 / FP64 Ray-Trace | |
| Medio AMD Ryzen 7 8845HS (12361 - 15911, n=12) | |
| Ninkear A16 Pro | |
| Medion S10 OLED | |
| Xiaomi RedmiBook Pro 16 2024 | |
| Ninkear N16-Pro-32+1TB | |
| Media de la clase Office (432 - 17834, n=90, últimos 2 años) | |
| Acer Aspire 16 A16-51GM-77G2 | |
| Lenovo IdeaPad Slim 5 16IRU9 | |
| AIDA64 / CPU PhotoWorxx | |
| Xiaomi RedmiBook Pro 16 2024 | |
| Medio AMD Ryzen 7 8845HS (33192 - 41668, n=12) | |
| Medion S10 OLED | |
| Lenovo IdeaPad Slim 5 16IRU9 | |
| Ninkear A16 Pro | |
| Acer Aspire 16 A16-51GM-77G2 | |
| Media de la clase Office (4814 - 54971, n=90, últimos 2 años) | |
| Ninkear N16-Pro-32+1TB | |
Rendimiento del sistema
CrossMark: Overall | Productivity | Creativity | Responsiveness
WebXPRT 3: Overall
WebXPRT 4: Overall
Mozilla Kraken 1.1: Total
| PCMark 10 / Score | |
| Ninkear A16 Pro | |
| Medio AMD Ryzen 7 8845HS, AMD Radeon 780M (7120 - 7641, n=7) | |
| Xiaomi RedmiBook Pro 16 2024 | |
| Acer Aspire 16 A16-51GM-77G2 | |
| Medion S10 OLED | |
| Lenovo IdeaPad Slim 5 16IRU9 | |
| Media de la clase Office (2463 - 7578, n=82, últimos 2 años) | |
| Ninkear N16-Pro-32+1TB | |
| PCMark 10 / Essentials | |
| Lenovo IdeaPad Slim 5 16IRU9 | |
| Acer Aspire 16 A16-51GM-77G2 | |
| Ninkear A16 Pro | |
| Medio AMD Ryzen 7 8845HS, AMD Radeon 780M (10685 - 11570, n=7) | |
| Xiaomi RedmiBook Pro 16 2024 | |
| Media de la clase Office (5575 - 20841, n=82, últimos 2 años) | |
| Ninkear N16-Pro-32+1TB | |
| Medion S10 OLED | |
| PCMark 10 / Productivity | |
| Ninkear A16 Pro | |
| Medio AMD Ryzen 7 8845HS, AMD Radeon 780M (9787 - 10482, n=7) | |
| Acer Aspire 16 A16-51GM-77G2 | |
| Xiaomi RedmiBook Pro 16 2024 | |
| Lenovo IdeaPad Slim 5 16IRU9 | |
| Medion S10 OLED | |
| Media de la clase Office (3041 - 10415, n=82, últimos 2 años) | |
| Ninkear N16-Pro-32+1TB | |
| PCMark 10 / Digital Content Creation | |
| Xiaomi RedmiBook Pro 16 2024 | |
| Medio AMD Ryzen 7 8845HS, AMD Radeon 780M (9009 - 10009, n=7) | |
| Ninkear A16 Pro | |
| Medion S10 OLED | |
| Acer Aspire 16 A16-51GM-77G2 | |
| Media de la clase Office (2049 - 11108, n=82, últimos 2 años) | |
| Lenovo IdeaPad Slim 5 16IRU9 | |
| Ninkear N16-Pro-32+1TB | |
| CrossMark / Overall | |
| Acer Aspire 16 A16-51GM-77G2 | |
| Medio AMD Ryzen 7 8845HS, AMD Radeon 780M (1633 - 1939, n=7) | |
| Xiaomi RedmiBook Pro 16 2024 | |
| Medion S10 OLED | |
| Lenovo IdeaPad Slim 5 16IRU9 | |
| Ninkear A16 Pro | |
| Ninkear N16-Pro-32+1TB | |
| Media de la clase Office (348 - 1891, n=84, últimos 2 años) | |
| CrossMark / Productivity | |
| Acer Aspire 16 A16-51GM-77G2 | |
| Medio AMD Ryzen 7 8845HS, AMD Radeon 780M (1562 - 1872, n=7) | |
| Xiaomi RedmiBook Pro 16 2024 | |
| Medion S10 OLED | |
| Lenovo IdeaPad Slim 5 16IRU9 | |
| Ninkear A16 Pro | |
| Ninkear N16-Pro-32+1TB | |
| Media de la clase Office (393 - 1870, n=84, últimos 2 años) | |
| CrossMark / Creativity | |
| Xiaomi RedmiBook Pro 16 2024 | |
| Medio AMD Ryzen 7 8845HS, AMD Radeon 780M (1734 - 2040, n=7) | |
| Ninkear A16 Pro | |
| Acer Aspire 16 A16-51GM-77G2 | |
| Medion S10 OLED | |
| Lenovo IdeaPad Slim 5 16IRU9 | |
| Ninkear N16-Pro-32+1TB | |
| Media de la clase Office (340 - 2155, n=84, últimos 2 años) | |
| CrossMark / Responsiveness | |
| Acer Aspire 16 A16-51GM-77G2 | |
| Medio AMD Ryzen 7 8845HS, AMD Radeon 780M (1437 - 1849, n=7) | |
| Xiaomi RedmiBook Pro 16 2024 | |
| Medion S10 OLED | |
| Lenovo IdeaPad Slim 5 16IRU9 | |
| Ninkear A16 Pro | |
| Ninkear N16-Pro-32+1TB | |
| Media de la clase Office (258 - 2017, n=84, últimos 2 años) | |
| WebXPRT 3 / Overall | |
| Lenovo IdeaPad Slim 5 16IRU9 | |
| Medio AMD Ryzen 7 8845HS, AMD Radeon 780M (295 - 334, n=7) | |
| Acer Aspire 16 A16-51GM-77G2 | |
| Ninkear A16 Pro | |
| Xiaomi RedmiBook Pro 16 2024 | |
| Ninkear N16-Pro-32+1TB | |
| Media de la clase Office (121 - 455, n=84, últimos 2 años) | |
| Medion S10 OLED | |
| WebXPRT 4 / Overall | |
| Acer Aspire 16 A16-51GM-77G2 | |
| Lenovo IdeaPad Slim 5 16IRU9 | |
| Medio AMD Ryzen 7 8845HS, AMD Radeon 780M (245 - 314, n=7) | |
| Ninkear A16 Pro | |
| Xiaomi RedmiBook Pro 16 2024 | |
| Medion S10 OLED | |
| Media de la clase Office (80 - 328, n=84, últimos 2 años) | |
| Mozilla Kraken 1.1 / Total | |
| Media de la clase Office (399 - 1966, n=92, últimos 2 años) | |
| Medion S10 OLED | |
| Medion S10 OLED | |
| Medio AMD Ryzen 7 8845HS, AMD Radeon 780M (501 - 664, n=7) | |
| Ninkear N16-Pro-32+1TB | |
| Ninkear A16 Pro | |
| Xiaomi RedmiBook Pro 16 2024 | |
| Lenovo IdeaPad Slim 5 16IRU9 | |
| Acer Aspire 16 A16-51GM-77G2 | |
* ... más pequeño es mejor
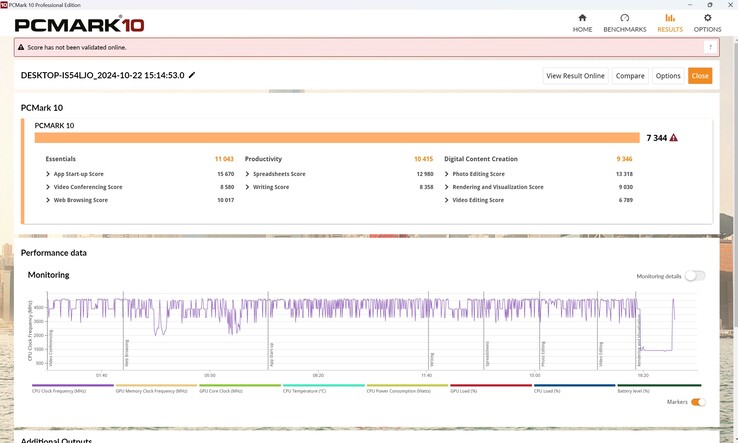
| PCMark 10 Score | 7344 puntos | |
ayuda | ||
| AIDA64 / Memory Copy | |
| Xiaomi RedmiBook Pro 16 2024 | |
| Medio AMD Ryzen 7 8845HS (61459 - 71873, n=12) | |
| Medion S10 OLED | |
| Ninkear A16 Pro | |
| Lenovo IdeaPad Slim 5 16IRU9 | |
| Acer Aspire 16 A16-51GM-77G2 | |
| Media de la clase Office (7158 - 108783, n=91, últimos 2 años) | |
| Ninkear N16-Pro-32+1TB | |
| AIDA64 / Memory Read | |
| Xiaomi RedmiBook Pro 16 2024 | |
| Medion S10 OLED | |
| Ninkear A16 Pro | |
| Acer Aspire 16 A16-51GM-77G2 | |
| Medio AMD Ryzen 7 8845HS (49866 - 61976, n=12) | |
| Media de la clase Office (7325 - 127282, n=91, últimos 2 años) | |
| Lenovo IdeaPad Slim 5 16IRU9 | |
| Ninkear N16-Pro-32+1TB | |
| AIDA64 / Memory Write | |
| Medio AMD Ryzen 7 8845HS (68425 - 93239, n=12) | |
| Lenovo IdeaPad Slim 5 16IRU9 | |
| Xiaomi RedmiBook Pro 16 2024 | |
| Ninkear A16 Pro | |
| Medion S10 OLED | |
| Acer Aspire 16 A16-51GM-77G2 | |
| Media de la clase Office (7579 - 117935, n=91, últimos 2 años) | |
| Ninkear N16-Pro-32+1TB | |
| AIDA64 / Memory Latency | |
| Medion S10 OLED | |
| Xiaomi RedmiBook Pro 16 2024 | |
| Ninkear A16 Pro | |
| Lenovo IdeaPad Slim 5 16IRU9 | |
| Medio AMD Ryzen 7 8845HS (82.5 - 117, n=12) | |
| Media de la clase Office (7.6 - 185.2, n=89, últimos 2 años) | |
| Acer Aspire 16 A16-51GM-77G2 | |
| Ninkear N16-Pro-32+1TB | |
* ... más pequeño es mejor
Latencia del CPD
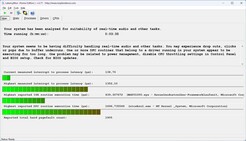
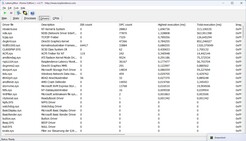
Se produjeron ligeros problemas en cuanto movimos el puntero del ratón tras iniciar LatencyMon. Estos aumentaron mínimamente al abrir el navegador; la apertura de varias pestañas dejó entonces de tener influencia sobre el valor. La reproducción de nuestro vídeo 4K/60 fps de YouTube se realizó sin caídas de fotogramas, aunque el valor de latencia volvió a aumentar ligeramente en la prueba Prime95 de 10 segundos. En general, sin embargo, el valor de latencia no fue muy alto e incluso fue el segundo más bajo de la comparación.
| DPC Latencies / LatencyMon - interrupt to process latency (max), Web, Youtube, Prime95 | |
| Medion S10 OLED | |
| Acer Aspire 16 A16-51GM-77G2 | |
| Lenovo IdeaPad Slim 5 16IRU9 | |
| Ninkear N16-Pro-32+1TB | |
| Ninkear A16 Pro | |
| Xiaomi RedmiBook Pro 16 2024 | |
* ... más pequeño es mejor
Dispositivo de almacenamiento
HWinfo también coincidió con la unidad SSD: nuestro vistazo al interior del portátil reveló la marca "Authorain" con una capacidad de 1 TB. Una búsqueda en Google tampoco arrojó nada al respecto, pero como sabemos, ya no es lo que era. La placa de características dice algo así como 6 GB/s, pero nosotros medimos alrededor de 2 GB/s. Los modelos de la competencia eran más rápidos, pero no lo notará mucho en la práctica.
Mantuvo su rendimiento durante mucho tiempo bajo un estrés constante, pero luego sufrió ligeras caídas durante el último tercio de la prueba.
| Drive Performance Rating - Percent | |
| Acer Aspire 16 A16-51GM-77G2 | |
| Medion S10 OLED | |
| Media de la clase Office | |
| Xiaomi RedmiBook Pro 16 2024 | |
| Lenovo IdeaPad Slim 5 16IRU9 | |
| Ninkear N16-Pro-32+1TB | |
| Ninkear A16 Pro | |
| Medio Authorain NV900-1T | |
* ... más pequeño es mejor
Reading continuous performance: DiskSpd Read Loop, Queue Depth 8
Tarjeta gráfica
La Radeon 780M integrada en la CPU puede utilizarse para aplicaciones 3D. No jugará a ningún juego actual y exigente con ella, pero sin embargo debería ser suficiente para aplicaciones multimedia y al menos para algunos juegos ligeros.
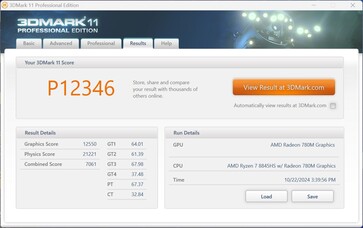
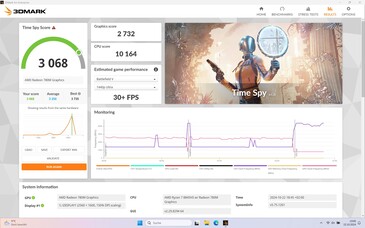
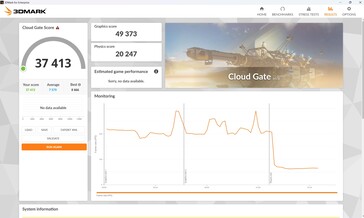
En la prueba 3DMark, rindió al nivel objetivo y superó a la antigua Intel UHD Graphics dentro de la Ninkear N16 Pro. En comparación con los gráficos Arc 8 del Core Ultra 7 155H, nuestro A16 Pro se situó en el medio entre el rapidísimo RedmiBook y el más bien lento Medion S10, ambos con la misma iGPU de Intel.
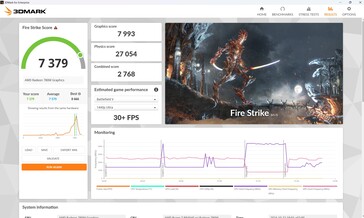
Incluso en la prueba 3D a través de Fire Strike, no se perdió rendimiento lejos de la toma de corriente.
A la hora de jugar, incluso lo hizo ligeramente mejor que el RedmiBook con la gráfica Intel, lo que demuestra que Intel sigue desperdiciando mucho potencial con sus controladores. Los juegos antiguos y menos exigentes como GTA V también se pueden jugar en Full HD con detalles altos, mientras que los títulos actuales como Cyberpunk se ejecutan sin problemas en Full HD como mucho con detalles medios, aunque lo más probable es que tenga que seleccionar detalles mínimos. Su rendimiento durante la prueba de resistencia de Cyberpunk 2077 fue agradable y consistente.
| 3DMark Performance Rating - Percent | |
| Acer Aspire 16 A16-51GM-77G2 | |
| Xiaomi RedmiBook Pro 16 2024 -1! | |
| Ninkear A16 Pro | |
| Medio AMD Radeon 780M | |
| Medion S10 OLED -1! | |
| Media de la clase Office | |
| Lenovo IdeaPad Slim 5 16IRU9 | |
| Ninkear N16-Pro-32+1TB | |
| 3DMark 11 - 1280x720 Performance GPU | |
| Acer Aspire 16 A16-51GM-77G2 | |
| Xiaomi RedmiBook Pro 16 2024 | |
| Ninkear A16 Pro | |
| Medio AMD Radeon 780M (7868 - 14274, n=63) | |
| Medion S10 OLED | |
| Media de la clase Office (1468 - 16418, n=87, últimos 2 años) | |
| Lenovo IdeaPad Slim 5 16IRU9 | |
| Ninkear N16-Pro-32+1TB | |
| 3DMark | |
| 1280x720 Cloud Gate Standard Graphics | |
| Acer Aspire 16 A16-51GM-77G2 | |
| Ninkear A16 Pro | |
| Medio AMD Radeon 780M (27771 - 53972, n=34) | |
| Lenovo IdeaPad Slim 5 16IRU9 | |
| Media de la clase Office (7982 - 58068, n=55, últimos 2 años) | |
| Ninkear N16-Pro-32+1TB | |
| 1920x1080 Fire Strike Graphics | |
| Acer Aspire 16 A16-51GM-77G2 | |
| Xiaomi RedmiBook Pro 16 2024 | |
| Ninkear A16 Pro | |
| Medio AMD Radeon 780M (4550 - 8904, n=65) | |
| Medion S10 OLED | |
| Media de la clase Office (736 - 10476, n=89, últimos 2 años) | |
| Lenovo IdeaPad Slim 5 16IRU9 | |
| Ninkear N16-Pro-32+1TB | |
| 2560x1440 Time Spy Graphics | |
| Xiaomi RedmiBook Pro 16 2024 | |
| Acer Aspire 16 A16-51GM-77G2 | |
| Ninkear A16 Pro | |
| Medio AMD Radeon 780M (1496 - 3196, n=65) | |
| Medion S10 OLED | |
| Media de la clase Office (313 - 4415, n=86, últimos 2 años) | |
| Lenovo IdeaPad Slim 5 16IRU9 | |
| Ninkear N16-Pro-32+1TB | |
| 3DMark 11 Performance | 12346 puntos | |
| 3DMark Cloud Gate Standard Score | 37413 puntos | |
| 3DMark Fire Strike Score | 7279 puntos | |
| 3DMark Time Spy Score | 3068 puntos | |
| 3DMark Steel Nomad Light Score | 2714 puntos | |
ayuda | ||
| Blender - v3.3 Classroom CPU | |
| Media de la clase Office (245 - 3964, n=87, últimos 2 años) | |
| Lenovo IdeaPad Slim 5 16IRU9 | |
| Acer Aspire 16 A16-51GM-77G2 | |
| Ninkear N16-Pro-32+1TB | |
| Medio AMD Radeon 780M (300 - 664, n=61) | |
| Ninkear A16 Pro | |
| Medion S10 OLED | |
| Xiaomi RedmiBook Pro 16 2024 | |
* ... más pequeño es mejor
| Performance Rating - Percent | |
| Acer Aspire 16 A16-51GM-77G2 | |
| Ninkear A16 Pro | |
| Xiaomi RedmiBook Pro 16 2024 -1! | |
| Medion S10 OLED | |
| Media de la clase Office | |
| Lenovo IdeaPad Slim 5 16IRU9 | |
| Ninkear N16-Pro-32+1TB -3! | |
| Baldur's Gate 3 - 1920x1080 Ultra Preset | |
| Acer Aspire 16 A16-51GM-77G2 | |
| Ninkear A16 Pro | |
| Media de la clase Office (7.96 - 30, n=32, últimos 2 años) | |
| Medion S10 OLED | |
| Lenovo IdeaPad Slim 5 16IRU9 | |
| GTA V - 1920x1080 Highest Settings possible AA:4xMSAA + FX AF:16x | |
| Acer Aspire 16 A16-51GM-77G2 | |
| Ninkear A16 Pro | |
| Xiaomi RedmiBook Pro 16 2024 | |
| Media de la clase Office (3.98 - 47.8, n=78, últimos 2 años) | |
| Medion S10 OLED | |
| Lenovo IdeaPad Slim 5 16IRU9 | |
| Ninkear N16-Pro-32+1TB | |
| Final Fantasy XV Benchmark - 1920x1080 High Quality | |
| Acer Aspire 16 A16-51GM-77G2 | |
| Xiaomi RedmiBook Pro 16 2024 | |
| Ninkear A16 Pro | |
| Medion S10 OLED | |
| Media de la clase Office (4.18 - 36.4, n=86, últimos 2 años) | |
| Lenovo IdeaPad Slim 5 16IRU9 | |
| Ninkear N16-Pro-32+1TB | |
| Strange Brigade - 1920x1080 ultra AA:ultra AF:16 | |
| Acer Aspire 16 A16-51GM-77G2 | |
| Xiaomi RedmiBook Pro 16 2024 | |
| Ninkear A16 Pro | |
| Medion S10 OLED | |
| Media de la clase Office (12.8 - 61.7, n=69, últimos 2 años) | |
| Lenovo IdeaPad Slim 5 16IRU9 | |
| Dota 2 Reborn - 1920x1080 ultra (3/3) best looking | |
| Acer Aspire 16 A16-51GM-77G2 | |
| Xiaomi RedmiBook Pro 16 2024 | |
| Ninkear A16 Pro | |
| Medion S10 OLED | |
| Lenovo IdeaPad Slim 5 16IRU9 | |
| Media de la clase Office (13.4 - 121.2, n=92, últimos 2 años) | |
| Ninkear N16-Pro-32+1TB | |
| X-Plane 11.11 - 1920x1080 high (fps_test=3) | |
| Acer Aspire 16 A16-51GM-77G2 | |
| Ninkear A16 Pro | |
| Lenovo IdeaPad Slim 5 16IRU9 | |
| Xiaomi RedmiBook Pro 16 2024 | |
| Media de la clase Office (8.88 - 92.6, n=84, últimos 2 años) | |
| Medion S10 OLED | |
Cyberpunk 2077 ultra FPS diagram
| bajo | medio | alto | ultra | QHD | |
|---|---|---|---|---|---|
| GTA V (2015) | 162.2 | 149.8 | 62.2 | 25.1 | 17.4 |
| Dota 2 Reborn (2015) | 148.4 | 117.9 | 76.4 | 70.6 | |
| Final Fantasy XV Benchmark (2018) | 74.3 | 37.2 | 27 | 19.3 | |
| X-Plane 11.11 (2018) | 64.9 | 47.8 | 40.1 | ||
| Strange Brigade (2018) | 149.3 | 62.6 | 53 | 45.6 | |
| Baldur's Gate 3 (2023) | 42 | 33.3 | 27.5 | 27 | |
| Cyberpunk 2077 2.2 Phantom Liberty (2023) | 39.2 | 31 | 24.9 | 21.8 |
Emisiones y potencia - El Ninkear silencioso y fresco
Emisiones sonoras
Los ventiladores están desactivados en su mayor parte en modo inactivo. Tampoco es particularmente ruidoso bajo carga; nuestro A16 Pro siguió siendo el más silencioso de la comparación.
Durante la prueba 3DMark 06-nuestro escenario de carga media-los ventiladores giraron al nivel de un RedmiBook silencioso, y sólo al final se aceleraron aún más.
Ruido
| Ocioso |
| 23 / 23 / 23 dB(A) |
| Carga |
| 37.68 / 37.41 dB(A) |
 | ||
30 dB silencioso 40 dB(A) audible 50 dB(A) ruidosamente alto |
||
min: | ||
| Ninkear A16 Pro Radeon 780M, R7 8845HS, Authorain NV900-1T | Ninkear N16-Pro-32+1TB UHD Graphics 64EUs, i7-13620H, Derlar FP3 NVMe M.2 SSD PCIe Gen 3.0X4 1 TB | Xiaomi RedmiBook Pro 16 2024 Arc 8-Core, Ultra 7 155H, YMTC PC300-1TB | Acer Aspire 16 A16-51GM-77G2 GeForce RTX 2050 Mobile, Core 7 150U, WD PC SN740 SDDQNQD-1T00-1014 | Lenovo IdeaPad Slim 5 16IRU9 Iris Xe G7 96EUs, Core 7 150U | Medion S10 OLED Arc 8-Core, Ultra 7 155H, Phison PS5019-E19 SSO1TBITC4-E19-V7 | |
|---|---|---|---|---|---|---|
| Noise | -8% | -3% | -18% | -5% | -16% | |
| apagado / medio ambiente * | 23 | 25 -9% | 24.4 -6% | 23 -0% | 23 -0% | 25 -9% |
| Idle Minimum * | 23 | 25 -9% | 24.4 -6% | 23 -0% | 23 -0% | 26 -13% |
| Idle Average * | 23 | 25 -9% | 24.4 -6% | 23 -0% | 23 -0% | 27 -17% |
| Idle Maximum * | 23 | 25 -9% | 24.4 -6% | 31 -35% | 23 -0% | 28 -22% |
| Load Average * | 37.68 | 35.4 6% | 32 15% | 46.57 -24% | 43.3 -15% | 43 -14% |
| Cyberpunk 2077 ultra * | 37.68 | 43.5 -15% | 50 -33% | 40.8 -8% | 42 -11% | |
| Load Maximum * | 37.41 | 42.2 -13% | 39.7 -6% | 50 -34% | 40.9 -9% | 48 -28% |
| Witcher 3 ultra * | 30.6 |
* ... más pequeño es mejor
Temperatura
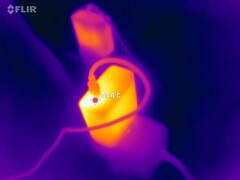
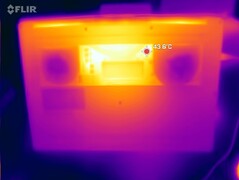
Sólo se calienta mucho en la parte inferior del portátil, en el centro de la pantalla. Aquí es donde localizamos un punto caliente de unos 50 °C. En todas las demás partes, la evolución de la temperatura se mantuvo moderada en un máximo de 43 °C, y los reposamanos se mantuvieron significativamente más fríos. Sin embargo, la pequeña fuente de alimentación USB-C se calentó hasta los 56 °C.
(±) La temperatura máxima en la parte superior es de 43 °C / 109 F, frente a la media de 34.3 °C / 94 F, que oscila entre 21.2 y 62.5 °C para la clase Office.
(-) El fondo se calienta hasta un máximo de 50 °C / 122 F, frente a la media de 36.8 °C / 98 F
(±) 3: The average temperature for the upper side is 35.7 °C / 96 F, compared to the average of 29.5 °C / 85 F for the class Office.
(+) El reposamanos y el panel táctil están a una temperatura inferior a la de la piel, con un máximo de 31 °C / 87.8 F y, por tanto, son fríos al tacto.
(-) La temperatura media de la zona del reposamanos de dispositivos similares fue de 27.6 °C / 81.7 F (-3.4 °C / -6.1 F).
| Ninkear A16 Pro AMD Ryzen 7 8845HS, AMD Radeon 780M | Ninkear N16-Pro-32+1TB Intel Core i7-13620H, Intel UHD Graphics 64EUs (Alder Lake 12th Gen) | Xiaomi RedmiBook Pro 16 2024 Intel Core Ultra 7 155H, Intel Arc 8-Core iGPU | Acer Aspire 16 A16-51GM-77G2 Intel Core 7 150U, NVIDIA GeForce RTX 2050 Mobile | Lenovo IdeaPad Slim 5 16IRU9 Intel Core 7 150U, Intel Iris Xe Graphics G7 96EUs | Medion S10 OLED Intel Core Ultra 7 155H, Intel Arc 8-Core iGPU | |
|---|---|---|---|---|---|---|
| Heat | 8% | 7% | -5% | 26% | -19% | |
| Maximum Upper Side * | 43 | 35.1 18% | 40.3 6% | 47 -9% | 35.4 18% | 55 -28% |
| Maximum Bottom * | 50 | 51 -2% | 45.9 8% | 50 -0% | 33 34% | 55 -10% |
| Idle Upper Side * | 27.1 | 26.3 | 31 | 30.2 | 32 | |
| Idle Bottom * | 33.8 | 27.9 | 32 | 30.2 | 33 |
* ... más pequeño es mejor
Altavoces
Los altavoces son medios en el mejor de los casos, apenas reproducen graves y sólo suenan a un volumen decepcionante. Se pueden conectar dispositivos de audio analógicos a través de la salida jack.
Ninkear A16 Pro análisis de audio
(±) | la sonoridad del altavoz es media pero buena (75.63 dB)
Graves 100 - 315 Hz
(-) | casi sin bajos - de media 21.5% inferior a la mediana
(±) | la linealidad de los graves es media (7.7% delta a frecuencia anterior)
Medios 400 - 2000 Hz
(±) | medias más altas - de media 7.6% más altas que la mediana
(±) | la linealidad de los medios es media (7% delta respecto a la frecuencia anterior)
Altos 2 - 16 kHz
(±) | máximos más altos - de media 5.8% más altos que la mediana
(+) | los máximos son lineales (6.7% delta a la frecuencia anterior)
Total 100 - 16.000 Hz
(±) | la linealidad del sonido global es media (26.2% de diferencia con la mediana)
En comparación con la misma clase
» 79% de todos los dispositivos probados de esta clase eran mejores, 7% similares, 14% peores
» El mejor tuvo un delta de 7%, la media fue 21%, el peor fue ###max##%
En comparación con todos los dispositivos probados
» 79% de todos los dispositivos probados eran mejores, 4% similares, 17% peores
» El mejor tuvo un delta de 4%, la media fue 24%, el peor fue ###max##%
Apple MacBook Pro 16 2021 M1 Pro análisis de audio
(+) | los altavoces pueden reproducir a un volumen relativamente alto (#84.7 dB)
Graves 100 - 315 Hz
(+) | buen bajo - sólo 3.8% lejos de la mediana
(+) | el bajo es lineal (5.2% delta a la frecuencia anterior)
Medios 400 - 2000 Hz
(+) | medios equilibrados - a sólo 1.3% de la mediana
(+) | los medios son lineales (2.1% delta a la frecuencia anterior)
Altos 2 - 16 kHz
(+) | máximos equilibrados - a sólo 1.9% de la mediana
(+) | los máximos son lineales (2.7% delta a la frecuencia anterior)
Total 100 - 16.000 Hz
(+) | el sonido global es lineal (4.6% de diferencia con la mediana)
En comparación con la misma clase
» 0% de todos los dispositivos probados de esta clase eran mejores, 0% similares, 100% peores
» El mejor tuvo un delta de 5%, la media fue 18%, el peor fue ###max##%
En comparación con todos los dispositivos probados
» 0% de todos los dispositivos probados eran mejores, 0% similares, 100% peores
» El mejor tuvo un delta de 4%, la media fue 24%, el peor fue ###max##%
Consumo de energía
Su consumo de energía es bastante bajo, especialmente en reposo. Su consumo aumenta ligeramente bajo carga, pero sigue siendo adecuado si lo comparamos con su rendimiento. Desgraciadamente, nos faltan aquí los valores comparativos del RedmiBook, mientras que los otros competidores, menos potentes, consumen menos bajo carga. El brillo de la pantalla no fue insignificante al medir su consumo en reposo, con alrededor de 4 a 5 vatios entre el brillo bajo y el máximo.
| Off / Standby | |
| Ocioso | |
| Carga |
|
Clave:
min: | |
Power consumption Cyberpunk / stress test
Power consumption with external monitor
Tiempos de ejecución
Ninkear ha instalado una gran batería de 80 Wh, que es más de lo que ofrece la competencia (con la excepción del RedmiBook). Sin embargo, el portátil no duró más que sus rivales, al menos en nuestras pruebas. 7.5 horas en la prueba WLAN estuvo bien en general, pero algunos competidores parecían durar más con menos capacidad.
| Ninkear A16 Pro R7 8845HS, Radeon 780M, 80 Wh | Ninkear N16-Pro-32+1TB i7-13620H, UHD Graphics 64EUs, 57.75 Wh | Xiaomi RedmiBook Pro 16 2024 Ultra 7 155H, Arc 8-Core, 99 Wh | Acer Aspire 16 A16-51GM-77G2 Core 7 150U, GeForce RTX 2050 Mobile, 48.5 Wh | Lenovo IdeaPad Slim 5 16IRU9 Core 7 150U, Iris Xe G7 96EUs, 57 Wh | Medion S10 OLED Ultra 7 155H, Arc 8-Core, 70 Wh | Media de la clase Office | |
|---|---|---|---|---|---|---|---|
| Duración de Batería | -28% | 79% | 41% | 38% | -3% | 36% | |
| WiFi v1.3 | 450 | 322 -28% | 983 118% | 607 35% | 761 69% | 436 -3% | 638 ? 42% |
| Load | 89 | 124 39% | 130 46% | 94 6% | 114.9 ? 29% | ||
| H.264 | 1308 | 498 | 750 ? | ||||
| Reader / Idle | 1568 | 1300 ? |
Valoración total de Notebookcheck
La Ninkear A16 Pro nos impresionó en muchos aspectos y, gracias a su mezcla de componentes buenos y baratos, da la sensación de ser incluso mejor en las áreas importantes que algunos competidores de precio más elevado.
Ninkear A16 Pro
- 10/24/2024 v8
Christian Hintze
Transparencia
La selección de los dispositivos que se van a reseñar corre a cargo de nuestro equipo editorial. La muestra de prueba fue proporcionada al autor en calidad de préstamo por el fabricante o el minorista a los efectos de esta reseña. El prestamista no tuvo ninguna influencia en esta reseña, ni el fabricante recibió una copia de la misma antes de su publicación. No había ninguna obligación de publicar esta reseña. Nunca aceptamos compensaciones o pagos a cambio de nuestras reseñas. Como empresa de medios independiente, Notebookcheck no está sujeta a la autoridad de fabricantes, minoristas o editores.
Así es como prueba Notebookcheck
Cada año, Notebookcheck revisa de forma independiente cientos de portátiles y smartphones utilizando procedimientos estandarizados para asegurar que todos los resultados son comparables. Hemos desarrollado continuamente nuestros métodos de prueba durante unos 20 años y hemos establecido los estándares de la industria en el proceso. En nuestros laboratorios de pruebas, técnicos y editores experimentados utilizan equipos de medición de alta calidad. Estas pruebas implican un proceso de validación en varias fases. Nuestro complejo sistema de clasificación se basa en cientos de mediciones y puntos de referencia bien fundamentados, lo que mantiene la objetividad.














 Total Sustainability Score:


