Notebookcheck Logo

Análisis AMD Ryzen 9 9955HX vs. Intel Core Ultra 9 275HX: La batalla por la CPU más rápida para juegos

Fire Range contra Arrow Lake.

Junto con las nuevas GPU RTX 5000 para portátiles, también han llegado las nuevas CPU HX de AMD e Intel. Comparamos el AMD Ryzen 9 9955HX con el Intel Core Ultra 9 275HX y comparamos no solo el rendimiento puro de la CPU sino también el rendimiento en juegos junto con la nueva GPU RTX 5090 para portátiles.
El AMD Ryzen 9 9955HX se enfrenta al Intel Core Ultra 9 275HX

Tanto AMD como Nvidia han presentado sus nuevos procesadores portátiles de gama alta de clase HX junto con las nuevas GPU RTX 5000 para portátiles. En este artículo de análisis, comparamos los AMD Ryzen 9 9955HX con el Intel Core Ultra 9 275HX.

Además del rendimiento bruto de la CPU, también analizamos varios puntos de referencia del sistema junto con puntos de referencia de juegos en combinación con la nueva GPU Nvidia GeForce RTX 5090 de 175 W para portátiles.

Visión general: Gama AMD Fire vs. Intel Arrow Lake

Las nuevas SKU de Intel y AMD se anunciaron oficialmente en el CES 2025, y ambos fabricantes afirman ofrecer los mejores procesadores móviles para aplicaciones creativas y juegos.

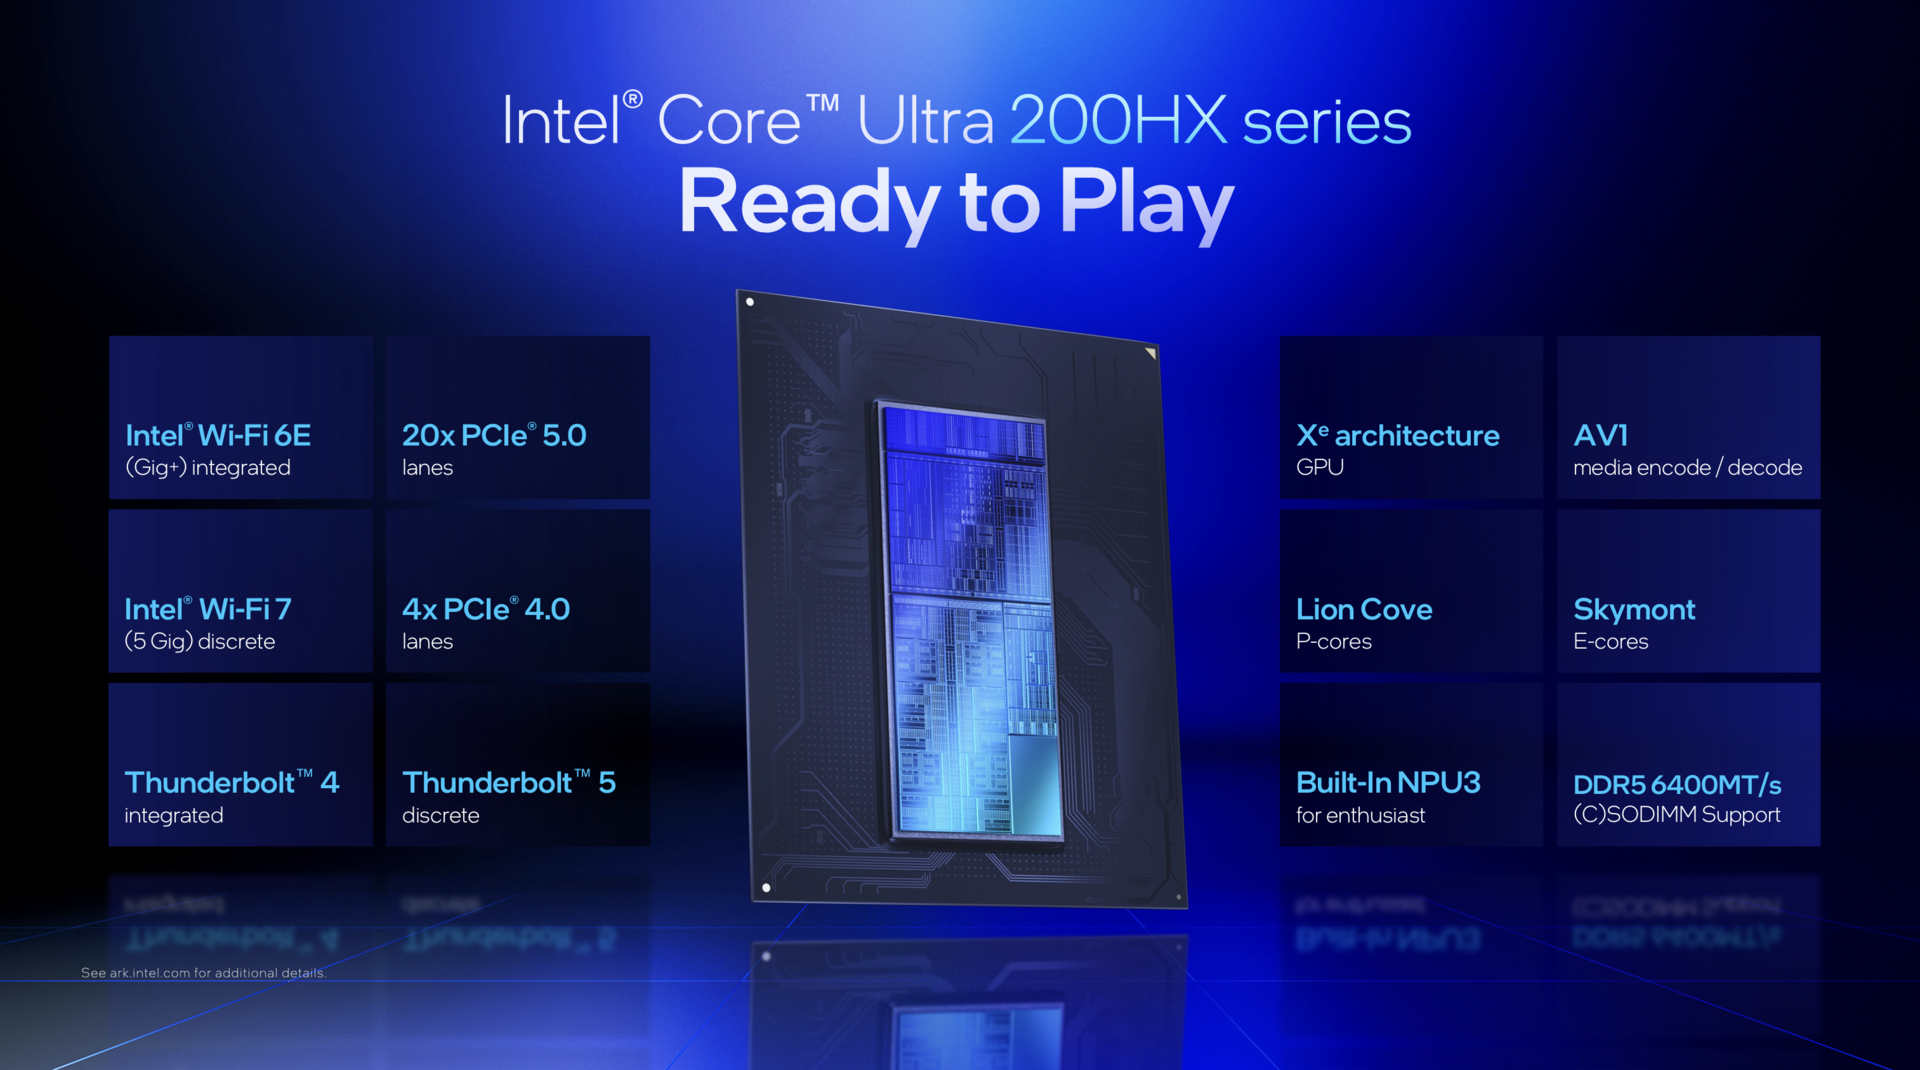
Las APU de la gama Fire de AMD se basan en los conocidos núcleos Zen 5 y también está disponible como opción una variante con caché 3D-V. Intel, por su parte, apuesta por la arquitectura Arrow Lake.

Gama AMD Fire HX
Gama AMD Fire HX
Intel Arrow Lake-HX
Intel Arrow Lake-HX

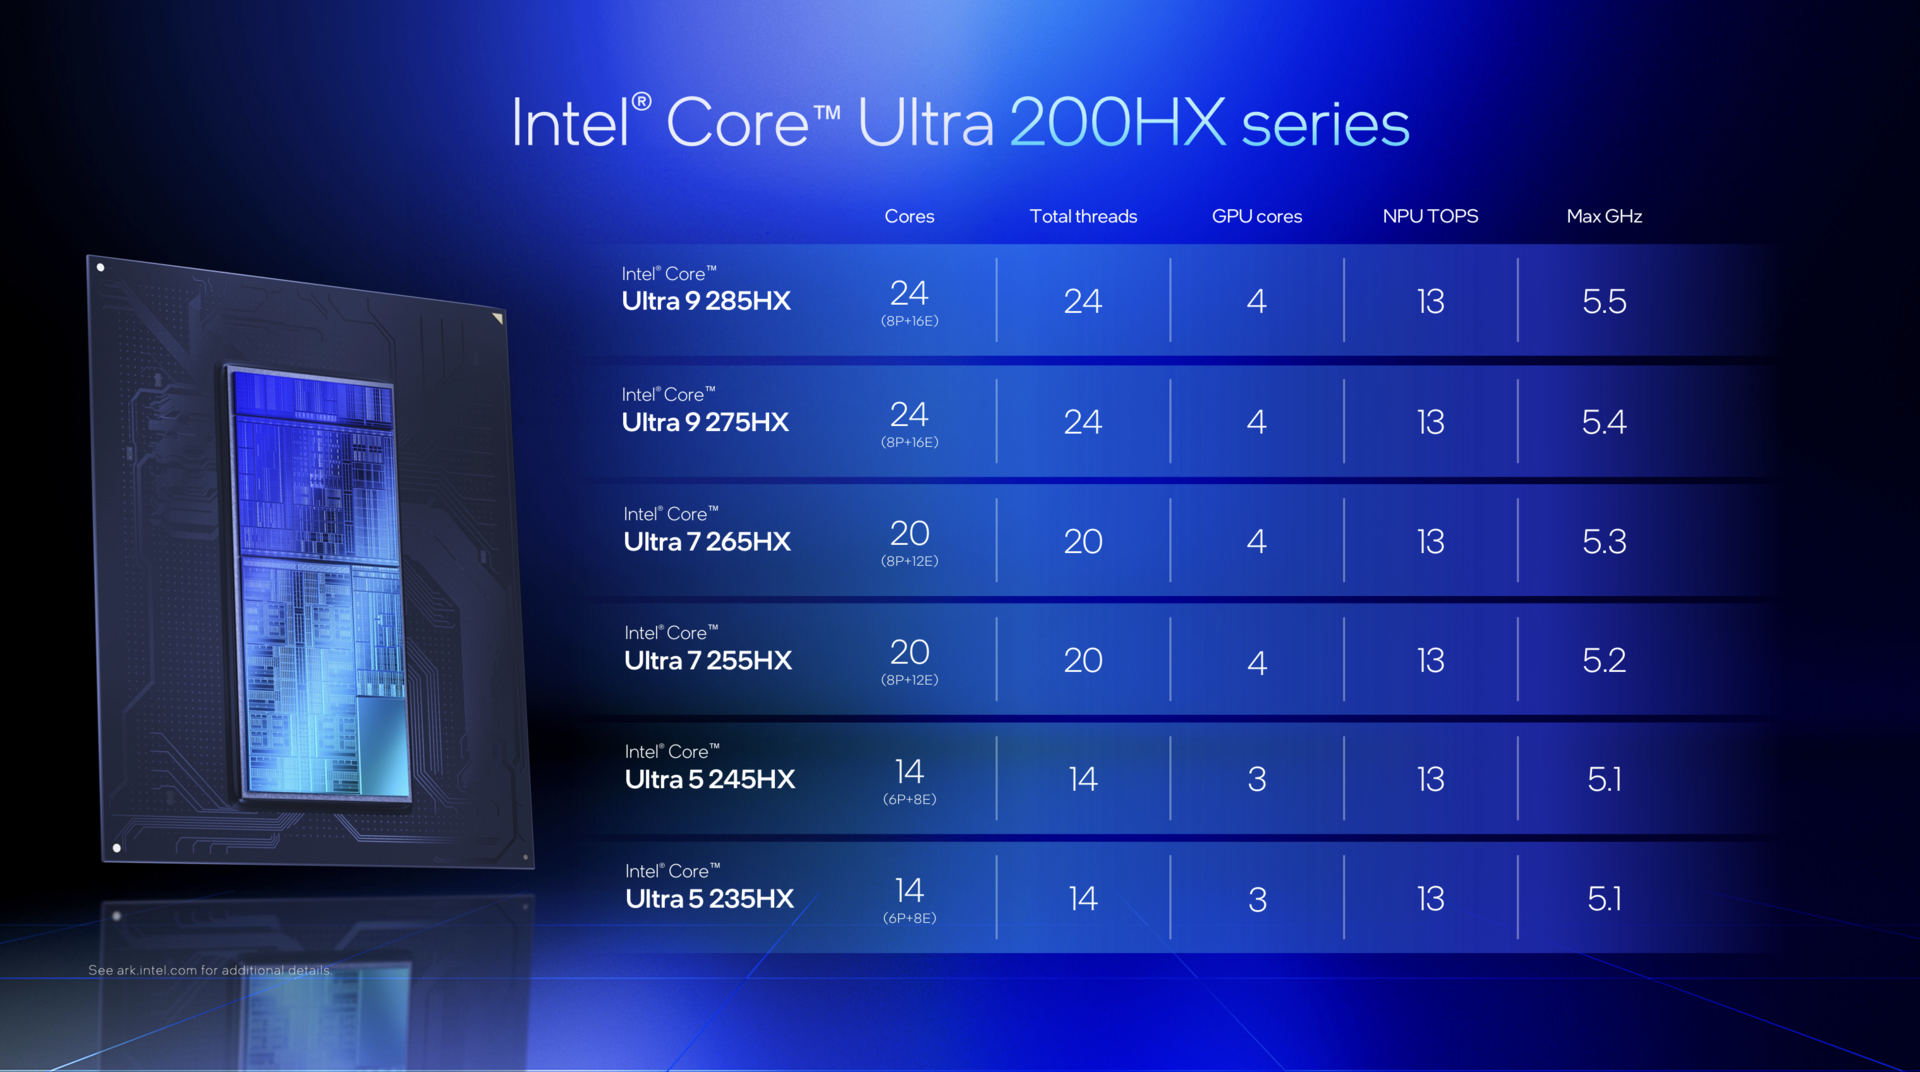
Nuestros dos procesadores de prueba son los AMD Ryzen 9 9955HX y el Intel Core Ultra 9 275HXque no son precisamente los más rápidos de sus respectivas gamas.

No obstante, es probable que estas dos CPU se utilicen con mayor frecuencia en portátiles de alto rendimiento para juegos/creadores. En teoría, el TDP de las CPU es de 54 W para AMD o 55 W para Intel, pero a plena carga ambas pueden consumir brevemente más de 150 W.

El Ryzen 9 9955HX utiliza 16 núcleos incluyendo hyperthreading (32 hilos), mientras que el Core Ultra 9 275HX utiliza un total de 24 núcleos (8x Rendimiento, 16x Eficiencia) sin hyperthreading.

Línea AMD Fire Range 9000HX
Línea Intel Arrow Lake Core Ultra 200HX

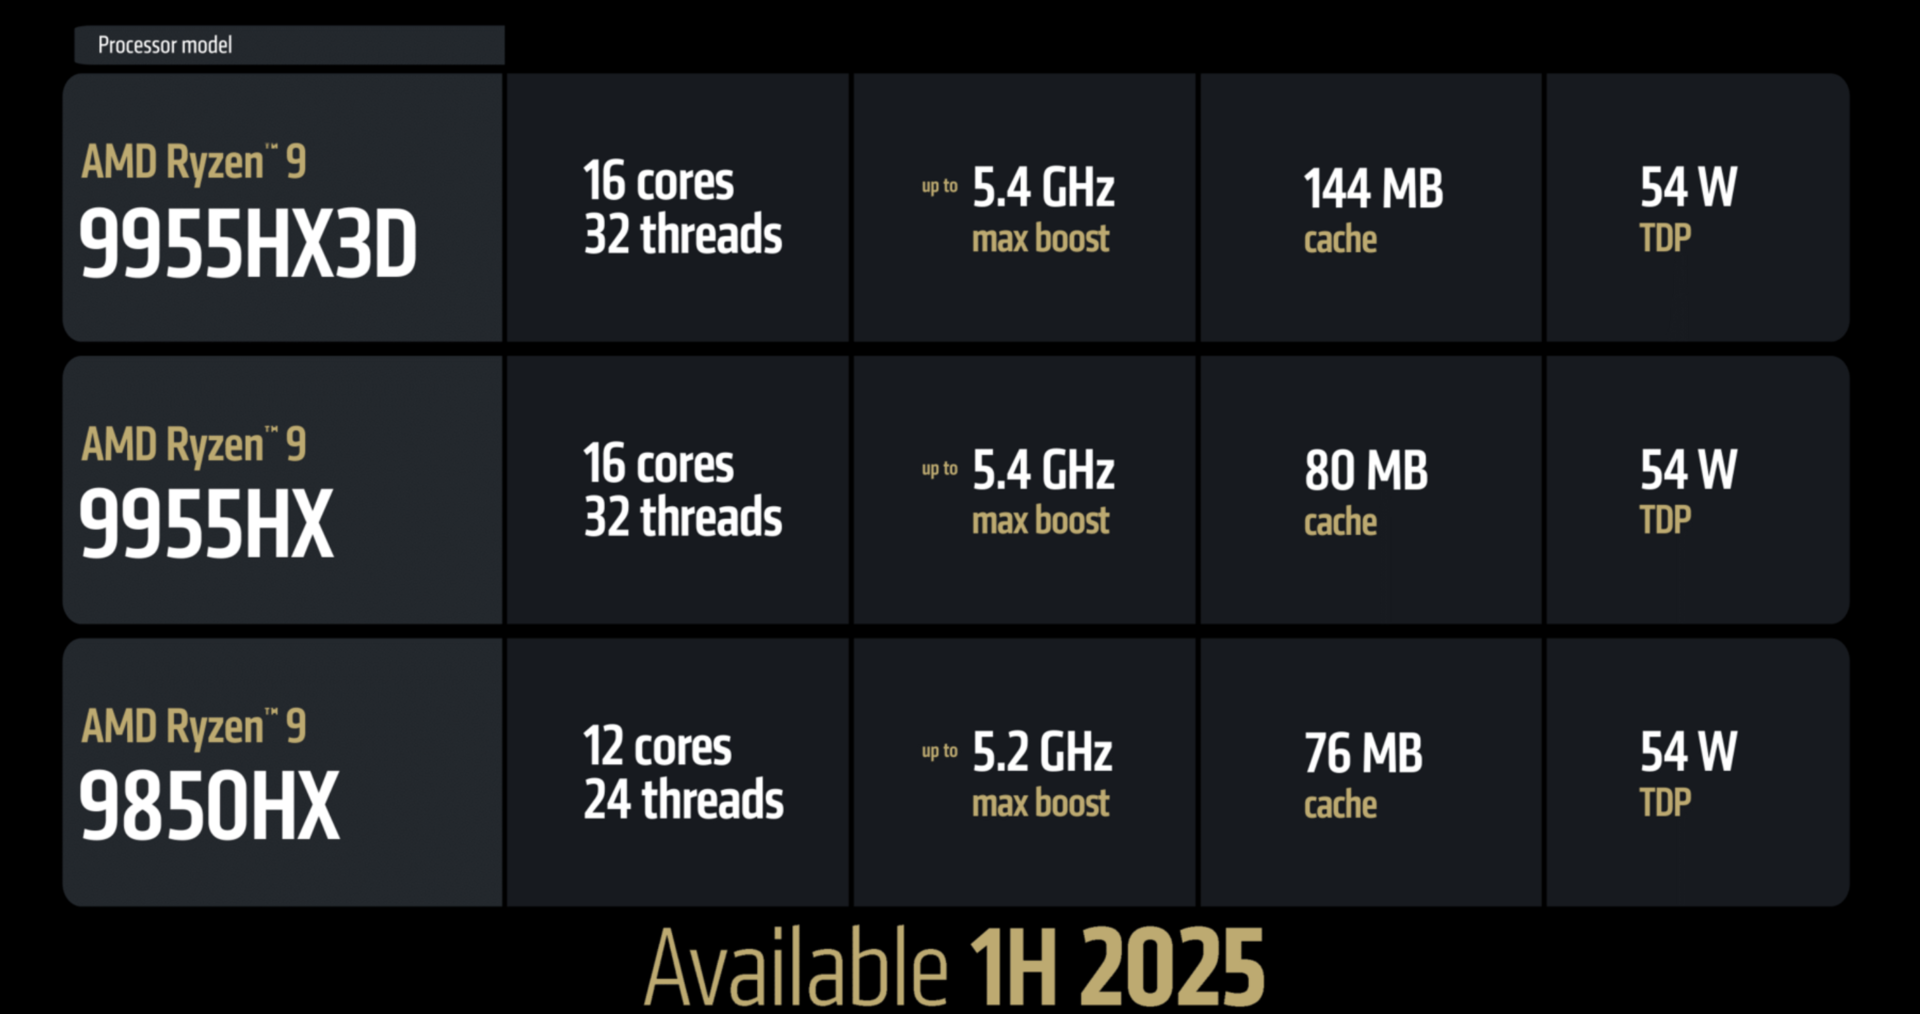
De particular interés es el Ryzen 9 9955HX3D, que por desgracia aún no estaba disponible para las pruebas. Gracias al 3D V-Cache, promete sobre todo un mayor rendimiento en juegos, que ya hemos visto muy claramente con su predecesor, el Ryzen 9 7945HX3D. Sólo podemos esperar que la disponibilidad sea mejor esta vez.

Sistemas de prueba: Asus Strix Scar 18 y XMG Neo 16 A25

Teníamos a nuestra disposición dos portátiles para juegos extremadamente potentes como sistemas de prueba. Uno era el nuevo Asus ROG Strix SCAR 18 G835LX con el Intel Core Ultra 9 275HX y 64 GB de RAM, y el otro era una muestra de ingeniería del nuevo XMG Neo 16 A25 con el AMD Ryzen 9 9955HX en combinación con 32 GB de RAM.

Ambos dispositivos estaban equipados con la nueva GPU Nvidia GeForce RTX 5090 para portátiles, que puede consumir hasta 175 W. Utilizamos el controlador Nvidia Game Ready 572.84 para ambos dispositivos, lo que lo hace ideal para las comparaciones de rendimiento.

Asus Strix Scar 18 G835LX
XMG Neo 16 A25
XMG Neo 16 A25

En este punto, sin embargo, nos abstendremos de realizar mediciones de consumo ampliadas y consideraciones de eficiencia, ya que la GPU Nvidia siempre estaba funcionando en el monitor externo en la muestra de ingeniería del XMG Neo 16, lo que naturalmente aumentaría el consumo de energía y distorsionaría los resultados de eficiencia. Proporcionaremos estos resultados lo antes posible.

Rendimiento de un solo núcleo

Hemos utilizado Cinebench 2024 y Geekbench 6 para las pruebas de rendimiento de la CPU, ya que estas dos pruebas se ejecutan de forma nativa en todas las plataformas y, por tanto, permiten una muy buena comparación del rendimiento.

En las pruebas de un solo núcleo, el Core Ultra 9 275HX fue capaz de aumentar su rendimiento en torno a un 6% en comparación con el Core i9-14900HX. El Ryzen 9 9955HX, por su parte, fue capaz de aumentar su rendimiento en torno a un 11% en comparación con el Ryzen 9 7945HX y ha alcanzado así al antiguo Core i9-14900HX.

Los dos vástagos móviles también están ligeramente por detrás de sus respectivos homólogos de sobremesa y, como era de esperar, Apple sigue teniendo una enorme ventaja con la generación M4.

En la prueba Geekbench, sin embargo, las tornas cambian y el Ryzen 9 9955HX se sitúa ligeramente por delante del Core Ultra 9 275HX.

Performance Rating - Percent
Apple M4 Max (16 cores)
Apple MacBook Pro 16 M4 Max, M4 Max 40-Core GPU
100 pt
Apple M4 Pro (14 cores)
Apple MacBook Pro 16 2024 M4 Pro, M4 Pro 20-Core GPU
99.4 pt
AMD Ryzen 9 9950X3D
AMD Ryzen 9 9950X3D, NVIDIA GeForce RTX 4090
83.1 pt
Intel Core Ultra 9 285K
Intel Core Ultra 9 285K, NVIDIA GeForce RTX 4090
83.1 pt
Apple M3 Max 16-Core
Apple MacBook Pro 14 2023 M3 Max, M3 Max 40-Core GPU
80 pt
Intel Core Ultra 9 275HX
Asus Strix Scar 18 G835LX, GeForce RTX 5090 Laptop
79.5 pt
AMD Ryzen 9 9955HX
SCHENKER Neo 16 A25 5090 Engineering Sample, GeForce RTX 5090 Laptop
77.9 pt
Intel Core i9-14900HX
MSI Raider 18 HX A14V, NVIDIA GeForce RTX 4080 Laptop GPU
75.3 pt
Intel Core Ultra 9 285H
MSI Prestige 16 AI Evo B2HMG, Arc 140T
73.2 pt
Intel Core i9-13900HK
Beelink GTI13 Ultra, Iris Xe G7 96EUs
71.8 pt
AMD Ryzen AI Max+ 395
Asus ROG Flow Z13 GZ302EA-RU073W, Radeon RX 8060S
71.2 pt
Intel Core i7-14700HX
Lenovo ThinkPad P16 Gen 2, NVIDIA RTX 4000 Ada Generation Laptop GPU
71.2 pt
AMD Ryzen 9 7945HX3D
Asus ROG Strix Scar 17 G733PYV-LL053X, NVIDIA GeForce RTX 4090 Laptop GPU
69.9 pt
AMD Ryzen 9 7945HX
Minisforum BD795i SE, Radeon 610M
69.4 pt
Cinebench 2024 - CPU Single Core
Apple M4 Pro (14 cores)
Apple MacBook Pro 16 2024 M4 Pro, M4 Pro 20-Core GPU
178 Points +38%
Apple M4 Max (16 cores)
Apple MacBook Pro 16 M4 Max, M4 Max 40-Core GPU
178 Points +38%
Intel Core Ultra 9 285K
Intel Core Ultra 9 285K, NVIDIA GeForce RTX 4090
144 Points +12%
Apple M3 Max 16-Core
Apple MacBook Pro 14 2023 M3 Max, M3 Max 40-Core GPU
140 Points +9%
AMD Ryzen 9 9950X3D
AMD Ryzen 9 9950X3D, NVIDIA GeForce RTX 4090
138.4 Points +7%
Intel Core Ultra 9 275HX
Asus Strix Scar 18 G835LX, GeForce RTX 5090 Laptop
138 Points +7%
Intel Core i9-14900HX
MSI Raider 18 HX A14V, NVIDIA GeForce RTX 4080 Laptop GPU
129.9 Points +1%
AMD Ryzen 9 9955HX
SCHENKER Neo 16 A25 5090 Engineering Sample, GeForce RTX 5090 Laptop
129 Points
Intel Core Ultra 9 285H
MSI Prestige 16 AI Evo B2HMG, Arc 140T
127 Points -2%
Intel Core i9-13900HK
Beelink GTI13 Ultra, Iris Xe G7 96EUs
123.5 Points -4%
Intel Core i7-14700HX
Lenovo ThinkPad P16 Gen 2, NVIDIA RTX 4000 Ada Generation Laptop GPU
120.7 Points -6%
AMD Ryzen AI Max+ 395
Asus ROG Flow Z13 GZ302EA-RU073W, Radeon RX 8060S
116.8 Points -9%
AMD Ryzen 9 7945HX
Minisforum BD795i SE, Radeon 610M
116 Points -10%
AMD Ryzen 9 7945HX3D
Asus ROG Strix Scar 17 G733PYV-LL053X, NVIDIA GeForce RTX 4090 Laptop GPU
115 Points -11%
Geekbench 6.4 - Single-Core
Apple M4 Max (16 cores)
Apple MacBook Pro 16 M4 Max, M4 Max 40-Core GPU
3880 Points +20%
Apple M4 Pro (14 cores)
Apple MacBook Pro 16 2024 M4 Pro, M4 Pro 20-Core GPU
3836 Points +19%
AMD Ryzen 9 9950X3D
AMD Ryzen 9 9950X3D, NVIDIA GeForce RTX 4090
3434 Points +6%
Intel Core Ultra 9 285K
Intel Core Ultra 9 285K, NVIDIA GeForce RTX 4090
3306 Points +2%
AMD Ryzen 9 9955HX
SCHENKER Neo 16 A25 5090 Engineering Sample, GeForce RTX 5090 Laptop
3230 Points
Intel Core Ultra 9 275HX
Asus Strix Scar 18 G835LX, GeForce RTX 5090 Laptop
3158 Points -2%
Apple M3 Max 16-Core
Apple MacBook Pro 14 2023 M3 Max, M3 Max 40-Core GPU
3157 Points -2%
Intel Core i9-14900HX
MSI Raider 18 HX A14V, NVIDIA GeForce RTX 4080 Laptop GPU
3010 Points -7%
AMD Ryzen AI Max+ 395
Asus ROG Flow Z13 GZ302EA-RU073W, Radeon RX 8060S
2978 Points -8%
AMD Ryzen 9 7945HX3D
Asus ROG Strix Scar 17 G733PYV-LL053X, NVIDIA GeForce RTX 4090 Laptop GPU
2916 Points -10%
Intel Core Ultra 9 285H
MSI Prestige 16 AI Evo B2HMG, Arc 140T
2912 Points -10%
Intel Core i7-14700HX
Lenovo ThinkPad P16 Gen 2, NVIDIA RTX 4000 Ada Generation Laptop GPU
2892 Points -10%
Intel Core i9-13900HK
Beelink GTI13 Ultra, Iris Xe G7 96EUs
2883 Points -11%
AMD Ryzen 9 7945HX
Minisforum BD795i SE, Radeon 610M
2858 Points -12%

Rendimiento multinúcleo

En la prueba múltiple Cinebench 2024, el nuevo Core Ultra 9 275HX rinde muy bien y puede superar al antiguo Core i9-14900HX por la friolera de un 30%. El Ultra 9 275HX también supera por poco al Apple M4 Max Que, sin embargo, requieren mucha menos potencia.

El Ryzen 9 9955HX se sitúa en torno a un 15 % por delante de sus predecesores y alrededor de un 7 % por detrás del 275HX. La prueba múltiple de Geekbench muestra una imagen similar, con los dos SoC M4 Max saliendo victoriosos en esta prueba.

Performance Rating - Percent
Intel Core Ultra 9 285K
Intel Core Ultra 9 285K, NVIDIA GeForce RTX 4090
92.1 pt
AMD Ryzen 9 9950X3D
AMD Ryzen 9 9950X3D, NVIDIA GeForce RTX 4090
92 pt
Apple M4 Max (16 cores)
Apple MacBook Pro 16 M4 Max, M4 Max 40-Core GPU
91.9 pt
Intel Core Ultra 9 275HX
Asus Strix Scar 18 G835LX, GeForce RTX 5090 Laptop
87.7 pt
AMD Ryzen 9 9955HX
SCHENKER Neo 16 A25 5090 Engineering Sample, GeForce RTX 5090 Laptop
80.2 pt
Apple M4 Pro (14 cores)
Apple MacBook Pro 16 2024 M4 Pro, M4 Pro 20-Core GPU
79.2 pt
AMD Ryzen AI Max+ 395
Asus ROG Flow Z13 GZ302EA-RU073W, Radeon RX 8060S
75.1 pt
Apple M3 Max 16-Core
Apple MacBook Pro 14 2023 M3 Max, M3 Max 40-Core GPU
72.7 pt
AMD Ryzen 9 7945HX
Minisforum BD795i SE, Radeon 610M
69.8 pt
AMD Ryzen 9 7945HX3D
Asus ROG Strix Scar 17 G733PYV-LL053X, NVIDIA GeForce RTX 4090 Laptop GPU
69.3 pt
Intel Core i9-14900HX
MSI Raider 18 HX A14V, NVIDIA GeForce RTX 4080 Laptop GPU
68.2 pt
Intel Core i7-14700HX
Lenovo ThinkPad P16 Gen 2, NVIDIA RTX 4000 Ada Generation Laptop GPU
59.3 pt
Intel Core Ultra 9 285H
MSI Prestige 16 AI Evo B2HMG, Arc 140T
53.8 pt
Intel Core i9-13900HK
Beelink GTI13 Ultra, Iris Xe G7 96EUs
45.9 pt
Cinebench 2024 - CPU Multi Core
Intel Core Ultra 9 285K
Intel Core Ultra 9 285K, NVIDIA GeForce RTX 4090
2436 Points +18%
AMD Ryzen 9 9950X3D
AMD Ryzen 9 9950X3D, NVIDIA GeForce RTX 4090
2365 Points +15%
Intel Core Ultra 9 275HX
Asus Strix Scar 18 G835LX, GeForce RTX 5090 Laptop
2223 Points +8%
Apple M4 Max (16 cores)
Apple MacBook Pro 16 M4 Max, M4 Max 40-Core GPU
2069 Points +1%
Apple M4 Max (16 cores)
Apple MacBook Pro 16 M4 Max, M4 Max 40-Core GPU
2015 Points -2%
AMD Ryzen 9 9955HX
SCHENKER Neo 16 A25 5090 Engineering Sample, GeForce RTX 5090 Laptop
2058 Points
AMD Ryzen 9 7945HX
Minisforum BD795i SE, Radeon 610M
1799 Points -13%
AMD Ryzen 9 7945HX3D
Asus ROG Strix Scar 17 G733PYV-LL053X, NVIDIA GeForce RTX 4090 Laptop GPU
1772 Points -14%
Apple M4 Pro (14 cores)
Apple MacBook Pro 16 2024 M4 Pro, M4 Pro 20-Core GPU
1729 Points -16%
Intel Core i9-14900HX
MSI Raider 18 HX A14V, NVIDIA GeForce RTX 4080 Laptop GPU
1728 Points -16%
AMD Ryzen AI Max+ 395
Asus ROG Flow Z13 GZ302EA-RU073W, Radeon RX 8060S
1648 Points -20%
Apple M3 Max 16-Core
Apple MacBook Pro 14 2023 M3 Max, M3 Max 40-Core GPU
1532 Points -26%
Intel Core i7-14700HX
Lenovo ThinkPad P16 Gen 2, NVIDIA RTX 4000 Ada Generation Laptop GPU
1345 Points -35%
Intel Core Ultra 9 285H
MSI Prestige 16 AI Evo B2HMG, Arc 140T
991 Points -52%
Intel Core i9-13900HK
Beelink GTI13 Ultra, Iris Xe G7 96EUs
980 Points -52%
Geekbench 6.4 - Multi-Core
Apple M4 Max (16 cores)
Apple MacBook Pro 16 M4 Max, M4 Max 40-Core GPU
25760 Points +32%
Apple M4 Pro (14 cores)
Apple MacBook Pro 16 2024 M4 Pro, M4 Pro 20-Core GPU
22509 Points +15%
AMD Ryzen 9 9950X3D
AMD Ryzen 9 9950X3D, NVIDIA GeForce RTX 4090
22405 Points +15%
Intel Core Ultra 9 285K
Intel Core Ultra 9 285K, NVIDIA GeForce RTX 4090
21688 Points +11%
Intel Core Ultra 9 275HX
Asus Strix Scar 18 G835LX, GeForce RTX 5090 Laptop
21668 Points +11%
AMD Ryzen AI Max+ 395
Asus ROG Flow Z13 GZ302EA-RU073W, Radeon RX 8060S
21269 Points +9%
Apple M3 Max 16-Core
Apple MacBook Pro 14 2023 M3 Max, M3 Max 40-Core GPU
21264 Points +9%
AMD Ryzen 9 9955HX
SCHENKER Neo 16 A25 5090 Engineering Sample, GeForce RTX 5090 Laptop
19563 Points
Intel Core Ultra 9 285H
MSI Prestige 16 AI Evo B2HMG, Arc 140T
17262 Points -12%
AMD Ryzen 9 7945HX3D
Asus ROG Strix Scar 17 G733PYV-LL053X, NVIDIA GeForce RTX 4090 Laptop GPU
16957 Points -13%
AMD Ryzen 9 7945HX
Minisforum BD795i SE, Radeon 610M
16946 Points -13%
Intel Core i9-14900HX
MSI Raider 18 HX A14V, NVIDIA GeForce RTX 4080 Laptop GPU
16855 Points -14%
Intel Core i7-14700HX
Lenovo ThinkPad P16 Gen 2, NVIDIA RTX 4000 Ada Generation Laptop GPU
16326 Points -17%
Intel Core i9-13900HK
Beelink GTI13 Ultra, Iris Xe G7 96EUs
13309 Points -32%

Puntos de referencia del sistema

En las pruebas comparativas del sistema como PCMark 10, CrossMark o las pruebas 3DMark Physics, la CPU AMD casi siempre tiene ventaja sobre la Core Ultra 9 275HX.

Sin embargo, también los demás componentes influyen, como es natural, en el rendimiento general del sistema.

PCMark 10 / Score
AMD Ryzen 9 9950X3D
AMD Ryzen 9 9950X3D, NVIDIA GeForce RTX 4090
10843 Points +15%
Intel Core Ultra 9 285K
Intel Core Ultra 9 285K, NVIDIA GeForce RTX 4090
10514 Points +12%
AMD Ryzen 9 9955HX
SCHENKER Neo 16 A25 5090 Engineering Sample, GeForce RTX 5090 Laptop
9402 Points
Intel Core i9-14900HX
MSI Raider 18 HX A14V, NVIDIA GeForce RTX 4080 Laptop GPU
9223 Points -2%
AMD Ryzen AI Max+ 395
Asus ROG Flow Z13 GZ302EA-RU073W, Radeon RX 8060S
9125 Points -3%
AMD Ryzen 9 7945HX3D
Asus ROG Strix Scar 17 G733PYV-LL053X, NVIDIA GeForce RTX 4090 Laptop GPU
9117 Points -3%
Intel Core Ultra 9 275HX
Asus Strix Scar 18 G835LX, GeForce RTX 5090 Laptop
8623 Points -8%
Intel Core i7-14700HX
Lenovo ThinkPad P16 Gen 2, NVIDIA RTX 4000 Ada Generation Laptop GPU
8353 Points -11%
Intel Core Ultra 9 285H
MSI Prestige 16 AI Evo B2HMG, Arc 140T
7838 Points -17%
Intel Core i9-13900HK
Beelink GTI13 Ultra, Iris Xe G7 96EUs
6791 Points -28%
AMD Ryzen 9 7945HX
Minisforum BD795i SE, Radeon 610M
6558 Points -30%
PCMark 10 / Essentials
AMD Ryzen 9 9950X3D
AMD Ryzen 9 9950X3D, NVIDIA GeForce RTX 4090
12435 Points +10%
AMD Ryzen AI Max+ 395
Asus ROG Flow Z13 GZ302EA-RU073W, Radeon RX 8060S
12005 Points +7%
Intel Core i9-13900HK
Beelink GTI13 Ultra, Iris Xe G7 96EUs
11963 Points +6%
Intel Core i9-14900HX
MSI Raider 18 HX A14V, NVIDIA GeForce RTX 4080 Laptop GPU
11825 Points +5%
Intel Core Ultra 9 285K
Intel Core Ultra 9 285K, NVIDIA GeForce RTX 4090
11613 Points +3%
AMD Ryzen 9 7945HX
Minisforum BD795i SE, Radeon 610M
11584 Points +3%
AMD Ryzen 9 7945HX3D
Asus ROG Strix Scar 17 G733PYV-LL053X, NVIDIA GeForce RTX 4090 Laptop GPU
11561 Points +3%
AMD Ryzen 9 9955HX
SCHENKER Neo 16 A25 5090 Engineering Sample, GeForce RTX 5090 Laptop
11271 Points
Intel Core Ultra 9 285H
MSI Prestige 16 AI Evo B2HMG, Arc 140T
11171 Points -1%
Intel Core i7-14700HX
Lenovo ThinkPad P16 Gen 2, NVIDIA RTX 4000 Ada Generation Laptop GPU
11157 Points -1%
Intel Core Ultra 9 275HX
Asus Strix Scar 18 G835LX, GeForce RTX 5090 Laptop
10966 Points -3%
PCMark 10 / Productivity
AMD Ryzen 9 9950X3D
AMD Ryzen 9 9950X3D, NVIDIA GeForce RTX 4090
12578 Points +19%
Intel Core Ultra 9 285K
Intel Core Ultra 9 285K, NVIDIA GeForce RTX 4090
12340 Points +16%
Intel Core i9-14900HX
MSI Raider 18 HX A14V, NVIDIA GeForce RTX 4080 Laptop GPU
11082 Points +5%
AMD Ryzen 9 7945HX3D
Asus ROG Strix Scar 17 G733PYV-LL053X, NVIDIA GeForce RTX 4090 Laptop GPU
10881 Points +3%
AMD Ryzen 9 9955HX
SCHENKER Neo 16 A25 5090 Engineering Sample, GeForce RTX 5090 Laptop
10601 Points
AMD Ryzen AI Max+ 395
Asus ROG Flow Z13 GZ302EA-RU073W, Radeon RX 8060S
10377 Points -2%
AMD Ryzen 9 7945HX
Minisforum BD795i SE, Radeon 610M
9965 Points -6%
Intel Core i7-14700HX
Lenovo ThinkPad P16 Gen 2, NVIDIA RTX 4000 Ada Generation Laptop GPU
9712 Points -8%
Intel Core Ultra 9 285H
MSI Prestige 16 AI Evo B2HMG, Arc 140T
9594 Points -9%
Intel Core Ultra 9 275HX
Asus Strix Scar 18 G835LX, GeForce RTX 5090 Laptop
9444 Points -11%
Intel Core i9-13900HK
Beelink GTI13 Ultra, Iris Xe G7 96EUs
8203 Points -23%
PCMark 10 / Digital Content Creation
AMD Ryzen 9 9950X3D
AMD Ryzen 9 9950X3D, NVIDIA GeForce RTX 4090
22121 Points +17%
Intel Core Ultra 9 285K
Intel Core Ultra 9 285K, NVIDIA GeForce RTX 4090
22005 Points +17%
AMD Ryzen 9 9955HX
SCHENKER Neo 16 A25 5090 Engineering Sample, GeForce RTX 5090 Laptop
18874 Points
Intel Core Ultra 9 275HX
Asus Strix Scar 18 G835LX, GeForce RTX 5090 Laptop
16802 Points -11%
AMD Ryzen AI Max+ 395
Asus ROG Flow Z13 GZ302EA-RU073W, Radeon RX 8060S
16551 Points -12%
AMD Ryzen 9 7945HX3D
Asus ROG Strix Scar 17 G733PYV-LL053X, NVIDIA GeForce RTX 4090 Laptop GPU
16348 Points -13%
Intel Core i9-14900HX
MSI Raider 18 HX A14V, NVIDIA GeForce RTX 4080 Laptop GPU
16246 Points -14%
Intel Core i7-14700HX
Lenovo ThinkPad P16 Gen 2, NVIDIA RTX 4000 Ada Generation Laptop GPU
14598 Points -23%
Intel Core Ultra 9 285H
MSI Prestige 16 AI Evo B2HMG, Arc 140T
12193 Points -35%
Intel Core i9-13900HK
Beelink GTI13 Ultra, Iris Xe G7 96EUs
8661 Points -54%
AMD Ryzen 9 7945HX
Minisforum BD795i SE, Radeon 610M
6630 Points -65%
CrossMark / Overall
Intel Core Ultra 9 285K
Intel Core Ultra 9 285K, NVIDIA GeForce RTX 4090
2529 Points +12%
AMD Ryzen 9 9950X3D
AMD Ryzen 9 9950X3D, NVIDIA GeForce RTX 4090
2380 Points +5%
AMD Ryzen AI Max+ 395
Asus ROG Flow Z13 GZ302EA-RU073W, Radeon RX 8060S
2274 Points +1%
AMD Ryzen 9 9955HX
SCHENKER Neo 16 A25 5090 Engineering Sample, GeForce RTX 5090 Laptop
2259 Points
Apple M4 Max (16 cores)
Apple MacBook Pro 16 M4 Max, M4 Max 40-Core GPU
2255 Points 0%
Intel Core Ultra 9 275HX
Asus Strix Scar 18 G835LX, GeForce RTX 5090 Laptop
2221 Points -2%
Intel Core Ultra 9 285H
MSI Prestige 16 AI Evo B2HMG, Arc 140T
2173 Points -4%
Intel Core i9-14900HX
MSI Raider 18 HX A14V, NVIDIA GeForce RTX 4080 Laptop GPU
2151 Points -5%
Apple M4 Pro (14 cores)
Apple MacBook Pro 16 2024 M4 Pro, M4 Pro 20-Core GPU
2148 Points -5%
AMD Ryzen 9 7945HX
Minisforum BD795i SE, Radeon 610M
2110 Points -7%
Intel Core i9-13900HK
Beelink GTI13 Ultra, Iris Xe G7 96EUs
2099 Points -7%
AMD Ryzen 9 7945HX3D
Asus ROG Strix Scar 17 G733PYV-LL053X, NVIDIA GeForce RTX 4090 Laptop GPU
2086 Points -8%
Apple M3 Max 16-Core
Apple MacBook Pro 14 2023 M3 Max, M3 Max 40-Core GPU
2032 Points -10%
Intel Core i7-14700HX
Lenovo ThinkPad P16 Gen 2, NVIDIA RTX 4000 Ada Generation Laptop GPU
2011 Points -11%
CrossMark / Productivity
Intel Core Ultra 9 285K
Intel Core Ultra 9 285K, NVIDIA GeForce RTX 4090
2369 Points +18%
AMD Ryzen 9 9950X3D
AMD Ryzen 9 9950X3D, NVIDIA GeForce RTX 4090
2085 Points +4%
Intel Core Ultra 9 285H
MSI Prestige 16 AI Evo B2HMG, Arc 140T
2050 Points +2%
Apple M4 Max (16 cores)
Apple MacBook Pro 16 M4 Max, M4 Max 40-Core GPU
2042 Points +1%
Intel Core Ultra 9 275HX
Asus Strix Scar 18 G835LX, GeForce RTX 5090 Laptop
2025 Points +1%
Intel Core i9-14900HX
MSI Raider 18 HX A14V, NVIDIA GeForce RTX 4080 Laptop GPU
2014 Points 0%
AMD Ryzen 9 9955HX
SCHENKER Neo 16 A25 5090 Engineering Sample, GeForce RTX 5090 Laptop
2014 Points
Intel Core i9-13900HK
Beelink GTI13 Ultra, Iris Xe G7 96EUs
2012 Points 0%
Apple M4 Pro (14 cores)
Apple MacBook Pro 16 2024 M4 Pro, M4 Pro 20-Core GPU
1980 Points -2%
AMD Ryzen 9 7945HX3D
Asus ROG Strix Scar 17 G733PYV-LL053X, NVIDIA GeForce RTX 4090 Laptop GPU
1948 Points -3%
AMD Ryzen 9 7945HX
Minisforum BD795i SE, Radeon 610M
1946 Points -3%
AMD Ryzen AI Max+ 395
Asus ROG Flow Z13 GZ302EA-RU073W, Radeon RX 8060S
1925 Points -4%
Intel Core i7-14700HX
Lenovo ThinkPad P16 Gen 2, NVIDIA RTX 4000 Ada Generation Laptop GPU
1862 Points -8%
Apple M3 Max 16-Core
Apple MacBook Pro 14 2023 M3 Max, M3 Max 40-Core GPU
1832 Points -9%
CrossMark / Creativity
AMD Ryzen 9 9950X3D
AMD Ryzen 9 9950X3D, NVIDIA GeForce RTX 4090
2987 Points +12%
AMD Ryzen AI Max+ 395
Asus ROG Flow Z13 GZ302EA-RU073W, Radeon RX 8060S
2949 Points +11%
Apple M4 Max (16 cores)
Apple MacBook Pro 16 M4 Max, M4 Max 40-Core GPU
2795 Points +5%
Intel Core Ultra 9 285K
Intel Core Ultra 9 285K, NVIDIA GeForce RTX 4090
2766 Points +4%
AMD Ryzen 9 9955HX
SCHENKER Neo 16 A25 5090 Engineering Sample, GeForce RTX 5090 Laptop
2661 Points
Intel Core Ultra 9 275HX
Asus Strix Scar 18 G835LX, GeForce RTX 5090 Laptop
2606 Points -2%
Apple M4 Pro (14 cores)
Apple MacBook Pro 16 2024 M4 Pro, M4 Pro 20-Core GPU
2590 Points -3%
Apple M3 Max 16-Core
Apple MacBook Pro 14 2023 M3 Max, M3 Max 40-Core GPU
2509 Points -6%
AMD Ryzen 9 7945HX3D
Asus ROG Strix Scar 17 G733PYV-LL053X, NVIDIA GeForce RTX 4090 Laptop GPU
2415 Points -9%
Intel Core i9-14900HX
MSI Raider 18 HX A14V, NVIDIA GeForce RTX 4080 Laptop GPU
2388 Points -10%
Intel Core Ultra 9 285H
MSI Prestige 16 AI Evo B2HMG, Arc 140T
2377 Points -11%
AMD Ryzen 9 7945HX
Minisforum BD795i SE, Radeon 610M
2363 Points -11%
Intel Core i7-14700HX
Lenovo ThinkPad P16 Gen 2, NVIDIA RTX 4000 Ada Generation Laptop GPU
2311 Points -13%
Intel Core i9-13900HK
Beelink GTI13 Ultra, Iris Xe G7 96EUs
2192 Points -18%
CrossMark / Responsiveness
Intel Core Ultra 9 285K
Intel Core Ultra 9 285K, NVIDIA GeForce RTX 4090
2351 Points +21%
Intel Core i9-13900HK
Beelink GTI13 Ultra, Iris Xe G7 96EUs
2097 Points +7%
Intel Core Ultra 9 285H
MSI Prestige 16 AI Evo B2HMG, Arc 140T
1981 Points +2%
AMD Ryzen 9 9955HX
SCHENKER Neo 16 A25 5090 Engineering Sample, GeForce RTX 5090 Laptop
1951 Points
AMD Ryzen 9 7945HX
Minisforum BD795i SE, Radeon 610M
1916 Points -2%
Intel Core i9-14900HX
MSI Raider 18 HX A14V, NVIDIA GeForce RTX 4080 Laptop GPU
1913 Points -2%
Intel Core Ultra 9 275HX
Asus Strix Scar 18 G835LX, GeForce RTX 5090 Laptop
1813 Points -7%
AMD Ryzen 9 9950X3D
AMD Ryzen 9 9950X3D, NVIDIA GeForce RTX 4090
1792 Points -8%
AMD Ryzen AI Max+ 395
Asus ROG Flow Z13 GZ302EA-RU073W, Radeon RX 8060S
1719 Points -12%
Intel Core i7-14700HX
Lenovo ThinkPad P16 Gen 2, NVIDIA RTX 4000 Ada Generation Laptop GPU
1666 Points -15%
AMD Ryzen 9 7945HX3D
Asus ROG Strix Scar 17 G733PYV-LL053X, NVIDIA GeForce RTX 4090 Laptop GPU
1649 Points -15%
Apple M4 Max (16 cores)
Apple MacBook Pro 16 M4 Max, M4 Max 40-Core GPU
1595 Points -18%
Apple M4 Pro (14 cores)
Apple MacBook Pro 16 2024 M4 Pro, M4 Pro 20-Core GPU
1566 Points -20%
Apple M3 Max 16-Core
Apple MacBook Pro 14 2023 M3 Max, M3 Max 40-Core GPU
1474 Points -24%
3DMark / Time Spy CPU
Intel Core Ultra 9 285K
Intel Core Ultra 9 285K, NVIDIA GeForce RTX 4090
18322 Points +39%
Intel Core i9-14900HX
MSI Raider 18 HX A14V, NVIDIA GeForce RTX 4080 Laptop GPU
17547 Points +33%
Intel Core Ultra 9 275HX
Asus Strix Scar 18 G835LX, GeForce RTX 5090 Laptop
17285 Points +31%
AMD Ryzen 9 9950X3D
AMD Ryzen 9 9950X3D, NVIDIA GeForce RTX 4090
16950 Points +29%
Intel Core i7-14700HX
Lenovo ThinkPad P16 Gen 2, NVIDIA RTX 4000 Ada Generation Laptop GPU
14526 Points +10%
AMD Ryzen 9 7945HX3D
Asus ROG Strix Scar 17 G733PYV-LL053X, NVIDIA GeForce RTX 4090 Laptop GPU
14131 Points +7%
AMD Ryzen 9 9955HX
SCHENKER Neo 16 A25 5090 Engineering Sample, GeForce RTX 5090 Laptop
13188 Points
Intel Core Ultra 9 285H
MSI Prestige 16 AI Evo B2HMG, Arc 140T
11650 Points -12%
Intel Core i9-13900HK
Beelink GTI13 Ultra, Iris Xe G7 96EUs
11314 Points -14%
AMD Ryzen AI Max+ 395
Asus ROG Flow Z13 GZ302EA-RU073W, Radeon RX 8060S
11285 Points -14%
3DMark / Fire Strike Physics
Intel Core Ultra 9 285K
Intel Core Ultra 9 285K, NVIDIA GeForce RTX 4090
53541 Points +25%
AMD Ryzen 9 9950X3D
AMD Ryzen 9 9950X3D, NVIDIA GeForce RTX 4090
49235 Points +15%
Intel Core Ultra 9 275HX
Asus Strix Scar 18 G835LX, GeForce RTX 5090 Laptop
48219 Points +12%
AMD Ryzen 9 9955HX
SCHENKER Neo 16 A25 5090 Engineering Sample, GeForce RTX 5090 Laptop
42890 Points
Intel Core i9-14900HX
MSI Raider 18 HX A14V, NVIDIA GeForce RTX 4080 Laptop GPU
41396 Points -3%
AMD Ryzen 9 7945HX3D
Asus ROG Strix Scar 17 G733PYV-LL053X, NVIDIA GeForce RTX 4090 Laptop GPU
38826 Points -9%
AMD Ryzen 9 7945HX
Minisforum BD795i SE, Radeon 610M
38792 Points -10%
AMD Ryzen AI Max+ 395
Asus ROG Flow Z13 GZ302EA-RU073W, Radeon RX 8060S
38075 Points -11%
Intel Core Ultra 9 285H
MSI Prestige 16 AI Evo B2HMG, Arc 140T
35044 Points -18%
Intel Core i7-14700HX
Lenovo ThinkPad P16 Gen 2, NVIDIA RTX 4000 Ada Generation Laptop GPU
30534 Points -29%
Intel Core i9-13900HK
Beelink GTI13 Ultra, Iris Xe G7 96EUs
26486 Points -38%

Rendimiento de juego

Ahora pasamos al rendimiento en juegos. Cogimos varios títulos actuales y los probamos, aunque no utilizamos tecnologías de escalado en cada caso, ya que queríamos ver la influencia de la CPU.

Hemos mantenido deliberadamente pequeño el grupo de comparación aquí y sólo hemos comparado los dos sujetos de prueba actuales y el ROG Strix Scar 17que se encontraba entre los portátiles para juegos más rápidos de la última generación gracias al procesador HX3D.

En todas las pruebas, el AMD Ryzen 9 9955HX está por delante del Core Ultra 9 275HX y la ventaja media es del 5%. El antiguo Strix Scar con el Ryzen 9 7945HX3D y la GPU RTX 4090 para portátiles puede mantenerse sorprendentemente bien e incluso está por delante en algunos títulos.

1080p Performance Rating - Percent
AMD Ryzen 9 9955HX
SCHENKER Neo 16 A25 5090 Engineering Sample, Nvidia GeForce RTX 5090 Laptop
99.7 pt
Intel Core Ultra 9 275HX
Asus Strix Scar 18 G835LX, Nvidia GeForce RTX 5090 Laptop
95.4 pt
AMD Ryzen 9 7945HX3D
Asus ROG Strix Scar 17 G733PYV-LL053X, NVIDIA GeForce RTX 4090 Laptop GPU
92.7 pt
Cyberpunk 2077 2.2 Phantom Liberty - 1920x1080 Ultra Preset (FSR off)
AMD Ryzen 9 7945HX3D
Asus ROG Strix Scar 17 G733PYV-LL053X, NVIDIA GeForce RTX 4090 Laptop GPU
158 (123.9min - 206max) fps +1%
AMD Ryzen 9 9955HX
SCHENKER Neo 16 A25 5090 Engineering Sample, Nvidia GeForce RTX 5090 Laptop
157 (116.5min - 208max) fps
Intel Core Ultra 9 275HX
Asus Strix Scar 18 G835LX, Nvidia GeForce RTX 5090 Laptop
154.9 (126.3min - 196max) fps -1%
F1 24 - 1920x1080 Ultra High Preset AA:T AF:16x
AMD Ryzen 9 9955HX
SCHENKER Neo 16 A25 5090 Engineering Sample, Nvidia GeForce RTX 5090 Laptop
158.3 (73min, 93P1 - 189max) fps
Intel Core Ultra 9 275HX
Asus Strix Scar 18 G835LX, Nvidia GeForce RTX 5090 Laptop
148 fps -7%
AMD Ryzen 9 7945HX3D
Asus ROG Strix Scar 17 G733PYV-LL053X, NVIDIA GeForce RTX 4090 Laptop GPU
144.9 (85min, 92P1 - 172max) fps -8%
Assassin's Creed Shadows - 1920x1080 Ultra High
AMD Ryzen 9 9955HX
SCHENKER Neo 16 A25 5090 Engineering Sample, Nvidia GeForce RTX 5090 Laptop
74 fps
Intel Core Ultra 9 275HX
Asus Strix Scar 18 G835LX, Nvidia GeForce RTX 5090 Laptop
65 fps -12%
AMD Ryzen 9 7945HX3D
Asus ROG Strix Scar 17 G733PYV-LL053X, NVIDIA GeForce RTX 4090 Laptop GPU
55 fps -26%
Call of Duty Black Ops 6 - 1920x1080 Extreme Preset
AMD Ryzen 9 7945HX3D
Asus ROG Strix Scar 17 G733PYV-LL053X, NVIDIA GeForce RTX 4090 Laptop GPU
150 fps +2%
AMD Ryzen 9 9955HX
SCHENKER Neo 16 A25 5090 Engineering Sample, Nvidia GeForce RTX 5090 Laptop
147 fps
Intel Core Ultra 9 275HX
Asus Strix Scar 18 G835LX, Nvidia GeForce RTX 5090 Laptop
147 fps 0%
Monster Hunter Wilds - 1920x1080 ultra, RT: high, no upscaling
AMD Ryzen 9 9955HX
SCHENKER Neo 16 A25 5090 Engineering Sample, Nvidia GeForce RTX 5090 Laptop
89 fps
Intel Core Ultra 9 275HX
Asus Strix Scar 18 G835LX, Nvidia GeForce RTX 5090 Laptop
87.6 fps -2%
AMD Ryzen 9 7945HX3D
Asus ROG Strix Scar 17 G733PYV-LL053X, NVIDIA GeForce RTX 4090 Laptop GPU
85.6 fps -4%
Indiana Jones and the Great Circle - 1920x1080 Very Ultra Preset
AMD Ryzen 9 9955HX
SCHENKER Neo 16 A25 5090 Engineering Sample, Nvidia GeForce RTX 5090 Laptop
130.6 fps
AMD Ryzen 9 7945HX3D
Asus ROG Strix Scar 17 G733PYV-LL053X, NVIDIA GeForce RTX 4090 Laptop GPU
128.4 fps -2%
Intel Core Ultra 9 275HX
Asus Strix Scar 18 G835LX, Nvidia GeForce RTX 5090 Laptop
127.9 fps -2%
Baldur's Gate 3 - 1920x1080 Ultra Preset
AMD Ryzen 9 9955HX
SCHENKER Neo 16 A25 5090 Engineering Sample, Nvidia GeForce RTX 5090 Laptop
202 fps
Intel Core Ultra 9 275HX
Asus Strix Scar 18 G835LX, Nvidia GeForce RTX 5090 Laptop
193.7 fps -4%
AMD Ryzen 9 7945HX3D
Asus ROG Strix Scar 17 G733PYV-LL053X, NVIDIA GeForce RTX 4090 Laptop GPU
178.8 fps -11%
Alan Wake 2 - 1920x1080 High Preset
AMD Ryzen 9 9955HX
SCHENKER Neo 16 A25 5090 Engineering Sample, Nvidia GeForce RTX 5090 Laptop
124.7 fps
Intel Core Ultra 9 275HX
Asus Strix Scar 18 G835LX, Nvidia GeForce RTX 5090 Laptop
116.4 fps -7%
AMD Ryzen 9 7945HX3D
Asus ROG Strix Scar 17 G733PYV-LL053X, NVIDIA GeForce RTX 4090 Laptop GPU
116.1 fps -7%

En resolución QHD, el Ryzen 9 9955HX sigue por delante del Core Ultra 9 275HX en todos los juegos, con una diferencia que vuelve a rondar el 5%. La antigua Strix Scar 17 sigue aguantando el tipo pero tiene que ceder un poco más de terreno a la nueva 2025 Scar 18.

QHD Performance Rating - Percent
AMD Ryzen 9 9955HX
SCHENKER Neo 16 A25 5090 Engineering Sample, Nvidia GeForce RTX 5090 Laptop
100 pt
Intel Core Ultra 9 275HX
Asus Strix Scar 18 G835LX, Nvidia GeForce RTX 5090 Laptop
94.5 pt
AMD Ryzen 9 7945HX3D
Asus ROG Strix Scar 17 G733PYV-LL053X, NVIDIA GeForce RTX 4090 Laptop GPU
91 pt
Cyberpunk 2077 2.2 Phantom Liberty - 2560x1440 Ultra Preset (FSR off)
AMD Ryzen 9 9955HX
SCHENKER Neo 16 A25 5090 Engineering Sample, Nvidia GeForce RTX 5090 Laptop
110.6 (91.2min - 141.1max) fps
Intel Core Ultra 9 275HX
Asus Strix Scar 18 G835LX, Nvidia GeForce RTX 5090 Laptop
106.8 (87.4min - 135.4max) fps -3%
AMD Ryzen 9 7945HX3D
Asus ROG Strix Scar 17 G733PYV-LL053X, NVIDIA GeForce RTX 4090 Laptop GPU
99.5 (80.5min - 128.2max) fps -10%
F1 24 - 2560x1440 Ultra High Preset AA:T AF:16x
AMD Ryzen 9 9955HX
SCHENKER Neo 16 A25 5090 Engineering Sample, Nvidia GeForce RTX 5090 Laptop
105.5 (73min, 83P1 - 126max) fps
Intel Core Ultra 9 275HX
Asus Strix Scar 18 G835LX, Nvidia GeForce RTX 5090 Laptop
100 fps -5%
AMD Ryzen 9 7945HX3D
Asus ROG Strix Scar 17 G733PYV-LL053X, NVIDIA GeForce RTX 4090 Laptop GPU
96.8 (79min, 78P1 - 118max) fps -8%
Assassin's Creed Shadows - 2560x1440 Ultra High
AMD Ryzen 9 9955HX
SCHENKER Neo 16 A25 5090 Engineering Sample, Nvidia GeForce RTX 5090 Laptop
59 fps
Intel Core Ultra 9 275HX
Asus Strix Scar 18 G835LX, Nvidia GeForce RTX 5090 Laptop
51 fps -14%
AMD Ryzen 9 7945HX3D
Asus ROG Strix Scar 17 G733PYV-LL053X, NVIDIA GeForce RTX 4090 Laptop GPU
47 fps -20%
Call of Duty Black Ops 6 - 2560x1440 Extreme Preset
AMD Ryzen 9 9955HX
SCHENKER Neo 16 A25 5090 Engineering Sample, Nvidia GeForce RTX 5090 Laptop
123 fps
AMD Ryzen 9 7945HX3D
Asus ROG Strix Scar 17 G733PYV-LL053X, NVIDIA GeForce RTX 4090 Laptop GPU
119 fps -3%
Intel Core Ultra 9 275HX
Asus Strix Scar 18 G835LX, Nvidia GeForce RTX 5090 Laptop
117 fps -5%
Monster Hunter Wilds - 2560x1440 ultra, RT: high, no upscaling
AMD Ryzen 9 9955HX
SCHENKER Neo 16 A25 5090 Engineering Sample, Nvidia GeForce RTX 5090 Laptop
75 fps
Intel Core Ultra 9 275HX
Asus Strix Scar 18 G835LX, Nvidia GeForce RTX 5090 Laptop
72 fps -4%
AMD Ryzen 9 7945HX3D
Asus ROG Strix Scar 17 G733PYV-LL053X, NVIDIA GeForce RTX 4090 Laptop GPU
69.4 fps -7%
Indiana Jones and the Great Circle - 2560x1440 Very Ultra Preset
AMD Ryzen 9 9955HX
SCHENKER Neo 16 A25 5090 Engineering Sample, Nvidia GeForce RTX 5090 Laptop
105 fps
Intel Core Ultra 9 275HX
Asus Strix Scar 18 G835LX, Nvidia GeForce RTX 5090 Laptop
102.2 fps -3%
AMD Ryzen 9 7945HX3D
Asus ROG Strix Scar 17 G733PYV-LL053X, NVIDIA GeForce RTX 4090 Laptop GPU
100.5 fps -4%
Baldur's Gate 3 - 2560x1440 Ultra Preset
AMD Ryzen 9 9955HX
SCHENKER Neo 16 A25 5090 Engineering Sample, Nvidia GeForce RTX 5090 Laptop
150.5 fps
Intel Core Ultra 9 275HX
Asus Strix Scar 18 G835LX, Nvidia GeForce RTX 5090 Laptop
145.6 fps -3%
AMD Ryzen 9 7945HX3D
Asus ROG Strix Scar 17 G733PYV-LL053X, NVIDIA GeForce RTX 4090 Laptop GPU
133.3 fps -11%
Alan Wake 2 - 2560x1440 High Preset
AMD Ryzen 9 9955HX
SCHENKER Neo 16 A25 5090 Engineering Sample, Nvidia GeForce RTX 5090 Laptop
88.3 fps
Intel Core Ultra 9 275HX
Asus Strix Scar 18 G835LX, Nvidia GeForce RTX 5090 Laptop
82.4 fps -7%
AMD Ryzen 9 7945HX3D
Asus ROG Strix Scar 17 G733PYV-LL053X, NVIDIA GeForce RTX 4090 Laptop GPU
82 fps -7%

A resolución 4K, la influencia del procesador disminuye aún más y la diferencia entre los chips AMD e Intel se hace más pequeña, aunque AMD consigue ligeras ventajas en todos los juegos.

La Strix Scar 17 se queda aquí más claramente rezagada, pero esto se debe a la GPU RTX 4090 para portátiles, más antigua.

4K Performance Rating - Percent
AMD Ryzen 9 9955HX
SCHENKER Neo 16 A25 5090 Engineering Sample, Nvidia GeForce RTX 5090 Laptop
100 pt
Intel Core Ultra 9 275HX
Asus Strix Scar 18 G835LX, Nvidia GeForce RTX 5090 Laptop
96.3 pt
AMD Ryzen 9 7945HX3D
Asus ROG Strix Scar 17 G733PYV-LL053X, NVIDIA GeForce RTX 4090 Laptop GPU
88.9 pt
F1 24 - 3840x2160 Ultra High Preset AA:T AF:16x
AMD Ryzen 9 9955HX
SCHENKER Neo 16 A25 5090 Engineering Sample, Nvidia GeForce RTX 5090 Laptop
54.2 (45min, 45P1 - 65max) fps
Intel Core Ultra 9 275HX
Asus Strix Scar 18 G835LX, Nvidia GeForce RTX 5090 Laptop
52 fps -4%
AMD Ryzen 9 7945HX3D
Asus ROG Strix Scar 17 G733PYV-LL053X, NVIDIA GeForce RTX 4090 Laptop GPU
48.4 (41min, 40P1 - 59max) fps -11%
Assassin's Creed Shadows - 3840x2160 Ultra High
AMD Ryzen 9 9955HX
SCHENKER Neo 16 A25 5090 Engineering Sample, Nvidia GeForce RTX 5090 Laptop
39 fps
Intel Core Ultra 9 275HX
Asus Strix Scar 18 G835LX, Nvidia GeForce RTX 5090 Laptop
36 fps -8%
AMD Ryzen 9 7945HX3D
Asus ROG Strix Scar 17 G733PYV-LL053X, NVIDIA GeForce RTX 4090 Laptop GPU
34 fps -13%
Call of Duty Black Ops 6 - 3840x2160 Extreme Preset
AMD Ryzen 9 9955HX
SCHENKER Neo 16 A25 5090 Engineering Sample, Nvidia GeForce RTX 5090 Laptop
82 fps
Intel Core Ultra 9 275HX
Asus Strix Scar 18 G835LX, Nvidia GeForce RTX 5090 Laptop
79 fps -4%
AMD Ryzen 9 7945HX3D
Asus ROG Strix Scar 17 G733PYV-LL053X, NVIDIA GeForce RTX 4090 Laptop GPU
76 fps -7%
Monster Hunter Wilds - 3840x2160 ultra, RT: high, no upscaling
AMD Ryzen 9 9955HX
SCHENKER Neo 16 A25 5090 Engineering Sample, Nvidia GeForce RTX 5090 Laptop
48.5 fps
Intel Core Ultra 9 275HX
Asus Strix Scar 18 G835LX, Nvidia GeForce RTX 5090 Laptop
46.3 fps -5%
AMD Ryzen 9 7945HX3D
Asus ROG Strix Scar 17 G733PYV-LL053X, NVIDIA GeForce RTX 4090 Laptop GPU
42.8 fps -12%
Indiana Jones and the Great Circle - 3840x2160 Very Ultra Preset
AMD Ryzen 9 9955HX
SCHENKER Neo 16 A25 5090 Engineering Sample, Nvidia GeForce RTX 5090 Laptop
66.6 fps
Intel Core Ultra 9 275HX
Asus Strix Scar 18 G835LX, Nvidia GeForce RTX 5090 Laptop
65 fps -2%
AMD Ryzen 9 7945HX3D
Asus ROG Strix Scar 17 G733PYV-LL053X, NVIDIA GeForce RTX 4090 Laptop GPU
60.6 fps -9%
Baldur's Gate 3 - 3840x2160 Ultra Preset
AMD Ryzen 9 9955HX
SCHENKER Neo 16 A25 5090 Engineering Sample, Nvidia GeForce RTX 5090 Laptop
84.3 fps
Intel Core Ultra 9 275HX
Asus Strix Scar 18 G835LX, Nvidia GeForce RTX 5090 Laptop
82.8 fps -2%
AMD Ryzen 9 7945HX3D
Asus ROG Strix Scar 17 G733PYV-LL053X, NVIDIA GeForce RTX 4090 Laptop GPU
74.6 fps -12%
Alan Wake 2 - 3840x2160 High Preset
AMD Ryzen 9 9955HX
SCHENKER Neo 16 A25 5090 Engineering Sample, Nvidia GeForce RTX 5090 Laptop
47.7 fps
Intel Core Ultra 9 275HX
Asus Strix Scar 18 G835LX, Nvidia GeForce RTX 5090 Laptop
46 fps -4%
AMD Ryzen 9 7945HX3D
Asus ROG Strix Scar 17 G733PYV-LL053X, NVIDIA GeForce RTX 4090 Laptop GPU
43.4 fps -9%
Cyberpunk 2077 2.2 Phantom Liberty - 3840x2160 Ultra Preset (FSR off)
AMD Ryzen 9 9955HX
SCHENKER Neo 16 A25 5090 Engineering Sample, Nvidia GeForce RTX 5090 Laptop
52.9 (42.8min - 66.9max) fps
Intel Core Ultra 9 275HX
Asus Strix Scar 18 G835LX, Nvidia GeForce RTX 5090 Laptop
52.1 (43.9min - 64.8max) fps -2%
AMD Ryzen 9 7945HX3D
Asus ROG Strix Scar 17 G733PYV-LL053X, NVIDIA GeForce RTX 4090 Laptop GPU
44.2 (37min - 55max) fps -16%

Rendimiento con diferentes límites de potencia

También probamos el rendimiento de los dos nuevos procesadores con límites de potencia fijos. Aquí puede ver que el Core Ultra 9 275HX ofrece un buen rendimiento incluso con valores de TDP más bajos y puede superar al Ryzen 9 9955HX, pero sólo en Cinebench 2024.

En el Cinebench R23 más antiguo, AMD está por delante hasta los 100 W pero después se queda atrás de forma bastante significativa.

Cinebench 2024 Multi
TDP AMD Ryzen 9 9955HX Core Ultra 9 275HX Core i9-14900HX
150 vatios 2.061 puntos 2.158 puntos 1.834 puntos
130 vatios 2.030 puntos 2.095 puntos 1.757 puntos
115 vatios 2,008 puntos 2,015 puntos 1,525 puntos
100 vatios 1.948 puntos 1.963 puntos 1.424 puntos
80 vatios 1.809 puntos 1.875 puntos 1.373 puntos
55 vatios 1.489 puntos 1.633 puntos 1.105 puntos
Cinebench R23 Multi
TDP AMD Ryzen 9 9955HX Core Ultra 9 275HX Ryzen 9 7945HX3D Ryzen 9 7945HX Core i9-14900HX
150 vatios 39,537 puntos 38,108 puntos 30,308 puntos
130 vatios 38.502 puntos 36.165 puntos 34.202 puntos 28.933
115 vatios 37.157 puntos 34.760 puntos 33.361 puntos 27.750
100 vatios 35.500 puntos 33.670 puntos 32.977 puntos 32.947 puntos 26.232 puntos
80 vatios 31.641 puntos 31.880 puntos 30.804 puntos 30.907 puntos 23.334 puntos
55 vatios 23.849 puntos 27.283 puntos 26.045 puntos 18.258 puntos

Conclusión: AMD tiene la CPU para juegos más rápida para portátiles a la espera de la llegada del Ryzen 9 9955HX3D

Los dos nuevos procesadores móviles de gama alta de AMD e Intel no ofrecen sorpresas y son más rápidos que sus respectivos predecesores tanto en las pruebas mononúcleo como en las multinúcleo. Intel también tiene una ligera ventaja en las pruebas sintéticas de Cinebench, pero no puede replicarla en Geekbench ni en los puntos de referencia del sistema.

En juegos, el ganador es bastante evidente porque con la idéntica GPU Nvidia GeForce RTX 5090 para portátiles (análisis detallado aquí), el procesador AMD sale ligeramente más rápido en todos los juegos que probamos.

Esto aumenta la preferencia por el inminente Ryzen 9 9955HX3D, que debería ofrecer de nuevo un rendimiento en juegos significativamente mejor. Sin embargo, no esperamos ver dispositivos de prueba con el chip HX3D hasta dentro de unas semanas, y sólo podemos esperar que la disponibilidad del procesador HX3D sea mejor en esta generación.

Please share our article, every link counts!
Mail Logo
> Análisis y pruebas de ordenadores portátiles y móviles teléfonos > Análisis > Análisis AMD Ryzen 9 9955HX vs. Intel Core Ultra 9 275HX: La batalla por la CPU más rápida para juegos
Andreas Osthoff, 2025-04- 7 (Update: 2025-04- 7)