Análisis del AMD Ryzen 7 9700X: Core i9-14900K niveles de rendimiento de un solo núcleo y juegos con Zen 5 por US$185 menos

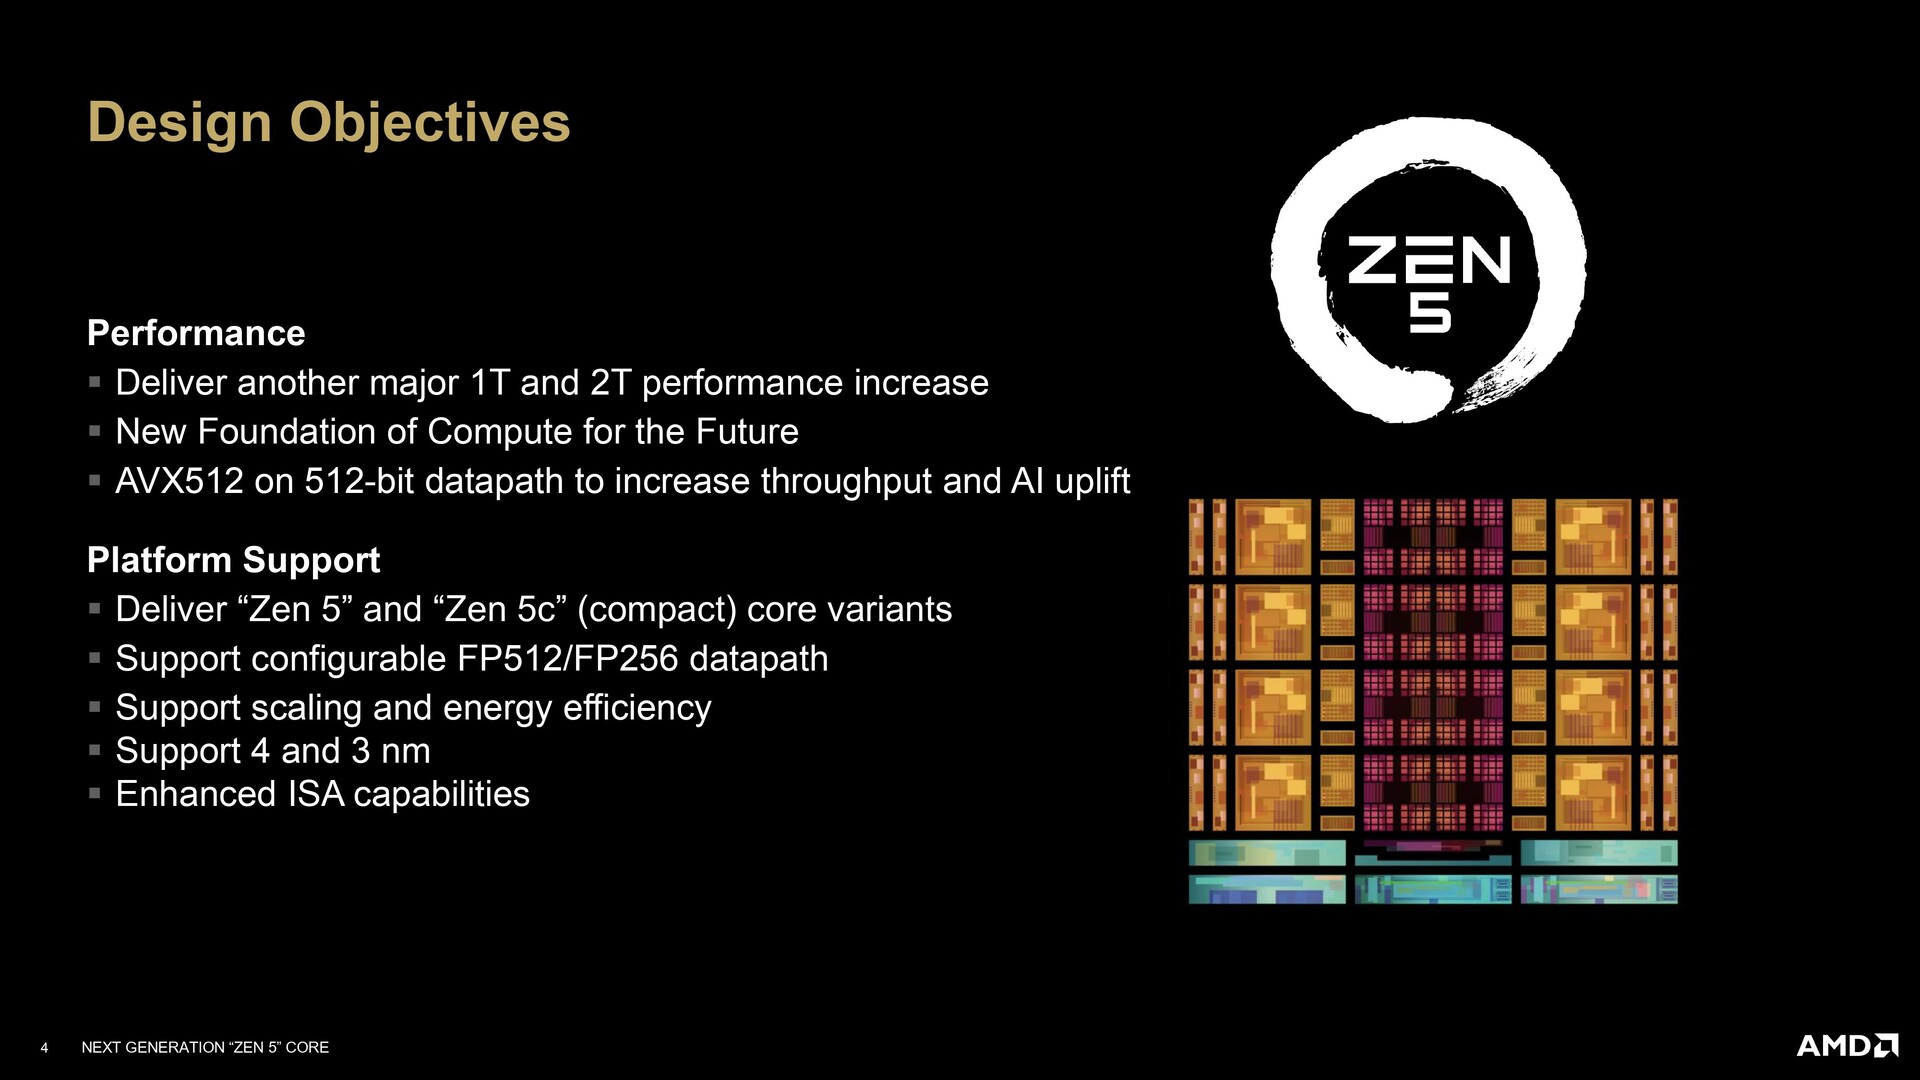
AMD lanzó recientemente las APU Ryzen 9000 Zen 5 "Granite Ridge" de 4 nm que suceden directamente a las ofertas Zen 4 del año pasado. Los objetivos declarados de AMD con Zen 5 son "importantes" aumentos de rendimiento de 1T y 2T y una ruta de datos AVX512 completa de 512 bits.
Según AMD, el núcleo Zen 5 está diseñado de forma que admita las próximas capacidades de IA, aunque el SoC en sí no cuenta con una NPU dedicada, a diferencia de lo que hemos visto con los nuevos APU Ryzen 9 AI HX Strix Points.
El Ryzen 5 9600X y el Ryzen 7 9700X vienen con frecuencias boost de +100 MHz en comparación con sus homólogos Zen 4. Sin embargo, estas CPU están limitadas a 65 W TDP out-of-the-box.
Esta limitación artificial del TDP es similar a ejecutar el Ryzen 7 7700X en modo ECO, pero los cambios de microarquitectura en Zen 5 se prestan a ganancias de rendimiento perceptibles incluso en este TDP restringido. La otra ventaja es que se puede poner casi cualquier refrigerador básico en el Ryzen 7 9700X y empezar a rodar la pelota.
Por supuesto, cuanto mejor sea la solución de refrigeración y la entrega de potencia de la placa base, mayor será el margen térmico y de potencia para que Precision Boost Overdrive 2 (PBO2) haga su magia. Sin embargo, los inconvenientes de este enfoque son unos relojes base más bajos y una diferencia de rendimiento global prácticamente nula en comparación con Zen 4, como pronto veremos.
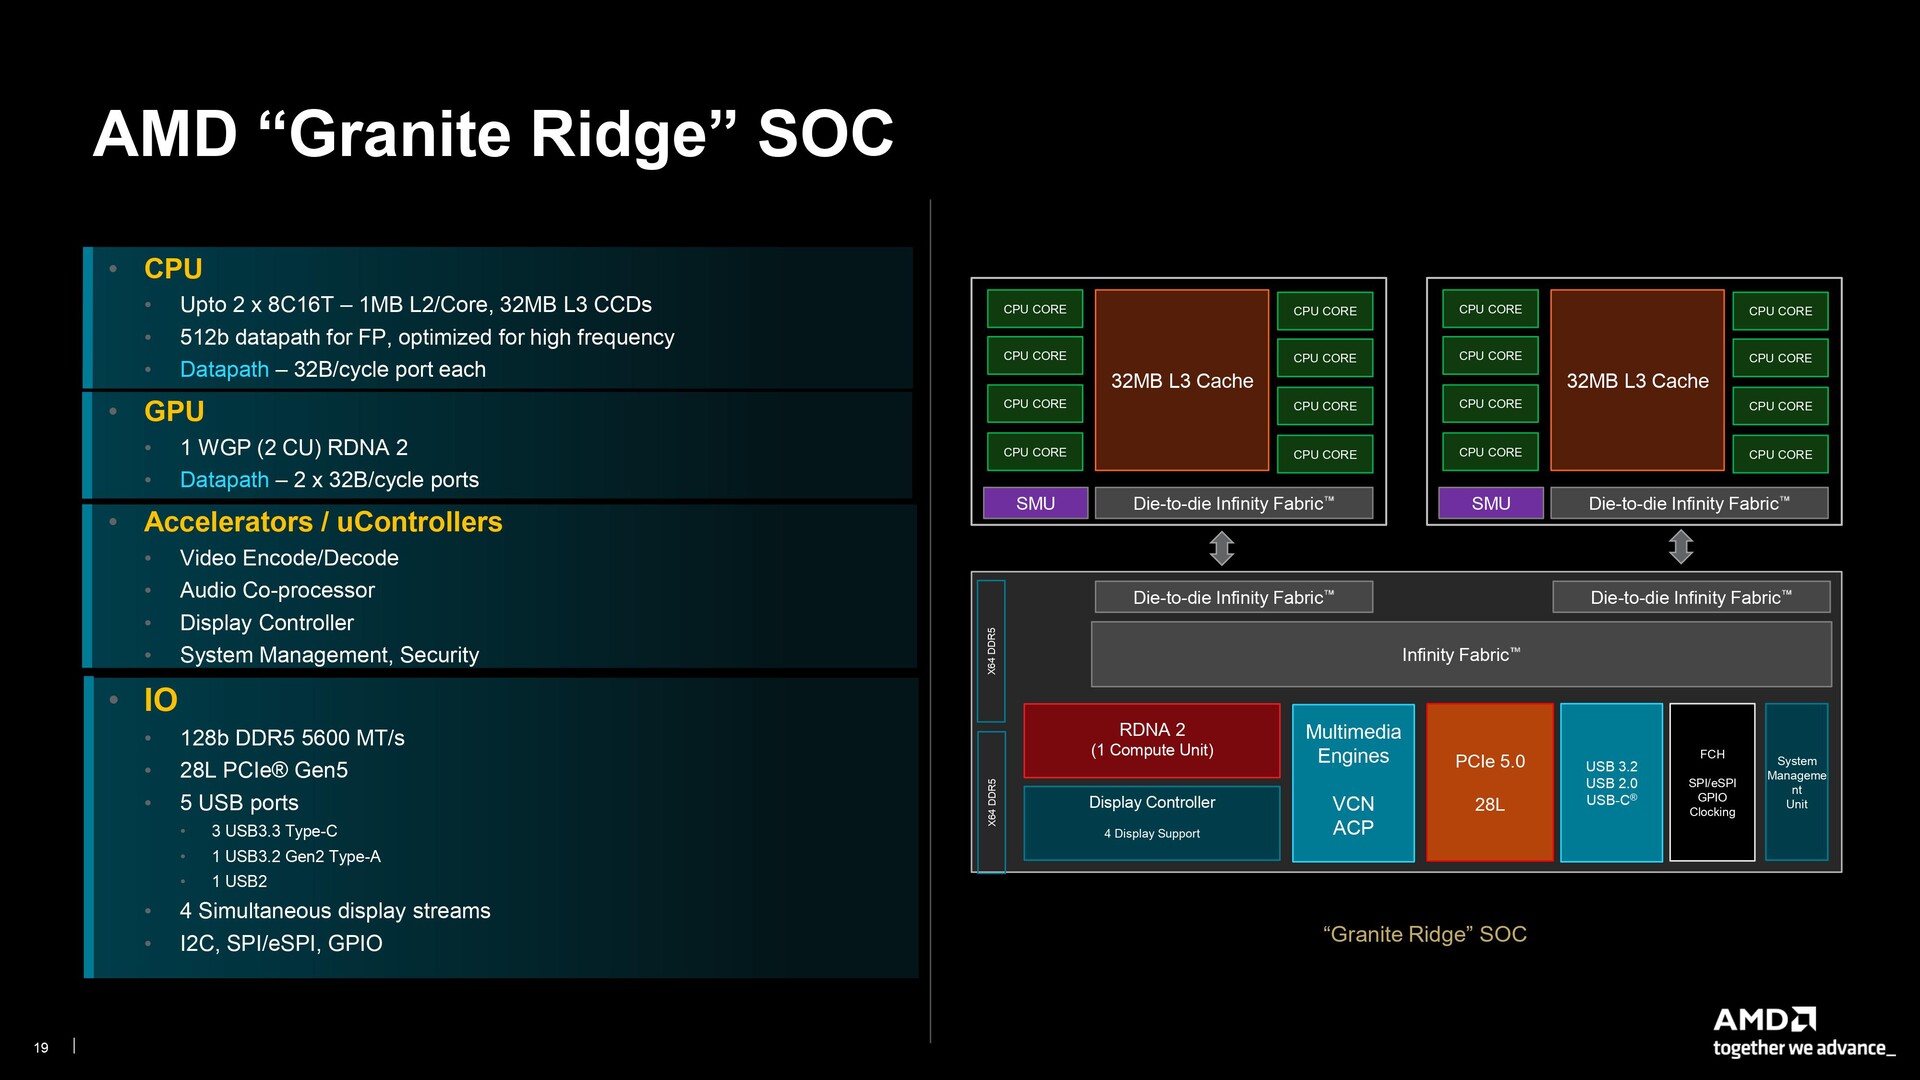
No se trata de un chip X3D, por lo que la caché combinada L2+L3 sigue siendo de 40 MB. El troquel de E/S se reutiliza del Zen 4, lo que significa que el SoC incorpora la misma iGPU RDNA 2 con dos unidades de cálculo (128 procesadores de flujo).
El principal cambio esta vez es el soporte para memoria DDR5-5600 que supuestamente puede alcanzar velocidades DDR5-8000 EXPO. Al igual que con la serie Ryzen 7000, AMD recomienda una relación UCLK y MCLK de 1:1 con FCLK configurado en Auto.
Zen 5 también trae una nueva característica de Memory Clocking On-the-Fly que permite cambiar sin problemas entre las velocidades de memoria Power-on-Reset (POR) y los perfiles EXPO directamente desde Ryzen Master. Los usuarios también pueden crear Perfiles de Rendimiento Optimizado de Memoria (OPP), que son básicamente configuraciones EXPO para memoria sin un perfil EXPO nativo.
Por último, hay una nueva función Curve Shaper además del ya existente Curve Optimizer que permite remodelar las curvas de voltaje, añadiendo o eliminando de 15 bandas diferentes de frecuencia-temperatura según sea necesario. Estas funciones de overclocking también son compatibles con las placas AM5 existentes mediante una actualización de la BIOS.
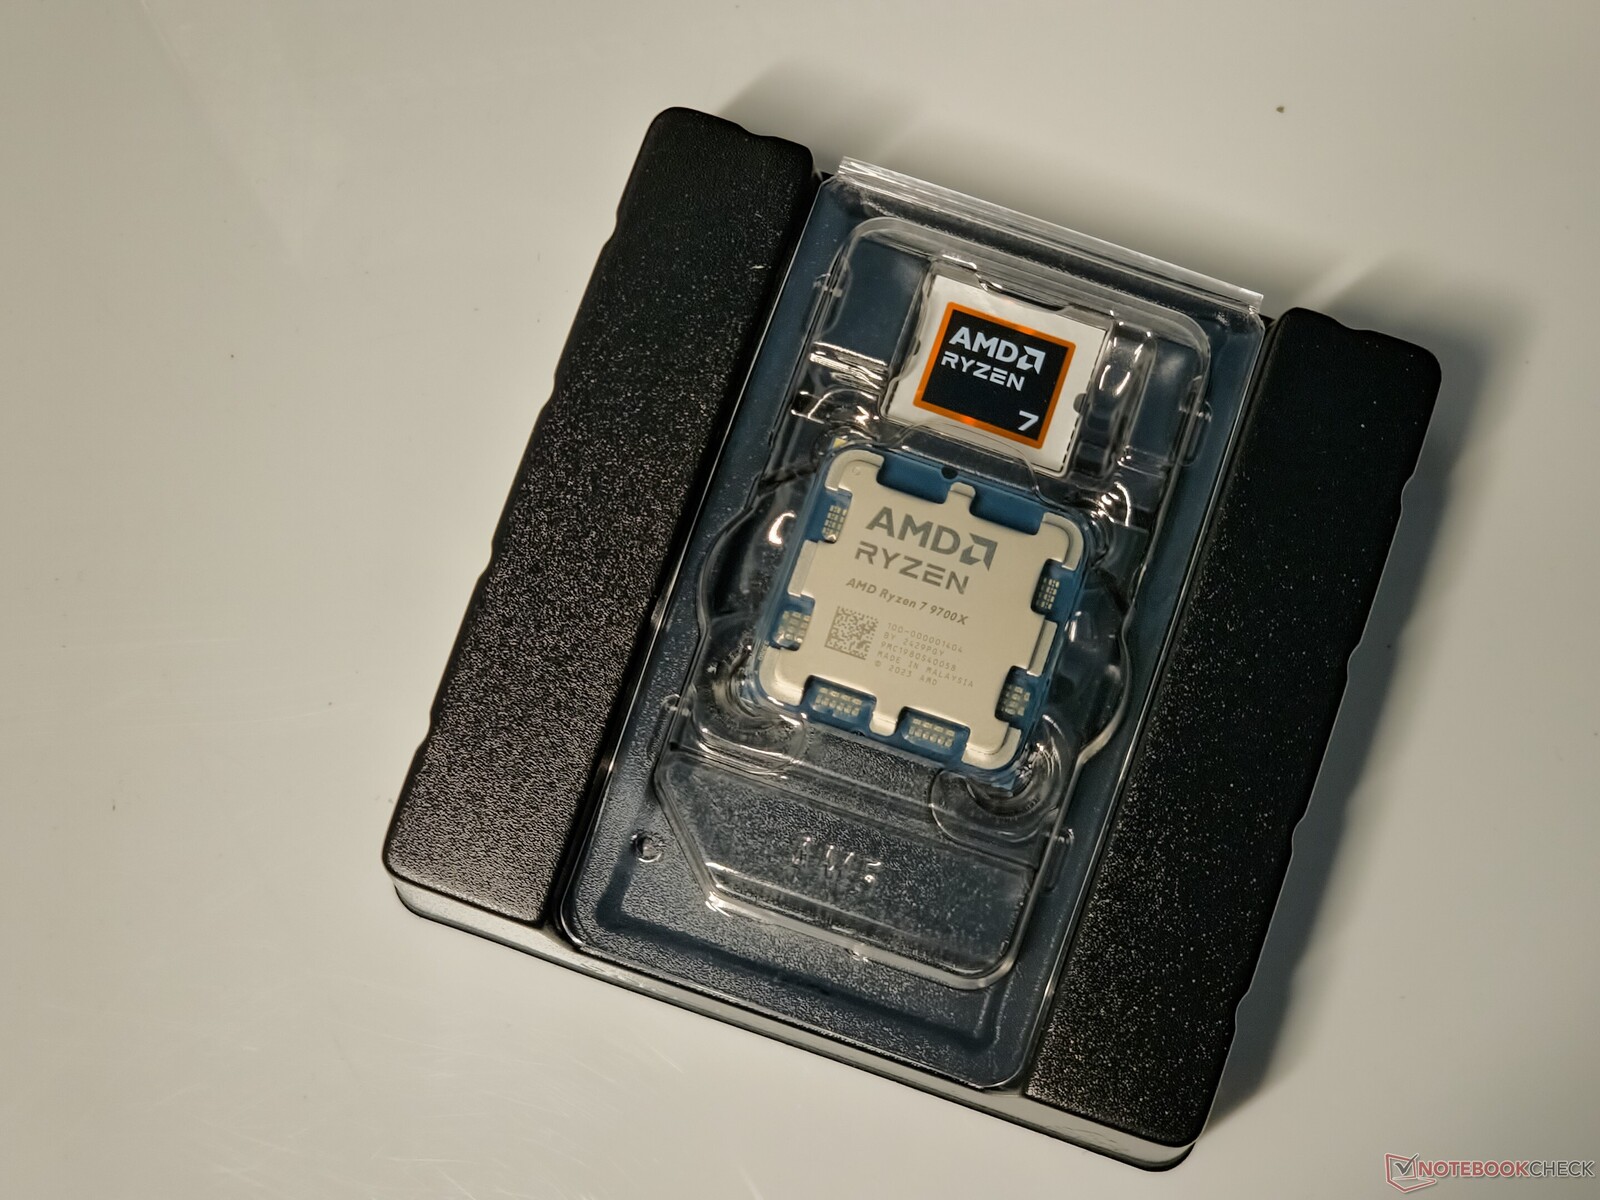
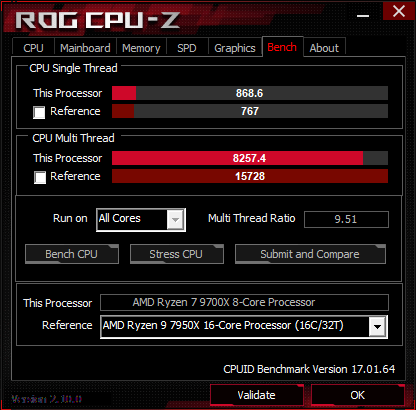
En este análisis, echamos un vistazo al procesador AMD Ryzen 7 9700X de 8 núcleos y 16 hilos para ver cómo se comporta frente a la competencia de Team Blue y sus propios compatriotas.
Visión general de los procesadores de sobremesa AMD Zen 5 "Granite Ridge" Ryzen 9000
| SKU | Núcleos / Hilos | Reloj base | Turbo Clock | Caché L2 | Caché L3 | TDP | Potencia de zócalo por defecto (PPT) | Precio de lanzamiento (SEP) |
|---|---|---|---|---|---|---|---|---|
| Ryzen 9 9950X | 16 / 32 | 4,3 GHz | 5,7 GHz | 16x 1 MB | 64 MB | 170 W | 200 W | 649 USD |
| Ryzen 9 9900X | 12 / 24 | 4,7 GHz | 5,6 GHz | 12x 1 MB | 64 MB | 120 W | 162 W | US$499 |
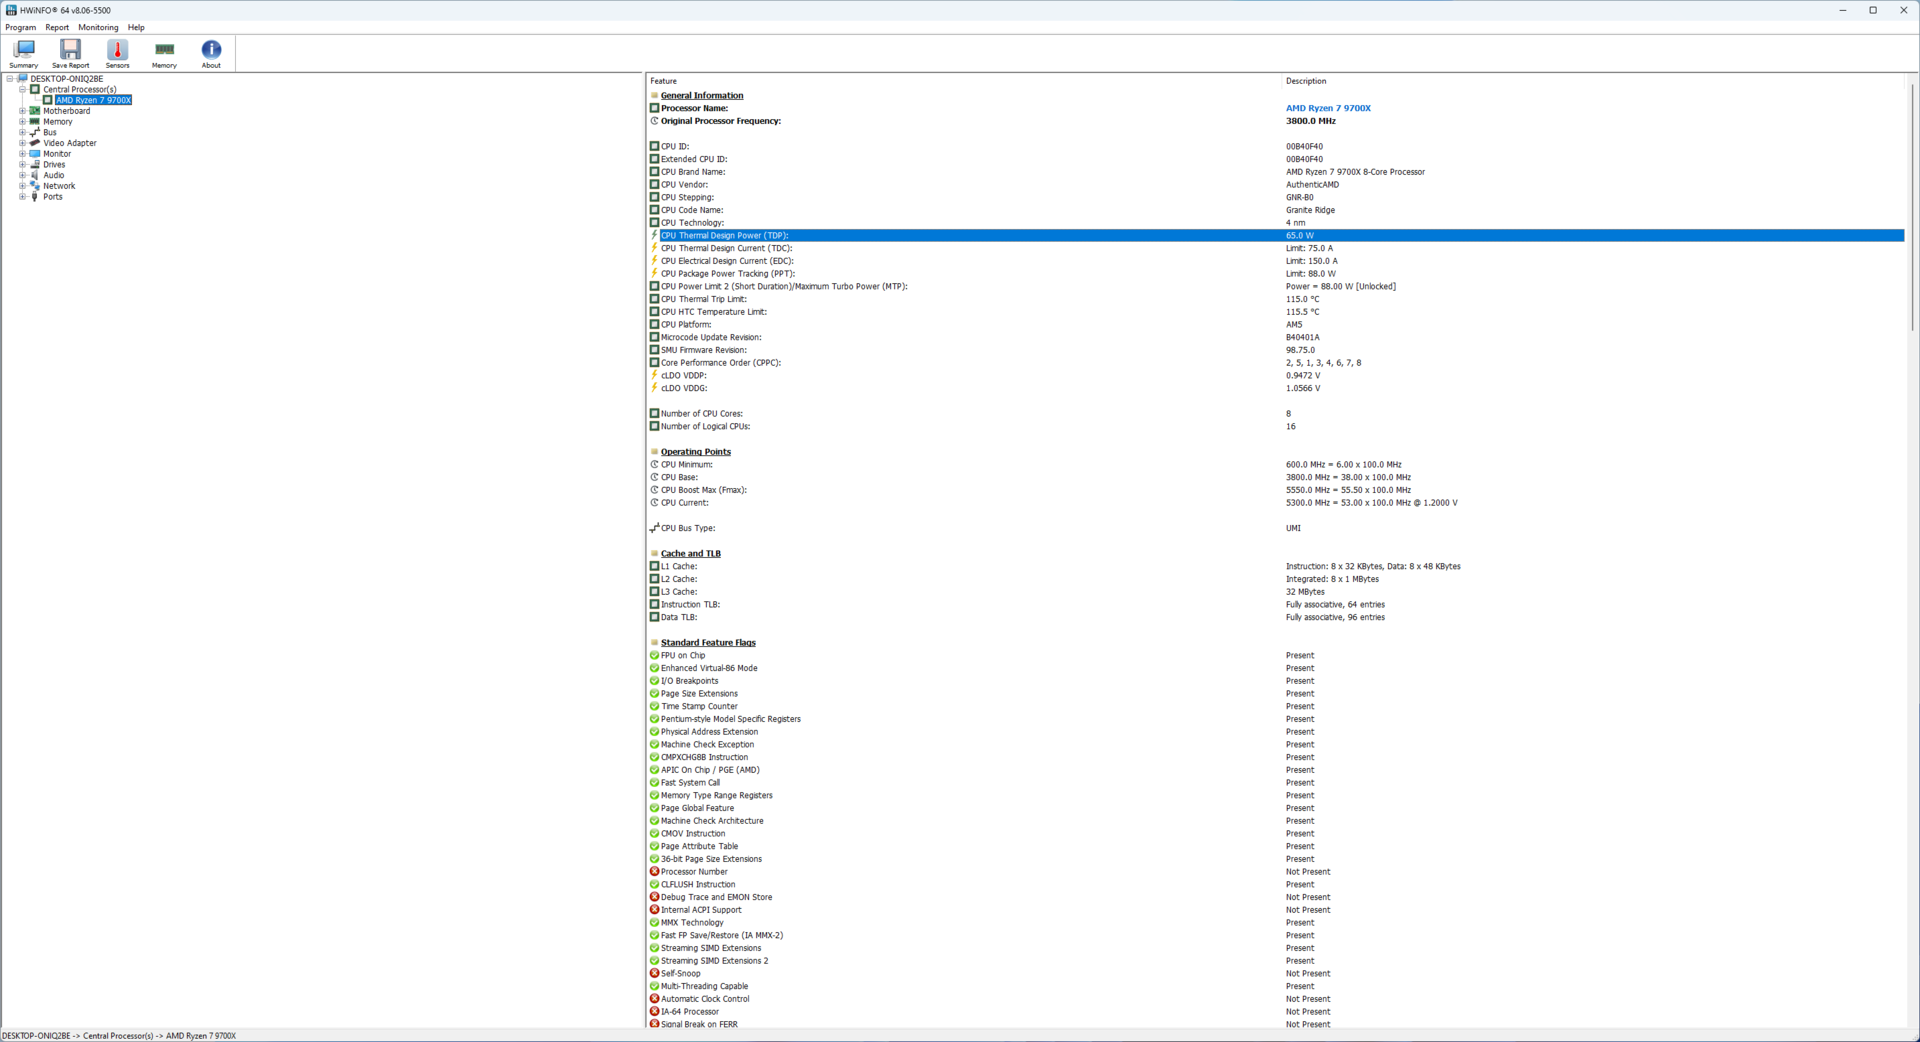
| Ryzen 7 9700X | 8/ 16 | 3.8 GHz | 5.5 GHz | 8x1 MB | 32 MB | 65 W | 88 W | US$359 |
| Ryzen 5 9600X | 6 / 12 | 3.9 GHz | 5.4 GHz | 6x 1 MB | 32 MB | 65 W | 88 W | US$279 |
El banco de pruebas: El AMD Ryzen 7 9700X hace buena pareja con la RTX 4090
Hemos utilizado los siguientes componentes en nuestra configuración de prueba para esta revisión:
- Banco de pruebas abierto Cooler Master MasterFrame 700
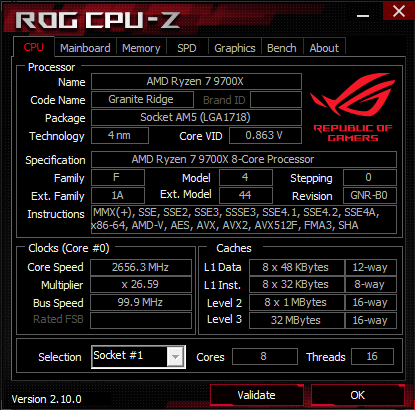
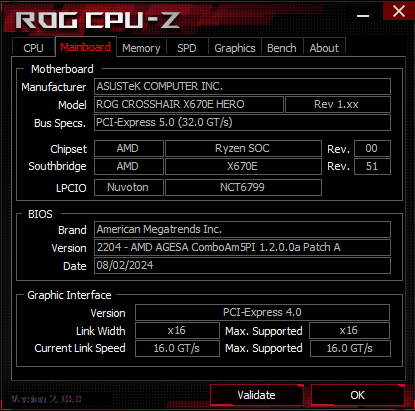
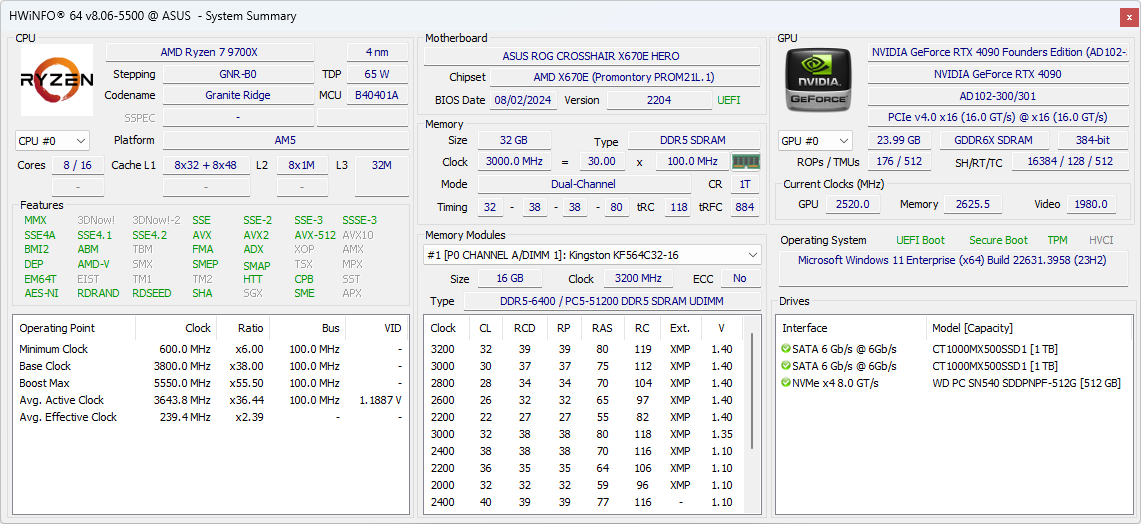
- Placa base Asus ROG Crosshair X670E Hero con BIOS 2204 (AGESA ComboAM5PI 1.2.0.0a Parche A)
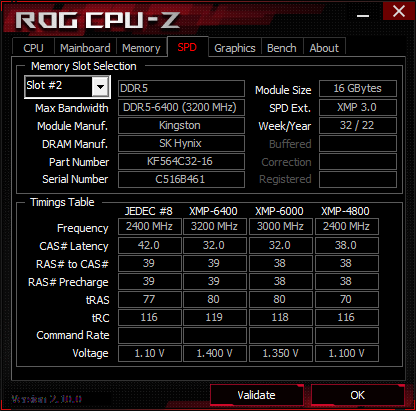
- Nvidia GeForce RTX 4090 Founders Edition GPU
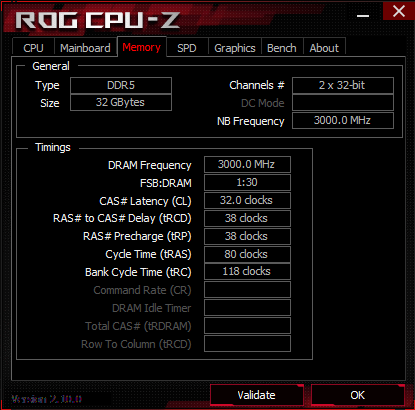
- 2x 16 GB de RAM Kingston Fury Beast DDR5-6400 funcionando a DDR5-6000 con tiempos 32-38-38-80 a 1,35 V
- Unidad SSD NVMe Western Digital PC SN540 de 512 GB y 2 unidades SSD SATA Crucial MX500 de 1 TB para el sistema operativo, pruebas de rendimiento y juegos
- MSI MAG 274UPF monitor 4K 144 Hz
- Refrigerador Thermaltake TH420 V2 Ultra EX ARGB AIO
- Fuente de alimentación totalmente modular Cooler Master MVE Gold V2 1250 ATX 3.0
Todas las pruebas se realizaron tras una instalación limpia de Windows 11 23H2 (Build 22621.3958) junto con los últimos controladores del chipset AMD y el controlador Nvidia Game Ready 560.81.
Seguimos teniendo problemas con la mayor duración del entrenamiento de la DDR5 con Zen 5, ya que el primer arranque tras la instalación de la CPU tarda entre cuatro y cinco minutos. Una vez superado este periodo inicial, los arranques sucesivos se completan en unos 10 segundos en una instalación fresca del SO.
Nos gustaría dar las gracias a AMD por proporcionar la muestra de prueba Ryzen 7 9700X, a Nvidia por la GPU RTX 4090 Founders Edition, a Asus por la placa base ROG Crosshair X670E Hero, a MSI por el monitor MAG274UPF, a Kingston por el kit de memoria DDR5, a Thermaltake por el TH420 V2 Ultra EX AIO y, por último, a Cooler Master por el banco de pruebas y la fuente de alimentación.
Rendimiento de la CPU: Las ganancias multinúcleo sobre Ryzen 7 7700X lastradas por un TDP de 65 W
El rendimiento acumulado de la CPU del AMD Ryzen 7 9700X está en líneas similares al del Intel Core i5-14600K, Core i5-13600Ke incluso el Core i9-12900K y el Ryzen 9 5950X. Sin embargo, la CPU Zen 5 no muestra ganancias de rendimiento perceptibles en general en comparación con un Ryzen 7 7700X.
Dicho esto, sí vemos ganancias decentes gen-gen en las puntuaciones de un solo núcleo de Cinebench y Geekbench donde el Ryzen 7 9700X demuestra hasta un 13% de ventaja sobre su predecesor Zen 4.
Sin embargo, las ganancias multinúcleo son muy mínimas en general, y prácticamente no vemos diferencias entre el Ryzen 7 9700X y el Ryzen 7 7700X en las pruebas de CPU acumulativas. Esto se debe probablemente al TDP reducido por defecto de 65 W, que es una especie de modo ECO. El TDP inferior supuestamente proporciona al algoritmo PBO2 un margen de potencia adicional para impulsar el rendimiento en escenarios de un solo núcleo, dado que estas CPU siguen funcionando a una TjMax constante de 95 °C.
AMD explica que el Ryzen 7 9700X y el Ryzen 5 9600X están dirigidos específicamente a casos de uso de baja potencia y es probable que estén limitados térmicamente en función de la solución de refrigeración.
Se rumorea en AMD Ryzen 7 9700X y Ryzen 5 9600X podrían obtener mejoras de rendimiento de dos dígitos gracias al nuevo parche de firmware de 105 W TDP que AMD podría ofrecer un nuevo parche AGESA que desbloqueará el TDP de 105 W, así que estaremos atentos. También puede desbloquear manualmente los límites de potencia ajustando los límites del PBO al máximo en la BIOS.
Curiosamente, el rendimiento de un solo núcleo del Ryzen 7 9700X de stock y del Ryzen 5 9600X es exactamente el mismo. Por lo tanto, si sus cargas de trabajo son principalmente de un solo hilo, podría conformarse fácilmente con el Ryzen 5 9600X y ahorrarse el cambio.
| CPU Performance rating - Percent | |
| Intel Core i9-14900K | |
| AMD Ryzen 9 7950X | |
| Intel Core i9-13900K | |
| AMD Ryzen 9 7950X3D | |
| Intel Core i7-14700K | |
| AMD Ryzen 9 7900X | |
| AMD Ryzen 9 5950X -1! | |
| AMD Ryzen 7 9700X | |
| Intel Core i9-12900K | |
| Intel Core i5-14600K | |
| AMD Ryzen 7 7700X -1! | |
| Intel Core i5-13600K | |
| AMD Ryzen 5 9600X | |
| AMD Ryzen 7 7800X3D -1! | |
| AMD Ryzen 5 7600X | |
| Intel Core i5-12600K | |
| Intel Core i5-13400 | |
| AMD Ryzen 5 5600X -1! | |
| Intel Core i5-12400F | |
| Cinebench R11.5 | |
| CPU Single 64Bit | |
| AMD Ryzen 7 9700X | |
| Intel Core i9-14900K | |
| AMD Ryzen 5 9600X | |
| Intel Core i9-13900K | |
| AMD Ryzen 9 7950X | |
| AMD Ryzen 9 7950X3D | |
| AMD Ryzen 9 7900X | |
| AMD Ryzen 5 7600X | |
| AMD Ryzen 7 7700X | |
| Intel Core i7-14700K | |
| Intel Core i5-14600K | |
| Intel Core i9-12900K | |
| Intel Core i5-13600K | |
| AMD Ryzen 7 7800X3D | |
| Intel Core i5-12600K | |
| AMD Ryzen 9 5950X | |
| Intel Core i5-13400 | |
| AMD Ryzen 5 5600X | |
| Intel Core i5-12400F | |
| CPU Multi 64Bit | |
| Intel Core i9-14900K | |
| Intel Core i9-13900K | |
| AMD Ryzen 9 7950X | |
| AMD Ryzen 9 7950X3D | |
| Intel Core i7-14700K | |
| AMD Ryzen 9 7900X | |
| AMD Ryzen 9 5950X | |
| Intel Core i9-12900K | |
| Intel Core i5-13600K | |
| Intel Core i5-14600K | |
| AMD Ryzen 7 9700X | |
| AMD Ryzen 7 7700X | |
| AMD Ryzen 7 7800X3D | |
| AMD Ryzen 5 9600X | |
| Intel Core i5-12600K | |
| AMD Ryzen 5 7600X | |
| Intel Core i5-13400 | |
| AMD Ryzen 5 5600X | |
| Intel Core i5-12400F | |
| Cinebench R15 | |
| CPU Single 64Bit | |
| AMD Ryzen 7 9700X | |
| AMD Ryzen 5 9600X | |
| Intel Core i9-14900K | |
| AMD Ryzen 9 7950X | |
| Intel Core i9-13900K | |
| AMD Ryzen 9 7950X3D | |
| AMD Ryzen 9 7900X | |
| AMD Ryzen 5 7600X | |
| AMD Ryzen 7 7700X | |
| Intel Core i7-14700K | |
| Intel Core i5-14600K | |
| AMD Ryzen 7 7800X3D | |
| Intel Core i5-13600K | |
| Intel Core i9-12900K | |
| Intel Core i5-12600K | |
| AMD Ryzen 9 5950X | |
| Intel Core i5-13400 | |
| AMD Ryzen 5 5600X | |
| Intel Core i5-12400F | |
| CPU Multi 64Bit | |
| Intel Core i9-14900K | |
| AMD Ryzen 9 7950X | |
| Intel Core i9-13900K | |
| AMD Ryzen 9 7950X3D | |
| Intel Core i7-14700K | |
| AMD Ryzen 9 7900X | |
| AMD Ryzen 9 5950X | |
| Intel Core i9-12900K | |
| Intel Core i5-13600K | |
| Intel Core i5-14600K | |
| AMD Ryzen 7 7700X | |
| AMD Ryzen 7 9700X | |
| AMD Ryzen 7 7800X3D | |
| AMD Ryzen 5 9600X | |
| Intel Core i5-12600K | |
| AMD Ryzen 5 7600X | |
| Intel Core i5-13400 | |
| AMD Ryzen 5 5600X | |
| Intel Core i5-12400F | |
| Cinebench R20 | |
| CPU (Single Core) | |
| Intel Core i9-14900K | |
| AMD Ryzen 7 9700X | |
| AMD Ryzen 5 9600X | |
| Intel Core i7-14700K | |
| Intel Core i9-13900K | |
| AMD Ryzen 9 7950X | |
| AMD Ryzen 9 7950X3D | |
| Intel Core i5-14600K | |
| AMD Ryzen 9 7900X | |
| Intel Core i5-13600K | |
| AMD Ryzen 7 7700X | |
| Intel Core i9-12900K | |
| AMD Ryzen 5 7600X | |
| Intel Core i5-12600K | |
| AMD Ryzen 7 7800X3D | |
| Intel Core i5-13400 | |
| Intel Core i5-12400F | |
| AMD Ryzen 9 5950X | |
| AMD Ryzen 5 5600X | |
| CPU (Multi Core) | |
| Intel Core i9-14900K | |
| Intel Core i9-13900K | |
| AMD Ryzen 9 7950X | |
| AMD Ryzen 9 7950X3D | |
| Intel Core i7-14700K | |
| AMD Ryzen 9 7900X | |
| AMD Ryzen 9 5950X | |
| Intel Core i9-12900K | |
| Intel Core i5-14600K | |
| Intel Core i5-13600K | |
| AMD Ryzen 7 9700X | |
| AMD Ryzen 7 7700X | |
| AMD Ryzen 7 7800X3D | |
| AMD Ryzen 5 9600X | |
| Intel Core i5-12600K | |
| Intel Core i5-13400 | |
| AMD Ryzen 5 7600X | |
| Intel Core i5-12400F | |
| AMD Ryzen 5 5600X | |
| Blender - v2.79 BMW27 CPU | |
| Intel Core i5-12400F | |
| AMD Ryzen 5 5600X | |
| Intel Core i5-13400 | |
| AMD Ryzen 5 7600X | |
| Intel Core i5-12600K | |
| AMD Ryzen 5 9600X | |
| AMD Ryzen 7 7800X3D | |
| AMD Ryzen 7 7700X | |
| AMD Ryzen 7 9700X | |
| Intel Core i5-13600K | |
| Intel Core i5-14600K | |
| Intel Core i9-12900K | |
| AMD Ryzen 9 5950X | |
| AMD Ryzen 9 7900X | |
| Intel Core i7-14700K | |
| AMD Ryzen 9 7950X3D | |
| AMD Ryzen 9 7950X | |
| Intel Core i9-13900K | |
| Intel Core i9-14900K | |
| HWBOT x265 Benchmark v2.2 - 4k Preset | |
| AMD Ryzen 9 7950X | |
| Intel Core i9-14900K | |
| Intel Core i9-13900K | |
| AMD Ryzen 9 7950X3D | |
| Intel Core i7-14700K | |
| AMD Ryzen 9 7900X | |
| AMD Ryzen 9 5950X | |
| Intel Core i5-12600K | |
| Intel Core i9-12900K | |
| Intel Core i5-14600K | |
| Intel Core i5-13600K | |
| AMD Ryzen 7 9700X | |
| AMD Ryzen 7 7700X | |
| AMD Ryzen 7 7800X3D | |
| AMD Ryzen 5 9600X | |
| AMD Ryzen 5 7600X | |
| Intel Core i5-13400 | |
| AMD Ryzen 5 5600X | |
| Intel Core i5-12400F | |
| Geekbench 4.4 | |
| 64 Bit Single-Core Score | |
| Intel Core i9-14900K | |
| AMD Ryzen 7 9700X | |
| AMD Ryzen 5 9600X | |
| Intel Core i9-13900K | |
| AMD Ryzen 9 7950X | |
| Intel Core i7-14700K | |
| AMD Ryzen 9 7950X3D | |
| AMD Ryzen 9 7900X | |
| AMD Ryzen 7 7800X3D | |
| AMD Ryzen 7 7700X | |
| AMD Ryzen 5 7600X | |
| Intel Core i5-14600K | |
| Intel Core i9-12900K | |
| Intel Core i5-13600K | |
| Intel Core i5-12600K | |
| Intel Core i5-13400 | |
| Intel Core i5-12400F | |
| AMD Ryzen 9 5950X | |
| AMD Ryzen 5 5600X | |
| 64 Bit Multi-Core Score | |
| AMD Ryzen 9 7950X | |
| Intel Core i9-14900K | |
| AMD Ryzen 9 7950X3D | |
| Intel Core i9-13900K | |
| Intel Core i7-14700K | |
| AMD Ryzen 9 7900X | |
| Intel Core i5-14600K | |
| Intel Core i9-12900K | |
| AMD Ryzen 9 5950X | |
| Intel Core i5-13600K | |
| AMD Ryzen 7 9700X | |
| AMD Ryzen 7 7700X | |
| AMD Ryzen 7 7800X3D | |
| AMD Ryzen 5 9600X | |
| AMD Ryzen 5 7600X | |
| Intel Core i5-12600K | |
| Intel Core i5-13400 | |
| AMD Ryzen 5 5600X | |
| Intel Core i5-12400F | |
| Geekbench 5.0 | |
| 5.0 Multi-Core | |
| Intel Core i9-14900K | |
| AMD Ryzen 9 7950X | |
| Intel Core i9-13900K | |
| AMD Ryzen 9 7950X3D | |
| Intel Core i7-14700K | |
| AMD Ryzen 9 7900X | |
| Intel Core i9-12900K | |
| Intel Core i5-14600K | |
| Intel Core i5-13600K | |
| AMD Ryzen 9 5950X | |
| AMD Ryzen 7 9700X | |
| AMD Ryzen 7 7700X | |
| AMD Ryzen 7 7800X3D | |
| Intel Core i5-12600K | |
| AMD Ryzen 5 9600X | |
| AMD Ryzen 5 7600X | |
| Intel Core i5-13400 | |
| Intel Core i5-12400F | |
| AMD Ryzen 5 5600X | |
| 5.0 Single-Core | |
| AMD Ryzen 7 9700X | |
| AMD Ryzen 5 9600X | |
| Intel Core i9-14900K | |
| AMD Ryzen 9 7950X | |
| Intel Core i9-13900K | |
| AMD Ryzen 9 7900X | |
| AMD Ryzen 9 7950X3D | |
| AMD Ryzen 5 7600X | |
| AMD Ryzen 7 7700X | |
| Intel Core i7-14700K | |
| Intel Core i5-14600K | |
| Intel Core i9-12900K | |
| AMD Ryzen 7 7800X3D | |
| Intel Core i5-13600K | |
| Intel Core i5-12600K | |
| Intel Core i5-13400 | |
| AMD Ryzen 9 5950X | |
| Intel Core i5-12400F | |
| AMD Ryzen 5 5600X | |
| R Benchmark 2.5 - Overall mean | |
| Intel Core i5-12400F | |
| AMD Ryzen 5 5600X | |
| Intel Core i5-13400 | |
| AMD Ryzen 9 5950X | |
| Intel Core i5-12600K | |
| Intel Core i9-12900K | |
| AMD Ryzen 7 7800X3D | |
| Intel Core i5-13600K | |
| Intel Core i5-14600K | |
| Intel Core i7-14700K | |
| AMD Ryzen 7 7700X | |
| AMD Ryzen 5 7600X | |
| AMD Ryzen 9 7900X | |
| AMD Ryzen 9 7950X3D | |
| AMD Ryzen 9 7950X | |
| Intel Core i9-13900K | |
| Intel Core i9-14900K | |
| AMD Ryzen 7 9700X | |
| AMD Ryzen 5 9600X | |
| LibreOffice - 20 Documents To PDF | |
| Intel Core i5-12600K | |
| Intel Core i5-12400F | |
| AMD Ryzen 5 9600X | |
| AMD Ryzen 9 5950X | |
| AMD Ryzen 5 5600X | |
| AMD Ryzen 7 9700X | |
| AMD Ryzen 7 7800X3D | |
| Intel Core i9-12900K | |
| Intel Core i7-14700K | |
| Intel Core i5-13400 | |
| AMD Ryzen 9 7950X3D | |
| AMD Ryzen 5 7600X | |
| Intel Core i9-13900K | |
| AMD Ryzen 9 7950X | |
| Intel Core i5-13600K | |
| AMD Ryzen 9 7900X | |
| AMD Ryzen 7 7700X | |
| Intel Core i9-14900K | |
| Intel Core i5-14600K | |
| WebXPRT 3 - Overall | |
| AMD Ryzen 7 9700X | |
| AMD Ryzen 9 7950X3D | |
| Intel Core i9-14900K | |
| AMD Ryzen 9 7900X | |
| AMD Ryzen 9 7950X | |
| AMD Ryzen 5 9600X | |
| AMD Ryzen 5 7600X | |
| Intel Core i9-13900K | |
| AMD Ryzen 7 7700X | |
| Intel Core i5-14600K | |
| AMD Ryzen 7 7800X3D | |
| Intel Core i7-14700K | |
| Intel Core i5-13600K | |
| Intel Core i9-12900K | |
| Intel Core i5-13400 | |
| Intel Core i5-12600K | |
| AMD Ryzen 9 5950X | |
| AMD Ryzen 5 5600X | |
| Intel Core i5-12400F | |
| Mozilla Kraken 1.1 - Total | |
| AMD Ryzen 5 5600X | |
| Intel Core i5-12400F | |
| AMD Ryzen 9 5950X | |
| Intel Core i5-13400 | |
| Intel Core i5-12600K | |
| AMD Ryzen 7 7800X3D | |
| Intel Core i9-12900K | |
| Intel Core i5-13600K | |
| Intel Core i5-14600K | |
| AMD Ryzen 5 7600X | |
| AMD Ryzen 7 7700X | |
| Intel Core i7-14700K | |
| AMD Ryzen 9 7950X3D | |
| AMD Ryzen 9 7950X | |
| Intel Core i9-13900K | |
| AMD Ryzen 9 7900X | |
| Intel Core i9-14900K | |
| AMD Ryzen 5 9600X | |
| AMD Ryzen 7 9700X | |
| V-Ray Benchmark Next 4.10 - CPU | |
| AMD Ryzen 9 7950X | |
| AMD Ryzen 9 7950X3D | |
| Intel Core i9-14900K | |
| Intel Core i9-13900K | |
| Intel Core i7-14700K | |
| AMD Ryzen 9 7900X | |
| AMD Ryzen 9 5950X | |
| Intel Core i9-12900K | |
| Intel Core i5-14600K | |
| Intel Core i5-13600K | |
| AMD Ryzen 7 9700X | |
| AMD Ryzen 7 7700X | |
| AMD Ryzen 5 9600X | |
| Intel Core i5-12600K | |
| AMD Ryzen 5 7600X | |
| Intel Core i5-13400 | |
| AMD Ryzen 5 5600X | |
| Intel Core i5-12400F | |
| V-Ray 5 Benchmark - CPU | |
| AMD Ryzen 9 7950X | |
| AMD Ryzen 9 7950X3D | |
| Intel Core i9-13900K | |
| Intel Core i9-14900K | |
| Intel Core i7-14700K | |
| AMD Ryzen 9 7900X | |
| Intel Core i9-12900K | |
| Intel Core i5-14600K | |
| Intel Core i5-13600K | |
| AMD Ryzen 7 9700X | |
| AMD Ryzen 7 7800X3D | |
| AMD Ryzen 5 9600X | |
| Intel Core i5-12600K | |
| AMD Ryzen 5 7600X | |
| Intel Core i5-13400 | |
| Intel Core i5-12400F | |
| Super Pi mod 1.5 XS 1M - 1M | |
| Intel Core i5-12400F | |
| AMD Ryzen 5 5600X | |
| Intel Core i5-13400 | |
| AMD Ryzen 5 9600X | |
| AMD Ryzen 7 9700X | |
| AMD Ryzen 5 7600X | |
| Intel Core i5-12600K | |
| AMD Ryzen 7 7800X3D | |
| AMD Ryzen 9 5950X | |
| Intel Core i9-12900K | |
| Intel Core i5-13600K | |
| AMD Ryzen 7 7700X | |
| Intel Core i5-14600K | |
| AMD Ryzen 9 7900X | |
| AMD Ryzen 9 7950X3D | |
| AMD Ryzen 9 7950X | |
| Intel Core i7-14700K | |
| Intel Core i9-13900K | |
| Intel Core i9-14900K | |
| Super Pi mod 1.5 XS 2M - 2M | |
| Intel Core i5-12400F | |
| Intel Core i5-13400 | |
| AMD Ryzen 5 5600X | |
| Intel Core i5-12600K | |
| AMD Ryzen 5 9600X | |
| AMD Ryzen 7 9700X | |
| AMD Ryzen 5 7600X | |
| Intel Core i9-12900K | |
| AMD Ryzen 7 7800X3D | |
| AMD Ryzen 9 5950X | |
| Intel Core i5-13600K | |
| Intel Core i5-14600K | |
| AMD Ryzen 7 7700X | |
| AMD Ryzen 9 7950X | |
| AMD Ryzen 9 7900X | |
| Intel Core i9-13900K | |
| AMD Ryzen 9 7950X3D | |
| Intel Core i7-14700K | |
| Intel Core i9-14900K | |
| Super Pi Mod 1.5 XS 32M - 32M | |
| Intel Core i5-12400F | |
| Intel Core i5-13400 | |
| AMD Ryzen 5 5600X | |
| AMD Ryzen 7 9700X | |
| AMD Ryzen 5 7600X | |
| Intel Core i5-12600K | |
| AMD Ryzen 5 9600X | |
| AMD Ryzen 9 5950X | |
| Intel Core i9-12900K | |
| AMD Ryzen 7 7800X3D | |
| Intel Core i5-13600K | |
| AMD Ryzen 7 7700X | |
| Intel Core i5-14600K | |
| AMD Ryzen 9 7900X | |
| AMD Ryzen 9 7950X | |
| Intel Core i7-14700K | |
| AMD Ryzen 9 7950X3D | |
| Intel Core i9-13900K | |
| Intel Core i9-14900K | |
* ... más pequeño es mejor
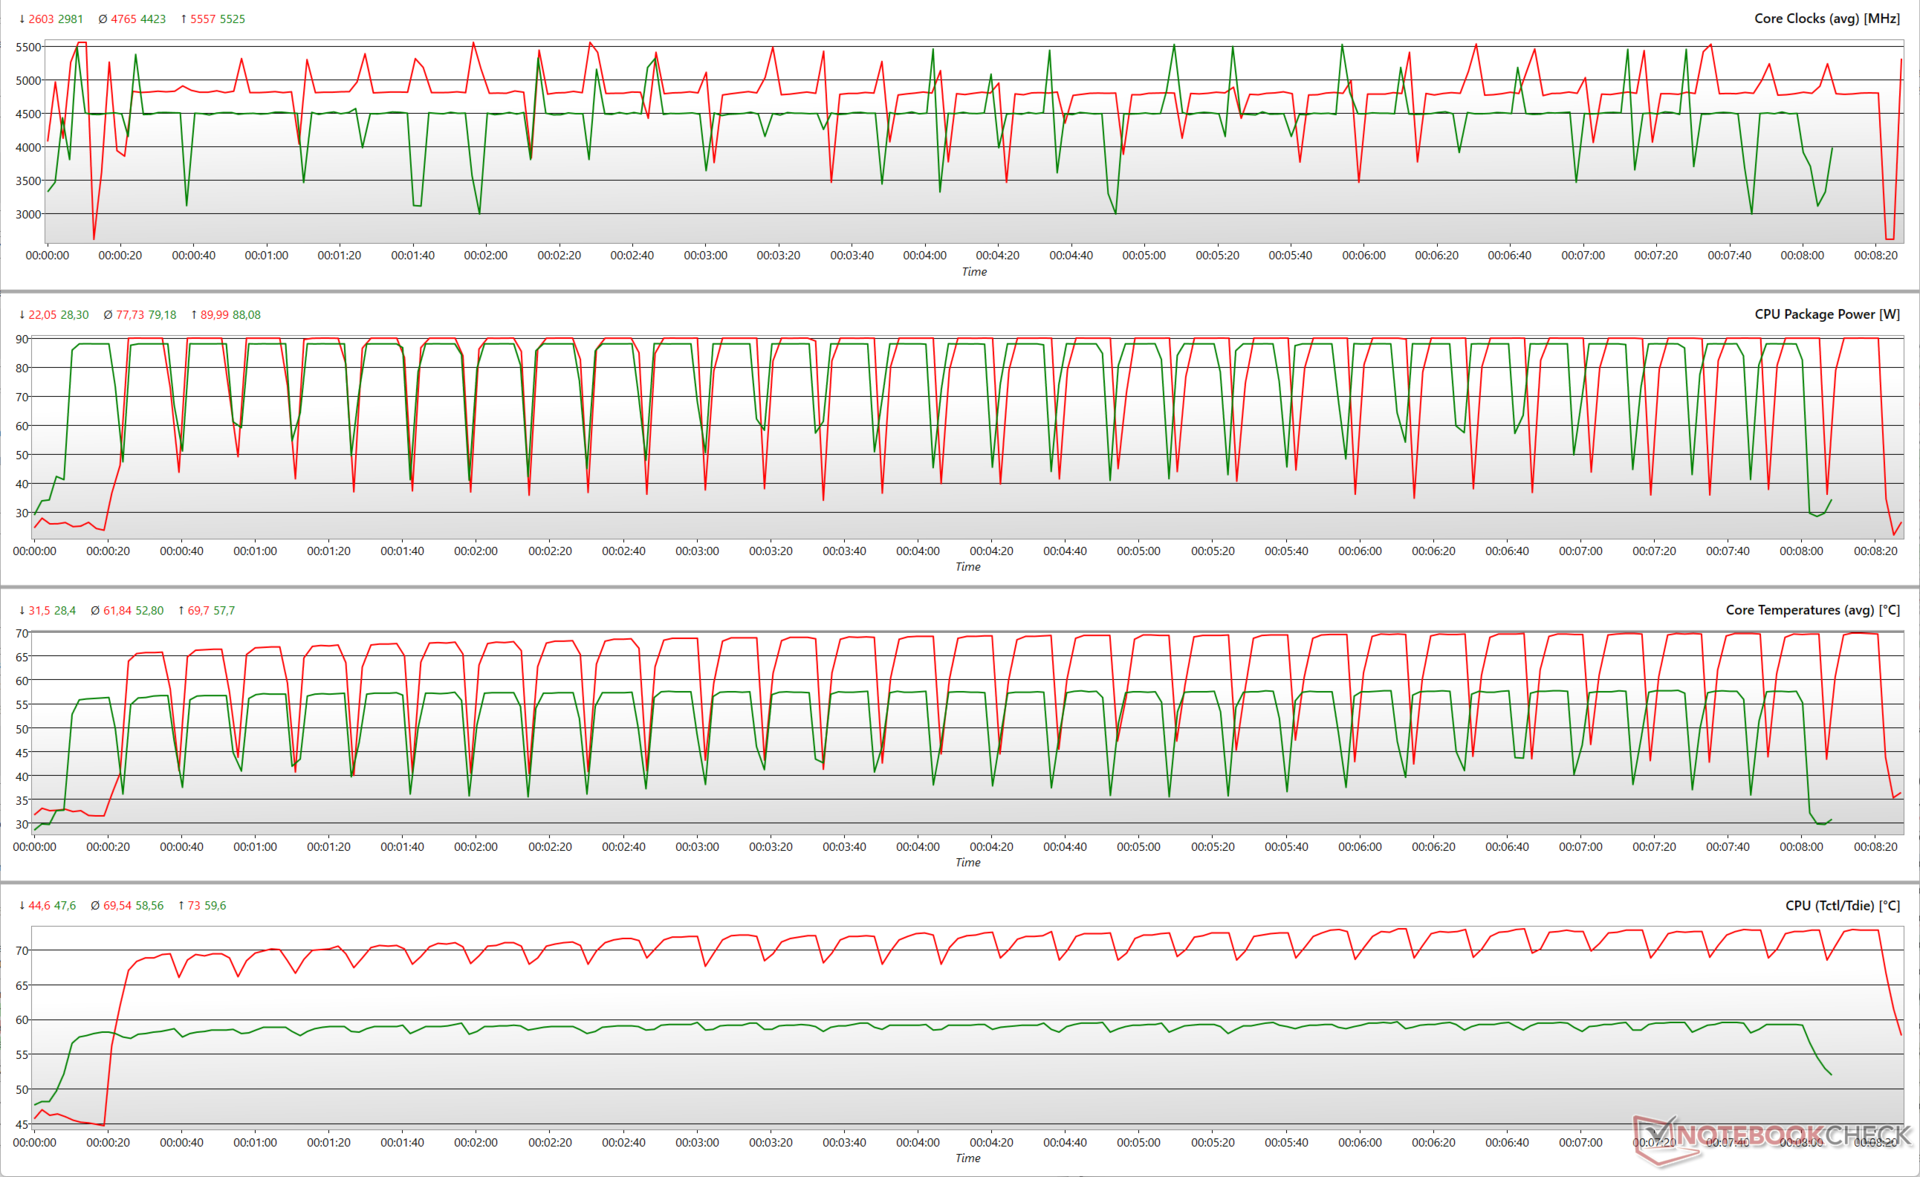
Bucle múltiple Cinebench R15
AMD no suministra un refrigerador en la caja para el Ryzen 7 9700X. Recomendamos utilizar una solución de refrigeración líquida AIO o por aire para permitir que la CPU despliegue toda su potencia.
El Ryzen 7 9700X ofrece un rendimiento bien sostenido y sin aceleración durante una prueba de bucle multinúcleo Cinebench R15 con el Thermaltake TH420 V2 Ultra EX ARGB AIO.
Mientras se ejecuta el bucle multinúcleo Cinebench R15, el Ryzen 7 9700X puede alcanzar un aumento de 5,5 GHz a la vez que consume 88 W. A esta frecuencia, las temperaturas medias de los núcleos alcanzan los 57,7 °C con un pico de Tdie de 59,6 °C. Los núcleos alcanzan una media de 4,4 GHz a 79 W y 52,8 °C durante la ejecución.
En comparación con el Ryzen 7 7700X restringido a 65 W, el Ryzen 7 9700X muestra relojes y utilización de energía casi idénticos. Sin embargo, el Ryzen 7 9700X alcanza estos valores a una temperatura de funcionamiento significativamente inferior en comparación con su homólogo Zen 4.
Rendimiento del sistema: No muy lejos de los Ryzen 9 7900X y Ryzen 9 7950X3D en general
El AMD Ryzen 7 9700X maneja las aplicaciones de productividad diarias con facilidad. La CPU Zen 5 encabeza la tabla en el rendimiento general de PCMark 10, superando incluso al Core i9-14900K en un 6%. Sin embargo, CrossMark en general ve al Ryzen 7 9700X por detrás del buque insignia de Intel en un 17%.
Las pruebas de CPU AIDA64 presentan una bolsa mixta. Aunque no es exactamente un topper gráfico, el Ryzen 7 9700X supera convincentemente al Core i5-14600K e incluso al Core i9-14900K en las pruebas CPU AES, FP32 Ray-Trace y FP64 Ray-Trace, mientras que sólo queda por detrás del Ryzen 9 7950X y el Ryzen 9 7950X3D.
Como señalamos en nuestro anterior análisis del Ryzen 7 7700X, la CPU tuvo problemas al ejecutar PCMark 10 con los ajustes de fábrica, lo que desgraciadamente la sitúa en un 15% de desventaja frente al Ryzen 7 9700X en esta comparación. Ambas CPU muestran un rendimiento general del sistema idéntico cuando PCMark 10 se deja fuera de la ecuación.
3DMark 11: 1280x720 Performance Physics
3DMark: 1920x1080 Fire Strike Physics | 2560x1440 Time Spy CPU
CrossMark: Overall | Responsiveness | Creativity | Productivity
PCMark 10: Score | Essentials | Productivity | Digital Content Creation
AIDA64: FP32 Ray-Trace | FPU Julia | CPU SHA3 | CPU Queen | FPU SinJulia | FPU Mandel | CPU AES | CPU ZLib | FP64 Ray-Trace | CPU PhotoWorxx
| System Performance rating | |
| Intel Core i9-14900K | |
| AMD Ryzen 9 7950X | |
| Intel Core i9-13900K | |
| AMD Ryzen 9 7950X3D -2! | |
| Intel Core i7-14700K | |
| AMD Ryzen 9 7900X | |
| AMD Ryzen 7 9700X | |
| Intel Core i5-14600K | |
| AMD Ryzen 7 7800X3D | |
| Intel Core i5-13600K | |
| AMD Ryzen 5 9600X | |
| AMD Ryzen 5 7600X | |
| AMD Ryzen 9 5950X | |
| AMD Ryzen 7 7700X -4! | |
| Intel Core i9-12900K -4! | |
| Intel Core i5-13400 | |
| Intel Core i5-12400F | |
| Intel Core i5-12600K -4! | |
| AMD Ryzen 5 5600X -3! | |
| 3DMark 11 / Performance Physics | |
| AMD Ryzen 9 7950X3D | |
| AMD Ryzen 7 7800X3D | |
| Intel Core i7-14700K | |
| Intel Core i9-13900K | |
| Intel Core i9-14900K | |
| Intel Core i5-14600K | |
| AMD Ryzen 7 7700X | |
| AMD Ryzen 7 9700X | |
| Intel Core i5-13600K | |
| AMD Ryzen 9 7900X | |
| AMD Ryzen 9 7950X | |
| Intel Core i9-12900K | |
| AMD Ryzen 5 9600X | |
| AMD Ryzen 5 7600X | |
| AMD Ryzen 9 5950X | |
| Intel Core i5-12600K | |
| Intel Core i5-13400 | |
| AMD Ryzen 5 5600X | |
| Intel Core i5-12400F | |
| 3DMark / Fire Strike Physics | |
| Intel Core i9-14900K | |
| Intel Core i9-13900K | |
| Intel Core i7-14700K | |
| AMD Ryzen 9 7950X3D | |
| AMD Ryzen 9 7900X | |
| AMD Ryzen 9 7950X | |
| Intel Core i5-14600K | |
| AMD Ryzen 9 5950X | |
| Intel Core i9-12900K | |
| AMD Ryzen 7 9700X | |
| Intel Core i5-13600K | |
| AMD Ryzen 7 7700X | |
| AMD Ryzen 5 9600X | |
| AMD Ryzen 7 7800X3D | |
| AMD Ryzen 5 7600X | |
| Intel Core i5-12600K | |
| Intel Core i5-13400 | |
| AMD Ryzen 5 5600X | |
| Intel Core i5-12400F | |
| 3DMark / Time Spy CPU | |
| Intel Core i9-14900K | |
| Intel Core i7-14700K | |
| Intel Core i9-13900K | |
| Intel Core i5-14600K | |
| Intel Core i9-12900K | |
| AMD Ryzen 9 7950X3D | |
| Intel Core i5-13600K | |
| AMD Ryzen 9 7900X | |
| AMD Ryzen 9 7950X | |
| AMD Ryzen 7 9700X | |
| AMD Ryzen 7 7700X | |
| AMD Ryzen 7 7800X3D | |
| Intel Core i5-12600K | |
| AMD Ryzen 9 5950X | |
| Intel Core i5-13400 | |
| AMD Ryzen 5 9600X | |
| AMD Ryzen 5 7600X | |
| Intel Core i5-12400F | |
| AMD Ryzen 5 5600X | |
| CrossMark / Overall | |
| Intel Core i9-14900K | |
| Intel Core i9-13900K | |
| AMD Ryzen 9 7950X | |
| AMD Ryzen 9 7900X | |
| Intel Core i5-14600K | |
| AMD Ryzen 7 7700X | |
| Intel Core i7-14700K | |
| Intel Core i5-13600K | |
| AMD Ryzen 5 7600X | |
| AMD Ryzen 7 7800X3D | |
| AMD Ryzen 9 7950X3D | |
| AMD Ryzen 7 9700X | |
| AMD Ryzen 5 9600X | |
| Intel Core i5-13400 | |
| Intel Core i5-12400F | |
| AMD Ryzen 9 5950X | |
| AMD Ryzen 5 5600X | |
| CrossMark / Responsiveness | |
| Intel Core i9-13900K | |
| Intel Core i9-14900K | |
| Intel Core i5-13600K | |
| AMD Ryzen 9 7950X | |
| AMD Ryzen 9 7900X | |
| AMD Ryzen 5 7600X | |
| Intel Core i5-14600K | |
| AMD Ryzen 7 7800X3D | |
| Intel Core i7-14700K | |
| AMD Ryzen 7 7700X | |
| Intel Core i5-13400 | |
| Intel Core i5-12400F | |
| AMD Ryzen 9 7950X3D | |
| AMD Ryzen 7 9700X | |
| AMD Ryzen 5 9600X | |
| AMD Ryzen 9 5950X | |
| CrossMark / Creativity | |
| Intel Core i9-14900K | |
| AMD Ryzen 9 7950X | |
| Intel Core i9-13900K | |
| AMD Ryzen 9 7900X | |
| Intel Core i7-14700K | |
| AMD Ryzen 7 9700X | |
| Intel Core i5-14600K | |
| AMD Ryzen 9 7950X3D | |
| AMD Ryzen 7 7700X | |
| AMD Ryzen 5 9600X | |
| AMD Ryzen 7 7800X3D | |
| AMD Ryzen 5 7600X | |
| Intel Core i5-13600K | |
| Intel Core i5-13400 | |
| Intel Core i5-12400F | |
| AMD Ryzen 9 5950X | |
| CrossMark / Productivity | |
| Intel Core i9-14900K | |
| Intel Core i9-13900K | |
| AMD Ryzen 9 7950X | |
| AMD Ryzen 9 7900X | |
| AMD Ryzen 7 7700X | |
| Intel Core i5-14600K | |
| Intel Core i5-13600K | |
| AMD Ryzen 5 7600X | |
| Intel Core i7-14700K | |
| AMD Ryzen 7 7800X3D | |
| AMD Ryzen 7 9700X | |
| AMD Ryzen 9 7950X3D | |
| AMD Ryzen 5 9600X | |
| Intel Core i5-13400 | |
| Intel Core i5-12400F | |
| AMD Ryzen 9 5950X | |
| PCMark 10 / Score | |
| AMD Ryzen 7 9700X | |
| Intel Core i9-14900K | |
| AMD Ryzen 5 9600X | |
| AMD Ryzen 9 7900X | |
| AMD Ryzen 9 7950X | |
| Intel Core i9-13900K | |
| Intel Core i7-14700K | |
| Intel Core i5-14600K | |
| AMD Ryzen 7 7800X3D | |
| AMD Ryzen 5 7600X | |
| Intel Core i5-13600K | |
| AMD Ryzen 9 5950X | |
| Intel Core i5-13400 | |
| Intel Core i9-12900K | |
| AMD Ryzen 5 5600X | |
| Intel Core i5-12600K | |
| Intel Core i5-12400F | |
| PCMark 10 / Essentials | |
| Intel Core i9-13900K | |
| AMD Ryzen 9 7900X | |
| AMD Ryzen 9 7950X | |
| AMD Ryzen 7 9700X | |
| Intel Core i9-14900K | |
| Intel Core i5-13600K | |
| AMD Ryzen 5 7600X | |
| AMD Ryzen 9 7950X3D | |
| AMD Ryzen 5 9600X | |
| Intel Core i7-14700K | |
| Intel Core i5-14600K | |
| AMD Ryzen 7 7800X3D | |
| AMD Ryzen 5 5600X | |
| AMD Ryzen 9 5950X | |
| Intel Core i9-12900K | |
| Intel Core i5-12600K | |
| Intel Core i5-13400 | |
| Intel Core i5-12400F | |
| PCMark 10 / Productivity | |
| AMD Ryzen 5 9600X | |
| AMD Ryzen 7 9700X | |
| AMD Ryzen 5 7600X | |
| AMD Ryzen 9 7950X3D | |
| AMD Ryzen 7 7800X3D | |
| Intel Core i5-14600K | |
| Intel Core i7-14700K | |
| AMD Ryzen 9 7900X | |
| AMD Ryzen 9 7950X | |
| Intel Core i9-14900K | |
| Intel Core i5-13600K | |
| Intel Core i9-13900K | |
| AMD Ryzen 9 5950X | |
| Intel Core i5-12600K | |
| AMD Ryzen 5 5600X | |
| Intel Core i5-13400 | |
| Intel Core i9-12900K | |
| Intel Core i5-12400F | |
| PCMark 10 / Digital Content Creation | |
| AMD Ryzen 7 9700X | |
| Intel Core i9-14900K | |
| AMD Ryzen 5 9600X | |
| Intel Core i7-14700K | |
| AMD Ryzen 9 7900X | |
| AMD Ryzen 9 7950X | |
| Intel Core i9-13900K | |
| Intel Core i5-14600K | |
| AMD Ryzen 7 7800X3D | |
| Intel Core i5-13600K | |
| Intel Core i5-13400 | |
| AMD Ryzen 5 7600X | |
| AMD Ryzen 9 5950X | |
| Intel Core i9-12900K | |
| Intel Core i5-12400F | |
| Intel Core i5-12600K | |
| AMD Ryzen 5 5600X | |
| AIDA64 / FP32 Ray-Trace | |
| AMD Ryzen 9 7950X | |
| AMD Ryzen 9 7950X3D | |
| AMD Ryzen 7 9700X | |
| Intel Core i9-14900K | |
| Intel Core i9-13900K | |
| AMD Ryzen 5 9600X | |
| AMD Ryzen 9 7900X | |
| AMD Ryzen 7 7700X | |
| Intel Core i7-14700K | |
| AMD Ryzen 7 7800X3D | |
| AMD Ryzen 9 5950X | |
| Intel Core i5-14600K | |
| Intel Core i5-13600K | |
| AMD Ryzen 5 7600X | |
| Intel Core i5-13400 | |
| Intel Core i5-12400F | |
| Intel Core i9-12900K | |
| AMD Ryzen 5 5600X | |
| Intel Core i5-12600K | |
| AIDA64 / FPU Julia | |
| AMD Ryzen 9 7950X3D | |
| AMD Ryzen 9 7950X | |
| AMD Ryzen 9 7900X | |
| Intel Core i9-14900K | |
| Intel Core i9-13900K | |
| Intel Core i7-14700K | |
| AMD Ryzen 9 5950X | |
| AMD Ryzen 7 7700X | |
| AMD Ryzen 7 7800X3D | |
| AMD Ryzen 7 9700X | |
| Intel Core i5-14600K | |
| Intel Core i5-13600K | |
| AMD Ryzen 5 7600X | |
| AMD Ryzen 5 9600X | |
| Intel Core i5-13400 | |
| Intel Core i5-12400F | |
| AMD Ryzen 5 5600X | |
| Intel Core i9-12900K | |
| Intel Core i5-12600K | |
| AIDA64 / CPU Queen | |
| AMD Ryzen 9 7950X | |
| AMD Ryzen 9 7950X3D | |
| AMD Ryzen 9 7900X | |
| Intel Core i7-14700K | |
| AMD Ryzen 9 5950X | |
| Intel Core i9-14900K | |
| Intel Core i9-13900K | |
| AMD Ryzen 7 7700X | |
| Intel Core i5-14600K | |
| AMD Ryzen 7 7800X3D | |
| Intel Core i5-13600K | |
| AMD Ryzen 7 9700X | |
| Intel Core i9-12900K | |
| AMD Ryzen 5 7600X | |
| AMD Ryzen 5 9600X | |
| Intel Core i5-12600K | |
| AMD Ryzen 5 5600X | |
| Intel Core i5-13400 | |
| Intel Core i5-12400F | |
| AIDA64 / FPU SinJulia | |
| AMD Ryzen 9 7950X | |
| AMD Ryzen 9 7950X3D | |
| AMD Ryzen 9 5950X | |
| AMD Ryzen 9 7900X | |
| Intel Core i9-14900K | |
| Intel Core i9-13900K | |
| Intel Core i7-14700K | |
| AMD Ryzen 7 9700X | |
| AMD Ryzen 7 7700X | |
| AMD Ryzen 7 7800X3D | |
| Intel Core i9-12900K | |
| AMD Ryzen 5 9600X | |
| AMD Ryzen 5 7600X | |
| Intel Core i5-14600K | |
| Intel Core i5-13600K | |
| AMD Ryzen 5 5600X | |
| Intel Core i5-12600K | |
| Intel Core i5-13400 | |
| Intel Core i5-12400F | |
| AIDA64 / FPU Mandel | |
| AMD Ryzen 9 7950X3D | |
| AMD Ryzen 9 7950X | |
| AMD Ryzen 9 7900X | |
| Intel Core i9-14900K | |
| Intel Core i9-13900K | |
| AMD Ryzen 9 5950X | |
| Intel Core i7-14700K | |
| AMD Ryzen 7 7700X | |
| AMD Ryzen 7 7800X3D | |
| AMD Ryzen 7 9700X | |
| Intel Core i5-14600K | |
| Intel Core i5-13600K | |
| AMD Ryzen 5 7600X | |
| AMD Ryzen 5 9600X | |
| Intel Core i5-13400 | |
| Intel Core i9-12900K | |
| AMD Ryzen 5 5600X | |
| Intel Core i5-12400F | |
| Intel Core i5-12600K | |
| AIDA64 / FP64 Ray-Trace | |
| AMD Ryzen 9 7950X | |
| AMD Ryzen 9 7950X3D | |
| AMD Ryzen 7 9700X | |
| Intel Core i9-14900K | |
| Intel Core i9-13900K | |
| AMD Ryzen 5 9600X | |
| AMD Ryzen 9 7900X | |
| Intel Core i7-14700K | |
| AMD Ryzen 7 7700X | |
| AMD Ryzen 7 7800X3D | |
| AMD Ryzen 9 5950X | |
| Intel Core i5-14600K | |
| Intel Core i5-13600K | |
| AMD Ryzen 5 7600X | |
| Intel Core i5-13400 | |
| Intel Core i9-12900K | |
| Intel Core i5-12400F | |
| AMD Ryzen 5 5600X | |
| Intel Core i5-12600K | |
| AIDA64 / CPU PhotoWorxx | |
| Intel Core i9-14900K | |
| Intel Core i5-14600K | |
| Intel Core i7-14700K | |
| AMD Ryzen 9 7950X3D | |
| Intel Core i9-13900K | |
| Intel Core i5-13400 | |
| Intel Core i5-12600K | |
| Intel Core i5-13600K | |
| Intel Core i9-12900K | |
| AMD Ryzen 7 7800X3D | |
| Intel Core i5-12400F | |
| AMD Ryzen 9 7950X | |
| AMD Ryzen 9 7900X | |
| AMD Ryzen 7 9700X | |
| AMD Ryzen 5 9600X | |
| AMD Ryzen 5 7600X | |
| AMD Ryzen 7 7700X | |
| AMD Ryzen 9 5950X | |
| AMD Ryzen 5 5600X | |
3DMark 11: 1280x720 Performance Physics
3DMark: 1920x1080 Fire Strike Physics | 2560x1440 Time Spy CPU
CrossMark: Overall | Responsiveness | Creativity | Productivity
PCMark 10: Score | Essentials | Productivity | Digital Content Creation
AIDA64: FP32 Ray-Trace | FPU Julia | CPU SHA3 | CPU Queen | FPU SinJulia | FPU Mandel | CPU AES | CPU ZLib | FP64 Ray-Trace | CPU PhotoWorxx
| Performance rating - Percent | |
| Intel Core i9-12900K -1! | |
| Intel Core i5-12600K -1! | |
| Intel Core i9-14900K | |
| Intel Core i7-14700K | |
| Intel Core i5-14600K | |
| AMD Ryzen 9 7950X3D | |
| AMD Ryzen 9 7950X | |
| AMD Ryzen 9 7900X | |
| Intel Core i9-13900K | |
| AMD Ryzen 7 7800X3D | |
| Intel Core i5-13400 | |
| Intel Core i5-12400F | |
| AMD Ryzen 7 9700X | |
| Intel Core i5-13600K | |
| AMD Ryzen 5 7600X | |
| AMD Ryzen 7 7700X | |
| AMD Ryzen 5 9600X | |
| AMD Ryzen 9 5950X | |
| AMD Ryzen 5 5600X | |
* ... más pequeño es mejor
| PCMark 10 Score | 10699 puntos | |
ayuda | ||
rendimiento 3D y en juegos: A la par con el Core i9-14900K y el Ryzen 9 7950X
En combinación con la Nvidia GeForce RTX 4090el AMD Ryzen 7 9700X está bastante a la par con el Ryzen 7 7800X3D y el Core i9-14900K en rendimiento gráfico 3DMark acumulado.
Tomados individualmente, el Ryzen 7 7800X3D muestra buenas ganancias sobre el Ryzen 7 9700X en 3DMark 11 Performance GPU y 3DMark Time Spy Graphics, pero este último logra una ventaja decente en Fire Strike Graphics.
| 3DMark Performance rating - Percent | |
| Intel Core i5-14600K | |
| AMD Ryzen 7 7800X3D | |
| AMD Ryzen 5 9600X | |
| AMD Ryzen 9 7950X | |
| AMD Ryzen 7 9700X | |
| AMD Ryzen 9 7950X3D | |
| Intel Core i9-14900K | |
| Intel Core i7-14700K | |
| Intel Core i5-13400 | |
| Intel Core i5-12400F | |
| Intel Core i9-13900K | |
| 3DMark 11 - 1280x720 Performance GPU | |
| AMD Ryzen 7 7800X3D | |
| Intel Core i5-14600K | |
| AMD Ryzen 9 7950X | |
| AMD Ryzen 9 7950X3D | |
| Intel Core i9-14900K | |
| Intel Core i5-13400 | |
| AMD Ryzen 5 9600X | |
| Intel Core i7-14700K | |
| Intel Core i5-12400F | |
| AMD Ryzen 7 9700X | |
| Intel Core i9-13900K | |
| 3DMark | |
| 2560x1440 Time Spy Graphics | |
| Intel Core i5-14600K | |
| Intel Core i9-14900K | |
| AMD Ryzen 7 7800X3D | |
| Intel Core i7-14700K | |
| AMD Ryzen 5 9600X | |
| AMD Ryzen 9 7950X | |
| AMD Ryzen 9 7950X3D | |
| AMD Ryzen 7 9700X | |
| Intel Core i9-13900K | |
| Intel Core i5-13400 | |
| Intel Core i5-12400F | |
| 1920x1080 Fire Strike Graphics | |
| Intel Core i5-14600K | |
| Intel Core i5-12400F | |
| AMD Ryzen 7 9700X | |
| AMD Ryzen 5 9600X | |
| Intel Core i5-13400 | |
| AMD Ryzen 7 7800X3D | |
| AMD Ryzen 9 7950X3D | |
| AMD Ryzen 9 7950X | |
| Intel Core i9-14900K | |
| Intel Core i7-14700K | |
| Intel Core i9-13900K | |
| 3DMark 11 Performance | 62688 puntos | |
| 3DMark Fire Strike Score | 54310 puntos | |
| 3DMark Time Spy Score | 29645 puntos | |
ayuda | ||
el juego a 720p es prácticamente inexistente hoy en día en los PC con GPU discretas, pero sigue sirviendo para estudiar el estrangulamiento de la CPU, especialmente en combinación con una tarjeta de gama alta como la RTX 4090.
El 3D V-Cache proporciona tanto al Ryzen 7 7800X3D como al Ryzen 9 7950X3D una ventaja perceptible en las pruebas de juegos. El Ryzen 7 9700X no parece ofrecer ninguna ganancia particular sobre el Ryzen 5 9600X en configuraciones de 720p y 1080p.
De hecho, el rendimiento del Ryzen 7 9700X es prácticamente indistinguible del del Ryzen 9 7950X, Core i9-13900Ky el Core i9-14900K a estas resoluciones, mientras que es un 14% más rápido en general en comparación con el Core i7-14700K.
| Gaming Performance rating - Percent | |
| AMD Ryzen 7 7800X3D | |
| AMD Ryzen 9 7950X3D | |
| Intel Core i9-14900K | |
| AMD Ryzen 7 9700X | |
| AMD Ryzen 5 9600X | |
| AMD Ryzen 9 7950X | |
| Intel Core i9-13900K | |
| Intel Core i5-14600K | |
| Intel Core i7-14700K | |
| Intel Core i5-13400 | |
| Intel Core i5-12400F | |
| F1 22 | |
| 1280x720 Ultra Low Preset AA:T AF:16x | |
| AMD Ryzen 7 7800X3D | |
| Intel Core i9-14900K | |
| AMD Ryzen 9 7950X3D | |
| AMD Ryzen 9 7950X | |
| AMD Ryzen 5 9600X | |
| AMD Ryzen 7 9700X | |
| Intel Core i9-13900K | |
| Intel Core i5-14600K | |
| Intel Core i7-14700K | |
| Intel Core i5-12400F | |
| Intel Core i5-13400 | |
| 1920x1080 Low Preset AA:T AF:16x | |
| AMD Ryzen 7 7800X3D | |
| AMD Ryzen 9 7950X3D | |
| Intel Core i9-14900K | |
| AMD Ryzen 9 7950X | |
| AMD Ryzen 5 9600X | |
| AMD Ryzen 7 9700X | |
| Intel Core i9-13900K | |
| Intel Core i5-14600K | |
| Intel Core i7-14700K | |
| Intel Core i5-12400F | |
| Intel Core i5-13400 | |
| 1920x1080 Ultra High Preset AA:T AF:16x | |
| AMD Ryzen 7 7800X3D | |
| Intel Core i9-14900K | |
| AMD Ryzen 7 9700X | |
| Intel Core i5-14600K | |
| AMD Ryzen 9 7950X3D | |
| AMD Ryzen 5 9600X | |
| Intel Core i9-13900K | |
| AMD Ryzen 9 7950X | |
| Intel Core i7-14700K | |
| Intel Core i5-12400F | |
| Intel Core i5-13400 | |
| Far Cry 5 | |
| 1280x720 Low Preset AA:T | |
| AMD Ryzen 7 7800X3D | |
| AMD Ryzen 9 7950X3D | |
| Intel Core i9-14900K | |
| AMD Ryzen 5 9600X | |
| AMD Ryzen 7 9700X | |
| Intel Core i5-14600K | |
| Intel Core i9-13900K | |
| AMD Ryzen 9 7950X | |
| Intel Core i5-13400 | |
| Intel Core i7-14700K | |
| Intel Core i5-12400F | |
| 1920x1080 Ultra Preset AA:T | |
| AMD Ryzen 7 7800X3D | |
| AMD Ryzen 9 7950X3D | |
| Intel Core i9-14900K | |
| Intel Core i9-13900K | |
| AMD Ryzen 5 9600X | |
| AMD Ryzen 7 9700X | |
| Intel Core i5-14600K | |
| AMD Ryzen 9 7950X | |
| Intel Core i7-14700K | |
| Intel Core i5-13400 | |
| Intel Core i5-12400F | |
| X-Plane 11.11 | |
| 1280x720 low (fps_test=1) | |
| AMD Ryzen 7 9700X | |
| Intel Core i9-13900K | |
| AMD Ryzen 5 9600X | |
| Intel Core i9-14900K | |
| Intel Core i5-14600K | |
| Intel Core i7-14700K | |
| AMD Ryzen 9 7950X3D | |
| AMD Ryzen 9 7950X | |
| AMD Ryzen 7 7800X3D | |
| Intel Core i5-13400 | |
| Intel Core i5-12400F | |
| 1920x1080 high (fps_test=3) | |
| AMD Ryzen 7 7800X3D | |
| AMD Ryzen 9 7950X3D | |
| AMD Ryzen 7 9700X | |
| AMD Ryzen 5 9600X | |
| Intel Core i9-13900K | |
| Intel Core i9-14900K | |
| Intel Core i7-14700K | |
| AMD Ryzen 9 7950X | |
| Intel Core i5-14600K | |
| Intel Core i5-13400 | |
| Intel Core i5-12400F | |
| Final Fantasy XV Benchmark | |
| 1280x720 Lite Quality | |
| AMD Ryzen 5 9600X | |
| AMD Ryzen 9 7950X | |
| Intel Core i9-13900K | |
| AMD Ryzen 7 7800X3D | |
| Intel Core i5-14600K | |
| Intel Core i9-14900K | |
| Intel Core i7-14700K | |
| AMD Ryzen 7 9700X | |
| AMD Ryzen 9 7950X3D | |
| Intel Core i5-12400F | |
| Intel Core i5-13400 | |
| 1920x1080 High Quality | |
| Intel Core i9-14900K | |
| AMD Ryzen 9 7950X | |
| AMD Ryzen 7 7800X3D | |
| Intel Core i5-14600K | |
| AMD Ryzen 9 7950X3D | |
| Intel Core i9-13900K | |
| AMD Ryzen 5 9600X | |
| Intel Core i7-14700K | |
| AMD Ryzen 7 9700X | |
| Intel Core i5-13400 | |
| Intel Core i5-12400F | |
| Dota 2 Reborn | |
| 1280x720 min (0/3) fastest | |
| AMD Ryzen 7 7800X3D | |
| AMD Ryzen 7 9700X | |
| AMD Ryzen 9 7950X3D | |
| AMD Ryzen 9 7950X | |
| Intel Core i9-14900K | |
| Intel Core i9-13900K | |
| AMD Ryzen 5 9600X | |
| Intel Core i5-14600K | |
| Intel Core i7-14700K | |
| Intel Core i5-12400F | |
| Intel Core i5-13400 | |
| 1920x1080 ultra (3/3) best looking | |
| AMD Ryzen 7 7800X3D | |
| AMD Ryzen 9 7950X3D | |
| Intel Core i9-13900K | |
| AMD Ryzen 7 9700X | |
| AMD Ryzen 9 7950X | |
| AMD Ryzen 5 9600X | |
| Intel Core i9-14900K | |
| Intel Core i5-14600K | |
| Intel Core i7-14700K | |
| Intel Core i5-13400 | |
| Intel Core i5-12400F | |
| The Witcher 3 | |
| 1024x768 Low Graphics & Postprocessing | |
| AMD Ryzen 9 7950X3D | |
| AMD Ryzen 7 7800X3D | |
| Intel Core i9-14900K | |
| AMD Ryzen 9 7950X | |
| AMD Ryzen 5 9600X | |
| AMD Ryzen 7 9700X | |
| Intel Core i9-13900K | |
| Intel Core i7-14700K | |
| Intel Core i5-14600K | |
| Intel Core i5-13400 | |
| Intel Core i5-12400F | |
| 1920x1080 Ultra Graphics & Postprocessing (HBAO+) | |
| AMD Ryzen 9 7950X | |
| Intel Core i5-14600K | |
| AMD Ryzen 7 7800X3D | |
| Intel Core i9-14900K | |
| AMD Ryzen 9 7950X3D | |
| Intel Core i9-13900K | |
| Intel Core i7-14700K | |
| AMD Ryzen 5 9600X | |
| AMD Ryzen 7 9700X | |
| Intel Core i5-13400 | |
| Intel Core i5-12400F | |
| GTA V | |
| 1024x768 Lowest Settings possible | |
| AMD Ryzen 7 7800X3D | |
| AMD Ryzen 9 7950X | |
| AMD Ryzen 5 9600X | |
| Intel Core i9-13900K | |
| AMD Ryzen 9 7950X3D | |
| Intel Core i9-14900K | |
| AMD Ryzen 7 9700X | |
| Intel Core i5-14600K | |
| Intel Core i7-14700K | |
| Intel Core i5-13400 | |
| Intel Core i5-12400F | |
| 1920x1080 Highest AA:4xMSAA + FX AF:16x | |
| AMD Ryzen 7 7800X3D | |
| Intel Core i9-14900K | |
| AMD Ryzen 7 9700X | |
| Intel Core i9-13900K | |
| AMD Ryzen 5 9600X | |
| Intel Core i5-14600K | |
| AMD Ryzen 9 7950X | |
| AMD Ryzen 9 7950X3D | |
| Intel Core i7-14700K | |
| Intel Core i5-13400 | |
| Intel Core i5-12400F | |
| Borderlands 3 | |
| 1280x720 Very Low Overall Quality (DX11) | |
| AMD Ryzen 7 7800X3D | |
| AMD Ryzen 9 7950X3D | |
| Intel Core i9-14900K | |
| AMD Ryzen 7 9700X | |
| AMD Ryzen 9 7950X | |
| Intel Core i9-13900K | |
| Intel Core i5-14600K | |
| AMD Ryzen 5 9600X | |
| Intel Core i7-14700K | |
| Intel Core i5-13400 | |
| Intel Core i5-12400F | |
| 1920x1080 Very Low Overall Quality (DX11) | |
| AMD Ryzen 9 7950X3D | |
| AMD Ryzen 7 7800X3D | |
| Intel Core i9-14900K | |
| AMD Ryzen 7 9700X | |
| Intel Core i9-13900K | |
| AMD Ryzen 9 7950X | |
| Intel Core i5-14600K | |
| AMD Ryzen 5 9600X | |
| Intel Core i7-14700K | |
| Intel Core i5-13400 | |
| Intel Core i5-12400F | |
| 1920x1080 Badass Overall Quality (DX11) | |
| AMD Ryzen 9 7950X3D | |
| AMD Ryzen 7 7800X3D | |
| Intel Core i9-14900K | |
| Intel Core i9-13900K | |
| AMD Ryzen 7 9700X | |
| AMD Ryzen 9 7950X | |
| Intel Core i5-14600K | |
| AMD Ryzen 5 9600X | |
| Intel Core i7-14700K | |
| Intel Core i5-13400 | |
| Intel Core i5-12400F | |
| Shadow of the Tomb Raider | |
| 1920x1080 Highest Preset AA:T | |
| AMD Ryzen 7 7800X3D | |
| AMD Ryzen 9 7950X3D | |
| Intel Core i9-14900K | |
| Intel Core i9-13900K | |
| AMD Ryzen 9 7950X | |
| AMD Ryzen 7 9700X | |
| AMD Ryzen 5 9600X | |
| Intel Core i5-14600K | |
| Intel Core i7-14700K | |
| Intel Core i5-13400 | |
| Intel Core i5-12400F | |
| 1280x720 Lowest Preset | |
| AMD Ryzen 7 7800X3D | |
| AMD Ryzen 9 7950X3D | |
| AMD Ryzen 7 9700X | |
| AMD Ryzen 9 7950X | |
| Intel Core i9-14900K | |
| Intel Core i9-13900K | |
| AMD Ryzen 5 9600X | |
| Intel Core i5-14600K | |
| Intel Core i7-14700K | |
| Intel Core i5-13400 | |
| Intel Core i5-12400F | |
| Metro Exodus | |
| 1280x720 Low Quality AF:4x | |
| AMD Ryzen 7 7800X3D | |
| AMD Ryzen 7 9700X | |
| AMD Ryzen 5 9600X | |
| Intel Core i9-14900K | |
| AMD Ryzen 9 7950X | |
| Intel Core i5-14600K | |
| AMD Ryzen 9 7950X3D | |
| Intel Core i7-14700K | |
| Intel Core i9-13900K | |
| Intel Core i5-12400F | |
| Intel Core i5-13400 | |
| 1920x1080 Ultra Quality AF:16x | |
| AMD Ryzen 7 7800X3D | |
| AMD Ryzen 5 9600X | |
| Intel Core i9-14900K | |
| AMD Ryzen 7 9700X | |
| Intel Core i5-14600K | |
| AMD Ryzen 9 7950X | |
| Intel Core i7-14700K | |
| AMD Ryzen 9 7950X3D | |
| Intel Core i9-13900K | |
| Intel Core i5-13400 | |
| Intel Core i5-12400F | |
| F1 2021 | |
| 1280x720 Ultra Low Preset | |
| AMD Ryzen 7 7800X3D | |
| Intel Core i9-14900K | |
| AMD Ryzen 9 7950X3D | |
| AMD Ryzen 9 7950X | |
| AMD Ryzen 5 9600X | |
| Intel Core i9-13900K | |
| AMD Ryzen 7 9700X | |
| Intel Core i5-14600K | |
| Intel Core i7-14700K | |
| Intel Core i5-12400F | |
| Intel Core i5-13400 | |
| 1920x1080 Ultra High Preset + Raytracing AA:T AF:16x | |
| AMD Ryzen 7 7800X3D | |
| Intel Core i9-14900K | |
| Intel Core i9-13900K | |
| AMD Ryzen 7 9700X | |
| AMD Ryzen 5 9600X | |
| Intel Core i5-14600K | |
| AMD Ryzen 9 7950X | |
| AMD Ryzen 9 7950X3D | |
| Intel Core i7-14700K | |
| Intel Core i5-12400F | |
| Intel Core i5-13400 | |
La delta con los chips X3D se reduce considerablemente en los ajustes QHD y UHD Ultra, ya que las cargas ahora dependen más de la GPU.
Una vez más, vemos que el Ryzen 7 9700X, el Ryzen 5 9600X, el Ryzen 9 7950X, el Core i9-13900K, el Core i9-14900K y ahora incluso el Core i5-14600K comparten el mismo estrado cuando los ajustes gráficos se elevan al máximo.
| Gaming Performance rating - Percent | |
| AMD Ryzen 7 7800X3D | |
| AMD Ryzen 9 7950X3D | |
| Intel Core i9-14900K | |
| AMD Ryzen 7 9700X | |
| Intel Core i5-14600K | |
| AMD Ryzen 9 7950X | |
| AMD Ryzen 5 9600X | |
| Intel Core i9-13900K | |
| Intel Core i7-14700K | |
| Intel Core i5-13400 | |
| Intel Core i5-12400F -1! | |
| F1 22 | |
| 2560x1440 Ultra High Preset AA:T AF:16x | |
| AMD Ryzen 7 7800X3D | |
| AMD Ryzen 5 9600X | |
| Intel Core i9-14900K | |
| Intel Core i5-14600K | |
| AMD Ryzen 7 9700X | |
| AMD Ryzen 9 7950X3D | |
| AMD Ryzen 9 7950X | |
| Intel Core i7-14700K | |
| Intel Core i9-13900K | |
| Intel Core i5-12400F | |
| Intel Core i5-13400 | |
| 3840x2160 Ultra High Preset AA:T AF:16x | |
| AMD Ryzen 5 9600X | |
| AMD Ryzen 7 9700X | |
| AMD Ryzen 7 7800X3D | |
| Intel Core i5-14600K | |
| Intel Core i9-14900K | |
| AMD Ryzen 9 7950X | |
| AMD Ryzen 9 7950X3D | |
| Intel Core i7-14700K | |
| Intel Core i5-12400F | |
| Intel Core i5-13400 | |
| Intel Core i9-13900K | |
| Far Cry 5 | |
| 2560x1440 Ultra Preset AA:T | |
| AMD Ryzen 7 7800X3D | |
| AMD Ryzen 9 7950X3D | |
| Intel Core i9-14900K | |
| Intel Core i9-13900K | |
| AMD Ryzen 5 9600X | |
| AMD Ryzen 7 9700X | |
| Intel Core i5-14600K | |
| AMD Ryzen 9 7950X | |
| Intel Core i7-14700K | |
| Intel Core i5-13400 | |
| Intel Core i5-12400F | |
| 3840x2160 Ultra Preset AA:T | |
| AMD Ryzen 7 7800X3D | |
| Intel Core i9-14900K | |
| AMD Ryzen 9 7950X3D | |
| Intel Core i5-14600K | |
| Intel Core i9-13900K | |
| AMD Ryzen 9 7950X | |
| AMD Ryzen 5 9600X | |
| AMD Ryzen 7 9700X | |
| Intel Core i7-14700K | |
| Intel Core i5-13400 | |
| Intel Core i5-12400F | |
| X-Plane 11.11 - 3840x2160 high (fps_test=3) | |
| AMD Ryzen 7 7800X3D | |
| AMD Ryzen 9 7950X3D | |
| AMD Ryzen 7 9700X | |
| Intel Core i9-13900K | |
| AMD Ryzen 5 9600X | |
| Intel Core i9-14900K | |
| Intel Core i7-14700K | |
| Intel Core i5-14600K | |
| AMD Ryzen 9 7950X | |
| Intel Core i5-13400 | |
| Intel Core i5-12400F | |
| Final Fantasy XV Benchmark | |
| 2560x1440 High Quality | |
| AMD Ryzen 7 7800X3D | |
| Intel Core i9-14900K | |
| Intel Core i5-14600K | |
| AMD Ryzen 9 7950X | |
| AMD Ryzen 9 7950X3D | |
| Intel Core i9-13900K | |
| Intel Core i7-14700K | |
| AMD Ryzen 5 9600X | |
| AMD Ryzen 7 9700X | |
| Intel Core i5-13400 | |
| Intel Core i5-12400F | |
| 3840x2160 High Quality | |
| Intel Core i9-14900K | |
| Intel Core i5-14600K | |
| AMD Ryzen 9 7950X | |
| Intel Core i7-14700K | |
| AMD Ryzen 7 7800X3D | |
| AMD Ryzen 9 7950X3D | |
| Intel Core i5-12400F | |
| Intel Core i9-13900K | |
| AMD Ryzen 5 9600X | |
| Intel Core i5-13400 | |
| AMD Ryzen 7 9700X | |
| Dota 2 Reborn - 3840x2160 ultra (3/3) best looking | |
| AMD Ryzen 7 7800X3D | |
| AMD Ryzen 9 7950X3D | |
| AMD Ryzen 7 9700X | |
| AMD Ryzen 9 7950X | |
| Intel Core i9-13900K | |
| Intel Core i9-14900K | |
| AMD Ryzen 5 9600X | |
| Intel Core i5-14600K | |
| Intel Core i7-14700K | |
| Intel Core i5-12400F | |
| Intel Core i5-13400 | |
| The Witcher 3 - 3840x2160 Ultra Graphics & Postprocessing (HBAO+) | |
| AMD Ryzen 9 7950X | |
| Intel Core i9-14900K | |
| AMD Ryzen 7 7800X3D | |
| Intel Core i5-12400F | |
| Intel Core i5-13400 | |
| Intel Core i5-14600K | |
| AMD Ryzen 9 7950X3D | |
| Intel Core i9-13900K | |
| AMD Ryzen 5 9600X | |
| Intel Core i7-14700K | |
| AMD Ryzen 7 9700X | |
| GTA V | |
| 2560x1440 Highest AA:4xMSAA + FX AF:16x | |
| AMD Ryzen 7 7800X3D | |
| Intel Core i9-14900K | |
| AMD Ryzen 7 9700X | |
| Intel Core i9-13900K | |
| AMD Ryzen 5 9600X | |
| AMD Ryzen 9 7950X | |
| Intel Core i5-14600K | |
| AMD Ryzen 9 7950X3D | |
| Intel Core i7-14700K | |
| Intel Core i5-13400 | |
| Intel Core i5-12400F | |
| 3840x2160 Highest AA:4xMSAA + FX AF:16x | |
| AMD Ryzen 7 7800X3D | |
| Intel Core i9-14900K | |
| Intel Core i5-14600K | |
| AMD Ryzen 5 9600X | |
| AMD Ryzen 7 9700X | |
| AMD Ryzen 9 7950X | |
| Intel Core i9-13900K | |
| AMD Ryzen 9 7950X3D | |
| Intel Core i7-14700K | |
| Intel Core i5-13400 | |
| Borderlands 3 | |
| 2560x1440 Badass Overall Quality (DX11) | |
| AMD Ryzen 7 7800X3D | |
| AMD Ryzen 9 7950X3D | |
| Intel Core i9-14900K | |
| Intel Core i9-13900K | |
| AMD Ryzen 7 9700X | |
| AMD Ryzen 9 7950X | |
| Intel Core i5-14600K | |
| Intel Core i7-14700K | |
| AMD Ryzen 5 9600X | |
| Intel Core i5-13400 | |
| Intel Core i5-12400F | |
| 3840x2160 Badass Overall Quality (DX11) | |
| Intel Core i9-14900K | |
| AMD Ryzen 7 7800X3D | |
| AMD Ryzen 9 7950X3D | |
| Intel Core i5-14600K | |
| AMD Ryzen 9 7950X | |
| Intel Core i9-13900K | |
| Intel Core i7-14700K | |
| AMD Ryzen 5 9600X | |
| AMD Ryzen 7 9700X | |
| Intel Core i5-13400 | |
| Intel Core i5-12400F | |
| Shadow of the Tomb Raider | |
| 2560x1440 Highest Preset AA:T | |
| AMD Ryzen 7 7800X3D | |
| AMD Ryzen 9 7950X3D | |
| Intel Core i9-14900K | |
| Intel Core i9-13900K | |
| AMD Ryzen 9 7950X | |
| AMD Ryzen 7 9700X | |
| AMD Ryzen 5 9600X | |
| Intel Core i5-14600K | |
| Intel Core i7-14700K | |
| Intel Core i5-13400 | |
| Intel Core i5-12400F | |
| 3840x2160 Highest Preset AA:T | |
| Intel Core i9-14900K | |
| Intel Core i5-14600K | |
| AMD Ryzen 5 9600X | |
| AMD Ryzen 7 7800X3D | |
| AMD Ryzen 9 7950X3D | |
| AMD Ryzen 9 7950X | |
| AMD Ryzen 7 9700X | |
| Intel Core i9-13900K | |
| Intel Core i7-14700K | |
| Intel Core i5-13400 | |
| Intel Core i5-12400F | |
| Metro Exodus | |
| 2560x1440 Ultra Quality AF:16x | |
| AMD Ryzen 7 7800X3D | |
| Intel Core i9-14900K | |
| AMD Ryzen 5 9600X | |
| AMD Ryzen 7 9700X | |
| Intel Core i5-14600K | |
| AMD Ryzen 9 7950X | |
| Intel Core i7-14700K | |
| AMD Ryzen 9 7950X3D | |
| Intel Core i9-13900K | |
| Intel Core i5-13400 | |
| Intel Core i5-12400F | |
| 3840x2160 Ultra Quality AF:16x | |
| Intel Core i9-14900K | |
| Intel Core i5-14600K | |
| AMD Ryzen 7 7800X3D | |
| AMD Ryzen 9 7950X | |
| AMD Ryzen 9 7950X3D | |
| AMD Ryzen 7 9700X | |
| Intel Core i7-14700K | |
| AMD Ryzen 5 9600X | |
| Intel Core i9-13900K | |
| Intel Core i5-13400 | |
| Intel Core i5-12400F | |
| F1 2021 | |
| 2560x1440 Ultra High Preset + Raytracing AA:T AF:16x | |
| AMD Ryzen 7 7800X3D | |
| AMD Ryzen 7 9700X | |
| Intel Core i9-14900K | |
| AMD Ryzen 5 9600X | |
| Intel Core i9-13900K | |
| AMD Ryzen 9 7950X3D | |
| Intel Core i5-14600K | |
| AMD Ryzen 9 7950X | |
| Intel Core i7-14700K | |
| Intel Core i5-12400F | |
| Intel Core i5-13400 | |
| 3840x2160 Ultra High Preset + Raytracing AA:T AF:16x | |
| AMD Ryzen 7 7800X3D | |
| AMD Ryzen 5 9600X | |
| AMD Ryzen 9 7950X3D | |
| Intel Core i9-14900K | |
| AMD Ryzen 7 9700X | |
| Intel Core i5-14600K | |
| AMD Ryzen 9 7950X | |
| Intel Core i7-14700K | |
| Intel Core i9-13900K | |
| Intel Core i5-12400F | |
| Intel Core i5-13400 | |
AMD Ryzen 7 9700X with Nvidia GeForce RTX 4090
| bajo | medio | alto | ultra | QHD DLSS | QHD FSR | QHD | 4K DLSS | 4K FSR | 4K | |
|---|---|---|---|---|---|---|---|---|---|---|
| GTA V (2015) | 187.9 | 187.8 | 187.6 | 170.4 | 169.3 | 187.6 | ||||
| The Witcher 3 (2015) | 751 | 696 | 579 | 283 | 242 | 275 | ||||
| Dota 2 Reborn (2015) | 319.7 | 273.5 | 261.7 | 239.4 | 237.2 | |||||
| Final Fantasy XV Benchmark (2018) | 235 | 233 | 226 | 213 | 148.3 | |||||
| X-Plane 11.11 (2018) | 256 | 226 | 171.8 | 142 | ||||||
| Far Cry 5 (2018) | 263 | 228 | 219 | 202 | 203 | 165 | ||||
| Strange Brigade (2018) | 786 | 655 | 637 | 616 | 536 | 283 | ||||
| Shadow of the Tomb Raider (2018) | 335 | 302 | 308 | 303 | 273 | 185 | ||||
| Metro Exodus (2019) | 351 | 302 | 256 | 213 | 190.5 | 138.6 | ||||
| Borderlands 3 (2019) | 247 | 222 | 202 | 192.8 | 188.3 | 131.5 | ||||
| F1 2021 (2021) | 642 | 624 | 545 | 287 | 292 | 203 | ||||
| Tiny Tina's Wonderlands (2022) | 445 | 392 | 331 | 288 | 225 | 128.9 | ||||
| F1 22 (2022) | 418 | 463 | 419 | 213 | 160 | 84.8 | ||||
| F1 23 (2023) | 426 | 449 | 426 | 197.6 | 154 | 133.3 | 80.3 | |||
| Baldur's Gate 3 (2023) | 353 | 334 | 307 | 302 | 250 | 215 | 143.2 | |||
| Cyberpunk 2077 (2023) | 257 | 258 | 236 | 214 | 156.6 | 74.5 | ||||
| Assassin's Creed Mirage (2023) | 280 | 270 | 256 | 188 | 178 | 158 | 127 | |||
| Call of Duty Modern Warfare 3 2023 (2023) | 417 | 364 | 310 | 296 | 235 | 173 | 165 | |||
| Avatar Frontiers of Pandora (2023) | 244 | 228 | 203 | 168.1 | 124 | 112.9 | 69.7 | |||
| Skull & Bones (2024) | 243 | 225 | 194 | 171 | 144 | 132 | 129 | 100 | ||
| F1 24 (2024) | 406 | 427 | 406 | 203 | 200 | 213 | 147.7 | 126.3 | 143.6 | 79.8 |
Consumo de energía: Ganancias tangibles de eficiencia en multinúcleo y juegos
Zen 4 ya era famoso por su superior eficiencia energética frente a las ofertas de Intel, y AMD parece continuar esta racha también con Zen 5.
El Ryzen 7 9700X ofrece la mejor eficiencia energética del grupo en The Witcher 3 a 1080p Ultra, superando al Ryzen 7 7800X3D por un pelo.
El Ryzen 5 9600X es un 13% más eficiente en Cinebench R23 mononúcleo, pero el Ryzen 7 9700X recupera el terreno perdido en Cinebench R23 eficiencia multinúcleo gracias a su mayor rendimiento.
Aunque el Core i5-14600K supera al Ryzen 7 9700X en un 21% en Cinebench R23 multi-núcleo, la CPU Zen 5 presume de un 22% más de eficiencia energética que su competidor de Intel.
Power Consumption: External monitor
: Cyberpunk 2077 ultra external monitor
| Power Consumption / Cinebench R15 Multi (external Monitor) | |
| Intel Core i9-14900K, NVIDIA GeForce RTX 4090 | |
| Intel Core i9-13900K, NVIDIA GeForce RTX 3090 | |
| Intel Core i7-14700K, NVIDIA GeForce RTX 4090 | |
| Intel Core i5-14600K, NVIDIA GeForce RTX 4090 | |
| Intel Core i9-12900K, NVIDIA Titan RTX (Idle: 70.5 W) | |
| AMD Ryzen 9 7950X, NVIDIA GeForce RTX 3090 | |
| AMD Ryzen 9 7900X, NVIDIA GeForce RTX 3090 | |
| Intel Core i5-13600K, NVIDIA GeForce RTX 3090 | |
| AMD Ryzen 9 7950X3D, NVIDIA GeForce RTX 4090 | |
| AMD Ryzen 7 7700X, NVIDIA GeForce RTX 3090 (Idle: 89.8 W) | |
| AMD Ryzen 9 5950X, NVIDIA Titan RTX (Idle: 78 W) | |
| AMD Ryzen 5 7600X, NVIDIA GeForce RTX 3090 | |
| AMD Ryzen 5 9600X, NVIDIA GeForce RTX 4090 | |
| AMD Ryzen 7 7800X3D, NVIDIA GeForce RTX 4090 | |
| Intel Core i5-12600K, NVIDIA Titan RTX (Idle: 70.45 W) | |
| Intel Core i5-13400, NVIDIA GeForce RTX 4090 | |
| Intel Core i5-12400F, NVIDIA GeForce RTX 4090 | |
| AMD Ryzen 7 9700X, NVIDIA GeForce RTX 4090 (Idle: 83 W) | |
| Power Consumption / The Witcher 3 ultra (external Monitor) | |
| Intel Core i5-14600K, NVIDIA GeForce RTX 4090 | |
| Intel Core i9-14900K, NVIDIA GeForce RTX 4090 | |
| AMD Ryzen 9 7900X, NVIDIA GeForce RTX 3090 | |
| AMD Ryzen 9 7950X, NVIDIA GeForce RTX 3090 | |
| Intel Core i9-13900K, NVIDIA GeForce RTX 3090 | |
| Intel Core i7-14700K, NVIDIA GeForce RTX 4090 | |
| AMD Ryzen 5 7600X, NVIDIA GeForce RTX 3090 | |
| AMD Ryzen 9 7950X3D, NVIDIA GeForce RTX 4090 | |
| AMD Ryzen 7 7700X, NVIDIA GeForce RTX 3090 (Idle: 89.8 W) | |
| Intel Core i5-13600K, NVIDIA GeForce RTX 3090 | |
| Intel Core i5-13400, NVIDIA GeForce RTX 4090 | |
| AMD Ryzen 7 7800X3D, NVIDIA GeForce RTX 4090 | |
| Intel Core i9-12900K, NVIDIA Titan RTX (Idle: 70.5 W) | |
| AMD Ryzen 7 9700X, NVIDIA GeForce RTX 4090 (Idle: 83 W) | |
| AMD Ryzen 9 5950X, NVIDIA Titan RTX (Idle: 78 W) | |
| Intel Core i5-12400F, NVIDIA GeForce RTX 4090 | |
| Intel Core i5-12600K, NVIDIA Titan RTX (Idle: 70.45 W) | |
| Power Consumption / Prime95 V2810 Stress (external Monitor) | |
| Intel Core i9-14900K, NVIDIA GeForce RTX 4090 | |
| Intel Core i9-13900K, NVIDIA GeForce RTX 3090 | |
| Intel Core i7-14700K, NVIDIA GeForce RTX 4090 | |
| Intel Core i5-14600K, NVIDIA GeForce RTX 4090 | |
| Intel Core i5-13600K, NVIDIA GeForce RTX 3090 | |
| AMD Ryzen 9 7950X, NVIDIA GeForce RTX 3090 | |
| AMD Ryzen 9 7900X, NVIDIA GeForce RTX 3090 | |
| Intel Core i9-12900K, NVIDIA Titan RTX (Idle: 70.5 W) | |
| AMD Ryzen 9 7950X3D, NVIDIA GeForce RTX 4090 | |
| Intel Core i5-12600K, NVIDIA Titan RTX (Idle: 70.45 W) | |
| AMD Ryzen 9 5950X, NVIDIA Titan RTX (Idle: 78 W) | |
| Intel Core i5-12400F, NVIDIA GeForce RTX 4090 | |
| AMD Ryzen 7 7700X, NVIDIA GeForce RTX 3090 (Idle: 89.8 W) | |
| Intel Core i5-13400, NVIDIA GeForce RTX 4090 | |
| AMD Ryzen 5 7600X, NVIDIA GeForce RTX 3090 | |
| AMD Ryzen 7 7800X3D, NVIDIA GeForce RTX 4090 | |
| AMD Ryzen 5 9600X, NVIDIA GeForce RTX 4090 | |
| AMD Ryzen 7 9700X, NVIDIA GeForce RTX 4090 (Idle: 83 W) | |
| Power Consumption | |
| AMD Ryzen 7 9700X, NVIDIA GeForce RTX 4090 | |
| AMD Ryzen 5 9600X, NVIDIA GeForce RTX 4090 | |
: Cyberpunk 2077 ultra external monitor
* ... más pequeño es mejor
| Power Consumption / Cinebench R23 Single Power Efficiency - external Monitor | |
| AMD Ryzen 7 9700X, NVIDIA GeForce RTX 4090 | |
| Intel Core i9-14900K, NVIDIA GeForce RTX 4090 | |
| AMD Ryzen 5 9600X, NVIDIA GeForce RTX 4090 | |
| Intel Core i7-14700K, NVIDIA GeForce RTX 4090 | |
| Intel Core i5-14600K, NVIDIA GeForce RTX 4090 | |
| AMD Ryzen 7 7800X3D, NVIDIA GeForce RTX 4090 | |
| Power Consumption / Witcher 3 ultra Efficiency (external Monitor) | |
| AMD Ryzen 7 9700X, NVIDIA GeForce RTX 4090 | |
| AMD Ryzen 7 7800X3D, NVIDIA GeForce RTX 4090 | |
| Intel Core i5-12400F, NVIDIA GeForce RTX 4090 | |
| AMD Ryzen 9 7950X3D, NVIDIA GeForce RTX 4090 | |
| AMD Ryzen 9 7950X, NVIDIA GeForce RTX 4090 | |
| Intel Core i9-14900K, NVIDIA GeForce RTX 4090 | |
| Intel Core i5-14600K, NVIDIA GeForce RTX 4090 | |
| Intel Core i5-13400, NVIDIA GeForce RTX 4090 | |
| Intel Core i7-14700K, NVIDIA GeForce RTX 4090 | |
Pro
Contra
Veredicto: Este chip Zen 5 es una propuesta de valor complicada
AMD consiguió una fórmula ganadora con Zen 4 el año pasado, y los chips Zen 5 de este año continúan el impulso. Aunque la arquitectura Zen 5 de 4 nm aporta cambios notables, muchos de ellos no siempre se traducen en ganancias de rendimiento bruto en todas las cargas de trabajo.
El menor TDP de 65 W por defecto permite un mayor margen de PBO, lo que da a la CPU la capacidad de alcanzar más fácilmente los aumentos de 5,5 GHz anunciados. Sin embargo, esto también se traduce en frecuencias de base más bajas y en una ganancia de rendimiento general no muy elevada con respecto al Zen 4.
El rendimiento mononúcleo es donde el Ryzen 7 9700X brilla con luz propia, a menudo royendo los talones de behemoths como el Intel Core i9-13900K y el Core i9-14900K. El rendimiento multinúcleo, sin embargo, queda por detrás del del Core i5-14600Kque ahora se puede conseguir por 300 dólares en Amazon, frente a los 360 dólares que cuesta el último de AMD.
El Ryzen 7 9700X también se presenta como una CPU excelente tanto para juegos de baja como de alta resolución, empatando prácticamente con todas las demás CPU para juegos aclamadas en la comparación, salvo el Ryzen 7000 X3D chips. El diseño de un solo CCD tampoco plantea problemas de programación, lo que significa que puede seguir arreglándoselas con Windows 10 sin tener que soportar necesariamente las travesuras de Windows 11.
El AMD Ryzen 7 9700X se basa en el éxito de Zen 4 y demuestra ser una excelente opción para cargas de trabajo de un solo núcleo y juegos. No obstante, su precio crea un dilema cuando se compara con las opciones de gama media de Intel y el propio Ryzen 5 9600X de nivel inferior de AMD"
La eficiencia energética es otro aspecto en el que AMD sigue mejorando. Mientras que la eficiencia energética de un solo núcleo no es mucho para escribir a casa - el Ryzen 5 9600X se lleva la palma en este aspecto-, el Ryzen 7 9700X sí muestra mejoras apreciables de eficiencia en cargas de trabajo multinúcleo y de juegos en comparación con las ofertas de Intel.
Entonces, ¿es el AMD Ryzen 7 9700X la elección definitiva para un equipo de gama media para juegos? La verdad es que es una decisión difícil.
El Intel Core i7-14700K ofrece un mayor número de núcleos y ahora se puede conseguir por 397 dólares en Amazon, es decir, 14 núcleos más y 12 subprocesos adicionales por sólo 37 dólares más. Incluso el Core i5-14600K ofrece ventajas inherentes en cargas de trabajo multinúcleo debido al mayor recuento de núcleos/hilos en comparación con el Ryzen 7 9700X.
Sin embargo, la situación actual de Intel con los procesadores de 13ª y 14ª generación hace que sean difíciles de recomendar en este momento. Claro, la compañía ha ofrecido mitigaciones para hacer frente a los consumos de alto voltaje y es honrar RMAs para las CPU degradadas, pero estos problemas no deberían haber existido en primer lugar. Recomendamos esperar hasta que Arrow Lake-S CPUs lleguen en los próximos meses si usted está planeando una construcción de novo con Intel en su interior.
Si sus usos principales son las cargas de trabajo de un solo subproceso y los juegos, el Ryzen 5 9600X a 279 dólares debería encajar perfectamente, ya que el Ryzen 7 9700X no ofrece ninguna ventaja práctica en estas áreas. El Ryzen 7 7700X, actualmente a US$299 en Amazon, también ofrece un gran valor.
Los ahorros así conseguidos se pueden utilizar para comprar una placa base Socket AM5 de calidad y memoria RAM DDR5 que todavía tienen un precio más elevado.
Precio y disponibilidad
El AMD Ryzen 7 9700X está disponible actualmente en Amazon US por 359 dólares y en Amazon DE por 386 euros.
El procesador se vende actualmente en Amazon India por ₹36.190 y también está disponible por precios ligeramente inferiores en los minoristas locales.
Transparencia
La selección de los dispositivos que se van a reseñar corre a cargo de nuestro equipo editorial. La muestra de prueba fue proporcionada al autor en calidad de préstamo por el fabricante o el minorista a los efectos de esta reseña. El prestamista no tuvo ninguna influencia en esta reseña, ni el fabricante recibió una copia de la misma antes de su publicación. No había ninguna obligación de publicar esta reseña. Como empresa de medios independiente, Notebookcheck no está sujeta a la autoridad de fabricantes, minoristas o editores.
Así es como prueba Notebookcheck
Cada año, Notebookcheck revisa de forma independiente cientos de portátiles y smartphones utilizando procedimientos estandarizados para asegurar que todos los resultados son comparables. Hemos desarrollado continuamente nuestros métodos de prueba durante unos 20 años y hemos establecido los estándares de la industria en el proceso. En nuestros laboratorios de pruebas, técnicos y editores experimentados utilizan equipos de medición de alta calidad. Estas pruebas implican un proceso de validación en varias fases. Nuestro complejo sistema de clasificación se basa en cientos de mediciones y puntos de referencia bien fundamentados, lo que mantiene la objetividad.Price comparison

