

Análisis del Lenovo LOQ 15: El portátil para juegos FHD con una RTX 4060 desde unos 1.000 dólares
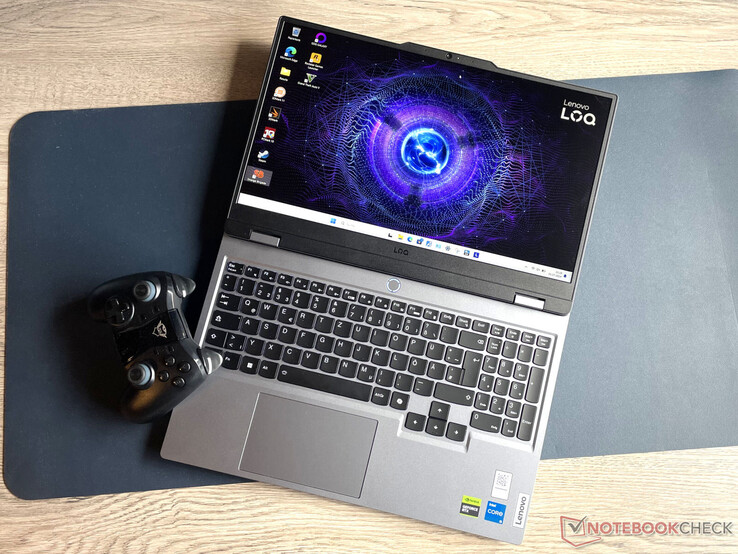
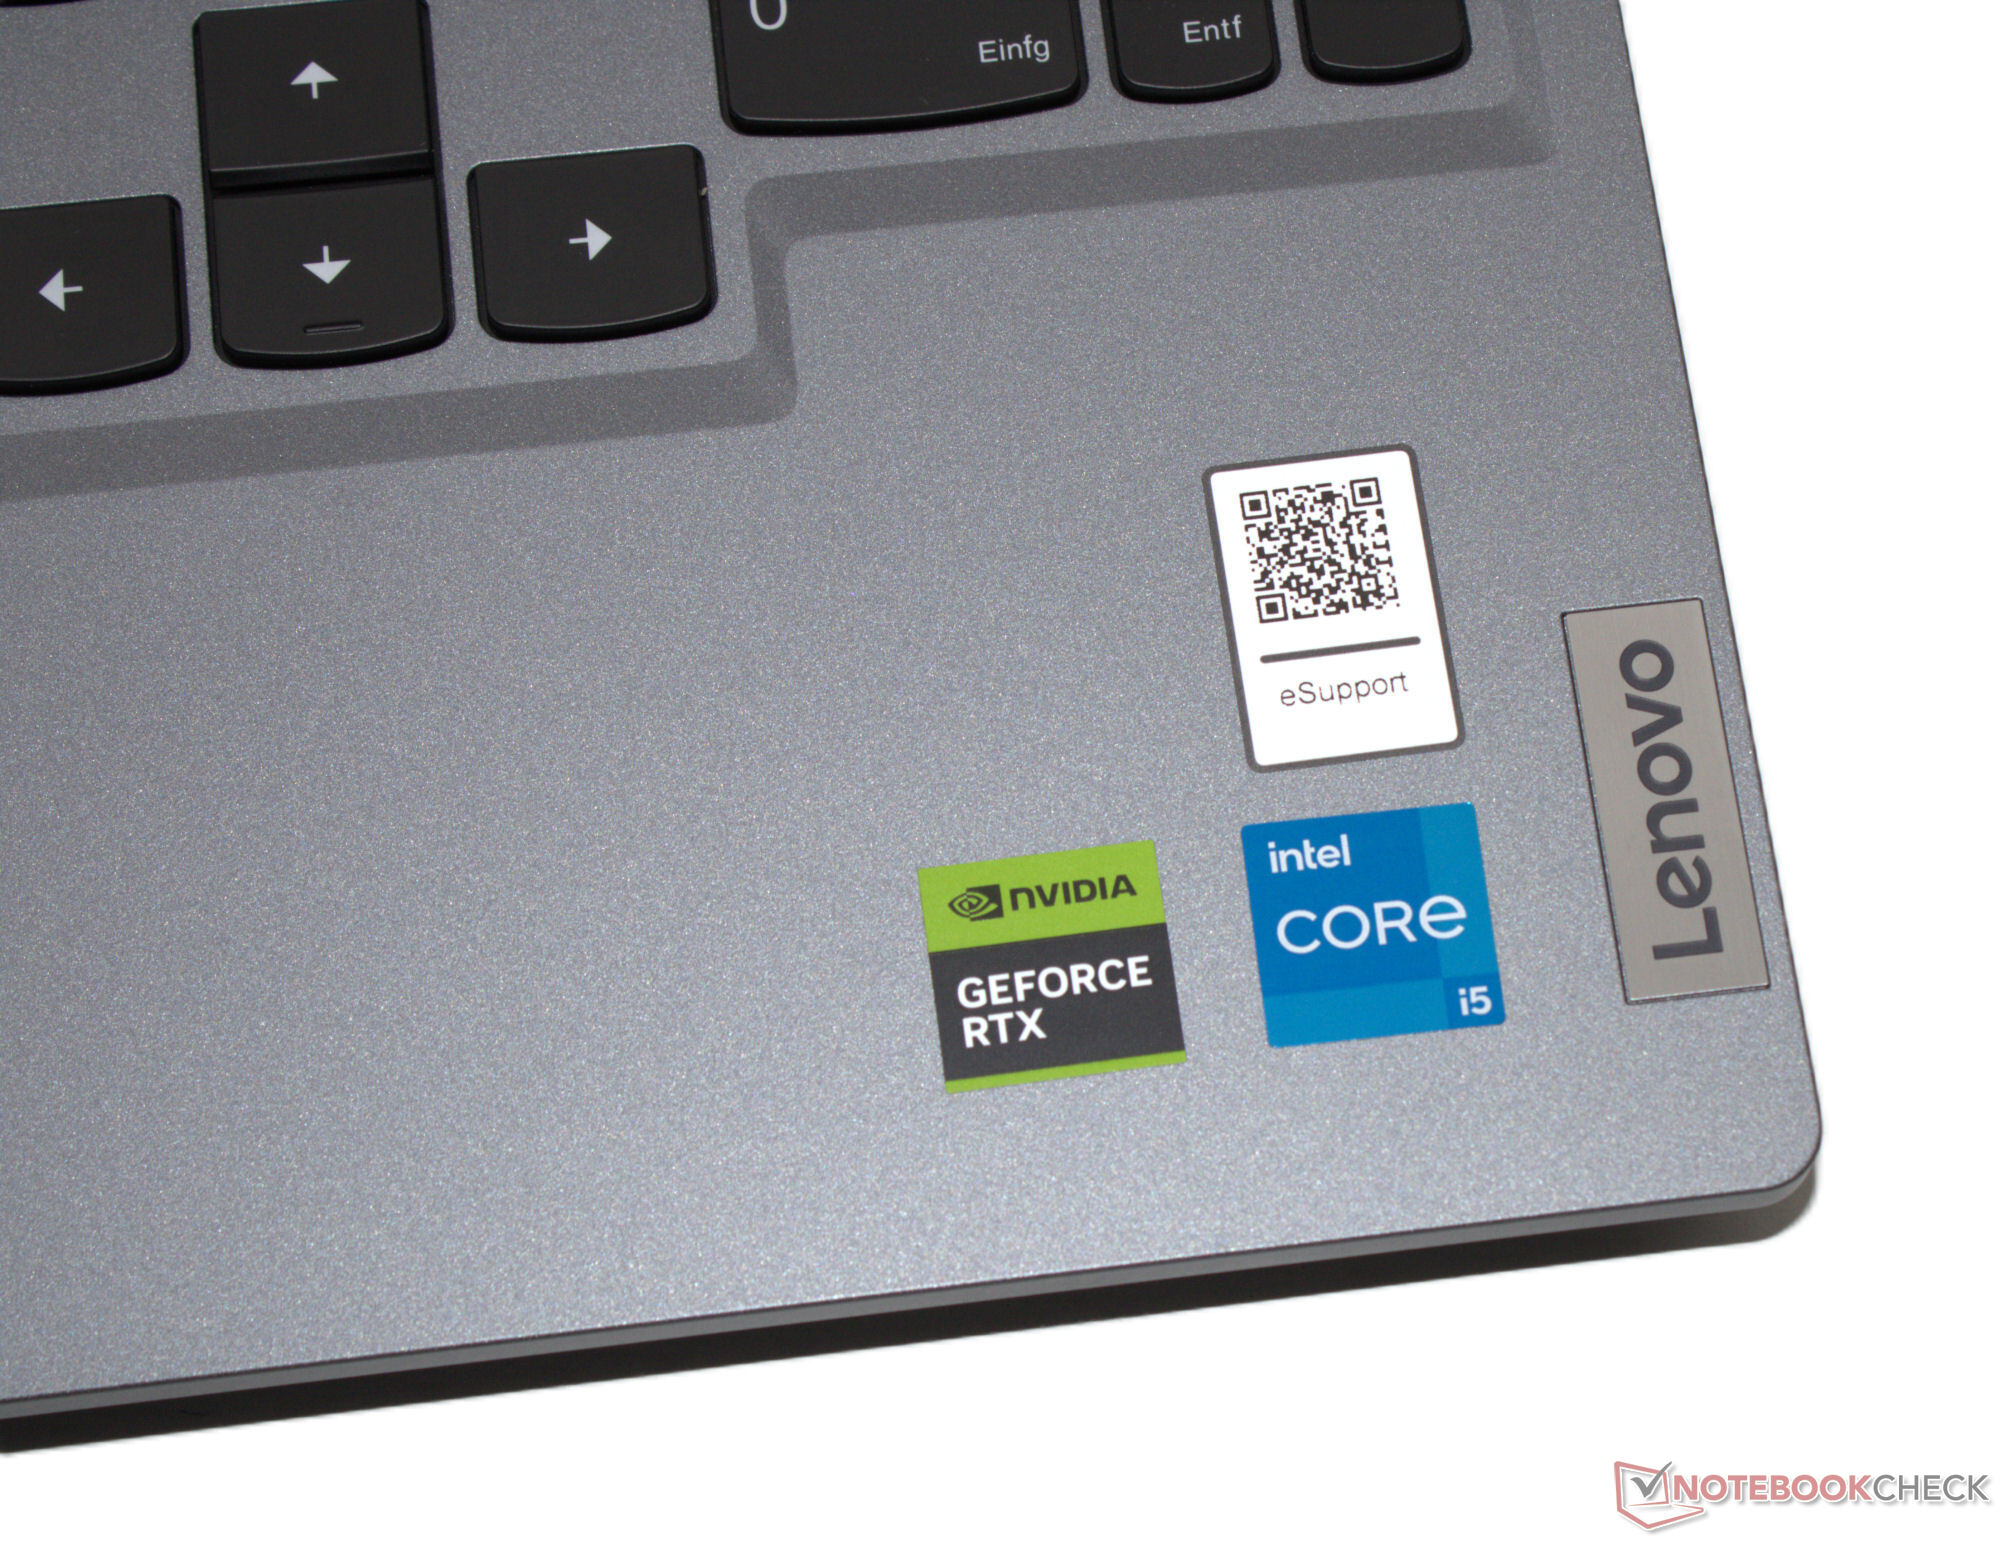
Dentro del catálogo de Lenovo, la serie LOQ está formada por portátiles económicos para juegos. El presente dispositivo de prueba encaja perfectamente en esta categoría: El fabricante pide algo más de 1.000 dólares (sin Windows) o 1.300 dólares (con Windows 11) por este paquete compuesto por un procesador Core i5, GeForce RTX 4060, 16 GB de RAM y una unidad SSD de 1 TB. El precio del portátil pasa factura: tiene una carcasa de plástico, una capacidad de batería relativamente baja y carece de Thunderbolt 4 o USB 4. Entre sus competidores se encuentran dispositivos como el Gigabyte G6X 9KG (2024), Dell G16, XMG Core 15 (M24) o el HP Victus 16 (2024).
La carcasa del Lenovo LOQ 15IRX9 no está construida de forma idéntica a la de sus modelos hermanos que ya hemos probado (Ryzen 7/RTX 4050, Core i7/RTX 4050).
Posibles contendientes en la comparación
Valoración | Versión | Fecha | Modelo | Peso | Altura | Tamaño | Resolución | Precio |
|---|---|---|---|---|---|---|---|---|
| 79 % | v8 | 07/2024 | Lenovo LOQ 15IRX9 i5-13450HX, NVIDIA GeForce RTX 4060 Laptop GPU | 2.4 kg | 23.9 mm | 15.60" | 1920x1080 | |
| 83.7 % | v8 | 06/2024 | SCHENKER XMG Core 15 (M24) R7 8845HS, NVIDIA GeForce RTX 4060 Laptop GPU | 2.1 kg | 21.9 mm | 15.30" | 2560x1600 | |
| 83.2 % v7 (old) | v7 (old) | 03/2024 | Gigabyte G6X 9KG (2024) i7-13650HX, NVIDIA GeForce RTX 4060 Laptop GPU | 2.6 kg | 25.1 mm | 16.00" | 1920x1200 | |
| 84.3 % v7 (old) | v7 (old) | 05/2024 | HP Victus 16 (2024) i7-14700HX, NVIDIA GeForce RTX 4060 Laptop GPU | 2.4 kg | 23.9 mm | 16.10" | 1920x1080 | |
| 85.5 % v7 (old) | v7 (old) | 02/2024 | Dell G16, i7-13650HX, RTX 4060 i7-13650HX, NVIDIA GeForce RTX 4060 Laptop GPU | 2.8 kg | 25.65 mm | 16.00" | 2560x1600 |
Tenga en cuenta que: recientemente hemos actualizado nuestro sistema de clasificación y los resultados de la versión 8 no son comparables con los de la versión 7. Encontrará más información aquí .
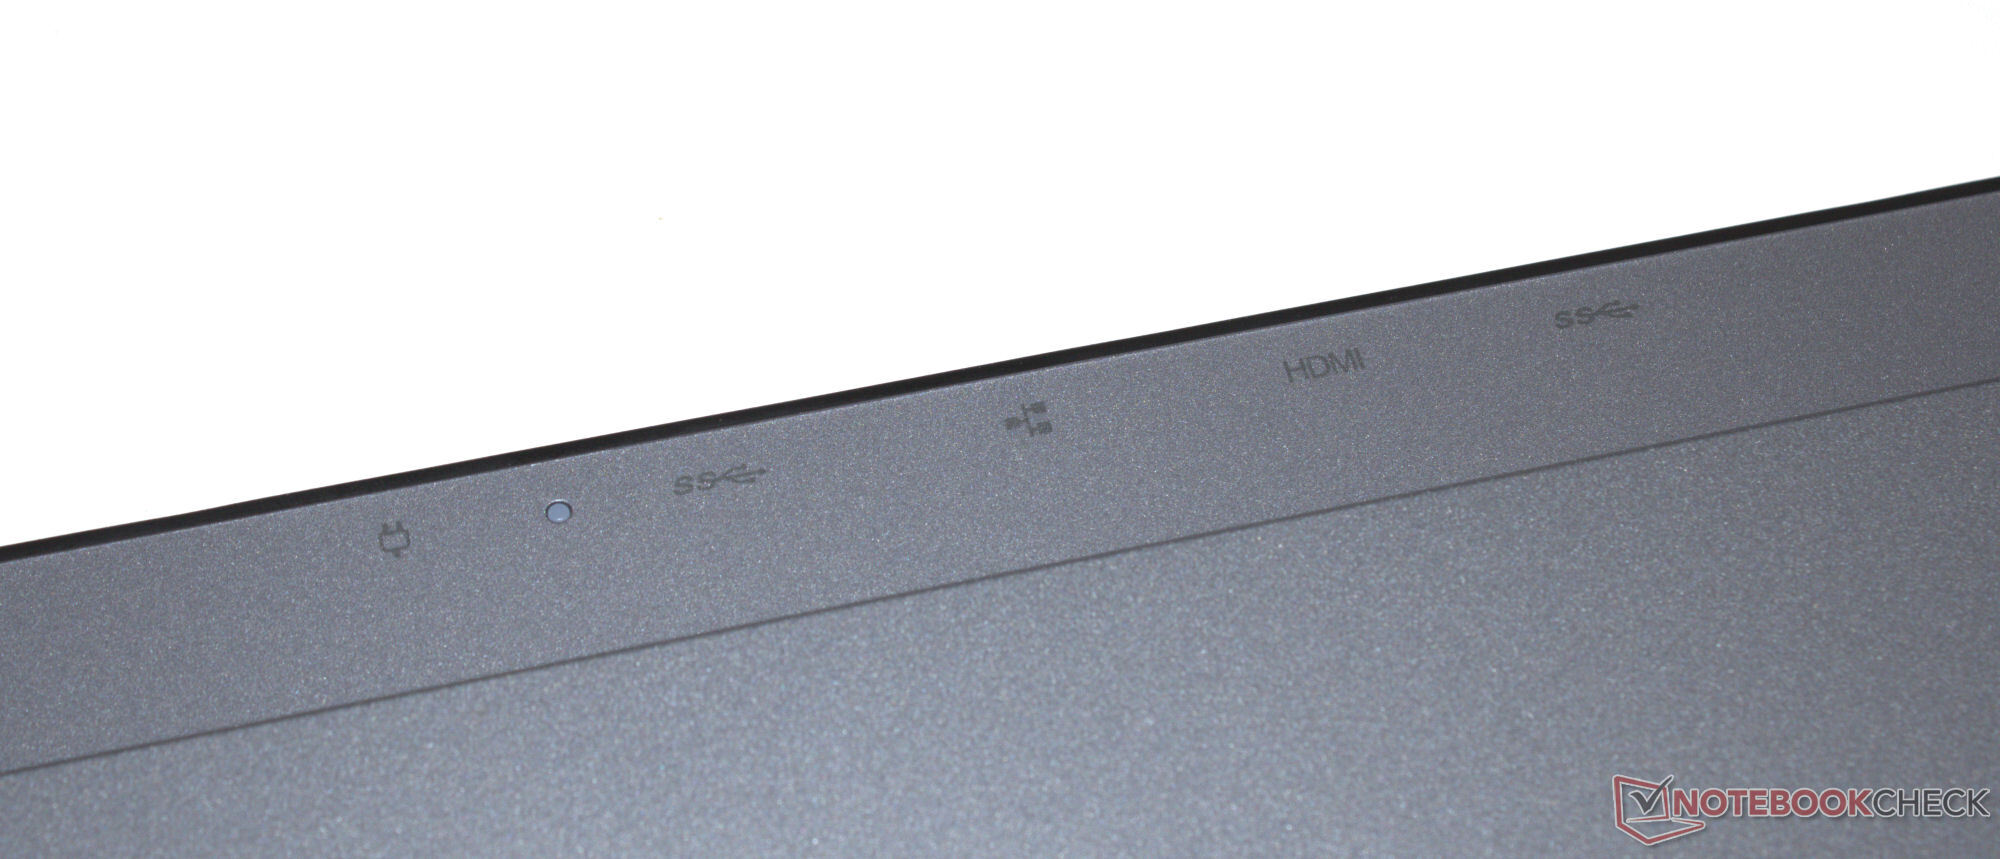
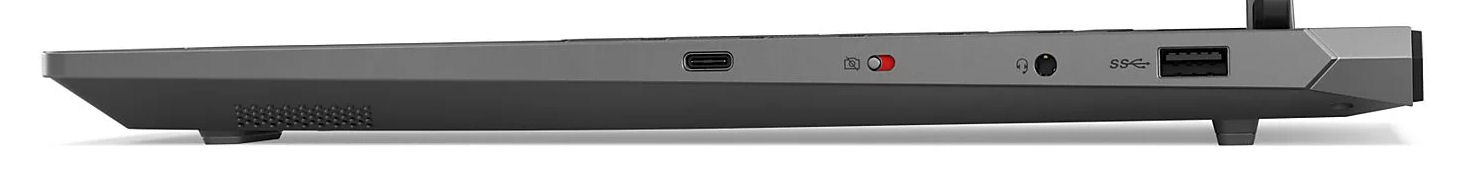
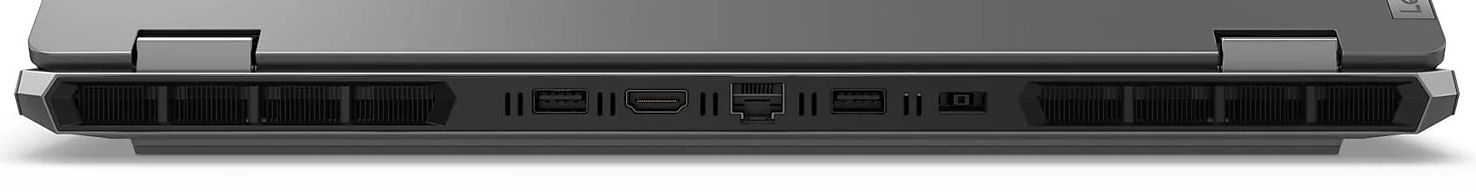
Caja y conectividad - El LOQ sin USB 4 pero con Power Delivery
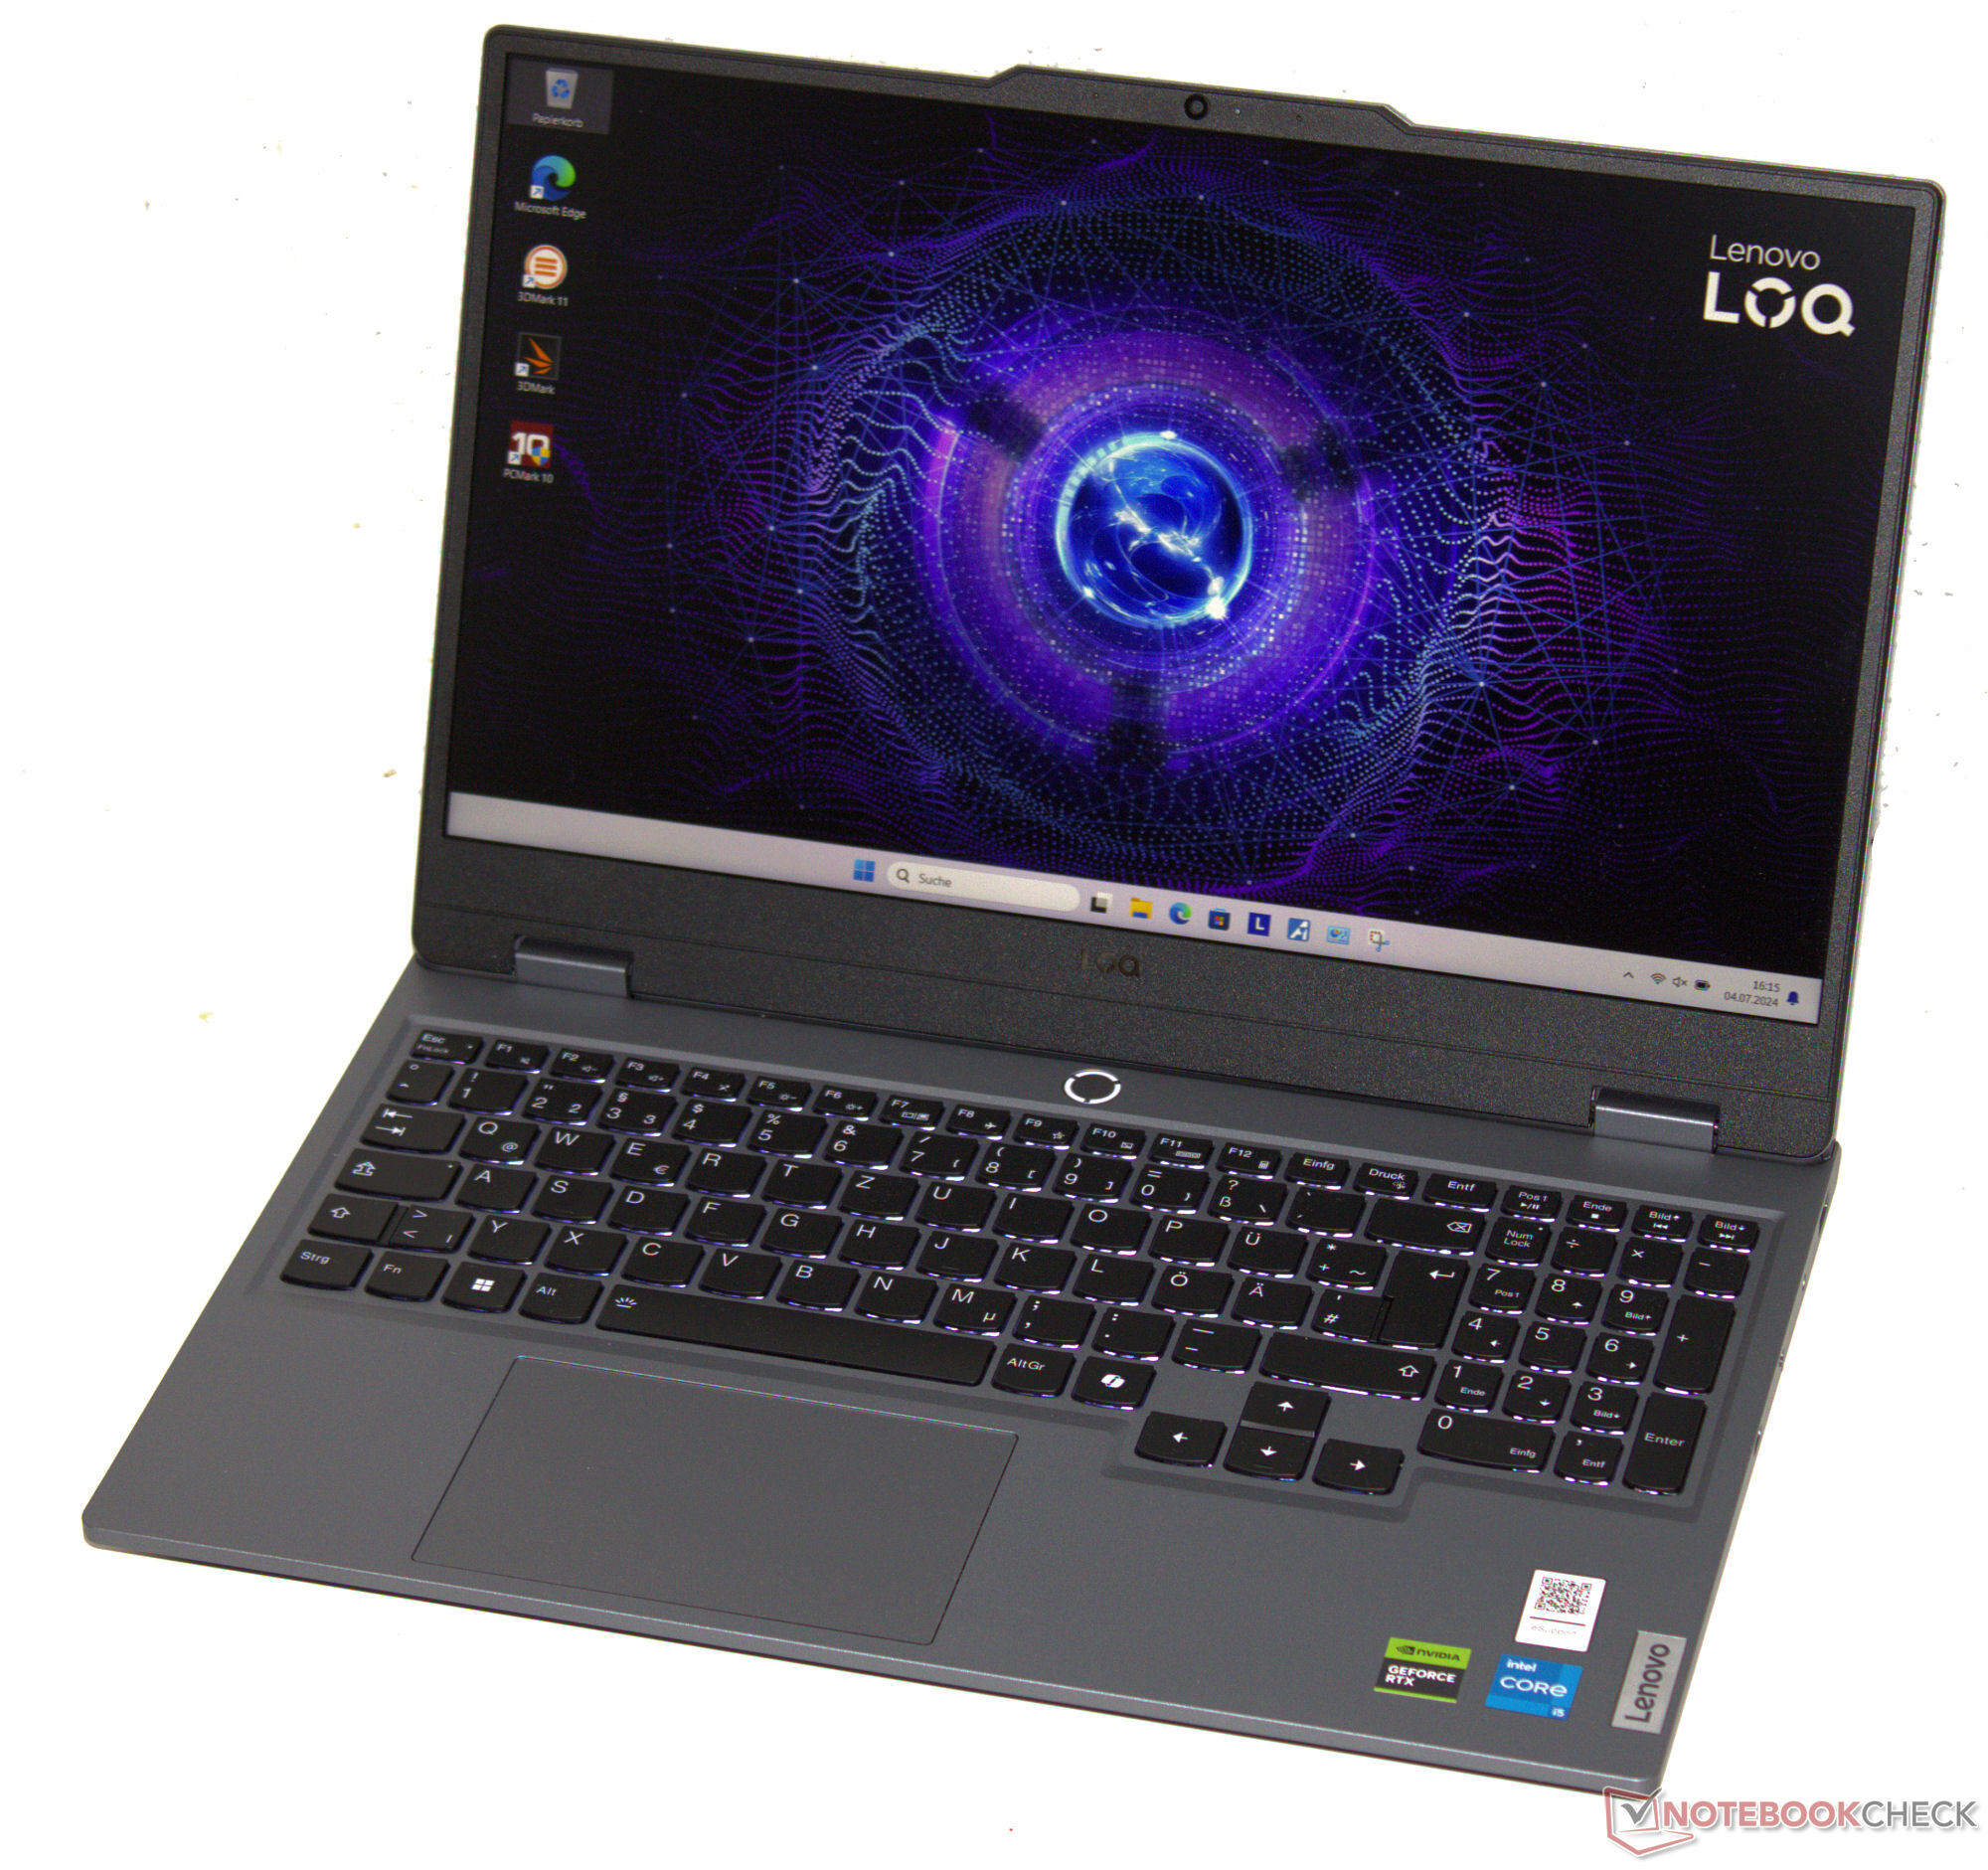
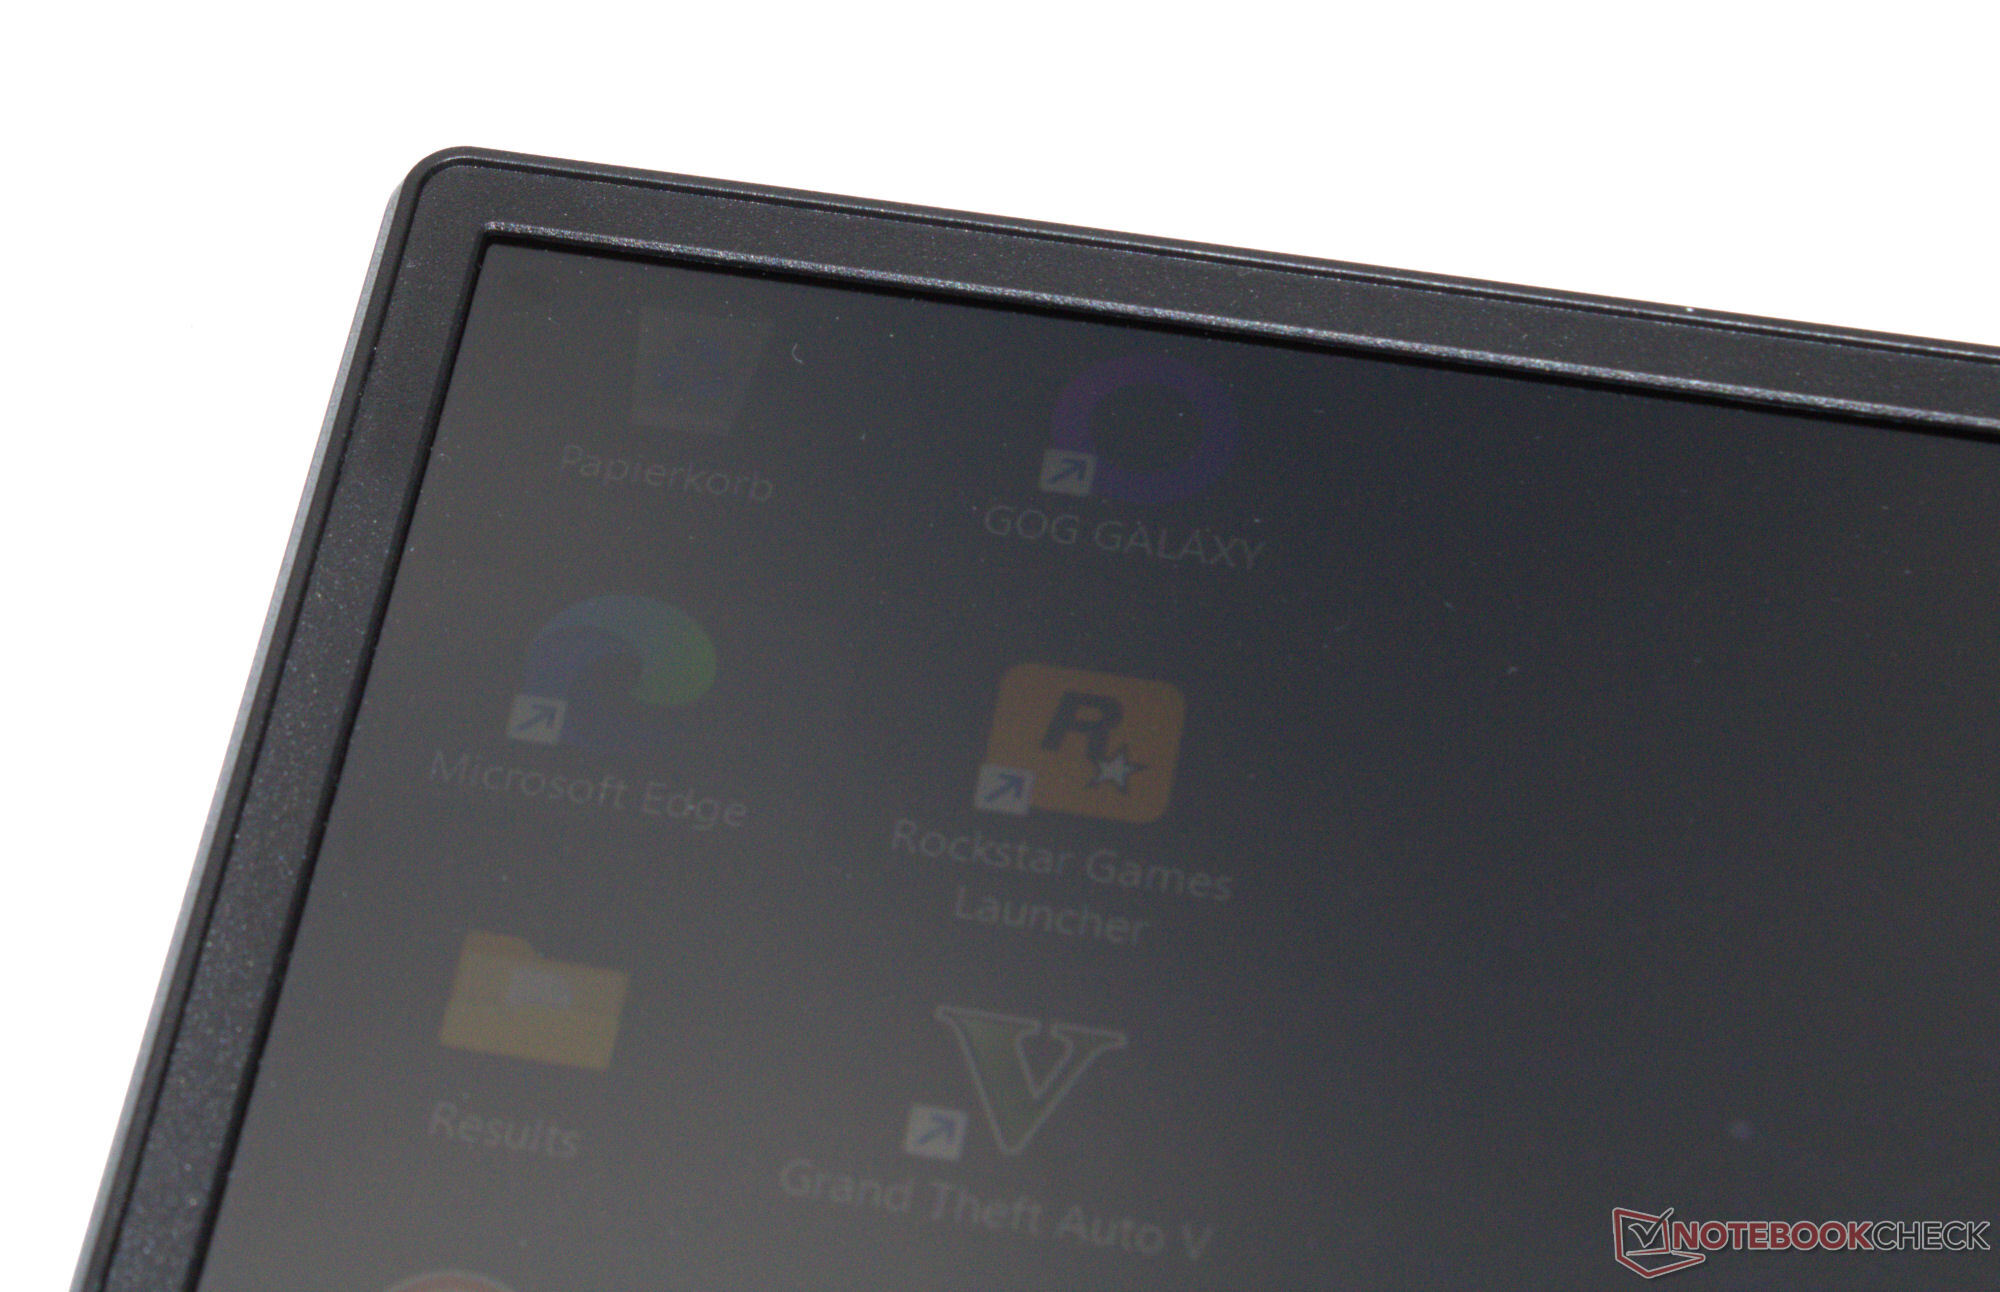
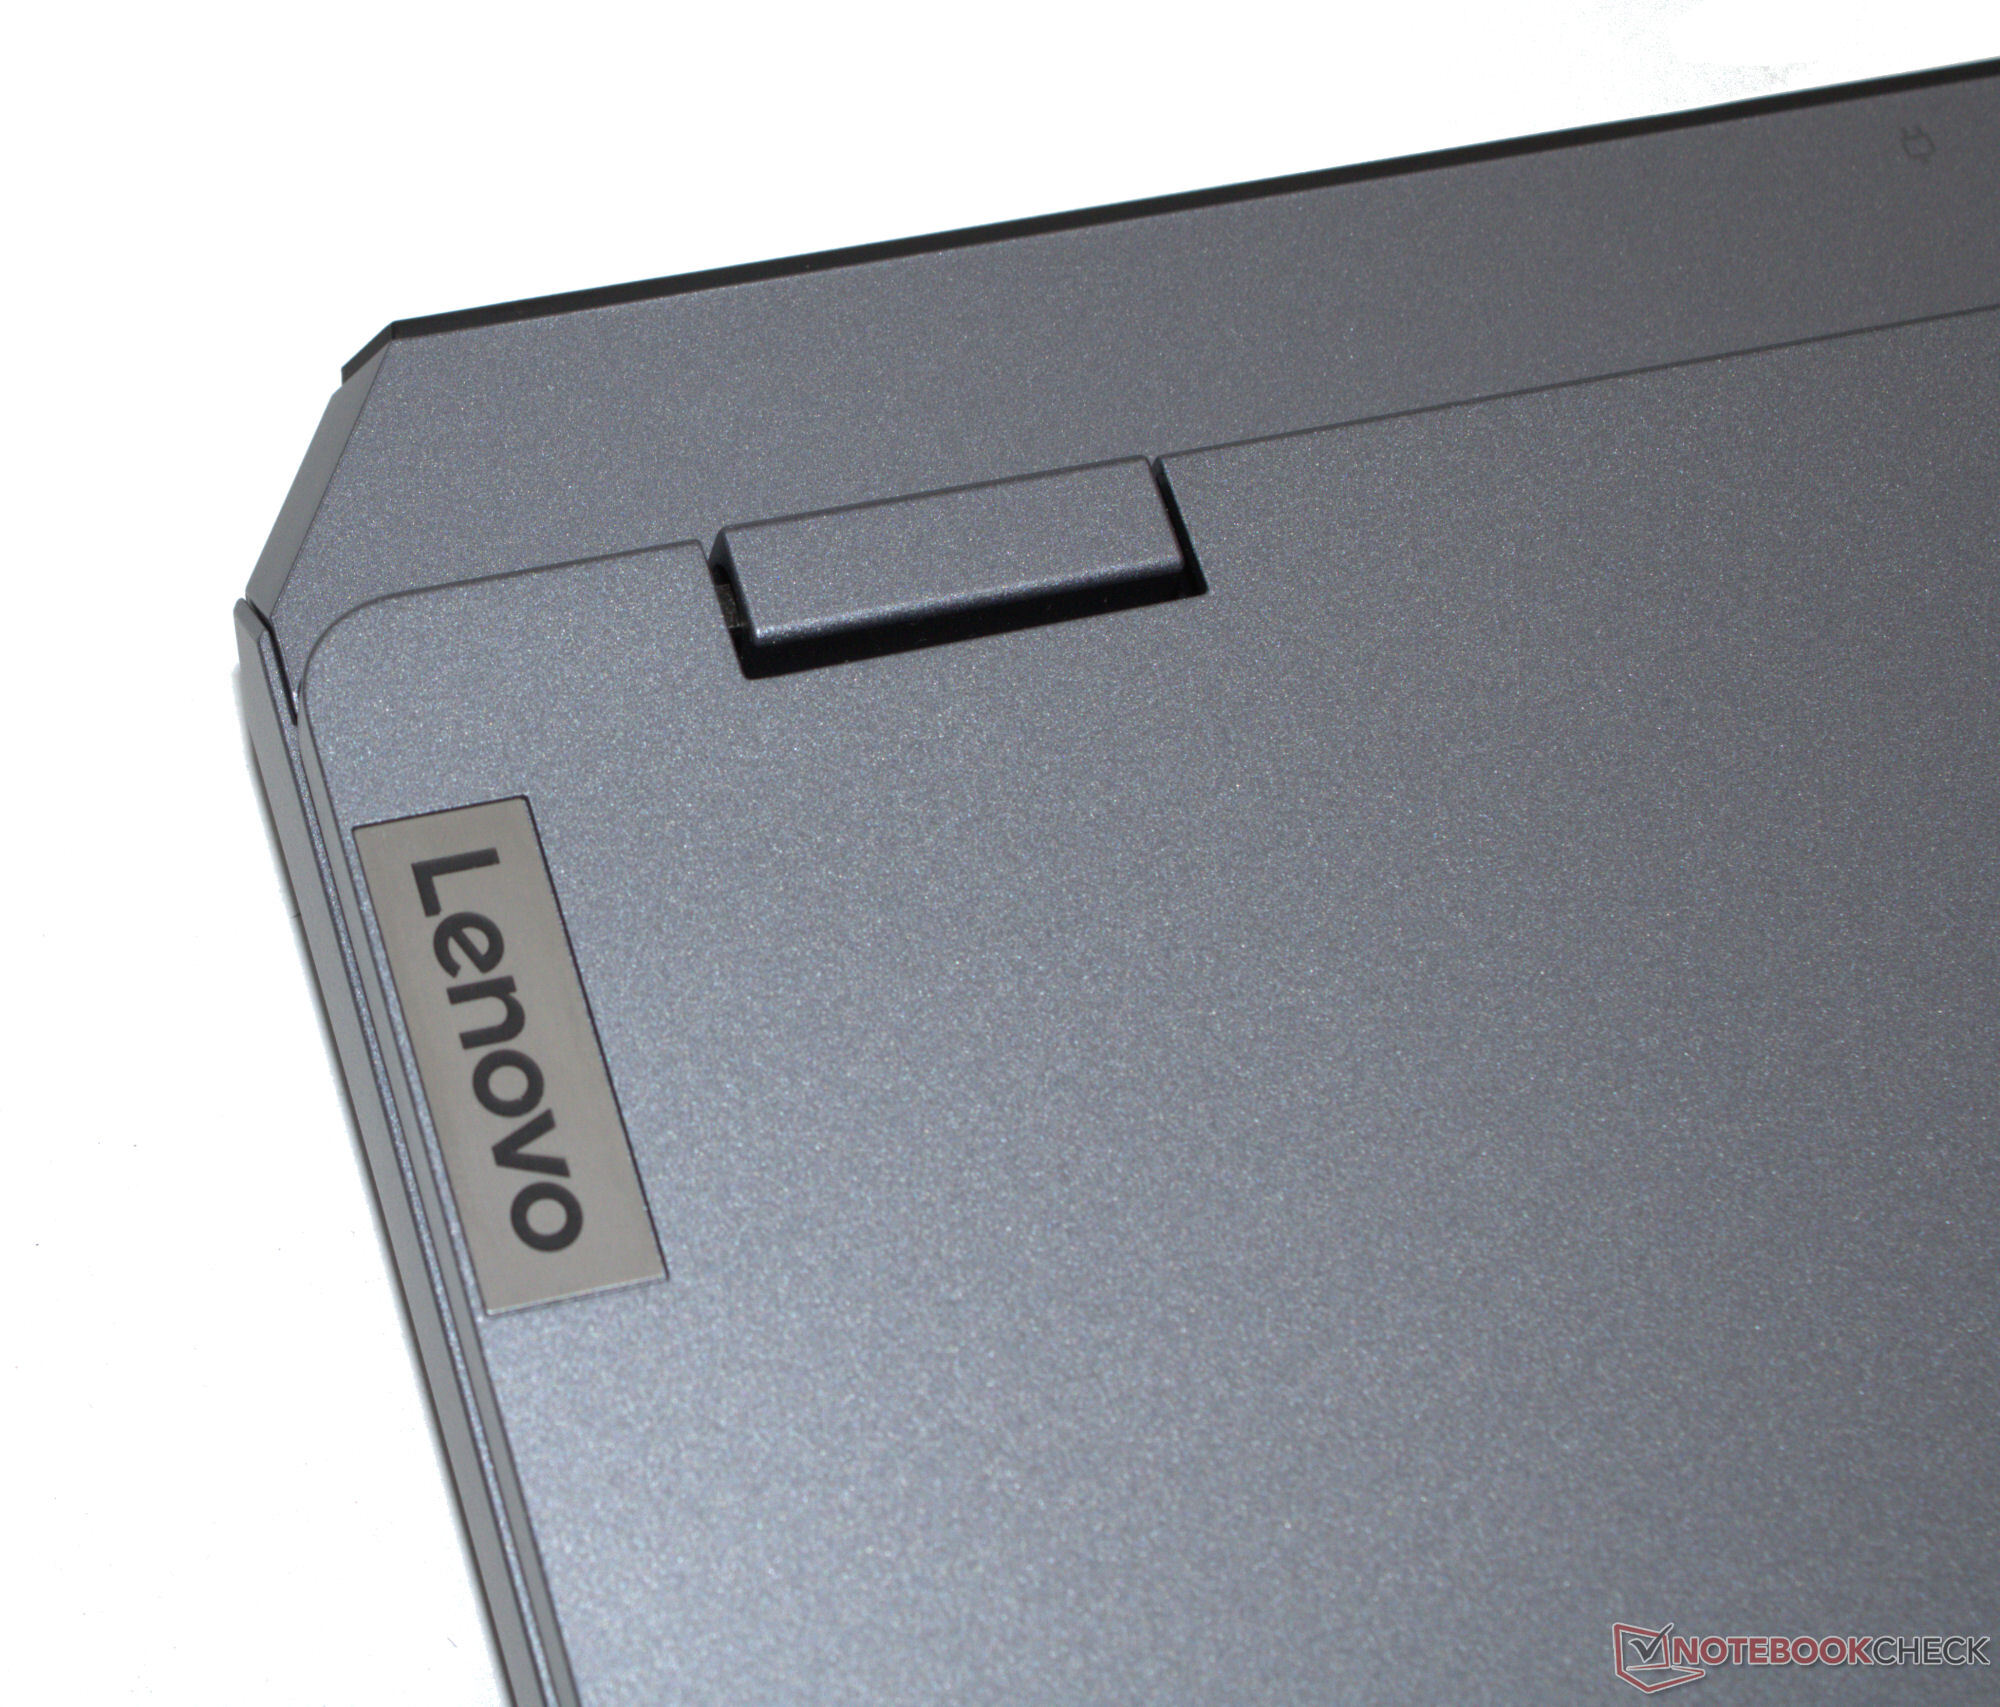
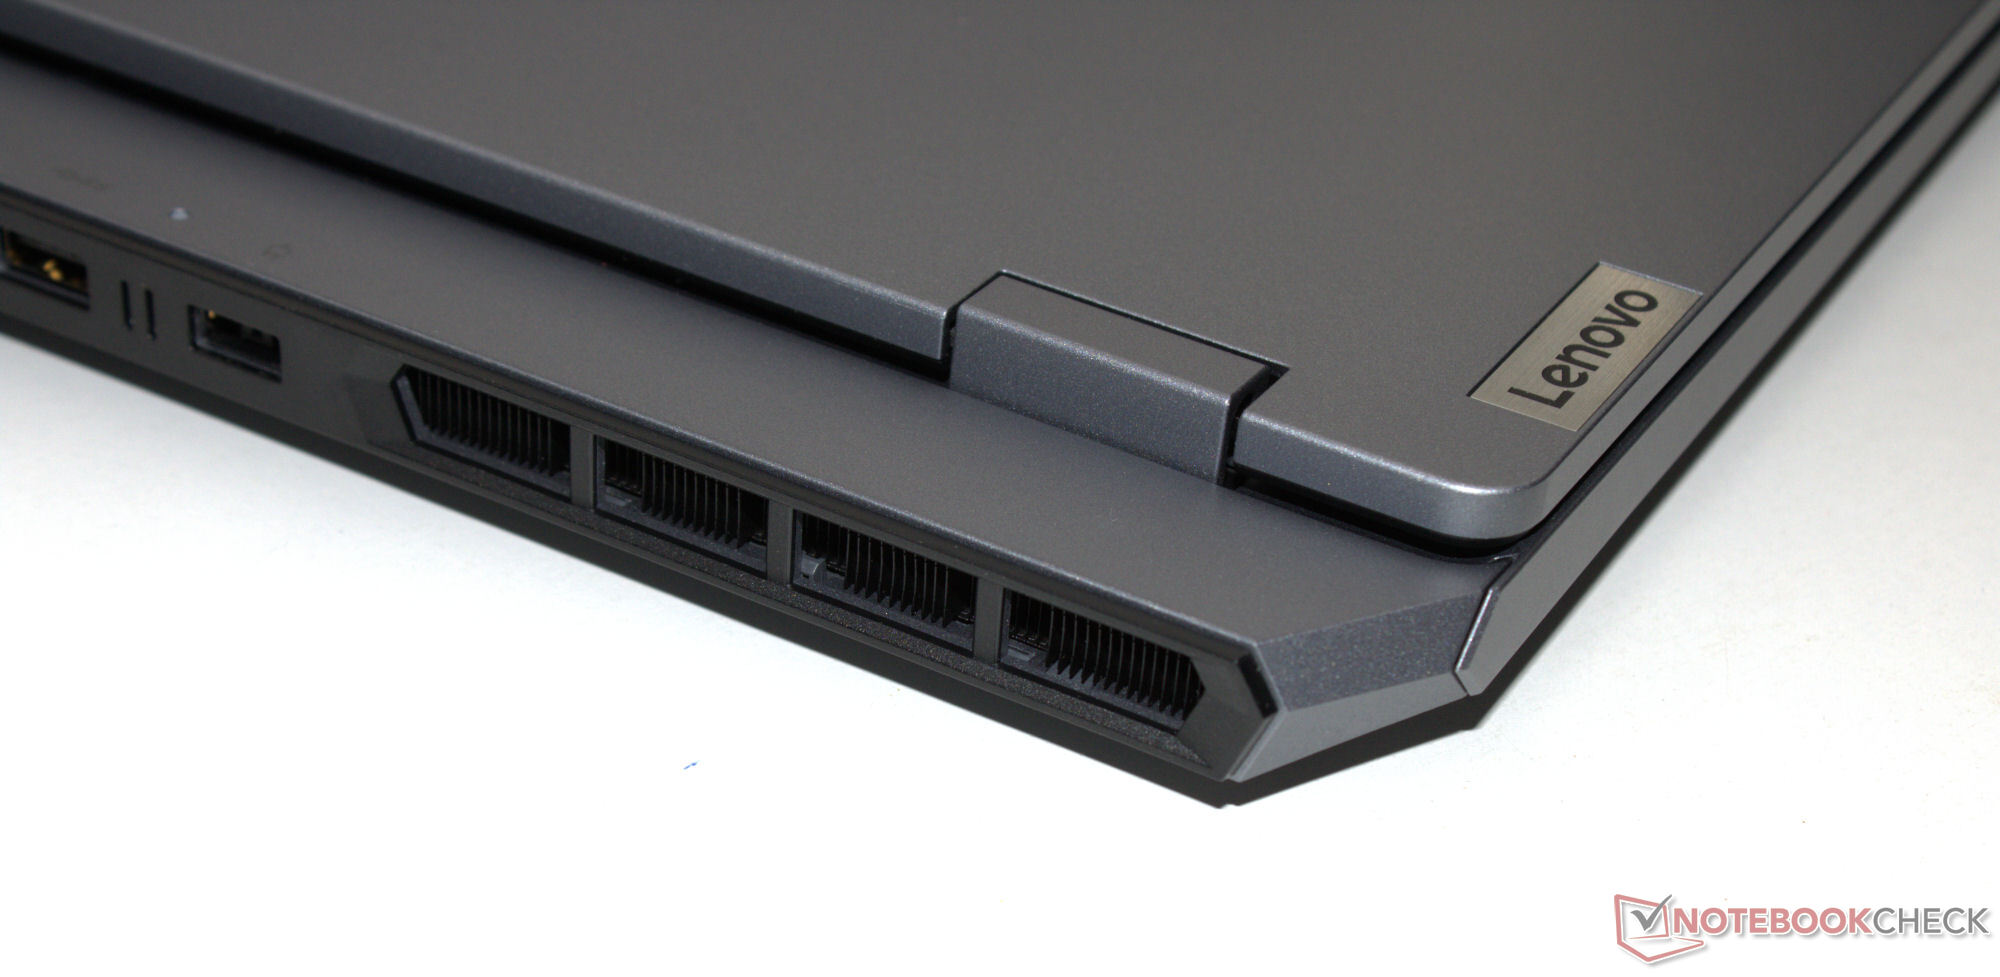
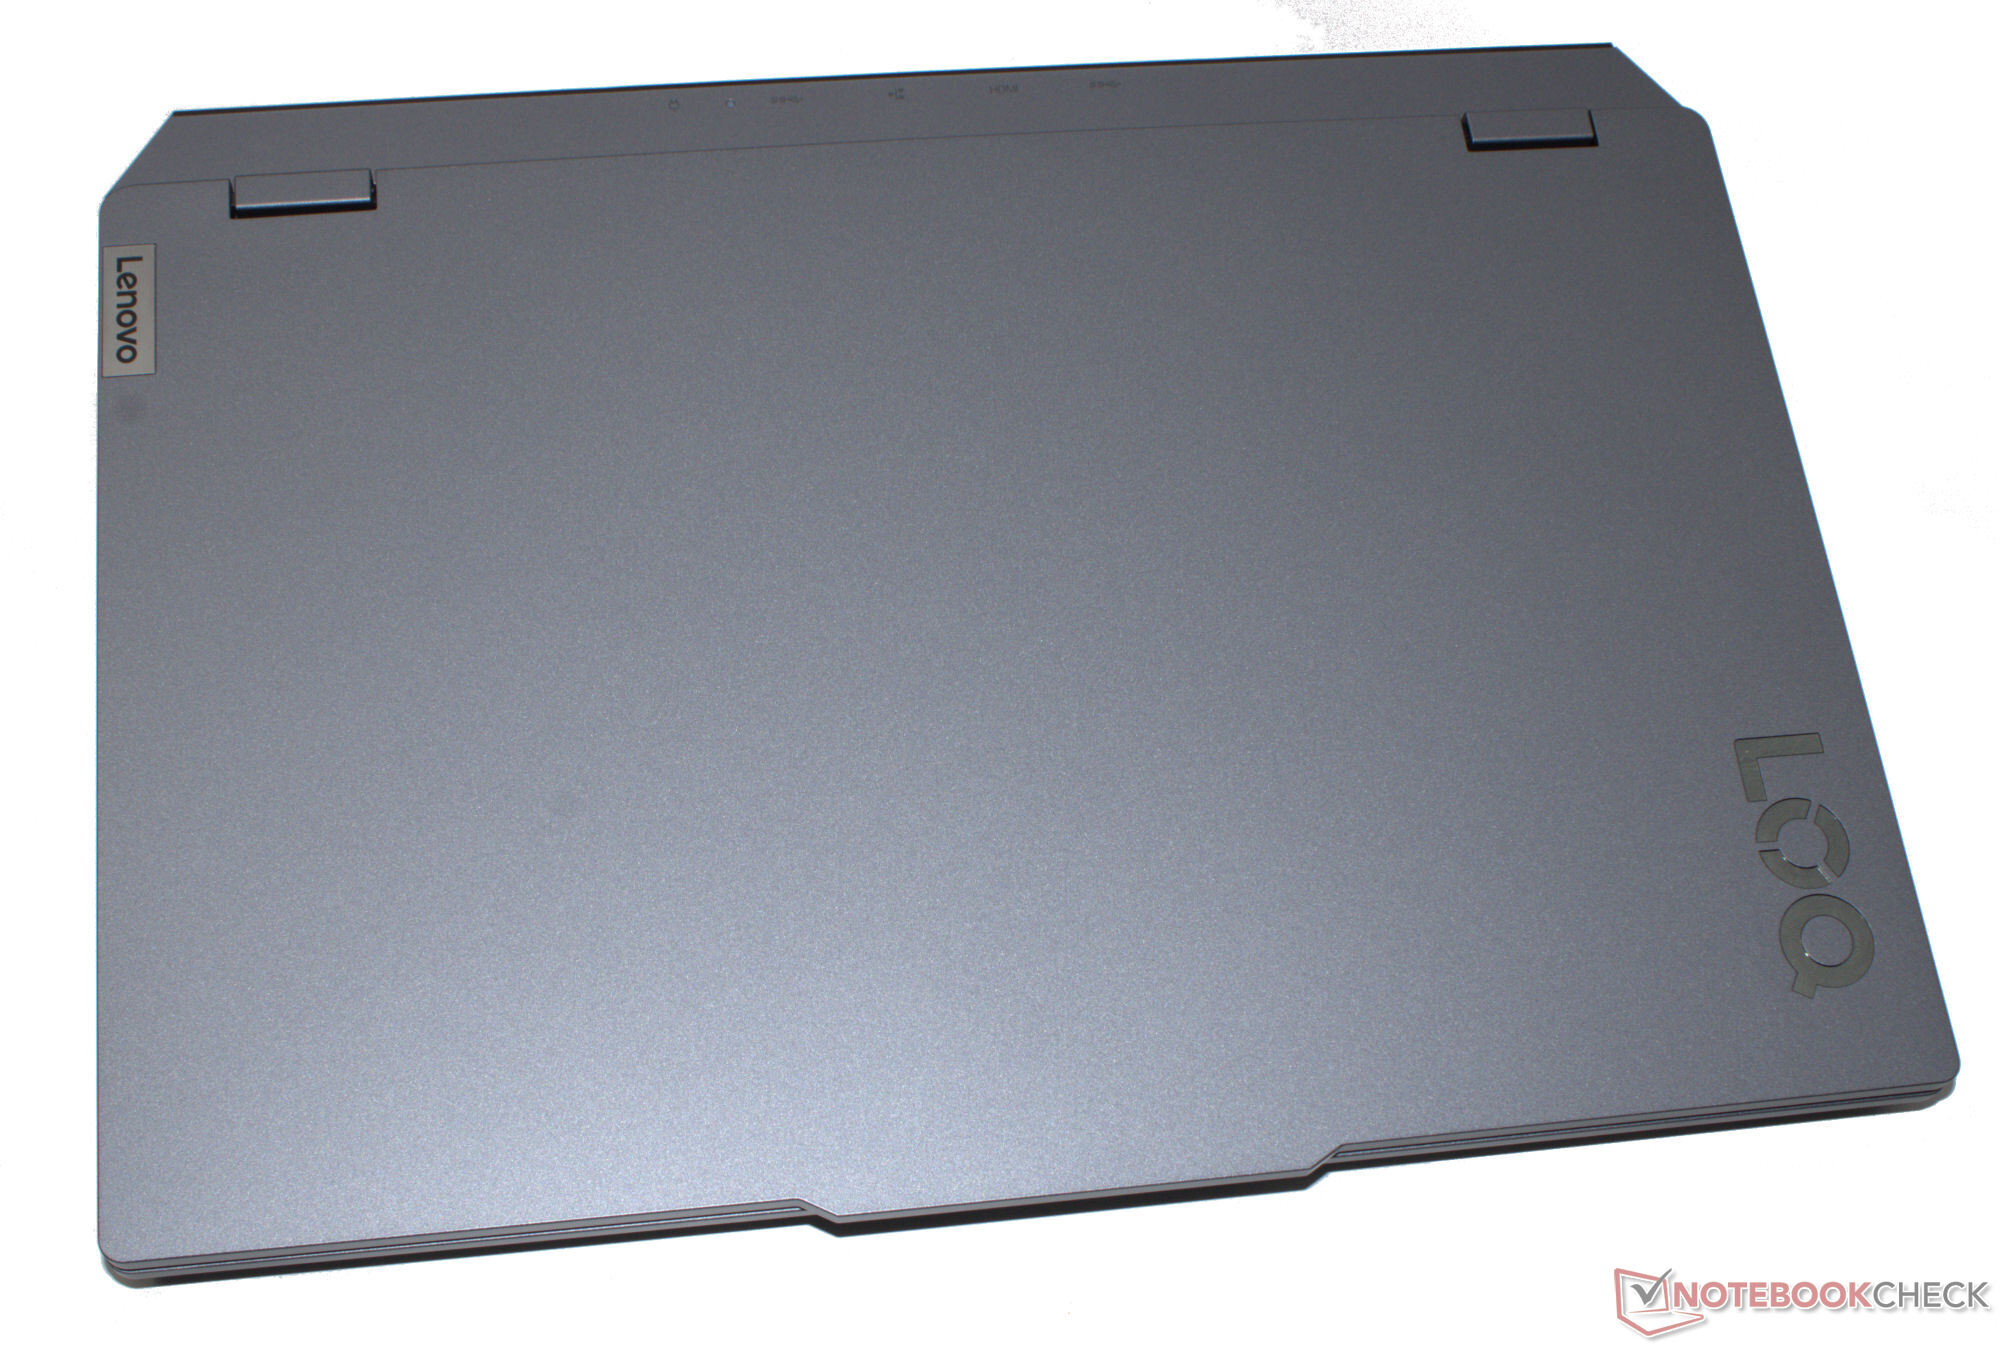
El hardware del portátil está alojado dentro de una carcasa de plástico gris mate (Luna Gray) que en general tiene un aspecto bastante elegante. La tapa y la unidad base pueden torcerse ligeramente, pero sigue siendo aceptable. Su estabilidad está bien. La tapa permite un ángulo máximo de apertura de hasta 180 grados. Las tiras de LED típicas de los portátiles para juegos no se ven por ninguna parte en este modelo.
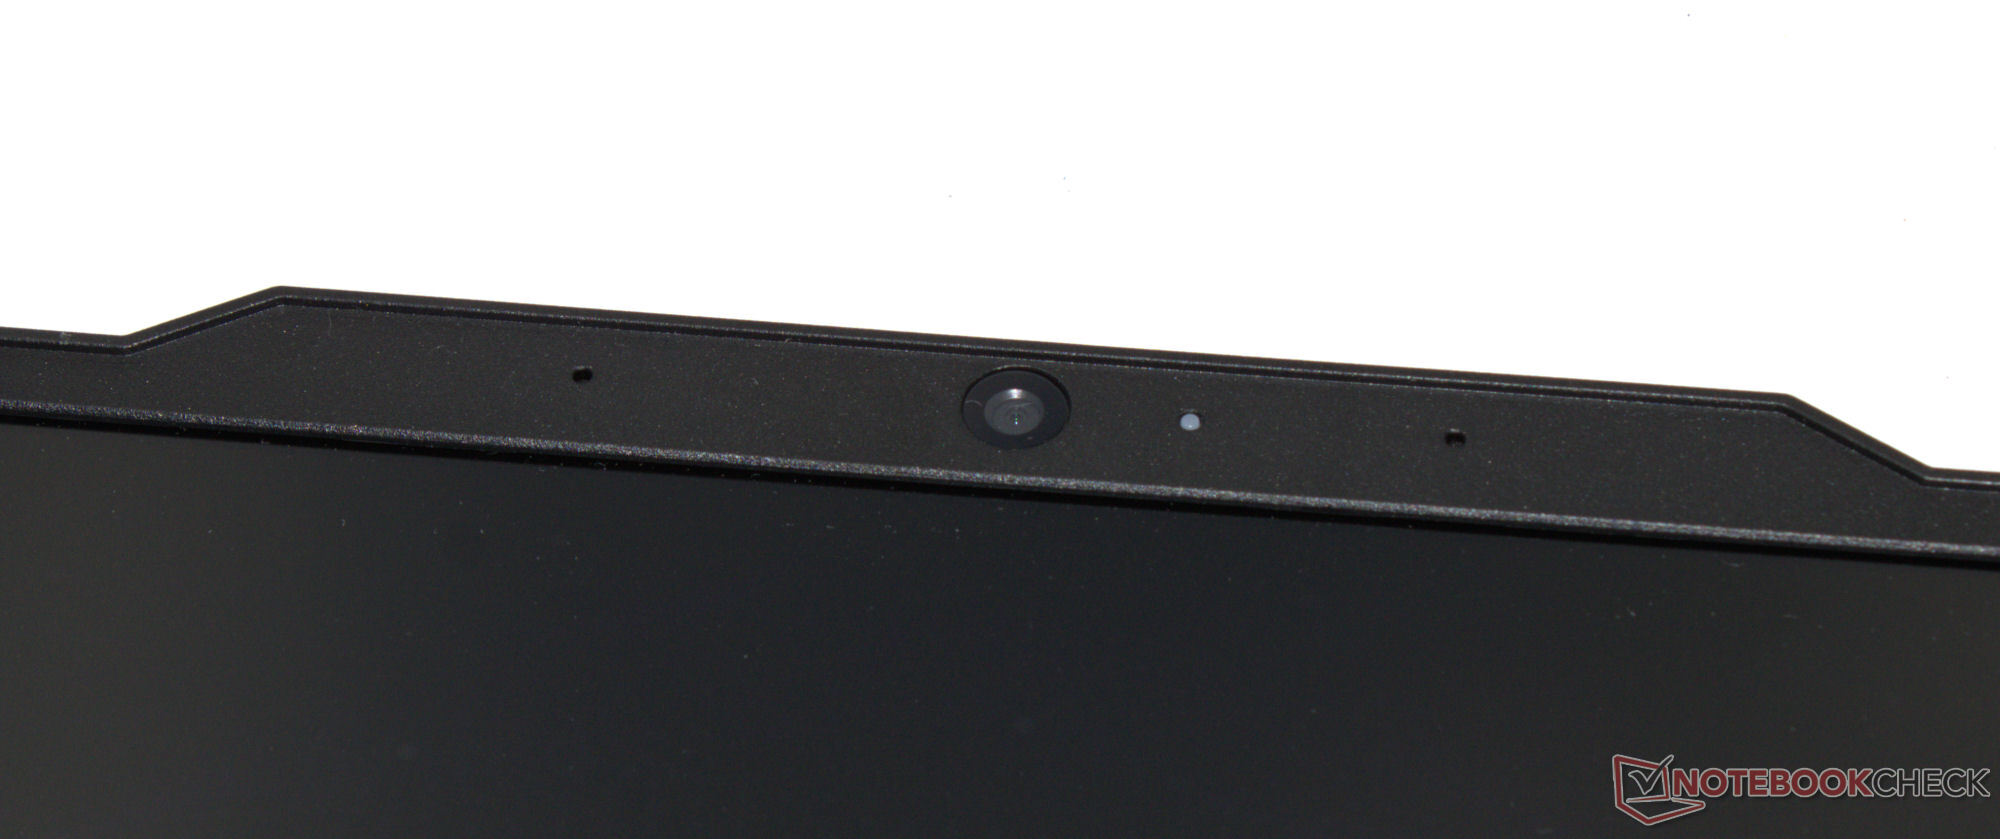
Tres conexiones USB-A (USB 3.2 Gen 1) así como un puerto USB-C (USB 3.2 Gen 2) deberían ser suficientes para la mayoría de los usuarios. Este último admite Power Delivery y el modo Display ALT. En total, el portátil cuenta con dos salidas de vídeo (1x HDMI, 1x DP). Su cámara web (2,1 MP, con interruptor de encendido/apagado) ofrece unos resultados medios. Lenovo no ha considerado necesario un lector de tarjetas SD.
Las velocidades de datos WiFi que medimos son sólidas, pero se quedan por detrás de lo que es posible hoy en día. El chip Realtek WiFi 6 (RTL8852BE) del portátil de Lenovo no puede alcanzar las mismas velocidades que los chips Intel instalados en muchos de sus competidores.


Sostenibilidad
El portátil y la fuente de alimentación se embalan dentro de una bolsa de plástico cada uno, mientras que el LOQ se protege durante la transmisión mediante inserciones de espuma. Los tipos de plástico utilizados vienen indicados por el fabricante. Una cubierta de papel protege la fuente de alimentación de posibles arañazos. Todo ello está alojado dentro de una caja de cartón -según el etiquetado, la madera que se ha utilizado procede de silvicultura sostenible.
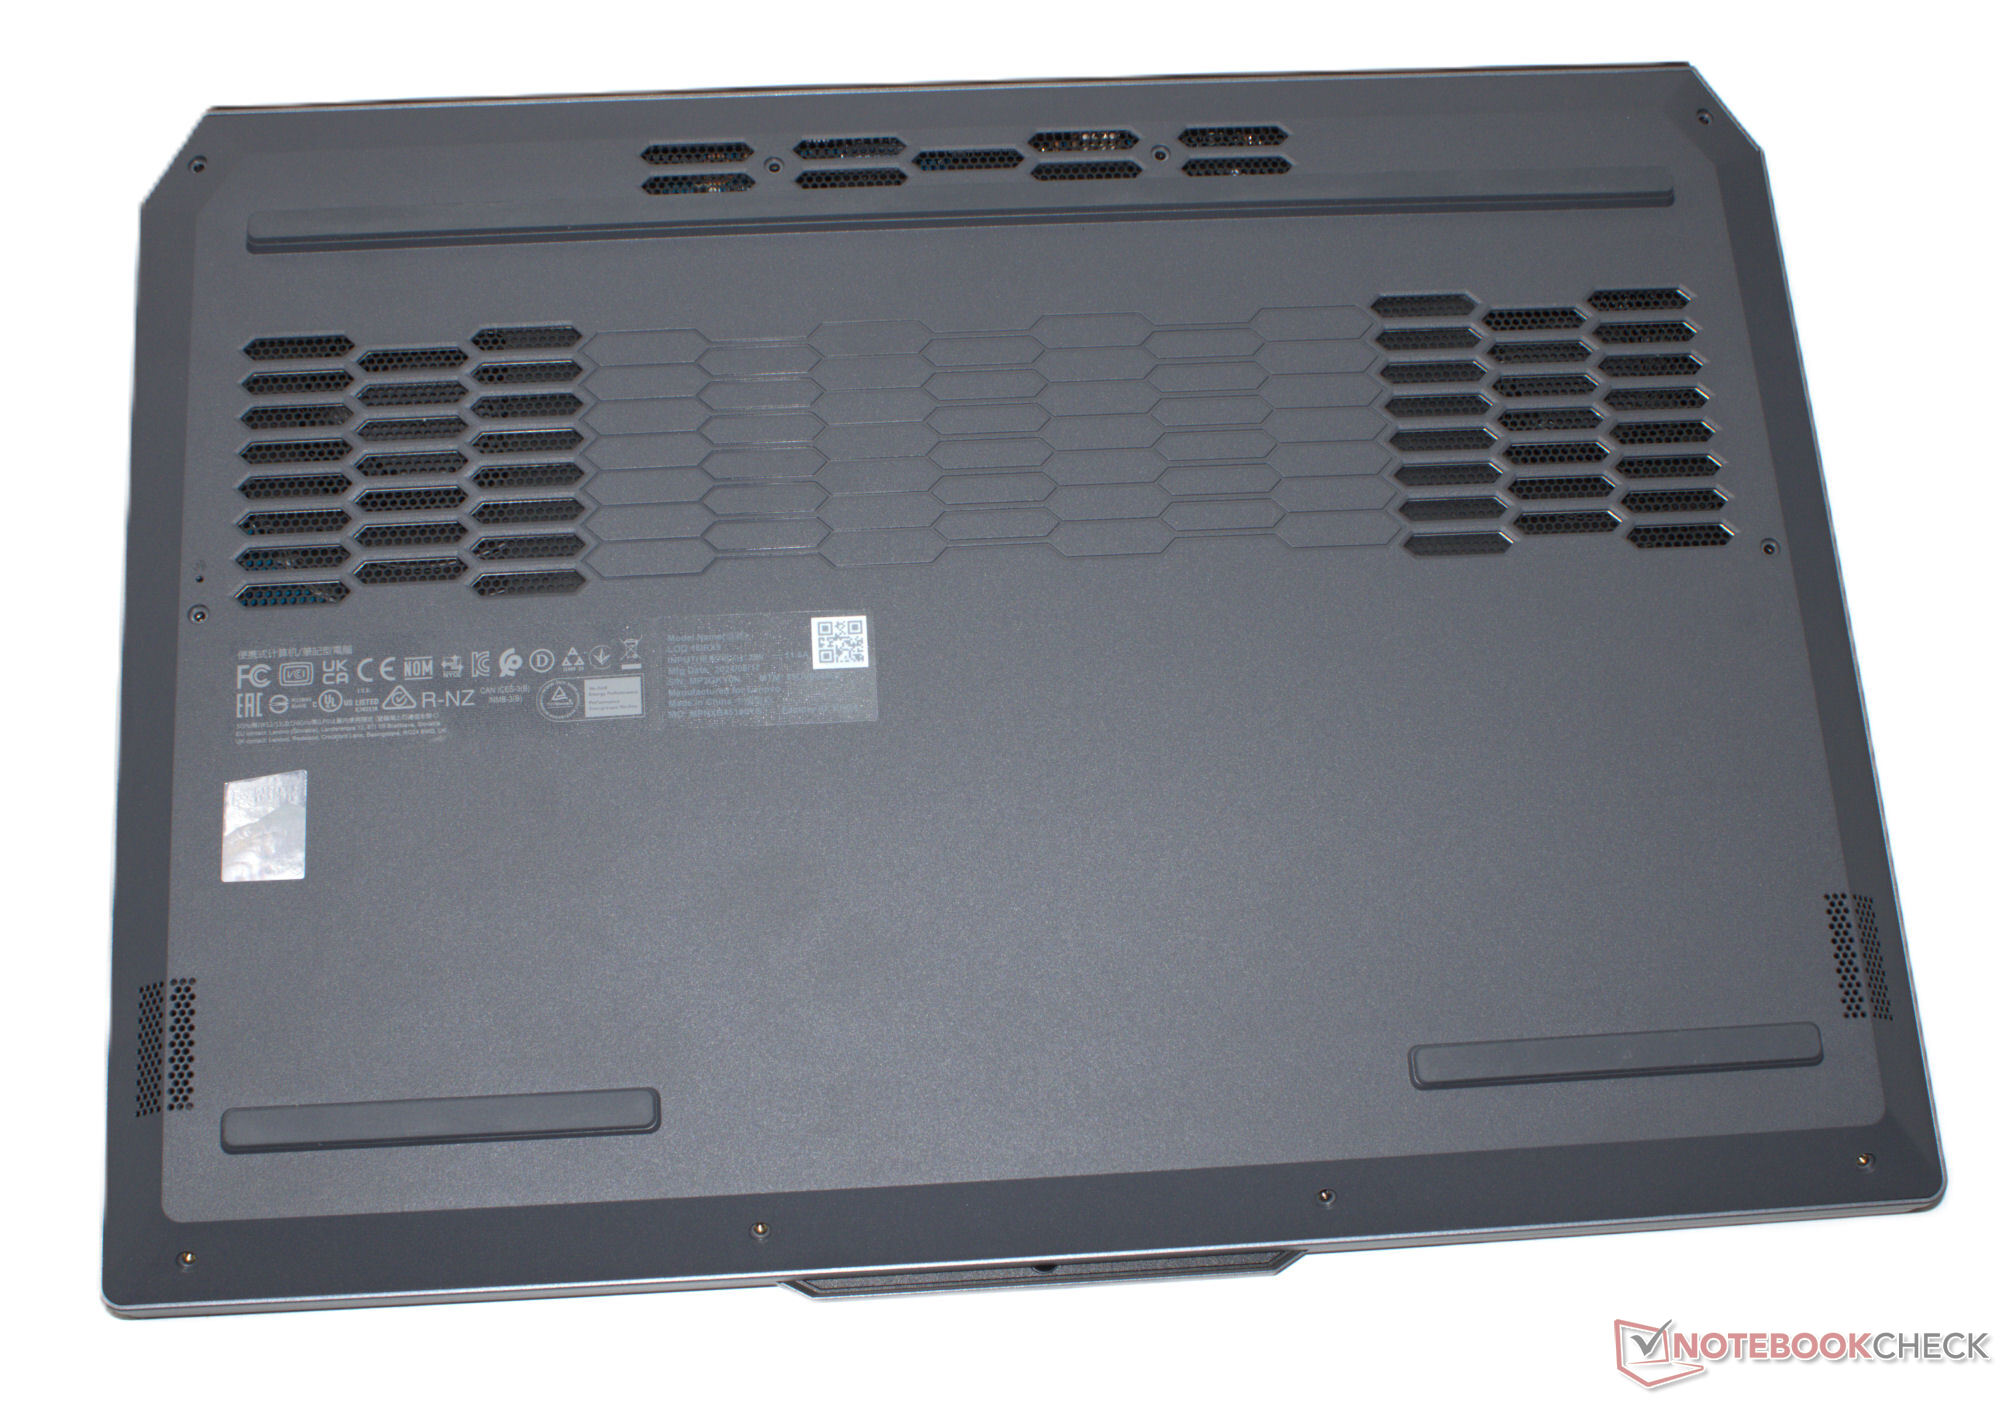
La reparación del aparato debería ser bastante sencilla: La placa inferior puede retirarse sin problemas, lo que le permite acceder a todo el hardware. No encontramos ninguna pieza pegada en el interior de la carcasa. Al utilizar Windows 11 como sistema operativo, las actualizaciones de software deberían estar garantizadas para los próximos años. El soporte de Lenovo finaliza el 31 de diciembre de 2029.
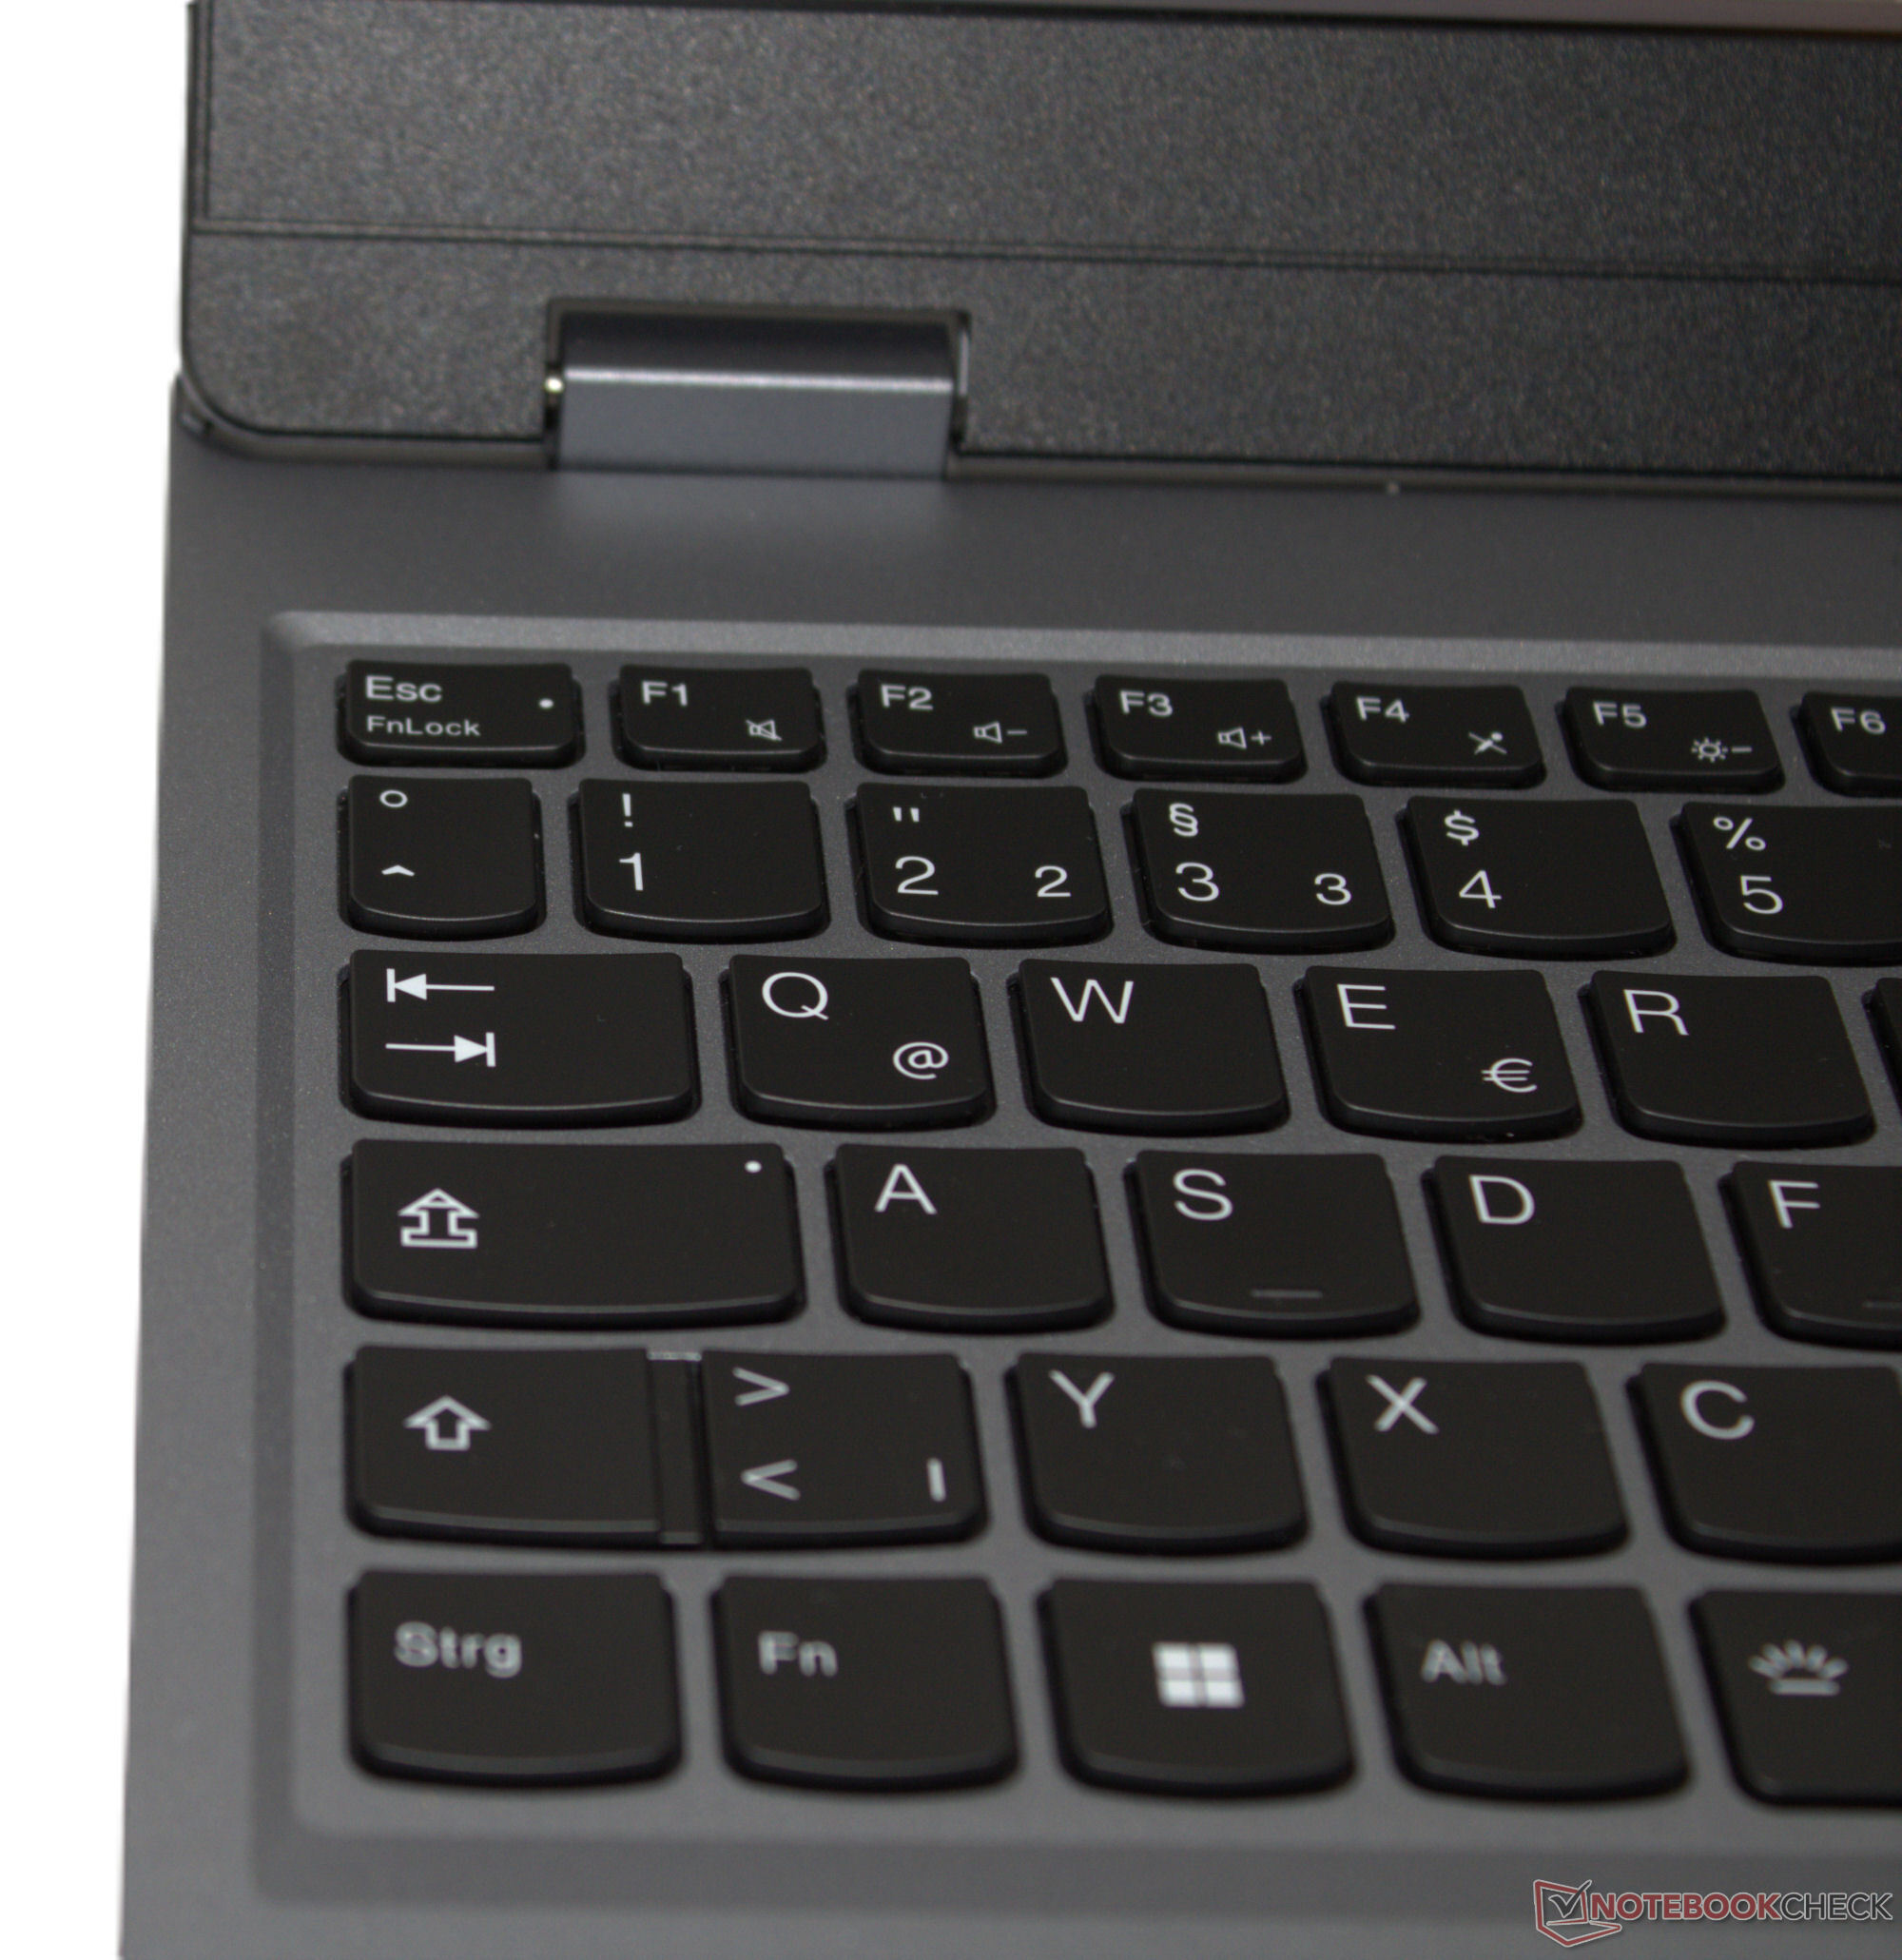
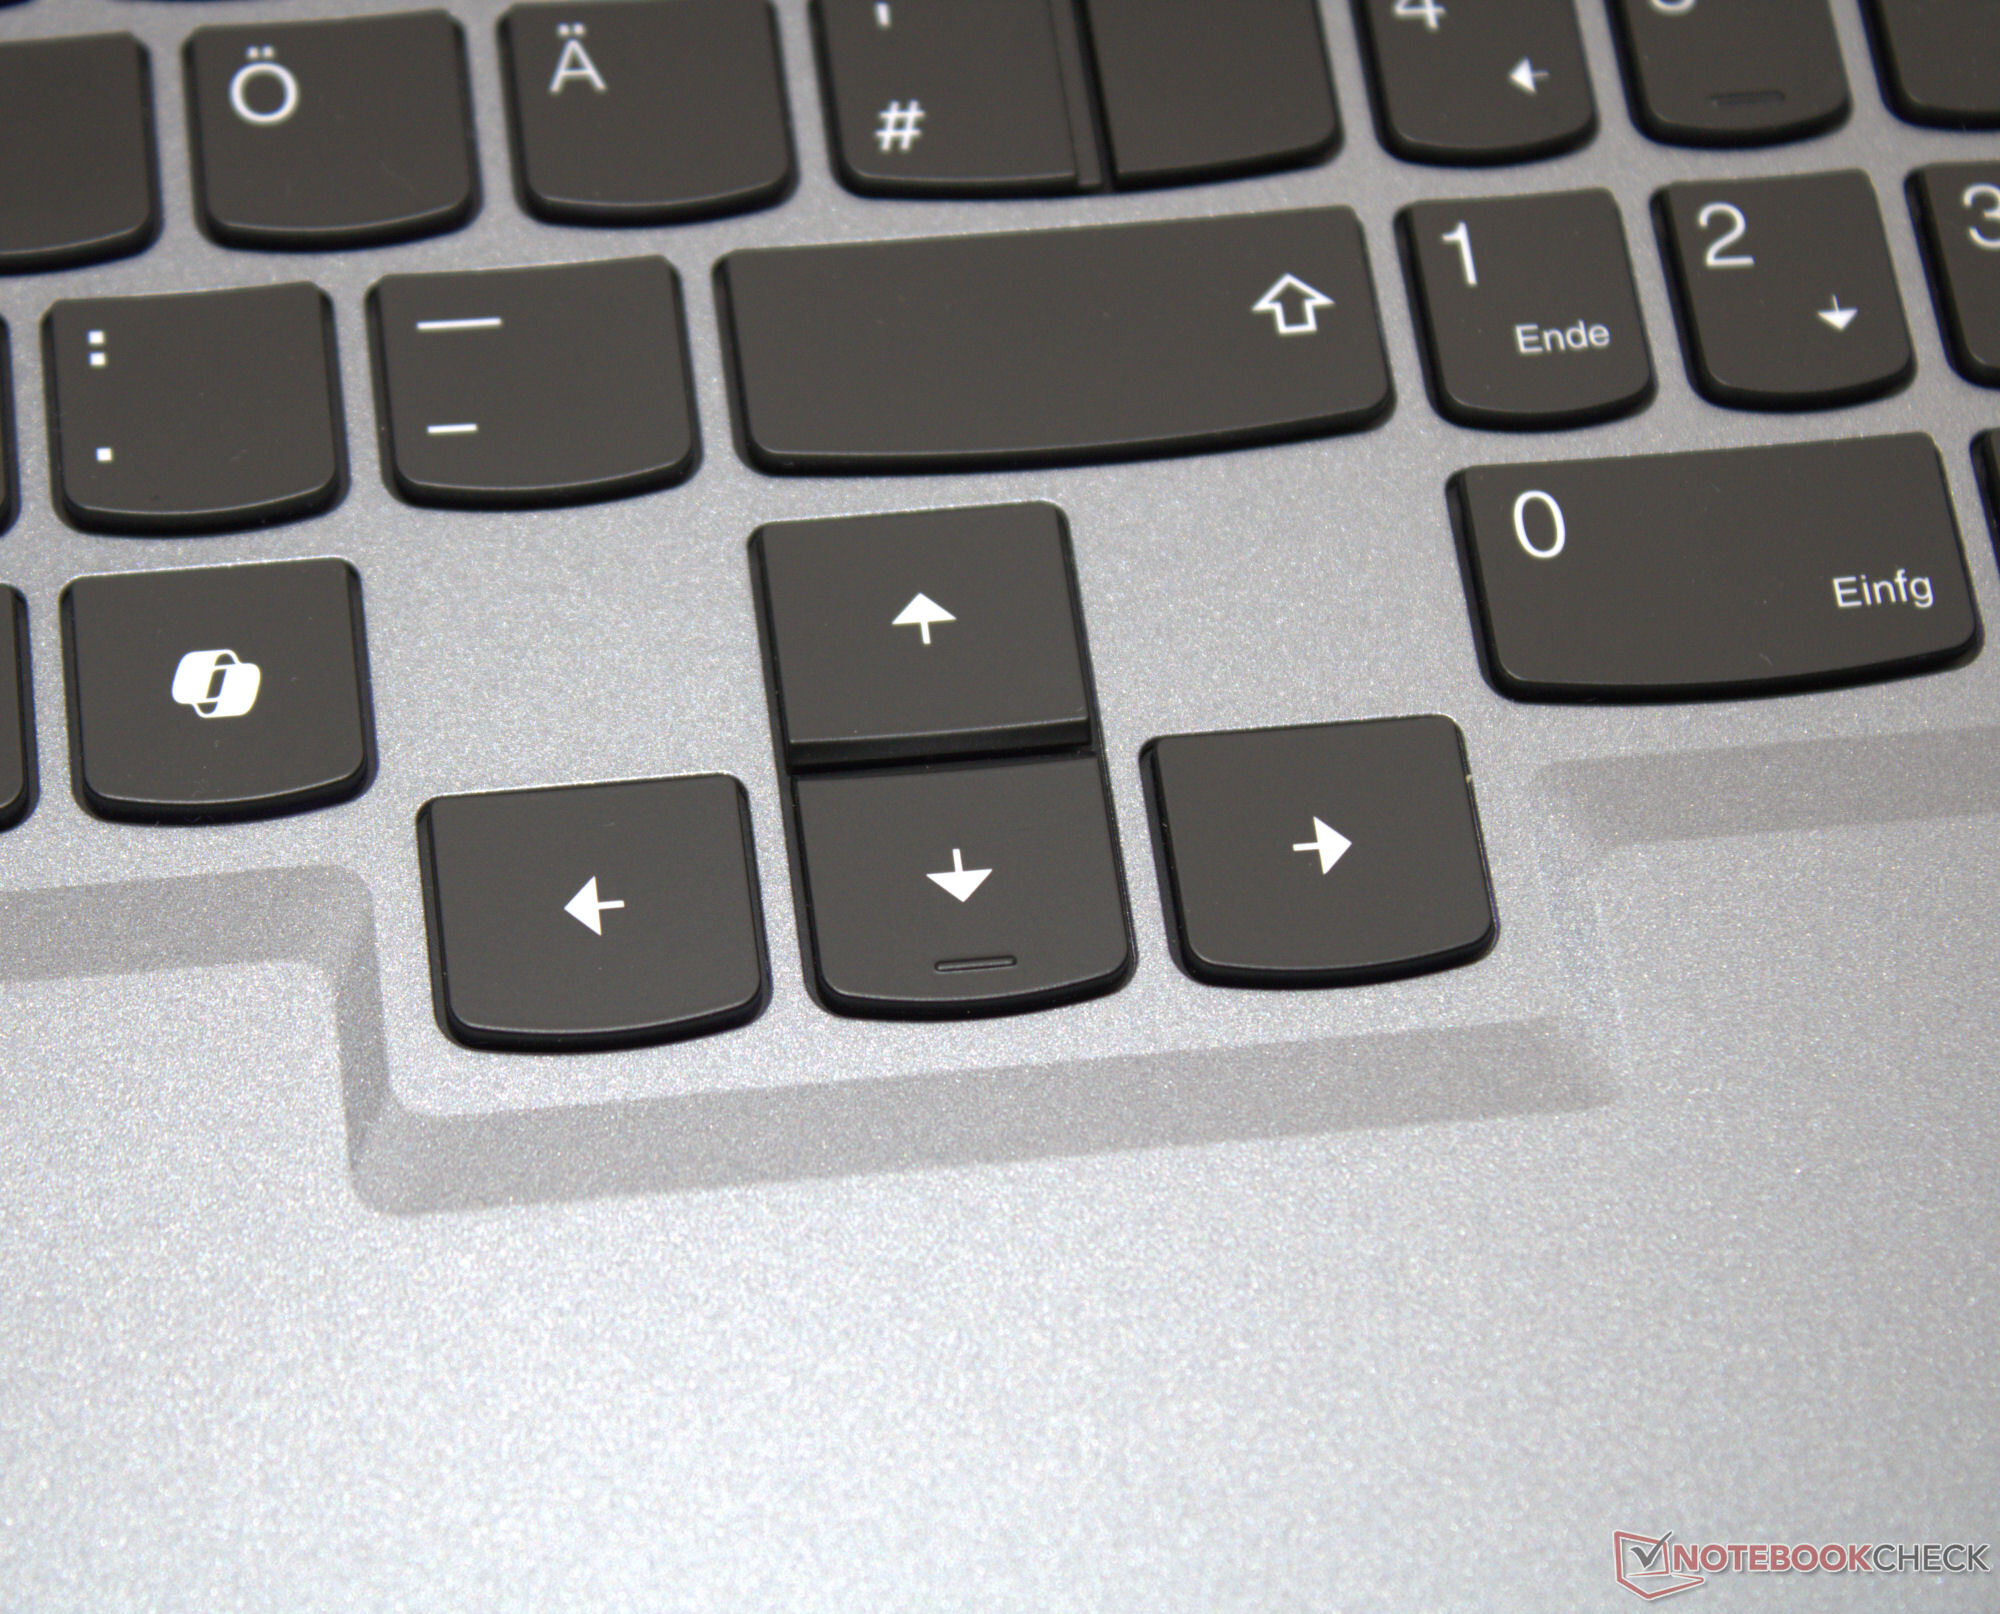
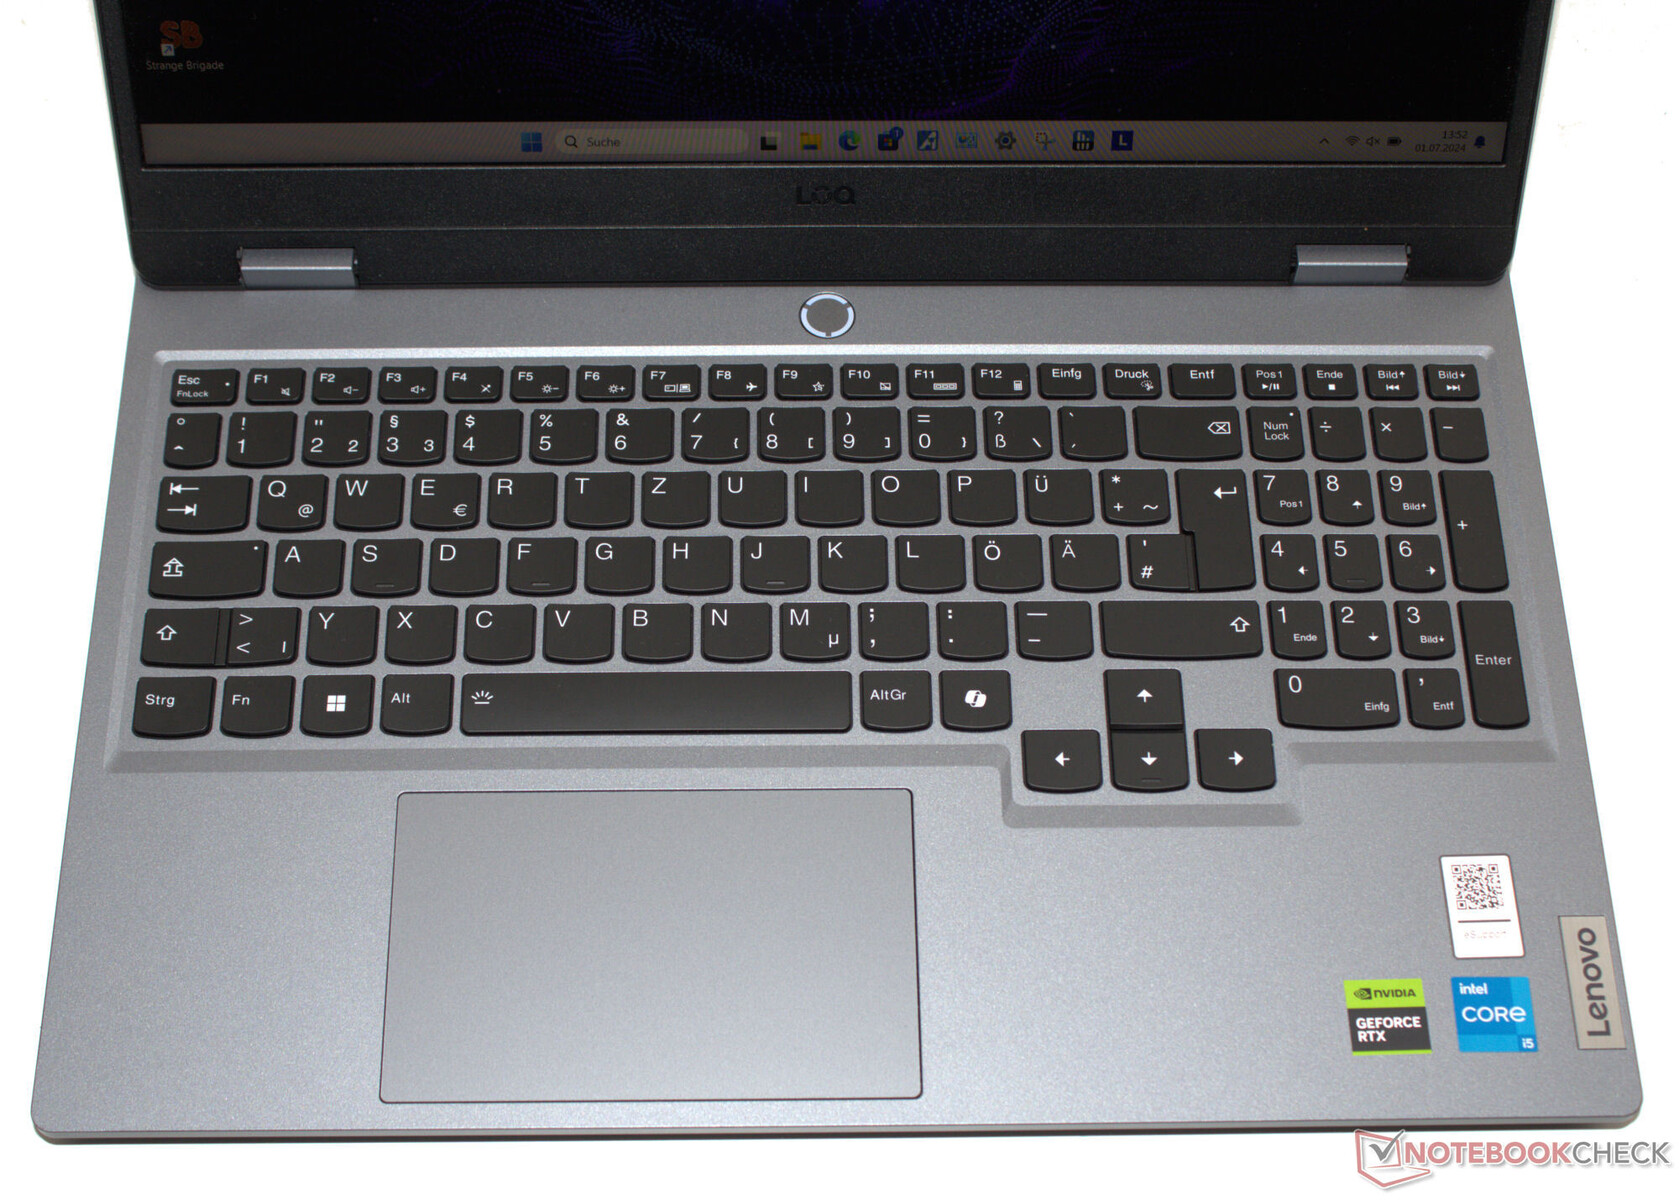
Dispositivos de entrada - El portátil Lenovo cuenta con teclas de flecha grandes
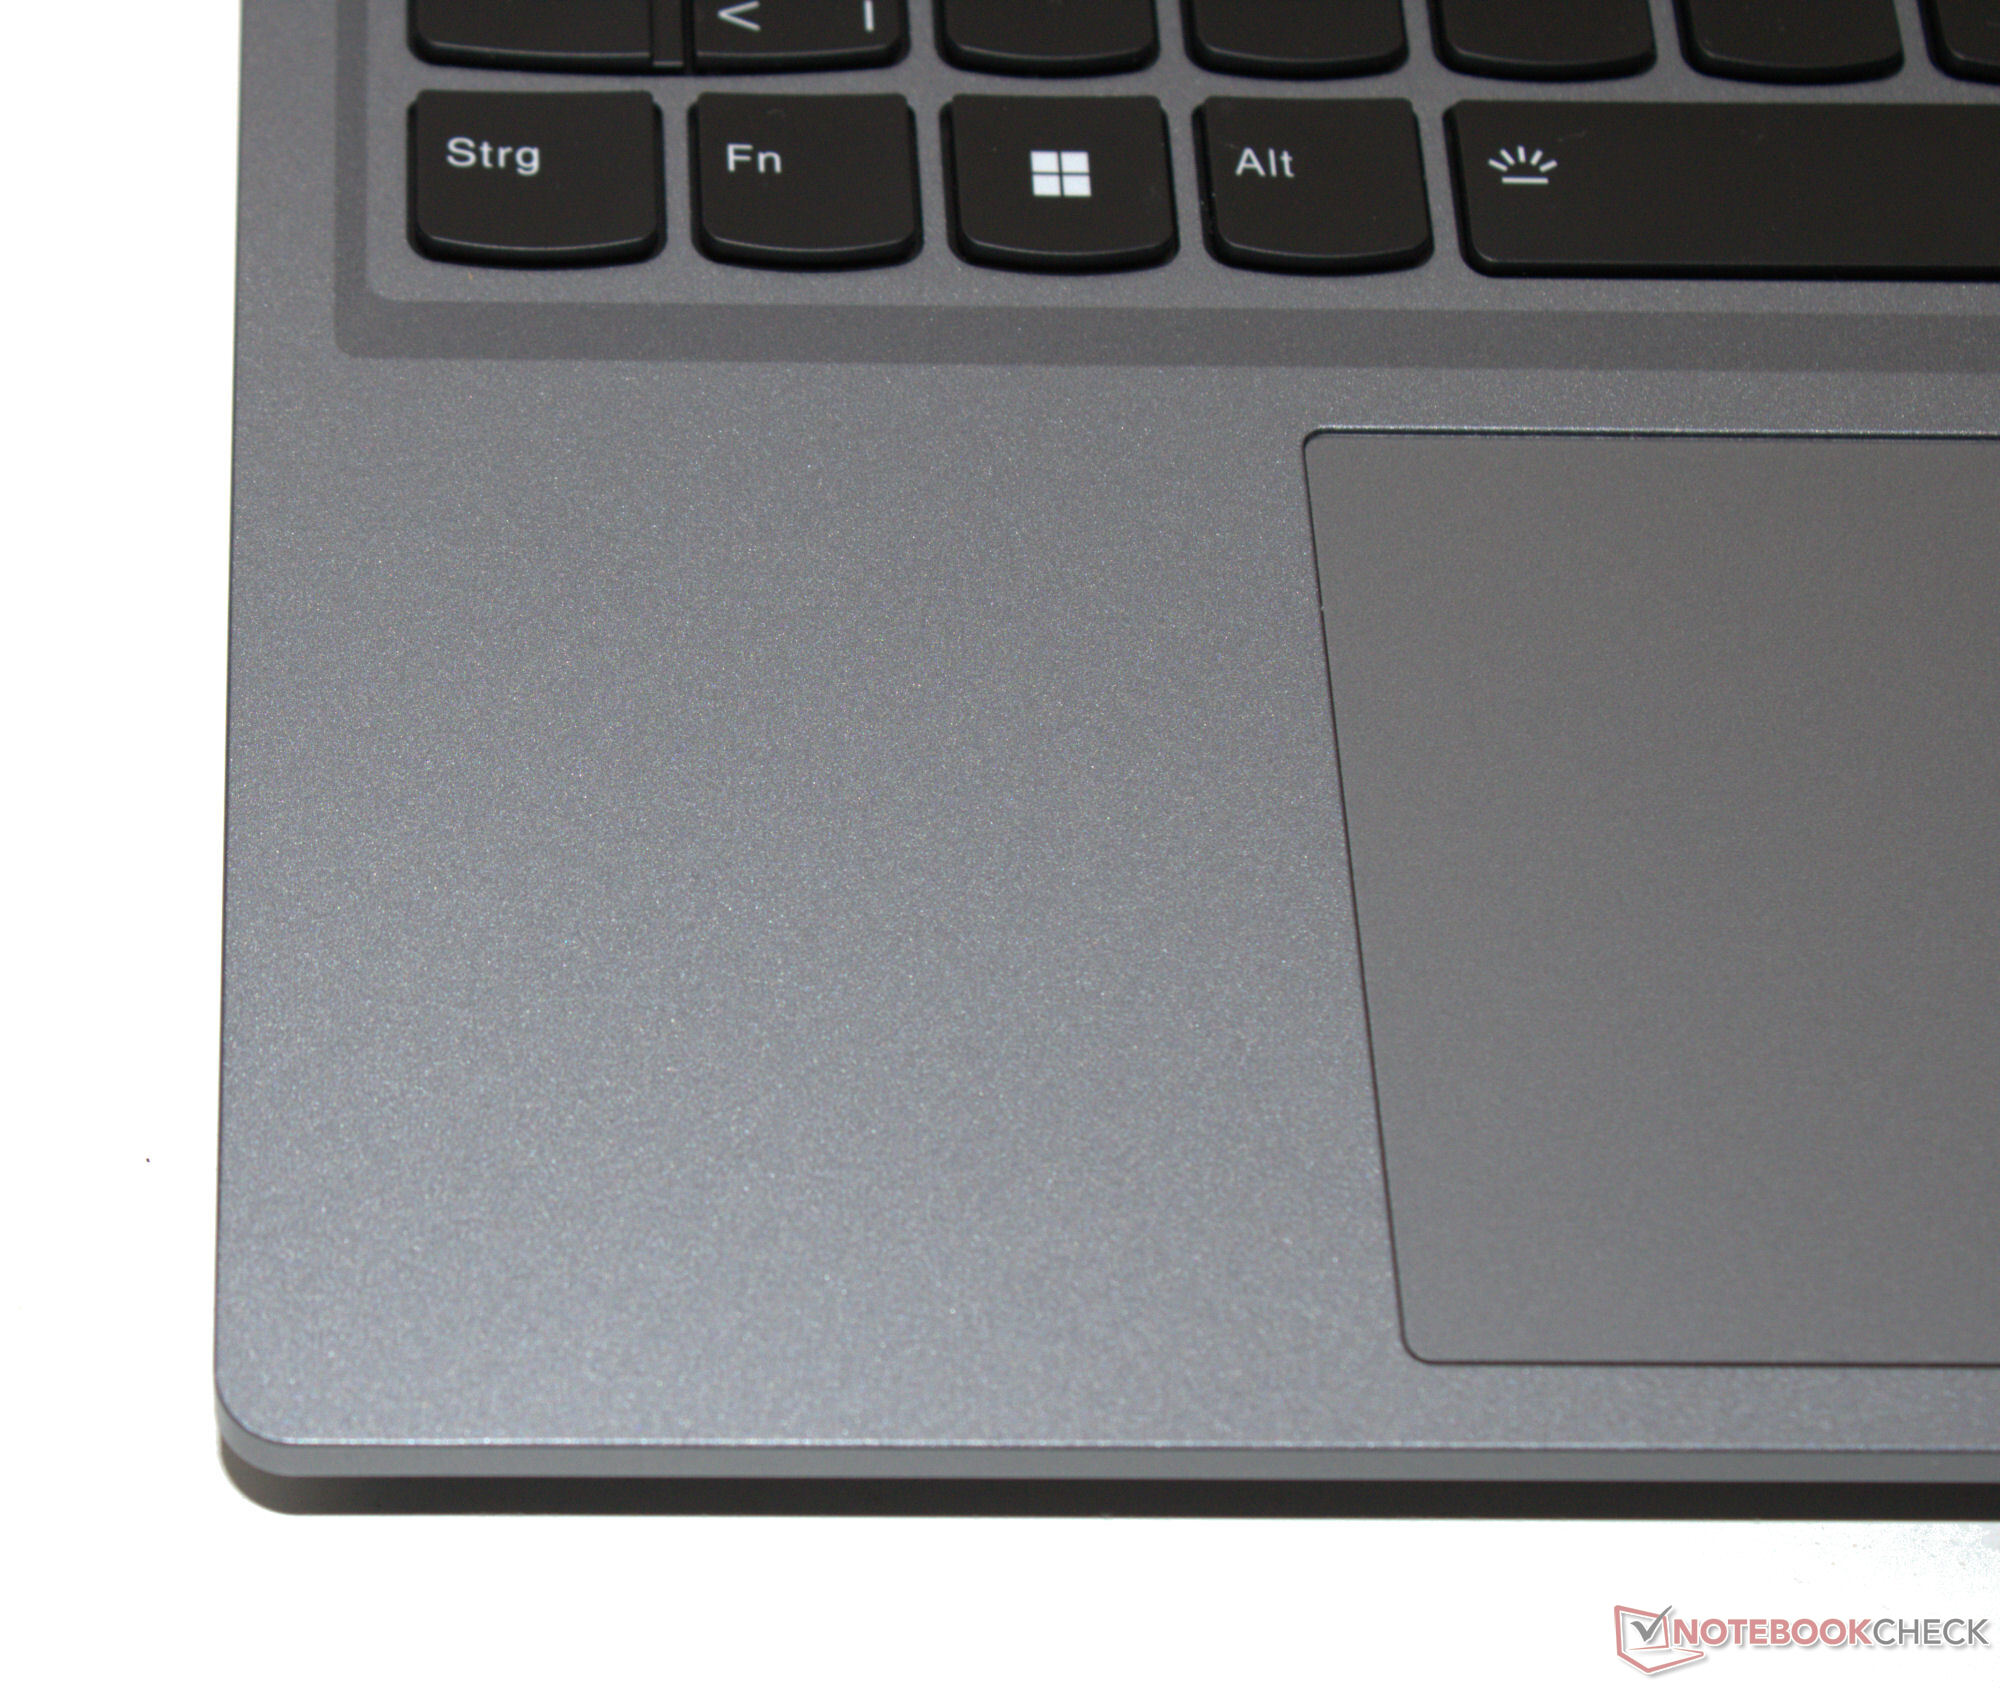
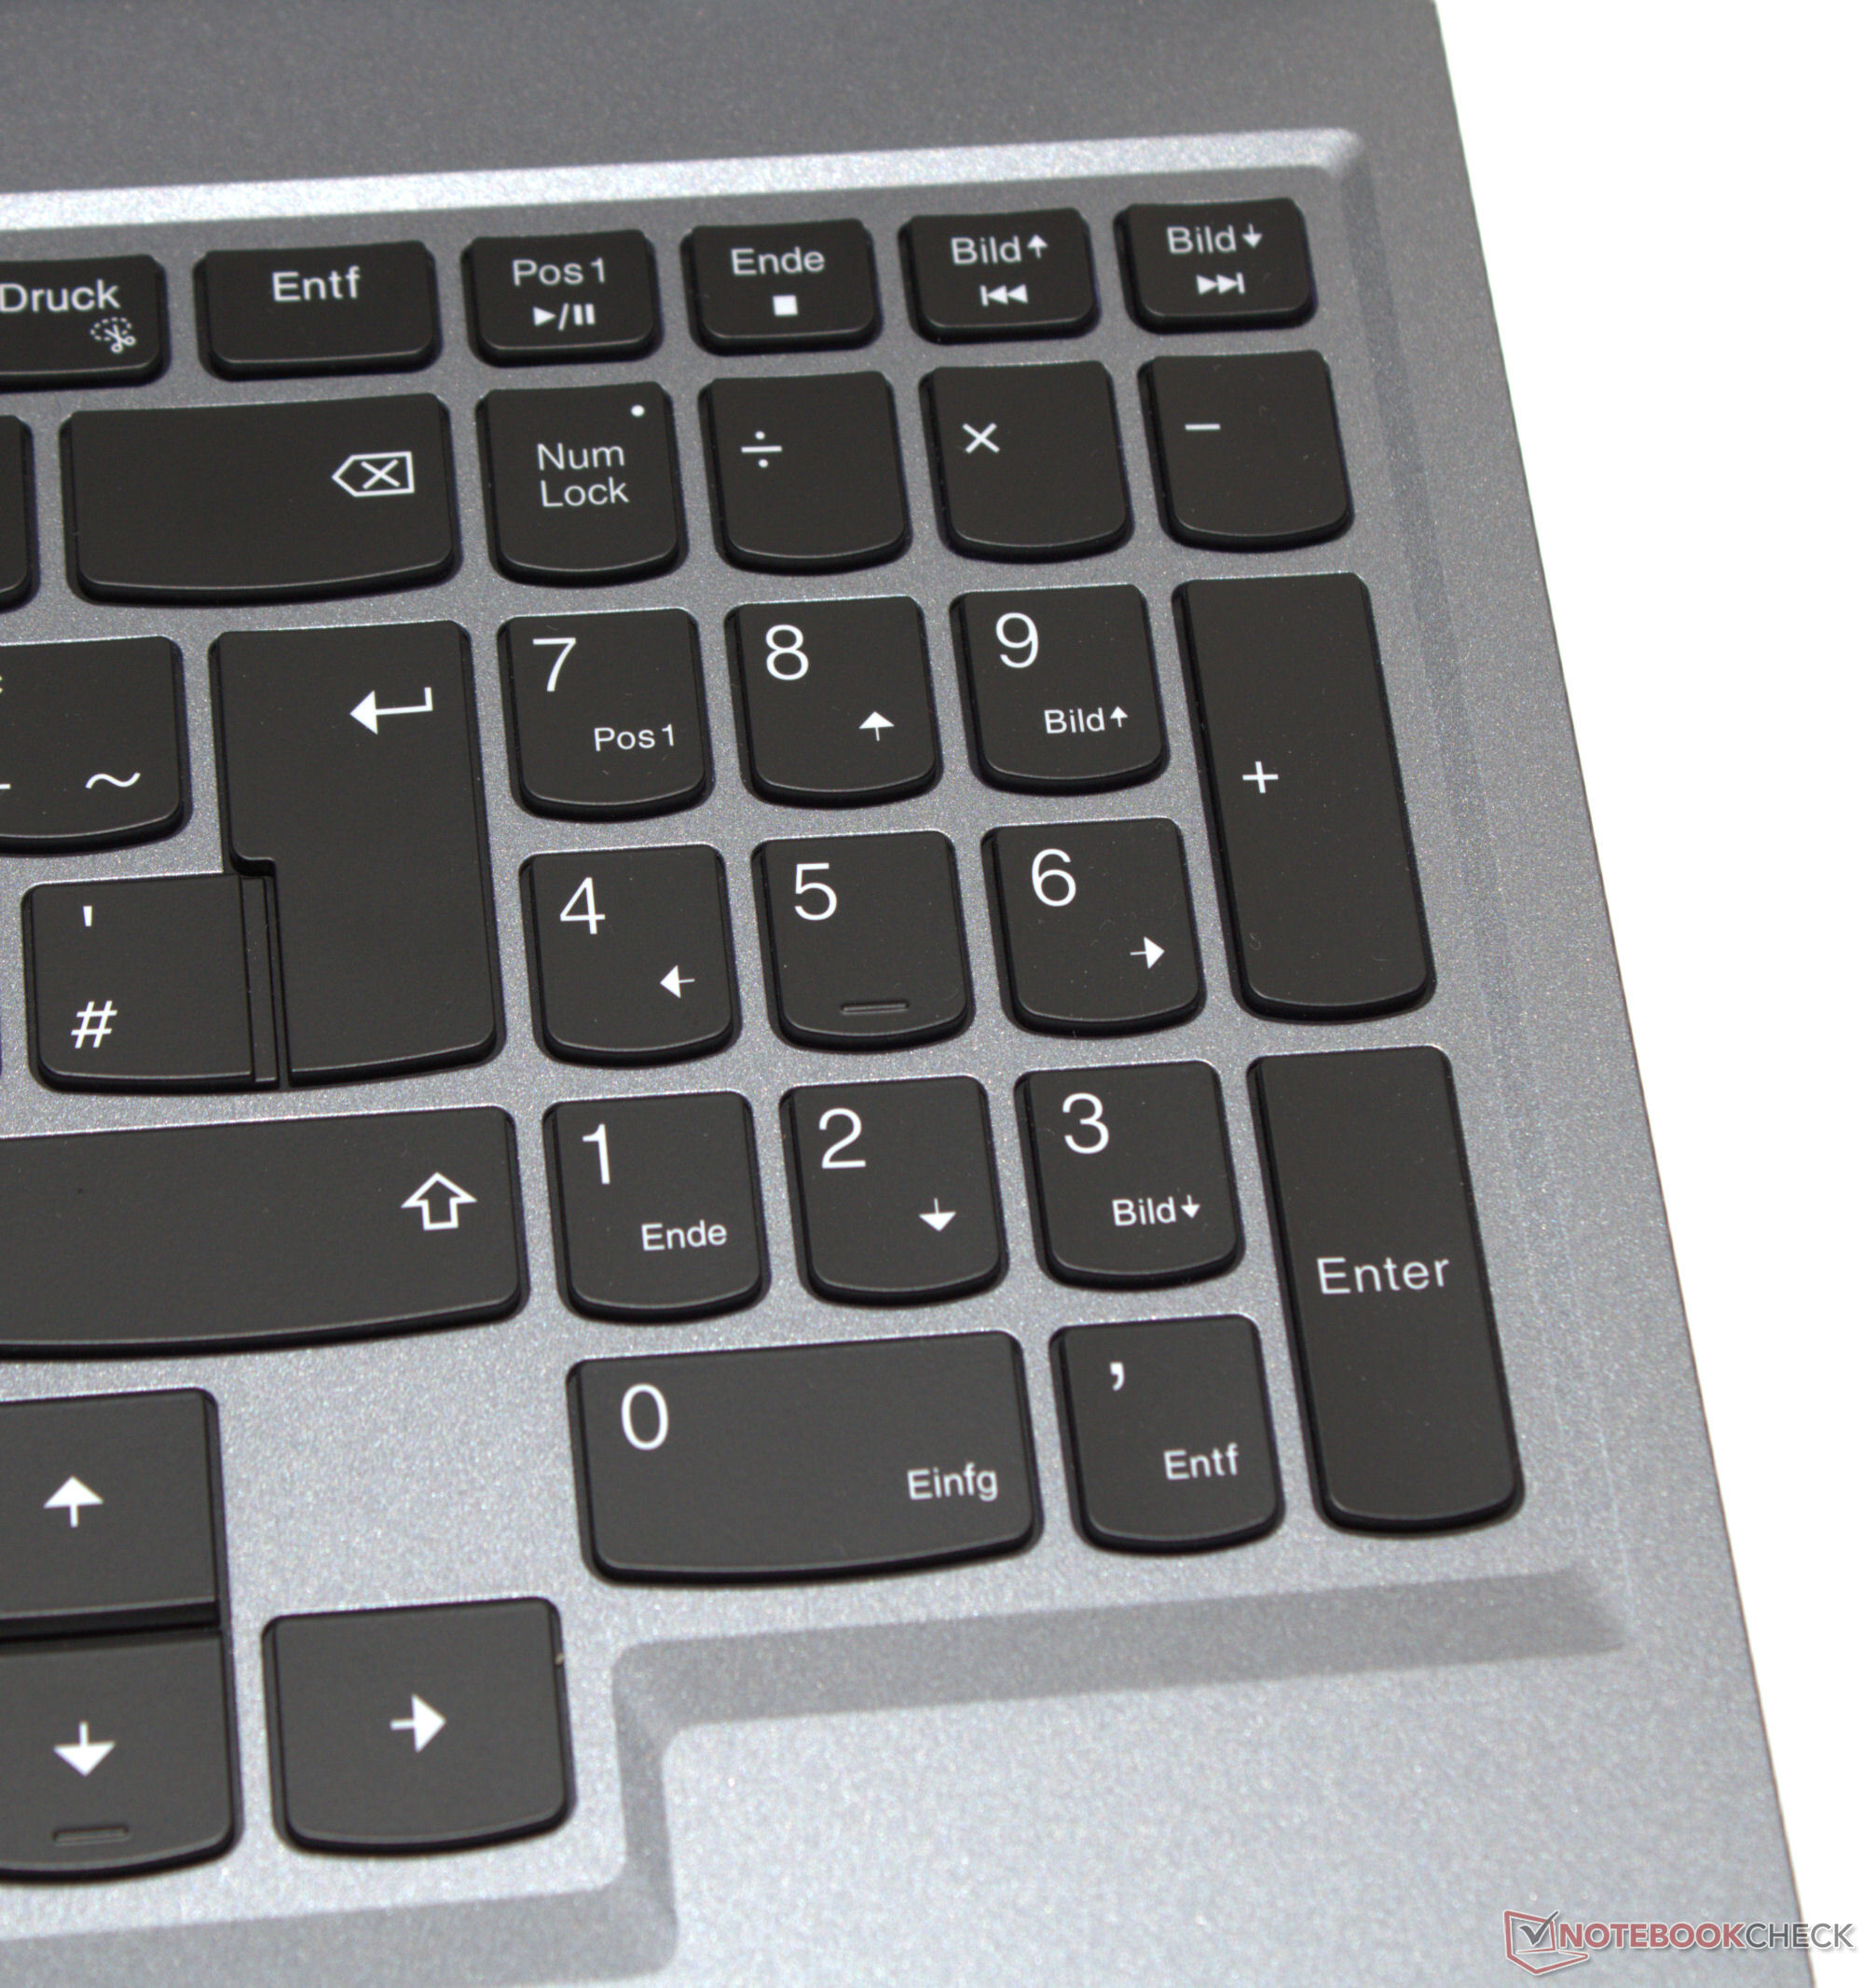
El teclado chiclet con retroiluminación blanca se extiende por todo el ancho del portátil y, además, incorpora un teclado numérico. La forma y disposición de las teclas se corresponden con la conocida distribución de Lenovo. Las teclas cóncavas ofrecen una resistencia agradable y un punto de presión claro. El teclado cede ligeramente al escribir, pero no es un problema. Un punto positivo: Las teclas de flecha desplazadas y de tamaño normal son cómodas de usar. Un clickpad multitáctil (aprox. 12 x 7,5 cm) con una elevación corta y un punto de presión claro sirve como sustituto del ratón.
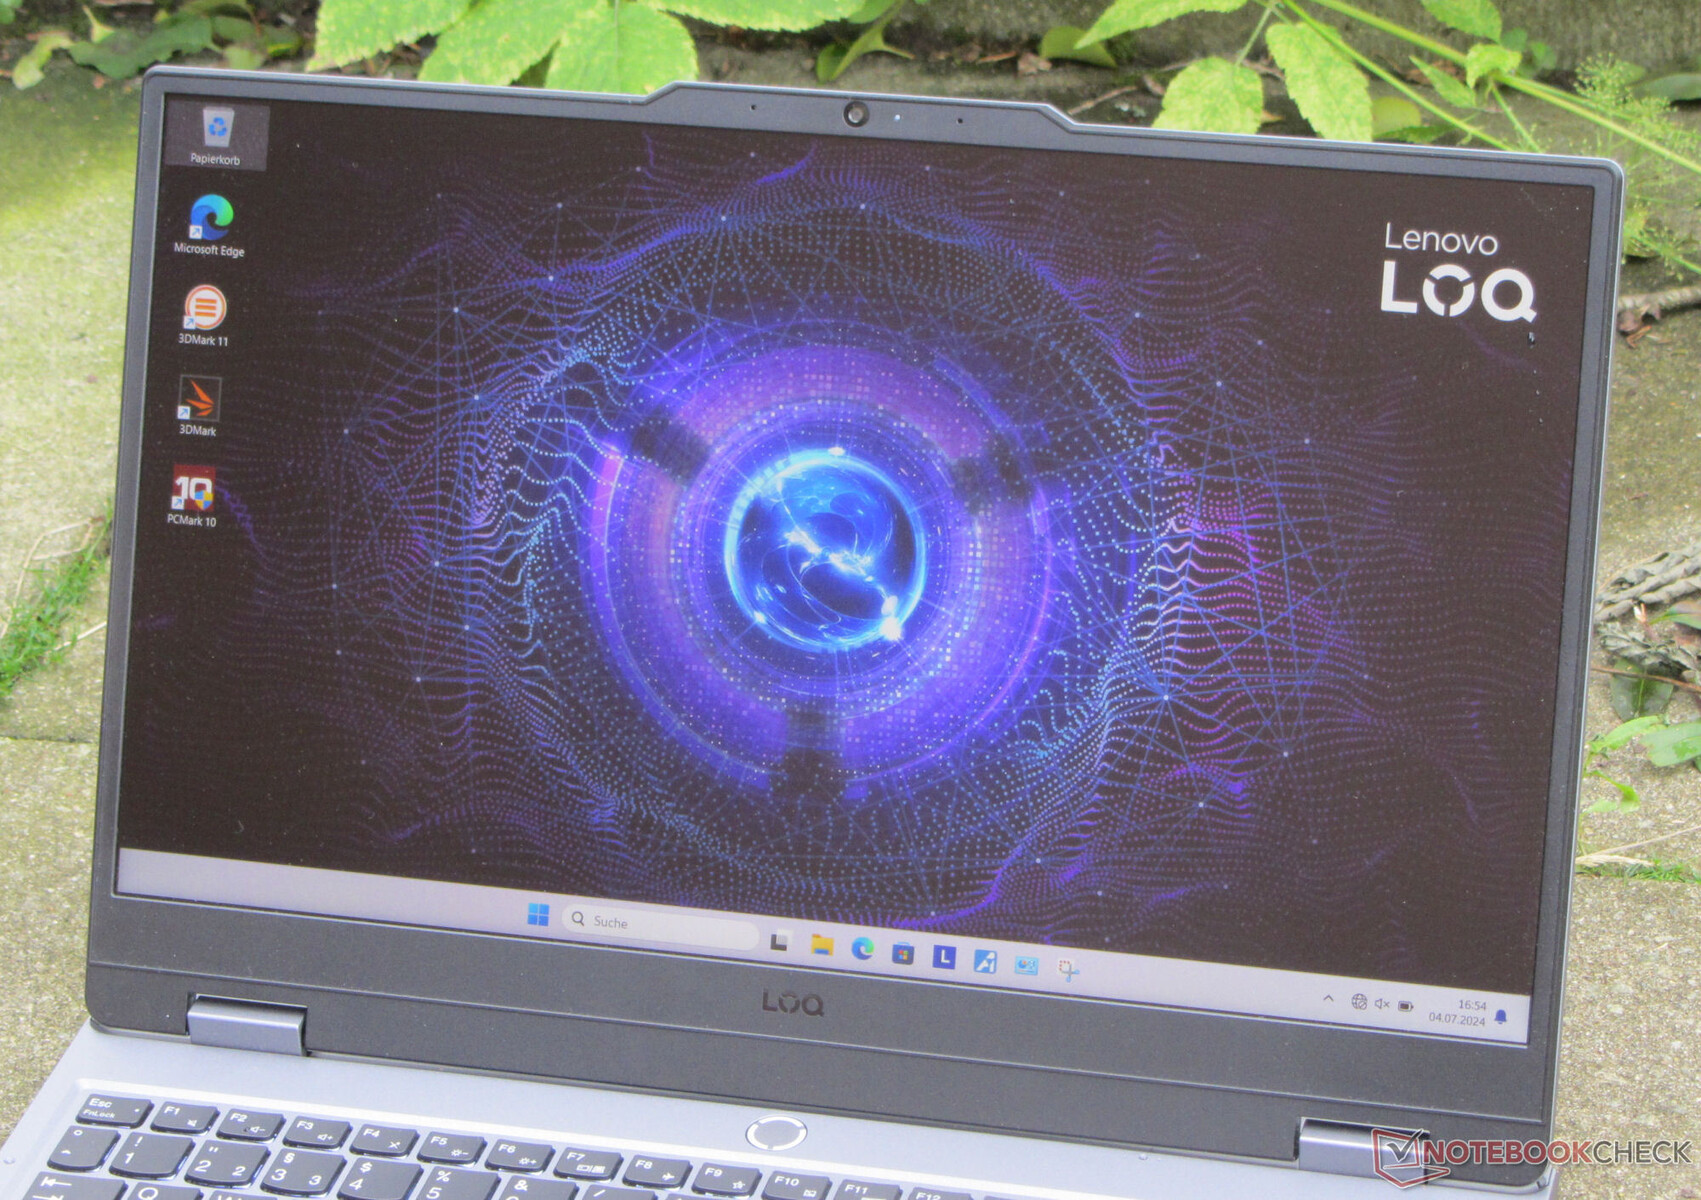
Pantalla - IPS a bordo
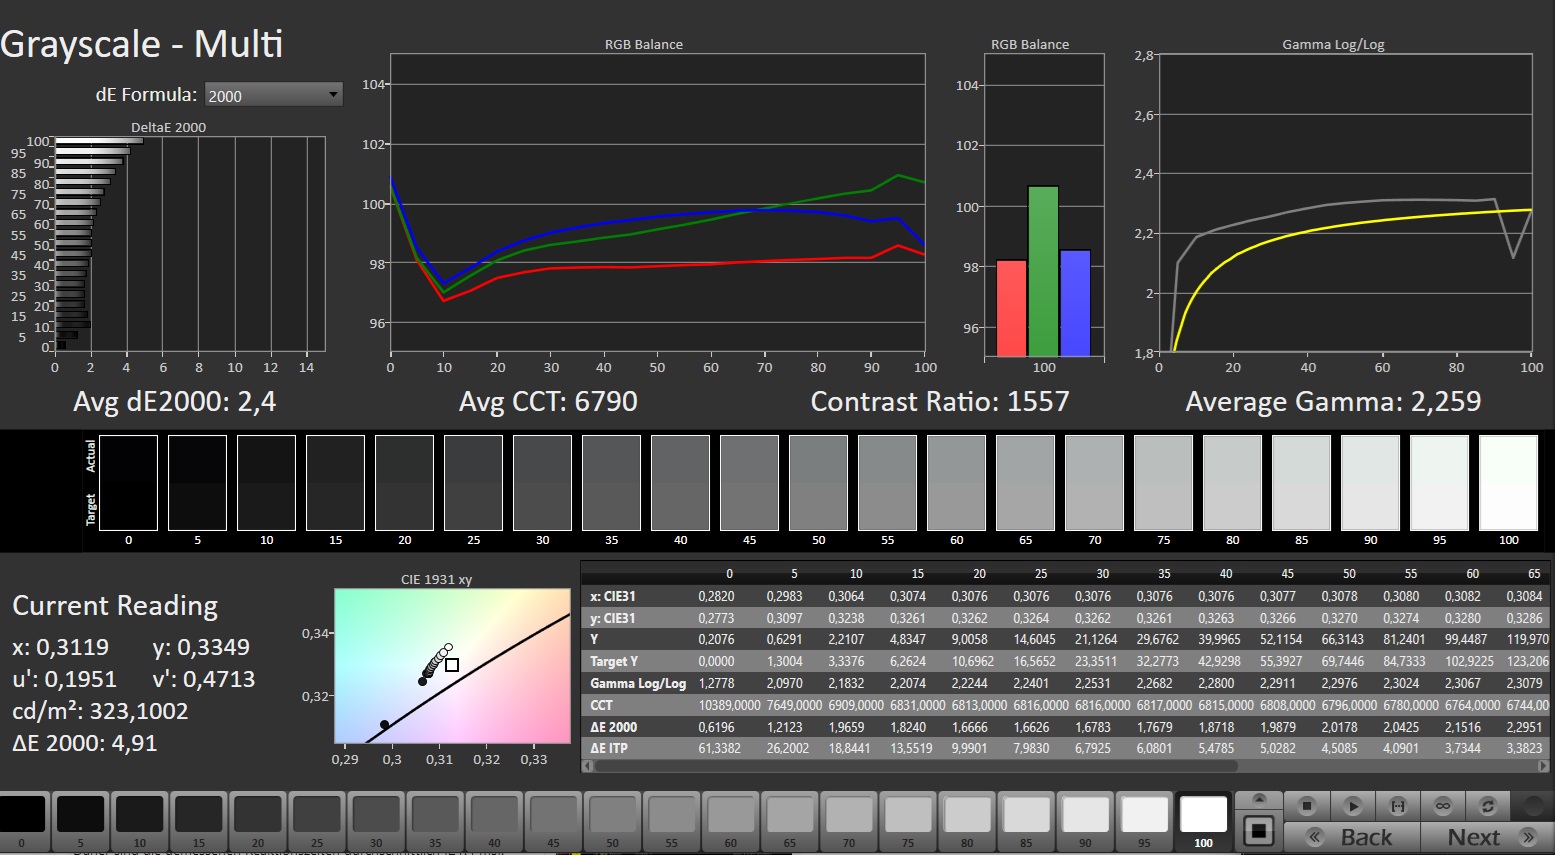
Lenovo ha equipado el LOQ con un panel de 144 Hz (FHD, IPS) con ángulo de visión estable y una relación de aspecto de 16:9 que incluye compatibilidad con G-Sync. Los buenos contrastes se ven contrarrestados por un brillo máximo ligeramente demasiado bajo. En general, la pantalla está diseñada para su uso en interiores, pero también podría leerse desde el exterior en condiciones climáticas adecuadas. No se detectó parpadeo PWM en nuestra prueba.

| |||||||||||||||||||||||||
iluminación: 88 %
Brillo con batería: 306 cd/m²
Contraste: 1457:1 (Negro: 0.21 cd/m²)
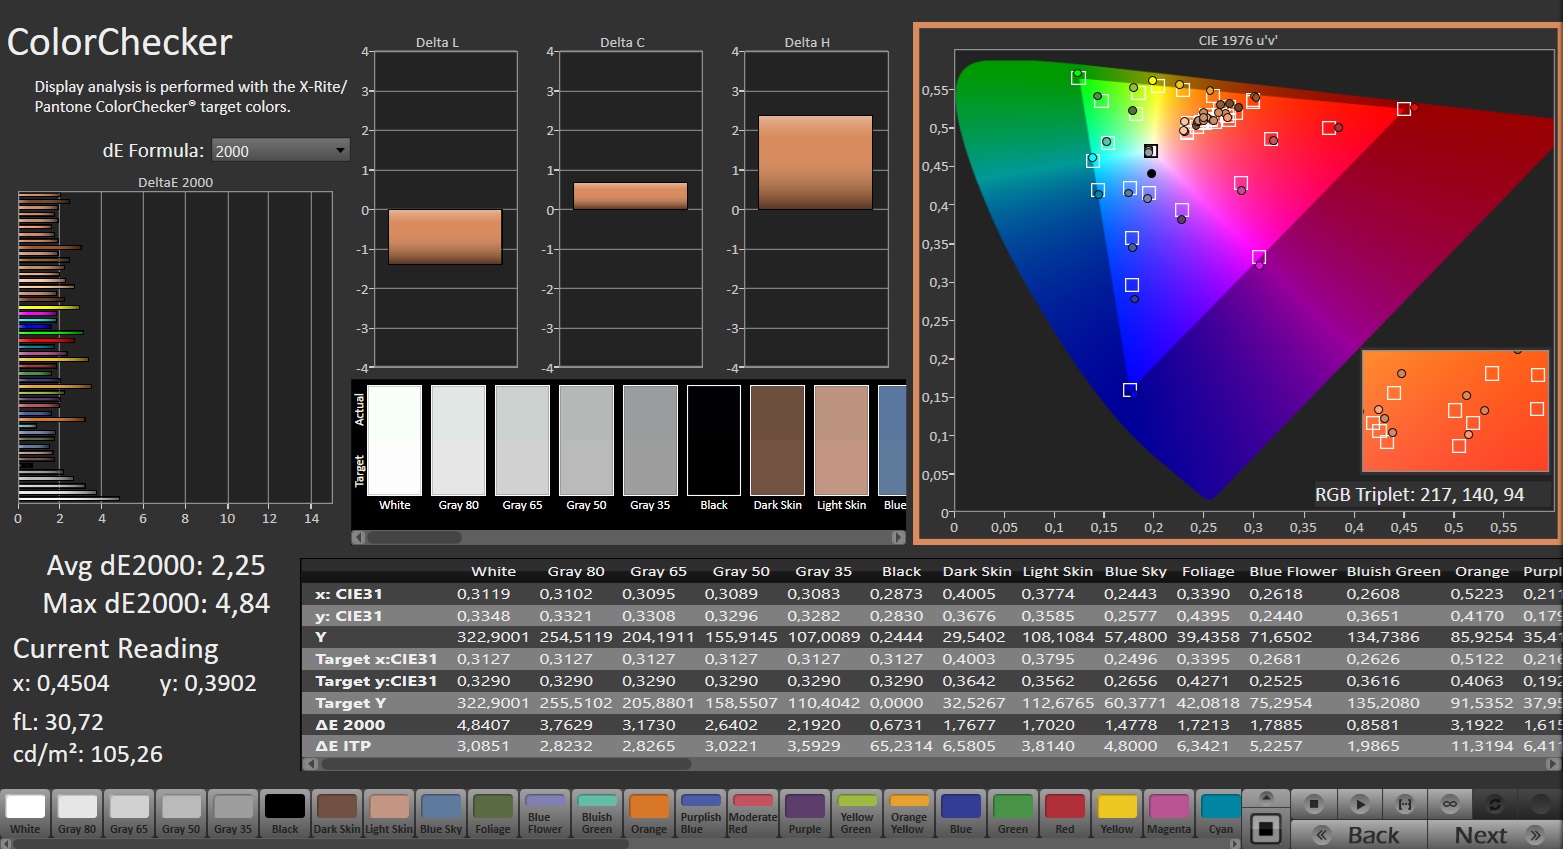
ΔE Color 2.25 | 0.5-29.43 Ø4.87, calibrated: 1.45
ΔE Greyscale 2.4 | 0.5-98 Ø5.1
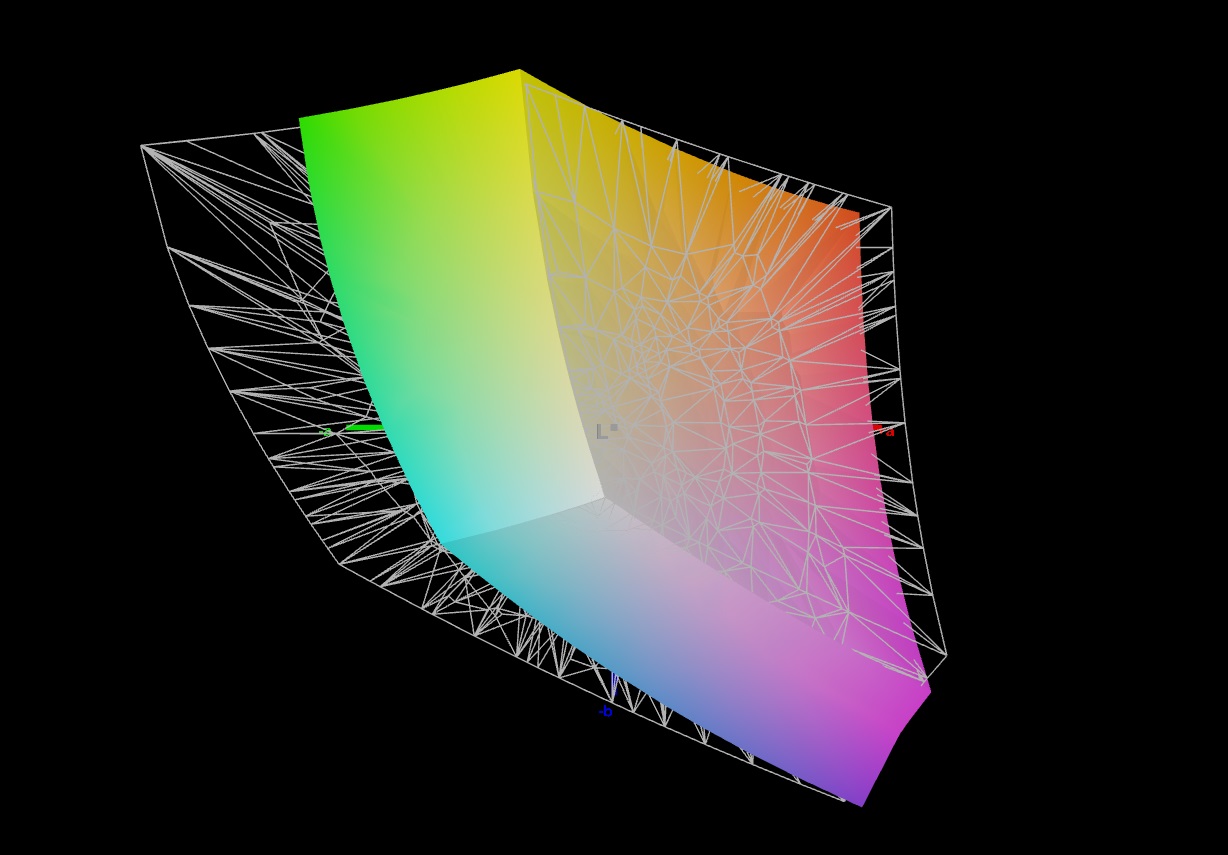
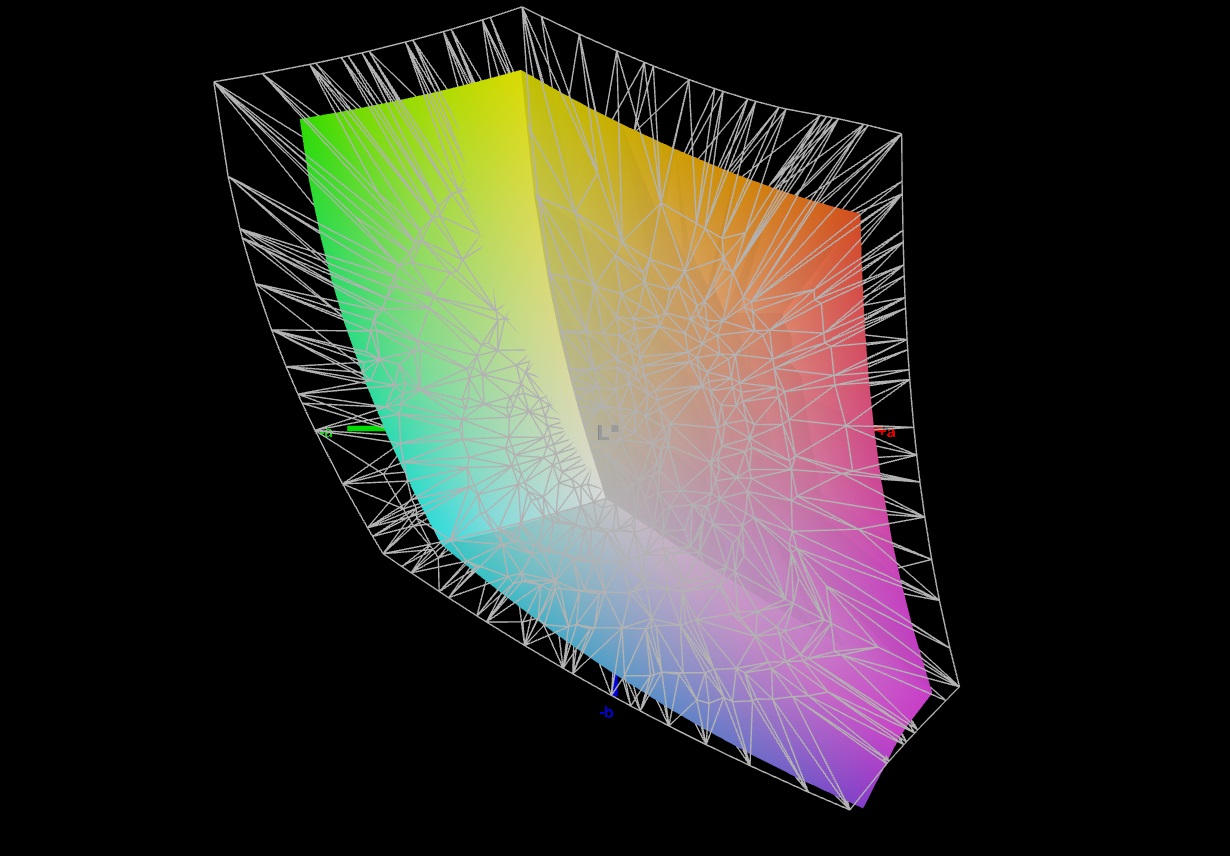
72.6% AdobeRGB 1998 (Argyll 2.2.0 3D)
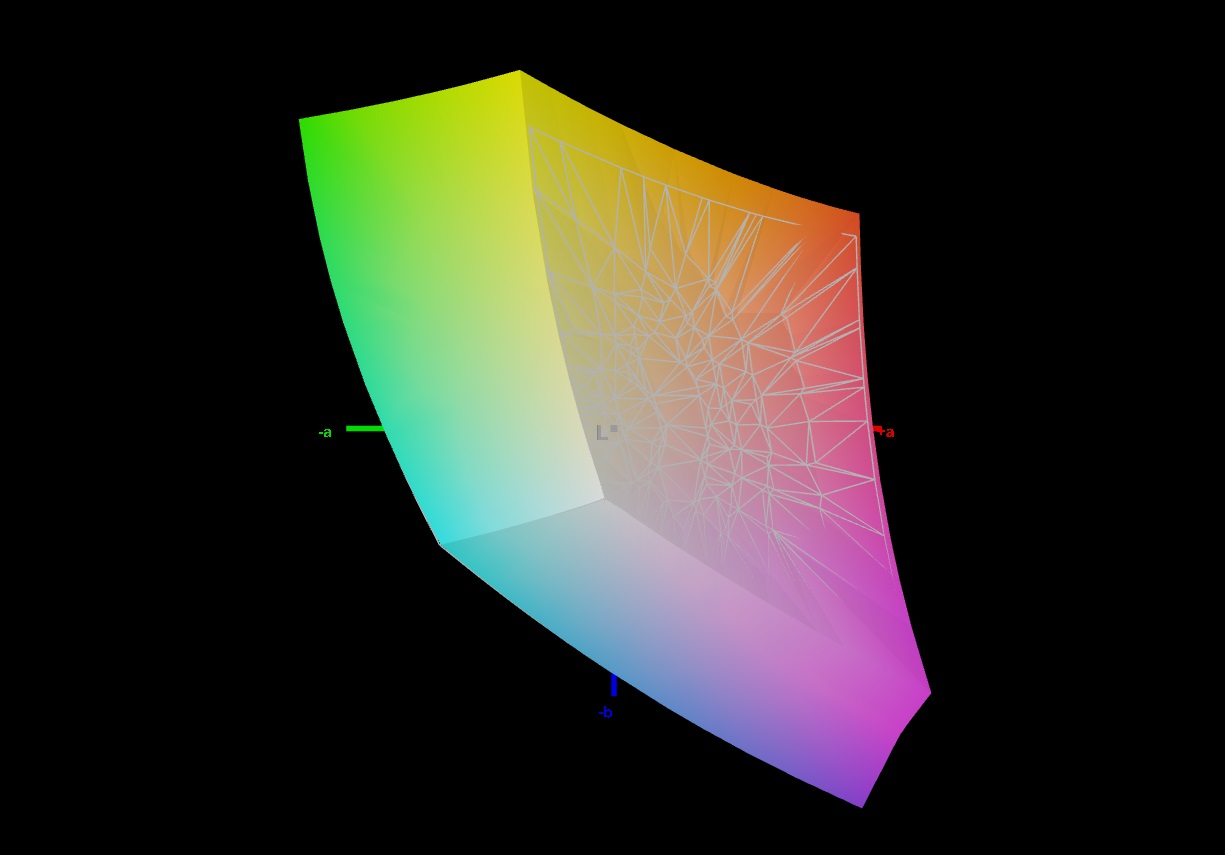
99.1% sRGB (Argyll 2.2.0 3D)
73.7% Display P3 (Argyll 2.2.0 3D)
Gamma: 2.259
| Lenovo LOQ 15IRX9 BOE NJ NE156FHM-NX9, IPS, 1920x1080, 15.6" | SCHENKER XMG Core 15 (M24) BOE NJ NE153QDM-NZ1 (BOE0C8E), IPS, 2560x1600, 15.3" | Gigabyte G6X 9KG (2024) BOE NE160WUM-NX6, IPS, 1920x1200, 16" | HP Victus 16 (2024) Chi Mei CMN163E, IPS, 1920x1080, 16.1" | Dell G16, i7-13650HX, RTX 4060 Chi Mei CMN161D (160GME), IPS, 2560x1600, 16" | |
|---|---|---|---|---|---|
| Display | 1% | -40% | -41% | -5% | |
| Display P3 Coverage | 73.7 | 73.2 -1% | 41.8 -43% | 41.3 -44% | 67.5 -8% |
| sRGB Coverage | 99.1 | 100 1% | 62.4 -37% | 61.7 -38% | 98.5 -1% |
| AdobeRGB 1998 Coverage | 72.6 | 74.6 3% | 43.3 -40% | 42.7 -41% | 69.3 -5% |
| Response Times | 68% | 4% | 25% | 68% | |
| Response Time Grey 50% / Grey 80% * | 42.2 ? | 9.6 ? 77% | 40.5 ? 4% | 28.6 ? 32% | 7.6 ? 82% |
| Response Time Black / White * | 22.6 ? | 9.2 ? 59% | 21.6 ? 4% | 18.7 ? 17% | 10.4 ? 54% |
| PWM Frequency | |||||
| Screen | 6% | -68% | -78% | -15% | |
| Brightness middle | 306 | 635 108% | 353 15% | 287 -6% | 369 21% |
| Brightness | 287 | 604 110% | 318 11% | 288 0% | 344 20% |
| Brightness Distribution | 88 | 91 3% | 81 -8% | 86 -2% | 89 1% |
| Black Level * | 0.21 | 0.64 -205% | 0.21 -0% | 0.19 10% | 0.26 -24% |
| Contrast | 1457 | 992 -32% | 1681 15% | 1511 4% | 1419 -3% |
| Colorchecker dE 2000 * | 2.25 | 1.89 16% | 5.21 -132% | 5.46 -143% | 3.04 -35% |
| Colorchecker dE 2000 max. * | 4.84 | 3.14 35% | 19.95 -312% | 20.36 -321% | 5.56 -15% |
| Colorchecker dE 2000 calibrated * | 1.45 | 1.14 21% | 3.61 -149% | 3.52 -143% | 2.35 -62% |
| Greyscale dE 2000 * | 2.4 | 2.53 -5% | 3.6 -50% | 4.8 -100% | 3.38 -41% |
| Gamma | 2.259 97% | 2.36 93% | 2.367 93% | 2.108 104% | 2.47 89% |
| CCT | 6790 96% | 6434 101% | 7138 91% | 6442 101% | 6040 108% |
| Media total (Programa/Opciones) | 25% /
14% | -35% /
-52% | -31% /
-55% | 16% /
-1% |
* ... más pequeño es mejor
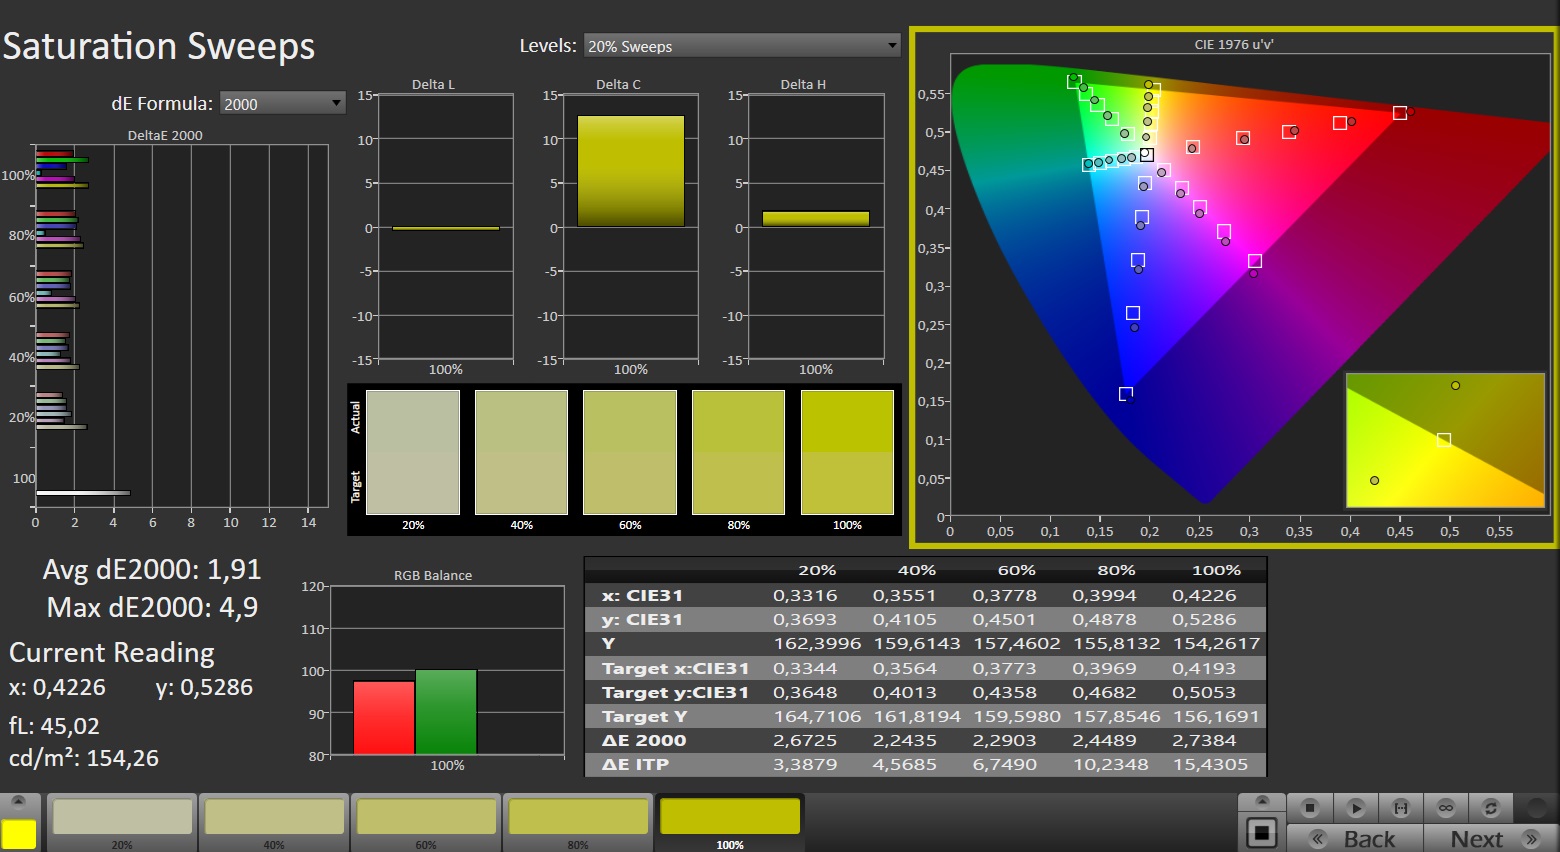
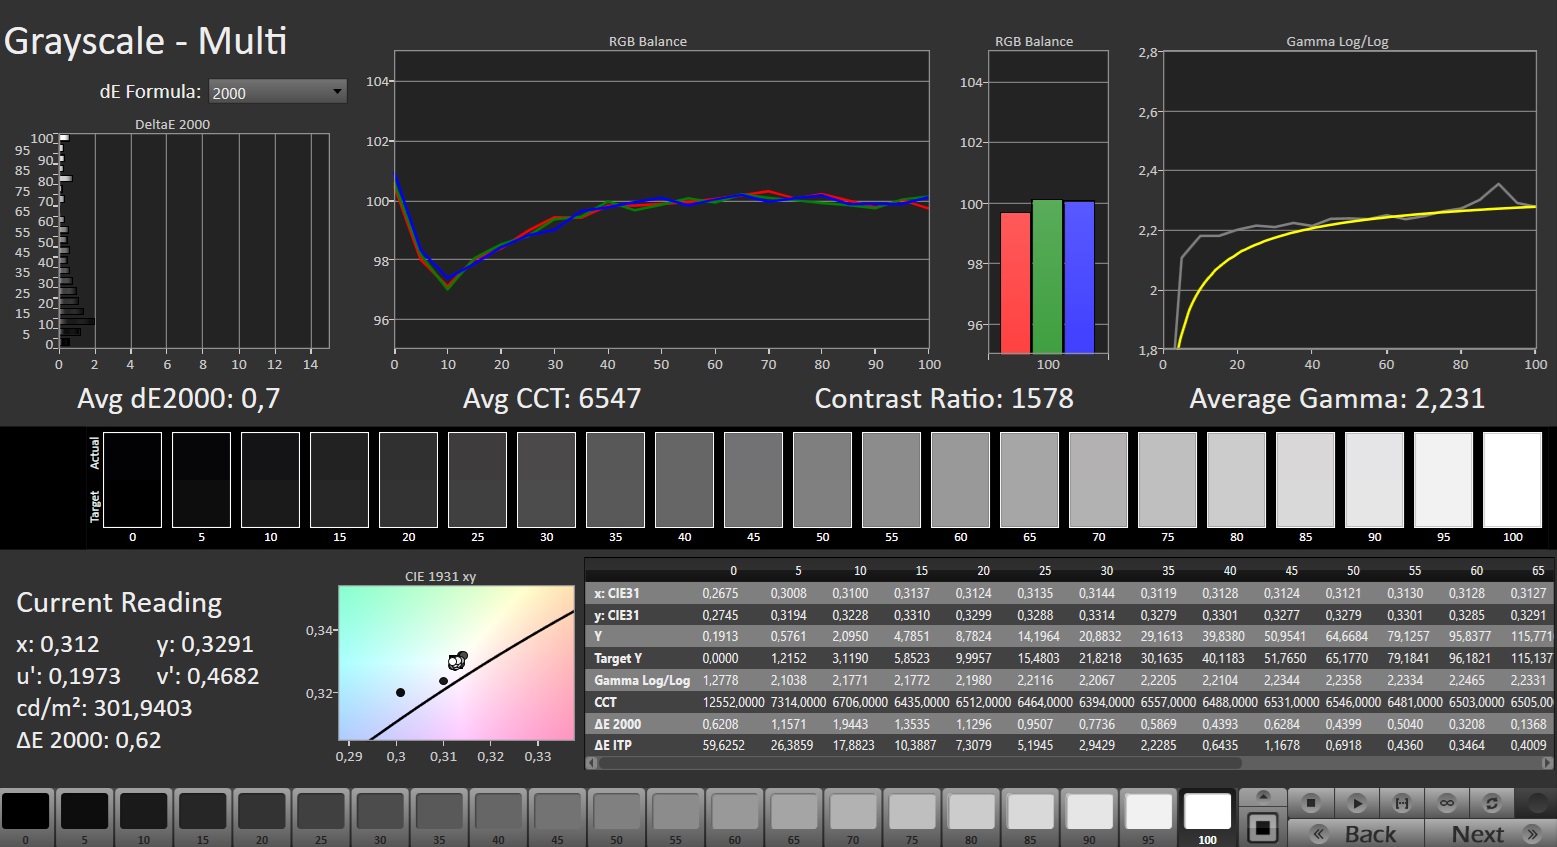
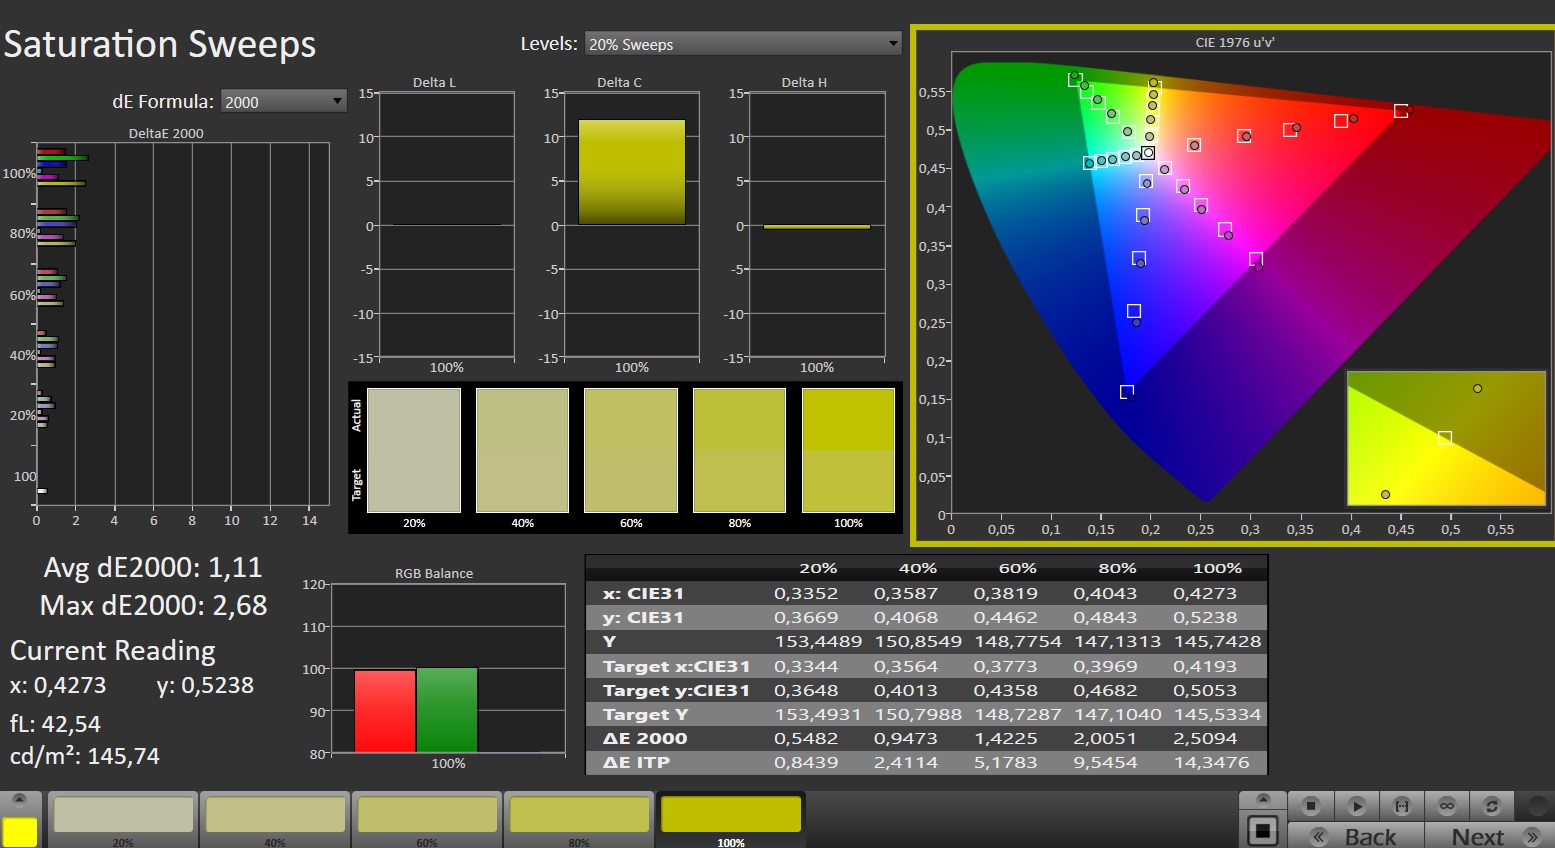
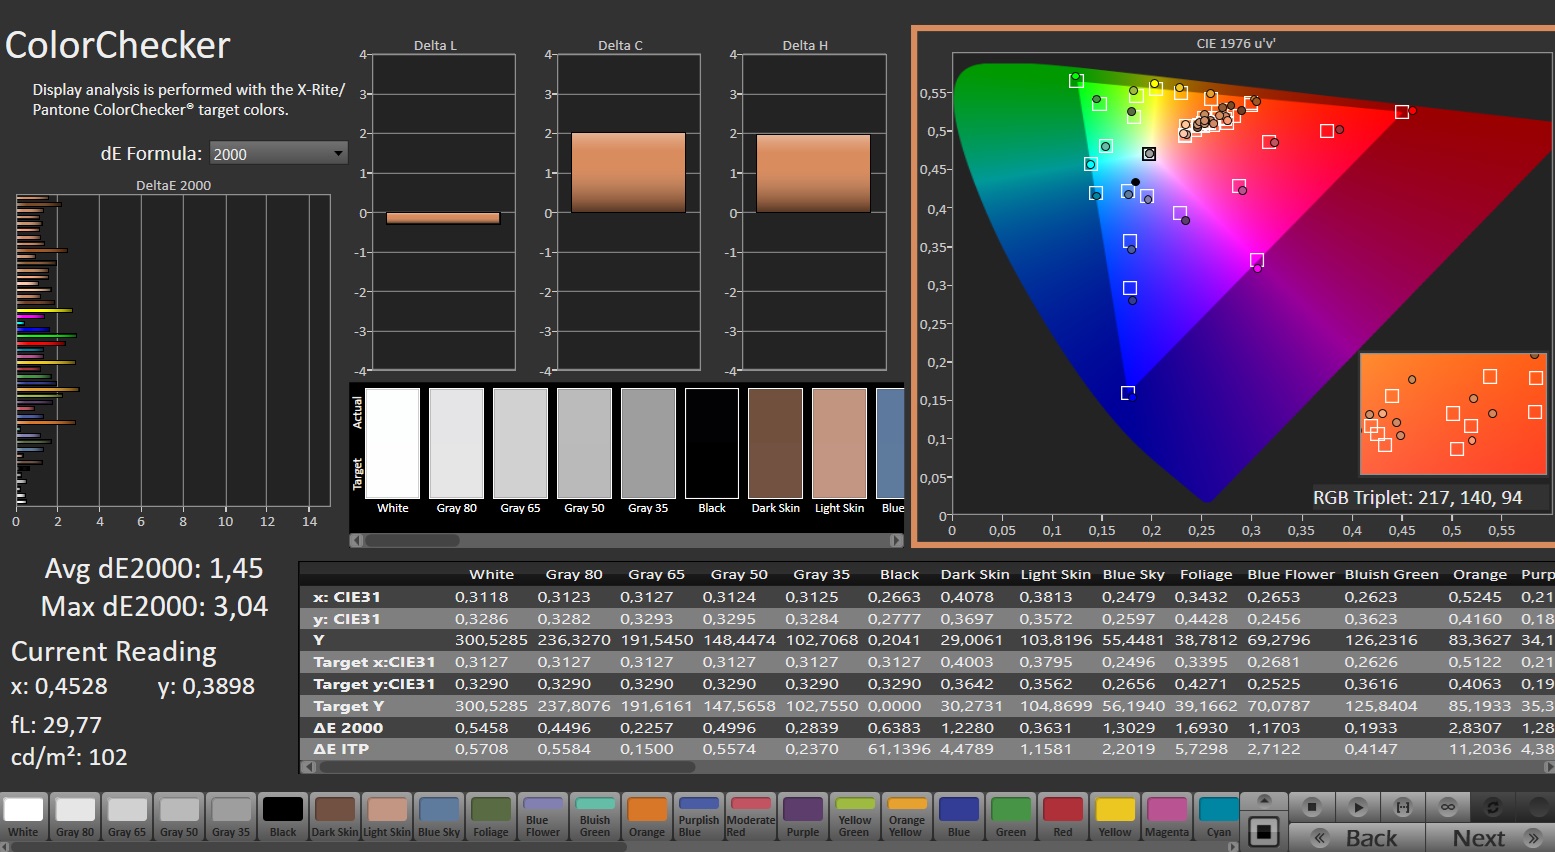
Nada más sacarla de la caja, la pantalla está bien calibrada: Con una desviación de aproximadamente 2,25, se ha alcanzado el valor objetivo (DeltaE < 3). Calibrar la pantalla reduce sus desviaciones a 1,45 y garantiza unos tonos grises más equilibrados. El panel puede representar el espacio sRGB casi en su totalidad, pero no los espacios AdobeRGB y DCI P3.
Tiempos de respuesta del display
| ↔ Tiempo de respuesta de Negro a Blanco | ||
|---|---|---|
| 22.6 ms ... subida ↗ y bajada ↘ combinada | ↗ 11.2 ms subida | 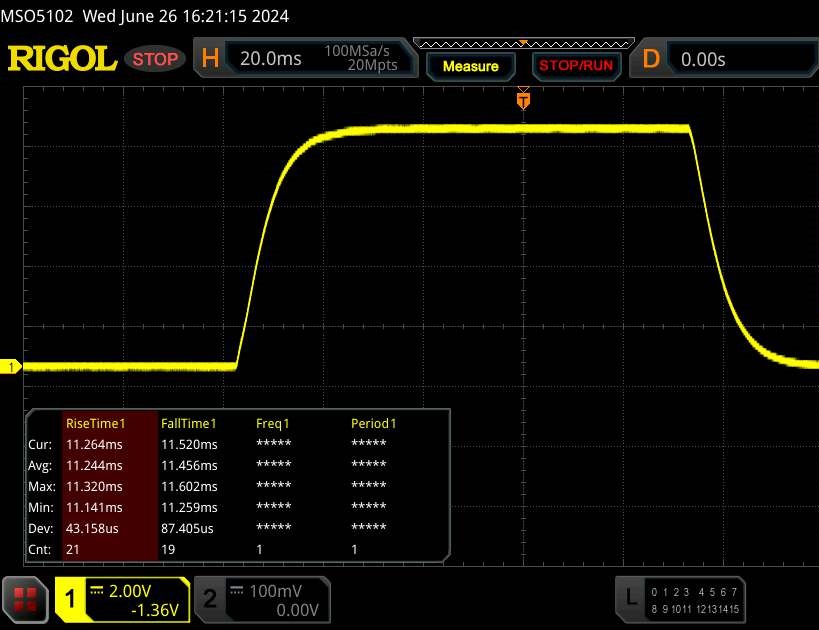 |
| ↘ 11.4 ms bajada | ||
| La pantalla mostró buenos tiempos de respuesta en nuestros tests pero podría ser demasiado lenta para los jugones competitivos. En comparación, todos los dispositivos de prueba van de ##min### (mínimo) a 240 (máximo) ms. » 48 % de todos los dispositivos son mejores. Eso quiere decir que el tiempo de respuesta es similar al dispositivo testado medio (20.8 ms). | ||
| ↔ Tiempo de respuesta 50% Gris a 80% Gris | ||
| 42.2 ms ... subida ↗ y bajada ↘ combinada | ↗ 19.1 ms subida | 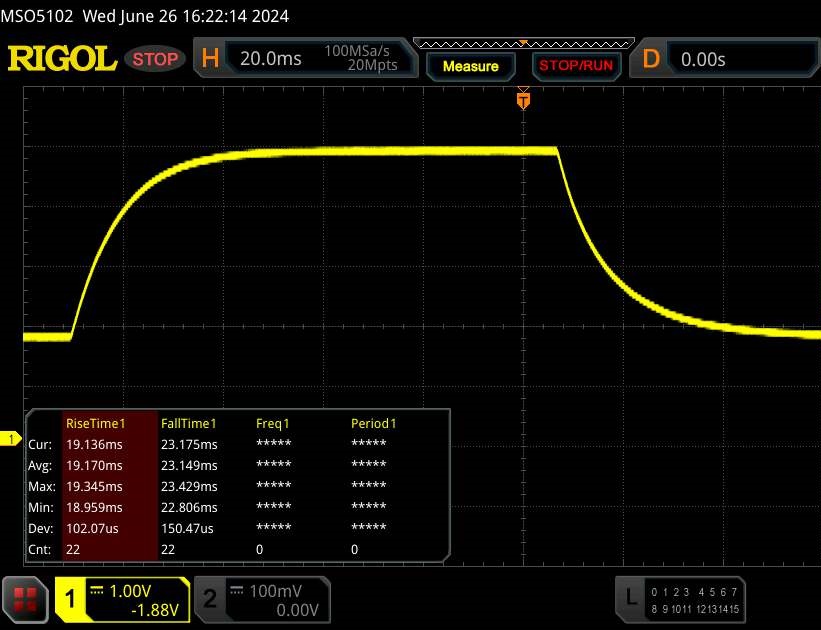 |
| ↘ 23.1 ms bajada | ||
| La pantalla mostró tiempos de respuesta lentos en nuestros tests y podría ser demasiado lenta para los jugones. En comparación, todos los dispositivos de prueba van de ##min### (mínimo) a 636 (máximo) ms. » 68 % de todos los dispositivos son mejores. Eso quiere decir que el tiempo de respuesta es peor que la media (32.5 ms) de todos los dispositivos testados. | ||
Parpadeo de Pantalla / PWM (Pulse-Width Modulation)
| Parpadeo de Pantalla / PWM no detectado | 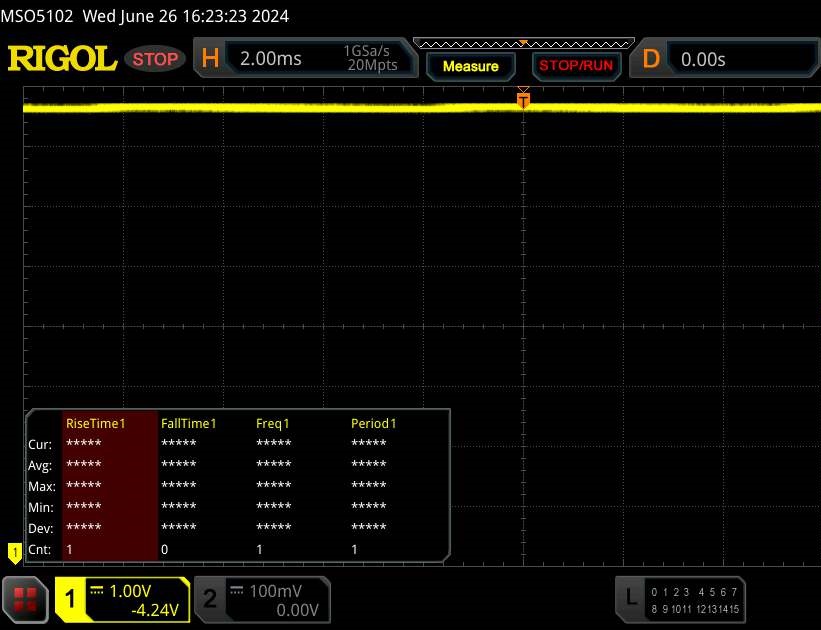 | ||
Comparación: 53 % de todos los dispositivos testados no usaron PWM para atenuar el display. Si se usó, medimos una media de 8516 (mínimo: 5 - máxmo: 343500) Hz. | |||
Rendimiento - Raptor Lake y Ada Lovelace impulsan el portátil
Los modelos LOQ son portátiles para juegos de nivel básico. Lenovo ofrece diferentes configuraciones, tanto con APU de AMD como con CPU de Intel. Raptor Lake y Ada Lovelace en la forma del Core i5-13450HX y la GeForce RTX 4060 impulsan el presente dispositivo de prueba. Se puede conseguir por unos 1.300 dólares (con Windows 11) o algo más de 1.000 dólares (sin Windows).
Condiciones de prueba
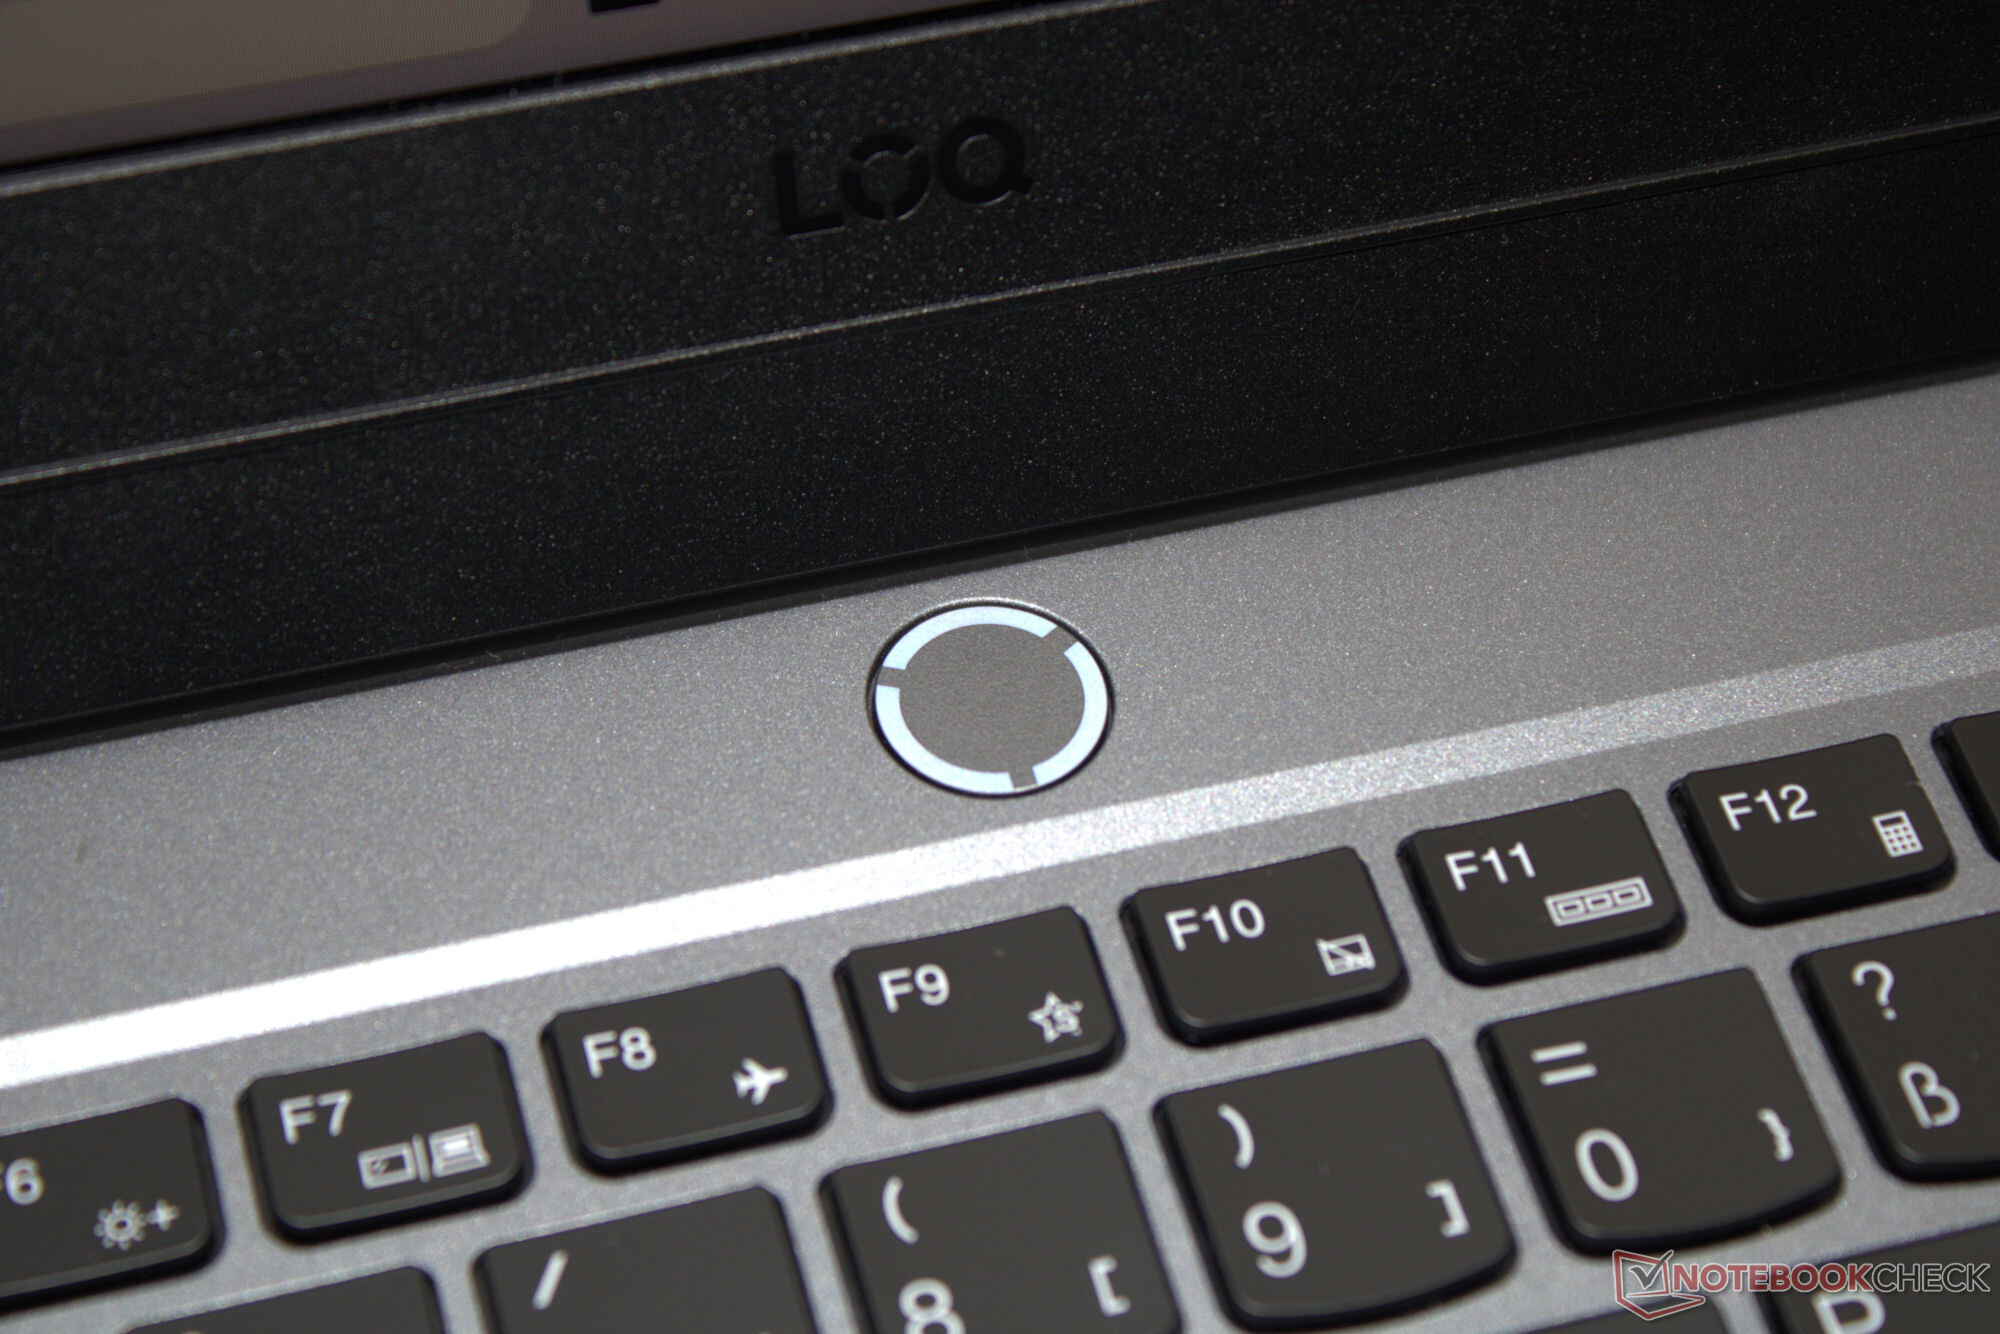
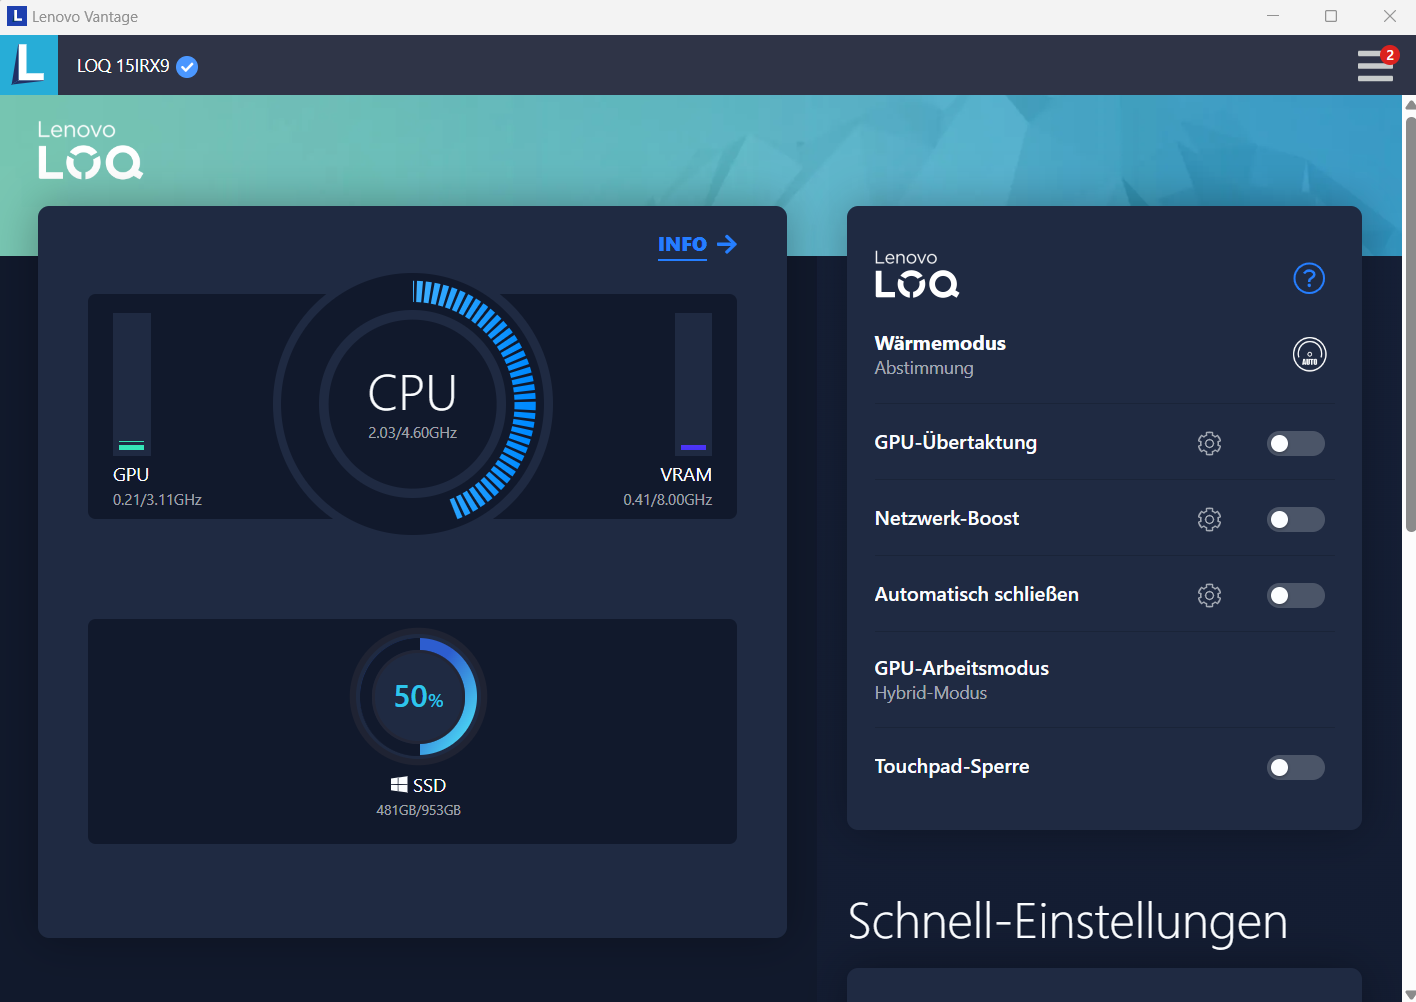
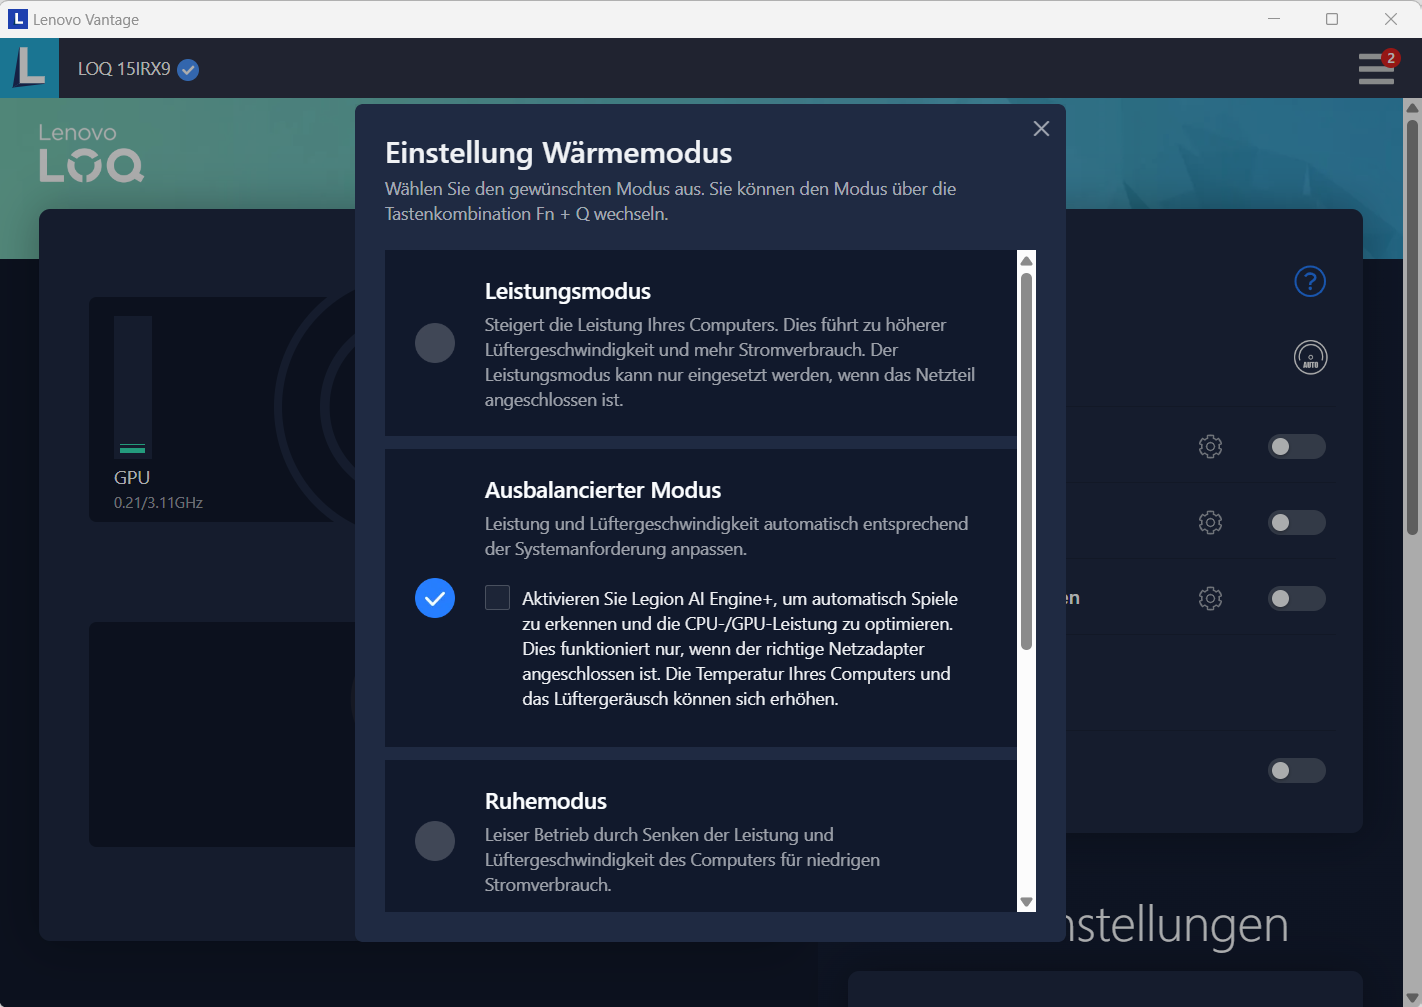
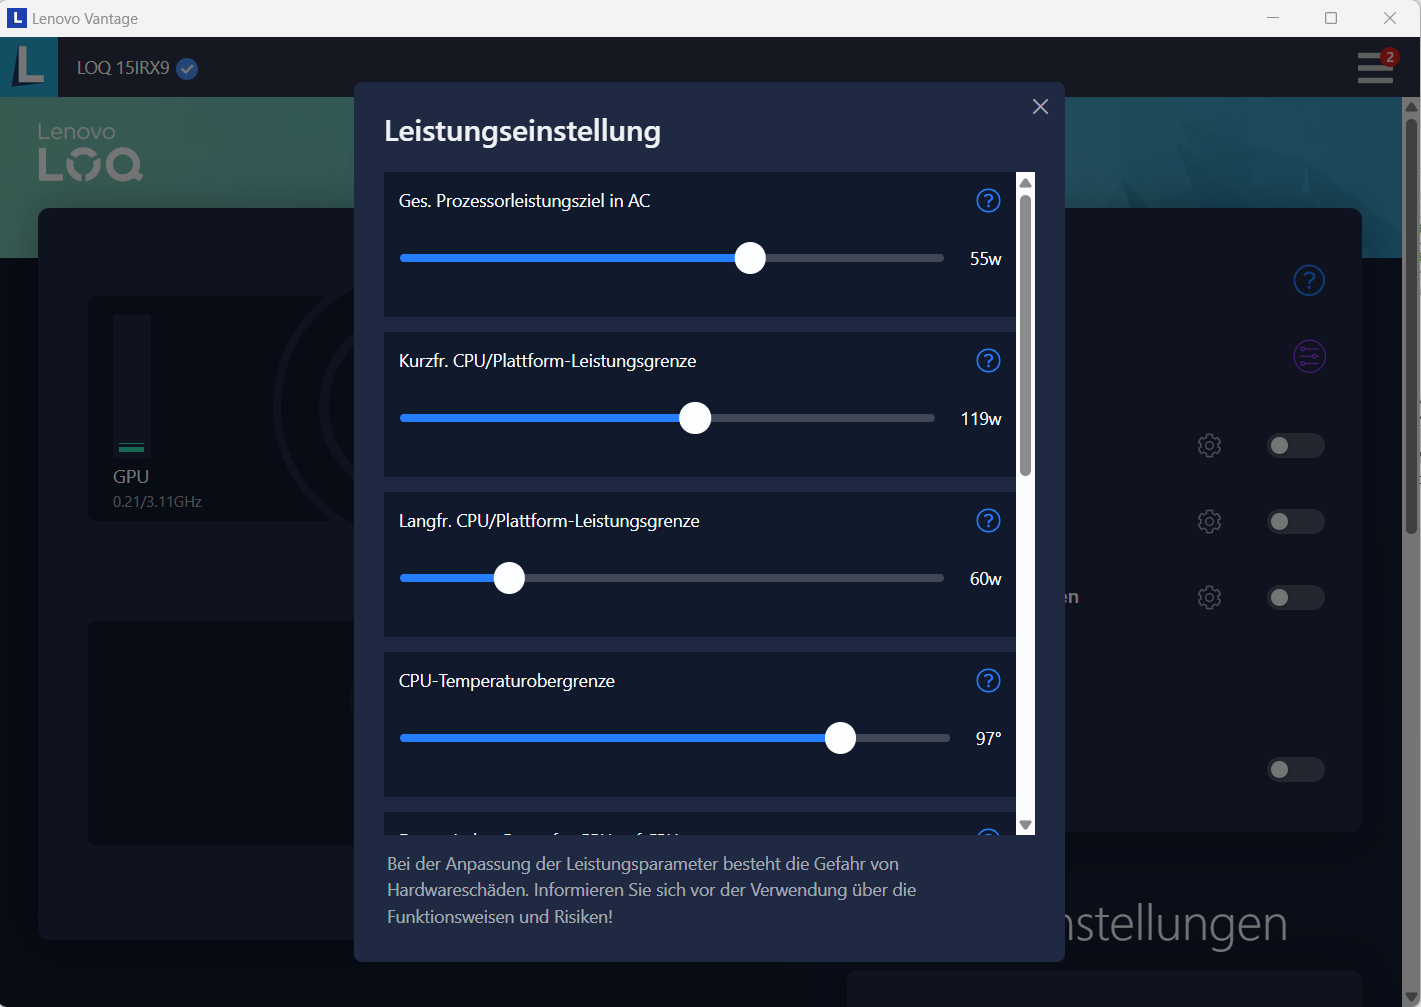
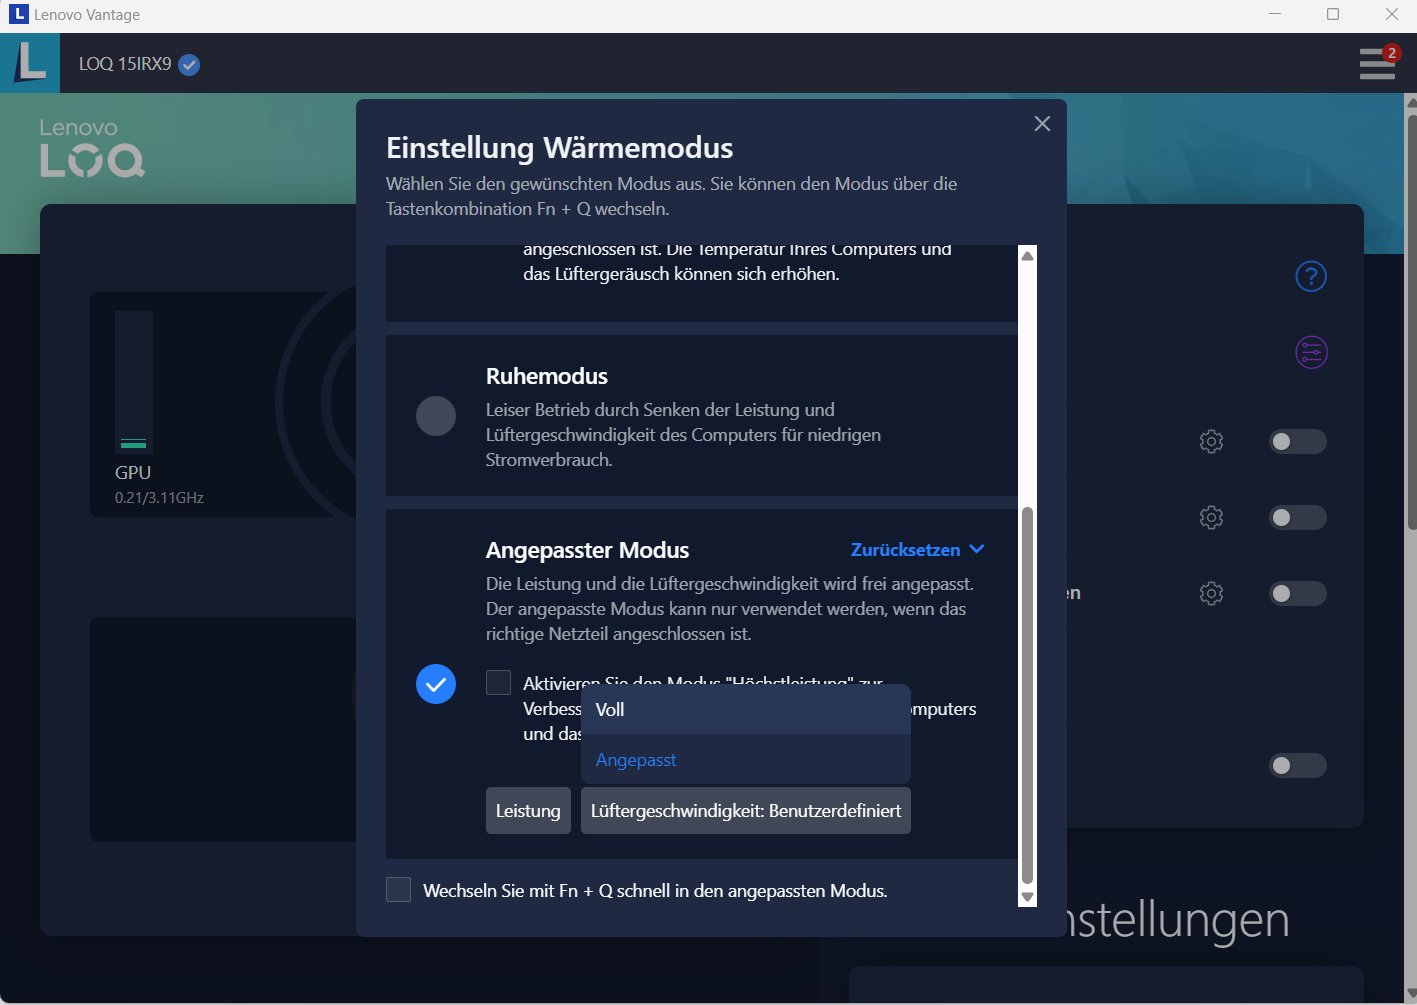
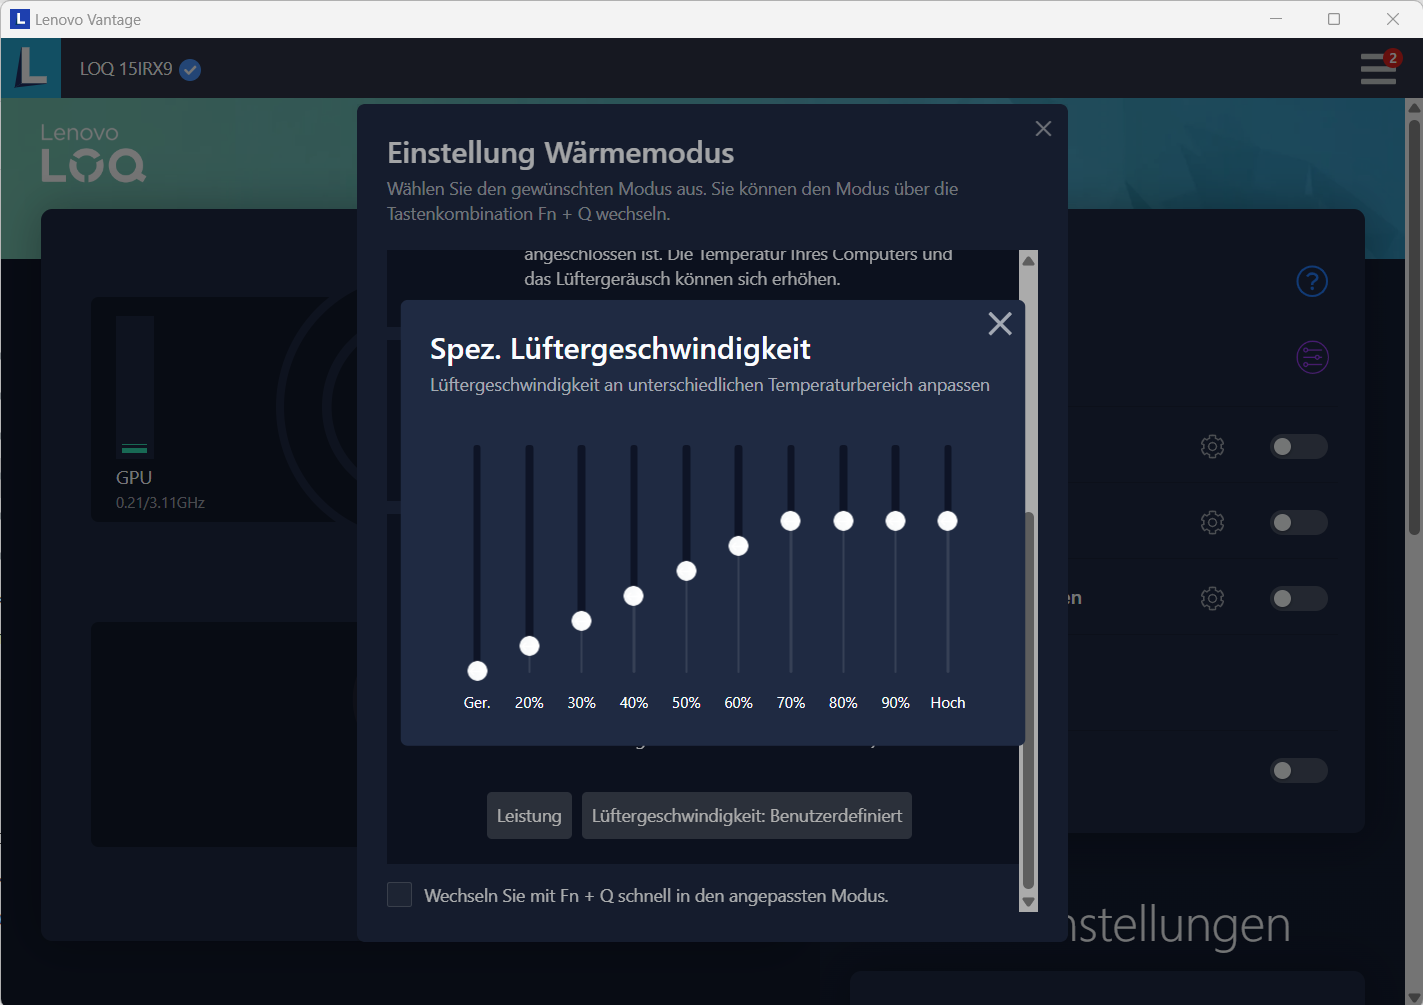
El portátil ofrece tres modos de rendimiento específicos del fabricante (véase la tabla), entre los que se puede cambiar mediante la combinación de teclas "Fn" + "Q". Nosotros utilizamos los modos equilibrado (pruebas de rendimiento) y silencioso (prueba de batería).
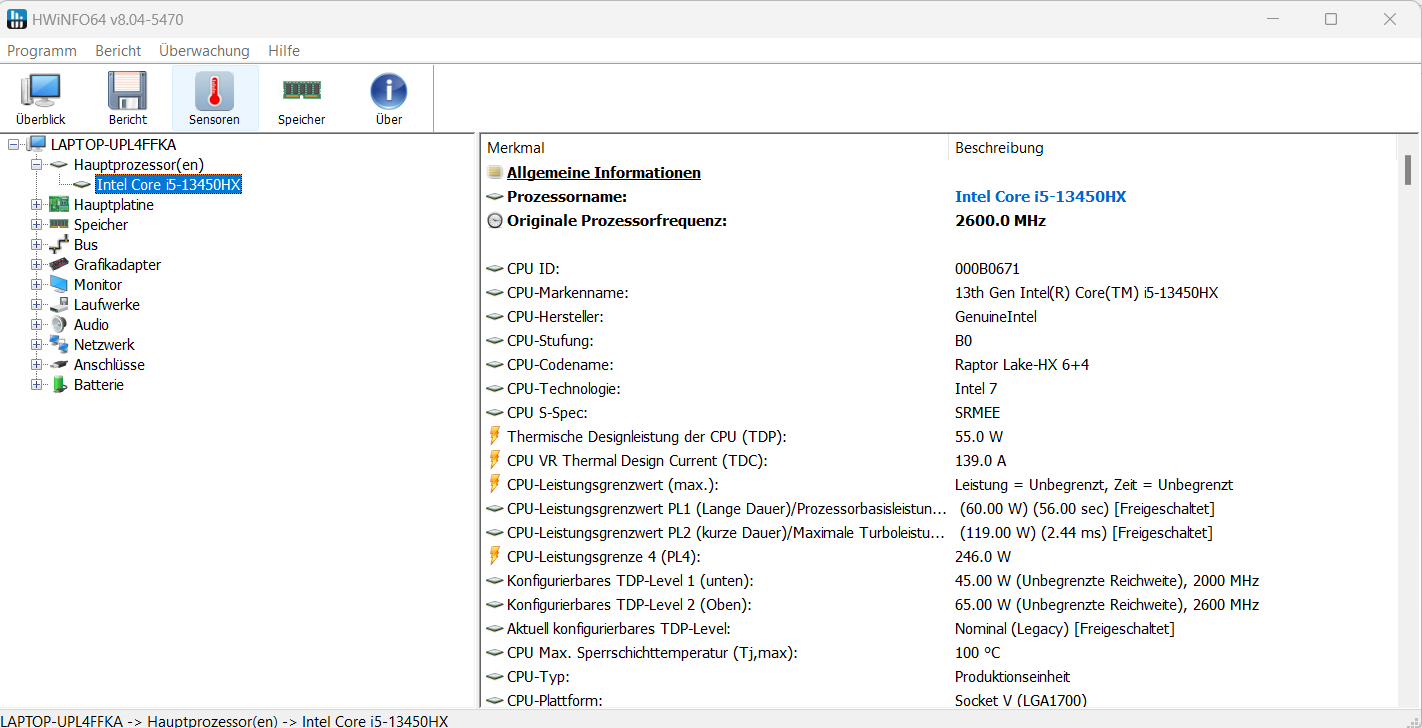
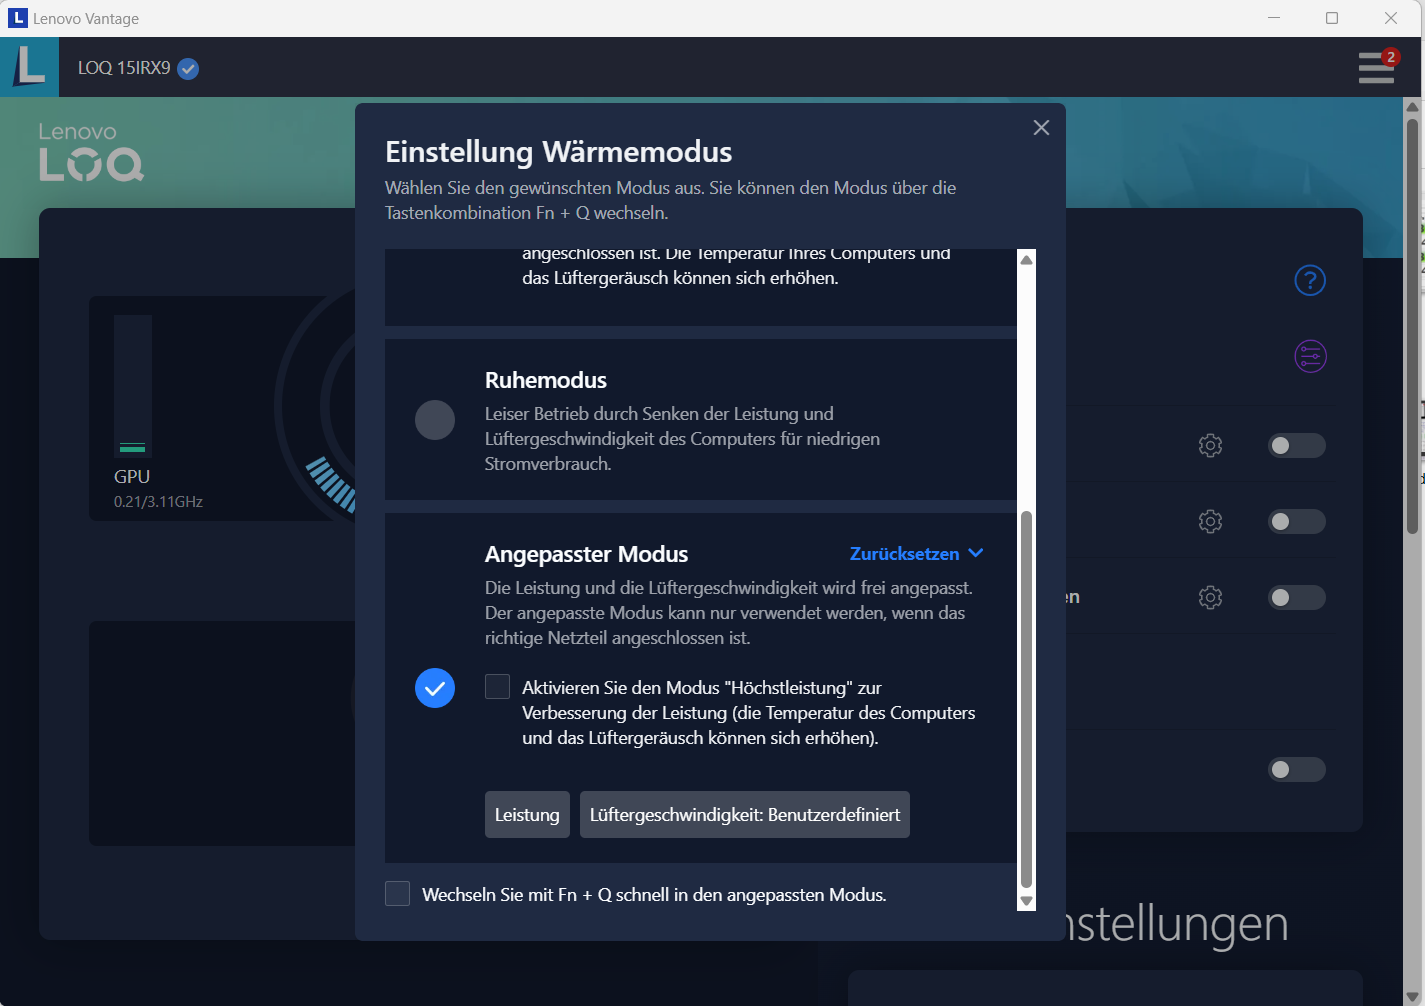
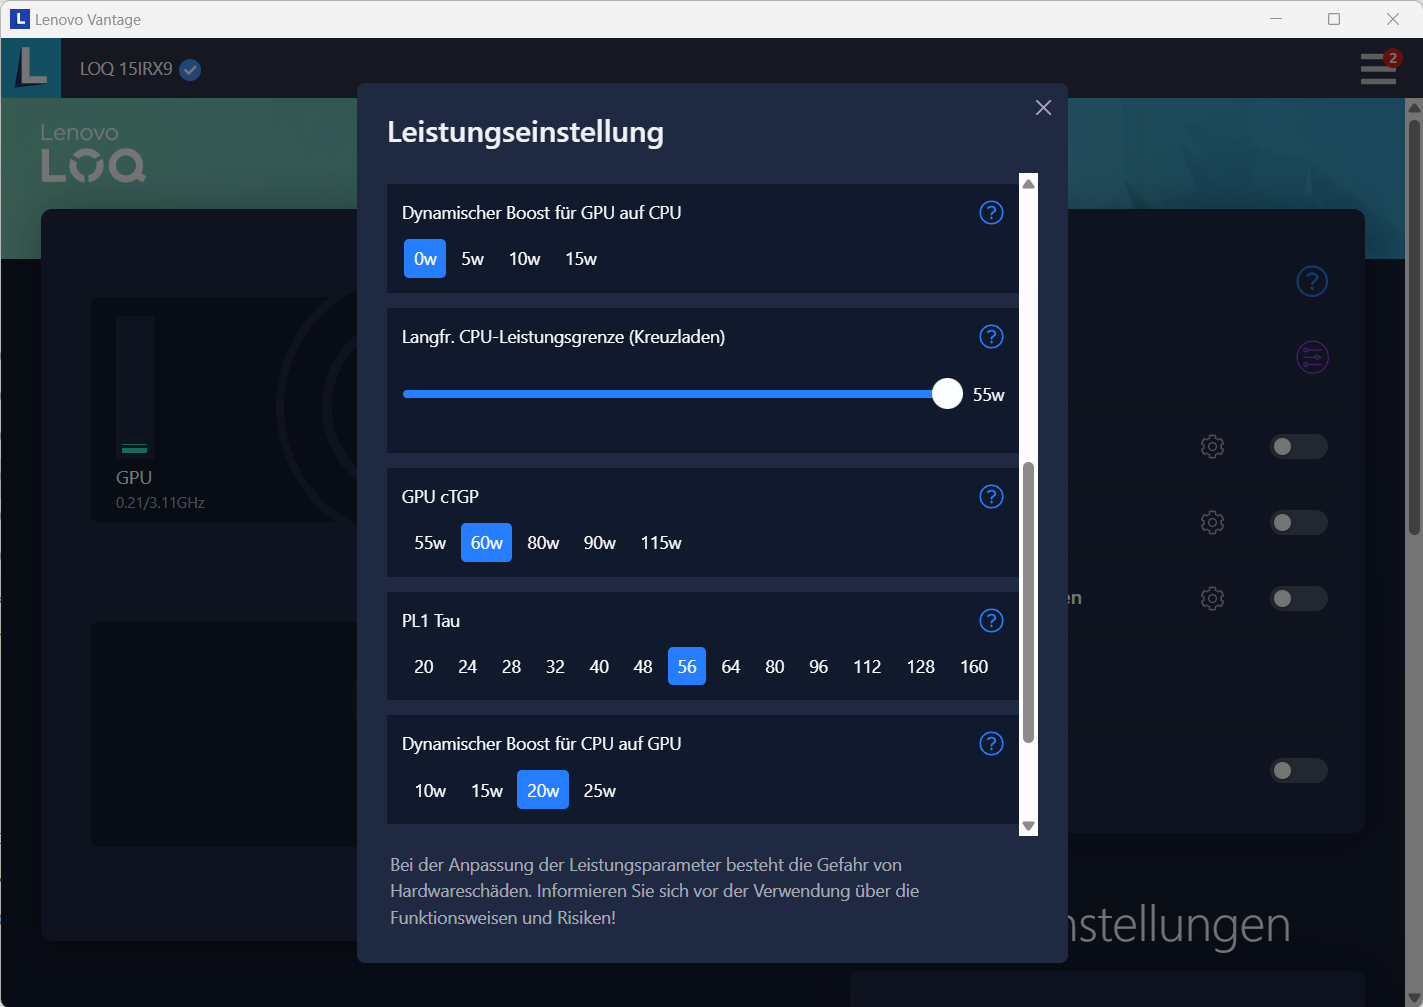
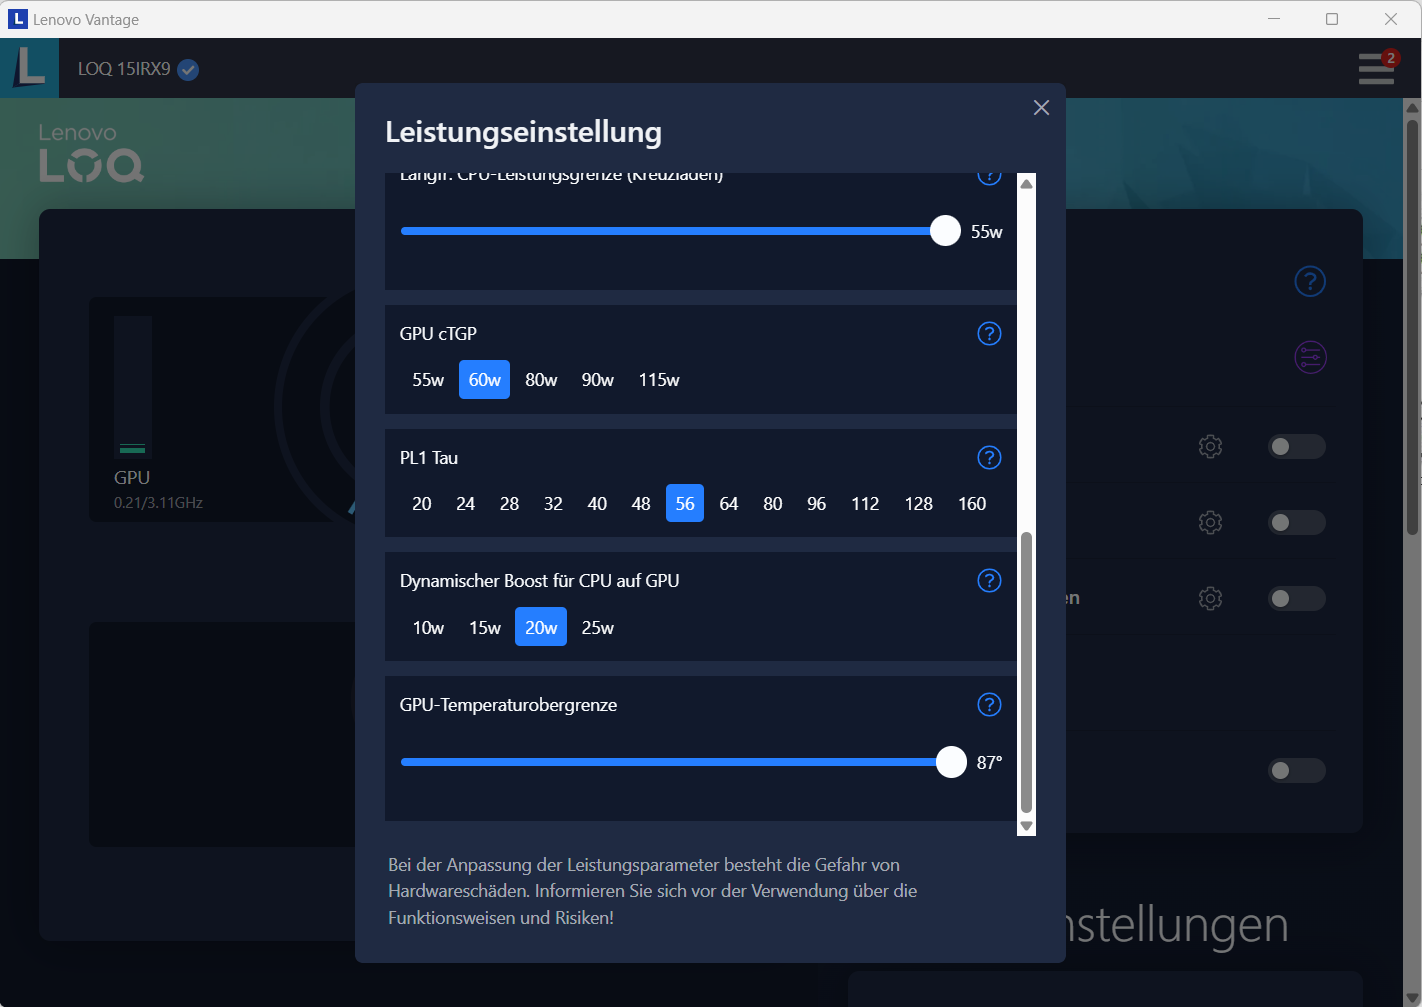
Se puede seleccionar un cuarto modo(personalizado) a través de Lenovo Vantage (centro de control del portátil). Esto permite configurar individualmente el rendimiento del procesador (límite de potencia) o de la GPU (TGP, Dynamic Boost, límite de temperatura) y la velocidad del ventilador. También es posible overclockear la GPU y la memoria gráfica independientemente del perfil.
| Modo rendimiento | Modo equilibrado | Modo silencioso | |
|---|---|---|---|
| Límite de potencia 1 (HWInfo) | 90 vatios | 60 vatios | 55 vatios |
| Límite de potencia 2 (HWInfo) | 162 vatios | 119 vatios | 65 vatios |
| Ruido (CP 2077 Phantom Liberty) | 54 dB(A) | 48 dB(A) | 39 dB(A) |
| Rendimiento (CP 2077 Phantom Liberty) | 70 fps | 66 fps | 52 fps |
Procesador
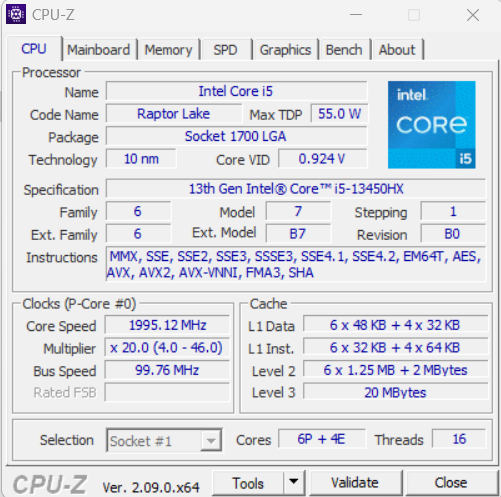
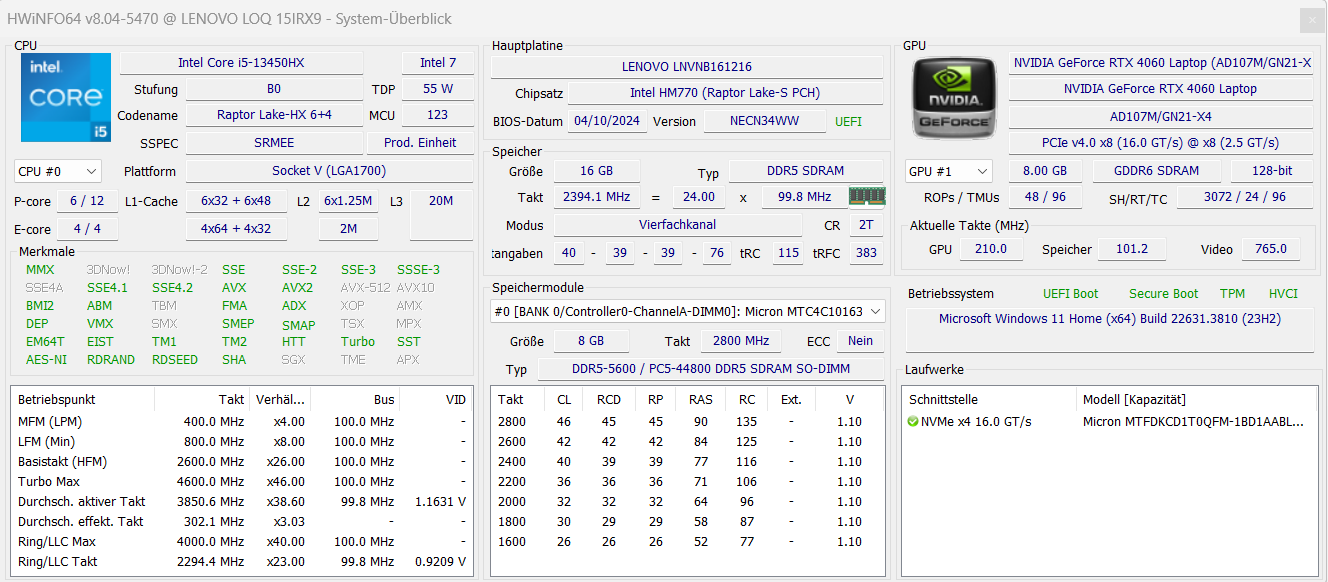
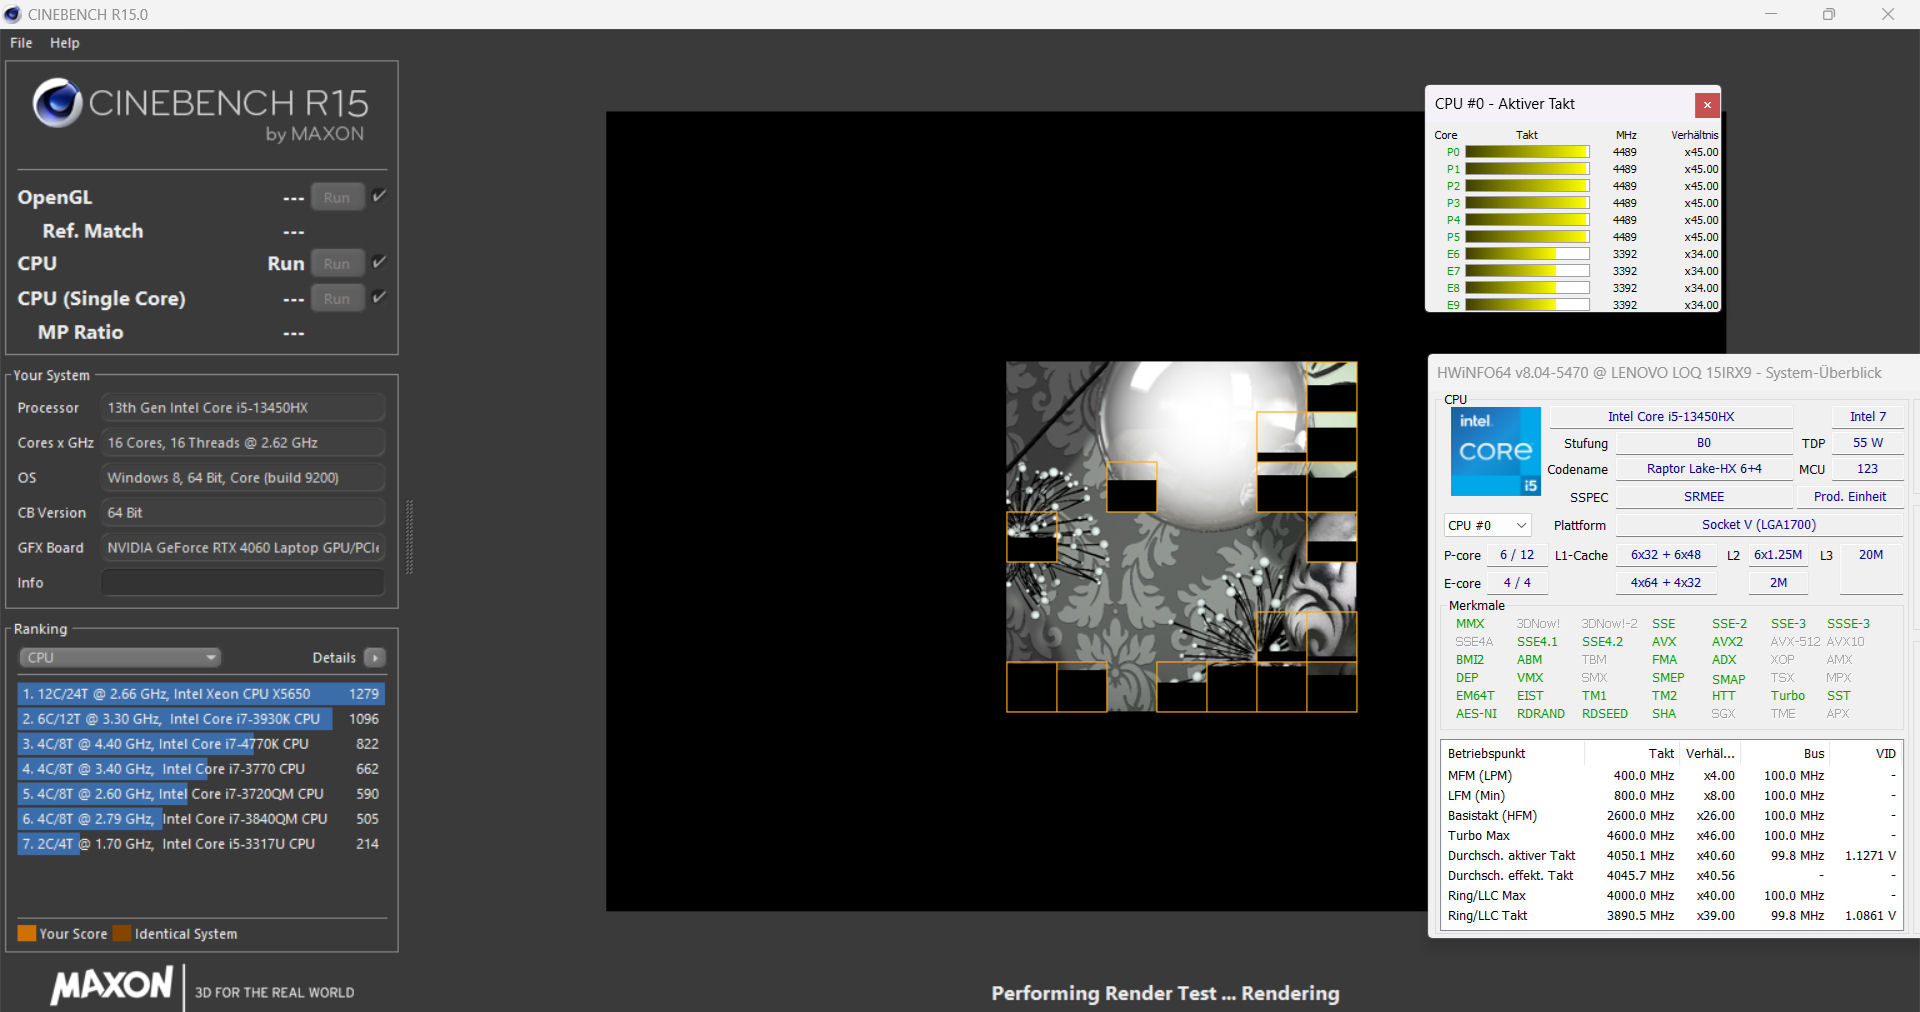
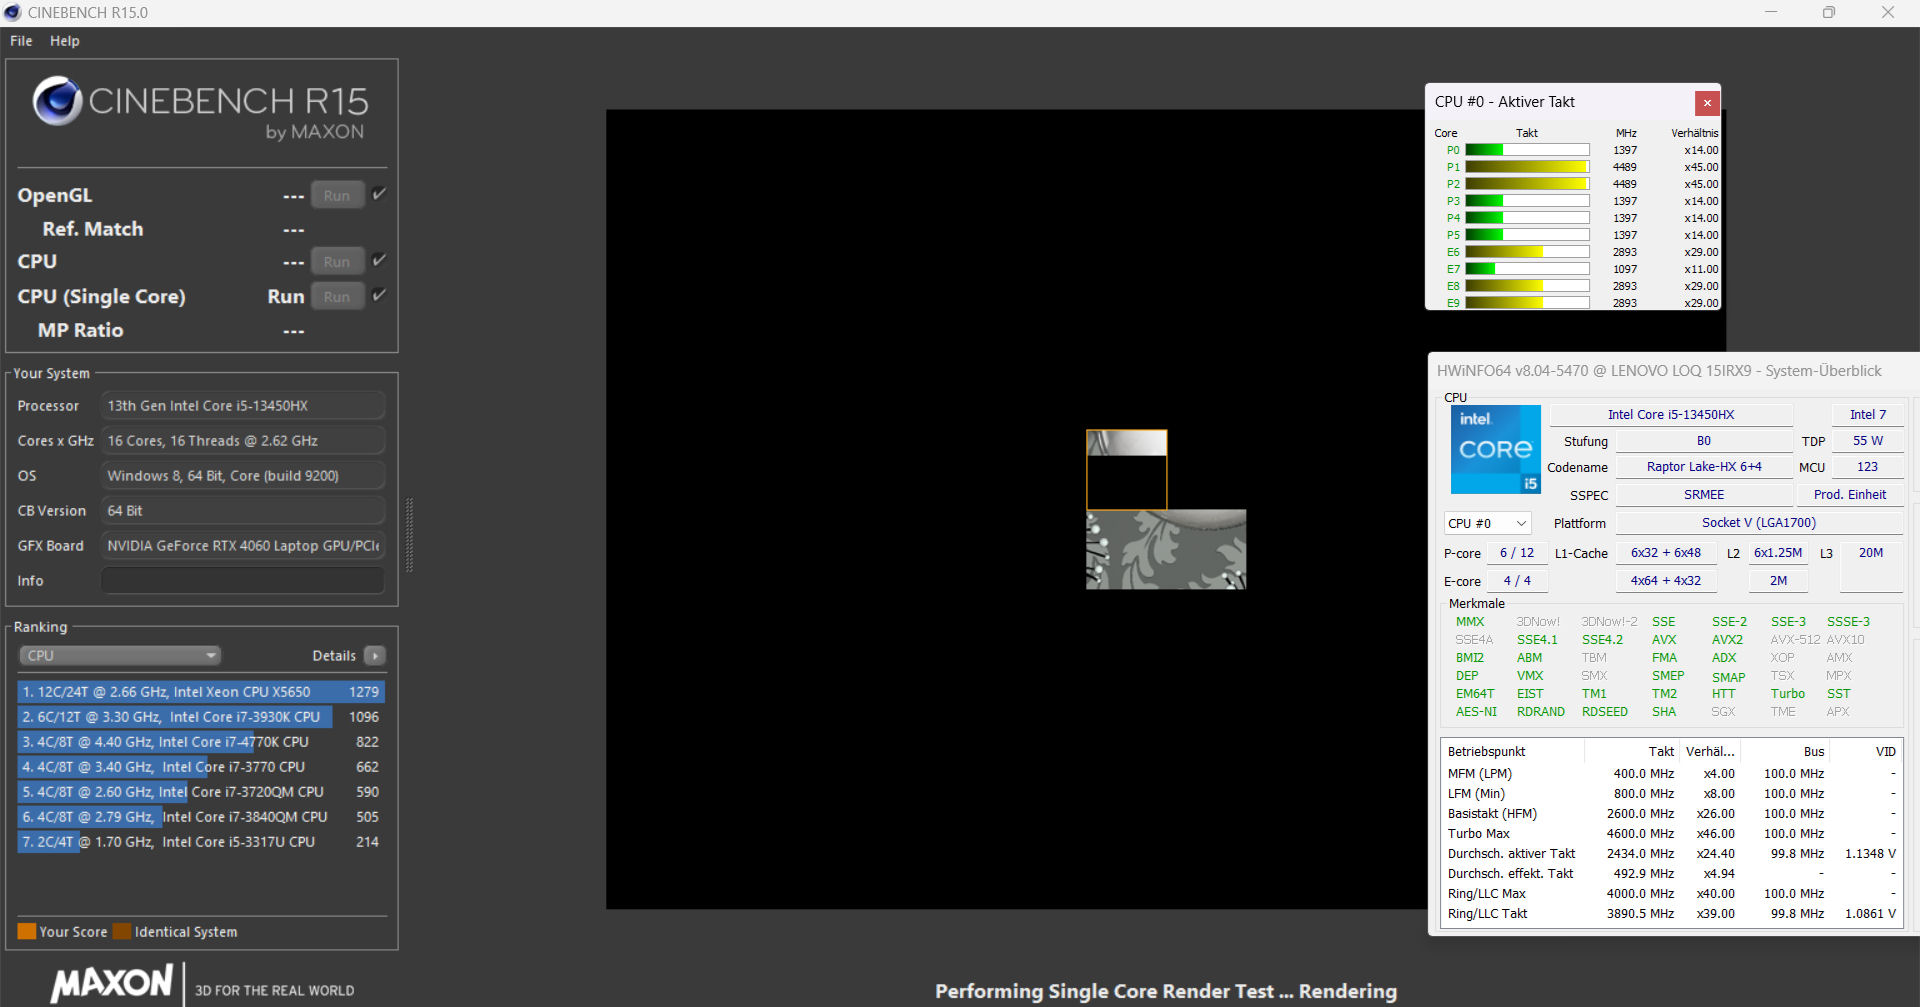
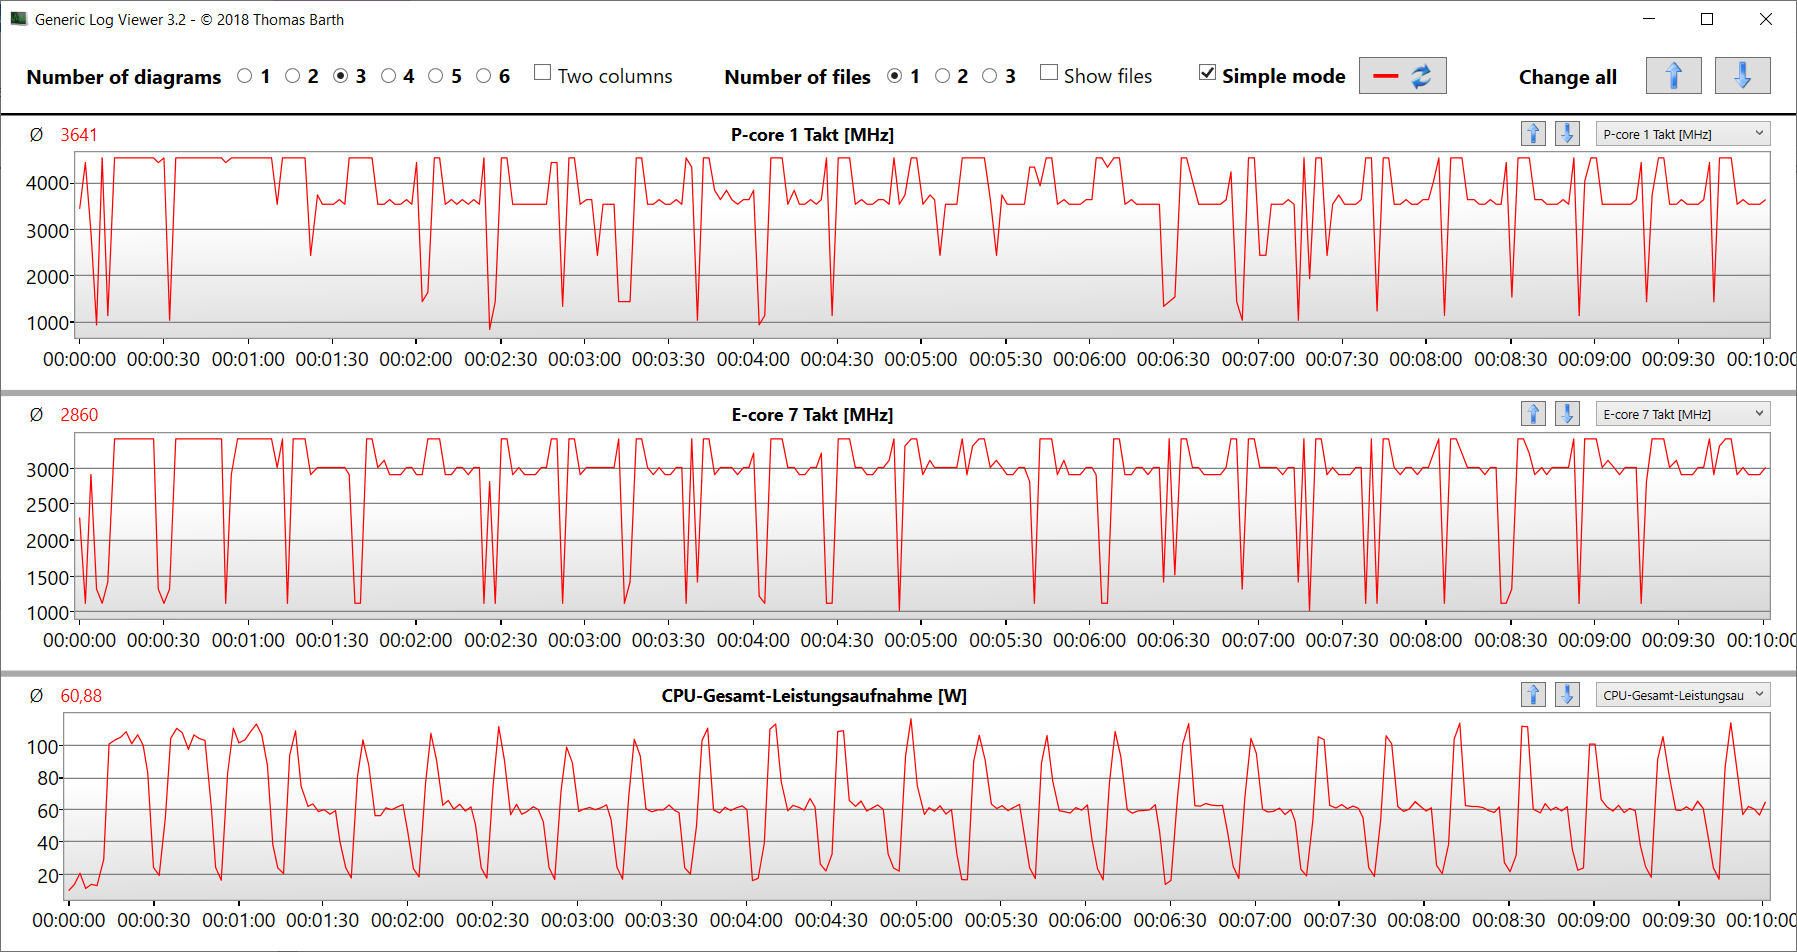
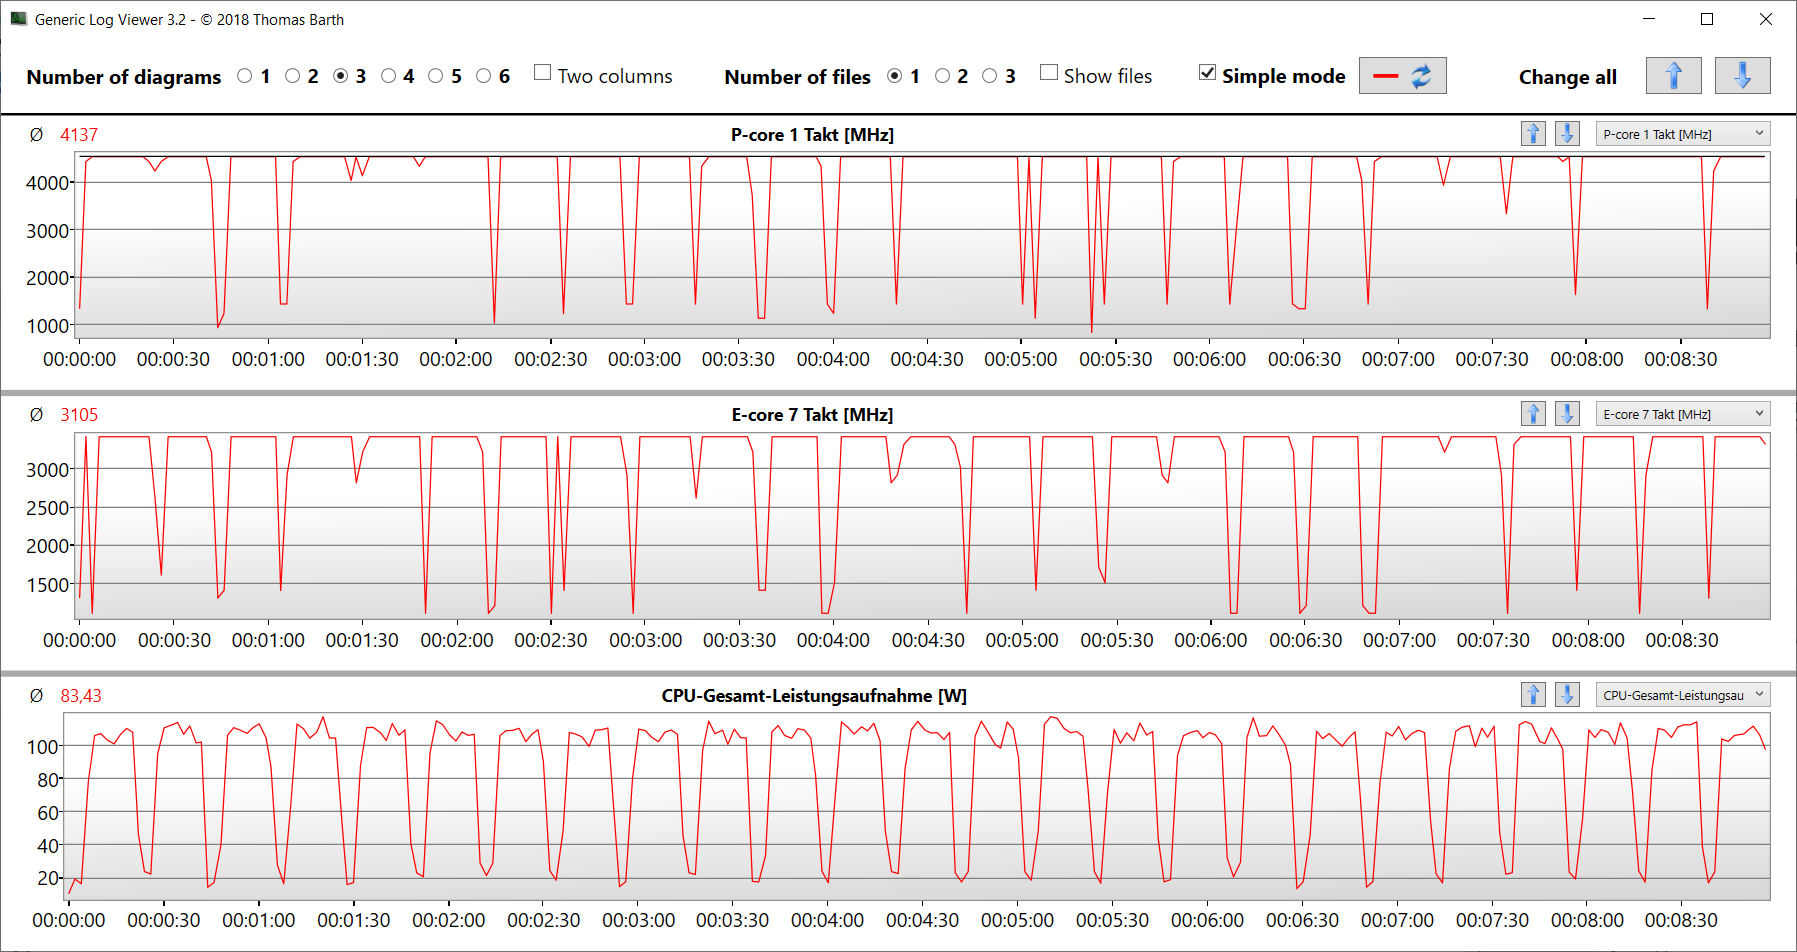
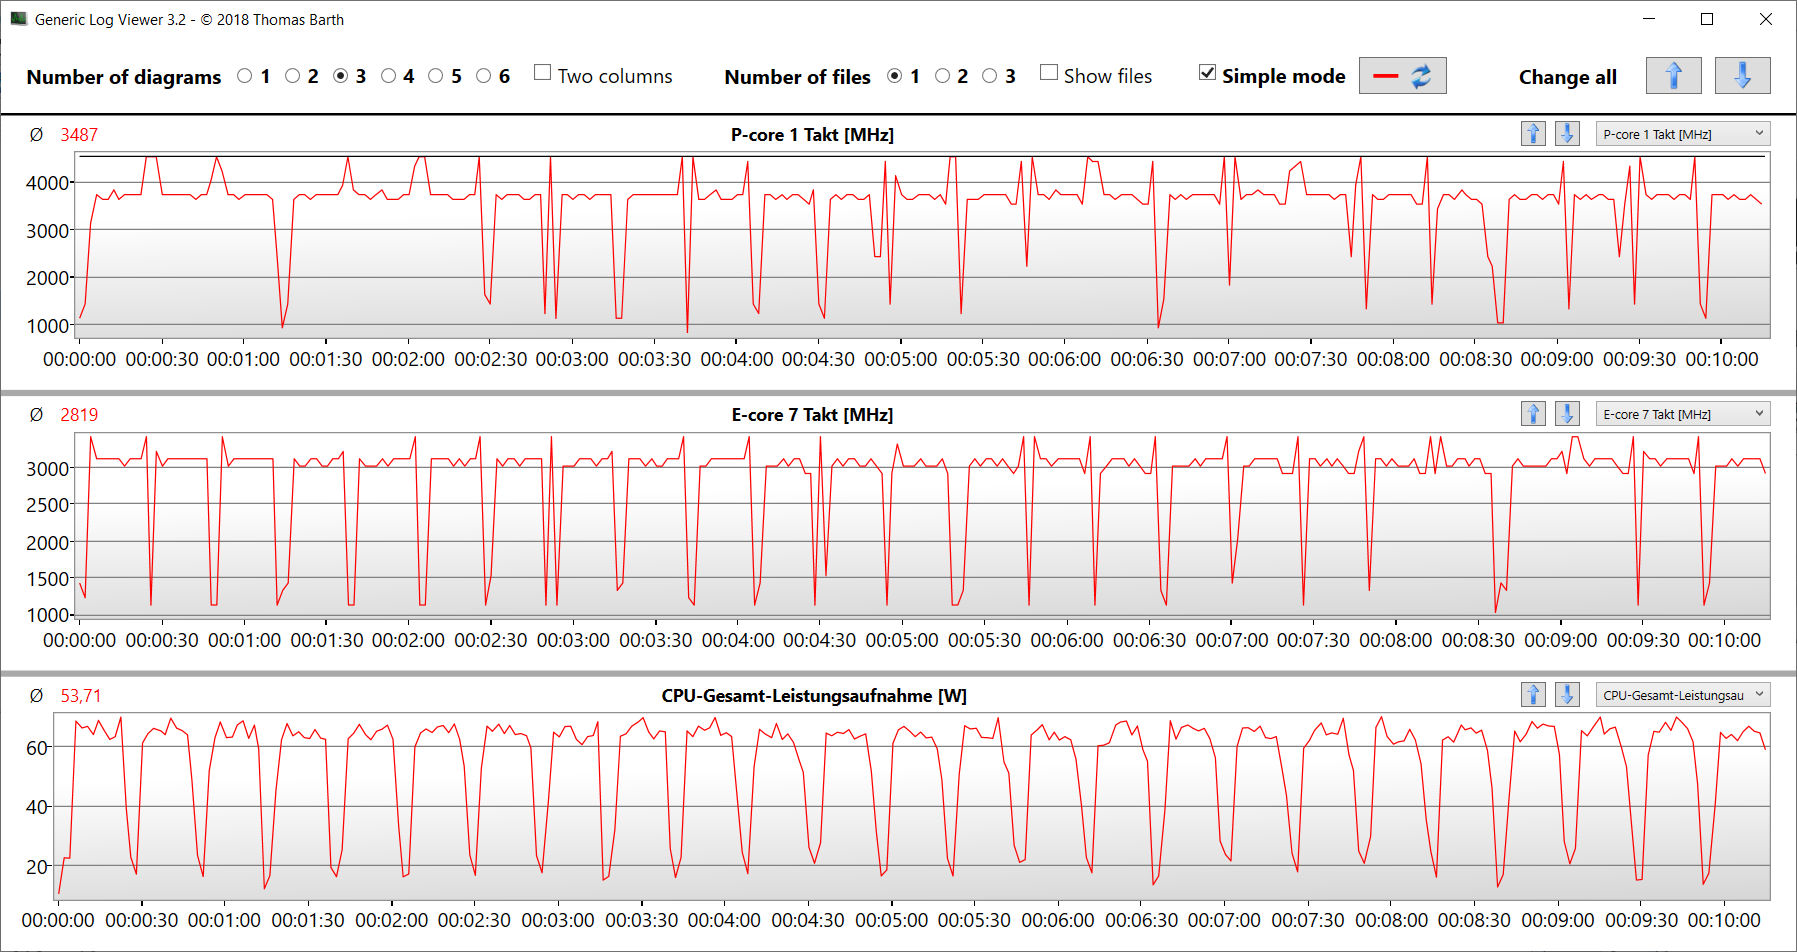
El Core i5-13450HX(Raptor Lake) de 10 núcleos de CPU (6P + 4E = 16 hilos) alcanzan velocidades de reloj máximas de 4,6 GHz (P) y 3,4 GHz (E). La carga multihilo continua (CB15 Loop) hizo que su velocidad de reloj se hundiera de la primera a la cuarta ejecución( modoequilibrado ). Después, se mantuvo estable. El modo de rendimiento mantiene la velocidad de reloj en un nivel permanentemente alto.
Los resultados del benchmark fueron tal y como esperábamos (modoequilibrado ), y el modo de rendimiento resultó en una (muy pequeña) ventaja. Dentro del campo de comparación, el Core i5 fue el que salió peor parado, ya que tiene el menor número de núcleos de computación. La CPU es una elección adecuada para un jugador económico.
Cinebench R15 Multi continuous test
| CPU Performance Rating - Percent | |
| Media de la clase Gaming | |
| HP Victus 16 (2024) | |
| SCHENKER XMG Core 15 (M24) | |
| Dell G16, i7-13650HX, RTX 4060 | |
| Gigabyte G6X 9KG (2024) | |
| Lenovo LOQ 15IRX9 | |
| Medio Intel Core i5-13450HX | |
| Lenovo LOQ 15IRX9 | |
| Cinebench R23 | |
| Multi Core | |
| HP Victus 16 (2024) | |
| Media de la clase Gaming (5668 - 39652, n=151, últimos 2 años) | |
| Dell G16, i7-13650HX, RTX 4060 | |
| Gigabyte G6X 9KG (2024) | |
| SCHENKER XMG Core 15 (M24) | |
| Lenovo LOQ 15IRX9 (Leistungsmodus) | |
| Medio Intel Core i5-13450HX (16575 - 17234, n=3) | |
| Lenovo LOQ 15IRX9 | |
| Single Core | |
| Dell G16, i7-13650HX, RTX 4060 | |
| Media de la clase Gaming (1136 - 2252, n=151, últimos 2 años) | |
| Gigabyte G6X 9KG (2024) | |
| SCHENKER XMG Core 15 (M24) | |
| Lenovo LOQ 15IRX9 (Leistungsmodus) | |
| Medio Intel Core i5-13450HX (1710 - 1766, n=3) | |
| Lenovo LOQ 15IRX9 | |
| HP Victus 16 (2024) | |
| Cinebench R20 | |
| CPU (Multi Core) | |
| HP Victus 16 (2024) | |
| Media de la clase Gaming (2179 - 15517, n=151, últimos 2 años) | |
| Dell G16, i7-13650HX, RTX 4060 | |
| Gigabyte G6X 9KG (2024) | |
| SCHENKER XMG Core 15 (M24) | |
| Lenovo LOQ 15IRX9 (Leistungsmodus) | |
| Medio Intel Core i5-13450HX (6489 - 6595, n=3) | |
| Lenovo LOQ 15IRX9 | |
| CPU (Single Core) | |
| Media de la clase Gaming (439 - 866, n=151, últimos 2 años) | |
| Dell G16, i7-13650HX, RTX 4060 | |
| Gigabyte G6X 9KG (2024) | |
| SCHENKER XMG Core 15 (M24) | |
| Lenovo LOQ 15IRX9 (Leistungsmodus) | |
| Medio Intel Core i5-13450HX (652 - 680, n=3) | |
| Lenovo LOQ 15IRX9 | |
| HP Victus 16 (2024) | |
| Cinebench R15 | |
| CPU Multi 64Bit | |
| HP Victus 16 (2024) | |
| Media de la clase Gaming (905 - 6074, n=154, últimos 2 años) | |
| Dell G16, i7-13650HX, RTX 4060 | |
| SCHENKER XMG Core 15 (M24) | |
| Gigabyte G6X 9KG (2024) | |
| Lenovo LOQ 15IRX9 (Leistungsmodus) | |
| Lenovo LOQ 15IRX9 | |
| Medio Intel Core i5-13450HX (2427 - 2505, n=3) | |
| CPU Single 64Bit | |
| SCHENKER XMG Core 15 (M24) | |
| Media de la clase Gaming (191.9 - 343, n=151, últimos 2 años) | |
| Dell G16, i7-13650HX, RTX 4060 | |
| Gigabyte G6X 9KG (2024) | |
| Lenovo LOQ 15IRX9 (Leistungsmodus) | |
| Medio Intel Core i5-13450HX (239 - 251, n=3) | |
| Lenovo LOQ 15IRX9 | |
| HP Victus 16 (2024) | |
| Blender - v2.79 BMW27 CPU | |
| Lenovo LOQ 15IRX9 | |
| Gigabyte G6X 9KG (2024) | |
| Medio Intel Core i5-13450HX (196 - 229, n=3) | |
| Lenovo LOQ 15IRX9 (Leistungsmodus) | |
| SCHENKER XMG Core 15 (M24) | |
| Media de la clase Gaming (81 - 555, n=144, últimos 2 años) | |
| HP Victus 16 (2024) | |
| Dell G16, i7-13650HX, RTX 4060 | |
| 7-Zip 18.03 | |
| 7z b 4 | |
| HP Victus 16 (2024) | |
| Media de la clase Gaming (23795 - 144064, n=149, últimos 2 años) | |
| Dell G16, i7-13650HX, RTX 4060 | |
| SCHENKER XMG Core 15 (M24) | |
| Gigabyte G6X 9KG (2024) | |
| Lenovo LOQ 15IRX9 (Leistungsmodus) | |
| Medio Intel Core i5-13450HX (59026 - 62204, n=3) | |
| Lenovo LOQ 15IRX9 | |
| 7z b 4 -mmt1 | |
| SCHENKER XMG Core 15 (M24) | |
| Media de la clase Gaming (4199 - 7573, n=149, últimos 2 años) | |
| Dell G16, i7-13650HX, RTX 4060 | |
| Gigabyte G6X 9KG (2024) | |
| HP Victus 16 (2024) | |
| Lenovo LOQ 15IRX9 (Leistungsmodus) | |
| Medio Intel Core i5-13450HX (5370 - 5576, n=3) | |
| Lenovo LOQ 15IRX9 | |
| Geekbench 6.4 | |
| Multi-Core | |
| HP Victus 16 (2024) (6.2.1) | |
| Media de la clase Gaming (5340 - 21668, n=119, últimos 2 años) | |
| SCHENKER XMG Core 15 (M24) (6.2.1) | |
| Dell G16, i7-13650HX, RTX 4060 (6.2.1) | |
| Gigabyte G6X 9KG (2024) (6.2.1) | |
| Lenovo LOQ 15IRX9 (6.2.1, Leistungsmodus) | |
| Medio Intel Core i5-13450HX (12619 - 12799, n=3) | |
| Lenovo LOQ 15IRX9 (6.2.1) | |
| Single-Core | |
| SCHENKER XMG Core 15 (M24) (6.2.1) | |
| Media de la clase Gaming (1490 - 3219, n=119, últimos 2 años) | |
| Dell G16, i7-13650HX, RTX 4060 (6.2.1) | |
| Gigabyte G6X 9KG (2024) (6.2.1) | |
| Lenovo LOQ 15IRX9 (6.2.1, Leistungsmodus) | |
| Medio Intel Core i5-13450HX (2381 - 2448, n=3) | |
| Lenovo LOQ 15IRX9 (6.2.1) | |
| HP Victus 16 (2024) (6.2.1) | |
| Geekbench 5.5 | |
| Multi-Core | |
| HP Victus 16 (2024) | |
| Media de la clase Gaming (4557 - 25855, n=148, últimos 2 años) | |
| Gigabyte G6X 9KG (2024) | |
| SCHENKER XMG Core 15 (M24) | |
| Dell G16, i7-13650HX, RTX 4060 | |
| Lenovo LOQ 15IRX9 | |
| Medio Intel Core i5-13450HX (11973 - 12022, n=3) | |
| Lenovo LOQ 15IRX9 (Leistungsmodus) | |
| Single-Core | |
| SCHENKER XMG Core 15 (M24) | |
| Media de la clase Gaming (986 - 2423, n=148, últimos 2 años) | |
| Dell G16, i7-13650HX, RTX 4060 | |
| Gigabyte G6X 9KG (2024) | |
| Lenovo LOQ 15IRX9 (Leistungsmodus) | |
| Medio Intel Core i5-13450HX (1696 - 1763, n=3) | |
| HP Victus 16 (2024) | |
| Lenovo LOQ 15IRX9 | |
| HWBOT x265 Benchmark v2.2 - 4k Preset | |
| Media de la clase Gaming (6.72 - 42.9, n=148, últimos 2 años) | |
| SCHENKER XMG Core 15 (M24) | |
| HP Victus 16 (2024) | |
| Lenovo LOQ 15IRX9 (Leistungsmodus) | |
| Dell G16, i7-13650HX, RTX 4060 | |
| Gigabyte G6X 9KG (2024) | |
| Medio Intel Core i5-13450HX (16.9 - 20.5, n=3) | |
| Lenovo LOQ 15IRX9 | |
| LibreOffice - 20 Documents To PDF | |
| Medio Intel Core i5-13450HX (49.5 - 96.6, n=3) | |
| Lenovo LOQ 15IRX9 (6.3.4.2) | |
| HP Victus 16 (2024) (6.3.4.2) | |
| Dell G16, i7-13650HX, RTX 4060 (6.3.4.2) | |
| Lenovo LOQ 15IRX9 (6.3.4.2, Leistungsmodus) | |
| SCHENKER XMG Core 15 (M24) (6.3.4.2) | |
| Media de la clase Gaming (19 - 96.6, n=147, últimos 2 años) | |
| Gigabyte G6X 9KG (2024) (6.3.4.2) | |
| R Benchmark 2.5 - Overall mean | |
| HP Victus 16 (2024) | |
| Lenovo LOQ 15IRX9 | |
| Medio Intel Core i5-13450HX (0.4582 - 0.4838, n=3) | |
| Lenovo LOQ 15IRX9 (Leistungsmodus) | |
| Media de la clase Gaming (0.3609 - 0.759, n=150, últimos 2 años) | |
| Gigabyte G6X 9KG (2024) | |
| SCHENKER XMG Core 15 (M24) | |
| Dell G16, i7-13650HX, RTX 4060 | |
| Dell G16, i7-13650HX, RTX 4060 | |
* ... más pequeño es mejor
AIDA64: FP32 Ray-Trace | FPU Julia | CPU SHA3 | CPU Queen | FPU SinJulia | FPU Mandel | CPU AES | CPU ZLib | FP64 Ray-Trace | CPU PhotoWorxx
| Performance Rating | |
| SCHENKER XMG Core 15 (M24) | |
| Media de la clase Gaming | |
| Dell G16, i7-13650HX, RTX 4060 | |
| HP Victus 16 (2024) | |
| Lenovo LOQ 15IRX9 | |
| Medio Intel Core i5-13450HX | |
| Gigabyte G6X 9KG (2024) | |
| Lenovo LOQ 15IRX9 | |
| AIDA64 / FP32 Ray-Trace | |
| SCHENKER XMG Core 15 (M24) (v6.92.6600) | |
| Media de la clase Gaming (4986 - 81639, n=147, últimos 2 años) | |
| Dell G16, i7-13650HX, RTX 4060 (v6.92.6600) | |
| Lenovo LOQ 15IRX9 (v6.92.6600, Leistungsmodus) | |
| HP Victus 16 (2024) (v6.92.6600) | |
| Medio Intel Core i5-13450HX (13747 - 17767, n=3) | |
| Lenovo LOQ 15IRX9 (v6.92.6600) | |
| Gigabyte G6X 9KG (2024) (v6.92.6600) | |
| AIDA64 / FPU Julia | |
| SCHENKER XMG Core 15 (M24) (v6.92.6600) | |
| Media de la clase Gaming (25360 - 252486, n=147, últimos 2 años) | |
| Dell G16, i7-13650HX, RTX 4060 (v6.92.6600) | |
| HP Victus 16 (2024) (v6.92.6600) | |
| Lenovo LOQ 15IRX9 (v6.92.6600, Leistungsmodus) | |
| Medio Intel Core i5-13450HX (71834 - 83862, n=3) | |
| Lenovo LOQ 15IRX9 (v6.92.6600) | |
| Gigabyte G6X 9KG (2024) (v6.92.6600) | |
| AIDA64 / CPU SHA3 | |
| SCHENKER XMG Core 15 (M24) (v6.92.6600) | |
| Media de la clase Gaming (1339 - 10389, n=147, últimos 2 años) | |
| Dell G16, i7-13650HX, RTX 4060 (v6.92.6600) | |
| HP Victus 16 (2024) (v6.92.6600) | |
| Lenovo LOQ 15IRX9 (v6.92.6600) | |
| Lenovo LOQ 15IRX9 (v6.92.6600, Leistungsmodus) | |
| Medio Intel Core i5-13450HX (3519 - 3530, n=3) | |
| Gigabyte G6X 9KG (2024) (v6.92.6600) | |
| AIDA64 / CPU Queen | |
| HP Victus 16 (2024) (v6.92.6600) | |
| SCHENKER XMG Core 15 (M24) (v6.92.6600) | |
| Media de la clase Gaming (50699 - 200651, n=147, últimos 2 años) | |
| Gigabyte G6X 9KG (2024) (v6.92.6600) | |
| Dell G16, i7-13650HX, RTX 4060 (v6.92.6600) | |
| Lenovo LOQ 15IRX9 (v6.92.6600) | |
| Medio Intel Core i5-13450HX (85888 - 86148, n=3) | |
| Lenovo LOQ 15IRX9 (v6.92.6600, Leistungsmodus) | |
| AIDA64 / FPU SinJulia | |
| SCHENKER XMG Core 15 (M24) (v6.92.6600) | |
| Media de la clase Gaming (4800 - 32988, n=147, últimos 2 años) | |
| HP Victus 16 (2024) (v6.92.6600) | |
| Dell G16, i7-13650HX, RTX 4060 (v6.92.6600) | |
| Lenovo LOQ 15IRX9 (v6.92.6600, Leistungsmodus) | |
| Lenovo LOQ 15IRX9 (v6.92.6600) | |
| Medio Intel Core i5-13450HX (9325 - 9354, n=3) | |
| Gigabyte G6X 9KG (2024) (v6.92.6600) | |
| AIDA64 / FPU Mandel | |
| SCHENKER XMG Core 15 (M24) (v6.92.6600) | |
| Media de la clase Gaming (12321 - 134044, n=147, últimos 2 años) | |
| Dell G16, i7-13650HX, RTX 4060 (v6.92.6600) | |
| Lenovo LOQ 15IRX9 (v6.92.6600, Leistungsmodus) | |
| HP Victus 16 (2024) (v6.92.6600) | |
| Medio Intel Core i5-13450HX (34956 - 42825, n=3) | |
| Lenovo LOQ 15IRX9 (v6.92.6600) | |
| Gigabyte G6X 9KG (2024) (v6.92.6600) | |
| AIDA64 / CPU AES | |
| Media de la clase Gaming (19065 - 328679, n=147, últimos 2 años) | |
| SCHENKER XMG Core 15 (M24) (v6.92.6600) | |
| Dell G16, i7-13650HX, RTX 4060 (v6.92.6600) | |
| HP Victus 16 (2024) (v6.92.6600) | |
| Medio Intel Core i5-13450HX (70296 - 70680, n=3) | |
| Lenovo LOQ 15IRX9 (v6.92.6600) | |
| Lenovo LOQ 15IRX9 (v6.92.6600, Leistungsmodus) | |
| Gigabyte G6X 9KG (2024) (v6.92.6600) | |
| AIDA64 / CPU ZLib | |
| Media de la clase Gaming (373 - 2531, n=147, últimos 2 años) | |
| Dell G16, i7-13650HX, RTX 4060 (v6.92.6600) | |
| HP Victus 16 (2024) (v6.92.6600) | |
| Gigabyte G6X 9KG (2024) (v6.92.6600) | |
| Lenovo LOQ 15IRX9 (v6.92.6600) | |
| Medio Intel Core i5-13450HX (977 - 1002, n=3) | |
| Lenovo LOQ 15IRX9 (v6.92.6600, Leistungsmodus) | |
| SCHENKER XMG Core 15 (M24) (v6.92.6600) | |
| AIDA64 / FP64 Ray-Trace | |
| SCHENKER XMG Core 15 (M24) (v6.92.6600) | |
| Media de la clase Gaming (2540 - 43430, n=147, últimos 2 años) | |
| Dell G16, i7-13650HX, RTX 4060 (v6.92.6600) | |
| Lenovo LOQ 15IRX9 (v6.92.6600, Leistungsmodus) | |
| HP Victus 16 (2024) (v6.92.6600) | |
| Medio Intel Core i5-13450HX (7428 - 9561, n=3) | |
| Lenovo LOQ 15IRX9 (v6.92.6600) | |
| Gigabyte G6X 9KG (2024) (v6.92.6600) | |
| AIDA64 / CPU PhotoWorxx | |
| SCHENKER XMG Core 15 (M24) (v6.92.6600) | |
| Media de la clase Gaming (10805 - 60161, n=147, últimos 2 años) | |
| HP Victus 16 (2024) (v6.92.6600) | |
| Gigabyte G6X 9KG (2024) (v6.92.6600) | |
| Lenovo LOQ 15IRX9 (v6.92.6600) | |
| Lenovo LOQ 15IRX9 (v6.92.6600, Leistungsmodus) | |
| Medio Intel Core i5-13450HX (36014 - 36764, n=3) | |
| Dell G16, i7-13650HX, RTX 4060 (v6.92.6600) | |
Rendimiento del sistema
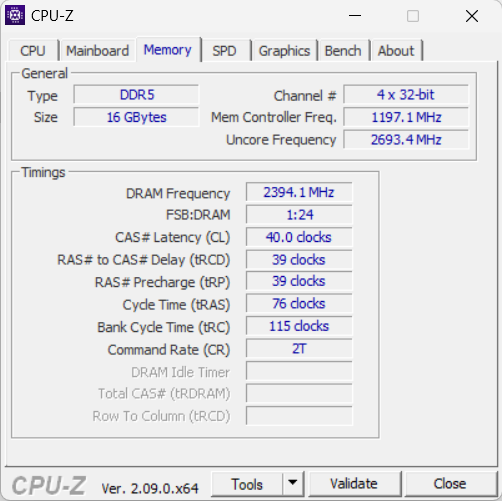
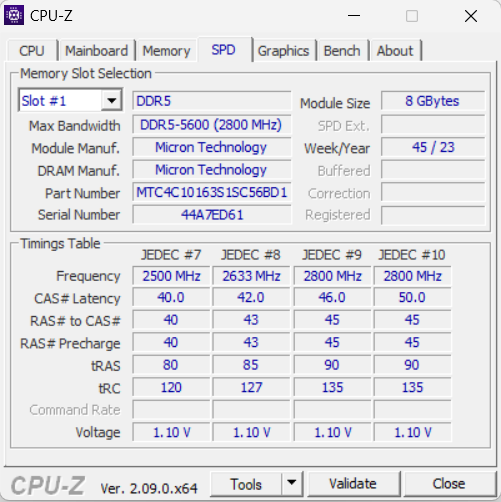
No le falta rendimiento al sistema: el ordenador maneja juegos, renderizado y streaming sin problemas. Las tasas de transferencia de la RAM son las esperadas para una RAM DDR5-5600.

CrossMark: Overall | Productivity | Creativity | Responsiveness
WebXPRT 3: Overall
WebXPRT 4: Overall
Mozilla Kraken 1.1: Total
| PCMark 10 / Score | |
| SCHENKER XMG Core 15 (M24) | |
| Media de la clase Gaming (5776 - 9852, n=133, últimos 2 años) | |
| Gigabyte G6X 9KG (2024) | |
| HP Victus 16 (2024) | |
| Dell G16, i7-13650HX, RTX 4060 | |
| Lenovo LOQ 15IRX9 | |
| Medio Intel Core i5-13450HX, NVIDIA GeForce RTX 4060 Laptop GPU (n=1) | |
| PCMark 10 / Essentials | |
| HP Victus 16 (2024) | |
| Media de la clase Gaming (9057 - 12600, n=133, últimos 2 años) | |
| Gigabyte G6X 9KG (2024) | |
| SCHENKER XMG Core 15 (M24) | |
| Dell G16, i7-13650HX, RTX 4060 | |
| Lenovo LOQ 15IRX9 | |
| Medio Intel Core i5-13450HX, NVIDIA GeForce RTX 4060 Laptop GPU (n=1) | |
| PCMark 10 / Productivity | |
| SCHENKER XMG Core 15 (M24) | |
| Gigabyte G6X 9KG (2024) | |
| Dell G16, i7-13650HX, RTX 4060 | |
| HP Victus 16 (2024) | |
| Media de la clase Gaming (6662 - 14612, n=133, últimos 2 años) | |
| Lenovo LOQ 15IRX9 | |
| Medio Intel Core i5-13450HX, NVIDIA GeForce RTX 4060 Laptop GPU (n=1) | |
| PCMark 10 / Digital Content Creation | |
| SCHENKER XMG Core 15 (M24) | |
| Media de la clase Gaming (6807 - 18475, n=133, últimos 2 años) | |
| Dell G16, i7-13650HX, RTX 4060 | |
| Gigabyte G6X 9KG (2024) | |
| Lenovo LOQ 15IRX9 | |
| Medio Intel Core i5-13450HX, NVIDIA GeForce RTX 4060 Laptop GPU (n=1) | |
| HP Victus 16 (2024) | |
| CrossMark / Overall | |
| Gigabyte G6X 9KG (2024) | |
| HP Victus 16 (2024) | |
| Media de la clase Gaming (1247 - 2344, n=114, últimos 2 años) | |
| SCHENKER XMG Core 15 (M24) | |
| Dell G16, i7-13650HX, RTX 4060 | |
| Lenovo LOQ 15IRX9 | |
| Medio Intel Core i5-13450HX, NVIDIA GeForce RTX 4060 Laptop GPU (n=1) | |
| CrossMark / Productivity | |
| Gigabyte G6X 9KG (2024) | |
| Media de la clase Gaming (1299 - 2204, n=114, últimos 2 años) | |
| SCHENKER XMG Core 15 (M24) | |
| HP Victus 16 (2024) | |
| Dell G16, i7-13650HX, RTX 4060 | |
| Lenovo LOQ 15IRX9 | |
| Medio Intel Core i5-13450HX, NVIDIA GeForce RTX 4060 Laptop GPU (n=1) | |
| CrossMark / Creativity | |
| HP Victus 16 (2024) | |
| SCHENKER XMG Core 15 (M24) | |
| Media de la clase Gaming (1275 - 2660, n=114, últimos 2 años) | |
| Gigabyte G6X 9KG (2024) | |
| Dell G16, i7-13650HX, RTX 4060 | |
| Lenovo LOQ 15IRX9 | |
| Medio Intel Core i5-13450HX, NVIDIA GeForce RTX 4060 Laptop GPU (n=1) | |
| CrossMark / Responsiveness | |
| Gigabyte G6X 9KG (2024) | |
| HP Victus 16 (2024) | |
| Lenovo LOQ 15IRX9 | |
| Medio Intel Core i5-13450HX, NVIDIA GeForce RTX 4060 Laptop GPU (n=1) | |
| Media de la clase Gaming (1030 - 2330, n=114, últimos 2 años) | |
| Dell G16, i7-13650HX, RTX 4060 | |
| SCHENKER XMG Core 15 (M24) | |
| WebXPRT 3 / Overall | |
| SCHENKER XMG Core 15 (M24) (Chrome 82) | |
| Gigabyte G6X 9KG (2024) (Chrome 82) | |
| Media de la clase Gaming (215 - 480, n=127, últimos 2 años) | |
| HP Victus 16 (2024) (Chrome 82) | |
| Dell G16, i7-13650HX, RTX 4060 (Chrome 82) | |
| Lenovo LOQ 15IRX9 (Chrome 82) | |
| Medio Intel Core i5-13450HX, NVIDIA GeForce RTX 4060 Laptop GPU (n=1) | |
| WebXPRT 4 / Overall | |
| Media de la clase Gaming (176.4 - 335, n=115, últimos 2 años) | |
| SCHENKER XMG Core 15 (M24) (Chrome 105.0.0.0) | |
| Gigabyte G6X 9KG (2024) (Chrome 105.0.0.0) | |
| HP Victus 16 (2024) (Chrome 105.0.0.0) | |
| Lenovo LOQ 15IRX9 (Chrome 105.0.0.0) | |
| Medio Intel Core i5-13450HX, NVIDIA GeForce RTX 4060 Laptop GPU (n=1) | |
| Mozilla Kraken 1.1 / Total | |
| Lenovo LOQ 15IRX9 (Chrome 82) | |
| Medio Intel Core i5-13450HX, NVIDIA GeForce RTX 4060 Laptop GPU (n=1) | |
| HP Victus 16 (2024) (Chrome 82) | |
| Gigabyte G6X 9KG (2024) (Chrome 82) | |
| Dell G16, i7-13650HX, RTX 4060 (Chrome 82) | |
| Media de la clase Gaming (409 - 674, n=139, últimos 2 años) | |
| SCHENKER XMG Core 15 (M24) (Chrome 82) | |
* ... más pequeño es mejor
| PCMark 10 Score | 6929 puntos | |
ayuda | ||
| AIDA64 / Memory Copy | |
| SCHENKER XMG Core 15 (M24) (v6.92.6600) | |
| HP Victus 16 (2024) (v6.92.6600) | |
| Media de la clase Gaming (21750 - 97515, n=147, últimos 2 años) | |
| Gigabyte G6X 9KG (2024) (v6.92.6600) | |
| Dell G16, i7-13650HX, RTX 4060 (v6.92.6600) | |
| Medio Intel Core i5-13450HX (58673 - 58861, n=3) | |
| Lenovo LOQ 15IRX9 (v6.92.6600) | |
| AIDA64 / Memory Read | |
| HP Victus 16 (2024) (v6.92.6600) | |
| Media de la clase Gaming (22956 - 102937, n=147, últimos 2 años) | |
| Gigabyte G6X 9KG (2024) (v6.92.6600) | |
| Lenovo LOQ 15IRX9 (v6.92.6600) | |
| Medio Intel Core i5-13450HX (66626 - 69024, n=3) | |
| Dell G16, i7-13650HX, RTX 4060 (v6.92.6600) | |
| SCHENKER XMG Core 15 (M24) (v6.92.6600) | |
| AIDA64 / Memory Write | |
| SCHENKER XMG Core 15 (M24) (v6.92.6600) | |
| Media de la clase Gaming (22297 - 108954, n=147, últimos 2 años) | |
| HP Victus 16 (2024) (v6.92.6600) | |
| Gigabyte G6X 9KG (2024) (v6.92.6600) | |
| Lenovo LOQ 15IRX9 (v6.92.6600) | |
| Medio Intel Core i5-13450HX (58540 - 60196, n=3) | |
| Dell G16, i7-13650HX, RTX 4060 (v6.92.6600) | |
| AIDA64 / Memory Latency | |
| HP Victus 16 (2024) (v6.92.6600) | |
| Media de la clase Gaming (59.5 - 259, n=147, últimos 2 años) | |
| Lenovo LOQ 15IRX9 (v6.92.6600) | |
| Medio Intel Core i5-13450HX (90 - 94.2, n=3) | |
| Dell G16, i7-13650HX, RTX 4060 (v6.92.6600) | |
| Gigabyte G6X 9KG (2024) (v6.92.6600) | |
| SCHENKER XMG Core 15 (M24) (v6.92.6600) | |
* ... más pequeño es mejor
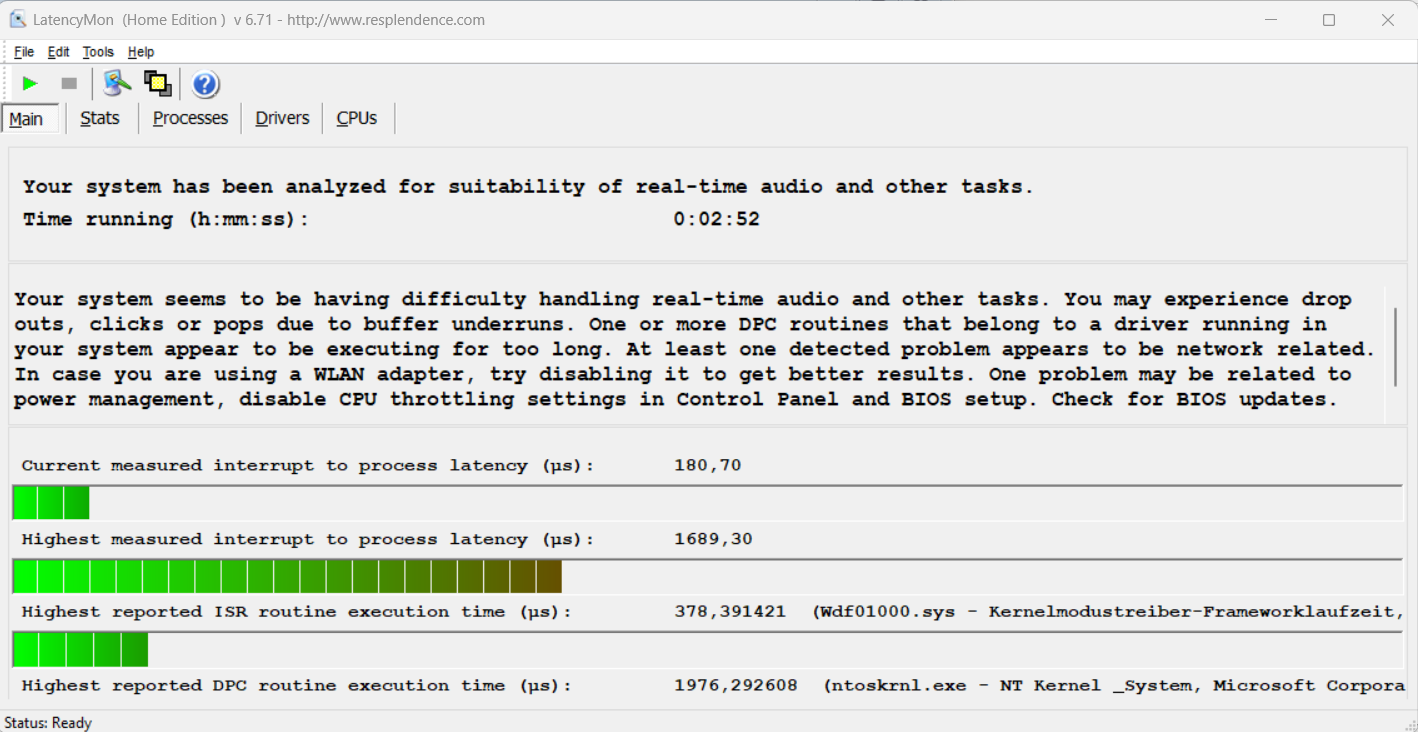
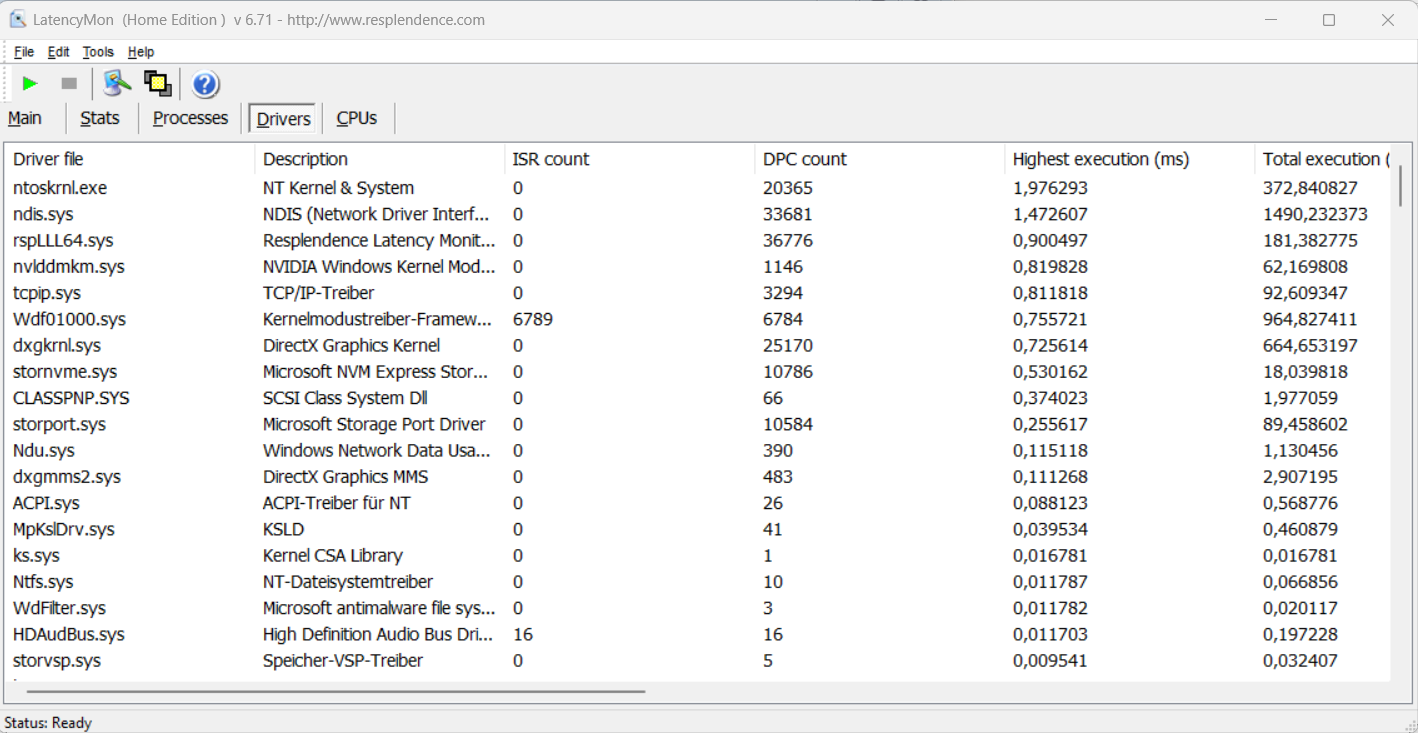
Latencias del CPD
La prueba de latencia estandarizada (navegación web, reproducción de vídeo 4k, Prime95 de alta carga) reveló algunas anomalías. El sistema no parece adecuado para la edición de vídeo y audio en tiempo real. Futuras actualizaciones del software podrían suponer mejoras o incluso empeoramientos.
| DPC Latencies / LatencyMon - interrupt to process latency (max), Web, Youtube, Prime95 | |
| Gigabyte G6X 9KG (2024) | |
| Lenovo LOQ 15IRX9 | |
| SCHENKER XMG Core 15 (M24) | |
| Dell G16, i7-13650HX, RTX 4060 | |
| HP Victus 16 (2024) | |
* ... más pequeño es mejor
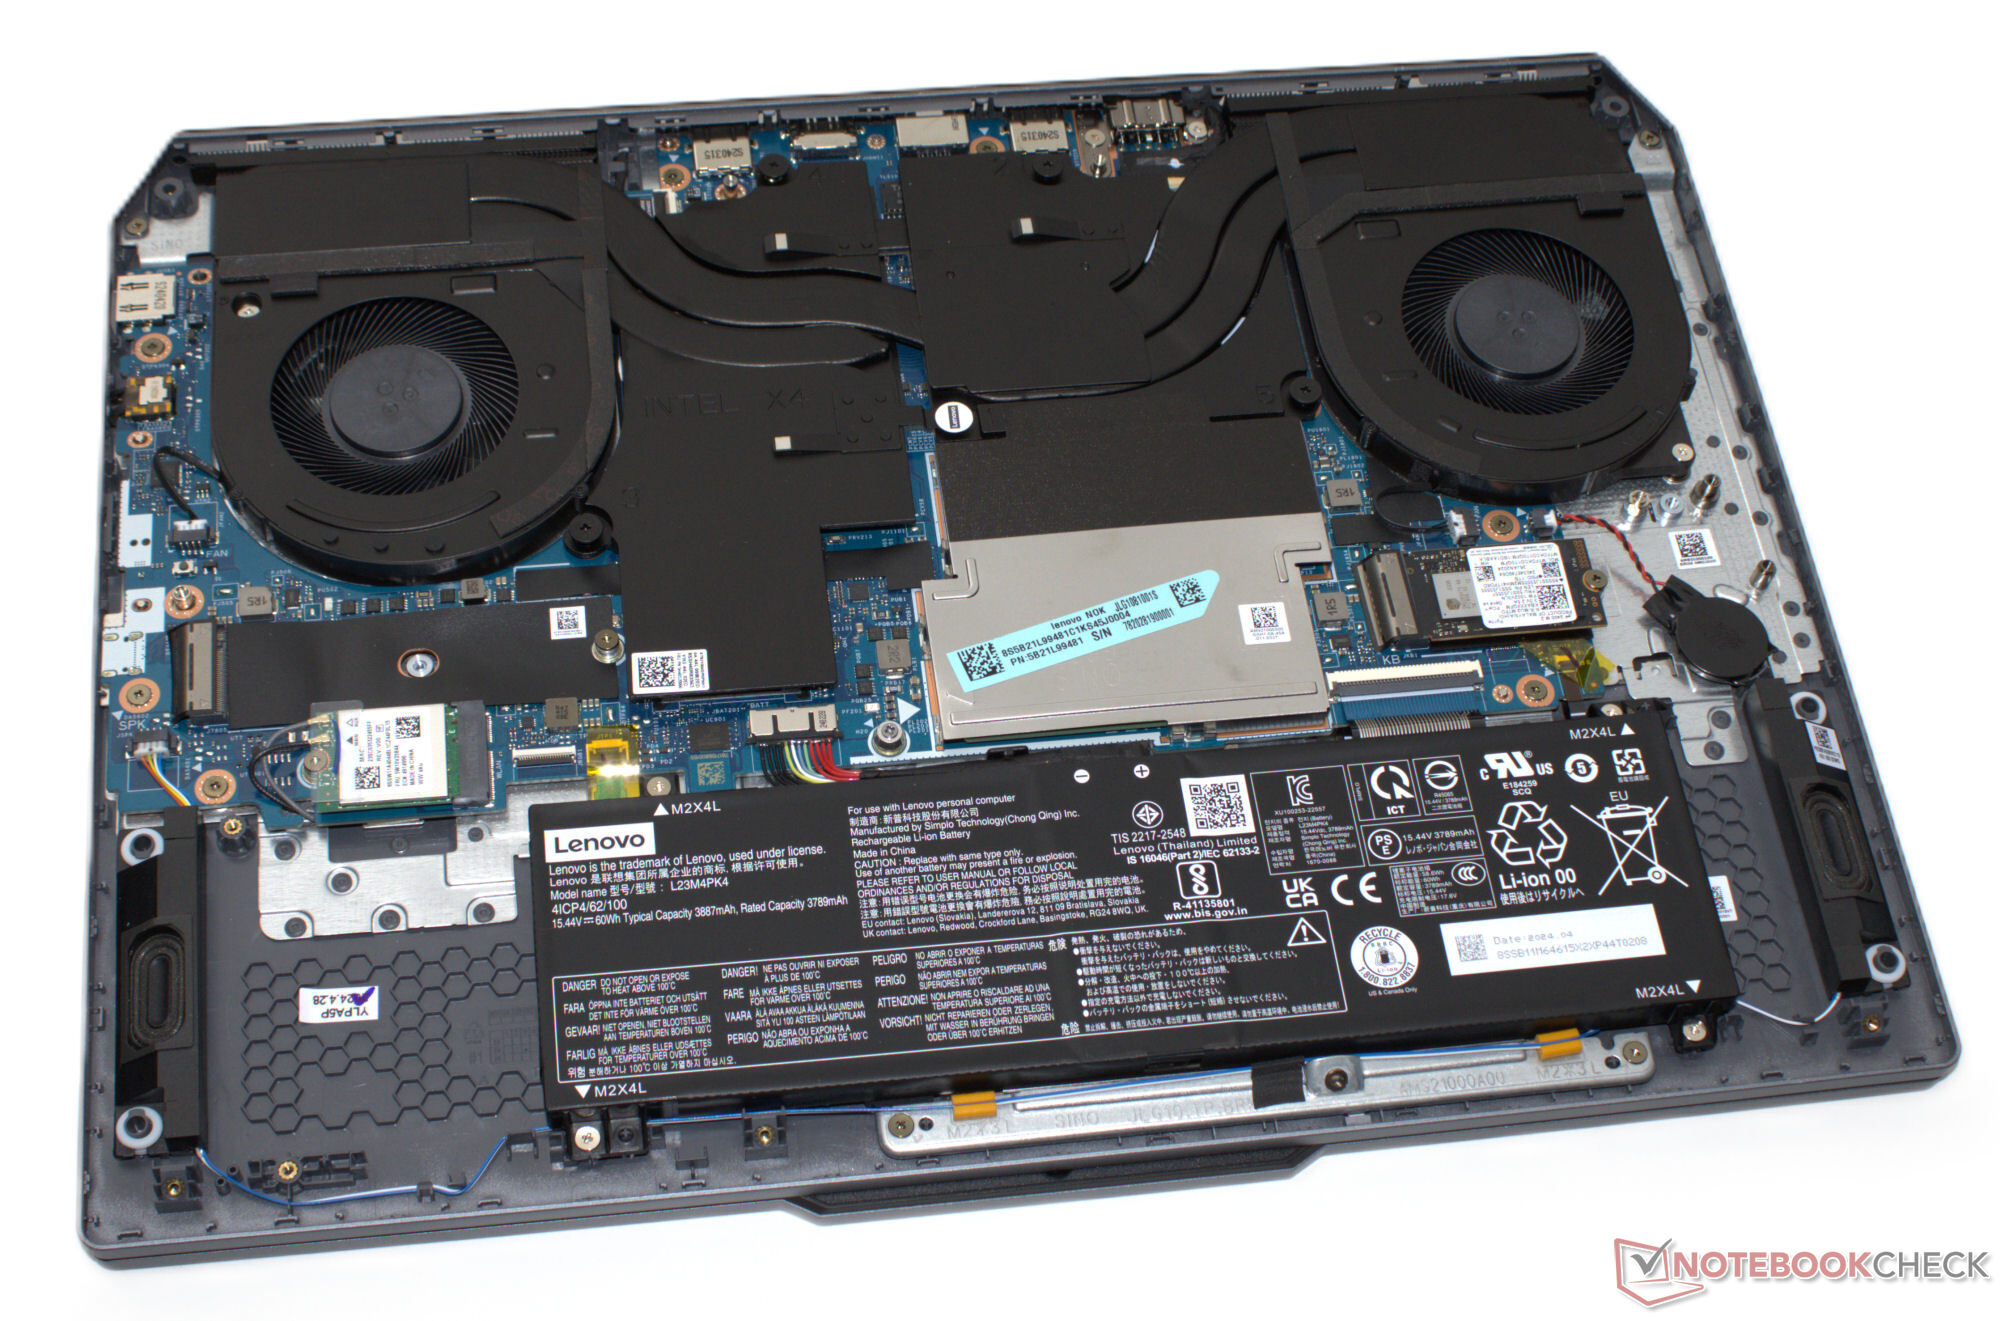
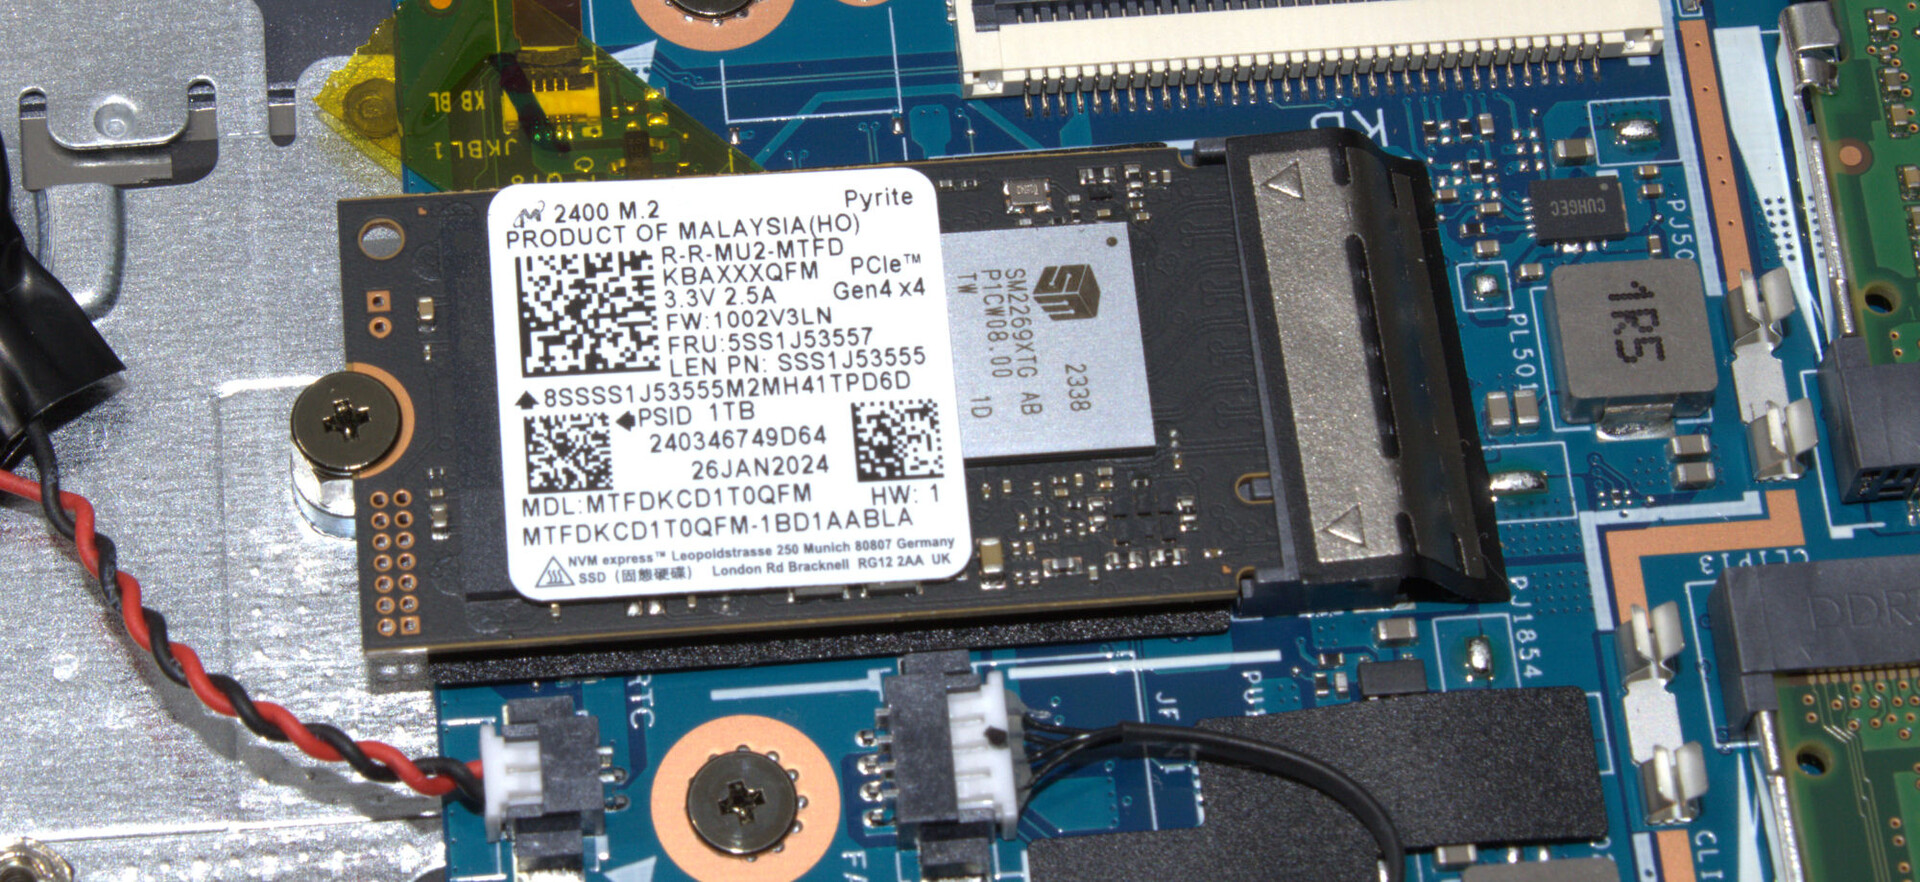
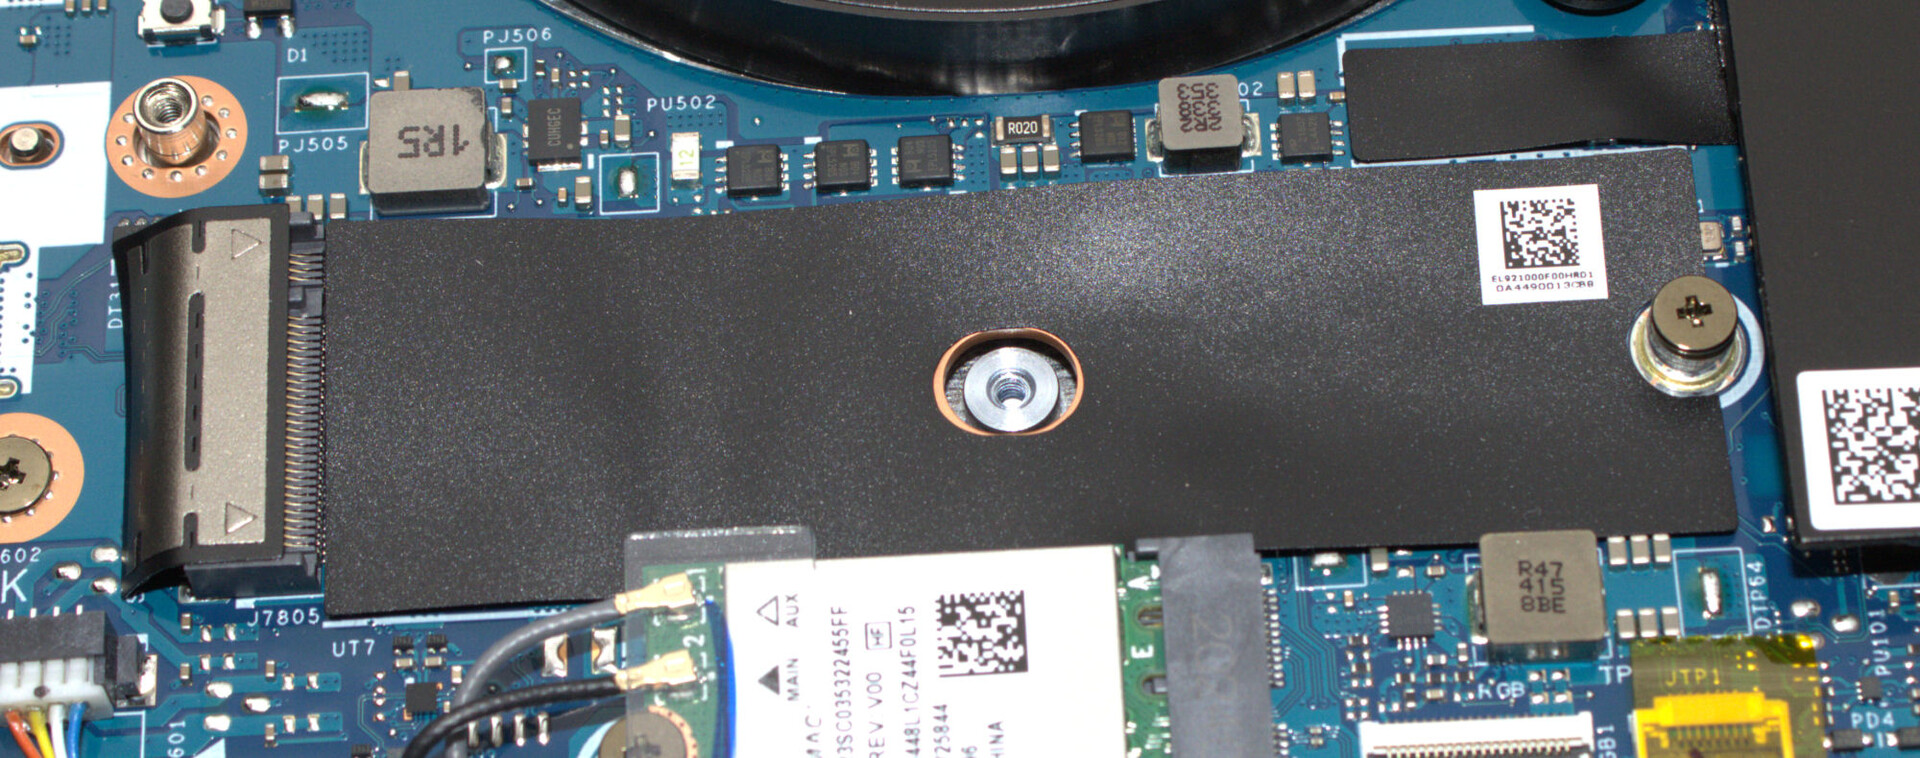
Dispositivos de almacenamiento
El LOQ tiene espacio para un total de dos SSD PCIe 4 (M.2 2280 o M.2 2242). La unidad SSD Micron (1 TB, M.2 2242) de nuestro dispositivo de pruebas ofrece buenas velocidades de datos, pero no puede clasificarse como uno de los modelos SSD de gama alta. Durante el transcurso posterior del bucle DiskSpd, observamos cierta ralentización inducida térmicamente.

* ... más pequeño es mejor
Reading continuous performance: DiskSpd Read Loop, Queue Depth 8
Tarjeta gráfica
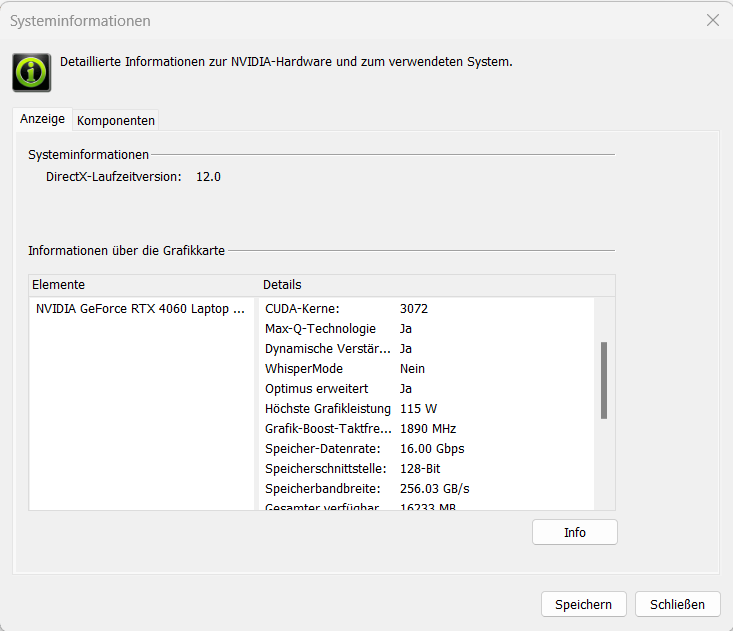
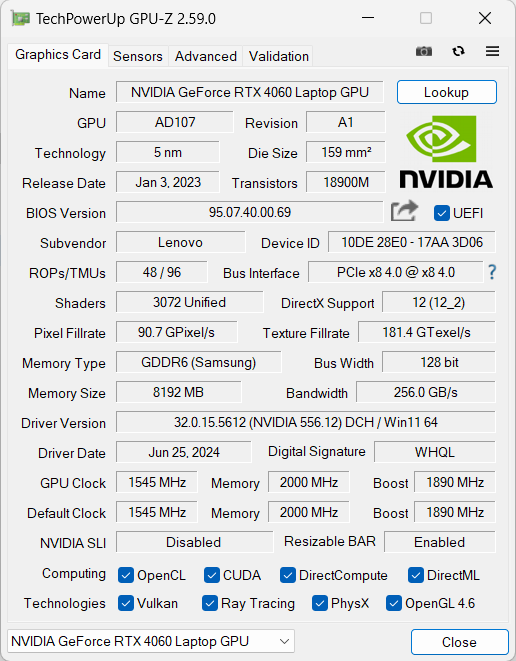
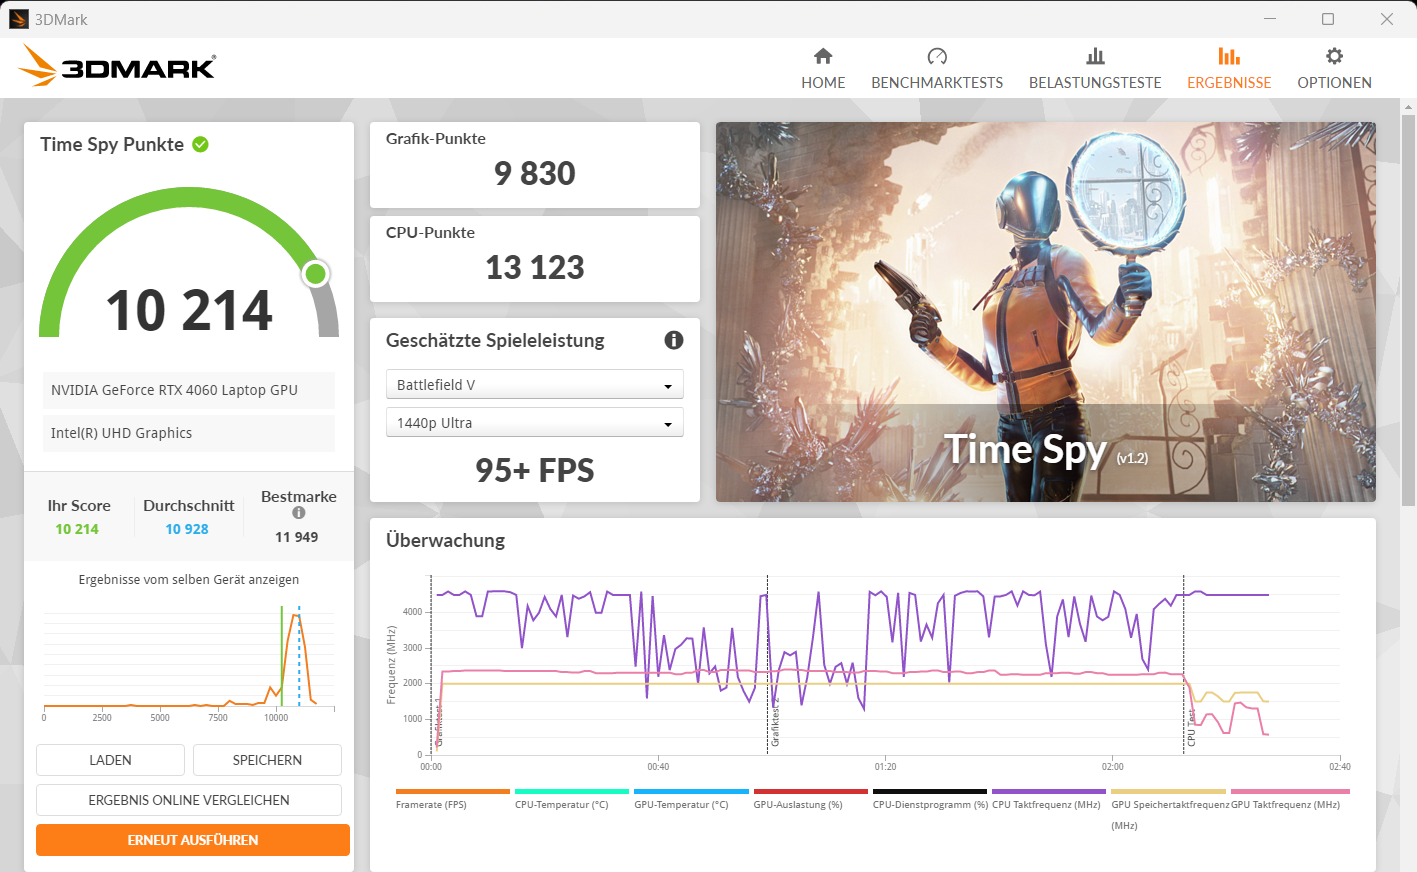
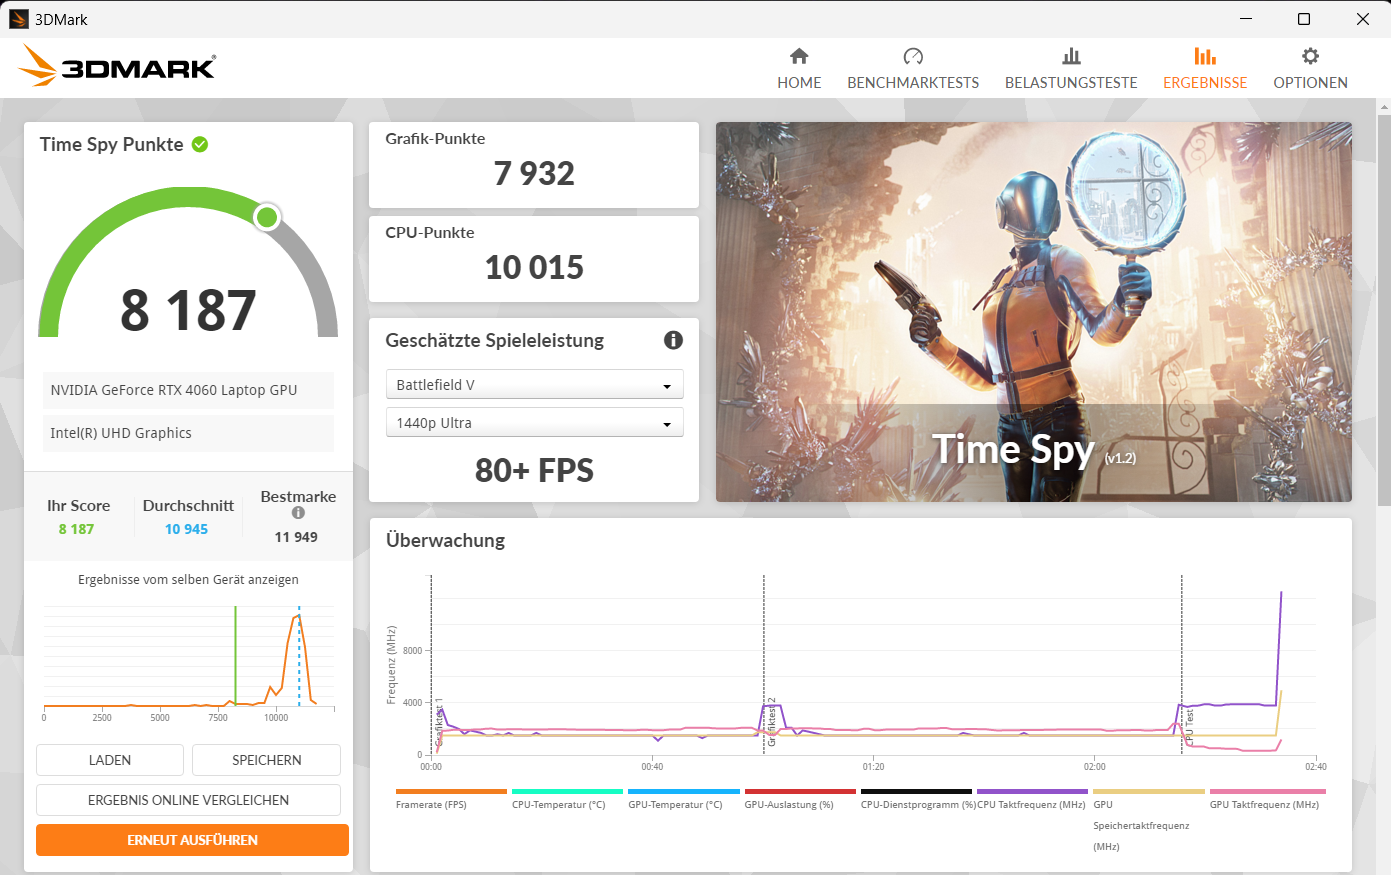
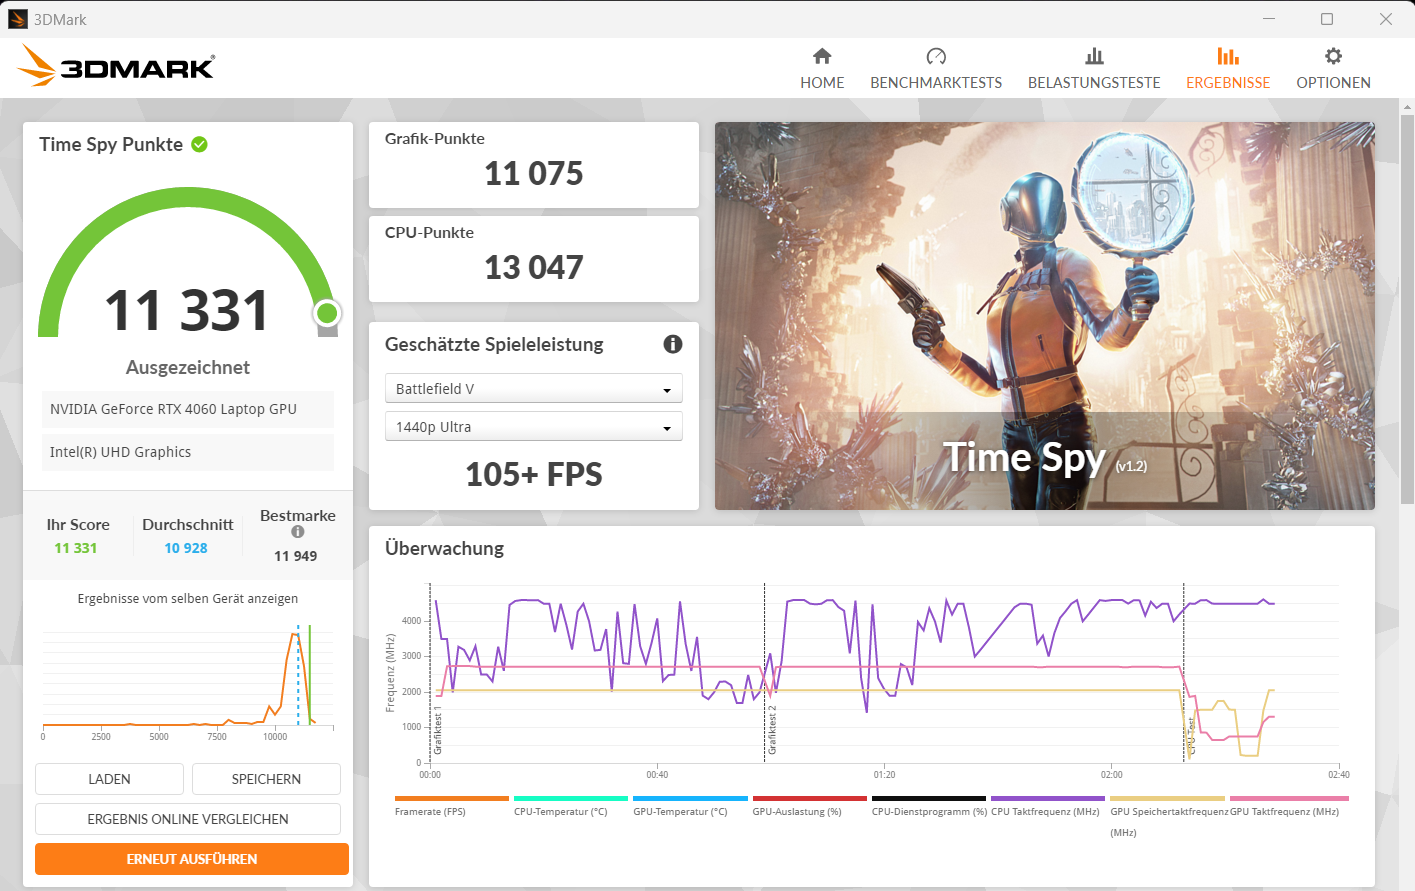
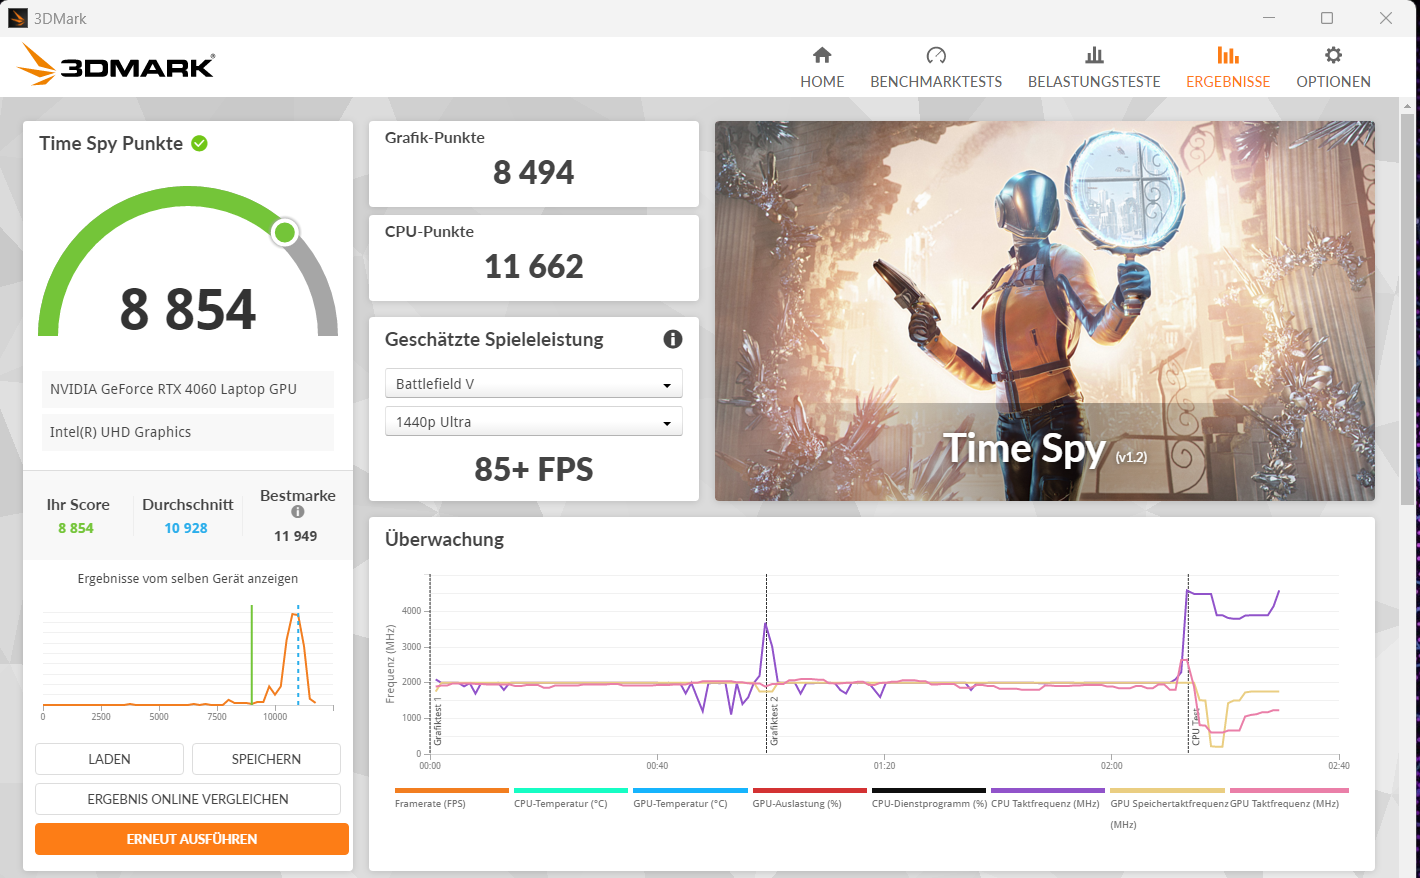
La GeForce RTX 4060 (3.072 sombreadores, bus de 128 bits, 8 GB GDDR6, 115 vatios) representa la gama media dentro de la actual línea de GPU móviles de Nvidia. Permite jugar en FHD con ajustes de altos a máximos. Sus resultados en los bancos de pruebas y sus velocidades de fotogramas están más o menos a la par con la media de la RTX-4060(modo equilibrado ). El modo de rendimiento dio como resultado valores mejorados. El cambio entre la dGPU y Optimus no requiere reinicio: Optimus avanzado es compatible.
| 3DMark Performance Rating - Percent | |
| Media de la clase Gaming | |
| SCHENKER XMG Core 15 (M24) | |
| Lenovo LOQ 15IRX9 | |
| Dell G16, i7-13650HX, RTX 4060 | |
| Lenovo LOQ 15IRX9 | |
| Gigabyte G6X 9KG (2024) | |
| HP Victus 16 (2024) | |
| Medio NVIDIA GeForce RTX 4060 Laptop GPU | |
| 3DMark 11 - 1280x720 Performance GPU | |
| Media de la clase Gaming (10741 - 72178, n=143, últimos 2 años) | |
| SCHENKER XMG Core 15 (M24) | |
| Lenovo LOQ 15IRX9 (Leistungsmodus) | |
| Dell G16, i7-13650HX, RTX 4060 | |
| Lenovo LOQ 15IRX9 | |
| Gigabyte G6X 9KG (2024) | |
| HP Victus 16 (2024) | |
| Medio NVIDIA GeForce RTX 4060 Laptop GPU (28136 - 38912, n=57) | |
| 3DMark | |
| 1920x1080 Fire Strike Graphics | |
| Media de la clase Gaming (2913 - 56116, n=155, últimos 2 años) | |
| SCHENKER XMG Core 15 (M24) | |
| Lenovo LOQ 15IRX9 (Leistungsmodus) | |
| Lenovo LOQ 15IRX9 | |
| Gigabyte G6X 9KG (2024) | |
| Dell G16, i7-13650HX, RTX 4060 | |
| HP Victus 16 (2024) | |
| Medio NVIDIA GeForce RTX 4060 Laptop GPU (20533 - 29656, n=54) | |
| 2560x1440 Time Spy Graphics | |
| Media de la clase Gaming (2295 - 24599, n=151, últimos 2 años) | |
| SCHENKER XMG Core 15 (M24) | |
| Lenovo LOQ 15IRX9 (Leistungsmodus) | |
| Dell G16, i7-13650HX, RTX 4060 | |
| Medio NVIDIA GeForce RTX 4060 Laptop GPU (7484 - 11451, n=56) | |
| HP Victus 16 (2024) | |
| Gigabyte G6X 9KG (2024) | |
| Lenovo LOQ 15IRX9 | |
| 3DMark 11 Performance | 30755 puntos | |
| 3DMark Fire Strike Score | 22788 puntos | |
| 3DMark Time Spy Score | 10214 puntos | |
| 3DMark Steel Nomad Score | 2143 puntos | |
ayuda | ||
| Geekbench 5.5 | |
| OpenCL Score | |
| Media de la clase Gaming (5039 - 270235, n=150, últimos 2 años) | |
| SCHENKER XMG Core 15 (M24) | |
| Lenovo LOQ 15IRX9 (Leistungsmodus) | |
| Lenovo LOQ 15IRX9 | |
| Gigabyte G6X 9KG (2024) | |
| Dell G16, i7-13650HX, RTX 4060 | |
| HP Victus 16 (2024) | |
| Medio NVIDIA GeForce RTX 4060 Laptop GPU (5039 - 112238, n=53) | |
| Vulkan Score 5.5 | |
| SCHENKER XMG Core 15 (M24) | |
| Lenovo LOQ 15IRX9 (Leistungsmodus) | |
| Lenovo LOQ 15IRX9 | |
| Media de la clase Gaming (9296 - 176078, n=103, últimos 2 años) | |
| Medio NVIDIA GeForce RTX 4060 Laptop GPU (28838 - 87612, n=31) | |
| HP Victus 16 (2024) | |
| Gigabyte G6X 9KG (2024) | |
| Geekbench 6.4 | |
| GPU OpenCL | |
| Media de la clase Gaming (4321 - 234213, n=118, últimos 2 años) | |
| Gigabyte G6X 9KG (2024) (6.2.1) | |
| SCHENKER XMG Core 15 (M24) (6.2.1) | |
| HP Victus 16 (2024) (6.2.1) | |
| Dell G16, i7-13650HX, RTX 4060 (6.2.1) | |
| Lenovo LOQ 15IRX9 (6.2.1, Leistungsmodus) | |
| Lenovo LOQ 15IRX9 (6.2.1) | |
| Medio NVIDIA GeForce RTX 4060 Laptop GPU (4321 - 100831, n=40) | |
| GPU Vulkan | |
| SCHENKER XMG Core 15 (M24) (6.2.1) | |
| Lenovo LOQ 15IRX9 (6.2.1, Leistungsmodus) | |
| Gigabyte G6X 9KG (2024) (6.2.1) | |
| Lenovo LOQ 15IRX9 (6.2.1) | |
| HP Victus 16 (2024) (6.2.1) | |
| Media de la clase Gaming (4286 - 231659, n=110, últimos 2 años) | |
| Medio NVIDIA GeForce RTX 4060 Laptop GPU (4286 - 101001, n=36) | |
| Dell G16, i7-13650HX, RTX 4060 (6.2.1) | |
| V-Ray 5 Benchmark | |
| GPU RTX | |
| Media de la clase Gaming (556 - 4011, n=88, últimos 2 años) | |
| Gigabyte G6X 9KG (2024) (5.0.1) | |
| HP Victus 16 (2024) (5.0.1) | |
| Lenovo LOQ 15IRX9 (5.0.1, Leistungsmodus) | |
| Dell G16, i7-13650HX, RTX 4060 (5.0.1) | |
| Medio NVIDIA GeForce RTX 4060 Laptop GPU (1387 - 1817, n=28) | |
| Lenovo LOQ 15IRX9 (5.0.1) | |
| GPU CUDA | |
| Media de la clase Gaming (300 - 3229, n=90, últimos 2 años) | |
| Lenovo LOQ 15IRX9 (5.0.1, Leistungsmodus) | |
| Gigabyte G6X 9KG (2024) (5.0.1) | |
| Lenovo LOQ 15IRX9 (5.0.1) | |
| HP Victus 16 (2024) (5.0.1) | |
| Medio NVIDIA GeForce RTX 4060 Laptop GPU (957 - 1294, n=29) | |
| Dell G16, i7-13650HX, RTX 4060 (5.0.1) | |
| CPU | |
| Media de la clase Gaming (3562 - 30302, n=92, últimos 2 años) | |
| HP Victus 16 (2024) (5.0.1) | |
| Medio NVIDIA GeForce RTX 4060 Laptop GPU (8364 - 21065, n=28) | |
| Gigabyte G6X 9KG (2024) (5.0.1) | |
| Lenovo LOQ 15IRX9 (5.0.1, Leistungsmodus) | |
| Dell G16, i7-13650HX, RTX 4060 (5.0.1) | |
| Lenovo LOQ 15IRX9 (5.0.1) | |
| V-Ray Benchmark Next 4.10 | |
| GPU | |
| SCHENKER XMG Core 15 (M24) (v4.10.07 ) | |
| Media de la clase Gaming (54 - 1317, n=122, últimos 2 años) | |
| Gigabyte G6X 9KG (2024) (v4.10.07 ) | |
| Lenovo LOQ 15IRX9 (v4.10.07, Leistungsmodus) | |
| Medio NVIDIA GeForce RTX 4060 Laptop GPU (483 - 715, n=46) | |
| HP Victus 16 (2024) (v4.10.07 ) | |
| Lenovo LOQ 15IRX9 (v4.10.07 ) | |
| CPU | |
| HP Victus 16 (2024) (v4.10.07 ) | |
| Media de la clase Gaming (5413 - 44129, n=122, últimos 2 años) | |
| Medio NVIDIA GeForce RTX 4060 Laptop GPU (12680 - 32360, n=46) | |
| SCHENKER XMG Core 15 (M24) (v4.10.07 ) | |
| Gigabyte G6X 9KG (2024) (v4.10.07 ) | |
| Lenovo LOQ 15IRX9 (v4.10.07, Leistungsmodus) | |
| Lenovo LOQ 15IRX9 (v4.10.07 ) | |
* ... más pequeño es mejor
| Performance Rating - Percent | |
| Media de la clase Gaming | |
| SCHENKER XMG Core 15 (M24) | |
| Dell G16, i7-13650HX, RTX 4060 | |
| Lenovo LOQ 15IRX9 | |
| Gigabyte G6X 9KG (2024) | |
| Medio NVIDIA GeForce RTX 4060 Laptop GPU | |
| HP Victus 16 (2024) | |
| Lenovo LOQ 15IRX9 | |
| Cyberpunk 2077 2.2 Phantom Liberty - 1920x1080 Ultra Preset (FSR off) | |
| SCHENKER XMG Core 15 (M24) (2.12) | |
| Media de la clase Gaming (6.76 - 158, n=90, últimos 2 años) | |
| Lenovo LOQ 15IRX9 (2.02, Leistungsmodus) | |
| Medio NVIDIA GeForce RTX 4060 Laptop GPU (56.4 - 93.1, n=31) | |
| Lenovo LOQ 15IRX9 (2.02) | |
| Dell G16, i7-13650HX, RTX 4060 (2.11) | |
| Gigabyte G6X 9KG (2024) (2.02) | |
| HP Victus 16 (2024) (2.02) | |
| GTA V - 1920x1080 Highest Settings possible AA:4xMSAA + FX AF:16x | |
| Dell G16, i7-13650HX, RTX 4060 | |
| SCHENKER XMG Core 15 (M24) | |
| Lenovo LOQ 15IRX9 (Leistungsmodus) | |
| Gigabyte G6X 9KG (2024) | |
| Lenovo LOQ 15IRX9 | |
| Media de la clase Gaming (12.1 - 168.2, n=132, últimos 2 años) | |
| HP Victus 16 (2024) | |
| Medio NVIDIA GeForce RTX 4060 Laptop GPU (76.9 - 126.3, n=48) | |
| Final Fantasy XV Benchmark - 1920x1080 High Quality | |
| Media de la clase Gaming (19.2 - 201, n=144, últimos 2 años) | |
| Lenovo LOQ 15IRX9 (1.3, Leistungsmodus) | |
| SCHENKER XMG Core 15 (M24) (1.3) | |
| Dell G16, i7-13650HX, RTX 4060 (1.3) | |
| Gigabyte G6X 9KG (2024) (1.3) | |
| Lenovo LOQ 15IRX9 (1.3) | |
| HP Victus 16 (2024) (1.3) | |
| Medio NVIDIA GeForce RTX 4060 Laptop GPU (75.1 - 109.8, n=51) | |
| Strange Brigade - 1920x1080 ultra AA:ultra AF:16 | |
| Media de la clase Gaming (38.9 - 420, n=140, últimos 2 años) | |
| SCHENKER XMG Core 15 (M24) (1.47.22.14 D3D12) | |
| Dell G16, i7-13650HX, RTX 4060 (1.47.22.14 D3D12) | |
| Lenovo LOQ 15IRX9 (1.47.22.14 D3D12, Leistungsmodus) | |
| Lenovo LOQ 15IRX9 (1.47.22.14 D3D12) | |
| Gigabyte G6X 9KG (2024) (1.47.22.14 D3D12) | |
| Medio NVIDIA GeForce RTX 4060 Laptop GPU (135.3 - 210, n=50) | |
| HP Victus 16 (2024) (1.47.22.14 D3D12) | |
| Dota 2 Reborn - 1920x1080 ultra (3/3) best looking | |
| HP Victus 16 (2024) | |
| Dell G16, i7-13650HX, RTX 4060 | |
| Media de la clase Gaming (65.1 - 220, n=148, últimos 2 años) | |
| Medio NVIDIA GeForce RTX 4060 Laptop GPU (115 - 183.8, n=53) | |
| Lenovo LOQ 15IRX9 (Leistungsmodus) | |
| Gigabyte G6X 9KG (2024) | |
| Lenovo LOQ 15IRX9 | |
| SCHENKER XMG Core 15 (M24) | |
| X-Plane 11.11 - 1920x1080 high (fps_test=3) | |
| Dell G16, i7-13650HX, RTX 4060 | |
| Gigabyte G6X 9KG (2024) | |
| Media de la clase Gaming (32.8 - 166.2, n=151, últimos 2 años) | |
| Medio NVIDIA GeForce RTX 4060 Laptop GPU (60.7 - 141.1, n=54) | |
| Lenovo LOQ 15IRX9 (Leistungsmodus) | |
| HP Victus 16 (2024) | |
| SCHENKER XMG Core 15 (M24) | |
| Lenovo LOQ 15IRX9 | |
| Dragon's Dogma 2 - 1920x1080 High Preset | |
| Media de la clase Gaming (49.5 - 80, n=8, últimos 2 años) | |
| HP Victus 16 (2024) | |
| Lenovo LOQ 15IRX9 | |
| Medio NVIDIA GeForce RTX 4060 Laptop GPU (57.2 - 67.7, n=5) | |
| Razer Blade 14 Mid 23 | |
| F1 24 - 1920x1080 Ultra High Preset AA:T AF:16x | |
| Media de la clase Gaming (54.1 - 148, n=19, últimos 2 años) | |
| Medio NVIDIA GeForce RTX 4060 Laptop GPU (47.5 - 61.6, n=10) | |
| Razer Blade 14 Mid 23 | |
| Lenovo LOQ 15IRX9 (1122588) | |
| Counter-Strike 2 - 1920x1080 Very High Preset | |
| Razer Blade 14 Mid 23 | |
| Medio NVIDIA GeForce RTX 4060 Laptop GPU (123.9 - 139.1, n=2) | |
| Lenovo LOQ 15IRX9 | |
| Media de la clase Gaming (11.5 - 189.7, n=10, últimos 2 años) | |
| Senua's Saga Hellblade 2 - 1920x1080 High Preset | |
| Media de la clase Gaming (38.4 - 78.8, n=6, últimos 2 años) | |
| Medio NVIDIA GeForce RTX 4060 Laptop GPU (37.6 - 39.5, n=3) | |
| Lenovo LOQ 15IRX9 | |
| Razer Blade 14 Mid 23 | |
| Ghost of Tsushima - 1920x1080 Very High Preset AA:T | |
| Lenovo LOQ 15IRX9 | |
| Medio NVIDIA GeForce RTX 4060 Laptop GPU (55.6 - 63.4, n=5) | |
| Media de la clase Gaming (28.5 - 73.7, n=7, últimos 2 años) | |
| Razer Blade 14 Mid 23 | |
Cyberpunk 2077 ultra FPS diagram
| bajo | medio | alto | ultra | |
|---|---|---|---|---|
| GTA V (2015) | 184.4 | 181.5 | 175.5 | 112.6 |
| Dota 2 Reborn (2015) | 171.2 | 156.8 | 149.4 | 141 |
| Final Fantasy XV Benchmark (2018) | 198.9 | 138.5 | 99.9 | |
| X-Plane 11.11 (2018) | 139.6 | 118.4 | 92.2 | |
| Strange Brigade (2018) | 425 | 260 | 209 | 182.7 |
| Cyberpunk 2077 2.2 Phantom Liberty (2023) | 118.9 | 94.3 | 80.1 | 71.4 |
| Counter-Strike 2 (2023) | 195.3 | 195 | 157 | 123.9 |
| Dragon's Dogma 2 (2024) | 70.6 | 63.3 | ||
| Ghost of Tsushima (2024) | 91 | 81.7 | 74.5 | 60.6 |
| Senua's Saga Hellblade 2 (2024) | 64.1 | 53.2 | 38.4 | |
| F1 24 (2024) | 216 | 201 | 162.5 | 54.1 |
Emisiones y potencia - El Lenovo LOQ con una duración de batería por debajo de la media
Emisiones sonoras
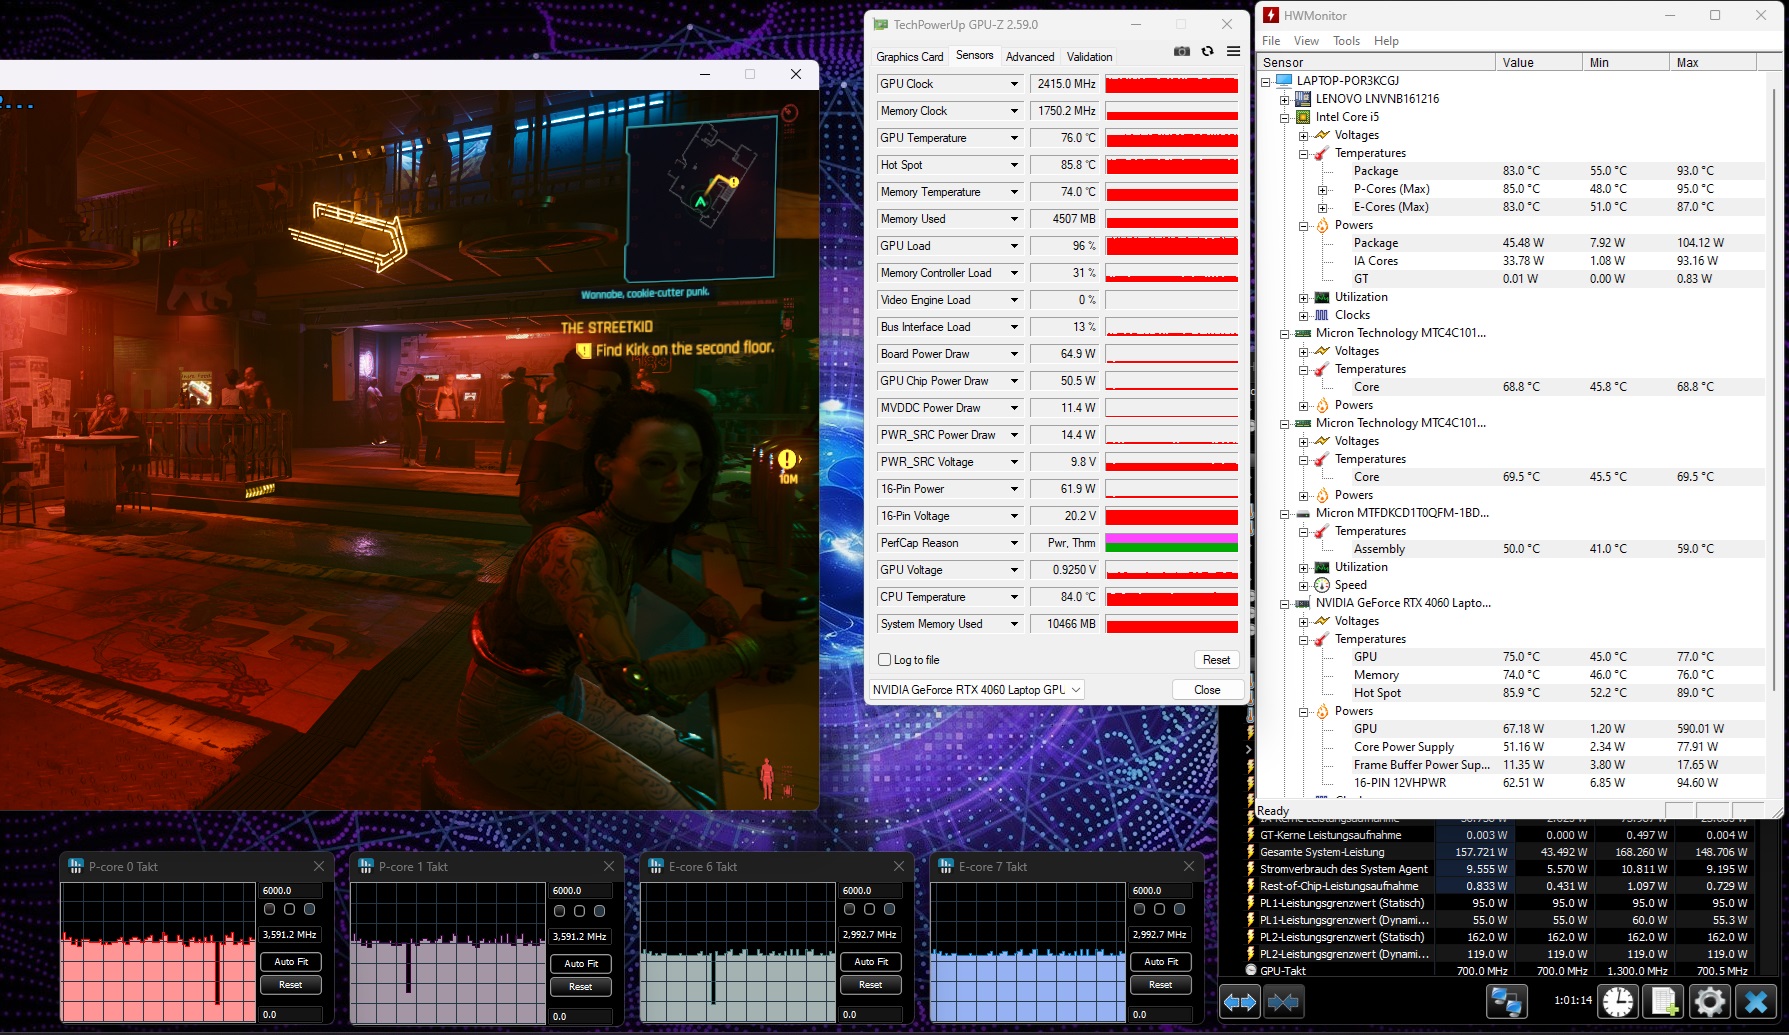
En lo que respecta a las emisiones de ruido, el portátil cumple con lo esperado para su clase: Bajo carga, produce mucho ruido. Jugar a Cyberpunk 2077 produce emisiones de ruido de 48 dB(A)(modo equilibrado ) y 54 dB(A)( modo de rendimiento). El modo silencioso reduce los niveles de ruido a valores más moderados, a costa del rendimiento del portátil. Los juegos deberían seguir siendo posibles-con ajustes reducidos.
El control del ventilador necesita algunos reajustes: En ralentí, los ventiladores se ponen en marcha repetidamente de forma breve, un comportamiento muy molesto a la larga. A veces también funcionan permanentemente a un nivel claramente audible.
Ruido
| Ocioso |
| 26 / 34 / 36 dB(A) |
| Carga |
| 48 / 50 dB(A) |
 | ||
30 dB silencioso 40 dB(A) audible 50 dB(A) ruidosamente alto |
||
min: | ||
| Lenovo LOQ 15IRX9 NVIDIA GeForce RTX 4060 Laptop GPU, i5-13450HX, Micron 2400 MTFDKCD1T0QFM | SCHENKER XMG Core 15 (M24) NVIDIA GeForce RTX 4060 Laptop GPU, R7 8845HS, Samsung 990 Pro 1 TB | Gigabyte G6X 9KG (2024) NVIDIA GeForce RTX 4060 Laptop GPU, i7-13650HX, Gigabyte AG450E1024-SI | HP Victus 16 (2024) NVIDIA GeForce RTX 4060 Laptop GPU, i7-14700HX, Kioxia XG8 KXG80ZNV512G | Dell G16, i7-13650HX, RTX 4060 NVIDIA GeForce RTX 4060 Laptop GPU, i7-13650HX, WD PC SN740 SDDPNQD-1T00 | |
|---|---|---|---|---|---|
| Noise | 14% | -4% | 4% | 20% | |
| apagado / medio ambiente * | 25 | 23 8% | 26 -4% | 25 -0% | 23 8% |
| Idle Minimum * | 26 | 23 12% | 30 -15% | 28 -8% | 23 12% |
| Idle Average * | 34 | 23 32% | 32 6% | 29 15% | 23 32% |
| Idle Maximum * | 36 | 23 36% | 35 3% | 33 8% | 27.96 22% |
| Load Average * | 48 | 38.92 19% | 51 -6% | 45 6% | 27.96 42% |
| Cyberpunk 2077 ultra * | 48 | 52.06 -8% | |||
| Load Maximum * | 50 | 52.09 -4% | 54 -8% | 48 4% | 47.89 4% |
| Witcher 3 ultra * | 50.96 | 51 | 43 | 47.89 |
* ... más pequeño es mejor
Temperatura
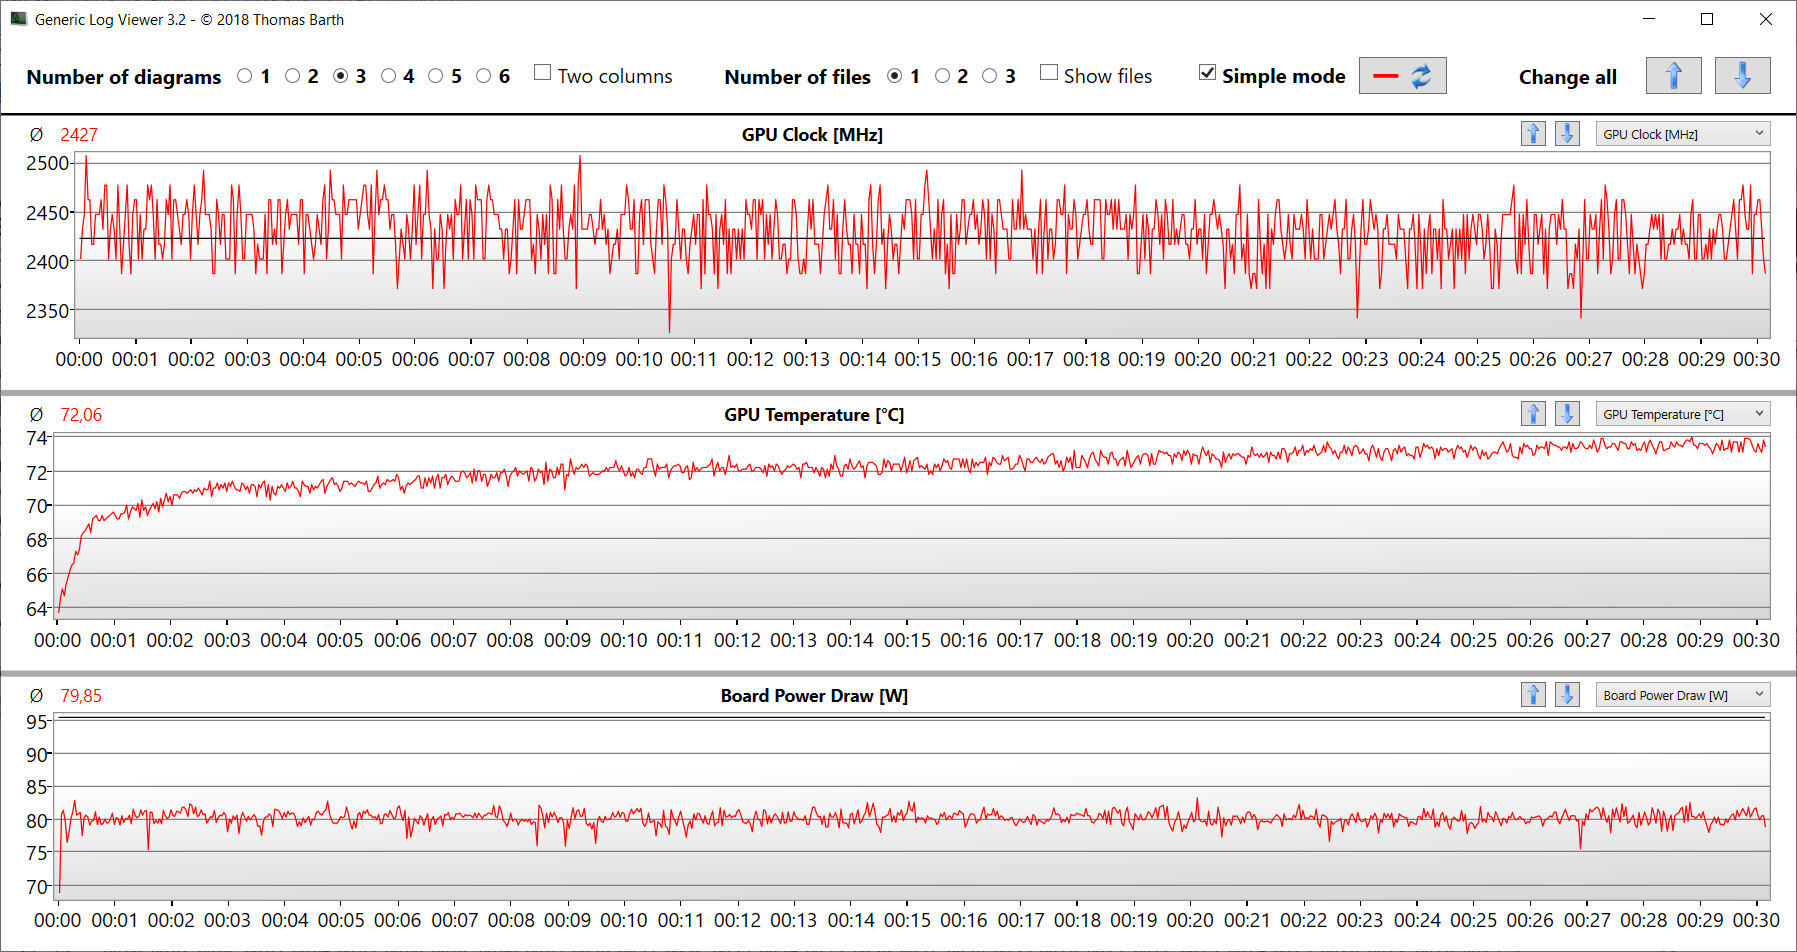
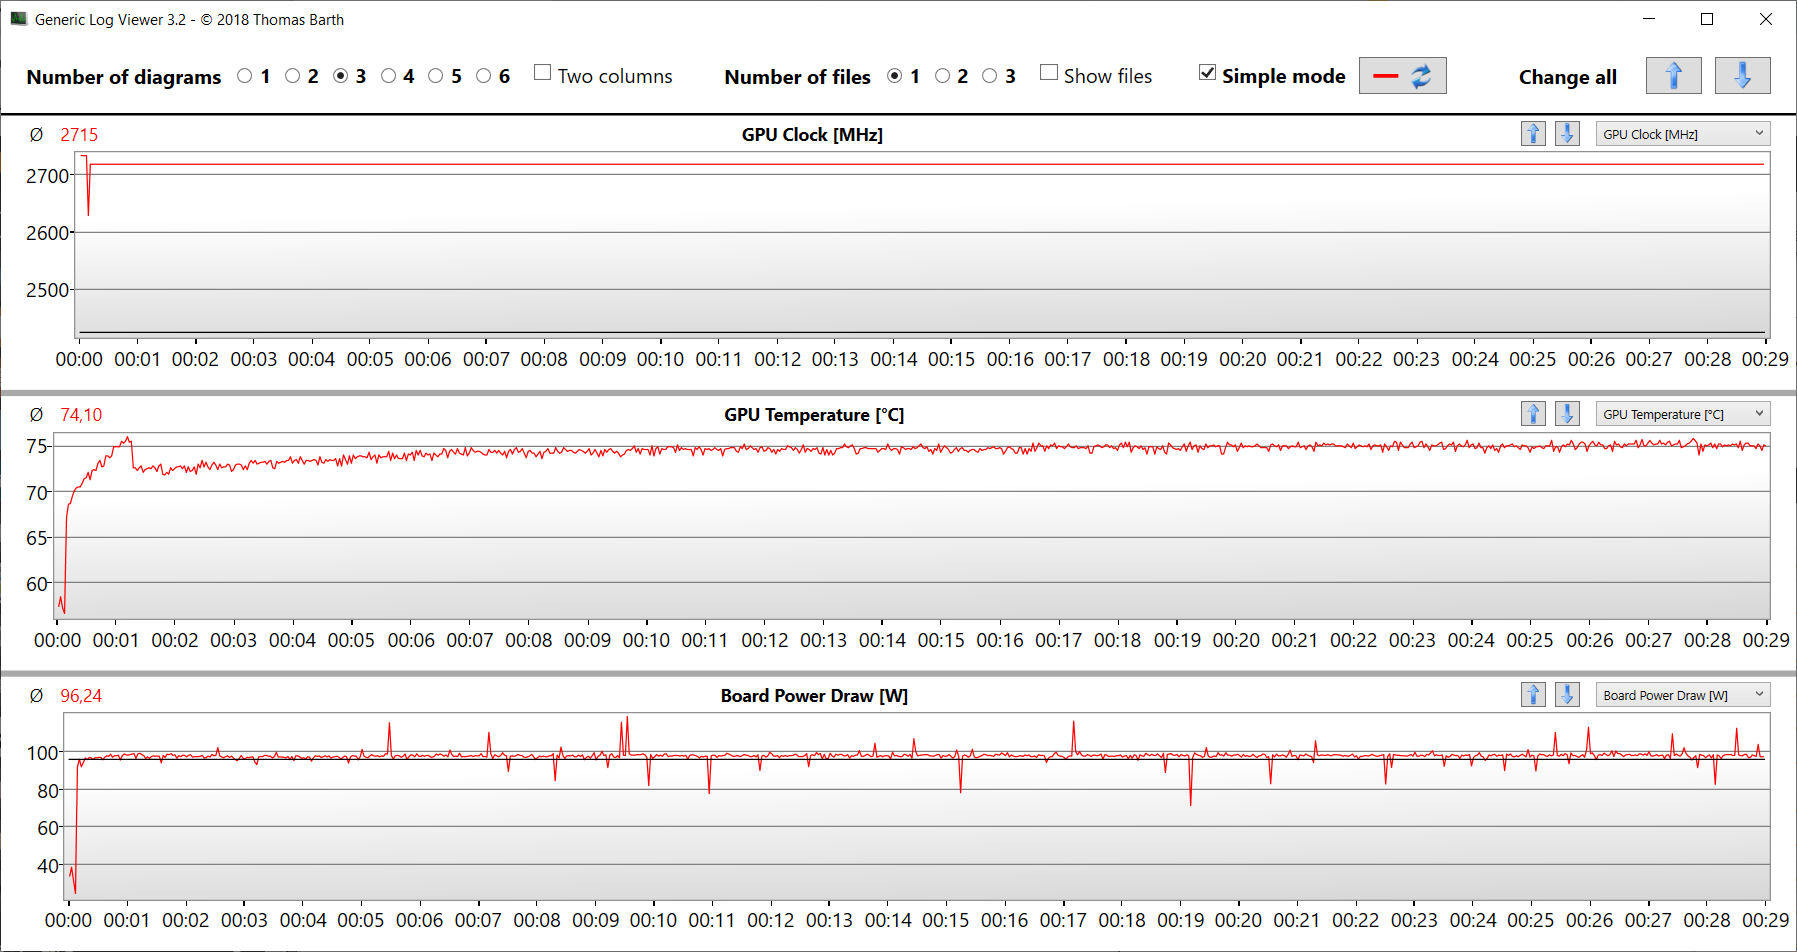
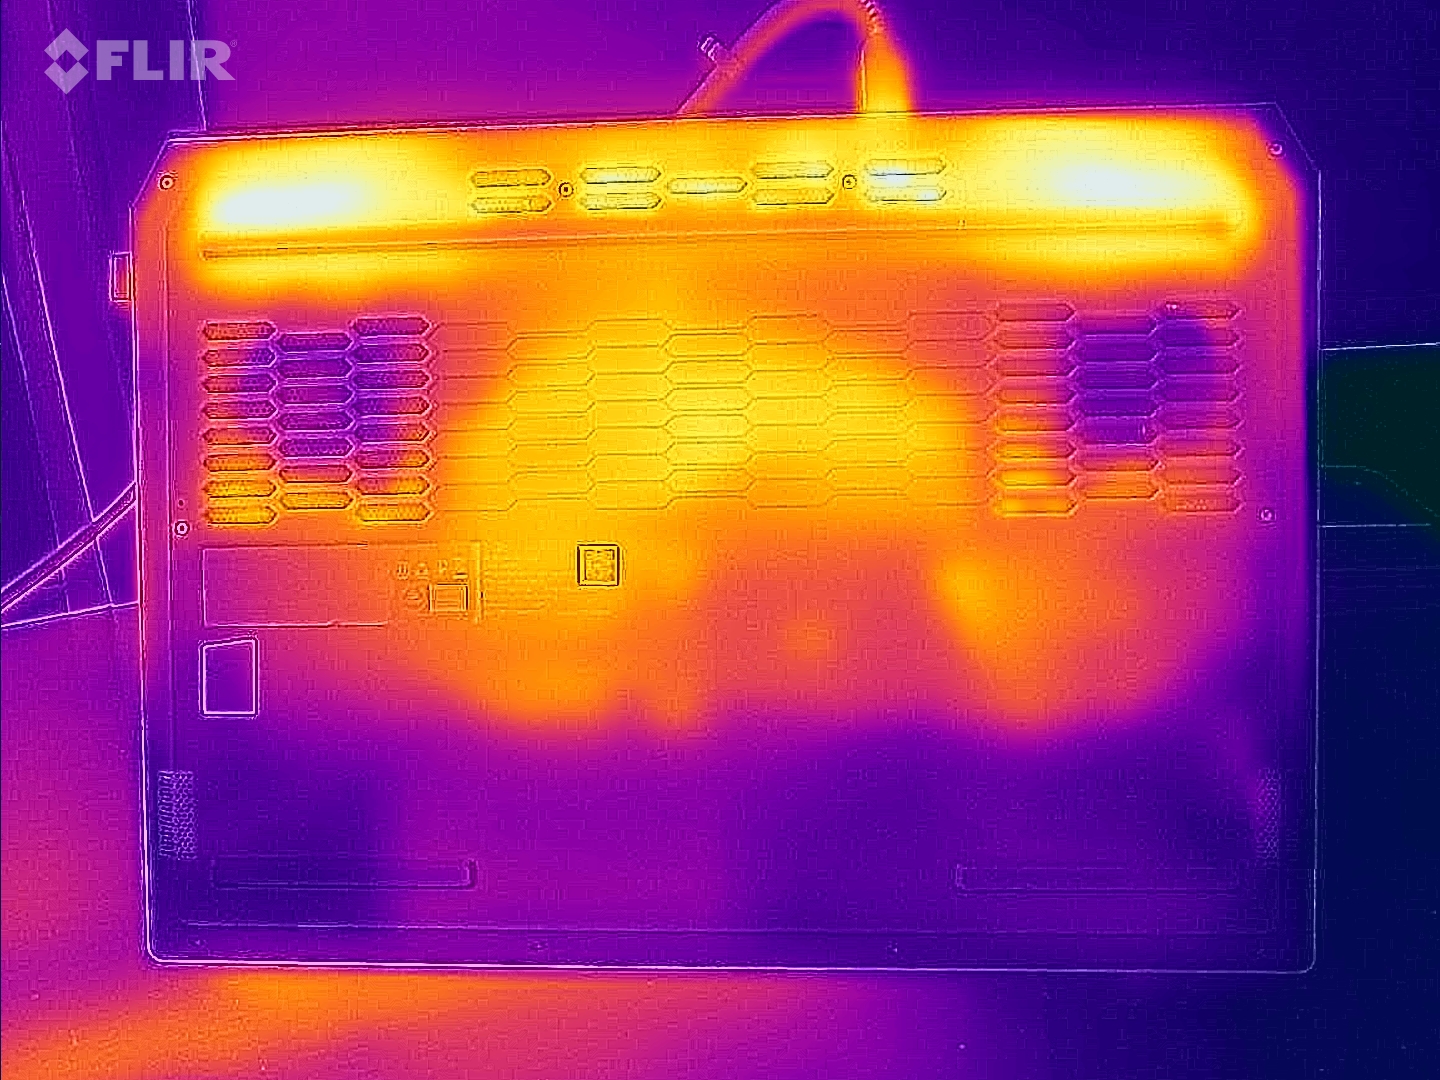
Bajo carga (prueba de estrés, Cyberpunk), el portátil se calienta notablemente: En ocasiones, supera la marca de los 50 grados Celsius. También alcanza valores más altos durante el uso diario (oficina, Internet) que muchos de los dispositivos de la comparación. Las temperaturas del reposamanos se mantienen semirrazonables.
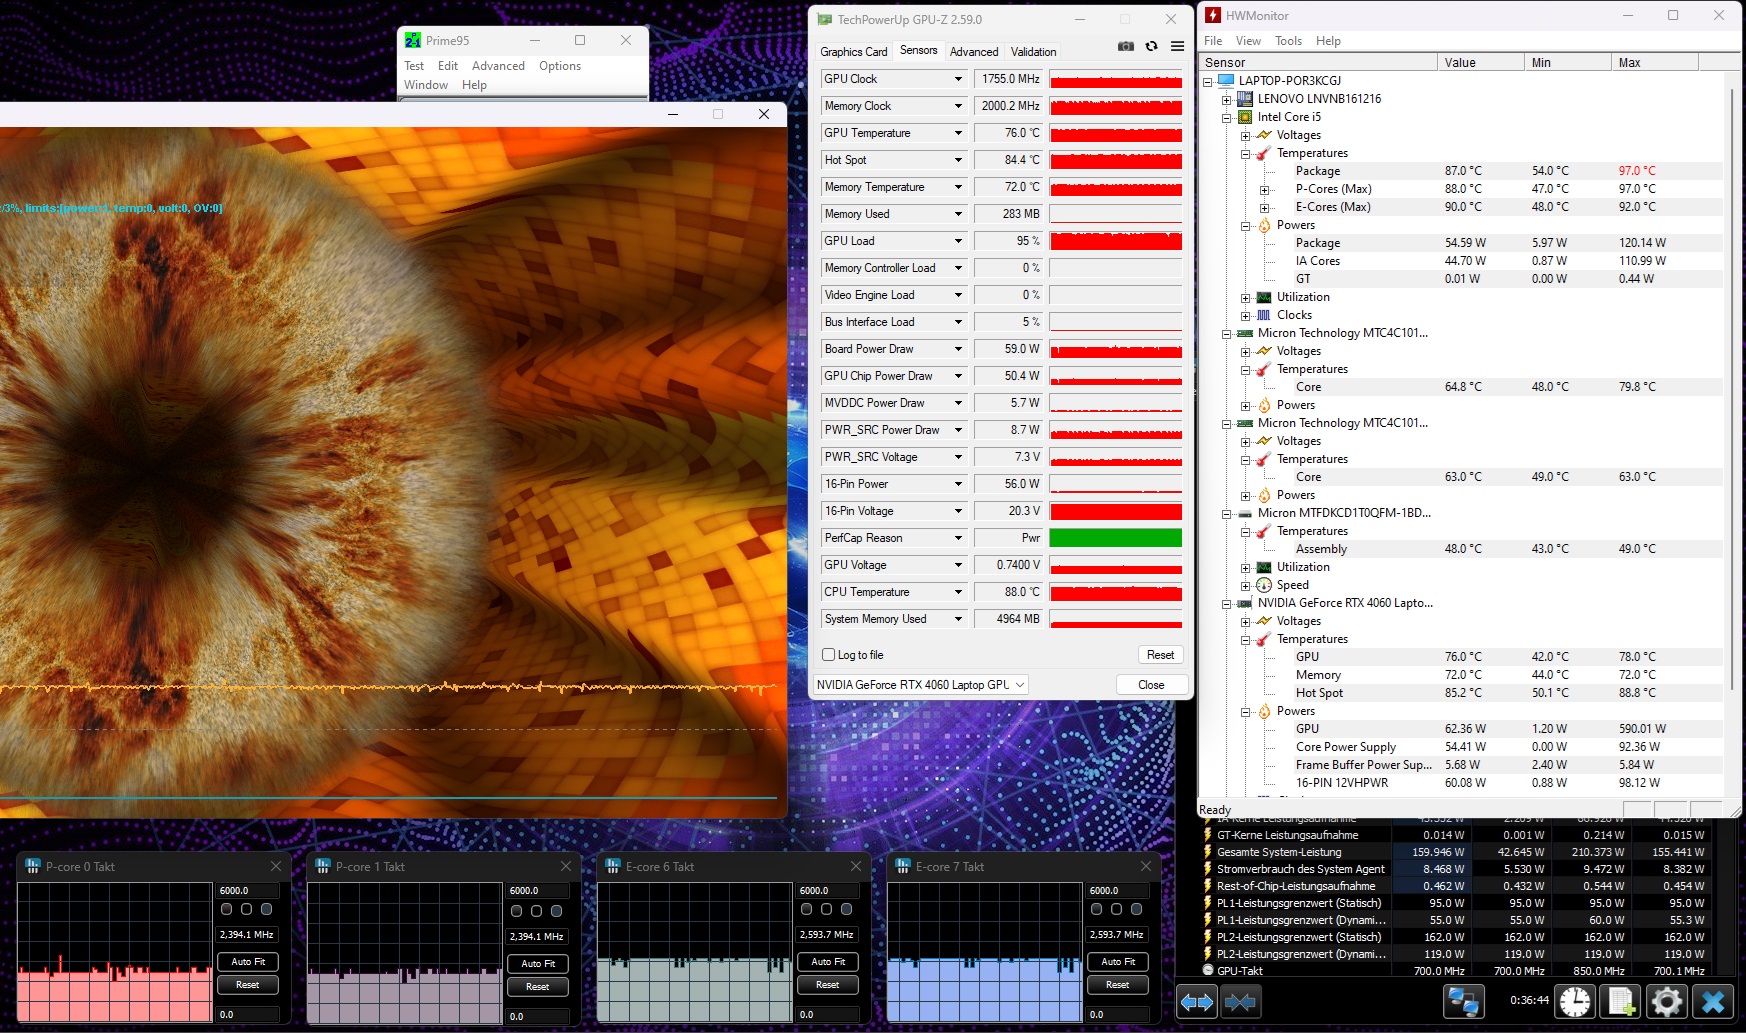
El escenario extremo (prueba de estrés con Prime95 y Furmark en funcionamiento continuo) comprueba la estabilidad del sistema a plena carga. La CPU funciona a unos 2,4 GHz (P) y 2,6 GHz (E), mientras que el núcleo gráfico alcanza valores en torno a los 1.800 MHz.
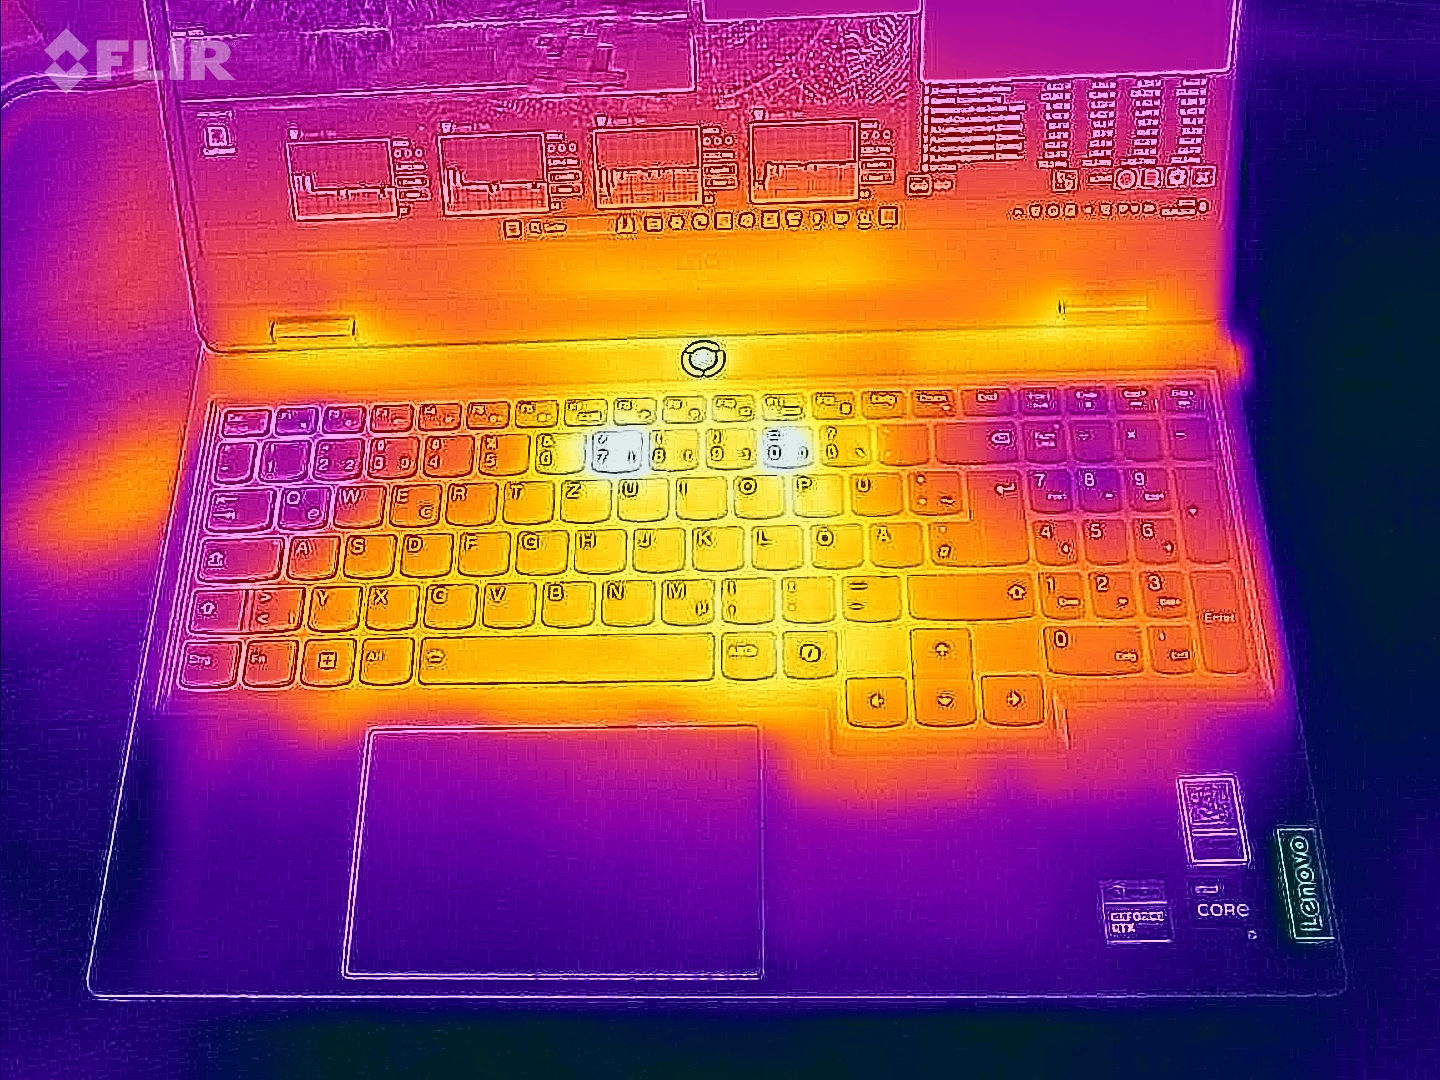

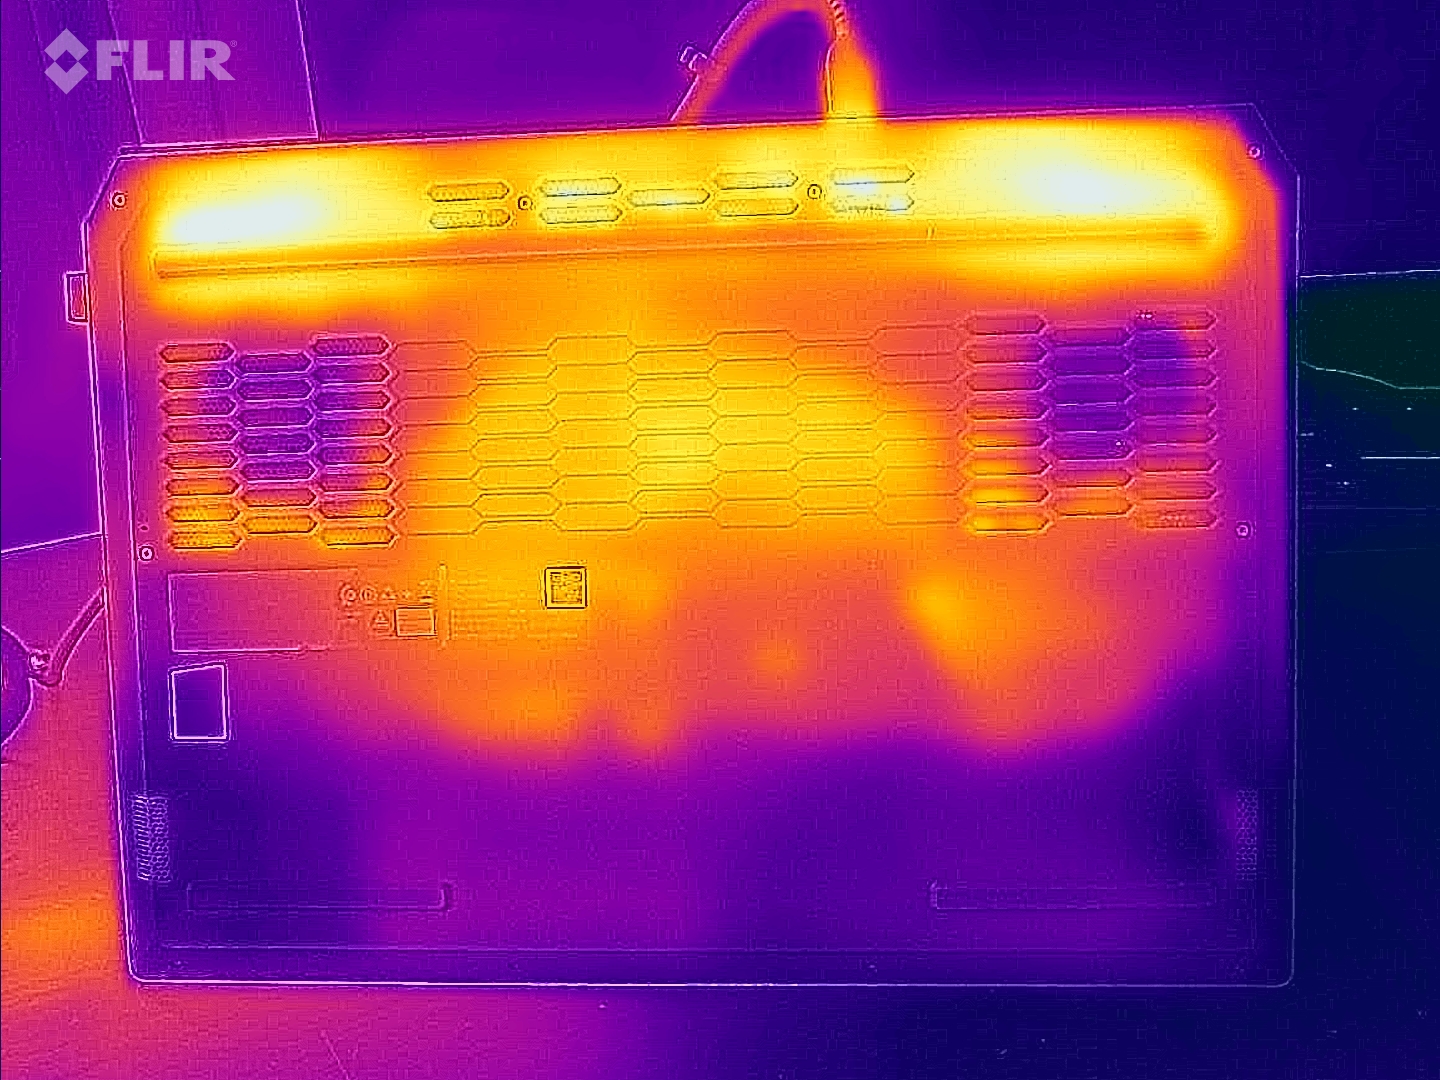
(-) La temperatura máxima en la parte superior es de 47 °C / 117 F, frente a la media de 40.4 °C / 105 F, que oscila entre 21.2 y 68.8 °C para la clase Gaming.
(-) El fondo se calienta hasta un máximo de 58 °C / 136 F, frente a la media de 43.2 °C / 110 F
(+) En reposo, la temperatura media de la parte superior es de 30.2 °C / 86# F, frente a la media del dispositivo de 33.9 °C / 93 F.
(-) 3: The average temperature for the upper side is 41.7 °C / 107 F, compared to the average of 33.9 °C / 93 F for the class Gaming.
(±) El reposamanos y el touchpad pueden calentarse mucho al tacto con un máximo de 38 °C / 100.4 F.
(-) La temperatura media de la zona del reposamanos de dispositivos similares fue de 28.9 °C / 84 F (-9.1 °C / -16.4 F).
| Lenovo LOQ 15IRX9 Intel Core i5-13450HX, NVIDIA GeForce RTX 4060 Laptop GPU | SCHENKER XMG Core 15 (M24) AMD Ryzen 7 8845HS, NVIDIA GeForce RTX 4060 Laptop GPU | Gigabyte G6X 9KG (2024) Intel Core i7-13650HX, NVIDIA GeForce RTX 4060 Laptop GPU | HP Victus 16 (2024) Intel Core i7-14700HX, NVIDIA GeForce RTX 4060 Laptop GPU | Dell G16, i7-13650HX, RTX 4060 Intel Core i7-13650HX, NVIDIA GeForce RTX 4060 Laptop GPU | |
|---|---|---|---|---|---|
| Heat | -8% | 9% | 15% | -3% | |
| Maximum Upper Side * | 47 | 52 -11% | 41 13% | 50 -6% | 49 -4% |
| Maximum Bottom * | 58 | 61 -5% | 43 26% | 50 14% | 58 -0% |
| Idle Upper Side * | 32 | 35 -9% | 32 -0% | 25 22% | 35 -9% |
| Idle Bottom * | 36 | 39 -8% | 37 -3% | 26 28% | 35 3% |
* ... más pequeño es mejor
Altavoces
Los altavoces estéreo producen un paisaje sonoro muy aceptable en general. Aun así, un poco más de graves no estaría de más.
Lenovo LOQ 15IRX9 análisis de audio
(±) | la sonoridad del altavoz es media pero buena (81 dB)
Graves 100 - 315 Hz
(±) | lubina reducida - en promedio 14.6% inferior a la mediana
(±) | la linealidad de los graves es media (9.6% delta a frecuencia anterior)
Medios 400 - 2000 Hz
(+) | medios equilibrados - a sólo 2.1% de la mediana
(+) | los medios son lineales (3.6% delta a la frecuencia anterior)
Altos 2 - 16 kHz
(±) | máximos más altos - de media 5.9% más altos que la mediana
(±) | la linealidad de los máximos es media (8.2% delta a frecuencia anterior)
Total 100 - 16.000 Hz
(+) | el sonido global es lineal (14.7% de diferencia con la mediana)
En comparación con la misma clase
» 27% de todos los dispositivos probados de esta clase eran mejores, 7% similares, 66% peores
» El mejor tuvo un delta de 6%, la media fue 18%, el peor fue ###max##%
En comparación con todos los dispositivos probados
» 17% de todos los dispositivos probados eran mejores, 4% similares, 79% peores
» El mejor tuvo un delta de 4%, la media fue 24%, el peor fue ###max##%
SCHENKER XMG Core 15 (M24) análisis de audio
(±) | la sonoridad del altavoz es media pero buena (79.12 dB)
Graves 100 - 315 Hz
(-) | casi sin bajos - de media 16.7% inferior a la mediana
(-) | los graves no son lineales (15.7% delta a la frecuencia anterior)
Medios 400 - 2000 Hz
(+) | medios equilibrados - a sólo 4.5% de la mediana
(+) | los medios son lineales (4.4% delta a la frecuencia anterior)
Altos 2 - 16 kHz
(+) | máximos equilibrados - a sólo 1% de la mediana
(+) | los máximos son lineales (2.7% delta a la frecuencia anterior)
Total 100 - 16.000 Hz
(+) | el sonido global es lineal (13.7% de diferencia con la mediana)
En comparación con la misma clase
» 20% de todos los dispositivos probados de esta clase eran mejores, 6% similares, 74% peores
» El mejor tuvo un delta de 6%, la media fue 18%, el peor fue ###max##%
En comparación con todos los dispositivos probados
» 13% de todos los dispositivos probados eran mejores, 3% similares, 83% peores
» El mejor tuvo un delta de 4%, la media fue 24%, el peor fue ###max##%
Consumo de energía
Su consumo de energía es bastante normal para el hardware instalado. Cyberpunk y las pruebas de estrés se ejecutaron con un consumo de energía relativamente constante. La fuente de alimentación es lo suficientemente potente con 230 vatios.
| Off / Standby | |
| Ocioso | |
| Carga |
|
Clave:
min: | |
| Lenovo LOQ 15IRX9 Intel Core i5-13450HX, NVIDIA GeForce RTX 4060 Laptop GPU | SCHENKER XMG Core 15 (M24) AMD Ryzen 7 8845HS, NVIDIA GeForce RTX 4060 Laptop GPU | Gigabyte G6X 9KG (2024) Intel Core i7-13650HX, NVIDIA GeForce RTX 4060 Laptop GPU | HP Victus 16 (2024) Intel Core i7-14700HX, NVIDIA GeForce RTX 4060 Laptop GPU | Dell G16, i7-13650HX, RTX 4060 Intel Core i7-13650HX, NVIDIA GeForce RTX 4060 Laptop GPU | |
|---|---|---|---|---|---|
| Power Consumption | 20% | 2% | 1% | 6% | |
| Idle Minimum * | 13 | 9.3 28% | 12 8% | 9 31% | 11 15% |
| Idle Average * | 18 | 12.9 28% | 13 28% | 15 17% | 14.8 18% |
| Idle Maximum * | 24 | 12.8 47% | 27 -13% | 23 4% | 16.8 30% |
| Load Average * | 85 | 105 -24% | 123 -45% | 103.7 -22% | |
| Cyberpunk 2077 ultra * | 155.7 | ||||
| Cyberpunk 2077 ultra external monitor * | 150.9 | ||||
| Load Maximum * | 232 | 286 -23% | 210 9% | 241 -4% | 255 -10% |
| Witcher 3 ultra * | 167 | 167.8 | 143.7 | 185 |
* ... más pequeño es mejor
Power consumption Cyberpunk 2077 / stress test
Power consumption with external monitor
Tiempos de ejecución
El dispositivo de 15,6 pulgadas logró una autonomía de 5:20 horas en nuestra prueba práctica de WLAN (mapeando la carga al acceder a sitios web mediante un script), lo que no es un valor sobresaliente. Su capacidad de batería comparativamente baja (60 Wh) se hace evidente aquí.
Pro
Contra
Veredicto - Un sólido jugador económico

El LOQ permite jugar en FHD con ajustes de altos a máximos-el Core i5-13450HX y GeForce RTX 4060 lo hacen posible. Al hacerlo, la CPU y la GPU funcionan con velocidades de reloj constantemente altas. Un SSD PCIe 4 (1 TB) garantiza que los tiempos de carga se mantengan cortos.
El LOQ 15IRX9 de Lenovo es un portátil de juegos FHD asequible que adolece de uno o dos defectos menores.
Las altas emisiones pueden reducirse a niveles moderados utilizando el modo silencioso, a costa del rendimiento del portátil. Su control de ventiladores podría mejorarse un poco: En modo inactivo, los ventiladores funcionan permanentemente o pulsan, lo que es totalmente innecesario.
Buscará una pantalla 16:10 en vano, ya que Lenovo se ha ceñido a una relación de aspecto 16:9. El panel instalado de 15,6 pulgadas (FHD, 144 Hz, G-Sync, sRGB) funciona bien, pero no le vendría mal ser un poco más brillante. El portátil no ofrece Thunderbolt 4 ni USB 4. Aún así: su puerto USB-C (USB 3.2 Gen 2) soporta Power Delivery y el modo Display ALT. La duración de la batería del dispositivo no batirá ningún récord mundial.
Una alternativa podría ser el Gigabyte G6X 9KG. Tiene una CPU ligeramente más potente, una pantalla 16:10 de 16 pulgadas, así como mejores tiempos de ejecución. En términos de cobertura del espacio de color, queda por detrás del LOQ.
Precio y disponibilidad
En el momento de escribir estas líneas, nuestra configuración del Lenovo LOQ 15IRX9 puede adquirirse a través de Amazon por 1.279 dólares.
Tenga en cuenta que: recientemente hemos actualizado nuestro sistema de clasificación y los resultados de la versión 8 no son comparables con los de la versión 7. Encontrará más información aquí .
Lenovo LOQ 15IRX9
- 07/08/2024 v8
Sascha Mölck
 Total Sustainability Score:
 Transparencia
La selección de los dispositivos que se van a reseñar corre a cargo de nuestro equipo editorial. La muestra de prueba fue proporcionada al autor en calidad de préstamo por el fabricante o el minorista a los efectos de esta reseña. El prestamista no tuvo ninguna influencia en esta reseña, ni el fabricante recibió una copia de la misma antes de su publicación. No había ninguna obligación de publicar esta reseña. Nunca aceptamos compensaciones o pagos a cambio de nuestras reseñas. Como empresa de medios independiente, Notebookcheck no está sujeta a la autoridad de fabricantes, minoristas o editores.
Así es como prueba Notebookcheck
Cada año, Notebookcheck revisa de forma independiente cientos de portátiles y smartphones utilizando procedimientos estandarizados para asegurar que todos los resultados son comparables. Hemos desarrollado continuamente nuestros métodos de prueba durante unos 20 años y hemos establecido los estándares de la industria en el proceso. En nuestros laboratorios de pruebas, técnicos y editores experimentados utilizan equipos de medición de alta calidad. Estas pruebas implican un proceso de validación en varias fases. Nuestro complejo sistema de clasificación se basa en cientos de mediciones y puntos de referencia bien fundamentados, lo que mantiene la objetividad.Price comparison

