Notebookcheck Logo

HP Victus 16 (2024) laptop review: RTX 4060 power paired with long runtimes
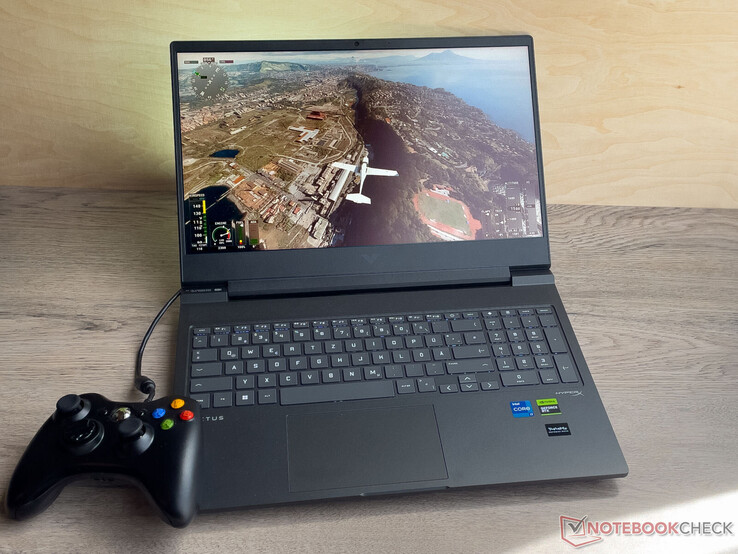
Lots of stamina.

A Core i7-14700HX, GeForce RTX 4060 and 16 GB RAM should be enough for FHD gaming with at least high settings. The combination of Power Delivery and very good runtimes makes it easier to use the laptop on the go. Its price is currently just over US$1,600.

HP's Victus series consists of entry-level to mid-range gaming laptops—the present test device can be classed as the latter: A Raptor Lake processor, GeForce RTX 4060, 16 GB RAM and a 512-GB SSD all contribute to a total package costing around US$1,600. Competitors include devices such as the Gigabyte G6X 9KG (2024), Dell G16, Asus TUF Gaming A16 FA617XS and the Lenovo Legion 5 16IRX G9.

The 2024 version of the Victus 16 is built identically to the 2023 model. We already tested two incarnations of the latter (RTX 4050 and RTX 4070).

HP Victus 16 (2024) (Victus 16 Serie)
Procesador
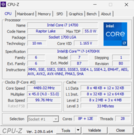
Intel Core i7-14700HX 20 x 3.9 - 5.5 GHz, 130 W PL2 / Short Burst, 130 W PL1 / Sustained, Raptor Lake-HX Refresh
Adaptador gráfico
NVIDIA GeForce RTX 4060 Laptop GPU - 8 GB VRAM, Núcleo: 2250 MHz, Memoría: 2000 MHz, 120 W TDP, GDDR6, 31.0.15.5222, Optimus
Memoría
16 GB 
, DDR5-5600, Dual-Channel mode, two memory slots (both in use)
pantalla
16.10 pulgadas 16:9, 1920 x 1080 pixels 137 PPI, Chi Mei CMN163E, IPS, lustroso: no, 144 Hz
Placa base
Intel HM770 (Raptor Lake-S PCH)
Disco duro
Kioxia XG8 KXG80ZNV512G, 512 GB 
, PCIe 4, M.2-2280, 415 GB libre
Conexiones
4 USB 3.0, USB-C Power Delivery (PD), 1 HDMI, 1 DisplayPort, Audio Conexiones: Audiokombo, TPM 2.0
Equipamento de red
Realtek RTL8168/8111 Gigabit-LAN (10/100/1000MBit/s), Realtek RTL8852BE (b/g/n = Wi-Fi 4/ac = Wi-Fi 5/ax = Wi-Fi 6/), Bluetooth 5.3
Tamaño
Alto x ancho x profundidad (en mm): 23.9 x 369 x 259.4
Battería
83 Wh, 6880 mAh Litio-Polimero
Cargando
carga rápida / Quickcharge
Sistema Operativo
Microsoft Windows 11 Home
Cámara
Webcam: FHD
Cámara principal: 2.1 MPix
Características adicionales
Altavoces: Stereo, Teclado: Chiclet, Luz de Teclado: si, McAfee LiveSafe (Trial), Microsoft 365 (Trial), Microsoft OneNote (Trial), 12 Meses Garantía
Peso
2.367 kg, Suministro de Electricidad: 776 g
Precio
1499 Euro
Amazon
Nota: El fabricante puede utilizar componentes de diferentes proveedores, incluidos paneles de visualización, unidades o lápices de memoria con especificaciones similares.


Posibles contendientes en la comparación

Valoración
Fecha
Modelo
Peso
Altura
Tamaño
Resolución
Precio
84.3 %
v7 (old)
05/2024
HP Victus 16 (2024)
i7-14700HX, NVIDIA GeForce RTX 4060 Laptop GPU
2.4 kg23.9 mm16.10"1920x1080
83.2 %
v7 (old)
03/2024
Gigabyte G6X 9KG (2024)
i7-13650HX, NVIDIA GeForce RTX 4060 Laptop GPU
2.6 kg25.1 mm16.00"1920x1200
85.5 %
v7 (old)
02/2024
Dell G16, i7-13650HX, RTX 4060
i7-13650HX, NVIDIA GeForce RTX 4060 Laptop GPU
2.8 kg25.65 mm16.00"2560x1600
89.1 %
v7 (old)
02/2024
Lenovo Legion 5 16IRX G9
i7-14650HX, NVIDIA GeForce RTX 4060 Laptop GPU
2.4 kg25.2 mm16.00"2560x1600
86.9 %
v7 (old)
06/2023
Asus TUF Gaming A16 FA617XS
R9 7940HS, Radeon RX 7600S
2.2 kg22.1 mm16.00"1920x1200

Case & connectivity - The HP Victus features Power Delivery

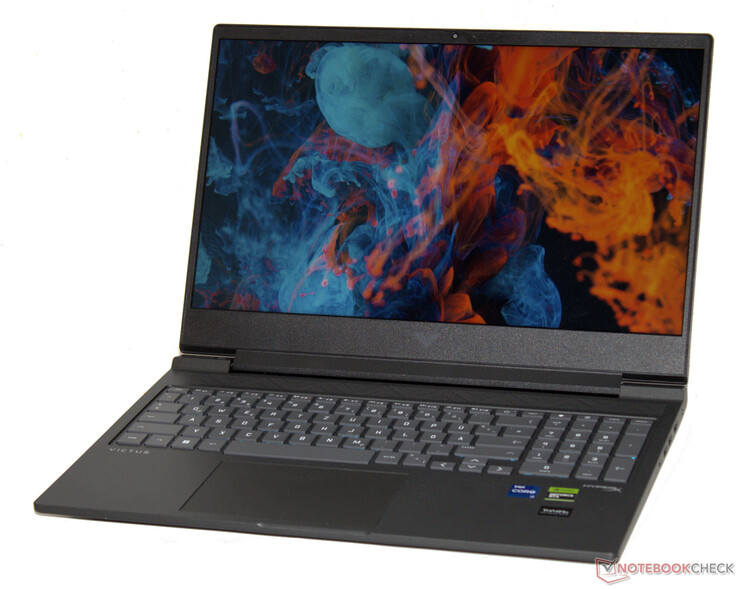
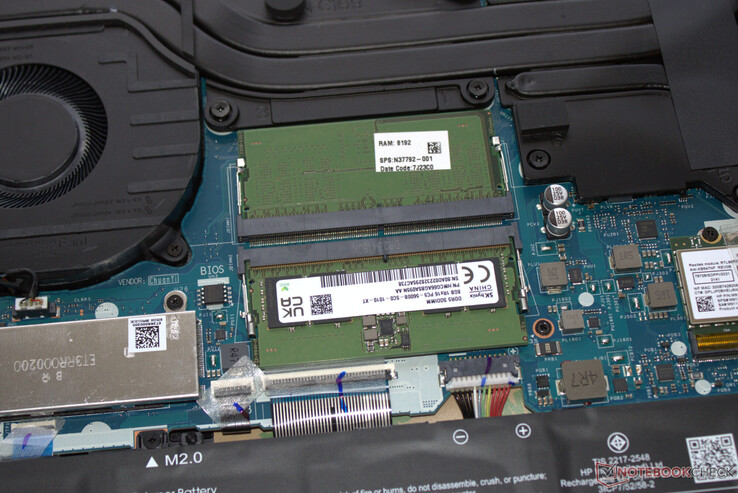
You can't expect high-quality materials: The laptop's entire case is made from matte plastic in the colorway "Mica Silver"—a dark-gray anthracite black. The lid and base unit can be twisted. No LED elements are used on its stripped-back case and the most eye-catching accessory is the Victus logo on the back of the device's lid. The battery (screwed in, not glued on) as well as the rest of its hardware can be accessed after removing the bottom case part.

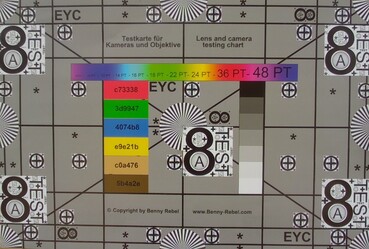
You will search for Thunderbolt and USB 4 in vain: All four USB ports (3x USB-A, 1x USB-C) follow the USB 3.2 Gen 1 standard. The USB-C port supports Power Delivery and can output a DisplayPort signal. In total, the laptop features two video outputs (1x HDMI, 1x DP). Its webcam (2.1 MP, with cover) delivers average results. It isn't equipped with an SD card reader.

The Victus is fitted with a Realtek WiFi 6 chip (RTL8852BE) which cannot compete with its competitors' Intel chips: The WiFi data rates we measured were decent, but they fall short of today's possibilities. 

Comparación de tamaños

369 mm 259.4 mm 23.9 mm 2.4 kg361 mm 259 mm 25.1 mm 2.6 kg359.7 mm 262.3 mm 25.2 mm 2.4 kg357 mm 289 mm 25.65 mm 2.8 kg355 mm 252 mm 22.1 mm 2.2 kg297 mm 210 mm 1 mm 5.7 g
Left side: Gigabit Ethernet, USB 3.2 Gen 1 (USB-A), audio combo
Right side: USB 3.2 Gen 1 (USB-C; Power Delivery, DisplayPort), 2x USB 3.2 Gen 1 (USB-A), HDMI, power connection
Networking
iperf3 transmit AXE11000
Dell G16, i7-13650HX, RTX 4060
Intel Wi-Fi 6 AX201
1570 (808min - 1639max) MBit/s +102%
Lenovo Legion 5 16IRX G9
Intel Wi-Fi 6E AX211
1489 (1329min, 1338.28P1 - 1686max) MBit/s +92%
Gigabyte G6X 9KG (2024)
Intel Wi-Fi 6E AX211
1337 (789min - 1521max) MBit/s +72%
Media de la clase Gaming
  (469 - 1843, n=147, últimos 2 años)
1231 MBit/s +59%
Medio Realtek RTL8852BE
  (536 - 926, n=44)
794 MBit/s +2%
Asus TUF Gaming A16 FA617XS
Realtek RTL8852BE
776 (392min - 802max) MBit/s 0%
HP Victus 16 (2024)
Realtek RTL8852BE
776 (487min - 929max) MBit/s
iperf3 receive AXE11000
Gigabyte G6X 9KG (2024)
Intel Wi-Fi 6E AX211
1683 (1630min - 1706max) MBit/s +72%
Dell G16, i7-13650HX, RTX 4060
Intel Wi-Fi 6 AX201
1585 (1273min - 1662max) MBit/s +62%
Media de la clase Gaming
  (680 - 1890, n=147, últimos 2 años)
1399 MBit/s +43%
Lenovo Legion 5 16IRX G9
Intel Wi-Fi 6E AX211
1398 (1327min, 1333.09P1 - 1464max) MBit/s +43%
HP Victus 16 (2024)
Realtek RTL8852BE
978 (960min - 990max) MBit/s
Asus TUF Gaming A16 FA617XS
Realtek RTL8852BE
905 (765min - 969max) MBit/s -7%
Medio Realtek RTL8852BE
  (455 - 984, n=45)
852 MBit/s -13%
050100150200250300350400450500550600650700750800850900950100010501100115012001250130013501400145015001550160016501700Tooltip
HP Victus 16 (2024) Realtek RTL8852BE; iperf3 transmit AXE11000; iperf 3.1.3: Ø776 (487-929)
Gigabyte G6X 9KG (2024) Intel Wi-Fi 6E AX211; iperf3 transmit AXE11000; iperf 3.1.3: Ø1336 (789-1521)
Dell G16, i7-13650HX, RTX 4060 Intel Wi-Fi 6 AX201; iperf3 transmit AXE11000; iperf 3.1.3: Ø1543 (808-1639)
Lenovo Legion 5 16IRX G9 Intel Wi-Fi 6E AX211; iperf3 transmit AXE11000: Ø1489 (1329-1686)
Asus TUF Gaming A16 FA617XS Realtek RTL8852BE; iperf3 transmit AXE11000; iperf 3.1.3: Ø763 (392-802)
HP Victus 16 (2024) Realtek RTL8852BE; iperf3 receive AXE11000; iperf 3.1.3: Ø978 (960-990)
Gigabyte G6X 9KG (2024) Intel Wi-Fi 6E AX211; iperf3 receive AXE11000; iperf 3.1.3: Ø1683 (1630-1706)
Dell G16, i7-13650HX, RTX 4060 Intel Wi-Fi 6 AX201; iperf3 receive AXE11000; iperf 3.1.3: Ø1585 (1273-1662)
Lenovo Legion 5 16IRX G9 Intel Wi-Fi 6E AX211; iperf3 receive AXE11000: Ø1398 (1327-1464)
Asus TUF Gaming A16 FA617XS Realtek RTL8852BE; iperf3 receive AXE11000; iperf 3.1.3: Ø905 (765-969)
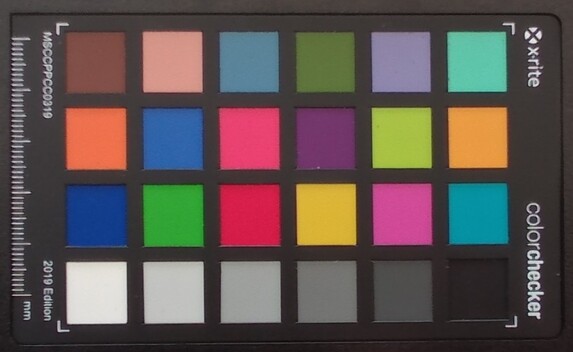
ColorChecker
6.4 ∆E
6.7 ∆E
9.2 ∆E
4.8 ∆E
4.8 ∆E
2.8 ∆E
14.7 ∆E
7.8 ∆E
9.1 ∆E
6.3 ∆E
1.9 ∆E
7.4 ∆E
4.9 ∆E
7.2 ∆E
8.5 ∆E
6.3 ∆E
3.8 ∆E
6.1 ∆E
4.7 ∆E
2.7 ∆E
1.9 ∆E
2 ∆E
2.6 ∆E
6.8 ∆E
ColorChecker HP Victus 16 (2024): 5.81 ∆E min: 1.89 - max: 14.74 ∆E

Input devices - The HP laptop with small arrow keys

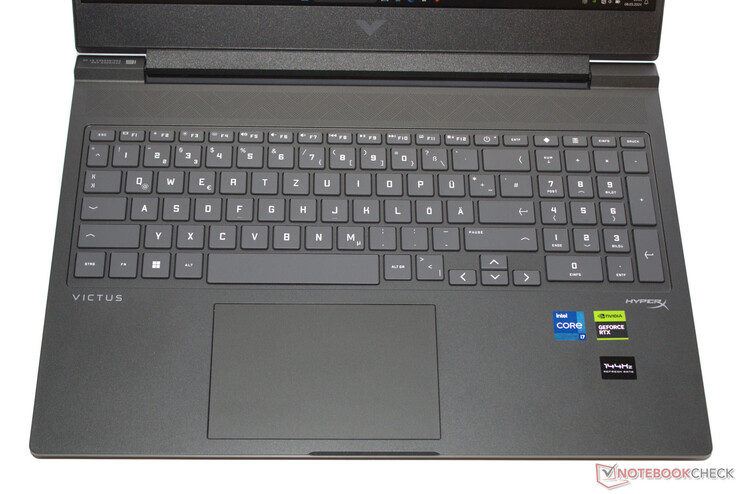
The chiclet keyboard's smooth keys (RGB lighting, number pad) feature a short lift and a clear pressure point. Their resistance could do with being a little more crisp. The keyboard bounces slightly when typing. Negative: Both the arrow keys and the Enter key are comparatively small. A clickpad (12.5 x 7.5 cm) with a short lift and a clear pressure point acts as a mouse replacement.

Keyboard HP Victus 16 (2024)

Display - IPS panel with low color accuracy

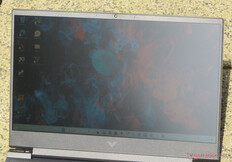
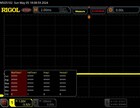
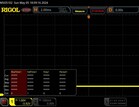
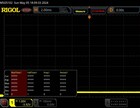
HP has equipped the Victus with a viewing-angle-stable 144 Hz panel (FHD, IPS) which has an aspect ratio of 16:9. It doesn't show any PWM flickering across all brightness levels. The 16.1-inch display's brightness and contrast are designed for indoor use—the target value (> 300 cd/m²) hasn't quite been met. You can read from the display outside as long as the sun isn't shining all too brightly. 

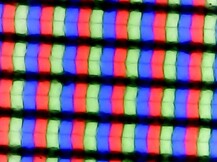
Sub-pixel array
Sub-pixel array
There is some backlight bleeding
Outdoor use
Outdoor use
315
cd/m²
301
cd/m²
292
cd/m²
287
cd/m²
287
cd/m²
273
cd/m²
286
cd/m²
272
cd/m²
282
cd/m²
Temperatura del cuarto
Chi Mei CMN163E tested with X-Rite i1Pro 2
Máximo: 315 cd/m² (Nits) Médio: 288.3 cd/m² Minimum: 13 cd/m²
iluminación: 86 %
Brillo con batería: 287 cd/m²
Contraste: 1511:1 (Negro: 0.19 cd/m²)
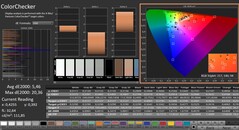
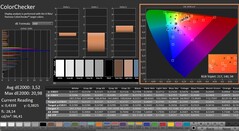
ΔE Color 5.46 | 0.5-29.43 Ø4.9, calibrated: 3.52
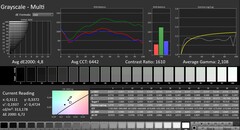
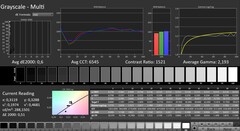
ΔE Greyscale 4.8 | 0.5-98 Ø5.2
42.7% AdobeRGB 1998 (Argyll 2.2.0 3D)
61.7% sRGB (Argyll 2.2.0 3D)
41.3% Display P3 (Argyll 2.2.0 3D)
Gamma: 2.108
HP Victus 16 (2024)
Chi Mei CMN163E, IPS, 1920x1080, 16.1"
Gigabyte G6X 9KG (2024)
BOE NE160WUM-NX6, IPS, 1920x1200, 16"
Dell G16, i7-13650HX, RTX 4060
Chi Mei CMN161D (160GME), IPS, 2560x1600, 16"
Lenovo Legion 5 16IRX G9
NE160QDM-NZ3, IPS, 2560x1600, 16"
Asus TUF Gaming A16 FA617XS
BOE NE160WUM-NX2, IPS, 1920x1200, 16"
Display
1%
62%
70%
64%
Display P3 Coverage
41.3
41.8
1%
67.5
63%
72.4
75%
69.3
68%
sRGB Coverage
61.7
62.4
1%
98.5
60%
100
62%
97.3
58%
AdobeRGB 1998 Coverage
42.7
43.3
1%
69.3
62%
74.1
74%
70.7
66%
Response Times
-29%
59%
55%
46%
Response Time Grey 50% / Grey 80% *
28.6 ?(13.3, 15.3)
40.5 ?(19, 21.5)
-42%
7.6 ?(3.8, 3.8)
73%
12.5 ?(6.1, 6.4)
56%
15.6 ?(7.3, 8.3)
45%
Response Time Black / White *
18.7 ?(9.6, 9.1)
21.6 ?(11.1, 10.5)
-16%
10.4 ?(5.8, 4.6)
44%
8.7 ?(4.6, 4.1)
53%
10 ?(5.7, 4.3)
47%
PWM Frequency
Screen
6%
21%
45%
29%
Brightness middle
287
353
23%
369
29%
526
83%
301
5%
Brightness
288
318
10%
344
19%
500
74%
294
2%
Brightness Distribution
86
81
-6%
89
3%
87
1%
94
9%
Black Level *
0.19
0.21
-11%
0.26
-37%
0.33
-74%
0.21
-11%
Contrast
1511
1681
11%
1419
-6%
1594
5%
1433
-5%
Colorchecker dE 2000 *
5.46
5.21
5%
3.04
44%
1.2
78%
1.79
67%
Colorchecker dE 2000 max. *
20.36
19.95
2%
5.56
73%
2.1
90%
3.48
83%
Colorchecker dE 2000 calibrated *
3.52
3.61
-3%
2.35
33%
1
72%
1.2
66%
Greyscale dE 2000 *
4.8
3.6
25%
3.38
30%
1.3
73%
2.5
48%
Gamma
2.108 104%
2.367 93%
2.47 89%
2.23 99%
2.265 97%
CCT
6442 101%
7138 91%
6040 108%
6391 102%
6157 106%
Media total (Programa/Opciones)
-7% / 0%
47% / 35%
57% / 52%
46% / 39%

* ... más pequeño es mejor

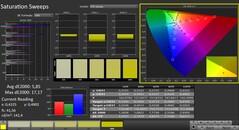
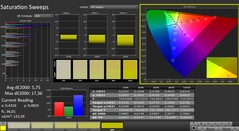
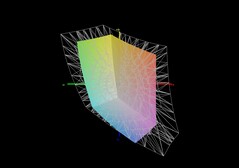
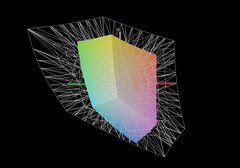
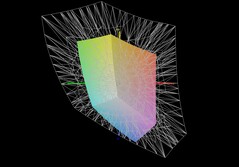
The panel cannot reproduce the common color spaces (AdobeRGB, sRGB, DCI-P3). In this respect, the screens of some competitors offer more. Its color reproduction is also not the best: Its factory deviation is 5.5 and a calibration reduces the value to around 3.5—in any case, its target (DeltaE < 3) has been missed.

CalMAN: grayscale
CalMAN: grayscale
CalMAN: color saturation
CalMAN: ColorChecker
CalMAN: grayscale (calibrated)
CalMAN: color saturation (calibrated)
CalMAN: ColorChecker (calibrated)
HP Victus 16-r1073ng vs sRGB
HP Victus 16-r1073ng vs AdobeRGB
HP Victus 16-r1073ng vs DCI-P3

Tiempos de respuesta del display

Los tiempos de respuesta del display muestran lo rápido que puede cambiar la pantalla de un color al siguiente. Tiempos lentos de respuesta pueden llevar a imágenes persistentes alrededor de objetos en movimiento o a displays borrosos. Particularmente los aficionados a los juegos 3D frenéticos deberían usar una pantalla con tiempos de respuesta rápidos.
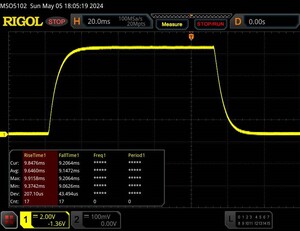
       Tiempo de respuesta de Negro a Blanco
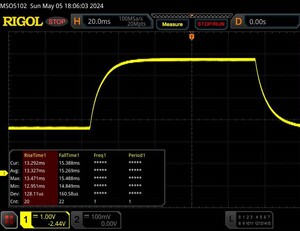
18.7 ms ... subida ↗ y bajada ↘ combinada↗ 9.6 ms subida
↘ 9.1 ms bajada
La pantalla mostró buenos tiempos de respuesta en nuestros tests pero podría ser demasiado lenta para los jugones competitivos.
En comparación, todos los dispositivos de prueba van de ##min### (mínimo) a 240 (máximo) ms. » 38 % de todos los dispositivos son mejores.
Esto quiere decir que el tiempo de respuesta medido es mejor que la media (20.9 ms) de todos los dispositivos testados.
       Tiempo de respuesta 50% Gris a 80% Gris
28.6 ms ... subida ↗ y bajada ↘ combinada↗ 13.3 ms subida
↘ 15.3 ms bajada
La pantalla mostró tiempos de respuesta relativamente lentos en nuestros tests pero podría ser demasiado lenta para los jugones.
En comparación, todos los dispositivos de prueba van de ##min### (mínimo) a 636 (máximo) ms. » 35 % de todos los dispositivos son mejores.
Esto quiere decir que el tiempo de respuesta medido es mejor que la media (32.8 ms) de todos los dispositivos testados.

Parpadeo de Pantalla / PWM (Pulse-Width Modulation)

Para atenuar el brillo de pantalla algunos portátiles están encendiendo y apagando la retroiluminación muy rápidamente. Esto se hace a una frecuencia que no debiera detectarse a simple vista. Si la frecuencia es demasiado lenta, la gente sensible podría experimentar problemas visuales, dolores de cabeza e incluso ver parpadeos.
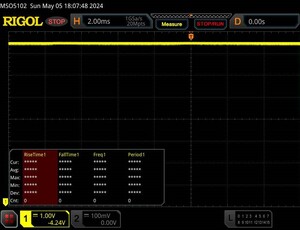
Parpadeo de Pantalla / PWM no detectado

Comparación: 53 % de todos los dispositivos testados no usaron PWM para atenuar el display. Si se usó, medimos una media de 8684 (mínimo: 5 - máxmo: 343500) Hz.

100 % brightness
100 % brightness
75 % brightness
75 % brightness
50 % brightness
50 % brightness
25 % brightness
25 % brightness
0 % brightness
0 % brightness

Performance - Raptor Lake and Ada Lovelace provide steam

HP has various configuration variants of the Victus 16 on offer. The currently cheapest version of the Victus 16 r1000 series can be found for around US$1,300 (Core i5-14500HX, GeForce RTX 4050, 16 GB RAM, 512 GB SSD, no Windows). For the present test device, you would have to spend around US$1,600.

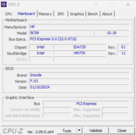
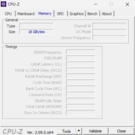
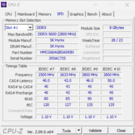
CPU-Z
CPU-Z
CPU-Z
CPU-Z
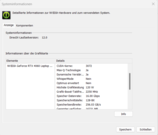
Nvidia system info
GPU-Z
GPU-Z
HWInfo
HWInfo
 

Testing conditions

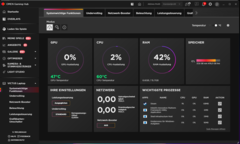
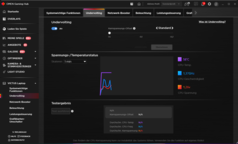
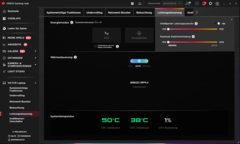
Three HP-specific system modes (see table) are available for users to choose from. The “Balanced” (benchmarks) and “ECO” (battery tests) modes were used during our test. Changing modes quickly can be done via a key combination (Fn + P). The “Omen Gaming Hub” (control center of the laptop) also lets you to select the mode. It also allows the CPU to be undervolted and an individual fan curve to be set, among other things.

Balanced Performance Eco
Power Limit 1 (HWInfo) 130 watts 130 watts 130 watts
Power Limit 2 (HWInfo) 130 watts 130 watts 130 watts
Performance (Witcher 3) 98 fps 100 fps 60 fps (locked)
Noise (Witcher 3) 43 dB(A) 52 dB(A) 38 dB(A)
Omen Gaming Hub
Omen Gaming Hub
Omen Gaming Hub
Omen Gaming Hub
Omen Gaming Hub
Omen Gaming Hub

Processor

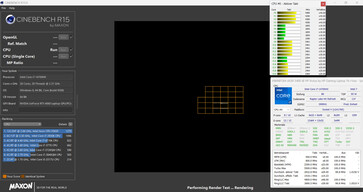
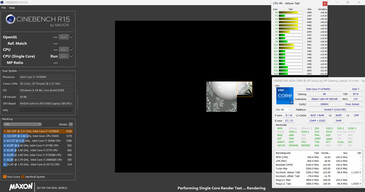
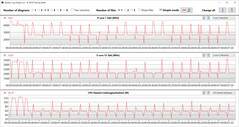
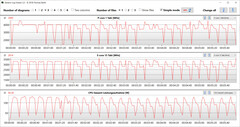
The Core i7-14700HX's (Raptor Lake) 20 CPU cores (8P + 12E = 28 threads) achieve maximum clock rates of 5.5 GHz (P) and 3.9 GHz (E). Permanent multi-thread load (CB15 Loop) leads the clock rate to sink from the first to the fourth run ("Balanced"). After this, it keeps a constant level. "Performance" results in a permanently higher clock rate.

The benchmark results were a little disappointing: Despite four additional CPU cores and higher clock rates, the CPU couldn't distance itself from the Legion 5 16IRX G9's Core i7-14650HX. Its multi-thread performance is practically the same, whereas the 14650HX is the clear winner when it comes to single-thread performance.

Multi-thread (connected to mains)
Single-thread (connected to mains)

Cinebench R15 Multi continuous test

019539058578097511701365156017551950214523402535273029253120331535103705Tooltip
HP Victus 16 (2024) Intel Core i7-14700HX: Ø2658 (2509.88-3812.18)
Gigabyte G6X 9KG (2024) Intel Core i7-13650HX: Ø2018 (1801.23-2863.69)
Dell G16, i7-13650HX, RTX 4060 Intel Core i7-13650HX: Ø2933 (2802.3-3015.45)
Lenovo Legion 5 16IRX G9 Intel Core i7-14650HX: Ø3471 (3409.19-3799.39)
Asus TUF Gaming A16 FA617XS AMD Ryzen 9 7940HS: Ø2646 (2596.9-2666.67)
HP Victus 16 (2024) Intel Core i7-14700HX; Leistung: Ø3535 (3382.95-3772.87)
CB15 Loop (Balanced)
CB15 Loop (Performance)
CB15 Loop (Eco)
CB15 Loop (Eco)
CPU Performance Rating - Percent
Lenovo Legion 5 16IRX G9
Intel Core i7-14650HX
84.2 pt
Medio Intel Core i7-14700HX
 
84.2 pt
HP Victus 16 (2024)
Intel Core i7-14700HX
79.2 pt
Media de la clase Gaming
 
77.4 pt
HP Victus 16 (2024)
Intel Core i7-14700HX
73.8 pt
Dell G16, i7-13650HX, RTX 4060
Intel Core i7-13650HX
72.1 pt
Gigabyte G6X 9KG (2024)
Intel Core i7-13650HX
69.5 pt
Asus TUF Gaming A16 FA617XS -2!
AMD Ryzen 9 7940HS
68.5 pt
Cinebench R23
Multi Core
Medio Intel Core i7-14700HX
  (22313 - 28122, n=7)
24631 Points +3%
HP Victus 16 (2024)
Intel Core i7-14700HX (Leistung)
24595 Points +3%
Lenovo Legion 5 16IRX G9
Intel Core i7-14650HX
24455 Points +2%
HP Victus 16 (2024)
Intel Core i7-14700HX
23887 Points
Media de la clase Gaming
  (5668 - 36249, n=187, últimos 2 años)
22019 Points -8%
Dell G16, i7-13650HX, RTX 4060
Intel Core i7-13650HX
20557 Points -14%
Gigabyte G6X 9KG (2024)
Intel Core i7-13650HX
18879 Points -21%
Asus TUF Gaming A16 FA617XS
AMD Ryzen 9 7940HS
16907 Points -29%
Single Core
Medio Intel Core i7-14700HX
  (1702 - 2144, n=7)
2000 Points +18%
Lenovo Legion 5 16IRX G9
Intel Core i7-14650HX
1963 Points +15%
Media de la clase Gaming
  (1136 - 2235, n=185, últimos 2 años)
1893 Points +11%
Dell G16, i7-13650HX, RTX 4060
Intel Core i7-13650HX
1881 Points +11%
Gigabyte G6X 9KG (2024)
Intel Core i7-13650HX
1813 Points +7%
Asus TUF Gaming A16 FA617XS
AMD Ryzen 9 7940HS
1791 Points +5%
HP Victus 16 (2024)
Intel Core i7-14700HX (Leistung)
1735 Points +2%
HP Victus 16 (2024)
Intel Core i7-14700HX
1702 Points
Cinebench R20
CPU (Multi Core)
Lenovo Legion 5 16IRX G9
Intel Core i7-14650HX
9349 Points +1%
HP Victus 16 (2024)
Intel Core i7-14700HX
9244 Points
Medio Intel Core i7-14700HX
  (8361 - 10498, n=7)
9231 Points 0%
HP Victus 16 (2024)
Intel Core i7-14700HX (Leistung)
8733 Points -6%
Media de la clase Gaming
  (2179 - 13832, n=185, últimos 2 años)
8379 Points -9%
Dell G16, i7-13650HX, RTX 4060
Intel Core i7-13650HX
7821 Points -15%
Gigabyte G6X 9KG (2024)
Intel Core i7-13650HX
7197 Points -22%
Asus TUF Gaming A16 FA617XS
AMD Ryzen 9 7940HS
6571 Points -29%
CPU (Single Core)
Medio Intel Core i7-14700HX
  (651 - 821, n=7)
765 Points +18%
Lenovo Legion 5 16IRX G9
Intel Core i7-14650HX
754 Points +16%
Media de la clase Gaming
  (439 - 856, n=185, últimos 2 años)
727 Points +12%
Dell G16, i7-13650HX, RTX 4060
Intel Core i7-13650HX
721 Points +11%
Asus TUF Gaming A16 FA617XS
AMD Ryzen 9 7940HS
702 Points +8%
Gigabyte G6X 9KG (2024)
Intel Core i7-13650HX
700 Points +8%
HP Victus 16 (2024)
Intel Core i7-14700HX (Leistung)
660 Points +1%
HP Victus 16 (2024)
Intel Core i7-14700HX
651 Points
Cinebench R15
CPU Multi 64Bit
HP Victus 16 (2024)
Intel Core i7-14700HX
3812 Points
Lenovo Legion 5 16IRX G9
Intel Core i7-14650HX
3799 (3409.19min - 3799.39max) Points 0%
Medio Intel Core i7-14700HX
  (3328 - 4137, n=7)
3752 Points -2%
HP Victus 16 (2024)
Intel Core i7-14700HX (Leistung)
3748 Points -2%
Media de la clase Gaming
  (905 - 5663, n=192, últimos 2 años)
3445 Points -10%
Dell G16, i7-13650HX, RTX 4060
Intel Core i7-13650HX
3015 (2802.3min - 3015.45max) Points -21%
Gigabyte G6X 9KG (2024)
Intel Core i7-13650HX
2864 Points -25%
Asus TUF Gaming A16 FA617XS
AMD Ryzen 9 7940HS
2666.7 Points -30%
CPU Single 64Bit
Lenovo Legion 5 16IRX G9
Intel Core i7-14650HX
287 Points +21%
Asus TUF Gaming A16 FA617XS
AMD Ryzen 9 7940HS
283 Points +19%
Medio Intel Core i7-14700HX
  (238 - 304, n=7)
281 Points +18%
Media de la clase Gaming
  (191.9 - 318, n=189, últimos 2 años)
278 Points +17%
Dell G16, i7-13650HX, RTX 4060
Intel Core i7-13650HX
269 Points +13%
Gigabyte G6X 9KG (2024)
Intel Core i7-13650HX
256 Points +8%
HP Victus 16 (2024)
Intel Core i7-14700HX (Leistung)
244 Points +3%
HP Victus 16 (2024)
Intel Core i7-14700HX
238 Points
Blender - v2.79 BMW27 CPU
Gigabyte G6X 9KG (2024)
Intel Core i7-13650HX
226 Seconds * -31%
Asus TUF Gaming A16 FA617XS
AMD Ryzen 9 7940HS
189 Seconds * -9%
HP Victus 16 (2024)
Intel Core i7-14700HX
173 Seconds *
Media de la clase Gaming
  (87 - 555, n=180, últimos 2 años)
169 Seconds * +2%
Dell G16, i7-13650HX, RTX 4060
Intel Core i7-13650HX
165 Seconds * +5%
Medio Intel Core i7-14700HX
  (126 - 184, n=7)
148.7 Seconds * +14%
Lenovo Legion 5 16IRX G9
Intel Core i7-14650HX
141 Seconds * +18%
HP Victus 16 (2024)
Intel Core i7-14700HX (Leistung)
137 Seconds * +21%
7-Zip 18.03
7z b 4
HP Victus 16 (2024)
Intel Core i7-14700HX (Leistung)
98097 MIPS +16%
Medio Intel Core i7-14700HX
  (84799 - 104730, n=7)
95840 MIPS +13%
Lenovo Legion 5 16IRX G9
Intel Core i7-14650HX
93686 MIPS +10%
Media de la clase Gaming
  (23795 - 140932, n=184, últimos 2 años)
85971 MIPS +1%
HP Victus 16 (2024)
Intel Core i7-14700HX
84799 MIPS
Dell G16, i7-13650HX, RTX 4060
Intel Core i7-13650HX
76328 MIPS -10%
Gigabyte G6X 9KG (2024)
Intel Core i7-13650HX
73927 MIPS -13%
Asus TUF Gaming A16 FA617XS
AMD Ryzen 9 7940HS
70081 MIPS -17%
7z b 4 -mmt1
Lenovo Legion 5 16IRX G9
Intel Core i7-14650HX
6695 MIPS +19%
Asus TUF Gaming A16 FA617XS
AMD Ryzen 9 7940HS
6621 MIPS +17%
Medio Intel Core i7-14700HX
  (5641 - 7041, n=7)
6595 MIPS +17%
Media de la clase Gaming
  (4199 - 7581, n=184, últimos 2 años)
6324 MIPS +12%
Dell G16, i7-13650HX, RTX 4060
Intel Core i7-13650HX
5944 MIPS +5%
Gigabyte G6X 9KG (2024)
Intel Core i7-13650HX
5828 MIPS +3%
HP Victus 16 (2024)
Intel Core i7-14700HX (Leistung)
5780 MIPS +2%
HP Victus 16 (2024)
Intel Core i7-14700HX
5641 MIPS
Geekbench 6.3
Multi-Core
Medio Intel Core i7-14700HX
  (14807 - 17562, n=7)
16228 Points +10%
Lenovo Legion 5 16IRX G9
Intel Core i7-14650HX (6.2.1)
16010 Points +8%
HP Victus 16 (2024)
Intel Core i7-14700HX (6.2.1, Leistung)
15057 Points +2%
HP Victus 16 (2024)
Intel Core i7-14700HX (6.2.1)
14807 Points
Media de la clase Gaming
  (5340 - 19665, n=114, últimos 2 años)
14216 Points -4%
Dell G16, i7-13650HX, RTX 4060
Intel Core i7-13650HX (6.2.1)
13711 Points -7%
Gigabyte G6X 9KG (2024)
Intel Core i7-13650HX (6.2.1)
13554 Points -8%
Single-Core
Medio Intel Core i7-14700HX
  (2378 - 2975, n=7)
2764 Points +16%
Lenovo Legion 5 16IRX G9
Intel Core i7-14650HX (6.2.1)
2761 Points +16%
Media de la clase Gaming
  (1490 - 3129, n=114, últimos 2 años)
2650 Points +11%
Dell G16, i7-13650HX, RTX 4060
Intel Core i7-13650HX (6.2.1)
2562 Points +8%
Gigabyte G6X 9KG (2024)
Intel Core i7-13650HX (6.2.1)
2505 Points +5%
HP Victus 16 (2024)
Intel Core i7-14700HX (6.2.1, Leistung)
2447 Points +3%
HP Victus 16 (2024)
Intel Core i7-14700HX (6.2.1)
2378 Points
Geekbench 5.5
Multi-Core
Medio Intel Core i7-14700HX
  (15705 - 19597, n=7)
17679 Points +6%
HP Victus 16 (2024)
Intel Core i7-14700HX (Leistung)
17161 Points +3%
Lenovo Legion 5 16IRX G9
Intel Core i7-14650HX
16810 Points 0%
HP Victus 16 (2024)
Intel Core i7-14700HX
16732 Points
Media de la clase Gaming
  (4557 - 23194, n=185, últimos 2 años)
15135 Points -10%
Gigabyte G6X 9KG (2024)
Intel Core i7-13650HX
13434 Points -20%
Dell G16, i7-13650HX, RTX 4060
Intel Core i7-13650HX
12509 Points -25%
Asus TUF Gaming A16 FA617XS
AMD Ryzen 9 7940HS
12111 Points -28%
Single-Core
Asus TUF Gaming A16 FA617XS
AMD Ryzen 9 7940HS
2032 Points +20%
Medio Intel Core i7-14700HX
  (1700 - 2133, n=7)
1982 Points +17%
Lenovo Legion 5 16IRX G9
Intel Core i7-14650HX
1933 Points +14%
Media de la clase Gaming
  (986 - 2210, n=185, últimos 2 años)
1899 Points +12%
Dell G16, i7-13650HX, RTX 4060
Intel Core i7-13650HX
1866 Points +10%
Gigabyte G6X 9KG (2024)
Intel Core i7-13650HX
1810 Points +6%
HP Victus 16 (2024)
Intel Core i7-14700HX (Leistung)
1728 Points +2%
HP Victus 16 (2024)
Intel Core i7-14700HX
1700 Points
HWBOT x265 Benchmark v2.2 - 4k Preset
HP Victus 16 (2024)
Intel Core i7-14700HX (Leistung)
26.9 fps +22%
Lenovo Legion 5 16IRX G9
Intel Core i7-14650HX
25.6 fps +16%
Medio Intel Core i7-14700HX
  (22 - 27.4, n=7)
25.1 fps +14%
Media de la clase Gaming
  (6.72 - 38.9, n=184, últimos 2 años)
23.6 fps +7%
HP Victus 16 (2024)
Intel Core i7-14700HX
22 fps
Asus TUF Gaming A16 FA617XS
AMD Ryzen 9 7940HS
20.8 fps -5%
Dell G16, i7-13650HX, RTX 4060
Intel Core i7-13650HX
20.1 fps -9%
Gigabyte G6X 9KG (2024)
Intel Core i7-13650HX
18.9 fps -14%
LibreOffice - 20 Documents To PDF
HP Victus 16 (2024)
Intel Core i7-14700HX (6.3.4.2)
55.3 s *
Dell G16, i7-13650HX, RTX 4060
Intel Core i7-13650HX (6.3.4.2)
53.4 s * +3%
Media de la clase Gaming
  (19 - 96.6, n=181, últimos 2 años)
47.3 s * +14%
Medio Intel Core i7-14700HX
  (41.9 - 55.3, n=7)
46.5 s * +16%
Lenovo Legion 5 16IRX G9
Intel Core i7-14650HX (6.3.4.2)
43.8 s * +21%
HP Victus 16 (2024)
Intel Core i7-14700HX (6.3.4.2. Leistung)
41.9 s * +24%
Asus TUF Gaming A16 FA617XS
AMD Ryzen 9 7940HS
41.7 s * +25%
Gigabyte G6X 9KG (2024)
Intel Core i7-13650HX (6.3.4.2)
38.9 s * +30%
R Benchmark 2.5 - Overall mean
HP Victus 16 (2024)
Intel Core i7-14700HX
0.4896 sec *
HP Victus 16 (2024)
Intel Core i7-14700HX (Leistung)
0.4693 sec * +4%
Gigabyte G6X 9KG (2024)
Intel Core i7-13650HX
0.4407 sec * +10%
Media de la clase Gaming
  (0.3609 - 0.759, n=185, últimos 2 años)
0.4362 sec * +11%
Asus TUF Gaming A16 FA617XS
AMD Ryzen 9 7940HS
0.4253 sec * +13%
Dell G16, i7-13650HX, RTX 4060
Intel Core i7-13650HX
0.4217 sec * +14%
Dell G16, i7-13650HX, RTX 4060
Intel Core i7-13650HX
0.4217 sec * +14%
Lenovo Legion 5 16IRX G9
Intel Core i7-14650HX
0.4195 sec * +14%
Medio Intel Core i7-14700HX
  (0.3821 - 0.4896, n=7)
0.4182 sec * +15%

* ... más pequeño es mejor

Cinebench R15 CPU Multi 64Bit
3812 Points
Cinebench R15 OpenGL 64Bit
218 fps
Cinebench R15 Ref. Match 64Bit
99.6 %
Cinebench R15 CPU Single 64Bit
238 Points
Cinebench R20 CPU (Multi Core)
9244 Points
Cinebench R20 CPU (Single Core)
651 Points
Cinebench R23 Multi Core
23887 Points
Cinebench R23 Single Core
1702 Points
Cinebench 2024 CPU Multi Core
1003 Points
Cinebench 2024 CPU Single Core
100.6 Points
ayuda
Performance Rating
HP Victus 16 (2024)
Intel Core i7-14700HX, NVIDIA GeForce RTX 4060 Laptop GPU
89.8 pt
Asus TUF Gaming A16 FA617XS
AMD Ryzen 9 7940HS, Radeon RX 7600S
88.6 pt
Medio Intel Core i7-14700HX
 
88.6 pt
Media de la clase Gaming
 
86.7 pt
Lenovo Legion 5 16IRX G9
Intel Core i7-14650HX, NVIDIA GeForce RTX 4060 Laptop GPU
75 pt
Dell G16, i7-13650HX, RTX 4060
Intel Core i7-13650HX, NVIDIA GeForce RTX 4060 Laptop GPU
74.6 pt
HP Victus 16 (2024)
Intel Core i7-14700HX, NVIDIA GeForce RTX 4060 Laptop GPU
73.7 pt
Gigabyte G6X 9KG (2024)
Intel Core i7-13650HX, NVIDIA GeForce RTX 4060 Laptop GPU
61.3 pt
AIDA64 / FP32 Ray-Trace
Asus TUF Gaming A16 FA617XS
AMD Ryzen 9 7940HS, Radeon RX 7600S (v6.75.6100)
28033 KRay/s +66%
Media de la clase Gaming
  (4986 - 60169, n=181, últimos 2 años)
22026 KRay/s +30%
HP Victus 16 (2024)
Intel Core i7-14700HX, NVIDIA GeForce RTX 4060 Laptop GPU (v6.92.6600, Leistung)
21950 KRay/s +30%
Medio Intel Core i7-14700HX
  (16932 - 23676, n=7)
21253 KRay/s +26%
Lenovo Legion 5 16IRX G9
Intel Core i7-14650HX, NVIDIA GeForce RTX 4060 Laptop GPU (v6.92.6600)
19044 KRay/s +12%
Dell G16, i7-13650HX, RTX 4060
Intel Core i7-13650HX, NVIDIA GeForce RTX 4060 Laptop GPU (v6.92.6600)
18836 KRay/s +11%
HP Victus 16 (2024)
Intel Core i7-14700HX, NVIDIA GeForce RTX 4060 Laptop GPU (v6.92.6600)
16932 KRay/s
Gigabyte G6X 9KG (2024)
Intel Core i7-13650HX, NVIDIA GeForce RTX 4060 Laptop GPU (v6.92.6600)
13404 KRay/s -21%
AIDA64 / FPU Julia
Asus TUF Gaming A16 FA617XS
AMD Ryzen 9 7940HS, Radeon RX 7600S (v6.75.6100)
122098 Points +41%
HP Victus 16 (2024)
Intel Core i7-14700HX, NVIDIA GeForce RTX 4060 Laptop GPU (v6.92.6600, Leistung)
113801 Points +32%
Medio Intel Core i7-14700HX
  (86338 - 116556, n=7)
107655 Points +25%
Media de la clase Gaming
  (25360 - 252486, n=181, últimos 2 años)
107276 Points +24%
Lenovo Legion 5 16IRX G9
Intel Core i7-14650HX, NVIDIA GeForce RTX 4060 Laptop GPU (v6.92.6600)
95271 Points +10%
Dell G16, i7-13650HX, RTX 4060
Intel Core i7-13650HX, NVIDIA GeForce RTX 4060 Laptop GPU (v6.92.6600)
93053 Points +8%
HP Victus 16 (2024)
Intel Core i7-14700HX, NVIDIA GeForce RTX 4060 Laptop GPU (v6.92.6600)
86338 Points
Gigabyte G6X 9KG (2024)
Intel Core i7-13650HX, NVIDIA GeForce RTX 4060 Laptop GPU (v6.92.6600)
68241 Points -21%
AIDA64 / CPU SHA3
HP Victus 16 (2024)
Intel Core i7-14700HX, NVIDIA GeForce RTX 4060 Laptop GPU (v6.92.6600, Leistung)
5484 MB/s +37%
Medio Intel Core i7-14700HX
  (4008 - 5567, n=7)
5065 MB/s +26%
Media de la clase Gaming
  (1339 - 10389, n=181, últimos 2 años)
4933 MB/s +23%
Asus TUF Gaming A16 FA617XS
AMD Ryzen 9 7940HS, Radeon RX 7600S (v6.75.6100)
4566 MB/s +14%
Dell G16, i7-13650HX, RTX 4060
Intel Core i7-13650HX, NVIDIA GeForce RTX 4060 Laptop GPU (v6.92.6600)
4256 MB/s +6%
Lenovo Legion 5 16IRX G9
Intel Core i7-14650HX, NVIDIA GeForce RTX 4060 Laptop GPU (v6.92.6600)
4214 MB/s +5%
HP Victus 16 (2024)
Intel Core i7-14700HX, NVIDIA GeForce RTX 4060 Laptop GPU (v6.92.6600)
4008 MB/s
Gigabyte G6X 9KG (2024)
Intel Core i7-13650HX, NVIDIA GeForce RTX 4060 Laptop GPU (v6.92.6600)
3127 MB/s -22%
AIDA64 / CPU Queen
Medio Intel Core i7-14700HX
  (129836 - 152200, n=7)
141316 Points +9%
HP Victus 16 (2024)
Intel Core i7-14700HX, NVIDIA GeForce RTX 4060 Laptop GPU (v6.92.6600, Leistung)
130041 Points 0%
HP Victus 16 (2024)
Intel Core i7-14700HX, NVIDIA GeForce RTX 4060 Laptop GPU (v6.92.6600)
129836 Points
Asus TUF Gaming A16 FA617XS
AMD Ryzen 9 7940HS, Radeon RX 7600S (v6.75.6100)
124433 Points -4%
Media de la clase Gaming
  (50699 - 200651, n=181, últimos 2 años)
117382 Points -10%
Gigabyte G6X 9KG (2024)
Intel Core i7-13650HX, NVIDIA GeForce RTX 4060 Laptop GPU (v6.92.6600)
110589 Points -15%
Dell G16, i7-13650HX, RTX 4060
Intel Core i7-13650HX, NVIDIA GeForce RTX 4060 Laptop GPU (v6.92.6600)
108955 Points -16%
Lenovo Legion 5 16IRX G9
Intel Core i7-14650HX, NVIDIA GeForce RTX 4060 Laptop GPU (v6.92.6600)
101500 Points -22%
AIDA64 / FPU SinJulia
Asus TUF Gaming A16 FA617XS
AMD Ryzen 9 7940HS, Radeon RX 7600S (v6.75.6100)
15380 Points +31%
Media de la clase Gaming
  (4800 - 32988, n=181, últimos 2 años)
13326 Points +14%
Medio Intel Core i7-14700HX
  (11704 - 14434, n=7)
13322 Points +14%
HP Victus 16 (2024)
Intel Core i7-14700HX, NVIDIA GeForce RTX 4060 Laptop GPU (v6.92.6600, Leistung)
13160 Points +12%
Lenovo Legion 5 16IRX G9
Intel Core i7-14650HX, NVIDIA GeForce RTX 4060 Laptop GPU (v6.92.6600)
11913 Points +2%
HP Victus 16 (2024)
Intel Core i7-14700HX, NVIDIA GeForce RTX 4060 Laptop GPU (v6.92.6600)
11704 Points
Dell G16, i7-13650HX, RTX 4060
Intel Core i7-13650HX, NVIDIA GeForce RTX 4060 Laptop GPU (v6.92.6600)
10802 Points -8%
Gigabyte G6X 9KG (2024)
Intel Core i7-13650HX, NVIDIA GeForce RTX 4060 Laptop GPU (v6.92.6600)
9134 Points -22%
AIDA64 / FPU Mandel
Asus TUF Gaming A16 FA617XS
AMD Ryzen 9 7940HS, Radeon RX 7600S (v6.75.6100)
63432 Points +51%
Media de la clase Gaming
  (12321 - 134044, n=181, últimos 2 años)
53979 Points +28%
HP Victus 16 (2024)
Intel Core i7-14700HX, NVIDIA GeForce RTX 4060 Laptop GPU (v6.92.6600, Leistung)
53189 Points +26%
Medio Intel Core i7-14700HX
  (42125 - 58380, n=7)
52861 Points +25%
Lenovo Legion 5 16IRX G9
Intel Core i7-14650HX, NVIDIA GeForce RTX 4060 Laptop GPU (v6.92.6600)
47097 Points +12%
Dell G16, i7-13650HX, RTX 4060
Intel Core i7-13650HX, NVIDIA GeForce RTX 4060 Laptop GPU (v6.92.6600)
45501 Points +8%
HP Victus 16 (2024)
Intel Core i7-14700HX, NVIDIA GeForce RTX 4060 Laptop GPU (v6.92.6600)
42125 Points
Gigabyte G6X 9KG (2024)
Intel Core i7-13650HX, NVIDIA GeForce RTX 4060 Laptop GPU (v6.92.6600)
33391 Points -21%
AIDA64 / CPU AES
Media de la clase Gaming
  (19065 - 328679, n=181, últimos 2 años)
109221 MB/s +33%
HP Victus 16 (2024)
Intel Core i7-14700HX, NVIDIA GeForce RTX 4060 Laptop GPU (v6.92.6600, Leistung)
107781 MB/s +31%
Medio Intel Core i7-14700HX
  (82161 - 113157, n=7)
101130 MB/s +23%
Lenovo Legion 5 16IRX G9
Intel Core i7-14650HX, NVIDIA GeForce RTX 4060 Laptop GPU (v6.92.6600)
86485 MB/s +5%
Asus TUF Gaming A16 FA617XS
AMD Ryzen 9 7940HS, Radeon RX 7600S (v6.75.6100)
86309 MB/s +5%
Dell G16, i7-13650HX, RTX 4060
Intel Core i7-13650HX, NVIDIA GeForce RTX 4060 Laptop GPU (v6.92.6600)
85224 MB/s +4%
HP Victus 16 (2024)
Intel Core i7-14700HX, NVIDIA GeForce RTX 4060 Laptop GPU (v6.92.6600)
82161 MB/s
Gigabyte G6X 9KG (2024)
Intel Core i7-13650HX, NVIDIA GeForce RTX 4060 Laptop GPU (v6.92.6600)
64436 MB/s -22%
AIDA64 / CPU ZLib
HP Victus 16 (2024)
Intel Core i7-14700HX, NVIDIA GeForce RTX 4060 Laptop GPU (v6.92.6600, Leistung)
1633 MB/s +39%
Medio Intel Core i7-14700HX
  (1177 - 1682, n=7)
1502 MB/s +28%
Media de la clase Gaming
  (373 - 2409, n=181, últimos 2 años)
1373 MB/s +17%
Lenovo Legion 5 16IRX G9
Intel Core i7-14650HX, NVIDIA GeForce RTX 4060 Laptop GPU (v6.92.6600)
1289 MB/s +10%
Dell G16, i7-13650HX, RTX 4060
Intel Core i7-13650HX, NVIDIA GeForce RTX 4060 Laptop GPU (v6.92.6600)
1237 MB/s +5%
HP Victus 16 (2024)
Intel Core i7-14700HX, NVIDIA GeForce RTX 4060 Laptop GPU (v6.92.6600)
1177 MB/s
Gigabyte G6X 9KG (2024)
Intel Core i7-13650HX, NVIDIA GeForce RTX 4060 Laptop GPU (v6.92.6600)
1136 MB/s -3%
Asus TUF Gaming A16 FA617XS
AMD Ryzen 9 7940HS, Radeon RX 7600S (v6.75.6100)
1089 MB/s -7%
AIDA64 / FP64 Ray-Trace
Asus TUF Gaming A16 FA617XS
AMD Ryzen 9 7940HS, Radeon RX 7600S (v6.75.6100)
15209 KRay/s +68%
Media de la clase Gaming
  (2540 - 31796, n=181, últimos 2 años)
11862 KRay/s +31%
Medio Intel Core i7-14700HX
  (9029 - 12928, n=7)
11393 KRay/s +26%
HP Victus 16 (2024)
Intel Core i7-14700HX, NVIDIA GeForce RTX 4060 Laptop GPU (v6.92.6600, Leistung)
11344 KRay/s +26%
Dell G16, i7-13650HX, RTX 4060
Intel Core i7-13650HX, NVIDIA GeForce RTX 4060 Laptop GPU (v6.92.6600)
10344 KRay/s +15%
Lenovo Legion 5 16IRX G9
Intel Core i7-14650HX, NVIDIA GeForce RTX 4060 Laptop GPU (v6.92.6600)
10316 KRay/s +14%
HP Victus 16 (2024)
Intel Core i7-14700HX, NVIDIA GeForce RTX 4060 Laptop GPU (v6.92.6600)
9029 KRay/s
Gigabyte G6X 9KG (2024)
Intel Core i7-13650HX, NVIDIA GeForce RTX 4060 Laptop GPU (v6.92.6600)
7270 KRay/s -19%
AIDA64 / CPU PhotoWorxx
Medio Intel Core i7-14700HX
  (39151 - 49671, n=7)
43200 MPixel/s +10%
Media de la clase Gaming
  (10805 - 60161, n=182, últimos 2 años)
40511 MPixel/s +3%
HP Victus 16 (2024)
Intel Core i7-14700HX, NVIDIA GeForce RTX 4060 Laptop GPU (v6.92.6600)
39448 MPixel/s
HP Victus 16 (2024)
Intel Core i7-14700HX, NVIDIA GeForce RTX 4060 Laptop GPU (v6.92.6600, Leistung)
39446 MPixel/s 0%
Gigabyte G6X 9KG (2024)
Intel Core i7-13650HX, NVIDIA GeForce RTX 4060 Laptop GPU (v6.92.6600)
36796 MPixel/s -7%
Dell G16, i7-13650HX, RTX 4060
Intel Core i7-13650HX, NVIDIA GeForce RTX 4060 Laptop GPU (v6.92.6600)
36170 MPixel/s -8%
Lenovo Legion 5 16IRX G9
Intel Core i7-14650HX, NVIDIA GeForce RTX 4060 Laptop GPU (v6.92.6600)
33763 MPixel/s -14%
Asus TUF Gaming A16 FA617XS
AMD Ryzen 9 7940HS, Radeon RX 7600S (v6.75.6100)
29922 MPixel/s -24%

System performance

The smooth-running system provides enough performance for demanding applications such as gaming, rendering and streaming. The RAM's transfer rates are at a normal level for DDR5-5600 RAM.

The RAM runs in dual-channel mode.
PCMark 10 / Score
Asus TUF Gaming A16 FA617XS
Radeon RX 7600S, R9 7940HS, Micron 2400 MTFDKBA512QFM
7927 Points +5%
Medio Intel Core i7-14700HX, NVIDIA GeForce RTX 4060 Laptop GPU
  (7528 - 8278, n=2)
7903 Points +5%
Media de la clase Gaming
  (5776 - 9852, n=163, últimos 2 años)
7825 Points +4%
Lenovo Legion 5 16IRX G9
NVIDIA GeForce RTX 4060 Laptop GPU, i7-14650HX, Samsung PM9A1 MZVL21T0HCLR
7645 Points +2%
Gigabyte G6X 9KG (2024)
NVIDIA GeForce RTX 4060 Laptop GPU, i7-13650HX, Gigabyte AG450E1024-SI
7613 Points +1%
HP Victus 16 (2024)
NVIDIA GeForce RTX 4060 Laptop GPU, i7-14700HX, Kioxia XG8 KXG80ZNV512G
7528 Points
Dell G16, i7-13650HX, RTX 4060
NVIDIA GeForce RTX 4060 Laptop GPU, i7-13650HX, WD PC SN740 SDDPNQD-1T00
7449 Points -1%
PCMark 10 / Essentials
Medio Intel Core i7-14700HX, NVIDIA GeForce RTX 4060 Laptop GPU
  (10778 - 11087, n=2)
10933 Points +1%
Asus TUF Gaming A16 FA617XS
Radeon RX 7600S, R9 7940HS, Micron 2400 MTFDKBA512QFM
10844 Points +1%
Media de la clase Gaming
  (9057 - 12600, n=162, últimos 2 años)
10842 Points +1%
Lenovo Legion 5 16IRX G9
NVIDIA GeForce RTX 4060 Laptop GPU, i7-14650HX, Samsung PM9A1 MZVL21T0HCLR
10804 Points 0%
HP Victus 16 (2024)
NVIDIA GeForce RTX 4060 Laptop GPU, i7-14700HX, Kioxia XG8 KXG80ZNV512G
10778 Points
Gigabyte G6X 9KG (2024)
NVIDIA GeForce RTX 4060 Laptop GPU, i7-13650HX, Gigabyte AG450E1024-SI
10333 Points -4%
Dell G16, i7-13650HX, RTX 4060
NVIDIA GeForce RTX 4060 Laptop GPU, i7-13650HX, WD PC SN740 SDDPNQD-1T00
9532 Points -12%
PCMark 10 / Productivity
Asus TUF Gaming A16 FA617XS
Radeon RX 7600S, R9 7940HS, Micron 2400 MTFDKBA512QFM
10505 Points +6%
Gigabyte G6X 9KG (2024)
NVIDIA GeForce RTX 4060 Laptop GPU, i7-13650HX, Gigabyte AG450E1024-SI
10204 Points +3%
Dell G16, i7-13650HX, RTX 4060
NVIDIA GeForce RTX 4060 Laptop GPU, i7-13650HX, WD PC SN740 SDDPNQD-1T00
10070 Points +2%
Media de la clase Gaming
  (6662 - 14612, n=162, últimos 2 años)
9918 Points 0%
HP Victus 16 (2024)
NVIDIA GeForce RTX 4060 Laptop GPU, i7-14700HX, Kioxia XG8 KXG80ZNV512G
9910 Points
Medio Intel Core i7-14700HX, NVIDIA GeForce RTX 4060 Laptop GPU
  (9823 - 9910, n=2)
9867 Points 0%
Lenovo Legion 5 16IRX G9
NVIDIA GeForce RTX 4060 Laptop GPU, i7-14650HX, Samsung PM9A1 MZVL21T0HCLR
9241 Points -7%
PCMark 10 / Digital Content Creation
Medio Intel Core i7-14700HX, NVIDIA GeForce RTX 4060 Laptop GPU
  (10841 - 14135, n=2)
12488 Points +15%
Media de la clase Gaming
  (6807 - 18475, n=162, últimos 2 años)
12205 Points +13%
Lenovo Legion 5 16IRX G9
NVIDIA GeForce RTX 4060 Laptop GPU, i7-14650HX, Samsung PM9A1 MZVL21T0HCLR
12144 Points +12%
Asus TUF Gaming A16 FA617XS
Radeon RX 7600S, R9 7940HS, Micron 2400 MTFDKBA512QFM
11868 Points +9%
Dell G16, i7-13650HX, RTX 4060
NVIDIA GeForce RTX 4060 Laptop GPU, i7-13650HX, WD PC SN740 SDDPNQD-1T00
11686 Points +8%
Gigabyte G6X 9KG (2024)
NVIDIA GeForce RTX 4060 Laptop GPU, i7-13650HX, Gigabyte AG450E1024-SI
11359 Points +5%
HP Victus 16 (2024)
NVIDIA GeForce RTX 4060 Laptop GPU, i7-14700HX, Kioxia XG8 KXG80ZNV512G
10841 Points
CrossMark / Overall
Lenovo Legion 5 16IRX G9
NVIDIA GeForce RTX 4060 Laptop GPU, i7-14650HX, Samsung PM9A1 MZVL21T0HCLR
2092 Points +9%
Medio Intel Core i7-14700HX, NVIDIA GeForce RTX 4060 Laptop GPU
  (1923 - 2132, n=2)
2028 Points +5%
Gigabyte G6X 9KG (2024)
NVIDIA GeForce RTX 4060 Laptop GPU, i7-13650HX, Gigabyte AG450E1024-SI
1951 Points +1%
HP Victus 16 (2024)
NVIDIA GeForce RTX 4060 Laptop GPU, i7-14700HX, Kioxia XG8 KXG80ZNV512G
1923 Points
Media de la clase Gaming
  (1247 - 2344, n=143, últimos 2 años)
1915 Points 0%
Dell G16, i7-13650HX, RTX 4060
NVIDIA GeForce RTX 4060 Laptop GPU, i7-13650HX, WD PC SN740 SDDPNQD-1T00
1842 Points -4%
Asus TUF Gaming A16 FA617XS
Radeon RX 7600S, R9 7940HS, Micron 2400 MTFDKBA512QFM
1774 Points -8%
CrossMark / Productivity
Lenovo Legion 5 16IRX G9
NVIDIA GeForce RTX 4060 Laptop GPU, i7-14650HX, Samsung PM9A1 MZVL21T0HCLR
1938 Points +9%
Medio Intel Core i7-14700HX, NVIDIA GeForce RTX 4060 Laptop GPU
  (1782 - 1973, n=2)
1878 Points +5%
Gigabyte G6X 9KG (2024)
NVIDIA GeForce RTX 4060 Laptop GPU, i7-13650HX, Gigabyte AG450E1024-SI
1864 Points +5%
Media de la clase Gaming
  (1299 - 2204, n=143, últimos 2 años)
1813 Points +2%
HP Victus 16 (2024)
NVIDIA GeForce RTX 4060 Laptop GPU, i7-14700HX, Kioxia XG8 KXG80ZNV512G
1782 Points
Dell G16, i7-13650HX, RTX 4060
NVIDIA GeForce RTX 4060 Laptop GPU, i7-13650HX, WD PC SN740 SDDPNQD-1T00
1730 Points -3%
Asus TUF Gaming A16 FA617XS
Radeon RX 7600S, R9 7940HS, Micron 2400 MTFDKBA512QFM
1715 Points -4%
CrossMark / Creativity
Lenovo Legion 5 16IRX G9
NVIDIA GeForce RTX 4060 Laptop GPU, i7-14650HX, Samsung PM9A1 MZVL21T0HCLR
2336 Points +11%
Medio Intel Core i7-14700HX, NVIDIA GeForce RTX 4060 Laptop GPU
  (2107 - 2399, n=2)
2253 Points +7%
HP Victus 16 (2024)
NVIDIA GeForce RTX 4060 Laptop GPU, i7-14700HX, Kioxia XG8 KXG80ZNV512G
2107 Points
Media de la clase Gaming
  (1275 - 2660, n=143, últimos 2 años)
2104 Points 0%
Gigabyte G6X 9KG (2024)
NVIDIA GeForce RTX 4060 Laptop GPU, i7-13650HX, Gigabyte AG450E1024-SI
2057 Points -2%
Dell G16, i7-13650HX, RTX 4060
NVIDIA GeForce RTX 4060 Laptop GPU, i7-13650HX, WD PC SN740 SDDPNQD-1T00
2020 Points -4%
Asus TUF Gaming A16 FA617XS
Radeon RX 7600S, R9 7940HS, Micron 2400 MTFDKBA512QFM
1990 Points -6%
CrossMark / Responsiveness
Gigabyte G6X 9KG (2024)
NVIDIA GeForce RTX 4060 Laptop GPU, i7-13650HX, Gigabyte AG450E1024-SI
1907 Points +4%
Lenovo Legion 5 16IRX G9
NVIDIA GeForce RTX 4060 Laptop GPU, i7-14650HX, Samsung PM9A1 MZVL21T0HCLR
1889 Points +3%
Medio Intel Core i7-14700HX, NVIDIA GeForce RTX 4060 Laptop GPU
  (1835 - 1885, n=2)
1860 Points +1%
HP Victus 16 (2024)
NVIDIA GeForce RTX 4060 Laptop GPU, i7-14700HX, Kioxia XG8 KXG80ZNV512G
1835 Points
Media de la clase Gaming
  (1030 - 2330, n=143, últimos 2 años)
1711 Points -7%
Dell G16, i7-13650HX, RTX 4060
NVIDIA GeForce RTX 4060 Laptop GPU, i7-13650HX, WD PC SN740 SDDPNQD-1T00
1686 Points -8%
Asus TUF Gaming A16 FA617XS
Radeon RX 7600S, R9 7940HS, Micron 2400 MTFDKBA512QFM
1388 Points -24%
WebXPRT 3 / Overall
Lenovo Legion 5 16IRX G9
NVIDIA GeForce RTX 4060 Laptop GPU, i7-14650HX, Samsung PM9A1 MZVL21T0HCLR
311 Points +13%
Media de la clase Gaming
  (215 - 480, n=160, últimos 2 años)
304 Points +10%
Gigabyte G6X 9KG (2024)
NVIDIA GeForce RTX 4060 Laptop GPU, i7-13650HX, Gigabyte AG450E1024-SI
302 Points +9%
Medio Intel Core i7-14700HX, NVIDIA GeForce RTX 4060 Laptop GPU
  (276 - 301, n=2)
289 Points +5%
HP Victus 16 (2024)
NVIDIA GeForce RTX 4060 Laptop GPU, i7-14700HX, Kioxia XG8 KXG80ZNV512G
276 Points
Dell G16, i7-13650HX, RTX 4060
NVIDIA GeForce RTX 4060 Laptop GPU, i7-13650HX, WD PC SN740 SDDPNQD-1T00
268 Points -3%
WebXPRT 4 / Overall
Lenovo Legion 5 16IRX G9
NVIDIA GeForce RTX 4060 Laptop GPU, i7-14650HX, Samsung PM9A1 MZVL21T0HCLR
283 Points +13%
Media de la clase Gaming
  (176.4 - 328, n=149, últimos 2 años)
268 Points +7%
Asus TUF Gaming A16 FA617XS
Radeon RX 7600S, R9 7940HS, Micron 2400 MTFDKBA512QFM
262 Points +4%
Medio Intel Core i7-14700HX, NVIDIA GeForce RTX 4060 Laptop GPU
  (251 - 273, n=2)
262 Points +4%
Gigabyte G6X 9KG (2024)
NVIDIA GeForce RTX 4060 Laptop GPU, i7-13650HX, Gigabyte AG450E1024-SI
260 Points +4%
HP Victus 16 (2024)
NVIDIA GeForce RTX 4060 Laptop GPU, i7-14700HX, Kioxia XG8 KXG80ZNV512G
251 Points
Mozilla Kraken 1.1 / Total
HP Victus 16 (2024)
NVIDIA GeForce RTX 4060 Laptop GPU, i7-14700HX, Kioxia XG8 KXG80ZNV512G
542 ms *
Gigabyte G6X 9KG (2024)
NVIDIA GeForce RTX 4060 Laptop GPU, i7-13650HX, Gigabyte AG450E1024-SI
511 ms * +6%
Dell G16, i7-13650HX, RTX 4060
NVIDIA GeForce RTX 4060 Laptop GPU, i7-13650HX, WD PC SN740 SDDPNQD-1T00
507 ms * +6%
Medio Intel Core i7-14700HX, NVIDIA GeForce RTX 4060 Laptop GPU
  (467 - 542, n=2)
505 ms * +7%
Asus TUF Gaming A16 FA617XS
Radeon RX 7600S, R9 7940HS, Micron 2400 MTFDKBA512QFM
504 ms * +7%
Media de la clase Gaming
  (421 - 674, n=175, últimos 2 años)
502 ms * +7%
Lenovo Legion 5 16IRX G9
NVIDIA GeForce RTX 4060 Laptop GPU, i7-14650HX, Samsung PM9A1 MZVL21T0HCLR
486 ms * +10%

* ... más pequeño es mejor

PCMark 10 Score
7528 puntos
ayuda
AIDA64 / Memory Copy
Medio Intel Core i7-14700HX
  (63949 - 78742, n=7)
71165 MB/s +7%
HP Victus 16 (2024)
Intel Core i7-14700HX, NVIDIA GeForce RTX 4060 Laptop GPU
66599 MB/s
Media de la clase Gaming
  (21842 - 94222, n=181, últimos 2 años)
65865 MB/s -1%
Gigabyte G6X 9KG (2024)
Intel Core i7-13650HX, NVIDIA GeForce RTX 4060 Laptop GPU
59896 MB/s -10%
Lenovo Legion 5 16IRX G9
Intel Core i7-14650HX, NVIDIA GeForce RTX 4060 Laptop GPU
59727 MB/s -10%
Asus TUF Gaming A16 FA617XS
AMD Ryzen 9 7940HS, Radeon RX 7600S
59712 MB/s -10%
Dell G16, i7-13650HX, RTX 4060
Intel Core i7-13650HX, NVIDIA GeForce RTX 4060 Laptop GPU
59266 MB/s -11%
AIDA64 / Memory Read
Medio Intel Core i7-14700HX
  (68593 - 86175, n=7)
81347 MB/s 0%
HP Victus 16 (2024)
Intel Core i7-14700HX, NVIDIA GeForce RTX 4060 Laptop GPU
81049 MB/s
Lenovo Legion 5 16IRX G9
Intel Core i7-14650HX, NVIDIA GeForce RTX 4060 Laptop GPU
71455 MB/s -12%
Media de la clase Gaming
  (23681 - 99713, n=181, últimos 2 años)
69737 MB/s -14%
Gigabyte G6X 9KG (2024)
Intel Core i7-13650HX, NVIDIA GeForce RTX 4060 Laptop GPU
68612 MB/s -15%
Dell G16, i7-13650HX, RTX 4060
Intel Core i7-13650HX, NVIDIA GeForce RTX 4060 Laptop GPU
67305 MB/s -17%
Asus TUF Gaming A16 FA617XS
AMD Ryzen 9 7940HS, Radeon RX 7600S
61609 MB/s -24%
AIDA64 / Memory Write
Asus TUF Gaming A16 FA617XS
AMD Ryzen 9 7940HS, Radeon RX 7600S
72541 MB/s +11%
Medio Intel Core i7-14700HX
  (64033 - 76689, n=7)
68661 MB/s +5%
Media de la clase Gaming
  (22986 - 108954, n=181, últimos 2 años)
67587 MB/s +4%
HP Victus 16 (2024)
Intel Core i7-14700HX, NVIDIA GeForce RTX 4060 Laptop GPU
65204 MB/s
Gigabyte G6X 9KG (2024)
Intel Core i7-13650HX, NVIDIA GeForce RTX 4060 Laptop GPU
60298 MB/s -8%
Dell G16, i7-13650HX, RTX 4060
Intel Core i7-13650HX, NVIDIA GeForce RTX 4060 Laptop GPU
58028 MB/s -11%
Lenovo Legion 5 16IRX G9
Intel Core i7-14650HX, NVIDIA GeForce RTX 4060 Laptop GPU
51138 MB/s -22%
AIDA64 / Memory Latency
HP Victus 16 (2024)
Intel Core i7-14700HX, NVIDIA GeForce RTX 4060 Laptop GPU
96.4 ns *
Media de la clase Gaming
  (59.5 - 259, n=181, últimos 2 años)
94.1 ns * +2%
Dell G16, i7-13650HX, RTX 4060
Intel Core i7-13650HX, NVIDIA GeForce RTX 4060 Laptop GPU
90.8 ns * +6%
Asus TUF Gaming A16 FA617XS
AMD Ryzen 9 7940HS, Radeon RX 7600S
90.4 ns * +6%
Gigabyte G6X 9KG (2024)
Intel Core i7-13650HX, NVIDIA GeForce RTX 4060 Laptop GPU
90.4 ns * +6%
Lenovo Legion 5 16IRX G9
Intel Core i7-14650HX, NVIDIA GeForce RTX 4060 Laptop GPU
89.8 ns * +7%
Medio Intel Core i7-14700HX
  (82.7 - 96.4, n=7)
89.3 ns * +7%

* ... más pequeño es mejor

DPC latencies

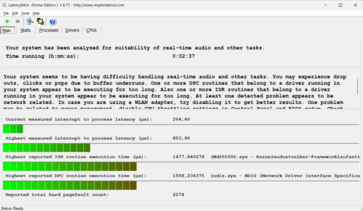
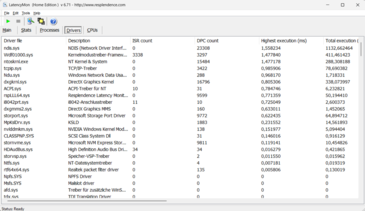
Checking the laptop's latencies (web surfing, 4k video playback, Prime95 high load) revealed some anomalies. The present hardware-software combination does not appear to be suitable for video and audio editing in real-time. Future software updates could lead to changes.

Latency Monitor
Latency Monitor
Latency Monitor
Latency Monitor
DPC Latencies / LatencyMon - interrupt to process latency (max), Web, Youtube, Prime95
Gigabyte G6X 9KG (2024)
NVIDIA GeForce RTX 4060 Laptop GPU, i7-13650HX, Gigabyte AG450E1024-SI
2316.1 μs * -171%
Lenovo Legion 5 16IRX G9
NVIDIA GeForce RTX 4060 Laptop GPU, i7-14650HX, Samsung PM9A1 MZVL21T0HCLR
2024.9 μs * -137%
Asus TUF Gaming A16 FA617XS
Radeon RX 7600S, R9 7940HS, Micron 2400 MTFDKBA512QFM
1128.7 μs * -32%
Dell G16, i7-13650HX, RTX 4060
NVIDIA GeForce RTX 4060 Laptop GPU, i7-13650HX, WD PC SN740 SDDPNQD-1T00
996.5 μs * -17%
HP Victus 16 (2024)
NVIDIA GeForce RTX 4060 Laptop GPU, i7-14700HX, Kioxia XG8 KXG80ZNV512G
853.9 μs *

* ... más pequeño es mejor

Storage devices

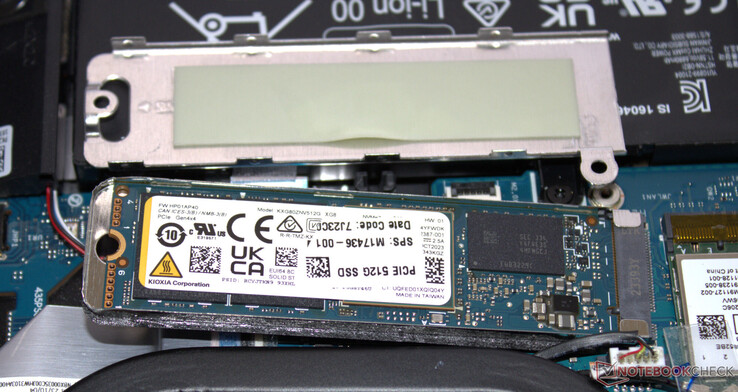
The PCIe 4 SSD (M.2-2280) from Kioxia features a capacity of 512 GB and delivers good transfer rates. During the course of the DiskSpd loop, its data rates sank step by step to a lower level as a result of thermal throttling. The laptop has space for a second SSD.

A PCIe 4 SSD serves as the system drive.
Kioxia XG8 KXG80ZNV512G
CDM 5/6 Read Seq Q32T1: 6944 MB/s
CDM 5/6 Write Seq Q32T1: 4288 MB/s
CDM 5/6 Read 4K Q32T1: 640.5 MB/s
CDM 5/6 Write 4K Q32T1: 436.2 MB/s
CDM 5 Read Seq: 3560 MB/s
CDM 5 Write Seq: 4049 MB/s
CDM 5/6 Read 4K: 64.97 MB/s
CDM 5/6 Write 4K: 244.5 MB/s
Drive Performance Rating - Percent
Lenovo Legion 5 16IRX G9
Samsung PM9A1 MZVL21T0HCLR
93.7 pt
Gigabyte G6X 9KG (2024)
Gigabyte AG450E1024-SI
85.3 pt
HP Victus 16 (2024)
Kioxia XG8 KXG80ZNV512G
78.9 pt
Media de la clase Gaming
 
77.9 pt
Dell G16, i7-13650HX, RTX 4060
WD PC SN740 SDDPNQD-1T00
76 pt
Medio Kioxia XG8 KXG80ZNV512G
 
63.8 pt
Asus TUF Gaming A16 FA617XS
Micron 2400 MTFDKBA512QFM
45.8 pt
DiskSpd
seq read
Lenovo Legion 5 16IRX G9
Samsung PM9A1 MZVL21T0HCLR
4182 (4112.68min - 4181.96max) MB/s +21%
Dell G16, i7-13650HX, RTX 4060
WD PC SN740 SDDPNQD-1T00
3748 (1761.44min - 3748.03max) MB/s +8%
Media de la clase Gaming
  (1319 - 7045, n=163, últimos 2 años)
3475 MB/s 0%
HP Victus 16 (2024)
Kioxia XG8 KXG80ZNV512G
3469 (3344.35min - 3469.11max) MB/s
Medio Kioxia XG8 KXG80ZNV512G
  (2866 - 3469, n=4)
3245 MB/s -6%
Gigabyte G6X 9KG (2024)
Gigabyte AG450E1024-SI
2366 (2263.79min - 2365.89max) MB/s -32%
Asus TUF Gaming A16 FA617XS
Micron 2400 MTFDKBA512QFM
2253 (2206.83min - 2252.55max) MB/s -35%
seq write
Gigabyte G6X 9KG (2024)
Gigabyte AG450E1024-SI
4659 (4410.1min - 4659.12max) MB/s +20%
Dell G16, i7-13650HX, RTX 4060
WD PC SN740 SDDPNQD-1T00
4403 (1750.56min - 4402.76max) MB/s +13%
Lenovo Legion 5 16IRX G9
Samsung PM9A1 MZVL21T0HCLR
4064 (3527.07min - 4064.49max) MB/s +4%
HP Victus 16 (2024)
Kioxia XG8 KXG80ZNV512G
3895 (3747.67min - 3894.8max) MB/s
Media de la clase Gaming
  (535 - 9307, n=163, últimos 2 años)
3827 MB/s -2%
Medio Kioxia XG8 KXG80ZNV512G
  (3104 - 3895, n=4)
3426 MB/s -12%
Asus TUF Gaming A16 FA617XS
Micron 2400 MTFDKBA512QFM
1671 (1641.02min - 1670.59max) MB/s -57%
seq q8 t1 read
HP Victus 16 (2024)
Kioxia XG8 KXG80ZNV512G
6933 (6552.34min - 6933.16max) MB/s
Medio Kioxia XG8 KXG80ZNV512G
  (6270 - 6933, n=4)
6675 MB/s -4%
Lenovo Legion 5 16IRX G9
Samsung PM9A1 MZVL21T0HCLR
6651 (5971.64min - 6651.33max) MB/s -4%
Media de la clase Gaming
  (2594 - 16089, n=163, últimos 2 años)
6317 MB/s -9%
Dell G16, i7-13650HX, RTX 4060
WD PC SN740 SDDPNQD-1T00
5226 (4792.98min - 5226.07max) MB/s -25%
Gigabyte G6X 9KG (2024)
Gigabyte AG450E1024-SI
5152 (4288.44min - 5152.1max) MB/s -26%
Asus TUF Gaming A16 FA617XS
Micron 2400 MTFDKBA512QFM
4294 (3669.6min - 4293.91max) MB/s -38%
seq q8 t1 write
Lenovo Legion 5 16IRX G9
Samsung PM9A1 MZVL21T0HCLR
4952 (4919.08min - 4952.42max) MB/s +13%
Media de la clase Gaming
  (539 - 14571, n=163, últimos 2 años)
4866 MB/s +11%
Gigabyte G6X 9KG (2024)
Gigabyte AG450E1024-SI
4775 (4754.8min - 4775.22max) MB/s +9%
Medio Kioxia XG8 KXG80ZNV512G
  (4392 - 5013, n=4)
4718 MB/s +7%
Dell G16, i7-13650HX, RTX 4060
WD PC SN740 SDDPNQD-1T00
4536 (3842.06min - 4535.88max) MB/s +3%
HP Victus 16 (2024)
Kioxia XG8 KXG80ZNV512G
4392 (3922.93min - 4391.65max) MB/s
Asus TUF Gaming A16 FA617XS
Micron 2400 MTFDKBA512QFM
1773 (1734.23min - 1773.16max) MB/s -60%
4k q1 t1 read
Lenovo Legion 5 16IRX G9
Samsung PM9A1 MZVL21T0HCLR
83.9 (83.66min - 83.86max) MB/s +82%
Media de la clase Gaming
  (30.6 - 95.9, n=163, últimos 2 años)
65.9 MB/s +43%
Dell G16, i7-13650HX, RTX 4060
WD PC SN740 SDDPNQD-1T00
62.1 (58.49min - 62.08max) MB/s +34%
Gigabyte G6X 9KG (2024)
Gigabyte AG450E1024-SI
56.2 (54.05min - 56.2max) MB/s +22%
Medio Kioxia XG8 KXG80ZNV512G
  (46.2 - 58, n=4)
53.5 MB/s +16%
HP Victus 16 (2024)
Kioxia XG8 KXG80ZNV512G
46.2 (45.32min - 46.24max) MB/s
Asus TUF Gaming A16 FA617XS
Micron 2400 MTFDKBA512QFM
32.8 (32.61min - 32.76max) MB/s -29%
4k q1 t1 write
Gigabyte G6X 9KG (2024)
Gigabyte AG450E1024-SI
298 (287.37min - 297.91max) MB/s +19%
HP Victus 16 (2024)
Kioxia XG8 KXG80ZNV512G
251 (249.24min - 250.87max) MB/s
Dell G16, i7-13650HX, RTX 4060
WD PC SN740 SDDPNQD-1T00
246 (245.02min - 245.66max) MB/s -2%
Lenovo Legion 5 16IRX G9
Samsung PM9A1 MZVL21T0HCLR
246 (236.18min - 245.56max) MB/s -2%
Media de la clase Gaming
  (78 - 397, n=163, últimos 2 años)
223 MB/s -11%
Medio Kioxia XG8 KXG80ZNV512G
  (125.2 - 251, n=4)
160.4 MB/s -36%
Asus TUF Gaming A16 FA617XS
Micron 2400 MTFDKBA512QFM
132 (125.41min - 131.99max) MB/s -47%
4k q32 t16 read
Lenovo Legion 5 16IRX G9
Samsung PM9A1 MZVL21T0HCLR
4010 (4002.81min - 4009.85max) MB/s +20%
HP Victus 16 (2024)
Kioxia XG8 KXG80ZNV512G
3330 (3310.23min - 3329.64max) MB/s
Gigabyte G6X 9KG (2024)
Gigabyte AG450E1024-SI
3293 (2898.17min - 3292.73max) MB/s -1%
Dell G16, i7-13650HX, RTX 4060
WD PC SN740 SDDPNQD-1T00
2620 (1053.51min - 2619.8max) MB/s -21%
Media de la clase Gaming
  (417 - 6172, n=163, últimos 2 años)
2587 MB/s -22%
Asus TUF Gaming A16 FA617XS
Micron 2400 MTFDKBA512QFM
1705 (1701.1min - 1704.63max) MB/s -49%
Medio Kioxia XG8 KXG80ZNV512G
  (792 - 3330, n=4)
1449 MB/s -56%
4k q32 t16 write
Gigabyte G6X 9KG (2024)
Gigabyte AG450E1024-SI
3074 (2966.78min - 3074.2max) MB/s +28%
Dell G16, i7-13650HX, RTX 4060
WD PC SN740 SDDPNQD-1T00
2918 (2441.74min - 2917.63max) MB/s +21%
Lenovo Legion 5 16IRX G9
Samsung PM9A1 MZVL21T0HCLR
2646 (2422.02min - 2645.88max) MB/s +10%
HP Victus 16 (2024)
Kioxia XG8 KXG80ZNV512G
2405 (937.07min - 2405.2max) MB/s
Media de la clase Gaming
  (162.3 - 4869, n=163, últimos 2 años)
2141 MB/s -11%
Asus TUF Gaming A16 FA617XS
Micron 2400 MTFDKBA512QFM
1585 (1554.44min - 1585.47max) MB/s -34%
Medio Kioxia XG8 KXG80ZNV512G
  (401 - 2405, n=4)
915 MB/s -62%
AS SSD
Score Total
Lenovo Legion 5 16IRX G9
Samsung PM9A1 MZVL21T0HCLR
8677 Points +17%
Gigabyte G6X 9KG (2024)
Gigabyte AG450E1024-SI
7807 Points +5%
HP Victus 16 (2024)
Kioxia XG8 KXG80ZNV512G
7423 Points
Media de la clase Gaming
  (2271 - 13854, n=155, últimos 2 años)
6753 Points -9%
Dell G16, i7-13650HX, RTX 4060
WD PC SN740 SDDPNQD-1T00
5239 Points -29%
Medio Kioxia XG8 KXG80ZNV512G
  (3541 - 7423, n=4)
5091 Points -31%
Asus TUF Gaming A16 FA617XS
Micron 2400 MTFDKBA512QFM
4261 Points -43%
Score Read
Lenovo Legion 5 16IRX G9
Samsung PM9A1 MZVL21T0HCLR
3242 Points +8%
Gigabyte G6X 9KG (2024)
Gigabyte AG450E1024-SI
3051 Points +1%
HP Victus 16 (2024)
Kioxia XG8 KXG80ZNV512G
3007 Points
Media de la clase Gaming
  (776 - 4721, n=155, últimos 2 años)
2448 Points -19%
Asus TUF Gaming A16 FA617XS
Micron 2400 MTFDKBA512QFM
1830 Points -39%
Medio Kioxia XG8 KXG80ZNV512G
  (1329 - 3007, n=4)
1763 Points -41%
Dell G16, i7-13650HX, RTX 4060
WD PC SN740 SDDPNQD-1T00
1648 Points -45%
Score Write
Lenovo Legion 5 16IRX G9
Samsung PM9A1 MZVL21T0HCLR
3846 Points +32%
Gigabyte G6X 9KG (2024)
Gigabyte AG450E1024-SI
3191 Points +9%
Media de la clase Gaming
  (515 - 7208, n=155, últimos 2 años)
3116 Points +7%
HP Victus 16 (2024)
Kioxia XG8 KXG80ZNV512G
2919 Points
Dell G16, i7-13650HX, RTX 4060
WD PC SN740 SDDPNQD-1T00
2751 Points -6%
Medio Kioxia XG8 KXG80ZNV512G
  (1585 - 2919, n=4)
2524 Points -14%
Asus TUF Gaming A16 FA617XS
Micron 2400 MTFDKBA512QFM
1604 Points -45%
Seq Read
Medio Kioxia XG8 KXG80ZNV512G
  (5151 - 6479, n=4)
5510 MB/s +5%
Lenovo Legion 5 16IRX G9
Samsung PM9A1 MZVL21T0HCLR
5413 MB/s +3%
HP Victus 16 (2024)
Kioxia XG8 KXG80ZNV512G
5247.63 MB/s
Media de la clase Gaming
  (2260 - 12763, n=155, últimos 2 años)
4953 MB/s -6%
Dell G16, i7-13650HX, RTX 4060
WD PC SN740 SDDPNQD-1T00
4491 MB/s -14%
Gigabyte G6X 9KG (2024)
Gigabyte AG450E1024-SI
4212.96 MB/s -20%
Asus TUF Gaming A16 FA617XS
Micron 2400 MTFDKBA512QFM
3690.93 MB/s -30%
Seq Write
HP Victus 16 (2024)
Kioxia XG8 KXG80ZNV512G
4617.83 MB/s
Dell G16, i7-13650HX, RTX 4060
WD PC SN740 SDDPNQD-1T00
4260 MB/s -8%
Gigabyte G6X 9KG (2024)
Gigabyte AG450E1024-SI
4234.14 MB/s -8%
Lenovo Legion 5 16IRX G9
Samsung PM9A1 MZVL21T0HCLR
3979 MB/s -14%
Media de la clase Gaming
  (495 - 11316, n=155, últimos 2 años)
3775 MB/s -18%
Medio Kioxia XG8 KXG80ZNV512G
  (2557 - 4618, n=4)
3179 MB/s -31%
Asus TUF Gaming A16 FA617XS
Micron 2400 MTFDKBA512QFM
1633.49 MB/s -65%
4K Read
Lenovo Legion 5 16IRX G9
Samsung PM9A1 MZVL21T0HCLR
81.2 MB/s +58%
Gigabyte G6X 9KG (2024)
Gigabyte AG450E1024-SI
78.34 MB/s +52%
Media de la clase Gaming
  (27.8 - 112.1, n=155, últimos 2 años)
64.9 MB/s +26%
Dell G16, i7-13650HX, RTX 4060
WD PC SN740 SDDPNQD-1T00
55.5 MB/s +8%
Medio Kioxia XG8 KXG80ZNV512G
  (51.4 - 56.6, n=4)
53.4 MB/s +4%
HP Victus 16 (2024)
Kioxia XG8 KXG80ZNV512G
51.41 MB/s
Asus TUF Gaming A16 FA617XS
Micron 2400 MTFDKBA512QFM
42.75 MB/s -17%
4K Write
Gigabyte G6X 9KG (2024)
Gigabyte AG450E1024-SI
254.58 MB/s +17%
HP Victus 16 (2024)
Kioxia XG8 KXG80ZNV512G
218.1 MB/s
Dell G16, i7-13650HX, RTX 4060
WD PC SN740 SDDPNQD-1T00
211 MB/s -3%
Media de la clase Gaming
  (79.4 - 512, n=155, últimos 2 años)
211 MB/s -3%
Lenovo Legion 5 16IRX G9
Samsung PM9A1 MZVL21T0HCLR
194.6 MB/s -11%
Medio Kioxia XG8 KXG80ZNV512G
  (156.5 - 218, n=4)
178.6 MB/s -18%
Asus TUF Gaming A16 FA617XS
Micron 2400 MTFDKBA512QFM
118.17 MB/s -46%
4K-64 Read
Lenovo Legion 5 16IRX G9
Samsung PM9A1 MZVL21T0HCLR
2619 MB/s +8%
Gigabyte G6X 9KG (2024)
Gigabyte AG450E1024-SI
2551.05 MB/s +5%
HP Victus 16 (2024)
Kioxia XG8 KXG80ZNV512G
2430.71 MB/s
Media de la clase Gaming
  (451 - 3475, n=155, últimos 2 años)
1882 MB/s -23%
Asus TUF Gaming A16 FA617XS
Micron 2400 MTFDKBA512QFM
1429.83 MB/s -41%
Medio Kioxia XG8 KXG80ZNV512G
  (759 - 2431, n=4)
1183 MB/s -51%
Dell G16, i7-13650HX, RTX 4060
WD PC SN740 SDDPNQD-1T00
1143 MB/s -53%
4K-64 Write
Lenovo Legion 5 16IRX G9
Samsung PM9A1 MZVL21T0HCLR
3253 MB/s +45%
Media de la clase Gaming
  (277 - 5909, n=155, últimos 2 años)
2530 MB/s +13%
Gigabyte G6X 9KG (2024)
Gigabyte AG450E1024-SI
2512.87 MB/s +12%
HP Victus 16 (2024)
Kioxia XG8 KXG80ZNV512G
2238.92 MB/s
Dell G16, i7-13650HX, RTX 4060
WD PC SN740 SDDPNQD-1T00
2114 MB/s -6%
Medio Kioxia XG8 KXG80ZNV512G
  (1173 - 2392, n=4)
2028 MB/s -9%
Asus TUF Gaming A16 FA617XS
Micron 2400 MTFDKBA512QFM
1411.25 MB/s -37%
Access Time Read
HP Victus 16 (2024)
Kioxia XG8 KXG80ZNV512G
0.137 ms *
Medio Kioxia XG8 KXG80ZNV512G
  (0.05 - 0.137, n=4)
0.0865 ms * +37%
Gigabyte G6X 9KG (2024)
Gigabyte AG450E1024-SI
0.067 ms * +51%
Asus TUF Gaming A16 FA617XS
Micron 2400 MTFDKBA512QFM
0.058 ms * +58%
Media de la clase Gaming
  (0.016 - 0.379, n=154, últimos 2 años)
0.05554 ms * +59%
Dell G16, i7-13650HX, RTX 4060
WD PC SN740 SDDPNQD-1T00
0.035 ms * +74%
Lenovo Legion 5 16IRX G9
Samsung PM9A1 MZVL21T0HCLR
0.021 ms * +85%
Access Time Write
Asus TUF Gaming A16 FA617XS
Micron 2400 MTFDKBA512QFM
0.118 ms * -521%
Medio Kioxia XG8 KXG80ZNV512G
  (0.019 - 0.082, n=4)
0.04925 ms * -159%
Media de la clase Gaming
  (0.011 - 1.028, n=155, últimos 2 años)
0.04707 ms * -148%
Lenovo Legion 5 16IRX G9
Samsung PM9A1 MZVL21T0HCLR
0.02 ms * -5%
HP Victus 16 (2024)
Kioxia XG8 KXG80ZNV512G
0.019 ms *
Dell G16, i7-13650HX, RTX 4060
WD PC SN740 SDDPNQD-1T00
0.018 ms * +5%
Gigabyte G6X 9KG (2024)
Gigabyte AG450E1024-SI
0.015 ms * +21%

* ... más pequeño es mejor

Reading continuous performance: DiskSpd Read Loop, Queue Depth 8

035070010501400175021002450280031503500385042004550490052505600595063006650Tooltip
HP Victus 16 (2024) Kioxia XG8 KXG80ZNV512G; diskspd 2.0.17 f: Ø5625 (4912.19-6954.3)
Gigabyte G6X 9KG (2024) Gigabyte AG450E1024-SI; diskspd 2.0.17 f: Ø5086 (4094.28-5122.29)
Dell G16, i7-13650HX, RTX 4060 WD PC SN740 SDDPNQD-1T00; diskspd 2.0.17 f: Ø2397 (880.89-5167.17)
Lenovo Legion 5 16IRX G9 Samsung PM9A1 MZVL21T0HCLR; diskspd 2.0.17 f: Ø4118 (3284.7-6662.02)
Asus TUF Gaming A16 FA617XS Micron 2400 MTFDKBA512QFM: Ø3496 (2896.67-3526.02)

Graphics card

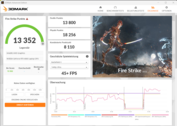
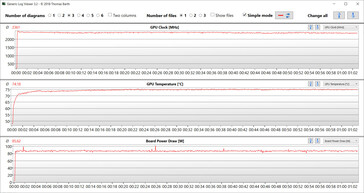
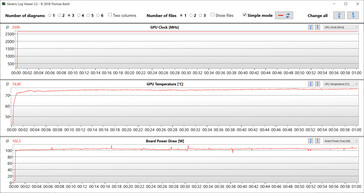
The mid-range GeForce RTX 4060 GPU (3,072 shaders, 128 bit bus, 8 GB GDDR6, 120 watts) allows FHD gaming using high to maximum settings. Its benchmark values and frame rates came slightly above the RTX 4060's average ("Balanced"). The profile "Performance" resulted in a minor advantage. Advanced Optimus isn't supported. This means that changing between the dGPU and Optimus requires a restart. 

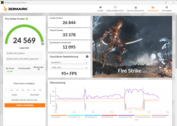
Fire Strike (connected to mains, Balanced)
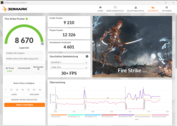
Fire Strike (battery mode, Balanced)
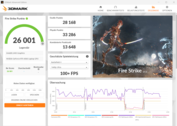
Fire Strike (connected to mains, Performance)
Fire Strike (connected to mains, Eco)
3DMark Performance Rating - Percent
Media de la clase Gaming
 
100 pt
Lenovo Legion 5 16IRX G9
NVIDIA GeForce RTX 4060 Laptop GPU, Intel Core i7-14650HX
85.7 pt
HP Victus 16 (2024)
NVIDIA GeForce RTX 4060 Laptop GPU, Intel Core i7-14700HX
85 pt
Dell G16, i7-13650HX, RTX 4060
NVIDIA GeForce RTX 4060 Laptop GPU, Intel Core i7-13650HX
82.8 pt
Gigabyte G6X 9KG (2024)
NVIDIA GeForce RTX 4060 Laptop GPU, Intel Core i7-13650HX
80.1 pt
HP Victus 16 (2024)
NVIDIA GeForce RTX 4060 Laptop GPU, Intel Core i7-14700HX
79.9 pt
Medio NVIDIA GeForce RTX 4060 Laptop GPU
 
78.6 pt
Asus TUF Gaming A16 FA617XS
AMD Radeon RX 7600S, AMD Ryzen 9 7940HS
75.8 pt
3DMark 11 - 1280x720 Performance GPU
Media de la clase Gaming
  (1029 - 72178, n=181, últimos 2 años)
44043 Points +26%
Lenovo Legion 5 16IRX G9
NVIDIA GeForce RTX 4060 Laptop GPU, Intel Core i7-14650HX
37410 Points +7%
HP Victus 16 (2024)
NVIDIA GeForce RTX 4060 Laptop GPU, Intel Core i7-14700HX (Leistung)
37186 Points +6%
Dell G16, i7-13650HX, RTX 4060
NVIDIA GeForce RTX 4060 Laptop GPU, Intel Core i7-13650HX
36185 Points +3%
Gigabyte G6X 9KG (2024)
NVIDIA GeForce RTX 4060 Laptop GPU, Intel Core i7-13650HX
35409 Points +1%
HP Victus 16 (2024)
NVIDIA GeForce RTX 4060 Laptop GPU, Intel Core i7-14700HX
35045 Points
Medio NVIDIA GeForce RTX 4060 Laptop GPU
  (28136 - 38912, n=56)
34832 Points -1%
Asus TUF Gaming A16 FA617XS
AMD Radeon RX 7600S, AMD Ryzen 9 7940HS
33037 Points -6%
3DMark
1920x1080 Fire Strike Graphics
Media de la clase Gaming
  (781 - 53059, n=193, últimos 2 años)
31600 Points +18%
HP Victus 16 (2024)
NVIDIA GeForce RTX 4060 Laptop GPU, Intel Core i7-14700HX (Leistung)
28168 Points +5%
Lenovo Legion 5 16IRX G9
NVIDIA GeForce RTX 4060 Laptop GPU, Intel Core i7-14650HX
27474 Points +2%
Gigabyte G6X 9KG (2024)
NVIDIA GeForce RTX 4060 Laptop GPU, Intel Core i7-13650HX
26964 Points 0%
Dell G16, i7-13650HX, RTX 4060
NVIDIA GeForce RTX 4060 Laptop GPU, Intel Core i7-13650HX
26952 Points 0%
HP Victus 16 (2024)
NVIDIA GeForce RTX 4060 Laptop GPU, Intel Core i7-14700HX
26844 Points
Asus TUF Gaming A16 FA617XS
AMD Radeon RX 7600S, AMD Ryzen 9 7940HS
26154 Points -3%
Medio NVIDIA GeForce RTX 4060 Laptop GPU
  (20533 - 29656, n=53)
25748 Points -4%
2560x1440 Time Spy Graphics
Media de la clase Gaming
  (224 - 22717, n=188, últimos 2 años)
13211 Points +33%
Lenovo Legion 5 16IRX G9
NVIDIA GeForce RTX 4060 Laptop GPU, Intel Core i7-14650HX
11267 Points +13%
HP Victus 16 (2024)
NVIDIA GeForce RTX 4060 Laptop GPU, Intel Core i7-14700HX (Leistung)
10742 Points +8%
Dell G16, i7-13650HX, RTX 4060
NVIDIA GeForce RTX 4060 Laptop GPU, Intel Core i7-13650HX
10680 Points +7%
HP Victus 16 (2024)
NVIDIA GeForce RTX 4060 Laptop GPU, Intel Core i7-14700HX
9937 Points
Medio NVIDIA GeForce RTX 4060 Laptop GPU
  (7484 - 11451, n=55)
9936 Points 0%
Gigabyte G6X 9KG (2024)
NVIDIA GeForce RTX 4060 Laptop GPU, Intel Core i7-13650HX
9841 Points -1%
Asus TUF Gaming A16 FA617XS
AMD Radeon RX 7600S, AMD Ryzen 9 7940HS
9203 Points -7%
3DMark 11 Performance
30439 puntos
3DMark Fire Strike Score
24569 puntos
3DMark Time Spy Score
10542 puntos
ayuda
Blender
v3.3 Classroom OPTIX/RTX
Dell G16, i7-13650HX, RTX 4060
NVIDIA GeForce RTX 4060 Laptop GPU, Intel Core i7-13650HX (3.3.3)
24 Seconds * -9%
Lenovo Legion 5 16IRX G9
NVIDIA GeForce RTX 4060 Laptop GPU, Intel Core i7-14650HX (3.3.3)
23 Seconds * -5%
Medio NVIDIA GeForce RTX 4060 Laptop GPU
  (19 - 28, n=52)
23 Seconds * -5%
HP Victus 16 (2024)
NVIDIA GeForce RTX 4060 Laptop GPU, Intel Core i7-14700HX (3.3.3)
22 Seconds *
HP Victus 16 (2024)
NVIDIA GeForce RTX 4060 Laptop GPU, Intel Core i7-14700HX (3.3.3, Leistung)
21 Seconds * +5%
Media de la clase Gaming
  (9 - 95, n=177, últimos 2 años)
20.7 Seconds * +6%
Gigabyte G6X 9KG (2024)
NVIDIA GeForce RTX 4060 Laptop GPU, Intel Core i7-13650HX (3.3.3)
20 Seconds * +9%
v3.3 Classroom CUDA
Dell G16, i7-13650HX, RTX 4060
NVIDIA GeForce RTX 4060 Laptop GPU, Intel Core i7-13650HX (3.3.3)
49 Seconds * -20%
Medio NVIDIA GeForce RTX 4060 Laptop GPU
  (39 - 53, n=52)
43.2 Seconds * -5%
Lenovo Legion 5 16IRX G9
NVIDIA GeForce RTX 4060 Laptop GPU, Intel Core i7-14650HX (3.3.3)
41 Seconds * -0%
HP Victus 16 (2024)
NVIDIA GeForce RTX 4060 Laptop GPU, Intel Core i7-14700HX (3.3.3)
41 Seconds *
HP Victus 16 (2024)
NVIDIA GeForce RTX 4060 Laptop GPU, Intel Core i7-14700HX (3.3.3, Leistung)
41 Seconds * -0%
Gigabyte G6X 9KG (2024)
NVIDIA GeForce RTX 4060 Laptop GPU, Intel Core i7-13650HX (3.3.3)
40 Seconds * +2%
Media de la clase Gaming
  (16 - 175, n=182, últimos 2 años)
36.1 Seconds * +12%
v3.3 Classroom CPU
Gigabyte G6X 9KG (2024)
NVIDIA GeForce RTX 4060 Laptop GPU, Intel Core i7-13650HX (3.3.3)
401 Seconds * -29%
HP Victus 16 (2024)
NVIDIA GeForce RTX 4060 Laptop GPU, Intel Core i7-14700HX (3.3.3)
312 Seconds *
Medio NVIDIA GeForce RTX 4060 Laptop GPU
  (189 - 452, n=52)
311 Seconds * -0%
Asus TUF Gaming A16 FA617XS
AMD Radeon RX 7600S, AMD Ryzen 9 7940HS (3.3.3)
301 Seconds * +4%
Media de la clase Gaming
  (138 - 962, n=186, últimos 2 años)
293 Seconds * +6%
Dell G16, i7-13650HX, RTX 4060
NVIDIA GeForce RTX 4060 Laptop GPU, Intel Core i7-13650HX (3.3.3)
272 Seconds * +13%
Lenovo Legion 5 16IRX G9
NVIDIA GeForce RTX 4060 Laptop GPU, Intel Core i7-14650HX (3.3.3)
247 Seconds * +21%
HP Victus 16 (2024)
NVIDIA GeForce RTX 4060 Laptop GPU, Intel Core i7-14700HX (3.3.3, Leistung)
240 Seconds * +23%
Geekbench 5.5
OpenCL Score
Media de la clase Gaming
  (5039 - 237138, n=187, últimos 2 años)
128049 Points +25%
HP Victus 16 (2024)
NVIDIA GeForce RTX 4060 Laptop GPU, Intel Core i7-14700HX (Leistung)
106786 Points +4%
Gigabyte G6X 9KG (2024)
NVIDIA GeForce RTX 4060 Laptop GPU, Intel Core i7-13650HX
103588 Points +1%
Dell G16, i7-13650HX, RTX 4060
NVIDIA GeForce RTX 4060 Laptop GPU, Intel Core i7-13650HX
103039 Points 0%
HP Victus 16 (2024)
NVIDIA GeForce RTX 4060 Laptop GPU, Intel Core i7-14700HX
102604 Points
Medio NVIDIA GeForce RTX 4060 Laptop GPU
  (5039 - 112238, n=52)
99381 Points -3%
Asus TUF Gaming A16 FA617XS
AMD Radeon RX 7600S, AMD Ryzen 9 7940HS
65110 Points -37%
Lenovo Legion 5 16IRX G9
NVIDIA GeForce RTX 4060 Laptop GPU, Intel Core i7-14650HX
5039 Points -95%
Vulkan Score 5.5
HP Victus 16 (2024)
NVIDIA GeForce RTX 4060 Laptop GPU, Intel Core i7-14700HX (Leistung)
74044 Points +20%
Media de la clase Gaming
  (7995 - 163089, n=117, últimos 2 años)
73138 Points +18%
Medio NVIDIA GeForce RTX 4060 Laptop GPU
  (28838 - 87612, n=30)
62733 Points +1%
HP Victus 16 (2024)
NVIDIA GeForce RTX 4060 Laptop GPU, Intel Core i7-14700HX
61926 Points
Gigabyte G6X 9KG (2024)
NVIDIA GeForce RTX 4060 Laptop GPU, Intel Core i7-13650HX
54630 Points -12%
Asus TUF Gaming A16 FA617XS
AMD Radeon RX 7600S, AMD Ryzen 9 7940HS
36222 Points -42%
Geekbench 6.3
GPU OpenCL
Media de la clase Gaming
  (4321 - 207373, n=113, últimos 2 años)
116786 Points +21%
Gigabyte G6X 9KG (2024)
NVIDIA GeForce RTX 4060 Laptop GPU, Intel Core i7-13650HX (6.2.1)
97899 Points +1%
HP Victus 16 (2024)
NVIDIA GeForce RTX 4060 Laptop GPU, Intel Core i7-14700HX (6.2.1)
96607 Points
Dell G16, i7-13650HX, RTX 4060
NVIDIA GeForce RTX 4060 Laptop GPU, Intel Core i7-13650HX (6.2.1)
93994 Points -3%
Medio NVIDIA GeForce RTX 4060 Laptop GPU
  (4321 - 100831, n=39)
90125 Points -7%
HP Victus 16 (2024)
NVIDIA GeForce RTX 4060 Laptop GPU, Intel Core i7-14700HX (6.2.1, Leistung)
87870 Points -9%
Lenovo Legion 5 16IRX G9
NVIDIA GeForce RTX 4060 Laptop GPU, Intel Core i7-14650HX (6.2.1)
4321 Points -96%
GPU Vulkan
Gigabyte G6X 9KG (2024)
NVIDIA GeForce RTX 4060 Laptop GPU, Intel Core i7-13650HX (6.2.1)
92895 Points +5%
HP Victus 16 (2024)
NVIDIA GeForce RTX 4060 Laptop GPU, Intel Core i7-14700HX (6.2.1, Leistung)
92607 Points +4%
HP Victus 16 (2024)
NVIDIA GeForce RTX 4060 Laptop GPU, Intel Core i7-14700HX (6.2.1)
88889 Points
Media de la clase Gaming
  (4286 - 196201, n=105, últimos 2 años)
84296 Points -5%
Medio NVIDIA GeForce RTX 4060 Laptop GPU
  (4286 - 101001, n=35)
65274 Points -27%
Lenovo Legion 5 16IRX G9
NVIDIA GeForce RTX 4060 Laptop GPU, Intel Core i7-14650HX (6.2.1)
4868 Points -95%
Dell G16, i7-13650HX, RTX 4060
NVIDIA GeForce RTX 4060 Laptop GPU, Intel Core i7-13650HX (6.2.1)
4769 Points -95%
V-Ray 5 Benchmark
GPU RTX
Media de la clase Gaming
  (171 - 3824, n=110, últimos 2 años)
2219 mpaths +25%
Gigabyte G6X 9KG (2024)
NVIDIA GeForce RTX 4060 Laptop GPU, Intel Core i7-13650HX (5.0.1)
1803 mpaths +1%
HP Victus 16 (2024)
NVIDIA GeForce RTX 4060 Laptop GPU, Intel Core i7-14700HX (5.0.1)
1782 mpaths
HP Victus 16 (2024)
NVIDIA GeForce RTX 4060 Laptop GPU, Intel Core i7-14700HX (5.0.1, Leistung)
1766 mpaths -1%
Dell G16, i7-13650HX, RTX 4060
NVIDIA GeForce RTX 4060 Laptop GPU, Intel Core i7-13650HX (5.0.1)
1744 mpaths -2%
Medio NVIDIA GeForce RTX 4060 Laptop GPU
  (1387 - 1817, n=28)
1711 mpaths -4%
GPU CUDA
Media de la clase Gaming
  (120 - 2797, n=112, últimos 2 años)
1592 mpaths +33%
Gigabyte G6X 9KG (2024)
NVIDIA GeForce RTX 4060 Laptop GPU, Intel Core i7-13650HX (5.0.1)
1220 mpaths +2%
HP Victus 16 (2024)
NVIDIA GeForce RTX 4060 Laptop GPU, Intel Core i7-14700HX (5.0.1)
1198 mpaths
HP Victus 16 (2024)
NVIDIA GeForce RTX 4060 Laptop GPU, Intel Core i7-14700HX (5.0.1, Leistung)
1197 mpaths 0%
Medio NVIDIA GeForce RTX 4060 Laptop GPU
  (957 - 1294, n=29)
1170 mpaths -2%
Dell G16, i7-13650HX, RTX 4060
NVIDIA GeForce RTX 4060 Laptop GPU, Intel Core i7-13650HX (5.0.1)
1157 mpaths -3%
Asus TUF Gaming A16 FA617XS
AMD Radeon RX 7600S, AMD Ryzen 9 7940HS (5.0.1)
300 mpaths -75%
CPU
HP Victus 16 (2024)
NVIDIA GeForce RTX 4060 Laptop GPU, Intel Core i7-14700HX (5.0.1)
17494 mpaths +25%
Media de la clase Gaming
  (3562 - 26944, n=114, últimos 2 años)
15263 mpaths +9%
HP Victus 16 (2024)
NVIDIA GeForce RTX 4060 Laptop GPU, Intel Core i7-14700HX (5.0.1)
13952 mpaths
Medio NVIDIA GeForce RTX 4060 Laptop GPU
  (8364 - 21065, n=28)
12813 mpaths -8%
Asus TUF Gaming A16 FA617XS
AMD Radeon RX 7600S, AMD Ryzen 9 7940HS (5.0.1)
12169 mpaths -13%
Gigabyte G6X 9KG (2024)
NVIDIA GeForce RTX 4060 Laptop GPU, Intel Core i7-13650HX (5.0.1)
11935 mpaths -14%
Dell G16, i7-13650HX, RTX 4060
NVIDIA GeForce RTX 4060 Laptop GPU, Intel Core i7-13650HX (5.0.1)
10897 mpaths -22%
V-Ray Benchmark Next 4.10
GPU
Media de la clase Gaming
  (54 - 1334, n=151, últimos 2 años)
714 mpaths +14%
Lenovo Legion 5 16IRX G9
NVIDIA GeForce RTX 4060 Laptop GPU, Intel Core i7-14650HX (v4.10.07 )
669 mpaths +7%
Gigabyte G6X 9KG (2024)
NVIDIA GeForce RTX 4060 Laptop GPU, Intel Core i7-13650HX (v4.10.07 )
648 mpaths +3%
HP Victus 16 (2024)
NVIDIA GeForce RTX 4060 Laptop GPU, Intel Core i7-14700HX (v4.10.07, Leistung)
636 mpaths +1%
Medio NVIDIA GeForce RTX 4060 Laptop GPU
  (483 - 715, n=45)
632 mpaths +1%
HP Victus 16 (2024)
NVIDIA GeForce RTX 4060 Laptop GPU, Intel Core i7-14700HX (v4.10.07 )
628 mpaths
Asus TUF Gaming A16 FA617XS
AMD Radeon RX 7600S, AMD Ryzen 9 7940HS (v4.10.07 )
96 mpaths -85%
CPU
HP Victus 16 (2024)
NVIDIA GeForce RTX 4060 Laptop GPU, Intel Core i7-14700HX (v4.10.07, Leistung)
26086 ksamples +21%
Lenovo Legion 5 16IRX G9
NVIDIA GeForce RTX 4060 Laptop GPU, Intel Core i7-14650HX (v4.10.07 )
24563 ksamples +14%
Media de la clase Gaming
  (5413 - 37629, n=151, últimos 2 años)
21560 ksamples 0%
HP Victus 16 (2024)
NVIDIA GeForce RTX 4060 Laptop GPU, Intel Core i7-14700HX (v4.10.07 )
21499 ksamples
Medio NVIDIA GeForce RTX 4060 Laptop GPU
  (12680 - 32360, n=45)
19596 ksamples -9%
Gigabyte G6X 9KG (2024)
NVIDIA GeForce RTX 4060 Laptop GPU, Intel Core i7-13650HX (v4.10.07 )
18304 ksamples -15%
Asus TUF Gaming A16 FA617XS
AMD Radeon RX 7600S, AMD Ryzen 9 7940HS (v4.10.07 )
17623 ksamples -18%

* ... más pequeño es mejor

Performance Rating - Percent
Media de la clase Gaming
 
94.6 pt
Lenovo Legion 5 16IRX G9
Intel Core i7-14650HX, NVIDIA GeForce RTX 4060 Laptop GPU
92.5 pt
HP Victus 16 (2024)
Intel Core i7-14700HX, NVIDIA GeForce RTX 4060 Laptop GPU
88.3 pt
Dell G16, i7-13650HX, RTX 4060
Intel Core i7-13650HX, NVIDIA GeForce RTX 4060 Laptop GPU
88 pt
Gigabyte G6X 9KG (2024)
Intel Core i7-13650HX, NVIDIA GeForce RTX 4060 Laptop GPU
83.8 pt
HP Victus 16 (2024)
Intel Core i7-14700HX, NVIDIA GeForce RTX 4060 Laptop GPU
82.3 pt
Medio NVIDIA GeForce RTX 4060 Laptop GPU
 
81.8 pt
Asus TUF Gaming A16 FA617XS
AMD Ryzen 9 7940HS, AMD Radeon RX 7600S
68.5 pt
The Witcher 3 - 1920x1080 Ultra Graphics & Postprocessing (HBAO+)
Media de la clase Gaming
  (18.4 - 216, n=160, últimos 2 años)
129.2 fps +29%
Dell G16, i7-13650HX, RTX 4060
Intel Core i7-13650HX, NVIDIA GeForce RTX 4060 Laptop GPU
108 fps +8%
HP Victus 16 (2024)
Intel Core i7-14700HX, NVIDIA GeForce RTX 4060 Laptop GPU
105 fps +5%
Medio NVIDIA GeForce RTX 4060 Laptop GPU
  (77 - 159.7, n=42)
100.4 fps +1%
Gigabyte G6X 9KG (2024)
Intel Core i7-13650HX, NVIDIA GeForce RTX 4060 Laptop GPU
100 (85min) fps 0%
HP Victus 16 (2024)
Intel Core i7-14700HX, NVIDIA GeForce RTX 4060 Laptop GPU
99.9 (85min) fps
Asus TUF Gaming A16 FA617XS
AMD Ryzen 9 7940HS, AMD Radeon RX 7600S
98.1 (84min) fps -2%
Lenovo Legion 5 16IRX G9
Intel Core i7-14650HX, NVIDIA GeForce RTX 4060 Laptop GPU
97.2 (93min, 94P1) fps -3%
GTA V - 1920x1080 Highest Settings possible AA:4xMSAA + FX AF:16x
Lenovo Legion 5 16IRX G9
Intel Core i7-14650HX, NVIDIA GeForce RTX 4060 Laptop GPU
120.2 (4.33min, 76.9P1) fps +9%
Dell G16, i7-13650HX, RTX 4060
Intel Core i7-13650HX, NVIDIA GeForce RTX 4060 Laptop GPU
117.4 (3.75min, 76.9P1) fps +7%
HP Victus 16 (2024)
Intel Core i7-14700HX, NVIDIA GeForce RTX 4060 Laptop GPU
116.8 (4.43min, 83.3P1) fps +6%
Gigabyte G6X 9KG (2024)
Intel Core i7-13650HX, NVIDIA GeForce RTX 4060 Laptop GPU
115.2 (4.02min, 76.9P1) fps +5%
Media de la clase Gaming
  (12.1 - 167.7, n=168, últimos 2 años)
114 fps +3%
HP Victus 16 (2024)
Intel Core i7-14700HX, NVIDIA GeForce RTX 4060 Laptop GPU
110.2 (8.03min, 76.9P1) fps
Medio NVIDIA GeForce RTX 4060 Laptop GPU
  (76.9 - 126.3, n=47)
107.6 fps -2%
Asus TUF Gaming A16 FA617XS
AMD Ryzen 9 7940HS, AMD Radeon RX 7600S
92.9 (26.7min, 62.5P1) fps -16%
Final Fantasy XV Benchmark - 1920x1080 High Quality
Media de la clase Gaming
  (19.2 - 201, n=180, últimos 2 años)
120.5 fps +23%
Lenovo Legion 5 16IRX G9
Intel Core i7-14650HX, NVIDIA GeForce RTX 4060 Laptop GPU
106.3 fps +8%
HP Victus 16 (2024)
Intel Core i7-14700HX, NVIDIA GeForce RTX 4060 Laptop GPU
104.9 fps +7%
Dell G16, i7-13650HX, RTX 4060
Intel Core i7-13650HX, NVIDIA GeForce RTX 4060 Laptop GPU
103.7 fps +6%
Gigabyte G6X 9KG (2024)
Intel Core i7-13650HX, NVIDIA GeForce RTX 4060 Laptop GPU
101.5 fps +3%
HP Victus 16 (2024)
Intel Core i7-14700HX, NVIDIA GeForce RTX 4060 Laptop GPU
98.1 fps
Medio NVIDIA GeForce RTX 4060 Laptop GPU
  (75.1 - 109.8, n=50)
97.3 fps -1%
Asus TUF Gaming A16 FA617XS
AMD Ryzen 9 7940HS, AMD Radeon RX 7600S
85.2 fps -13%
Strange Brigade - 1920x1080 ultra AA:ultra AF:16
Media de la clase Gaming
  (38.9 - 421, n=176, últimos 2 años)
230 fps +28%
Lenovo Legion 5 16IRX G9
Intel Core i7-14650HX, NVIDIA GeForce RTX 4060 Laptop GPU
210 fps +17%
Dell G16, i7-13650HX, RTX 4060
Intel Core i7-13650HX, NVIDIA GeForce RTX 4060 Laptop GPU
194.9 (18.1min, 141.1P1) fps +9%
HP Victus 16 (2024)
Intel Core i7-14700HX, NVIDIA GeForce RTX 4060 Laptop GPU
190.2 (76.2min, 139.6P1) fps +6%
Gigabyte G6X 9KG (2024)
Intel Core i7-13650HX, NVIDIA GeForce RTX 4060 Laptop GPU
182.2 (56.5min, 132.3P1) fps +2%
Medio NVIDIA GeForce RTX 4060 Laptop GPU
  (135.3 - 210, n=49)
181.3 fps +1%
HP Victus 16 (2024)
Intel Core i7-14700HX, NVIDIA GeForce RTX 4060 Laptop GPU
179 (76.4min, 130.3P1) fps
Asus TUF Gaming A16 FA617XS
AMD Ryzen 9 7940HS, AMD Radeon RX 7600S
163.3 (16.3min, 119.3P1) fps -9%
Dota 2 Reborn - 1920x1080 ultra (3/3) best looking
Lenovo Legion 5 16IRX G9
Intel Core i7-14650HX, NVIDIA GeForce RTX 4060 Laptop GPU
168.7 (146.8min) fps +13%
HP Victus 16 (2024)
Intel Core i7-14700HX, NVIDIA GeForce RTX 4060 Laptop GPU
156.8 (135.3min) fps +5%
Media de la clase Gaming
  (65.1 - 220, n=185, últimos 2 años)
151.4 fps +1%
HP Victus 16 (2024)
Intel Core i7-14700HX, NVIDIA GeForce RTX 4060 Laptop GPU
149.7 (130.4min) fps
Dell G16, i7-13650HX, RTX 4060
Intel Core i7-13650HX, NVIDIA GeForce RTX 4060 Laptop GPU
149 (130min) fps 0%
Medio NVIDIA GeForce RTX 4060 Laptop GPU
  (115 - 183.8, n=52)
145 fps -3%
Gigabyte G6X 9KG (2024)
Intel Core i7-13650HX, NVIDIA GeForce RTX 4060 Laptop GPU
142.4 (120.3min) fps -5%
Asus TUF Gaming A16 FA617XS
AMD Ryzen 9 7940HS, AMD Radeon RX 7600S
121.6 (100.8min) fps -19%
X-Plane 11.11 - 1920x1080 high (fps_test=3)
Lenovo Legion 5 16IRX G9
Intel Core i7-14650HX, NVIDIA GeForce RTX 4060 Laptop GPU
130.9 fps +31%
HP Victus 16 (2024)
Intel Core i7-14700HX, NVIDIA GeForce RTX 4060 Laptop GPU
116 fps +16%
Dell G16, i7-13650HX, RTX 4060
Intel Core i7-13650HX, NVIDIA GeForce RTX 4060 Laptop GPU
114.9 fps +15%
Media de la clase Gaming
  (32.8 - 166.2, n=192, últimos 2 años)
108.5 fps +8%
Gigabyte G6X 9KG (2024)
Intel Core i7-13650HX, NVIDIA GeForce RTX 4060 Laptop GPU
107.1 fps +7%
Medio NVIDIA GeForce RTX 4060 Laptop GPU
  (60.7 - 141.1, n=53)
102.1 fps +2%
HP Victus 16 (2024)
Intel Core i7-14700HX, NVIDIA GeForce RTX 4060 Laptop GPU
100.3 fps
Asus TUF Gaming A16 FA617XS
AMD Ryzen 9 7940HS, AMD Radeon RX 7600S
57.3 fps -43%
Cyberpunk 2077 2.1 Phantom Liberty
1920x1080 Ultra Preset (FSR off)
Media de la clase Gaming
  (6.76 - 144.7, n=82, últimos 2 años)
86.5 fps +29%
Lenovo Legion 5 16IRX G9
Intel Core i7-14650HX, NVIDIA GeForce RTX 4060 Laptop GPU (2.02)
81.8 (19.5min) fps +22%
HP Victus 16 (2024)
Intel Core i7-14700HX, NVIDIA GeForce RTX 4060 Laptop GPU (2.02, Leistung)
74.8 (29.9min) fps +11%
Medio NVIDIA GeForce RTX 4060 Laptop GPU
  (56.4 - 93.1, n=30)
71.5 fps +7%
Dell G16, i7-13650HX, RTX 4060
Intel Core i7-13650HX, NVIDIA GeForce RTX 4060 Laptop GPU (2.11)
69.8 (60.3min) fps +4%
Gigabyte G6X 9KG (2024)
Intel Core i7-13650HX, NVIDIA GeForce RTX 4060 Laptop GPU (2.02)
69.7 (39min) fps +4%
HP Victus 16 (2024)
Intel Core i7-14700HX, NVIDIA GeForce RTX 4060 Laptop GPU (2.02)
67.1 (20.8min) fps
2560x1440 Ultra Preset (FSR off)
Media de la clase Gaming
  (24.8 - 110, n=72, últimos 2 años)
64.9 fps
Lenovo Legion 5 16IRX G9
Intel Core i7-14650HX, NVIDIA GeForce RTX 4060 Laptop GPU (2.02)
49.7 (26.6min) fps
Dell G16, i7-13650HX, RTX 4060
Intel Core i7-13650HX, NVIDIA GeForce RTX 4060 Laptop GPU (2.11)
45.6 (38.6min) fps
Medio NVIDIA GeForce RTX 4060 Laptop GPU
  (32.9 - 51.8, n=19)
43.8 fps
1920x1080 Ray Tracing Ultra Preset (DLSS off)
Media de la clase Gaming
  (11.9 - 77.7, n=55, últimos 2 años)
45.5 fps +42%
HP Victus 16 (2024)
Intel Core i7-14700HX, NVIDIA GeForce RTX 4060 Laptop GPU (2.02, Leistung)
35.1 (21.5min) fps +10%
Medio NVIDIA GeForce RTX 4060 Laptop GPU
  (23.6 - 37.4, n=21)
32.9 fps +3%
Gigabyte G6X 9KG (2024)
Intel Core i7-13650HX, NVIDIA GeForce RTX 4060 Laptop GPU (2.02)
32.6 (21min) fps +2%
HP Victus 16 (2024)
Intel Core i7-14700HX, NVIDIA GeForce RTX 4060 Laptop GPU (2.02)
32 (24.5min) fps
Dragon's Dogma 2 - 1920x1080 High Preset
Media de la clase Gaming
  (49.5 - 80, n=8, últimos 2 años)
64.5 fps +2%
HP Victus 16 (2024)
Intel Core i7-14700HX, NVIDIA GeForce RTX 4060 Laptop GPU
63.3 (25.6min, 34.9P0.1, 46.2P1) fps
Medio NVIDIA GeForce RTX 4060 Laptop GPU
  (57.2 - 67.7, n=5)
62.3 fps -2%
Razer Blade 14 Mid 23
AMD Ryzen 9 7940HS, NVIDIA GeForce RTX 4060 Laptop GPU
57.2 (28min, 31.4P0.1, 38.3P1) fps -10%
Palworld - 1920x1080 Epic Preset AA:TSR
Razer Blade 14 Mid 23
AMD Ryzen 9 7940HS, NVIDIA GeForce RTX 4060 Laptop GPU
87.8 (13.4min, 18.4P0.1, 44.8P1) fps +5%
Medio NVIDIA GeForce RTX 4060 Laptop GPU
  (83.9 - 87.8, n=2)
85.9 fps +2%
HP Victus 16 (2024)
Intel Core i7-14700HX, NVIDIA GeForce RTX 4060 Laptop GPU
83.9 (9.32min, 42.3P0.1, 70.8P1) fps
Media de la clase Gaming
  (20.9 - 150.9, n=8, últimos 2 años)
69.4 fps -17%
The Finals
1920x1080 Epic Preset
Razer Blade 14 Mid 23
AMD Ryzen 9 7940HS, NVIDIA GeForce RTX 4060 Laptop GPU
126 (38.9min, 73.3P0.1, 93.8P1) fps +3%
Medio NVIDIA GeForce RTX 4060 Laptop GPU
  (122.3 - 126, n=2)
124.2 fps +2%
HP Victus 16 (2024)
Intel Core i7-14700HX, NVIDIA GeForce RTX 4060 Laptop GPU
122.3 (54.5min, 76.3P0.1, 86.9P1) fps
Media de la clase Gaming
  (24.8 - 211, n=12, últimos 2 años)
108 fps -12%
1920x1080 Epic Preset + Epic RTX Global Illumination
Media de la clase Gaming
  (51.1 - 190.8, n=7, últimos 2 años)
121.9 fps +4%
Razer Blade 14 Mid 23
AMD Ryzen 9 7940HS, NVIDIA GeForce RTX 4060 Laptop GPU
121.1 (60.6min, 76.7P0.1, 91P1) fps +4%
Medio NVIDIA GeForce RTX 4060 Laptop GPU
  (116.8 - 121.1, n=2)
119 fps +2%
HP Victus 16 (2024)
Intel Core i7-14700HX, NVIDIA GeForce RTX 4060 Laptop GPU
116.8 (63.9min, 73P0.1, 81.4P1) fps
EA Sports WRC - 1920x1080 Ultra Preset AA:Epic AF:16x
HP Victus 16 (2024)
Intel Core i7-14700HX, NVIDIA GeForce RTX 4060 Laptop GPU
79.6 (29.1min, 53.7P0.1, 62.8P1) fps
Medio NVIDIA GeForce RTX 4060 Laptop GPU
  (78.4 - 79.6, n=2)
79 fps -1%
Razer Blade 14 Mid 23
AMD Ryzen 9 7940HS, NVIDIA GeForce RTX 4060 Laptop GPU
78.4 (21.9min, 39.1P0.1, 58.5P1) fps -2%
Media de la clase Gaming
  (15.4 - 115.1, n=7, últimos 2 años)
60.7 fps -24%
Enshrouded - 1920x1080 Max. Quality AA:FX
HP Victus 16 (2024)
Intel Core i7-14700HX, NVIDIA GeForce RTX 4060 Laptop GPU
51.1 (36.6min, 36.7P0.1, 39.2P1) fps
Media de la clase Gaming
  (9.48 - 101.5, n=12, últimos 2 años)
49.9 fps -2%
Medio NVIDIA GeForce RTX 4060 Laptop GPU
  (43 - 51.1, n=2)
47.1 fps -8%
Razer Blade 14 Mid 23
AMD Ryzen 9 7940HS, NVIDIA GeForce RTX 4060 Laptop GPU
43 (26.1min, 27.2P0.1, 32.3P1) fps -16%

Witcher 3 FPS diagram

0102030405060708090100Tooltip
HP Victus 16 (2024) i7-14700HX, NVIDIA GeForce RTX 4060 Laptop GPU: Ø96.1 (91-101)
Gigabyte G6X 9KG (2024) i7-13650HX, NVIDIA GeForce RTX 4060 Laptop GPU: Ø93.3 (88-99)
Dell G16, i7-13650HX, RTX 4060 i7-13650HX, NVIDIA GeForce RTX 4060 Laptop GPU: Ø105.6 (100-109)
Lenovo Legion 5 16IRX G9 i7-14650HX, NVIDIA GeForce RTX 4060 Laptop GPU: Ø97.2 (93-102)
Asus TUF Gaming A16 FA617XS R9 7940HS, Radeon RX 7600S; neu: Ø95.2 (89-101)
HP Victus 16 (2024) i7-14700HX, NVIDIA GeForce RTX 4060 Laptop GPU; Leistung: Ø102.7 (97-106)
Witcher 3 (Balanced)
Witcher 3 (Performance)
bajomedioaltoultra
GTA V (2015) 185.8 181.2 176.1 110.2
The Witcher 3 (2015) 448.6 297.7 181.9 99.9
Dota 2 Reborn (2015) 198.1 177.8 168.4 149.7
Final Fantasy XV Benchmark (2018) 208 135.3 98.1
X-Plane 11.11 (2018) 154.4 129.2 100.3
Strange Brigade (2018) 406 253 205 179
Cyberpunk 2077 2.1 Phantom Liberty (2023) 113.6 90 76.9 67.1
EA Sports WRC (2023) 129.3 93.7 85.2 79.6
The Finals (2023) 196.7 161.7 155.9 122.3
Palworld (2024) 139.2 116.3 91.8 83.9
Enshrouded (2024) 85.5 71.2 59.7 51.1
Dragon's Dogma 2 (2024) 67.1 63.3

Emissions & power - The gaming laptop with impressive runtimes

Noise emissions

The fans are usually kept as low as possible and only spin faster when there is no other option. Nevertheless, the device's noise emissions rise to up to 48 dB(A) under full load ("Balanced"). "Performance" results in even higher values. Significantly quieter use can be achieved using the "Eco" mode.

In idle mode or under low load, it is possible that the fans remain completely still. However, the HP bios option "fan always on" (which is active by default) would have to be deactivated for this. Otherwise, it ensures that the fans are always running.

Ruido

Ocioso
28 / 29 / 33 dB(A)
Carga
45 / 48 dB(A)
  red to green bar
 
 
30 dB
silencioso
40 dB(A)
audible
50 dB(A)
ruidosamente alto
 
min: dark, med: mid, max: light   Earthworks M23R, Arta (15 cm de distancia)   ruido ambiental: 25 dB(A)
dB(A) 0102030405060708090Deep BassMiddle BassHigh BassLower RangeMidsHigher MidsLower HighsMid HighsUpper HighsSuper Highs2038.139.433.935.737.62534.734.935.33237.23140.644.741.641.343.84027.129.12725.6285028.625.322.118.626.66335.229.123.522.444802420.115.614.732.4100242017.117.325.512525.519.917.214.827.916026.520.518.215.729.320027.323.22017.332.425028.520.517.614.930.931528.419.215.91230.840030.420.917.110.234.450031.82218.411.435.763034.123.418.911.136.780033.823.218.813.336.9100035.224.118.910.739125036.624.218.711.139.5160034.822.117.311.838.3200034.921.617.61238250032.320.216.812.436315030.718.715.413.633.9400030.51814.913.933.9500028.815.913.613.332.863002614.513.513.330.880002113.713.513.625.61000018.613.413.213.122.81250014.512.912.812.717.41600012.712.512.212.213.6SPL44.632.828.824.847.9N4.61.71.10.66.1median 28.8median 20.2median 17.1median 13.1median 32.8Delta4.33.12.41.25.4hearing rangehide median Fan NoiseHP Victus 16 (2024)
HP Victus 16 (2024)
NVIDIA GeForce RTX 4060 Laptop GPU, i7-14700HX, Kioxia XG8 KXG80ZNV512G
Gigabyte G6X 9KG (2024)
NVIDIA GeForce RTX 4060 Laptop GPU, i7-13650HX, Gigabyte AG450E1024-SI
Dell G16, i7-13650HX, RTX 4060
NVIDIA GeForce RTX 4060 Laptop GPU, i7-13650HX, WD PC SN740 SDDPNQD-1T00
Lenovo Legion 5 16IRX G9
NVIDIA GeForce RTX 4060 Laptop GPU, i7-14650HX, Samsung PM9A1 MZVL21T0HCLR
Asus TUF Gaming A16 FA617XS
Radeon RX 7600S, R9 7940HS, Micron 2400 MTFDKBA512QFM
Noise
-10%
13%
-3%
2%
apagado / medio ambiente *
25
26
-4%
23
8%
24
4%
25
-0%
Idle Minimum *
28
30
-7%
23
18%
24
14%
25
11%
Idle Average *
29
32
-10%
23
21%
28.8
1%
26
10%
Idle Maximum *
33
35
-6%
27.96
15%
32
3%
28
15%
Load Average *
45
51
-13%
27.96
38%
45.5
-1%
43
4%
Witcher 3 ultra *
43
51
-19%
47.89
-11%
53.1
-23%
51
-19%
Load Maximum *
48
54
-13%
47.89
-0%
55.7
-16%
53
-10%

* ... más pequeño es mejor

Temperature

The stress test and Witcher 3 test cause the laptop to heat up noticeably. Temperatures of 50 °C were reached at certain points during the tests. In everyday use (office, internet), the values generally remain in the green range.

The extreme stress test scenario (Prime95 and Furmark in continuous operation) checks the system's stability under full load. The CPU clock fluctuated at the beginning, but then it stabilized at a low level later on. The GPU worked at almost full power.

Furmark & Prime95
Furmark & Prime95
Furmark & Prime95
Furmark & Prime95
Furmark & Prime95
Furmark & Prime95
Witcher 3
Witcher 3
Witcher 3
Witcher 3
Witcher 3
Witcher 3
 50 °C46 °C40 °C 
 43 °C42 °C39 °C 
 30 °C28 °C29 °C 
Máximo: 50 °C
Médio: 38.6 °C
47 °C50 °C44 °C
39 °C42 °C40 °C
25 °C29 °C27 °C
Máximo: 50 °C
Médio: 38.1 °C
Conector de corriente  45 °C | Temperatura del cuarto 21 °C | Fluke t3000FC (calibrated), Voltcraft IR-900
(-) La temperatura media de la parte superior bajo carga máxima es de 38.6 °C / 101 F, en comparación con la media de 33.9 °C / 93 F de los dispositivos de la clase Gaming.
(-) La temperatura máxima en la parte superior es de 50 °C / 122 F, frente a la media de 40.5 °C / 105 F, que oscila entre 21.2 y 68.8 °C para la clase Gaming.
(-) El fondo se calienta hasta un máximo de 50 °C / 122 F, frente a la media de 43.2 °C / 110 F
(+) En reposo, la temperatura media de la parte superior es de 24.7 °C / 76# F, frente a la media del dispositivo de 33.9 °C / 93 F.
(-) Jugando a The Witcher 3, la temperatura media de la parte superior es de 38.3 °C / 101 F, frente a la media del dispositivo de 33.9 °C / 93 F.
(+) El reposamanos y el panel táctil están a una temperatura inferior a la de la piel, con un máximo de 31 °C / 87.8 F y, por tanto, son fríos al tacto.
(-) La temperatura media de la zona del reposamanos de dispositivos similares fue de 28.9 °C / 84 F (-2.1 °C / -3.8 F).
HP Victus 16 (2024)
Intel Core i7-14700HX, NVIDIA GeForce RTX 4060 Laptop GPU
Gigabyte G6X 9KG (2024)
Intel Core i7-13650HX, NVIDIA GeForce RTX 4060 Laptop GPU
Dell G16, i7-13650HX, RTX 4060
Intel Core i7-13650HX, NVIDIA GeForce RTX 4060 Laptop GPU
Lenovo Legion 5 16IRX G9
Intel Core i7-14650HX, NVIDIA GeForce RTX 4060 Laptop GPU
Asus TUF Gaming A16 FA617XS
AMD Ryzen 9 7940HS, AMD Radeon RX 7600S
Heat
-10%
-22%
-7%
-9%
Maximum Upper Side *
50
41
18%
49
2%
40.4
19%
53
-6%
Maximum Bottom *
50
43
14%
58
-16%
43.8
12%
48
4%
Idle Upper Side *
25
32
-28%
35
-40%
30.3
-21%
30
-20%
Idle Bottom *
26
37
-42%
35
-35%
35.3
-36%
30
-15%

* ... más pequeño es mejor

Speakers

The laptop's stereo speakers produce a decent sound overall, although it could do with having more bass.

dB(A) 0102030405060708090Deep BassMiddle BassHigh BassLower RangeMidsHigher MidsLower HighsMid HighsUpper HighsSuper Highs2035.736.5253234.23141.348.74025.632.45018.6236322.426.28014.721.410017.324.712514.833.516015.744.720017.356.425014.964.53151265.840010.267.850011.467.363011.170.580013.373.3100010.771.1125011.168.9160011.868.620001269.8250012.463.6315013.666.3400013.965.3500013.368.5630013.370.7800013.672.21000013.173.71250012.776.11600012.272.6SPL24.882N0.655.5median 13.1median 68.5Delta1.25.744.942.637.539.646.946.632.93544.744.428.630.525.128.529.525.326.228.525.532.921.742.622.157.417.566.414.773.813.573.516.275.21273.310.9671169.21167.610.969.211.565.712.561.812.667.112.772.213.364.913.866.613.56812.469.111.961.92681.50.854.1median 13.3median 673.27.2hearing rangehide median Pink NoiseHP Victus 16 (2024)Gigabyte G6X 9KG (2024)
Diagrama de frecuencia en comparación (¡las casillas de verificación se pueden marcar y desmarcar!)
HP Victus 16 (2024) análisis de audio

(+) | los altavoces pueden reproducir a un volumen relativamente alto (#82 dB)
Graves 100 - 315 Hz
(-) | casi sin bajos - de media 20.3% inferior a la mediana
(±) | la linealidad de los graves es media (13.3% delta a frecuencia anterior)
Medios 400 - 2000 Hz
(+) | medios equilibrados - a sólo 1.6% de la mediana
(+) | los medios son lineales (3.3% delta a la frecuencia anterior)
Altos 2 - 16 kHz
(+) | máximos equilibrados - a sólo 3.1% de la mediana
(+) | los máximos son lineales (4.7% delta a la frecuencia anterior)
Total 100 - 16.000 Hz
(+) | el sonido global es lineal (14% de diferencia con la mediana)
En comparación con la misma clase
» 22% de todos los dispositivos probados de esta clase eran mejores, 7% similares, 72% peores
» El mejor tuvo un delta de 6%, la media fue 18%, el peor fue ###max##%
En comparación con todos los dispositivos probados
» 14% de todos los dispositivos probados eran mejores, 4% similares, 82% peores
» El mejor tuvo un delta de 4%, la media fue 25%, el peor fue ###max##%

Gigabyte G6X 9KG (2024) análisis de audio

(+) | los altavoces pueden reproducir a un volumen relativamente alto (#82 dB)
Graves 100 - 315 Hz
(-) | casi sin bajos - de media 24.9% inferior a la mediana
(±) | la linealidad de los graves es media (13.7% delta a frecuencia anterior)
Medios 400 - 2000 Hz
(+) | medios equilibrados - a sólo 4.1% de la mediana
(+) | los medios son lineales (5.4% delta a la frecuencia anterior)
Altos 2 - 16 kHz
(+) | máximos equilibrados - a sólo 2.2% de la mediana
(±) | la linealidad de los máximos es media (7.4% delta a frecuencia anterior)
Total 100 - 16.000 Hz
(±) | la linealidad del sonido global es media (17.2% de diferencia con la mediana)
En comparación con la misma clase
» 45% de todos los dispositivos probados de esta clase eran mejores, 11% similares, 44% peores
» El mejor tuvo un delta de 6%, la media fue 18%, el peor fue ###max##%
En comparación con todos los dispositivos probados
» 28% de todos los dispositivos probados eran mejores, 8% similares, 64% peores
» El mejor tuvo un delta de 4%, la media fue 25%, el peor fue ###max##%

Power consumption

Its power consumption is pretty normal for the installed hardware. While the Witcher 3 test was run with constant power consumption, the laptop's demand fluctuated at the start of the stress test. The power supply unit (230 watts) is sufficiently sized.

Consumo de corriente
Off / Standbydarklight 0.1 /  Watt
Ociosodarkmidlight 9 / 15 / 23 Watt
Carga midlight 123 / 241 Watt
 color bar
Clave: min: dark, med: mid, max: light        Metrahit Energy

Power consumption Witcher 3 / stress test

0153045607590105120135150165180195210225240Tooltip
HP Victus 16 (2024); Witcher 3 ultra: Ø143.7 (139.6-148.9)
HP Victus 16 (2024); 1280x720 Prime95 28.10 and Furmark 1.25: Ø176.9 (160-241)
HP Victus 16 (2024); Idle 150cd/m2: Ø15.4 (8.88-23.2)

Power consumption with external monitor

0153045607590105120135150165180195210Tooltip
HP Victus 16 (2024); Prime95 V2810 Stress (external Monitor): Ø101.3 (80.6-220)
HP Victus 16 (2024); Cinebench R23 Multi (external Monitor): Ø152.2 (82.6-170)
HP Victus 16 (2024); 1280x720 FurMark 1.19 GPU Stress Test (external Monitor): Ø125.7 (123.3-128.7)
HP Victus 16 (2024); 1920x1080 The Witcher 3 ultra (external Monitor): Ø137.3 (133.1-145.6)
HP Victus 16 (2024); Idle 1min (external Monitor): Ø22.6 (21.3-25.2)

Runtimes

The 16.1-inch device achieved a runtime of 8:31 hours during our practical WLAN test (illustrating the load when accessing websites using a script)—a very good value. Within the comparison field, only the Asus TUF Gaming A16 did better.

Tiempo de Ejecución de la Batería
WiFi Websurfing (Edge 124)
8h 31min
Battery Runtime - WiFi Websurfing
Asus TUF Gaming A16 FA617XS
R9 7940HS, Radeon RX 7600S, 90 Wh
745 min +46%
HP Victus 16 (2024)
i7-14700HX, NVIDIA GeForce RTX 4060 Laptop GPU, 83 Wh
511 min
Gigabyte G6X 9KG (2024)
i7-13650HX, NVIDIA GeForce RTX 4060 Laptop GPU, 73 Wh
474 min -7%
Lenovo Legion 5 16IRX G9
i7-14650HX, NVIDIA GeForce RTX 4060 Laptop GPU, 80 Wh
444 min -13%
Dell G16, i7-13650HX, RTX 4060
i7-13650HX, NVIDIA GeForce RTX 4060 Laptop GPU, 86 Wh
378 min -26%
Media de la clase Gaming
  (85 - 889, n=153, últimos 2 años)
377 min -26%

Pro

+ matte FHD display (144 Hz)
+ two SSD slots (PCIe 4, M.2-2280)
+ RAM can be swapped out/expanded
+ Power Delivery
+ very good battery life
+ can run quietly
+ undervolting via software

Contra

- display with only low color space coverage
- loud under load
- no Thunderbolt 4/USB 4
- no SD card reader
- unstable plastic case

Verdict - A solid mid-range gaming laptop

The HP Victus 16-r1073ng, test sample provided by Playox.

The Victus allows FHD gaming with high to maximum settings. The required power is delivered by the Core i7-14700HX and the GeForce RTX 4060. A shame: The CPU's single-core performance is slightly below what could be possible. As is standard for the class, its emissions can be sunk down to moderate values by forgoing some performance. Positive: Below full load, the laptop's noise emissions are acceptable.

Storage greed at HP: A US$1,600 gaming laptop needs to offer more storage.

HP hasn't hopped on the 16:10 bandwagon—instead, it has stayed true to the 16:9 aspect ratio: The installed 16.1-inch panel (FHD, 144 Hz) is fine—however, when taken into account the device's price of about US$1,600, it should really offer better color space coverage. Its 512 GB storage is not a lot for a gaming laptop. You would expect more for the price in this aspect, too.

HP hasn't given this laptop modern connections such as Thunderbolt 4/USB 4 but even so, it hasn't forgotten useful functions such as Power Delivery—the battery can be charged via a USB-C power supply (100 watts). Positive: The fully charged battery is enough for WiFi runtimes of around 8.5 hours—a value which a lot of other gaming laptops can only dream of achieving. 

A viable alternative could be the Gigabyte G6X 9KG (2024). This laptop offers comparable computing power and similarly good runtimes but instead of a 16:9 panel, it features a 16:10 one. 

Price and availability

The HP Victus 16 (2024) can currently be purchased on Amazon for about US$1,333. This is the variant with the Core i7-13700HX, NVIDIA GeForce RTX 4060, 64GB DDR5 RAM and a 2TB SSD. 

You can also configure a custom variant via HP's website.

HP Victus 16 (2024) - 05/14/2024 v7 (old)
Sascha Mölck

Acabado
74 / 98 → 76%
Teclado
79%
Ratón
83%
Conectividad
62 / 80 → 78%
Peso
61 / 10-66 → 90%
Battería
83 / 95 → 87%
Pantalla
81%
Rendimiento de juegos
98%
Rendimiento de la Aplicación
87%
Temperatura
86 / 95 → 91%
Ruido
76 / 90 → 84%
Audio
80%
Cámara
46 / 85 → 55%
Médio
77%
84%
Gaming - media ponderada

Transparencia

La selección de los dispositivos que se van a reseñar corre a cargo de nuestro equipo editorial. La muestra de prueba fue proporcionada al autor en calidad de préstamo por el fabricante o el minorista a los efectos de esta reseña. El prestamista no tuvo ninguna influencia en esta reseña, ni el fabricante recibió una copia de la misma antes de su publicación. No había ninguna obligación de publicar esta reseña. Nunca aceptamos compensaciones o pagos a cambio de nuestras reseñas. Como empresa de medios independiente, Notebookcheck no está sujeta a la autoridad de fabricantes, minoristas o editores.

Así es como prueba Notebookcheck

Cada año, Notebookcheck revisa de forma independiente cientos de portátiles y smartphones utilizando procedimientos estandarizados para asegurar que todos los resultados son comparables. Hemos desarrollado continuamente nuestros métodos de prueba durante unos 20 años y hemos establecido los estándares de la industria en el proceso. En nuestros laboratorios de pruebas, técnicos y editores experimentados utilizan equipos de medición de alta calidad. Estas pruebas implican un proceso de validación en varias fases. Nuestro complejo sistema de clasificación se basa en cientos de mediciones y puntos de referencia bien fundamentados, lo que mantiene la objetividad.

Price comparison

Please share our article, every link counts!
Mail Logo
> Análisis y pruebas de ordenadores portátiles y móviles teléfonos > Análisis > HP Victus 16 (2024) laptop review: RTX 4060 power paired with long runtimes
Sascha Mölck, 2024-05-17 (Update: 2024-05-17)