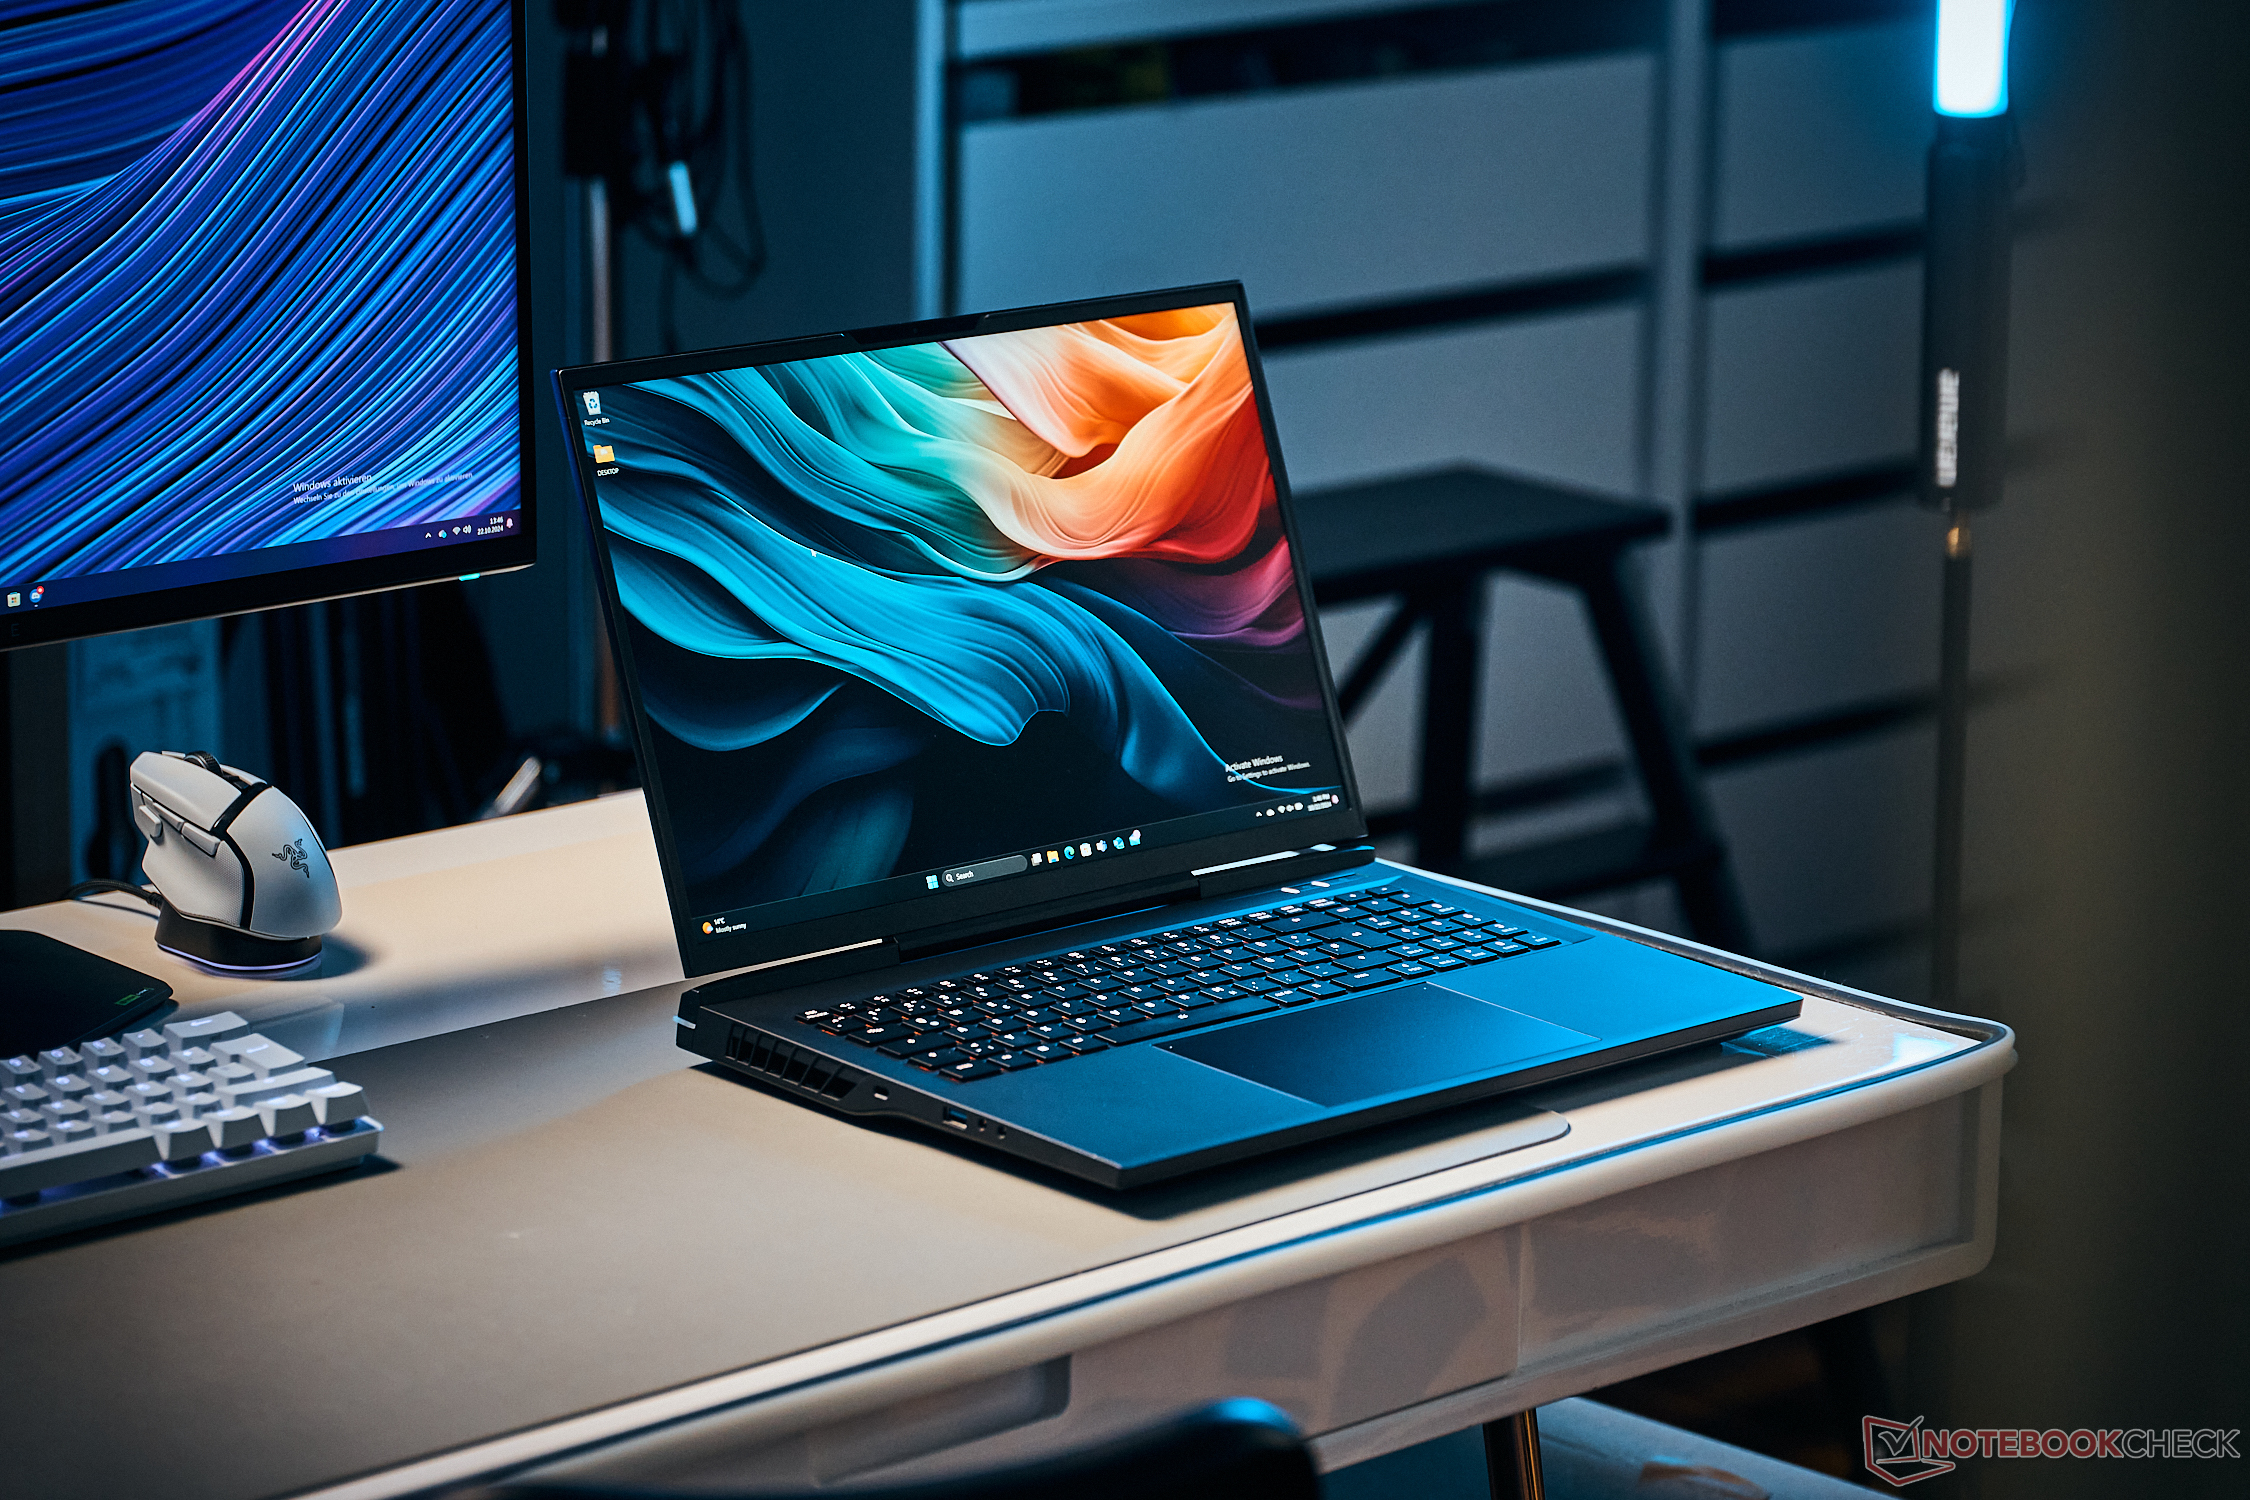
Análisis del XMG Neo 17 E24 - Rápido portátil para juegos con refrigeración por agua opcional
Portátil RTX 4080 y teclado mecánico.
Con el XMG Neo 17, obtendrá un gamer de pura raza que puede equiparse con los componentes más rápidos del mercado. También dispone opcionalmente de un teclado mecánico Cherry y un sistema externo de refrigeración por agua, que no sólo reduce las temperaturas sino también el ruido de fondo.Andreas Osthoff, 👁 Andreas Osthoff (traducido por DeepL / Ninh Duy) Publicado 🇺🇸 🇩🇪 ...
Veredicto - XMG Neo 17 se centra en el rendimiento para juegos
El XMG Neo 17 se presenta en la prueba como un potente portátil para juegos con un enfoque obvio en el máximo rendimiento de los componentes. El Intel Core i9-14900HX se utiliza como procesador en todas las configuraciones, mientras que las GPU Nvidia dedicadas pueden someterse a overclocking. El resultado es uno de los portátiles RTX 4080 más rápidos que hemos probado hasta la fecha. Esto proporciona un rendimiento suficiente para el rápido panel QHD de 240 Hz, que también es muy adecuado para los juegos. El circuito para la refrigeración por agua externa Oasis opcional se ha mejorado y ahora también cubre el procesador. El resultado son temperaturas significativamente más bajas y, por tanto, un menor nivel de ruido al jugar.
El gamer también da la talla en otras áreas: hay suficientes puertos disponibles, la carcasa es de buena calidad y el teclado mecánico Cherry opcional es muy bueno, aunque también muy ruidoso. La capacidad de RAM/SSD también se puede configurar y actualizarla más adelante no supone ningún problema. El portátil de 17 pulgadas es relativamente grande y no es ligero, con algo menos de 3 kg. La unidad de refrigeración hace un buen trabajo incluso sin la refrigeración por agua Oasis, pero los ventiladores se vuelven muy ruidosos al jugar y debería utilizar auriculares.
En cuanto al precio, más de 3.000 euros no es desde luego ninguna ganga, pero esto se debe principalmente a la GPU GeForce. Si busca un gamer de pura raza y además quiere aprovechar la refrigeración por agua, el XMG Neo 17 es sin duda una buena elección.
Pro
Contra
Precio y disponibilidad
El Schenker Neo 17 E24 puede configurarse y encargarse directamente a Bestware. El precio de partida es de 1.949 euros para la configuración con el portátil RTX 4060 y de 2.924 euros para el portátil RTX 4080.
Posibles contendientes en la comparación
Imagen | Modelo | Geizhals | Peso | Altura | Pantalla |
|---|---|---|---|---|---|
| SCHENKER XMG Neo 17 E24 Intel Core i9-14900HX ⎘ NVIDIA GeForce RTX 4080 Laptop GPU ⎘ 32 GB Memoría, 1024 GB SSD | Listenpreis 3189€ | 2.9 kg | 27 mm | 17.00" 2560x1600 178 PPI IPS | |
| Medion Erazer Beast X40 2024 Intel Core i9-14900HX ⎘ NVIDIA GeForce RTX 4090 Laptop GPU ⎘ 32 GB Memoría, 1024 GB SSD | Listenpreis 4000 Euro | 2.9 kg | 36 mm | 17.00" 2560x1600 178 PPI IPS | |
| HP Omen 17-db0079ng AMD Ryzen 7 8845HS ⎘ NVIDIA GeForce RTX 4070 Laptop GPU ⎘ 32 GB Memoría, 1024 GB SSD | Listenpreis 1900€ | 2.8 kg | 30.1 mm | 17.30" 2560x1440 170 PPI IPS | |
| Eurocom Raptor X17 Core i9-14900HX Intel Core i9-14900HX ⎘ NVIDIA GeForce RTX 4090 Laptop GPU ⎘ 32 GB Memoría, 2048 GB SSD | Listenpreis 4500 USD | 3.4 kg | 24.9 mm | 17.30" 3840x2160 255 PPI IPS | |
| MSI GE78HX 13VH-070US Intel Core i9-13950HX ⎘ NVIDIA GeForce RTX 4080 Laptop GPU ⎘ 32 GB Memoría, 2048 GB SSD | Listenpreis 3600 USD | 3 kg | 23 mm | 17.00" 2560x1600 178 PPI IPS |
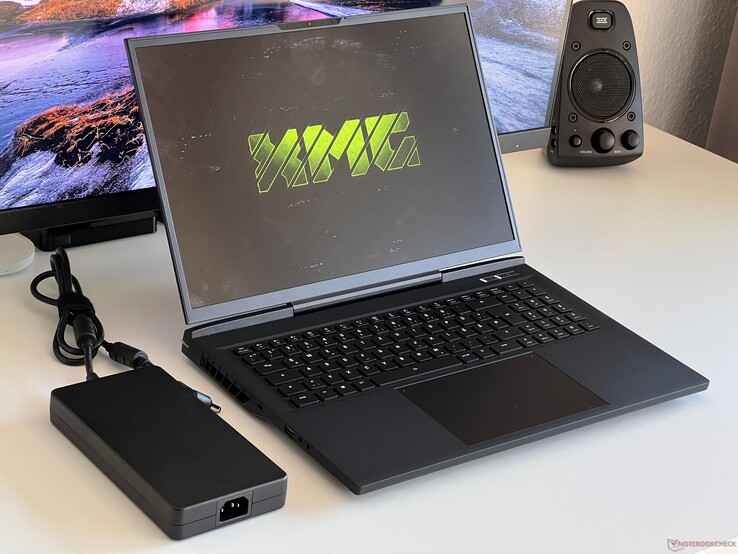
Con el XMG Neo 17 E24, Schenker ofrece un potente portátil para juegos de 17 pulgadas con un panel QHD de 240 Hz (G-Sync). El procesador es siempre el Core i9-14900HX de Intel y para la tarjeta gráfica, puede elegir entre la Portátil Nvidia GeForce RTX 4060 y todos los demás modelos hasta el GeForce Portátil RTX 4090. La memoria RAM/SSD se puede configurar ampliamente y, además de un teclado mecánico, también está disponible como opción el sistema de refrigeración por agua externo Oasis, que puede aumentar significativamente la capacidad de refrigeración del portátil.
Nuestro dispositivo de prueba está equipado con el procesador dedicado GeForce Portátil RTX 4080 GPU, 32 GB de RAM y una unidad SSD de 1 TB de Samsung, lo que eleva el precio incluyendo el teclado mecánico Cherry a 3.182 euros (precio base 1.948 euros). También echamos un vistazo a algunos puntos de referencia del Neo 17 con el portátil RTX 4090 en combinación con el sistema de refrigeración por agua Oasis (199 euros).
Top 10 Análisis
» Top 10 Portátiles Multimedia
» Top 10 Portátiles de Juego
» Top 10 Portátiles de Juego ligeros
» Top 10 Portátiles Asequibles de Oficina/Empresa
» Top 10 Portátiles de Juego Ligeros
» Top 10 Portátiles de Oficina/Empresa Premium
» Top 10 Estaciones de Trabajo
» Top 10 Subportátiles
» Top 10 Ultrabooks
» Top 10 Convertibles
» Top 10 Tablets
» Top 10 Tablets Windows
» Top 10 Tablets de menos de 250 Euros
» Top 10 Phablets (>5.5")
» Top 10 Smartphones
» Top 10 Smartphones (≤5")
» Top 10 Smartphones de menos de 300 Euros
» Top 10 Smartphones de menos de 120 Euros
» Top 10 Portátiles de menos de 1000 Euros
» Top 10 Portátiles de menos de 500 Euros
» Top 10 Portátiles de menos de 300 Euros
» Los Mejores Displays de Portátiles Analizados por Notebookcheck
Especificaciones
Maletín y equipamiento
Ya estamos familiarizados con el chasis de metal negro y la unidad base de goma del Medion Erazer Beastque se basa en el mismo barebone. Hay una tira de LED en la parte trasera y un logotipo XMG en la tapa, pero por lo demás, no hay molestas pegatinas del fabricante. La estabilidad general es muy buena, pero con un peso de algo menos de 2,9 kg y una altura de 2,7 cm, el Neo 17 tampoco es ligero. La cubierta inferior de la carcasa se puede retirar con relativa facilidad (también hay que aflojar los dos tornillos de la conexión de refrigeración por agua) y puede acceder a todos los componentes importantes, incluida la RAM, 2x SSD M.2-2280 o el módulo WLAN.
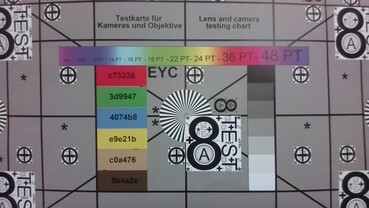
La gama de conexiones es muy amplia ya que, además de suficientes puertos USB, también están disponibles Thunderbolt 4 y HDMI. El lector de tarjetas alcanza velocidades de transferencia medias junto con nuestra tarjeta de referencia (Angelbird AV Pro V60) y la webcam 1080p toma imágenes suficientemente nítidas. El módulo Wi-Fi 6E de Intel (AX211) alcanza tasas de transferencia muy buenas en conjunción con nuestro router de referencia, pero el último estándar Wi-Fi 7 aún no es compatible.
| SD Card Reader | |
| average JPG Copy Test (av. of 3 runs) | |
| Media de la clase Gaming (19 - 197.3, n=68, últimos 2 años) | |
| SCHENKER XMG Neo 17 E24 (Angelbird AV Pro V60) | |
| Medion Erazer Beast X40 2024 (AV PRO microSD 128 GB V60) | |
| MSI GE78HX 13VH-070US (Angelibird AV Pro V60) | |
| maximum AS SSD Seq Read Test (1GB) | |
| Media de la clase Gaming (25.8 - 263, n=67, últimos 2 años) | |
| Medion Erazer Beast X40 2024 (AV PRO microSD 128 GB V60) | |
| MSI GE78HX 13VH-070US (Angelibird AV Pro V60) | |
| SCHENKER XMG Neo 17 E24 (Angelbird AV Pro V60) | |
| Networking | |
| SCHENKER XMG Neo 17 E24 | |
| iperf3 transmit AXE11000 | |
| iperf3 receive AXE11000 | |
| Medion Erazer Beast X40 2024 | |
| iperf3 transmit AXE11000 | |
| iperf3 receive AXE11000 | |
| HP Omen 17-db0079ng | |
| iperf3 transmit AXE11000 | |
| iperf3 receive AXE11000 | |
| Eurocom Raptor X17 Core i9-14900HX | |
| iperf3 transmit AXE11000 | |
| iperf3 receive AXE11000 | |
| iperf3 transmit AXE11000 6GHz | |
| iperf3 receive AXE11000 6GHz | |
| MSI GE78HX 13VH-070US | |
| iperf3 transmit AXE11000 | |
| iperf3 receive AXE11000 | |
| iperf3 transmit AXE11000 6GHz | |
| iperf3 receive AXE11000 6GHz | |

Dispositivos de entrada - Teclado mecánico Cherry
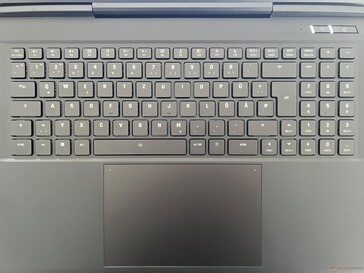
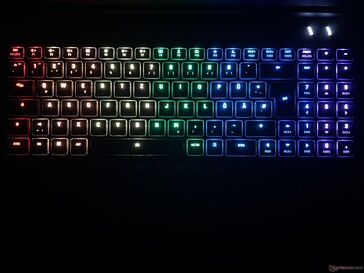
El Neo 17 está disponible con un teclado de membrana convencional con 4 zonas de iluminación o con un teclado mecánico con iluminación individual de las teclas (recargo de 95 euros). Éste también está instalado en nuestro aparato de pruebas, con interruptores táctiles de Cherry (MX ULP). Éstos hacen honor a su nombre y ofrecen una sensación de tecleo muy táctil y precisa, pero las teclas también son muy ruidosas. Definitivamente, esto debe tenerse en cuenta a la hora de hacer su elección. El gran ClickPad de cristal (15 x 9,5 cm) funciona sin problemas.
Pantalla - QHD con 240 Hz
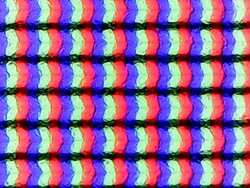
La pantalla IPS de 17 pulgadas con superficie mate ofrece una resolución de 2.560 x 1.600 píxeles (16:10) y es muy adecuada para juegos gracias a los rápidos tiempos de respuesta y a la frecuencia de 240 Hz. La calidad de imagen subjetiva también es muy buena. No se utiliza PWM y no hay grandes problemas de halos.
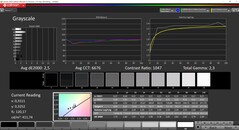
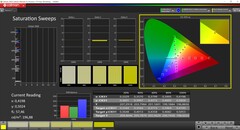
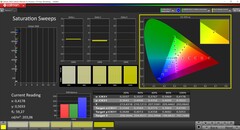
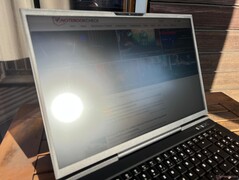
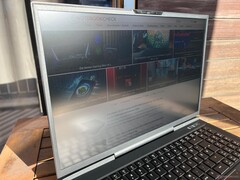
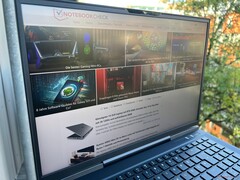
El brillo medio ronda los 400 cd/m², aunque el nivel de negro es ligeramente superior, de 0,39. Esto da como resultado una relación de contraste máxima de algo más de 1.000:1, lo que está bien. El panel debería ser aún más brillante en exteriores. El calibrado de fábrica ya es muy bueno, pero podemos optimizar aún más la pantalla con nuestro calibrado. El perfil correspondiente está disponible para su descarga gratuita en el recuadro de la derecha. Junto con la cobertura sRGB completa, el panel también es adecuado para editar imágenes/vídeos.
| |||||||||||||||||||||||||
iluminación: 88 %
Brillo con batería: 412 cd/m²
Contraste: 1056:1 (Negro: 0.39 cd/m²)
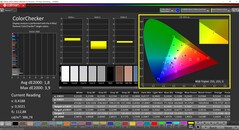
ΔE Color 1.8 | 0.5-29.43 Ø4.87, calibrated: 0.9
ΔE Greyscale 2.5 | 0.5-98 Ø5.1
69.6% AdobeRGB 1998 (Argyll 2.2.0 3D)
98.4% sRGB (Argyll 2.2.0 3D)
69% Display P3 (Argyll 2.2.0 3D)
Gamma: 2.3
| SCHENKER XMG Neo 17 E24 NE170QDM-NZ1, IPS, 2560x1600, 17", 240 Hz | Medion Erazer Beast X40 2024 BOE NE170QDM-NZ1, IPS, 2560x1600, 17", 240 Hz | HP Omen 17-db0079ng BOE0B67, IPS, 2560x1440, 17.3", 240 Hz | Eurocom Raptor X17 Core i9-14900HX BOE CQ NE173QUM-NY1, IPS, 3840x2160, 17.3", 144 Hz | MSI GE78HX 13VH-070US AU Optronics B170QAN01.2, IPS, 2560x1600, 17", 240 Hz | |
|---|---|---|---|---|---|
| Display | -0% | -3% | 20% | 22% | |
| Display P3 Coverage | 69 | 68.1 -1% | 66.2 -4% | 95.9 39% | 97.6 41% |
| sRGB Coverage | 98.4 | 99.5 1% | 95.5 -3% | 99.8 1% | 99.9 2% |
| AdobeRGB 1998 Coverage | 69.6 | 69 -1% | 68.1 -2% | 84.2 21% | 86.5 24% |
| Response Times | 4% | -17% | -40% | 38% | |
| Response Time Grey 50% / Grey 80% * | 12.1 ? | 11.7 ? 3% | 14.4 ? -19% | 14.8 ? -22% | 4.2 ? 65% |
| Response Time Black / White * | 7.2 ? | 6.9 ? 4% | 8.3 ? -15% | 11.4 ? -58% | 6.4 ? 11% |
| PWM Frequency | |||||
| Screen | 14% | -9% | -25% | -51% | |
| Brightness middle | 412 | 422 2% | 363 -12% | 544.6 32% | 398.6 -3% |
| Brightness | 401 | 388 -3% | 341 -15% | 507 26% | 384 -4% |
| Brightness Distribution | 88 | 87 -1% | 84 -5% | 77 -12% | 89 1% |
| Black Level * | 0.39 | 0.42 -8% | 0.38 3% | 0.48 -23% | 0.46 -18% |
| Contrast | 1056 | 1005 -5% | 955 -10% | 1135 7% | 867 -18% |
| Colorchecker dE 2000 * | 1.8 | 1.42 21% | 1.74 3% | 3.38 -88% | 4.05 -125% |
| Colorchecker dE 2000 max. * | 3.9 | 1.97 49% | 5.39 -38% | 7.13 -83% | 8.68 -123% |
| Colorchecker dE 2000 calibrated * | 0.9 | 0.7 22% | 1.43 -59% | 1.03 -14% | 1.02 -13% |
| Greyscale dE 2000 * | 2.5 | 1.2 52% | 1.3 48% | 4.3 -72% | 6.5 -160% |
| Gamma | 2.3 96% | 2.078 106% | 2.235 98% | 2.42 91% | 2.11 104% |
| CCT | 6676 97% | 6581 99% | 6346 102% | 7356 88% | 7518 86% |
| Media total (Programa/Opciones) | 6% /
10% | -10% /
-9% | -15% /
-18% | 3% /
-23% |
* ... más pequeño es mejor
Tiempos de respuesta del display
| ↔ Tiempo de respuesta de Negro a Blanco | ||
|---|---|---|
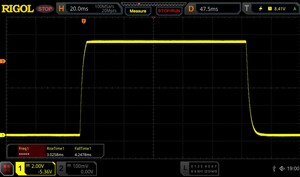
| 7.2 ms ... subida ↗ y bajada ↘ combinada | ↗ 3 ms subida | |
| ↘ 4.2 ms bajada | ||
| La pantalla mostró tiempos de respuesta muy rápidos en nuestros tests y debería ser adecuada para juegos frenéticos. En comparación, todos los dispositivos de prueba van de ##min### (mínimo) a 240 (máximo) ms. » 18 % de todos los dispositivos son mejores. Esto quiere decir que el tiempo de respuesta medido es mejor que la media (20.8 ms) de todos los dispositivos testados. | ||
| ↔ Tiempo de respuesta 50% Gris a 80% Gris | ||
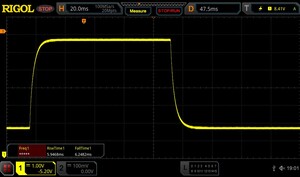
| 12.1 ms ... subida ↗ y bajada ↘ combinada | ↗ 5.9 ms subida | |
| ↘ 6.2 ms bajada | ||
| La pantalla mostró buenos tiempos de respuesta en nuestros tests pero podría ser demasiado lenta para los jugones competitivos. En comparación, todos los dispositivos de prueba van de ##min### (mínimo) a 636 (máximo) ms. » 23 % de todos los dispositivos son mejores. Esto quiere decir que el tiempo de respuesta medido es mejor que la media (32.5 ms) de todos los dispositivos testados. | ||
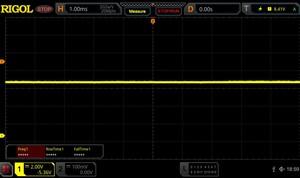
Parpadeo de Pantalla / PWM (Pulse-Width Modulation)
| Parpadeo de Pantalla / PWM no detectado | |||
Comparación: 53 % de todos los dispositivos testados no usaron PWM para atenuar el display. Si se usó, medimos una media de 8516 (mínimo: 5 - máxmo: 343500) Hz. | |||
Rendimiento - Raptor Lake-HX
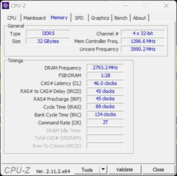
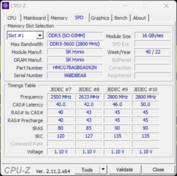
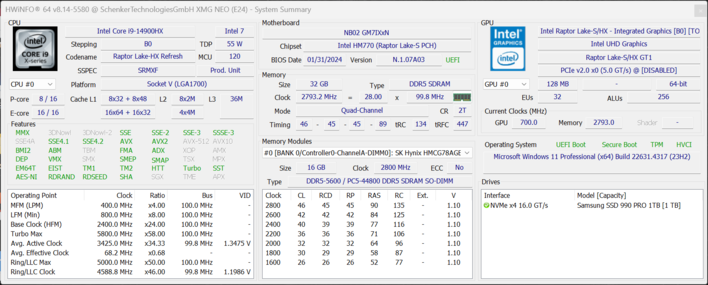
El Neo 17 está equipado exclusivamente con el Intel Core i9-14900HX. se instalan 16 GB de RAM de serie, pero es posible instalar hasta 96 GB gracias a dos ranuras SO-DIMM (recargo de 260 euros).
Condiciones de la prueba
El XMG Neo 17 ofrece varios perfiles de energía, que hemos resumido en la siguiente tabla. Hemos utilizado el modo Overboost para nuestras pruebas y mediciones, ya que la diferencia de ruido en comparación con el modo Enthusiast es pequeña. El fabricante también proporciona una Deep Dive para obtener más información técnica sobre el Neo 17 y los perfiles de energía.
| Perfil energético | TDP de la CPU | CB R23 Multi | TDP de la GPU | Time Spy Gráficos | CP 2077 Ultra QHD | Volumen máx. del ventilador |
|---|---|---|---|---|---|---|
| Equilibrada | 45 W | 14.899 puntos | 130 W | 10.778 puntos | 73,9 FPS | 43,1 dB(A) |
| Enthusiast | 75 W | 22.027 puntos | 150 W | 18.021 puntos | 78,6 FPS | 49,9 dB(A) |
| Overboost | 160/140 W | 31.740 puntos | 175 W | 19.155 puntos | 80,7 FPS | 51,9 dB(A) |
Procesador - Core i9-14900HX
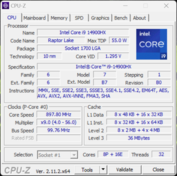
El Intel Core i9-14900HX sigue siendo uno de los procesadores móviles más rápidos y es poco probable que esto cambie mucho con los próximos chips Arrow Lake. La entrega de potencia del procesador es excelente, ya que puede consumir 160 vatios durante periodos cortos y 140 vatios de forma continua. Para el usuario, esto significa un rendimiento muy alto y constante. Sin embargo, hay que esperar pérdidas significativas en modo batería, ya que la CPU puede consumir un máximo de 35 vatios, lo que corresponde a una reducción del rendimiento del 65% en las pruebas multinúcleo. Encontrará más pruebas de rendimiento de la CPU en nuestra sección de tecnología.
Cinebench R15 Multi loop
Cinebench R23: Multi Core | Single Core
Cinebench R20: CPU (Multi Core) | CPU (Single Core)
Cinebench R15: CPU Multi 64Bit | CPU Single 64Bit
Blender: v2.79 BMW27 CPU
7-Zip 18.03: 7z b 4 | 7z b 4 -mmt1
Geekbench 6.4: Multi-Core | Single-Core
Geekbench 5.5: Multi-Core | Single-Core
HWBOT x265 Benchmark v2.2: 4k Preset
LibreOffice : 20 Documents To PDF
R Benchmark 2.5: Overall mean
| CPU Performance Rating | |
| SCHENKER XMG Neo 17 E24 | |
| MSI GE78HX 13VH-070US -2! | |
| Medio Intel Core i9-14900HX | |
| Eurocom Raptor X17 Core i9-14900HX | |
| Medion Erazer Beast X40 2024 | |
| Media de la clase Gaming | |
| HP Omen 17-db0079ng | |
| Cinebench R23 / Multi Core | |
| MSI GE78HX 13VH-070US | |
| SCHENKER XMG Neo 17 E24 | |
| Eurocom Raptor X17 Core i9-14900HX | |
| Medio Intel Core i9-14900HX (17078 - 36249, n=37) | |
| Medion Erazer Beast X40 2024 | |
| Media de la clase Gaming (5668 - 39652, n=151, últimos 2 años) | |
| HP Omen 17-db0079ng | |
| Cinebench R23 / Single Core | |
| SCHENKER XMG Neo 17 E24 | |
| Medion Erazer Beast X40 2024 | |
| Medio Intel Core i9-14900HX (1720 - 2245, n=37) | |
| MSI GE78HX 13VH-070US | |
| Eurocom Raptor X17 Core i9-14900HX | |
| Media de la clase Gaming (1136 - 2252, n=151, últimos 2 años) | |
| HP Omen 17-db0079ng | |
| Cinebench R20 / CPU (Multi Core) | |
| MSI GE78HX 13VH-070US | |
| SCHENKER XMG Neo 17 E24 | |
| Eurocom Raptor X17 Core i9-14900HX | |
| Medio Intel Core i9-14900HX (6579 - 13832, n=37) | |
| Medion Erazer Beast X40 2024 | |
| Media de la clase Gaming (2179 - 15517, n=151, últimos 2 años) | |
| HP Omen 17-db0079ng | |
| Cinebench R20 / CPU (Single Core) | |
| SCHENKER XMG Neo 17 E24 | |
| Medion Erazer Beast X40 2024 | |
| Medio Intel Core i9-14900HX (657 - 859, n=37) | |
| Eurocom Raptor X17 Core i9-14900HX | |
| MSI GE78HX 13VH-070US | |
| Media de la clase Gaming (439 - 866, n=151, últimos 2 años) | |
| HP Omen 17-db0079ng | |
| Cinebench R15 / CPU Multi 64Bit | |
| MSI GE78HX 13VH-070US | |
| SCHENKER XMG Neo 17 E24 | |
| Eurocom Raptor X17 Core i9-14900HX | |
| Medio Intel Core i9-14900HX (3263 - 5589, n=38) | |
| Media de la clase Gaming (905 - 6074, n=154, últimos 2 años) | |
| Medion Erazer Beast X40 2024 | |
| HP Omen 17-db0079ng | |
| Cinebench R15 / CPU Single 64Bit | |
| SCHENKER XMG Neo 17 E24 | |
| Medion Erazer Beast X40 2024 | |
| Medio Intel Core i9-14900HX (247 - 323, n=37) | |
| MSI GE78HX 13VH-070US | |
| Eurocom Raptor X17 Core i9-14900HX | |
| Media de la clase Gaming (191.9 - 343, n=151, últimos 2 años) | |
| HP Omen 17-db0079ng | |
| Blender / v2.79 BMW27 CPU | |
| HP Omen 17-db0079ng | |
| Media de la clase Gaming (81 - 555, n=144, últimos 2 años) | |
| Medion Erazer Beast X40 2024 | |
| Medio Intel Core i9-14900HX (91 - 206, n=37) | |
| Eurocom Raptor X17 Core i9-14900HX | |
| SCHENKER XMG Neo 17 E24 | |
| MSI GE78HX 13VH-070US | |
| 7-Zip 18.03 / 7z b 4 | |
| MSI GE78HX 13VH-070US | |
| SCHENKER XMG Neo 17 E24 | |
| Eurocom Raptor X17 Core i9-14900HX | |
| Medio Intel Core i9-14900HX (66769 - 136645, n=37) | |
| Medion Erazer Beast X40 2024 | |
| Media de la clase Gaming (23795 - 144064, n=149, últimos 2 años) | |
| HP Omen 17-db0079ng | |
| 7-Zip 18.03 / 7z b 4 -mmt1 | |
| Medion Erazer Beast X40 2024 | |
| SCHENKER XMG Neo 17 E24 | |
| MSI GE78HX 13VH-070US | |
| Medio Intel Core i9-14900HX (5452 - 7545, n=37) | |
| Eurocom Raptor X17 Core i9-14900HX | |
| Media de la clase Gaming (4199 - 7573, n=149, últimos 2 años) | |
| HP Omen 17-db0079ng | |
| Geekbench 6.4 / Multi-Core | |
| SCHENKER XMG Neo 17 E24 | |
| Eurocom Raptor X17 Core i9-14900HX | |
| Medio Intel Core i9-14900HX (13158 - 19665, n=37) | |
| Medion Erazer Beast X40 2024 | |
| Media de la clase Gaming (5340 - 21668, n=119, últimos 2 años) | |
| HP Omen 17-db0079ng | |
| Geekbench 6.4 / Single-Core | |
| Medion Erazer Beast X40 2024 | |
| SCHENKER XMG Neo 17 E24 | |
| Medio Intel Core i9-14900HX (2419 - 3129, n=37) | |
| Eurocom Raptor X17 Core i9-14900HX | |
| Media de la clase Gaming (1490 - 3219, n=119, últimos 2 años) | |
| HP Omen 17-db0079ng | |
| Geekbench 5.5 / Multi-Core | |
| MSI GE78HX 13VH-070US | |
| SCHENKER XMG Neo 17 E24 | |
| Medio Intel Core i9-14900HX (8618 - 23194, n=37) | |
| Medion Erazer Beast X40 2024 | |
| Media de la clase Gaming (4557 - 25855, n=148, últimos 2 años) | |
| HP Omen 17-db0079ng | |
| Eurocom Raptor X17 Core i9-14900HX | |
| Geekbench 5.5 / Single-Core | |
| Medion Erazer Beast X40 2024 | |
| SCHENKER XMG Neo 17 E24 | |
| MSI GE78HX 13VH-070US | |
| Medio Intel Core i9-14900HX (1669 - 2210, n=37) | |
| Media de la clase Gaming (986 - 2423, n=148, últimos 2 años) | |
| HP Omen 17-db0079ng | |
| Eurocom Raptor X17 Core i9-14900HX | |
| HWBOT x265 Benchmark v2.2 / 4k Preset | |
| MSI GE78HX 13VH-070US | |
| Eurocom Raptor X17 Core i9-14900HX | |
| SCHENKER XMG Neo 17 E24 | |
| Medio Intel Core i9-14900HX (16.8 - 38.9, n=37) | |
| Medion Erazer Beast X40 2024 | |
| Media de la clase Gaming (6.72 - 42.9, n=148, últimos 2 años) | |
| HP Omen 17-db0079ng | |
| LibreOffice / 20 Documents To PDF | |
| HP Omen 17-db0079ng | |
| Media de la clase Gaming (19 - 96.6, n=147, últimos 2 años) | |
| MSI GE78HX 13VH-070US | |
| Medion Erazer Beast X40 2024 | |
| Medio Intel Core i9-14900HX (19 - 85.1, n=37) | |
| SCHENKER XMG Neo 17 E24 | |
| Eurocom Raptor X17 Core i9-14900HX | |
| R Benchmark 2.5 / Overall mean | |
| HP Omen 17-db0079ng | |
| Media de la clase Gaming (0.3609 - 0.759, n=150, últimos 2 años) | |
| Medio Intel Core i9-14900HX (0.3604 - 0.4859, n=37) | |
| Eurocom Raptor X17 Core i9-14900HX | |
| MSI GE78HX 13VH-070US | |
| SCHENKER XMG Neo 17 E24 | |
| Medion Erazer Beast X40 2024 | |
* ... más pequeño es mejor
AIDA64: FP32 Ray-Trace | FPU Julia | CPU SHA3 | CPU Queen | FPU SinJulia | FPU Mandel | CPU AES | CPU ZLib | FP64 Ray-Trace | CPU PhotoWorxx
| Performance Rating | |
| Eurocom Raptor X17 Core i9-14900HX | |
| SCHENKER XMG Neo 17 E24 | |
| MSI GE78HX 13VH-070US | |
| Medio Intel Core i9-14900HX | |
| HP Omen 17-db0079ng | |
| Medion Erazer Beast X40 2024 | |
| Media de la clase Gaming | |
| AIDA64 / FP32 Ray-Trace | |
| SCHENKER XMG Neo 17 E24 | |
| MSI GE78HX 13VH-070US | |
| Eurocom Raptor X17 Core i9-14900HX | |
| HP Omen 17-db0079ng | |
| Medio Intel Core i9-14900HX (13098 - 33474, n=36) | |
| Media de la clase Gaming (4986 - 81639, n=147, últimos 2 años) | |
| Medion Erazer Beast X40 2024 | |
| AIDA64 / FPU Julia | |
| SCHENKER XMG Neo 17 E24 | |
| MSI GE78HX 13VH-070US | |
| Eurocom Raptor X17 Core i9-14900HX | |
| Medio Intel Core i9-14900HX (67573 - 166040, n=36) | |
| HP Omen 17-db0079ng | |
| Media de la clase Gaming (25360 - 252486, n=147, últimos 2 años) | |
| Medion Erazer Beast X40 2024 | |
| AIDA64 / CPU SHA3 | |
| Eurocom Raptor X17 Core i9-14900HX | |
| SCHENKER XMG Neo 17 E24 | |
| MSI GE78HX 13VH-070US | |
| Medio Intel Core i9-14900HX (3589 - 7979, n=36) | |
| Medion Erazer Beast X40 2024 | |
| Media de la clase Gaming (1339 - 10389, n=147, últimos 2 años) | |
| HP Omen 17-db0079ng | |
| AIDA64 / CPU Queen | |
| Eurocom Raptor X17 Core i9-14900HX | |
| SCHENKER XMG Neo 17 E24 | |
| MSI GE78HX 13VH-070US | |
| Medio Intel Core i9-14900HX (118405 - 148966, n=36) | |
| Medion Erazer Beast X40 2024 | |
| HP Omen 17-db0079ng | |
| Media de la clase Gaming (50699 - 200651, n=147, últimos 2 años) | |
| AIDA64 / FPU SinJulia | |
| MSI GE78HX 13VH-070US | |
| SCHENKER XMG Neo 17 E24 | |
| Eurocom Raptor X17 Core i9-14900HX | |
| Medio Intel Core i9-14900HX (10475 - 18517, n=36) | |
| HP Omen 17-db0079ng | |
| Medion Erazer Beast X40 2024 | |
| Media de la clase Gaming (4800 - 32988, n=147, últimos 2 años) | |
| AIDA64 / FPU Mandel | |
| SCHENKER XMG Neo 17 E24 | |
| MSI GE78HX 13VH-070US | |
| Eurocom Raptor X17 Core i9-14900HX | |
| Medio Intel Core i9-14900HX (32543 - 83662, n=36) | |
| HP Omen 17-db0079ng | |
| Media de la clase Gaming (12321 - 134044, n=147, últimos 2 años) | |
| Medion Erazer Beast X40 2024 | |
| AIDA64 / CPU AES | |
| Eurocom Raptor X17 Core i9-14900HX | |
| Medio Intel Core i9-14900HX (86964 - 241777, n=36) | |
| SCHENKER XMG Neo 17 E24 | |
| MSI GE78HX 13VH-070US | |
| Media de la clase Gaming (19065 - 328679, n=147, últimos 2 años) | |
| Medion Erazer Beast X40 2024 | |
| HP Omen 17-db0079ng | |
| AIDA64 / CPU ZLib | |
| MSI GE78HX 13VH-070US | |
| Eurocom Raptor X17 Core i9-14900HX | |
| SCHENKER XMG Neo 17 E24 | |
| Medio Intel Core i9-14900HX (1054 - 2292, n=36) | |
| Medion Erazer Beast X40 2024 | |
| Media de la clase Gaming (373 - 2531, n=147, últimos 2 años) | |
| HP Omen 17-db0079ng | |
| AIDA64 / FP64 Ray-Trace | |
| MSI GE78HX 13VH-070US | |
| SCHENKER XMG Neo 17 E24 | |
| Eurocom Raptor X17 Core i9-14900HX | |
| HP Omen 17-db0079ng | |
| Medio Intel Core i9-14900HX (6809 - 18349, n=36) | |
| Media de la clase Gaming (2540 - 43430, n=147, últimos 2 años) | |
| Medion Erazer Beast X40 2024 | |
| AIDA64 / CPU PhotoWorxx | |
| Eurocom Raptor X17 Core i9-14900HX | |
| MSI GE78HX 13VH-070US | |
| SCHENKER XMG Neo 17 E24 | |
| Medion Erazer Beast X40 2024 | |
| Medio Intel Core i9-14900HX (23903 - 54702, n=36) | |
| HP Omen 17-db0079ng | |
| Media de la clase Gaming (10805 - 60161, n=147, últimos 2 años) | |
Rendimiento del sistema
El Neo 17 también impresiona en los puntos de referencia sintéticos del sistema, aunque la competencia suele estar muy reñida aquí. En el uso diario, esto se traduce en un sistema extremadamente sensible, aunque se produce un breve cuelgue al cambiar la tarjeta gráfica. Sin embargo, esto es completamente normal y puede evitarse desactivando por completo la iGPU.
CrossMark: Overall | Productivity | Creativity | Responsiveness
WebXPRT 3: Overall
WebXPRT 4: Overall
Mozilla Kraken 1.1: Total
| PCMark 10 / Score | |
| Medion Erazer Beast X40 2024 | |
| MSI GE78HX 13VH-070US | |
| Medio Intel Core i9-14900HX, NVIDIA GeForce RTX 4080 Laptop GPU (7703 - 9223, n=7) | |
| SCHENKER XMG Neo 17 E24 | |
| Media de la clase Gaming (5776 - 9852, n=133, últimos 2 años) | |
| HP Omen 17-db0079ng | |
| PCMark 10 / Essentials | |
| Medio Intel Core i9-14900HX, NVIDIA GeForce RTX 4080 Laptop GPU (11255 - 12600, n=7) | |
| MSI GE78HX 13VH-070US | |
| SCHENKER XMG Neo 17 E24 | |
| Medion Erazer Beast X40 2024 | |
| Media de la clase Gaming (9057 - 12600, n=133, últimos 2 años) | |
| HP Omen 17-db0079ng | |
| PCMark 10 / Productivity | |
| Medion Erazer Beast X40 2024 | |
| SCHENKER XMG Neo 17 E24 | |
| MSI GE78HX 13VH-070US | |
| Medio Intel Core i9-14900HX, NVIDIA GeForce RTX 4080 Laptop GPU (6662 - 11410, n=7) | |
| HP Omen 17-db0079ng | |
| Media de la clase Gaming (6662 - 14612, n=133, últimos 2 años) | |
| PCMark 10 / Digital Content Creation | |
| Medion Erazer Beast X40 2024 | |
| MSI GE78HX 13VH-070US | |
| Medio Intel Core i9-14900HX, NVIDIA GeForce RTX 4080 Laptop GPU (14211 - 16246, n=7) | |
| SCHENKER XMG Neo 17 E24 | |
| Media de la clase Gaming (6807 - 18475, n=133, últimos 2 años) | |
| HP Omen 17-db0079ng | |
| CrossMark / Overall | |
| Eurocom Raptor X17 Core i9-14900HX | |
| Medio Intel Core i9-14900HX, NVIDIA GeForce RTX 4080 Laptop GPU (1992 - 2334, n=7) | |
| Medion Erazer Beast X40 2024 | |
| SCHENKER XMG Neo 17 E24 | |
| MSI GE78HX 13VH-070US | |
| Media de la clase Gaming (1247 - 2344, n=114, últimos 2 años) | |
| HP Omen 17-db0079ng | |
| CrossMark / Productivity | |
| Eurocom Raptor X17 Core i9-14900HX | |
| Medion Erazer Beast X40 2024 | |
| Medio Intel Core i9-14900HX, NVIDIA GeForce RTX 4080 Laptop GPU (1812 - 2204, n=7) | |
| MSI GE78HX 13VH-070US | |
| SCHENKER XMG Neo 17 E24 | |
| Media de la clase Gaming (1299 - 2204, n=114, últimos 2 años) | |
| HP Omen 17-db0079ng | |
| CrossMark / Creativity | |
| Medio Intel Core i9-14900HX, NVIDIA GeForce RTX 4080 Laptop GPU (2327 - 2500, n=7) | |
| SCHENKER XMG Neo 17 E24 | |
| Eurocom Raptor X17 Core i9-14900HX | |
| Medion Erazer Beast X40 2024 | |
| Media de la clase Gaming (1275 - 2660, n=114, últimos 2 años) | |
| MSI GE78HX 13VH-070US | |
| HP Omen 17-db0079ng | |
| CrossMark / Responsiveness | |
| Eurocom Raptor X17 Core i9-14900HX | |
| Medio Intel Core i9-14900HX, NVIDIA GeForce RTX 4080 Laptop GPU (1520 - 2254, n=7) | |
| Medion Erazer Beast X40 2024 | |
| Media de la clase Gaming (1030 - 2330, n=114, últimos 2 años) | |
| MSI GE78HX 13VH-070US | |
| SCHENKER XMG Neo 17 E24 | |
| HP Omen 17-db0079ng | |
| WebXPRT 3 / Overall | |
| Eurocom Raptor X17 Core i9-14900HX | |
| SCHENKER XMG Neo 17 E24 | |
| Medio Intel Core i9-14900HX, NVIDIA GeForce RTX 4080 Laptop GPU (310 - 345, n=7) | |
| Medion Erazer Beast X40 2024 | |
| MSI GE78HX 13VH-070US | |
| Media de la clase Gaming (215 - 480, n=127, últimos 2 años) | |
| HP Omen 17-db0079ng | |
| WebXPRT 4 / Overall | |
| SCHENKER XMG Neo 17 E24 | |
| Medio Intel Core i9-14900HX, NVIDIA GeForce RTX 4080 Laptop GPU (300 - 321, n=7) | |
| Eurocom Raptor X17 Core i9-14900HX | |
| Medion Erazer Beast X40 2024 | |
| MSI GE78HX 13VH-070US | |
| Media de la clase Gaming (176.4 - 335, n=115, últimos 2 años) | |
| Mozilla Kraken 1.1 / Total | |
| HP Omen 17-db0079ng | |
| Media de la clase Gaming (409 - 674, n=139, últimos 2 años) | |
| MSI GE78HX 13VH-070US | |
| Eurocom Raptor X17 Core i9-14900HX | |
| Medio Intel Core i9-14900HX, NVIDIA GeForce RTX 4080 Laptop GPU (437 - 446, n=7) | |
| SCHENKER XMG Neo 17 E24 | |
| Medion Erazer Beast X40 2024 | |
* ... más pequeño es mejor
| PCMark 10 Score | 8694 puntos | |
ayuda | ||
| AIDA64 / Memory Copy | |
| Medion Erazer Beast X40 2024 | |
| SCHENKER XMG Neo 17 E24 | |
| MSI GE78HX 13VH-070US | |
| Eurocom Raptor X17 Core i9-14900HX | |
| Medio Intel Core i9-14900HX (38028 - 83392, n=36) | |
| HP Omen 17-db0079ng | |
| Media de la clase Gaming (21750 - 97515, n=147, últimos 2 años) | |
| AIDA64 / Memory Read | |
| SCHENKER XMG Neo 17 E24 | |
| MSI GE78HX 13VH-070US | |
| Medion Erazer Beast X40 2024 | |
| Medio Intel Core i9-14900HX (43306 - 87568, n=36) | |
| Eurocom Raptor X17 Core i9-14900HX | |
| Media de la clase Gaming (22956 - 102937, n=147, últimos 2 años) | |
| HP Omen 17-db0079ng | |
| AIDA64 / Memory Write | |
| HP Omen 17-db0079ng | |
| Medion Erazer Beast X40 2024 | |
| SCHENKER XMG Neo 17 E24 | |
| MSI GE78HX 13VH-070US | |
| Eurocom Raptor X17 Core i9-14900HX | |
| Medio Intel Core i9-14900HX (37146 - 80589, n=36) | |
| Media de la clase Gaming (22297 - 108954, n=147, últimos 2 años) | |
| AIDA64 / Memory Latency | |
| HP Omen 17-db0079ng | |
| Media de la clase Gaming (59.5 - 259, n=147, últimos 2 años) | |
| Eurocom Raptor X17 Core i9-14900HX | |
| Medio Intel Core i9-14900HX (76.1 - 105, n=36) | |
| MSI GE78HX 13VH-070US | |
| SCHENKER XMG Neo 17 E24 | |
| Medion Erazer Beast X40 2024 | |
* ... más pequeño es mejor
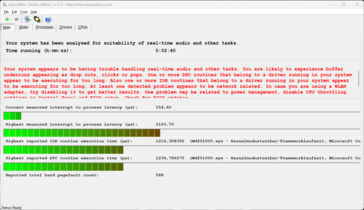
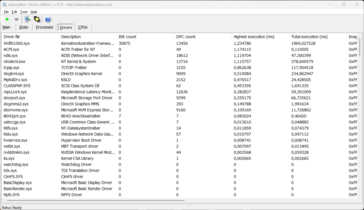
Latencias del CPD
| DPC Latencies / LatencyMon - interrupt to process latency (max), Web, Youtube, Prime95 | |
| MSI GE78HX 13VH-070US | |
| SCHENKER XMG Neo 17 E24 | |
| HP Omen 17-db0079ng | |
| Medion Erazer Beast X40 2024 | |
| Eurocom Raptor X17 Core i9-14900HX | |
* ... más pequeño es mejor
Almacenamiento masivo
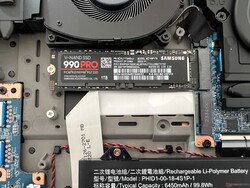
El Neo 17 ofrece dos ranuras rápidas M.2-2280 que están conectadas a través de PCIe 4.0 x4. En el dispositivo de prueba está instalada la versión de 1 TB de la Samsung 990 Pro, que alcanza rápidas tasas de transferencia y es una de las unidades SSD más rápidas del mercado. Además, el rendimiento se mantiene completamente estable incluso bajo carga constante. Tras el arranque inicial, el usuario dispone de 864 GB. Encontrará más pruebas comparativas de SSD aquí.
* ... más pequeño es mejor
Continuous read: DiskSpd Read Loop, Queue Depth 8
Tarjeta gráfica
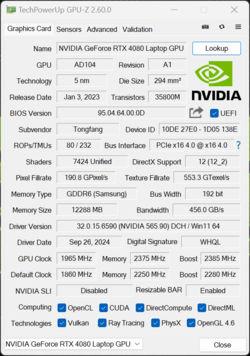
En nuestro dispositivo de prueba, el dedicado Portátil Nvidia GeForce RTX 4080 con 12 GB de VRAM. La tarjeta gráfica puede consumir un máximo de 175 vatios (150 vatios TGP + 25 vatios Dynamic Boost), por lo que el Neo 17 puede aprovechar al máximo la GPU. Gracias a la conmutación gráfica Advanced Optimus, el rendimiento en los juegos es extraordinario y la RTX 4080 del portátil es completamente suficiente para la resolución QHD nativa. Además, el rendimiento se mantiene completamente estable incluso bajo carga constante.
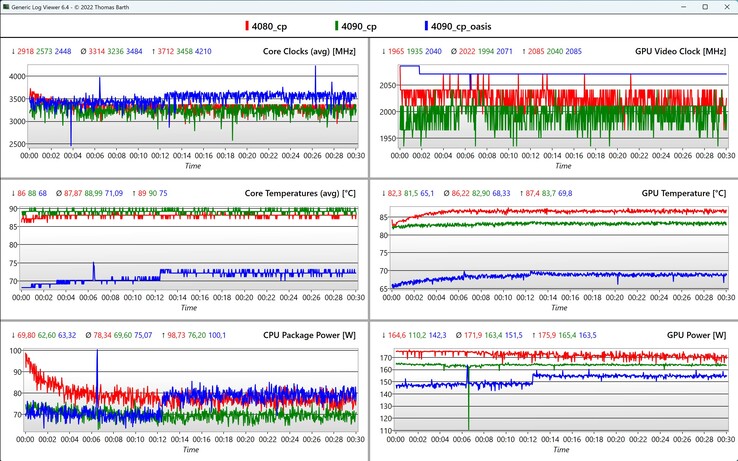
Al comparar los datos de la CPU/GPU en nuestro bucle Cyberpunk 2077, la ventaja de la refrigeración externa por agua se hace muy evidente, ya que las temperaturas de la CPU/GPU son unos 20 °C más bajas, por lo que los ventiladores también tienen que trabajar menos.
En modo batería, el consumo de energía de la GPU se limita a 52 vatios, razón por la cual el rendimiento de la GPU es alrededor de un 53% inferior. Encontrará más pruebas comparativas de la GPU aquí.
| 3DMark Performance Rating - Percent | |
| Eurocom Raptor X17 Core i9-14900HX | |
| SCHENKER Neo 17 2024 Engineering Sample -1! | |
| Medion Erazer Beast X40 2024 | |
| SCHENKER XMG Neo 17 E24 | |
| MSI GE78HX 13VH-070US | |
| Medio NVIDIA GeForce RTX 4080 Laptop GPU | |
| HP Omen 17-db0079ng | |
| Media de la clase Gaming | |
| 3DMark 11 - 1280x720 Performance GPU | |
| SCHENKER Neo 17 2024 Engineering Sample | |
| Medion Erazer Beast X40 2024 | |
| Eurocom Raptor X17 Core i9-14900HX | |
| SCHENKER XMG Neo 17 E24 | |
| MSI GE78HX 13VH-070US | |
| Medio NVIDIA GeForce RTX 4080 Laptop GPU (45199 - 63128, n=24) | |
| HP Omen 17-db0079ng | |
| Media de la clase Gaming (10741 - 72178, n=143, últimos 2 años) | |
| 3DMark 11 Performance | 45722 puntos | |
| 3DMark Fire Strike Score | 34851 puntos | |
| 3DMark Time Spy Score | 18980 puntos | |
ayuda | ||
| Blender / v3.3 Classroom OPTIX/RTX | |
| HP Omen 17-db0079ng | |
| Media de la clase Gaming (10 - 95, n=143, últimos 2 años) | |
| Medio NVIDIA GeForce RTX 4080 Laptop GPU (13 - 20, n=22) | |
| MSI GE78HX 13VH-070US | |
| SCHENKER XMG Neo 17 E24 | |
| Eurocom Raptor X17 Core i9-14900HX | |
| Medion Erazer Beast X40 2024 | |
| Blender / v3.3 Classroom CUDA | |
| Media de la clase Gaming (16 - 175, n=145, últimos 2 años) | |
| HP Omen 17-db0079ng | |
| Medio NVIDIA GeForce RTX 4080 Laptop GPU (21 - 28, n=23) | |
| MSI GE78HX 13VH-070US | |
| SCHENKER XMG Neo 17 E24 | |
| Eurocom Raptor X17 Core i9-14900HX | |
| Medion Erazer Beast X40 2024 | |
| Blender / v3.3 Classroom CPU | |
| HP Omen 17-db0079ng | |
| Media de la clase Gaming (123 - 962, n=150, últimos 2 años) | |
| Medion Erazer Beast X40 2024 | |
| Medio NVIDIA GeForce RTX 4080 Laptop GPU (177 - 337, n=23) | |
| Eurocom Raptor X17 Core i9-14900HX | |
| SCHENKER XMG Neo 17 E24 | |
| MSI GE78HX 13VH-070US | |
* ... más pequeño es mejor
| Performance Rating - Percent | |
| Eurocom Raptor X17 Core i9-14900HX -1! | |
| SCHENKER Neo 17 2024 Engineering Sample -2! | |
| Medion Erazer Beast X40 2024 -1! | |
| SCHENKER XMG Neo 17 E24 | |
| MSI GE78HX 13VH-070US -2! | |
| Media de la clase Gaming | |
| HP Omen 17-db0079ng -1! | |
| Cyberpunk 2077 2.2 Phantom Liberty - 1920x1080 Ultra Preset (FSR off) | |
| Eurocom Raptor X17 Core i9-14900HX | |
| SCHENKER XMG Neo 17 E24 | |
| Medion Erazer Beast X40 2024 | |
| HP Omen 17-db0079ng | |
| Media de la clase Gaming (6.76 - 158, n=90, últimos 2 años) | |
| Baldur's Gate 3 - 1920x1080 Ultra Preset | |
| Eurocom Raptor X17 Core i9-14900HX | |
| Media de la clase Gaming (34.5 - 208, n=57, últimos 2 años) | |
| SCHENKER XMG Neo 17 E24 | |
| GTA V - 1920x1080 Highest Settings possible AA:4xMSAA + FX AF:16x | |
| Eurocom Raptor X17 Core i9-14900HX | |
| SCHENKER XMG Neo 17 E24 | |
| SCHENKER Neo 17 2024 Engineering Sample | |
| Medion Erazer Beast X40 2024 | |
| Media de la clase Gaming (12.1 - 168.2, n=132, últimos 2 años) | |
| HP Omen 17-db0079ng | |
| MSI GE78HX 13VH-070US | |
| Final Fantasy XV Benchmark - 1920x1080 High Quality | |
| SCHENKER Neo 17 2024 Engineering Sample | |
| Medion Erazer Beast X40 2024 | |
| SCHENKER XMG Neo 17 E24 | |
| MSI GE78HX 13VH-070US | |
| HP Omen 17-db0079ng | |
| Media de la clase Gaming (19.2 - 201, n=144, últimos 2 años) | |
| Strange Brigade - 1920x1080 ultra AA:ultra AF:16 | |
| Eurocom Raptor X17 Core i9-14900HX | |
| SCHENKER Neo 17 2024 Engineering Sample | |
| Medion Erazer Beast X40 2024 | |
| SCHENKER XMG Neo 17 E24 | |
| MSI GE78HX 13VH-070US | |
| Media de la clase Gaming (38.9 - 420, n=140, últimos 2 años) | |
| HP Omen 17-db0079ng | |
| Dota 2 Reborn - 1920x1080 ultra (3/3) best looking | |
| Eurocom Raptor X17 Core i9-14900HX | |
| Medion Erazer Beast X40 2024 | |
| SCHENKER Neo 17 2024 Engineering Sample | |
| SCHENKER XMG Neo 17 E24 | |
| Media de la clase Gaming (65.1 - 220, n=148, últimos 2 años) | |
| MSI GE78HX 13VH-070US | |
| HP Omen 17-db0079ng | |
| X-Plane 11.11 - 1920x1080 high (fps_test=3) | |
| Eurocom Raptor X17 Core i9-14900HX | |
| Medion Erazer Beast X40 2024 | |
| SCHENKER XMG Neo 17 E24 | |
| MSI GE78HX 13VH-070US | |
| SCHENKER Neo 17 2024 Engineering Sample | |
| Media de la clase Gaming (32.8 - 166.2, n=151, últimos 2 años) | |
| HP Omen 17-db0079ng | |
Cyberpunk 2077 Ultra FPS chart
| bajo | medio | alto | ultra | QHD DLSS | QHD | 4K | |
|---|---|---|---|---|---|---|---|
| GTA V (2015) | 181.7 | 143.4 | 135.1 | 163.7 | |||
| Dota 2 Reborn (2015) | 220 | 197.1 | 194 | 179.7 | |||
| Final Fantasy XV Benchmark (2018) | 226 | 215 | 173.9 | 134.4 | |||
| X-Plane 11.11 (2018) | 202 | 176.8 | 138.9 | ||||
| Far Cry 5 (2018) | 179 | 162 | 157 | ||||
| Strange Brigade (2018) | 381 | 347 | 239 | 122 | |||
| Shadow of the Tomb Raider (2018) | 212 | 176 | |||||
| Far Cry 6 (2021) | 156 | 141 | |||||
| F1 23 (2023) | 321 | 111.6 | 70.7 | 35.5 | |||
| Baldur's Gate 3 (2023) | 231 | 143 | 122.2 | 111.8 | 88.3 | ||
| Cyberpunk 2077 2.2 Phantom Liberty (2023) | 101.1 | 146.9 | 133.8 | 121.3 | 110.1 | 80.7 | |
| Assassin's Creed Mirage (2023) | 197 | 153 | 129 | ||||
| Call of Duty Modern Warfare 3 2023 (2023) | 180 | 171 | 123 | ||||
| Avatar Frontiers of Pandora (2023) | 125 | 97 | 66 | ||||
| F1 24 (2024) | 304 | 323 | 289 | 112.2 | 71.2 |
Emisiones y energía
Emisiones sonoras
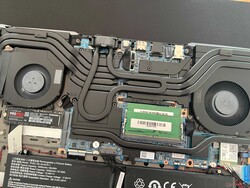
La refrigeración con dos ventiladores es básicamente la misma que la del modelo del año pasado, pero las configuraciones del Neo 17 con el portátil RTX 4080/4090 ofrecen un canal modificado para la refrigeración por agua, que ahora también pasa directamente por encima de la CPU. Los ventiladores están siempre en marcha, pero durante tareas muy sencillas (navegar por Internet, correos electrónicos, vídeos) sólo se oye un ruido muy bajo. Cuando se juega, sin embargo, se vuelve significativamente más ruidoso, con 52 dB(A). Aunque hay competidores más ruidosos, debería utilizar auriculares cuando juegue. Durante las pruebas comparativas/juegos, también se oyó un ligero ruido de bobina.
Ruido
| Ocioso |
| 28.1 / 28.1 / 28.1 dB(A) |
| HDD |
| 0 dB(A) |
| Carga |
| 43.1 / 51.9 dB(A) |
 | ||
30 dB silencioso 40 dB(A) audible 50 dB(A) ruidosamente alto |
||
min: | ||
| SCHENKER XMG Neo 17 E24 NVIDIA GeForce RTX 4080 Laptop GPU, i9-14900HX, Samsung 990 Pro 1 TB | Medion Erazer Beast X40 2024 NVIDIA GeForce RTX 4090 Laptop GPU, i9-14900HX, Phison E18-1TB-PHISON-SSD-BICS5 | HP Omen 17-db0079ng NVIDIA GeForce RTX 4070 Laptop GPU, R7 8845HS, WD PC SN560 SDDPNQE-1T00 | Eurocom Raptor X17 Core i9-14900HX NVIDIA GeForce RTX 4090 Laptop GPU, i9-14900HX, Corsair MP700 Pro 2TB | MSI GE78HX 13VH-070US NVIDIA GeForce RTX 4080 Laptop GPU, i9-13950HX, Samsung PM9A1 MZVL22T0HBLB | |
|---|---|---|---|---|---|
| Noise | -6% | -2% | -7% | -0% | |
| apagado / medio ambiente * | 23.3 | 25 -7% | 25 -7% | 23.7 -2% | 23.4 -0% |
| Idle Minimum * | 28.1 | 28 -0% | 25 11% | 31.7 -13% | 24.2 14% |
| Idle Average * | 28.1 | 29 -3% | 29 -3% | 31.7 -13% | 25.6 9% |
| Idle Maximum * | 28.1 | 32 -14% | 33 -17% | 32.9 -17% | 31 -10% |
| Load Average * | 43.1 | 48 -11% | 45 -4% | 34 21% | 43.3 -0% |
| Cyberpunk 2077 ultra * | 51.9 | 48 8% | |||
| Load Maximum * | 51.9 | 52 -0% | 52 -0% | 61.6 -19% | 59.1 -14% |
| Witcher 3 ultra * | 50 | 61.6 | 56.3 |
* ... más pequeño es mejor
Temperatura
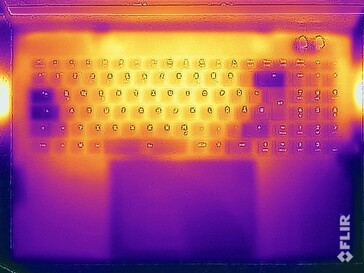
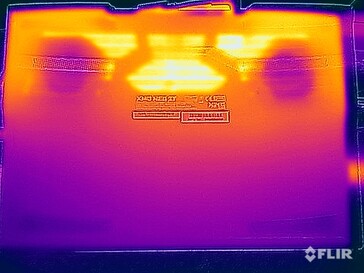
Schenker utiliza una interfaz térmica de metal líquido tanto para la CPU como para la GPU en configuraciones a partir de la RTX 4080 para portátiles. Las temperaturas de la carcasa se mantienen frescas durante tareas sencillas, pero medimos más de 50 °C en la parte inferior en determinados puntos bajo carga. Sin embargo, debido a su tamaño, el Neo 17 no se colocará sobre los muslos, por lo que estos valores no son problemáticos. La zona del teclado también se calienta notablemente, pero aquí no hay limitaciones. En la prueba de estrés, la tarjeta gráfica se estabilizó en 160 vatios y el procesador en unos 70 vatios.
(-) La temperatura máxima en la parte superior es de 46.2 °C / 115 F, frente a la media de 40.4 °C / 105 F, que oscila entre 21.2 y 68.8 °C para la clase Gaming.
(-) El fondo se calienta hasta un máximo de 56.7 °C / 134 F, frente a la media de 43.2 °C / 110 F
(+) En reposo, la temperatura media de la parte superior es de 28.2 °C / 83# F, frente a la media del dispositivo de 33.9 °C / 93 F.
(-) 3: The average temperature for the upper side is 39.8 °C / 104 F, compared to the average of 33.9 °C / 93 F for the class Gaming.
(+) Los reposamanos y el panel táctil alcanzan como máximo la temperatura de la piel (33.5 °C / 92.3 F) y, por tanto, no están calientes.
(-) La temperatura media de la zona del reposamanos de dispositivos similares fue de 28.9 °C / 84 F (-4.6 °C / -8.3 F).
| SCHENKER XMG Neo 17 E24 Intel Core i9-14900HX, NVIDIA GeForce RTX 4080 Laptop GPU | Medion Erazer Beast X40 2024 Intel Core i9-14900HX, NVIDIA GeForce RTX 4090 Laptop GPU | HP Omen 17-db0079ng AMD Ryzen 7 8845HS, NVIDIA GeForce RTX 4070 Laptop GPU | Eurocom Raptor X17 Core i9-14900HX Intel Core i9-14900HX, NVIDIA GeForce RTX 4090 Laptop GPU | MSI GE78HX 13VH-070US Intel Core i9-13950HX, NVIDIA GeForce RTX 4080 Laptop GPU | |
|---|---|---|---|---|---|
| Heat | 1% | 14% | 1% | 10% | |
| Maximum Upper Side * | 46.2 | 47 -2% | 44 5% | 52.2 -13% | 37.4 19% |
| Maximum Bottom * | 56.7 | 54 5% | 45 21% | 53.2 6% | 45 21% |
| Idle Upper Side * | 29.8 | 30 -1% | 26 13% | 28.6 4% | 29.8 -0% |
| Idle Bottom * | 32 | 32 -0% | 27 16% | 29.8 7% | 32.4 -1% |
* ... más pequeño es mejor
Altavoz
Los altavoces estéreo no son especialmente buenos pero son suficientes para algún vídeo ocasional de YouTube. Sin embargo, los altavoces no son realmente útiles para jugar debido a los ruidosos ventiladores.
SCHENKER XMG Neo 17 E24 análisis de audio
(+) | los altavoces pueden reproducir a un volumen relativamente alto (#83.7 dB)
Graves 100 - 315 Hz
(-) | casi sin bajos - de media 19% inferior a la mediana
(+) | el bajo es lineal (6% delta a la frecuencia anterior)
Medios 400 - 2000 Hz
(±) | medias más altas - de media 6.6% más altas que la mediana
(±) | la linealidad de los medios es media (9.4% delta respecto a la frecuencia anterior)
Altos 2 - 16 kHz
(+) | máximos equilibrados - a sólo 3.6% de la mediana
(±) | la linealidad de los máximos es media (7.1% delta a frecuencia anterior)
Total 100 - 16.000 Hz
(±) | la linealidad del sonido global es media (18.3% de diferencia con la mediana)
En comparación con la misma clase
» 56% de todos los dispositivos probados de esta clase eran mejores, 8% similares, 35% peores
» El mejor tuvo un delta de 6%, la media fue 18%, el peor fue ###max##%
En comparación con todos los dispositivos probados
» 37% de todos los dispositivos probados eran mejores, 7% similares, 55% peores
» El mejor tuvo un delta de 4%, la media fue 24%, el peor fue ###max##%
Medion Erazer Beast X40 2024 análisis de audio
(+) | los altavoces pueden reproducir a un volumen relativamente alto (#88 dB)
Graves 100 - 315 Hz
(±) | lubina reducida - en promedio 14.7% inferior a la mediana
(±) | la linealidad de los graves es media (7.2% delta a frecuencia anterior)
Medios 400 - 2000 Hz
(+) | medios equilibrados - a sólo 3.7% de la mediana
(+) | los medios son lineales (5.8% delta a la frecuencia anterior)
Altos 2 - 16 kHz
(+) | máximos equilibrados - a sólo 2.8% de la mediana
(+) | los máximos son lineales (6.4% delta a la frecuencia anterior)
Total 100 - 16.000 Hz
(+) | el sonido global es lineal (12.1% de diferencia con la mediana)
En comparación con la misma clase
» 11% de todos los dispositivos probados de esta clase eran mejores, 4% similares, 85% peores
» El mejor tuvo un delta de 6%, la media fue 18%, el peor fue ###max##%
En comparación con todos los dispositivos probados
» 8% de todos los dispositivos probados eran mejores, 2% similares, 90% peores
» El mejor tuvo un delta de 4%, la media fue 24%, el peor fue ###max##%
HP Omen 17-db0079ng análisis de audio
(±) | la sonoridad del altavoz es media pero buena (80 dB)
Graves 100 - 315 Hz
(-) | casi sin bajos - de media 19.1% inferior a la mediana
(±) | la linealidad de los graves es media (10.3% delta a frecuencia anterior)
Medios 400 - 2000 Hz
(+) | medios equilibrados - a sólo 1.9% de la mediana
(+) | los medios son lineales (4.4% delta a la frecuencia anterior)
Altos 2 - 16 kHz
(+) | máximos equilibrados - a sólo 3.8% de la mediana
(±) | la linealidad de los máximos es media (7.8% delta a frecuencia anterior)
Total 100 - 16.000 Hz
(+) | el sonido global es lineal (14.3% de diferencia con la mediana)
En comparación con la misma clase
» 25% de todos los dispositivos probados de esta clase eran mejores, 7% similares, 69% peores
» El mejor tuvo un delta de 6%, la media fue 18%, el peor fue ###max##%
En comparación con todos los dispositivos probados
» 16% de todos los dispositivos probados eran mejores, 4% similares, 80% peores
» El mejor tuvo un delta de 4%, la media fue 24%, el peor fue ###max##%
Eurocom Raptor X17 Core i9-14900HX análisis de audio
(±) | la sonoridad del altavoz es media pero buena (74.2 dB)
Graves 100 - 315 Hz
(±) | lubina reducida - en promedio 13.4% inferior a la mediana
(±) | la linealidad de los graves es media (10.1% delta a frecuencia anterior)
Medios 400 - 2000 Hz
(±) | medias más altas - de media 6.6% más altas que la mediana
(±) | la linealidad de los medios es media (8.6% delta respecto a la frecuencia anterior)
Altos 2 - 16 kHz
(+) | máximos equilibrados - a sólo 2% de la mediana
(±) | la linealidad de los máximos es media (8.5% delta a frecuencia anterior)
Total 100 - 16.000 Hz
(±) | la linealidad del sonido global es media (24% de diferencia con la mediana)
En comparación con la misma clase
» 85% de todos los dispositivos probados de esta clase eran mejores, 5% similares, 10% peores
» El mejor tuvo un delta de 6%, la media fue 18%, el peor fue ###max##%
En comparación con todos los dispositivos probados
» 70% de todos los dispositivos probados eran mejores, 7% similares, 23% peores
» El mejor tuvo un delta de 4%, la media fue 24%, el peor fue ###max##%
MSI GE78HX 13VH-070US análisis de audio
(+) | los altavoces pueden reproducir a un volumen relativamente alto (#84.4 dB)
Graves 100 - 315 Hz
(±) | lubina reducida - en promedio 8.3% inferior a la mediana
(±) | la linealidad de los graves es media (9.3% delta a frecuencia anterior)
Medios 400 - 2000 Hz
(±) | medias más altas - de media 6.8% más altas que la mediana
(+) | los medios son lineales (3.4% delta a la frecuencia anterior)
Altos 2 - 16 kHz
(+) | máximos equilibrados - a sólo 2% de la mediana
(+) | los máximos son lineales (2.6% delta a la frecuencia anterior)
Total 100 - 16.000 Hz
(+) | el sonido global es lineal (12% de diferencia con la mediana)
En comparación con la misma clase
» 11% de todos los dispositivos probados de esta clase eran mejores, 4% similares, 85% peores
» El mejor tuvo un delta de 6%, la media fue 18%, el peor fue ###max##%
En comparación con todos los dispositivos probados
» 8% de todos los dispositivos probados eran mejores, 2% similares, 90% peores
» El mejor tuvo un delta de 4%, la media fue 24%, el peor fue ###max##%
Consumo de energía
El consumo máximo en reposo de 13 vatios es muy bajo para un gran portátil de 17 pulgadas. Cuando se juega, sin embargo, ronda los 300 vatios, lo que no es sorprendente dados los elevados valores TDP/TGP. La fuente de alimentación de 330 vatios suministrada tiene unas dimensiones adecuadas. Sin embargo, el consumo en espera de 2,1 vatios es demasiado elevado.
| Off / Standby | |
| Ocioso | |
| Carga |
|
Clave:
min: | |
Power consumption Cyberpunk / Stresstest
Power consumption with external monitor
Duración de las pilas
El Neo 17 está equipado con una batería de 99 Wh, que logra una decente autonomía de unas 6 horas en modo WLAN a 150 cd/m² (58% del brillo máximo del dispositivo de prueba). Esto sitúa al gran jugador en el medio campo en comparación con la competencia. Una carga completa con el dispositivo encendido tarda 107 minutos, con lo que el 80% de la batería vuelve a estar disponible tras unos 45 minutos.
Valoración general de Notebookcheck
El XMG Neo 17 se centra claramente en el rendimiento para juegos y el rendimiento es muy bueno. Gracias a la refrigeración por agua opcional, las temperaturas y, por tanto, también el ruido del ventilador pueden reducirse significativamente una vez más. El panel QHD mate con 240 Hz y tiempos de respuesta rápidos también es muy adecuado para los juegos.
SCHENKER XMG Neo 17 E24
- 11/27/2024 v8
Andreas Osthoff
Transparencia
La selección de los dispositivos que se van a reseñar corre a cargo de nuestro equipo editorial. La muestra de prueba fue proporcionada al autor en calidad de préstamo por el fabricante o el minorista a los efectos de esta reseña. El prestamista no tuvo ninguna influencia en esta reseña, ni el fabricante recibió una copia de la misma antes de su publicación. No había ninguna obligación de publicar esta reseña. Nunca aceptamos compensaciones o pagos a cambio de nuestras reseñas. Como empresa de medios independiente, Notebookcheck no está sujeta a la autoridad de fabricantes, minoristas o editores.
Así es como prueba Notebookcheck
Cada año, Notebookcheck revisa de forma independiente cientos de portátiles y smartphones utilizando procedimientos estandarizados para asegurar que todos los resultados son comparables. Hemos desarrollado continuamente nuestros métodos de prueba durante unos 20 años y hemos establecido los estándares de la industria en el proceso. En nuestros laboratorios de pruebas, técnicos y editores experimentados utilizan equipos de medición de alta calidad. Estas pruebas implican un proceso de validación en varias fases. Nuestro complejo sistema de clasificación se basa en cientos de mediciones y puntos de referencia bien fundamentados, lo que mantiene la objetividad.

















 Total Sustainability Score:


