

Análisis del XMG Pro 16 Studio (Mid 24): Core i9 y RTX 4070 para jugadores y creadores
¿El deleite del creador?
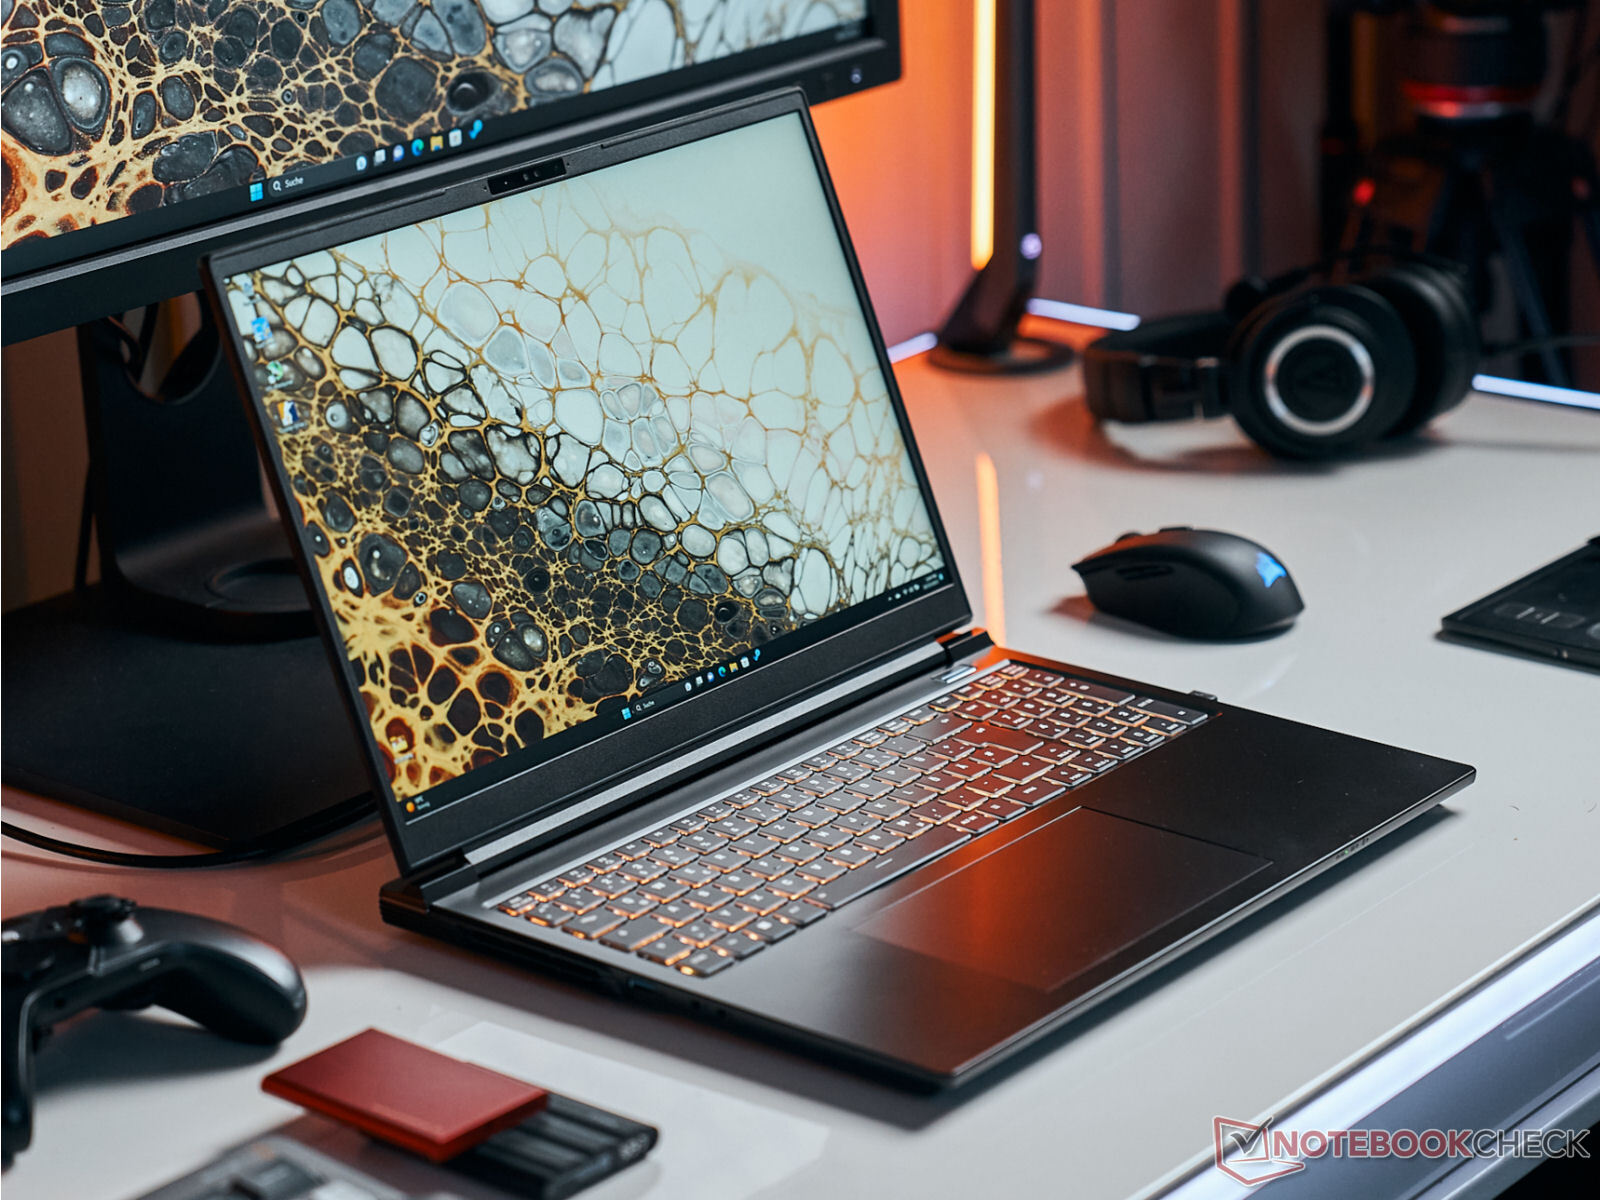
Los creadores de contenidos y los jugadores constituyen el mercado objetivo del XMG Pro 16 Studio: Schenker ha elaborado una oferta compuesta por un procesador Core i9, RTX 4070, puerto Thunderbolt 4 y una pantalla 16:10 (QHD+, 240Hz, sRGB). Una buena refrigeración está supuestamente asegurada mediante el uso de una Cámara de Vapor.Sascha Mölck, 👁 Florian Glaser (traducido por DeepL / Ninh Duy) Publicado 🇺🇸 🇩🇪 ...
El XMG Pro 16 Studio (Mid 24) está dirigido a jugadores y creadores. Lleva a bordo el hardware correspondiente: Un Core i9-14900HX, GeForce RTX 4070 así como una pantalla calibrada (X-Rite) de 16 pulgadas con una relación de aspecto de 16:10. Como base sirve un barebone (PE60SNE-S) del fabricante Clevo. Se trata del sucesor del XMG Pro 16 (mediados de 23) que -visualmente- tiene el mismo aspecto. Entre sus competidores se encuentran el Lenovo Legion Pro 5 16IRX9, Acer Predator Helios Neo 16 (2024), Lenovo Legion 7 16 G9 y el Aorus 16X (2024).
Posibles contendientes en la comparación
Valoración | Versión | Fecha | Modelo | Peso | Altura | Tamaño | Resolución | Precio |
|---|---|---|---|---|---|---|---|---|
| 81.2 % | v8 | 07/2024 | SCHENKER XMG Pro 16 Studio (Mid 24) i9-14900HX, NVIDIA GeForce RTX 4070 Laptop GPU | 2.3 kg | 19.9 mm | 16.00" | 2560x1600 | |
| 86.8 % v7 (old) | v7 (old) | 05/2024 | Acer Predator Helios Neo 16 (2024) i7-14700HX, NVIDIA GeForce RTX 4070 Laptop GPU | 2.6 kg | 25.95 mm | 16.00" | 2560x1600 | |
| 89.3 % v7 (old) | v7 (old) | 04/2024 | Lenovo Legion Pro 5 16IRX9 i9-14900HX, NVIDIA GeForce RTX 4070 Laptop GPU | 2.5 kg | 26.95 mm | 16.00" | 2560x1600 | |
| 87.4 % v7 (old) | v7 (old) | 04/2024 | Aorus 16X 2024 i9-14900HX, NVIDIA GeForce RTX 4070 Laptop GPU | 2.3 kg | 20 mm | 16.00" | 2560x1600 | |
| 90.8 % v7 (old) | v7 (old) | 04/2024 | Lenovo Legion 7 16 IRX G9 i9-14900HX, NVIDIA GeForce RTX 4070 Laptop GPU | 2.3 kg | 19.8 mm | 16.00" | 3200x2000 |
Tenga en cuenta que: recientemente hemos actualizado nuestro sistema de clasificación y los resultados de la versión 8 no son comparables con los de la versión 7. Encontrará más información aquí.
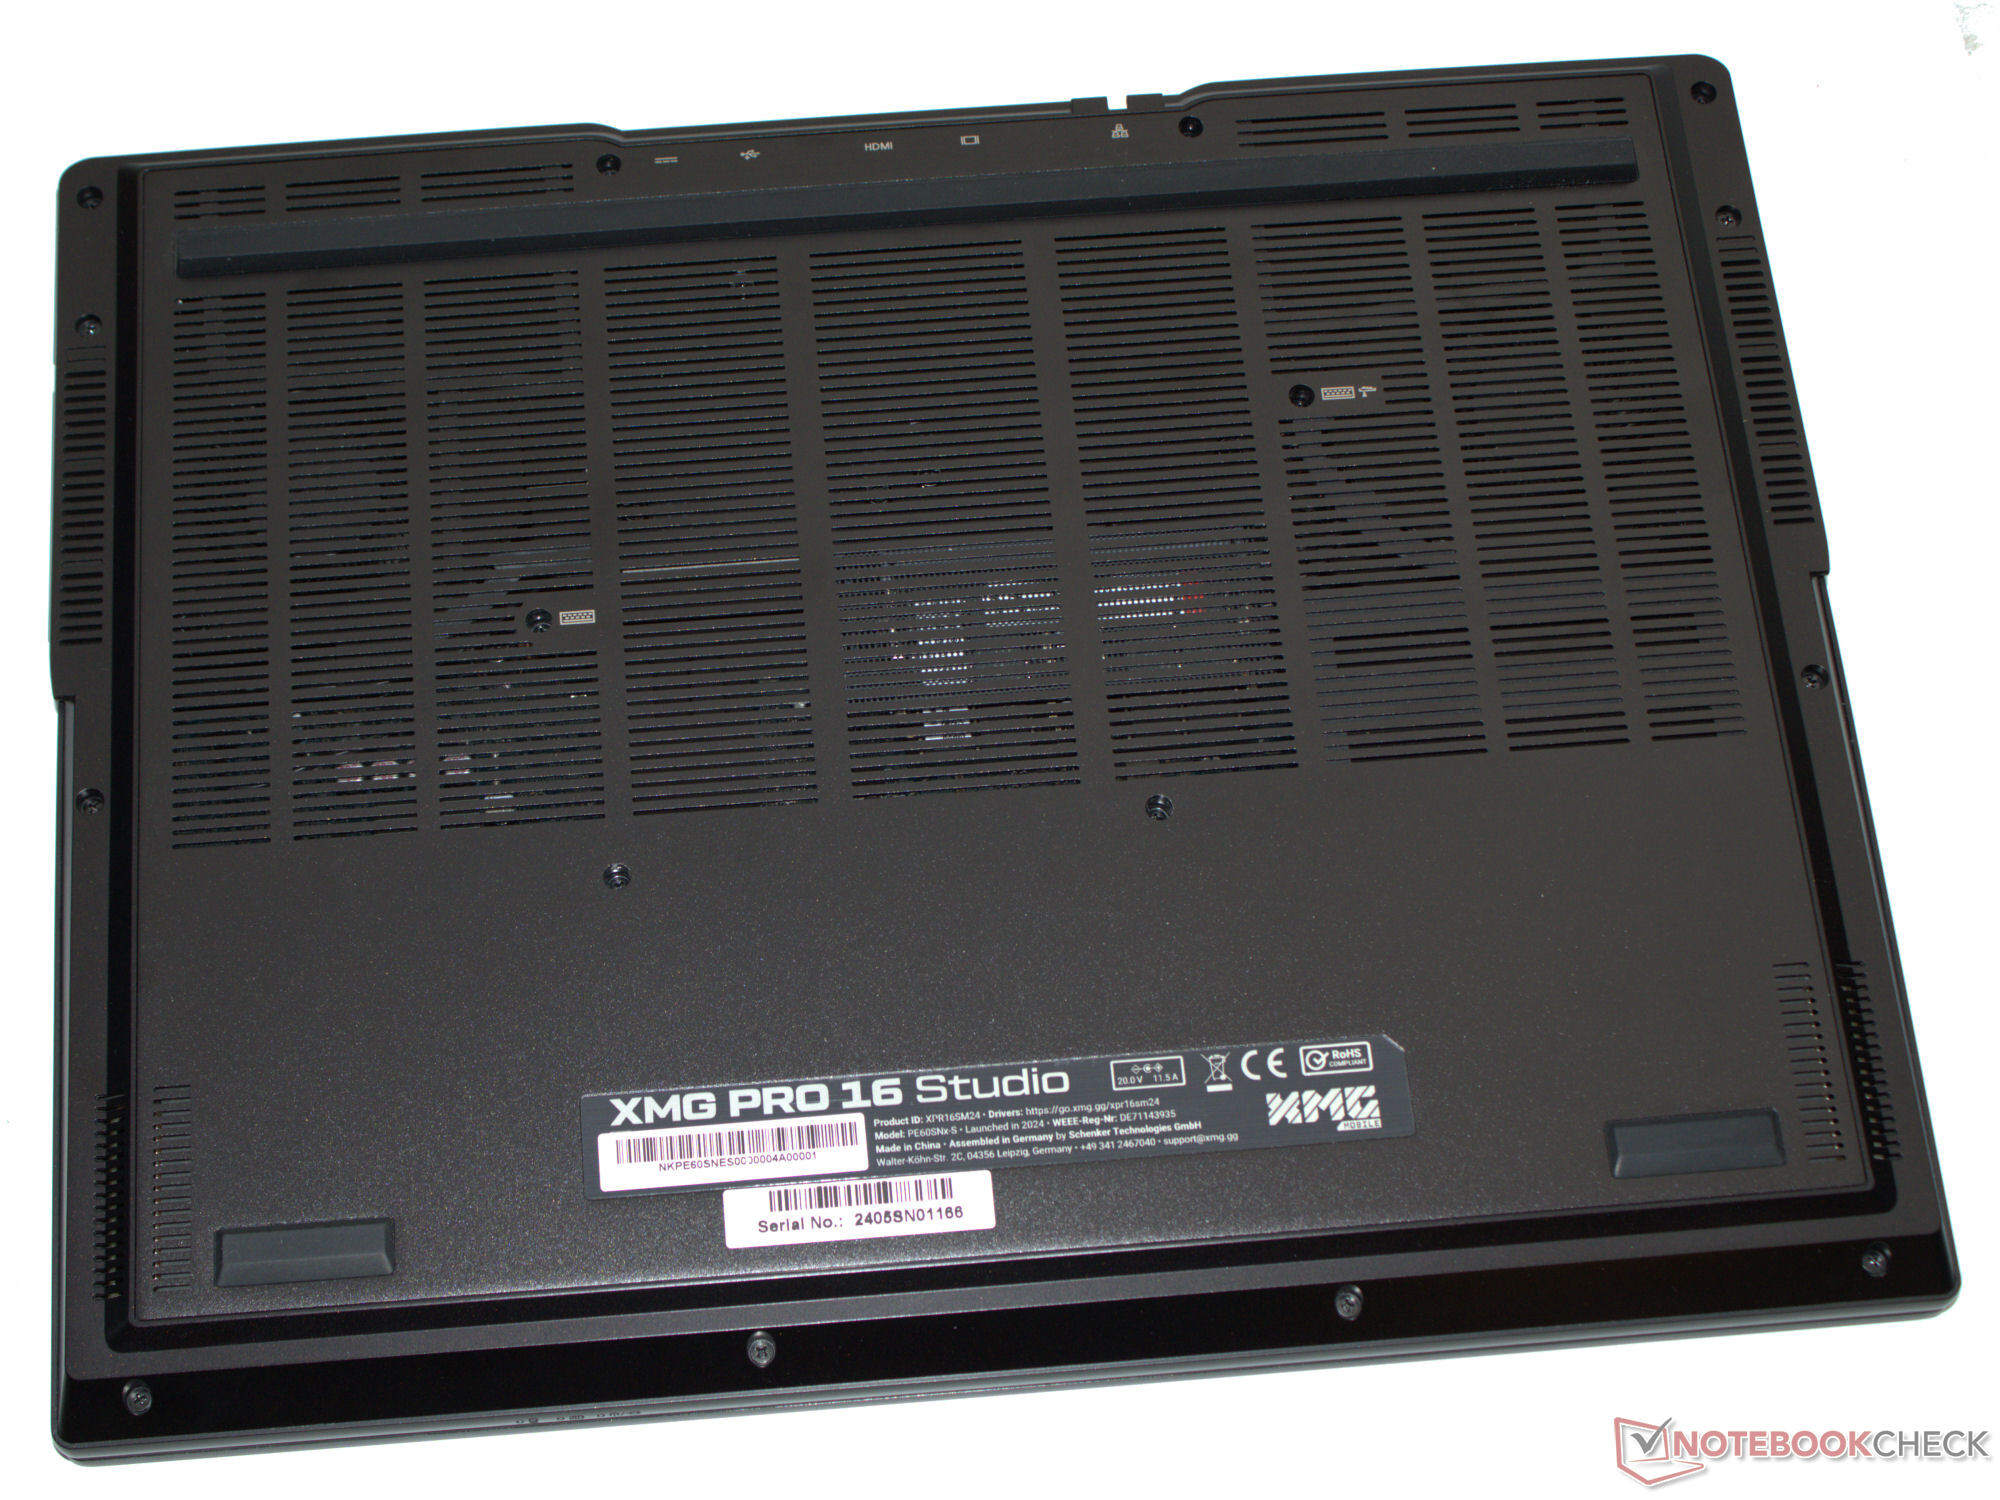
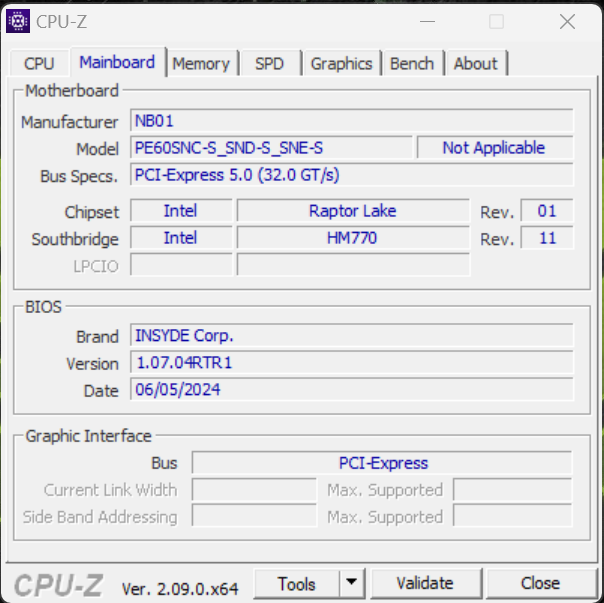
Caja y conectividad - Schenker utiliza un barebone de Clevo
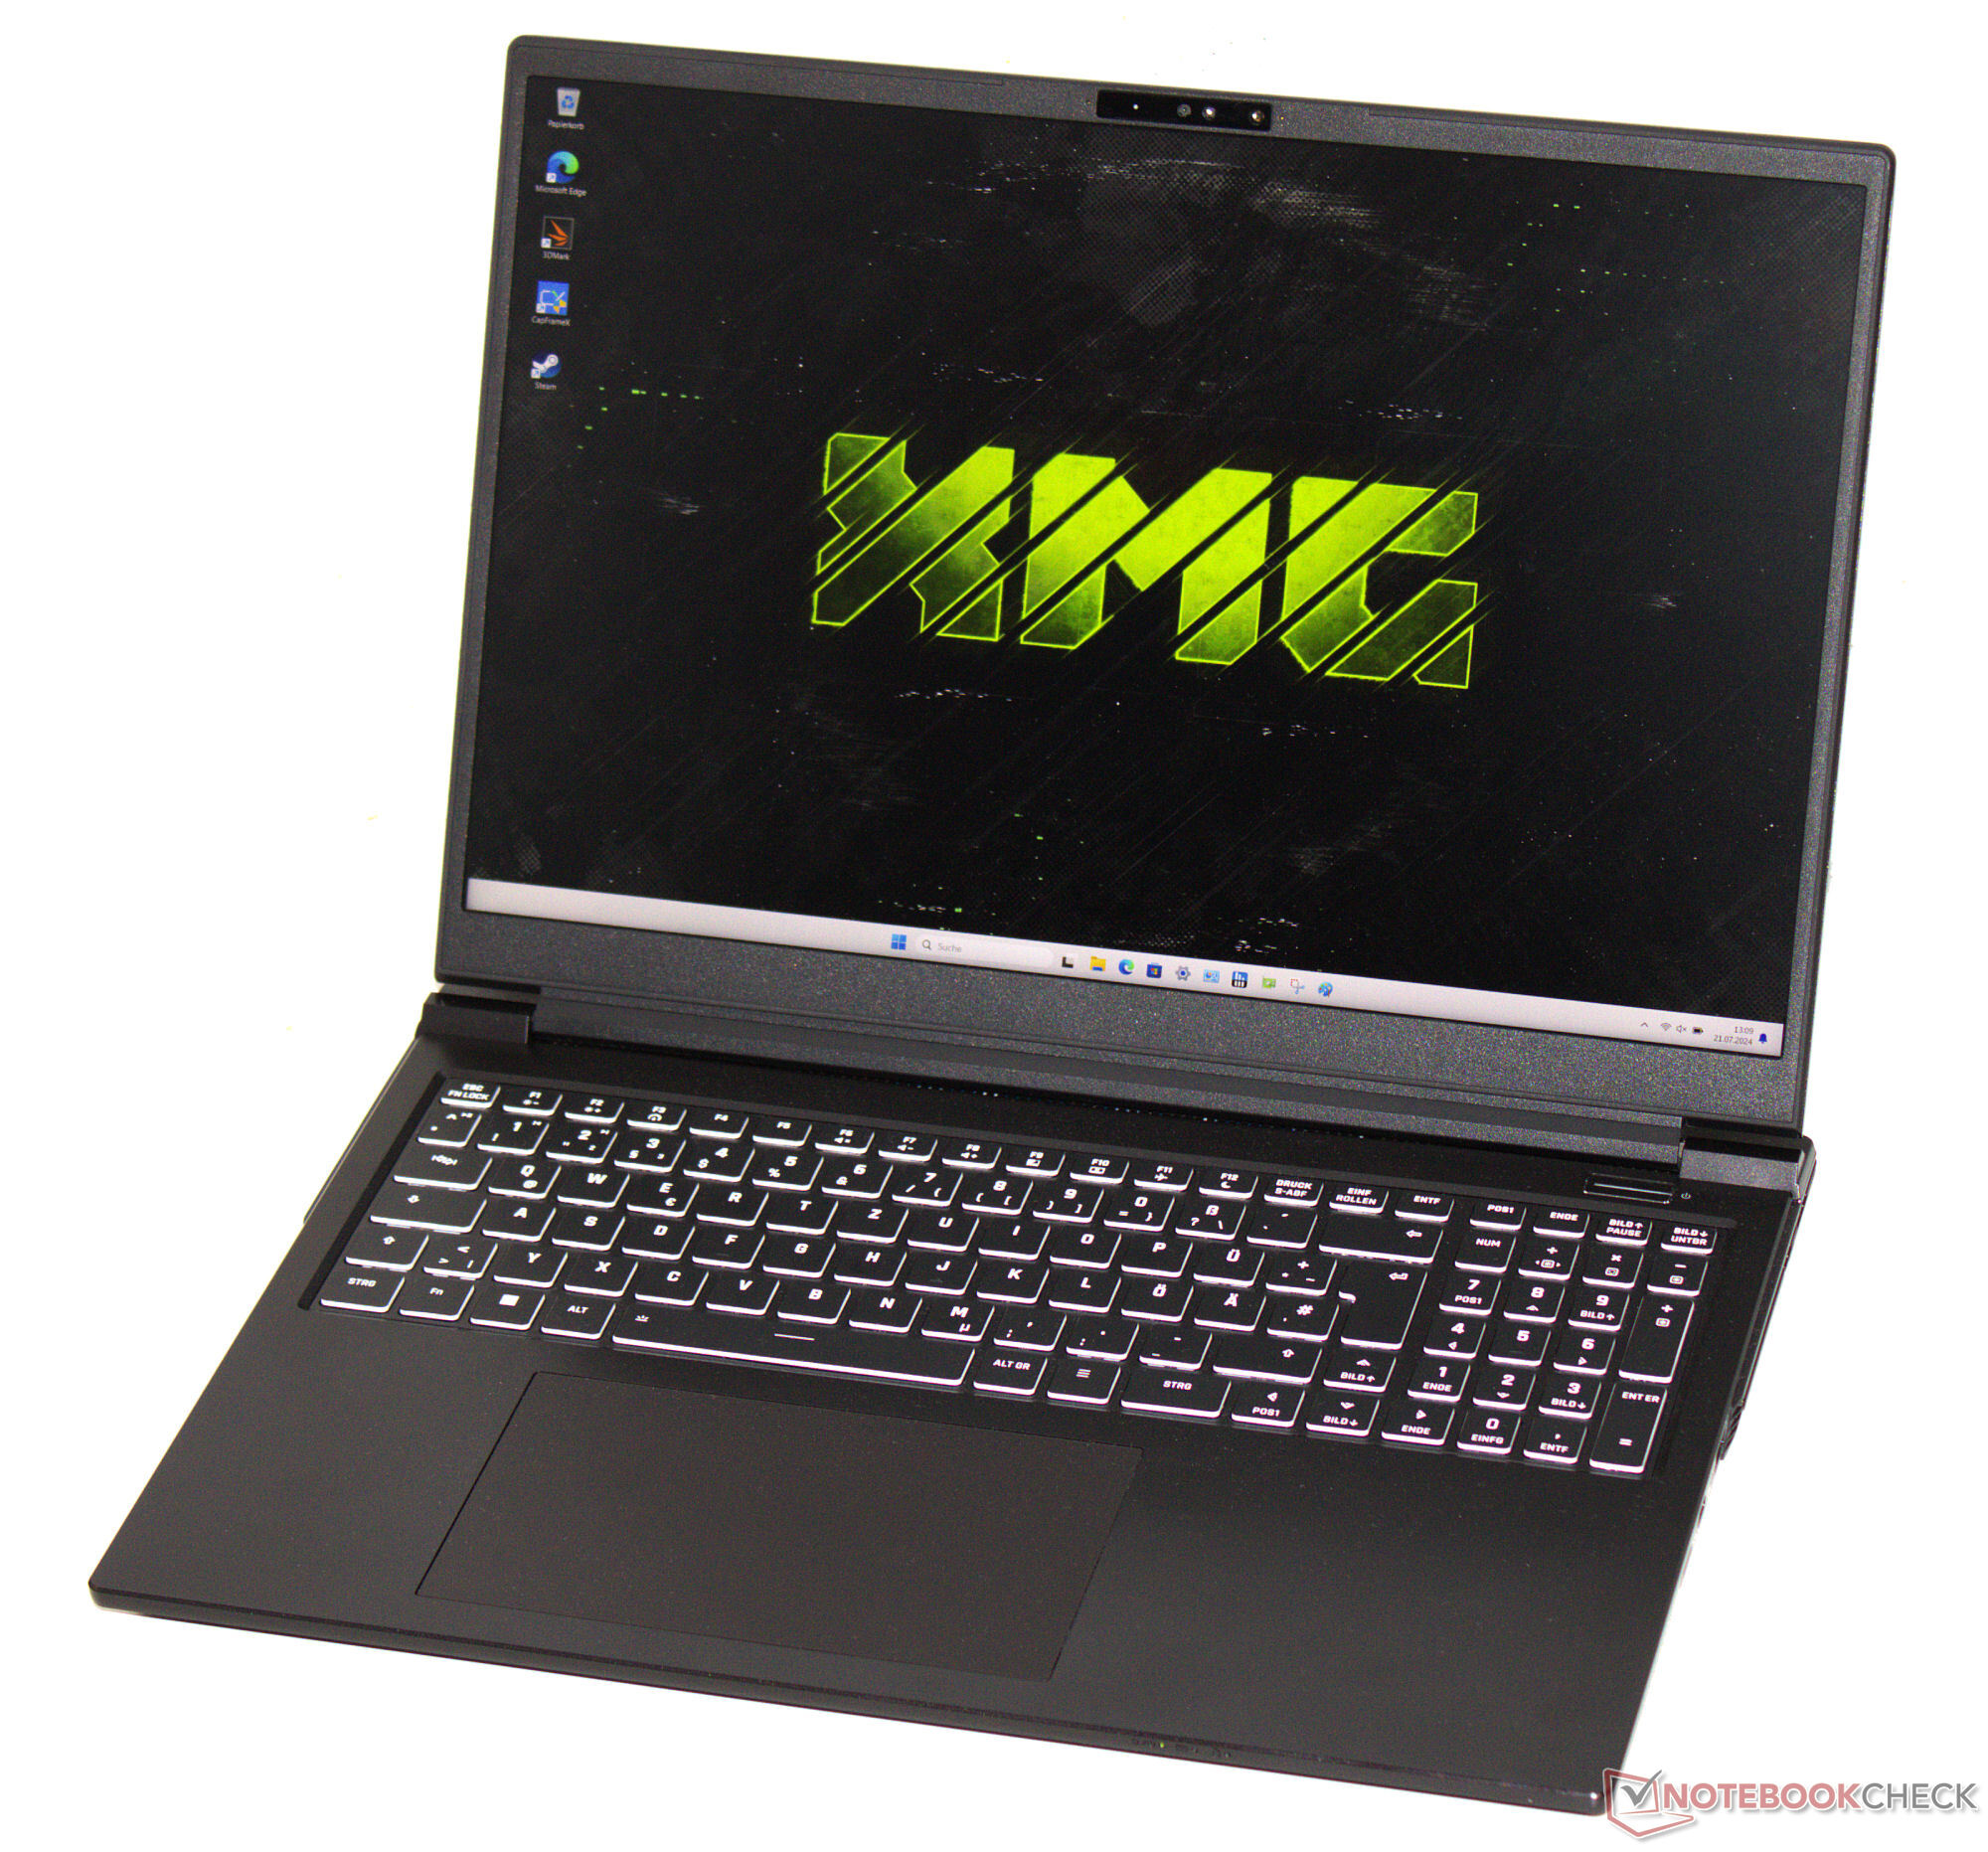
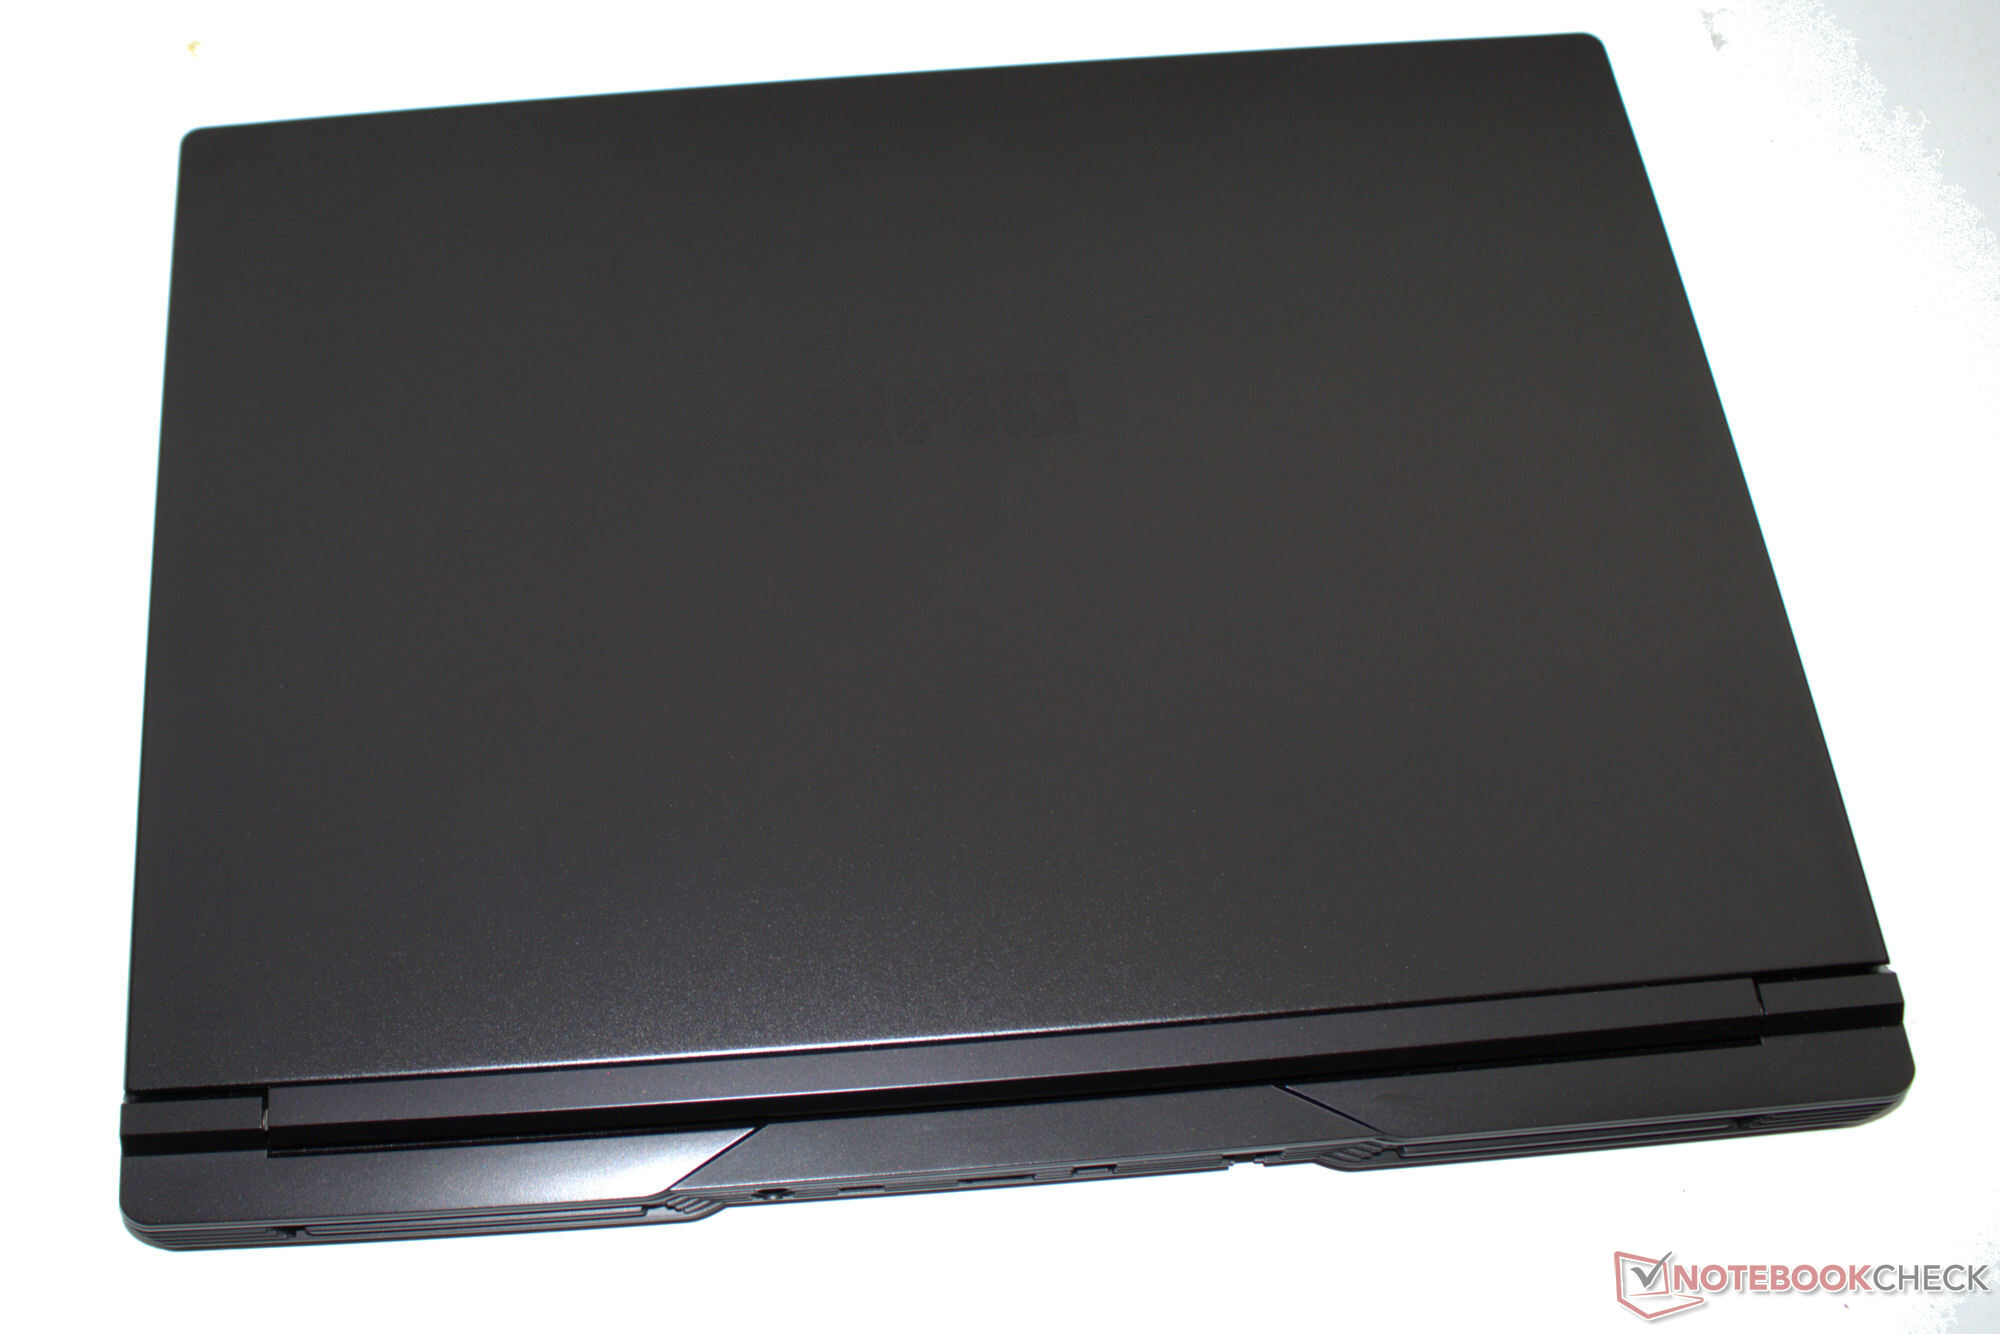
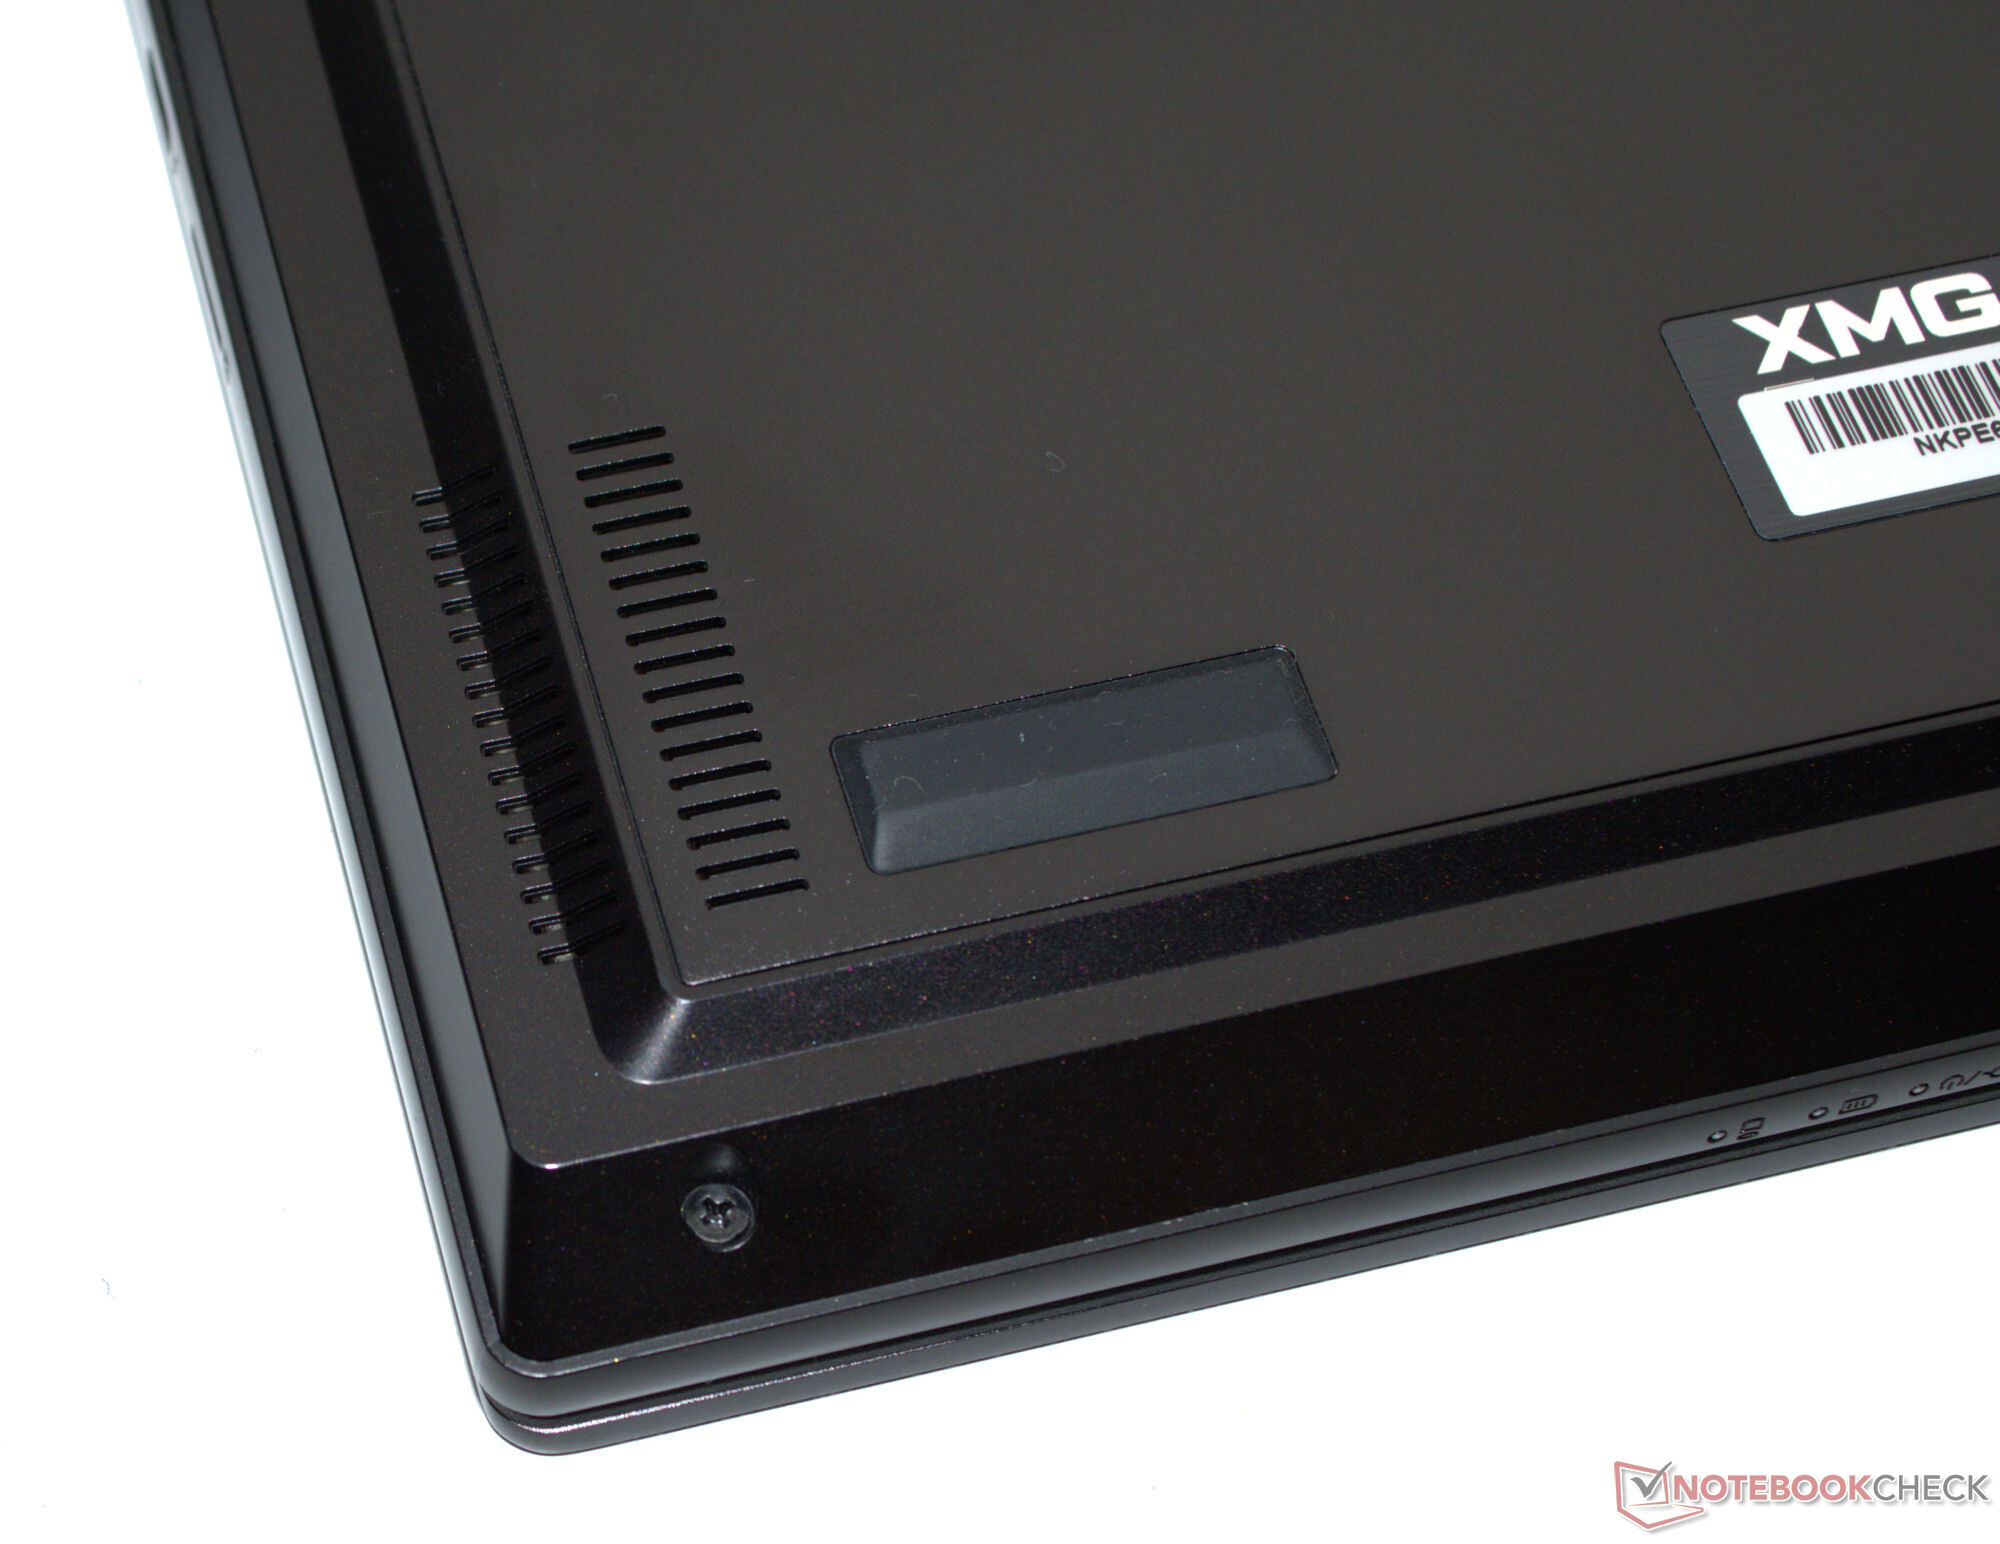
Desde el exterior, nada ha cambiado: la última Pro 16 utiliza la misma carcasa de aluminio negro mate del modelo del año pasado-si sólo tiene en cuenta su carcasa exterior. La unidad base y la tapa pueden torcerse ligeramente, pero su calidad de construcción es buena. Buscará en vano tiras de LED en una carcasa de aspecto tan serio. El ángulo máximo de apertura de la tapa es de 130 grados.
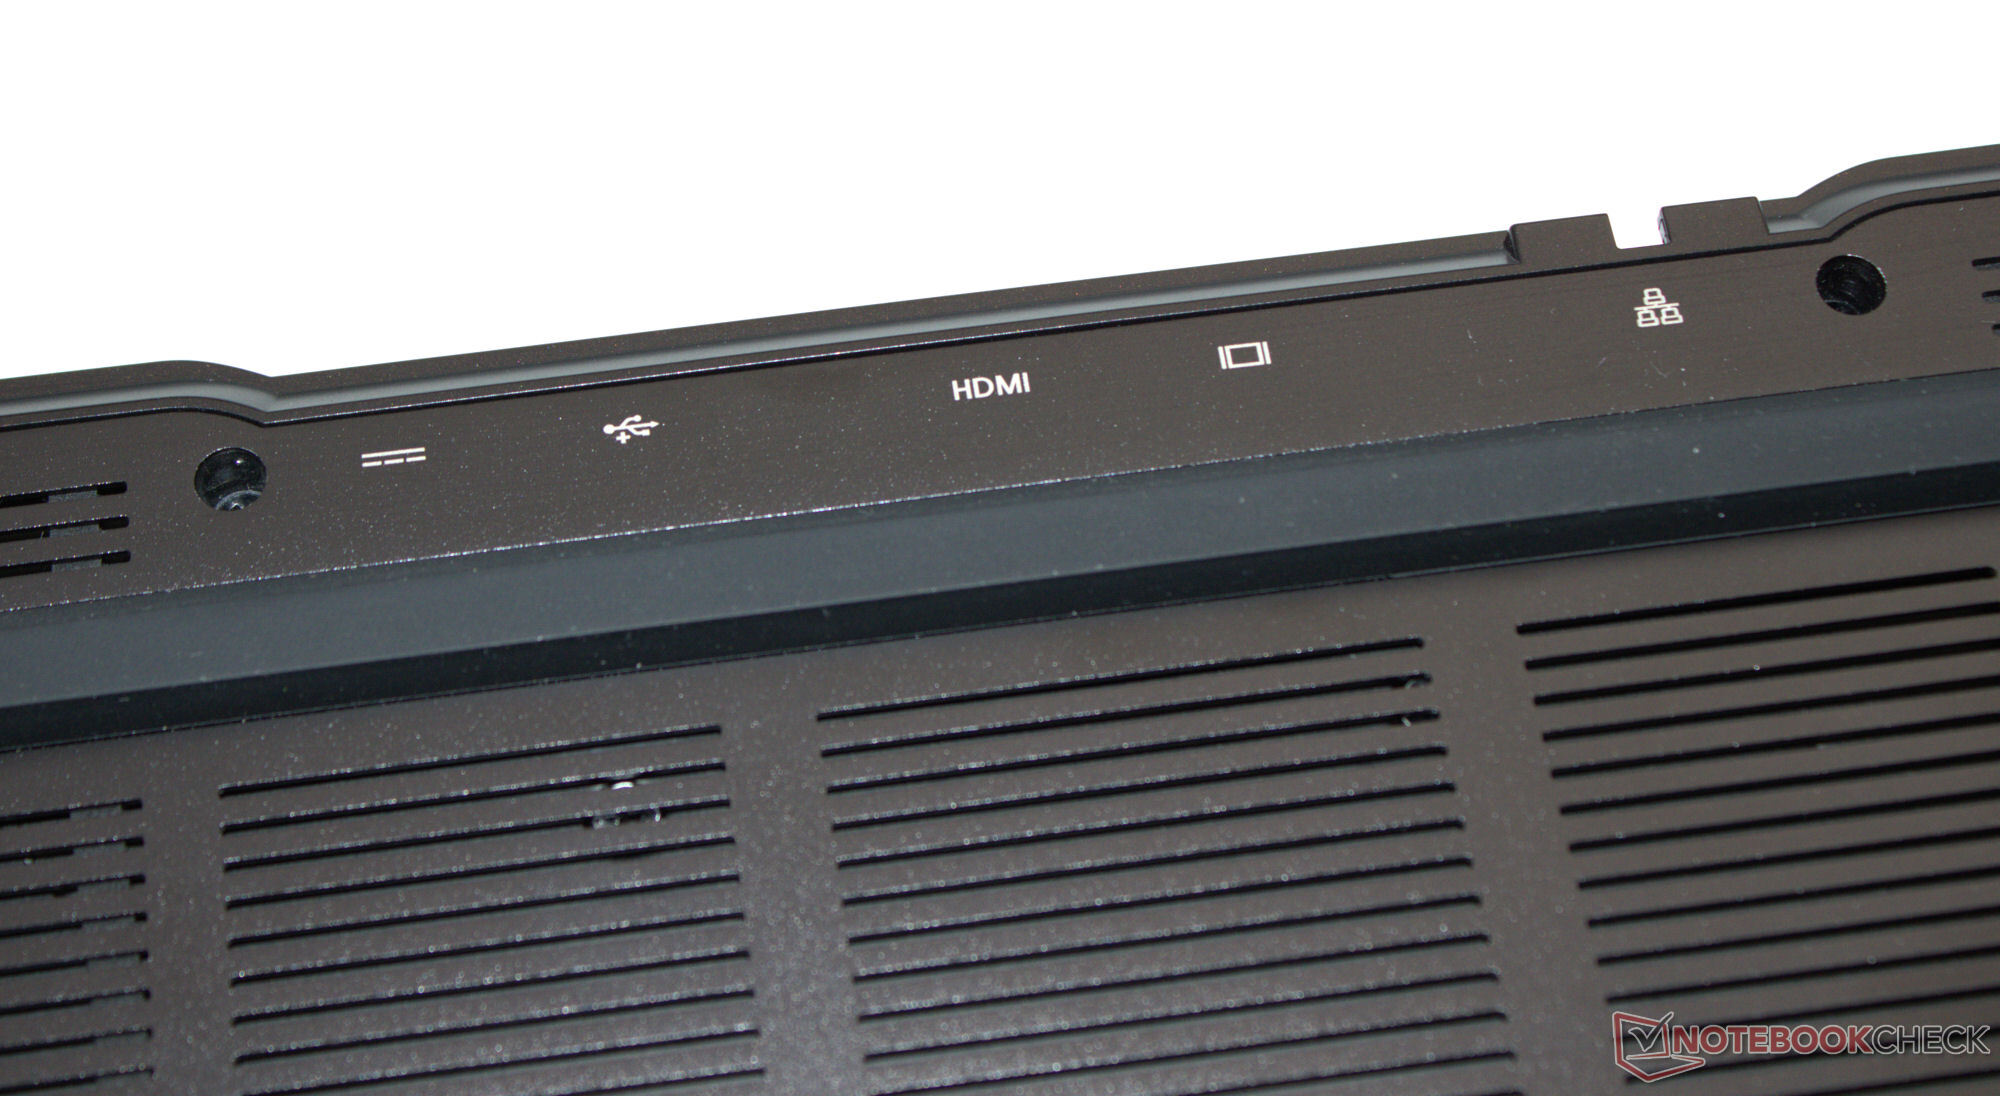
Dos puertos USB-A (USB 3.2 Gen 1), dos puertos USB-C (1x USB 3.2 Gen 2, 1x TB 4/USB 4) así como tres salidas de vídeo deberían ser suficientes para la mayoría de los usuarios; en el peor de los casos, quizá tenga que echar mano de una estación de acoplamiento. Soporta Power Delivery gracias al puerto TB4. El puerto Gigabit Ethernet permite velocidades de transmisión de datos de hasta 2,5 Gbit/s.
En condiciones óptimas (sin dispositivos WiFi cerca, corta distancia entre el portátil y el PC servidor), el chip WiFi-6E de Intel (AX211) produce velocidades de datos de buenas a muy buenas. La cámara web FHD (2,1 MP, sin tapa) no realiza tomas sorprendentes. El lector de tarjetas MicroSD (tarjeta de referencia: AV PRO microSD 128 GB V60) es de velocidad media.


| SD Card Reader | |
| average JPG Copy Test (av. of 3 runs) | |
| Aorus 16X 2024 (AV PRO microSD 128 GB V60) | |
| Media de la clase Gaming (19 - 197.3, n=68, últimos 2 años) | |
| SCHENKER XMG Pro 16 Studio (Mid 23) (AV PRO microSD 128 GB V60) | |
| SCHENKER XMG Pro 16 Studio (Mid 24) (AV PRO microSD 128 GB V60) | |
| Lenovo Legion 7 16 IRX G9 (Angelbird AV Pro V60) | |
| Acer Predator Helios Neo 16 (2024) (AV PRO microSD 128 GB V60) | |
| maximum AS SSD Seq Read Test (1GB) | |
| Aorus 16X 2024 (AV PRO microSD 128 GB V60) | |
| Media de la clase Gaming (25.8 - 263, n=67, últimos 2 años) | |
| SCHENKER XMG Pro 16 Studio (Mid 23) (AV PRO microSD 128 GB V60) | |
| Lenovo Legion 7 16 IRX G9 (Angelbird AV Pro V60) | |
| SCHENKER XMG Pro 16 Studio (Mid 24) (AV PRO microSD 128 GB V60) | |
| Acer Predator Helios Neo 16 (2024) (AV PRO microSD 128 GB V60) | |

 NVIDIA GeForce RTX 4070 Laptop GPU, i9-14900HX, Samsung 990 Pro 1 TB")
 NVIDIA GeForce RTX 4070 Laptop GPU, i9-14900HX, Samsung 990 Pro 1 TB")
Sostenibilidad
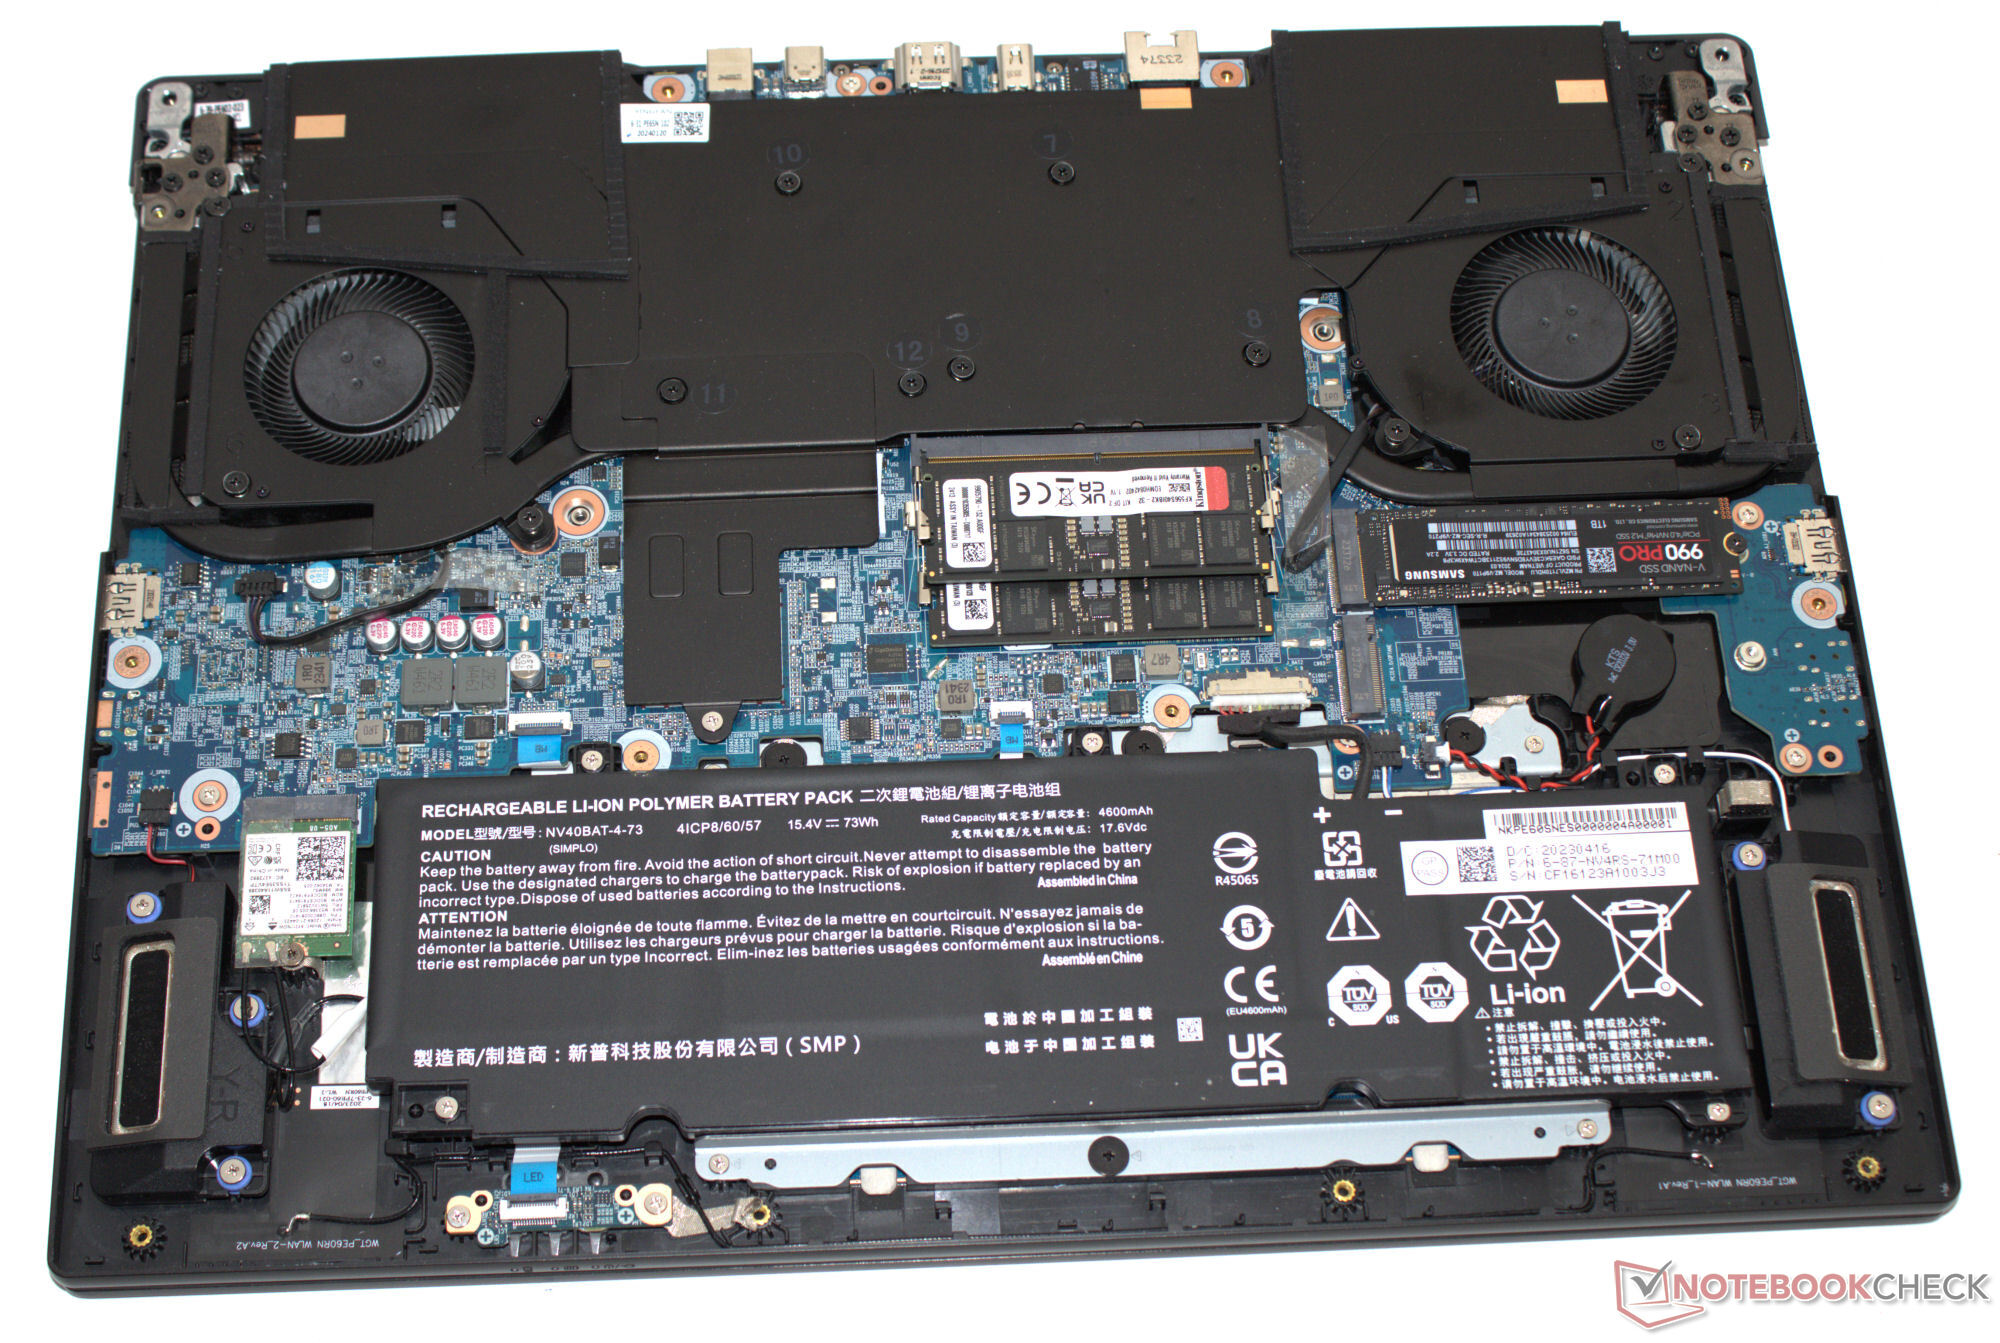
El portátil y los accesorios están protegidos por todo tipo de fundas de plástico (soporte de espuma, película, bolsa). Los nombres de los plásticos utilizados están impresos en ellas. Excepción: La funda de película transparente de la tapa carece de la información correspondiente. Se puede acceder al hardware del aparato después de retirar la placa base, por lo que podrá llevar a cabo tareas de mantenimiento y reparación. Las actualizaciones de software deberían estar aseguradas para los próximos años.
Dispositivos de entrada - El portátil XMG con teclado intercambiable
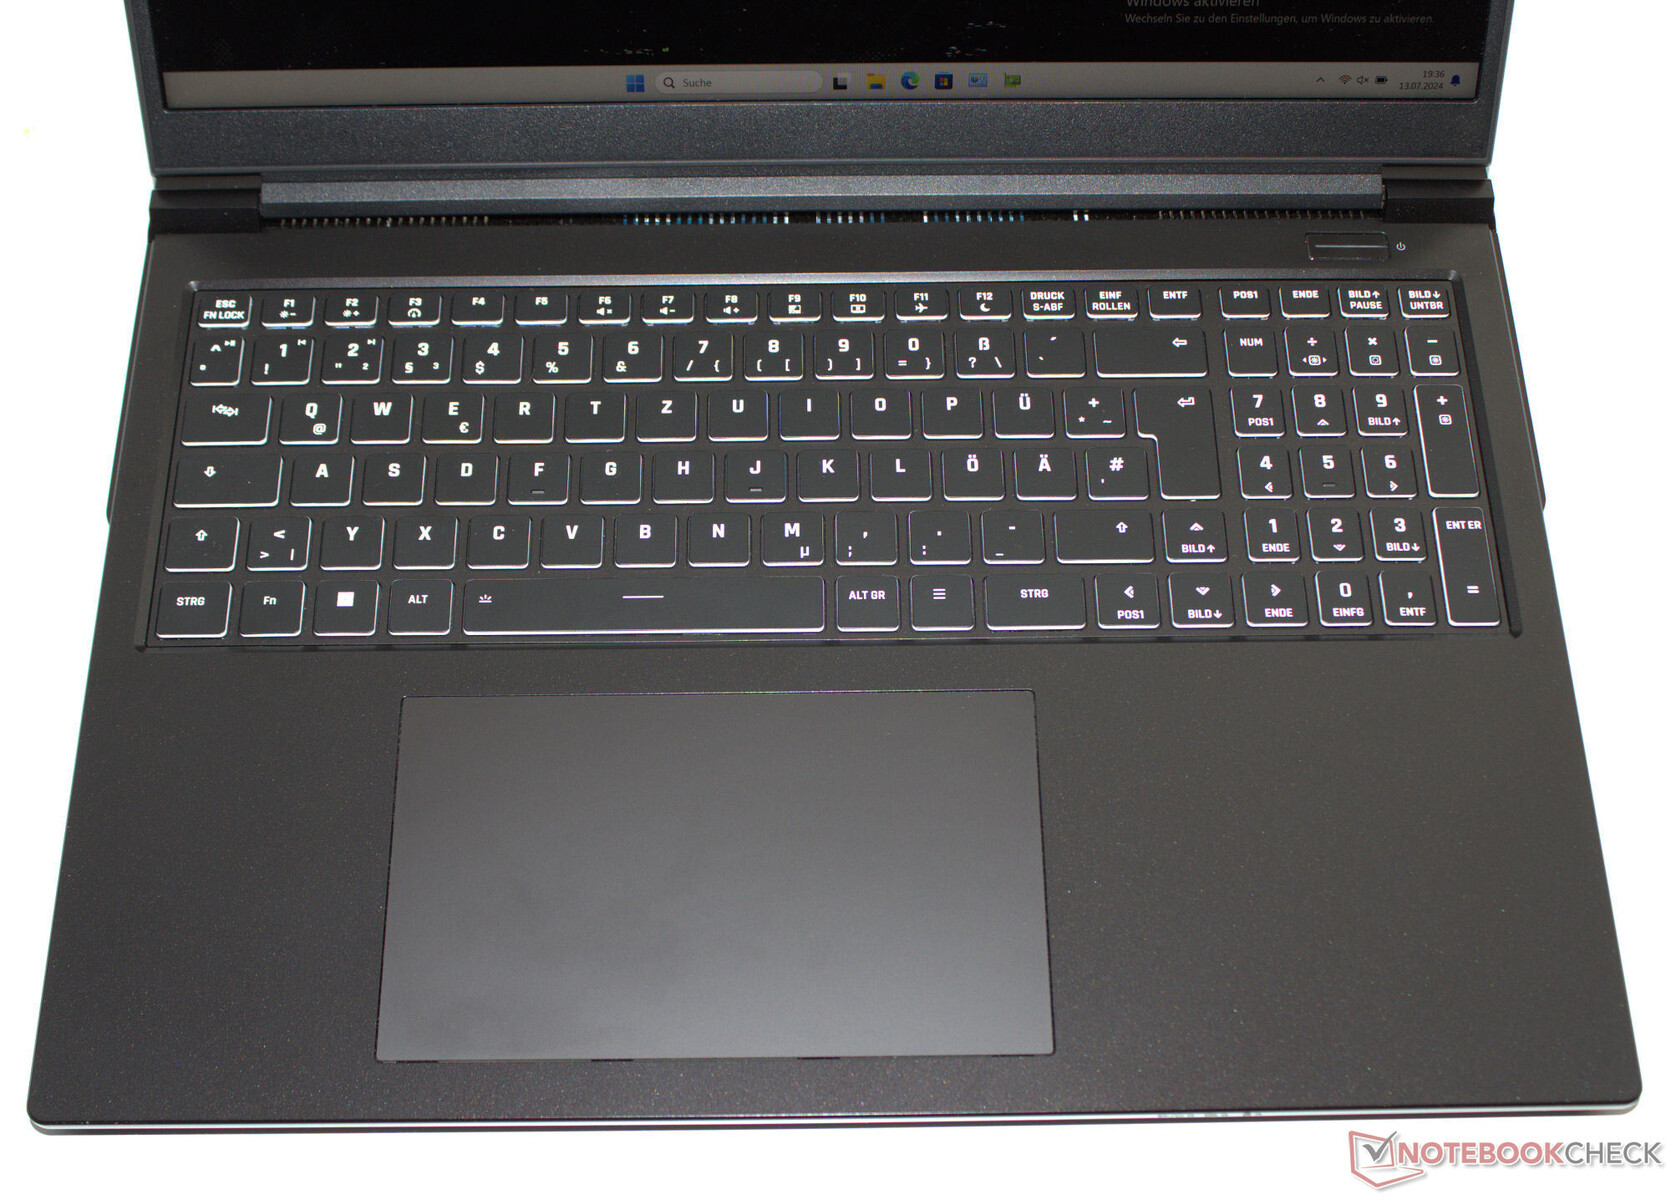
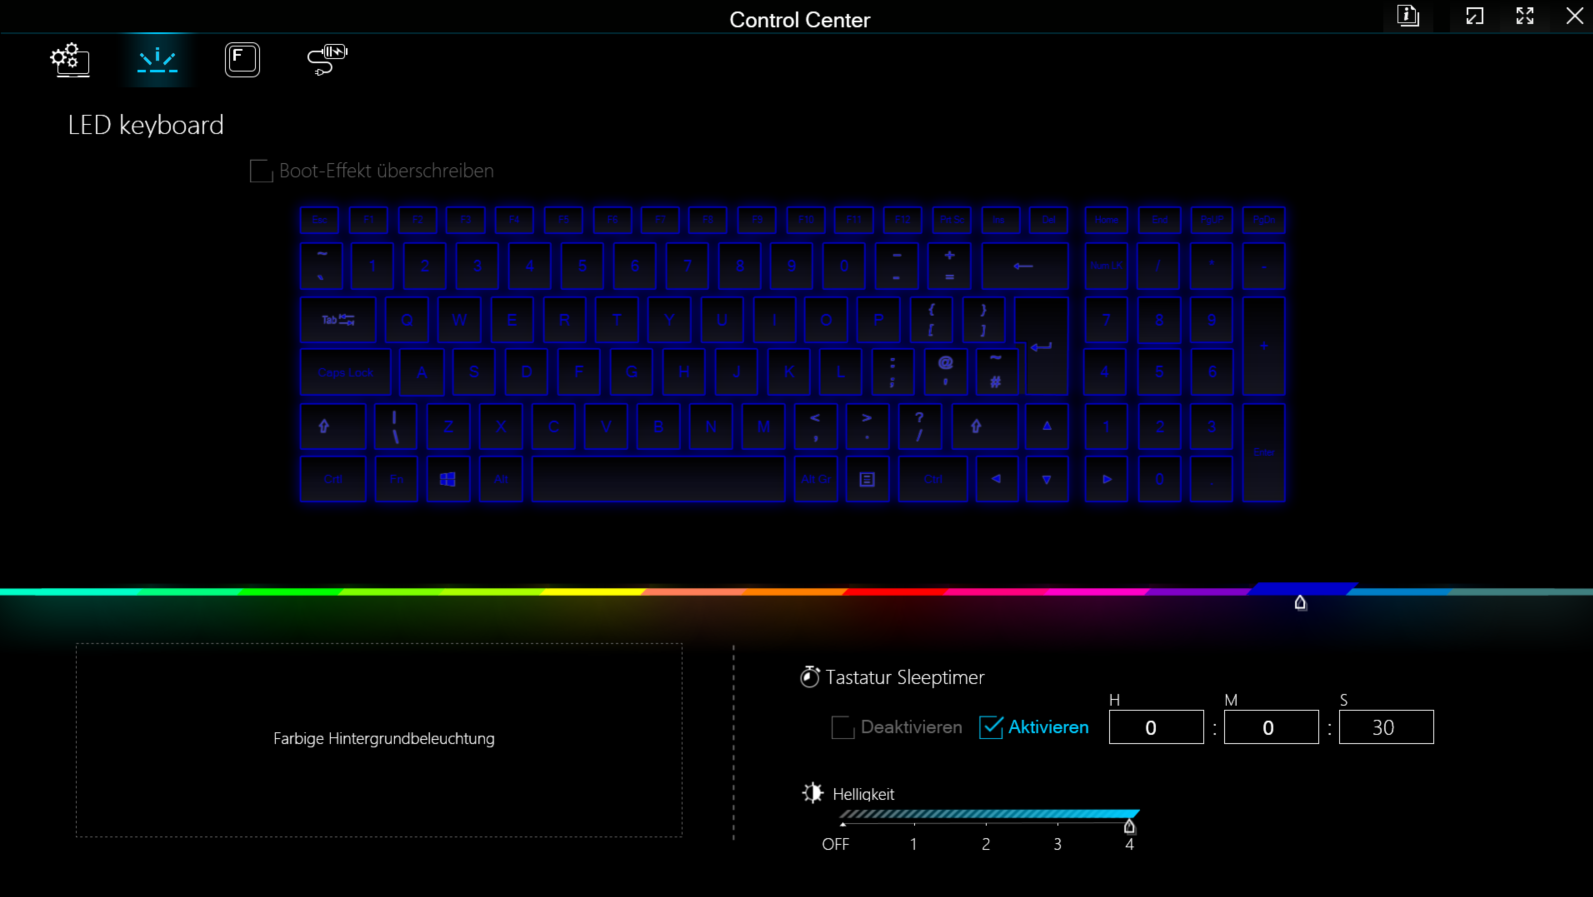
A menudo la regla con Schenker, y una excepción cuando se trata de otros fabricantes: El teclado chiclet retroiluminado (RGB, de cuatro niveles) podría sustituirse fácilmente, ya que sólo está sujeto por dos tornillos (y algunos clips). Sus teclas planas y suaves tienen un recorrido medio y un punto de presión claro. Su resistencia podría ser más nítida, pero esto es cuestión de gustos. Una ligera cesión del teclado no debería molestarle durante el uso diario. Positivo: Las cuatro teclas de flecha son de tamaño normal. Un clickpad multitáctil de tamaño generoso (15,1 x 9,1 cm) sirve para controlar el puntero del ratón.
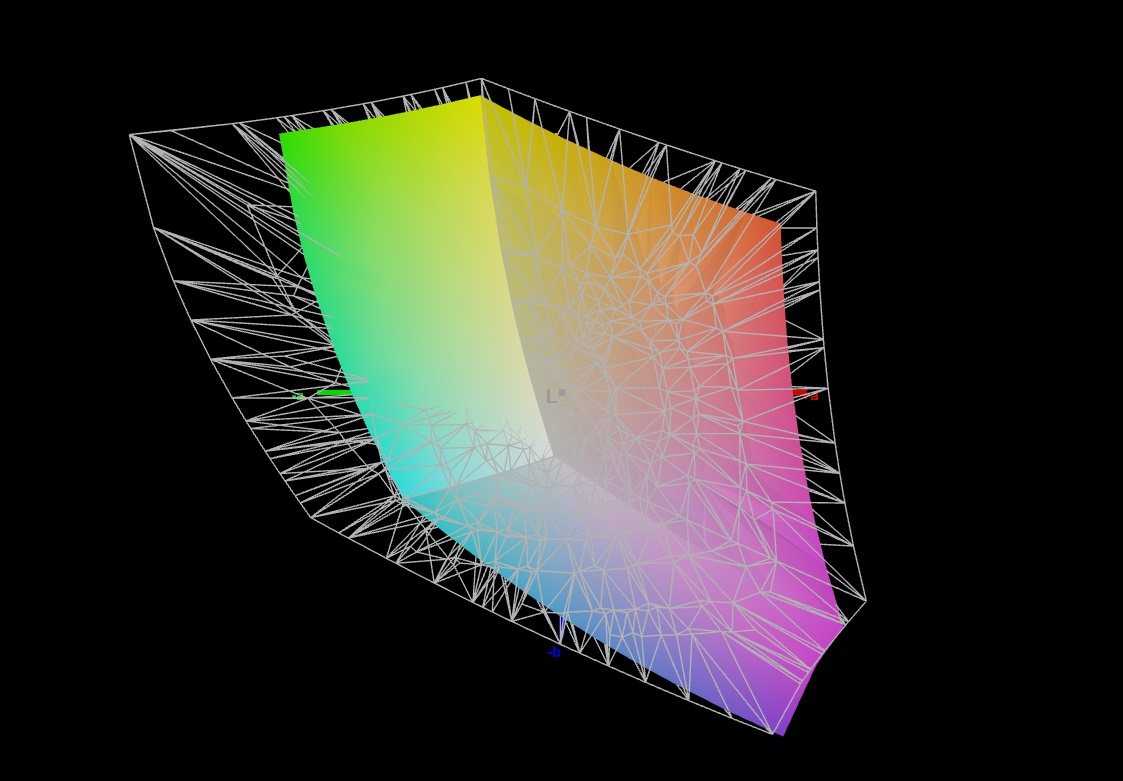
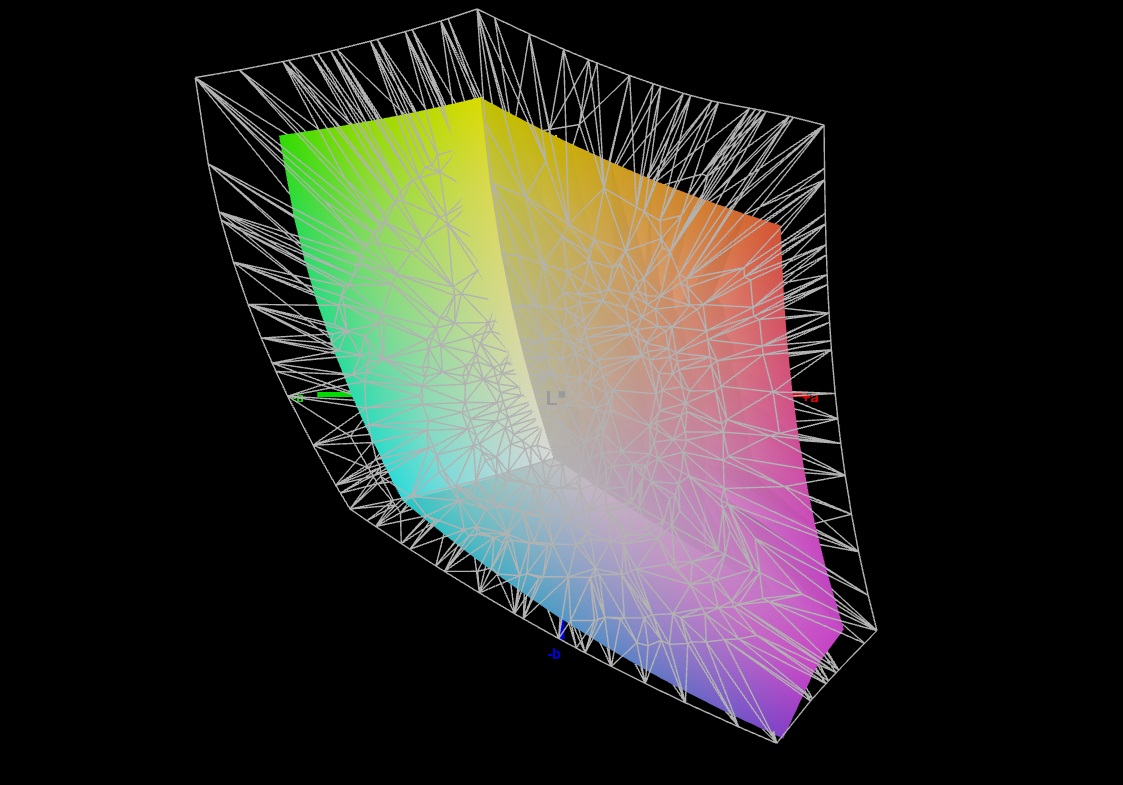
Pantalla - 16:10, IPS, sRGB
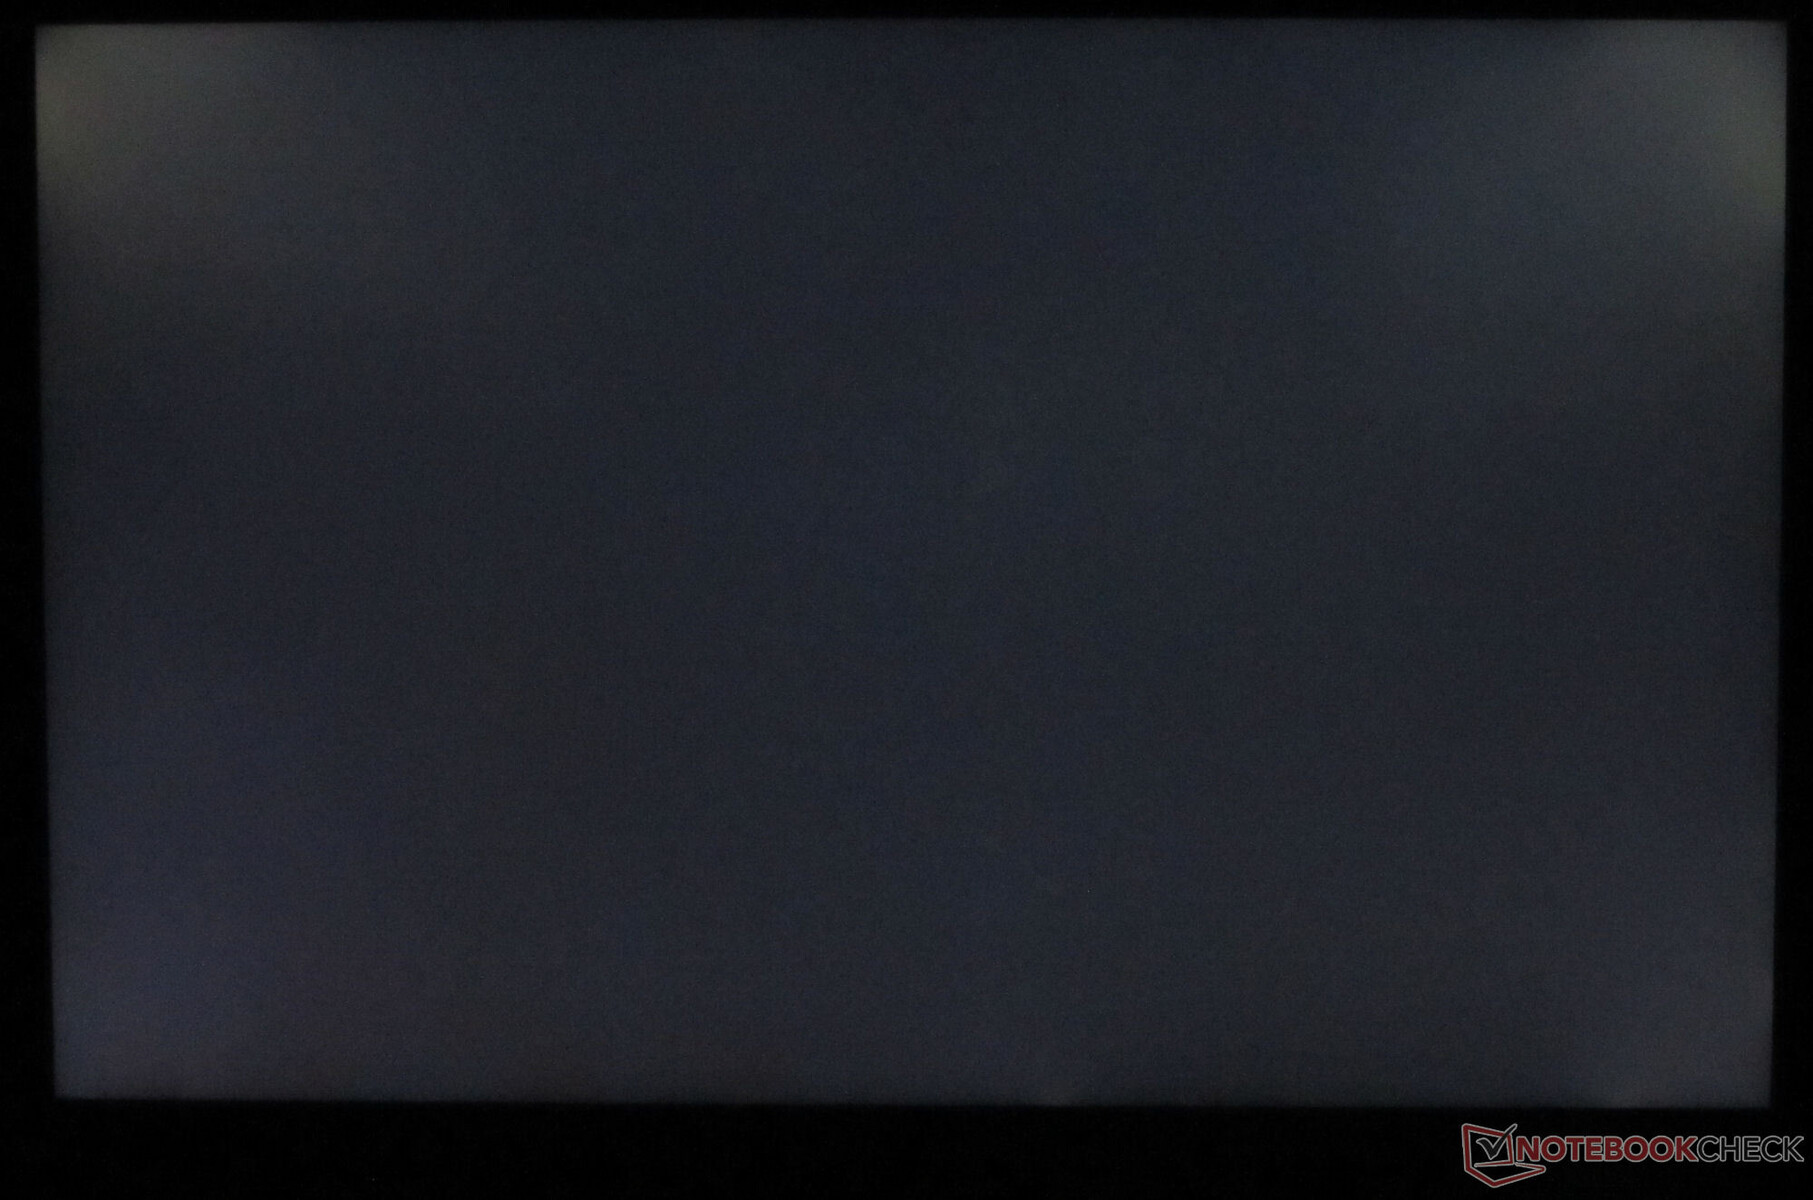
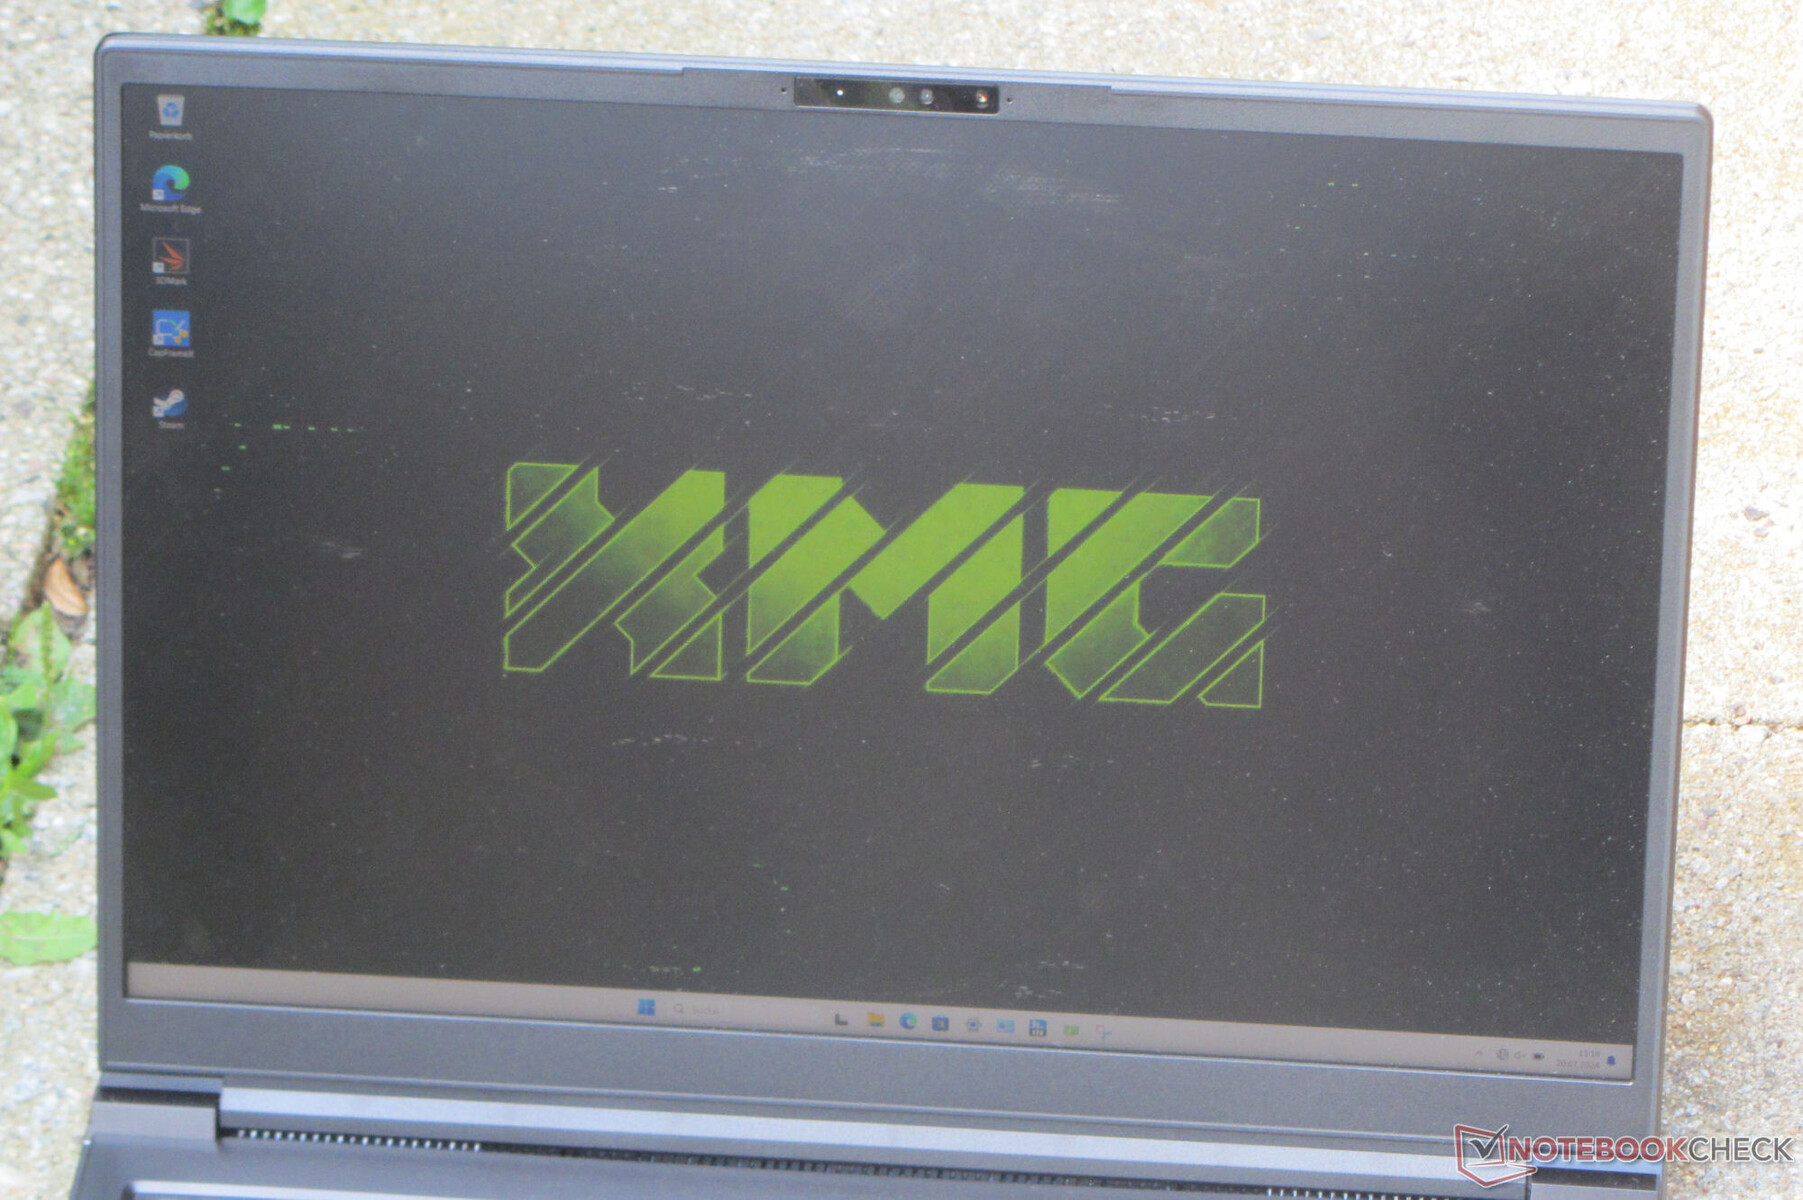
La pantalla de 16 pulgadas (2.560 x 1.600 píxeles) con una relación de aspecto 16:10 resulta familiar: El portátil hace uso del mismo panel IPS de BOE que ya se utilizó en la versión 2023 del Pro 16. Sin embargo, se beneficia de un brillo máximo ligeramente superior. En conjunto, los valores de la pantalla que hemos medido son suficientes para un uso en interiores. Leer al aire libre debería ser posible siempre que el sol no sea demasiado brillante. Positivo: El panel sensible de 240 Hz no muestra parpadeo PWM. No dispone de opciones de visualización alternativas.
| |||||||||||||||||||||||||
iluminación: 86 %
Brillo con batería: 416 cd/m²
Contraste: 1095:1 (Negro: 0.38 cd/m²)
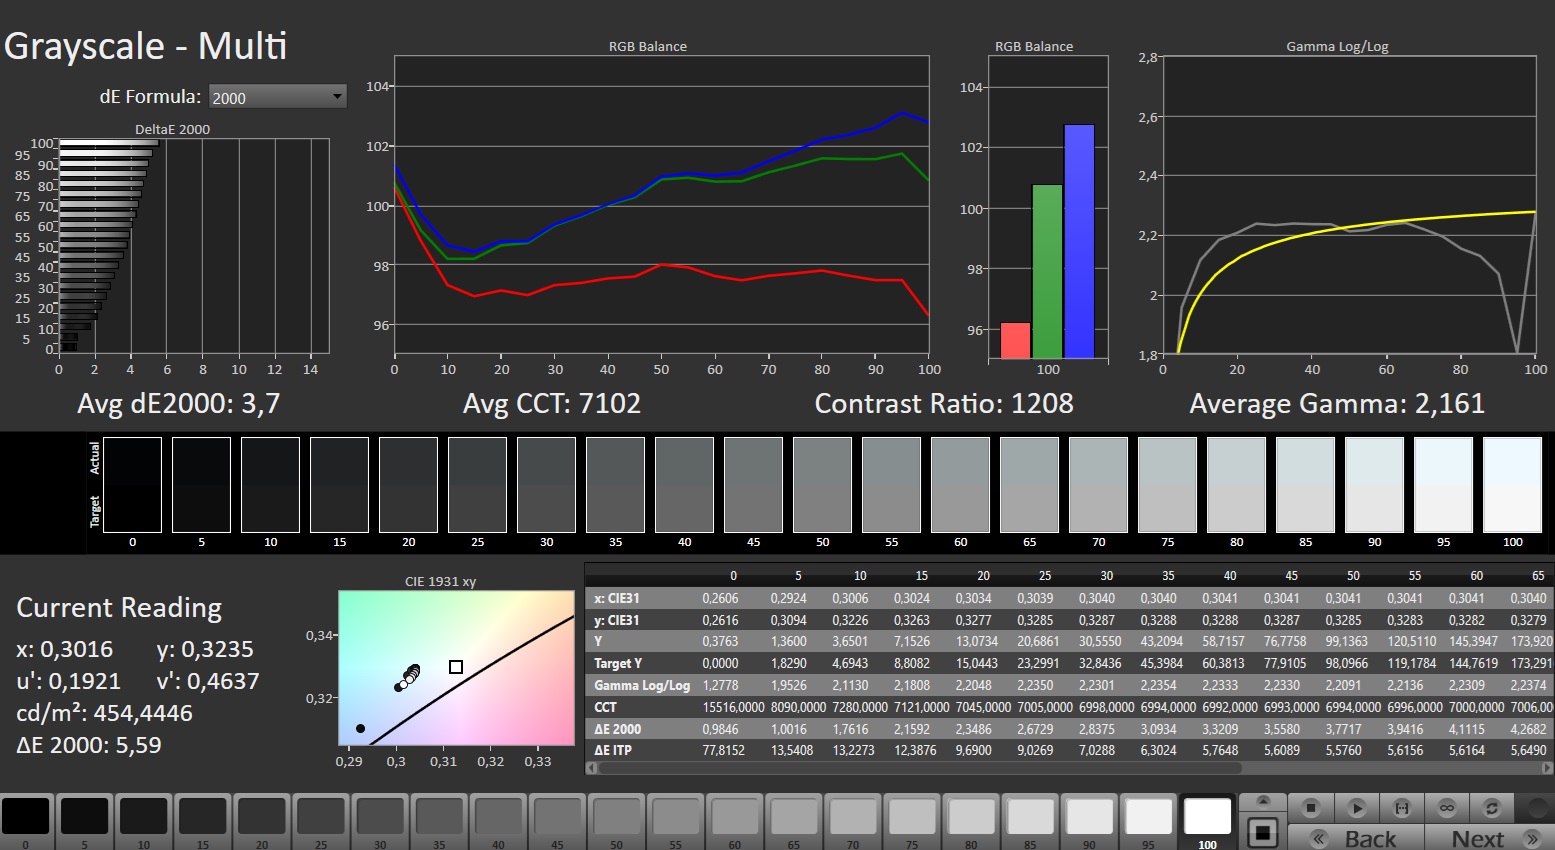
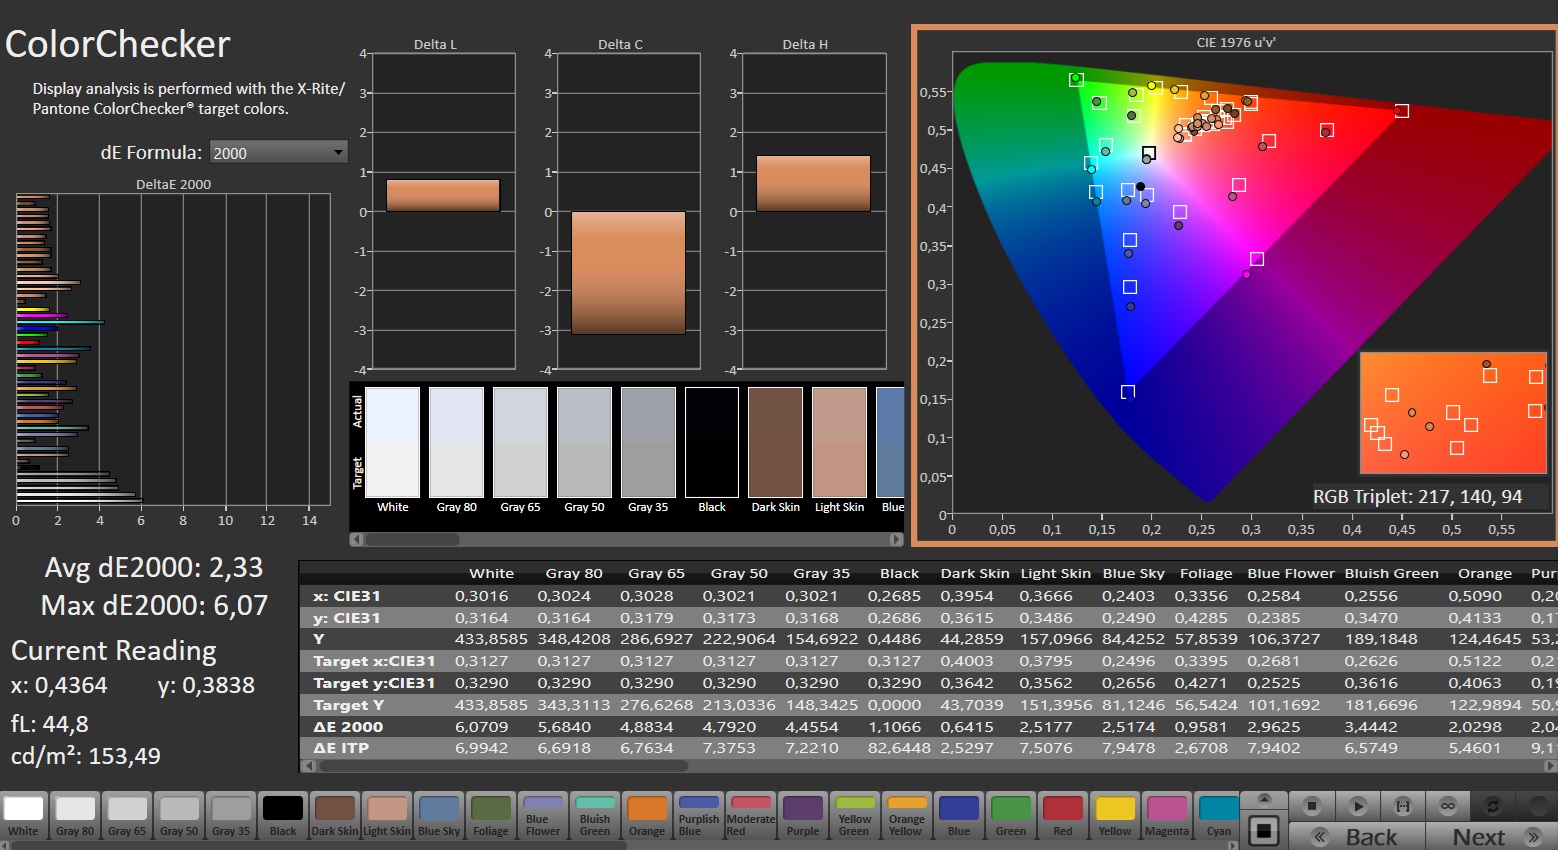
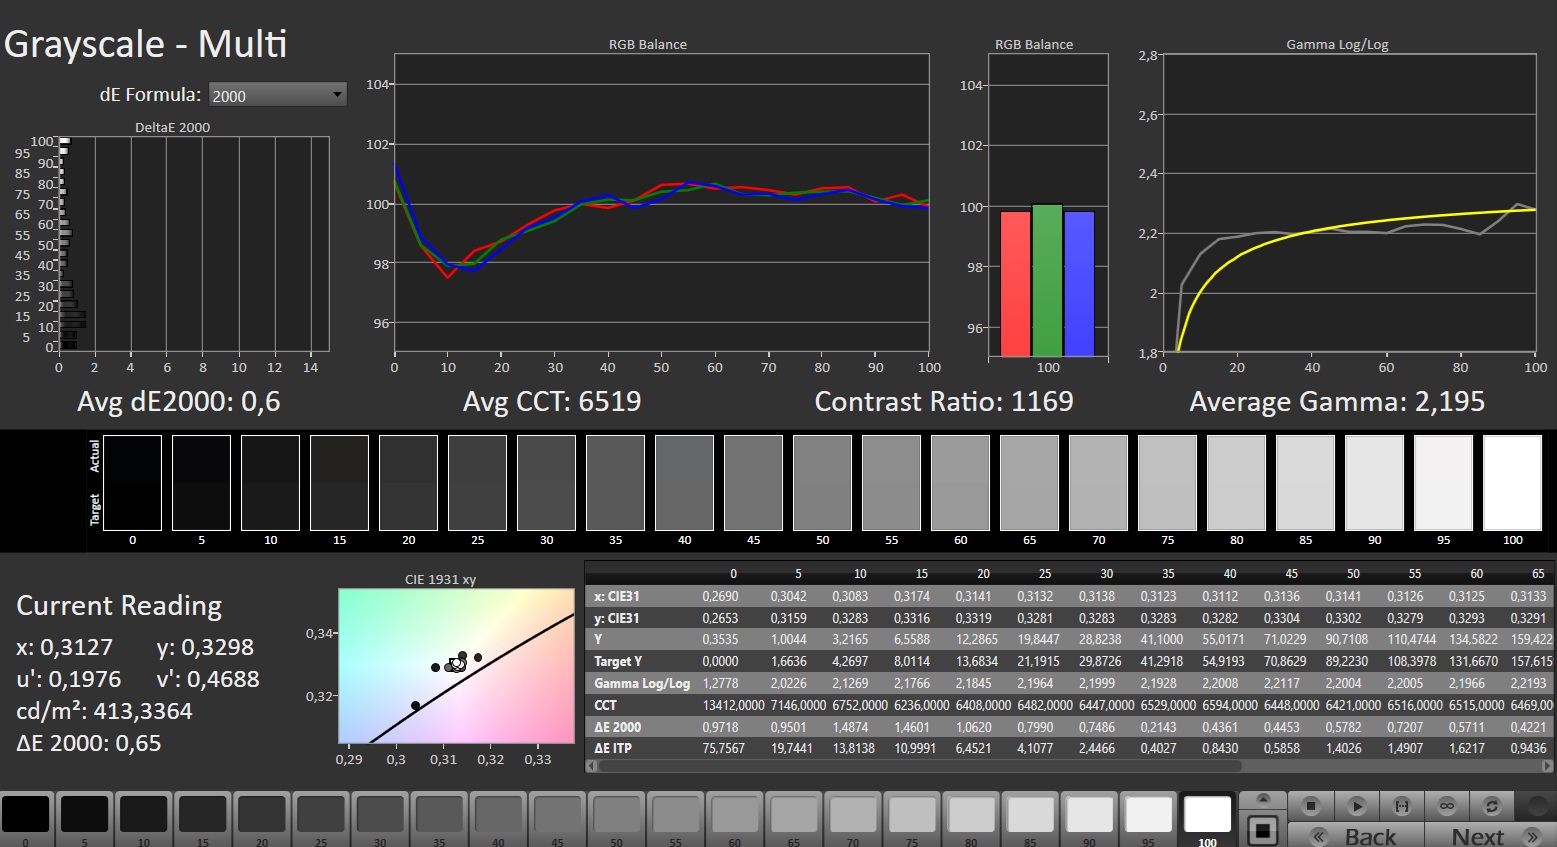
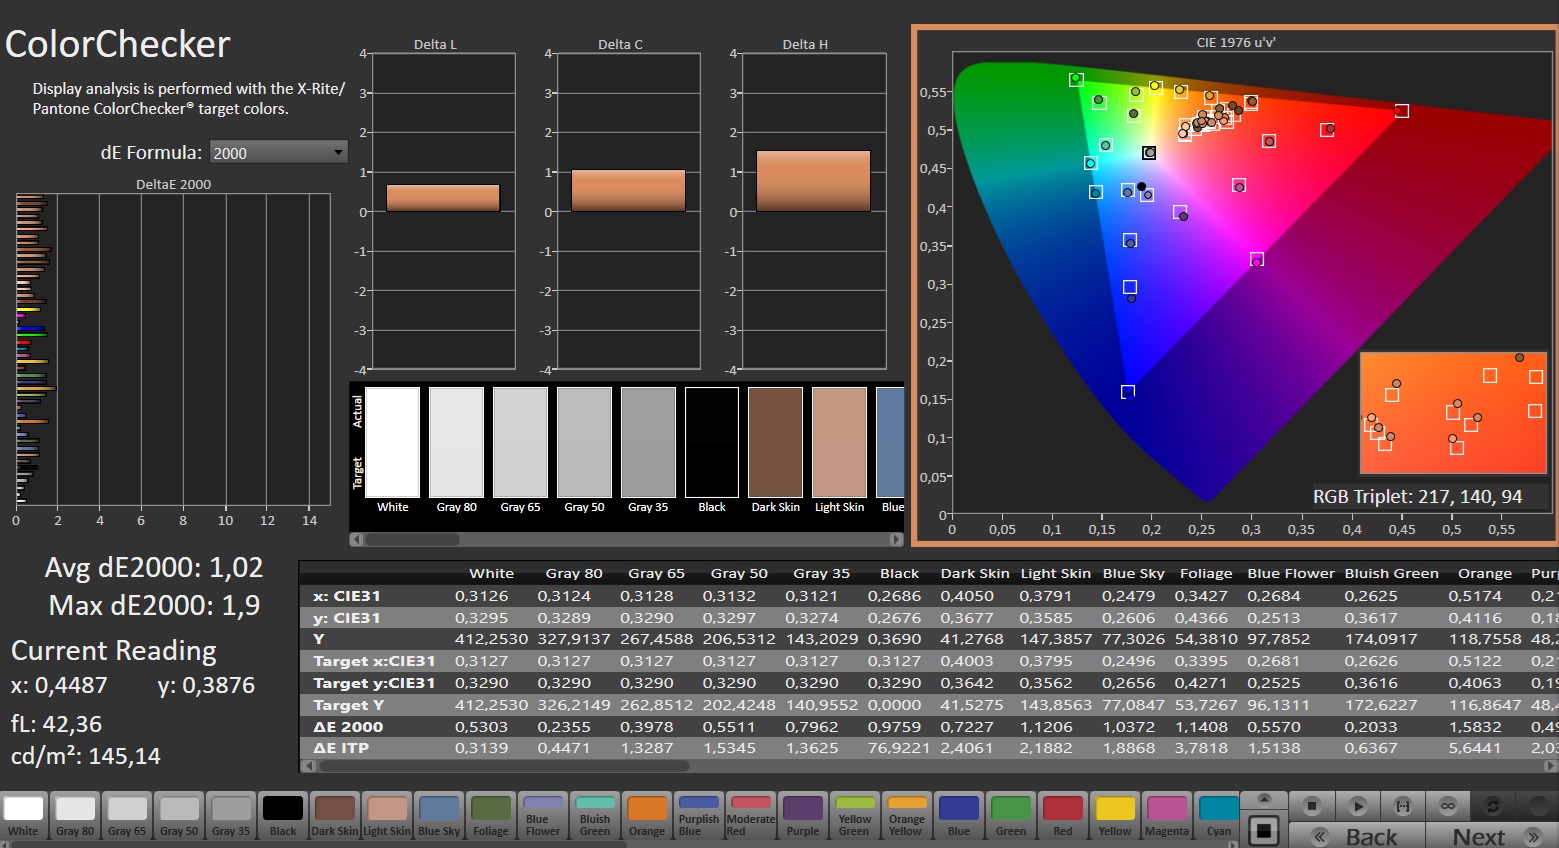
ΔE Color 2.33 | 0.5-29.43 Ø4.87, calibrated: 1.02
ΔE Greyscale 3.7 | 0.5-98 Ø5.1
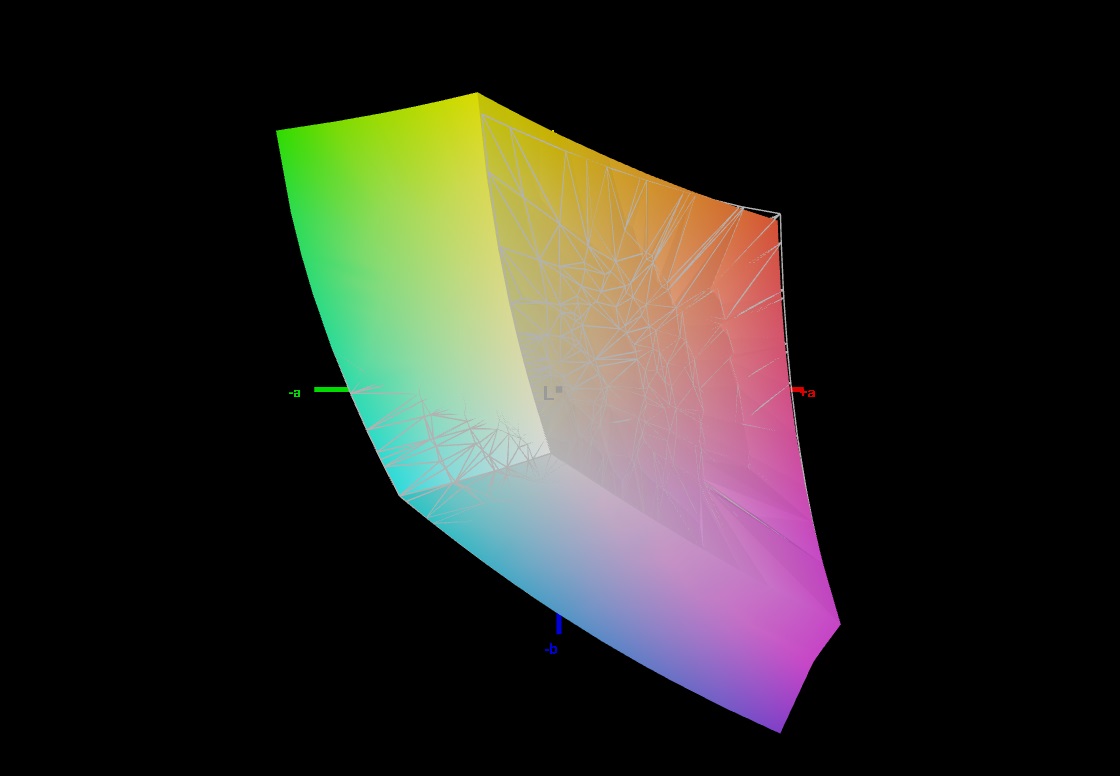
70.8% AdobeRGB 1998 (Argyll 2.2.0 3D)
99.5% sRGB (Argyll 2.2.0 3D)
68.8% Display P3 (Argyll 2.2.0 3D)
Gamma: 2.161
| SCHENKER XMG Pro 16 Studio (Mid 24) BOE CQ NE160QDM-NZ1, IPS, 2560x1600, 16" | Acer Predator Helios Neo 16 (2024) Chi Mei N160GME-GTB, LED, 2560x1600, 16" | Lenovo Legion Pro 5 16IRX9 BOE NE160QDM-NYC, IPS, 2560x1600, 16" | Aorus 16X 2024 BOE CQ NE160QDM-NY1, IPS, 2560x1600, 16" | SCHENKER XMG Pro 16 Studio (Mid 23) BOE CQ NE160QDM-NZ1, IPS, 2560x1600, 16" | Lenovo Legion 7 16 IRX G9 MNG007ZA1-2, IPS, 3200x2000, 16" | |
|---|---|---|---|---|---|---|
| Display | 20% | 0% | -2% | -0% | 21% | |
| Display P3 Coverage | 68.8 | 95.9 39% | 69.3 1% | 67.2 -2% | 69.4 1% | 95 38% |
| sRGB Coverage | 99.5 | 99.8 0% | 99.4 0% | 96.7 -3% | 98.2 -1% | 100 1% |
| AdobeRGB 1998 Coverage | 70.8 | 86.4 22% | 70.1 -1% | 69.3 -2% | 70.1 -1% | 87.2 23% |
| Response Times | 11% | -18% | 28% | -9% | -14% | |
| Response Time Grey 50% / Grey 80% * | 12.7 ? | 5 ? 61% | 11.9 ? 6% | 7.5 ? 41% | 12.2 ? 4% | 14.4 ? -13% |
| Response Time Black / White * | 6.3 ? | 8.8 ? -40% | 8.9 ? -41% | 5.4 ? 14% | 7.7 ? -22% | 7.2 ? -14% |
| PWM Frequency | ||||||
| Screen | 19% | 20% | 4% | -5% | 23% | |
| Brightness middle | 416 | 521 25% | 384 -8% | 542 30% | 349 -16% | 412 -1% |
| Brightness | 392 | 506 29% | 366 -7% | 504 29% | 348 -11% | 396 1% |
| Brightness Distribution | 86 | 85 -1% | 91 6% | 86 0% | 93 8% | 89 3% |
| Black Level * | 0.38 | 0.44 -16% | 0.35 8% | 0.45 -18% | 0.32 16% | 0.43 -13% |
| Contrast | 1095 | 1184 8% | 1097 0% | 1204 10% | 1091 0% | 958 -13% |
| Colorchecker dE 2000 * | 2.33 | 1.74 25% | 0.97 58% | 2.73 -17% | 1.98 15% | 0.9 61% |
| Colorchecker dE 2000 max. * | 6.07 | 3.88 36% | 3.57 41% | 5.29 13% | 7.56 -25% | 2 67% |
| Colorchecker dE 2000 calibrated * | 1.02 | 0.52 49% | 0.77 25% | 1.32 -29% | 1.45 -42% | 0.6 41% |
| Greyscale dE 2000 * | 3.7 | 3 19% | 1.5 59% | 2.9 22% | 3.3 11% | 1.4 62% |
| Gamma | 2.161 102% | 2.164 102% | 2.24 98% | 2.192 100% | 2.137 103% | 2.23 99% |
| CCT | 7102 92% | 6816 95% | 6709 97% | 6173 105% | 6672 97% | 6731 97% |
| Media total (Programa/Opciones) | 17% /
18% | 1% /
11% | 10% /
6% | -5% /
-5% | 10% /
17% |
* ... más pequeño es mejor
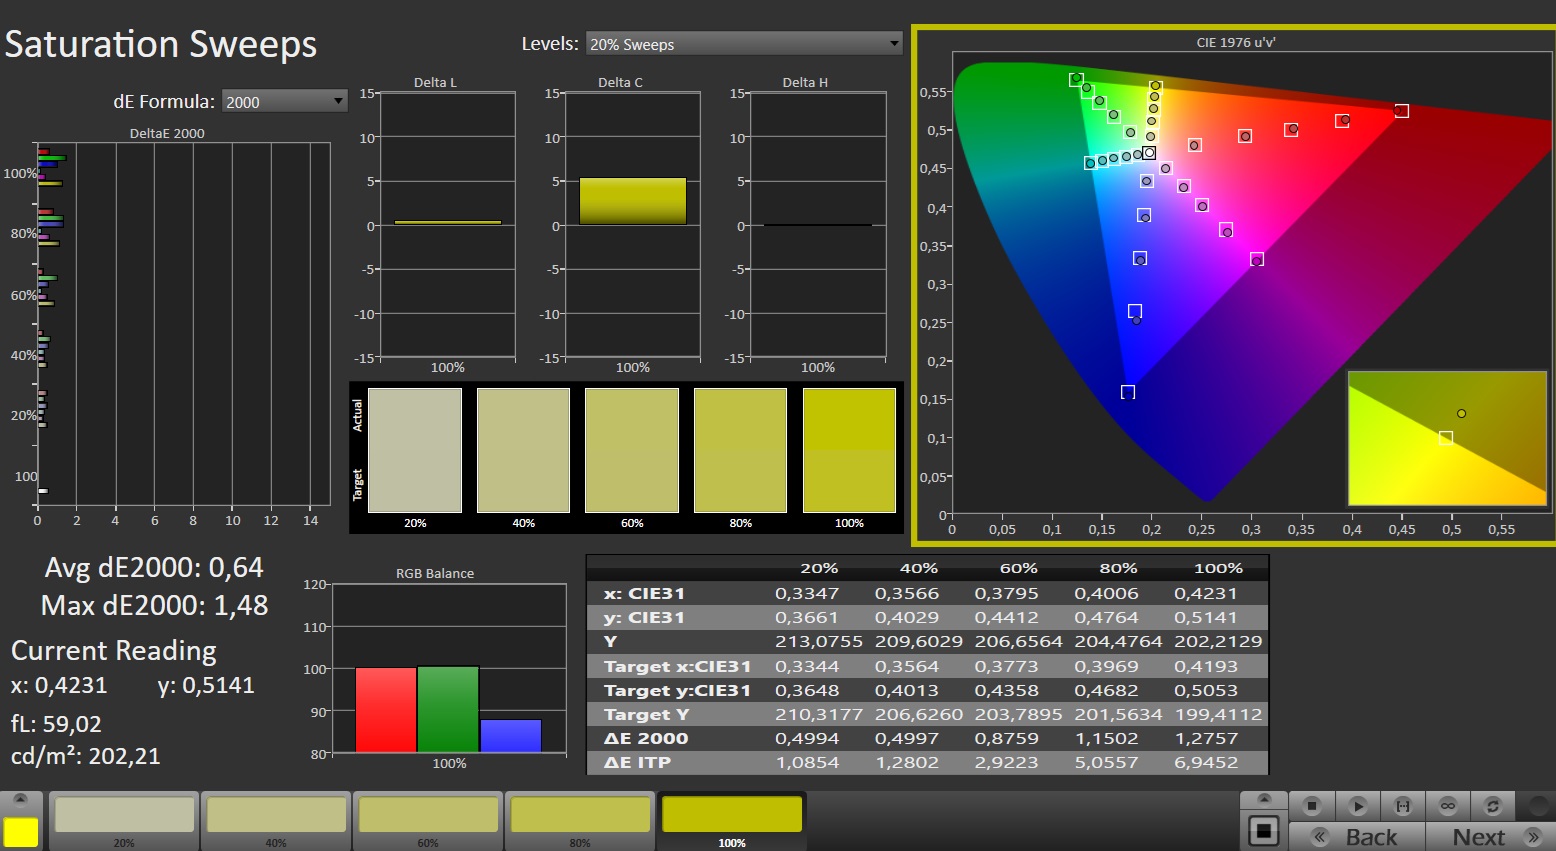
La cobertura del espacio de color del panel instalado es decepcionante. Sólo se puede reproducir el espacio sRGB, no los espacios AdobeRGB y DCI-P3. Sin embargo, esto no difiere de las pantallas de la mayoría de los competidores. No obstante, la pantalla de un portátil que se comercializa como "estación de trabajo profesional para la creación de contenidos" debería ofrecer realmente la gama completa. Su reproducción del color parece mejor: Una ligera desviación de 2,26 (objetivo: DeltaE < 3) podría reducirse a 1,03 realizando un calibrado.

Tiempos de respuesta del display
| ↔ Tiempo de respuesta de Negro a Blanco | ||
|---|---|---|
| 6.3 ms ... subida ↗ y bajada ↘ combinada | ↗ 2.5 ms subida | 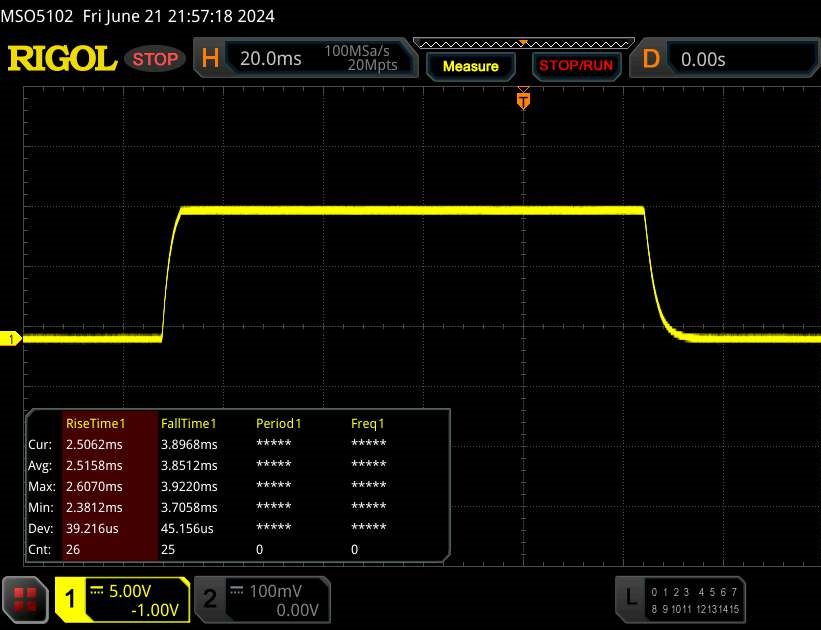 |
| ↘ 3.8 ms bajada | ||
| La pantalla mostró tiempos de respuesta muy rápidos en nuestros tests y debería ser adecuada para juegos frenéticos. En comparación, todos los dispositivos de prueba van de ##min### (mínimo) a 240 (máximo) ms. » 17 % de todos los dispositivos son mejores. Esto quiere decir que el tiempo de respuesta medido es mejor que la media (20.8 ms) de todos los dispositivos testados. | ||
| ↔ Tiempo de respuesta 50% Gris a 80% Gris | ||
| 12.7 ms ... subida ↗ y bajada ↘ combinada | ↗ 6 ms subida | 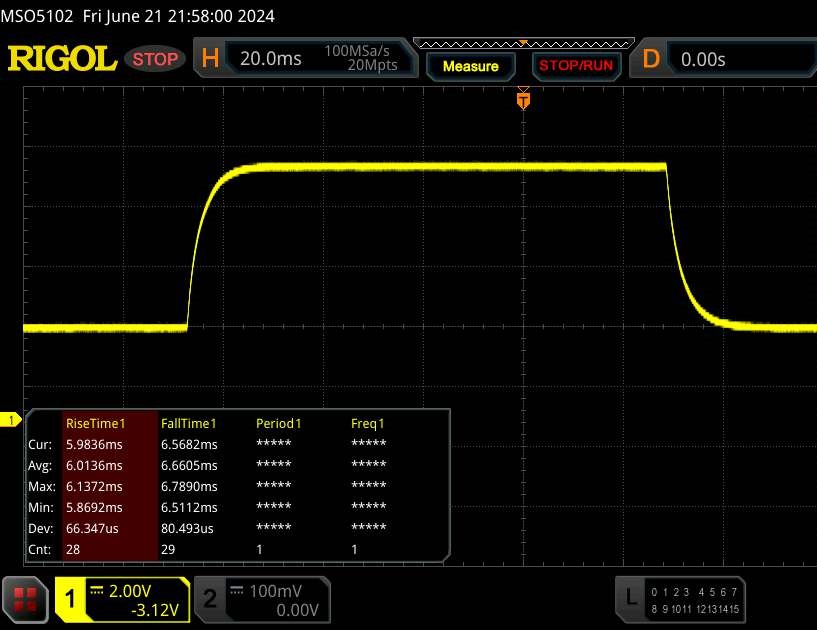 |
| ↘ 6.7 ms bajada | ||
| La pantalla mostró buenos tiempos de respuesta en nuestros tests pero podría ser demasiado lenta para los jugones competitivos. En comparación, todos los dispositivos de prueba van de ##min### (mínimo) a 636 (máximo) ms. » 23 % de todos los dispositivos son mejores. Esto quiere decir que el tiempo de respuesta medido es mejor que la media (32.5 ms) de todos los dispositivos testados. | ||
Parpadeo de Pantalla / PWM (Pulse-Width Modulation)
| Parpadeo de Pantalla / PWM no detectado |  | ||
Comparación: 53 % de todos los dispositivos testados no usaron PWM para atenuar el display. Si se usó, medimos una media de 8516 (mínimo: 5 - máxmo: 343500) Hz. | |||
Rendimiento - Raptor Lake Refresh sustituye a Raptor Lake
El XMG Pro 16 Studio (Mid 24), descrito por Schenker como un "portátil de creación de contenidos", está dirigido a jugadores y creadores. Todos los modelos incorporan un Core i9-14900HX y la selección de GPU disponibles incluye una RTX 4060 y una RTX 4070 -nuestro dispositivo de prueba está equipado con una RTX 4070. Esta variante está disponible por unos 2.500 dólares. Los precios comienzan en torno a los 1.800 dólares.
Condiciones de prueba
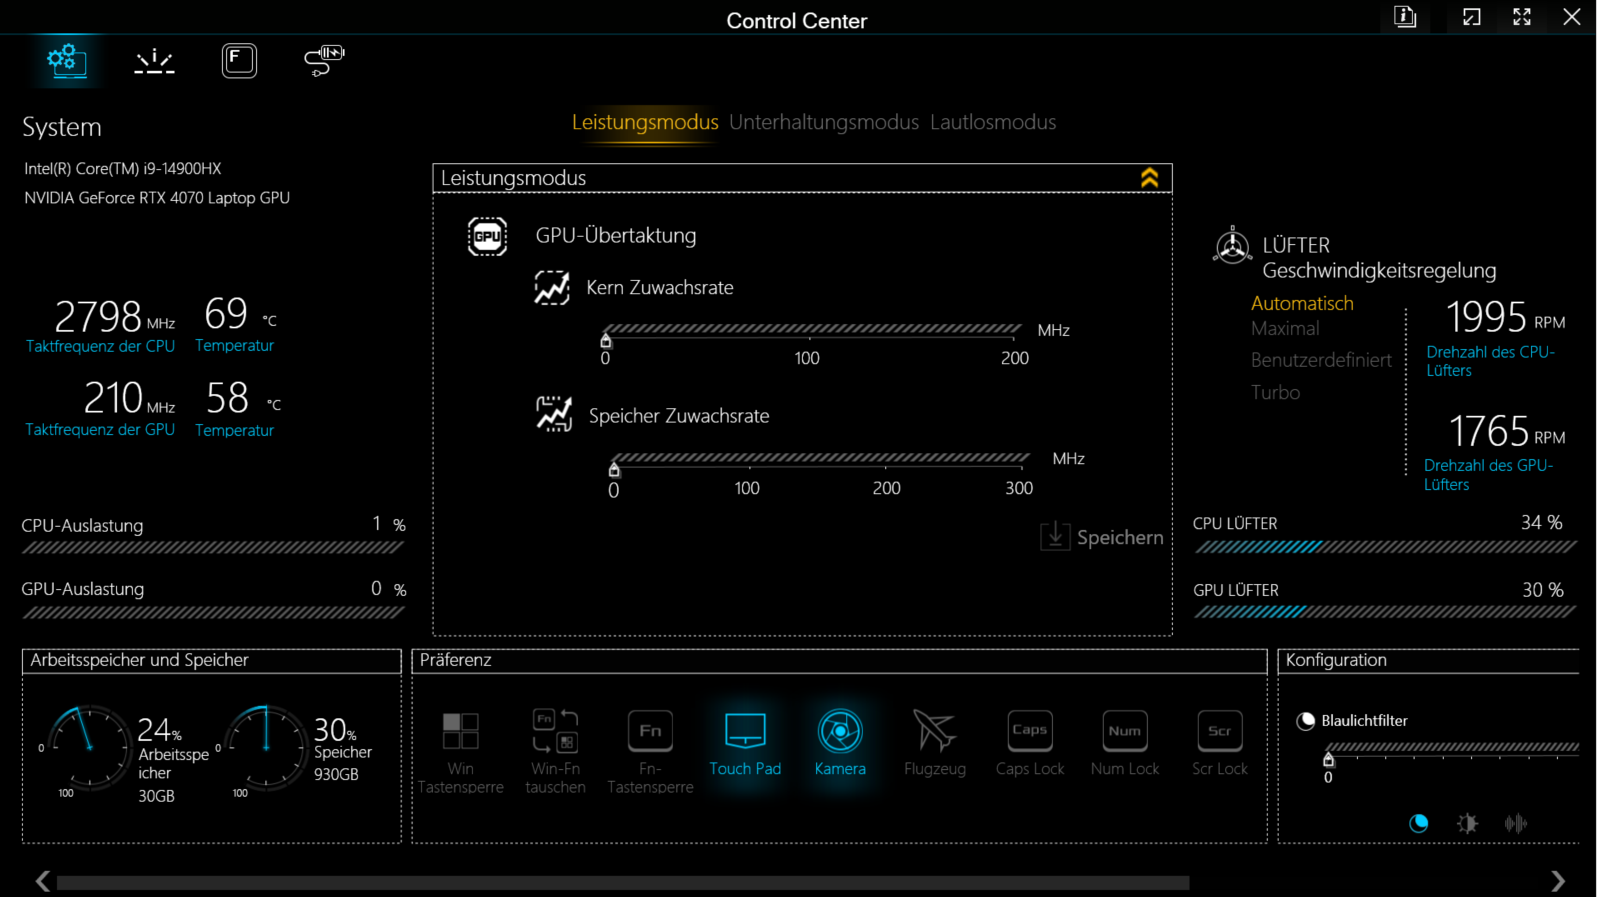
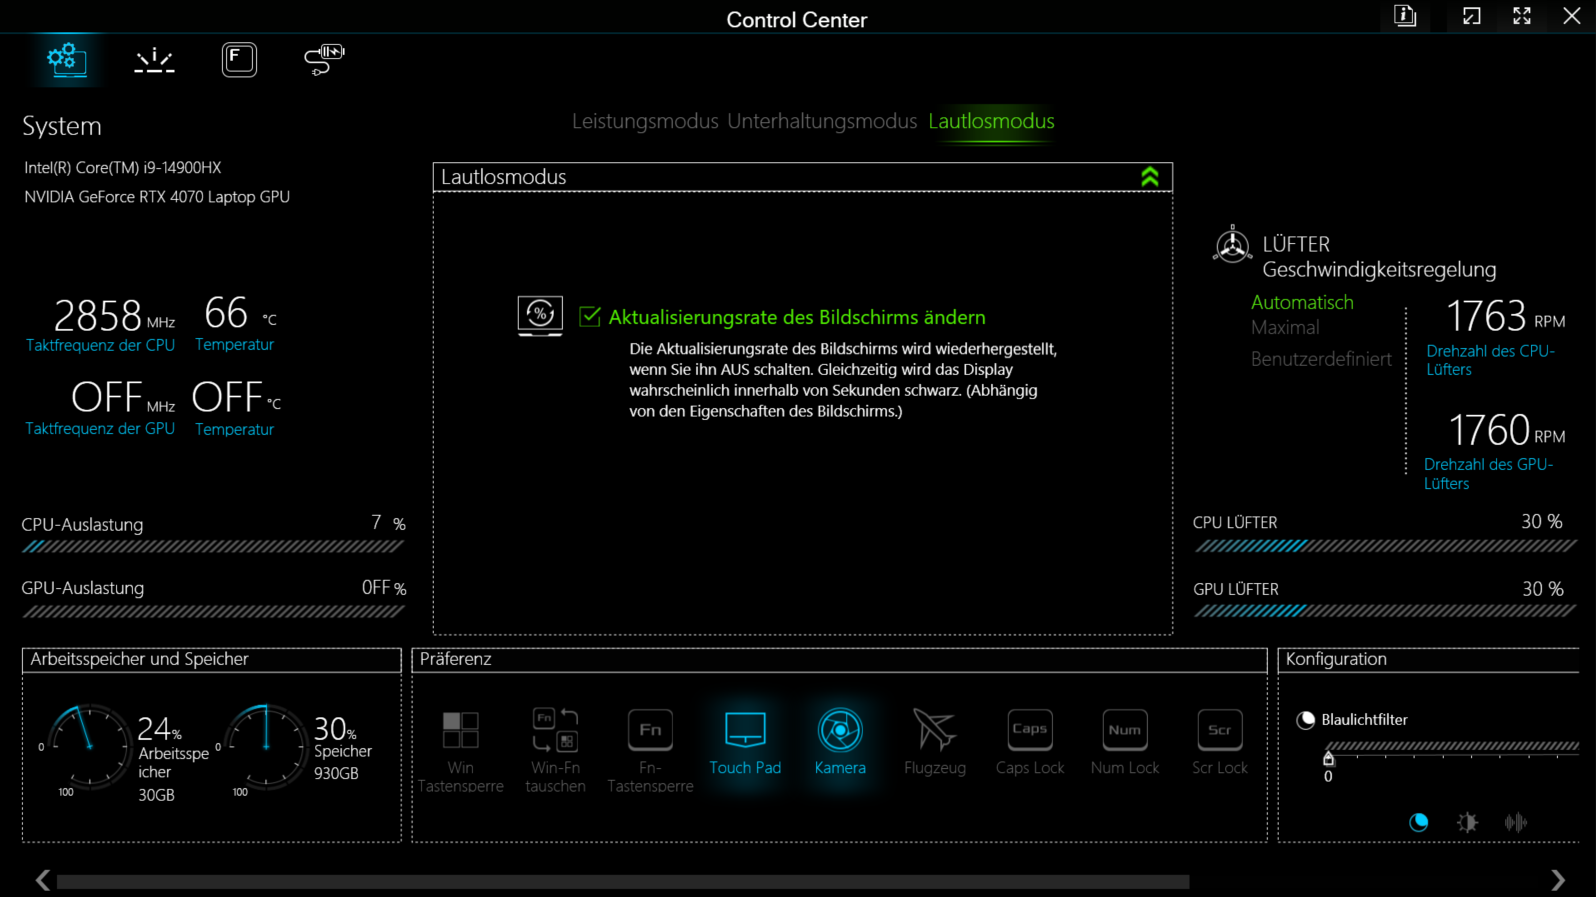
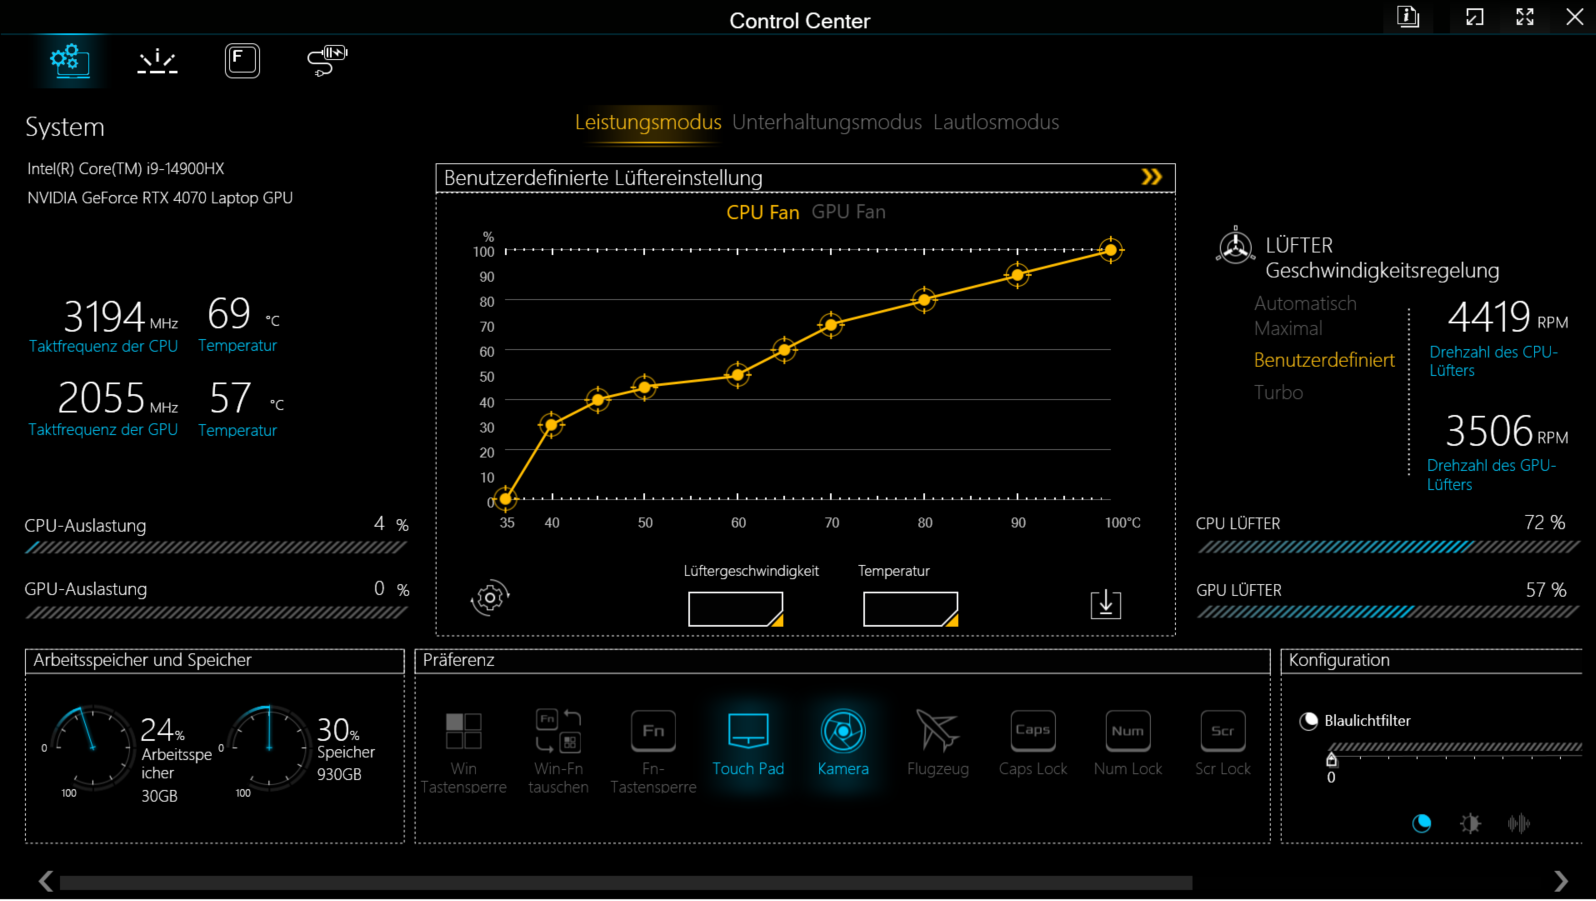
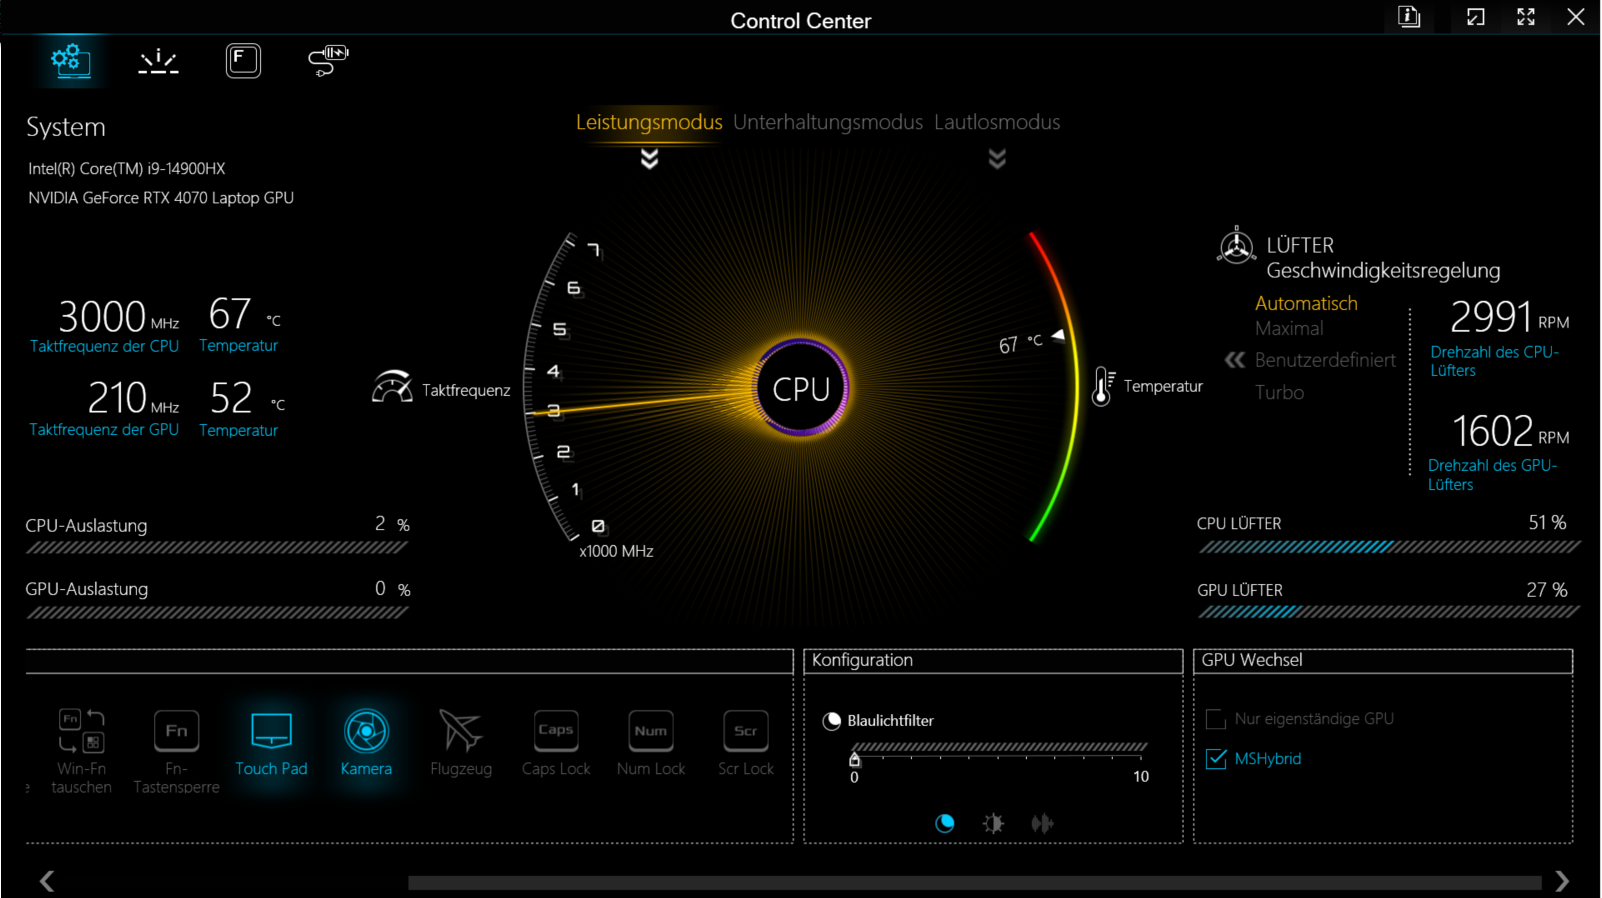
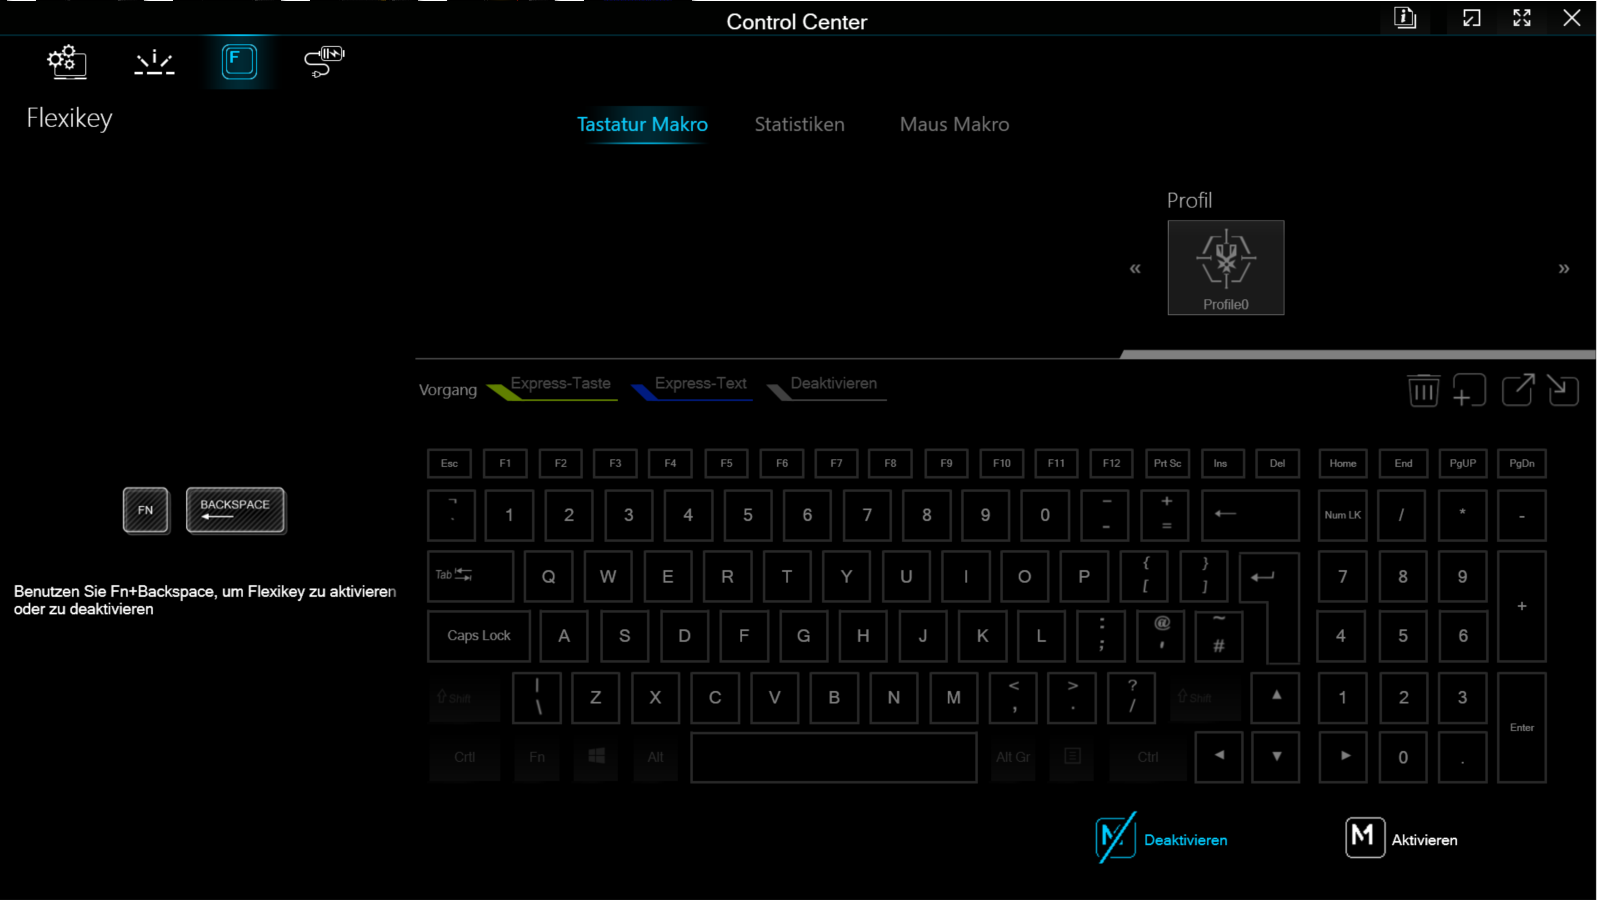
Se puede elegir entre tres modos de rendimiento específicos del fabricante (véase la tabla), entre los que se puede cambiar mediante el software Control Center (el centro de control del portátil). Nosotros utilizamos los modos rendimiento (benchmarks) y silencioso (pruebas de batería). Optimus estaba activo.
| Modo de rendimiento | Modo de entretenimiento | Modo silencioso (dGPU apagada) | |
|---|---|---|---|
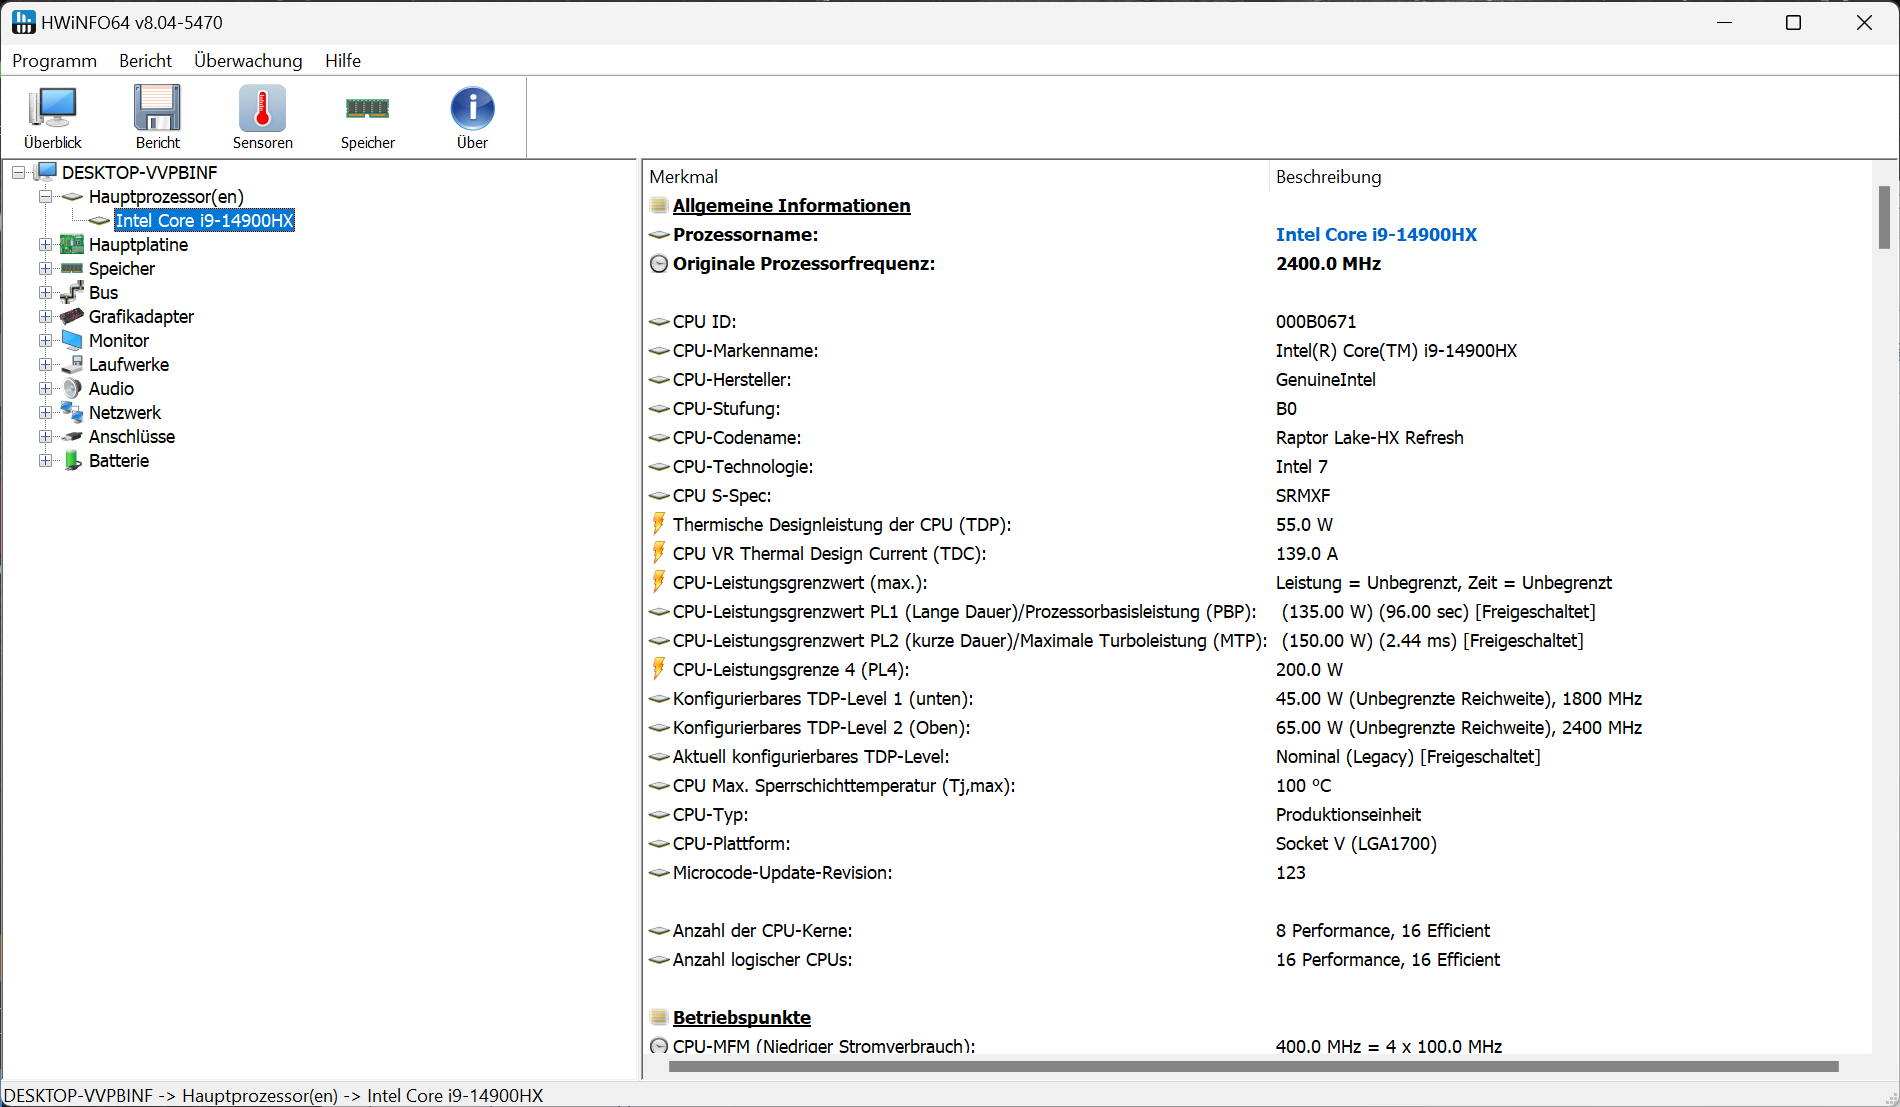
| Límite de potencia 1 (HWInfo) | 135 vatios | 55 vatios | 25 vatios |
| Límite de potencia 2 (HWInfo) | 150 vatios | 135 vatios | 35 vatios |
| Ruido (CP 2077 Phantom) | 53 dB (A) | 49 dB (A) | - |
| Rendimiento (CP 2077 Phantom) | 78 fps | 73 fps | - |
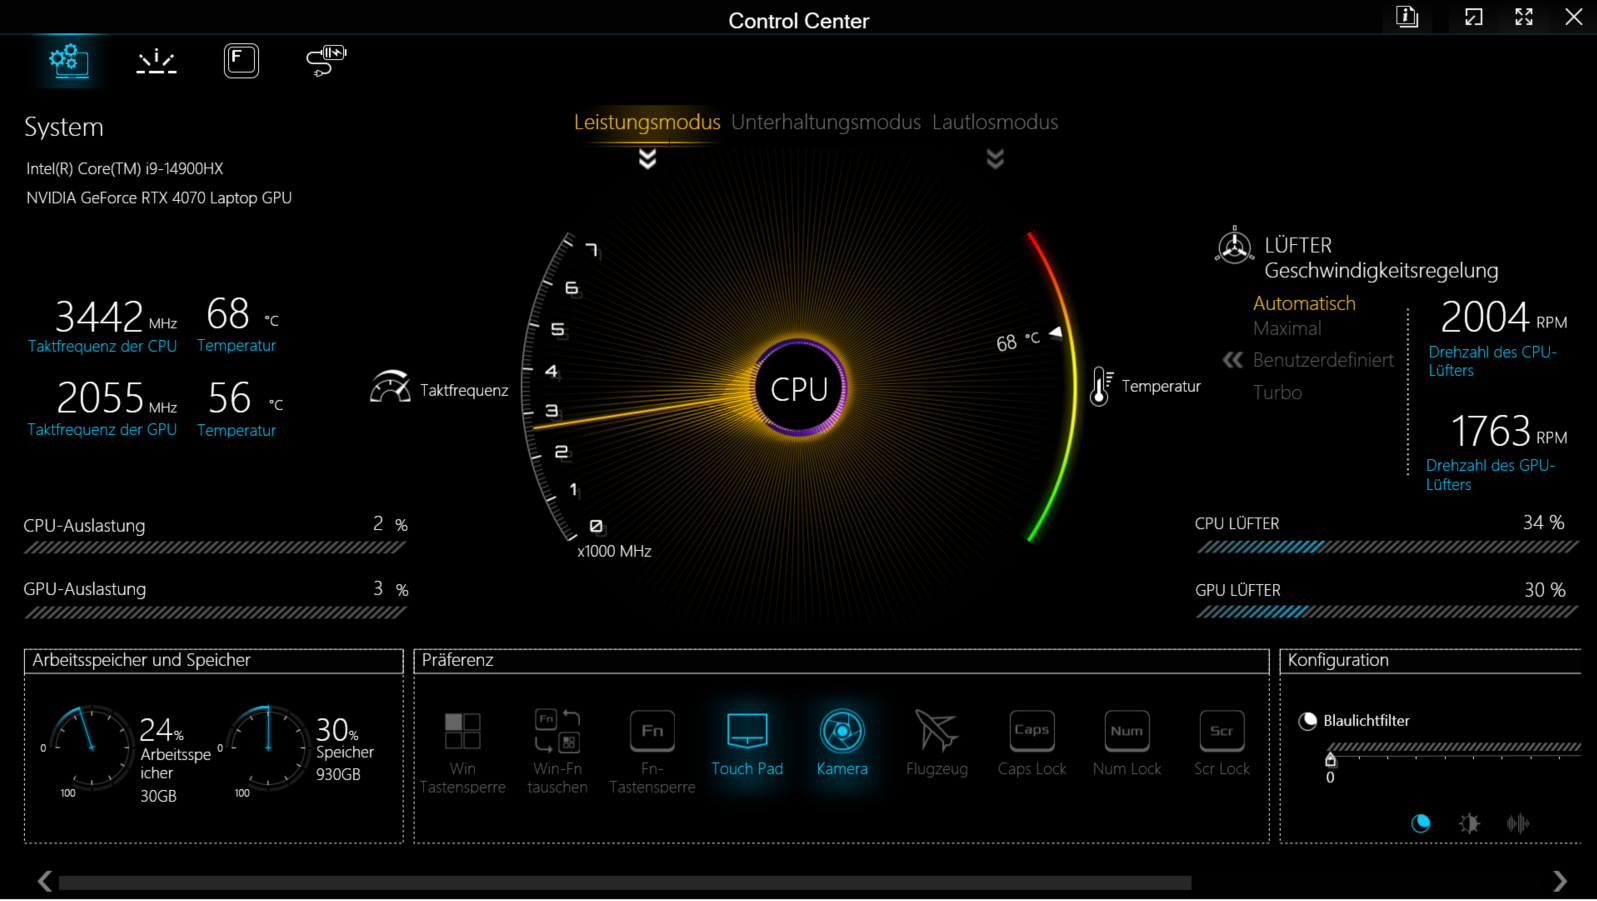
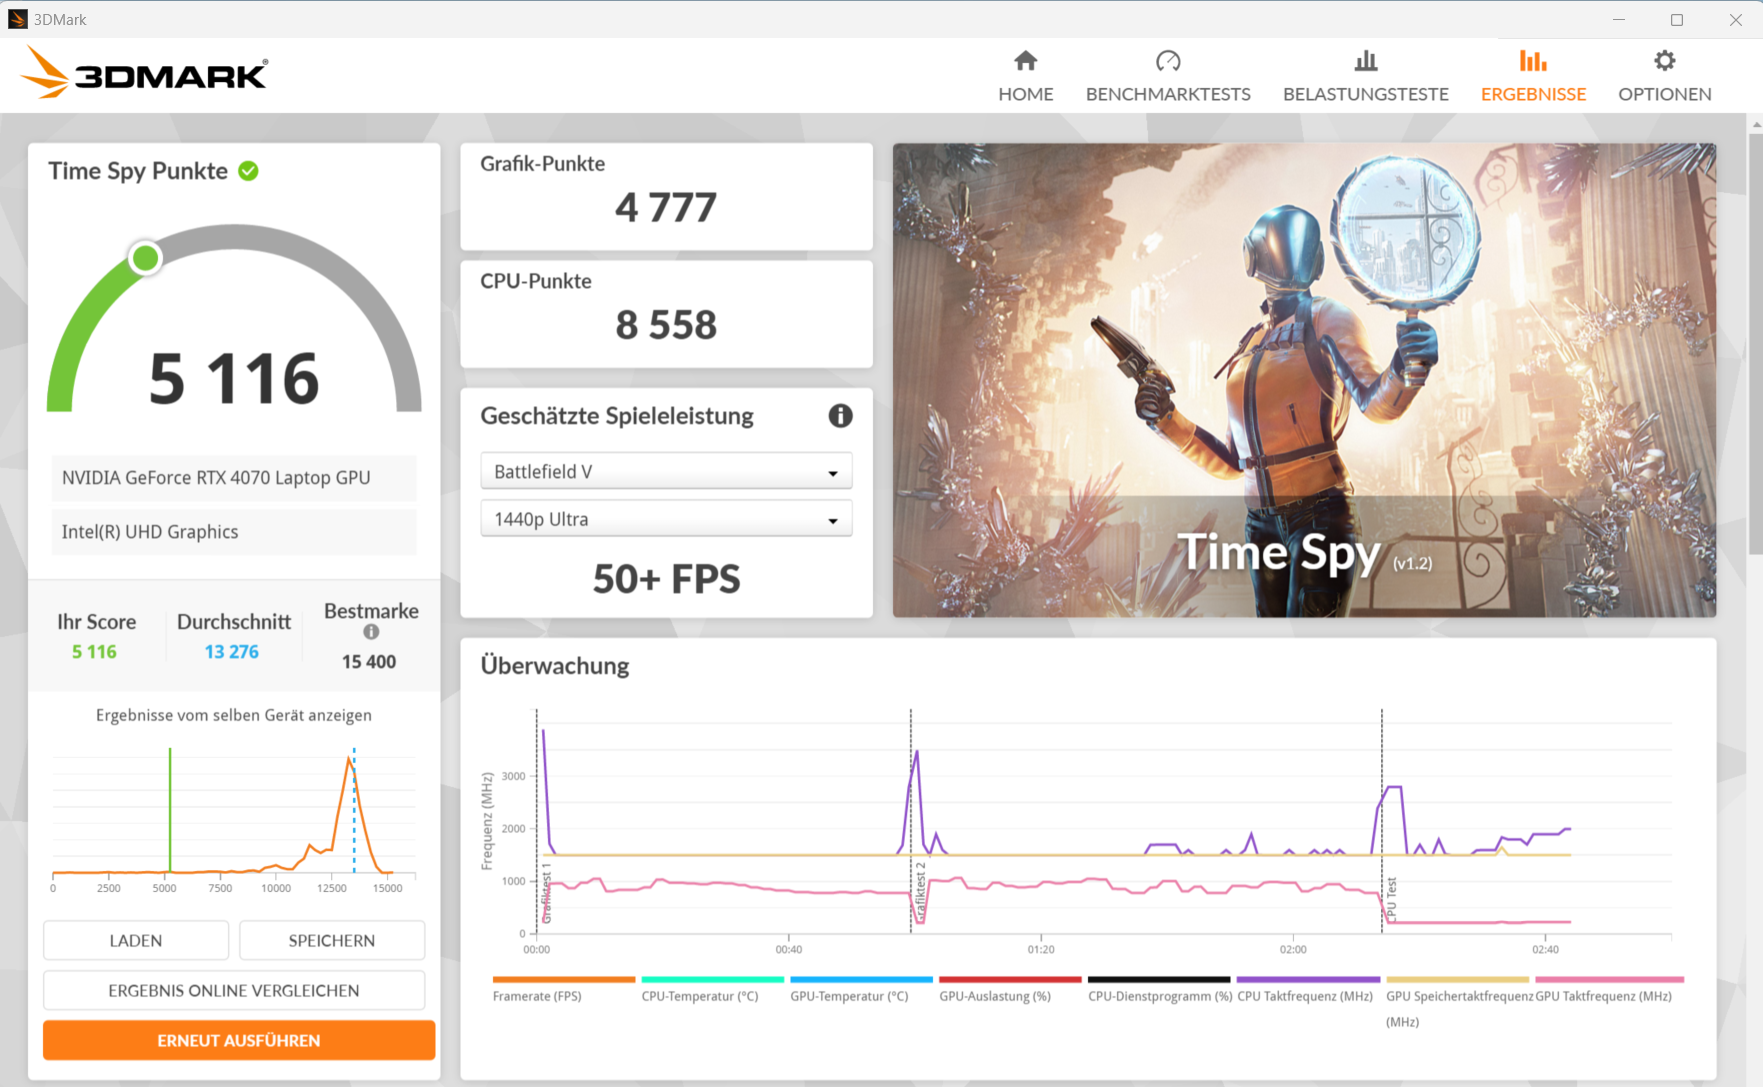
Problemas con el modo de entretenimiento
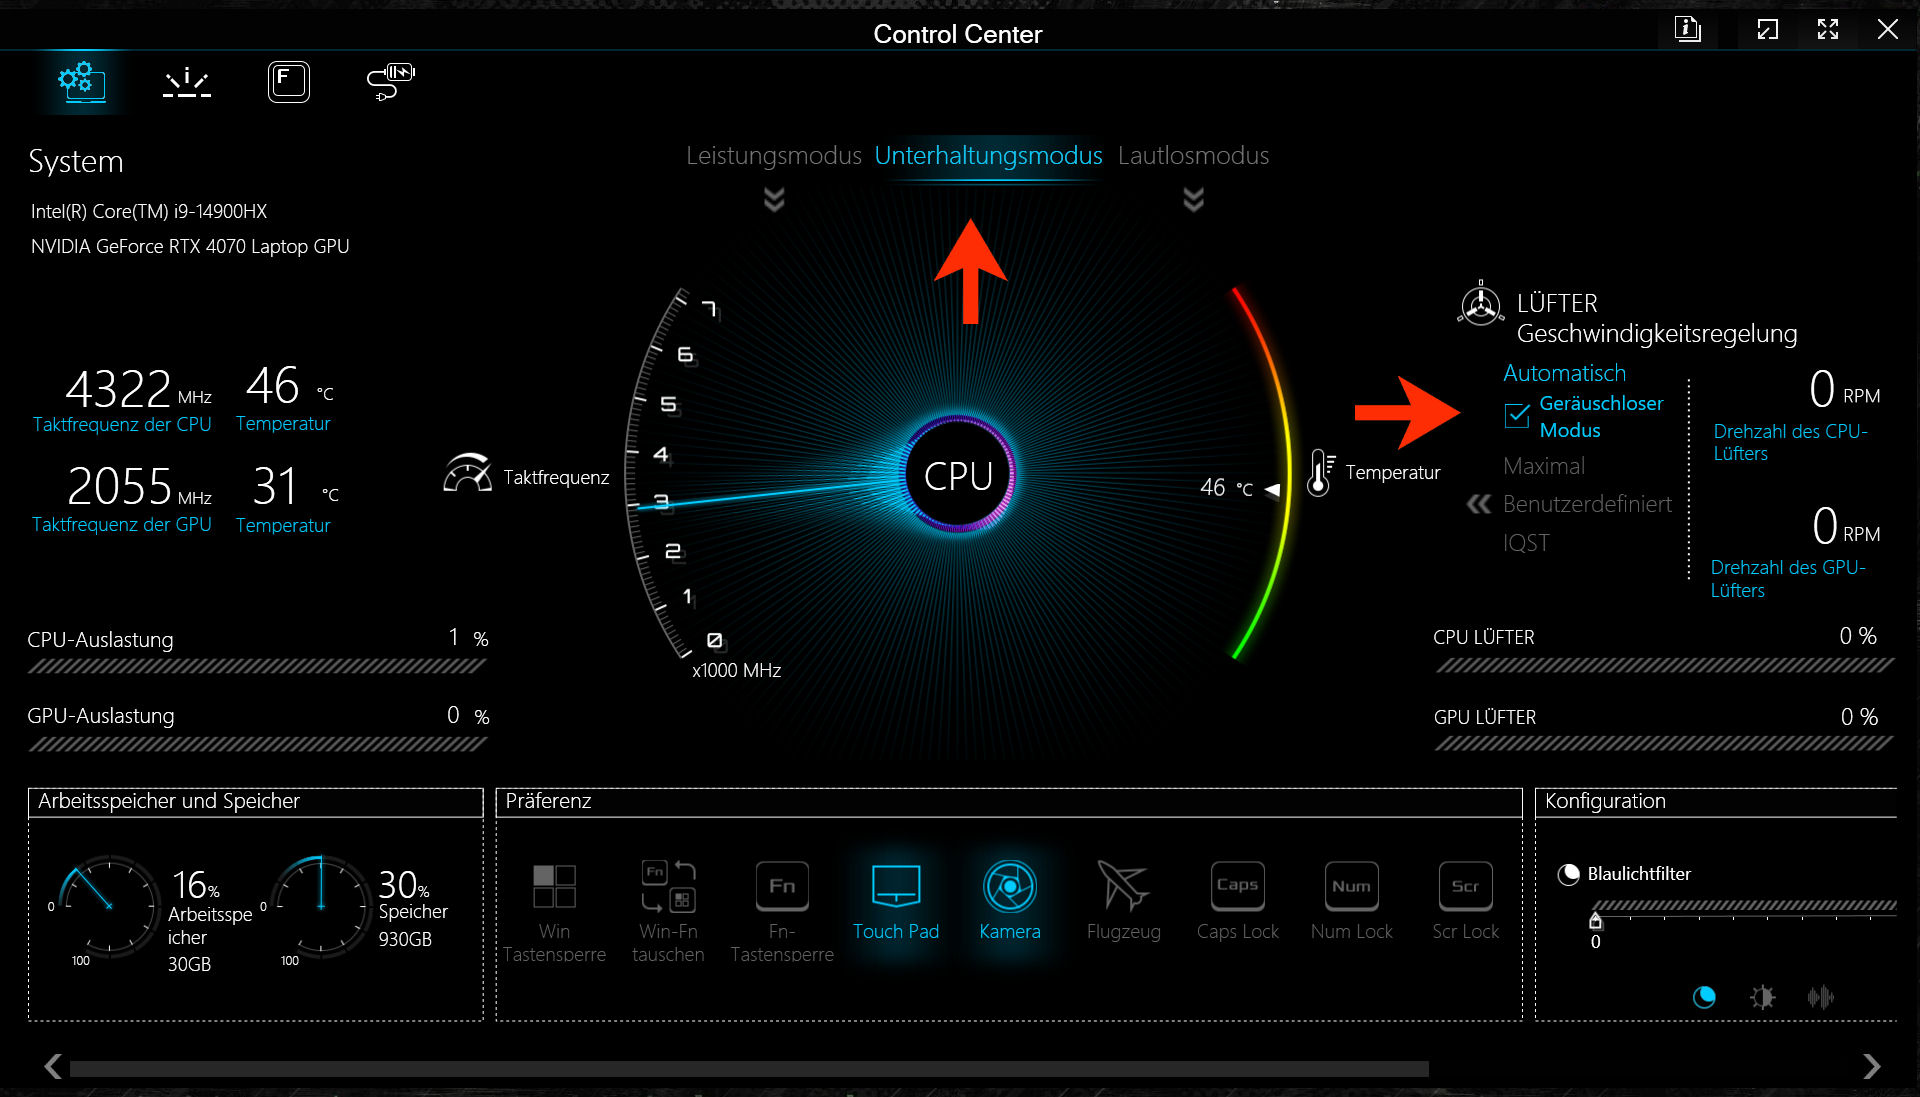
El perfil "entretenimiento" provocó fluctuaciones significativas en el rendimiento durante nuestra prueba. Como resultado, nos abstuvimos de utilizarlo. En el transcurso de la prueba, Schenker pudo indicar una forma de evitar el problema: activar la opción de ventilador "modo silencioso" dentro del Centro de control. Es de esperar que una futura actualización de la BIOS solucione este error.
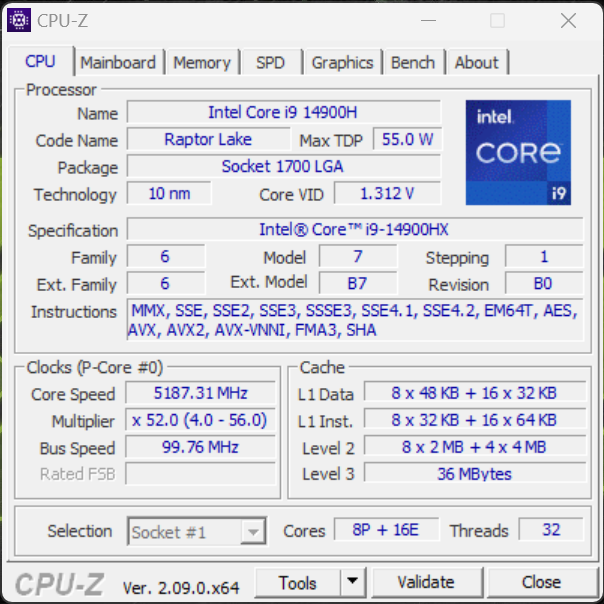
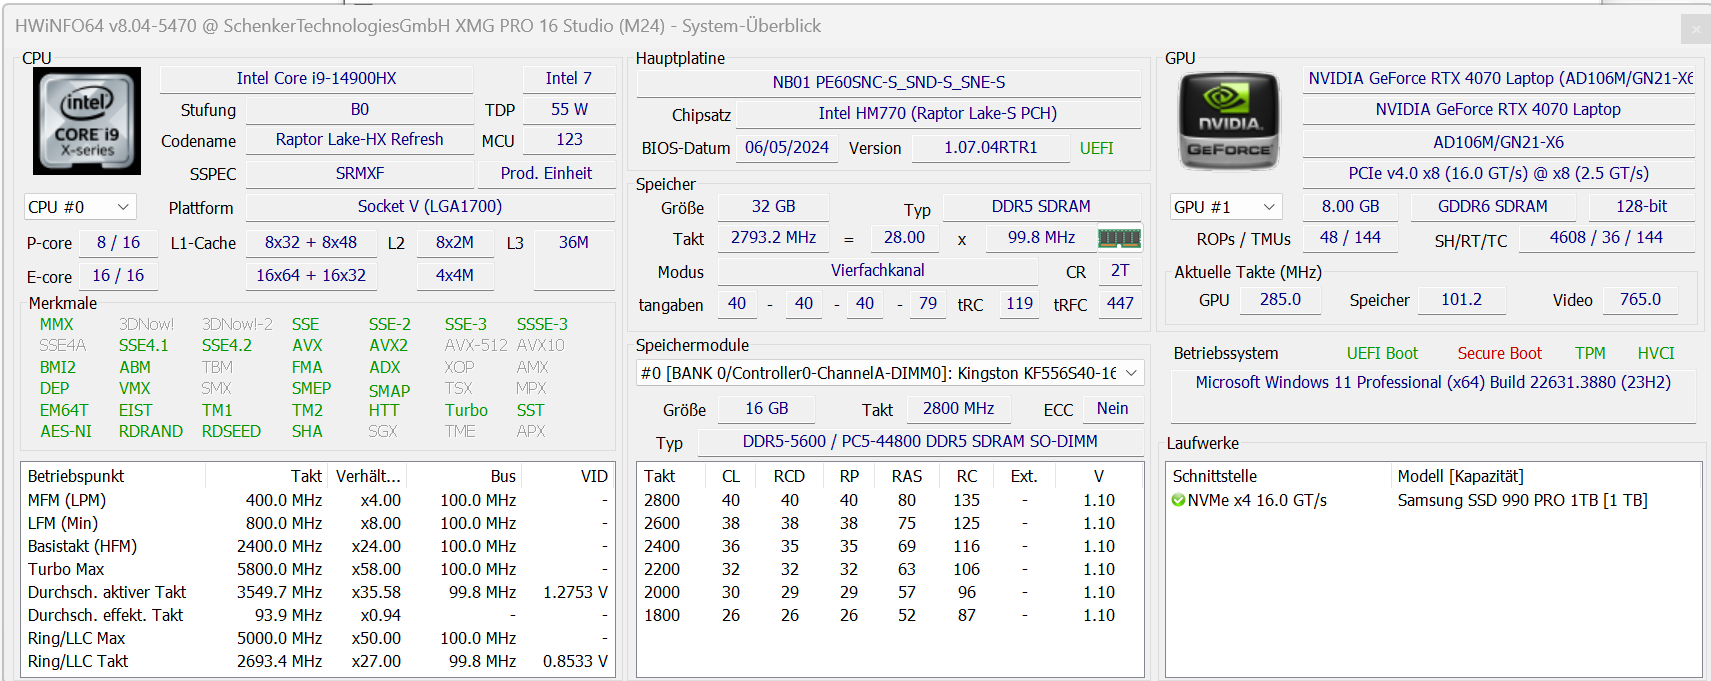
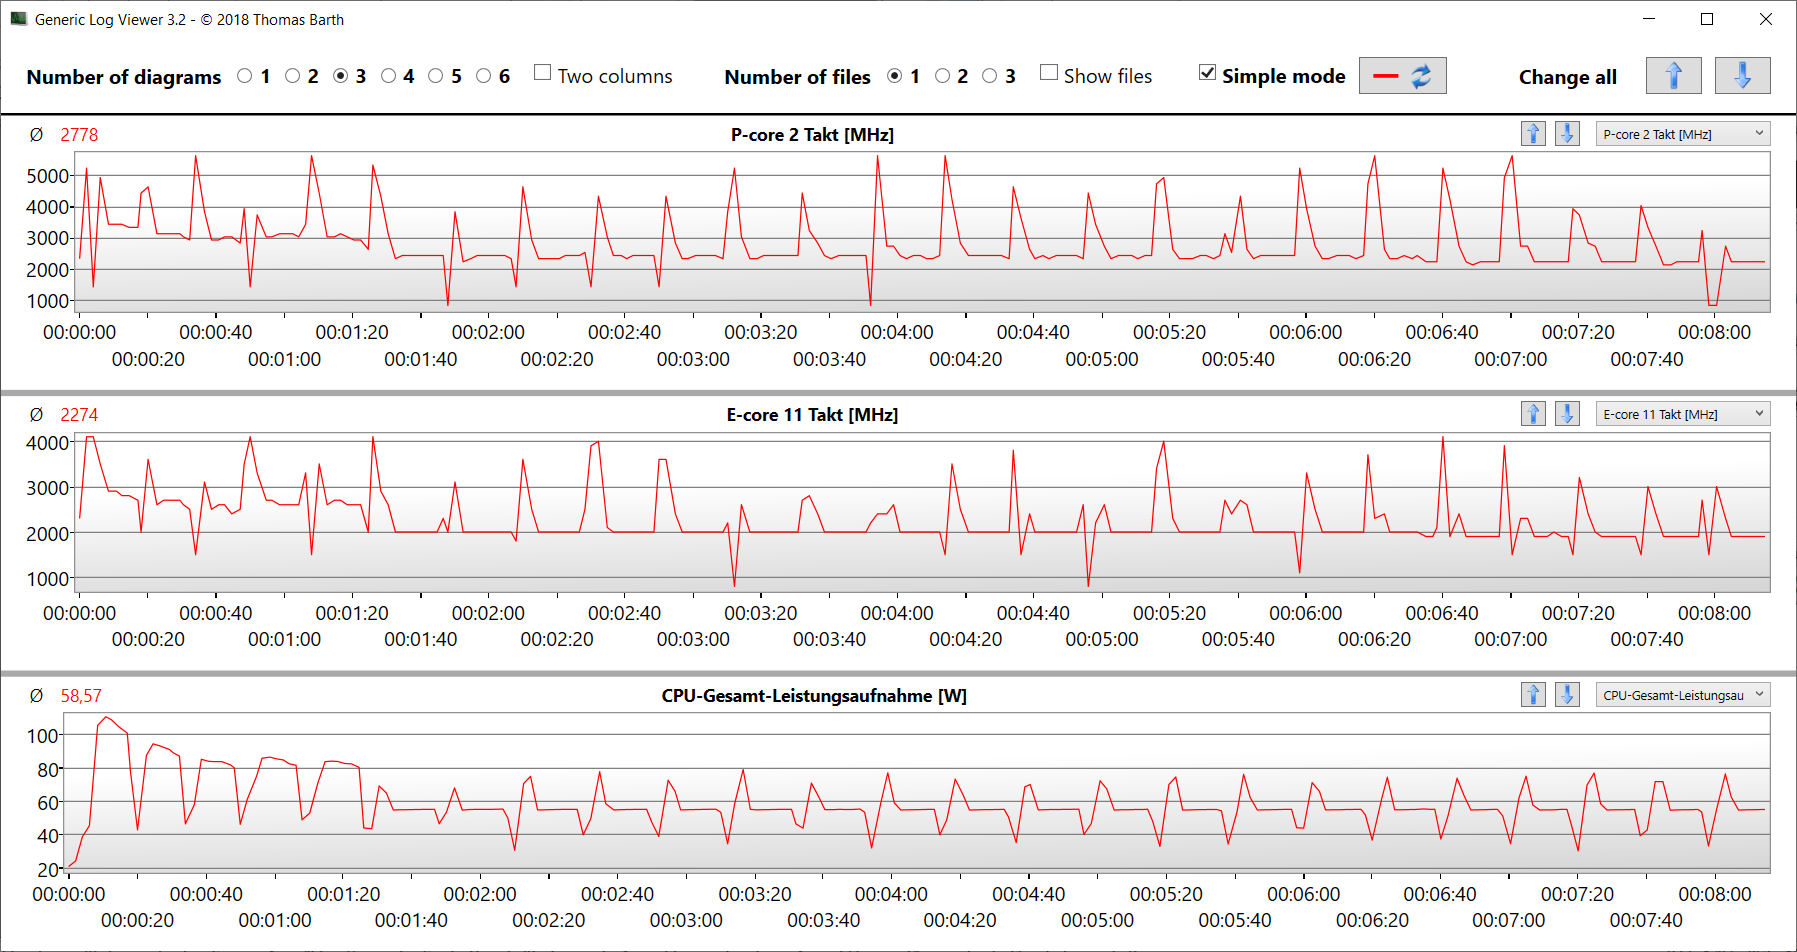
Procesador
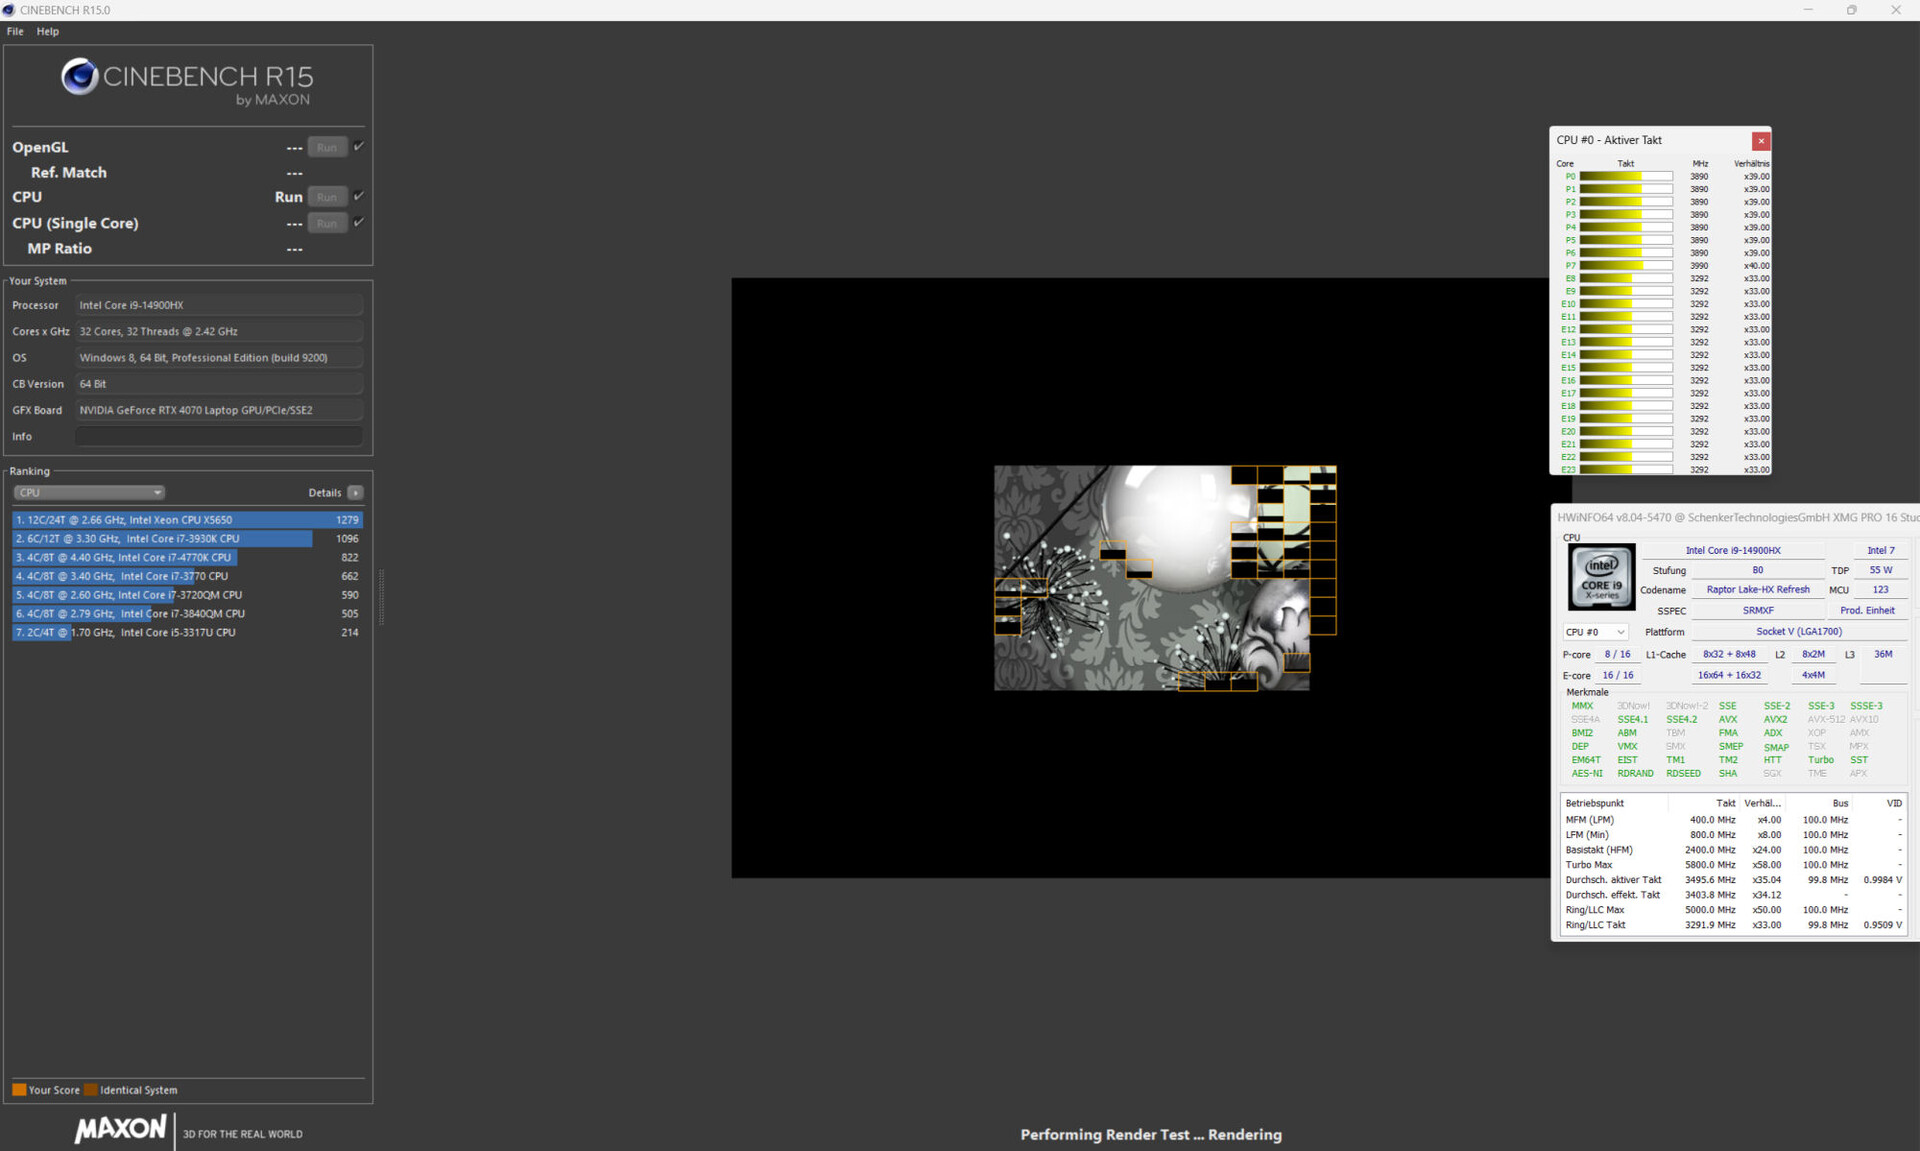
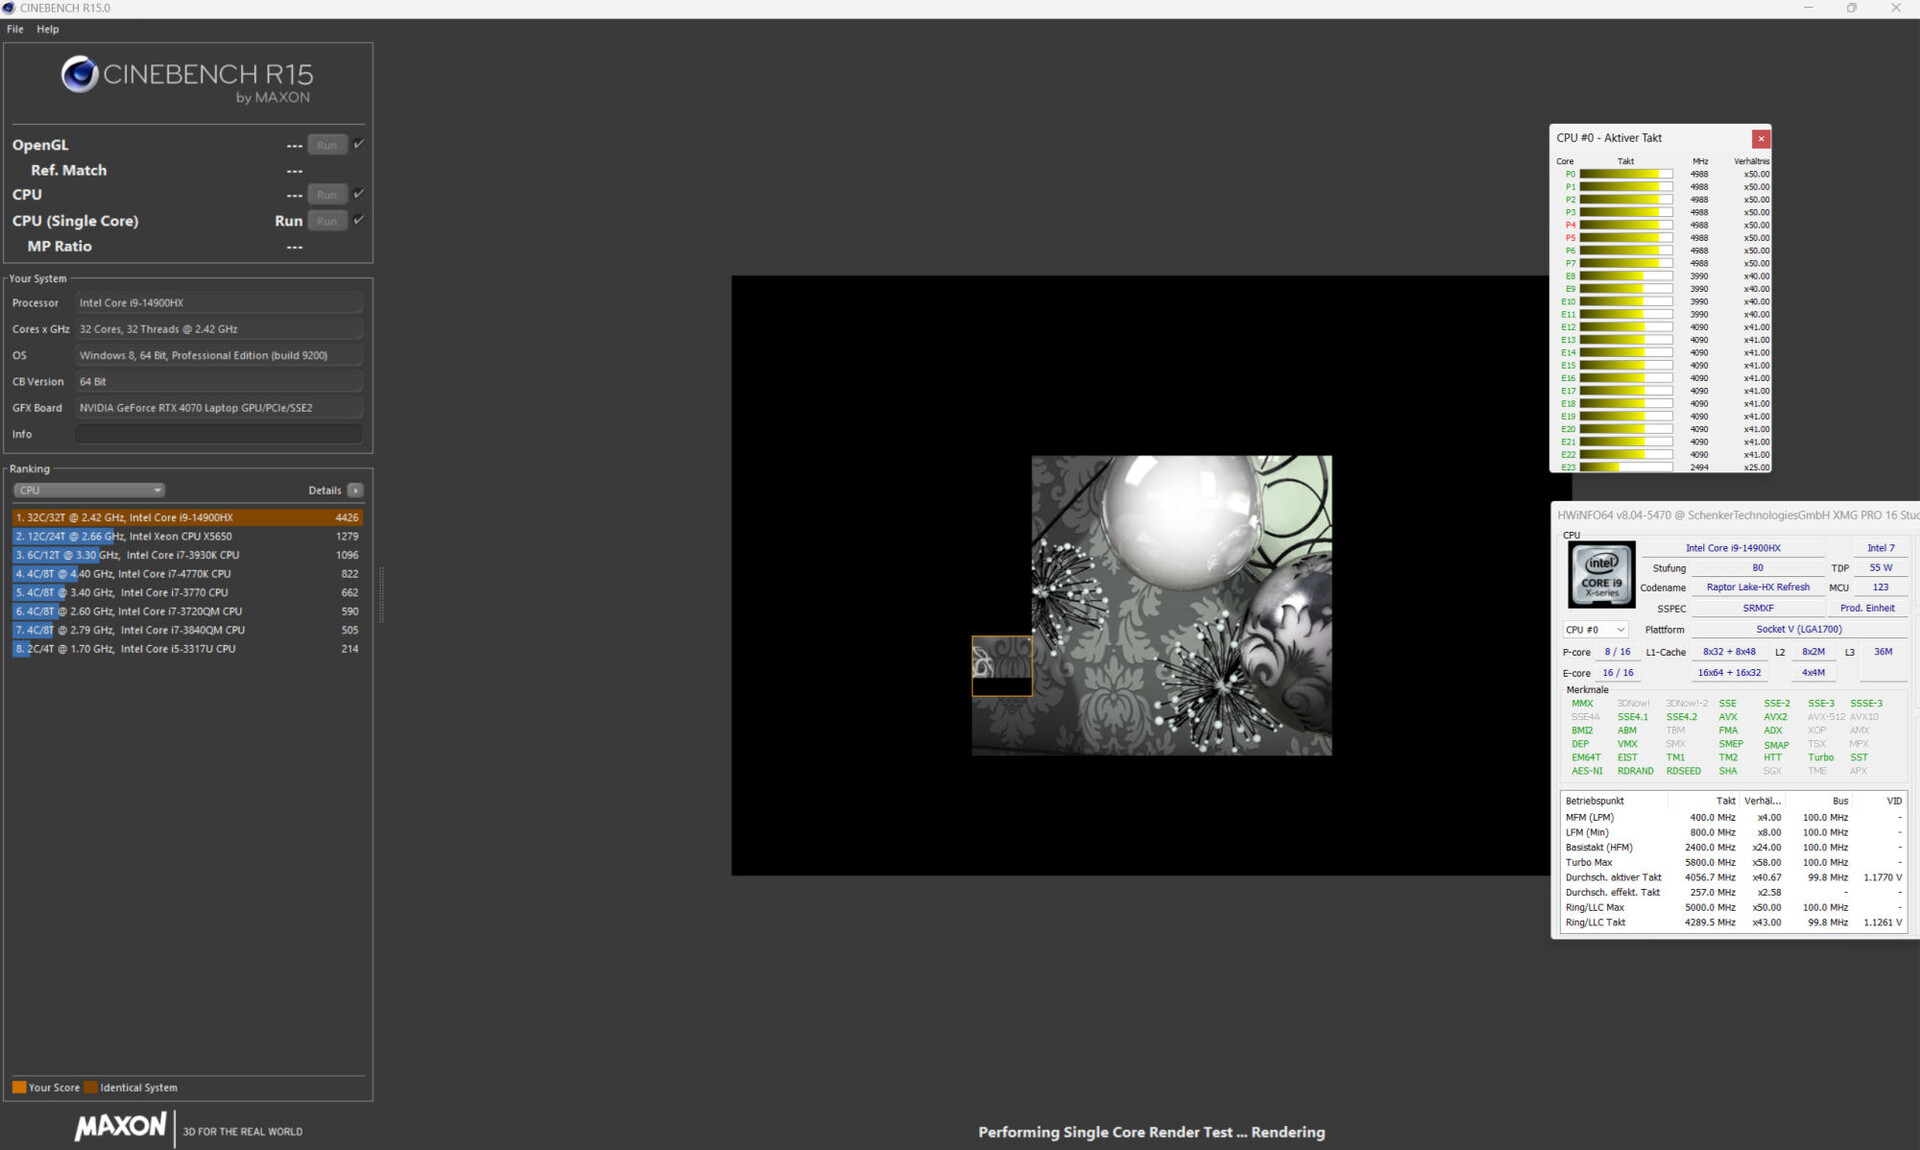
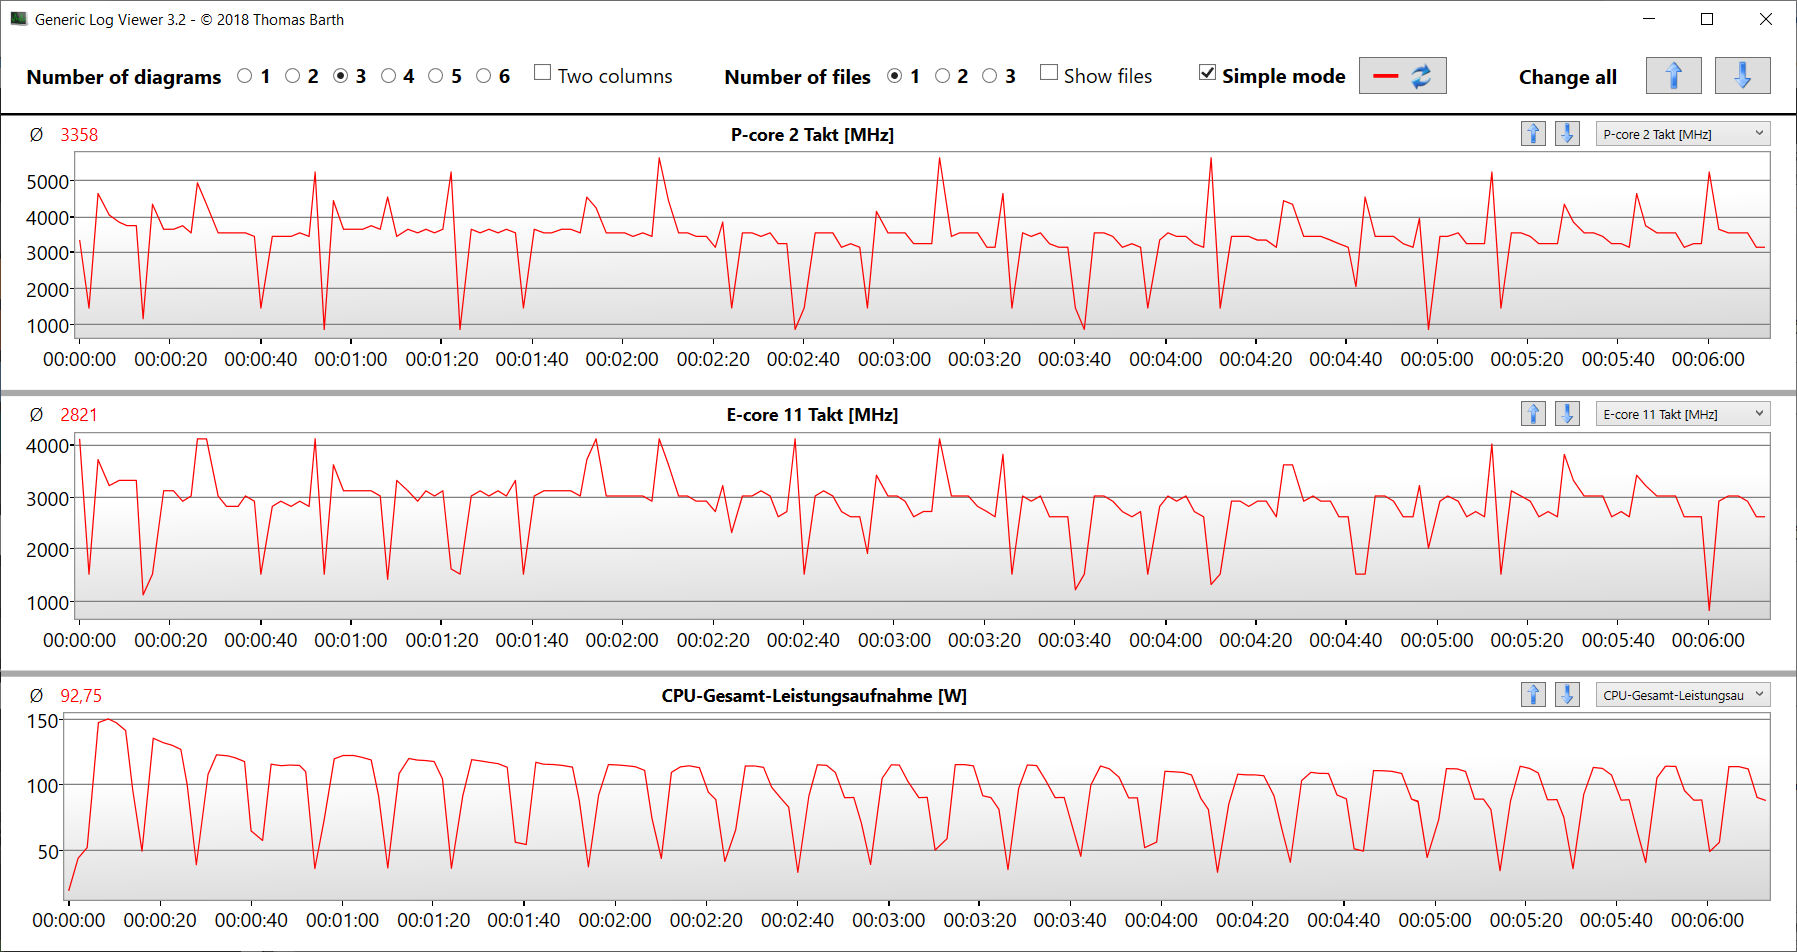
El Core i9-14900HX (Raptor Lake) se utiliza en todas las variantes de configuración Pro 16. Sus 24 núcleos (8P + 16E) pueden procesar un total de 32 hilos. Una sorpresa: Incluso cuando el modo de rendimiento está activo, el procesador no puede trabajar a plena potencia todo el tiempo. La carga continua de varios hilos (CB15 Loop) hizo que el reloj de la CPU cayera significativamente de la primera a la quinta ejecución. Después, la curva se aplanó. Sus resultados en los benchmarks están por debajo de la media anterior de la CPU.
Cinebench R15 Multi continuous test
* ... más pequeño es mejor
AIDA64: FP32 Ray-Trace | FPU Julia | CPU SHA3 | CPU Queen | FPU SinJulia | FPU Mandel | CPU AES | CPU ZLib | FP64 Ray-Trace | CPU PhotoWorxx
| Performance Rating | |
| Lenovo Legion Pro 5 16IRX9 | |
| Medio Intel Core i9-14900HX | |
| Aorus 16X 2024 | |
| Lenovo Legion 7 16 IRX G9 | |
| SCHENKER XMG Pro 16 Studio (Mid 24) | |
| Acer Predator Helios Neo 16 (2024) | |
| Media de la clase Gaming | |
| SCHENKER XMG Pro 16 Studio (Mid 23) | |
| AIDA64 / FP32 Ray-Trace | |
| Lenovo Legion 7 16 IRX G9 | |
| Lenovo Legion Pro 5 16IRX9 | |
| Medio Intel Core i9-14900HX (13098 - 33474, n=36) | |
| Aorus 16X 2024 | |
| Media de la clase Gaming (4986 - 81639, n=147, últimos 2 años) | |
| Acer Predator Helios Neo 16 (2024) | |
| SCHENKER XMG Pro 16 Studio (Mid 24) | |
| SCHENKER XMG Pro 16 Studio (Mid 23) | |
| AIDA64 / FPU Julia | |
| Lenovo Legion Pro 5 16IRX9 | |
| Medio Intel Core i9-14900HX (67573 - 166040, n=36) | |
| Lenovo Legion 7 16 IRX G9 | |
| Aorus 16X 2024 | |
| SCHENKER XMG Pro 16 Studio (Mid 24) | |
| Acer Predator Helios Neo 16 (2024) | |
| Media de la clase Gaming (25360 - 252486, n=147, últimos 2 años) | |
| SCHENKER XMG Pro 16 Studio (Mid 23) | |
| AIDA64 / CPU SHA3 | |
| Lenovo Legion Pro 5 16IRX9 | |
| Medio Intel Core i9-14900HX (3589 - 7979, n=36) | |
| Aorus 16X 2024 | |
| Lenovo Legion 7 16 IRX G9 | |
| SCHENKER XMG Pro 16 Studio (Mid 24) | |
| Acer Predator Helios Neo 16 (2024) | |
| Media de la clase Gaming (1339 - 10389, n=147, últimos 2 años) | |
| SCHENKER XMG Pro 16 Studio (Mid 23) | |
| AIDA64 / CPU Queen | |
| Acer Predator Helios Neo 16 (2024) | |
| Lenovo Legion Pro 5 16IRX9 | |
| Lenovo Legion 7 16 IRX G9 | |
| Aorus 16X 2024 | |
| Medio Intel Core i9-14900HX (118405 - 148966, n=36) | |
| SCHENKER XMG Pro 16 Studio (Mid 24) | |
| Media de la clase Gaming (50699 - 200651, n=147, últimos 2 años) | |
| SCHENKER XMG Pro 16 Studio (Mid 23) | |
| AIDA64 / FPU SinJulia | |
| Lenovo Legion Pro 5 16IRX9 | |
| Medio Intel Core i9-14900HX (10475 - 18517, n=36) | |
| Aorus 16X 2024 | |
| Lenovo Legion 7 16 IRX G9 | |
| SCHENKER XMG Pro 16 Studio (Mid 24) | |
| Acer Predator Helios Neo 16 (2024) | |
| Media de la clase Gaming (4800 - 32988, n=147, últimos 2 años) | |
| SCHENKER XMG Pro 16 Studio (Mid 23) | |
| AIDA64 / FPU Mandel | |
| Lenovo Legion Pro 5 16IRX9 | |
| Medio Intel Core i9-14900HX (32543 - 83662, n=36) | |
| Aorus 16X 2024 | |
| Acer Predator Helios Neo 16 (2024) | |
| Media de la clase Gaming (12321 - 134044, n=147, últimos 2 años) | |
| SCHENKER XMG Pro 16 Studio (Mid 24) | |
| Lenovo Legion 7 16 IRX G9 | |
| SCHENKER XMG Pro 16 Studio (Mid 23) | |
| AIDA64 / CPU AES | |
| SCHENKER XMG Pro 16 Studio (Mid 23) | |
| Medio Intel Core i9-14900HX (86964 - 241777, n=36) | |
| Lenovo Legion Pro 5 16IRX9 | |
| Aorus 16X 2024 | |
| Lenovo Legion 7 16 IRX G9 | |
| SCHENKER XMG Pro 16 Studio (Mid 24) | |
| Media de la clase Gaming (19065 - 328679, n=147, últimos 2 años) | |
| Acer Predator Helios Neo 16 (2024) | |
| AIDA64 / CPU ZLib | |
| Lenovo Legion Pro 5 16IRX9 | |
| Medio Intel Core i9-14900HX (1054 - 2292, n=36) | |
| Aorus 16X 2024 | |
| SCHENKER XMG Pro 16 Studio (Mid 24) | |
| Lenovo Legion 7 16 IRX G9 | |
| Acer Predator Helios Neo 16 (2024) | |
| Media de la clase Gaming (373 - 2531, n=147, últimos 2 años) | |
| SCHENKER XMG Pro 16 Studio (Mid 23) | |
| AIDA64 / FP64 Ray-Trace | |
| Lenovo Legion Pro 5 16IRX9 | |
| Medio Intel Core i9-14900HX (6809 - 18349, n=36) | |
| Lenovo Legion 7 16 IRX G9 | |
| Aorus 16X 2024 | |
| Media de la clase Gaming (2540 - 43430, n=147, últimos 2 años) | |
| SCHENKER XMG Pro 16 Studio (Mid 24) | |
| Acer Predator Helios Neo 16 (2024) | |
| SCHENKER XMG Pro 16 Studio (Mid 23) | |
| AIDA64 / CPU PhotoWorxx | |
| Lenovo Legion Pro 5 16IRX9 | |
| Aorus 16X 2024 | |
| SCHENKER XMG Pro 16 Studio (Mid 24) | |
| Lenovo Legion 7 16 IRX G9 | |
| SCHENKER XMG Pro 16 Studio (Mid 23) | |
| Medio Intel Core i9-14900HX (23903 - 54702, n=36) | |
| Acer Predator Helios Neo 16 (2024) | |
| Media de la clase Gaming (10805 - 60161, n=147, últimos 2 años) | |
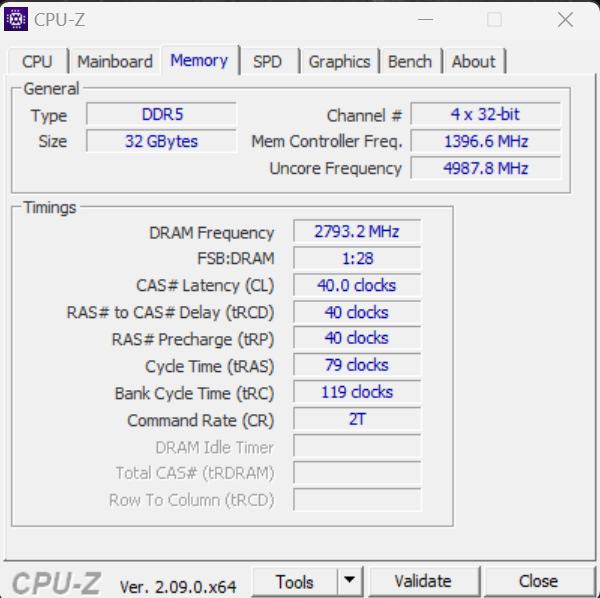
Rendimiento del sistema
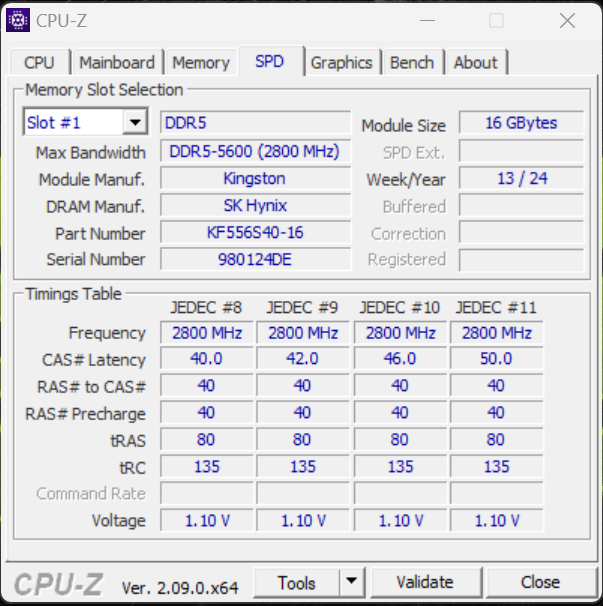
El sistema, que funciona sin problemas, proporciona suficiente rendimiento para juegos, renderizado y streaming, pero el hardware instalado no es capaz de establecer nuevos récords. Las tasas de transferencia de la RAM están en un nivel normal para una RAM DDR5-5600.

CrossMark: Overall | Productivity | Creativity | Responsiveness
WebXPRT 3: Overall
WebXPRT 4: Overall
Mozilla Kraken 1.1: Total
| PCMark 10 / Score | |
| Lenovo Legion Pro 5 16IRX9 | |
| Aorus 16X 2024 | |
| Acer Predator Helios Neo 16 (2024) | |
| Medio Intel Core i9-14900HX, NVIDIA GeForce RTX 4070 Laptop GPU (7768 - 8550, n=8) | |
| SCHENKER XMG Pro 16 Studio (Mid 24) | |
| Lenovo Legion 7 16 IRX G9 | |
| SCHENKER XMG Pro 16 Studio (Mid 23) | |
| Media de la clase Gaming (5776 - 9852, n=133, últimos 2 años) | |
| PCMark 10 / Essentials | |
| SCHENKER XMG Pro 16 Studio (Mid 23) | |
| Acer Predator Helios Neo 16 (2024) | |
| Lenovo Legion Pro 5 16IRX9 | |
| Aorus 16X 2024 | |
| Lenovo Legion 7 16 IRX G9 | |
| Medio Intel Core i9-14900HX, NVIDIA GeForce RTX 4070 Laptop GPU (10104 - 11815, n=8) | |
| Media de la clase Gaming (9057 - 12600, n=133, últimos 2 años) | |
| SCHENKER XMG Pro 16 Studio (Mid 24) | |
| PCMark 10 / Productivity | |
| Aorus 16X 2024 | |
| SCHENKER XMG Pro 16 Studio (Mid 24) | |
| Medio Intel Core i9-14900HX, NVIDIA GeForce RTX 4070 Laptop GPU (9577 - 11103, n=8) | |
| SCHENKER XMG Pro 16 Studio (Mid 23) | |
| Acer Predator Helios Neo 16 (2024) | |
| Lenovo Legion Pro 5 16IRX9 | |
| Media de la clase Gaming (6662 - 14612, n=133, últimos 2 años) | |
| Lenovo Legion 7 16 IRX G9 | |
| PCMark 10 / Digital Content Creation | |
| Lenovo Legion Pro 5 16IRX9 | |
| Lenovo Legion 7 16 IRX G9 | |
| Medio Intel Core i9-14900HX, NVIDIA GeForce RTX 4070 Laptop GPU (12114 - 14827, n=8) | |
| Aorus 16X 2024 | |
| Acer Predator Helios Neo 16 (2024) | |
| SCHENKER XMG Pro 16 Studio (Mid 24) | |
| Media de la clase Gaming (6807 - 18475, n=133, últimos 2 años) | |
| SCHENKER XMG Pro 16 Studio (Mid 23) | |
| CrossMark / Overall | |
| Aorus 16X 2024 | |
| Lenovo Legion 7 16 IRX G9 | |
| Acer Predator Helios Neo 16 (2024) | |
| Medio Intel Core i9-14900HX, NVIDIA GeForce RTX 4070 Laptop GPU (2002 - 2312, n=7) | |
| SCHENKER XMG Pro 16 Studio (Mid 24) | |
| Lenovo Legion Pro 5 16IRX9 | |
| SCHENKER XMG Pro 16 Studio (Mid 23) | |
| Media de la clase Gaming (1247 - 2344, n=114, últimos 2 años) | |
| CrossMark / Productivity | |
| Aorus 16X 2024 | |
| Lenovo Legion 7 16 IRX G9 | |
| Acer Predator Helios Neo 16 (2024) | |
| Medio Intel Core i9-14900HX, NVIDIA GeForce RTX 4070 Laptop GPU (1827 - 2191, n=7) | |
| SCHENKER XMG Pro 16 Studio (Mid 24) | |
| SCHENKER XMG Pro 16 Studio (Mid 23) | |
| Lenovo Legion Pro 5 16IRX9 | |
| Media de la clase Gaming (1299 - 2204, n=114, últimos 2 años) | |
| CrossMark / Creativity | |
| Aorus 16X 2024 | |
| Acer Predator Helios Neo 16 (2024) | |
| Lenovo Legion 7 16 IRX G9 | |
| SCHENKER XMG Pro 16 Studio (Mid 24) | |
| Medio Intel Core i9-14900HX, NVIDIA GeForce RTX 4070 Laptop GPU (2258 - 2458, n=7) | |
| Lenovo Legion Pro 5 16IRX9 | |
| Media de la clase Gaming (1275 - 2660, n=114, últimos 2 años) | |
| SCHENKER XMG Pro 16 Studio (Mid 23) | |
| CrossMark / Responsiveness | |
| Lenovo Legion 7 16 IRX G9 | |
| Aorus 16X 2024 | |
| Medio Intel Core i9-14900HX, NVIDIA GeForce RTX 4070 Laptop GPU (1734 - 2330, n=7) | |
| Acer Predator Helios Neo 16 (2024) | |
| SCHENKER XMG Pro 16 Studio (Mid 23) | |
| Lenovo Legion Pro 5 16IRX9 | |
| SCHENKER XMG Pro 16 Studio (Mid 24) | |
| Media de la clase Gaming (1030 - 2330, n=114, últimos 2 años) | |
| WebXPRT 3 / Overall | |
| Lenovo Legion 7 16 IRX G9 | |
| Aorus 16X 2024 | |
| Acer Predator Helios Neo 16 (2024) | |
| Lenovo Legion Pro 5 16IRX9 | |
| Medio Intel Core i9-14900HX, NVIDIA GeForce RTX 4070 Laptop GPU (269 - 342, n=8) | |
| SCHENKER XMG Pro 16 Studio (Mid 23) | |
| SCHENKER XMG Pro 16 Studio (Mid 24) | |
| Media de la clase Gaming (215 - 480, n=127, últimos 2 años) | |
| WebXPRT 4 / Overall | |
| Acer Predator Helios Neo 16 (2024) | |
| SCHENKER XMG Pro 16 Studio (Mid 24) | |
| Medio Intel Core i9-14900HX, NVIDIA GeForce RTX 4070 Laptop GPU (291 - 304, n=6) | |
| Lenovo Legion 7 16 IRX G9 | |
| Lenovo Legion Pro 5 16IRX9 | |
| Media de la clase Gaming (176.4 - 335, n=115, últimos 2 años) | |
| Mozilla Kraken 1.1 / Total | |
| SCHENKER XMG Pro 16 Studio (Mid 23) | |
| Media de la clase Gaming (409 - 674, n=139, últimos 2 años) | |
| SCHENKER XMG Pro 16 Studio (Mid 24) | |
| Lenovo Legion Pro 5 16IRX9 | |
| Medio Intel Core i9-14900HX, NVIDIA GeForce RTX 4070 Laptop GPU (431 - 469, n=8) | |
| Acer Predator Helios Neo 16 (2024) | |
| Lenovo Legion 7 16 IRX G9 | |
| Aorus 16X 2024 | |
* ... más pequeño es mejor
| PCMark 10 Score | 8166 puntos | |
ayuda | ||
| AIDA64 / Memory Copy | |
| Lenovo Legion Pro 5 16IRX9 | |
| Lenovo Legion 7 16 IRX G9 | |
| Aorus 16X 2024 | |
| SCHENKER XMG Pro 16 Studio (Mid 24) | |
| Acer Predator Helios Neo 16 (2024) | |
| Medio Intel Core i9-14900HX (38028 - 83392, n=36) | |
| SCHENKER XMG Pro 16 Studio (Mid 23) | |
| Media de la clase Gaming (21750 - 97515, n=147, últimos 2 años) | |
| AIDA64 / Memory Read | |
| Aorus 16X 2024 | |
| Lenovo Legion Pro 5 16IRX9 | |
| Lenovo Legion 7 16 IRX G9 | |
| SCHENKER XMG Pro 16 Studio (Mid 24) | |
| Acer Predator Helios Neo 16 (2024) | |
| Medio Intel Core i9-14900HX (43306 - 87568, n=36) | |
| SCHENKER XMG Pro 16 Studio (Mid 23) | |
| Media de la clase Gaming (22956 - 102937, n=147, últimos 2 años) | |
| AIDA64 / Memory Write | |
| Aorus 16X 2024 | |
| Lenovo Legion Pro 5 16IRX9 | |
| Lenovo Legion 7 16 IRX G9 | |
| SCHENKER XMG Pro 16 Studio (Mid 24) | |
| Medio Intel Core i9-14900HX (37146 - 80589, n=36) | |
| SCHENKER XMG Pro 16 Studio (Mid 23) | |
| Acer Predator Helios Neo 16 (2024) | |
| Media de la clase Gaming (22297 - 108954, n=147, últimos 2 años) | |
| AIDA64 / Memory Latency | |
| Media de la clase Gaming (59.5 - 259, n=147, últimos 2 años) | |
| Acer Predator Helios Neo 16 (2024) | |
| SCHENKER XMG Pro 16 Studio (Mid 23) | |
| Medio Intel Core i9-14900HX (76.1 - 105, n=36) | |
| SCHENKER XMG Pro 16 Studio (Mid 24) | |
| Lenovo Legion 7 16 IRX G9 | |
| Lenovo Legion Pro 5 16IRX9 | |
| Aorus 16X 2024 | |
* ... más pequeño es mejor
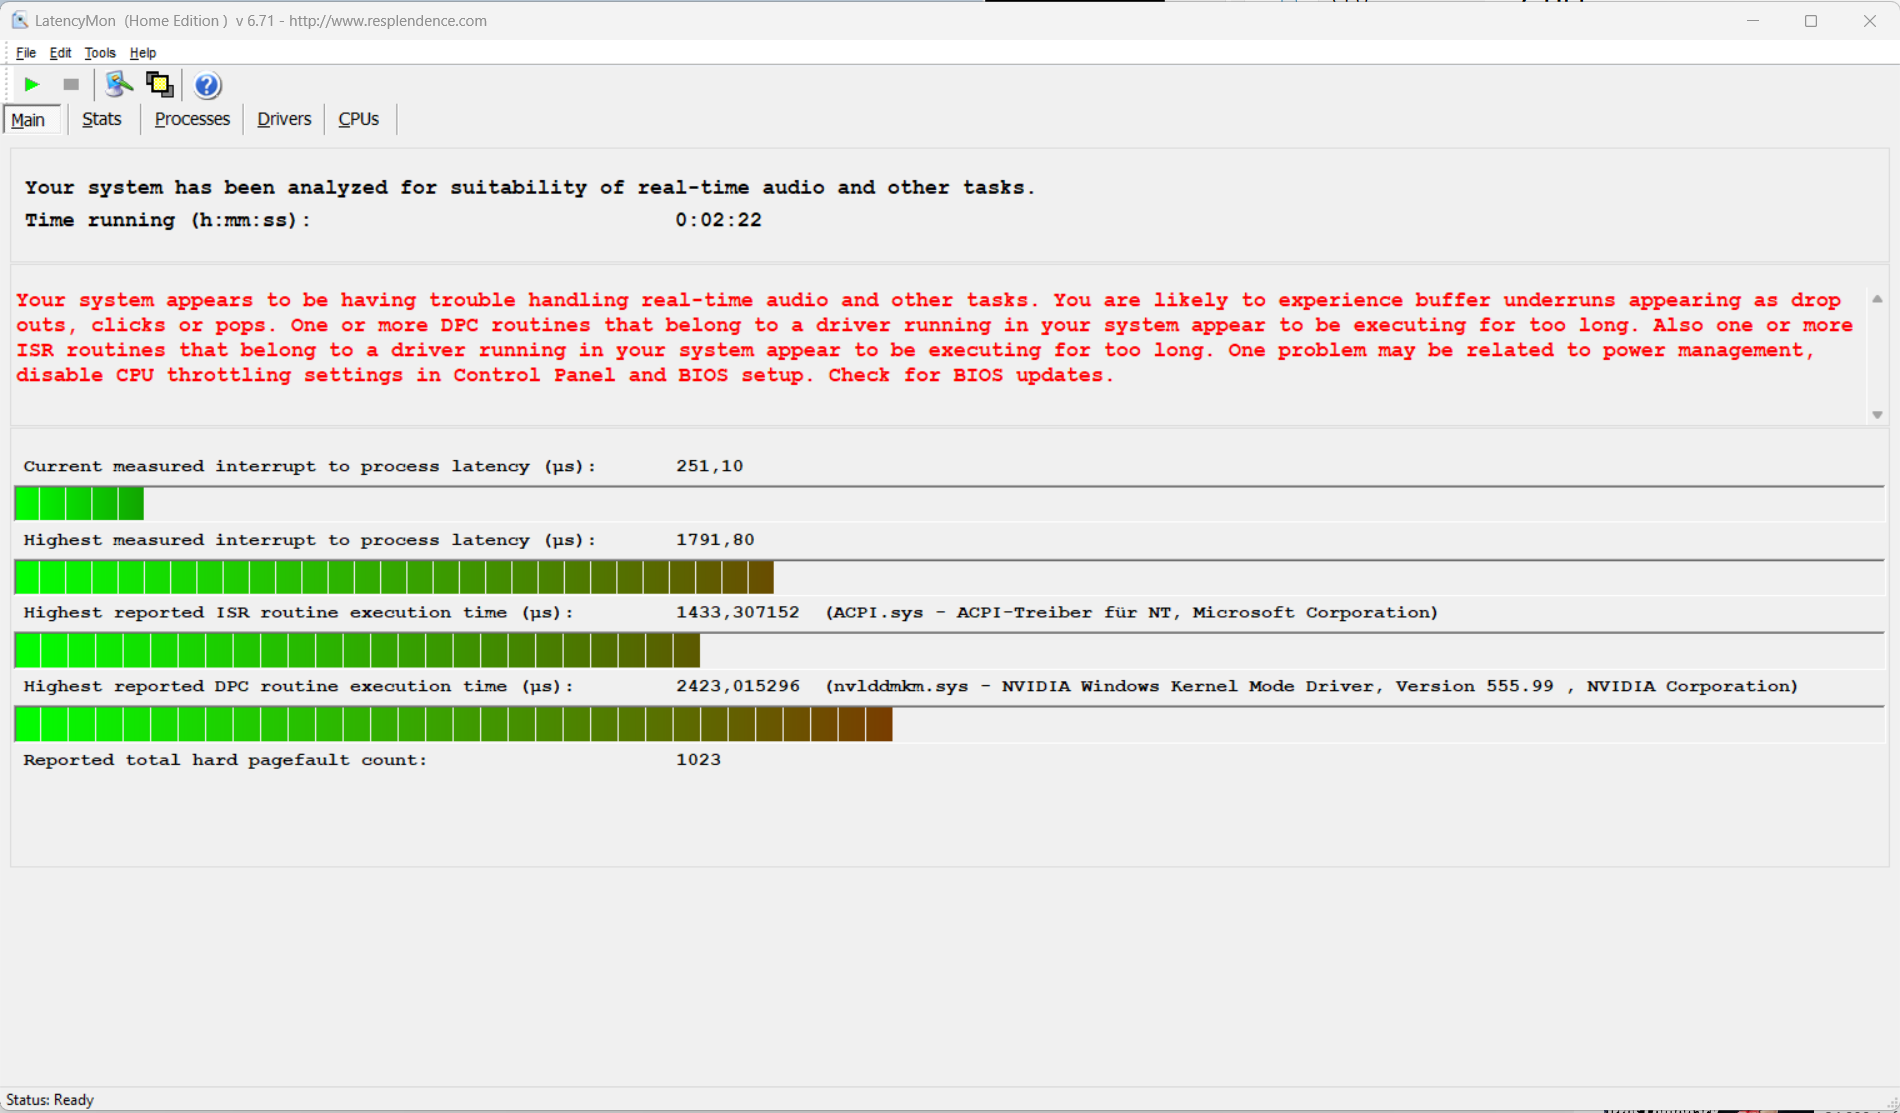
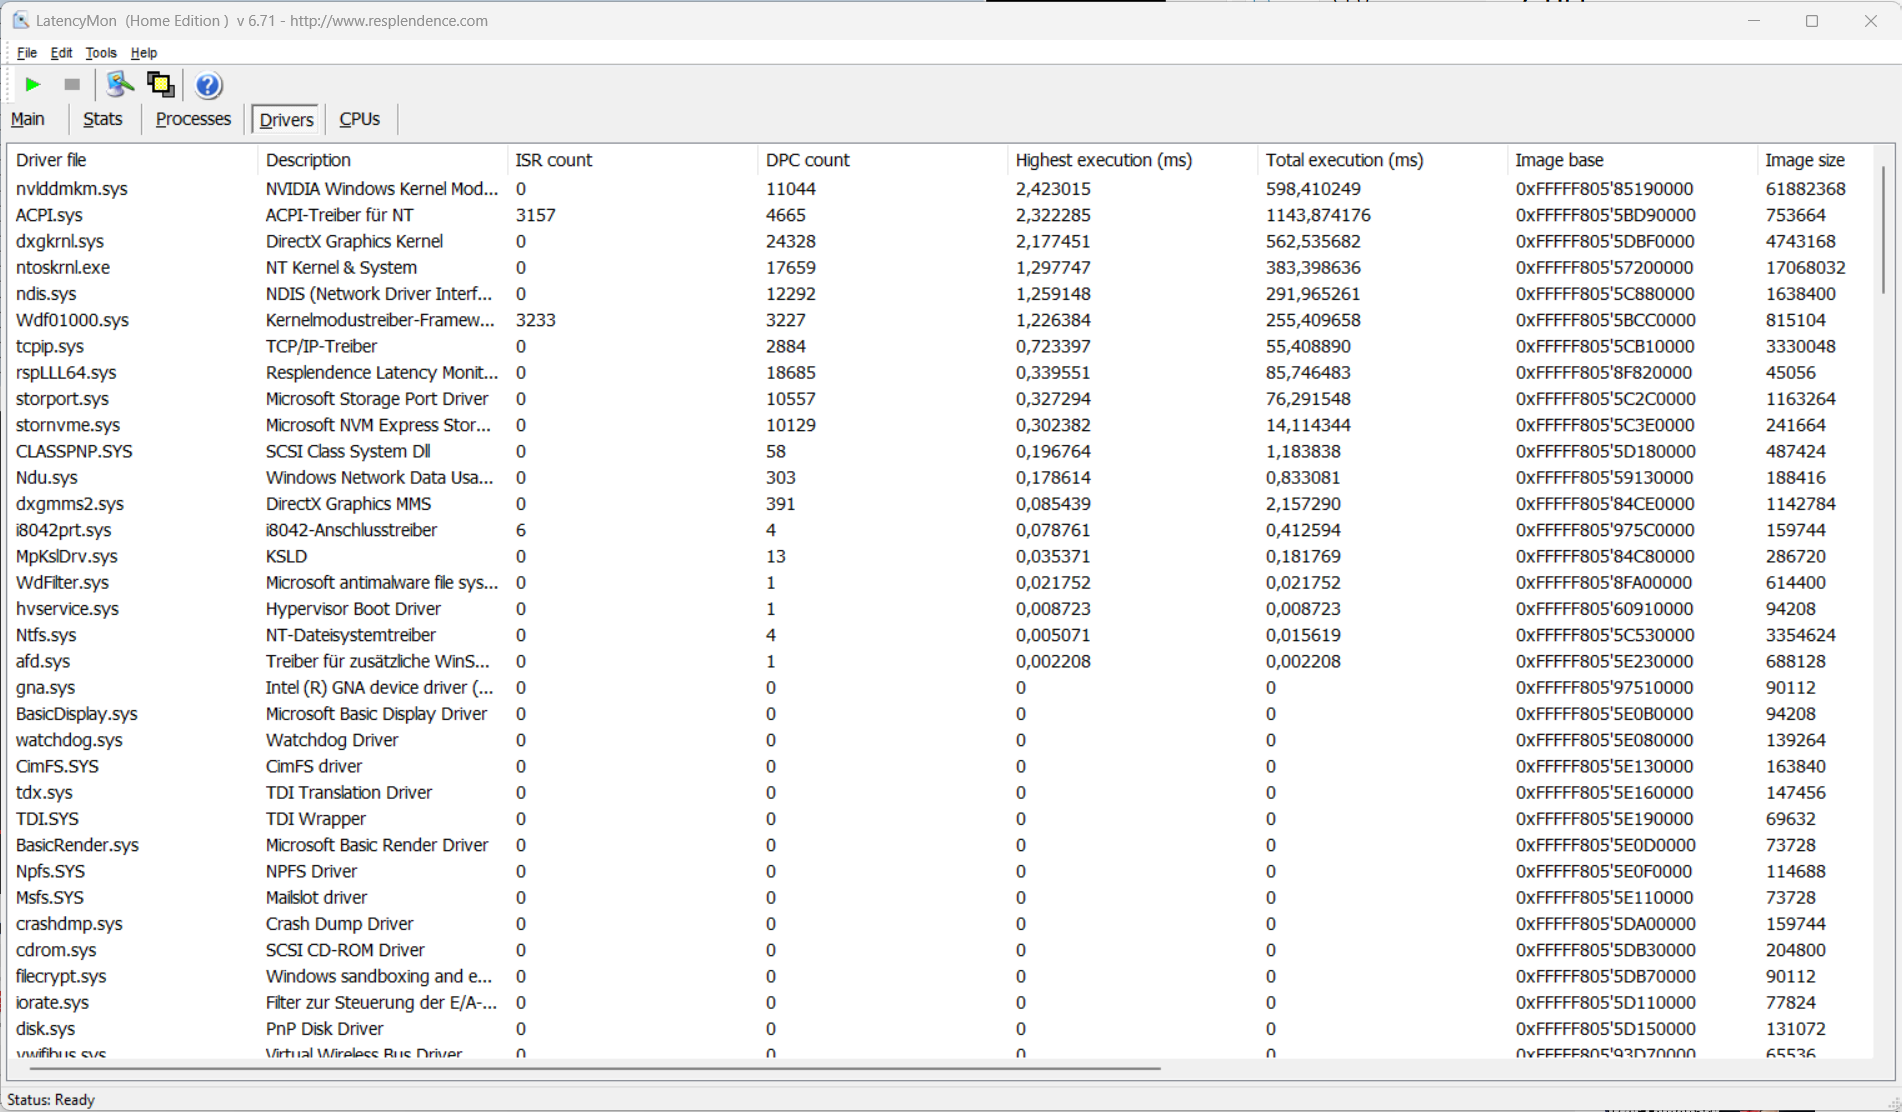
Latencias del CPD
Debido a las latencias relativamente altas del portátil, no está prevista la edición de vídeo y audio en tiempo real. No obstante, futuras actualizaciones del software podrían provocar cambios en este sentido.
| DPC Latencies / LatencyMon - interrupt to process latency (max), Web, Youtube, Prime95 | |
| SCHENKER XMG Pro 16 Studio (Mid 23) | |
| SCHENKER XMG Pro 16 Studio (Mid 24) | |
| Lenovo Legion 7 16 IRX G9 | |
| Acer Predator Helios Neo 16 (2024) | |
| Aorus 16X 2024 | |
| Lenovo Legion Pro 5 16IRX9 | |
* ... más pequeño es mejor
Dispositivos de almacenamiento
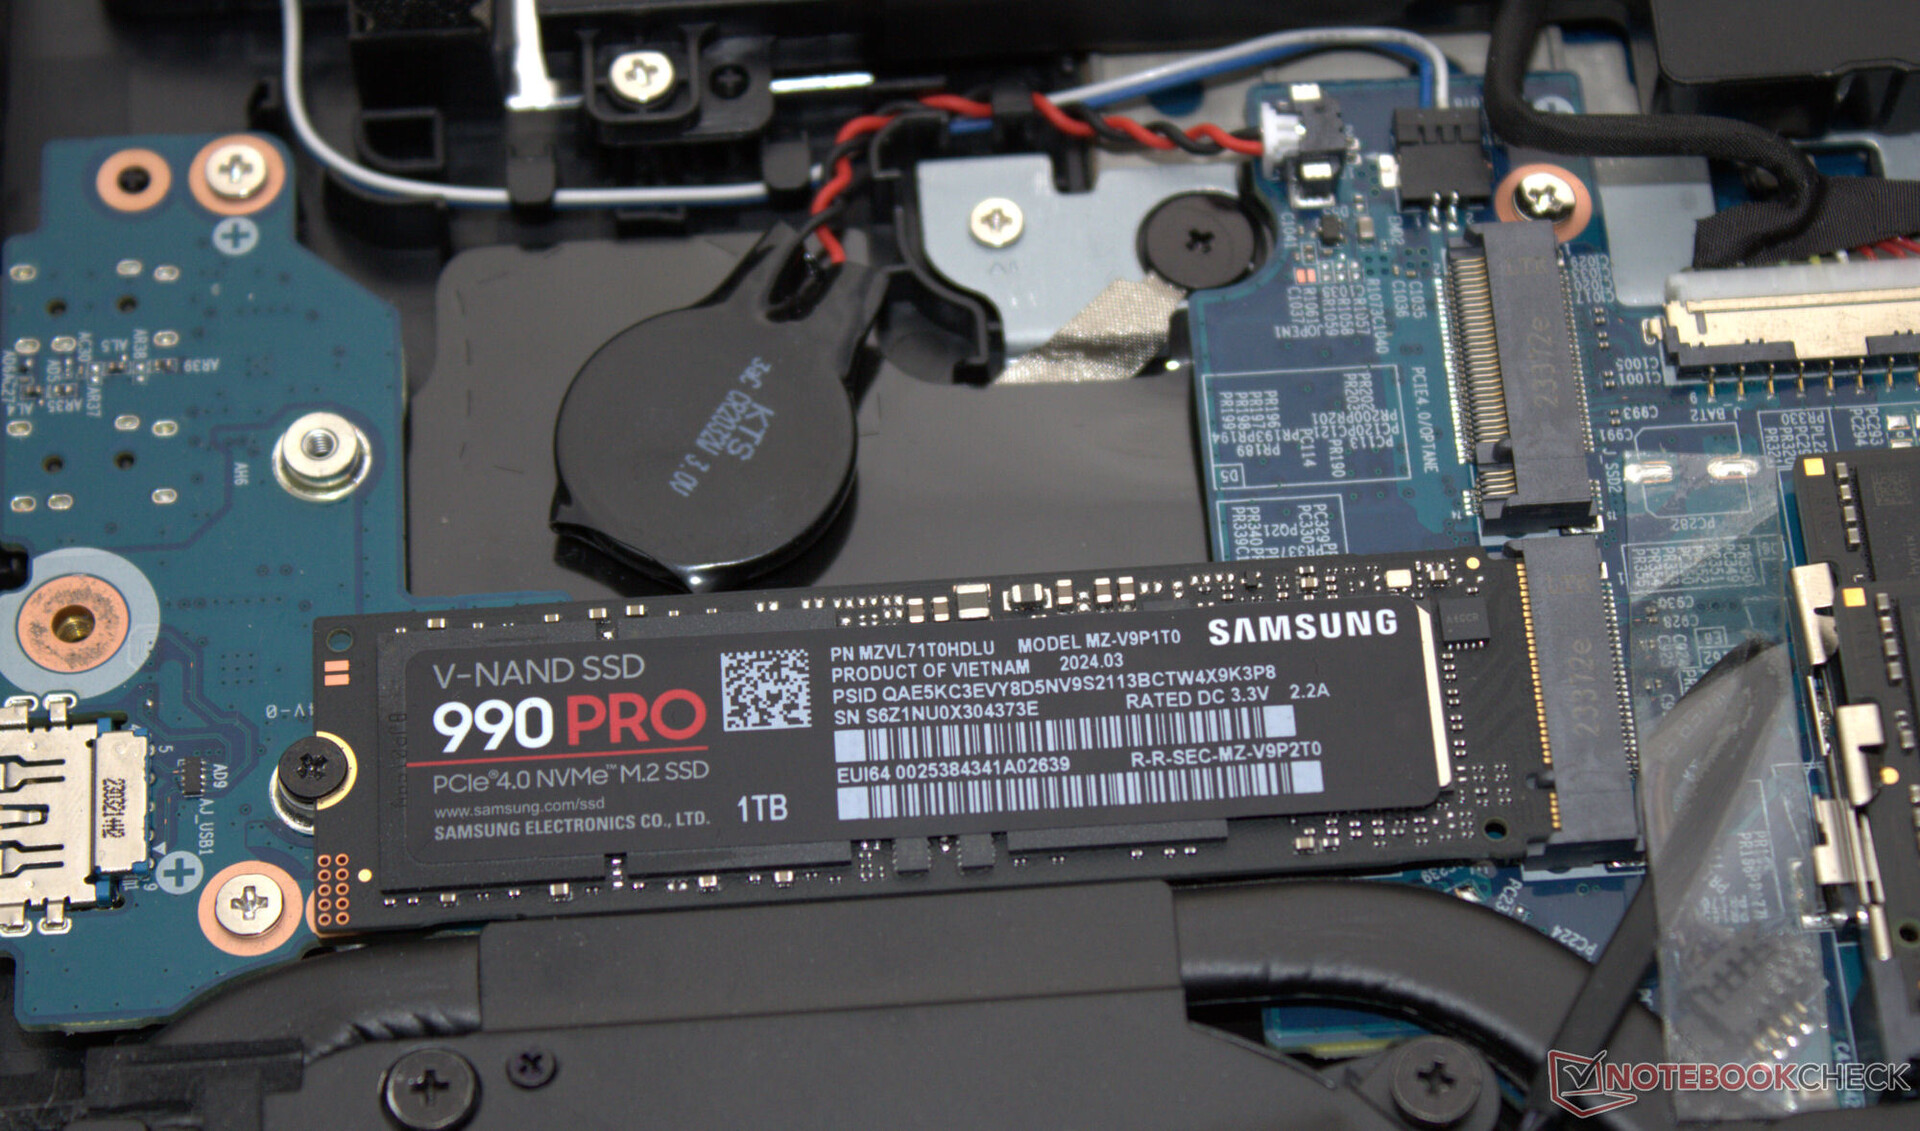
La tienda en línea de Schenker tiene una gran variedad de unidades SSD entre las que elegir; nuestro dispositivo de prueba cuenta con un modelo ultrarrápido (1 TB, PCIe 4, M.2-2280) de Samsung. Positivo: No se produjo estrangulamiento inducido térmicamente. El portátil puede alojar hasta dos SSD PCIe 4 (M.2-2280). Soporta RAID-0/1.

* ... más pequeño es mejor
Reading continuous performance: DiskSpd Read Loop, Queue Depth 8
Tarjeta gráfica
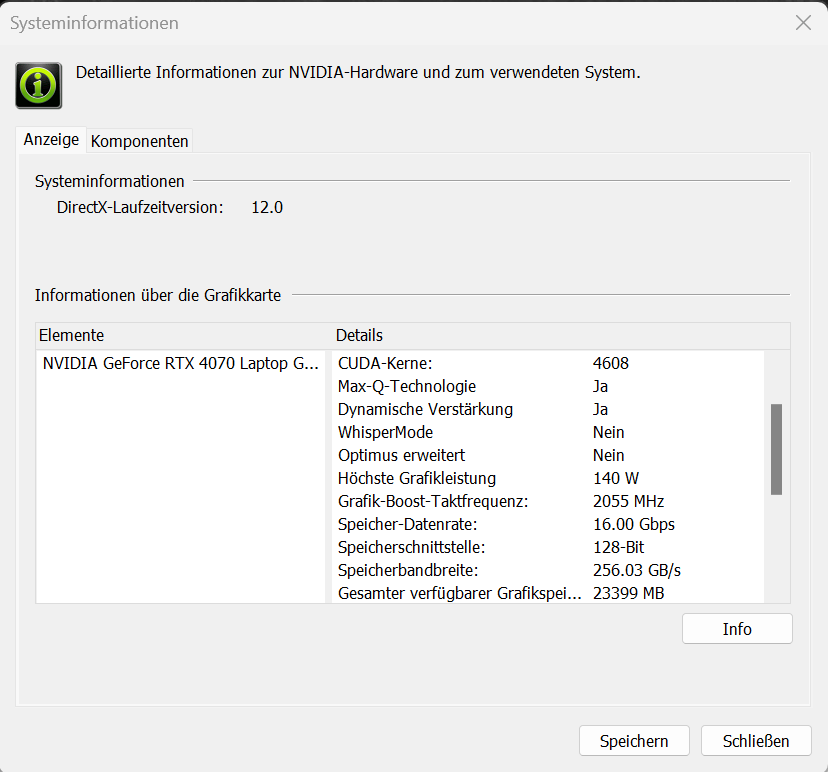
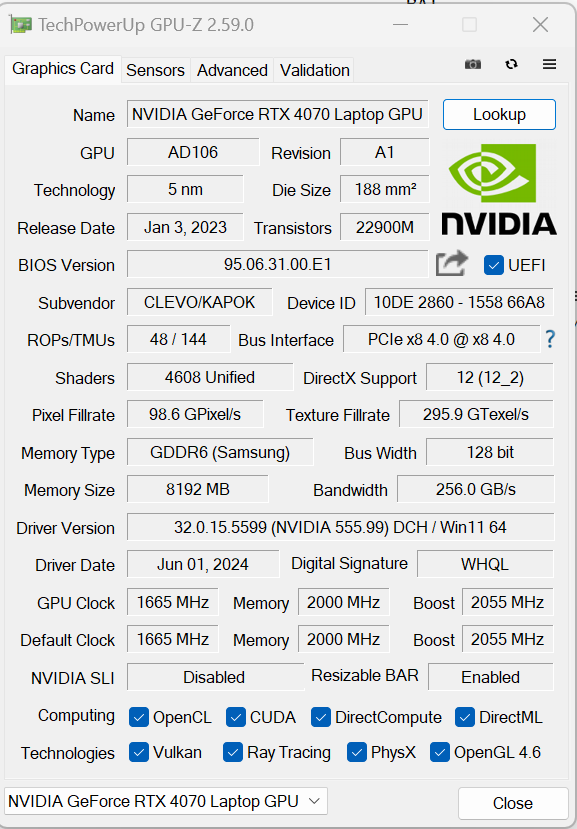
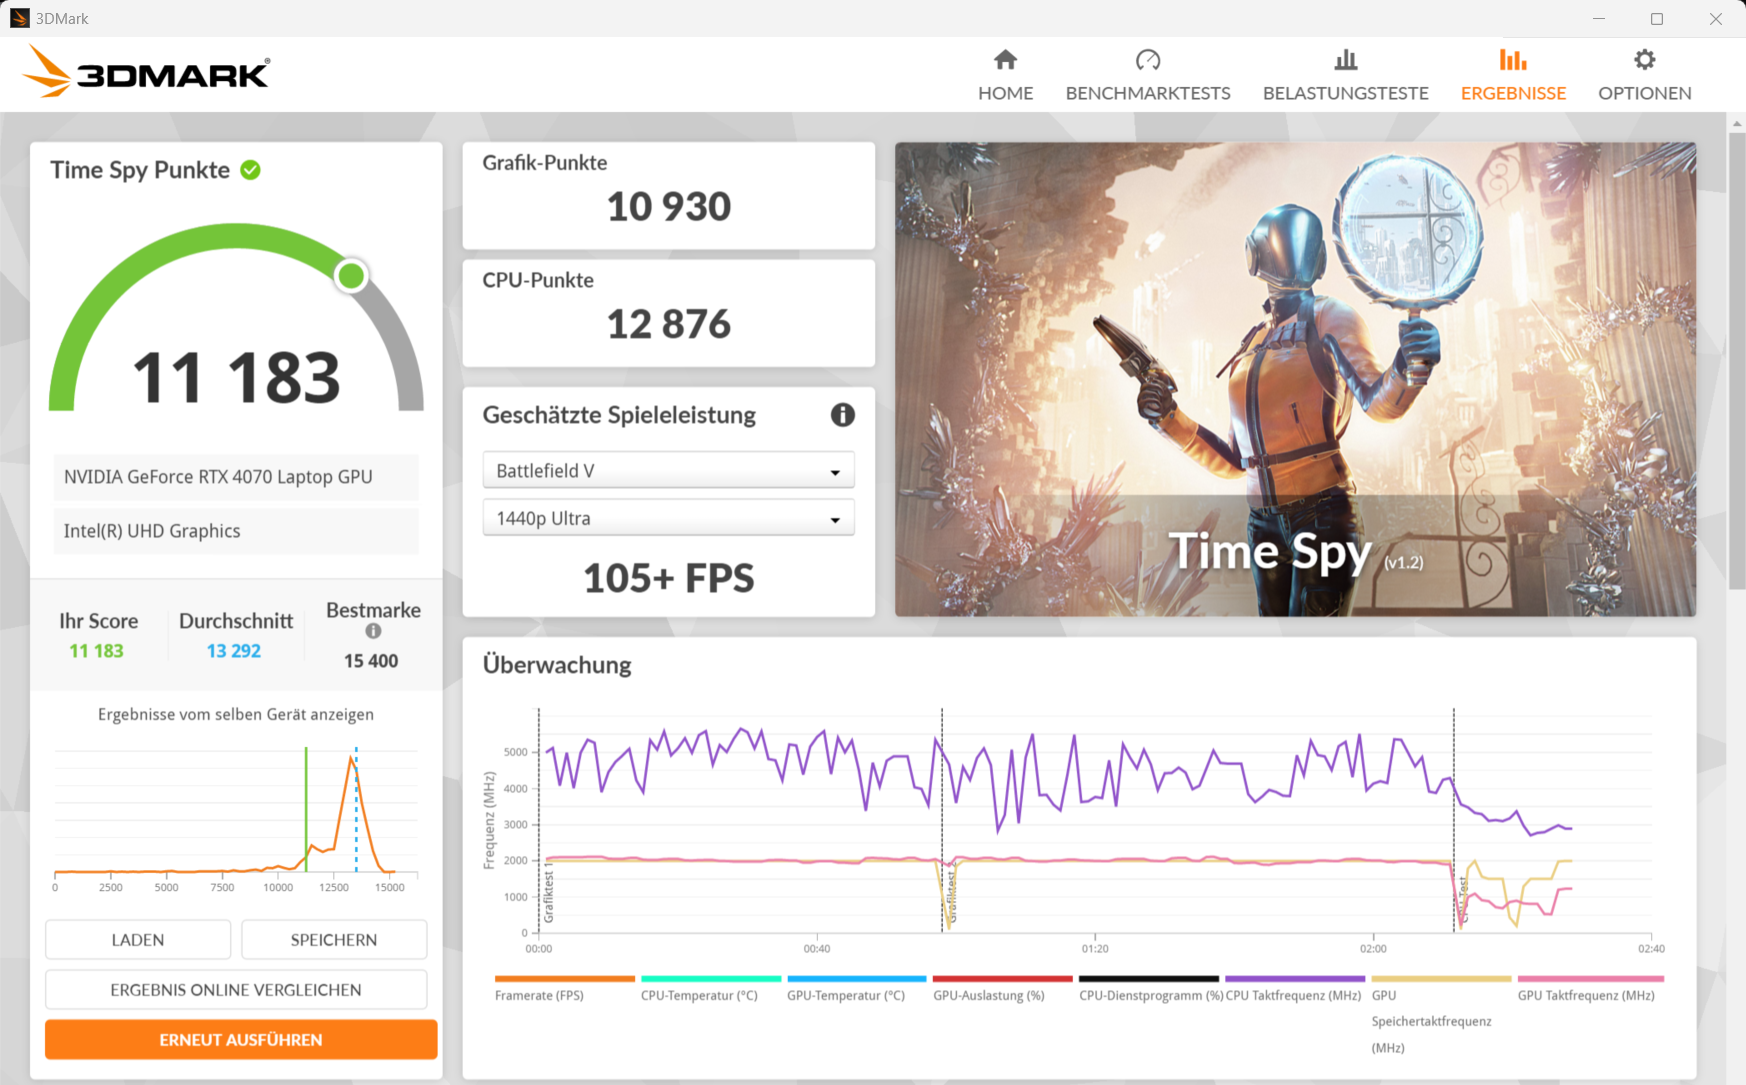
Los juegos QHD con ajustes de altos a máximos no son un problema para la instalada GeForce RTX 4070 (TGP: 140 vatios): Ofrece velocidades de fotogramas (y resultados de pruebas comparativas) ligeramente superiores a la media de la GPU. Un poco justo para los requisitos actuales: La GPU sólo dispone de 8 GB de VRAM (GDDR6). El cambio entre dGPU y Optimus requiere un reinicio.

| 3DMark 11 Performance | 34173 puntos | |
| 3DMark Fire Strike Score | 23584 puntos | |
| 3DMark Time Spy Score | 12286 puntos | |
| 3DMark Steel Nomad Score | 2598 puntos | |
ayuda | ||
* ... más pequeño es mejor
| Cyberpunk 2077 2.2 Phantom Liberty - 1920x1080 Ultra Preset (FSR off) | |
| Media de la clase Gaming (6.76 - 158, n=90, últimos 2 años) | |
| SCHENKER XMG Pro 16 Studio (Mid 23) | |
| Lenovo Legion Pro 5 16IRX9 | |
| Lenovo Legion 7 16 IRX G9 | |
| Acer Predator Helios Neo 16 (2024) | |
| SCHENKER XMG Pro 16 Studio (Mid 24) | |
| Medio NVIDIA GeForce RTX 4070 Laptop GPU (30.7 - 90.7, n=38) | |
| Aorus 16X 2024 | |
| GTA V - 1920x1080 Highest Settings possible AA:4xMSAA + FX AF:16x | |
| Acer Predator Helios Neo 16 (2024) | |
| Lenovo Legion Pro 5 16IRX9 | |
| SCHENKER XMG Pro 16 Studio (Mid 24) | |
| SCHENKER XMG Pro 16 Studio (Mid 23) | |
| Lenovo Legion 7 16 IRX G9 | |
| Media de la clase Gaming (12.1 - 168.2, n=132, últimos 2 años) | |
| Medio NVIDIA GeForce RTX 4070 Laptop GPU (48.3 - 141.6, n=62) | |
| Aorus 16X 2024 | |
| Senua's Saga Hellblade 2 | |
| 1920x1080 High Preset | |
| Media de la clase Gaming (38.4 - 78.8, n=6, últimos 2 años) | |
| SCHENKER XMG Pro 16 Studio (Mid 24) | |
| Medio NVIDIA GeForce RTX 4070 Laptop GPU (34.3 - 51.2, n=4) | |
| 2560x1440 High Preset | |
| Media de la clase Gaming (27.1 - 57.3, n=4, últimos 2 años) | |
| SCHENKER XMG Pro 16 Studio (Mid 24) | |
| Medio NVIDIA GeForce RTX 4070 Laptop GPU (23.7 - 33.3, n=4) | |
| 2560x1440 High Preset + Quality DLSS | |
| Media de la clase Gaming (42.2 - 83.1, n=3, últimos 2 años) | |
| SCHENKER XMG Pro 16 Studio (Mid 24) | |
| Medio NVIDIA GeForce RTX 4070 Laptop GPU (42.2 - 47.8, n=2) | |
| Ghost of Tsushima | |
| 1920x1080 Very High Preset AA:T | |
| SCHENKER XMG Pro 16 Studio (Mid 24) | |
| Medio NVIDIA GeForce RTX 4070 Laptop GPU (55.3 - 73.7, n=5) | |
| Media de la clase Gaming (28.5 - 73.7, n=7, últimos 2 años) | |
| 2560x1440 Very High Preset AA:T | |
| SCHENKER XMG Pro 16 Studio (Mid 24) | |
| Medio NVIDIA GeForce RTX 4070 Laptop GPU (43.6 - 56.1, n=5) | |
| Media de la clase Gaming (22.7 - 56.1, n=5, últimos 2 años) | |
| 2560x1440 Very High Preset + Quality DLSS | |
| SCHENKER XMG Pro 16 Studio (Mid 24) | |
| Media de la clase Gaming (63.6 - 74.2, n=3, últimos 2 años) | |
| Medio NVIDIA GeForce RTX 4070 Laptop GPU (57 - 74.2, n=3) | |
| The First Descendant | |
| 1920x1080 Ultra Preset | |
| SCHENKER XMG Pro 16 Studio (Mid 24) | |
| Medio NVIDIA GeForce RTX 4070 Laptop GPU (73.7 - 83.6, n=5) | |
| Media de la clase Gaming (15.4 - 80, n=5, últimos 2 años) | |
| 2560x1440 Ultra Preset | |
| SCHENKER XMG Pro 16 Studio (Mid 24) | |
| Medio NVIDIA GeForce RTX 4070 Laptop GPU (48.2 - 52.5, n=5) | |
| Media de la clase Gaming (43.7 - 51.2, n=3, últimos 2 años) | |
| 2560x1440 Ultra Preset + Ultra Ray Tracing + DLSS Quality | |
| SCHENKER XMG Pro 16 Studio (Mid 24) | |
| Medio NVIDIA GeForce RTX 4070 Laptop GPU (48.6 - 51.8, n=2) | |
| Media de la clase Gaming (43.3 - 51.8, n=2, últimos 2 años) | |
| F1 24 | |
| 1920x1080 Ultra High Preset AA:T AF:16x | |
| Media de la clase Gaming (54.1 - 148, n=19, últimos 2 años) | |
| SCHENKER XMG Pro 16 Studio (Mid 24) | |
| Medio NVIDIA GeForce RTX 4070 Laptop GPU (58.4 - 78.1, n=9) | |
| 2560x1440 Ultra High Preset AA:T AF:16x | |
| Media de la clase Gaming (36.7 - 100, n=16, últimos 2 años) | |
| SCHENKER XMG Pro 16 Studio (Mid 24) | |
| Medio NVIDIA GeForce RTX 4070 Laptop GPU (36.8 - 50.9, n=9) | |
| 2560x1440 Ultra High Preset + Quality DLSS AF:16x | |
| Media de la clase Gaming (59.2 - 150.4, n=12, últimos 2 años) | |
| SCHENKER XMG Pro 16 Studio (Mid 24) | |
| Medio NVIDIA GeForce RTX 4070 Laptop GPU (57 - 73.9, n=6) | |
Cyberpunk 2077 ultra FPS diagram
| bajo | medio | alto | ultra | QHD DLSS | QHD | |
|---|---|---|---|---|---|---|
| GTA V (2015) | 186.7 | 184.9 | 180.9 | 126 | 95.9 | |
| Dota 2 Reborn (2015) | 231 | 196.2 | 181.6 | 160.8 | ||
| Final Fantasy XV Benchmark (2018) | 214 | 163.6 | 119.7 | 86.8 | ||
| X-Plane 11.11 (2018) | 178 | 147.3 | 119.5 | |||
| Strange Brigade (2018) | 457 | 297 | 236 | 206 | 135.9 | |
| Baldur's Gate 3 (2023) | 171.8 | 132 | 115.3 | 111.8 | 77.2 | |
| Cyberpunk 2077 2.2 Phantom Liberty (2023) | 126.3 | 112.1 | 95.5 | 82.5 | 48.6 | |
| Dragon's Dogma 2 (2024) | 81 | 70.4 | 58.5 | |||
| Ghost of Tsushima (2024) | 114.9 | 102.8 | 93 | 73.7 | 74.2 | 56.1 |
| Senua's Saga Hellblade 2 (2024) | 78.3 | 64.9 | 51.2 | 47.8 | 33.3 | |
| F1 24 (2024) | 239 | 238 | 203 | 70.4 | 45.1 | |
| The First Descendant (2024) | 171 | 110.9 | 91.3 | 80 | 51.2 |
Emisiones y potencia - El XMG Pro con un alto consumo de energía
Emisiones sonoras
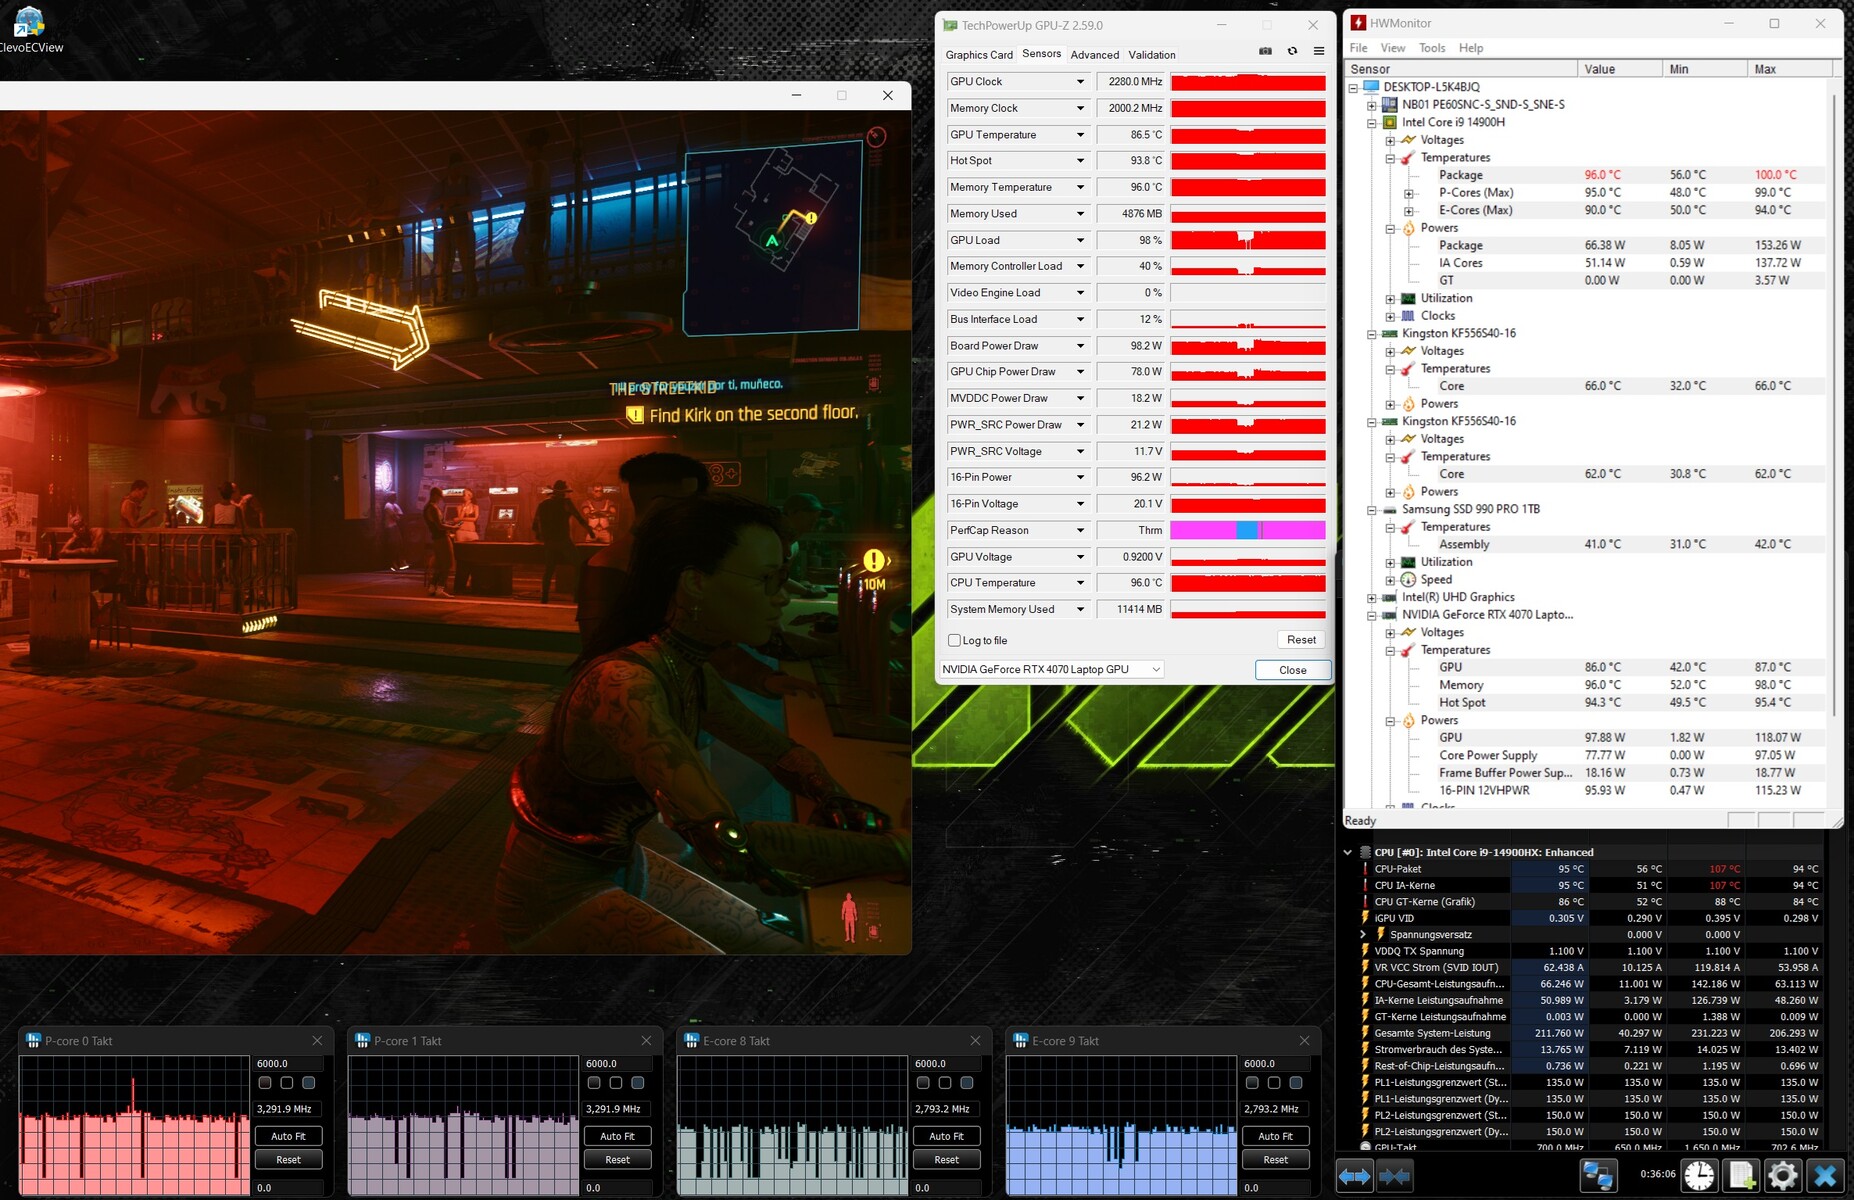
Cyberpunk 2077 aumenta las emisiones de ruido del portátil hasta 53 dB(A)( modo derendimiento ), mientras que el perfil de entretenimiento produce valores algo más moderados. El modo silencioso no es adecuado para juegos, ya que la dGPU está desactivada. El nivel de ruido del aparato es menor en ralentí y durante el uso cotidiano (oficina, internet): Los ventiladores no se aceleran excesivamente y, en ocasiones, se quedan parados. A veces, puede oírse un crujido electrónico procedente del interior del portátil.
Ruido
| Ocioso |
| 28 / 31 / 35 dB(A) |
| Carga |
| 52 / 52 dB(A) |
 | ||
30 dB silencioso 40 dB(A) audible 50 dB(A) ruidosamente alto |
||
min: | ||
| SCHENKER XMG Pro 16 Studio (Mid 24) NVIDIA GeForce RTX 4070 Laptop GPU, i9-14900HX, Samsung 990 Pro 1 TB | Acer Predator Helios Neo 16 (2024) NVIDIA GeForce RTX 4070 Laptop GPU, i7-14700HX, Samsung PM9A1a MZVL21T0HDLU | Lenovo Legion Pro 5 16IRX9 NVIDIA GeForce RTX 4070 Laptop GPU, i9-14900HX, Samsung PM9A1 MZVL21T0HCLR | Aorus 16X 2024 NVIDIA GeForce RTX 4070 Laptop GPU, i9-14900HX, Gigabyte AG450E1024-SI | SCHENKER XMG Pro 16 Studio (Mid 23) NVIDIA GeForce RTX 4070 Laptop GPU, i9-13900H, Samsung 990 Pro 1 TB | Lenovo Legion 7 16 IRX G9 NVIDIA GeForce RTX 4070 Laptop GPU, i9-14900HX, SK Hynix HFS001TEJ9X115N | |
|---|---|---|---|---|---|---|
| Noise | 3% | 10% | -3% | 7% | 16% | |
| apagado / medio ambiente * | 25 | 25.2 -1% | 23.9 4% | 26 -4% | 25 -0% | 24.5 2% |
| Idle Minimum * | 28 | 27.8 1% | 24.3 13% | 26 7% | 26 7% | 24.5 12% |
| Idle Average * | 31 | 32 -3% | 24.3 22% | 32 -3% | 29 6% | 24.5 21% |
| Idle Maximum * | 35 | 29.6 15% | 28.9 17% | 38 -9% | 34 3% | 24.5 30% |
| Load Average * | 52 | 45.2 13% | 45.8 12% | 54 -4% | 43 17% | 34.8 33% |
| Cyberpunk 2077 ultra * | 53 | |||||
| Load Maximum * | 52 | 55.8 -7% | 56.6 -9% | 55 -6% | 48 8% | 54.1 -4% |
| Witcher 3 ultra * | 51 | 50 | 48 | 54.1 |
* ... más pequeño es mejor
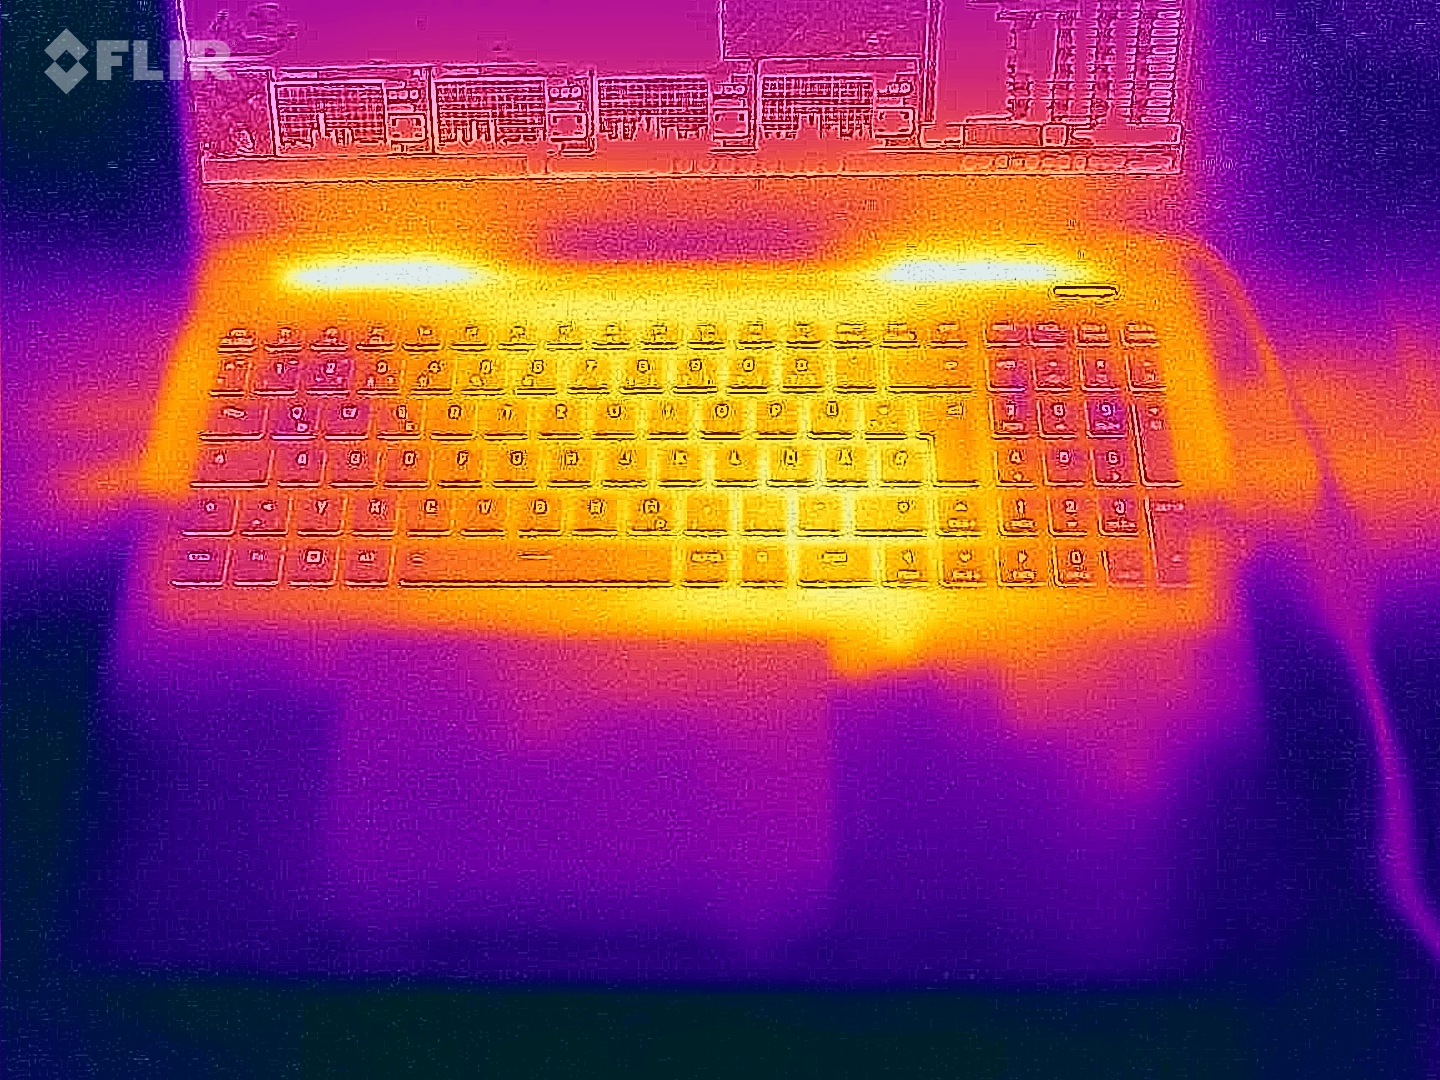
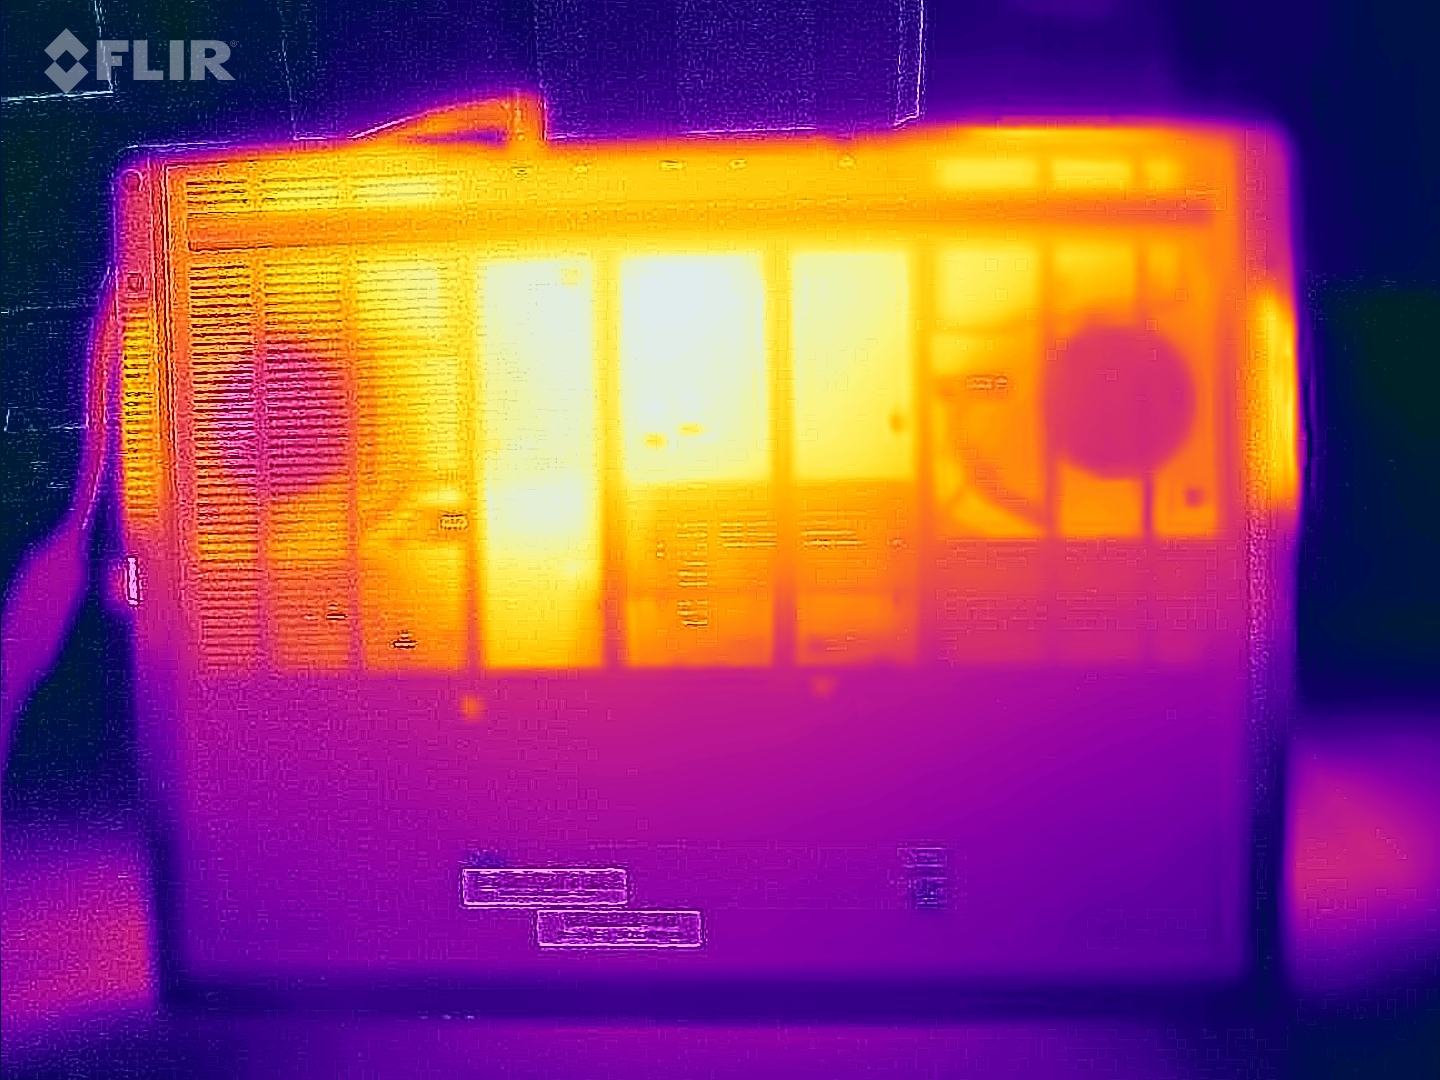
Temperatura
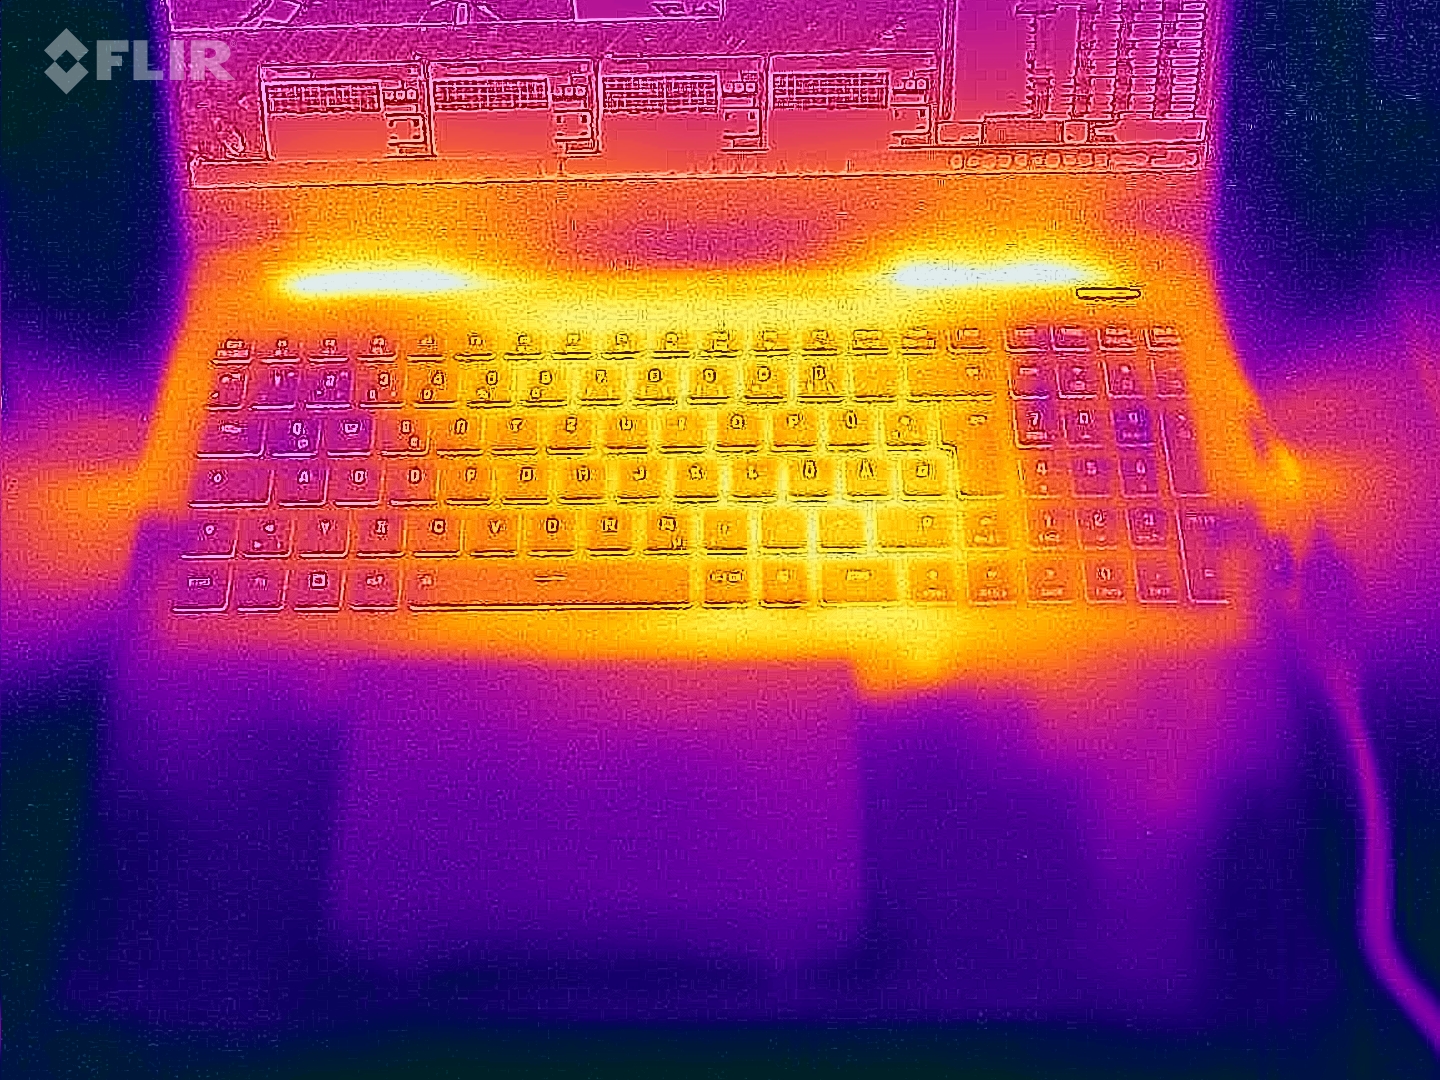
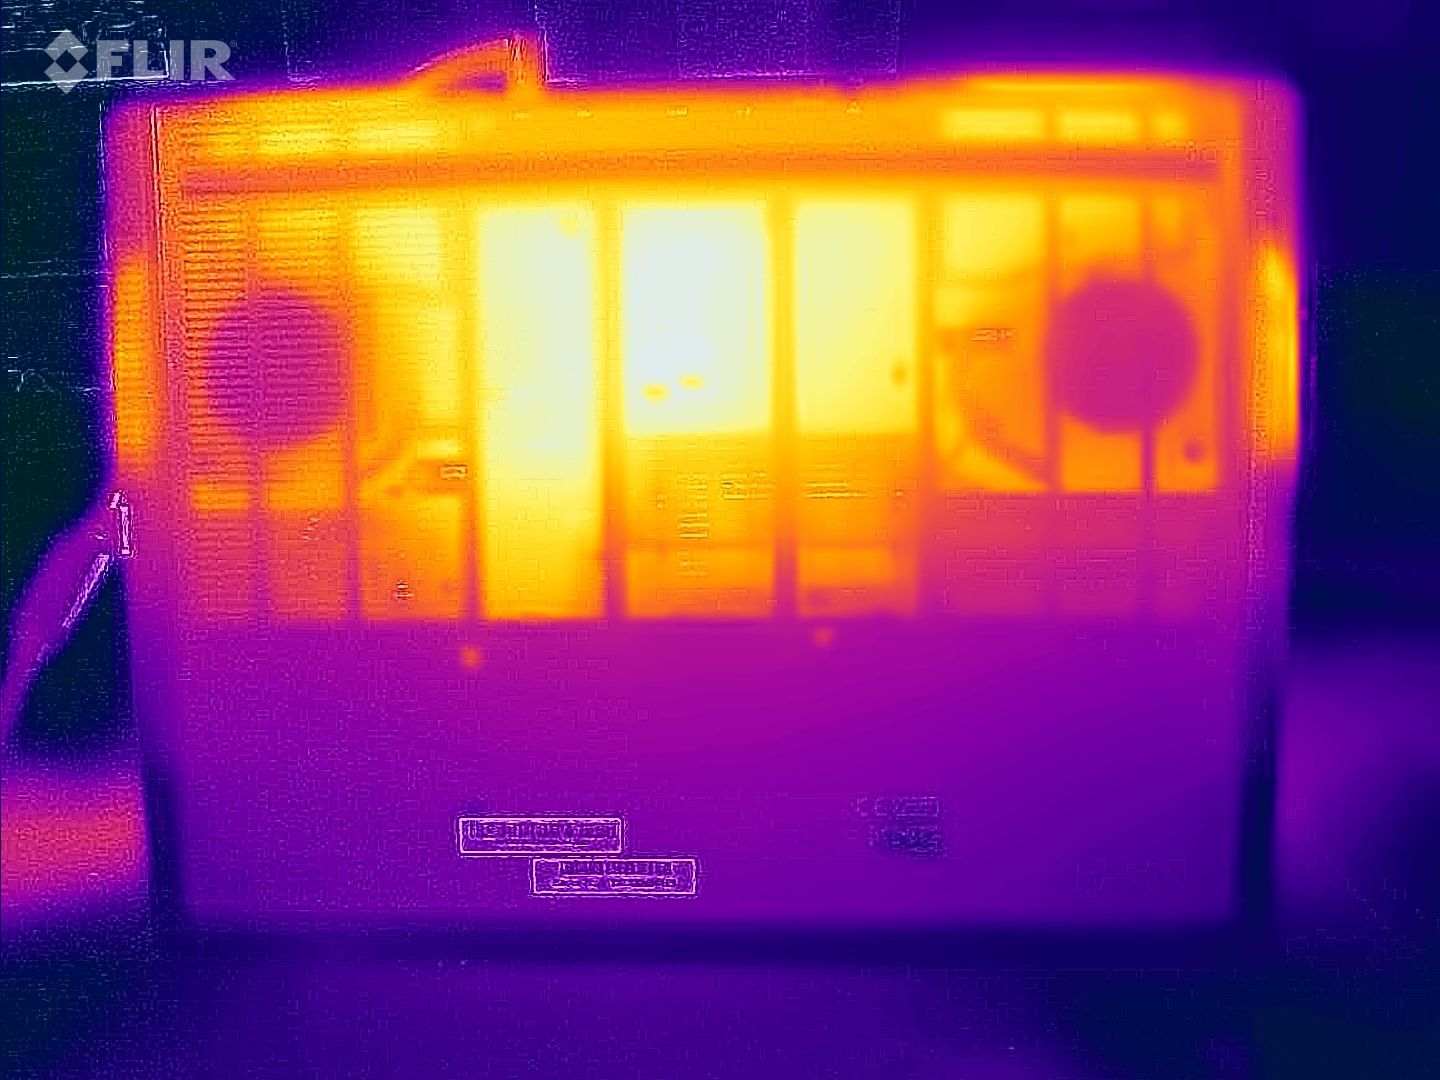
El portátil se calienta notablemente: Cyberpunk y las pruebas de estrés dieron lugar a temperaturas superiores a 60 grados Celsius en determinados momentos. También se pueden alcanzar valores superiores a la media durante el uso diario (oficina, Internet). Las temperaturas del reposamanos no son tan malas.
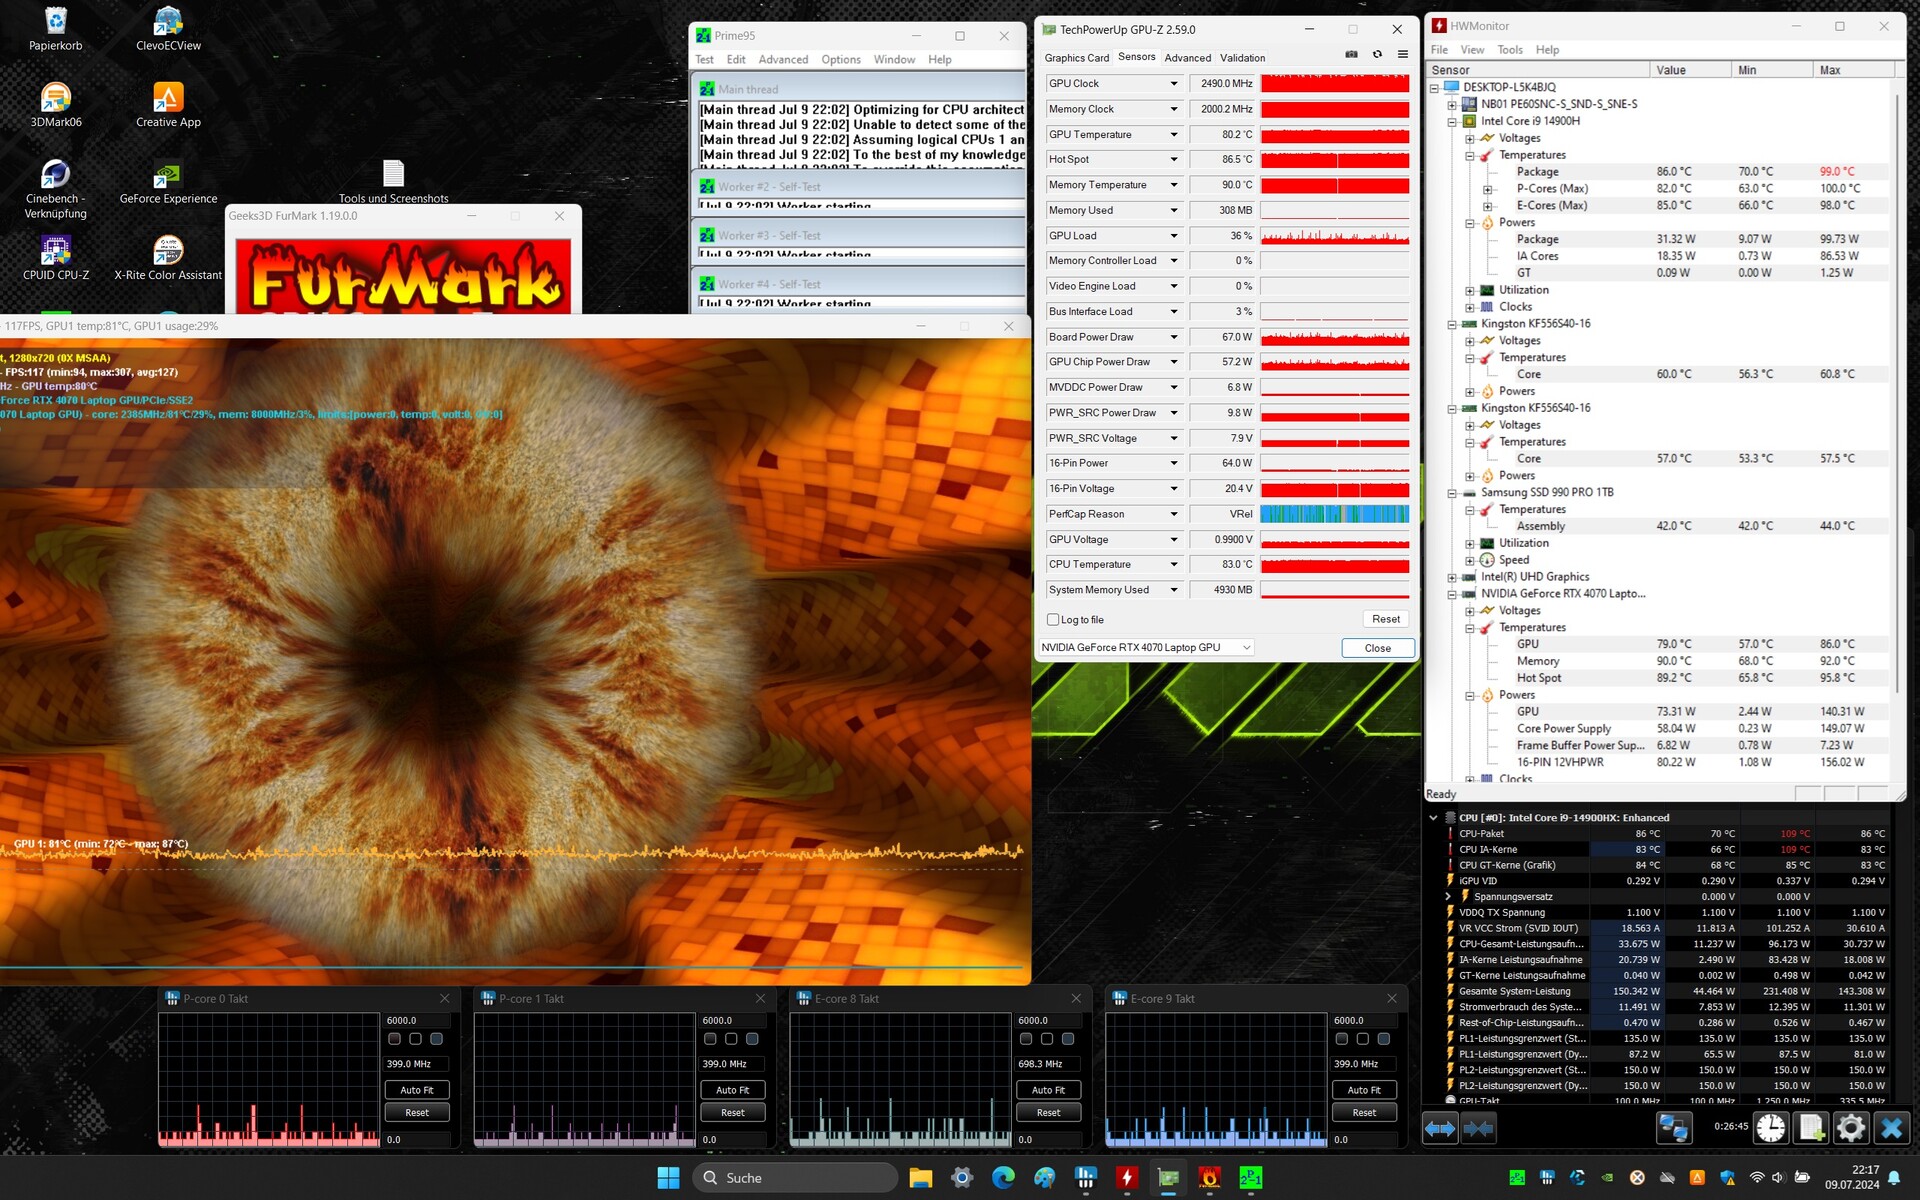
El escenario de prueba de estrés extremo (Prime95 y Furmark en funcionamiento continuo) comprueba la estabilidad del sistema a plena carga. Las prioridades del dispositivo están claramente distribuidas: Mientras la GPU funcionaba a plena potencia, el reloj de la CPU (de 400 MHz a 2 GHz) estaba por debajo del reloj base.
(-) La temperatura máxima en la parte superior es de 51 °C / 124 F, frente a la media de 40.4 °C / 105 F, que oscila entre 21.2 y 68.8 °C para la clase Gaming.
(-) El fondo se calienta hasta un máximo de 66 °C / 151 F, frente a la media de 43.2 °C / 110 F
(±) En reposo, la temperatura media de la parte superior es de 32.3 °C / 90# F, frente a la media del dispositivo de 33.9 °C / 93 F.
(-) 3: The average temperature for the upper side is 42.2 °C / 108 F, compared to the average of 33.9 °C / 93 F for the class Gaming.
(+) El reposamanos y el panel táctil están a una temperatura inferior a la de la piel, con un máximo de 31 °C / 87.8 F y, por tanto, son fríos al tacto.
(-) La temperatura media de la zona del reposamanos de dispositivos similares fue de 28.9 °C / 84 F (-2.1 °C / -3.8 F).
| SCHENKER XMG Pro 16 Studio (Mid 24) Intel Core i9-14900HX, NVIDIA GeForce RTX 4070 Laptop GPU | Acer Predator Helios Neo 16 (2024) Intel Core i7-14700HX, NVIDIA GeForce RTX 4070 Laptop GPU | Lenovo Legion Pro 5 16IRX9 Intel Core i9-14900HX, NVIDIA GeForce RTX 4070 Laptop GPU | Aorus 16X 2024 Intel Core i9-14900HX, NVIDIA GeForce RTX 4070 Laptop GPU | SCHENKER XMG Pro 16 Studio (Mid 23) Intel Core i9-13900H, NVIDIA GeForce RTX 4070 Laptop GPU | Lenovo Legion 7 16 IRX G9 Intel Core i9-14900HX, NVIDIA GeForce RTX 4070 Laptop GPU | |
|---|---|---|---|---|---|---|
| Heat | 9% | 11% | 14% | 2% | 22% | |
| Maximum Upper Side * | 51 | 58 -14% | 43.8 14% | 41 20% | 55 -8% | 43.7 14% |
| Maximum Bottom * | 66 | 45.2 32% | 55.4 16% | 41 38% | 66 -0% | 42.9 35% |
| Idle Upper Side * | 35 | 31.1 11% | 32.8 6% | 37 -6% | 33 6% | 29.1 17% |
| Idle Bottom * | 39 | 37.2 5% | 36 8% | 38 3% | 35 10% | 30.6 22% |
* ... más pequeño es mejor
Altavoces
Hay una clara falta de graves. Por lo demás, los altavoces estéreo producen un sonido aceptable. Su nivel máximo podría ser ligeramente superior.
SCHENKER XMG Pro 16 Studio (Mid 24) análisis de audio
(±) | la sonoridad del altavoz es media pero buena (79 dB)
Graves 100 - 315 Hz
(-) | casi sin bajos - de media 15.1% inferior a la mediana
(±) | la linealidad de los graves es media (13.6% delta a frecuencia anterior)
Medios 400 - 2000 Hz
(±) | medias más altas - de media 5.3% más altas que la mediana
(+) | los medios son lineales (4.4% delta a la frecuencia anterior)
Altos 2 - 16 kHz
(+) | máximos equilibrados - a sólo 4.4% de la mediana
(+) | los máximos son lineales (4.9% delta a la frecuencia anterior)
Total 100 - 16.000 Hz
(±) | la linealidad del sonido global es media (17.7% de diferencia con la mediana)
En comparación con la misma clase
» 50% de todos los dispositivos probados de esta clase eran mejores, 10% similares, 40% peores
» El mejor tuvo un delta de 6%, la media fue 18%, el peor fue ###max##%
En comparación con todos los dispositivos probados
» 33% de todos los dispositivos probados eran mejores, 8% similares, 59% peores
» El mejor tuvo un delta de 4%, la media fue 24%, el peor fue ###max##%
Lenovo Legion Pro 5 16IRX9 análisis de audio
(±) | la sonoridad del altavoz es media pero buena (80.7 dB)
Graves 100 - 315 Hz
(-) | casi sin bajos - de media 19% inferior a la mediana
(±) | la linealidad de los graves es media (10.1% delta a frecuencia anterior)
Medios 400 - 2000 Hz
(+) | medios equilibrados - a sólo 4.7% de la mediana
(+) | los medios son lineales (5.7% delta a la frecuencia anterior)
Altos 2 - 16 kHz
(+) | máximos equilibrados - a sólo 3.3% de la mediana
(+) | los máximos son lineales (5.6% delta a la frecuencia anterior)
Total 100 - 16.000 Hz
(±) | la linealidad del sonido global es media (17.2% de diferencia con la mediana)
En comparación con la misma clase
» 45% de todos los dispositivos probados de esta clase eran mejores, 11% similares, 44% peores
» El mejor tuvo un delta de 6%, la media fue 18%, el peor fue ###max##%
En comparación con todos los dispositivos probados
» 29% de todos los dispositivos probados eran mejores, 8% similares, 63% peores
» El mejor tuvo un delta de 4%, la media fue 24%, el peor fue ###max##%
Consumo de energía
En modo inactivo, el consumo de energía del portátil es demasiado alto, significativamente superior al del modelo predecesor equipado de forma similar. Cyberpunk y las pruebas de estrés se ejecutaron con un consumo de energía ligeramente decreciente y en constante fluctuación. La fuente de alimentación de 230 vatios sigue teniendo un tamaño suficiente. Los picos de carga a corto plazo, como al inicio de la prueba de estrés, no suponen un problema para ella.
| Off / Standby | |
| Ocioso | |
| Carga |
|
Clave:
min: | |
| SCHENKER XMG Pro 16 Studio (Mid 24) NVIDIA GeForce RTX 4070 Laptop GPU, i9-14900HX, Samsung 990 Pro 1 TB | Acer Predator Helios Neo 16 (2024) NVIDIA GeForce RTX 4070 Laptop GPU, i7-14700HX, Samsung PM9A1a MZVL21T0HDLU | Lenovo Legion Pro 5 16IRX9 NVIDIA GeForce RTX 4070 Laptop GPU, i9-14900HX, Samsung PM9A1 MZVL21T0HCLR | Aorus 16X 2024 NVIDIA GeForce RTX 4070 Laptop GPU, i9-14900HX, Gigabyte AG450E1024-SI | SCHENKER XMG Pro 16 Studio (Mid 23) NVIDIA GeForce RTX 4070 Laptop GPU, i9-13900H, Samsung 990 Pro 1 TB | |
|---|---|---|---|---|---|
| Power Consumption | 11% | 23% | 22% | 43% | |
| Idle Minimum * | 31 | 26.7 14% | 12.5 60% | 13 58% | 8 74% |
| Idle Average * | 33 | 24.4 26% | 24.6 25% | 18 45% | 12 64% |
| Idle Maximum * | 41 | 32.7 20% | 24.8 40% | 35 15% | 23 44% |
| Load Average * | 114 | 122.1 -7% | 109.6 4% | 138 -21% | 94 18% |
| Cyberpunk 2077 ultra * | 218 | ||||
| Cyberpunk 2077 ultra external monitor * | 196.8 | ||||
| Load Maximum * | 250 | 241 4% | 284.9 -14% | 222 11% | 215 14% |
| Witcher 3 ultra * | 190.6 | 218 | 172.6 | 181.5 |
* ... más pequeño es mejor
Power consumption Cyberpunk / stress test
Power consumption with external monitor
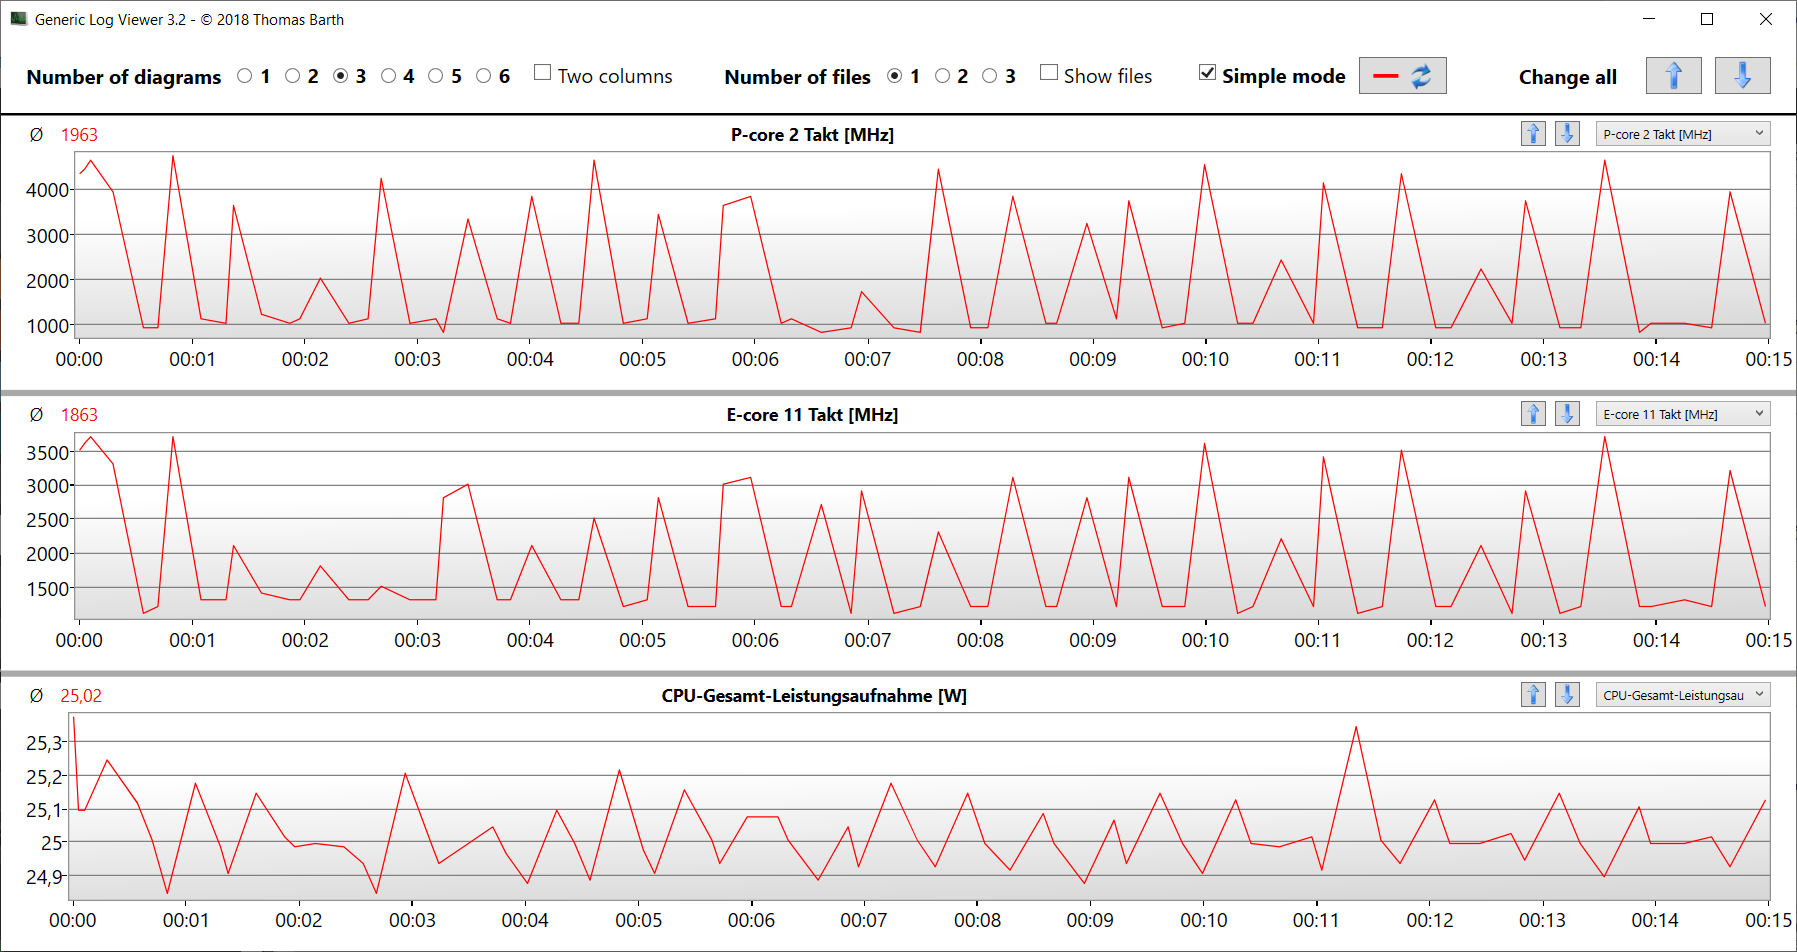
Tiempos de ejecución
El Pro 16 también requiere más energía que su predecesor bajo carga en modo batería. Como resultado, alcanzó una autonomía de 5:37 horas durante la prueba WiFi (asignando la carga al acceder a sitios web utilizando un script). Esto lo deja una buena hora por detrás de su predecesor-que tenía la misma capacidad de batería de 73 Wh.
Pro
Contra
Veredicto - Una potencia con problemas
La Pro 16 se centra en una potencia de GPU permanentemente alta con valores de rendimiento ligeramente superiores a la media de la GPU. La CPU ya tiene que tomárselo con calma al cabo de poco tiempo: el CB15 Loop lo puso de manifiesto.
La XMG Pro 16 Studio (Mid 24) puede asignarse al departamento de mantenimiento de modelos. Aparte del cambio de Raptor Lake a Raptor Lake Refresh, el portátil no presenta ninguna novedad significativa.
El ruido y el desarrollo de calor del dispositivo, así como su consumo de energía en modo inactivo son todos (demasiado) altos. Con respecto a lo hambriento de energía que es el portátil, no podemos descartar que nuestra muestra de prueba tenga algún defecto. Sus tiempos de ejecución son decentes.
Su panel 16:10 instalado (16 pulgadas, 2.560 x 1.600 píxeles, sRGB, IPS, 240 Hz) está bien, pero carece del espacio de color DCI-P3 que es un requisito previo para un portátil creador. Aun así, el dispositivo puede alojar dos SSD PCIe 4 y admite RAID 0/1. Un puerto TB-4 ofrece opciones de ampliación (GPU externa, docking) y admite Power Delivery.
Una alternativa podría ser el Aorus 16X (2024). Puede obtener un poco más de potencia de cálculo de la misma CPU, cuenta con una pantalla mucho más brillante (incluyendo Dolby Vision) y, además, presume de mejores tiempos de ejecución.
Precio y disponibilidad
El nuevo XMG Pro 16 Studio (Mid 24) puede configurarse y encargarse a través de bestware.comy el dispositivo de prueba actual cuesta unos 2.500 dólares.
Tenga en cuenta que: recientemente hemos actualizado nuestro sistema de clasificación y los resultados de la versión 8 no son comparables con los de la versión 7. Encontrará más información aquí.
SCHENKER XMG Pro 16 Studio (Mid 24)
- 07/23/2024 v8
Sascha Mölck
 Total Sustainability Score:
 Transparencia
La selección de los dispositivos que se van a reseñar corre a cargo de nuestro equipo editorial. La muestra de prueba fue proporcionada al autor en calidad de préstamo por el fabricante o el minorista a los efectos de esta reseña. El prestamista no tuvo ninguna influencia en esta reseña, ni el fabricante recibió una copia de la misma antes de su publicación. No había ninguna obligación de publicar esta reseña. Nunca aceptamos compensaciones o pagos a cambio de nuestras reseñas. Como empresa de medios independiente, Notebookcheck no está sujeta a la autoridad de fabricantes, minoristas o editores.
Así es como prueba Notebookcheck
Cada año, Notebookcheck revisa de forma independiente cientos de portátiles y smartphones utilizando procedimientos estandarizados para asegurar que todos los resultados son comparables. Hemos desarrollado continuamente nuestros métodos de prueba durante unos 20 años y hemos establecido los estándares de la industria en el proceso. En nuestros laboratorios de pruebas, técnicos y editores experimentados utilizan equipos de medición de alta calidad. Estas pruebas implican un proceso de validación en varias fases. Nuestro complejo sistema de clasificación se basa en cientos de mediciones y puntos de referencia bien fundamentados, lo que mantiene la objetividad.Price comparison

