Análisis del portátil Lenovo ThinkBook 13x G4: Uno de los mejores subportátiles aparte del teclado
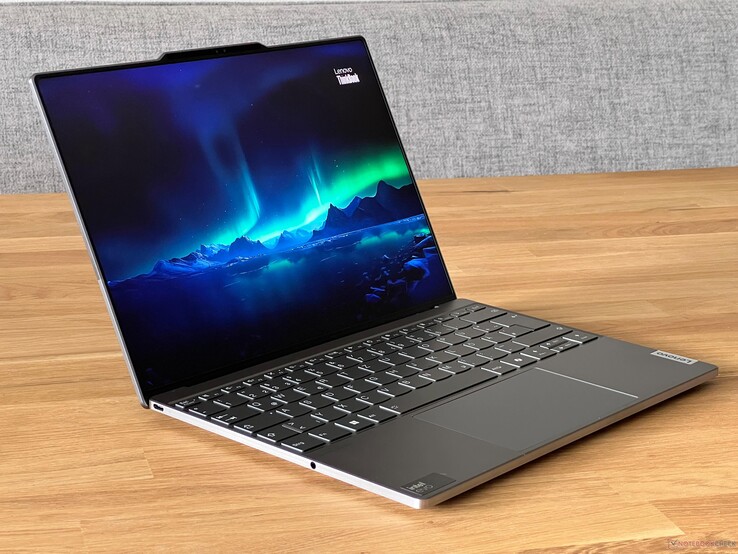
Los modelos de la serie ThinkBook están dirigidos principalmente a clientes empresariales que no desean gastar los elevados precios de los ThinkPads en sus empleados. El nuevo ThinkBook 13x G4 es un subportátil compacto que también puede interesar a los compradores particulares, ya que ofrece un rendimiento decente, una gran batería, una pantalla IPS 3:2 de alta resolución con superficie mate y un chasis de aluminio por unos 1.100 dólares
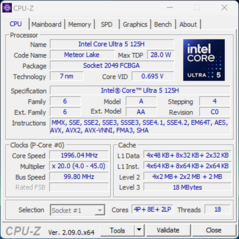
Nuestro modelo de prueba del ThinkBook 13x G4 lleva el número de modelo 21KR0008GE y viene con el procesador Core Ultra 5 125H, 16 GB de RAM, 512 GB de almacenamiento SSD y una pantalla de 2,8K (2880 x 1920) por 1.106 dólares.
Posibles contendientes en la comparación
Valoración | Fecha | Modelo | Peso | Altura | Tamaño | Resolución | Precio |
|---|---|---|---|---|---|---|---|
| 90.1 % v7 (old) | 05/2024 | Lenovo ThinkBook 13x G4 21KR0008GE Ultra 5 125H, Arc 7-Core | 1.2 kg | 12.9 mm | 13.50" | 2880x1920 | |
| 86.5 % v7 (old) | 05/2024 | Dell XPS 13 9340 Core Ultra 7 Ultra 7 155H, Arc 8-Core | 1.2 kg | 15.3 mm | 13.40" | 1920x1200 | |
| 92.4 % v7 (old) | 03/2024 | Apple MacBook Air 13 M3 10C GPU M3, M3 10-Core GPU | 1.2 kg | 11.3 mm | 13.60" | 2560x1664 | |
| 86.6 % v7 (old) | 03/2024 | MSI Prestige 13 AI Evo Ultra 7 155H, Arc 8-Core | 967 g | 16.9 mm | 13.30" | 2880x1800 | |
| 89.5 % v7 (old) | 01/2024 | Lenovo ThinkPad Z13 Gen 2 R7 PRO 7840U, Radeon 780M | 1.2 kg | 13.99 mm | 13.30" | 2880x1800 | |
| 91.9 % v7 (old) | 07/2023 | HP Dragonfly G4 i7-1365U, Iris Xe G7 96EUs | 1.1 kg | 16.3 mm | 13.50" | 1920x1280 |
Carcasa - ThinkBook con chasis de aluminio
Fundamentalmente, el diseño del ThinkBook 13x G4 no difiere de sus hermanos más baratos, ya que la carcasa gris plateada tiene una tapa de dos tonos con letras grandes y parece muy sencilla a primera vista. Mientras que los modelos más baratos, como el ThinkBook 16 G6, normalmente sólo tienen una tapa con pantalla de aluminio y el resto de la carcasa es de plástico, el ThinkBook 13x G4 también utiliza aluminio para la unidad base. Los laterales de la unidad base están pulidos y el dispositivo tiene un aspecto general de gran calidad. La unidad base no es cónica en los laterales, lo que hace que el dispositivo parezca algo más voluminoso de lo que es en realidad.
Como en todos los demás modelos, Lenovo utiliza una joroba para la cámara, que aquí parece muy grande. No tiene un aspecto agradable, pero al menos ayuda al abrir la tapa. Al abrir la tapa se notan dos cosas: los bordes de la pantalla muy estrechos y el ángulo de apertura significativamente limitado a un máximo de 135 grados en comparación con los ThinkPad. No obstante, las propias bisagras están bien ajustadas y mantienen la tapa firmemente en su sitio, aparte de un mínimo balanceo al ajustar el ángulo. A pesar de su delgado diseño, la tapa es muy estable y no pudimos provocar ningún error o distorsión de la imagen. La estabilidad de la unidad base es excelente y sólo la zona central del teclado cede ligeramente bajo presión. No se detectaron crujidos. La mano de obra tampoco da motivos de crítica.
Top 10 Análisis
» Top 10 Portátiles Multimedia
» Top 10 Portátiles de Juego
» Top 10 Portátiles de Juego ligeros
» Top 10 Portátiles Asequibles de Oficina/Empresa
» Top 10 Portátiles de Juego Ligeros
» Top 10 Portátiles de Oficina/Empresa Premium
» Top 10 Estaciones de Trabajo
» Top 10 Subportátiles
» Top 10 Ultrabooks
» Top 10 Convertibles
» Top 10 Tablets
» Top 10 Tablets Windows
» Top 10 Tablets de menos de 250 Euros
» Top 10 Phablets (>5.5")
» Top 10 Smartphones
» Top 10 Smartphones (≤5")
» Top 10 Smartphones de menos de 300 Euros
» Top 10 Smartphones de menos de 120 Euros
» Top 10 Portátiles de menos de 1000 Euros
» Top 10 Portátiles de menos de 500 Euros
» Top 10 Portátiles de menos de 300 Euros
» Los Mejores Displays de Portátiles Analizados por Notebookcheck
Como se ha descrito anteriormente, el ThinkBook 13x G4 parece algo más grueso debido a su diseño, pero las apariencias engañan y, con una altura de tan sólo 12,9 mm, es uno de los dispositivos más delgados de nuestro grupo de comparación, sólo superado por el MacBook Air M3. Por otra parte, el portátil de Lenovo ocupa menos espacio en el escritorio que el Air M3 y es también uno de los modelos más compactos en general, por lo que puede guardarse fácilmente en cualquier bolsa. Sin embargo, con 1,2 kg, también es uno de los dispositivos más pesados de esta lista y la fuente de alimentación enchufable de 65 vatios añade otros 191 gramos. La hoja de datos oficial también menciona un modelo de magnesio con un peso de alrededor de 1 kg, pero no hemos podido encontrar la configuración correspondiente.
Equipamiento - 3x Thunderbolt 4
Lenovo equipa el ThinkBook 13x G4 con tres rápidos puertos USB-C, incluido Thunderbolt 4. El posicionamiento parece un poco inusual al principio, pero resulta ser bastante práctico en la práctica. Uno de los puertos está en la parte frontal derecha, donde se pueden conectar fácilmente memorias USB, y el dispositivo se puede cargar por ambos lados. Sin embargo, se necesitan adaptadores para los dispositivos USB-A y tampoco hay lector de tarjetas. Existen modelos opcionales con la conexión Magic Bay de Lenovo, en cuyo caso la joroba de la cámara es más gruesa y está equipada con clavijas pogo. De este modo, se pueden conectar aquí accesorios opcionales como una cámara web 4K.
Comunicación
En el ThinkBook 13x G4 aún no se ha instalado un módulo WiFi 7, pero sí el conocido módulo AX211 de Intel. Éste admite WiFi 6E, así como Bluetooth 5.3. En las pruebas con nuestro router de referencia Asus, las tasas de transferencia fueron muy altas y estables. Tampoco tuvimos problemas con la estabilidad de la señal.
| Networking | |
| Lenovo ThinkBook 13x G4 21KR0008GE | |
| iperf3 transmit AXE11000 | |
| iperf3 receive AXE11000 | |
| Dell XPS 13 9340 Core Ultra 7 | |
| iperf3 transmit AXE11000 | |
| iperf3 receive AXE11000 | |
| Apple MacBook Air 13 M3 10C GPU | |
| iperf3 transmit AXE11000 | |
| iperf3 receive AXE11000 | |
| MSI Prestige 13 AI Evo | |
| iperf3 transmit AXE11000 | |
| iperf3 receive AXE11000 | |
| Lenovo ThinkPad Z13 Gen 2 | |
| iperf3 transmit AXE11000 | |
| iperf3 receive AXE11000 | |
| iperf3 transmit AXE11000 6GHz | |
| iperf3 receive AXE11000 6GHz | |
| HP Dragonfly G4 | |
| iperf3 transmit AXE11000 | |
| iperf3 receive AXE11000 | |
| iperf3 transmit AXE11000 6GHz | |
| iperf3 receive AXE11000 6GHz | |
Cámara web
La cámara web de 1080p en el marco superior de la pantalla hace su trabajo, pero no debe esperar milagros. También hay un sensor de infrarrojos para el reconocimiento facial a través de Windows Hello.

Mantenimiento
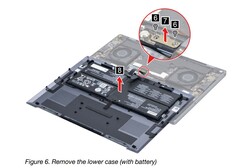
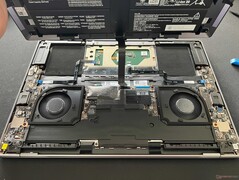
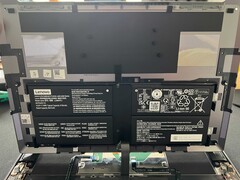
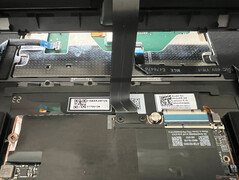
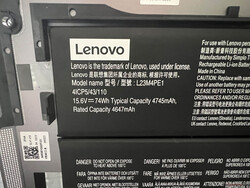
Nos sorprendió cuando abrimos la carcasa: aunque la placa base se puede retirar fácilmente, las opciones de mantenimiento son enormemente limitadas. La batería está sujeta a la tapa de la base y conectada a la placa base mediante un cable plano, que también está atornillado. Esto también se describe en el manual de mantenimiento, pero el procedimiento puede resultar engorroso para los usuarios inexpertos.
Dispositivos de entrada - Panel táctil háptico, pero teclado débil
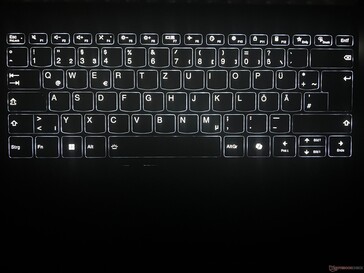
El teclado es uno de los puntos débiles del ThinkBook 13x G4, ya que el recorrido de las teclas es muy corto y la experiencia de escritura no es muy cómoda. Las pulsaciones en sí son precisas y no demasiado ruidosas, pero si escribe mucho y está acostumbrado a un teclado con mayor recorrido de teclas, debería probar la entrada antes de comprarlo si es posible. La disposición es sencilla y ahora también hay una tecla de copiloto, aunque las teclas de flecha verticales son bastante pequeñas. Dispone de retroiluminación blanca de dos niveles, que también puede activarse automáticamente mediante un sensor.
Dispone de un panel táctil háptico para controlar el puntero, que proporciona retroalimentación a través de motores de vibración. Funciona muy bien, pero el ruido del clic podría ser un poco más silencioso. La ventaja de esta solución es que puede hacer clic en cualquier parte del pad y obtener la misma respuesta. Las propiedades de deslizamiento de la superficie de cristal son excelentes. Con 12 x 7,5 cm, hay espacio suficiente para movimientos/gestos.
Pantalla - 2.8K IPS con 120 Hz
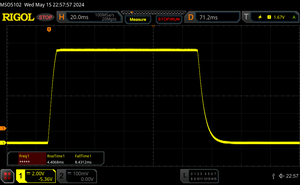
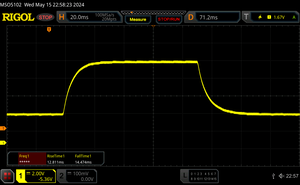
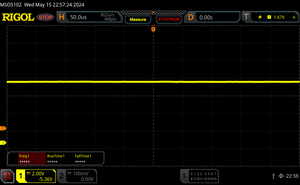
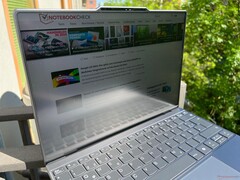
Lenovo renuncia a una pantalla OLED en el ThinkBook 13x G4 y en su lugar instala un panel IPS de alta resolución en formato 3:2. Gracias a la resolución de 2880 x 1920, todo el contenido es muy nítido y los colores vivos, aunque no estén al nivel OLED. En general, la calidad subjetiva de la imagen es muy buena, ya que las zonas brillantes no aparecen granuladas y los movimientos se benefician del aumento de frecuencia. La ausencia de parpadeo PWM es también una gran ventaja y los tiempos de respuesta son también discretos. Tanto el brillo como la temperatura del color se ajustan automáticamente mediante un sensor.
El brillo medio es de 513 cd/m² y el nivel de negro ligeramente superior, de 0,38 cd/m², pero aún así se obtiene una relación de contraste muy buena. Los halos no son un problema importante y el panel también admite contenidos HDR, pero el brillo máximo sigue siendo de 540 cd/m².
| |||||||||||||||||||||||||
iluminación: 89 %
Brillo con batería: 539 cd/m²
Contraste: 1418:1 (Negro: 0.38 cd/m²)
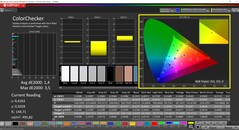
ΔE Color 1.4 | 0.5-29.43 Ø4.87, calibrated: 0.7
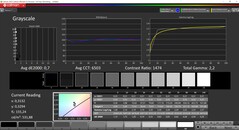
ΔE Greyscale 2.2 | 0.5-98 Ø5.1
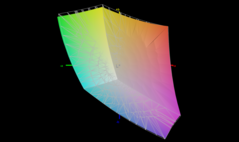
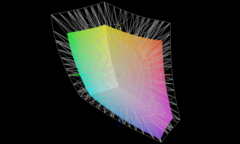
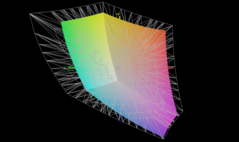
67.7% AdobeRGB 1998 (Argyll 2.2.0 3D)
97.3% sRGB (Argyll 2.2.0 3D)
65.5% Display P3 (Argyll 2.2.0 3D)
Gamma: 2.19
| Lenovo ThinkBook 13x G4 21KR0008GE LEN135WQ+, IPS, 2880x1920, 13.5" | Dell XPS 13 9340 Core Ultra 7 SHP1593, IPS, 1920x1200, 13.4" | Apple MacBook Air 13 M3 10C GPU IPS, 2560x1664, 13.6" | MSI Prestige 13 AI Evo ATNA33AA07-0, OLED, 2880x1800, 13.3" | Lenovo ThinkPad Z13 Gen 2 ATNA33AA02-0, OLED, 2880x1800, 13.3" | HP Dragonfly G4 Chi Mei CMN13C0, IPS, 1920x1280, 13.5" | |
|---|---|---|---|---|---|---|
| Display | 4% | 28% | 33% | 33% | 3% | |
| Display P3 Coverage | 65.5 | 69.4 6% | 98.4 50% | 99.9 53% | 99.7 52% | 68.4 4% |
| sRGB Coverage | 97.3 | 97.8 1% | 99.9 3% | 100 3% | 100 3% | 98.3 1% |
| AdobeRGB 1998 Coverage | 67.7 | 71.7 6% | 87.9 30% | 97.8 44% | 97.3 44% | 70.4 4% |
| Response Times | -87% | -70% | 92% | 88% | -112% | |
| Response Time Grey 50% / Grey 80% * | 27.3 ? | 43.2 ? -58% | 34.5 ? -26% | 1.54 ? 94% | 2.1 ? 92% | 48.8 ? -79% |
| Response Time Black / White * | 12.8 ? | 27.6 ? -116% | 27.2 ? -113% | 1.44 ? 89% | 2.2 ? 83% | 31.3 ? -145% |
| PWM Frequency | 240 ? | 60.1 ? | ||||
| Screen | -40% | 1% | -11% | 7% | -9% | |
| Brightness middle | 539 | 429 -20% | 525 -3% | 404 -25% | 372 -31% | 408.8 -24% |
| Brightness | 513 | 407 -21% | 506 -1% | 407 -21% | 375 -27% | 399 -22% |
| Brightness Distribution | 89 | 90 1% | 92 3% | 98 10% | 99 11% | 90 1% |
| Black Level * | 0.38 | 0.28 26% | 0.42 -11% | 0.32 16% | ||
| Contrast | 1418 | 1532 8% | 1250 -12% | 1278 -10% | ||
| Colorchecker dE 2000 * | 1.4 | 2.6 -86% | 1.4 -0% | 2.1 -50% | 0.88 37% | 2.02 -44% |
| Colorchecker dE 2000 max. * | 3.5 | 6.6 -89% | 2.8 20% | 4.3 -23% | 3.22 8% | 3.84 -10% |
| Colorchecker dE 2000 calibrated * | 0.7 | 1.4 -100% | 0.61 13% | |||
| Greyscale dE 2000 * | 2.2 | 4 -82% | 2 9% | 1.2 45% | 1.2 45% | 2.3 -5% |
| Gamma | 2.19 100% | 2.23 99% | 2.2 100% | 2.16 102% | 2.18 101% | 2.2 100% |
| CCT | 6710 97% | 7332 89% | 6876 95% | 6465 101% | 6326 103% | 6203 105% |
| Media total (Programa/Opciones) | -41% /
-37% | -14% /
-4% | 38% /
20% | 43% /
29% | -39% /
-21% |
* ... más pequeño es mejor
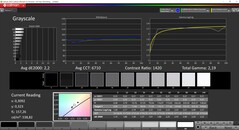
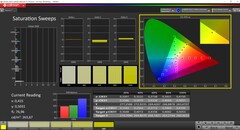
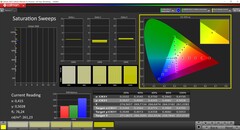
La pantalla ya está bien ajustada de fábrica y nuestro análisis con el software profesional CalMAN (X-Rite i1 Pro 2) sólo muestra un mínimo tinte azul, que no es perceptible en la práctica. Todos los colores están ya por debajo del importante umbral DeltaE-2000 de 3 en comparación con el espacio de color de referencia sRGB, por lo que la calibración no es absolutamente necesaria. Pudimos mejorar algo la pantalla con nuestro propio calibrado (el perfil correspondiente puede descargarse gratuitamente más arriba) y eliminar también el mínimo tinte de color. El espacio de color sRGB está cubierto casi por completo, por lo que el ThinkBook es adecuado para la edición de vídeo e imágenes.
Tiempos de respuesta del display
| ↔ Tiempo de respuesta de Negro a Blanco | ||
|---|---|---|
| 12.8 ms ... subida ↗ y bajada ↘ combinada | ↗ 4.4 ms subida | |
| ↘ 8.4 ms bajada | ||
| La pantalla mostró buenos tiempos de respuesta en nuestros tests pero podría ser demasiado lenta para los jugones competitivos. En comparación, todos los dispositivos de prueba van de ##min### (mínimo) a 240 (máximo) ms. » 30 % de todos los dispositivos son mejores. Esto quiere decir que el tiempo de respuesta medido es mejor que la media (20.8 ms) de todos los dispositivos testados. | ||
| ↔ Tiempo de respuesta 50% Gris a 80% Gris | ||
| 27.3 ms ... subida ↗ y bajada ↘ combinada | ↗ 12.8 ms subida | |
| ↘ 14.5 ms bajada | ||
| La pantalla mostró tiempos de respuesta relativamente lentos en nuestros tests pero podría ser demasiado lenta para los jugones. En comparación, todos los dispositivos de prueba van de ##min### (mínimo) a 636 (máximo) ms. » 34 % de todos los dispositivos son mejores. Esto quiere decir que el tiempo de respuesta medido es mejor que la media (32.5 ms) de todos los dispositivos testados. | ||
Parpadeo de Pantalla / PWM (Pulse-Width Modulation)
| Parpadeo de Pantalla / PWM no detectado | |||
Comparación: 53 % de todos los dispositivos testados no usaron PWM para atenuar el display. Si se usó, medimos una media de 8516 (mínimo: 5 - máxmo: 343500) Hz. | |||
Rendimiento - Core Ultra y hasta 32 GB de RAM
Curiosamente, Lenovo sólo ofrece el ThinkBook 13x G4 con el Core Ultra 5 125H o con el Core Ultra 9 185H, pero el popular Core Ultra 7 155H no está disponible. También tiene que elegir el Core Ultra 9 para pasar de 16 a 32 GB de RAM, ambos con recargos moderados.
Condiciones de prueba
Como es habitual, Lenovo ofrece varios modos de energía y, a diferencia de los modelos ThinkPad, éstos no están directamente vinculados a la configuración de energía de Windows. Los perfiles pueden cambiarse a través del software Vantage preinstalado o de la combinación de teclas Fn+Q. Hemos enumerado los valores de TDP correspondientes en la tabla siguiente. Para nuestras pruebas, utilizamos el perfil Auto, que está activo por defecto.
| Modo de alimentación | TDP | CB R23 Multi | Time Spy Gráficos | volumen máx. del ventilador |
|---|---|---|---|---|
| Ahorro de batería | 44 -> 18 vatios | 5.536 puntos | 2.471 puntos | 33,9 dB(A) |
| Auto | 51 -> 28 vatios | 9.194 puntos | 3.248 puntos | 40,7 dB(A) -> 36,8 dB(A) |
| Rendimiento | 51 -> 35 vatios | 12.188 puntos | 3.382 puntos | 42,5 dB(A) |
En el modo de rendimiento, el procesador funciona significativamente más tiempo a 51 vatios, mientras que en el modo automático son sólo unos segundos. Si necesita el máximo rendimiento de la CPU, este modo merece la pena. Para tareas menos exigentes en el día a día, puede utilizar el modo de ahorro de batería sin dudarlo y beneficiarse de ventiladores más silenciosos.
Procesador - Core Ultra 5 125H
El Core Ultra 5 125H de nuestro dispositivo de prueba pertenece a la actual generación Meteor Lake de Intel y ofrece dos núcleos de rendimiento menos que el ampliamente utilizado Core Ultra 7 155H. Los cuatro núcleos P existentes también alcanzan una velocidad de reloj máxima inferior de hasta 4,5 GHz. En el ThinkBook, el procesador consume hasta 51 vatios durante unos segundos antes de estabilizarse en 28 vatios, lo que puede verse claramente en nuestro bucle Cinebench. Este nivel de rendimiento es perfectamente suficiente para las tareas cotidianas, pero los resultados no son realmente buenos y el Core Ultra 5 no tiene ninguna posibilidad frente a un procesador Zen4 de AMD. Apple's refrigerado pasivamente M3 también ofrece un mejor rendimiento, tanto en las pruebas mononúcleo como multinúcleo. En modo batería, el procesador también puede consumir hasta 51 vatios, pero luego baja rápidamente a 25 vatios, por lo que el rendimiento aquí es ligeramente inferior que en funcionamiento con red eléctrica (-4%). Encontrará más pruebas de rendimiento de la CPU en nuestra sección técnica.
Cinebench R15 Multi Sustained Load
Cinebench R23: Multi Core | Single Core
Cinebench R20: CPU (Multi Core) | CPU (Single Core)
Cinebench R15: CPU Multi 64Bit | CPU Single 64Bit
Blender: v2.79 BMW27 CPU
7-Zip 18.03: 7z b 4 | 7z b 4 -mmt1
Geekbench 6.4: Multi-Core | Single-Core
Geekbench 5.5: Multi-Core | Single-Core
HWBOT x265 Benchmark v2.2: 4k Preset
LibreOffice : 20 Documents To PDF
R Benchmark 2.5: Overall mean
| CPU Performance Rating | |
| Lenovo ThinkPad Z13 Gen 2 | |
| Apple MacBook Air 13 M3 10C GPU -9! | |
| Dell XPS 13 9340 Core Ultra 7 | |
| Media de la clase Subnotebook | |
| MSI Prestige 13 AI Evo | |
| Medio Intel Core Ultra 5 125H | |
| Lenovo ThinkBook 13x G4 21KR0008GE -1! | |
| HP Dragonfly G4 -2! | |
| Cinebench R23 / Multi Core | |
| Lenovo ThinkPad Z13 Gen 2 | |
| Dell XPS 13 9340 Core Ultra 7 | |
| Medio Intel Core Ultra 5 125H (9194 - 14564, n=6) | |
| Media de la clase Subnotebook (1555 - 21812, n=75, últimos 2 años) | |
| Apple MacBook Air 13 M3 10C GPU | |
| MSI Prestige 13 AI Evo | |
| Lenovo ThinkBook 13x G4 21KR0008GE | |
| HP Dragonfly G4 | |
| Cinebench R23 / Single Core | |
| Apple MacBook Air 13 M3 10C GPU | |
| HP Dragonfly G4 | |
| Lenovo ThinkPad Z13 Gen 2 | |
| Dell XPS 13 9340 Core Ultra 7 | |
| Media de la clase Subnotebook (358 - 2165, n=75, últimos 2 años) | |
| MSI Prestige 13 AI Evo | |
| Medio Intel Core Ultra 5 125H (1549 - 1735, n=6) | |
| Lenovo ThinkBook 13x G4 21KR0008GE | |
| Cinebench R20 / CPU (Multi Core) | |
| Lenovo ThinkPad Z13 Gen 2 | |
| Dell XPS 13 9340 Core Ultra 7 | |
| Medio Intel Core Ultra 5 125H (3673 - 5618, n=6) | |
| Media de la clase Subnotebook (579 - 8541, n=70, últimos 2 años) | |
| MSI Prestige 13 AI Evo | |
| Lenovo ThinkBook 13x G4 21KR0008GE | |
| HP Dragonfly G4 | |
| Cinebench R20 / CPU (Single Core) | |
| HP Dragonfly G4 | |
| Lenovo ThinkPad Z13 Gen 2 | |
| Dell XPS 13 9340 Core Ultra 7 | |
| Lenovo ThinkBook 13x G4 21KR0008GE | |
| Medio Intel Core Ultra 5 125H (622 - 664, n=6) | |
| Media de la clase Subnotebook (128 - 826, n=70, últimos 2 años) | |
| MSI Prestige 13 AI Evo | |
| Cinebench R15 / CPU Multi 64Bit | |
| Dell XPS 13 9340 Core Ultra 7 | |
| Lenovo ThinkPad Z13 Gen 2 | |
| MSI Prestige 13 AI Evo | |
| Medio Intel Core Ultra 5 125H (1700 - 2245, n=6) | |
| Media de la clase Subnotebook (327 - 3345, n=75, últimos 2 años) | |
| Lenovo ThinkBook 13x G4 21KR0008GE | |
| HP Dragonfly G4 | |
| Cinebench R15 / CPU Single 64Bit | |
| Lenovo ThinkPad Z13 Gen 2 | |
| HP Dragonfly G4 | |
| Dell XPS 13 9340 Core Ultra 7 | |
| Media de la clase Subnotebook (72.4 - 322, n=71, últimos 2 años) | |
| Lenovo ThinkBook 13x G4 21KR0008GE | |
| Medio Intel Core Ultra 5 125H (235 - 251, n=6) | |
| MSI Prestige 13 AI Evo | |
| Blender / v2.79 BMW27 CPU | |
| Apple MacBook Air 13 M3 10C GPU | |
| HP Dragonfly G4 | |
| Media de la clase Subnotebook (159 - 2271, n=74, últimos 2 años) | |
| Lenovo ThinkBook 13x G4 21KR0008GE | |
| MSI Prestige 13 AI Evo | |
| Medio Intel Core Ultra 5 125H (228 - 364, n=6) | |
| Dell XPS 13 9340 Core Ultra 7 | |
| Lenovo ThinkPad Z13 Gen 2 | |
| 7-Zip 18.03 / 7z b 4 | |
| Lenovo ThinkPad Z13 Gen 2 | |
| Dell XPS 13 9340 Core Ultra 7 | |
| Media de la clase Subnotebook (11668 - 77867, n=66, últimos 2 años) | |
| MSI Prestige 13 AI Evo | |
| HP Dragonfly G4 | |
| Medio Intel Core Ultra 5 125H (0 - 0, n=2) | |
| 7-Zip 18.03 / 7z b 4 -mmt1 | |
| HP Dragonfly G4 | |
| Lenovo ThinkPad Z13 Gen 2 | |
| Media de la clase Subnotebook (2643 - 6442, n=68, últimos 2 años) | |
| MSI Prestige 13 AI Evo | |
| Dell XPS 13 9340 Core Ultra 7 | |
| Lenovo ThinkBook 13x G4 21KR0008GE | |
| Medio Intel Core Ultra 5 125H (4663 - 5136, n=6) | |
| Geekbench 6.4 / Multi-Core | |
| Lenovo ThinkPad Z13 Gen 2 | |
| Apple MacBook Air 13 M3 10C GPU | |
| Dell XPS 13 9340 Core Ultra 7 | |
| Media de la clase Subnotebook (2244 - 17489, n=72, últimos 2 años) | |
| Medio Intel Core Ultra 5 125H (11087 - 11749, n=6) | |
| Lenovo ThinkBook 13x G4 21KR0008GE | |
| MSI Prestige 13 AI Evo | |
| Geekbench 6.4 / Single-Core | |
| Apple MacBook Air 13 M3 10C GPU | |
| Media de la clase Subnotebook (960 - 3655, n=67, últimos 2 años) | |
| Lenovo ThinkPad Z13 Gen 2 | |
| MSI Prestige 13 AI Evo | |
| Dell XPS 13 9340 Core Ultra 7 | |
| Lenovo ThinkBook 13x G4 21KR0008GE | |
| Medio Intel Core Ultra 5 125H (2199 - 2316, n=6) | |
| Geekbench 5.5 / Multi-Core | |
| Dell XPS 13 9340 Core Ultra 7 | |
| Lenovo ThinkPad Z13 Gen 2 | |
| Apple MacBook Air 13 M3 10C GPU | |
| Medio Intel Core Ultra 5 125H (9696 - 10856, n=6) | |
| Lenovo ThinkBook 13x G4 21KR0008GE | |
| Media de la clase Subnotebook (2557 - 17218, n=67, últimos 2 años) | |
| MSI Prestige 13 AI Evo | |
| HP Dragonfly G4 | |
| Geekbench 5.5 / Single-Core | |
| Apple MacBook Air 13 M3 10C GPU | |
| HP Dragonfly G4 | |
| Lenovo ThinkPad Z13 Gen 2 | |
| Media de la clase Subnotebook (726 - 2350, n=67, últimos 2 años) | |
| Dell XPS 13 9340 Core Ultra 7 | |
| MSI Prestige 13 AI Evo | |
| Lenovo ThinkBook 13x G4 21KR0008GE | |
| Medio Intel Core Ultra 5 125H (1593 - 1699, n=6) | |
| HWBOT x265 Benchmark v2.2 / 4k Preset | |
| Lenovo ThinkPad Z13 Gen 2 | |
| Dell XPS 13 9340 Core Ultra 7 | |
| Medio Intel Core Ultra 5 125H (9.7 - 16.7, n=6) | |
| Media de la clase Subnotebook (0.97 - 25.1, n=69, últimos 2 años) | |
| MSI Prestige 13 AI Evo | |
| Lenovo ThinkBook 13x G4 21KR0008GE | |
| HP Dragonfly G4 | |
| LibreOffice / 20 Documents To PDF | |
| Media de la clase Subnotebook (38.5 - 220, n=67, últimos 2 años) | |
| Medio Intel Core Ultra 5 125H (42.7 - 70.9, n=6) | |
| Lenovo ThinkBook 13x G4 21KR0008GE | |
| Lenovo ThinkPad Z13 Gen 2 | |
| Dell XPS 13 9340 Core Ultra 7 | |
| HP Dragonfly G4 | |
| MSI Prestige 13 AI Evo | |
| R Benchmark 2.5 / Overall mean | |
| Media de la clase Subnotebook (0.403 - 1.456, n=69, últimos 2 años) | |
| Medio Intel Core Ultra 5 125H (0.4898 - 0.53, n=6) | |
| Lenovo ThinkBook 13x G4 21KR0008GE | |
| Dell XPS 13 9340 Core Ultra 7 | |
| Lenovo ThinkPad Z13 Gen 2 | |
| MSI Prestige 13 AI Evo | |
| HP Dragonfly G4 | |
* ... más pequeño es mejor
AIDA64: FP32 Ray-Trace | FPU Julia | CPU SHA3 | CPU Queen | FPU SinJulia | FPU Mandel | CPU AES | CPU ZLib | FP64 Ray-Trace | CPU PhotoWorxx
| Performance Rating | |
| Lenovo ThinkPad Z13 Gen 2 | |
| Dell XPS 13 9340 Core Ultra 7 | |
| Medio Intel Core Ultra 5 125H | |
| Media de la clase Subnotebook | |
| Lenovo ThinkBook 13x G4 21KR0008GE | |
| MSI Prestige 13 AI Evo | |
| HP Dragonfly G4 | |
| AIDA64 / FP32 Ray-Trace | |
| Lenovo ThinkPad Z13 Gen 2 | |
| Media de la clase Subnotebook (1135 - 32888, n=69, últimos 2 años) | |
| Dell XPS 13 9340 Core Ultra 7 | |
| Medio Intel Core Ultra 5 125H (8430 - 13639, n=6) | |
| Lenovo ThinkBook 13x G4 21KR0008GE | |
| HP Dragonfly G4 | |
| MSI Prestige 13 AI Evo | |
| AIDA64 / FPU Julia | |
| Lenovo ThinkPad Z13 Gen 2 | |
| Dell XPS 13 9340 Core Ultra 7 | |
| Media de la clase Subnotebook (5218 - 123315, n=69, últimos 2 años) | |
| Medio Intel Core Ultra 5 125H (43652 - 70880, n=6) | |
| MSI Prestige 13 AI Evo | |
| Lenovo ThinkBook 13x G4 21KR0008GE | |
| HP Dragonfly G4 | |
| AIDA64 / CPU SHA3 | |
| Lenovo ThinkPad Z13 Gen 2 | |
| Dell XPS 13 9340 Core Ultra 7 | |
| Media de la clase Subnotebook (444 - 5287, n=69, últimos 2 años) | |
| Medio Intel Core Ultra 5 125H (2047 - 3404, n=6) | |
| Lenovo ThinkBook 13x G4 21KR0008GE | |
| MSI Prestige 13 AI Evo | |
| HP Dragonfly G4 | |
| AIDA64 / CPU Queen | |
| Lenovo ThinkPad Z13 Gen 2 | |
| Lenovo ThinkBook 13x G4 21KR0008GE | |
| Dell XPS 13 9340 Core Ultra 7 | |
| Medio Intel Core Ultra 5 125H (77892 - 79986, n=6) | |
| Media de la clase Subnotebook (10579 - 115682, n=69, últimos 2 años) | |
| HP Dragonfly G4 | |
| MSI Prestige 13 AI Evo | |
| AIDA64 / FPU SinJulia | |
| Lenovo ThinkPad Z13 Gen 2 | |
| Dell XPS 13 9340 Core Ultra 7 | |
| Medio Intel Core Ultra 5 125H (6588 - 7851, n=6) | |
| Media de la clase Subnotebook (744 - 18418, n=69, últimos 2 años) | |
| Lenovo ThinkBook 13x G4 21KR0008GE | |
| MSI Prestige 13 AI Evo | |
| HP Dragonfly G4 | |
| AIDA64 / FPU Mandel | |
| Lenovo ThinkPad Z13 Gen 2 | |
| Dell XPS 13 9340 Core Ultra 7 | |
| Media de la clase Subnotebook (3341 - 65433, n=69, últimos 2 años) | |
| Medio Intel Core Ultra 5 125H (21210 - 35321, n=6) | |
| MSI Prestige 13 AI Evo | |
| Lenovo ThinkBook 13x G4 21KR0008GE | |
| HP Dragonfly G4 | |
| AIDA64 / CPU AES | |
| Lenovo ThinkPad Z13 Gen 2 | |
| Medio Intel Core Ultra 5 125H (45524 - 108402, n=6) | |
| Dell XPS 13 9340 Core Ultra 7 | |
| Media de la clase Subnotebook (638 - 161430, n=69, últimos 2 años) | |
| Lenovo ThinkBook 13x G4 21KR0008GE | |
| MSI Prestige 13 AI Evo | |
| HP Dragonfly G4 | |
| AIDA64 / CPU ZLib | |
| Lenovo ThinkPad Z13 Gen 2 | |
| Dell XPS 13 9340 Core Ultra 7 | |
| Medio Intel Core Ultra 5 125H (594 - 994, n=6) | |
| Media de la clase Subnotebook (164.9 - 1379, n=69, últimos 2 años) | |
| Lenovo ThinkBook 13x G4 21KR0008GE | |
| MSI Prestige 13 AI Evo | |
| HP Dragonfly G4 | |
| AIDA64 / FP64 Ray-Trace | |
| Lenovo ThinkPad Z13 Gen 2 | |
| Media de la clase Subnotebook (610 - 17495, n=69, últimos 2 años) | |
| Dell XPS 13 9340 Core Ultra 7 | |
| Medio Intel Core Ultra 5 125H (4345 - 7221, n=6) | |
| Lenovo ThinkBook 13x G4 21KR0008GE | |
| MSI Prestige 13 AI Evo | |
| HP Dragonfly G4 | |
| AIDA64 / CPU PhotoWorxx | |
| Dell XPS 13 9340 Core Ultra 7 | |
| Lenovo ThinkBook 13x G4 21KR0008GE | |
| Medio Intel Core Ultra 5 125H (45724 - 49844, n=6) | |
| MSI Prestige 13 AI Evo | |
| Media de la clase Subnotebook (6569 - 64588, n=69, últimos 2 años) | |
| Lenovo ThinkPad Z13 Gen 2 | |
| HP Dragonfly G4 | |
Rendimiento del sistema
En el uso diario, el ThinkBook 13x G4 es un portátil rápido que procesa todas las entradas sin retrasos apreciables. Los resultados de los benchmarks están en línea con las expectativas y no experimentamos ningún problema con la estabilidad del sistema durante las pruebas.
CrossMark: Overall | Productivity | Creativity | Responsiveness
WebXPRT 3: Overall
WebXPRT 4: Overall
Mozilla Kraken 1.1: Total
| PCMark 10 / Score | |
| Lenovo ThinkPad Z13 Gen 2 | |
| Dell XPS 13 9340 Core Ultra 7 | |
| Media de la clase Subnotebook (4993 - 7788, n=58, últimos 2 años) | |
| Medio Intel Core Ultra 5 125H, Intel Arc 7-Core iGPU (6194 - 6463, n=6) | |
| Lenovo ThinkBook 13x G4 21KR0008GE | |
| MSI Prestige 13 AI Evo | |
| HP Dragonfly G4 | |
| PCMark 10 / Essentials | |
| Lenovo ThinkPad Z13 Gen 2 | |
| HP Dragonfly G4 | |
| Dell XPS 13 9340 Core Ultra 7 | |
| Media de la clase Subnotebook (9363 - 11331, n=58, últimos 2 años) | |
| Medio Intel Core Ultra 5 125H, Intel Arc 7-Core iGPU (9427 - 10697, n=6) | |
| Lenovo ThinkBook 13x G4 21KR0008GE | |
| MSI Prestige 13 AI Evo | |
| PCMark 10 / Productivity | |
| Lenovo ThinkPad Z13 Gen 2 | |
| MSI Prestige 13 AI Evo | |
| Media de la clase Subnotebook (5435 - 10623, n=58, últimos 2 años) | |
| Dell XPS 13 9340 Core Ultra 7 | |
| Lenovo ThinkBook 13x G4 21KR0008GE | |
| Medio Intel Core Ultra 5 125H, Intel Arc 7-Core iGPU (7042 - 8000, n=6) | |
| HP Dragonfly G4 | |
| PCMark 10 / Digital Content Creation | |
| Lenovo ThinkPad Z13 Gen 2 | |
| Medio Intel Core Ultra 5 125H, Intel Arc 7-Core iGPU (8198 - 9506, n=6) | |
| Media de la clase Subnotebook (5305 - 12442, n=58, últimos 2 años) | |
| Dell XPS 13 9340 Core Ultra 7 | |
| Lenovo ThinkBook 13x G4 21KR0008GE | |
| MSI Prestige 13 AI Evo | |
| HP Dragonfly G4 | |
| CrossMark / Overall | |
| Apple MacBook Air 13 M3 10C GPU | |
| Dell XPS 13 9340 Core Ultra 7 | |
| HP Dragonfly G4 | |
| Media de la clase Subnotebook (365 - 2018, n=67, últimos 2 años) | |
| Medio Intel Core Ultra 5 125H, Intel Arc 7-Core iGPU (1522 - 1633, n=5) | |
| Lenovo ThinkBook 13x G4 21KR0008GE | |
| Lenovo ThinkPad Z13 Gen 2 | |
| MSI Prestige 13 AI Evo | |
| CrossMark / Productivity | |
| Apple MacBook Air 13 M3 10C GPU | |
| HP Dragonfly G4 | |
| Dell XPS 13 9340 Core Ultra 7 | |
| Media de la clase Subnotebook (364 - 1875, n=67, últimos 2 años) | |
| Medio Intel Core Ultra 5 125H, Intel Arc 7-Core iGPU (1432 - 1594, n=5) | |
| Lenovo ThinkBook 13x G4 21KR0008GE | |
| Lenovo ThinkPad Z13 Gen 2 | |
| MSI Prestige 13 AI Evo | |
| CrossMark / Creativity | |
| Apple MacBook Air 13 M3 10C GPU | |
| Dell XPS 13 9340 Core Ultra 7 | |
| Lenovo ThinkPad Z13 Gen 2 | |
| Media de la clase Subnotebook (372 - 2396, n=67, últimos 2 años) | |
| HP Dragonfly G4 | |
| Medio Intel Core Ultra 5 125H, Intel Arc 7-Core iGPU (1683 - 1765, n=5) | |
| Lenovo ThinkBook 13x G4 21KR0008GE | |
| MSI Prestige 13 AI Evo | |
| CrossMark / Responsiveness | |
| Dell XPS 13 9340 Core Ultra 7 | |
| HP Dragonfly G4 | |
| Apple MacBook Air 13 M3 10C GPU | |
| Medio Intel Core Ultra 5 125H, Intel Arc 7-Core iGPU (1171 - 1520, n=5) | |
| Media de la clase Subnotebook (312 - 1899, n=67, últimos 2 años) | |
| MSI Prestige 13 AI Evo | |
| Lenovo ThinkBook 13x G4 21KR0008GE | |
| Lenovo ThinkPad Z13 Gen 2 | |
| WebXPRT 3 / Overall | |
| Apple MacBook Air 13 M3 10C GPU | |
| Media de la clase Subnotebook (156 - 479, n=66, últimos 2 años) | |
| HP Dragonfly G4 | |
| Lenovo ThinkPad Z13 Gen 2 | |
| Dell XPS 13 9340 Core Ultra 7 | |
| MSI Prestige 13 AI Evo | |
| Medio Intel Core Ultra 5 125H, Intel Arc 7-Core iGPU (245 - 263, n=6) | |
| Lenovo ThinkBook 13x G4 21KR0008GE | |
| WebXPRT 4 / Overall | |
| Apple MacBook Air 13 M3 10C GPU | |
| HP Dragonfly G4 | |
| Media de la clase Subnotebook (132 - 348, n=67, últimos 2 años) | |
| Dell XPS 13 9340 Core Ultra 7 | |
| MSI Prestige 13 AI Evo | |
| Lenovo ThinkBook 13x G4 21KR0008GE | |
| Lenovo ThinkPad Z13 Gen 2 | |
| Medio Intel Core Ultra 5 125H, Intel Arc 7-Core iGPU (227 - 240, n=5) | |
| Mozilla Kraken 1.1 / Total | |
| Medio Intel Core Ultra 5 125H, Intel Arc 7-Core iGPU (560 - 595, n=6) | |
| Lenovo ThinkPad Z13 Gen 2 | |
| Lenovo ThinkBook 13x G4 21KR0008GE | |
| MSI Prestige 13 AI Evo | |
| Dell XPS 13 9340 Core Ultra 7 | |
| Media de la clase Subnotebook (278 - 1104, n=75, últimos 2 años) | |
| HP Dragonfly G4 | |
| Apple MacBook Air 13 M3 10C GPU | |
* ... más pequeño es mejor
| PCMark 10 Score | 6293 puntos | |
ayuda | ||
| AIDA64 / Memory Copy | |
| Dell XPS 13 9340 Core Ultra 7 | |
| Lenovo ThinkBook 13x G4 21KR0008GE | |
| MSI Prestige 13 AI Evo | |
| Medio Intel Core Ultra 5 125H (67482 - 87473, n=6) | |
| Media de la clase Subnotebook (14554 - 109035, n=69, últimos 2 años) | |
| Lenovo ThinkPad Z13 Gen 2 | |
| HP Dragonfly G4 | |
| AIDA64 / Memory Read | |
| Dell XPS 13 9340 Core Ultra 7 | |
| Lenovo ThinkBook 13x G4 21KR0008GE | |
| Medio Intel Core Ultra 5 125H (70520 - 76803, n=6) | |
| MSI Prestige 13 AI Evo | |
| Media de la clase Subnotebook (15948 - 122210, n=69, últimos 2 años) | |
| Lenovo ThinkPad Z13 Gen 2 | |
| HP Dragonfly G4 | |
| AIDA64 / Memory Write | |
| Lenovo ThinkPad Z13 Gen 2 | |
| Media de la clase Subnotebook (15709 - 117898, n=69, últimos 2 años) | |
| MSI Prestige 13 AI Evo | |
| Dell XPS 13 9340 Core Ultra 7 | |
| HP Dragonfly G4 | |
| Medio Intel Core Ultra 5 125H (63162 - 72443, n=6) | |
| Lenovo ThinkBook 13x G4 21KR0008GE | |
| AIDA64 / Memory Latency | |
| MSI Prestige 13 AI Evo | |
| Medio Intel Core Ultra 5 125H (127.3 - 184.8, n=6) | |
| Lenovo ThinkPad Z13 Gen 2 | |
| Lenovo ThinkBook 13x G4 21KR0008GE | |
| Dell XPS 13 9340 Core Ultra 7 | |
| Media de la clase Subnotebook (7.2 - 187.8, n=68, últimos 2 años) | |
| HP Dragonfly G4 | |
* ... más pequeño es mejor
Latencia del CPD
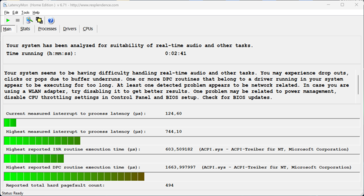
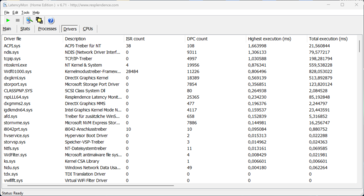
En nuestra prueba de latencia estandarizada (navegación web, reproducción 4K de YouTube, carga de la CPU), nuestro dispositivo de prueba no muestra limitaciones con su versión actual de BIOS. Aunque uno de los controladores muestra un pico, el importante valor "interrupt-to-process-latency" es bajo.
| DPC Latencies / LatencyMon - interrupt to process latency (max), Web, Youtube, Prime95 | |
| MSI Prestige 13 AI Evo | |
| Lenovo ThinkPad Z13 Gen 2 | |
| HP Dragonfly G4 | |
| Lenovo ThinkBook 13x G4 21KR0008GE | |
| Dell XPS 13 9340 Core Ultra 7 | |
* ... más pequeño es mejor
Dispositivos de almacenamiento
Lenovo instala una SSD M.2-2242 compacta con conexión PCIe 4.0, que en nuestro dispositivo de prueba procede de Samsung (PM9C1a) y ofrece una capacidad de almacenamiento de 512 GB. Tras la primera puesta en marcha, quedan 422 GB. Las tasas de transferencia están bien, pero el rendimiento no se mantiene estable bajo una carga prolongada. En el uso diario, sin embargo, esto no tiene ningún efecto, ya que el rendimiento sigue siendo suficiente (más de 3,3 GB/s). Encontrará más pruebas comparativas de SSD aquí.
* ... más pequeño es mejor
Sustained Read Performance: DiskSpd Read Loop, Queue Depth 8
Tarjeta gráfica - Arc Graphics con 7 núcleos Xe
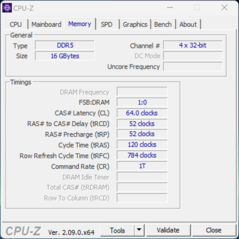
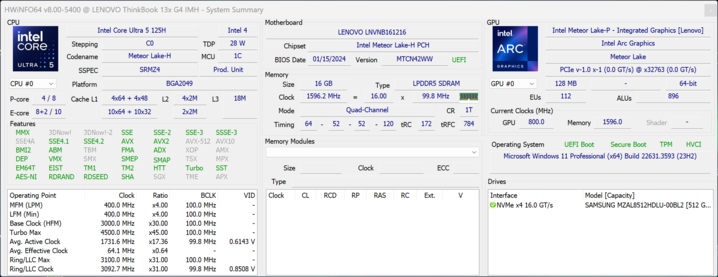
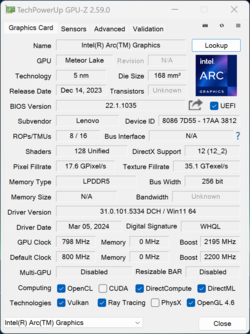
Junto con el Core Ultra 5 125H, se utiliza la gráfica integrada más lenta Intel Arc Graphics con 7 núcleos Xe. Gracias a la rápida RAM, el rendimiento gráfico es muy bueno en general y apenas difiere de los portátiles con la variante más rápida de 8 núcleos que hemos probado hasta ahora. Esto también se aplica al Dell XPS 13 9340 y al MSI Prestige 13 AI Evo. El ThinkPad Z13 Gen2 con el procesador AMD y la Radeon 780M también se ve superado en las pruebas sintéticas.
El Radeon 780M sigue teniendo una ligera ventaja en las pruebas comparativas de juegos, pero el ThinkBook 13x G4 vuelve a quedar por delante de los supuestamente más rápidos Dell XPS 13 y MSI Prestige 13. Tampoco notamos ningún problema de caídas de fotogramas durante los juegos. En general, muchos títulos antiguos o menos exigentes se pueden jugar sin problemas a detalles medios o altos en 1080p. Con títulos modernos como Cyberpunk 2077, sin embargo, las cosas se ponen difíciles, y además de reducir la resolución o los detalles, aquí también se deben utilizar tecnologías de aumento de escala.
El rendimiento gráfico se mantiene estable bajo carga prolongada y en modo batería. Encontrará más pruebas comparativas de gráficos en nuestra sección de tecnología.
| 3DMark 11 Performance | 11306 puntos | |
| 3DMark Fire Strike Score | 7500 puntos | |
| 3DMark Time Spy Score | 3498 puntos | |
ayuda | ||
| Blender / v3.3 Classroom CPU | |
| HP Dragonfly G4 | |
| Lenovo ThinkBook 13x G4 21KR0008GE | |
| MSI Prestige 13 AI Evo | |
| Media de la clase Subnotebook (241 - 1127, n=71, últimos 2 años) | |
| Apple MacBook Air 13 M3 10C GPU | |
| Medio Intel Arc 7-Core iGPU (391 - 671, n=6) | |
| Dell XPS 13 9340 Core Ultra 7 | |
| Lenovo ThinkPad Z13 Gen 2 | |
| Blender / v3.3 Classroom METAL | |
| Media de la clase Subnotebook (103 - 237, n=4, últimos 2 años) | |
| Apple MacBook Air 13 M3 10C GPU | |
* ... más pequeño es mejor
| Performance Rating - Percent | |
| Lenovo ThinkPad Z13 Gen 2 -1! | |
| Media de la clase Subnotebook | |
| Lenovo ThinkBook 13x G4 21KR0008GE | |
| Dell XPS 13 9340 Core Ultra 7 | |
| MSI Prestige 13 AI Evo | |
| HP Dragonfly G4 | |
| The Witcher 3 - 1920x1080 Ultra Graphics & Postprocessing (HBAO+) | |
| Lenovo ThinkPad Z13 Gen 2 | |
| Lenovo ThinkBook 13x G4 21KR0008GE | |
| Media de la clase Subnotebook (8.5 - 43.7, n=49, últimos 2 años) | |
| Dell XPS 13 9340 Core Ultra 7 | |
| HP Dragonfly G4 | |
| MSI Prestige 13 AI Evo | |
| GTA V - 1920x1080 Highest Settings possible AA:4xMSAA + FX AF:16x | |
| Media de la clase Subnotebook (7.81 - 53, n=66, últimos 2 años) | |
| Lenovo ThinkBook 13x G4 21KR0008GE | |
| Dell XPS 13 9340 Core Ultra 7 | |
| HP Dragonfly G4 | |
| MSI Prestige 13 AI Evo | |
| Final Fantasy XV Benchmark - 1920x1080 High Quality | |
| Lenovo ThinkPad Z13 Gen 2 | |
| Dell XPS 13 9340 Core Ultra 7 | |
| Lenovo ThinkBook 13x G4 21KR0008GE | |
| Media de la clase Subnotebook (11.9 - 44.2, n=71, últimos 2 años) | |
| MSI Prestige 13 AI Evo | |
| HP Dragonfly G4 | |
| Strange Brigade - 1920x1080 ultra AA:ultra AF:16 | |
| Lenovo ThinkBook 13x G4 21KR0008GE | |
| Lenovo ThinkPad Z13 Gen 2 | |
| Media de la clase Subnotebook (17.7 - 70.7, n=70, últimos 2 años) | |
| Dell XPS 13 9340 Core Ultra 7 | |
| MSI Prestige 13 AI Evo | |
| HP Dragonfly G4 | |
| Dota 2 Reborn - 1920x1080 ultra (3/3) best looking | |
| Lenovo ThinkPad Z13 Gen 2 | |
| Dell XPS 13 9340 Core Ultra 7 | |
| Lenovo ThinkBook 13x G4 21KR0008GE | |
| Media de la clase Subnotebook (13 - 99.5, n=74, últimos 2 años) | |
| HP Dragonfly G4 | |
| MSI Prestige 13 AI Evo | |
| X-Plane 11.11 - 1920x1080 high (fps_test=3) | |
| Lenovo ThinkBook 13x G4 21KR0008GE | |
| Media de la clase Subnotebook (20.7 - 97.1, n=63, últimos 2 años) | |
| MSI Prestige 13 AI Evo | |
| Dell XPS 13 9340 Core Ultra 7 | |
| HP Dragonfly G4 | |
| Lenovo ThinkPad Z13 Gen 2 | |
Witcher 3 FPS chart
| bajo | medio | alto | ultra | |
|---|---|---|---|---|
| GTA V (2015) | 116.9 | 106.4 | 32.4 | 14.8 |
| The Witcher 3 (2015) | 126 | 80 | 45 | 23.4 |
| Dota 2 Reborn (2015) | 93.8 | 83 | 68.4 | 64.9 |
| Final Fantasy XV Benchmark (2018) | 59.8 | 33.4 | 25.3 | |
| X-Plane 11.11 (2018) | 52 | 40.1 | 34.2 | |
| Far Cry 5 (2018) | 64 | 37 | 35 | 31 |
| Strange Brigade (2018) | 141 | 68 | 54 | 44 |
| F1 23 (2023) | 58.7 | 53.5 | 37.3 | |
| Cyberpunk 2077 2.2 Phantom Liberty (2023) | 23.2 | 19.8 | 16.6 | 14.8 |
Emisiones - Excelentes altavoces
Ruido
Los dos ventiladores suelen permanecer muy silenciosos o desactivados en el uso diario y no son molestos en absoluto, ni siquiera bajo carga elevada. Sólo registramos un valor máximo de 40,7 dB(A) durante un breve espacio de tiempo antes de que los ventiladores se estabilizaran en 36,8 dB(A). En el modo de rendimiento, el máximo es de 42,5 dB(A) y de 33,9 dB(A) en el modo de ahorro de batería. No se detectaron otros ruidos electrónicos, como el zumbido de la bobina.
Ruido
| Ocioso |
| 24.5 / 24.5 / 27.1 dB(A) |
| Carga |
| 33.3 / 40.7 dB(A) |
 | ||
30 dB silencioso 40 dB(A) audible 50 dB(A) ruidosamente alto |
||
min: | ||
| Lenovo ThinkBook 13x G4 21KR0008GE Arc 7-Core, Ultra 5 125H, Samsung PM9C1a MZAL8512HDLU | Dell XPS 13 9340 Core Ultra 7 Arc 8-Core, Ultra 7 155H, Micron 2550 512GB | MSI Prestige 13 AI Evo Arc 8-Core, Ultra 7 155H, Samsung PM9A1 MZVL21T0HCLR | Lenovo ThinkPad Z13 Gen 2 Radeon 780M, R7 PRO 7840U, SK hynix BC901 HFS001TEJ4X164N | HP Dragonfly G4 Iris Xe G7 96EUs, i7-1365U, Micron 3400 MTFDKBA512TFH 512GB | |
|---|---|---|---|---|---|
| Noise | -4% | 2% | -5% | 8% | |
| apagado / medio ambiente * | 24.5 | 25.1 -2% | 23.4 4% | 25.1 -2% | 23.3 5% |
| Idle Minimum * | 24.5 | 25.1 -2% | 23.4 4% | 25.8 -5% | 23.5 4% |
| Idle Average * | 24.5 | 25.1 -2% | 26.9 -10% | 25.8 -5% | 23.5 4% |
| Idle Maximum * | 27.1 | 25.1 7% | 26.9 1% | 28.3 -4% | 26.8 1% |
| Load Average * | 33.3 | 37.4 -12% | 32 4% | 28.3 15% | 27.2 18% |
| Witcher 3 ultra * | 36.8 | 42.5 -15% | 32 13% | 44.8 -22% | 32.7 11% |
| Load Maximum * | 40.7 | 42.5 -4% | 40.3 1% | 44.8 -10% | 35 14% |
* ... más pequeño es mejor
Temperatura
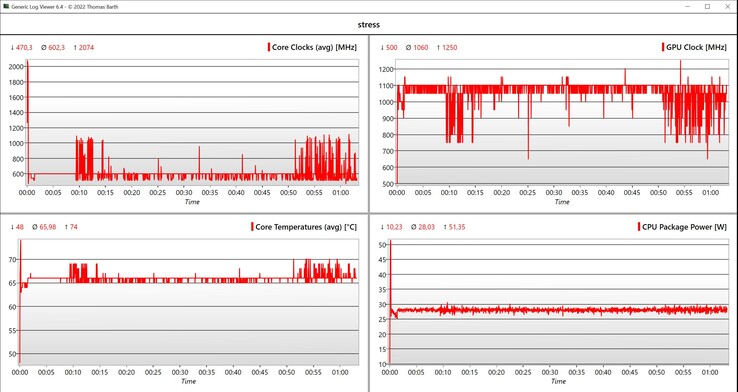
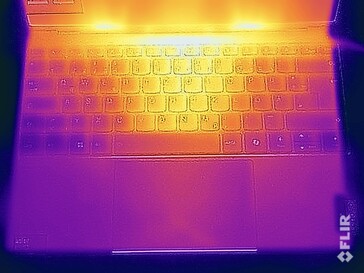
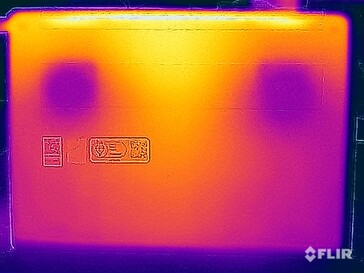
Lenovo tiene las temperaturas superficiales del ThinkBook 13x G4 bien controladas. El dispositivo prácticamente no se calienta en absoluto en reposo y con poca carga, y sólo hay un punto caliente en el que medimos más de 40 °C bajo carga. Esto es en la parte superior de la unidad base, encima del teclado, donde de todas formas no se toca el dispositivo. La temperatura máxima en la parte inferior es de 39 °C, por lo que puede colocar el dispositivo sobre sus muslos sin problemas, incluso bajo carga. En la prueba de estrés con carga combinada de CPU y GPU, el SoC se estabiliza rápidamente en 28 vatios y se mantiene en este nivel.
(±) La temperatura máxima en la parte superior es de 43.1 °C / 110 F, frente a la media de 35.9 °C / 97 F, que oscila entre 21.4 y 59 °C para la clase Subnotebook.
(+) El fondo se calienta hasta un máximo de 39.2 °C / 103 F, frente a la media de 39.3 °C / 103 F
(+) En reposo, la temperatura media de la parte superior es de 27.1 °C / 81# F, frente a la media del dispositivo de 30.8 °C / 87 F.
(±) Jugando a The Witcher 3, la temperatura media de la parte superior es de 35 °C / 95 F, frente a la media del dispositivo de 30.8 °C / 87 F.
(+) El reposamanos y el panel táctil están a una temperatura inferior a la de la piel, con un máximo de 29.3 °C / 84.7 F y, por tanto, son fríos al tacto.
(±) La temperatura media de la zona del reposamanos de dispositivos similares fue de 28.2 °C / 82.8 F (-1.1 °C / -1.9 F).
| Lenovo ThinkBook 13x G4 21KR0008GE Intel Core Ultra 5 125H, Intel Arc 7-Core iGPU | Dell XPS 13 9340 Core Ultra 7 Intel Core Ultra 7 155H, Intel Arc 8-Core iGPU | Apple MacBook Air 13 M3 10C GPU Apple M3, Apple M3 10-Core GPU | MSI Prestige 13 AI Evo Intel Core Ultra 7 155H, Intel Arc 8-Core iGPU | Lenovo ThinkPad Z13 Gen 2 AMD Ryzen 7 PRO 7840U, AMD Radeon 780M | HP Dragonfly G4 Intel Core i7-1365U, Intel Iris Xe Graphics G7 96EUs | |
|---|---|---|---|---|---|---|
| Heat | 4% | 7% | 6% | 2% | 1% | |
| Maximum Upper Side * | 43.1 | 41 5% | 44.3 -3% | 40.9 5% | 46.2 -7% | 38.6 10% |
| Maximum Bottom * | 39.2 | 43.5 -11% | 43.4 -11% | 40.4 -3% | 48.4 -23% | 40.4 -3% |
| Idle Upper Side * | 28.3 | 25.3 11% | 22.3 21% | 25 12% | 23.2 18% | 28.2 -0% |
| Idle Bottom * | 28 | 25.5 9% | 22.1 21% | 25.5 9% | 23 18% | 29 -4% |
* ... más pequeño es mejor
Altavoces
El ThinkBook 13x G4 ofrece cuatro altavoces compuestos por dos tweeters y dos woofers de 2 vatios cada uno, lo que se traduce en una excelente calidad de sonido. En este aspecto, el ThinkBook puede incluso plantar cara al MacBook Air 13. Los graves son algo limitados en comparación con portátiles multimedia más grandes, pero el resultado sigue siendo muy bueno dado el tamaño del chasis.
Lenovo ThinkBook 13x G4 21KR0008GE análisis de audio
(+) | los altavoces pueden reproducir a un volumen relativamente alto (#83.8 dB)
Graves 100 - 315 Hz
(±) | lubina reducida - en promedio 9% inferior a la mediana
(±) | la linealidad de los graves es media (8% delta a frecuencia anterior)
Medios 400 - 2000 Hz
(+) | medios equilibrados - a sólo 2.4% de la mediana
(+) | los medios son lineales (2.9% delta a la frecuencia anterior)
Altos 2 - 16 kHz
(+) | máximos equilibrados - a sólo 3.2% de la mediana
(+) | los máximos son lineales (3.4% delta a la frecuencia anterior)
Total 100 - 16.000 Hz
(+) | el sonido global es lineal (8.6% de diferencia con la mediana)
En comparación con la misma clase
» 3% de todos los dispositivos probados de esta clase eran mejores, 1% similares, 97% peores
» El mejor tuvo un delta de 5%, la media fue 19%, el peor fue ###max##%
En comparación con todos los dispositivos probados
» 2% de todos los dispositivos probados eran mejores, 1% similares, 97% peores
» El mejor tuvo un delta de 4%, la media fue 24%, el peor fue ###max##%
Dell XPS 13 9340 Core Ultra 7 análisis de audio
(+) | los altavoces pueden reproducir a un volumen relativamente alto (#83.2 dB)
Graves 100 - 315 Hz
(-) | casi sin bajos - de media 17% inferior a la mediana
(±) | la linealidad de los graves es media (9.3% delta a frecuencia anterior)
Medios 400 - 2000 Hz
(+) | medios equilibrados - a sólo 2.1% de la mediana
(+) | los medios son lineales (4.7% delta a la frecuencia anterior)
Altos 2 - 16 kHz
(+) | máximos equilibrados - a sólo 2.5% de la mediana
(+) | los máximos son lineales (4.6% delta a la frecuencia anterior)
Total 100 - 16.000 Hz
(+) | el sonido global es lineal (11.6% de diferencia con la mediana)
En comparación con la misma clase
» 12% de todos los dispositivos probados de esta clase eran mejores, 3% similares, 85% peores
» El mejor tuvo un delta de 5%, la media fue 19%, el peor fue ###max##%
En comparación con todos los dispositivos probados
» 7% de todos los dispositivos probados eran mejores, 2% similares, 91% peores
» El mejor tuvo un delta de 4%, la media fue 24%, el peor fue ###max##%
Apple MacBook Air 13 M3 10C GPU análisis de audio
(+) | los altavoces pueden reproducir a un volumen relativamente alto (#83.2 dB)
Graves 100 - 315 Hz
(±) | lubina reducida - en promedio 13.3% inferior a la mediana
(±) | la linealidad de los graves es media (11.3% delta a frecuencia anterior)
Medios 400 - 2000 Hz
(+) | medios equilibrados - a sólo 0.4% de la mediana
(+) | los medios son lineales (1.6% delta a la frecuencia anterior)
Altos 2 - 16 kHz
(+) | máximos equilibrados - a sólo 4.5% de la mediana
(+) | los máximos son lineales (1.9% delta a la frecuencia anterior)
Total 100 - 16.000 Hz
(+) | el sonido global es lineal (10.7% de diferencia con la mediana)
En comparación con la misma clase
» 8% de todos los dispositivos probados de esta clase eran mejores, 3% similares, 89% peores
» El mejor tuvo un delta de 5%, la media fue 19%, el peor fue ###max##%
En comparación con todos los dispositivos probados
» 5% de todos los dispositivos probados eran mejores, 1% similares, 94% peores
» El mejor tuvo un delta de 4%, la media fue 24%, el peor fue ###max##%
Gestión de la energía - Largos tiempos de funcionamiento
Consumo de energía
Nuestras mediciones de consumo no muestran sorpresas y, como era de esperar, el panel de alta resolución y brillo requiere algo más de energía que el XPS 13 con la pantalla de 1080p, por ejemplo. Con un máximo de 8,9 vatios en modo inactivo, el consumo no es demasiado elevado. Bajo carga máxima, el dispositivo alcanza brevemente el límite de la fuente de alimentación de 65 vatios, pero desciende a ~45 vatios después de sólo unos segundos y luego se mantiene en este nivel.
| Off / Standby | |
| Ocioso | |
| Carga |
|
Clave:
min: | |
| Lenovo ThinkBook 13x G4 21KR0008GE Ultra 5 125H, Arc 7-Core, Samsung PM9C1a MZAL8512HDLU, IPS, 2880x1920, 13.5" | Dell XPS 13 9340 Core Ultra 7 Ultra 7 155H, Arc 8-Core, Micron 2550 512GB, IPS, 1920x1200, 13.4" | Apple MacBook Air 13 M3 10C GPU M3, M3 10-Core GPU, Apple SSD AP0512Z, IPS, 2560x1664, 13.6" | MSI Prestige 13 AI Evo Ultra 7 155H, Arc 8-Core, Samsung PM9A1 MZVL21T0HCLR, OLED, 2880x1800, 13.3" | Lenovo ThinkPad Z13 Gen 2 R7 PRO 7840U, Radeon 780M, SK hynix BC901 HFS001TEJ4X164N, OLED, 2880x1800, 13.3" | HP Dragonfly G4 i7-1365U, Iris Xe G7 96EUs, Micron 3400 MTFDKBA512TFH 512GB, IPS, 1920x1280, 13.5" | Medio Intel Arc 7-Core iGPU | Media de la clase Subnotebook | |
|---|---|---|---|---|---|---|---|---|
| Power Consumption | 13% | 28% | 14% | 1% | 14% | -20% | 7% | |
| Idle Minimum * | 5.4 | 3.8 30% | 1.95 64% | 4.5 17% | 5.8 -7% | 4.1 24% | 6.88 ? -27% | 4.31 ? 20% |
| Idle Average * | 7.8 | 7 10% | 8.7 -12% | 8 -3% | 6.2 21% | 7.5 4% | 9.02 ? -16% | 7.33 ? 6% |
| Idle Maximum * | 8.9 | 7.3 18% | 8.9 -0% | 8.7 2% | 12.7 -43% | 8.2 8% | 12.2 ? -37% | 9.09 ? -2% |
| Load Average * | 49.4 | 52.6 -6% | 34.3 31% | 36.1 27% | 27.2 45% | 35.5 28% | 51.4 ? -4% | 44.9 ? 9% |
| Witcher 3 ultra * | 44.4 | 38.3 14% | 28.6 36% | 29.7 33% | 54.1 -22% | 37.5 16% | ||
| Load Maximum * | 68.8 | 62.7 9% | 35.4 49% | 65 6% | 61.4 11% | 66.5 3% | 78.3 ? -14% | 68.7 ? -0% |
* ... más pequeño es mejor
Power consumption Witcher 3 / Stress test
Power consumption with external monitor
Duración de las pilas
Con su gran batería de 74 Wh, el ThinkBook 13x G4 logra tiempos de ejecución buenos, pero no sobresalientes, en nuestra prueba WLAN. A 150 cd/m² (correspondiente al 56% del brillo máximo del dispositivo de prueba), medimos algo menos de 11,5 horas a 60 Hz y alrededor de 10,5 horas a 120 Hz. A pleno brillo, seguimos obteniendo 9 horas (60 Hz) y 7,5 horas (120 Hz). En la prueba de vídeo a 150 cd/m², el ThinkBook alcanza unas extraordinarias 20,5 horas y supera claramente a todos los competidores. Con carga completa y brillo máximo, termina tras algo menos de 2 horas. Una carga completa tarda 113 minutos con el dispositivo encendido (80% tras 66 minutos). También existe un modo de carga exprés, pero no proporciona ninguna ventaja con la fuente de alimentación de 65 vatios.
| Lenovo ThinkBook 13x G4 21KR0008GE Ultra 5 125H, Arc 7-Core, 74 Wh | Dell XPS 13 9340 Core Ultra 7 Ultra 7 155H, Arc 8-Core, 55 Wh | Apple MacBook Air 13 M3 10C GPU M3, M3 10-Core GPU, 52.6 Wh | MSI Prestige 13 AI Evo Ultra 7 155H, Arc 8-Core, 75 Wh | Lenovo ThinkPad Z13 Gen 2 R7 PRO 7840U, Radeon 780M, 51.5 Wh | HP Dragonfly G4 i7-1365U, Iris Xe G7 96EUs, 68 Wh | Media de la clase Subnotebook | |
|---|---|---|---|---|---|---|---|
| Duración de Batería | 4% | 22% | 10% | -31% | 53% | -2% | |
| H.264 | 1229 | 1053 -14% | 1044 -15% | 1002 -18% | 963 ? -22% | ||
| WiFi v1.3 | 684 | 769 12% | 914 34% | 694 1% | 469 -31% | 954 39% | 757 ? 11% |
| Load | 116 | 131 13% | 171 47% | 169 46% | 192 66% | 122 ? 5% |
Pro
Contra
Veredicto- El ThinkBook 13x G4 es un gran subportátil si puede llegar a un acuerdo con el teclado
El ThinkBook 13x G4 nos ha sorprendido porque Lenovo ofrece un ultrabook muy móvil con un chasis metálico de alta calidad y una pantalla 3:2 mate. No hay limitaciones en términos de mano de obra o estabilidad, y no se puede esperar un chasis de metal en un ThinkBook (normalmente sólo la tapa es de aluminio). Hay tres puertos Thunderbolt 4, que a veces requieren adaptadores en el uso diario, pero deberían ser suficientes. Las opciones de mantenimiento son limitadas, sin embargo, ya que la batería está unida a la parte inferior del chasis.
El rendimiento del Core Ultra 5 125H es suficiente para el uso diario, pero no bate ningún récord. De hecho, habríamos preferido un procesador AMD dado el límite de potencia de 28 vatios. El Core Ultra 9 185H también está disponible como opción, pero sólo por un fuerte recargo. los 32 GB de RAM también sólo pueden combinarse con el Core Ultra 9. La pantalla IPS mate con 120 Hz es impresionante en todos los aspectos. La calidad de imagen subjetiva no es tan buena como en los paneles OLED, pero no hay reflejos y el parpadeo PWM es inexistente. La duración de la batería es perfectamente aceptable. También integra un magnífico sistema de audio con cuatro altavoces.
El ThinkBook 13x G4 de Lenovo impresiona con un chasis de alta calidad, altavoces excelentes, una buena pantalla IPS y una larga duración de la batería. Sin embargo, el teclado tiene sus limitaciones.
Además de las escasas opciones de mantenimiento, incluida la RAM soldada, el otro gran punto débil del ThinkBook 13x G4 es el teclado. Aunque las pulsaciones son firmes, el recorrido de las teclas es muy limitado, lo que afecta notablemente a la comodidad de escritura. Ciertamente puede acostumbrarse al teclado y también depende un poco del tipo de teclado que haya utilizado antes, pero esto podría haberse evitado fácilmente con un poco más de recorrido de las teclas. El teclado del Dell XPS 13 9340por ejemplo, es más cómodo, pero los usuarios tienen que soportar la disposición poco habitual y las teclas de función capacitivas. En general, el 13x G4 ofrece una relación calidad-precio significativamente mejor. El Apple MacBook Air M3 sigue siendo un fuerte competidor, ya que ofrece más rendimiento en combinación con la refrigeración pasiva, pero sólo utiliza una pantalla de 60 Hz.
Precio y disponibilidad
En la tienda web de Lenovo en EE.UU., el modelo base del Thinkbook 13x Gen 4 comienza en $1106,00. Por supuesto, se puede configurar con una CPU más potente, RAM adicional y más almacenamiento.
Lenovo ThinkBook 13x G4 21KR0008GE
- 05/23/2024 v7 (old)
Andreas Osthoff
Transparencia
La selección de los dispositivos que se van a reseñar corre a cargo de nuestro equipo editorial. La muestra de prueba fue proporcionada al autor en calidad de préstamo por el fabricante o el minorista a los efectos de esta reseña. El prestamista no tuvo ninguna influencia en esta reseña, ni el fabricante recibió una copia de la misma antes de su publicación. No había ninguna obligación de publicar esta reseña. Nunca aceptamos compensaciones o pagos a cambio de nuestras reseñas. Como empresa de medios independiente, Notebookcheck no está sujeta a la autoridad de fabricantes, minoristas o editores.
Así es como prueba Notebookcheck
Cada año, Notebookcheck revisa de forma independiente cientos de portátiles y smartphones utilizando procedimientos estandarizados para asegurar que todos los resultados son comparables. Hemos desarrollado continuamente nuestros métodos de prueba durante unos 20 años y hemos establecido los estándares de la industria en el proceso. En nuestros laboratorios de pruebas, técnicos y editores experimentados utilizan equipos de medición de alta calidad. Estas pruebas implican un proceso de validación en varias fases. Nuestro complejo sistema de clasificación se basa en cientos de mediciones y puntos de referencia bien fundamentados, lo que mantiene la objetividad.


