Notebookcheck Logo
Teaser

Análisis del portátil MSI Katana A15 AI: RTX 4070 gamer perjudicado por las medidas de ahorro

Cerca pero no hay puro.

MSI se aventura en el competitivo sector de los portátiles para juegos de gama media con el Katana A15 AI. Este portátil de 15 pulgadas incorpora un potente procesador Ryzen junto con una GeForce RTX 4060 o RTX 4070 - y decepciona enormemente en un aspecto crucial.
Florian Glaser, 👁 Florian Glaser (traducido por DeepL / Ninh Duy) Published 🇺🇸 🇩🇪 ...
AMD Ryzen (Zen) Nvidia Geforce Gaming Laptop / Notebook MSI

Veredicto - MSI corta demasiadas esquinas

El Katana A15 AI tiene el mismo conjunto de deficiencias que el Acer Nitro V 16 ANV16 recientemente analizado. Su pantalla simplemente no da la talla teniendo en cuenta el precio, que es bastante considerable. Mientras que algunos portátiles RTX 4070 más asequibles como el Lenovo LOQ 15ARP9, el Asus TUF Gaming F15 FX507ZI4-LP031 y el HP Victus 16-s0177ng ofrecen una cobertura sRGB del 100% (según las respectivas hojas de especificaciones al menos), el portátil de MSI se queda corto por debajo del 70%, haciendo que la imagen mostrada sea más bien pálida y sin brillo.

MSI también debería haberse esforzado más en otras áreas, como la carcasa de aspecto barato y desvencijado, la escasa capacidad y autonomía de la batería, el pequeño panel táctil y los mediocres altavoces. Aquí no hay USB 4 y puede costar acostumbrarse a la disposición poco convencional del teclado.

El Katana A15 destaca de la multitud sólo en algunos aspectos positivos, siendo sus dos memorias RAM y sus dos ranuras M.2 especialmente encomiables. En general, es difícil recomendar la compra de este portátil debido a los numerosos problemas que descubrimos, especialmente teniendo en cuenta el precio (la SKU de prueba comienza en 1.500 euros). Varios sistemas rivales son notablemente más rápidos. Algunos de ellos también son más baratos.

Pro

+ El Centro MSI tiene un aspecto limpio, ofrece muchas opciones y modos
+ dos ranuras para RAM y dos para SSD
+ buen rendimiento del sistema
+ Interruptor MUX

Contra

- la carcasa traquetea, parece barata y atrae las huellas dactilares
- pantalla poco brillante y con poco color
- cuesta acostumbrarse a la disposición del teclado
- el sonido y la webcam podrían ser mejores
- batería pequeña, poca duración
- sin USB 4, sin lector de tarjetas

Precio y disponibilidad

En EE.UU., el MSI Katana A15 AI está disponible en Amazon, entre otras opciones.

Amazon Logo
$1,579.00
MSI Katana A15 AI 15.6” 165Hz QHD Gaming Laptop: Ryzen 9-8945HS, NVIDIA Geforce RTX 4070, 32GB DDR5, 1TB NVMe SSD, Cooler Boost 5, Win 11: Black B8VG-450US

Posibles contendientes en la comparación

Image
Modelo
Price
Peso
Altura
Display
1.
76.4%
MSI Katana A15 AI B8VG
AMD Ryzen 9 8945HS ⎘
NVIDIA GeForce RTX 4070 Laptop GPU ⎘
16 GB Memoría, 1024 GB SSD
Amazon:
1. $1,579.00
MSI Katana A15 AI 15.6” 16...
2. $49.99
230W 240W AC Charger for MSI...
3. $64.99
200W Katana A17 A15 Charger ...
List Price: 1500 EUR
2.3 kg24.9 mm15.60"
1920x1080
141 PPI
IPS
2.
86.6% v7 (old)
HP Omen 16-xf0376ng
HP Omen 16-xf0376ng
AMD Ryzen 7 7840HS ⎘
NVIDIA GeForce RTX 4070 Laptop GPU ⎘
16 GB Memoría, 512 GB SSD
Amazon: $1,250.00
List Price: 1900 EUR
2.4 kg23.5 mm16.10"
1920x1080
137 PPI
IPS
3.
85.1% v7 (old)
HP Victus 16-r0077ng
Intel Core i7-13700H ⎘
NVIDIA GeForce RTX 4070 Laptop GPU ⎘
16 GB Memoría, 1024 GB SSD
Amazon:
1. $989.49
HP - Victus 16.1" Gaming Lap...
2. $115.99
19.5V 11.8A Power Supply 230...
List Price: 1630 EUR
2.4 kg24 mm16.10"
1920x1080
137 PPI
IPS
4.
85.7% v7 (old)
Aorus 15 BSF
Aorus 15 BSF
Intel Core i7-13700H ⎘
NVIDIA GeForce RTX 4070 Laptop GPU ⎘
16 GB Memoría, 1024 GB SSD
Amazon:
1. $52.99
240W 230W Laptop Charger for...
2. $59.99
230W 180W AC Charger Fit for...
3. $45.99
Smatree Hard EVA Protective ...
List Price: 1749 Euro
2.4 kg20.9 mm15.60"
2560x1440
188 PPI
IPS
5.
88.4% v7 (old)
Lenovo Legion Pro 5 16ARX8
AMD Ryzen 7 7745HX ⎘
NVIDIA GeForce RTX 4070 Laptop GPU ⎘
16 GB Memoría, 1024 GB SSD
Amazon: $999.99
List Price: 1600 USD
2.5 kg26.8 mm16.00"
2560x1600
189 PPI
IPS

En Alemania, donde se realizaron las pruebas, la Katana A15 AI se ofrece actualmente en dos configuraciones. El modelo B8VG-451 que cuesta más de 1.100 euros viene con el Ryzen 7 8845HS, GeForce Portátil RTX 4060 y un SSD de 512 GB mientras que nuestro modelo de prueba, el B8VG-459, tiene un precio de 1.500 euros y cuenta con el Ryzen 9 8945HS, GeForce Portátil RTX 4070 y un SSD de 1 TB. Ambas SKU están equipadas con una pantalla IPS Full-HD mate de 144 Hz y 16 GB de RAM DDR5-5600.

Especificaciones

MSI Katana A15 AI B8VG (Katana 15 2024 Serie)
Procesador
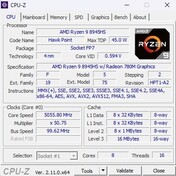
AMD Ryzen 9 8945HS 8 x 4 - 5.2 GHz, 54 W PL2 / Short Burst, 50 W PL1 / Sustained, Hawk Point-HS (Zen 4)
Adaptador gráfico
NVIDIA GeForce RTX 4070 Laptop GPU - 8 GB VRAM, Núcleo: 1605 MHz, Memoría: 2000 MHz, 105 W TDP, GDDR6, ForceWare 566.36, MUX-Switch
Memoría
16 GB 
, 2x 8 GB SO-DIMM DDR5-5600, two slots (both in use)
pantalla
15.60 pulgadas 16:9, 1920 x 1080 pixels 141 PPI, CMN N156HRA-EA1, IPS, Full-HD, lustroso: no, 144 Hz
Placa base
AMD Promontory/Bixby FCH
Disco duro
WD PC SN560 SDDPNQE-1T00, 1024 GB 
, NVMe SSD, two M.2 slots (one empty)
Tarjeta de sonido
Realtek ALC256 @ AMD K19.7 - Audio Processor - High Definition Audio Controller
Conexiones
1 USB 2.0, 3 USB 3.0, 1 HDMI, 1 DisplayPort, Audio Conexiones: Combined (Headset/Mic)
Equipamento de red
Realtek PCIe GBE Family Controller (10/100/1000MBit/s), MediaTek RZ616 (a/b/g/n = Wi-Fi 4/ac = Wi-Fi 5/ax = Wi-Fi 6/ Wi-Fi 6E 6 GHz), Bluetooth 5.3
Tamaño
Alto x ancho x profundidad (en mm): 24.9 x 359 x 259
Battería
53.5 Wh Litio-Polimero, 3-cell
Sistema Operativo
Microsoft Windows 11 Home
Camera
Webcam: HD 720p
Características adicionales
Altavoces: Stereo, Teclado: Chiclet, 4 zones, Luz de Teclado: si, 200 W Power Supply, MSI Center, 24 Meses Garantía
Peso
2.3 kg, Suministro de Electricidad: 733 g
Precio
1500 EUR
Note: The manufacturer may use components from different suppliers including display panels, drives or memory sticks with similar specifications.


Caso

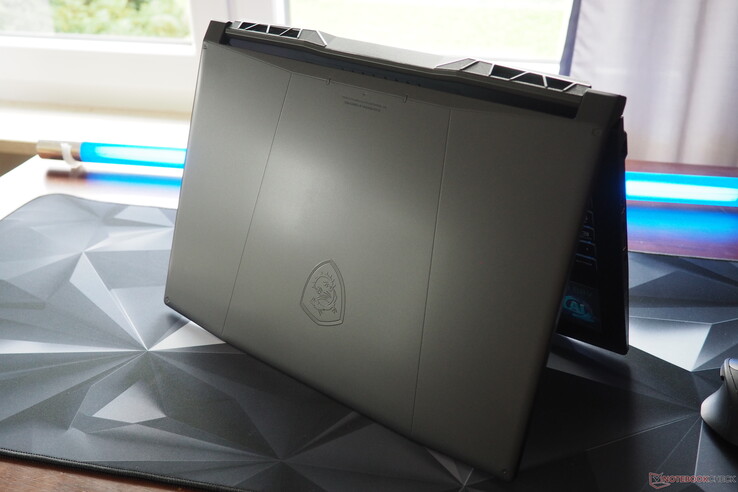
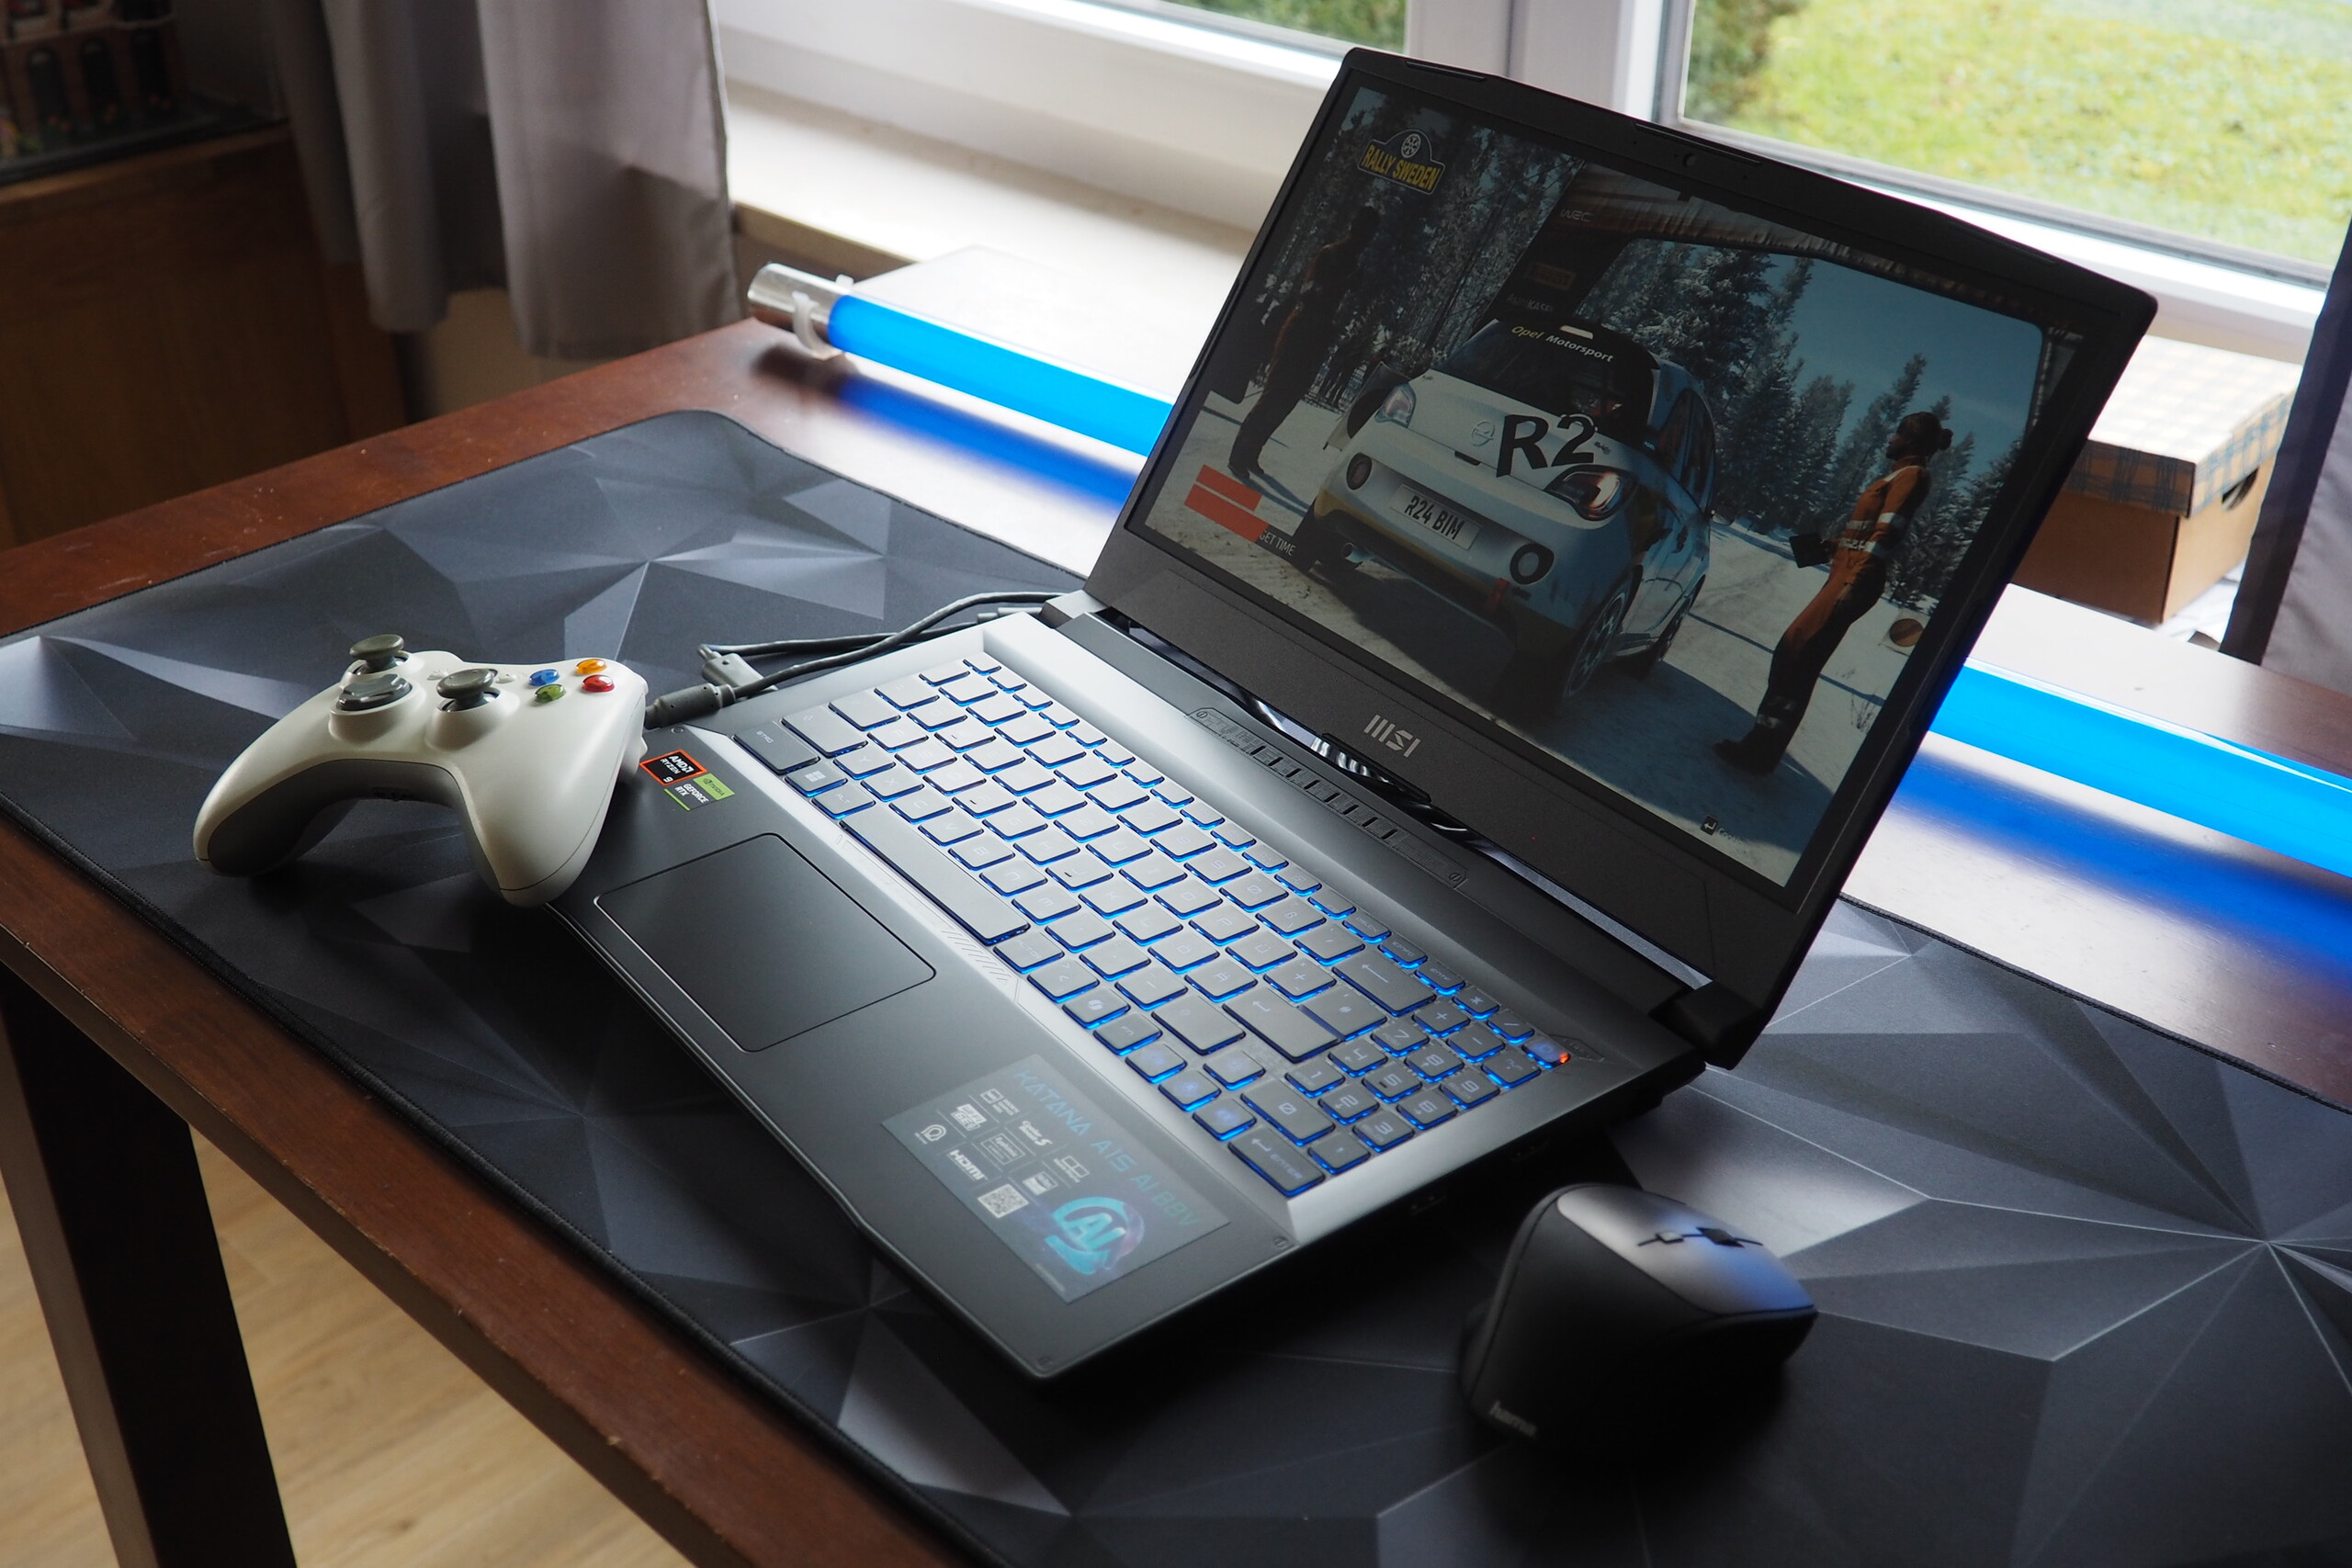
Los compradores de portátiles para juegos económicos a menudo tienen que conformarse con carcasas de baja calidad. Es la misma historia con el Katana. La carcasa no parece especialmente de alta calidad, en gran parte debido al uso extensivo de plásticos. Su color oscuro también la hace muy propensa a las huellas dactilares, y su estabilidad es mediocre. En el lado positivo, el portátil está relativamente bien hecho y tiene un generoso ángulo máximo de apertura de 180°, lo que siempre es un toque bienvenido.

MSI Katana A15 AI
MSI Katana A15 AI
MSI Katana A15 AI
MSI Katana A15 AI
MSI Katana A15 AI
MSI Katana A15 AI
MSI Katana A15 AI
MSI Katana A15 AI
MSI Katana A15 AI

El tamaño y el peso del portátil MSI están a la altura de la competencia. Con un peso de 2,3 kg, el sistema es ligeramente más ligero que sus rivales de 2,4 a 2,5 kg.

Comparación de tamaños

369 mm 259 mm 24 mm 2.4 kg369 mm 259 mm 23.5 mm 2.4 kg363.4 mm 260.4 mm 26.8 mm 2.5 kg359 mm 259 mm 24.9 mm 2.3 kg360 mm 272 mm 20.9 mm 2.4 kg297 mm 210 mm 1 mm 5.7 g

Conectividad

Para aquellos que puedan vivir sin un lector de tarjetas y puertos USB de última generación, la Katana A15 AI ofrece una sólida selección de puertos. Su borde izquierdo cuenta con un puerto de entrada de alimentación y dos puertos USB (uno 3.0 y otro 2.0), mientras que el lado derecho alberga una toma de audio, USB-A 3.0, USB-C 3.0 (con DisplayPort), HDMI 2.1 y un puerto LAN Gigabit RJ45. Dado que algunos puertos están situados en el centro del borde de la carcasa, los cables pueden estorbar la mano con la que el usuario sujeta el ratón.

Izquierda: Power-in, USB-A 3.0, USB-A 2.0
Derecha: Audio 3,5 mm, USB-A 3.0, USB-C 3.0 (incl. DisplayPort), HDMI 2.1, RJ45 Gigabit LAN

Comunicación

El módulo Wi-Fi 6E RZ616 integrado procede de MediaTek y ofrece velocidades de carga ligeramente por debajo de la media, combinadas con velocidades de descarga ligeramente superiores a la media.

Networking
iperf3 transmit AXE11000
Aorus 15 BSF
Intel Wi-Fi 6E AX211
1418 (735min - 1503max) MBit/s +56%
HP Omen 16-xf0376ng
Realtek 8852CE
1326 (976min - 1449max) MBit/s +46%
Average of class Gaming
  (469 - 1843, n=148, last 2 years)
1231 MBit/s +35%
Lenovo Legion Pro 5 16ARX8
MediaTek Wi-Fi 6E MT7922 160MHz Wireless LAN Card
1173 (839min - 1366max) MBit/s +29%
Average MediaTek RZ616
  (593 - 1793, n=16)
1155 MBit/s +27%
MSI Katana A15 AI B8VG
MediaTek RZ616
910 (364min - 1017max) MBit/s
HP Victus 16-r0077ng
MediaTek MT7921
714 (679min - 745max) MBit/s -22%
iperf3 receive AXE11000
MSI Katana A15 AI B8VG
MediaTek RZ616
1716 (1651min - 1742max) MBit/s
Aorus 15 BSF
Intel Wi-Fi 6E AX211
1636 (1534min - 1678max) MBit/s -5%
Average MediaTek RZ616
  (750 - 1752, n=16)
1527 MBit/s -11%
HP Omen 16-xf0376ng
Realtek 8852CE
1481 (741min - 1496max) MBit/s -14%
Lenovo Legion Pro 5 16ARX8
MediaTek Wi-Fi 6E MT7922 160MHz Wireless LAN Card
1438 (767min - 1513max) MBit/s -16%
Average of class Gaming
  (680 - 1890, n=148, last 2 years)
1399 MBit/s -18%
HP Victus 16-r0077ng
MediaTek MT7921
726 (714min - 732max) MBit/s -58%
050100150200250300350400450500550600650700750800850900950100010501100115012001250130013501400145015001550160016501700Tooltip
MSI Katana A15 AI B8VG MediaTek RZ616; iperf3 transmit AXE11000; iperf 3.1.3: Ø898 (364-1017)
HP Omen 16-xf0376ng Realtek 8852CE; iperf3 transmit AXE11000; iperf 3.1.3: Ø1326 (976-1449)
HP Victus 16-r0077ng MediaTek MT7921; iperf3 transmit AXE11000; iperf 3.1.3: Ø714 (679-745)
Aorus 15 BSF Intel Wi-Fi 6E AX211; iperf3 transmit AXE11000; iperf 3.1.3: Ø1394 (735-1503)
Lenovo Legion Pro 5 16ARX8 MediaTek Wi-Fi 6E MT7922 160MHz Wireless LAN Card; iperf3 transmit AXE11000; iperf 3.1.3: Ø1174 (839-1366)
MSI Katana A15 AI B8VG MediaTek RZ616; iperf3 receive AXE11000; iperf 3.1.3: Ø1716 (1651-1742)
HP Omen 16-xf0376ng Realtek 8852CE; iperf3 receive AXE11000; iperf 3.1.3: Ø1456 (741-1496)
HP Victus 16-r0077ng MediaTek MT7921; iperf3 receive AXE11000; iperf 3.1.3: Ø726 (714-732)
Aorus 15 BSF Intel Wi-Fi 6E AX211; iperf3 receive AXE11000; iperf 3.1.3: Ø1635 (1534-1678)
Lenovo Legion Pro 5 16ARX8 MediaTek Wi-Fi 6E MT7922 160MHz Wireless LAN Card; iperf3 receive AXE11000; iperf 3.1.3: Ø1412 (767-1513)

Cámara web

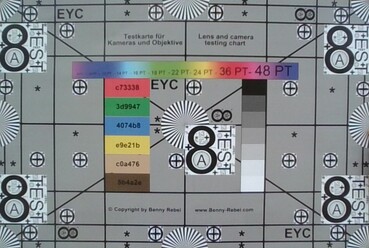
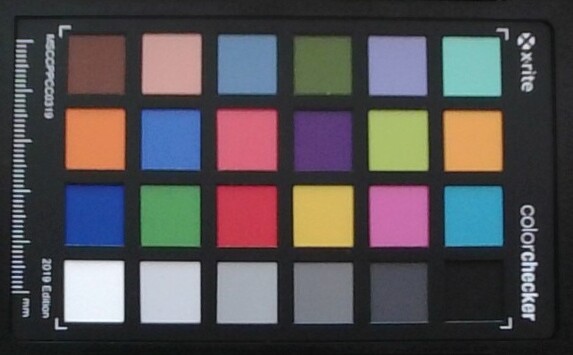
Como era de esperar, la webcam de 720p produce imágenes que no son muy nítidas, con una precisión del color que cae en la gama media. No hay cubierta de privacidad.
ColorChecker
4 ∆E
6.9 ∆E
6.1 ∆E
2.1 ∆E
6.2 ∆E
6.5 ∆E
7.8 ∆E
11.2 ∆E
6.8 ∆E
3.4 ∆E
6.1 ∆E
7.5 ∆E
4.9 ∆E
5 ∆E
6.8 ∆E
8.9 ∆E
6.9 ∆E
9.5 ∆E
4.7 ∆E
5.3 ∆E
5.1 ∆E
5.8 ∆E
6.9 ∆E
7.4 ∆E
ColorChecker MSI Katana A15 AI B8VG: 6.33 ∆E min: 2.15 - max: 11.22 ∆E

Accesorios

El portátil viene con varios folletos informativos y un cargador de 200 vatios (incluido el cable) que pesa alrededor de 0,7 kg.

Mantenimiento

Como uno de los tornillos está cubierto por una pegatina de "precinto de fábrica" y el aparato era una unidad de tienda, nos abstuvimos de abrir el chasis. Sin embargo, siempre que el mantenimiento y las actualizaciones se realicen de forma profesional, no debería haber problema en retirar la pegatina (al menos en Alemania).

Sostenibilidad

El cartón es el principal material de embalaje utilizado, aunque MSI también emplea film de plástico para algunos componentes, como el portátil, el cargador (incluido su cable) y los folletos informativos.

Garantía

En Alemania se aplica la garantía habitual de 2 años.

Dispositivos de entrada

Teclado

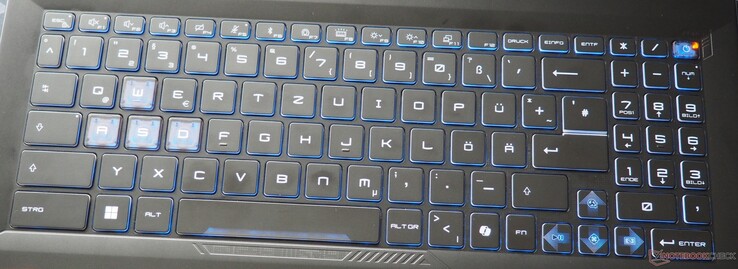
Los dispositivos de entrada son sólidos en general, aunque todavía hay margen de mejora. Para empezar, la disposición del teclado puede no sentar bien a algunos usuarios. MSI sigue utilizando su disposición poco convencional, que se desvía del estándar alemán en varios aspectos. Cuesta un poco acostumbrarse al teclado numérico de tres columnas en lugar de la disposición habitual de cuatro columnas. Aunque la experiencia de escritura es decente para un portátil de juegos, escribir no se siente tan bien como lo haría con un teclado mecánico y la retroalimentación no es tan refinada aquí. En el lado positivo, aquellos a los que les gusten las configuraciones coloridas apreciarán los efectos de iluminación RGB.

MSI Katana A15 AI

Panel táctil

El touchpad es relativamente pequeño para un portátil de 15 pulgadas, ya que mide 10,5 x 6,5 cm. Aunque su superficie parece suficientemente lisa, sus propiedades de deslizamiento dejan margen de mejora. Lo mismo ocurre con su precisión, que no es precisamente ideal. Además, el panel táctil tiende a traquetear durante su uso, lo que realmente no da una impresión de alta calidad. Esto es un recordatorio de la mala calidad de construcción de la carcasa.
Mostrar

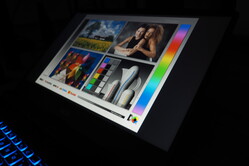
Aunque el panel táctil no es genial, la mayor debilidad del Katana A15 es su pantalla, que, como ya se ha señalado, tiene una cobertura del espacio de color muy pobre, de sólo el 65% sRGB.

276
cd/m²
284
cd/m²
286
cd/m²
255
cd/m²
277
cd/m²
256
cd/m²
220
cd/m²
244
cd/m²
233
cd/m²
Temperatura del cuarto
CMN N156HRA-EA1 tested with X-Rite i1Pro 2
Máximo: 286 cd/m² (Nits) Médio: 259 cd/m² Minimum: 13 cd/m²
iluminación: 77 %
Brillo con batería: 277 cd/m²
Contraste: 1458:1 (Negro: 0.19 cd/m²)
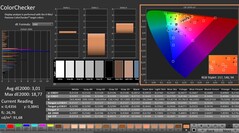
ΔE Color 4.3 | 0.5-29.43 Ø4.9, calibrated: 3.01
ΔE Greyscale 3.6 | 0.5-98 Ø5.2
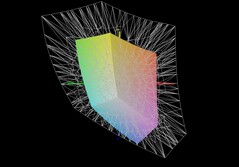
45.1% AdobeRGB 1998 (Argyll 2.2.0 3D)
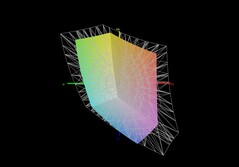
65.1% sRGB (Argyll 2.2.0 3D)
43.6% Display P3 (Argyll 2.2.0 3D)
Gamma: 2.322
MSI Katana A15 AI B8VG
CMN N156HRA-EA1, IPS, 1920x1080, 15.6", 144 Hz
HP Omen 16-xf0376ng
BOE0B81, IPS, 1920x1080, 16.1", 165 Hz
HP Victus 16-r0077ng
CMN162D, IPS, 1920x1080, 16.1", 144 Hz
Aorus 15 BSF
Sharp LQ156T1JW05, IPS, 2560x1440, 15.6", 165 Hz
Lenovo Legion Pro 5 16ARX8
CSOT T3 MNG007DA1-Q, IPS, 2560x1600, 16", 165 Hz
Display
59%
52%
89%
58%
Display P3 Coverage
43.6
72.1
65%
66.7
53%
98.2
125%
70.4
61%
sRGB Coverage
65.1
99.6
53%
98
51%
99.9
53%
99.6
53%
AdobeRGB 1998 Coverage
45.1
72.3
60%
69
53%
85.7
90%
72.6
61%
Response Times
59%
54%
61%
63%
Response Time Grey 50% / Grey 80% *
28.5 ?(13.6, 14.9)
12.3 ?(5.9, 6.4)
57%
13.3 ?(6, 7.3)
53%
11.3 ?(5.2, 6.1)
60%
7 ?(3.2, 3.8)
75%
Response Time Black / White *
18.3 ?(9.9, 8.4)
7.2 ?(4, 3.2)
61%
8.2 ?(4.5, 3.7)
55%
7 ?(3.4, 3.6)
62%
9.1 ?(4.9, 4.2)
50%
PWM Frequency
Screen
8%
29%
9%
33%
Brightness middle
277
350
26%
308
11%
299
8%
355.3
28%
Brightness
259
338
31%
285
10%
282
9%
340
31%
Brightness Distribution
77
91
18%
85
10%
82
6%
91
18%
Black Level *
0.19
0.35
-84%
0.25
-32%
0.31
-63%
0.32
-68%
Contrast
1458
1000
-31%
1232
-16%
965
-34%
1110
-24%
Colorchecker dE 2000 *
4.3
3.29
23%
1.3
70%
2.24
48%
1.13
74%
Colorchecker dE 2000 max. *
19.14
8.47
56%
2.76
86%
4.29
78%
2.78
85%
Colorchecker dE 2000 calibrated *
3.01
2.23
26%
0.92
69%
2.62
13%
0.32
89%
Greyscale dE 2000 *
3.6
3.2
11%
1.7
53%
3
17%
1.4
61%
Gamma
2.322 95%
2.131 103%
2.167 102%
2.086 105%
2.24 98%
CCT
7182 91%
6317 103%
6767 96%
6289 103%
6372 102%
Media total (Programa/Opciones)
42% / 27%
45% / 38%
53% / 34%
51% / 42%

* ... más pequeño es mejor

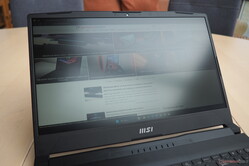
Lo anterior, combinado con un brillo de retroiluminación muy moderado (~259 cd/m²), significa que el contenido de la pantalla a menudo puede ser difícil de distinguir. En pocas palabras, estos paneles de visualización son totalmente inapropiados para cualquier producto de este rango de precios.

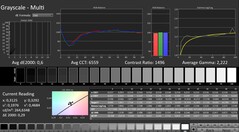
CalMAN: Escala de grises
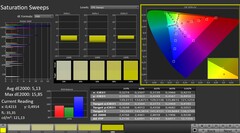
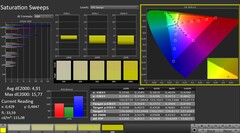
CalMAN: Barridos de saturación
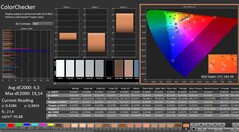
CalMAN: ColorChecker
CalMAN: Escala de grises (calibrada)
CalMAN: Barridos de saturación (calibrados)
CalMAN: ColorChecker (calibrado)

La pantalla de 144 Hz es realmente buena en algunos aspectos, al menos para los estándares IPS. No es que suponga una gran diferencia. Su relación de contraste es bastante decente con 1458:1, y el valor de negro de 0,19 cd/m² tampoco es nada del otro mundo.

MSI Katana A15 AI vs sRGB
MSI Katana A15 AI vs AdobeRGB
MSI Katana A15 AI vs DCI-P3

Por otro lado, sus tiempos de respuesta están por detrás de los de la competencia. Menos mal que aquí no hay el parpadeo PWM habitual en los paneles OLED.

Los ángulos de visión son decentes, aunque no especialmente impresionantes.

La Katana A15 AI a la luz del día
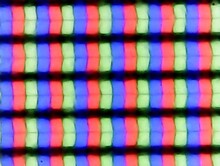
Subpíxeles
Subpíxeles
Ángulos de visión
Ángulos de visión

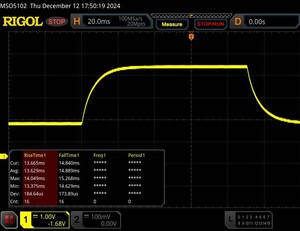
Tiempos de respuesta del display

Los tiempos de respuesta del display muestran lo rápido que puede cambiar la pantalla de un color al siguiente. Tiempos lentos de respuesta pueden llevar a imágenes persistentes alrededor de objetos en movimiento o a displays borrosos. Particularmente los aficionados a los juegos 3D frenéticos deberían usar una pantalla con tiempos de respuesta rápidos.
       Tiempo de respuesta de Negro a Blanco
18.3 ms ... subida ↗ y bajada ↘ combinada↗ 9.9 ms subida
↘ 8.4 ms bajada
La pantalla mostró buenos tiempos de respuesta en nuestros tests pero podría ser demasiado lenta para los jugones competitivos.
En comparación, todos los dispositivos de prueba van de ##min### (mínimo) a 240 (máximo) ms. » 37 % de todos los dispositivos son mejores.
Esto quiere decir que el tiempo de respuesta medido es mejor que la media (20.9 ms) de todos los dispositivos testados.
       Tiempo de respuesta 50% Gris a 80% Gris
28.5 ms ... subida ↗ y bajada ↘ combinada↗ 13.6 ms subida
↘ 14.9 ms bajada
La pantalla mostró tiempos de respuesta relativamente lentos en nuestros tests pero podría ser demasiado lenta para los jugones.
En comparación, todos los dispositivos de prueba van de ##min### (mínimo) a 636 (máximo) ms. » 34 % de todos los dispositivos son mejores.
Esto quiere decir que el tiempo de respuesta medido es mejor que la media (32.8 ms) de todos los dispositivos testados.

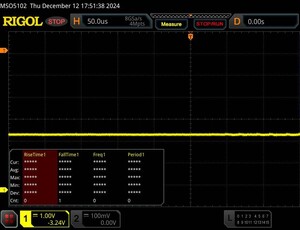
Parpadeo de Pantalla / PWM (Pulse-Width Modulation)

Para atenuar el brillo de pantalla algunos portátiles están encendiendo y apagando la retroiluminación muy rápidamente. Esto se hace a una frecuencia que no debiera detectarse a simple vista. Si la frecuencia es demasiado lenta, la gente sensible podría experimentar problemas visuales, dolores de cabeza e incluso ver parpadeos.
Parpadeo de Pantalla / PWM no detectado

Comparación: 53 % de todos los dispositivos testados no usaron PWM para atenuar el display. Si se usó, medimos una media de 8698 (mínimo: 5 - máxmo: 343500) Hz.

100 % de luminosidad
75 % de luminosidad
75 % de luminosidad
50 % de luminosidad
50 % de luminosidad
25 % de luminosidad
25 % de luminosidad
0 % de luminosidad
0 % de luminosidad

Rendimiento

Tanto la RTX 4060 como la RTX 4070 vienen con 8 GB de VRAM que no es mucho. Esto convierte esencialmente al Katana A15 AI en un portátil para juegos de gama media. Sin embargo, los chips Ryzen utilizados deberían tener potencia suficiente para aplicaciones exigentes durante años. Además, la RAM y el almacenamiento se pueden actualizar o sustituir si es necesario.

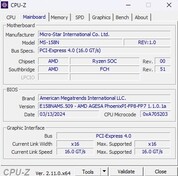
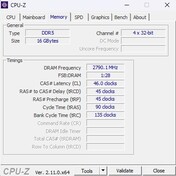
CPU-Z
CPU-Z
CPU-Z
CPU-Z
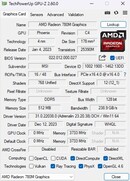
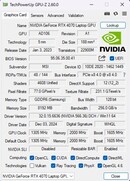
GPU-Z
GPU-Z
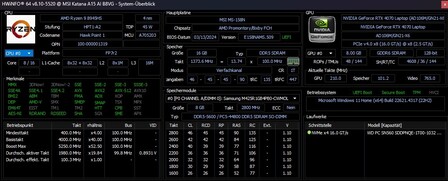
HWiNFO
 

Condiciones de la prueba

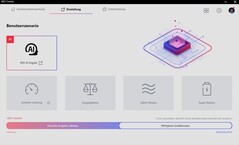
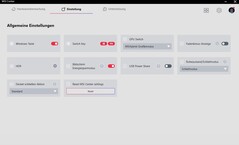
El Centro MSI, algo lento, ofrece varios modos en 'Escenario de usuario', que van desde 'Superbatería' a 'Rendimiento extremo', con algunos modos que hacen que el comportamiento del ventilador cambie drásticamente. Todas nuestras mediciones y pruebas se realizaron con el modo 'MSI AI Engine' activo, que maximiza el rendimiento gráfico mientras mantiene el TDP de la CPU en el nivel del modo 'Equilibrado'.

Centro ICM
Centro ICM
Centro ICM
Cyberpunk 2077 Loop (FHD/Ultra) MSIAI Engine Rendimientoextremo Equilibrado Modo silencioso
Ruido 52 dB(A) 52 dB(A) 48 dB(A) 39 dB(A)
Rendimiento 74 fps 74 fps 64 fps 62 fps
CPU PL1 (HWiNFO) 50 W 54 W 50 W 35 W
CPU PL2 (HWiNFO) 54 W 65 W 54 W 40 W

Procesador

El Ryzen 9 8945HS en el Katana A15 AI ofrece un rendimiento que no es ni particularmente impresionante ni decepcionante. Sus resultados son comparables a los del Ryzen 7 7840HS en el HP Omen 16, mientras que el Ryzen 7 7745HX en el Lenovo Legion Pro 5 16 es aproximadamente un 10% más rápido en todas las pruebas. El 8945HS cuenta con ocho núcleos de CPU capaces de procesar hasta 16 hilos simultáneamente a través de SMT. Con la conmutación de gráficos integrada, las tareas sencillas como el trabajo de oficina, la reproducción de vídeo y la navegación por Internet son gestionadas por el procesador integrado Radeon 780Mahorrando energía. El conmutador MUX permite desactivar la GPU integrada y confiar únicamente en la tarjeta gráfica Nvidia.

Cinebench R15 Multi loop

01503004506007509001050120013501500165018001950210022502400255027002850Tooltip
MSI Katana A15 AI B8VG AMD Ryzen 9 8945HS: Ø2571 (2495.48-2619.69)
HP Omen 16-xf0376ng AMD Ryzen 7 7840HS: Ø2531 (2518.1-2561.97)
HP Victus 16-r0077ng Intel Core i7-13700H: Ø2242 (2203.13-2316.56)
Aorus 15 BSF Intel Core i7-13700H: Ø2187 (2043.32-2737.16)
Lenovo Legion Pro 5 16ARX8 AMD Ryzen 7 7745HX: Ø2918 (2861.03-2977.96)
CPU Performance Rating - Percent
Average of class Gaming
 
83.5 pt
Lenovo Legion Pro 5 16ARX8 -2!
AMD Ryzen 7 7745HX
78.3 pt
Average AMD Ryzen 9 8945HS
 
74.3 pt
Aorus 15 BSF
Intel Core i7-13700H
73.3 pt
HP Omen 16-xf0376ng
AMD Ryzen 7 7840HS
71.6 pt
MSI Katana A15 AI B8VG
AMD Ryzen 9 8945HS
71 pt
HP Victus 16-r0077ng
Intel Core i7-13700H
64.4 pt
Cinebench R23
Multi Core
Average of class Gaming
  (5668 - 36249, n=190, last 2 years)
21995 Points +34%
Lenovo Legion Pro 5 16ARX8
AMD Ryzen 7 7745HX
18060 (17729.5min - 18059.9max) Points +10%
Aorus 15 BSF
Intel Core i7-13700H
17219 Points +5%
Average AMD Ryzen 9 8945HS
  (16463 - 17376, n=5)
16958 Points +3%
MSI Katana A15 AI B8VG
AMD Ryzen 9 8945HS
16463 Points
HP Omen 16-xf0376ng
AMD Ryzen 7 7840HS
16188 Points -2%
HP Victus 16-r0077ng
Intel Core i7-13700H
15410 Points -6%
Single Core
Aorus 15 BSF
Intel Core i7-13700H
1899 Points +10%
Average of class Gaming
  (1136 - 2235, n=189, last 2 years)
1894 Points +10%
Lenovo Legion Pro 5 16ARX8
AMD Ryzen 7 7745HX
1846 Points +7%
Average AMD Ryzen 9 8945HS
  (1719 - 1825, n=5)
1792 Points +4%
HP Omen 16-xf0376ng
AMD Ryzen 7 7840HS
1785 Points +4%
MSI Katana A15 AI B8VG
AMD Ryzen 9 8945HS
1719 Points
HP Victus 16-r0077ng
Intel Core i7-13700H
1687 Points -2%
Cinebench R20
CPU (Multi Core)
Average of class Gaming
  (2179 - 13832, n=187, last 2 years)
8354 Points +30%
Lenovo Legion Pro 5 16ARX8
AMD Ryzen 7 7745HX
7072 Points +10%
Aorus 15 BSF
Intel Core i7-13700H
6650 Points +4%
Average AMD Ryzen 9 8945HS
  (6404 - 6785, n=5)
6617 Points +3%
MSI Katana A15 AI B8VG
AMD Ryzen 9 8945HS
6404 Points
HP Omen 16-xf0376ng
AMD Ryzen 7 7840HS
6224 Points -3%
HP Victus 16-r0077ng
Intel Core i7-13700H
5895 Points -8%
CPU (Single Core)
Aorus 15 BSF
Intel Core i7-13700H
732 Points +8%
Average of class Gaming
  (439 - 856, n=187, last 2 years)
727 Points +8%
Lenovo Legion Pro 5 16ARX8
AMD Ryzen 7 7745HX
717 Points +6%
Average AMD Ryzen 9 8945HS
  (676 - 711, n=5)
696 Points +3%
HP Omen 16-xf0376ng
AMD Ryzen 7 7840HS
693 Points +3%
MSI Katana A15 AI B8VG
AMD Ryzen 9 8945HS
676 Points
HP Victus 16-r0077ng
Intel Core i7-13700H
649 Points -4%
Cinebench R15
CPU Multi 64Bit
Average of class Gaming
  (905 - 5663, n=194, last 2 years)
3437 Points +31%
Lenovo Legion Pro 5 16ARX8
AMD Ryzen 7 7745HX
2978 (2861.03min - 2977.96max) Points +14%
Aorus 15 BSF
Intel Core i7-13700H
2737 Points +4%
Average AMD Ryzen 9 8945HS
  (2620 - 2775, n=5)
2671 Points +2%
MSI Katana A15 AI B8VG
AMD Ryzen 9 8945HS
2620 (2495.48min - 2619.69max) Points
HP Omen 16-xf0376ng
AMD Ryzen 7 7840HS
2562 (2518.1min - 2561.97max) Points -2%
HP Victus 16-r0077ng
Intel Core i7-13700H
2317 (2203.13min - 2316.56max) Points -12%
CPU Single 64Bit
Lenovo Legion Pro 5 16ARX8
AMD Ryzen 7 7745HX
294 Points +11%
HP Omen 16-xf0376ng
AMD Ryzen 7 7840HS
280 Points +6%
Average AMD Ryzen 9 8945HS
  (265 - 287, n=5)
279 Points +5%
Average of class Gaming
  (191.9 - 318, n=191, last 2 years)
278 Points +5%
Aorus 15 BSF
Intel Core i7-13700H
272 Points +3%
MSI Katana A15 AI B8VG
AMD Ryzen 9 8945HS
265 Points
HP Victus 16-r0077ng
Intel Core i7-13700H
245 Points -8%
Blender - v2.79 BMW27 CPU
Aorus 15 BSF
Intel Core i7-13700H
220 Seconds * -11%
HP Victus 16-r0077ng
Intel Core i7-13700H
215 Seconds * -9%
HP Omen 16-xf0376ng
AMD Ryzen 7 7840HS
198 Seconds * -0%
MSI Katana A15 AI B8VG
AMD Ryzen 9 8945HS
198 Seconds *
Average AMD Ryzen 9 8945HS
  (186 - 198, n=5)
192.8 Seconds * +3%
Lenovo Legion Pro 5 16ARX8
AMD Ryzen 7 7745HX
174 Seconds * +12%
Average of class Gaming
  (87 - 555, n=182, last 2 years)
169.1 Seconds * +15%
7-Zip 18.03
7z b 4
Average of class Gaming
  (23795 - 140932, n=186, last 2 years)
85775 MIPS +25%
Lenovo Legion Pro 5 16ARX8
AMD Ryzen 7 7745HX
75557 MIPS +10%
Average AMD Ryzen 9 8945HS
  (68889 - 72821, n=5)
71330 MIPS +4%
MSI Katana A15 AI B8VG
AMD Ryzen 9 8945HS
68889 MIPS
HP Omen 16-xf0376ng
AMD Ryzen 7 7840HS
68646 MIPS 0%
HP Victus 16-r0077ng
Intel Core i7-13700H
65405 MIPS -5%
Aorus 15 BSF
Intel Core i7-13700H
62343 MIPS -10%
7z b 4 -mmt1
Lenovo Legion Pro 5 16ARX8
AMD Ryzen 7 7745HX
7244 MIPS +11%
HP Omen 16-xf0376ng
AMD Ryzen 7 7840HS
6640 MIPS +2%
MSI Katana A15 AI B8VG
AMD Ryzen 9 8945HS
6501 MIPS
Average AMD Ryzen 9 8945HS
  (5994 - 6668, n=5)
6332 MIPS -3%
Average of class Gaming
  (4199 - 7581, n=186, last 2 years)
6316 MIPS -3%
Aorus 15 BSF
Intel Core i7-13700H
6197 MIPS -5%
HP Victus 16-r0077ng
Intel Core i7-13700H
5559 MIPS -14%
Geekbench 6.3
Multi-Core
Average of class Gaming
  (5340 - 19665, n=114, last 2 years)
14198 Points +18%
Aorus 15 BSF
Intel Core i7-13700H
13493 Points +12%
Average AMD Ryzen 9 8945HS
  (12015 - 13715, n=6)
13157 Points +10%
HP Omen 16-xf0376ng
AMD Ryzen 7 7840HS
12111 Points +1%
MSI Katana A15 AI B8VG
AMD Ryzen 9 8945HS
12015 Points
HP Victus 16-r0077ng
Intel Core i7-13700H
11741 Points -2%
Single-Core
HP Omen 16-xf0376ng
AMD Ryzen 7 7840HS
2670 Points +11%
Average of class Gaming
  (1490 - 3129, n=114, last 2 years)
2647 Points +10%
Aorus 15 BSF
Intel Core i7-13700H
2627 Points +10%
Average AMD Ryzen 9 8945HS
  (2399 - 2707, n=6)
2625 Points +9%
MSI Katana A15 AI B8VG
AMD Ryzen 9 8945HS
2399 Points
HP Victus 16-r0077ng
Intel Core i7-13700H
2395 Points 0%
Geekbench 5.5
Multi-Core
Average of class Gaming
  (4557 - 23194, n=187, last 2 years)
15108 Points +38%
Aorus 15 BSF
Intel Core i7-13700H
13409 Points +22%
Lenovo Legion Pro 5 16ARX8
AMD Ryzen 7 7745HX
12378 Points +13%
Average AMD Ryzen 9 8945HS
  (10985 - 12481, n=6)
11890 Points +8%
HP Victus 16-r0077ng
Intel Core i7-13700H
11504 Points +5%
HP Omen 16-xf0376ng
AMD Ryzen 7 7840HS
11414 Points +4%
MSI Katana A15 AI B8VG
AMD Ryzen 9 8945HS
10985 Points
Single-Core
Lenovo Legion Pro 5 16ARX8
AMD Ryzen 7 7745HX
2040 Points +5%
HP Omen 16-xf0376ng
AMD Ryzen 7 7840HS
2005 Points +3%
MSI Katana A15 AI B8VG
AMD Ryzen 9 8945HS
1950 Points
Average AMD Ryzen 9 8945HS
  (1835 - 2039, n=6)
1937 Points -1%
Average of class Gaming
  (986 - 2210, n=187, last 2 years)
1897 Points -3%
Aorus 15 BSF
Intel Core i7-13700H
1880 Points -4%
HP Victus 16-r0077ng
Intel Core i7-13700H
1685 Points -14%
HWBOT x265 Benchmark v2.2 - 4k Preset
Average of class Gaming
  (6.72 - 38.9, n=186, last 2 years)
23.6 fps +19%
Lenovo Legion Pro 5 16ARX8
AMD Ryzen 7 7745HX
23.2 fps +17%
Average AMD Ryzen 9 8945HS
  (19.8 - 22.2, n=5)
21.1 fps +7%
HP Omen 16-xf0376ng
AMD Ryzen 7 7840HS
19.8 fps 0%
MSI Katana A15 AI B8VG
AMD Ryzen 9 8945HS
19.8 fps
HP Victus 16-r0077ng
Intel Core i7-13700H
16.6 fps -16%
Aorus 15 BSF
Intel Core i7-13700H
16.4 fps -17%
LibreOffice - 20 Documents To PDF
HP Omen 16-xf0376ng
AMD Ryzen 7 7840HS
65.1 s * -19%
HP Victus 16-r0077ng
Intel Core i7-13700H
61.5 s * -12%
MSI Katana A15 AI B8VG
AMD Ryzen 9 8945HS
54.9 s *
Average AMD Ryzen 9 8945HS
  (48.4 - 54.9, n=4)
51.6 s * +6%
Average of class Gaming
  (31.4 - 199, n=183, last 2 years)
48.2 s * +12%
Aorus 15 BSF
Intel Core i7-13700H
47.1 s * +14%
Lenovo Legion Pro 5 16ARX8
AMD Ryzen 7 7745HX
37.9 s * +31%
R Benchmark 2.5 - Overall mean
HP Victus 16-r0077ng
Intel Core i7-13700H
0.504 sec * -16%
Aorus 15 BSF
Intel Core i7-13700H
0.4421 sec * -1%
Average of class Gaming
  (0.3609 - 0.759, n=187, last 2 years)
0.4365 sec * -0%
Average AMD Ryzen 9 8945HS
  (0.4294 - 0.4452, n=4)
0.4362 sec * -0%
MSI Katana A15 AI B8VG
AMD Ryzen 9 8945HS
0.4357 sec *
HP Omen 16-xf0376ng
AMD Ryzen 7 7840HS
0.4309 sec * +1%
Lenovo Legion Pro 5 16ARX8
AMD Ryzen 7 7745HX
0.421 sec * +3%

* ... más pequeño es mejor

Cinebench R15 CPU Multi 64Bit
2620 Points
Cinebench R15 Ref. Match 64Bit
99.6 %
Cinebench R15 CPU Single 64Bit
265 Points
Cinebench R20 CPU (Multi Core)
6404 Points
Cinebench R20 CPU (Single Core)
676 Points
Cinebench R23 Single Core
1719 Points
Cinebench R23 Multi Core
16463 Points
ayuda
Performance Rating
Average AMD Ryzen 9 8945HS
 
93.6 pt
Lenovo Legion Pro 5 16ARX8
AMD Ryzen 7 7745HX, NVIDIA GeForce RTX 4070 Laptop GPU
91.3 pt
MSI Katana A15 AI B8VG
AMD Ryzen 9 8945HS, NVIDIA GeForce RTX 4070 Laptop GPU
88.8 pt
Average of class Gaming
 
88.7 pt
HP Omen 16-xf0376ng
AMD Ryzen 7 7840HS, NVIDIA GeForce RTX 4070 Laptop GPU
85.1 pt
Aorus 15 BSF
Intel Core i7-13700H, NVIDIA GeForce RTX 4070 Laptop GPU
66.8 pt
HP Victus 16-r0077ng
Intel Core i7-13700H, NVIDIA GeForce RTX 4070 Laptop GPU
62.8 pt
AIDA64 / FP32 Ray-Trace
Lenovo Legion Pro 5 16ARX8
AMD Ryzen 7 7745HX, NVIDIA GeForce RTX 4070 Laptop GPU
29656 KRay/s +11%
Average AMD Ryzen 9 8945HS
  (26817 - 28836, n=4)
27600 KRay/s +3%
MSI Katana A15 AI B8VG
AMD Ryzen 9 8945HS, NVIDIA GeForce RTX 4070 Laptop GPU
26817 KRay/s
HP Omen 16-xf0376ng
AMD Ryzen 7 7840HS, NVIDIA GeForce RTX 4070 Laptop GPU
25896 KRay/s -3%
Average of class Gaming
  (4986 - 60169, n=183, last 2 years)
21969 KRay/s -18%
HP Victus 16-r0077ng
Intel Core i7-13700H, NVIDIA GeForce RTX 4070 Laptop GPU
14470 KRay/s -46%
Aorus 15 BSF
Intel Core i7-13700H, NVIDIA GeForce RTX 4070 Laptop GPU
13479 KRay/s -50%
AIDA64 / FPU Julia
Lenovo Legion Pro 5 16ARX8
AMD Ryzen 7 7745HX, NVIDIA GeForce RTX 4070 Laptop GPU
120974 Points +7%
Average AMD Ryzen 9 8945HS
  (113231 - 122633, n=4)
116809 Points +3%
MSI Katana A15 AI B8VG
AMD Ryzen 9 8945HS, NVIDIA GeForce RTX 4070 Laptop GPU
113231 Points
HP Omen 16-xf0376ng
AMD Ryzen 7 7840HS, NVIDIA GeForce RTX 4070 Laptop GPU
109633 Points -3%
Average of class Gaming
  (25360 - 252486, n=183, last 2 years)
107028 Points -5%
HP Victus 16-r0077ng
Intel Core i7-13700H, NVIDIA GeForce RTX 4070 Laptop GPU
72193 Points -36%
Aorus 15 BSF
Intel Core i7-13700H, NVIDIA GeForce RTX 4070 Laptop GPU
69345 Points -39%
AIDA64 / CPU SHA3
Lenovo Legion Pro 5 16ARX8
AMD Ryzen 7 7745HX, NVIDIA GeForce RTX 4070 Laptop GPU
4974 MB/s +3%
Average AMD Ryzen 9 8945HS
  (4839 - 5077, n=4)
4955 MB/s +2%
Average of class Gaming
  (1339 - 10389, n=183, last 2 years)
4923 MB/s +2%
MSI Katana A15 AI B8VG
AMD Ryzen 9 8945HS, NVIDIA GeForce RTX 4070 Laptop GPU
4839 MB/s
HP Omen 16-xf0376ng
AMD Ryzen 7 7840HS, NVIDIA GeForce RTX 4070 Laptop GPU
4602 MB/s -5%
HP Victus 16-r0077ng
Intel Core i7-13700H, NVIDIA GeForce RTX 4070 Laptop GPU
3326 MB/s -31%
Aorus 15 BSF
Intel Core i7-13700H, NVIDIA GeForce RTX 4070 Laptop GPU
3238 MB/s -33%
AIDA64 / CPU Queen
Lenovo Legion Pro 5 16ARX8
AMD Ryzen 7 7745HX, NVIDIA GeForce RTX 4070 Laptop GPU
126954 Points +6%
Average AMD Ryzen 9 8945HS
  (119279 - 125044, n=4)
121122 Points +2%
MSI Katana A15 AI B8VG
AMD Ryzen 9 8945HS, NVIDIA GeForce RTX 4070 Laptop GPU
119279 Points
HP Omen 16-xf0376ng
AMD Ryzen 7 7840HS, NVIDIA GeForce RTX 4070 Laptop GPU
117257 Points -2%
Average of class Gaming
  (50699 - 200651, n=183, last 2 years)
117123 Points -2%
Aorus 15 BSF
Intel Core i7-13700H, NVIDIA GeForce RTX 4070 Laptop GPU
105776 Points -11%
HP Victus 16-r0077ng
Intel Core i7-13700H, NVIDIA GeForce RTX 4070 Laptop GPU
91638 Points -23%
AIDA64 / FPU SinJulia
Lenovo Legion Pro 5 16ARX8
AMD Ryzen 7 7745HX, NVIDIA GeForce RTX 4070 Laptop GPU
15887 Points +4%
Average AMD Ryzen 9 8945HS
  (15026 - 15661, n=4)
15352 Points 0%
MSI Katana A15 AI B8VG
AMD Ryzen 9 8945HS, NVIDIA GeForce RTX 4070 Laptop GPU
15308 Points
HP Omen 16-xf0376ng
AMD Ryzen 7 7840HS, NVIDIA GeForce RTX 4070 Laptop GPU
15036 Points -2%
Average of class Gaming
  (4800 - 32988, n=183, last 2 years)
13292 Points -13%
Aorus 15 BSF
Intel Core i7-13700H, NVIDIA GeForce RTX 4070 Laptop GPU
9143 Points -40%
HP Victus 16-r0077ng
Intel Core i7-13700H, NVIDIA GeForce RTX 4070 Laptop GPU
8677 Points -43%
AIDA64 / FPU Mandel
Lenovo Legion Pro 5 16ARX8
AMD Ryzen 7 7745HX, NVIDIA GeForce RTX 4070 Laptop GPU
64255 Points +6%
Average AMD Ryzen 9 8945HS
  (60420 - 65746, n=4)
62427 Points +3%
MSI Katana A15 AI B8VG
AMD Ryzen 9 8945HS, NVIDIA GeForce RTX 4070 Laptop GPU
60420 Points
HP Omen 16-xf0376ng
AMD Ryzen 7 7840HS, NVIDIA GeForce RTX 4070 Laptop GPU
58454 Points -3%
Average of class Gaming
  (12321 - 134044, n=183, last 2 years)
53848 Points -11%
HP Victus 16-r0077ng
Intel Core i7-13700H, NVIDIA GeForce RTX 4070 Laptop GPU
36179 Points -40%
Aorus 15 BSF
Intel Core i7-13700H, NVIDIA GeForce RTX 4070 Laptop GPU
33785 Points -44%
AIDA64 / CPU AES
Aorus 15 BSF
Intel Core i7-13700H, NVIDIA GeForce RTX 4070 Laptop GPU
119772 MB/s +38%
Average of class Gaming
  (19065 - 328679, n=183, last 2 years)
109230 MB/s +26%
Average AMD Ryzen 9 8945HS
  (86495 - 169431, n=4)
109074 MB/s +26%
MSI Katana A15 AI B8VG
AMD Ryzen 9 8945HS, NVIDIA GeForce RTX 4070 Laptop GPU
86495 MB/s
Lenovo Legion Pro 5 16ARX8
AMD Ryzen 7 7745HX, NVIDIA GeForce RTX 4070 Laptop GPU
71191 MB/s -18%
HP Omen 16-xf0376ng
AMD Ryzen 7 7840HS, NVIDIA GeForce RTX 4070 Laptop GPU
67389 MB/s -22%
HP Victus 16-r0077ng
Intel Core i7-13700H, NVIDIA GeForce RTX 4070 Laptop GPU
66484 MB/s -23%
AIDA64 / CPU ZLib
Average of class Gaming
  (373 - 2409, n=183, last 2 years)
1371 MB/s +27%
Lenovo Legion Pro 5 16ARX8
AMD Ryzen 7 7745HX, NVIDIA GeForce RTX 4070 Laptop GPU
1147 MB/s +7%
Average AMD Ryzen 9 8945HS
  (1029 - 1135, n=4)
1089 MB/s +1%
MSI Katana A15 AI B8VG
AMD Ryzen 9 8945HS, NVIDIA GeForce RTX 4070 Laptop GPU
1076 MB/s
HP Omen 16-xf0376ng
AMD Ryzen 7 7840HS, NVIDIA GeForce RTX 4070 Laptop GPU
1062 MB/s -1%
HP Victus 16-r0077ng
Intel Core i7-13700H, NVIDIA GeForce RTX 4070 Laptop GPU
950 MB/s -12%
Aorus 15 BSF
Intel Core i7-13700H, NVIDIA GeForce RTX 4070 Laptop GPU
917 MB/s -15%
AIDA64 / FP64 Ray-Trace
Lenovo Legion Pro 5 16ARX8
AMD Ryzen 7 7745HX, NVIDIA GeForce RTX 4070 Laptop GPU
15975 KRay/s +12%
Average AMD Ryzen 9 8945HS
  (14216 - 15588, n=4)
14748 KRay/s +4%
MSI Katana A15 AI B8VG
AMD Ryzen 9 8945HS, NVIDIA GeForce RTX 4070 Laptop GPU
14216 KRay/s
HP Omen 16-xf0376ng
AMD Ryzen 7 7840HS, NVIDIA GeForce RTX 4070 Laptop GPU
13731 KRay/s -3%
Average of class Gaming
  (2540 - 31796, n=183, last 2 years)
11830 KRay/s -17%
HP Victus 16-r0077ng
Intel Core i7-13700H, NVIDIA GeForce RTX 4070 Laptop GPU
7770 KRay/s -45%
Aorus 15 BSF
Intel Core i7-13700H, NVIDIA GeForce RTX 4070 Laptop GPU
7334 KRay/s -48%
AIDA64 / CPU PhotoWorxx
Average of class Gaming
  (10805 - 60161, n=184, last 2 years)
40511 MPixel/s +21%
HP Victus 16-r0077ng
Intel Core i7-13700H, NVIDIA GeForce RTX 4070 Laptop GPU
39045 MPixel/s +17%
Average AMD Ryzen 9 8945HS
  (33371 - 40815, n=4)
38308 MPixel/s +15%
Aorus 15 BSF
Intel Core i7-13700H, NVIDIA GeForce RTX 4070 Laptop GPU
37932 MPixel/s +14%
HP Omen 16-xf0376ng
AMD Ryzen 7 7840HS, NVIDIA GeForce RTX 4070 Laptop GPU
33395 MPixel/s 0%
MSI Katana A15 AI B8VG
AMD Ryzen 9 8945HS, NVIDIA GeForce RTX 4070 Laptop GPU
33371 MPixel/s
Lenovo Legion Pro 5 16ARX8
AMD Ryzen 7 7745HX, NVIDIA GeForce RTX 4070 Laptop GPU
28499 MPixel/s -15%

Rendimiento del sistema

El rendimiento del sistema es consistentemente bueno, con el Katana rindiendo de forma similar a sus competidores en PCMark 10. Las velocidades de transferencia de datos de la RAM son impresionantes para tratarse de módulos de 5.600 MT/s.

PCMark 10 / Score
Lenovo Legion Pro 5 16ARX8
NVIDIA GeForce RTX 4070 Laptop GPU, R7 7745HX, Samsung PM9A1 MZVL21T0HCLR
8206 Points +10%
HP Omen 16-xf0376ng
NVIDIA GeForce RTX 4070 Laptop GPU, R7 7840HS, WDC PC SN810 512GB
8167 Points +9%
Average of class Gaming
  (5776 - 9852, n=164, last 2 years)
7811 Points +5%
Average AMD Ryzen 9 8945HS, NVIDIA GeForce RTX 4070 Laptop GPU
  (7436 - 8312, n=3)
7740 Points +4%
MSI Katana A15 AI B8VG
NVIDIA GeForce RTX 4070 Laptop GPU, R9 8945HS, WD PC SN560 SDDPNQE-1T00
7473 Points
Aorus 15 BSF
NVIDIA GeForce RTX 4070 Laptop GPU, i7-13700H, Gigabyte AG470S1TB-SI B10
7309 Points -2%
HP Victus 16-r0077ng
NVIDIA GeForce RTX 4070 Laptop GPU, i7-13700H, Kioxia XG8 KXG80ZNV1T02
7158 Points -4%
PCMark 10 / Essentials
HP Omen 16-xf0376ng
NVIDIA GeForce RTX 4070 Laptop GPU, R7 7840HS, WDC PC SN810 512GB
11250 Points +16%
Lenovo Legion Pro 5 16ARX8
NVIDIA GeForce RTX 4070 Laptop GPU, R7 7745HX, Samsung PM9A1 MZVL21T0HCLR
11074 Points +14%
Average of class Gaming
  (9057 - 12334, n=163, last 2 years)
10829 Points +12%
Aorus 15 BSF
NVIDIA GeForce RTX 4070 Laptop GPU, i7-13700H, Gigabyte AG470S1TB-SI B10
10812 Points +12%
HP Victus 16-r0077ng
NVIDIA GeForce RTX 4070 Laptop GPU, i7-13700H, Kioxia XG8 KXG80ZNV1T02
10707 Points +11%
Average AMD Ryzen 9 8945HS, NVIDIA GeForce RTX 4070 Laptop GPU
  (9672 - 11290, n=3)
10274 Points +6%
MSI Katana A15 AI B8VG
NVIDIA GeForce RTX 4070 Laptop GPU, R9 8945HS, WD PC SN560 SDDPNQE-1T00
9672 Points
PCMark 10 / Productivity
Lenovo Legion Pro 5 16ARX8
NVIDIA GeForce RTX 4070 Laptop GPU, R7 7745HX, Samsung PM9A1 MZVL21T0HCLR
10235 Points +7%
HP Omen 16-xf0376ng
NVIDIA GeForce RTX 4070 Laptop GPU, R7 7840HS, WDC PC SN810 512GB
10179 Points +6%
Average of class Gaming
  (6662 - 14612, n=163, last 2 years)
9907 Points +3%
Average AMD Ryzen 9 8945HS, NVIDIA GeForce RTX 4070 Laptop GPU
  (9502 - 10332, n=3)
9809 Points +2%
MSI Katana A15 AI B8VG
NVIDIA GeForce RTX 4070 Laptop GPU, R9 8945HS, WD PC SN560 SDDPNQE-1T00
9593 Points
Aorus 15 BSF
NVIDIA GeForce RTX 4070 Laptop GPU, i7-13700H, Gigabyte AG470S1TB-SI B10
9033 Points -6%
HP Victus 16-r0077ng
NVIDIA GeForce RTX 4070 Laptop GPU, i7-13700H, Kioxia XG8 KXG80ZNV1T02
8974 Points -6%
PCMark 10 / Digital Content Creation
Lenovo Legion Pro 5 16ARX8
NVIDIA GeForce RTX 4070 Laptop GPU, R7 7745HX, Samsung PM9A1 MZVL21T0HCLR
13229 Points +8%
HP Omen 16-xf0376ng
NVIDIA GeForce RTX 4070 Laptop GPU, R7 7840HS, WDC PC SN810 512GB
12908 Points +6%
Average AMD Ryzen 9 8945HS, NVIDIA GeForce RTX 4070 Laptop GPU
  (11907 - 13363, n=3)
12492 Points +2%
MSI Katana A15 AI B8VG
NVIDIA GeForce RTX 4070 Laptop GPU, R9 8945HS, WD PC SN560 SDDPNQE-1T00
12207 Points
Average of class Gaming
  (6807 - 18475, n=163, last 2 years)
12167 Points 0%
Aorus 15 BSF
NVIDIA GeForce RTX 4070 Laptop GPU, i7-13700H, Gigabyte AG470S1TB-SI B10
10847 Points -11%
HP Victus 16-r0077ng
NVIDIA GeForce RTX 4070 Laptop GPU, i7-13700H, Kioxia XG8 KXG80ZNV1T02
10358 Points -15%
CrossMark / Overall
Aorus 15 BSF
NVIDIA GeForce RTX 4070 Laptop GPU, i7-13700H, Gigabyte AG470S1TB-SI B10
2073 Points
Lenovo Legion Pro 5 16ARX8
NVIDIA GeForce RTX 4070 Laptop GPU, R7 7745HX, Samsung PM9A1 MZVL21T0HCLR
2027 Points
Average of class Gaming
  (1247 - 2344, n=144, last 2 years)
1909 Points
Average AMD Ryzen 9 8945HS, NVIDIA GeForce RTX 4070 Laptop GPU
  (1767 - 1830, n=2)
1799 Points
CrossMark / Productivity
Aorus 15 BSF
NVIDIA GeForce RTX 4070 Laptop GPU, i7-13700H, Gigabyte AG470S1TB-SI B10
2006 Points
Lenovo Legion Pro 5 16ARX8
NVIDIA GeForce RTX 4070 Laptop GPU, R7 7745HX, Samsung PM9A1 MZVL21T0HCLR
1930 Points
Average of class Gaming
  (1299 - 2204, n=144, last 2 years)
1808 Points
Average AMD Ryzen 9 8945HS, NVIDIA GeForce RTX 4070 Laptop GPU
  (1686 - 1783, n=2)
1735 Points
CrossMark / Creativity
Lenovo Legion Pro 5 16ARX8
NVIDIA GeForce RTX 4070 Laptop GPU, R7 7745HX, Samsung PM9A1 MZVL21T0HCLR
2222 Points
Aorus 15 BSF
NVIDIA GeForce RTX 4070 Laptop GPU, i7-13700H, Gigabyte AG470S1TB-SI B10
2100 Points
Average of class Gaming
  (1275 - 2660, n=144, last 2 years)
2099 Points
Average AMD Ryzen 9 8945HS, NVIDIA GeForce RTX 4070 Laptop GPU
  (1935 - 1960, n=2)
1948 Points
CrossMark / Responsiveness
Aorus 15 BSF
NVIDIA GeForce RTX 4070 Laptop GPU, i7-13700H, Gigabyte AG470S1TB-SI B10
2202 Points
Lenovo Legion Pro 5 16ARX8
NVIDIA GeForce RTX 4070 Laptop GPU, R7 7745HX, Samsung PM9A1 MZVL21T0HCLR
1785 Points
Average of class Gaming
  (1030 - 2330, n=144, last 2 years)
1706 Points
Average AMD Ryzen 9 8945HS, NVIDIA GeForce RTX 4070 Laptop GPU
  (1489 - 1672, n=2)
1581 Points
WebXPRT 3 / Overall
Lenovo Legion Pro 5 16ARX8
NVIDIA GeForce RTX 4070 Laptop GPU, R7 7745HX, Samsung PM9A1 MZVL21T0HCLR
345 Points +29%
HP Omen 16-xf0376ng
NVIDIA GeForce RTX 4070 Laptop GPU, R7 7840HS, WDC PC SN810 512GB
325 Points +21%
HP Omen 16-xf0376ng
NVIDIA GeForce RTX 4070 Laptop GPU, R7 7840HS, WDC PC SN810 512GB
325 Points +21%
Aorus 15 BSF
NVIDIA GeForce RTX 4070 Laptop GPU, i7-13700H, Gigabyte AG470S1TB-SI B10
310 Points +16%
Average of class Gaming
  (215 - 480, n=162, last 2 years)
304 Points +13%
Average AMD Ryzen 9 8945HS, NVIDIA GeForce RTX 4070 Laptop GPU
  (268 - 324, n=3)
298 Points +11%
HP Victus 16-r0077ng
NVIDIA GeForce RTX 4070 Laptop GPU, i7-13700H, Kioxia XG8 KXG80ZNV1T02
277 Points +3%
HP Victus 16-r0077ng
NVIDIA GeForce RTX 4070 Laptop GPU, i7-13700H, Kioxia XG8 KXG80ZNV1T02
277 Points +3%
MSI Katana A15 AI B8VG
NVIDIA GeForce RTX 4070 Laptop GPU, R9 8945HS, WD PC SN560 SDDPNQE-1T00
268 Points
WebXPRT 4 / Overall
Lenovo Legion Pro 5 16ARX8
NVIDIA GeForce RTX 4070 Laptop GPU, R7 7745HX, Samsung PM9A1 MZVL21T0HCLR
283 Points +25%
Aorus 15 BSF
NVIDIA GeForce RTX 4070 Laptop GPU, i7-13700H, Gigabyte AG470S1TB-SI B10
277 Points +23%
Average of class Gaming
  (176.4 - 328, n=151, last 2 years)
267 Points +18%
HP Omen 16-xf0376ng
NVIDIA GeForce RTX 4070 Laptop GPU, R7 7840HS, WDC PC SN810 512GB
263 Points +16%
HP Omen 16-xf0376ng
NVIDIA GeForce RTX 4070 Laptop GPU, R7 7840HS, WDC PC SN810 512GB
263 Points +16%
Average AMD Ryzen 9 8945HS, NVIDIA GeForce RTX 4070 Laptop GPU
  (226 - 269, n=3)
248 Points +10%
HP Victus 16-r0077ng
NVIDIA GeForce RTX 4070 Laptop GPU, i7-13700H, Kioxia XG8 KXG80ZNV1T02
246 Points +9%
HP Victus 16-r0077ng
NVIDIA GeForce RTX 4070 Laptop GPU, i7-13700H, Kioxia XG8 KXG80ZNV1T02
246 Points +9%
MSI Katana A15 AI B8VG
NVIDIA GeForce RTX 4070 Laptop GPU, R9 8945HS, WD PC SN560 SDDPNQE-1T00
226 Points
Mozilla Kraken 1.1 / Total
MSI Katana A15 AI B8VG
NVIDIA GeForce RTX 4070 Laptop GPU, R9 8945HS, WD PC SN560 SDDPNQE-1T00
586 ms *
MSI Katana A15 AI B8VG
NVIDIA GeForce RTX 4070 Laptop GPU, R9 8945HS, WD PC SN560 SDDPNQE-1T00
586 ms * -0%
HP Victus 16-r0077ng
NVIDIA GeForce RTX 4070 Laptop GPU, i7-13700H, Kioxia XG8 KXG80ZNV1T02
543 ms * +7%
HP Victus 16-r0077ng
NVIDIA GeForce RTX 4070 Laptop GPU, i7-13700H, Kioxia XG8 KXG80ZNV1T02
543 ms * +7%
Average AMD Ryzen 9 8945HS, NVIDIA GeForce RTX 4070 Laptop GPU
  (488 - 586, n=4)
542 ms * +8%
Average of class Gaming
  (421 - 674, n=177, last 2 years)
503 ms * +14%
HP Omen 16-xf0376ng
NVIDIA GeForce RTX 4070 Laptop GPU, R7 7840HS, WDC PC SN810 512GB
498 ms * +15%
HP Omen 16-xf0376ng
NVIDIA GeForce RTX 4070 Laptop GPU, R7 7840HS, WDC PC SN810 512GB
498 ms * +15%
Aorus 15 BSF
NVIDIA GeForce RTX 4070 Laptop GPU, i7-13700H, Gigabyte AG470S1TB-SI B10
494 ms * +16%
Lenovo Legion Pro 5 16ARX8
NVIDIA GeForce RTX 4070 Laptop GPU, R7 7745HX, Samsung PM9A1 MZVL21T0HCLR
471 ms * +20%

* ... más pequeño es mejor

PCMark 10 Score
7473 puntos
ayuda
AIDA64 / Memory Copy
Average AMD Ryzen 9 8945HS
  (62371 - 68976, n=4)
67176 MB/s +8%
Average of class Gaming
  (21842 - 94325, n=183, last 2 years)
65908 MB/s +6%
MSI Katana A15 AI B8VG
AMD Ryzen 9 8945HS, NVIDIA GeForce RTX 4070 Laptop GPU
62371 MB/s
HP Omen 16-xf0376ng
AMD Ryzen 7 7840HS, NVIDIA GeForce RTX 4070 Laptop GPU
62231 MB/s 0%
HP Victus 16-r0077ng
Intel Core i7-13700H, NVIDIA GeForce RTX 4070 Laptop GPU
60917 MB/s -2%
Aorus 15 BSF
Intel Core i7-13700H, NVIDIA GeForce RTX 4070 Laptop GPU
59991 MB/s -4%
Lenovo Legion Pro 5 16ARX8
AMD Ryzen 7 7745HX, NVIDIA GeForce RTX 4070 Laptop GPU
50007 MB/s -20%
AIDA64 / Memory Read
HP Victus 16-r0077ng
Intel Core i7-13700H, NVIDIA GeForce RTX 4070 Laptop GPU
70121 MB/s +14%
Average of class Gaming
  (23681 - 99713, n=183, last 2 years)
69720 MB/s +13%
Aorus 15 BSF
Intel Core i7-13700H, NVIDIA GeForce RTX 4070 Laptop GPU
67672 MB/s +10%
MSI Katana A15 AI B8VG
AMD Ryzen 9 8945HS, NVIDIA GeForce RTX 4070 Laptop GPU
61532 MB/s
HP Omen 16-xf0376ng
AMD Ryzen 7 7840HS, NVIDIA GeForce RTX 4070 Laptop GPU
61147 MB/s -1%
Average AMD Ryzen 9 8945HS
  (49966 - 61710, n=4)
58659 MB/s -5%
Lenovo Legion Pro 5 16ARX8
AMD Ryzen 7 7745HX, NVIDIA GeForce RTX 4070 Laptop GPU
50703 MB/s -18%
AIDA64 / Memory Write
Aorus 15 BSF
Intel Core i7-13700H, NVIDIA GeForce RTX 4070 Laptop GPU
99898 MB/s +28%
Average AMD Ryzen 9 8945HS
  (78351 - 93153, n=4)
86433 MB/s +10%
HP Omen 16-xf0376ng
AMD Ryzen 7 7840HS, NVIDIA GeForce RTX 4070 Laptop GPU
78406 MB/s 0%
MSI Katana A15 AI B8VG
AMD Ryzen 9 8945HS, NVIDIA GeForce RTX 4070 Laptop GPU
78351 MB/s
Average of class Gaming
  (22986 - 108954, n=183, last 2 years)
67506 MB/s -14%
HP Victus 16-r0077ng
Intel Core i7-13700H, NVIDIA GeForce RTX 4070 Laptop GPU
61520 MB/s -21%
Lenovo Legion Pro 5 16ARX8
AMD Ryzen 7 7745HX, NVIDIA GeForce RTX 4070 Laptop GPU
54587 MB/s -30%
AIDA64 / Memory Latency
Average AMD Ryzen 9 8945HS
  (91.2 - 110.4, n=4)
97.1 ns * -6%
Average of class Gaming
  (59.5 - 259, n=183, last 2 years)
94.3 ns * -3%
HP Victus 16-r0077ng
Intel Core i7-13700H, NVIDIA GeForce RTX 4070 Laptop GPU
94.1 ns * -3%
Aorus 15 BSF
Intel Core i7-13700H, NVIDIA GeForce RTX 4070 Laptop GPU
91.8 ns * -1%
MSI Katana A15 AI B8VG
AMD Ryzen 9 8945HS, NVIDIA GeForce RTX 4070 Laptop GPU
91.3 ns *
HP Omen 16-xf0376ng
AMD Ryzen 7 7840HS, NVIDIA GeForce RTX 4070 Laptop GPU
89.8 ns * +2%
Lenovo Legion Pro 5 16ARX8
AMD Ryzen 7 7745HX, NVIDIA GeForce RTX 4070 Laptop GPU
86.5 ns * +5%

* ... más pequeño es mejor

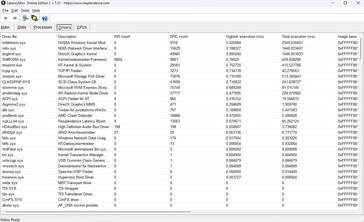
Latencias del CPD

Las cosas son mucho menos impresionantes en este departamento. Según la herramienta LatencyMon, las latencias pueden dispararse durante ciertas tareas. Dicho esto, de los sistemas rivales, sólo el Legion Pro 5 consigue mantenerse por debajo de 1000 µs.

LatencyMon
LatencyMon
DPC Latencies / LatencyMon - interrupt to process latency (max), Web, Youtube, Prime95
MSI Katana A15 AI B8VG
NVIDIA GeForce RTX 4070 Laptop GPU, R9 8945HS, WD PC SN560 SDDPNQE-1T00
2467.1 μs *
HP Omen 16-xf0376ng
NVIDIA GeForce RTX 4070 Laptop GPU, R7 7840HS, WDC PC SN810 512GB
2185.9 μs * +11%
HP Victus 16-r0077ng
NVIDIA GeForce RTX 4070 Laptop GPU, i7-13700H, Kioxia XG8 KXG80ZNV1T02
1697 μs * +31%
Aorus 15 BSF
NVIDIA GeForce RTX 4070 Laptop GPU, i7-13700H, Gigabyte AG470S1TB-SI B10
1664.7 μs * +33%
Lenovo Legion Pro 5 16ARX8
NVIDIA GeForce RTX 4070 Laptop GPU, R7 7745HX, Samsung PM9A1 MZVL21T0HCLR
603 μs * +76%

* ... más pequeño es mejor

Dispositivos de almacenamiento

Puede que la unidad SSD de 1 TB de WDC (modelo PC SN560) no se encuentre entre las más rápidas de su clase, pero su rendimiento está lejos de ser decepcionante. Aunque nuestra prueba en bucle reveló algunas fluctuaciones de rendimiento a lo largo del tiempo, éstas se mantuvieron dentro de unos límites aceptables, algo que no podemos decir de la Legion Pro 5.

WD PC SN560 SDDPNQE-1T00
CDM 5/6 Read Seq Q32T1: 4931 MB/s
CDM 5/6 Write Seq Q32T1: 3255 MB/s
CDM 5/6 Read 4K Q32T1: 831.3 MB/s
CDM 5/6 Write 4K Q32T1: 682.1 MB/s
CDM 5 Read Seq: 3569 MB/s
CDM 5 Write Seq: 3249 MB/s
CDM 5/6 Read 4K: 72.18 MB/s
CDM 5/6 Write 4K: 245.4 MB/s
Drive Performance Rating - Percent
Aorus 15 BSF
Gigabyte AG470S1TB-SI B10
90.5 pt
Lenovo Legion Pro 5 16ARX8
Samsung PM9A1 MZVL21T0HCLR
81 pt
Average of class Gaming
 
66.3 pt
HP Omen 16-xf0376ng
WDC PC SN810 512GB
58.9 pt
HP Victus 16-r0077ng
Kioxia XG8 KXG80ZNV1T02
56.5 pt
MSI Katana A15 AI B8VG
WD PC SN560 SDDPNQE-1T00
56.3 pt
Average WD PC SN560 SDDPNQE-1T00
 
47.7 pt
DiskSpd
seq read
Lenovo Legion Pro 5 16ARX8
Samsung PM9A1 MZVL21T0HCLR
4677 (4664.17min - 4676.56max) MB/s +53%
Aorus 15 BSF
Gigabyte AG470S1TB-SI B10
4224 (3897.73min - 4223.61max) MB/s +38%
HP Omen 16-xf0376ng
WDC PC SN810 512GB
3550 (3505.51min - 3549.67max) MB/s +16%
Average of class Gaming
  (1319 - 7045, n=165, last 2 years)
3476 MB/s +14%
Average WD PC SN560 SDDPNQE-1T00
  (2406 - 4128, n=20)
3165 MB/s +4%
MSI Katana A15 AI B8VG
WD PC SN560 SDDPNQE-1T00
3057 (3033.1min - 3057.23max) MB/s
HP Victus 16-r0077ng
Kioxia XG8 KXG80ZNV1T02
2735 (2694.63min - 2735.3max) MB/s -11%
seq write
Lenovo Legion Pro 5 16ARX8
Samsung PM9A1 MZVL21T0HCLR
4326 (4313.21min - 4326.48max) MB/s +42%
Average of class Gaming
  (535 - 9307, n=165, last 2 years)
3825 MB/s +26%
HP Omen 16-xf0376ng
WDC PC SN810 512GB
3783 (3552.81min - 3782.83max) MB/s +24%
HP Victus 16-r0077ng
Kioxia XG8 KXG80ZNV1T02
3641 (3537min - 3640.66max) MB/s +19%
Aorus 15 BSF
Gigabyte AG470S1TB-SI B10
3300 (3281.98min - 3300.19max) MB/s +8%
MSI Katana A15 AI B8VG
WD PC SN560 SDDPNQE-1T00
3047 (3017.8min - 3046.74max) MB/s
Average WD PC SN560 SDDPNQE-1T00
  (2235 - 3416, n=20)
2924 MB/s -4%
seq q8 t1 read
HP Omen 16-xf0376ng
WDC PC SN810 512GB
6889 (5972.9min - 6888.72max) MB/s +39%
Aorus 15 BSF
Gigabyte AG470S1TB-SI B10
6864 (6443.08min - 6863.98max) MB/s +38%
Lenovo Legion Pro 5 16ARX8
Samsung PM9A1 MZVL21T0HCLR
6660 (6017.57min - 6659.93max) MB/s +34%
Average of class Gaming
  (2594 - 16089, n=165, last 2 years)
6318 MB/s +27%
HP Victus 16-r0077ng
Kioxia XG8 KXG80ZNV1T02
6169 (5196.32min - 6168.56max) MB/s +24%
MSI Katana A15 AI B8VG
WD PC SN560 SDDPNQE-1T00
4964 (4657.56min - 4964.38max) MB/s
Average WD PC SN560 SDDPNQE-1T00
  (3728 - 5023, n=20)
4908 MB/s -1%
seq q8 t1 write
HP Victus 16-r0077ng
Kioxia XG8 KXG80ZNV1T02
5355 (5315.44min - 5354.87max) MB/s +71%
Lenovo Legion Pro 5 16ARX8
Samsung PM9A1 MZVL21T0HCLR
4943 (4926min - 4942.6max) MB/s +58%
Average of class Gaming
  (539 - 14571, n=165, last 2 years)
4860 MB/s +55%
HP Omen 16-xf0376ng
WDC PC SN810 512GB
4459 (4352.43min - 4459.27max) MB/s +42%
Aorus 15 BSF
Gigabyte AG470S1TB-SI B10
3683 MB/s +18%
Average WD PC SN560 SDDPNQE-1T00
  (2957 - 3464, n=20)
3226 MB/s +3%
MSI Katana A15 AI B8VG
WD PC SN560 SDDPNQE-1T00
3133 (3095.61min - 3133.38max) MB/s
4k q1 t1 read
Aorus 15 BSF
Gigabyte AG470S1TB-SI B10
91 (90.05min - 91max) MB/s +36%
Lenovo Legion Pro 5 16ARX8
Samsung PM9A1 MZVL21T0HCLR
80.1 (78.57min - 80.12max) MB/s +20%
MSI Katana A15 AI B8VG
WD PC SN560 SDDPNQE-1T00
67 (65.53min - 66.98max) MB/s
HP Omen 16-xf0376ng
WDC PC SN810 512GB
66.1 (65.3min - 66.08max) MB/s -1%
Average of class Gaming
  (30.6 - 95.9, n=165, last 2 years)
65.9 MB/s -2%
Average WD PC SN560 SDDPNQE-1T00
  (41.9 - 73.3, n=20)
57 MB/s -15%
HP Victus 16-r0077ng
Kioxia XG8 KXG80ZNV1T02
56.6 (54min - 56.56max) MB/s -16%
4k q1 t1 write
Aorus 15 BSF
Gigabyte AG470S1TB-SI B10
341 (323.98min - 341.02max) MB/s +45%
Lenovo Legion Pro 5 16ARX8
Samsung PM9A1 MZVL21T0HCLR
244 (243min - 243.65max) MB/s +4%
MSI Katana A15 AI B8VG
WD PC SN560 SDDPNQE-1T00
235 (232.56min - 235.28max) MB/s
Average of class Gaming
  (78 - 397, n=165, last 2 years)
223 MB/s -5%
Average WD PC SN560 SDDPNQE-1T00
  (78 - 318, n=20)
177.4 MB/s -25%
HP Omen 16-xf0376ng
WDC PC SN810 512GB
155.1 (147.48min - 155.14max) MB/s -34%
HP Victus 16-r0077ng
Kioxia XG8 KXG80ZNV1T02
142.3 (140.08min - 142.3max) MB/s -39%
4k q32 t16 read
Lenovo Legion Pro 5 16ARX8
Samsung PM9A1 MZVL21T0HCLR
4173 (4166.98min - 4173.4max) MB/s +172%
Aorus 15 BSF
Gigabyte AG470S1TB-SI B10
3429 (3303.46min - 3428.75max) MB/s +123%
Average of class Gaming
  (417 - 6172, n=165, last 2 years)
2578 MB/s +68%
MSI Katana A15 AI B8VG
WD PC SN560 SDDPNQE-1T00
1535 (1532.27min - 1535.13max) MB/s
HP Omen 16-xf0376ng
WDC PC SN810 512GB
1217 (1195.73min - 1216.61max) MB/s -21%
Average WD PC SN560 SDDPNQE-1T00
  (592 - 1544, n=20)
1085 MB/s -29%
HP Victus 16-r0077ng
Kioxia XG8 KXG80ZNV1T02
1004 (933.19min - 1004.48max) MB/s -35%
4k q32 t16 write
Aorus 15 BSF
Gigabyte AG470S1TB-SI B10
3667 (3605.94min - 3667.28max) MB/s +55%
Lenovo Legion Pro 5 16ARX8
Samsung PM9A1 MZVL21T0HCLR
3552 (3546.24min - 3551.63max) MB/s +51%
MSI Katana A15 AI B8VG
WD PC SN560 SDDPNQE-1T00
2359 (2065.68min - 2358.59max) MB/s
Average of class Gaming
  (162.3 - 4869, n=165, last 2 years)
2134 MB/s -10%
Average WD PC SN560 SDDPNQE-1T00
  (227 - 2783, n=20)
1079 MB/s -54%
HP Victus 16-r0077ng
Kioxia XG8 KXG80ZNV1T02
488 (476.91min - 488.32max) MB/s -79%
HP Omen 16-xf0376ng
WDC PC SN810 512GB
486 (470.43min - 486.44max) MB/s -79%
AS SSD
Score Total
Aorus 15 BSF
Gigabyte AG470S1TB-SI B10
10783 Points +104%
Lenovo Legion Pro 5 16ARX8
Samsung PM9A1 MZVL21T0HCLR
8963 Points +70%
Average of class Gaming
  (2271 - 13854, n=156, last 2 years)
6746 Points +28%
MSI Katana A15 AI B8VG
WD PC SN560 SDDPNQE-1T00
5282 Points
HP Omen 16-xf0376ng
WDC PC SN810 512GB
5262 Points 0%
HP Victus 16-r0077ng
Kioxia XG8 KXG80ZNV1T02
4988 Points -6%
Average WD PC SN560 SDDPNQE-1T00
  (2750 - 5610, n=18)
4125 Points -22%
Score Read
Aorus 15 BSF
Gigabyte AG470S1TB-SI B10
3628 Points +107%
Lenovo Legion Pro 5 16ARX8
Samsung PM9A1 MZVL21T0HCLR
3449 Points +97%
Average of class Gaming
  (776 - 4721, n=156, last 2 years)
2444 Points +39%
MSI Katana A15 AI B8VG
WD PC SN560 SDDPNQE-1T00
1752 Points
HP Omen 16-xf0376ng
WDC PC SN810 512GB
1638 Points -7%
HP Victus 16-r0077ng
Kioxia XG8 KXG80ZNV1T02
1480 Points -16%
Average WD PC SN560 SDDPNQE-1T00
  (872 - 1761, n=18)
1349 Points -23%
Score Write
Aorus 15 BSF
Gigabyte AG470S1TB-SI B10
5339 Points +99%
Lenovo Legion Pro 5 16ARX8
Samsung PM9A1 MZVL21T0HCLR
3832 Points +43%
Average of class Gaming
  (515 - 7208, n=156, last 2 years)
3115 Points +16%
HP Omen 16-xf0376ng
WDC PC SN810 512GB
2885 Points +8%
HP Victus 16-r0077ng
Kioxia XG8 KXG80ZNV1T02
2858 Points +7%
MSI Katana A15 AI B8VG
WD PC SN560 SDDPNQE-1T00
2682 Points
Average WD PC SN560 SDDPNQE-1T00
  (651 - 3010, n=18)
2156 Points -20%
Seq Read
Lenovo Legion Pro 5 16ARX8
Samsung PM9A1 MZVL21T0HCLR
5621.18 MB/s +33%
Aorus 15 BSF
Gigabyte AG470S1TB-SI B10
5549.04 MB/s +31%
HP Victus 16-r0077ng
Kioxia XG8 KXG80ZNV1T02
5265.97 MB/s +24%
HP Omen 16-xf0376ng
WDC PC SN810 512GB
5080.22 MB/s +20%
Average of class Gaming
  (2260 - 12763, n=156, last 2 years)
4956 MB/s +17%
MSI Katana A15 AI B8VG
WD PC SN560 SDDPNQE-1T00
4237.61 MB/s
Average WD PC SN560 SDDPNQE-1T00
  (3074 - 4328, n=18)
3885 MB/s -8%
Seq Write
Aorus 15 BSF
Gigabyte AG470S1TB-SI B10
4476.18 MB/s +45%
Lenovo Legion Pro 5 16ARX8
Samsung PM9A1 MZVL21T0HCLR
4010.3 MB/s +30%
Average of class Gaming
  (495 - 11316, n=156, last 2 years)
3774 MB/s +23%
MSI Katana A15 AI B8VG
WD PC SN560 SDDPNQE-1T00
3080.08 MB/s
HP Victus 16-r0077ng
Kioxia XG8 KXG80ZNV1T02
2831.66 MB/s -8%
HP Omen 16-xf0376ng
WDC PC SN810 512GB
2824.64 MB/s -8%
Average WD PC SN560 SDDPNQE-1T00
  (1536 - 3101, n=18)
2315 MB/s -25%
4K Read
Aorus 15 BSF
Gigabyte AG470S1TB-SI B10
112.08 MB/s +90%
Lenovo Legion Pro 5 16ARX8
Samsung PM9A1 MZVL21T0HCLR
73.46 MB/s +25%
HP Omen 16-xf0376ng
WDC PC SN810 512GB
65.35 MB/s +11%
Average of class Gaming
  (27.8 - 112.1, n=156, last 2 years)
65 MB/s +10%
HP Victus 16-r0077ng
Kioxia XG8 KXG80ZNV1T02
61.43 MB/s +4%
MSI Katana A15 AI B8VG
WD PC SN560 SDDPNQE-1T00
58.84 MB/s
Average WD PC SN560 SDDPNQE-1T00
  (36.6 - 61.3, n=18)
50.1 MB/s -15%
4K Write
Aorus 15 BSF
Gigabyte AG470S1TB-SI B10
358.18 MB/s +87%
Average of class Gaming
  (108.8 - 512, n=156, last 2 years)
212 MB/s +11%
Lenovo Legion Pro 5 16ARX8
Samsung PM9A1 MZVL21T0HCLR
211.54 MB/s +10%
HP Victus 16-r0077ng
Kioxia XG8 KXG80ZNV1T02
209.28 MB/s +9%
Average WD PC SN560 SDDPNQE-1T00
  (117 - 512, n=18)
204 MB/s +6%
HP Omen 16-xf0376ng
WDC PC SN810 512GB
194.78 MB/s +2%
MSI Katana A15 AI B8VG
WD PC SN560 SDDPNQE-1T00
191.64 MB/s
4K-64 Read
Aorus 15 BSF
Gigabyte AG470S1TB-SI B10
2960.59 MB/s +133%
Lenovo Legion Pro 5 16ARX8
Samsung PM9A1 MZVL21T0HCLR
2813.87 MB/s +122%
Average of class Gaming
  (451 - 3475, n=156, last 2 years)
1878 MB/s +48%
MSI Katana A15 AI B8VG
WD PC SN560 SDDPNQE-1T00
1269.87 MB/s
HP Omen 16-xf0376ng
WDC PC SN810 512GB
1064.22 MB/s -16%
Average WD PC SN560 SDDPNQE-1T00
  (457 - 1272, n=18)
910 MB/s -28%
HP Victus 16-r0077ng
Kioxia XG8 KXG80ZNV1T02
892.37 MB/s -30%
4K-64 Write
Aorus 15 BSF
Gigabyte AG470S1TB-SI B10
4533.18 MB/s +108%
Lenovo Legion Pro 5 16ARX8
Samsung PM9A1 MZVL21T0HCLR
3219.74 MB/s +48%
Average of class Gaming
  (277 - 5909, n=156, last 2 years)
2529 MB/s +16%
HP Omen 16-xf0376ng
WDC PC SN810 512GB
2408.24 MB/s +10%
HP Victus 16-r0077ng
Kioxia XG8 KXG80ZNV1T02
2365.53 MB/s +8%
MSI Katana A15 AI B8VG
WD PC SN560 SDDPNQE-1T00
2181.93 MB/s
Average WD PC SN560 SDDPNQE-1T00
  (172.9 - 2500, n=18)
1736 MB/s -20%
Access Time Read
MSI Katana A15 AI B8VG
WD PC SN560 SDDPNQE-1T00
0.083 ms *
Average WD PC SN560 SDDPNQE-1T00
  (0.026 - 0.17, n=18)
0.07078 ms * +15%
Aorus 15 BSF
Gigabyte AG470S1TB-SI B10
0.065 ms * +22%
Average of class Gaming
  (0.016 - 0.379, n=155, last 2 years)
0.05532 ms * +33%
HP Victus 16-r0077ng
Kioxia XG8 KXG80ZNV1T02
0.052 ms * +37%
HP Omen 16-xf0376ng
WDC PC SN810 512GB
0.051 ms * +39%
Lenovo Legion Pro 5 16ARX8
Samsung PM9A1 MZVL21T0HCLR
0.031 ms * +63%
Access Time Write
Lenovo Legion Pro 5 16ARX8
Samsung PM9A1 MZVL21T0HCLR
0.064 ms * -237%
Average of class Gaming
  (0.011 - 1.028, n=156, last 2 years)
0.04699 ms * -147%
Average WD PC SN560 SDDPNQE-1T00
  (0.016 - 0.088, n=18)
0.03311 ms * -74%
HP Victus 16-r0077ng
Kioxia XG8 KXG80ZNV1T02
0.02 ms * -5%
HP Omen 16-xf0376ng
WDC PC SN810 512GB
0.019 ms * -0%
MSI Katana A15 AI B8VG
WD PC SN560 SDDPNQE-1T00
0.019 ms *
Aorus 15 BSF
Gigabyte AG470S1TB-SI B10
0.011 ms * +42%

* ... más pequeño es mejor

Reading continuous performance: DiskSpd Read Loop, Queue Depth 8

035070010501400175021002450280031503500385042004550490052505600595063006650Tooltip
MSI Katana A15 AI B8VG WD PC SN560 SDDPNQE-1T00; diskspd 2.0.17 f: Ø4772 (4090.08-4974.23)
HP Omen 16-xf0376ng WDC PC SN810 512GB: Ø6732 (5625.82-6897.16)
HP Victus 16-r0077ng Kioxia XG8 KXG80ZNV1T02: Ø5244 (4542.22-6091.41)
Aorus 15 BSF Gigabyte AG470S1TB-SI B10: Ø6908 (6337.08-6965.69)
Lenovo Legion Pro 5 16ARX8 Samsung PM9A1 MZVL21T0HCLR: Ø6087 (3287.84-6658.98)

Rendimiento de la GPU

Se espera que la GeForce RTX 4070 sea sucedida por un nuevo modelo en las próximas semanas o meses. Aunque sigue siendo una GPU de juego muy rápida en el sector de los portátiles a partir de 2024, sus limitados 8 GB de VRAM se revelan cada vez con más frecuencia como un cuello de botella, a veces incluso en Full HD. Títulos lanzados recientemente, como Indiana Jones, ponen de manifiesto que quienes se tomen en serio los juegos estarán mejor servidos con una tarjeta gráfica que disponga de al menos 12 GB de VRAM. En otras palabras, la RTX 4070 podría no ser una buena inversión a largo plazo.

Otro aspecto a tener en cuenta es que MSI ha optado por un TGP relativamente bajo de 105 vatios para la RTX 4070, a pesar de que la GPU admite hasta 140 vatios. Esta decisión se refleja en los resultados de los benchmarks, en los que la Katana queda por detrás de la competencia. De media, sus rivales potenciadas con RTX 4070 la superan entre un 9% y un 16% en las pruebas de gráficos sintéticos.

3DMark Performance Rating - Percent
HP Omen 16-xf0376ng
NVIDIA GeForce RTX 4070 Laptop GPU, AMD Ryzen 7 7840HS
96.7 pt
Lenovo Legion Pro 5 16ARX8 -1!
NVIDIA GeForce RTX 4070 Laptop GPU, AMD Ryzen 7 7745HX
95.8 pt
Average of class Gaming
 
93.5 pt
Aorus 15 BSF
NVIDIA GeForce RTX 4070 Laptop GPU, Intel Core i7-13700H
91.7 pt
HP Victus 16-r0077ng
NVIDIA GeForce RTX 4070 Laptop GPU, Intel Core i7-13700H
90.5 pt
Average NVIDIA GeForce RTX 4070 Laptop GPU
 
86.8 pt
MSI Katana A15 AI B8VG
NVIDIA GeForce RTX 4070 Laptop GPU, AMD Ryzen 9 8945HS
83.2 pt
3DMark 11 - 1280x720 Performance GPU
Average of class Gaming
  (1029 - 72178, n=183, last 2 years)
43888 Points +25%
HP Omen 16-xf0376ng
NVIDIA GeForce RTX 4070 Laptop GPU, AMD Ryzen 7 7840HS
42142 Points +20%
Aorus 15 BSF
NVIDIA GeForce RTX 4070 Laptop GPU, Intel Core i7-13700H
41438 Points +18%
Lenovo Legion Pro 5 16ARX8
NVIDIA GeForce RTX 4070 Laptop GPU, AMD Ryzen 7 7745HX
41090 Points +17%
Average NVIDIA GeForce RTX 4070 Laptop GPU
  (24229 - 46434, n=65)
40385 Points +15%
HP Victus 16-r0077ng
NVIDIA GeForce RTX 4070 Laptop GPU, Intel Core i7-13700H
39951 Points +13%
MSI Katana A15 AI B8VG
NVIDIA GeForce RTX 4070 Laptop GPU, AMD Ryzen 9 8945HS
35251 Points
3DMark
1280x720 Cloud Gate Standard Graphics
HP Omen 16-xf0376ng
NVIDIA GeForce RTX 4070 Laptop GPU, AMD Ryzen 7 7840HS
193851 Points +9%
MSI Katana A15 AI B8VG
NVIDIA GeForce RTX 4070 Laptop GPU, AMD Ryzen 9 8945HS
177332 Points
HP Victus 16-r0077ng
NVIDIA GeForce RTX 4070 Laptop GPU, Intel Core i7-13700H
175566 Points -1%
Aorus 15 BSF
NVIDIA GeForce RTX 4070 Laptop GPU, Intel Core i7-13700H
165849 Points -6%
Average NVIDIA GeForce RTX 4070 Laptop GPU
  (54238 - 193851, n=28)
145941 Points -18%
Average of class Gaming
  (15902 - 193851, n=100, last 2 years)
144664 Points -18%
1920x1080 Fire Strike Graphics
HP Omen 16-xf0376ng
NVIDIA GeForce RTX 4070 Laptop GPU, AMD Ryzen 7 7840HS
31698 Points +17%
Average of class Gaming
  (781 - 53059, n=194, last 2 years)
31464 Points +16%
Lenovo Legion Pro 5 16ARX8
NVIDIA GeForce RTX 4070 Laptop GPU, AMD Ryzen 7 7745HX
30936 Points +14%
HP Victus 16-r0077ng
NVIDIA GeForce RTX 4070 Laptop GPU, Intel Core i7-13700H
30239 Points +12%
Aorus 15 BSF
NVIDIA GeForce RTX 4070 Laptop GPU, Intel Core i7-13700H
30081 Points +11%
Average NVIDIA GeForce RTX 4070 Laptop GPU
  (12242 - 33451, n=69)
29068 Points +7%
MSI Katana A15 AI B8VG
NVIDIA GeForce RTX 4070 Laptop GPU, AMD Ryzen 9 8945HS
27080 Points
2560x1440 Time Spy Graphics
Average of class Gaming
  (224 - 22717, n=189, last 2 years)
13138 Points +32%
Lenovo Legion Pro 5 16ARX8
NVIDIA GeForce RTX 4070 Laptop GPU, AMD Ryzen 7 7745HX
12617 Points +27%
Aorus 15 BSF
NVIDIA GeForce RTX 4070 Laptop GPU, Intel Core i7-13700H
12079 Points +22%
HP Omen 16-xf0376ng
NVIDIA GeForce RTX 4070 Laptop GPU, AMD Ryzen 7 7840HS
11907 Points +20%
Average NVIDIA GeForce RTX 4070 Laptop GPU
  (5012 - 13391, n=67)
11602 Points +17%
HP Victus 16-r0077ng
NVIDIA GeForce RTX 4070 Laptop GPU, Intel Core i7-13700H
11168 Points +12%
MSI Katana A15 AI B8VG
NVIDIA GeForce RTX 4070 Laptop GPU, AMD Ryzen 9 8945HS
9933 Points
3DMark 11 Performance
28162 puntos
3DMark Ice Storm Standard Score
147014 puntos
3DMark Cloud Gate Standard Score
61833 puntos
3DMark Fire Strike Score
23834 puntos
3DMark Time Spy Score
9759 puntos
ayuda
Blender
v3.3 Classroom OPTIX/RTX
Aorus 15 BSF
NVIDIA GeForce RTX 4070 Laptop GPU, Intel Core i7-13700H
23 Seconds * -0%
HP Victus 16-r0077ng
NVIDIA GeForce RTX 4070 Laptop GPU, Intel Core i7-13700H
23 Seconds * -0%
MSI Katana A15 AI B8VG
NVIDIA GeForce RTX 4070 Laptop GPU, AMD Ryzen 9 8945HS
23 Seconds *
Average NVIDIA GeForce RTX 4070 Laptop GPU
  (18 - 30, n=66)
21.5 Seconds * +7%
HP Omen 16-xf0376ng
NVIDIA GeForce RTX 4070 Laptop GPU, AMD Ryzen 7 7840HS
21 Seconds * +9%
Average of class Gaming
  (9 - 95, n=179, last 2 years)
20.8 Seconds * +10%
Lenovo Legion Pro 5 16ARX8
NVIDIA GeForce RTX 4070 Laptop GPU, AMD Ryzen 7 7745HX
19 Seconds * +17%
v3.3 Classroom CUDA
Average NVIDIA GeForce RTX 4070 Laptop GPU
  (32 - 181, n=68)
40.1 Seconds * -11%
Average of class Gaming
  (16 - 175, n=185, last 2 years)
36.7 Seconds * -2%
Aorus 15 BSF
NVIDIA GeForce RTX 4070 Laptop GPU, Intel Core i7-13700H
36 Seconds * -0%
HP Victus 16-r0077ng
NVIDIA GeForce RTX 4070 Laptop GPU, Intel Core i7-13700H
36 Seconds * -0%
MSI Katana A15 AI B8VG
NVIDIA GeForce RTX 4070 Laptop GPU, AMD Ryzen 9 8945HS
36 Seconds *
HP Omen 16-xf0376ng
NVIDIA GeForce RTX 4070 Laptop GPU, AMD Ryzen 7 7840HS
35 Seconds * +3%
Lenovo Legion Pro 5 16ARX8
NVIDIA GeForce RTX 4070 Laptop GPU, AMD Ryzen 7 7745HX
33 Seconds * +8%
v3.3 Classroom CPU
Aorus 15 BSF
NVIDIA GeForce RTX 4070 Laptop GPU, Intel Core i7-13700H
390 Seconds * -22%
HP Victus 16-r0077ng
NVIDIA GeForce RTX 4070 Laptop GPU, Intel Core i7-13700H
379 Seconds * -18%
HP Omen 16-xf0376ng
NVIDIA GeForce RTX 4070 Laptop GPU, AMD Ryzen 7 7840HS
320 Seconds * -0%
MSI Katana A15 AI B8VG
NVIDIA GeForce RTX 4070 Laptop GPU, AMD Ryzen 9 8945HS
320 Seconds *
Average of class Gaming
  (138 - 962, n=188, last 2 years)
293 Seconds * +8%
Average NVIDIA GeForce RTX 4070 Laptop GPU
  (158 - 440, n=65)
289 Seconds * +10%
Lenovo Legion Pro 5 16ARX8
NVIDIA GeForce RTX 4070 Laptop GPU, AMD Ryzen 7 7745HX
277 Seconds * +13%

* ... más pequeño es mejor

Rendimiento en juegos

Afortunadamente, el portátil de 15 pulgadas se comporta ligeramente mejor en los juegos que en las pruebas comparativas, con resultados que lo sitúan al mismo nivel que el portátil medio con RTX 4070 de nuestra base de datos. En general, la tarjeta gráfica puede manejar sin problemas casi todos los títulos modernos con los ajustes máximos en la resolución nativa de 1.920 x 1.080. Sin embargo, en juegos extremadamente intensivos en CPU o mal optimizados, como Star Wars Forajidospuede tener dificultades para ofrecer una tasa de fps lo suficientemente alta. En estos casos, la tecnología de reescalado DLSS resulta muy útil.

Performance Rating - Percent
Lenovo Legion Pro 5 16ARX8 -2!
AMD Ryzen 7 7745HX, NVIDIA GeForce RTX 4070 Laptop GPU
99.2 pt
Average of class Gaming
 
95.9 pt
Average NVIDIA GeForce RTX 4070 Laptop GPU
 
90 pt
MSI Katana A15 AI B8VG -1!
AMD Ryzen 9 8945HS, NVIDIA GeForce RTX 4070 Laptop GPU
88.8 pt
Aorus 15 BSF -2!
Intel Core i7-13700H, NVIDIA GeForce RTX 4070 Laptop GPU
87.7 pt
HP Victus 16-r0077ng -1!
Intel Core i7-13700H, NVIDIA GeForce RTX 4070 Laptop GPU
86.4 pt
HP Omen 16-xf0376ng -2!
AMD Ryzen 7 7840HS, NVIDIA GeForce RTX 4070 Laptop GPU
84.3 pt
Cyberpunk 2077 2.1 Phantom Liberty - 1920x1080 Ultra Preset (FSR off)
Average of class Gaming
  (6.76 - 144.7, n=82, last 2 years)
85.8 fps +2%
MSI Katana A15 AI B8VG
AMD Ryzen 9 8945HS, NVIDIA GeForce RTX 4070 Laptop GPU
84 (69min) fps
Average NVIDIA GeForce RTX 4070 Laptop GPU
  (30.7 - 90.7, n=36)
79.1 fps -6%
Baldur's Gate 3 - 1920x1080 Ultra Preset
MSI Katana A15 AI B8VG
AMD Ryzen 9 8945HS, NVIDIA GeForce RTX 4070 Laptop GPU
104.9 (21.8min, 32.8P0.1, 61.8P1) fps
Average of class Gaming
  (34.5 - 208, n=47, last 2 years)
102.1 fps -3%
Average NVIDIA GeForce RTX 4070 Laptop GPU
  (66.7 - 128.5, n=26)
101 fps -4%
HP Victus 16-r0077ng
Intel Core i7-13700H, NVIDIA GeForce RTX 4070 Laptop GPU
95.4 (26.9min, 35P0.1, 50.4P1) fps -9%
Aorus 15 BSF
Intel Core i7-13700H, NVIDIA GeForce RTX 4070 Laptop GPU
88.5 (29.4min, 33.7P0.1, 62.1P1) fps -16%
GTA V - 1920x1080 Highest Settings possible AA:4xMSAA + FX AF:16x
Lenovo Legion Pro 5 16ARX8
AMD Ryzen 7 7745HX, NVIDIA GeForce RTX 4070 Laptop GPU
119.9 (3.81min, 76.9P1) fps +10%
Average of class Gaming
  (12.1 - 167.7, n=170, last 2 years)
113.8 fps +5%
HP Victus 16-r0077ng
Intel Core i7-13700H, NVIDIA GeForce RTX 4070 Laptop GPU
112.8 (4.13min, 66.7P1) fps +4%
Average NVIDIA GeForce RTX 4070 Laptop GPU
  (48.3 - 141.6, n=61)
111.1 fps +2%
MSI Katana A15 AI B8VG
AMD Ryzen 9 8945HS, NVIDIA GeForce RTX 4070 Laptop GPU
108.7 (19.6min, 76.9P1) fps
HP Omen 16-xf0376ng
AMD Ryzen 7 7840HS, NVIDIA GeForce RTX 4070 Laptop GPU
105.9 (19.5min, 76.9P1) fps -3%
Final Fantasy XV Benchmark - 1920x1080 High Quality
Average of class Gaming
  (19.2 - 201, n=182, last 2 years)
120.1 fps +19%
Lenovo Legion Pro 5 16ARX8
AMD Ryzen 7 7745HX, NVIDIA GeForce RTX 4070 Laptop GPU
119.9 fps +19%
Aorus 15 BSF
Intel Core i7-13700H, NVIDIA GeForce RTX 4070 Laptop GPU
115.4 fps +14%
Average NVIDIA GeForce RTX 4070 Laptop GPU
  (41 - 131.9, n=63)
110.9 fps +10%
HP Victus 16-r0077ng
Intel Core i7-13700H, NVIDIA GeForce RTX 4070 Laptop GPU
109.3 fps +8%
HP Omen 16-xf0376ng
AMD Ryzen 7 7840HS, NVIDIA GeForce RTX 4070 Laptop GPU
108.7 fps +8%
MSI Katana A15 AI B8VG
AMD Ryzen 9 8945HS, NVIDIA GeForce RTX 4070 Laptop GPU
101.1 fps
Strange Brigade - 1920x1080 ultra AA:ultra AF:16
Average of class Gaming
  (38.9 - 421, n=178, last 2 years)
230 fps
Lenovo Legion Pro 5 16ARX8
AMD Ryzen 7 7745HX, NVIDIA GeForce RTX 4070 Laptop GPU
223 (89min, 167.8P1) fps
Aorus 15 BSF
Intel Core i7-13700H, NVIDIA GeForce RTX 4070 Laptop GPU
202 (30.6min, 150.9P1) fps
Average NVIDIA GeForce RTX 4070 Laptop GPU
  (76.3 - 234, n=62)
196.3 fps
HP Victus 16-r0077ng
Intel Core i7-13700H, NVIDIA GeForce RTX 4070 Laptop GPU
192 (24.8min, 138.8P1) fps
HP Omen 16-xf0376ng
AMD Ryzen 7 7840HS, NVIDIA GeForce RTX 4070 Laptop GPU
190.3 (22.4min, 141.8P1) fps
Dota 2 Reborn - 1920x1080 ultra (3/3) best looking
Lenovo Legion Pro 5 16ARX8
AMD Ryzen 7 7745HX, NVIDIA GeForce RTX 4070 Laptop GPU
182 (152.8min) fps +40%
Average of class Gaming
  (65.1 - 220, n=187, last 2 years)
151.2 fps +16%
Aorus 15 BSF
Intel Core i7-13700H, NVIDIA GeForce RTX 4070 Laptop GPU
149.9 (129.9min) fps +15%
Average NVIDIA GeForce RTX 4070 Laptop GPU
  (89.7 - 191.2, n=65)
147.9 fps +14%
HP Omen 16-xf0376ng
AMD Ryzen 7 7840HS, NVIDIA GeForce RTX 4070 Laptop GPU
137.8 (120.3min) fps +6%
HP Victus 16-r0077ng
Intel Core i7-13700H, NVIDIA GeForce RTX 4070 Laptop GPU
131.6 (112.7min) fps +1%
MSI Katana A15 AI B8VG
AMD Ryzen 9 8945HS, NVIDIA GeForce RTX 4070 Laptop GPU
129.9 (111.1min) fps
bajomedioaltoultra
GTA V (2015) 174.9 164.8 108.7
Dota 2 Reborn (2015) 158.8 136.1 138.6 129.9
Final Fantasy XV Benchmark (2018) 135.6 101.1
X-Plane 11.11 (2018) 80.6 74.7 52.1
Baldur's Gate 3 (2023) 130.5 108.2 104.9
Cyberpunk 2077 2.1 Phantom Liberty (2023) 113.8 96.2 84
Prince of Persia The Lost Crown (2024) 323 322 321
Star Wars Outlaws (2024) 45.9 39.6 31.9
Space Marine 2 (2024) 75.2 74.2 73.1
Final Fantasy XVI (2024) 68.1 59 50.6
God of War Ragnarök (2024) 111.7 97.9 90.5
Until Dawn (2024) 88.2 62.7 46.9
Call of Duty Black Ops 6 (2024) 121 87 81
Stalker 2 (2024) 54.5 49.9 43.5
Cyberpunk 2077 2.1 Phantom Liberty
1920x1080 High Preset (FSR off)
MSI Katana A15 AI B8VG
AMD Ryzen 9 8945HS, NVIDIA GeForce RTX 4070 Laptop GPU
96.2 (81min) fps
Average NVIDIA GeForce RTX 4070 Laptop GPU
  (74.7 - 103.6, n=29)
92.1 fps -4%
Average of class Gaming
  (7.4 - 164.5, n=62, last 2 years)
91.5 fps -5%
1920x1080 Ultra Preset (FSR off)
Average of class Gaming
  (6.76 - 144.7, n=82, last 2 years)
85.8 fps +2%
MSI Katana A15 AI B8VG
AMD Ryzen 9 8945HS, NVIDIA GeForce RTX 4070 Laptop GPU
84 (69min) fps
Average NVIDIA GeForce RTX 4070 Laptop GPU
  (30.7 - 90.7, n=36)
79.1 fps -6%

Comprobamos el rendimiento 3D sostenido del sistema ejecutando Cyberpunk 2077 durante aproximadamente 30 minutos. El resultado: El Katana A15 ofreció velocidades de fotogramas estables sin caídas inesperadas de fps.

Cyberpunk 2077 Ultra fps chart

051015202530354045505560657075Tooltip
MSI Katana A15 AI B8VG R9 8945HS, NVIDIA GeForce RTX 4070 Laptop GPU: Ø79.1 (71.6-79.7)

Emisiones

Emisiones sonoras

El modo AI mantiene los niveles de ruido moderados en ralentí, aparte de las ocasionales ráfagas de actividad del ventilador, pero genera mucho ruido cuando el sistema se estresa. Al ejecutar Cyberpunk 2077, el sistema alcanzó un nivel de ruido de 52 dB(A), lo que probablemente resulte desagradable para muchos usuarios, especialmente si no se utilizan auriculares.

Ruido

Ocioso
25 / 26 / 27 dB(A)
Carga
40 / 50 dB(A)
  red to green bar
 
 
30 dB
silencioso
40 dB(A)
audible
50 dB(A)
ruidosamente alto
 
min: dark, med: mid, max: light   Earthworks M23R, Arta (15 cm de distancia)   environment noise: 25 dB(A)
dB(A) 0102030405060708090Deep BassMiddle BassHigh BassLower RangeMidsHigher MidsLower HighsMid HighsUpper HighsSuper Highs20494142.747.738.752.32540.844.737.742.238.940.73150.452.5554946.848.4403536.339.134.431.137.45036.73635.228.927.135.56326.928.525.632.827.828.98020.823.622.917.916.923.410019.420.320.915.614.327.312516.717.323.617.315.630.316020.619.422.518.217.229.320024.624.524.922.320.228.725018.519.623.317.615.329.931515.718.523.113.514.929.840016.318.726.11212.632.350015.415.627.113.112.133.463012.212.928.211.310.534.780011.613.327.911.310.934.7100011.712.329.811.310.936.21250121230.211.411.337160011.912.531.811.611.340200012.112.730.512.111.640250012.412.53112.61241.5315012.613.527.713.212.639400013.214.527.413.61339.5500013.614251413.738.5630013.917.918.914.313.731.1800013.915.518.114.514.226.91000013.915.619.914.213.422.41250013.714.320.713.812.818.91600012.41320.112.512.114.8SPL25.72740.425.424.849.8N0.70.93.30.70.66.6median 13.7median 14.5median 25median 13.5median 12.8median 32.3Delta2.634.11.91.45hearing rangehide median Fan NoiseMSI Katana A15 AI B8VG
MSI Katana A15 AI B8VG
R9 8945HS, NVIDIA GeForce RTX 4070 Laptop GPU
HP Omen 16-xf0376ng
R7 7840HS, NVIDIA GeForce RTX 4070 Laptop GPU
HP Victus 16-r0077ng
i7-13700H, NVIDIA GeForce RTX 4070 Laptop GPU
Aorus 15 BSF
i7-13700H, NVIDIA GeForce RTX 4070 Laptop GPU
Lenovo Legion Pro 5 16ARX8
R7 7745HX, NVIDIA GeForce RTX 4070 Laptop GPU
Noise
-5%
-7%
-16%
7%
off / environment *
25
24
4%
25
-0%
24
4%
23.2
7%
Idle Minimum *
25
25
-0%
28
-12%
25
-0%
23.2
7%
Idle Average *
26
29
-12%
29
-12%
31
-19%
23.2
11%
Idle Maximum *
27
32
-19%
30
-11%
37
-37%
26.2
3%
Load Average *
40
44
-10%
43
-8%
51
-28%
31.4
21%
Cyberpunk 2077 ultra *
52
Load Maximum *
50
46
8%
48
4%
57
-14%
53.8
-8%
Witcher 3 ultra *
44
46
48.4

* ... más pequeño es mejor

Temperatura

Los portátiles para juegos tienden a calentarse significativamente cuando se ejecutan aplicaciones con un uso intensivo de gráficos. Es poco probable que esto sorprenda a nadie. El Katana A15 alcanza un máximo de 47 °C en la parte superior y 46 °C en la inferior, lo que lo hace algo incómodo para interactuar con él, pero sigue siendo más frío que algunos de sus competidores (eche un vistazo a la tabla).

El lado positivo es que el reposamanos se mantiene relativamente fresco en todas las condiciones, lo que garantiza cierta comodidad durante su uso.

 48 °C47 °C45 °C 
 47 °C46 °C39 °C 
 31 °C31 °C30 °C 
Máximo: 48 °C
Médio: 40.4 °C
45 °C43 °C46 °C
35 °C40 °C35 °C
27 °C27 °C24 °C
Máximo: 46 °C
Médio: 35.8 °C
Conector de corriente  48 °C | Temperatura del cuarto 21 °C | Fluke t3000FC (calibrated), Voltcraft IR-900
(-) The average temperature for the upper side under maximal load is 40.4 °C / 105 F, compared to the average of 33.9 °C / 93 F for the devices in the class Gaming.
(-) The maximum temperature on the upper side is 48 °C / 118 F, compared to the average of 40.5 °C / 105 F, ranging from 21.2 to 68.8 °C for the class Gaming.
(-) The bottom heats up to a maximum of 46 °C / 115 F, compared to the average of 43.2 °C / 110 F
(+) In idle usage, the average temperature for the upper side is 31.1 °C / 88 F, compared to the device average of 33.9 °C / 93 F.
(-) 3: The average temperature for the upper side is 41.6 °C / 107 F, compared to the average of 33.9 °C / 93 F for the class Gaming.
(+) The palmrests and touchpad are reaching skin temperature as a maximum (34 °C / 93.2 F) and are therefore not hot.
(-) The average temperature of the palmrest area of similar devices was 28.9 °C / 84 F (-5.1 °C / -9.2 F).
MSI Katana A15 AI B8VG
R9 8945HS, NVIDIA GeForce RTX 4070 Laptop GPU
HP Omen 16-xf0376ng
R7 7840HS, NVIDIA GeForce RTX 4070 Laptop GPU
HP Victus 16-r0077ng
i7-13700H, NVIDIA GeForce RTX 4070 Laptop GPU
Aorus 15 BSF
i7-13700H, NVIDIA GeForce RTX 4070 Laptop GPU
Lenovo Legion Pro 5 16ARX8
R7 7745HX, NVIDIA GeForce RTX 4070 Laptop GPU
Heat
-2%
-4%
-5%
12%
Maximum Upper Side *
48
49
-2%
51
-6%
48
-0%
41.8
13%
Maximum Bottom *
46
57
-24%
54
-17%
47
-2%
41.4
10%
Idle Upper Side *
34
31
9%
37
-9%
39
-15%
29
15%
Idle Bottom *
34
31
9%
29
15%
35
-3%
30.4
11%

* ... más pequeño es mejor

Prueba de esfuerzo

Debido a las mayores velocidades de reloj, los componentes alcanzan temperaturas más elevadas bajo la carga de juego de Cyberpunk 2077 en comparación con nuestras pruebas de estrés con Furmark y Prime95. El juego de rol hace que tanto la CPU como la GPU se calienten hasta casi 80 °C.

Furmark y Prime95
Furmark y Prime95
Furmark y Prime95
Furmark y Prime95
Furmark y Prime95
Furmark y Prime95
Cyberpunk 2077
Cyberpunk 2077
Cyberpunk 2077
Cyberpunk 2077
Cyberpunk 2077
Cyberpunk 2077

Altavoces

Los altavoces 2.0 ofrecen un rendimiento bastante poco impresionante. Sólo lo hacen bien cuando se trata de agudos. Nuestro análisis de audio revela que los tonos graves y medios son igualmente decepcionantes. Los fabricantes de la competencia, como HP (véase el Omen 16 para la comparación), tienden a esforzarse más en sus sistemas de audio. El volumen máximo de 81 dB también deja margen de mejora.

dB(A) 0102030405060708090Deep BassMiddle BassHigh BassLower RangeMidsHigher MidsLower HighsMid HighsUpper HighsSuper Highs2038.744.22538.939.93146.844.84031.1325027.129.96327.829.18016.920.410014.324.312515.634.916017.239.920020.247.625015.349.731514.950.440012.657.150012.16163010.566.880010.970.1100010.972.4125011.366160011.371.4200011.67225001273.5315012.666.840001362.7500013.763.5630013.760.7800014.263.71000013.461.61250012.858.61600012.163.7SPL24.880.8N0.645.9median 12.8median 62.7Delta1.48.63644.231.740.939.245.127.83722.533.122.628.615.731.614.42614.438.514.352.217.457.714.363.311.363.210.465.410.568.612.170.211.975.510.473.110.571.910.569.411.26811.661.812.460.912.760.112.765.113.162.114.269.813.770.812.868.411.862.224.381.10.651.3median 12.4median 65.11.45.6hearing rangehide median Pink NoiseMSI Katana A15 AI B8VGHP Omen 16-xf0376ng
Diagrama de frecuencia en comparación (¡las casillas de verificación se pueden marcar y desmarcar!)
MSI Katana A15 AI B8VG audio analysis

(±) | speaker loudness is average but good (81 dB)
Bass 100 - 315 Hz
(-) | nearly no bass - on average 21.6% lower than median
(±) | linearity of bass is average (10% delta to prev. frequency)
Mids 400 - 2000 Hz
(±) | higher mids - on average 6.2% higher than median
(±) | linearity of mids is average (8.6% delta to prev. frequency)
Highs 2 - 16 kHz
(+) | balanced highs - only 2.8% away from median
(+) | highs are linear (6% delta to prev. frequency)
Overall 100 - 16.000 Hz
(±) | linearity of overall sound is average (19.2% difference to median)
Compared to same class
» 63% of all tested devices in this class were better, 7% similar, 30% worse
» The best had a delta of 6%, average was 18%, worst was 132%
Compared to all devices tested
» 43% of all tested devices were better, 7% similar, 50% worse
» The best had a delta of 4%, average was 25%, worst was 134%

HP Omen 16-xf0376ng audio analysis

(±) | speaker loudness is average but good (81 dB)
Bass 100 - 315 Hz
(±) | reduced bass - on average 14.9% lower than median
(±) | linearity of bass is average (13.6% delta to prev. frequency)
Mids 400 - 2000 Hz
(±) | higher mids - on average 5.2% higher than median
(+) | mids are linear (4.7% delta to prev. frequency)
Highs 2 - 16 kHz
(+) | balanced highs - only 3.7% away from median
(+) | highs are linear (6.6% delta to prev. frequency)
Overall 100 - 16.000 Hz
(+) | overall sound is linear (14.6% difference to median)
Compared to same class
» 26% of all tested devices in this class were better, 7% similar, 67% worse
» The best had a delta of 6%, average was 18%, worst was 132%
Compared to all devices tested
» 16% of all tested devices were better, 4% similar, 80% worse
» The best had a delta of 4%, average was 25%, worst was 134%

Gestión de la energía

Consumo de energía

Los chips AMD Ryzen reciben muchos elogios por su moderado consumo de energía. Si bien aquí esto es cierto bajo carga, el consumo del sistema en reposo es sospechosamente alto. Incluso con la conmutación gráfica activada, el Katana A15 consume entre 13 y 23 vatios en el modo AI, superando los valores que obtuvimos al probar sistemas rivales.

Consumo de corriente
Off / Standbydarklight 0.1 / 2.8 Watt
Ociosodarkmidlight 13 / 18 / 23 Watt
Carga midlight 63 / 159 Watt
 color bar
Clave: min: dark, med: mid, max: light        Metrahit Energy
MSI Katana A15 AI B8VG
R9 8945HS, NVIDIA GeForce RTX 4070 Laptop GPU
HP Omen 16-xf0376ng
R7 7840HS, NVIDIA GeForce RTX 4070 Laptop GPU
HP Victus 16-r0077ng
i7-13700H, NVIDIA GeForce RTX 4070 Laptop GPU
Aorus 15 BSF
i7-13700H, NVIDIA GeForce RTX 4070 Laptop GPU
Lenovo Legion Pro 5 16ARX8
R7 7745HX, NVIDIA GeForce RTX 4070 Laptop GPU
Average of class Gaming
 
Power Consumption
4%
-3%
-2%
-24%
-30%
Idle Minimum *
13
9
31%
8
38%
7
46%
8.1
38%
Idle Average *
18
14
22%
13
28%
12
33%
15.9
12%
Idle Maximum *
23
20
13%
22
4%
20
13%
37.2
-62%
Load Average *
63
84
-33%
86
-37%
94
-49%
90.9
-44%
Cyberpunk 2077 ultra external monitor *
156
Cyberpunk 2077 ultra *
156.8
Load Maximum *
159
176
-11%
233
-47%
247
-55%
263.5
-66%
Witcher 3 ultra *
140.9
141.8
175.8
189.6

* ... más pequeño es mejor

Power consumption - Cyberpunk 2077

0102030405060708090100110120130140150160Tooltip
MSI Katana A15 AI B8VG; 1280x720 Prime95 28.10 and Furmark 1.25: Ø129.9 (122.2-146.9)
MSI Katana A15 AI B8VG; Idle 150cd/m2: Ø17.6 (13.2-22.7)
MSI Katana A15 AI B8VG; Cyberpunk 2077 FHD ultra no FSR 150cd: Ø156.8 (154.6-164.4)

Power consumption - external monitor

0102030405060708090100110120130140150160Tooltip
MSI Katana A15 AI B8VG; Prime95 V2810 Stress (external Monitor): Ø80.8 (79.1-96)
MSI Katana A15 AI B8VG; Cinebench R23 Multi (external Monitor): Ø84.5 (80.8-96.3)
MSI Katana A15 AI B8VG; 1280x720 FurMark 1.19 GPU Stress Test (external Monitor): Ø109.1 (106.1-116.3)
MSI Katana A15 AI B8VG; Idle 1min (external Monitor): Ø17.1 (12.7-27.4)
MSI Katana A15 AI B8VG; Cyberpunk 2077 FHD ultra no FSR (external Monitor): Ø156 (152.1-163.6)

Duración de las pilas

Su consumo de energía en ralentí es bastante elevado y la capacidad de su batería, de sólo 53,5 Wh, es más bien modesta. La combinación de ambos factores da como resultado una duración de la batería poco impresionante. En nuestra prueba de navegación web Wi-Fi con el brillo de la pantalla ajustado a 150 cd/m², el Katana A15 apenas dura 4 horas, lo que es un resultado bastante decepcionante. La mayoría de los competidores obtienen resultados notablemente mejores, a menudo ayudados por baterías de mayor capacidad.
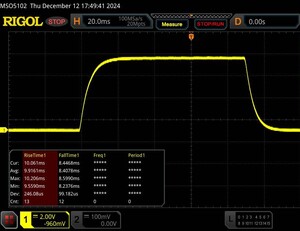
Tiempo de Ejecución de la Batería
WiFi Websurfing
3h 57min
MSI Katana A15 AI B8VG
R9 8945HS, NVIDIA GeForce RTX 4070 Laptop GPU, 53.5 Wh
HP Omen 16-xf0376ng
R7 7840HS, NVIDIA GeForce RTX 4070 Laptop GPU, 83 Wh
HP Victus 16-r0077ng
i7-13700H, NVIDIA GeForce RTX 4070 Laptop GPU, 83 Wh
Aorus 15 BSF
i7-13700H, NVIDIA GeForce RTX 4070 Laptop GPU, 99 Wh
Lenovo Legion Pro 5 16ARX8
R7 7745HX, NVIDIA GeForce RTX 4070 Laptop GPU, 80 Wh
Average of class Gaming
 
Duración de Batería
45%
80%
161%
1%
59%
WiFi v1.3
237
344
45%
426
80%
619
161%
240
1%
Reader / Idle
654
392
H.264
541
Load
132
61

Valoración de Notebookcheck

Si el Katana A15 AI tuviera una carcasa de mayor calidad, una pantalla mejor y una batería más grande, su precio sería mucho más fácil de digerir. Sin embargo, tal y como está ahora, apenas es competitivo y parece excesivamente caro en comparación con algunos de sus rivales.
MSI Katana A15 AI B8VG - 12/20/2024 v8
Florian Glaser

Acabado
69 / 98 → 70%
Teclado
77%
Ratón
72%
Conectividad
54 / 80 → 68%
Peso
61 / 10-68 → 88%
Battería
57 / 95 → 60%
Pantalla
73%
Rendimiento de juegos
85%
Rendimiento de la Aplicación
84%
AI Performance
74%
Temperatura
84 / 95 → 89%
Ruido
75 / 90 → 83%
Audio
69%
Cámara
34 / 75 → 45%
Médio
57%
76%
Gaming - media ponderada
CO2 Emissions
No Data
Materials
0%
Packaging
50%
Power Use
73.1%
Repairability
50%
Software Updates
22.3%
Recycle Logo Total Sustainability Score: 32.6%

Transparency

The selection of devices to be reviewed is made by our editorial team. The test sample was provided to the author as a loan by the manufacturer or retailer for the purpose of this review. The lender had no influence on this review, nor did the manufacturer receive a copy of this review before publication. There was no obligation to publish this review. We never accept compensation or payment in return for our reviews. As an independent media company, Notebookcheck is not subjected to the authority of manufacturers, retailers or publishers.

This is how Notebookcheck is testing

Every year, Notebookcheck independently reviews hundreds of laptops and smartphones using standardized procedures to ensure that all results are comparable. We have continuously developed our test methods for around 20 years and set industry standards in the process. In our test labs, high-quality measuring equipment is utilized by experienced technicians and editors. These tests involve a multi-stage validation process. Our complex rating system is based on hundreds of well-founded measurements and benchmarks, which maintains objectivity. Further information on our test methods can be found here.

Please share our article, every link counts!
Mail Logo
> Análisis y pruebas de ordenadores portátiles y móviles teléfonos > Análisis > Análisis del portátil MSI Katana A15 AI: RTX 4070 gamer perjudicado por las medidas de ahorro
Florian Glaser, 2025-01- 5 (Update: 2025-01- 5)