Notebookcheck Logo

Análisis del portátil MSI Titan GT77 12UHS: El niño del cartel de Alder Lake-HX con un rendimiento de clase de escritorio sin obstáculos
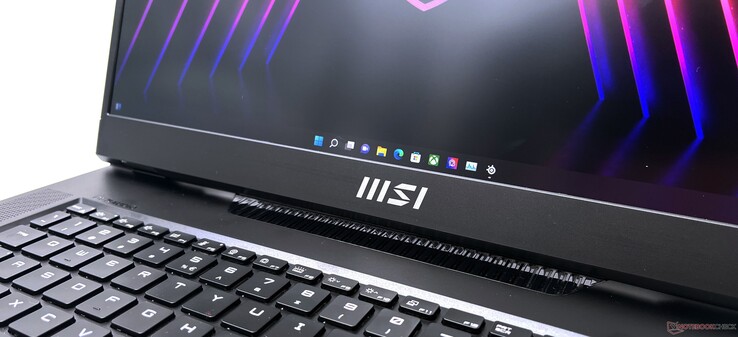
Los Titanes han llegado.

Tras un paréntesis de dos años, el MSI Titan GT77 significa que la compañía resucita su icónica línea de portátiles insignia. El Titan GT77 está equipado con el Core i9-12900HX, una GPU RTX 3080 Ti Laptop de 175 W, y otros detalles como un montón de almacenamiento NVMe, memoria RAM DDR5-4800, y un teclado mecánico Cherry MX muy táctil - casi todo lo que aspiran los jugadores entusiastas. La Titan GT77 es un sustituto de sobremesa muy codiciado, pero no está exenta de ciertas carencias.

La MSI Titan ha sido el buque insignia de la compañía hasta la 10ª generación de Intel Titan GT76 en 2020. En la 11ª generación, MSI optó por limitar su oferta de buques insignia al GE76 Raider 11UH. El GE76 Raider recibirá una actualización de Alder Lake también en 2022 con el GE76 Raider 12U. Sin embargo, la introducción de la plataforma Alder Lake-HX por parte de Intel supuso un incentivo para que MSI reviviera la icónica clase Titan de portátiles

La serie MSI Titan GT77 12U de este año pretende ser un paquete integral que ofrece casi todo lo que un jugador entusiasta desearía. ¿Una CPU de clase de escritorio? Comprobado. ¿Memoria máxima? Sí. ¿La GPU más rápida posible? Comprobado. ¿Todo el almacenamiento que puedas llenar? Comprobado. ¿Un teclado mecánico Cherry MX? Comprobado. ¿Una pantalla con alta tasa de refresco? Comprobado, y doblemente comprobado.

Aunque MSI ha presentado oficialmente la gama HX en la India, en el momento de redactar este artículo estos portátiles aún no estaban disponibles en las tiendas del país. Nuestra muestra de análisis del MSI Titan GT77 12UHS fue proporcionada por Intel India y está equipada con el Core i9-12900HX64 GB de RAM DDR5-4800, una GPU portátil RTX 3080 Ti de 175 W GPU RTX 3080 Ti para portátiles4 SSD NVMe Samsung PM9A1 de 1 TB, un panel FHD de 17,3 pulgadas y 360 Hz, y una batería de 99,9 Whr. Según Intel, esta configuración le costará unos 4.999 dólares (convertidos en unos ₹3.96.617).

También hay un modelo más asequible de la Titan GT77 que cuenta con un Core i7-12800HX y una GPU RTX 3070 Ti para portátiles por unos 3.100 dólares. Nuestro modelo FHD 360 Hz aún no está disponible online en MSI o Amazon y todas las configuraciones actualmente disponibles hacen uso de una pantalla UHD de 120 Hz, cuyo análisis seguirá pronto.

En este análisis, nos disponemos a evaluar el MSI Titan GT77 y ver cómo los nuevos procesadores Alder Lake-HX de Intel para la clase de sobremesa ayudan al resurgimiento del icónico Titan y a la experiencia de usar el que es potencialmente el portátil para juegos más potente del mercado.

MSI Titan GT77 12UHS (Titan GT77 Serie)
Procesador
Intel Core i9-12900HX 16 x 1.7 - 5 GHz, 200 W PL2 / Short Burst, 125 W PL1 / Sustained, Alder Lake-HX
Adaptador gráfico
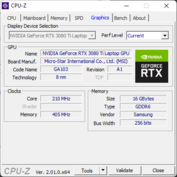
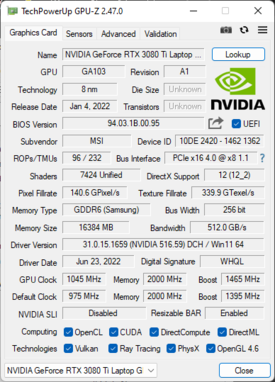
NVIDIA GeForce RTX 3080 Ti Laptop GPU - 16 GB VRAM, 175 W TDP, GDDR6, MUX Switch, Game Ready Driver 516.59
Memoría
64 GB 
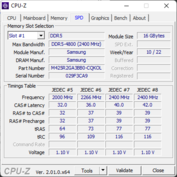
, Quad-channel DDR5-4800, Timings: 32-32-32-63
pantalla
17.30 pulgadas 16:9, 1920 x 1080 pixels 127 PPI, No, Sharp SHP1544 LQ173M1JW08, IPS-Level, lustroso: no, 360 Hz
Placa base
Intel HM670 (Alder Lake-S PCH)
Disco duro
Samsung PM9A1 MZVL21T0HCLR, 1024 GB 
, 4x 1 TB (non-RAID), 842 GB libre
Tarjeta de sonido
Intel Alder Lake-S PCH - cAVS (Audio, Voice, Speech)
Conexiones
3 USB 3.1 Gen2, 2 Thunderbolt, 1 HDMI, 1 DisplayPort, Audio Conexiones: 3.5 mm combo audio jack, Card Reader: Realtek PCIe SD card reader, 1 Lector de Huellas Digitales
Equipamento de red
Killer E3100G 2.5 Gigabit Ethernet Controller (10/100/1000/2500MBit/s), Killer Wi-Fi 6E AX1675i 160MHz Wireless Network Adapter (a/b/g/n = Wi-Fi 4/ac = Wi-Fi 5/ax = Wi-Fi 6/), Bluetooth 5.3
Tamaño
Alto x ancho x profundidad (en mm): 23 x 397 x 330
Battería
99.9 Wh Litio-Ion, 4-cell
Sistema Operativo
Microsoft Windows 11 Pro
Camera
Webcam: 720p IR
Características adicionales
Altavoces: 2x 2 W Speakers, 2x 2 W Woofers, Teclado: Mechanical, Luz de Teclado: si, MSI Center, MS Office, 12 Meses Garantía
Peso
3.3 kg
Note: The manufacturer may use components from different suppliers including display panels, drives or memory sticks with similar specifications.


Posibles contendientes en la comparación

Valoración
Fecha
Modelo
Peso
Altura
Tamaño
Resolución
Price
88.3 %
v7 (old)
08/2022
MSI Titan GT77 12UHS
i9-12900HX, GeForce RTX 3080 Ti Laptop GPU
3.3 kg23 mm17.30"1920x1080
83.7 %
v7 (old)
08/2022
Aorus 17X XES
i9-12900HX, GeForce RTX 3070 Ti Laptop GPU
2.7 kg30 mm17.30"1920x1080
86.8 %
v7 (old)
07/2022
MSI Raider GE77 HX 12UHS
i9-12900HX, GeForce RTX 3080 Ti Laptop GPU
3.1 kg25.9 mm17.30"3840x2160
87.7 %
v7 (old)
07/2022
MSI GE67 HX 12UGS
i7-12800HX, GeForce RTX 3070 Ti Laptop GPU
2.5 kg23.4 mm15.60"1920x1080
88.2 %
v7 (old)
05/2022
Asus ROG Zephyrus Duo 16 GX650RX
R9 6900HX, GeForce RTX 3080 Ti Laptop GPU
2.6 kg20.5 mm16.00"3840x2400
89.2 %
v7 (old)
05/2022
Alienware x17 R2 P48E
i9-12900HK, GeForce RTX 3080 Ti Laptop GPU
3.1 kg20.9 mm17.30"1920x1080
84.7 %
v7 (old)
03/2022
Gigabyte Aero 16 YE5
i9-12900HK, GeForce RTX 3080 Ti Laptop GPU
2.3 kg22.4 mm16.00"3840x2400
87.5 %
v7 (old)
01/2022
MSI GE76 Raider
i9-12900HK, GeForce RTX 3080 Ti Laptop GPU
3 kg26 mm17.30"1920x1080

Caja: significativamente más delgada que la Titan GT76

El Titan GT77 mantiene elementos del lenguaje de diseño del antiguo Titan GT76, pero con algunos cambios notables. El portátil luce un diseño totalmente negro que sólo tiene 23 mm de grosor en comparación con los 42 mm del Titan GT76. MSI coloca la mayor parte de la tecnología de procesamiento y refrigeración en la parte trasera del chasis, lo que permite al fabricante reducir el grosor total.

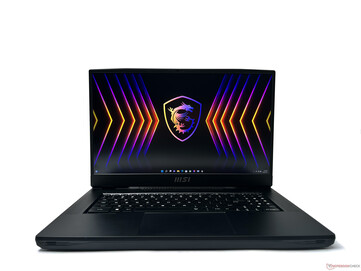
El chasis es principalmente de plástico, pero tiene un tacto suficientemente bueno y ayuda a mantener el peso del dispositivo bajo control. La estética es bastante agradable para un portátil de juegos para entusiastas, sin demasiada excentricidad gamer a primera vista. Eso sí, prepárate para limpiar tus huellas dactilares a menudo.

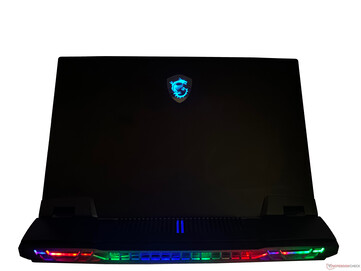
La tapa de la pantalla tiene un acabado de aluminio y ahora tiene un logo MSI que brilla en glorioso RGB. La tapa puede abrirse con un dedo sin que el dispositivo se deslice. Se observa algo de flexión tanto en la tapa como en la cubierta del teclado, pero no es evidente en el uso habitual

A diferencia del GE76 Raider, no hay barra de luz RGB en la parte delantera. En su lugar, MSI ha colocado unos 27 LEDs RGB en las rejillas de ventilación traseras. También hay una tira RGB corta y paralela en las rejillas de entrada traseras, justo detrás de la pantalla. Hay otros dos escapes, cada uno a cada lado del portátil.

El panel inferior es probablemente la parte más débil del chasis y su construcción parece inferior a la del resto de la carcasa. Esto probablemente se puede pasar por alto teniendo en cuenta que no vas a interactuar con la cubierta inferior tan a menudo. Sin embargo, ofrece un buen número de salidas de aire.

En general, el MSI Titan GT77 tiene una construcción sólida con mejoras en la portabilidad en comparación con los anteriores Titans.

Comparación de tamaños

398 mm 258 mm 30 mm 2.7 kg397 mm 284 mm 26 mm 3 kg397 mm 284 mm 25.9 mm 3.1 kg399.23 mm 299.57 mm 20.9 mm 3.1 kg397 mm 330 mm 23 mm 3.3 kg358 mm 267 mm 23.4 mm 2.5 kg356 mm 248.5 mm 22.4 mm 2.3 kg355 mm 266 mm 20.5 mm 2.6 kg297 mm 210 mm 1 mm 5.7 g

Conectividad: Adecuada selección de puertos con lector de tarjetas SD de tamaño completo y Wi-Fi 6E

El Titan GT77 ofrece una selección de puertos ligeramente diferente pero adecuada en comparación con el Titan GT76. Además, implementa los últimos estándares de conectividad que esperarías encontrar en un portátil de juegos para entusiastas en 2022.

Hacia la izquierda, tenemos el puerto DC-in propio de MSI, 2 puertos USB 3.2 Gen2 Tipo-A, un lector de tarjetas UHS-III Express de tamaño completo, y un conector de audio combinado. Esta vez no hay puerto de entrada de micrófono separado. A la derecha, tenemos otro puerto USB 3.2 Gen2 Tipo-A, 2 puertos Thunderbolt 4, una salida mini-DisplayPort, una salida HDMI que soporta hasta 4K 120 Hz u 8K 60 Hz, y un puerto RJ-45 de 2,5 GbE.

Los puertos están convenientemente situados y no dificultan la conectividad de los periféricos. No hay ranura de bloqueo Kensington disponible.

Izquierda: puerto de entrada de CC, 2 USB 3.2 Gen2 Tipo-A, lector de tarjetas SD Express, conector de audio combinado
Derecha: USB 3.2 Gen2 Tipo-A, 2x Thunderbolt 4, salida mini-DisplayPort, salida HDMI
En la parte trasera: No hay puertos

Lector de tarjetas SD

El Titan GT77 ofrece por fin una ranura para tarjetas SD de tamaño completo, lo que es un avance bienvenido. El lector de tarjetas es sensiblemente más rápido que el del Raider GE77 HX 12UHS pero va por detrás de otros de la competencia.

SD Card Reader
average JPG Copy Test (av. of 3 runs)
Alienware x17 R2 P48E
Intel Core i9-12900HK (AV Pro V60)
182.9 MB/s +165%
Asus ROG Zephyrus Duo 16 GX650RX
AMD Ryzen 9 6900HX (AV PRO microSD 128 GB V60)
155 MB/s +124%
Average of class Gaming
  (19 - 202, n=88, last 2 years)
95.7 MB/s +38%
MSI GE67 HX 12UGS
Intel Core i7-12800HX (Toshiba Exceria Pro SDXC 64 GB UHS-II)
83.2 MB/s +20%
MSI GE76 Raider
Intel Core i9-12900HK (AV PRO microSD 128 GB V60)
79.9 MB/s +16%
MSI Titan GT77 12UHS
Intel Core i9-12900HX (AV PRO microSD 128 GB V60)
69.1 (68.5min - 72.99max) MB/s
MSI Raider GE77 HX 12UHS
Intel Core i9-12900HX (AV PRO microSD 128 GB V60)
60 MB/s -13%
maximum AS SSD Seq Read Test (1GB)
Alienware x17 R2 P48E
Intel Core i9-12900HK (AV Pro V60)
220.6 MB/s +150%
Asus ROG Zephyrus Duo 16 GX650RX
AMD Ryzen 9 6900HX (AV PRO microSD 128 GB V60)
185 MB/s +110%
Average of class Gaming
  (25.8 - 269, n=89, last 2 years)
119.6 MB/s +36%
MSI Titan GT77 12UHS
Intel Core i9-12900HX (AV PRO microSD 128 GB V60)
88.14 MB/s
MSI GE67 HX 12UGS
Intel Core i7-12800HX (Toshiba Exceria Pro SDXC 64 GB UHS-II)
82.3 MB/s -7%

Comunicación

La tarjeta Wi-Fi Killer AX1675i ofrece un buen rendimiento de red

Nuestra unidad Titan GT77 venía equipada con una tarjeta WLAN Killer Wi-Fi 6E AX1675i. El rendimiento Wi-Fi está en general por encima de la media de su clase tanto en la banda de 5 GHz como en la de 6 GHz, con mínimas caídas en el rendimiento cuando lo probamos con nuestro router de referencia Asus ROG Rapture GT-AXE11000

Hemos observado que el rendimiento de 6 GHz del AX1675i no parece ofrecer ninguna ventaja tangible sobre los 5 GHz en términos de rendimiento medio. Sin embargo, si tienes un router con capacidad para 6E, el uso de esta banda puede ayudar a aumentar los picos de rendimiento.


Networking
iperf3 receive AXE11000 6GHz
Aorus 17X XES
Intel Wi-Fi 6E AX211
1755 (1679min - 1765max) MBit/s +4%
MSI Raider GE77 HX 12UHS
Killer Wi-Fi 6E AX1675i 160MHz Wireless Network Adapter
1715 (1595min - 1747max) MBit/s +2%
MSI Titan GT77 12UHS
Killer Wi-Fi 6E AX1675i 160MHz Wireless Network Adapter
1680 (1438min - 1732max) MBit/s
Average Killer Wi-Fi 6E AX1675i 160MHz Wireless Network Adapter
  (1327 - 1788, n=20)
1553 MBit/s -8%
Average of class Gaming
  (853 - 1788, n=70, last 2 years)
1489 MBit/s -11%
MSI GE67 HX 12UGS
Killer Wi-Fi 6E AX1675i 160MHz Wireless Network Adapter
1461 (1392min - 1501max) MBit/s -13%
iperf3 transmit AXE11000 6GHz
Aorus 17X XES
Intel Wi-Fi 6E AX211
1648 (1133min - 1711max) MBit/s +11%
Average Killer Wi-Fi 6E AX1675i 160MHz Wireless Network Adapter
  (1229 - 1693, n=19)
1519 MBit/s +2%
MSI Titan GT77 12UHS
Killer Wi-Fi 6E AX1675i 160MHz Wireless Network Adapter
1488 (1300min - 1531max) MBit/s
Average of class Gaming
  (648 - 1878, n=70, last 2 years)
1434 MBit/s -4%
MSI GE67 HX 12UGS
Killer Wi-Fi 6E AX1675i 160MHz Wireless Network Adapter
1348 (1151min - 1393max) MBit/s -9%
iperf3 receive AXE11000
Asus ROG Zephyrus Duo 16 GX650RX
MediaTek Wi-Fi 6E MT7922 160MHz Wireless LAN Card
1692 (1567min - 1738max) MBit/s 0%
MSI Titan GT77 12UHS
Killer Wi-Fi 6E AX1675i 160MHz Wireless Network Adapter
1691 (1589min - 1731max) MBit/s
Average Killer Wi-Fi 6E AX1675i 160MHz Wireless Network Adapter
  (872 - 1714, n=28)
1473 MBit/s -13%
Average of class Gaming
  (680 - 1890, n=149, last 2 years)
1387 MBit/s -18%
Gigabyte Aero 16 YE5
Intel Wi-Fi 6E AX210
1030 (752min - 1313max) MBit/s -39%
iperf3 transmit AXE11000
Asus ROG Zephyrus Duo 16 GX650RX
MediaTek Wi-Fi 6E MT7922 160MHz Wireless LAN Card
1695 (1556min - 1768max) MBit/s +5%
MSI Titan GT77 12UHS
Killer Wi-Fi 6E AX1675i 160MHz Wireless Network Adapter
1610 (1421min - 1675max) MBit/s
Average Killer Wi-Fi 6E AX1675i 160MHz Wireless Network Adapter
  (942 - 1622, n=26)
1358 MBit/s -16%
Gigabyte Aero 16 YE5
Intel Wi-Fi 6E AX210
1333 (1044min - 1390max) MBit/s -17%
Average of class Gaming
  (469 - 1843, n=149, last 2 years)
1238 MBit/s -23%
050100150200250300350400450500550600650700750800850900950100010501100115012001250130013501400145015001550160016501700Tooltip
MSI Titan GT77 12UHS Killer Wi-Fi 6E AX1675i 160MHz Wireless Network Adapter; iperf3 transmit AXE11000 6GHz; iperf 3.1.3: Ø1488 (1300-1531)
MSI GE67 HX 12UGS Killer Wi-Fi 6E AX1675i 160MHz Wireless Network Adapter; iperf3 transmit AXE11000 6GHz; iperf 3.1.3: Ø1348 (1151-1393)
MSI Titan GT77 12UHS Killer Wi-Fi 6E AX1675i 160MHz Wireless Network Adapter; iperf3 receive AXE11000 6GHz; iperf 3.1.3: Ø1680 (1438-1732)
MSI GE67 HX 12UGS Killer Wi-Fi 6E AX1675i 160MHz Wireless Network Adapter; iperf3 receive AXE11000 6GHz; iperf 3.1.3: Ø1460 (1392-1501)
MSI Titan GT77 12UHS Killer Wi-Fi 6E AX1675i 160MHz Wireless Network Adapter; iperf3 transmit AXE11000; iperf 3.1.3: Ø1610 (1421-1675)
MSI Titan GT77 12UHS Killer Wi-Fi 6E AX1675i 160MHz Wireless Network Adapter; iperf3 receive AXE11000; iperf 3.1.3: Ø1691 (1589-1731)

Cámara web

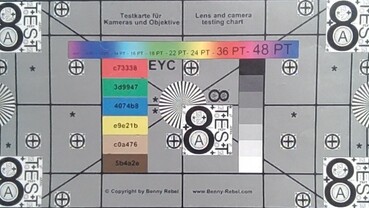
No es raro encontrar cámaras web pésimas en los portátiles para juegos, pero la cámara 720p del Titan GT77 tiene un rendimiento bastante pobre para un dispositivo de 2022. Una webcam FHD muy mejorada está disponible en el GE76 Raider 12U.

Como se aprecia en nuestras imágenes de ColorChecker Passport y de la tabla de pruebas, la precisión del color es bastante pobre, con mucho ruido y una falta general de nitidez incluso bajo luz ambiental brillante. No hay obturador de privacidad físico disponible, pero la webcam puede activarse/desactivarse usando un atajo de teclado o a través del Centro MSI.

ColorChecker
26.1 ∆E
20.3 ∆E
23.9 ∆E
25.1 ∆E
24 ∆E
17.8 ∆E
20 ∆E
29.1 ∆E
23.2 ∆E
21.4 ∆E
17.2 ∆E
23.7 ∆E
22.1 ∆E
20.5 ∆E
26.7 ∆E
14.3 ∆E
24.1 ∆E
25.1 ∆E
2.3 ∆E
11.9 ∆E
19.2 ∆E
20.6 ∆E
22.6 ∆E
10.2 ∆E
ColorChecker MSI Titan GT77 12UHS: 20.48 ∆E min: 2.33 - max: 29.08 ∆E

Seguridad

El Titan GT77 ofrece tanto la cámara IR como la biometría basada en la huella dactilar compatible con Windows Hello, lo que es una rareza en los portátiles para juegos. Ambas formas de biometría son fáciles de registrar y son bastante rápidas y sensibles.

Además, también está presente un módulo TPM 2.0.

Accesorios

Dado que se trata de una unidad personalizada y sembrada por Intel, no encontramos ningún accesorio adicional en la caja, aparte del enorme bloque de alimentación de 330 W.

Mantenimiento

No hay una escotilla de mantenimiento. El panel inferior puede abrirse después de quitar 11 tornillos PH1, pero se necesita algo de esfuerzo para separarlo completamente del resto del chasis.

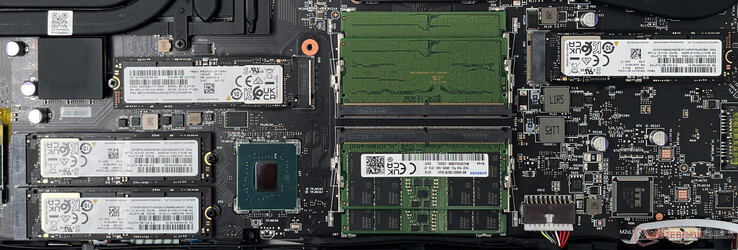
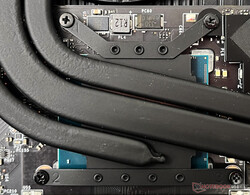
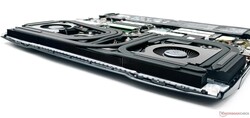
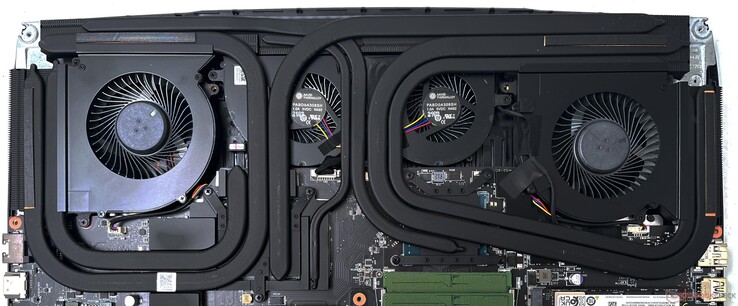
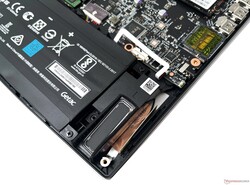
En el interior, nos encontramos con una disposición de piezas bastante ocupada. Al más puro estilo Titan, el sistema de refrigeración es enorme, con cuatro ventiladores, siete heatpipes y seis salidas de aire.

Las cuatro ranuras SSD de nuestra unidad venían ocupadas con unidades PCIe Gen4 NVMe de 1 TB. Debajo de la cubierta de aluminio hay cuatro palos de memoria DDR5-4800 de 16 GB cada uno: puedes meter hasta 128 GB de memoria DDR5-4800 aquí

La batería de 99,9 WHr se puede retirar para su sustitución. La tarjeta WLAN Killer AX1675i, los SSD NVMe y la memoria DDR5 pueden actualizarse.


Internos de la MSI Titan GT77

Garantía

Dependiendo de la región, MSI ofrece una garantía estándar de un año o una garantía de dos años para sus portátiles para juegos junto con un seguro de viaje global. Como la nuestra es una unidad personalizada, no venía con ninguna información de garantía.

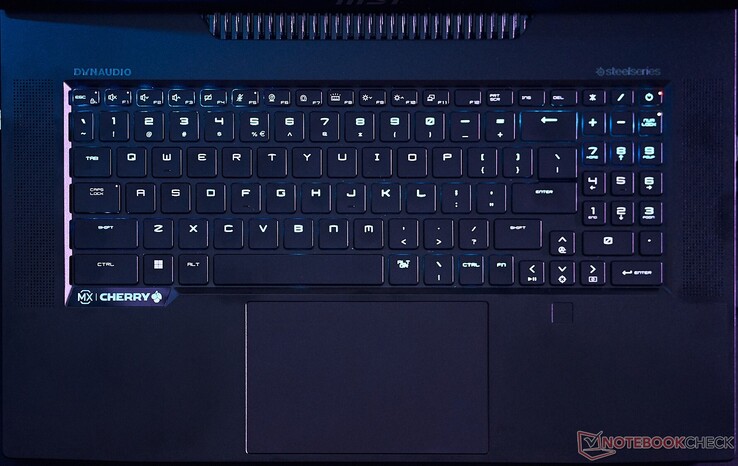
Dispositivos de entrada: Delicioso teclado Cherry MX y gran touchpad

Teclado

El teclado SteelSeries con interruptores mecánicos Cherry MX Ultra Low Profile presenta una gran experiencia de escritura con una excelente respuesta táctil, una respuesta rápida y un sonido de escritura nítido. Todas las teclas pueden iluminarse individualmente, y el software SteelSeries GG permite configurar todo tipo de efectos de iluminación RGB y atajos de macro

Sin embargo, sólo la zona principal de escritura utiliza teclas mecánicas Cherry MX. Las teclas de función, las teclas de dirección y el teclado numérico parecen conformarse con interruptores de membrana convencionales. La ubicación de la tecla Fn puede llevar algún tiempo para acostumbrarse si eres nuevo en los portátiles MSI. Al pulsar la tecla Fn se iluminan las funciones adicionales solo en las teclas F1-F12, lo que ayuda a una fácil legibilidad en ambientes oscuros.

Las teclas Inicio, Fin, Avance y Retroceso de página sólo están disponibles en el teclado numérico y requieren que se desactive el Bloqueo numérico si se desea utilizarlas. Las teclas de dirección tienen un tamaño decente, pero la falta de teclas mecánicas es un problema si te gustan los juegos de carreras. Es importante que la zona del teclado se mantenga relativamente limpia, ya que el polvo o las partículas de comida pueden alojarse fácilmente bajo las teclas y plantear problemas de accionamiento.

Teclado táctil

El touchpad es un paso adelante respecto a lo que habíamos visto en el Titan GT76. Ahora tiene un diseño sin botones y mide 13 x 8,2 cm, lo que permite un deslizamiento sin esfuerzo.

El touchpad se desliza con relativa facilidad y es compatible con los gestos de Windows Precision.

El teclado SteelSeries con interruptores Cherry MX ofrece una gran experiencia de escritura y juego

Pantalla: panel FHD de 360 Hz con bajos tiempos de respuesta y software de color defectuoso

Nuestra unidad Titan GT77 venía equipada con un panel FHD de 360 Hz. Actualmente, la Titan GT77 solo puede configurarse con un panel UHD de 120 Hz, pero es probable que la empresa también ofrezca una opción FHD de 360 Hz más adelante.

Esta pantalla no ofrece ningún tipo de soporte HDR o G-Sync. En el momento de las pruebas, True Color sólo soportaba sRGB y algunos otros ajustes de reducción de luz azul. Ahora, MSI ha actualizado la aplicación para incluir también los espacios de color AdobeRGB y Display P3.

Dicho esto, usar True Color en este portátil puede ser un poco molesto. Hay un error en la aplicación que no le permite jugar bien con los últimos controladores iGPU de Intel. La actualización de los controladores gráficos de Intel blanquea todos los colores y hace que toda la pantalla tenga un aspecto muy desagradable. Por suerte, MSI reconoce el problema y te dirige a un enlace para solucionarlo. Básicamente, todo lo que hay que hacer es bajar los controladores de la iGPU de Intel a una versión más antigua. En nuestras pruebas, encontramos que la versión 30.0.101.1994 funciona bien. Otra solución es cambiar del modo MSHybrid al modo de gráficos discretos.

El tamaño de los píxeles individuales parece bastante grande dado que se trata de una pantalla de 127 PPI. Observamos sangrado de luz en las esquinas bajo una larga exposición.

La distribución del brillo es decente con un 79%, pero la relación de contraste de 700:1 es apenas la media. Subjetivamente, la pantalla del Titan GT77 ofrece una experiencia de visualización decente si su uso principal es el juego.

Matriz de subpíxeles con revestimiento mate
La luz de fondo se ve en las esquinas bajo una larga exposición
304
cd/m²
294
cd/m²
300
cd/m²
278
cd/m²
280
cd/m²
274
cd/m²
253
cd/m²
239
cd/m²
254
cd/m²
Temperatura del cuarto
Sharp SHP1544 LQ173M1JW08 tested with X-Rite i1Basic Pro 3
Máximo: 304 cd/m² (Nits) Médio: 275.1 cd/m² Minimum: 13.32 cd/m²
iluminación: 79 %
Brillo con batería: 280 cd/m²
Contraste: 700:1 (Negro: 0.4 cd/m²)
ΔE Color 2.1 | 0.5-29.43 Ø4.92, calibrated: 1.58
ΔE Greyscale 3.3 | 0.5-98 Ø5.2
73% AdobeRGB 1998 (Argyll 2.2.0 3D)
98.9% sRGB (Argyll 2.2.0 3D)
70.8% Display P3 (Argyll 2.2.0 3D)
Gamma: 2.13
MSI Titan GT77 12UHS
Sharp SHP1544 LQ173M1JW08, IPS-Level, 1920x1080, 17.3"
MSI Titan GT77 12UHS
AU Optronics B173ZAN06.1, IPS, 3840x2160, 17.3"
Aorus 17X XES
Sharp SHP1563, IPS, 1920x1080, 17.3"
MSI Raider GE77 HX 12UHS
AU Optronics B173ZAN06.1, IPS, 3840x2160, 17.3"
MSI GE67 HX 12UGS
Samsung ATNA562P02-0, OLED, 1920x1080, 15.6"
Asus ROG Zephyrus Duo 16 GX650RX
BOE NE160QAM-NX1, IPS-Level, 3840x2400, 16"
Alienware x17 R2 P48E
AU Optronics B173HAN, IPS, 1920x1080, 17.3"
MSI GE76 Raider
AU Optronics B173HAN05.4 (AUOE295), IPS-Level, 1920x1080, 17.3"
Display
19%
-1%
18%
-2%
19%
7%
-9%
Display P3 Coverage
70.8
97
37%
70.1
-1%
96.6
36%
71.7
1%
98
38%
79.2
12%
63.1
-11%
sRGB Coverage
98.9
99.8
1%
99.9
1%
99.8
1%
89.7
-9%
99.9
1%
99.8
1%
94
-5%
AdobeRGB 1998 Coverage
73
86.2
18%
71.9
-2%
85.8
18%
75.2
3%
86.3
18%
79.6
9%
65.2
-11%
Response Times
-35%
-11%
-49%
92%
-194%
-192%
-84%
Response Time Grey 50% / Grey 80% *
3.03 ?(1.28, 1.75)
5.2 ?(1.2, 4)
-72%
3.4 ?(1.4, 2)
-12%
5.8 ?(1.6, 4.2)
-91%
0.25 ?(0.13, 0.12)
92%
14.6 ?(6.7, 7.9)
-382%
12.4 ?(6.4, 6)
-309%
5.6 ?(2, 3.6)
-85%
Response Time Black / White *
5.28 ?(2.32, 2.96)
5.1 ?(1.5, 3.6)
3%
5.8 ?(2.5, 3.3)
-10%
5.6 ?(1.9, 3.7)
-6%
0.4 ?(0.2, 0.2)
92%
5.6 ?(2, 3.6)
-6%
9.2 ?(5.2, 4)
-74%
9.6 ?(5.2, 4.4)
-82%
PWM Frequency
480.4 ?(100)
Screen
10%
-18%
-1%
-13%
9%
11%
32%
Brightness middle
280
418
49%
278
-1%
381
36%
356.1
27%
459
64%
365.4
31%
290
4%
Brightness
275
401
46%
273
-1%
371
35%
358
30%
434
58%
344
25%
290
5%
Brightness Distribution
79
91
15%
79
0%
84
6%
99
25%
88
11%
85
8%
96
22%
Black Level *
0.4
0.48
-20%
0.26
35%
0.52
-30%
0.44
-10%
0.29
27%
0.23
42%
Contrast
700
871
24%
1069
53%
733
5%
1043
49%
1260
80%
1261
80%
Colorchecker dE 2000 *
2.1
2.47
-18%
3.96
-89%
4.83
-130%
2.97
-41%
3.17
-51%
1.59
24%
Colorchecker dE 2000 max. *
5.83
7.81
-34%
10.78
-85%
7.94
-36%
8.13
-39%
7.69
-32%
3.17
46%
Colorchecker dE 2000 calibrated *
1.58
0.66
58%
1.07
32%
2.53
-60%
1.03
35%
0.51
68%
0.87
45%
Greyscale dE 2000 *
3.3
4.4
-33%
6.8
-106%
3.1
6%
4.9
-48%
5.3
-61%
2.5
24%
Gamma
2.13 103%
2.129 103%
2.224 99%
2.2 100%
2.235 98%
2.18 101%
2.253 98%
CCT
7060 92%
7197 90%
7651 85%
5938 109%
6775 96%
5879 111%
6640 98%
Media total (Programa/Opciones)
-2% / 5%
-10% / -13%
-11% / -5%
26% / 9%
-55% / -18%
-58% / -19%
-20% / 7%

* ... más pequeño es mejor

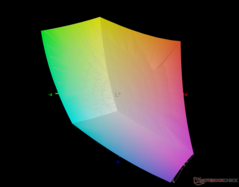
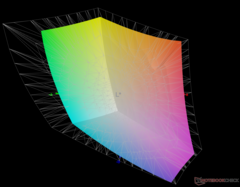
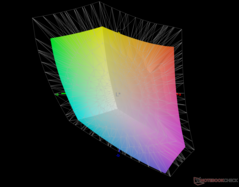
Dado que la Titan GT77 está dirigida principalmente a los jugadores entusiastas, la cobertura del espacio de color no provoca ninguna exuberancia. La cobertura de la gama sRGB del 98,9% es buena y el 73% de AdobeRGB debería seguir siendo un buen augurio para la creación de contenidos no profesionales. El modelo con panel UHD ofrece coberturas AdobeRGB y Display P3 muy mejoradas.

vs. sRGB - 98,9% de cobertura
vs. AdobeRGB - 73% de cobertura
frente a la pantalla P3 - 70,8% de cobertura

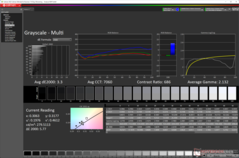
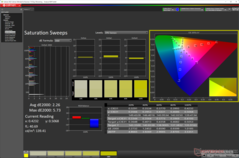
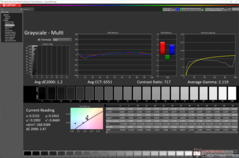
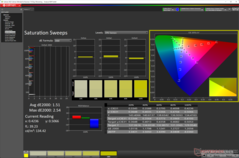
La precisión del color no es tan mala desde el principio, con un promedio de Delta E en escala de grises de 3,3 y un promedio de Delta E en ColorChecker de 2,1. Pudimos ajustar aún más el Delta E medio de la escala de grises a 1,2 y el Delta E medio de ColorChecker a 1,58 con nuestra rutina de calibración de color estandarizada utilizando el espectrofotómetro X-rite i1Basic Pro 3 y el software de calibración Calman de Portrait Displays.

Nuestro archivo ICC calibrado puede descargarse desde el enlace anterior.

Escala de grises antes de la calibración
ColorChecker antes de la calibración
Barridos de saturación antes de la calibración
Escala de grises después de la calibración
ColorChecker después de la calibración
Barridos de saturación después de la calibración

El panel Sharp SHP1544 del Titan GT77 ofrece muy buenos tiempos de respuesta. Obviamente no puede igualar los tiempos de respuesta ultrabajos que ofrece el panel Samsung OLED del Raider GE67 HX 12UGS, pero está a la altura de la competencia.

Tiempos de respuesta del display

Los tiempos de respuesta del display muestran lo rápido que puede cambiar la pantalla de un color al siguiente. Tiempos lentos de respuesta pueden llevar a imágenes persistentes alrededor de objetos en movimiento o a displays borrosos. Particularmente los aficionados a los juegos 3D frenéticos deberían usar una pantalla con tiempos de respuesta rápidos.
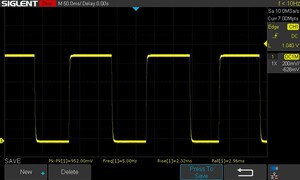
       Tiempo de respuesta de Negro a Blanco
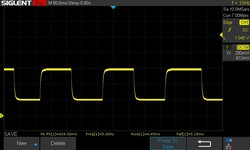
5.28 ms ... subida ↗ y bajada ↘ combinada↗ 2.32 ms subida
↘ 2.96 ms bajada
La pantalla mostró tiempos de respuesta muy rápidos en nuestros tests y debería ser adecuada para juegos frenéticos.
En comparación, todos los dispositivos de prueba van de ##min### (mínimo) a 240 (máximo) ms. » 14 % de todos los dispositivos son mejores.
Esto quiere decir que el tiempo de respuesta medido es mejor que la media (21 ms) de todos los dispositivos testados.
       Tiempo de respuesta 50% Gris a 80% Gris
3.03 ms ... subida ↗ y bajada ↘ combinada↗ 1.28 ms subida
↘ 1.75 ms bajada
La pantalla mostró tiempos de respuesta muy rápidos en nuestros tests y debería ser adecuada para juegos frenéticos.
En comparación, todos los dispositivos de prueba van de ##min### (mínimo) a 636 (máximo) ms. » 9 % de todos los dispositivos son mejores.
Esto quiere decir que el tiempo de respuesta medido es mejor que la media (32.9 ms) de todos los dispositivos testados.
el tiempo de respuesta del 50% de gris al 80% de gris aumenta a 9,73 ms con la sobremarcha desactivada

Observamos una combinación de 5,28 ms durante la transición del 100% de negro al 100% de blanco. El panel utiliza la sobremarcha por defecto, como se desprende del "cuerno" en el patrón del osciloscopio. Esto da como resultado un tiempo de respuesta rápido de 3,03 ms del 50% de gris al 80% de gris

Hemos observado que este valor puede aumentar hasta 9,73 ms con la sobremarcha desactivada.

Parpadeo de Pantalla / PWM (Pulse-Width Modulation)

Para atenuar el brillo de pantalla algunos portátiles están encendiendo y apagando la retroiluminación muy rápidamente. Esto se hace a una frecuencia que no debiera detectarse a simple vista. Si la frecuencia es demasiado lenta, la gente sensible podría experimentar problemas visuales, dolores de cabeza e incluso ver parpadeos.
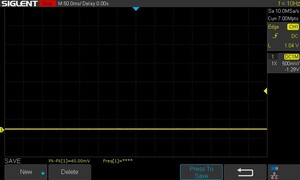
Parpadeo de Pantalla / PWM no detectado ≤ 100 % de brillo

Comparación: 53 % de todos los dispositivos testados no usaron PWM para atenuar el display. Si se usó, medimos una media de 8743 (mínimo: 5 - máxmo: 343500) Hz.

No observamos ningún parpadeo PWM en todos los niveles de brillo probados, por lo que las largas maratones de juegos no deberían causar mucha fatiga ocular.

Para más información, consulte nuestro artículo "Por qué la modulación por ancho de pulsos (PWM) es un dolor de cabeza", y consulta también nuestraTabla de clasificación PWMpara comparar la frecuencia PWM de todos los dispositivos analizados.

La visualización en exteriores es manejable siempre que no haya demasiada luz solar cayendo directamente sobre la pantalla. Observamos pérdida de brillo e información de color en ángulos de visión extremos.

Visualización en exteriores en condiciones de luminosidad
Visualización al aire libre bajo la sombra
Pérdida de brillo y color en ángulos de visión extremos

Rendimiento: El mejor combo de Core i9-12900HX y RTX 3080 Ti

Nuestra unidad de prueba Titan GT77 12UHS está equipada con el Intel Core i9-12900HX y una GPU de 175 w GPU Nvidia GeForce RTX 3080 Ti para portátiles. También hay una unidad Titan GT77 12UGS con el mismo procesador Core i9-12900HX pero con una GPU de 150 W GPU RTX 3070 Ti para portátiles. MSI también ofrece una Titan GT77 equipada con el Core i7-12800HX y la GPU RTX 3070 Ti para portátiles.


Condiciones de la prueba

Como es habitual en los portátiles MSI, la aplicación MSI Center es el lugar al que acudir para todo tipo de ajustes de rendimiento. Dada la naturaleza de la bestia, optamos por el perfil de Rendimiento Extremo que permite que el Core i9-12900HX funcione a una PL1 (potencia base del procesador) de 125 W y una PL2 (potencia máxima del turbo) de 200 W

El Centro MSI permite el cambio MUX entre los modos MSHybrid y GPU discreta. Nosotros optamos por la opción de GPU discreta para que la RTX 3080 Ti pueda sacar todo su potencial. No hay Advanced Optimus disponible, por lo que tendrás que reiniciar el portátil cada vez que se cambie manualmente el MUX.

La elección de los modos de rendimiento tiene un impacto significativo en los niveles de ruido, como veremos en breve.

Modos de actuación
Modos de actuación
Interruptor de modo GPU
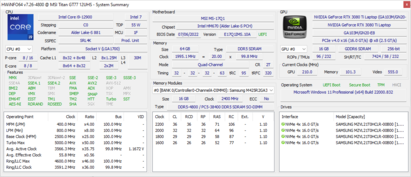
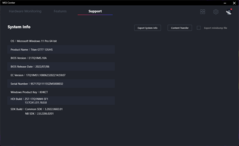
Información del sistema

La siguiente tabla ilustra cómo varían el PL1 (potencia base del procesador) y el PL2 (potencia máxima del turbo) en los distintos modos de rendimiento. Los modos Equilibrado y Rendimiento Extremo son similares en su mayor parte, aunque este último permite un PL1 más alto.

Aunque el perfil equilibrado debería ser suficiente para la mayoría de las tareas, incluidos los juegos, recomendamos optar por el modo de rendimiento extremo para extraer el máximo jugo posible del procesador.

Modo de rendimiento PL1 (PBP) / Tau PL2 (MTP) / Tau
Silencioso 30 W / 56 s 30 W / 2,44 ms
Equilibrado 100 W / 56 s 200 W / 2,44 ms
Rendimiento extremo 125 W / 56 s 200 W / 2,44 ms

Procesador

El Core i9-12900HX ofrece un rendimiento de clase de escritorio

El Core i9-12900HX es un procesador de 16 núcleos y 24 hilos Alder Lake-HX con 8 núcleos P y 8 núcleos E. Alder Lake-HX es esencialmente una versión móvil de Alder Lake-S de escritorio en un zócalo BGA. También es la primera plataforma móvil que ofrece compatibilidad con PCIe Gen5

El Core i9-12900HX viene desbloqueado y puedes entrar en los controles ocultos de la BIOS de MSI (pulsar Mayúsculas Derecha + Ctrl Derecha + Alt Izquierda + F2) para subvolucionar u overclockear la CPU. Sin embargo, los ajustes de potencia de fábrica ya superan el espacio térmico disponible, como se desprende de las pruebas de estrés que aparecen a continuación

En términos de rendimiento general de la CPU, la Titan GT77 encabeza la tabla, sólo igualada por la Raider GE77 HX 12 UHS. Encontramos que el Core i9-12900HX no está demasiado lejos de la media de los ordenadores de sobremesa Core i9-12900K en la mayoría de las pruebas de CPU.

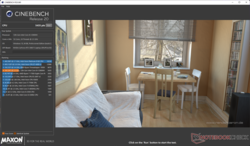
El Cooler Boost Titan de MSI es capaz de asegurar que el Core i9-12900HX no se ralentice bajo carga, como demuestra el rendimiento consistente en la prueba de bucle multinúcleo Cinebench R15.


Cinebench R15 Multi Loop

018036054072090010801260144016201800198021602340252027002880306032403420Tooltip
MSI Titan GT77 12UHS Intel Core i9-12900HX: Ø3311 (3259.45-3569.52)
Aorus 17X XES Intel Core i9-12900HX: Ø2729 (2696.14-2830.06)
MSI Raider GE77 HX 12UHS Intel Core i9-12900HX: Ø3290 (2874.6-3561.89)
MSI GE67 HX 12UGS Intel Core i7-12800HX: Ø3215 (3163.31-3383.24)
Asus ROG Zephyrus Duo 16 GX650RX AMD Ryzen 9 6900HX: Ø2247 (2222.47-2257.72)
Alienware x17 R2 P48E Intel Core i9-12900HK: Ø2889 (2849.61-2917.79)
Gigabyte Aero 16 YE5 Intel Core i9-12900HK: Ø2616 (2562.79-2779.9)
MSI GE76 Raider Intel Core i9-12900HK: Ø2722 (2660.99-2908.88)

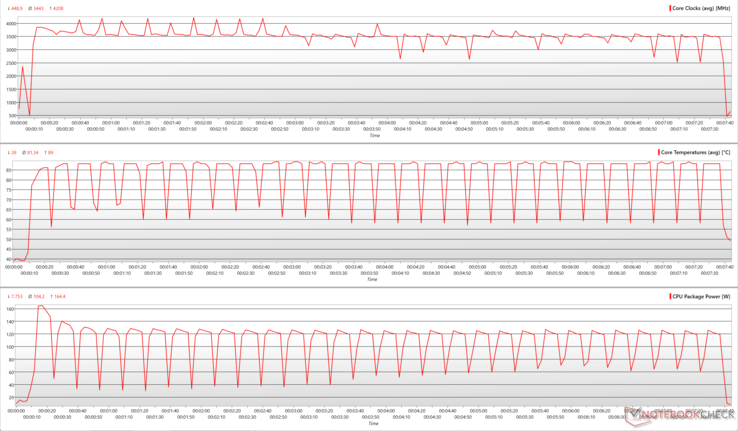
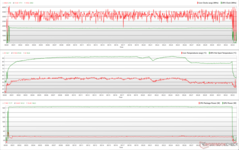
El siguiente gráfico ilustra cómo varían los parámetros importantes de la CPU durante una prueba de bucle multinúcleo de Cinebench R15. Aunque el Core i9-12900HX de la Titan GT77 está configurado para funcionar a un máximo de 200 W PL2, vemos que el valor máximo es de unos 165 W. Los núcleos P pueden aumentar hasta los 4,8 GHz, mientras que los núcleos E funcionan a la marca de 3,5 GHz.

Nos dimos cuenta de un error en la aplicación MSI Center que siempre revierte el perfil a Rendimiento Extremo cada vez que se lanza un benchmark ligado a la CPU como Cinebench. Esto limitó nuestra capacidad de ejecutar el mismo bucle en otros perfiles de rendimiento, como Balanced, Silent o Super Battery. Esperemos que MSI pueda arreglar esto en una futura actualización de software.

Relojes de la CPU, temperaturas de los núcleos y potencias de los paquetes durante un bucle de Cinebench R15 en el modo de rendimiento extremo
La puntuación de Cinebench R20 cae significativamente en la energía de la batería

El Core i9-12900HX del Aorus 17X XES empata con el de la Titan GT77 en las pruebas mononúcleo, pero se queda atrás en las multinúcleo. Esto se debe probablemente a los límites de potencia más bajos del portátil Aorus. El Core i7-12800HX en el Raider GE67 HX 12UGS le pisa los talones al Core i9-12900HX con deltas de rendimiento de un solo dígito en la mayoría de las pruebas de CPU.

Por tanto, la Titan GT77 SKU con Core i7-12800HX podría ser una buena inversión si quieres ahorrar algo de dinero con un sacrificio de rendimiento insignificante.

El rendimiento multinúcleo cae un 37,2% en batería.

CPU Performance Rating: Percent
Cinebench R23: Multi Core | Single Core
Cinebench R20: CPU (Multi Core) | CPU (Single Core)
Cinebench R15: CPU Multi 64Bit | CPU Single 64Bit
Blender: v2.79 BMW27 CPU
7-Zip 18.03: 7z b 4 | 7z b 4 -mmt1
Geekbench 5.5: Multi-Core | Single-Core
HWBOT x265 Benchmark v2.2: 4k Preset
LibreOffice : 20 Documents To PDF
R Benchmark 2.5: Overall mean
CPU Performance Rating
Average Intel Core i9-12900K
 
84 pt
MSI Titan GT77 12UHS
Intel Core i9-12900HX
76.9 pt
MSI Raider GE77 HX 12UHS
Intel Core i9-12900HX
76.8 pt
Average Intel Core i9-12900HX
 
76.3 pt
Average of class Gaming
 
71.9 pt
MSI GE67 HX 12UGS
Intel Core i7-12800HX
70.7 pt
Aorus 17X XES
Intel Core i9-12900HX
68.5 pt
MSI GE76 Raider
Intel Core i9-12900HK
68.2 pt
Alienware x17 R2 P48E
Intel Core i9-12900HK
67.9 pt
Gigabyte Aero 16 YE5
Intel Core i9-12900HK
66.5 pt
Asus ROG Zephyrus Duo 16 GX650RX
AMD Ryzen 9 6900HX
54.7 pt
Cinebench R23 / Multi Core
Average Intel Core i9-12900K
  (25245 - 27005, n=2)
26125 Points +14%
MSI Raider GE77 HX 12UHS
Intel Core i9-12900HX
23124 Points +1%
MSI Titan GT77 12UHS
Intel Core i9-12900HX
22982 Points
Average Intel Core i9-12900HX
  (18337 - 23482, n=8)
22529 Points -2%
MSI GE67 HX 12UGS
Intel Core i7-12800HX
22456 (19998.9min - 22456.2max) Points -2%
Average of class Gaming
  (5668 - 36249, n=191, last 2 years)
21701 Points -6%
Alienware x17 R2 P48E
Intel Core i9-12900HK
18870 (18654.1min - 18869.7max) Points -18%
Aorus 17X XES
Intel Core i9-12900HX
18337 Points -20%
MSI GE76 Raider
Intel Core i9-12900HK
18288 Points -20%
Gigabyte Aero 16 YE5
Intel Core i9-12900HK
18106 Points -21%
Asus ROG Zephyrus Duo 16 GX650RX
AMD Ryzen 9 6900HX
14085 Points -39%
Cinebench R23 / Single Core
Average Intel Core i9-12900K
  (1998 - 2011, n=2)
2005 Points +5%
Gigabyte Aero 16 YE5
Intel Core i9-12900HK
1940 Points +1%
Aorus 17X XES
Intel Core i9-12900HX
1928 Points +1%
Average Intel Core i9-12900HX
  (1897 - 1936, n=8)
1917 Points 0%
MSI Titan GT77 12UHS
Intel Core i9-12900HX
1913 Points
MSI GE76 Raider
Intel Core i9-12900HK
1909 Points 0%
MSI Raider GE77 HX 12UHS
Intel Core i9-12900HX
1907 Points 0%
Alienware x17 R2 P48E
Intel Core i9-12900HK
1905 Points 0%
Average of class Gaming
  (1088 - 2235, n=189, last 2 years)
1880 Points -2%
MSI GE67 HX 12UGS
Intel Core i7-12800HX
1812 Points -5%
Asus ROG Zephyrus Duo 16 GX650RX
AMD Ryzen 9 6900HX
1566 Points -18%
Cinebench R20 / CPU (Multi Core)
Average Intel Core i9-12900K
  (9630 - 10240, n=2)
9935 Points +15%
MSI Raider GE77 HX 12UHS
Intel Core i9-12900HX
8828 Points +2%
MSI Titan GT77 12UHS
Intel Core i9-12900HX
8667 Points
Average Intel Core i9-12900HX
  (7037 - 9042, n=8)
8602 Points -1%
MSI GE67 HX 12UGS
Intel Core i7-12800HX
8564 Points -1%
Average of class Gaming
  (2179 - 13832, n=189, last 2 years)
8258 Points -5%
Alienware x17 R2 P48E
Intel Core i9-12900HK
7169 Points -17%
Aorus 17X XES
Intel Core i9-12900HX
7037 Points -19%
Gigabyte Aero 16 YE5
Intel Core i9-12900HK
6941 Points -20%
MSI GE76 Raider
Intel Core i9-12900HK
6849 Points -21%
Asus ROG Zephyrus Duo 16 GX650RX
AMD Ryzen 9 6900HX
5489 Points -37%
Cinebench R20 / CPU (Single Core)
Average Intel Core i9-12900K
  (766 - 777, n=2)
772 Points +5%
MSI Raider GE77 HX 12UHS
Intel Core i9-12900HX
742 Points +1%
Aorus 17X XES
Intel Core i9-12900HX
740 Points 0%
MSI Titan GT77 12UHS
Intel Core i9-12900HX
738 Points
Average Intel Core i9-12900HX
  (728 - 745, n=8)
738 Points 0%
MSI GE76 Raider
Intel Core i9-12900HK
734 Points -1%
Alienware x17 R2 P48E
Intel Core i9-12900HK
727 Points -1%
Average of class Gaming
  (427 - 856, n=189, last 2 years)
722 Points -2%
Gigabyte Aero 16 YE5
Intel Core i9-12900HK
685 Points -7%
MSI GE67 HX 12UGS
Intel Core i7-12800HX
676 Points -8%
Asus ROG Zephyrus Duo 16 GX650RX
AMD Ryzen 9 6900HX
595 Points -19%
Cinebench R15 / CPU Multi 64Bit
Average Intel Core i9-12900K
  (3473 - 4102, n=3)
3877 Points +9%
MSI Titan GT77 12UHS
Intel Core i9-12900HX
3570 (3259.45min - 3569.52max) Points
MSI Raider GE77 HX 12UHS
Intel Core i9-12900HX
3562 Points 0%
Average Intel Core i9-12900HX
  (2830 - 3652, n=8)
3493 Points -2%
Average of class Gaming
  (905 - 5663, n=196, last 2 years)
3402 Points -5%
MSI GE67 HX 12UGS
Intel Core i7-12800HX
3383 (3163.31min - 3383.24max) Points -5%
Alienware x17 R2 P48E
Intel Core i9-12900HK
2918 (2849.61min - 2917.79max) Points -18%
MSI GE76 Raider
Intel Core i9-12900HK
2909 (2660.99min - 2908.88max) Points -19%
Aorus 17X XES
Intel Core i9-12900HX
2830 (2696.14min - 2830.06max) Points -21%
Gigabyte Aero 16 YE5
Intel Core i9-12900HK
2780 Points -22%
Asus ROG Zephyrus Duo 16 GX650RX
AMD Ryzen 9 6900HX
2292 Points -36%
Cinebench R15 / CPU Single 64Bit
Average Intel Core i9-12900K
  (286 - 292, n=3)
289 Points +4%
MSI Raider GE77 HX 12UHS
Intel Core i9-12900HX
280 Points +1%
Gigabyte Aero 16 YE5
Intel Core i9-12900HK
279 Points 0%
MSI Titan GT77 12UHS
Intel Core i9-12900HX
278 Points
Average Intel Core i9-12900HX
  (274 - 282, n=8)
278 Points 0%
Average of class Gaming
  (176.6 - 318, n=193, last 2 years)
277 Points 0%
Aorus 17X XES
Intel Core i9-12900HX
276 Points -1%
MSI GE76 Raider
Intel Core i9-12900HK
275 Points -1%
Alienware x17 R2 P48E
Intel Core i9-12900HK
272 Points -2%
MSI GE67 HX 12UGS
Intel Core i7-12800HX
260 Points -6%
Asus ROG Zephyrus Duo 16 GX650RX
AMD Ryzen 9 6900HX
249 Points -10%
Blender / v2.79 BMW27 CPU
Asus ROG Zephyrus Duo 16 GX650RX
AMD Ryzen 9 6900HX
220 Seconds * -50%
Aorus 17X XES
Intel Core i9-12900HX
201 Seconds * -37%
Gigabyte Aero 16 YE5
Intel Core i9-12900HK
200 Seconds * -36%
MSI GE76 Raider
Intel Core i9-12900HK
181 Seconds * -23%
Alienware x17 R2 P48E
Intel Core i9-12900HK
173.6 Seconds * -18%
Average of class Gaming
  (87 - 555, n=184, last 2 years)
171.9 Seconds * -17%
Average Intel Core i9-12900HX
  (144 - 201, n=8)
154.4 Seconds * -5%
MSI GE67 HX 12UGS
Intel Core i7-12800HX
153.1 Seconds * -4%
MSI Raider GE77 HX 12UHS
Intel Core i9-12900HX
150.5 Seconds * -2%
MSI Titan GT77 12UHS
Intel Core i9-12900HX
147 Seconds *
Average Intel Core i9-12900K
  (121.1 - 128.3, n=2)
124.7 Seconds * +15%
7-Zip 18.03 / 7z b 4
Average Intel Core i9-12900K
  (96960 - 97671, n=2)
97316 MIPS +13%
MSI Raider GE77 HX 12UHS
Intel Core i9-12900HX
86541 MIPS 0%
MSI Titan GT77 12UHS
Intel Core i9-12900HX
86234 MIPS
Average of class Gaming
  (23795 - 140932, n=188, last 2 years)
84837 MIPS -2%
Average Intel Core i9-12900HX
  (69778 - 88128, n=7)
84614 MIPS -2%
MSI GE67 HX 12UGS
Intel Core i7-12800HX
76947 MIPS -11%
MSI GE76 Raider
Intel Core i9-12900HK
72836 MIPS -16%
Aorus 17X XES
Intel Core i9-12900HX
69778 MIPS -19%
Alienware x17 R2 P48E
Intel Core i9-12900HK
69146 MIPS -20%
Gigabyte Aero 16 YE5
Intel Core i9-12900HK
68520 MIPS -21%
Asus ROG Zephyrus Duo 16 GX650RX
AMD Ryzen 9 6900HX
64457 MIPS -25%
7-Zip 18.03 / 7z b 4 -mmt1
Average Intel Core i9-12900K
  (6571 - 6580, n=2)
6576 MIPS +5%
MSI Raider GE77 HX 12UHS
Intel Core i9-12900HX
6357 MIPS +2%
Aorus 17X XES
Intel Core i9-12900HX
6343 MIPS +1%
Average Intel Core i9-12900HX
  (6165 - 6358, n=7)
6293 MIPS +1%
Average of class Gaming
  (4168 - 7581, n=188, last 2 years)
6286 MIPS 0%
MSI Titan GT77 12UHS
Intel Core i9-12900HX
6256 MIPS
Gigabyte Aero 16 YE5
Intel Core i9-12900HK
6186 MIPS -1%
MSI GE76 Raider
Intel Core i9-12900HK
6144 MIPS -2%
Alienware x17 R2 P48E
Intel Core i9-12900HK
5803 MIPS -7%
Asus ROG Zephyrus Duo 16 GX650RX
AMD Ryzen 9 6900HX
5727 MIPS -8%
MSI GE67 HX 12UGS
Intel Core i7-12800HX
5624 MIPS -10%
Geekbench 5.5 / Multi-Core
Average Intel Core i9-12900K
  (17698 - 17854, n=2)
17776 Points +9%
MSI Raider GE77 HX 12UHS
Intel Core i9-12900HX
16448 Points +1%
MSI Titan GT77 12UHS
Intel Core i9-12900HX
16250 Points
Average Intel Core i9-12900HX
  (15116 - 16925, n=8)
16247 Points 0%
Aorus 17X XES
Intel Core i9-12900HX
15116 Points -7%
Average of class Gaming
  (4557 - 23194, n=189, last 2 years)
14925 Points -8%
MSI GE67 HX 12UGS
Intel Core i7-12800HX
14213 Points -13%
Gigabyte Aero 16 YE5
Intel Core i9-12900HK
13865 Points -15%
Alienware x17 R2 P48E
Intel Core i9-12900HK
13717 Points -16%
MSI GE76 Raider
Intel Core i9-12900HK
13648 Points -16%
Asus ROG Zephyrus Duo 16 GX650RX
AMD Ryzen 9 6900HX
10167 Points -37%
Geekbench 5.5 / Single-Core
Average Intel Core i9-12900K
  (1969 - 2042, n=2)
2006 Points +4%
MSI Raider GE77 HX 12UHS
Intel Core i9-12900HX
1949 Points +1%
MSI Titan GT77 12UHS
Intel Core i9-12900HX
1923 Points
MSI GE76 Raider
Intel Core i9-12900HK
1918 Points 0%
Average Intel Core i9-12900HX
  (1874 - 1949, n=8)
1909 Points -1%
Aorus 17X XES
Intel Core i9-12900HX
1902 Points -1%
Average of class Gaming
  (986 - 2210, n=189, last 2 years)
1885 Points -2%
Alienware x17 R2 P48E
Intel Core i9-12900HK
1878 Points -2%
Gigabyte Aero 16 YE5
Intel Core i9-12900HK
1870 Points -3%
MSI GE67 HX 12UGS
Intel Core i7-12800HX
1759 Points -9%
Asus ROG Zephyrus Duo 16 GX650RX
AMD Ryzen 9 6900HX
1594 Points -17%
HWBOT x265 Benchmark v2.2 / 4k Preset
Average Intel Core i9-12900K
  (29 - 30, n=2)
29.5 fps +15%
MSI Raider GE77 HX 12UHS
Intel Core i9-12900HX
26 fps +2%
MSI Titan GT77 12UHS
Intel Core i9-12900HX
25.6 fps
Average Intel Core i9-12900HX
  (19.6 - 26.6, n=7)
25 fps -2%
MSI GE67 HX 12UGS
Intel Core i7-12800HX
24.9 fps -3%
Average of class Gaming
  (6.72 - 38.9, n=188, last 2 years)
23.4 fps -9%
Alienware x17 R2 P48E
Intel Core i9-12900HK
21.4 fps -16%
MSI GE76 Raider
Intel Core i9-12900HK
19.9 fps -22%
Aorus 17X XES
Intel Core i9-12900HX
19.6 fps -23%
Gigabyte Aero 16 YE5
Intel Core i9-12900HK
18.1 fps -29%
Asus ROG Zephyrus Duo 16 GX650RX
AMD Ryzen 9 6900HX
18 fps -30%
LibreOffice / 20 Documents To PDF
Average of class Gaming
  (31.4 - 96.6, n=185, last 2 years)
47.5 s * -22%
Asus ROG Zephyrus Duo 16 GX650RX
AMD Ryzen 9 6900HX
45 s * -15%
MSI Raider GE77 HX 12UHS
Intel Core i9-12900HX
42.4 s * -9%
MSI GE67 HX 12UGS
Intel Core i7-12800HX
42 s * -8%
Alienware x17 R2 P48E
Intel Core i9-12900HK
40.7 s * -4%
Average Intel Core i9-12900K
  (38.1 - 40.6, n=2)
39.4 s * -1%
Gigabyte Aero 16 YE5
Intel Core i9-12900HK
39 s * -0%
MSI Titan GT77 12UHS
Intel Core i9-12900HX
39 s *
MSI GE76 Raider
Intel Core i9-12900HK
38.9 s * -0%
Aorus 17X XES
Intel Core i9-12900HX
37.7 s * +3%
Average Intel Core i9-12900HX
  (33.6 - 42.4, n=7)
37.4 s * +4%
R Benchmark 2.5 / Overall mean
Asus ROG Zephyrus Duo 16 GX650RX
AMD Ryzen 9 6900HX
0.4799 sec * -14%
MSI GE67 HX 12UGS
Intel Core i7-12800HX
0.459 sec * -9%
Average of class Gaming
  (0.3609 - 0.759, n=189, last 2 years)
0.4399 sec * -5%
Alienware x17 R2 P48E
Intel Core i9-12900HK
0.4323 sec * -3%
MSI GE76 Raider
Intel Core i9-12900HK
0.4252 sec * -1%
MSI Raider GE77 HX 12UHS
Intel Core i9-12900HX
0.4239 sec * -1%
Average Intel Core i9-12900HX
  (0.4159 - 0.4242, n=7)
0.4211 sec * -0%
MSI Titan GT77 12UHS
Intel Core i9-12900HX
0.4194 sec *
Aorus 17X XES
Intel Core i9-12900HX
0.4159 sec * +1%
Gigabyte Aero 16 YE5
Intel Core i9-12900HK
0.4155 sec * +1%
Average Intel Core i9-12900K
  (0.3946 - 0.4216, n=2)
0.4081 sec * +3%

* ... más pequeño es mejor

Cinebench R15 CPU Multi 64Bit
3570 Points
Cinebench R15 OpenGL 64Bit
269 fps
Cinebench R15 Ref. Match 64Bit
99.6 %
Cinebench R15 CPU Single 64Bit
278 Points
Cinebench R20 CPU (Multi Core)
8667 Points
Cinebench R20 CPU (Single Core)
738 Points
Cinebench R23 Multi Core
22982 Points
Cinebench R23 Single Core
1913 Points
ayuda
Performance Rating
MSI Raider GE77 HX 12UHS
Intel Core i9-12900HX, GeForce RTX 3080 Ti Laptop GPU
94.1 pt
MSI Titan GT77 12UHS
Intel Core i9-12900HX, GeForce RTX 3080 Ti Laptop GPU
93.5 pt
Average of class Gaming
 
90.4 pt
Average Intel Core i9-12900HX
 
88 pt
Average Intel Core i9-12900K
 
80 pt
Asus ROG Zephyrus Duo 16 GX650RX
AMD Ryzen 9 6900HX, GeForce RTX 3080 Ti Laptop GPU
79.2 pt
Aorus 17X XES
Intel Core i9-12900HX, GeForce RTX 3070 Ti Laptop GPU
73.4 pt
MSI GE67 HX 12UGS
Intel Core i7-12800HX, GeForce RTX 3070 Ti Laptop GPU
66.7 pt
Alienware x17 R2 P48E
Intel Core i9-12900HK, GeForce RTX 3080 Ti Laptop GPU
62 pt
MSI GE76 Raider
Intel Core i9-12900HK, GeForce RTX 3080 Ti Laptop GPU
59.7 pt
Gigabyte Aero 16 YE5
Intel Core i9-12900HK, GeForce RTX 3080 Ti Laptop GPU
56.3 pt
AIDA64 / FP32 Ray-Trace
MSI Titan GT77 12UHS
Intel Core i9-12900HX, GeForce RTX 3080 Ti Laptop GPU
21797 KRay/s
Average of class Gaming
  (4986 - 60169, n=185, last 2 years)
21686 KRay/s -1%
MSI Raider GE77 HX 12UHS
Intel Core i9-12900HX, GeForce RTX 3080 Ti Laptop GPU
20004 KRay/s -8%
Average Intel Core i9-12900HX
  (11535 - 22183, n=7)
19240 KRay/s -12%
Asus ROG Zephyrus Duo 16 GX650RX
AMD Ryzen 9 6900HX, GeForce RTX 3080 Ti Laptop GPU
16852 KRay/s -23%
Aorus 17X XES
Intel Core i9-12900HX, GeForce RTX 3070 Ti Laptop GPU
15255 KRay/s -30%
Average Intel Core i9-12900K
  (12739 - 13345, n=3)
13117 KRay/s -40%
MSI GE67 HX 12UGS
Intel Core i7-12800HX, GeForce RTX 3070 Ti Laptop GPU
11088 KRay/s -49%
Alienware x17 R2 P48E
Intel Core i9-12900HK, GeForce RTX 3080 Ti Laptop GPU
9759 KRay/s -55%
MSI GE76 Raider
Intel Core i9-12900HK, GeForce RTX 3080 Ti Laptop GPU
9065 KRay/s -58%
Gigabyte Aero 16 YE5
Intel Core i9-12900HK, GeForce RTX 3080 Ti Laptop GPU
8265 KRay/s -62%
AIDA64 / FPU Julia
MSI Raider GE77 HX 12UHS
Intel Core i9-12900HX, GeForce RTX 3080 Ti Laptop GPU
110093 Points +3%
MSI Titan GT77 12UHS
Intel Core i9-12900HX, GeForce RTX 3080 Ti Laptop GPU
107354 Points
Average of class Gaming
  (25360 - 252486, n=185, last 2 years)
106189 Points -1%
Asus ROG Zephyrus Duo 16 GX650RX
AMD Ryzen 9 6900HX, GeForce RTX 3080 Ti Laptop GPU
103794 Points -3%
Average Intel Core i9-12900HX
  (52916 - 110093, n=7)
96060 Points -11%
Aorus 17X XES
Intel Core i9-12900HX, GeForce RTX 3070 Ti Laptop GPU
78356 Points -27%
Average Intel Core i9-12900K
  (58406 - 59419, n=3)
58991 Points -45%
MSI GE67 HX 12UGS
Intel Core i7-12800HX, GeForce RTX 3070 Ti Laptop GPU
49654 Points -54%
Alienware x17 R2 P48E
Intel Core i9-12900HK, GeForce RTX 3080 Ti Laptop GPU
43695 Points -59%
MSI GE76 Raider
Intel Core i9-12900HK, GeForce RTX 3080 Ti Laptop GPU
40570 Points -62%
Gigabyte Aero 16 YE5
Intel Core i9-12900HK, GeForce RTX 3080 Ti Laptop GPU
38277 Points -64%
AIDA64 / CPU SHA3
MSI Raider GE77 HX 12UHS
Intel Core i9-12900HX, GeForce RTX 3080 Ti Laptop GPU
5123 MB/s +4%
Average Intel Core i9-12900K
  (4796 - 5127, n=3)
4958 MB/s 0%
MSI Titan GT77 12UHS
Intel Core i9-12900HX, GeForce RTX 3080 Ti Laptop GPU
4945 MB/s
Average of class Gaming
  (1339 - 10389, n=185, last 2 years)
4862 MB/s -2%
Average Intel Core i9-12900HX
  (3559 - 5123, n=7)
4698 MB/s -5%
MSI GE67 HX 12UGS
Intel Core i7-12800HX, GeForce RTX 3070 Ti Laptop GPU
3977 MB/s -20%
Aorus 17X XES
Intel Core i9-12900HX, GeForce RTX 3070 Ti Laptop GPU
3559 MB/s -28%
Asus ROG Zephyrus Duo 16 GX650RX
AMD Ryzen 9 6900HX, GeForce RTX 3080 Ti Laptop GPU
3547 MB/s -28%
Alienware x17 R2 P48E
Intel Core i9-12900HK, GeForce RTX 3080 Ti Laptop GPU
3504 MB/s -29%
MSI GE76 Raider
Intel Core i9-12900HK, GeForce RTX 3080 Ti Laptop GPU
3178 MB/s -36%
Gigabyte Aero 16 YE5
Intel Core i9-12900HK, GeForce RTX 3080 Ti Laptop GPU
2931 MB/s -41%
AIDA64 / CPU Queen
Average of class Gaming
  (50699 - 200651, n=185, last 2 years)
116446 Points +12%
Average Intel Core i9-12900K
  (112066 - 112694, n=3)
112400 Points +8%
Alienware x17 R2 P48E
Intel Core i9-12900HK, GeForce RTX 3080 Ti Laptop GPU
107120 Points +3%
Gigabyte Aero 16 YE5
Intel Core i9-12900HK, GeForce RTX 3080 Ti Laptop GPU
107042 Points +3%
MSI GE76 Raider
Intel Core i9-12900HK, GeForce RTX 3080 Ti Laptop GPU
106414 Points +3%
Asus ROG Zephyrus Duo 16 GX650RX
AMD Ryzen 9 6900HX, GeForce RTX 3080 Ti Laptop GPU
104920 Points +1%
Aorus 17X XES
Intel Core i9-12900HX, GeForce RTX 3070 Ti Laptop GPU
104457 Points +1%
MSI Titan GT77 12UHS
Intel Core i9-12900HX, GeForce RTX 3080 Ti Laptop GPU
103770 Points
Average Intel Core i9-12900HX
  (101029 - 104457, n=7)
102903 Points -1%
MSI Raider GE77 HX 12UHS
Intel Core i9-12900HX, GeForce RTX 3080 Ti Laptop GPU
102056 Points -2%
MSI GE67 HX 12UGS
Intel Core i7-12800HX, GeForce RTX 3070 Ti Laptop GPU
91366 Points -12%
AIDA64 / FPU SinJulia
Average Intel Core i9-12900K
  (14590 - 14664, n=3)
14623 Points +13%
Average of class Gaming
  (4800 - 32988, n=185, last 2 years)
13194 Points +2%
MSI Titan GT77 12UHS
Intel Core i9-12900HX, GeForce RTX 3080 Ti Laptop GPU
12969 Points
Asus ROG Zephyrus Duo 16 GX650RX
AMD Ryzen 9 6900HX, GeForce RTX 3080 Ti Laptop GPU
12955 Points 0%
MSI Raider GE77 HX 12UHS
Intel Core i9-12900HX, GeForce RTX 3080 Ti Laptop GPU
12924 Points 0%
Average Intel Core i9-12900HX
  (10475 - 13062, n=7)
12627 Points -3%
MSI GE67 HX 12UGS
Intel Core i7-12800HX, GeForce RTX 3070 Ti Laptop GPU
12303 Points -5%
Aorus 17X XES
Intel Core i9-12900HX, GeForce RTX 3070 Ti Laptop GPU
10475 Points -19%
Alienware x17 R2 P48E
Intel Core i9-12900HK, GeForce RTX 3080 Ti Laptop GPU
10402 Points -20%
MSI GE76 Raider
Intel Core i9-12900HK, GeForce RTX 3080 Ti Laptop GPU
10237 Points -21%
Gigabyte Aero 16 YE5
Intel Core i9-12900HK, GeForce RTX 3080 Ti Laptop GPU
9655 Points -26%
AIDA64 / FPU Mandel
Asus ROG Zephyrus Duo 16 GX650RX
AMD Ryzen 9 6900HX, GeForce RTX 3080 Ti Laptop GPU
57334 Points +9%
Average of class Gaming
  (12321 - 134044, n=185, last 2 years)
53500 Points +2%
MSI Titan GT77 12UHS
Intel Core i9-12900HX, GeForce RTX 3080 Ti Laptop GPU
52544 Points
MSI Raider GE77 HX 12UHS
Intel Core i9-12900HX, GeForce RTX 3080 Ti Laptop GPU
52105 Points -1%
Average Intel Core i9-12900HX
  (31779 - 53628, n=7)
47917 Points -9%
Aorus 17X XES
Intel Core i9-12900HX, GeForce RTX 3070 Ti Laptop GPU
39016 Points -26%
Average Intel Core i9-12900K
  (35801 - 39323, n=3)
37722 Points -28%
MSI GE67 HX 12UGS
Intel Core i7-12800HX, GeForce RTX 3070 Ti Laptop GPU
31771 Points -40%
Alienware x17 R2 P48E
Intel Core i9-12900HK, GeForce RTX 3080 Ti Laptop GPU
27285 Points -48%
MSI GE76 Raider
Intel Core i9-12900HK, GeForce RTX 3080 Ti Laptop GPU
24693 Points -53%
Gigabyte Aero 16 YE5
Intel Core i9-12900HK, GeForce RTX 3080 Ti Laptop GPU
22873 Points -56%
AIDA64 / CPU AES
MSI Raider GE77 HX 12UHS
Intel Core i9-12900HX, GeForce RTX 3080 Ti Laptop GPU
183146 MB/s +2%
MSI Titan GT77 12UHS
Intel Core i9-12900HX, GeForce RTX 3080 Ti Laptop GPU
179186 MB/s
Average Intel Core i9-12900HX
  (125268 - 183146, n=7)
166223 MB/s -7%
Asus ROG Zephyrus Duo 16 GX650RX
AMD Ryzen 9 6900HX, GeForce RTX 3080 Ti Laptop GPU
139407 MB/s -22%
Aorus 17X XES
Intel Core i9-12900HX, GeForce RTX 3070 Ti Laptop GPU
134645 MB/s -25%
Average Intel Core i9-12900K
  (94062 - 140055, n=3)
123813 MB/s -31%
MSI GE67 HX 12UGS
Intel Core i7-12800HX, GeForce RTX 3070 Ti Laptop GPU
117708 MB/s -34%
Average of class Gaming
  (19065 - 328679, n=185, last 2 years)
109209 MB/s -39%
Alienware x17 R2 P48E
Intel Core i9-12900HK, GeForce RTX 3080 Ti Laptop GPU
106367 MB/s -41%
MSI GE76 Raider
Intel Core i9-12900HK, GeForce RTX 3080 Ti Laptop GPU
100062 MB/s -44%
Gigabyte Aero 16 YE5
Intel Core i9-12900HK, GeForce RTX 3080 Ti Laptop GPU
91041 MB/s -49%
AIDA64 / CPU ZLib
Average Intel Core i9-12900K
  (1537 - 1608, n=3)
1568 MB/s +13%
MSI Raider GE77 HX 12UHS
Intel Core i9-12900HX, GeForce RTX 3080 Ti Laptop GPU
1393 MB/s 0%
MSI Titan GT77 12UHS
Intel Core i9-12900HX, GeForce RTX 3080 Ti Laptop GPU
1389 MB/s
Average of class Gaming
  (373 - 2409, n=185, last 2 years)
1352 MB/s -3%
MSI GE67 HX 12UGS
Intel Core i7-12800HX, GeForce RTX 3070 Ti Laptop GPU
1351 MB/s -3%
Average Intel Core i9-12900HX
  (990 - 1408, n=7)
1336 MB/s -4%
Alienware x17 R2 P48E
Intel Core i9-12900HK, GeForce RTX 3080 Ti Laptop GPU
1203 MB/s -13%
MSI GE76 Raider
Intel Core i9-12900HK, GeForce RTX 3080 Ti Laptop GPU
1085 MB/s -22%
Aorus 17X XES
Intel Core i9-12900HX, GeForce RTX 3070 Ti Laptop GPU
990 MB/s -29%
Gigabyte Aero 16 YE5
Intel Core i9-12900HK, GeForce RTX 3080 Ti Laptop GPU
988 MB/s -29%
Asus ROG Zephyrus Duo 16 GX650RX
AMD Ryzen 9 6900HX, GeForce RTX 3080 Ti Laptop GPU
890 MB/s -36%
AIDA64 / FP64 Ray-Trace
Average of class Gaming
  (2540 - 31796, n=185, last 2 years)
11679 KRay/s +1%
MSI Titan GT77 12UHS
Intel Core i9-12900HX, GeForce RTX 3080 Ti Laptop GPU
11612 KRay/s
MSI Raider GE77 HX 12UHS
Intel Core i9-12900HX, GeForce RTX 3080 Ti Laptop GPU
10864 KRay/s -6%
Average Intel Core i9-12900HX
  (6663 - 11913, n=7)
10470 KRay/s -10%
Asus ROG Zephyrus Duo 16 GX650RX
AMD Ryzen 9 6900HX, GeForce RTX 3080 Ti Laptop GPU
9001 KRay/s -22%
Aorus 17X XES
Intel Core i9-12900HX, GeForce RTX 3070 Ti Laptop GPU
8518 KRay/s -27%
Average Intel Core i9-12900K
  (7586 - 8283, n=3)
7982 KRay/s -31%
MSI GE67 HX 12UGS
Intel Core i7-12800HX, GeForce RTX 3070 Ti Laptop GPU
6675 KRay/s -43%
Alienware x17 R2 P48E
Intel Core i9-12900HK, GeForce RTX 3080 Ti Laptop GPU
5748 KRay/s -50%
MSI GE76 Raider
Intel Core i9-12900HK, GeForce RTX 3080 Ti Laptop GPU
5239 KRay/s -55%
Gigabyte Aero 16 YE5
Intel Core i9-12900HK, GeForce RTX 3080 Ti Laptop GPU
4776 KRay/s -59%
AIDA64 / CPU PhotoWorxx
MSI Raider GE77 HX 12UHS
Intel Core i9-12900HX, GeForce RTX 3080 Ti Laptop GPU
47710 MPixel/s +16%
Average Intel Core i9-12900K
  (33311 - 49236, n=3)
43618 MPixel/s +6%
Average Intel Core i9-12900HX
  (40239 - 47710, n=7)
42604 MPixel/s +4%
MSI Titan GT77 12UHS
Intel Core i9-12900HX, GeForce RTX 3080 Ti Laptop GPU
41007 MPixel/s
Aorus 17X XES
Intel Core i9-12900HX, GeForce RTX 3070 Ti Laptop GPU
40386 MPixel/s -2%
MSI GE76 Raider
Intel Core i9-12900HK, GeForce RTX 3080 Ti Laptop GPU
40000 MPixel/s -2%
Average of class Gaming
  (10805 - 60161, n=186, last 2 years)
39997 MPixel/s -2%
Gigabyte Aero 16 YE5
Intel Core i9-12900HK, GeForce RTX 3080 Ti Laptop GPU
38990 MPixel/s -5%
Alienware x17 R2 P48E
Intel Core i9-12900HK, GeForce RTX 3080 Ti Laptop GPU
34534 MPixel/s -16%
MSI GE67 HX 12UGS
Intel Core i7-12800HX, GeForce RTX 3070 Ti Laptop GPU
32445 MPixel/s -21%
Asus ROG Zephyrus Duo 16 GX650RX
AMD Ryzen 9 6900HX, GeForce RTX 3080 Ti Laptop GPU
29705 MPixel/s -28%

Consulte nuestra sección dedicada al Intel Core i9-12900HX para obtener más información y comparaciones.

Rendimiento del sistema

El rendimiento general del sistema está en la línea esperada para un portátil con unas tripas tan potentes. Sin embargo, la velocidad de lectura/escritura de la memoria parece haberse visto afectada en comparación con el Raider GE77 HX 12UHS. Por lo demás, no notamos ningún problema en la productividad diaria o en las tareas de navegación web.

PCMark 10 / Score
MSI Titan GT77 12UHS
GeForce RTX 3080 Ti Laptop GPU, i9-12900HX, Samsung PM9A1 MZVL21T0HCLR
8203 Points
Alienware x17 R2 P48E
GeForce RTX 3080 Ti Laptop GPU, i9-12900HK, 2x Samsung PM9A1 1TB (RAID 0)
8186 Points 0%
MSI GE67 HX 12UGS
GeForce RTX 3070 Ti Laptop GPU, i7-12800HX, Samsung PM9A1 MZVL21T0HCLR
8042 Points -2%
MSI GE76 Raider
GeForce RTX 3080 Ti Laptop GPU, i9-12900HK, Samsung PM9A1 MZVL22T0HBLB
8007 Points -2%
Average Intel Core i9-12900HX, NVIDIA GeForce RTX 3080 Ti Laptop GPU
  (6812 - 8636, n=6)
7915 Points -4%
Aorus 17X XES
GeForce RTX 3070 Ti Laptop GPU, i9-12900HX, Gigabyte AG470S1TB-SI B10
7899 Points -4%
Gigabyte Aero 16 YE5
GeForce RTX 3080 Ti Laptop GPU, i9-12900HK, Phison ESR01TBMFCT
7816 Points -5%
Average of class Gaming
  (5776 - 9852, n=166, last 2 years)
7775 Points -5%
MSI Raider GE77 HX 12UHS
GeForce RTX 3080 Ti Laptop GPU, i9-12900HX, Samsung PM9A1 MZVL22T0HBLB
6993 Points -15%
Asus ROG Zephyrus Duo 16 GX650RX
GeForce RTX 3080 Ti Laptop GPU, R9 6900HX, 2x Samsung SSD 980 Pro 2TB MZ-V8P2T0 (RAID 0)
6351 Points -23%
PCMark 10 / Essentials
Alienware x17 R2 P48E
GeForce RTX 3080 Ti Laptop GPU, i9-12900HK, 2x Samsung PM9A1 1TB (RAID 0)
11205 Points +1%
MSI Titan GT77 12UHS
GeForce RTX 3080 Ti Laptop GPU, i9-12900HX, Samsung PM9A1 MZVL21T0HCLR
11093 Points
Gigabyte Aero 16 YE5
GeForce RTX 3080 Ti Laptop GPU, i9-12900HK, Phison ESR01TBMFCT
10945 Points -1%
MSI GE67 HX 12UGS
GeForce RTX 3070 Ti Laptop GPU, i7-12800HX, Samsung PM9A1 MZVL21T0HCLR
10919 Points -2%
Average of class Gaming
  (9057 - 12334, n=165, last 2 years)
10833 Points -2%
MSI GE76 Raider
GeForce RTX 3080 Ti Laptop GPU, i9-12900HK, Samsung PM9A1 MZVL22T0HBLB
10688 Points -4%
Average Intel Core i9-12900HX, NVIDIA GeForce RTX 3080 Ti Laptop GPU
  (9598 - 11192, n=6)
10636 Points -4%
Aorus 17X XES
GeForce RTX 3070 Ti Laptop GPU, i9-12900HX, Gigabyte AG470S1TB-SI B10
10589 Points -5%
MSI Raider GE77 HX 12UHS
GeForce RTX 3080 Ti Laptop GPU, i9-12900HX, Samsung PM9A1 MZVL22T0HBLB
9761 Points -12%
Asus ROG Zephyrus Duo 16 GX650RX
GeForce RTX 3080 Ti Laptop GPU, R9 6900HX, 2x Samsung SSD 980 Pro 2TB MZ-V8P2T0 (RAID 0)
9374 Points -15%
PCMark 10 / Productivity
Average Intel Core i9-12900HX, NVIDIA GeForce RTX 3080 Ti Laptop GPU
  (9365 - 10932, n=6)
10276 Points +1%
Aorus 17X XES
GeForce RTX 3070 Ti Laptop GPU, i9-12900HX, Gigabyte AG470S1TB-SI B10
10237 Points +1%
MSI Titan GT77 12UHS
GeForce RTX 3080 Ti Laptop GPU, i9-12900HX, Samsung PM9A1 MZVL21T0HCLR
10178 Points
Alienware x17 R2 P48E
GeForce RTX 3080 Ti Laptop GPU, i9-12900HK, 2x Samsung PM9A1 1TB (RAID 0)
10144 Points 0%
MSI GE76 Raider
GeForce RTX 3080 Ti Laptop GPU, i9-12900HK, Samsung PM9A1 MZVL22T0HBLB
10100 Points -1%
Gigabyte Aero 16 YE5
GeForce RTX 3080 Ti Laptop GPU, i9-12900HK, Phison ESR01TBMFCT
10050 Points -1%
MSI GE67 HX 12UGS
GeForce RTX 3070 Ti Laptop GPU, i7-12800HX, Samsung PM9A1 MZVL21T0HCLR
10023 Points -2%
Average of class Gaming
  (6662 - 14612, n=165, last 2 years)
9877 Points -3%
MSI Raider GE77 HX 12UHS
GeForce RTX 3080 Ti Laptop GPU, i9-12900HX, Samsung PM9A1 MZVL22T0HBLB
9682 Points -5%
Asus ROG Zephyrus Duo 16 GX650RX
GeForce RTX 3080 Ti Laptop GPU, R9 6900HX, 2x Samsung SSD 980 Pro 2TB MZ-V8P2T0 (RAID 0)
7704 Points -24%
PCMark 10 / Digital Content Creation
MSI Titan GT77 12UHS
GeForce RTX 3080 Ti Laptop GPU, i9-12900HX, Samsung PM9A1 MZVL21T0HCLR
13270 Points
Alienware x17 R2 P48E
GeForce RTX 3080 Ti Laptop GPU, i9-12900HK, 2x Samsung PM9A1 1TB (RAID 0)
13098 Points -1%
MSI GE76 Raider
GeForce RTX 3080 Ti Laptop GPU, i9-12900HK, Samsung PM9A1 MZVL22T0HBLB
12905 Points -3%
MSI GE67 HX 12UGS
GeForce RTX 3070 Ti Laptop GPU, i7-12800HX, Samsung PM9A1 MZVL21T0HCLR
12897 Points -3%
Average Intel Core i9-12900HX, NVIDIA GeForce RTX 3080 Ti Laptop GPU
  (9543 - 14291, n=6)
12358 Points -7%
Aorus 17X XES
GeForce RTX 3070 Ti Laptop GPU, i9-12900HX, Gigabyte AG470S1TB-SI B10
12342 Points -7%
Average of class Gaming
  (6703 - 18475, n=165, last 2 years)
12039 Points -9%
Gigabyte Aero 16 YE5
GeForce RTX 3080 Ti Laptop GPU, i9-12900HK, Phison ESR01TBMFCT
11777 Points -11%
MSI Raider GE77 HX 12UHS
GeForce RTX 3080 Ti Laptop GPU, i9-12900HX, Samsung PM9A1 MZVL22T0HBLB
9822 Points -26%
Asus ROG Zephyrus Duo 16 GX650RX
GeForce RTX 3080 Ti Laptop GPU, R9 6900HX, 2x Samsung SSD 980 Pro 2TB MZ-V8P2T0 (RAID 0)
9626 Points -27%
CrossMark / Overall
MSI Raider GE77 HX 12UHS
GeForce RTX 3080 Ti Laptop GPU, i9-12900HX, Samsung PM9A1 MZVL22T0HBLB
2169 Points +3%
Aorus 17X XES
GeForce RTX 3070 Ti Laptop GPU, i9-12900HX, Gigabyte AG470S1TB-SI B10
2155 Points +2%
Average Intel Core i9-12900HX, NVIDIA GeForce RTX 3080 Ti Laptop GPU
  (2108 - 2170, n=5)
2145 Points +2%
Gigabyte Aero 16 YE5
GeForce RTX 3080 Ti Laptop GPU, i9-12900HK, Phison ESR01TBMFCT
2113 Points 0%
MSI Titan GT77 12UHS
GeForce RTX 3080 Ti Laptop GPU, i9-12900HX, Samsung PM9A1 MZVL21T0HCLR
2108 Points
MSI GE67 HX 12UGS
GeForce RTX 3070 Ti Laptop GPU, i7-12800HX, Samsung PM9A1 MZVL21T0HCLR
1973 Points -6%
Alienware x17 R2 P48E
GeForce RTX 3080 Ti Laptop GPU, i9-12900HK, 2x Samsung PM9A1 1TB (RAID 0)
1903 Points -10%
Average of class Gaming
  (1247 - 2344, n=149, last 2 years)
1900 Points -10%
Asus ROG Zephyrus Duo 16 GX650RX
GeForce RTX 3080 Ti Laptop GPU, R9 6900HX, 2x Samsung SSD 980 Pro 2TB MZ-V8P2T0 (RAID 0)
1711 Points -19%
CrossMark / Productivity
MSI Raider GE77 HX 12UHS
GeForce RTX 3080 Ti Laptop GPU, i9-12900HX, Samsung PM9A1 MZVL22T0HBLB
2047 Points +3%
Gigabyte Aero 16 YE5
GeForce RTX 3080 Ti Laptop GPU, i9-12900HK, Phison ESR01TBMFCT
2031 Points +3%
Aorus 17X XES
GeForce RTX 3070 Ti Laptop GPU, i9-12900HX, Gigabyte AG470S1TB-SI B10
2030 Points +3%
Average Intel Core i9-12900HX, NVIDIA GeForce RTX 3080 Ti Laptop GPU
  (1978 - 2047, n=5)
2015 Points +2%
MSI Titan GT77 12UHS
GeForce RTX 3080 Ti Laptop GPU, i9-12900HX, Samsung PM9A1 MZVL21T0HCLR
1978 Points
MSI GE67 HX 12UGS
GeForce RTX 3070 Ti Laptop GPU, i7-12800HX, Samsung PM9A1 MZVL21T0HCLR
1874 Points -5%
Alienware x17 R2 P48E
GeForce RTX 3080 Ti Laptop GPU, i9-12900HK, 2x Samsung PM9A1 1TB (RAID 0)
1808 Points -9%
Average of class Gaming
  (1299 - 2204, n=149, last 2 years)
1802 Points -9%
Asus ROG Zephyrus Duo 16 GX650RX
GeForce RTX 3080 Ti Laptop GPU, R9 6900HX, 2x Samsung SSD 980 Pro 2TB MZ-V8P2T0 (RAID 0)
1698 Points -14%
CrossMark / Creativity
MSI Raider GE77 HX 12UHS
GeForce RTX 3080 Ti Laptop GPU, i9-12900HX, Samsung PM9A1 MZVL22T0HBLB
2328 Points +2%
Average Intel Core i9-12900HX, NVIDIA GeForce RTX 3080 Ti Laptop GPU
  (2288 - 2366, n=5)
2322 Points +1%
Aorus 17X XES
GeForce RTX 3070 Ti Laptop GPU, i9-12900HX, Gigabyte AG470S1TB-SI B10
2304 Points +1%
MSI Titan GT77 12UHS
GeForce RTX 3080 Ti Laptop GPU, i9-12900HX, Samsung PM9A1 MZVL21T0HCLR
2288 Points
Gigabyte Aero 16 YE5
GeForce RTX 3080 Ti Laptop GPU, i9-12900HK, Phison ESR01TBMFCT
2161 Points -6%
Alienware x17 R2 P48E
GeForce RTX 3080 Ti Laptop GPU, i9-12900HK, 2x Samsung PM9A1 1TB (RAID 0)
2095 Points -8%
MSI GE67 HX 12UGS
GeForce RTX 3070 Ti Laptop GPU, i7-12800HX, Samsung PM9A1 MZVL21T0HCLR
2089 Points -9%
Average of class Gaming
  (1275 - 2660, n=149, last 2 years)
2085 Points -9%
Asus ROG Zephyrus Duo 16 GX650RX
GeForce RTX 3080 Ti Laptop GPU, R9 6900HX, 2x Samsung SSD 980 Pro 2TB MZ-V8P2T0 (RAID 0)
1724 Points -25%
CrossMark / Responsiveness
Gigabyte Aero 16 YE5
GeForce RTX 3080 Ti Laptop GPU, i9-12900HK, Phison ESR01TBMFCT
2228 Points +12%
Aorus 17X XES
GeForce RTX 3070 Ti Laptop GPU, i9-12900HX, Gigabyte AG470S1TB-SI B10
2113 Points +6%
MSI Raider GE77 HX 12UHS
GeForce RTX 3080 Ti Laptop GPU, i9-12900HX, Samsung PM9A1 MZVL22T0HBLB
2090 Points +5%
Average Intel Core i9-12900HX, NVIDIA GeForce RTX 3080 Ti Laptop GPU
  (1991 - 2090, n=5)
2042 Points +3%
MSI Titan GT77 12UHS
GeForce RTX 3080 Ti Laptop GPU, i9-12900HX, Samsung PM9A1 MZVL21T0HCLR
1991 Points
MSI GE67 HX 12UGS
GeForce RTX 3070 Ti Laptop GPU, i7-12800HX, Samsung PM9A1 MZVL21T0HCLR
1941 Points -3%
Asus ROG Zephyrus Duo 16 GX650RX
GeForce RTX 3080 Ti Laptop GPU, R9 6900HX, 2x Samsung SSD 980 Pro 2TB MZ-V8P2T0 (RAID 0)
1715 Points -14%
Average of class Gaming
  (1030 - 2330, n=149, last 2 years)
1698 Points -15%
Alienware x17 R2 P48E
GeForce RTX 3080 Ti Laptop GPU, i9-12900HK, 2x Samsung PM9A1 1TB (RAID 0)
1666 Points -16%
PCMark 8 Home Score Accelerated v2
6253 puntos
PCMark 8 Creative Score Accelerated v2
10390 puntos
PCMark 8 Work Score Accelerated v2
7085 puntos
PCMark 10 Score
8203 puntos
ayuda
AIDA64 / Memory Copy
MSI Raider GE77 HX 12UHS
Intel Core i9-12900HX, GeForce RTX 3080 Ti Laptop GPU
70863 MB/s +11%
Average Intel Core i9-12900HX
  (62852 - 70863, n=7)
65526 MB/s +2%
Average of class Gaming
  (21842 - 94222, n=185, last 2 years)
65054 MB/s +2%
MSI Titan GT77 12UHS
Intel Core i9-12900HX, GeForce RTX 3080 Ti Laptop GPU
64030 MB/s
Aorus 17X XES
Intel Core i9-12900HX, GeForce RTX 3070 Ti Laptop GPU
62852 MB/s -2%
MSI GE76 Raider
Intel Core i9-12900HK, GeForce RTX 3080 Ti Laptop GPU
62554 MB/s -2%
Gigabyte Aero 16 YE5
Intel Core i9-12900HK, GeForce RTX 3080 Ti Laptop GPU
62419 MB/s -3%
Alienware x17 R2 P48E
Intel Core i9-12900HK, GeForce RTX 3080 Ti Laptop GPU
53861 MB/s -16%
Asus ROG Zephyrus Duo 16 GX650RX
AMD Ryzen 9 6900HX, GeForce RTX 3080 Ti Laptop GPU
53162 MB/s -17%
MSI GE67 HX 12UGS
Intel Core i7-12800HX, GeForce RTX 3070 Ti Laptop GPU
49810 MB/s -22%
AIDA64 / Memory Read
MSI Raider GE77 HX 12UHS
Intel Core i9-12900HX, GeForce RTX 3080 Ti Laptop GPU
72930 MB/s +17%
Average of class Gaming
  (23681 - 99713, n=185, last 2 years)
68795 MB/s +11%
Aorus 17X XES
Intel Core i9-12900HX, GeForce RTX 3070 Ti Laptop GPU
68051 MB/s +10%
Average Intel Core i9-12900HX
  (62140 - 72930, n=7)
67115 MB/s +8%
Gigabyte Aero 16 YE5
Intel Core i9-12900HK, GeForce RTX 3080 Ti Laptop GPU
65835 MB/s +6%
MSI GE76 Raider
Intel Core i9-12900HK, GeForce RTX 3080 Ti Laptop GPU
65452 MB/s +5%
MSI Titan GT77 12UHS
Intel Core i9-12900HX, GeForce RTX 3080 Ti Laptop GPU
62140 MB/s
MSI GE67 HX 12UGS
Intel Core i7-12800HX, GeForce RTX 3070 Ti Laptop GPU
57329 MB/s -8%
Alienware x17 R2 P48E
Intel Core i9-12900HK, GeForce RTX 3080 Ti Laptop GPU
57237 MB/s -8%
Asus ROG Zephyrus Duo 16 GX650RX
AMD Ryzen 9 6900HX, GeForce RTX 3080 Ti Laptop GPU
53321 MB/s -14%
AIDA64 / Memory Write
MSI Raider GE77 HX 12UHS
Intel Core i9-12900HX, GeForce RTX 3080 Ti Laptop GPU
67353 MB/s +12%
Average of class Gaming
  (22986 - 108954, n=185, last 2 years)
66829 MB/s +11%
MSI GE76 Raider
Intel Core i9-12900HK, GeForce RTX 3080 Ti Laptop GPU
64282 MB/s +7%
Average Intel Core i9-12900HX
  (60001 - 68782, n=7)
62827 MB/s +5%
Gigabyte Aero 16 YE5
Intel Core i9-12900HK, GeForce RTX 3080 Ti Laptop GPU
61981 MB/s +3%
MSI Titan GT77 12UHS
Intel Core i9-12900HX, GeForce RTX 3080 Ti Laptop GPU
60014 MB/s
Aorus 17X XES
Intel Core i9-12900HX, GeForce RTX 3070 Ti Laptop GPU
60001 MB/s 0%
MSI GE67 HX 12UGS
Intel Core i7-12800HX, GeForce RTX 3070 Ti Laptop GPU
57764 MB/s -4%
Asus ROG Zephyrus Duo 16 GX650RX
AMD Ryzen 9 6900HX, GeForce RTX 3080 Ti Laptop GPU
57180 MB/s -5%
Alienware x17 R2 P48E
Intel Core i9-12900HK, GeForce RTX 3080 Ti Laptop GPU
54443 MB/s -9%
AIDA64 / Memory Latency
Alienware x17 R2 P48E
Intel Core i9-12900HK, GeForce RTX 3080 Ti Laptop GPU
98.4 ns * -11%
MSI GE67 HX 12UGS
Intel Core i7-12800HX, GeForce RTX 3070 Ti Laptop GPU
95.7 ns * -8%
Average of class Gaming
  (59.5 - 259, n=185, last 2 years)
94.2 ns * -6%
MSI GE76 Raider
Intel Core i9-12900HK, GeForce RTX 3080 Ti Laptop GPU
92.6 ns * -4%
Asus ROG Zephyrus Duo 16 GX650RX
AMD Ryzen 9 6900HX, GeForce RTX 3080 Ti Laptop GPU
92.3 ns * -4%
Gigabyte Aero 16 YE5
Intel Core i9-12900HK, GeForce RTX 3080 Ti Laptop GPU
89.7 ns * -1%
MSI Titan GT77 12UHS
Intel Core i9-12900HX, GeForce RTX 3080 Ti Laptop GPU
88.8 ns *
Average Intel Core i9-12900HX
  (83.9 - 93.4, n=7)
87.9 ns * +1%
Aorus 17X XES
Intel Core i9-12900HX, GeForce RTX 3070 Ti Laptop GPU
87 ns * +2%
MSI Raider GE77 HX 12UHS
Intel Core i9-12900HX, GeForce RTX 3080 Ti Laptop GPU
83.9 ns * +6%

* ... más pequeño es mejor

Latencia del CPD

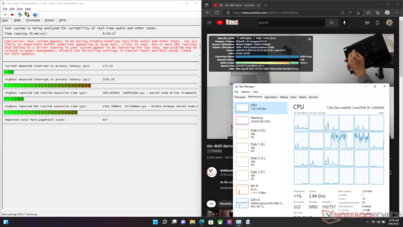
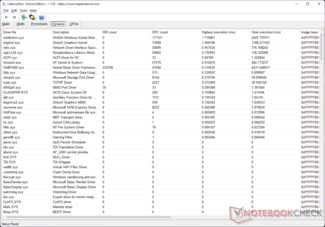
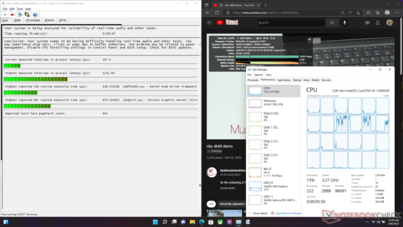
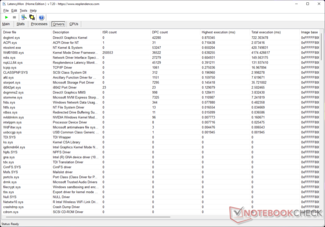
La MSI Titan GT77 sufre problemas de latencia DPC cuando se ejecuta en modo dGPU debido a los altos tiempos de ejecución del controlador Nvidia. El cambio al modo MSHybrid mejora considerablemente la latencia DPC, aunque es posible que quieras ajustar algunas de las configuraciones de rendimiento si te dedicas a los flujos de trabajo de audio/vídeo en tiempo real.

Latencia DPC - modo dGPU
El controlador del sistema en modo Kernel de Nvidia tiene el mayor tiempo de ejecución
Latencia del CPD - Modo MSHybrid
El núcleo gráfico de DirectX tiene el mayor tiempo de ejecución
DPC Latencies / LatencyMon - interrupt to process latency (max), Web, Youtube, Prime95
MSI Titan GT77 12UHS
GeForce RTX 3080 Ti Laptop GPU, i9-12900HX, Samsung PM9A1 MZVL21T0HCLR (dGPU)
2203.2 μs *
MSI Titan GT77 12UHS
GeForce RTX 3080 Ti Laptop GPU, i9-12900HX, Samsung PM9A1 MZVL21T0HCLR (MSHybrid)
638.25 μs * +71%
MSI GE67 HX 12UGS
GeForce RTX 3070 Ti Laptop GPU, i7-12800HX, Samsung PM9A1 MZVL21T0HCLR (Edge 103.0.1264.37)
1698.6 μs * +23%
MSI Raider GE77 HX 12UHS
GeForce RTX 3080 Ti Laptop GPU, i9-12900HX, Samsung PM9A1 MZVL22T0HBLB
1684.6 μs * +24%
MSI GE76 Raider
GeForce RTX 3080 Ti Laptop GPU, i9-12900HK, Samsung PM9A1 MZVL22T0HBLB
1642 μs * +25%
Aorus 17X XES
GeForce RTX 3070 Ti Laptop GPU, i9-12900HX, Gigabyte AG470S1TB-SI B10
1115 μs * +49%
Alienware x17 R2 P48E
GeForce RTX 3080 Ti Laptop GPU, i9-12900HK, 2x Samsung PM9A1 1TB (RAID 0) (Edge 101.0.1210.32)
1101.9 μs * +50%
Gigabyte Aero 16 YE5
GeForce RTX 3080 Ti Laptop GPU, i9-12900HK, Phison ESR01TBMFCT
623 μs * +72%
Asus ROG Zephyrus Duo 16 GX650RX
GeForce RTX 3080 Ti Laptop GPU, R9 6900HX, 2x Samsung SSD 980 Pro 2TB MZ-V8P2T0 (RAID 0)
521.5 μs * +76%

* ... más pequeño es mejor

Nuestro Clasificación de la latencia del CPD ofrece más comparaciones de latencia entre los dispositivos analizados.

Dispositivos de almacenamiento

El subsistema de almacenamiento es un área que MSI podría haber hecho mejor. Usa los SSDs NVMe PM9A1 de gama alta de Samsung - tenemos cuatro de ellos en nuestra unidad - pero la falta de cualquier tipo de solución térmica en estas unidades impide seriamente su rendimiento.

En las ejecuciones iniciales del benchmark, observamos un pobre rendimiento de lectura/escritura secuencial en todas las unidades excepto en la unidad D:. Sólo en las ejecuciones posteriores pudimos lograr cierta paridad en el rendimiento de todas las unidades instaladas.

La primera ranura M.2 es compatible con PCIe Gen5, lo que es una buena cosa para tener si usted planea la transición a la próxima generación de almacenamiento en la línea. Ésta y la segunda ranura M.2, que es PCIe Gen4, se conectan directamente a la CPU. Hay otras dos ranuras M.2 PCIe Gen4 que se conectan al chipset

La primera ranura M.2 de la Titan GT77 admite almacenamiento PCIe Gen5

No hay posibilidad de instalar unidades SATA de 2,5 pulgadas adicionales.

Samsung PM9A1 MZVL21T0HCLR
CDM 5/6 Read Seq Q32T1: 7058.7 MB/s
CDM 5/6 Write Seq Q32T1: 5157.6 MB/s
CDM 5/6 Read 4K Q32T1: 948.9 MB/s
CDM 5/6 Write 4K Q32T1: 744.5 MB/s
CDM 5 Read Seq: 4112 MB/s
CDM 5 Write Seq: 3844 MB/s
CDM 5/6 Read 4K: 82.19 MB/s
CDM 5/6 Write 4K: 243.5 MB/s
CDM 6 Write 4K Q8T8: 3017.8 MB/s
CDM 6 Read 4K Q8T8: 2927.6 MB/s
Drive Performance Rating - Percent
Gigabyte Aero 16 YE5
Phison ESR01TBMFCT
82 pt
MSI Raider GE77 HX 12UHS
Samsung PM9A1 MZVL22T0HBLB
77.7 pt
Aorus 17X XES
Gigabyte AG470S1TB-SI B10
76.2 pt
MSI GE67 HX 12UGS
Samsung PM9A1 MZVL21T0HCLR
76.2 pt
Asus ROG Zephyrus Duo 16 GX650RX
2x Samsung SSD 980 Pro 2TB MZ-V8P2T0 (RAID 0)
75.5 pt
MSI GE76 Raider
Samsung PM9A1 MZVL22T0HBLB
73.4 pt
MSI Titan GT77 12UHS
Samsung PM9A1 MZVL21T0HCLR
72.5 pt
Average Samsung PM9A1 MZVL21T0HCLR
 
62 pt
Average of class Gaming
 
59.4 pt
Alienware x17 R2 P48E
2x Samsung PM9A1 1TB (RAID 0)
57.2 pt
DiskSpd
seq read
Alienware x17 R2 P48E
2x Samsung PM9A1 1TB (RAID 0)
4931 (4875.77min - 4930.83max) MB/s +38%
Asus ROG Zephyrus Duo 16 GX650RX
2x Samsung SSD 980 Pro 2TB MZ-V8P2T0 (RAID 0)
4903 MB/s +38%
MSI GE67 HX 12UGS
Samsung PM9A1 MZVL21T0HCLR
3929 (3604.38min - 3929.22max) MB/s +10%
Aorus 17X XES
Gigabyte AG470S1TB-SI B10
3871 (2700.14min - 3870.94max) MB/s +9%
Gigabyte Aero 16 YE5
Phison ESR01TBMFCT
3819 (3405.77min - 3819.33max) MB/s +7%
Average Samsung PM9A1 MZVL21T0HCLR
  (1761 - 4677, n=85)
3764 MB/s +6%
MSI Raider GE77 HX 12UHS
Samsung PM9A1 MZVL22T0HBLB
3713 (3643.38min - 3713.01max) MB/s +4%
MSI Titan GT77 12UHS
Samsung PM9A1 MZVL21T0HCLR
3561 (3468.06min - 3560.96max) MB/s
Average of class Gaming
  (1319 - 7045, n=166, last 2 years)
3477 MB/s -2%
MSI GE76 Raider
Samsung PM9A1 MZVL22T0HBLB
2529 (2450.31min - 2528.54max) MB/s -29%
seq write
Asus ROG Zephyrus Duo 16 GX650RX
2x Samsung SSD 980 Pro 2TB MZ-V8P2T0 (RAID 0)
7889 (6495.73min - 7888.81max) MB/s +99%
Alienware x17 R2 P48E
2x Samsung PM9A1 1TB (RAID 0)
4819 (4728.89min - 4819.25max) MB/s +22%
Gigabyte Aero 16 YE5
Phison ESR01TBMFCT
4457 MB/s +12%
Aorus 17X XES
Gigabyte AG470S1TB-SI B10
4224 (3372.85min - 4224.08max) MB/s +7%
MSI GE67 HX 12UGS
Samsung PM9A1 MZVL21T0HCLR
4063 (4026.53min - 4062.87max) MB/s +2%
MSI Titan GT77 12UHS
Samsung PM9A1 MZVL21T0HCLR
3966 (3885.39min - 3966.13max) MB/s
MSI GE76 Raider
Samsung PM9A1 MZVL22T0HBLB
3923 (3818.83min - 3922.64max) MB/s -1%
Average of class Gaming
  (535 - 9307, n=166, last 2 years)
3794 MB/s -4%
MSI Raider GE77 HX 12UHS
Samsung PM9A1 MZVL22T0HBLB
3706 (3661.84min - 3706.09max) MB/s -7%
Average Samsung PM9A1 MZVL21T0HCLR
  (2220 - 4564, n=85)
3578 MB/s -10%
seq q8 t1 read
Alienware x17 R2 P48E
2x Samsung PM9A1 1TB (RAID 0)
13195 (9412.86min - 13194.8max) MB/s +96%
Asus ROG Zephyrus Duo 16 GX650RX
2x Samsung SSD 980 Pro 2TB MZ-V8P2T0 (RAID 0)
10557 (9742.97min - 10557.3max) MB/s +57%
Gigabyte Aero 16 YE5
Phison ESR01TBMFCT
7028 (6634.28min - 7027.76max) MB/s +5%
Aorus 17X XES
Gigabyte AG470S1TB-SI B10
6921 (6272.83min - 6920.6max) MB/s +3%
MSI GE76 Raider
Samsung PM9A1 MZVL22T0HBLB
6722 (5765.49min - 6722max) MB/s 0%
MSI Titan GT77 12UHS
Samsung PM9A1 MZVL21T0HCLR
6722 (987.46min - 6721.79max) MB/s
MSI Raider GE77 HX 12UHS
Samsung PM9A1 MZVL22T0HBLB
6695 (6233.69min - 6694.56max) MB/s 0%
MSI GE67 HX 12UGS
Samsung PM9A1 MZVL21T0HCLR
6683 (5972.9min - 6683.05max) MB/s -1%
Average Samsung PM9A1 MZVL21T0HCLR
  (3421 - 7100, n=85)
6477 MB/s -4%
Average of class Gaming
  (2594 - 16089, n=166, last 2 years)
6320 MB/s -6%
seq q8 t1 write
Asus ROG Zephyrus Duo 16 GX650RX
2x Samsung SSD 980 Pro 2TB MZ-V8P2T0 (RAID 0)
9830 (9799.27min - 9829.82max) MB/s +95%
Alienware x17 R2 P48E
2x Samsung PM9A1 1TB (RAID 0)
8227 (8104.29min - 8226.71max) MB/s +63%
MSI Titan GT77 12UHS
Samsung PM9A1 MZVL21T0HCLR
5037 (5025min - 5036.73max) MB/s
Gigabyte Aero 16 YE5
Phison ESR01TBMFCT
5004 (4980.32min - 5004.43max) MB/s -1%
MSI GE76 Raider
Samsung PM9A1 MZVL22T0HBLB
4999 (4978.75min - 4998.98max) MB/s -1%
MSI GE67 HX 12UGS
Samsung PM9A1 MZVL21T0HCLR
4985 (4972.98min - 4985.35max) MB/s -1%
MSI Raider GE77 HX 12UHS
Samsung PM9A1 MZVL22T0HBLB
4959 (4940min - 4958.51max) MB/s -2%
Aorus 17X XES
Gigabyte AG470S1TB-SI B10
4852 (4198.71min - 4852.39max) MB/s -4%
Average of class Gaming
  (539 - 14571, n=166, last 2 years)
4842 MB/s -4%
Average Samsung PM9A1 MZVL21T0HCLR
  (2216 - 5281, n=85)
4814 MB/s -4%
4k q1 t1 read
MSI GE67 HX 12UGS
Samsung PM9A1 MZVL21T0HCLR
93 (92.3min - 92.97max) MB/s +21%
MSI GE76 Raider
Samsung PM9A1 MZVL22T0HBLB
89.8 (89.42min - 89.75max) MB/s +17%
Gigabyte Aero 16 YE5
Phison ESR01TBMFCT
88.7 MB/s +15%
MSI Raider GE77 HX 12UHS
Samsung PM9A1 MZVL22T0HBLB
83 (80.23min - 83.02max) MB/s +8%
Alienware x17 R2 P48E
2x Samsung PM9A1 1TB (RAID 0)
79.3 (77.82min - 79.25max) MB/s +3%
MSI Titan GT77 12UHS
Samsung PM9A1 MZVL21T0HCLR
77 (74.91min - 76.95max) MB/s
Average Samsung PM9A1 MZVL21T0HCLR
  (48.4 - 97.4, n=85)
76.7 MB/s 0%
Aorus 17X XES
Gigabyte AG470S1TB-SI B10
74.1 (64.69min - 74.09max) MB/s -4%
Asus ROG Zephyrus Duo 16 GX650RX
2x Samsung SSD 980 Pro 2TB MZ-V8P2T0 (RAID 0)
73.1 (72.79min - 73.06max) MB/s -5%
Average of class Gaming
  (30.6 - 95.9, n=166, last 2 years)
65.8 MB/s -15%
4k q1 t1 write
Gigabyte Aero 16 YE5
Phison ESR01TBMFCT
373 (371.9min - 373.21max) MB/s +55%
Asus ROG Zephyrus Duo 16 GX650RX
2x Samsung SSD 980 Pro 2TB MZ-V8P2T0 (RAID 0)
359 (324.09min - 358.58max) MB/s +49%
Aorus 17X XES
Gigabyte AG470S1TB-SI B10
319 (315.54min - 318.7max) MB/s +32%
MSI Raider GE77 HX 12UHS
Samsung PM9A1 MZVL22T0HBLB
286 (284.91min - 285.72max) MB/s +19%
MSI GE76 Raider
Samsung PM9A1 MZVL22T0HBLB
275 (273.95min - 275.11max) MB/s +14%
MSI GE67 HX 12UGS
Samsung PM9A1 MZVL21T0HCLR
275 (263.41min - 275.06max) MB/s +14%
MSI Titan GT77 12UHS
Samsung PM9A1 MZVL21T0HCLR
241 MB/s
Average of class Gaming
  (66.6 - 397, n=166, last 2 years)
221 MB/s -8%
Average Samsung PM9A1 MZVL21T0HCLR
  (49.9 - 280, n=85)
188.5 MB/s -22%
Alienware x17 R2 P48E
2x Samsung PM9A1 1TB (RAID 0)
170.2 (168.21min - 170.2max) MB/s -29%
4k q32 t16 read
MSI GE67 HX 12UGS
Samsung PM9A1 MZVL21T0HCLR
4176 (4172.05min - 4175.71max) MB/s +10%
MSI Raider GE77 HX 12UHS
Samsung PM9A1 MZVL22T0HBLB
4075 (4059.83min - 4075.02max) MB/s +7%
MSI GE76 Raider
Samsung PM9A1 MZVL22T0HBLB
4073 (4064.94min - 4073.47max) MB/s +7%
MSI Titan GT77 12UHS
Samsung PM9A1 MZVL21T0HCLR
3797 (3780.09min - 3796.62max) MB/s
Aorus 17X XES
Gigabyte AG470S1TB-SI B10
3564 (3554.96min - 3563.6max) MB/s -6%
Gigabyte Aero 16 YE5
Phison ESR01TBMFCT
3555 (3552.55min - 3555.1max) MB/s -6%
Average Samsung PM9A1 MZVL21T0HCLR
  (376 - 4185, n=85)
2579 MB/s -32%
Average of class Gaming
  (417 - 6172, n=166, last 2 years)
2553 MB/s -33%
Asus ROG Zephyrus Duo 16 GX650RX
2x Samsung SSD 980 Pro 2TB MZ-V8P2T0 (RAID 0)
2390 (2226.95min - 2390.15max) MB/s -37%
Alienware x17 R2 P48E
2x Samsung PM9A1 1TB (RAID 0)
874 (867.39min - 873.79max) MB/s -77%
4k q32 t16 write
Gigabyte Aero 16 YE5
Phison ESR01TBMFCT
3612 (3585.78min - 3612.01max) MB/s +3%
Aorus 17X XES
Gigabyte AG470S1TB-SI B10
3570 (3534.41min - 3570.18max) MB/s +2%
MSI Titan GT77 12UHS
Samsung PM9A1 MZVL21T0HCLR
3504 (3465.89min - 3503.69max) MB/s
MSI Raider GE77 HX 12UHS
Samsung PM9A1 MZVL22T0HBLB
3503 (3468.77min - 3503.3max) MB/s 0%
MSI GE67 HX 12UGS
Samsung PM9A1 MZVL21T0HCLR
3491 (3437.82min - 3491.16max) MB/s 0%
Average of class Gaming
  (162.3 - 4869, n=166, last 2 years)
2112 MB/s -40%
Average Samsung PM9A1 MZVL21T0HCLR
  (291 - 3559, n=85)
1957 MB/s -44%
Asus ROG Zephyrus Duo 16 GX650RX
2x Samsung SSD 980 Pro 2TB MZ-V8P2T0 (RAID 0)
1542 (1501.74min - 1541.63max) MB/s -56%
MSI GE76 Raider
Samsung PM9A1 MZVL22T0HBLB
1066 (1060.72min - 1066.17max) MB/s -70%
Alienware x17 R2 P48E
2x Samsung PM9A1 1TB (RAID 0)
461 (442.02min - 461.29max) MB/s -87%
AS SSD
Score Total
Gigabyte Aero 16 YE5
Phison ESR01TBMFCT
9380 Points +10%
Aorus 17X XES
Gigabyte AG470S1TB-SI B10
9242 Points +9%
MSI GE76 Raider
Samsung PM9A1 MZVL22T0HBLB
8982 Points +6%
MSI GE67 HX 12UGS
Samsung PM9A1 MZVL21T0HCLR
8980 Points +6%
MSI Raider GE77 HX 12UHS
Samsung PM9A1 MZVL22T0HBLB
8951 Points +5%
MSI Titan GT77 12UHS
Samsung PM9A1 MZVL21T0HCLR
8492 Points
Average Samsung PM9A1 MZVL21T0HCLR
  (2577 - 9147, n=85)
6855 Points -19%
Average of class Gaming
  (2271 - 13854, n=157, last 2 years)
6729 Points -21%
Asus ROG Zephyrus Duo 16 GX650RX
2x Samsung SSD 980 Pro 2TB MZ-V8P2T0 (RAID 0)
6635 Points -22%
Alienware x17 R2 P48E
2x Samsung PM9A1 1TB (RAID 0)
4941 Points -42%
Score Read
Gigabyte Aero 16 YE5
Phison ESR01TBMFCT
3634 Points +9%
Aorus 17X XES
Gigabyte AG470S1TB-SI B10
3629 Points +9%
MSI GE67 HX 12UGS
Samsung PM9A1 MZVL21T0HCLR
3469 Points +4%
MSI Raider GE77 HX 12UHS
Samsung PM9A1 MZVL22T0HBLB
3399 Points +2%
MSI GE76 Raider
Samsung PM9A1 MZVL22T0HBLB
3344 Points +1%
MSI Titan GT77 12UHS
Samsung PM9A1 MZVL21T0HCLR
3327 Points
Asus ROG Zephyrus Duo 16 GX650RX
2x Samsung SSD 980 Pro 2TB MZ-V8P2T0 (RAID 0)
2619 Points -21%
Average of class Gaming
  (776 - 4721, n=157, last 2 years)
2440 Points -27%
Average Samsung PM9A1 MZVL21T0HCLR
  (983 - 3469, n=85)
2417 Points -27%
Alienware x17 R2 P48E
2x Samsung PM9A1 1TB (RAID 0)
1948 Points -41%
Score Write
MSI GE76 Raider
Samsung PM9A1 MZVL22T0HBLB
3997 Points +13%
Gigabyte Aero 16 YE5
Phison ESR01TBMFCT
3991 Points +13%
MSI Raider GE77 HX 12UHS
Samsung PM9A1 MZVL22T0HBLB
3882 Points +10%
Aorus 17X XES
Gigabyte AG470S1TB-SI B10
3877 Points +10%
MSI GE67 HX 12UGS
Samsung PM9A1 MZVL21T0HCLR
3799 Points +8%
MSI Titan GT77 12UHS
Samsung PM9A1 MZVL21T0HCLR
3531 Points
Average Samsung PM9A1 MZVL21T0HCLR
  (921 - 4043, n=85)
3272 Points -7%
Average of class Gaming
  (515 - 7208, n=157, last 2 years)
3106 Points -12%
Asus ROG Zephyrus Duo 16 GX650RX
2x Samsung SSD 980 Pro 2TB MZ-V8P2T0 (RAID 0)
2556 Points -28%
Alienware x17 R2 P48E
2x Samsung PM9A1 1TB (RAID 0)
2137 Points -39%
Seq Read
Alienware x17 R2 P48E
2x Samsung PM9A1 1TB (RAID 0)
6561.69 MB/s +30%
Aorus 17X XES
Gigabyte AG470S1TB-SI B10
5715 MB/s +13%
Gigabyte Aero 16 YE5
Phison ESR01TBMFCT
5588 MB/s +10%
Asus ROG Zephyrus Duo 16 GX650RX
2x Samsung SSD 980 Pro 2TB MZ-V8P2T0 (RAID 0)
5344.88 MB/s +6%
MSI GE67 HX 12UGS
Samsung PM9A1 MZVL21T0HCLR
5282.63 MB/s +4%
MSI GE76 Raider
Samsung PM9A1 MZVL22T0HBLB
5120 MB/s +1%
MSI Titan GT77 12UHS
Samsung PM9A1 MZVL21T0HCLR
5061.06 MB/s
MSI Raider GE77 HX 12UHS
Samsung PM9A1 MZVL22T0HBLB
5053.82 MB/s 0%
Average of class Gaming
  (2260 - 12763, n=157, last 2 years)
4939 MB/s -2%
Average Samsung PM9A1 MZVL21T0HCLR
  (2638 - 5621, n=85)
4891 MB/s -3%
Seq Write
Asus ROG Zephyrus Duo 16 GX650RX
2x Samsung SSD 980 Pro 2TB MZ-V8P2T0 (RAID 0)
7663.27 MB/s +104%
MSI GE67 HX 12UGS
Samsung PM9A1 MZVL21T0HCLR
3975.65 MB/s +6%
MSI Titan GT77 12UHS
Samsung PM9A1 MZVL21T0HCLR
3764.99 MB/s
Average of class Gaming
  (495 - 11316, n=157, last 2 years)
3737 MB/s -1%
MSI GE76 Raider
Samsung PM9A1 MZVL22T0HBLB
3692 MB/s -2%
MSI Raider GE77 HX 12UHS
Samsung PM9A1 MZVL22T0HBLB
3628.78 MB/s -4%
Alienware x17 R2 P48E
2x Samsung PM9A1 1TB (RAID 0)
3480.87 MB/s -8%
Average Samsung PM9A1 MZVL21T0HCLR
  (1617 - 4526, n=85)
3320 MB/s -12%
Gigabyte Aero 16 YE5
Phison ESR01TBMFCT
3267 MB/s -13%
Aorus 17X XES
Gigabyte AG470S1TB-SI B10
3218 MB/s -15%
4K Read
Gigabyte Aero 16 YE5
Phison ESR01TBMFCT
109.4 MB/s +57%
Aorus 17X XES
Gigabyte AG470S1TB-SI B10
94.04 MB/s +35%
MSI GE67 HX 12UGS
Samsung PM9A1 MZVL21T0HCLR
86.37 MB/s +24%
MSI GE76 Raider
Samsung PM9A1 MZVL22T0HBLB
82.8 MB/s +18%
MSI Raider GE77 HX 12UHS
Samsung PM9A1 MZVL22T0HBLB
82.47 MB/s +18%
Average Samsung PM9A1 MZVL21T0HCLR
  (45.9 - 89.2, n=85)
72.4 MB/s +4%
MSI Titan GT77 12UHS
Samsung PM9A1 MZVL21T0HCLR
69.89 MB/s
Alienware x17 R2 P48E
2x Samsung PM9A1 1TB (RAID 0)
69.21 MB/s -1%
Asus ROG Zephyrus Duo 16 GX650RX
2x Samsung SSD 980 Pro 2TB MZ-V8P2T0 (RAID 0)
68.93 MB/s -1%
Average of class Gaming
  (27.8 - 112.1, n=157, last 2 years)
65 MB/s -7%
4K Write
Asus ROG Zephyrus Duo 16 GX650RX
2x Samsung SSD 980 Pro 2TB MZ-V8P2T0 (RAID 0)
328.69 MB/s +55%
Gigabyte Aero 16 YE5
Phison ESR01TBMFCT
321.6 MB/s +52%
Aorus 17X XES
Gigabyte AG470S1TB-SI B10
256.3 MB/s +21%
MSI Raider GE77 HX 12UHS
Samsung PM9A1 MZVL22T0HBLB
247.61 MB/s +17%
MSI GE76 Raider
Samsung PM9A1 MZVL22T0HBLB
241.3 MB/s +14%
MSI GE67 HX 12UGS
Samsung PM9A1 MZVL21T0HCLR
240.81 MB/s +14%
MSI Titan GT77 12UHS
Samsung PM9A1 MZVL21T0HCLR
211.73 MB/s
Average of class Gaming
  (108.8 - 512, n=157, last 2 years)
211 MB/s 0%
Average Samsung PM9A1 MZVL21T0HCLR
  (118.6 - 246, n=85)
186 MB/s -12%
Alienware x17 R2 P48E
2x Samsung PM9A1 1TB (RAID 0)
184.49 MB/s -13%
4K-64 Read
Gigabyte Aero 16 YE5
Phison ESR01TBMFCT
2966 MB/s +8%
Aorus 17X XES
Gigabyte AG470S1TB-SI B10
2963 MB/s +8%
MSI GE67 HX 12UGS
Samsung PM9A1 MZVL21T0HCLR
2854.25 MB/s +4%
MSI Raider GE77 HX 12UHS
Samsung PM9A1 MZVL22T0HBLB
2811.14 MB/s +2%
MSI Titan GT77 12UHS
Samsung PM9A1 MZVL21T0HCLR
2751.05 MB/s
MSI GE76 Raider
Samsung PM9A1 MZVL22T0HBLB
2749 MB/s 0%
Asus ROG Zephyrus Duo 16 GX650RX
2x Samsung SSD 980 Pro 2TB MZ-V8P2T0 (RAID 0)
2015.68 MB/s -27%
Average of class Gaming
  (451 - 3475, n=157, last 2 years)
1875 MB/s -32%
Average Samsung PM9A1 MZVL21T0HCLR
  (421 - 2854, n=85)
1855 MB/s -33%
Alienware x17 R2 P48E
2x Samsung PM9A1 1TB (RAID 0)
1223.07 MB/s -56%
4K-64 Write
MSI GE76 Raider
Samsung PM9A1 MZVL22T0HBLB
3387 MB/s +15%
Gigabyte Aero 16 YE5
Phison ESR01TBMFCT
3342 MB/s +14%
Aorus 17X XES
Gigabyte AG470S1TB-SI B10
3299 MB/s +12%
MSI Raider GE77 HX 12UHS
Samsung PM9A1 MZVL22T0HBLB
3271.86 MB/s +11%
MSI GE67 HX 12UGS
Samsung PM9A1 MZVL21T0HCLR
3160.56 MB/s +7%
MSI Titan GT77 12UHS
Samsung PM9A1 MZVL21T0HCLR
2942.87 MB/s
Average Samsung PM9A1 MZVL21T0HCLR
  (367 - 3451, n=85)
2754 MB/s -6%
Average of class Gaming
  (277 - 5909, n=157, last 2 years)
2524 MB/s -14%
Alienware x17 R2 P48E
2x Samsung PM9A1 1TB (RAID 0)
1604.89 MB/s -45%
Asus ROG Zephyrus Duo 16 GX650RX
2x Samsung SSD 980 Pro 2TB MZ-V8P2T0 (RAID 0)
1460.96 MB/s -50%
Access Time Read
Aorus 17X XES
Gigabyte AG470S1TB-SI B10
0.085 ms * -73%
Gigabyte Aero 16 YE5
Phison ESR01TBMFCT
0.056 ms * -14%
Average of class Gaming
  (0.016 - 0.379, n=156, last 2 years)
0.05537 ms * -13%
Asus ROG Zephyrus Duo 16 GX650RX
2x Samsung SSD 980 Pro 2TB MZ-V8P2T0 (RAID 0)
0.053 ms * -8%
MSI Titan GT77 12UHS
Samsung PM9A1 MZVL21T0HCLR
0.049 ms *
Average Samsung PM9A1 MZVL21T0HCLR
  (0.018 - 0.083, n=84)
0.03777 ms * +23%
Alienware x17 R2 P48E
2x Samsung PM9A1 1TB (RAID 0)
0.03 ms * +39%
MSI Raider GE77 HX 12UHS
Samsung PM9A1 MZVL22T0HBLB
0.03 ms * +39%
MSI GE76 Raider
Samsung PM9A1 MZVL22T0HBLB
0.029 ms * +41%
MSI GE67 HX 12UGS
Samsung PM9A1 MZVL21T0HCLR
0.029 ms * +41%
Access Time Write
Alienware x17 R2 P48E
2x Samsung PM9A1 1TB (RAID 0)
0.066 ms * -230%
MSI GE67 HX 12UGS
Samsung PM9A1 MZVL21T0HCLR
0.054 ms * -170%
Average of class Gaming
  (0.011 - 1.028, n=157, last 2 years)
0.04852 ms * -143%
Average Samsung PM9A1 MZVL21T0HCLR
  (0.017 - 0.101, n=85)
0.03406 ms * -70%
MSI Titan GT77 12UHS
Samsung PM9A1 MZVL21T0HCLR
0.02 ms *
MSI GE76 Raider
Samsung PM9A1 MZVL22T0HBLB
0.018 ms * +10%
MSI Raider GE77 HX 12UHS
Samsung PM9A1 MZVL22T0HBLB
0.017 ms * +15%
Aorus 17X XES
Gigabyte AG470S1TB-SI B10
0.014 ms * +30%
Asus ROG Zephyrus Duo 16 GX650RX
2x Samsung SSD 980 Pro 2TB MZ-V8P2T0 (RAID 0)
0.013 ms * +35%
Gigabyte Aero 16 YE5
Phison ESR01TBMFCT
0.012 ms * +40%

* ... más pequeño es mejor

Debido a la falta de una solución térmica eficaz en la unidad o en el panel inferior, a menudo experimentamos graves caídas de rendimiento en las pruebas de lectura/escritura. El Samsung PM9A1 es incapaz de mantener una buena velocidad de lectura sostenida, como se vio en nuestra prueba DiskSpd Read Loop con una profundidad de cola de 8.

Disk Throttling: DiskSpd Read Loop, Queue Depth 8

03256509751300162519502275260029253250357539004225455048755200552558506175Tooltip
MSI Titan GT77 12UHS: Ø4885 (3287-6413.09)

Consulte nuestra sección dedicada a Benchmarks de SSD y HDD para ver más comparaciones de dispositivos de almacenamiento.

Rendimiento de la GPU

La RTX 3080 Ti de la Titan GT77 funciona con un TGP de 175 W

Nuestra unidad de prueba Titan GT77 tiene una GPU RTX 3080 Ti para portátiles de 175 W. MSI o Intel no especifican explícitamente el Dynamic Boost para esta GPU, pero suponemos que sería de 15 W

El rendimiento general en 3DMark empata con el de otros portátiles con RTX 3080 Ti en la comparación. La RTX 3080 Ti del Gigabyte Aero 16 YE5 es alrededor de un 26% más lenta en general en 3DMark debido al bajo TGP de 105 W.

GPU-Z - GPU Nvidia GeForce RTX 3080 Ti para portátiles
3DMark Time Spy Las puntuaciones caen drásticamente con la batería

El rendimiento de la GPU cae en picado con la batería, con una pérdida de rendimiento de hasta el 75% en Time Spy Graphics. Según 3DMark, la puntuación reducida sigue correspondiendo a unos 40+ fps en Battlefield V a 1440p Ultra.

La desconexión de la red eléctrica también reduce la tasa de refresco de la pantalla de 360 Hz a 60 Hz.

3DMark Performance Rating - Percent
MSI GE76 Raider
NVIDIA GeForce RTX 3080 Ti Laptop GPU, Intel Core i9-12900HK
99.3 pt
MSI Titan GT77 12UHS
NVIDIA GeForce RTX 3080 Ti Laptop GPU, Intel Core i9-12900HX
99.1 pt
Alienware x17 R2 P48E
NVIDIA GeForce RTX 3080 Ti Laptop GPU, Intel Core i9-12900HK
92.8 pt
MSI GE67 HX 12UGS
NVIDIA GeForce RTX 3070 Ti Laptop GPU, Intel Core i7-12800HX
89.9 pt
Average of class Gaming
 
89.7 pt
MSI Raider GE77 HX 12UHS
NVIDIA GeForce RTX 3080 Ti Laptop GPU, Intel Core i9-12900HX
86.5 pt
Average NVIDIA GeForce RTX 3080 Ti Laptop GPU
 
84.1 pt
Aorus 17X XES
NVIDIA GeForce RTX 3070 Ti Laptop GPU, Intel Core i9-12900HX
74.1 pt
Asus ROG Zephyrus Duo 16 GX650RX
NVIDIA GeForce RTX 3080 Ti Laptop GPU, AMD Ryzen 9 6900HX
73.4 pt
Gigabyte Aero 16 YE5
NVIDIA GeForce RTX 3080 Ti Laptop GPU, Intel Core i9-12900HK
63.3 pt
3DMark 11 - 1280x720 Performance GPU
MSI GE76 Raider
NVIDIA GeForce RTX 3080 Ti Laptop GPU, Intel Core i9-12900HK
45050 Points 0%
MSI Titan GT77 12UHS
NVIDIA GeForce RTX 3080 Ti Laptop GPU, Intel Core i9-12900HX
44906 Points
MSI Raider GE77 HX 12UHS
NVIDIA GeForce RTX 3080 Ti Laptop GPU, Intel Core i9-12900HX
44393 Points -1%
Alienware x17 R2 P48E
NVIDIA GeForce RTX 3080 Ti Laptop GPU, Intel Core i9-12900HK
44381 Points -1%
Average of class Gaming
  (1029 - 72178, n=184, last 2 years)
43666 Points -3%
MSI GE67 HX 12UGS
NVIDIA GeForce RTX 3070 Ti Laptop GPU, Intel Core i7-12800HX
42212 Points -6%
Asus ROG Zephyrus Duo 16 GX650RX
NVIDIA GeForce RTX 3080 Ti Laptop GPU, AMD Ryzen 9 6900HX
40257 Points -10%
Average NVIDIA GeForce RTX 3080 Ti Laptop GPU
  (13920 - 45841, n=45)
39402 Points -12%
Gigabyte Aero 16 YE5
NVIDIA GeForce RTX 3080 Ti Laptop GPU, Intel Core i9-12900HK
33249 Points -26%
Aorus 17X XES
NVIDIA GeForce RTX 3070 Ti Laptop GPU, Intel Core i9-12900HX
32001 Points -29%
3DMark
1280x720 Cloud Gate Standard Graphics
MSI GE76 Raider
NVIDIA GeForce RTX 3080 Ti Laptop GPU, Intel Core i9-12900HK
192520 Points +3%
MSI Titan GT77 12UHS
NVIDIA GeForce RTX 3080 Ti Laptop GPU, Intel Core i9-12900HX
186284 Points
MSI GE67 HX 12UGS
NVIDIA GeForce RTX 3070 Ti Laptop GPU, Intel Core i7-12800HX
168590 Points -9%
Aorus 17X XES
NVIDIA GeForce RTX 3070 Ti Laptop GPU, Intel Core i9-12900HX
151618 Points -19%
Alienware x17 R2 P48E
NVIDIA GeForce RTX 3080 Ti Laptop GPU, Intel Core i9-12900HK
150156 Points -19%
Average NVIDIA GeForce RTX 3080 Ti Laptop GPU
  (73574 - 192520, n=26)
145836 Points -22%
Average of class Gaming
  (15902 - 193851, n=100, last 2 years)
143183 Points -23%
MSI Raider GE77 HX 12UHS
NVIDIA GeForce RTX 3080 Ti Laptop GPU, Intel Core i9-12900HX
116343 Points -38%
Asus ROG Zephyrus Duo 16 GX650RX
NVIDIA GeForce RTX 3080 Ti Laptop GPU, AMD Ryzen 9 6900HX
79498 Points -57%
Gigabyte Aero 16 YE5
NVIDIA GeForce RTX 3080 Ti Laptop GPU, Intel Core i9-12900HK
73574 Points -61%
1920x1080 Fire Strike Graphics
MSI Titan GT77 12UHS
NVIDIA GeForce RTX 3080 Ti Laptop GPU, Intel Core i9-12900HX
34439 Points
MSI GE76 Raider
NVIDIA GeForce RTX 3080 Ti Laptop GPU, Intel Core i9-12900HK
34041 Points -1%
Alienware x17 R2 P48E
NVIDIA GeForce RTX 3080 Ti Laptop GPU, Intel Core i9-12900HK
32849 Points -5%
MSI Raider GE77 HX 12UHS
NVIDIA GeForce RTX 3080 Ti Laptop GPU, Intel Core i9-12900HX
31732 Points -8%
Average of class Gaming
  (781 - 53059, n=194, last 2 years)
31337 Points -9%
MSI GE67 HX 12UGS
NVIDIA GeForce RTX 3070 Ti Laptop GPU, Intel Core i7-12800HX
31096 Points -10%
Average NVIDIA GeForce RTX 3080 Ti Laptop GPU
  (6928 - 34439, n=43)
29496 Points -14%
Asus ROG Zephyrus Duo 16 GX650RX
NVIDIA GeForce RTX 3080 Ti Laptop GPU, AMD Ryzen 9 6900HX
27562 Points -20%
Aorus 17X XES
NVIDIA GeForce RTX 3070 Ti Laptop GPU, Intel Core i9-12900HX
25538 Points -26%
Gigabyte Aero 16 YE5
NVIDIA GeForce RTX 3080 Ti Laptop GPU, Intel Core i9-12900HK
24580 Points -29%
2560x1440 Time Spy Graphics
MSI Titan GT77 12UHS
NVIDIA GeForce RTX 3080 Ti Laptop GPU, Intel Core i9-12900HX
13554 Points
Alienware x17 R2 P48E
NVIDIA GeForce RTX 3080 Ti Laptop GPU, Intel Core i9-12900HK
13455 Points -1%
MSI GE76 Raider
NVIDIA GeForce RTX 3080 Ti Laptop GPU, Intel Core i9-12900HK
13324 Points -2%
Average of class Gaming
  (224 - 22717, n=189, last 2 years)
13077 Points -4%
MSI Raider GE77 HX 12UHS
NVIDIA GeForce RTX 3080 Ti Laptop GPU, Intel Core i9-12900HX
12865 Points -5%
MSI GE67 HX 12UGS
NVIDIA GeForce RTX 3070 Ti Laptop GPU, Intel Core i7-12800HX
11938 Points -12%
Average NVIDIA GeForce RTX 3080 Ti Laptop GPU
  (4921 - 13835, n=43)
11850 Points -13%
Asus ROG Zephyrus Duo 16 GX650RX
NVIDIA GeForce RTX 3080 Ti Laptop GPU, AMD Ryzen 9 6900HX
11227 Points -17%
Aorus 17X XES
NVIDIA GeForce RTX 3070 Ti Laptop GPU, Intel Core i9-12900HX
9834 Points -27%
Gigabyte Aero 16 YE5
NVIDIA GeForce RTX 3080 Ti Laptop GPU, Intel Core i9-12900HK
9488 Points -30%
3DMark 11 Performance
36141 puntos
3DMark Ice Storm Standard Score
290945 puntos
3DMark Cloud Gate Standard Score
65134 puntos
3DMark Fire Strike Score
30196 puntos
3DMark Fire Strike Extreme Score
16347 puntos
3DMark Time Spy Score
13618 puntos
ayuda

Rendimiento de los juegos

La Titan GT77 encabeza las listas en la mayoría de juegos que hemos probado y suele empatar con la Raider GE77 HX 12UHS. La RTX 3080 Ti es capaz de ejecutar un buen número de títulos modernos a 4K Ultra con velocidades de fotogramas que a menudo superan los 60 fps. El rendimiento del trazado de rayos es decente, pero querrás habilitar el DLSS para obtener mayores velocidades de fotogramas.

The Witcher 3
1366x768 Medium Graphics & Postprocessing
MSI Titan GT77 12UHS
Intel Core i9-12900HX, NVIDIA GeForce RTX 3080 Ti Laptop GPU
411 (335min, 342.98P1) fps
MSI Raider GE77 HX 12UHS
Intel Core i9-12900HX, NVIDIA GeForce RTX 3080 Ti Laptop GPU
392 (38.3min, 108.2P0.1, 238P1) fps -5%
Alienware x17 R2 P48E
Intel Core i9-12900HK, NVIDIA GeForce RTX 3080 Ti Laptop GPU
388.5 (358min) fps -5%
MSI GE76 Raider
Intel Core i9-12900HK, NVIDIA GeForce RTX 3080 Ti Laptop GPU
384 (317min) fps -7%
Average of class Gaming
  (168.5 - 617, n=100, last 2 years)
362 fps -12%
Average NVIDIA GeForce RTX 3080 Ti Laptop GPU
  (200 - 411, n=26)
330 fps -20%
MSI GE67 HX 12UGS
Intel Core i7-12800HX, NVIDIA GeForce RTX 3070 Ti Laptop GPU
329 (295min) fps -20%
Asus ROG Zephyrus Duo 16 GX650RX
AMD Ryzen 9 6900HX, NVIDIA GeForce RTX 3080 Ti Laptop GPU
298 (53.9min, 130.5P0.1, 211P1) fps -27%
Gigabyte Aero 16 YE5
Intel Core i9-12900HK, NVIDIA GeForce RTX 3080 Ti Laptop GPU
278 (27min, 80.6P0.1, 167P1) fps -32%
1920x1080 High Graphics & Postprocessing (Nvidia HairWorks Off)
Alienware x17 R2 P48E
Intel Core i9-12900HK, NVIDIA GeForce RTX 3080 Ti Laptop GPU
267.7 (247min) fps +3%
MSI Titan GT77 12UHS
Intel Core i9-12900HX, NVIDIA GeForce RTX 3080 Ti Laptop GPU
260 (213min, 216.3P1) fps
MSI Raider GE77 HX 12UHS
Intel Core i9-12900HX, NVIDIA GeForce RTX 3080 Ti Laptop GPU
249 (39.7min, 69.3P0.1, 165.5P1) fps -4%
MSI GE76 Raider
Intel Core i9-12900HK, NVIDIA GeForce RTX 3080 Ti Laptop GPU
247 (213min) fps -5%
Average of class Gaming
  (35.6 - 449, n=123, last 2 years)
239 fps -8%
MSI GE67 HX 12UGS
Intel Core i7-12800HX, NVIDIA GeForce RTX 3070 Ti Laptop GPU
223.3 (204min) fps -14%
Average NVIDIA GeForce RTX 3080 Ti Laptop GPU
  (144 - 268, n=28)
220 fps -15%
Asus ROG Zephyrus Duo 16 GX650RX
AMD Ryzen 9 6900HX, NVIDIA GeForce RTX 3080 Ti Laptop GPU
197.9 (47.7min, 61.4P0.1, 127.7P1) fps -24%
Aorus 17X XES
Intel Core i9-12900HX, NVIDIA GeForce RTX 3070 Ti Laptop GPU
158 fps -39%
Gigabyte Aero 16 YE5
Intel Core i9-12900HK, NVIDIA GeForce RTX 3080 Ti Laptop GPU
144 (33.3min, 39.8P0.1, 65P1) fps -45%
1920x1080 Ultra Graphics & Postprocessing (HBAO+)
MSI Titan GT77 12UHS
Intel Core i9-12900HX, NVIDIA GeForce RTX 3080 Ti Laptop GPU
129.3 (110min, 111.14P1) fps
Alienware x17 R2 P48E
Intel Core i9-12900HK, NVIDIA GeForce RTX 3080 Ti Laptop GPU
128 (124min) fps -1%
Average of class Gaming
  (18.4 - 216, n=166, last 2 years)
127.4 fps -1%
MSI Raider GE77 HX 12UHS
Intel Core i9-12900HX, NVIDIA GeForce RTX 3080 Ti Laptop GPU
126.7 (29.1min, 45.6P0.1, 97.9P1) fps -2%
MSI GE76 Raider
Intel Core i9-12900HK, NVIDIA GeForce RTX 3080 Ti Laptop GPU
126 (108min) fps -3%
MSI GE67 HX 12UGS
Intel Core i7-12800HX, NVIDIA GeForce RTX 3070 Ti Laptop GPU
112.7 (105min) fps -13%
Average NVIDIA GeForce RTX 3080 Ti Laptop GPU
  (30 - 130.6, n=43)
112.1 fps -13%
Asus ROG Zephyrus Duo 16 GX650RX
AMD Ryzen 9 6900HX, NVIDIA GeForce RTX 3080 Ti Laptop GPU
111.1 (30min, 41.5P0.1, 74.7P1) fps -14%
Aorus 17X XES
Intel Core i9-12900HX, NVIDIA GeForce RTX 3070 Ti Laptop GPU
93.7 (80min) fps -28%
Gigabyte Aero 16 YE5
Intel Core i9-12900HK, NVIDIA GeForce RTX 3080 Ti Laptop GPU
92.2 (19.1min, 45.8P0.1, 67.7P1) fps -29%
GTA V
1366x768 Normal/Off AF:4x
MSI Raider GE77 HX 12UHS
Intel Core i9-12900HX, NVIDIA GeForce RTX 3080 Ti Laptop GPU
187 (1.55min, 200P1) fps 0%
MSI Titan GT77 12UHS
Intel Core i9-12900HX, NVIDIA GeForce RTX 3080 Ti Laptop GPU
186.8 (1.467min, 166.7P1) fps
Alienware x17 R2 P48E
Intel Core i9-12900HK, NVIDIA GeForce RTX 3080 Ti Laptop GPU
185.1 (2.11min, 142.9P1) fps -1%
Gigabyte Aero 16 YE5
Intel Core i9-12900HK, NVIDIA GeForce RTX 3080 Ti Laptop GPU
185 (2.04min, 143P1) fps -1%
MSI GE67 HX 12UGS
Intel Core i7-12800HX, NVIDIA GeForce RTX 3070 Ti Laptop GPU
184.7 (1.994min, 125P1) fps -1%
MSI GE76 Raider
Intel Core i9-12900HK, NVIDIA GeForce RTX 3080 Ti Laptop GPU
184 (2.19min, 143P1) fps -1%
Average NVIDIA GeForce RTX 3080 Ti Laptop GPU
  (170.7 - 187, n=26)
182.1 fps -3%
Average of class Gaming
  (121.7 - 187.6, n=122, last 2 years)
180 fps -4%
Asus ROG Zephyrus Duo 16 GX650RX
AMD Ryzen 9 6900HX, NVIDIA GeForce RTX 3080 Ti Laptop GPU
175.4 (5.56min, 125P1) fps -6%
1920x1080 Normal/Off AF:4x
MSI Raider GE77 HX 12UHS
Intel Core i9-12900HX, NVIDIA GeForce RTX 3080 Ti Laptop GPU
186.7 (1.946min, 166.7P1) fps 0%
MSI Titan GT77 12UHS
Intel Core i9-12900HX, NVIDIA GeForce RTX 3080 Ti Laptop GPU
185.9 (2.14min, 166.7P1) fps
Alienware x17 R2 P48E
Intel Core i9-12900HK, NVIDIA GeForce RTX 3080 Ti Laptop GPU
184.5 (2.01min, 142.9P1) fps -1%
MSI GE76 Raider
Intel Core i9-12900HK, NVIDIA GeForce RTX 3080 Ti Laptop GPU
184 (1.687min, 125P1) fps -1%
MSI GE67 HX 12UGS
Intel Core i7-12800HX, NVIDIA GeForce RTX 3070 Ti Laptop GPU
183.7 (2.06min, 142.9P1) fps -1%
Gigabyte Aero 16 YE5
Intel Core i9-12900HK, NVIDIA GeForce RTX 3080 Ti Laptop GPU
182 (3.65min, 125P1) fps -2%
Average NVIDIA GeForce RTX 3080 Ti Laptop GPU
  (169.8 - 187.4, n=22)
181.1 fps -3%
Average of class Gaming
  (79.6 - 187.7, n=122, last 2 years)
178.5 fps -4%
Asus ROG Zephyrus Duo 16 GX650RX
AMD Ryzen 9 6900HX, NVIDIA GeForce RTX 3080 Ti Laptop GPU
175.5 (5.19min, 125P1) fps -6%
1920x1080 High/On (Advanced Graphics Off) AA:2xMSAA + FX AF:8x
MSI Raider GE77 HX 12UHS
Intel Core i9-12900HX, NVIDIA GeForce RTX 3080 Ti Laptop GPU
184.3 (1.907min, 142.9P1) fps +1%
MSI Titan GT77 12UHS
Intel Core i9-12900HX, NVIDIA GeForce RTX 3080 Ti Laptop GPU
182.7 (8.3min, 142.9P1) fps
Alienware x17 R2 P48E
Intel Core i9-12900HK, NVIDIA GeForce RTX 3080 Ti Laptop GPU
180.8 (3.24min, 142.9P1) fps -1%
Gigabyte Aero 16 YE5
Intel Core i9-12900HK, NVIDIA GeForce RTX 3080 Ti Laptop GPU
179 (3.17min, 143P1) fps -2%
Aorus 17X XES
Intel Core i9-12900HX, NVIDIA GeForce RTX 3070 Ti Laptop GPU
178.5 (3.24min, 125P1) fps -2%
MSI GE67 HX 12UGS
Intel Core i7-12800HX, NVIDIA GeForce RTX 3070 Ti Laptop GPU
178.1 (3.97min, 142.9P1) fps -3%
MSI GE76 Raider
Intel Core i9-12900HK, NVIDIA GeForce RTX 3080 Ti Laptop GPU
176 (4.26min, 125P1) fps -4%
Average NVIDIA GeForce RTX 3080 Ti Laptop GPU
  (153.4 - 184.3, n=28)
175.1 fps -4%
Average of class Gaming
  (24.2 - 187.1, n=144, last 2 years)
168.7 fps -8%
Asus ROG Zephyrus Duo 16 GX650RX
AMD Ryzen 9 6900HX, NVIDIA GeForce RTX 3080 Ti Laptop GPU
158.9 (4.88min, 111.1P1) fps -13%
1920x1080 Highest Settings possible AA:4xMSAA + FX AF:16x
MSI Raider GE77 HX 12UHS
Intel Core i9-12900HX, NVIDIA GeForce RTX 3080 Ti Laptop GPU
136 (4.34min, 90.9P1) fps +3%
MSI Titan GT77 12UHS
Intel Core i9-12900HX, NVIDIA GeForce RTX 3080 Ti Laptop GPU
131.8 (6.21min, 90.9P1) fps
Alienware x17 R2 P48E
Intel Core i9-12900HK, NVIDIA GeForce RTX 3080 Ti Laptop GPU
126.3 (5.94min, 90.9P1) fps -4%
MSI GE76 Raider
Intel Core i9-12900HK, NVIDIA GeForce RTX 3080 Ti Laptop GPU
125 (10.6min, 83.3P1) fps -5%
MSI GE67 HX 12UGS
Intel Core i7-12800HX, NVIDIA GeForce RTX 3070 Ti Laptop GPU
122 (6.11min, 90.9P1) fps -7%
Average of class Gaming
  (12.1 - 167.7, n=169, last 2 years)
113.1 fps -14%
Gigabyte Aero 16 YE5
Intel Core i9-12900HK, NVIDIA GeForce RTX 3080 Ti Laptop GPU
113 (20.6min, 76.9P1) fps -14%
Average NVIDIA GeForce RTX 3080 Ti Laptop GPU
  (30 - 139.2, n=42)
111 fps -16%
Aorus 17X XES
Intel Core i9-12900HX, NVIDIA GeForce RTX 3070 Ti Laptop GPU
110.9 (6.17min, 76.9P1) fps -16%
Asus ROG Zephyrus Duo 16 GX650RX
AMD Ryzen 9 6900HX, NVIDIA GeForce RTX 3080 Ti Laptop GPU
101.5 (21.1min, 71.4P1) fps -23%
Final Fantasy XV Benchmark
1920x1080 Standard Quality
MSI Titan GT77 12UHS
Intel Core i9-12900HX, NVIDIA GeForce RTX 3080 Ti Laptop GPU
189.3 fps
MSI Raider GE77 HX 12UHS
Intel Core i9-12900HX, NVIDIA GeForce RTX 3080 Ti Laptop GPU
175.6 fps -7%
MSI GE76 Raider
Intel Core i9-12900HK, NVIDIA GeForce RTX 3080 Ti Laptop GPU
171 (94min) fps -10%
Alienware x17 R2 P48E
Intel Core i9-12900HK, NVIDIA GeForce RTX 3080 Ti Laptop GPU
167.8 fps -11%
MSI GE67 HX 12UGS
Intel Core i7-12800HX, NVIDIA GeForce RTX 3070 Ti Laptop GPU
162.6 fps -14%
Average of class Gaming
  (33.5 - 230, n=144, last 2 years)
153.9 fps -19%
Average NVIDIA GeForce RTX 3080 Ti Laptop GPU
  (110 - 189.3, n=27)
151.7 fps -20%
Asus ROG Zephyrus Duo 16 GX650RX
AMD Ryzen 9 6900HX, NVIDIA GeForce RTX 3080 Ti Laptop GPU
138.7 fps -27%
Gigabyte Aero 16 YE5
Intel Core i9-12900HK, NVIDIA GeForce RTX 3080 Ti Laptop GPU
110 fps -42%
1920x1080 High Quality
MSI Titan GT77 12UHS
Intel Core i9-12900HX, NVIDIA GeForce RTX 3080 Ti Laptop GPU
137.6 fps
MSI Raider GE77 HX 12UHS
Intel Core i9-12900HX, NVIDIA GeForce RTX 3080 Ti Laptop GPU
132 fps -4%
MSI GE76 Raider
Intel Core i9-12900HK, NVIDIA GeForce RTX 3080 Ti Laptop GPU
131 (86min) fps -5%
Alienware x17 R2 P48E
Intel Core i9-12900HK, NVIDIA GeForce RTX 3080 Ti Laptop GPU
127.8 fps -7%
MSI GE67 HX 12UGS
Intel Core i7-12800HX, NVIDIA GeForce RTX 3070 Ti Laptop GPU
122.4 fps -11%
Average of class Gaming
  (19.2 - 201, n=182, last 2 years)
119.3 fps -13%
Average NVIDIA GeForce RTX 3080 Ti Laptop GPU
  (30.7 - 140.6, n=42)
113.8 fps -17%
Asus ROG Zephyrus Duo 16 GX650RX
AMD Ryzen 9 6900HX, NVIDIA GeForce RTX 3080 Ti Laptop GPU
108 fps -22%
Aorus 17X XES
Intel Core i9-12900HX, NVIDIA GeForce RTX 3070 Ti Laptop GPU
94.7 fps -31%
Gigabyte Aero 16 YE5
Intel Core i9-12900HK, NVIDIA GeForce RTX 3080 Ti Laptop GPU
85.8 fps -38%
F1 2021
1920x1080 Medium Preset AA:T AF:16x
MSI Titan GT77 12UHS
Intel Core i9-12900HX, NVIDIA GeForce RTX 3080 Ti Laptop GPU
383 (310min, 250P1) fps
MSI GE76 Raider
Intel Core i9-12900HK, NVIDIA GeForce RTX 3080 Ti Laptop GPU
342 (273min) fps -11%
Average of class Gaming
  (84.8 - 616, n=16, last 2 years)
317 fps -17%
Average NVIDIA GeForce RTX 3080 Ti Laptop GPU
  (207 - 401, n=17)
296 fps -23%
Asus ROG Zephyrus Duo 16 GX650RX
AMD Ryzen 9 6900HX, NVIDIA GeForce RTX 3080 Ti Laptop GPU
275 (215min, 187P1) fps -28%
MSI Raider GE77 HX 12UHS
Intel Core i9-12900HX, NVIDIA GeForce RTX 3080 Ti Laptop GPU
243 (202min, 152P1) fps -37%
Gigabyte Aero 16 YE5
Intel Core i9-12900HK, NVIDIA GeForce RTX 3080 Ti Laptop GPU
236 (209min, 157P1) fps -38%
1920x1080 High Preset AA:T AF:16x
MSI Titan GT77 12UHS
Intel Core i9-12900HX, NVIDIA GeForce RTX 3080 Ti Laptop GPU
302 (224min, 161P1) fps
MSI GE76 Raider
Intel Core i9-12900HK, NVIDIA GeForce RTX 3080 Ti Laptop GPU
289 (228min) fps -4%
Average of class Gaming
  (65.1 - 470, n=17, last 2 years)
261 fps -14%
Average NVIDIA GeForce RTX 3080 Ti Laptop GPU
  (182.1 - 316, n=17)
247 fps -18%
Asus ROG Zephyrus Duo 16 GX650RX
AMD Ryzen 9 6900HX, NVIDIA GeForce RTX 3080 Ti Laptop GPU
225 (189min, 124P1) fps -25%
MSI Raider GE77 HX 12UHS
Intel Core i9-12900HX, NVIDIA GeForce RTX 3080 Ti Laptop GPU
207 (180min, 131P1) fps -31%
Gigabyte Aero 16 YE5
Intel Core i9-12900HK, NVIDIA GeForce RTX 3080 Ti Laptop GPU
196 (173min, 129P1) fps -35%
1920x1080 Ultra High Preset + Raytracing AA:T AF:16x
MSI Titan GT77 12UHS
Intel Core i9-12900HX, NVIDIA GeForce RTX 3080 Ti Laptop GPU
158.2 (133min, 130P1) fps
MSI GE76 Raider
Intel Core i9-12900HK, NVIDIA GeForce RTX 3080 Ti Laptop GPU
157 (132min) fps -1%
Average of class Gaming
  (27.6 - 271, n=17, last 2 years)
142.5 fps -10%
MSI Raider GE77 HX 12UHS
Intel Core i9-12900HX, NVIDIA GeForce RTX 3080 Ti Laptop GPU
133.8 (114min, 91P1) fps -15%
Asus ROG Zephyrus Duo 16 GX650RX
AMD Ryzen 9 6900HX, NVIDIA GeForce RTX 3080 Ti Laptop GPU
130.2 (109min, 92P1) fps -18%
Average NVIDIA GeForce RTX 3080 Ti Laptop GPU
  (30.2 - 160.6, n=30)
126.1 fps -20%
Gigabyte Aero 16 YE5
Intel Core i9-12900HK, NVIDIA GeForce RTX 3080 Ti Laptop GPU
103 (76min, 83P1) fps -35%
Cyberpunk 2077 1.6
1920x1080 Medium Preset
MSI Titan GT77 12UHS
Intel Core i9-12900HX, NVIDIA GeForce RTX 3080 Ti Laptop GPU
150.3 (46min) fps
Alienware x17 R2 P48E
Intel Core i9-12900HK, NVIDIA GeForce RTX 3080 Ti Laptop GPU
142 (34.8min) fps -6%
MSI GE67 HX 12UGS
Intel Core i7-12800HX, NVIDIA GeForce RTX 3070 Ti Laptop GPU
133.2 (37.3min) fps -11%
Average NVIDIA GeForce RTX 3080 Ti Laptop GPU
  (78 - 159.7, n=14)
123.7 fps -18%
Asus ROG Zephyrus Duo 16 GX650RX
AMD Ryzen 9 6900HX, NVIDIA GeForce RTX 3080 Ti Laptop GPU
119.6 (36.8min) fps -20%
Average of class Gaming
  (15 - 178.6, n=46, last 2 years)
108.9 fps -28%
Gigabyte Aero 16 YE5
Intel Core i9-12900HK, NVIDIA GeForce RTX 3080 Ti Laptop GPU
96.4 (71.1min) fps -36%
1920x1080 High Preset
MSI Titan GT77 12UHS
Intel Core i9-12900HX, NVIDIA GeForce RTX 3080 Ti Laptop GPU
120.5 (53.2min) fps
Alienware x17 R2 P48E
Intel Core i9-12900HK, NVIDIA GeForce RTX 3080 Ti Laptop GPU
116.2 (29.8min) fps -4%
MSI GE67 HX 12UGS
Intel Core i7-12800HX, NVIDIA GeForce RTX 3070 Ti Laptop GPU
106 (54.1min) fps -12%
Average NVIDIA GeForce RTX 3080 Ti Laptop GPU
  (64 - 145.6, n=14)
102.8 fps -15%
Asus ROG Zephyrus Duo 16 GX650RX
AMD Ryzen 9 6900HX, NVIDIA GeForce RTX 3080 Ti Laptop GPU
98.3 (22.1min) fps -18%
Average of class Gaming
  (12.2 - 205, n=59, last 2 years)
98.2 fps -19%
Gigabyte Aero 16 YE5
Intel Core i9-12900HK, NVIDIA GeForce RTX 3080 Ti Laptop GPU
72.4 (49.6min) fps -40%
1920x1080 Ultra Preset
Alienware x17 R2 P48E
Intel Core i9-12900HK, NVIDIA GeForce RTX 3080 Ti Laptop GPU
115.7 (46.4min) fps +16%
MSI Titan GT77 12UHS
Intel Core i9-12900HX, NVIDIA GeForce RTX 3080 Ti Laptop GPU
99.4 (40.7min) fps
Asus ROG Zephyrus Duo 16 GX650RX
AMD Ryzen 9 6900HX, NVIDIA GeForce RTX 3080 Ti Laptop GPU
99.1 (29min) fps 0%
Average NVIDIA GeForce RTX 3080 Ti Laptop GPU
  (54 - 144.1, n=16)
93.6 fps -6%
Average of class Gaming
  (16.7 - 159.7, n=70, last 2 years)
92.6 fps -7%
MSI GE67 HX 12UGS
Intel Core i7-12800HX, NVIDIA GeForce RTX 3070 Ti Laptop GPU
88.1 (60.7min) fps -11%
Gigabyte Aero 16 YE5
Intel Core i9-12900HK, NVIDIA GeForce RTX 3080 Ti Laptop GPU
73.2 (55.1min) fps -26%
1920x1080 Ray Tracing Ultra Preset (DLSS off)
Gigabyte Aero 16 YE5
Intel Core i9-12900HK, NVIDIA GeForce RTX 3080 Ti Laptop GPU
49.9 (28.1min) fps +7%
Average of class Gaming
  (19.1 - 74, n=26, last 2 years)
48.1 fps +3%
MSI Titan GT77 12UHS
Intel Core i9-12900HX, NVIDIA GeForce RTX 3080 Ti Laptop GPU
46.7 (34.5min) fps
Average NVIDIA GeForce RTX 3080 Ti Laptop GPU
  (39.2 - 49.9, n=7)
43.3 fps -7%
Asus ROG Zephyrus Duo 16 GX650RX
AMD Ryzen 9 6900HX, NVIDIA GeForce RTX 3080 Ti Laptop GPU
40.3 (29.8min) fps -14%

La tabla de FPS de Witcher 3

La velocidad de fotogramas en El Witcher 3 a 1080p Ultra con el personaje inmóvil durante toda la prueba es bastante consistente y no muestra signos perceptibles de ralentización.

0102030405060708090100110120130Tooltip
MSI Titan GT77 12UHS i9-12900HX, GeForce RTX 3080 Ti Laptop GPU: Ø132 (125-136)
bajomedioaltoultra
GTA V (2015) 187.1 186.8 182.7 131.8
The Witcher 3 (2015) 543 411 260 129.3
Dota 2 Reborn (2015) 204.5 184.5 179.8 170.5
Final Fantasy XV Benchmark (2018) 222 189.3 137.6
X-Plane 11.11 (2018) 184 160.4 123.8
Far Cry 5 (2018) 192 173 164 153
Strange Brigade (2018) 535 313 248 219
Watch Dogs Legion (2020) 141.4 134.1 121.4 84
F1 2021 (2021) 404 383 302 158.2
Cyberpunk 2077 1.6 (2022) 169.8 150.3 120.5 99.4
F1 22 (2022) 226 227 196.5 79.8

Consulte nuestra sección dedicada Nvidia GeForce RTX 3080 Ti GPU para portátiles y de juegos para obtener más información y comparaciones de juegos.

Emisiones: Una gran potencia conlleva un gran ruido y calor

Ruido del sistema

Los componentes internos de primera línea combinados con el enorme sistema de refrigeración hacen que la Titan GT77 pueda acelerar sus motores como ninguna otra, especialmente en el modo de rendimiento extremo. Dicho esto, el portátil es relativamente silencioso en reposo en todos los modos de rendimiento probados.

Los modos Equilibrado y Rendimiento Extremo son bastante similares, salvo por un PL1 de 25 W menos en el primero. Por tanto, observamos que el perfil de ruido bajo varias cargas en estos dos modos de rendimiento es más o menos similar. No obstante, MSI parece haber limitado la emisión de ruido en el perfil equilibrado a unos 50 dB(A) mientras que los ventiladores pueden llegar a ser un poco más ruidosos hasta 57 dB(A) en el perfil de rendimiento extremo.

Si prefieres un perfil de funcionamiento más silencioso para tareas menos exigentes, considera usar el perfil Silencioso en el que el ruido de los ventiladores está justo por debajo de los 35 dB(A).

Ruido

Ocioso
24.53 / 24.53 / 24.53 dB(A)
Carga
46.25 / 54.25 dB(A)
  red to green bar
 
 
30 dB
silencioso
40 dB(A)
audible
50 dB(A)
ruidosamente alto
 
min: dark, med: mid, max: light   Earthworks M23R, Arta (15 cm de distancia)   environment noise: 21.9 dB(A)
dB(A) 0102030405060708090Deep BassMiddle BassHigh BassLower RangeMidsHigher MidsLower HighsMid HighsUpper HighsSuper Highs2021.517.521.52520.218.620.23119.213.419.24018.713.118.75019.314.619.36324.520.324.58024.415.624.410027.32327.312527.415.927.416029.721.429.720028.420.128.425034.51834.531535.518.335.540036.11836.150036.714.936.763036.816.236.88004013.640100040.11340.1125043.21243.2160043.31143.3200044.510.544.5250044.810.844.831504310.243400043.610.843.6500042.810.542.8630041.810.141.8800037.49.837.41000036.39.836.31250033.31033.31600025.914.125.9SPL54.324.554.3N9.30.69.3median 36.8median 13median 36.8Delta63.86hearing rangehide median Fan NoiseMSI Titan GT77 12UHS
Perfil de ruido medio del ventilador en varios modos de funcionamiento
Perfil de ruido máximo del ventilador en varios modos de rendimiento
El perfil de ruido del ventilador Witcher 3 en varios modos de rendimiento
MSI Titan GT77 12UHS
Intel Core i9-12900HX, NVIDIA GeForce RTX 3080 Ti Laptop GPU
Aorus 17X XES
Intel Core i9-12900HX, NVIDIA GeForce RTX 3070 Ti Laptop GPU
MSI Raider GE77 HX 12UHS
Intel Core i9-12900HX, NVIDIA GeForce RTX 3080 Ti Laptop GPU
MSI GE67 HX 12UGS
Intel Core i7-12800HX, NVIDIA GeForce RTX 3070 Ti Laptop GPU
Alienware x17 R2 P48E
Intel Core i9-12900HK, NVIDIA GeForce RTX 3080 Ti Laptop GPU
Noise
-18%
-23%
2%
8%
off / environment *
21.9
26
-19%
26
-19%
22.7
-4%
22.7
-4%
Idle Minimum *
24.53
28
-14%
26
-6%
22.9
7%
23.1
6%
Idle Average *
24.53
32
-30%
34
-39%
22.9
7%
23.1
6%
Idle Maximum *
24.53
38
-55%
46
-88%
22.9
7%
23.1
6%
Load Average *
46.25
53
-15%
50
-8%
44.4
4%
31.9
31%
Witcher 3 ultra *
56.86
54
5%
55
3%
55.7
2%
52.5
8%
Load Maximum *
54.25
55
-1%
57
-5%
57.4
-6%
52.5
3%

* ... más pequeño es mejor

Temperatura

Válvulas de escape Titan GT77

Las temperaturas superficiales son definitivamente más altas a pesar del robusto sistema de refrigeración. Registramos un máximo de 40.8 °C en la parte superior y 52.4 °C en la inferior bajo la carga máxima de Prime95 y FurMark funcionando juntos

El estrés con The Witcher 3 a 1080p Ultra resulta en puntos calientes de temperatura de 47 °C y 47.6 °C en la parte superior e inferior, respectivamente. Las zonas del reposamanos y del touchpad permanecen relativamente frías incluso bajo estrés.

 40.8 °C40.8 °C37.4 °C 
 40 °C40.8 °C37 °C 
 31.2 °C30.2 °C30.4 °C 
Máximo: 40.8 °C
Médio: 36.5 °C
34.6 °C39.8 °C41.4 °C
34.2 °C52.4 °C51 °C
32.2 °C49.8 °C49.2 °C
Máximo: 52.4 °C
Médio: 42.7 °C
Conector de corriente  40.8 °C | Temperatura del cuarto 22 °C | Amprobe TMD-50 // Fluke 62 Mini IR Thermometer
(±) The average temperature for the upper side under maximal load is 36.5 °C / 98 F, compared to the average of 33.9 °C / 93 F for the devices in the class Gaming.
(±) The maximum temperature on the upper side is 40.8 °C / 105 F, compared to the average of 40.5 °C / 105 F, ranging from 21.2 to 68.8 °C for the class Gaming.
(-) The bottom heats up to a maximum of 52.4 °C / 126 F, compared to the average of 43.2 °C / 110 F
(±) In idle usage, the average temperature for the upper side is 32 °C / 90 F, compared to the device average of 33.9 °C / 93 F.
(-) Playing The Witcher 3, the average temperature for the upper side is 40.4 °C / 105 F, compared to the device average of 33.9 °C / 93 F.
(+) The palmrests and touchpad are reaching skin temperature as a maximum (33.4 °C / 92.1 F) and are therefore not hot.
(-) The average temperature of the palmrest area of similar devices was 28.9 °C / 84 F (-4.5 °C / -8.1 F).

Dado su peso, la Titan GT77 no es algo que se usaría en un regazo. Aunque nuestras pruebas de estrés representan escenarios extremos, recomendamos utilizar los modos de rendimiento Silencio o Equilibrado para garantizar que las temperaturas de la superficie estén dentro de los límites tolerables.

Sistema inactivo - Arriba
Sistema en reposo - Parte inferior
Prime95 + FurMark stress - Top
Prime95 + FurMark stress - Bottom
El estrés de Witcher 3 - Arriba
El estrés de Witcher 3 - Fondo
MSI Titan GT77 12UHS
Intel Core i9-12900HX, NVIDIA GeForce RTX 3080 Ti Laptop GPU
Aorus 17X XES
Intel Core i9-12900HX, NVIDIA GeForce RTX 3070 Ti Laptop GPU
MSI Raider GE77 HX 12UHS
Intel Core i9-12900HX, NVIDIA GeForce RTX 3080 Ti Laptop GPU
MSI GE67 HX 12UGS
Intel Core i7-12800HX, NVIDIA GeForce RTX 3070 Ti Laptop GPU
Alienware x17 R2 P48E
Intel Core i9-12900HK, NVIDIA GeForce RTX 3080 Ti Laptop GPU
Heat
-13%
-16%
20%
8%
Maximum Upper Side *
40.8
54
-32%
53
-30%
34.4
16%
49.6
-22%
Maximum Bottom *
52.4
58
-11%
58
-11%
42
20%
42.4
19%
Idle Upper Side *
34.6
37
-7%
38
-10%
24
31%
29.2
16%
Idle Bottom *
38.4
39
-2%
43
-12%
33.2
14%
32
17%

* ... más pequeño es mejor

Prueba de esfuerzo

Al estresar la Titan GT77 con Prime95 ejecutando FFTs en el lugar, el Core i9-12900HX alcanza los 4,1 GHz a unos 155 W, pero observamos que los relojes se estabilizan entre 3 GHz y 3,5 GHz a 120 W a los cuatro minutos de la prueba.

Según MSI, la Titan GT77 utiliza MSI OverBoost para una carga combinada de 250 W (75 W de CPU + 175 W de GPU) tanto de la CPU como de la GPU dependiendo del escenario. Al añadir FurMark a Prime95, el reloj de la CPU alcanza inicialmente un pico de 4,1 GHz a unos 140 W y, a partir de ahí, oscila entre 3 GHz y 3,5 GHz a 120 W. La GPU RTX 3080 Ti Laptop muestra relojes inconsistentes en esta carga de trabajo coincidiendo con la fluctuación de energía.

MSI Cooler Boost Titan emplea un sistema de refrigeración de cuatro ventiladores y siete tubos de calor

Vemos que la GPU se acerca a los 175 W TGP al principio de la prueba, pero sólo es capaz de utilizar unos 80-90 W durante la mayor parte de la prueba. A veces vemos picos de hasta 185 W, pero eso hace que el TDP de la CPU baje a 75 W. Los relojes de la GPU durante el estrés combinado de Prime95 y FurMark no son estables y siguen oscilando entre los relojes base y los de refuerzo con regularidad para adaptarse a los requisitos de energía de la CPU.

La ejecución de Witcher 3 a 1080p Ultra presenta un escenario de estrés más real con un rendimiento mucho más predecible. Aunque los relojes de la CPU son relativamente inestables, encontramos que la RTX 3080 Ti marca un reloj consistente de 1,8 GHz a 165 W tras un máximo inicial de 2 GHz. El TDP de la CPU no pasa de 35 W durante esta prueba, lo que resulta en una carga combinada de 200 W.

Sistema inactivo
Sistema inactivo
Prime95 + estrés FurMark
El estrés de Witcher 3
Relojes de la CPU/GPU, temperaturas y variaciones de potencia durante el estrés de Prime95
Relojes de la CPU/GPU, temperaturas y variaciones de potencia durante el estrés de Prime95+FurMark
Relojes de la CPU/GPU, temperaturas y variaciones de potencia durante el estrés de The Witcher 3
Prueba de esfuerzo Relojdela CPU (GHz) Reloj de la GPU (MHz) Temperaturamediadela CPU (°C) Temperatura media de la GPU (°C)
Sistema en reposo 0,75 210 39 46,4
Prime95 3,2 210 85 42,1
Prime95+ FurMark 3,1 1.395 88 48,6
El Witcher 3 1,6 1.964,6 58 78,4

Altavoces

Los altavoces del Titan GT77 tienen un volumen adecuado y unos graves decentes
Diagrama de ruido rosa

El Titan GT77 viene con una configuración de cuatro altavoces con dos woofers de 2 W y dos altavoces de 2 W. La calidad del sonido es alta, con 83,4 dB(A), y es suficiente para llenar una habitación de tamaño medio sin mucha distorsión a volúmenes altos.

El chasis relativamente grande garantiza que los radiadores pasivos tengan suficiente espacio para producir una respuesta de graves decente. El Titan GT77 brilla por reproducir bien los medios y los agudos. Subjetivamente, la calidad de audio es más que pasable para la mayoría de los casos de uso.

Los jugadores podrán aprovechar al máximo el hardware de audio disponible con un buen par de auriculares. Sin embargo, los audiófilos encontrarán un poco decepcionante la falta de una toma de entrada de micrófono/línea dedicada.

MSI no ofrece la certificación Dolby Atmos para la Titan GT77, pero la aplicación Nahimic incluida ofrece muchas opciones de personalización.

dB(A) 0102030405060708090Deep BassMiddle BassHigh BassLower RangeMidsHigher MidsLower HighsMid HighsUpper HighsSuper Highs20018.927.525019.124.2310151640014.515.950014.815.663021.321.58001725.5100020.437.2125014.442.2160014.655.5200018.260.325001565.1315012.268.2400014.570.550009.371.76300977.180008.374100008.474.4125008.475.2160008.671.2200009.670.5250009.872.4315009.668.2400009.664500009.965.2630009.969.9800009.5651000009.465.41250009.2621600008.459.2SPL83.421.983.4N60.20.460.2median 9.6median 68.2median 71.8Delta722.45.726.325.821.422.12624.925.127.622.532.523.448.72655.818.860.922.167.2267019.372.317.674.217.774.319.575.31571.711.871.311.27410.574.21072.710.17210.67210.97511.374.811.671.71269.71269.612.371.112.669.61270.111.269.824.784.70.666.6median 12median 71.73.42.2hearing rangehide median Pink NoiseMSI Titan GT77 12UHSApple MacBook Pro 16 2021 M1 Pro
Diagrama de frecuencia en comparación (¡las casillas de verificación se pueden marcar y desmarcar!)
MSI Titan GT77 12UHS audio analysis

(+) | speakers can play relatively loud (83.4 dB)
Bass 100 - 315 Hz
(-) | nearly no bass - on average 71.8% lower than median
(+) | bass is linear (0% delta to prev. frequency)
Mids 400 - 2000 Hz
(-) | nearly no mids - on average 71.8% lower than median
(+) | mids are linear (0% delta to prev. frequency)
Highs 2 - 16 kHz
(-) | nearly no highs - on average 71.8% lower than median
(+) | highs are linear (0% delta to prev. frequency)
Overall 100 - 16.000 Hz
(-) | overall sound is not linear (107.7% difference to median)
Compared to same class
» 100% of all tested devices in this class were better, 0% similar, 0% worse
» The best had a delta of 6%, average was 18%, worst was 132%
Compared to all devices tested
» 96% of all tested devices were better, 0% similar, 4% worse
» The best had a delta of 4%, average was 25%, worst was 134%

Apple MacBook Pro 16 2021 M1 Pro audio analysis

(+) | speakers can play relatively loud (84.7 dB)
Bass 100 - 315 Hz
(+) | good bass - only 3.8% away from median
(+) | bass is linear (5.2% delta to prev. frequency)
Mids 400 - 2000 Hz
(+) | balanced mids - only 1.3% away from median
(+) | mids are linear (2.1% delta to prev. frequency)
Highs 2 - 16 kHz
(+) | balanced highs - only 1.9% away from median
(+) | highs are linear (2.7% delta to prev. frequency)
Overall 100 - 16.000 Hz
(+) | overall sound is linear (4.6% difference to median)
Compared to same class
» 0% of all tested devices in this class were better, 0% similar, 100% worse
» The best had a delta of 5%, average was 18%, worst was 45%
Compared to all devices tested
» 0% of all tested devices were better, 0% similar, 100% worse
» The best had a delta of 4%, average was 25%, worst was 134%

Gestión de la energía: Consumo de energía inconsistente a carga máxima

Consumo de energía

El adaptador de 330 W suministrado es suficiente para alimentar a la Titan GT77 con cargas de trabajo exigentes. El consumo de energía en ralentí y en carga está en el lado más alto, lo que no es sorprendente dada la carnosidad de los componentes internos. El consumo bajo carga es comparable al del Raider GE77 HX 12UHS.

Una carga combinada de Prime95 y Furmark muestra un consumo de energía muy oscilante que coincide con nuestras observaciones anteriores durante la prueba de estrés.

El Alienware x17 R2 con un Core i9-12900HK es aproximadamente un 8% menos eficiente energéticamente en general.

Consumo de corriente
Off / Standbydarklight 0.36 / 1.58 Watt
Ociosodarkmidlight 30.21 / 32.42 / 33.7 Watt
Carga midlight 125.09 / 321.88 Watt
 color bar
Clave: min: dark, med: mid, max: light        Metrahit Energy
MSI Titan GT77 12UHS
i9-12900HX, GeForce RTX 3080 Ti Laptop GPU, 1920x1080,
Aorus 17X XES
i9-12900HX, GeForce RTX 3070 Ti Laptop GPU, 1920x1080,
MSI Raider GE77 HX 12UHS
i9-12900HX, GeForce RTX 3080 Ti Laptop GPU, 3840x2160,
MSI GE67 HX 12UGS
i7-12800HX, GeForce RTX 3070 Ti Laptop GPU, 1920x1080,
Asus ROG Zephyrus Duo 16 GX650RX
R9 6900HX, GeForce RTX 3080 Ti Laptop GPU, 3840x2400,
Alienware x17 R2 P48E
i9-12900HK, GeForce RTX 3080 Ti Laptop GPU, 1920x1080,
Average NVIDIA GeForce RTX 3080 Ti Laptop GPU
 
Average of class Gaming
 
Power Consumption
8%
16%
23%
23%
-8%
19%
31%
Idle Minimum *
30.21
18
40%
13
57%
16.1
47%
19
37%
24.1
20%
17.2 ?(7 - 33.2, n=28)
43%
Idle Average *
32.42
28
14%
19
41%
17.1
47%
24
26%
28.5
12%
23.3 ?(11 - 38, n=28)
28%
Idle Maximum *
33.7
36
-7%
29
14%
26.6
21%
31
8%
60
-78%
Load Average *
125.09
153
-22%
143
-14%
116.3
7%
104
17%
128.7
-3%
121.2 ?(92 - 150, n=28)
3%
Witcher 3 ultra *
256
221
14%
247
4%
237
7%
186.5
27%
254
1%
Load Maximum *
321.88
290
10%
352
-9%
291.1
10%
256
20%
323
-0%

* ... más pequeño es mejor

Power Consumption - The Witcher 3 / Stress test

020406080100120140160180200220240260280300320Tooltip
MSI Titan GT77 12UHS; 3DMark06 Return To Proxycon: Ø125.9 (117.9-199.6)
MSI Titan GT77 12UHS; 1280x720 Prime95 28.10 and Furmark 1.25: Ø277 (206-322)
MSI Titan GT77 12UHS; Witcher 3 ultra: Ø256 (250-265)

Power Consumption - External monitor

0153045607590105120135150165180195210225240Tooltip
MSI Titan GT77 12UHS; Prime95 V2810 Stress (external Monitor): Ø179.4 (164.7-215)
MSI Titan GT77 12UHS; Cinebench R15 Multi (external Monitor): Ø215 (209-218)
MSI Titan GT77 12UHS; Cinebench R20 Single (external Monitor): Ø69.7 (63-111.5)
MSI Titan GT77 12UHS; Cinebench R20 Multi (external Monitor): Ø173.7 (158.8-213)
MSI Titan GT77 12UHS; Cinebench R23 Single (external Monitor): Ø68.7 (63.7-87.6)
MSI Titan GT77 12UHS; Cinebench R23 Multi (external Monitor): Ø187.5 (166.8-230)
MSI Titan GT77 12UHS; 1280x720 FurMark 1.19 GPU Stress Test (external Monitor): Ø239 (230-248)
MSI Titan GT77 12UHS; 1920x1080 The Witcher 3 ultra (external Monitor): Ø247 (242-254)
MSI Titan GT77 12UHS; Idle 1min (external Monitor): Ø25.6 (20-52.7)

Duración de la batería

Como era de esperar, los tiempos de funcionamiento lejos de la pared están en la media incluso con la batería de 4 celdas de 99,9 WHr al máximo.

Registramos cerca de 7 horas y 13 minutos durante la prueba de video H.264 1080p y cerca de 7 horas con nuestro script de navegación Wi-Fi estandarizado, ambos a 150 cd/m2 de brillo. Por lo tanto, un uso prudente con un brillo de pantalla más bajo, en modo silencioso o superbatería y con los efectos RGB del chasis desactivados, puede conseguir tiempos de funcionamiento cercanos a un día de trabajo típico.

Es posible jugar con la energía de la batería durante aproximadamente 1,5 horas, incluso con un brillo de pantalla reducido. Todas las pruebas de duración de la batería se realizaron en el modo MSHybrid con una tasa de refresco de 60 Hz.

La Titan GT77 cuenta con una batería de 99,9 WHr al máximo
Tiempo de Ejecución de la Batería
Witcher 3 ultra 150cd
1h 30min
WiFi Websurfing
6h 52.1min
WiFi Websurfing max. Brightness
5h 34.5min
Big Buck Bunny H.264 1080p
7h 13min
Carga (máximo brillo)
1h 22min
MSI Titan GT77 12UHS
i9-12900HX, GeForce RTX 3080 Ti Laptop GPU, 99.9 Wh
Aorus 17X XES
i9-12900HX, GeForce RTX 3070 Ti Laptop GPU, 99 Wh
MSI Raider GE77 HX 12UHS
i9-12900HX, GeForce RTX 3080 Ti Laptop GPU, 99.99 Wh
MSI GE67 HX 12UGS
i7-12800HX, GeForce RTX 3070 Ti Laptop GPU, 99.9 Wh
Asus ROG Zephyrus Duo 16 GX650RX
R9 6900HX, GeForce RTX 3080 Ti Laptop GPU, 90 Wh
Alienware x17 R2 P48E
i9-12900HK, GeForce RTX 3080 Ti Laptop GPU, 87 Wh
Average of class Gaming
 
Duración de Batería
-26%
6%
19%
6%
-58%
-6%
H.264
433
226
-48%
389
-10%
559
29%
WiFi v1.3
412.1
266
-35%
324
-21%
336
-18%
469
14%
117
-72%
Witcher 3 ultra
90
Load
82
86
5%
122
49%
128
56%
62
-24%
46
-44%
Reader / Idle
590
505
749
234

Pro

+ Chasis más delgado en comparación con la generación anterior de Titanes
+ Lector de huellas dactilares e IR biométricos
+ Teclado mecánico Cherry MX y gran touchpad
+ Cuatro ranuras NVMe, incluida una ranura PCIe Gen5
+ pantalla de 360 Hz con bajos tiempos de respuesta y sin PWM
+ Rendimiento de la CPU y la GPU líder en las listas de éxitos

Contra

- El rendimiento de la tarjeta SD y del Wi-Fi 6E podría ser mejor
- Webcam deficiente de 720p
- Software MSI Center y MSI True Color defectuoso
- Aceleración severa del SSD
- Elevadas emisiones de calor y ruido
- Consumo de energía inconsistente bajo carga máxima

Veredicto: Un gran escaparate de 5.000 dólares para Alder Lake-HX

MS Titan GT77 12UHS. Unidad de revisión por cortesía de Intel India.

MSI ha revivido su icónica línea Titan tras un paréntesis de dos años, y la Titan GT77 hace todo lo posible para estar a la altura del nombre. El chasis rediseñado es ahora más delgado y ofrece una mejor estética que la generación anterior de Titan. Aunque está hecho principalmente de plástico, el Titan GT77 sigue dando la sensación de ser de primera calidad y estar bien construido.

Las características de conectividad están a la altura de un portátil insignia de 2022. La cámara web de 720p no es adecuada para el precio que se pide. El teclado mecánico Cherry MX y el amplio touchpad son adiciones bienvenidas en el Titan GT77.

El panel FHD de nuestra unidad, que actualmente no está disponible en las tiendas, era mediocre en el mejor de los casos, con una distribución del brillo y un ratio de contraste mediocres. Sin embargo, ofrece una tasa de refresco de 360 Hz y unos tiempos de respuesta bajos que deberían complacer a los jugadores competitivos. Para el resto de propósitos, recomendamos optar por los modelos con panel UHD.

La combinación de Core i9-12900HX y la GPU RTX 3080 Ti de 175 W para portátiles ofrece una gran potencia de procesamiento para casi cualquier carga de trabajo que le eches, siempre que no te importen las altas emisiones de calor y ruido.

De momento no hay demasiados portátiles Alder Lake-HX en el mercado. Pero si tienes los bolsillos llenos y necesitas un rendimiento absolutamente sin obstáculos, de primera línea y con un aspecto a la altura, hay muy pocos portátiles para juegos que puedan competir con el MSI Titan GT77.

Sin embargo, el Titan GT77 tiene algunos defectos evidentes. MSI tiene que trabajar en el subsistema de almacenamiento - el lector de tarjetas SD podría mejorar su velocidad y las unidades NVMe merecen una solución térmica adecuada. El rendimiento del Wi-Fi 6E también tiene que ser revisado. La suite de software de MSI también necesita arreglar algunos errores, particularmente MSI True Color. La funcionalidad OverDrive de MSI también puede necesitar algunos ajustes para asegurar un reparto de energía más equitativo entre la CPU y la GPU para obtener frecuencias y consumos consistentes.

¿Deberías ir a por la Titan GT77 ahora mismo? Es una pregunta discutible si estás dispuesto a desembolsar cinco mil dólares. Sin embargo, la Titan GT77 tiene algunos competidores capaces de ahorrarte bastante dinero. El Raider GE67 HX 12UGS con el Core i9-12800HX y la RTX 3070 Ti, por ejemplo, suele acercarse bastante a la Titan GT77 de máxima especificación por la mitad de precio (2.500 dólares).

Si lo que buscas es una pantalla de 360 Hz, el Alienware x17 R2 ofrece un rendimiento comparable, aunque cuenta con el Core i9-12900HK, por 3.900 dólares. El Aorus 17X XES queda por detrás del Titan GT77 en cuanto a rendimiento general de la CPU y la GPU, pero su precio de 2.999 dólares merece una consideración. Si características como el teclado mecánico y una plétora de ranuras NVMe son más importantes, puedes conseguir la Titan GT77 con un Core i7-12800HX y una RTX 3070 Ti por cerca de 3.100 dólares.


Download your licensed rating image as SVG / PNG

Precio y disponibilidad

Nuestra MSI Titan GT77 de prueba es una unidad personalizada sembrada directamente por Intel, por lo que no hay información oficial de precios disponible. Sin embargo, Intel nos dijo que esta configuración se acerca a los 5.000 dólares.

Las unidades de venta al público de la Titan GT77 están llegando poco a poco a todo el mundo. Actualmente, el Titan GT77 con Core i9-12900HX, RTX 3080 Ti, 64 GB de RAM DDR5-4800, 2 TB de SSD NVMe y una pantalla UHD de 120 Hz está disponible por unos 5.361 dólares en la tienda oficial de MSI en Malasia https://mystore.msi.com/product/msi-titan-gt77-12uhs-034/

Los que estén en los Estados Unidos, pueden pedir un Titan GT77 12UHS-007 con Core i7-12800HX y RTX 3080 Ti por 3.899 dólares. También hay una Titan GT77 12UHS-009 disponible con un Core i7-12800HX y RTX 3070 Ti por 3.053 dólares.

MSI Titan GT77 12UHS - 08/28/2022 v7 (old)
Vaidyanathan Subramaniam

Acabado
84 / 98 → 86%
Teclado
94%
Ratón
89%
Conectividad
68 / 80 → 85%
Peso
55 / 10-66 → 80%
Battería
72 / 95 → 76%
Pantalla
83%
Rendimiento de juegos
100%
Rendimiento de la Aplicación
98%
Temperatura
84 / 95 → 88%
Ruido
72 / 90 → 80%
Audio
88%
Cámara
25 / 85 → 29%
Médio
78%
88%
Gaming - media ponderada

Price comparison

Please share our article, every link counts!
Mail Logo
> Análisis y pruebas de ordenadores portátiles y móviles teléfonos > Análisis > Análisis del portátil MSI Titan GT77 12UHS: El niño del cartel de Alder Lake-HX con un rendimiento de clase de escritorio sin obstáculos
Vaidyanathan Subramaniam, 2022-08-22 (Update: 2022-08-22)