Reseña del Geekom XT13 Pro: El mini PC NUC prescinde de Meteor Lake y sólo recibe un Intel Core i9-13900H
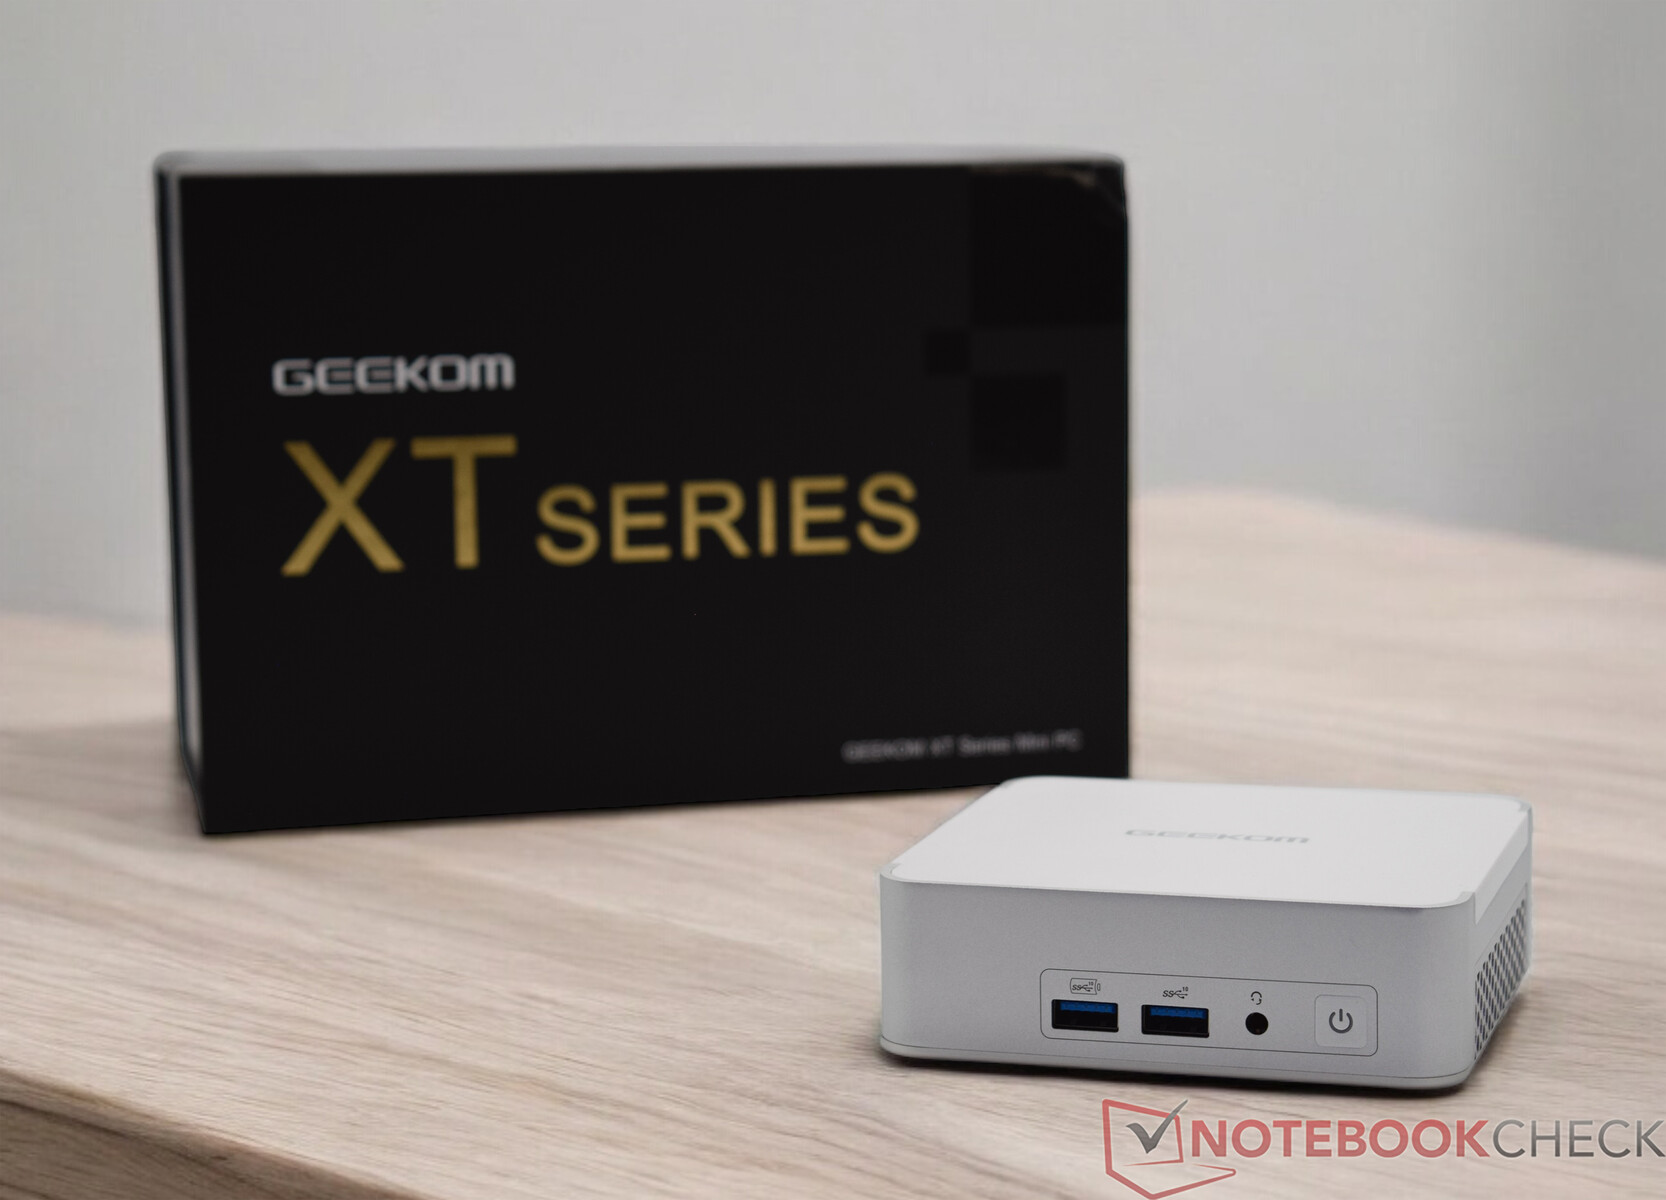
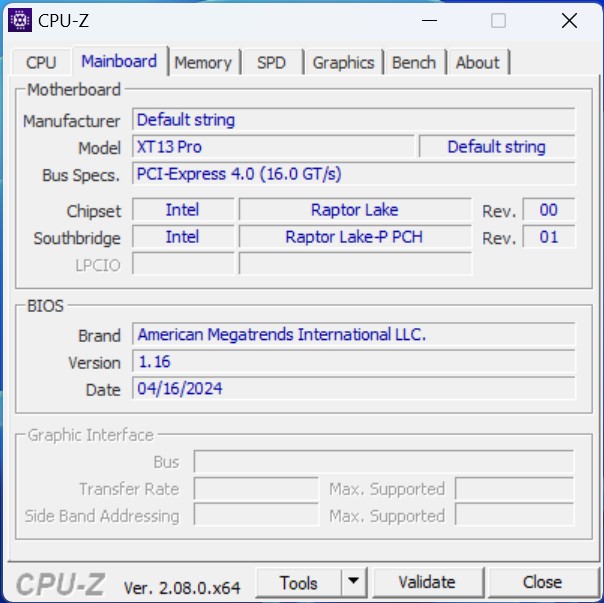
El Geekom XT13 Pro hereda el Geekom XT12 Pro y viene en la configuración superior con un Intel Core i9-13900H equipado. También cuenta con 32 GB de RAM DDR4 y una unidad SSD de 2 TB, aunque esto tiene un precio. El precio es de 999 euros, por lo que realmente no es una ganga. Por 769 euros, el Geekom XT13 Pro está disponible con un Intel Core i7-13620H y una unidad SSD de 1 TB. Geekom ha decidido no utilizar los nuevos procesadores Meteor Lake y se queda con los antiguos Raptor Lake. Esta prueba demostrará si esta es la forma correcta de hacer frente a la competencia.
También se plantea la cuestión de si este precio está justificado. También abordaremos este importante punto específicamente después del análisis de rendimiento. En cualquier caso, el propio fabricante pone el listón muy alto.
Posibles contendientes en la comparación
Valoración | Versión | Fecha | Modelo | Memoria | Peso | Altura |
|---|---|---|---|---|---|---|
| 72.8 % | v8 | 08/2024 | Geekom XT13 Pro i9-13900H, Iris Xe G7 96EUs | 32768 MB | 555 g | 37 mm |
| 80.8 % | v8 | 06/2024 | Aoostar GEM12 R7 8845HS, Radeon 780M | 32768 MB | 653 g | 60 mm |
| 87.5 % v7 (old) | v7 (old) | 05/2024 | Minisforum AtomMan X7 Ti Ultra 9 185H, Arc 8-Core | 32768 MB | 863 g | 48.6 mm |
| 83.4 % v7 (old) | v7 (old) | 04/2024 | Acemagic F2A Ultra 7 155H, Arc 8-Core | 32768 MB | 768 g | 57 mm |
| 84.1 % | v8 | 04/2024 | Geekom XT12 Pro i9-12900H, Iris Xe G7 96EUs | 32768 MB | 545 g | 37 mm |
| 82.6 % v7 (old) | v7 (old) | 03/2024 | Geekom A7 R9 7940HS, Radeon 780M | 32768 MB | 417 g | 38 mm |
Nota: Hemos actualizado nuestro sistema de clasificación y los resultados de la versión 8 no son comparables con los de la versión 7 disponibles aquí.
Maletín - Procesamiento perfecto de metal y plástico
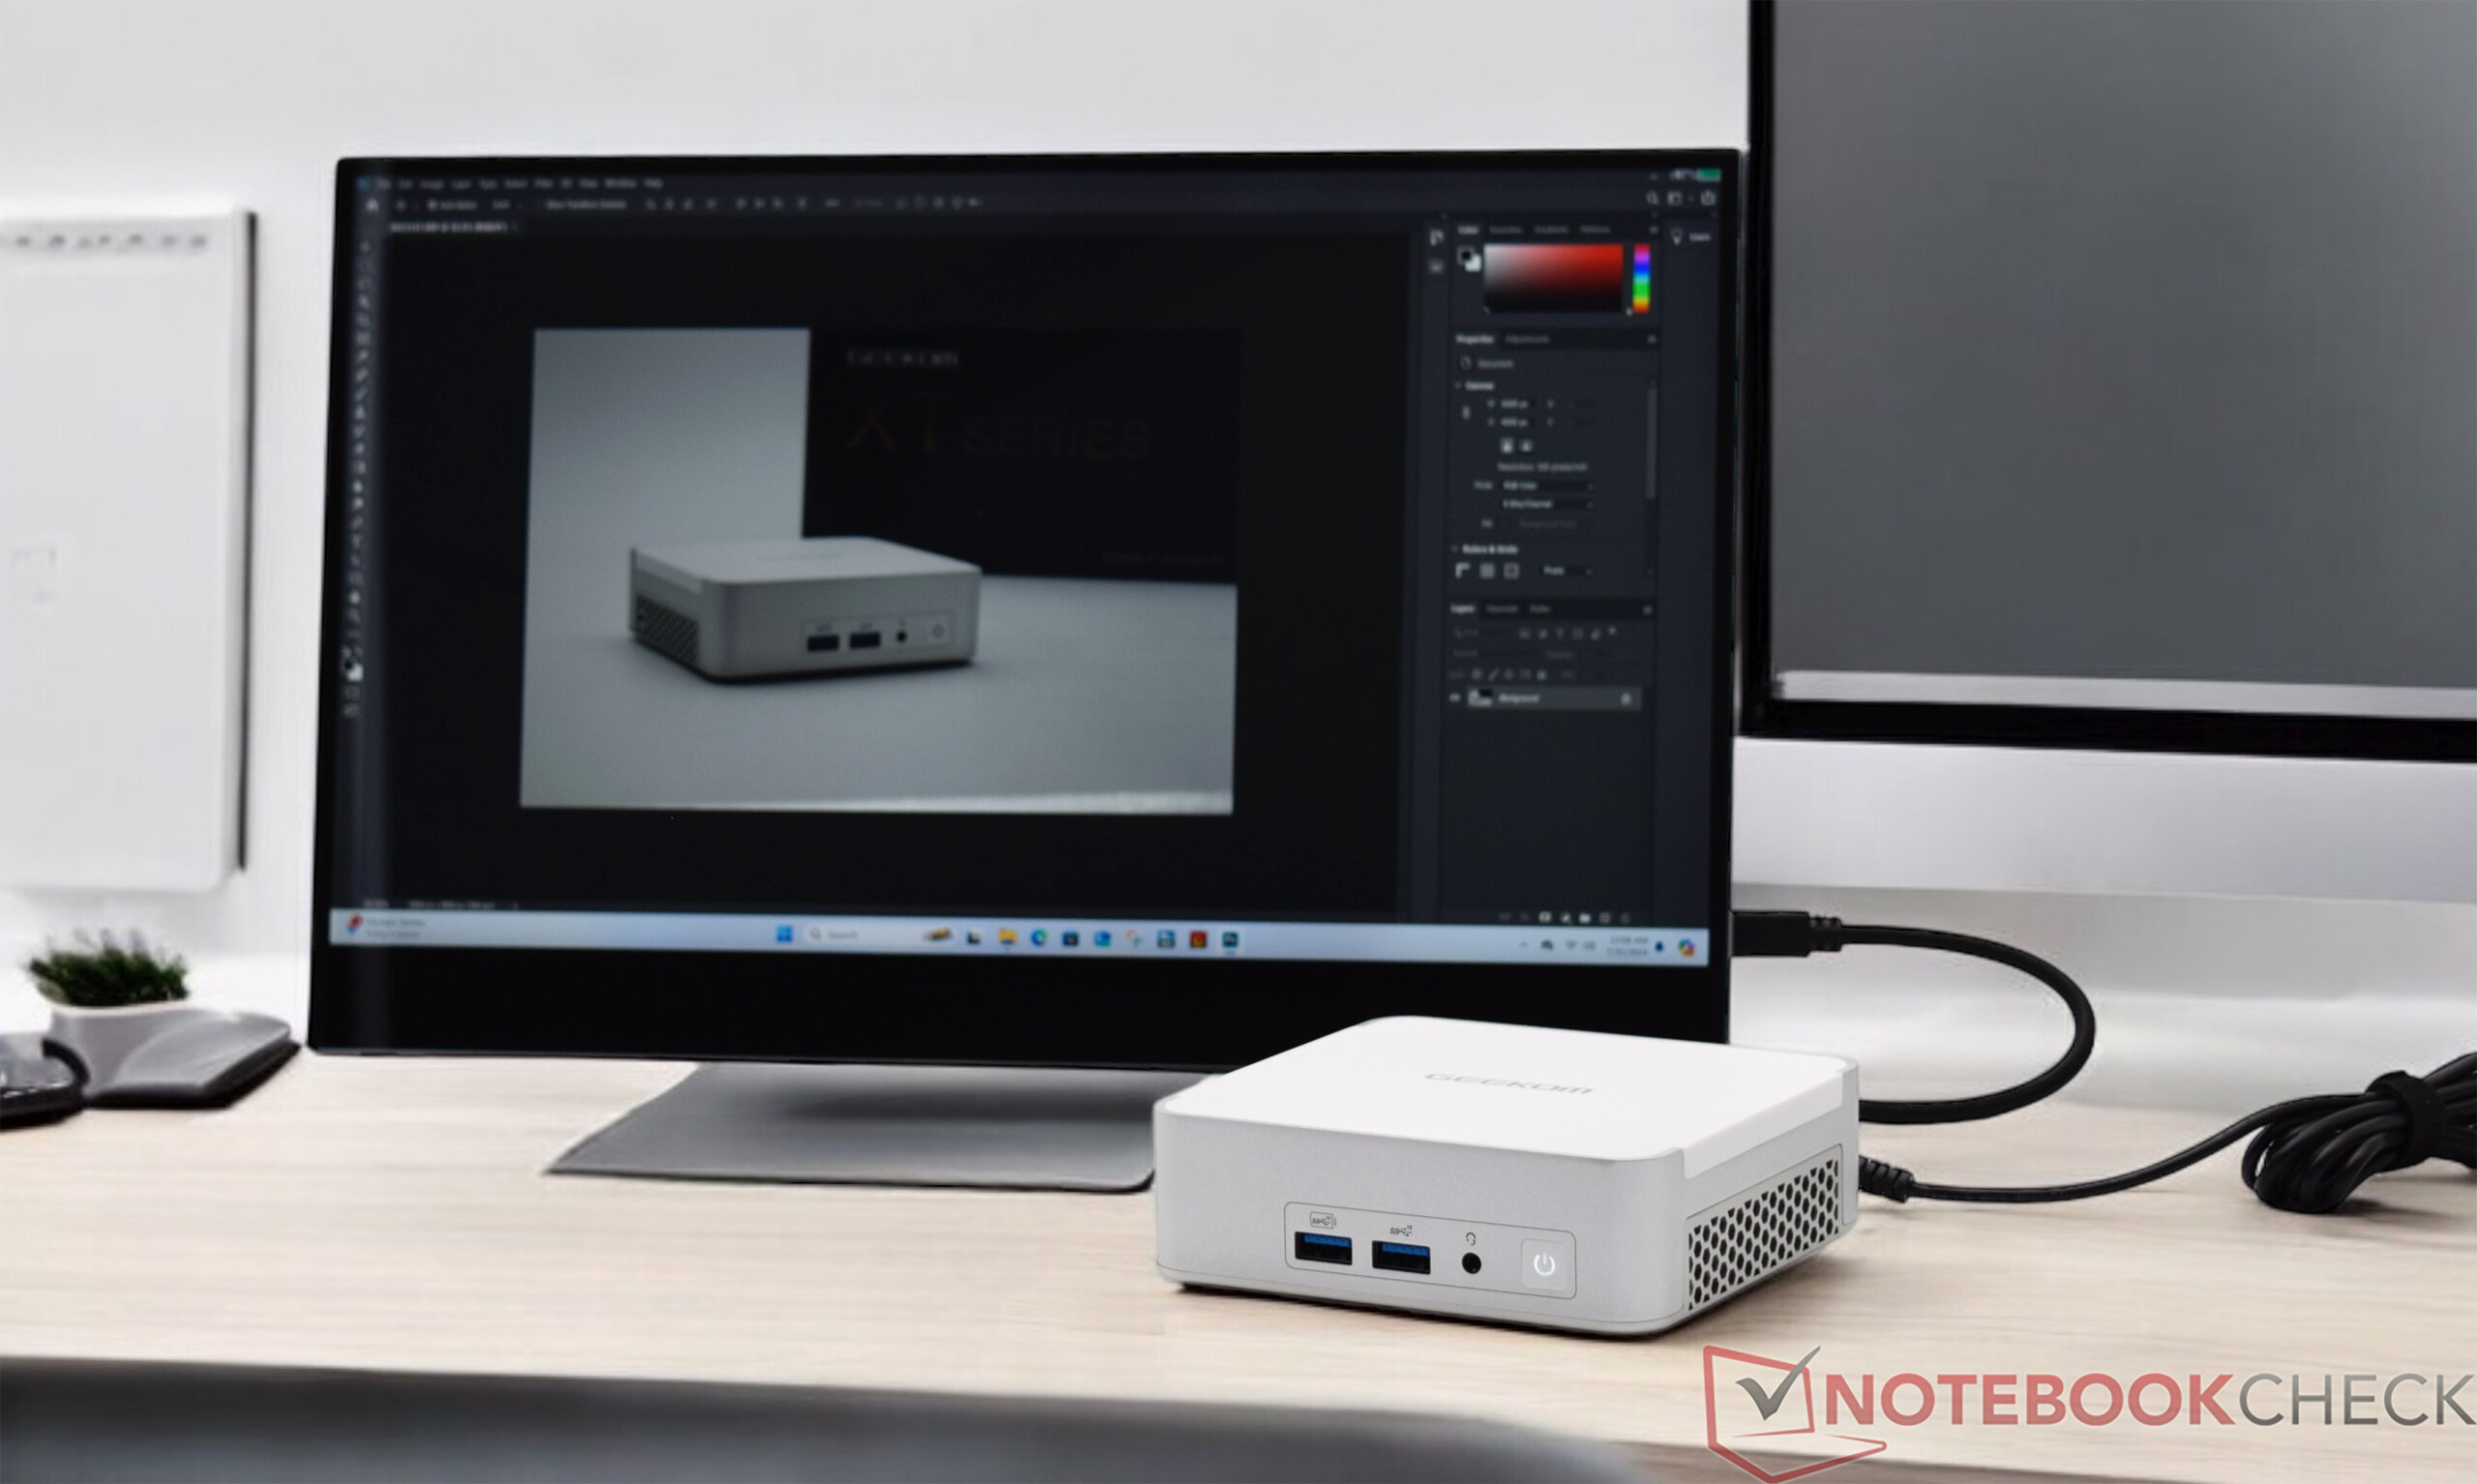
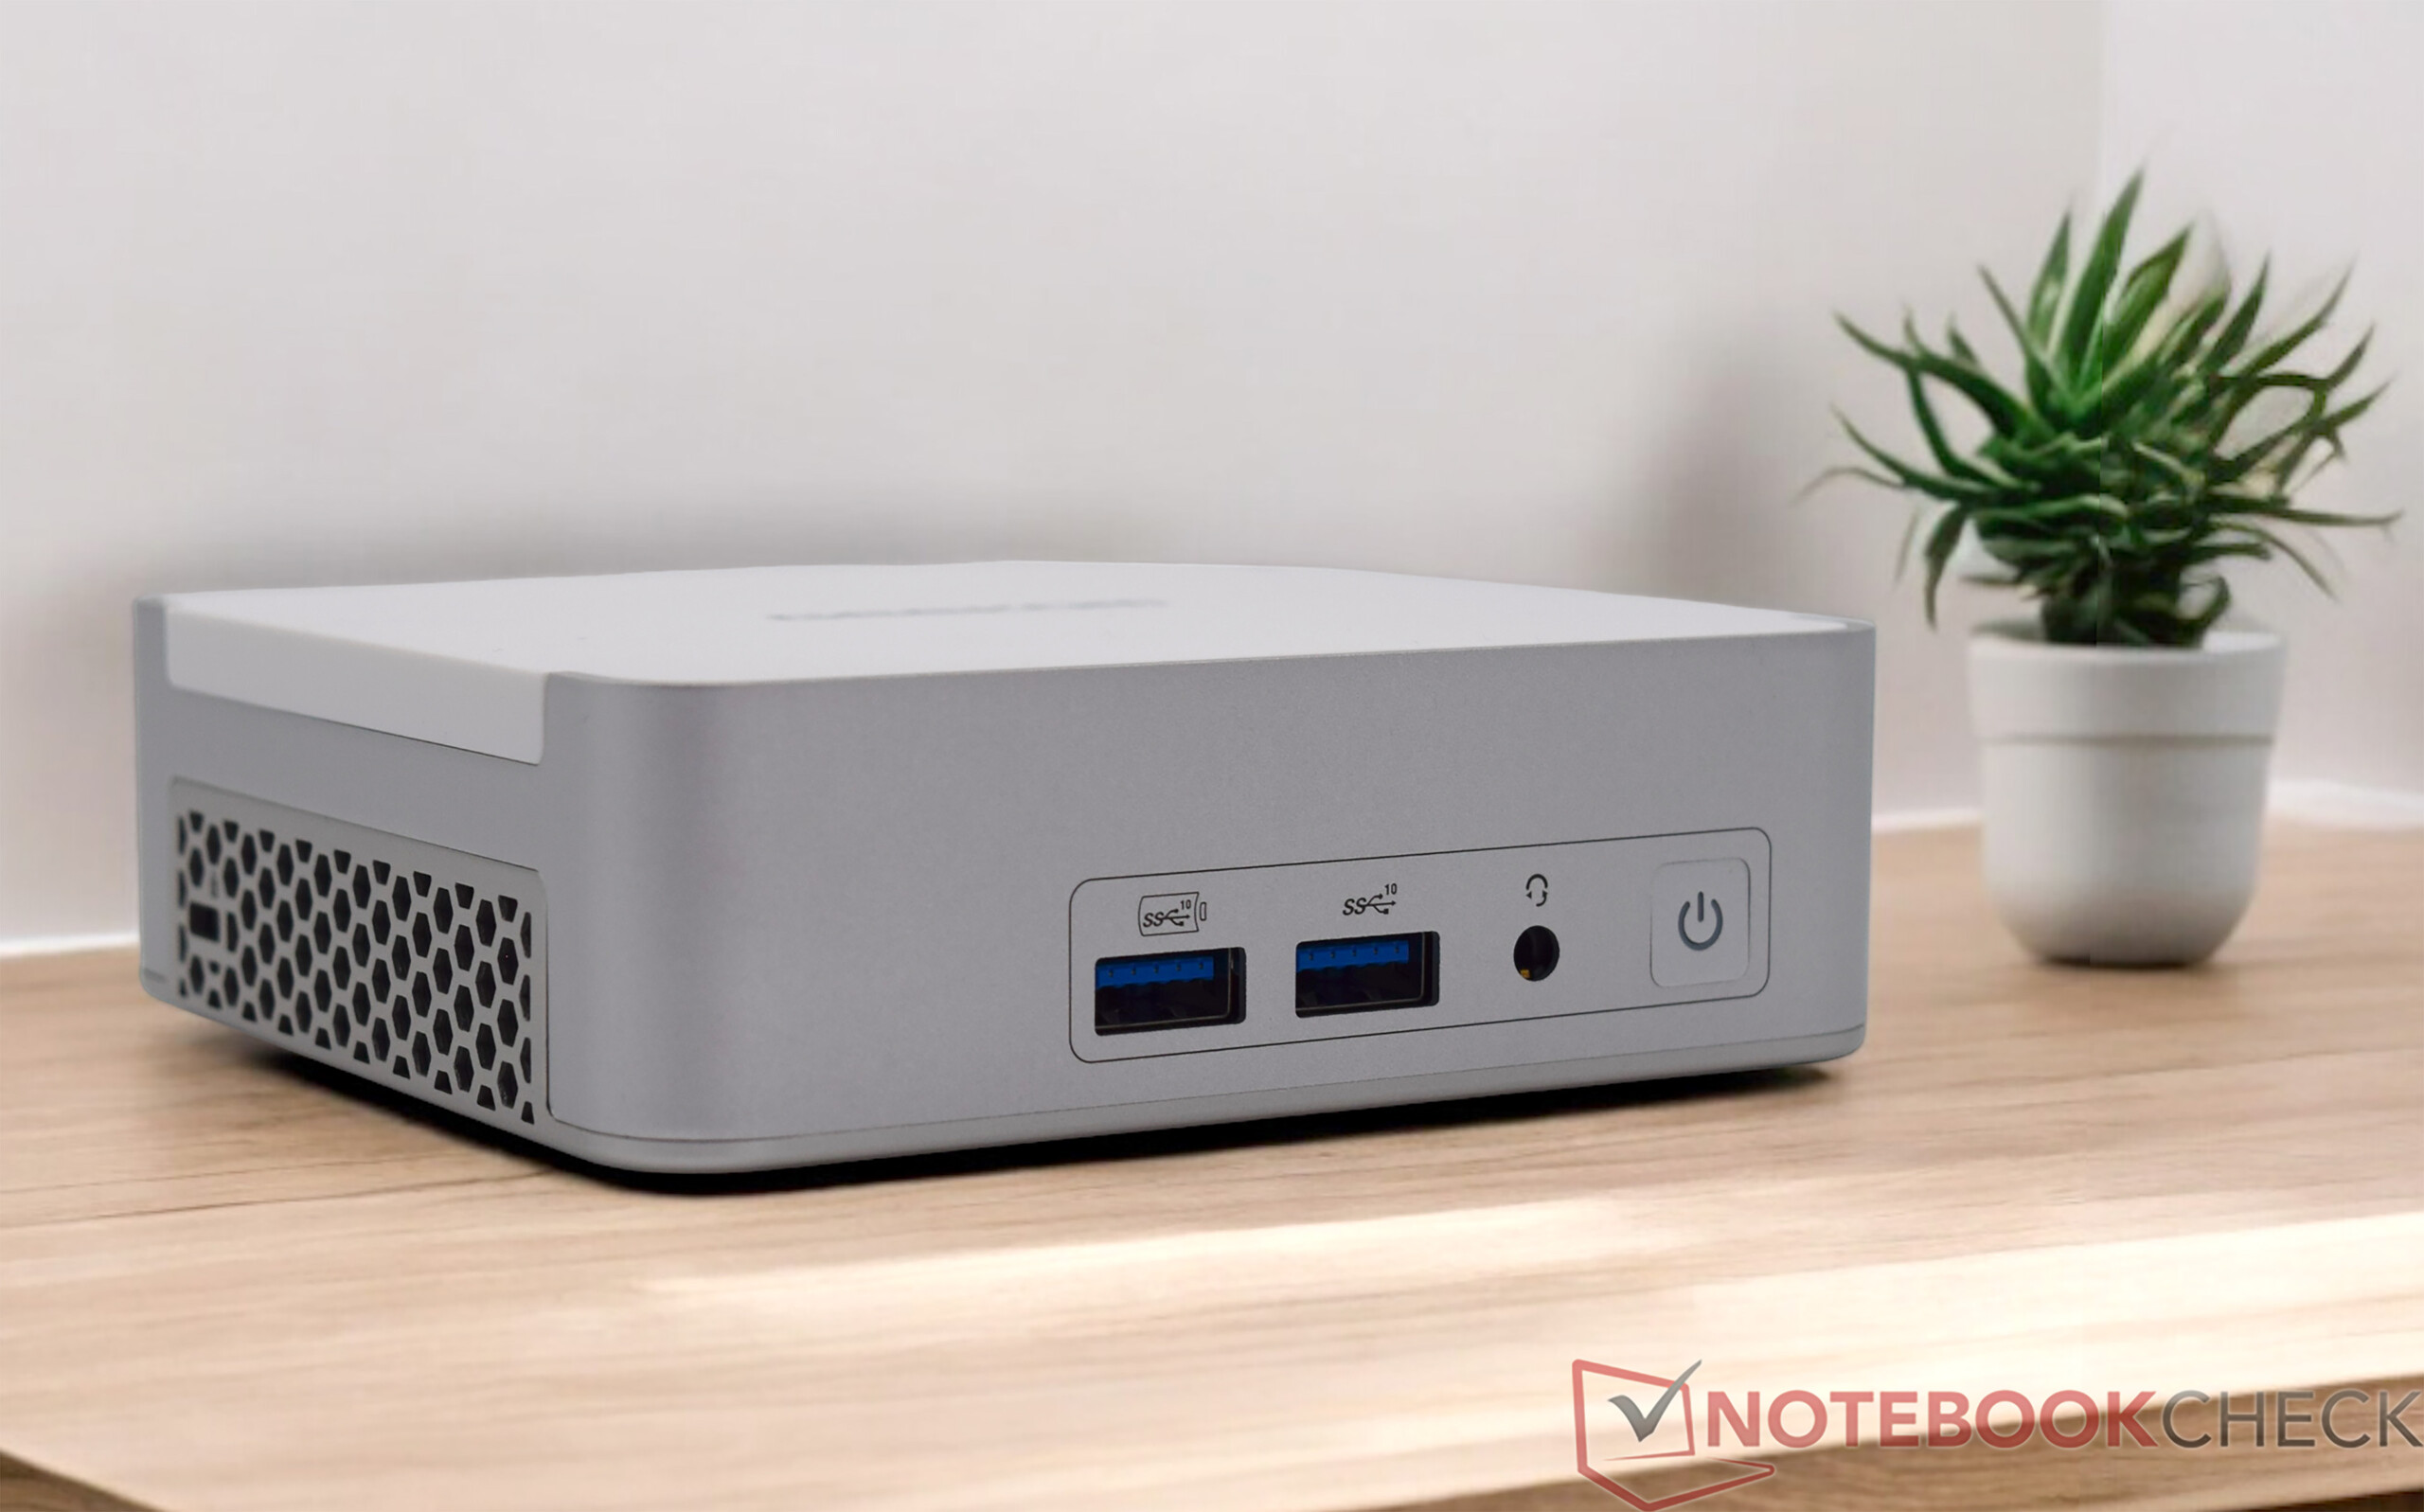
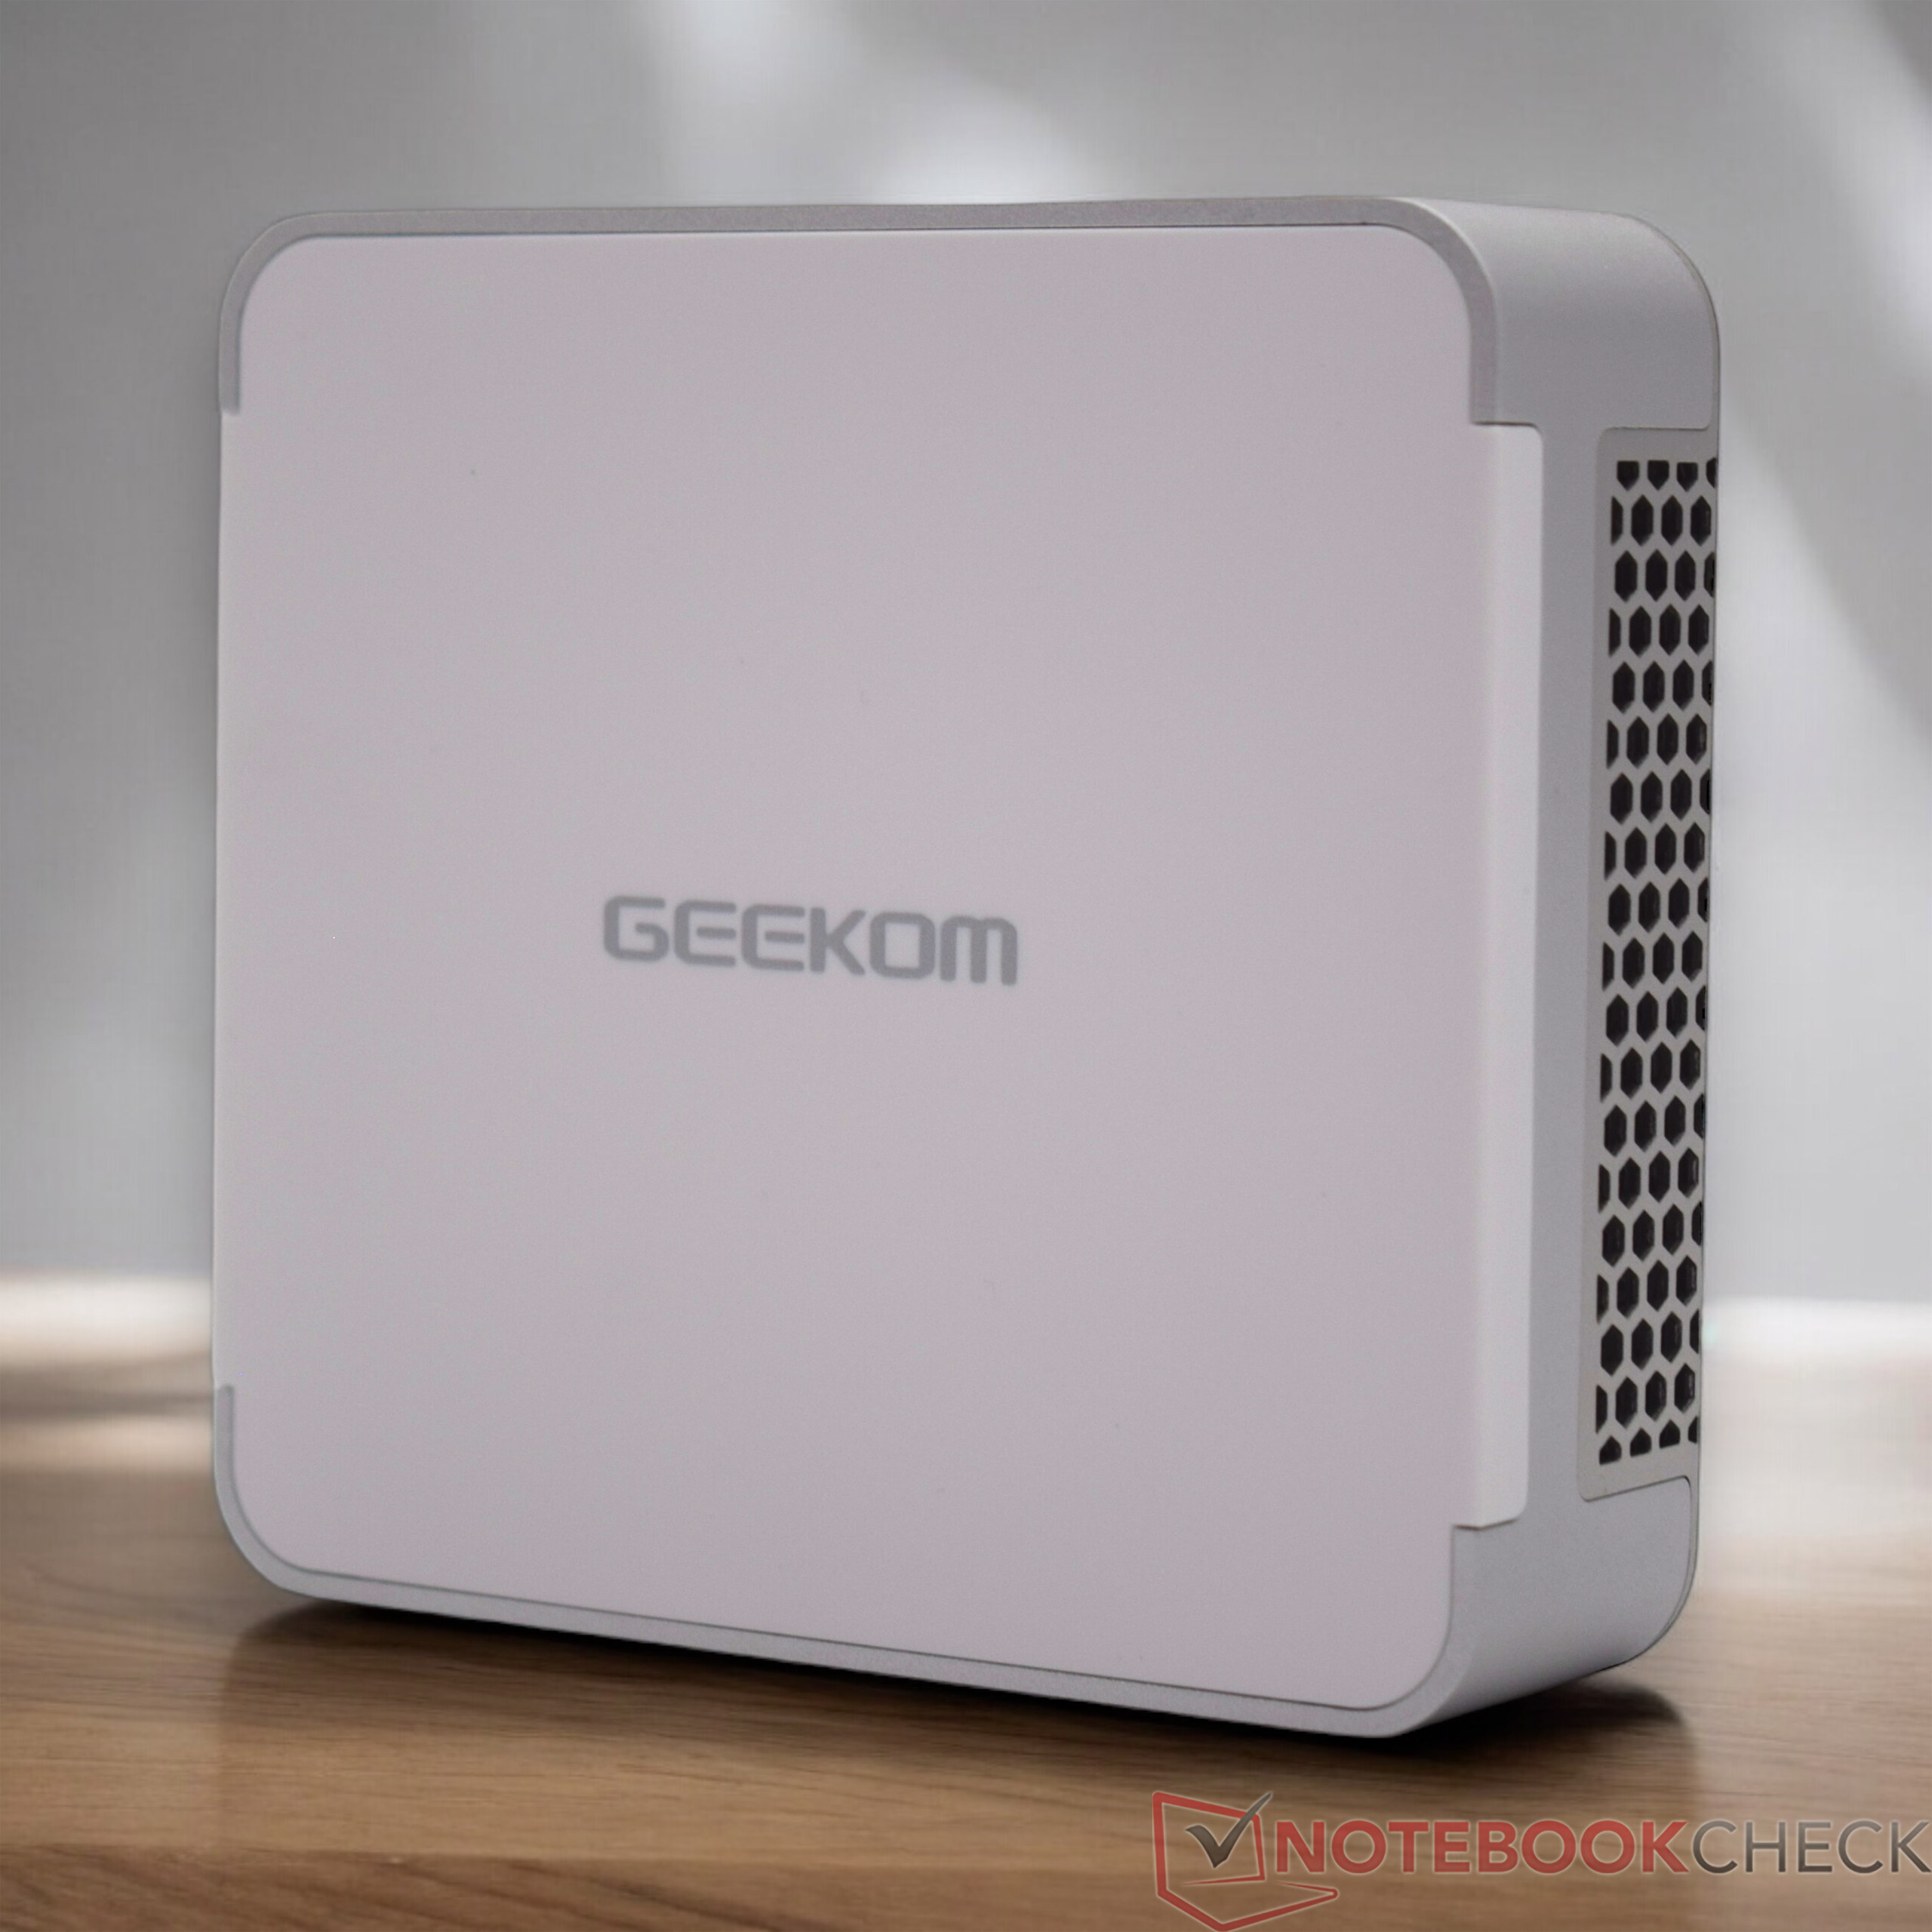
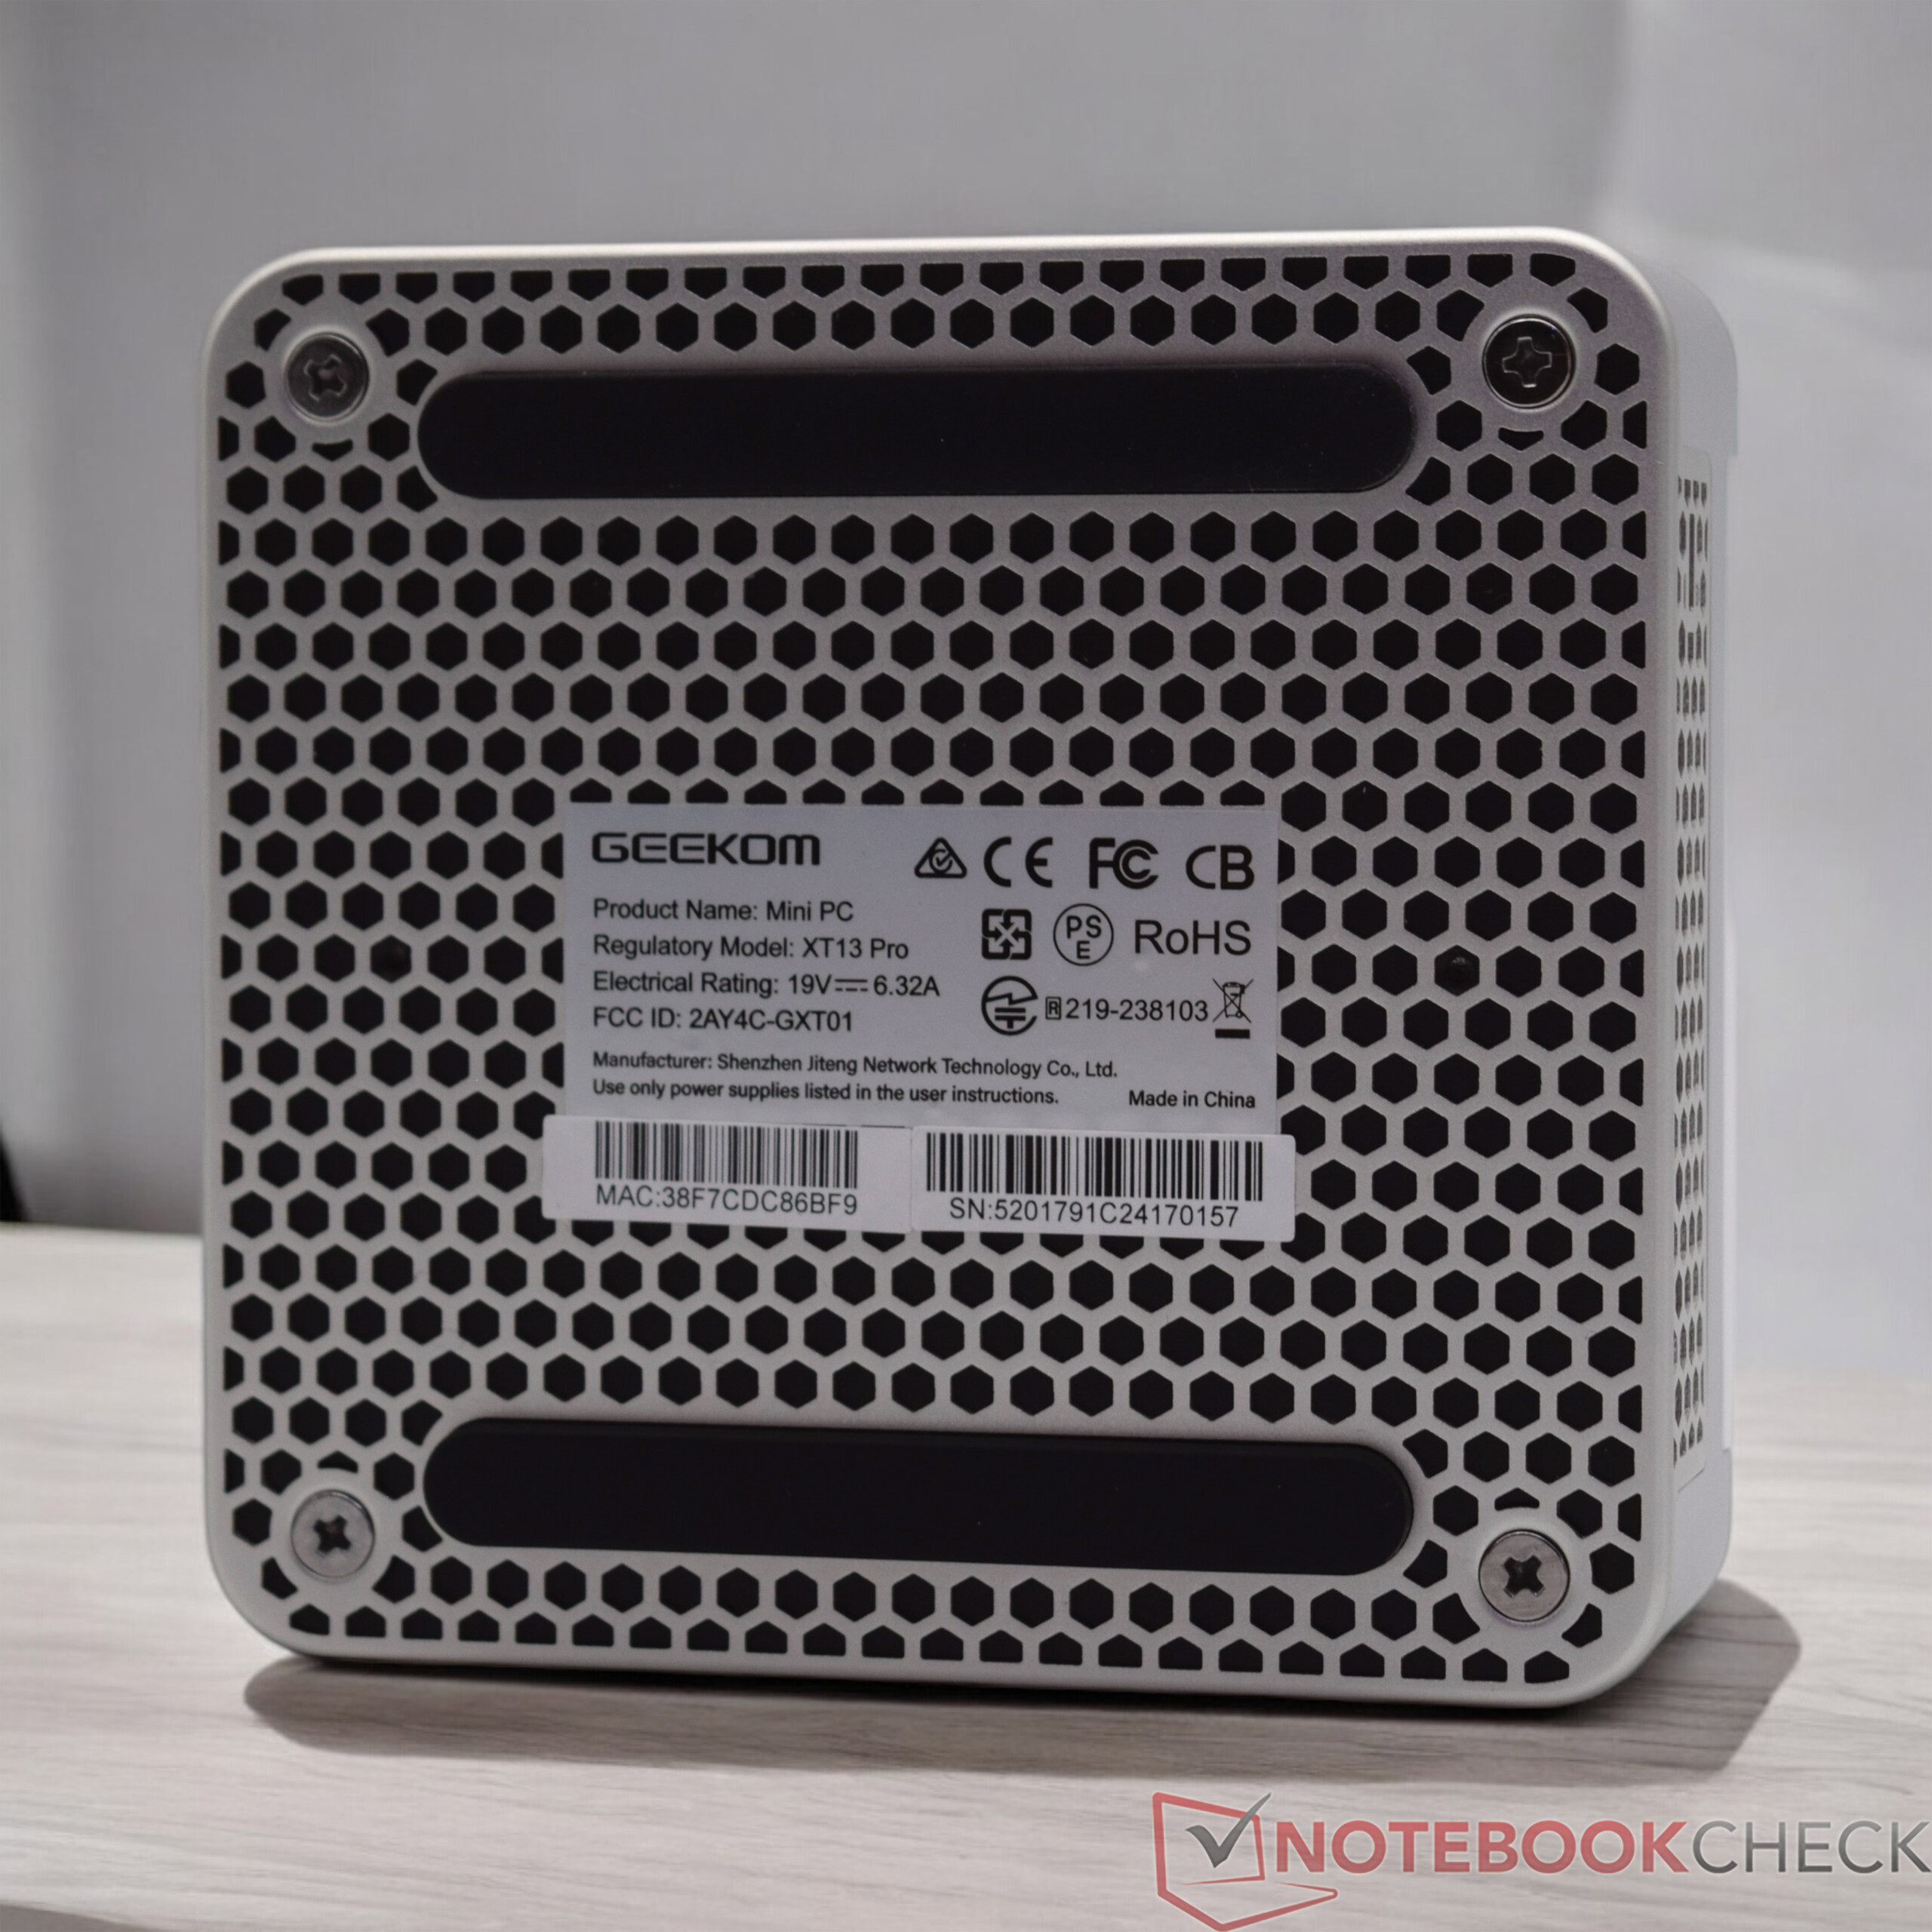
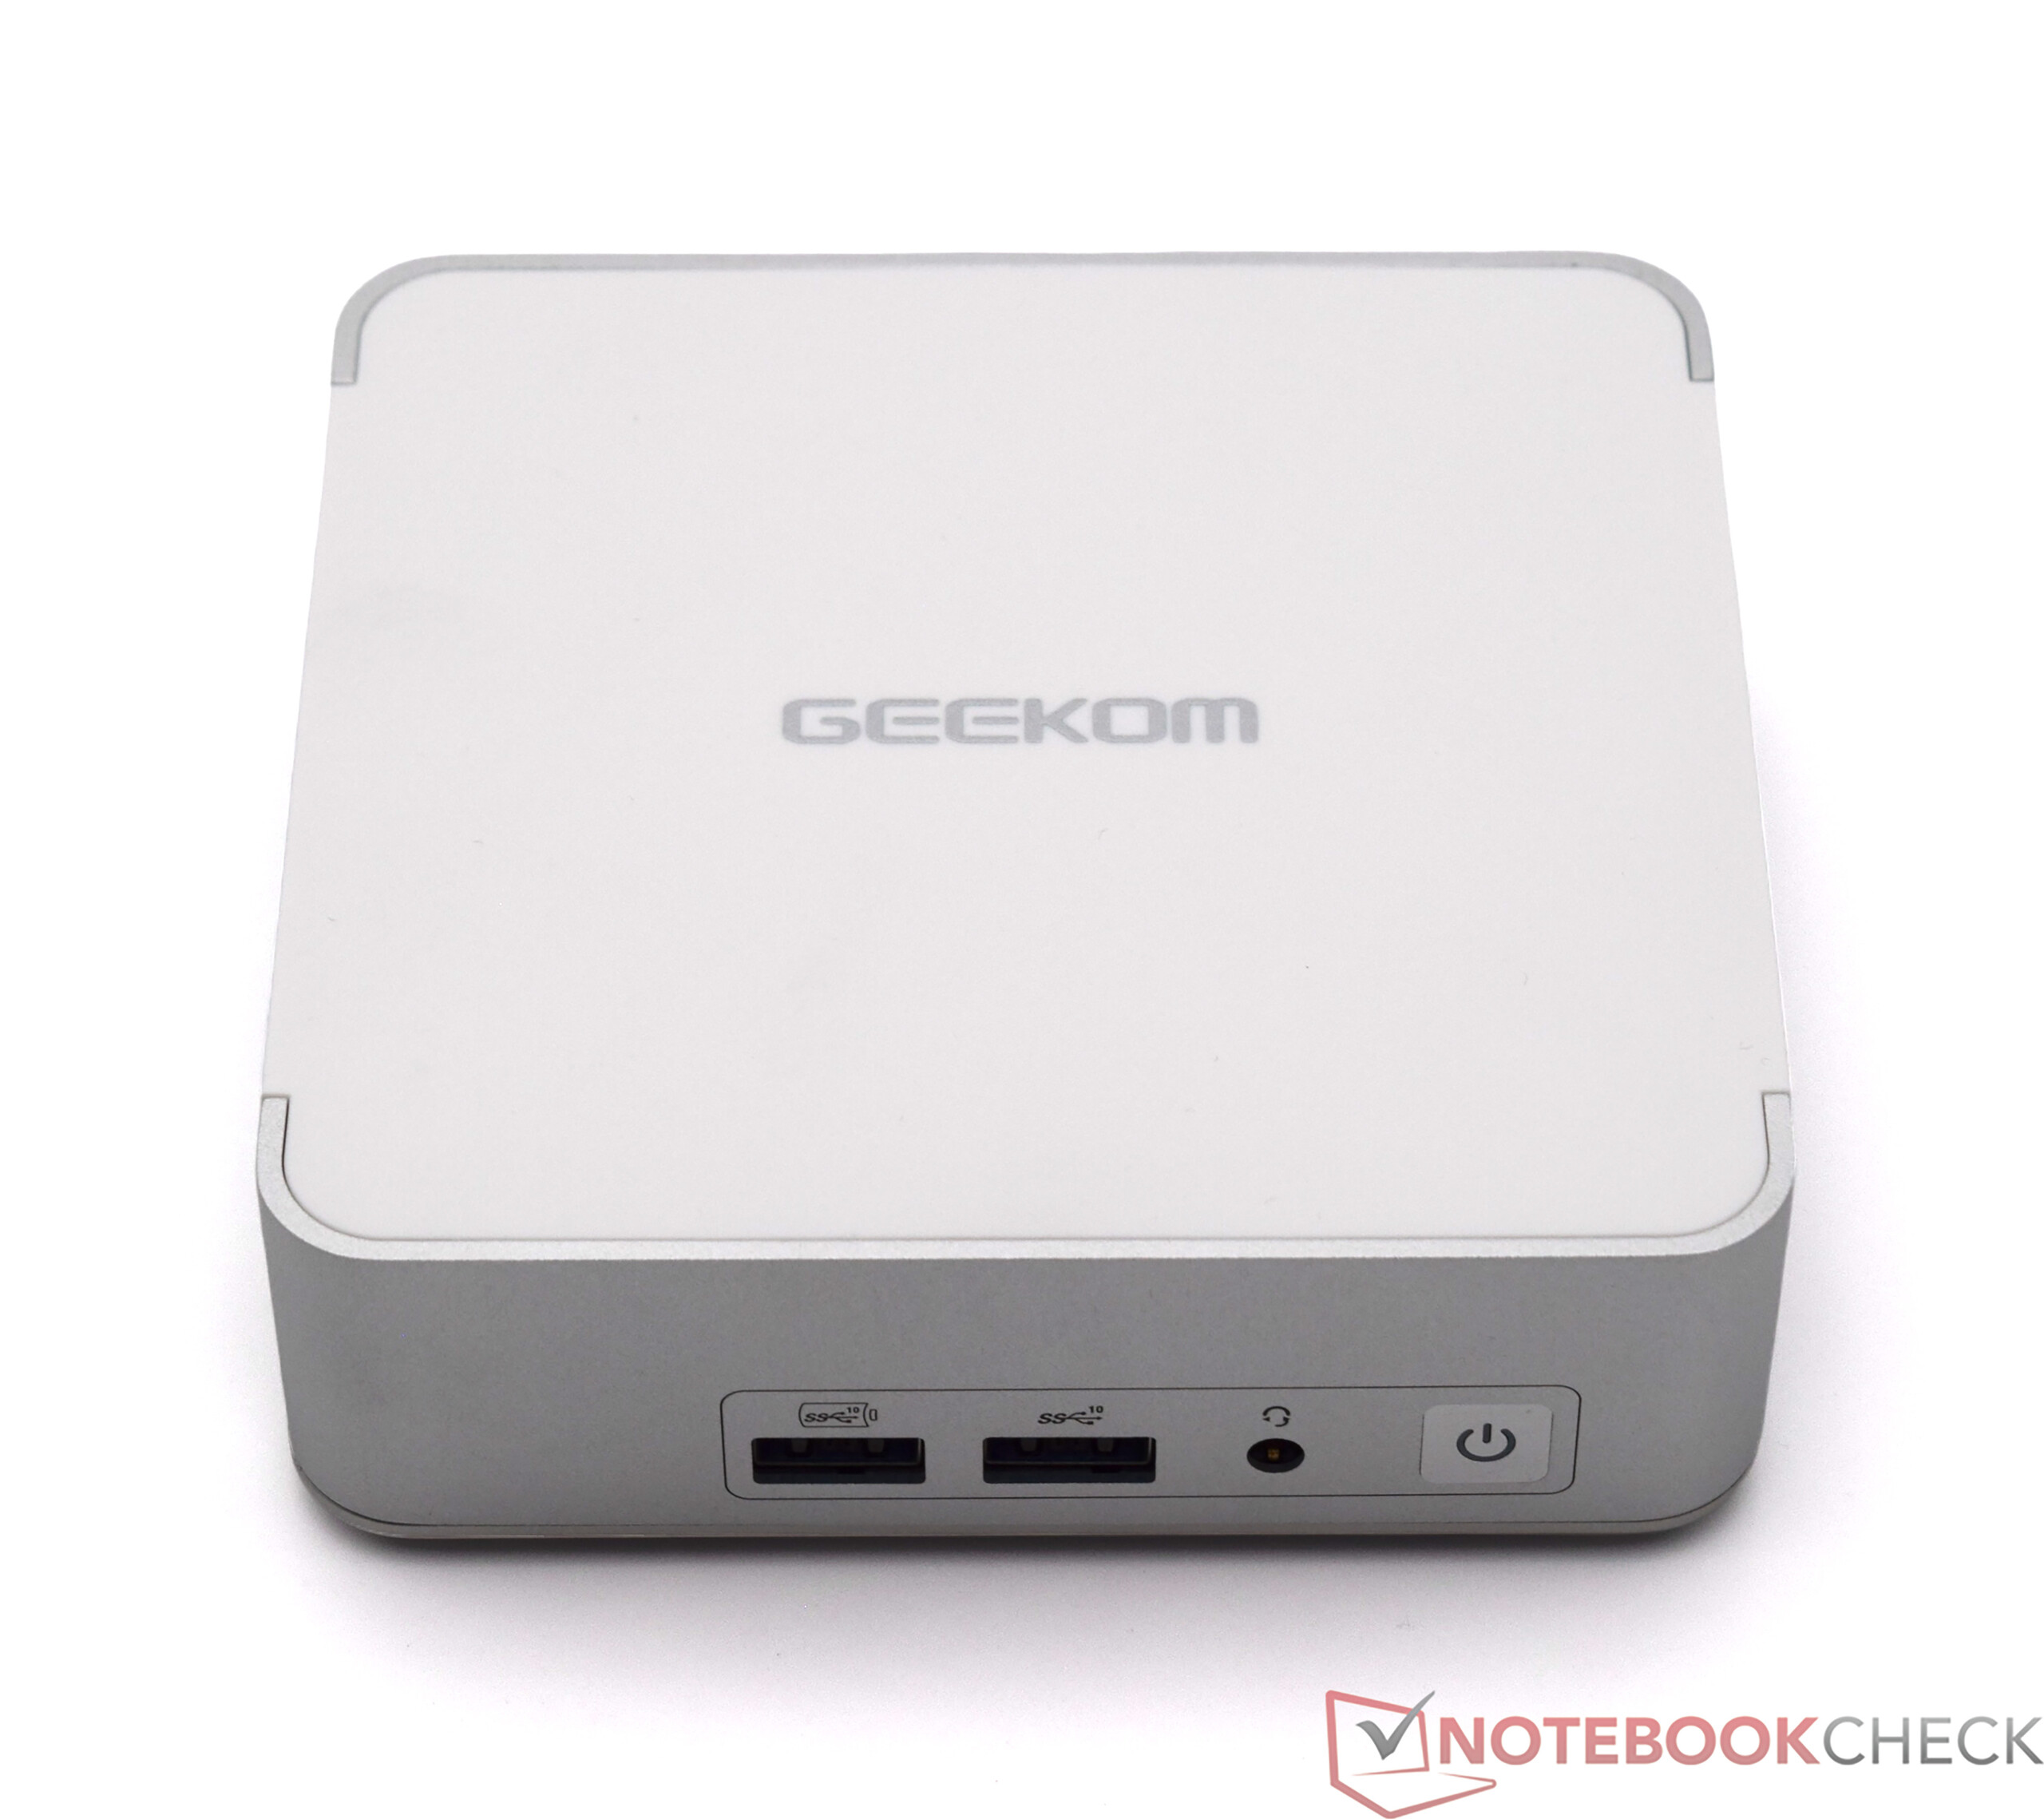
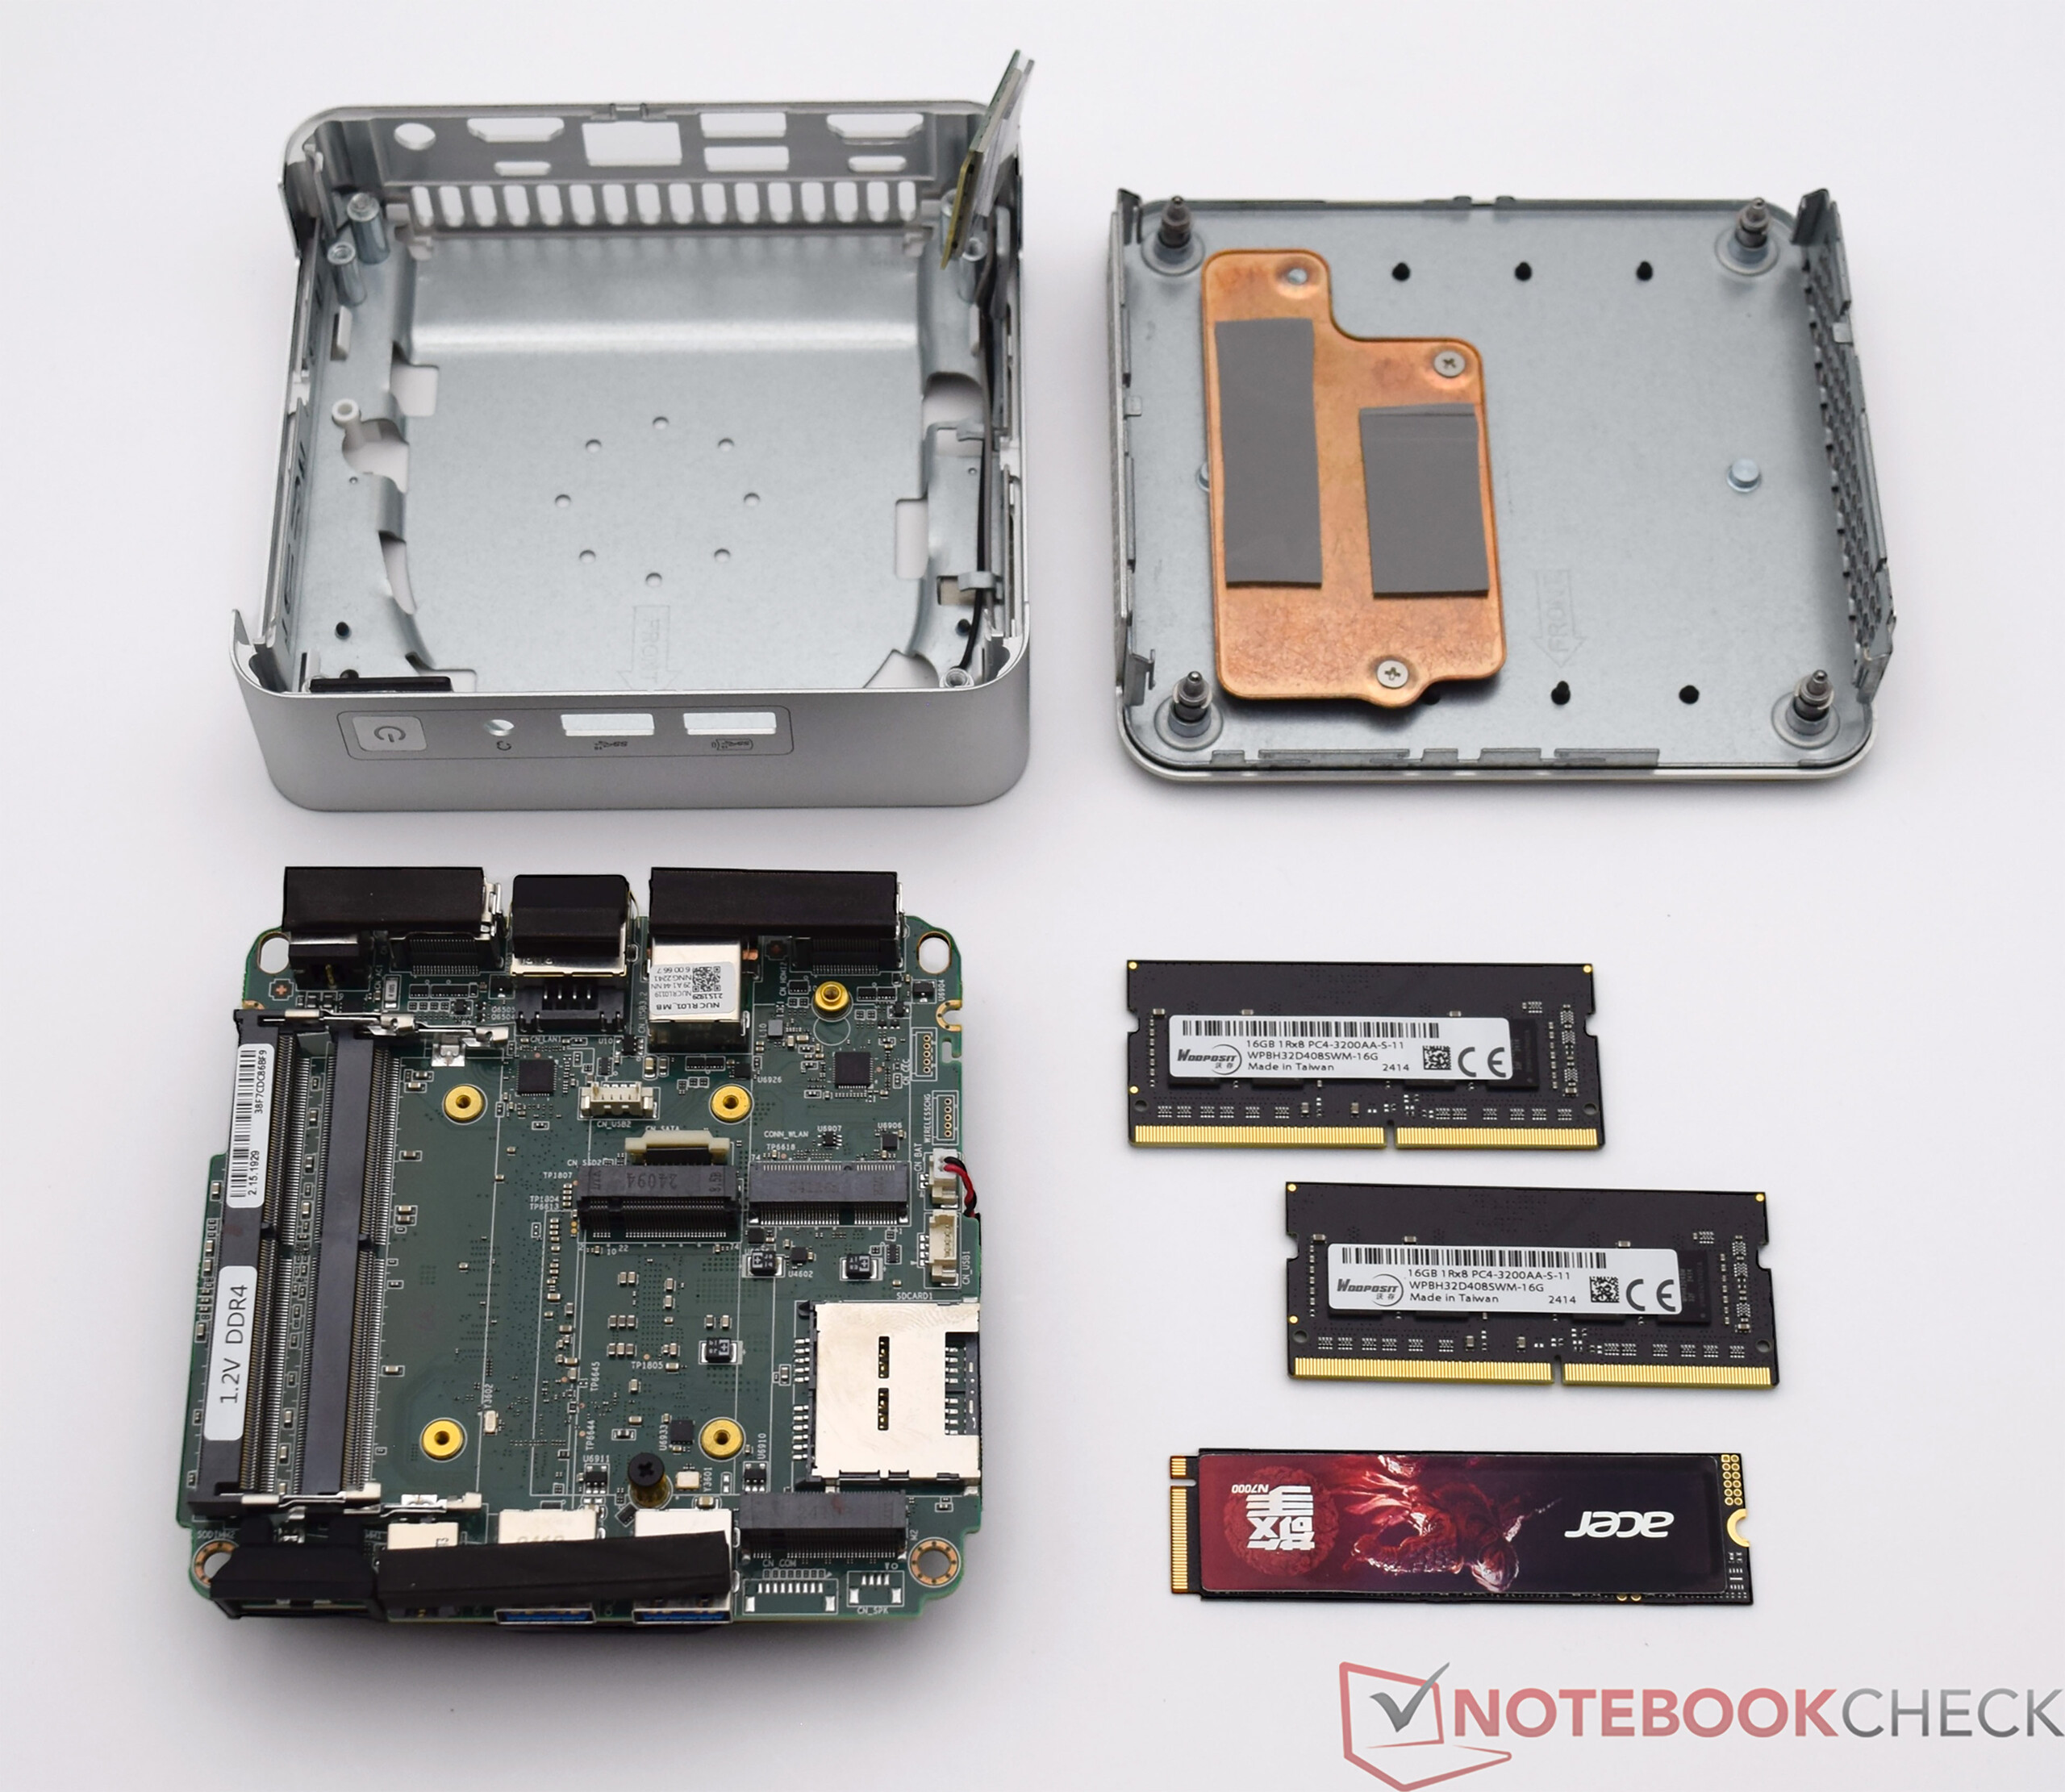
La carcasa del Geekom XT13 Pro resulta familiar, ya se utilizó para el Geekom XT12 Pro. Tampoco se puede negar la similitud con el kit Intel NUC 13 Pro Desk Edition. Básicamente, el aspecto no tiene nada de malo. Nuestra muestra de prueba está una vez más perfectamente acabada y todo encaja de maravilla. Sin embargo, nos hubiera gustado ver una nueva carcasa para diferenciarlo ligeramente de la competencia interna. El mini PC sólo ocupa 11,7 x 11,2 centímetros sobre el escritorio, lo que lo convierte en uno de los dispositivos más compactos. El Geekom XT13 Pro también puede fijarse directamente a un monitor mediante el soporte VESA suministrado.
Equipamiento - Buena selección y 2x USB4
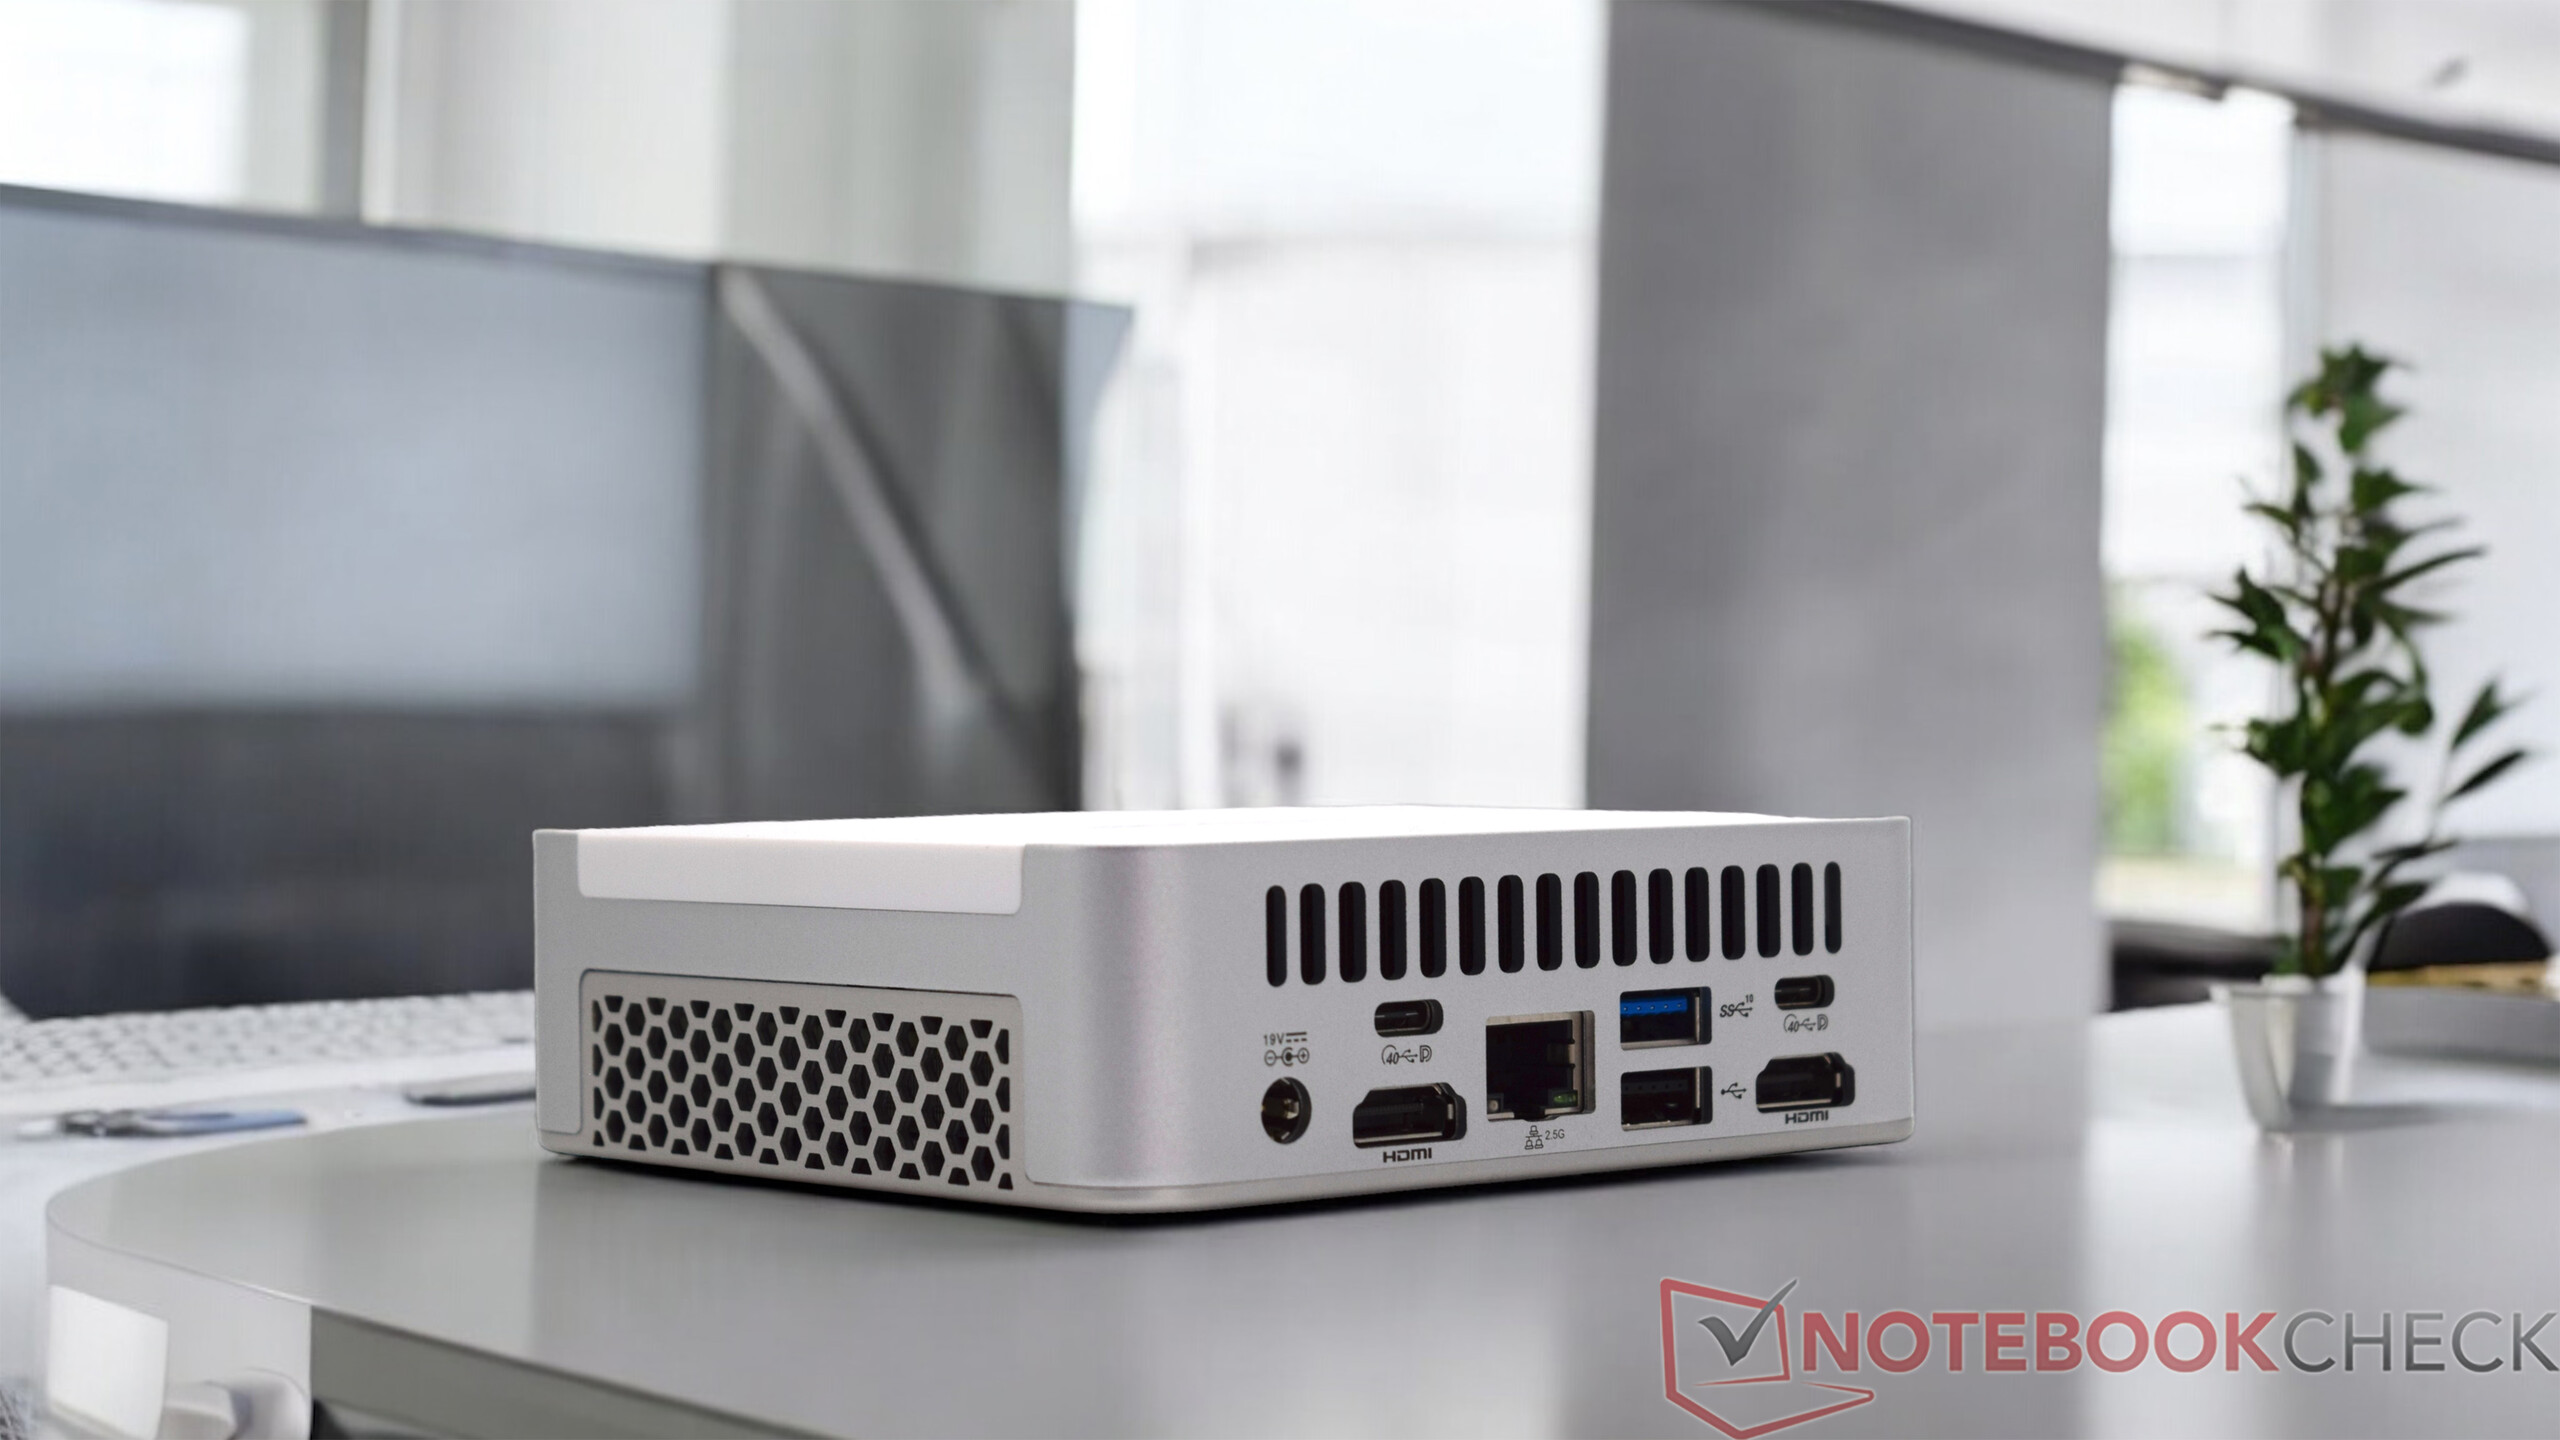
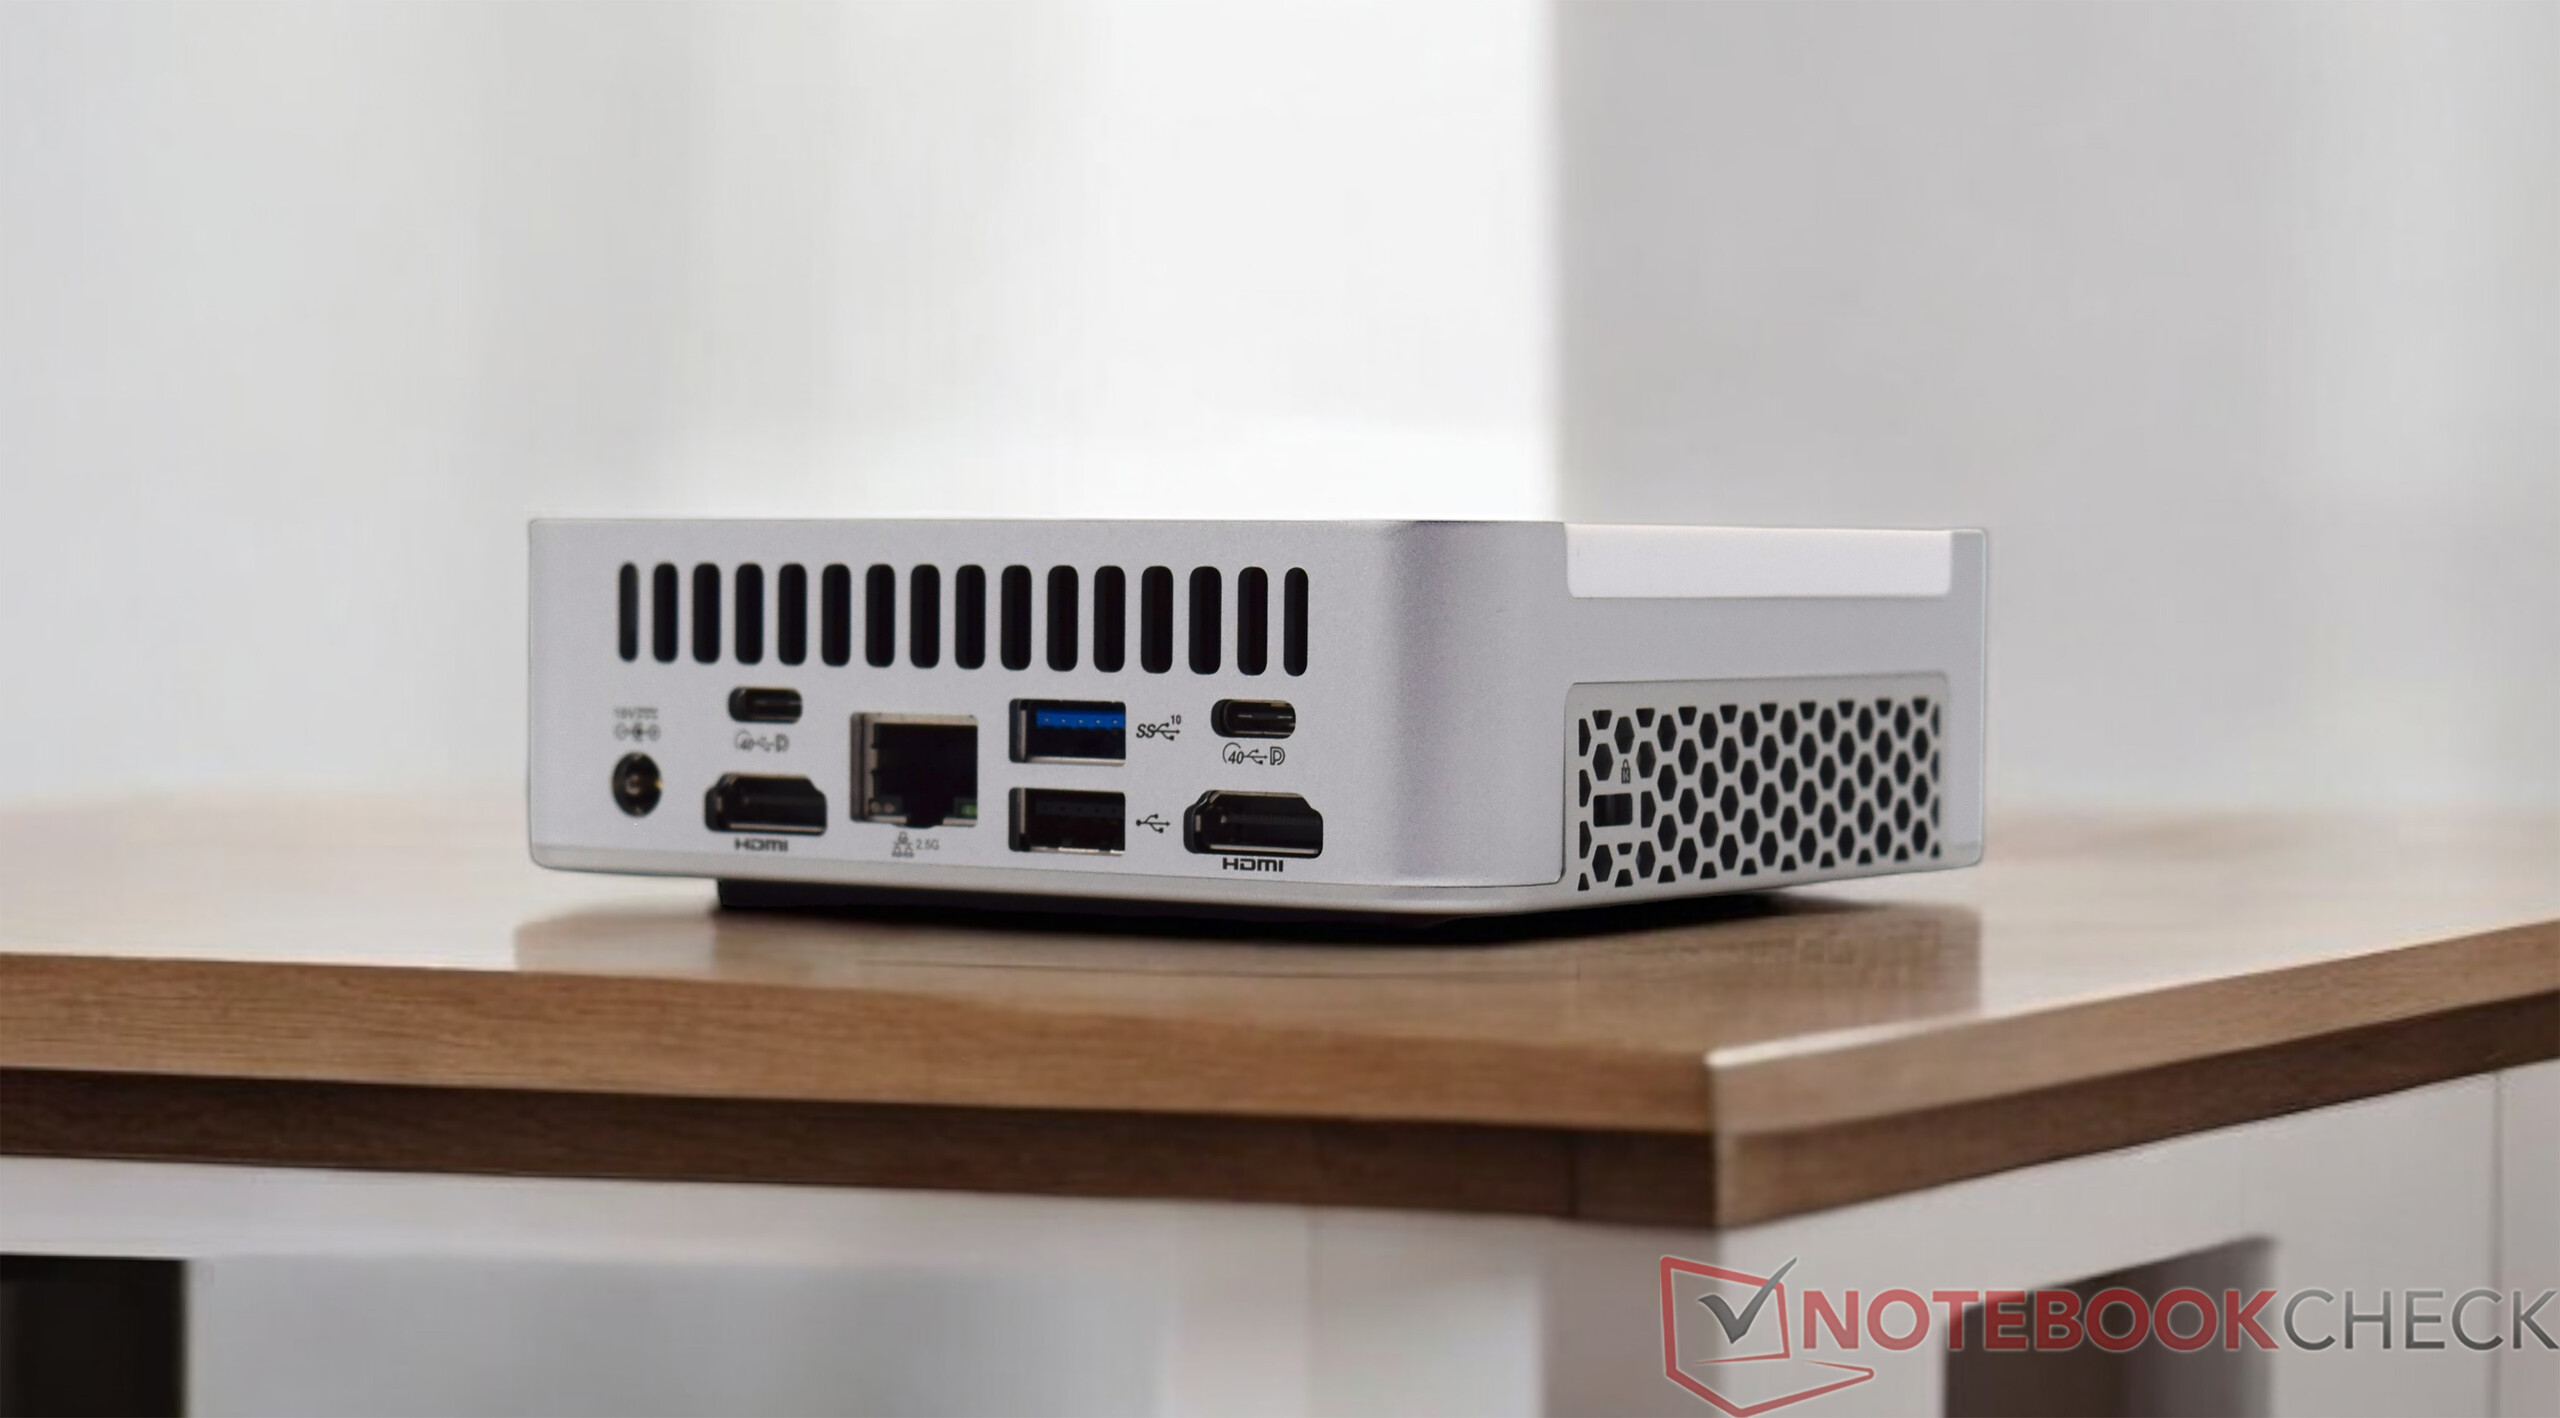
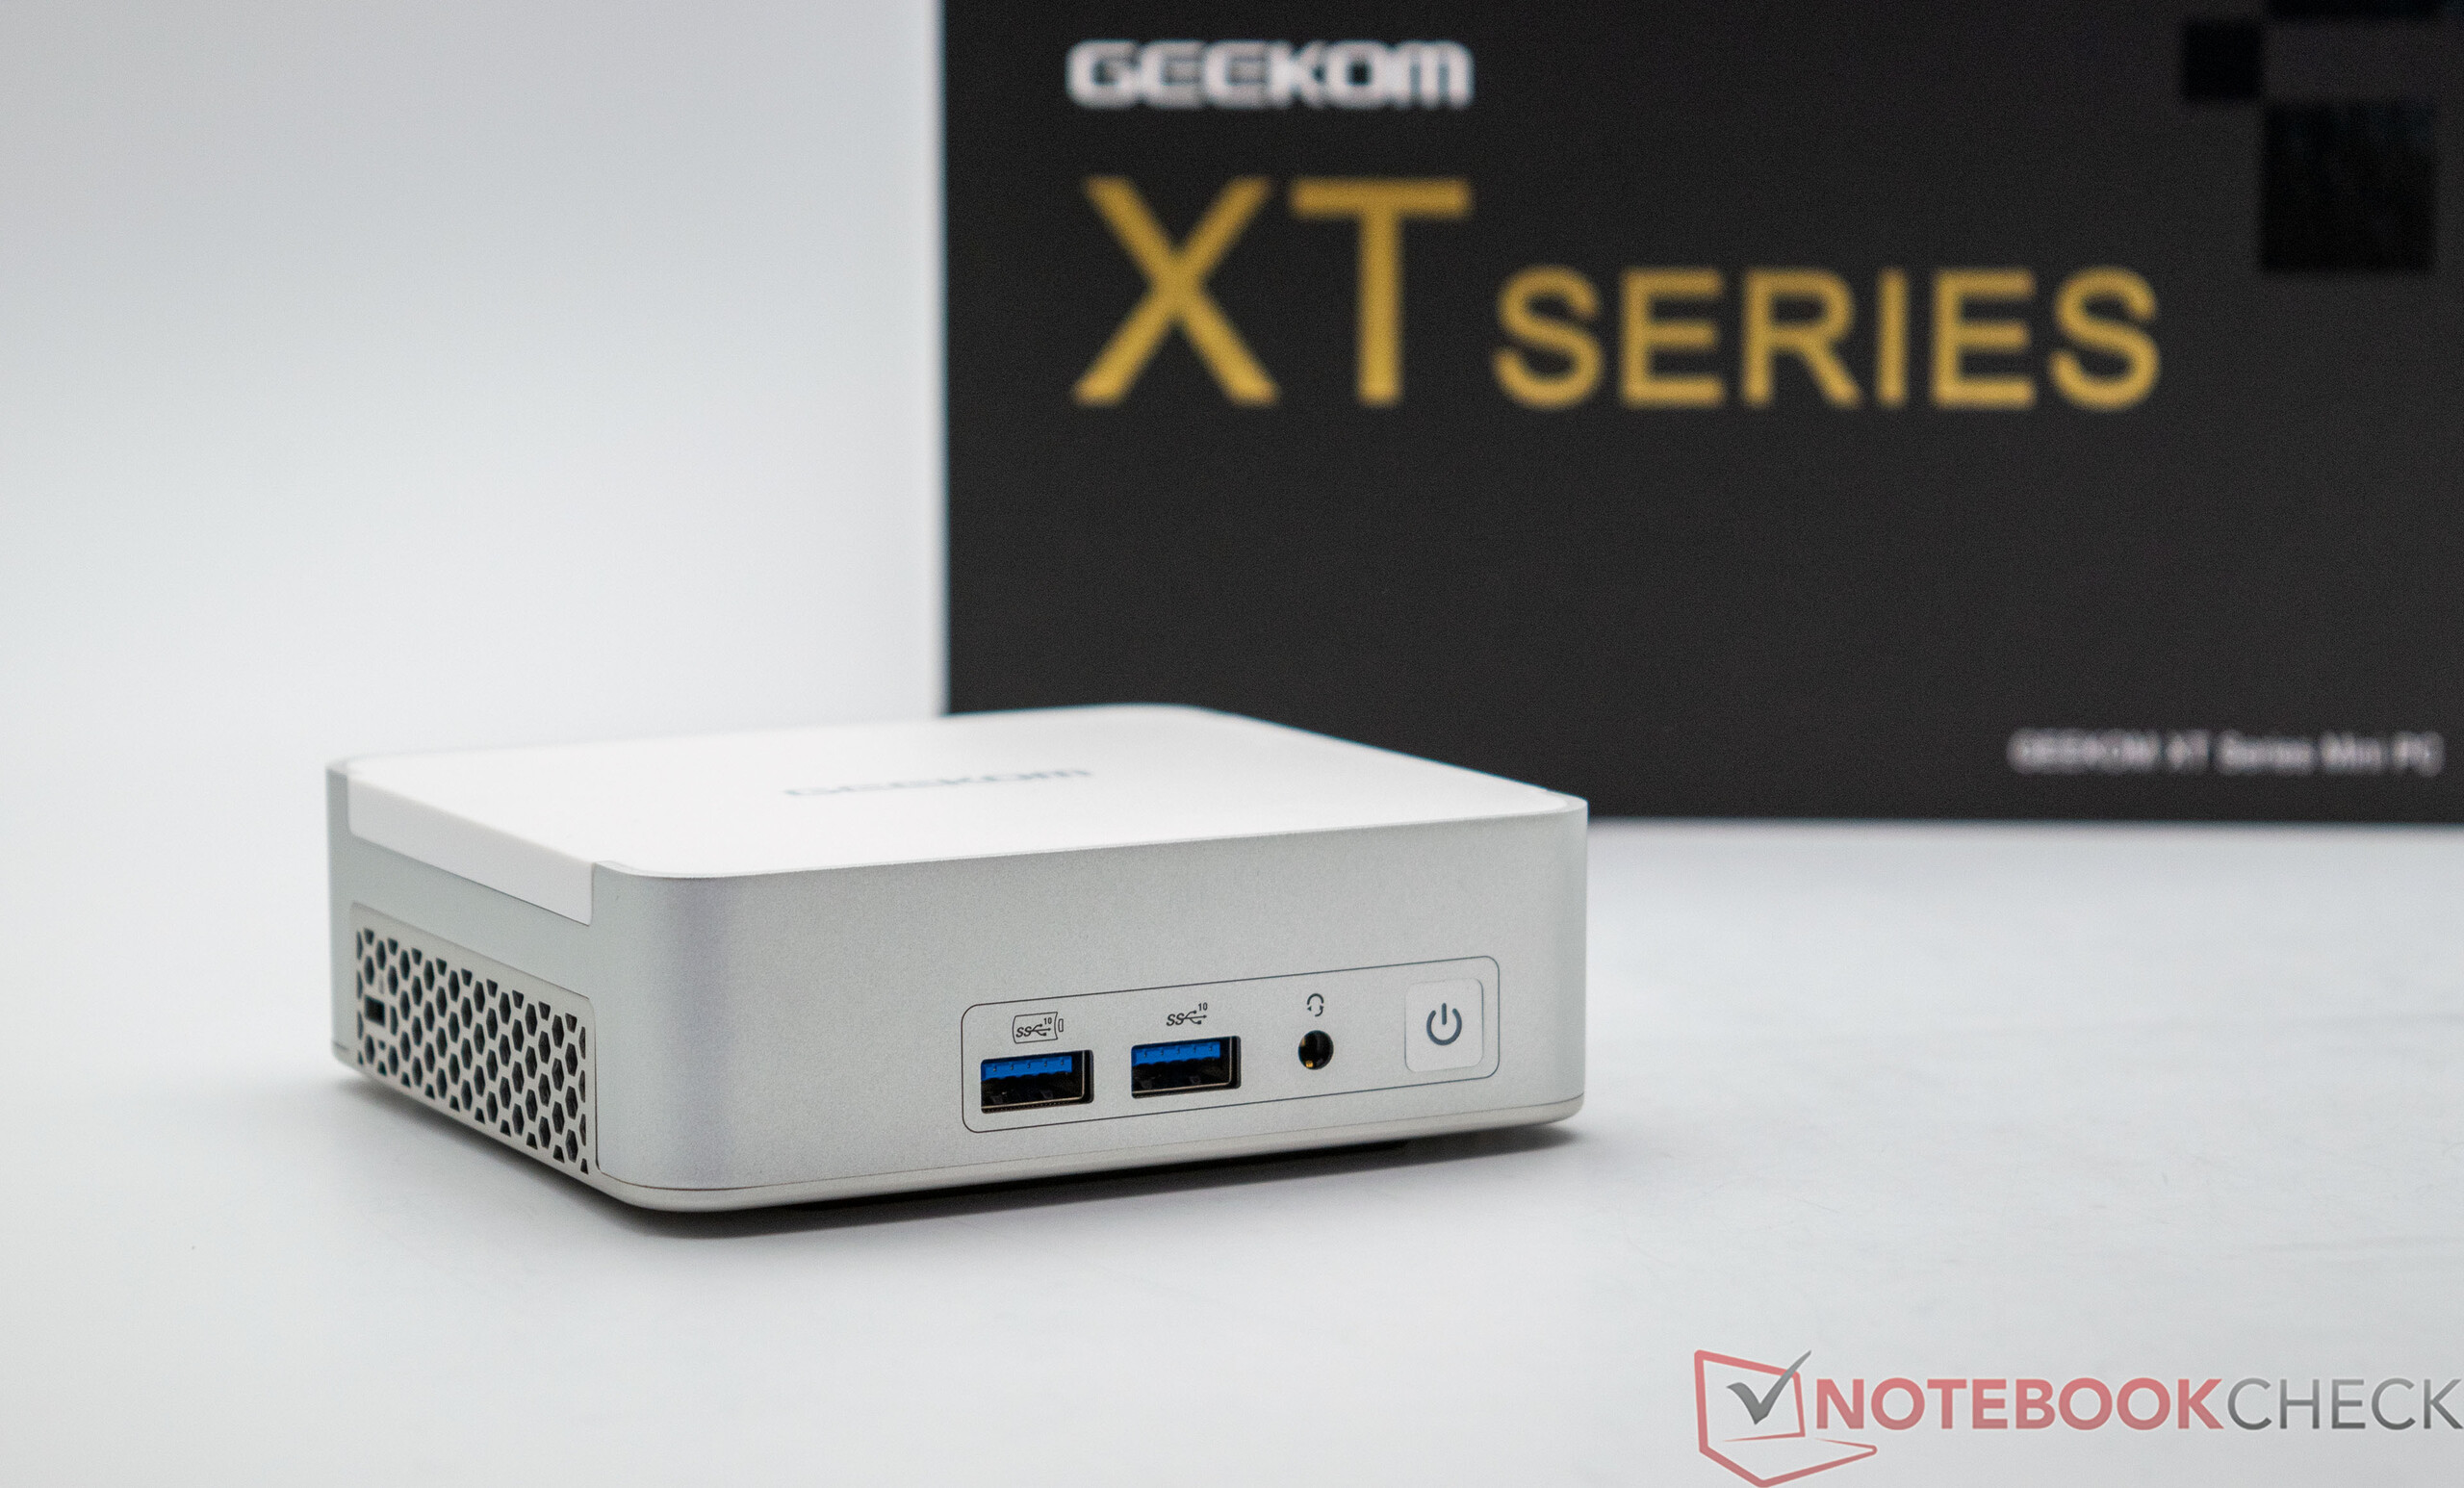
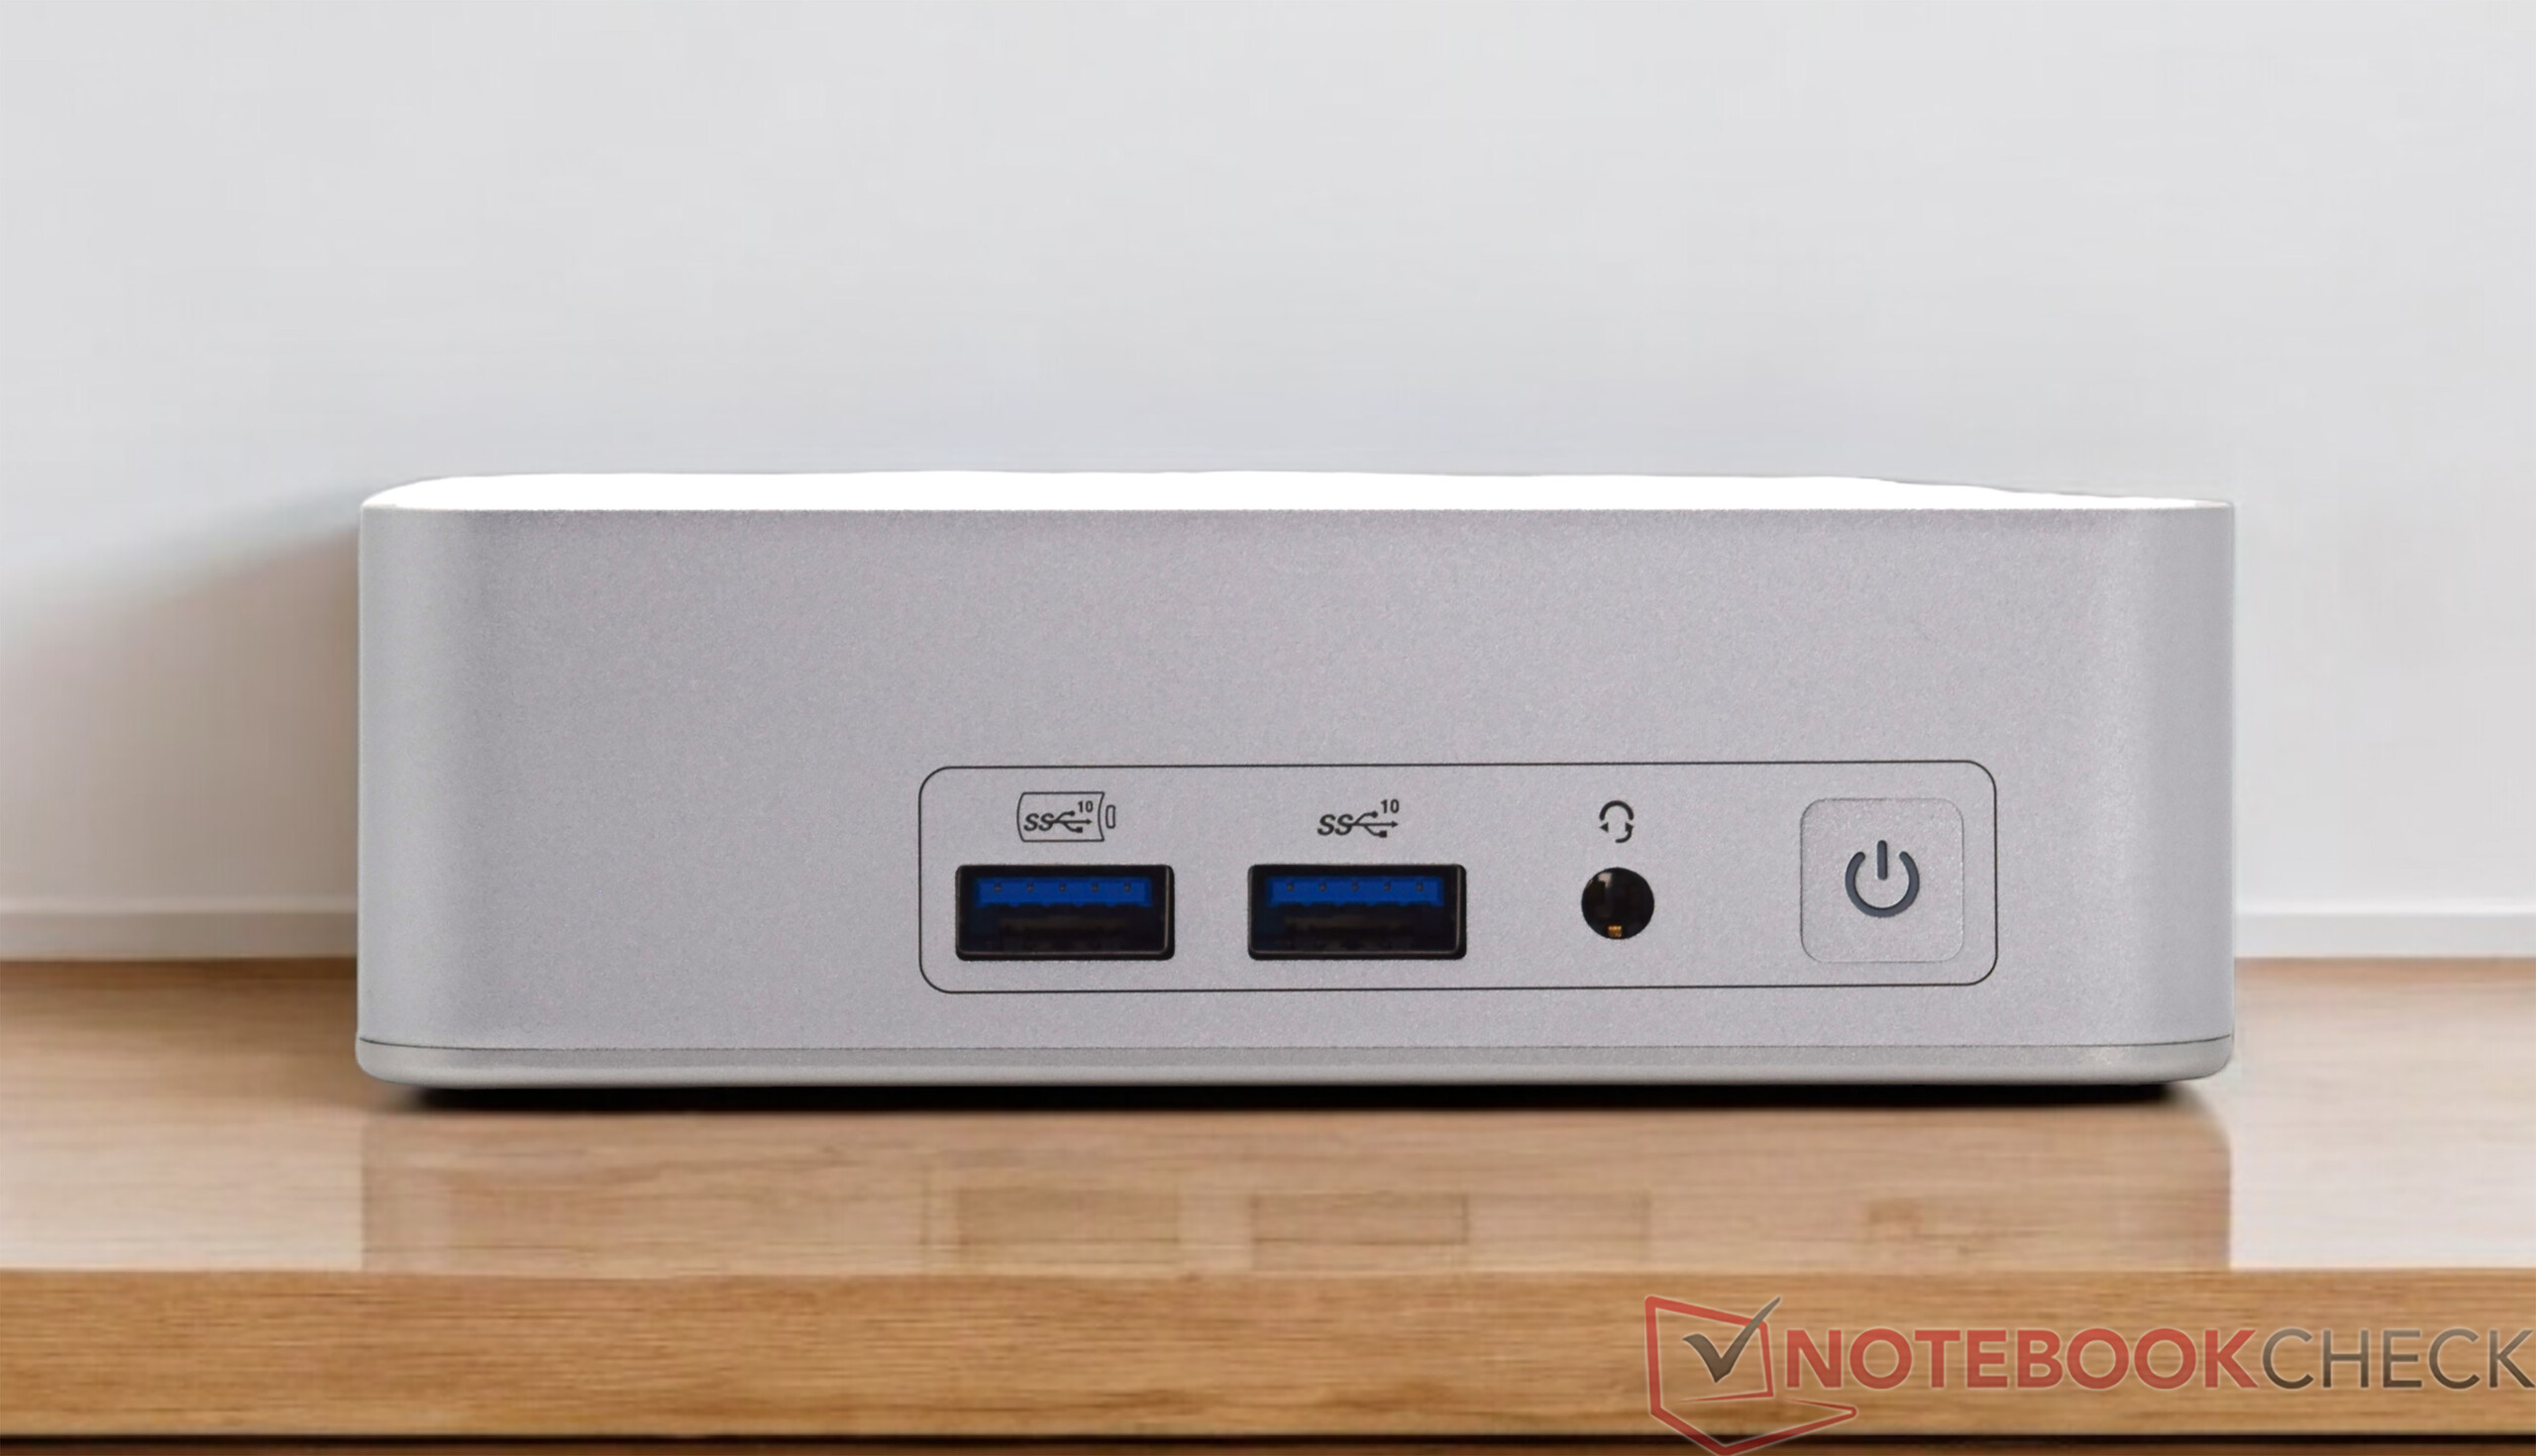
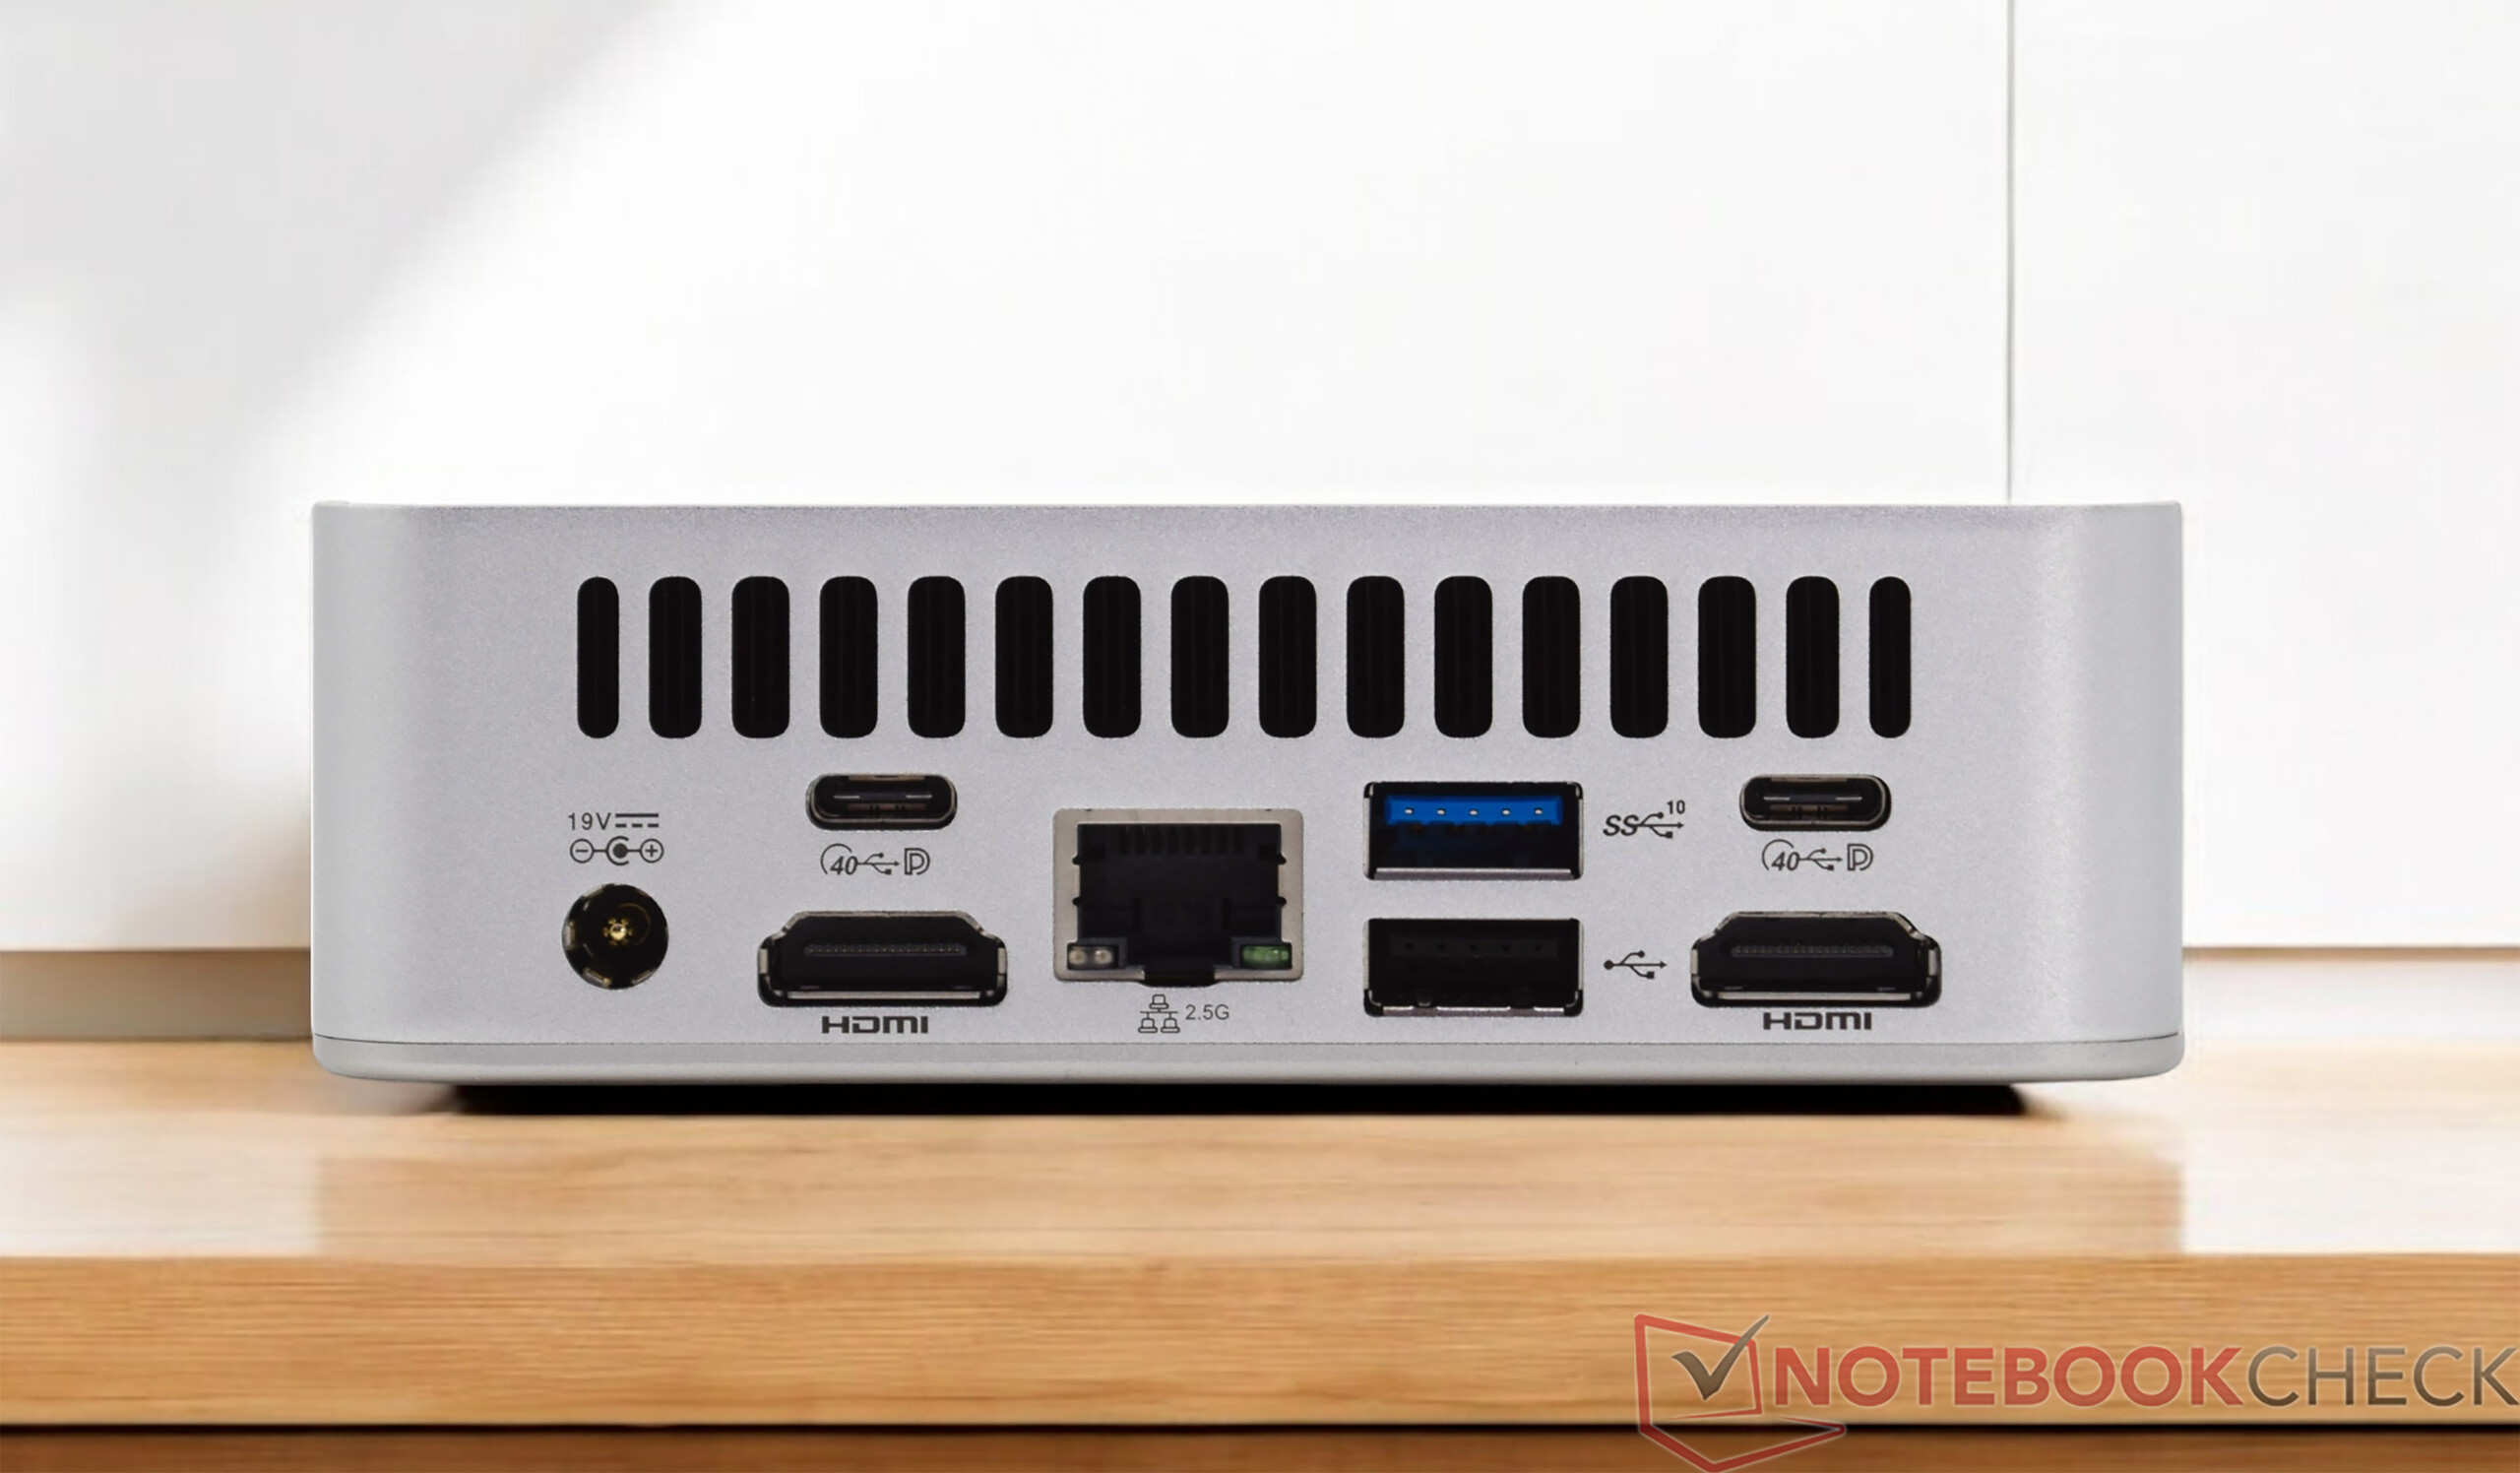
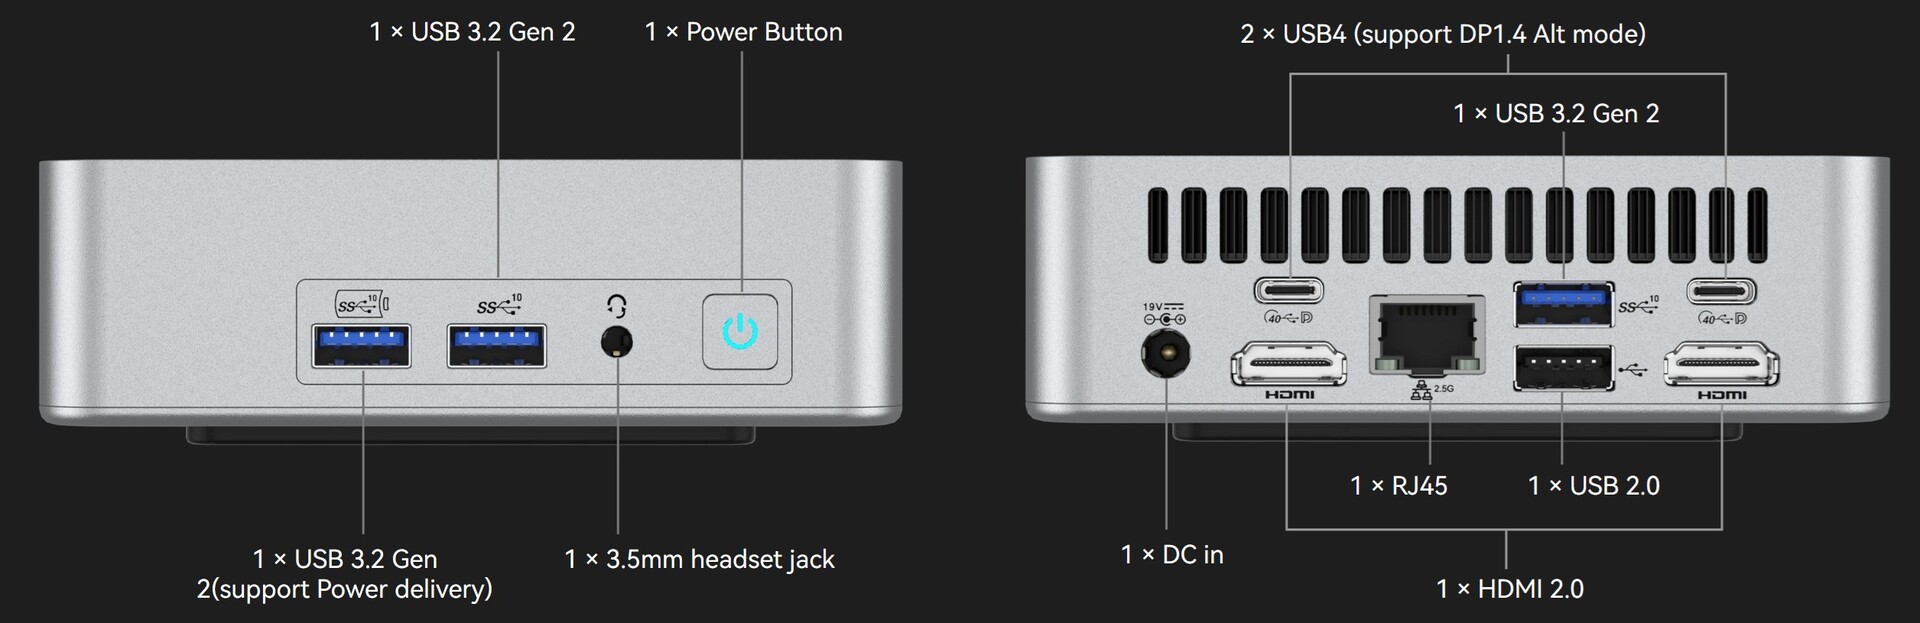
En cuanto a las interfaces externas, el Geekom XT13 Pro tiene las mismas opciones que el Geekom XT12 Pro. Aunque el dispositivo es muy compacto, dispone de muchas conexiones diferentes. Las dos tomas USB-C de la parte trasera son modernos puertos USB4, lo que amplía enormemente la gama de aplicaciones con los accesorios adecuados. Se pueden utilizar un total de cuatro pantallas simultáneamente y también hay una conexión LAN.
Comunicación
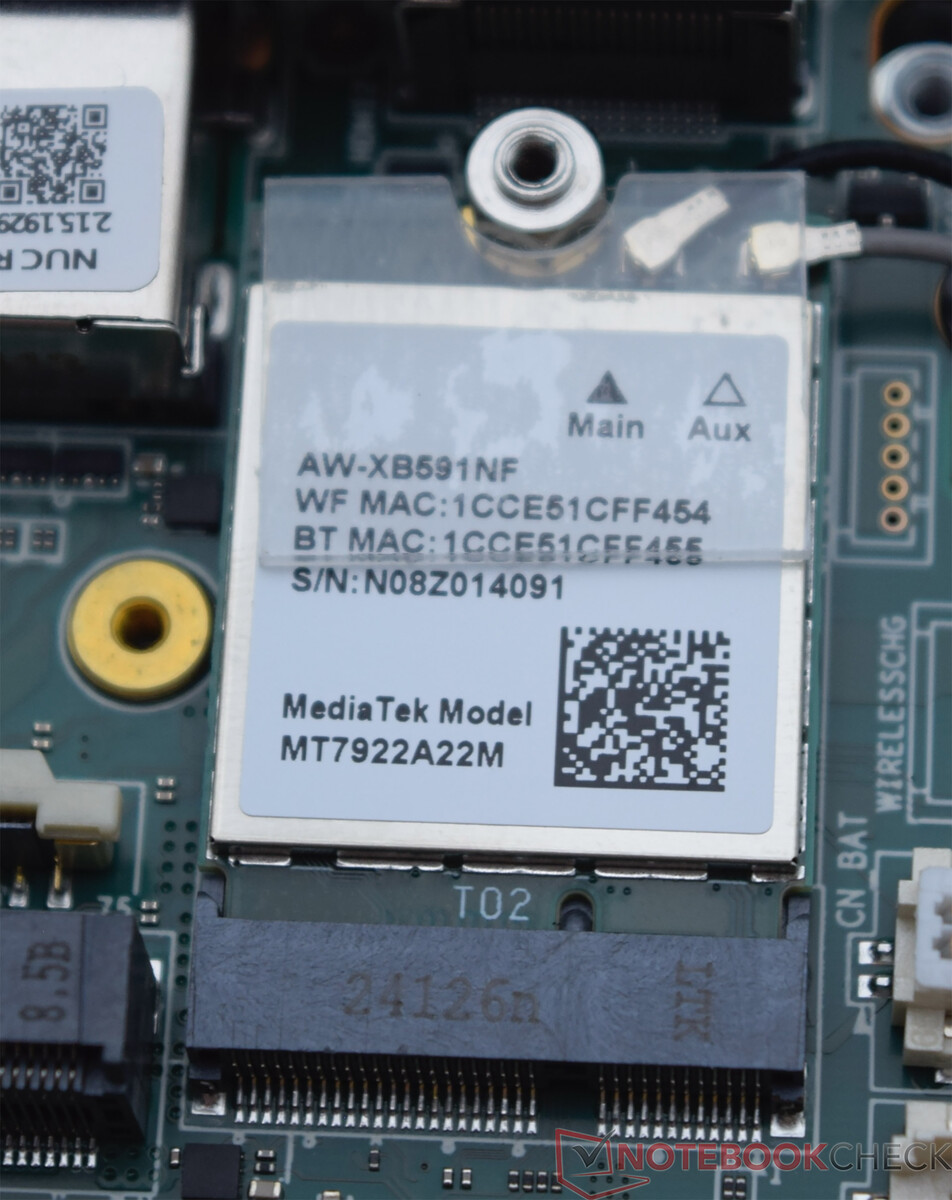
El Geekom XT13 Pro utiliza un conocido módulo inalámbrico que Geekom instala en muchos de sus dispositivos. El módulo WLAN MediaTek Wi-Fi 6E MT7922 puede proporcionar un rendimiento adecuado en nuestro dispositivo de prueba. No obstante, si es posible, debería utilizarse principalmente el rango de frecuencias de 6 GHz. Como alternativa, también puede utilizarse la conexión por cable. En ese caso, incluso son posibles velocidades de transmisión de datos de hasta 2,5 GBit/s.
Accesorios
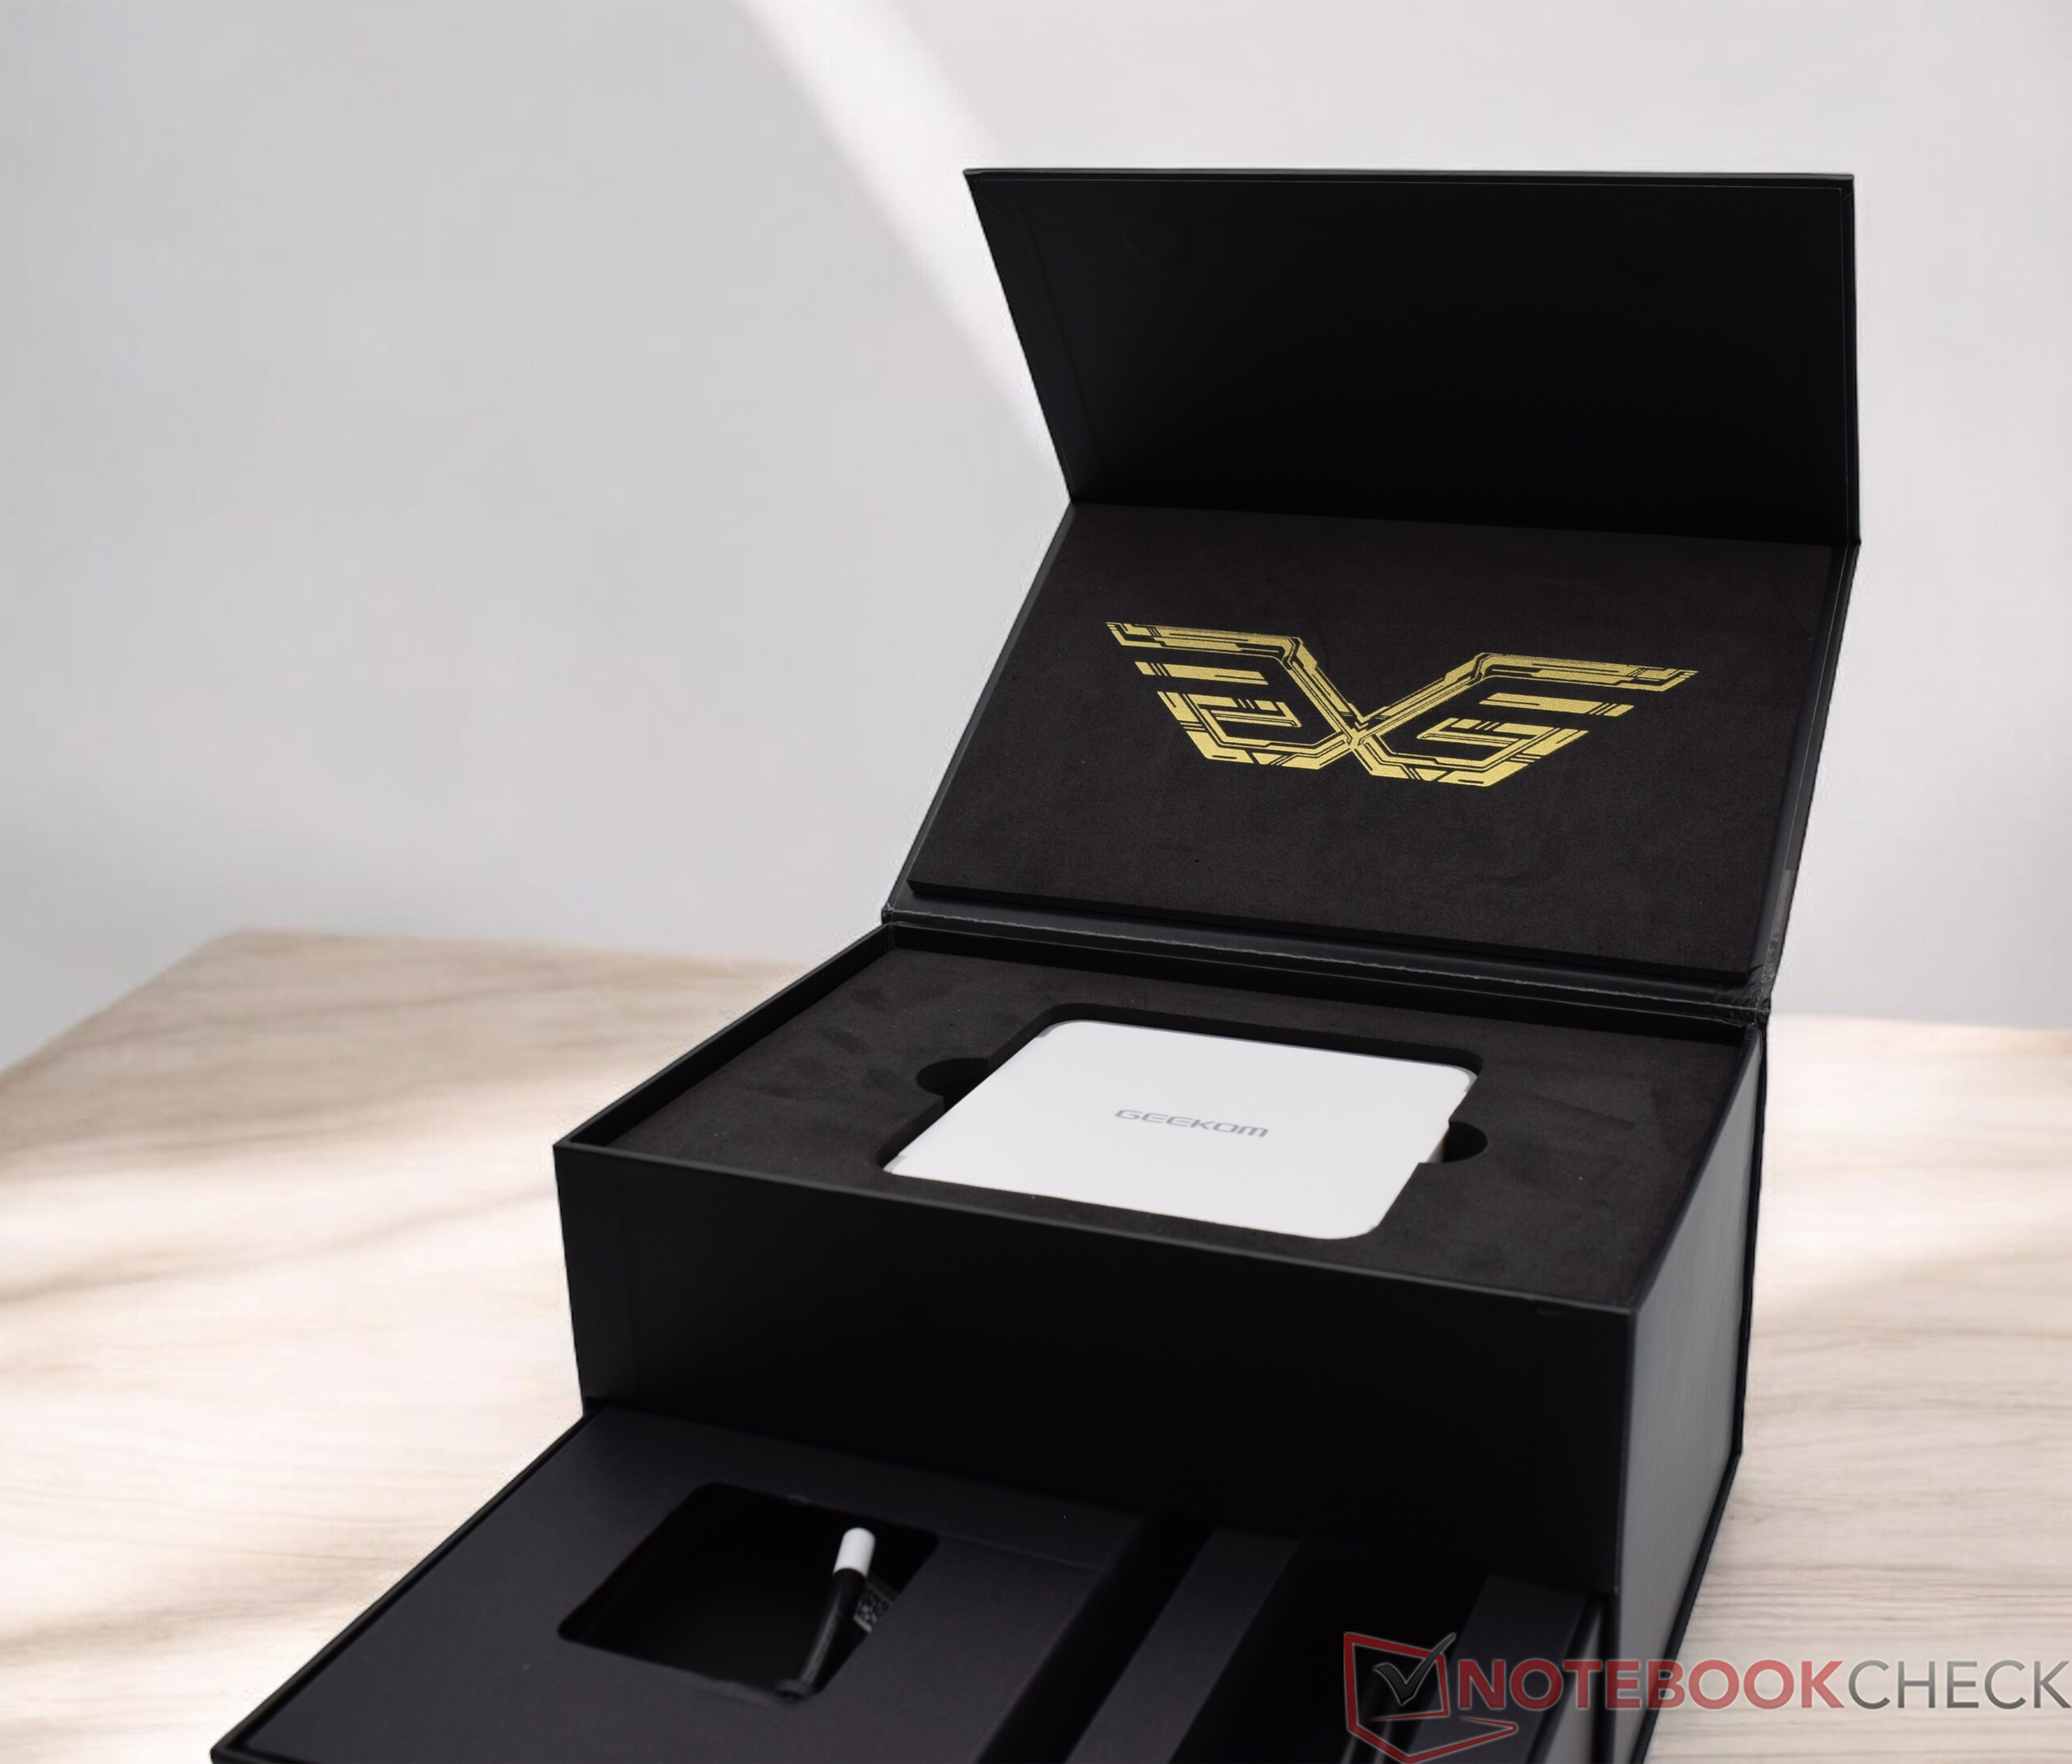
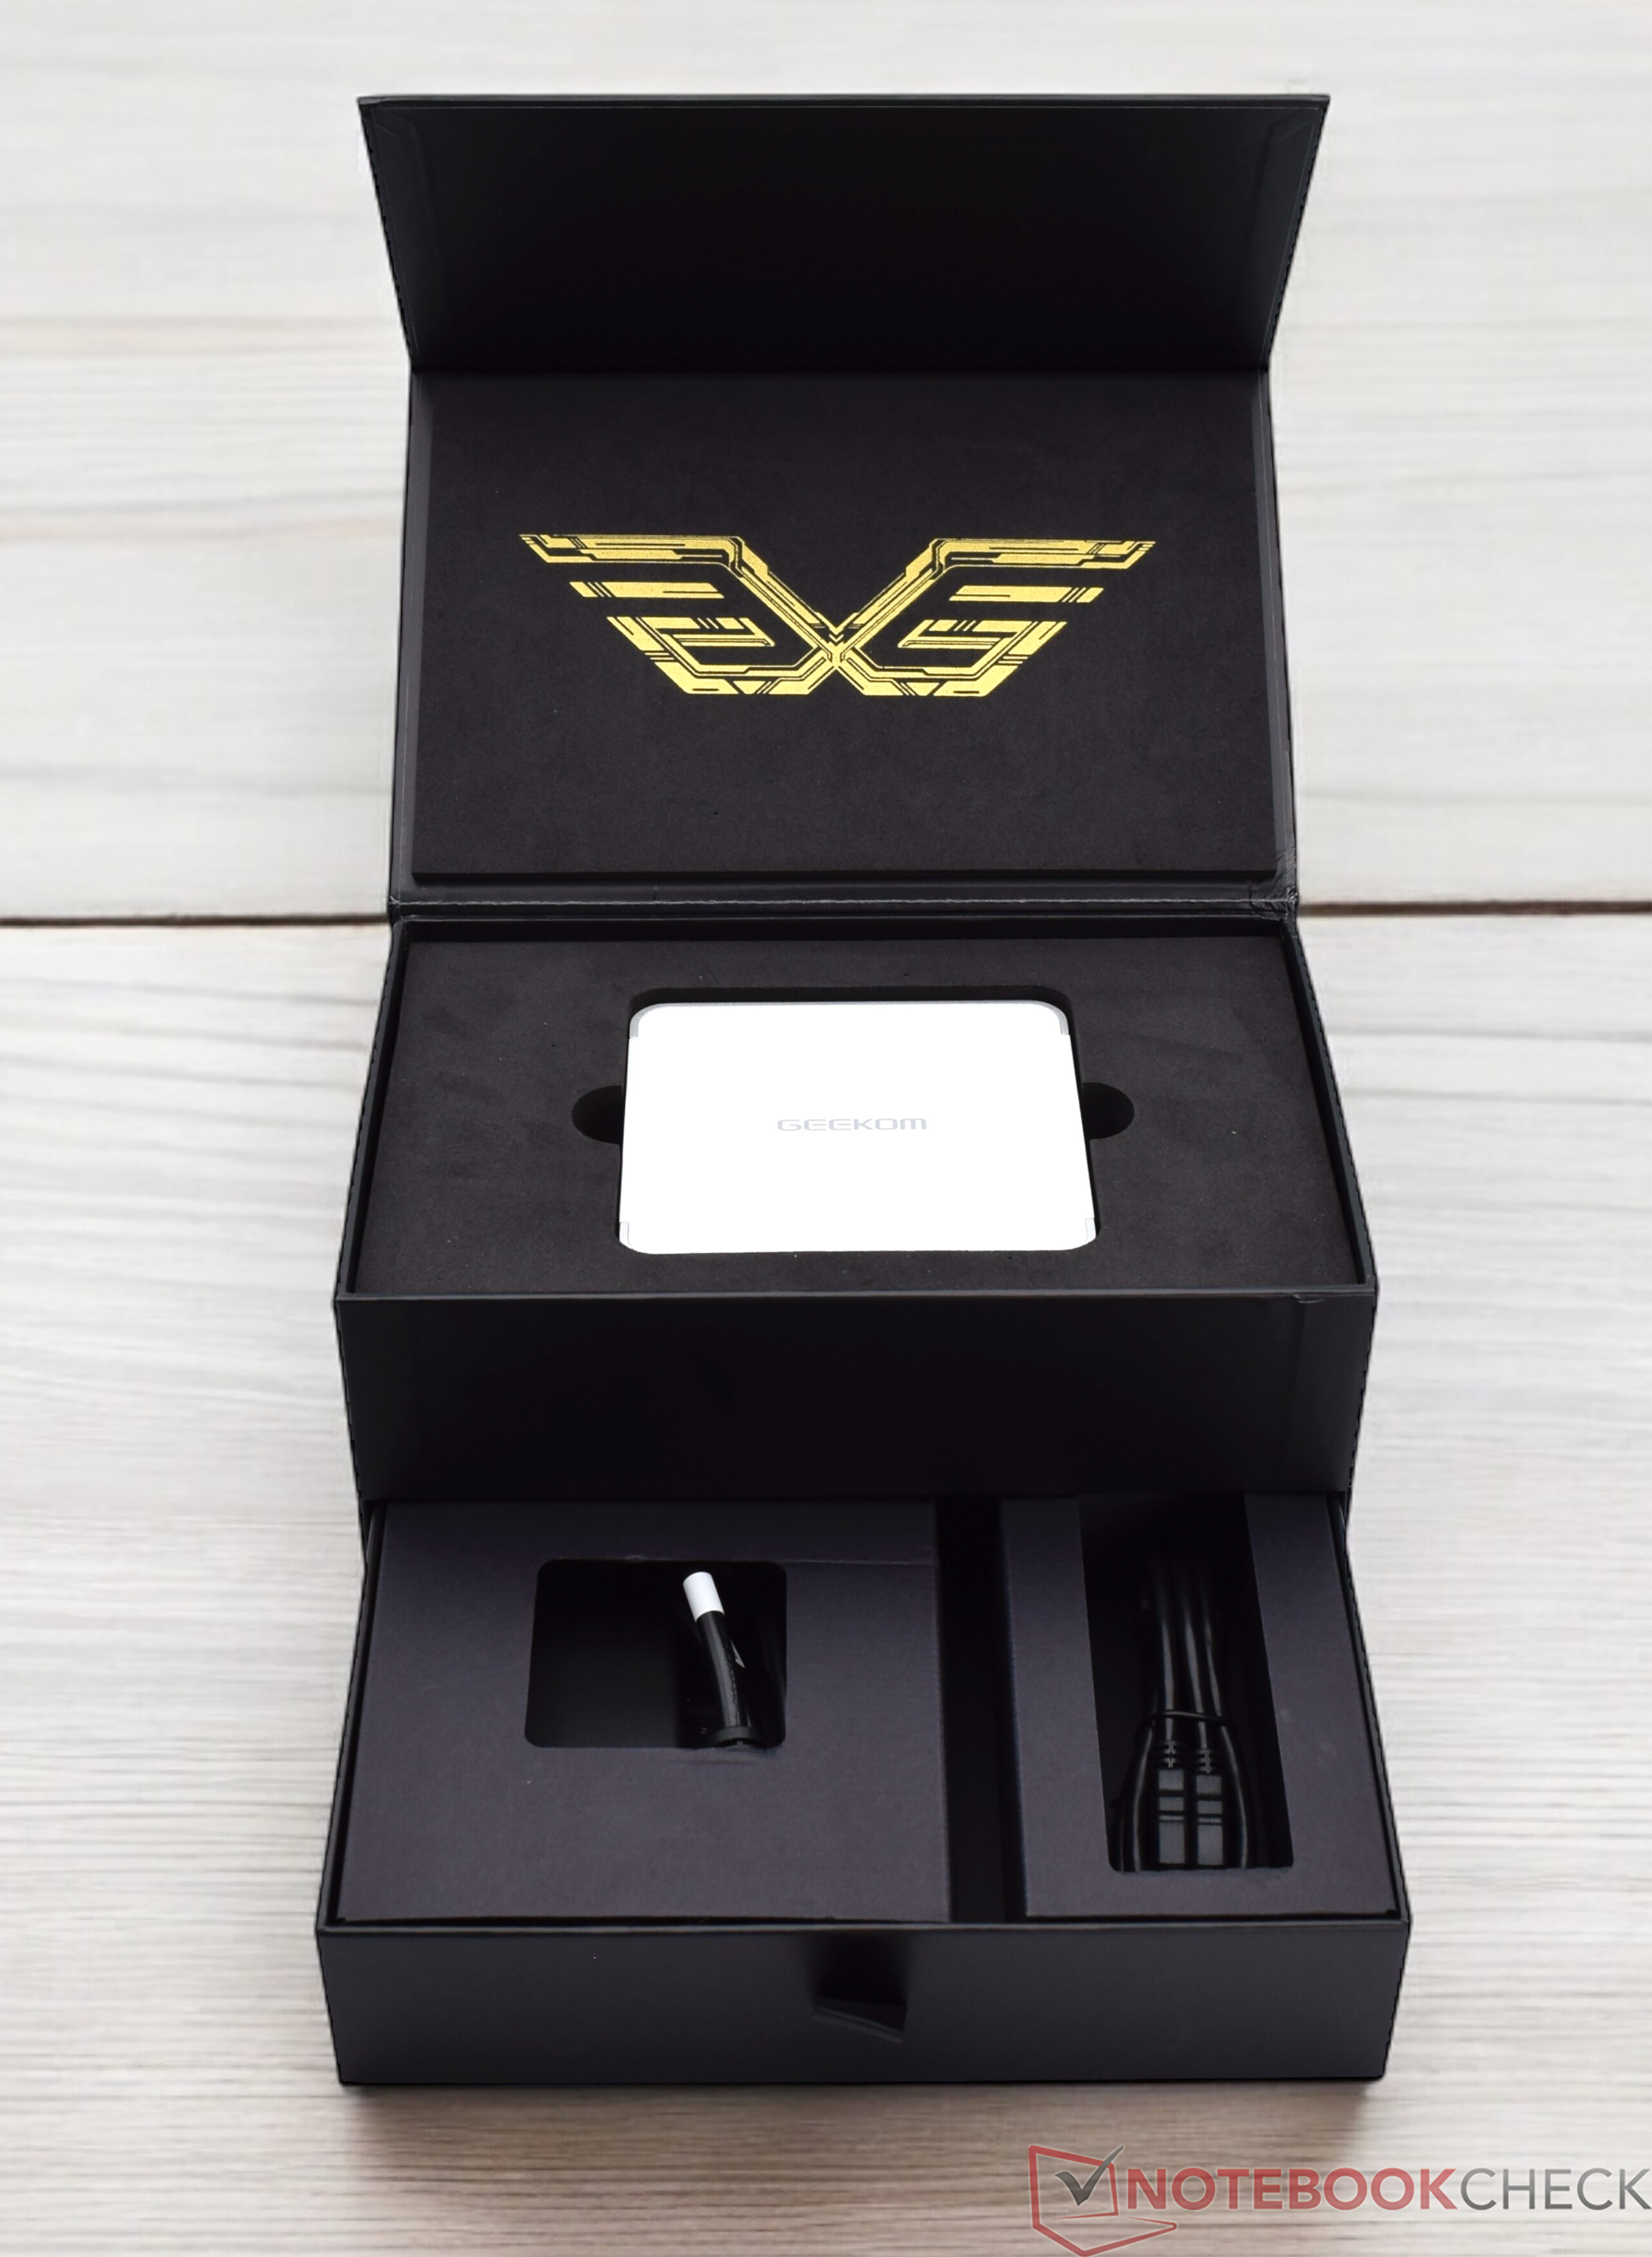
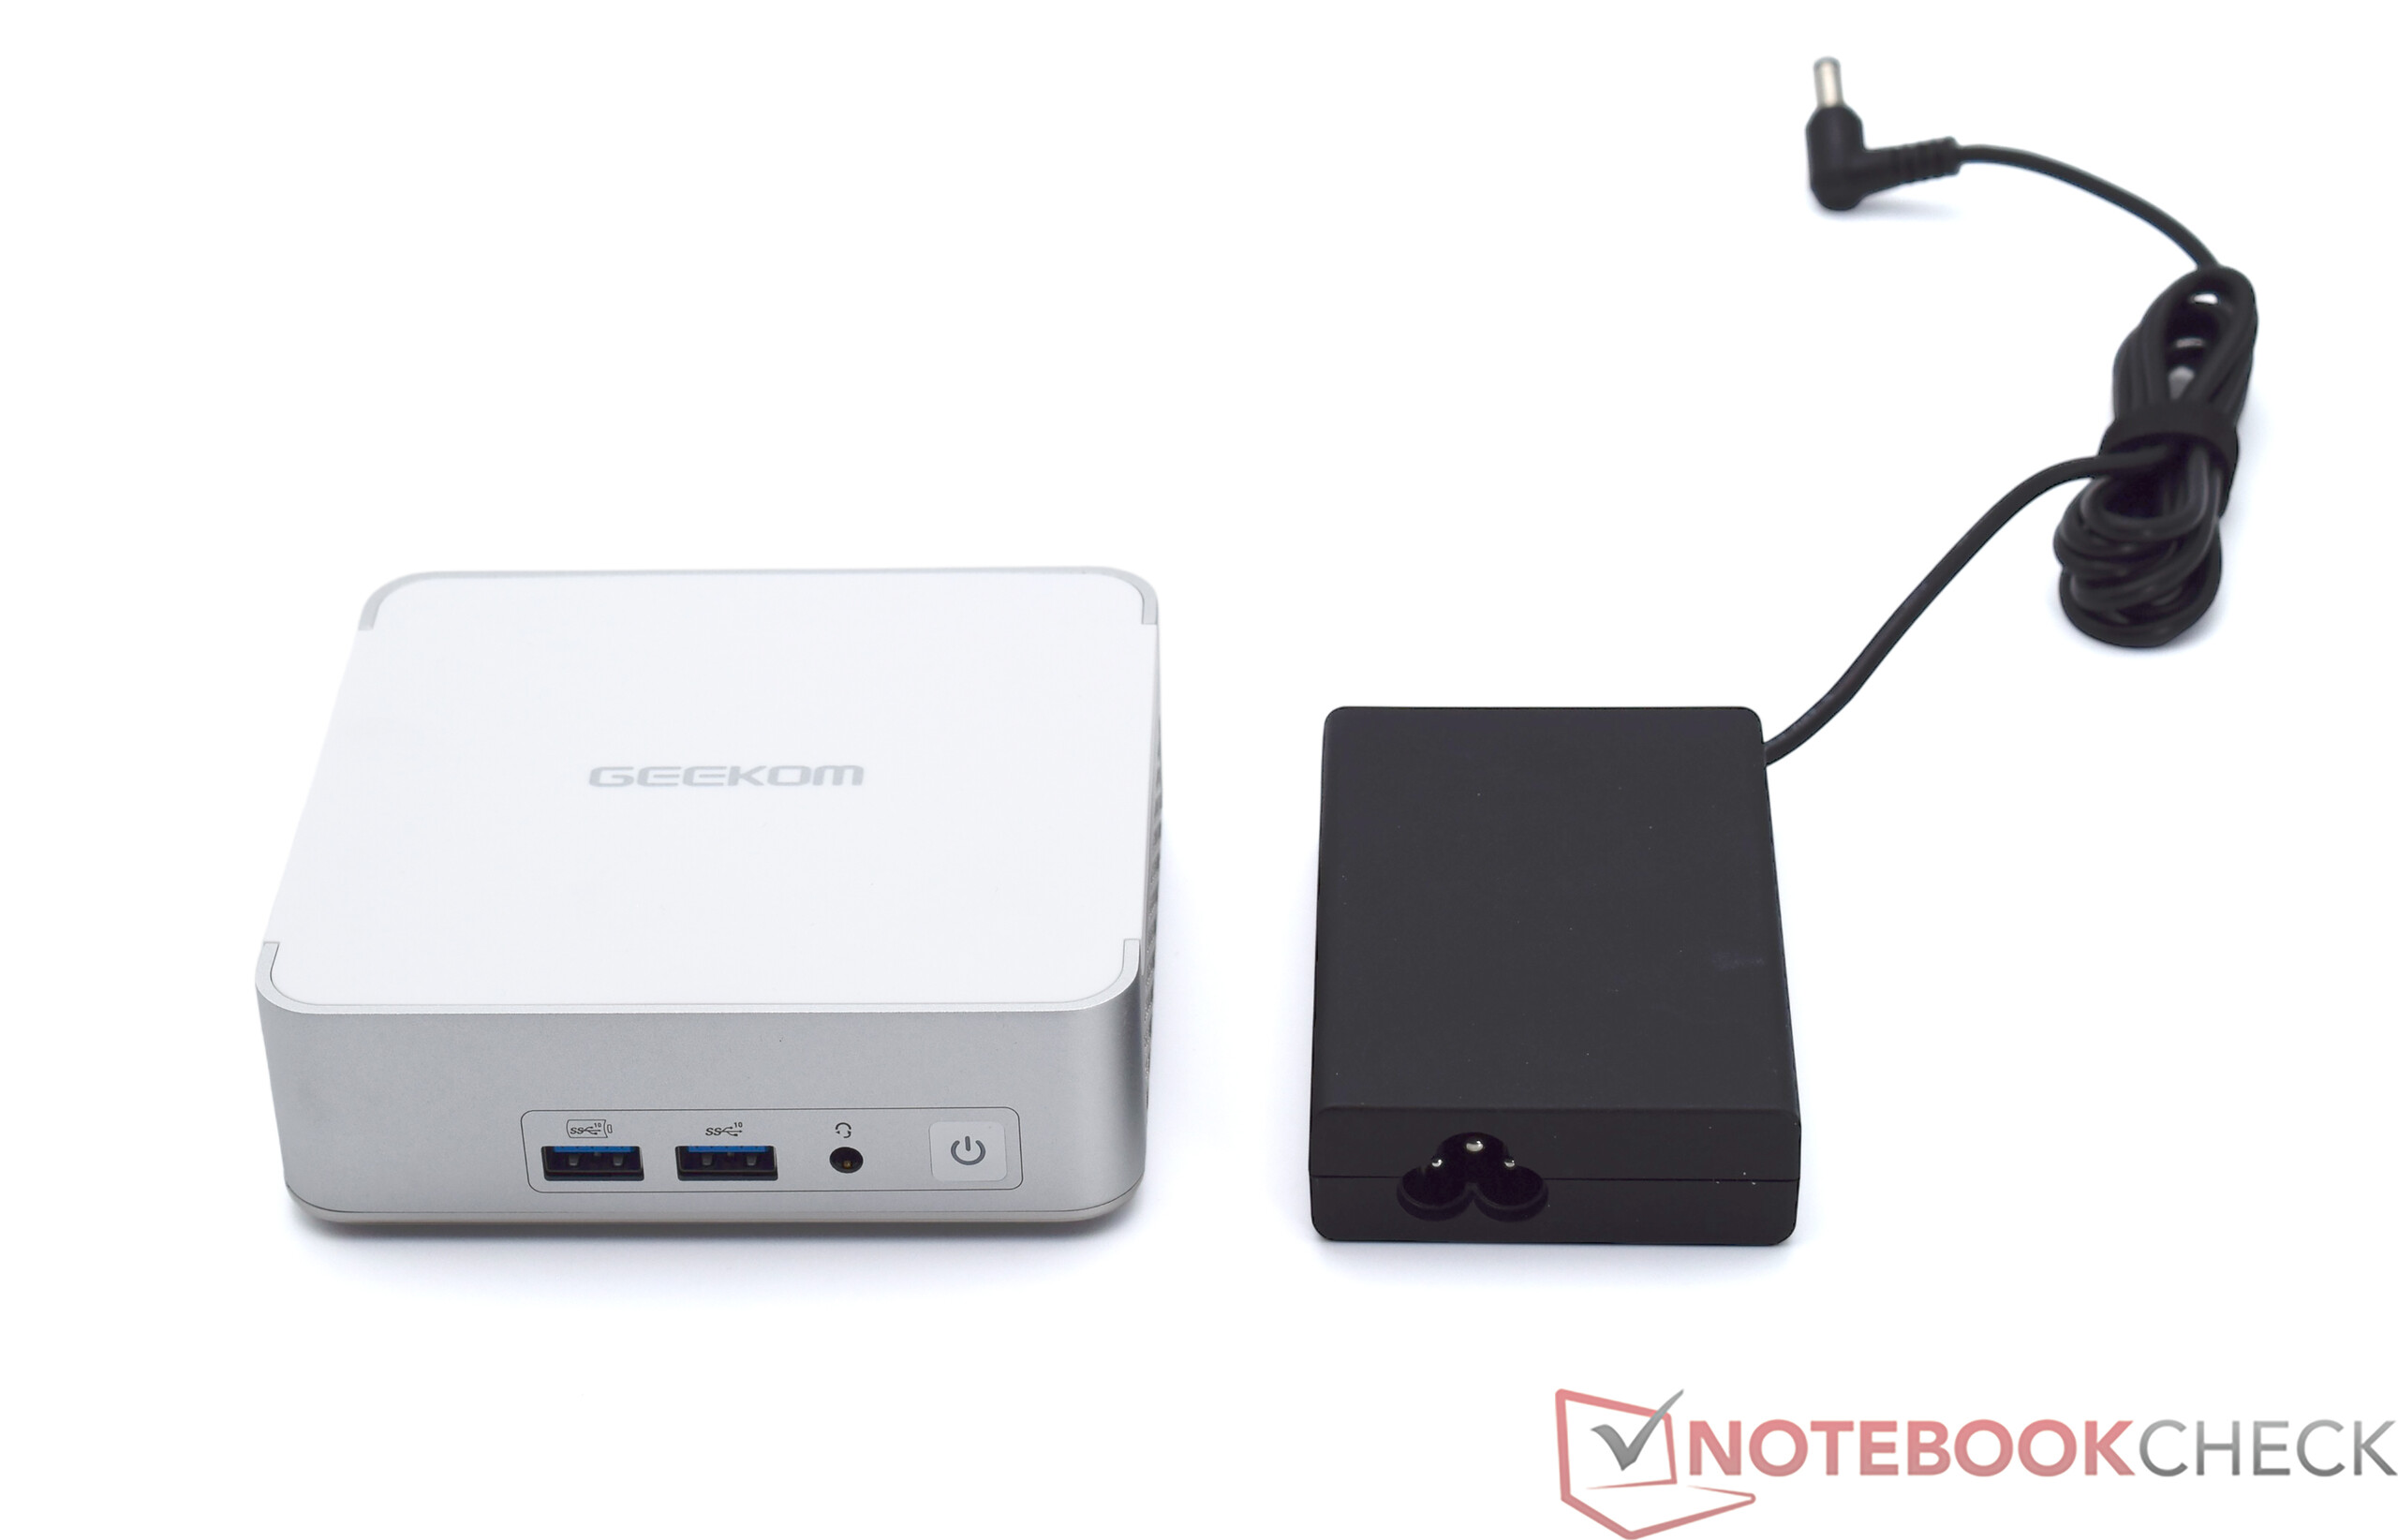
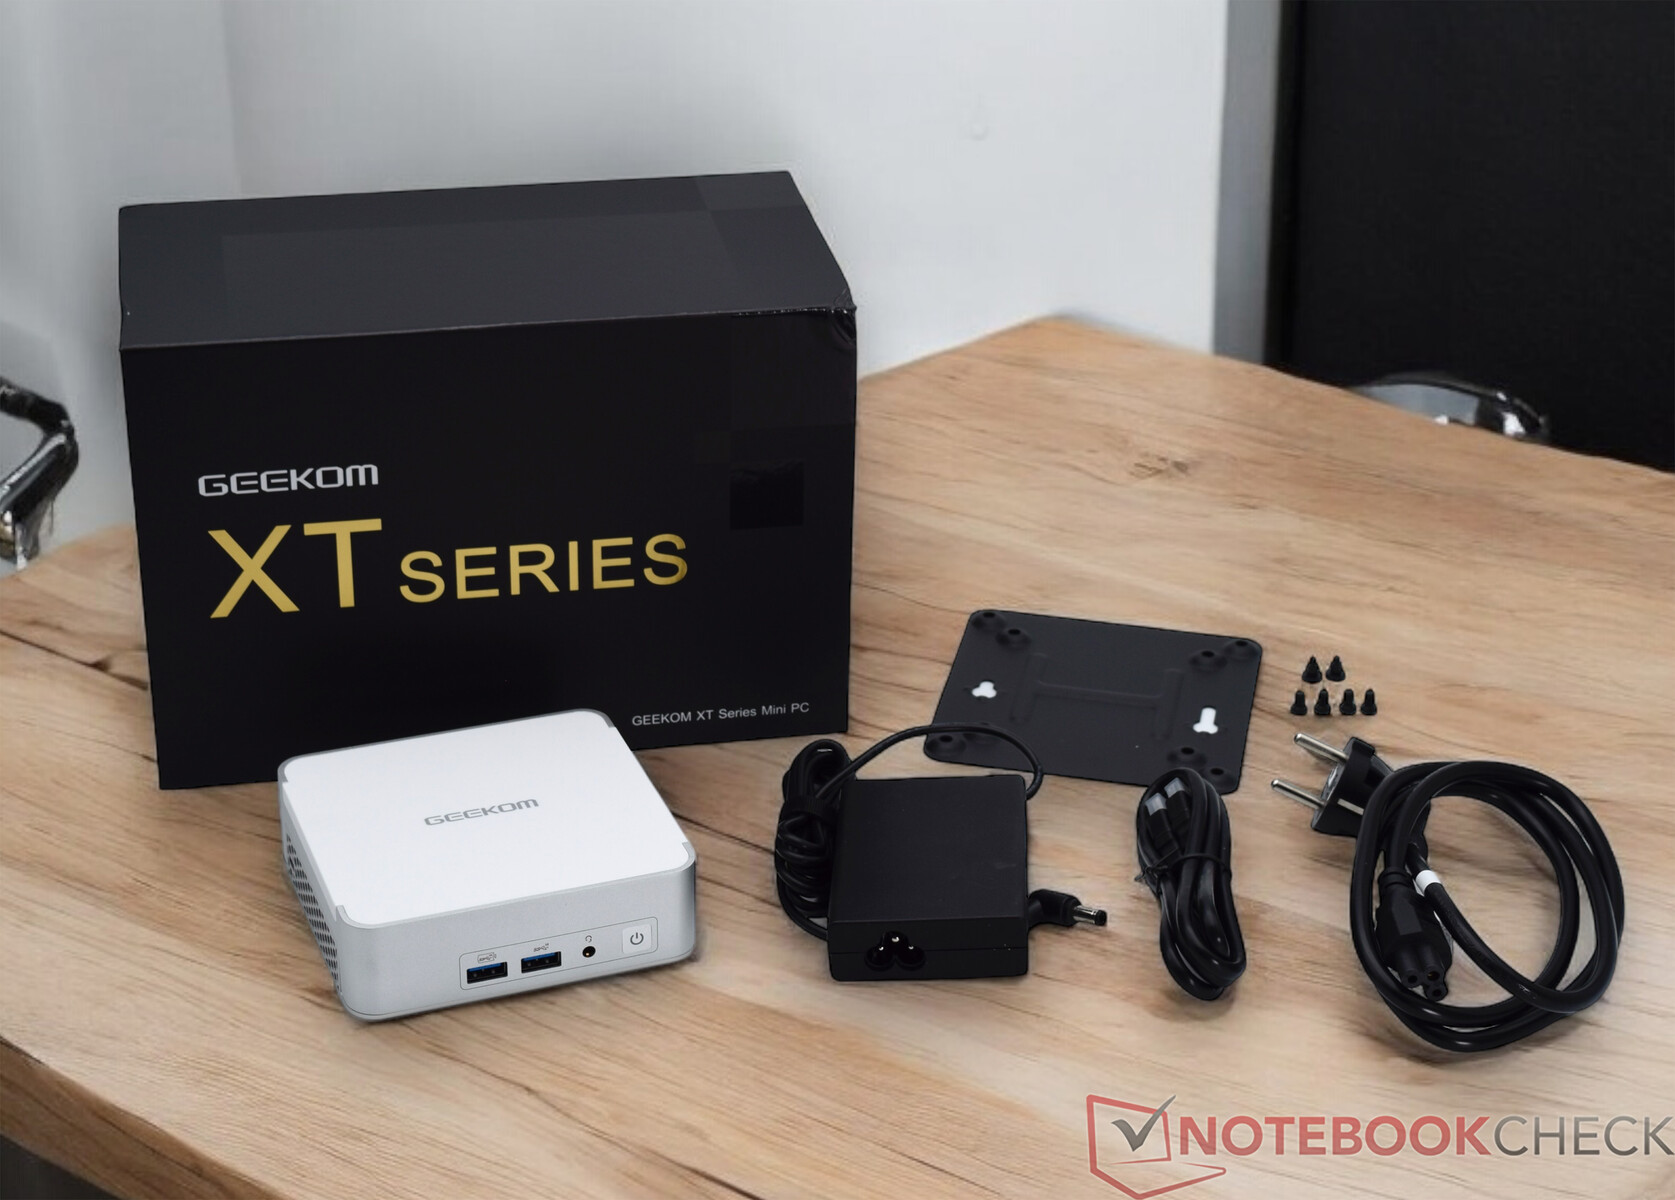
El volumen de suministro del Geekom XT13 Pro ofrece el estándar habitual. Además del propio aparato, la caja contiene la fuente de alimentación de 120 vatios y un soporte VESA con material de montaje. También se incluye un cable HDMI y la obligatoria tarjeta de agradecimiento de Geekom.
Mantenimiento
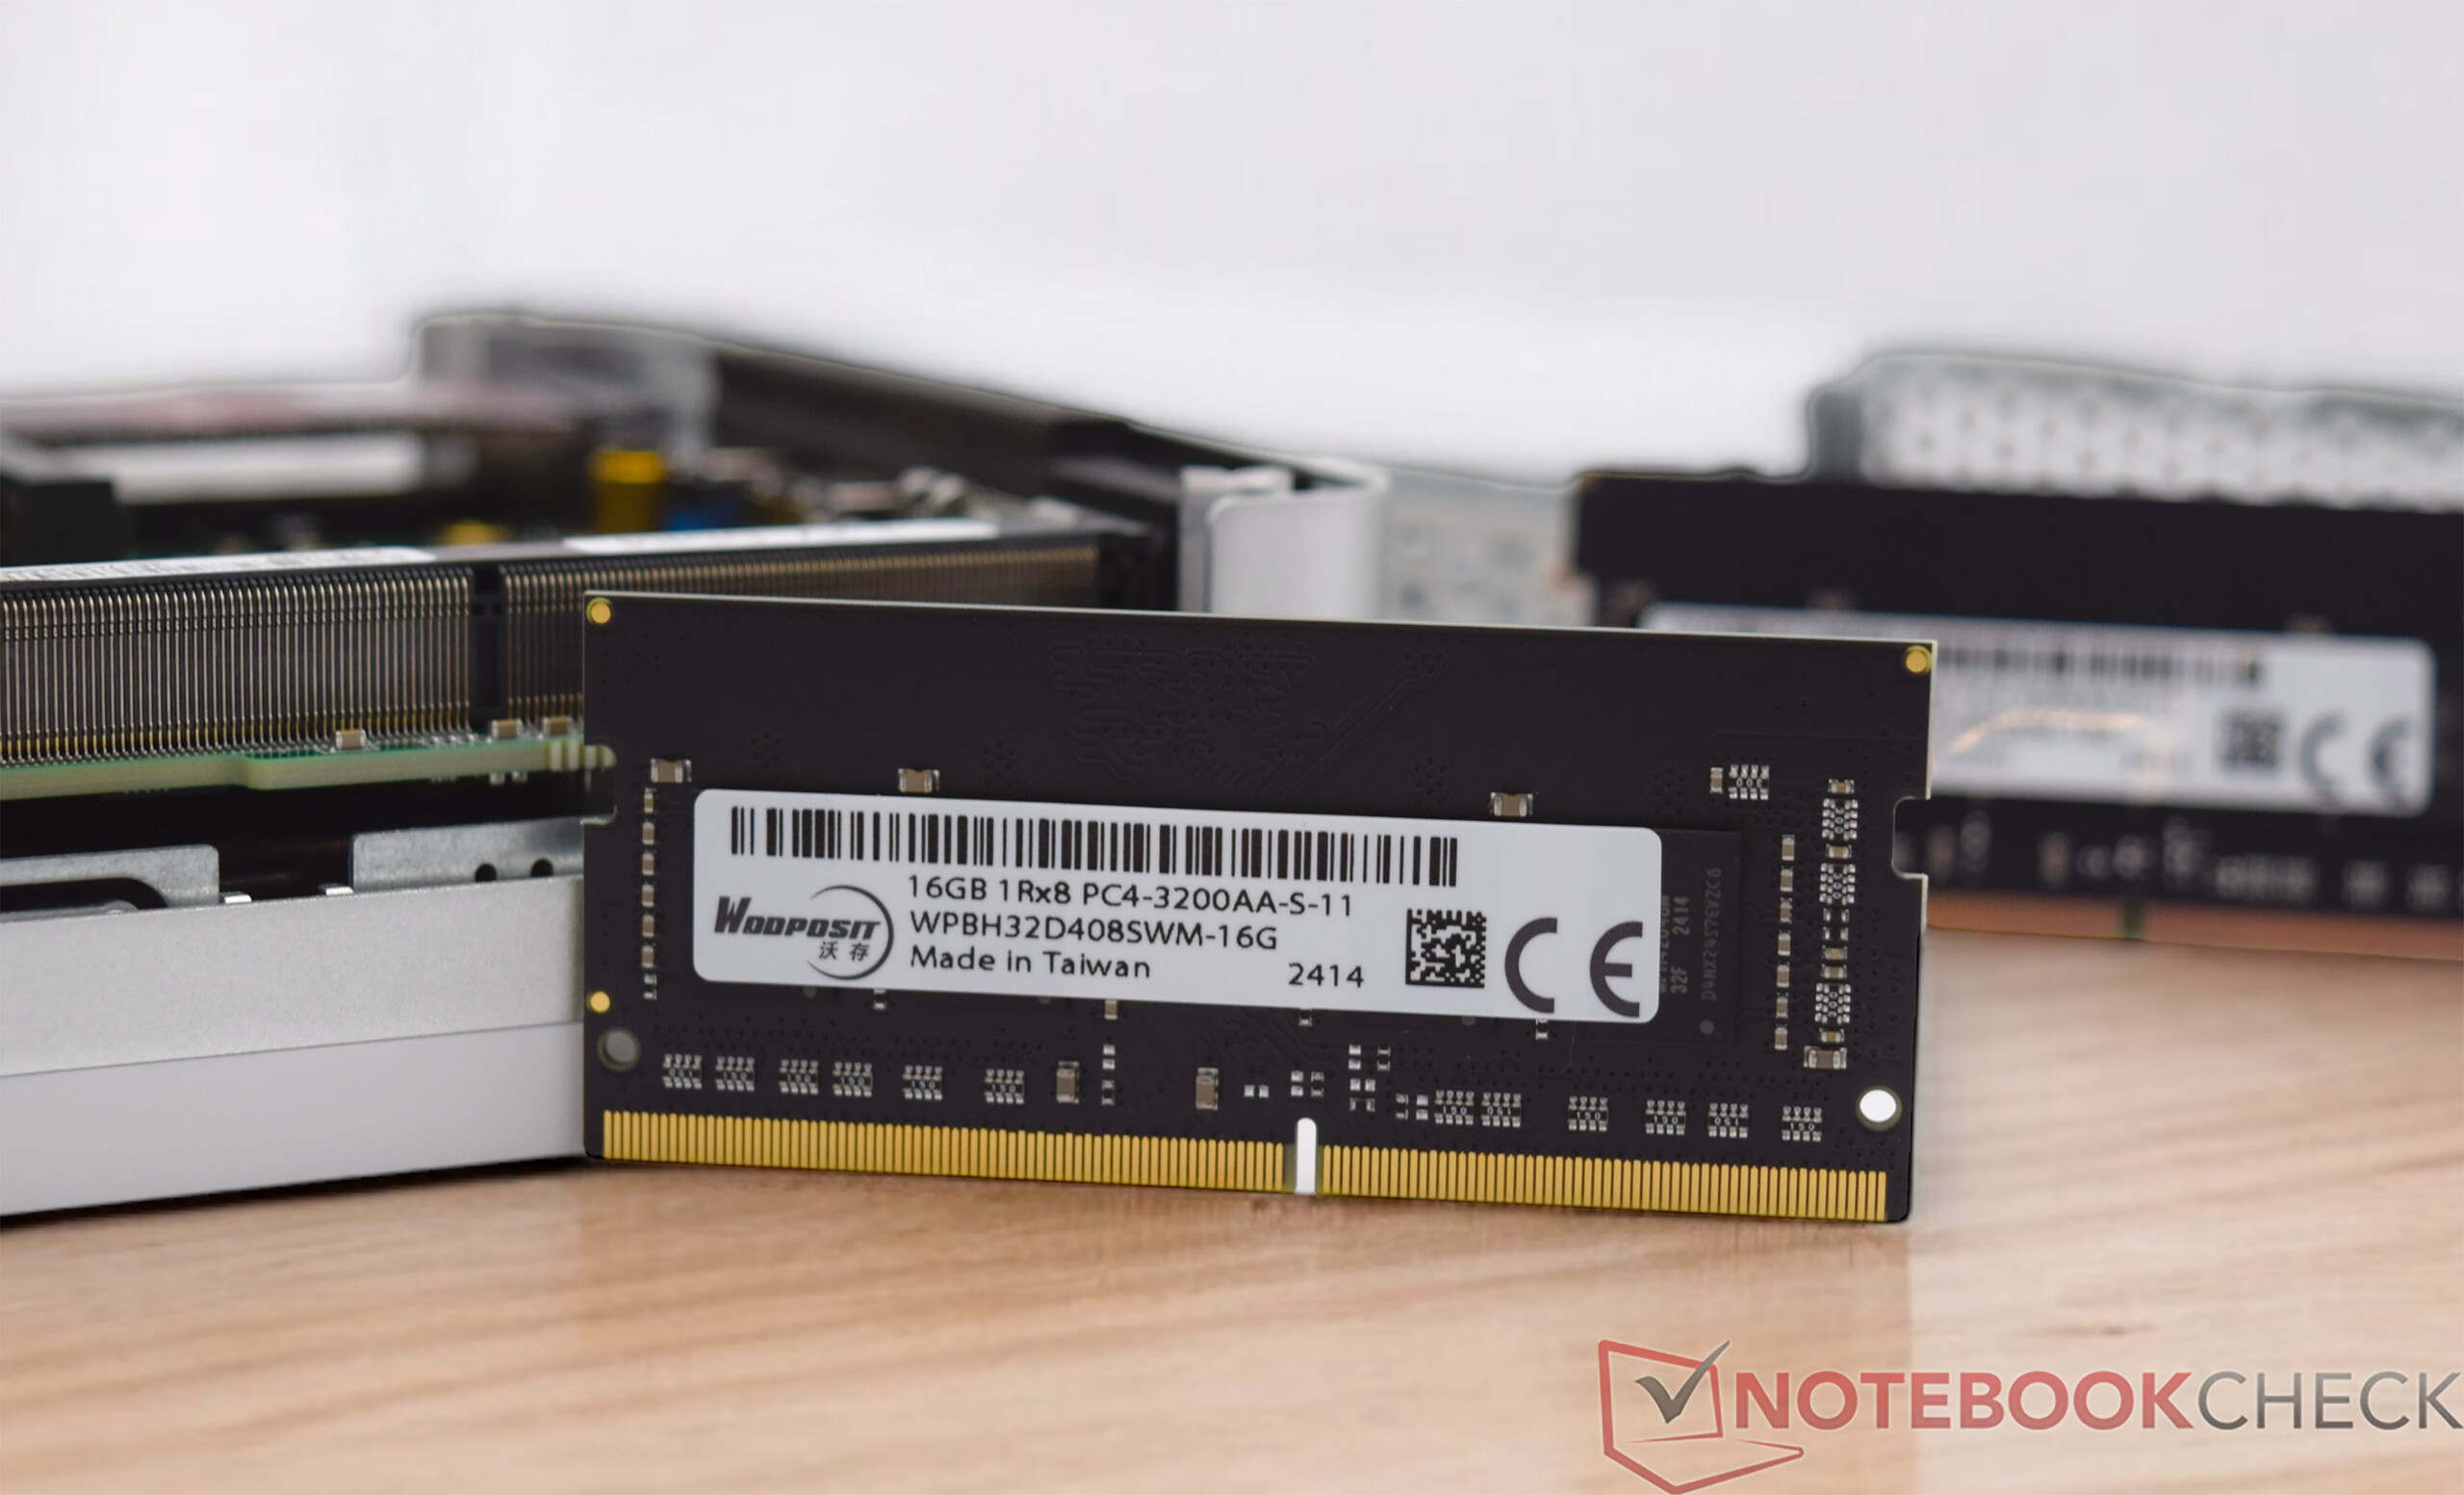
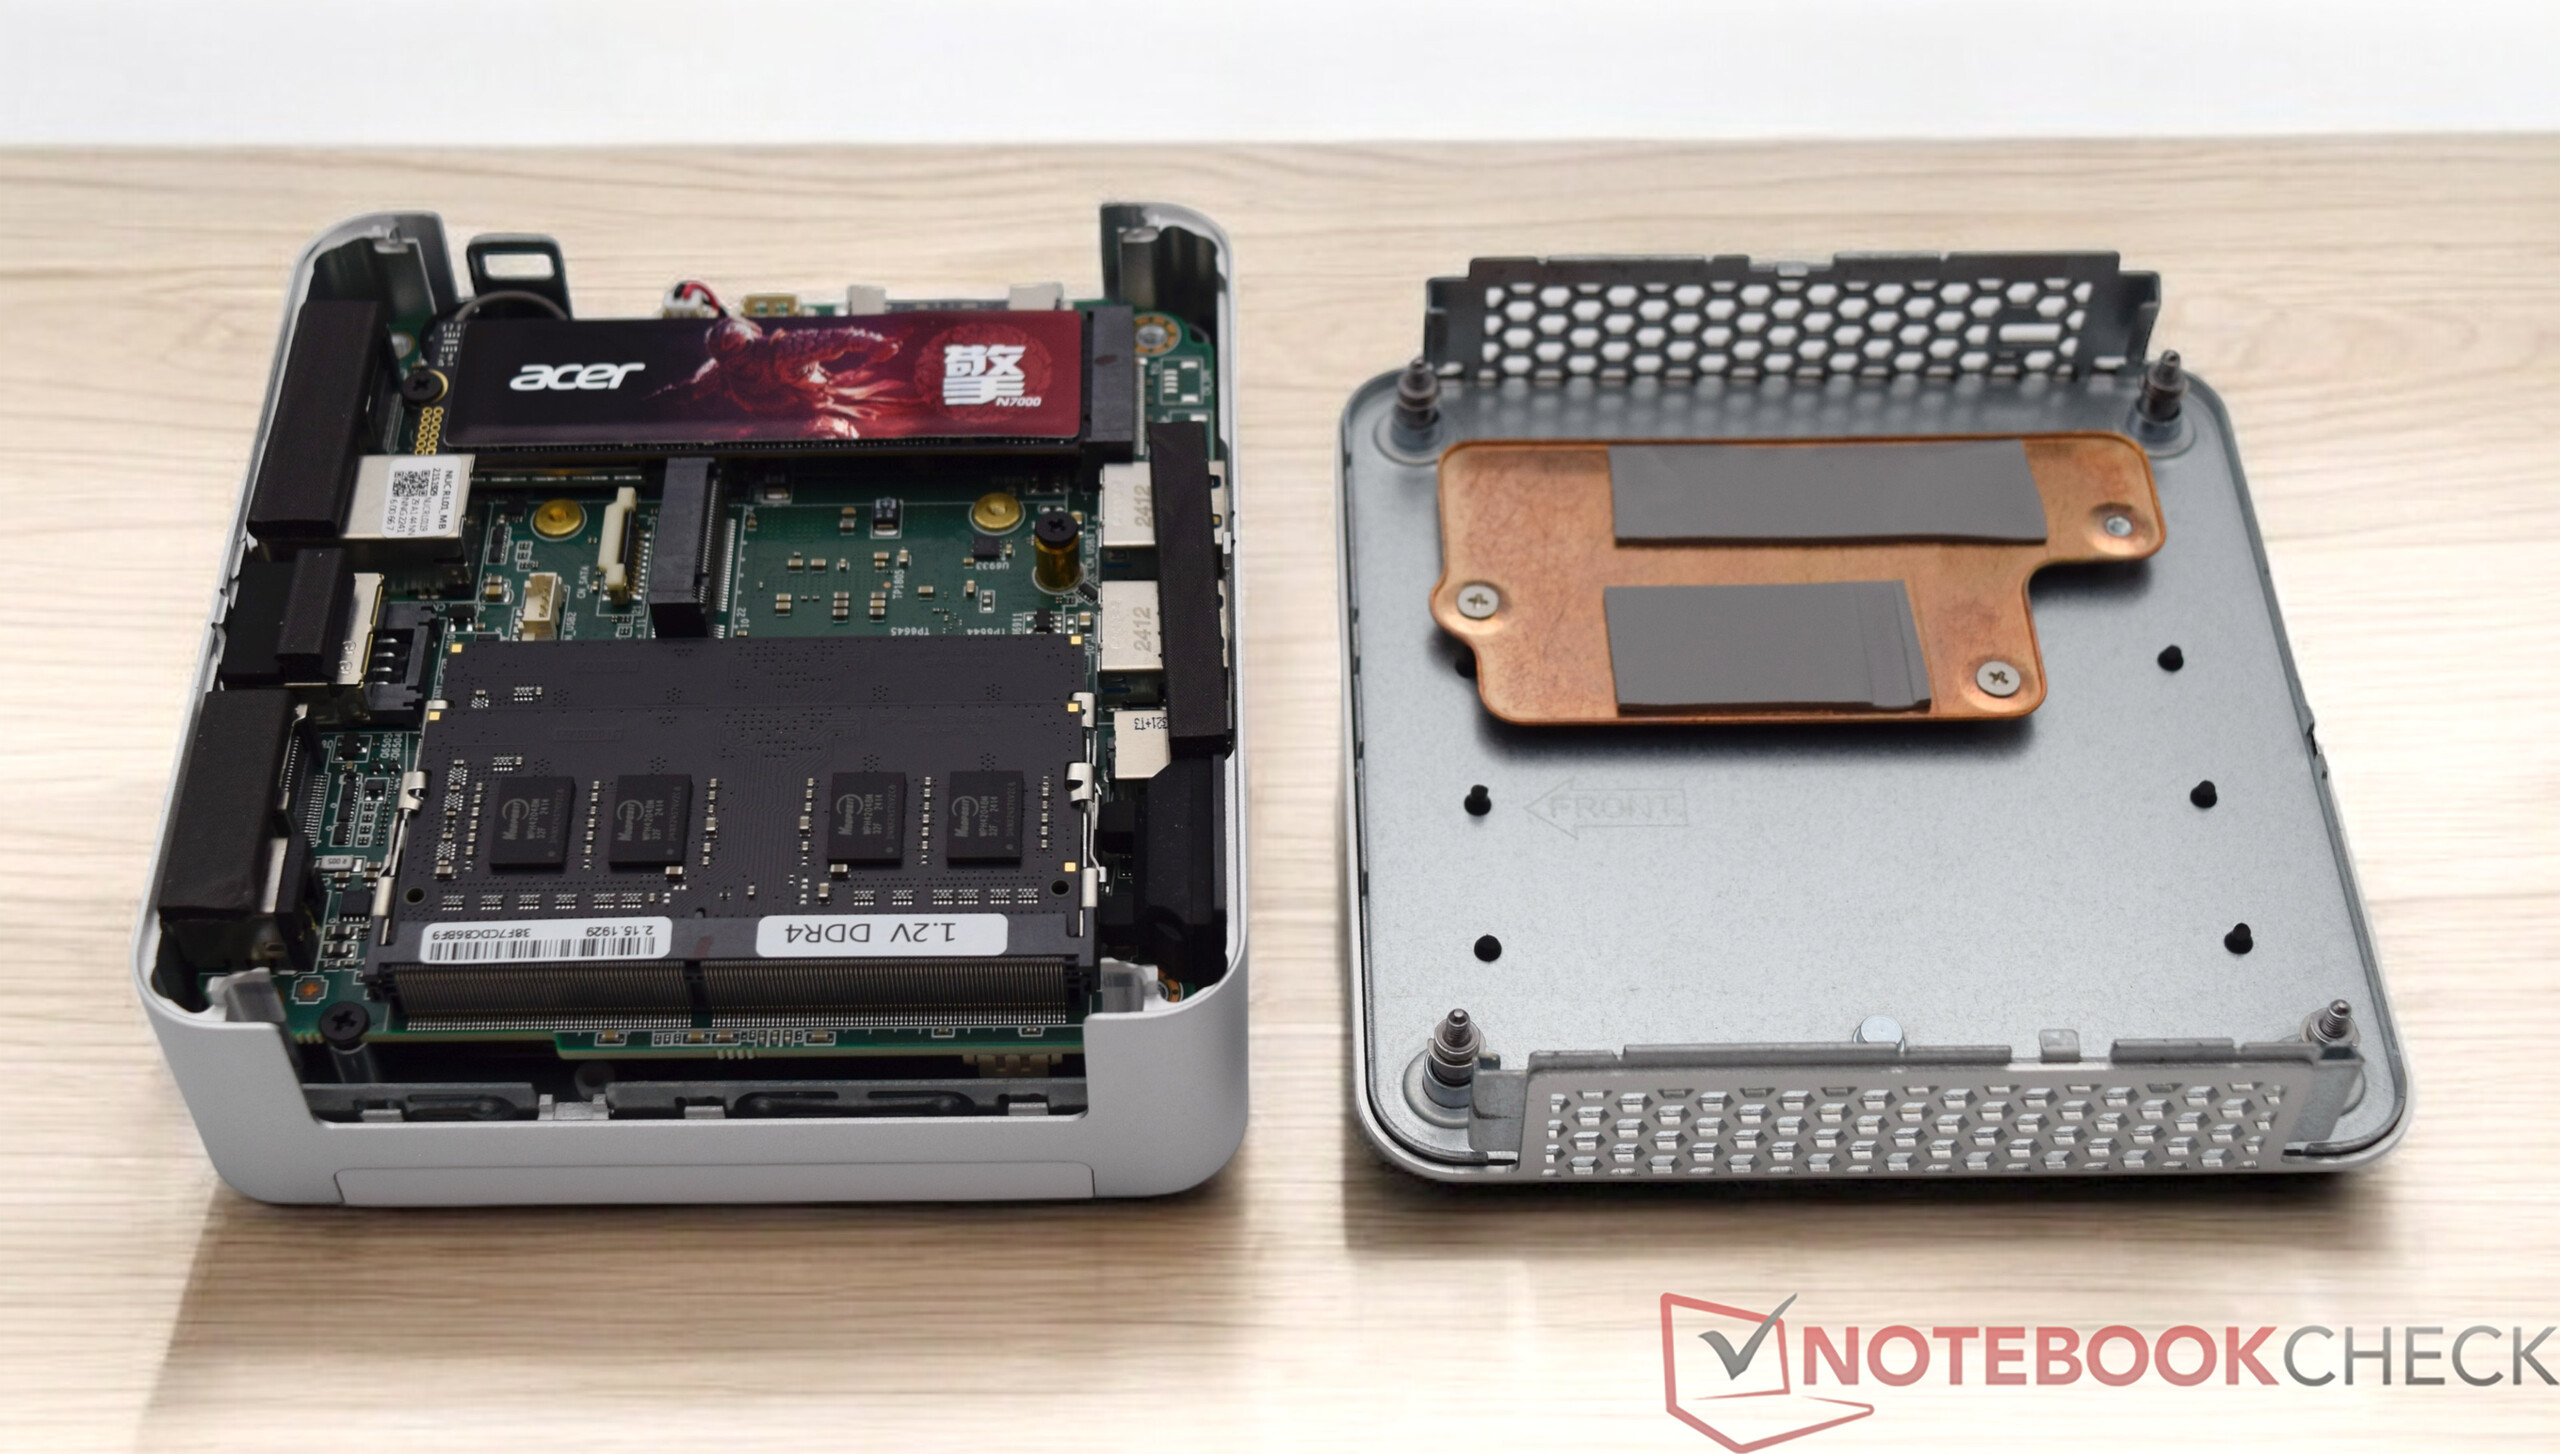
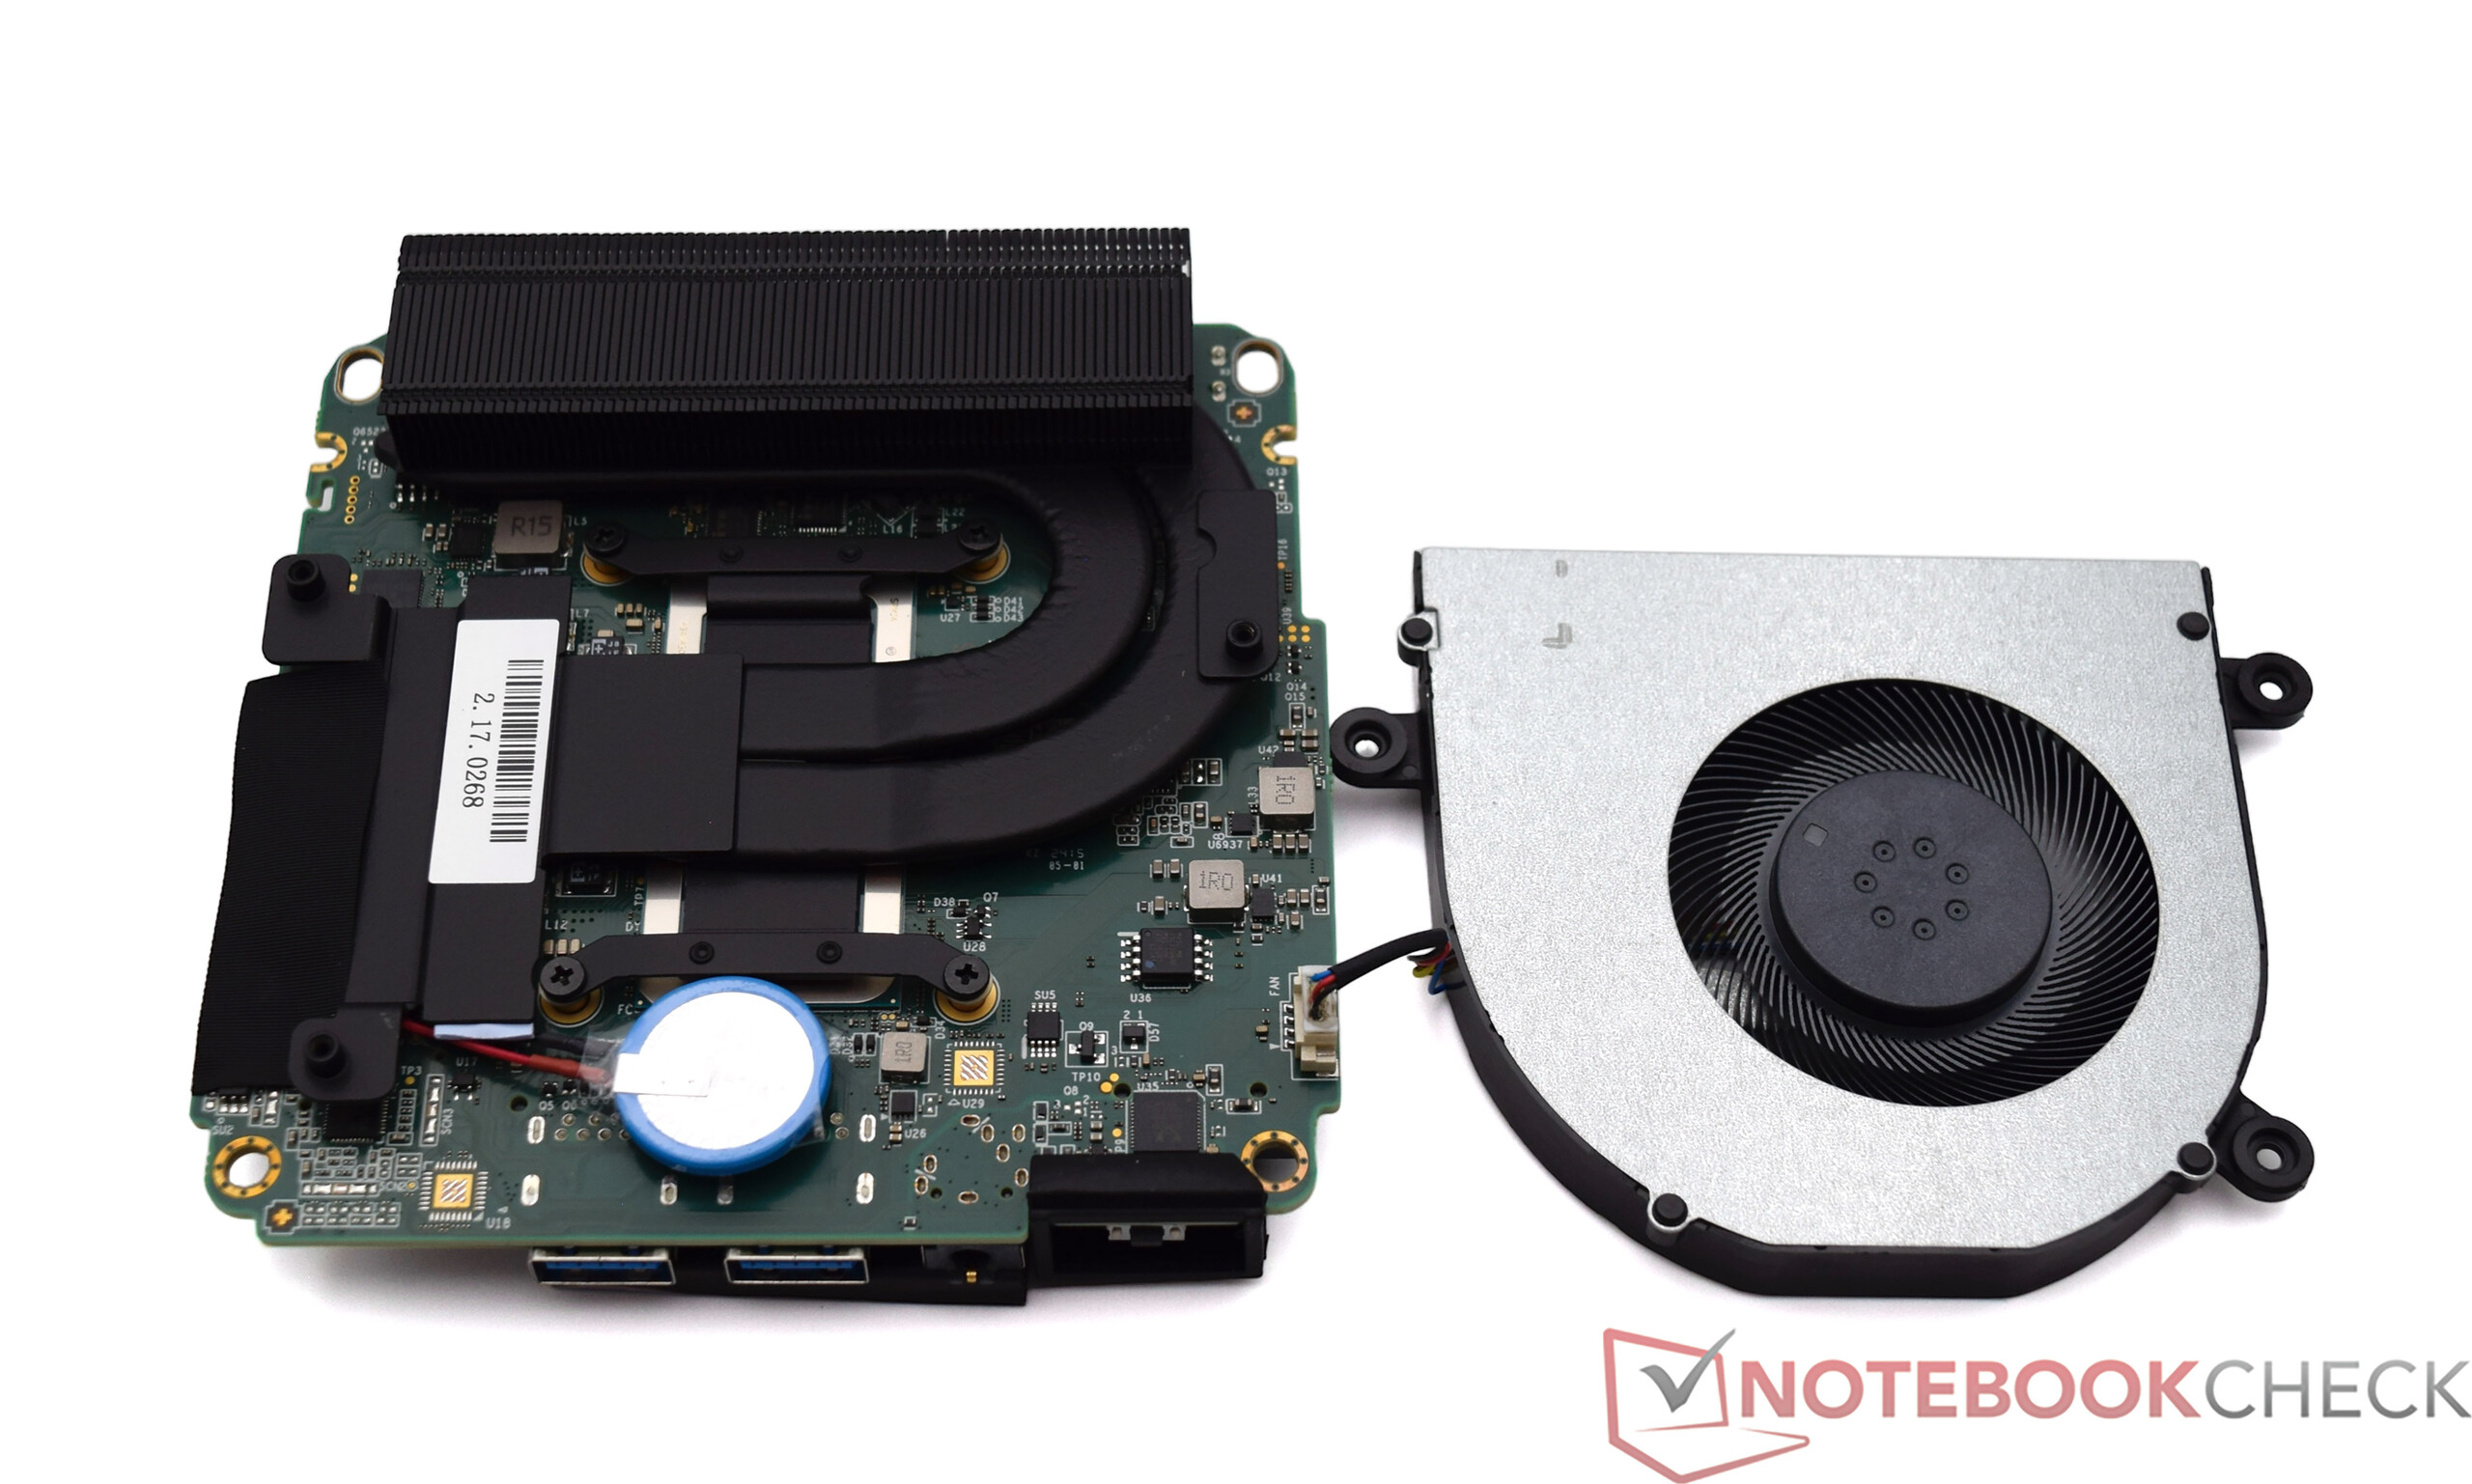
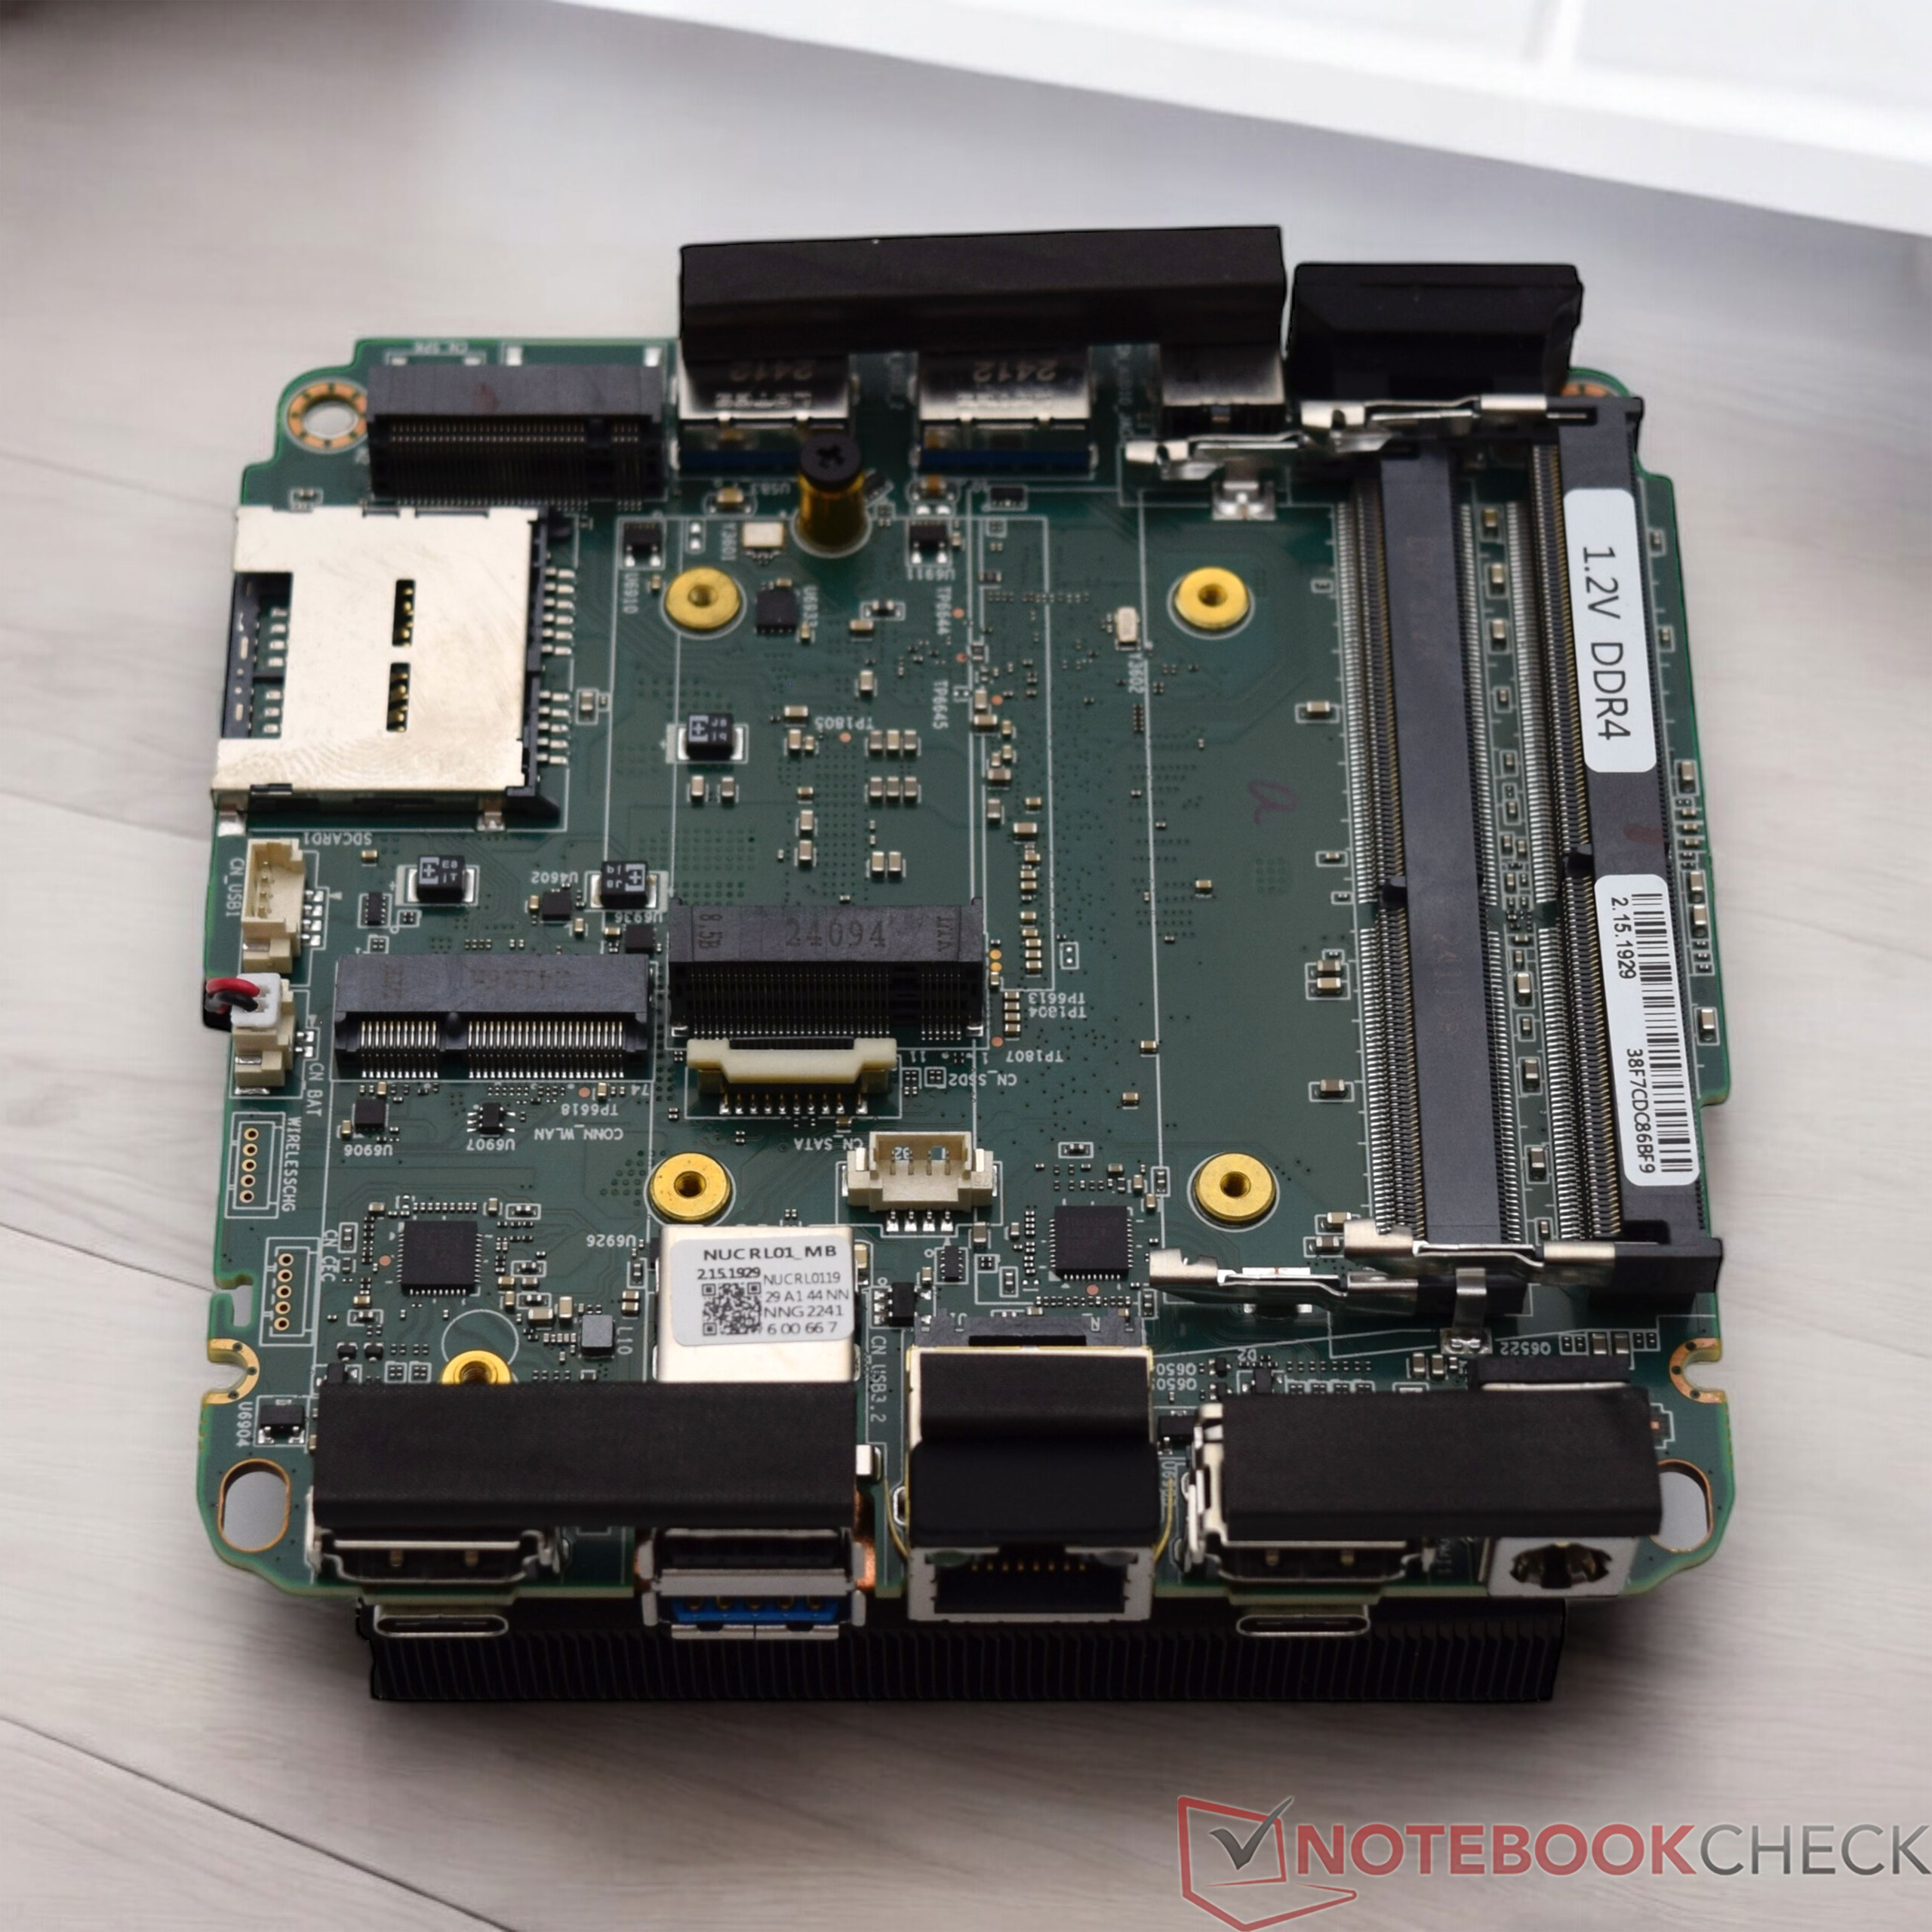
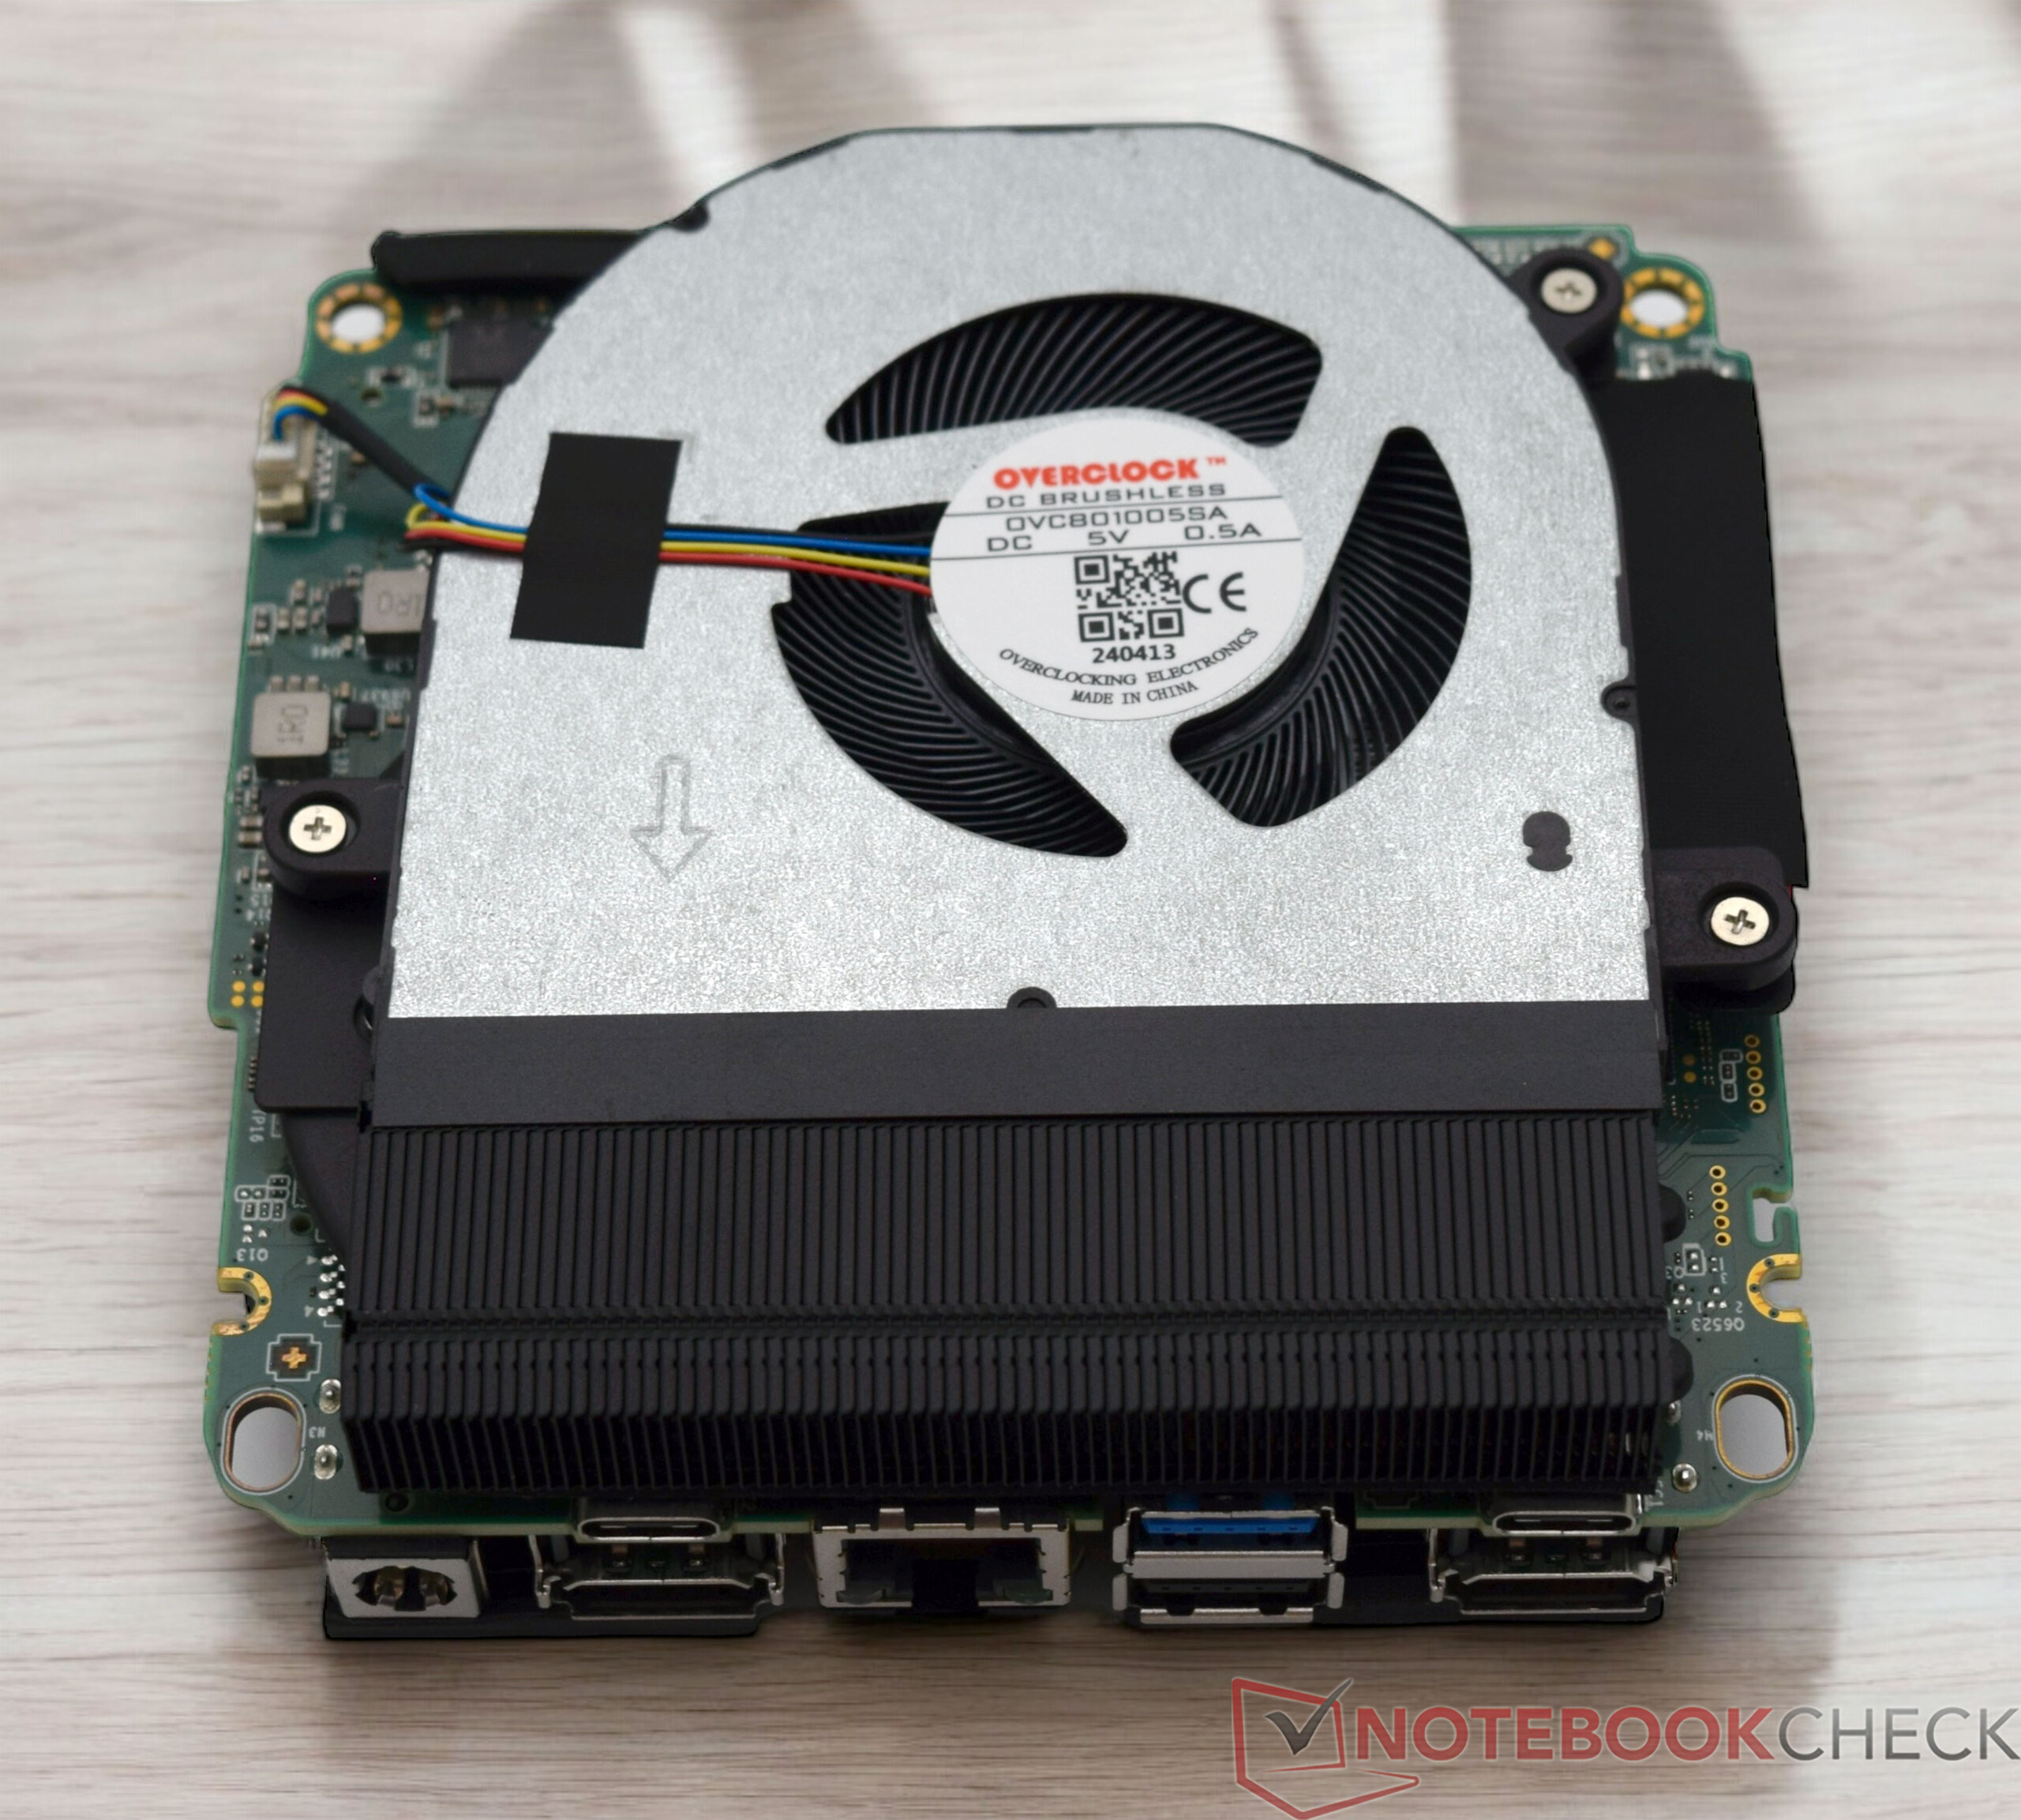
La Geekom XT13 Pro es fácil de abrir. Sólo hay que aflojar cuatro pequeños tornillos en la parte inferior, que fijan la placa base al resto de la carcasa. Hay un refrigerador SSD en la propia placa base, por lo que debe tener un poco más de cuidado en este punto. La RAM y el almacenamiento masivo son entonces fácilmente accesibles. En nuestro caso, se puede instalar una SSD adicional. Sin embargo, aquí hay que respetar la norma correcta, ya que sólo son compatibles las SSD SATA con una longitud de 42 milímetros.
Sostenibilidad
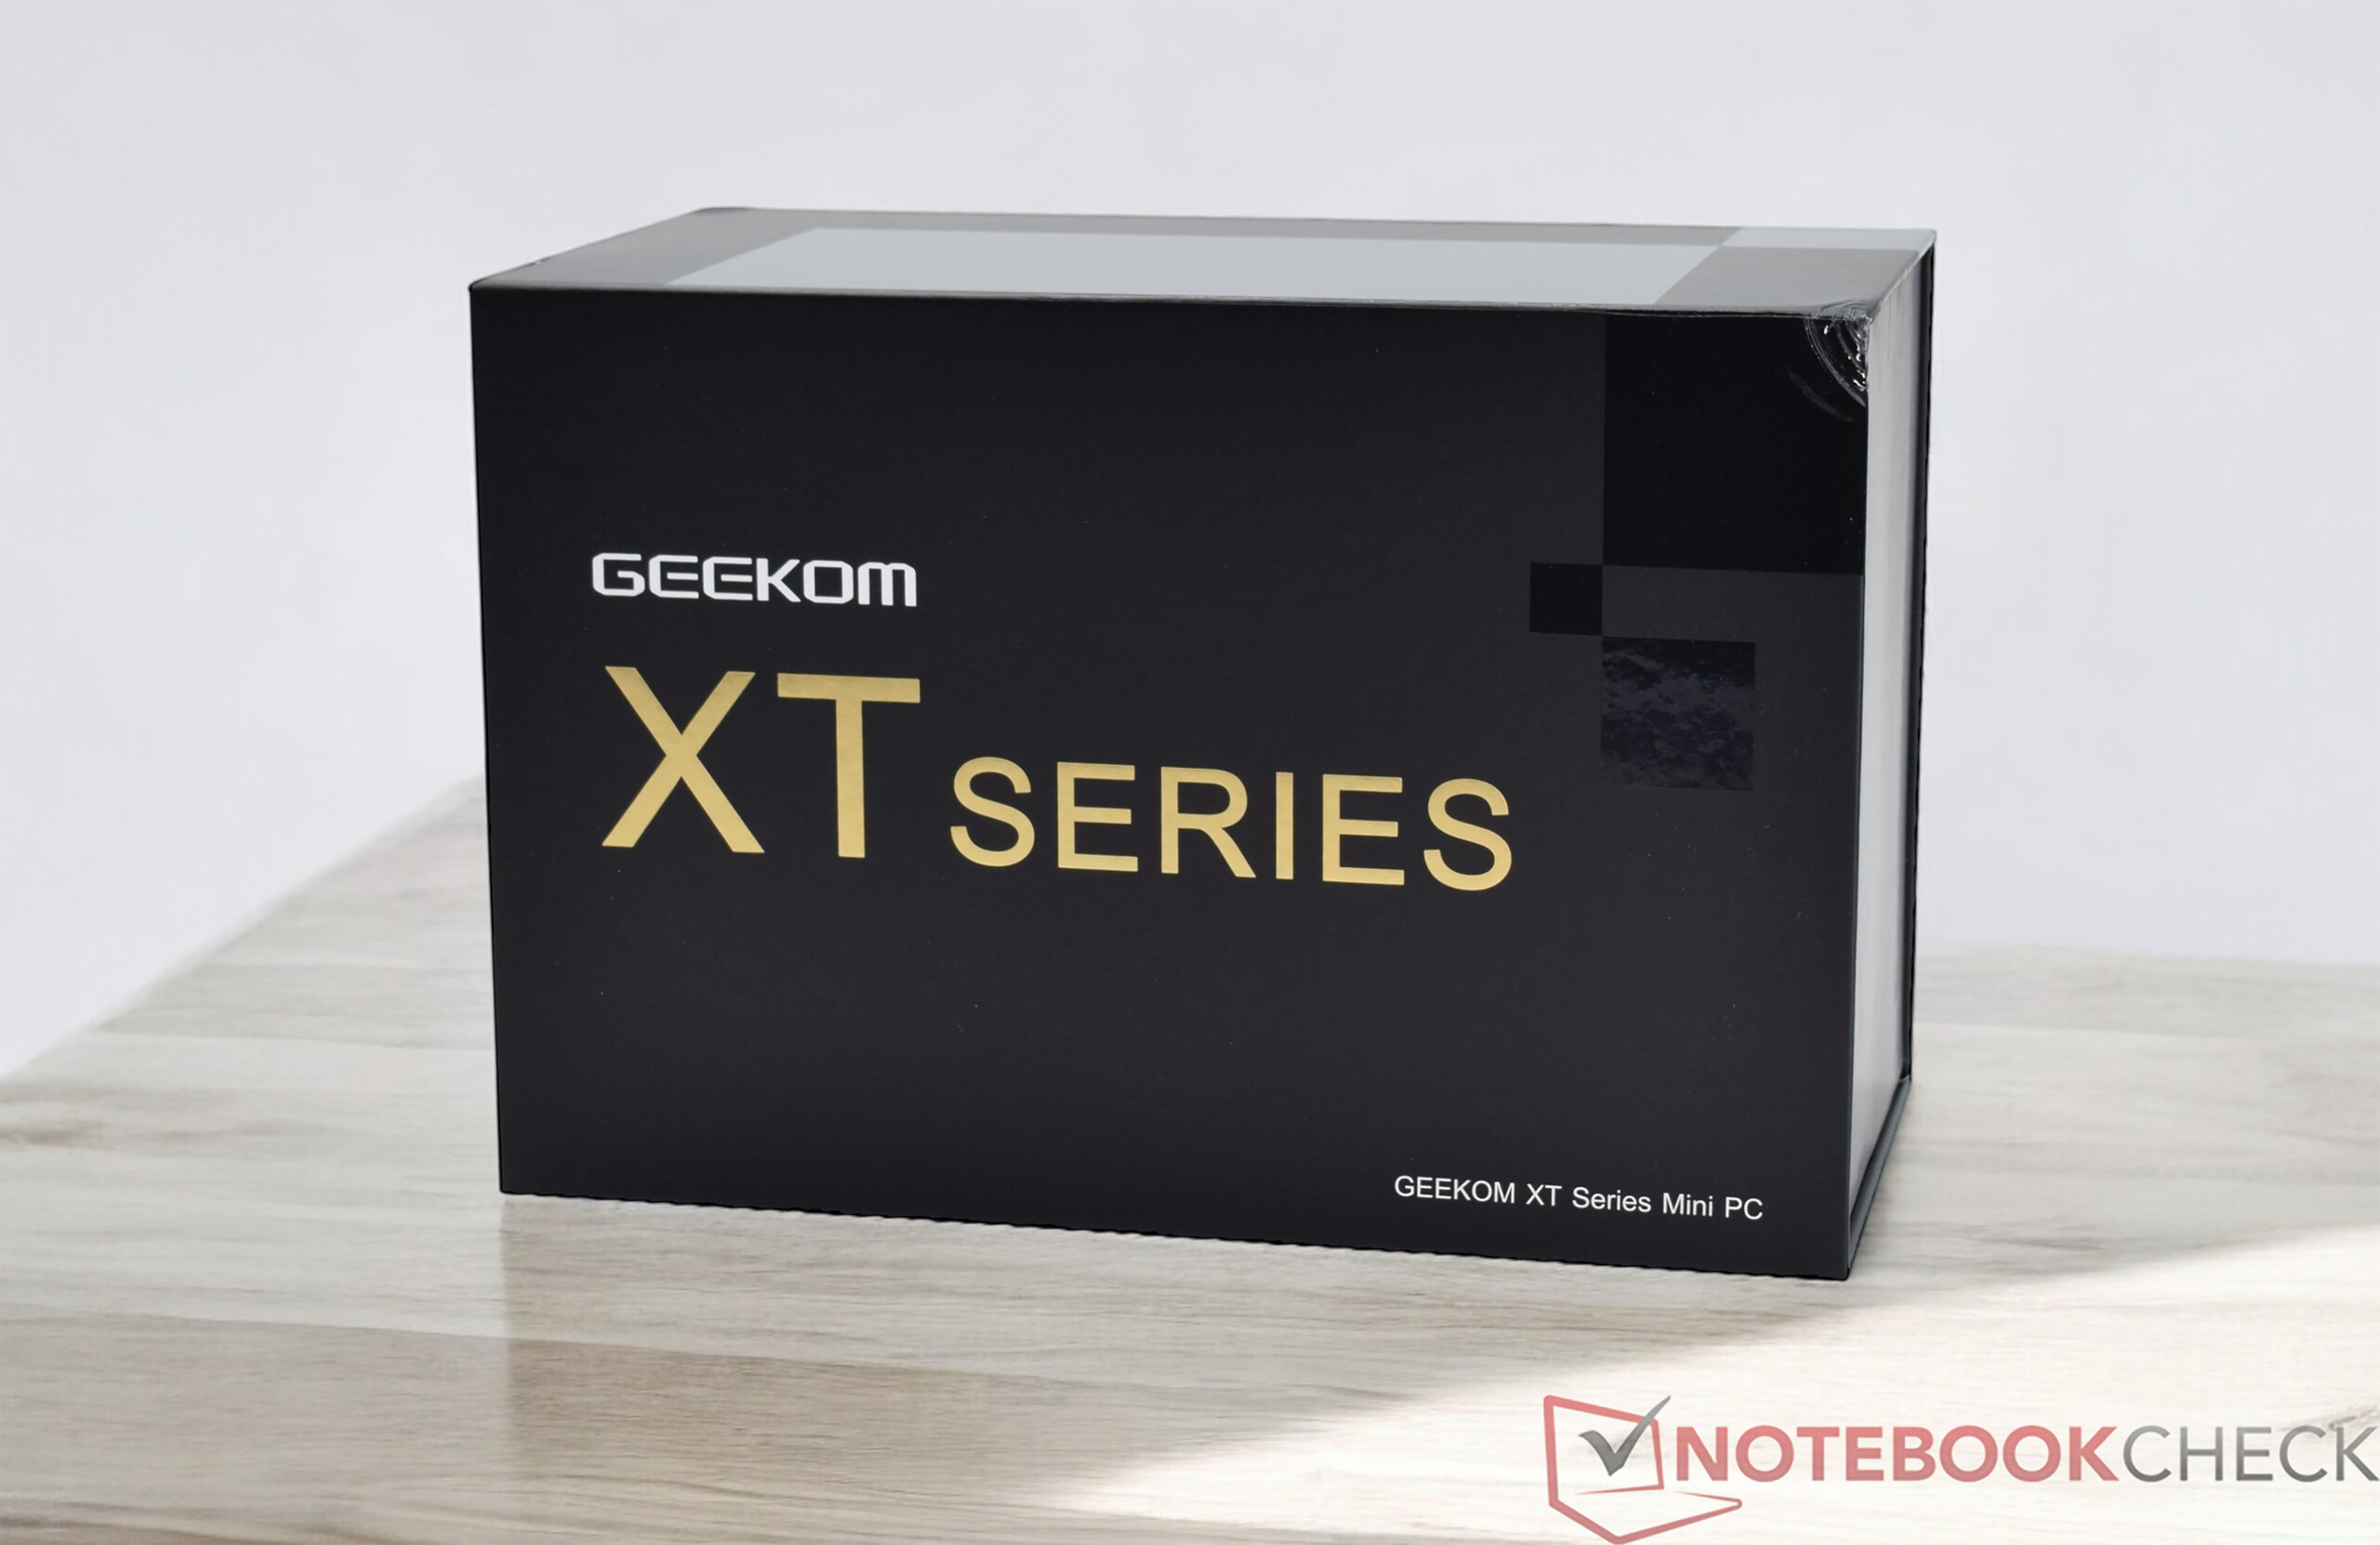
El Geekom XT13 Pro se entrega en una caja comparativamente grande con mucho "aire". Hemos visto que Geekom hace las cosas de otra manera. Además, los accesorios estándar suministrados están empaquetados en bolsas de plástico separadas, lo que podría mejorarse en términos de sostenibilidad. El aparato en sí está fabricado principalmente en metal y plástico. Sin embargo, no sabemos si se han utilizado materiales reciclados en su fabricación. Como nota positiva, el fabricante ofrece una garantía de 36 meses.
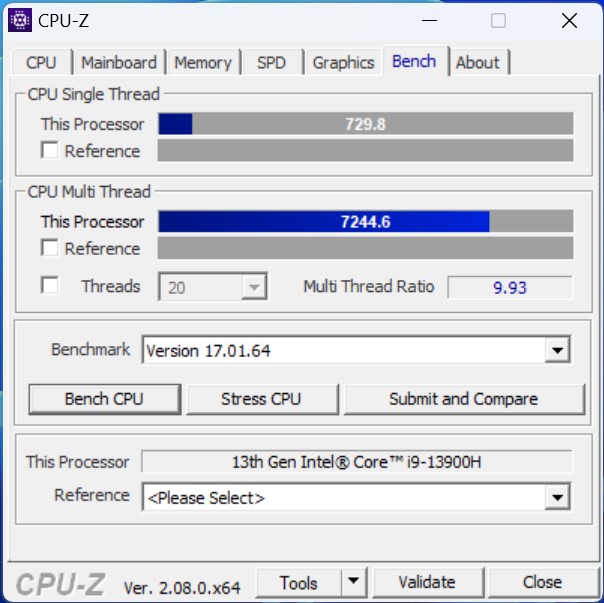
Rendimiento - Intel Core i9-13900H con 14 núcleos y 20 hilos
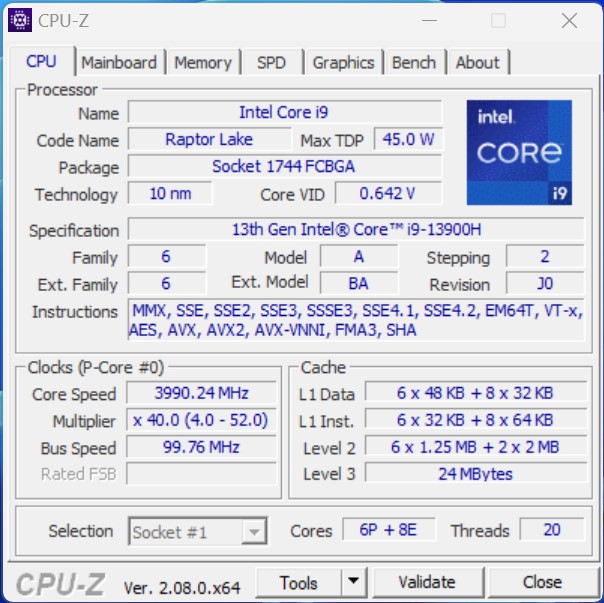
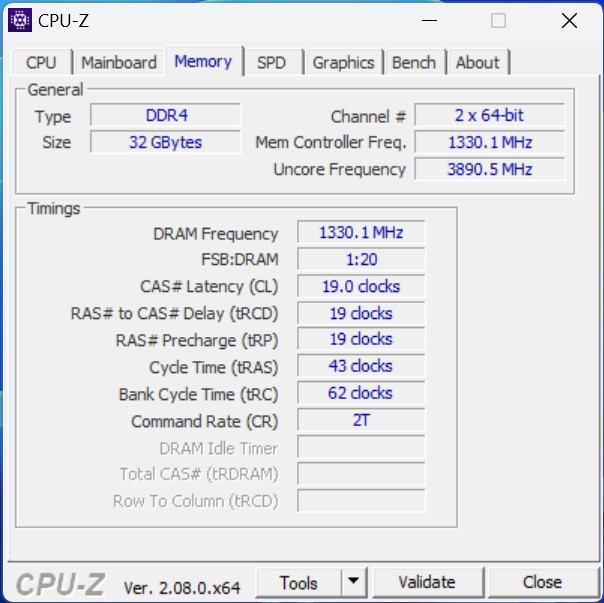
El Geekom XT13 Pro viene en la configuración superior con el Intel Core i9-13900H en la configuración superior. Alternativamente, el PC NUC también puede equiparse con un ligeramente más débil Intel Core i7-13620H que también está equipado con 6 núcleos P y sólo debería estar en ligera desventaja con el modelo superior en términos de rendimiento. siempre se incluyen 32 GB de RAM DDR4, aunque la rápida SSD NVMe proporciona una sólida configuración básica. El Geekom XT13 Pro tampoco es una tarea insuperable para las aplicaciones ávidas de rendimiento. No obstante, el rendimiento 3D de la iGPU es el mayor punto débil, pero esto puede mejorarse notablemente con una eGPU.
Condiciones de la prueba
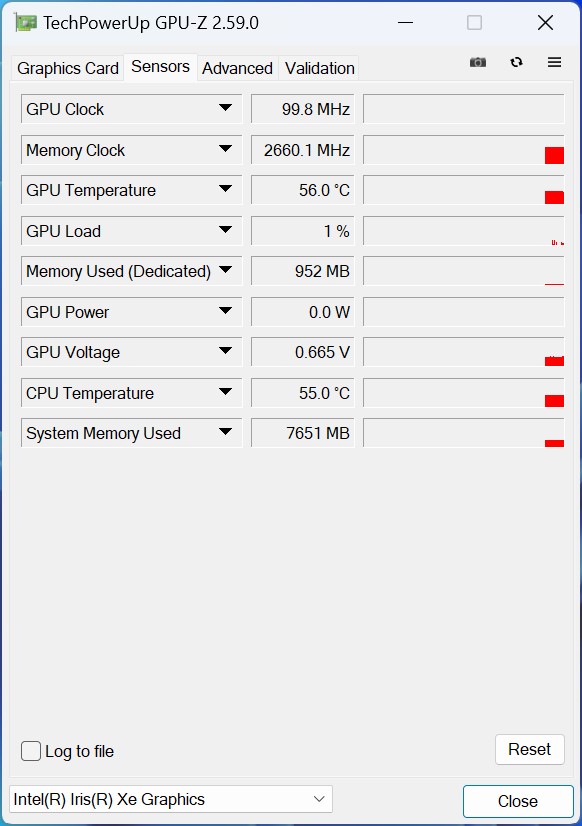
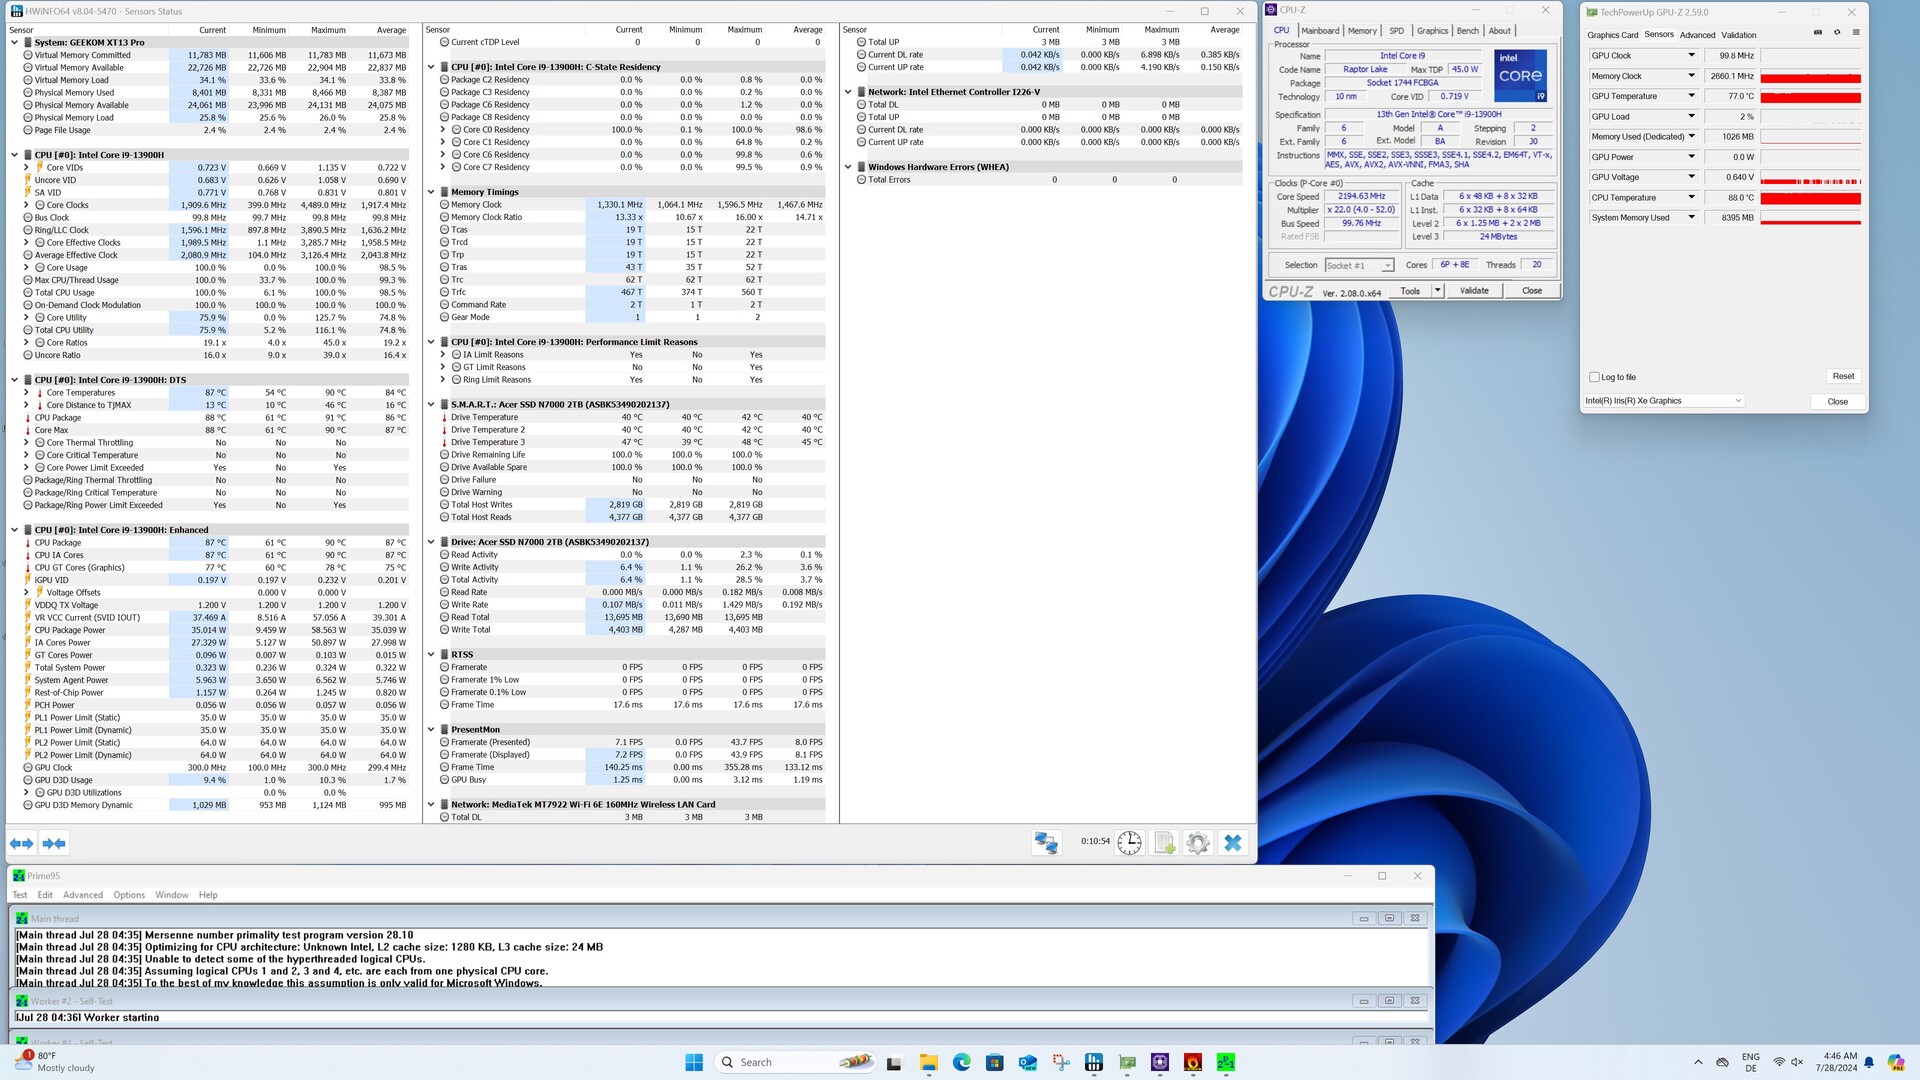
Para todas las pruebas de rendimiento con el Geekom XT13 Pro, utilizamos el perfil de energía "Alto rendimiento". Sólo hubo desviaciones de éste en las mediciones de consumo de energía y ruido según nuestros Criterios de prueba. De acuerdo con las especificaciones del fabricante, Geekom permite que el SoC funcione con el consumo de energía más bajo. En cifras, esto significa un límite de potencia de 35 vatios bajo carga continua, aunque se permiten hasta 64 vatios durante periodos cortos.
Procesador

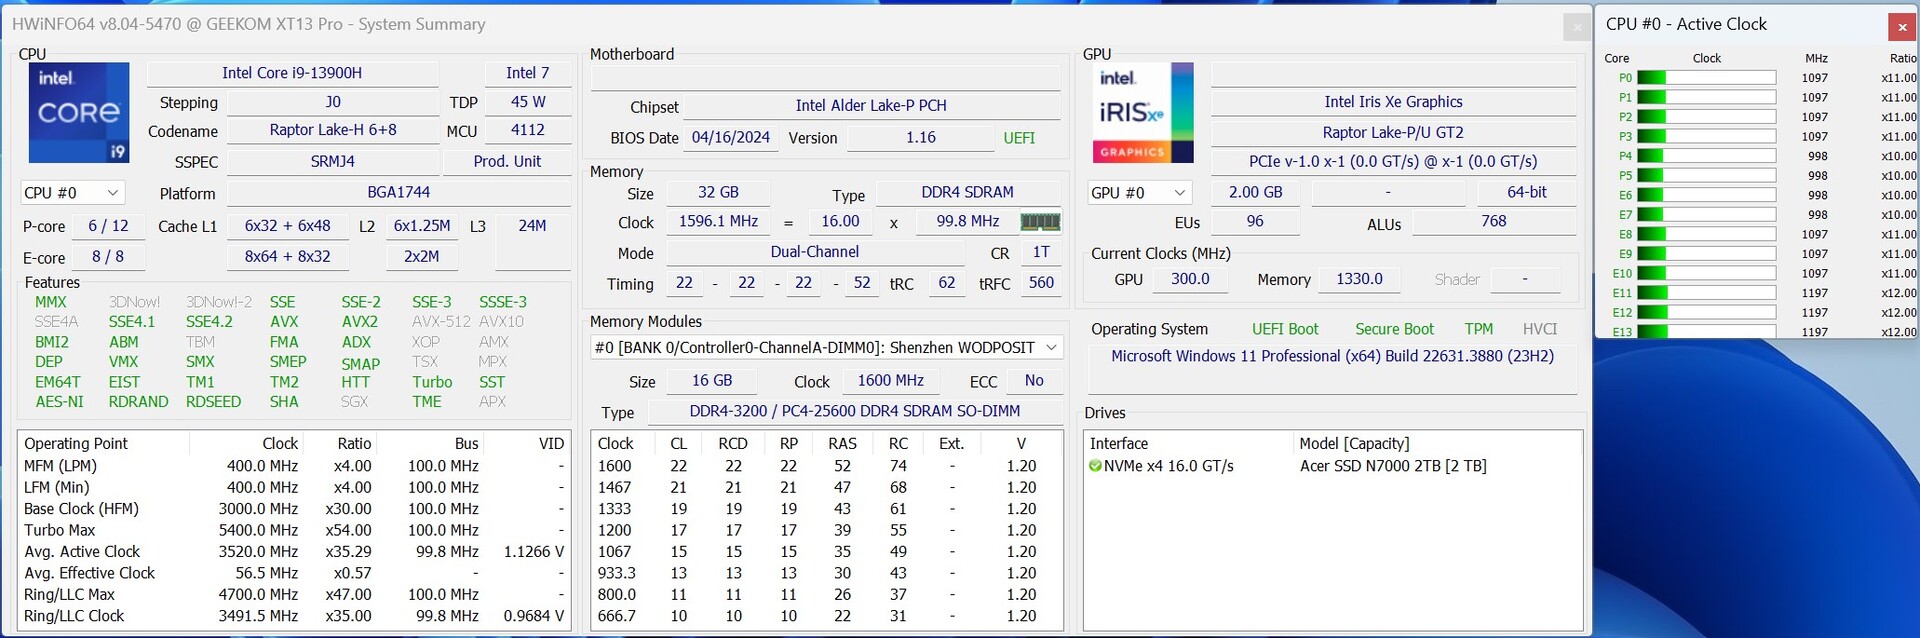
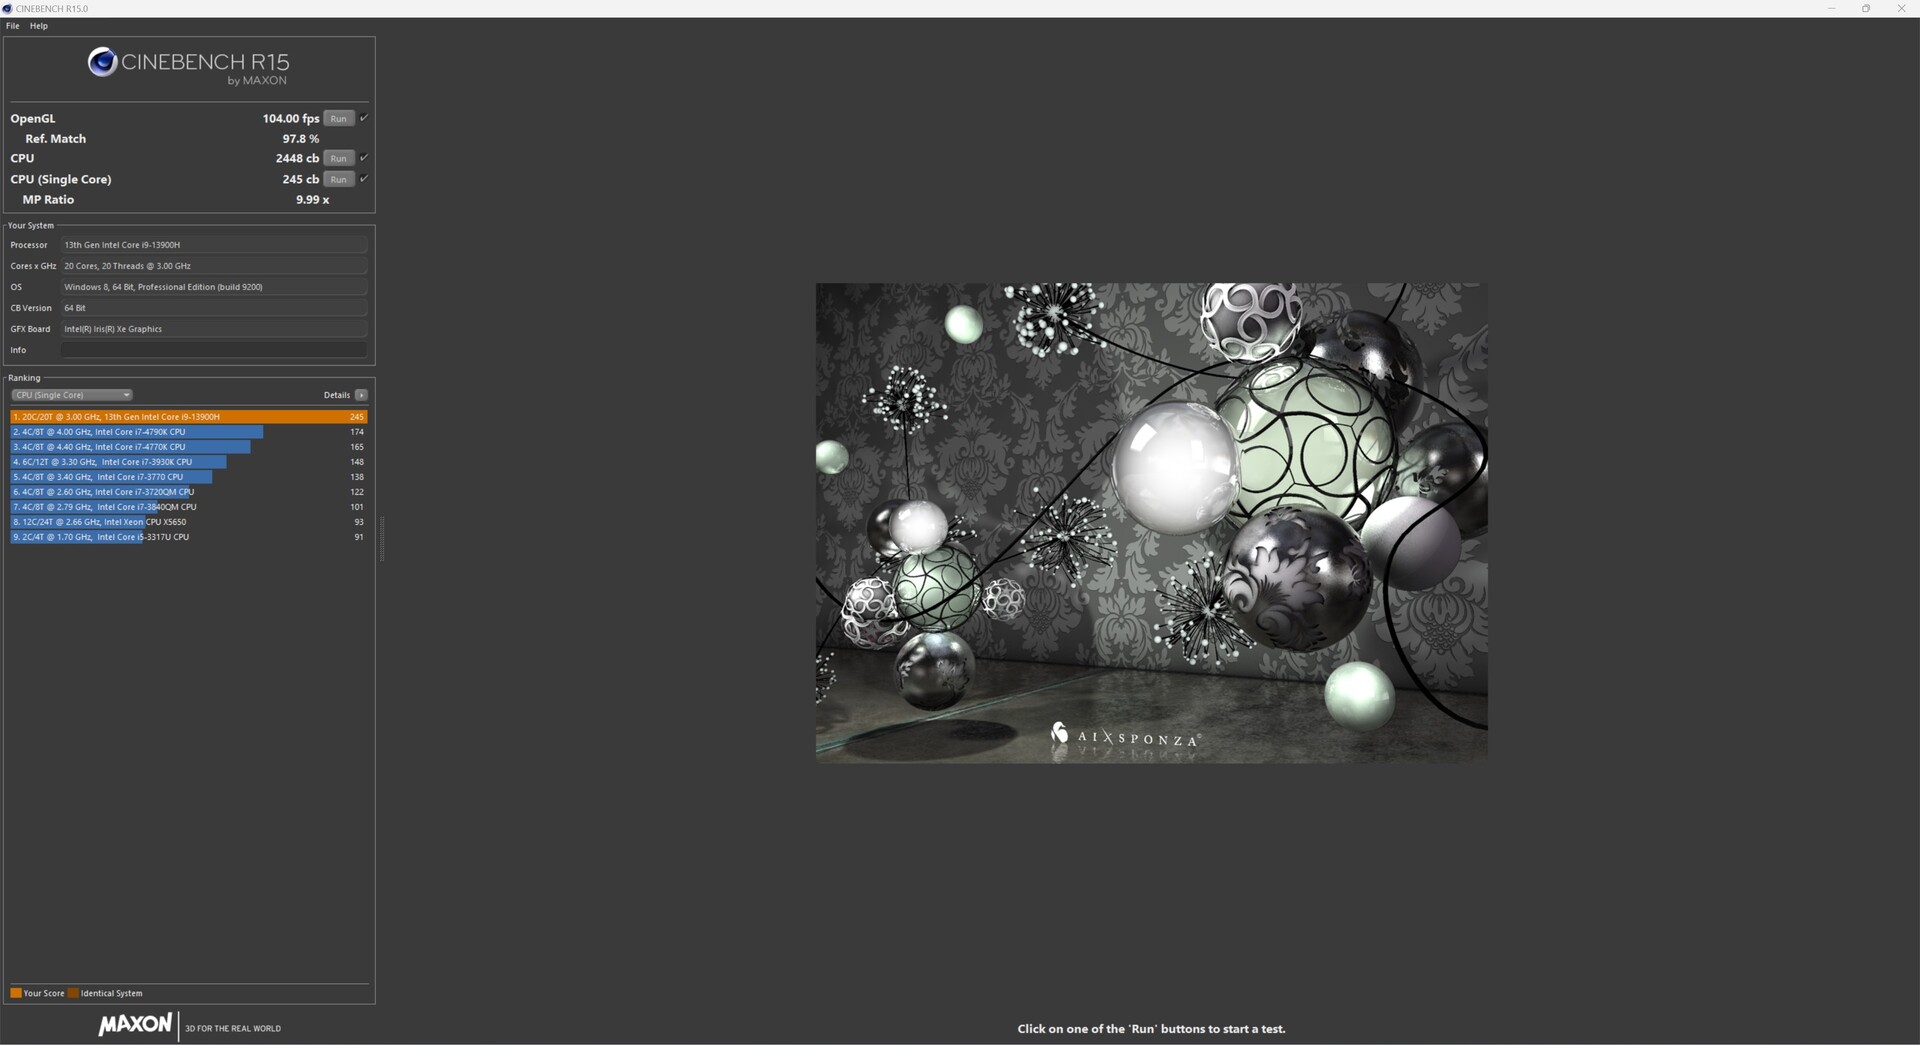
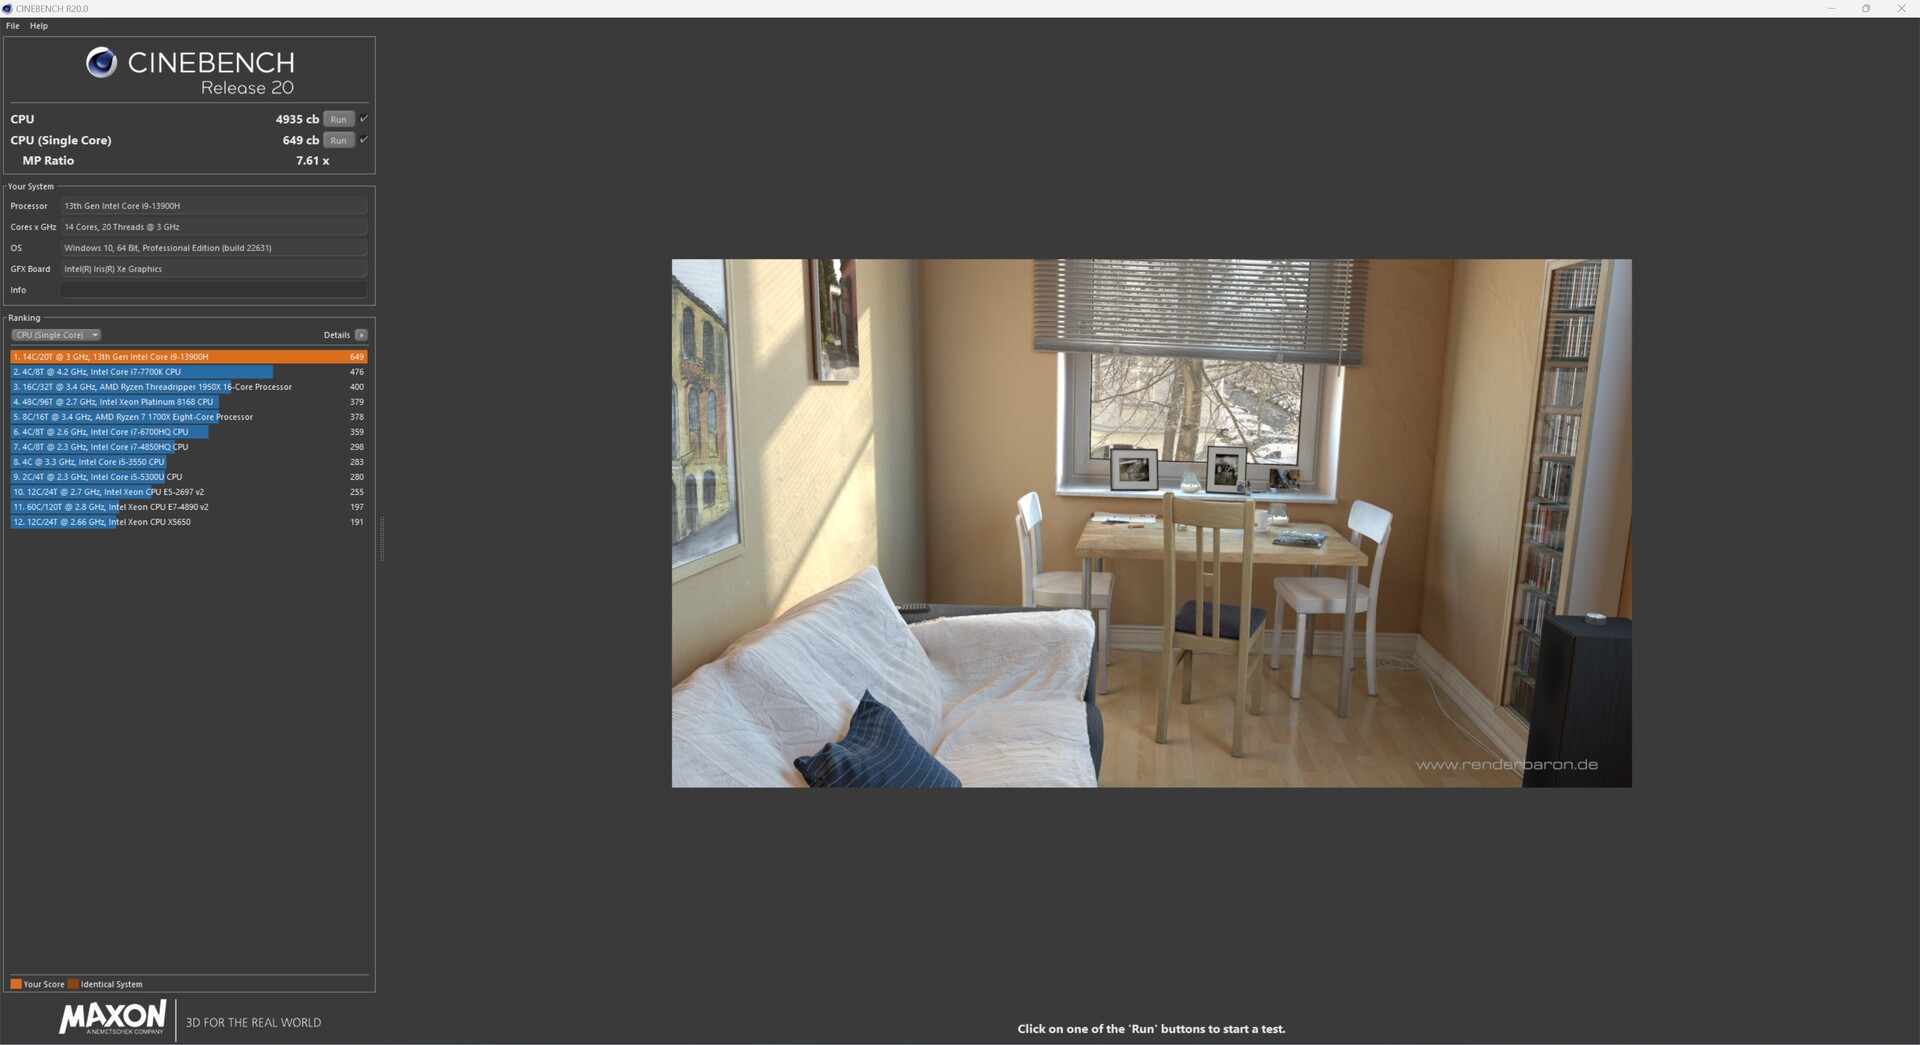
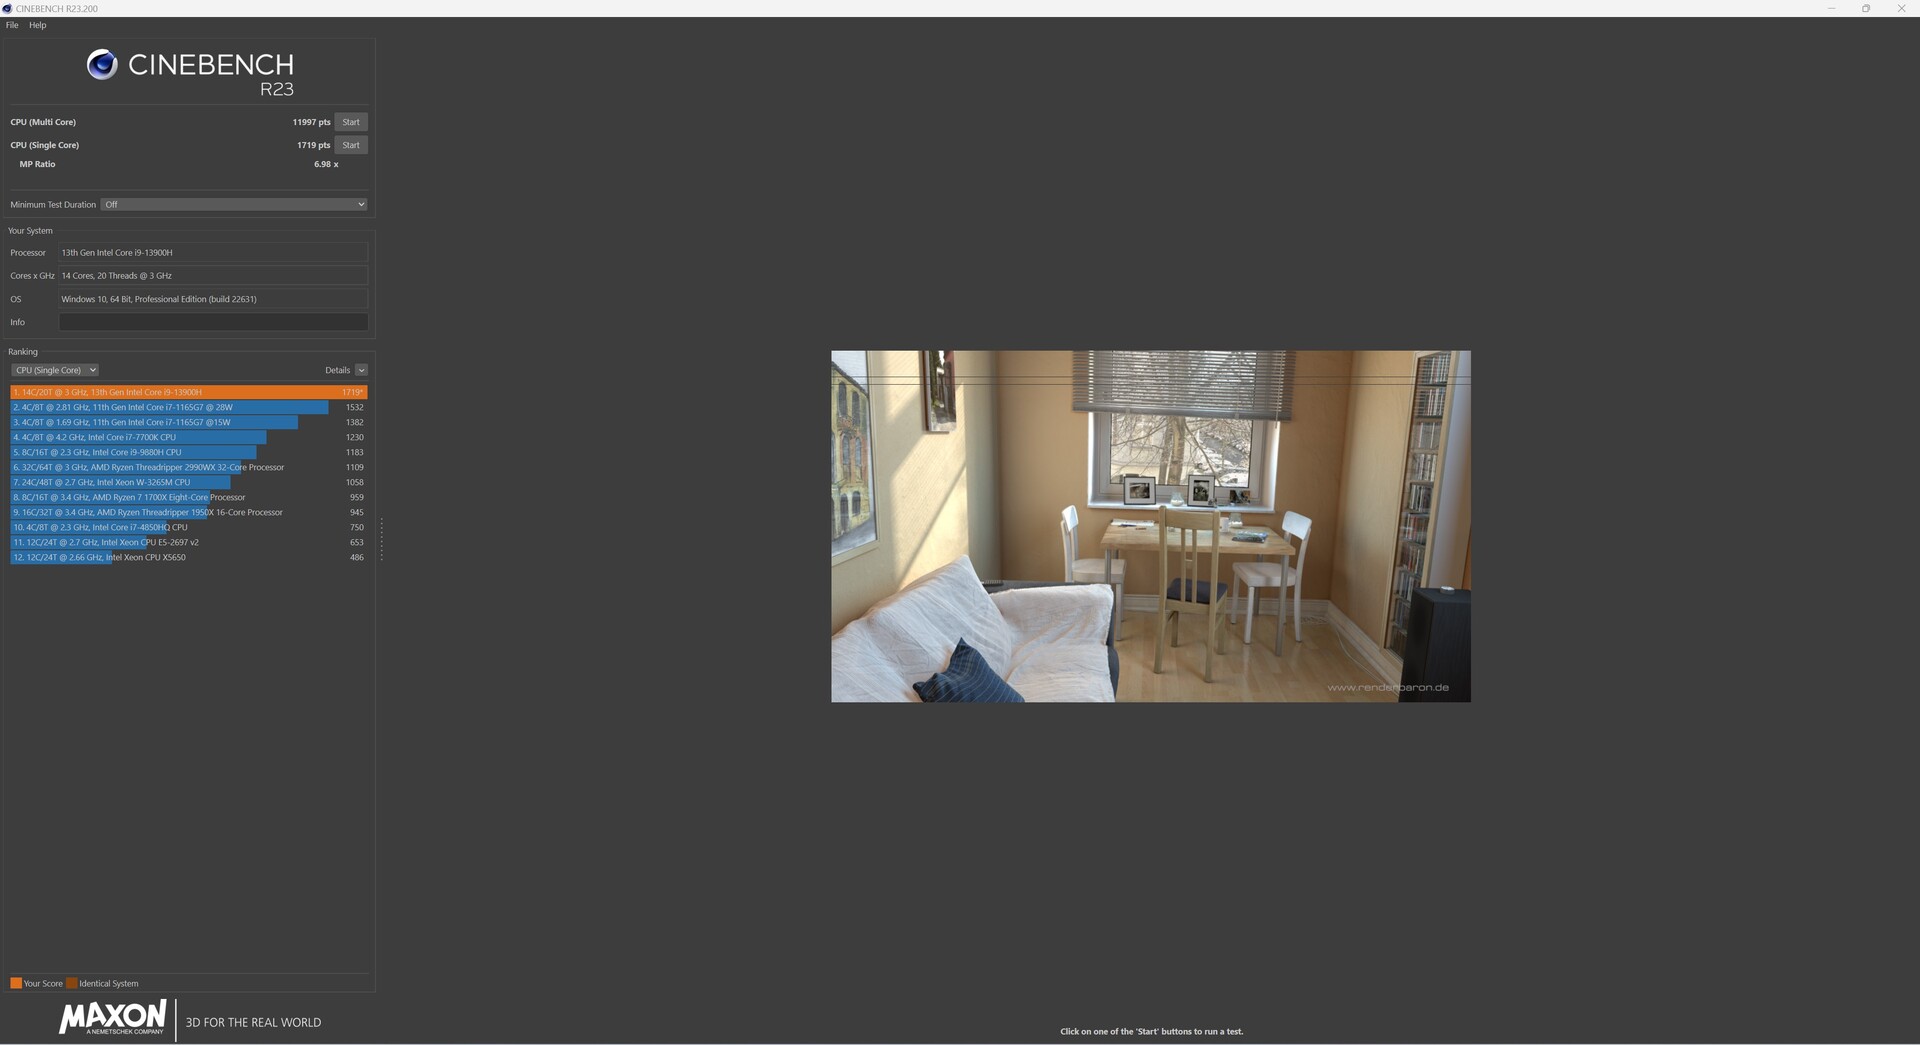
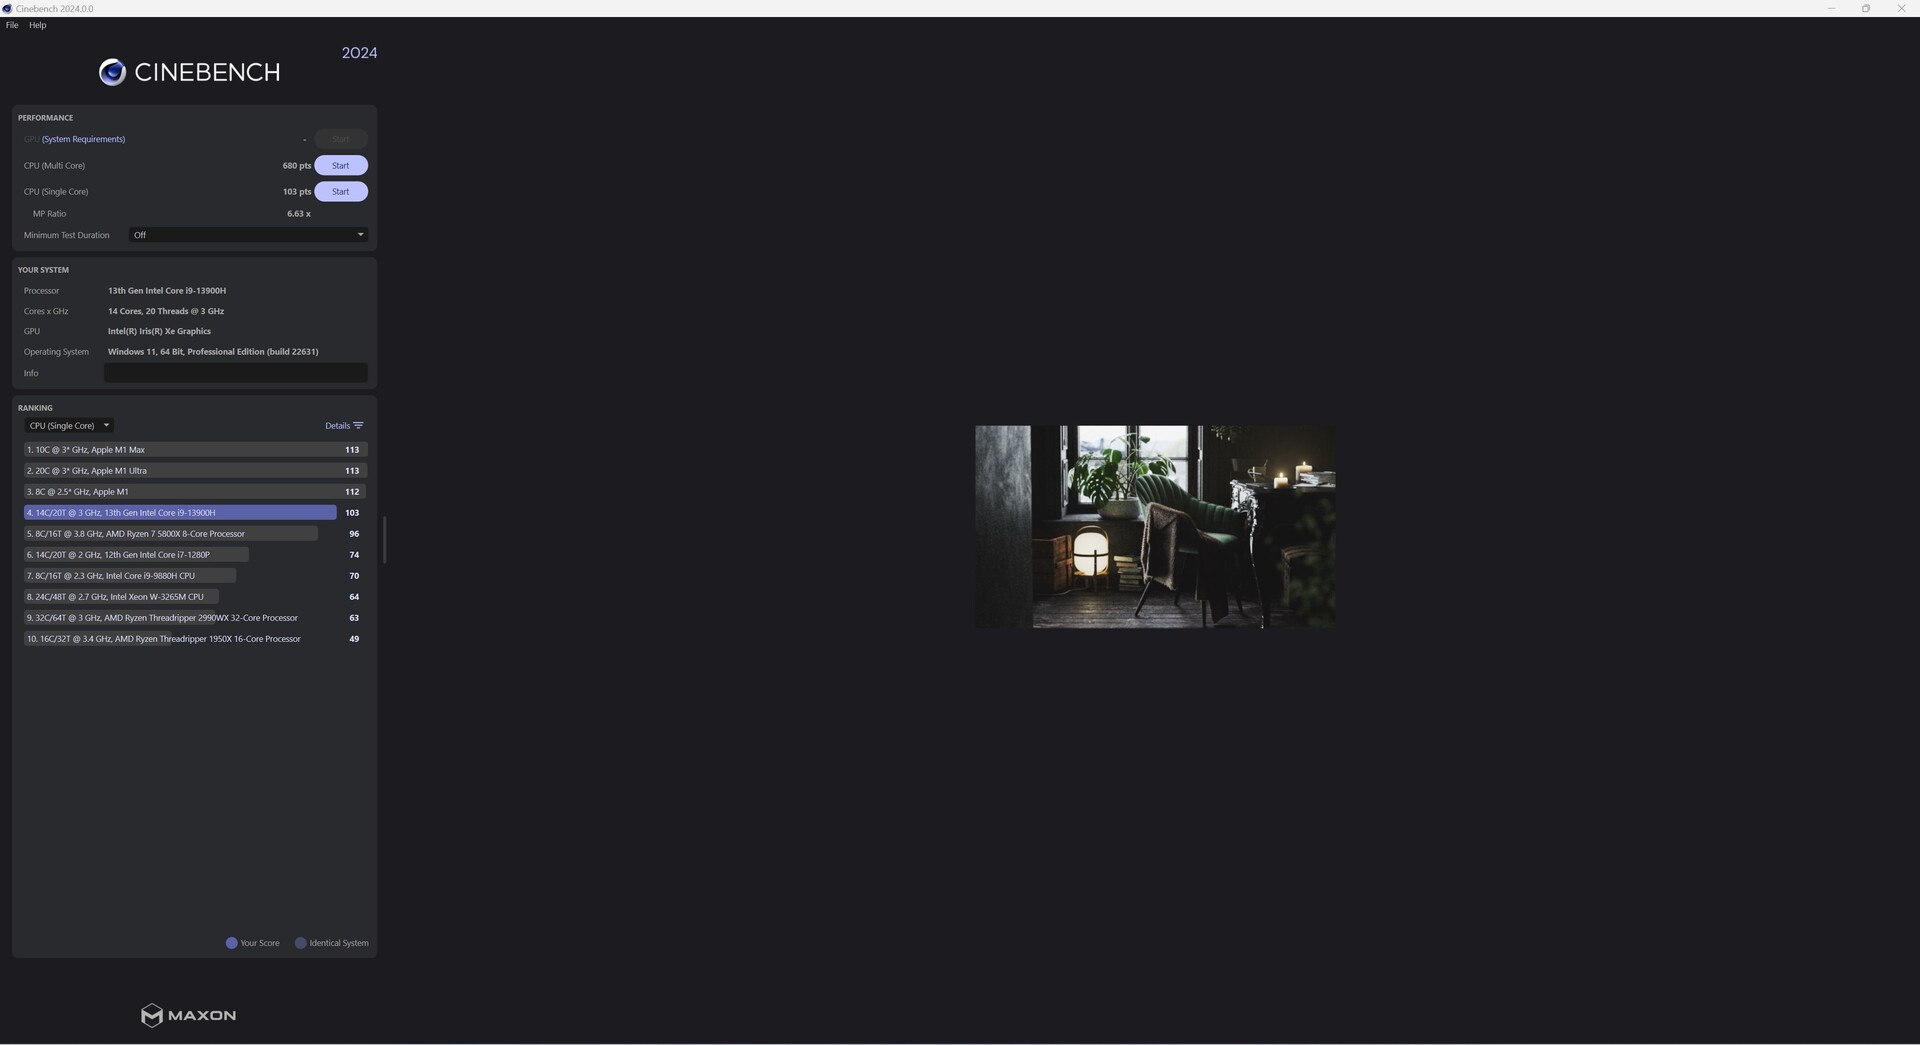
El Intel Core i9-13900H se basa en la arquitectura Raptor Lake y combina núcleos 6P y 8E. Técnicamente, hay Intel Core i9-12900H como podemos ver en los resultados de nuestro benchmark en la clasificación de rendimiento en comparación con el Geekom XT12 Pro. En detalle, sin embargo, vemos una ligera ventaja a favor del Intel Core i9-13900H, que puede llamar la atención con un rendimiento multi-núcleo ligeramente mejor. Un AMD Ryzen 9 7940HS o los modelos más recientes de Intel de la serie Meteor Lake. Sin embargo, la diferencia con los modelos ligeramente más rápidos de la competencia no es muy grande. No se puede hablar de una diferencia notable en el rendimiento en el uso diario debido a las pequeñas diferencias.
Puede encontrar más pruebas comparativas de los procesadores aquí.
| Performance rating - Percent | |
| Geekom A7 | |
| Aoostar GEM12 | |
| Minisforum AtomMan X7 Ti | |
| Acemagic F2A | |
| Geekom XT13 Pro | |
| Geekom XT12 Pro | |
| Cinebench 2024 | |
| CPU Multi Core | |
| Minisforum AtomMan X7 Ti | |
| Acemagic F2A | |
| Aoostar GEM12 | |
| Geekom A7 | |
| Geekom XT13 Pro | |
| Geekom XT12 Pro | |
| CPU Single Core | |
| Minisforum AtomMan X7 Ti | |
| Geekom A7 | |
| Geekom XT12 Pro | |
| Aoostar GEM12 | |
| Acemagic F2A | |
| Geekom XT13 Pro | |
| Cinebench R15 | |
| CPU Single 64Bit | |
| Aoostar GEM12 | |
| Geekom A7 | |
| Minisforum AtomMan X7 Ti | |
| Acemagic F2A | |
| Geekom XT12 Pro | |
| Geekom XT13 Pro | |
| CPU Multi 64Bit | |
| Minisforum AtomMan X7 Ti | |
| Acemagic F2A | |
| Aoostar GEM12 | |
| Geekom A7 | |
| Geekom XT13 Pro | |
| Geekom XT12 Pro | |
| Cinebench R20 | |
| CPU (Single Core) | |
| Minisforum AtomMan X7 Ti | |
| Geekom XT12 Pro | |
| Geekom A7 | |
| Aoostar GEM12 | |
| Acemagic F2A | |
| Geekom XT13 Pro | |
| CPU (Multi Core) | |
| Minisforum AtomMan X7 Ti | |
| Acemagic F2A | |
| Aoostar GEM12 | |
| Geekom A7 | |
| Geekom XT13 Pro | |
| Geekom XT12 Pro | |
| Cinebench R11.5 | |
| CPU Single 64Bit | |
| Geekom A7 | |
| Aoostar GEM12 | |
| Minisforum AtomMan X7 Ti | |
| Acemagic F2A | |
| Geekom XT12 Pro | |
| Geekom XT13 Pro | |
| CPU Multi 64Bit | |
| Minisforum AtomMan X7 Ti | |
| Acemagic F2A | |
| Geekom A7 | |
| Aoostar GEM12 | |
| Geekom XT13 Pro | |
| Geekom XT12 Pro | |
| Cinebench R10 | |
| Rendering Single CPUs 64Bit | |
| Minisforum AtomMan X7 Ti | |
| Geekom A7 | |
| Aoostar GEM12 | |
| Acemagic F2A | |
| Geekom XT13 Pro | |
| Geekom XT12 Pro | |
| Rendering Multiple CPUs 64Bit | |
| Acemagic F2A | |
| Minisforum AtomMan X7 Ti | |
| Aoostar GEM12 | |
| Geekom A7 | |
| Geekom XT13 Pro | |
| Geekom XT12 Pro | |
| Blender - v2.79 BMW27 CPU | |
| Geekom XT12 Pro | |
| Geekom XT13 Pro | |
| Geekom A7 | |
| Aoostar GEM12 | |
| Acemagic F2A | |
| Minisforum AtomMan X7 Ti | |
| wPrime 2.10 | |
| 32m | |
| Geekom XT12 Pro | |
| Acemagic F2A | |
| Geekom XT13 Pro | |
| Minisforum AtomMan X7 Ti | |
| Aoostar GEM12 | |
| Geekom A7 | |
| 1024m | |
| Minisforum AtomMan X7 Ti | |
| Geekom XT13 Pro | |
| Geekom XT12 Pro | |
| Acemagic F2A | |
| Aoostar GEM12 | |
| Geekom A7 | |
| WinRAR - Result | |
| Geekom XT12 Pro | |
| Minisforum AtomMan X7 Ti | |
| Acemagic F2A | |
| Geekom A7 | |
| Aoostar GEM12 | |
| Geekom XT13 Pro | |
| Geekbench 5.0 | |
| 5.0 Multi-Core | |
| Minisforum AtomMan X7 Ti | |
| Acemagic F2A | |
| Geekom A7 | |
| Aoostar GEM12 | |
| Geekom XT13 Pro | |
| Geekom XT12 Pro | |
| 5.0 Single-Core | |
| Geekom A7 | |
| Aoostar GEM12 | |
| Minisforum AtomMan X7 Ti | |
| Geekom XT12 Pro | |
| Acemagic F2A | |
| Geekom XT13 Pro | |
| Geekbench 4.4 | |
| 64 Bit Single-Core Score | |
| Geekom A7 | |
| Aoostar GEM12 | |
| Geekom XT12 Pro | |
| Minisforum AtomMan X7 Ti | |
| Geekom XT13 Pro | |
| Acemagic F2A | |
| 64 Bit Multi-Core Score | |
| Geekom A7 | |
| Minisforum AtomMan X7 Ti | |
| Aoostar GEM12 | |
| Acemagic F2A | |
| Geekom XT13 Pro | |
| Geekom XT12 Pro | |
| 3DMark 11 - 1280x720 Performance Physics | |
| Geekom A7 | |
| Minisforum AtomMan X7 Ti | |
| Aoostar GEM12 | |
| Acemagic F2A | |
| Geekom XT13 Pro | |
| Geekom XT12 Pro | |
| HWBOT x265 Benchmark v2.2 - 4k Preset | |
| Minisforum AtomMan X7 Ti | |
| Geekom A7 | |
| Aoostar GEM12 | |
| Acemagic F2A | |
| Geekom XT13 Pro | |
| Geekom XT12 Pro | |
| R Benchmark 2.5 - Overall mean | |
| Geekom XT13 Pro | |
| Acemagic F2A | |
| Geekom XT12 Pro | |
| Minisforum AtomMan X7 Ti | |
| Aoostar GEM12 | |
| Geekom A7 | |
| LibreOffice - 20 Documents To PDF | |
| Geekom A7 | |
| Minisforum AtomMan X7 Ti | |
| Aoostar GEM12 | |
| Geekom XT13 Pro | |
| Acemagic F2A | |
| Geekom XT12 Pro | |
| WebXPRT 3 - Overall | |
| Geekom A7 | |
| Aoostar GEM12 | |
| Geekom XT12 Pro | |
| Acemagic F2A | |
| Geekom XT13 Pro | |
| Minisforum AtomMan X7 Ti | |
| Mozilla Kraken 1.1 - Total | |
| Geekom XT13 Pro | |
| Acemagic F2A | |
| Minisforum AtomMan X7 Ti | |
| Aoostar GEM12 | |
| Geekom XT12 Pro | |
| Geekom A7 | |
| 3DMark | |
| 1920x1080 Fire Strike Physics | |
| Aoostar GEM12 | |
| Minisforum AtomMan X7 Ti | |
| Geekom A7 | |
| Acemagic F2A | |
| Geekom XT13 Pro | |
| Geekom XT12 Pro | |
| 2560x1440 Time Spy CPU | |
| Minisforum AtomMan X7 Ti | |
| Aoostar GEM12 | |
| Geekom A7 | |
| Acemagic F2A | |
| Geekom XT13 Pro | |
| Geekom XT12 Pro | |
| Super Pi mod 1.5 XS 1M - 1M | |
| Geekom XT13 Pro | |
| Geekom XT12 Pro | |
| Geekom A7 | |
| Aoostar GEM12 | |
| Acemagic F2A | |
| Minisforum AtomMan X7 Ti | |
| Super Pi mod 1.5 XS 2M - 2M | |
| Geekom A7 | |
| Aoostar GEM12 | |
| Geekom XT13 Pro | |
| Geekom XT12 Pro | |
| Acemagic F2A | |
| Minisforum AtomMan X7 Ti | |
| Super Pi Mod 1.5 XS 32M - 32M | |
| Aoostar GEM12 | |
| Geekom A7 | |
| Geekom XT13 Pro | |
| Geekom XT12 Pro | |
| Acemagic F2A | |
| Minisforum AtomMan X7 Ti | |
* ... más pequeño es mejor
AIDA64: FP32 Ray-Trace | FPU Julia | CPU SHA3 | CPU Queen | FPU SinJulia | FPU Mandel | CPU AES | CPU ZLib | FP64 Ray-Trace | CPU PhotoWorxx
| Performance rating | |
| Geekom A7 | |
| Aoostar GEM12 | |
| Media de la clase Mini PC | |
| Minisforum AtomMan X7 Ti | |
| Acemagic F2A | |
| Geekom XT13 Pro | |
| Geekom XT12 Pro | |
| AIDA64 / FP32 Ray-Trace | |
| Aoostar GEM12 | |
| Geekom A7 | |
| Media de la clase Mini PC (974 - 82725, n=112, últimos 2 años) | |
| Acemagic F2A | |
| Minisforum AtomMan X7 Ti | |
| Geekom XT13 Pro | |
| Geekom XT12 Pro | |
| AIDA64 / FPU Julia | |
| Aoostar GEM12 | |
| Geekom A7 | |
| Media de la clase Mini PC (6115 - 363782, n=112, últimos 2 años) | |
| Minisforum AtomMan X7 Ti | |
| Acemagic F2A | |
| Geekom XT13 Pro | |
| Geekom XT12 Pro | |
| AIDA64 / CPU SHA3 | |
| Geekom A7 | |
| Aoostar GEM12 | |
| Minisforum AtomMan X7 Ti | |
| Acemagic F2A | |
| Media de la clase Mini PC (385 - 9475, n=112, últimos 2 años) | |
| Geekom XT13 Pro | |
| Geekom XT12 Pro | |
| AIDA64 / CPU Queen | |
| Geekom A7 | |
| Aoostar GEM12 | |
| Media de la clase Mini PC (20501 - 184747, n=103, últimos 2 años) | |
| Geekom XT13 Pro | |
| Acemagic F2A | |
| Minisforum AtomMan X7 Ti | |
| Geekom XT12 Pro | |
| AIDA64 / FPU SinJulia | |
| Aoostar GEM12 | |
| Geekom A7 | |
| Media de la clase Mini PC (1019 - 31931, n=112, últimos 2 años) | |
| Minisforum AtomMan X7 Ti | |
| Acemagic F2A | |
| Geekom XT13 Pro | |
| Geekom XT12 Pro | |
| AIDA64 / FPU Mandel | |
| Aoostar GEM12 | |
| Geekom A7 | |
| Media de la clase Mini PC (3322 - 192994, n=112, últimos 2 años) | |
| Acemagic F2A | |
| Minisforum AtomMan X7 Ti | |
| Geekom XT13 Pro | |
| Geekom XT12 Pro | |
| AIDA64 / CPU AES | |
| Geekom A7 | |
| Minisforum AtomMan X7 Ti | |
| Acemagic F2A | |
| Geekom XT13 Pro | |
| Geekom XT12 Pro | |
| Media de la clase Mini PC (9214 - 325960, n=111, últimos 2 años) | |
| Aoostar GEM12 | |
| AIDA64 / CPU ZLib | |
| Minisforum AtomMan X7 Ti | |
| Acemagic F2A | |
| Media de la clase Mini PC (127.2 - 2431, n=112, últimos 2 años) | |
| Aoostar GEM12 | |
| Geekom A7 | |
| Geekom XT13 Pro | |
| Geekom XT12 Pro | |
| AIDA64 / FP64 Ray-Trace | |
| Aoostar GEM12 | |
| Geekom A7 | |
| Media de la clase Mini PC (537 - 43587, n=112, últimos 2 años) | |
| Acemagic F2A | |
| Minisforum AtomMan X7 Ti | |
| Geekom XT13 Pro | |
| Geekom XT12 Pro | |
| AIDA64 / CPU PhotoWorxx | |
| Minisforum AtomMan X7 Ti | |
| Geekom A7 | |
| Aoostar GEM12 | |
| Media de la clase Mini PC (8069 - 96843, n=112, últimos 2 años) | |
| Acemagic F2A | |
| Geekom XT13 Pro | |
| Geekom XT12 Pro | |
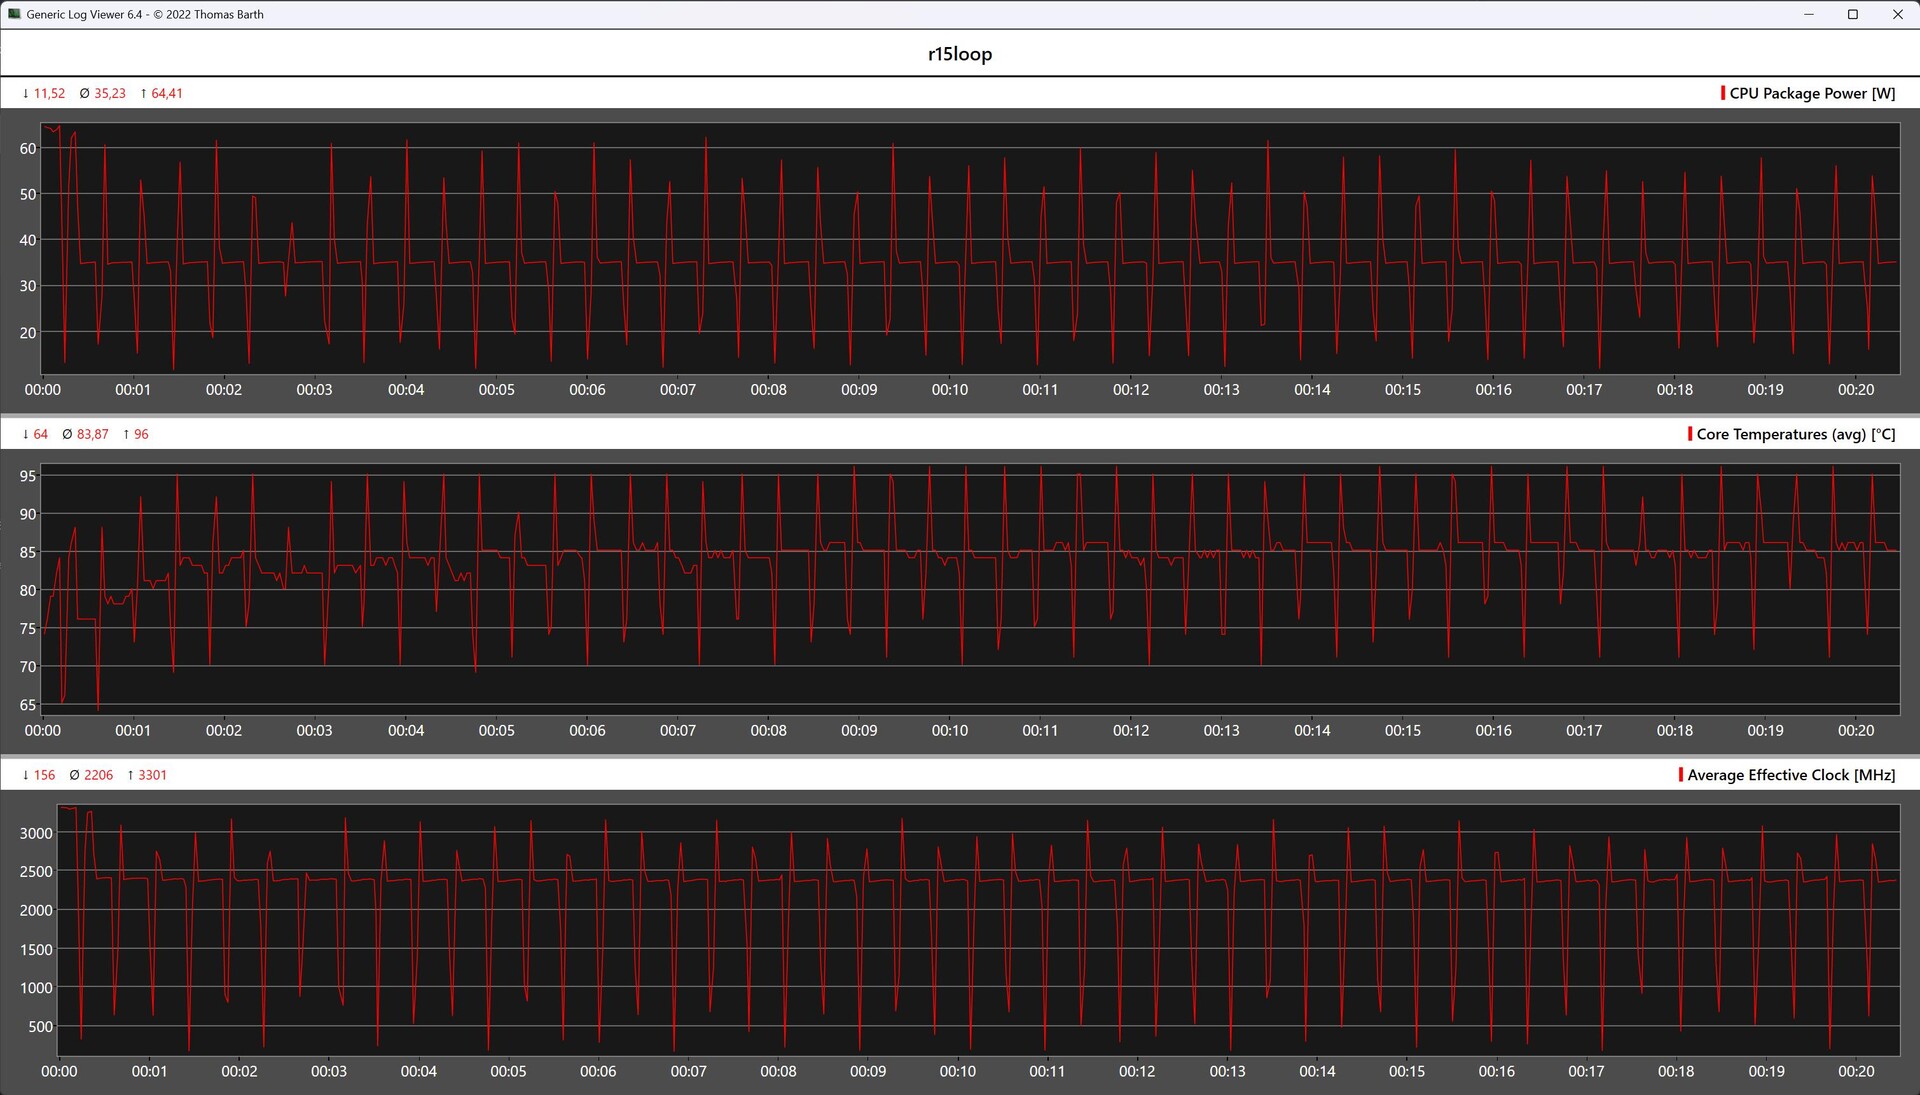
Cinebench R15 Bucle múltiple
El bucle continuo Cinebench R15 de nuestra muestra de prueba corre casi paralelo al del Geekom XT12 Pro. Al final, sin embargo, el modelo más reciente XT13 Pro es capaz de distanciarse con una clara ventaja. También se puede observar que el pequeño sistema de refrigeración no consigue mantener el Turbo del SoC durante un periodo de tiempo prolongado. El límite máximo de potencia de 64 vatios sólo se alcanza durante un corto periodo de tiempo porque el consumo de energía tiene que ser estrangulado debido a las altas temperaturas.
Rendimiento del sistema
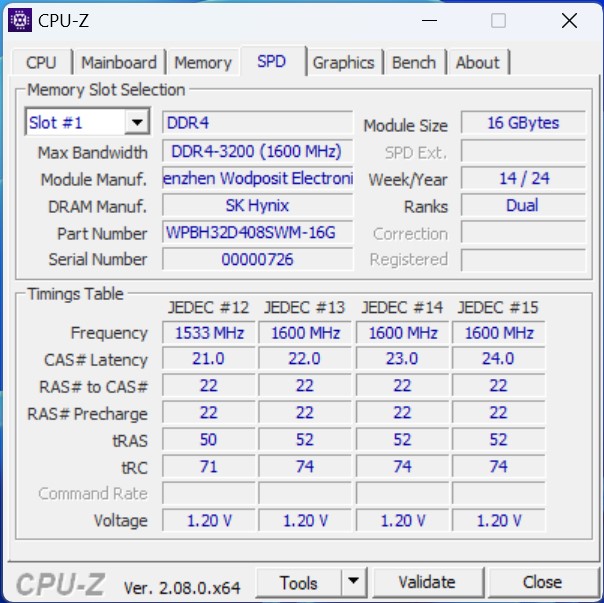
En las pruebas de rendimiento del sistema, el rendimiento documentado del Geekom XT13 Pro sólo es lo suficientemente bueno para ocupar un lugar en la parte baja de la clasificación. Subjetivamente, sin embargo, podemos decir que el Geekom XT13 Pro ofrece un rendimiento decente. No pudimos observar ninguna latencia perceptible al trabajar con el dispositivo durante la fase de prueba. En lo que respecta a la elección de la memoria RAM, el estándar DDR4, más lento, se toma la revancha, como se desprende de las pruebas comparativas AIDA64. Técnicamente, el Intel Core i9-13900H podría combinarse con DDR5 (5.200 MT/s).
| AIDA64 / Memory Copy | |
| Minisforum AtomMan X7 Ti | |
| Aoostar GEM12 | |
| Geekom A7 | |
| Media de la clase Mini PC (15933 - 163031, n=112, últimos 2 años) | |
| Acemagic F2A | |
| Geekom XT13 Pro | |
| Geekom XT12 Pro | |
| AIDA64 / Memory Read | |
| Minisforum AtomMan X7 Ti | |
| Acemagic F2A | |
| Media de la clase Mini PC (14143 - 123769, n=112, últimos 2 años) | |
| Geekom A7 | |
| Aoostar GEM12 | |
| Geekom XT12 Pro | |
| Geekom XT13 Pro | |
| AIDA64 / Memory Write | |
| Geekom A7 | |
| Aoostar GEM12 | |
| Media de la clase Mini PC (10630 - 216693, n=112, últimos 2 años) | |
| Minisforum AtomMan X7 Ti | |
| Acemagic F2A | |
| Geekom XT13 Pro | |
| Geekom XT12 Pro | |
| AIDA64 / Memory Latency | |
| Acemagic F2A | |
| Minisforum AtomMan X7 Ti | |
| Media de la clase Mini PC (0 - 184.8, n=113, últimos 2 años) | |
| Geekom A7 | |
| Aoostar GEM12 | |
| Geekom XT13 Pro | |
| Geekom XT12 Pro | |
* ... más pequeño es mejor
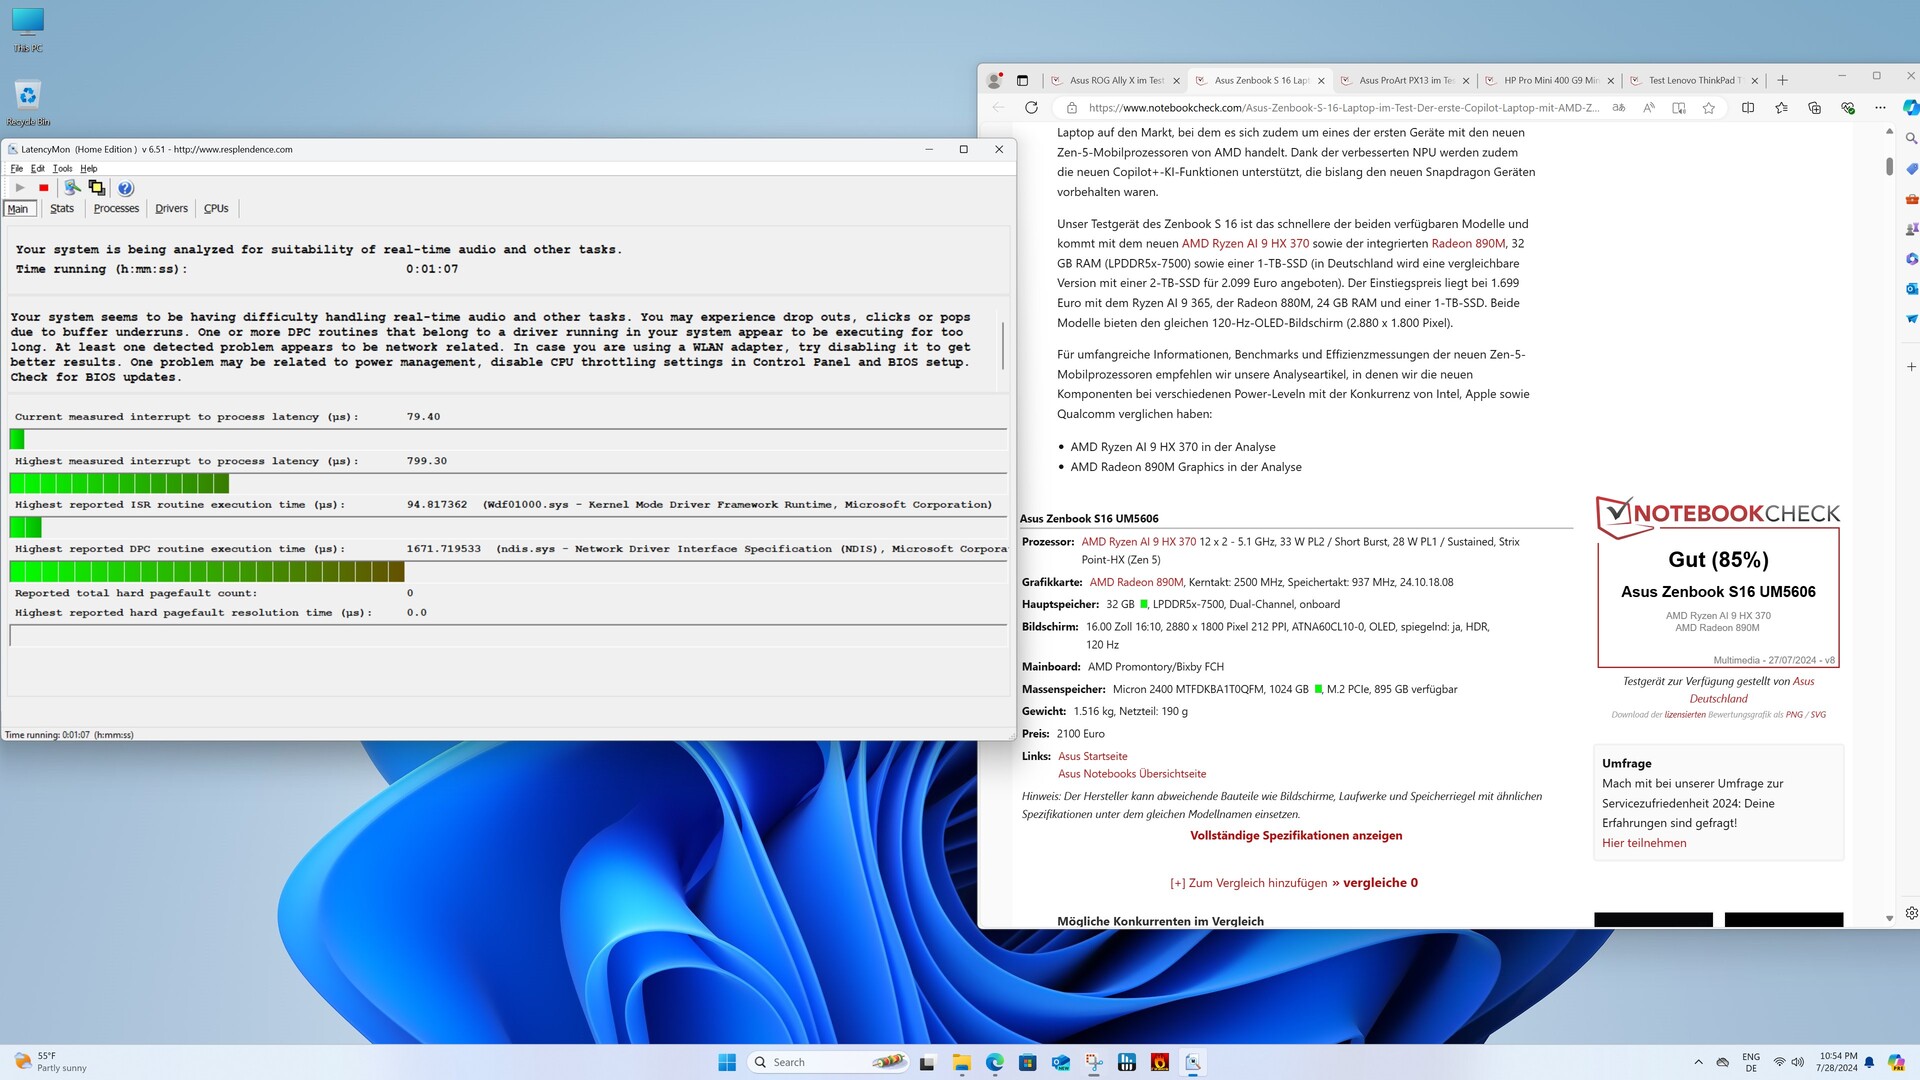
Latencias del CPD
No observamos latencias de CPD extremadamente excesivas con el Geekom XT13 Pro. Este fue el caso con el Geekom XT12 Pro. No obstante, nuestra muestra de prueba está lejos de unos resultados sobresalientes. Alcanzamos el valor máximo incluso navegando simplemente con el navegador Edge.
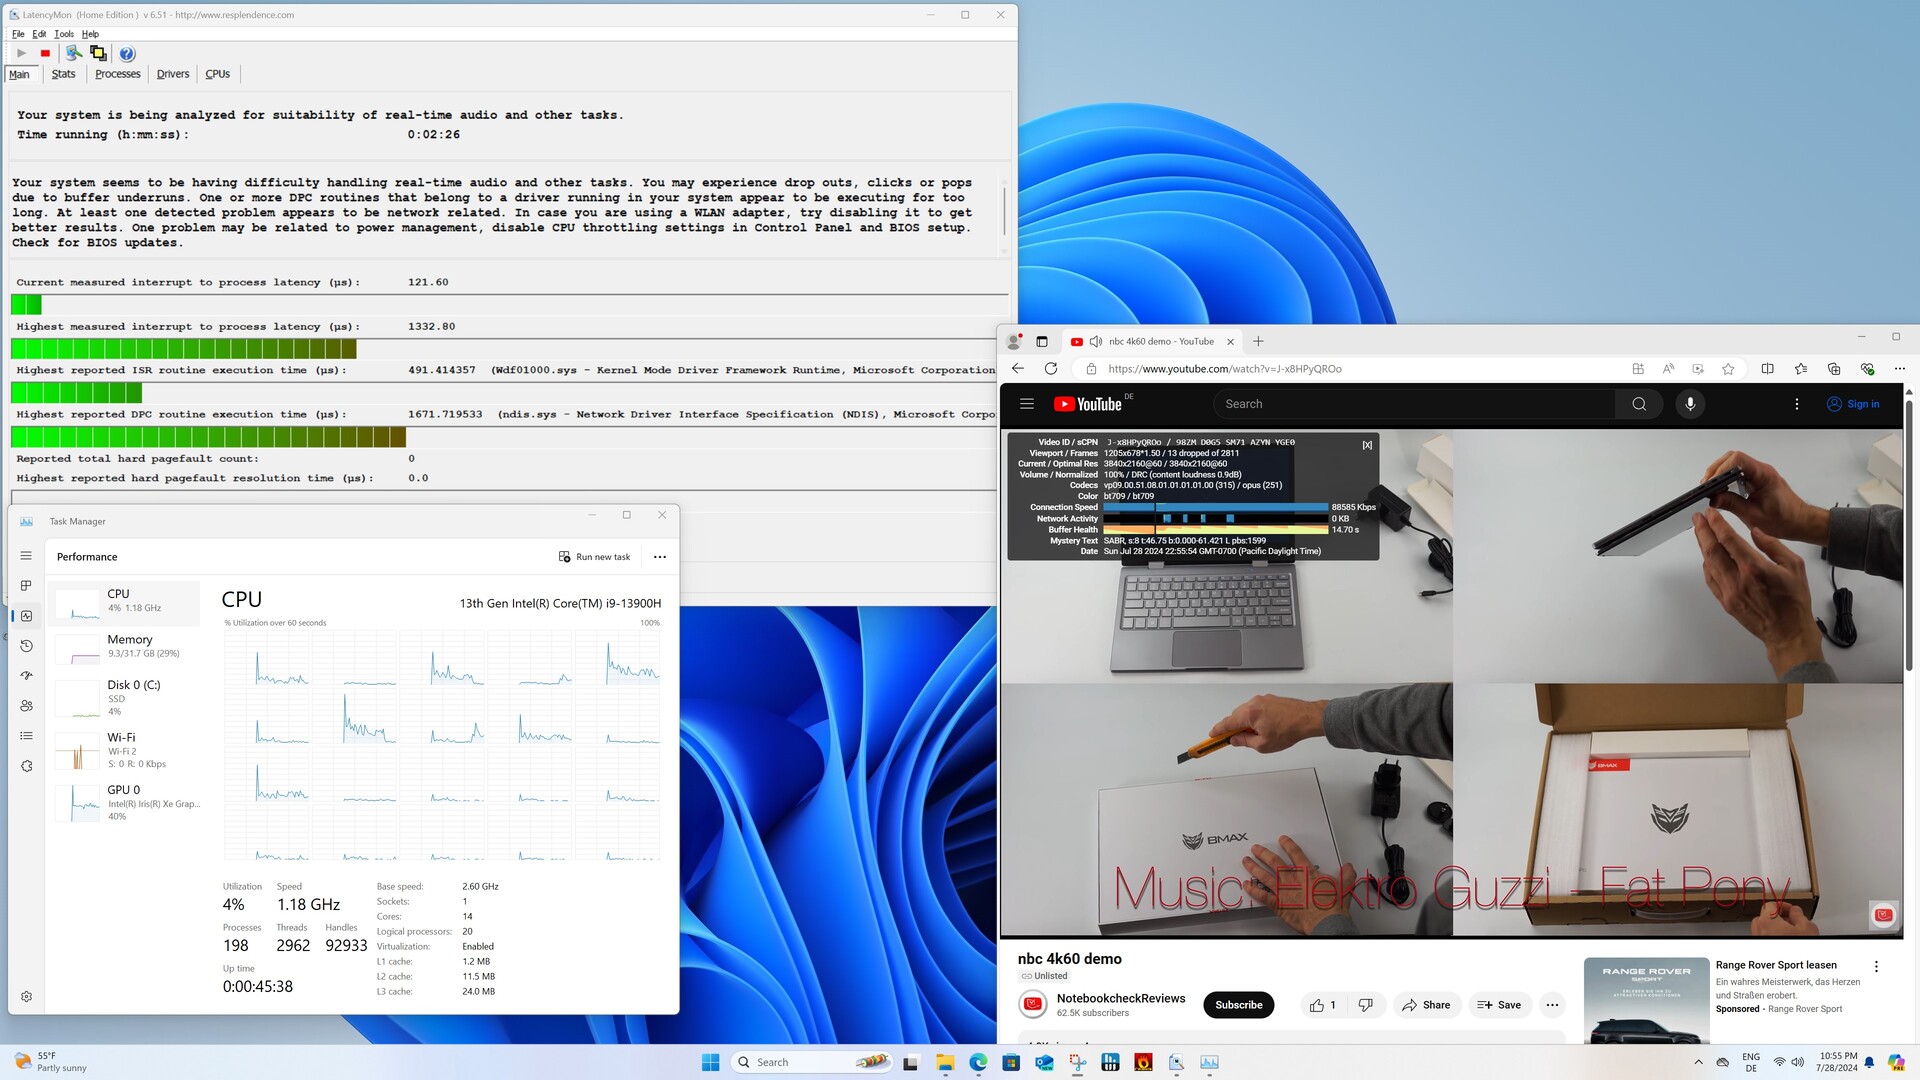

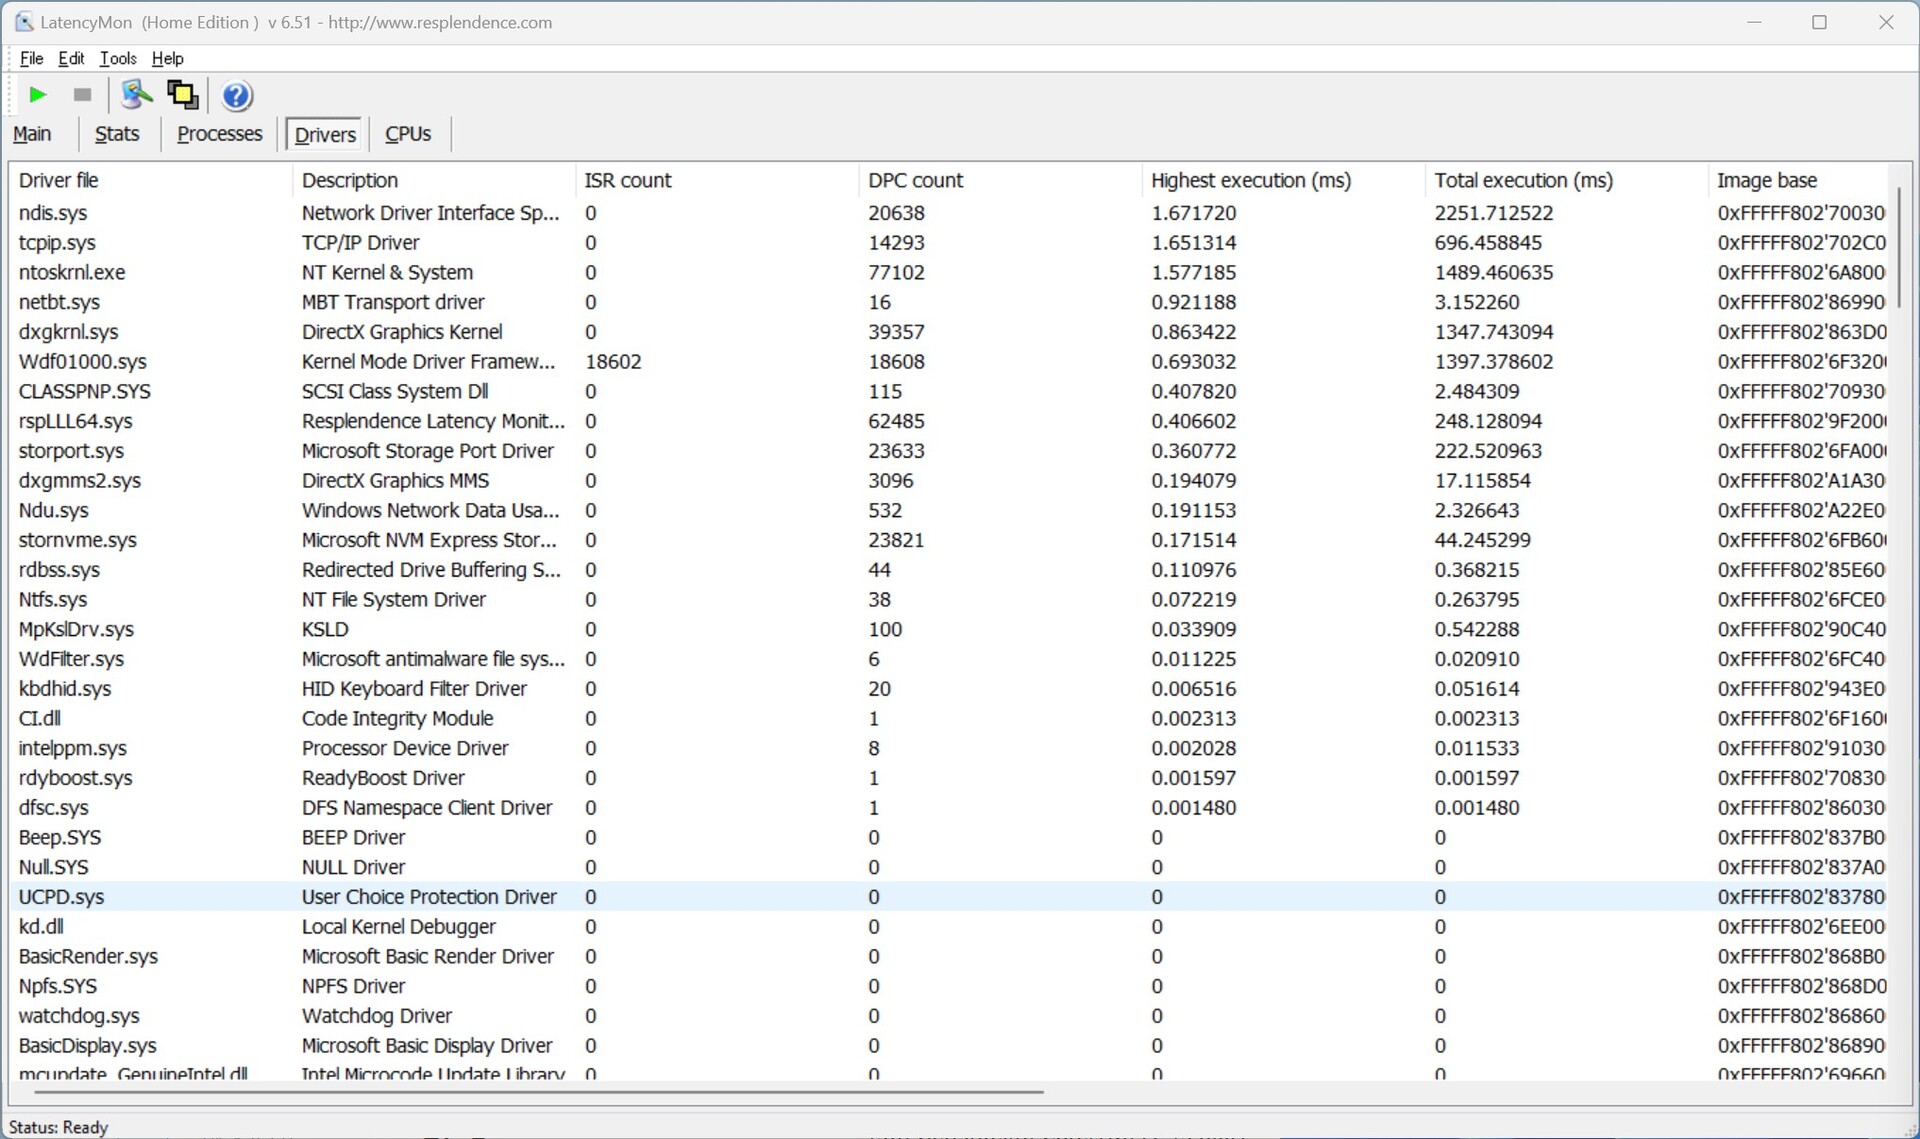
| DPC Latencies / LatencyMon - interrupt to process latency (max), Web, Youtube, Prime95 | |
| Acemagic F2A | |
| Geekom XT12 Pro | |
| Minisforum AtomMan X7 Ti | |
| Geekom XT13 Pro | |
| Geekom A7 | |
| Aoostar GEM12 | |
* ... más pequeño es mejor
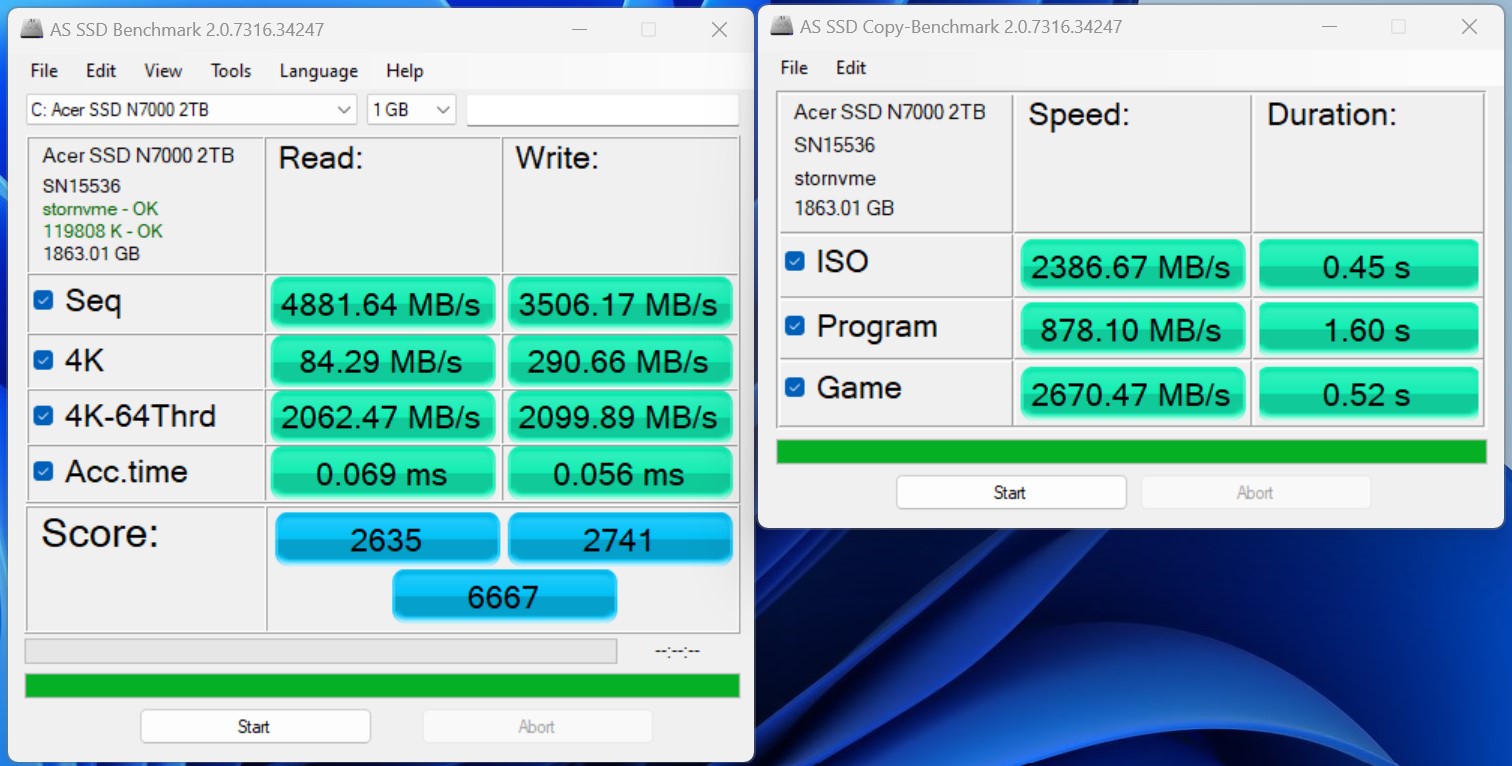
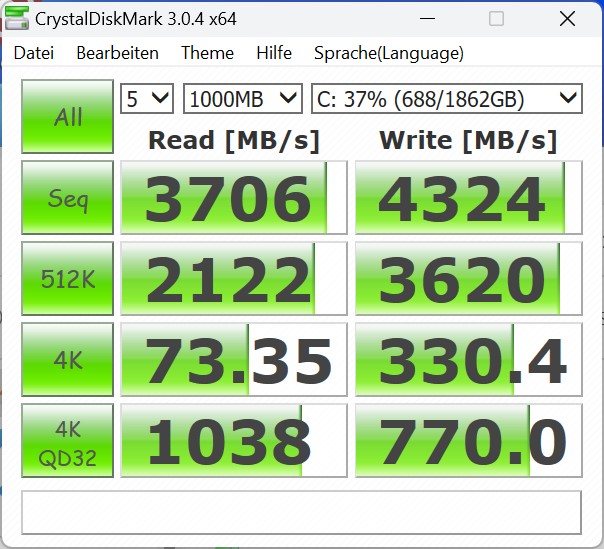
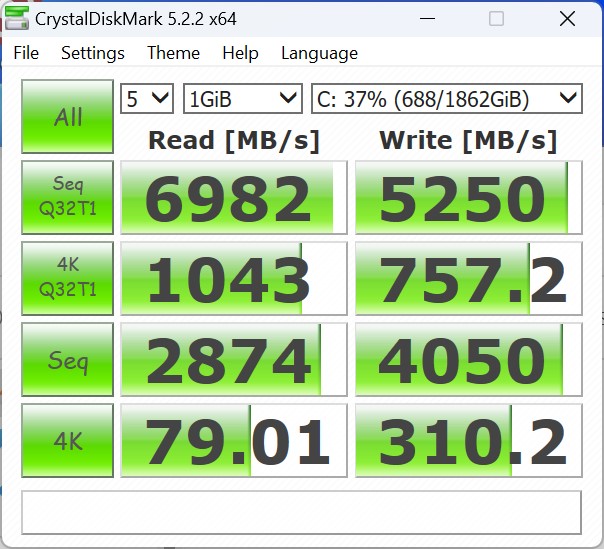
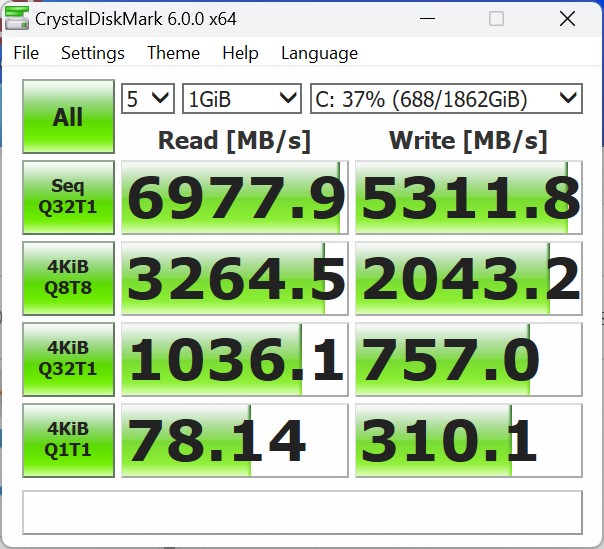
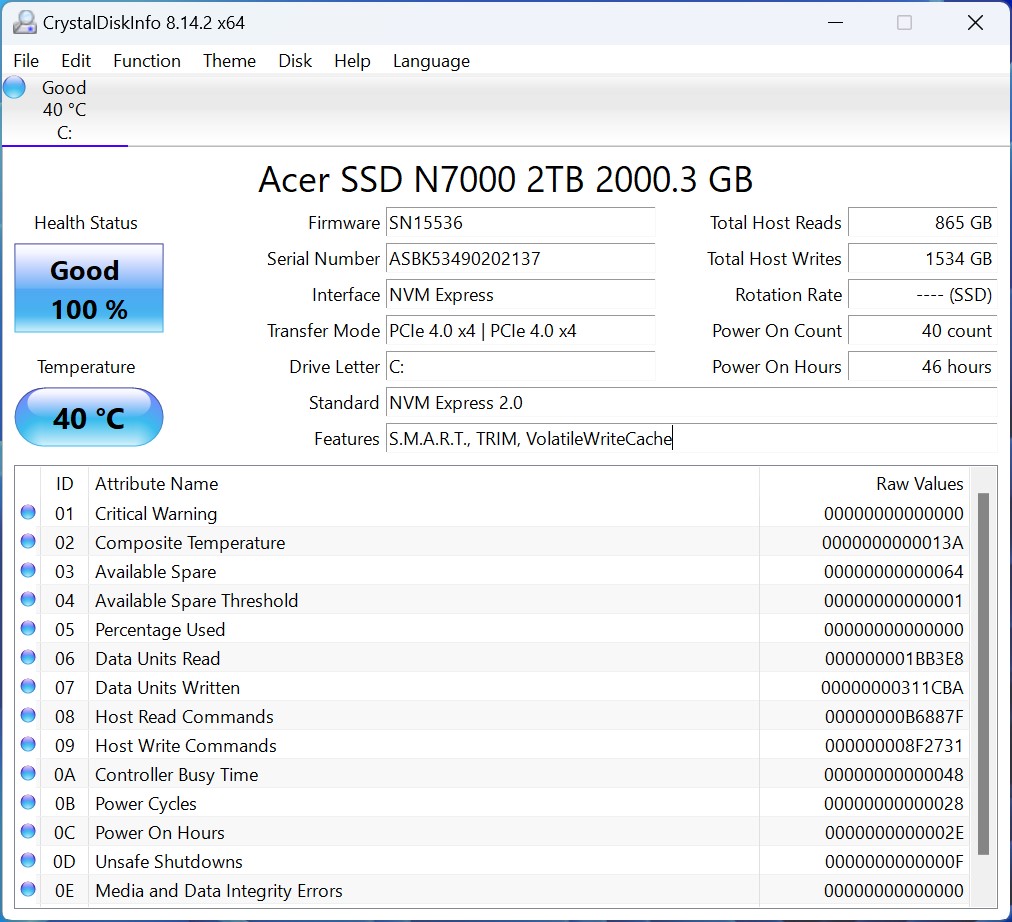
Almacenamiento masivo
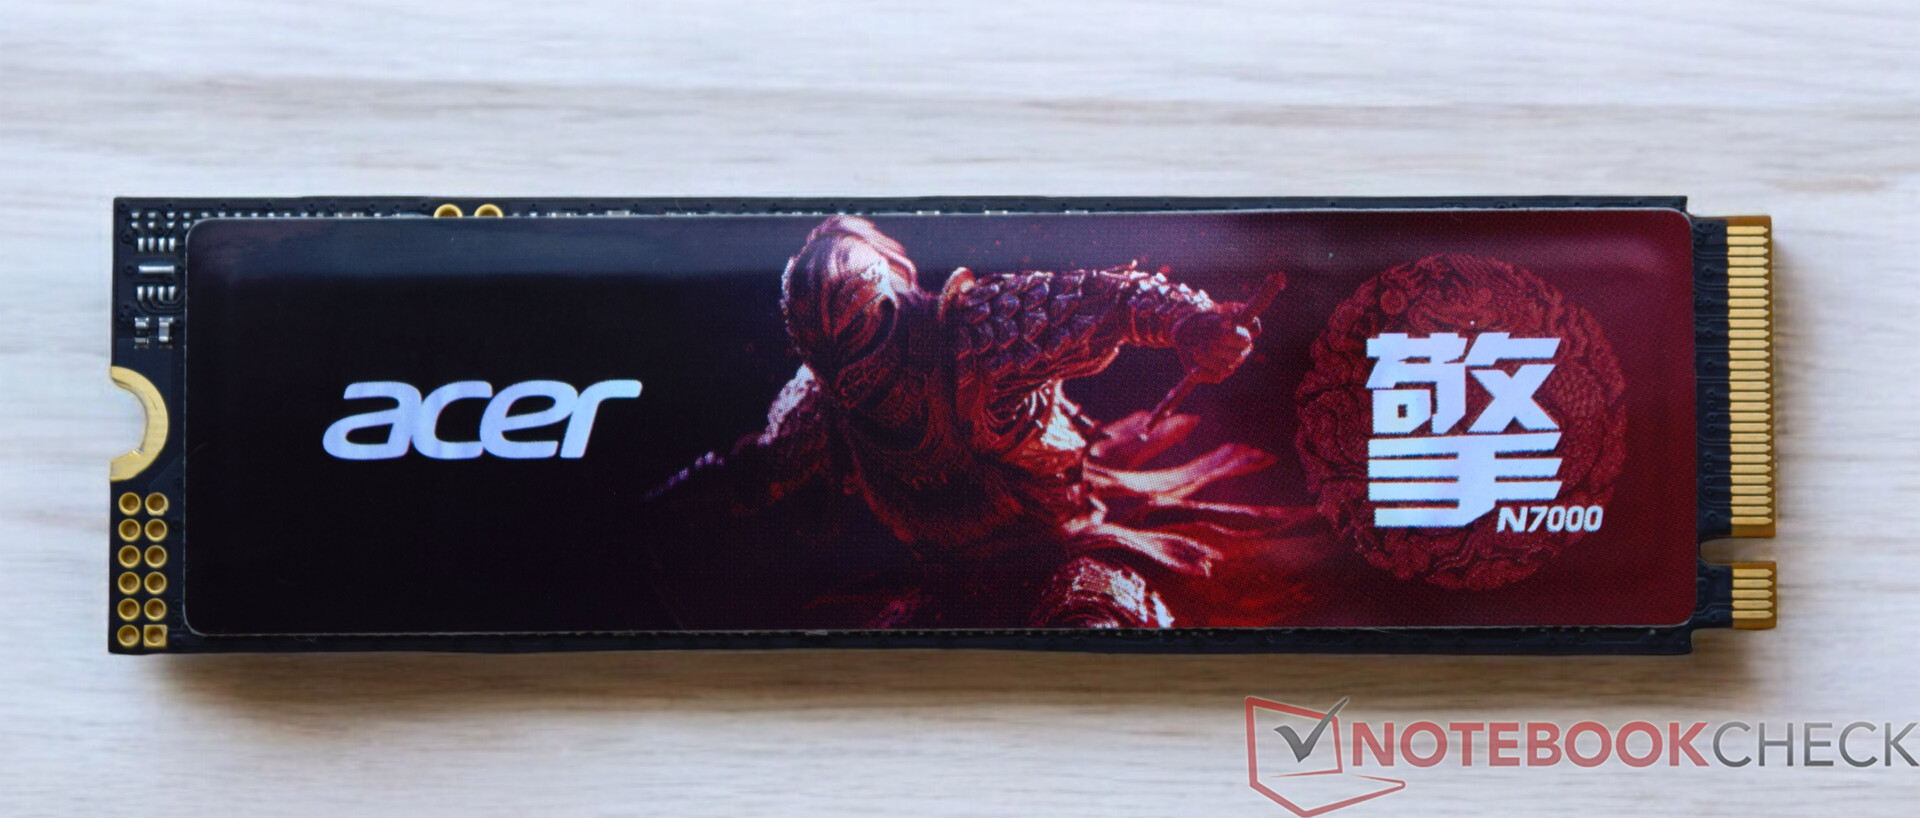
El Geekom XT13 Pro está equipado con una unidad SSD de Acer con 2 TB de espacio de almacenamiento. El mismo modelo ya estaba en el Geekom GT13 y ofreció un gran rendimiento en todas las pruebas. La conexión técnica es óptima y las tasas de transferencia resultantes son muy elevadas. Bajo carga continua, el Acer N7000 tiene ligeros problemas para mantener estable el rendimiento de lectura. Afortunadamente, no se trata de una desventaja extrema. Como puede verse en el gráfico, el Acer N7000 aún puede rendir significativamente mejor con un rendimiento de lectura reducido que el Geekom XT12 Pro o el Acemagic F2A. La prueba del Geekom XT12 Pro reveló un problema con la posición de la almohadilla térmica, lo que no ocurre con el Geekom XT13 Pro. Las almohadillas térmicas están en la posición correcta. Como ya mencionamos en la sección de mantenimiento, se puede instalar una SSD adicional en la Geekom XT13 Pro. Sin embargo, la segunda ranura M.2 sólo admite unidades SSD SATA con una longitud de 42 milímetros (M.2-2242).
Para más comparaciones y puntos de referencia, consulte nuestra Tabla comparativa.

| Drive Performance rating - Percent | |
| Aoostar GEM12 | |
| Geekom XT13 Pro | |
| Geekom XT12 Pro | |
| Minisforum AtomMan X7 Ti | |
| Media de la clase Mini PC | |
| Geekom A7 | |
| Acemagic F2A | |
* ... más pequeño es mejor
Continuous read: DiskSpd Read Loop, Queue Depth 8
Gráficos
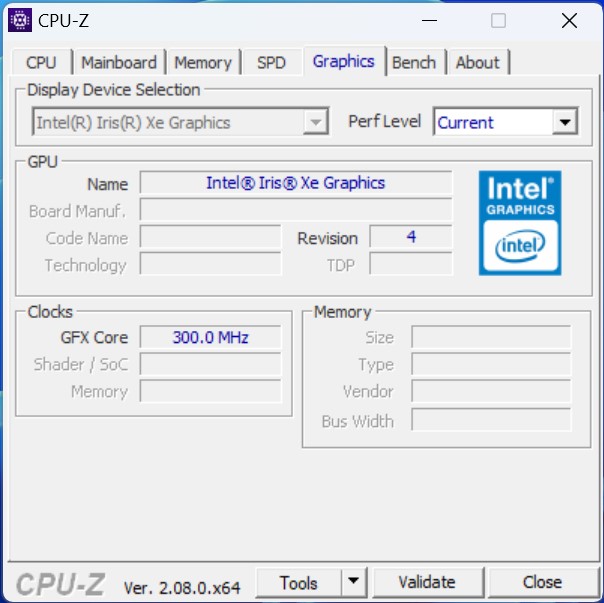
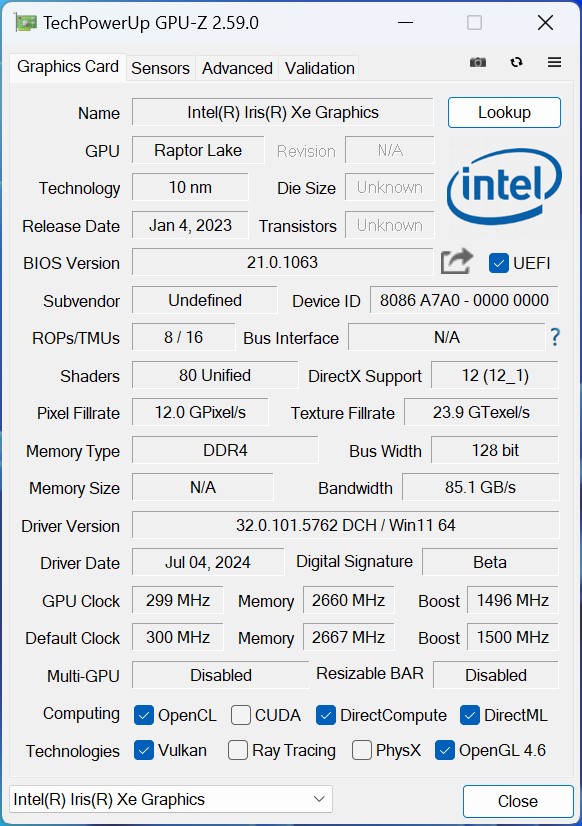
El Gráficos Intel Iris Xe G7 se encarga de los cálculos 3D y es responsable de la salida de imágenes. Con 96 UE, el Intel Core i9-13900H es el modelo más rápido de la serie. Sin embargo, el anticuado modelo lo tiene difícil para imponerse a los modernos representantes. Si Geekom ya se hubiera atrevido a dar el paso de instalar un SoC Meteor Lake en el XT13 Pro, se podría haber esperado un aumento claramente perceptible del rendimiento 3D. El rendimiento de una iGPU Intel Arc de 8 núcleos se aprecia perfectamente en los datos comparativos. Mientras tanto, se obtiene aún más rendimiento 3D si se instala una AMD Radeon 780M en el sistema. La propia Geekom ofrece ahora varios dispositivos con esta iGPU, lo que significa que el fabricante se está complicando la vida en esta disciplina. Un ejemplo de ello es el Geekom A7y el Geekom A8o el Geekom AE7.
Encontrará más comparaciones y pruebas comparativas en nuestra Tabla comparativa de GPU.
| 3DMark Performance rating - Percent | |
| Geekom A7 | |
| Aoostar GEM12 | |
| Acemagic F2A | |
| Minisforum AtomMan X7 Ti | |
| Geekom XT13 Pro | |
| Geekom XT12 Pro | |
| 3DMark 11 - 1280x720 Performance GPU | |
| Geekom A7 | |
| Aoostar GEM12 | |
| Acemagic F2A | |
| Minisforum AtomMan X7 Ti | |
| Geekom XT13 Pro | |
| Geekom XT12 Pro | |
| 3DMark | |
| 2560x1440 Time Spy Graphics | |
| Acemagic F2A | |
| Minisforum AtomMan X7 Ti | |
| Geekom A7 | |
| Aoostar GEM12 | |
| Geekom XT13 Pro | |
| Geekom XT12 Pro | |
| 1920x1080 Fire Strike Graphics | |
| Geekom A7 | |
| Aoostar GEM12 | |
| Acemagic F2A | |
| Minisforum AtomMan X7 Ti | |
| Geekom XT13 Pro | |
| Geekom XT12 Pro | |
| Unigine Heaven 4.0 | |
| Extreme Preset OpenGL | |
| Aoostar GEM12 | |
| Acemagic F2A | |
| Minisforum AtomMan X7 Ti | |
| Geekom A7 | |
| Geekom XT13 Pro | |
| Geekom XT12 Pro | |
| Extreme Preset DX11 | |
| Aoostar GEM12 | |
| Minisforum AtomMan X7 Ti | |
| Acemagic F2A | |
| Geekom A7 | |
| Geekom XT13 Pro | |
| Geekom XT12 Pro | |
| Unigine Valley 1.0 | |
| 1920x1080 Extreme HD DirectX AA:x8 | |
| Aoostar GEM12 | |
| Minisforum AtomMan X7 Ti | |
| Geekom A7 | |
| Acemagic F2A | |
| Geekom XT13 Pro | |
| Geekom XT12 Pro | |
| 1920x1080 Extreme HD Preset OpenGL AA:x8 | |
| Minisforum AtomMan X7 Ti | |
| Aoostar GEM12 | |
| Acemagic F2A | |
| Geekom XT13 Pro | |
| Geekom XT12 Pro | |
| Geekom A7 | |
| Unigine Superposition | |
| 1280x720 720p Low | |
| Aoostar GEM12 | |
| Acemagic F2A | |
| Minisforum AtomMan X7 Ti | |
| Geekom A7 | |
| Geekom XT13 Pro | |
| Geekom XT12 Pro | |
| 1920x1080 1080p High | |
| Aoostar GEM12 | |
| Acemagic F2A | |
| Minisforum AtomMan X7 Ti | |
| Geekom A7 | |
| Geekom XT13 Pro | |
| Geekom XT12 Pro | |
| 1920x1080 1080p Extreme | |
| Acemagic F2A | |
| Minisforum AtomMan X7 Ti | |
| Aoostar GEM12 | |
| Geekom A7 | |
| Geekom XT13 Pro | |
| Geekom XT12 Pro | |
| ComputeMark v2.1 | |
| 1024x600 Normal, Score | |
| Geekom A7 | |
| Aoostar GEM12 | |
| Acemagic F2A | |
| Minisforum AtomMan X7 Ti | |
| Geekom XT13 Pro | |
| Geekom XT12 Pro | |
| 1024x600 Normal, Fluid 3DTex | |
| Aoostar GEM12 | |
| Geekom A7 | |
| Minisforum AtomMan X7 Ti | |
| Acemagic F2A | |
| Geekom XT13 Pro | |
| Geekom XT12 Pro | |
| 1024x600 Normal, Fluid 2DTexArr | |
| Geekom A7 | |
| Aoostar GEM12 | |
| Minisforum AtomMan X7 Ti | |
| Acemagic F2A | |
| Geekom XT13 Pro | |
| Geekom XT12 Pro | |
| 1024x600 Normal, Mandel Vector | |
| Geekom A7 | |
| Aoostar GEM12 | |
| Acemagic F2A | |
| Minisforum AtomMan X7 Ti | |
| Geekom XT12 Pro | |
| Geekom XT13 Pro | |
| 1024x600 Normal, Mandel Scalar | |
| Geekom A7 | |
| Aoostar GEM12 | |
| Acemagic F2A | |
| Minisforum AtomMan X7 Ti | |
| Geekom XT12 Pro | |
| Geekom XT13 Pro | |
| 1024x600 Normal, QJuliaRayTrace | |
| Geekom A7 | |
| Aoostar GEM12 | |
| Acemagic F2A | |
| Minisforum AtomMan X7 Ti | |
| Geekom XT13 Pro | |
| Geekom XT12 Pro | |
| LuxMark v2.0 64Bit | |
| Room GPUs-only | |
| Geekom A7 | |
| Aoostar GEM12 | |
| Minisforum AtomMan X7 Ti | |
| Geekom XT13 Pro | |
| Acemagic F2A | |
| Sala GPUs-only | |
| Minisforum AtomMan X7 Ti | |
| Acemagic F2A | |
| Geekom XT13 Pro | |
| Geekom A7 | |
| Aoostar GEM12 | |
| Affinity Photo 2 - Combined (Single / Multi GPU) | |
| Minisforum AtomMan X7 Ti | |
| Acemagic F2A | |
| Geekom XT13 Pro | |
| Geekom XT12 Pro | |
| Aoostar GEM12 | |
| Geekom A7 | |
| Geekom XT13 Pro, Intel Iris Xe Graphics G7 96EUs i9-13900H | Aoostar GEM12, AMD Radeon 780M R7 8845HS | Minisforum AtomMan X7 Ti, Intel Arc 8-Core iGPU Ultra 9 185H | Acemagic F2A, Intel Arc 8-Core iGPU Ultra 7 155H | Geekom XT12 Pro, Intel Iris Xe Graphics G7 96EUs i9-12900H | Geekom A7, AMD Radeon 780M R9 7940HS | Media de la clase Mini PC | |
|---|---|---|---|---|---|---|---|
| SPECviewperf 2020 | 309% | 36% | 25% | -4% | 278% | 481% | |
| 3840x2160 Medical (medical-03) (fps) | 3.63 | 11.2 209% | 4.23 17% | 5.05 39% | 3.49 -4% | 11.1 206% | 20.8 ? 473% |
| 3840x2160 Energy (energy-03) (fps) | 3.15 | 19.9 532% | 6.03 91% | 4.61 46% | 3.05 -3% | 14.1 348% | 31.1 ? 887% |
| 3840x2160 Creo (creo-03) (fps) | 16 | 33.4 109% | 18.5 16% | 17.9 12% | 14.8 -7% | 31.4 96% | 47.7 ? 198% |
| 3840x2160 CATIA (catia-06) (fps) | 7.9 | 23.2 194% | 11.1 41% | 10 27% | 7.78 -2% | 24.8 214% | 32.5 ? 311% |
| 3840x2160 3ds Max (3dsmax-07) (fps) | 10.3 | 20.4 98% | 14.9 45% | 12.9 25% | 9.69 -6% | 20.9 103% | 50.4 ? 389% |
| 3840x2160 Siemens NX (snx-04) (fps) | 6.13 | 64.1 946% | 6.24 2% | 5.7 -7% | 6.29 3% | 61.4 902% | 50.3 ? 721% |
| 3840x2160 Maya (maya-06) (fps) | 26.8 | 47.7 78% | 37.7 41% | 35.4 32% | 23.9 -11% | 47 75% | 130.4 ? 387% |
| 3DMark 05 Standard | 29045 puntos | |
| 3DMark 06 Score 1366x768 | 30156 puntos | |
| 3DMark Vantage P Result | 28599 puntos | |
| 3DMark 11 Performance | 8024 puntos | |
| 3DMark Ice Storm Standard Score | 155640 puntos | |
| 3DMark Cloud Gate Standard Score | 28112 puntos | |
| 3DMark Fire Strike Score | 5448 puntos | |
| 3DMark Fire Strike Extreme Score | 2570 puntos | |
| 3DMark Time Spy Score | 1920 puntos | |
| 3DMark Steel Nomad Score | 183 puntos | |
| 3DMark Steel Nomad Light Score | 1276 puntos | |
ayuda | ||
Rendimiento en juegos
La iGPU Intel Iris Xe es incapaz de hacer frente a la mayoría de los juegos. La vetusta iGPU sólo consigue velocidades de fotogramas adecuadas, si acaso, en resoluciones bajas y un preajuste gráfico bajo o medio. Si aún así desea utilizar el Geekom XT13 Pro para jugar, tendrá que dar un rodeo mediante una tarjeta gráfica externa. Varios modelos pueden utilizarse con el dispositivo a través de USB4.
| Dota 2 Reborn | |
| 1280x720 min (0/3) fastest | |
| Geekom A7 | |
| Aoostar GEM12 | |
| Geekom XT13 Pro | |
| Minisforum AtomMan X7 Ti | |
| Geekom XT12 Pro | |
| Acemagic F2A | |
| 1920x1080 high (2/3) | |
| Geekom A7 | |
| Aoostar GEM12 | |
| Minisforum AtomMan X7 Ti | |
| Acemagic F2A | |
| Geekom XT13 Pro | |
| Geekom XT12 Pro | |
| GTA V | |
| 1024x768 Lowest Settings possible | |
| Geekom A7 | |
| Aoostar GEM12 | |
| Minisforum AtomMan X7 Ti | |
| Acemagic F2A | |
| Geekom XT13 Pro | |
| 1920x1080 High/On (Advanced Graphics Off) AA:2xMSAA + FX AF:8x | |
| Geekom A7 | |
| Aoostar GEM12 | |
| Minisforum AtomMan X7 Ti | |
| Acemagic F2A | |
| Geekom XT13 Pro | |
| Cyberpunk 2077 | |
| 1920x1080 Low Preset (FSR off) | |
| Aoostar GEM12 | |
| Minisforum AtomMan X7 Ti | |
| Acemagic F2A | |
| Geekom XT13 Pro | |
| Geekom XT12 Pro | |
| 1920x1080 High Preset (FSR off) | |
| Aoostar GEM12 | |
| Minisforum AtomMan X7 Ti | |
| Acemagic F2A | |
| Geekom XT13 Pro | |
| Geekom XT12 Pro | |
| Baldur's Gate 3 | |
| 1280x720 Low Preset AA:SM | |
| Aoostar GEM12 | |
| Minisforum AtomMan X7 Ti | |
| Geekom XT13 Pro | |
| 1920x1080 High Preset AA:T | |
| Aoostar GEM12 | |
| Minisforum AtomMan X7 Ti | |
| Geekom XT13 Pro | |
| F1 24 | |
| 1920x1080 Low Preset AA:T AF:16x | |
| Minisforum AtomMan X7 Ti | |
| Acemagic F2A | |
| Geekom XT13 Pro | |
| 1920x1080 High Preset AA:T AF:16x | |
| Minisforum AtomMan X7 Ti | |
| Acemagic F2A | |
| Geekom XT13 Pro | |
FPS chart
| bajo | medio | alto | ultra | |
|---|---|---|---|---|
| GTA V (2015) | 123.5 | 105.9 | 22.1 | 9 |
| Dota 2 Reborn (2015) | 117.2 | 82.9 | 72.5 | 66.5 |
| Final Fantasy XV Benchmark (2018) | 46 | 25.7 | 18.2 | |
| Baldur's Gate 3 (2023) | 19.9 | 15.4 | 13.5 | 13 |
| Cyberpunk 2077 (2023) | 18.6 | 15 | 13 | 11.4 |
| F1 24 (2024) | 43.1 | 37.3 | 26.7 |
Comprobación del rendimiento de la Geekom XT13 Pro con una Nvidia GeForce RTX 3060 Ti
El Geekom XT13 Pro dispone de dos puertos USB4, que admiten el uso de tarjetas gráficas externas. Sin influir en el resultado global, realizamos algunas pruebas con la Razer Core X y una Nvidia GeForce RTX 3060 Ti. En comparación con la iGPU envejecida del Intel Core i9-13900H, el rendimiento 3D puede incrementarse masivamente. La comparación con los otros dispositivos de prueba muestra un resultado casi idéntico en las pruebas sintéticas. El rendimiento en juegos también se puede aumentar significativamente con esta combinación, como se puede ver en los juegos probados. Incluso los juegos más modernos pueden disfrutarse con todo detalle.
| Performance rating - Percent | |
| Geekom AE7 (Nvidia GeForce RTX 3060 Ti FE) | |
| Geekom A8 (Nvidia GeForce RTX 3060 Ti FE) | |
| Geekom GT13 Pro (Nvidia GeForce RTX 3060 Ti FE) | |
| Geekom XT13 Pro (Nvidia GeForce RTX 3060 Ti FE) | |
| Geekom XT12 Pro (Nvidia GeForce RTX 3060 Ti FE) | |
| Minisforum UH125 Pro (Nvidia GeForce RTX 3060 Ti FE) | |
| 3DMark 11 - 1280x720 Performance GPU | |
| Geekom A8 (Nvidia GeForce RTX 3060 Ti FE) | |
| Geekom AE7 (Nvidia GeForce RTX 3060 Ti FE) | |
| Geekom XT13 Pro (Nvidia GeForce RTX 3060 Ti FE) | |
| Geekom GT13 Pro (Nvidia GeForce RTX 3060 Ti FE) | |
| Geekom XT12 Pro (Nvidia GeForce RTX 3060 Ti FE) | |
| Minisforum UH125 Pro (Nvidia GeForce RTX 3060 Ti FE) | |
| 3DMark | |
| 2560x1440 Time Spy Graphics | |
| Geekom A8 (Nvidia GeForce RTX 3060 Ti FE) | |
| Geekom AE7 (Nvidia GeForce RTX 3060 Ti FE) | |
| Geekom XT13 Pro (Nvidia GeForce RTX 3060 Ti FE) | |
| Geekom GT13 Pro (Nvidia GeForce RTX 3060 Ti FE) | |
| Geekom XT12 Pro (Nvidia GeForce RTX 3060 Ti FE) | |
| Minisforum UH125 Pro (Nvidia GeForce RTX 3060 Ti FE) | |
| 1920x1080 Fire Strike Graphics | |
| Geekom AE7 (Nvidia GeForce RTX 3060 Ti FE) | |
| Geekom GT13 Pro (Nvidia GeForce RTX 3060 Ti FE) | |
| Geekom A8 (Nvidia GeForce RTX 3060 Ti FE) | |
| Geekom XT13 Pro (Nvidia GeForce RTX 3060 Ti FE) | |
| Minisforum UH125 Pro (Nvidia GeForce RTX 3060 Ti FE) | |
| Geekom XT12 Pro (Nvidia GeForce RTX 3060 Ti FE) | |
| 3840x2160 Fire Strike Ultra Graphics | |
| Geekom GT13 Pro (Nvidia GeForce RTX 3060 Ti FE) | |
| Geekom AE7 (Nvidia GeForce RTX 3060 Ti FE) | |
| Geekom XT12 Pro (Nvidia GeForce RTX 3060 Ti FE) | |
| Geekom XT13 Pro (Nvidia GeForce RTX 3060 Ti FE) | |
| Geekom A8 (Nvidia GeForce RTX 3060 Ti FE) | |
| Minisforum UH125 Pro (Nvidia GeForce RTX 3060 Ti FE) | |
| Unigine Superposition | |
| 1280x720 720p Low | |
| Geekom AE7 (Nvidia GeForce RTX 3060 Ti FE) | |
| Geekom GT13 Pro (Nvidia GeForce RTX 3060 Ti FE) | |
| Geekom A8 (Nvidia GeForce RTX 3060 Ti FE) | |
| Geekom XT13 Pro (Nvidia GeForce RTX 3060 Ti FE) | |
| Geekom XT12 Pro (Nvidia GeForce RTX 3060 Ti FE) | |
| Minisforum UH125 Pro (Nvidia GeForce RTX 3060 Ti FE) | |
| 1920x1080 1080p High | |
| Geekom GT13 Pro (Nvidia GeForce RTX 3060 Ti FE) | |
| Geekom A8 (Nvidia GeForce RTX 3060 Ti FE) | |
| Geekom AE7 (Nvidia GeForce RTX 3060 Ti FE) | |
| Geekom XT13 Pro (Nvidia GeForce RTX 3060 Ti FE) | |
| Minisforum UH125 Pro (Nvidia GeForce RTX 3060 Ti FE) | |
| Geekom XT12 Pro (Nvidia GeForce RTX 3060 Ti FE) | |
| 1920x1080 1080p Extreme | |
| Geekom GT13 Pro (Nvidia GeForce RTX 3060 Ti FE) | |
| Geekom XT13 Pro (Nvidia GeForce RTX 3060 Ti FE) | |
| Geekom XT12 Pro (Nvidia GeForce RTX 3060 Ti FE) | |
| Minisforum UH125 Pro (Nvidia GeForce RTX 3060 Ti FE) | |
| Geekom A8 (Nvidia GeForce RTX 3060 Ti FE) | |
| Geekom AE7 (Nvidia GeForce RTX 3060 Ti FE) | |
| 3840x2160 4k Optimized | |
| Geekom GT13 Pro (Nvidia GeForce RTX 3060 Ti FE) | |
| Geekom XT13 Pro (Nvidia GeForce RTX 3060 Ti FE) | |
| Geekom XT12 Pro (Nvidia GeForce RTX 3060 Ti FE) | |
| Geekom A8 (Nvidia GeForce RTX 3060 Ti FE) | |
| Minisforum UH125 Pro (Nvidia GeForce RTX 3060 Ti FE) | |
| Geekom AE7 (Nvidia GeForce RTX 3060 Ti FE) | |
| 7680x4320 8k Optimized | |
| Geekom GT13 Pro (Nvidia GeForce RTX 3060 Ti FE) | |
| Geekom XT13 Pro (Nvidia GeForce RTX 3060 Ti FE) | |
| Geekom XT12 Pro (Nvidia GeForce RTX 3060 Ti FE) | |
| Minisforum UH125 Pro (Nvidia GeForce RTX 3060 Ti FE) | |
| Geekom A8 (Nvidia GeForce RTX 3060 Ti FE) | |
| Geekom AE7 (Nvidia GeForce RTX 3060 Ti FE) | |
| Unigine Valley 1.0 | |
| 1920x1080 Extreme HD DirectX AA:x8 | |
| Geekom XT12 Pro (Nvidia GeForce RTX 3060 Ti FE) | |
| Geekom GT13 Pro (Nvidia GeForce RTX 3060 Ti FE) | |
| Geekom XT13 Pro (Nvidia GeForce RTX 3060 Ti FE) | |
| Geekom A8 (Nvidia GeForce RTX 3060 Ti FE) | |
| Geekom AE7 (Nvidia GeForce RTX 3060 Ti FE) | |
| Minisforum UH125 Pro (Nvidia GeForce RTX 3060 Ti FE) | |
| 1920x1080 Extreme HD Preset OpenGL AA:x8 | |
| Geekom GT13 Pro (Nvidia GeForce RTX 3060 Ti FE) | |
| Geekom XT12 Pro (Nvidia GeForce RTX 3060 Ti FE) | |
| Geekom XT13 Pro (Nvidia GeForce RTX 3060 Ti FE) | |
| Geekom A8 (Nvidia GeForce RTX 3060 Ti FE) | |
| Geekom AE7 (Nvidia GeForce RTX 3060 Ti FE) | |
| Minisforum UH125 Pro (Nvidia GeForce RTX 3060 Ti FE) | |
| Unigine Heaven 4.0 | |
| Extreme Preset OpenGL | |
| Geekom A8 (Nvidia GeForce RTX 3060 Ti FE) | |
| Geekom AE7 (Nvidia GeForce RTX 3060 Ti FE) | |
| Geekom GT13 Pro (Nvidia GeForce RTX 3060 Ti FE) | |
| Geekom XT13 Pro (Nvidia GeForce RTX 3060 Ti FE) | |
| Minisforum UH125 Pro (Nvidia GeForce RTX 3060 Ti FE) | |
| Geekom XT12 Pro (Nvidia GeForce RTX 3060 Ti FE) | |
| Extreme Preset DX11 | |
| Geekom XT13 Pro (Nvidia GeForce RTX 3060 Ti FE) | |
| Geekom GT13 Pro (Nvidia GeForce RTX 3060 Ti FE) | |
| Geekom A8 (Nvidia GeForce RTX 3060 Ti FE) | |
| Geekom XT12 Pro (Nvidia GeForce RTX 3060 Ti FE) | |
| Geekom AE7 (Nvidia GeForce RTX 3060 Ti FE) | |
| Minisforum UH125 Pro (Nvidia GeForce RTX 3060 Ti FE) | |
| ComputeMark v2.1 | |
| 1024x600 Normal, Score | |
| Geekom GT13 Pro (Nvidia GeForce RTX 3060 Ti FE) | |
| Geekom AE7 (Nvidia GeForce RTX 3060 Ti FE) | |
| Geekom A8 (Nvidia GeForce RTX 3060 Ti FE) | |
| Geekom XT13 Pro (Nvidia GeForce RTX 3060 Ti FE) | |
| Minisforum UH125 Pro (Nvidia GeForce RTX 3060 Ti FE) | |
| Geekom XT12 Pro (Nvidia GeForce RTX 3060 Ti FE) | |
| 1024x600 Normal, Fluid 3DTex | |
| Geekom GT13 Pro (Nvidia GeForce RTX 3060 Ti FE) | |
| Geekom AE7 (Nvidia GeForce RTX 3060 Ti FE) | |
| Minisforum UH125 Pro (Nvidia GeForce RTX 3060 Ti FE) | |
| Geekom A8 (Nvidia GeForce RTX 3060 Ti FE) | |
| Geekom XT13 Pro (Nvidia GeForce RTX 3060 Ti FE) | |
| Geekom XT12 Pro (Nvidia GeForce RTX 3060 Ti FE) | |
| 1024x600 Normal, Fluid 2DTexArr | |
| Geekom GT13 Pro (Nvidia GeForce RTX 3060 Ti FE) | |
| Geekom AE7 (Nvidia GeForce RTX 3060 Ti FE) | |
| Minisforum UH125 Pro (Nvidia GeForce RTX 3060 Ti FE) | |
| Geekom A8 (Nvidia GeForce RTX 3060 Ti FE) | |
| Geekom XT13 Pro (Nvidia GeForce RTX 3060 Ti FE) | |
| Geekom XT12 Pro (Nvidia GeForce RTX 3060 Ti FE) | |
| 1024x600 Normal, Mandel Vector | |
| Geekom GT13 Pro (Nvidia GeForce RTX 3060 Ti FE) | |
| Geekom AE7 (Nvidia GeForce RTX 3060 Ti FE) | |
| Geekom A8 (Nvidia GeForce RTX 3060 Ti FE) | |
| Geekom XT13 Pro (Nvidia GeForce RTX 3060 Ti FE) | |
| Minisforum UH125 Pro (Nvidia GeForce RTX 3060 Ti FE) | |
| Geekom XT12 Pro (Nvidia GeForce RTX 3060 Ti FE) | |
| 1024x600 Normal, Mandel Scalar | |
| Geekom GT13 Pro (Nvidia GeForce RTX 3060 Ti FE) | |
| Geekom AE7 (Nvidia GeForce RTX 3060 Ti FE) | |
| Geekom A8 (Nvidia GeForce RTX 3060 Ti FE) | |
| Geekom XT13 Pro (Nvidia GeForce RTX 3060 Ti FE) | |
| Minisforum UH125 Pro (Nvidia GeForce RTX 3060 Ti FE) | |
| Geekom XT12 Pro (Nvidia GeForce RTX 3060 Ti FE) | |
| 1024x600 Normal, QJuliaRayTrace | |
| Geekom GT13 Pro (Nvidia GeForce RTX 3060 Ti FE) | |
| Geekom AE7 (Nvidia GeForce RTX 3060 Ti FE) | |
| Geekom A8 (Nvidia GeForce RTX 3060 Ti FE) | |
| Geekom XT13 Pro (Nvidia GeForce RTX 3060 Ti FE) | |
| Minisforum UH125 Pro (Nvidia GeForce RTX 3060 Ti FE) | |
| Geekom XT12 Pro (Nvidia GeForce RTX 3060 Ti FE) | |
| Photoshop PugetBench - GPU Score | |
| Geekom A8 (Nvidia GeForce RTX 3060 Ti FE) | |
| Geekom AE7 (Nvidia GeForce RTX 3060 Ti FE) | |
| Geekom XT12 Pro (Nvidia GeForce RTX 3060 Ti FE) | |
| Geekom GT13 Pro (Nvidia GeForce RTX 3060 Ti FE) | |
| Minisforum UH125 Pro (Nvidia GeForce RTX 3060 Ti FE) | |
| Geekom XT13 Pro (Nvidia GeForce RTX 3060 Ti FE) | |
| Premiere Pro PugetBench - GPU 0.9 | |
| Geekom A8 (Nvidia GeForce RTX 3060 Ti FE) | |
| Geekom AE7 (Nvidia GeForce RTX 3060 Ti FE) | |
| Geekom GT13 Pro (Nvidia GeForce RTX 3060 Ti FE) | |
| Minisforum UH125 Pro (Nvidia GeForce RTX 3060 Ti FE) | |
| Geekom XT13 Pro (Nvidia GeForce RTX 3060 Ti FE) | |
| Geekom XT12 Pro (Nvidia GeForce RTX 3060 Ti FE) | |
| Cyberpunk 2077 | |
| 1280x720 Low Preset (FSR off) | |
| Geekom AE7 (Nvidia GeForce RTX 3060 Ti FE) | |
| Geekom A8 (Nvidia GeForce RTX 3060 Ti FE) | |
| Geekom XT13 Pro (Nvidia GeForce RTX 3060 Ti FE) | |
| Geekom GT13 Pro (Nvidia GeForce RTX 3060 Ti FE) | |
| Geekom XT12 Pro (Nvidia GeForce RTX 3060 Ti FE) | |
| Minisforum UH125 Pro (Nvidia GeForce RTX 3060 Ti FE) | |
| Geekom XT13 Pro | |
| 1920x1080 Medium Preset (FSR off) | |
| Geekom AE7 (Nvidia GeForce RTX 3060 Ti FE) | |
| Geekom XT13 Pro (Nvidia GeForce RTX 3060 Ti FE) | |
| Geekom A8 (Nvidia GeForce RTX 3060 Ti FE) | |
| Geekom GT13 Pro (Nvidia GeForce RTX 3060 Ti FE) | |
| Geekom XT12 Pro (Nvidia GeForce RTX 3060 Ti FE) | |
| Minisforum UH125 Pro (Nvidia GeForce RTX 3060 Ti FE) | |
| Geekom XT13 Pro | |
| 1920x1080 Ultra Preset (FSR off) | |
| Geekom AE7 (Nvidia GeForce RTX 3060 Ti FE) | |
| Geekom XT13 Pro (Nvidia GeForce RTX 3060 Ti FE) | |
| Geekom GT13 Pro (Nvidia GeForce RTX 3060 Ti FE) | |
| Geekom A8 (Nvidia GeForce RTX 3060 Ti FE) | |
| Geekom XT12 Pro (Nvidia GeForce RTX 3060 Ti FE) | |
| Minisforum UH125 Pro (Nvidia GeForce RTX 3060 Ti FE) | |
| Geekom XT13 Pro | |
| Baldur's Gate 3 | |
| 1920x1080 Low Preset AA:SM | |
| Geekom GT13 Pro (Nvidia GeForce RTX 3060 Ti FE) | |
| Geekom XT12 Pro (Nvidia GeForce RTX 3060 Ti FE) | |
| Geekom XT13 Pro (Nvidia GeForce RTX 3060 Ti FE) | |
| Geekom AE7 (Nvidia GeForce RTX 3060 Ti FE) | |
| Geekom A8 (Nvidia GeForce RTX 3060 Ti FE) | |
| Minisforum UH125 Pro (Nvidia GeForce RTX 3060 Ti FE) | |
| Geekom XT13 Pro | |
| 1920x1080 Medium Preset AA:T | |
| Geekom XT13 Pro (Nvidia GeForce RTX 3060 Ti FE) | |
| Geekom GT13 Pro (Nvidia GeForce RTX 3060 Ti FE) | |
| Geekom A8 (Nvidia GeForce RTX 3060 Ti FE) | |
| Geekom XT12 Pro (Nvidia GeForce RTX 3060 Ti FE) | |
| Geekom AE7 (Nvidia GeForce RTX 3060 Ti FE) | |
| Minisforum UH125 Pro (Nvidia GeForce RTX 3060 Ti FE) | |
| Geekom XT13 Pro | |
| 1920x1080 Ultra Preset AA:T | |
| Geekom GT13 Pro (Nvidia GeForce RTX 3060 Ti FE) | |
| Geekom XT13 Pro (Nvidia GeForce RTX 3060 Ti FE) | |
| Geekom A8 (Nvidia GeForce RTX 3060 Ti FE) | |
| Geekom XT12 Pro (Nvidia GeForce RTX 3060 Ti FE) | |
| Geekom AE7 (Nvidia GeForce RTX 3060 Ti FE) | |
| Minisforum UH125 Pro (Nvidia GeForce RTX 3060 Ti FE) | |
| Geekom XT13 Pro | |
| F1 24 | |
| 1920x1080 Low Preset AA:T AF:16x | |
| Geekom AE7 (Nvidia GeForce RTX 3060 Ti FE) | |
| Geekom A8 (Nvidia GeForce RTX 3060 Ti FE) | |
| Geekom GT13 Pro (Nvidia GeForce RTX 3060 Ti FE) | |
| Geekom XT13 Pro (Nvidia GeForce RTX 3060 Ti FE) | |
| Geekom XT12 Pro (Nvidia GeForce RTX 3060 Ti FE) | |
| Minisforum UH125 Pro (Nvidia GeForce RTX 3060 Ti FE) | |
| Geekom XT13 Pro | |
| 1920x1080 Medium Preset AA:T AF:16x | |
| Geekom A8 (Nvidia GeForce RTX 3060 Ti FE) | |
| Geekom AE7 (Nvidia GeForce RTX 3060 Ti FE) | |
| Geekom XT12 Pro (Nvidia GeForce RTX 3060 Ti FE) | |
| Geekom XT13 Pro (Nvidia GeForce RTX 3060 Ti FE) | |
| Geekom GT13 Pro (Nvidia GeForce RTX 3060 Ti FE) | |
| Minisforum UH125 Pro (Nvidia GeForce RTX 3060 Ti FE) | |
| Geekom XT13 Pro | |
| 1920x1080 Ultra High Preset AA:T AF:16x | |
| Geekom AE7 (Nvidia GeForce RTX 3060 Ti FE) | |
| Geekom A8 (Nvidia GeForce RTX 3060 Ti FE) | |
| Geekom XT13 Pro (Nvidia GeForce RTX 3060 Ti FE) | |
| Geekom GT13 Pro (Nvidia GeForce RTX 3060 Ti FE) | |
| Geekom XT12 Pro (Nvidia GeForce RTX 3060 Ti FE) | |
| Minisforum UH125 Pro (Nvidia GeForce RTX 3060 Ti FE) | |
| Geekom XT13 Pro, Intel Iris Xe Graphics G7 96EUs i9-13900H | Geekom XT13 Pro (Nvidia GeForce RTX 3060 Ti FE), i9-13900H | Geekom GT13 Pro (Nvidia GeForce RTX 3060 Ti FE), i9-13900H | Geekom XT12 Pro (Nvidia GeForce RTX 3060 Ti FE), i9-12900H | Minisforum UH125 Pro (Nvidia GeForce RTX 3060 Ti FE), Ultra 5 125H | Geekom AE7 (Nvidia GeForce RTX 3060 Ti FE), R9 7940HS | Geekom A8 (Nvidia GeForce RTX 3060 Ti FE), R9 8945HS | Media de la clase Mini PC | |
|---|---|---|---|---|---|---|---|---|
| SPECviewperf 2020 | 391% | 387% | 321% | 182% | 395% | 516% | 481% | |
| 3840x2160 Medical (medical-03) (fps) | 3.63 | 13 258% | 10.8 198% | 11.8 225% | 10.9 200% | 13 258% | 10.8 198% | 20.8 ? 473% |
| 3840x2160 Energy (energy-03) (fps) | 3.15 | 20.9 563% | 21 567% | 18.9 500% | 17.8 465% | 20.9 563% | 50.3 1497% | 31.1 ? 887% |
| 3840x2160 Creo (creo-03) (fps) | 16 | 74.2 364% | 76.4 378% | 62.7 292% | 26.6 66% | 76.8 380% | 76.6 379% | 47.7 ? 198% |
| 3840x2160 CATIA (catia-06) (fps) | 7.9 | 39.4 399% | 40.1 408% | 32.8 315% | 23.6 199% | 39.2 396% | 38.8 391% | 32.5 ? 311% |
| 3840x2160 3ds Max (3dsmax-07) (fps) | 10.3 | 47.2 358% | 47.3 359% | 40 288% | 28.7 179% | 46.5 351% | 45.9 346% | 50.4 ? 389% |
| 3840x2160 Siemens NX (snx-04) (fps) | 6.13 | 16.5 169% | 16.5 169% | 15.2 148% | 11.4 86% | 16.6 171% | 16.6 171% | 50.3 ? 721% |
| 3840x2160 Maya (maya-06) (fps) | 26.8 | 194 624% | 196 631% | 155 478% | 47.5 77% | 199 643% | 195 628% | 130.4 ? 387% |
| bajo | medio | alto | ultra | QHD | 4K | |
|---|---|---|---|---|---|---|
| GTA V (2015) | 182.2 | 178.4 | 170.3 | 104.2 | 92.7 | 103.4 |
| Dota 2 Reborn (2015) | 165.8 | 138.3 | 132 | 121.9 | 104.6 | |
| Final Fantasy XV Benchmark (2018) | 183.7 | 142.2 | 98.8 | 77.6 | 48.6 | |
| X-Plane 11.11 (2018) | 146.4 | 137.9 | 106.3 | 92.1 | ||
| Baldur's Gate 3 (2023) | 113 | 91.3 | 79 | 78.5 | 61.6 | 37.1 |
| Cyberpunk 2077 (2023) | 88.2 | 81.4 | 71.7 | 64.4 | 44.5 | 22.2 |
| F1 24 (2024) | 76.9 | 73.1 | 60.5 | 42.2 | 36.9 | 19.2 |
Emisiones - Refrigeración débil y bajo consumo de energía
Emisiones sonoras
Ni siquiera los aparatos del mismo diseño fueron capaces de impresionar con valores máximos en cuanto a emisiones sonoras. Esto también se aplica al Geekom XT13 Pro, al menos bajo carga. El mini PC es muy silencioso en reposo y apenas se oye. Sin embargo, el ventilador está siempre en marcha, lo que significa que no es posible un funcionamiento semipasivo. Bajo carga, el ventilador se acelera ocasionalmente de forma considerable, y pudimos medir un nivel de presión sonora máximo de 49,5 dB(A). Sin embargo, el volumen máximo no siempre está presente. Durante la prueba de estrés, la velocidad del ventilador fluctuó una y otra vez, de modo que el Geekom XT13 Pro sólo alcanzó los 38 dB(A) bajo carga. Observamos el mismo fenómeno bajo carga media. Aquí, el volumen medible fluctúa entre 38 y 42,2 dB(A)
Por desgracia, el Geekom XT12 Pro no es uno de los dispositivos más silenciosos. El dispositivo funciona casi en silencio cuando está en ralentí, sólo es audible el ruido de un ventilador silencioso. Esto cambia bajo carga, ya que el mini PC es claramente audible con hasta 44,2 dB(A). Incluso pudimos medir hasta 47,2 dB(A) durante los juegos. Sin embargo, no pudimos detectar un nivel de presión sonora permanentemente alto durante los juegos. Aquí, el resultado fluctuó entre 39 y 47,2 dB(A).
Ruido
| Ocioso |
| 27.6 / 27.8 / 27.9 dB(A) |
| Carga |
| 42.2 / 49.5 dB(A) |
 | ||
30 dB silencioso 40 dB(A) audible 50 dB(A) ruidosamente alto |
||
min: | ||
| Geekom XT13 Pro i9-13900H, Iris Xe G7 96EUs | Aoostar GEM12 R7 8845HS, Radeon 780M | Minisforum AtomMan X7 Ti Ultra 9 185H, Arc 8-Core | Acemagic F2A Ultra 7 155H, Arc 8-Core | Geekom XT12 Pro i9-12900H, Iris Xe G7 96EUs | Geekom A7 R9 7940HS, Radeon 780M | |
|---|---|---|---|---|---|---|
| Noise | 10% | 1% | 2% | 2% | -9% | |
| apagado / medio ambiente * (dB) | 25 | 24.3 3% | 24.1 4% | 24.9 -0% | 25.4 -2% | 25.4 -2% |
| Idle Minimum * (dB) | 27.6 | 27.5 -0% | 29.8 -8% | 25.4 8% | 28 -1% | 33.3 -21% |
| Idle Average * (dB) | 27.8 | 27.6 1% | 29.9 -8% | 25.7 8% | 28.1 -1% | 33.6 -21% |
| Idle Maximum * (dB) | 27.9 | 27.6 1% | 30 -8% | 25.7 8% | 28.5 -2% | 33.7 -21% |
| Load Average * (dB) | 42.2 | 36 15% | 37.3 12% | 47.8 -13% | 39.6 6% | 43.3 -3% |
| Cyberpunk 2077 ultra * (dB) | 46.6 | 35.4 24% | ||||
| Load Maximum * (dB) | 49.5 | 38.2 23% | 43.5 12% | 49 1% | 44.2 11% | 43.3 13% |
| Witcher 3 ultra * (dB) | 35.4 | 40.2 | 45.23 | 47.2 | 43.2 |
* ... más pequeño es mejor
Temperatura
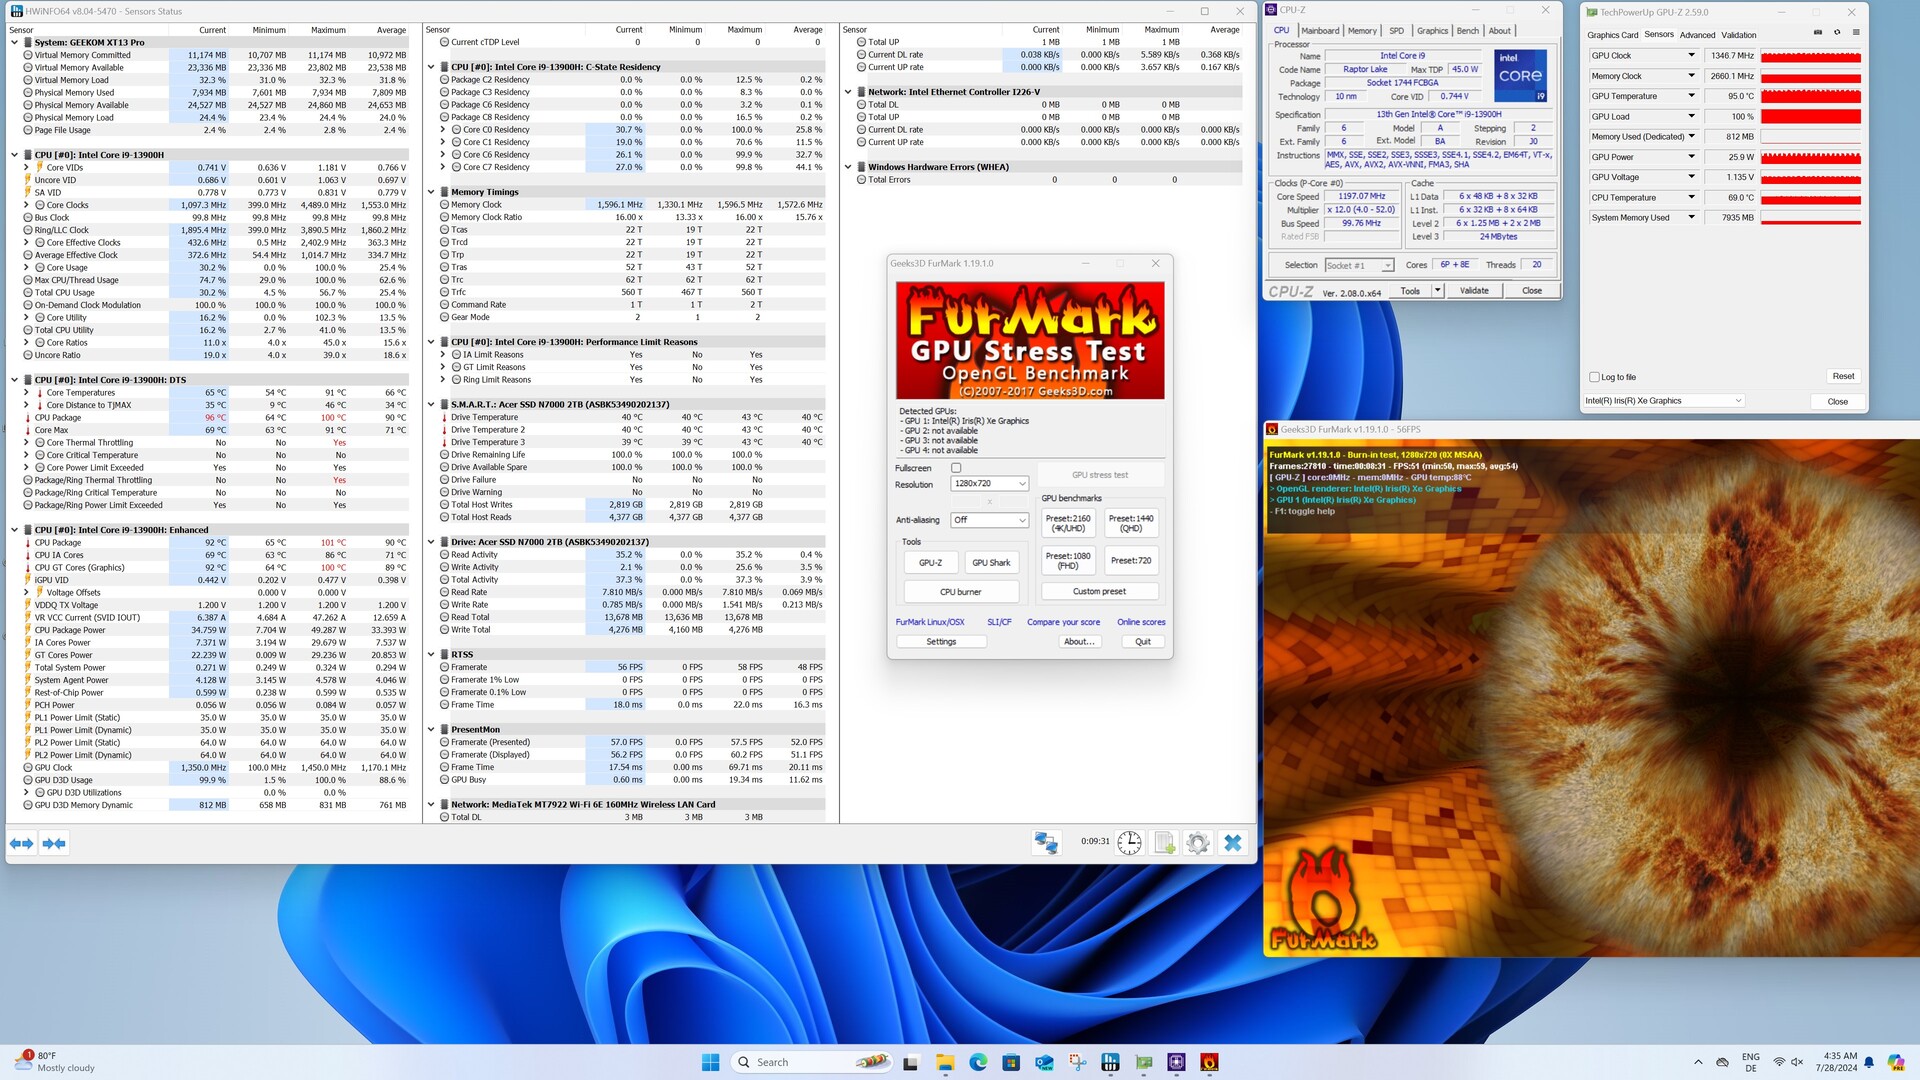
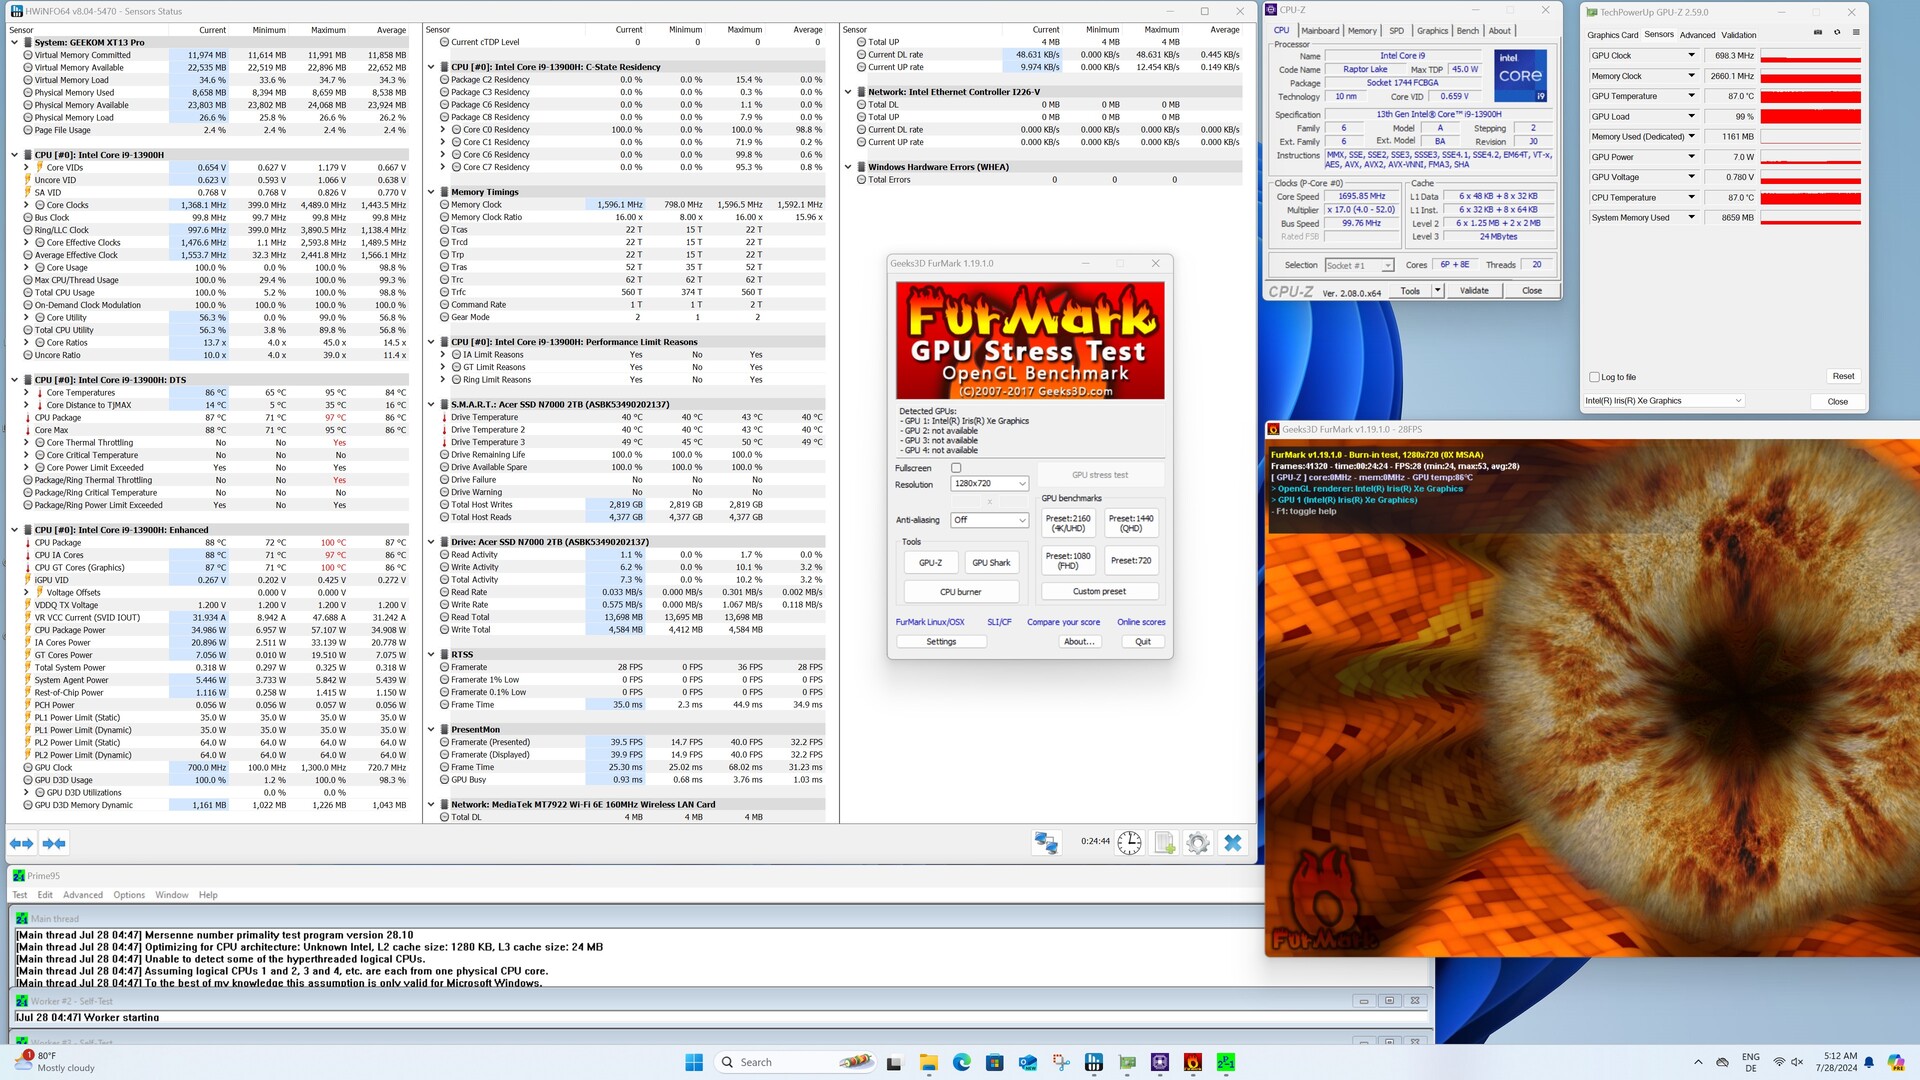
La carcasa se calienta notablemente bajo carga. Sin embargo, no encontramos valores críticos. El SoC parece un poco diferente, ya que Geekom no limita la temperatura máxima, que alcanza rápidamente los 100 °C bajo carga. A diferencia del multiloop de Cinebench R15, el Intel Core i9-13900H no supera el límite de 64 vatios en la prueba de estrés. El SoC se calienta demasiado rápido y el rendimiento tiene que reducirse. Durante un periodo de tiempo más largo, la temperatura se estabiliza entonces en torno a los 90 °C, lo que no supone ningún problema para el procesador. El diseño extremadamente compacto simplemente hace imposible instalar un sistema de refrigeración más potente.
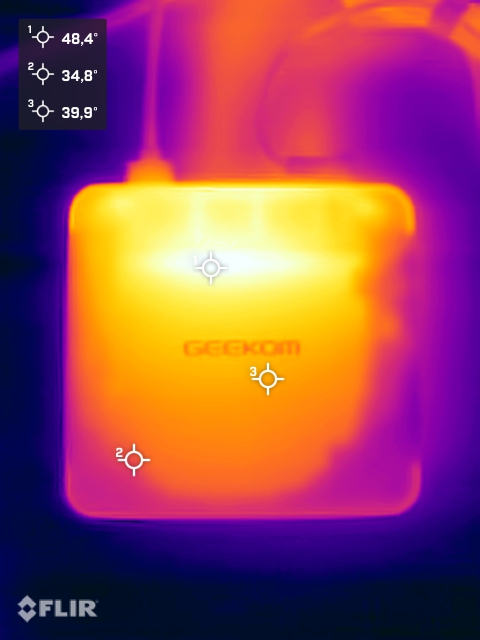
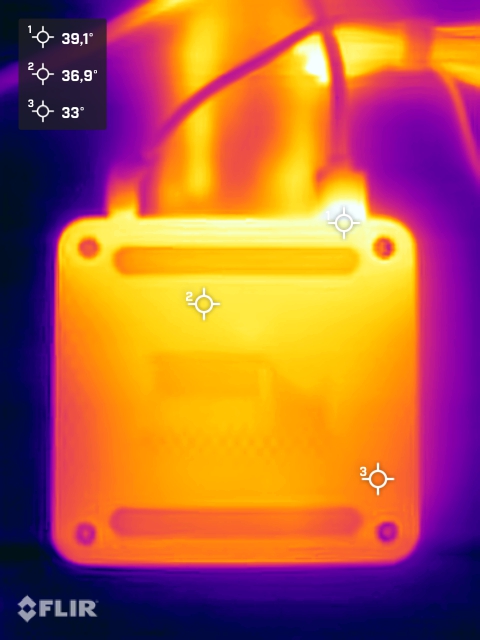
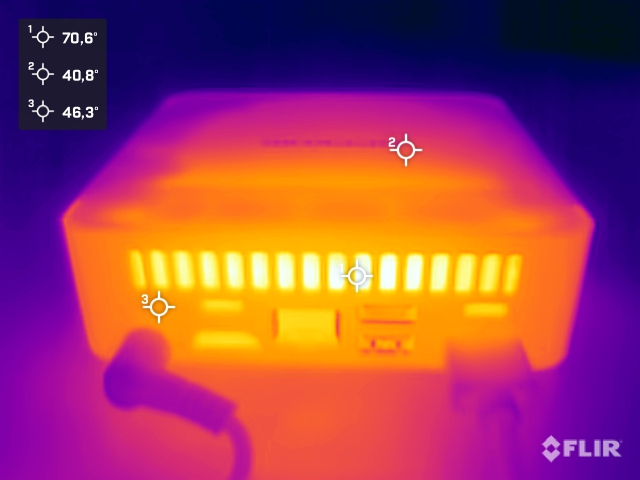
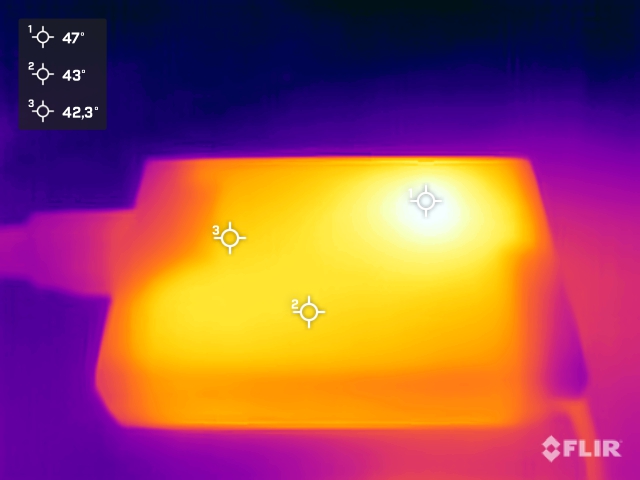
(-) La temperatura máxima en la parte superior es de 45.7 °C / 114 F, frente a la media de 35.6 °C / 96 F, que oscila entre 20.6 y 69.5 °C para la clase Mini PC.
(±) El fondo se calienta hasta un máximo de 40.3 °C / 105 F, frente a la media de 36.3 °C / 97 F
(+) En reposo, la temperatura media de la parte superior es de 27.9 °C / 82# F, frente a la media del dispositivo de 32.3 °C / 90 F.
Consumo de energía
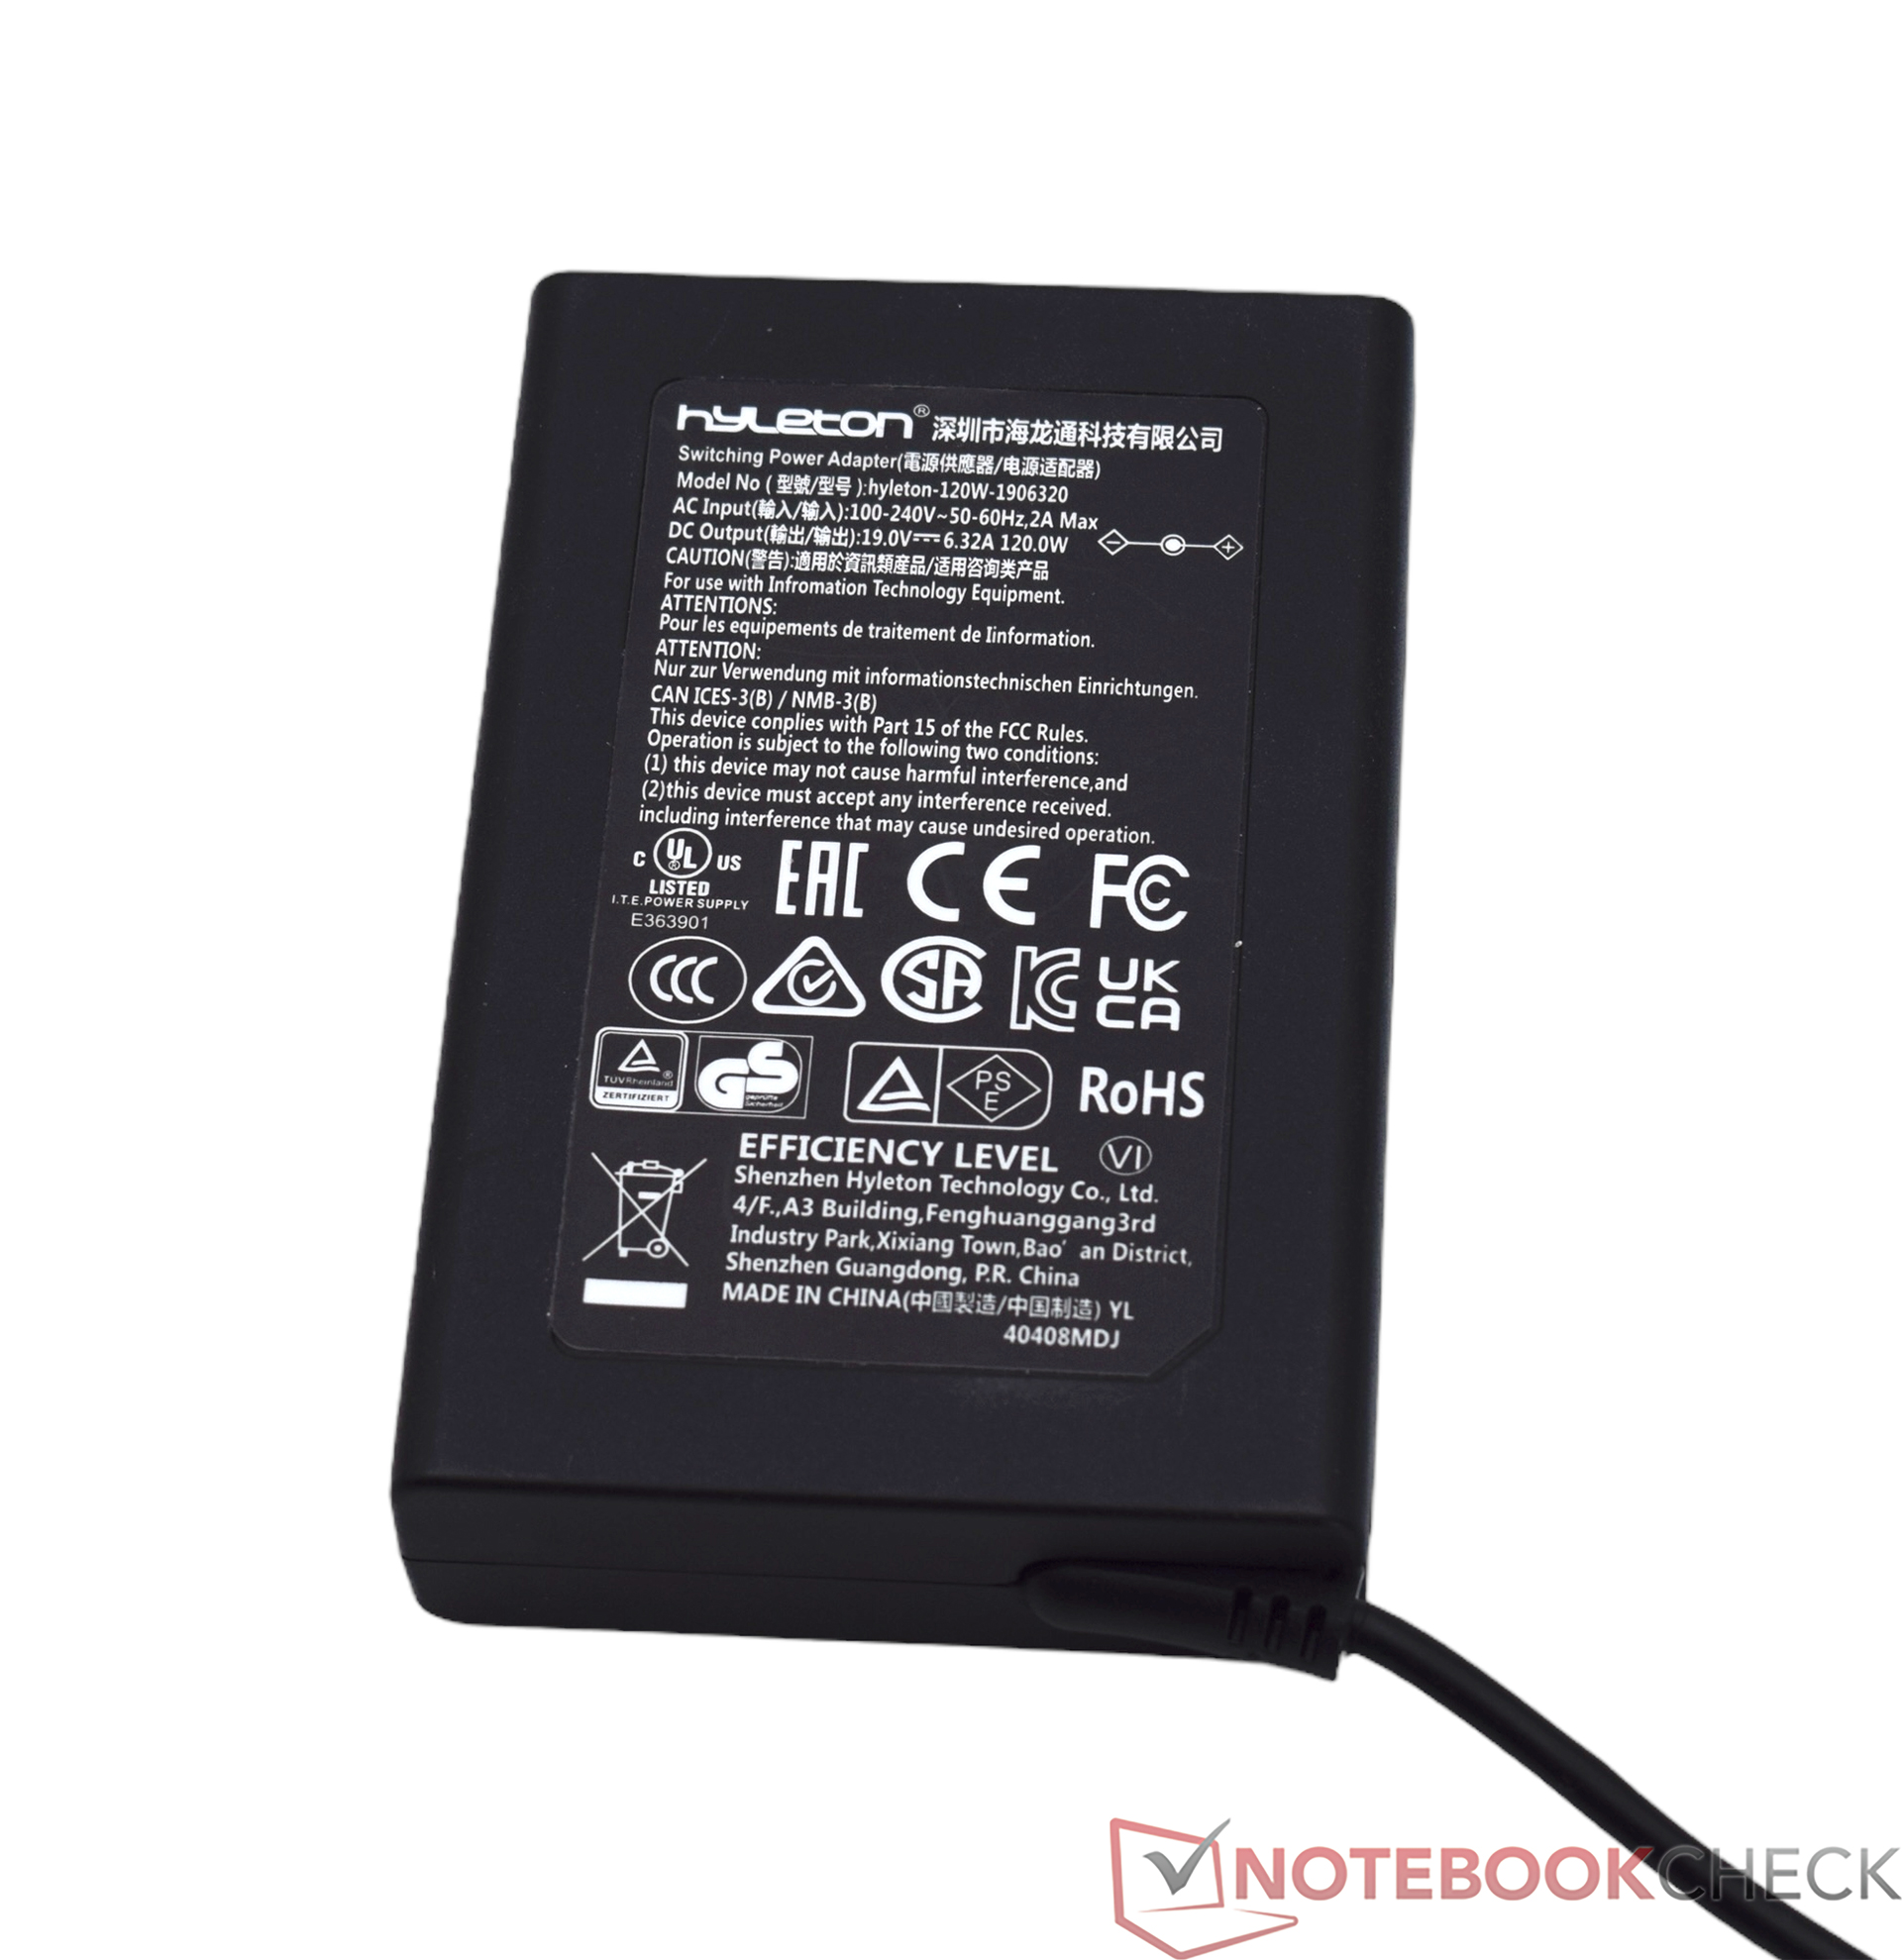
El consumo de energía del Geekom XT13 Pro se compara muy favorablemente con el de sus competidores. Sólo medimos valores bajos incluso en modo inactivo. Los bajos límites de potencia (PL1 y PL2) del Intel Core i9-13900H garantizan un requerimiento de energía relativamente bajo bajo carga. Bajo carga media, el sistema se las arregla con algo menos de 50 vatios. Bajo carga, sólo vemos los 94,5 vatios durante un breve periodo de tiempo en el que el sistema aún puede hacer uso del Turbo. Pudimos observar un comportamiento un tanto peculiar. En la prueba Cinebench R23 Sigle, documentamos una gran cantidad de picos, lo que nunca se ha visto en otros dispositivos de prueba. Repetimos la prueba varias veces, con el mismo resultado. Es razonable suponer que el SoC está trabajando repetidamente a una temperatura límite en este caso, lo que le permite absorber brevemente más potencia. La alimentación eléctrica corre a cargo de una pequeña fuente de alimentación de 120 vatios. La misma fuente de alimentación se incluye en muchos dispositivos Geekom.
| Off / Standby | |
| Ocioso | |
| Carga |
|
Clave:
min: | |
| Geekom XT13 Pro i9-13900H, Iris Xe G7 96EUs | Aoostar GEM12 R7 8845HS, Radeon 780M | Minisforum AtomMan X7 Ti Ultra 9 185H, Arc 8-Core | Acemagic F2A Ultra 7 155H, Arc 8-Core | Geekom XT12 Pro i9-12900H, Iris Xe G7 96EUs | Geekom A7 R9 7940HS, Radeon 780M | Medio Intel Iris Xe Graphics G7 96EUs | Media de la clase Mini PC | |
|---|---|---|---|---|---|---|---|---|
| Power Consumption | -38% | -34% | -35% | -21% | 11% | 1% | -42% | |
| Idle Minimum * (Watt) | 6.3 | 8.2 -30% | 8.2 -30% | 9.1 -44% | 5.7 10% | 3.8 40% | 5.51 ? 13% | 9 ? -43% |
| Idle Average * (Watt) | 7.1 | 10 -41% | 12.1 -70% | 10.3 -45% | 9.5 -34% | 4.8 32% | 8.66 ? -22% | 11.2 ? -58% |
| Idle Maximum * (Watt) | 9 | 14.6 -62% | 14 -56% | 14.4 -60% | 16.5 -83% | 6.5 28% | 10.9 ? -21% | 14.4 ? -60% |
| Load Average * (Watt) | 49.8 | 73.9 -48% | 53.1 -7% | 54.9 -10% | 53.3 -7% | 71.9 -44% | 45.6 ? 8% | 65.2 ? -31% |
| Cyberpunk 2077 ultra external monitor * (Watt) | 54 | 79.9 -48% | ||||||
| Load Maximum * (Watt) | 94.5 | 95.3 -1% | 100.4 -6% | 110.4 -17% | 87.8 7% | 94.7 -0% | 67.8 ? 28% | 112.8 ? -19% |
* ... más pequeño es mejor
Efficiency
| Performance rating - Percent | |
| Geekom A8, R9 8945HS | |
| Minisforum AtomMan X7 Ti | |
| Acemagic F2A | |
| Geekom XT13 Pro | |
| Geekom XT12 Pro | |
| Power Consumption | |
| Cinebench R23 Multi Power Efficiency - external Monitor | |
| Geekom A8, R9 8945HS | |
| Minisforum AtomMan X7 Ti | |
| Geekom XT13 Pro | |
| Acemagic F2A | |
| Geekom XT12 Pro | |
| Cinebench R23 Single Power Efficiency - external Monitor | |
| Geekom A8, R9 8945HS | |
| Minisforum AtomMan X7 Ti | |
| Acemagic F2A | |
| Geekom XT13 Pro | |
| Geekom XT12 Pro | |
| Cinebench R15 Multi Efficiency (external Monitor) | |
| Geekom A8, R9 8945HS | |
| Minisforum AtomMan X7 Ti | |
| Geekom XT13 Pro | |
| Acemagic F2A | |
| Geekom XT12 Pro | |
Power consumption with external monitor
Power consumption with external monitor
Pro
Contra
Veredicto - Precio premium sin prestaciones premium

El Geekom XT13 Pro es un mini PC potente. Sin embargo, ya pudimos comprobarlo con el Geekom XT12 Pro. Si sólo comparamos estos dos modelos entre sí, puede optar por el dispositivo más antiguo sin que ello suponga una pérdida notable de rendimiento. El Intel Core i9-13900H del Geekom XT13 Pro no puede proporcionar un aumento notable del rendimiento. Las diferencias técnicas con respecto al Intel Core i9-12900H son demasiado pequeñas. Geekom no se atreve a dar el atrevido paso de un mini PC basado en la serie Meteor Lake. Esto significa que Geekom se queda atrás, ya que muchos otros fabricantes ya han equipado sus series de modelos con los últimos procesadores de Intel. La mayor desventaja del Geekom XT13 Pro es la iGPU, que es inferior a la de los representantes modernos en todas las pruebas. Sin embargo, Geekom no sólo es inferior a sus competidores en este aspecto, sino también a sí mismo. La propia cartera de Geekom incluye mini PC con los últimos SoC de AMD, que técnicamente no son mucho peores, pero ofrecen un resultado globalmente mejor. Ni siquiera hemos mirado aún el precio. Desgraciadamente, el Geekom XT13 Pro está completamente fuera de lugar aquí. 999 euros es actualmente la factura si se quiere que sea el modelo superior. Otros mini PC cuestan un poco menos pero ofrecen más prestaciones.
El Geekom XT13 Pro ofrece un rendimiento adecuado con el Intel Core i9-13900H e impresiona por sus versátiles características. Sin embargo, la relación precio-rendimiento del Geekom XT13 Pro no está a la altura en absoluto.
Hay que destacar positivamente la buena conectividad, con la que Geekom ha ganado puntos repetidamente en el pasado. Las numerosas conexiones incluyen dos puertos USB4, lo que puede influir en la decisión de compra en términos de garantía de futuro. Los tres años de garantía del fabricante también hablan a favor de un dispositivo de Geekom. Por supuesto, también está disponible para otros dispositivos del fabricante. La eficiencia sólo podría aumentar ligeramente en comparación con el Geekom XT12 Pro. En esta disciplina, el Intel Core i9-13900H es claramente inferior a los procesadores Meteor Lake más modernos. Por esta razón, no podemos dar al Geekom XT13 Pro una recomendación de compra, incluso en relación con el elevado precio de compra. Si no queremos que el Geekom XT13 Pro se convierta en un calentador de estanterías, Geekom necesita revisar urgentemente sus precios actuales.
Nota: Recientemente hemos actualizado nuestro sistema de clasificación y los resultados de la versión 8 no son comparables con los de la versión 7. Encontrará más información aquí.
Geekom XT13 Pro
- 10/29/2025 v8
Sebastian Bade
 Total Sustainability Score:
 Transparencia
Nuestro equipo editorial se encarga de seleccionar los dispositivos que se someten a revisión. La muestra de prueba fue entregada al autor por el fabricante de forma gratuita para los fines de la revisión. No hubo influencia de terceros en esta revisión, ni el fabricante recibió una copia de esta revisión antes de su publicación. No había ninguna obligación de publicar esta reseña. Como empresa de medios independiente, Notebookcheck no está sujeta a la autoridad de fabricantes, minoristas o editores.
Así es como prueba Notebookcheck
Cada año, Notebookcheck revisa de forma independiente cientos de portátiles y smartphones utilizando procedimientos estandarizados para asegurar que todos los resultados son comparables. Hemos desarrollado continuamente nuestros métodos de prueba durante unos 20 años y hemos establecido los estándares de la industria en el proceso. En nuestros laboratorios de pruebas, técnicos y editores experimentados utilizan equipos de medición de alta calidad. Estas pruebas implican un proceso de validación en varias fases. Nuestro complejo sistema de clasificación se basa en cientos de mediciones y puntos de referencia bien fundamentados, lo que mantiene la objetividad.Price comparison
