

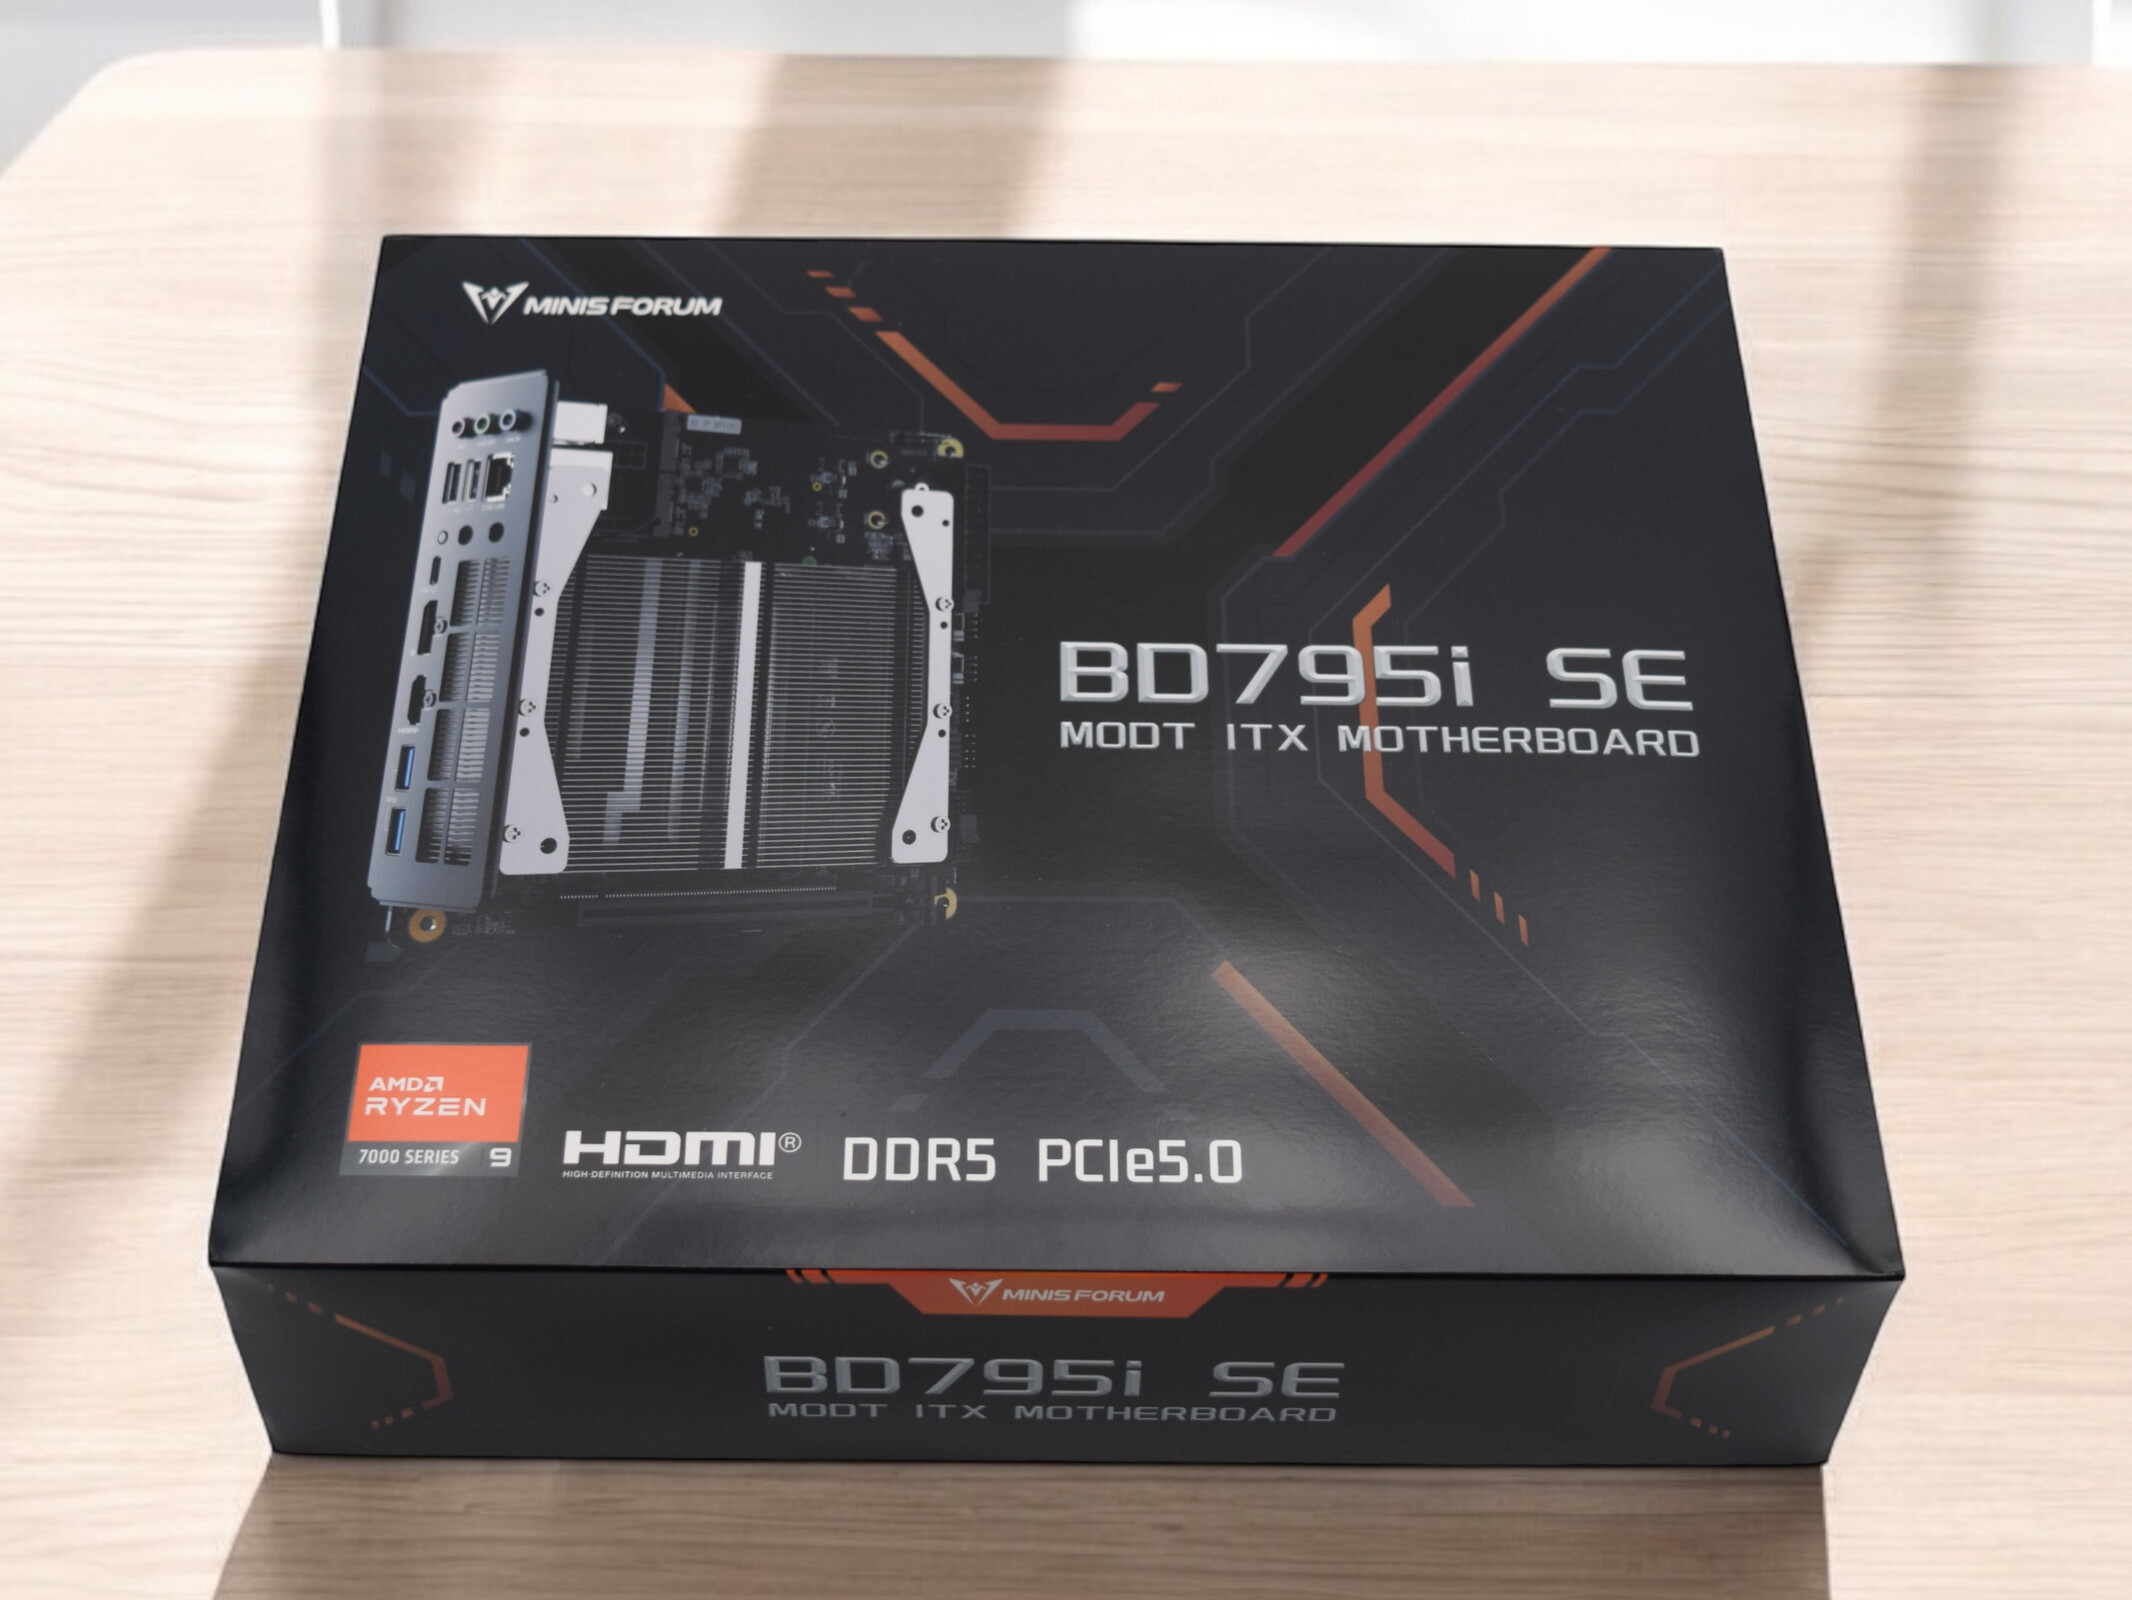
Revisión de la Minisforum BD795i SE: La placa base de sobremesa Mini-ITX con una CPU AMD Ryzen 9 como solución DIY para mini PCs de juegos
Mucho rendimiento, poca conectividad.
El Minisforum BD795i SE promete un alto rendimiento y es ideal para construir PCs Mini-ITX compactos. Con su AMD Ryzen 9 7945HX instalado de fábrica, está dirigido a usuarios exigentes. Probamos su rendimiento durante tareas intensivas y analizamos su rendimiento en juegos con una Nvidia GeForce RTX 4090.Sebastian Bade, 👁 Sebastian Bade (traducido por DeepL / Ninh Duy) Publicado 🇺🇸 🇩🇪 ...
Veredicto - Una potente base para sistemas de alto rendimiento
La Minisforum BD795i SE es una potente placa base Mini-ITX con un AMD Ryzen 9 7945HX instalado de forma permanente. Técnicamente, es similar a la Minisforum BD790i, pero prescinde de WLAN y de un refrigerador SSD activo. En cuanto al precio, el Minisforum BD795i SE es muy atractivo por 399,92 dólares (Amazon) y ofrece mucho rendimiento por relativamente poco dinero. En este rango de precios, otras configuraciones de sobremesa convencionales no pueden hacerle sombra al potente AMD Ryzen 9 7945HX.
Existen algunas limitaciones en lo que respecta a su refrigeración, ya que el disipador de calor instalado de fábrica no puede sustituirse. La CPU también está instalada de forma permanente, pero con sus 16 núcleos y 32 hilos, seguro que sigue ofreciendo suficiente rendimiento durante mucho tiempo. En cuanto a las conexiones, la BD795i SE no puede estar a la altura de las placas base Mini-ITX clásicas, ya que sólo cuenta con los puertos más esenciales. Sin embargo, dispone de todo lo necesario para sistemas compactos de alto rendimiento; sobre todo, su compatibilidad total con PCIe 5.0 para SSD y tarjetas gráficas es un claro punto a favor.
Pro
Contra
Precio y disponibilidad
Actualmente, puede adquirir el Minisforum BD795i SE en Amazon por 399,92 dólares.
Índice
- Veredicto - Una potente base para sistemas de alto rendimiento
- El Minisforum BD795i SE en detalle
- Alcance de la entrega y conectividad
- Puntos de referencia del procesador
- Resultados de Cinebench AMD Ryzen 9 7945HX
- Rendimiento del sistema
- Latencias del CPD
- Dispositivo de almacenamiento
- Tarjeta gráfica - La AMD Radeon 610M como iGPU
- El Minisforum BD795i SE con la Nvidia GeForce RTX 4090
- Necesidad de energía y temperaturas
- Valoración total de Notebookcheck
Minisforum es conocido principalmente por sus mini PC de diversas clases de rendimiento. Desde hace algún tiempo, el fabricante también se ha aventurado en el sector de los ordenadores de sobremesa en forma de diversas placas base. Toma potentes procesadores del sector de los portátiles, lo que hace que este concepto sea fundamentalmente diferente de las amplias masas del segmento de los ordenadores de sobremesa. La BD770i con su Ryzen 7 7745HX así como la BD790I ya obtuvieron buenos resultados en nuestras pruebas.
La Minisforum BD795i SE es una potente placa base Mini-ITX y es ideal para sistemas compactos. En comparación con la BD790i, ofrece unas prestaciones ligeramente reducidas, pero es más barata y sigue siendo potente. El AMD Ryzen 9 7945HX es un SoC extremadamente potente con 16 núcleos Zen4 y es uno de los procesadores móviles más rápidos de AMD. Para evaluar su rendimiento en juegos, probamos el sistema con una Nvidia GeForce RTX 4090, que puede conectarse sin restricciones gracias a una ranura PCIe x16 completa.
Placas base Minisforum comparadas
| Nombre | BD795i SE | BD790i X3D | BD790i SE | BD770i | AR900i |
| CPU | AMD Ryzen 9 7945HX | AMD Ryzen 9 7945HX3D | AMD Ryzen 9 7940HX | AMD Ryzen 7 7745HX | Procesador Intel Core i9-13900HX |
| Núcleos / hilos | 16 / 32 | 16 / 32 | 16/32 | 8/16 | 24/32 |
| GPU | AMD Radeon 610M | AMD Radeon 610M | AMD Radeon 610M | AMD Radeon 610M | Intel UHD Graphics |
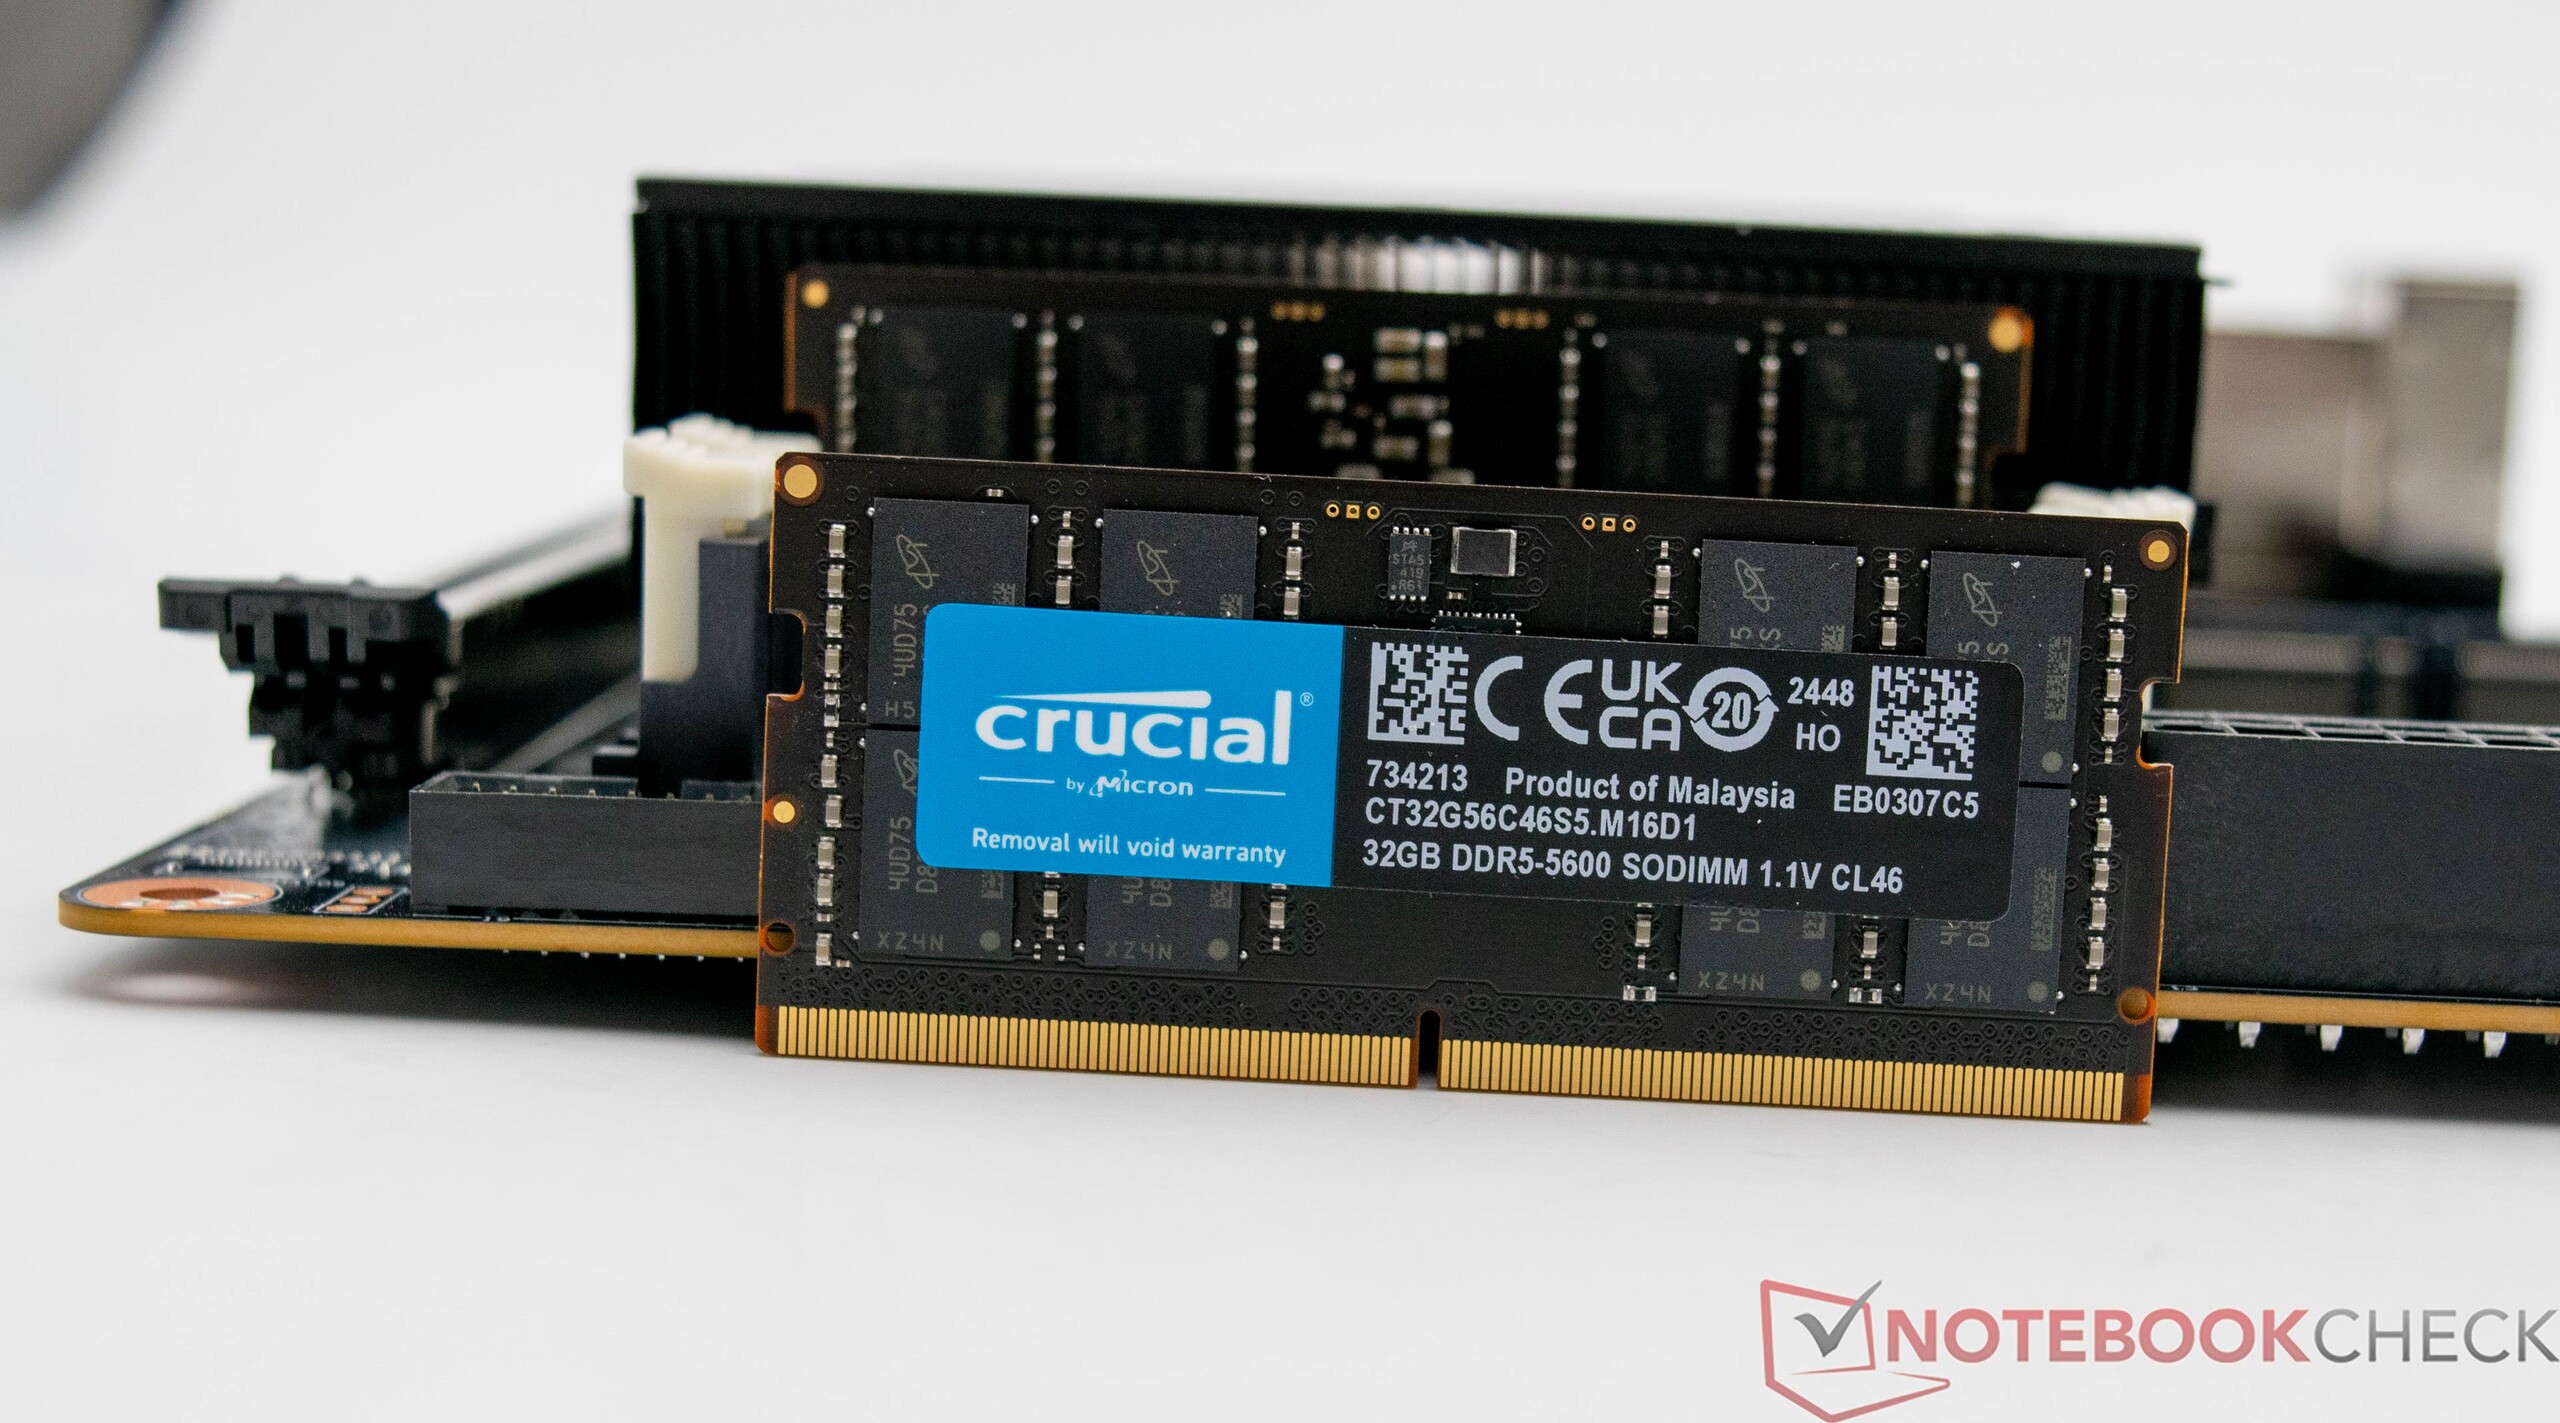
| Tipos de memoria | DDR5-5200 SODIMM | DDR5-5200 SODIMM | DDR5-5200 SODIMM | DDR5-5200 SODIMM | DDR5-5600 SODIMM |
| Tamaño máximo de memoria | 96 GB | 96 GB | 64 GB | 64 GB | 64 GB |
El Minisforum BD795i SE en detalle


Alcance de la entrega y conectividad
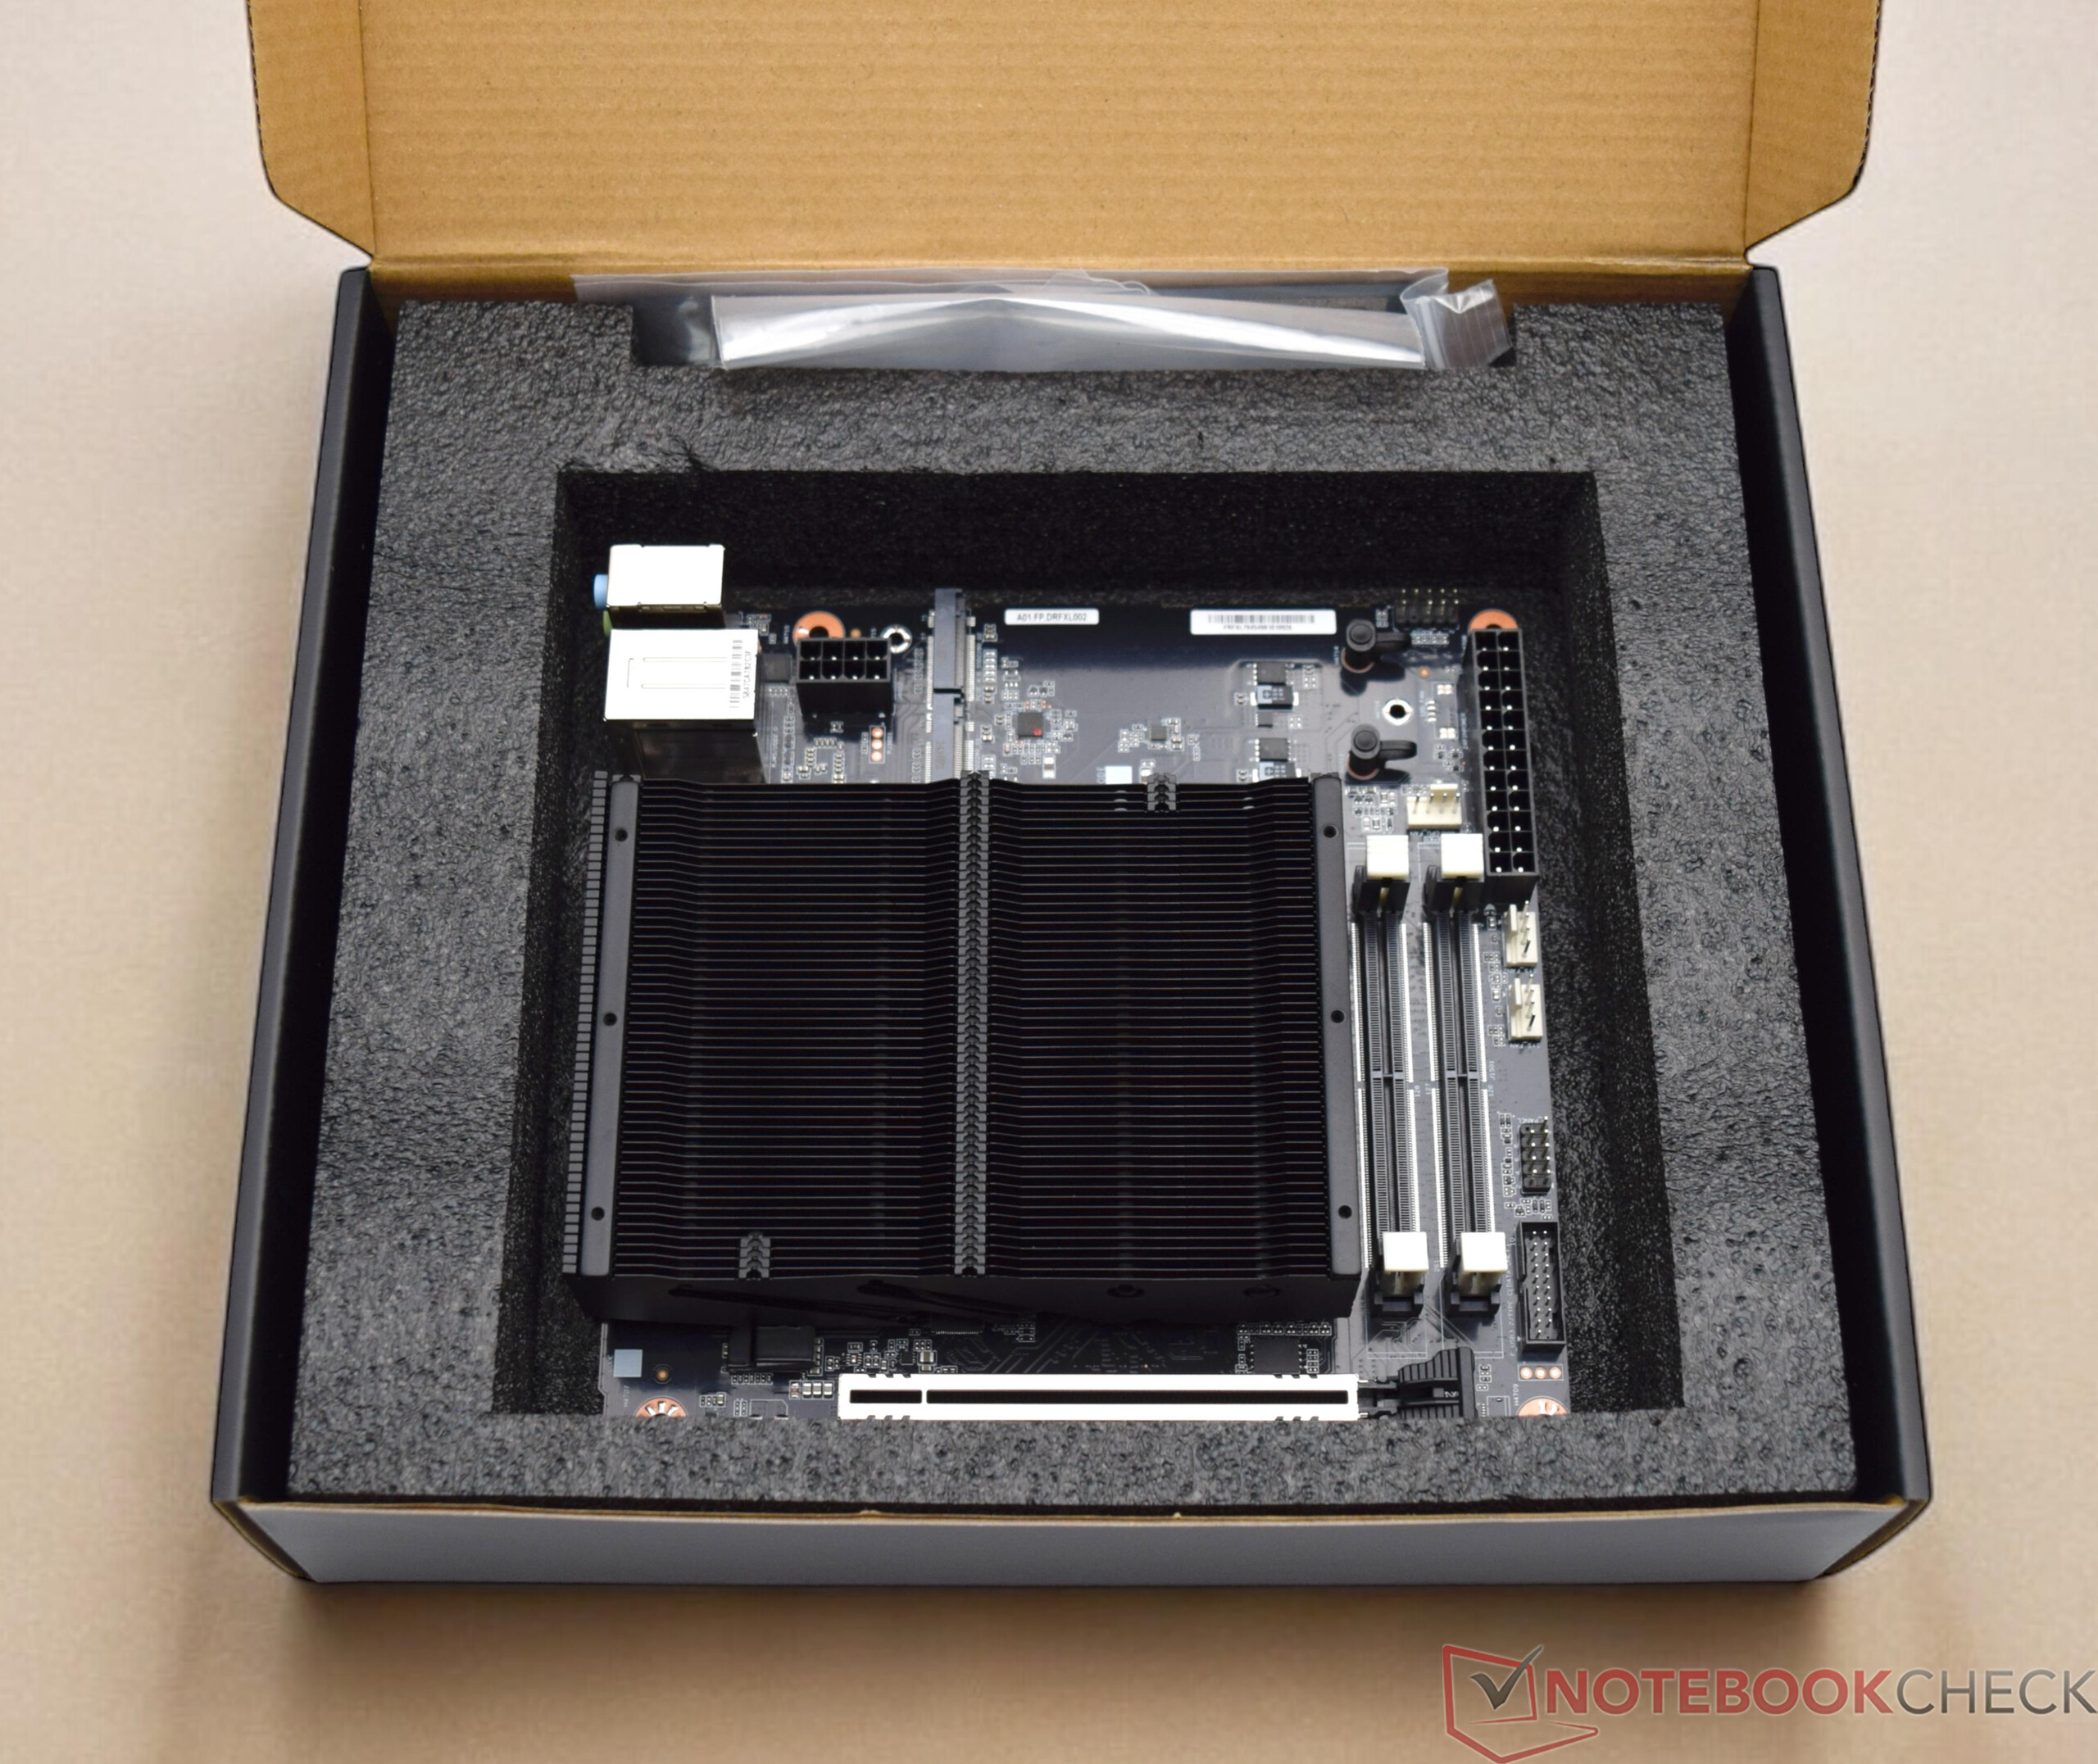
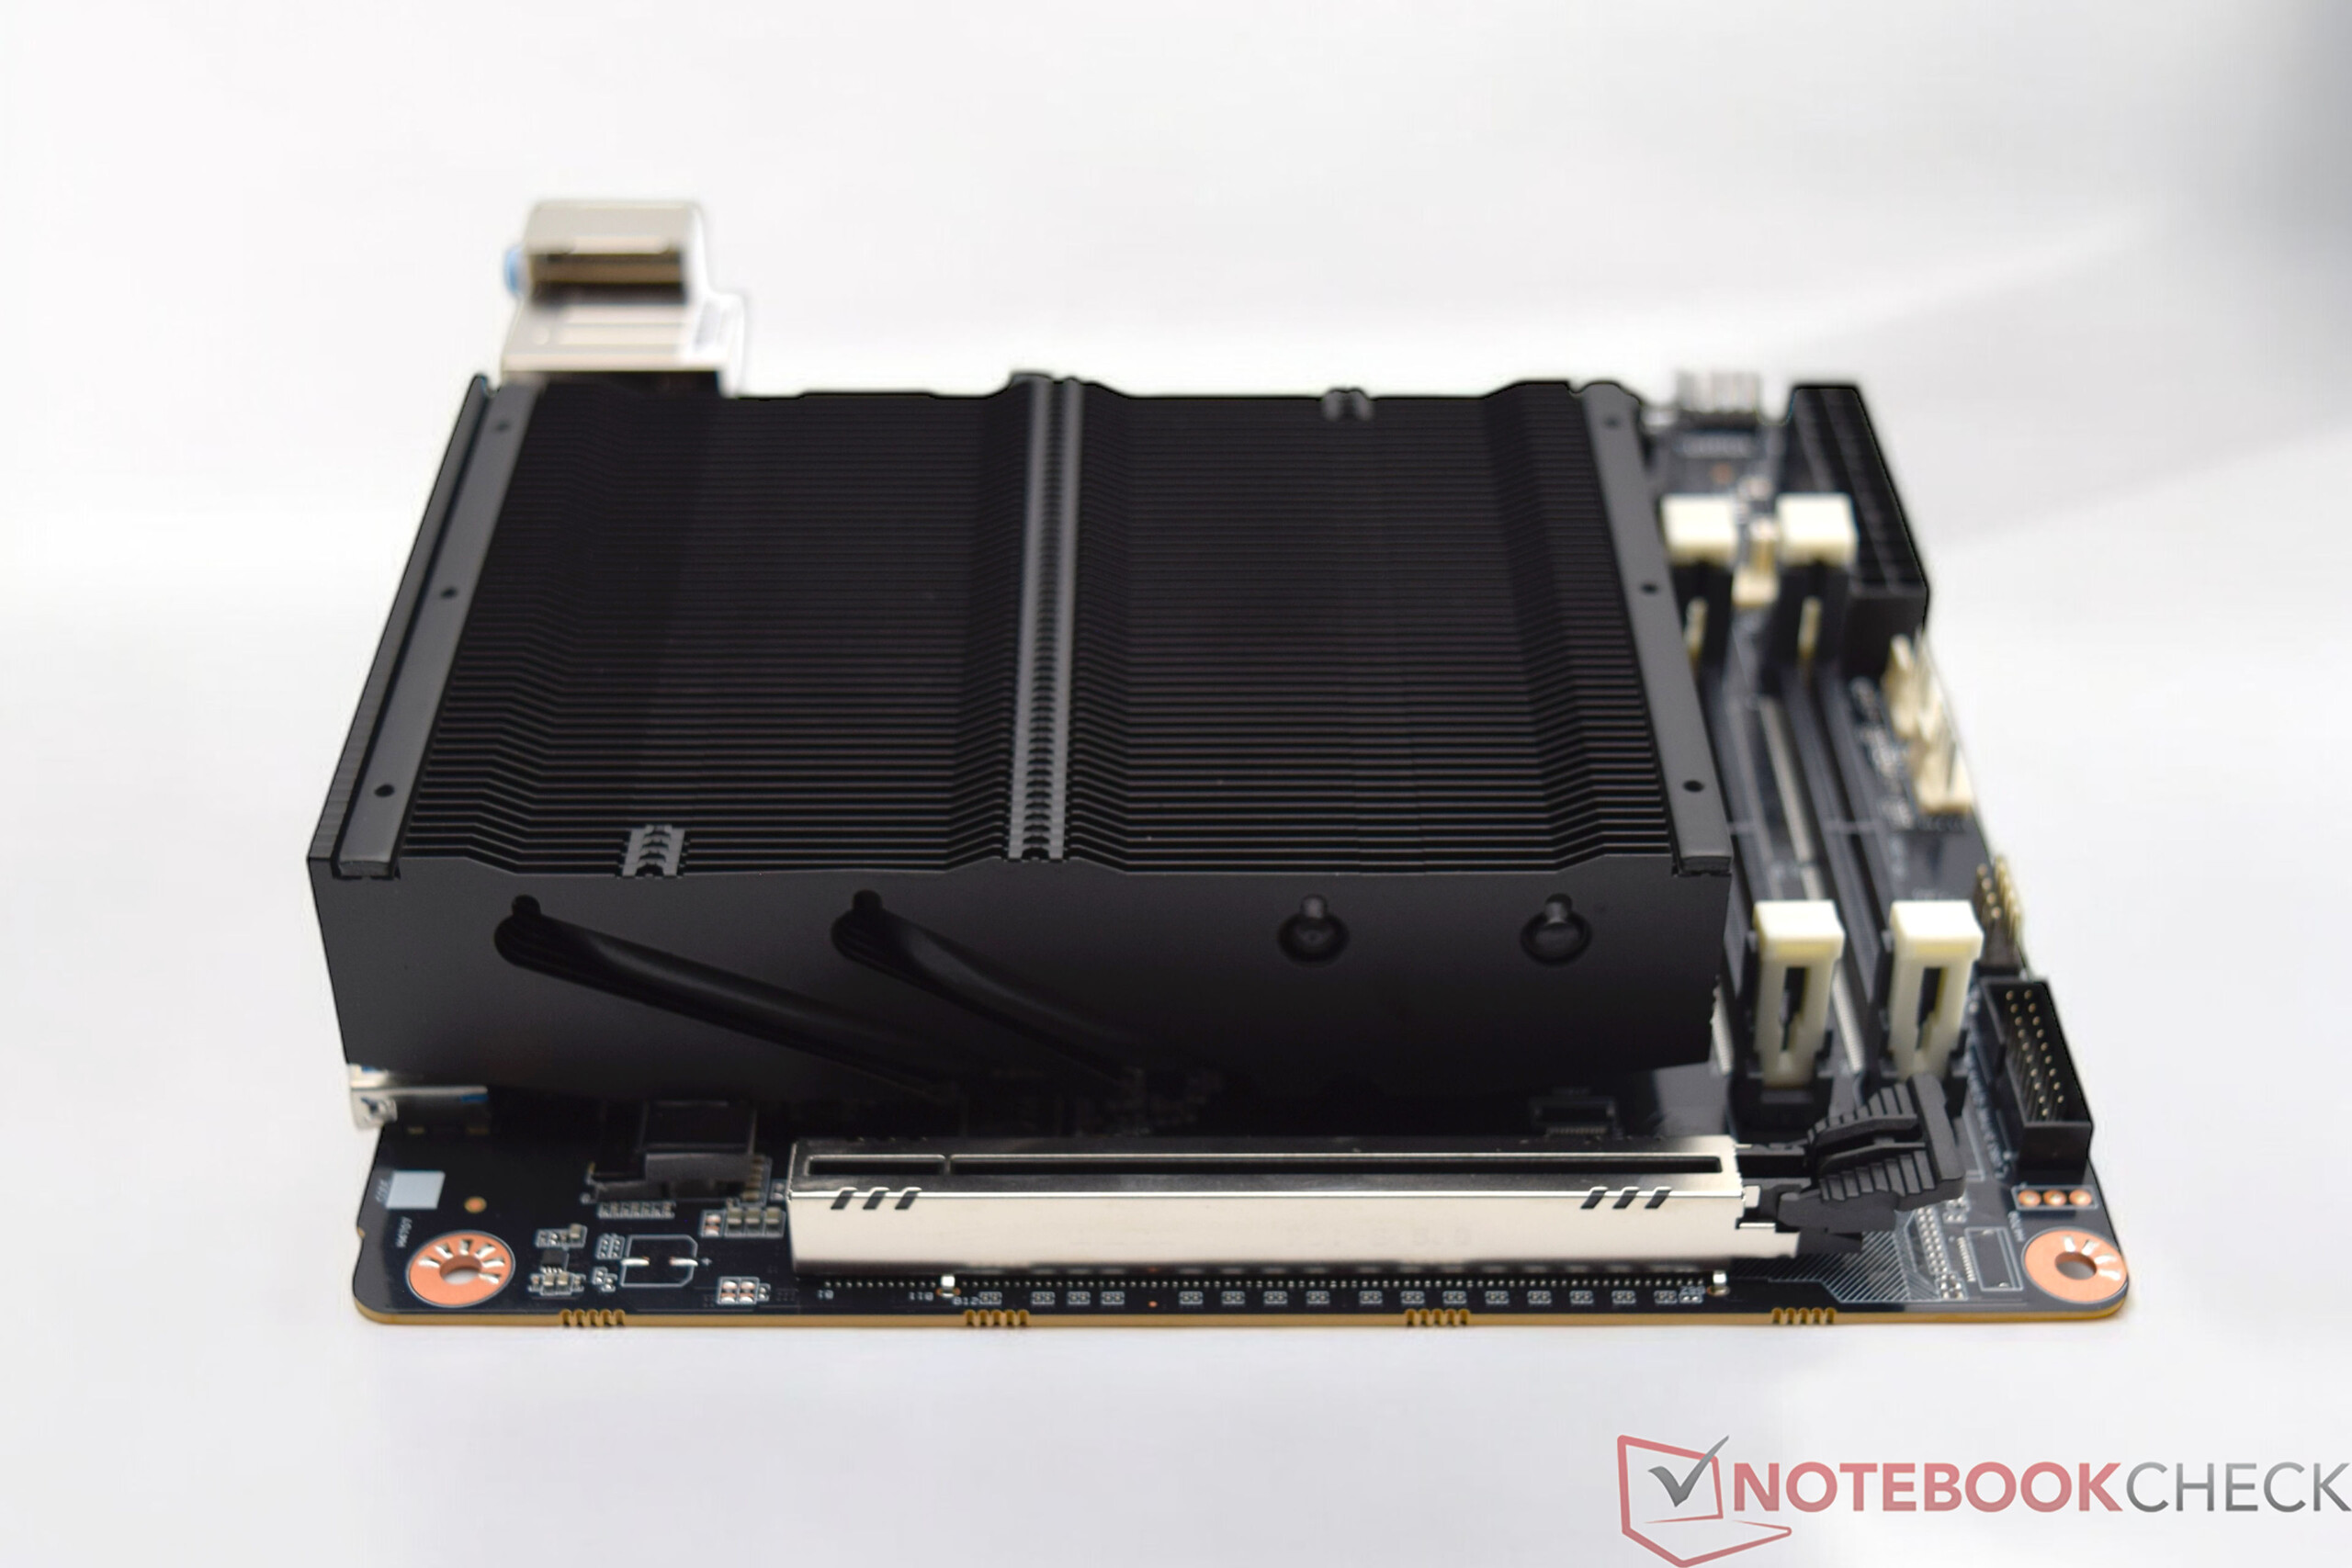
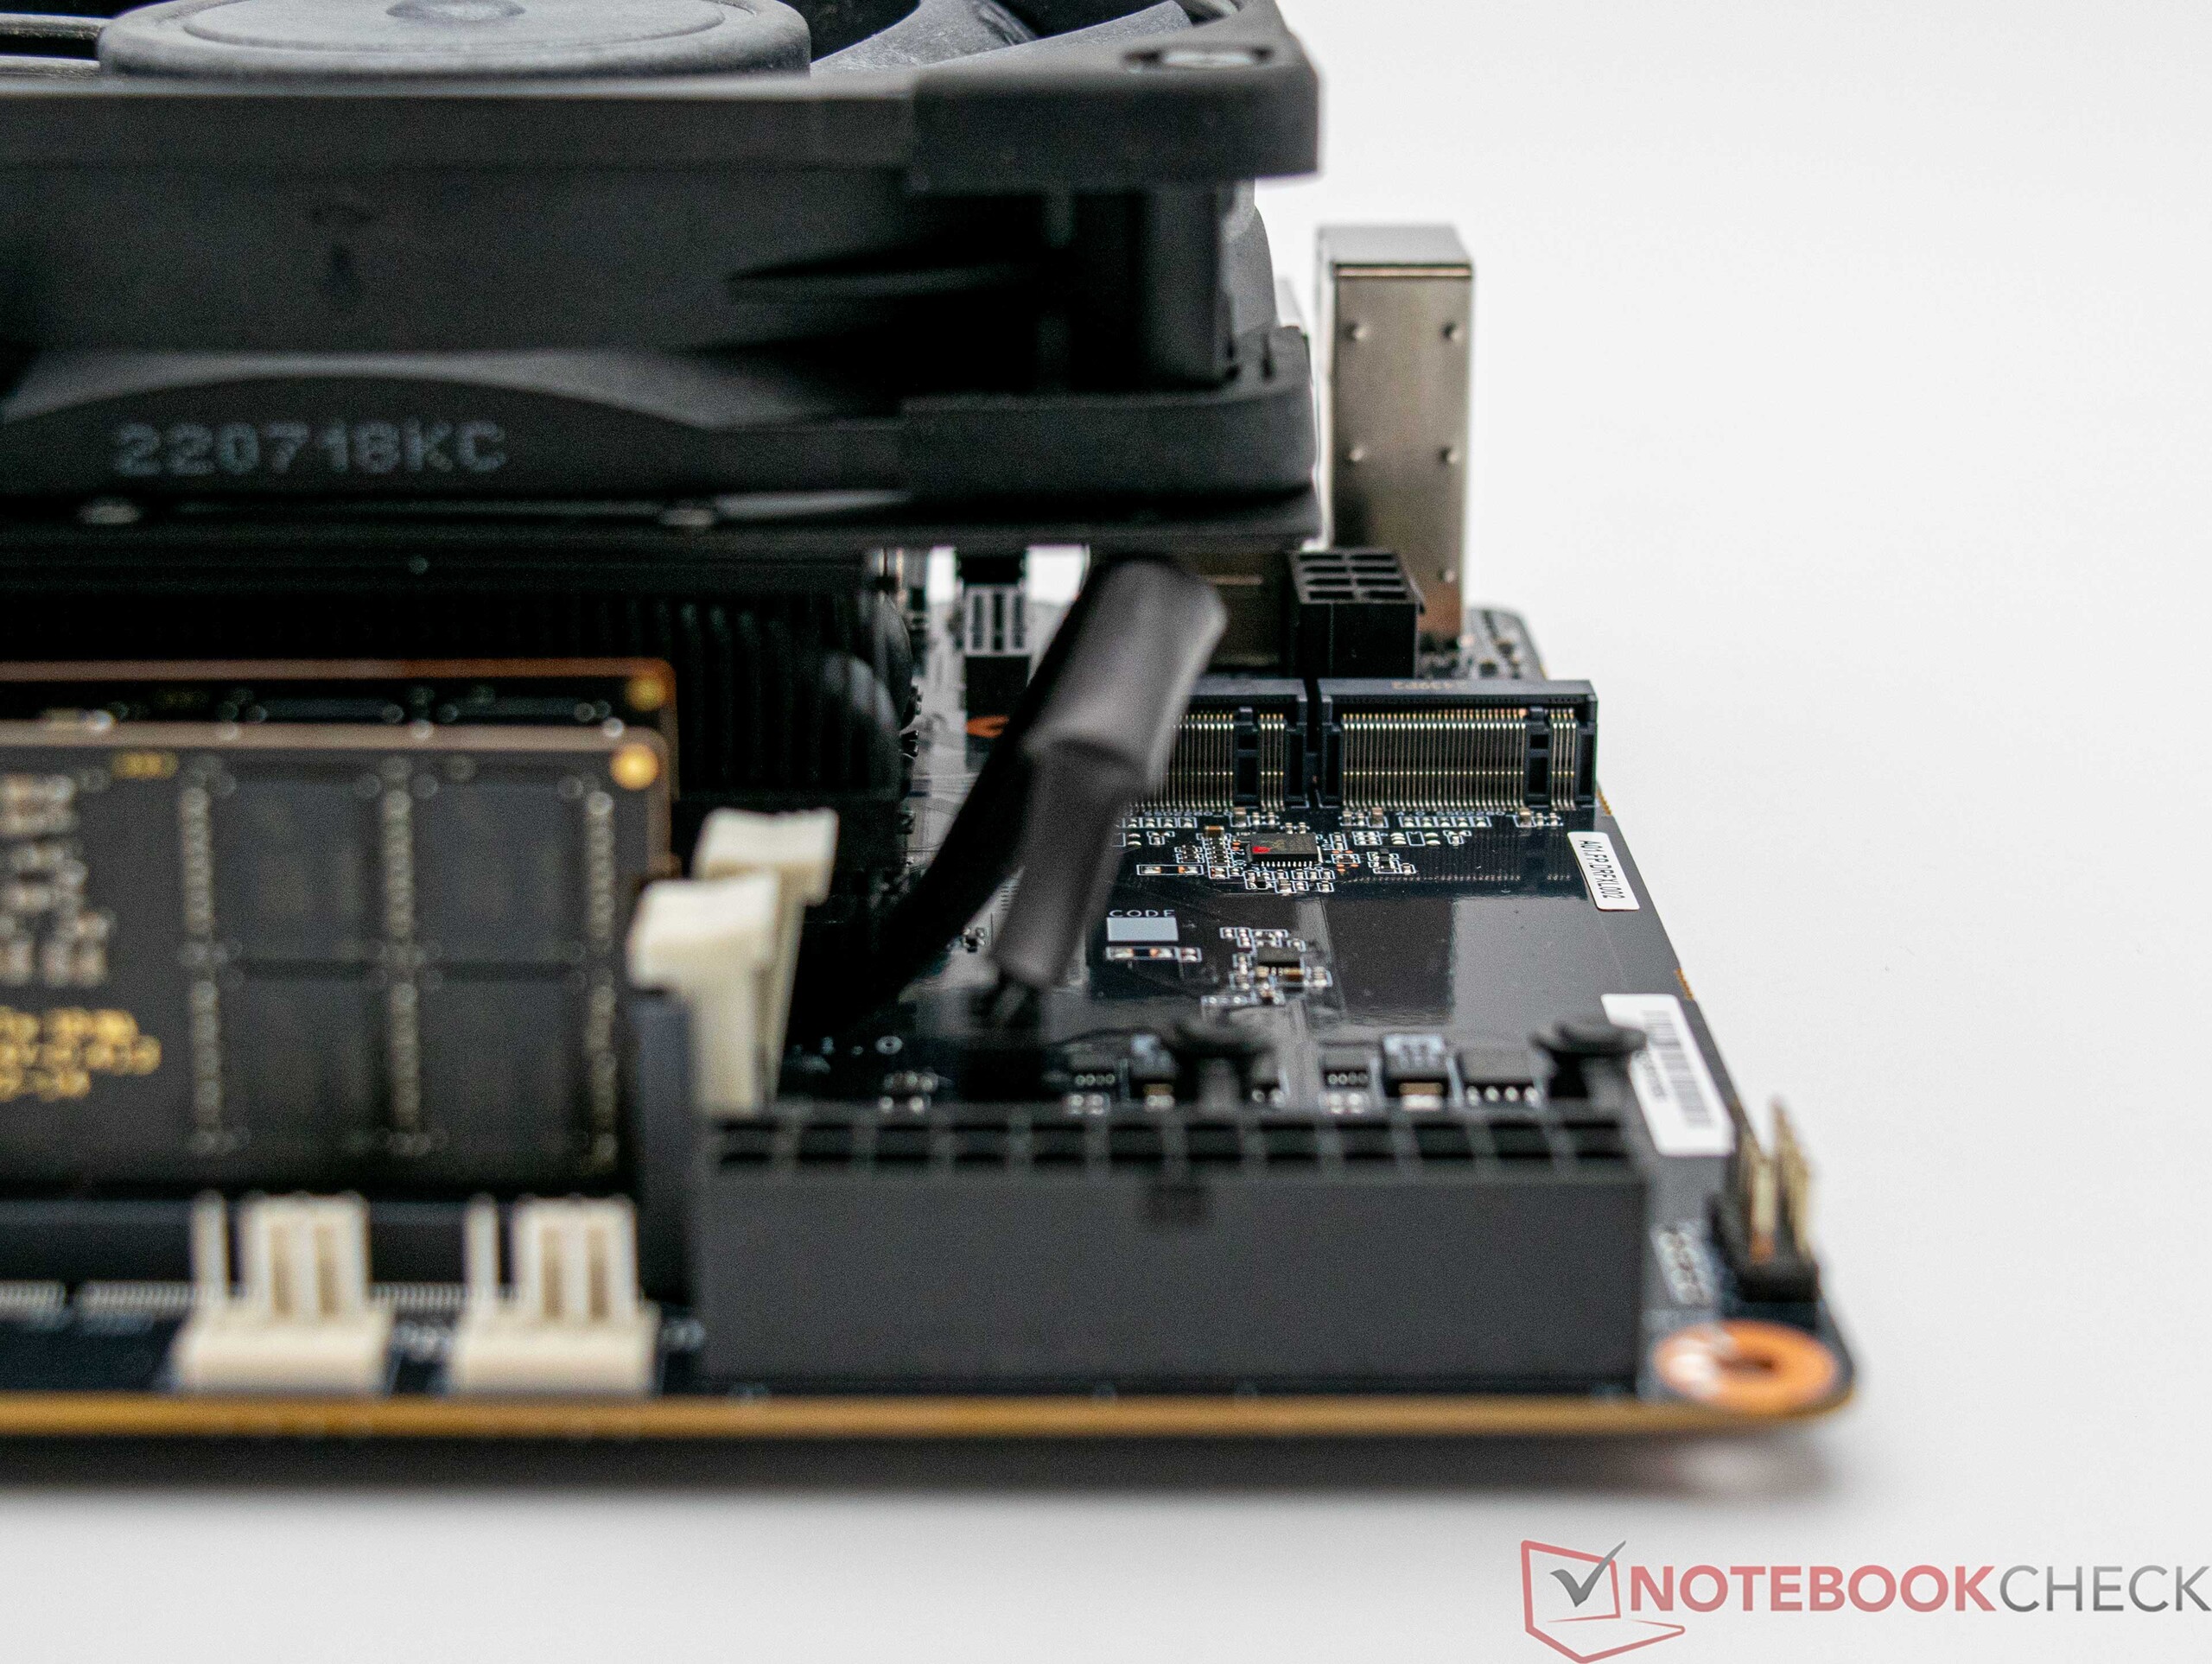
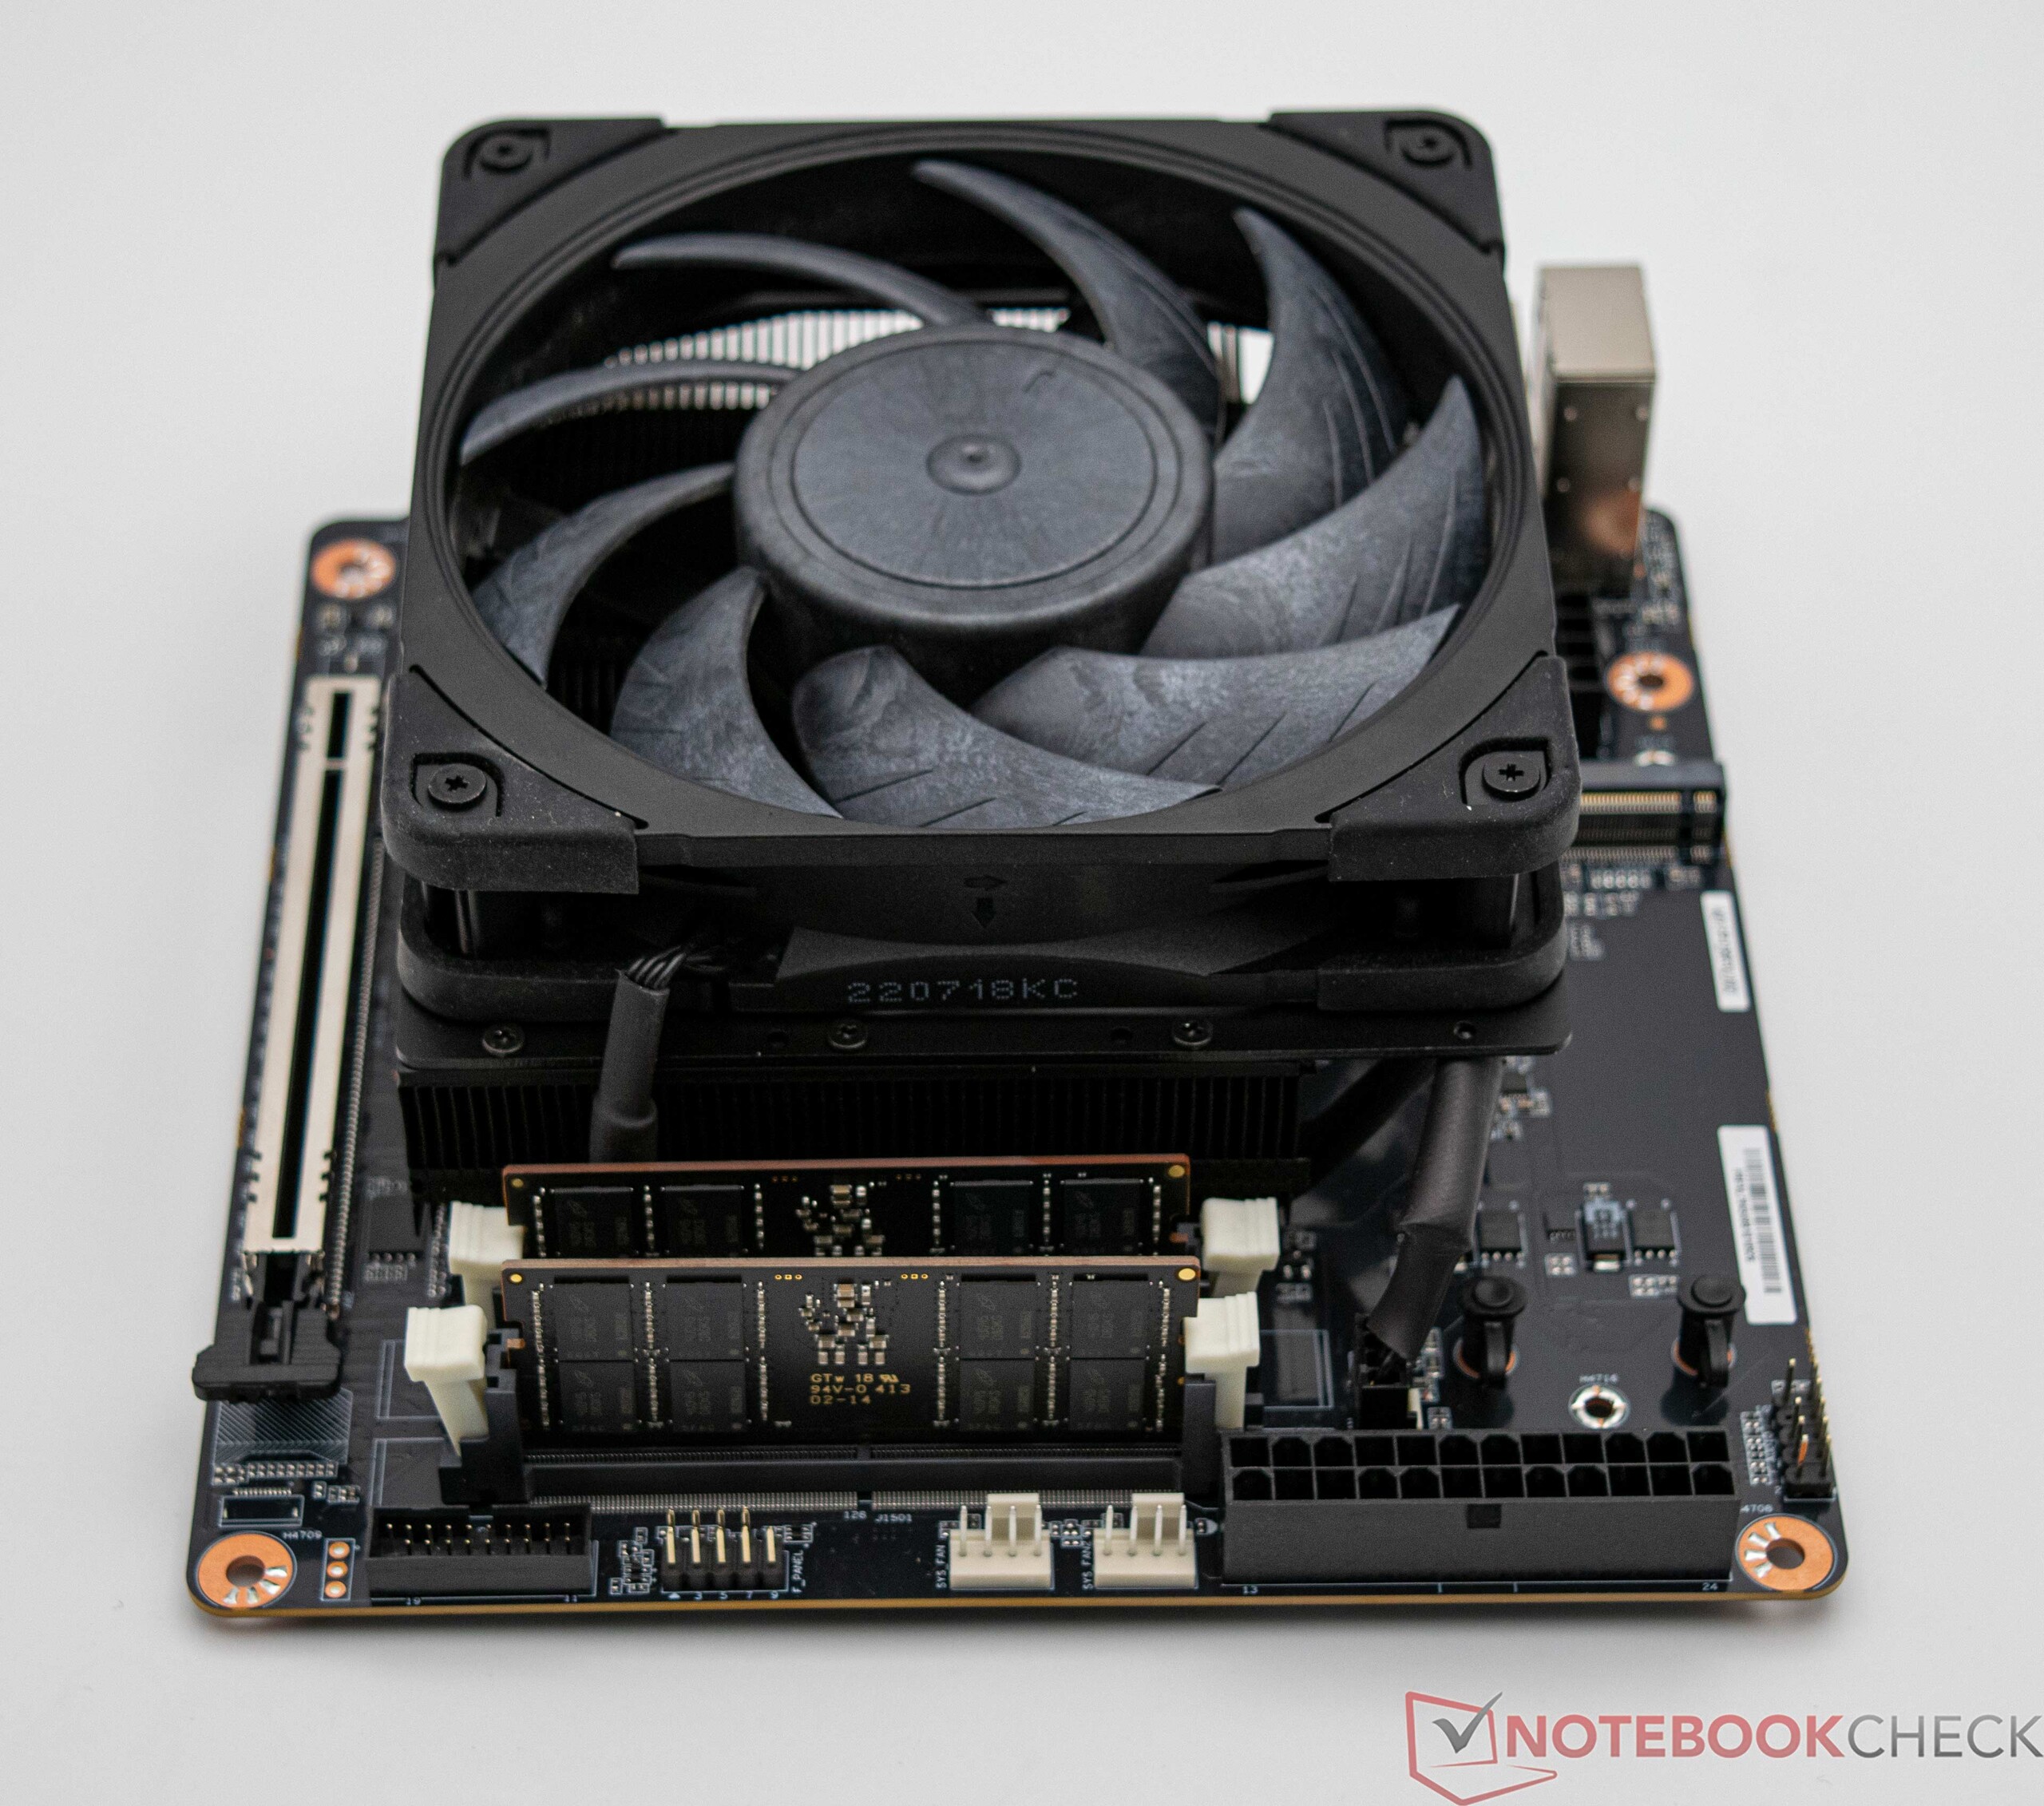
El volumen de suministro del Minisforum BD795i SE es casi idéntico al del BD790i. Viene con un refrigerador preinstalado que cubre la CPU y los convertidores de voltaje. También se incluye con la placa base un escudo IO (no preinstalado). Minisforum ha prescindido de la antena WLAN relativamente grande incluida con el BD790ihaciendo su caja algo más pequeña. No obstante, se incluye un soporte para instalar posteriormente un módulo WLAN. Al igual que en los sistemas barebone, al adquirir el Minisforum BD795i SE tendrá que encargarse usted mismo de la SSD, la RAM, la fuente de alimentación, la caja y un ventilador de 120 mm.
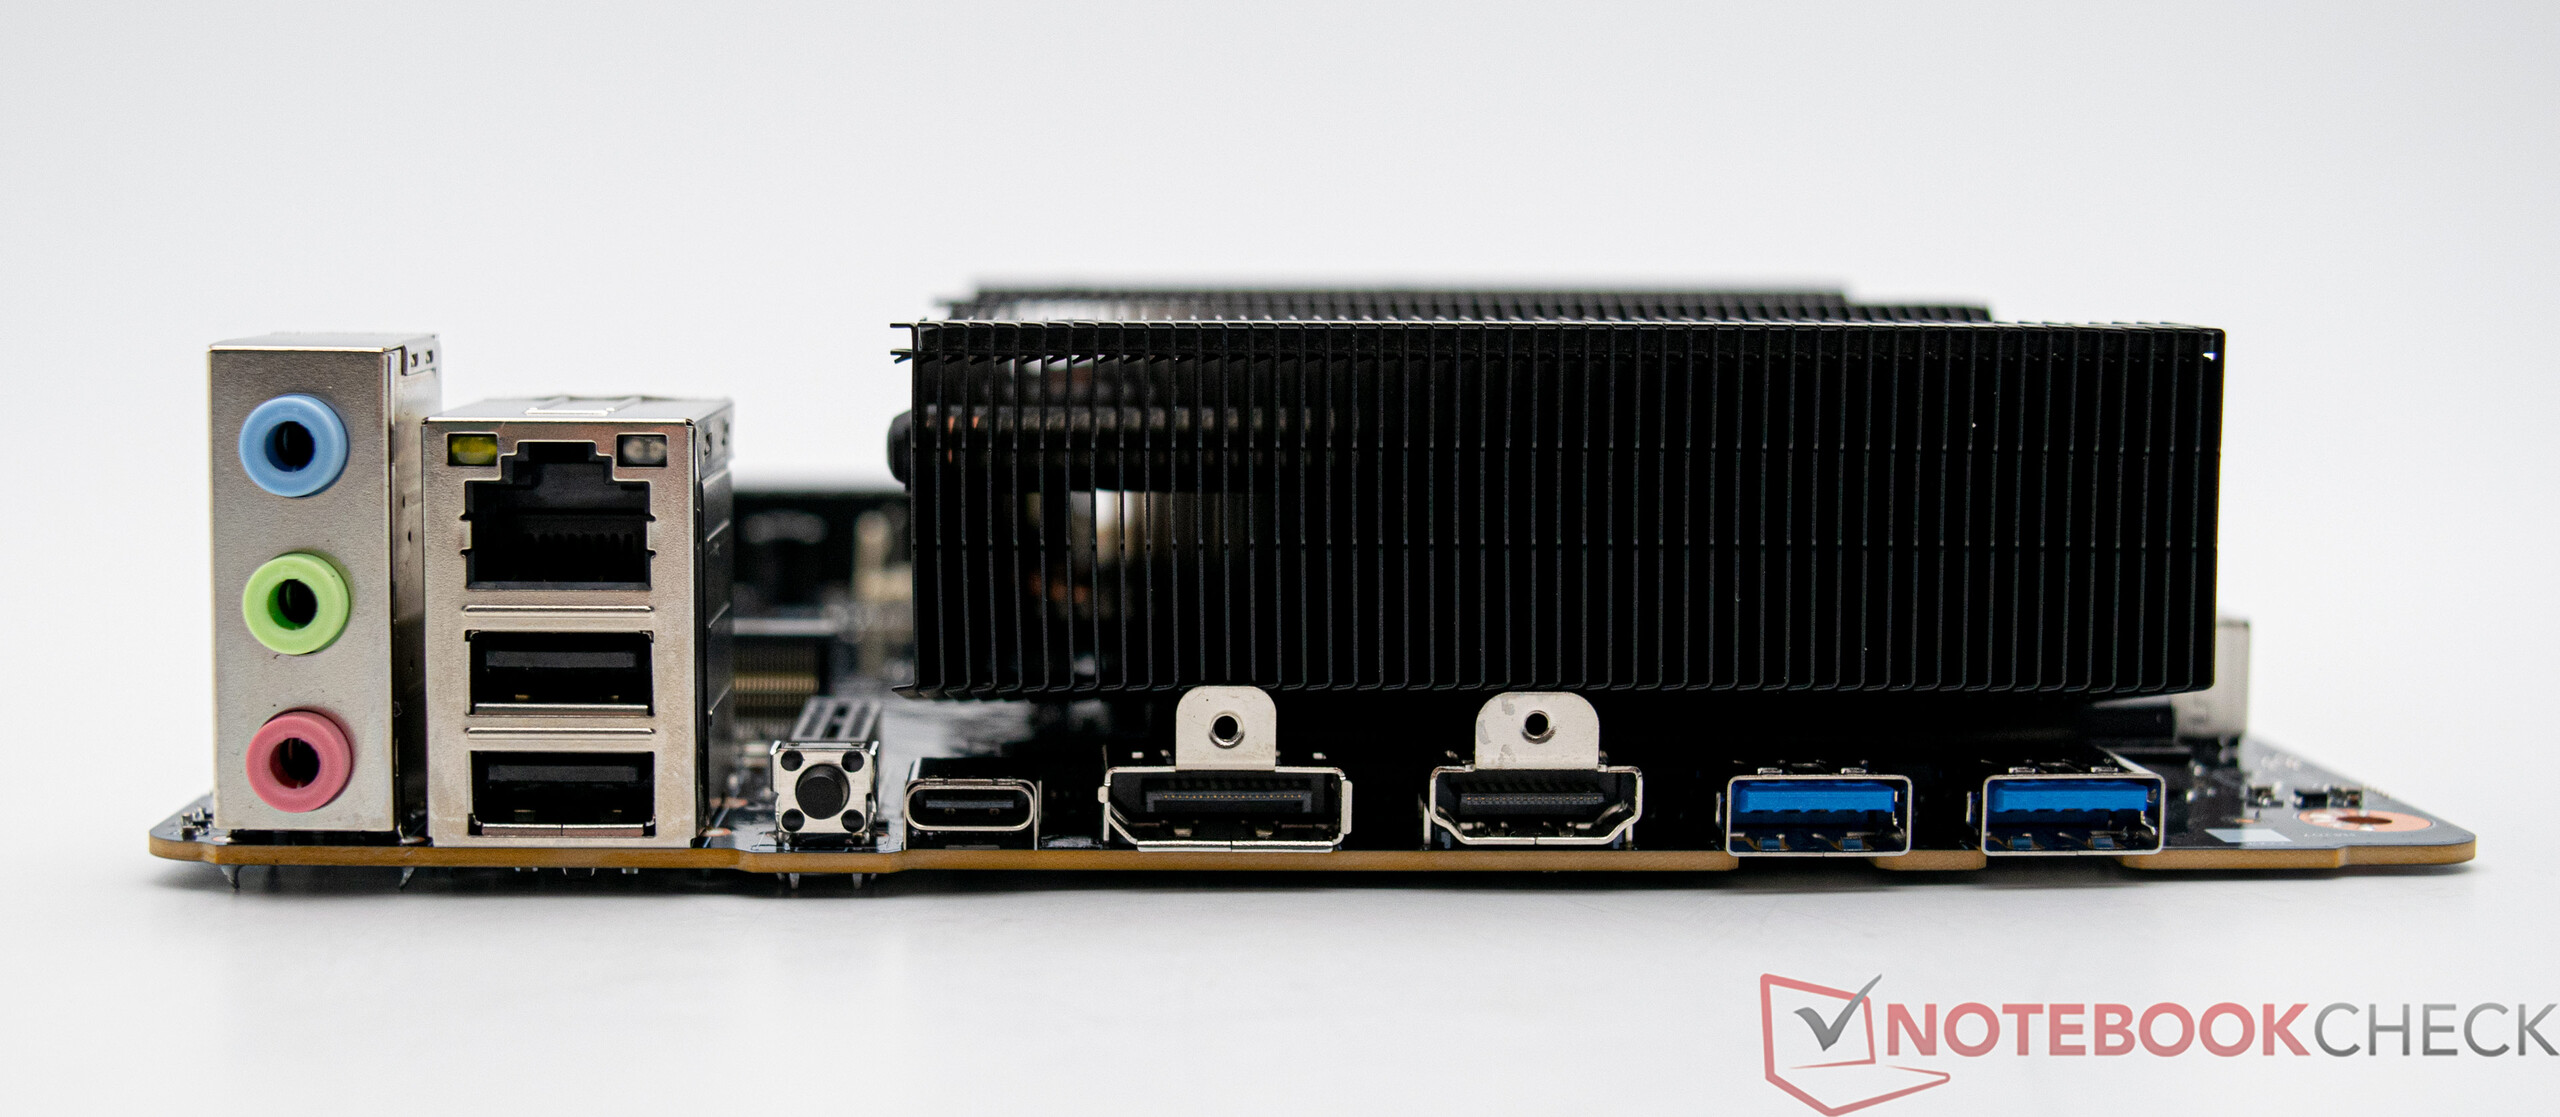
Su conectividad es bastante básica. Sólo hay unas pocas conexiones en la parte trasera, pero todos los puertos importantes están ahí. La placa también cuenta con un conector USB 3.2 interno, lo que significa que se pueden utilizar un total de seis puertos USB A. Se echan en falta otras conexiones como los cabezales ARGB o un conector USB-C adicional. No hay alternativa al disipador preinstalado, ya que no hay opción de montaje para disipadores más potentes; la refrigeración por separado de los convertidores de voltaje sería beneficiosa en este caso.
Condiciones de prueba
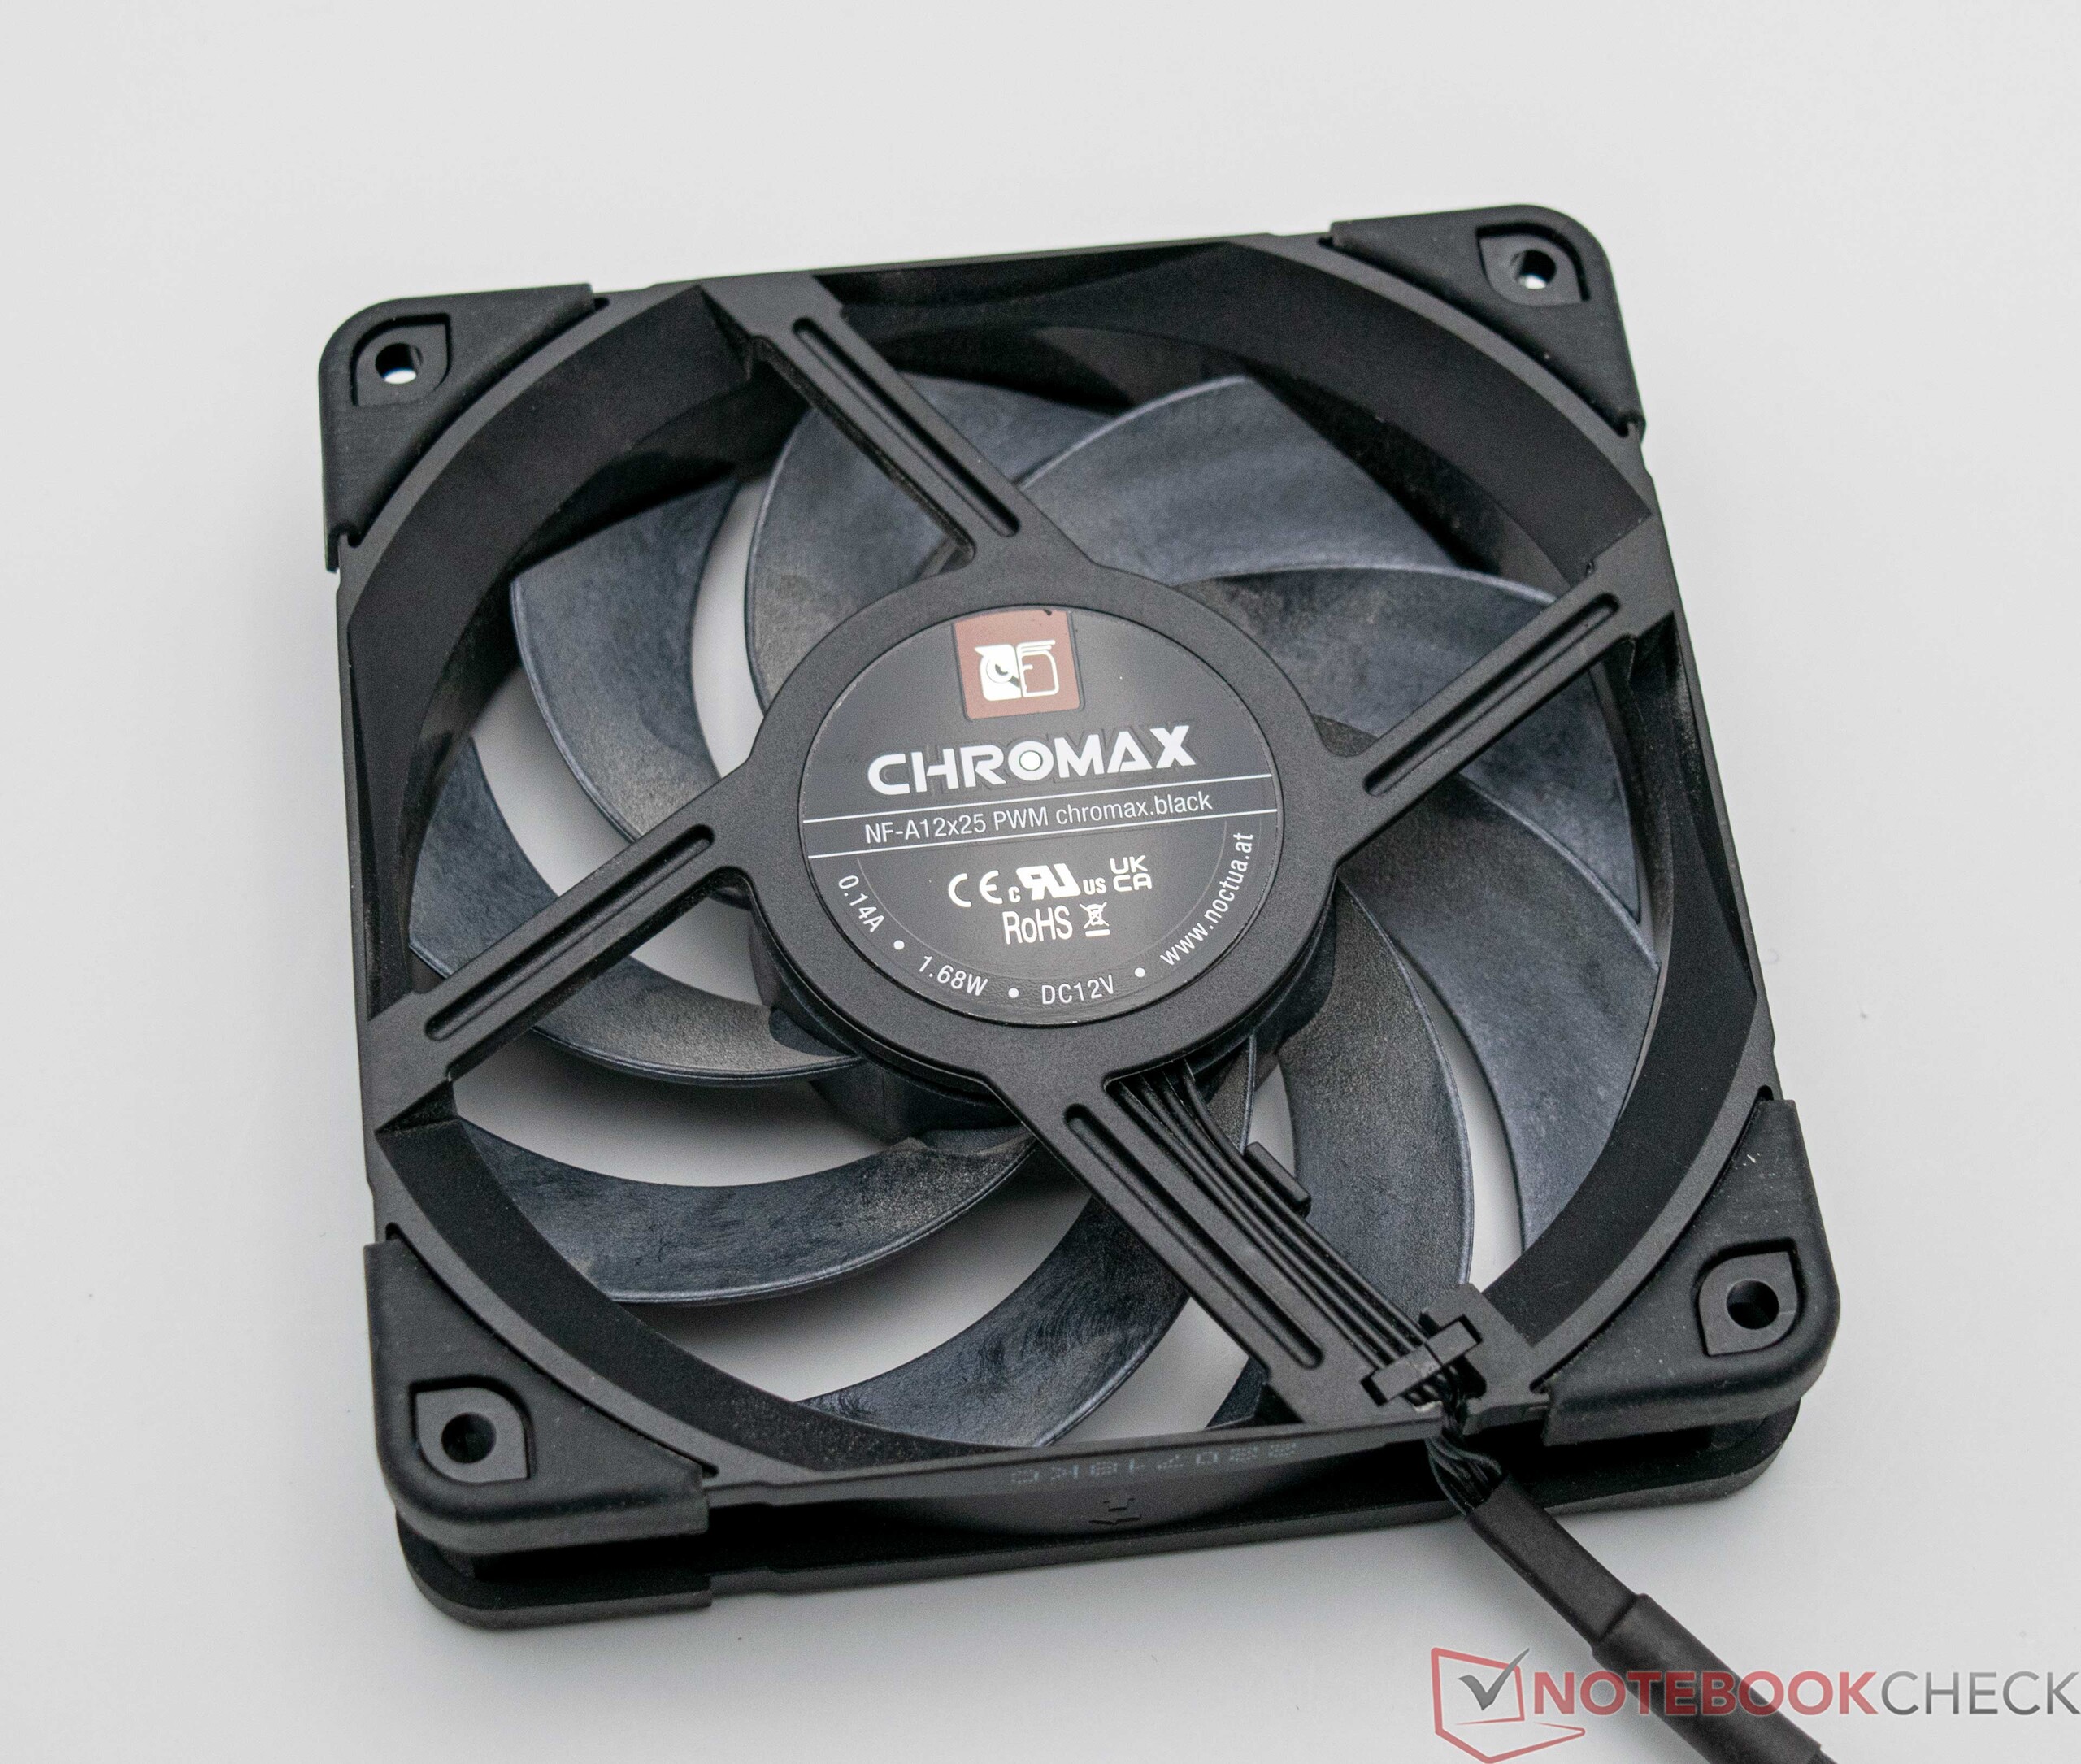
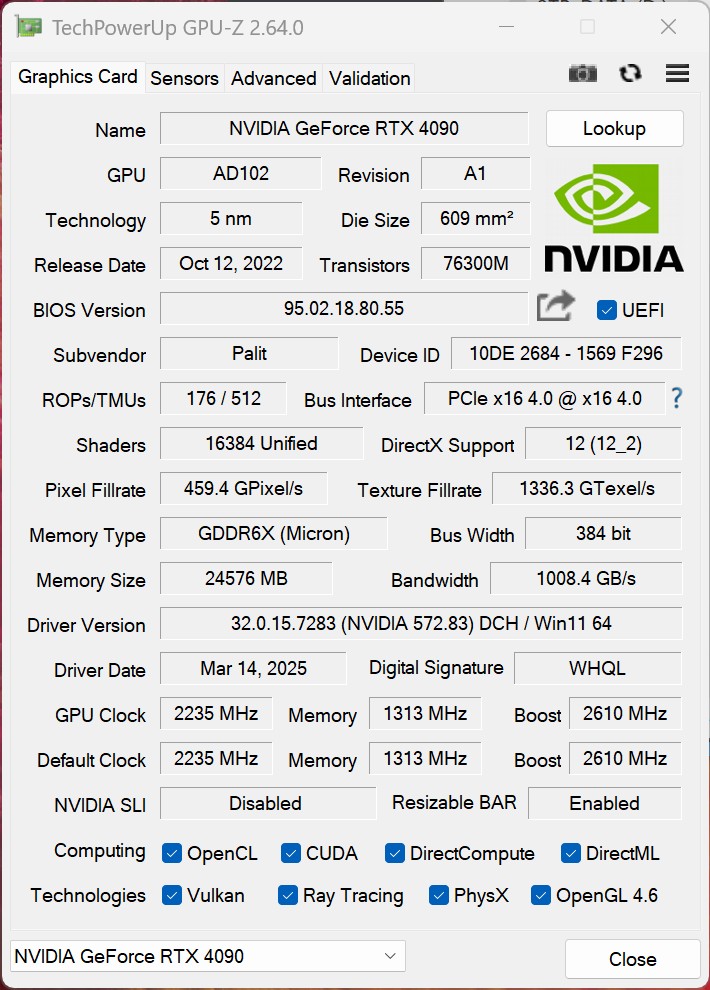
Realizamos todas las pruebas de rendimiento en una configuración abierta sobre una mesa de sobremesa Streacom BC1 V2. Utilizamos un Noctua NF-A12x25 como ventilador, y usamos nuestro Palit GeForce RTX 4090 Gamerock OC para las pruebas de juegos en combinación con una tarjeta gráfica dedicada.
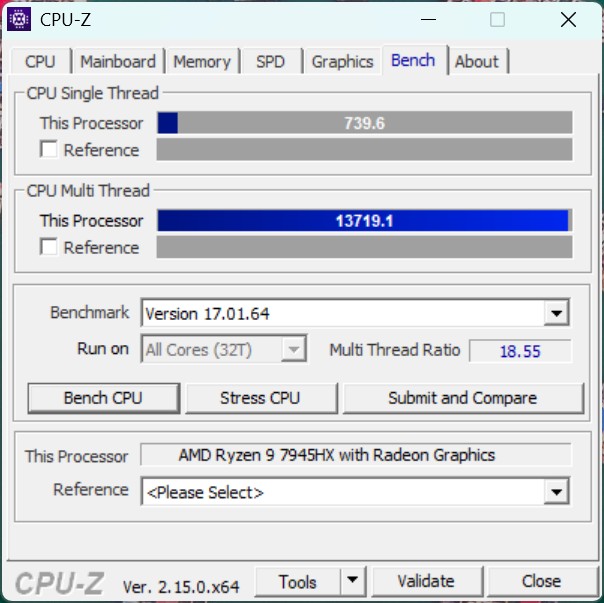
Puntos de referencia del procesador
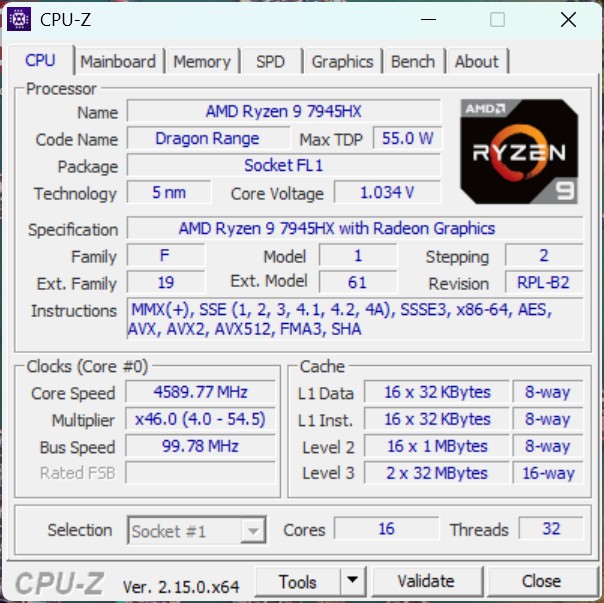
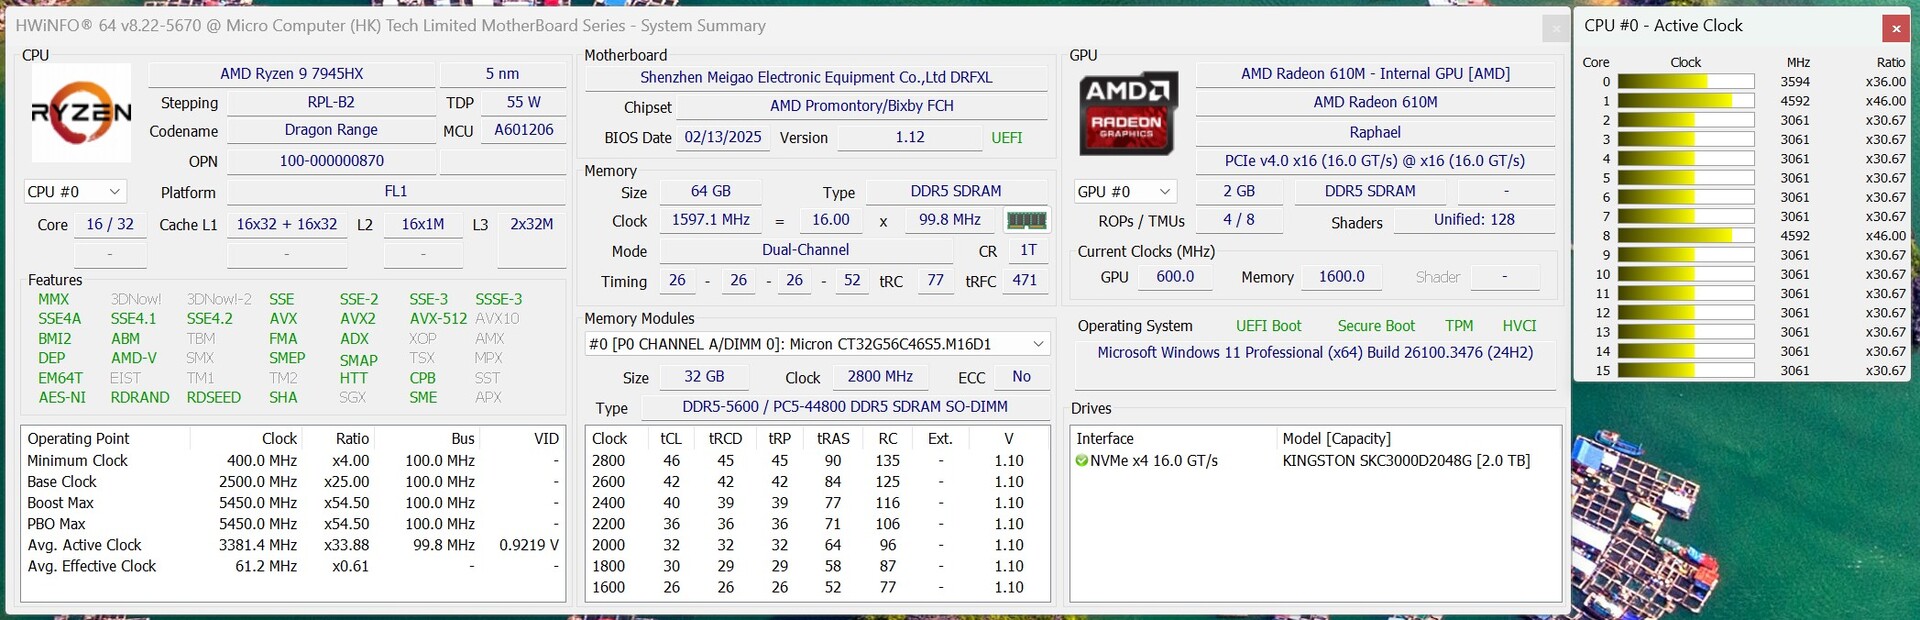
El Minisforum BD795i SE está equipado con el potente AMD Ryzen 9 7945HXun procesador para portátiles con 16 núcleos Zen4 y 32 hilos. Durante nuestras pruebas, su rendimiento se situó entre el AMD Ryzen 9 7900X y el AMD Ryzen 9 7950X y fue comparable al Intel Core i7-14700K. Una gran ventaja sobre las CPU de sobremesa es su eficiencia: con sólo 100 vatios, es más frugal y es significativamente más fácil de refrigerar.
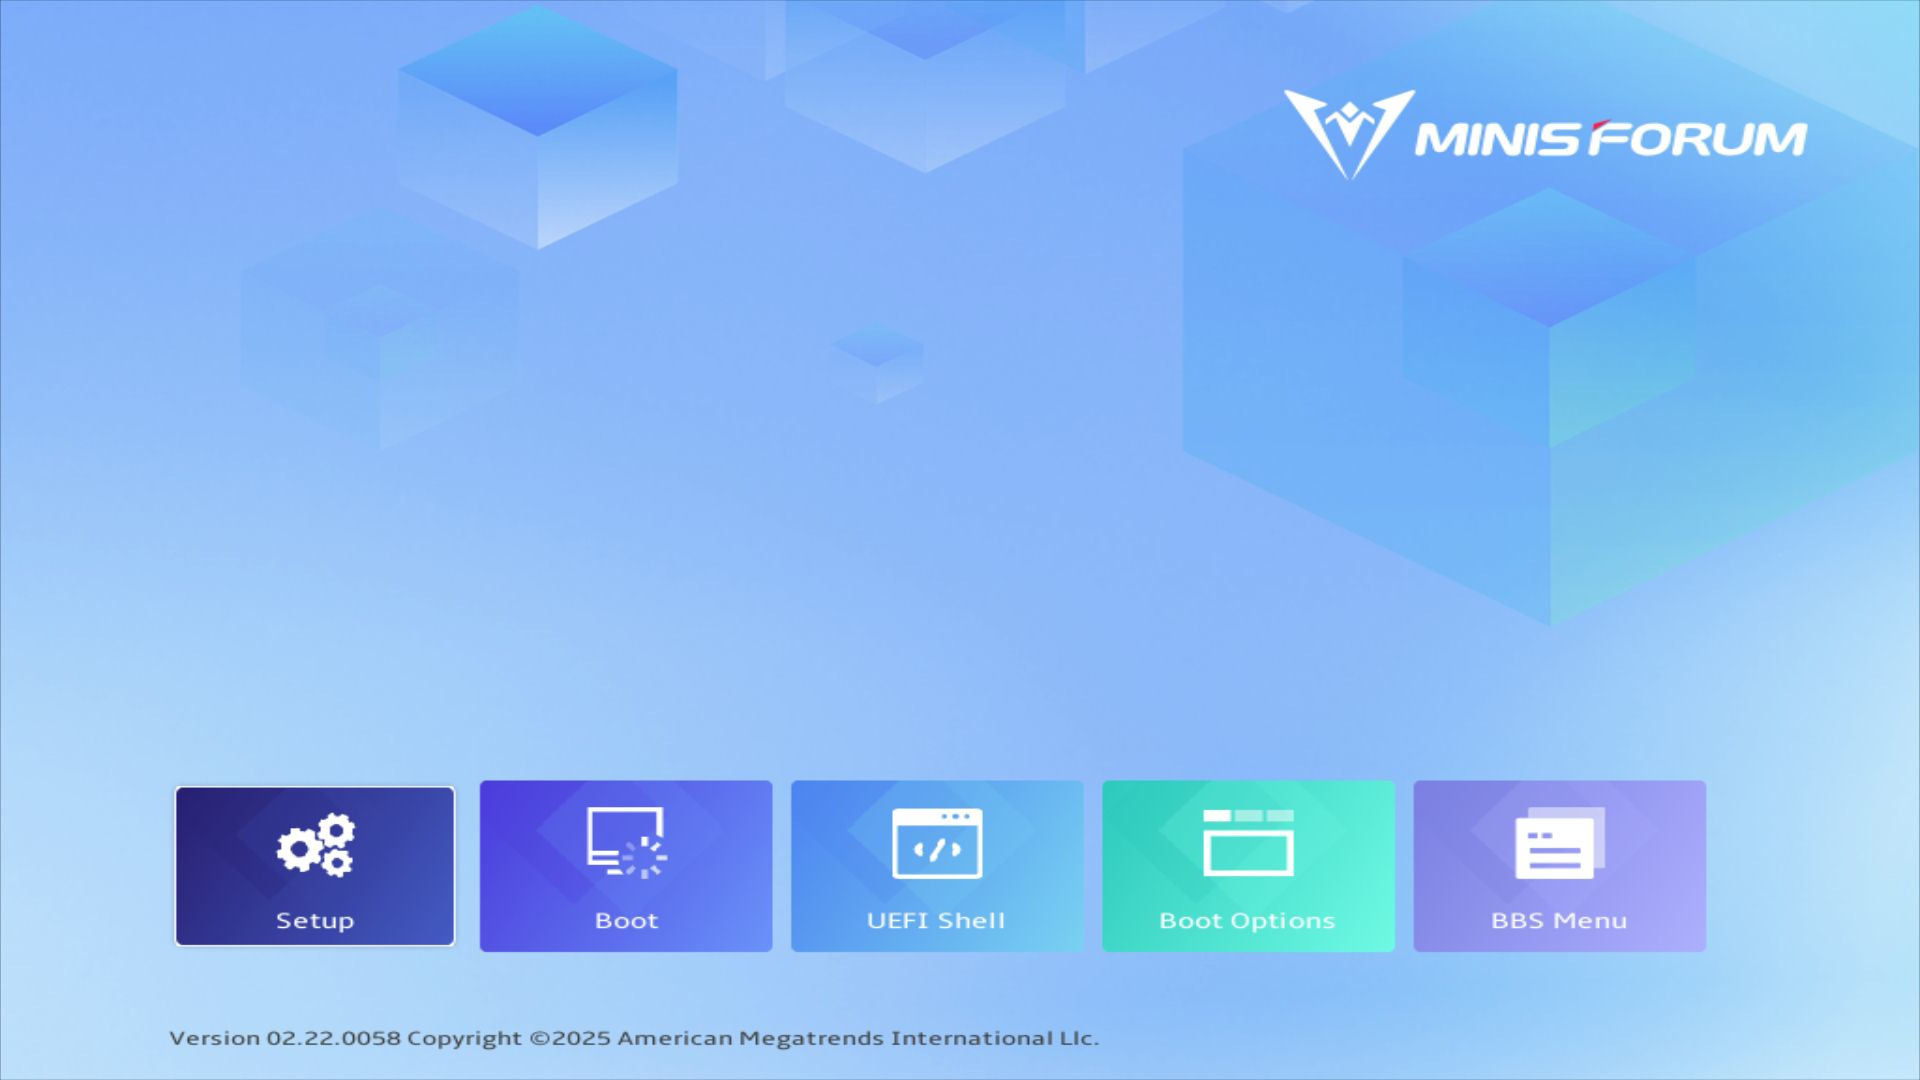
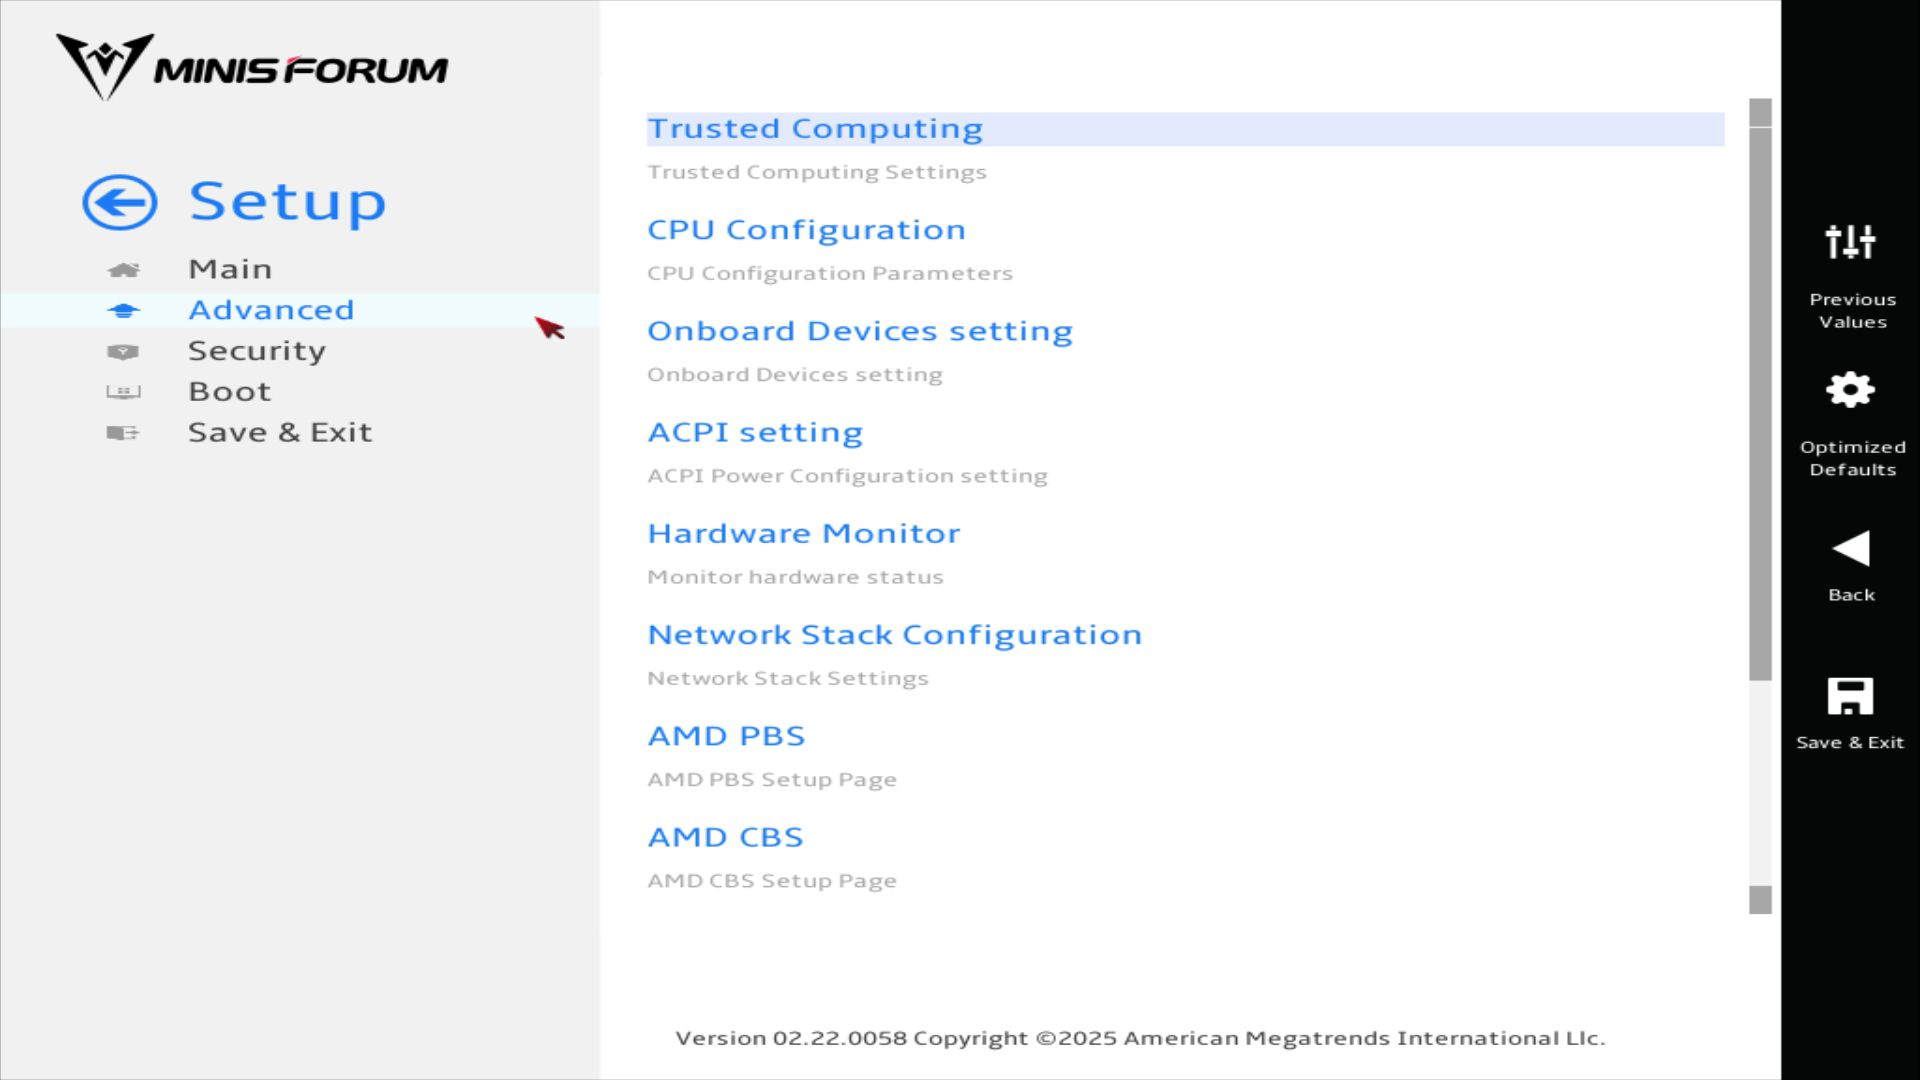
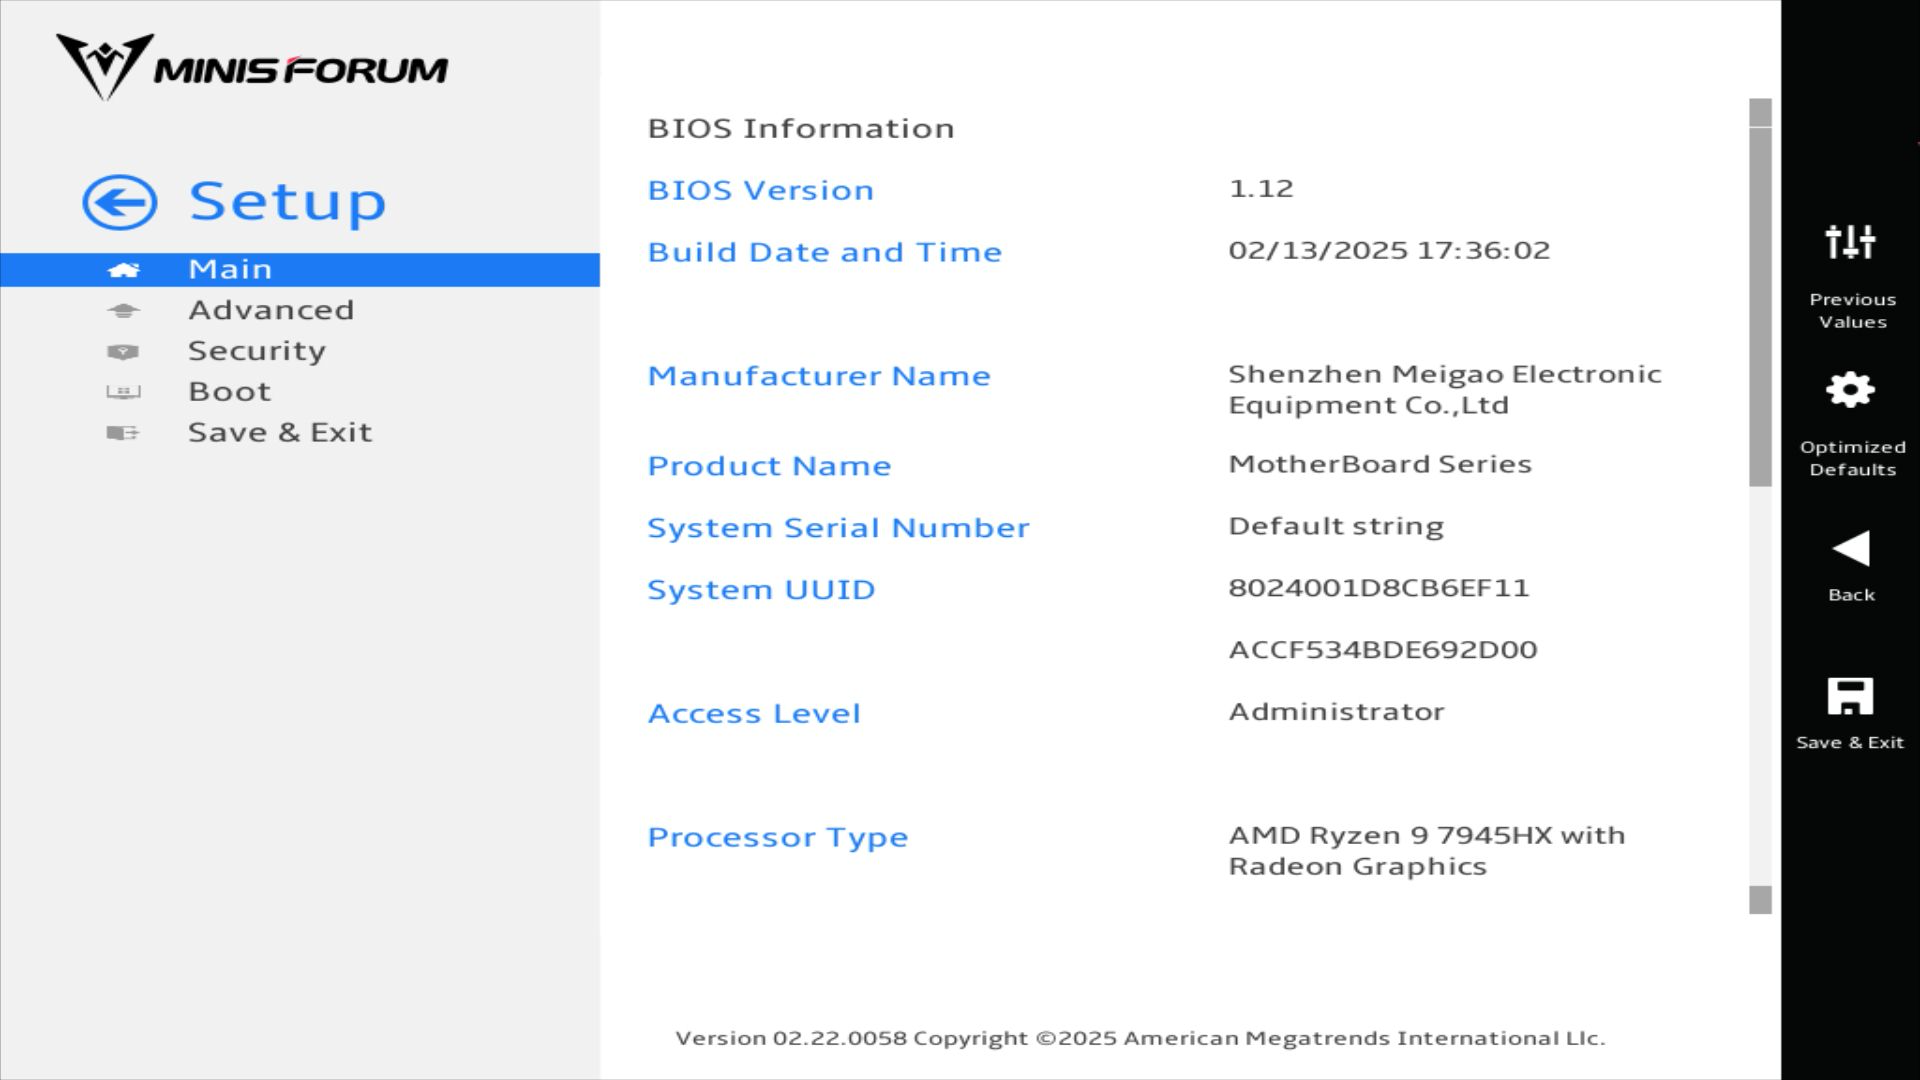
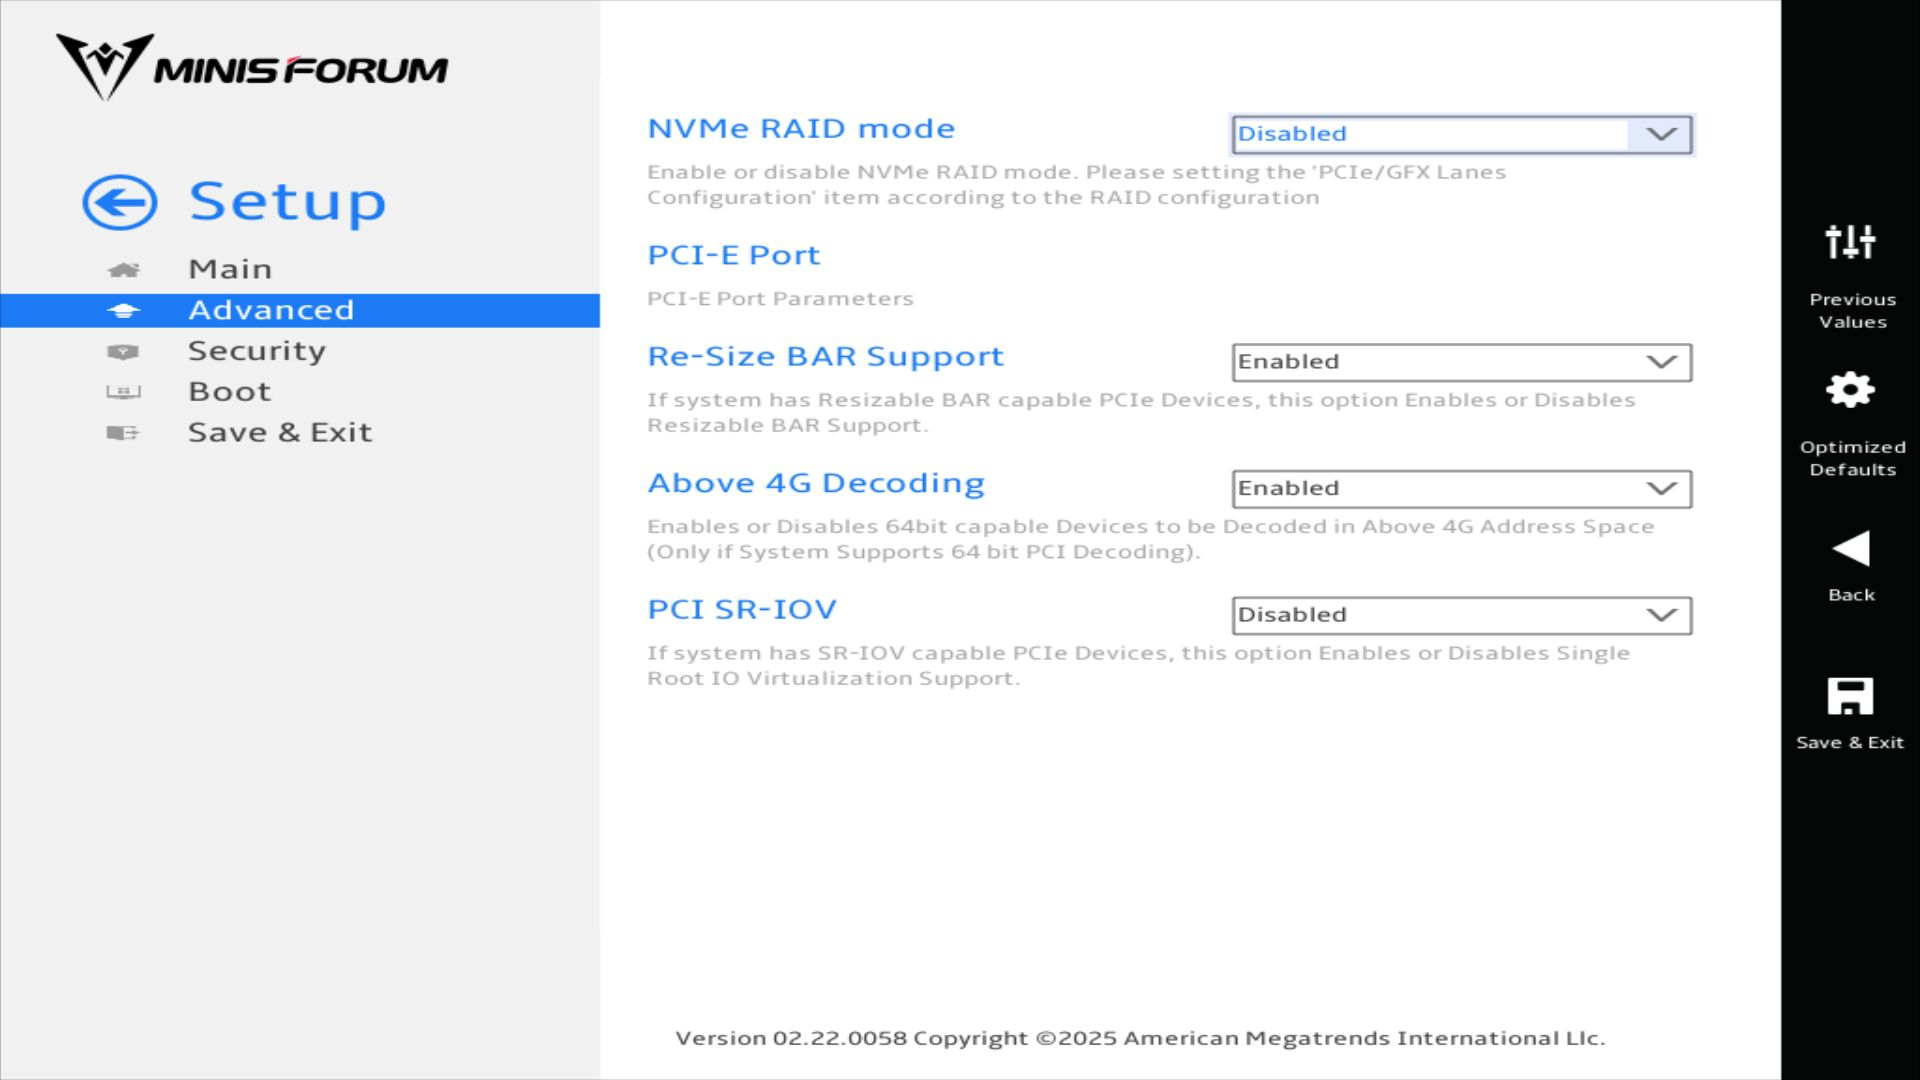
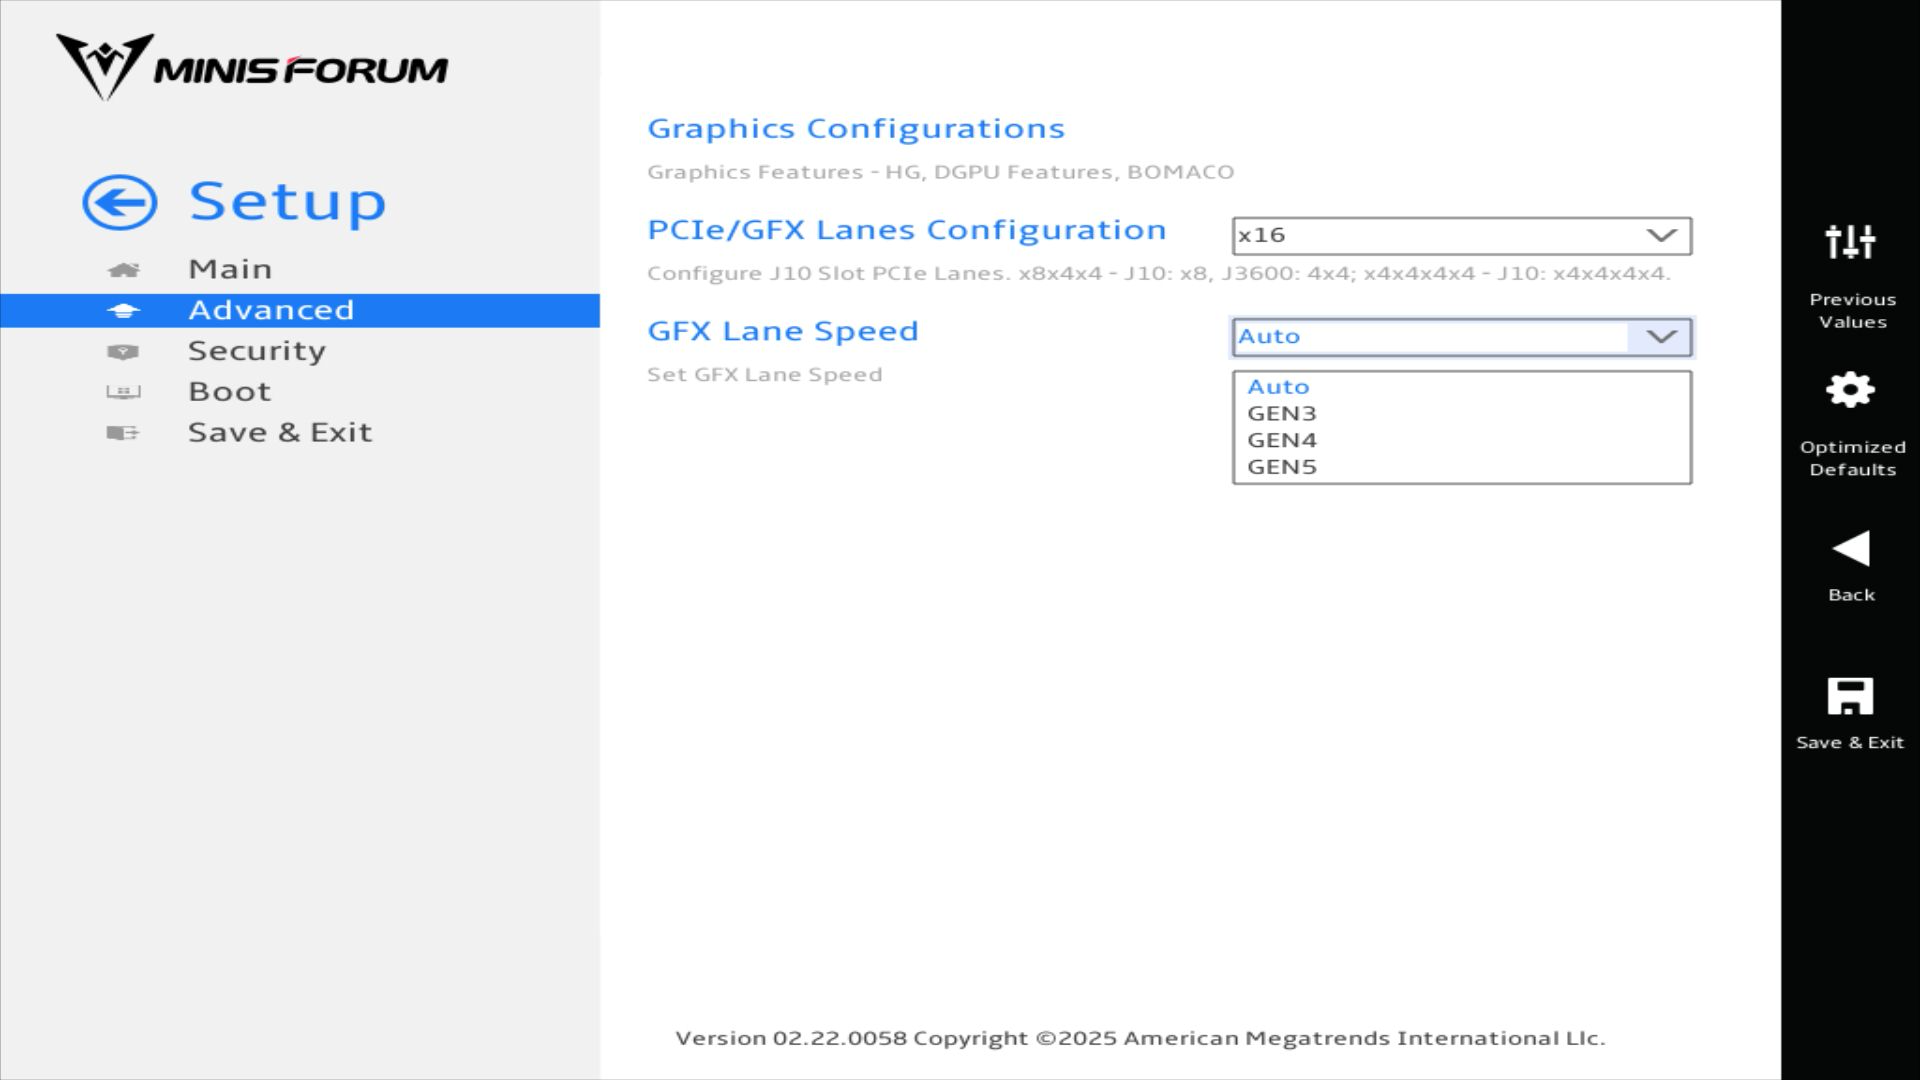
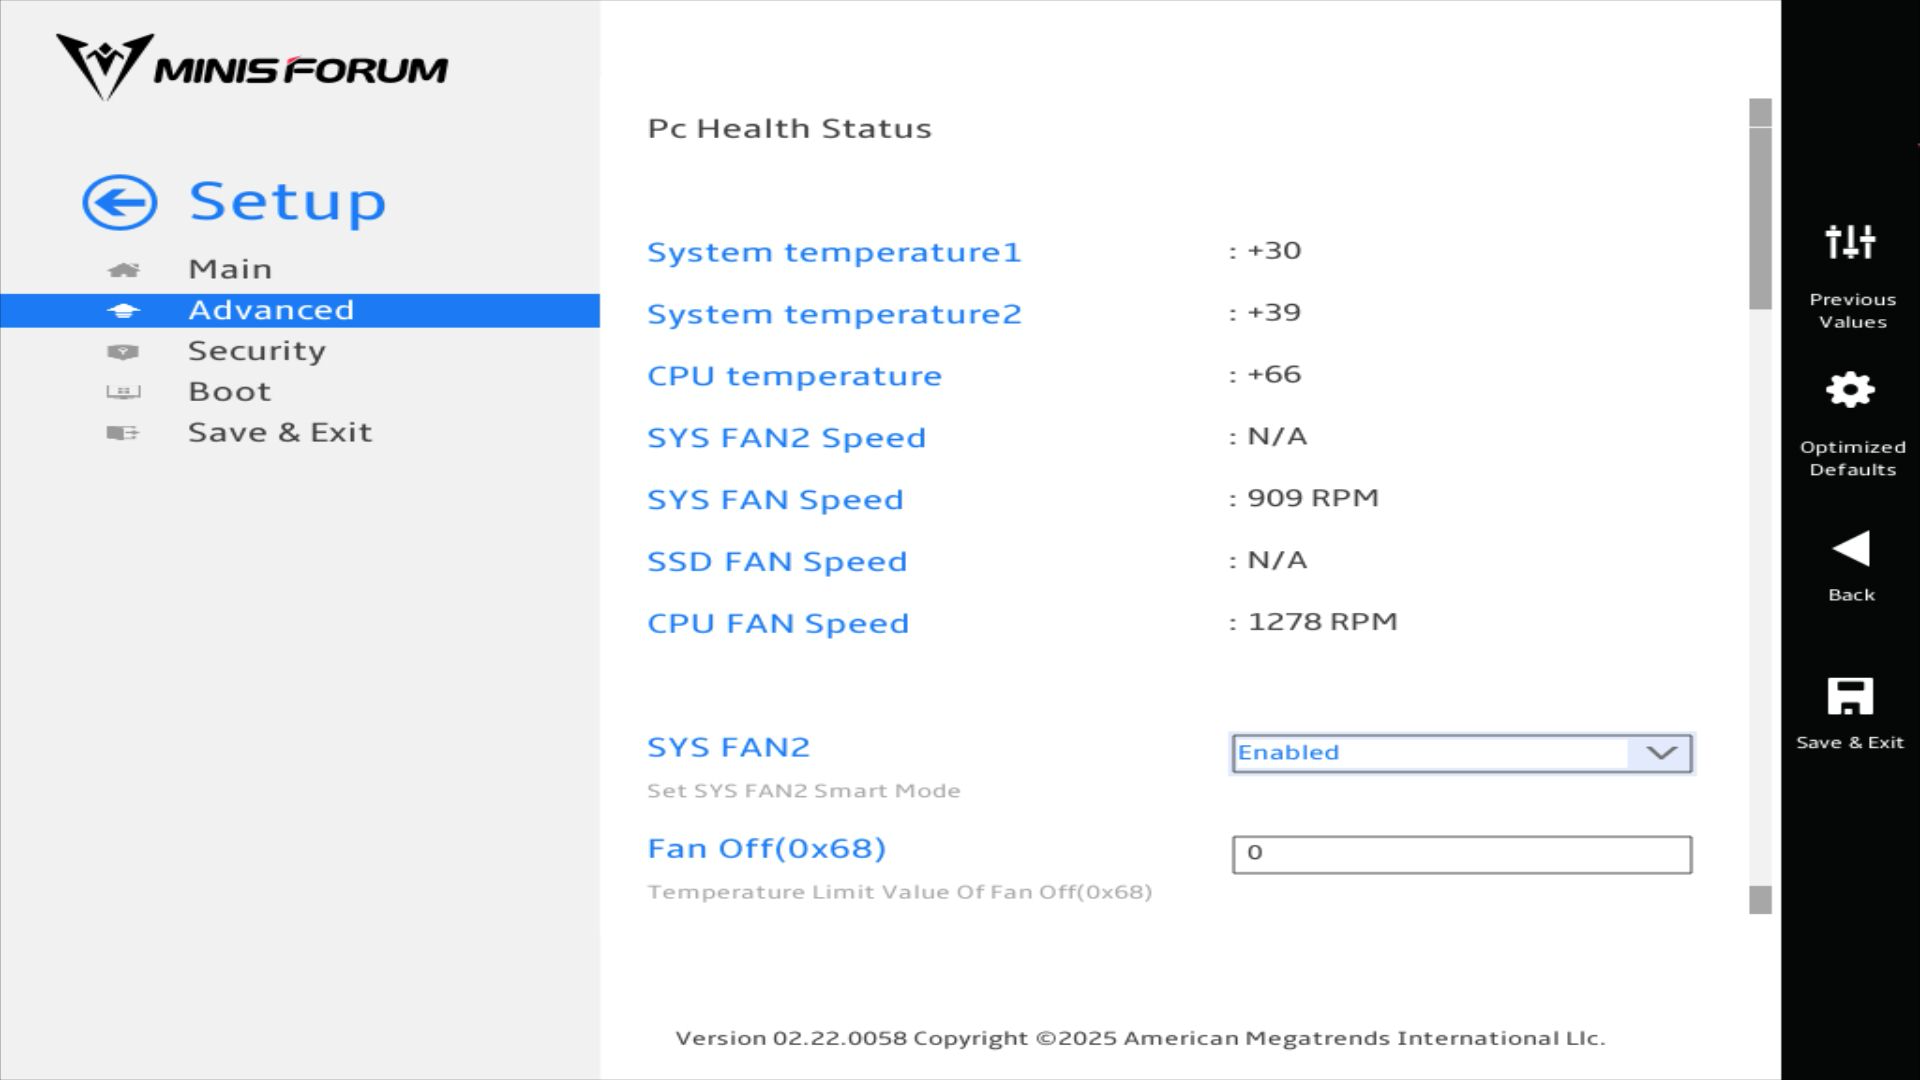
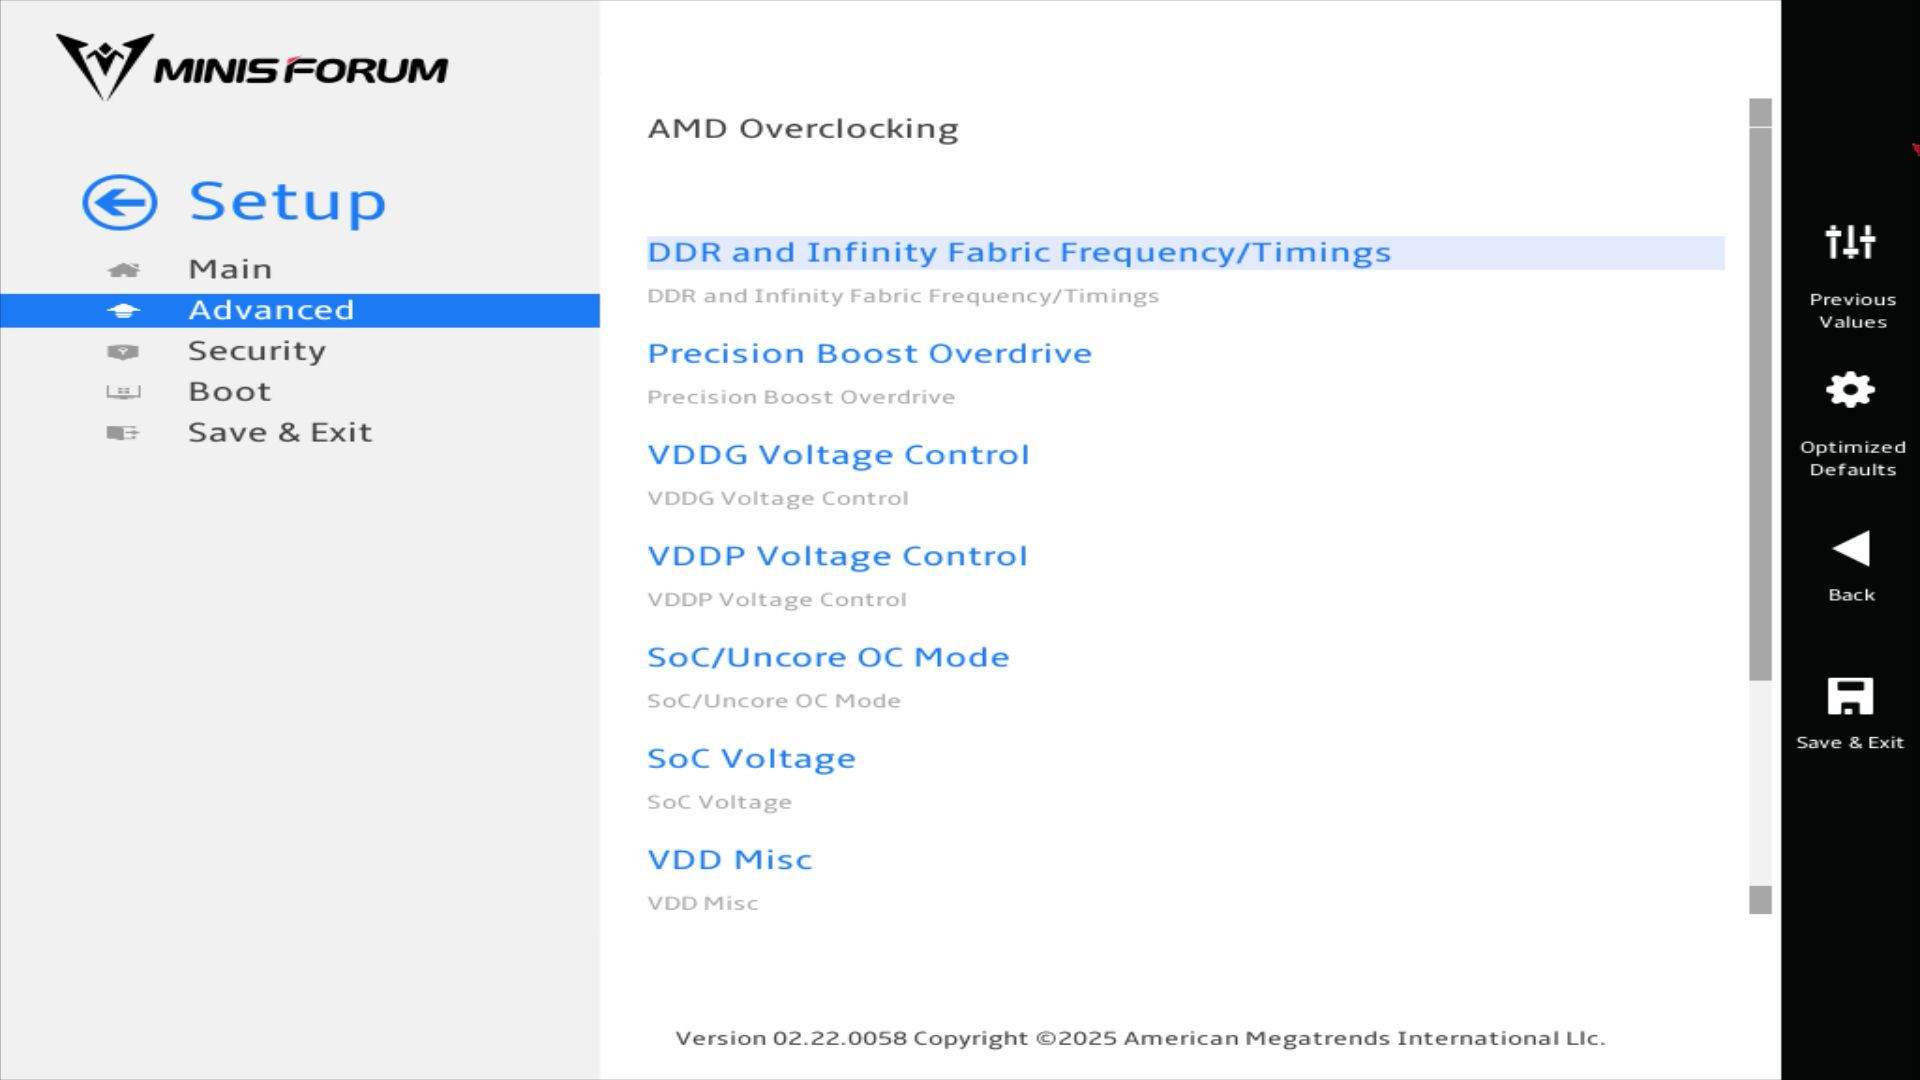
Opciones UEFI
* ... más pequeño es mejor
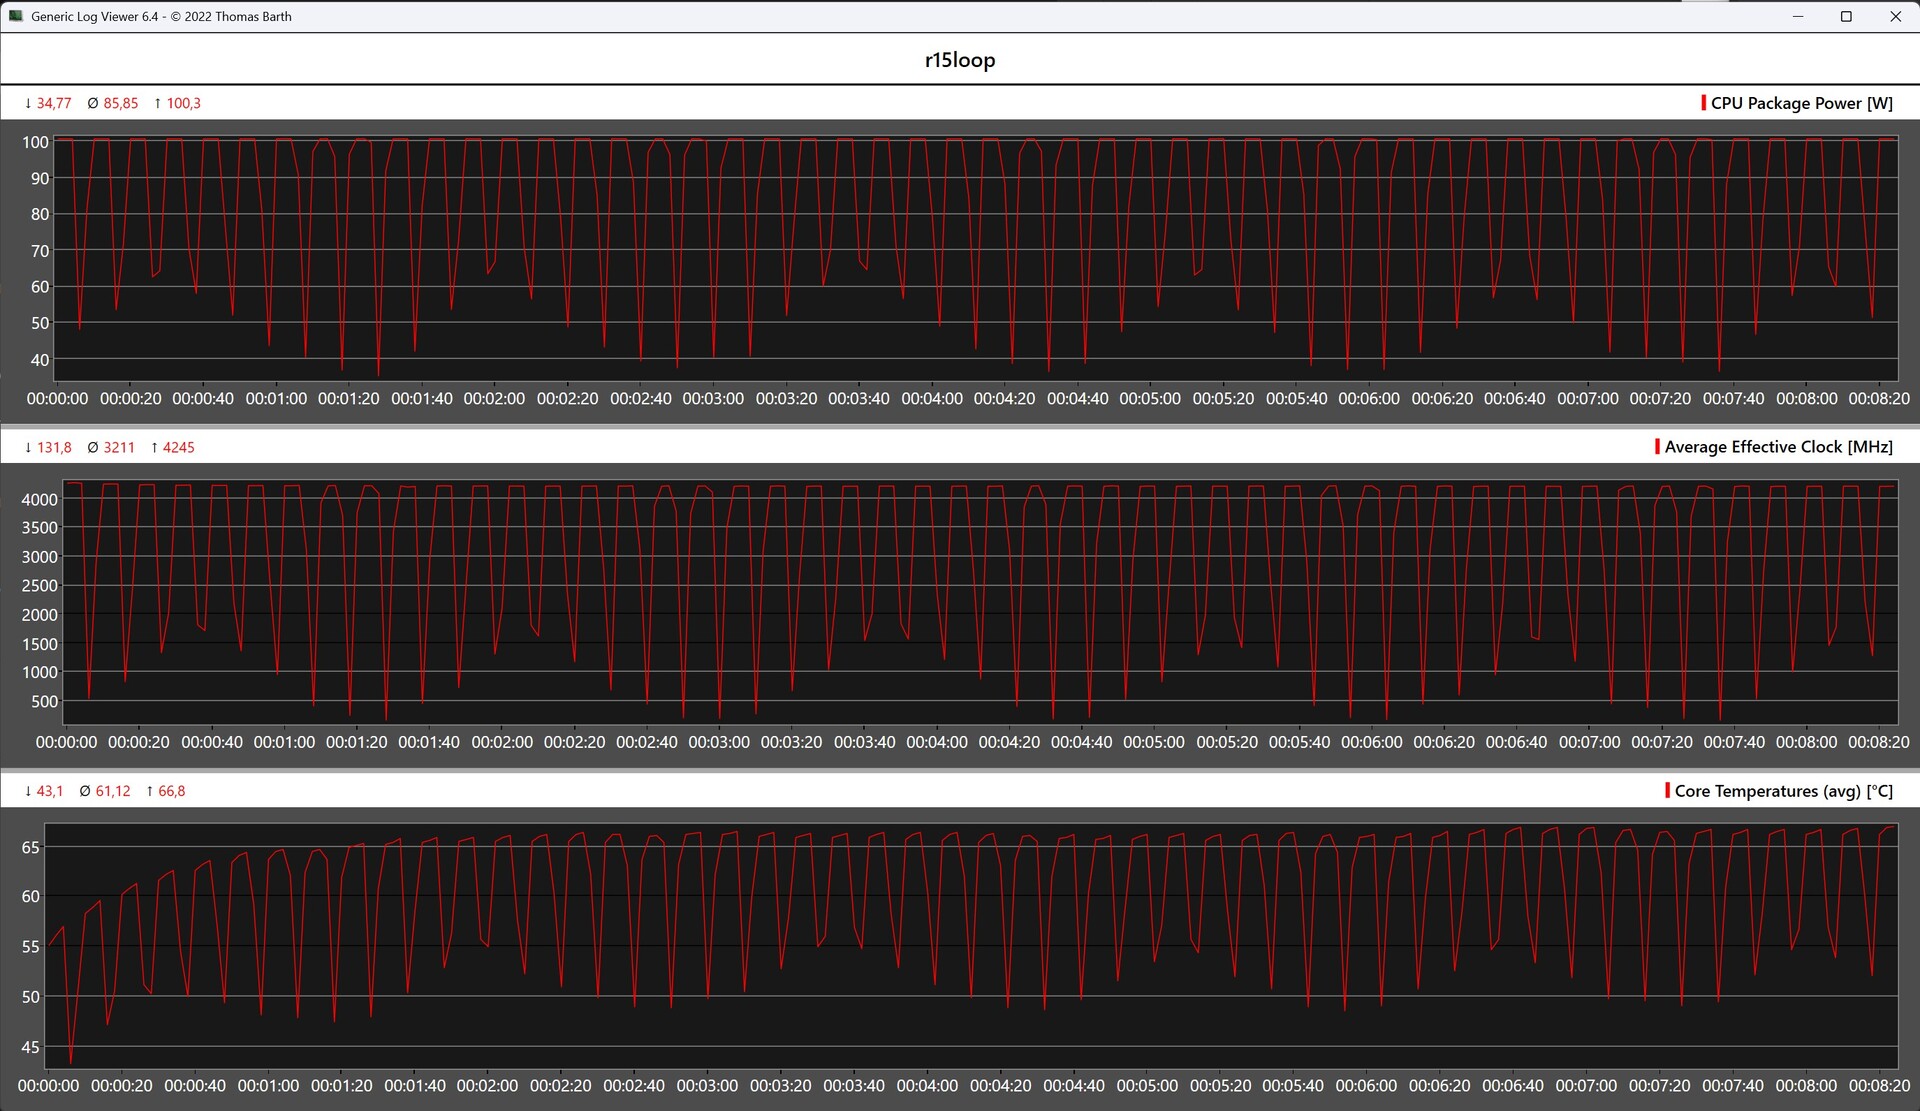
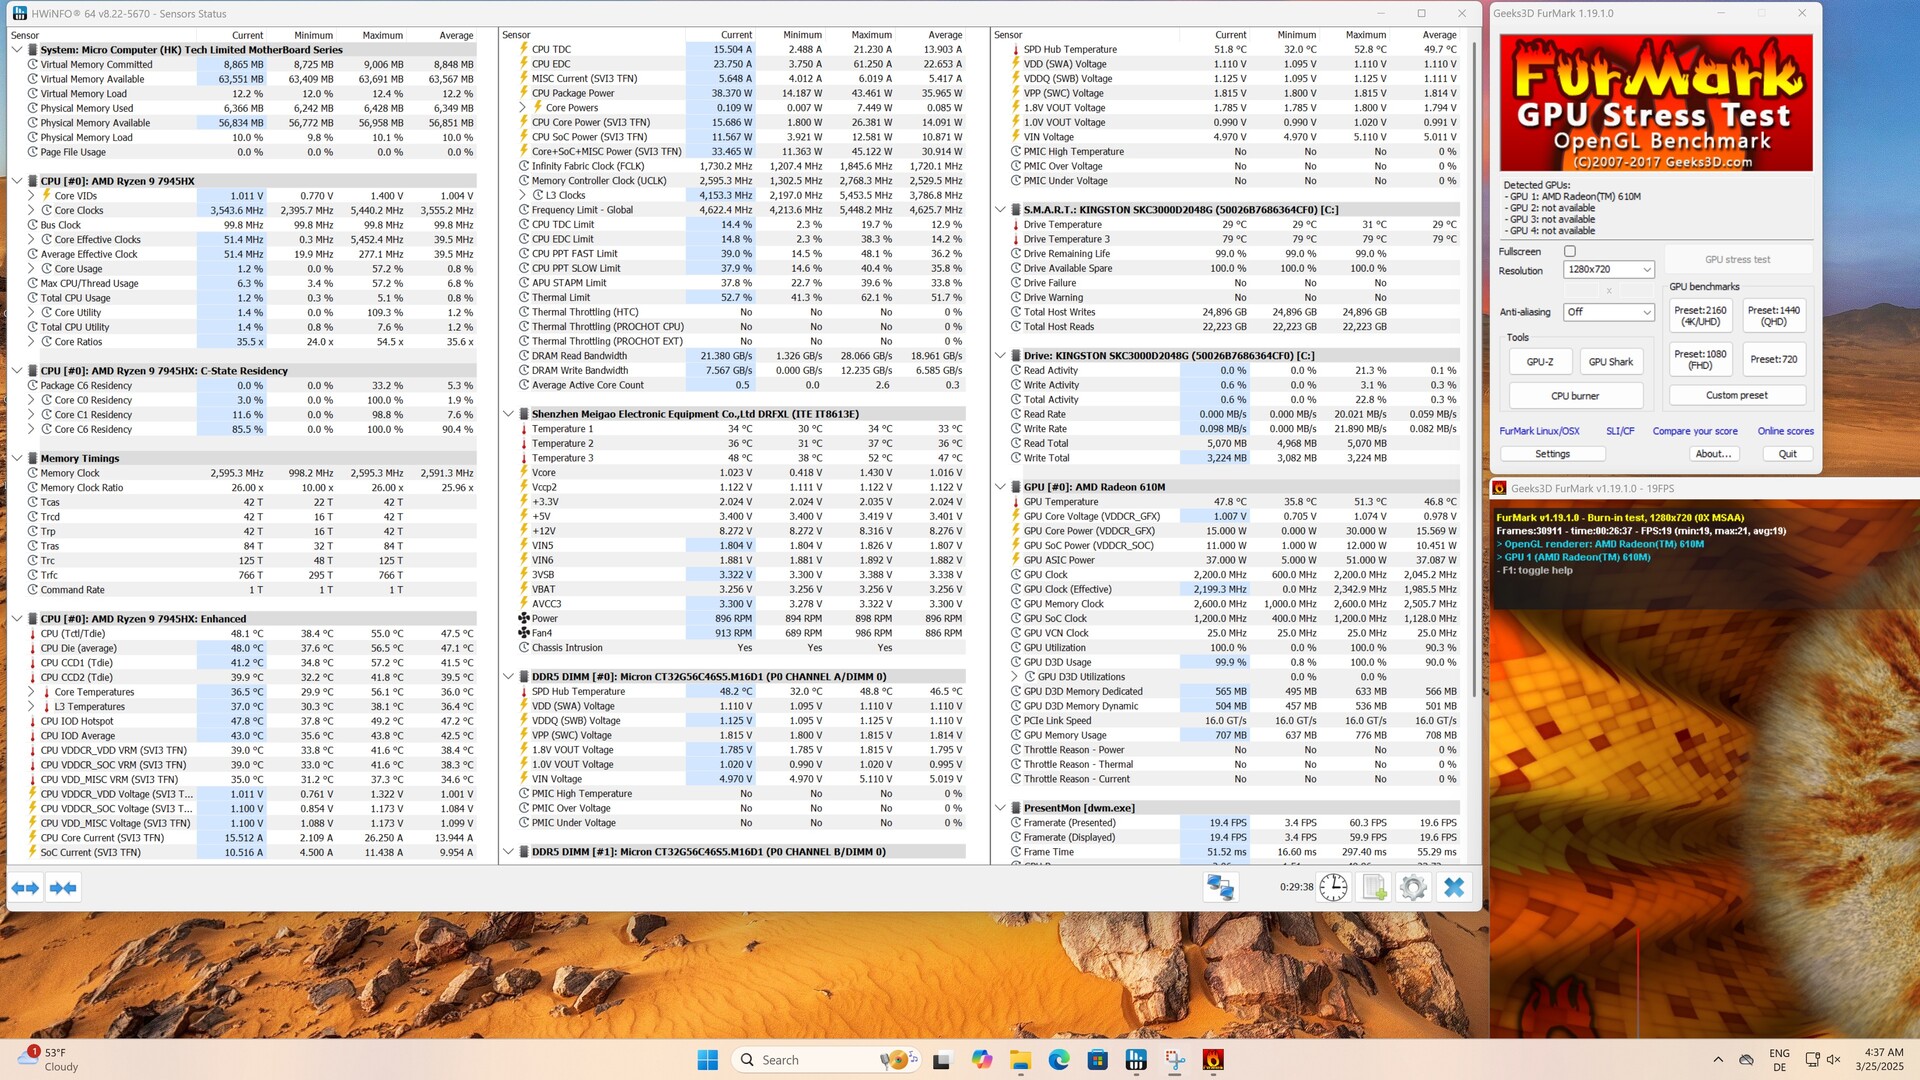
Resultados de Cinebench AMD Ryzen 9 7945HX
En combinación con su AMD Ryzen 9 7945HX, el Minisforum BD795i SE dominó sin problemas el bucle continuo Cinebench R15. El rendimiento del procesador de 16 núcleos se mantuvo estable a lo largo de 50 ejecuciones sin ninguna caída bajo carga continua. El refrigerador instalado de fábrica en combinación con el ventilador de 120 milímetros de Noctua garantizaron una refrigeración eficaz.
Rendimiento del sistema
Durante las pruebas comparativas de rendimiento del sistema, nuestro sistema de pruebas con el Minisforum BD795i SE no pudo seguir el ritmo de la competencia todo el tiempo, pero se mantuvo a un alto nivel en general. El eficiente AMD Ryzen 9 7945HX no muestra debilidades durante el uso diario y, gracias a su rápida SSD NVMe y a la RAM DDR5, puede incluso asumir tareas exigentes sin problemas.
* ... más pequeño es mejor
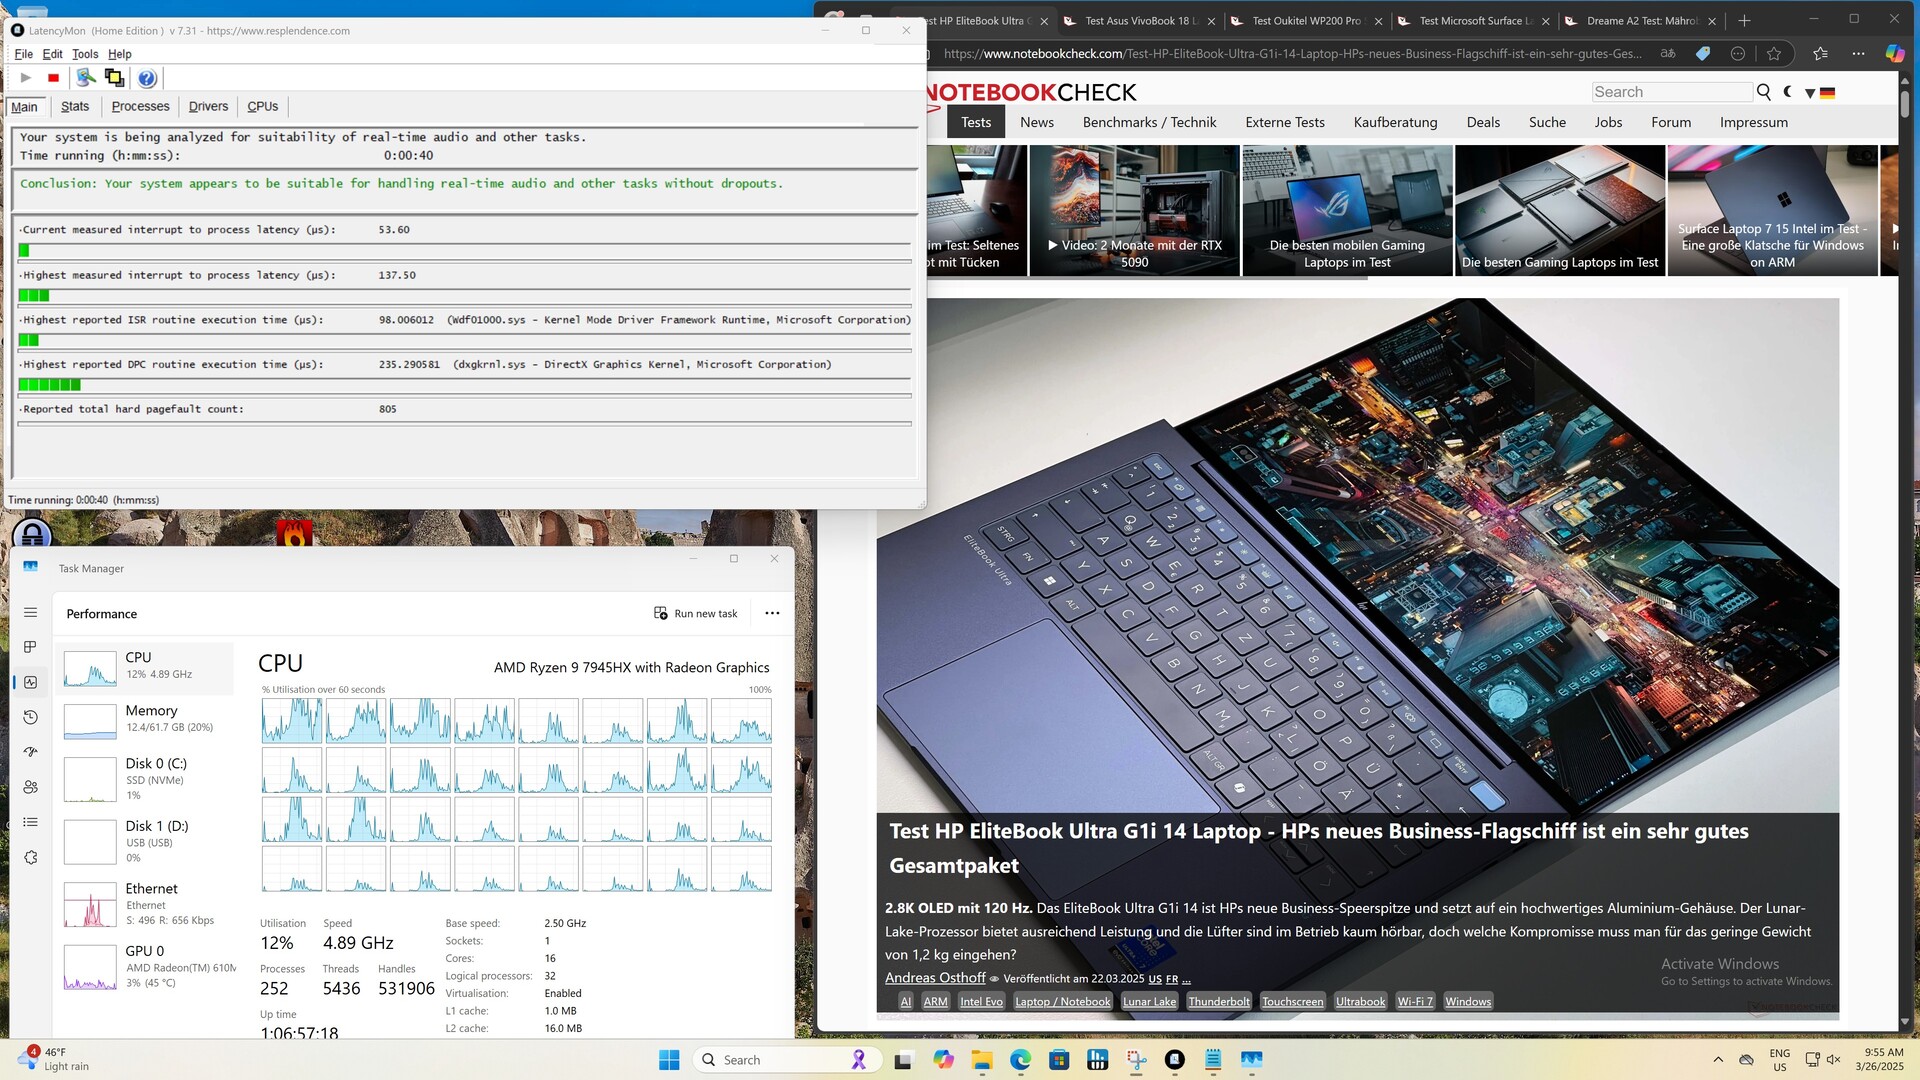
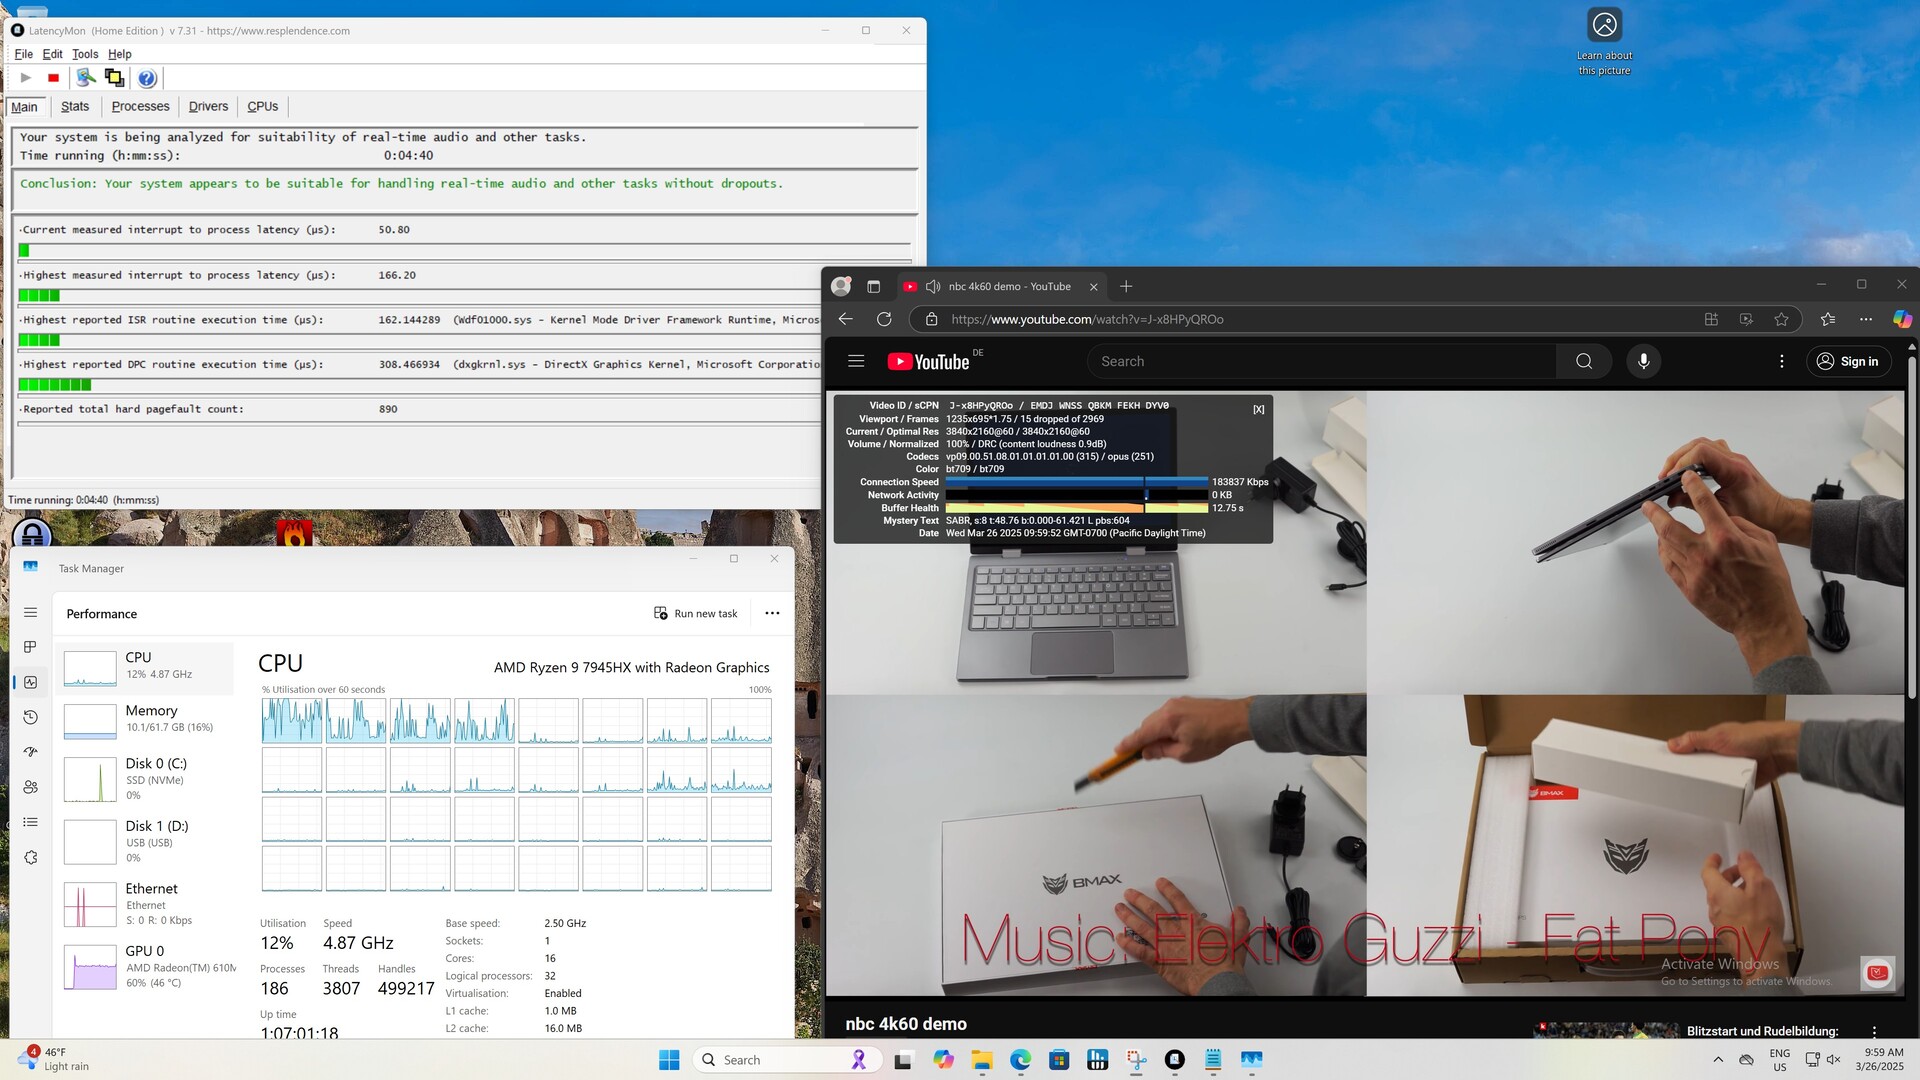
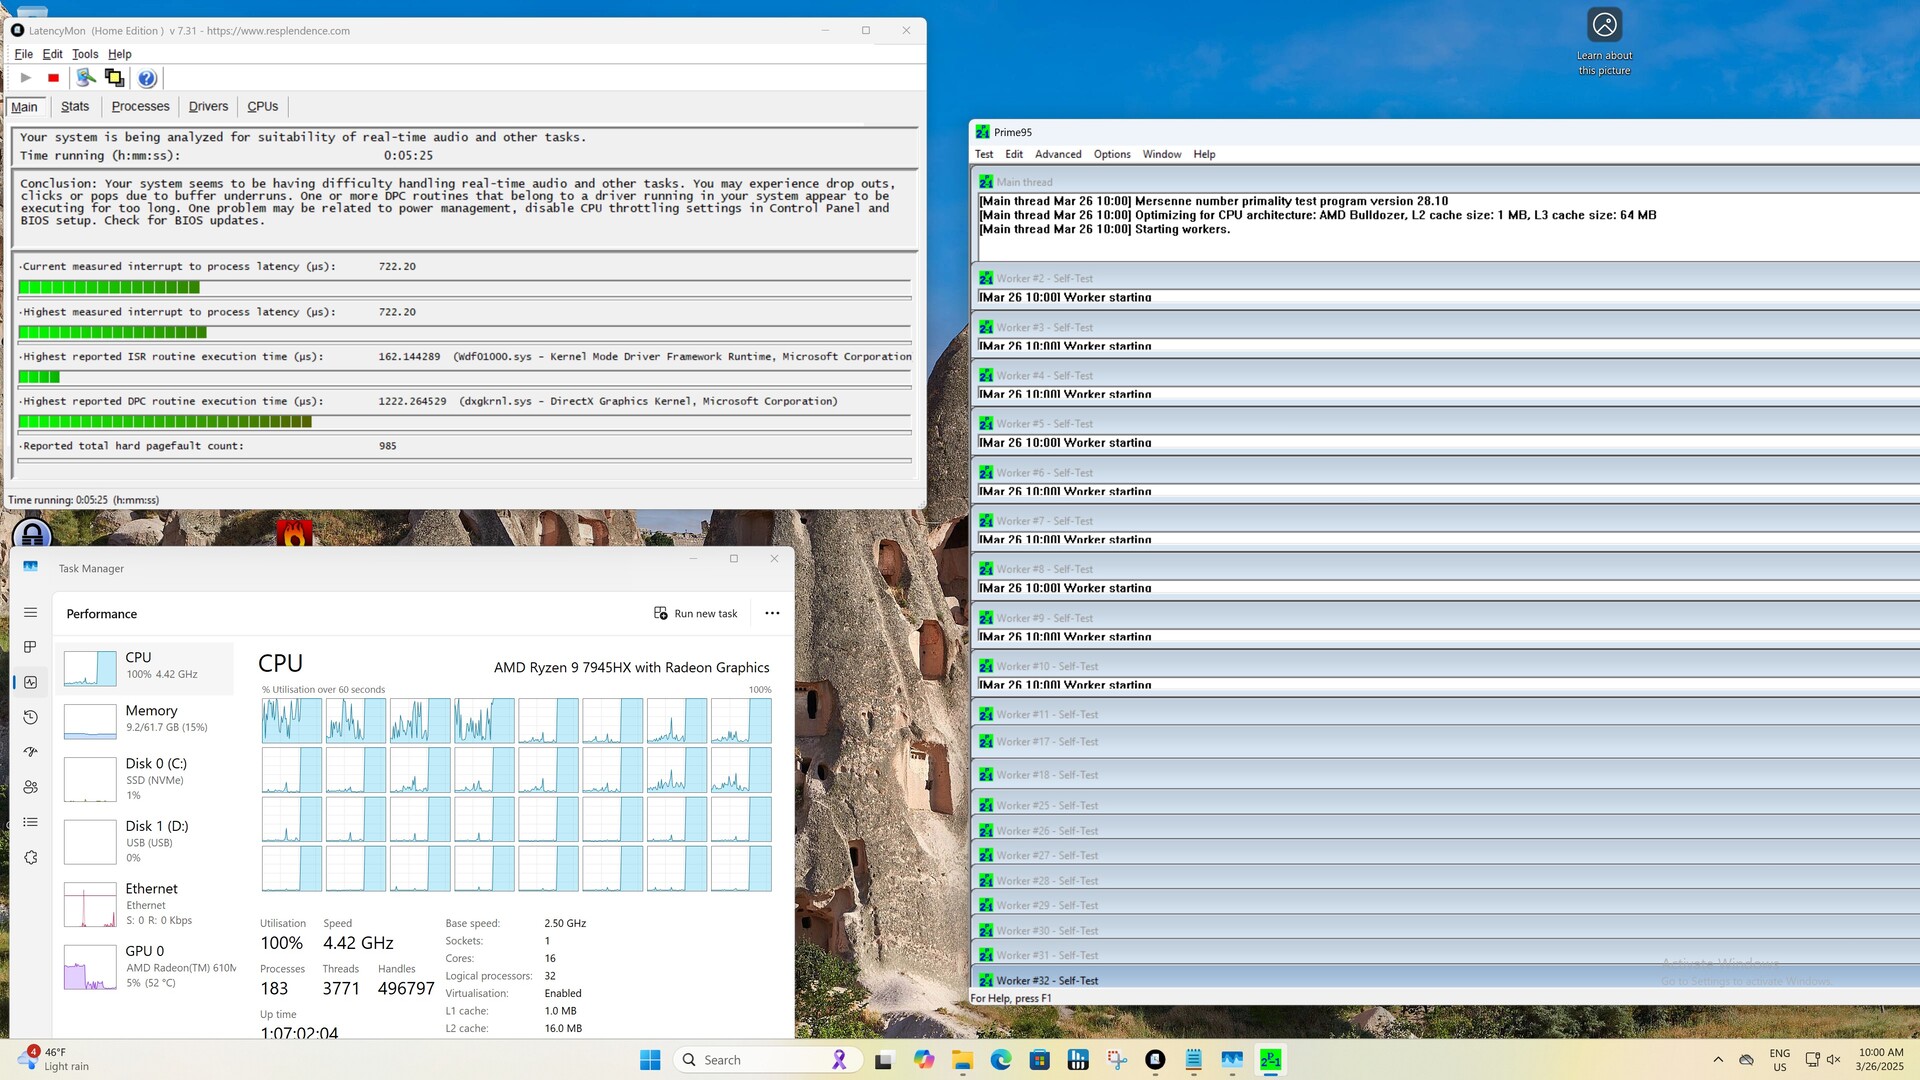
Latencias del CPD
Nuestro sistema de prueba con el Minisforum BD795i SE reveló latencias moderadas. Todo funcionó sin problemas al navegar por Internet y reproducir un vídeo de prueba 4K, mientras que las latencias sólo aumentaron al ejecutar Prime95.

| DPC Latencies / LatencyMon - interrupt to process latency (max), Web, Youtube, Prime95 | |
| Minisforum BD790i | |
| Minisforum BD795i SE | |
| Minisforum EliteMini UM780 XTX | |
| Minisforum Venus Series UM790 Pro | |
| Minisforum BD770i | |
* ... más pequeño es mejor
Dispositivo de almacenamiento
Minisforum sólo suministra la placa base BD795 SE, por lo que los componentes que falten, como la RAM, la SSD, la fuente de alimentación y el ventilador de la CPU, tendrá que añadirlos usted mismo. Nosotros elegimos la Kingston KC3000 (2 TB, PCIe 4.0 x4), que no puede aprovechar todo el potencial de la placa con sus dos ranuras PCIe 5.0. Ambas ranuras M.2 están situadas en la parte superior y reciben aire fresco a través del ventilador de la CPU. También se pueden instalar unidades SSD con un refrigerador preinstalado de fábrica (altura máxima aproximada de 27 milímetros).

Reading continuous performance: DiskSpd Read Loop, Queue Depth 8
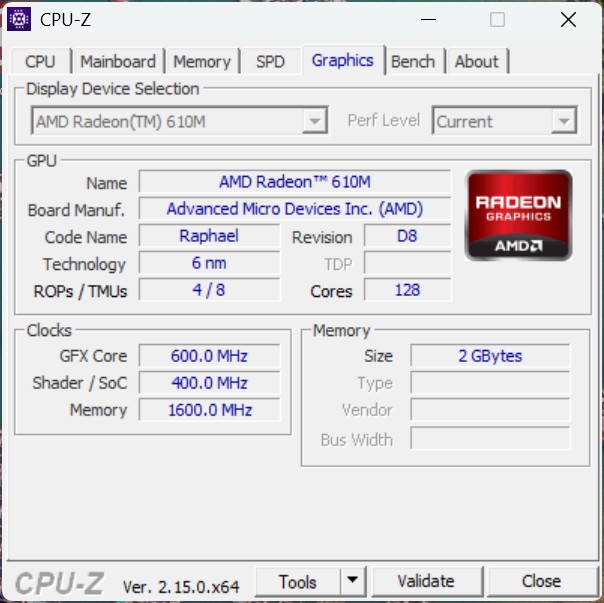
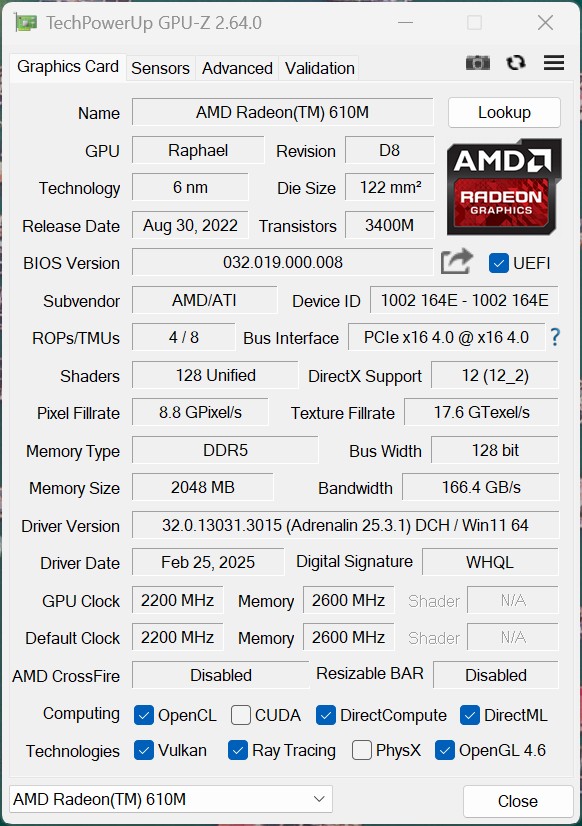
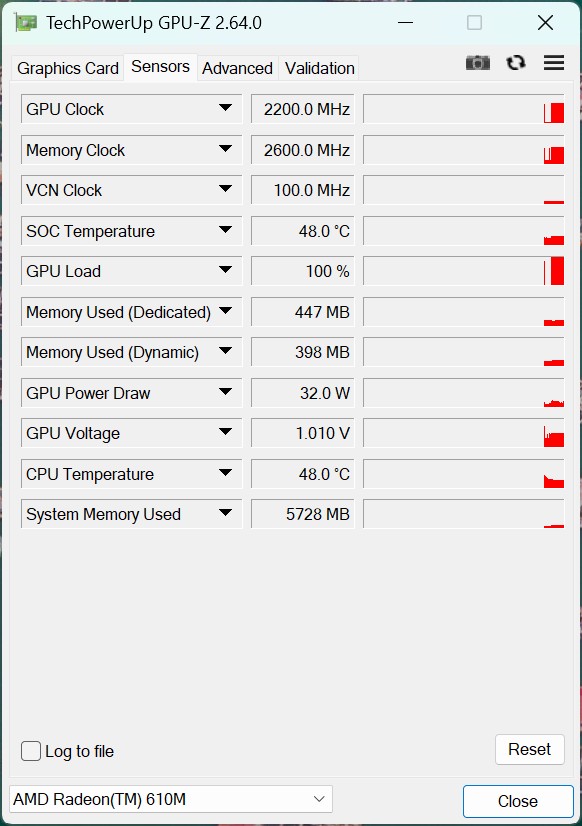
Tarjeta gráfica - La AMD Radeon 610M como iGPU
El AMD Ryzen 9 7945HX incorpora una iGPU RDNA2 sencilla con 2 CU y 128 unidades de sombreado, a saber, la AMD Radeon 610M. No ofrece un mayor rendimiento 3D que la iGPU del Ryzen 7 7745HX, lo que significa que los resultados fueron casi idénticos. Resultó ser claramente inferior a la AMD Radeon 780M y sólo es adecuada para la salida de imágenes sencillas.
| Unigine Valley 1.0 | |
| 1920x1080 Extreme HD DirectX AA:x8 | |
| Minisforum EliteMini UM780 XTX | |
| Minisforum Venus Series UM790 Pro | |
| Minisforum Mars Series MC560 | |
| NiPoGi AD08 | |
| Minisforum BD770i | |
| Medio AMD Radeon 610M (9.8 - 10, n=3) | |
| Minisforum BD795i SE | |
| Acemagic AD15 | |
| 1920x1080 Extreme HD Preset OpenGL AA:x8 | |
| Minisforum EliteMini UM780 XTX | |
| Minisforum Venus Series UM790 Pro | |
| NiPoGi AD08 | |
| Minisforum Mars Series MC560 | |
| Acemagic AD15 | |
| Minisforum BD770i | |
| Medio AMD Radeon 610M (9.1 - 9.6, n=3) | |
| Minisforum BD795i SE | |
| Affinity Photo 2 - Combined (Single / Multi GPU) | |
| NiPoGi AD08 | |
| Medio AMD Radeon 610M (889 - 5750, n=3) | |
| Acemagic AD15 | |
| Minisforum EliteMini UM780 XTX | |
| Minisforum Mars Series MC560 | |
| Minisforum Venus Series UM790 Pro | |
| Minisforum BD795i SE | |
| Minisforum BD770i | |
| 3DMark 06 Standard Score | 20555 puntos | |
| 3DMark Vantage P Result | 12092 puntos | |
| 3DMark 11 Performance | 3873 puntos | |
| 3DMark Ice Storm Standard Score | 41556 puntos | |
| 3DMark Cloud Gate Standard Score | 14629 puntos | |
| 3DMark Fire Strike Score | 2156 puntos | |
| 3DMark Fire Strike Extreme Score | 530 puntos | |
| 3DMark Time Spy Score | 740 puntos | |
ayuda | ||
| bajo | medio | alto | ultra | |
|---|---|---|---|---|
| The Witcher 3 (2015) | 39.3 | 23.6 | 12.8 | |
| Dota 2 Reborn (2015) | 195.8 | 76.9 | 34.9 | 31.3 |
| Final Fantasy XV Benchmark (2018) | 23.4 | 10.9 | 7.05 | |
| X-Plane 11.11 (2018) | 37.1 | 23.7 | 19.5 | |
| Baldur's Gate 3 (2023) | 9.31 | 7.03 |
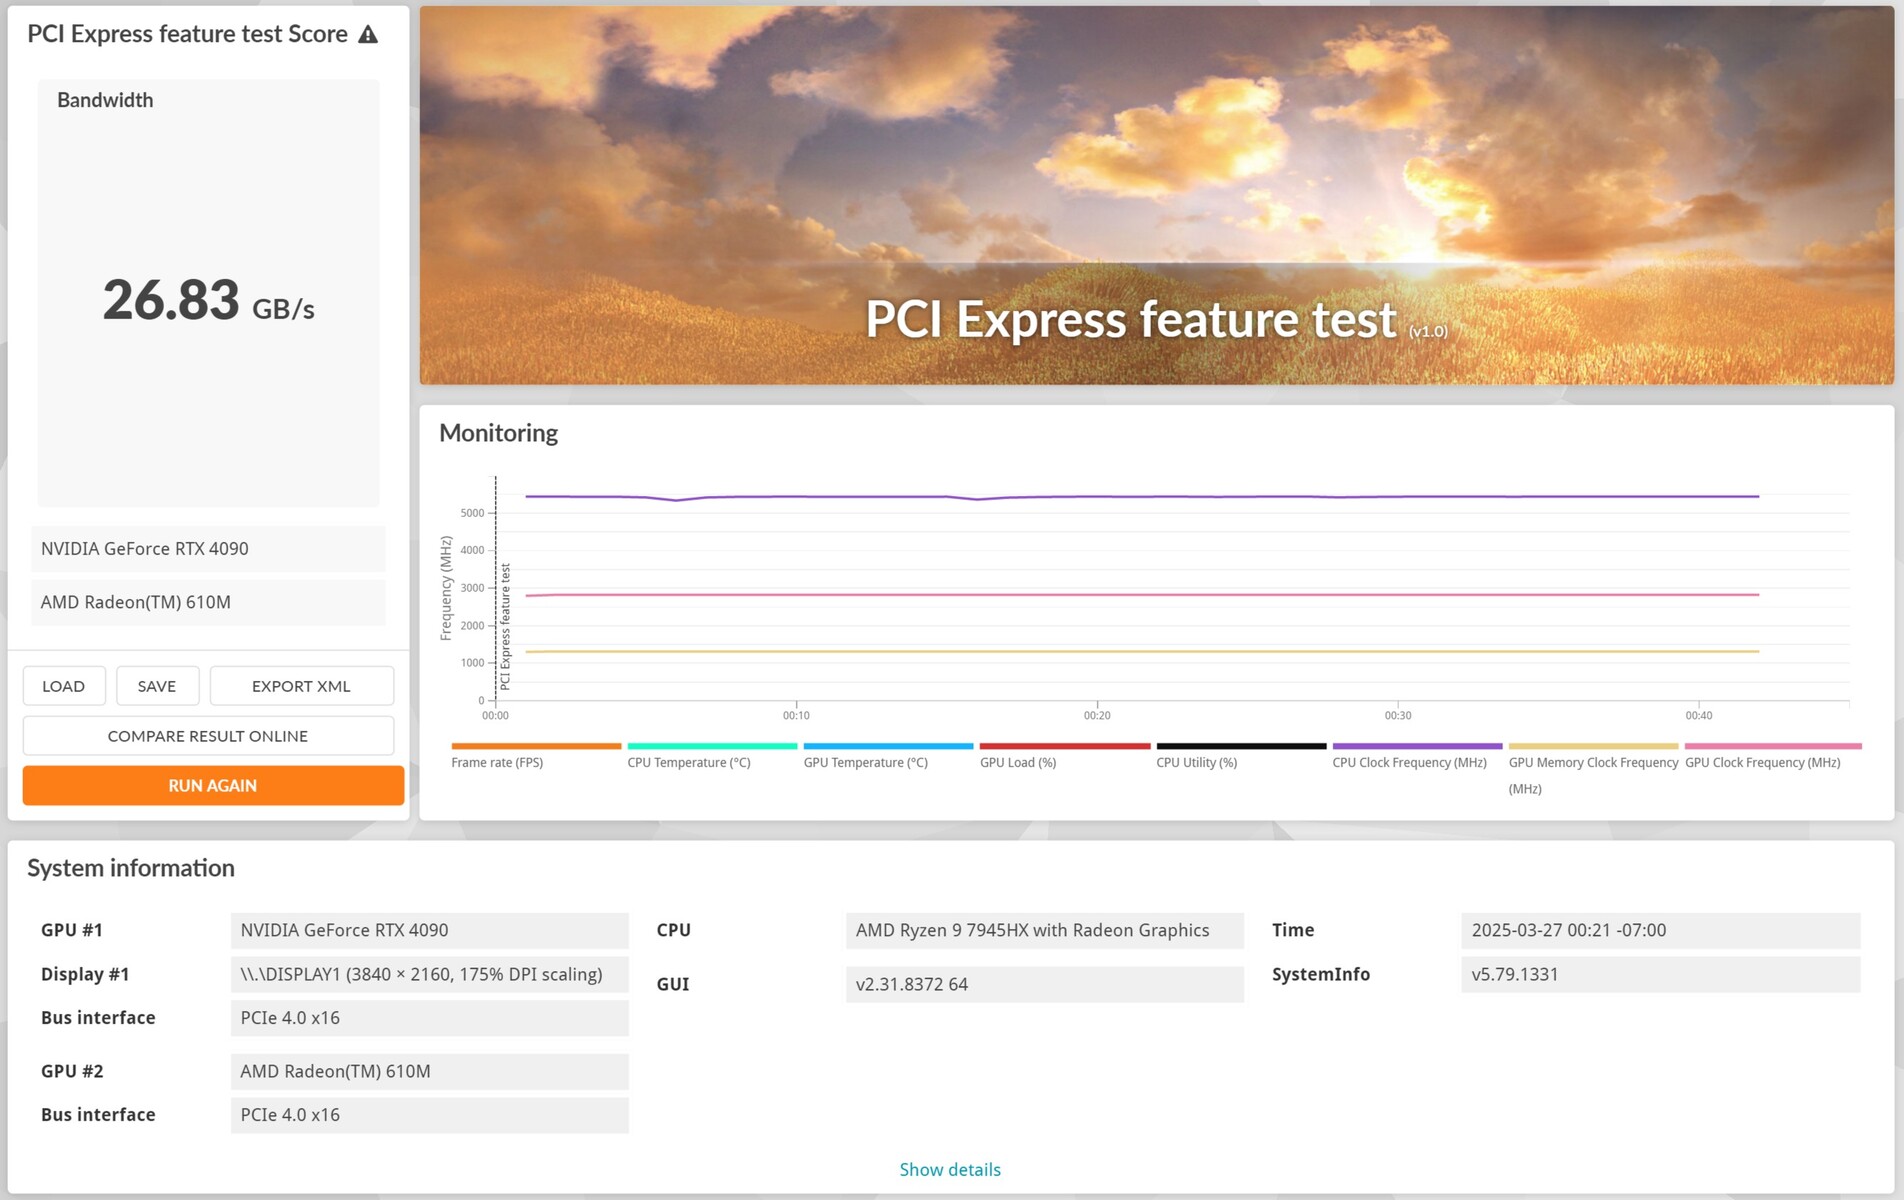
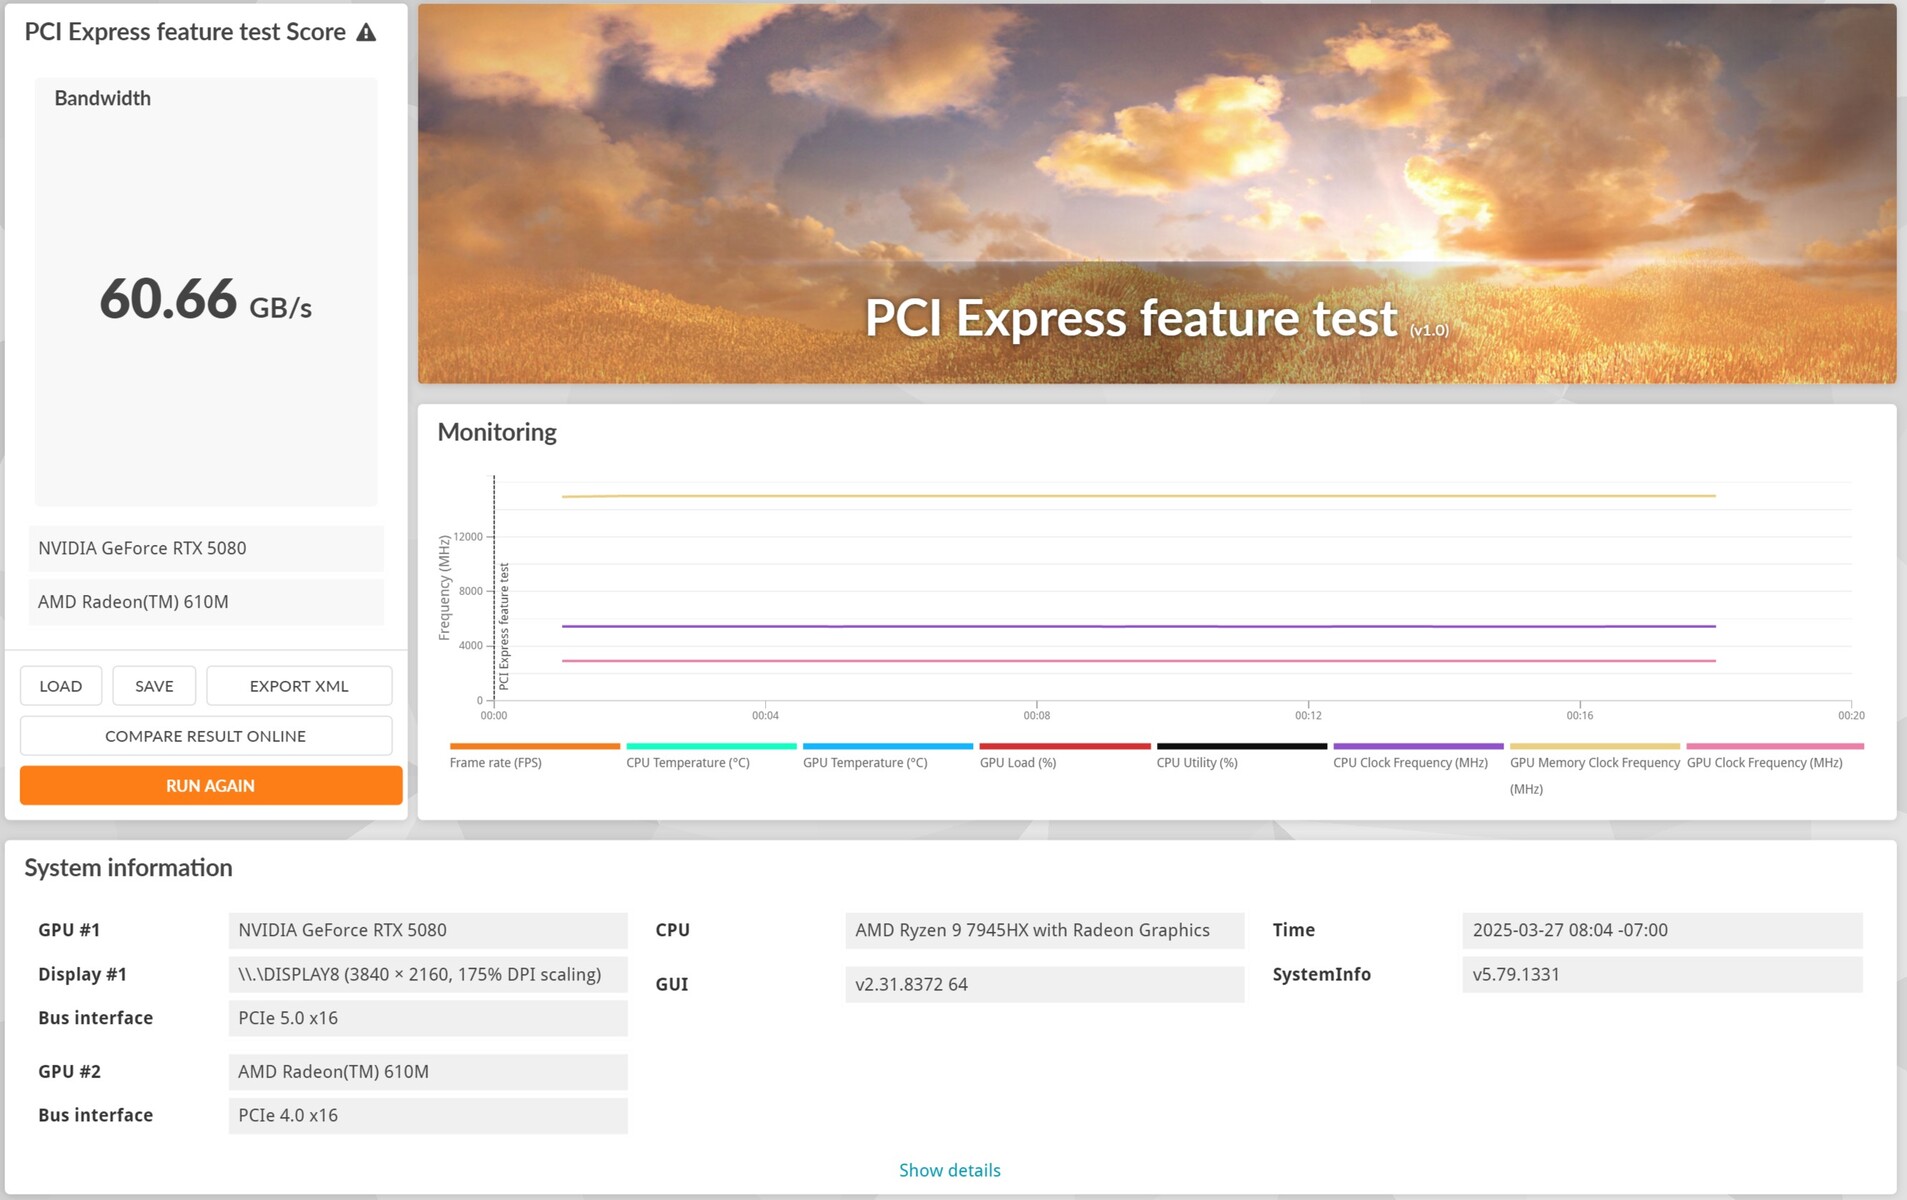
El Minisforum BD795i SE con la Nvidia GeForce RTX 4090
Durante nuestra prueba, el Minisforum BD795i SE ofreció un rendimiento impresionante en combinación con la Nvidia GeForce RTX 4090. Gracias a su ranura PCIe 5.0 x16 completa, la tarjeta gráfica pudo desplegar todo su potencial. Al ejecutar juegos actuales, el sistema logró altas tasas de fps y se mostró con fluidez en 4K con el máximo de detalles. La prueba de ancho de banda junto con una tarjeta Nvidia GeForce RTX 5080 confirmó la plena utilización de la interfaz PCIe 5.0 x16.
Performance comparison at CPU limit at 720p / 1,080p
| Performance Rating - Percent | |
| AMD Ryzen 7 9800X3D | |
| Intel Core Ultra 9 285K | |
| Intel Core Ultra 5 245K | |
| Minisforum BD795i SE, RTX 4090 | |
| Minisforum UM890 Pro (Nvidia GeForce RTX 4090 @OCuLink) | |
| 3DMark 11 - 1280x720 Performance GPU | |
| AMD Ryzen 7 9800X3D | |
| Intel Core Ultra 5 245K | |
| Minisforum UM890 Pro (Nvidia GeForce RTX 4090 @OCuLink) | |
| Intel Core Ultra 9 285K | |
| Minisforum BD795i SE, RTX 4090 | |
| 3DMark | |
| 2560x1440 Time Spy Graphics | |
| AMD Ryzen 7 9800X3D | |
| Intel Core Ultra 5 245K | |
| Intel Core Ultra 9 285K | |
| Minisforum UM890 Pro (Nvidia GeForce RTX 4090 @OCuLink) | |
| Minisforum BD795i SE, RTX 4090 | |
| 1920x1080 Fire Strike Graphics | |
| AMD Ryzen 7 9800X3D | |
| Intel Core Ultra 5 245K | |
| Minisforum UM890 Pro (Nvidia GeForce RTX 4090 @OCuLink) | |
| Minisforum BD795i SE, RTX 4090 | |
| Intel Core Ultra 9 285K | |
| 3840x2160 Fire Strike Ultra Graphics | |
| Minisforum BD795i SE, RTX 4090 | |
| Intel Core Ultra 5 245K | |
| AMD Ryzen 7 9800X3D | |
| Intel Core Ultra 9 285K | |
| Minisforum UM890 Pro (Nvidia GeForce RTX 4090 @OCuLink) | |
| Unigine Superposition | |
| 1280x720 720p Low | |
| AMD Ryzen 7 9800X3D | |
| Intel Core Ultra 9 285K | |
| Minisforum BD795i SE, RTX 4090 | |
| Intel Core Ultra 5 245K | |
| Minisforum UM890 Pro (Nvidia GeForce RTX 4090 @OCuLink) | |
| 1920x1080 1080p High | |
| AMD Ryzen 7 9800X3D | |
| Minisforum BD795i SE, RTX 4090 | |
| Intel Core Ultra 9 285K | |
| Intel Core Ultra 5 245K | |
| Minisforum UM890 Pro (Nvidia GeForce RTX 4090 @OCuLink) | |
| 1920x1080 1080p Extreme | |
| Intel Core Ultra 9 285K | |
| Minisforum BD795i SE, RTX 4090 | |
| AMD Ryzen 7 9800X3D | |
| Intel Core Ultra 5 245K | |
| Minisforum UM890 Pro (Nvidia GeForce RTX 4090 @OCuLink) | |
| 3840x2160 4k Optimized | |
| AMD Ryzen 7 9800X3D | |
| Intel Core Ultra 9 285K | |
| Minisforum BD795i SE, RTX 4090 | |
| Intel Core Ultra 5 245K | |
| Minisforum UM890 Pro (Nvidia GeForce RTX 4090 @OCuLink) | |
| 7680x4320 8k Optimized | |
| AMD Ryzen 7 9800X3D | |
| Intel Core Ultra 5 245K | |
| Intel Core Ultra 9 285K | |
| Minisforum BD795i SE, RTX 4090 | |
| Minisforum UM890 Pro (Nvidia GeForce RTX 4090 @OCuLink) | |
| Unigine Valley 1.0 | |
| 1920x1080 Extreme HD DirectX AA:x8 | |
| AMD Ryzen 7 9800X3D | |
| Intel Core Ultra 9 285K | |
| Minisforum BD795i SE, RTX 4090 | |
| Intel Core Ultra 5 245K | |
| Minisforum UM890 Pro (Nvidia GeForce RTX 4090 @OCuLink) | |
| 1920x1080 Extreme HD Preset OpenGL AA:x8 | |
| AMD Ryzen 7 9800X3D | |
| Intel Core Ultra 9 285K | |
| Intel Core Ultra 5 245K | |
| Minisforum BD795i SE, RTX 4090 | |
| Minisforum UM890 Pro (Nvidia GeForce RTX 4090 @OCuLink) | |
| Unigine Heaven 4.0 | |
| Extreme Preset OpenGL | |
| AMD Ryzen 7 9800X3D | |
| Intel Core Ultra 9 285K | |
| Minisforum BD795i SE, RTX 4090 | |
| Intel Core Ultra 5 245K | |
| Minisforum UM890 Pro (Nvidia GeForce RTX 4090 @OCuLink) | |
| Extreme Preset DX11 | |
| AMD Ryzen 7 9800X3D | |
| Intel Core Ultra 9 285K | |
| Minisforum BD795i SE, RTX 4090 | |
| Intel Core Ultra 5 245K | |
| Minisforum UM890 Pro (Nvidia GeForce RTX 4090 @OCuLink) | |
| ComputeMark v2.1 | |
| 1024x600 Normal, Score | |
| AMD Ryzen 7 9800X3D | |
| Minisforum BD795i SE, RTX 4090 | |
| Intel Core Ultra 9 285K | |
| Intel Core Ultra 5 245K | |
| Minisforum UM890 Pro (Nvidia GeForce RTX 4090 @OCuLink) | |
| 1024x600 Normal, Fluid 3DTex | |
| Minisforum BD795i SE, RTX 4090 | |
| AMD Ryzen 7 9800X3D | |
| Intel Core Ultra 9 285K | |
| Minisforum UM890 Pro (Nvidia GeForce RTX 4090 @OCuLink) | |
| Intel Core Ultra 5 245K | |
| 1024x600 Normal, Fluid 2DTexArr | |
| AMD Ryzen 7 9800X3D | |
| Minisforum BD795i SE, RTX 4090 | |
| Intel Core Ultra 9 285K | |
| Intel Core Ultra 5 245K | |
| Minisforum UM890 Pro (Nvidia GeForce RTX 4090 @OCuLink) | |
| 1024x600 Normal, Mandel Vector | |
| AMD Ryzen 7 9800X3D | |
| Intel Core Ultra 9 285K | |
| Minisforum BD795i SE, RTX 4090 | |
| Intel Core Ultra 5 245K | |
| Minisforum UM890 Pro (Nvidia GeForce RTX 4090 @OCuLink) | |
| 1024x600 Normal, Mandel Scalar | |
| AMD Ryzen 7 9800X3D | |
| Minisforum BD795i SE, RTX 4090 | |
| Intel Core Ultra 5 245K | |
| Intel Core Ultra 9 285K | |
| Minisforum UM890 Pro (Nvidia GeForce RTX 4090 @OCuLink) | |
| 1024x600 Normal, QJuliaRayTrace | |
| AMD Ryzen 7 9800X3D | |
| Minisforum BD795i SE, RTX 4090 | |
| Intel Core Ultra 5 245K | |
| Intel Core Ultra 9 285K | |
| Minisforum UM890 Pro (Nvidia GeForce RTX 4090 @OCuLink) | |
Performance comparison at CPU limit at 720p / 1,080p
| Performance Rating - Percent | |
| AMD Ryzen 7 9800X3D | |
| Minisforum BD795i SE, RTX 4090 | |
| F1 24 - 1920x1080 Low Preset AA:T AF:16x | |
| AMD Ryzen 7 9800X3D | |
| Minisforum BD795i SE, RTX 4090 | |
| Indiana Jones and the Great Circle - 1920x1080 Low Preset | |
| AMD Ryzen 7 9800X3D | |
| Minisforum BD795i SE, RTX 4090 | |
| Black Myth: Wukong - 1280x720 low TSR 100 | |
| AMD Ryzen 7 9800X3D | |
| Minisforum BD795i SE, RTX 4090 | |
| Baldur's Gate 3 - 1280x720 Low Preset | |
| AMD Ryzen 7 9800X3D | |
| Minisforum BD795i SE, RTX 4090 | |
| The Witcher 3 - 1024x768 Low Graphics & Postprocessing | |
| AMD Ryzen 7 9800X3D | |
| Minisforum BD795i SE, RTX 4090 | |
| Final Fantasy XV Benchmark - 1280x720 Lite Quality | |
| AMD Ryzen 7 9800X3D | |
| Minisforum BD795i SE, RTX 4090 | |
Performance comparison at GPU limit at 2,160p
| Performance Rating - Percent | |
| AMD Ryzen 7 9800X3D | |
| Minisforum BD795i SE, RTX 4090 | |
| F1 24 - 3840x2160 Ultra High Preset AA:T AF:16x | |
| Minisforum BD795i SE, RTX 4090 | |
| AMD Ryzen 7 9800X3D | |
| Indiana Jones and the Great Circle - 3840x2160 Very Ultra Preset | |
| AMD Ryzen 7 9800X3D | |
| Minisforum BD795i SE, RTX 4090 | |
| Black Myth: Wukong - 3840x2160 cinematic TSR 100 | |
| AMD Ryzen 7 9800X3D | |
| Minisforum BD795i SE, RTX 4090 | |
| Baldur's Gate 3 - 3840x2160 Ultra Preset | |
| AMD Ryzen 7 9800X3D | |
| Minisforum BD795i SE, RTX 4090 | |
| The Witcher 3 - 3840x2160 Ultra Graphics & Postprocessing (HBAO+) | |
| AMD Ryzen 7 9800X3D | |
| Minisforum BD795i SE, RTX 4090 | |
| Final Fantasy XV Benchmark - 3840x2160 High Quality | |
| AMD Ryzen 7 9800X3D | |
| Minisforum BD795i SE, RTX 4090 | |
| bajo | medio | alto | ultra | QHD | 4K | |
|---|---|---|---|---|---|---|
| The Witcher 3 (2015) | 670 | 579 | 531 | 288 | 251 | 273 |
| Dota 2 Reborn (2015) | 252 | 219 | 204 | 197.2 | 192.1 | |
| Final Fantasy XV Benchmark (2018) | 233 | 231 | 210 | 204 | 160.1 | |
| X-Plane 11.11 (2018) | 128 | 121 | 97.4 | 90.8 | ||
| Strange Brigade (2018) | 593 | 472 | 465 | 478 | 467 | 290 |
| Baldur's Gate 3 (2023) | 282 | 252 | 232 | 228 | 204 | 128.1 |
| Cyberpunk 2077 2.2 Phantom Liberty (2023) | 185.3 | 184.3 | 175.3 | 166.2 | 155.7 | 78.1 |
| F1 24 (2024) | 351 | 370 | 357 | 184.5 | 168.4 | 93.4 |
| Black Myth: Wukong (2024) | 201 | 172 | 137 | 88 | 69 | 44 |
| Indiana Jones and the Great Circle (2024) | 246 | 210 | 194 | 163.8 | 107.5 | |
| Monster Hunter Wilds (2025) | 104.2 | 101.1 | 93.7 | 92.7 | 70.6 |
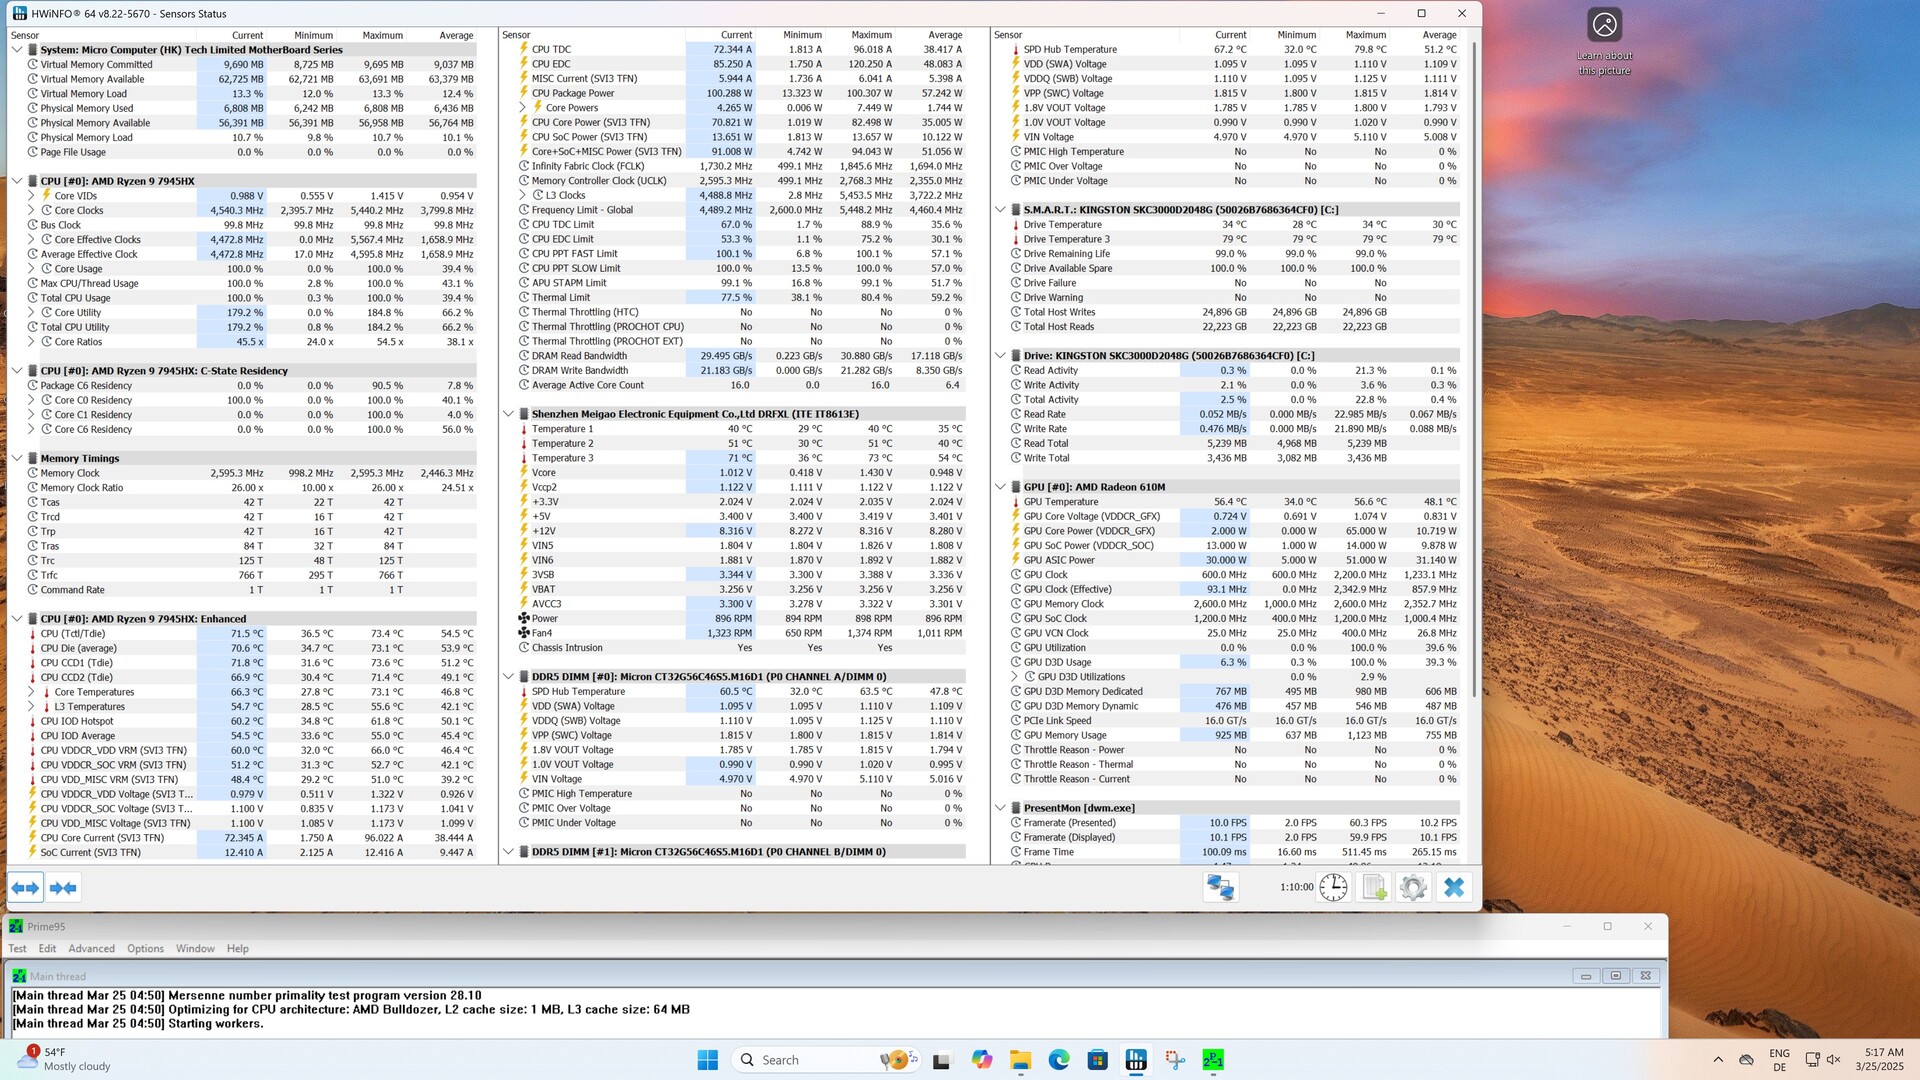
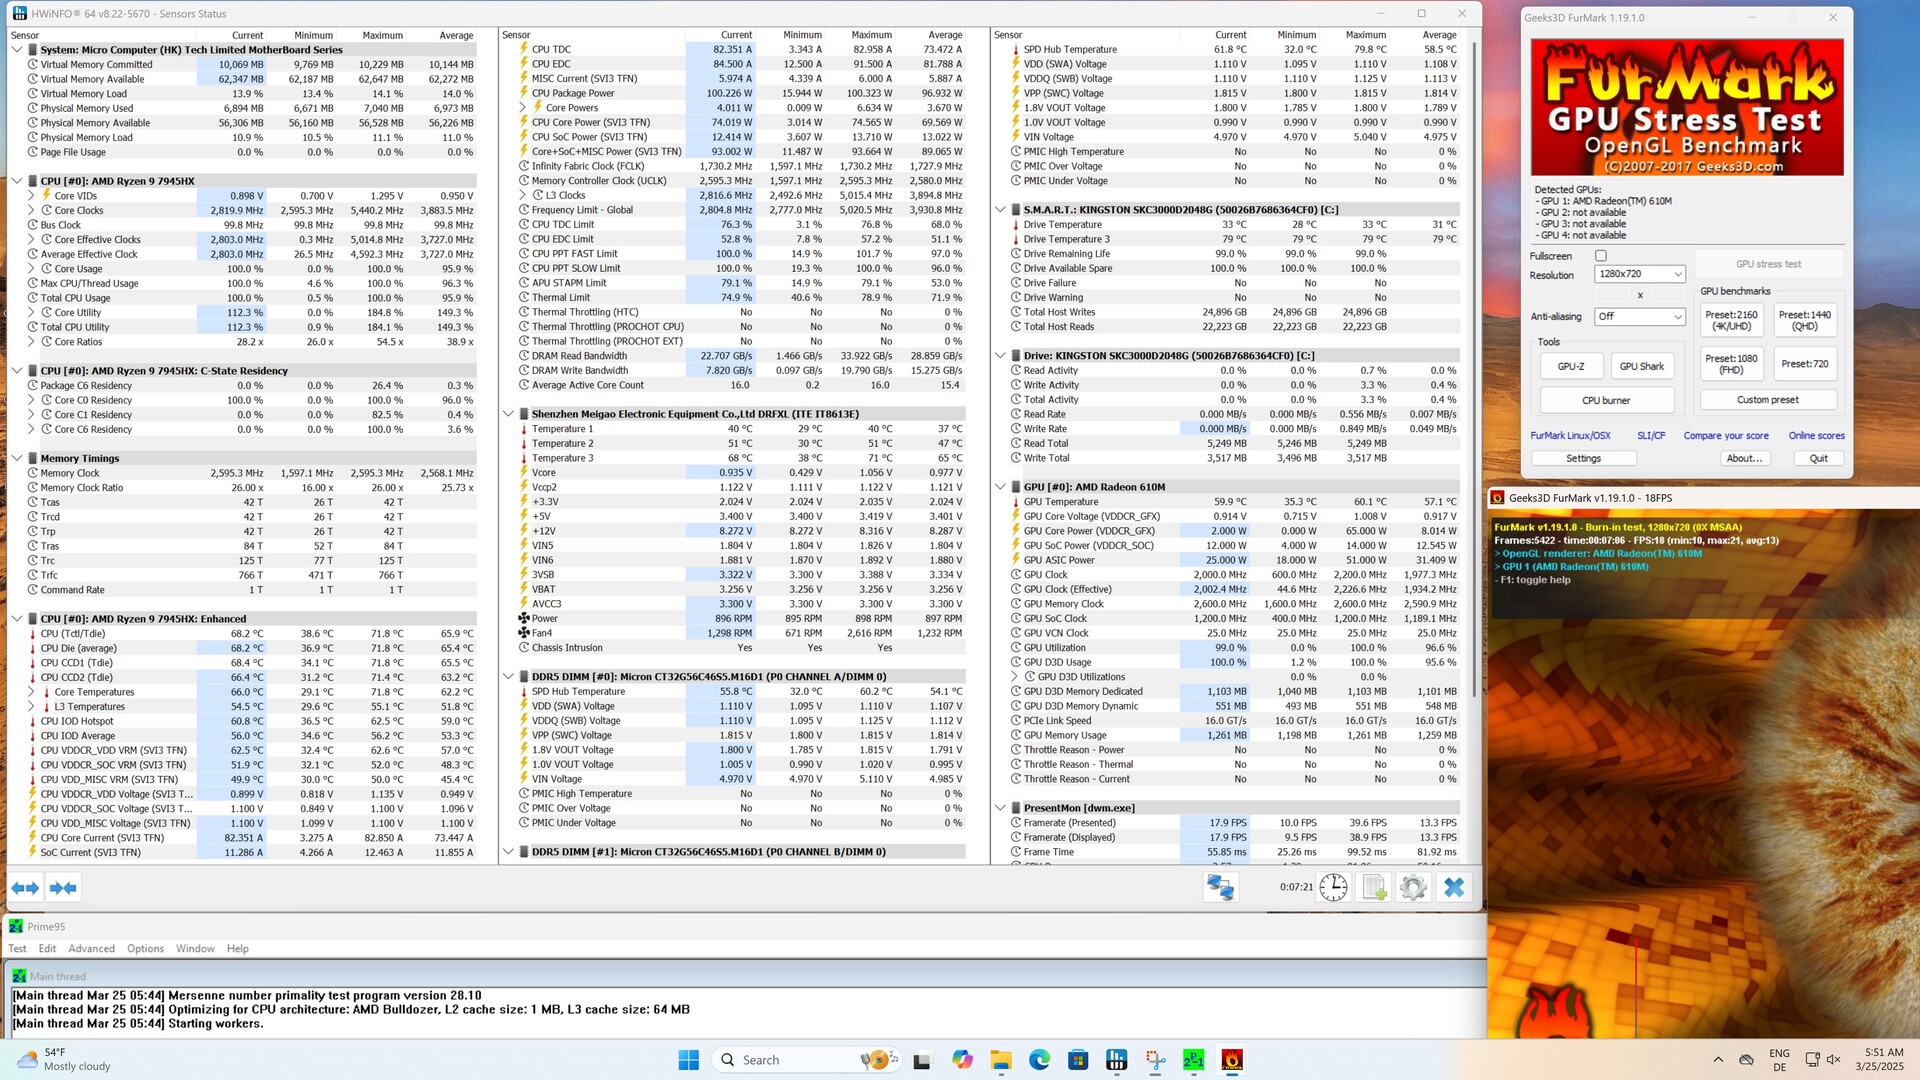
Necesidad de energía y temperaturas
Minisforum suministra el BD795i SE con refrigeración por tubo de calor preinstalada para la CPU y el convertidor de voltaje. El usuario tiene que instalar un ventilador de 120 mm, pero el material de montaje necesario ya está incluido. Nosotros utilizamos el Noctua NF-A12x25, que ya demostró su valía en nuestra revisión de los BD770i y BD790i. Una gran ventaja del BD795i SE es su alta eficiencia: Durante la multiprueba Cinebench R15, medimos sólo unos 140 vatios, impresionante para el rendimiento que ofrece.
En cuanto a sus emisiones de ruido: La placa base en sí no produjo ningún ruido durante nuestra prueba, ya que no hay elementos de refrigeración activos. La refrigeración funcionó eficazmente y no se produjeron temperaturas críticas. No obstante, una refrigeración separada para la CPU y los VRM tendría sentido, especialmente si se utiliza refrigeración por agua AiO. La BD795M de Minisforum, por ejemplo, es una placa base mATX del mismo fabricante que permite utilizar sus propias soluciones de refrigeración. ¿Por qué no también para los modelos Mini-ITX?
En comparación con los fabricantes de placas base establecidos, la BIOS sólo ofrece unas pocas opciones. Aunque puede ajustar el consumo de energía de la CPU, no puede ajustar la curva del ventilador. Si Minisforum continúa sirviendo al mercado, sería deseable una optimización de la BIOS más fácil de usar. Una herramienta de monitorización basada en Windows sería sin duda un complemento útil en este sentido.
Efficiency overview
| Performance Rating - Percent | |
| Minisforum BD790i | |
| Minisforum BD795i SE | |
| Minisforum BD770i | |
| Intel Core Ultra 9 285K | |
| Intel Core Ultra 5 245K | |
| AMD Ryzen 7 9800X3D | |
| Power Consumption | |
| Cinebench R23 Multi Power Efficiency - external Monitor | |
| Minisforum BD790i | |
| Minisforum BD795i SE | |
| Minisforum BD770i | |
| Intel Core Ultra 9 285K | |
| Intel Core Ultra 5 245K | |
| AMD Ryzen 7 9800X3D | |
| Cinebench R23 Single Power Efficiency - external Monitor | |
| Minisforum BD770i | |
| Minisforum BD790i | |
| Minisforum BD795i SE | |
| Intel Core Ultra 9 285K | |
| Intel Core Ultra 5 245K | |
| AMD Ryzen 7 9800X3D | |
| Cinebench R15 Multi Efficiency (external Monitor) | |
| Minisforum BD790i | |
| Minisforum BD795i SE | |
| Minisforum BD770i | |
| Intel Core Ultra 9 285K | |
| Intel Core Ultra 5 245K | |
| AMD Ryzen 7 9800X3D | |
Power consumption without dedicated graphics card
Power consumption with Nvidia GeForce RTX 4090
Valoración total de Notebookcheck
La Minisforum BD795i SE es una potente placa base mini-ITX equipada con el AMD Ryzen 9 7945HX. Gracias a su diseño compacto y a su eficaz refrigeración, es ideal para pequeños PC de alto rendimiento. Sin embargo, su BIOS sólo ofrece opciones limitadas y su refrigeración podría ser más flexible.
Transparencia
Nuestro equipo editorial se encarga de seleccionar los dispositivos que se someten a revisión. La muestra de prueba fue entregada al autor por el fabricante de forma gratuita para los fines de la revisión. No hubo influencia de terceros en esta revisión, ni el fabricante recibió una copia de esta revisión antes de su publicación. No había ninguna obligación de publicar esta reseña. Nunca aceptamos compensaciones o pagos a cambio de nuestras reseñas. Como empresa de medios independiente, Notebookcheck no está sujeta a la autoridad de fabricantes, minoristas o editores.
Así es como prueba Notebookcheck
Cada año, Notebookcheck revisa de forma independiente cientos de portátiles y smartphones utilizando procedimientos estandarizados para asegurar que todos los resultados son comparables. Hemos desarrollado continuamente nuestros métodos de prueba durante unos 20 años y hemos establecido los estándares de la industria en el proceso. En nuestros laboratorios de pruebas, técnicos y editores experimentados utilizan equipos de medición de alta calidad. Estas pruebas implican un proceso de validación en varias fases. Nuestro complejo sistema de clasificación se basa en cientos de mediciones y puntos de referencia bien fundamentados, lo que mantiene la objetividad.
