

Análisis del portátil Lenovo ThinkPad P14s G5: la estación de trabajo móvil ahora con una RTX 500 Ada y un panel IPS 3K
Lenovo ha tomado una nueva ruta con su estación de trabajo móvil ThinkPad P14s G5, ya que mientras que los modelos predecesores siempre se basaron en los respectivos modelos de la serie T, el nuevo P14s G5 con CPU Intel ha recibido su propio diseño, incluyendo una nueva pantalla de 14,5 pulgadas (antes era de 14 pulgadas). El P14s G5 con los procesadores AMD, por otro lado, sigue utilizando la carcasa antigua junto con su panel de 14 pulgadas.
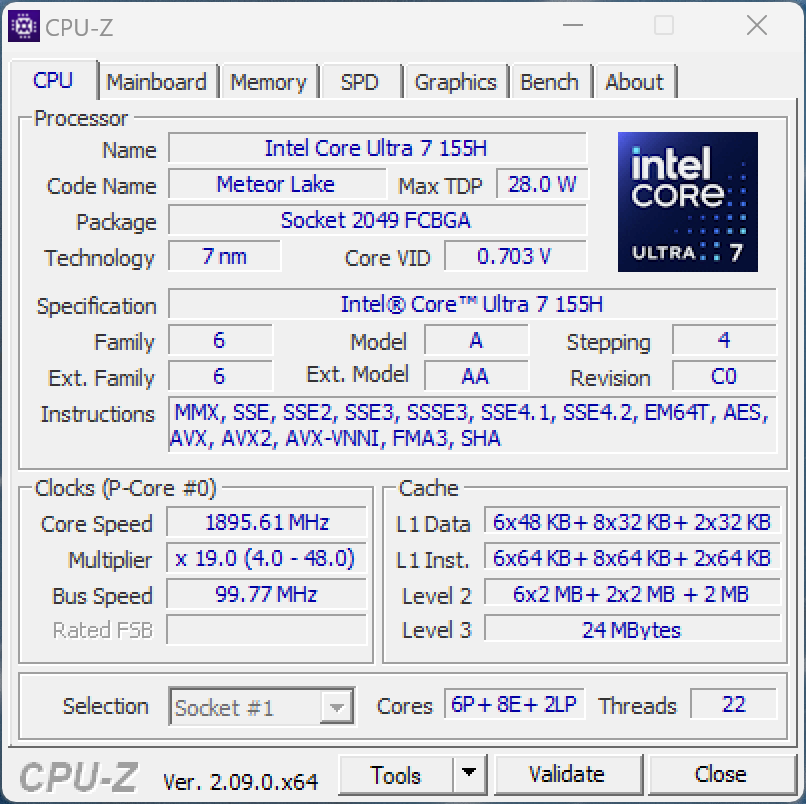
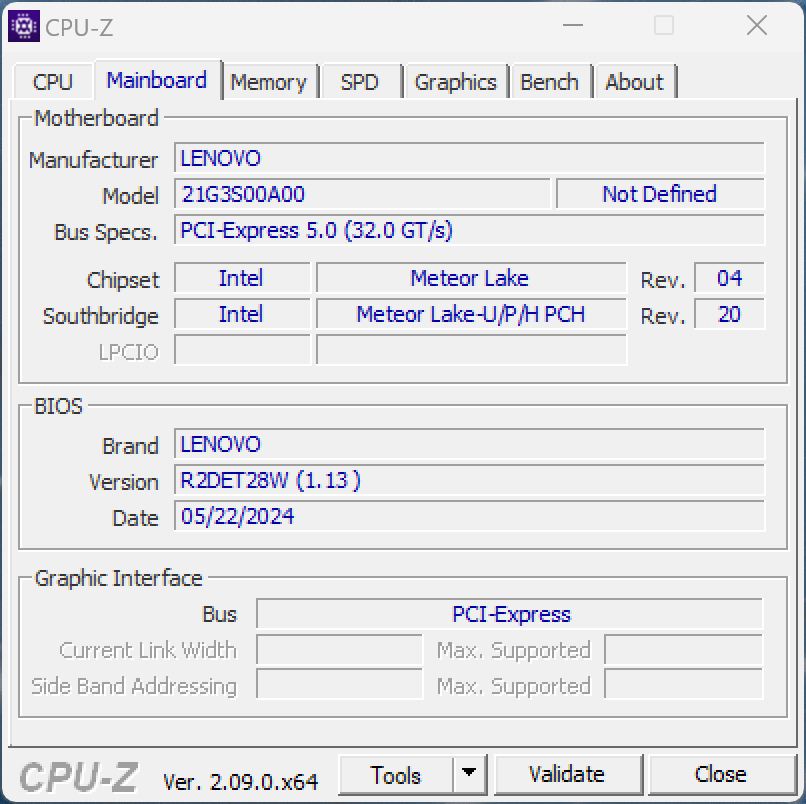
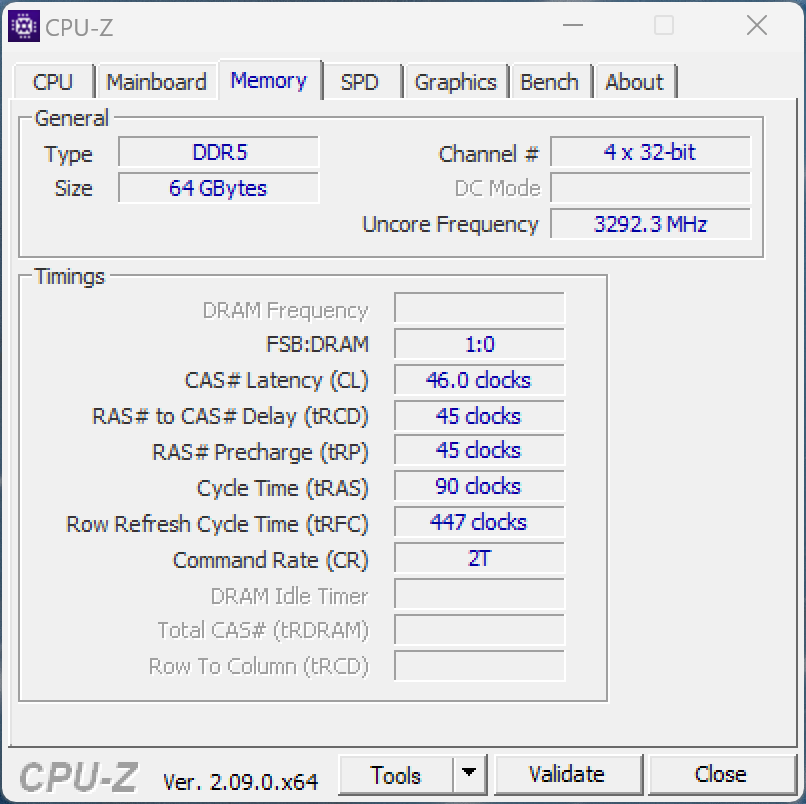
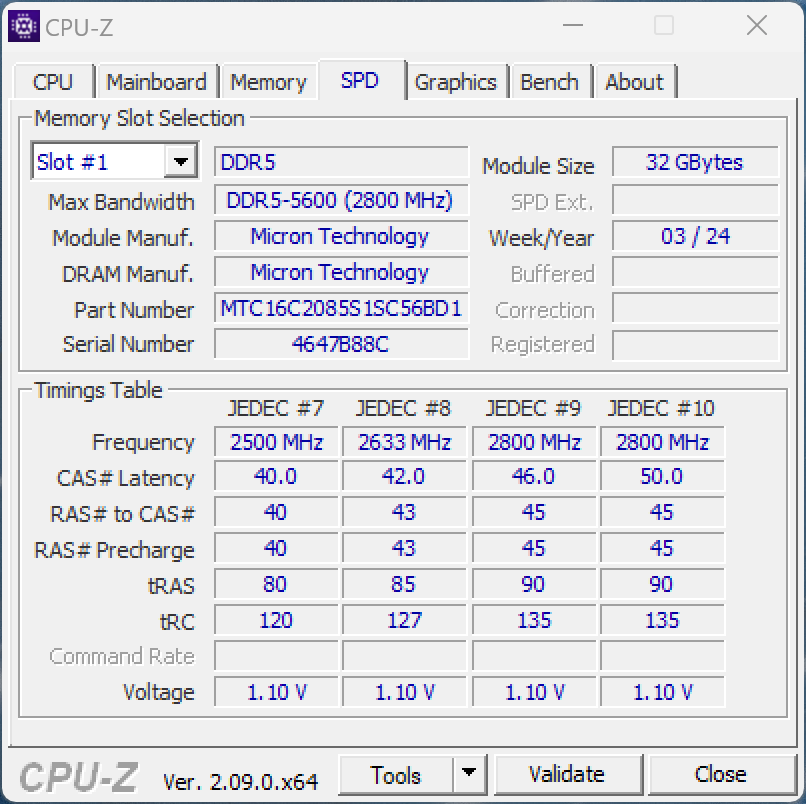
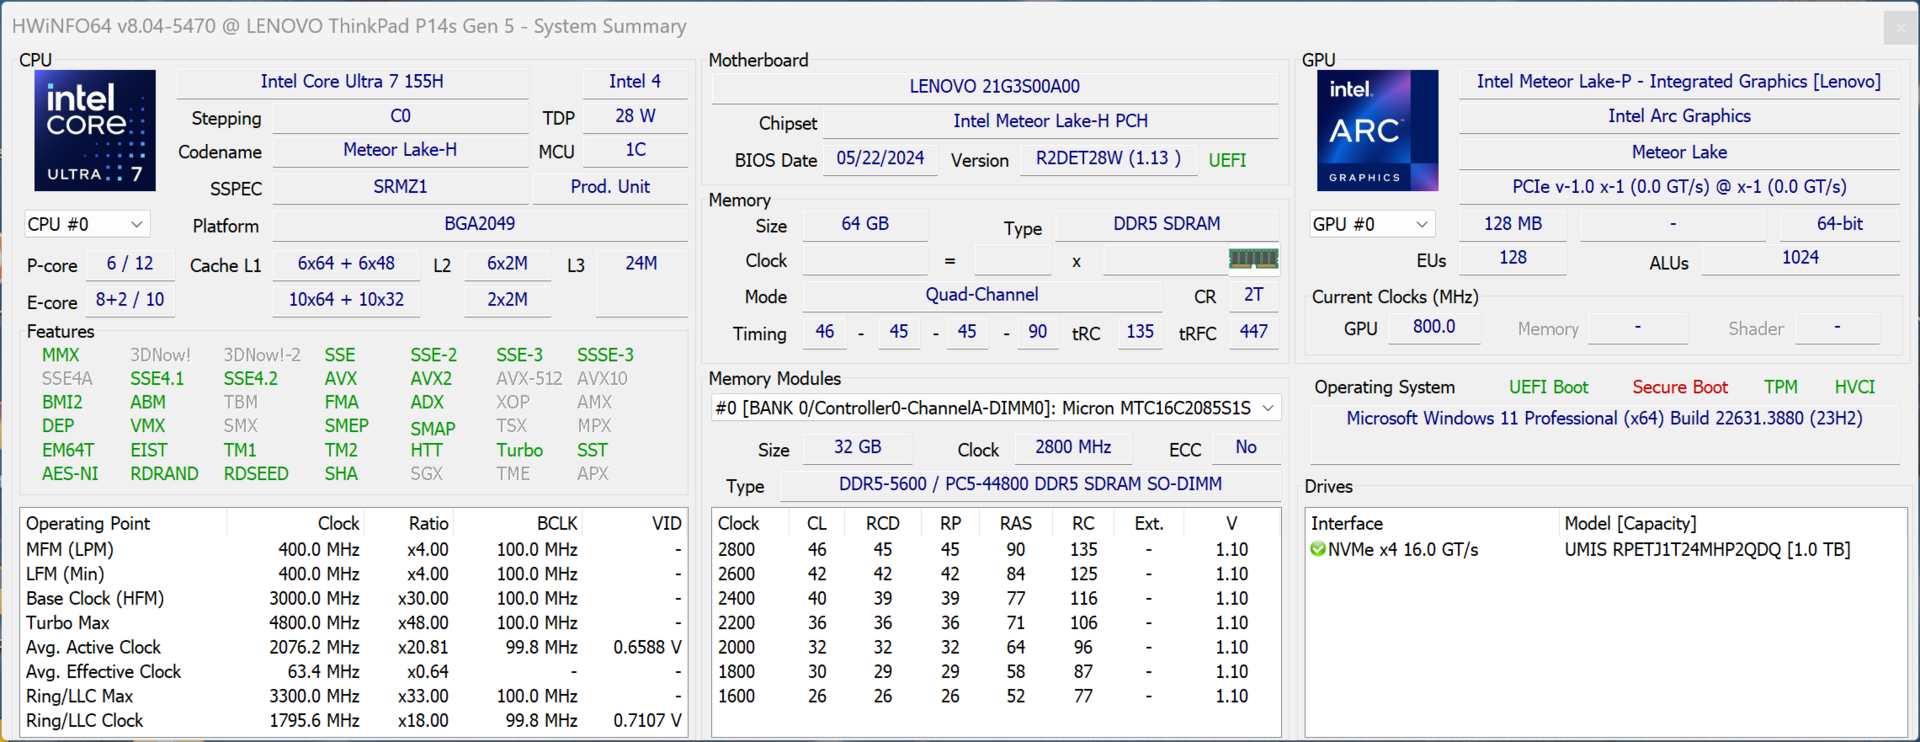
Nuestro dispositivo de prueba es la versión Campus 21G3S00A00 por unos 2.100 dólares sin sistema operativo pero con una configuración muy buena. Aparte de su nueva pantalla 3K, ha sido equipado con el Core Ultra 7 155H en combinación con 64 GB de RAM, una unidad SSD de 1 TB, así como el procesador dedicado Nvidia RTX 500 Ada. En la actualidad no existe un modelo de gama alta correspondiente para clientes particulares; si configura el dispositivo a través del sitio web de Lenovo, acabará actualmente en algo más de 2.700 dólares, incluido Windows 11 Home.
Posibles contendientes en la comparación
Valoración | Versión | Fecha | Modelo | Peso | Altura | Tamaño | Resolución | Precio |
|---|---|---|---|---|---|---|---|---|
| 82.5 % | v8 | 07/2024 | Lenovo ThinkPad P14s G5 21G3S00A00 Ultra 7 155H, Nvidia RTX 500 Ada Generation Laptop GPU | 1.7 kg | 22 mm | 14.50" | 3072x1920 | |
| 80.3 % | v8 | 07/2024 | HP ZBook Firefly 14 G11 Ultra 7 165H, RTX A500 Laptop GPU | 1.5 kg | 19.2 mm | 14.00" | 2560x1600 | |
| 81 % | v8 | 07/2024 | Lenovo ThinkPad P14s G4 21HF0017GE i7-1370P, RTX A500 Laptop GPU | 1.5 kg | 22.7 mm | 14.00" | 2880x1800 | |
| 89.3 % v7 (old) | v7 (old) | 04/2024 | Dell Precision 5000 5490 Ultra 9 185H, NVIDIA RTX 3000 Ada Generation Laptop GPU | 1.6 kg | 18.95 mm | 14.00" | 2560x1600 | |
| 85.5 % v7 (old) | v7 (old) | 10/2023 | Microsoft Surface Laptop Studio 2 RTX 4060 i7-13700H, NVIDIA GeForce RTX 4060 Laptop GPU | 2 kg | 22 mm | 14.40" | 2400x1600 | |
| 89.8 % v7 (old) | v7 (old) | 07/2023 | Lenovo Yoga Pro 9-14IRP G8 i7-13705H, NVIDIA GeForce RTX 4050 Laptop GPU | 1.7 kg | 17.6 mm | 14.50" | 3072x1920 |
Tenga en cuenta que: recientemente hemos actualizado nuestro sistema de clasificación y los resultados de la versión 8 no son comparables con los de la versión 7. Encontrará más información aquí .
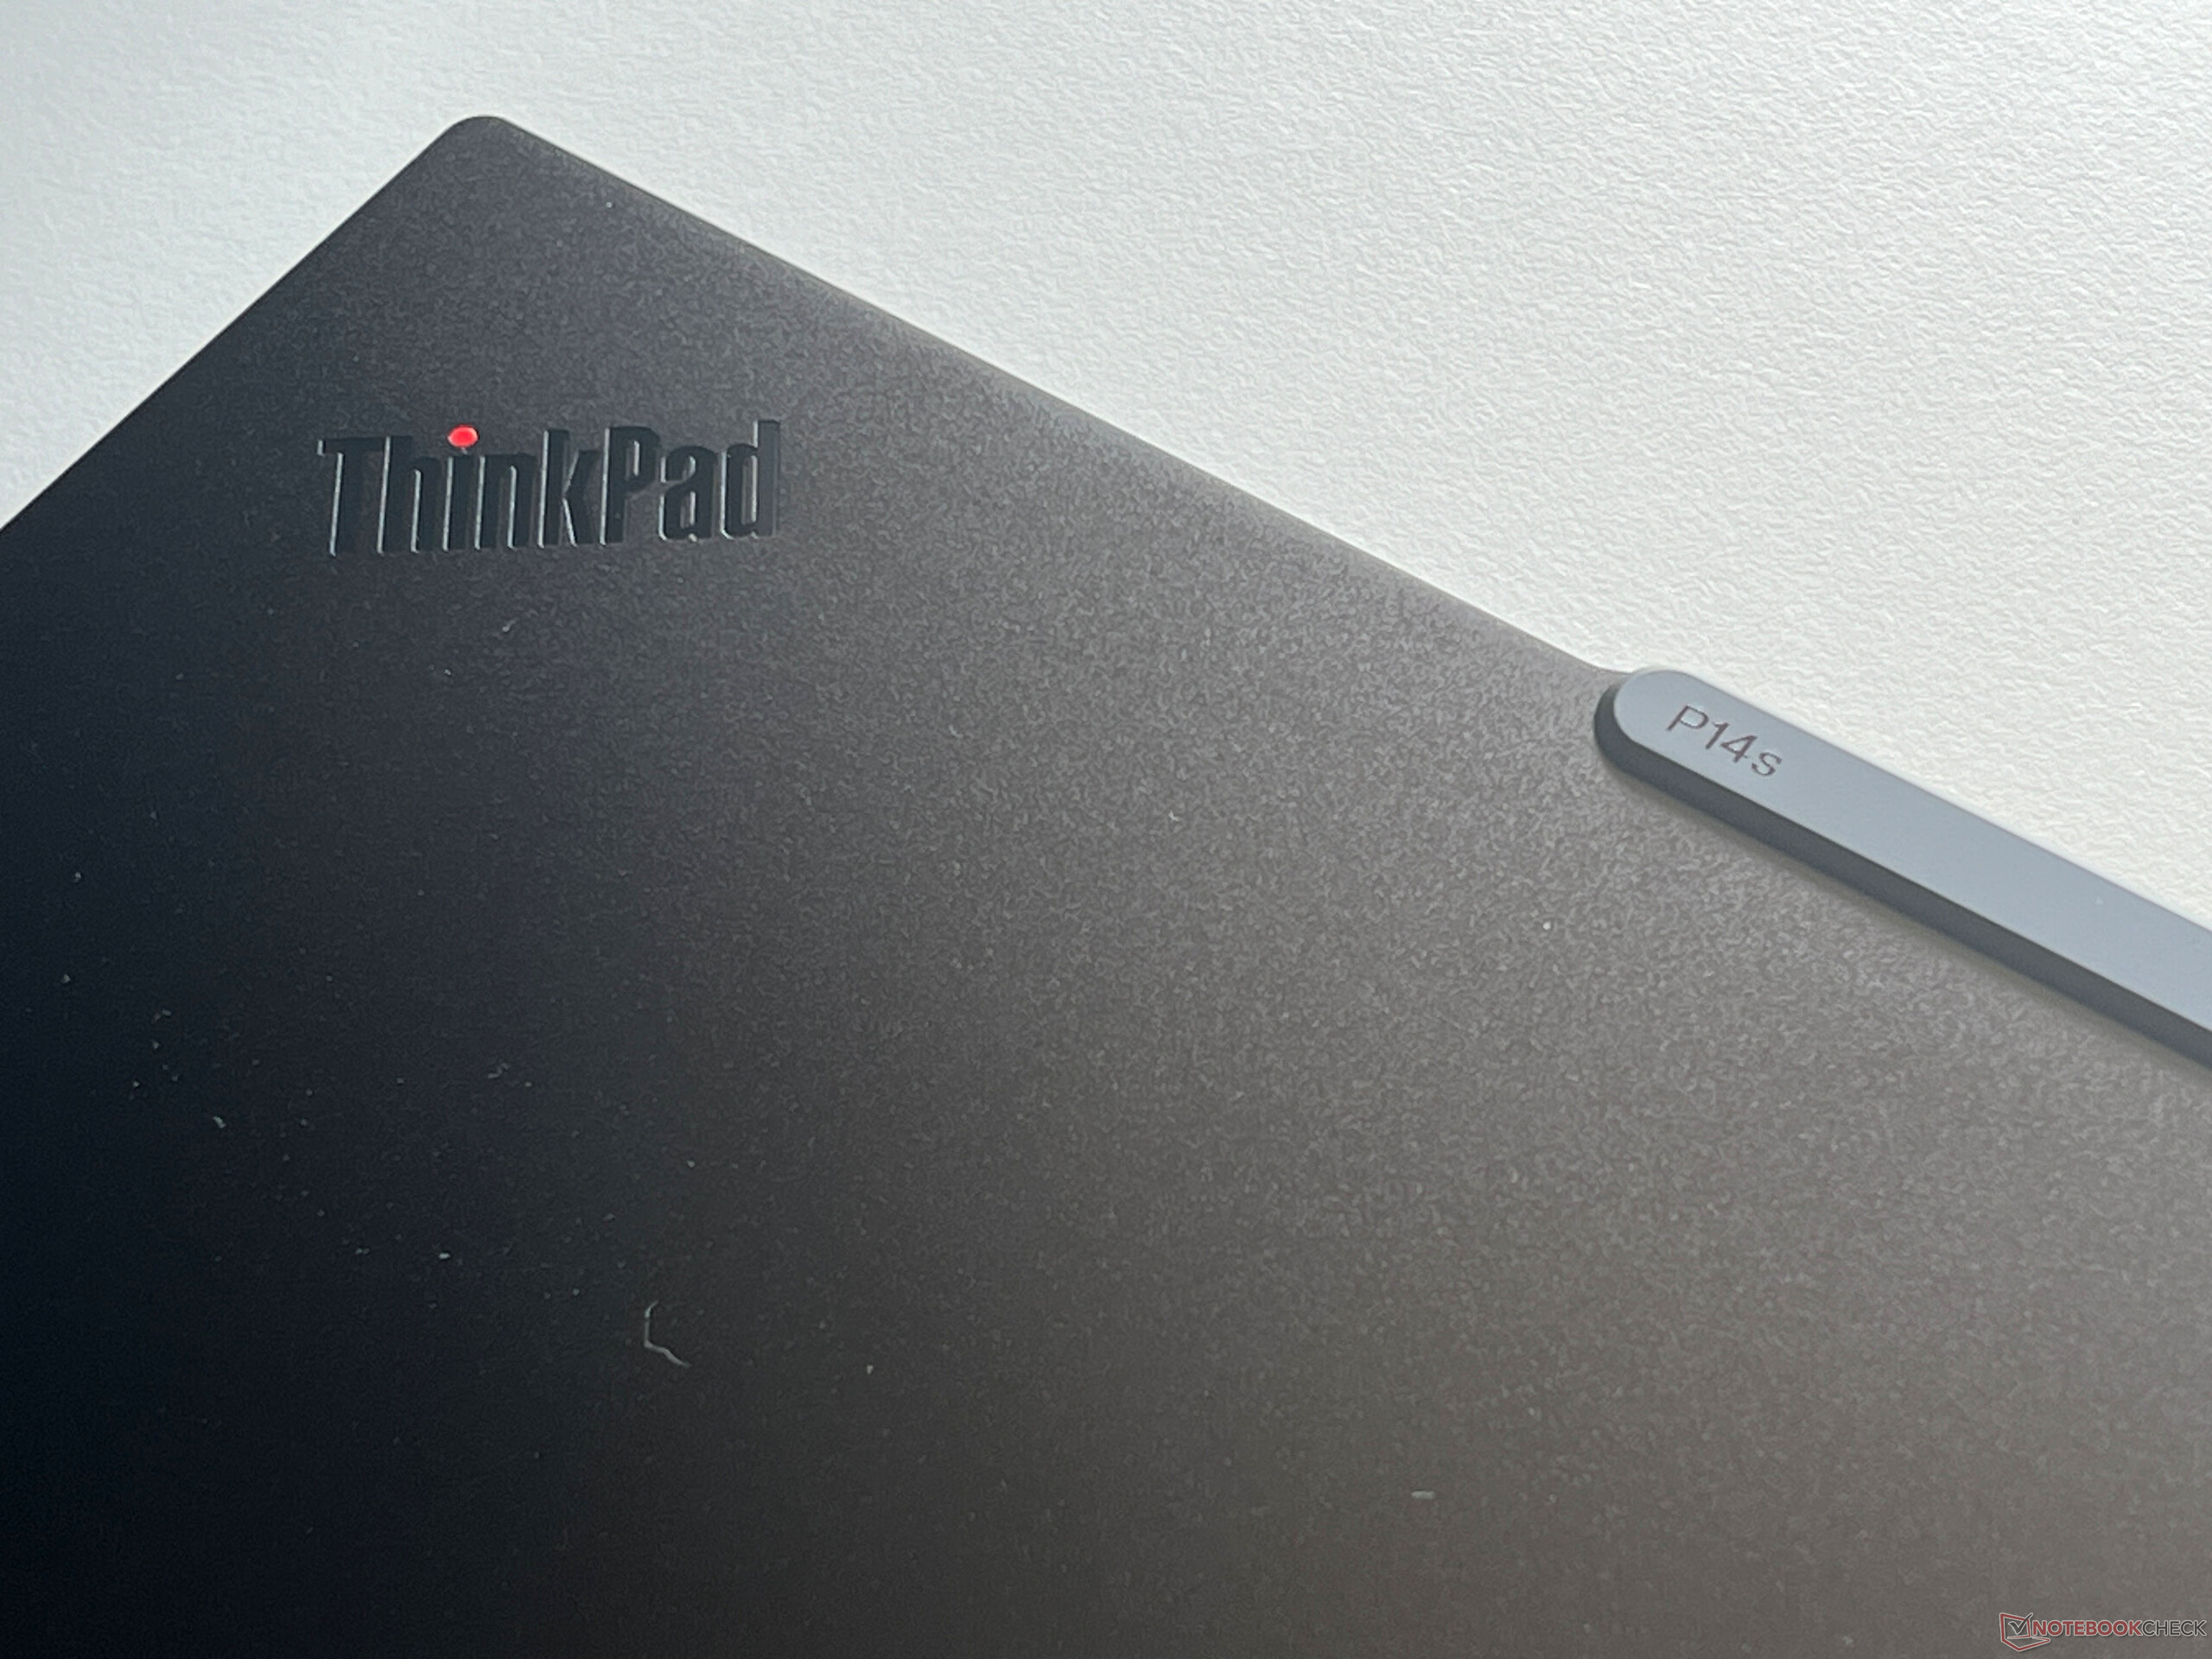
Caso - Lenovo ha engañado con sus dimensiones
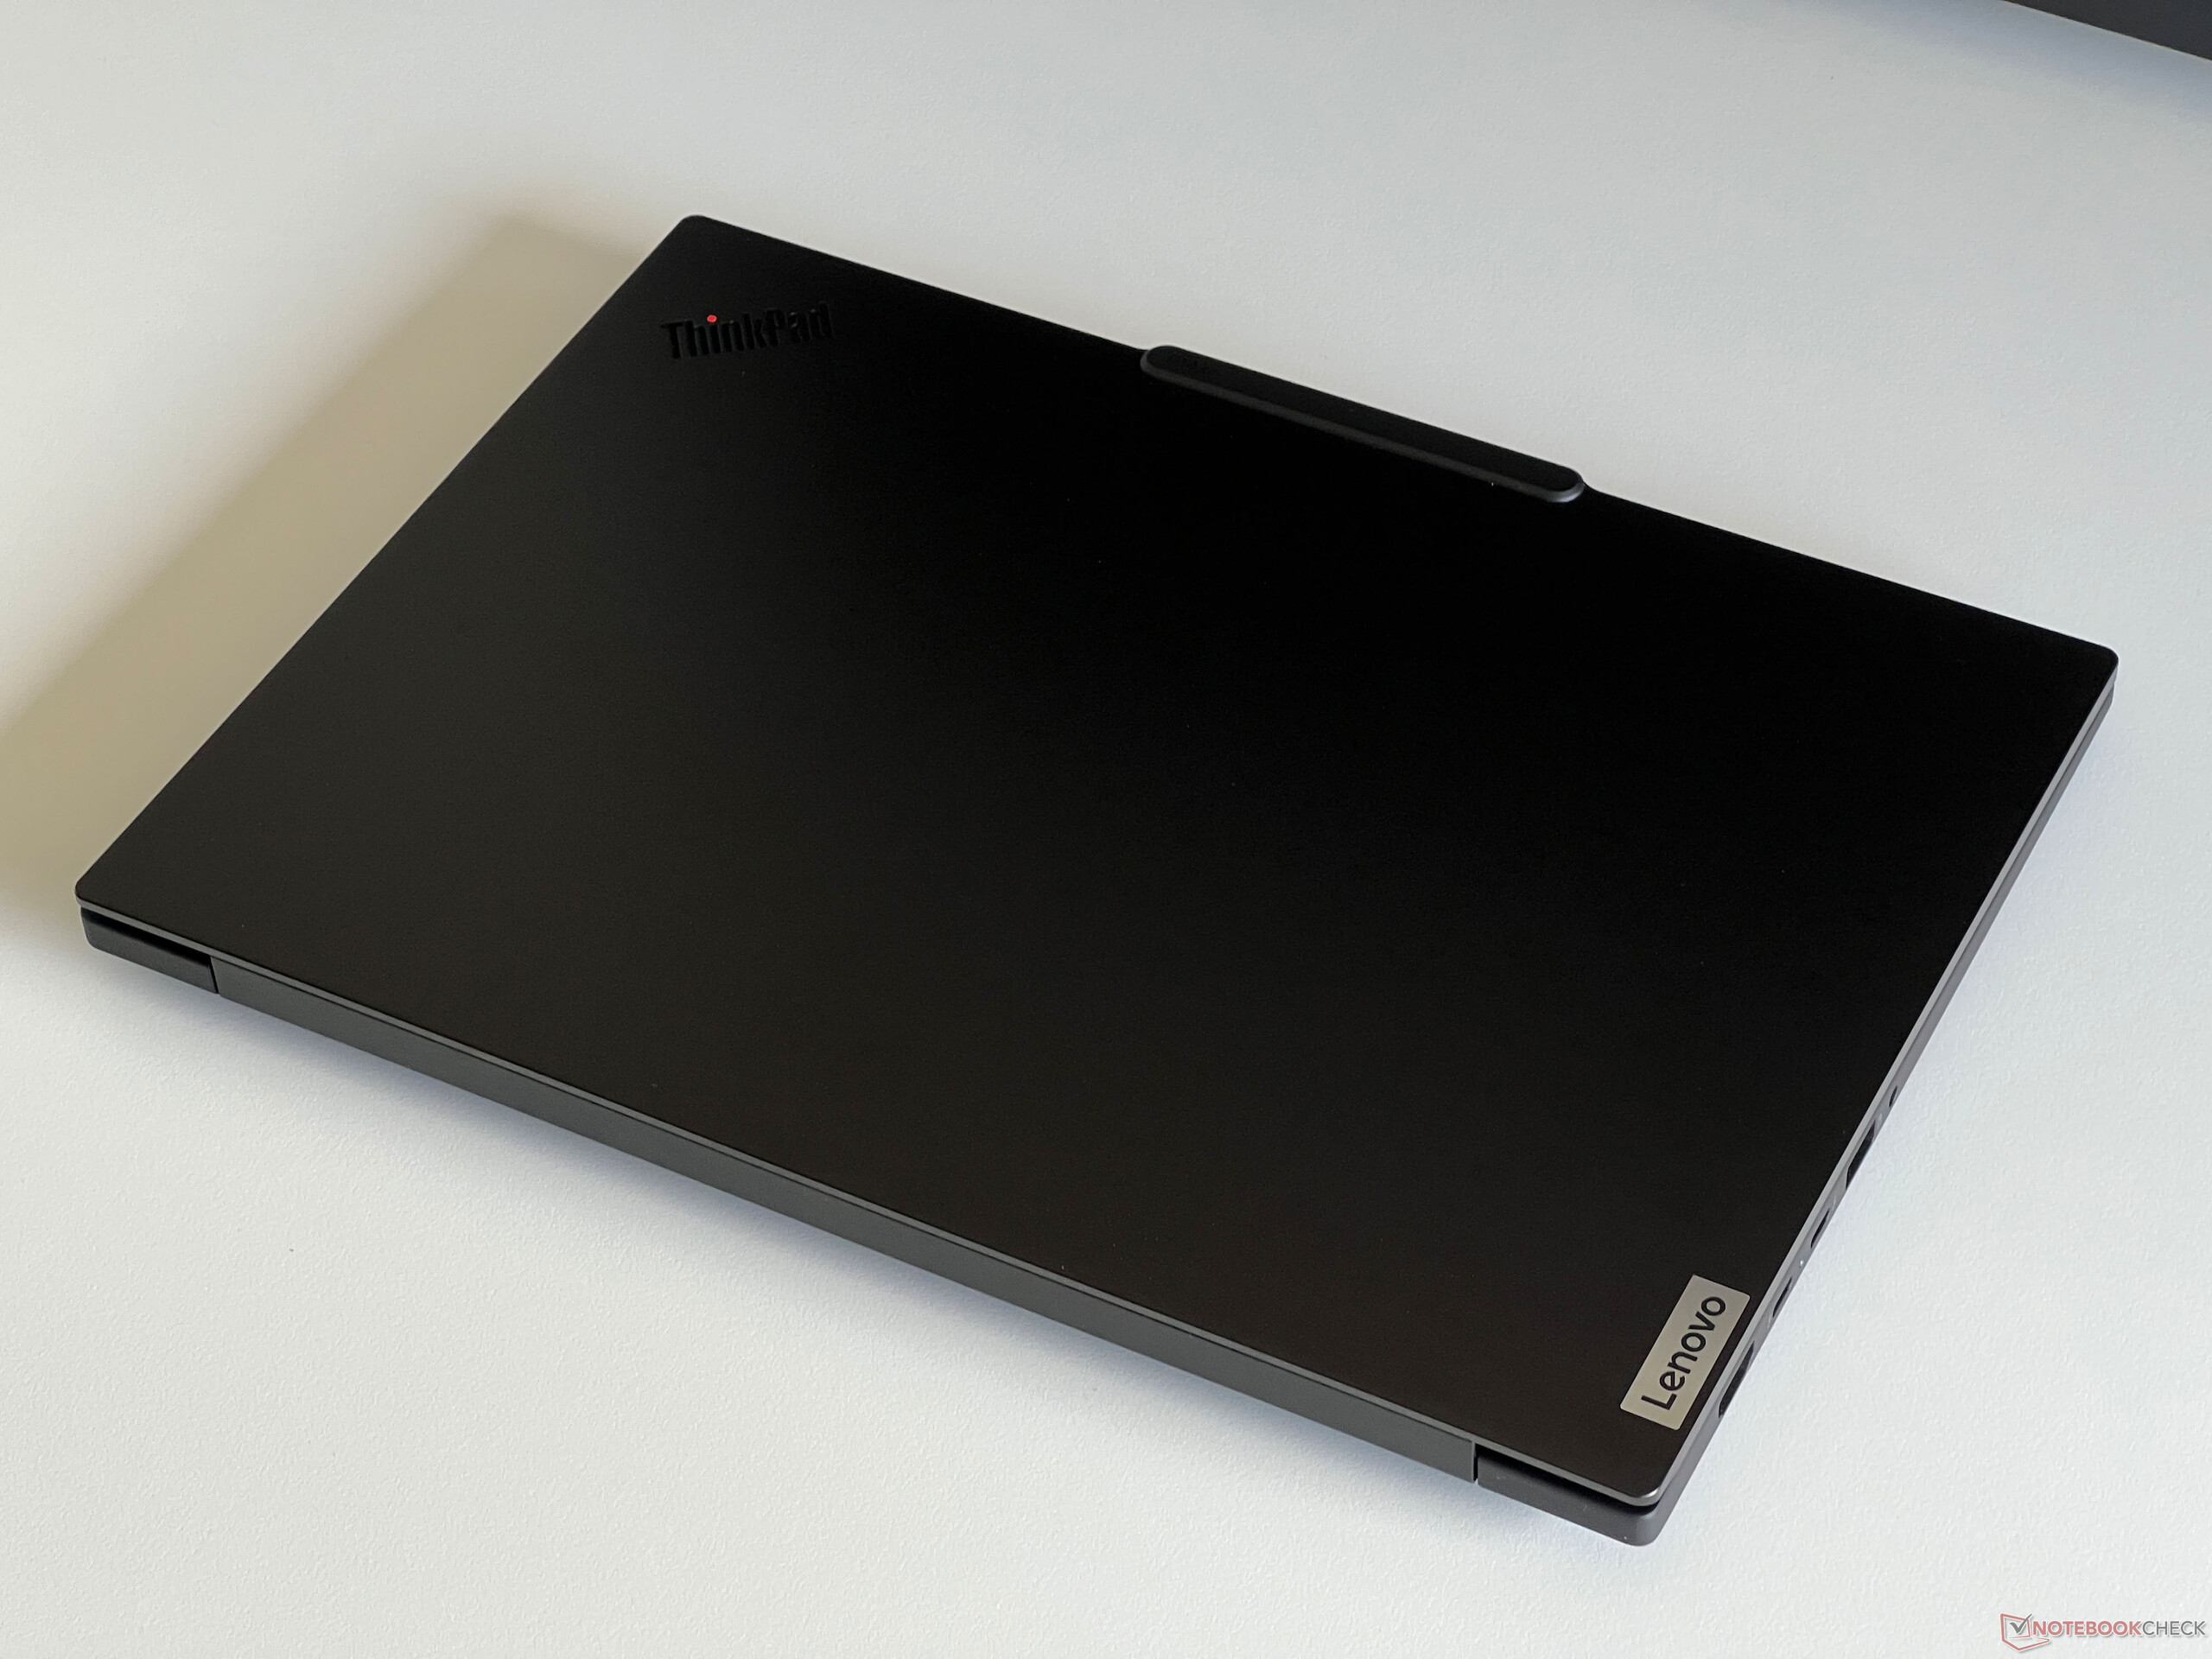
El ThinkPad P14s es una estación de trabajo móvil y, cuando lo coge por primera vez, se da cuenta inmediatamente de que no es un dispositivo especialmente delgado ni ligero. Sin embargo, cuando miramos su hoja de datos, nos sorprendimos porque Lenovo indica una altura de 18,5 mm, lo que simplemente no es correcto. Medimos alrededor de 22 mm sin los pies, lo que supone otra diferencia significativa.
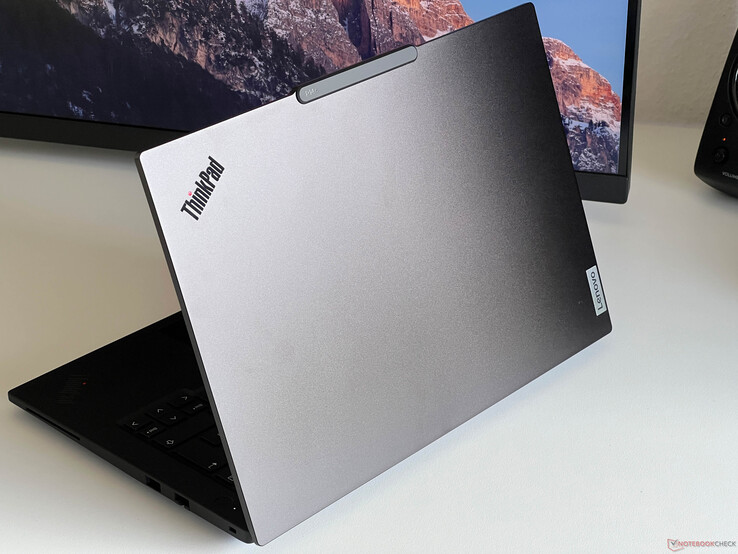
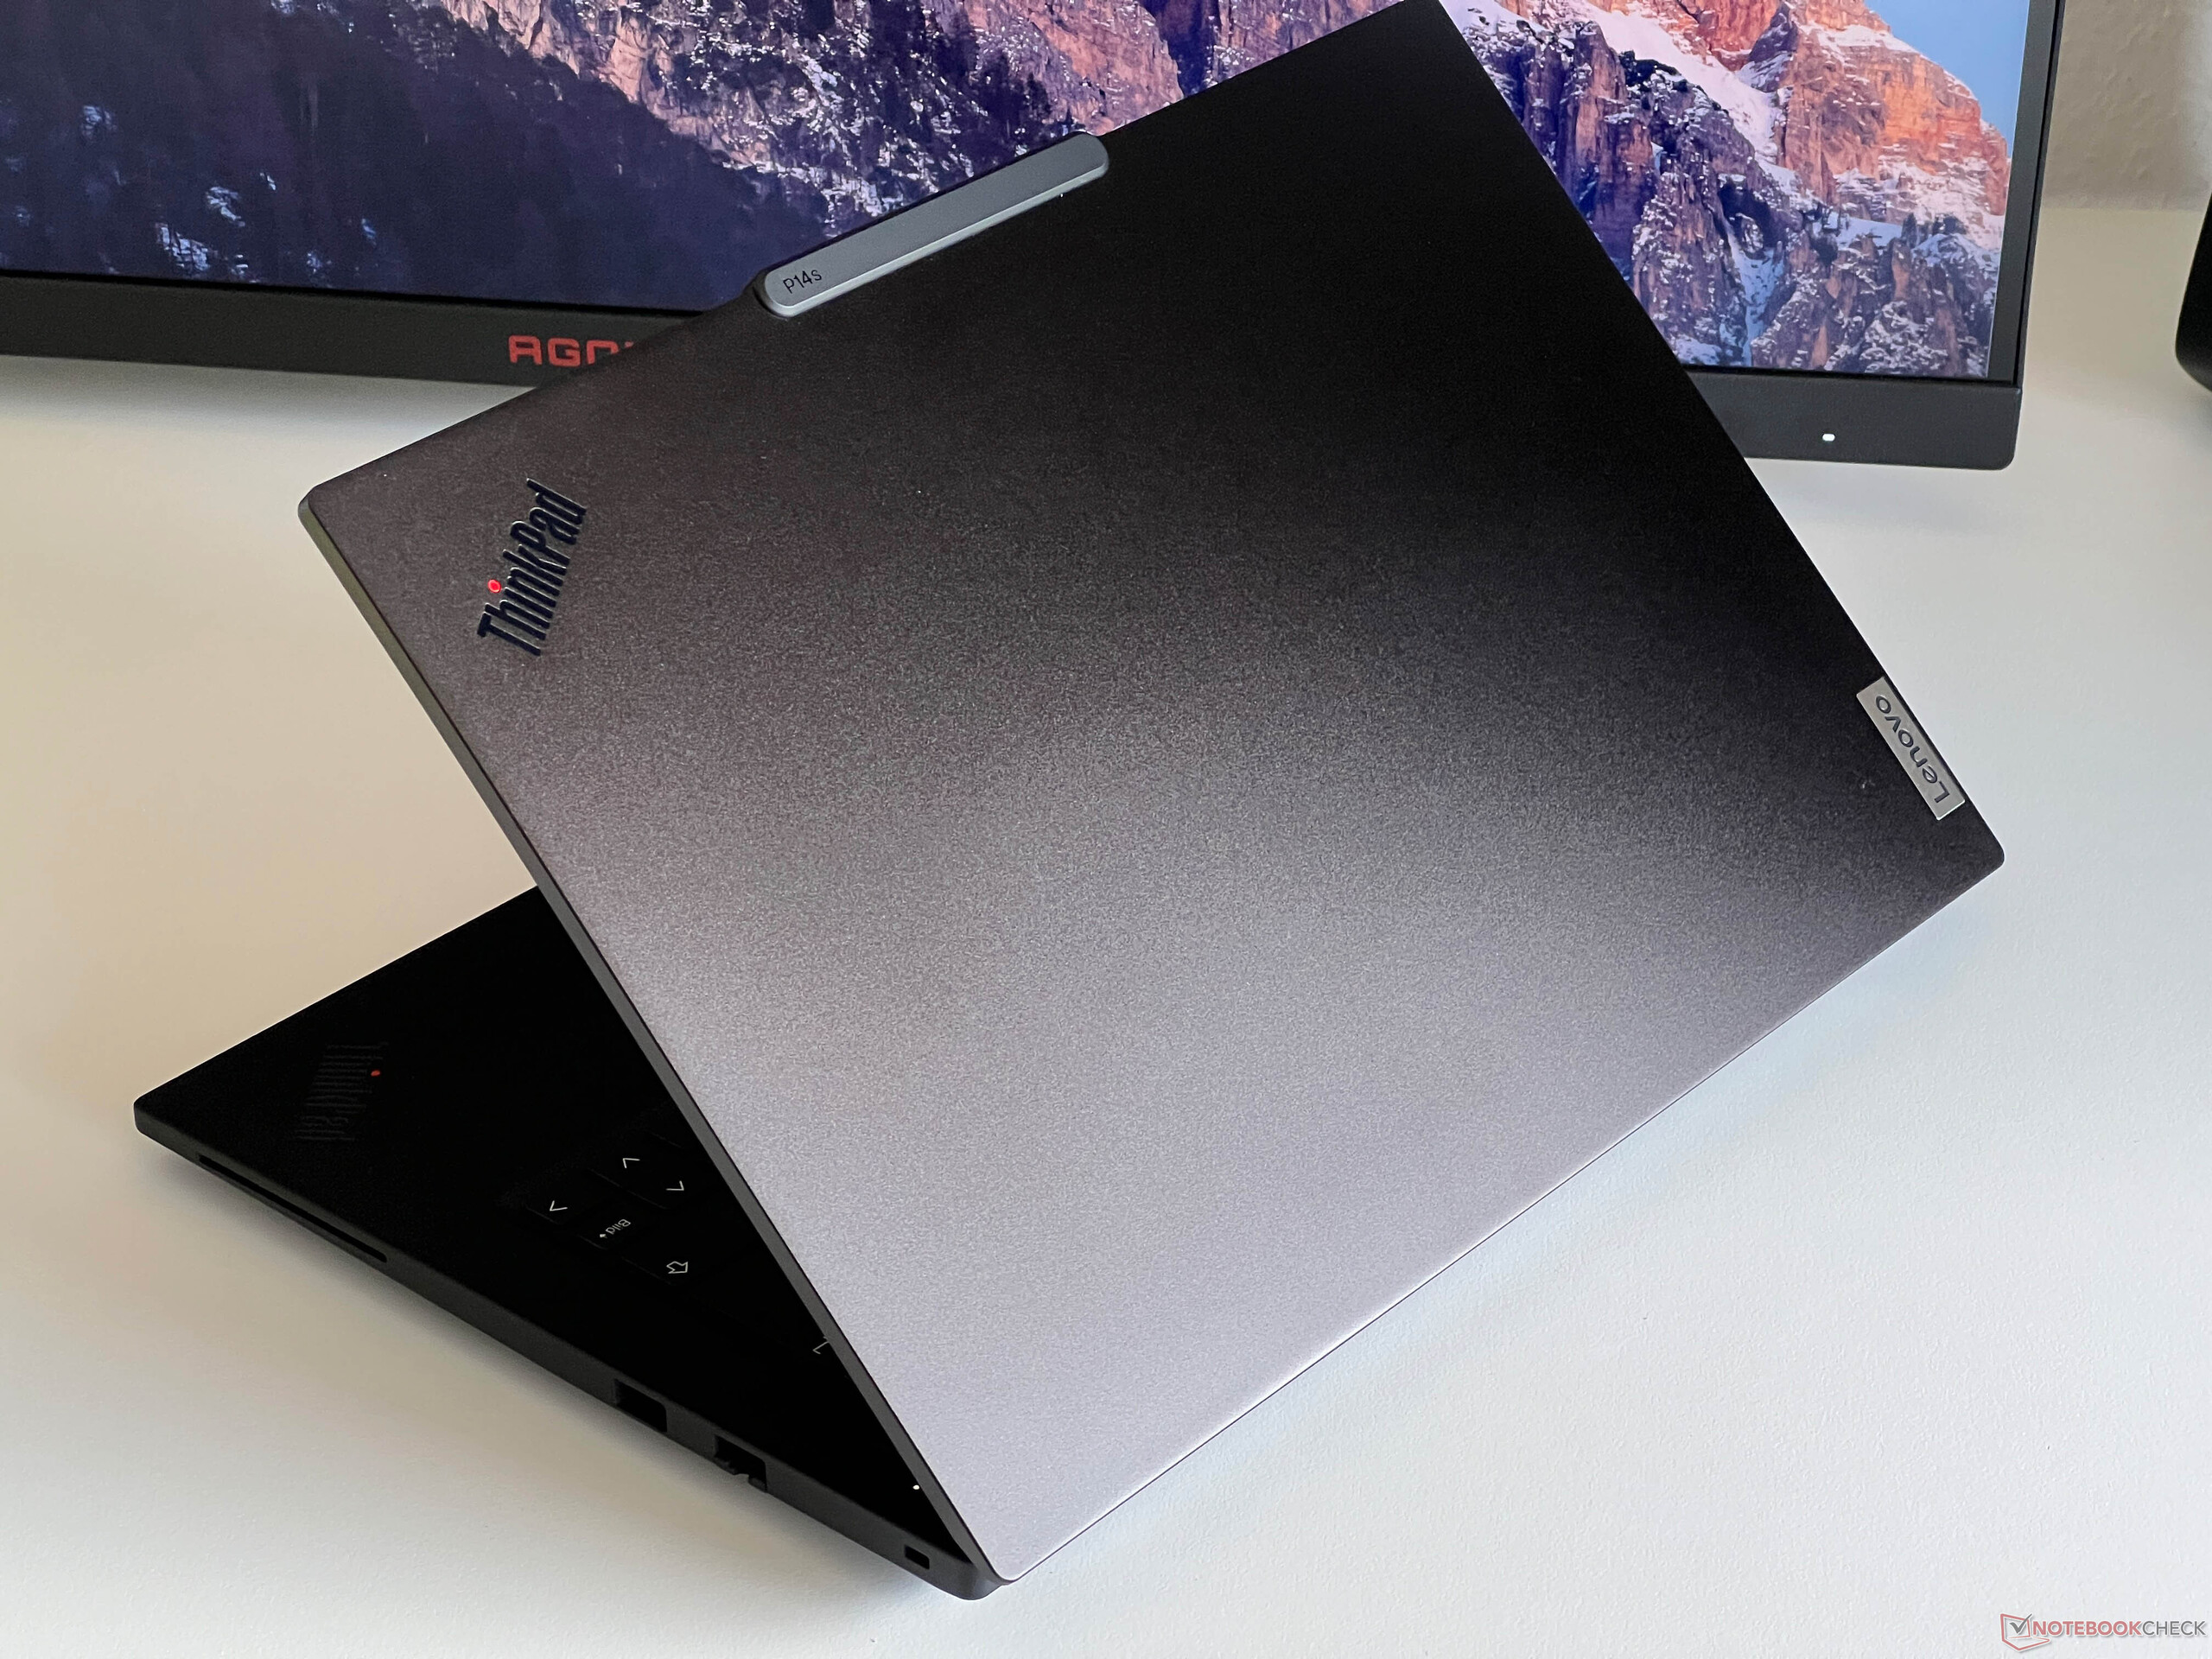
Desde el exterior, el ThinkPad P14s G5 presenta el mismo diseño que los modelos actuales del fabricante, que lamentablemente incluye la protuberancia de la cámara, poco atractiva y sobresaliente. Aparte de eso, su diseño se ha mantenido simple y, para algunas personas, quizás un poco aburrido. Las superficies lisas de la tapa y la parte inferior (ambas de aluminio) son muy susceptibles de acumular marcas de huellas dactilares, mientras que la parte superior de la unidad base (aleación de magnesio y aluminio) tiene un tacto ligeramente engomado y no tiene tantos problemas con esto. Los biseles de la pantalla son ligeramente más estrechos que en el modelo predecesor, por lo que hay espacio para el panel más grande de 14,5 pulgadas.
La estabilidad de la unidad base es sobresaliente y no se puede presionar ni torcer nada, aunque al aplicar presión en la zona situada a la derecha del teclado se producen ligeros crujidos en nuestro dispositivo de prueba. La tapa de la pantalla también es muy estable y no pudimos provocar ningún error de imagen durante nuestra prueba. Las bisagras están bastante apretadas en general, pero aún así puede abrir el dispositivo con una mano. Sin embargo, no es posible evitar completamente que se balancee al cambiar el ángulo de apertura (máx. 180 grados).
Ya hemos hablado de su altura, pero el nuevo P14s G5 es también uno de los modelos más grandes de nuestro grupo de comparación en lo que se refiere a su tamaño. Su peso es de 1,72 kg y la fuente de alimentación de 135 vatios pesa otros 527 gramos.
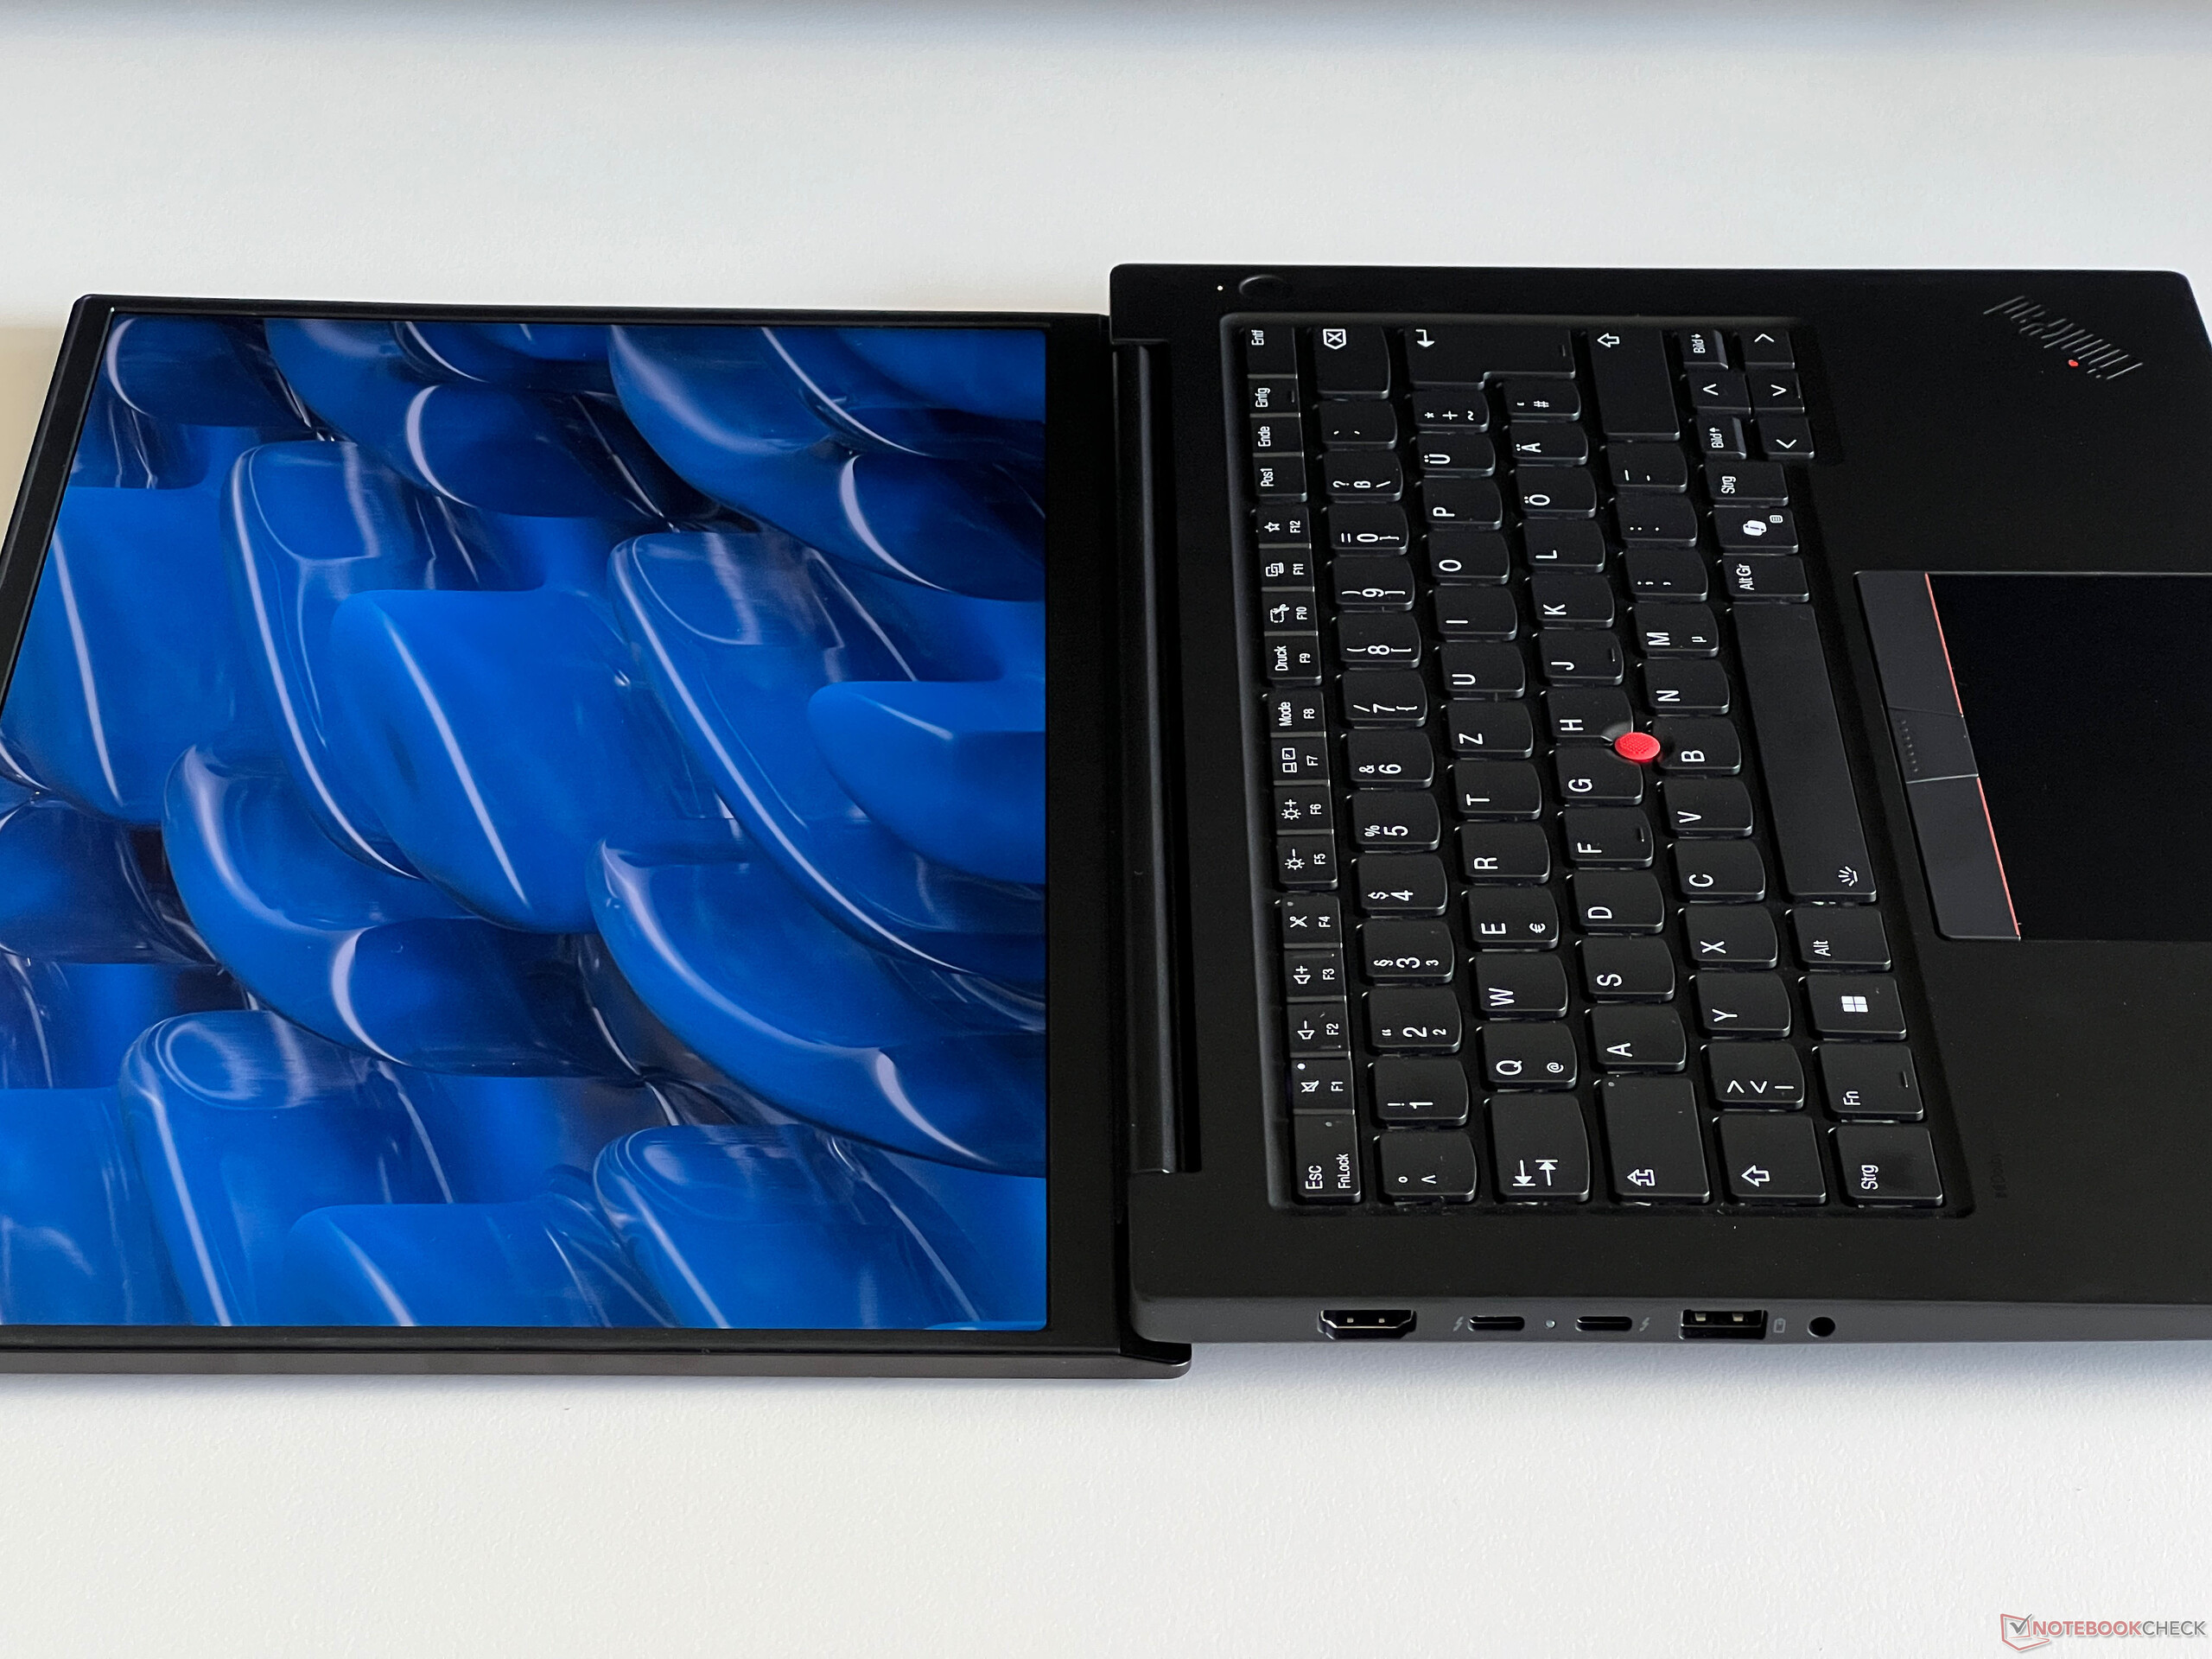
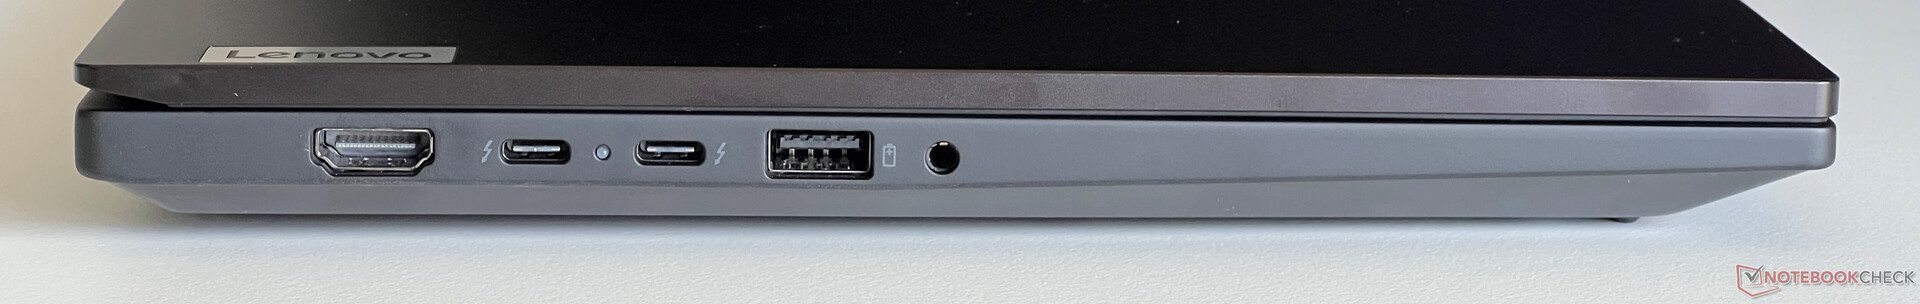
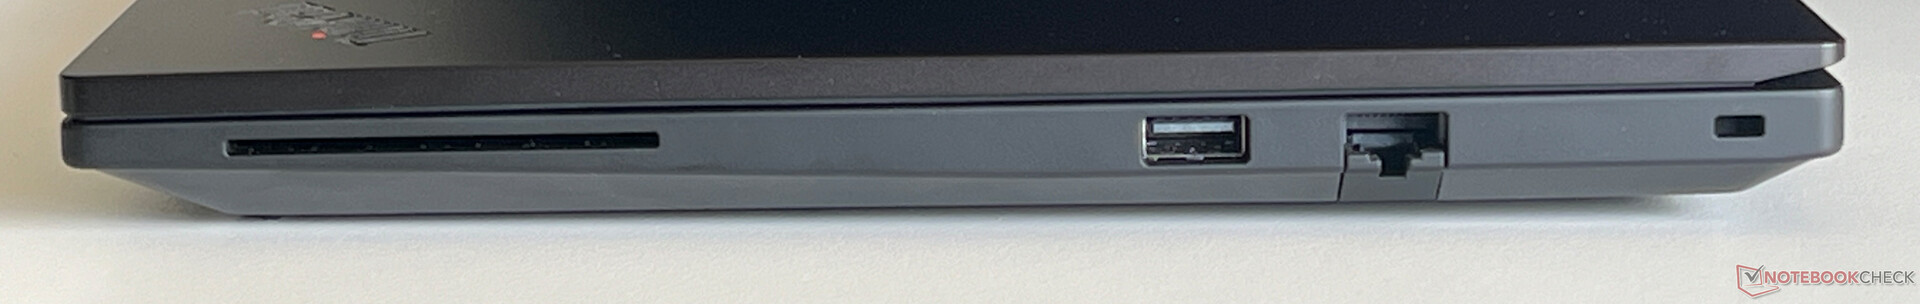
Conectividad - Thunderbolt 4 y un lector SmartCard
No hay sorpresas para los usuarios en lo que respecta a las conexiones y, además de los modernos puertos Thunderbolt 4, también hay instalados dos puertos USB-A normales. Esto significa que no tendrá que echar mano de adaptadores durante el uso diario. Nuestro dispositivo de pruebas también está equipado con un lector de tarjetas SmartCard opcional, pero no tiene lector de tarjetas SD.
Comunicación
Lenovo ha instalado el módulo WLAN Intel AX211 que también es compatible con las modernas redes de 6 GHz y Bluetooth 5.3. Sin embargo, no lleva a bordo un módulo Wi-Fi 7. En nuestra prueba utilizando nuestro router de referencia de Asus, sus tasas de transferencia fueron excelentes y también muy estables, por lo que no debería haber problemas durante el uso en este sentido. También dispone de un puerto Gigabit Ethernet (Intel i219-V) para redes cableadas.
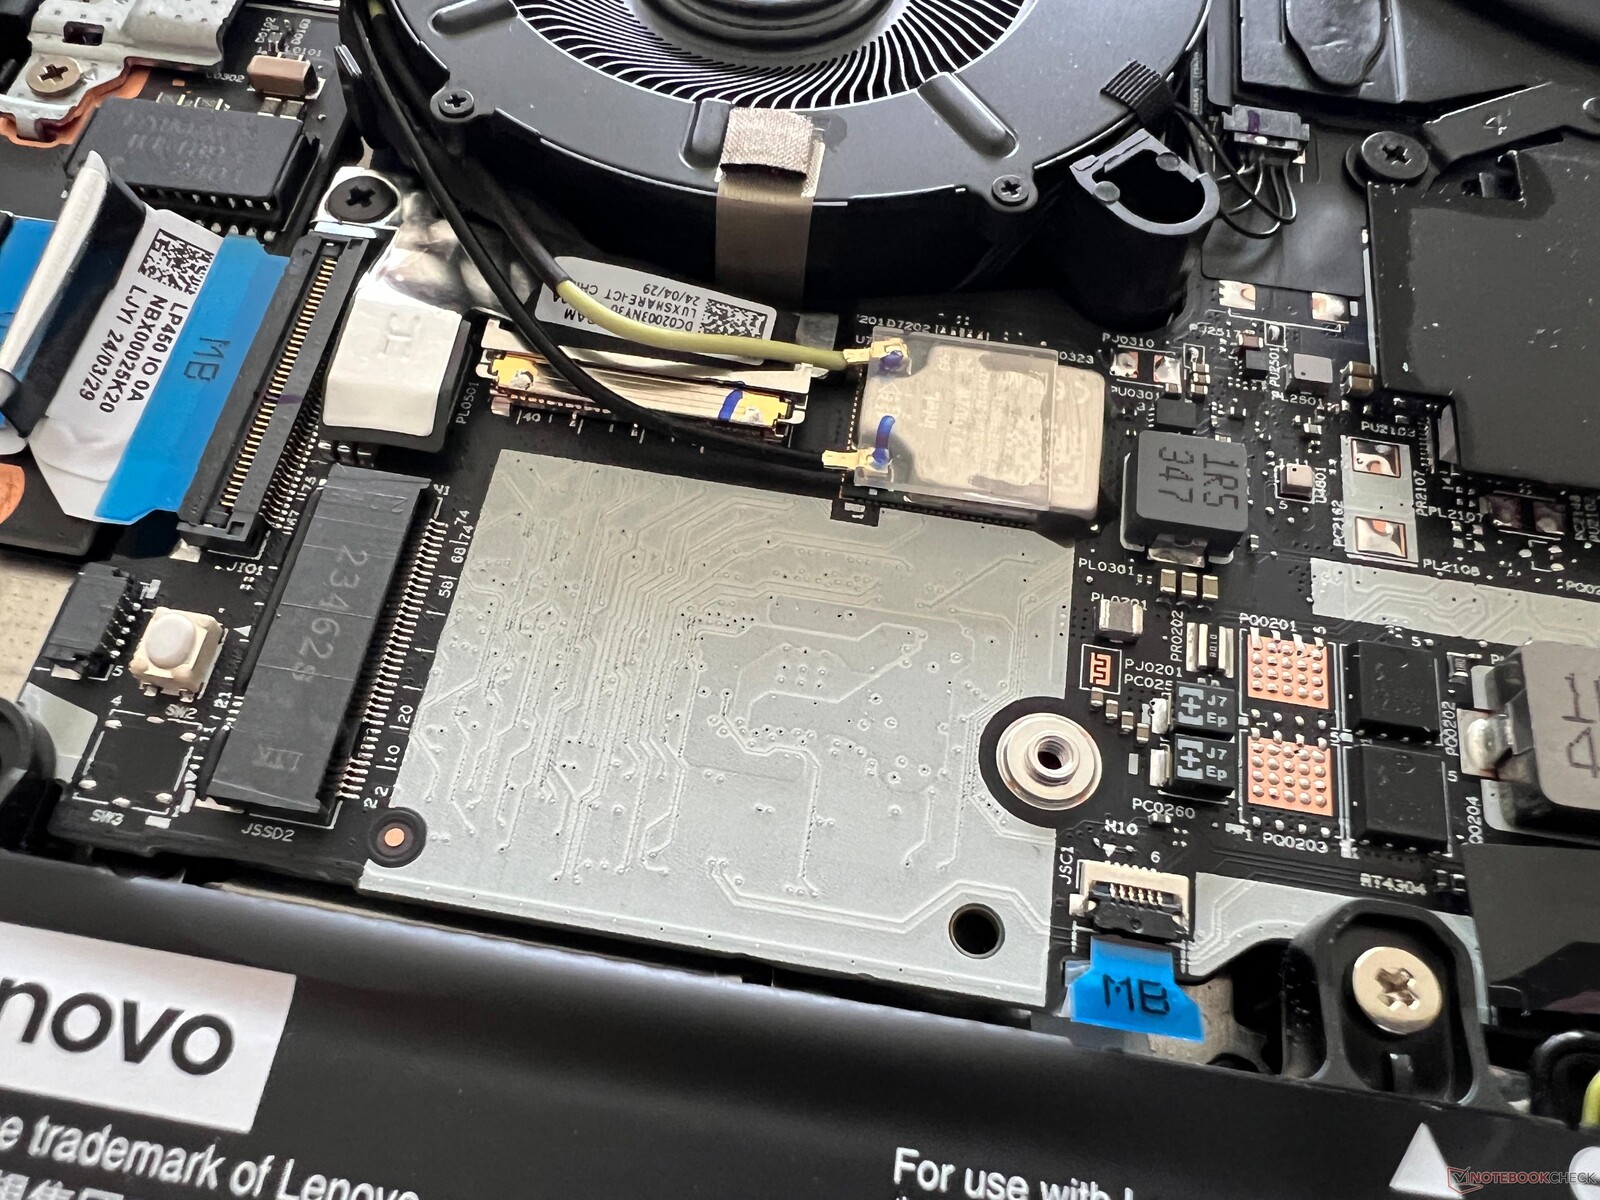
El P14s G5 cuenta además con una ranura M.2-2242 para un módulo WWAN, pero actualmente no se dispone de las configuraciones correspondientes en Alemania (donde se realizó esta prueba) debido a un litigio legal. También faltan las antenas necesarias (no están preparadas para WWAN), por lo que los usuarios no pueden reequipar el módulo sin tomar medidas adicionales.
| Networking | |
| Lenovo ThinkPad P14s G5 21G3S00A00 | |
| iperf3 transmit AXE11000 | |
| iperf3 receive AXE11000 | |
| HP ZBook Firefly 14 G11 | |
| iperf3 transmit AXE11000 | |
| iperf3 receive AXE11000 | |
| iperf3 transmit AXE11000 6GHz | |
| iperf3 receive AXE11000 6GHz | |
| Dell Precision 5000 5490 | |
| iperf3 transmit AXE11000 | |
| iperf3 receive AXE11000 | |
| iperf3 transmit AXE11000 6GHz | |
| iperf3 receive AXE11000 6GHz | |
| Lenovo ThinkPad P14s G4 21HF0017GE | |
| iperf3 transmit AXE11000 | |
| iperf3 receive AXE11000 | |
| iperf3 transmit AXE11000 6GHz | |
| iperf3 receive AXE11000 6GHz | |
| Microsoft Surface Laptop Studio 2 RTX 4060 | |
| iperf3 transmit AXE11000 | |
| iperf3 receive AXE11000 | |
| Lenovo Yoga Pro 9-14IRP G8 | |
| iperf3 transmit AXE11000 | |
| iperf3 receive AXE11000 | |
Cámara web
La webcam puede capturar imágenes de hasta 5 MP en 4:3 (2.592 x 1.944 píxeles) o de 3,7 MP en 16:9 (2.560 x 1.440 píxeles). Su nitidez de imagen es mejor que la de los sensores habituales de 2 MP y también es compatible con los efectos adicionales de Windows Studio.


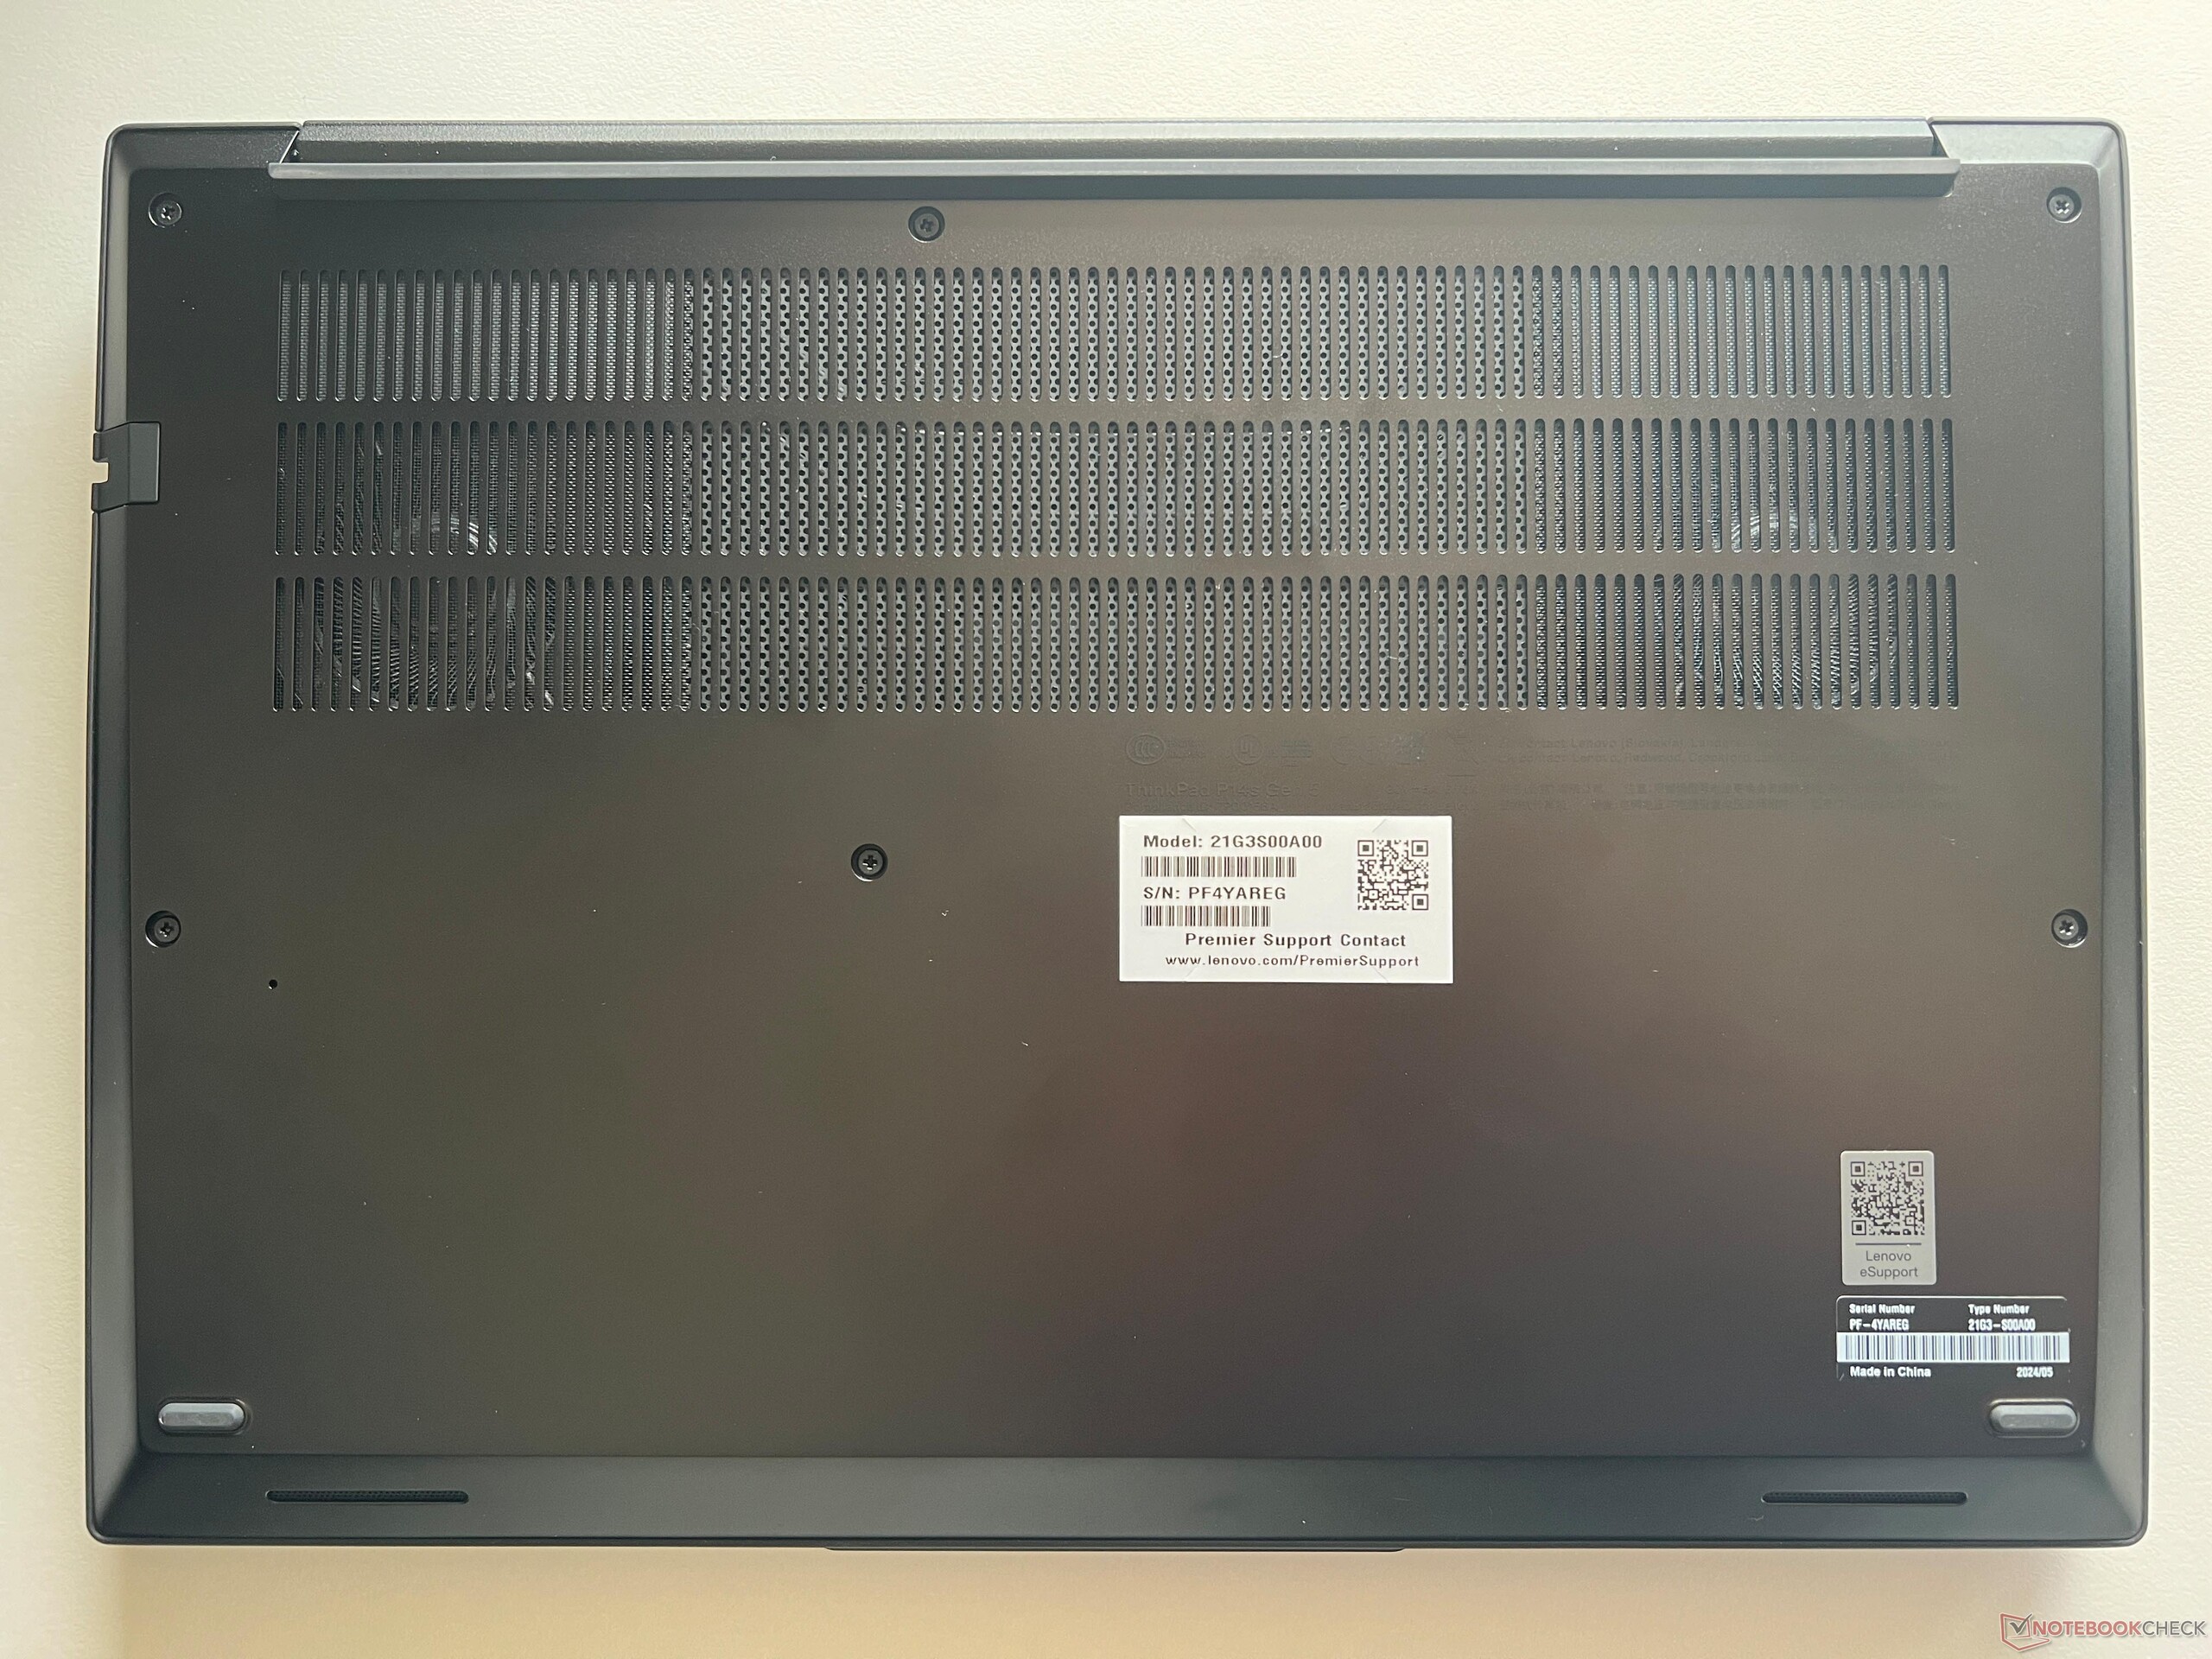
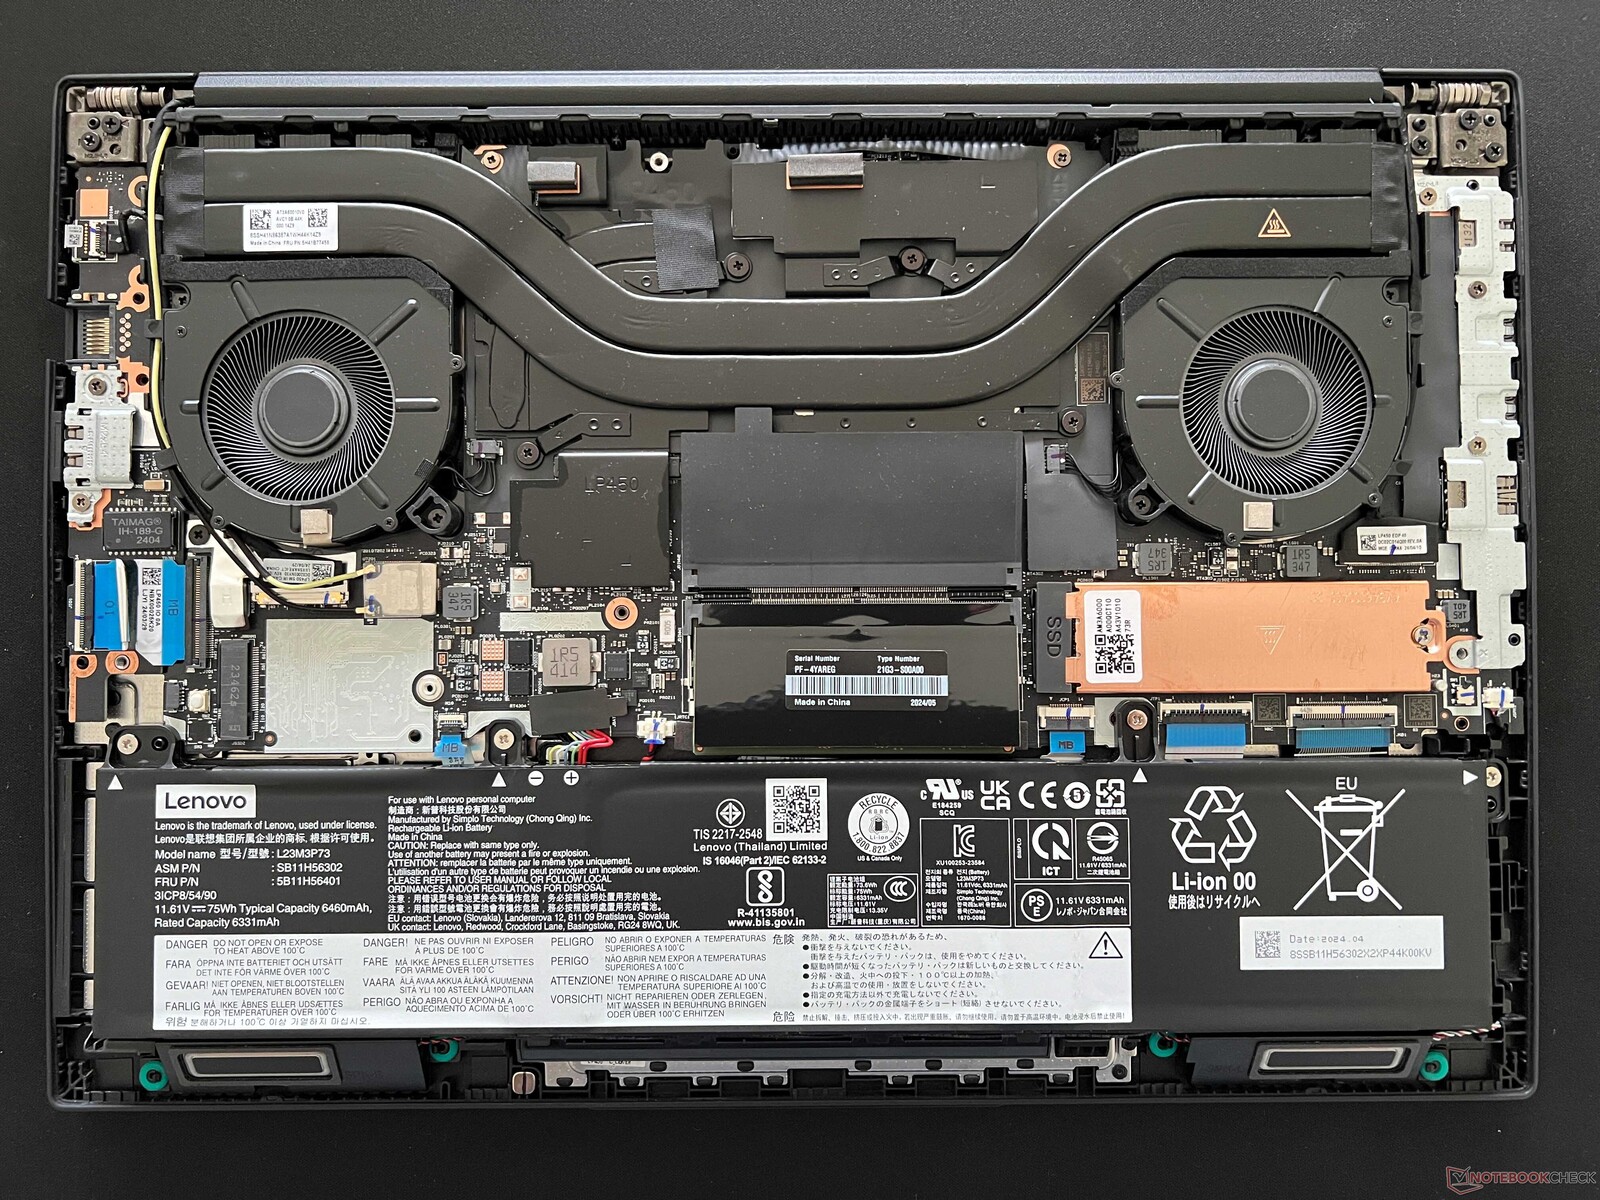
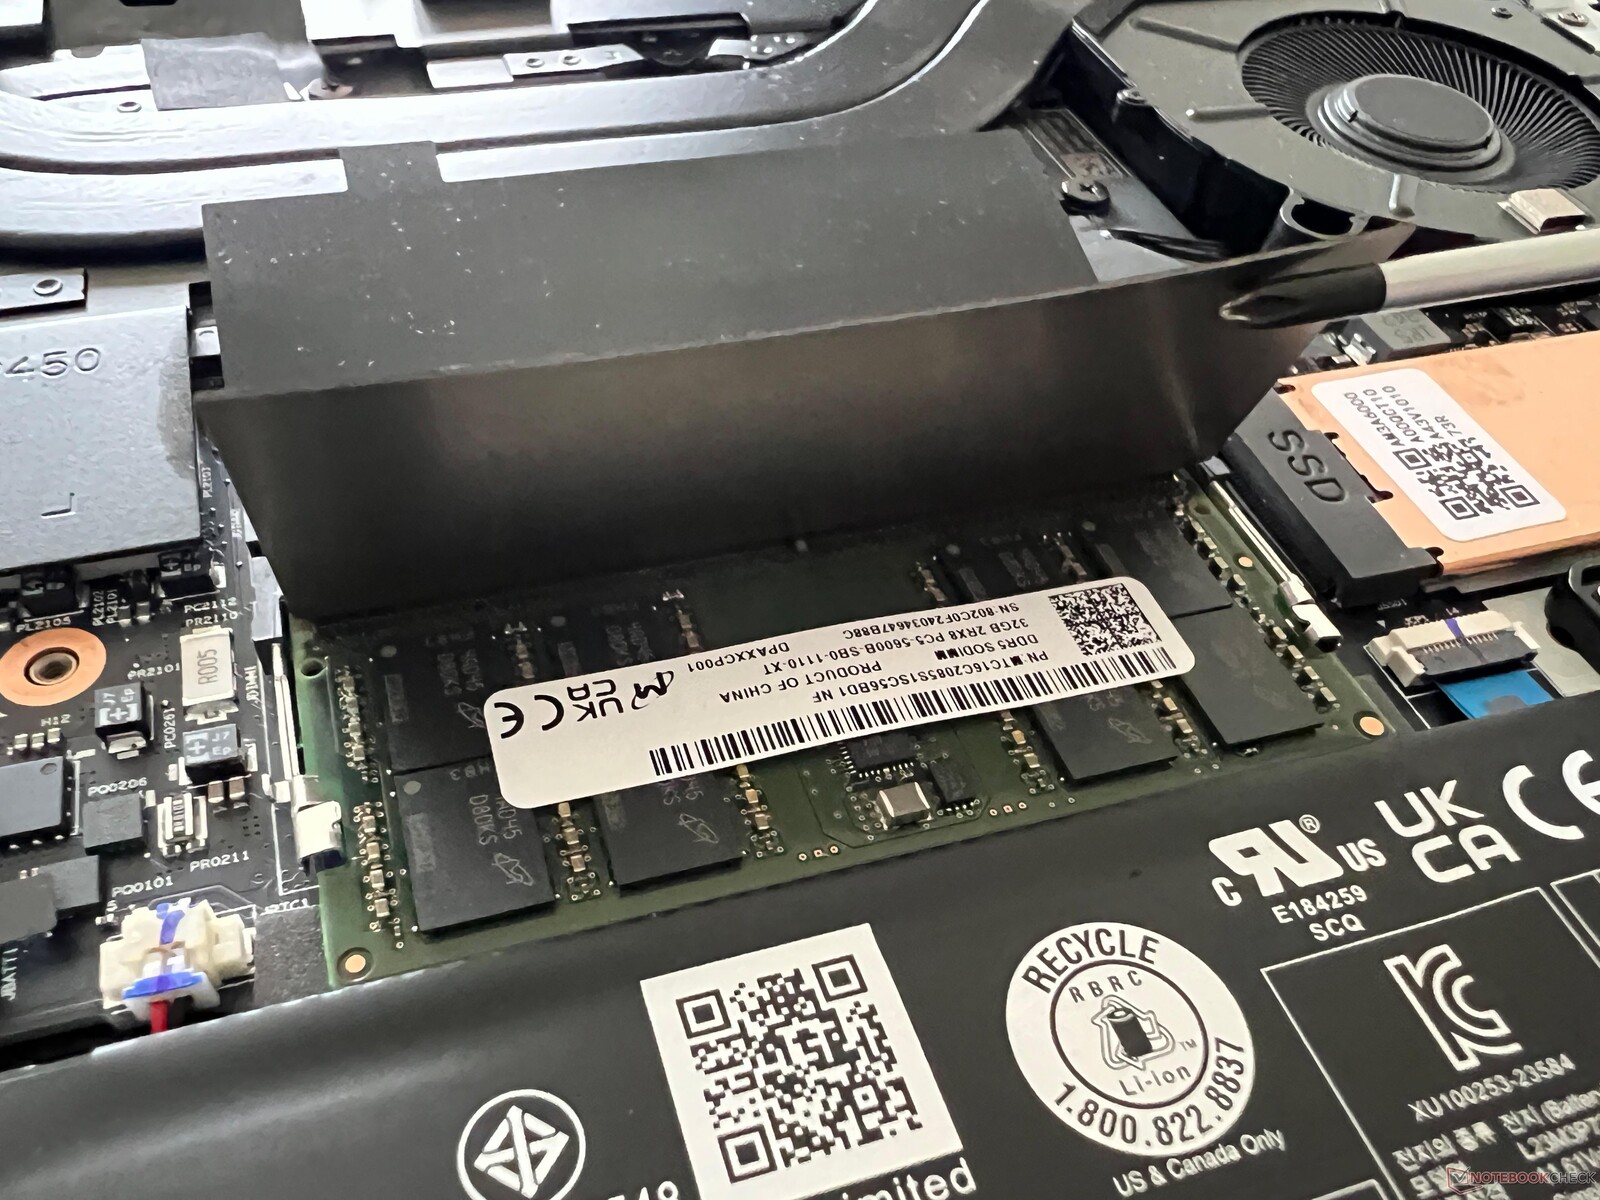
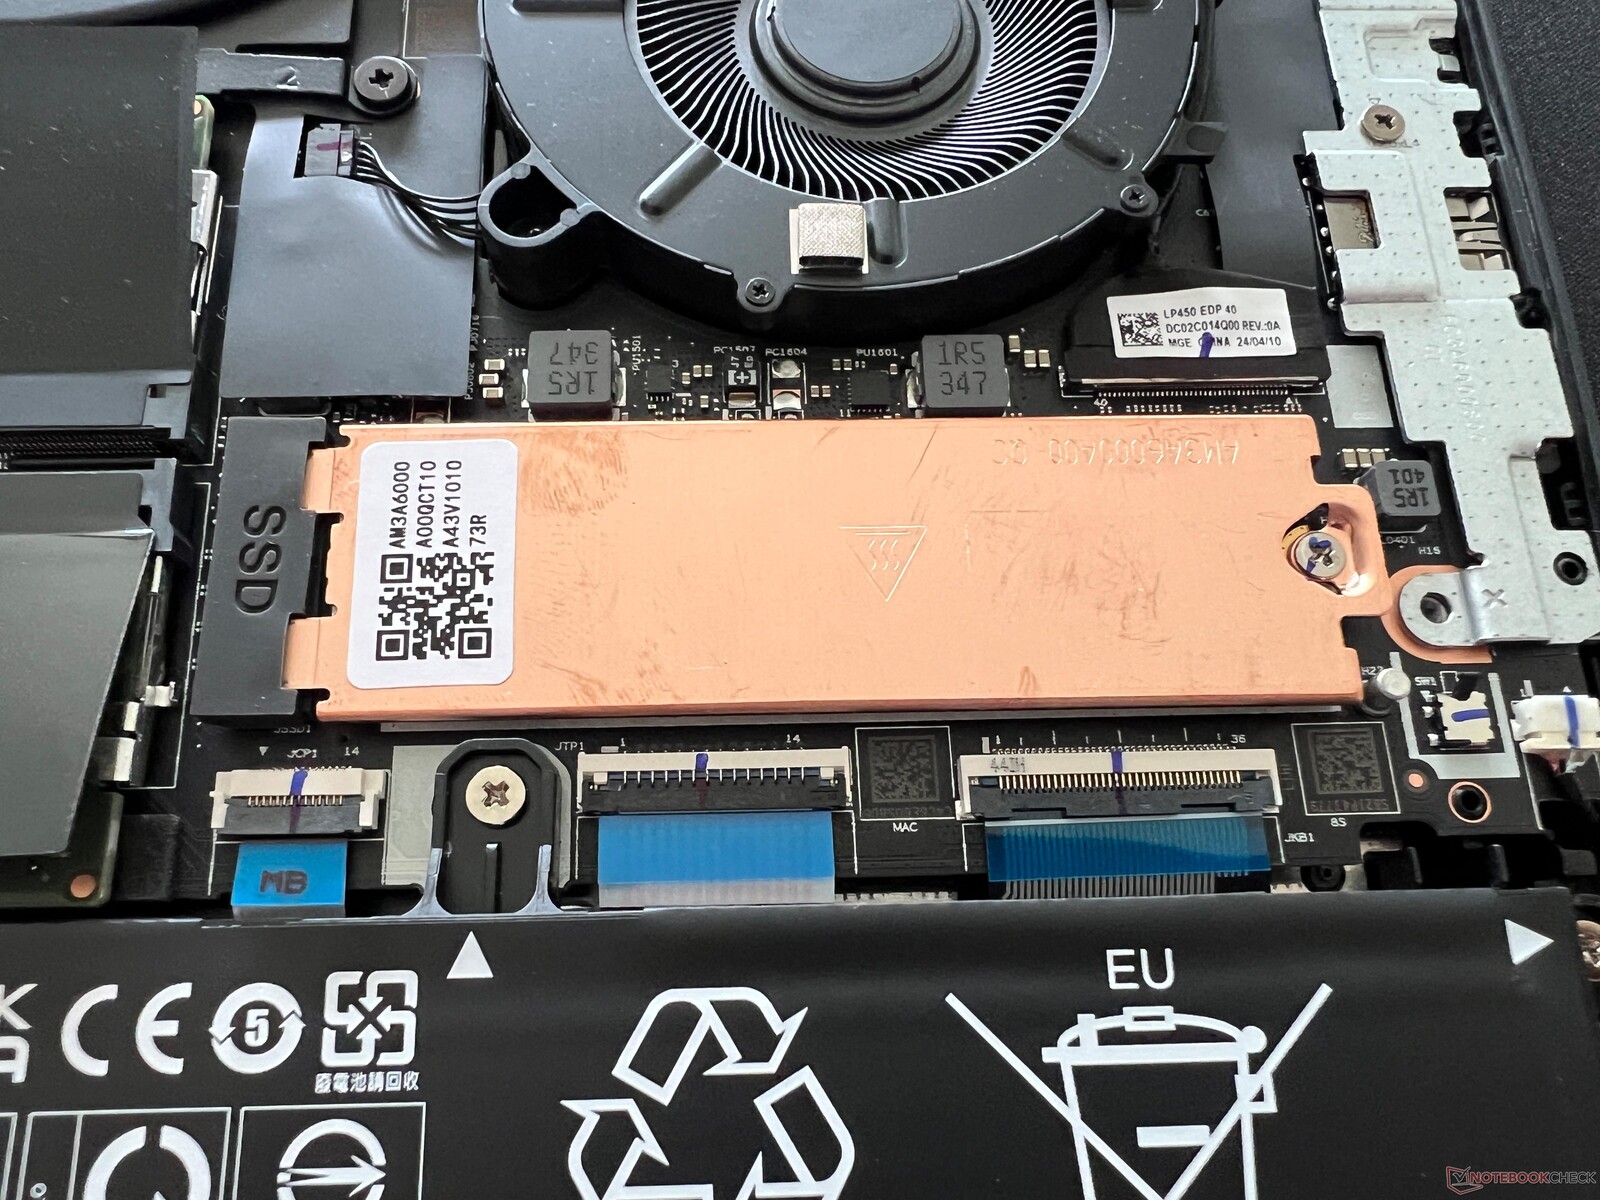
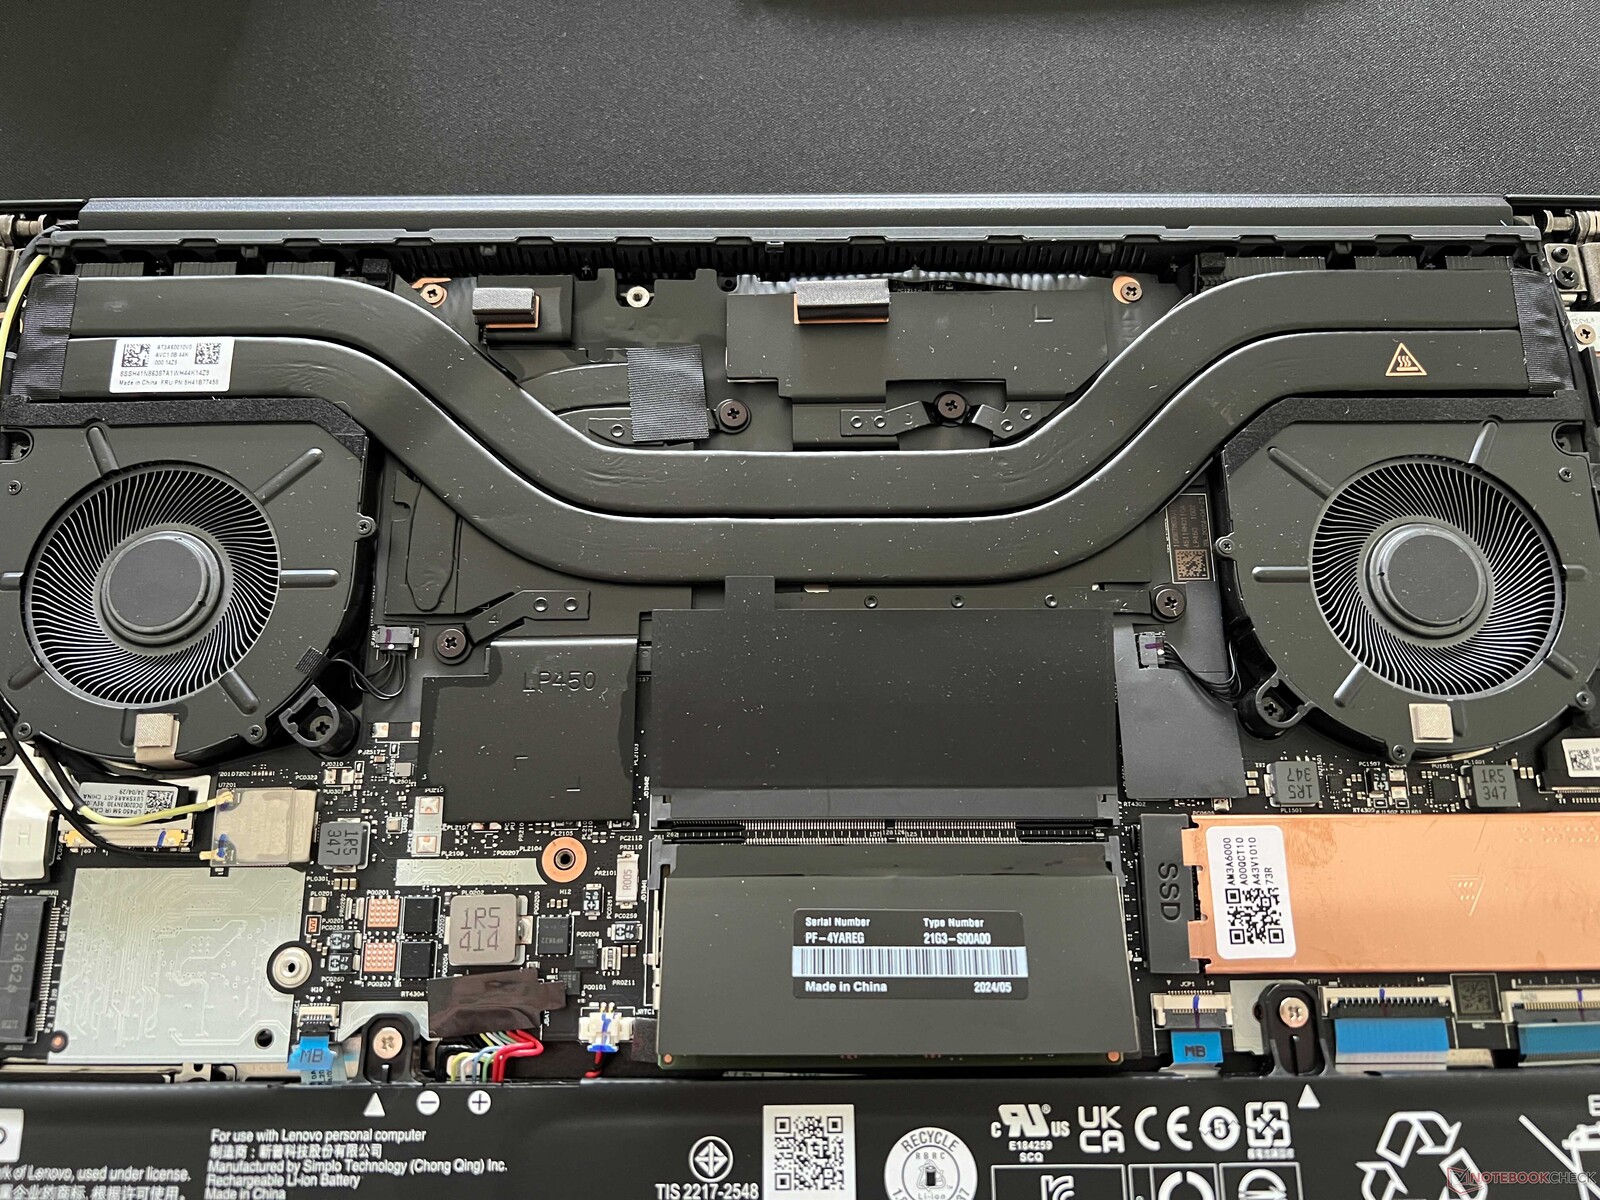
Mantenimiento
La tapa inferior de la carcasa está fijada con seis tornillos Phillips y puede retirarse fácilmente. El procesador, la tarjeta gráfica y el módulo WLAN están soldados, pero tanto la unidad SSD M.2 2280 como la memoria RAM pueden ampliarse. Las dos ranuras DIMM pueden alojar módulos con un máximo de 48 GB, lo que significa que se puede instalar en el portátil un total de 96 GB de RAM.
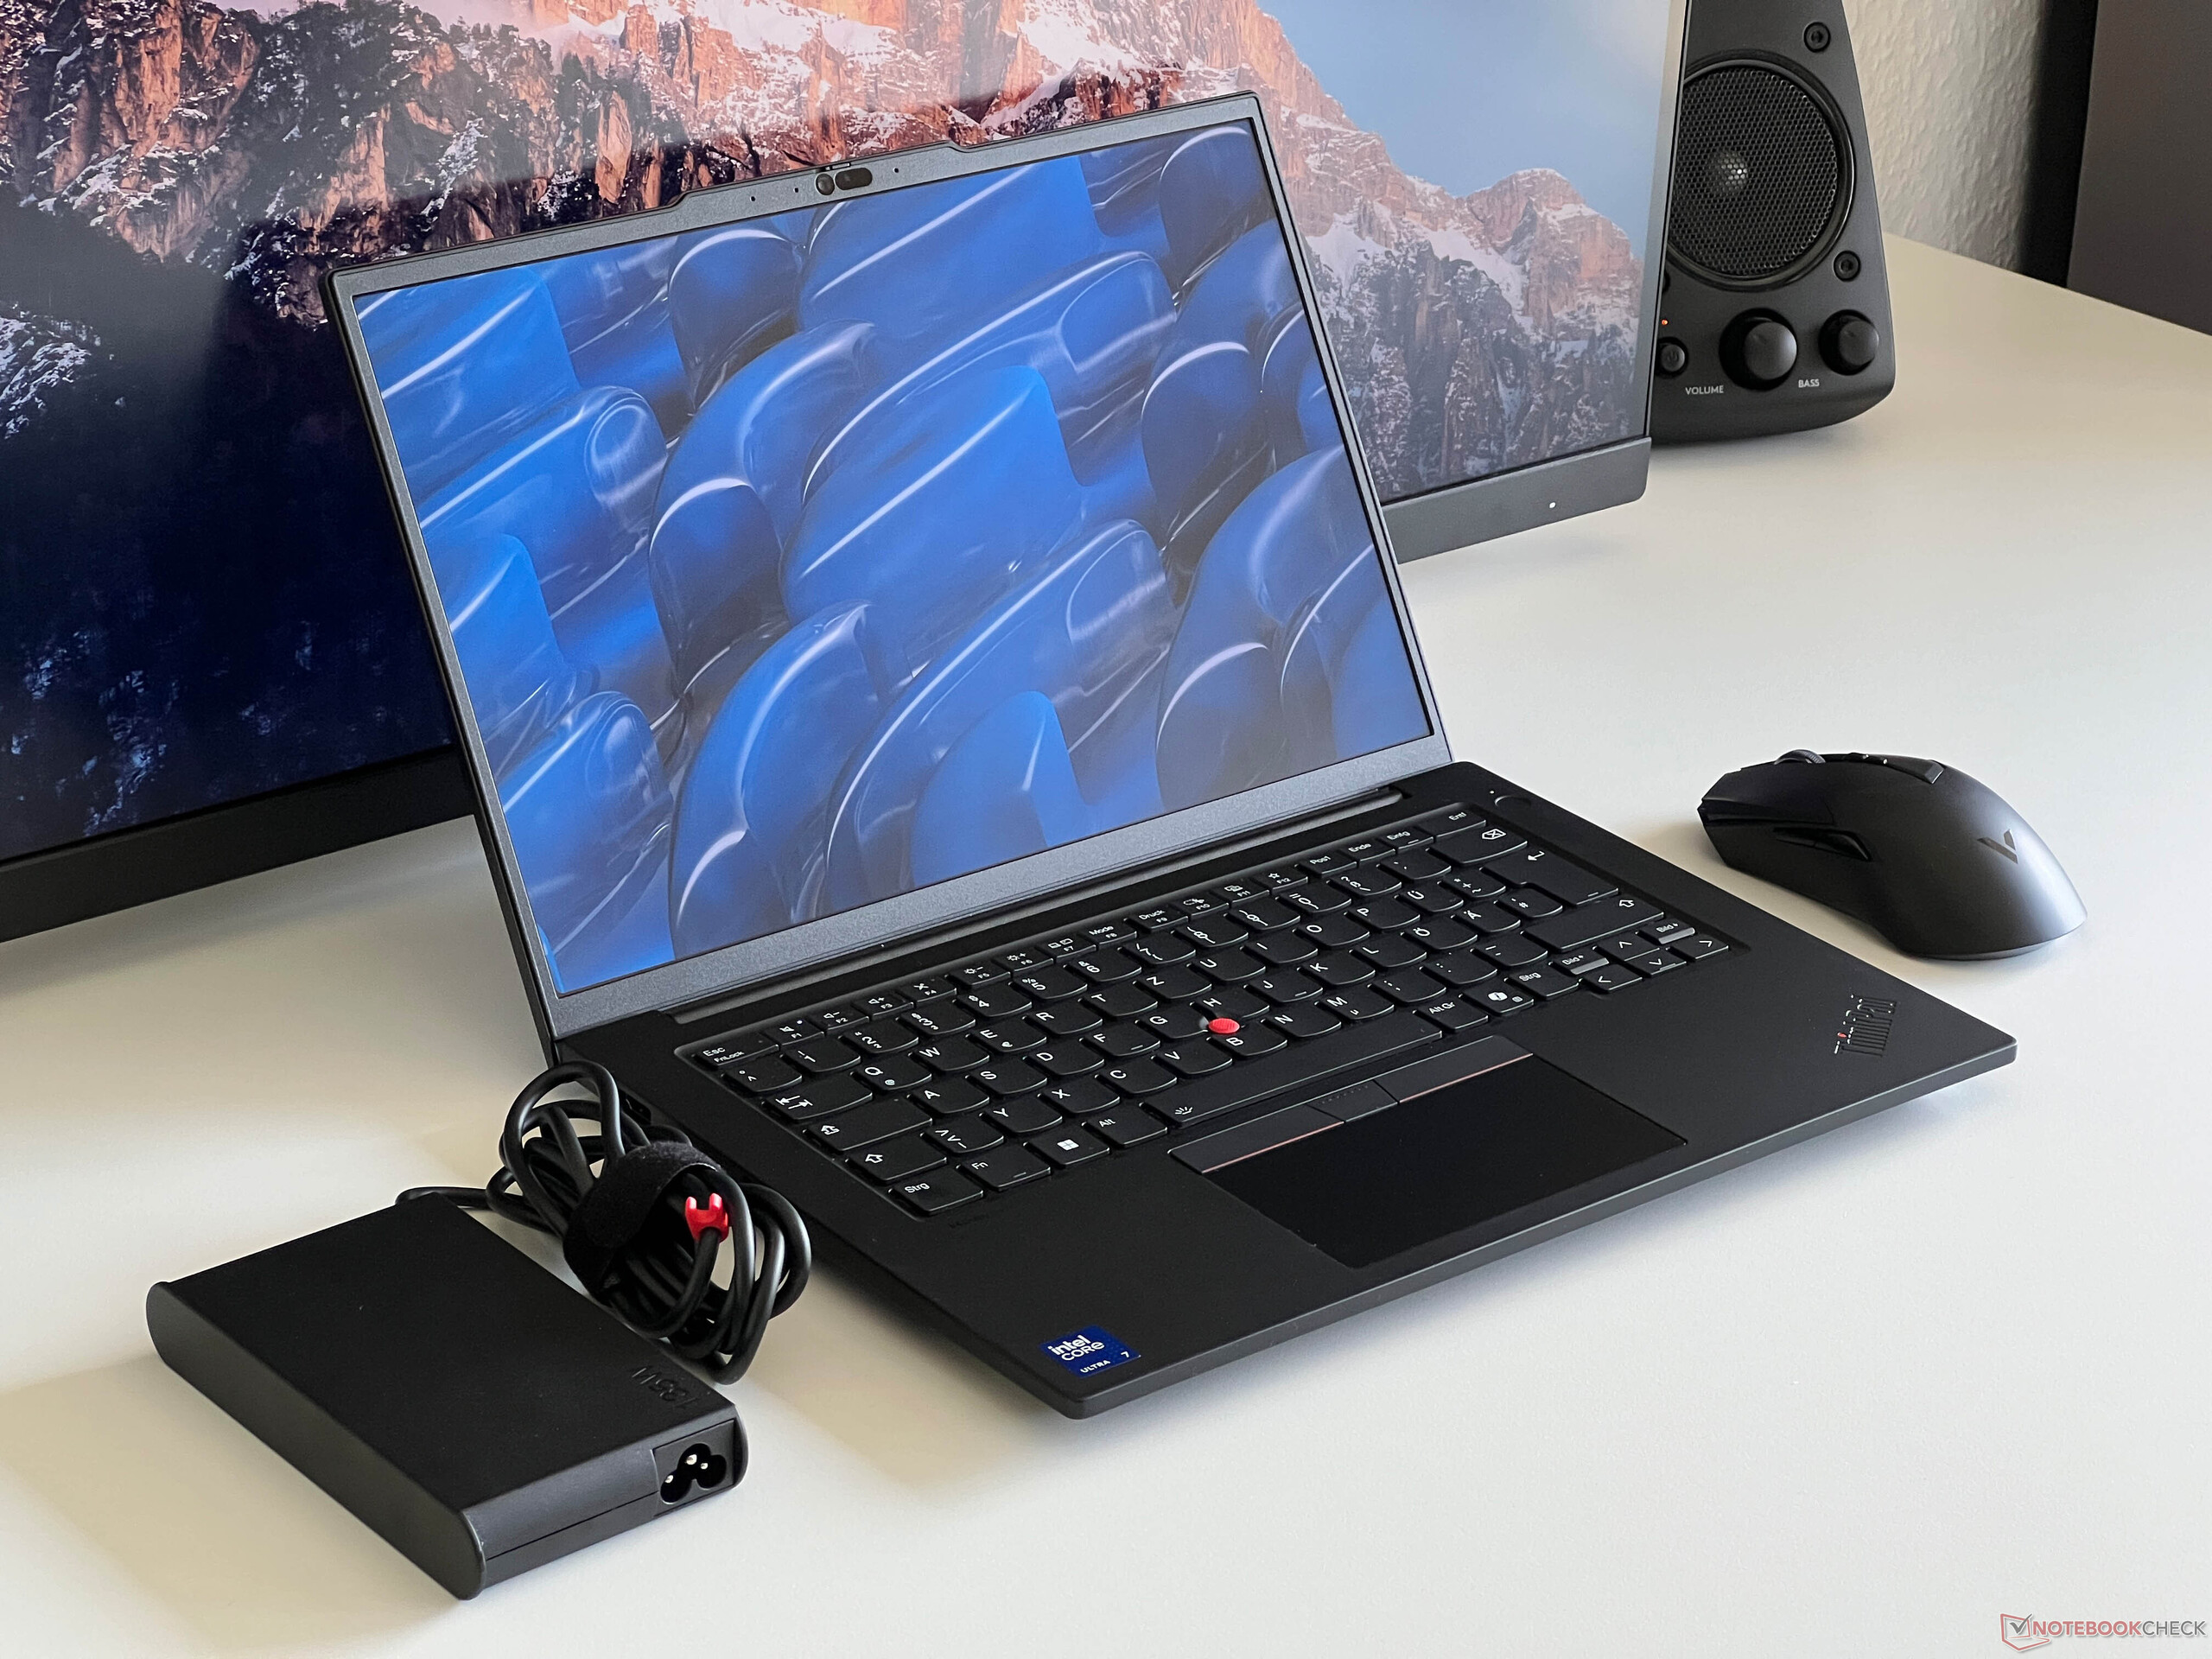
Dispositivos de entrada: elevación de 1,5 mm y nuevo posicionamiento de la tecla Fn
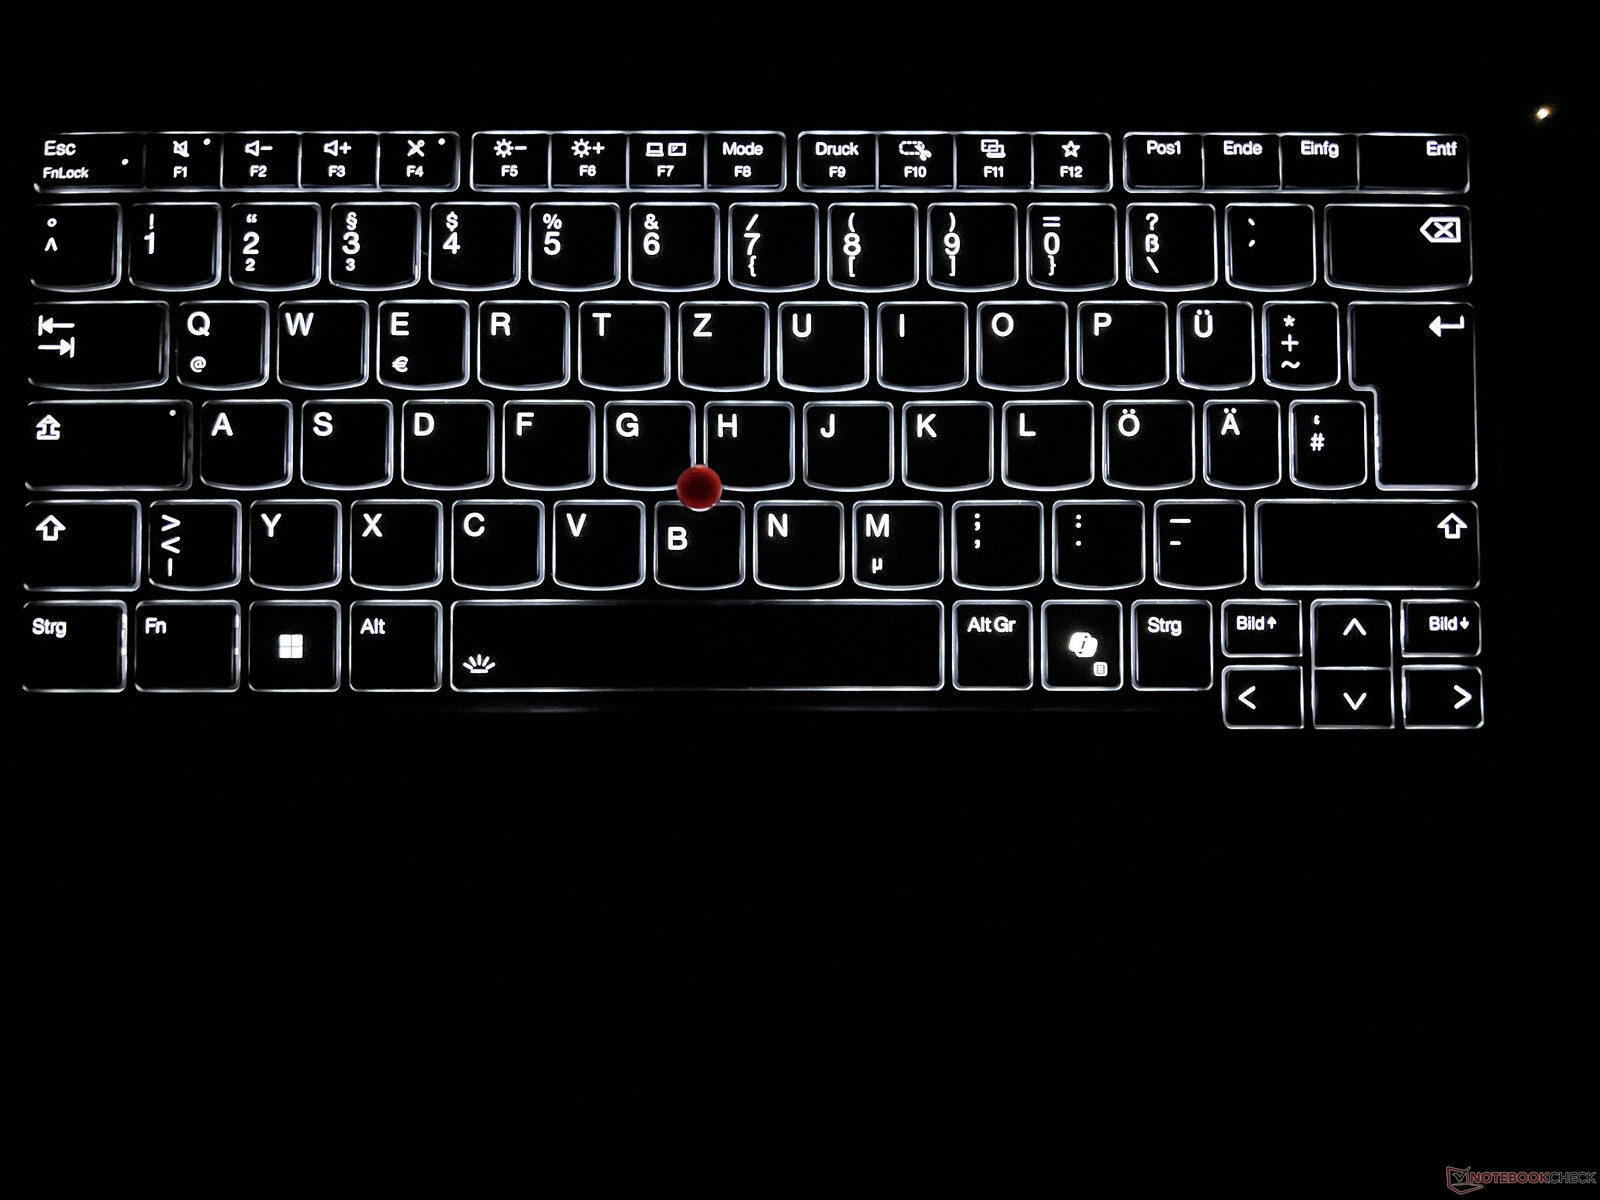
El teclado es un modelo familiar con una elevación de 1,5 mm. Resulta agradable teclear en él, pero este ThinkPad ya no puede diferenciarse de otros competidores en este aspecto. Todavía tenemos en uso un ThinkPad X1 Carbon con una elevación de tecla de 1,8 mm y definitivamente se nota la diferencia. Una novedad desde el año 2024 es la sustitución de las teclas Fn y Ctrl, que sin duda causará algunos problemas a los veteranos de ThinkPad al principio. Ahora también se ha instalado una tecla Co-Pilot. La retroiluminación blanca de dos niveles del teclado no puede activarse mediante un sensor. El botón de encendido está situado en la parte superior derecha junto al teclado y también sirve como escáner de huellas dactilares.
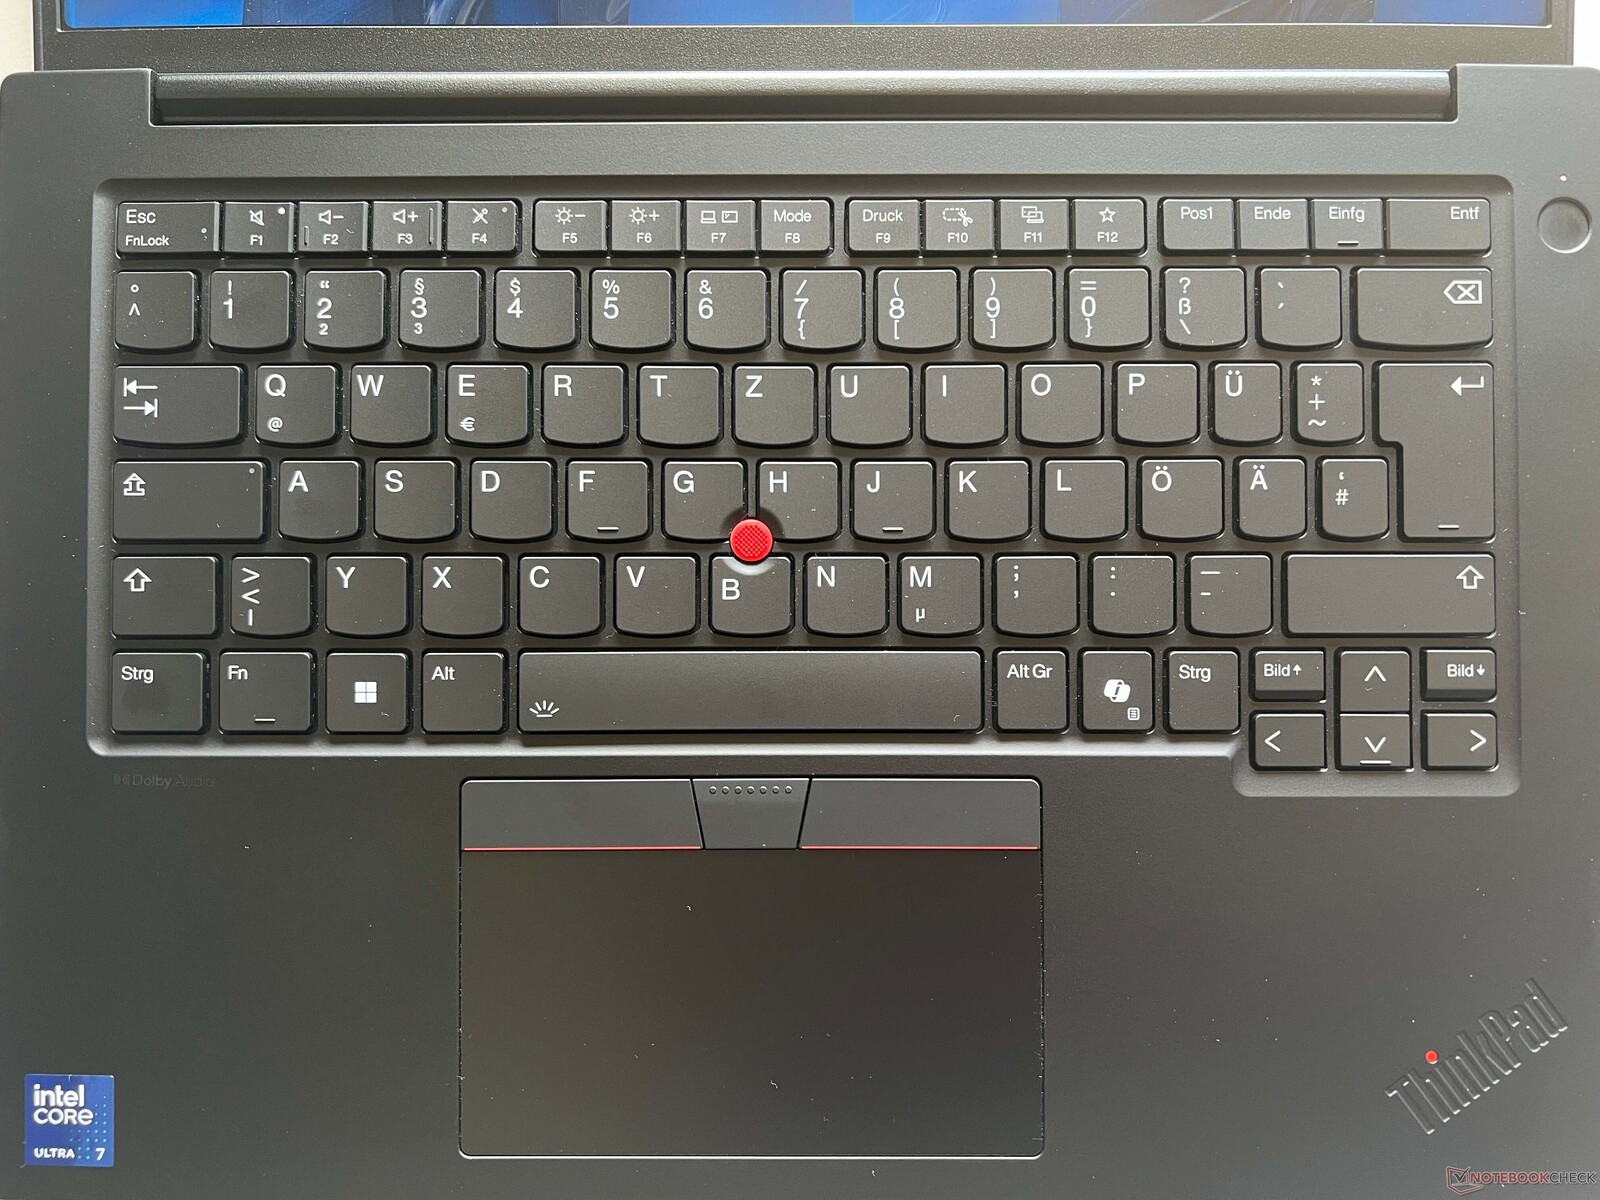
Para los estándares actuales, el clickpad de 11,5 x 6 cm del portátil no es especialmente grande, ya que también tiene que hacer sitio a los botones adicionales para el TrackPoint. Sin embargo, su tacto es agradable y suave; sólo el propio ruido del clic es un poco demasiado alto. Por supuesto, también puede utilizar el TrackPoint como alternativa, que funciona muy bien (una vez que se acostumbra a él). Las teclas dedicadas causaron muy buena impresión en nuestro dispositivo de prueba gracias a sus clics amortiguados y de alta calidad, y no notamos holgura alguna.
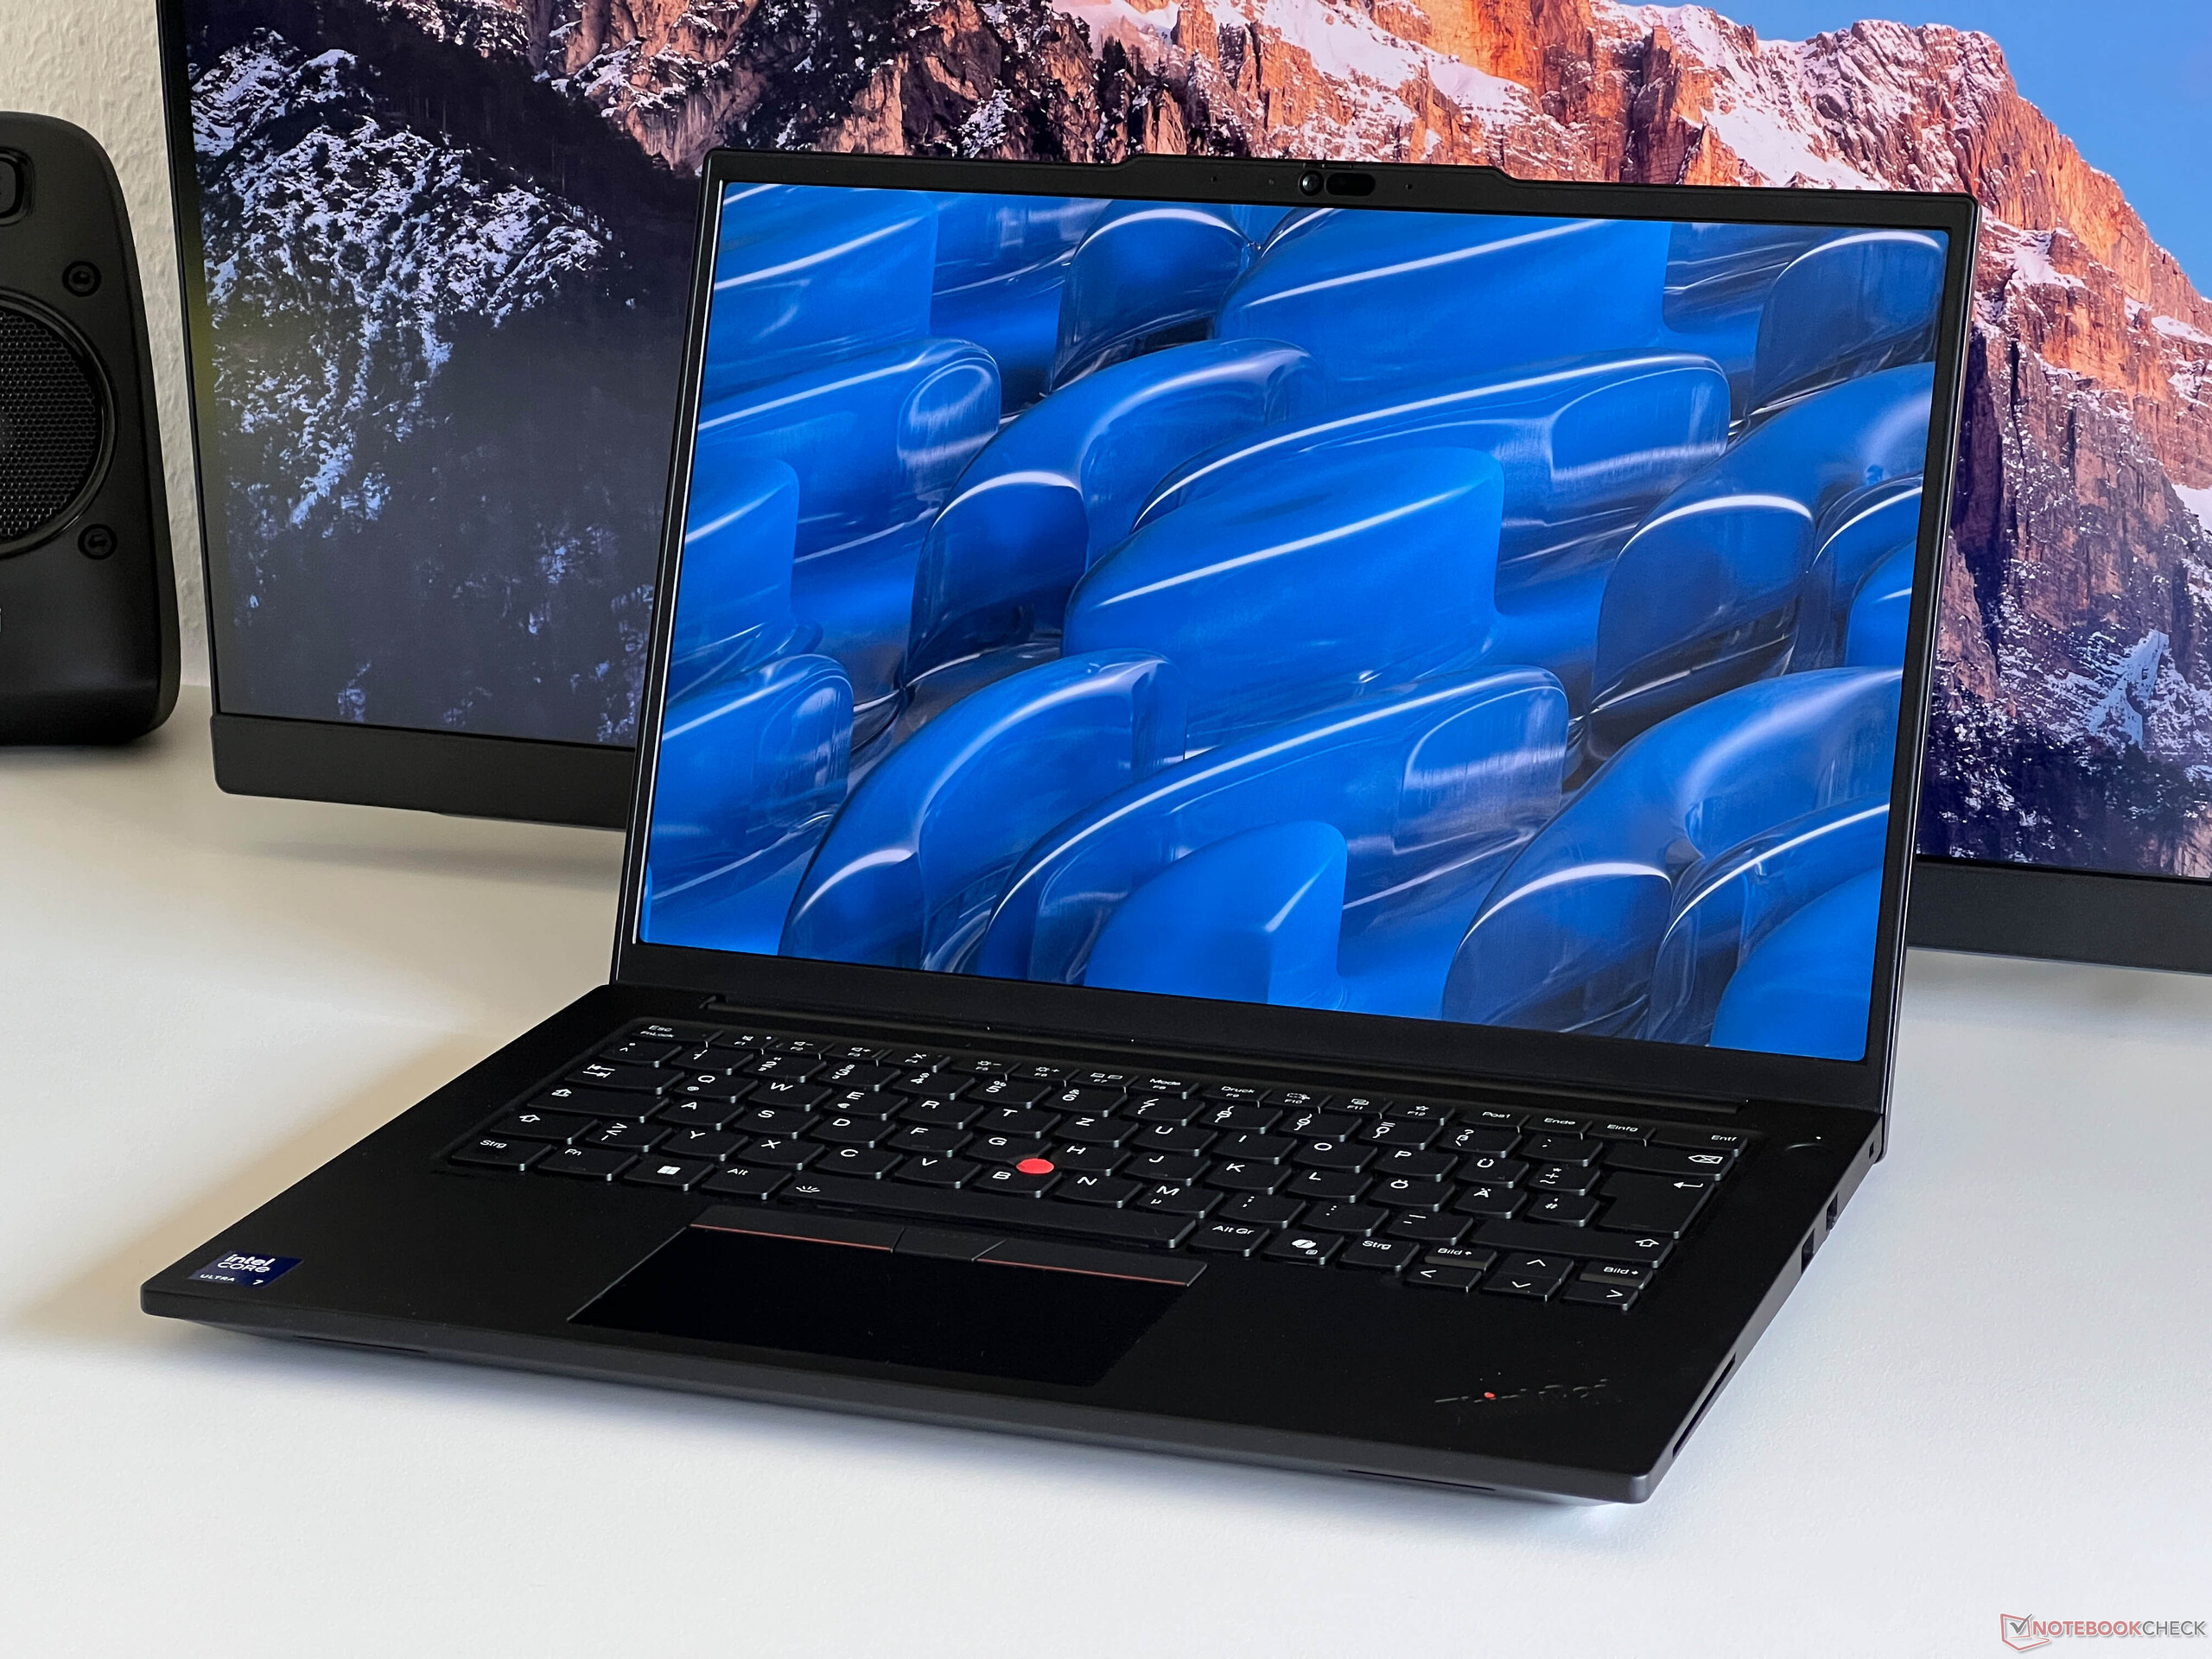
Pantalla - 3K IPS a 120 Hz
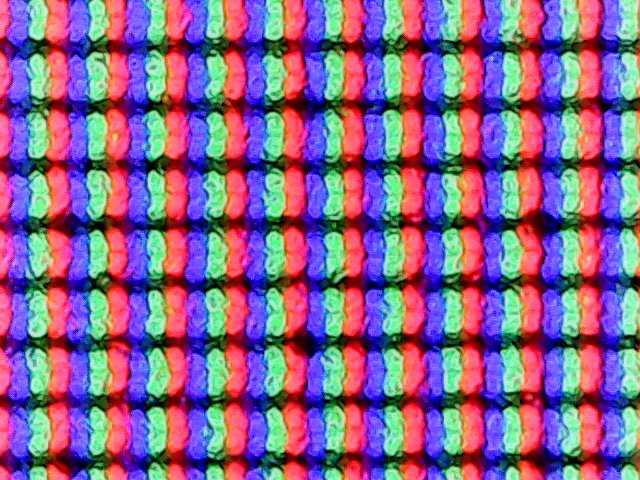
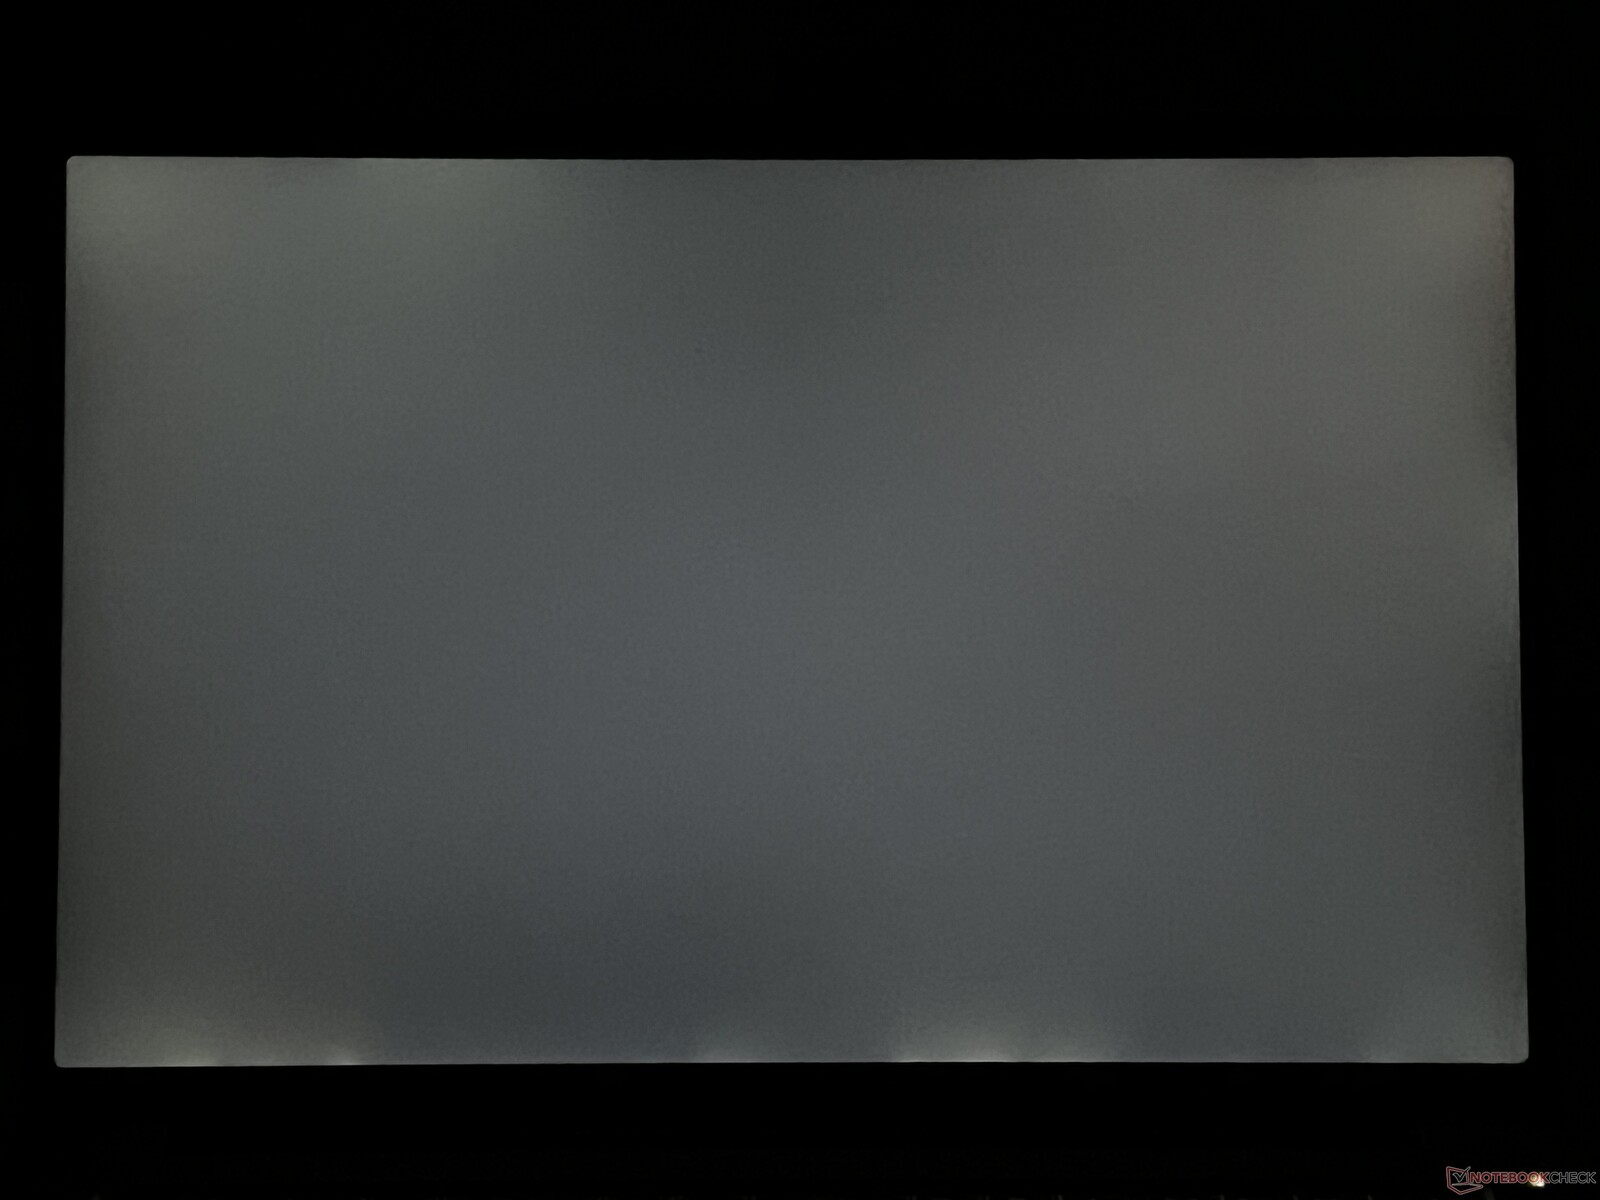
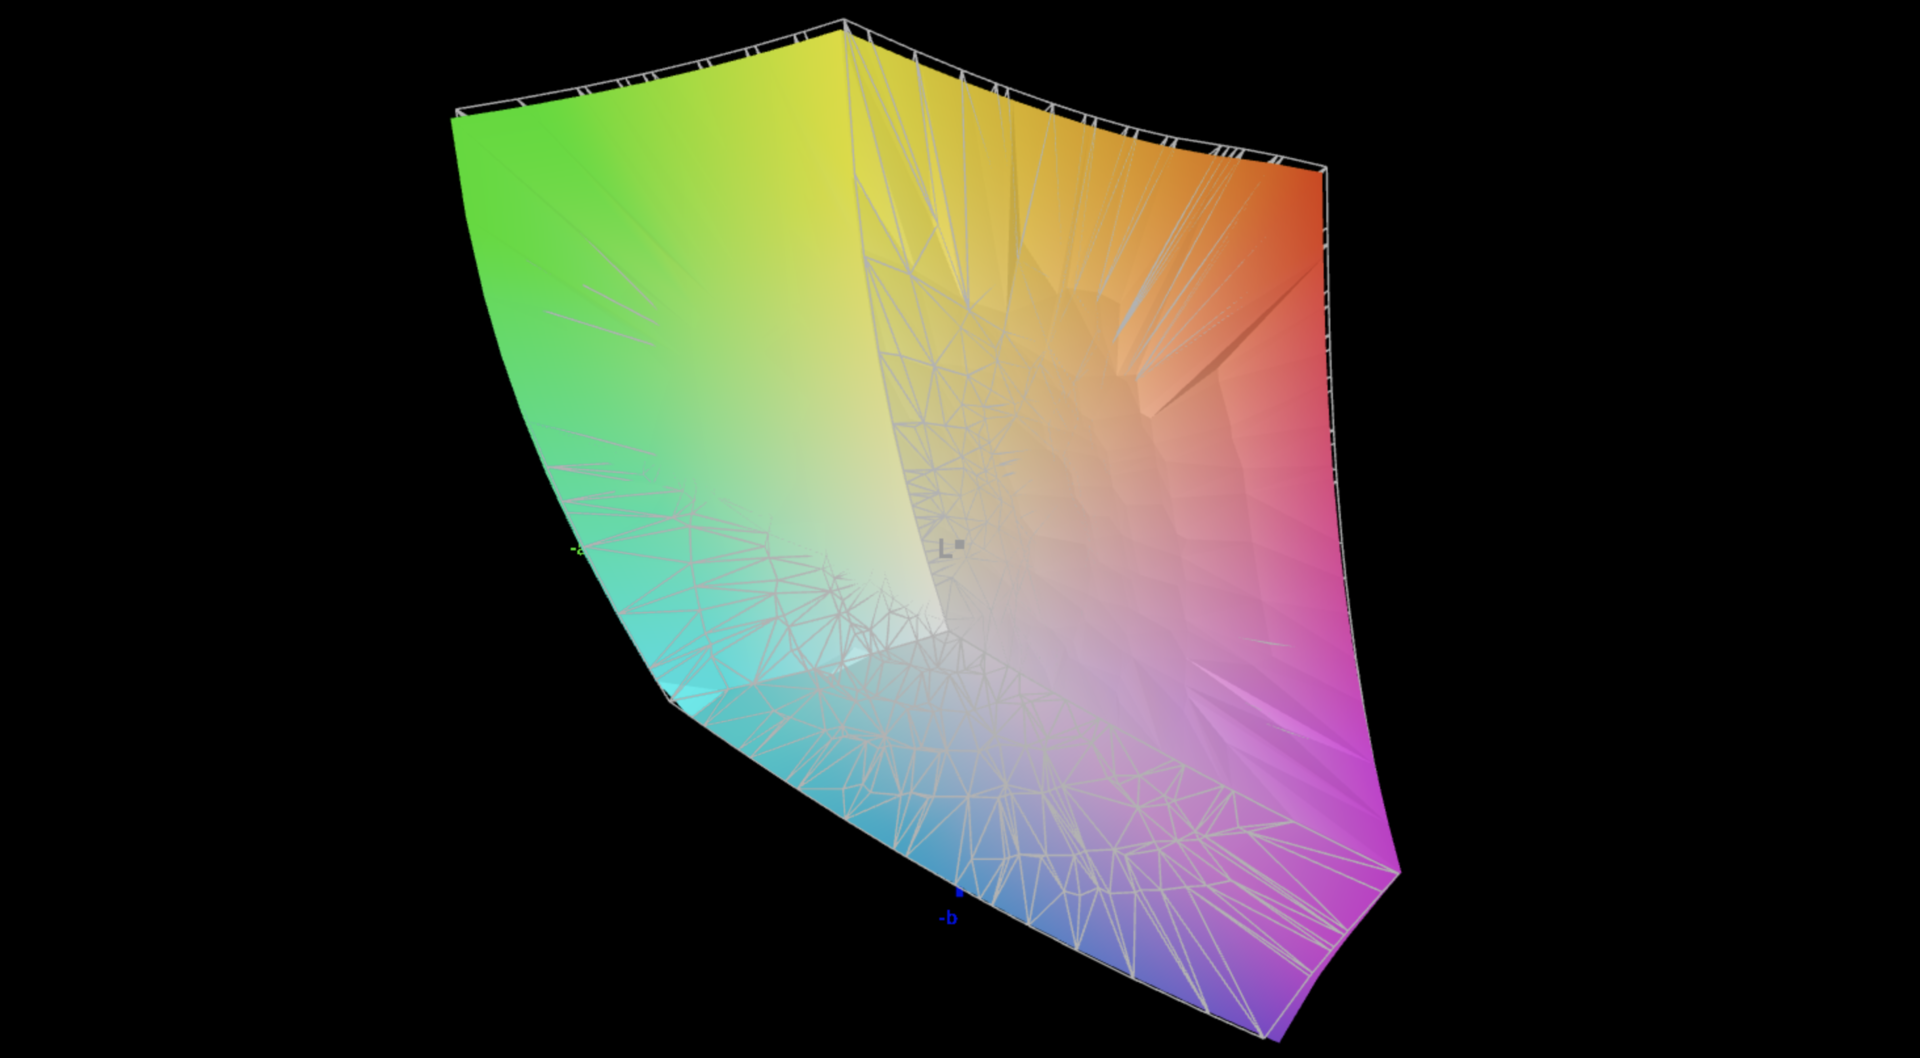
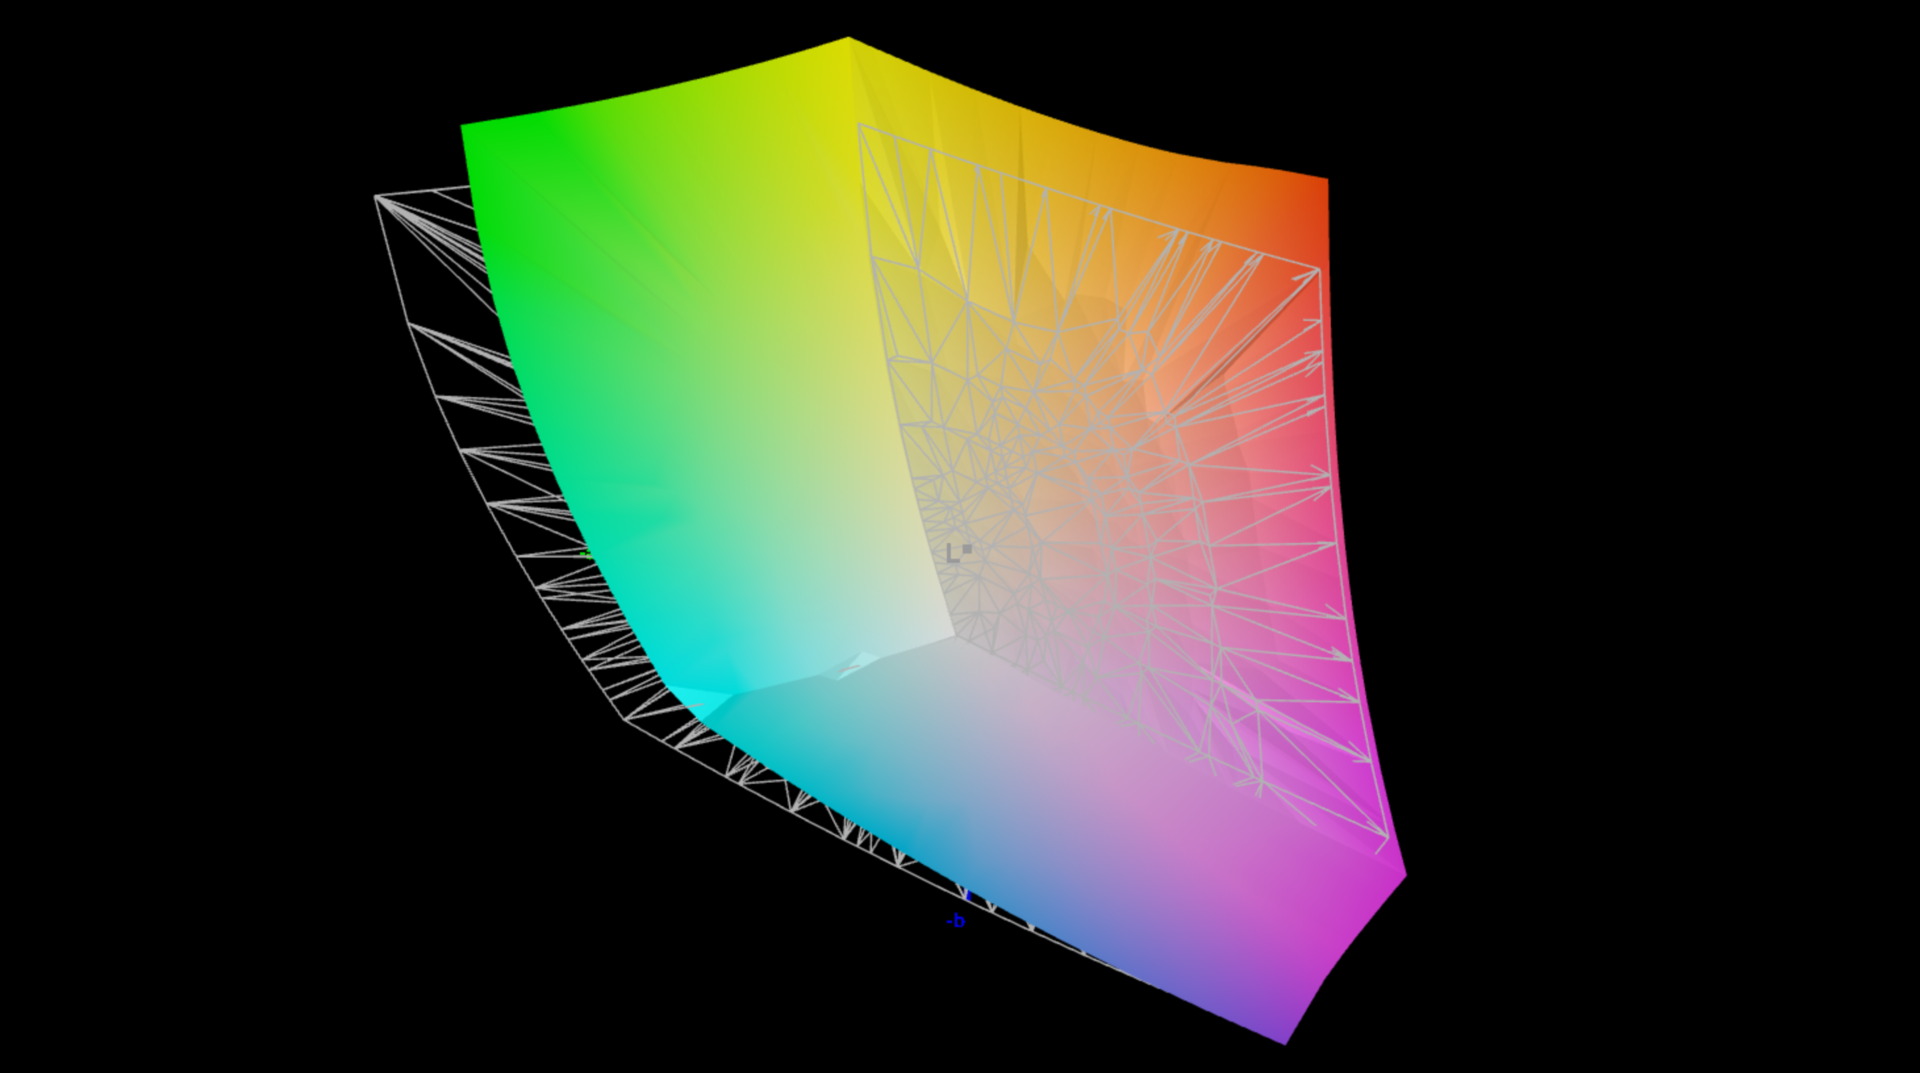
Lenovo ya no ofrece la pantalla OLED opcional vista en el P14s G4 en este modelo Intel actualizado; en su lugar, sólo puede elegir paneles IPS mate de 14,5 pulgadas. El nuevo modelo 3K con una resolución de 3.072 x 1.920 píxeles, una frecuencia de actualización de 120 Hz y cobertura del espacio de color P3 está instalado en nuestro dispositivo de prueba. Subjetivamente, su calidad de imagen es estupenda, ya que incluso en una inspección más cercana, sólo se aprecia un mínimo de granulado cuando se representan contenidos claros. Afortunadamente, esto no es perceptible al ver la pantalla desde una distancia normal. Todo el contenido se representa muy nítido y los colores se ven supervibrantes. Por supuesto, los colores en esta pantalla no son tan vibrantes como en los paneles OLED, pero la pantalla es al menos mate y no utiliza PWM. Los movimientos se ven suaves gracias a su mayor frecuencia de refresco, y sus tiempos de respuesta están bien (sin efecto fantasma). Con el brillo ajustado a niveles altos y al ver una imagen oscura, puede apreciarse un ligero sangrado de la retroiluminación a lo largo de los bordes de la pantalla. Ni su brillo ni su temperatura de color se pueden ajustar automáticamente, y el contenido HDR no es compatible.
Lenovo anuncia un brillo de 430 cd/m², pero sólo pudimos confirmarlo en el centro de la pantalla. De media, su brillo es de poco más de 400 cd/m². El valor de negro de la pantalla es de 0,32 cd/m², lo que resulta en una relación de contraste máxima de algo menos de 1.400,1. Son valores razonables en general, pero tampoco se puede decir que sean buenos. Esto también puede verse en comparación con la competencia, ya que el nuevo HP ZBook Firefly G11por ejemplo, consigue un brillo de unos 550 cd/m² con su pantalla de 120 Hz (aunque su resolución sea ligeramente inferior). Lenovo también tiene otros paneles en oferta, como el mini panel LED superior a 165 Hz dentro del Yoga Pro 9i 14 (también de 14,5 pulgadas y 3.072 x 1.920 píxeles).
| |||||||||||||||||||||||||
iluminación: 87 %
Brillo con batería: 439 cd/m²
Contraste: 1372:1 (Negro: 0.32 cd/m²)
ΔE Color 2.1 | 0.5-29.43 Ø4.87, calibrated: 0.8
ΔE Greyscale 3.9 | 0.5-98 Ø5.1
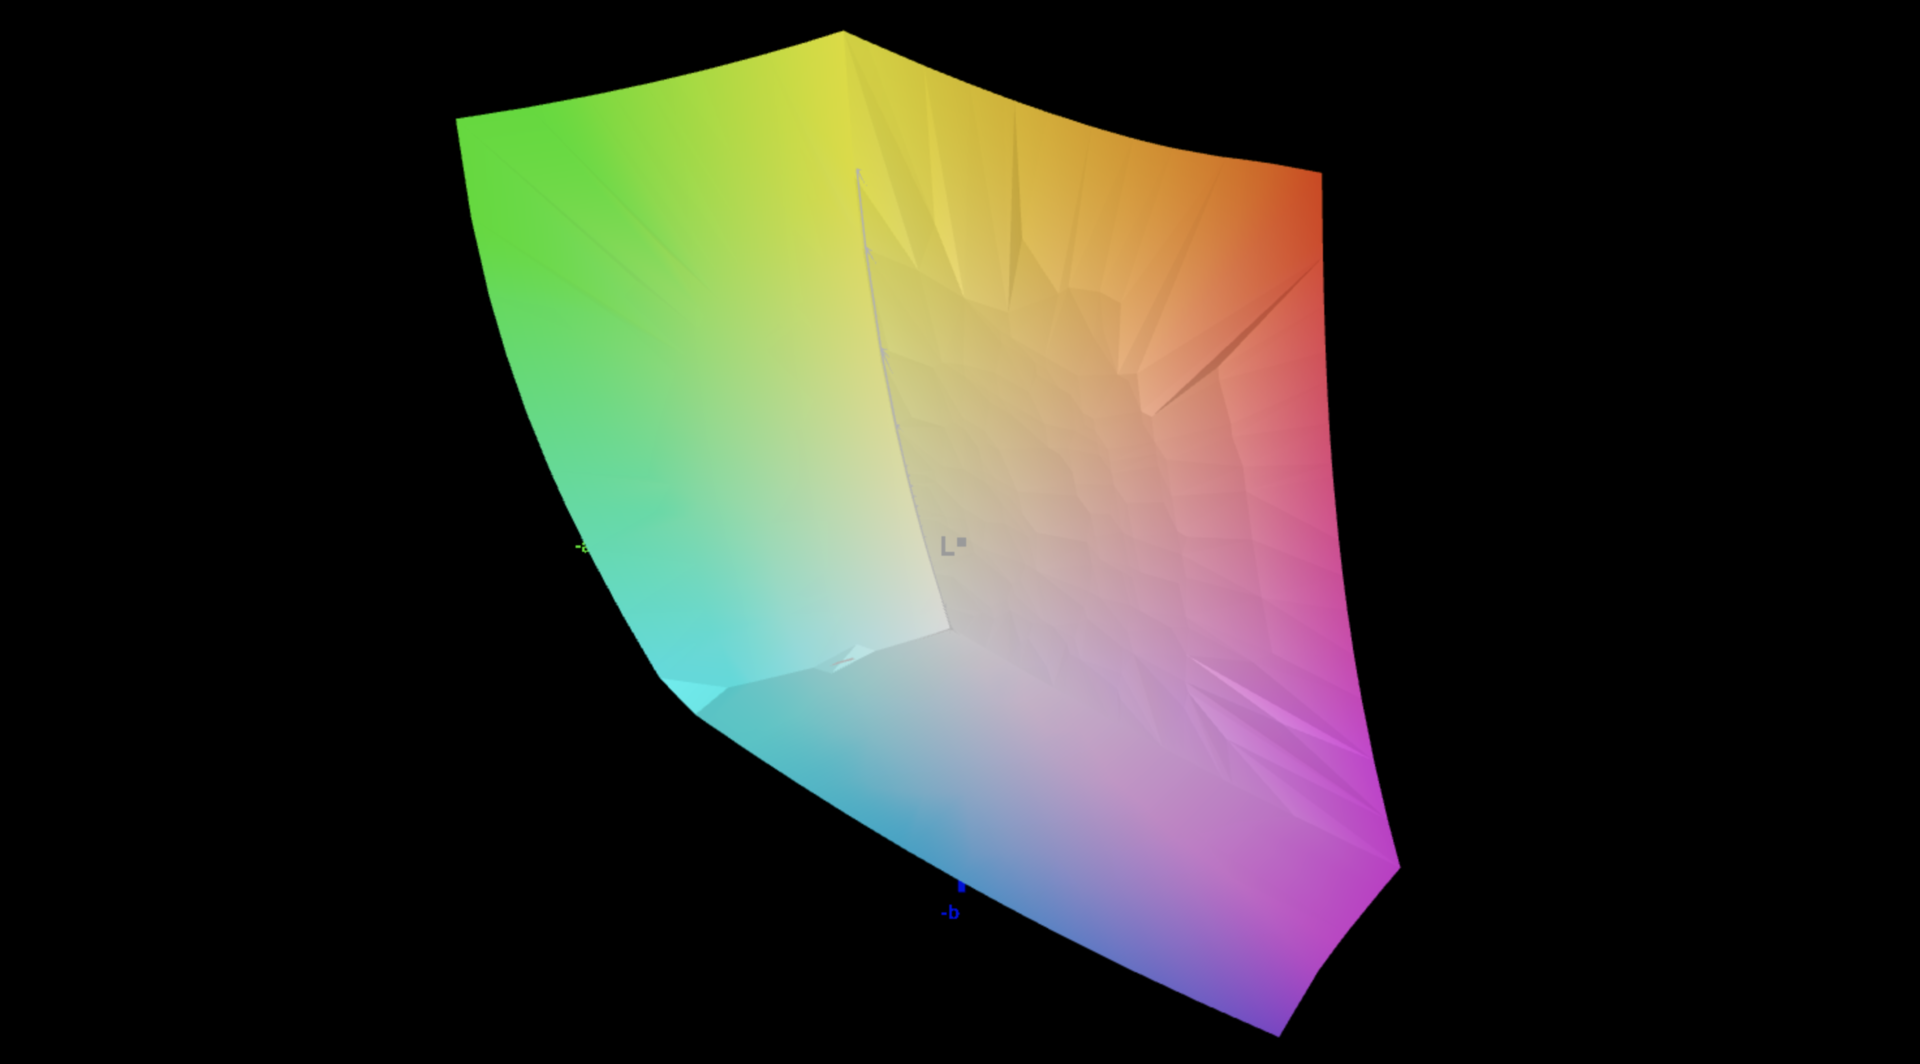
87.4% AdobeRGB 1998 (Argyll 2.2.0 3D)
100% sRGB (Argyll 2.2.0 3D)
98.4% Display P3 (Argyll 2.2.0 3D)
Gamma: 2.2
| Lenovo ThinkPad P14s G5 21G3S00A00 LEN145-3K, IPS, 3072x1920, 14.5", 120 Hz | HP ZBook Firefly 14 G11 AUO6DA8, IPS, 2560x1600, 14", 120 Hz | Dell Precision 5000 5490 AU Optronics B140QAN, IPS, 2560x1600, 14", 60 Hz | Lenovo ThinkPad P14s G4 21HF0017GE ATNA40YK15-0, OLED, 2880x1800, 14", 60 Hz | Microsoft Surface Laptop Studio 2 RTX 4060 LQ144P1JX01, IPS, 2400x1600, 14.4", 120 Hz | Lenovo Yoga Pro 9-14IRP G8 CSOT T3 MNE507HZ2-1, Mini-LED, 3072x1920, 14.5", 165 Hz | |
|---|---|---|---|---|---|---|
| Display | 0% | -9% | 4% | -18% | 1% | |
| Display P3 Coverage | 98.4 | 98.9 1% | 79.7 -19% | 99.9 2% | 66.7 -32% | 92 -7% |
| sRGB Coverage | 100 | 99.9 0% | 100 0% | 100 0% | 99 -1% | 99.7 0% |
| AdobeRGB 1998 Coverage | 87.4 | 86.6 -1% | 79.5 -9% | 97 11% | 68.9 -21% | 96.9 11% |
| Response Times | 52% | -98% | 88% | -143% | 41% | |
| Response Time Grey 50% / Grey 80% * | 30.2 ? | 12.3 ? 59% | 52.3 ? -73% | 3 ? 90% | 77.6 ? -157% | 12.7 ? 58% |
| Response Time Black / White * | 15 ? | 8.3 ? 45% | 33.3 ? -122% | 2.2 ? 85% | 34.3 ? -129% | 11.4 ? 24% |
| PWM Frequency | 360 ? | 17600 ? | 6000 ? | |||
| Screen | 6% | 9% | -90% | 43% | 19% | |
| Brightness middle | 439 | 554.1 26% | 485.1 11% | 432 -2% | 511 16% | 670 53% |
| Brightness | 406 | 540 33% | 471 16% | 432 6% | 503 24% | 680 67% |
| Brightness Distribution | 87 | 93 7% | 90 3% | 98 13% | 89 2% | 89 2% |
| Black Level * | 0.32 | 0.58 -81% | 0.38 -19% | 0.26 19% | 0.19 41% | |
| Contrast | 1372 | 955 -30% | 1277 -7% | 1965 43% | 3526 157% | |
| Colorchecker dE 2000 * | 2.1 | 2.54 -21% | 2.15 -2% | 4.8 -129% | 0.5 76% | 4 -90% |
| Colorchecker dE 2000 max. * | 6.2 | 4.99 20% | 5.39 13% | 9.2 -48% | 1.1 82% | 4.5 27% |
| Colorchecker dE 2000 calibrated * | 0.8 | 0.56 30% | 0.67 16% | 4.9 -513% | 1.3 -63% | |
| Greyscale dE 2000 * | 3.9 | 1 74% | 2 49% | 2.3 41% | 0.8 79% | 4.9 -26% |
| Gamma | 2.2 100% | 2.3 96% | 2.3 96% | 2.23 99% | 2.19 100% | 2.22 99% |
| CCT | 7013 93% | 6556 99% | 6826 95% | 6391 102% | 6650 98% | 5735 113% |
| Media total (Programa/Opciones) | 19% /
12% | -33% /
-10% | 1% /
-37% | -39% /
0% | 20% /
18% |
* ... más pequeño es mejor
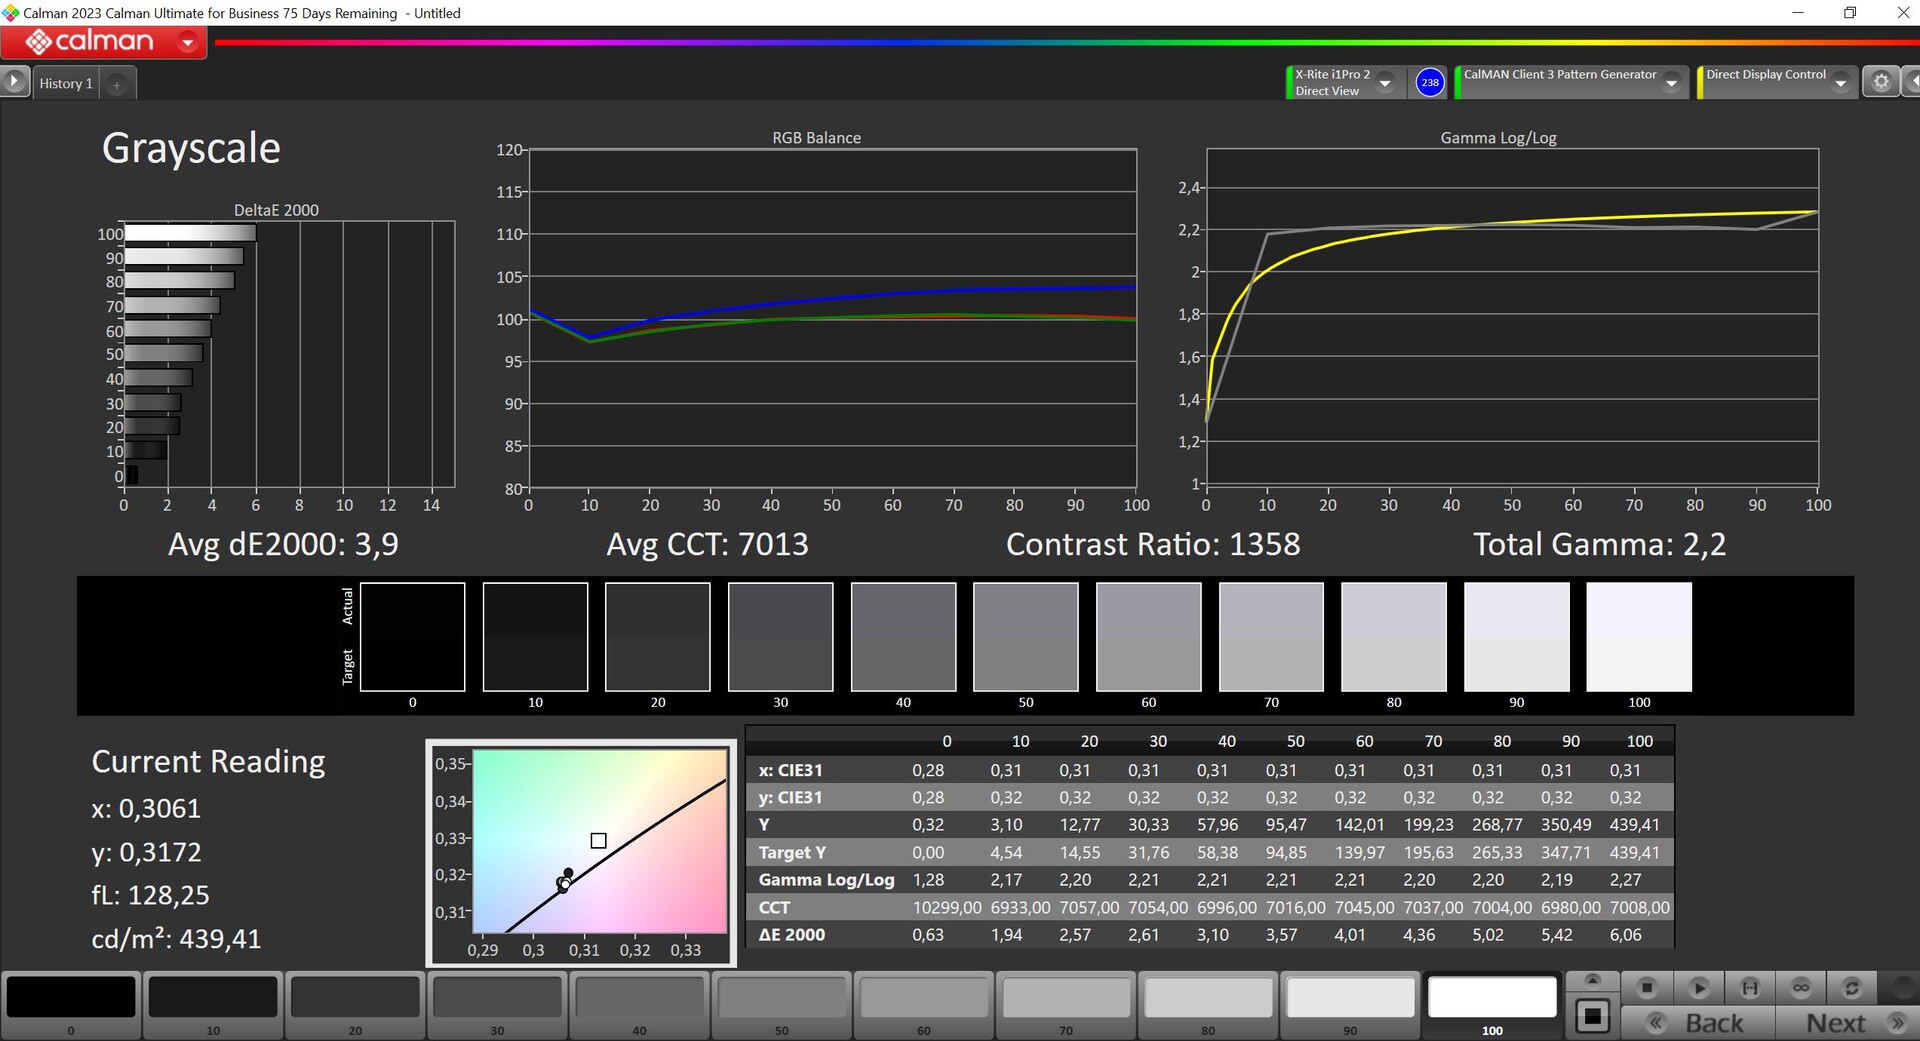
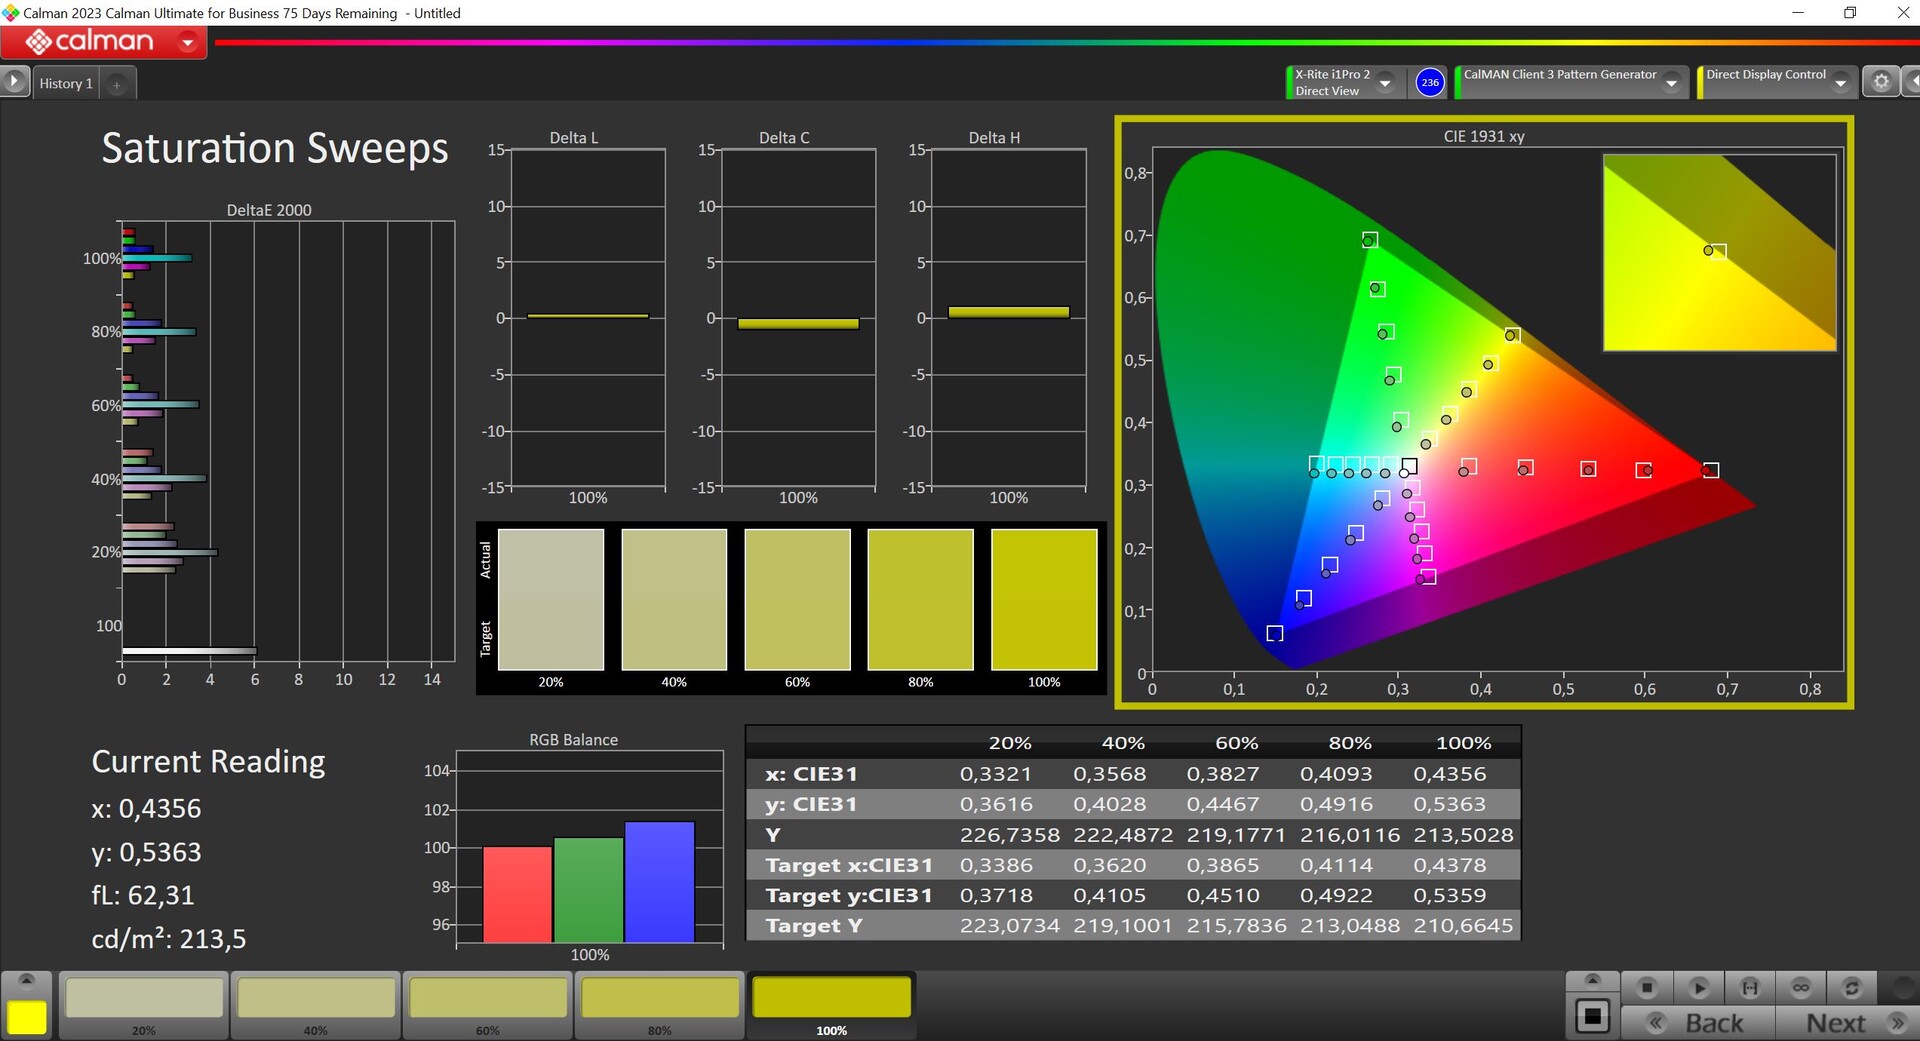
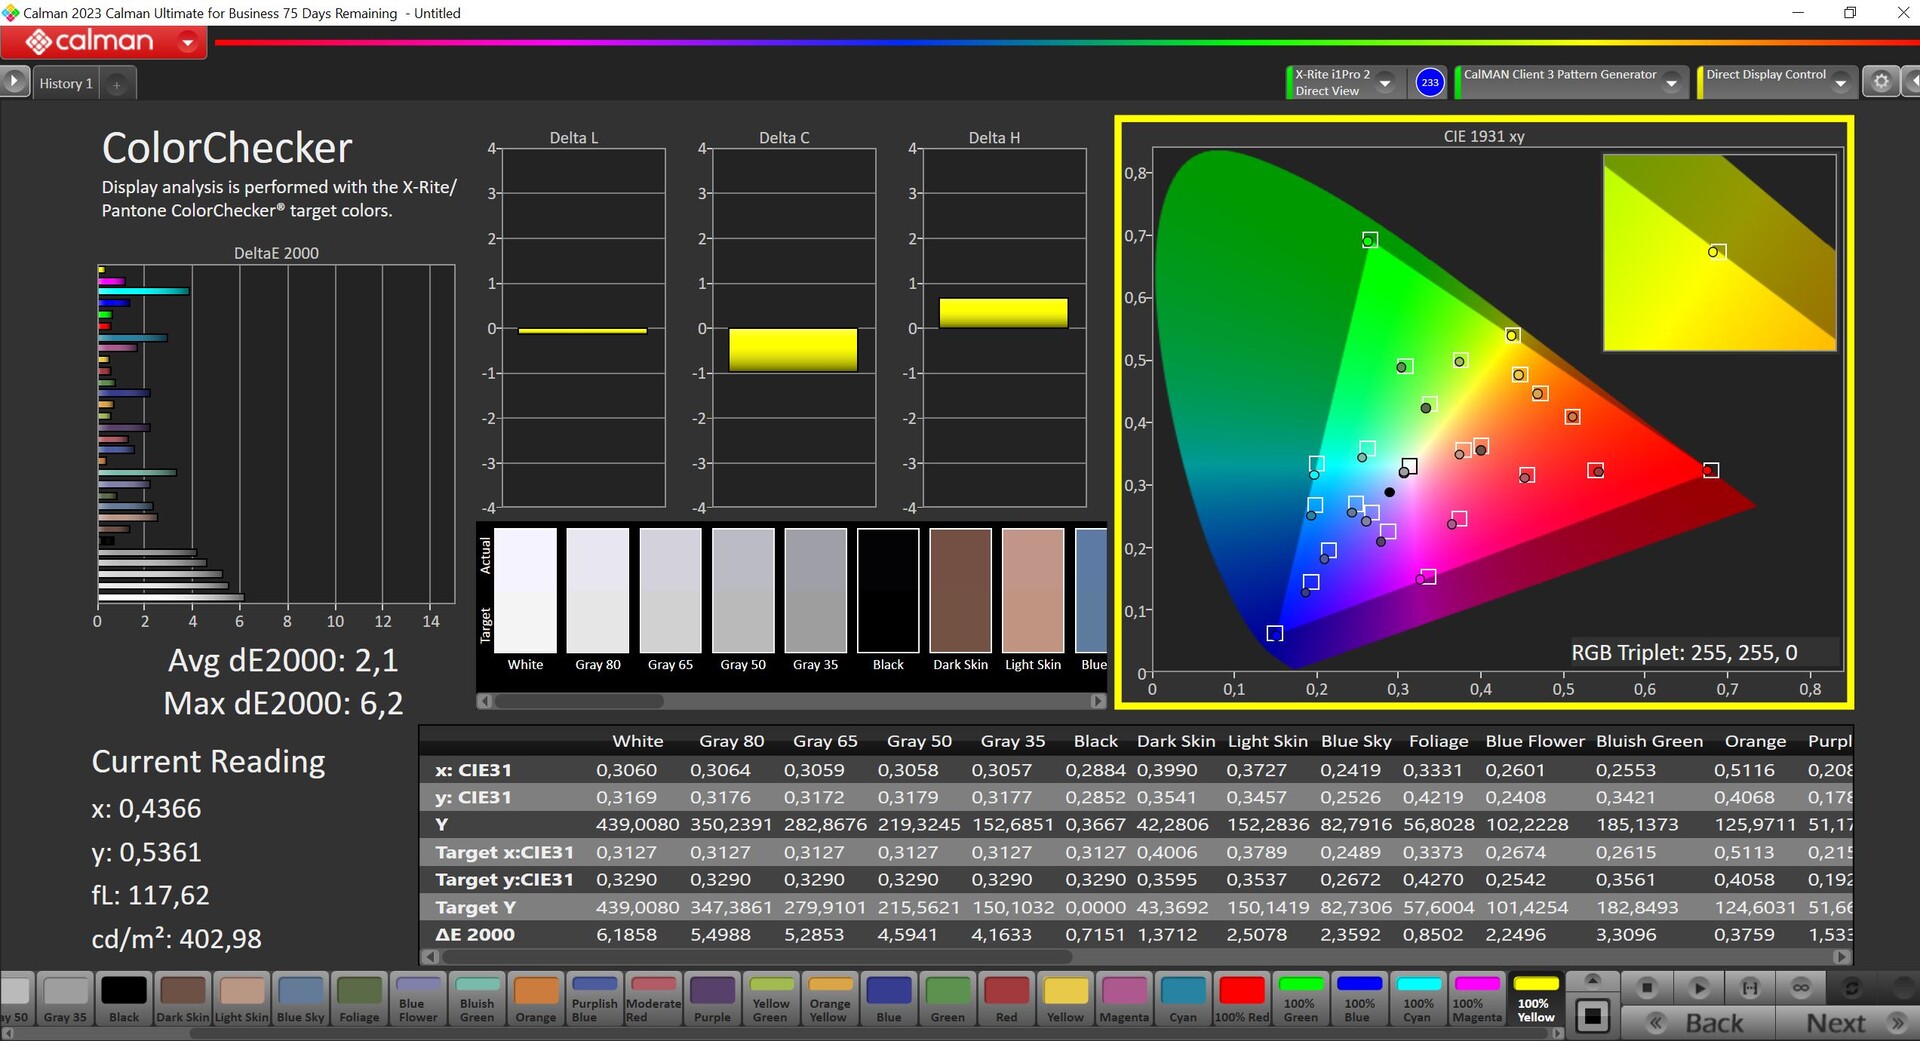
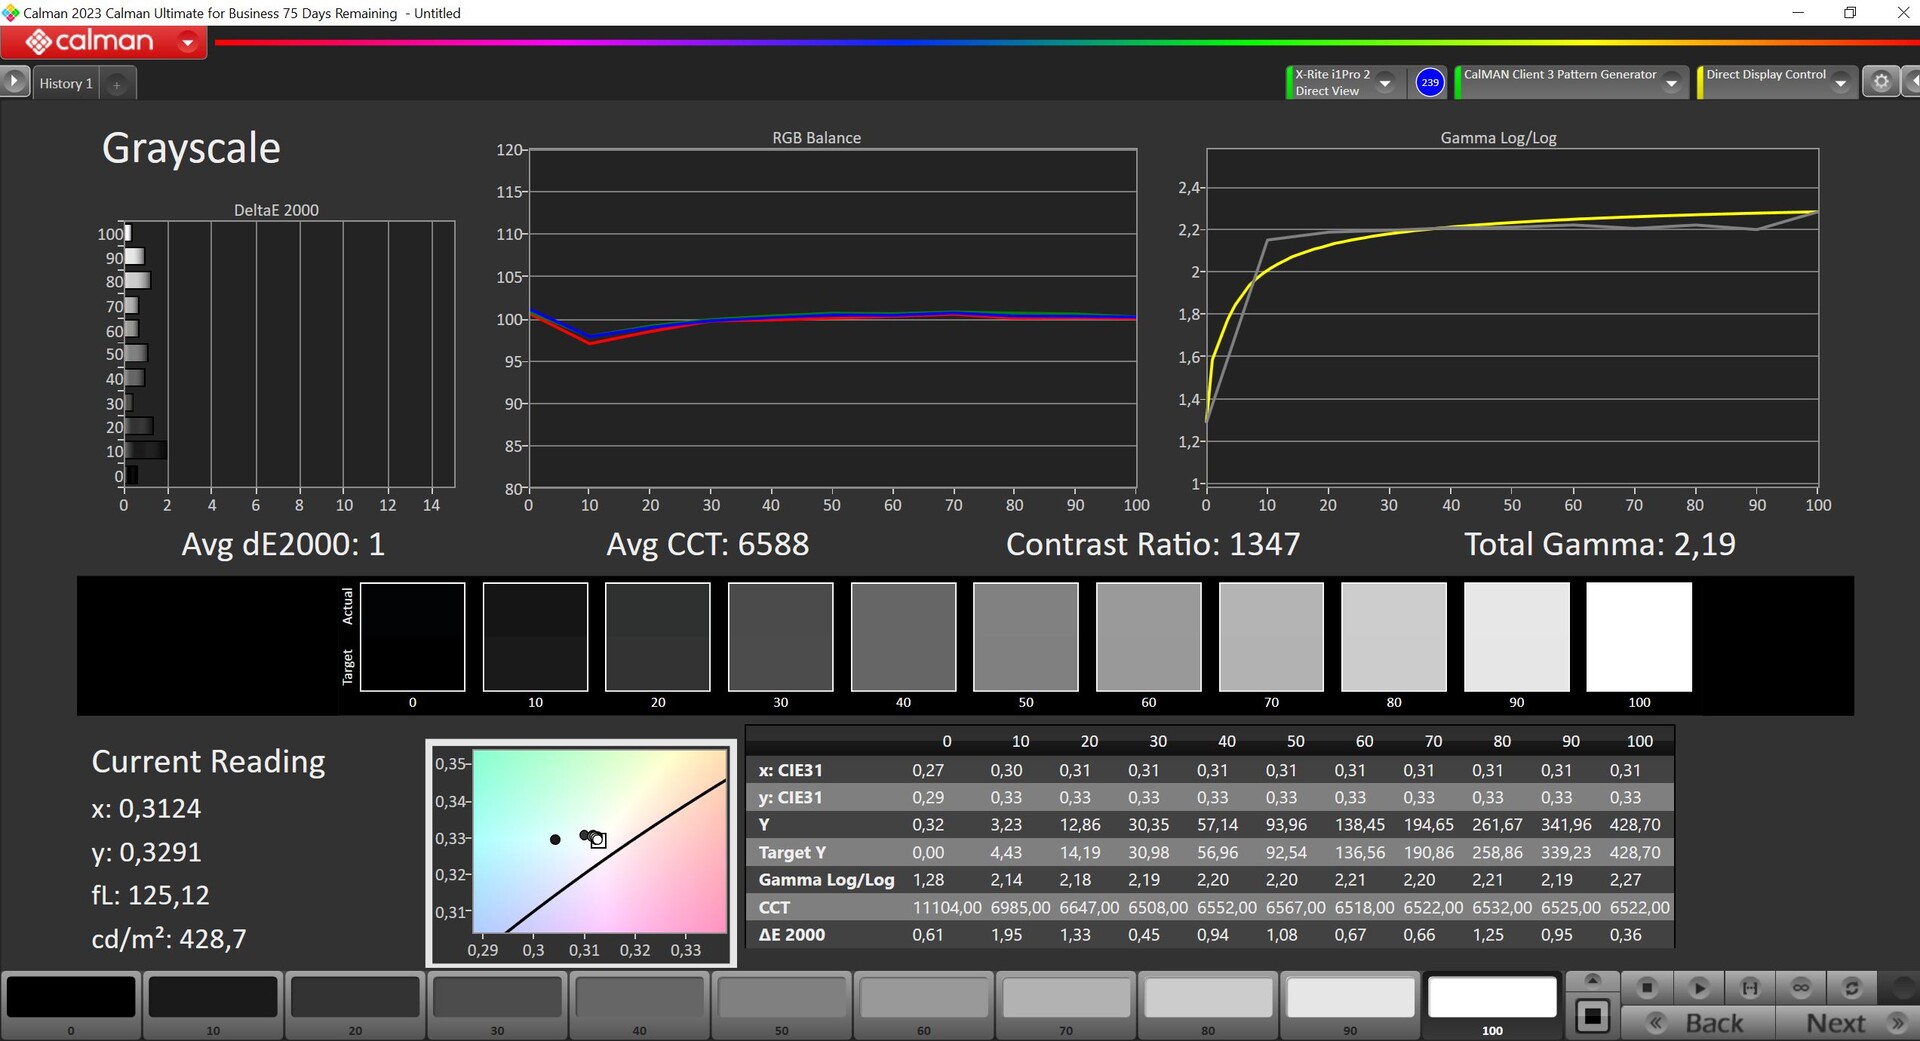
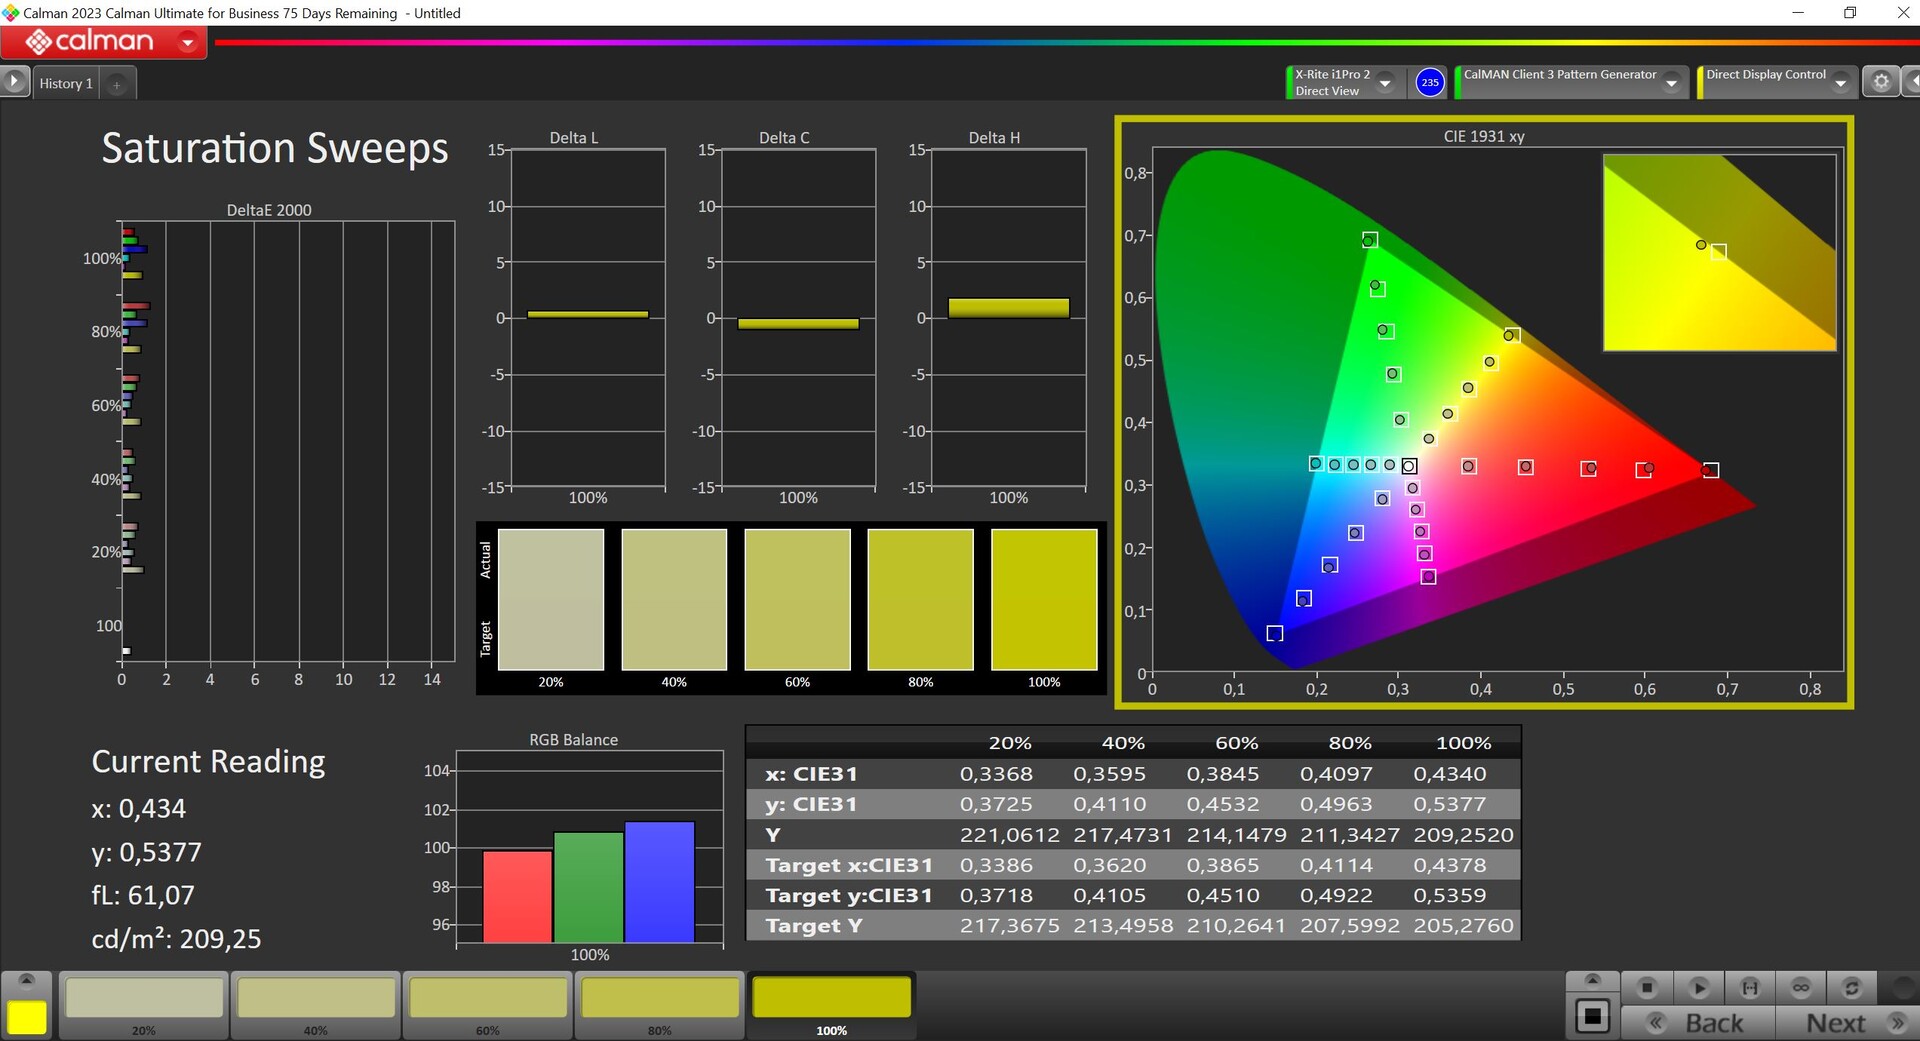
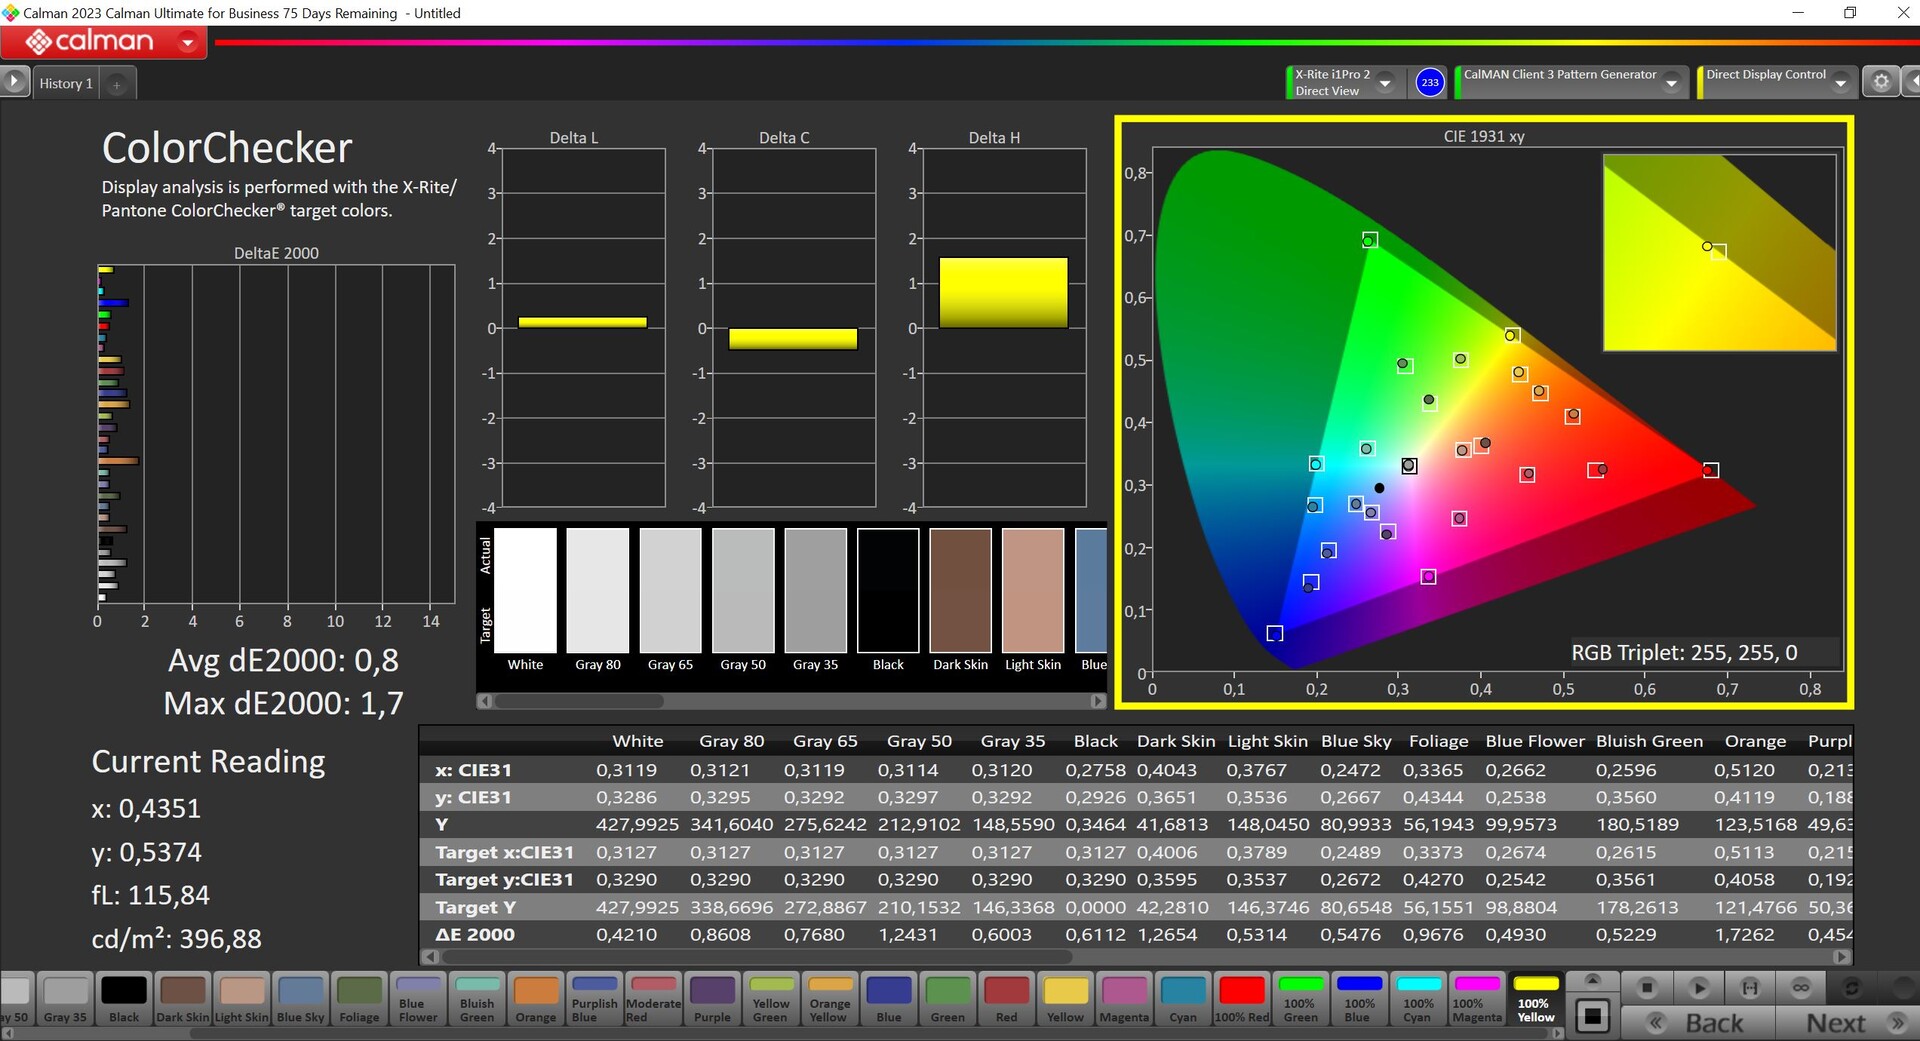
Analizamos el panel utilizando el software profesional CalMAN (X-Rite i1 Pro 2), pero Lenovo no proporciona un perfil sRGB. Nada más sacarla de la caja, la pantalla tiene un tinte azulado en combinación con una temperatura de color demasiado fría, y algunas desviaciones de color están por encima del valor objetivo de 3. Al realizar nuestra propia calibración, mejoramos significativamente su representación y corregimos su escala de grises y sus desviaciones de color. El perfil correspondiente puede descargarse gratuitamente más arriba. El panel cubre totalmente los espacios de color P3 y sRGB.
Tiempos de respuesta del display
| ↔ Tiempo de respuesta de Negro a Blanco | ||
|---|---|---|
| 15 ms ... subida ↗ y bajada ↘ combinada | ↗ 5.8 ms subida | 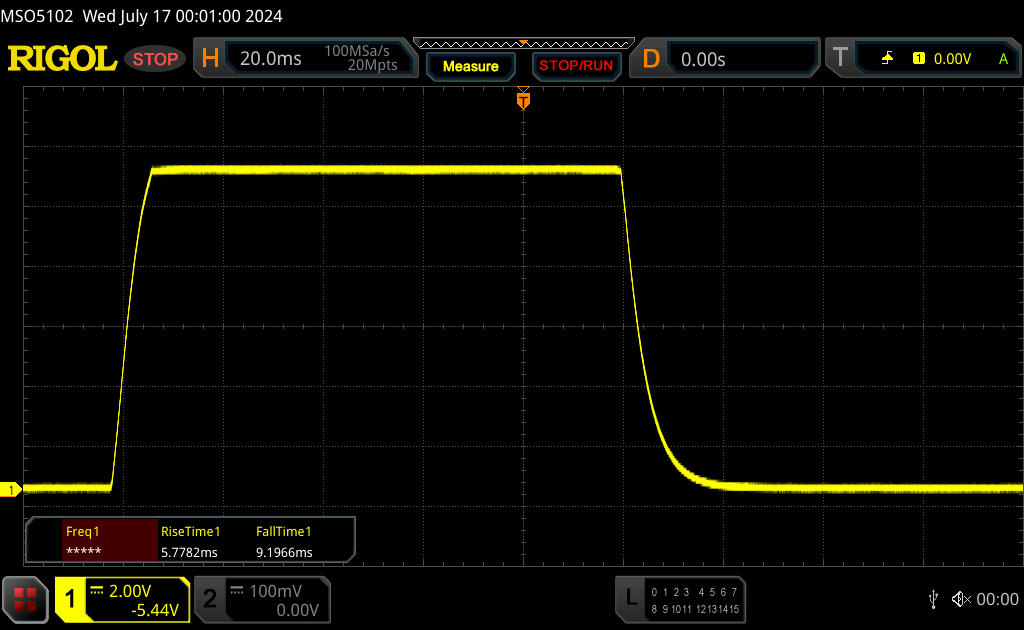 |
| ↘ 9.2 ms bajada | ||
| La pantalla mostró buenos tiempos de respuesta en nuestros tests pero podría ser demasiado lenta para los jugones competitivos. En comparación, todos los dispositivos de prueba van de ##min### (mínimo) a 240 (máximo) ms. » 33 % de todos los dispositivos son mejores. Esto quiere decir que el tiempo de respuesta medido es mejor que la media (20.8 ms) de todos los dispositivos testados. | ||
| ↔ Tiempo de respuesta 50% Gris a 80% Gris | ||
| 30.2 ms ... subida ↗ y bajada ↘ combinada | ↗ 14 ms subida | 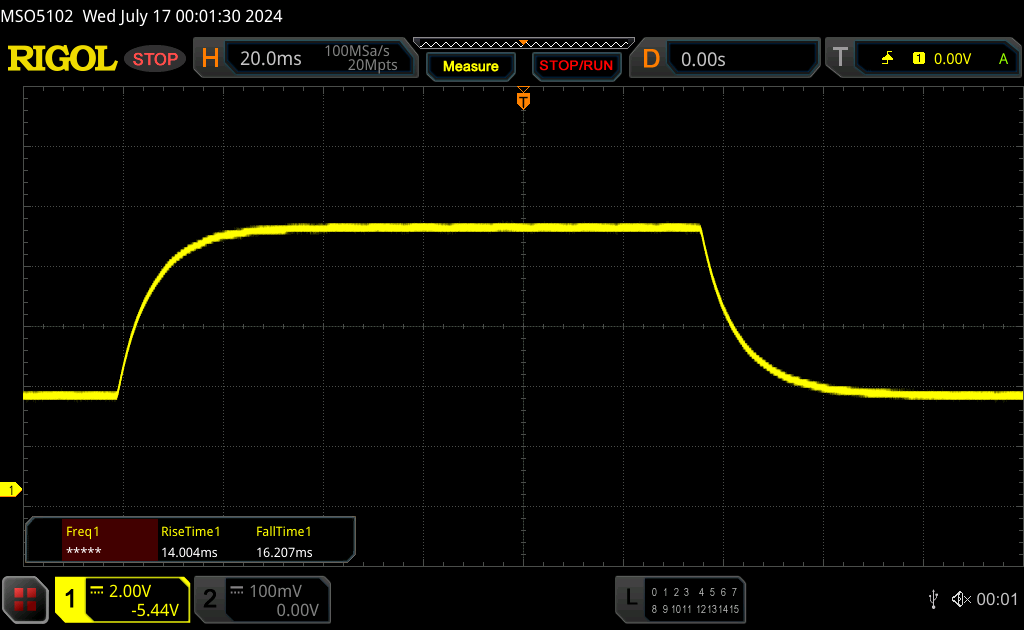 |
| ↘ 16.2 ms bajada | ||
| La pantalla mostró tiempos de respuesta lentos en nuestros tests y podría ser demasiado lenta para los jugones. En comparación, todos los dispositivos de prueba van de ##min### (mínimo) a 636 (máximo) ms. » 37 % de todos los dispositivos son mejores. Eso quiere decir que el tiempo de respuesta es similar al dispositivo testado medio (32.5 ms). | ||
Parpadeo de Pantalla / PWM (Pulse-Width Modulation)
| Parpadeo de Pantalla / PWM no detectado |  | ||
Comparación: 53 % de todos los dispositivos testados no usaron PWM para atenuar el display. Si se usó, medimos una media de 8516 (mínimo: 5 - máxmo: 343500) Hz. | |||
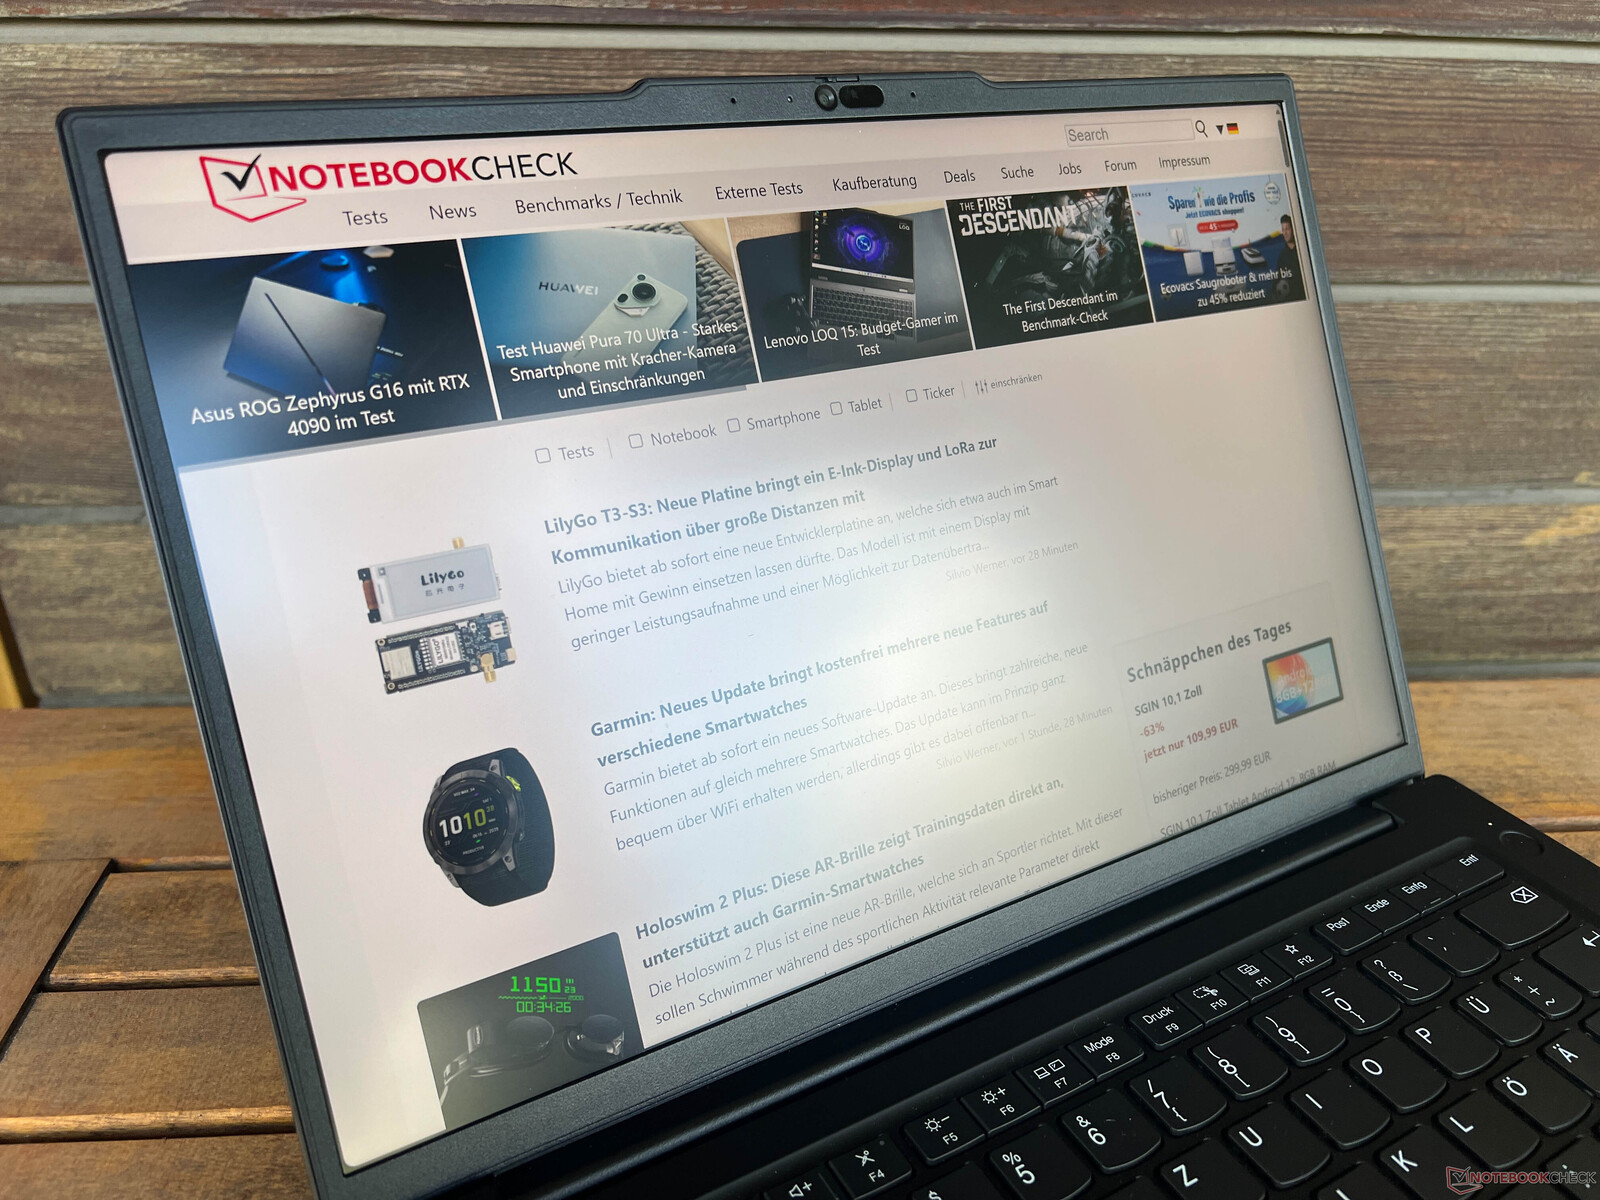
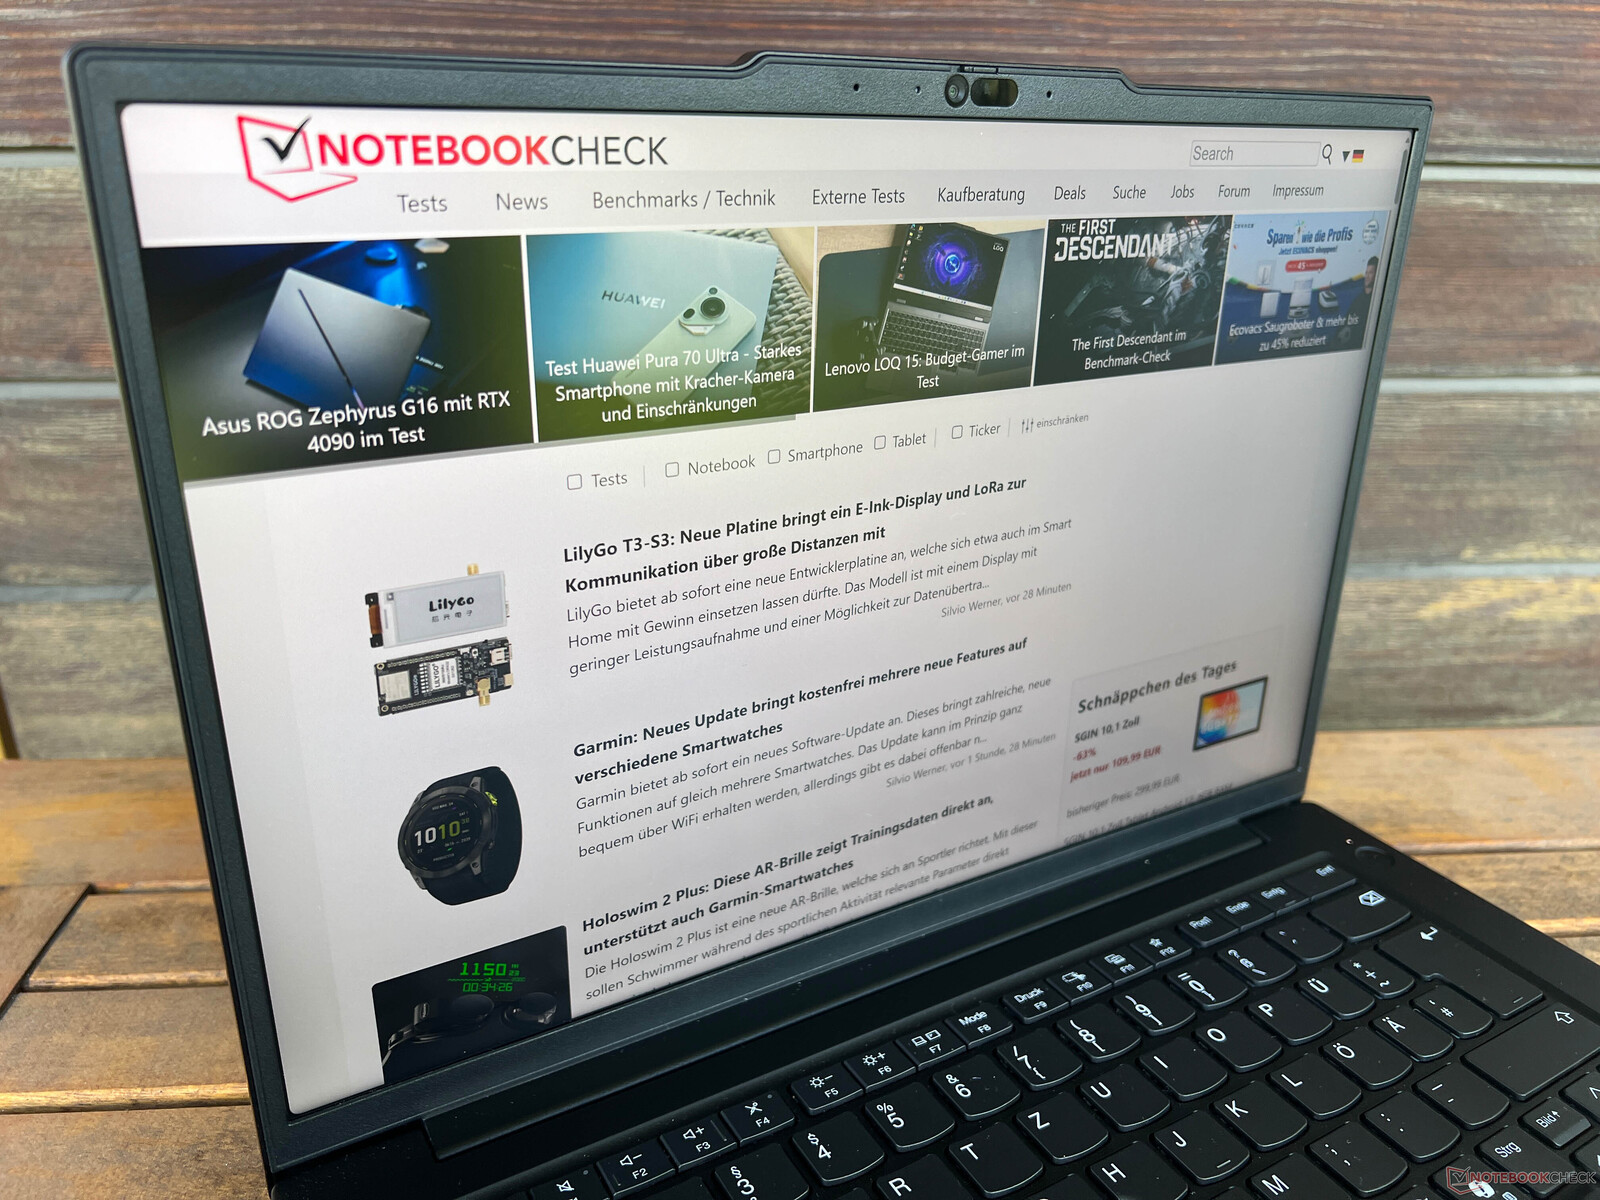
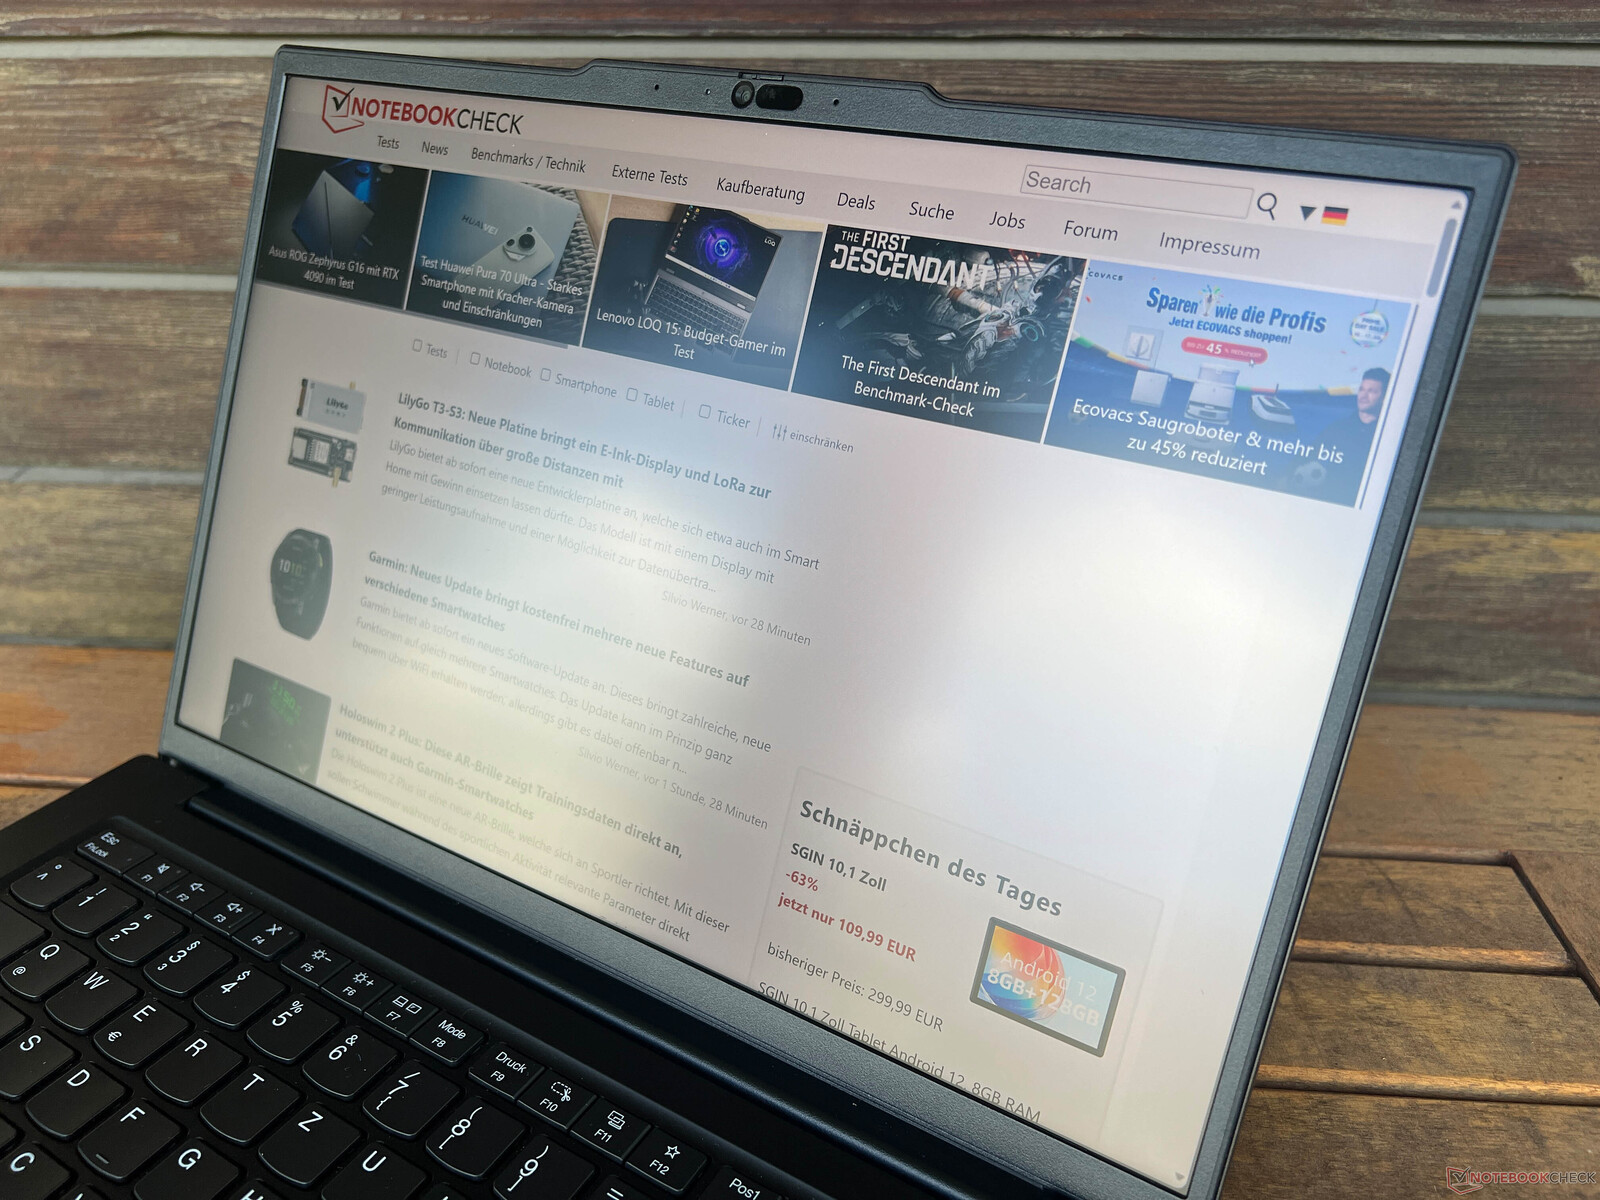
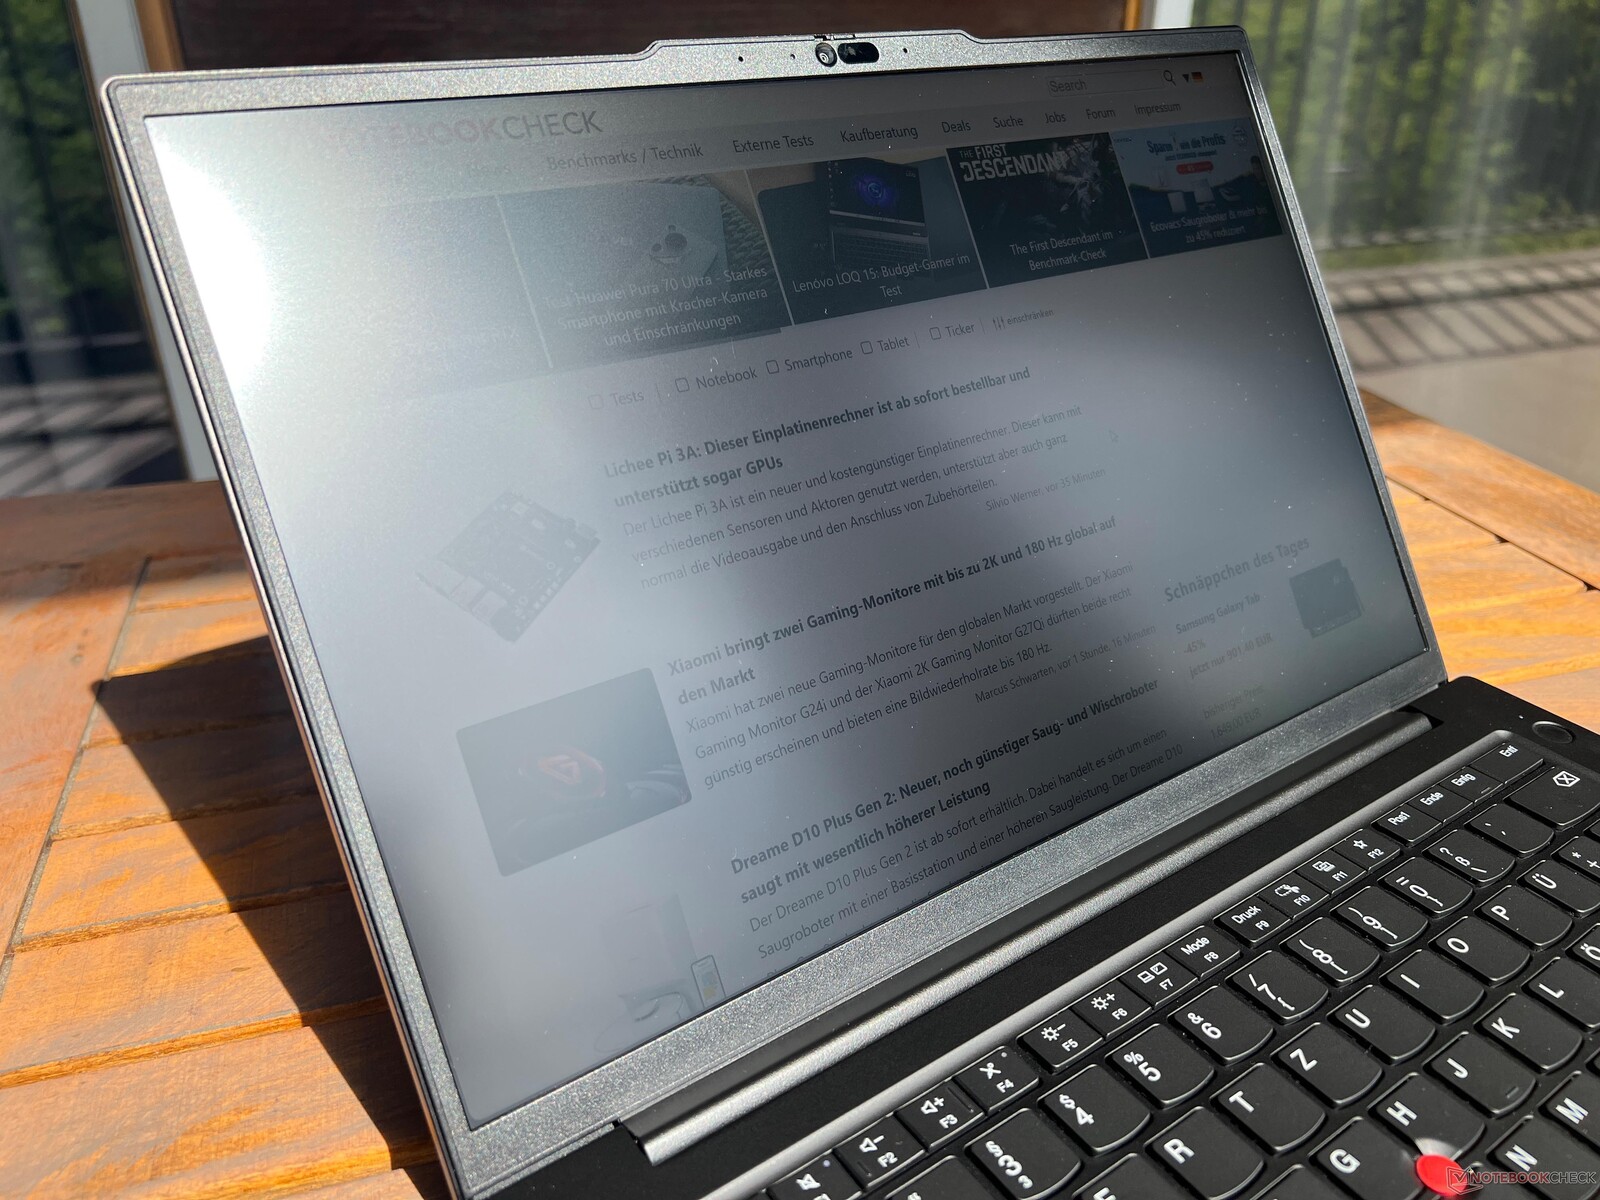
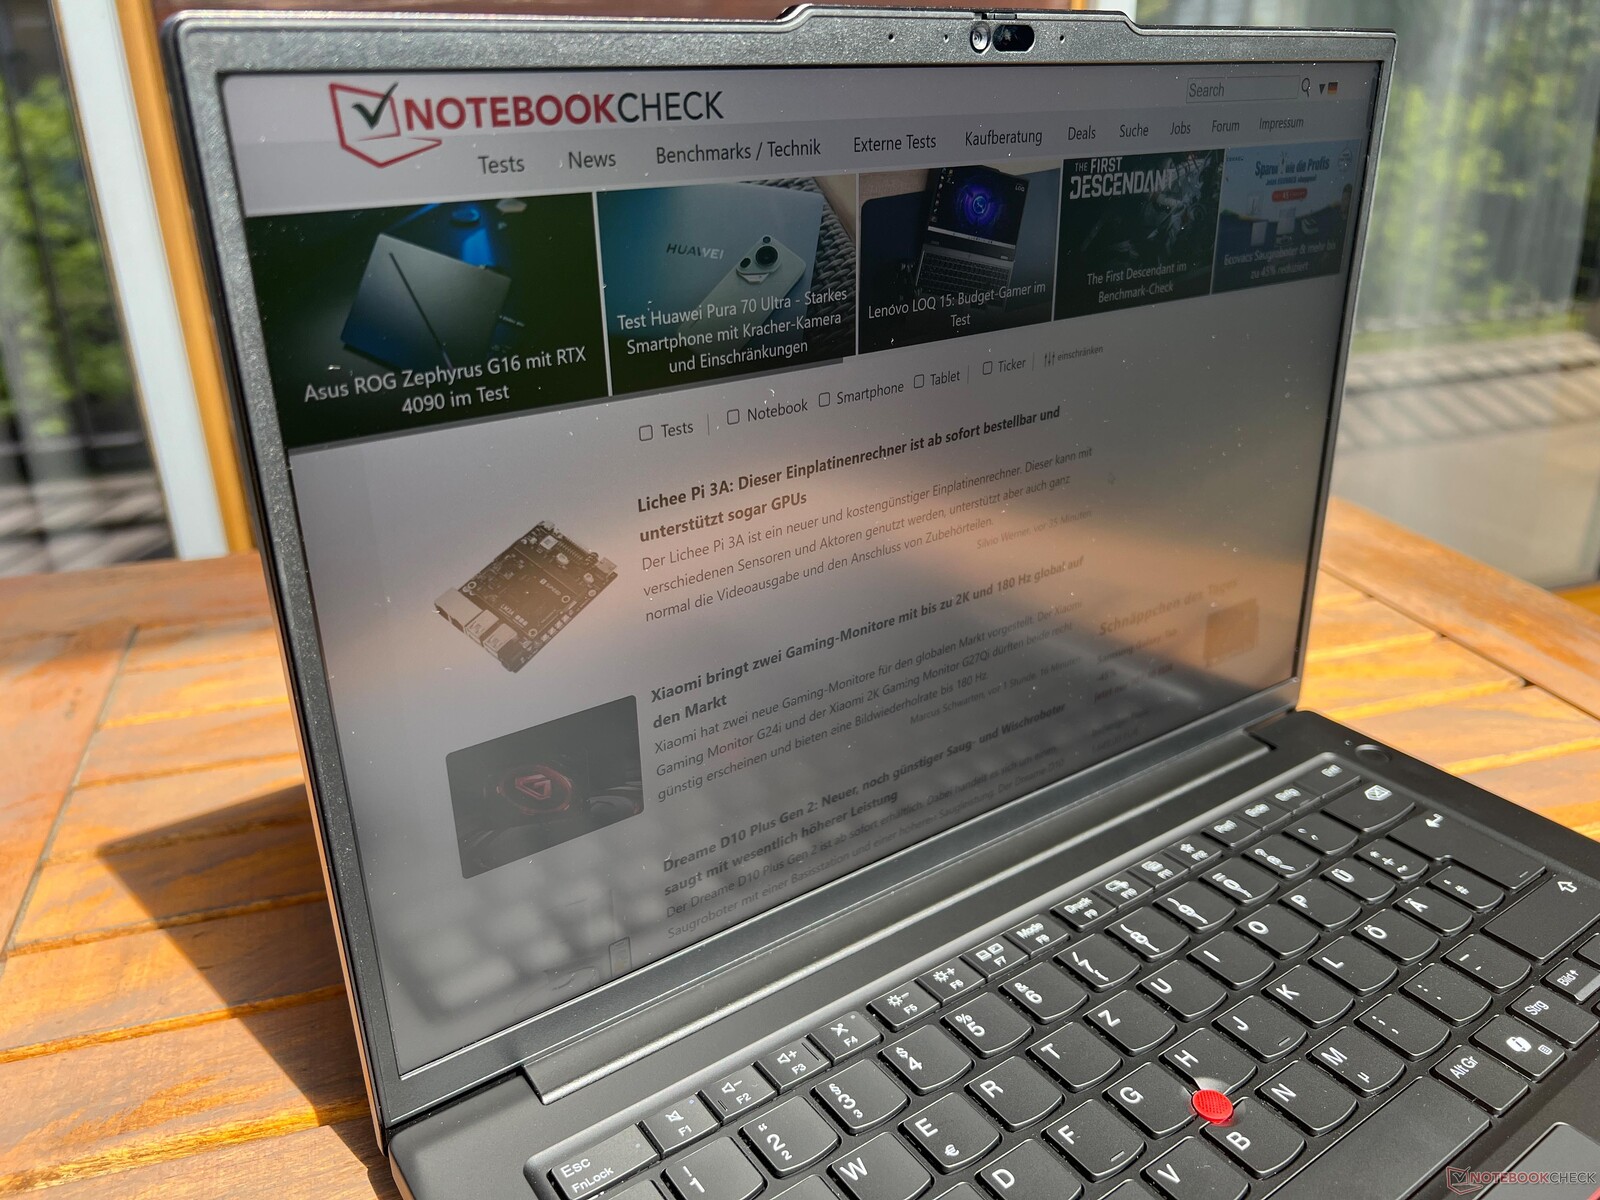
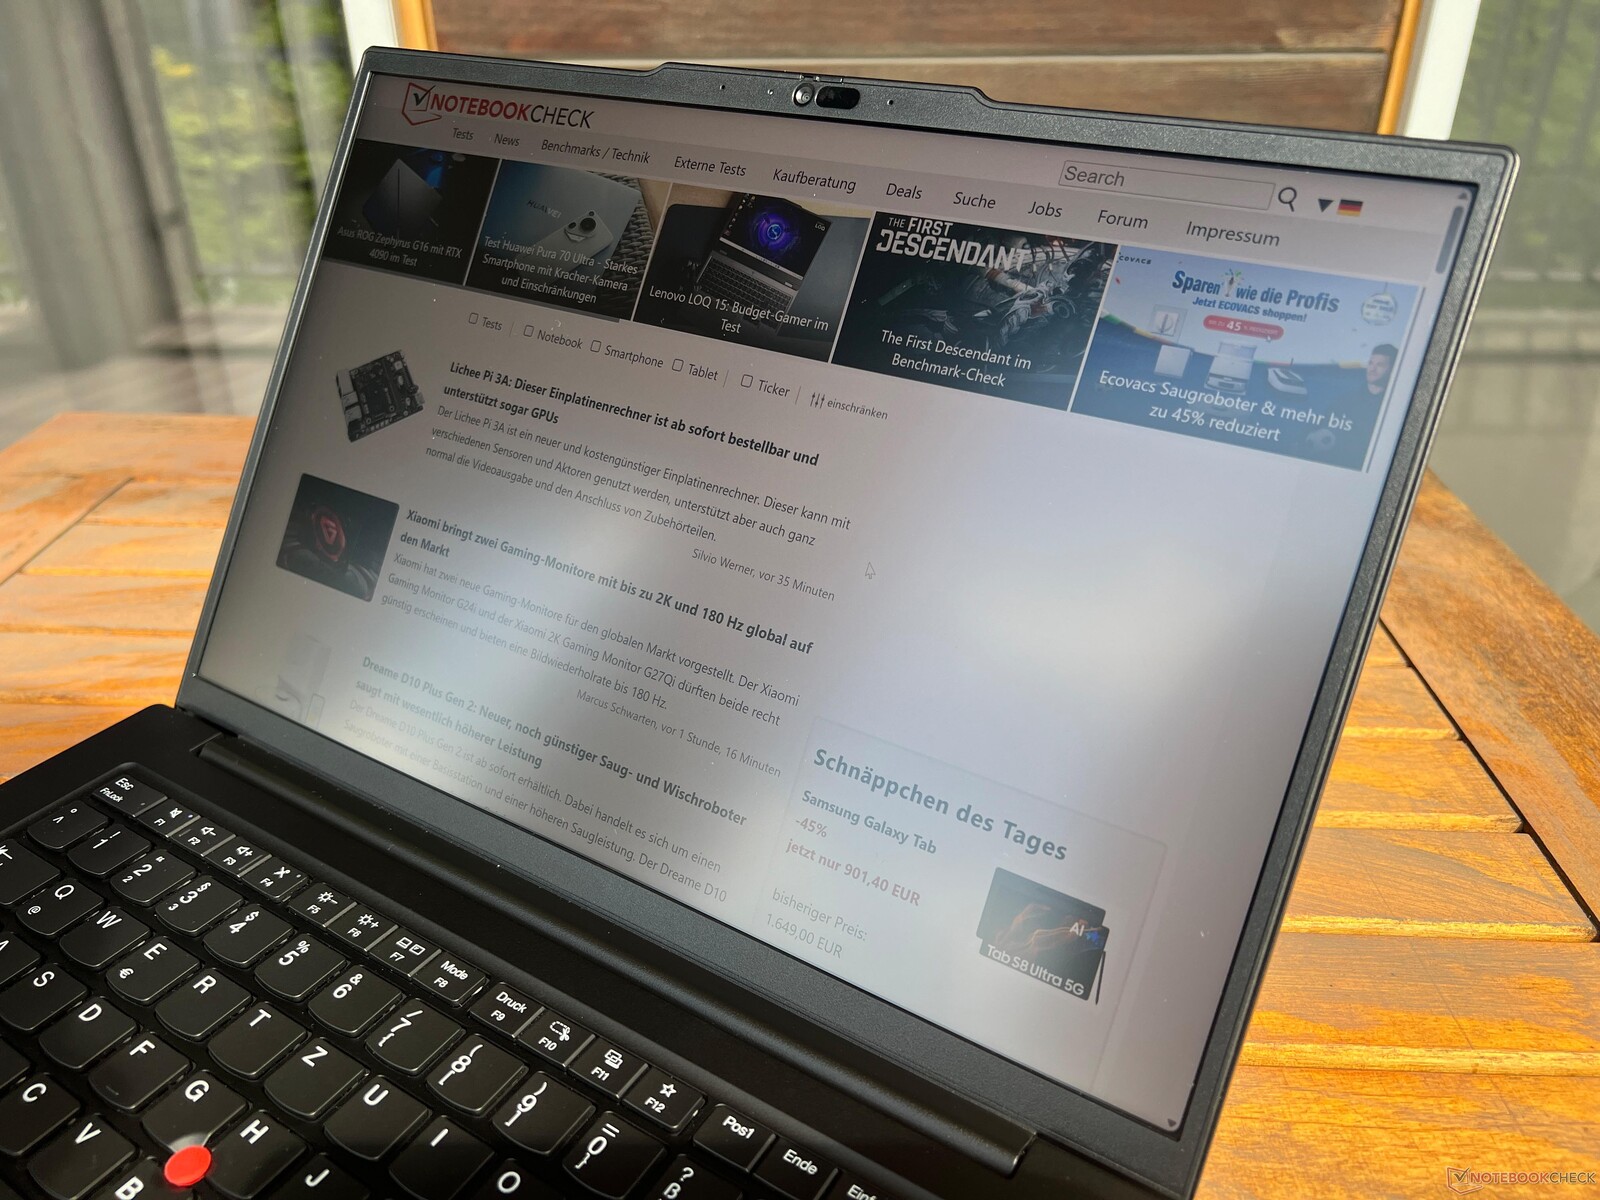
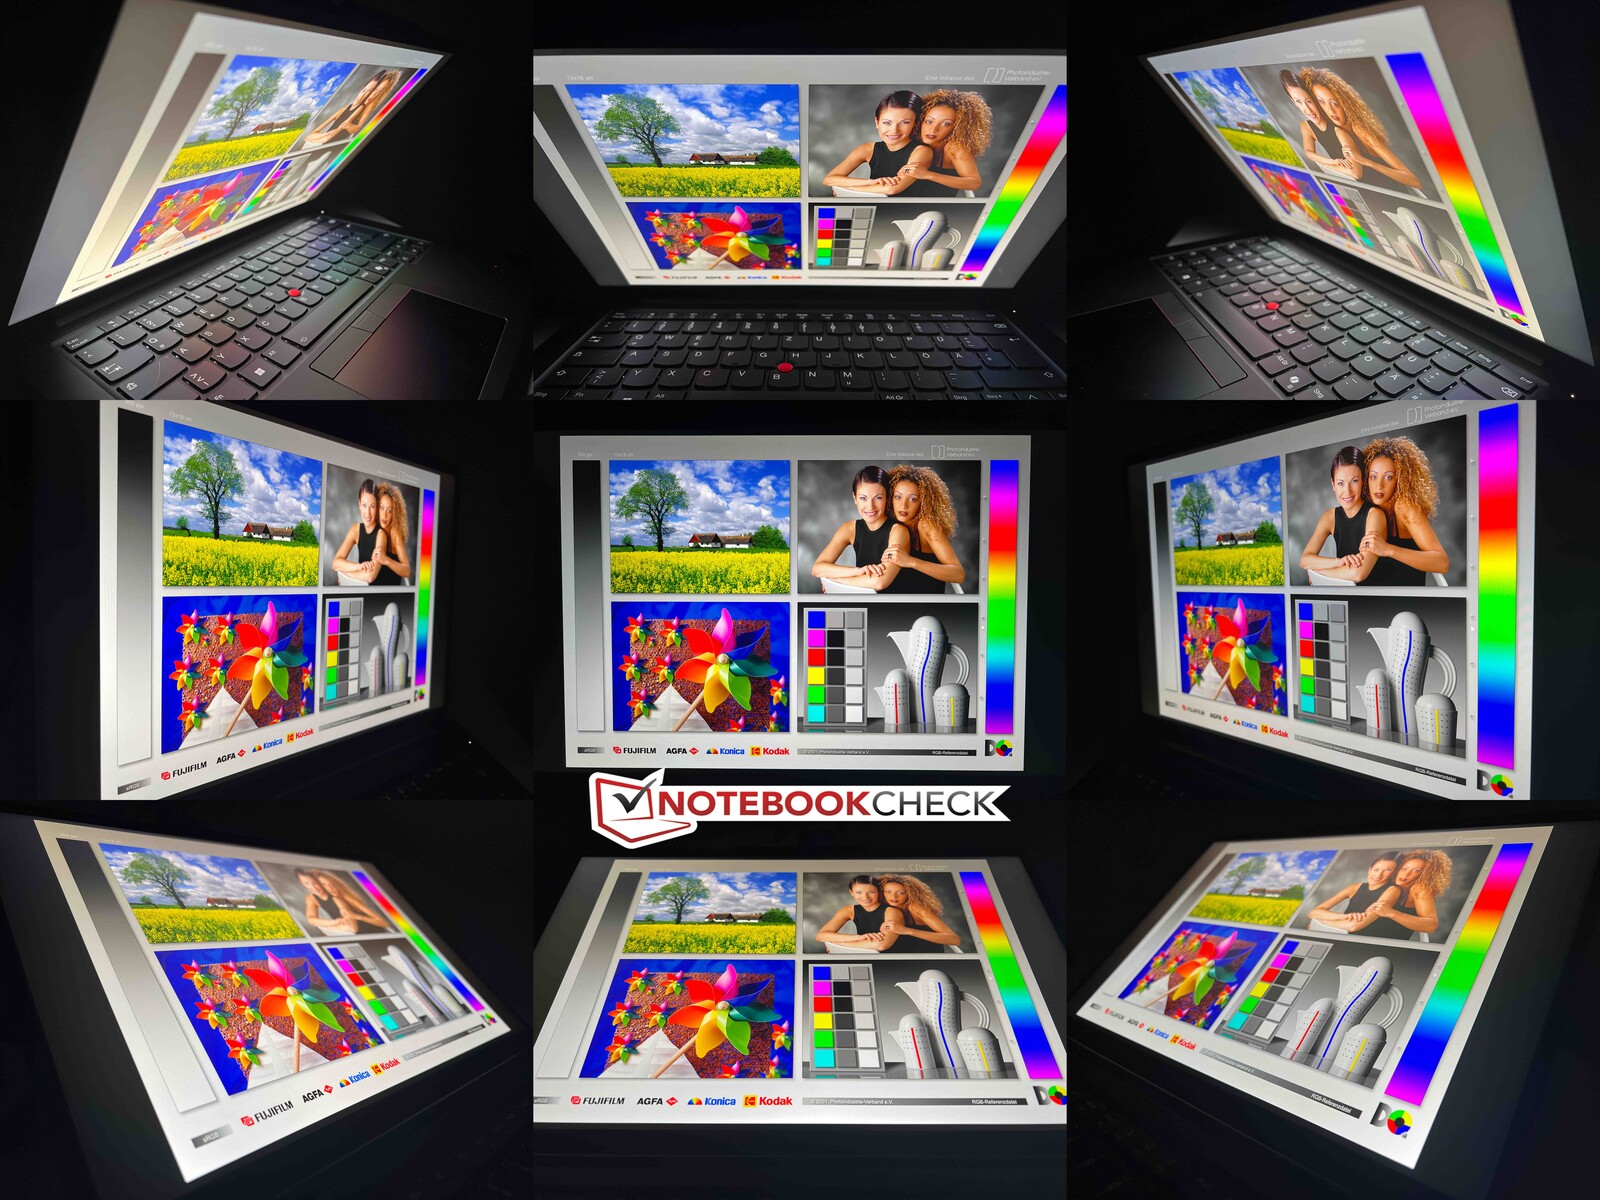
El panel mate rinde bien en exteriores, pero su brillo en particular podría mejorar un poco en días muy luminosos. La estabilidad del ángulo de visión del panel IPS es buena.
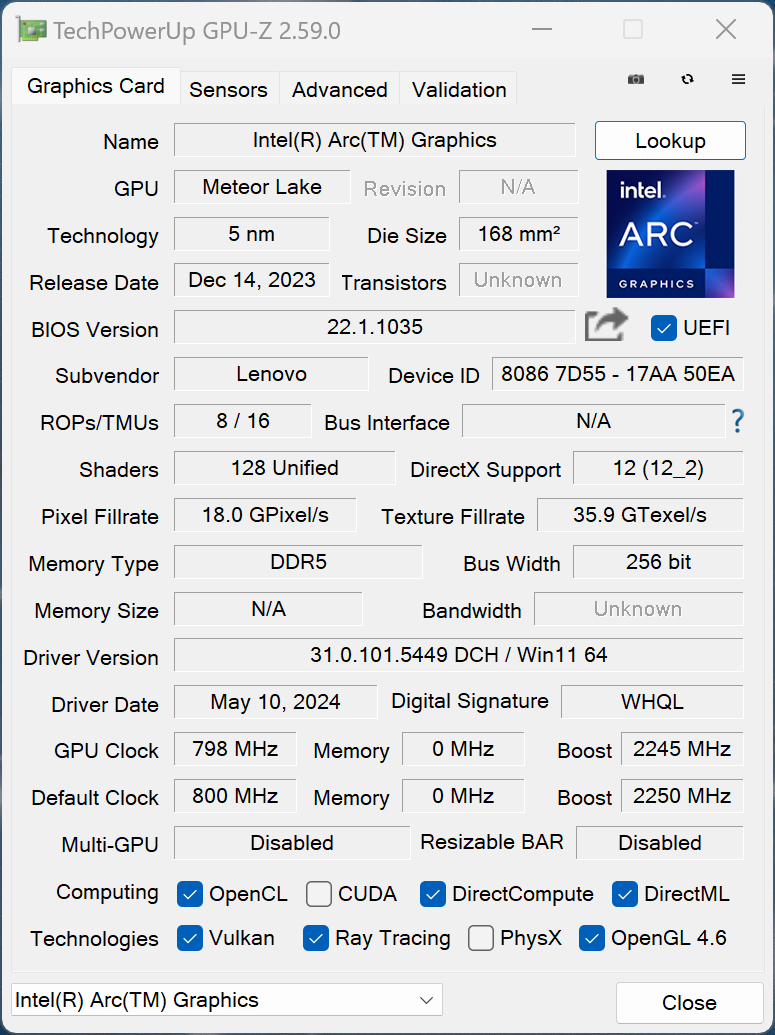
Rendimiento - Meteor Lake y RTX 500 Ada
La versión Intel del ThinkPad P14s G5 sólo está disponible con CPU Meteor Lake. En cuanto a la GPU, puede elegir entre la integrada Gráficos Intel Arc y la dedicada Nvidia RTX 500 Ada. La versión AMD del P14s G5 con el diseño antiguo, por otra parte, sólo está disponible con una iGPU.
Condiciones de prueba
Lenovo ha vinculado durante mucho tiempo sus propios perfiles de energía ThinkPad directamente a la configuración de energía de Windows. La siguiente tabla resume los ajustes TDP/TGP correspondientes. Realizamos los puntos de referencia y las mediciones utilizando el mejor rendimiento, que está configurado por defecto.
| Modo de rendimiento | TDP de la CPU | CB R23 Multi | TGP de la GPU | Time Spy gráficos | Prueba de estrés | emisiones máximas de ruido del ventilador |
|---|---|---|---|---|---|---|
| Mejor ahorro de energía | 80/30 vatios | 12.089 puntos | 35 vatios | 4.848 puntos | CPU: 15 vatios GPU: 35 vatios |
38,3 dB(A) |
| Equilibrada | 80/40 vatios | 17.620 puntos | 40 vatios | 4.981 puntos | CPU: 17 vatios GPU: 35 vatios |
44,8 dB(A) |
| Mejor rendimiento | 80/50 vatios | 17.612 puntos | 50 vatios | 5.278 puntos | CPU: 25 vatios GPU: 35 vatios |
46,8 dB(A) |
Procesador - Intel Core Ultra 7 155H
El Core Ultra 7 155H forma parte de la actual generación Meteor Lake de Intel y se utiliza en muchos portátiles. Gracias a sus elevados límites de potencia, los resultados de los benchmarks del procesador fueron muy buenos y superó tanto al Core i7-1370P como al AMD Ryzen 7 PRO 7840U en los modelos P14s-G4. Incluso el nominalmente más rápido Core Ultra 7 165H en el interior del ZBook Firefly 14 G11 era significativamente más lento. Sin embargo, también hay que mencionar que los antiguos chips Raptor Lake de Intel (por ejemplo, el Core i7-13700H) ofrecían un mayor rendimiento de un solo núcleo. En modo batería, el procesador puede consumir un máximo de 55 vatios, por lo que su rendimiento multinúcleo es un 8% inferior. Encontrará más pruebas comparativas de CPU en nuestra sección de tecnología.
Cinebench R15 Multi continuous test
Cinebench R23: Multi Core | Single Core
Cinebench R20: CPU (Multi Core) | CPU (Single Core)
Cinebench R15: CPU Multi 64Bit | CPU Single 64Bit
Blender: v2.79 BMW27 CPU
7-Zip 18.03: 7z b 4 | 7z b 4 -mmt1
Geekbench 6.4: Multi-Core | Single-Core
Geekbench 5.5: Multi-Core | Single-Core
HWBOT x265 Benchmark v2.2: 4k Preset
LibreOffice : 20 Documents To PDF
R Benchmark 2.5: Overall mean
| CPU Performance Rating | |
| Media de la clase Workstation | |
| Lenovo Yoga Pro 9-14IRP G8 | |
| Microsoft Surface Laptop Studio 2 RTX 4060 | |
| Lenovo ThinkPad P14s G5 21G3S00A00 | |
| Dell Precision 5000 5490 | |
| Lenovo ThinkPad P14s G4 21HF0017GE | |
| Medio Intel Core Ultra 7 155H | |
| HP ZBook Firefly 14 G11 | |
| Lenovo ThinkPad P14s G4 21K5000LGE | |
| Cinebench R23 / Multi Core | |
| Media de la clase Workstation (11507 - 30706, n=25, últimos 2 años) | |
| Lenovo Yoga Pro 9-14IRP G8 | |
| Lenovo ThinkPad P14s G5 21G3S00A00 | |
| Dell Precision 5000 5490 | |
| Microsoft Surface Laptop Studio 2 RTX 4060 | |
| Medio Intel Core Ultra 7 155H (9769 - 19007, n=52) | |
| Lenovo ThinkPad P14s G4 21HF0017GE | |
| HP ZBook Firefly 14 G11 | |
| Lenovo ThinkPad P14s G4 21K5000LGE | |
| Cinebench R23 / Single Core | |
| Lenovo ThinkPad P14s G4 21HF0017GE | |
| Microsoft Surface Laptop Studio 2 RTX 4060 | |
| Media de la clase Workstation (1581 - 2178, n=25, últimos 2 años) | |
| Lenovo Yoga Pro 9-14IRP G8 | |
| Lenovo ThinkPad P14s G5 21G3S00A00 | |
| Dell Precision 5000 5490 | |
| HP ZBook Firefly 14 G11 | |
| Medio Intel Core Ultra 7 155H (1496 - 1815, n=52) | |
| Lenovo ThinkPad P14s G4 21K5000LGE | |
| Cinebench R20 / CPU (Multi Core) | |
| Media de la clase Workstation (4530 - 11816, n=25, últimos 2 años) | |
| Lenovo Yoga Pro 9-14IRP G8 | |
| Lenovo ThinkPad P14s G5 21G3S00A00 | |
| Dell Precision 5000 5490 | |
| Microsoft Surface Laptop Studio 2 RTX 4060 | |
| Medio Intel Core Ultra 7 155H (3798 - 7409, n=50) | |
| Lenovo ThinkPad P14s G4 21HF0017GE | |
| Lenovo ThinkPad P14s G4 21K5000LGE | |
| HP ZBook Firefly 14 G11 | |
| Cinebench R20 / CPU (Single Core) | |
| Microsoft Surface Laptop Studio 2 RTX 4060 | |
| Lenovo ThinkPad P14s G4 21HF0017GE | |
| Lenovo Yoga Pro 9-14IRP G8 | |
| Media de la clase Workstation (612 - 827, n=25, últimos 2 años) | |
| Lenovo ThinkPad P14s G5 21G3S00A00 | |
| Dell Precision 5000 5490 | |
| HP ZBook Firefly 14 G11 | |
| Medio Intel Core Ultra 7 155H (601 - 696, n=50) | |
| Lenovo ThinkPad P14s G4 21K5000LGE | |
| Cinebench R15 / CPU Multi 64Bit | |
| Media de la clase Workstation (1863 - 4784, n=25, últimos 2 años) | |
| Dell Precision 5000 5490 | |
| Lenovo Yoga Pro 9-14IRP G8 | |
| Lenovo ThinkPad P14s G5 21G3S00A00 | |
| Microsoft Surface Laptop Studio 2 RTX 4060 | |
| HP ZBook Firefly 14 G11 | |
| Medio Intel Core Ultra 7 155H (1932 - 2880, n=56) | |
| Lenovo ThinkPad P14s G4 21HF0017GE | |
| Lenovo ThinkPad P14s G4 21K5000LGE | |
| Cinebench R15 / CPU Single 64Bit | |
| Microsoft Surface Laptop Studio 2 RTX 4060 | |
| Lenovo Yoga Pro 9-14IRP G8 | |
| Media de la clase Workstation (167 - 307, n=25, últimos 2 años) | |
| Lenovo ThinkPad P14s G4 21K5000LGE | |
| Lenovo ThinkPad P14s G5 21G3S00A00 | |
| Lenovo ThinkPad P14s G4 21HF0017GE | |
| HP ZBook Firefly 14 G11 | |
| Dell Precision 5000 5490 | |
| Medio Intel Core Ultra 7 155H (99.6 - 268, n=52) | |
| Blender / v2.79 BMW27 CPU | |
| HP ZBook Firefly 14 G11 | |
| Lenovo ThinkPad P14s G4 21HF0017GE | |
| Microsoft Surface Laptop Studio 2 RTX 4060 | |
| Lenovo ThinkPad P14s G4 21K5000LGE | |
| Medio Intel Core Ultra 7 155H (175 - 381, n=47) | |
| Dell Precision 5000 5490 | |
| Lenovo ThinkPad P14s G5 21G3S00A00 | |
| Media de la clase Workstation (102 - 270, n=25, últimos 2 años) | |
| Lenovo Yoga Pro 9-14IRP G8 | |
| 7-Zip 18.03 / 7z b 4 | |
| Media de la clase Workstation (51096 - 109760, n=25, últimos 2 años) | |
| Lenovo Yoga Pro 9-14IRP G8 | |
| Lenovo ThinkPad P14s G5 21G3S00A00 | |
| Dell Precision 5000 5490 | |
| Microsoft Surface Laptop Studio 2 RTX 4060 | |
| Medio Intel Core Ultra 7 155H (41739 - 70254, n=50) | |
| Lenovo ThinkPad P14s G4 21K5000LGE | |
| HP ZBook Firefly 14 G11 | |
| Lenovo ThinkPad P14s G4 21HF0017GE | |
| 7-Zip 18.03 / 7z b 4 -mmt1 | |
| Microsoft Surface Laptop Studio 2 RTX 4060 | |
| Lenovo ThinkPad P14s G4 21HF0017GE | |
| Media de la clase Workstation (4981 - 6960, n=25, últimos 2 años) | |
| Lenovo Yoga Pro 9-14IRP G8 | |
| Lenovo ThinkPad P14s G4 21K5000LGE | |
| Lenovo ThinkPad P14s G5 21G3S00A00 | |
| Dell Precision 5000 5490 | |
| HP ZBook Firefly 14 G11 | |
| Medio Intel Core Ultra 7 155H (4594 - 5621, n=50) | |
| Geekbench 6.4 / Multi-Core | |
| Lenovo Yoga Pro 9-14IRP G8 | |
| Lenovo Yoga Pro 9-14IRP G8 | |
| Dell Precision 5000 5490 | |
| Microsoft Surface Laptop Studio 2 RTX 4060 | |
| Media de la clase Workstation (10200 - 16855, n=23, últimos 2 años) | |
| Lenovo ThinkPad P14s G5 21G3S00A00 | |
| Lenovo ThinkPad P14s G4 21HF0017GE | |
| Medio Intel Core Ultra 7 155H (7732 - 13656, n=55) | |
| HP ZBook Firefly 14 G11 | |
| Lenovo ThinkPad P14s G4 21K5000LGE | |
| Geekbench 6.4 / Single-Core | |
| Lenovo ThinkPad P14s G4 21HF0017GE | |
| Microsoft Surface Laptop Studio 2 RTX 4060 | |
| Lenovo Yoga Pro 9-14IRP G8 | |
| Lenovo Yoga Pro 9-14IRP G8 | |
| Media de la clase Workstation (2352 - 2949, n=23, últimos 2 años) | |
| Lenovo ThinkPad P14s G4 21K5000LGE | |
| Lenovo ThinkPad P14s G5 21G3S00A00 | |
| HP ZBook Firefly 14 G11 | |
| Dell Precision 5000 5490 | |
| Medio Intel Core Ultra 7 155H (1901 - 2473, n=52) | |
| Geekbench 5.5 / Multi-Core | |
| Lenovo Yoga Pro 9-14IRP G8 | |
| Media de la clase Workstation (8863 - 19316, n=25, últimos 2 años) | |
| Lenovo ThinkPad P14s G5 21G3S00A00 | |
| Microsoft Surface Laptop Studio 2 RTX 4060 | |
| Dell Precision 5000 5490 | |
| HP ZBook Firefly 14 G11 | |
| Medio Intel Core Ultra 7 155H (10017 - 13556, n=52) | |
| Lenovo ThinkPad P14s G4 21HF0017GE | |
| Lenovo ThinkPad P14s G4 21K5000LGE | |
| Geekbench 5.5 / Single-Core | |
| Media de la clase Workstation (1740 - 2095, n=25, últimos 2 años) | |
| Lenovo Yoga Pro 9-14IRP G8 | |
| Microsoft Surface Laptop Studio 2 RTX 4060 | |
| Lenovo ThinkPad P14s G4 21HF0017GE | |
| Lenovo ThinkPad P14s G5 21G3S00A00 | |
| HP ZBook Firefly 14 G11 | |
| Dell Precision 5000 5490 | |
| Medio Intel Core Ultra 7 155H (1462 - 1824, n=52) | |
| Lenovo ThinkPad P14s G4 21K5000LGE | |
| HWBOT x265 Benchmark v2.2 / 4k Preset | |
| Media de la clase Workstation (14.4 - 33, n=25, últimos 2 años) | |
| Lenovo ThinkPad P14s G5 21G3S00A00 | |
| Lenovo Yoga Pro 9-14IRP G8 | |
| Microsoft Surface Laptop Studio 2 RTX 4060 | |
| Dell Precision 5000 5490 | |
| Lenovo ThinkPad P14s G4 21K5000LGE | |
| Medio Intel Core Ultra 7 155H (9.93 - 21.2, n=50) | |
| Lenovo ThinkPad P14s G4 21HF0017GE | |
| HP ZBook Firefly 14 G11 | |
| LibreOffice / 20 Documents To PDF | |
| Lenovo ThinkPad P14s G4 21K5000LGE | |
| HP ZBook Firefly 14 G11 | |
| Lenovo ThinkPad P14s G5 21G3S00A00 | |
| Medio Intel Core Ultra 7 155H (37.5 - 79.2, n=49) | |
| Lenovo Yoga Pro 9-14IRP G8 | |
| Media de la clase Workstation (36.5 - 56.9, n=25, últimos 2 años) | |
| Microsoft Surface Laptop Studio 2 RTX 4060 | |
| Lenovo ThinkPad P14s G4 21HF0017GE | |
| Dell Precision 5000 5490 | |
| R Benchmark 2.5 / Overall mean | |
| Medio Intel Core Ultra 7 155H (0.4457 - 0.53, n=49) | |
| Lenovo ThinkPad P14s G4 21K5000LGE | |
| Dell Precision 5000 5490 | |
| Lenovo ThinkPad P14s G5 21G3S00A00 | |
| HP ZBook Firefly 14 G11 | |
| Media de la clase Workstation (0.3825 - 0.4888, n=25, últimos 2 años) | |
| Microsoft Surface Laptop Studio 2 RTX 4060 | |
| Lenovo ThinkPad P14s G4 21HF0017GE | |
| Lenovo Yoga Pro 9-14IRP G8 | |
* ... más pequeño es mejor
AIDA64: FP32 Ray-Trace | FPU Julia | CPU SHA3 | CPU Queen | FPU SinJulia | FPU Mandel | CPU AES | CPU ZLib | FP64 Ray-Trace | CPU PhotoWorxx
| Performance Rating | |
| Media de la clase Workstation | |
| Lenovo Yoga Pro 9-14IRP G8 | |
| Lenovo ThinkPad P14s G5 21G3S00A00 | |
| Dell Precision 5000 5490 | |
| Medio Intel Core Ultra 7 155H | |
| Microsoft Surface Laptop Studio 2 RTX 4060 | |
| Lenovo ThinkPad P14s G4 21HF0017GE | |
| HP ZBook Firefly 14 G11 | |
| AIDA64 / FP32 Ray-Trace | |
| Media de la clase Workstation (10658 - 61611, n=25, últimos 2 años) | |
| Lenovo Yoga Pro 9-14IRP G8 | |
| Lenovo ThinkPad P14s G5 21G3S00A00 | |
| Dell Precision 5000 5490 | |
| Medio Intel Core Ultra 7 155H (6670 - 18470, n=50) | |
| Microsoft Surface Laptop Studio 2 RTX 4060 | |
| Lenovo ThinkPad P14s G4 21HF0017GE | |
| HP ZBook Firefly 14 G11 | |
| AIDA64 / FPU Julia | |
| Media de la clase Workstation (56664 - 183843, n=25, últimos 2 años) | |
| Lenovo ThinkPad P14s G5 21G3S00A00 | |
| Lenovo Yoga Pro 9-14IRP G8 | |
| Dell Precision 5000 5490 | |
| Microsoft Surface Laptop Studio 2 RTX 4060 | |
| Medio Intel Core Ultra 7 155H (40905 - 93181, n=50) | |
| Lenovo ThinkPad P14s G4 21HF0017GE | |
| HP ZBook Firefly 14 G11 | |
| AIDA64 / CPU SHA3 | |
| Media de la clase Workstation (2608 - 8341, n=25, últimos 2 años) | |
| Dell Precision 5000 5490 | |
| Lenovo ThinkPad P14s G5 21G3S00A00 | |
| Lenovo Yoga Pro 9-14IRP G8 | |
| Medio Intel Core Ultra 7 155H (1940 - 4436, n=50) | |
| Microsoft Surface Laptop Studio 2 RTX 4060 | |
| Lenovo ThinkPad P14s G4 21HF0017GE | |
| HP ZBook Firefly 14 G11 | |
| AIDA64 / CPU Queen | |
| Media de la clase Workstation (84022 - 144411, n=25, últimos 2 años) | |
| Lenovo Yoga Pro 9-14IRP G8 | |
| Microsoft Surface Laptop Studio 2 RTX 4060 | |
| Lenovo ThinkPad P14s G4 21HF0017GE | |
| Dell Precision 5000 5490 | |
| HP ZBook Firefly 14 G11 | |
| Lenovo ThinkPad P14s G5 21G3S00A00 | |
| Medio Intel Core Ultra 7 155H (64698 - 94181, n=50) | |
| AIDA64 / FPU SinJulia | |
| Media de la clase Workstation (7906 - 29343, n=25, últimos 2 años) | |
| Lenovo Yoga Pro 9-14IRP G8 | |
| Lenovo ThinkPad P14s G5 21G3S00A00 | |
| Dell Precision 5000 5490 | |
| Medio Intel Core Ultra 7 155H (5639 - 10647, n=50) | |
| Microsoft Surface Laptop Studio 2 RTX 4060 | |
| HP ZBook Firefly 14 G11 | |
| Lenovo ThinkPad P14s G4 21HF0017GE | |
| AIDA64 / FPU Mandel | |
| Media de la clase Workstation (27301 - 97385, n=25, últimos 2 años) | |
| Lenovo Yoga Pro 9-14IRP G8 | |
| Lenovo ThinkPad P14s G5 21G3S00A00 | |
| Dell Precision 5000 5490 | |
| Medio Intel Core Ultra 7 155H (18236 - 47685, n=50) | |
| Microsoft Surface Laptop Studio 2 RTX 4060 | |
| Lenovo ThinkPad P14s G4 21HF0017GE | |
| HP ZBook Firefly 14 G11 | |
| AIDA64 / CPU AES | |
| Media de la clase Workstation (56077 - 187841, n=25, últimos 2 años) | |
| Lenovo ThinkPad P14s G5 21G3S00A00 | |
| Medio Intel Core Ultra 7 155H (45713 - 152179, n=50) | |
| Dell Precision 5000 5490 | |
| Lenovo Yoga Pro 9-14IRP G8 | |
| Microsoft Surface Laptop Studio 2 RTX 4060 | |
| Lenovo ThinkPad P14s G4 21HF0017GE | |
| HP ZBook Firefly 14 G11 | |
| AIDA64 / CPU ZLib | |
| Media de la clase Workstation (742 - 2057, n=25, últimos 2 años) | |
| Lenovo ThinkPad P14s G5 21G3S00A00 | |
| Lenovo Yoga Pro 9-14IRP G8 | |
| Dell Precision 5000 5490 | |
| Medio Intel Core Ultra 7 155H (557 - 1250, n=50) | |
| Microsoft Surface Laptop Studio 2 RTX 4060 | |
| Lenovo ThinkPad P14s G4 21HF0017GE | |
| HP ZBook Firefly 14 G11 | |
| AIDA64 / FP64 Ray-Trace | |
| Media de la clase Workstation (5580 - 32891, n=25, últimos 2 años) | |
| Lenovo Yoga Pro 9-14IRP G8 | |
| Lenovo ThinkPad P14s G5 21G3S00A00 | |
| Dell Precision 5000 5490 | |
| Microsoft Surface Laptop Studio 2 RTX 4060 | |
| Medio Intel Core Ultra 7 155H (3569 - 9802, n=50) | |
| Lenovo ThinkPad P14s G4 21HF0017GE | |
| HP ZBook Firefly 14 G11 | |
| AIDA64 / CPU PhotoWorxx | |
| Lenovo Yoga Pro 9-14IRP G8 | |
| Dell Precision 5000 5490 | |
| Lenovo ThinkPad P14s G5 21G3S00A00 | |
| Medio Intel Core Ultra 7 155H (32719 - 54223, n=50) | |
| HP ZBook Firefly 14 G11 | |
| Media de la clase Workstation (24325 - 93684, n=25, últimos 2 años) | |
| Microsoft Surface Laptop Studio 2 RTX 4060 | |
| Lenovo ThinkPad P14s G4 21HF0017GE | |
Rendimiento del sistema
El ThinkPad P14s G5 es un portátil superrápido, lo que también se confirmó durante las pruebas comparativas sintéticas. Aunque otros dispositivos fueron a veces incluso más rápidos durante esta prueba, las diferencias globales son pequeñas y todas las entradas son procesadas rápidamente por el sistema. Además, no tuvimos problemas con la estabilidad del sistema durante la prueba.
CrossMark: Overall | Productivity | Creativity | Responsiveness
WebXPRT 3: Overall
WebXPRT 4: Overall
Mozilla Kraken 1.1: Total
| PCMark 10 / Score | |
| Media de la clase Workstation (6336 - 8587, n=25, últimos 2 años) | |
| Lenovo Yoga Pro 9-14IRP G8 | |
| Dell Precision 5000 5490 | |
| Microsoft Surface Laptop Studio 2 RTX 4060 | |
| Lenovo ThinkPad P14s G4 21HF0017GE | |
| Lenovo ThinkPad P14s G5 21G3S00A00 | |
| Medio Intel Core Ultra 7 155H, Nvidia RTX 500 Ada Generation Laptop GPU (n=1) | |
| HP ZBook Firefly 14 G11 | |
| PCMark 10 / Essentials | |
| Lenovo Yoga Pro 9-14IRP G8 | |
| Dell Precision 5000 5490 | |
| Lenovo ThinkPad P14s G5 21G3S00A00 | |
| Medio Intel Core Ultra 7 155H, Nvidia RTX 500 Ada Generation Laptop GPU (n=1) | |
| Media de la clase Workstation (9647 - 12197, n=25, últimos 2 años) | |
| Microsoft Surface Laptop Studio 2 RTX 4060 | |
| Lenovo ThinkPad P14s G4 21HF0017GE | |
| HP ZBook Firefly 14 G11 | |
| PCMark 10 / Productivity | |
| Lenovo ThinkPad P14s G4 21HF0017GE | |
| Media de la clase Workstation (8829 - 10820, n=25, últimos 2 años) | |
| HP ZBook Firefly 14 G11 | |
| Lenovo ThinkPad P14s G5 21G3S00A00 | |
| Medio Intel Core Ultra 7 155H, Nvidia RTX 500 Ada Generation Laptop GPU (n=1) | |
| Microsoft Surface Laptop Studio 2 RTX 4060 | |
| Dell Precision 5000 5490 | |
| Lenovo Yoga Pro 9-14IRP G8 | |
| PCMark 10 / Digital Content Creation | |
| Media de la clase Workstation (7589 - 15093, n=25, últimos 2 años) | |
| Lenovo Yoga Pro 9-14IRP G8 | |
| Microsoft Surface Laptop Studio 2 RTX 4060 | |
| Dell Precision 5000 5490 | |
| Lenovo ThinkPad P14s G5 21G3S00A00 | |
| Medio Intel Core Ultra 7 155H, Nvidia RTX 500 Ada Generation Laptop GPU (n=1) | |
| Lenovo ThinkPad P14s G4 21HF0017GE | |
| HP ZBook Firefly 14 G11 | |
| CrossMark / Overall | |
| Lenovo Yoga Pro 9-14IRP G8 | |
| Lenovo ThinkPad P14s G4 21HF0017GE | |
| Media de la clase Workstation (1574 - 2037, n=23, últimos 2 años) | |
| Dell Precision 5000 5490 | |
| Microsoft Surface Laptop Studio 2 RTX 4060 | |
| Lenovo ThinkPad P14s G5 21G3S00A00 | |
| Medio Intel Core Ultra 7 155H, Nvidia RTX 500 Ada Generation Laptop GPU (n=1) | |
| HP ZBook Firefly 14 G11 | |
| CrossMark / Productivity | |
| Lenovo Yoga Pro 9-14IRP G8 | |
| Lenovo ThinkPad P14s G4 21HF0017GE | |
| Media de la clase Workstation (1546 - 1902, n=23, últimos 2 años) | |
| Dell Precision 5000 5490 | |
| Microsoft Surface Laptop Studio 2 RTX 4060 | |
| HP ZBook Firefly 14 G11 | |
| Lenovo ThinkPad P14s G5 21G3S00A00 | |
| Medio Intel Core Ultra 7 155H, Nvidia RTX 500 Ada Generation Laptop GPU (n=1) | |
| CrossMark / Creativity | |
| Lenovo Yoga Pro 9-14IRP G8 | |
| Lenovo ThinkPad P14s G4 21HF0017GE | |
| Media de la clase Workstation (1655 - 2412, n=23, últimos 2 años) | |
| Microsoft Surface Laptop Studio 2 RTX 4060 | |
| Dell Precision 5000 5490 | |
| HP ZBook Firefly 14 G11 | |
| Lenovo ThinkPad P14s G5 21G3S00A00 | |
| Medio Intel Core Ultra 7 155H, Nvidia RTX 500 Ada Generation Laptop GPU (n=1) | |
| CrossMark / Responsiveness | |
| Lenovo ThinkPad P14s G4 21HF0017GE | |
| Lenovo Yoga Pro 9-14IRP G8 | |
| Media de la clase Workstation (1304 - 1730, n=23, últimos 2 años) | |
| Lenovo ThinkPad P14s G5 21G3S00A00 | |
| Medio Intel Core Ultra 7 155H, Nvidia RTX 500 Ada Generation Laptop GPU (n=1) | |
| Dell Precision 5000 5490 | |
| Microsoft Surface Laptop Studio 2 RTX 4060 | |
| HP ZBook Firefly 14 G11 | |
| WebXPRT 3 / Overall | |
| Lenovo Yoga Pro 9-14IRP G8 | |
| Media de la clase Workstation (259 - 415, n=26, últimos 2 años) | |
| Microsoft Surface Laptop Studio 2 RTX 4060 | |
| Lenovo ThinkPad P14s G4 21HF0017GE | |
| HP ZBook Firefly 14 G11 | |
| Dell Precision 5000 5490 | |
| Lenovo ThinkPad P14s G5 21G3S00A00 | |
| Medio Intel Core Ultra 7 155H, Nvidia RTX 500 Ada Generation Laptop GPU (n=1) | |
| WebXPRT 4 / Overall | |
| Microsoft Surface Laptop Studio 2 RTX 4060 | |
| Lenovo Yoga Pro 9-14IRP G8 | |
| Lenovo ThinkPad P14s G4 21HF0017GE | |
| Lenovo ThinkPad P14s G4 21HF0017GE | |
| Dell Precision 5000 5490 | |
| Media de la clase Workstation (199.4 - 338, n=22, últimos 2 años) | |
| HP ZBook Firefly 14 G11 | |
| Lenovo ThinkPad P14s G5 21G3S00A00 | |
| Medio Intel Core Ultra 7 155H, Nvidia RTX 500 Ada Generation Laptop GPU (n=1) | |
| Mozilla Kraken 1.1 / Total | |
| Lenovo ThinkPad P14s G5 21G3S00A00 | |
| Medio Intel Core Ultra 7 155H, Nvidia RTX 500 Ada Generation Laptop GPU (n=1) | |
| Dell Precision 5000 5490 | |
| HP ZBook Firefly 14 G11 | |
| Media de la clase Workstation (433 - 591, n=26, últimos 2 años) | |
| Lenovo Yoga Pro 9-14IRP G8 | |
| Microsoft Surface Laptop Studio 2 RTX 4060 | |
| Lenovo ThinkPad P14s G4 21HF0017GE | |
* ... más pequeño es mejor
| PCMark 10 Score | 6974 puntos | |
ayuda | ||
| AIDA64 / Memory Copy | |
| Dell Precision 5000 5490 | |
| Medio Intel Core Ultra 7 155H (62397 - 96791, n=50) | |
| Lenovo Yoga Pro 9-14IRP G8 | |
| Lenovo ThinkPad P14s G5 21G3S00A00 | |
| HP ZBook Firefly 14 G11 | |
| Media de la clase Workstation (34323 - 158632, n=25, últimos 2 años) | |
| Microsoft Surface Laptop Studio 2 RTX 4060 | |
| Lenovo ThinkPad P14s G4 21HF0017GE | |
| AIDA64 / Memory Read | |
| Dell Precision 5000 5490 | |
| Medio Intel Core Ultra 7 155H (60544 - 90647, n=50) | |
| Lenovo ThinkPad P14s G5 21G3S00A00 | |
| HP ZBook Firefly 14 G11 | |
| Lenovo Yoga Pro 9-14IRP G8 | |
| Media de la clase Workstation (30787 - 121177, n=25, últimos 2 años) | |
| Microsoft Surface Laptop Studio 2 RTX 4060 | |
| Lenovo ThinkPad P14s G4 21HF0017GE | |
| AIDA64 / Memory Write | |
| Dell Precision 5000 5490 | |
| Lenovo Yoga Pro 9-14IRP G8 | |
| Media de la clase Workstation (39166 - 212172, n=25, últimos 2 años) | |
| Microsoft Surface Laptop Studio 2 RTX 4060 | |
| Lenovo ThinkPad P14s G5 21G3S00A00 | |
| Medio Intel Core Ultra 7 155H (58692 - 93451, n=50) | |
| HP ZBook Firefly 14 G11 | |
| Lenovo ThinkPad P14s G4 21HF0017GE | |
| AIDA64 / Memory Latency | |
| Medio Intel Core Ultra 7 155H (116.2 - 233, n=50) | |
| Dell Precision 5000 5490 | |
| HP ZBook Firefly 14 G11 | |
| Lenovo ThinkPad P14s G5 21G3S00A00 | |
| Media de la clase Workstation (83.4 - 165.2, n=25, últimos 2 años) | |
| Lenovo ThinkPad P14s G4 21HF0017GE | |
| Lenovo Yoga Pro 9-14IRP G8 | |
| Microsoft Surface Laptop Studio 2 RTX 4060 | |
* ... más pequeño es mejor
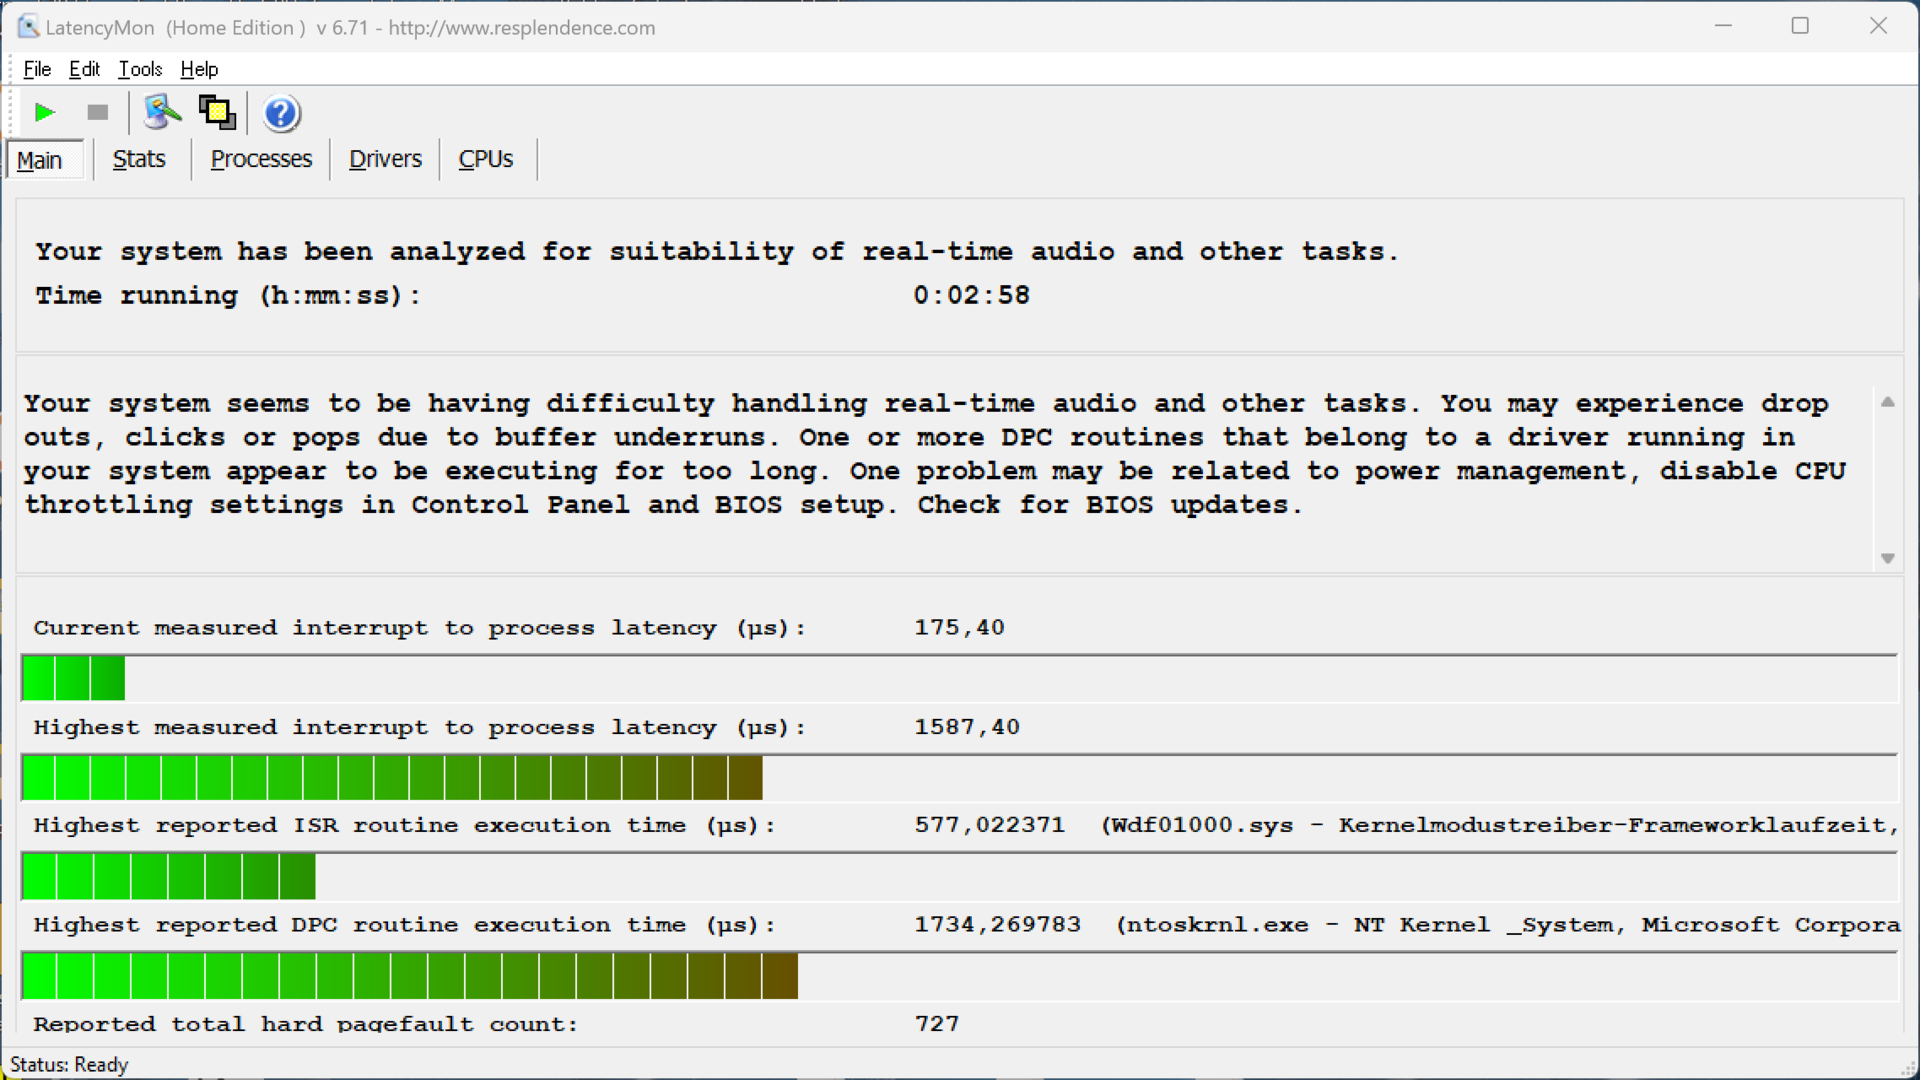
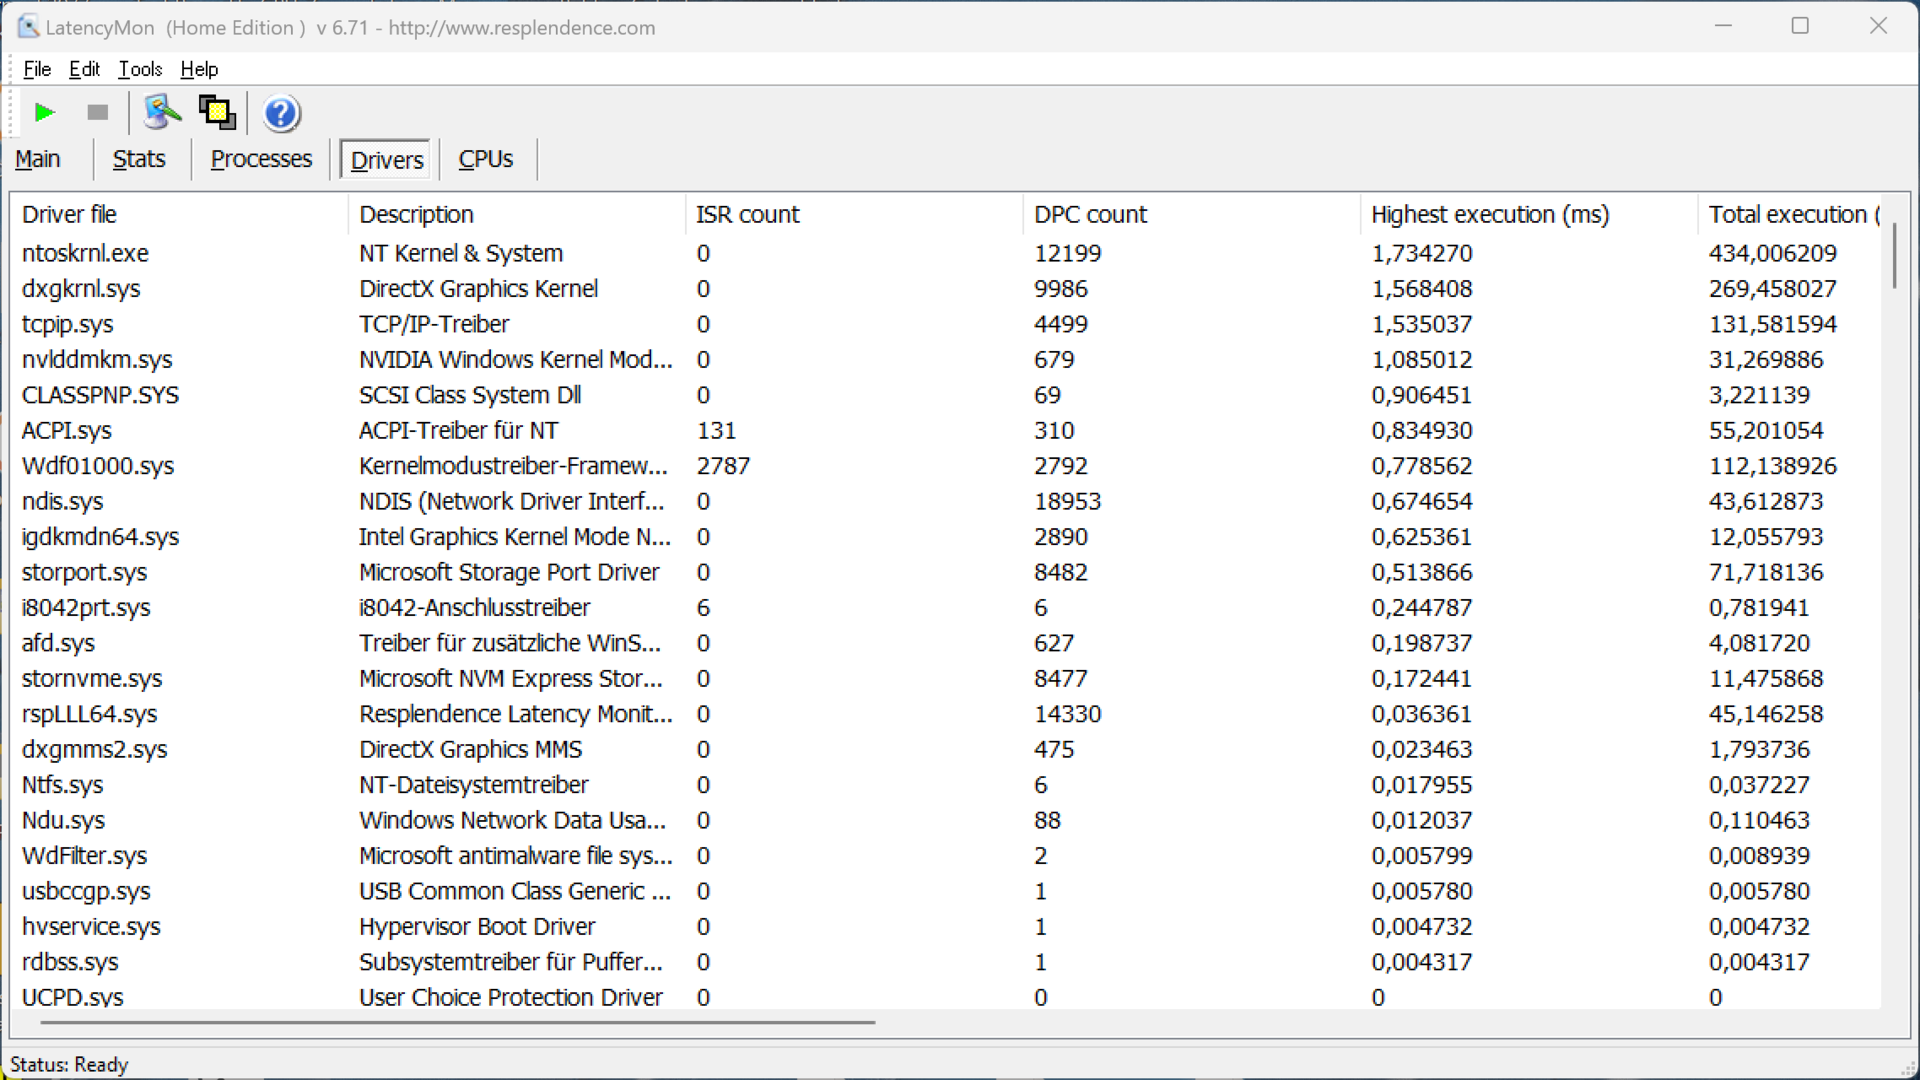
Latencias del CPD
En nuestra prueba de latencia estandarizada (navegación por Internet, vídeo 4K de YouTube, carga de la CPU), el dispositivo de prueba con la versión actual de la BIOS mostró ligeras limitaciones al utilizar aplicaciones de audio en tiempo real.
| DPC Latencies / LatencyMon - interrupt to process latency (max), Web, Youtube, Prime95 | |
| Microsoft Surface Laptop Studio 2 RTX 4060 | |
| HP ZBook Firefly 14 G11 | |
| Dell Precision 5000 5490 | |
| Lenovo ThinkPad P14s G4 21HF0017GE | |
| Lenovo ThinkPad P14s G5 21G3S00A00 | |
| Lenovo Yoga Pro 9-14IRP G8 | |
* ... más pequeño es mejor
Dispositivo de almacenamiento
El P14s G5 cuenta con una ranura M.2 2280 que se conecta a través de PCIe 4.0. La versión de 1 TB de la UMIS AM630 está instalada en nuestro dispositivo de prueba. Tras arrancar el dispositivo por primera vez, los usuarios tienen 871 GB a su disposición. Con velocidades de transferencia de hasta 7 GB/s, su rendimiento es muy bueno, aunque no puede mantener estos valores completamente constantes bajo carga continua. Sin embargo, como los valores siguen estando por encima de los 4 GB/s, los usuarios no deberían encontrar limitaciones. Encontrará más pruebas comparativas de SSD aquí.

* ... más pequeño es mejor
Reading continuous performance: DiskSpd Read Loop, Queue Depth 8
Tarjeta gráfica - Nvidia RTX 500 Ada
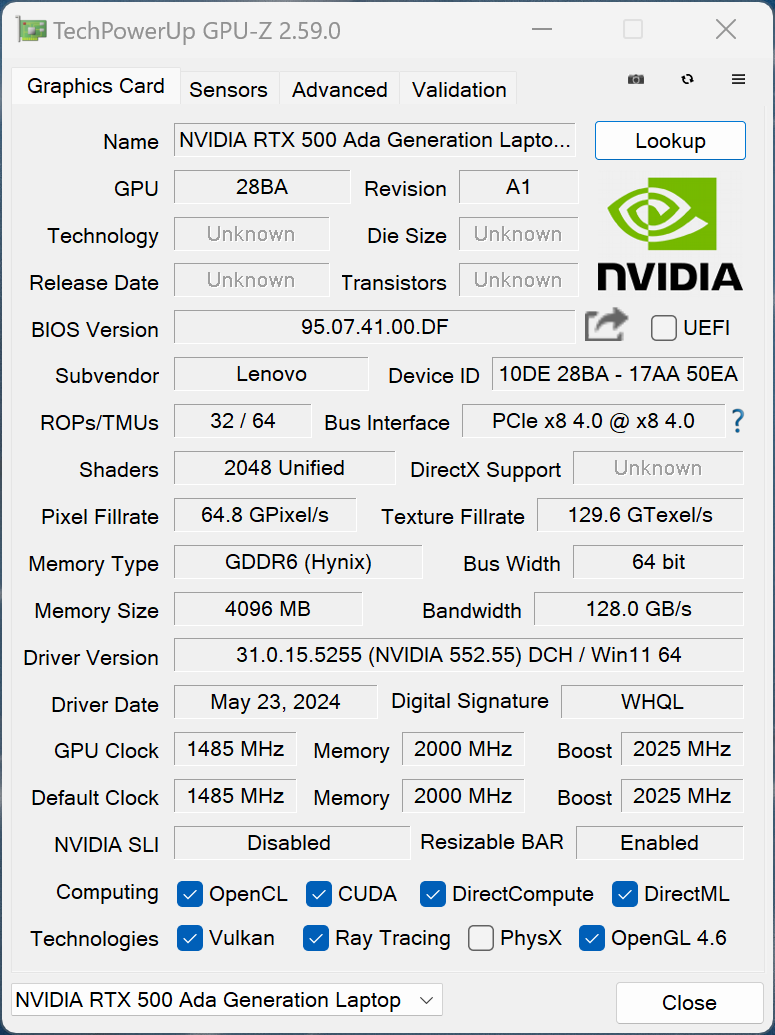
Opcionalmente puede obtener el P14s G5 con la Nvidia RTX 500 Adaque es actualmente la GPU móvil profesional más pequeña de Nvidia. La RTX 500 Ada se basa en el chip AD107GLM con 2.048 núcleos CUDA y 4 GB de VRAM GDDR6. Es, por tanto, una versión adelgazada de la RTX 1000 Ada y, en consecuencia, también del GeForce RTX 4050 Portátil-ambos equipados con 2.560 núcleos CUDA y 6 GB de VRAM. En el interior del ThinkPad P14s G5, la RTX 500 Ada puede consumir un máximo de 50 vatios y el sistema admite la conmutación de gráficos a través de la tecnología Optimus de Nvidia. En comparación con los modelos GeForce, las GPU profesionales ofrecen certificaciones ISV que garantizan la máxima compatibilidad con las aplicaciones profesionales.
En comparación con el antiguo portátil RTX A500 (que se basa en la GeForce RTX 3050 y se utiliza en el actual ZBook Firefly 14 G11por ejemplo), su rendimiento tanto en las pruebas 3DMark como en las profesionales SPECviewperf fue significativamente mejor (50-80 %), pero el portátil de consumo GeForce RTX 4050 ofrece aún más rendimiento 3D. Es una pena que Lenovo no ofrezca también la RTX 1000 Ada en el interior del P14s G5.
El rendimiento de la GPU se mantiene estable bajo carga constante y en modo batería. Más pruebas de rendimiento de la GPU están disponibles aquí.
| 3DMark 06 Standard Score | 50935 puntos | |
| 3DMark Vantage P Result | 66297 puntos | |
| 3DMark 11 Performance | 20426 puntos | |
| 3DMark Fire Strike Score | 12761 puntos | |
| 3DMark Time Spy Score | 5745 puntos | |
| 3DMark Steel Nomad Score | 981 puntos | |
| 3DMark Steel Nomad Light Score | 5441 puntos | |
ayuda | ||
| Performance Rating - Percent | |
| Dell Precision 5000 5490 -1! | |
| Lenovo ThinkPad P14s G5 21G3S00A00 | |
| Lenovo ThinkPad P14s G4 21HF0017GE -1! | |
| HP ZBook Firefly 14 G11 -1! | |
| Blender / v3.3 Classroom OPTIX/RTX | |
| HP ZBook Firefly 14 G11 | |
| Lenovo ThinkPad P14s G4 21HF0017GE | |
| Lenovo ThinkPad P14s G5 21G3S00A00 | |
| Medio Nvidia RTX 500 Ada Generation Laptop GPU (n=1) | |
| Media de la clase Workstation (13 - 95, n=21, últimos 2 años) | |
| Lenovo Yoga Pro 9-14IRP G8 | |
| Dell Precision 5000 5490 | |
| Microsoft Surface Laptop Studio 2 RTX 4060 | |
| Blender / v3.3 Classroom CUDA | |
| Lenovo ThinkPad P14s G4 21HF0017GE | |
| HP ZBook Firefly 14 G11 | |
| Lenovo ThinkPad P14s G5 21G3S00A00 | |
| Medio Nvidia RTX 500 Ada Generation Laptop GPU (n=1) | |
| Media de la clase Workstation (18 - 155, n=21, últimos 2 años) | |
| Lenovo Yoga Pro 9-14IRP G8 | |
| Dell Precision 5000 5490 | |
| Microsoft Surface Laptop Studio 2 RTX 4060 | |
| Blender / v3.3 Classroom CPU | |
| Lenovo ThinkPad P14s G4 21HF0017GE | |
| HP ZBook Firefly 14 G11 | |
| Microsoft Surface Laptop Studio 2 RTX 4060 | |
| Dell Precision 5000 5490 | |
| Lenovo ThinkPad P14s G5 21G3S00A00 | |
| Medio Nvidia RTX 500 Ada Generation Laptop GPU (n=1) | |
| Lenovo Yoga Pro 9-14IRP G8 | |
| Media de la clase Workstation (159 - 472, n=26, últimos 2 años) | |
* ... más pequeño es mejor
Rendimiento en juegos
También puede jugar a juegos en el ThinkPad P14s G5 si desea relajarse después del trabajo, aunque su rendimiento es, una vez más, significativamente inferior al del consumidor GeForce Portátil RTX 4050. Esto significa que por lo general está limitado a una resolución de 1080p y los detalles altos o máximos sólo son posibles cuando se juega a juegos más antiguos o menos exigentes. A su vez, juegos actuales como F1 24 o Cyberpunk 2077 requieren una mayor reducción de los detalles. El DLSS upsampling también puede utilizarse para juegos compatibles; por ejemplo, pudimos aumentar el rendimiento del portátil al ejecutar Cyberpunk 2077 (1080p, Ultra) de 25 fps a 45 fps (DLSS equilibrado). Su rendimiento en juegos se mantiene completamente estable incluso durante sesiones más largas.
| Cyberpunk 2077 2.2 Phantom Liberty - 1920x1080 Ultra Preset (FSR off) | |
| Media de la clase Workstation (19.6 - 113.5, n=16, últimos 2 años) | |
| Microsoft Surface Laptop Studio 2 RTX 4060 | |
| Dell Precision 5000 5490 | |
| Lenovo ThinkPad P14s G5 21G3S00A00 | |
| Lenovo ThinkPad P14s G4 21HF0017GE | |
| HP ZBook Firefly 14 G11 | |
| GTA V - 1920x1080 Highest Settings possible AA:4xMSAA + FX AF:16x | |
| Microsoft Surface Laptop Studio 2 RTX 4060 | |
| Lenovo Yoga Pro 9-14IRP G8 | |
| Media de la clase Workstation (18.3 - 126.7, n=22, últimos 2 años) | |
| Lenovo ThinkPad P14s G5 21G3S00A00 | |
| Lenovo ThinkPad P14s G4 21HF0017GE | |
| F1 24 - 1920x1080 Ultra High Preset AA:T AF:16x | |
| Media de la clase Workstation (11.7 - 47.5, n=4, últimos 2 años) | |
| Lenovo ThinkPad P14s G5 21G3S00A00 | |
| Medio Nvidia RTX 500 Ada Generation Laptop GPU (n=1) | |
| Lenovo ThinkPad P14s G4 21HF0017GE | |
Cyberpunk 2077 ultra FPS diagram
| bajo | medio | alto | ultra | QHD | |
|---|---|---|---|---|---|
| GTA V (2015) | 182.7 | 177.4 | 138.2 | 64.6 | 45.1 |
| The Witcher 3 (2015) | 278 | 175 | 91 | 51 | 36 |
| Dota 2 Reborn (2015) | 176.2 | 156.1 | 148.1 | 137.4 | |
| Final Fantasy XV Benchmark (2018) | 130.5 | 71 | 50 | 36.1 | |
| X-Plane 11.11 (2018) | 128.3 | 103.5 | 81.5 | ||
| Far Cry 5 (2018) | 135 | 86 | 78 | 74 | 50 |
| Strange Brigade (2018) | 316 | 126 | 104 | 91 | 63 |
| Far Cry 6 (2021) | 126 | 80 | 68 | ||
| F1 22 (2022) | 150.4 | 134.4 | 99.6 | 32.9 | |
| F1 23 (2023) | 136.5 | 119.8 | 84.1 | 25 | 16 |
| Baldur's Gate 3 (2023) | 69.4 | 53.6 | 39 | 38.9 | 26.8 |
| Cyberpunk 2077 2.2 Phantom Liberty (2023) | 52.9 | 37.7 | 25.4 | 25 | 19.8 |
| Assassin's Creed Mirage (2023) | 78 | 69 | 55 | 40 | 32 |
| Total War Pharaoh (2023) | 199 | 129 | 73 | 56 | 39 |
| Call of Duty Modern Warfare 3 2023 (2023) | 88 | 78 | 58 | 49 | 33 |
| Avatar Frontiers of Pandora (2023) | 42 | 38 | 32 | 20 | |
| Ghost of Tsushima (2024) | 56.4 | 47.1 | 40.2 | 30.9 | 22 |
| F1 24 (2024) | 112.9 | 80.8 | 26.5 | 16 | 22 |
Emisiones - Ventiladores ruidosos
Emisiones sonoras
El sistema de refrigeración del portátil consta de dos ventiladores y se pone en marcha muy rápidamente incluso durante picos de carga cortos. Incluso al hacer cosas muy sencillas como reproducir vídeos de YouTube, los ventiladores estuvieron siempre activos a bajas velocidades durante nuestra prueba -esto sólo pudo reducirse un poco utilizando un perfil de energía más débil. El dispositivo también se volvió rápidamente más ruidoso bajo carga y medimos 46,8 dB(A) tanto al jugar como en la prueba de estrés. El modo equilibrado no era mucho más silencioso con 44,8 dB(A) e incluso cuando se utilizaba el mejor modo de ahorro de energía, los ventiladores seguían siendo claramente audibles con hasta 38,3 dB(A). Ningún otro ruido electrónico salió de nuestro dispositivo de prueba durante la fase de prueba.
Ruido
| Ocioso |
| 24.6 / 24.6 / 27.5 dB(A) |
| Carga |
| 41.2 / 46.8 dB(A) |
 | ||
30 dB silencioso 40 dB(A) audible 50 dB(A) ruidosamente alto |
||
min: | ||
| Lenovo ThinkPad P14s G5 21G3S00A00 Nvidia RTX 500 Ada Generation Laptop GPU, Ultra 7 155H, Lenovo UMIS AM630 RPETJ1T24MGE2QDQ | HP ZBook Firefly 14 G11 RTX A500 Laptop GPU, Ultra 7 165H, Kioxia XG8 KXG80ZNV512G | Dell Precision 5000 5490 NVIDIA RTX 3000 Ada Generation Laptop GPU, Ultra 9 185H, Kioxia XG8 KXG80ZNV1T02 | Lenovo ThinkPad P14s G4 21HF0017GE RTX A500 Laptop GPU, i7-1370P, SK Hynix HFS002TEJ9X162N | Microsoft Surface Laptop Studio 2 RTX 4060 NVIDIA GeForce RTX 4060 Laptop GPU, i7-13700H, Kioxia XG8 KXG80ZNV1T02 | Lenovo Yoga Pro 9-14IRP G8 NVIDIA GeForce RTX 4050 Laptop GPU, i7-13705H, Samsung PM9A1 MZVL21T0HCLR | |
|---|---|---|---|---|---|---|
| Noise | 3% | 3% | 2% | -3% | -4% | |
| apagado / medio ambiente * | 24.6 | 24.3 1% | 22.8 7% | 24.6 -0% | 23.9 3% | 24.8 -1% |
| Idle Minimum * | 24.6 | 24.6 -0% | 23.8 3% | 24.6 -0% | 23.9 3% | 24.8 -1% |
| Idle Average * | 24.6 | 25.2 -2% | 23.8 3% | 24.6 -0% | 24.4 1% | 24.8 -1% |
| Idle Maximum * | 27.5 | 26.8 3% | 24.7 10% | 25.9 6% | 26.9 2% | 24.8 10% |
| Load Average * | 41.2 | 38.9 6% | 38.9 6% | 41.3 -0% | 48.5 -18% | 47.4 -15% |
| Cyberpunk 2077 ultra * | 46.8 | 41.8 11% | 44.2 6% | |||
| Load Maximum * | 46.8 | 45.8 2% | 51.4 -10% | 46.2 1% | 51.8 -11% | 52.9 -13% |
| Witcher 3 ultra * | 49.9 | 46 | 51.8 | 52.9 |
* ... más pequeño es mejor
Temperatura
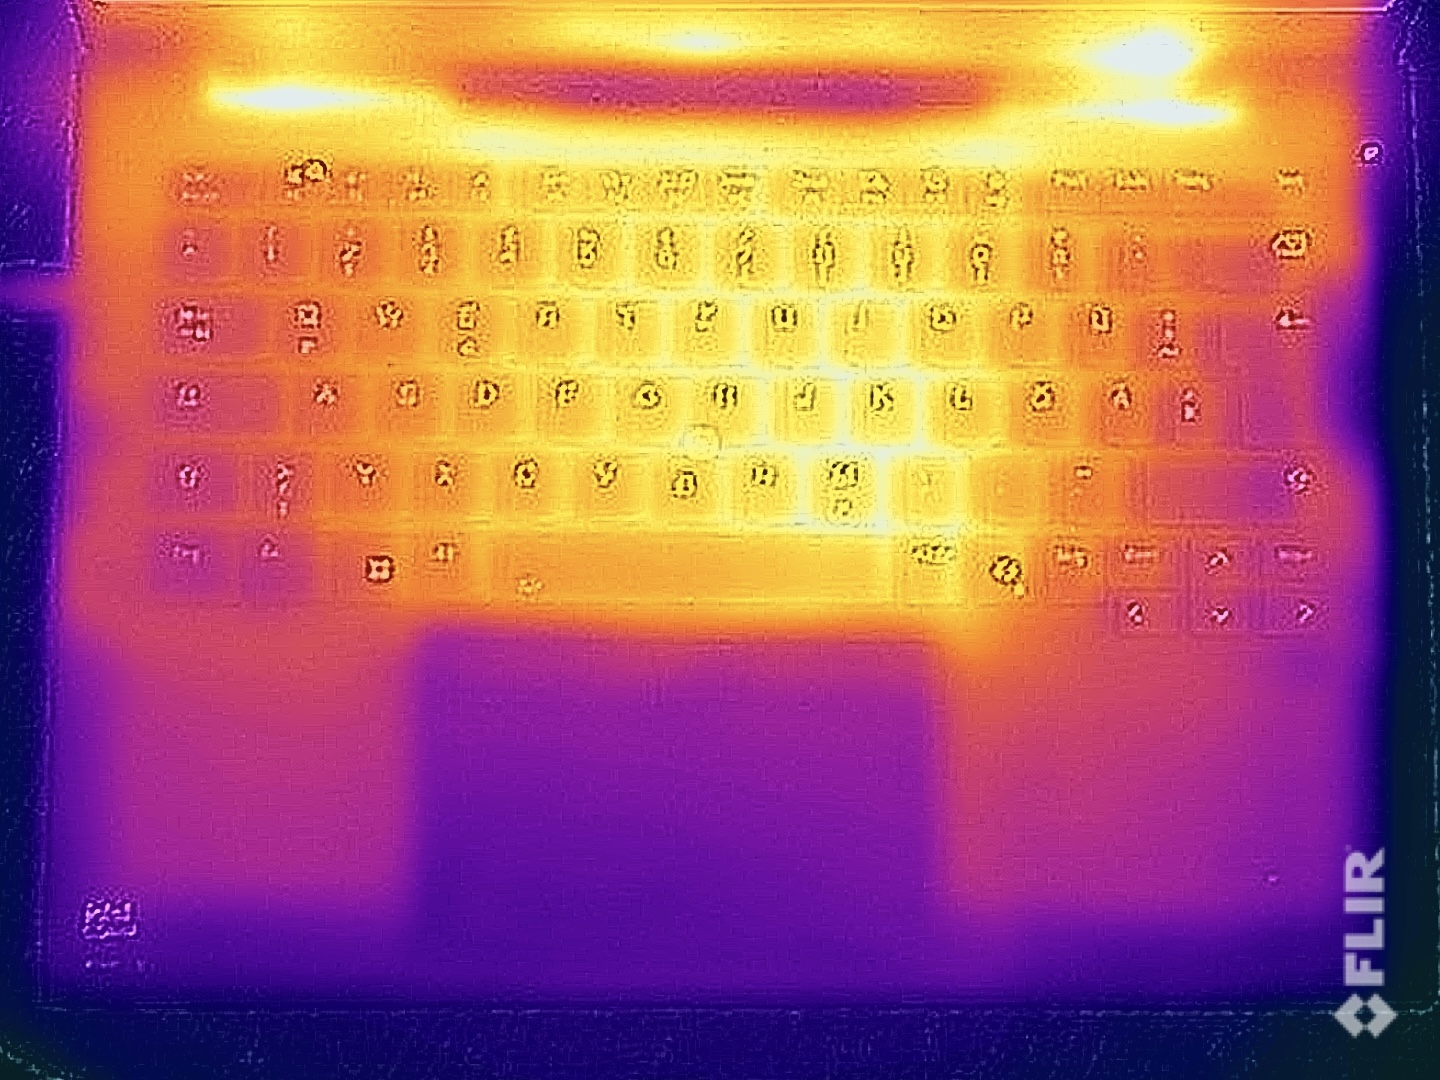
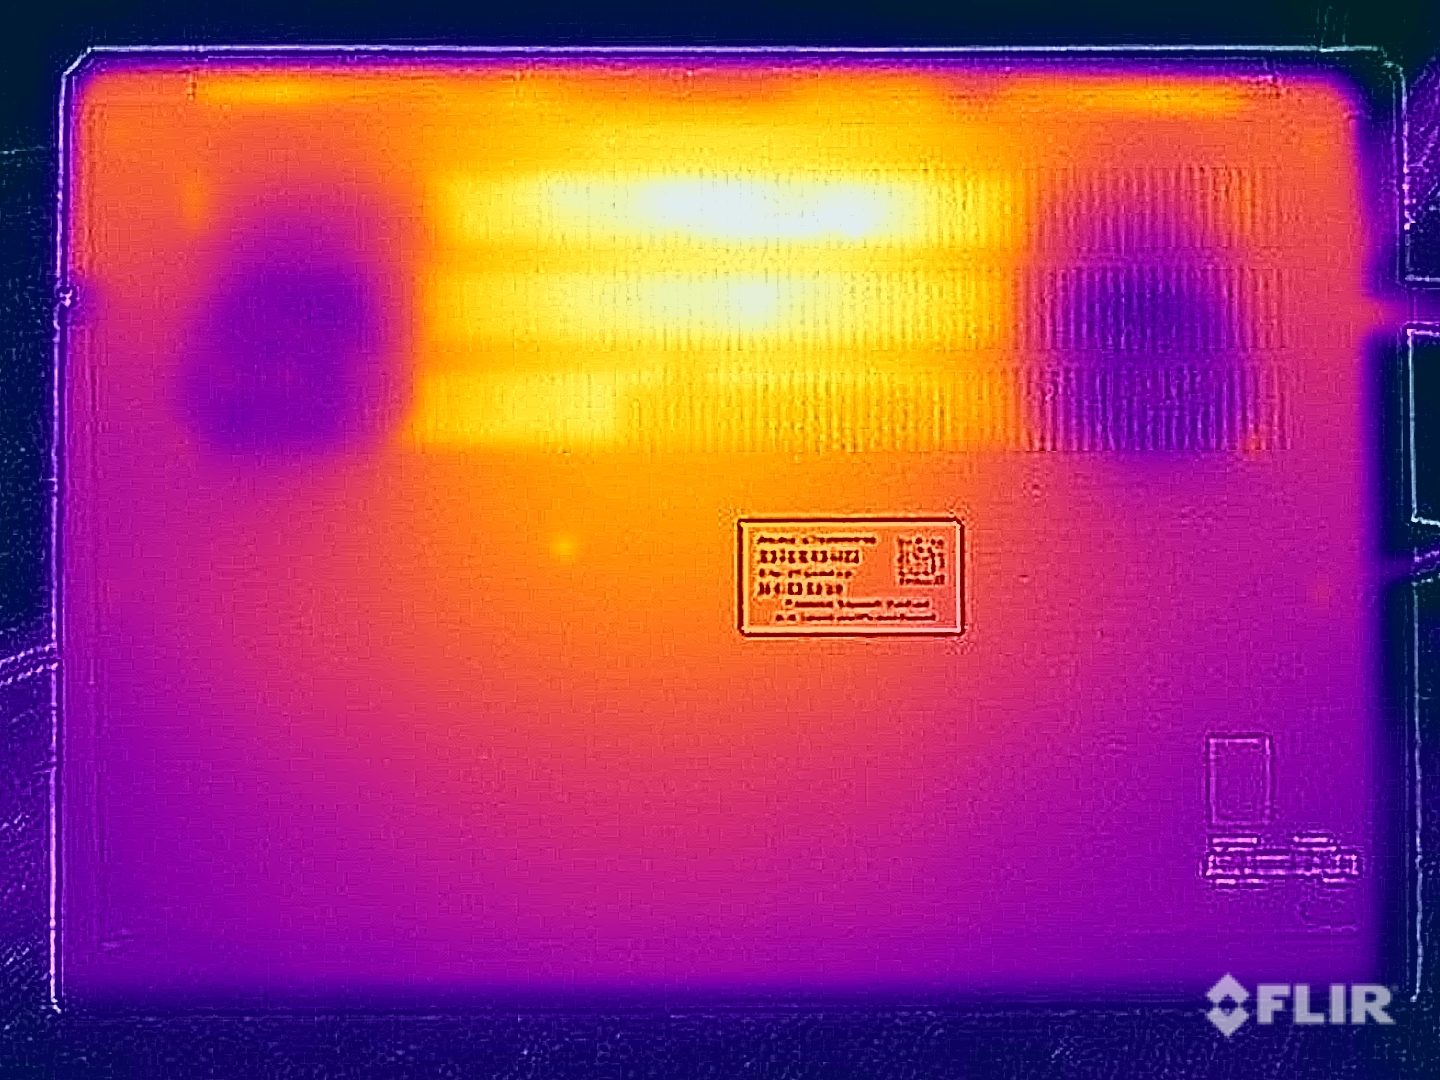
Algunas partes de la superficie del ThinkPad P14s G5 ya alcanzaron temperaturas de 30 °C en reposo, por lo que la capacidad de refrigeración pasiva del dispositivo no parece ser la mejor. Bajo carga, observamos un punto caliente de unos 47 °C en la zona central trasera de la parte inferior, pero este valor no es crítico. Aún así, probablemente no debería colocar el portátil sobre sus muslos. La zona del teclado también se calienta notablemente, medimos un pico de 41 °C, pero esto no debería suponer ninguna limitación durante el uso.
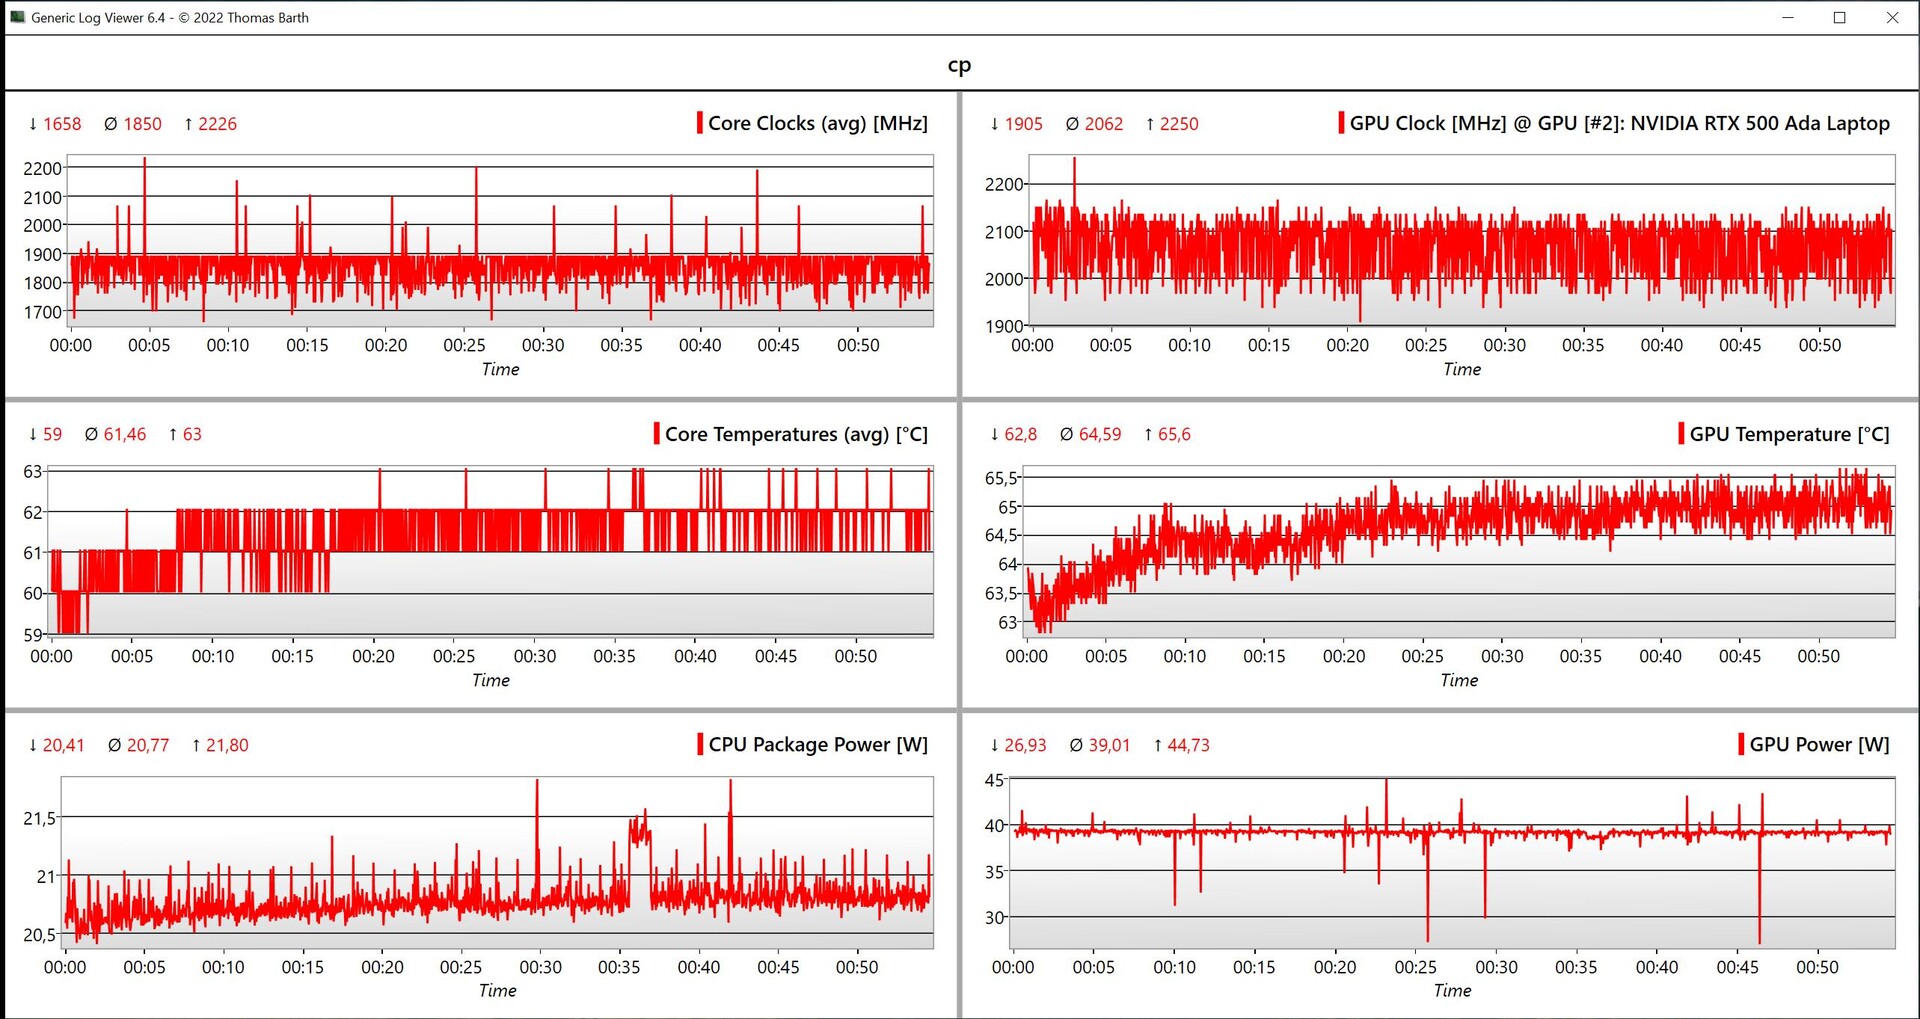
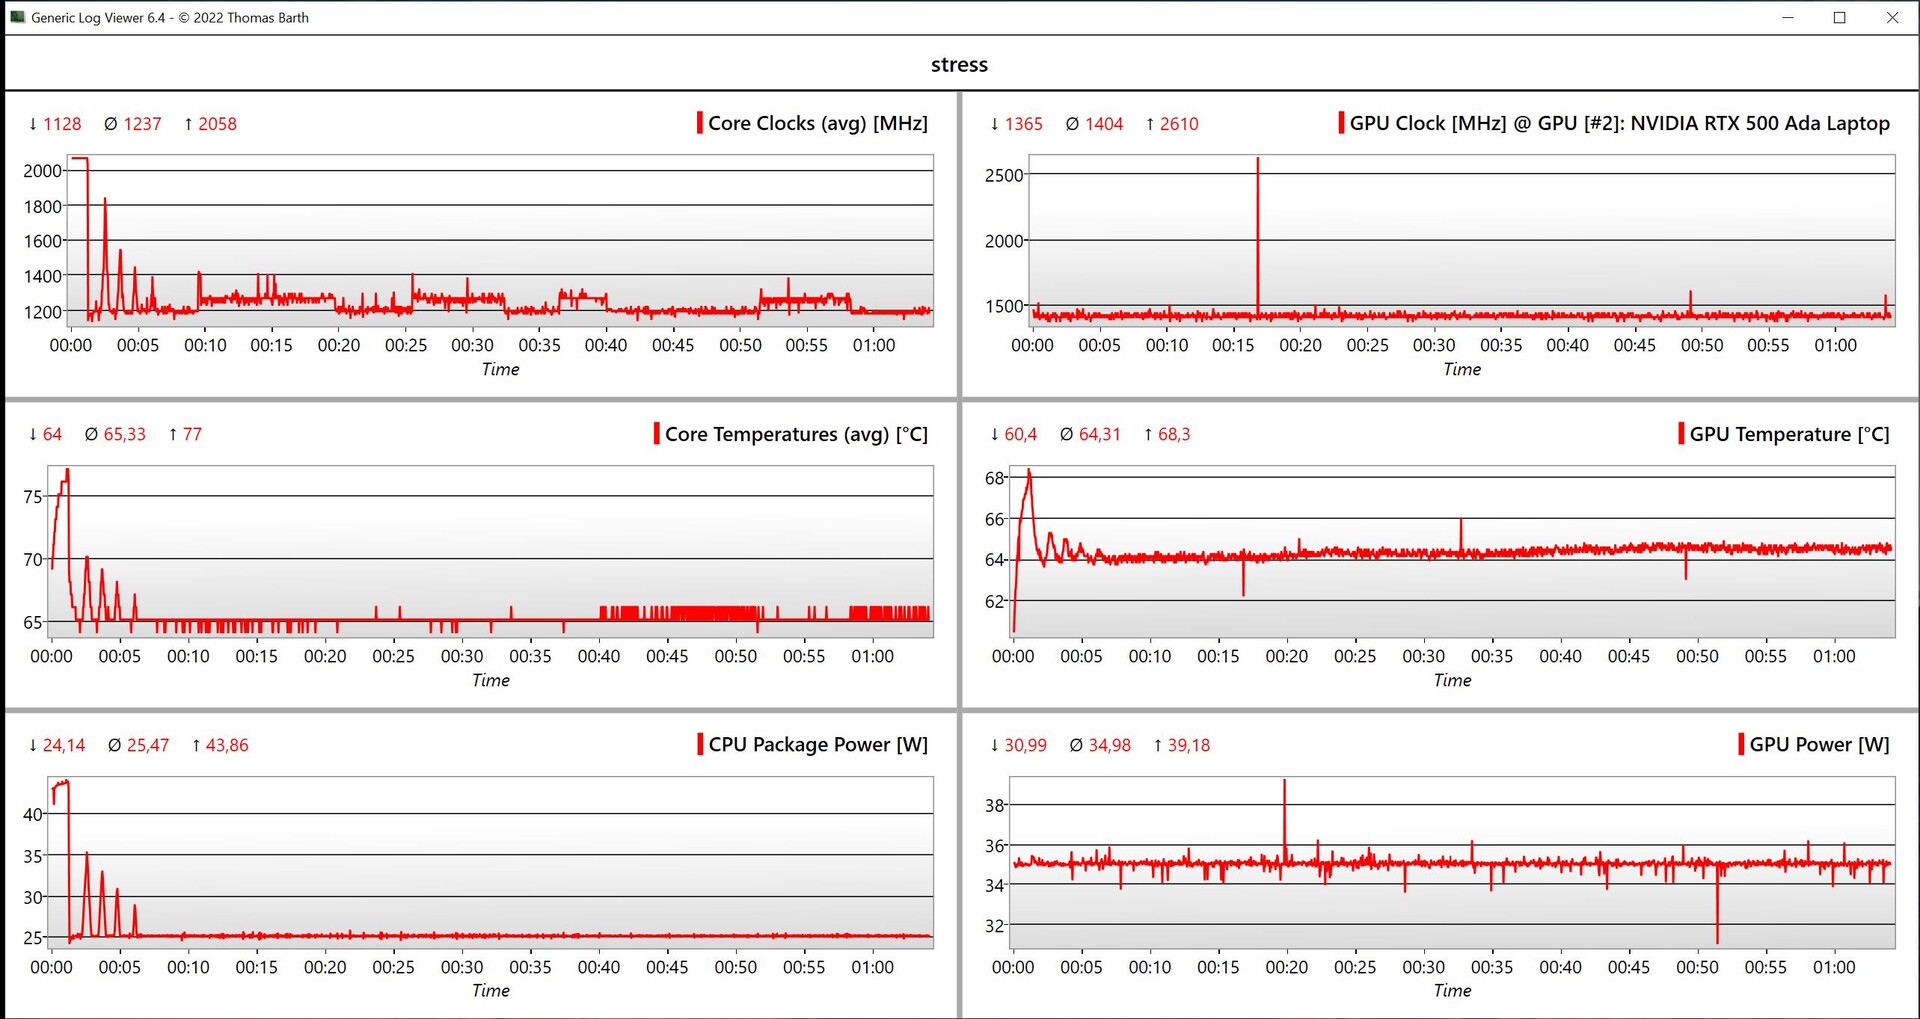
Durante la prueba de estrés con carga combinada de CPU/GPU, la tarjeta gráfica fue la preferida por el sistema y funcionó constantemente a 35 vatios, mientras que el procesador se estabilizó rápidamente a sólo 25 vatios. En total, el sistema puede enfriar 60 vatios de forma permanente.
(±) La temperatura máxima en la parte superior es de 41.3 °C / 106 F, frente a la media de 38.2 °C / 101 F, que oscila entre 22.2 y 69.8 °C para la clase Workstation.
(-) El fondo se calienta hasta un máximo de 47 °C / 117 F, frente a la media de 41.2 °C / 106 F
(+) En reposo, la temperatura media de la parte superior es de 29.1 °C / 84# F, frente a la media del dispositivo de 32 °C / 90 F.
(±) 3: The average temperature for the upper side is 36.3 °C / 97 F, compared to the average of 32 °C / 90 F for the class Workstation.
(+) El reposamanos y el panel táctil están a una temperatura inferior a la de la piel, con un máximo de 30.2 °C / 86.4 F y, por tanto, son fríos al tacto.
(-) La temperatura media de la zona del reposamanos de dispositivos similares fue de 27.8 °C / 82 F (-2.4 °C / -4.4 F).
| Lenovo ThinkPad P14s G5 21G3S00A00 Intel Core Ultra 7 155H, Nvidia RTX 500 Ada Generation Laptop GPU | HP ZBook Firefly 14 G11 Intel Core Ultra 7 165H, NVIDIA RTX A500 Laptop GPU | Dell Precision 5000 5490 Intel Core Ultra 9 185H, NVIDIA RTX 3000 Ada Generation Laptop GPU | Lenovo ThinkPad P14s G4 21HF0017GE Intel Core i7-1370P, NVIDIA RTX A500 Laptop GPU | Microsoft Surface Laptop Studio 2 RTX 4060 Intel Core i7-13700H, NVIDIA GeForce RTX 4060 Laptop GPU | Lenovo Yoga Pro 9-14IRP G8 Intel Core i7-13705H, NVIDIA GeForce RTX 4050 Laptop GPU | |
|---|---|---|---|---|---|---|
| Heat | 2% | 4% | -8% | 11% | 0% | |
| Maximum Upper Side * | 41.3 | 42.8 -4% | 43.2 -5% | 55.3 -34% | 40.4 2% | 41 1% |
| Maximum Bottom * | 47 | 44 6% | 38.4 18% | 48.7 -4% | 42.2 10% | 56.7 -21% |
| Idle Upper Side * | 30.2 | 30.6 -1% | 31.6 -5% | 31 -3% | 26.6 12% | 27.4 9% |
| Idle Bottom * | 33.2 | 31.4 5% | 30.6 8% | 29.9 10% | 27 19% | 29.1 12% |
* ... más pequeño es mejor
Altavoces
Los dos altavoces estéreo están situados bajo el borde frontal de la unidad base y emiten el sonido hacia abajo, donde idealmente se refleja hacia el usuario desde una superficie dura. Durante nuestro análisis, los módulos funcionaron bien, no sólo por su volumen, sino también por lo equilibrados que sonaban los agudos y los medios. Esto también beneficia a las voces. Sólo los graves sonaban un poco débiles, por lo que la música o las películas no resultan tan potentes como podrían.
Lenovo ThinkPad P14s G5 21G3S00A00 análisis de audio
(+) | los altavoces pueden reproducir a un volumen relativamente alto (#87 dB)
Graves 100 - 315 Hz
(-) | casi sin bajos - de media 18.8% inferior a la mediana
(±) | la linealidad de los graves es media (8.3% delta a frecuencia anterior)
Medios 400 - 2000 Hz
(+) | medios equilibrados - a sólo 2.7% de la mediana
(+) | los medios son lineales (2.8% delta a la frecuencia anterior)
Altos 2 - 16 kHz
(+) | máximos equilibrados - a sólo 2.4% de la mediana
(+) | los máximos son lineales (3.5% delta a la frecuencia anterior)
Total 100 - 16.000 Hz
(+) | el sonido global es lineal (12.2% de diferencia con la mediana)
En comparación con la misma clase
» 14% de todos los dispositivos probados de esta clase eran mejores, 3% similares, 83% peores
» El mejor tuvo un delta de 7%, la media fue 18%, el peor fue ###max##%
En comparación con todos los dispositivos probados
» 8% de todos los dispositivos probados eran mejores, 2% similares, 89% peores
» El mejor tuvo un delta de 4%, la media fue 24%, el peor fue ###max##%
HP ZBook Firefly 14 G11 análisis de audio
(+) | los altavoces pueden reproducir a un volumen relativamente alto (#83.7 dB)
Graves 100 - 315 Hz
(-) | casi sin bajos - de media 21.6% inferior a la mediana
(±) | la linealidad de los graves es media (10% delta a frecuencia anterior)
Medios 400 - 2000 Hz
(+) | medios equilibrados - a sólo 4.5% de la mediana
(+) | los medios son lineales (4.3% delta a la frecuencia anterior)
Altos 2 - 16 kHz
(+) | máximos equilibrados - a sólo 3.4% de la mediana
(+) | los máximos son lineales (3.2% delta a la frecuencia anterior)
Total 100 - 16.000 Hz
(±) | la linealidad del sonido global es media (16.2% de diferencia con la mediana)
En comparación con la misma clase
» 38% de todos los dispositivos probados de esta clase eran mejores, 7% similares, 55% peores
» El mejor tuvo un delta de 7%, la media fue 18%, el peor fue ###max##%
En comparación con todos los dispositivos probados
» 24% de todos los dispositivos probados eran mejores, 5% similares, 71% peores
» El mejor tuvo un delta de 4%, la media fue 24%, el peor fue ###max##%
Lenovo Yoga Pro 9-14IRP G8 análisis de audio
(±) | la sonoridad del altavoz es media pero buena (81.8 dB)
Graves 100 - 315 Hz
(±) | lubina reducida - en promedio 5.9% inferior a la mediana
(±) | la linealidad de los graves es media (7.8% delta a frecuencia anterior)
Medios 400 - 2000 Hz
(+) | medios equilibrados - a sólo 2.3% de la mediana
(+) | los medios son lineales (3.2% delta a la frecuencia anterior)
Altos 2 - 16 kHz
(+) | máximos equilibrados - a sólo 2.5% de la mediana
(+) | los máximos son lineales (3.4% delta a la frecuencia anterior)
Total 100 - 16.000 Hz
(+) | el sonido global es lineal (7.3% de diferencia con la mediana)
En comparación con la misma clase
» 4% de todos los dispositivos probados de esta clase eran mejores, 1% similares, 95% peores
» El mejor tuvo un delta de 5%, la media fue 18%, el peor fue ###max##%
En comparación con todos los dispositivos probados
» 1% de todos los dispositivos probados eran mejores, 0% similares, 99% peores
» El mejor tuvo un delta de 4%, la media fue 24%, el peor fue ###max##%
Gestión de la energía - El panel 3K necesita mucha energía
Consumo de energía
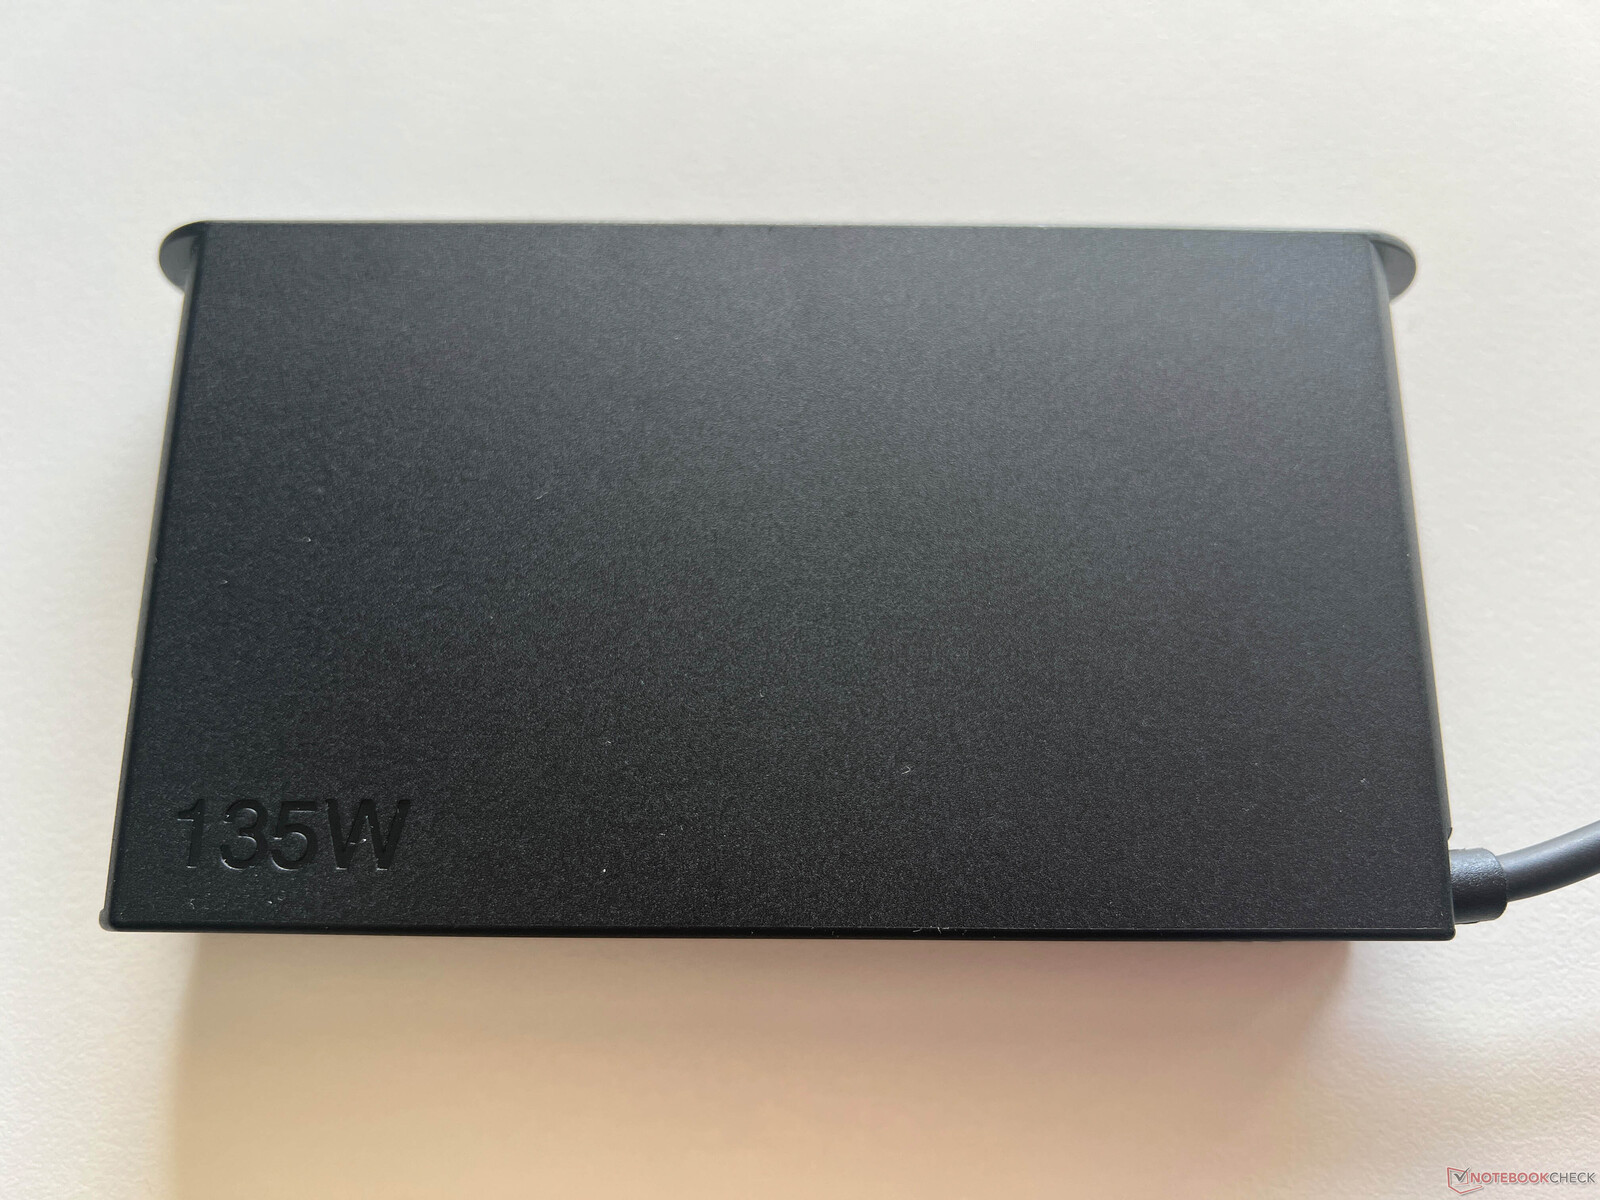
Nuestras mediciones de consumo mostraron claramente que el nuevo panel 3K requiere mucha energía. A pesar de su menor brillo máximo, el consumo máximo en reposo del portátil es superior al del ZBook Firefly 14 G11por ejemplo. Cuando se juega, el dispositivo requiere entre 80-90 vatios, mientras que vimos 137 vatios durante unos segundos durante la prueba de estrés. Sin embargo, este valor se estabilizó rápidamente en 90 vatios y se mantuvo en este nivel. Por tanto, la fuente de alimentación de 135 vatios es suficiente. Las configuraciones sin la RTX 500 Ada se entregan con una fuente de alimentación más débil de 100 vatios.
| Off / Standby | |
| Ocioso | |
| Carga |
|
Clave:
min: | |
| Lenovo ThinkPad P14s G5 21G3S00A00 Ultra 7 155H, Nvidia RTX 500 Ada Generation Laptop GPU, Lenovo UMIS AM630 RPETJ1T24MGE2QDQ, IPS, 3072x1920, 14.5" | HP ZBook Firefly 14 G11 Ultra 7 165H, RTX A500 Laptop GPU, Kioxia XG8 KXG80ZNV512G, IPS, 2560x1600, 14" | Dell Precision 5000 5490 Ultra 9 185H, NVIDIA RTX 3000 Ada Generation Laptop GPU, Kioxia XG8 KXG80ZNV1T02, IPS, 2560x1600, 14" | Lenovo ThinkPad P14s G4 21HF0017GE i7-1370P, RTX A500 Laptop GPU, SK Hynix HFS002TEJ9X162N, OLED, 2880x1800, 14" | Microsoft Surface Laptop Studio 2 RTX 4060 i7-13700H, NVIDIA GeForce RTX 4060 Laptop GPU, Kioxia XG8 KXG80ZNV1T02, IPS, 2400x1600, 14.4" | Lenovo Yoga Pro 9-14IRP G8 i7-13705H, NVIDIA GeForce RTX 4050 Laptop GPU, Samsung PM9A1 MZVL21T0HCLR, Mini-LED, 3072x1920, 14.5" | Medio Nvidia RTX 500 Ada Generation Laptop GPU | Media de la clase Workstation | |
|---|---|---|---|---|---|---|---|---|
| Power Consumption | 21% | -9% | 30% | 37% | -23% | 0% | -6% | |
| Idle Minimum * | 7.5 | 6.6 12% | 11.1 -48% | 6.3 16% | 3 60% | 10.9 -45% | 7.5 ? -0% | 8.43 ? -12% |
| Idle Average * | 13.5 | 12.7 6% | 14.8 -10% | 7 48% | 7.1 47% | 17.7 -31% | 13.5 ? -0% | 12.4 ? 8% |
| Idle Maximum * | 14.2 | 13.3 6% | 16.5 -16% | 8.1 43% | 7.6 46% | 19.3 -36% | 14.2 ? -0% | 17.8 ? -25% |
| Load Average * | 100.2 | 67 33% | 70.1 30% | 84.6 16% | 73.1 27% | 93.3 7% | 100.2 ? -0% | 88.4 ? 12% |
| Cyberpunk 2077 ultra * | 86.7 | 63.4 27% | ||||||
| Cyberpunk 2077 ultra external monitor * | 84.6 | 58.1 31% | ||||||
| Load Maximum * | 137.4 | 94.9 31% | 137.5 -0% | 98.3 28% | 128.5 6% | 150.2 -9% | 137.4 ? -0% | 154.1 ? -12% |
| Witcher 3 ultra * | 93.1 | 56.5 | 113.9 | 129.5 |
* ... más pequeño es mejor
Power consumption Cyberpunk / stress test
Power consumption with external monitor
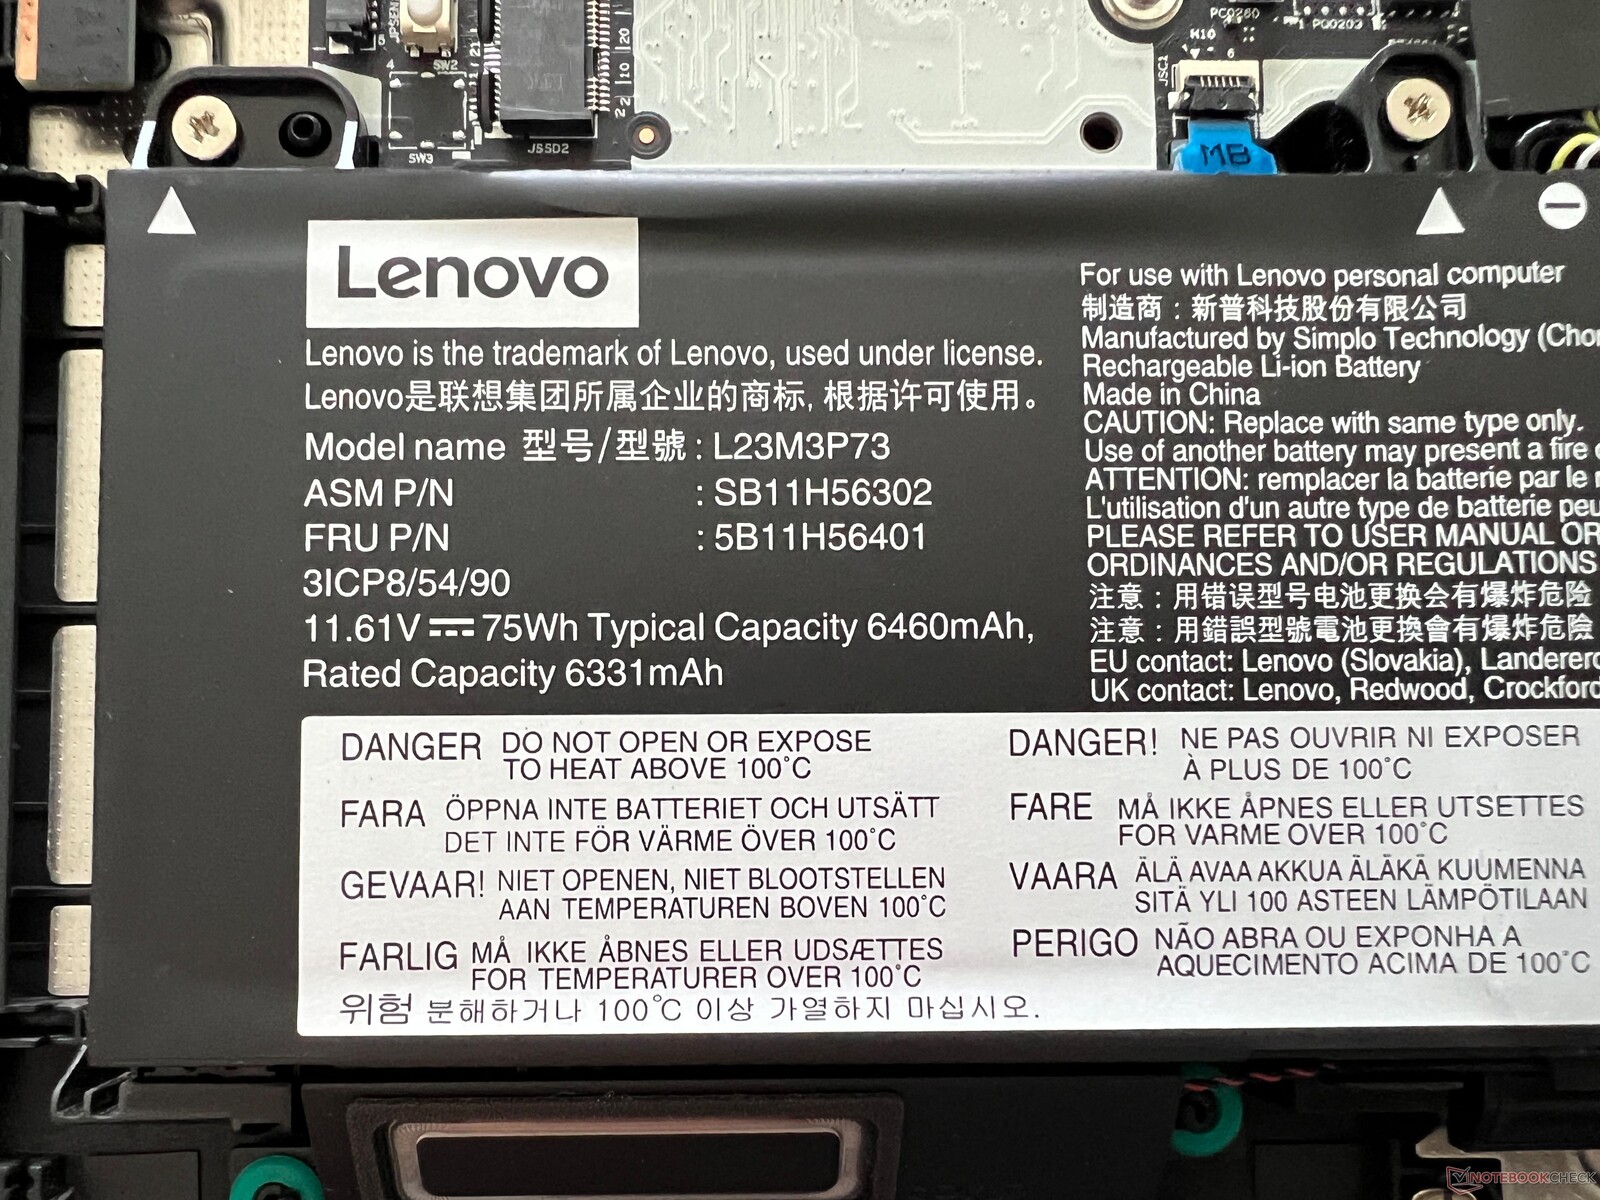
Tiempos de ejecución
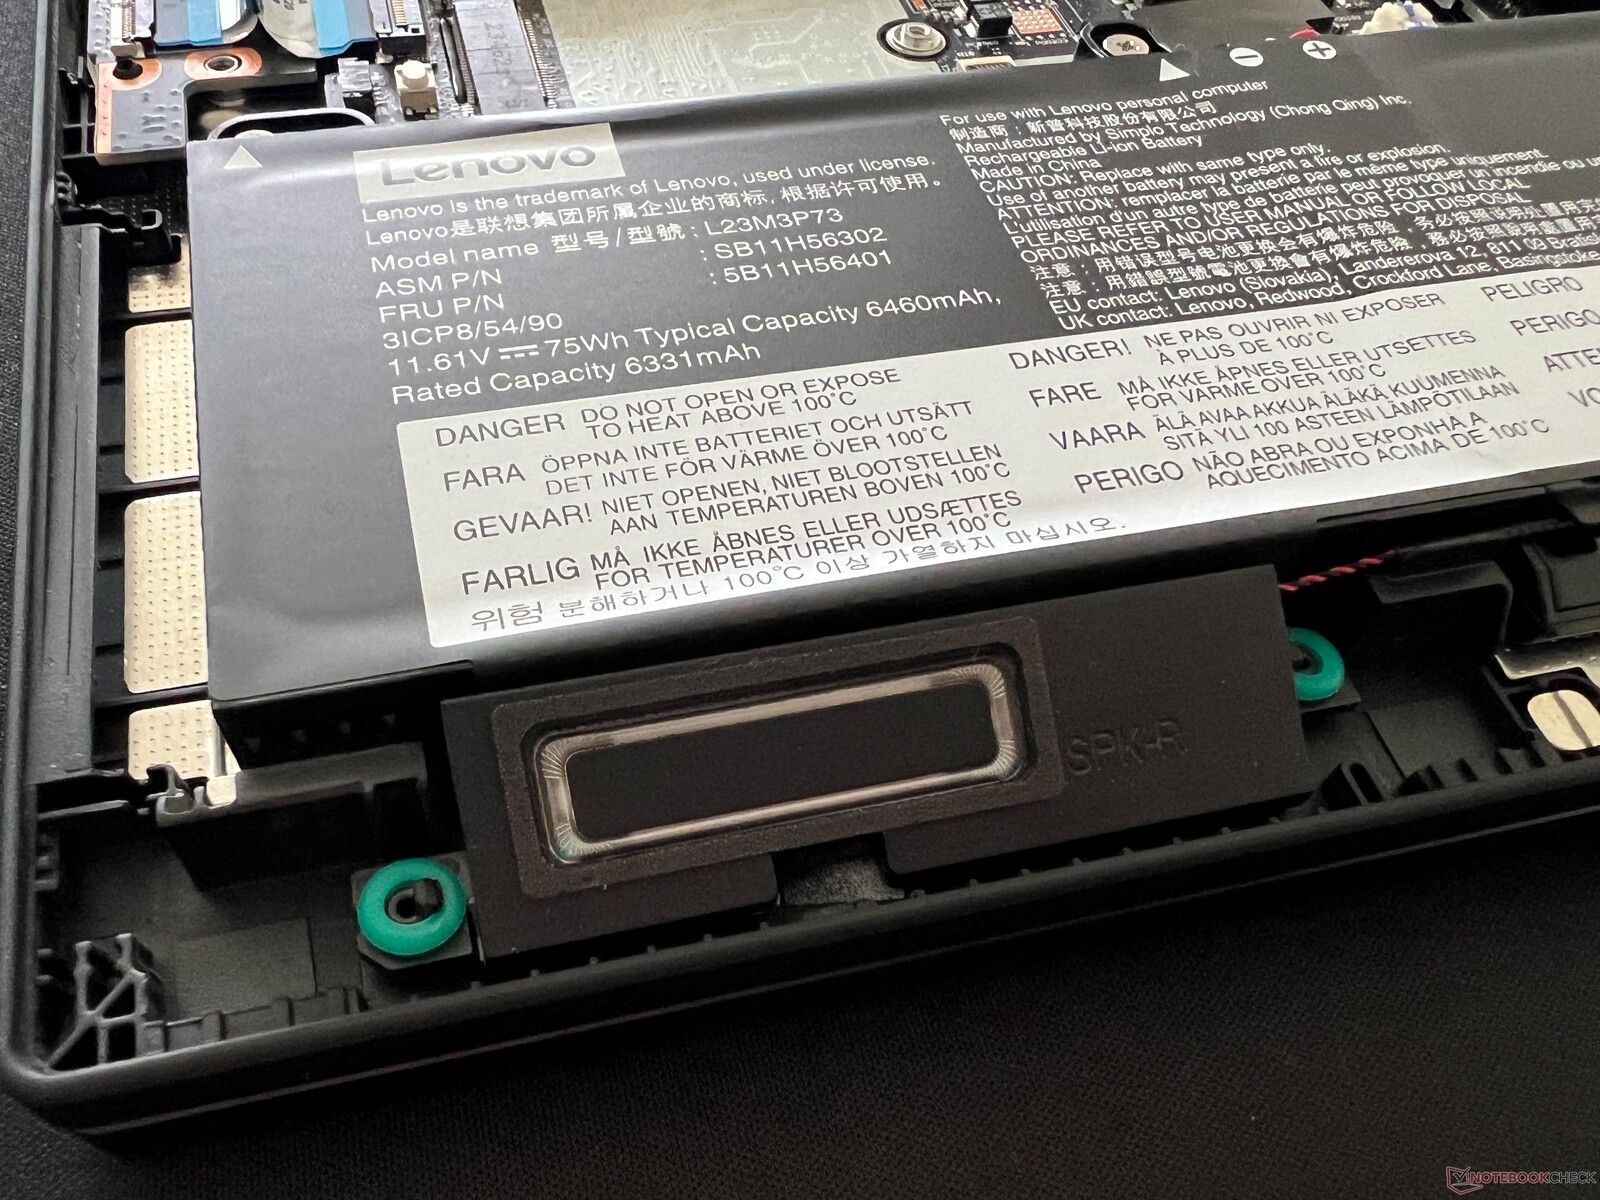
El nuevo ThinkPad P14s G5 Intel está disponible con dos tamaños de batería diferentes (57 o 75 Wh). Nuestro dispositivo de prueba está equipado con la batería más grande de 75 Wh, necesaria para lograr tiempos de ejecución decentes ya que cuenta con un panel 3K. Por cierto, su frecuencia de actualización no se puede cambiar actualmente, ya que el modo de señal activa se mantiene siempre en 120 Hz; Lenovo podría mejorar esto con una actualización. A 120 Hz, sus resultados son sólo la media. Durante la prueba WLAN a 150 cd/m² (corresponde al 66 % del brillo máximo de nuestro dispositivo de prueba), observamos algo menos de 8 horas, lo que sólo fue superado por el antiguo P14s G4 con su batería de 52,5 Wh. A pleno brillo, la prueba WLAN sólo duró 5:43 horas. En la prueba de vídeo, duró algo menos de 9 horas y bajo carga, la batería se agotó en unos 80 minutos.
El dispositivo tarda 128 minutos en cargarse por completo con la fuente de alimentación de 135 vatios cuando está encendido, con lo que el 80 % de su capacidad vuelve a estar disponible tras 75 minutos.
| Lenovo ThinkPad P14s G5 21G3S00A00 Ultra 7 155H, Nvidia RTX 500 Ada Generation Laptop GPU, 75 Wh | HP ZBook Firefly 14 G11 Ultra 7 165H, RTX A500 Laptop GPU, 56 Wh | Dell Precision 5000 5490 Ultra 9 185H, NVIDIA RTX 3000 Ada Generation Laptop GPU, 72 Wh | Lenovo ThinkPad P14s G4 21HF0017GE i7-1370P, RTX A500 Laptop GPU, 52.5 Wh | Microsoft Surface Laptop Studio 2 RTX 4060 i7-13700H, NVIDIA GeForce RTX 4060 Laptop GPU, 58 Wh | Lenovo Yoga Pro 9-14IRP G8 i7-13705H, NVIDIA GeForce RTX 4050 Laptop GPU, 75 Wh | Media de la clase Workstation | |
|---|---|---|---|---|---|---|---|
| Duración de Batería | 9% | 39% | -23% | 33% | -2% | 14% | |
| H.264 | 534 | 675 26% | 547 2% | 733 ? 37% | |||
| WiFi v1.3 | 473 | 517 9% | 658 39% | 367 -22% | 498 5% | 477 1% | 502 ? 6% |
| Load | 78 | 59 -24% | 132 69% | 72 -8% | 77.4 ? -1% |
Pro
Contra
Veredicto - El ThinkPad P14s G5 ahora con una GPU más rápida


Al principio de esta prueba, nos preguntamos si el desarrollo de este portátil iba de nuevo en la dirección correcta. El nuevo ThinkPad P14s G5 (Intel) muestra un gran potencial: la decisión de no utilizar la carcasa más fina posible, su cambio del panel OLED opcional a una pantalla IPS mate sin PWM, así como su memoria RAM actualizable, benefician enormemente a una estación de trabajo móvil. Sin embargo, estos pasos no son suficientes a nuestros ojos. Aunque el rendimiento de los componentes está bien en general, simplemente hay que preguntarse por qué el fabricante no ofrece la RTX 1000 Ada más rápida, por ejemplo, teniendo en cuenta la gruesa carcasa del portátil, o por qué incluso el panel IPS opcional con su resolución 3K sigue por detrás de la competencia en términos de brillo. A fin de cuentas, Lenovo se las ha arreglado para utilizar componentes más potentes y un panel mini LED mucho más brillante dentro del Yoga Pro 9 14-todo dentro de una carcasa más delgada.
La nueva pantalla IPS en sí, con su resolución 3K y cobertura P3, es un panel bastante decente, pero Lenovo debería dar a los usuarios acceso a un perfil sRGB -además, actualmente no se puede reducir su frecuencia de actualización a 60 Hz, lo que mejoraría un poco más la duración de la batería del dispositivo. El RTX 500 Ada's el rendimiento gráfico es mucho mejor que el del antiguo portátil RTX A500 y su procesador Meteor Lake tampoco decepciona, mientras que la refrigeración del portátil llegó a su límite durante la prueba de estrés. En vista de su gruesa unidad base, una capacidad de refrigeración máxima de 60 vatios (CPU/GPU combinadas) no es terriblemente impresionante, especialmente si se compara con potentes portátiles multimedia de 14 pulgadas. En cuanto a su teclado, la nueva posición de la tecla Fn sin duda costará acostumbrarse a los veteranos de ThinkPad, pero la calidad del teclado en sí no ha cambiado. Así que el teclado es bueno, pero nada especial. De nuevo, tenemos que preguntarnos por qué no se podría haber instalado un teclado de 1,8 mm en una unidad base tan gruesa.
La versión Intel del ThinkPad P14s G5 ofrece buenas opciones de mantenimiento, así como una nueva pantalla de 14,5 pulgadas. Su rendimiento también es un poco mejor que el de su predecesor, pero a pesar de su gruesa unidad base, la estación de trabajo móvil sólo puede adquirirse con la GPU de nivel básico de Nvidia en el mejor de los casos, es decir, la RTX 500 Ada.
El ThinkPad P14s ofrece otras ventajas como buenas opciones de mantenimiento, incluyendo dos ranuras de RAM para hasta 96 GB de RAM. Dispone de suficientes puertos y su webcam de 5 MP hace un trabajo decente. En términos de rendimiento, también es claramente superior a su competidor directo, el HP ZBook Firefly 14 G11. Sin embargo, si no depende de las certificaciones ISV, hoy en día puede obtener un rendimiento significativamente mayor de los dispositivos multimedia, especialmente en términos de tarjetas gráficas. La gran diferencia entre los modelos Intel y AMD tampoco es una buena situación para los clientes.
Precio y disponibilidad
El ThinkPad P14s G5 puede configurarse a través de la tienda online de Lenovo, con precios a partir de 2.439 dólares.
Tenga en cuenta que: recientemente hemos actualizado nuestro sistema de clasificación y los resultados de la versión 8 no son comparables con los de la versión 7. Encontrará más información aquí.
Lenovo ThinkPad P14s G5 21G3S00A00
- 07/18/2024 v8
Andreas Osthoff
 Total Sustainability Score:
 Transparencia
La selección de los dispositivos que se van a reseñar corre a cargo de nuestro equipo editorial. La muestra de prueba fue proporcionada al autor en calidad de préstamo por el fabricante o el minorista a los efectos de esta reseña. El prestamista no tuvo ninguna influencia en esta reseña, ni el fabricante recibió una copia de la misma antes de su publicación. No había ninguna obligación de publicar esta reseña. Nunca aceptamos compensaciones o pagos a cambio de nuestras reseñas. Como empresa de medios independiente, Notebookcheck no está sujeta a la autoridad de fabricantes, minoristas o editores.
Así es como prueba Notebookcheck
Cada año, Notebookcheck revisa de forma independiente cientos de portátiles y smartphones utilizando procedimientos estandarizados para asegurar que todos los resultados son comparables. Hemos desarrollado continuamente nuestros métodos de prueba durante unos 20 años y hemos establecido los estándares de la industria en el proceso. En nuestros laboratorios de pruebas, técnicos y editores experimentados utilizan equipos de medición de alta calidad. Estas pruebas implican un proceso de validación en varias fases. Nuestro complejo sistema de clasificación se basa en cientos de mediciones y puntos de referencia bien fundamentados, lo que mantiene la objetividad.Price comparison

