

Análisis del portátil HP ZBook Firefly 14 G11: Actualización del Core Ultra con gráficos Nvidia RTX A500
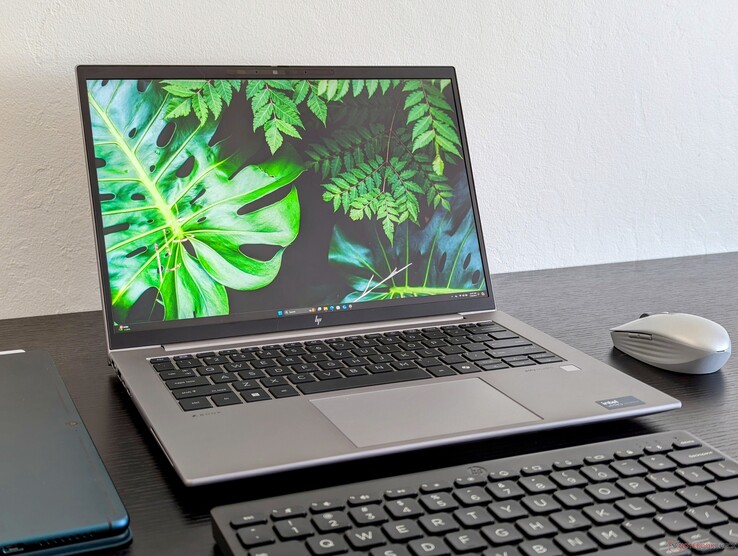
El ZBook Firefly 14 se ha renovado este año por undécima vez consecutiva. Llamado ZBook Firefly 14 G11, sucede al ZBook Firefly 14 G10 actualizando la CPU a Intel Meteor Lake y la opción de gráficos discretos Nvidia. Por lo demás, el chasis es el mismo de antaño, por lo que recomendamos consultar nuestro análisis del Firefly 14 G10 o G9 para saber más sobre las características físicas del modelo.
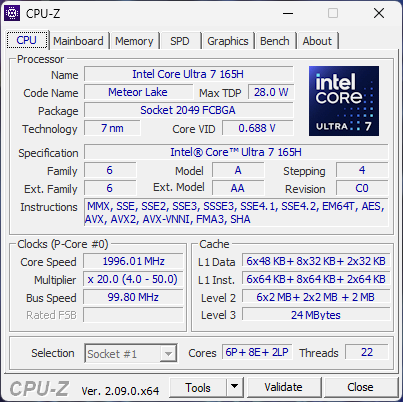
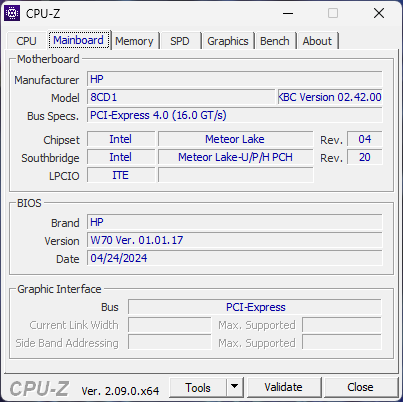
Nuestra unidad de prueba es la configuración de gama más alta con la CPU Core Ultra 7 165H habilitada para vPro, la GPU RTX A500 y la pantalla IPS de resolución 2560 x 1600 por unos 3500 dólares al por menor. Como es habitual en los ZBook, las opciones de configuración son mucho más amplias que en la mayoría de los modelos de consumo, con CPU que van desde el Core Ultra 5 125U hasta el Core Ultra 7 165H y gráficos integrados o Nvidia RTX A500. Las SKU de AMD con procesadores Ryzen Zen 4 también están disponibles bajo el nombre de ZBook Firefly 14 G11 A.
Las alternativas al ZBook Firefly 14 incluyen otras estaciones de trabajo móviles delgadas de 14 pulgadas como el Dell Precision 5490 o Lenovo ThinkPad P14s G4.
Más opiniones sobre HP:
Posibles contendientes en la comparación
Valoración | Versión | Fecha | Modelo | Peso | Altura | Tamaño | Resolución | Precio |
|---|---|---|---|---|---|---|---|---|
| 80.3 % | v8 | 07/2024 | HP ZBook Firefly 14 G11 Ultra 7 165H, RTX A500 Laptop GPU | 1.5 kg | 19.2 mm | 14.00" | 2560x1600 | |
| 87.4 % v7 (old) | v7 (old) | 10/2023 | HP ZBook Firefly 14 G10 A R5 PRO 7640HS, Radeon 760M | 1.5 kg | 20 mm | 14.00" | 1920x1200 | |
| 83.6 % v7 (old) | v7 (old) | 10/2022 | HP ZBook Firefly 14 G9-6B8A2EA i7-1265U, T550 Laptop GPU | 1.5 kg | 19.9 mm | 14.00" | 1920x1200 | |
| 89.3 % v7 (old) | v7 (old) | 04/2024 | Dell Precision 5000 5490 Ultra 9 185H, NVIDIA RTX 3000 Ada Generation Laptop GPU | 1.6 kg | 18.95 mm | 14.00" | 2560x1600 | |
| 81 % | v8 | 07/2024 | Lenovo ThinkPad P14s G4 21HF0017GE i7-1370P, RTX A500 Laptop GPU | 1.5 kg | 22.7 mm | 14.00" | 2880x1800 | |
| 84.3 % v7 (old) | v7 (old) | 04/2024 | Asus ExpertBook B3 B3404CVF i7-1355U, GeForce RTX 2050 Mobile | 1.7 kg | 23.9 mm | 14.00" | 1920x1200 |
Nota: Hemos actualizado nuestro sistema de evaluación y los resultados de la versión 8 no se pueden comparar con los de la versión 7. Más información aquí verfügbar.
Nota: Recientemente hemos actualizado nuestro sistema de clasificación y los resultados de la versión 8 no son comparables con los de la versión 7. Encontrará más información aquí .
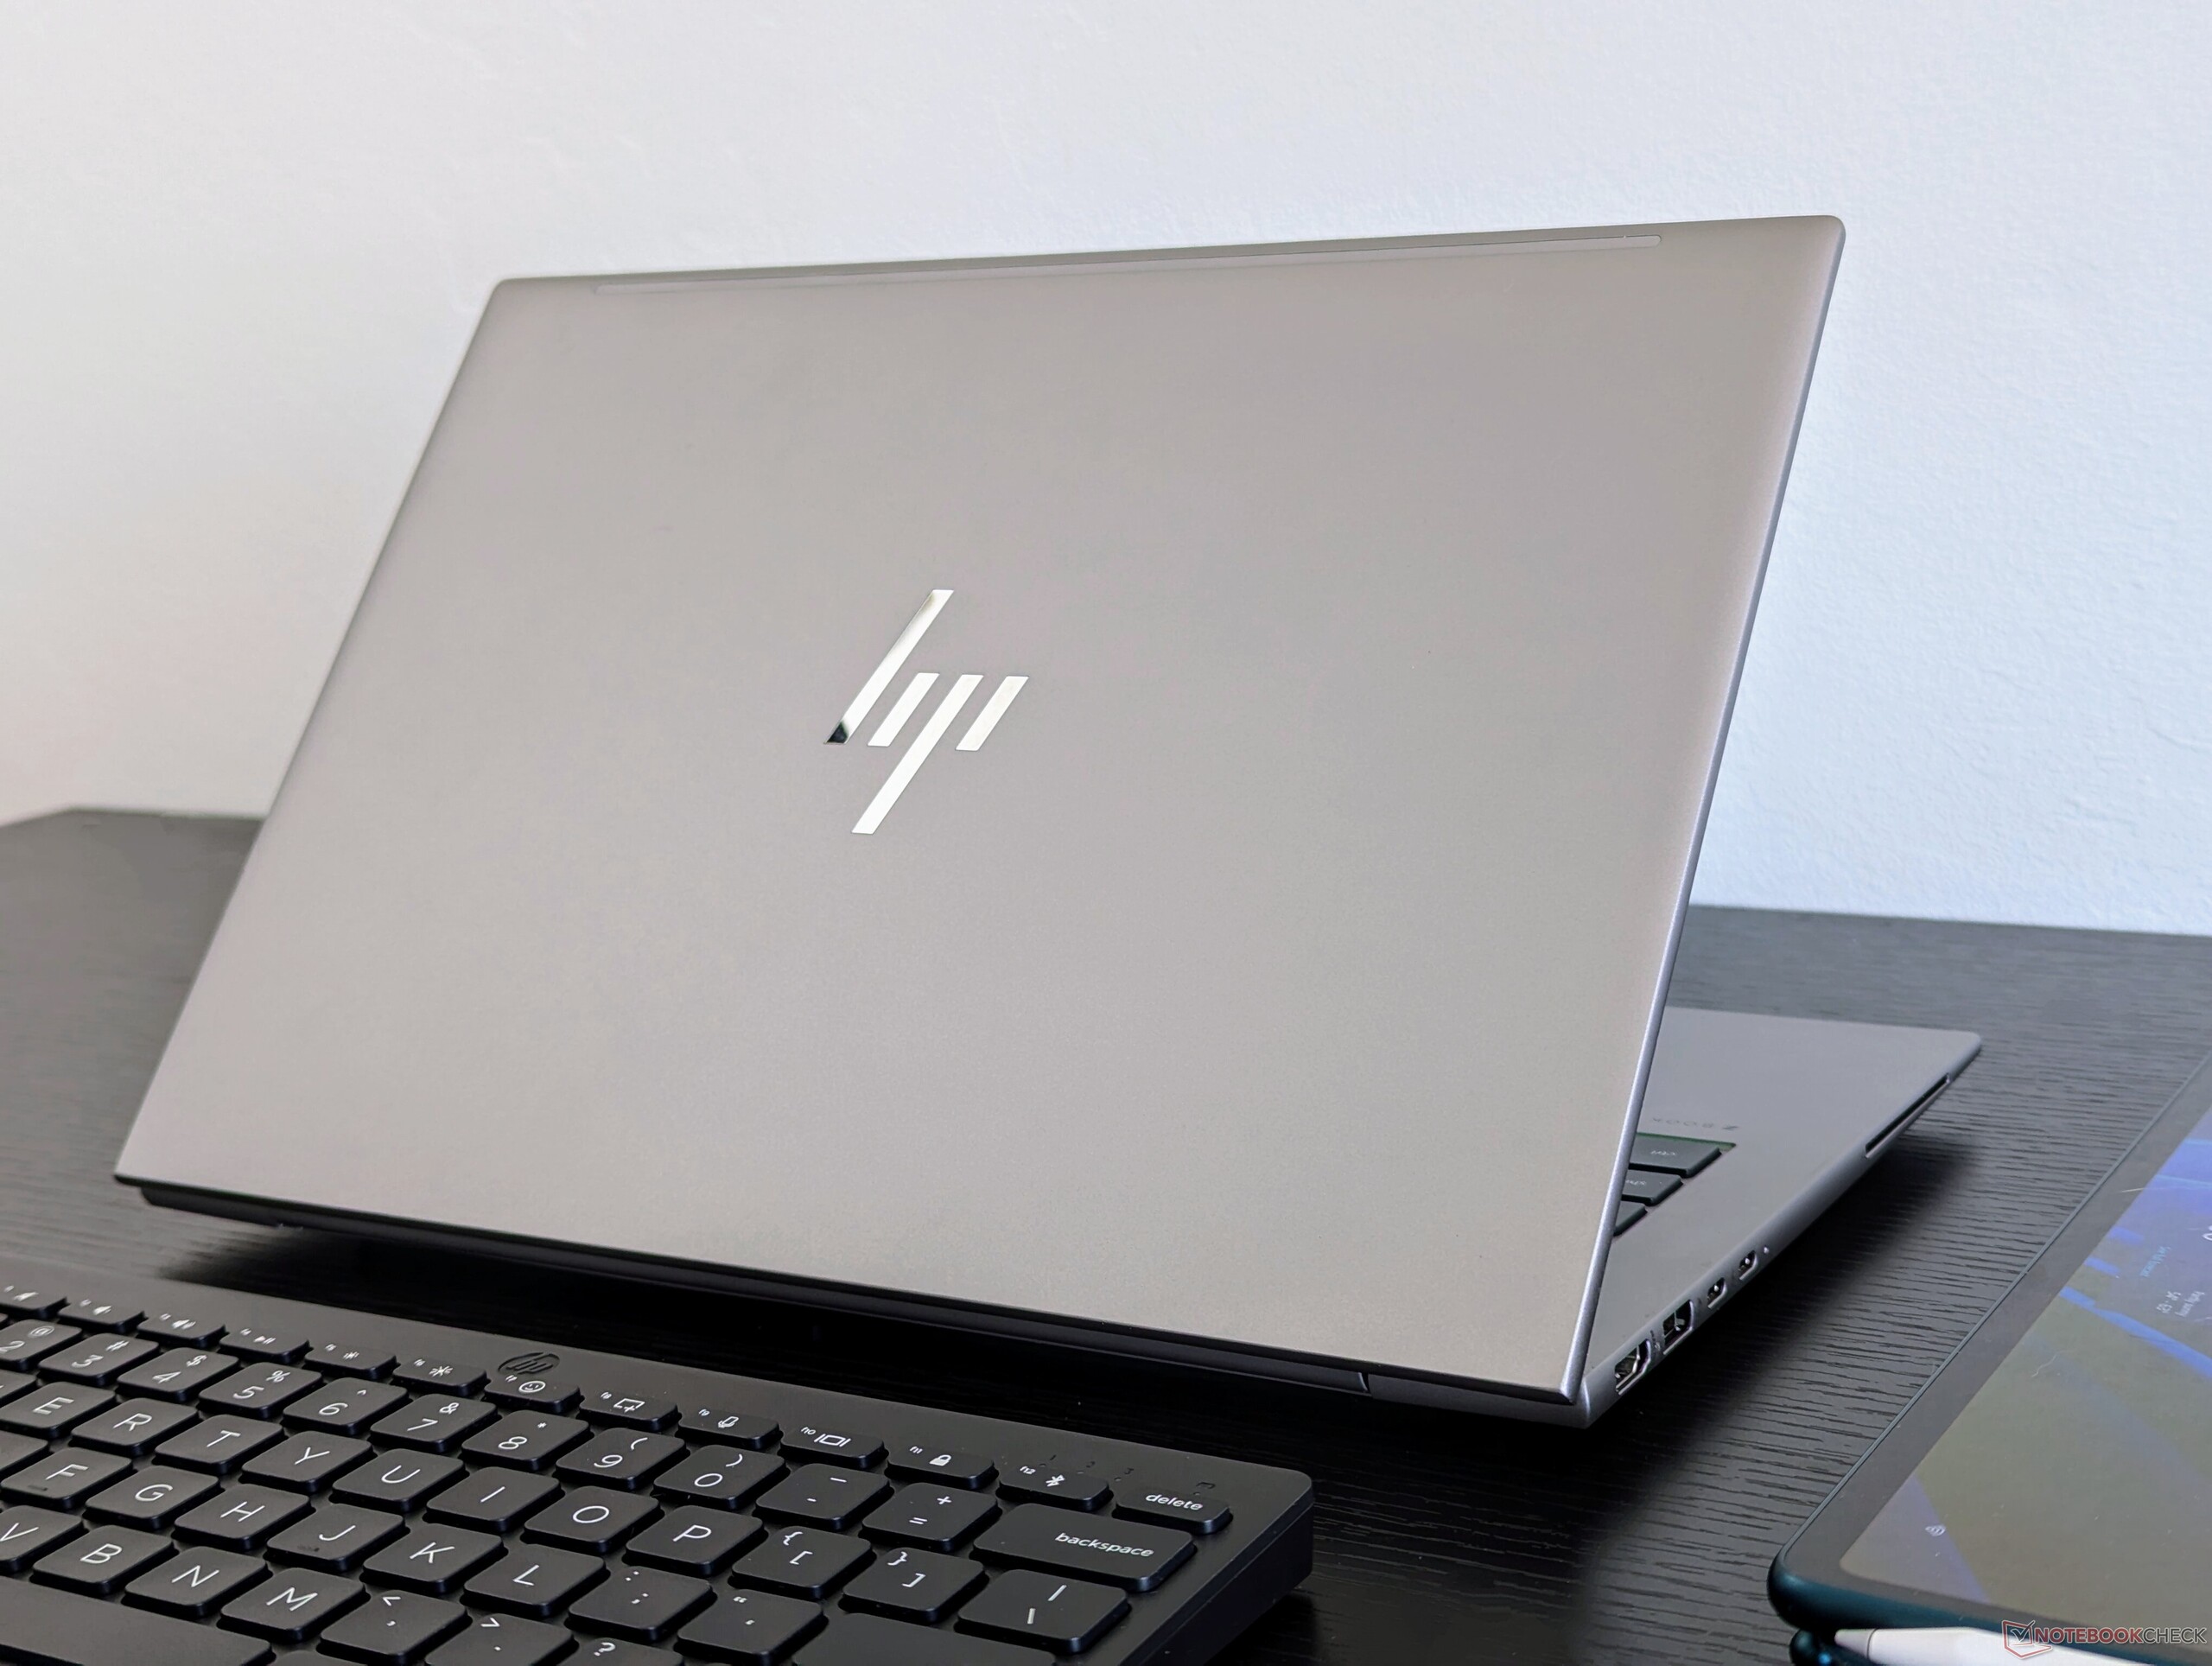
Carcasa - Aspecto familiar de ZBook
Aunque el chasis permanece inalterado, puede distinguir el ZBook Firefly 14 G11 de las entradas anteriores de la serie buscando la nueva tecla Co-Pilot en el teclado. La mayoría de los PC Windows con Meteor Lake tendrán una tecla Co-Pilot integrada, ya que se espera que sean compatibles con las futuras funciones aceleradas por IA.
Conectividad


Comunicación
| Networking | |
| iperf3 transmit AX12 | |
| HP ZBook Firefly 14 G8 2C9Q2EA | |
| iperf3 receive AX12 | |
| HP ZBook Firefly 14 G8 2C9Q2EA | |
| iperf3 transmit AXE11000 | |
| HP ZBook Firefly 14 G11 | |
| Asus ExpertBook B3 B3404CVF | |
| Dell Precision 5000 5490 | |
| HP ZBook Firefly 14 G10 A | |
| Lenovo ThinkPad P14s G4 21HF0017GE | |
| iperf3 receive AXE11000 | |
| HP ZBook Firefly 14 G10 A | |
| Lenovo ThinkPad P14s G4 21HF0017GE | |
| HP ZBook Firefly 14 G11 | |
| Asus ExpertBook B3 B3404CVF | |
| Dell Precision 5000 5490 | |
| iperf3 transmit AXE11000 6GHz | |
| Asus ExpertBook B3 B3404CVF | |
| HP ZBook Firefly 14 G11 | |
| Dell Precision 5000 5490 | |
| Lenovo ThinkPad P14s G4 21HF0017GE | |
| iperf3 receive AXE11000 6GHz | |
| HP ZBook Firefly 14 G11 | |
| Lenovo ThinkPad P14s G4 21HF0017GE | |
| Dell Precision 5000 5490 | |
| Asus ExpertBook B3 B3404CVF | |
Cámara web
La cámara web de 5 MP se mantiene sin cambios respecto al modelo 2023. Tanto un sensor IR como un obturador deslizante físico vienen incorporados.


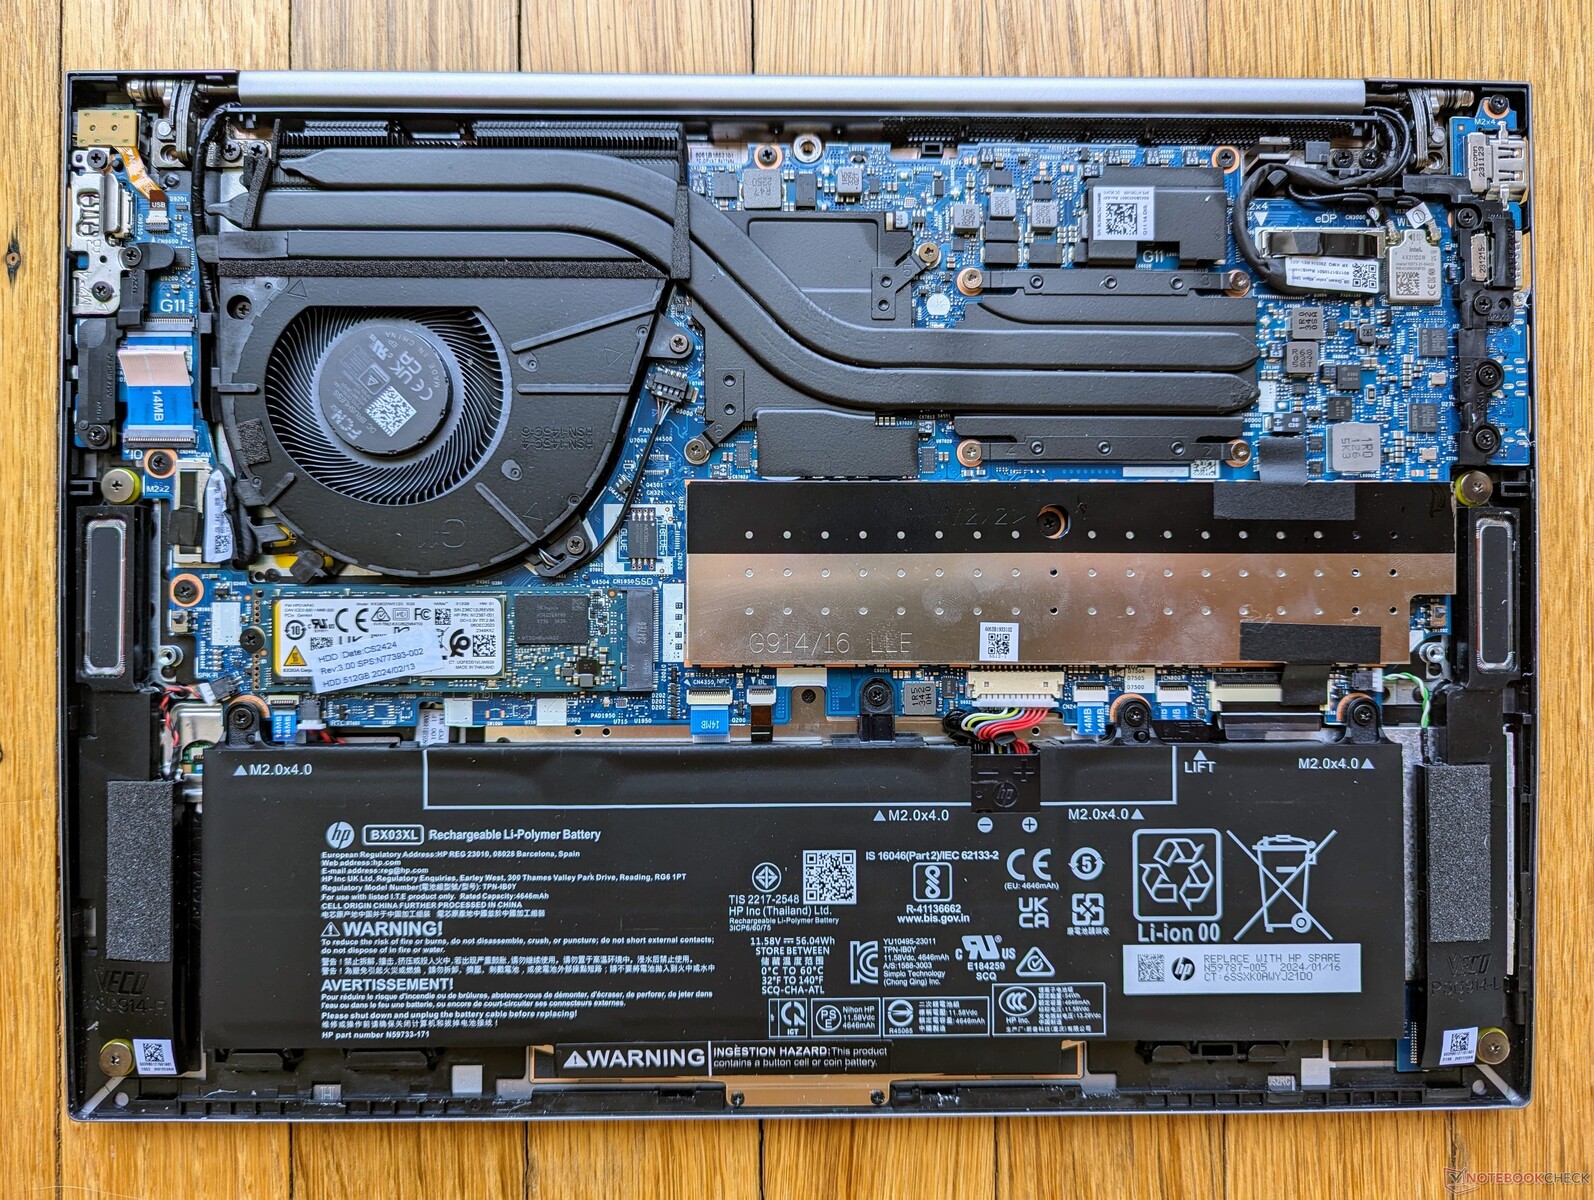
Mantenimiento
El panel inferior sólo requiere un destornillador Phillips para retirarlo y facilitar el mantenimiento. Los componentes internos se han mantenido prácticamente iguales desde el ZBook Firefly 14 G9 de 2022.

Garantía
Sólo un año de garantía limitada del fabricante viene de serie si se compra en los EE.UU. mientras que los modelos ZBook más grandes suelen venir con tres años en su lugar.
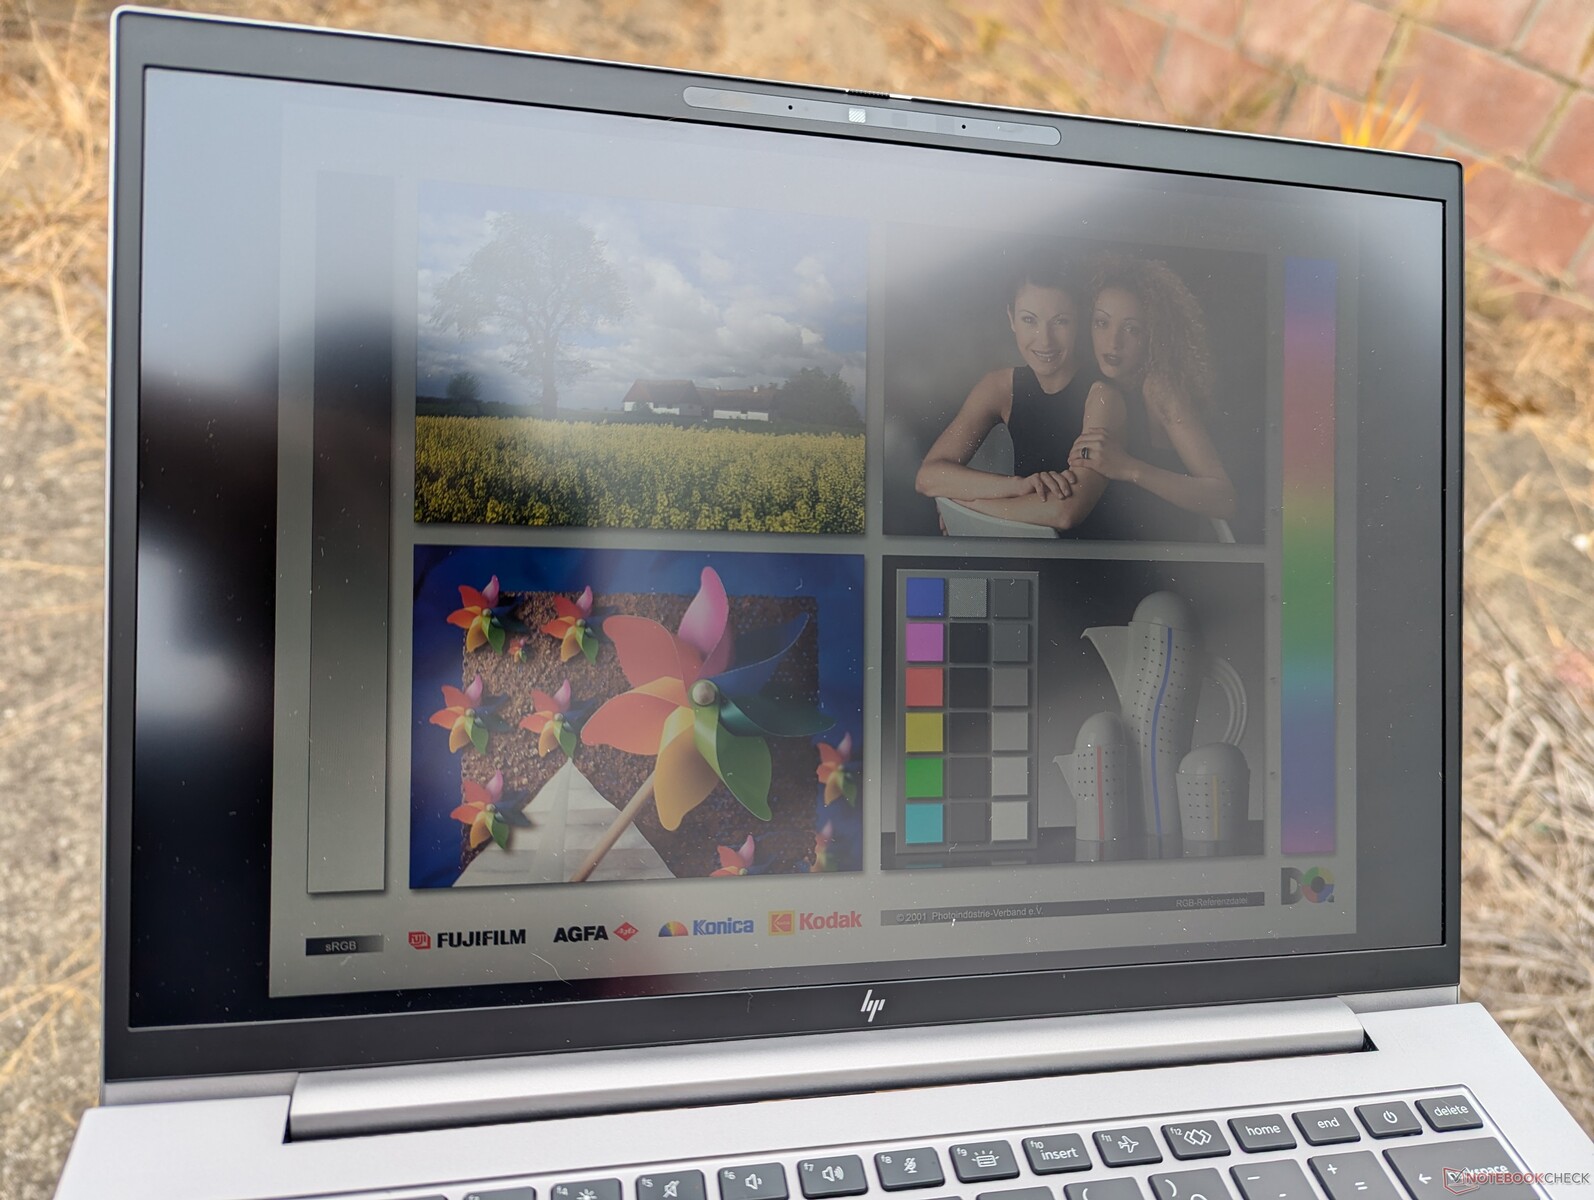
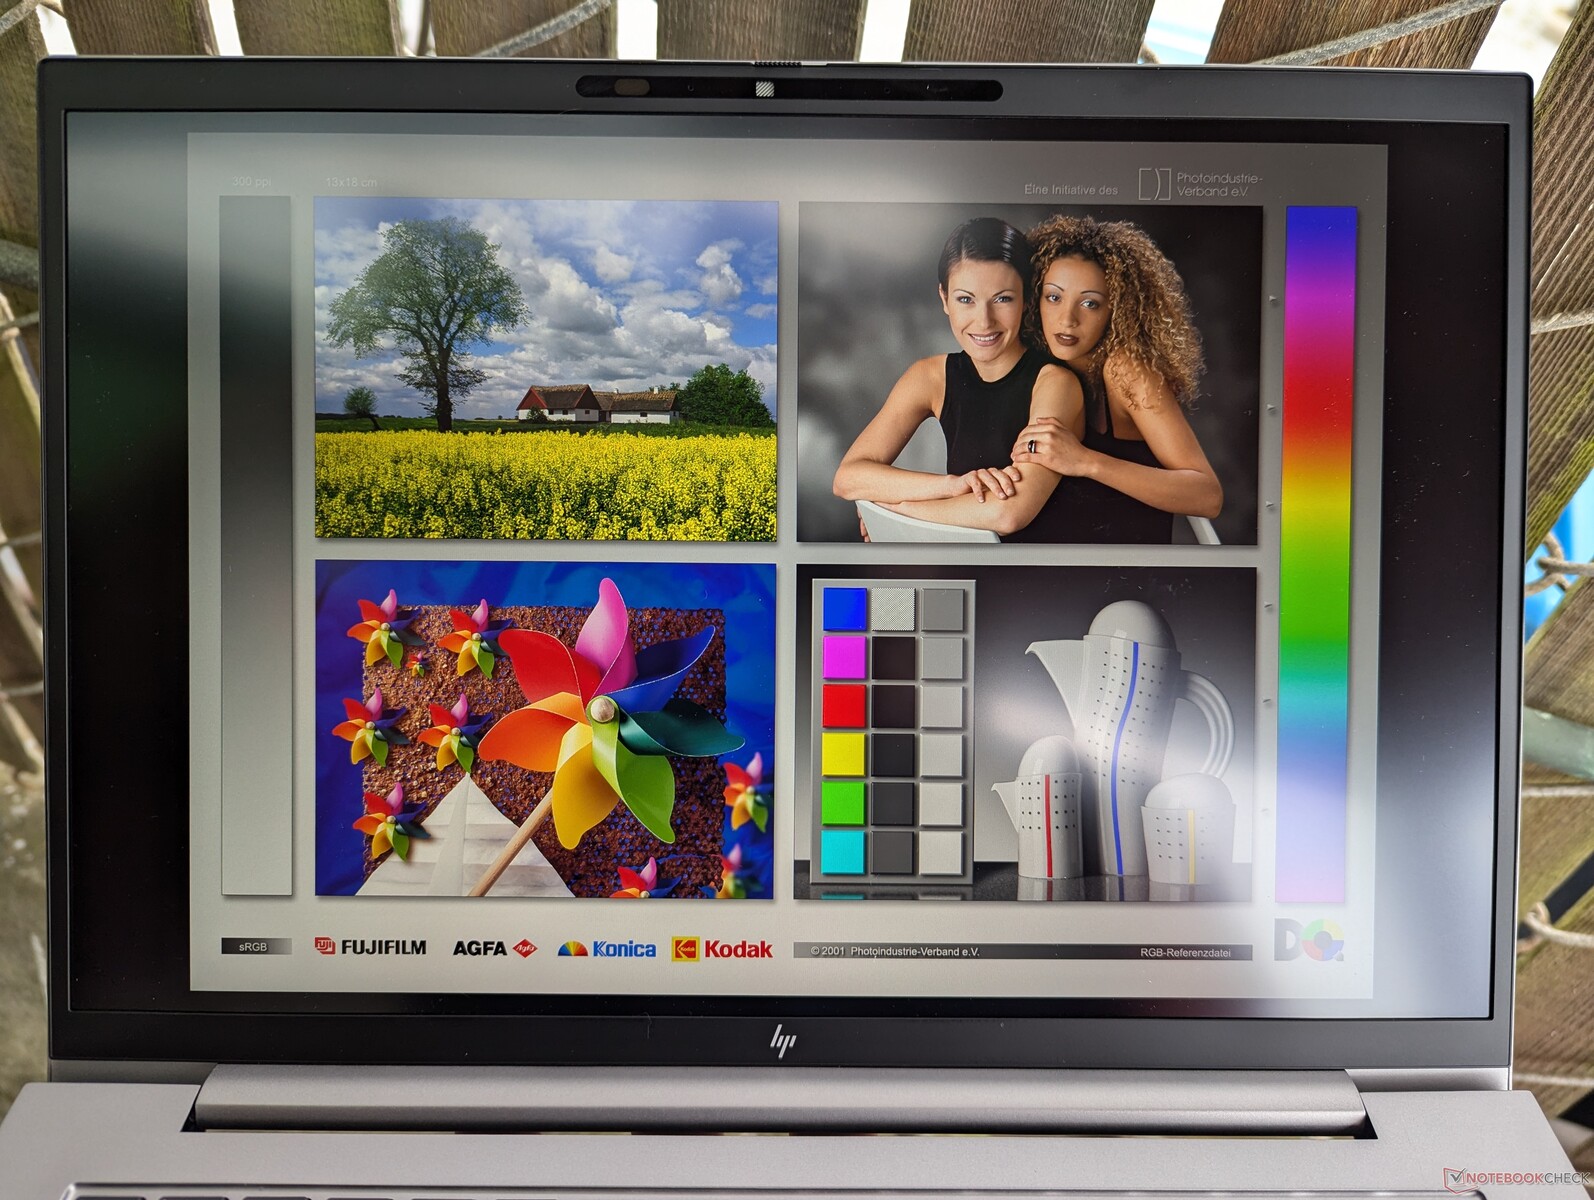
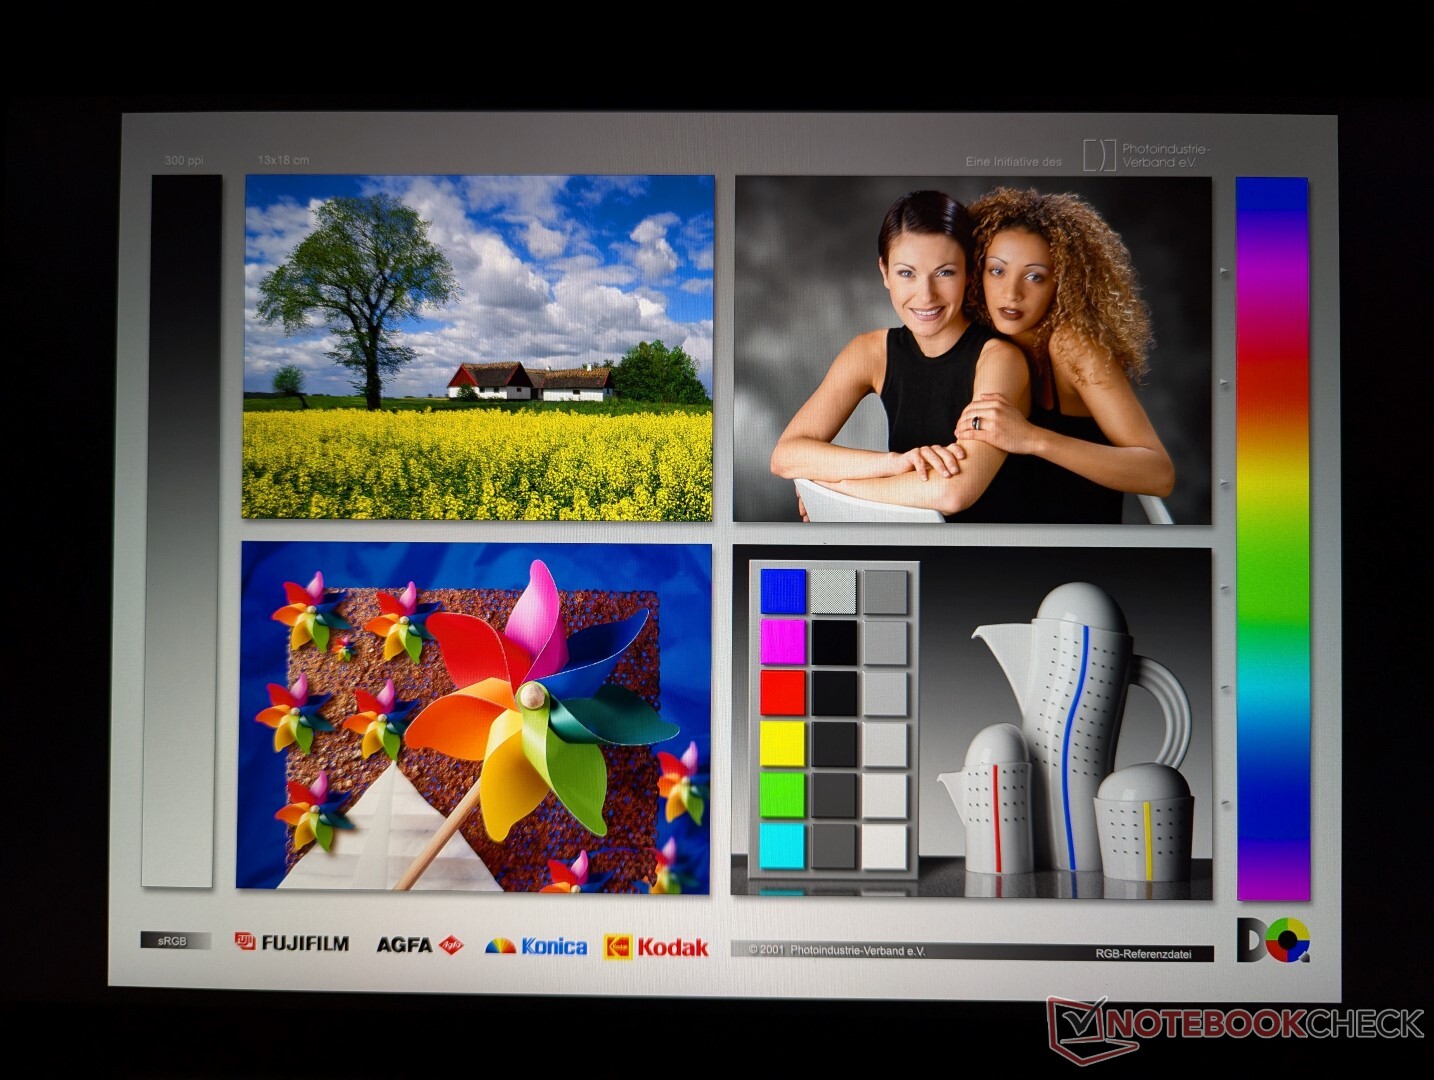
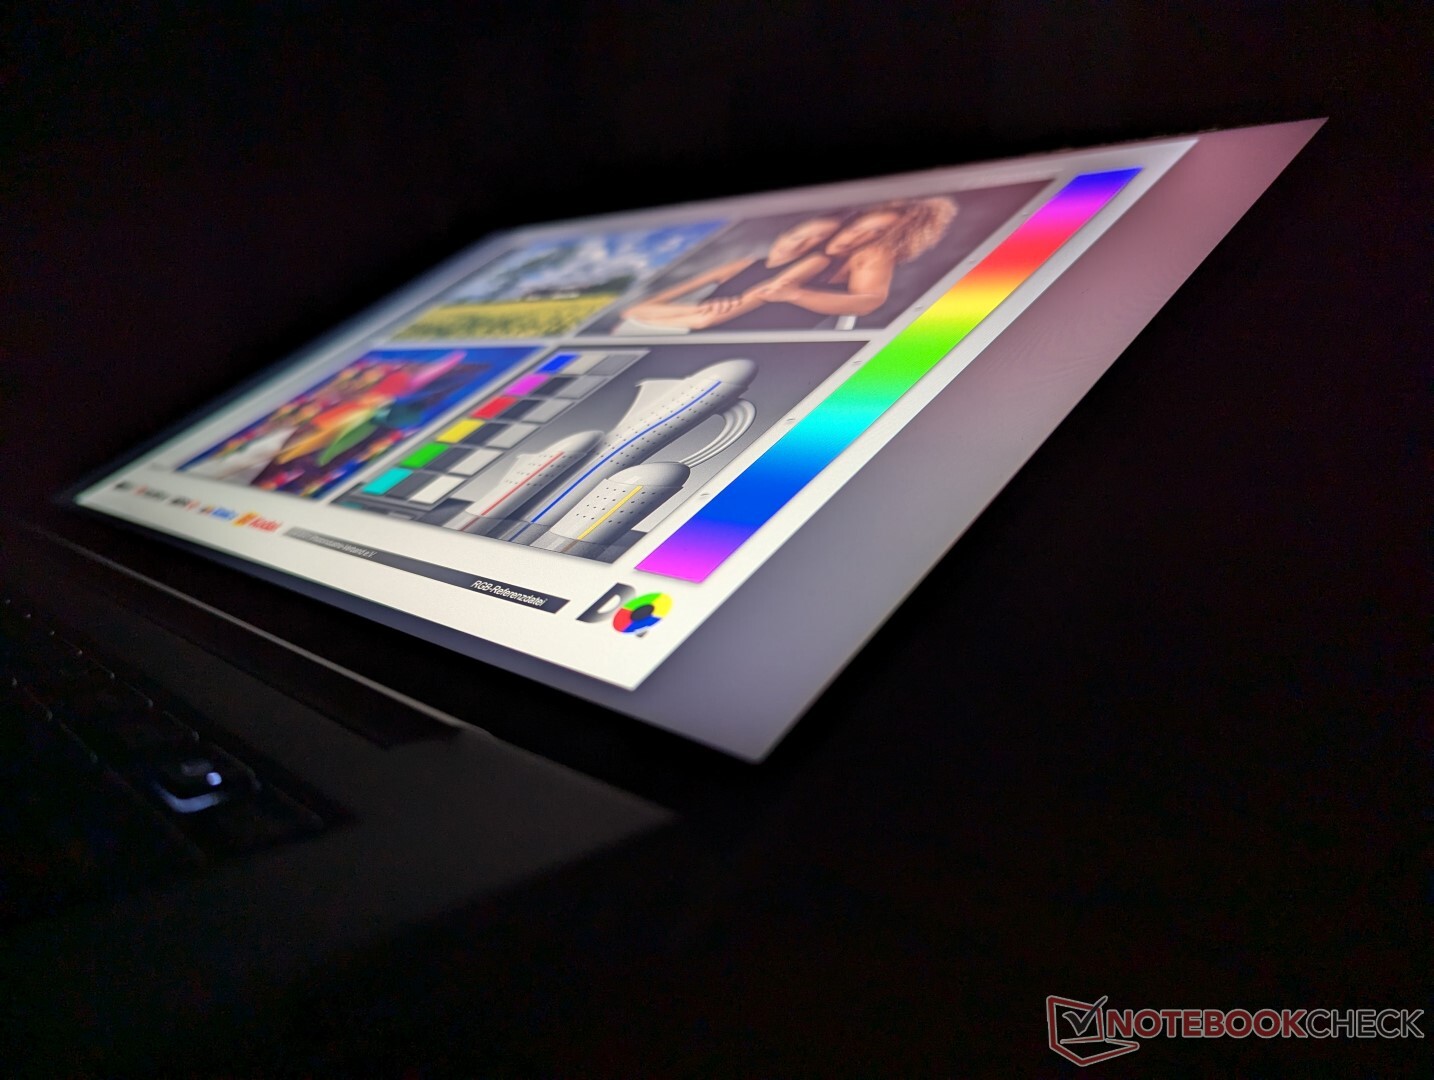
Pantalla - Poner el sueño en DreamColor
Hay disponibles un total de cinco opciones de pantalla, ordenadas de gama alta a gama baja. Tenga en cuenta que sólo una opción de panel está disponible con pantalla táctil. Nuestra unidad de prueba viene equipada con la opción en negrita a continuación.
- 2560 x 1600, 120 Hz, IPS, mate, 500 nits, 100% DCI-P3, HP DreamColor
- 1920 x 1200, 60 Hz, IPS, mate, 400 nits, 100% sRGB
- 1920 x 1200, 60 Hz IPS, mate, 1000 nits, 100% sRGB, HP Sure View
- 1920 x 1200, 60 Hz, IPS, mate, 300 nits, ~60% sRGB, pantalla táctil
- 1920 x 1200, 60 Hz, IPS, mate, 300 nits, ~60% sRGB
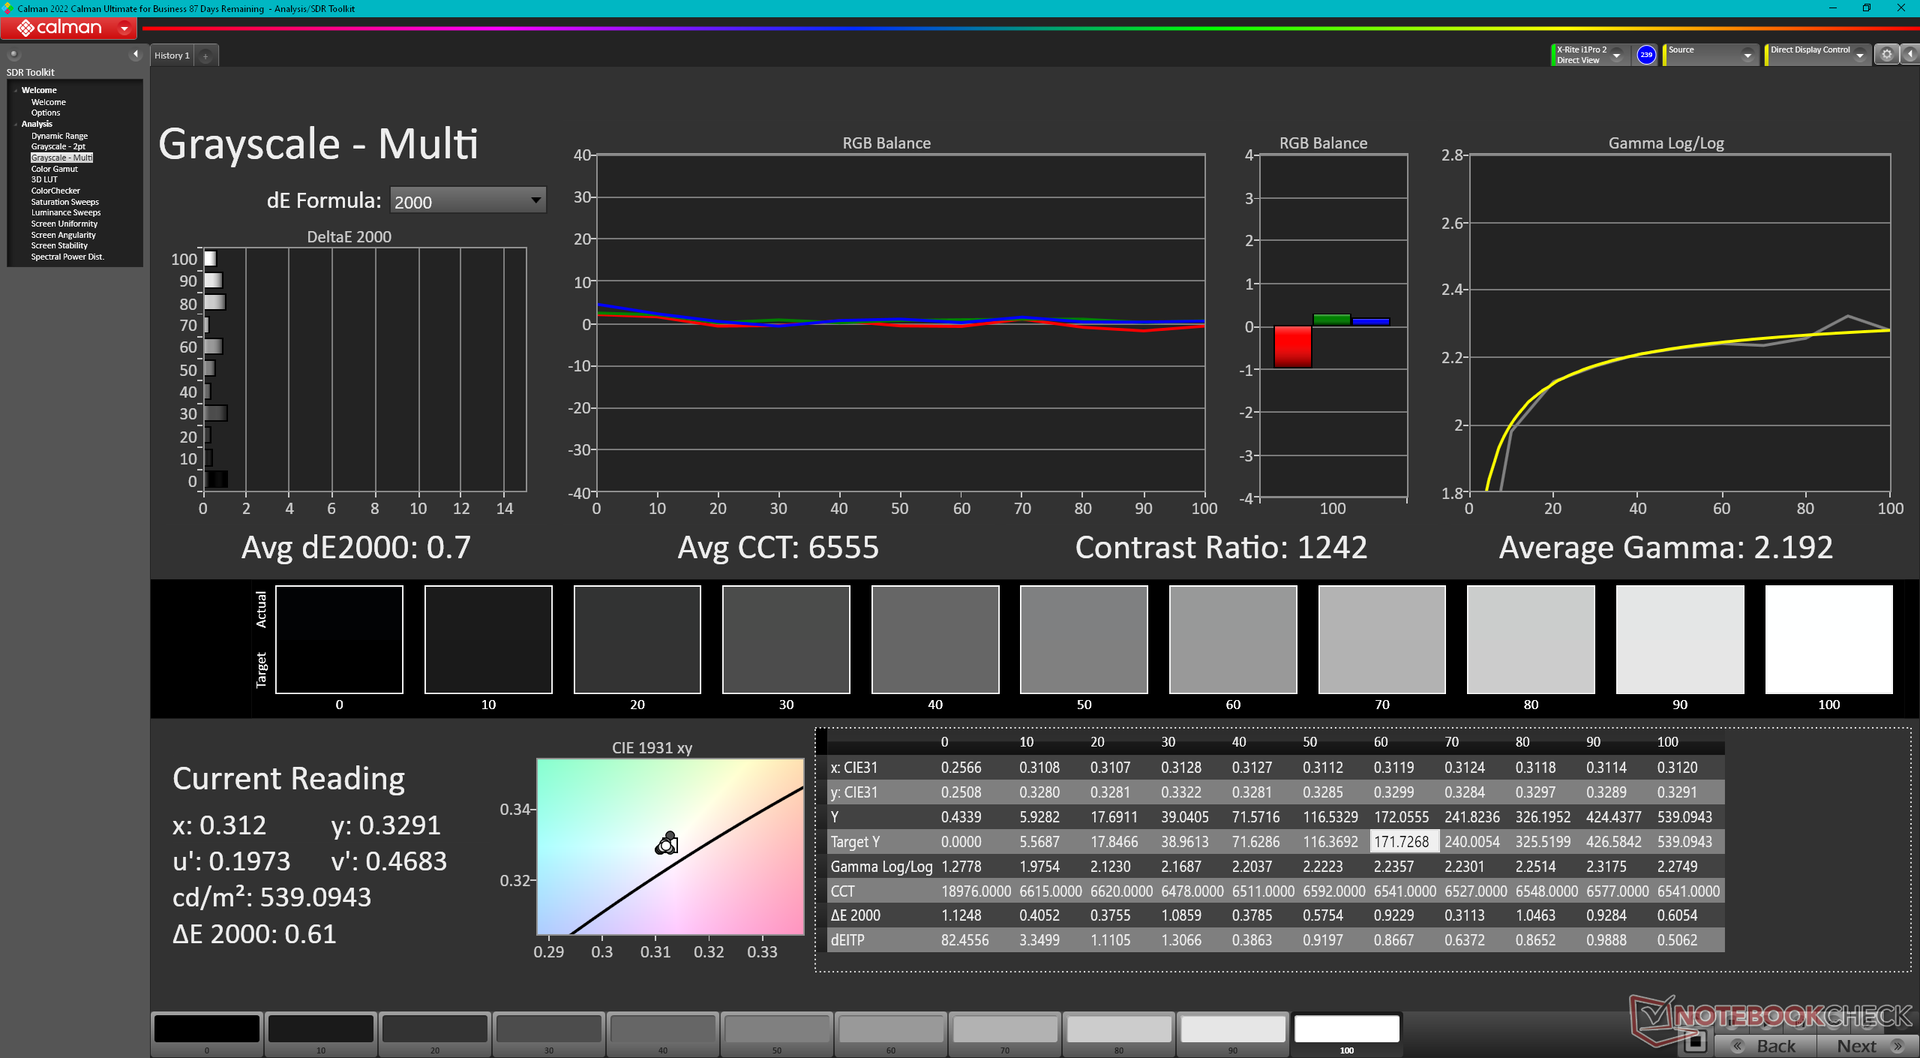
La ZBook Firefly 14 G11 es una de las pocas estaciones de trabajo de 14 pulgadas que viene con una opción de pantalla 1600p120. El panel 1600p del Precision 5490por ejemplo, está limitado a sólo 60 Hz en comparación. Se trata de una de las mejores pantallas 2K de 14 pulgadas que hemos visto, ya que ofrece frecuencias de actualización rápidas, colores DCI-P3 completos y tiempos de respuesta blanco-negro y gris-gris aún más rápidos que la mayoría de las estaciones de trabajo para limitar las imágenes fantasma. Sin embargo, sigue siendo lamentable que el modelo no venga con opciones OLED.
| |||||||||||||||||||||||||
iluminación: 93 %
Brillo con batería: 554.1 cd/m²
Contraste: 955:1 (Negro: 0.58 cd/m²)
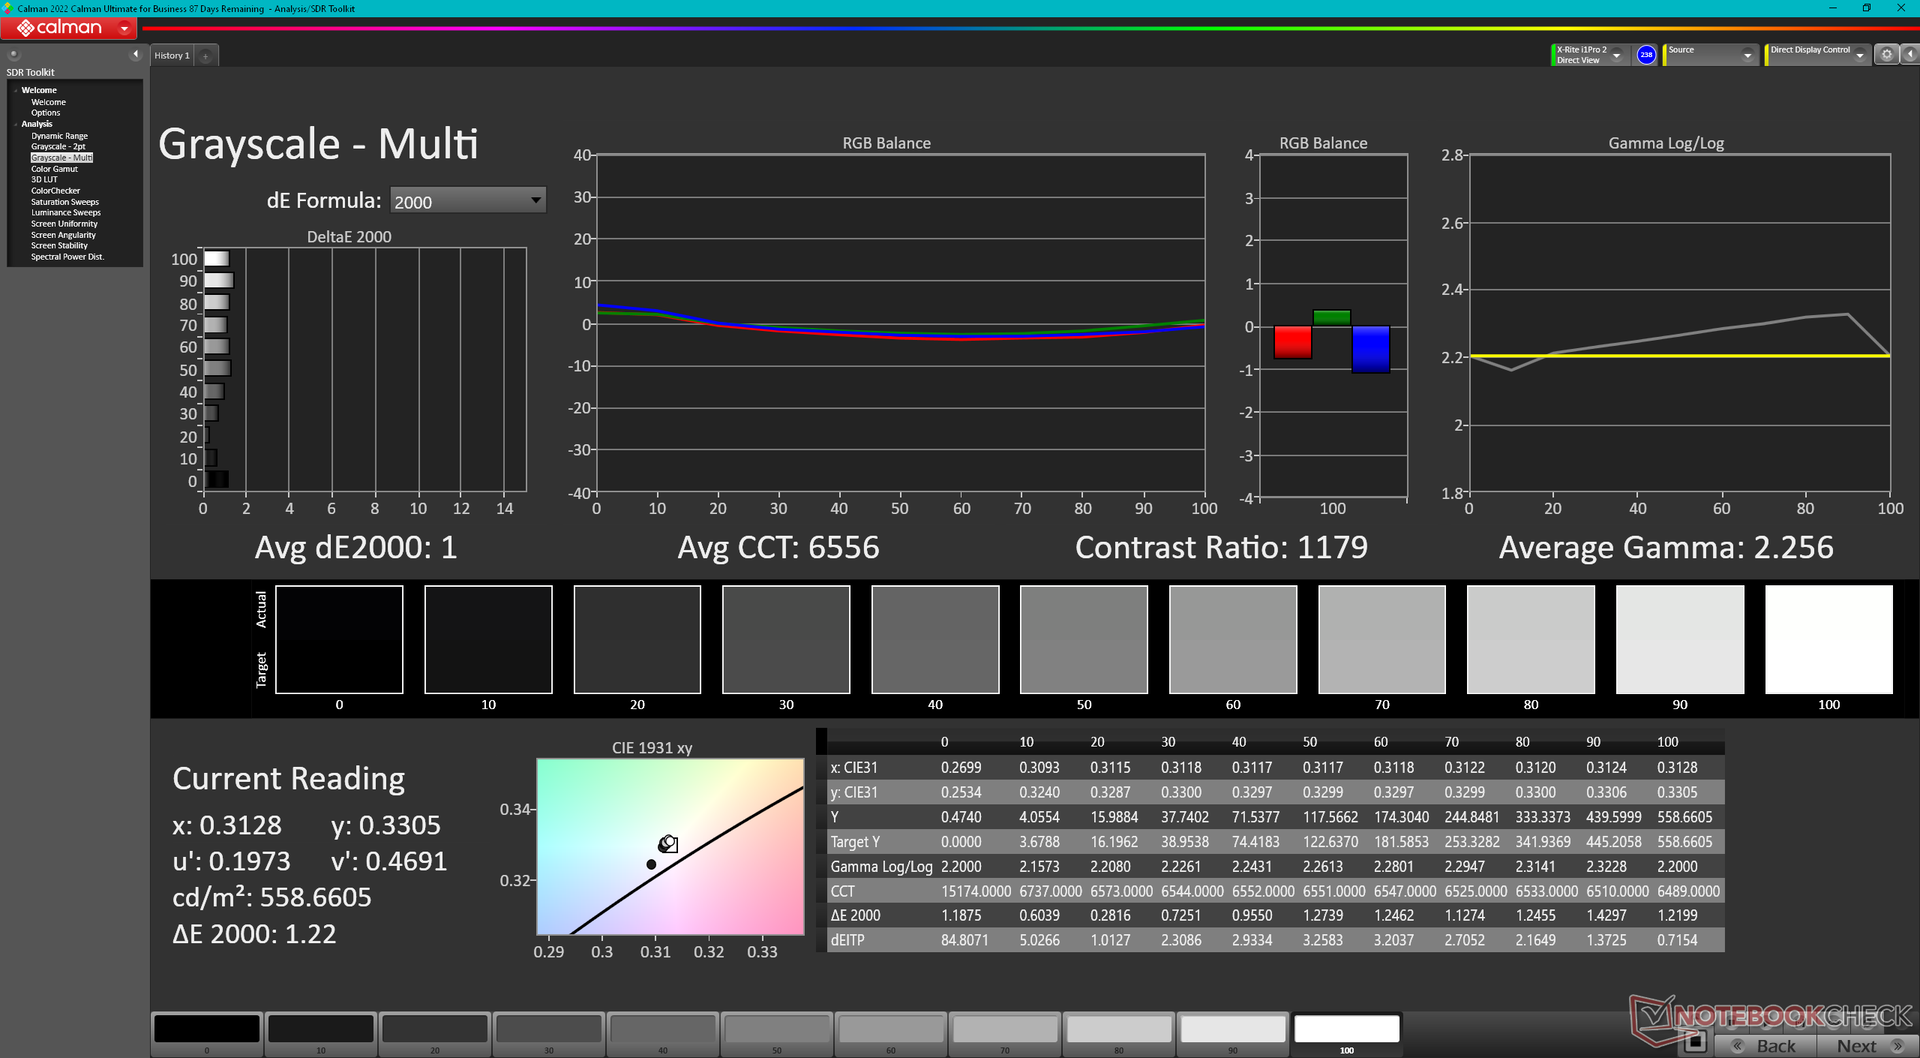
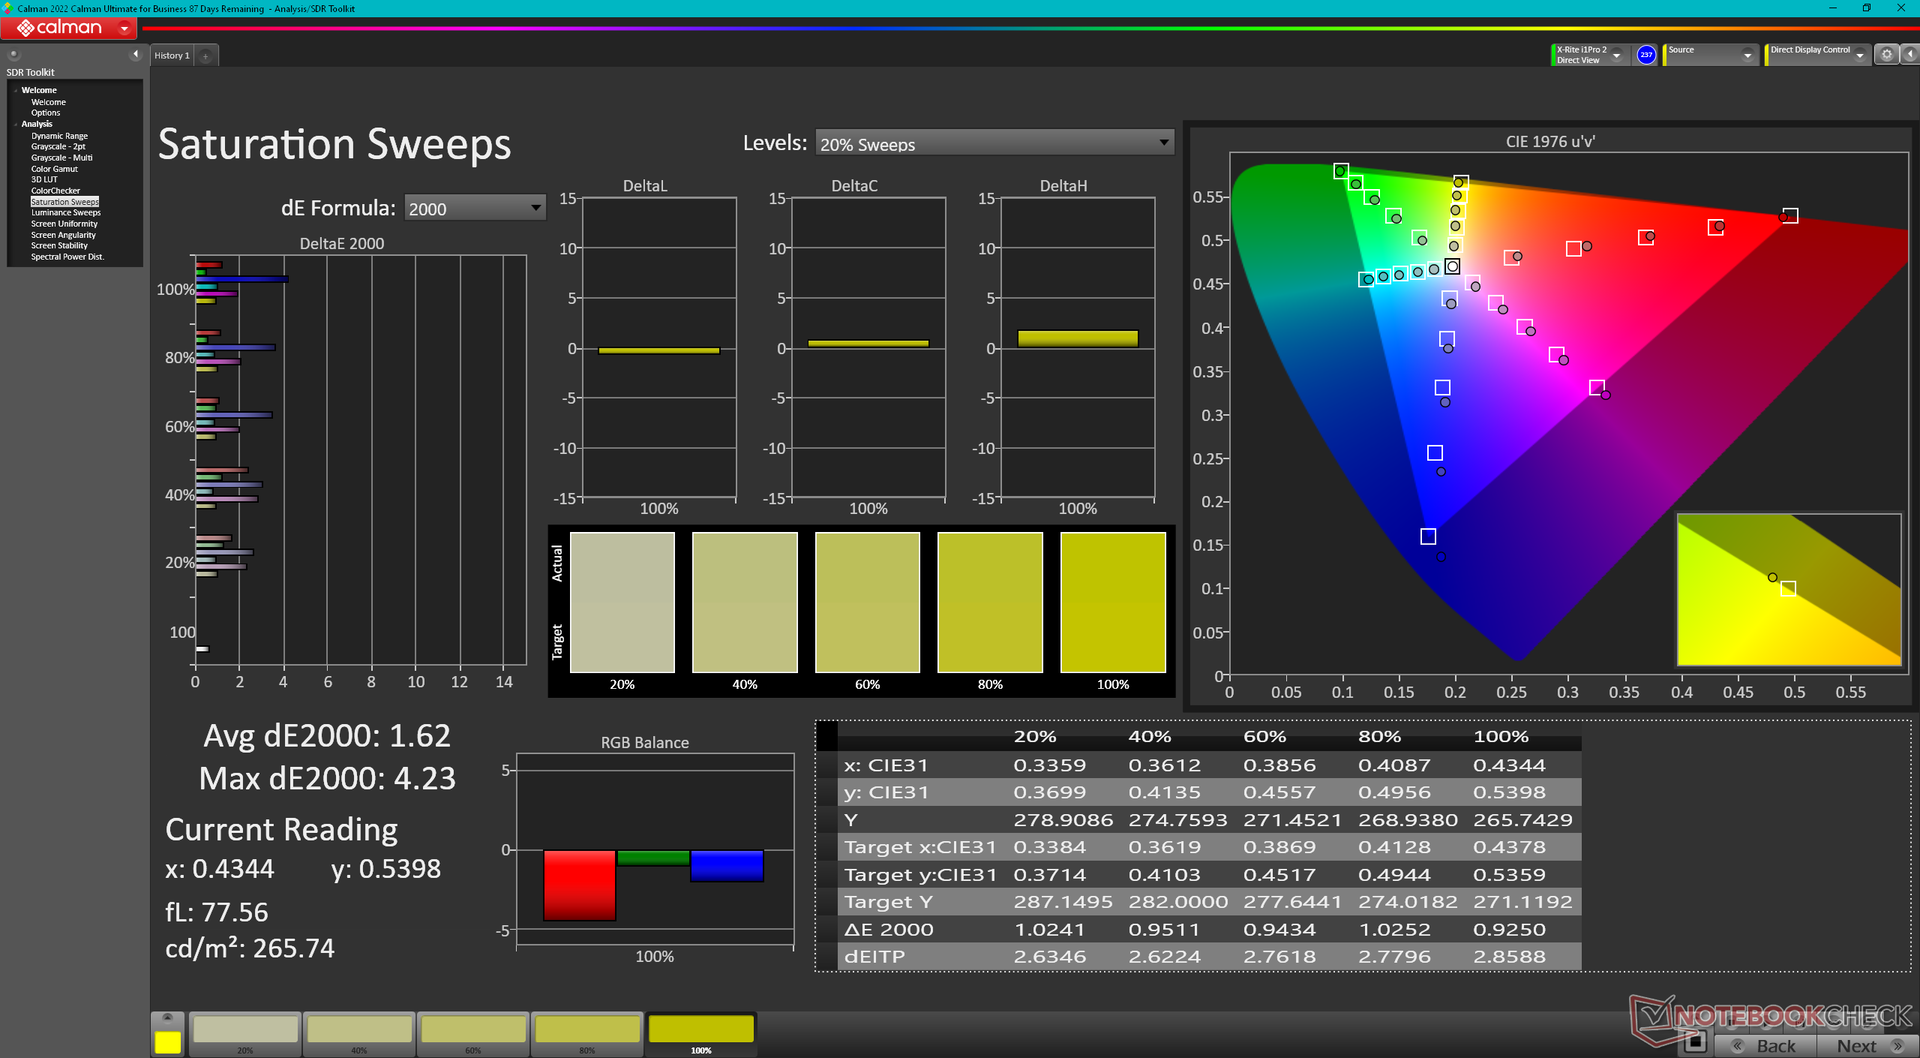
ΔE Color 2.54 | 0.5-29.43 Ø4.87, calibrated: 0.56
ΔE Greyscale 1 | 0.5-98 Ø5.1
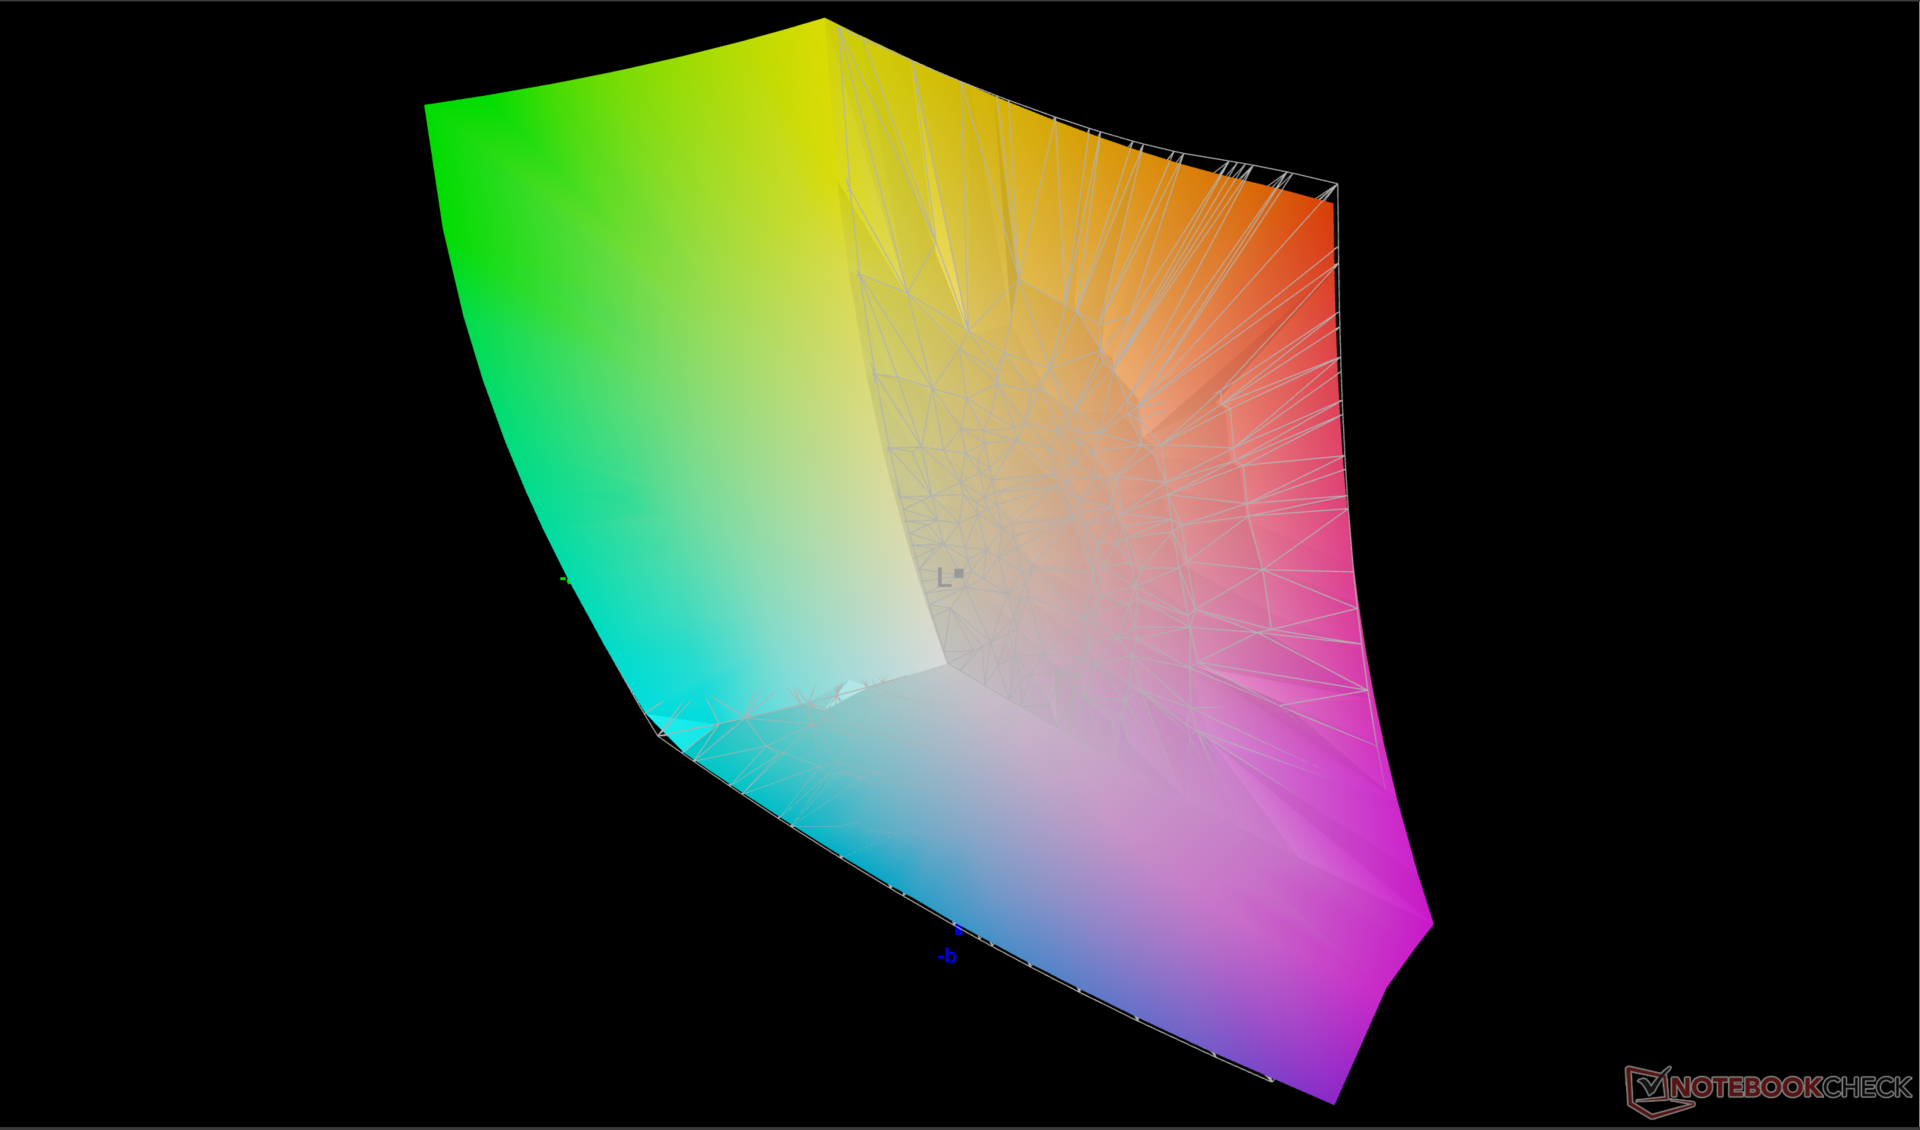
86.6% AdobeRGB 1998 (Argyll 2.2.0 3D)
99.9% sRGB (Argyll 2.2.0 3D)
98.9% Display P3 (Argyll 2.2.0 3D)
Gamma: 2.3
| HP ZBook Firefly 14 G11 AUO6DA8, IPS, 2560x1600, 14" | HP ZBook Firefly 14 G10 A CMN1435, IPS, 1920x1200, 14" | HP ZBook Firefly 14 G8 2C9Q2EA AU Optronics AUO068B, IPS, 1920x1080, 14" | Dell Precision 5000 5490 AU Optronics B140QAN, IPS, 2560x1600, 14" | Lenovo ThinkPad P14s G4 21HF0017GE ATNA40YK15-0, OLED, 2880x1800, 14" | Asus ExpertBook B3 B3404CVF BOE NV140WUM-N43, IPS, 1920x1200, 14" | |
|---|---|---|---|---|---|---|
| Display | -17% | -16% | -9% | 4% | -52% | |
| Display P3 Coverage | 98.9 | 68.7 -31% | 70 -29% | 79.7 -19% | 99.9 1% | 39.4 -60% |
| sRGB Coverage | 99.9 | 98.2 -2% | 99.5 0% | 100 0% | 100 0% | 58.2 -42% |
| AdobeRGB 1998 Coverage | 86.6 | 70.8 -18% | 71.4 -18% | 79.5 -8% | 97 12% | 40.7 -53% |
| Response Times | -281% | -338% | -313% | 75% | -114% | |
| Response Time Grey 50% / Grey 80% * | 12.3 ? | 56.2 ? -357% | 64.4 ? -424% | 52.3 ? -325% | 3 ? 76% | 23 ? -87% |
| Response Time Black / White * | 8.3 ? | 25.2 ? -204% | 29.2 ? -252% | 33.3 ? -301% | 2.2 ? 73% | 20 ? -141% |
| PWM Frequency | 360 ? | |||||
| Screen | -20% | -37% | -8% | -159% | -125% | |
| Brightness middle | 554.1 | 397 -28% | 461 -17% | 485.1 -12% | 432 -22% | 319 -42% |
| Brightness | 540 | 367 -32% | 439 -19% | 471 -13% | 432 -20% | 312 -42% |
| Brightness Distribution | 93 | 86 -8% | 89 -4% | 90 -3% | 98 5% | 91 -2% |
| Black Level * | 0.58 | 0.25 57% | 0.24 59% | 0.38 34% | 0.3515 39% | |
| Contrast | 955 | 1588 66% | 1921 101% | 1277 34% | 908 -5% | |
| Colorchecker dE 2000 * | 2.54 | 2.35 7% | 2.6 -2% | 2.15 15% | 4.8 -89% | 5.47 -115% |
| Colorchecker dE 2000 max. * | 4.99 | 4.68 6% | 5.8 -16% | 5.39 -8% | 9.2 -84% | 9.44 -89% |
| Colorchecker dE 2000 calibrated * | 0.56 | 1.15 -105% | 1.1 -96% | 0.67 -20% | 4.9 -775% | 3.89 -595% |
| Greyscale dE 2000 * | 1 | 2.4 -140% | 4.4 -340% | 2 -100% | 2.3 -130% | 3.7 -270% |
| Gamma | 2.3 96% | 2.067 106% | 2.29 96% | 2.3 96% | 2.23 99% | 1.97 112% |
| CCT | 6556 99% | 6409 101% | 6478 100% | 6826 95% | 6391 102% | 6712 97% |
| Color Space (Percent of AdobeRGB 1998) | 65.2 | |||||
| Color Space (Percent of sRGB) | 99.4 | |||||
| Media total (Programa/Opciones) | -106% /
-56% | -130% /
-76% | -110% /
-52% | -27% /
-79% | -97% /
-107% |
* ... más pequeño es mejor

La pantalla viene precalibrada con el estándar DCI-P3 para una precisión excelente nada más sacarla de la caja. Los valores medios deltaE de escala de grises y color son de sólo 1,0 y 2,54, respectivamente, lo que significa que no será necesaria una calibración por parte del usuario final para la mayoría.

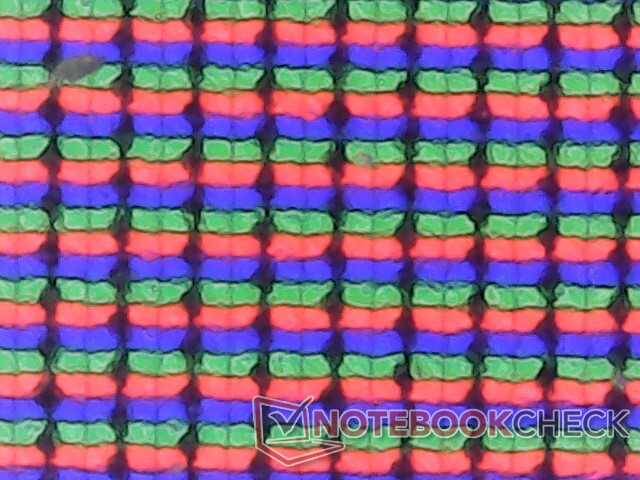
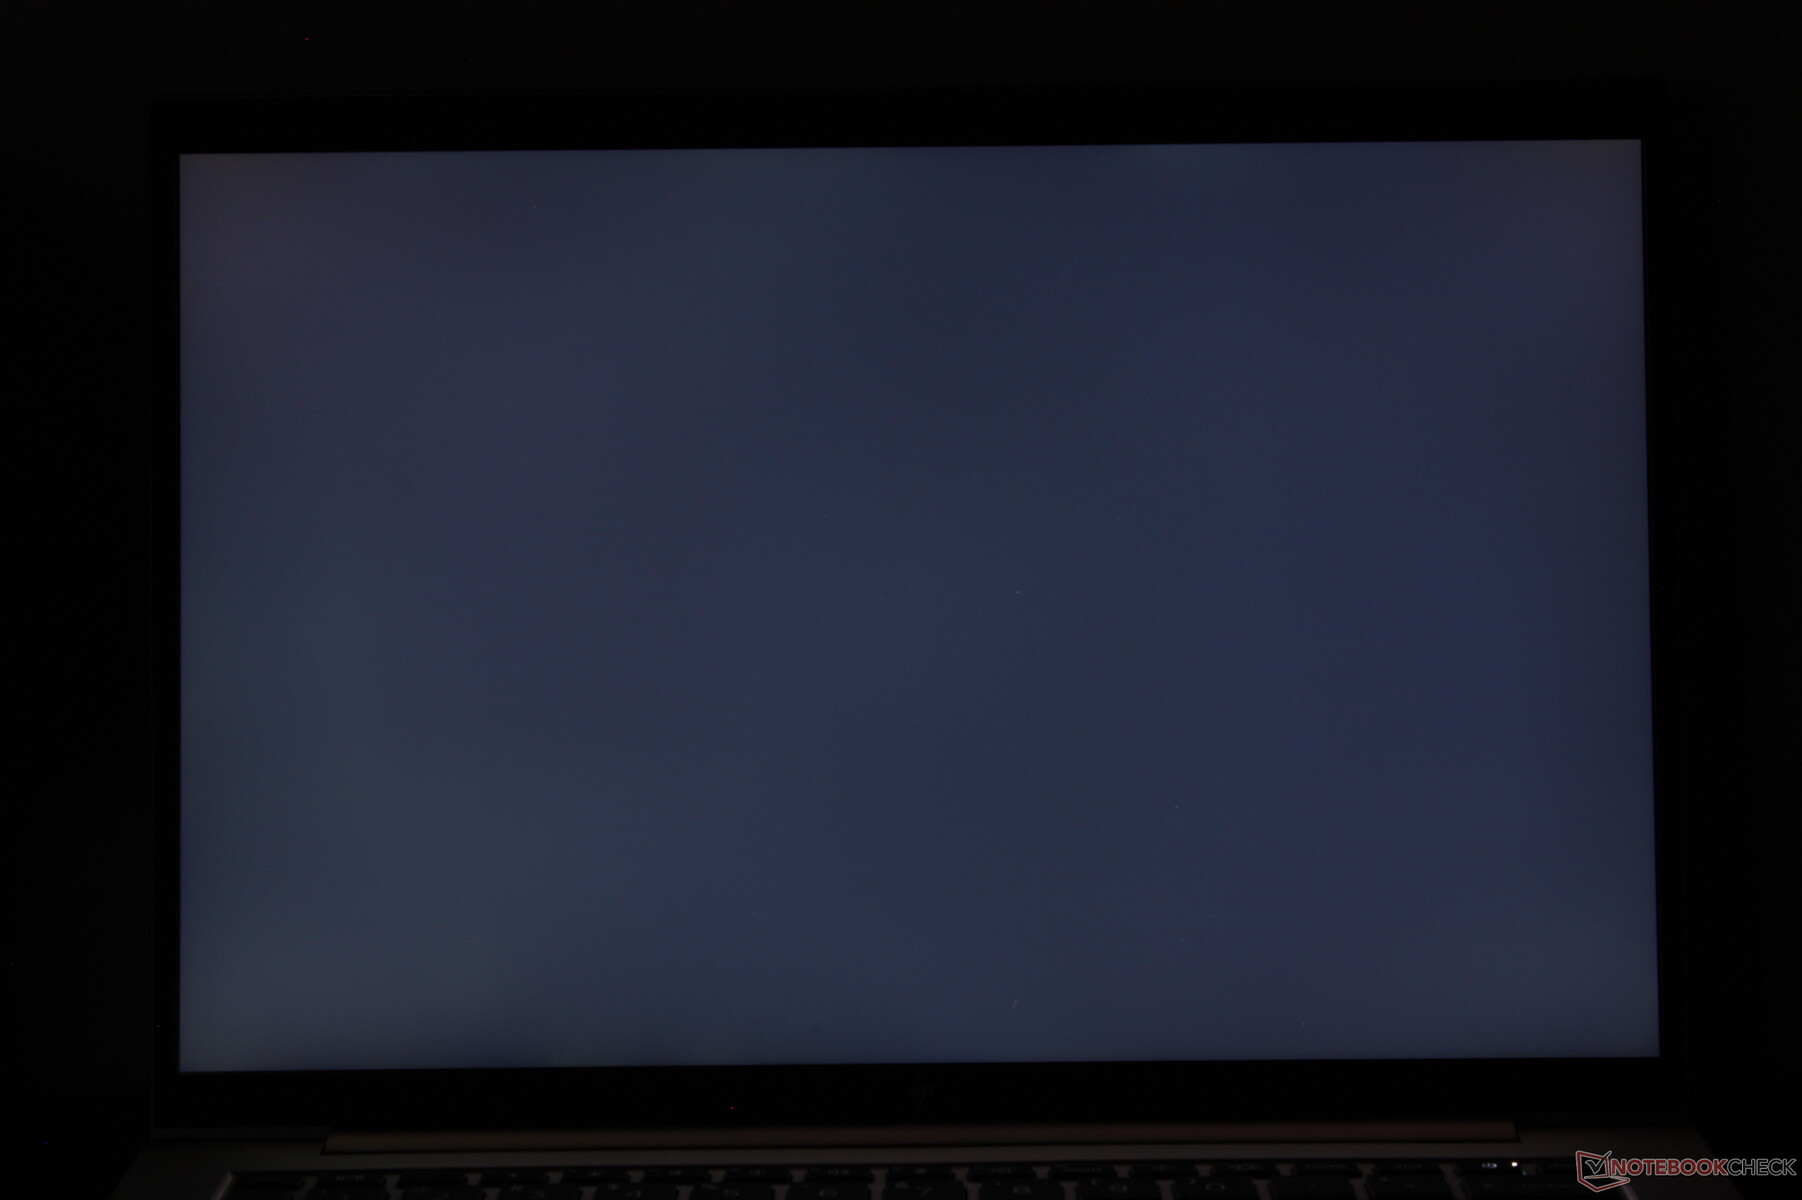
Parpadeo de Pantalla / PWM (Pulse-Width Modulation)
| Parpadeo de Pantalla / PWM no detectado |  | ||
Comparación: 53 % de todos los dispositivos testados no usaron PWM para atenuar el display. Si se usó, medimos una media de 8516 (mínimo: 5 - máxmo: 343500) Hz. | |||
Rendimiento - 14ª generación Meteor Lake Boost

Condiciones de prueba
Pusimos tanto Windows como MyHP en modo Rendimiento antes de ejecutar los puntos de referencia que se indican a continuación.

Procesador
El Core Ultra 7 165H es aproximadamente entre un 20 y un 25 por ciento más rápido que el Ryzen 5 Pro 7640HS en la Firefly G10 A del año pasado cuando se trata de cargas de trabajo multihilo. Desafortunadamente, la CPU Intel de nuestra Firefly G11 se ralentizaba bastante después de sólo dos bucles en nuestra prueba de estrés CineBench R15 xT, como muestra el gráfico comparativo que aparece a continuación. El rendimiento multihilo puede caer hasta un 35 por ciento con el tiempo, lo que supone una de las caídas más pronunciadas que hemos visto en un portátil Core de la serie H. Las diferencias de rendimiento entre el Core Ultra 7 165H y el Ryzen 5 Pro 7640HS se vuelven mucho más estrechas después de tener en cuenta cualquier estrangulamiento.
La configuración con opciones de gama baja de la serie Core U como el Core Ultra 7 165U se espera que afecte al rendimiento hasta en un 25 a 30 por ciento basándonos en nuestro tiempo con el Dell Latitude 9450 2 en 1. Sin embargo, cualquier estrangulamiento con la CPU Core serie U puede ser menos grave y, por tanto, la delta de rendimiento entre nuestra Core Ultra 7 165H y la Core Ultra 7 165U podría ser menor de lo esperado. En cualquier caso, las ventajas de rendimiento completas de la Core Ultra 7 165H no pueden mantenerse durante periodos prolongados en la HP.
Cinebench R15 Multi Loop
Cinebench R23: Multi Core | Single Core
Cinebench R20: CPU (Multi Core) | CPU (Single Core)
Cinebench R15: CPU Multi 64Bit | CPU Single 64Bit
Blender: v2.79 BMW27 CPU
7-Zip 18.03: 7z b 4 | 7z b 4 -mmt1
Geekbench 6.4: Multi-Core | Single-Core
Geekbench 5.5: Multi-Core | Single-Core
HWBOT x265 Benchmark v2.2: 4k Preset
LibreOffice : 20 Documents To PDF
R Benchmark 2.5: Overall mean
* ... más pequeño es mejor
AIDA64: FP32 Ray-Trace | FPU Julia | CPU SHA3 | CPU Queen | FPU SinJulia | FPU Mandel | CPU AES | CPU ZLib | FP64 Ray-Trace | CPU PhotoWorxx
| Performance Rating | |
| Dell Precision 5000 5490 | |
| HP ZBook Firefly 14 G10 A | |
| Medio Intel Core Ultra 7 165H | |
| Lenovo ThinkPad P14s G4 21HF0017GE | |
| HP ZBook Firefly 14 G11 | |
| Asus ExpertBook B3 B3404CVF | |
| HP ZBook Firefly 14 G8 2C9Q2EA | |
| AIDA64 / FP32 Ray-Trace | |
| HP ZBook Firefly 14 G10 A | |
| Dell Precision 5000 5490 | |
| Medio Intel Core Ultra 7 165H (10658 - 14235, n=3) | |
| Lenovo ThinkPad P14s G4 21HF0017GE | |
| HP ZBook Firefly 14 G11 | |
| Asus ExpertBook B3 B3404CVF | |
| HP ZBook Firefly 14 G8 2C9Q2EA | |
| AIDA64 / FPU Julia | |
| HP ZBook Firefly 14 G10 A | |
| Dell Precision 5000 5490 | |
| Medio Intel Core Ultra 7 165H (56664 - 75077, n=3) | |
| Lenovo ThinkPad P14s G4 21HF0017GE | |
| HP ZBook Firefly 14 G11 | |
| Asus ExpertBook B3 B3404CVF | |
| HP ZBook Firefly 14 G8 2C9Q2EA | |
| AIDA64 / CPU SHA3 | |
| Dell Precision 5000 5490 | |
| HP ZBook Firefly 14 G10 A | |
| Medio Intel Core Ultra 7 165H (2608 - 3473, n=3) | |
| Lenovo ThinkPad P14s G4 21HF0017GE | |
| HP ZBook Firefly 14 G11 | |
| Asus ExpertBook B3 B3404CVF | |
| HP ZBook Firefly 14 G8 2C9Q2EA | |
| AIDA64 / CPU Queen | |
| Lenovo ThinkPad P14s G4 21HF0017GE | |
| Dell Precision 5000 5490 | |
| HP ZBook Firefly 14 G10 A | |
| HP ZBook Firefly 14 G11 | |
| Medio Intel Core Ultra 7 165H (82058 - 86192, n=3) | |
| Asus ExpertBook B3 B3404CVF | |
| HP ZBook Firefly 14 G8 2C9Q2EA | |
| AIDA64 / FPU SinJulia | |
| HP ZBook Firefly 14 G10 A | |
| Dell Precision 5000 5490 | |
| Medio Intel Core Ultra 7 165H (8232 - 9798, n=3) | |
| HP ZBook Firefly 14 G11 | |
| Lenovo ThinkPad P14s G4 21HF0017GE | |
| Asus ExpertBook B3 B3404CVF | |
| HP ZBook Firefly 14 G8 2C9Q2EA | |
| AIDA64 / FPU Mandel | |
| HP ZBook Firefly 14 G10 A | |
| Dell Precision 5000 5490 | |
| Medio Intel Core Ultra 7 165H (27301 - 36957, n=3) | |
| Lenovo ThinkPad P14s G4 21HF0017GE | |
| HP ZBook Firefly 14 G11 | |
| Asus ExpertBook B3 B3404CVF | |
| HP ZBook Firefly 14 G8 2C9Q2EA | |
| AIDA64 / CPU AES | |
| Dell Precision 5000 5490 | |
| HP ZBook Firefly 14 G8 2C9Q2EA | |
| Medio Intel Core Ultra 7 165H (56077 - 73297, n=3) | |
| HP ZBook Firefly 14 G10 A | |
| Lenovo ThinkPad P14s G4 21HF0017GE | |
| HP ZBook Firefly 14 G11 | |
| Asus ExpertBook B3 B3404CVF | |
| AIDA64 / CPU ZLib | |
| Dell Precision 5000 5490 | |
| Medio Intel Core Ultra 7 165H (742 - 1018, n=3) | |
| Lenovo ThinkPad P14s G4 21HF0017GE | |
| HP ZBook Firefly 14 G10 A | |
| HP ZBook Firefly 14 G11 | |
| Asus ExpertBook B3 B3404CVF | |
| HP ZBook Firefly 14 G8 2C9Q2EA | |
| AIDA64 / FP64 Ray-Trace | |
| HP ZBook Firefly 14 G10 A | |
| Dell Precision 5000 5490 | |
| Medio Intel Core Ultra 7 165H (5580 - 7521, n=3) | |
| Lenovo ThinkPad P14s G4 21HF0017GE | |
| HP ZBook Firefly 14 G11 | |
| Asus ExpertBook B3 B3404CVF | |
| HP ZBook Firefly 14 G8 2C9Q2EA | |
| AIDA64 / CPU PhotoWorxx | |
| Dell Precision 5000 5490 | |
| Medio Intel Core Ultra 7 165H (44396 - 48762, n=3) | |
| Asus ExpertBook B3 B3404CVF | |
| HP ZBook Firefly 14 G11 | |
| Lenovo ThinkPad P14s G4 21HF0017GE | |
| HP ZBook Firefly 14 G10 A | |
| HP ZBook Firefly 14 G8 2C9Q2EA | |
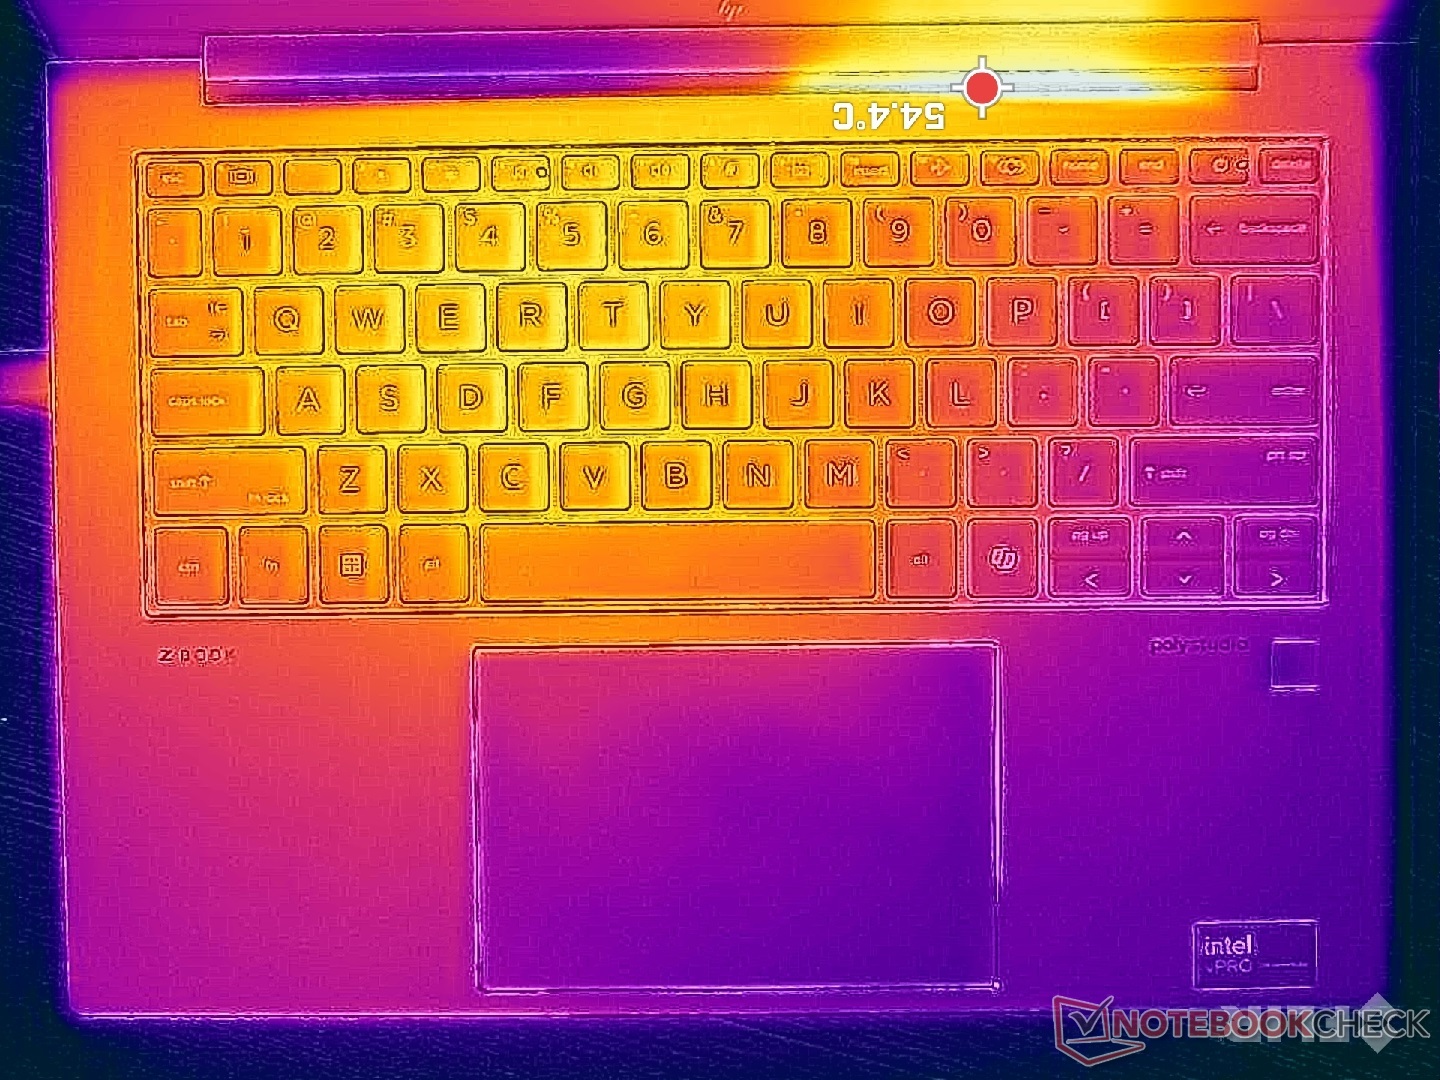
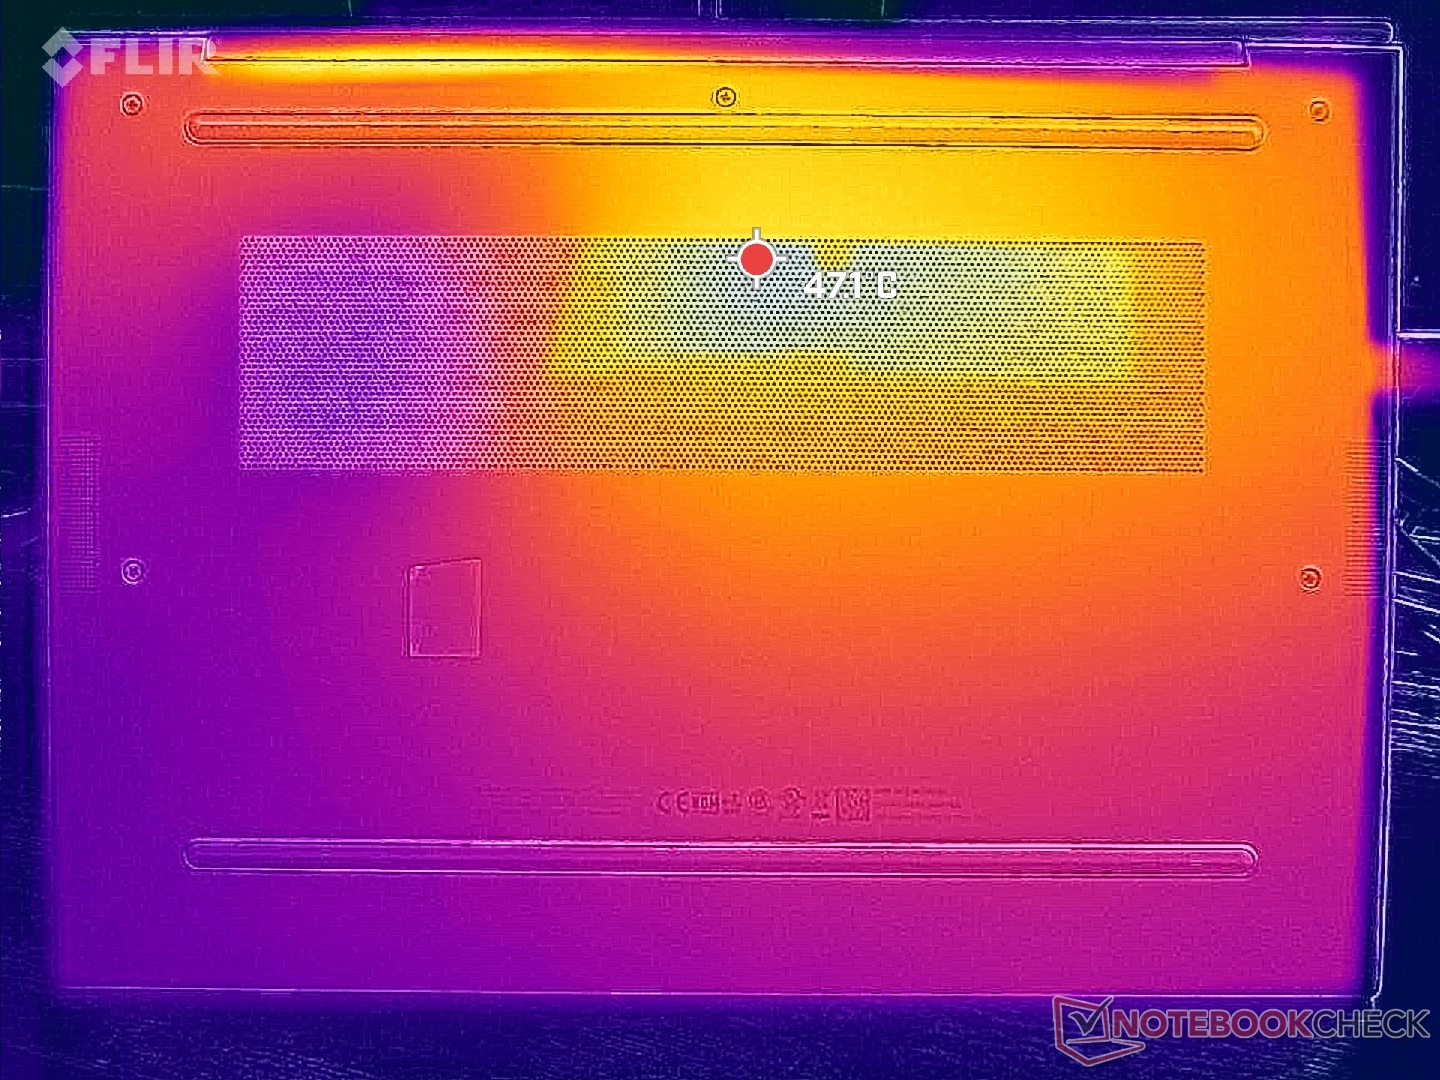
Prueba de estrés
Al ejecutar el estrés Prime95, la CPU aumentaría a 2,9 GHz y 63 W antes de alcanzar los 93 C sólo unos segundos después. A partir de entonces, caería bruscamente a sólo 1,2 GHz y 26 W para mantener una temperatura del núcleo más fría de 78 C. El rendimiento Turbo Boost muy limitado se alinea con nuestros resultados del bucle CineBench R15 xT señalados anteriormente.
Tanto la CPU como la GPU tienden a rondar los 70 C cuando se ejecutan cargas exigentes durante largos periodos, lo que está en la media para un subportátil y cerca de lo que registramos en el Firefly 14 G10 A.
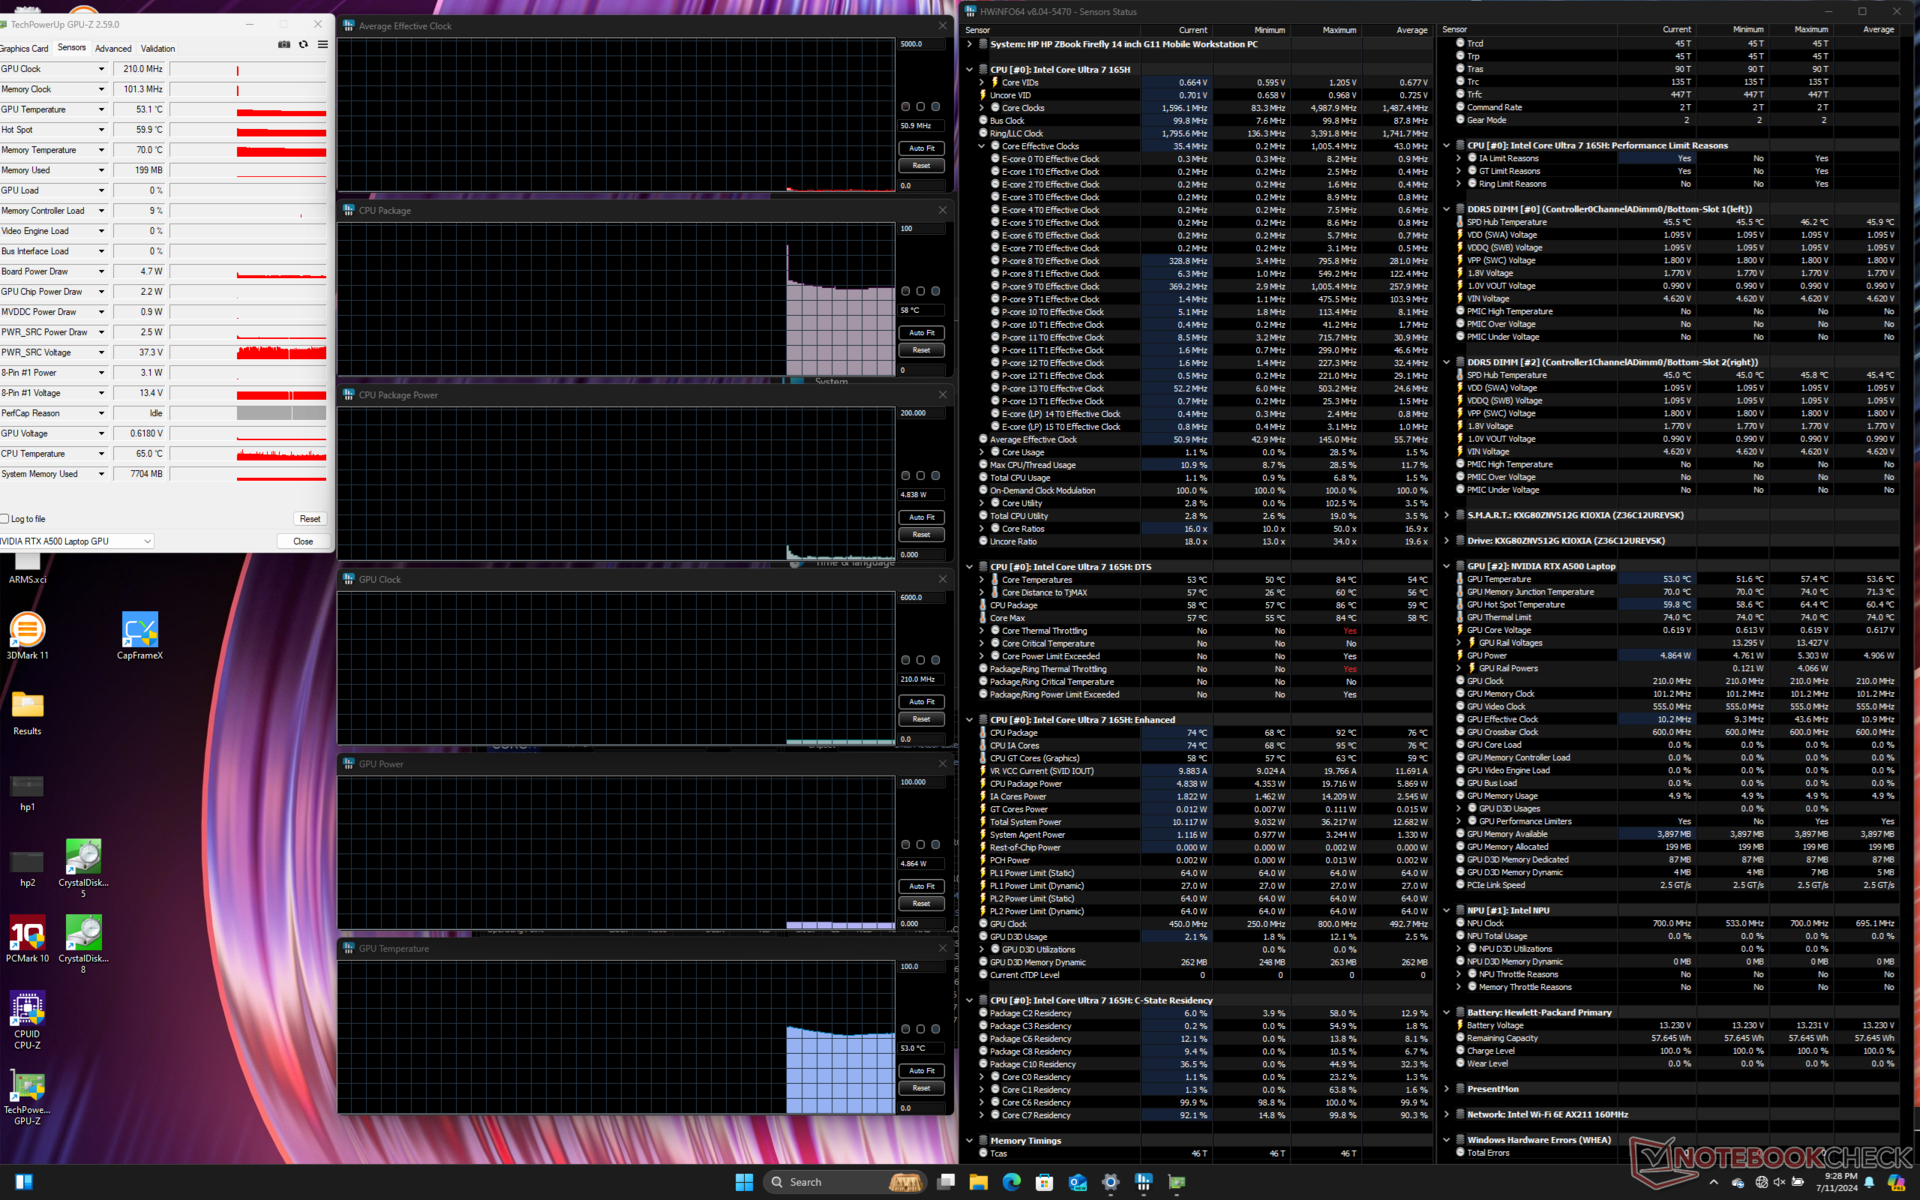
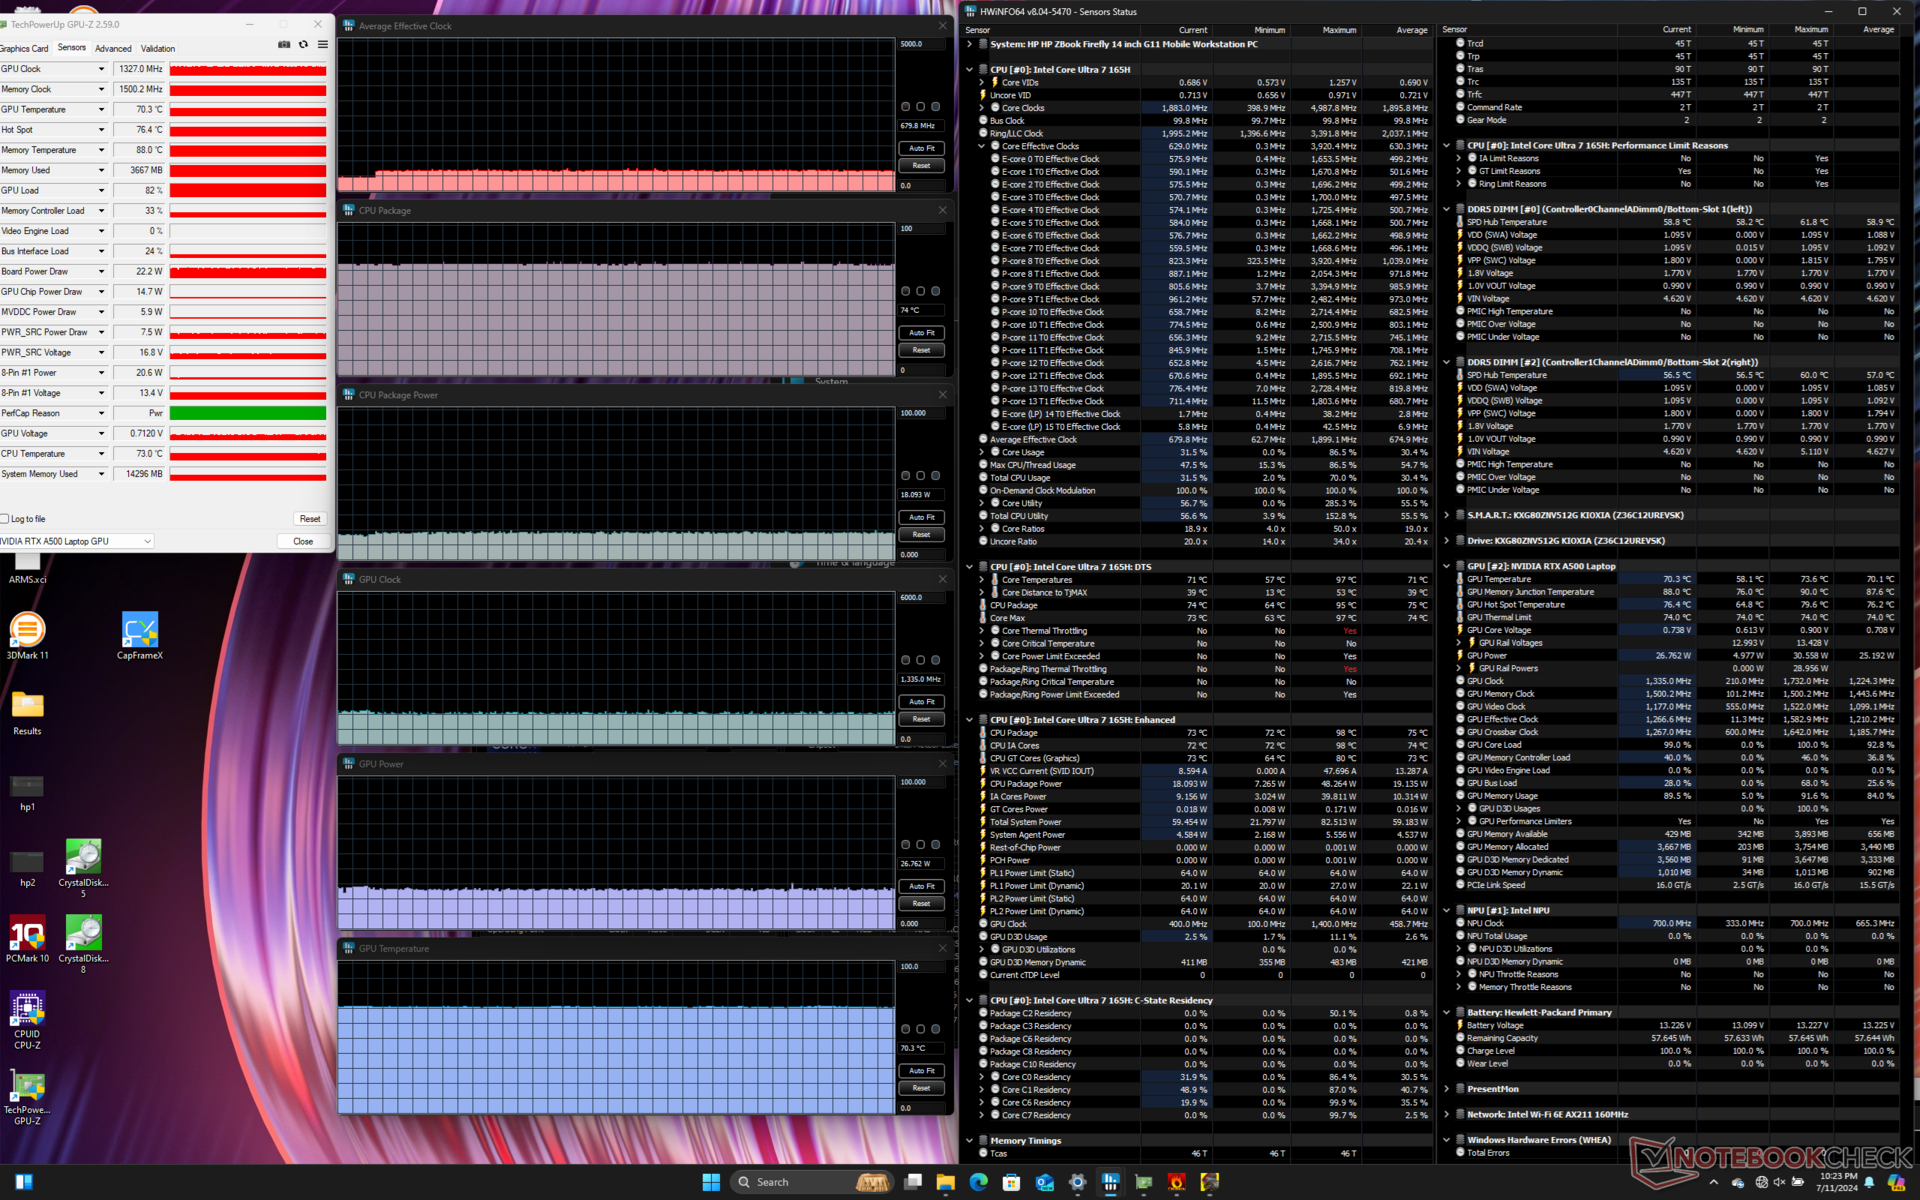
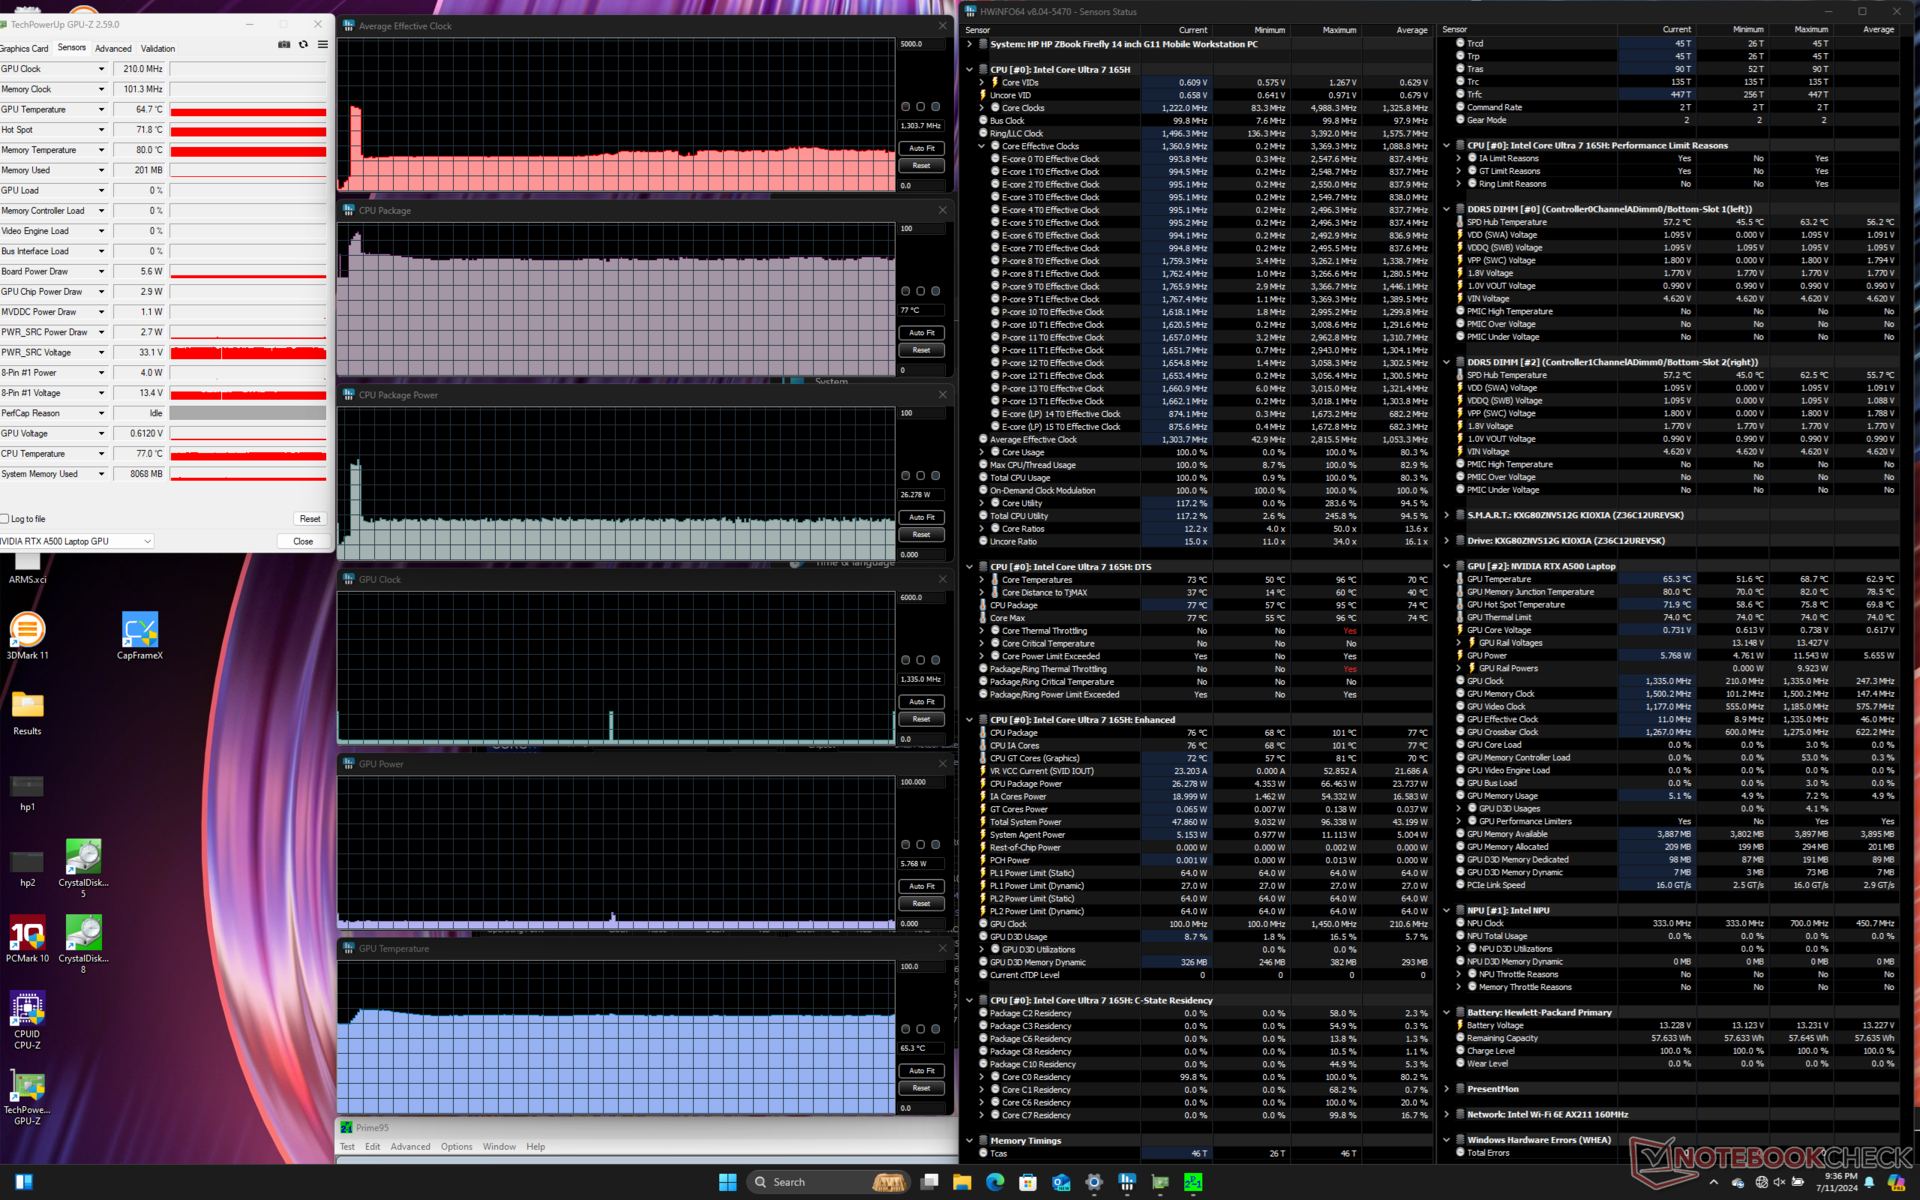
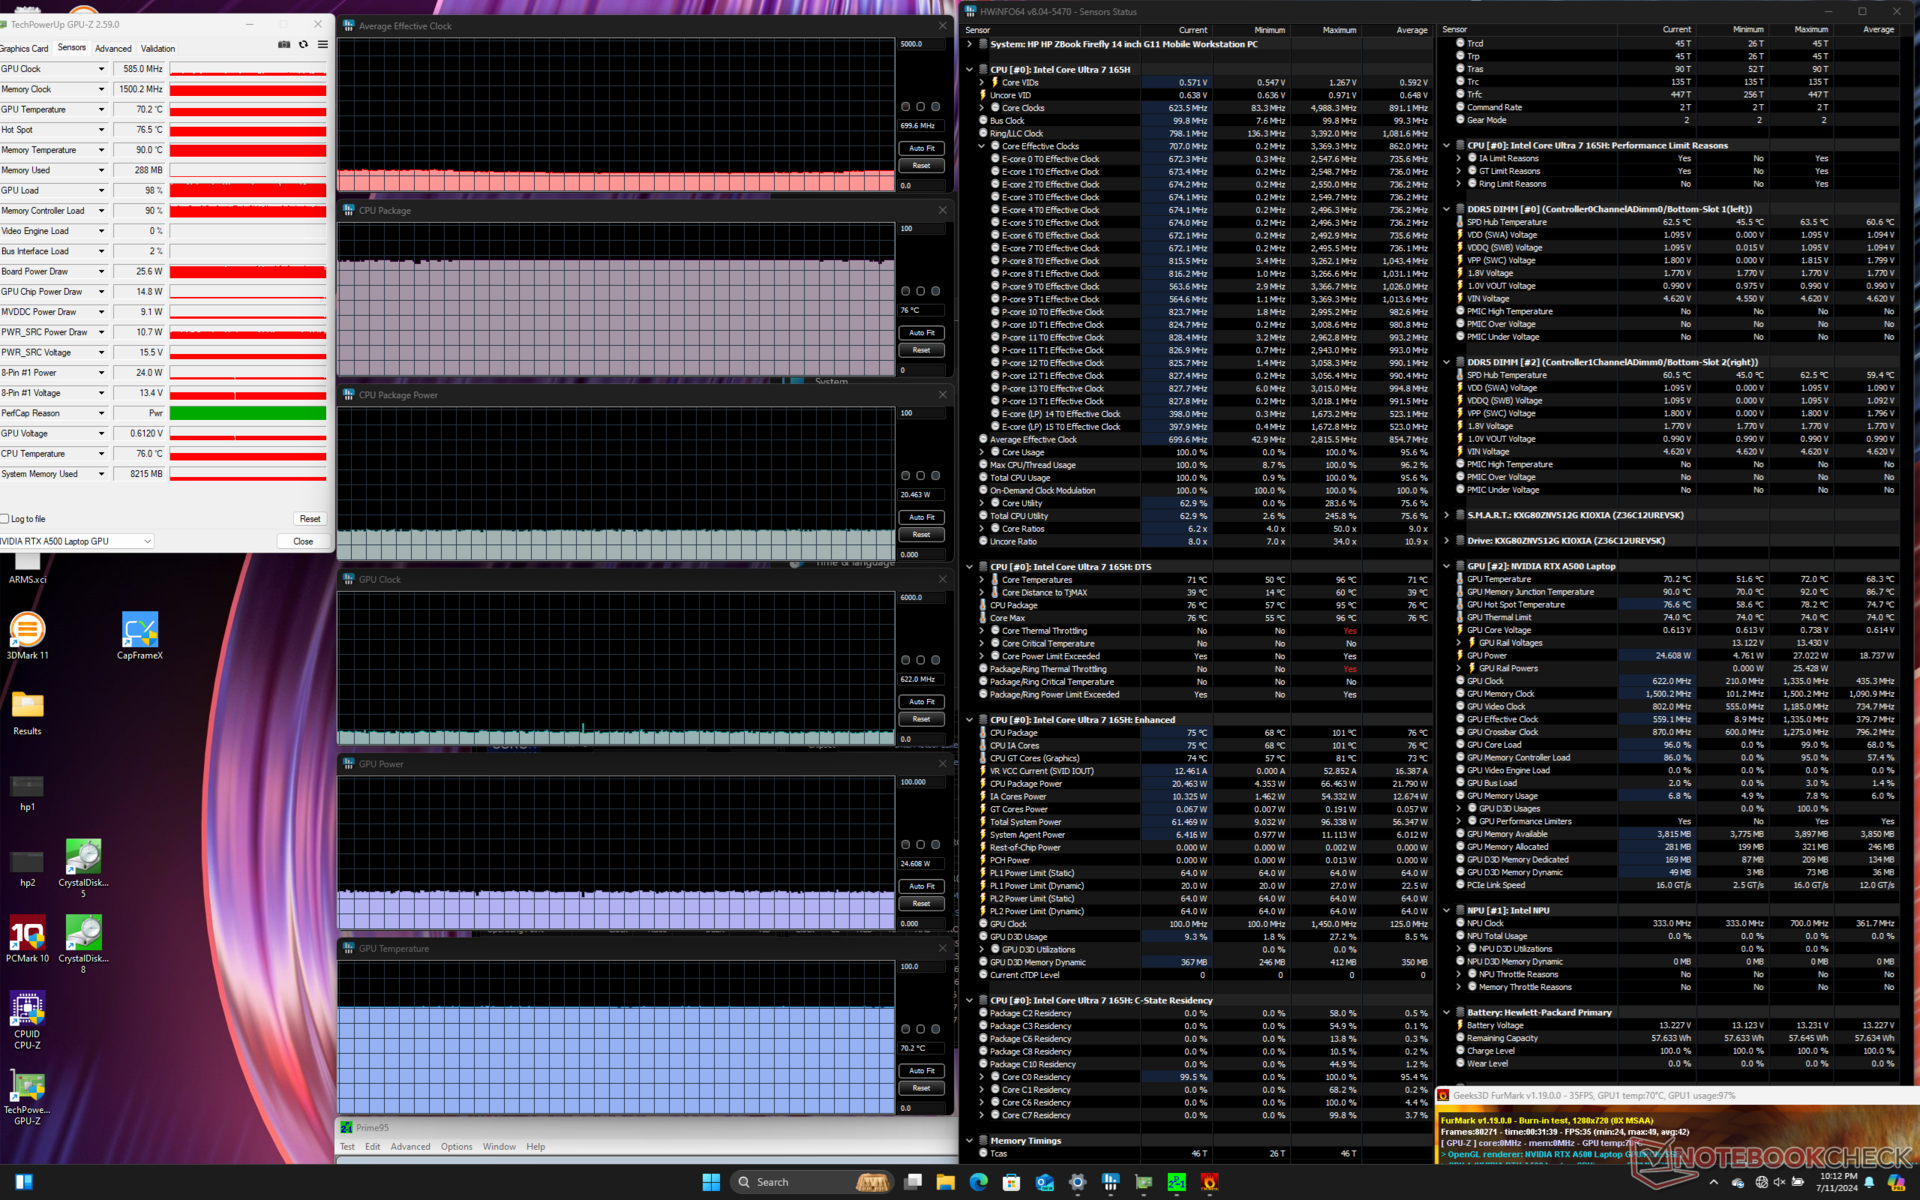
| Reloj medio de la CPU (GHz) | Reloj medio de la GPU (MHz) | Temperatura media dela CPU (°C) | Temperatura media de la GPU (°C) | |
| Sistema en reposo | -- | -- | 58 | 53 |
| Prime95 Stress | 1.3 | -- | 77 | 65 |
| Prime95+ FurMark Estrés | 0,7 | 622 | 76 | 70 |
| Cyberpunk 2077 Estrés | ~0,7 | 1335 | 74 | 70 |
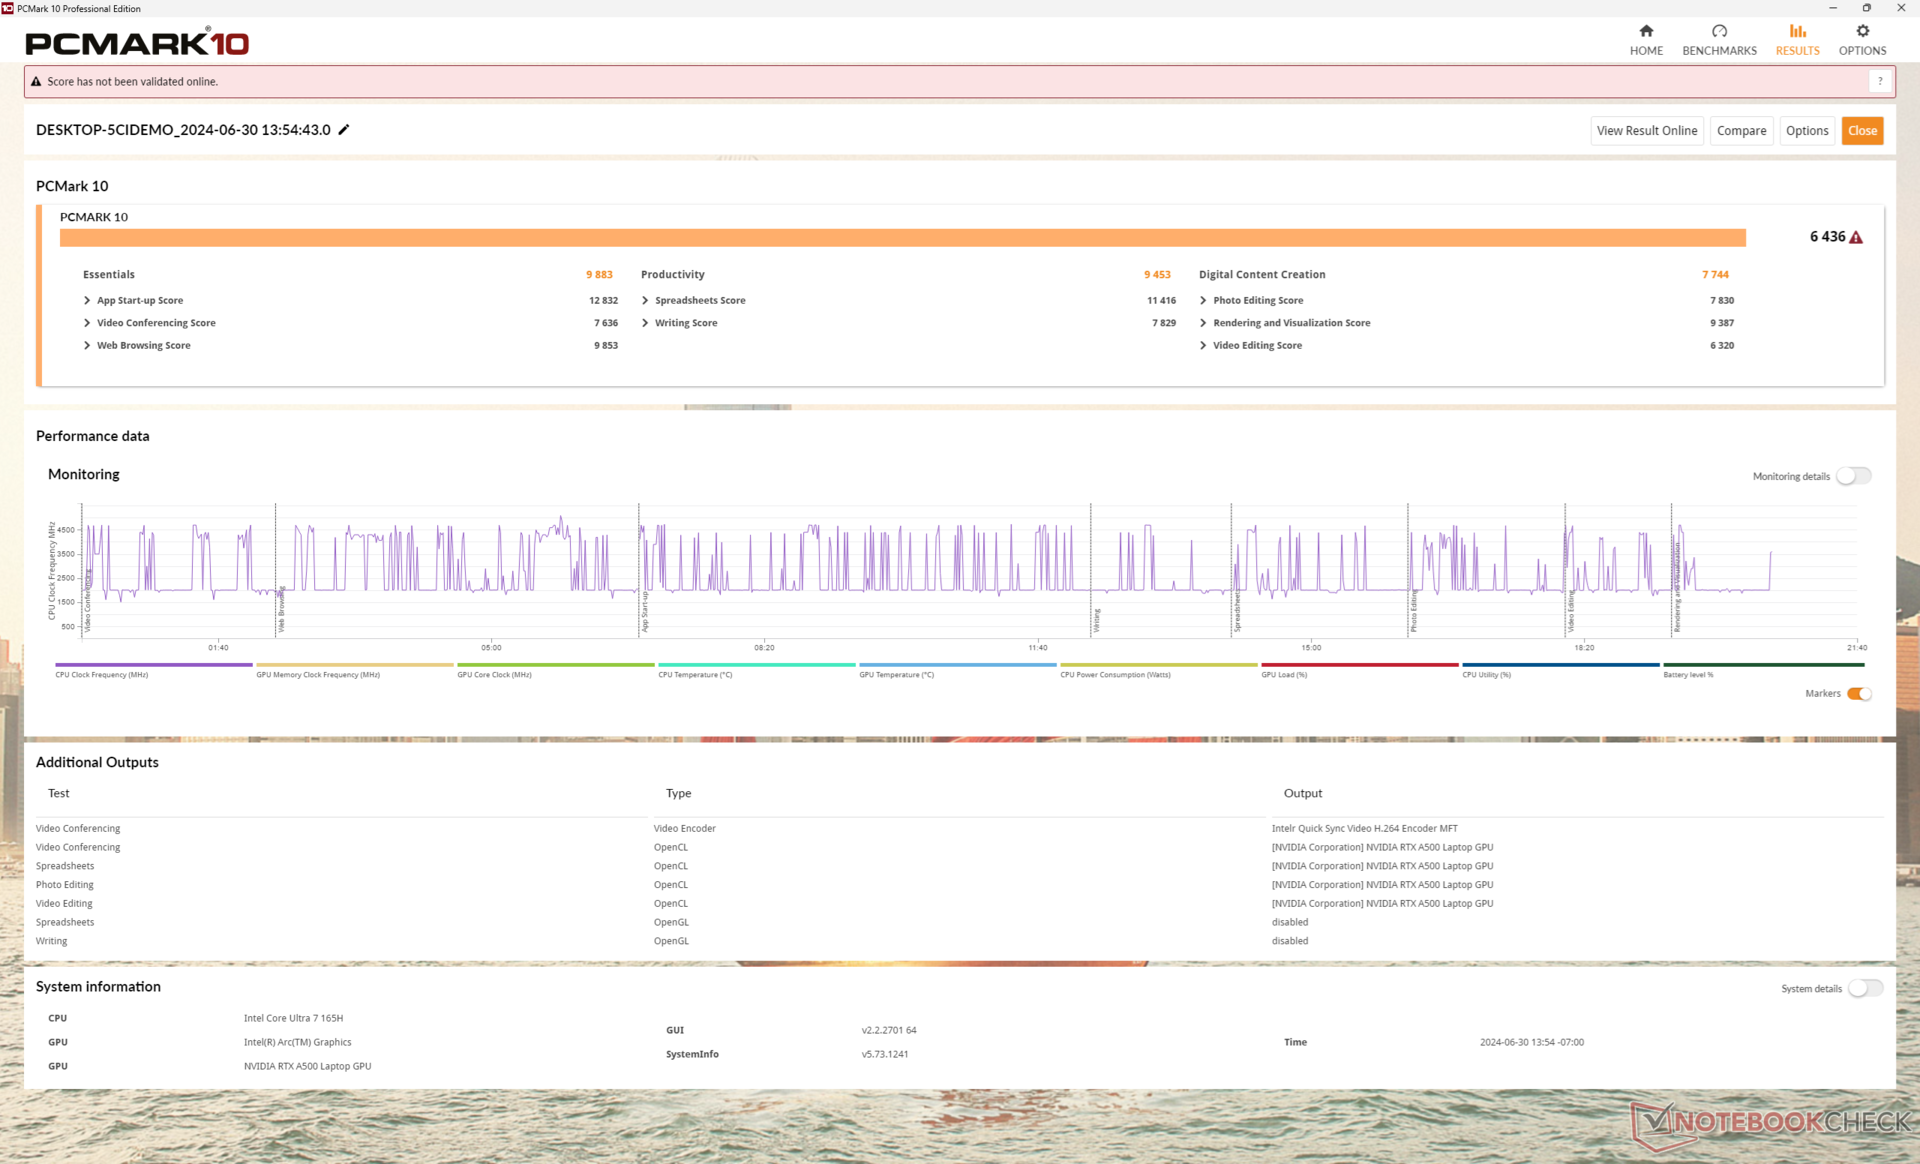
Rendimiento del sistema
Las puntuaciones de PCMark son casi idénticas a las del Firefly 14 G10 A para demostrar que la mayoría de las aplicaciones cotidianas no se ejecutan más rápido en el último modelo. Por supuesto, otras aplicaciones más exigentes favorecen a nuestro Firefly 14 G11 de forma mucho más consistente como se muestra en nuestra sección de Rendimiento de la GPU más abajo.
CrossMark: Overall | Productivity | Creativity | Responsiveness
WebXPRT 3: Overall
WebXPRT 4: Overall
Mozilla Kraken 1.1: Total
| PCMark 10 / Score | |
| Dell Precision 5000 5490 | |
| Lenovo ThinkPad P14s G4 21HF0017GE | |
| HP ZBook Firefly 14 G11 | |
| Medio Intel Core Ultra 7 165H, NVIDIA RTX A500 Laptop GPU (n=1) | |
| HP ZBook Firefly 14 G10 A | |
| Asus ExpertBook B3 B3404CVF | |
| HP ZBook Firefly 14 G8 2C9Q2EA | |
| PCMark 10 / Essentials | |
| Dell Precision 5000 5490 | |
| Asus ExpertBook B3 B3404CVF | |
| Lenovo ThinkPad P14s G4 21HF0017GE | |
| HP ZBook Firefly 14 G11 | |
| Medio Intel Core Ultra 7 165H, NVIDIA RTX A500 Laptop GPU (n=1) | |
| HP ZBook Firefly 14 G10 A | |
| HP ZBook Firefly 14 G8 2C9Q2EA | |
| PCMark 10 / Productivity | |
| Lenovo ThinkPad P14s G4 21HF0017GE | |
| HP ZBook Firefly 14 G11 | |
| Medio Intel Core Ultra 7 165H, NVIDIA RTX A500 Laptop GPU (n=1) | |
| HP ZBook Firefly 14 G10 A | |
| Dell Precision 5000 5490 | |
| Asus ExpertBook B3 B3404CVF | |
| HP ZBook Firefly 14 G8 2C9Q2EA | |
| PCMark 10 / Digital Content Creation | |
| Dell Precision 5000 5490 | |
| Lenovo ThinkPad P14s G4 21HF0017GE | |
| HP ZBook Firefly 14 G11 | |
| Medio Intel Core Ultra 7 165H, NVIDIA RTX A500 Laptop GPU (n=1) | |
| HP ZBook Firefly 14 G10 A | |
| Asus ExpertBook B3 B3404CVF | |
| HP ZBook Firefly 14 G8 2C9Q2EA | |
| CrossMark / Overall | |
| Lenovo ThinkPad P14s G4 21HF0017GE | |
| Asus ExpertBook B3 B3404CVF | |
| Dell Precision 5000 5490 | |
| HP ZBook Firefly 14 G11 | |
| Medio Intel Core Ultra 7 165H, NVIDIA RTX A500 Laptop GPU (n=1) | |
| CrossMark / Productivity | |
| Asus ExpertBook B3 B3404CVF | |
| Lenovo ThinkPad P14s G4 21HF0017GE | |
| Dell Precision 5000 5490 | |
| HP ZBook Firefly 14 G11 | |
| Medio Intel Core Ultra 7 165H, NVIDIA RTX A500 Laptop GPU (n=1) | |
| CrossMark / Creativity | |
| Lenovo ThinkPad P14s G4 21HF0017GE | |
| Dell Precision 5000 5490 | |
| HP ZBook Firefly 14 G11 | |
| Medio Intel Core Ultra 7 165H, NVIDIA RTX A500 Laptop GPU (n=1) | |
| Asus ExpertBook B3 B3404CVF | |
| CrossMark / Responsiveness | |
| Asus ExpertBook B3 B3404CVF | |
| Lenovo ThinkPad P14s G4 21HF0017GE | |
| Dell Precision 5000 5490 | |
| HP ZBook Firefly 14 G11 | |
| Medio Intel Core Ultra 7 165H, NVIDIA RTX A500 Laptop GPU (n=1) | |
| WebXPRT 3 / Overall | |
| Lenovo ThinkPad P14s G4 21HF0017GE | |
| HP ZBook Firefly 14 G11 | |
| Medio Intel Core Ultra 7 165H, NVIDIA RTX A500 Laptop GPU (n=1) | |
| Dell Precision 5000 5490 | |
| Asus ExpertBook B3 B3404CVF | |
| HP ZBook Firefly 14 G10 A | |
| HP ZBook Firefly 14 G10 A | |
| WebXPRT 4 / Overall | |
| Lenovo ThinkPad P14s G4 21HF0017GE | |
| Lenovo ThinkPad P14s G4 21HF0017GE | |
| Dell Precision 5000 5490 | |
| Asus ExpertBook B3 B3404CVF | |
| HP ZBook Firefly 14 G11 | |
| Medio Intel Core Ultra 7 165H, NVIDIA RTX A500 Laptop GPU (n=1) | |
| Mozilla Kraken 1.1 / Total | |
| HP ZBook Firefly 14 G8 2C9Q2EA | |
| HP ZBook Firefly 14 G10 A | |
| HP ZBook Firefly 14 G10 A | |
| Dell Precision 5000 5490 | |
| HP ZBook Firefly 14 G11 | |
| Medio Intel Core Ultra 7 165H, NVIDIA RTX A500 Laptop GPU (n=1) | |
| Asus ExpertBook B3 B3404CVF | |
| Lenovo ThinkPad P14s G4 21HF0017GE | |
* ... más pequeño es mejor
| PCMark 10 Score | 6436 puntos | |
ayuda | ||
| AIDA64 / Memory Copy | |
| Dell Precision 5000 5490 | |
| Medio Intel Core Ultra 7 165H (72539 - 88831, n=3) | |
| HP ZBook Firefly 14 G11 | |
| Asus ExpertBook B3 B3404CVF | |
| HP ZBook Firefly 14 G10 A | |
| Lenovo ThinkPad P14s G4 21HF0017GE | |
| HP ZBook Firefly 14 G8 2C9Q2EA | |
| AIDA64 / Memory Read | |
| Dell Precision 5000 5490 | |
| Medio Intel Core Ultra 7 165H (73908 - 87187, n=3) | |
| HP ZBook Firefly 14 G11 | |
| Asus ExpertBook B3 B3404CVF | |
| HP ZBook Firefly 14 G10 A | |
| Lenovo ThinkPad P14s G4 21HF0017GE | |
| HP ZBook Firefly 14 G8 2C9Q2EA | |
| AIDA64 / Memory Write | |
| Dell Precision 5000 5490 | |
| HP ZBook Firefly 14 G10 A | |
| Medio Intel Core Ultra 7 165H (72057 - 75839, n=3) | |
| HP ZBook Firefly 14 G11 | |
| Asus ExpertBook B3 B3404CVF | |
| Lenovo ThinkPad P14s G4 21HF0017GE | |
| HP ZBook Firefly 14 G8 2C9Q2EA | |
| AIDA64 / Memory Latency | |
| Dell Precision 5000 5490 | |
| Medio Intel Core Ultra 7 165H (120.8 - 145.6, n=3) | |
| HP ZBook Firefly 14 G11 | |
| HP ZBook Firefly 14 G10 A | |
| Lenovo ThinkPad P14s G4 21HF0017GE | |
| Asus ExpertBook B3 B3404CVF | |
| HP ZBook Firefly 14 G8 2C9Q2EA | |
* ... más pequeño es mejor
Latencia del CPD
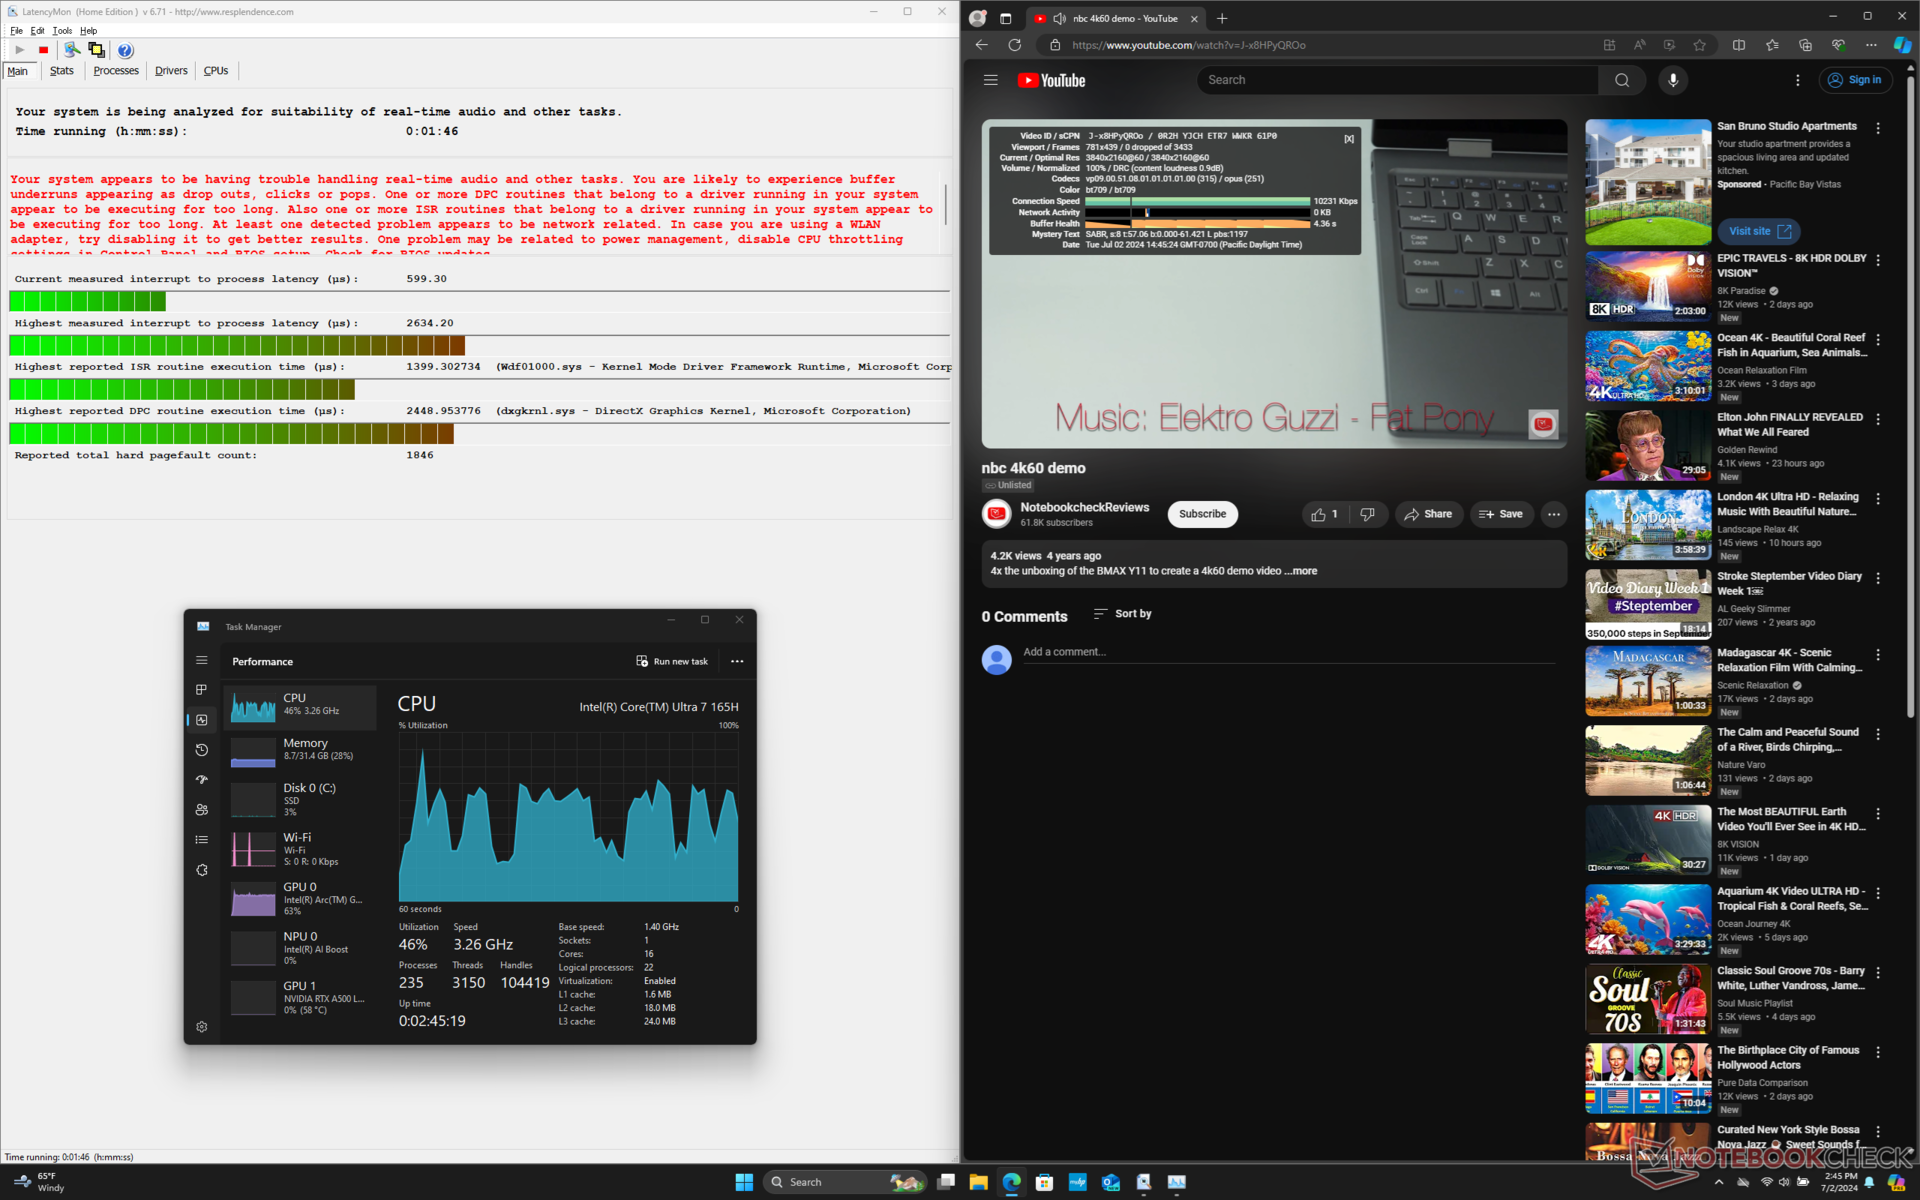
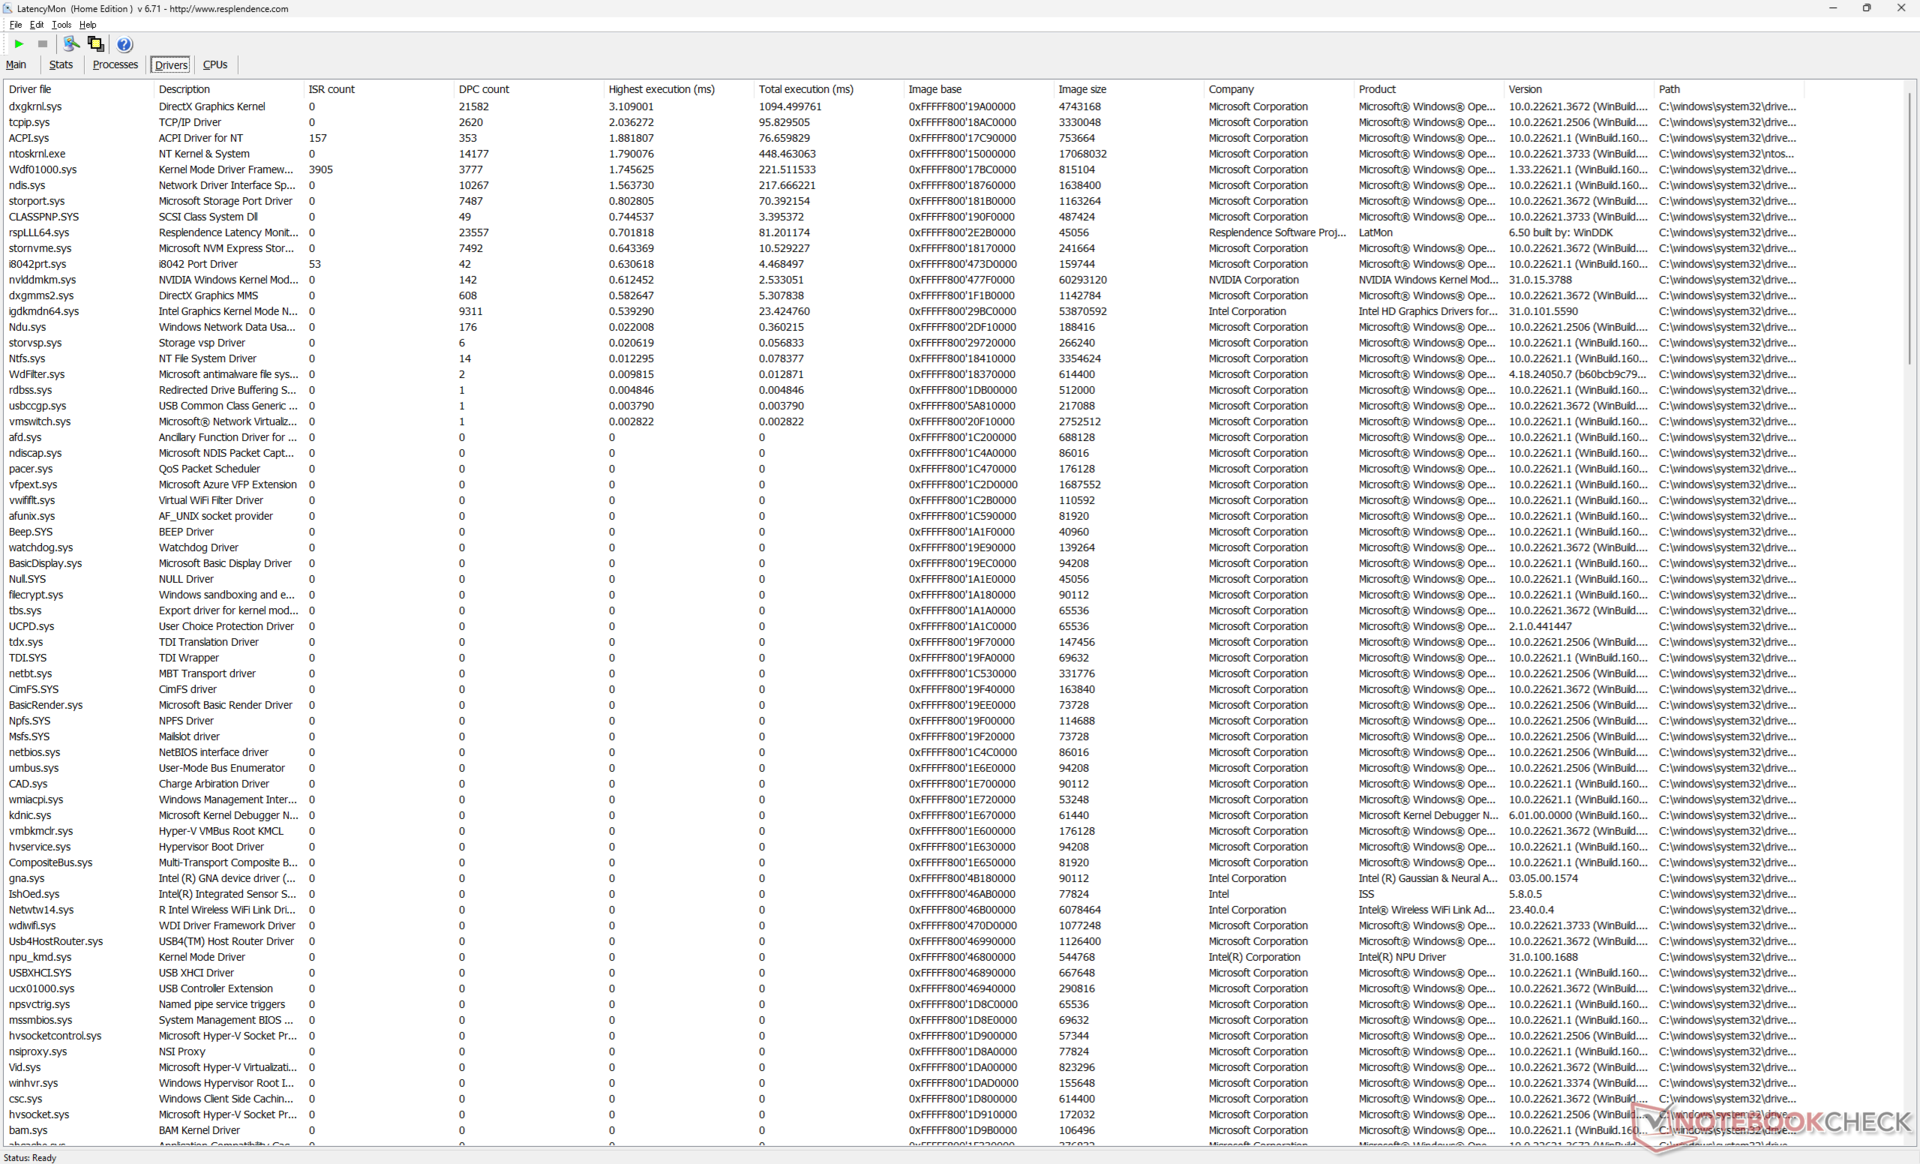
LatencyMon revela problemas de CPD al abrir varias pestañas del navegador de nuestra página principal. por lo demás, la reproducción de vídeo 4K a 60 FPS es perfecta sin que se registren caídas de fotogramas, pero la utilización de la CPU sería inusualmente alta con picos de hasta el 50 por ciento a lo largo de la prueba.
| DPC Latencies / LatencyMon - interrupt to process latency (max), Web, Youtube, Prime95 | |
| HP ZBook Firefly 14 G8 2C9Q2EA | |
| HP ZBook Firefly 14 G11 | |
| Dell Precision 5000 5490 | |
| Lenovo ThinkPad P14s G4 21HF0017GE | |
| HP ZBook Firefly 14 G10 A | |
| Asus ExpertBook B3 B3404CVF | |
* ... más pequeño es mejor
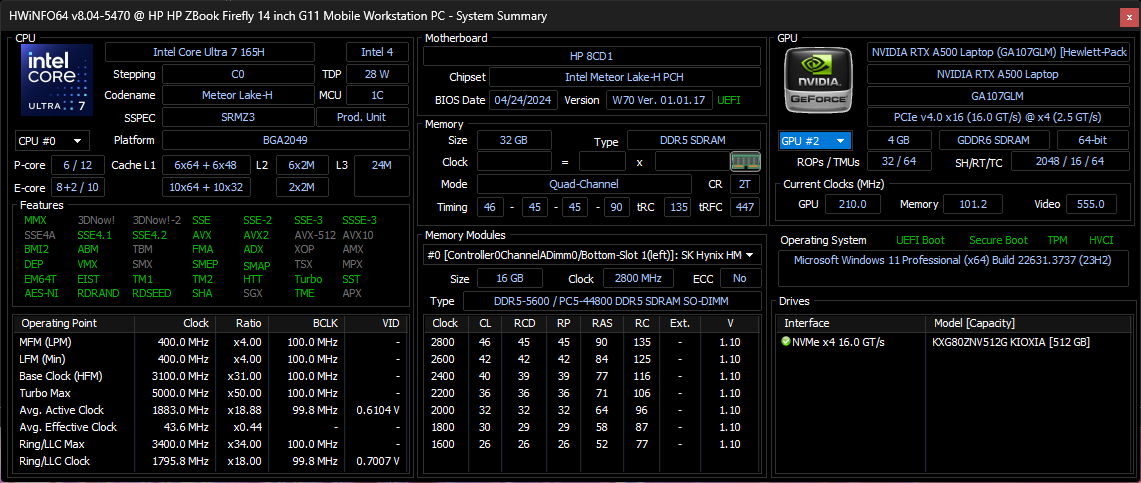
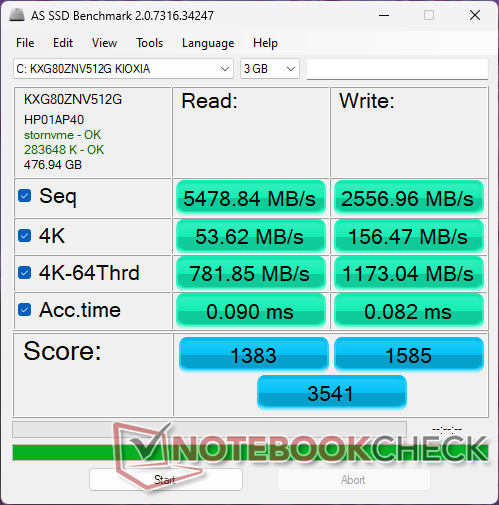
Dispositivos de almacenamiento
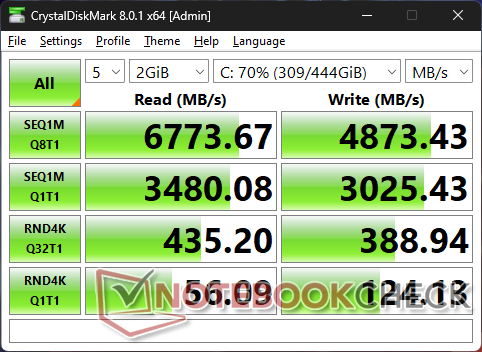
HP parece seguir apostando por las unidades de Kioxia o Samsung para su serie Firefly 14. En este caso, nuestra unidad viene con el mismo Kioxia XG8 KXG80ZNV512G que se encuentra en el Firefly 14 G8. La unidad PCIe4 x4 puede ofrecer velocidades de transferencia de hasta 6700 MB/s, pero desgraciadamente se ralentiza hasta los 3600 MB/s tras sólo un minuto en nuestra prueba de estrés en bucle DiskSpd, como muestra el gráfico siguiente.

| Drive Performance Rating - Percent | |
| Lenovo ThinkPad P14s G4 21HF0017GE | |
| Asus ExpertBook B3 B3404CVF | |
| Dell Precision 5000 5490 | |
| HP ZBook Firefly 14 G11 | |
| HP ZBook Firefly 14 G8 2C9Q2EA | |
| HP ZBook Firefly 14 G10 A | |
* ... más pequeño es mejor
Disk Throttling: DiskSpd Read Loop, Queue Depth 8
Rendimiento de la GPU - Gráficos Nvidia RTX A500 más antiguos
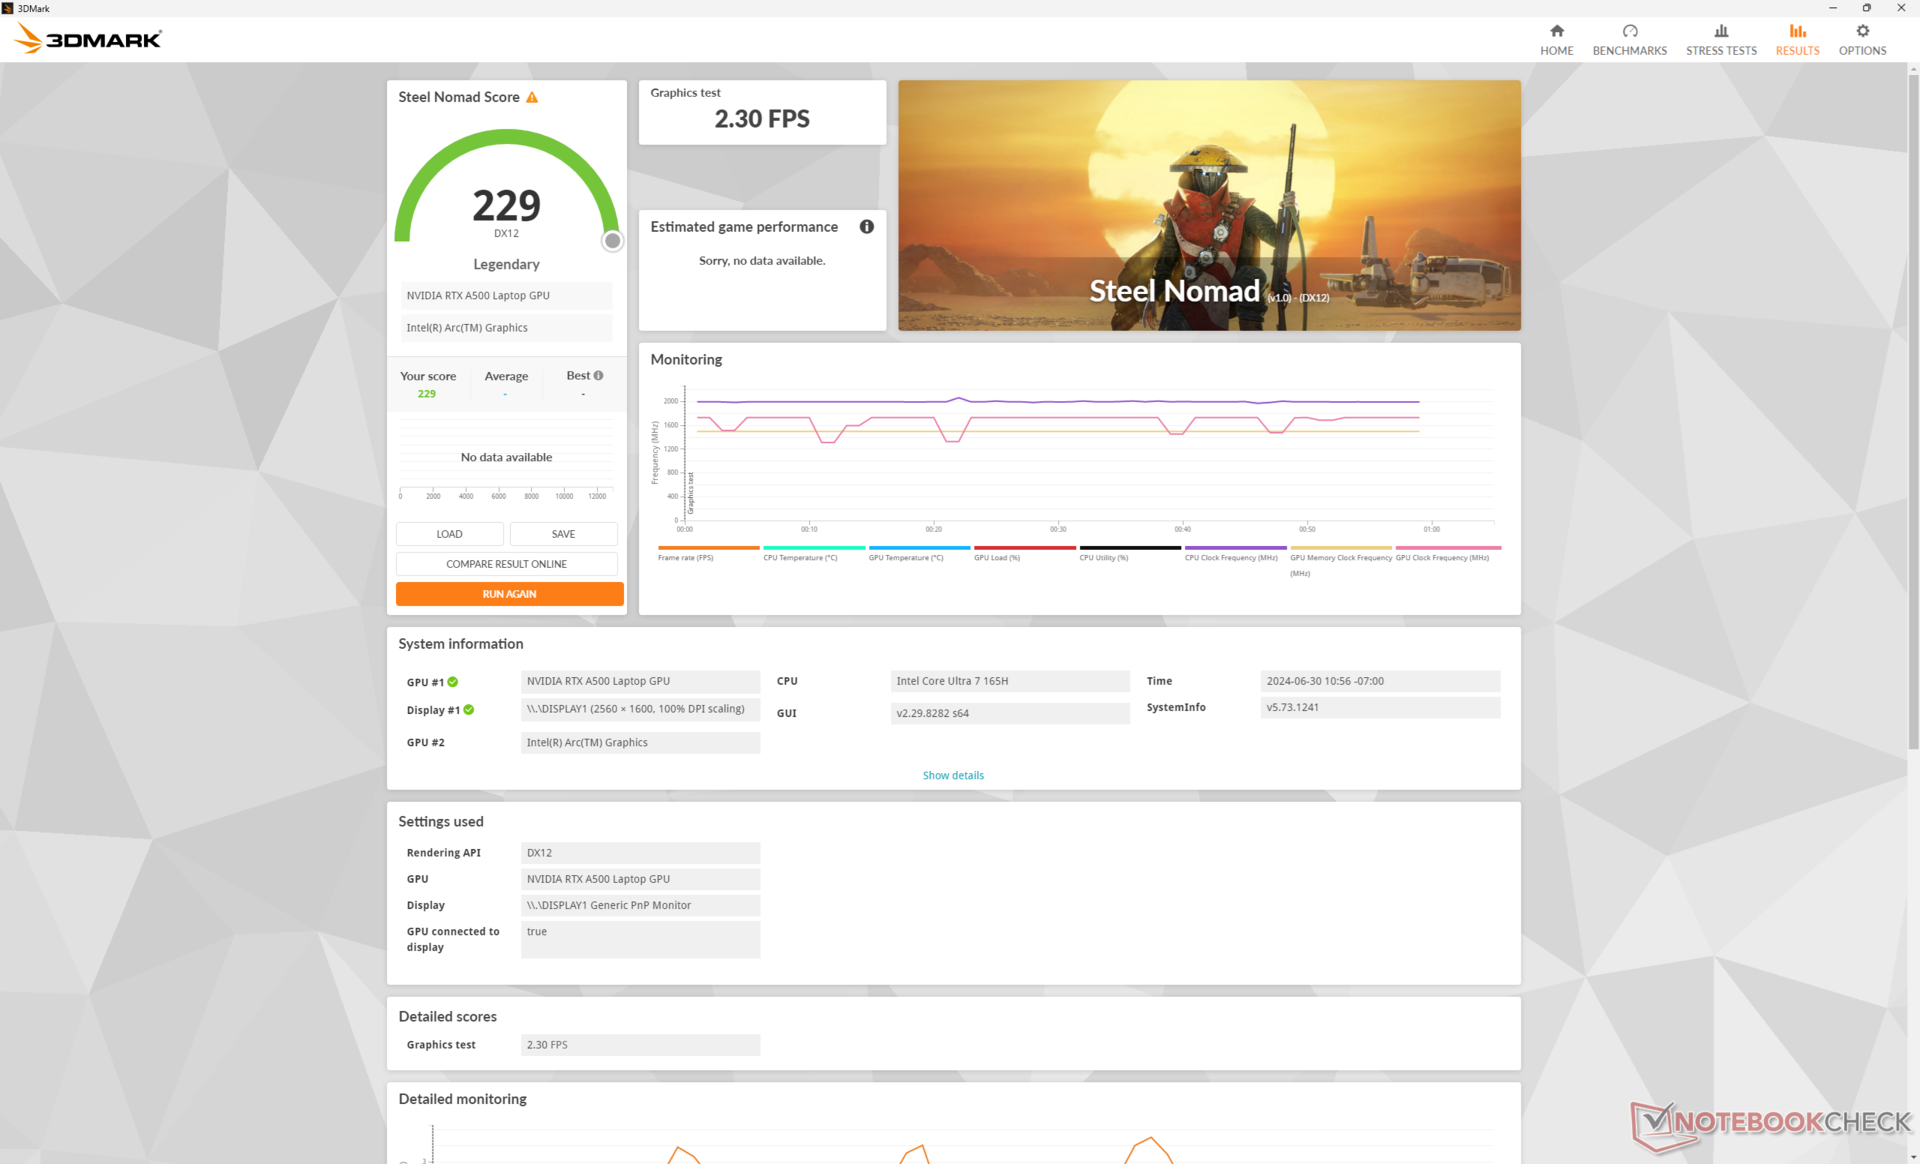
La RTX A500 es la GPU profesional discreta más lenta disponible basada en la antigua arquitectura Ampere y es la única opción discreta para la Firefly 14 G11. La GPU está empezando a mostrar su edad ya que las últimas GPU integradas de la competencia como la Arc 8 o Radeon 780M pueden casi igualar a la RTX A500 en las pruebas de rendimiento 3DMark y en los juegos. Sin embargo, la GPU Nvidia sigue corriendo vueltas alrededor de la Intel y AMD iGPU cuando se trata de aplicaciones profesionales como Blender o los representados en SPECviewperf.
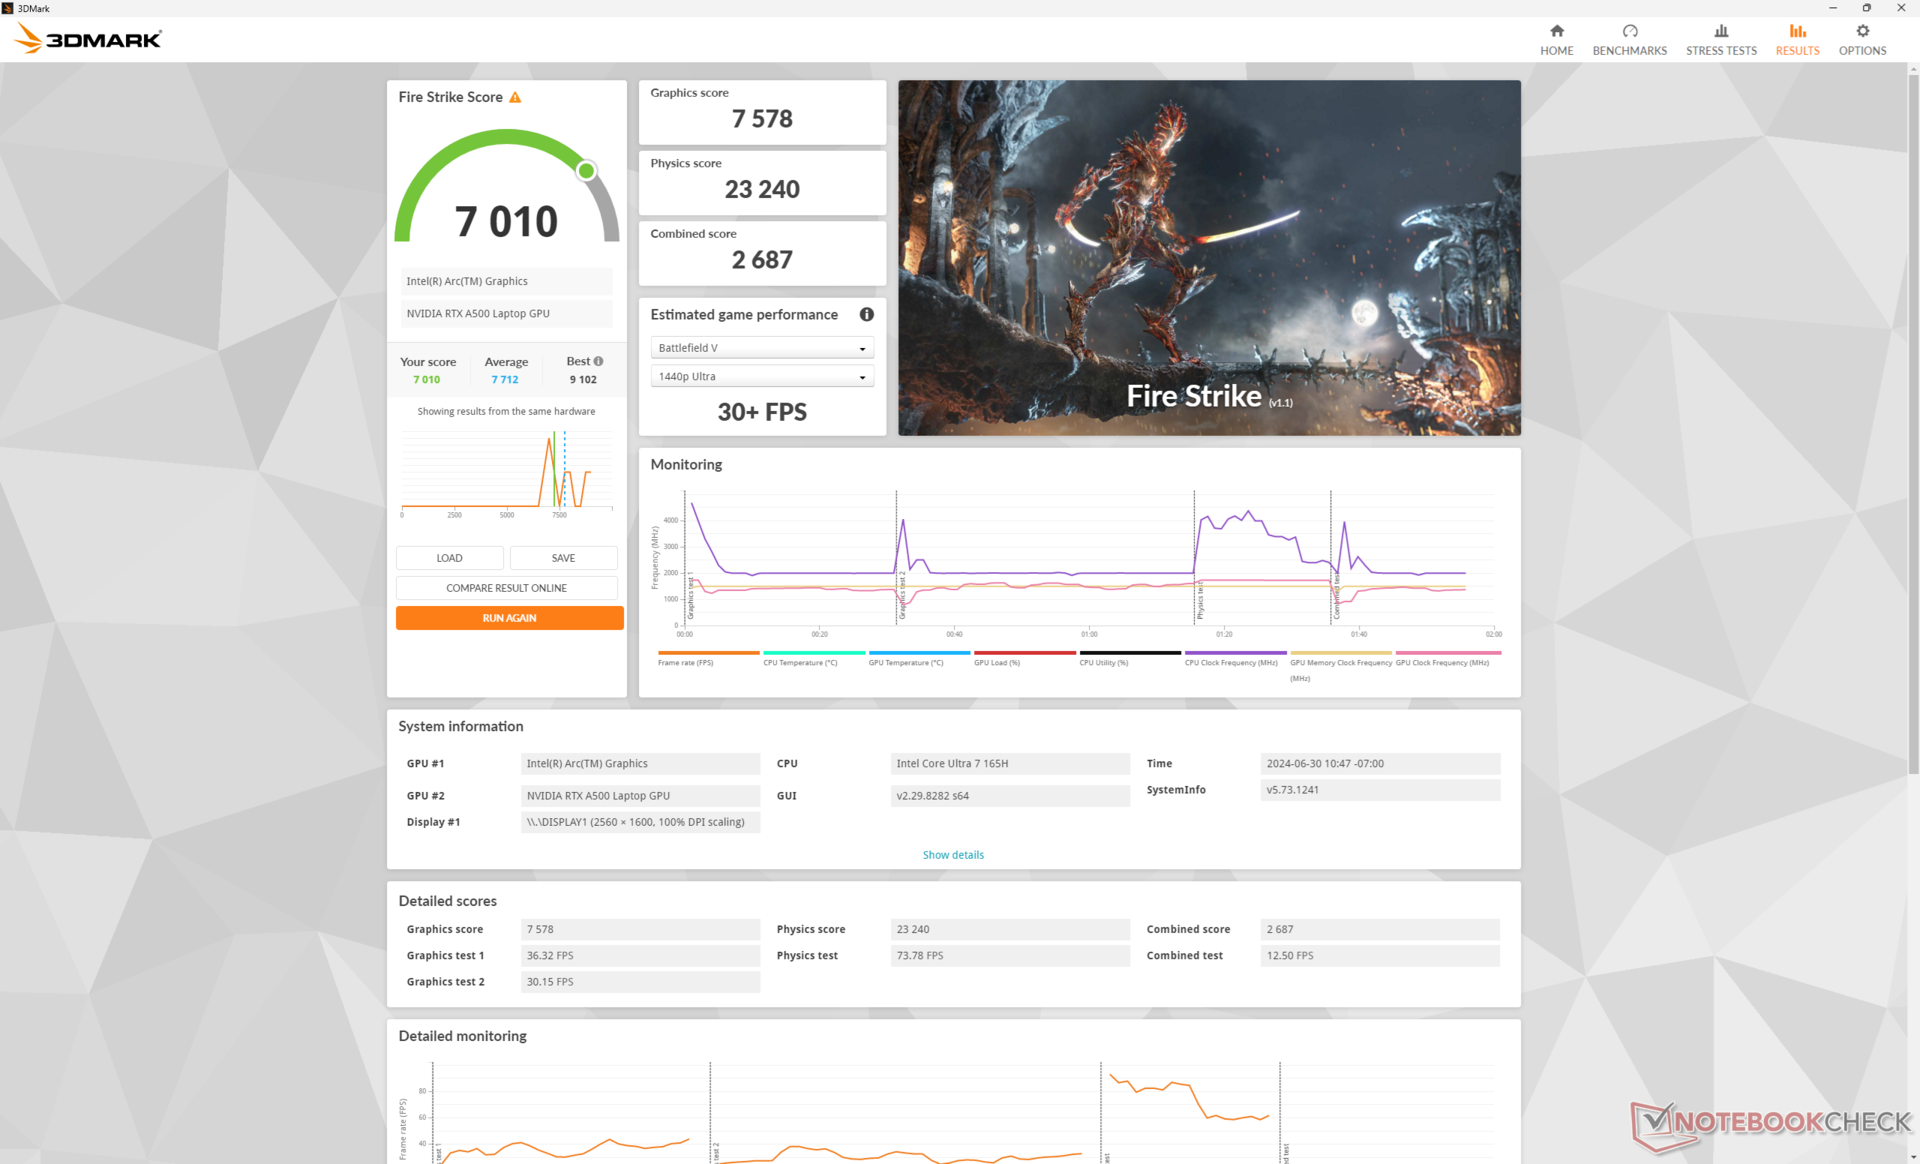
| Perfil de potencia | Puntuación de gráficos | Puntuación de física | Puntuación combinada |
| Modo Rendimiento | 7578 | 23240 | 2687 |
| Modo equilibrado | 7554 (-0%) | 22308 (-4%) | 2695 (-0%) |
| Batería | 5706 (-25%) | 16248 (-30%) | 2120 (-21%) |
Parece que no hay apenas diferencias de rendimiento entre configurar el sistema en modo Rendimiento o en modo Equilibrado, como muestra nuestra tabla de resultados Fire Strike anterior. Sin embargo, el funcionamiento con batería tiene un impacto mucho más significativo tanto en la CPU como en la GPU.
| 3DMark Performance Rating - Percent | |
| Dell Precision 5000 5490 | |
| Dell Precision 5480 -3! | |
| Dell Precision 5000 5470 -9! | |
| HP ZBook Firefly 14 G11 | |
| Medio NVIDIA RTX A500 Laptop GPU | |
| Lenovo ThinkPad P14s G4 21HF0017GE -15! | |
| Asus ExpertBook B3 B3404CVF -32! | |
| Lenovo ThinkPad P14s G4 21K5000LGE -19! | |
| Lenovo ThinkPad P14s G3 AMD 21J6S05000 -15! | |
| HP ZBook Firefly 14 G10 A -31! | |
| HP ZBook Firefly 14 G9-6B8A2EA -16! | |
| HP ZBook Firefly 14 G9-6B8A2EA -16! | |
| Lenovo ThinkPad P14s Gen2-20VX000GGE -16! | |
| Lenovo ThinkPad P14s G2 AMD -16! | |
| HP ZBook Firefly 14 G7 -15! | |
| Lenovo ThinkPad P14s Gen1-20Y10002GE -16! | |
| HP ZBook 14u G6 6TP71EA -16! | |
| Lenovo ThinkPad P14s Gen1 20S40009GE -16! | |
| Lenovo ThinkPad P43s-20RH001FGE -16! | |
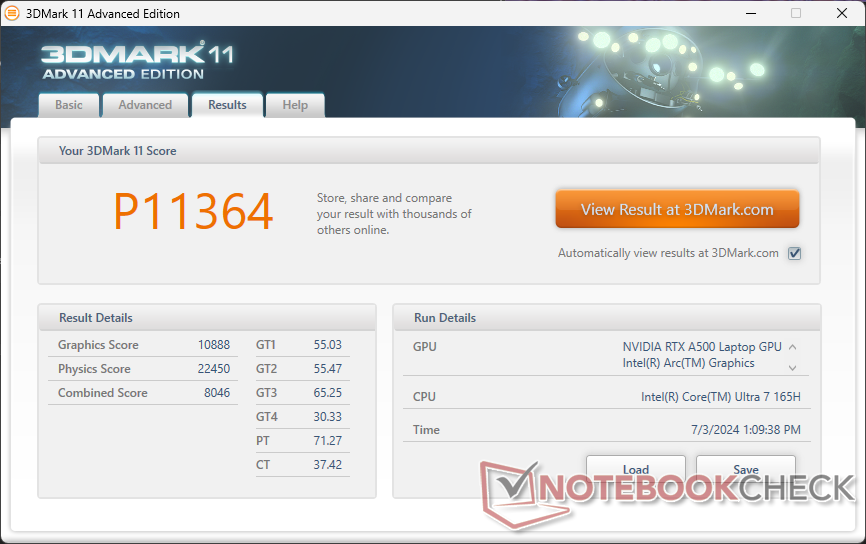
| 3DMark 11 Performance | 11364 puntos | |
| 3DMark Cloud Gate Standard Score | 30528 puntos | |
| 3DMark Fire Strike Score | 7010 puntos | |
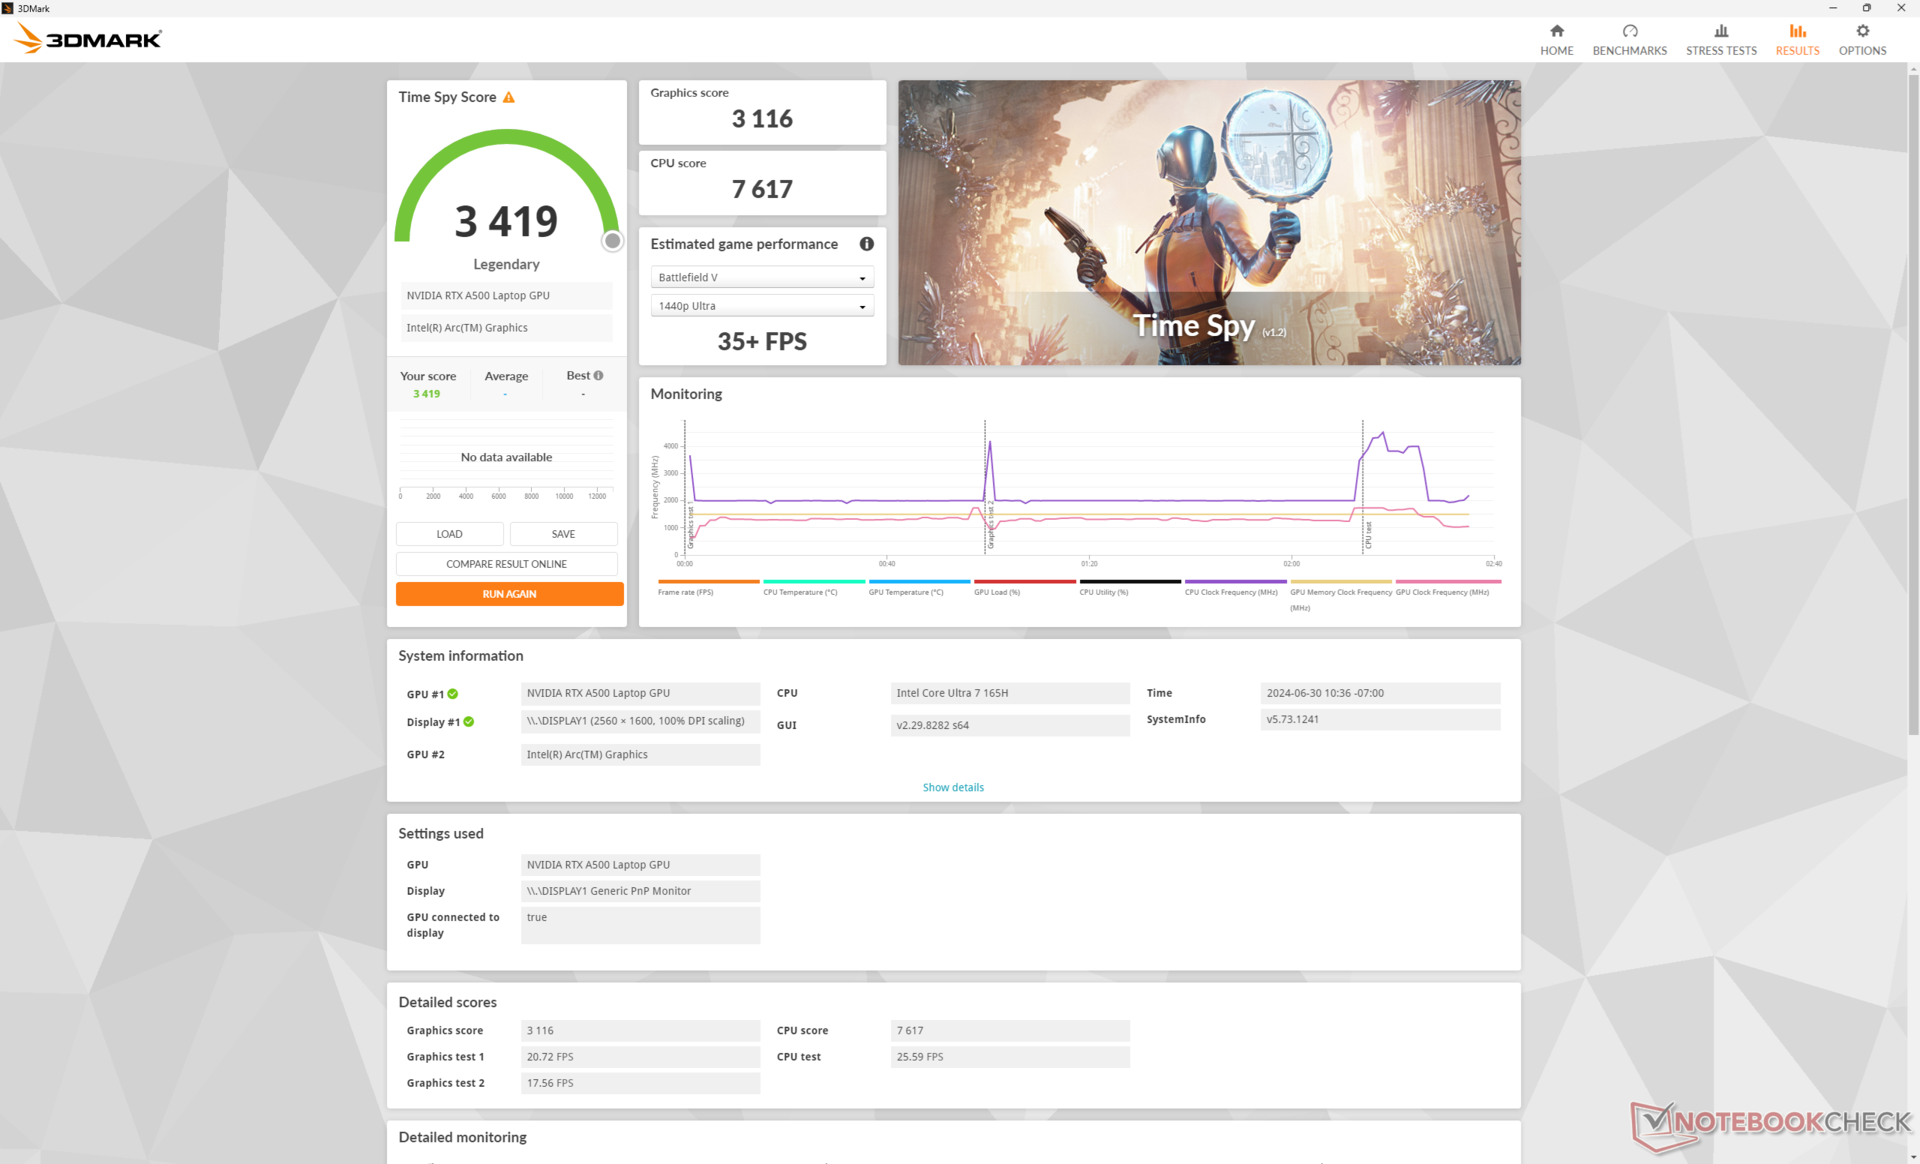
| 3DMark Time Spy Score | 3419 puntos | |
| 3DMark Steel Nomad Score | 229 puntos | |
ayuda | ||
* ... más pequeño es mejor
| Performance Rating - Percent | |
| Dell Precision 5000 5490 | |
| Asus ExpertBook B3 B3404CVF -1! | |
| Lenovo ThinkPad P14s G4 21HF0017GE | |
| HP ZBook Firefly 14 G11 | |
| HP ZBook Firefly 14 G8 2C9Q2EA -1! | |
| HP ZBook Firefly 14 G10 A -1! | |
| The Witcher 3 - 1920x1080 Ultra Graphics & Postprocessing (HBAO+) | |
| Dell Precision 5000 5490 | |
| Asus ExpertBook B3 B3404CVF | |
| Lenovo ThinkPad P14s G4 21HF0017GE | |
| HP ZBook Firefly 14 G11 | |
| HP ZBook Firefly 14 G10 A | |
| HP ZBook Firefly 14 G8 2C9Q2EA | |
| Final Fantasy XV Benchmark - 1920x1080 High Quality | |
| Dell Precision 5000 5490 | |
| Asus ExpertBook B3 B3404CVF | |
| Lenovo ThinkPad P14s G4 21HF0017GE | |
| HP ZBook Firefly 14 G11 | |
| HP ZBook Firefly 14 G10 A | |
| HP ZBook Firefly 14 G8 2C9Q2EA | |
| Strange Brigade - 1920x1080 ultra AA:ultra AF:16 | |
| Dell Precision 5000 5490 | |
| Asus ExpertBook B3 B3404CVF | |
| HP ZBook Firefly 14 G11 | |
| Lenovo ThinkPad P14s G4 21HF0017GE | |
| HP ZBook Firefly 14 G10 A | |
| Dota 2 Reborn - 1920x1080 ultra (3/3) best looking | |
| Dell Precision 5000 5490 | |
| Asus ExpertBook B3 B3404CVF | |
| Lenovo ThinkPad P14s G4 21HF0017GE | |
| HP ZBook Firefly 14 G11 | |
| HP ZBook Firefly 14 G8 2C9Q2EA | |
| HP ZBook Firefly 14 G10 A | |
| X-Plane 11.11 - 1920x1080 high (fps_test=3) | |
| Asus ExpertBook B3 B3404CVF | |
| HP ZBook Firefly 14 G11 | |
| Dell Precision 5000 5490 | |
| Lenovo ThinkPad P14s G4 21HF0017GE | |
| HP ZBook Firefly 14 G8 2C9Q2EA | |
| HP ZBook Firefly 14 G10 A | |
| Far Cry 5 - 1920x1080 Ultra Preset AA:T | |
| Dell Precision 5000 5490 | |
| Lenovo ThinkPad P14s G4 21HF0017GE | |
| HP ZBook Firefly 14 G11 | |
| HP ZBook Firefly 14 G8 2C9Q2EA | |
| Cyberpunk 2077 2.2 Phantom Liberty | |
| 1280x720 Low Preset (FSR off) | |
| Dell Precision 5000 5490 | |
| Lenovo ThinkPad P14s G4 21HF0017GE | |
| Asus ExpertBook B3 B3404CVF | |
| Medio NVIDIA RTX A500 Laptop GPU (60.2 - 69.8, n=2) | |
| HP ZBook Firefly 14 G11 | |
| 1920x1080 Low Preset (FSR off) | |
| Dell Precision 5000 5490 | |
| Asus ExpertBook B3 B3404CVF | |
| Lenovo ThinkPad P14s G4 21HF0017GE | |
| Medio NVIDIA RTX A500 Laptop GPU (39.8 - 43.3, n=2) | |
| HP ZBook Firefly 14 G11 | |
| 1920x1080 Medium Preset (FSR off) | |
| Dell Precision 5000 5490 | |
| Asus ExpertBook B3 B3404CVF | |
| Lenovo ThinkPad P14s G4 21HF0017GE | |
| Medio NVIDIA RTX A500 Laptop GPU (31.1 - 32.1, n=2) | |
| HP ZBook Firefly 14 G11 | |
| 1920x1080 High Preset (FSR off) | |
| Dell Precision 5000 5490 | |
| Asus ExpertBook B3 B3404CVF | |
| Lenovo ThinkPad P14s G4 21HF0017GE | |
| Medio NVIDIA RTX A500 Laptop GPU (23.6 - 25.1, n=2) | |
| HP ZBook Firefly 14 G11 | |
| 1920x1080 Ultra Preset (FSR off) | |
| Dell Precision 5000 5490 | |
| Asus ExpertBook B3 B3404CVF | |
| Lenovo ThinkPad P14s G4 21HF0017GE | |
| Medio NVIDIA RTX A500 Laptop GPU (19.6 - 20.4, n=2) | |
| HP ZBook Firefly 14 G11 | |
| Tiny Tina's Wonderlands | |
| 1920x1080 Low Preset (DX12) | |
| Dell Precision 5480 | |
| Dell Precision 5000 5490 | |
| HP ZBook Firefly 14 G11 | |
| Medio NVIDIA RTX A500 Laptop GPU (n=1) | |
| 1920x1080 Medium Preset (DX12) | |
| Dell Precision 5480 | |
| Dell Precision 5000 5490 | |
| HP ZBook Firefly 14 G11 | |
| Medio NVIDIA RTX A500 Laptop GPU (n=1) | |
| 1920x1080 High Preset (DX12) | |
| Dell Precision 5000 5490 | |
| Dell Precision 5480 | |
| HP ZBook Firefly 14 G11 | |
| Medio NVIDIA RTX A500 Laptop GPU (n=1) | |
| 1920x1080 Badass Preset (DX12) | |
| Dell Precision 5000 5490 | |
| Dell Precision 5480 | |
| HP ZBook Firefly 14 G11 | |
| Medio NVIDIA RTX A500 Laptop GPU (n=1) | |
Cyberpunk 2077 ultra FPS Chart
| bajo | medio | alto | ultra | |
|---|---|---|---|---|
| The Witcher 3 (2015) | 134.6 | 81.6 | 53.4 | 26.3 |
| Dota 2 Reborn (2015) | 160.4 | 130.5 | 96.2 | 91.6 |
| Final Fantasy XV Benchmark (2018) | 78.6 | 44.2 | 31.4 | |
| X-Plane 11.11 (2018) | 113.3 | 98 | 81.6 | |
| Far Cry 5 (2018) | 81 | 51 | 46 | 44 |
| Strange Brigade (2018) | 168.9 | 74.9 | 62.5 | 54.5 |
| Tiny Tina's Wonderlands (2022) | 66.2 | 53.5 | 36.2 | 27.6 |
| F1 22 (2022) | 92.5 | 85.2 | 57.8 | 16.9 |
| Baldur's Gate 3 (2023) | 39.9 | 34.5 | 31.2 | 30.2 |
| Cyberpunk 2077 2.2 Phantom Liberty (2023) | 39.8 | 31.1 | 23.6 | 19.6 |
Emisiones
Ruido del sistema
No hace falta mucho para que el ventilador se ponga en marcha, lo que provoca pulsaciones más frecuentes y audibles de RPM más altas y RPM más bajas. El simple ralentí en el escritorio, por ejemplo, haría que el ventilador cicle entre 24 y 29 dB(A). Una vez que se introducen cargas más altas, las revoluciones del ventilador aumentarían con bastante rapidez, por lo que el sistema nunca está en silencio durante mucho tiempo cuando se pone a funcionar. El techo de ruido del ventilador parece ser el mismo que en el más lento ZBook Firefly 14 G10 A en 46 dB(A) ya que la solución de refrigeración subyacente no ha cambiado.
Ruido
| Ocioso |
| 24.6 / 25.2 / 26.8 dB(A) |
| Carga |
| 38.9 / 45.8 dB(A) |
 | ||
30 dB silencioso 40 dB(A) audible 50 dB(A) ruidosamente alto |
||
min: | ||
| HP ZBook Firefly 14 G11 RTX A500 Laptop GPU, Ultra 7 165H, Kioxia XG8 KXG80ZNV512G | HP ZBook Firefly 14 G10 A Radeon 760M, R5 PRO 7640HS, Samsung PM9B1 512GB MZVL4512HBLU | HP ZBook Firefly 14 G8 2C9Q2EA T500 Laptop GPU, i7-1165G7, Toshiba XG6 KXG60ZNV1T02 | Dell Precision 5000 5490 NVIDIA RTX 3000 Ada Generation Laptop GPU, Ultra 9 185H, Kioxia XG8 KXG80ZNV1T02 | Lenovo ThinkPad P14s G4 21HF0017GE RTX A500 Laptop GPU, i7-1370P, SK Hynix HFS002TEJ9X162N | Asus ExpertBook B3 B3404CVF GeForce RTX 2050 Mobile, i7-1355U, Micron 2400 MTFDKBA1T0QFM | |
|---|---|---|---|---|---|---|
| Noise | -4% | -5% | 2% | -1% | -4% | |
| apagado / medio ambiente * | 24.3 | 25 -3% | 28.7 -18% | 22.8 6% | 24.6 -1% | 24.5 -1% |
| Idle Minimum * | 24.6 | 25 -2% | 28.7 -17% | 23.8 3% | 24.6 -0% | 25.5 -4% |
| Idle Average * | 25.2 | 26 -3% | 28.7 -14% | 23.8 6% | 24.6 2% | 25.5 -1% |
| Idle Maximum * | 26.8 | 27 -1% | 28.7 -7% | 24.7 8% | 25.9 3% | 27.5 -3% |
| Load Average * | 38.9 | 45 -16% | 34 13% | 38.9 -0% | 41.3 -6% | 42.3 -9% |
| Cyberpunk 2077 ultra * | 41.8 | 44.2 -6% | ||||
| Load Maximum * | 45.8 | 46 -0% | 40.1 12% | 51.4 -12% | 46.2 -1% | 49.3 -8% |
| Witcher 3 ultra * | 45 | 40.1 | 49.9 | 46 |
* ... más pequeño es mejor
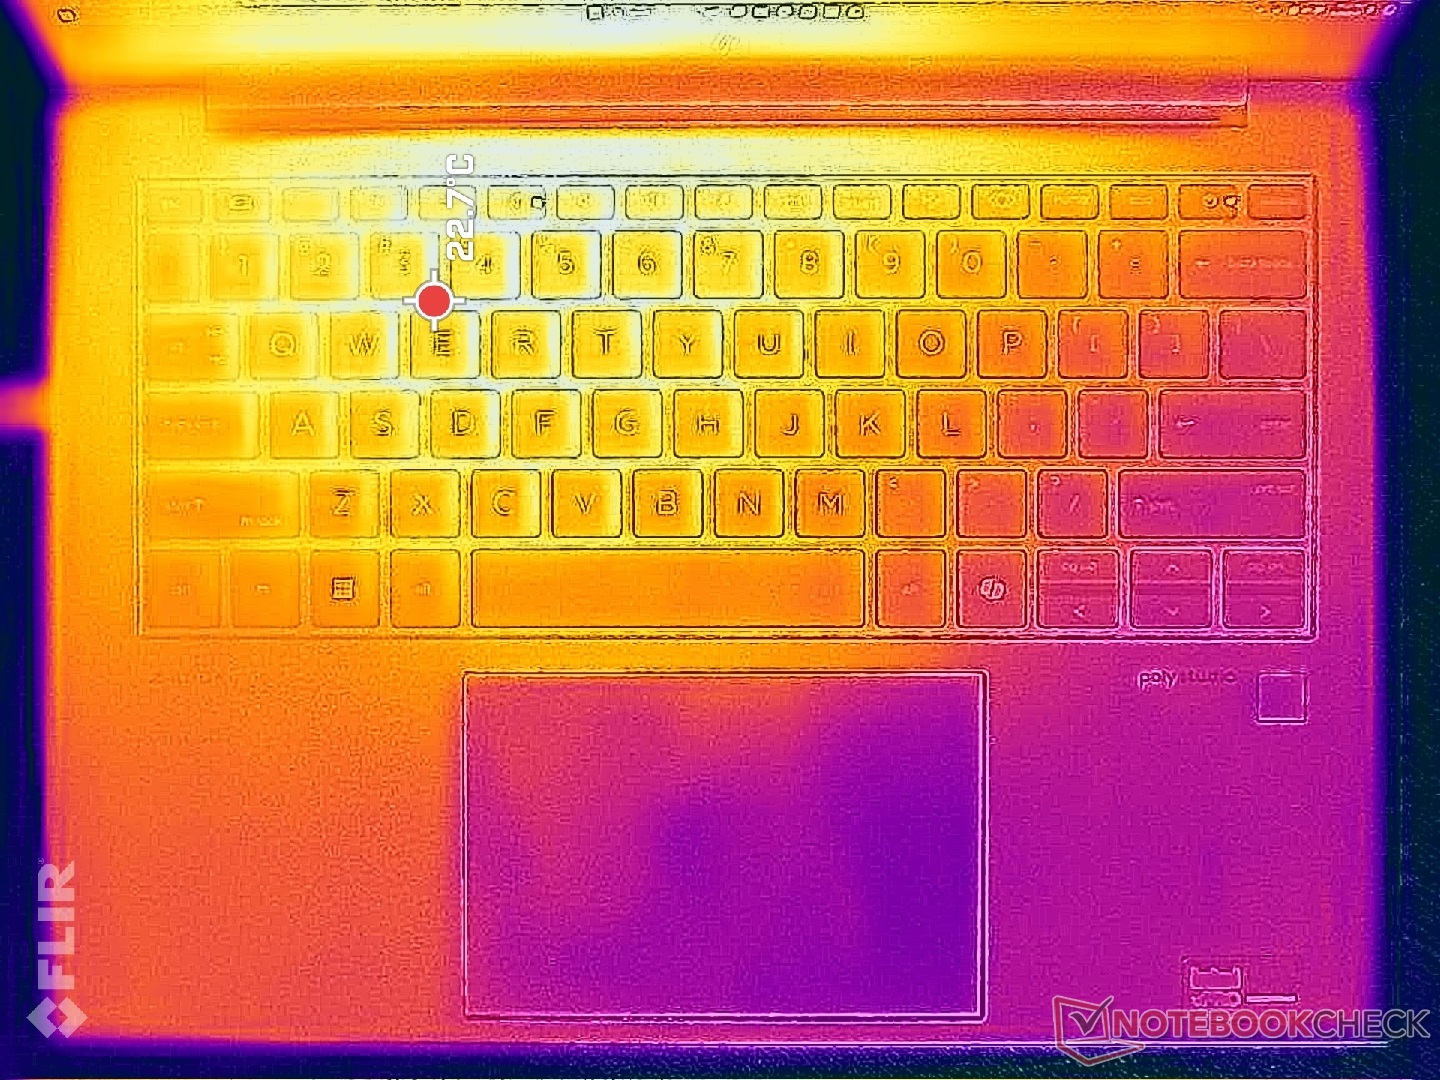
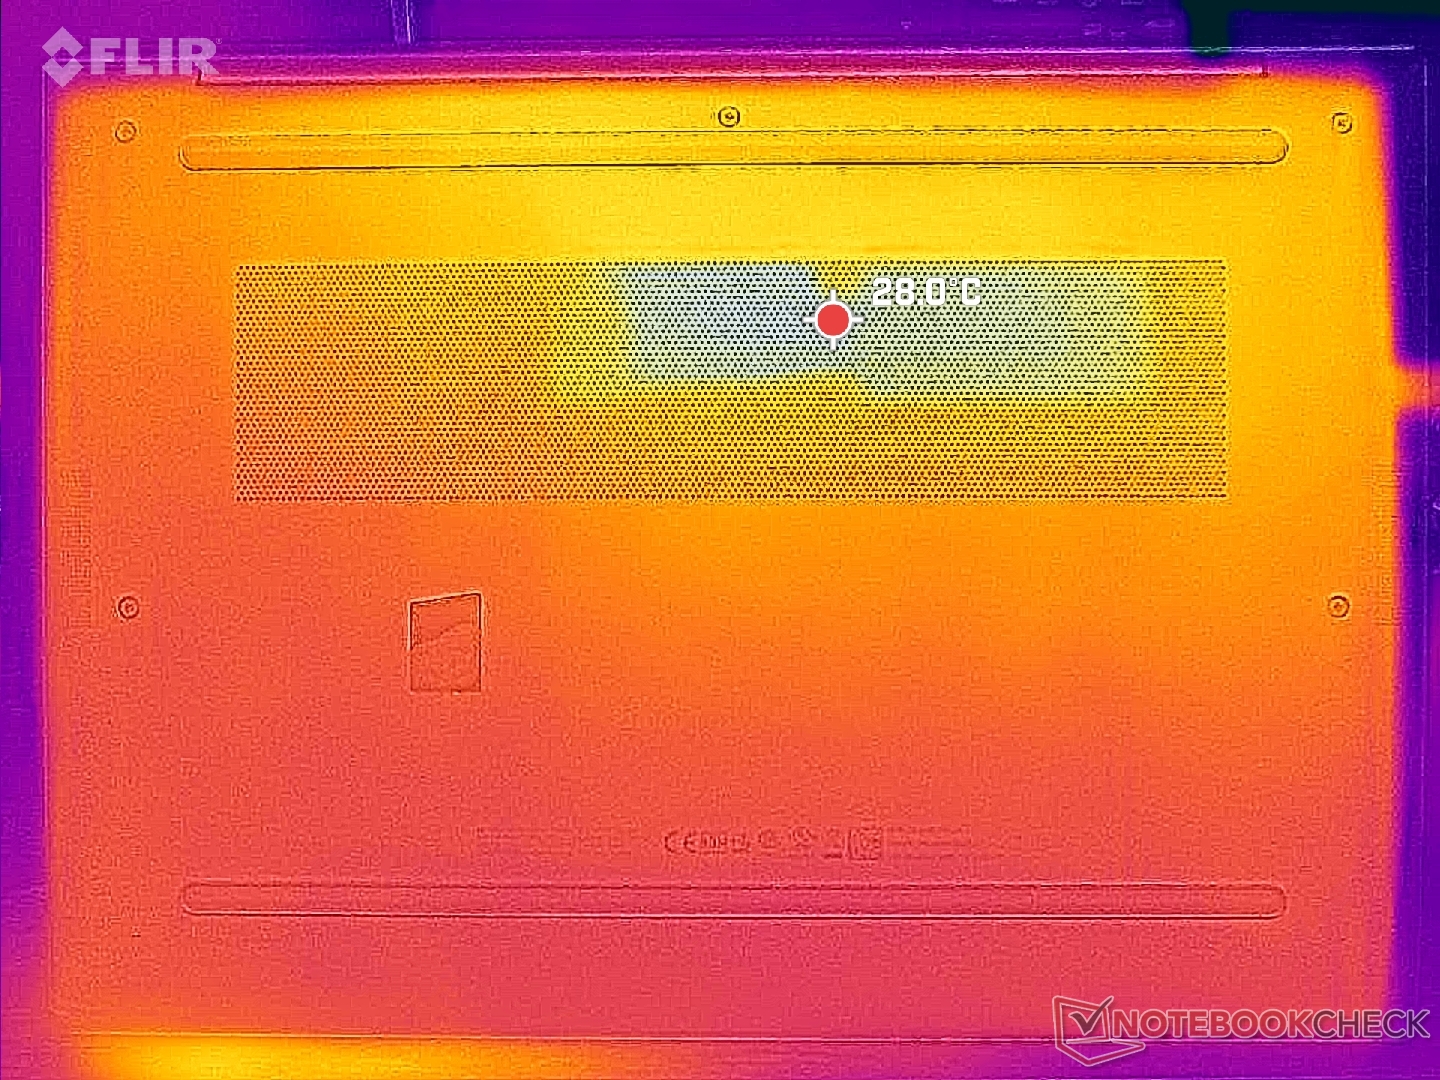
Temperatura
Las temperaturas superficiales no son más cálidas que las que registramos en el ZBook Firefly 14 G10 A a pesar de la presencia de una dGPU en nuestra unidad ZBook Firefly 14 G11. De hecho, registramos temperaturas más frías que antes de media. Esto puede atribuirse a los niveles de estrangulamiento de rendimiento más pronunciados de la Firefly 14 G11 cuando se somete a un alto estrés, lo que naturalmente conduce a un menor consumo y a temperaturas más controladas. Esto también se alinea con nuestros resultados del bucle CineBench R15 xT anteriores y las observaciones de consumo de energía.
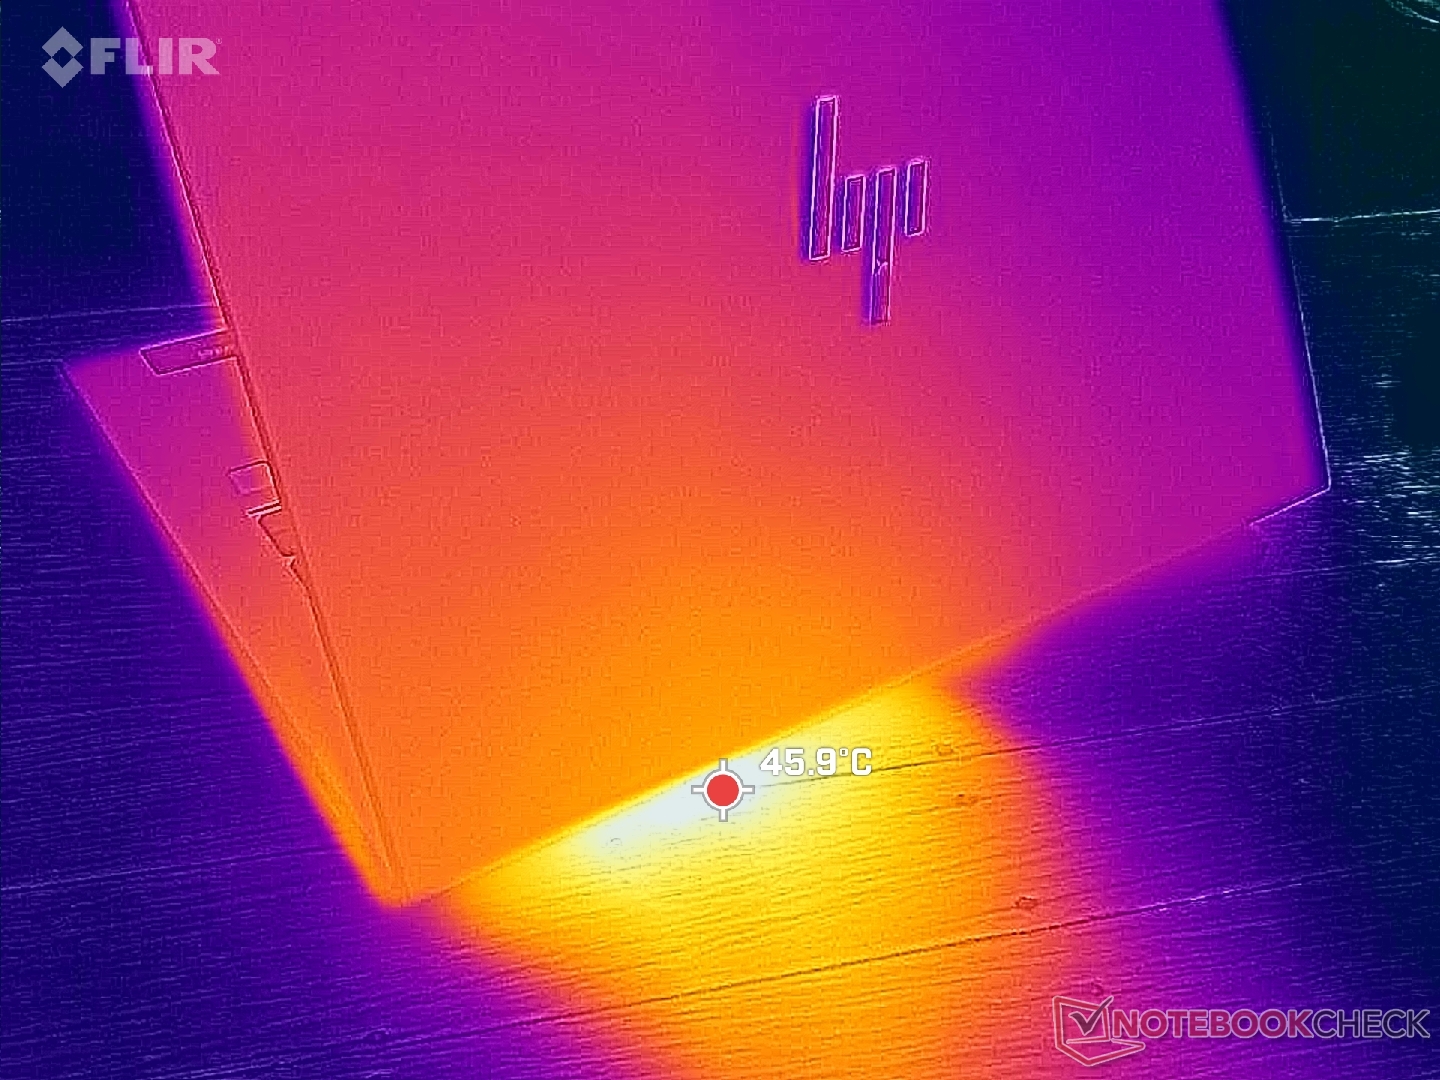
(±) La temperatura máxima en la parte superior es de 42.8 °C / 109 F, frente a la media de 38.2 °C / 101 F, que oscila entre 22.2 y 69.8 °C para la clase Workstation.
(±) El fondo se calienta hasta un máximo de 44 °C / 111 F, frente a la media de 41.2 °C / 106 F
(+) En reposo, la temperatura media de la parte superior es de 28.5 °C / 83# F, frente a la media del dispositivo de 32 °C / 90 F.
(+) Los reposamanos y el panel táctil alcanzan como máximo la temperatura de la piel (33.2 °C / 91.8 F) y, por tanto, no están calientes.
(-) La temperatura media de la zona del reposamanos de dispositivos similares fue de 27.8 °C / 82 F (-5.4 °C / -9.8 F).
| HP ZBook Firefly 14 G11 Intel Core Ultra 7 165H, NVIDIA RTX A500 Laptop GPU | HP ZBook Firefly 14 G10 A AMD Ryzen 5 PRO 7640HS, AMD Radeon 760M | HP ZBook Firefly 14 G8 2C9Q2EA Intel Core i7-1165G7, NVIDIA T500 Laptop GPU | Dell Precision 5000 5490 Intel Core Ultra 9 185H, NVIDIA RTX 3000 Ada Generation Laptop GPU | Lenovo ThinkPad P14s G4 21HF0017GE Intel Core i7-1370P, NVIDIA RTX A500 Laptop GPU | Asus ExpertBook B3 B3404CVF Intel Core i7-1355U, NVIDIA GeForce RTX 2050 Mobile | |
|---|---|---|---|---|---|---|
| Heat | -0% | 8% | 3% | -9% | 12% | |
| Maximum Upper Side * | 42.8 | 50 -17% | 42.6 -0% | 43.2 -1% | 55.3 -29% | 33.2 22% |
| Maximum Bottom * | 44 | 51 -16% | 49.4 -12% | 38.4 13% | 48.7 -11% | 40.4 8% |
| Idle Upper Side * | 30.6 | 25 18% | 24.2 21% | 31.6 -3% | 31 -1% | 28.3 8% |
| Idle Bottom * | 31.4 | 27 14% | 24.6 22% | 30.6 3% | 29.9 5% | 28 11% |
* ... más pequeño es mejor
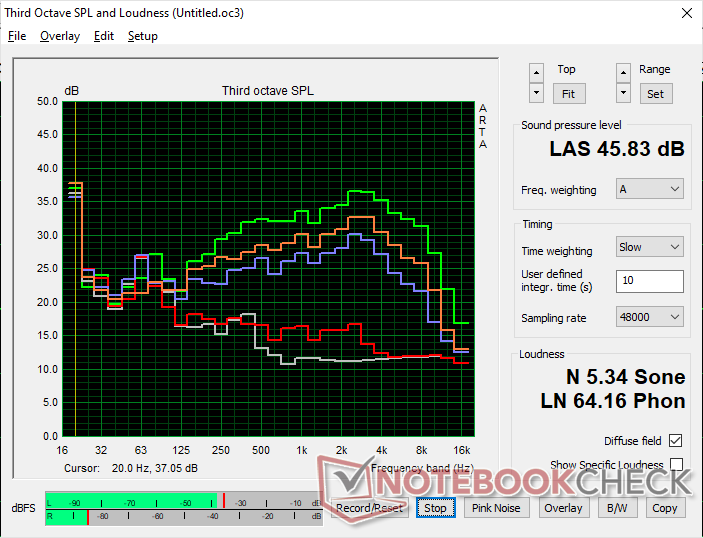
Altavoces
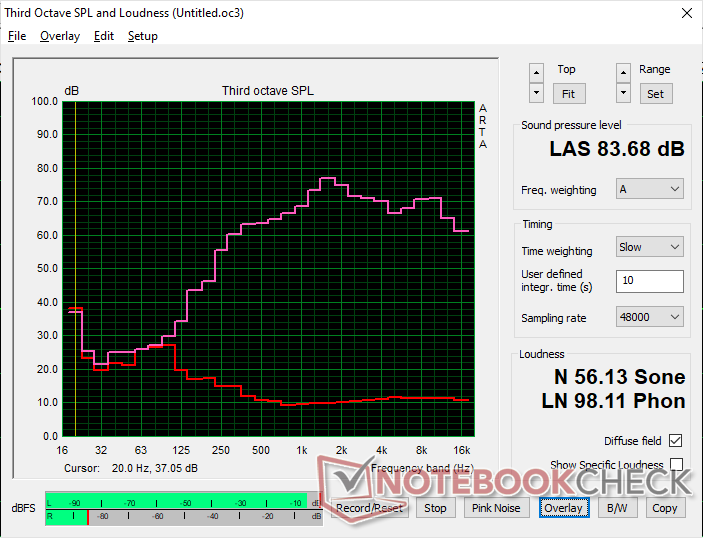
HP ZBook Firefly 14 G11 análisis de audio
(+) | los altavoces pueden reproducir a un volumen relativamente alto (#83.7 dB)
Graves 100 - 315 Hz
(-) | casi sin bajos - de media 21.6% inferior a la mediana
(±) | la linealidad de los graves es media (10% delta a frecuencia anterior)
Medios 400 - 2000 Hz
(+) | medios equilibrados - a sólo 4.5% de la mediana
(+) | los medios son lineales (4.3% delta a la frecuencia anterior)
Altos 2 - 16 kHz
(+) | máximos equilibrados - a sólo 3.4% de la mediana
(+) | los máximos son lineales (3.2% delta a la frecuencia anterior)
Total 100 - 16.000 Hz
(±) | la linealidad del sonido global es media (16.2% de diferencia con la mediana)
En comparación con la misma clase
» 38% de todos los dispositivos probados de esta clase eran mejores, 7% similares, 55% peores
» El mejor tuvo un delta de 7%, la media fue 18%, el peor fue ###max##%
En comparación con todos los dispositivos probados
» 24% de todos los dispositivos probados eran mejores, 5% similares, 71% peores
» El mejor tuvo un delta de 4%, la media fue 24%, el peor fue ###max##%
Apple MacBook Pro 16 2021 M1 Pro análisis de audio
(+) | los altavoces pueden reproducir a un volumen relativamente alto (#84.7 dB)
Graves 100 - 315 Hz
(+) | buen bajo - sólo 3.8% lejos de la mediana
(+) | el bajo es lineal (5.2% delta a la frecuencia anterior)
Medios 400 - 2000 Hz
(+) | medios equilibrados - a sólo 1.3% de la mediana
(+) | los medios son lineales (2.1% delta a la frecuencia anterior)
Altos 2 - 16 kHz
(+) | máximos equilibrados - a sólo 1.9% de la mediana
(+) | los máximos son lineales (2.7% delta a la frecuencia anterior)
Total 100 - 16.000 Hz
(+) | el sonido global es lineal (4.6% de diferencia con la mediana)
En comparación con la misma clase
» 0% de todos los dispositivos probados de esta clase eran mejores, 0% similares, 100% peores
» El mejor tuvo un delta de 5%, la media fue 18%, el peor fue ###max##%
En comparación con todos los dispositivos probados
» 0% de todos los dispositivos probados eran mejores, 0% similares, 100% peores
» El mejor tuvo un delta de 4%, la media fue 24%, el peor fue ###max##%
Gestión energética: más exigente que nunca
Consumo de energía
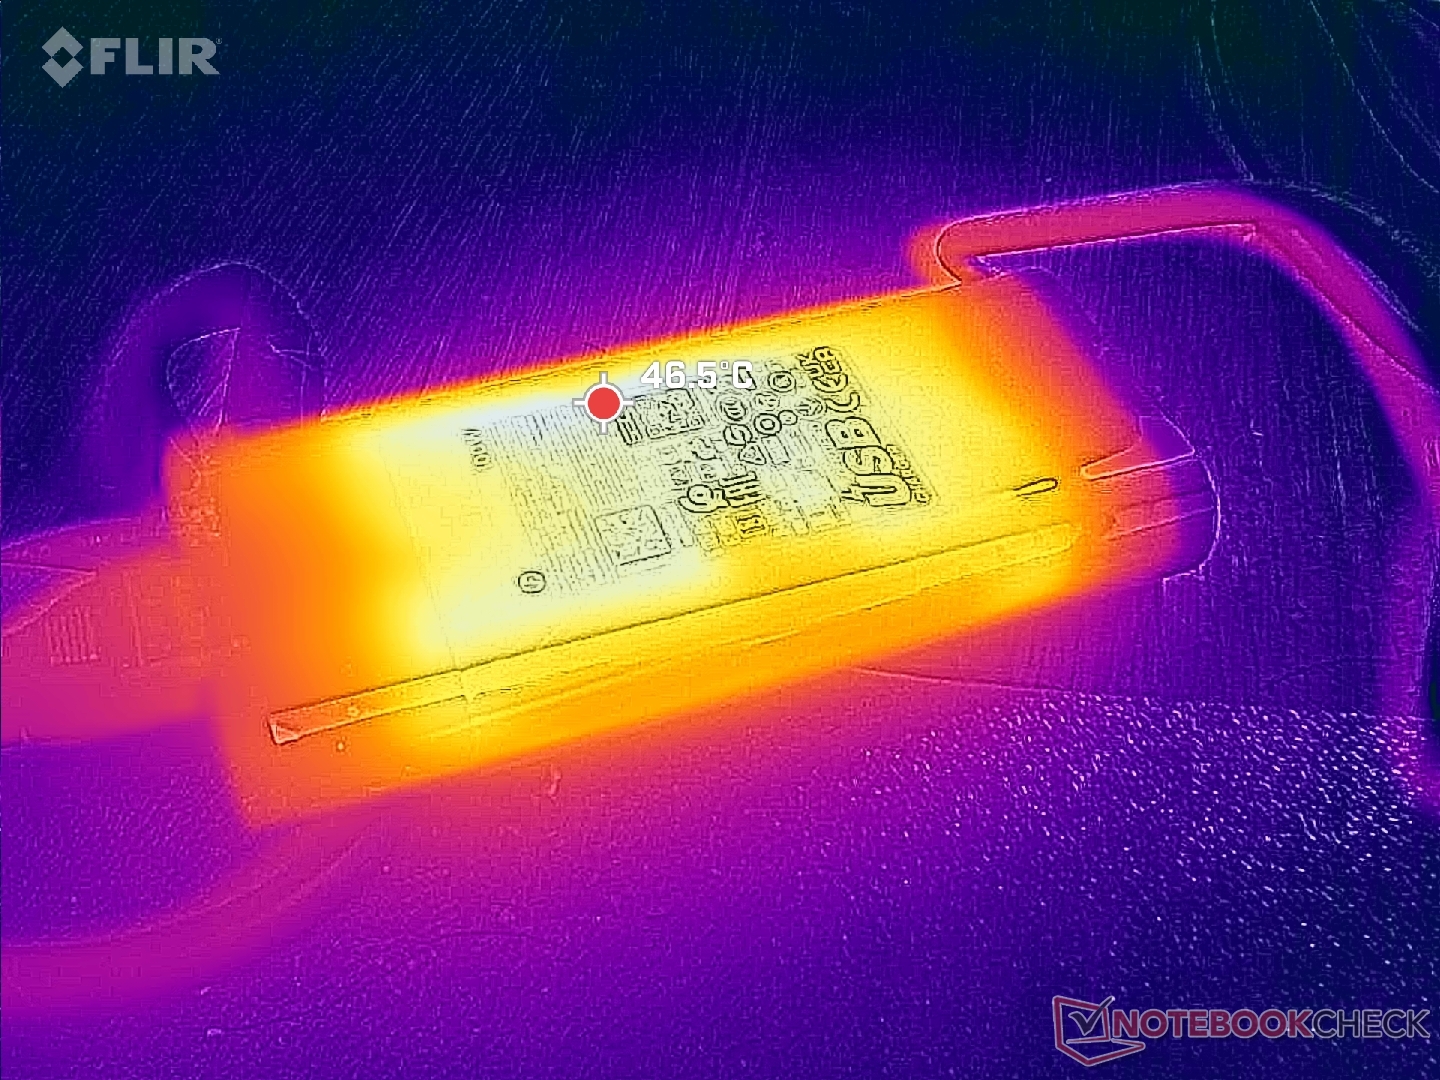
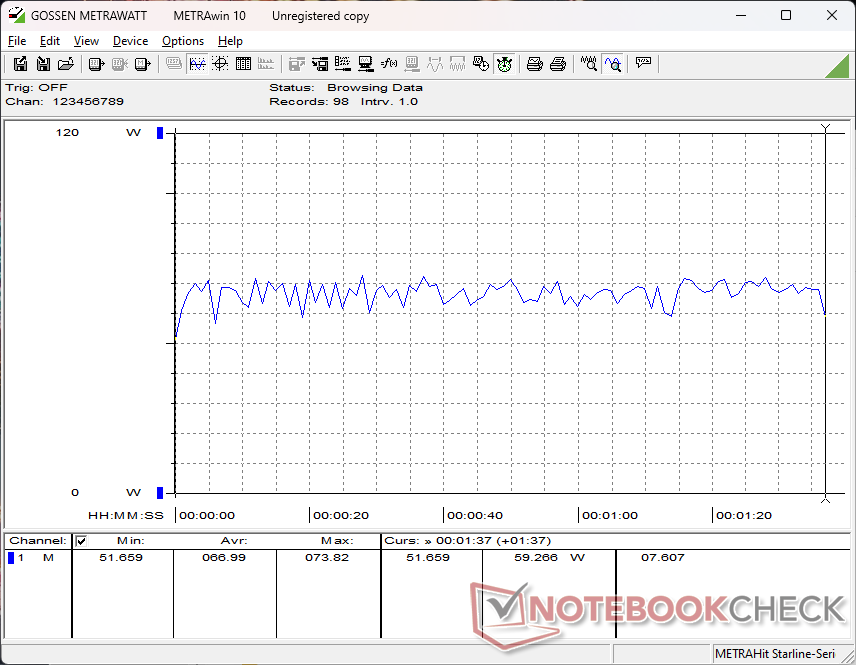
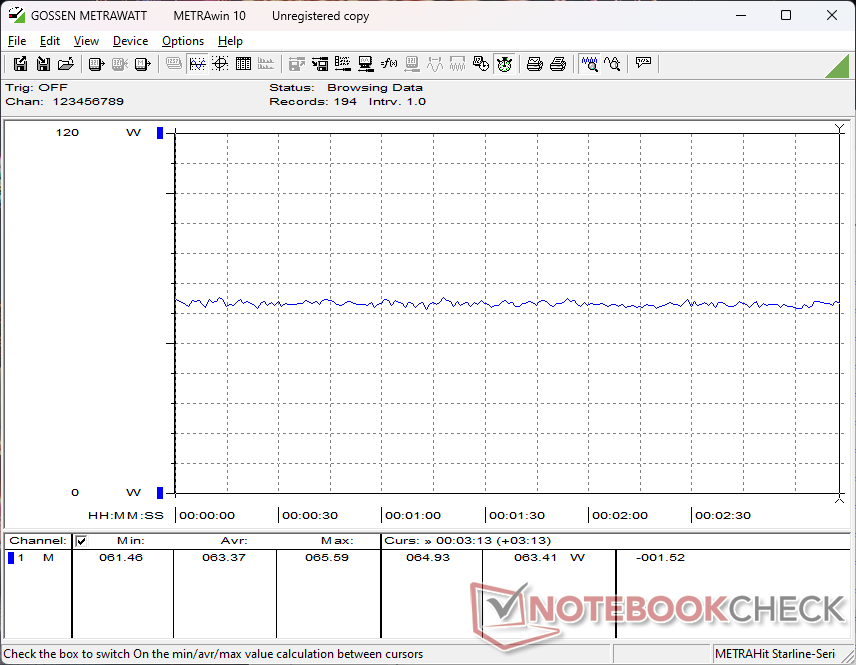
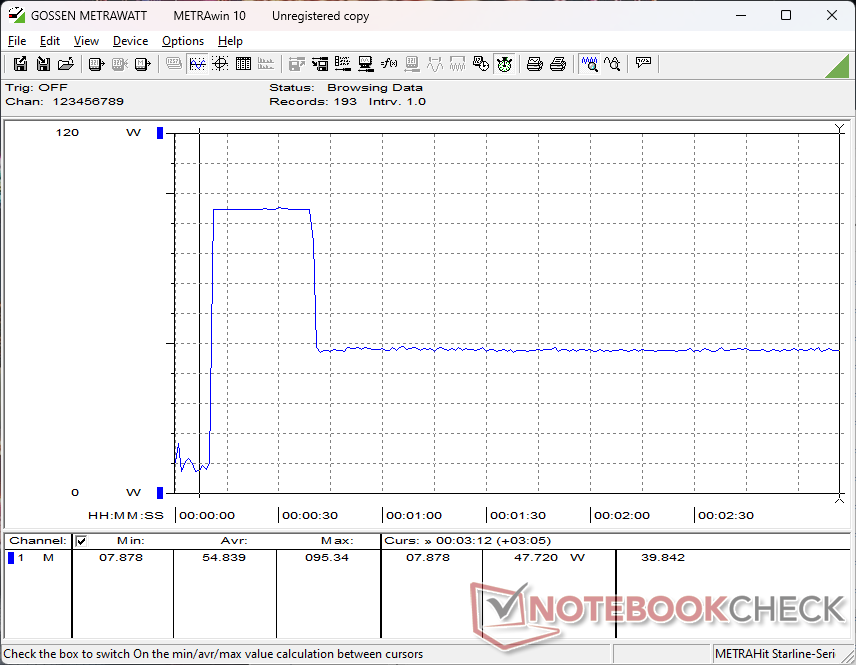
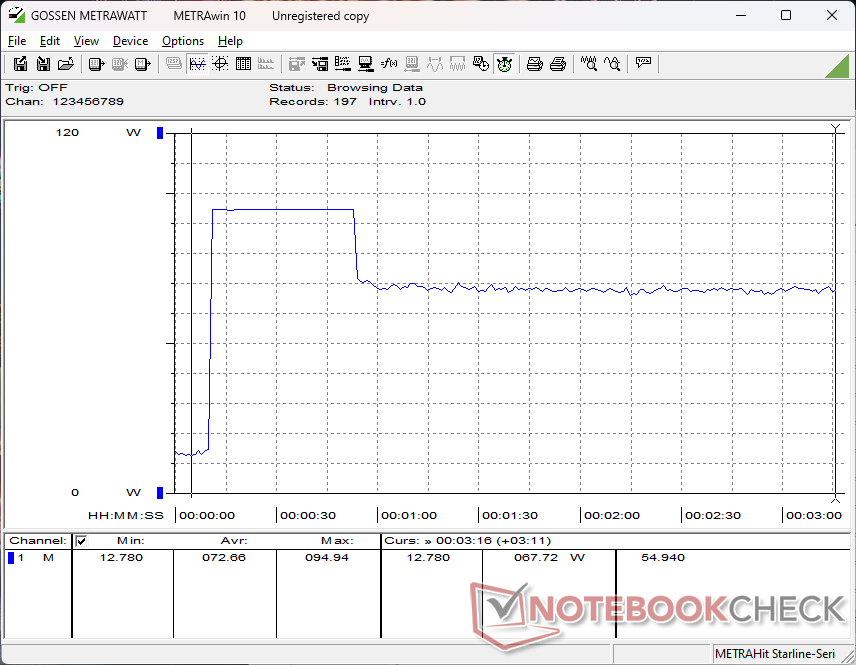
El ralentí en el sobremesa exige casi el doble de energía que en el ZBook Firefly 14 G10 A debido en gran parte a la GPU discreta, la mayor resolución de pantalla y la frecuencia de actualización más rápida. Aunque las diferencias nominales son sólo de unos pocos vatios, el impacto en la duración de la batería durante varias horas puede ser significativo, como demuestran nuestras pruebas de duración de la batería a continuación. El consumo cuando se ejecutan cargas más exigentes como Cyberpunk 2077 también es generalmente mayor en nuestro ZBook Firefly 14 G11 alimentado por Intel en varios vatios.
Nuestro sistema se entrega con un adaptador de CA USB-C de 100 W más grande (~13,5 x 6 x 2,3 cm) en comparación con el adaptador de CA USB-C de 65 W de la ZBook Firefly 14 G10 A debido a las especificaciones más exigentes. Hemos podido medir un consumo máximo temporal de 95 W cuando la CPU y la GPU están a pleno rendimiento.
| Off / Standby | |
| Ocioso | |
| Carga |
|
Clave:
min: | |
| HP ZBook Firefly 14 G11 Ultra 7 165H, RTX A500 Laptop GPU, Kioxia XG8 KXG80ZNV512G, IPS, 2560x1600, 14" | HP ZBook Firefly 14 G10 A R5 PRO 7640HS, Radeon 760M, Samsung PM9B1 512GB MZVL4512HBLU, IPS, 1920x1200, 14" | HP ZBook Firefly 14 G8 2C9Q2EA i7-1165G7, T500 Laptop GPU, Toshiba XG6 KXG60ZNV1T02, IPS, 1920x1080, 14" | Dell Precision 5000 5490 Ultra 9 185H, NVIDIA RTX 3000 Ada Generation Laptop GPU, Kioxia XG8 KXG80ZNV1T02, IPS, 2560x1600, 14" | Lenovo ThinkPad P14s G4 21HF0017GE i7-1370P, RTX A500 Laptop GPU, SK Hynix HFS002TEJ9X162N, OLED, 2880x1800, 14" | Asus ExpertBook B3 B3404CVF i7-1355U, GeForce RTX 2050 Mobile, Micron 2400 MTFDKBA1T0QFM, IPS, 1920x1200, 14" | |
|---|---|---|---|---|---|---|
| Power Consumption | 42% | 36% | -32% | 12% | 21% | |
| Idle Minimum * | 6.6 | 3 55% | 3.1 53% | 11.1 -68% | 6.3 5% | 4.95 25% |
| Idle Average * | 12.7 | 4 69% | 4.7 63% | 14.8 -17% | 7 45% | 5.5 57% |
| Idle Maximum * | 13.3 | 8 40% | 8.6 35% | 16.5 -24% | 8.1 39% | 8.2 38% |
| Load Average * | 67 | 56 16% | 64.8 3% | 70.1 -5% | 84.6 -26% | 77.9 -16% |
| Cyberpunk 2077 ultra * | 63.4 | |||||
| Cyberpunk 2077 ultra external monitor * | 58.1 | |||||
| Load Maximum * | 94.9 | 66 30% | 68.5 28% | 137.5 -45% | 98.3 -4% | 95 -0% |
| Witcher 3 ultra * | 58.2 | 59.6 | 93.1 | 56.5 | 59.1 |
* ... más pequeño es mejor
Power Consumption Cyberpunk / Stress Test
Power Consumption external Monitor
Duración de las pilas
El tiempo de ejecución WLAN es más de 4 horas más corto que el que registramos en el ZBook Firefly 14 G10 A del año pasado impulsado por AMD. Esto puede atribuirse a las diferencias de GPU y pantalla mencionadas anteriormente. Aún así, 8,5 horas de navegación en el mundo real sigue siendo bastante bueno para un ZBook impulsado por una CPU de la serie H y gráficos Nvidia RTX.
La carga desde vacío a plena capacidad es relativamente rápida, con sólo unos 80 minutos.
| HP ZBook Firefly 14 G11 Ultra 7 165H, RTX A500 Laptop GPU, 56 Wh | HP ZBook Firefly 14 G10 A R5 PRO 7640HS, Radeon 760M, 51 Wh | HP ZBook Firefly 14 G8 2C9Q2EA i7-1165G7, T500 Laptop GPU, 53 Wh | Dell Precision 5000 5490 Ultra 9 185H, NVIDIA RTX 3000 Ada Generation Laptop GPU, 72 Wh | Lenovo ThinkPad P14s G4 21HF0017GE i7-1370P, RTX A500 Laptop GPU, 52.5 Wh | Asus ExpertBook B3 B3404CVF i7-1355U, GeForce RTX 2050 Mobile, 63 Wh | |
|---|---|---|---|---|---|---|
| Duración de Batería | 51% | 49% | 27% | -29% | 27% | |
| WiFi v1.3 | 517 | 782 51% | 770 49% | 658 27% | 367 -29% | 655 27% |
| Load | 257 | 59 |
Pro
Contra
Veredicto - Mejor con las opciones Core Ultra de la serie U
Cuando se trata de configuraciones, la mayoría de los modelos de portátiles suelen ceñirse a una familia de opciones de procesador para una mejor optimización. En el Firefly 14 G11, sin embargo, los usuarios pueden elegir entre procesadores Core Ultra U y Core Ultra H más gráficos Nvidia integrados y/o discretos. Dado que las CPU de la serie H y las dGPU tienen envolventes de potencia mucho mayores que las de la serie Core U y las opciones iGPU, la solución de refrigeración del portátil debe estar a la altura para soportar los chips más exigentes.
Por desgracia para el Firefly 14 G11, la ralentización de la CPU se producía con bastante facilidad en nuestra configuración de gama alta, lo que sugiere que la solución de refrigeración y el chasis se diseñaron más bien para los procesadores Core serie U. Optar por una SKU de gama alta de la serie H puede proporcionarle más rendimiento para ráfagas muy cortas, pero el estrangulamiento pronunciado entra en acción cuando se ejecutan cargas de trabajo más largas. Esto hace que las configuraciones con procesadores Intel de la serie H sean más difíciles de recomendar, ya que los usuarios avanzados no podrán aprovechar plenamente la CPU de alto rendimiento.
El Firefly 14 G11 se ve y se siente como el mejor de su clase, especialmente si se configura con la nueva pantalla de 120 Hz. Sus opciones de rendimiento, sin embargo, están limitadas por la anticuada solución de refrigeración y el diseño del chasis.
Aparte de las complicaciones del procesador, la anticuada GPU RTX A500 empieza a parecer poco potente especialmente cuando otras estaciones de trabajo de 14 pulgadas como la Dell Precision 5490 ofrecen GPU RTX mucho más rápidas de la nueva generación Ada Lovelace.
El Firefly 14 G11 sigue siendo muy cómodo de usar gracias a su factor de forma portátil, su respetable pantalla de 120 Hz y su cómodo teclado y clickpad. Sin embargo, sus opciones de GPU discreta y el equilibrio de rendimiento podrían necesitar un poco más de ajuste fino.
Precio y disponibilidad
HP ya está distribuyendo el Firefly 14 G11 a partir de 2100 $ para la configuración básica Core Ultra 125U sin gráficos discretos hasta más de 3500 $ como se ha revisado.
Nota: Hemos actualizado nuestro sistema de evaluación y los resultados de la versión 8 no se pueden comparar con los de la versión 7. Más información aquí verfügbar.
Nota: Recientemente hemos actualizado nuestro sistema de clasificación y los resultados de la versión 8 no son comparables con los de la versión 7. Encontrará más información aquí .
HP ZBook Firefly 14 G11
- 07/16/2024 v8
Allen Ngo
 Total Sustainability Score:
 Transparencia
La selección de los dispositivos que se van a reseñar corre a cargo de nuestro equipo editorial. La muestra de prueba fue proporcionada al autor en calidad de préstamo por el fabricante o el minorista a los efectos de esta reseña. El prestamista no tuvo ninguna influencia en esta reseña, ni el fabricante recibió una copia de la misma antes de su publicación. No había ninguna obligación de publicar esta reseña. Nunca aceptamos compensaciones o pagos a cambio de nuestras reseñas. Como empresa de medios independiente, Notebookcheck no está sujeta a la autoridad de fabricantes, minoristas o editores.
Así es como prueba Notebookcheck
Cada año, Notebookcheck revisa de forma independiente cientos de portátiles y smartphones utilizando procedimientos estandarizados para asegurar que todos los resultados son comparables. Hemos desarrollado continuamente nuestros métodos de prueba durante unos 20 años y hemos establecido los estándares de la industria en el proceso. En nuestros laboratorios de pruebas, técnicos y editores experimentados utilizan equipos de medición de alta calidad. Estas pruebas implican un proceso de validación en varias fases. Nuestro complejo sistema de clasificación se basa en cientos de mediciones y puntos de referencia bien fundamentados, lo que mantiene la objetividad.Price comparison

