

Análisis del portátil MSI Sword 16 HX: Potencia de juego ahogada por una pantalla poco impresionante
Necesita más tiempo en la piedra de afilar.
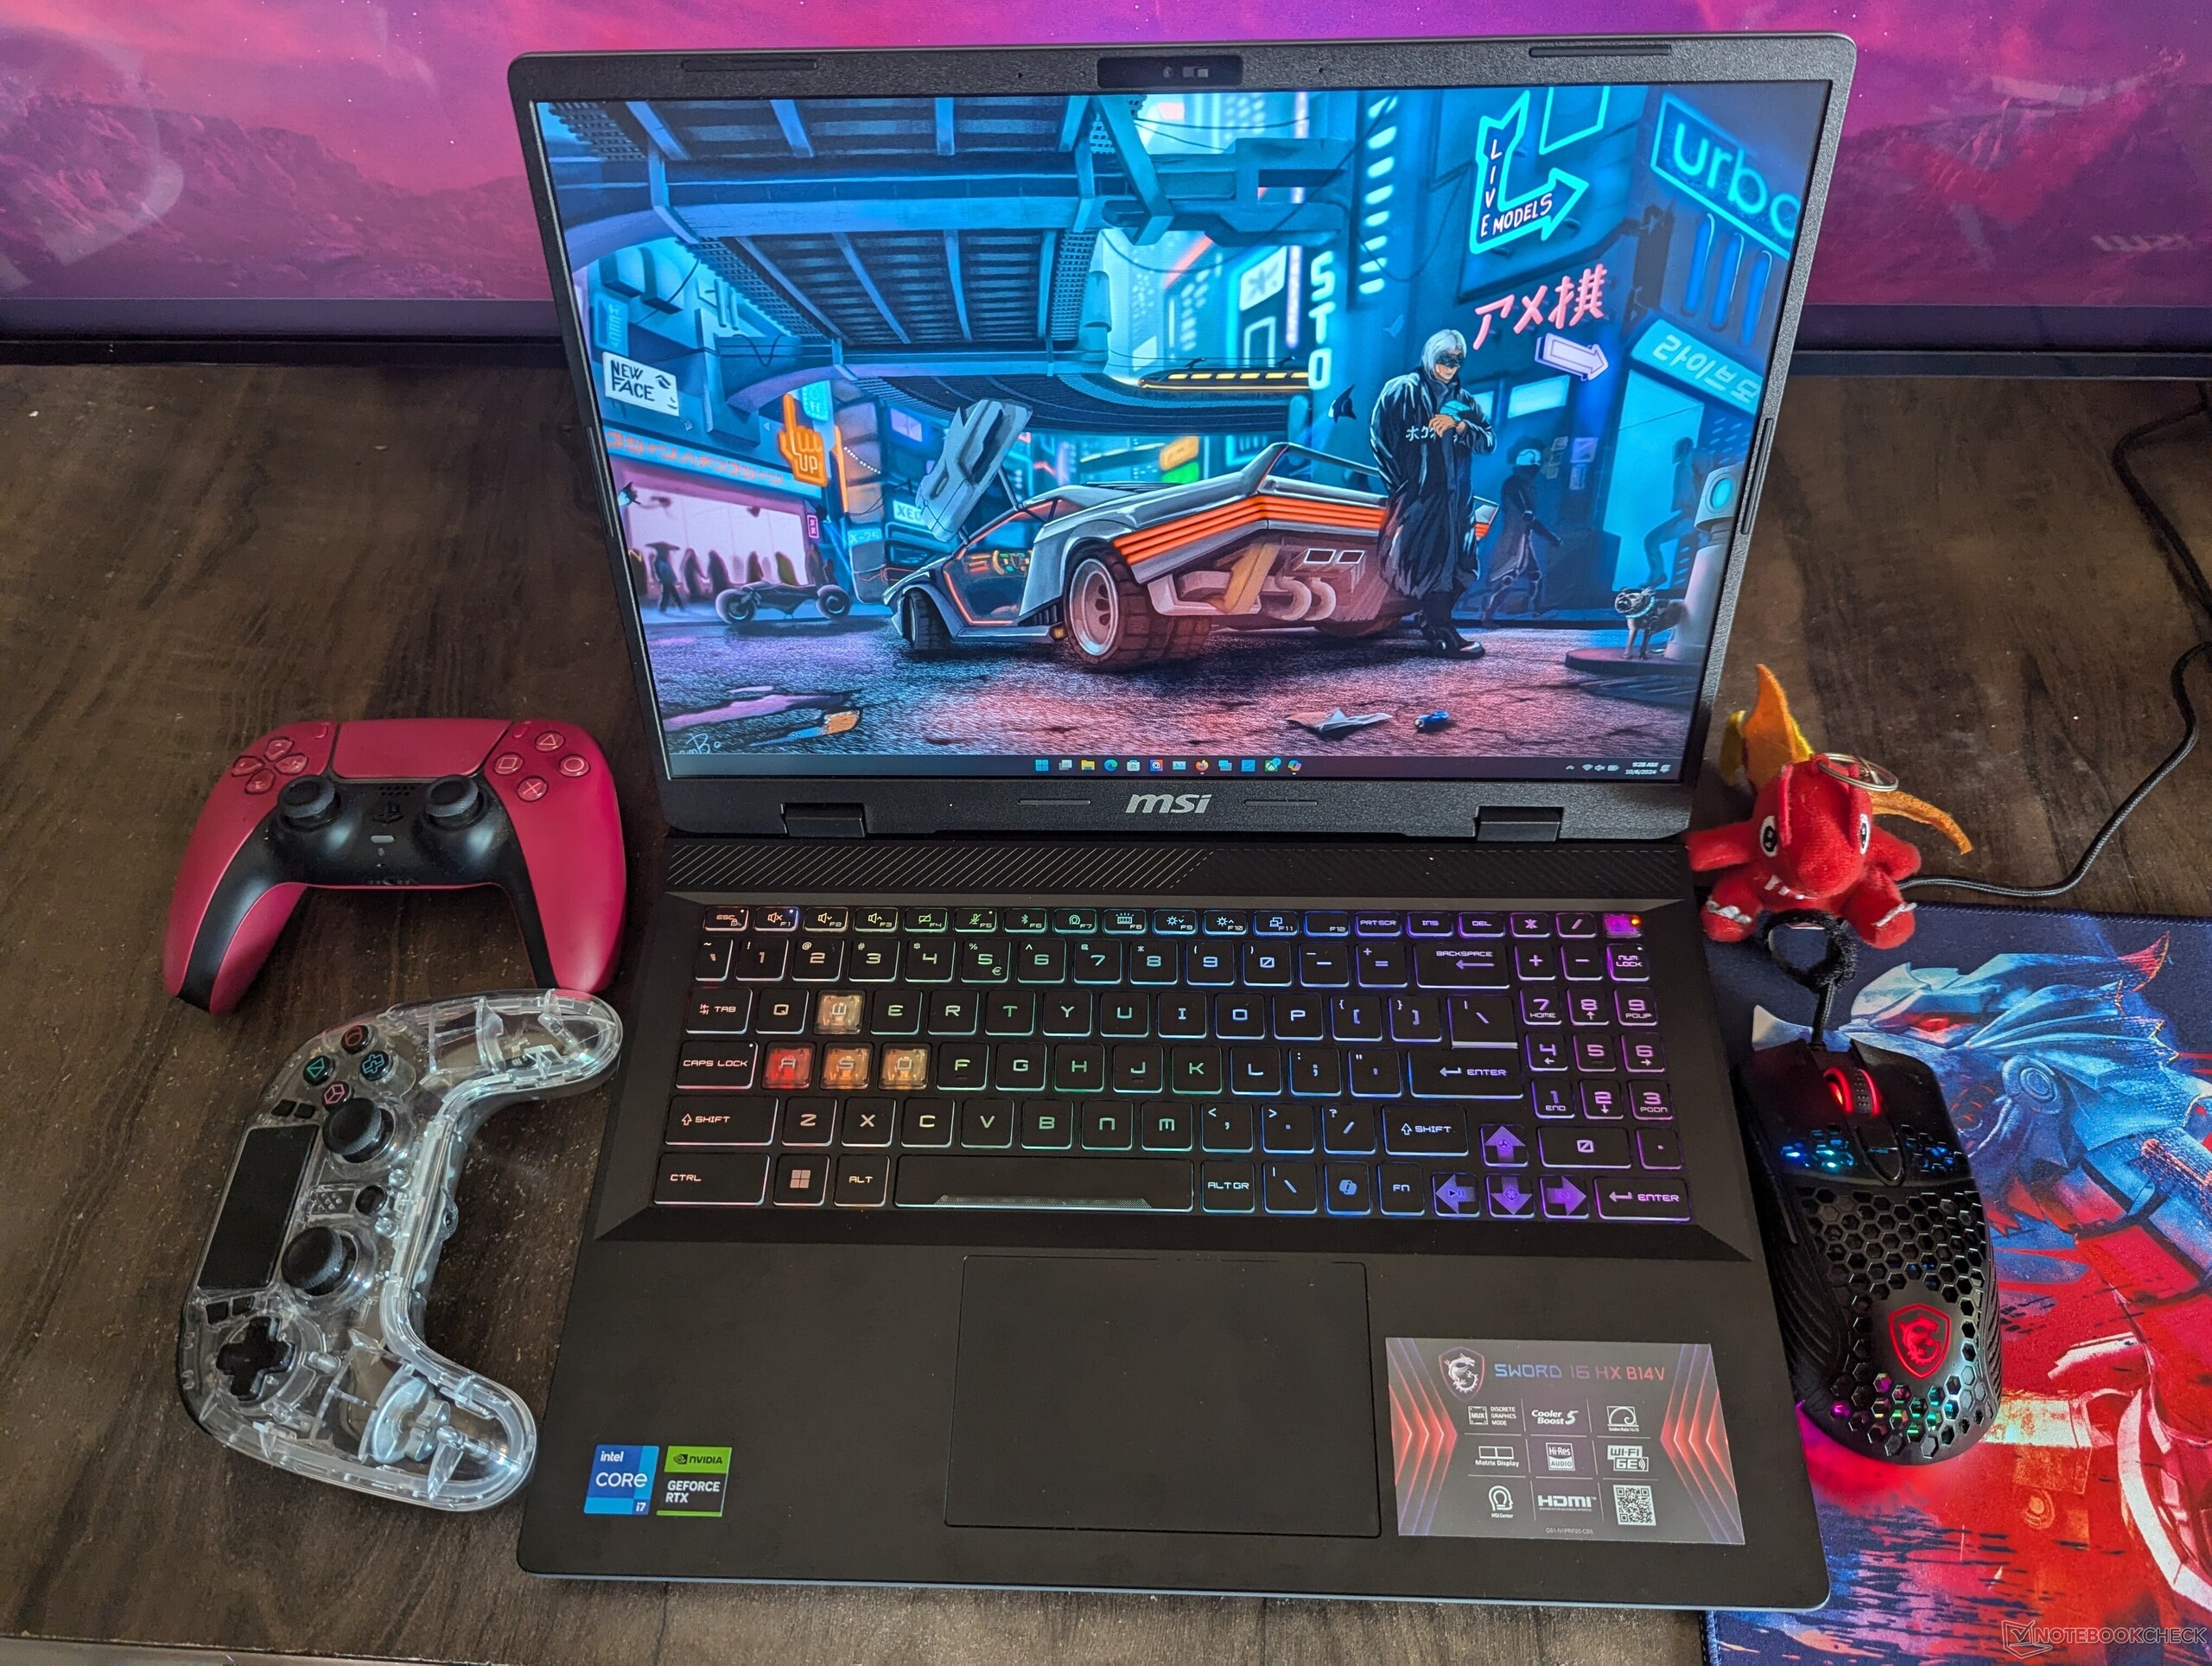
El MSI Sword 16 HX tiene todas las campanas y silbatos de un portátil de juegos moderno, con un Intel Core i7-14700HX, una Nvidia GeForce RTX 4070 de 115 vatios, 16 GB de RAM DDR5, 1 TB de SSD y una pantalla WUXGA (1.920 x 1.200) de 16 pulgadas y 144 Hz. En este análisis, determinamos cómo se comporta el Sword 16 HX frente a sus homólogos con hardware similar y analizamos algunos de sus puntos fuertes y compromisos.Anil Ganti, 👁 Vaidyanathan Subramaniam (traducido por DeepL / Ninh Duy) Publicado 🇺🇸 🇩🇪 ...
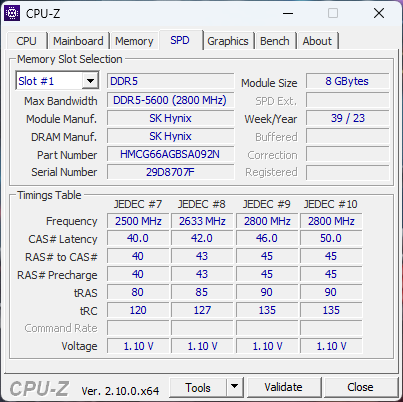
El MSI Sword 16 HX se sitúa en el centro del repertorio de la compañía y pretende equilibrar precio y rendimiento. Esta variante en particular viene con un potente hardware que incluye el basado en Raptor Lake HX Intel Core i7-14700HXbasado en Ada Lovelace Nvidia GeForce RTX 4070, 16 GB de RAM DDR5-5600 y 1 TB de almacenamiento a bordo.
Esencialmente, este es uno de los mejores portátiles para juegos Intel/Nvidia que se pueden comprar incluso hoy en día porque Raptor Lake-HX supera a Meteor Lake en rendimiento bruto. En la India, el Sword 16 HX cuesta ₹1.73.990 (2.071 $), pero puede adquirirse por ₹1.38.790 (1.654 $) en el momento de escribir estas líneas.
Posibles contendientes en la comparación
Valoración | Versión | Fecha | Modelo | Peso | Altura | Tamaño | Resolución | Precio |
|---|---|---|---|---|---|---|---|---|
| 79 % | v8 | 10/2024 | MSI Sword 16 HX B14VGKG i7-14700HX, NVIDIA GeForce RTX 4070 Laptop GPU | 2.3 kg | 27.7 mm | 16.00" | 1920x1200 | |
| 80.4 % | v8 | 07/2024 | HP Omen 17-db0079ng R7 8845HS, NVIDIA GeForce RTX 4070 Laptop GPU | 2.8 kg | 30.1 mm | 17.30" | 2560x1440 | |
| 90.8 % v7 (old) | v7 (old) | 04/2024 | Lenovo Legion 7 16 IRX G9 i9-14900HX, NVIDIA GeForce RTX 4070 Laptop GPU | 2.3 kg | 19.8 mm | 16.00" | 3200x2000 | |
| 86.8 % v7 (old) | v7 (old) | 05/2024 | Acer Predator Helios Neo 16 (2024) i7-14700HX, NVIDIA GeForce RTX 4070 Laptop GPU | 2.6 kg | 25.95 mm | 16.00" | 2560x1600 | |
| 90.2 % v7 (old) | v7 (old) | 03/2024 | Alienware m16 R2 Ultra 7 155H, NVIDIA GeForce RTX 4070 Laptop GPU | 2.5 kg | 23.5 mm | 16.00" | 2560x1600 | |
| 88.4 % v7 (old) | v7 (old) | 04/2023 | Asus ROG Strix G17 G713PI R9 7945HX, NVIDIA GeForce RTX 4070 Laptop GPU | 2.8 kg | 30.7 mm | 17.30" | 2560x1440 | |
| 85.1 % v7 (old) | v7 (old) | 09/2023 | HP Victus 16-r0077ng i7-13700H, NVIDIA GeForce RTX 4070 Laptop GPU | 2.4 kg | 24 mm | 16.10" | 1920x1080 |
Nota: Recientemente hemos actualizado nuestro sistema de clasificación y los resultados de la versión 8 no son comparables con los de la versión 7. Encontrará más información aquí .
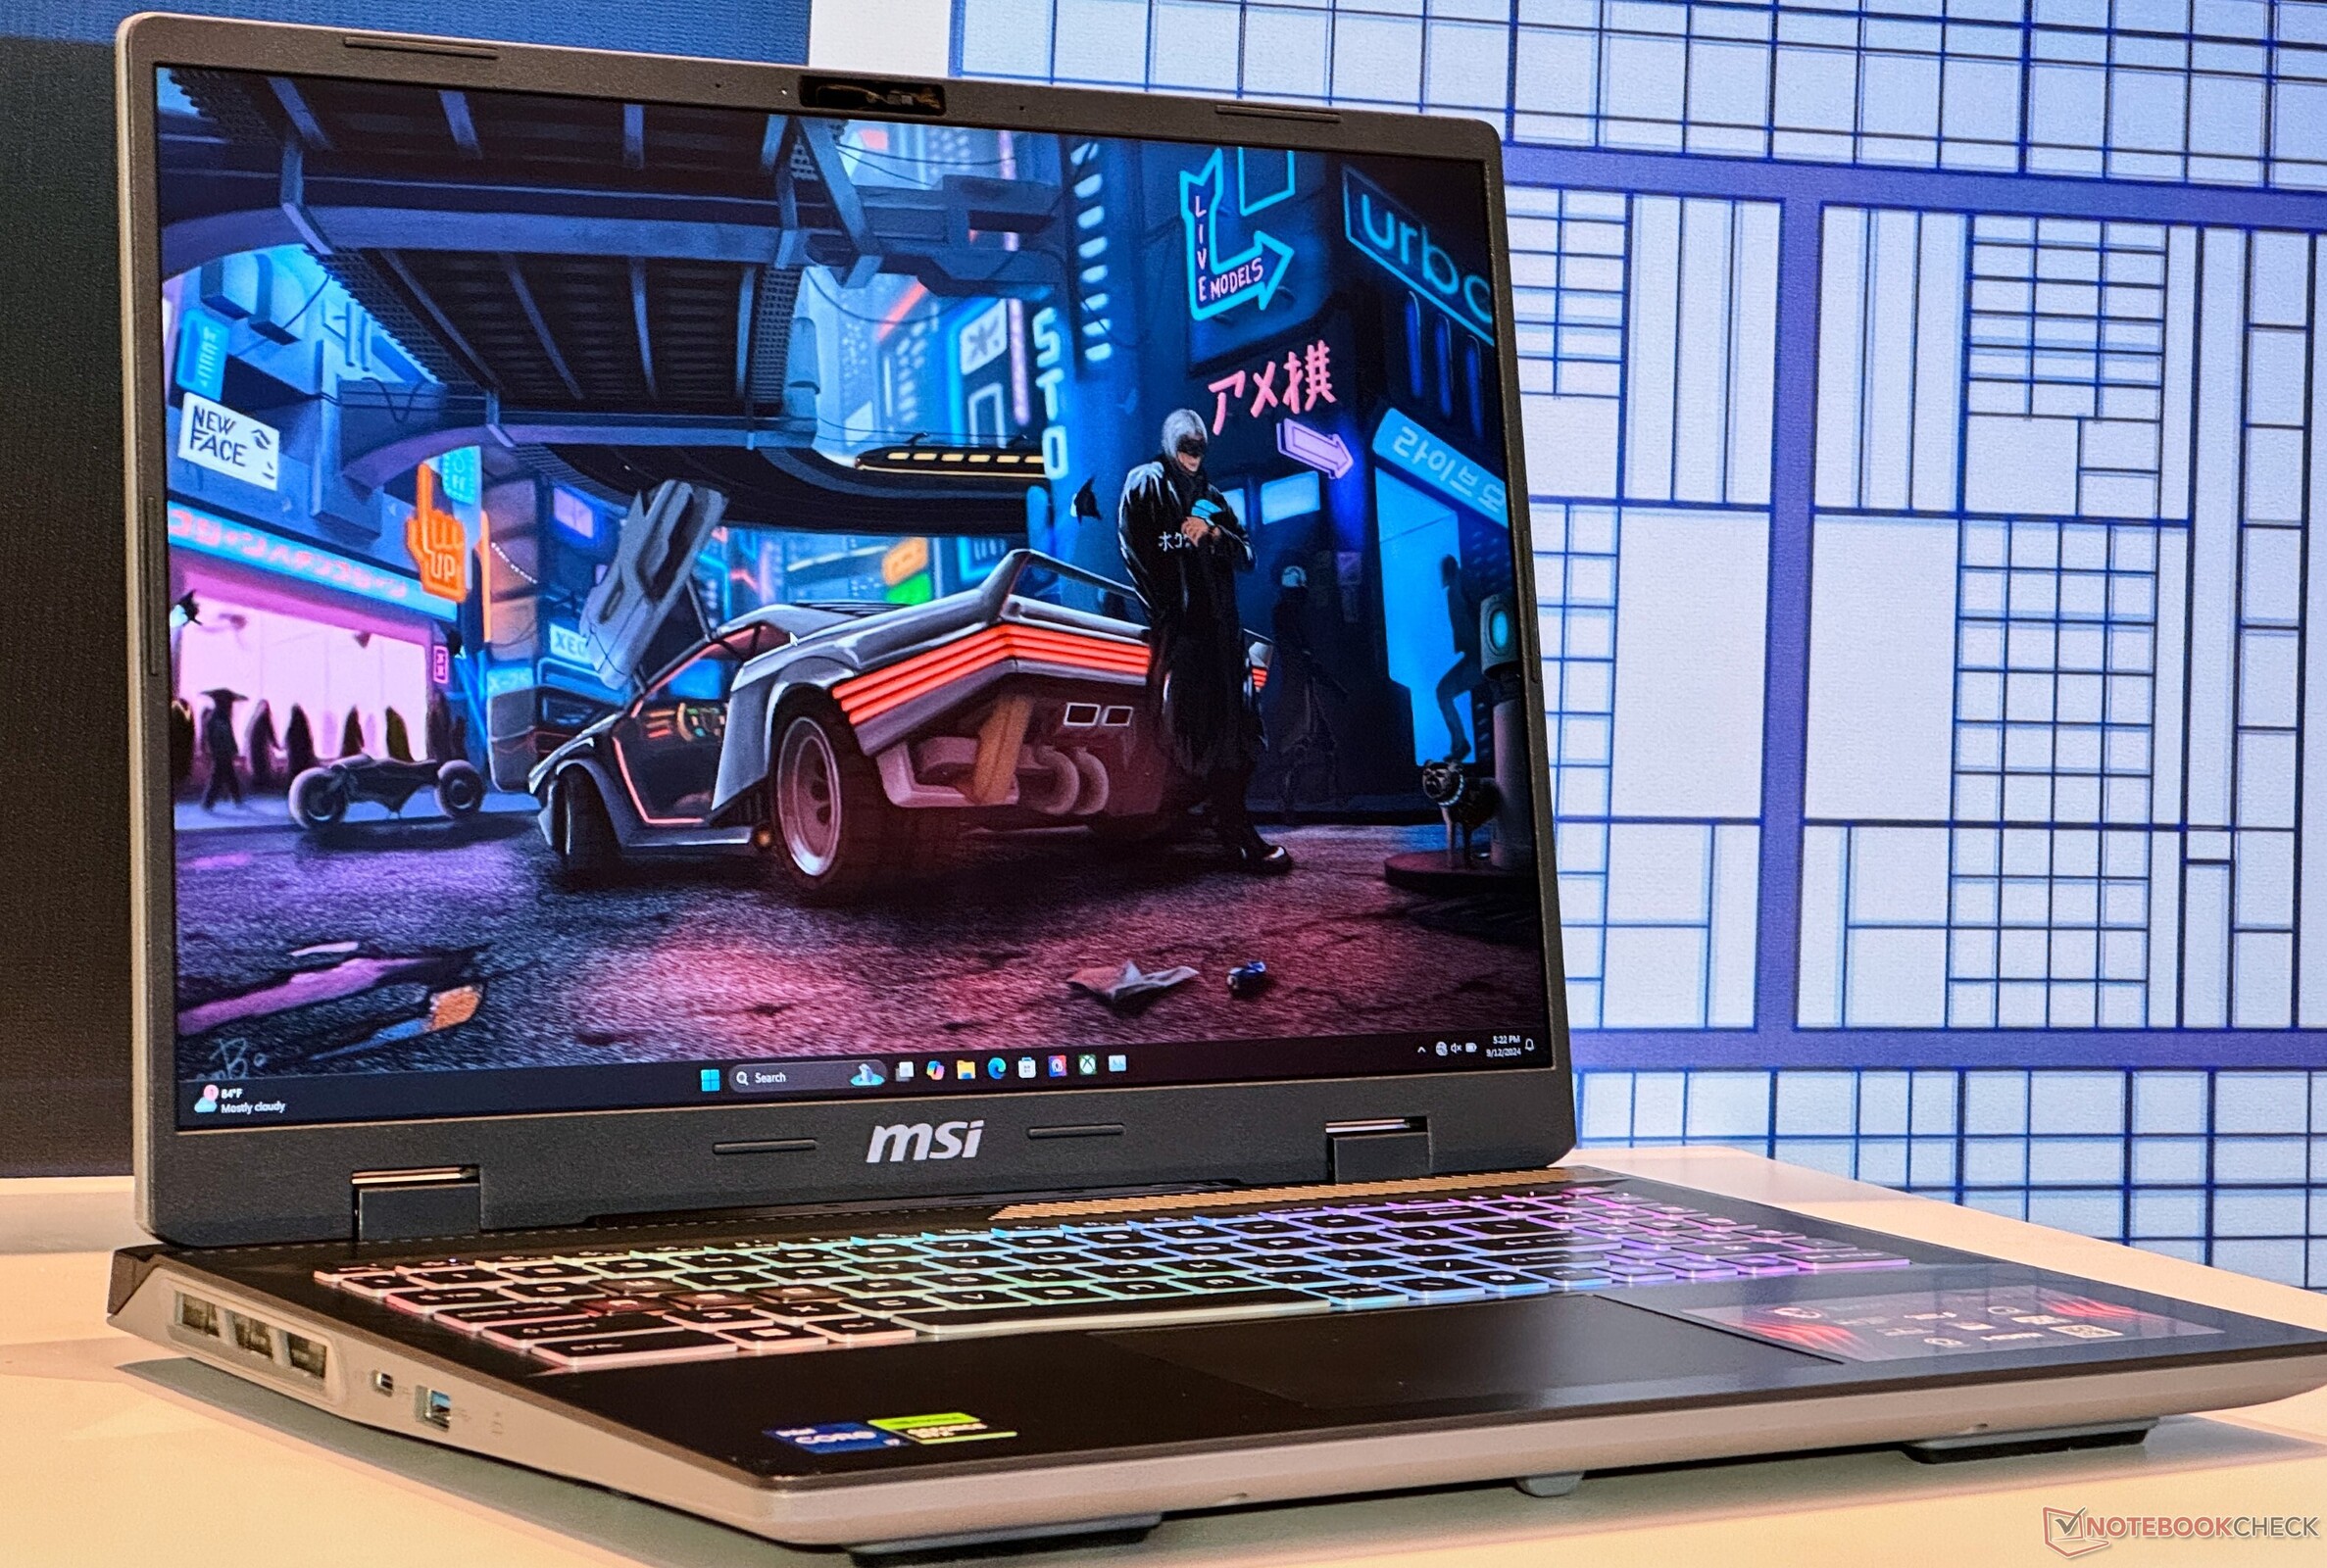
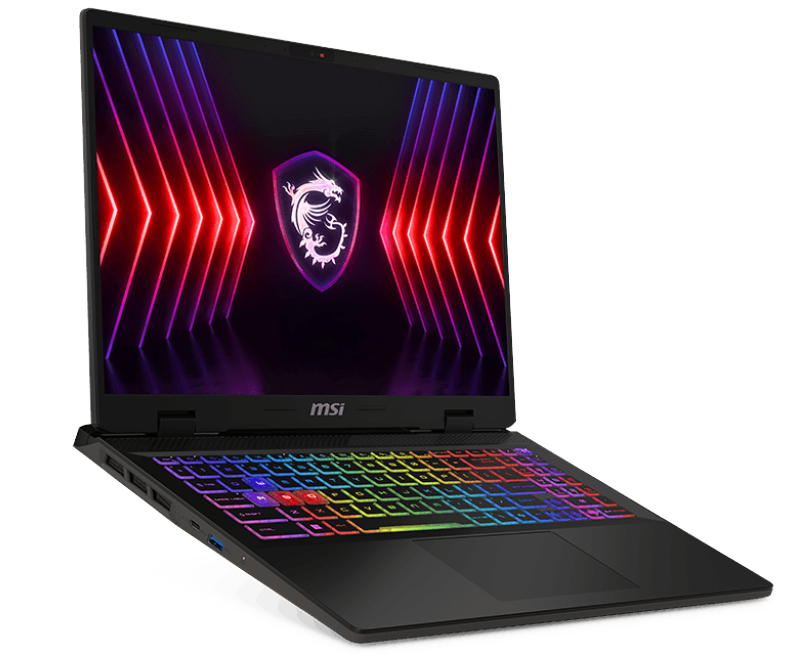
Chasis: Plástico de construcción robusta
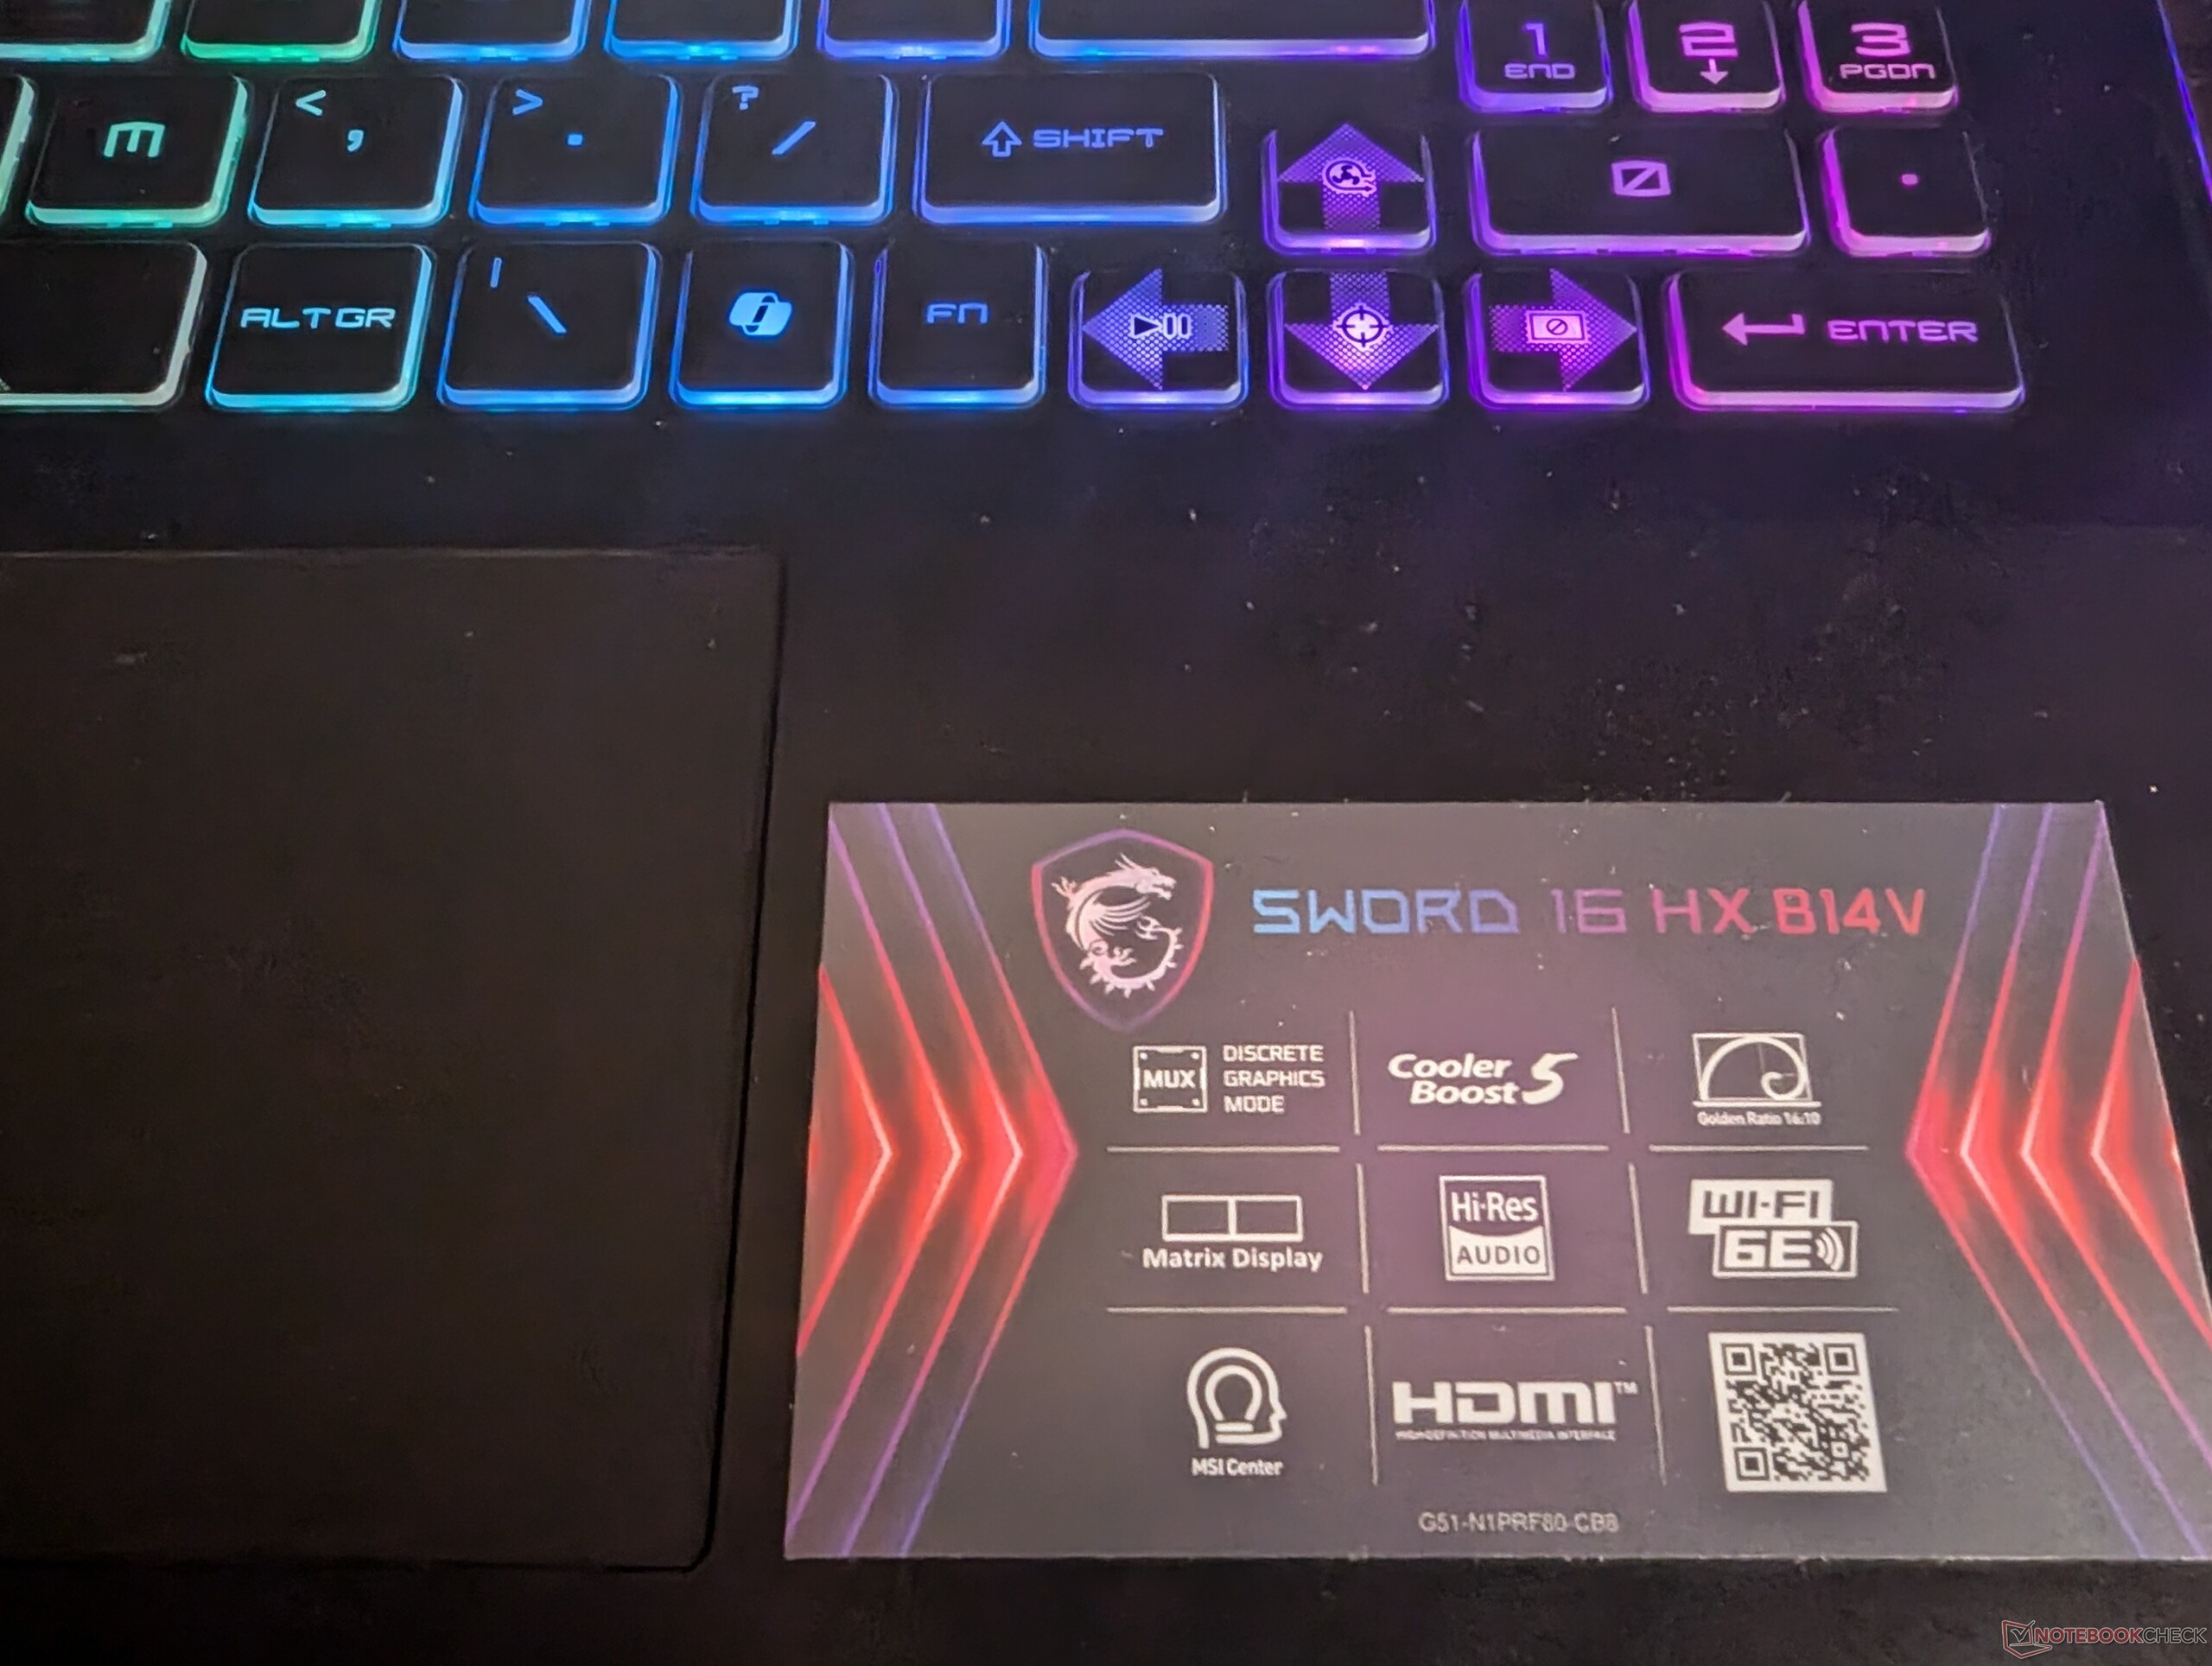
El MSI Sword 16 HX viene con un chasis de plástico estándar. Conseguimos uno de los colores más oscuros y es, por desgracia, un imán para las huellas dactilares y la grasa. Hay un logotipo de MSI en la parte posterior (y uno diminuto debajo de la pantalla) y pegatinas que destacan sus características clave junto al trackpad.
A pesar de su construcción en plástico, el chasis es robusto con una flexión mínima. Su pantalla y bisagras son rígidas y no se retuercen mucho cuando se aplica poca presión. A diferencia de otras ofertas más premium, no puede abrir la pantalla con un dedo sin que el portátil se mueva.
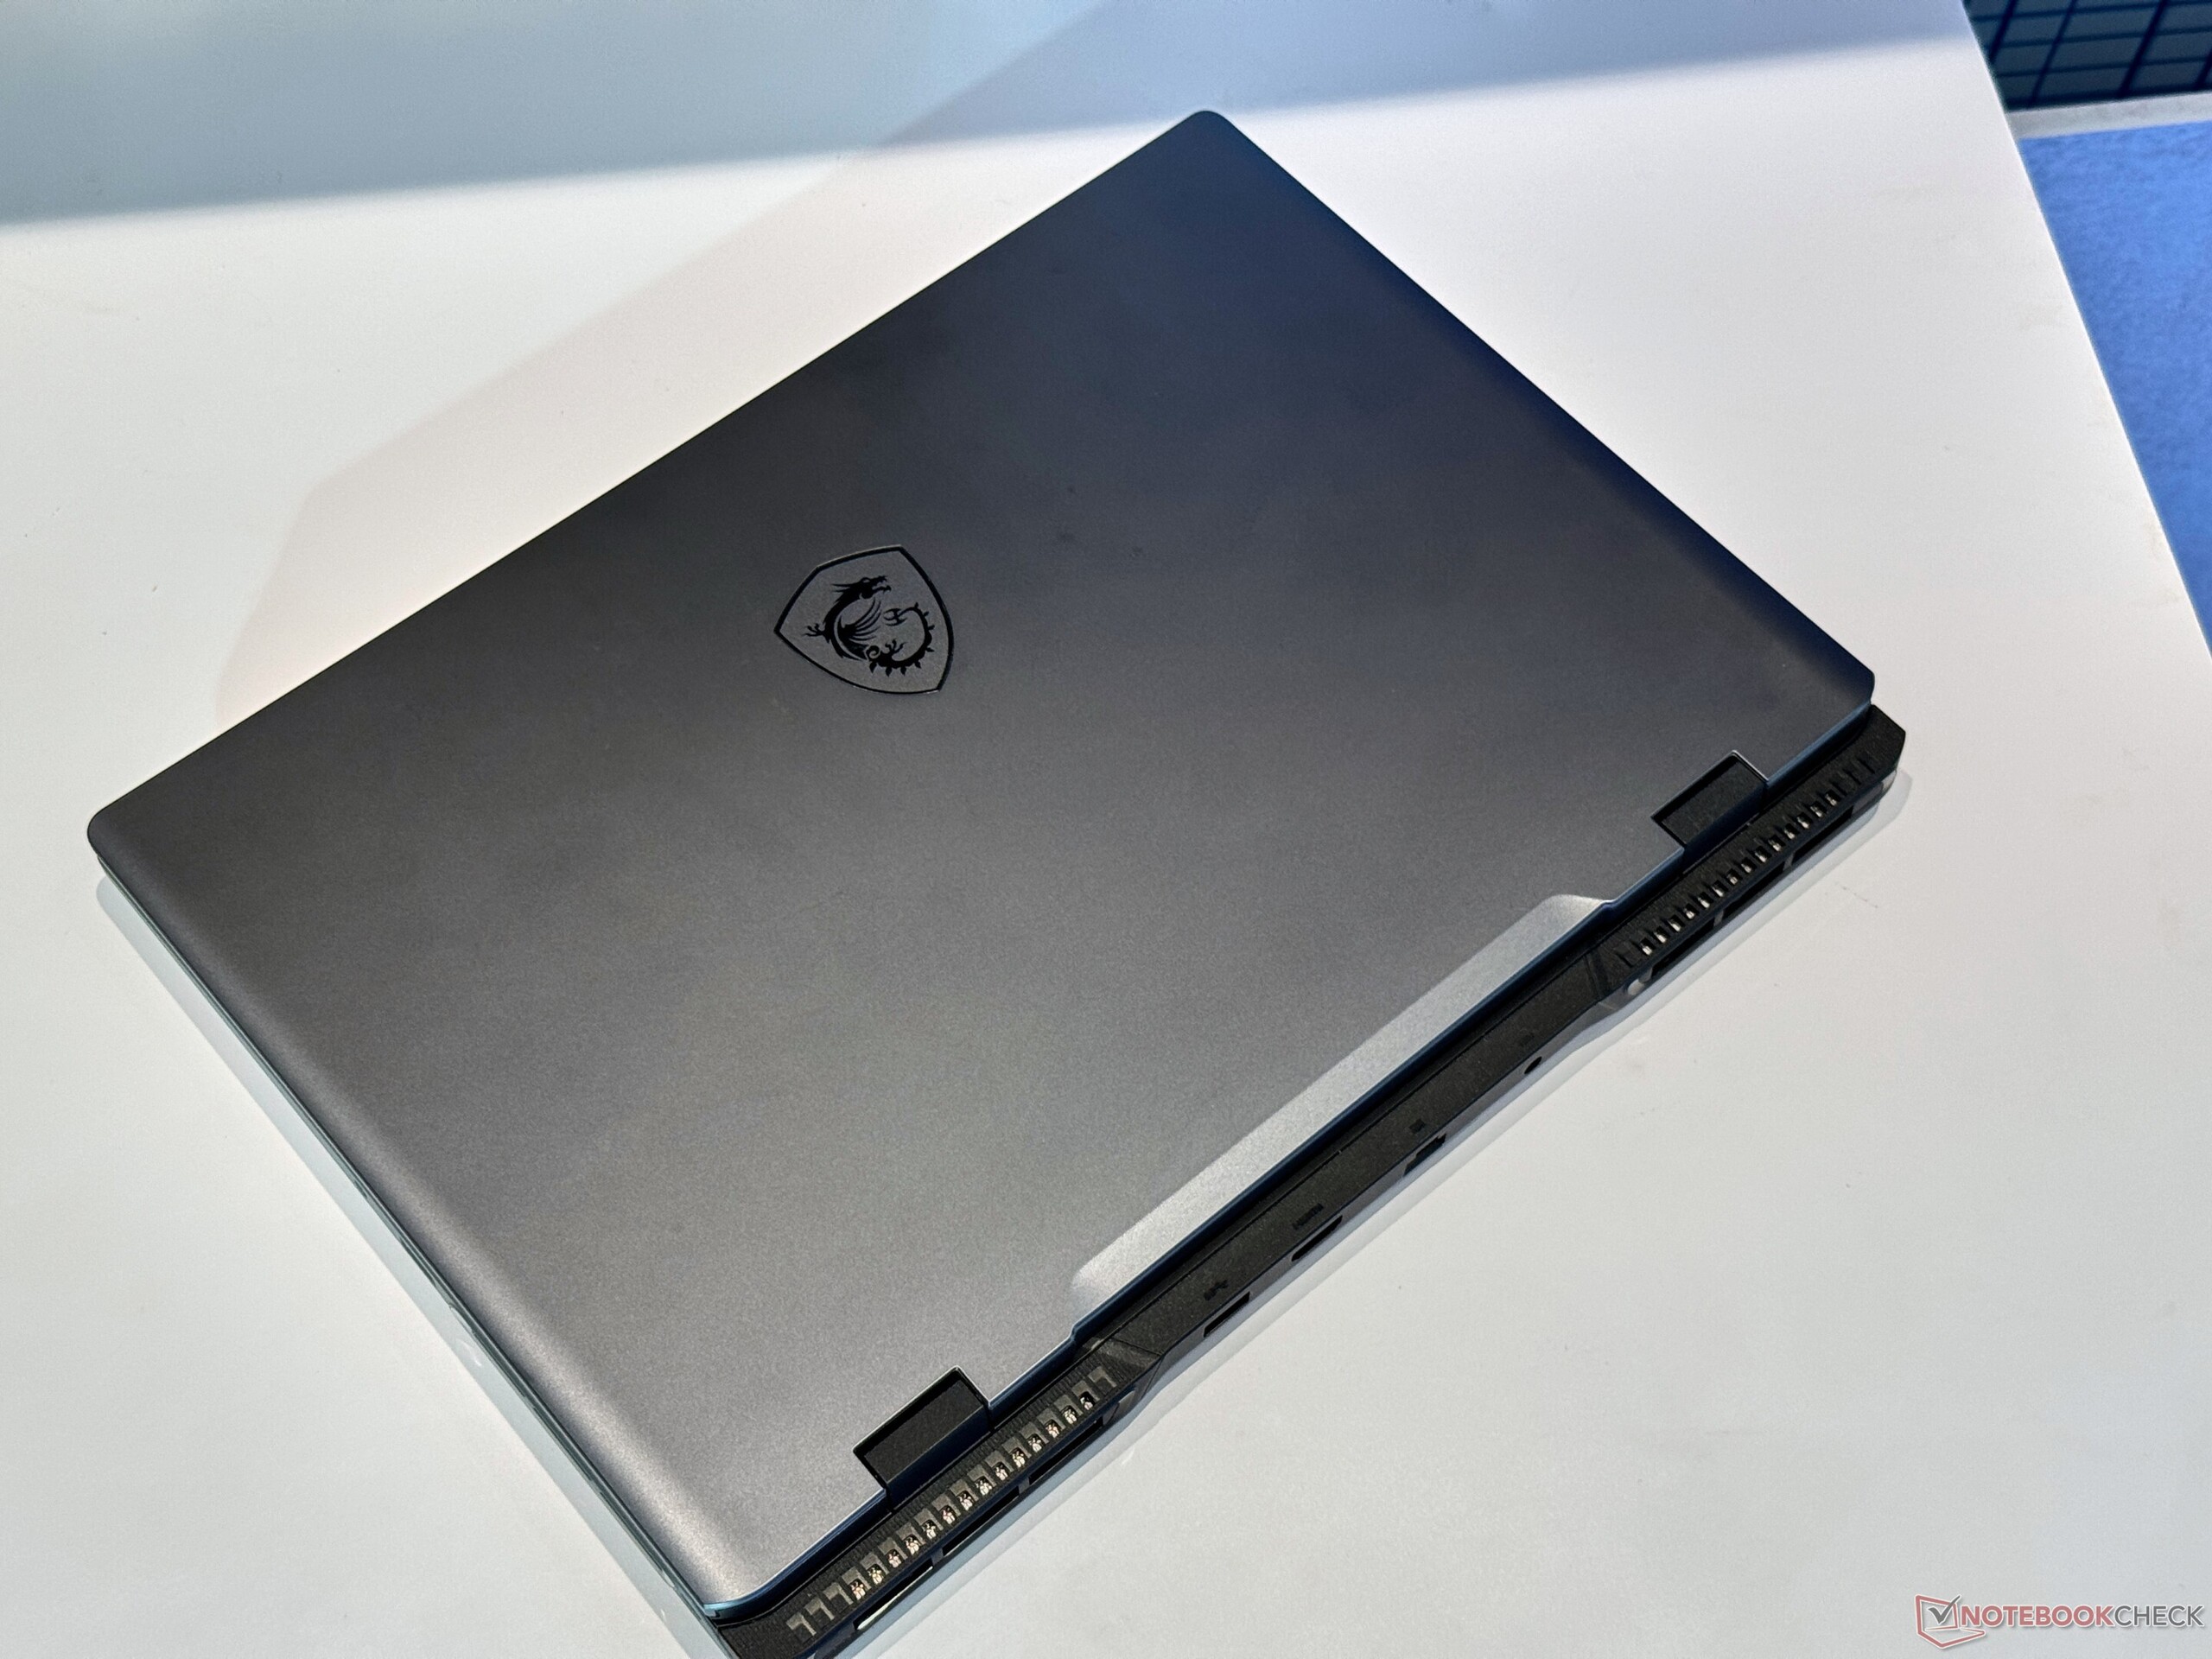
Con un peso de 2,3 kg, el MSI Sword 16 HX no es lo que uno llamaría portátil, pero puede cargarlo en su mochila si así lo desea.
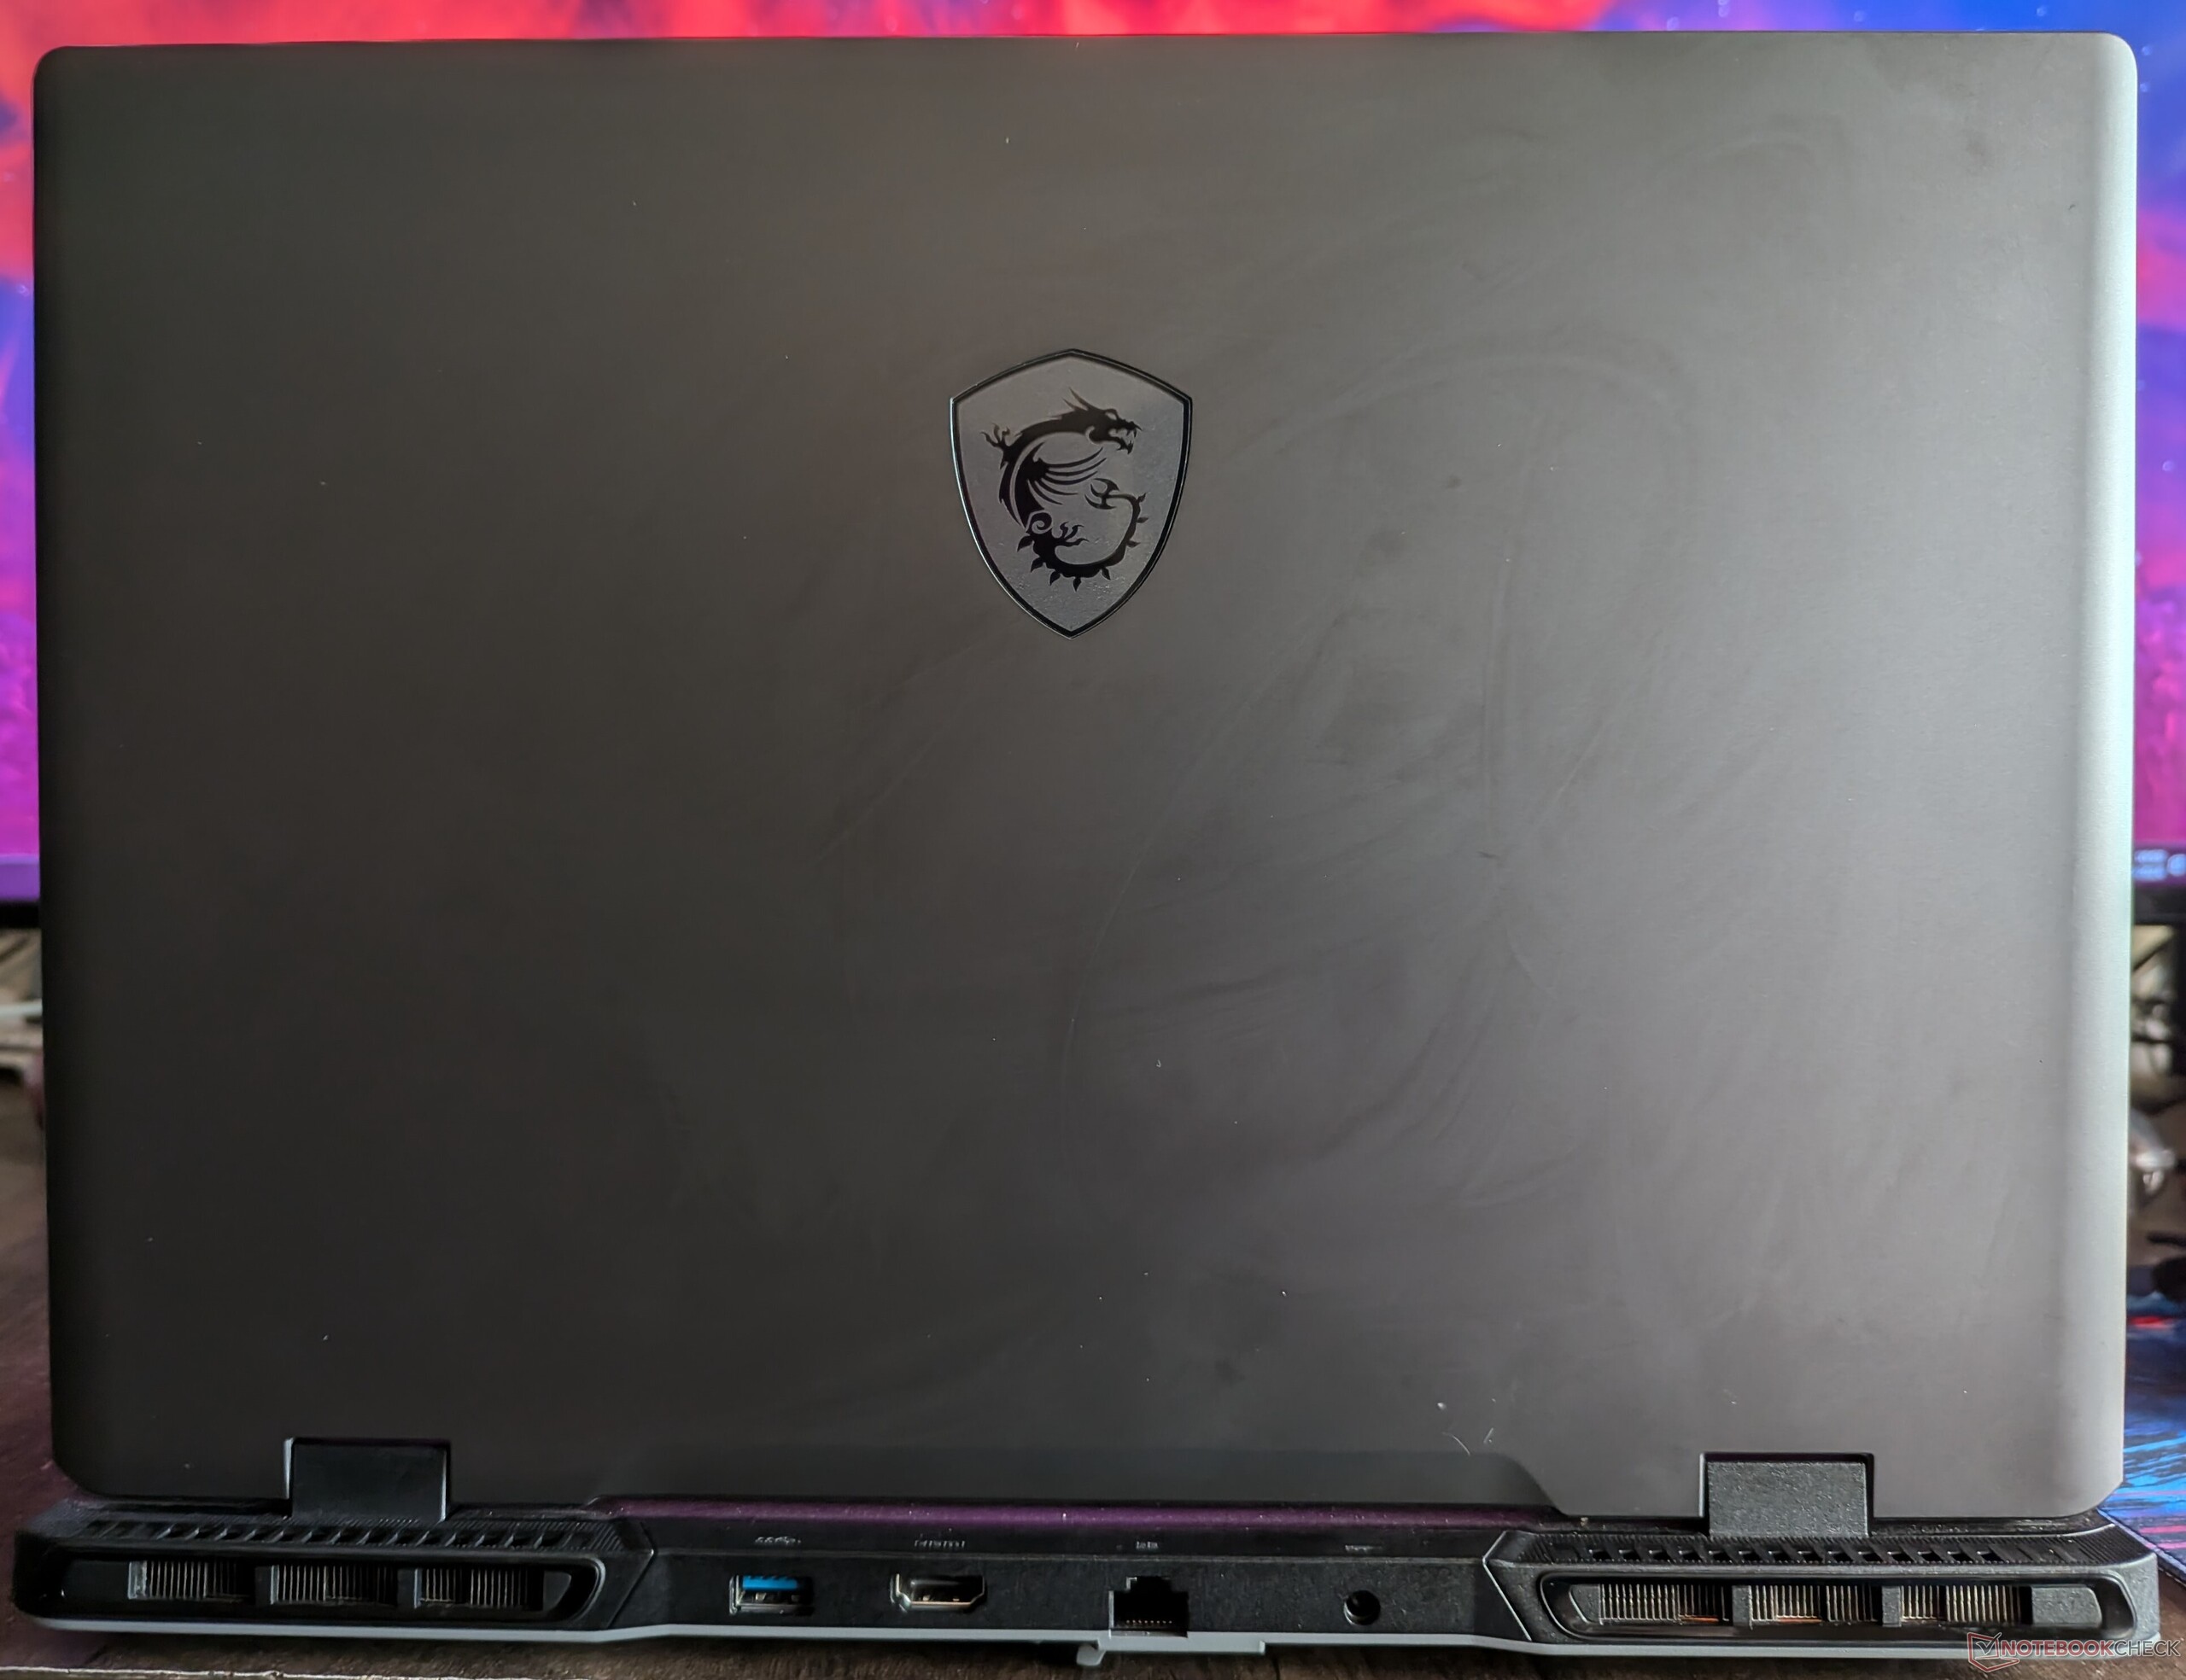
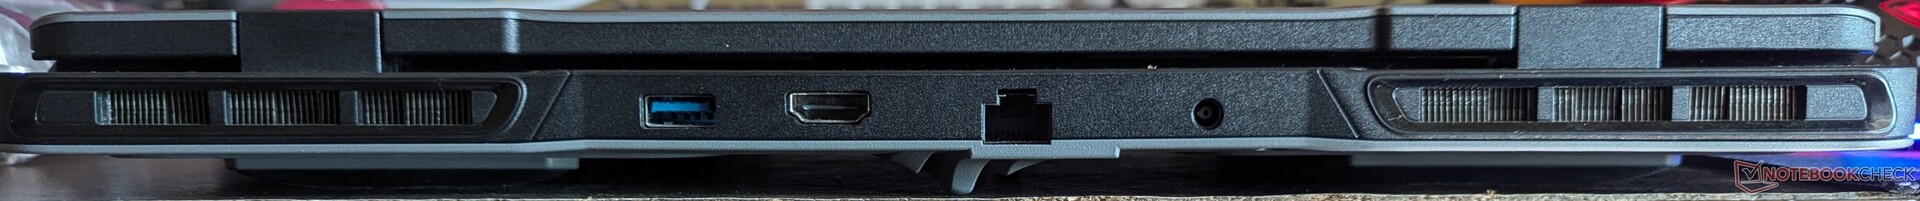
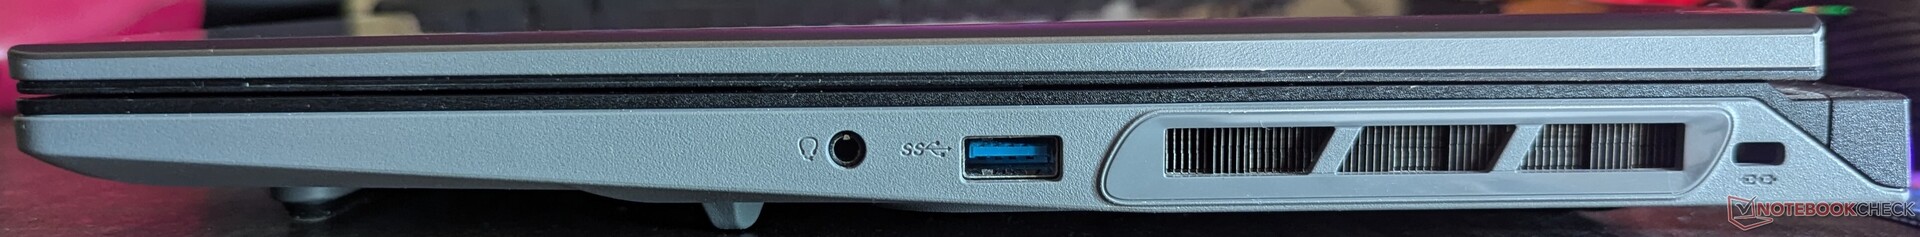
Conectividad: Wi-Fi 6E ultrarrápida y Ethernet
Los portátiles para juegos se utilizan a menudo como sobremesa y necesitan muchas E/S para cumplir esa función. Sin embargo, notamos algunos problemas con los puertos. Para empezar, no puede cargar el portátil con el puerto USB Tipo-C. Eso le obliga a utilizar el cargador de clavija de barril de la parte trasera, que está situado justo al lado de las rejillas de ventilación.
Esto coloca el cable de carga en ángulo recto justo delante de la rejilla de ventilación y lo somete a una ráfaga incesante de aire caliente. Con el tiempo, el calor podría roer el aislamiento de plástico e inutilizar el cable.
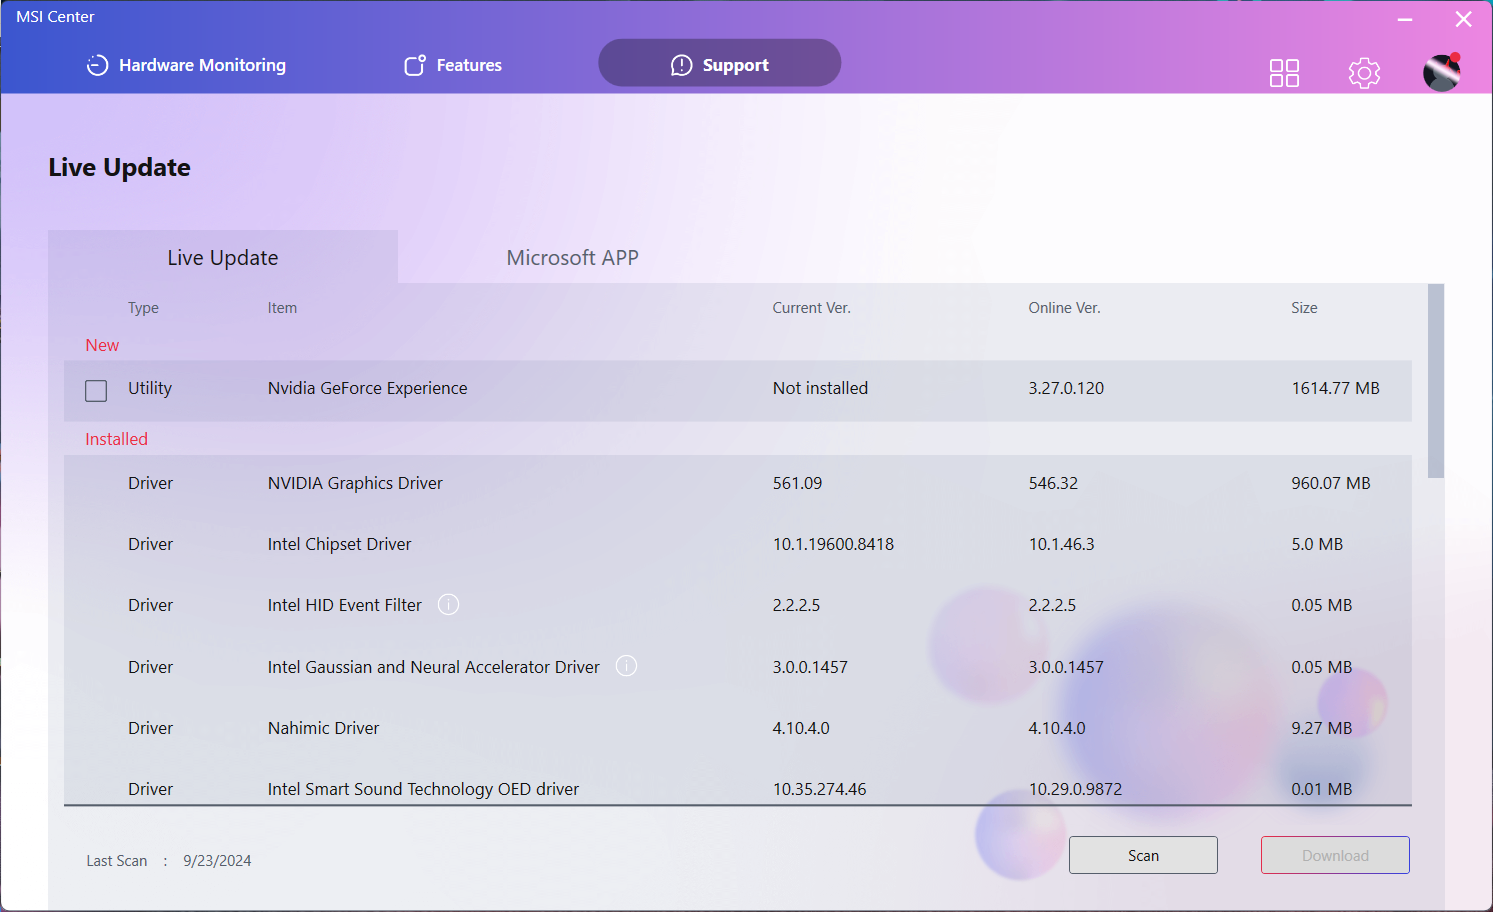
Además, el puerto HDMI incluido se negó rotundamente a funcionar a 1440p 144 Hz en nuestro monitor externo y se limitó a 100 Hz por alguna razón. Nos pusimos en contacto con MSI que nos proporcionó una BIOS actualizada (E15P2IMS.10D) que resuelve este problema. Esta BIOS también está disponible en la página de soporte del portátil https://www.msi.com/Laptop/Sword-16-HX-B14VX/support?sub_product=Sword-16-HX-B14VGKGpero no pudimos flashear la misma en nuestra unidad de prueba.

Comunicación
El Sword 16 HX viene con una radio Wi-Fi 6E de Intel. En condiciones ideales, puede obtener fácilmente velocidades de transferencia superiores a 1 Gbps en las bandas de 5 GHz y 6 GHz.
Quienes busquen velocidad garantizada y baja latencia pueden confiar en la toma Ethernet RJ45.
| Networking / iperf3 transmit AXE11000 | |
| Lenovo Legion 7 16 IRX G9 | |
| Asus ROG Strix G17 G713PI | |
| MSI Sword 16 HX B14VGKG | |
| Medio Intel Wi-Fi 6E AX211 (64 - 1921, n=251) | |
| Media de la clase Gaming (469 - 1843, n=122, últimos 2 años) | |
| Alienware m16 R2 | |
| Acer Predator Helios Neo 16 (2024) | |
| HP Omen 17-db0079ng | |
| HP Victus 16-r0077ng | |
| Networking / iperf3 receive AXE11000 | |
| Lenovo Legion 7 16 IRX G9 | |
| Asus ROG Strix G17 G713PI | |
| MSI Sword 16 HX B14VGKG | |
| Media de la clase Gaming (680 - 1744, n=122, últimos 2 años) | |
| Medio Intel Wi-Fi 6E AX211 (582 - 1890, n=251) | |
| Alienware m16 R2 | |
| Acer Predator Helios Neo 16 (2024) | |
| HP Omen 17-db0079ng | |
| HP Victus 16-r0077ng | |
| Networking / iperf3 transmit AXE11000 6GHz | |
| MSI Sword 16 HX B14VGKG | |
| Acer Predator Helios Neo 16 (2024) | |
| Media de la clase Gaming (648 - 2355, n=56, últimos 2 años) | |
| Alienware m16 R2 | |
| Medio Intel Wi-Fi 6E AX211 (385 - 1851, n=217) | |
| Networking / iperf3 receive AXE11000 6GHz | |
| Acer Predator Helios Neo 16 (2024) | |
| MSI Sword 16 HX B14VGKG | |
| Medio Intel Wi-Fi 6E AX211 (700 - 1857, n=217) | |
| Media de la clase Gaming (853 - 1788, n=56, últimos 2 años) | |
| Alienware m16 R2 | |
Cámara web
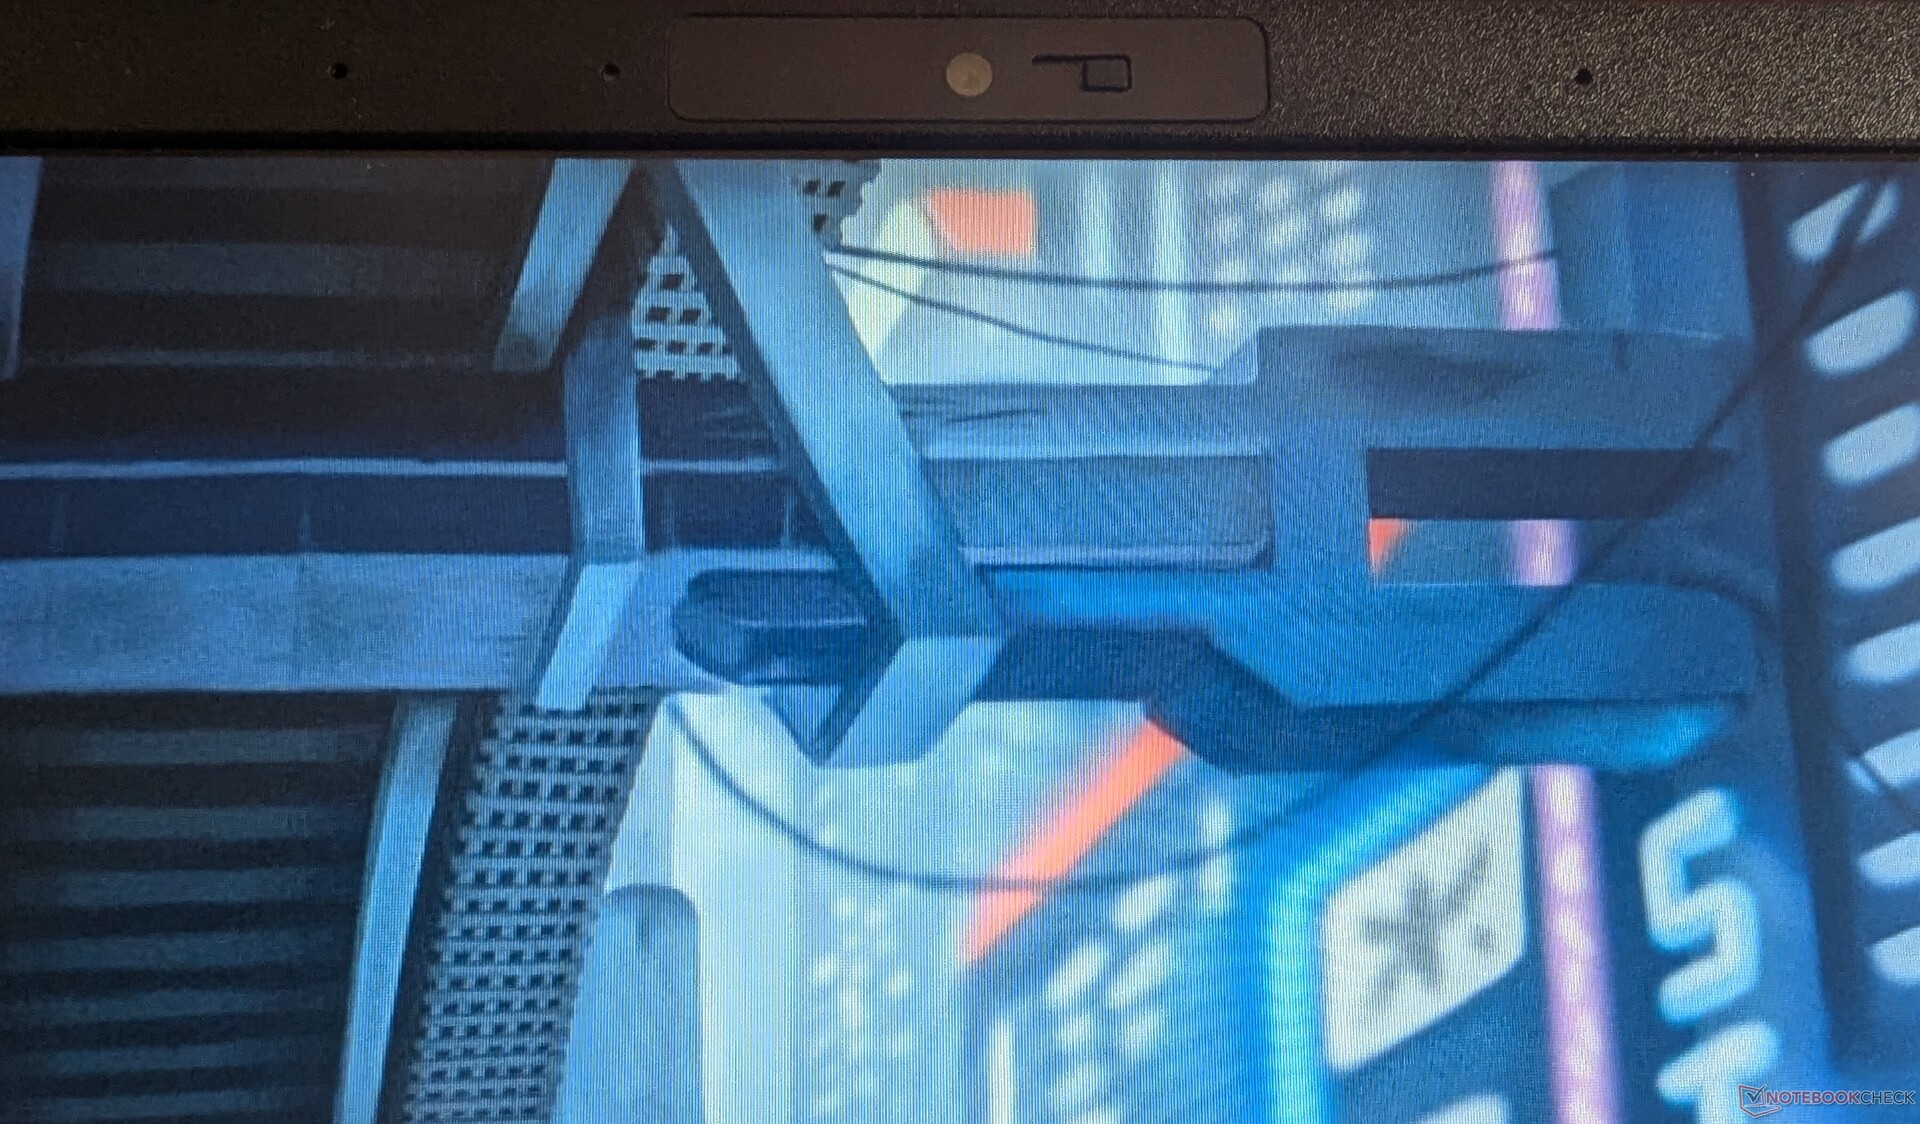
MSI utiliza una webcam 1080p antigua en el Sword 16 HX. No es particularmente precisa en cuanto al color y sufre a la hora de reproducir correctamente los tonos azules.
Si quiere hacer livestreaming, es mejor que invierta en una webcam externa. Por lo demás, debería funcionar bien para el uso diario e incluso viene con un obturador de privacidad físico.


Seguridad
Aparte del obturador de privacidad de la webcam, el MSI Sword 16 HX viene con un módulo TPM 2.0 estándar y una ranura de bloqueo Kensington para mayor seguridad.
Mantenimiento
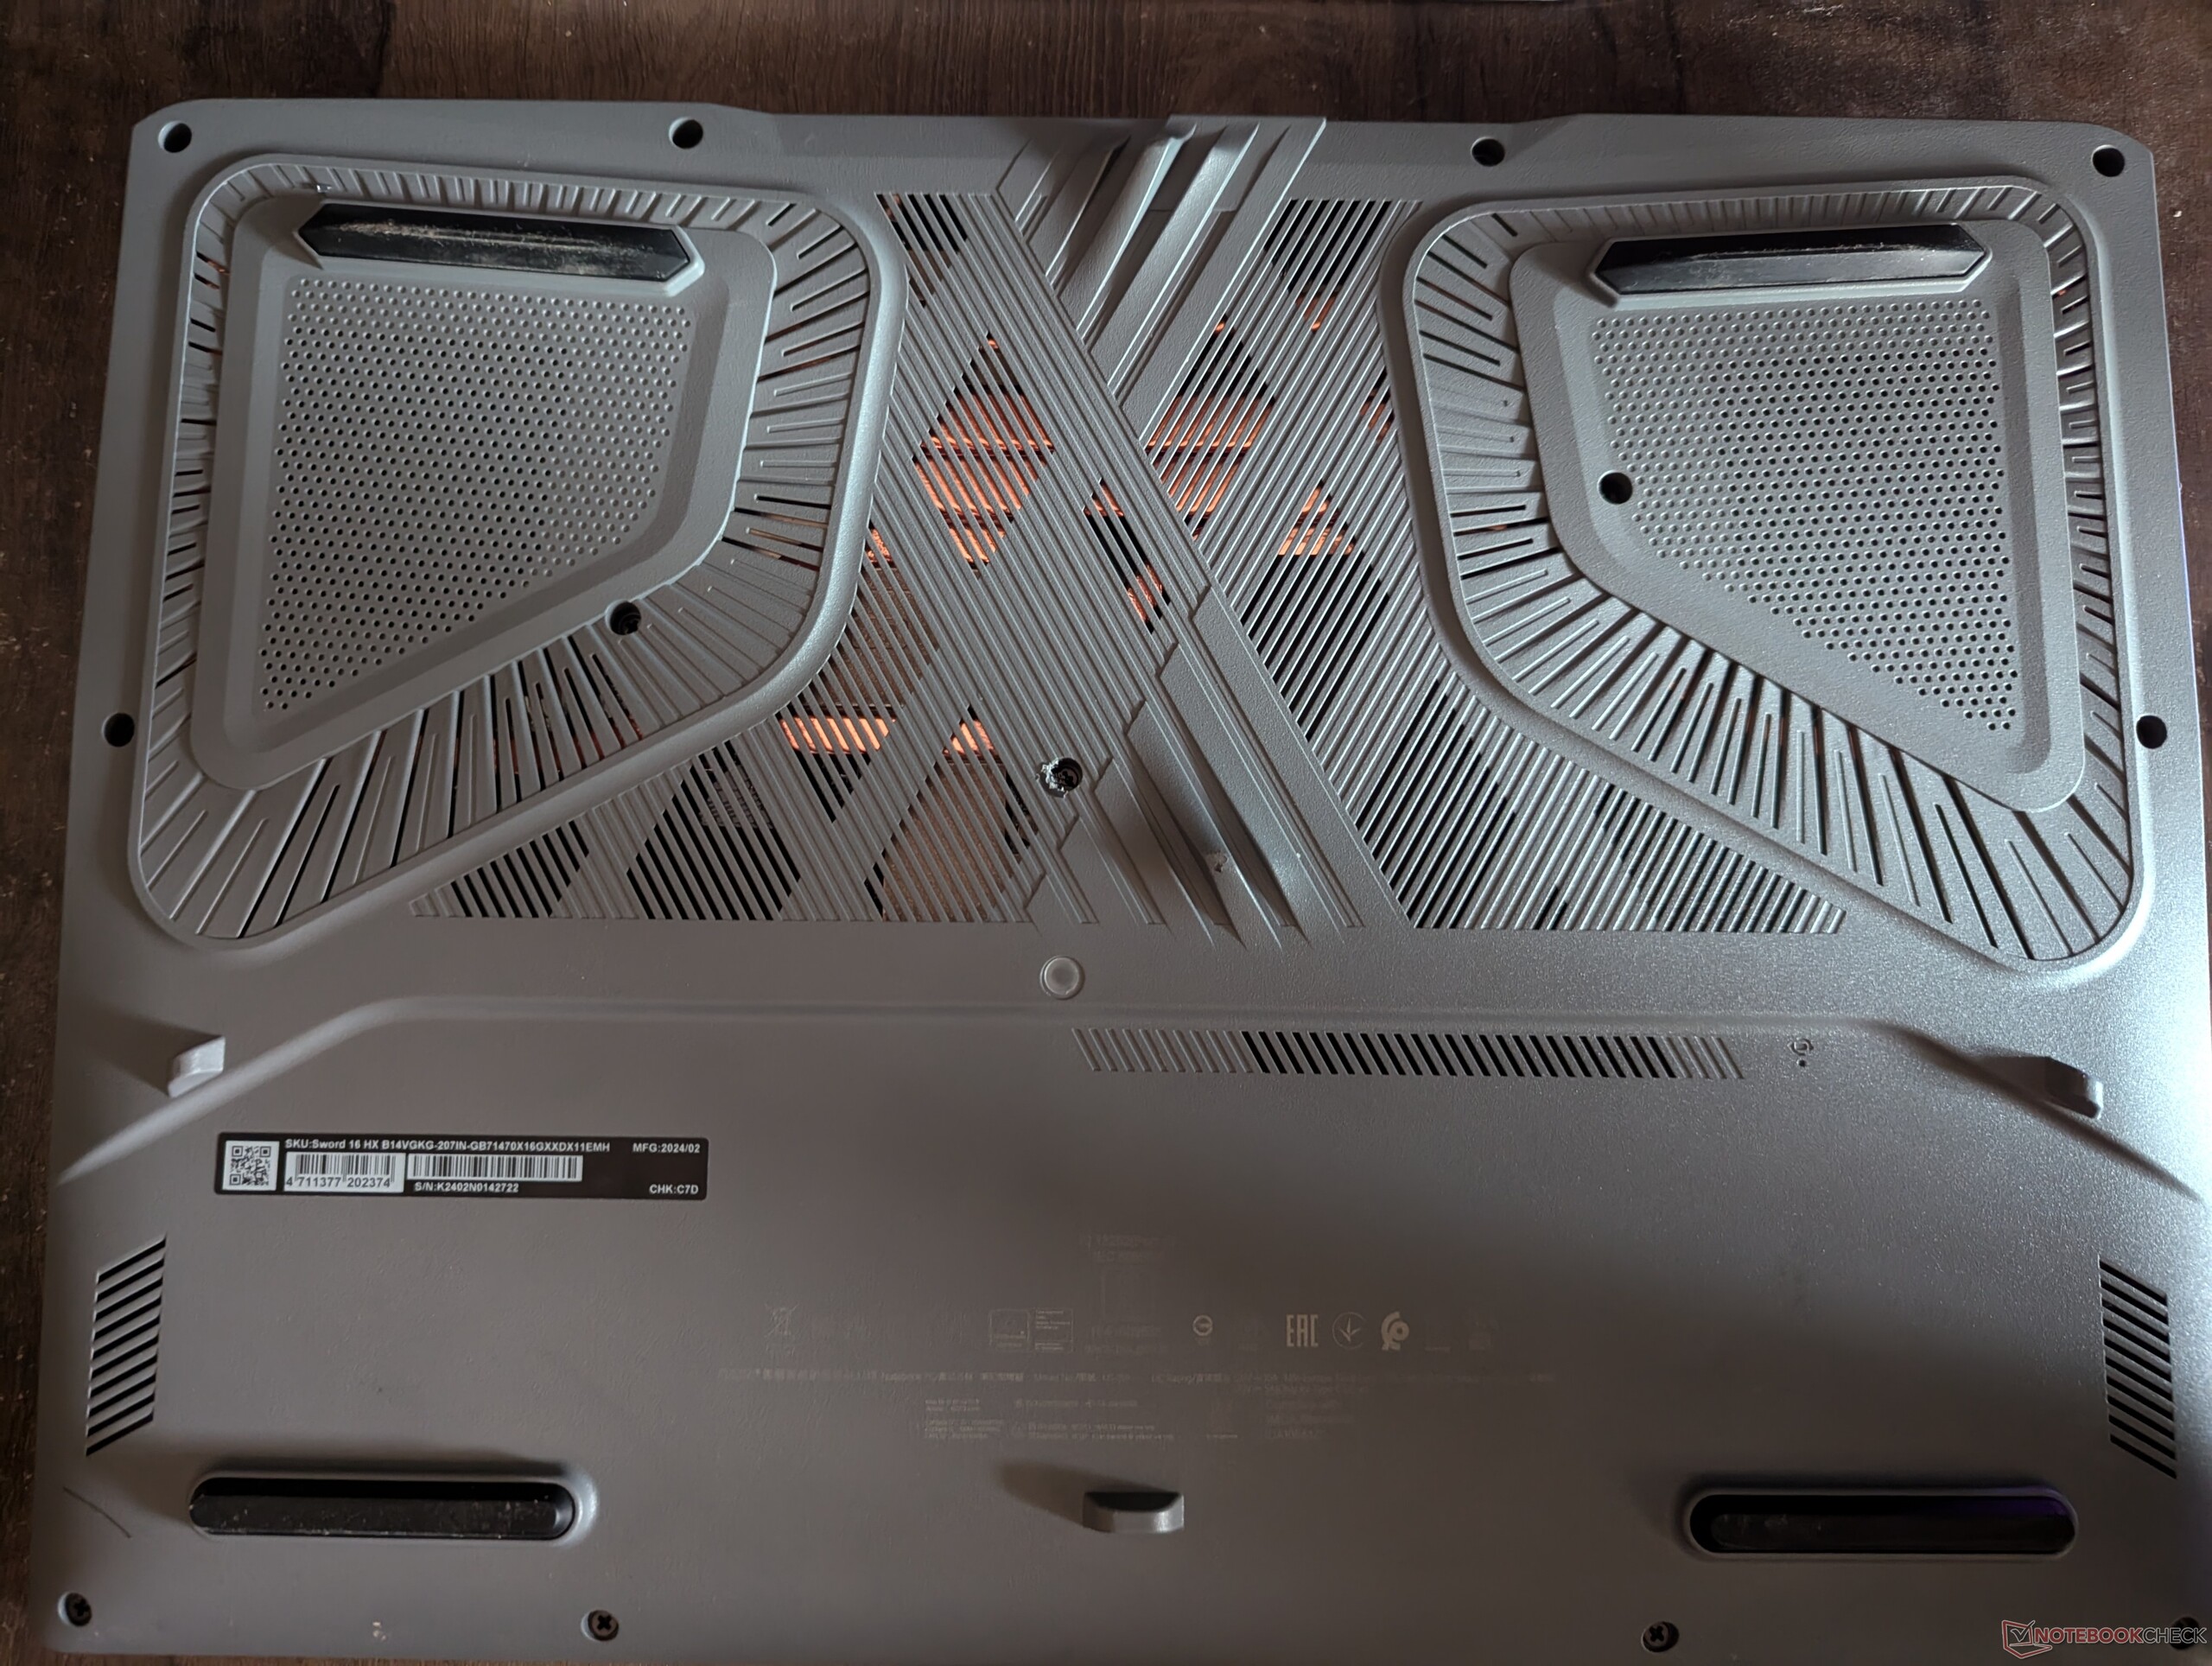
Abrir el MSI Sword 16 HX puede resultar un poco engorroso. Hay 12 tornillos en total, uno de los cuales está oculto bajo una pegatina que dice "La garantía queda anulada si se retira".
Sin embargo, una vez dentro, tanto la RAM como el SSD son reemplazables por el usuario. La primera puede ampliarse hasta 96 GB, y la segunda incluye una ranura PCIe Gen4 y otra PCIe Gen5.
Desgraciadamente, no podemos publicar imágenes del interior del Sword 16 porque MSI nos pidió que no lo desmontáramos.
Sostenibilidad
La caja de venta al público del MSI Sword 16 HX viene con un montón de envoltorios de cartón innecesarios. Salvo un poco de poliestireno y plástico superfluo, la mayor parte del contenido es de cartón y puede reciclarse.
La página web de RSC de MSI afirma que la empresa ha logrado una reducción del 58,9% de las emisiones de CO2e de Alcance 1+2 para finales de 2022 y tiene como objetivo una reducción del 80% de las emisiones de CO2e para 2030.
Accesorios y garantía
MSI ofrece una garantía estándar internacional de un año y nacional de dos años con el Sword 16 HX en India. Actualmente, no hay planes de garantía extendida disponibles directamente de MSI, pero su kilometraje puede variar con los minoristas de terceros.
Dispositivos de entrada: Gran teclado RGB con un trackpad menos que ideal
El Sword 16 HX viene con un teclado y un trackpad estándar que se encuentran en la mayoría de los portátiles para juegos.
Teclado
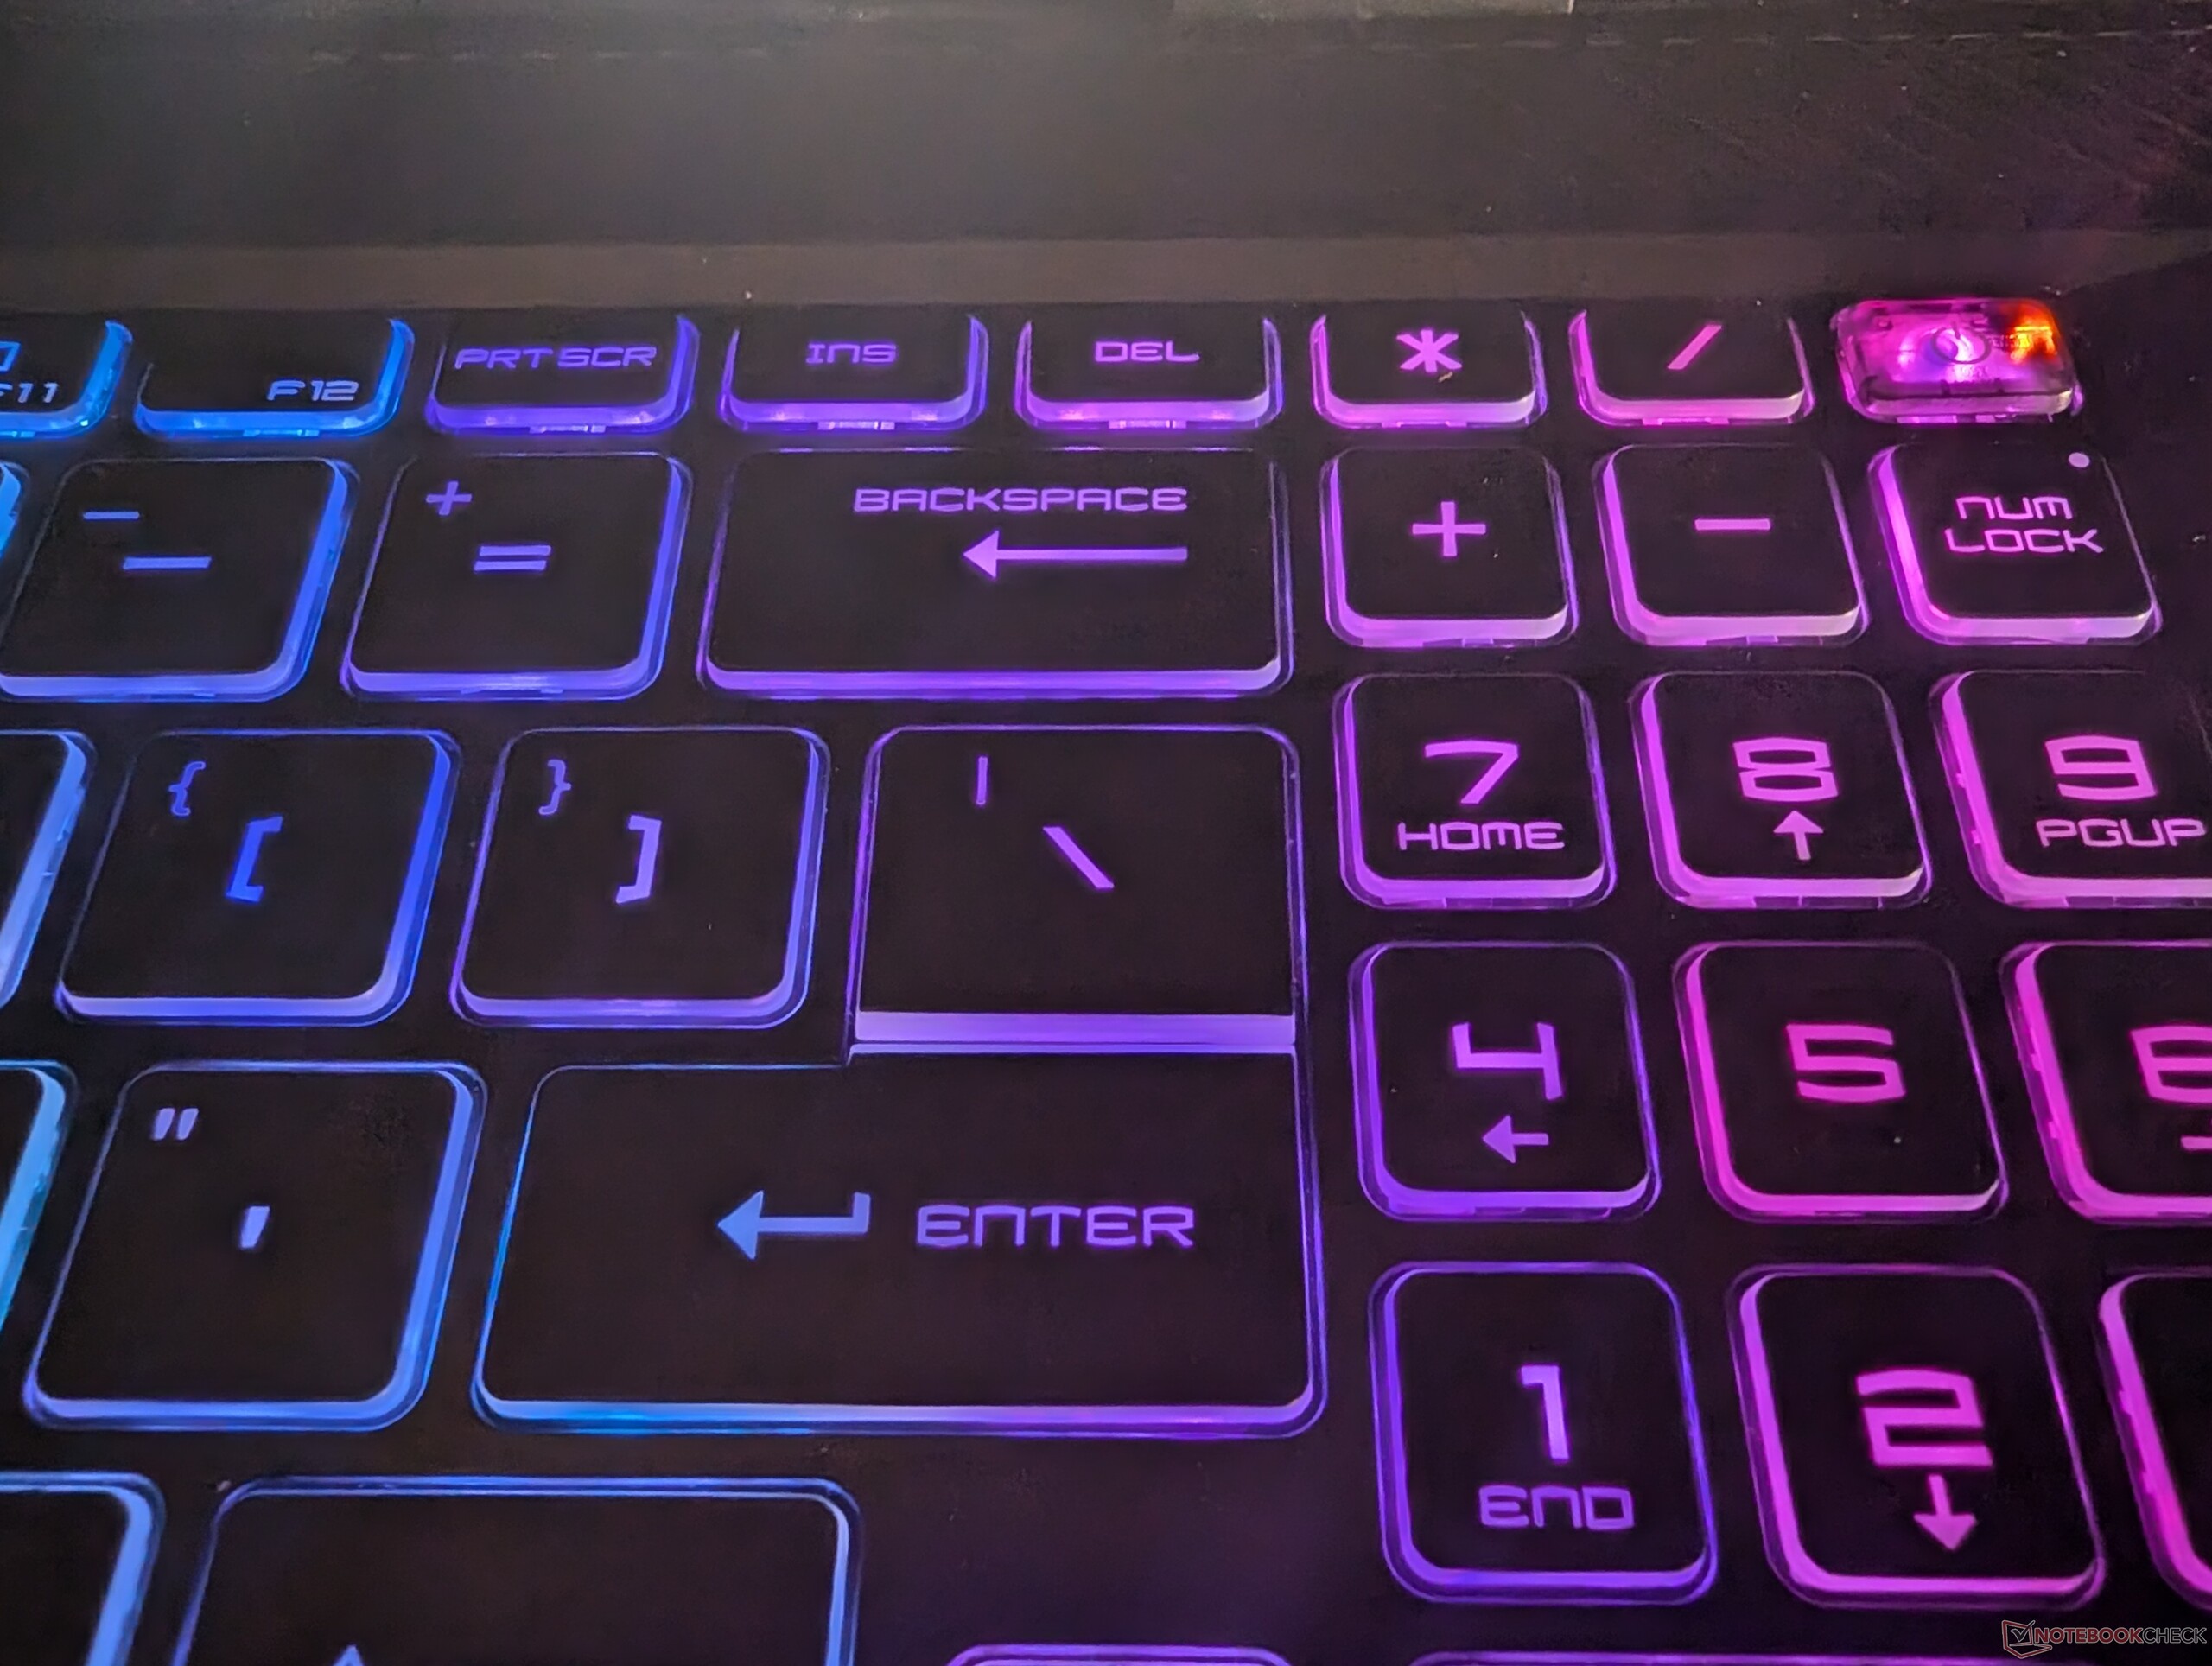
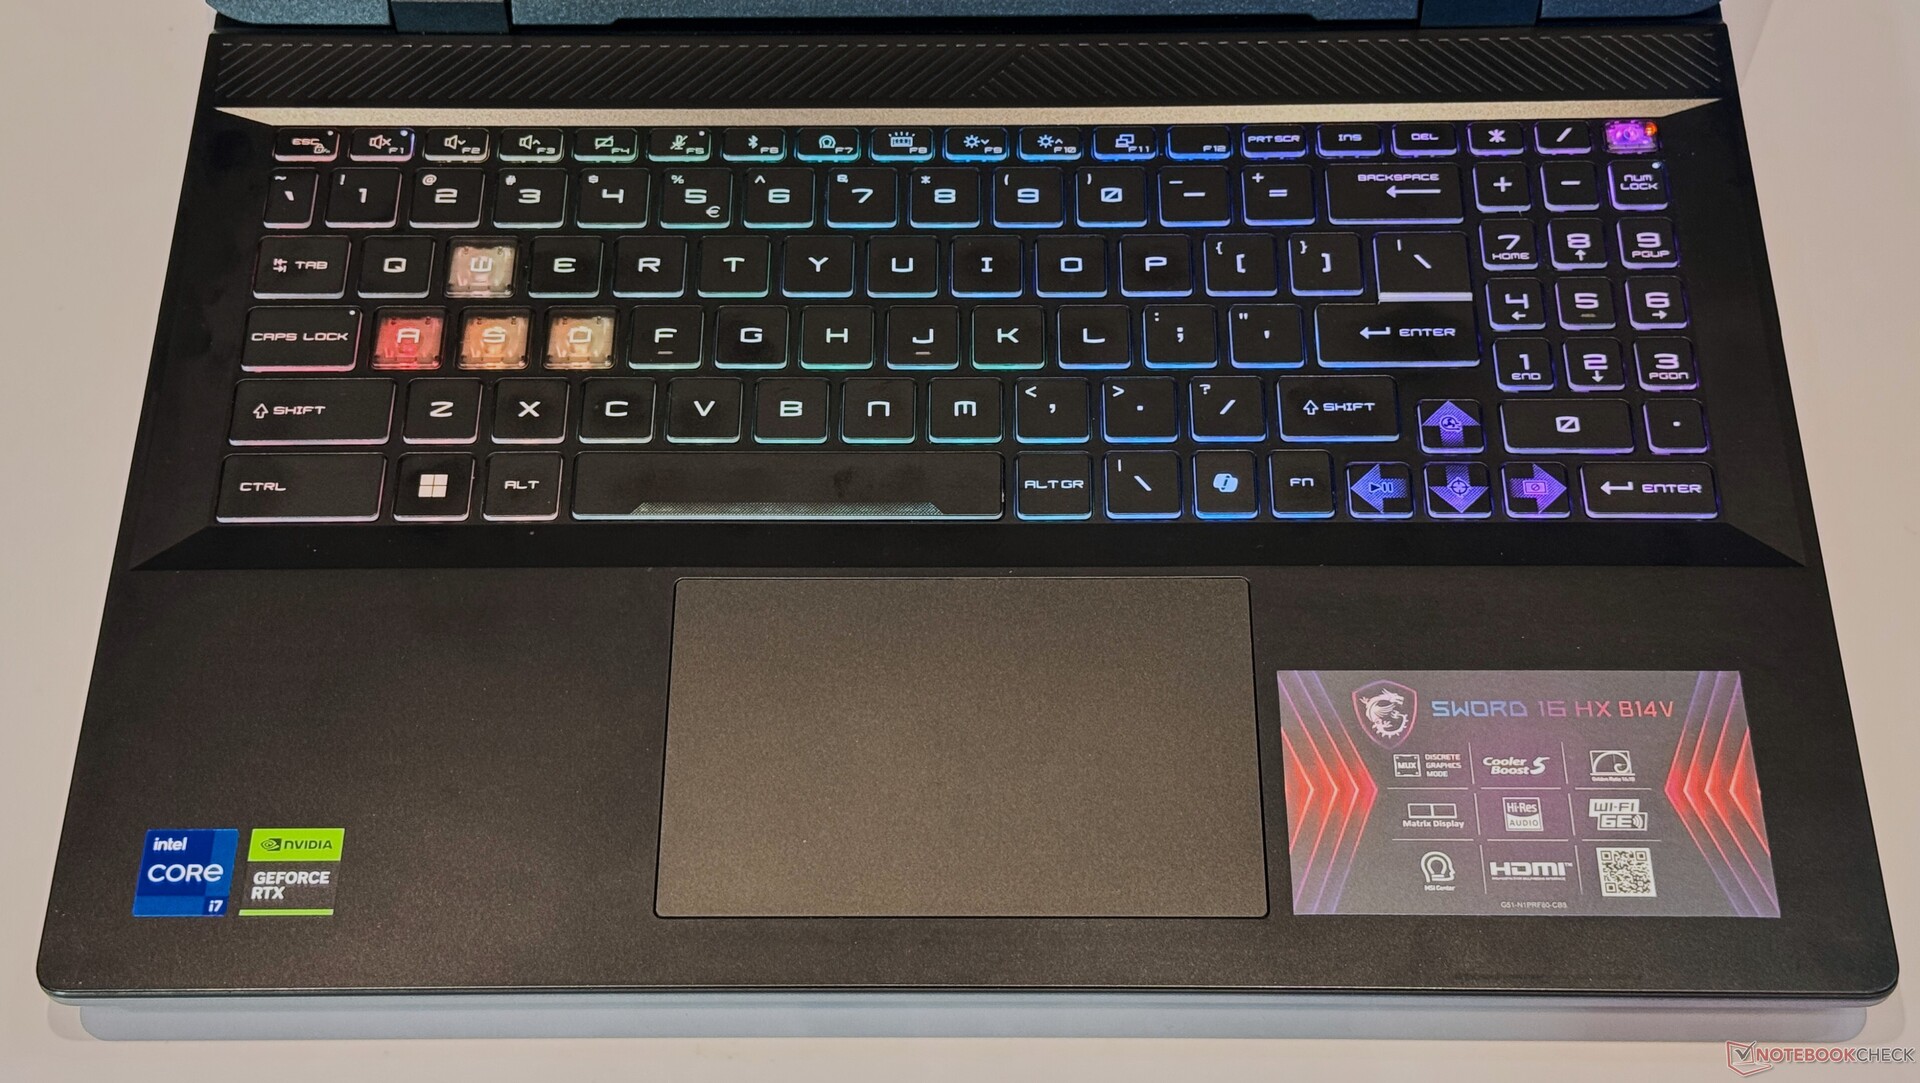
Su factor de forma de 16 pulgadas permite a MSI incluir un Numpad completo con el Sword 16. Las teclas del Numpad pueden resultar un poco pequeñas para las personas con dedos grandes.
El teclado en sí es robusto y no se flexiona bajo presión. Además, las teclas en sí eran cómodas para escribir y no requerían mucha fuerza de activación.
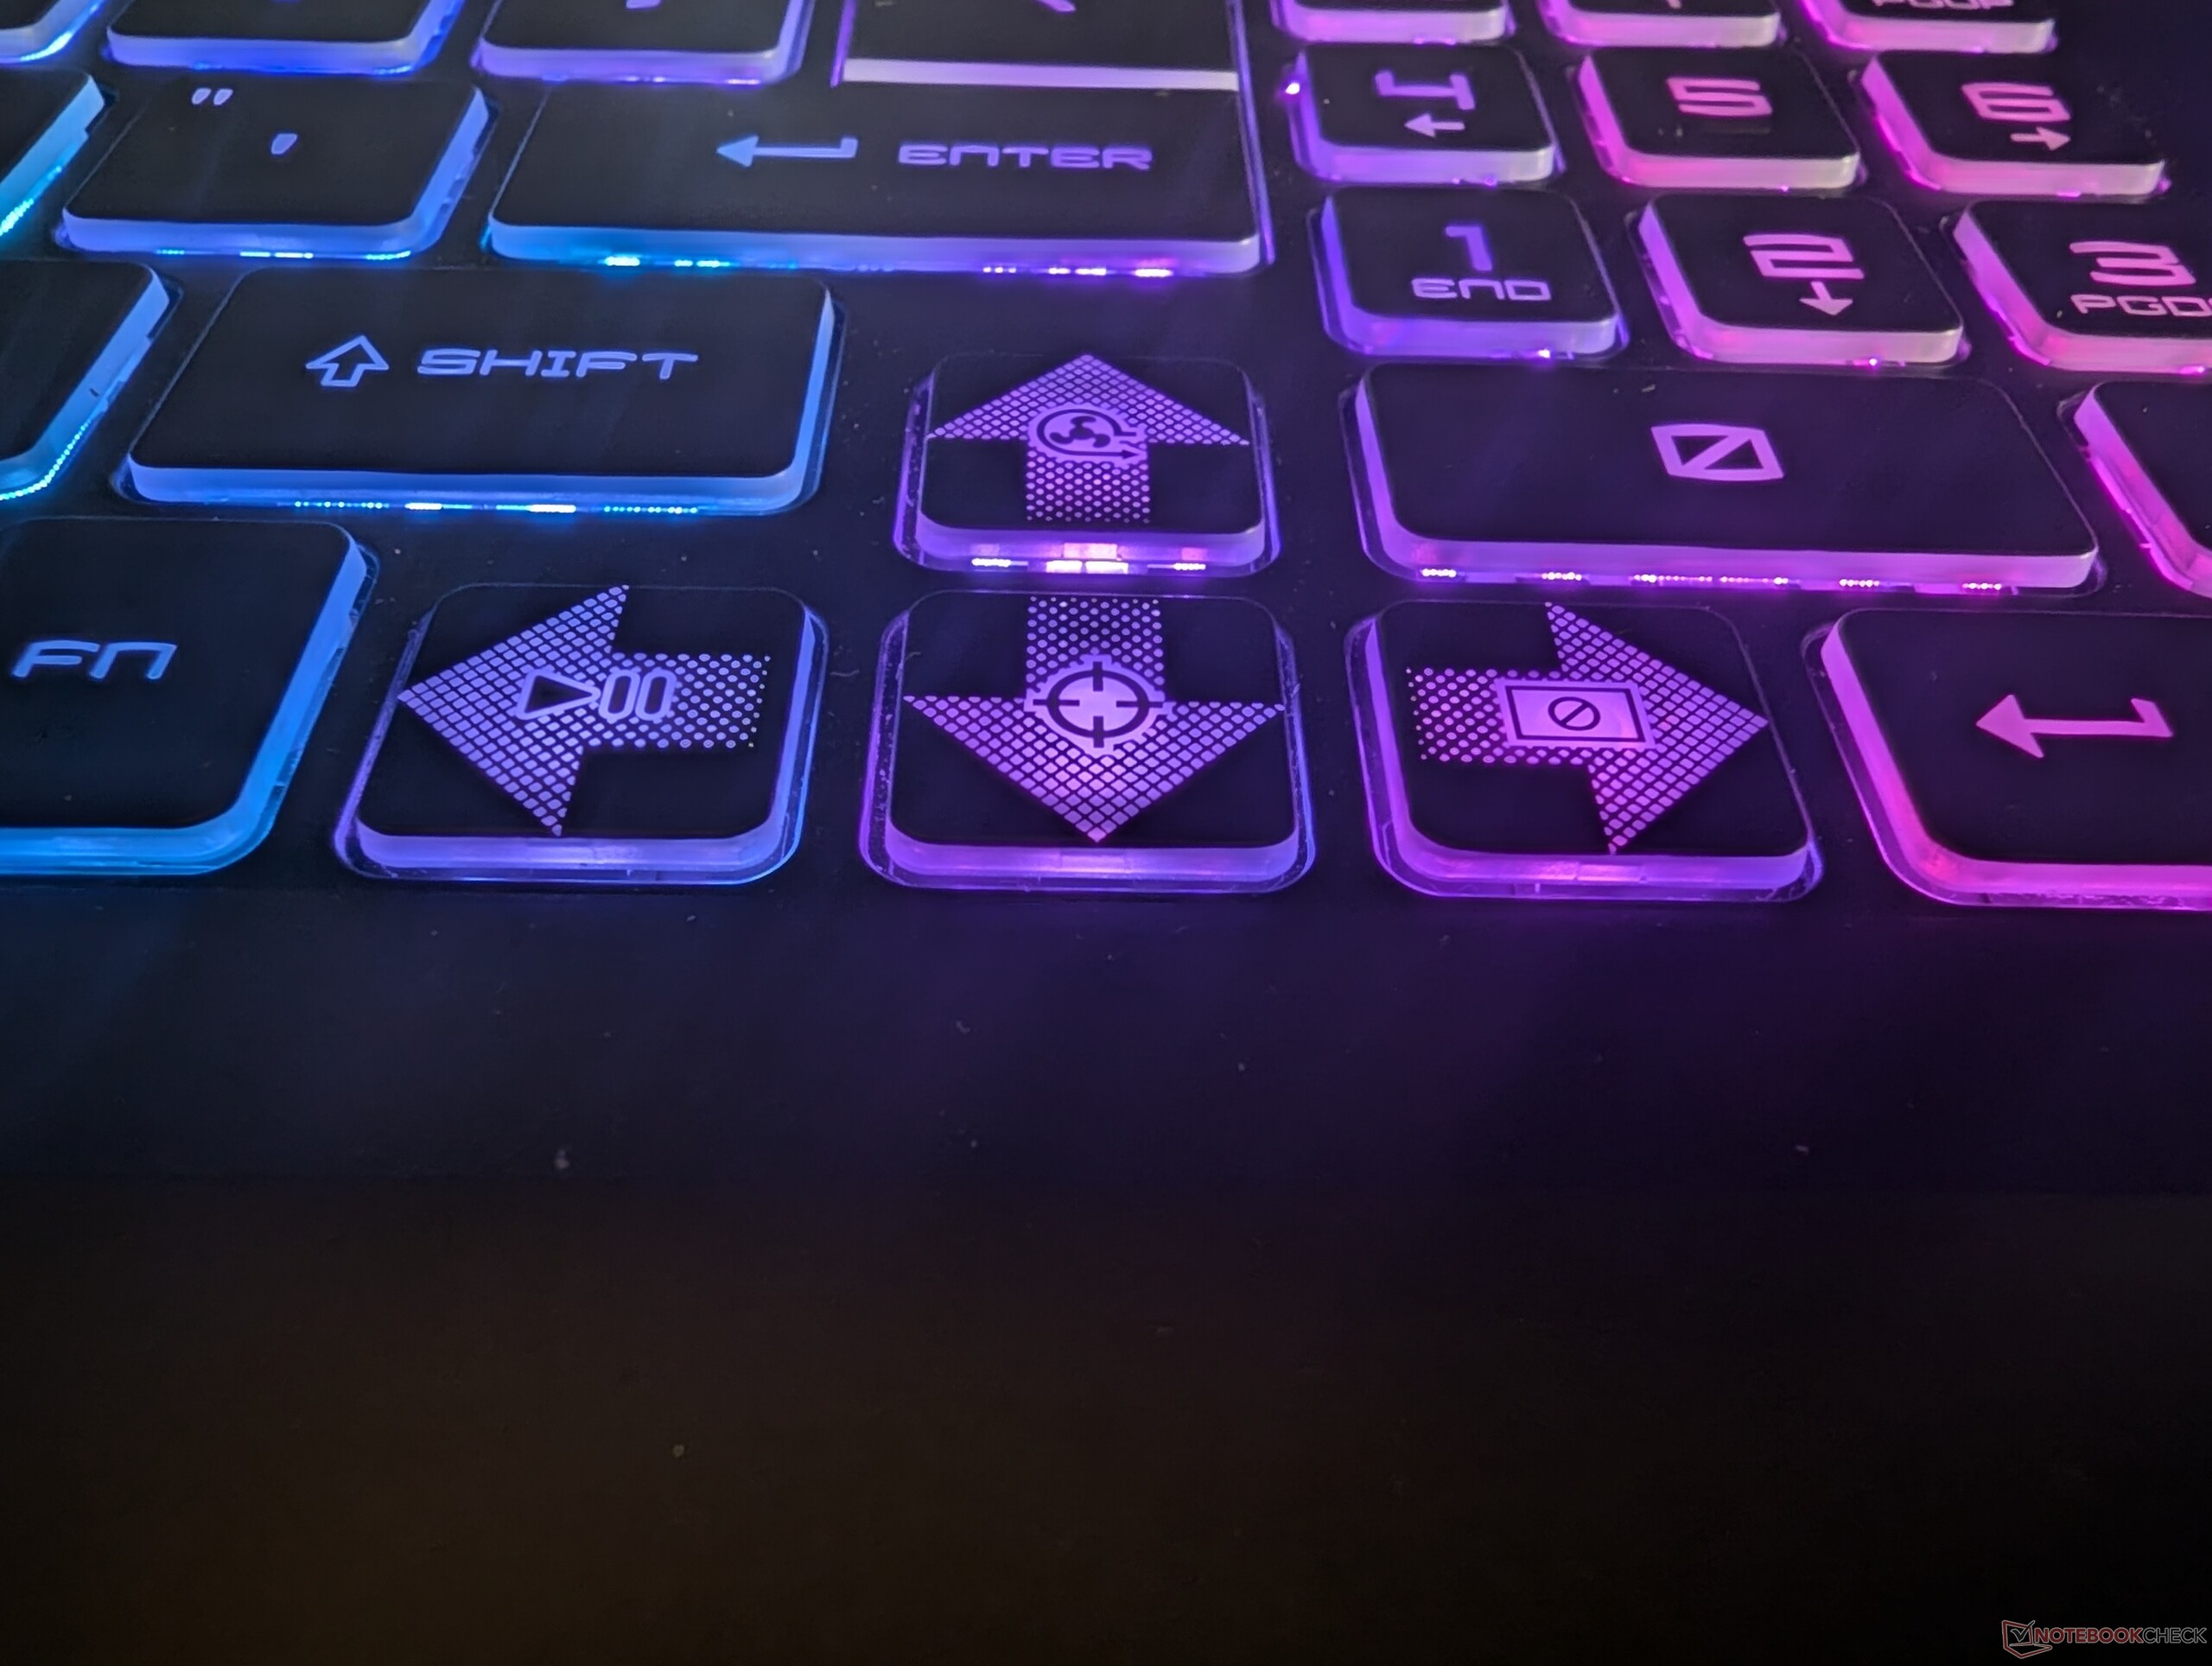
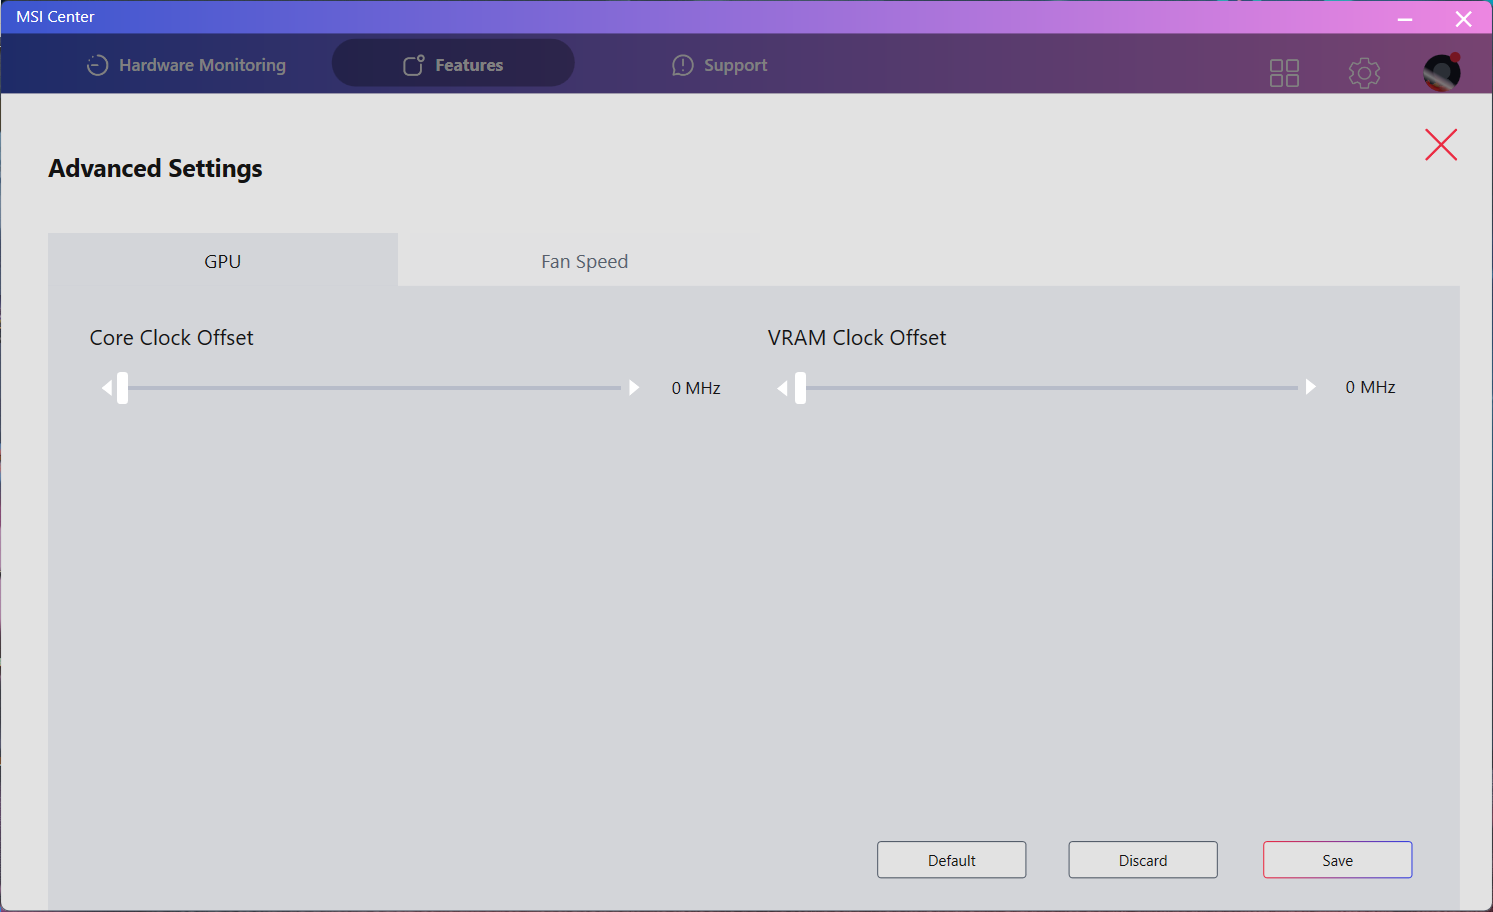
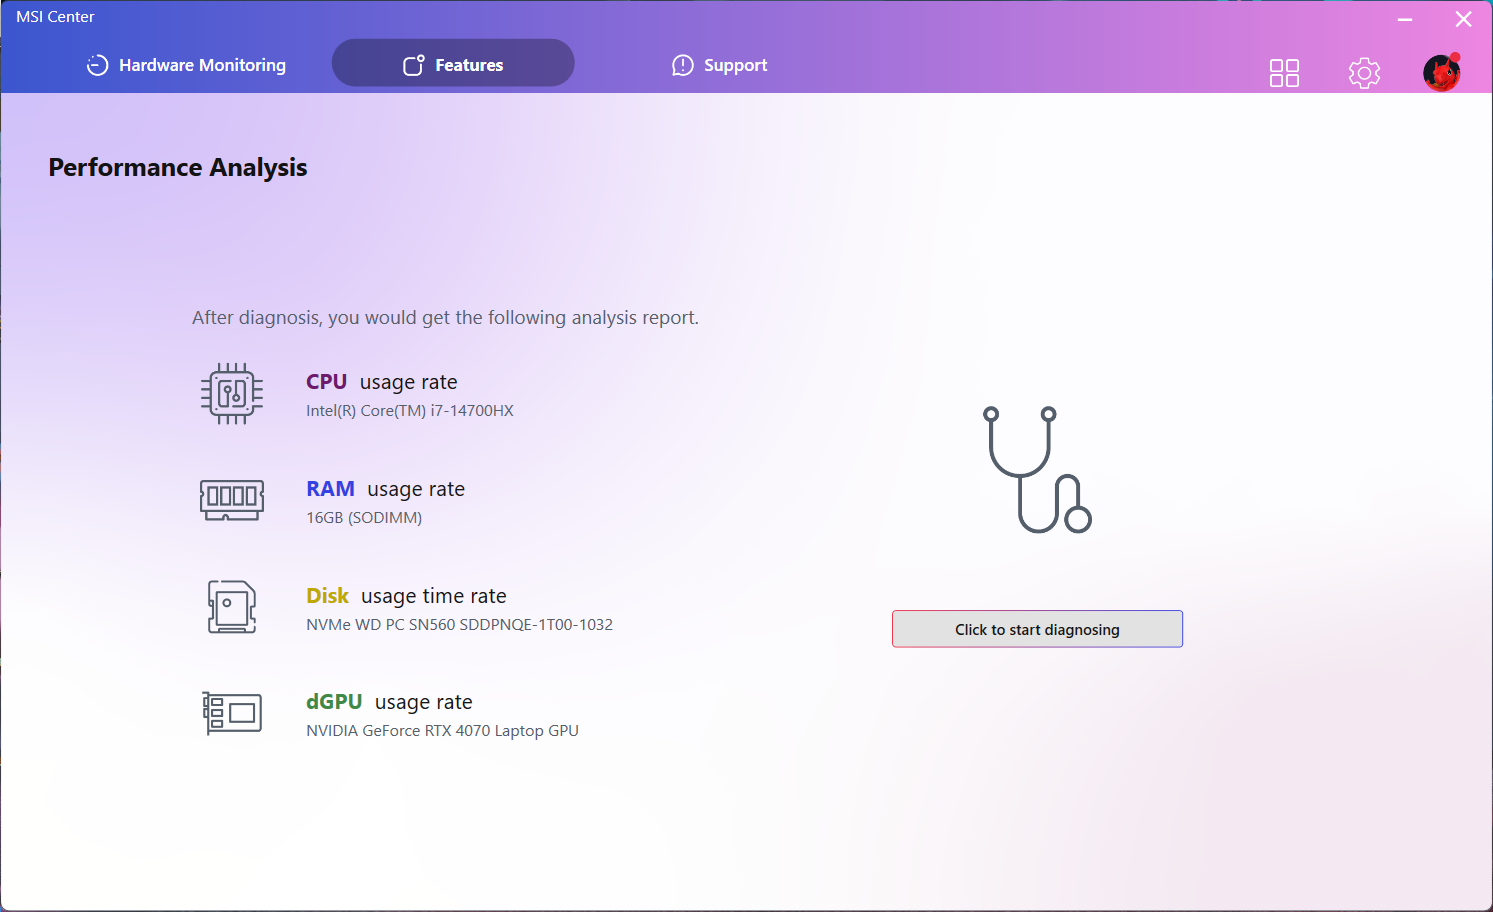
Puede animar el teclado con RGB, que se puede configurar a través de Mystic Light en MSI Center. El botón de encendido y las teclas W/A/S/D son transparentes y puede que no resulten atractivos para todo el mundo.
Aunque no viene con una NPU dedicada, el Sword 16 HX viene con una tecla dedicada Windows Copilot en detrimento de Ctrl derecha.
La tecla de función dedicada se puede utilizar para acceder a funciones de uso común como el cambio de perfil sobre la marcha, el sonido, el brillo de la pantalla y el brillo de la retroiluminación del teclado. El Centro MSI le permite intercambiar la tecla 'Win' y 'Fn'.
Panel táctil
El MSI Sword 16 HX soporta todos los gestos táctiles de Windows. Aunque el trackpad es bastante preciso y hace un trabajo decente al seguir el ritmo de su dedo incluso en los bordes, su rechazo de la palma de la mano deja mucho que desear.
La mayoría de las veces, acabará con clics accidentales si lo presiona con demasiada fuerza. Por suerte, puede desactivar el trackpad directamente pulsando 'Fn' y 'F4' a la vez. Si tiene que utilizar el trackpad como dispositivo de entrada principal, asegúrese de ceñirse a la zona inferior para hacer clic, porque la parte superior no hace clic con tanta facilidad.
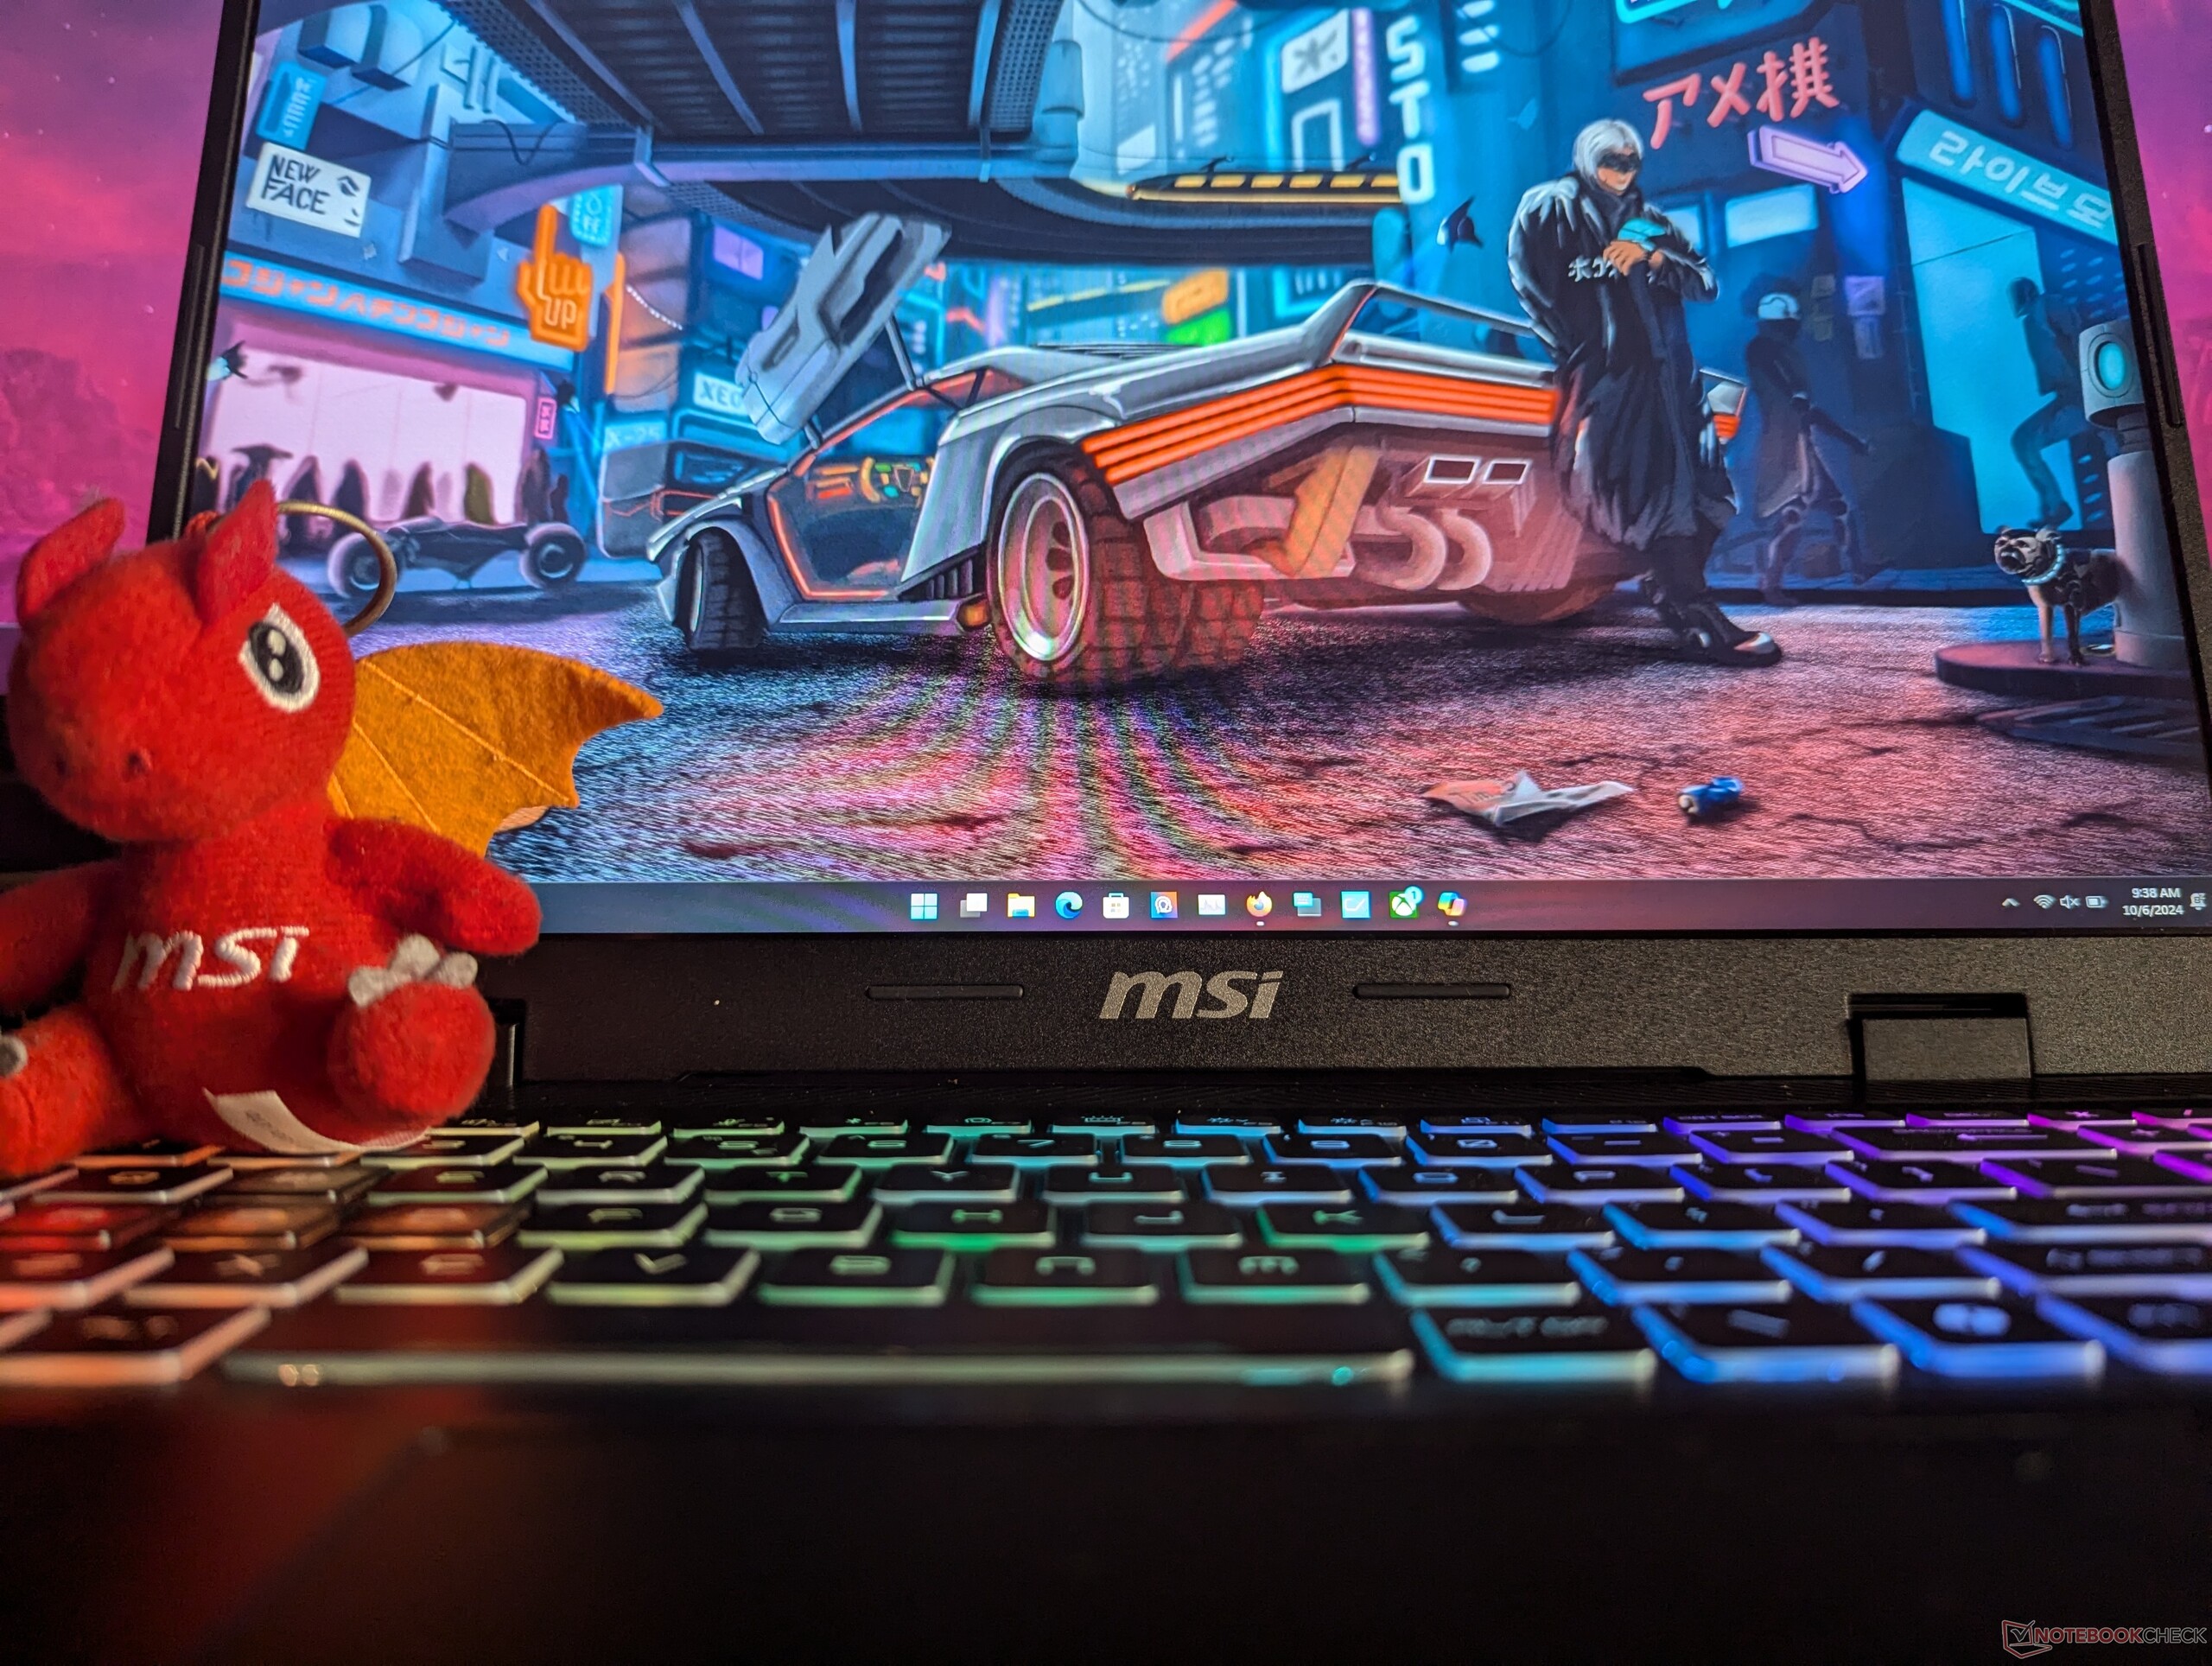
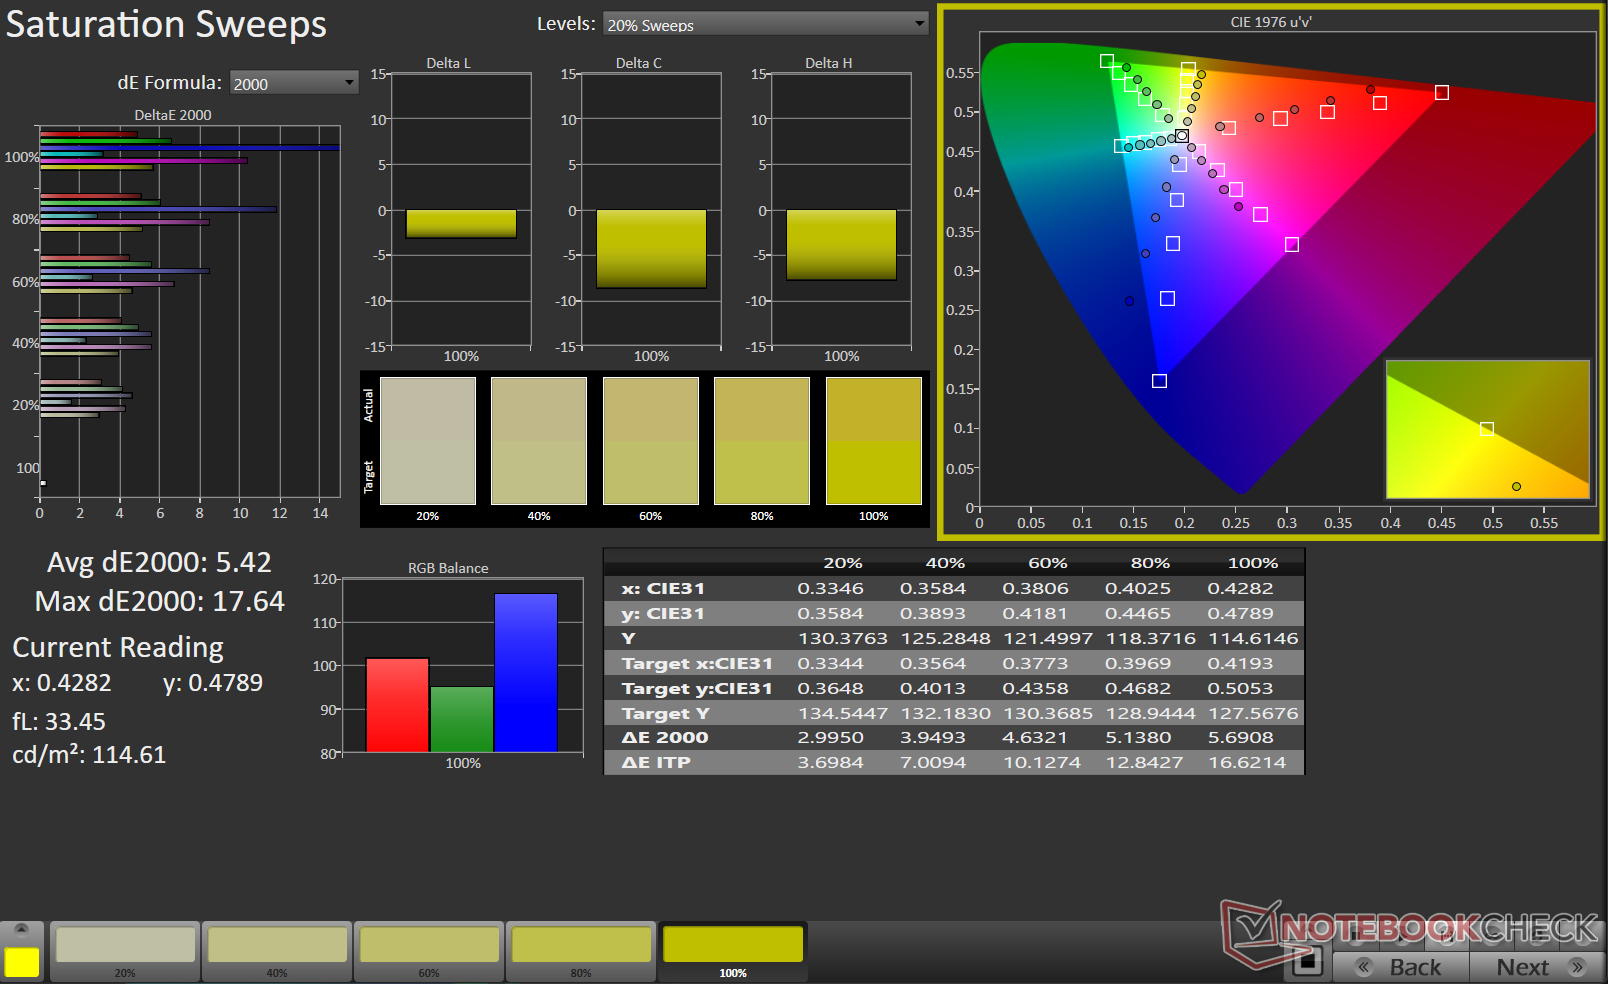
Pantalla: Pantalla inferior con poca precisión de color y brillo mediocre
Nuestra variante Sword 16 HX utiliza la misma pantalla que el MSI Raider GE68 HX 13VF que probamos el año pasado. El Sword 16 HX viene con un panel IPS de 16 pulgadas FHD+ (1.920 x 1.200) a 144 Hz. También está disponible una versión de mayor resolución con una resolución QHD+ (2.560 x 1.600) y la misma frecuencia de actualización.
Su brillo máximo alcanza los 312 nits, pero no de forma uniforme. Afortunadamente, la pantalla mate tiene un sangrado de retroiluminación mínimo. Sin embargo, su tiempo de respuesta de gris a gris es bastante alto, 26,32 ms, al igual que el de blanco a blanco (17,17 ms).
Probablemente sea mejor conectarlo a una pantalla externa si quiere jugar de forma competitiva. La elección del panel por parte de MSI es desconcertante, ya que el Sword 16 es más que capaz de ejecutar títulos de alta fidelidad, sólo para que su experiencia visual se vea amortiguada por su pantalla inferior.


| |||||||||||||||||||||||||
iluminación: 87 %
Brillo con batería: 283 cd/m²
Contraste: 1196:1 (Negro: 0.24 cd/m²)
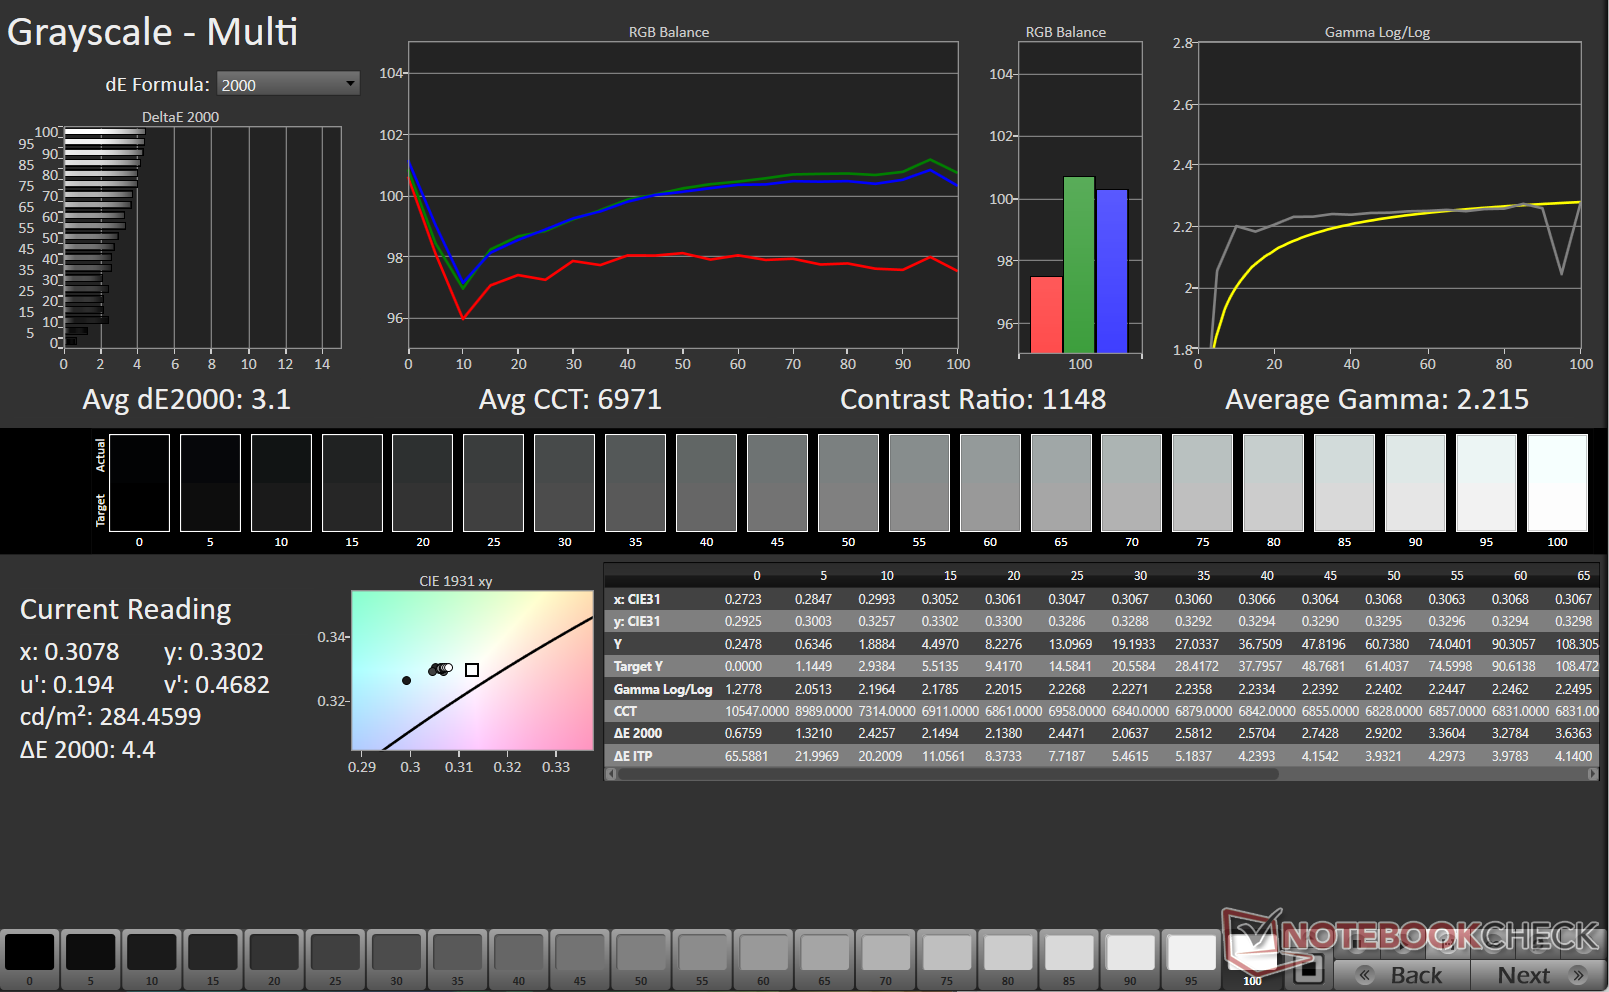
ΔE Color 4.24 | 0.5-29.43 Ø4.87, calibrated: 3.39
ΔE Greyscale 3.1 | 0.5-98 Ø5.1
43.3% AdobeRGB 1998 (Argyll 2.2.0 3D)
62.2% sRGB (Argyll 2.2.0 3D)
41.8% Display P3 (Argyll 2.2.0 3D)
Gamma: 2.21
| MSI Sword 16 HX B14VGKG Chi Mei N160JME-GTK, IPS, 1920x1200, 16", 144 Hz | HP Omen 17-db0079ng BOE0B67, IPS, 2560x1440, 17.3", 240 Hz | Lenovo Legion 7 16 IRX G9 MNG007ZA1-2, IPS, 3200x2000, 16", 165 Hz | Acer Predator Helios Neo 16 (2024) Chi Mei N160GME-GTB, LED, 2560x1600, 16", 240 Hz | Alienware m16 R2 BOE NE16NYH, IPS, 2560x1600, 16", 240 Hz | Asus ROG Strix G17 G713PI BOE0B69, IPS, 2560x1440, 17.3", 240 Hz | HP Victus 16-r0077ng CMN162D, IPS, 1920x1080, 16.1", 144 Hz | |
|---|---|---|---|---|---|---|---|
| Display | 56% | 96% | 96% | 65% | 98% | 59% | |
| Display P3 Coverage | 41.8 | 66.2 58% | 95 127% | 95.9 129% | 71 70% | 98.3 135% | 66.7 60% |
| sRGB Coverage | 62.2 | 95.5 54% | 100 61% | 99.8 60% | 100 61% | 100 61% | 98 58% |
| AdobeRGB 1998 Coverage | 43.3 | 68.1 57% | 87.2 101% | 86.4 100% | 71.4 65% | 85.9 98% | 69 59% |
| Response Times | 49% | 52% | 65% | 64% | 65% | 51% | |
| Response Time Grey 50% / Grey 80% * | 26.32 ? | 14.4 ? 45% | 14.4 ? 45% | 5 ? 81% | 5.7 ? 78% | 5.3 ? 80% | 13.3 ? 49% |
| Response Time Black / White * | 17.17 ? | 8.3 ? 52% | 7.2 ? 58% | 8.8 ? 49% | 8.7 ? 49% | 8.6 ? 50% | 8.2 ? 52% |
| PWM Frequency | |||||||
| Screen | 24% | 32% | 33% | 29% | 26% | 31% | |
| Brightness middle | 287 | 363 26% | 412 44% | 521 82% | 345.8 20% | 327 14% | 308 7% |
| Brightness | 289 | 341 18% | 396 37% | 506 75% | 337 17% | 320 11% | 285 -1% |
| Brightness Distribution | 87 | 84 -3% | 89 2% | 85 -2% | 87 0% | 89 2% | 85 -2% |
| Black Level * | 0.24 | 0.38 -58% | 0.43 -79% | 0.44 -83% | 0.3 -25% | 0.38 -58% | 0.25 -4% |
| Contrast | 1196 | 955 -20% | 958 -20% | 1184 -1% | 1153 -4% | 861 -28% | 1232 3% |
| Colorchecker dE 2000 * | 4.24 | 1.74 59% | 0.9 79% | 1.74 59% | 1.99 53% | 1.01 76% | 1.3 69% |
| Colorchecker dE 2000 max. * | 21.42 | 5.39 75% | 2 91% | 3.88 82% | 3.52 84% | 4.01 81% | 2.76 87% |
| Colorchecker dE 2000 calibrated * | 3.39 | 1.43 58% | 0.6 82% | 0.52 85% | 0.62 82% | 0.41 88% | 0.92 73% |
| Greyscale dE 2000 * | 3.1 | 1.3 58% | 1.4 55% | 3 3% | 2.1 32% | 1.6 48% | 1.7 45% |
| Gamma | 2.21 100% | 2.235 98% | 2.23 99% | 2.164 102% | 2.32 95% | 2.168 101% | 2.167 102% |
| CCT | 6971 93% | 6346 102% | 6731 97% | 6816 95% | 6369 102% | 6659 98% | 6767 96% |
| Media total (Programa/Opciones) | 43% /
34% | 60% /
49% | 65% /
51% | 53% /
42% | 63% /
47% | 47% /
40% |
* ... más pequeño es mejor
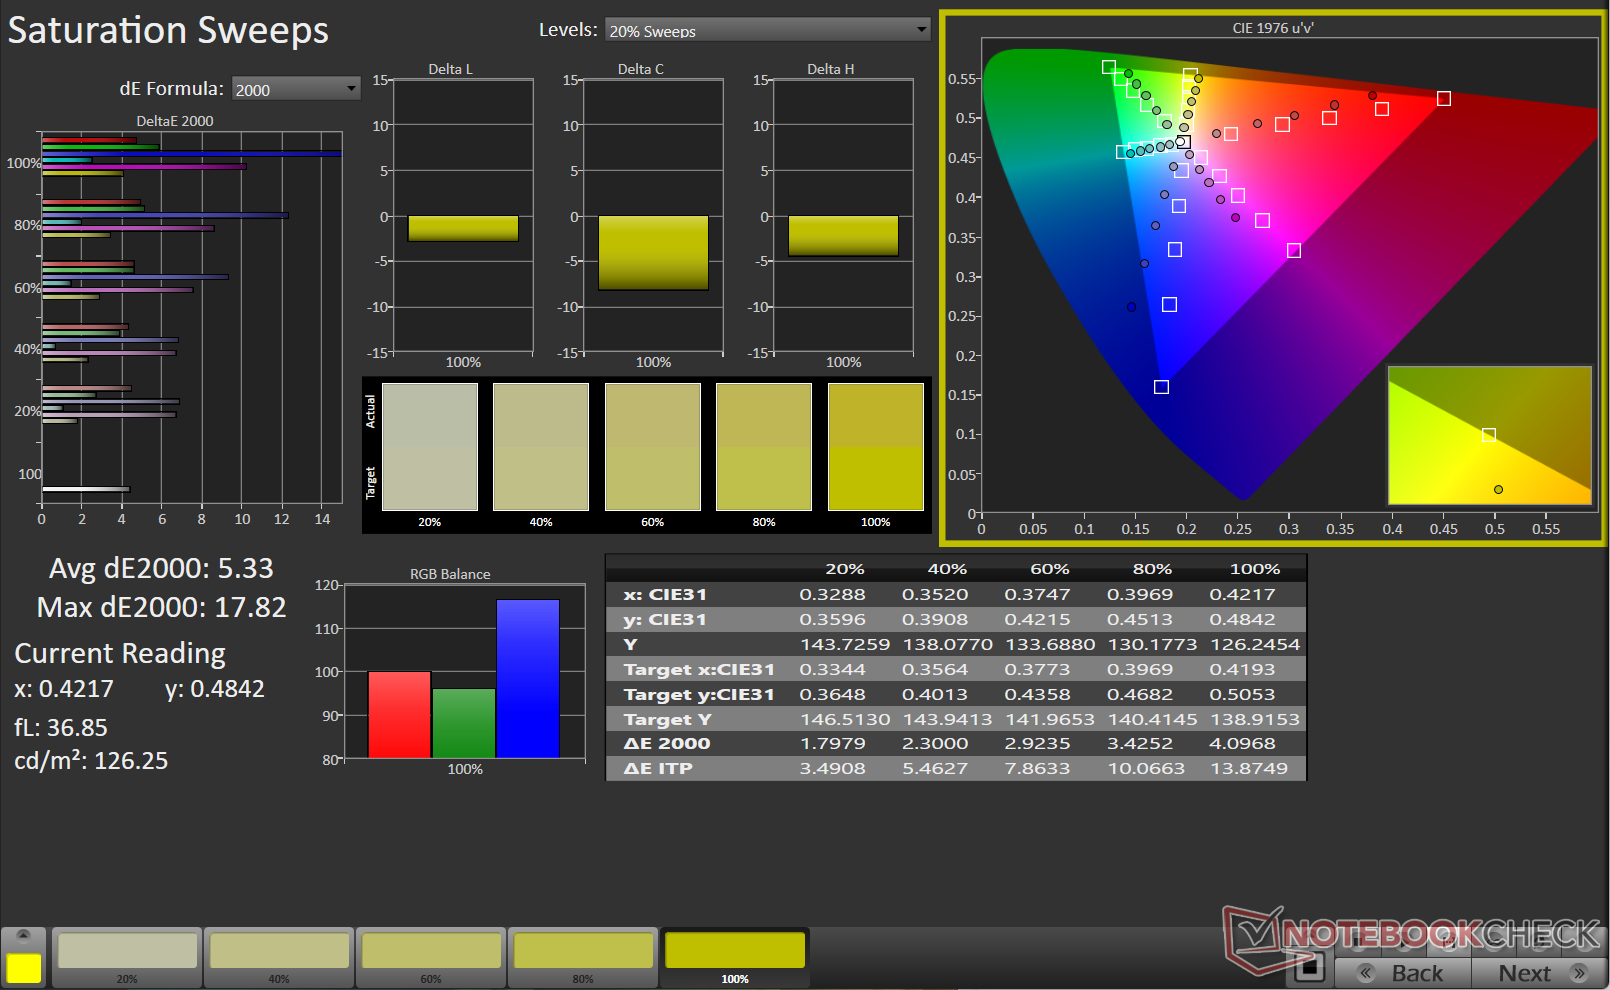
Por desgracia, la precisión del color no es uno de los puntos fuertes del Sword 16, como demuestra su mediocre cobertura de las gamas de color sRGB, Adobe RGB y Display P3.
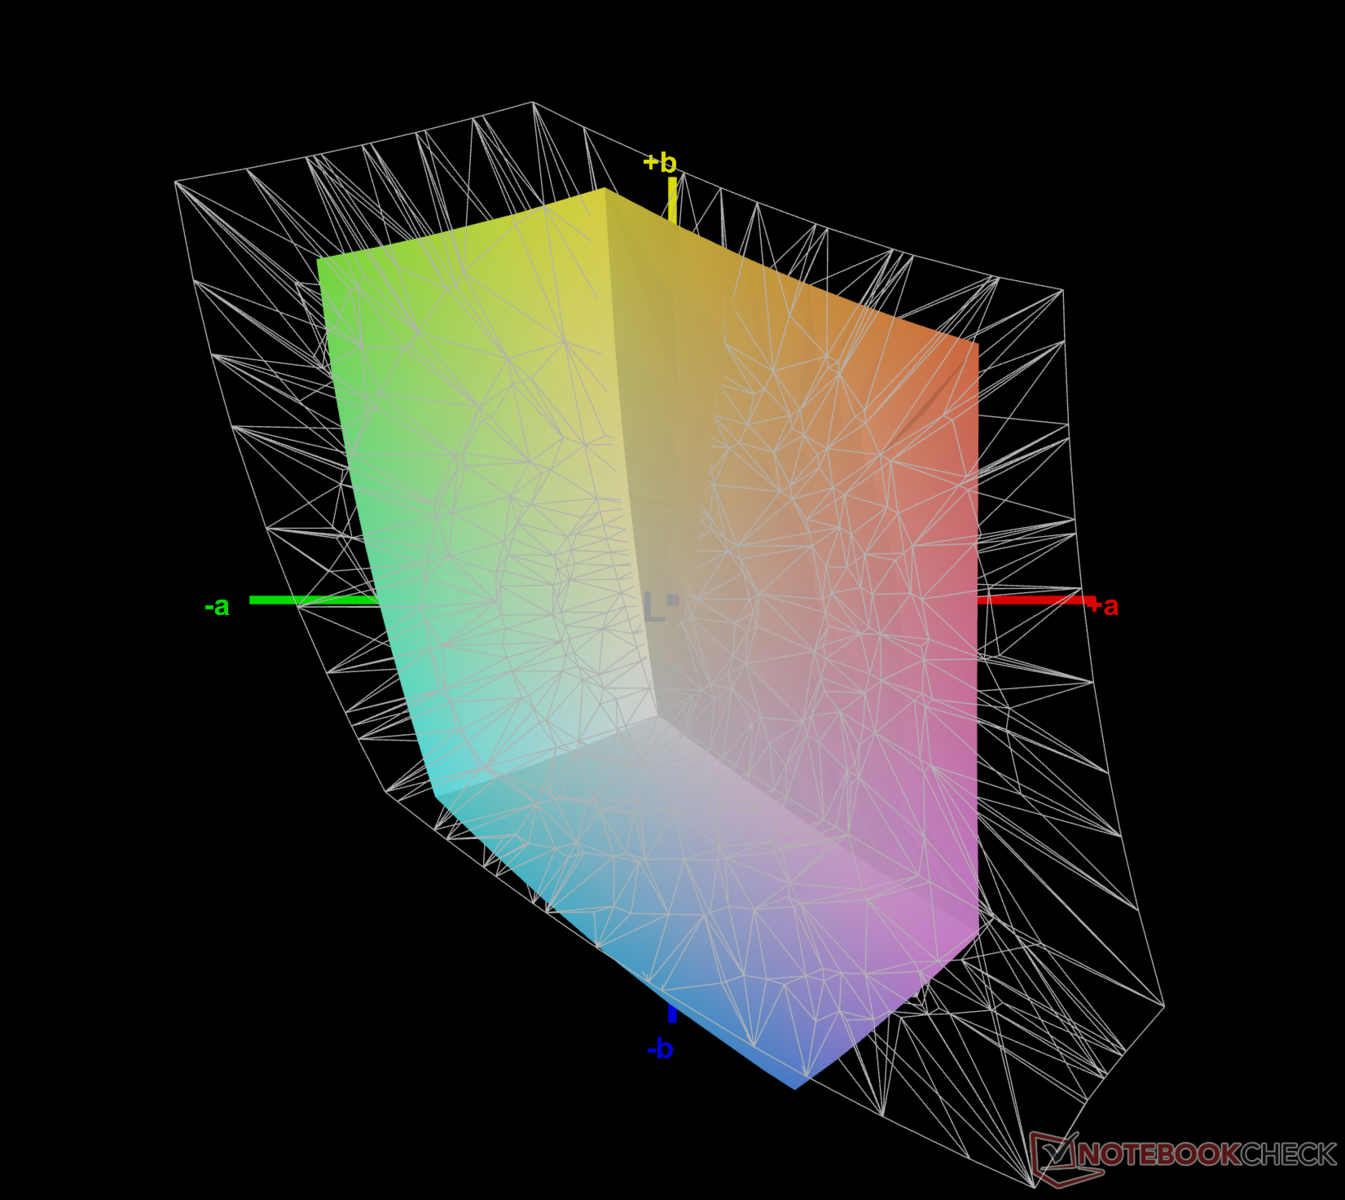
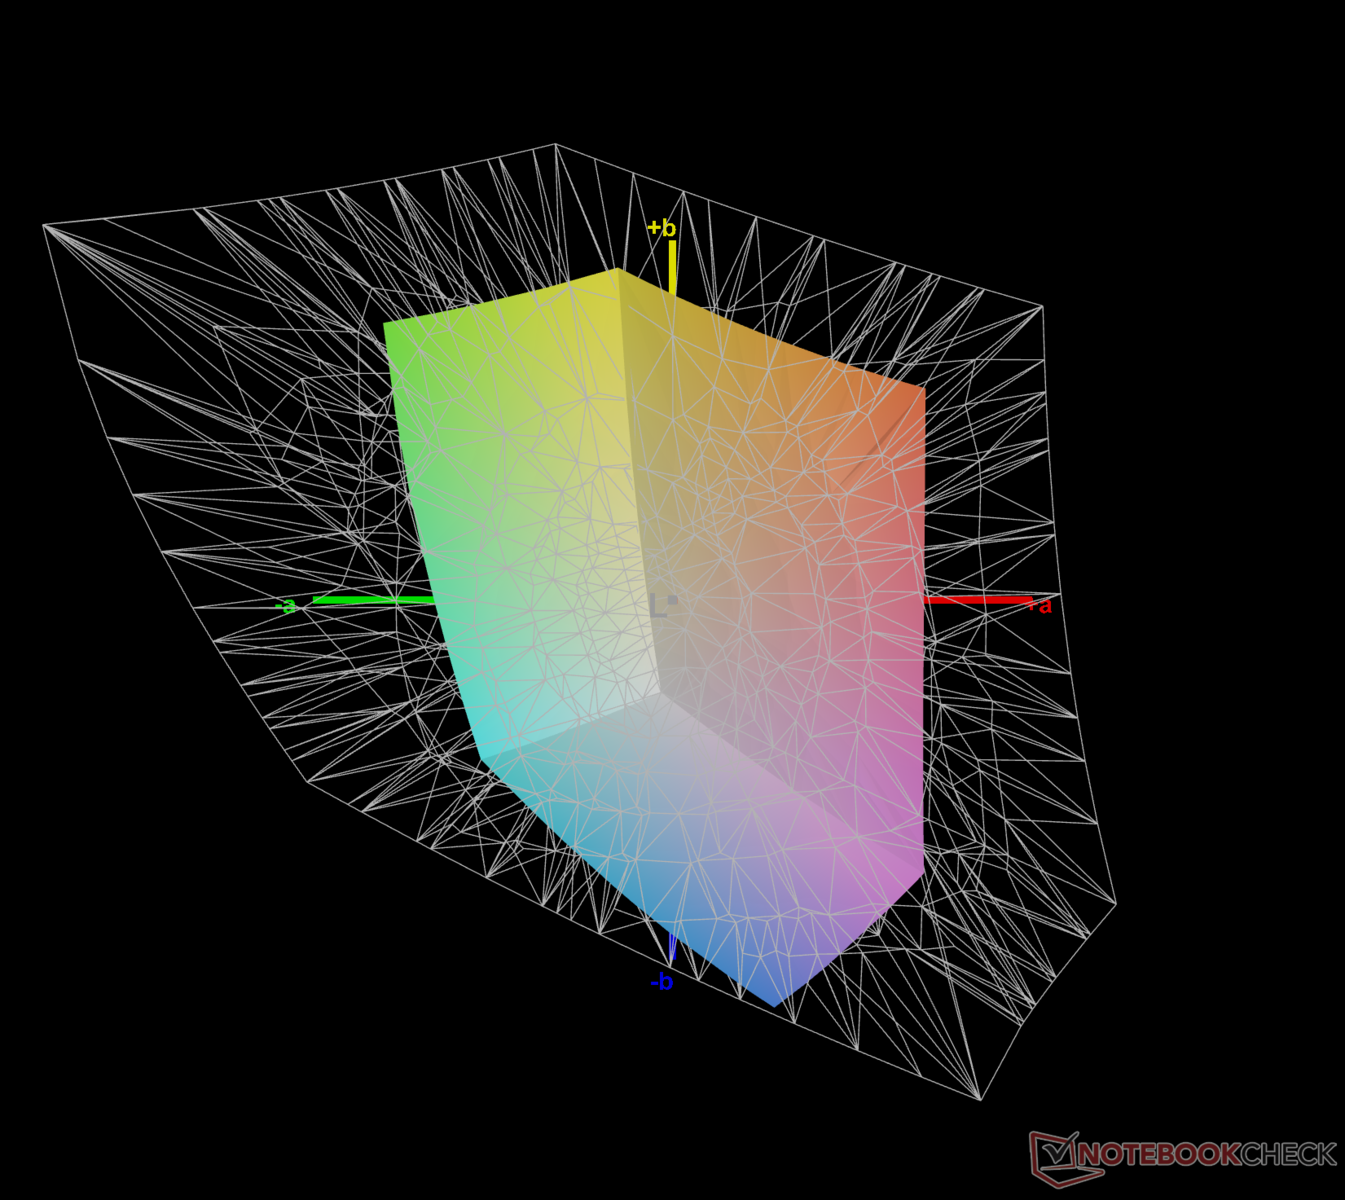
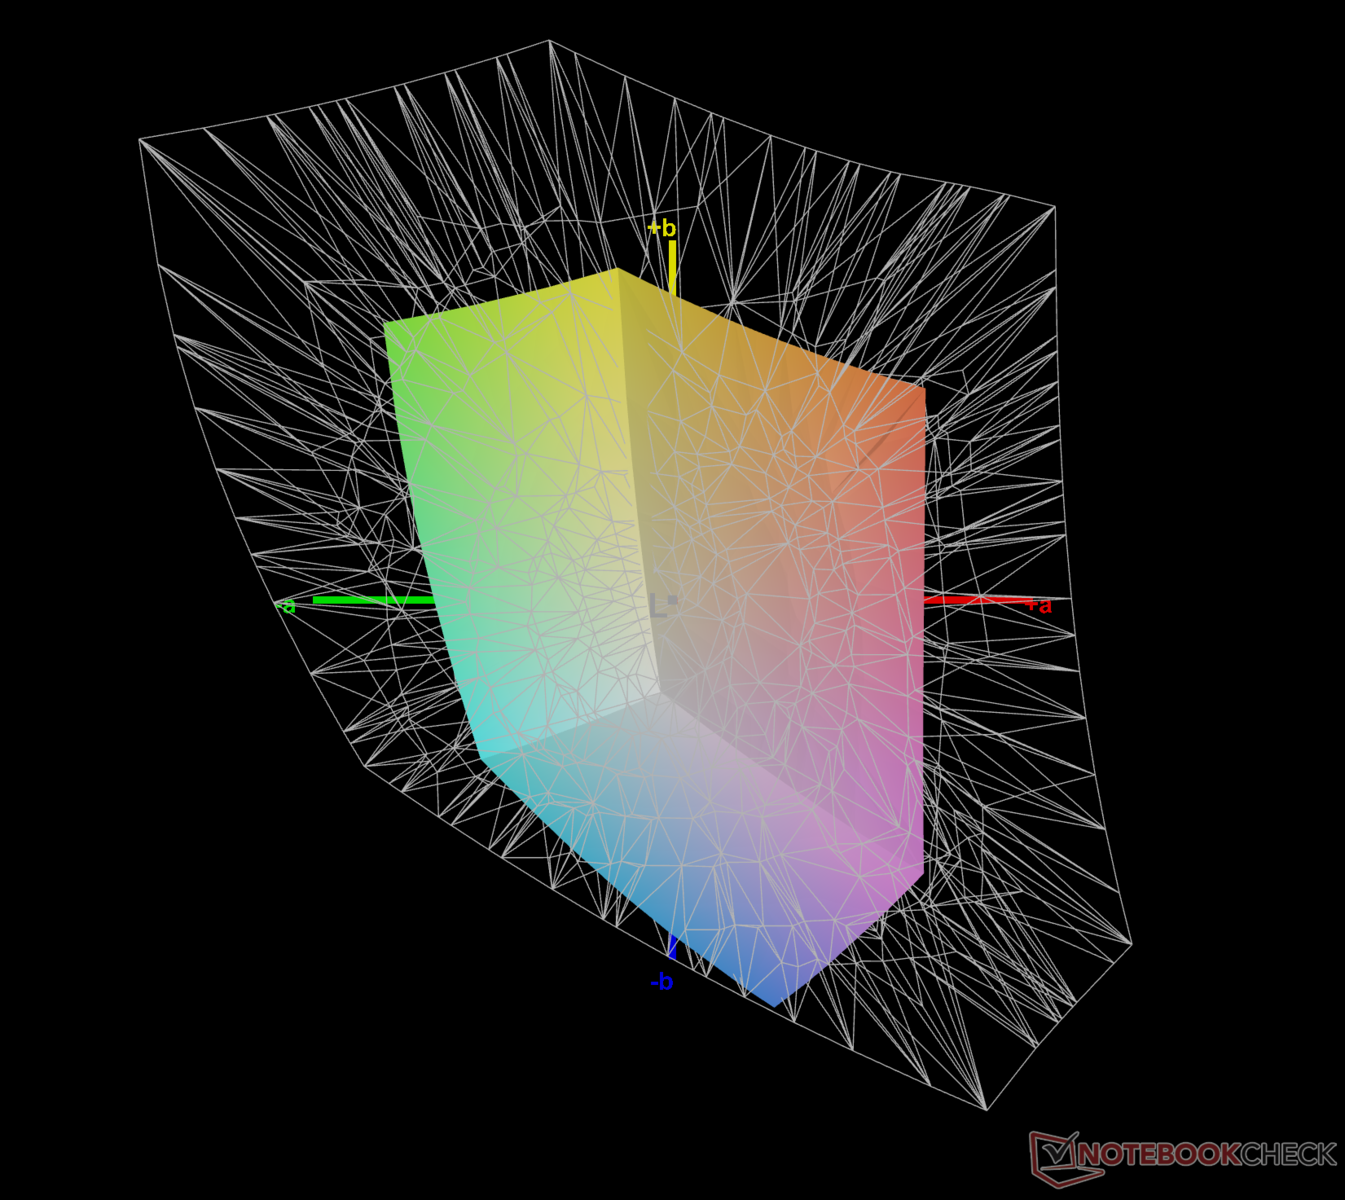
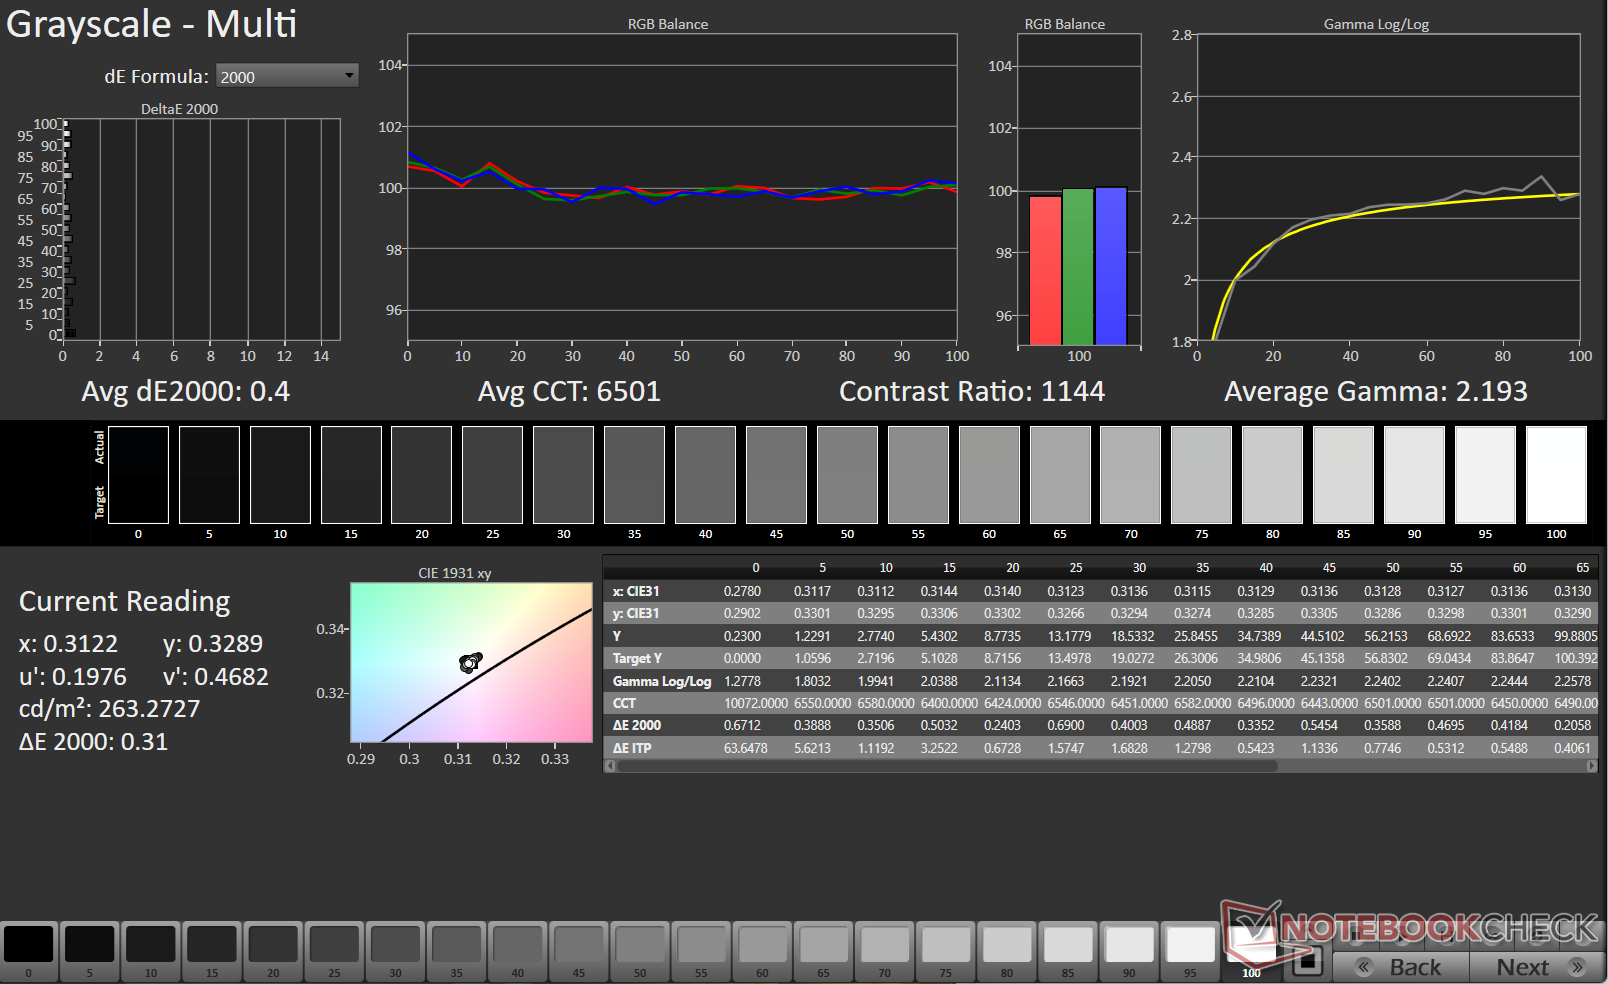
Utilizando la calibración del color Calman de Portrait Displays con un espectrofotómetro X-Rite i1Basic Pro 3, pudimos reducir el deltaE 2000 de la escala de grises. Sin embargo, no se observó mucha mejora en los valores de ColorChecker incluso después de la calibración.


Tiempos de respuesta del display
| ↔ Tiempo de respuesta de Negro a Blanco | ||
|---|---|---|
| 17.17 ms ... subida ↗ y bajada ↘ combinada | ↗ 9.26 ms subida | 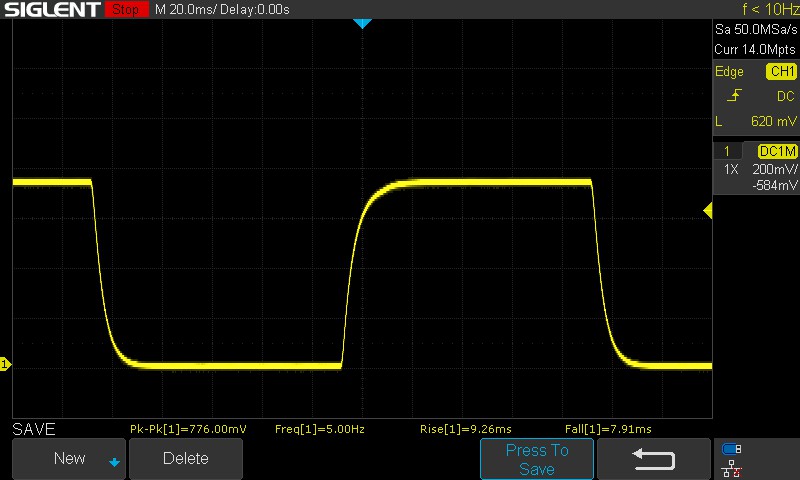 |
| ↘ 7.91 ms bajada | ||
| La pantalla mostró buenos tiempos de respuesta en nuestros tests pero podría ser demasiado lenta para los jugones competitivos. En comparación, todos los dispositivos de prueba van de ##min### (mínimo) a 240 (máximo) ms. » 36 % de todos los dispositivos son mejores. Esto quiere decir que el tiempo de respuesta medido es mejor que la media (20.8 ms) de todos los dispositivos testados. | ||
| ↔ Tiempo de respuesta 50% Gris a 80% Gris | ||
| 26.32 ms ... subida ↗ y bajada ↘ combinada | ↗ 13.37 ms subida | 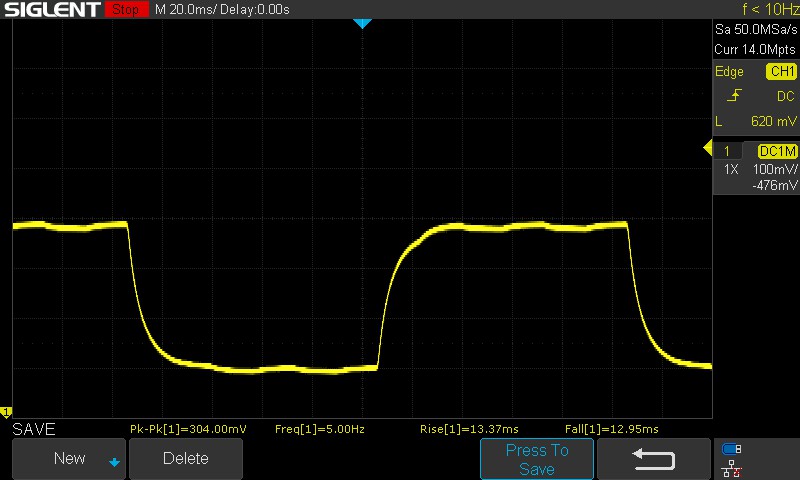 |
| ↘ 12.95 ms bajada | ||
| La pantalla mostró tiempos de respuesta relativamente lentos en nuestros tests pero podría ser demasiado lenta para los jugones. En comparación, todos los dispositivos de prueba van de ##min### (mínimo) a 636 (máximo) ms. » 33 % de todos los dispositivos son mejores. Esto quiere decir que el tiempo de respuesta medido es mejor que la media (32.5 ms) de todos los dispositivos testados. | ||
Parpadeo de Pantalla / PWM (Pulse-Width Modulation)
| Parpadeo de Pantalla / PWM no detectado | ≤ 100 % de brillo | 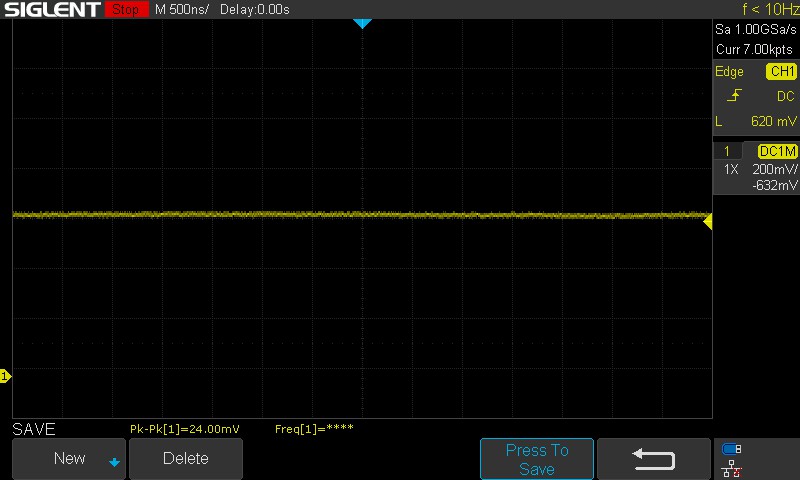 | |
Comparación: 53 % de todos los dispositivos testados no usaron PWM para atenuar el display. Si se usó, medimos una media de 8516 (mínimo: 5 - máxmo: 343500) Hz. | |||
No detectamos ningún PWM en todos los niveles de brillo probados.


Para más información, consulte nuestro artículo "¿Por qué el PWM es un dolor de cabeza?" y también nuestra Tabla de clasificación PWM para una comparación del PWM medido en todos los dispositivos revisados.
La pantalla del MSI Sword 16 es lo suficientemente brillante para su uso en exteriores. Sin embargo, recomendaríamos no utilizarlo bajo la luz directa del sol ya que puede abrumar fácilmente la pantalla del portátil.
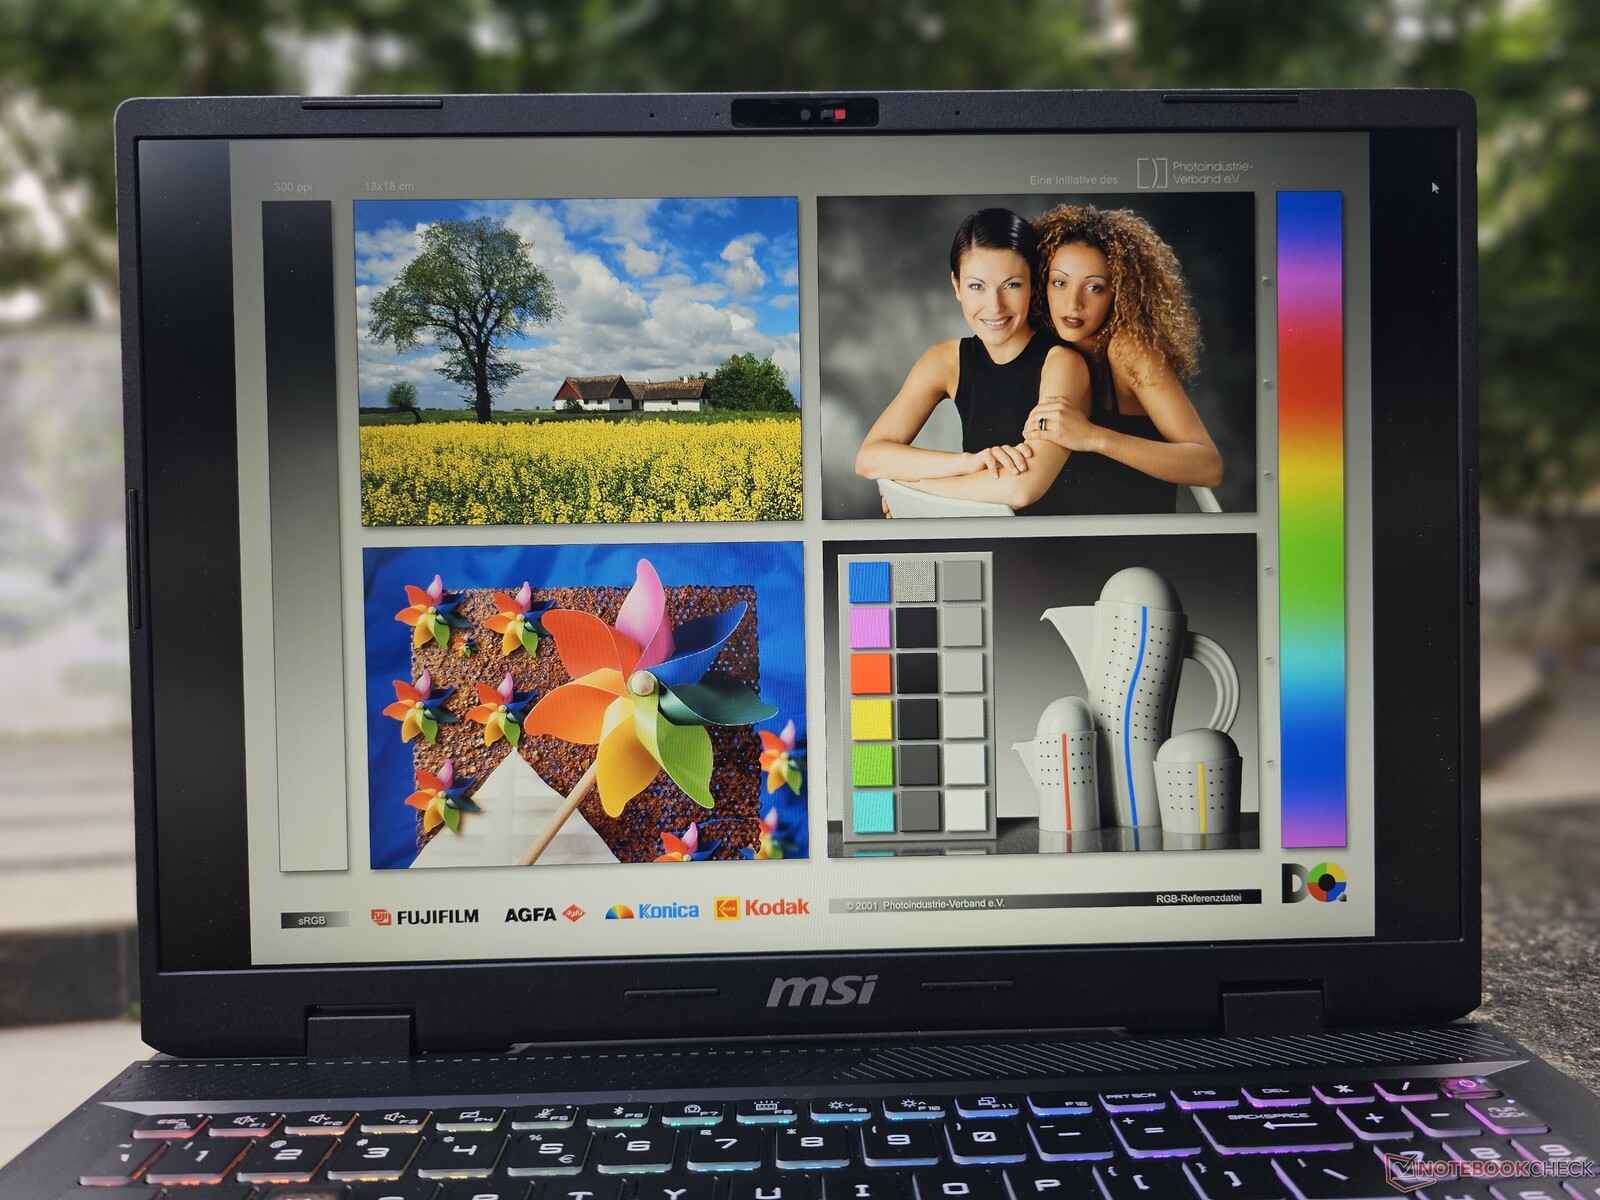
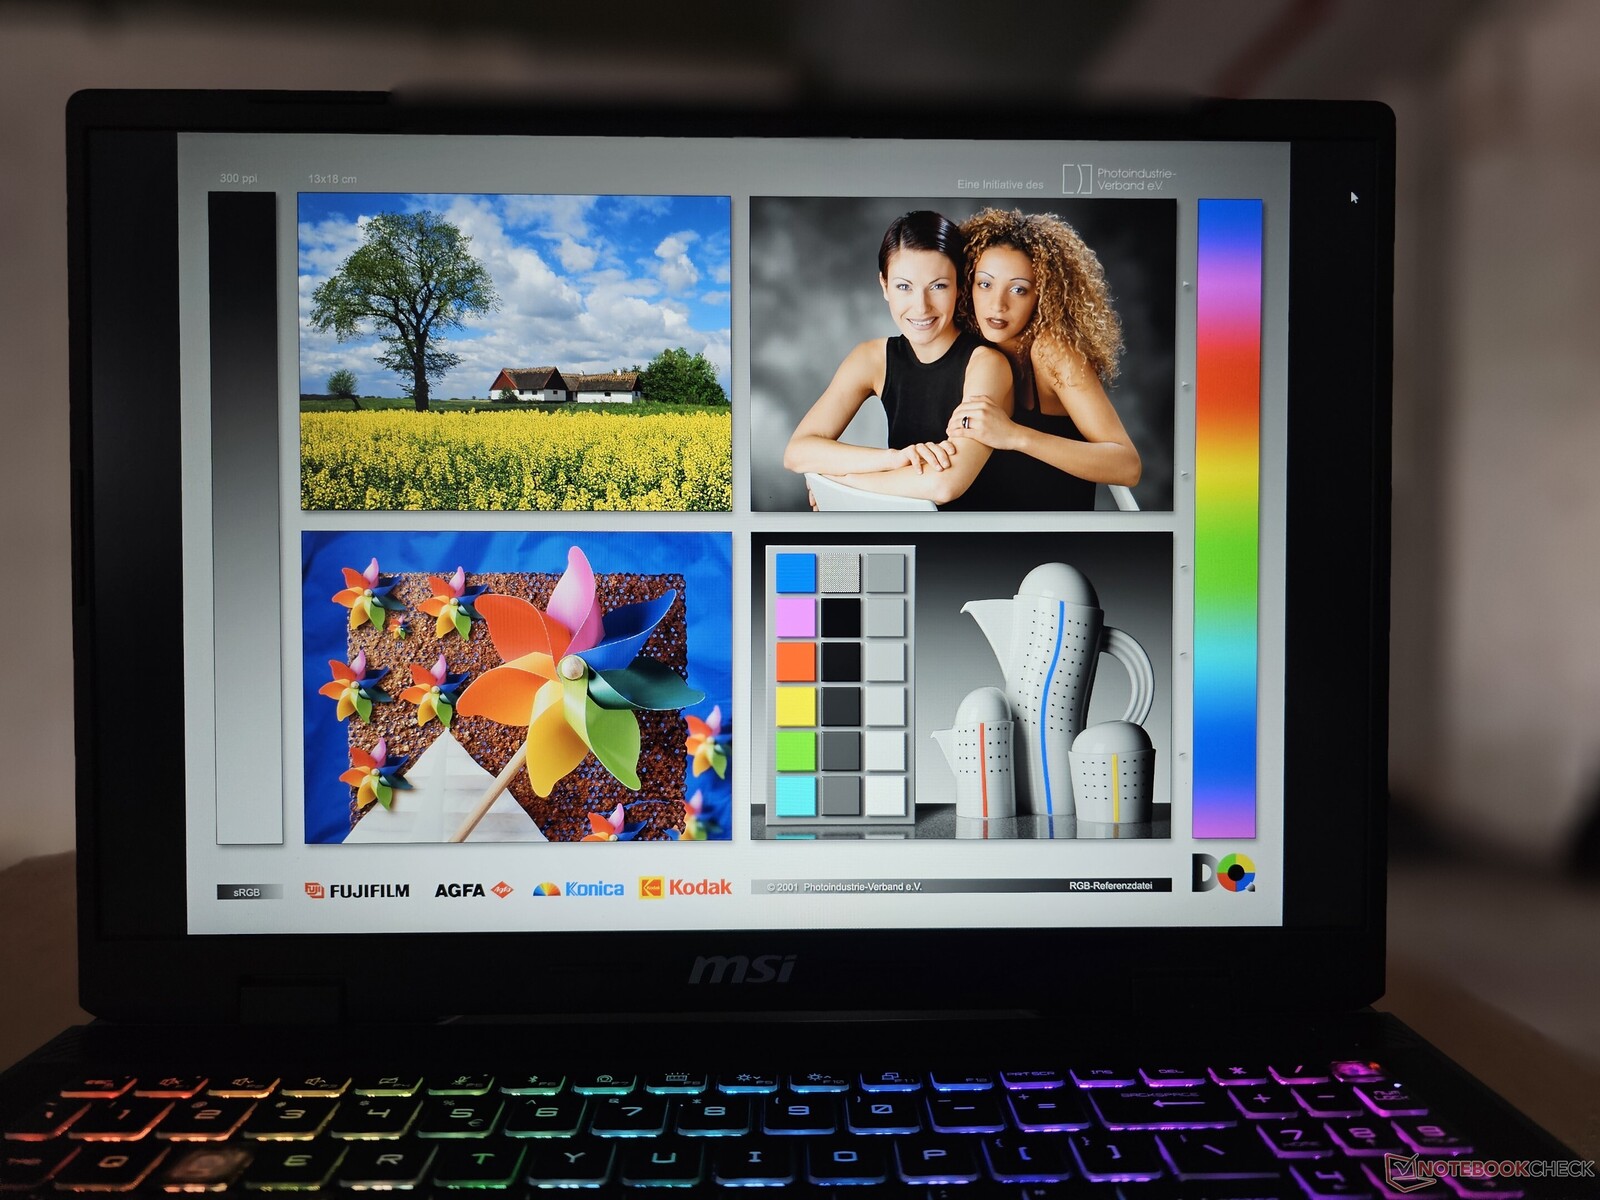

El panel IPS permite unos ángulos de visión decentes, pero hay una notable pérdida de detalles debido a la precisión del color del panel, que no es ideal.
Rendimiento: Core i7-14700HX y GeForce RTX 4070 forman un potente combo
Tenemos la variante engalanada del MSI Sword 16 HX con una GPU Nvidia GeForce TX 4070 para portátiles e Intel Core i7-14700HX. Otras configuraciones posibles mantienen la misma CPU pero sustituyen la GPU por una RTX 4060 y una RTX 4050.
Aunque muchos considerarían (correctamente) que 8 GB de VRAM son un poco escasos, aún se puede jugar con ellos hasta a 4K con algunos compromisos.
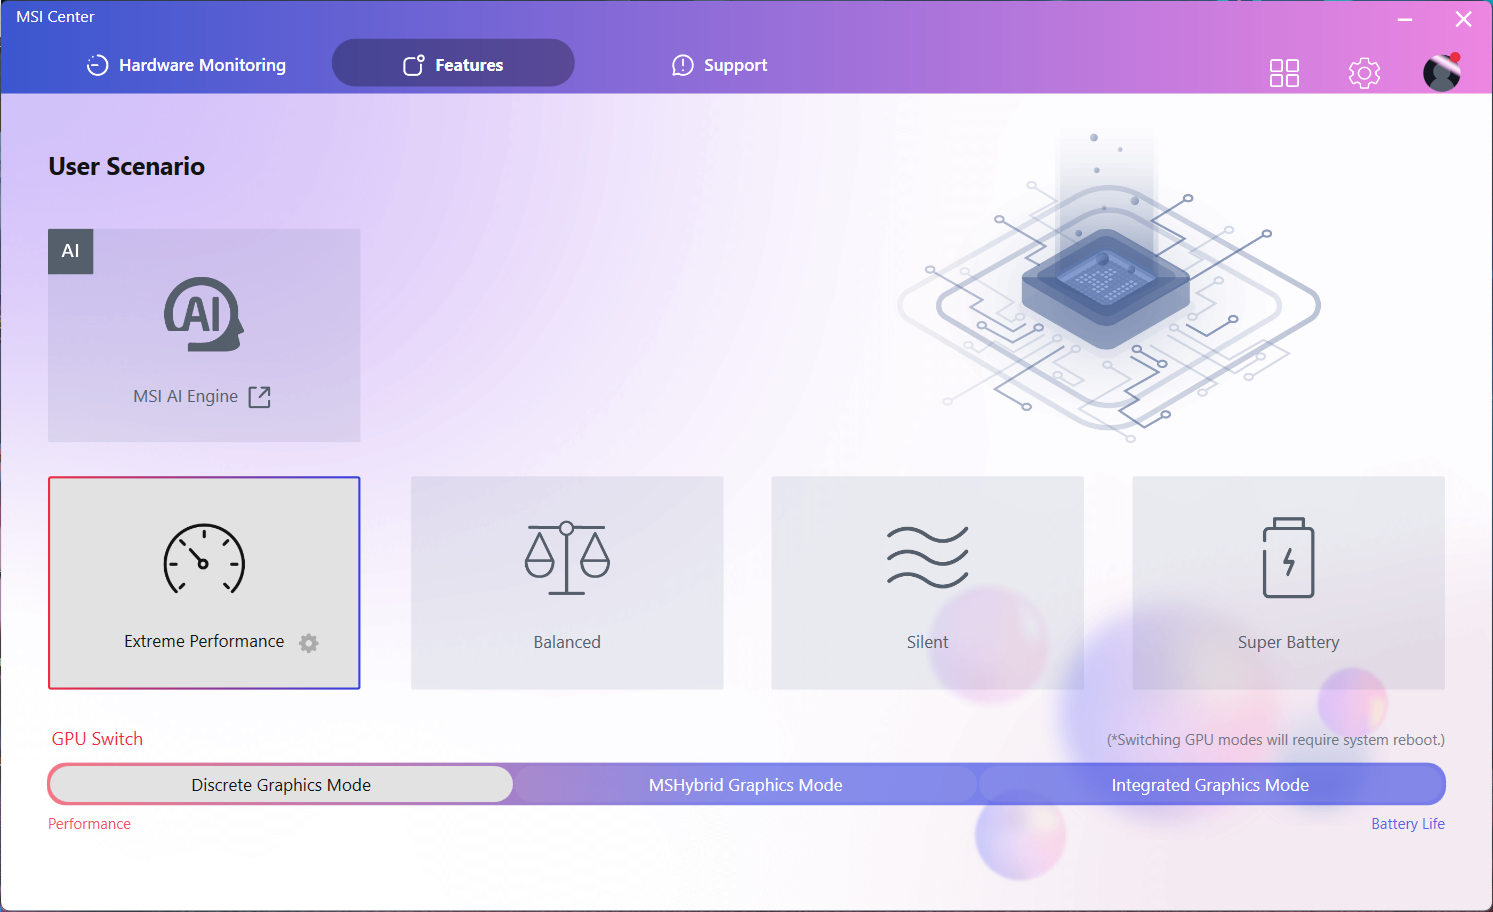
Condiciones de prueba
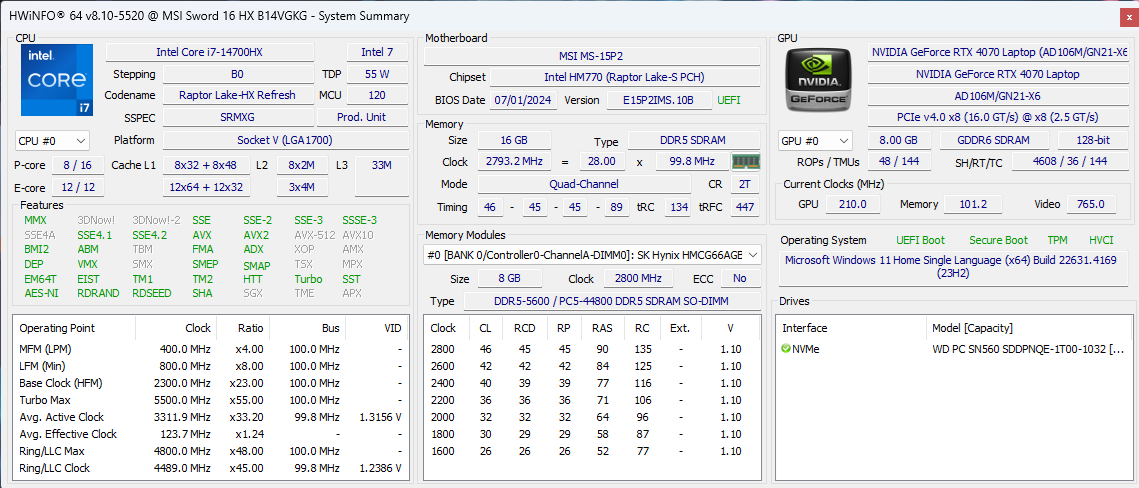
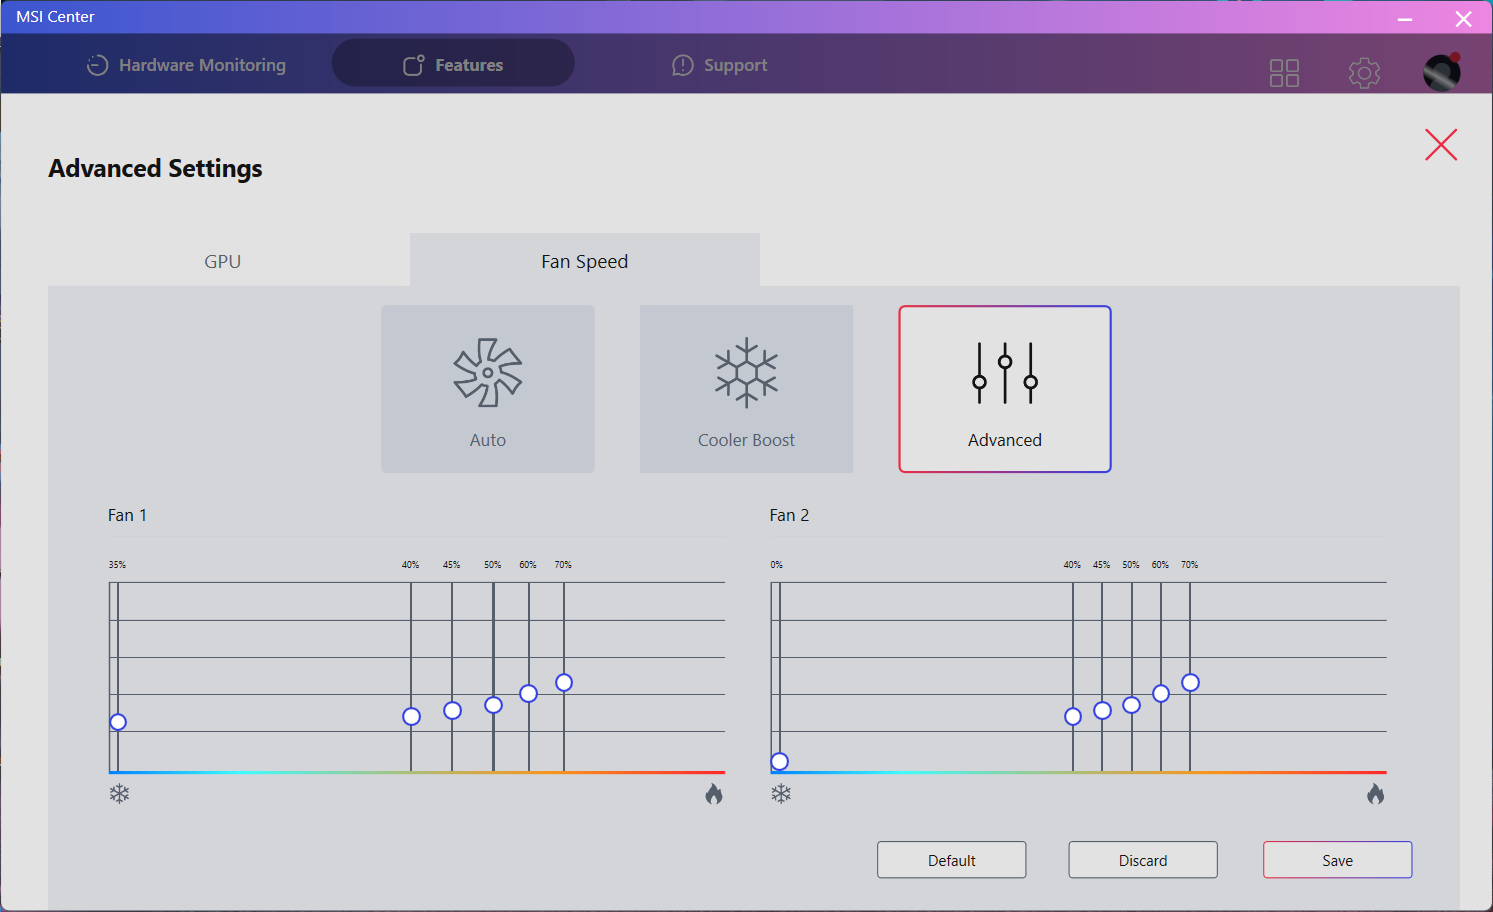
MSI ofrece cuatro modos de rendimiento en el Sword 16: Rendimiento Extremo, Equilibrado, Silencioso y Super Batería. Utilizamos Rendimiento Extremo para todas nuestras pruebas de juegos y Super Batería para las pruebas de duración de la batería. Los valores PL1 y PL2 para la CPU se limitaron a 100 y 120 vatios, respectivamente, mientras que la GPU se anuncia para llegar hasta los 115 vatios. El cambio entre perfiles puede hacerse manualmente a través del Centro MSI o pulsando las teclas 'Fn' y 'F7'.

| Modo de rendimiento | PL1 | PL2 | Cinebench R15 | Cinebench R15 (25 bucles) |
|---|---|---|---|---|
| Rendimiento extremo | 100 | 120 | 3.264 (100%) | 3.198 (100%) |
| Equilibrado | 60 | 80 | 2.978 (-8,76%) | 2.728 (-14%) |
| Silencioso | 45 | 60 | 2.198 (-32%) | 1.361 (-57%) |
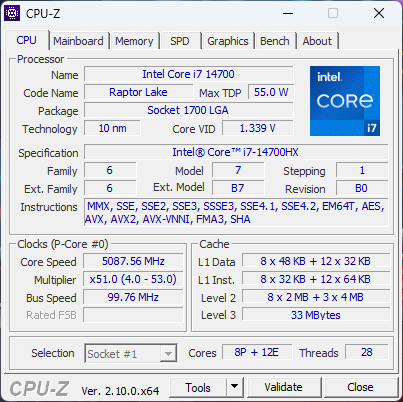
Procesador
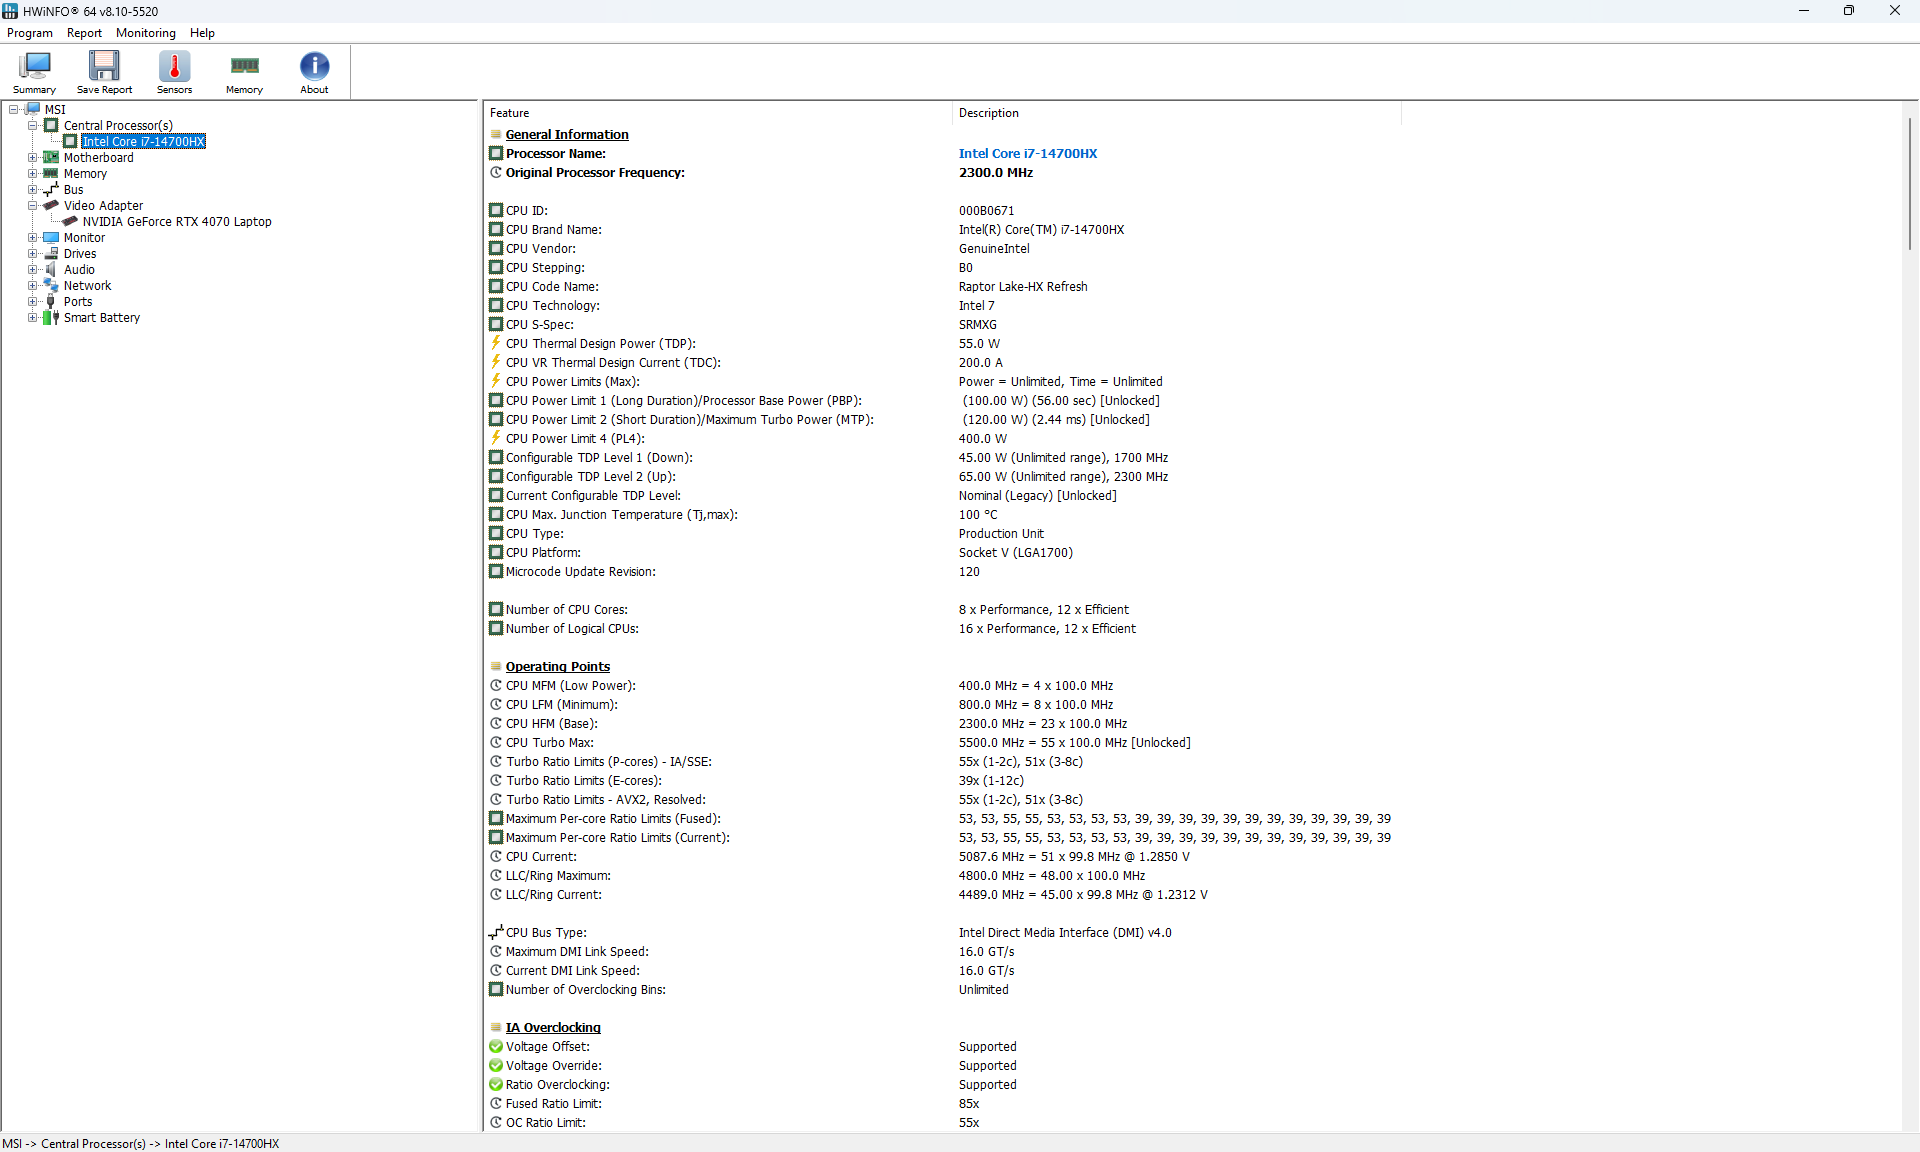
El Intel Core i7-14700HX es una CPU Raptor Lake-HX de segunda generación con 8 núcleos de rendimiento y 12 de eficiencia. La hoja de especificaciones oficial de Intel dice que el primero puede aumentar hasta 5,2 GHz y el segundo hasta 3,9 GHz.
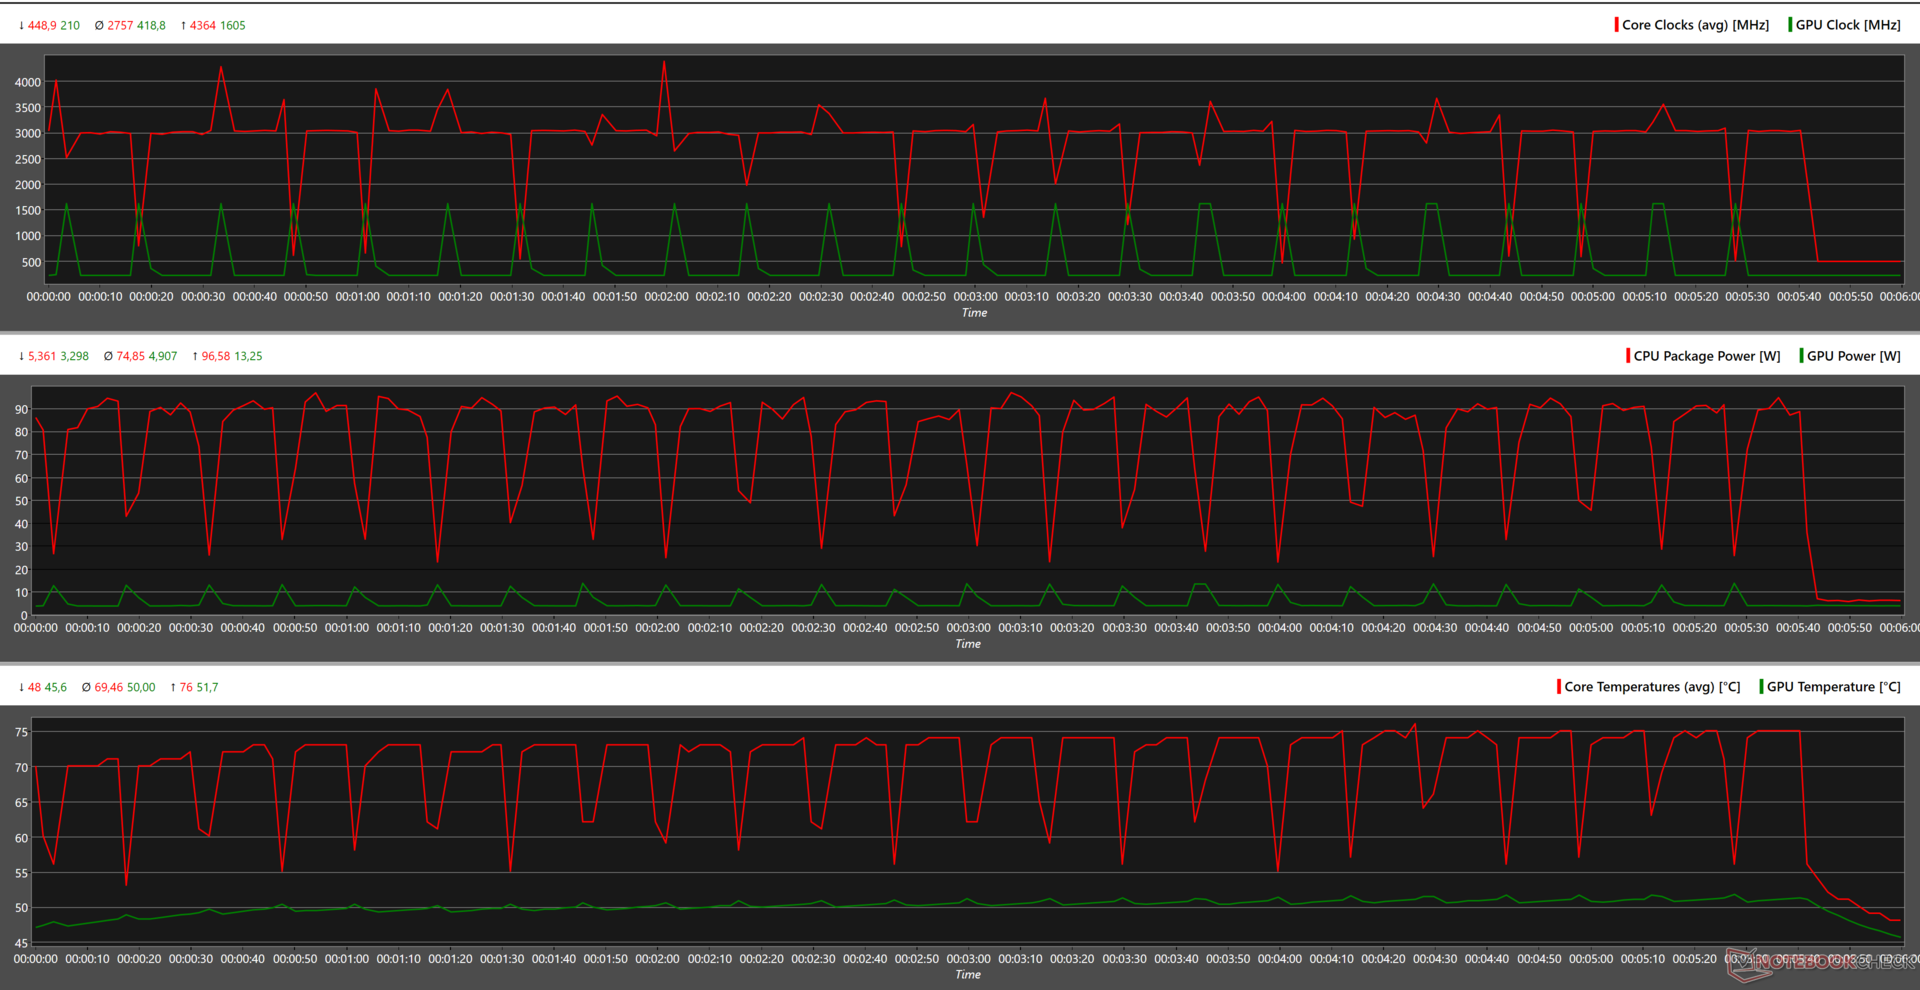
En el modo de rendimiento extremo, una ejecución multinúcleo de 25 bucles de Cinebench R15 revela que la CPU es capaz de alcanzar picos de reloj de 4,3 GHz mientras consume hasta 96 vatios de potencia. Su puntuación se mantiene más o menos constante a lo largo de la ejecución, oscilando entre 3.327 y 3.250 puntos.
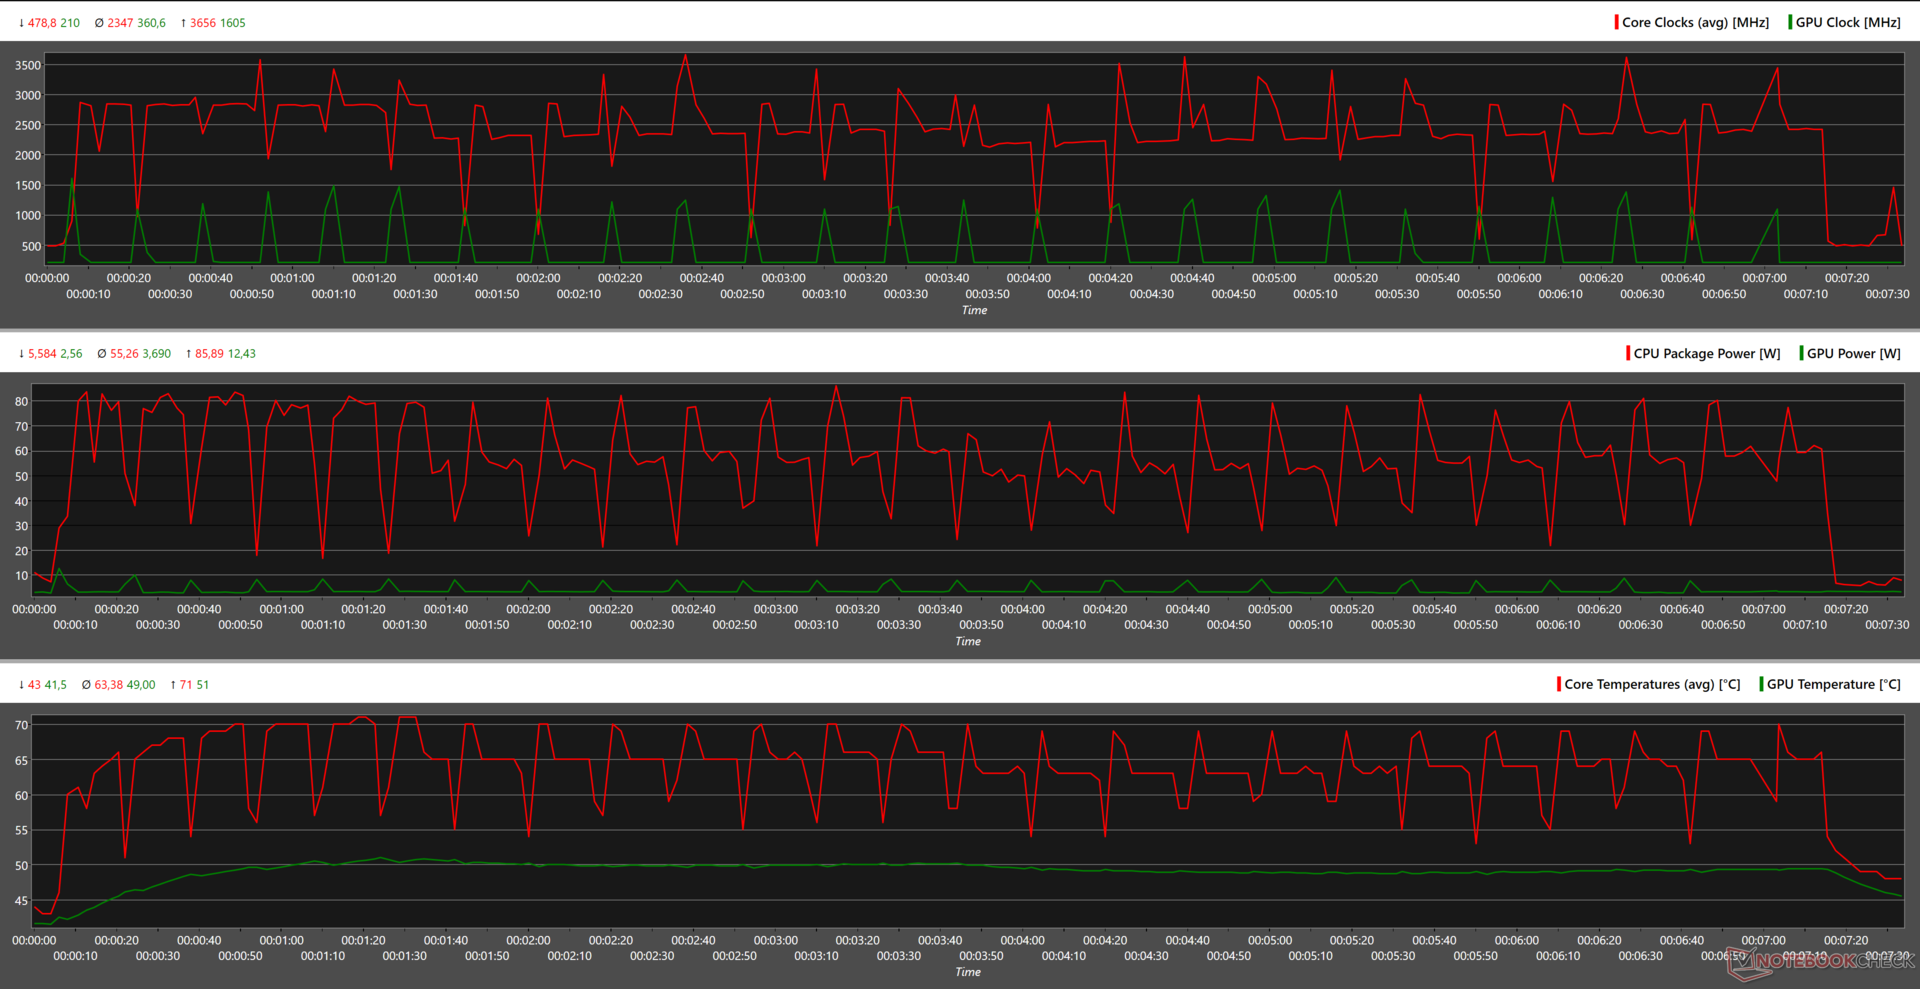
En el modo equilibrado, puede ver que la potencia del paquete de la CPU alcanza un máximo de 85 vatios antes de establecerse en 55 vatios. Del mismo modo, aumenta hasta los 3,6 GHz, y cae hasta los 2,3 GHz, donde permanece durante toda la ejecución.
Consulte nuestra sección dedicada al Intel Core i7-14700HX para obtener más información sobre la CPU.
Cinebench R15 Multi Loop
Cinebench R23: Multi Core | Single Core
Cinebench R20: CPU (Multi Core) | CPU (Single Core)
Cinebench R15: CPU Multi 64Bit | CPU Single 64Bit
Blender: v2.79 BMW27 CPU
7-Zip 18.03: 7z b 4 | 7z b 4 -mmt1
Geekbench 6.4: Multi-Core | Single-Core
Geekbench 5.5: Multi-Core | Single-Core
HWBOT x265 Benchmark v2.2: 4k Preset
LibreOffice : 20 Documents To PDF
R Benchmark 2.5: Overall mean
| CPU Performance Rating | |
| Lenovo Legion 7 16 IRX G9 | |
| Asus ROG Strix G17 G713PI -2! | |
| Acer Predator Helios Neo 16 (2024) | |
| Medio Intel Core i7-14700HX | |
| MSI Sword 16 HX B14VGKG | |
| Media de la clase Gaming | |
| Alienware m16 R2 -1! | |
| HP Omen 17-db0079ng | |
| HP Victus 16-r0077ng | |
| Cinebench R23 / Multi Core | |
| Asus ROG Strix G17 G713PI | |
| Lenovo Legion 7 16 IRX G9 | |
| Medio Intel Core i7-14700HX (22313 - 28122, n=7) | |
| Acer Predator Helios Neo 16 (2024) | |
| MSI Sword 16 HX B14VGKG | |
| Media de la clase Gaming (5668 - 39652, n=151, últimos 2 años) | |
| Alienware m16 R2 | |
| HP Omen 17-db0079ng | |
| HP Victus 16-r0077ng | |
| Cinebench R23 / Single Core | |
| Lenovo Legion 7 16 IRX G9 | |
| MSI Sword 16 HX B14VGKG | |
| Acer Predator Helios Neo 16 (2024) | |
| Medio Intel Core i7-14700HX (1702 - 2144, n=7) | |
| Media de la clase Gaming (1136 - 2252, n=151, últimos 2 años) | |
| Asus ROG Strix G17 G713PI | |
| Alienware m16 R2 | |
| HP Victus 16-r0077ng | |
| HP Omen 17-db0079ng | |
| Cinebench R20 / CPU (Multi Core) | |
| Lenovo Legion 7 16 IRX G9 | |
| Asus ROG Strix G17 G713PI | |
| Medio Intel Core i7-14700HX (8361 - 10498, n=7) | |
| MSI Sword 16 HX B14VGKG | |
| Acer Predator Helios Neo 16 (2024) | |
| Media de la clase Gaming (2179 - 15517, n=151, últimos 2 años) | |
| Alienware m16 R2 | |
| HP Omen 17-db0079ng | |
| HP Victus 16-r0077ng | |
| Cinebench R20 / CPU (Single Core) | |
| Lenovo Legion 7 16 IRX G9 | |
| MSI Sword 16 HX B14VGKG | |
| Acer Predator Helios Neo 16 (2024) | |
| Medio Intel Core i7-14700HX (651 - 821, n=7) | |
| Media de la clase Gaming (439 - 866, n=151, últimos 2 años) | |
| Asus ROG Strix G17 G713PI | |
| HP Omen 17-db0079ng | |
| Alienware m16 R2 | |
| HP Victus 16-r0077ng | |
| Cinebench R15 / CPU Multi 64Bit | |
| Asus ROG Strix G17 G713PI | |
| Lenovo Legion 7 16 IRX G9 | |
| Medio Intel Core i7-14700HX (3328 - 4137, n=7) | |
| Acer Predator Helios Neo 16 (2024) | |
| MSI Sword 16 HX B14VGKG | |
| Media de la clase Gaming (905 - 6074, n=154, últimos 2 años) | |
| Alienware m16 R2 | |
| HP Omen 17-db0079ng | |
| HP Victus 16-r0077ng | |
| Cinebench R15 / CPU Single 64Bit | |
| Lenovo Legion 7 16 IRX G9 | |
| MSI Sword 16 HX B14VGKG | |
| Asus ROG Strix G17 G713PI | |
| Acer Predator Helios Neo 16 (2024) | |
| Medio Intel Core i7-14700HX (238 - 304, n=7) | |
| Media de la clase Gaming (191.9 - 343, n=151, últimos 2 años) | |
| HP Omen 17-db0079ng | |
| Alienware m16 R2 | |
| HP Victus 16-r0077ng | |
| Blender / v2.79 BMW27 CPU | |
| HP Victus 16-r0077ng | |
| HP Omen 17-db0079ng | |
| Media de la clase Gaming (81 - 555, n=144, últimos 2 años) | |
| Medio Intel Core i7-14700HX (126 - 184, n=7) | |
| MSI Sword 16 HX B14VGKG | |
| Acer Predator Helios Neo 16 (2024) | |
| Lenovo Legion 7 16 IRX G9 | |
| Asus ROG Strix G17 G713PI | |
| 7-Zip 18.03 / 7z b 4 | |
| Asus ROG Strix G17 G713PI | |
| Lenovo Legion 7 16 IRX G9 | |
| Medio Intel Core i7-14700HX (84799 - 104730, n=7) | |
| Acer Predator Helios Neo 16 (2024) | |
| MSI Sword 16 HX B14VGKG | |
| Media de la clase Gaming (23795 - 144064, n=149, últimos 2 años) | |
| Alienware m16 R2 | |
| HP Victus 16-r0077ng | |
| HP Omen 17-db0079ng | |
| 7-Zip 18.03 / 7z b 4 -mmt1 | |
| Asus ROG Strix G17 G713PI | |
| Lenovo Legion 7 16 IRX G9 | |
| MSI Sword 16 HX B14VGKG | |
| Acer Predator Helios Neo 16 (2024) | |
| Medio Intel Core i7-14700HX (5641 - 7041, n=7) | |
| Media de la clase Gaming (4199 - 7573, n=149, últimos 2 años) | |
| HP Victus 16-r0077ng | |
| HP Omen 17-db0079ng | |
| Alienware m16 R2 | |
| Geekbench 6.4 / Multi-Core | |
| Lenovo Legion 7 16 IRX G9 | |
| Acer Predator Helios Neo 16 (2024) | |
| Medio Intel Core i7-14700HX (14807 - 17562, n=7) | |
| MSI Sword 16 HX B14VGKG | |
| Media de la clase Gaming (5340 - 21668, n=119, últimos 2 años) | |
| HP Omen 17-db0079ng | |
| Alienware m16 R2 | |
| HP Victus 16-r0077ng | |
| Geekbench 6.4 / Single-Core | |
| Lenovo Legion 7 16 IRX G9 | |
| Acer Predator Helios Neo 16 (2024) | |
| MSI Sword 16 HX B14VGKG | |
| Medio Intel Core i7-14700HX (2378 - 2975, n=7) | |
| Media de la clase Gaming (1490 - 3219, n=119, últimos 2 años) | |
| HP Omen 17-db0079ng | |
| HP Victus 16-r0077ng | |
| Alienware m16 R2 | |
| Geekbench 5.5 / Multi-Core | |
| Lenovo Legion 7 16 IRX G9 | |
| Asus ROG Strix G17 G713PI | |
| Acer Predator Helios Neo 16 (2024) | |
| Medio Intel Core i7-14700HX (15705 - 19597, n=7) | |
| MSI Sword 16 HX B14VGKG | |
| Media de la clase Gaming (4557 - 25855, n=148, últimos 2 años) | |
| Alienware m16 R2 | |
| HP Omen 17-db0079ng | |
| HP Victus 16-r0077ng | |
| Geekbench 5.5 / Single-Core | |
| Acer Predator Helios Neo 16 (2024) | |
| Lenovo Legion 7 16 IRX G9 | |
| MSI Sword 16 HX B14VGKG | |
| Asus ROG Strix G17 G713PI | |
| Medio Intel Core i7-14700HX (1700 - 2133, n=7) | |
| Media de la clase Gaming (986 - 2423, n=148, últimos 2 años) | |
| HP Omen 17-db0079ng | |
| Alienware m16 R2 | |
| HP Victus 16-r0077ng | |
| HWBOT x265 Benchmark v2.2 / 4k Preset | |
| Asus ROG Strix G17 G713PI | |
| Lenovo Legion 7 16 IRX G9 | |
| Medio Intel Core i7-14700HX (22 - 27.4, n=7) | |
| Acer Predator Helios Neo 16 (2024) | |
| MSI Sword 16 HX B14VGKG | |
| Media de la clase Gaming (6.72 - 42.9, n=148, últimos 2 años) | |
| Alienware m16 R2 | |
| HP Omen 17-db0079ng | |
| HP Victus 16-r0077ng | |
| LibreOffice / 20 Documents To PDF | |
| HP Omen 17-db0079ng | |
| HP Victus 16-r0077ng | |
| Alienware m16 R2 | |
| Media de la clase Gaming (19 - 96.6, n=147, últimos 2 años) | |
| Medio Intel Core i7-14700HX (41.9 - 55.3, n=7) | |
| Asus ROG Strix G17 G713PI | |
| Lenovo Legion 7 16 IRX G9 | |
| MSI Sword 16 HX B14VGKG | |
| Acer Predator Helios Neo 16 (2024) | |
| R Benchmark 2.5 / Overall mean | |
| HP Victus 16-r0077ng | |
| HP Omen 17-db0079ng | |
| Alienware m16 R2 | |
| Media de la clase Gaming (0.3609 - 0.759, n=150, últimos 2 años) | |
| Medio Intel Core i7-14700HX (0.3821 - 0.4896, n=7) | |
| Asus ROG Strix G17 G713PI | |
| MSI Sword 16 HX B14VGKG | |
| Lenovo Legion 7 16 IRX G9 | |
| Acer Predator Helios Neo 16 (2024) | |
* ... más pequeño es mejor
AIDA64: FP32 Ray-Trace | FPU Julia | CPU SHA3 | CPU Queen | FPU SinJulia | FPU Mandel | CPU AES | CPU ZLib | FP64 Ray-Trace | CPU PhotoWorxx
| Performance Rating | |
| Asus ROG Strix G17 G713PI | |
| Lenovo Legion 7 16 IRX G9 | |
| Acer Predator Helios Neo 16 (2024) | |
| Medio Intel Core i7-14700HX | |
| HP Omen 17-db0079ng | |
| Media de la clase Gaming | |
| MSI Sword 16 HX B14VGKG | |
| Alienware m16 R2 | |
| HP Victus 16-r0077ng | |
| AIDA64 / FP32 Ray-Trace | |
| Asus ROG Strix G17 G713PI | |
| HP Omen 17-db0079ng | |
| Lenovo Legion 7 16 IRX G9 | |
| Media de la clase Gaming (4986 - 81639, n=147, últimos 2 años) | |
| Acer Predator Helios Neo 16 (2024) | |
| Medio Intel Core i7-14700HX (16932 - 23676, n=7) | |
| MSI Sword 16 HX B14VGKG | |
| Alienware m16 R2 | |
| HP Victus 16-r0077ng | |
| AIDA64 / FPU Julia | |
| Asus ROG Strix G17 G713PI | |
| Lenovo Legion 7 16 IRX G9 | |
| HP Omen 17-db0079ng | |
| Medio Intel Core i7-14700HX (86338 - 116556, n=7) | |
| Acer Predator Helios Neo 16 (2024) | |
| Media de la clase Gaming (25360 - 252486, n=147, últimos 2 años) | |
| MSI Sword 16 HX B14VGKG | |
| Alienware m16 R2 | |
| HP Victus 16-r0077ng | |
| AIDA64 / CPU SHA3 | |
| Asus ROG Strix G17 G713PI | |
| Lenovo Legion 7 16 IRX G9 | |
| Medio Intel Core i7-14700HX (4008 - 5567, n=7) | |
| Acer Predator Helios Neo 16 (2024) | |
| Media de la clase Gaming (1339 - 10389, n=147, últimos 2 años) | |
| HP Omen 17-db0079ng | |
| MSI Sword 16 HX B14VGKG | |
| Alienware m16 R2 | |
| HP Victus 16-r0077ng | |
| AIDA64 / CPU Queen | |
| Asus ROG Strix G17 G713PI | |
| Acer Predator Helios Neo 16 (2024) | |
| Lenovo Legion 7 16 IRX G9 | |
| Medio Intel Core i7-14700HX (129836 - 152200, n=7) | |
| MSI Sword 16 HX B14VGKG | |
| HP Omen 17-db0079ng | |
| Media de la clase Gaming (50699 - 200651, n=147, últimos 2 años) | |
| HP Victus 16-r0077ng | |
| Alienware m16 R2 | |
| AIDA64 / FPU SinJulia | |
| Asus ROG Strix G17 G713PI | |
| HP Omen 17-db0079ng | |
| Lenovo Legion 7 16 IRX G9 | |
| Acer Predator Helios Neo 16 (2024) | |
| Medio Intel Core i7-14700HX (11704 - 14434, n=7) | |
| Media de la clase Gaming (4800 - 32988, n=147, últimos 2 años) | |
| MSI Sword 16 HX B14VGKG | |
| Alienware m16 R2 | |
| HP Victus 16-r0077ng | |
| AIDA64 / FPU Mandel | |
| Asus ROG Strix G17 G713PI | |
| HP Omen 17-db0079ng | |
| Acer Predator Helios Neo 16 (2024) | |
| Media de la clase Gaming (12321 - 134044, n=147, últimos 2 años) | |
| Medio Intel Core i7-14700HX (42125 - 58380, n=7) | |
| MSI Sword 16 HX B14VGKG | |
| Alienware m16 R2 | |
| Lenovo Legion 7 16 IRX G9 | |
| HP Victus 16-r0077ng | |
| AIDA64 / CPU AES | |
| Asus ROG Strix G17 G713PI | |
| Lenovo Legion 7 16 IRX G9 | |
| Media de la clase Gaming (19065 - 328679, n=147, últimos 2 años) | |
| Medio Intel Core i7-14700HX (82161 - 113157, n=7) | |
| Acer Predator Helios Neo 16 (2024) | |
| MSI Sword 16 HX B14VGKG | |
| HP Omen 17-db0079ng | |
| Alienware m16 R2 | |
| HP Victus 16-r0077ng | |
| AIDA64 / CPU ZLib | |
| Asus ROG Strix G17 G713PI | |
| Lenovo Legion 7 16 IRX G9 | |
| Medio Intel Core i7-14700HX (1177 - 1682, n=7) | |
| Acer Predator Helios Neo 16 (2024) | |
| MSI Sword 16 HX B14VGKG | |
| Media de la clase Gaming (373 - 2531, n=147, últimos 2 años) | |
| Alienware m16 R2 | |
| HP Omen 17-db0079ng | |
| HP Victus 16-r0077ng | |
| AIDA64 / FP64 Ray-Trace | |
| Asus ROG Strix G17 G713PI | |
| HP Omen 17-db0079ng | |
| Lenovo Legion 7 16 IRX G9 | |
| Media de la clase Gaming (2540 - 43430, n=147, últimos 2 años) | |
| Acer Predator Helios Neo 16 (2024) | |
| Medio Intel Core i7-14700HX (9029 - 12928, n=7) | |
| MSI Sword 16 HX B14VGKG | |
| Alienware m16 R2 | |
| HP Victus 16-r0077ng | |
| AIDA64 / CPU PhotoWorxx | |
| Lenovo Legion 7 16 IRX G9 | |
| Acer Predator Helios Neo 16 (2024) | |
| Medio Intel Core i7-14700HX (39151 - 49671, n=7) | |
| HP Omen 17-db0079ng | |
| Media de la clase Gaming (10805 - 60161, n=147, últimos 2 años) | |
| Alienware m16 R2 | |
| MSI Sword 16 HX B14VGKG | |
| HP Victus 16-r0077ng | |
| Asus ROG Strix G17 G713PI | |
Rendimiento del sistema
La potente CPU y GPU del Sword 16 HX hacen un trabajo corto con tareas cotidianas como videollamadas, hojas de Excel, etc. Sin embargo, es posible que tenga que cambiar a un modo que consuma menos energía (Silencioso/Equilibrado) para obtener más duración de la batería.
CrossMark: Overall | Productivity | Creativity | Responsiveness
WebXPRT 3: Overall
WebXPRT 4: Overall
Mozilla Kraken 1.1: Total
| PCMark 10 / Score | |
| MSI Sword 16 HX B14VGKG | |
| Medio Intel Core i7-14700HX, NVIDIA GeForce RTX 4070 Laptop GPU (8302 - 8512, n=2) | |
| Acer Predator Helios Neo 16 (2024) | |
| Lenovo Legion 7 16 IRX G9 | |
| Media de la clase Gaming (5776 - 9852, n=133, últimos 2 años) | |
| HP Omen 17-db0079ng | |
| Alienware m16 R2 | |
| Asus ROG Strix G17 G713PI | |
| HP Victus 16-r0077ng | |
| PCMark 10 / Essentials | |
| Acer Predator Helios Neo 16 (2024) | |
| Medio Intel Core i7-14700HX, NVIDIA GeForce RTX 4070 Laptop GPU (10939 - 11708, n=2) | |
| Asus ROG Strix G17 G713PI | |
| Lenovo Legion 7 16 IRX G9 | |
| MSI Sword 16 HX B14VGKG | |
| Media de la clase Gaming (9057 - 12600, n=133, últimos 2 años) | |
| HP Victus 16-r0077ng | |
| HP Omen 17-db0079ng | |
| Alienware m16 R2 | |
| PCMark 10 / Productivity | |
| Asus ROG Strix G17 G713PI | |
| MSI Sword 16 HX B14VGKG | |
| Medio Intel Core i7-14700HX, NVIDIA GeForce RTX 4070 Laptop GPU (10273 - 10925, n=2) | |
| Acer Predator Helios Neo 16 (2024) | |
| HP Omen 17-db0079ng | |
| Media de la clase Gaming (6662 - 14612, n=133, últimos 2 años) | |
| Lenovo Legion 7 16 IRX G9 | |
| Alienware m16 R2 | |
| HP Victus 16-r0077ng | |
| PCMark 10 / Digital Content Creation | |
| MSI Sword 16 HX B14VGKG | |
| Medio Intel Core i7-14700HX, NVIDIA GeForce RTX 4070 Laptop GPU (12909 - 14003, n=2) | |
| Lenovo Legion 7 16 IRX G9 | |
| Alienware m16 R2 | |
| Acer Predator Helios Neo 16 (2024) | |
| Media de la clase Gaming (6807 - 18475, n=133, últimos 2 años) | |
| HP Omen 17-db0079ng | |
| HP Victus 16-r0077ng | |
| Asus ROG Strix G17 G713PI | |
| CrossMark / Overall | |
| Lenovo Legion 7 16 IRX G9 | |
| Acer Predator Helios Neo 16 (2024) | |
| Medio Intel Core i7-14700HX, NVIDIA GeForce RTX 4070 Laptop GPU (2138 - 2235, n=2) | |
| MSI Sword 16 HX B14VGKG | |
| Asus ROG Strix G17 G713PI | |
| Media de la clase Gaming (1247 - 2344, n=114, últimos 2 años) | |
| Alienware m16 R2 | |
| HP Omen 17-db0079ng | |
| CrossMark / Productivity | |
| Lenovo Legion 7 16 IRX G9 | |
| Acer Predator Helios Neo 16 (2024) | |
| Medio Intel Core i7-14700HX, NVIDIA GeForce RTX 4070 Laptop GPU (2035 - 2093, n=2) | |
| MSI Sword 16 HX B14VGKG | |
| Asus ROG Strix G17 G713PI | |
| Media de la clase Gaming (1299 - 2204, n=114, últimos 2 años) | |
| Alienware m16 R2 | |
| HP Omen 17-db0079ng | |
| CrossMark / Creativity | |
| Acer Predator Helios Neo 16 (2024) | |
| Lenovo Legion 7 16 IRX G9 | |
| Medio Intel Core i7-14700HX, NVIDIA GeForce RTX 4070 Laptop GPU (2311 - 2455, n=2) | |
| Asus ROG Strix G17 G713PI | |
| MSI Sword 16 HX B14VGKG | |
| Media de la clase Gaming (1275 - 2660, n=114, últimos 2 años) | |
| Alienware m16 R2 | |
| HP Omen 17-db0079ng | |
| CrossMark / Responsiveness | |
| Lenovo Legion 7 16 IRX G9 | |
| Acer Predator Helios Neo 16 (2024) | |
| Medio Intel Core i7-14700HX, NVIDIA GeForce RTX 4070 Laptop GPU (1960 - 2053, n=2) | |
| MSI Sword 16 HX B14VGKG | |
| Media de la clase Gaming (1030 - 2330, n=114, últimos 2 años) | |
| Asus ROG Strix G17 G713PI | |
| Alienware m16 R2 | |
| HP Omen 17-db0079ng | |
| WebXPRT 3 / Overall | |
| Lenovo Legion 7 16 IRX G9 | |
| Acer Predator Helios Neo 16 (2024) | |
| Asus ROG Strix G17 G713PI | |
| Medio Intel Core i7-14700HX, NVIDIA GeForce RTX 4070 Laptop GPU (302 - 323, n=2) | |
| MSI Sword 16 HX B14VGKG | |
| Media de la clase Gaming (215 - 480, n=127, últimos 2 años) | |
| Alienware m16 R2 | |
| HP Victus 16-r0077ng | |
| HP Victus 16-r0077ng | |
| HP Omen 17-db0079ng | |
| WebXPRT 4 / Overall | |
| Acer Predator Helios Neo 16 (2024) | |
| Lenovo Legion 7 16 IRX G9 | |
| Medio Intel Core i7-14700HX, NVIDIA GeForce RTX 4070 Laptop GPU (274 - 307, n=2) | |
| Asus ROG Strix G17 G713PI | |
| MSI Sword 16 HX B14VGKG | |
| Media de la clase Gaming (176.4 - 335, n=115, últimos 2 años) | |
| Alienware m16 R2 | |
| HP Victus 16-r0077ng | |
| HP Victus 16-r0077ng | |
| Mozilla Kraken 1.1 / Total | |
| HP Omen 17-db0079ng | |
| Alienware m16 R2 | |
| HP Victus 16-r0077ng | |
| HP Victus 16-r0077ng | |
| Media de la clase Gaming (409 - 674, n=139, últimos 2 años) | |
| Asus ROG Strix G17 G713PI | |
| MSI Sword 16 HX B14VGKG | |
| MSI Sword 16 HX B14VGKG | |
| Medio Intel Core i7-14700HX, NVIDIA GeForce RTX 4070 Laptop GPU (447 - 449, n=3) | |
| Acer Predator Helios Neo 16 (2024) | |
| Lenovo Legion 7 16 IRX G9 | |
* ... más pequeño es mejor
| PCMark 10 Score | 8512 puntos | |
ayuda | ||
| AIDA64 / Memory Copy | |
| Lenovo Legion 7 16 IRX G9 | |
| Acer Predator Helios Neo 16 (2024) | |
| Medio Intel Core i7-14700HX (63949 - 78742, n=7) | |
| MSI Sword 16 HX B14VGKG | |
| HP Omen 17-db0079ng | |
| Media de la clase Gaming (21750 - 97515, n=147, últimos 2 años) | |
| Alienware m16 R2 | |
| HP Victus 16-r0077ng | |
| Asus ROG Strix G17 G713PI | |
| AIDA64 / Memory Read | |
| Lenovo Legion 7 16 IRX G9 | |
| MSI Sword 16 HX B14VGKG | |
| Acer Predator Helios Neo 16 (2024) | |
| Medio Intel Core i7-14700HX (68593 - 86175, n=7) | |
| Alienware m16 R2 | |
| HP Victus 16-r0077ng | |
| Media de la clase Gaming (22956 - 102937, n=147, últimos 2 años) | |
| HP Omen 17-db0079ng | |
| Asus ROG Strix G17 G713PI | |
| AIDA64 / Memory Write | |
| HP Omen 17-db0079ng | |
| Lenovo Legion 7 16 IRX G9 | |
| Acer Predator Helios Neo 16 (2024) | |
| Medio Intel Core i7-14700HX (64033 - 76689, n=7) | |
| Media de la clase Gaming (22297 - 108954, n=147, últimos 2 años) | |
| Alienware m16 R2 | |
| MSI Sword 16 HX B14VGKG | |
| HP Victus 16-r0077ng | |
| Asus ROG Strix G17 G713PI | |
| AIDA64 / Memory Latency | |
| Alienware m16 R2 | |
| HP Omen 17-db0079ng | |
| Media de la clase Gaming (59.5 - 259, n=147, últimos 2 años) | |
| HP Victus 16-r0077ng | |
| Acer Predator Helios Neo 16 (2024) | |
| Medio Intel Core i7-14700HX (82.7 - 96.4, n=7) | |
| Asus ROG Strix G17 G713PI | |
| Lenovo Legion 7 16 IRX G9 | |
| MSI Sword 16 HX B14VGKG | |
* ... más pequeño es mejor
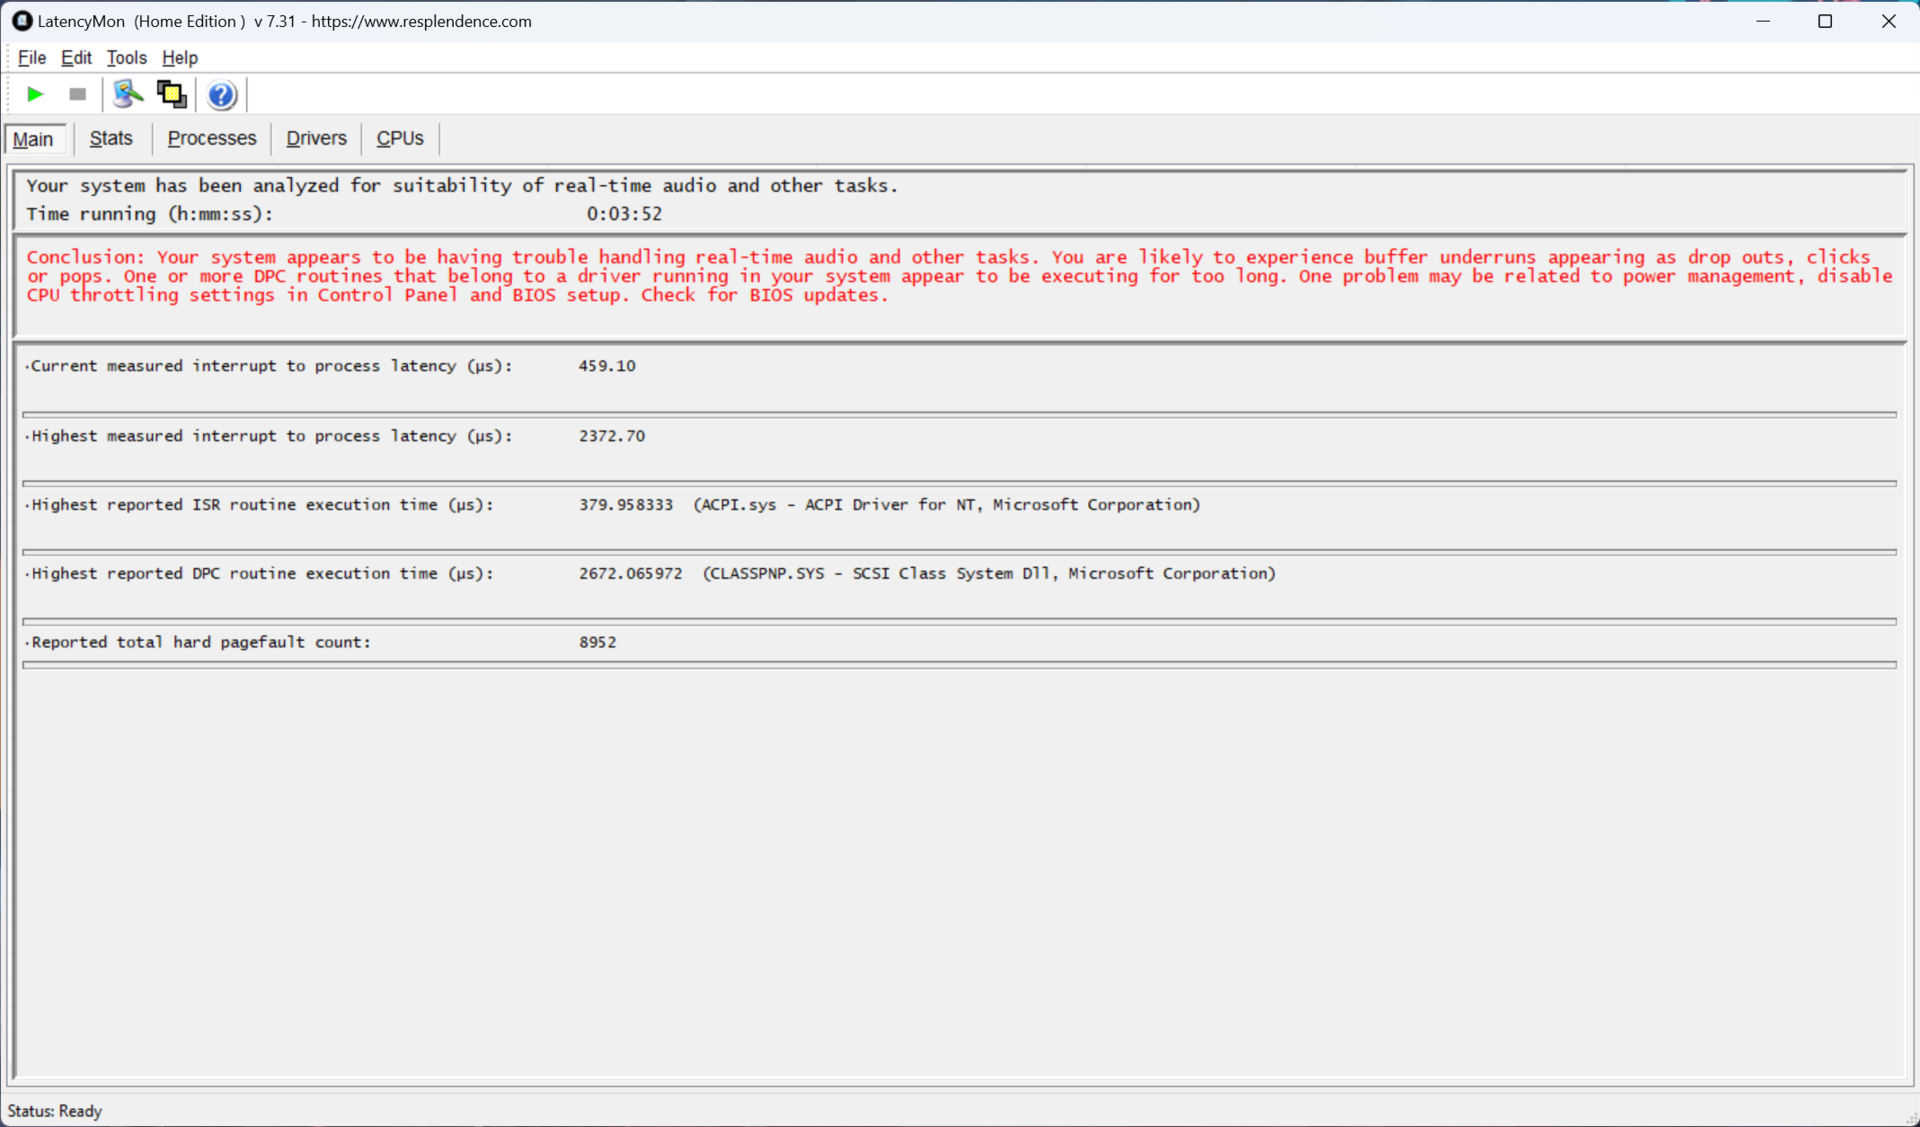
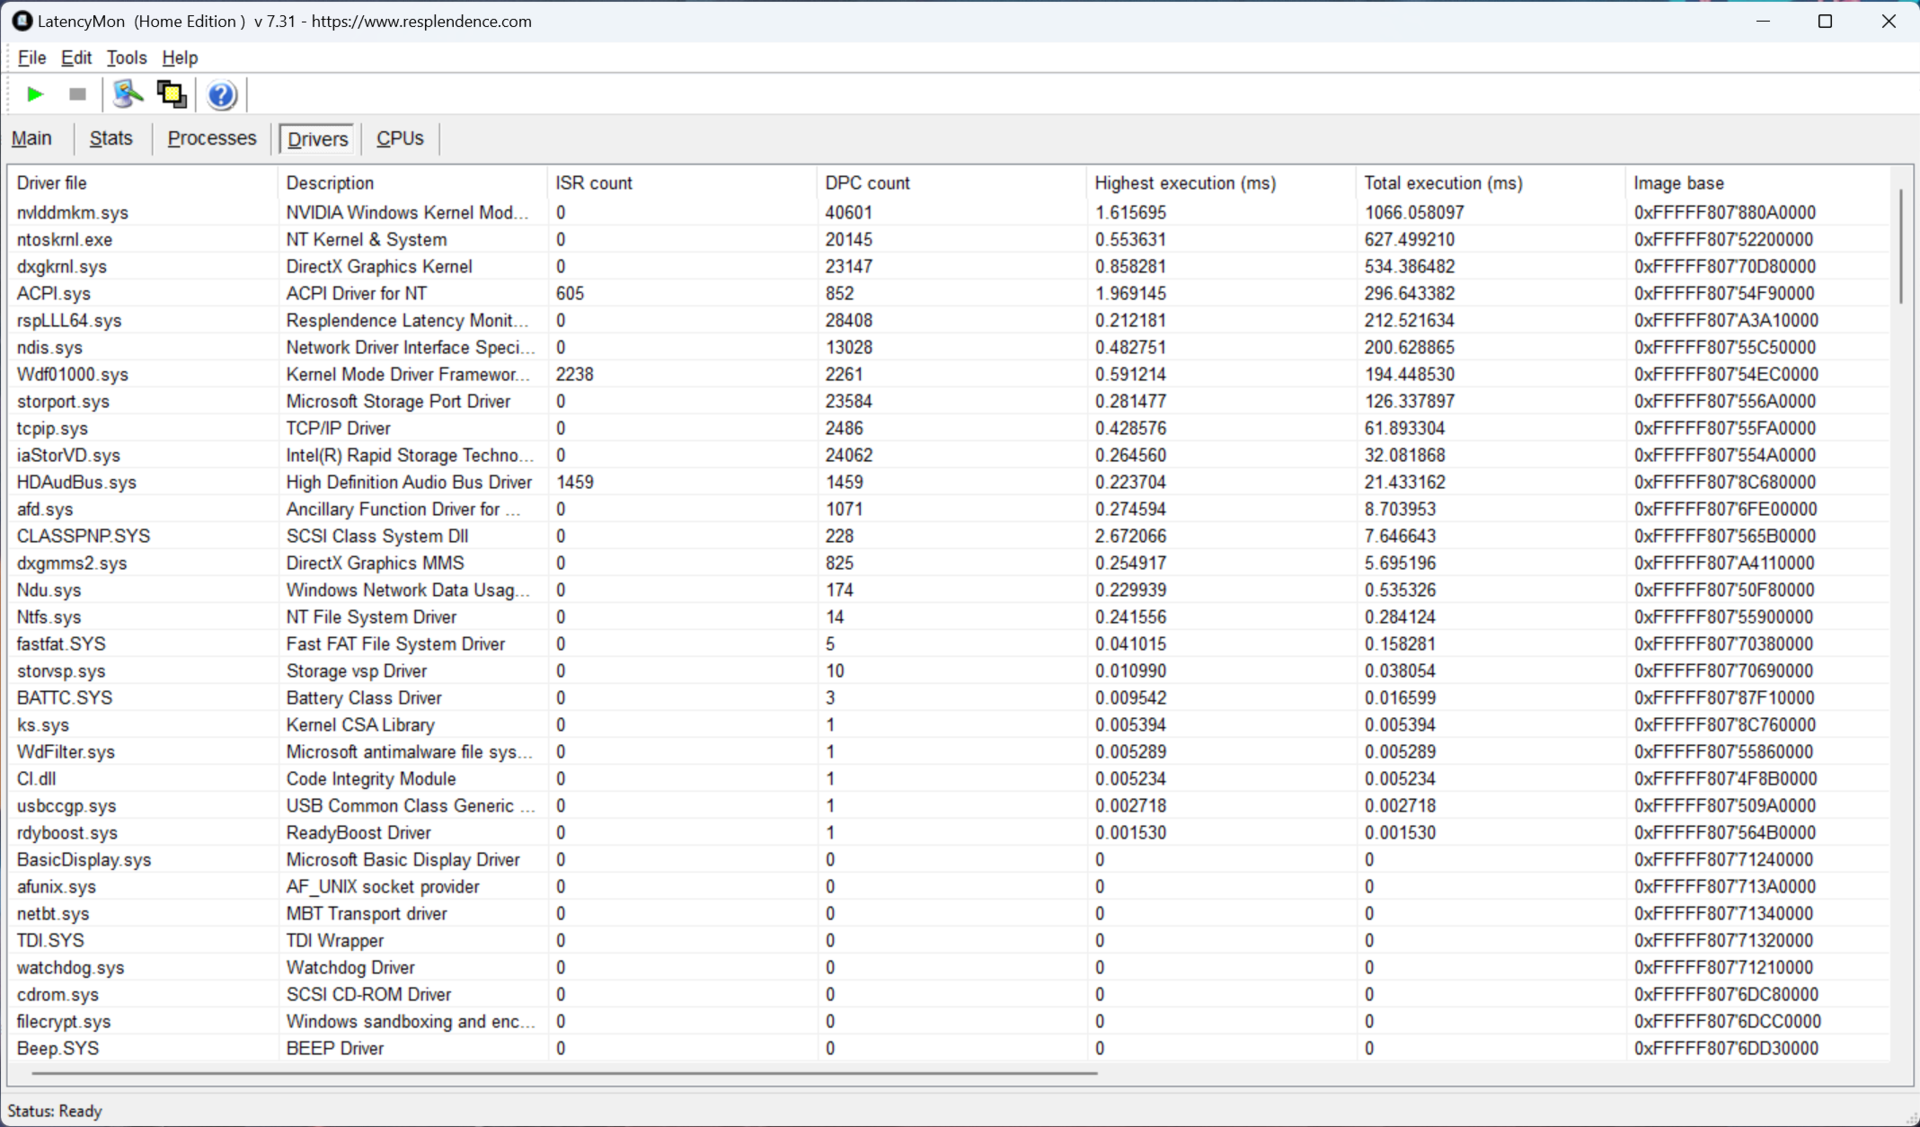
Latencia del CPD
Por desgracia, el MSI Sword 16 HX no es ideal para aplicaciones de edición de audio y vídeo en tiempo real. Su latencia DPC está en el lado más alto debido a los controladores de Nvidia. Una futura actualización del software debería solucionar el problema.
| DPC Latencies / LatencyMon - interrupt to process latency (max), Web, Youtube, Prime95 | |
| MSI Sword 16 HX B14VGKG | |
| Alienware m16 R2 | |
| HP Omen 17-db0079ng | |
| HP Victus 16-r0077ng | |
| Lenovo Legion 7 16 IRX G9 | |
| Asus ROG Strix G17 G713PI | |
| Acer Predator Helios Neo 16 (2024) | |
* ... más pequeño es mejor
Dispositivos de almacenamiento
Por desgracia, la unidad SSD NVMe Western Digital PC SN560 del Sword 16 HX es una de las más lentas del mercado. Es superada ampliamente por las ofertas competidoras de Samsung, Kioxia y SK Hynix.
Como no pudimos mirar en el interior, no sabemos dónde está conectada la SSD PC SN560, pero es probable que esté encajada en la ranura PCIe Gen5.

* ... más pequeño es mejor
Disk Throttling: DiskSpd Read Loop, Queue Depth 8
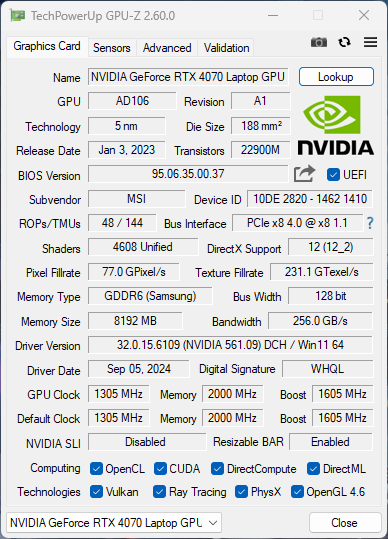
Rendimiento de la GPU
El Nvidia GeForce RTX 4070 que se encuentra en la MSI Sword 16 HX no es una de las más rápidas que hemos probado, pero podemos achacar eso a su TDP de 115 vatios frente a los 140 vatios de las otras. La decisión de MSI de utilizar una variante de 115 vatios tiene sentido, ya que refrigerar su variante de 150 vatios sería todo un reto en este nivel de precio.
Dicho esto, la configuración actual de MSI prioriza la GPU sobre la CPU. En una carga de trabajo intensiva mixta de CPU y GPU, la GeForce RTX 4070 funciona constantemente a 115 vatios, mientras que el Core i7-14700HX se mantiene estable en torno a los 86 vatios.
En general, el rendimiento del portátil en las pruebas sintéticas es aceptable y se sitúa en línea con otras SKU RTX 4070 de 115 vatios. MSI le permite cambiar entre ella y la iGPU a través de software. Sin embargo, el cambio entre GPU requiere un reinicio. También tiene la opción de dejar que Windows cambie automáticamente entre la dGPU y la iGPU.
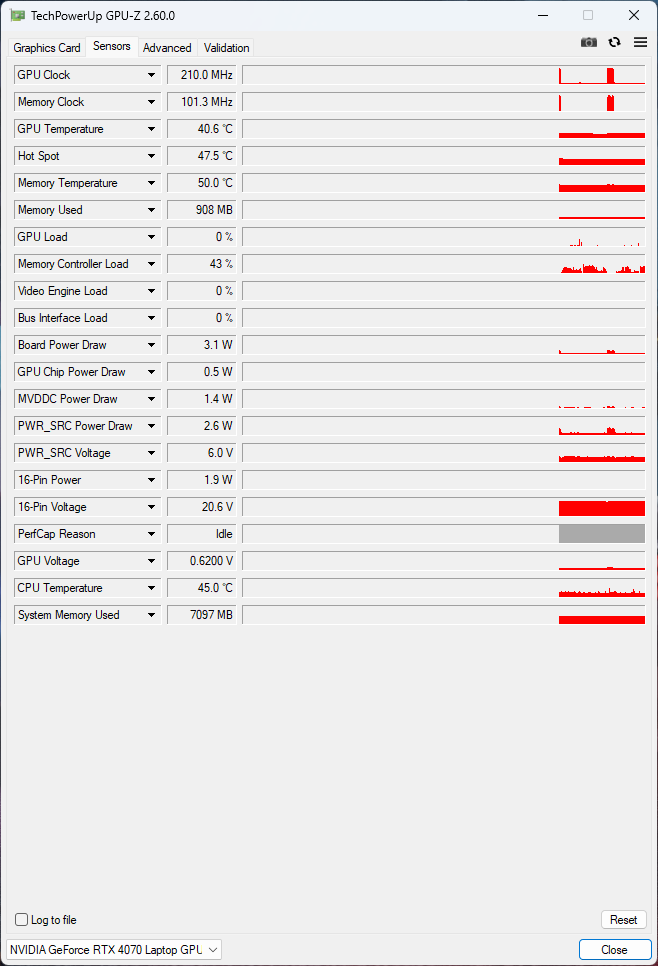
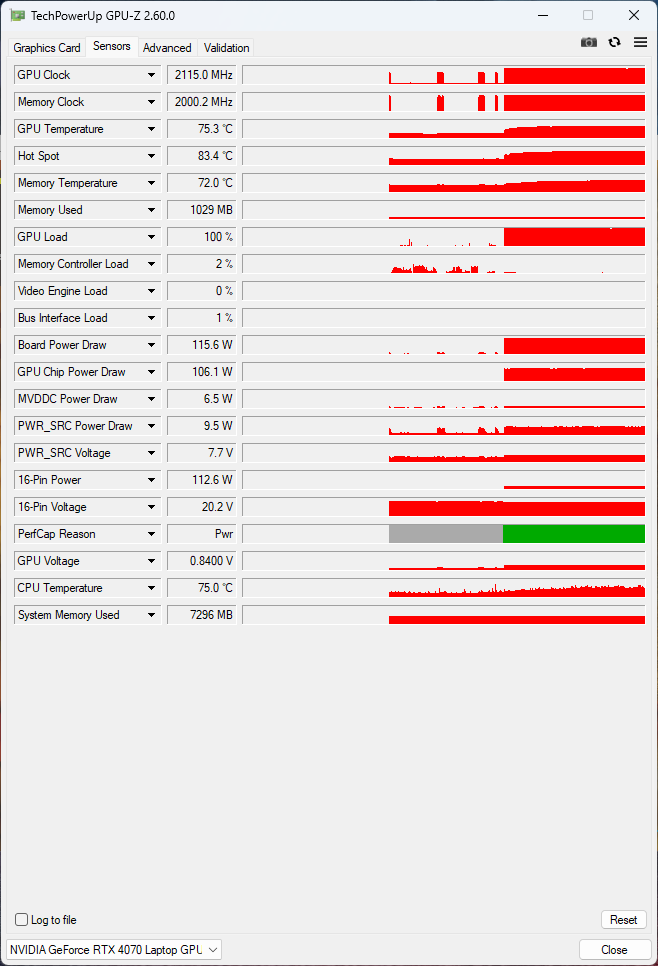
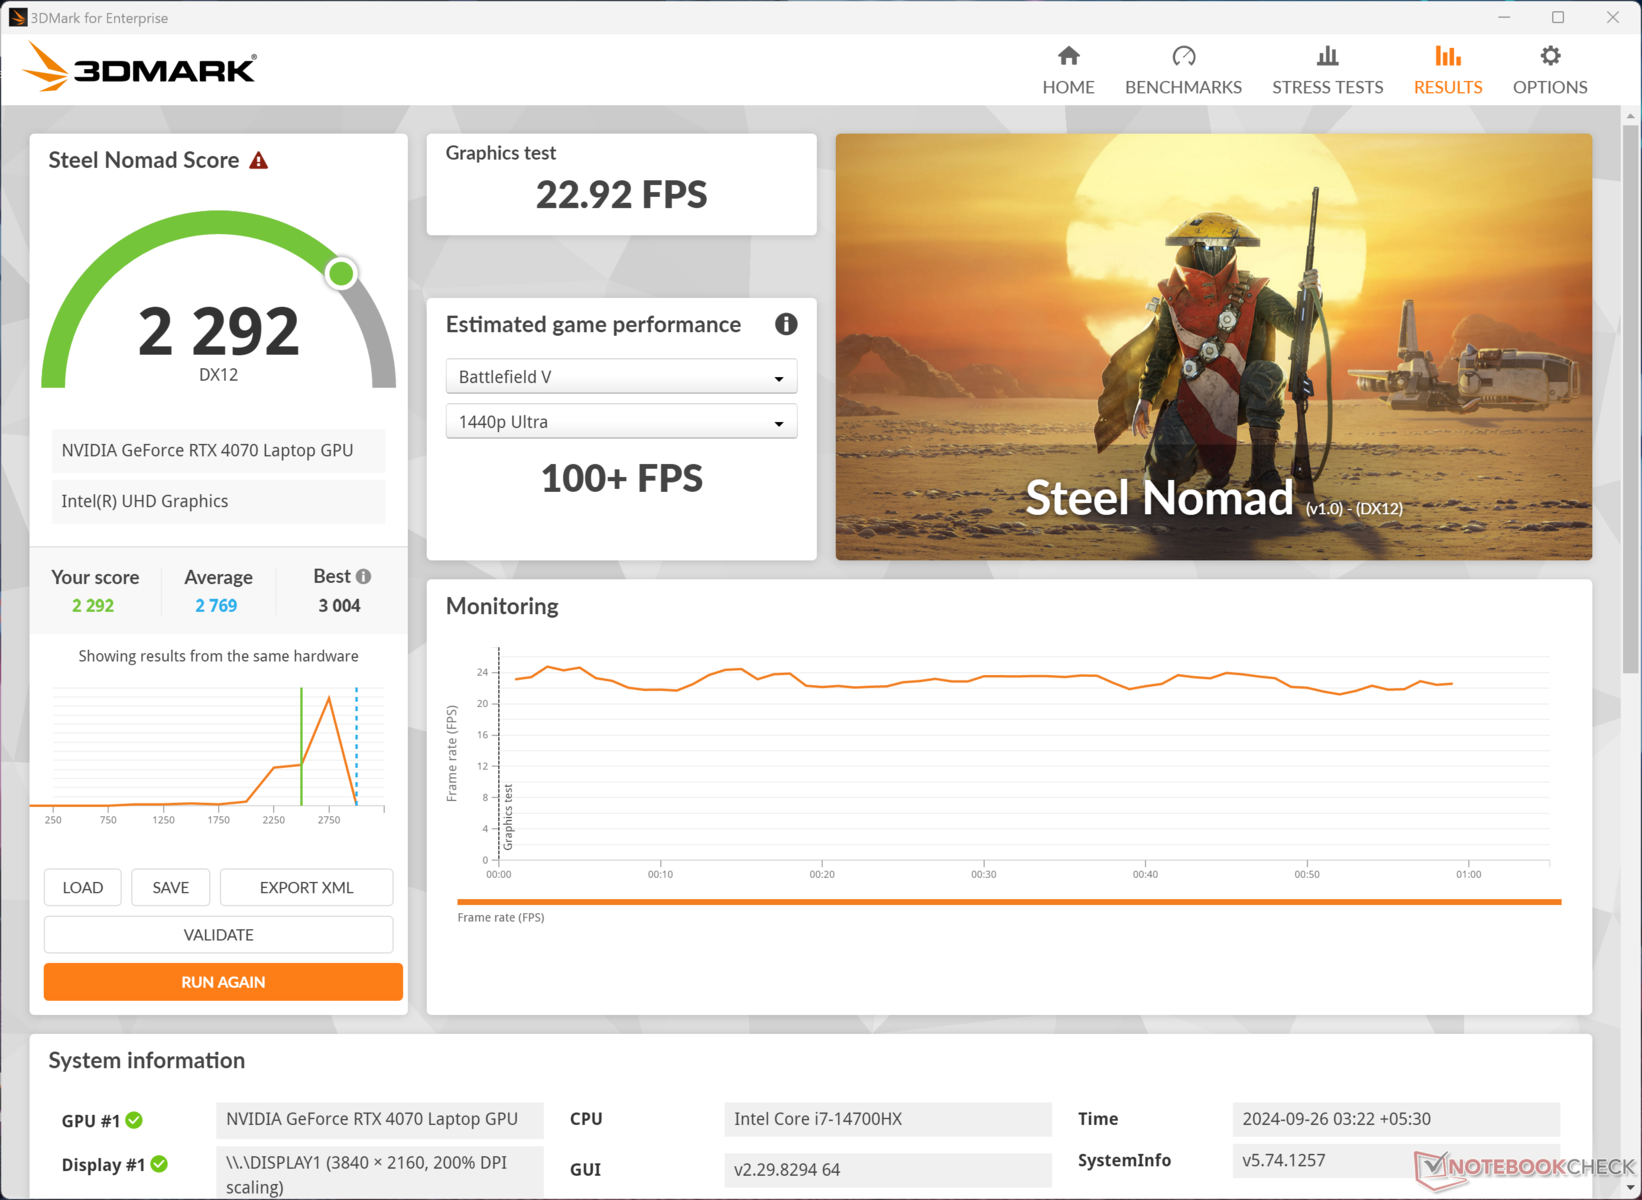
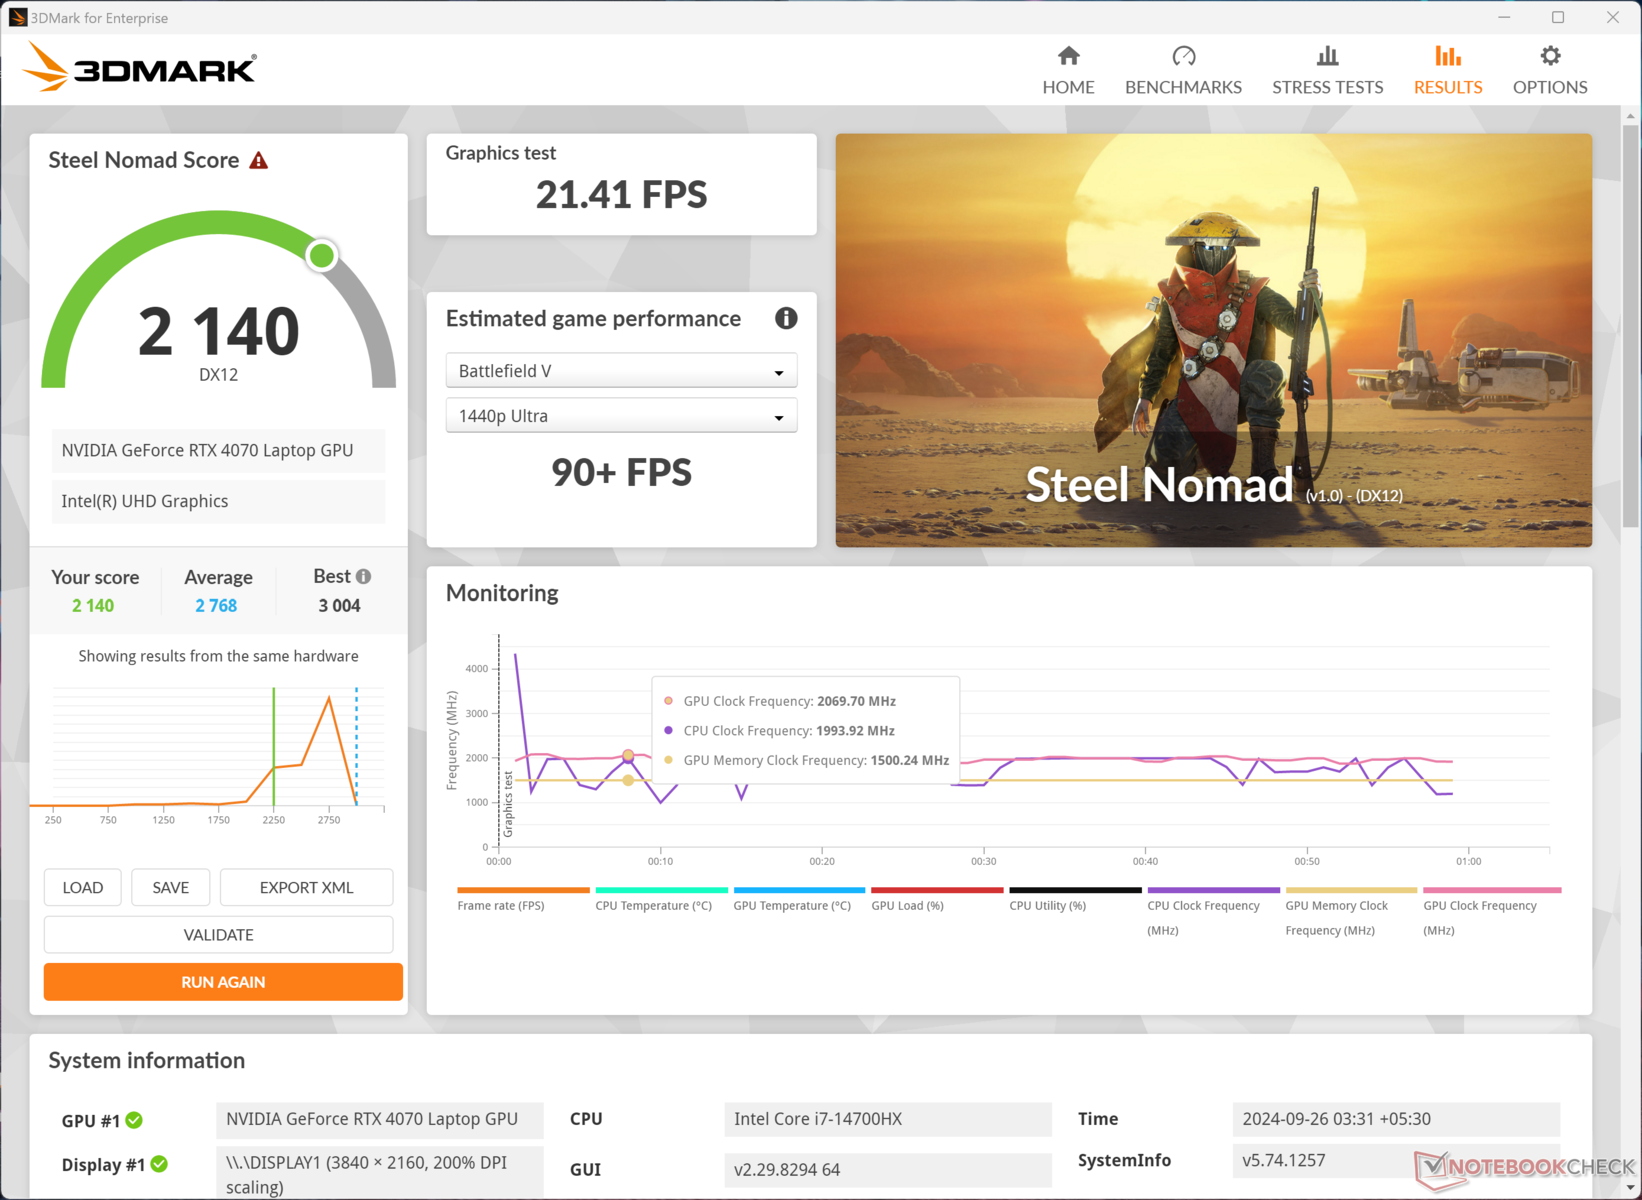
Hay una pérdida notable en el rendimiento de la GPU al cambiar entre varios perfiles de potencia. En 3DMark Steel Nomad, la Sword 16 obtiene 2.643 puntos en el perfil Rendimiento extremo. Esa cifra baja a 2.140 (-19%) en Silencioso.

| 3DMark Cloud Gate Standard Score | 59887 puntos | |
| 3DMark Fire Strike Score | 28285 puntos | |
| 3DMark Fire Strike Extreme Score | 14311 puntos | |
| 3DMark Steel Nomad Score | 2991 puntos | |
ayuda | ||
| Blender / v3.3 Classroom OPTIX/RTX | |
| HP Victus 16-r0077ng | |
| HP Omen 17-db0079ng | |
| Medio NVIDIA GeForce RTX 4070 Laptop GPU (18 - 30, n=67) | |
| Media de la clase Gaming (10 - 95, n=143, últimos 2 años) | |
| MSI Sword 16 HX B14VGKG | |
| Asus ROG Strix G17 G713PI | |
| Alienware m16 R2 | |
| Lenovo Legion 7 16 IRX G9 | |
| Acer Predator Helios Neo 16 (2024) | |
| Blender / v3.3 Classroom CUDA | |
| Media de la clase Gaming (16 - 175, n=145, últimos 2 años) | |
| HP Victus 16-r0077ng | |
| Medio NVIDIA GeForce RTX 4070 Laptop GPU (32 - 50, n=66) | |
| Asus ROG Strix G17 G713PI | |
| MSI Sword 16 HX B14VGKG | |
| Alienware m16 R2 | |
| Acer Predator Helios Neo 16 (2024) | |
| HP Omen 17-db0079ng | |
| Lenovo Legion 7 16 IRX G9 | |
| Blender / v3.3 Classroom CPU | |
| HP Victus 16-r0077ng | |
| HP Omen 17-db0079ng | |
| Media de la clase Gaming (123 - 962, n=150, últimos 2 años) | |
| Alienware m16 R2 | |
| Medio NVIDIA GeForce RTX 4070 Laptop GPU (158 - 440, n=66) | |
| MSI Sword 16 HX B14VGKG | |
| Acer Predator Helios Neo 16 (2024) | |
| Lenovo Legion 7 16 IRX G9 | |
| Asus ROG Strix G17 G713PI | |
* ... más pequeño es mejor
Rendimiento en juegos
Como portátil para juegos, el Sword 16 HX tiene un único propósito... jugar. Como era de esperar, puede hacerlo bastante bien. Dejando a un lado la pantalla mediocre, el combo CPU/GPU puede ejecutar fácilmente incluso los títulos más exigentes a velocidades de fotogramas respetables.
Todos los títulos que probamos funcionaron bastante bien a 1440p. el juego a 4K, por otro lado, podría ser un desafío, especialmente para los títulos más nuevos. Si no le queda más remedio que jugar a 4K, tendrá que desembolsar más dinero para adquirir un portátil equipado con una RTX 4080/4090 o recurrir a DLSS/FSR o incluso a XeSS.
| The Witcher 3 - 1920x1080 Ultra Graphics & Postprocessing (HBAO+) | |
| Acer Predator Helios Neo 16 (2024) | |
| MSI Sword 16 HX B14VGKG | |
| Media de la clase Gaming (18.4 - 214, n=119, últimos 2 años) | |
| Alienware m16 R2 | |
| Asus ROG Strix G17 G713PI | |
| HP Victus 16-r0077ng | |
| Lenovo Legion 7 16 IRX G9 | |
| GTA V - 1920x1080 Highest Settings possible AA:4xMSAA + FX AF:16x | |
| Acer Predator Helios Neo 16 (2024) | |
| Lenovo Legion 7 16 IRX G9 | |
| Asus ROG Strix G17 G713PI | |
| HP Victus 16-r0077ng | |
| Media de la clase Gaming (12.1 - 168.2, n=132, últimos 2 años) | |
| MSI Sword 16 HX B14VGKG | |
| HP Omen 17-db0079ng | |
| Final Fantasy XV Benchmark - 1920x1080 High Quality | |
| Acer Predator Helios Neo 16 (2024) | |
| Lenovo Legion 7 16 IRX G9 | |
| Alienware m16 R2 | |
| HP Omen 17-db0079ng | |
| Media de la clase Gaming (19.2 - 201, n=144, últimos 2 años) | |
| Asus ROG Strix G17 G713PI | |
| MSI Sword 16 HX B14VGKG | |
| HP Victus 16-r0077ng | |
| GTA V | |
| 1920x1080 Highest Settings possible AA:4xMSAA + FX AF:16x | |
| Acer Predator Helios Neo 16 (2024) | |
| Lenovo Legion 7 16 IRX G9 | |
| Asus ROG Strix G17 G713PI | |
| HP Victus 16-r0077ng | |
| Media de la clase Gaming (12.1 - 168.2, n=132, últimos 2 años) | |
| Medio NVIDIA GeForce RTX 4070 Laptop GPU (48.3 - 141.6, n=62) | |
| MSI Sword 16 HX B14VGKG | |
| HP Omen 17-db0079ng | |
| 2560x1440 Highest Settings possible AA:4xMSAA + FX AF:16x | |
| Media de la clase Gaming (36.9 - 163.3, n=82, últimos 2 años) | |
| Acer Predator Helios Neo 16 (2024) | |
| Lenovo Legion 7 16 IRX G9 | |
| HP Omen 17-db0079ng | |
| MSI Sword 16 HX B14VGKG | |
| Medio NVIDIA GeForce RTX 4070 Laptop GPU (36.9 - 102.2, n=50) | |
| 3840x2160 High/On (Advanced Graphics Off) AA:FX AF:8x | |
| Media de la clase Gaming (68.8 - 183.2, n=31, últimos 2 años) | |
| MSI Sword 16 HX B14VGKG | |
| Medio NVIDIA GeForce RTX 4070 Laptop GPU (53 - 99.8, n=16) | |
Cyberpunk 2077 2.1 se ejecuta sin problemas durante un bucle prolongado de 20 minutos. Aunque hubo caídas de fotogramas entre medias, fueron menores y no afectarán a la experiencia de juego de forma significativa.
Cyberpunk 2077 1080p Ultra FPS Chart
| bajo | medio | alto | ultra | QHD DLSS | QHD | 4K DLSS | 4K | |
|---|---|---|---|---|---|---|---|---|
| GTA V (2015) | 174.4 | 171.6 | 164.5 | 105.9 | 87.6 | 88.8 | ||
| The Witcher 3 (2015) | 428 | 328 | 239 | 125.4 | 91.1 | |||
| Dota 2 Reborn (2015) | 194.7 | 174.6 | 170.6 | 158.6 | 134.6 | |||
| Final Fantasy XV Benchmark (2018) | 215 | 151.9 | 110.6 | 45 | ||||
| X-Plane 11.11 (2018) | 187.5 | 164.7 | 128.4 | 112.8 | ||||
| Far Cry 5 (2018) | 173 | 153 | 145 | 138 | 113 | 61 | ||
| Strange Brigade (2018) | 420 | 282 | 233 | 195.7 | 133.9 | 66.7 | ||
| Far Cry 6 (2021) | 150.2 | 132.1 | 120.8 | 96.3 | 74.5 | 12.8 | ||
| Baldur's Gate 3 (2023) | 155.4 | 132.5 | 113.8 | 113.6 | 85.7 | 66.4 | 43.5 | |
| Cyberpunk 2077 2.2 Phantom Liberty (2023) | 116.3 | 110.2 | 94.1 | 83.6 | 51.8 | 21.9 | ||
| F1 24 (2024) | 249 | 212 | 193.9 | 68.9 | 44.8 | 35.4 | 21.8 | |
| Black Myth: Wukong (2024) | 89.8 | 68.5 | 54.1 | 34.7 | 39.2 | 25.7 | 26.2 | 12.6 |
Emisiones: Funciona fuerte y caliente
Ruido del sistema
Una de las primeras cosas que notamos del Sword 16 es lo ruidosos que pueden llegar a ser sus ventiladores bajo carga. Incluso cuando se coloca a unos metros de distancia, el ruido puede llegar hasta los 55 dB(A) mientras se juega. Eso no es necesariamente algo malo, ya que el portátil necesita toda la refrigeración que pueda conseguir para mantener las térmicas bajo control.
Ruido
| Ocioso |
| 23.31 / 23.31 / 23.31 dB(A) |
| Carga |
| 42.71 / 50.34 dB(A) |
 | ||
30 dB silencioso 40 dB(A) audible 50 dB(A) ruidosamente alto |
||
min: | ||
| Modo de rendimiento (PL1 / PL2) | En ralentí dB(A) | Carga media dB(A) | Carga máxima dB(A) | Cyberpunk 2077 1080p Ultra dB(A) |
|---|---|---|---|---|
| Silencioso (45 / 60 W) | 23,31 | 30,35 | 36,74 | 36,72 / 44 fps |
| Equilibrada (60 / 80 W) | 23,31 | 42,30 | 42,61 | 42,20 / 65 fps |
| Extreme (100 / 120 W) | 23.44 | 42.71 | 50.34 | 50.40 / 82 fps |
| CoolerBoost (100 / 120 W) | 55,02 | 55,02 | 55,02 | 55,02 / 82 fps |
| MSI Sword 16 HX B14VGKG i7-14700HX, NVIDIA GeForce RTX 4070 Laptop GPU | HP Omen 17-db0079ng R7 8845HS, NVIDIA GeForce RTX 4070 Laptop GPU | Lenovo Legion 7 16 IRX G9 i9-14900HX, NVIDIA GeForce RTX 4070 Laptop GPU | Acer Predator Helios Neo 16 (2024) i7-14700HX, NVIDIA GeForce RTX 4070 Laptop GPU | Alienware m16 R2 Ultra 7 155H, NVIDIA GeForce RTX 4070 Laptop GPU | Asus ROG Strix G17 G713PI R9 7945HX, NVIDIA GeForce RTX 4070 Laptop GPU | HP Victus 16-r0077ng i7-13700H, NVIDIA GeForce RTX 4070 Laptop GPU | |
|---|---|---|---|---|---|---|---|
| Noise | -12% | -1% | -18% | -5% | -12% | -13% | |
| apagado / medio ambiente * | 23.31 | 25 -7% | 24.5 -5% | 25.2 -8% | 24.7 -6% | 25 -7% | 25 -7% |
| Idle Minimum * | 23.31 | 25 -7% | 24.5 -5% | 27.8 -19% | 25.3 -9% | 26 -12% | 28 -20% |
| Idle Average * | 23.31 | 29 -24% | 24.5 -5% | 32 -37% | 25.3 -9% | 29 -24% | 29 -24% |
| Idle Maximum * | 23.31 | 33 -42% | 24.5 -5% | 29.6 -27% | 25.3 -9% | 30 -29% | 30 -29% |
| Load Average * | 42.71 | 45 -5% | 34.8 19% | 45.2 -6% | 31.7 26% | 46 -8% | 43 -1% |
| Cyberpunk 2077 ultra * | 50.4 | 48 5% | |||||
| Load Maximum * | 50.34 | 52 -3% | 54.1 -7% | 55.8 -11% | 62 -23% | 47 7% | 48 5% |
| Witcher 3 ultra * | 54.1 | 53.8 | 46 | 46 |
* ... más pequeño es mejor
Temperatura
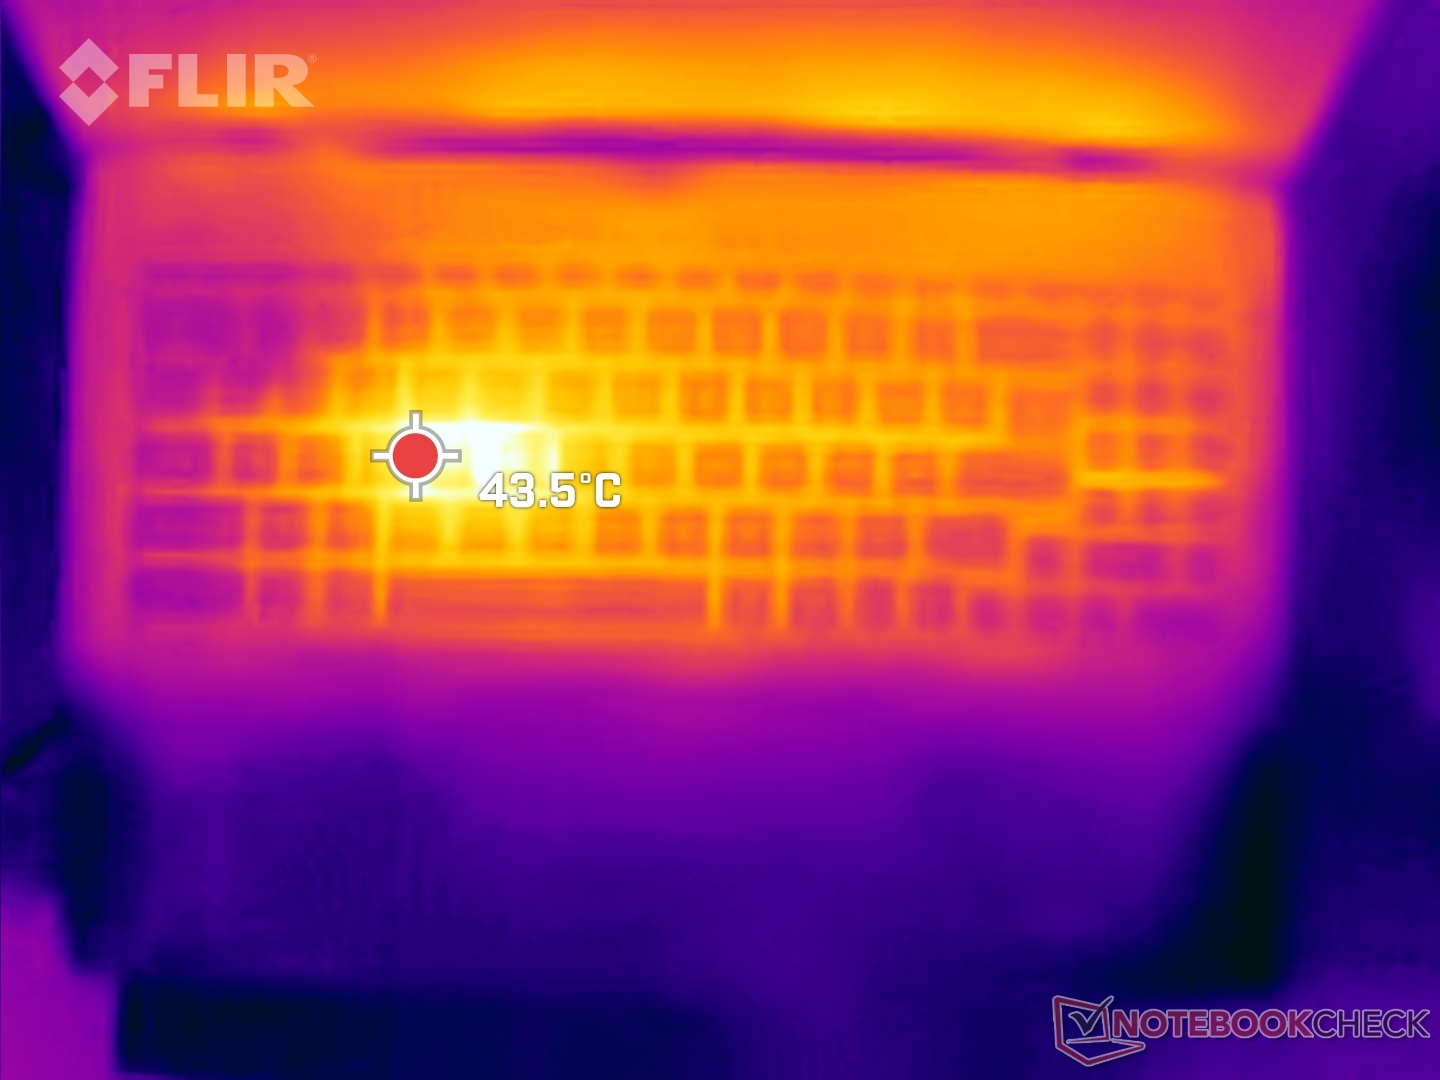
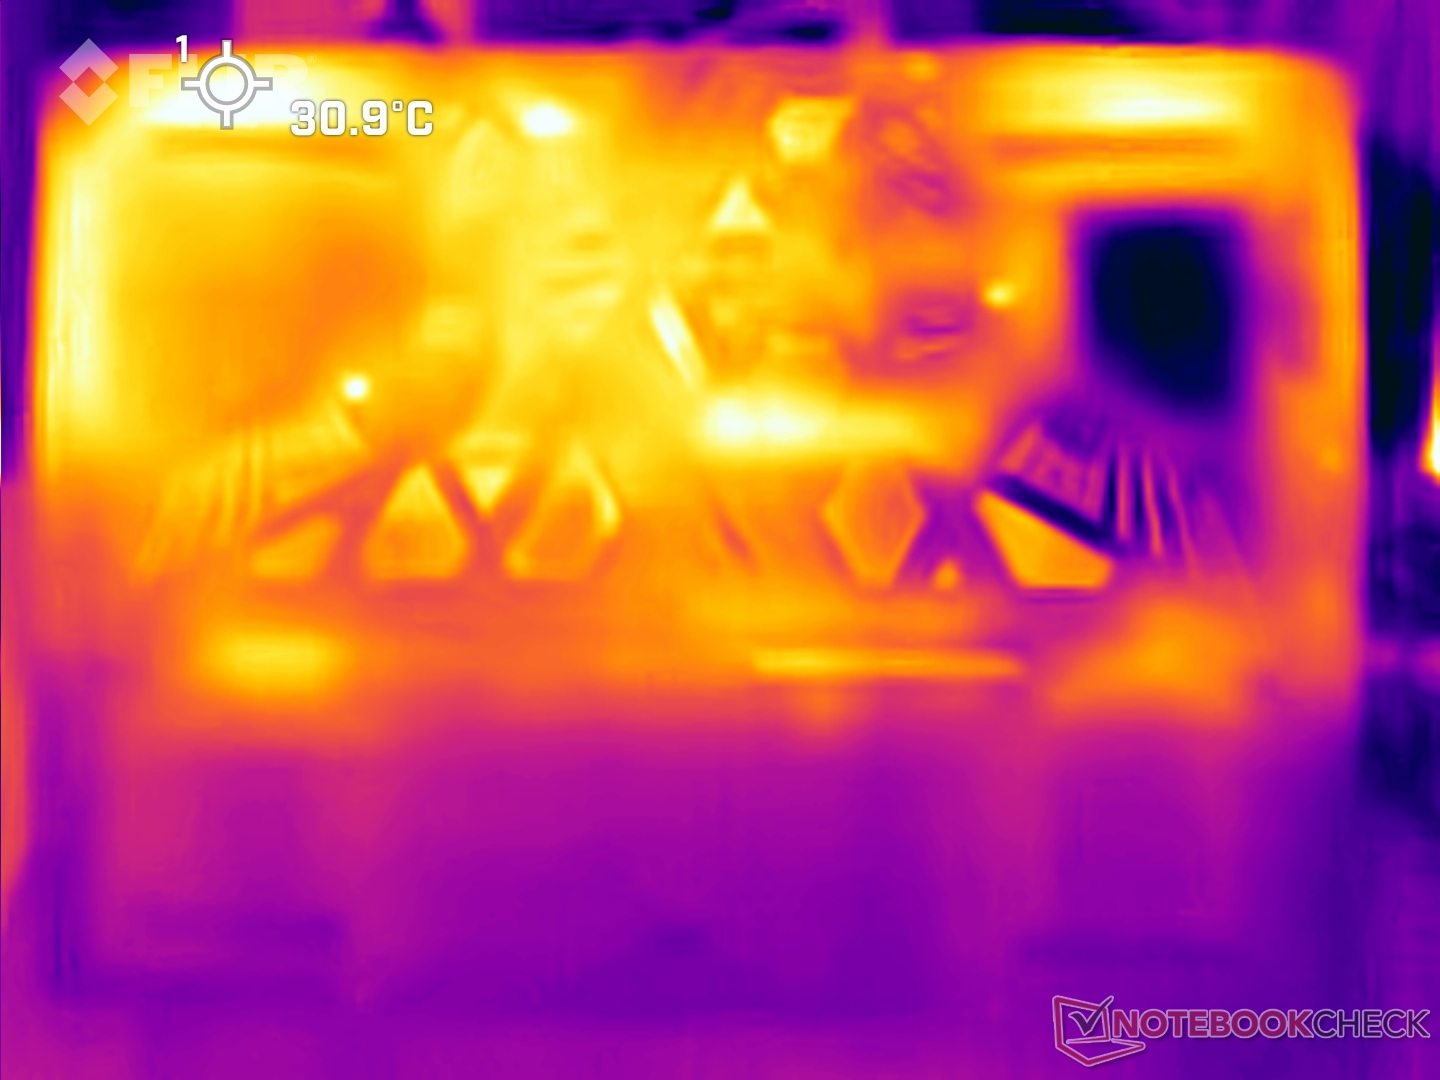
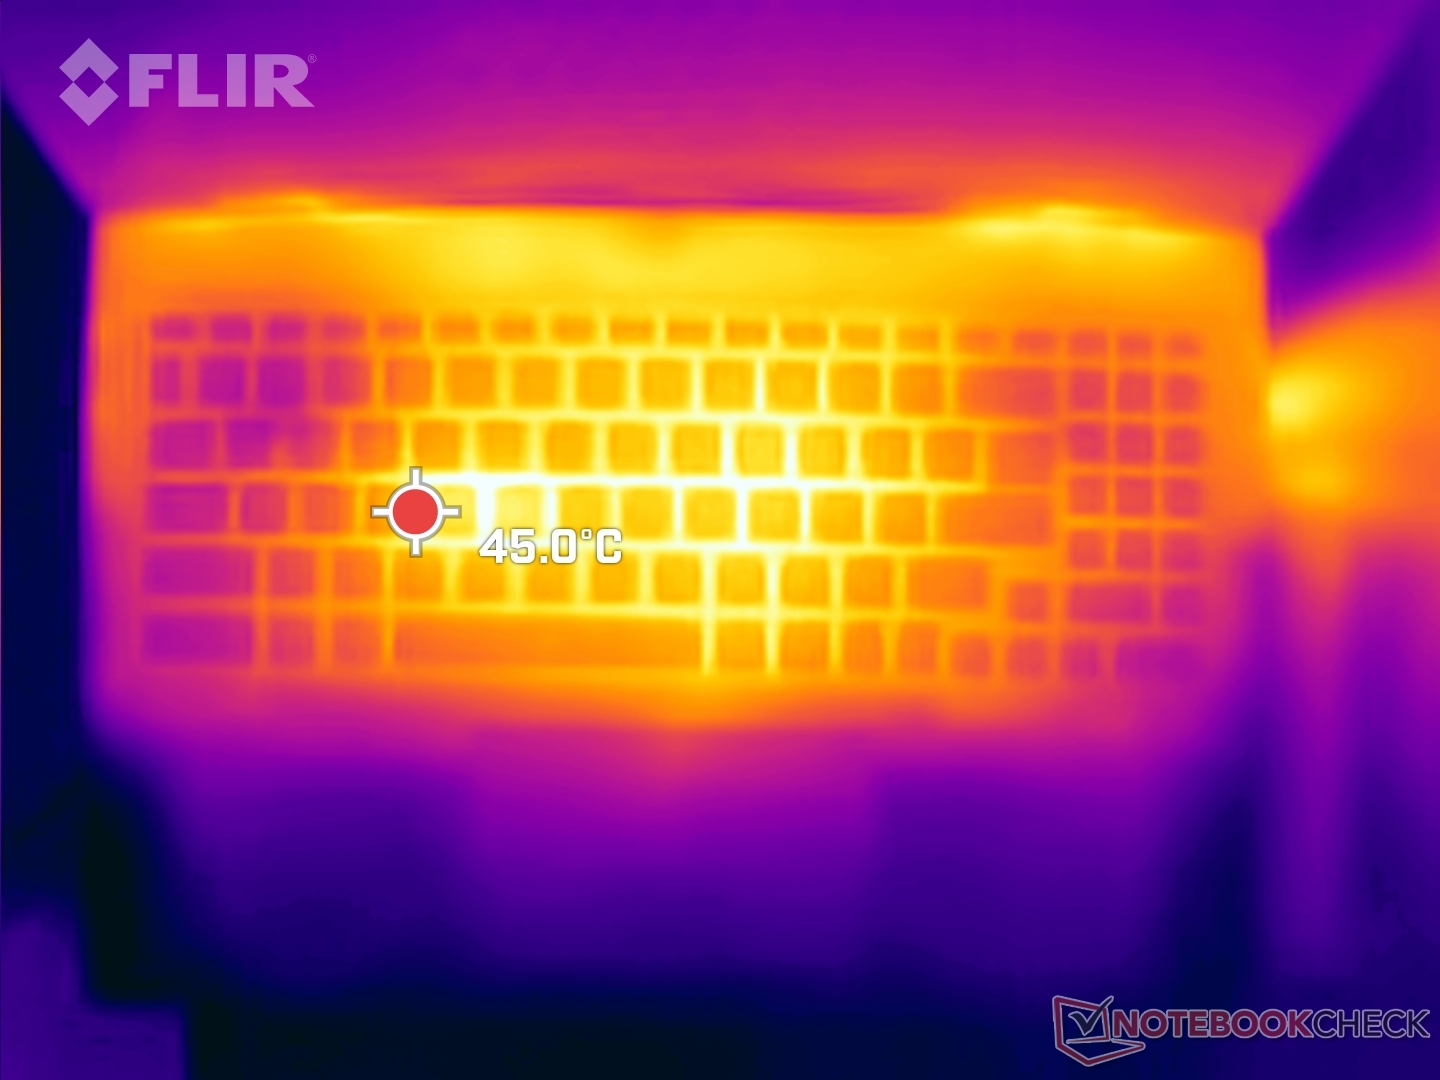
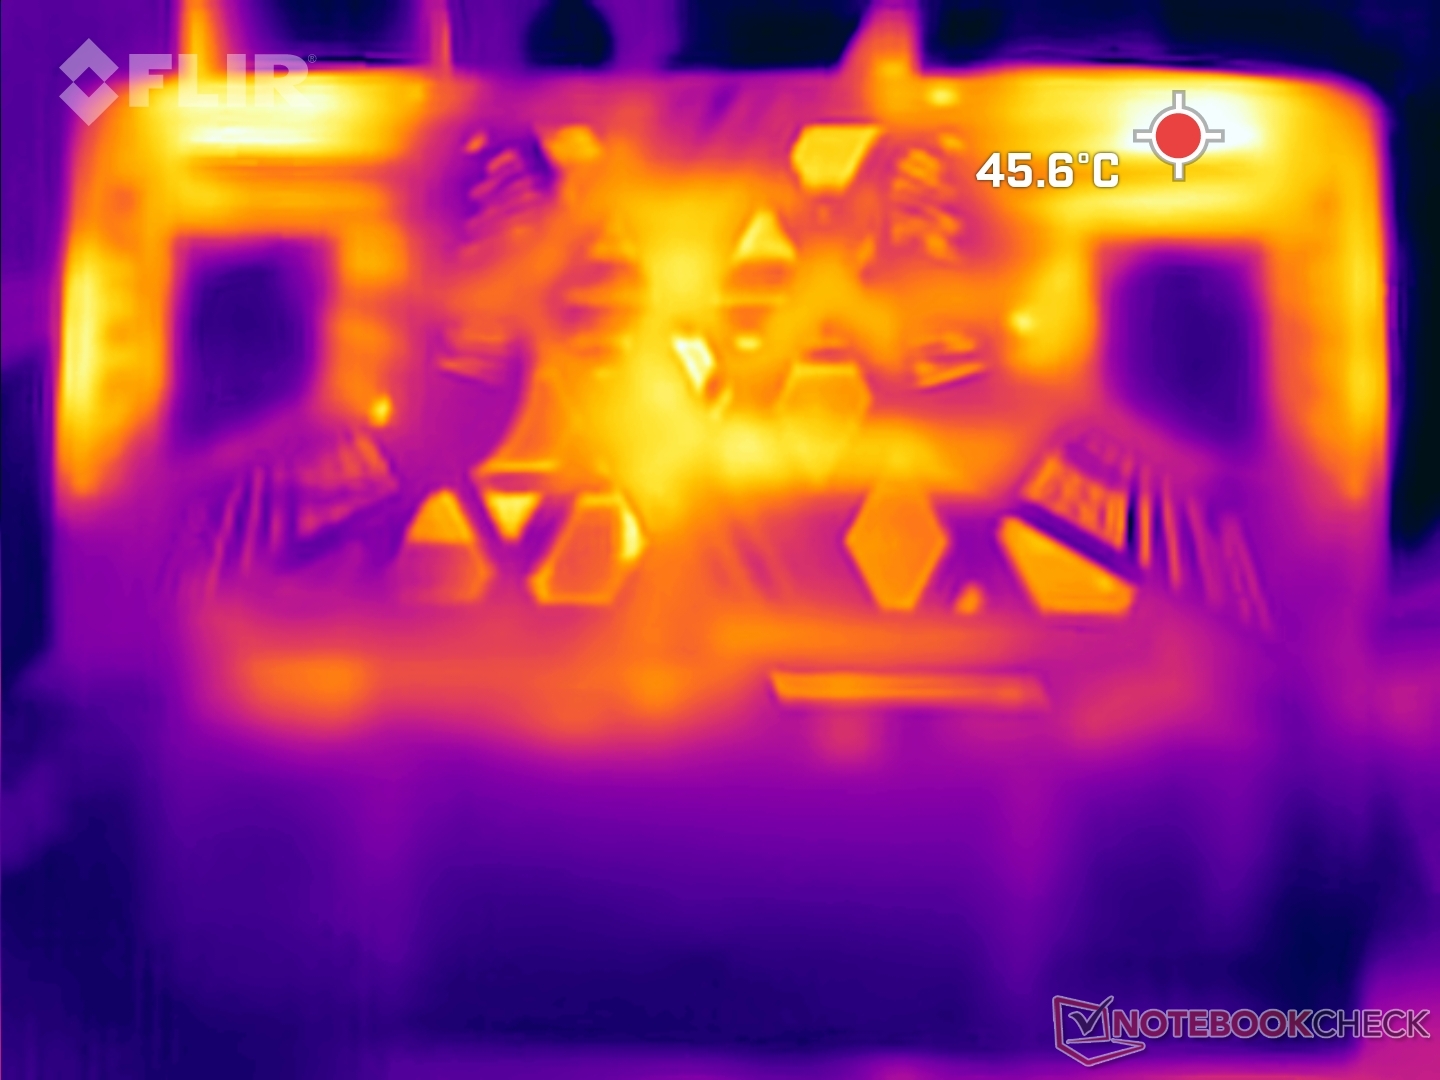
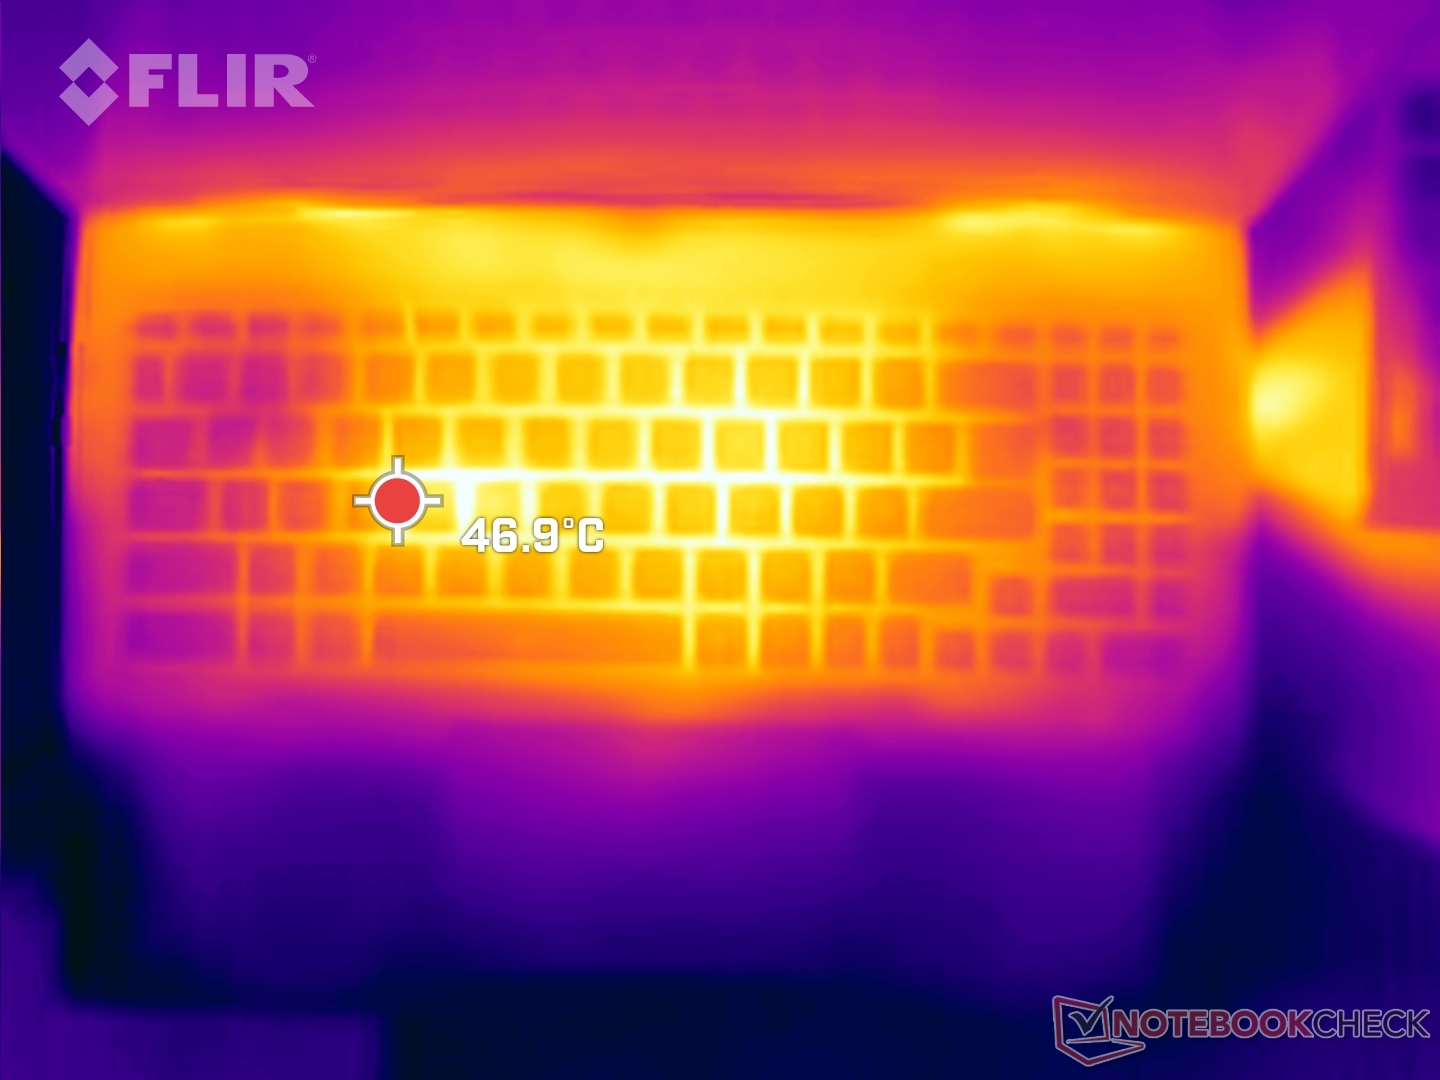
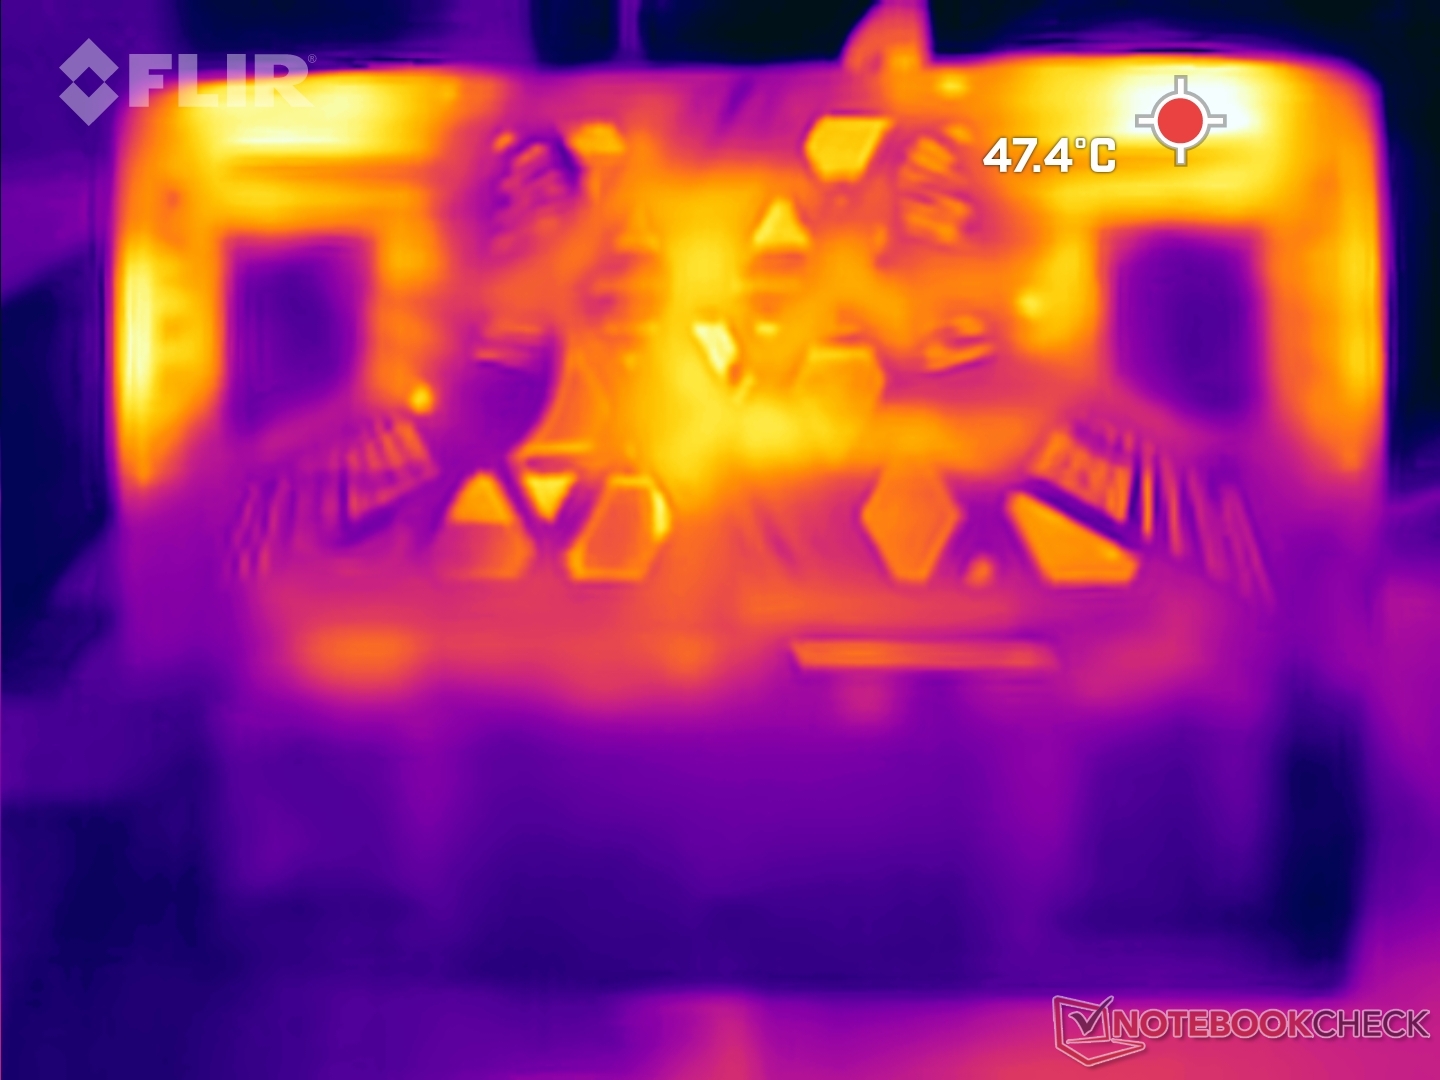
Todos los ventiladores y aparatos de transferencia de calor hacen que el Sword 16 se caliente al tacto mientras se juega. En Cyberpunk 2077 2.1, se nota que el teclado se calienta más.
Puede alcanzar fácilmente los 45 °C cerca de la zona del teclado y los 48 °C en la zona superior izquierda, justo al lado del conector de alimentación.
(-) La temperatura máxima en la parte superior es de 47.8 °C / 118 F, frente a la media de 40.4 °C / 105 F, que oscila entre 21.2 y 68.8 °C para la clase Gaming.
(-) El fondo se calienta hasta un máximo de 45.8 °C / 114 F, frente a la media de 43.2 °C / 110 F
(+) En reposo, la temperatura media de la parte superior es de 31.2 °C / 88# F, frente a la media del dispositivo de 33.9 °C / 93 F.
(-) 3: The average temperature for the upper side is 40.4 °C / 105 F, compared to the average of 33.9 °C / 93 F for the class Gaming.
(+) El reposamanos y el panel táctil están a una temperatura inferior a la de la piel, con un máximo de 31.8 °C / 89.2 F y, por tanto, son fríos al tacto.
(-) La temperatura media de la zona del reposamanos de dispositivos similares fue de 28.9 °C / 84 F (-2.9 °C / -5.2 F).
| MSI Sword 16 HX B14VGKG Intel Core i7-14700HX, NVIDIA GeForce RTX 4070 Laptop GPU | HP Omen 17-db0079ng AMD Ryzen 7 8845HS, NVIDIA GeForce RTX 4070 Laptop GPU | Lenovo Legion 7 16 IRX G9 Intel Core i9-14900HX, NVIDIA GeForce RTX 4070 Laptop GPU | Acer Predator Helios Neo 16 (2024) Intel Core i7-14700HX, NVIDIA GeForce RTX 4070 Laptop GPU | Alienware m16 R2 Intel Core Ultra 7 155H, NVIDIA GeForce RTX 4070 Laptop GPU | Asus ROG Strix G17 G713PI AMD Ryzen 9 7945HX, NVIDIA GeForce RTX 4070 Laptop GPU | HP Victus 16-r0077ng Intel Core i7-13700H, NVIDIA GeForce RTX 4070 Laptop GPU | |
|---|---|---|---|---|---|---|---|
| Heat | 13% | 9% | -7% | -9% | 6% | -5% | |
| Maximum Upper Side * | 47.8 | 44 8% | 43.7 9% | 58 -21% | 44.8 6% | 42 12% | 51 -7% |
| Maximum Bottom * | 45.8 | 45 2% | 42.9 6% | 45.2 1% | 48 -5% | 41 10% | 54 -18% |
| Idle Upper Side * | 38.6 | 26 33% | 29.1 25% | 31.1 19% | 37.2 4% | 33 15% | 37 4% |
| Idle Bottom * | 29.6 | 27 9% | 30.6 -3% | 37.2 -26% | 42 -42% | 34 -15% | 29 2% |
* ... más pequeño es mejor
Prueba de estrés
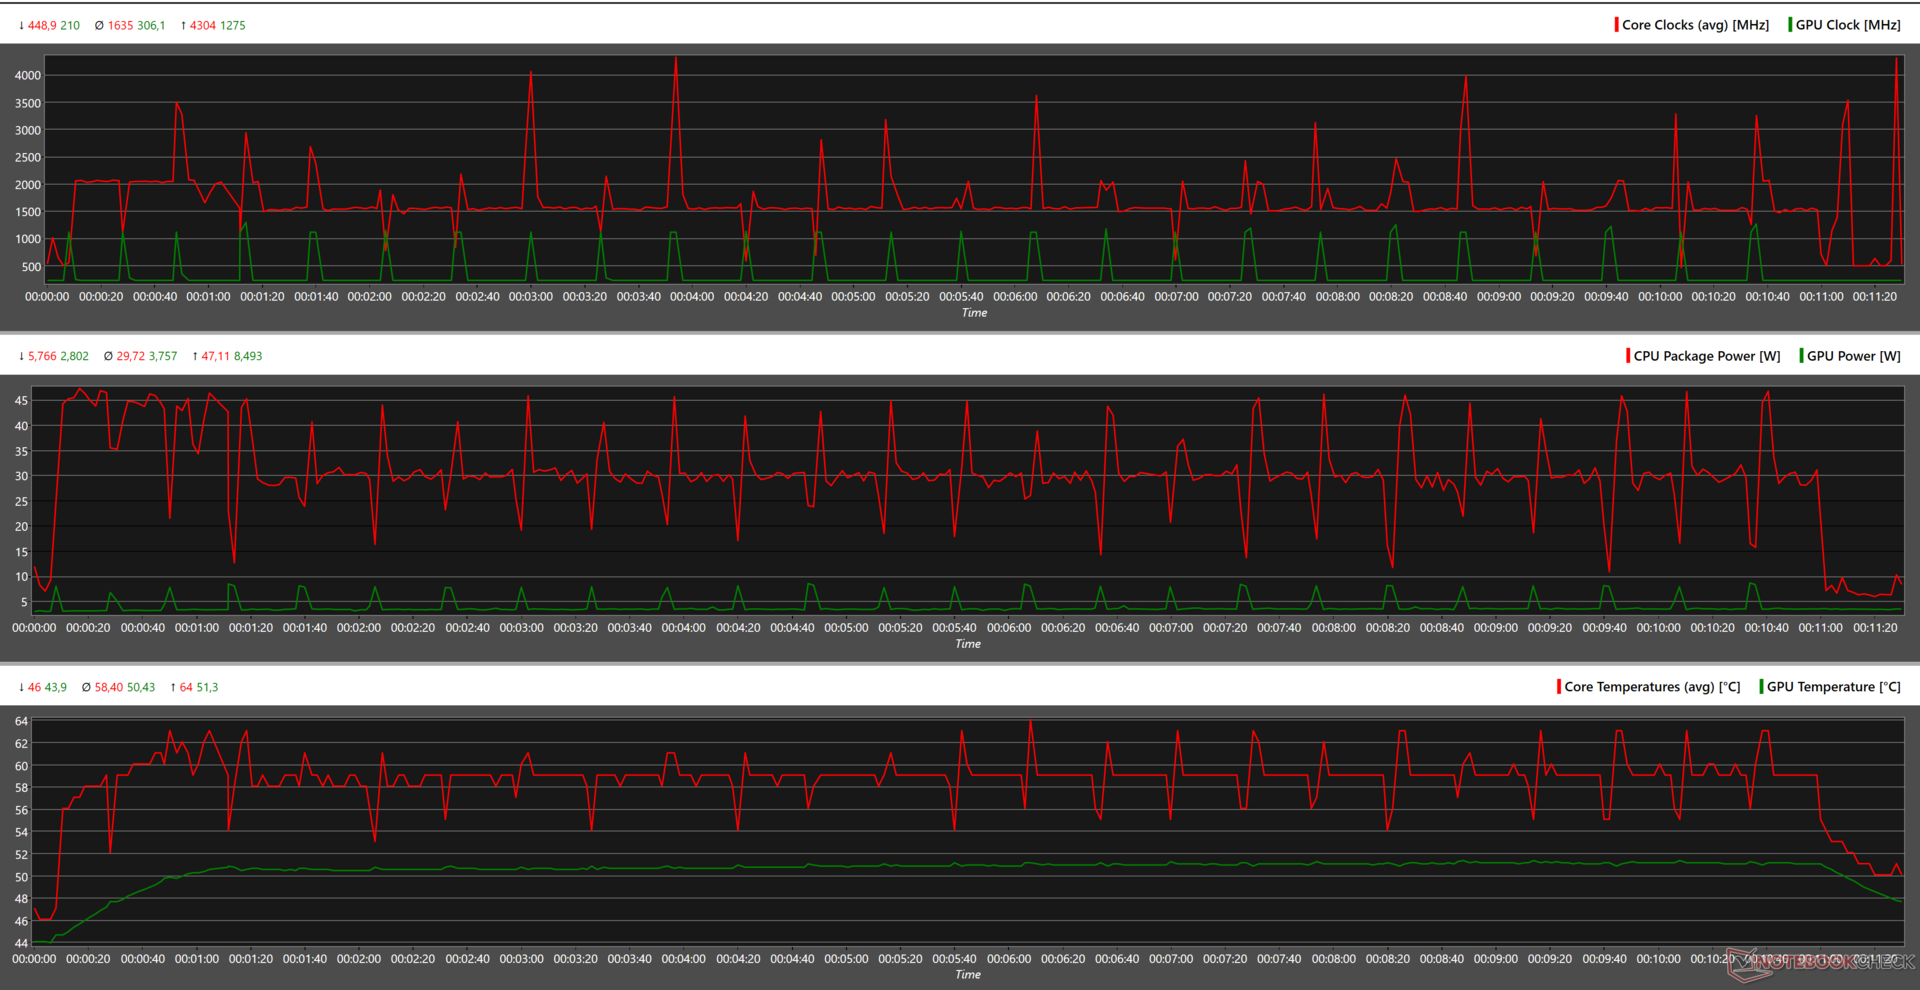
Golpear el Sword 16 HX con una carga combinada de Prime95 y Furmark lleva su CPU y GPU a sus límites. El Core i7-14700HX arranca a 4,3 GHz antes de establecerse en 2,6 GHz. La Nvidia GeForce RTX 4070 mantiene una frecuencia estable de 2,0 GHz durante toda la ejecución.
La CPU y la GPU se disputan la potencia, con la primera consumiendo unos constantes 62 vatios y la segunda esforzándose por alcanzar su pico de 115 vatios.
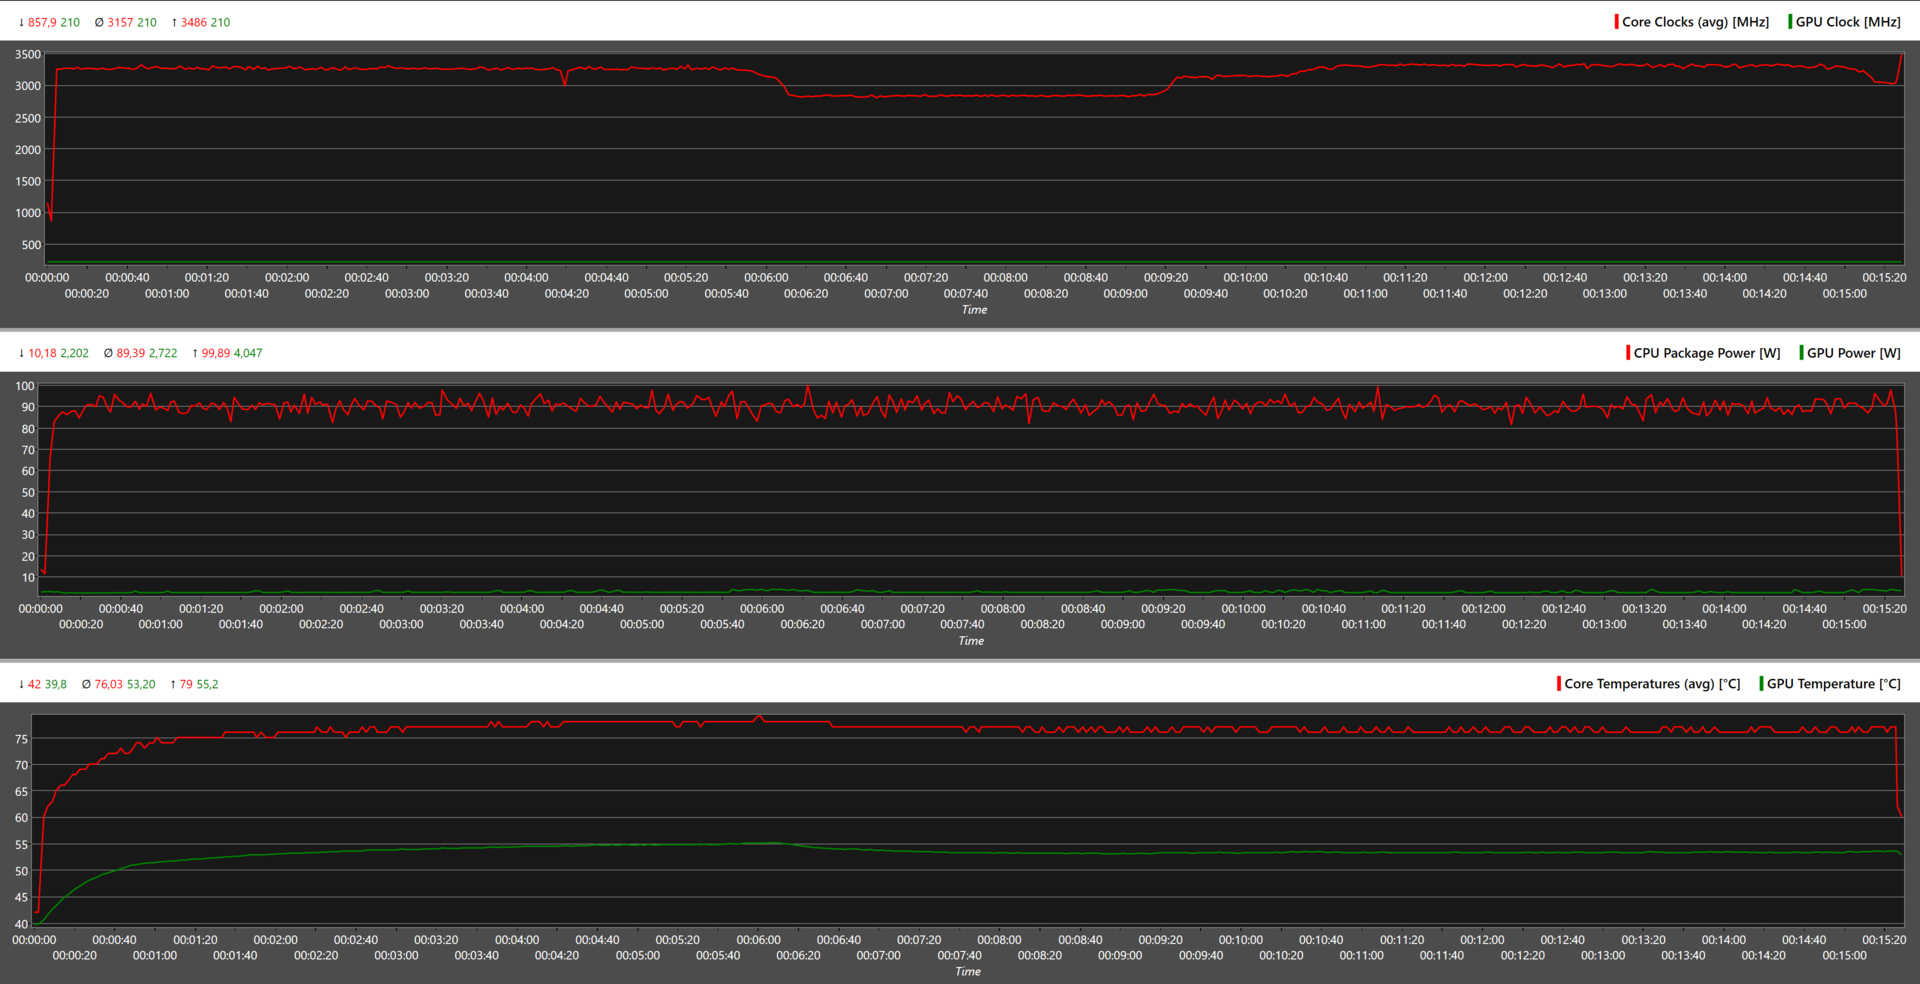
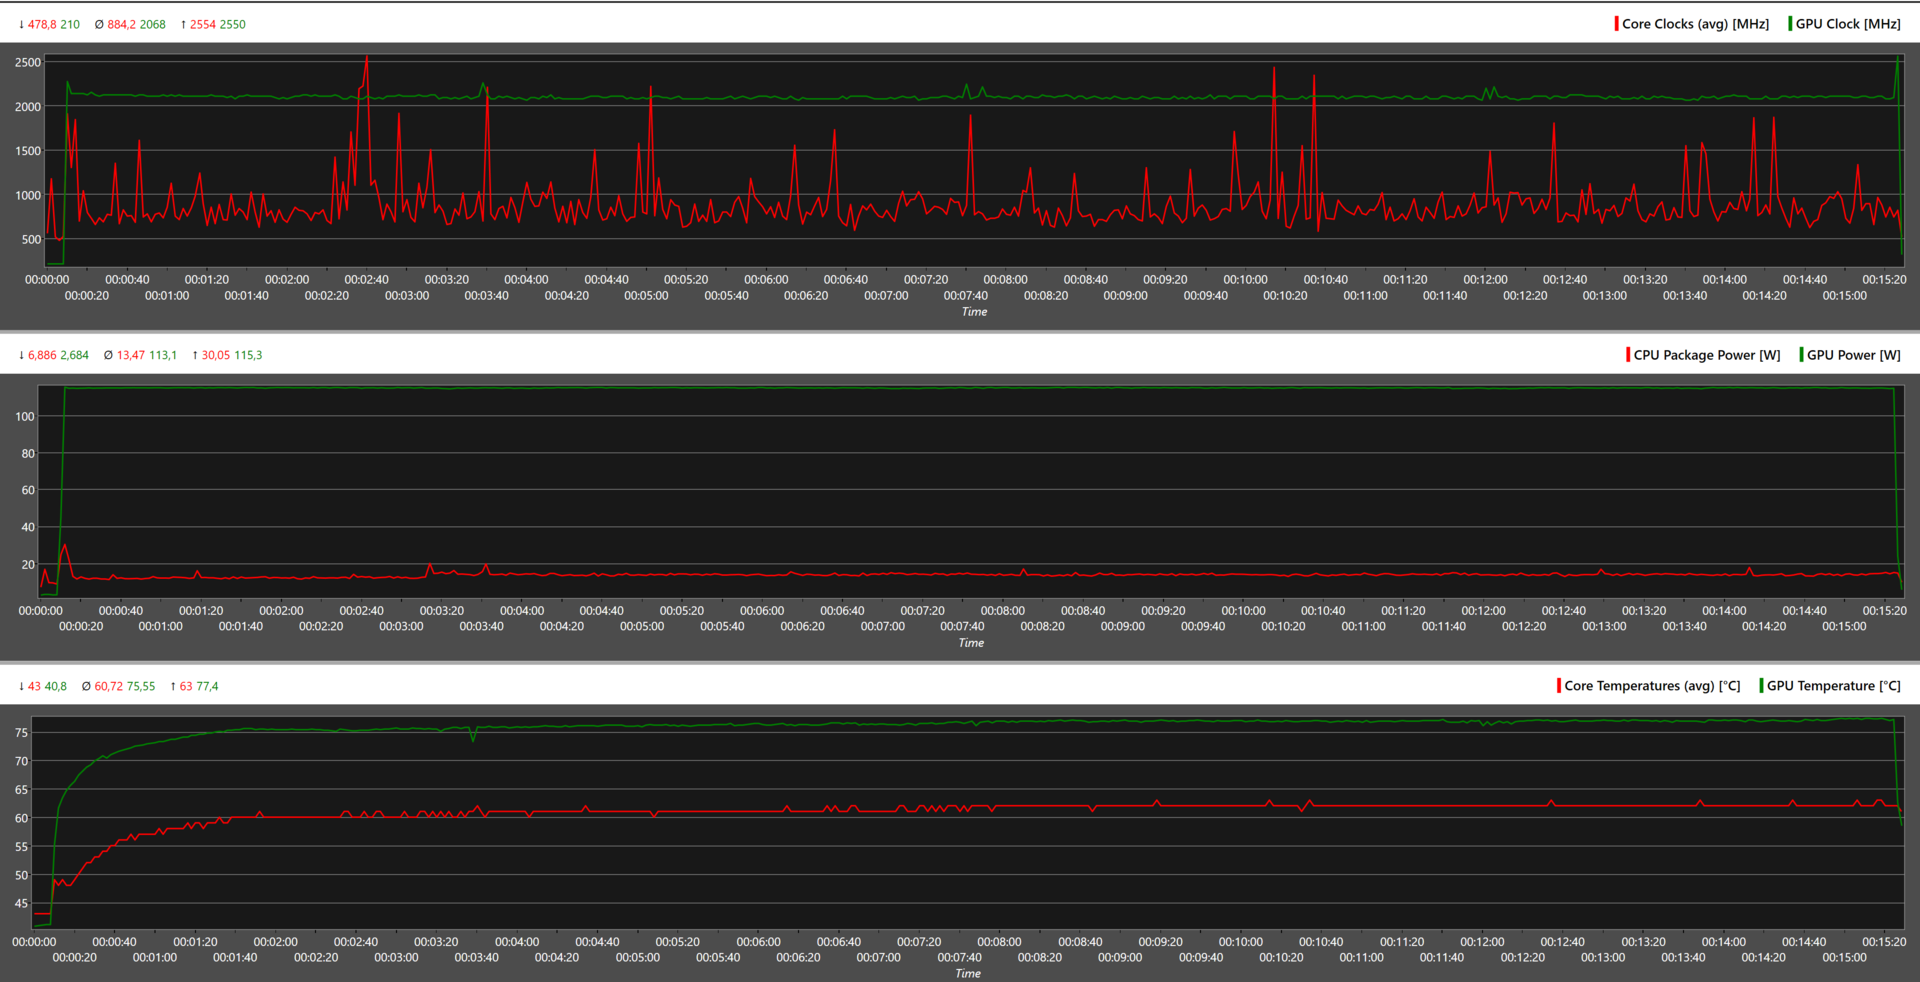
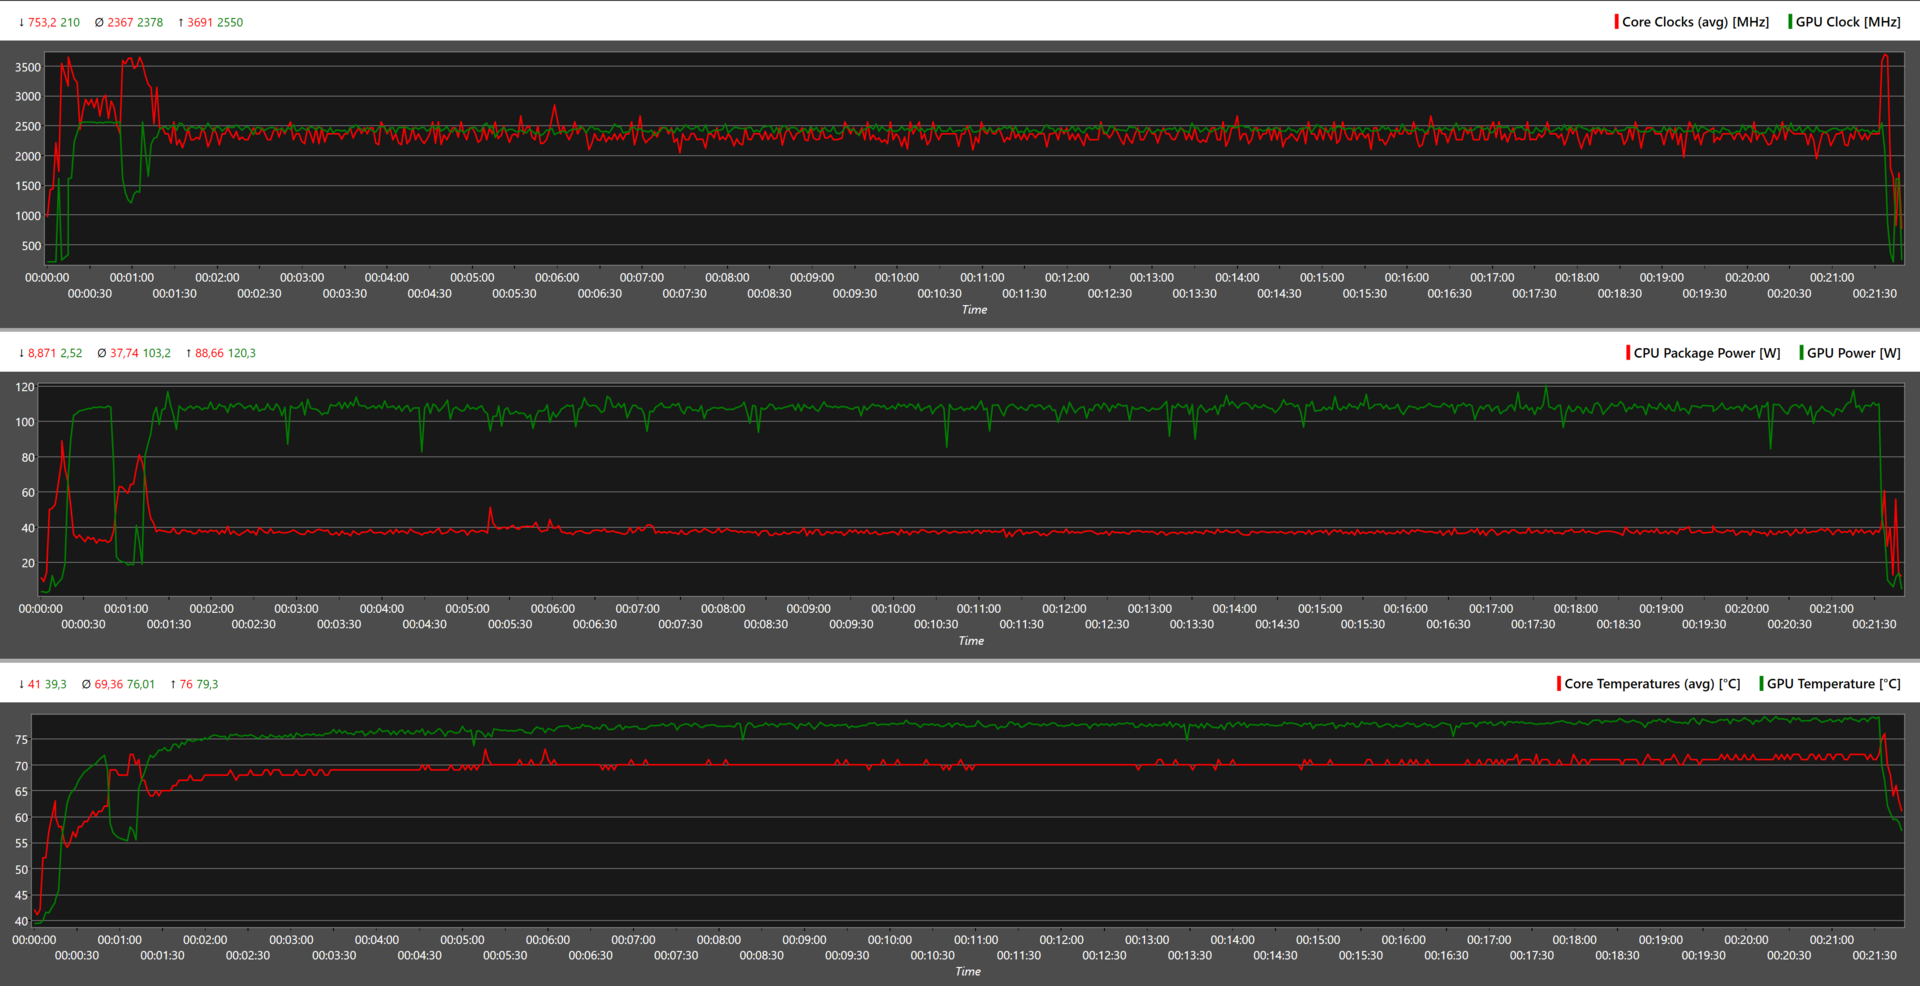
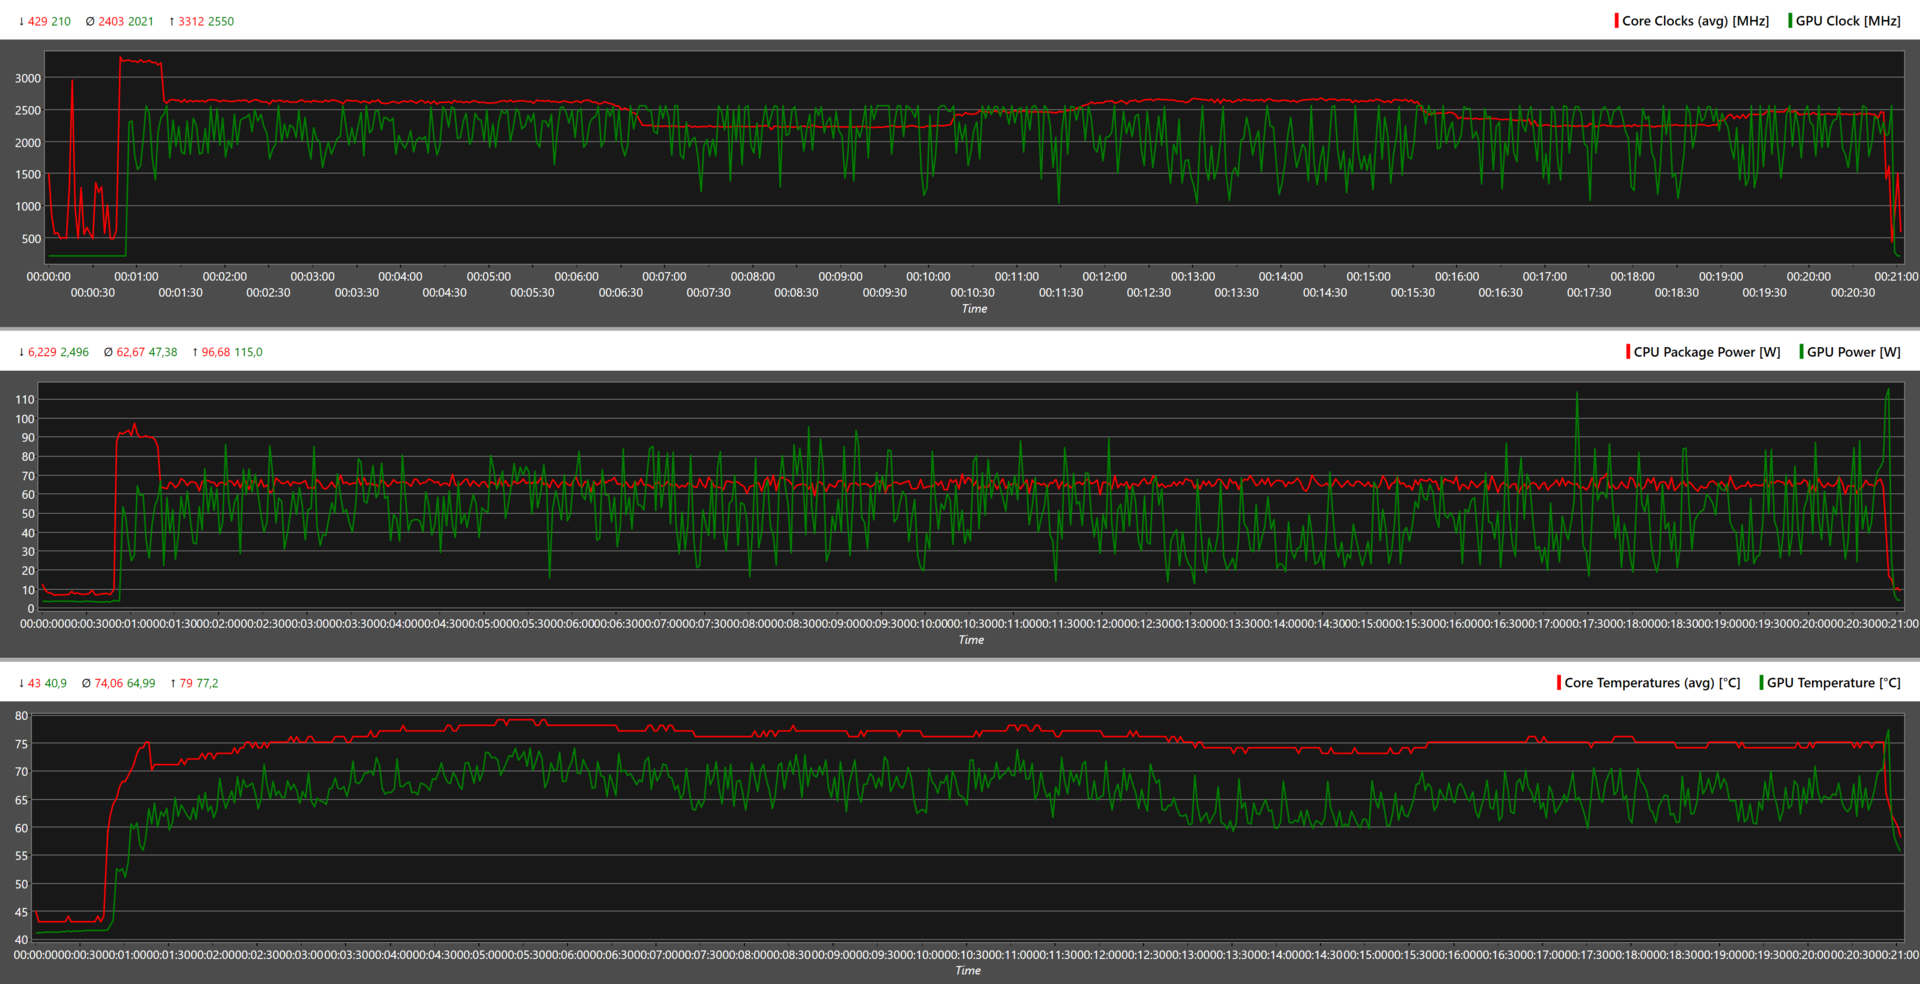
| Reloj de la CPU (GHz) | Reloj de la GPU (MHz) | Temperatura media dela CPU (°C) | Temperatura media de la GPU (°C) | |
| Sistema en reposo | 0,726 | 769 | 43 | 41 |
| Estrés Prime95 | 3,5 | 60,8 | 79 | 60 |
| Prime95 + FurMark Estrés | 2,6 | 2.000 | 77 | 71 |
| Cyberpunk 2077 Estrés | 2,6 | 2.300 | 73 | 83 |
Altavoces
Como portátil de gama media, el MSI Sword 16 compromete la calidad de los altavoces. Sus graves son decepcionantes, y sus medios y agudos son apenas aceptables. Incluso si desea utilizar los altavoces integrados, corre el riesgo de quedar ahogado por el abrumador ruido del ventilador. Afortunadamente, puede conectar sus propios dispositivos de audio a través del conector de audio de 3,5 mm incluido, Bluetooth 5.3 o incluso USB-C.
MSI Sword 16 HX B14VGKG análisis de audio
(±) | la sonoridad del altavoz es media pero buena (77.9 dB)
Graves 100 - 315 Hz
(-) | casi sin bajos - de media 19.7% inferior a la mediana
(±) | la linealidad de los graves es media (13.5% delta a frecuencia anterior)
Medios 400 - 2000 Hz
(+) | medios equilibrados - a sólo 3.4% de la mediana
(+) | los medios son lineales (6.3% delta a la frecuencia anterior)
Altos 2 - 16 kHz
(+) | máximos equilibrados - a sólo 2.3% de la mediana
(+) | los máximos son lineales (4.8% delta a la frecuencia anterior)
Total 100 - 16.000 Hz
(±) | la linealidad del sonido global es media (15.2% de diferencia con la mediana)
En comparación con la misma clase
» 31% de todos los dispositivos probados de esta clase eran mejores, 6% similares, 63% peores
» El mejor tuvo un delta de 6%, la media fue 18%, el peor fue ###max##%
En comparación con todos los dispositivos probados
» 20% de todos los dispositivos probados eran mejores, 4% similares, 77% peores
» El mejor tuvo un delta de 4%, la media fue 24%, el peor fue ###max##%
Apple MacBook Pro 16 2021 M1 Pro análisis de audio
(+) | los altavoces pueden reproducir a un volumen relativamente alto (#84.7 dB)
Graves 100 - 315 Hz
(+) | buen bajo - sólo 3.8% lejos de la mediana
(+) | el bajo es lineal (5.2% delta a la frecuencia anterior)
Medios 400 - 2000 Hz
(+) | medios equilibrados - a sólo 1.3% de la mediana
(+) | los medios son lineales (2.1% delta a la frecuencia anterior)
Altos 2 - 16 kHz
(+) | máximos equilibrados - a sólo 1.9% de la mediana
(+) | los máximos son lineales (2.7% delta a la frecuencia anterior)
Total 100 - 16.000 Hz
(+) | el sonido global es lineal (4.6% de diferencia con la mediana)
En comparación con la misma clase
» 0% de todos los dispositivos probados de esta clase eran mejores, 0% similares, 100% peores
» El mejor tuvo un delta de 5%, la media fue 18%, el peor fue ###max##%
En comparación con todos los dispositivos probados
» 0% de todos los dispositivos probados eran mejores, 0% similares, 100% peores
» El mejor tuvo un delta de 4%, la media fue 24%, el peor fue ###max##%
Gestión de la energía: Elevados consumos en reposo con escasos tiempos de ejecución de la reproducción de vídeo
Consumo de energía
El MSI Sword 16 HX puede consumir hasta 226 vatios de potencia bajo carga. Su adaptador de corriente está clasificado para 250 vatios y no debería tener problemas para mantenerlo a tope durante sesiones de juego prolongadas.
Raptor Lake-HX (y los procesadores HX de Intel en general) no se diseñaron pensando en escenarios de bajo consumo, como confirma el uso de energía en reposo del portátil de 22,39 vatios.
| Off / Standby | |
| Ocioso | |
| Carga |
|
Clave:
min: | |
| MSI Sword 16 HX B14VGKG i7-14700HX, NVIDIA GeForce RTX 4070 Laptop GPU, IPS, 1920x1200, 16" | HP Omen 17-db0079ng R7 8845HS, NVIDIA GeForce RTX 4070 Laptop GPU, IPS, 2560x1440, 17.3" | Lenovo Legion 7 16 IRX G9 i9-14900HX, NVIDIA GeForce RTX 4070 Laptop GPU, IPS, 3200x2000, 16" | Acer Predator Helios Neo 16 (2024) i7-14700HX, NVIDIA GeForce RTX 4070 Laptop GPU, LED, 2560x1600, 16" | Alienware m16 R2 Ultra 7 155H, NVIDIA GeForce RTX 4070 Laptop GPU, IPS, 2560x1600, 16" | Asus ROG Strix G17 G713PI R9 7945HX, NVIDIA GeForce RTX 4070 Laptop GPU, IPS, 2560x1440, 17.3" | HP Victus 16-r0077ng i7-13700H, NVIDIA GeForce RTX 4070 Laptop GPU, IPS, 1920x1080, 16.1" | Medio NVIDIA GeForce RTX 4070 Laptop GPU | Media de la clase Gaming | |
|---|---|---|---|---|---|---|---|---|---|
| Power Consumption | 23% | 2% | -17% | 7% | -0% | 25% | 14% | 8% | |
| Idle Minimum * | 19.61 | 6 69% | 15.4 21% | 26.7 -36% | 8.1 59% | 15 24% | 8 59% | 12.8 ? 35% | 13.4 ? 32% |
| Idle Average * | 22.39 | 12 46% | 21.2 5% | 24.4 -9% | 13 42% | 20 11% | 13 42% | 17.8 ? 21% | 18.9 ? 16% |
| Idle Maximum * | 23.51 | 18 23% | 21.9 7% | 32.7 -39% | 40.3 -71% | 29 -23% | 22 6% | 24.3 ? -3% | 26.3 ? -12% |
| Load Average * | 114.8 | 71 38% | 128.5 -12% | 122.1 -6% | 79 31% | 121 -5% | 86 25% | 96.9 ? 16% | 102.7 ? 11% |
| Cyberpunk 2077 ultra * | 183.7 | 197 -7% | |||||||
| Cyberpunk 2077 ultra external monitor * | 181.1 | 191.8 -6% | |||||||
| Witcher 3 ultra * | 179.3 | 188.4 -5% | 190.6 -6% | 188.1 -5% | 179.8 -0% | 141.8 21% | |||
| Load Maximum * | 226 | 228 -1% | 239.1 -6% | 241 -7% | 254.9 -13% | 246 -9% | 233 -3% | 221 ? 2% | 244 ? -8% |
* ... más pequeño es mejor
Power consumption: Cyberpunk 2077 / Stress test
Power consumption: External monitor
Duración de las pilas
Dado que el MSI Sword 16 es un gama media, tiene que conformarse con una unidad de 65 Wh que no dura mucho cuando la CPU/GPU se estresan incluso ligeramente. Con el modo 'Super Batería' activado, conseguimos hasta 4 horas y 40 minutos de autonomía con la pantalla ajustada a 150 nits.
Curiosamente, la duración de la batería se redujo durante la reproducción de vídeo H.246, probablemente debido a que el portátil no conmuta automáticamente a la iGPU. Si tiene que utilizar el portátil lejos de la red eléctrica, le recomendamos que cambie a los modos 'Silencio' o 'Superbatería' para una duración óptima de la batería.
| MSI Sword 16 HX B14VGKG i7-14700HX, NVIDIA GeForce RTX 4070 Laptop GPU, 65 Wh | HP Omen 17-db0079ng R7 8845HS, NVIDIA GeForce RTX 4070 Laptop GPU, 83 Wh | Lenovo Legion 7 16 IRX G9 i9-14900HX, NVIDIA GeForce RTX 4070 Laptop GPU, 99.9 Wh | Acer Predator Helios Neo 16 (2024) i7-14700HX, NVIDIA GeForce RTX 4070 Laptop GPU, 90.61 Wh | Alienware m16 R2 Ultra 7 155H, NVIDIA GeForce RTX 4070 Laptop GPU, 90 Wh | Asus ROG Strix G17 G713PI R9 7945HX, NVIDIA GeForce RTX 4070 Laptop GPU, 90 Wh | HP Victus 16-r0077ng i7-13700H, NVIDIA GeForce RTX 4070 Laptop GPU, 83 Wh | Media de la clase Gaming | |
|---|---|---|---|---|---|---|---|---|
| Duración de Batería | 109% | 142% | 38% | 41% | 8% | 52% | 113% | |
| H.264 | 129 | 462 258% | 620 381% | 242 88% | 166 29% | 447 ? 247% | ||
| WiFi v1.3 | 280 | 544 94% | 433 55% | 227 -19% | 483 73% | 255 -9% | 426 52% | 387 ? 38% |
| Cyberpunk 2077 ultra 150cd | 80 | 59 -26% | ||||||
| Load | 55 | 49 -11% | 79 44% | 60 9% | 58 5% | 84.5 ? 54% | ||
| Reader / Idle | 356 | 758 | 585 ? | |||||
| Witcher 3 ultra | 64 | 74.7 ? |
Pro
Contra
Veredicto: Un portátil para juegos decente que no intenta eclipsar a su competencia
Nuestro principal problema con el MSI Sword 16 HX es su pantalla. No sólo su precisión de color está por debajo de la media, sino que sus tiempos de respuesta son elevados, lo que la hace poco ideal para títulos FPS de ritmo rápido. Afortunadamente, se compensa fácilmente conectando un monitor externo.
Otras peculiaridades son su conector de alimentación de posición cuestionable, la lentitud de su SSD y los problemas con el puerto HDMI. Asegúrese de comprobar la versión de su BIOS y actualizarla. Dicho esto, está diseñado para jugar, y cumple esa tarea bastante bien.
El MSI Sword 16 HX hace bien en salvar la distancia entre precio y rendimiento con una mezcla de hardware potente y un precio de venta justo"
Por ahora, un combo Raptor Lake-HX más Ada Lovelace es casi el mejor combo que se puede conseguir en un portátil para juegos. El encaprichamiento de Intel y AMD con la IA significa que no tendremos nuevas SKU de alta potencia hasta el año que viene. Basándonos en la trayectoria actuallas nuevas GPU para portátiles de Nvidia/AMD podrían tardar aún más en llegar.
Con los costes de hardware del PC por las nubes, el MSI Sword 16 HX puede servir como un decente sustituto del sobremesa. Si desea una pantalla y almacenamiento mejores, considere el Acer Predator Helios Neo 16 o el Lenovo Legion 7 16 G9. Ambos cuestan más o menos lo mismo y son notablemente mejores que el MSI Sword 16 en ese aspecto.
Precio y disponibilidad
La variante MSI Sword 16 HX probada arriba se vende actualmente por ₹1.38.990 en Amazon India. Una versión de especificaciones inferiores con la misma CPU y una GeForce RTX 4060 se puede conseguir por ₹1.17.990.
Nota: Recientemente hemos actualizado nuestro sistema de clasificación y los resultados de la versión 8 no son comparables con los de la versión 7. Encontrará más información aquí .
MSI Sword 16 HX B14VGKG
- 10/08/2024 v8
Anil Ganti
 Total Sustainability Score:
 Transparencia
La selección de los dispositivos que se van a reseñar corre a cargo de nuestro equipo editorial. La muestra de prueba fue proporcionada al autor en calidad de préstamo por el fabricante o el minorista a los efectos de esta reseña. El prestamista no tuvo ninguna influencia en esta reseña, ni el fabricante recibió una copia de la misma antes de su publicación. No había ninguna obligación de publicar esta reseña. Nunca aceptamos compensaciones o pagos a cambio de nuestras reseñas. Como empresa de medios independiente, Notebookcheck no está sujeta a la autoridad de fabricantes, minoristas o editores.
Así es como prueba Notebookcheck
Cada año, Notebookcheck revisa de forma independiente cientos de portátiles y smartphones utilizando procedimientos estandarizados para asegurar que todos los resultados son comparables. Hemos desarrollado continuamente nuestros métodos de prueba durante unos 20 años y hemos establecido los estándares de la industria en el proceso. En nuestros laboratorios de pruebas, técnicos y editores experimentados utilizan equipos de medición de alta calidad. Estas pruebas implican un proceso de validación en varias fases. Nuestro complejo sistema de clasificación se basa en cientos de mediciones y puntos de referencia bien fundamentados, lo que mantiene la objetividad.Price comparison

