

El portátil RTX 5080 es óptimo para jugar en WQHD - Análisis del Asus ROG Strix G16 G615
¿Quién necesita realmente el portátil RTX 5090?
La nueva Asus ROG Strix G16 está disponible como máximo con la RTX 5080 Laptop, pero esto no supondrá un gran problema a la hora de jugar. El Strix G16 representa un buen paquete de juego con una pantalla IPS mate, un rápido Core Ultra 9 275 HX, y muy buenas opciones de mantenimiento.Andreas Osthoff, 👁 Andreas Osthoff (traducido por DeepL / Ninh Duy) Publicado 🇺🇸 🇩🇪 ...
Veredicto - El ROG Strix G16 es un buen portátil para juegos
El nuevo Asus ROG Strix G16 es un potente portátil para juegos que deja una buena impresión general en nuestra prueba. El hecho de que el panel Mini-LED y el portátil RTX 5090 estén reservados para el Strix SCAR 16, más caro, no representa un gran problema. El panel IPS mate con 240 Hz se queda ligeramente atrás en cuanto a su contraste, pero por otro lado no habrá ningún parpadeo PWM y la calidad de imagen es muy buena en general. En este caso sólo tendrá que conformarse con prescindir del HDR.
El nuevo portátil GeForce RTX 5080 es muy adecuado para la resolución nativa WQHD, y junto con el rápido Intel Core Ultra 9 275HX, obtendrá un gran rendimiento en los juegos, aunque el antiguo portátil RTX 4080 no se quedará atrás por mucho. Por lo tanto, una actualización sólo tendrá realmente sentido para los usuarios de antiguas GPU RTX 3000. La RTX 5090 Laptop volvería a ser ligeramente más rápida, pero sólo podrá aprovechar realmente su ventaja en 4K. Lo que resulta más molesto es el hecho de que Asus sólo ofrezca el procesador para juegos Ryzen 9 9955HX, potencialmente mejor, en combinación con el Portátil RTX 5070 Ti en un diseño de carcasa más antiguo.
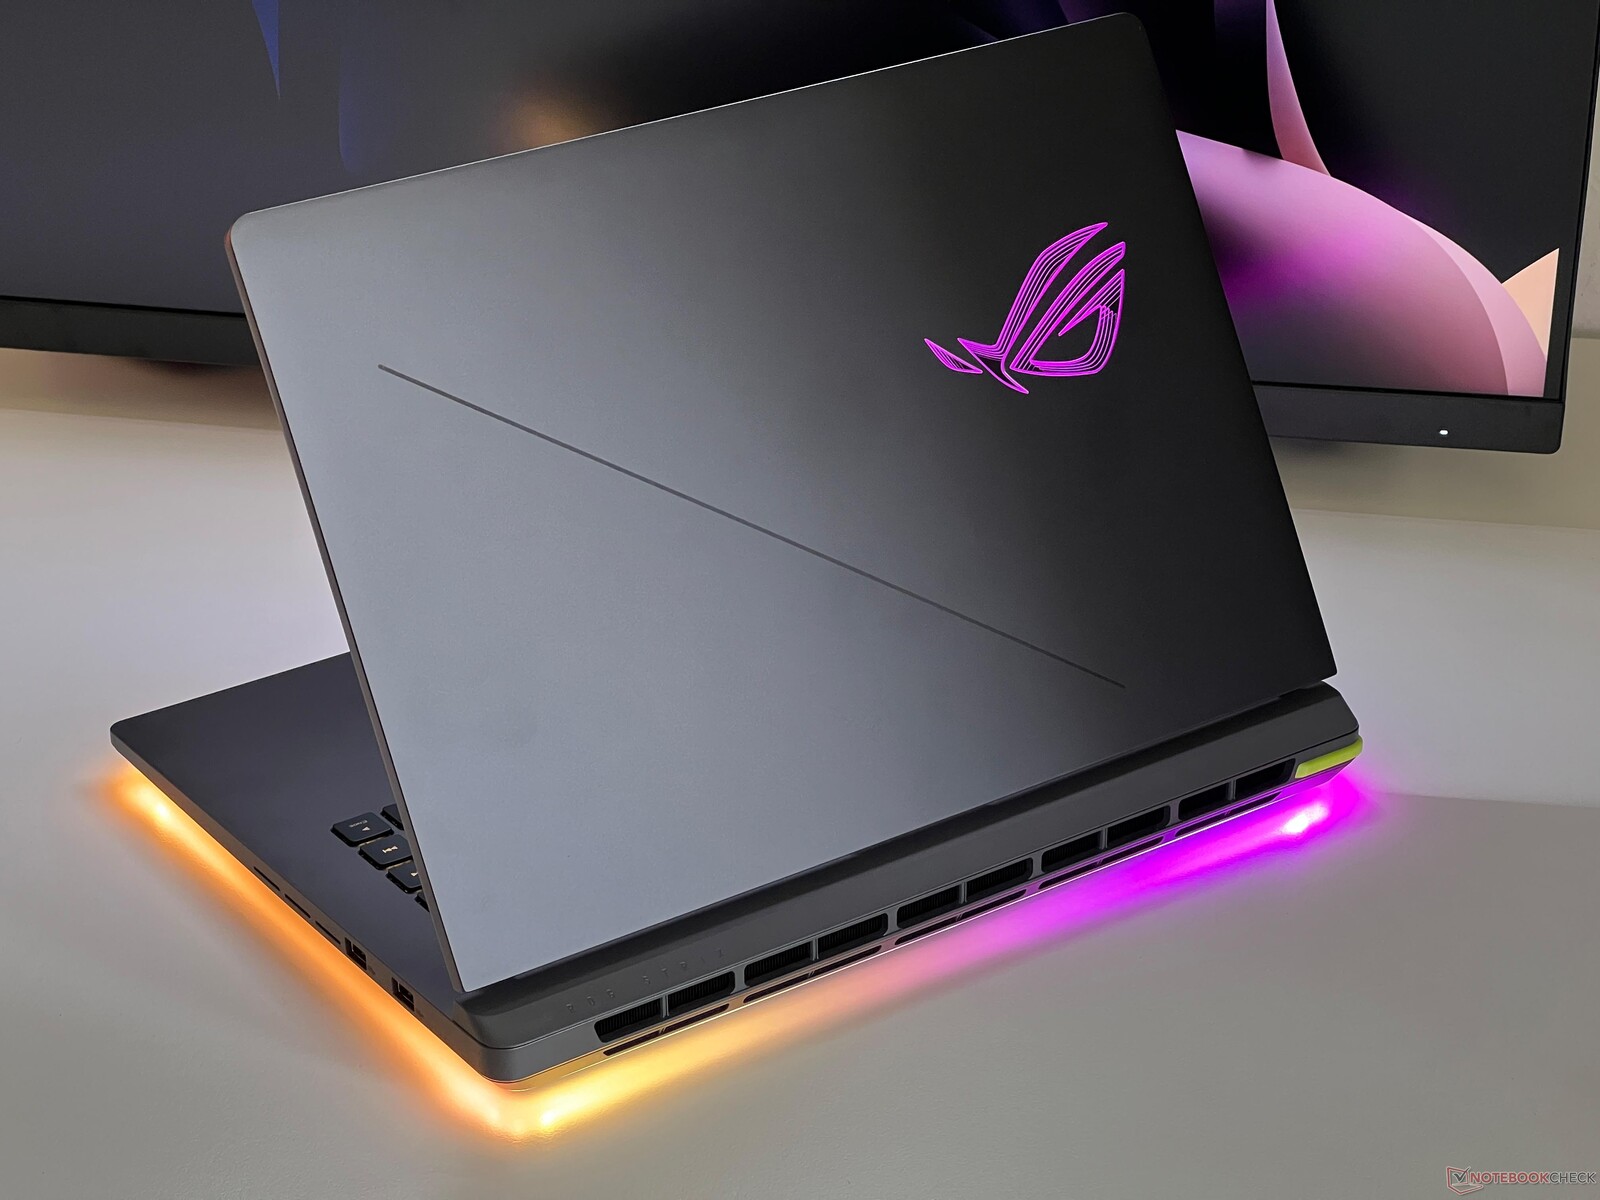
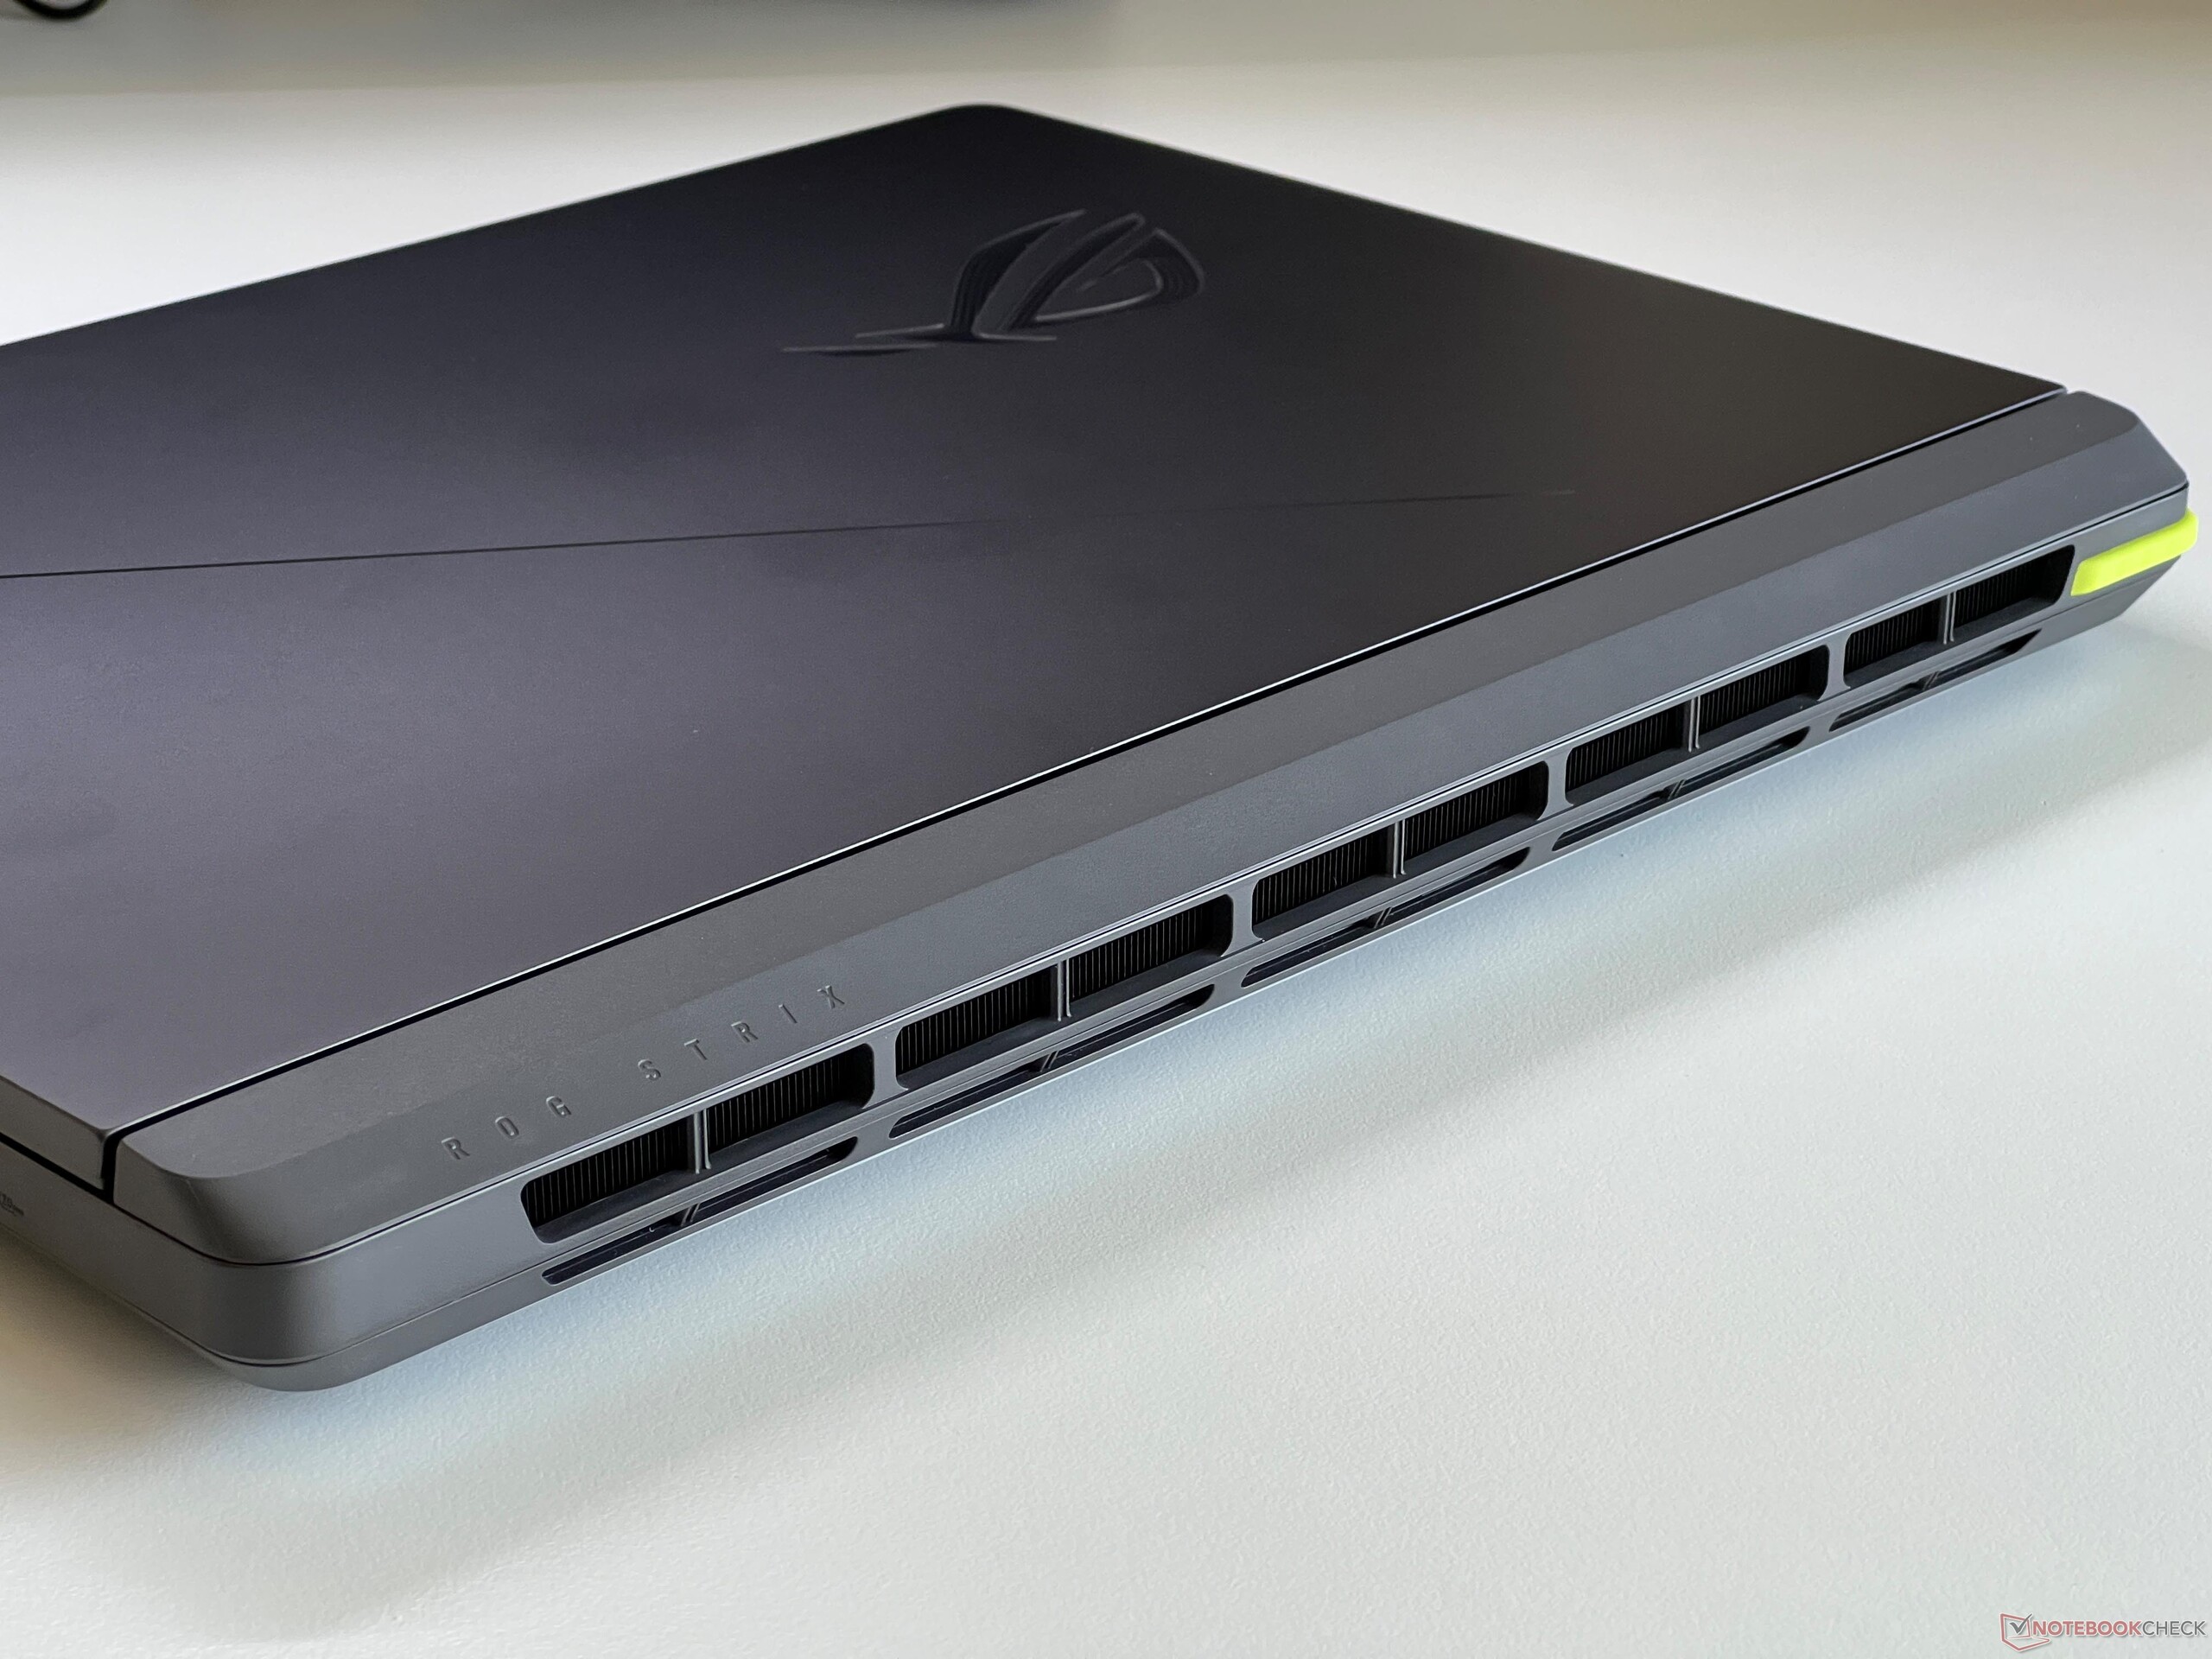
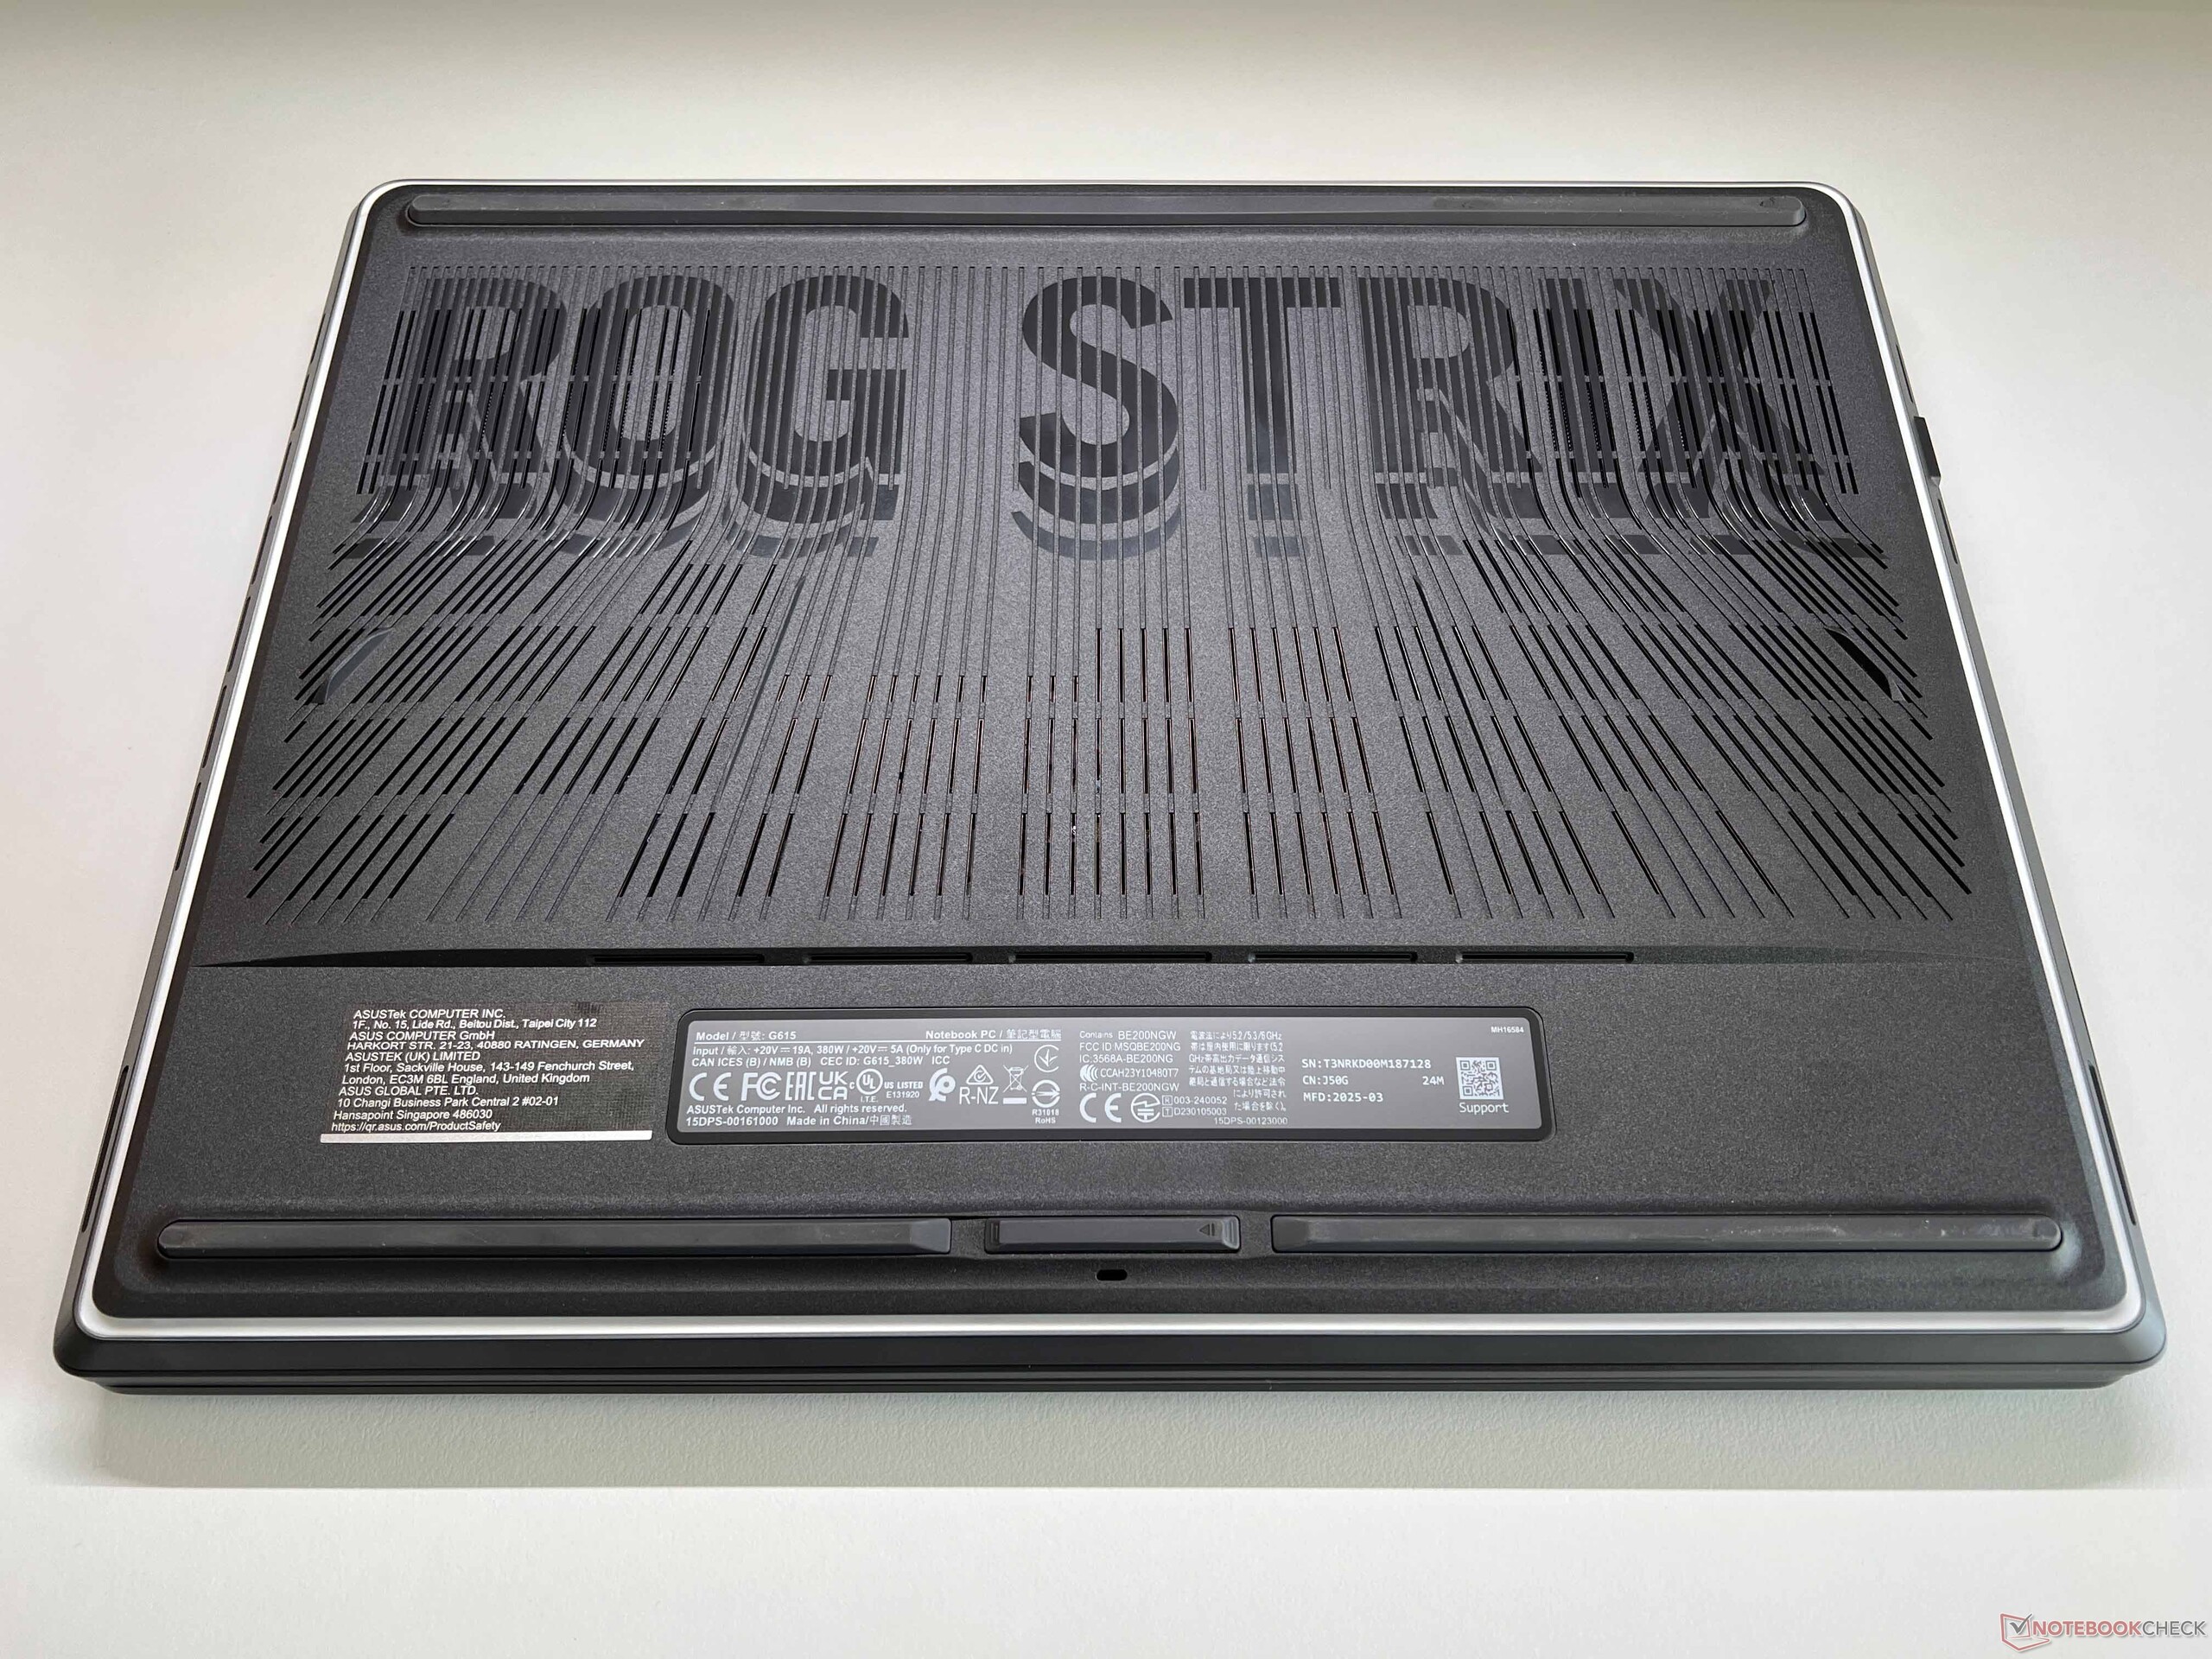
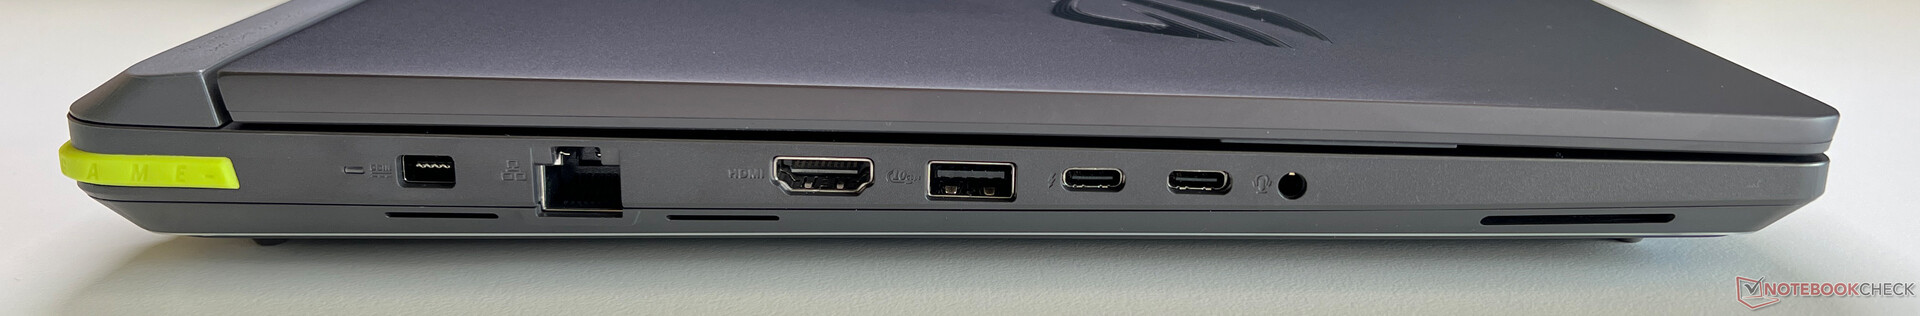
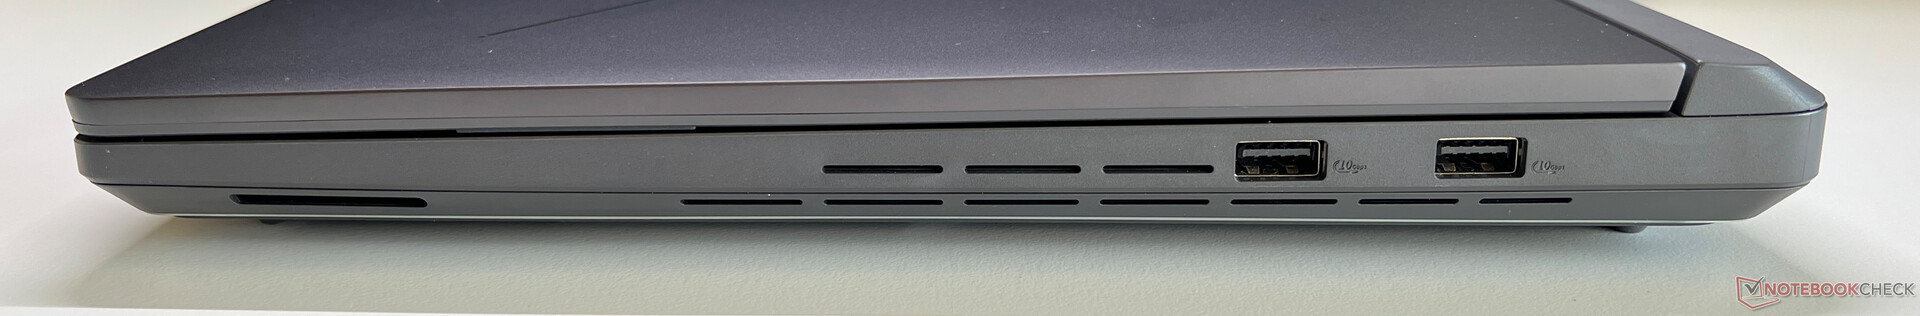
La carcasa está fabricada exclusivamente en plástico, pero las superficies grises no son tan propensas a recoger la suciedad como las de la ROG Strix SCAR negra. La calidad de la carcasa es buena en general, destacando la barra LED iluminada alrededor de la parte inferior y el mecanismo de desbloqueo del lugar de la base. Aparte de su colocación, tampoco tenemos quejas sobre las conexiones, ya que se incluyen dos rápidas conexiones Thunderbolt 5. El teclado es muy cómodo pero carece de teclado numérico. La duración de la batería del Strix G16 también está por delante de sus competidores.
El competidor probablemente más cercano, el Lenovo Legion Pro 7i 16 G10, obtiene un rendimiento de juego ligeramente superior del portátil RTX 5080 y ofrece una pantalla OLED muy buena, aunque es reflectante y produce parpadeos PWM. Además, la configuración comparable cuesta 300 euros (~341 dólares) más. En un futuro próximo, también probaremos el XMG Neo 16 con el AMD Ryzen 9 9955HX y el Portátil RTX 5080, cuya muestra de ingeniería ya dejó una muy buena impresión.
Pro
Contra
Precio y disponibilidad
La ROG Strix G16 (2025) parte de $1800 de Asus en EE.UU., con el modelo RTX 5080 costando 2700 $.
Índice
- Veredicto - El ROG Strix G16 es un buen portátil para juegos
- Especificaciones
- Caja - Gris oscuro con mucha iluminación
- Equipo - Strix G16 con Thunderbolt 5
- Dispositivos de entrada - Un teclado cómodo
- Pantalla - IPS con 240 Hz y G-Sync
- Rendimiento - Portátil Core Ultra 9 y RTX 5080
- Emisiones - Bajas temperaturas
- Gestión de la energía - Portátil para juegos con batería de larga duración
- Valoración general de Notebookcheck
- Possible Alternatives in Comparison
Los modelos ROG Strix son los portátiles para juegos de gama alta de Asus, y existen algunas diferencias entre los modelos Strix y Strix SCAR. Los modelos insignia ROG SCAR están disponibles con la GPU más rápida (RTX 5090 Laptop) y ofrecen paneles Mini-LED, así como opciones de iluminación adicionales en forma de pantallas secundarias en la tapa de la pantalla. Por el contrario, la ROG Strix normal (G16 o G18) está disponible con la RTX 5080 Laptop como máximo e incluye pantallas IPS. Los modelos AMD de la G16/G18 con el Ryzen 9 9955HX están incluso limitados a la RTX 5070 Ti y también utilizan una carcasa completamente diferente (sin la nueva tapa de mantenimiento).
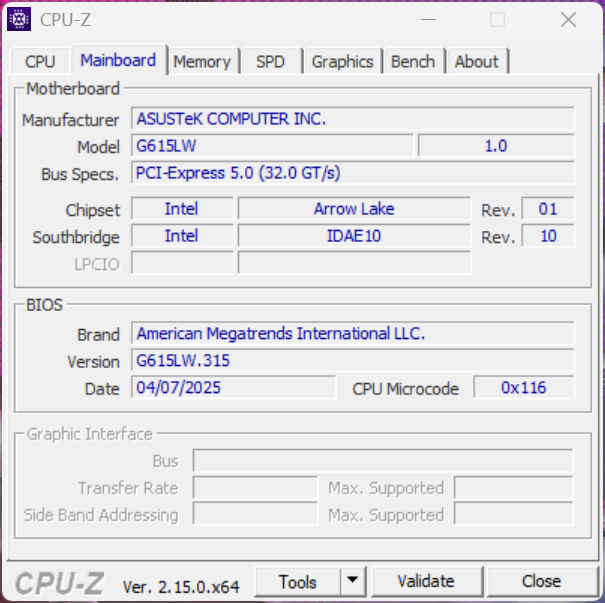
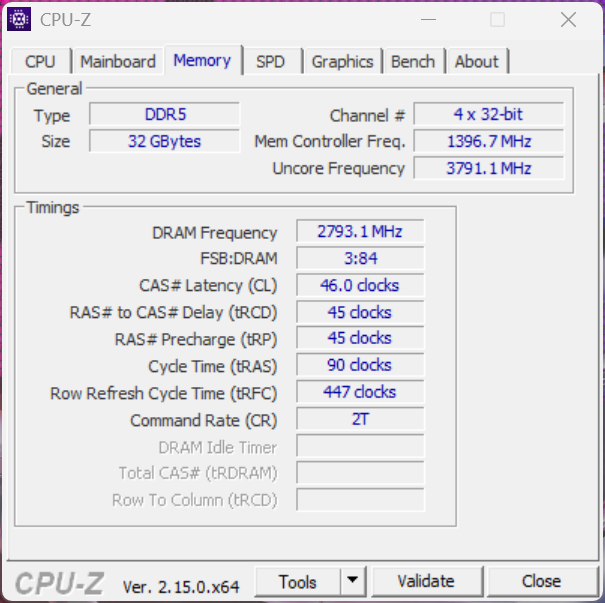
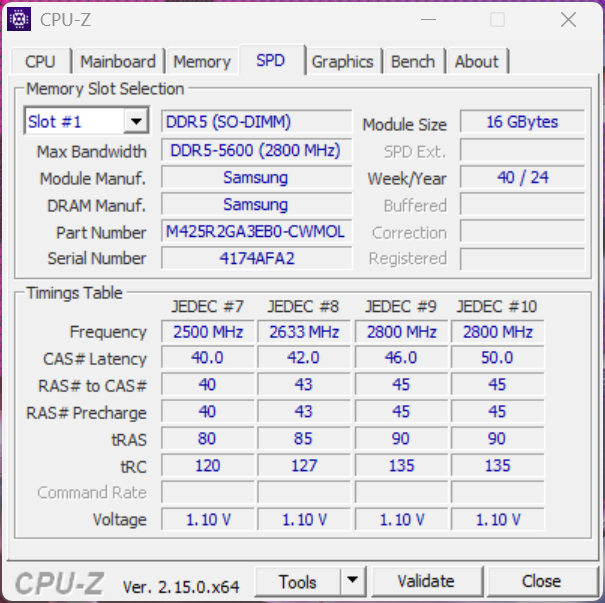
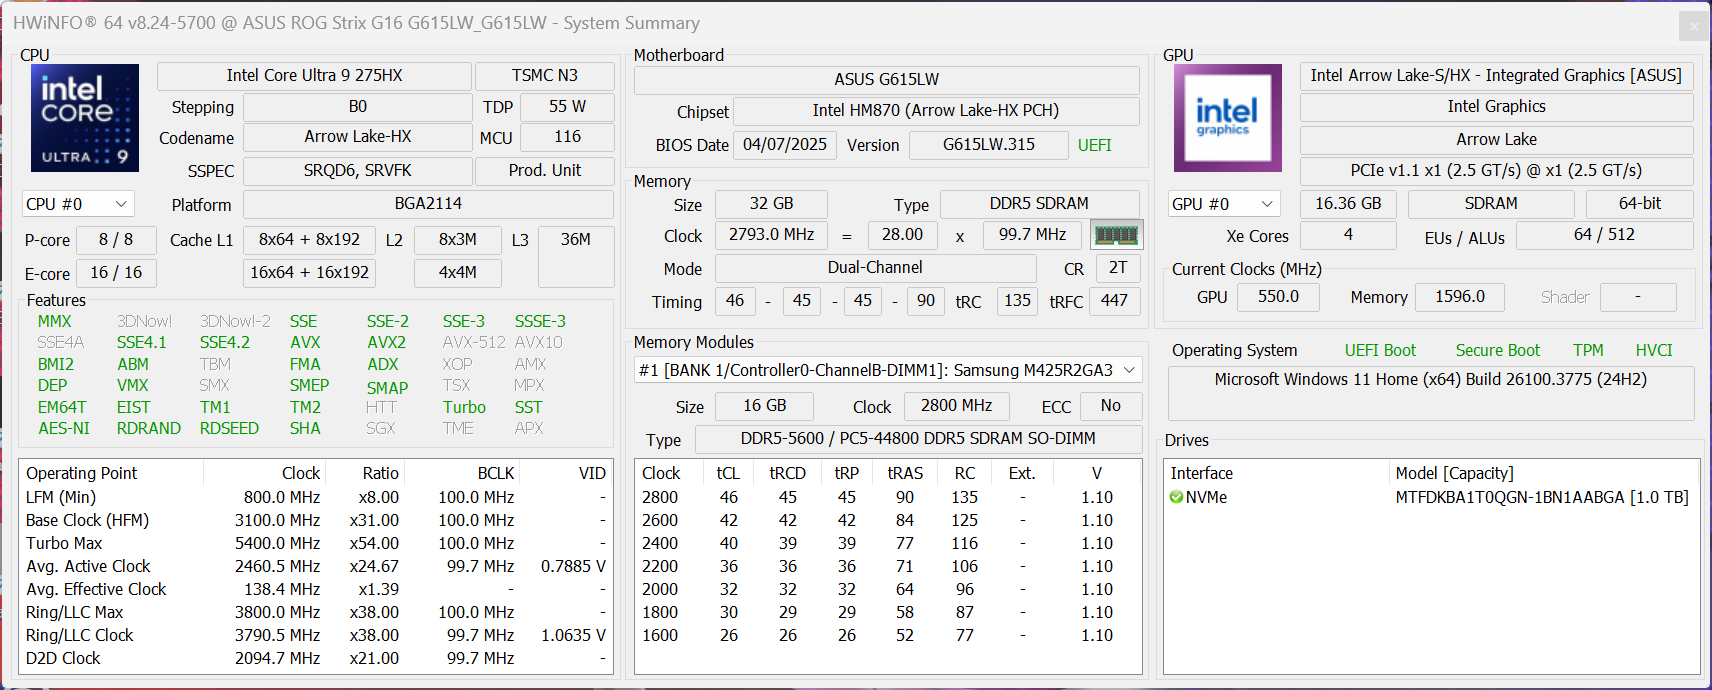
Hoy probamos el ROG Strix G16 G615 con el Intel Core Ultra 9 275HX, 32 GB de RAM, una unidad SSD de 1 TB, un panel WQHD-IPS con 240 Hz y el portátil GeForce RTX 5080, disponible a un PVPR de 3.299 euros (en Alemania, ~3.750 dólares).
Especificaciones
Caja - Gris oscuro con mucha iluminación
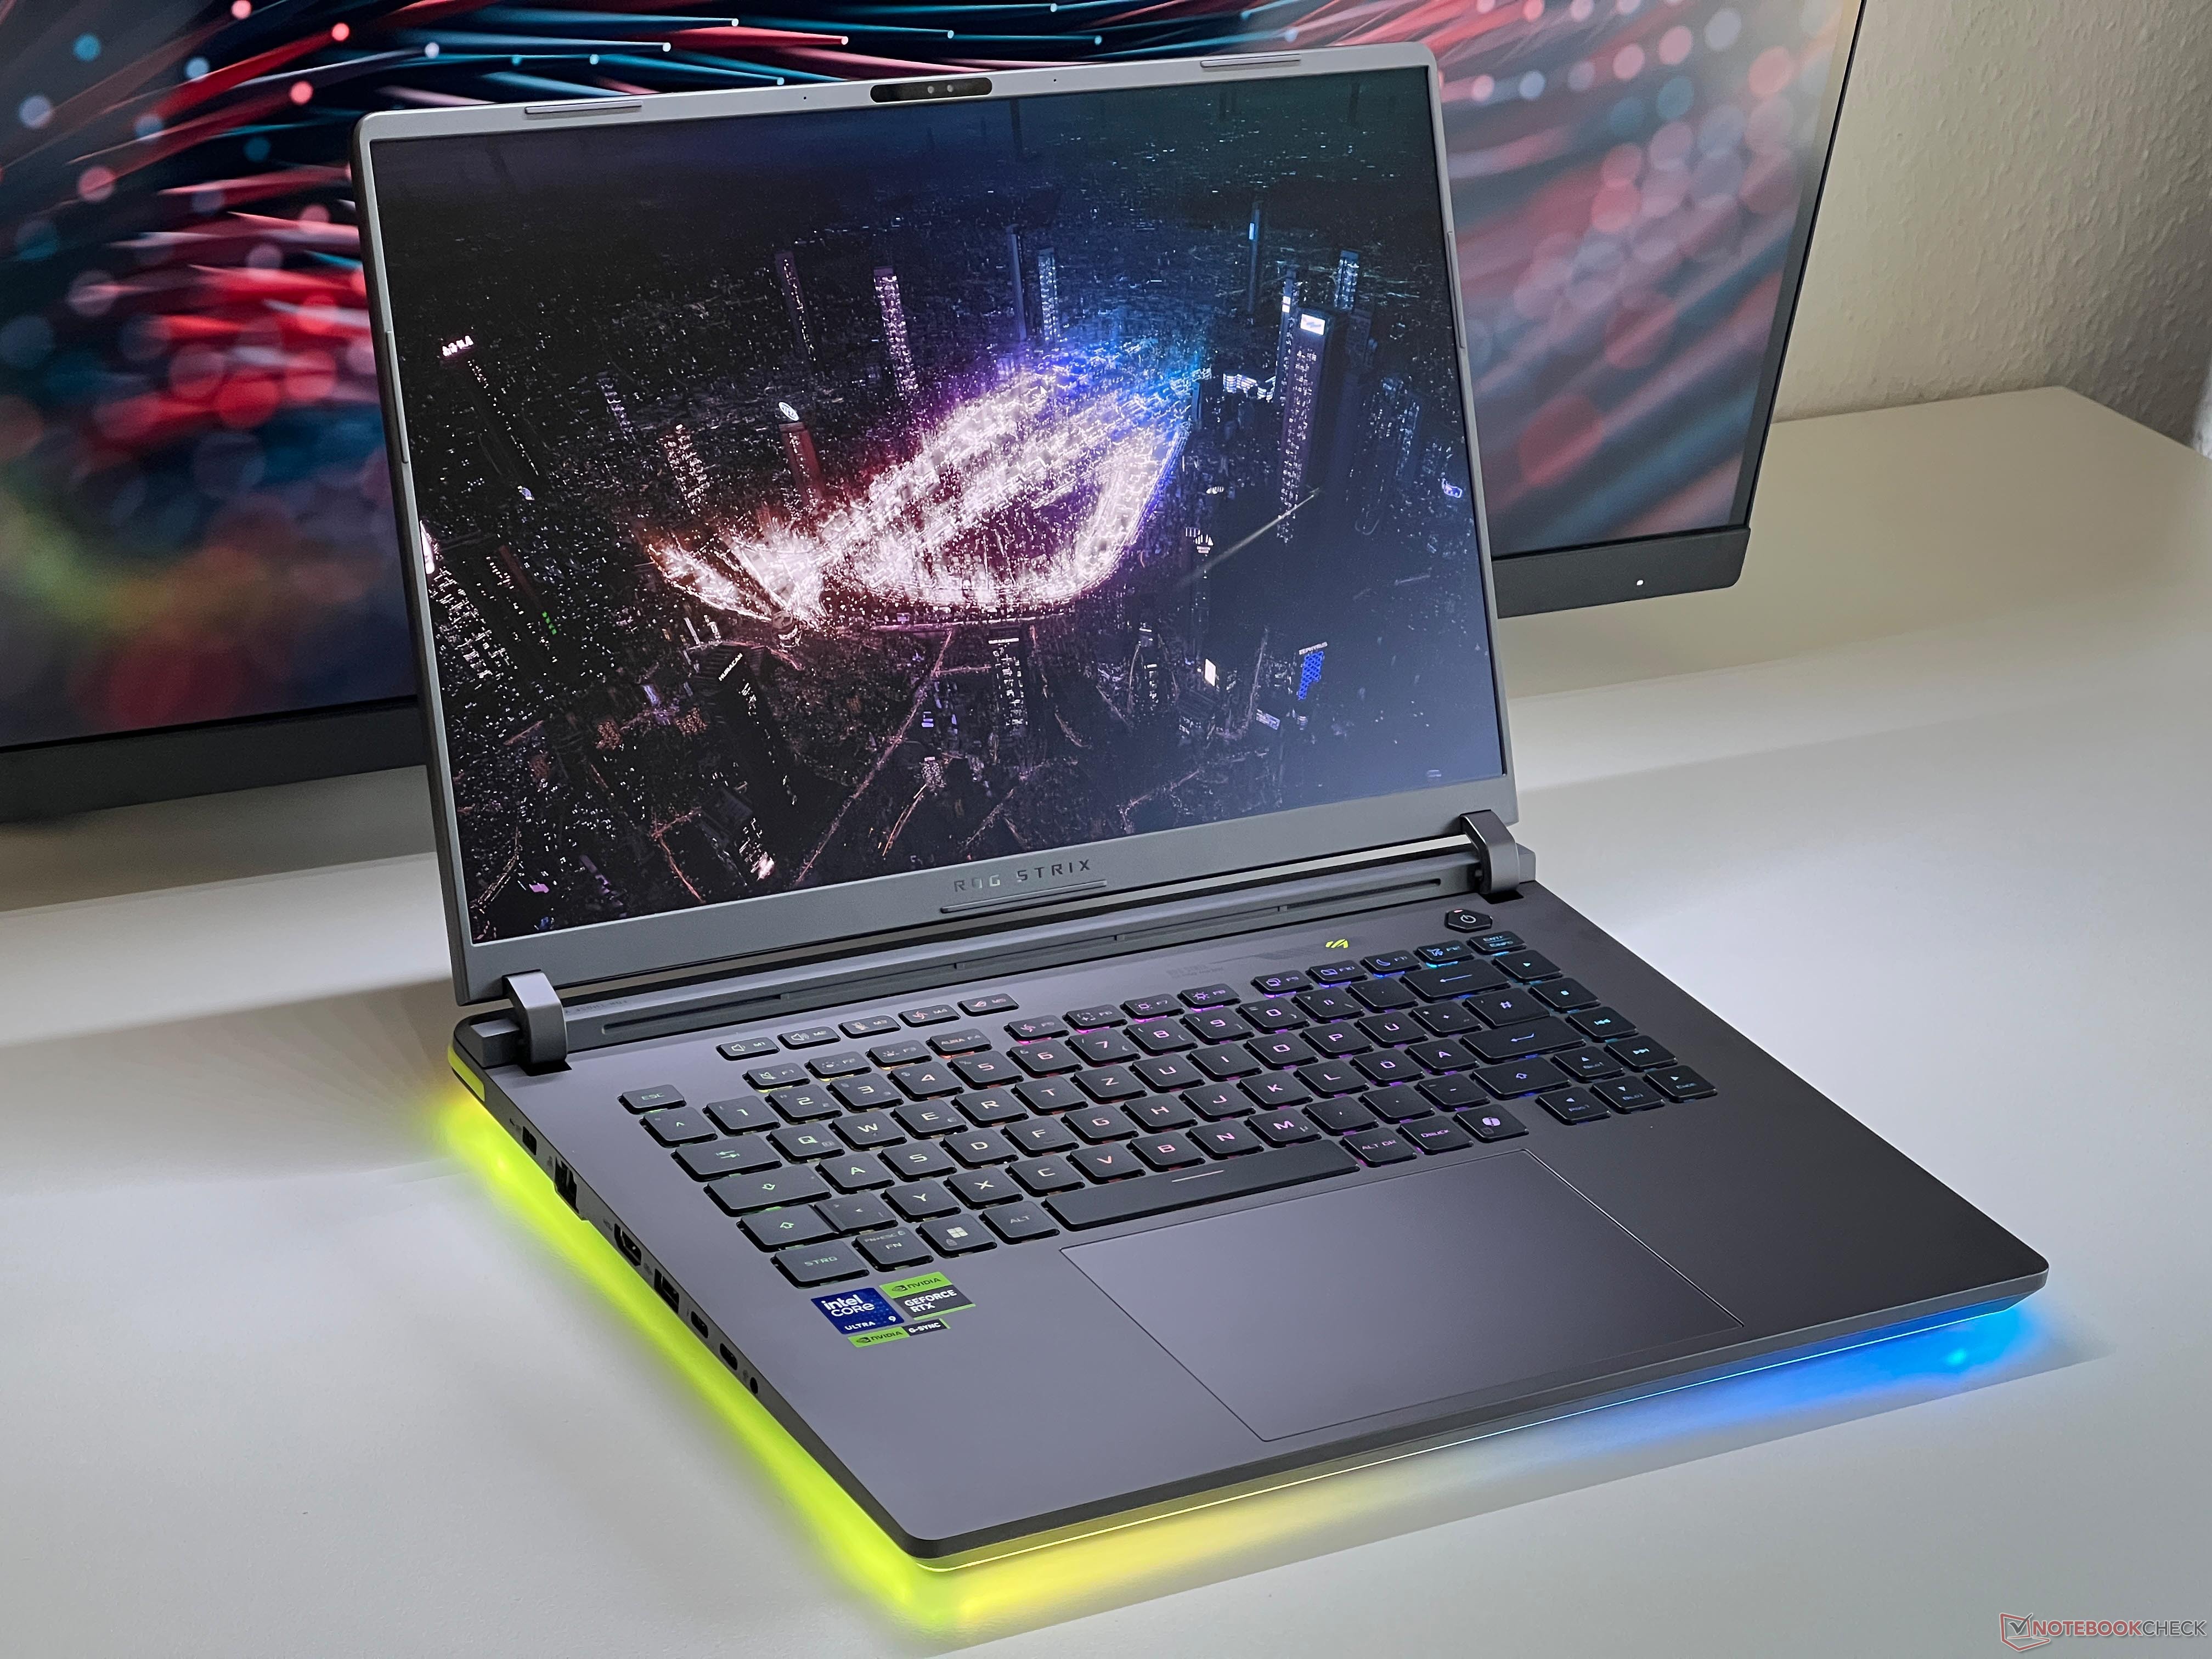
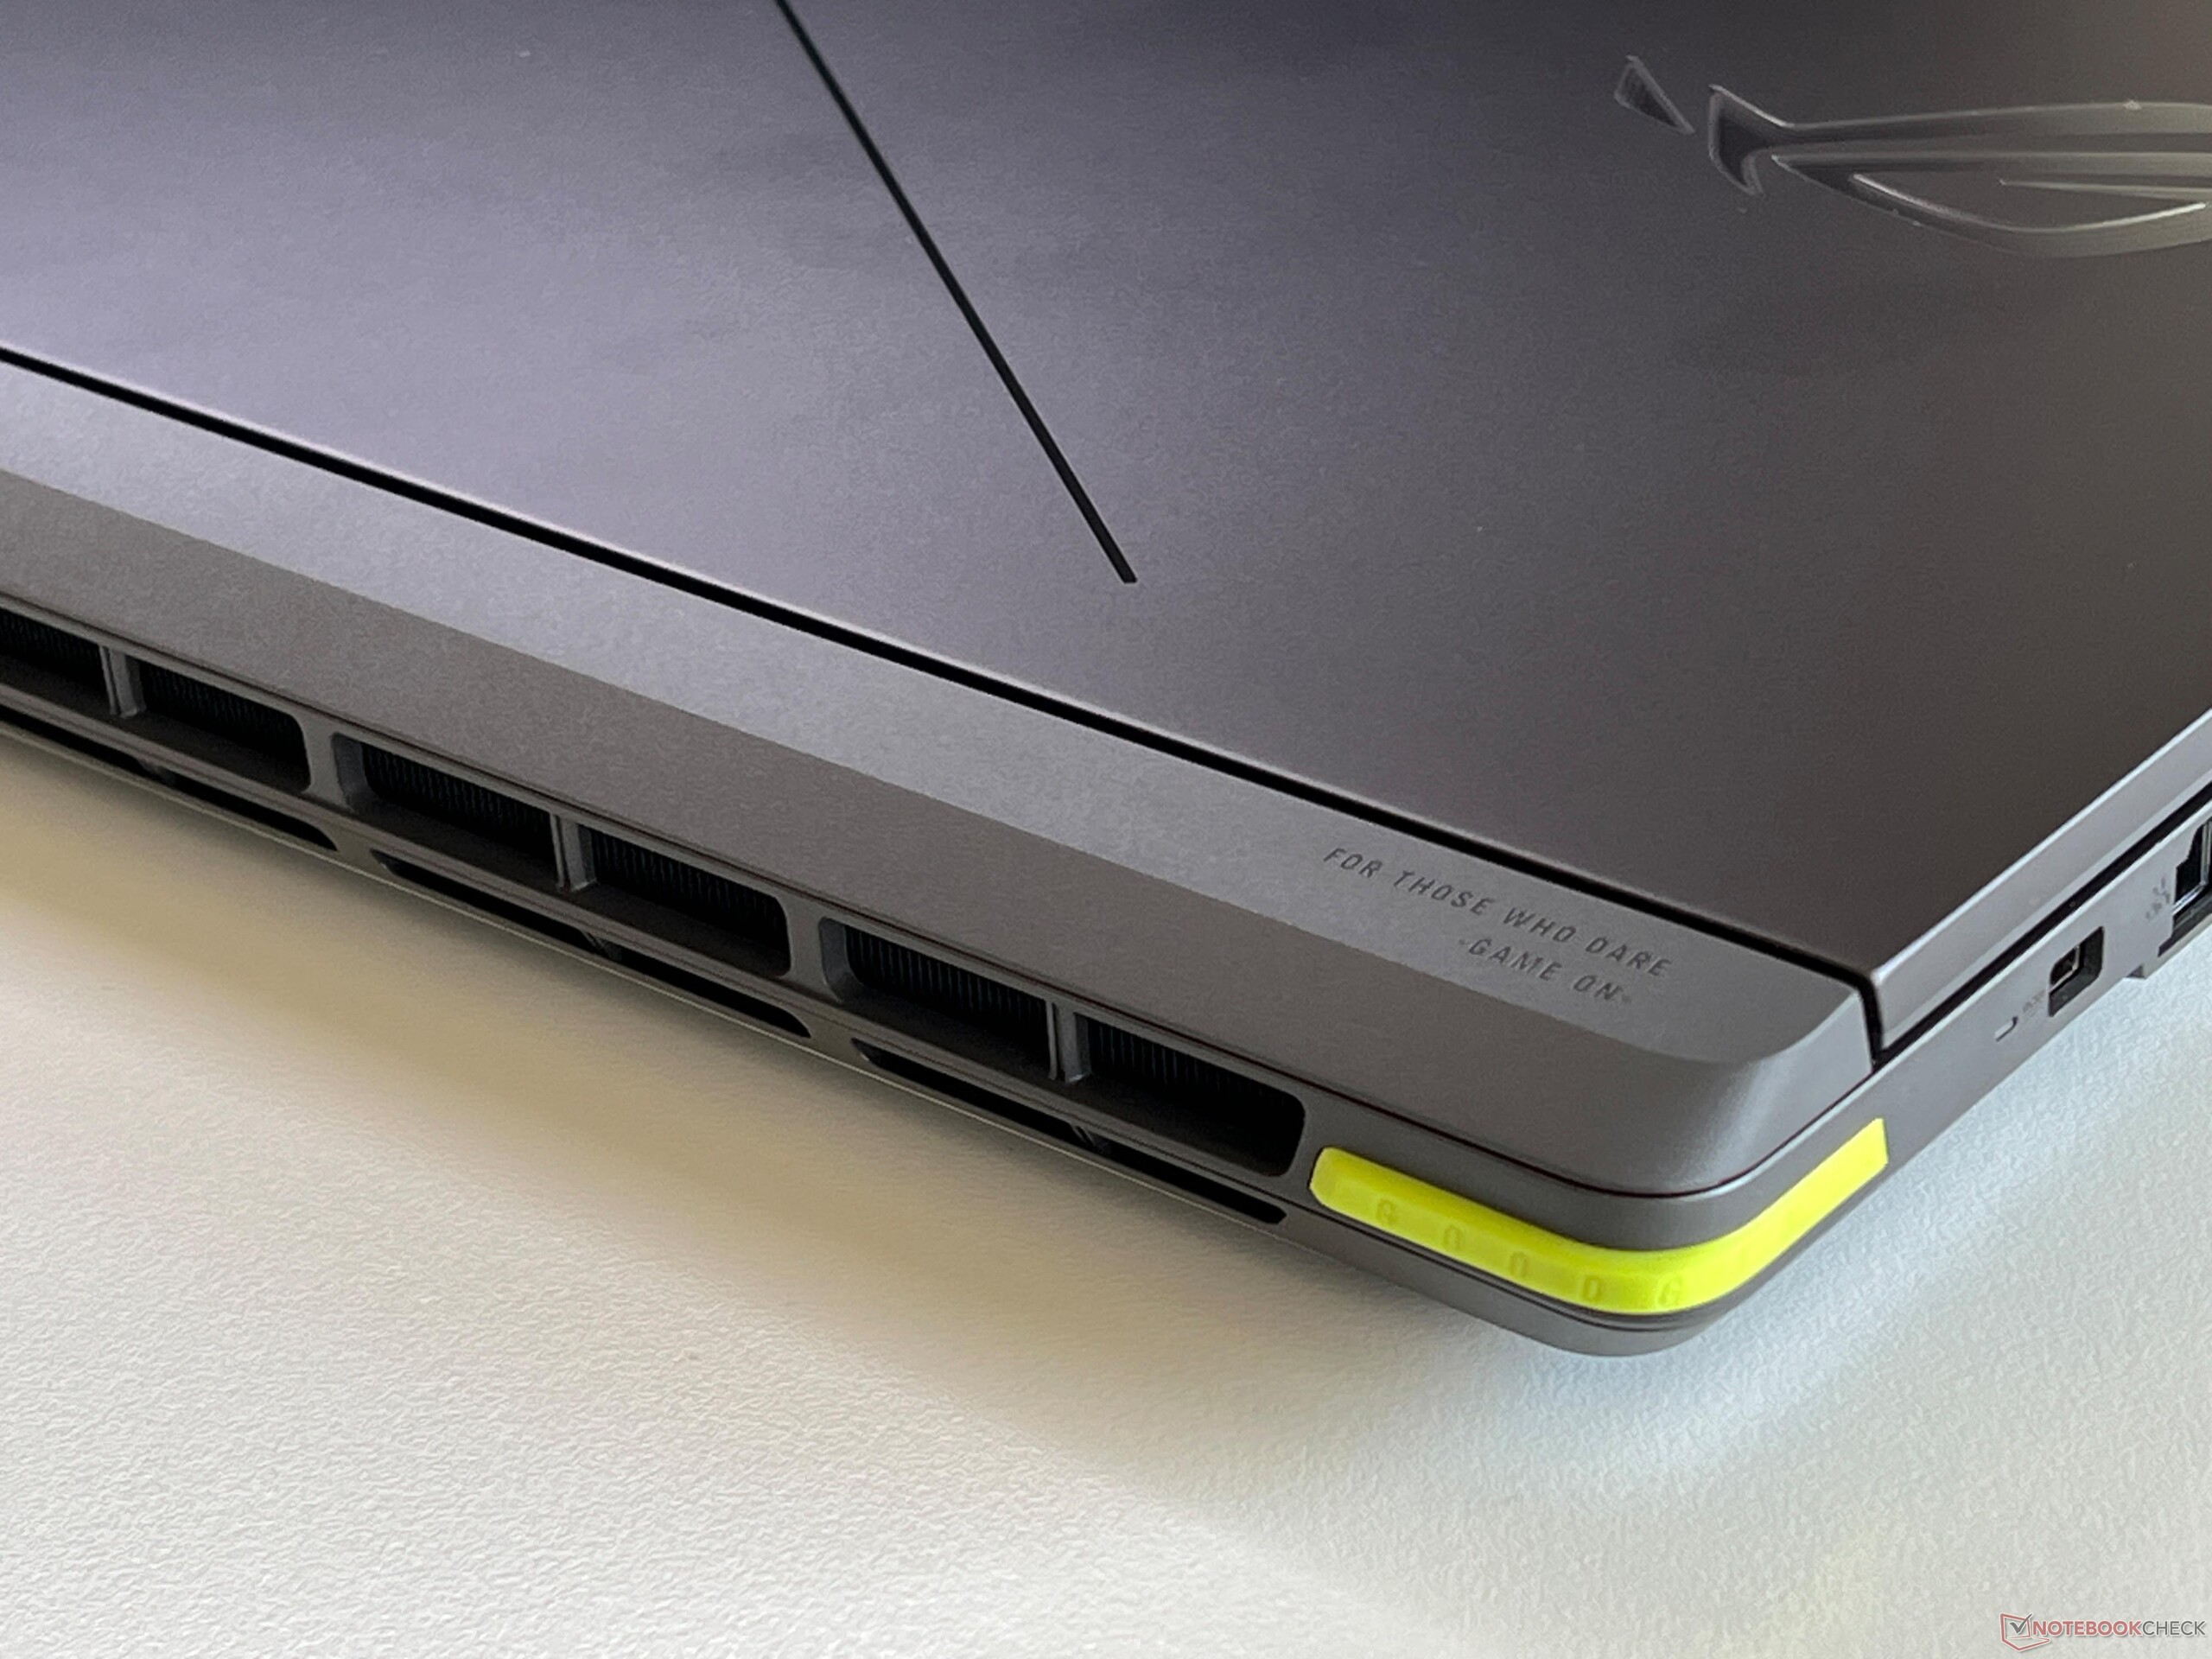
Como ya se ha mencionado, la Strix G16 comparte muchos elementos comunes con la serie Strix SCAR, incluida la carcasa de plástico, la barra de LED iluminada que rodea la base y el logotipo iluminado. Sólo no tendrá la pantalla DotMatrix adicional en la tapa. Además, hay dos pequeños elementos de diseño en verde neón (el logotipo ROG encima del teclado y una pequeña franja en la esquina trasera izquierda). Puede volverse loco con la iluminación, pero también puede desactivarla por completo para un aspecto menos llamativo. Las superficies de plástico gris oscuro no son tan propensas a mostrar huellas dactilares y suciedad como las superficies negras del Strix SCAR 18 que probamos recientemente.
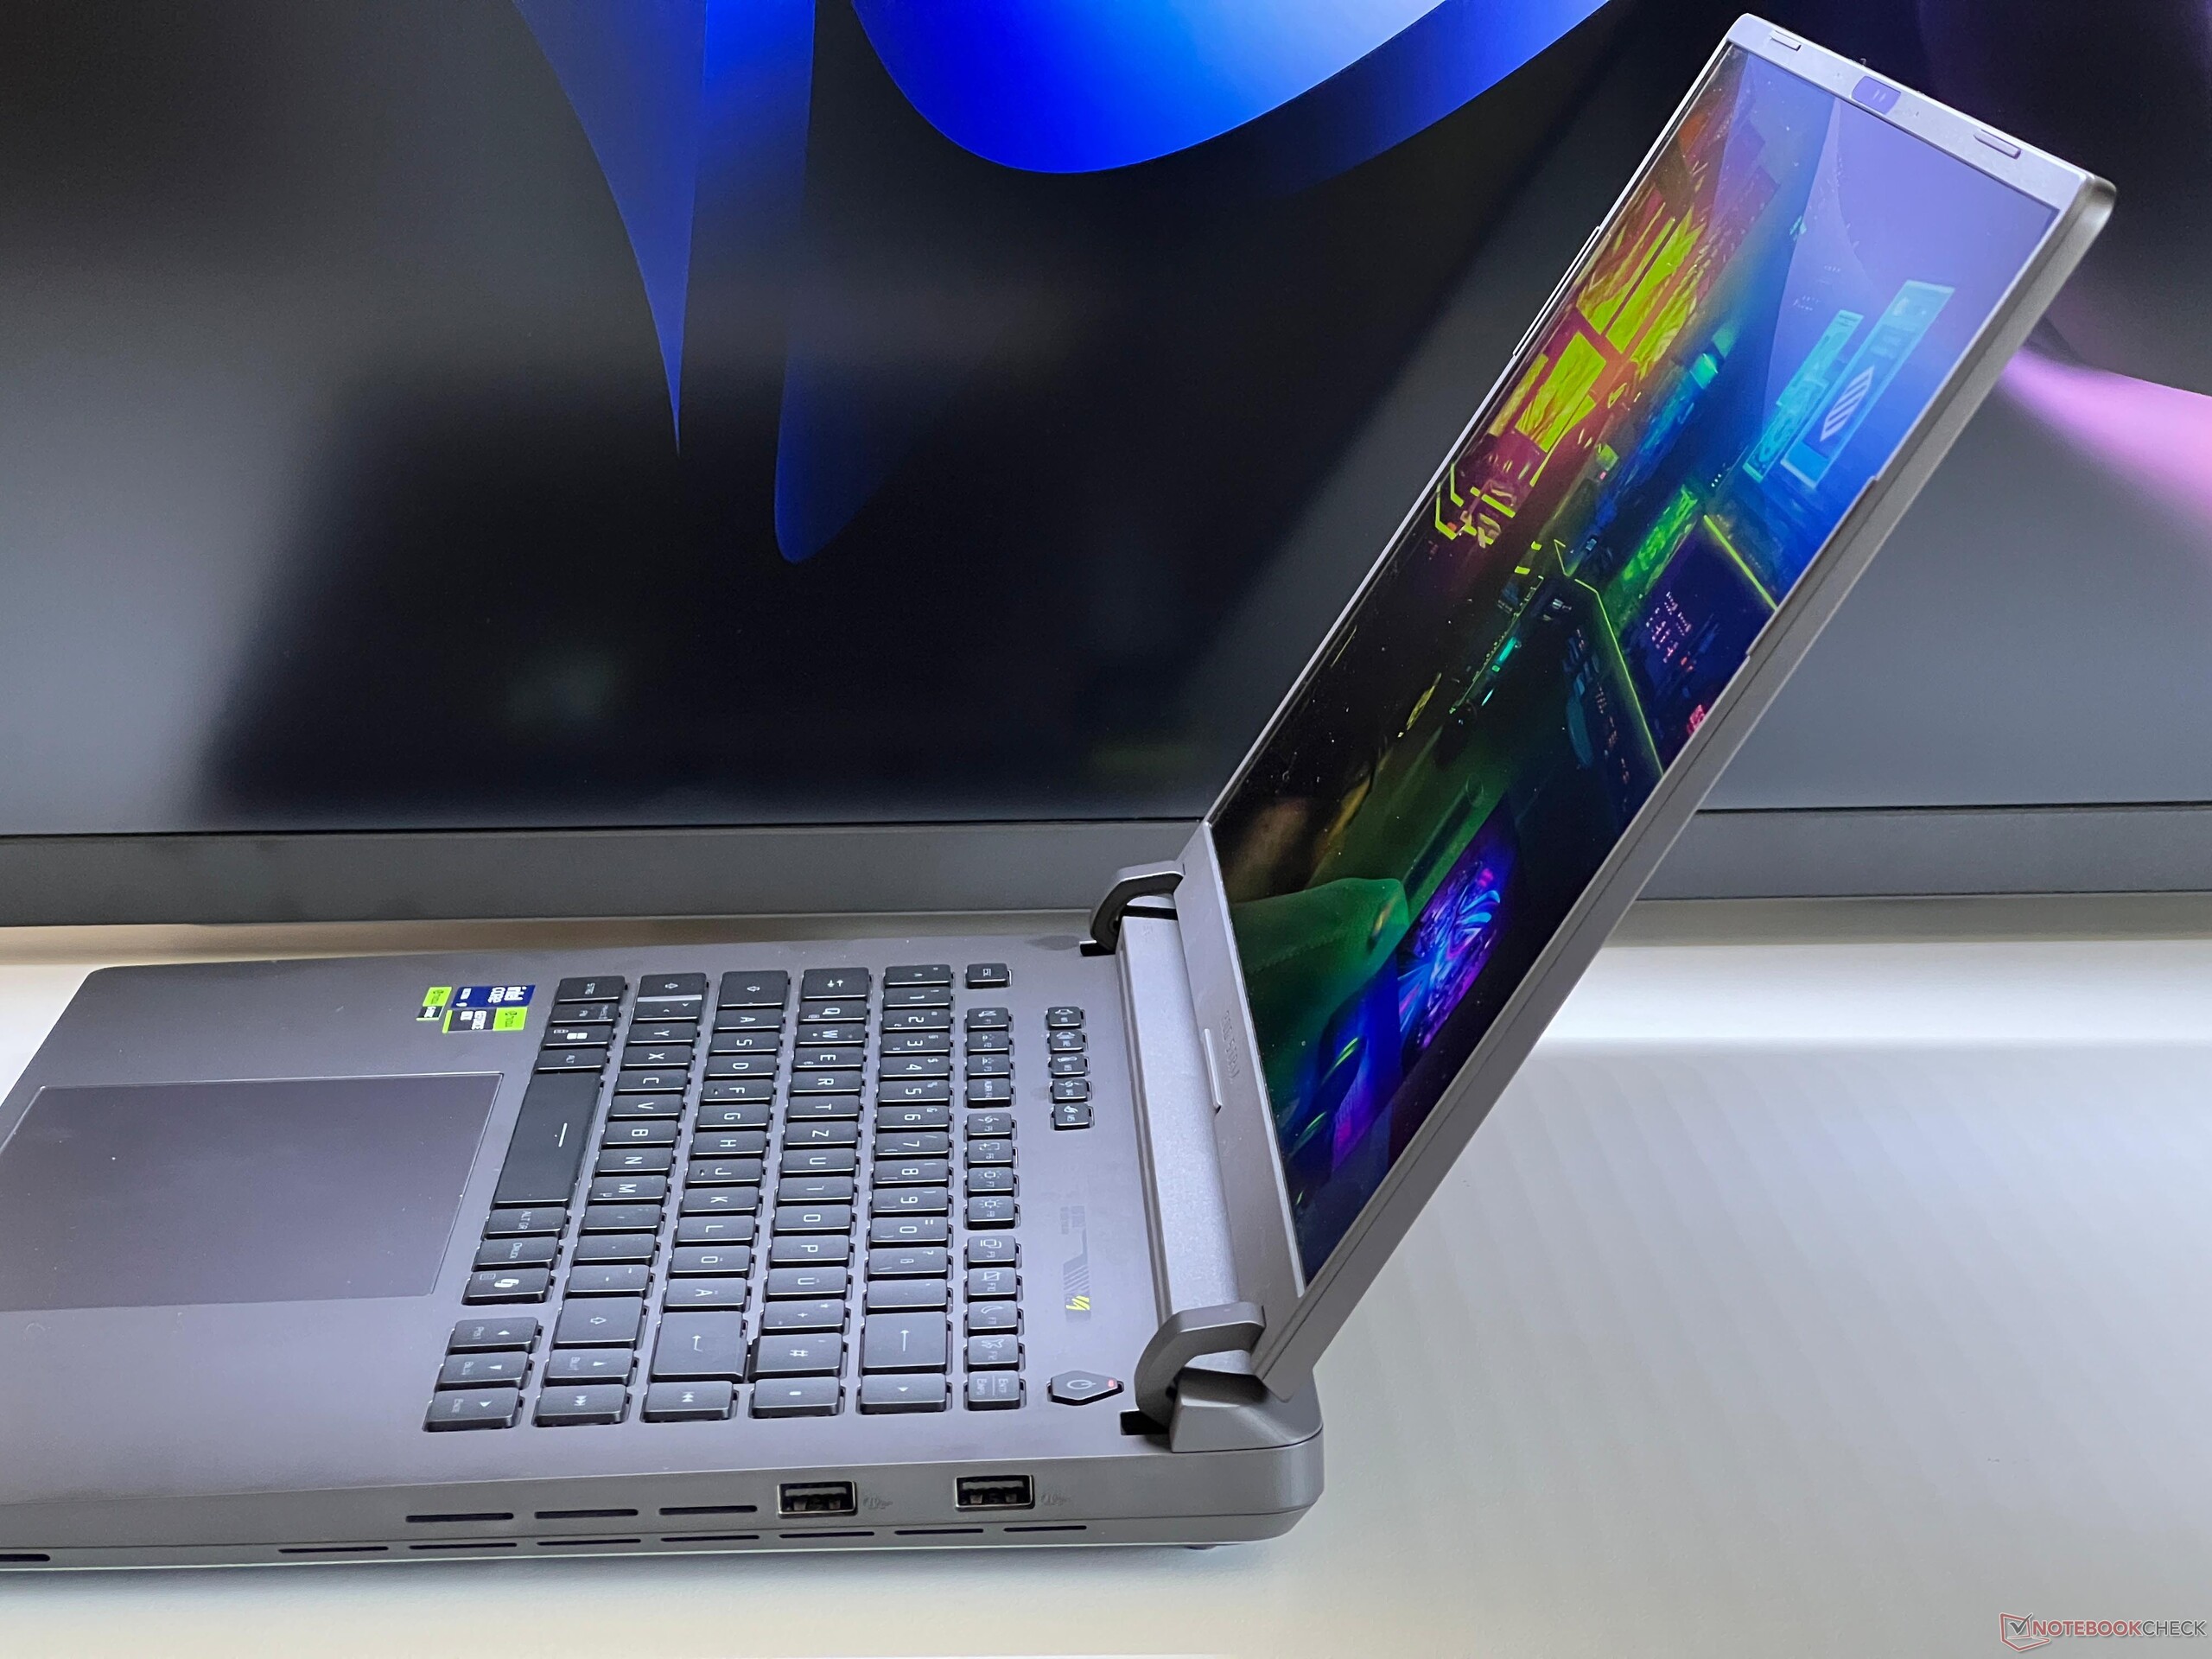
La calidad de la carcasa es muy buena en general, aunque ya se debería poder esperar una carcasa metálica a este precio. Ni con la estabilidad ni con la mano de obra encontramos ningún tipo de problema. Las bisagras también hacen un buen trabajo, pero el ángulo máximo de apertura es sólo de unos 130 grados.
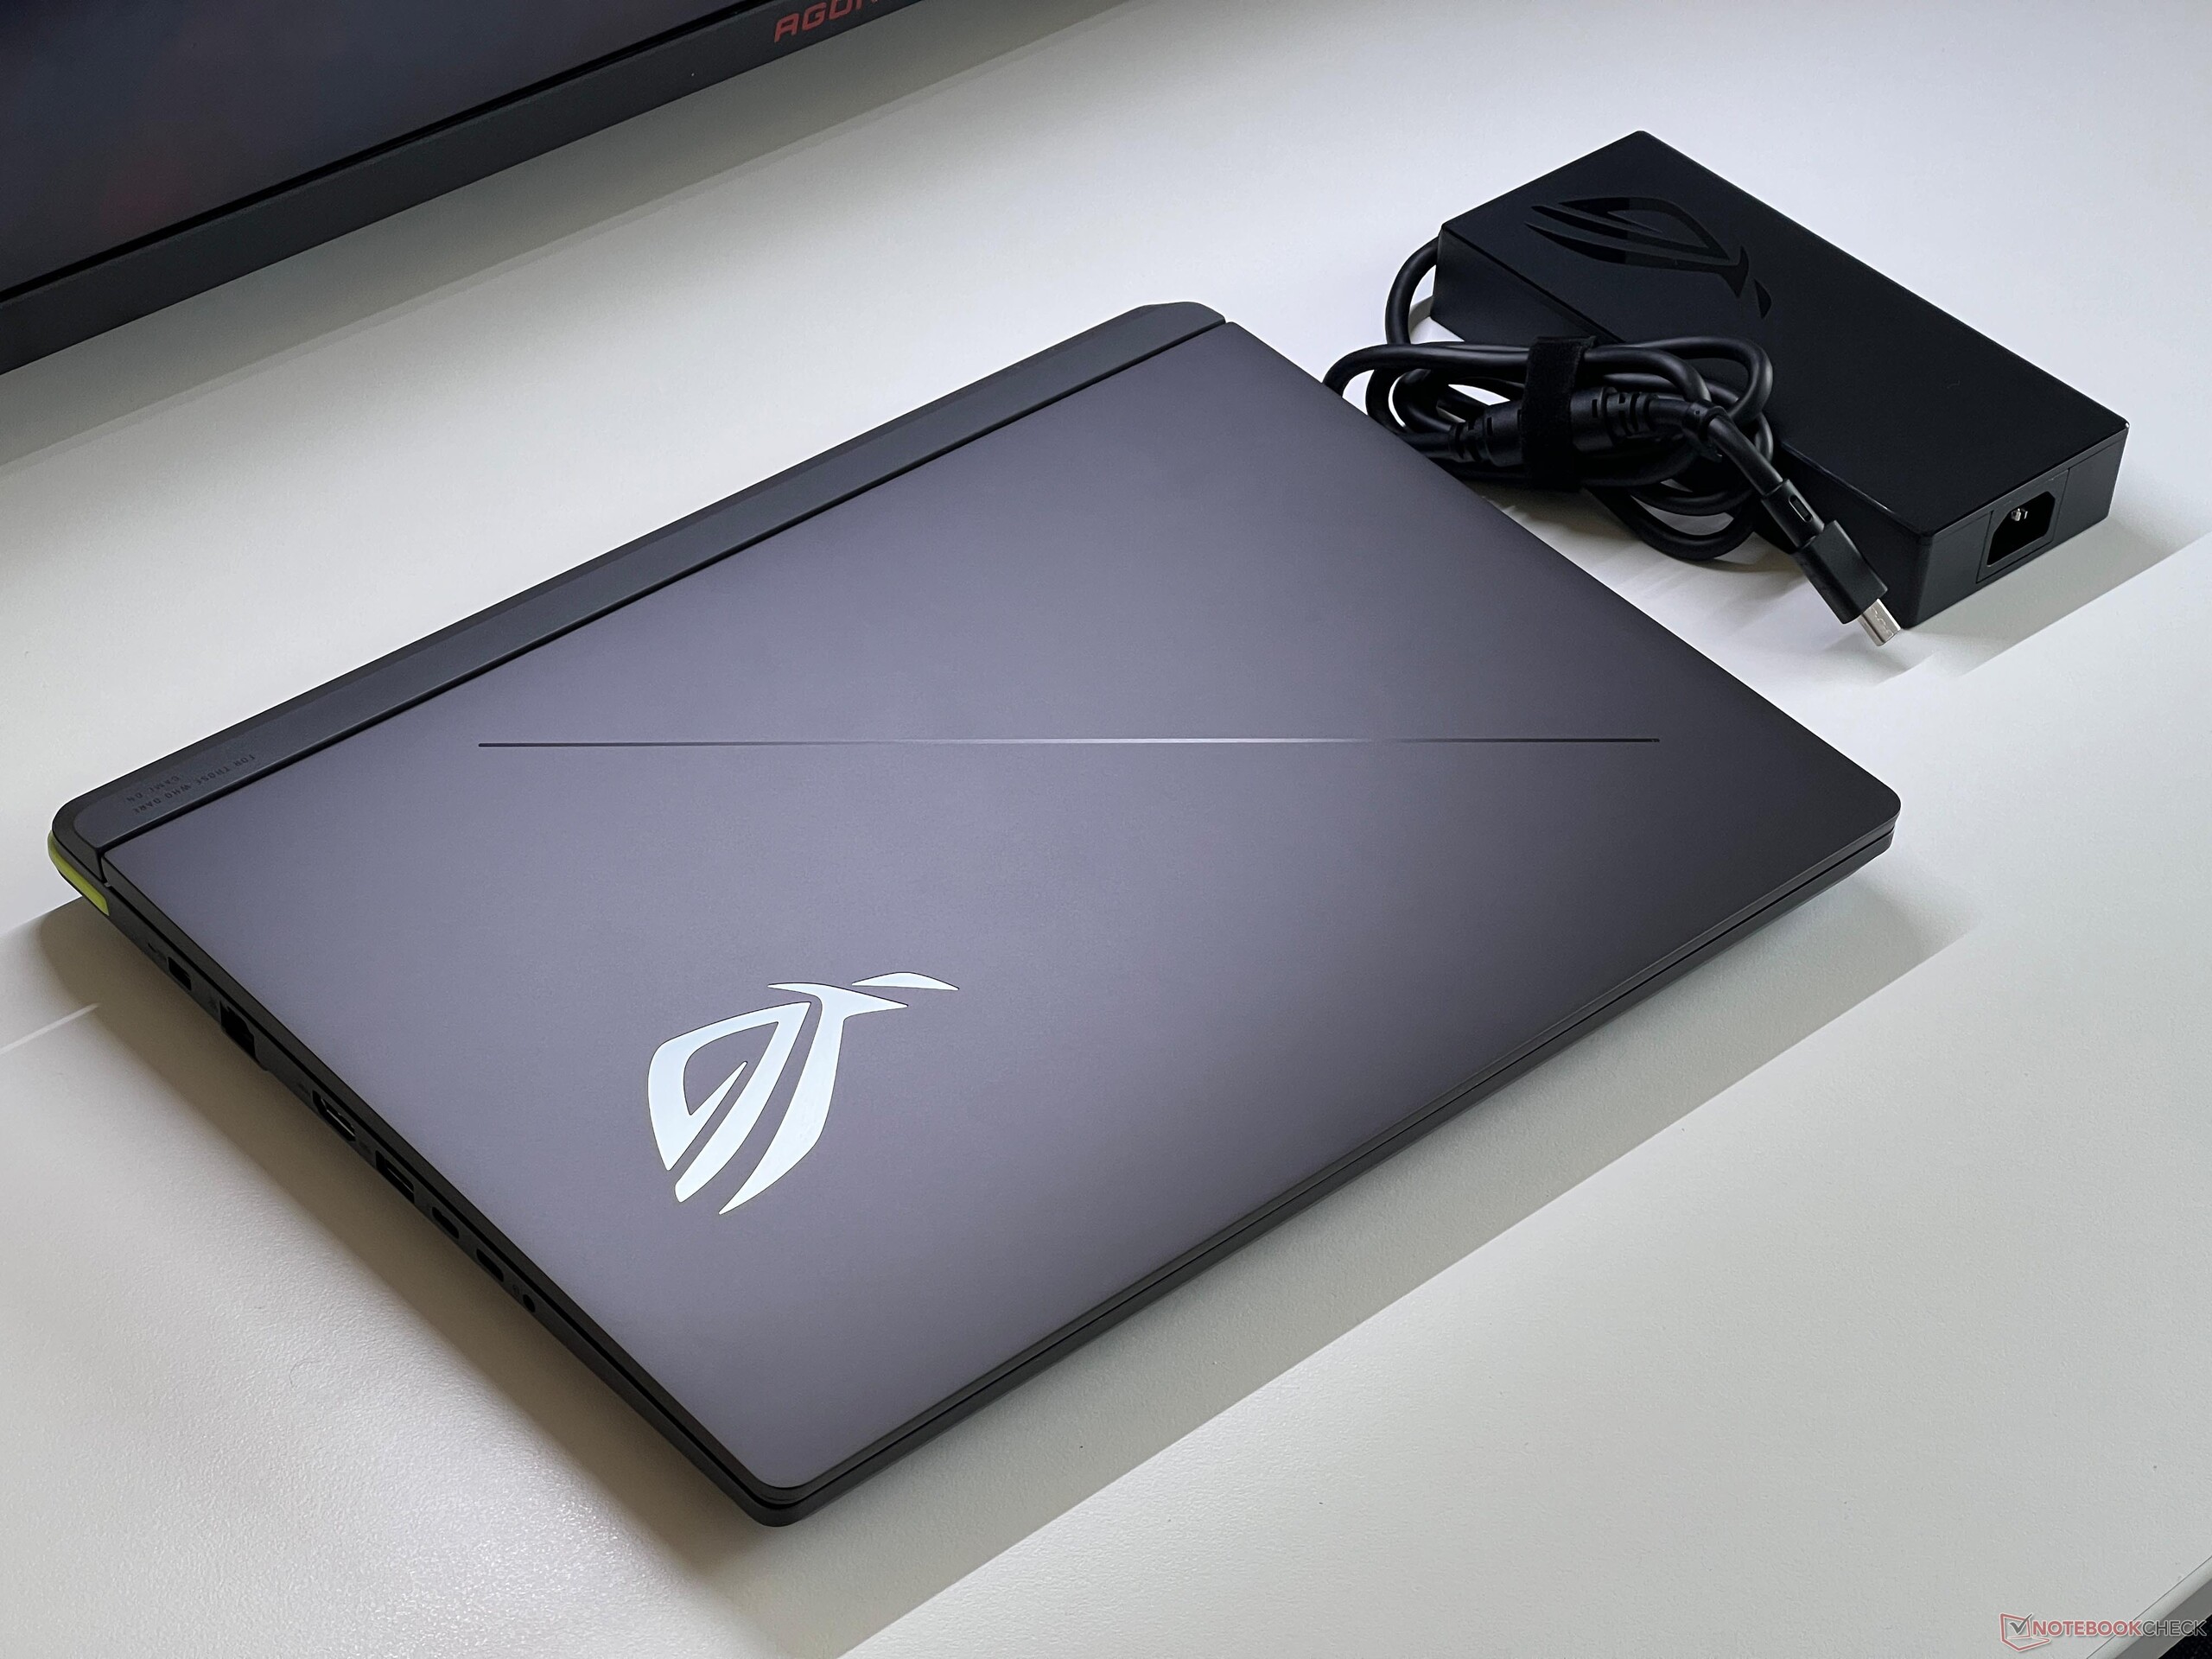
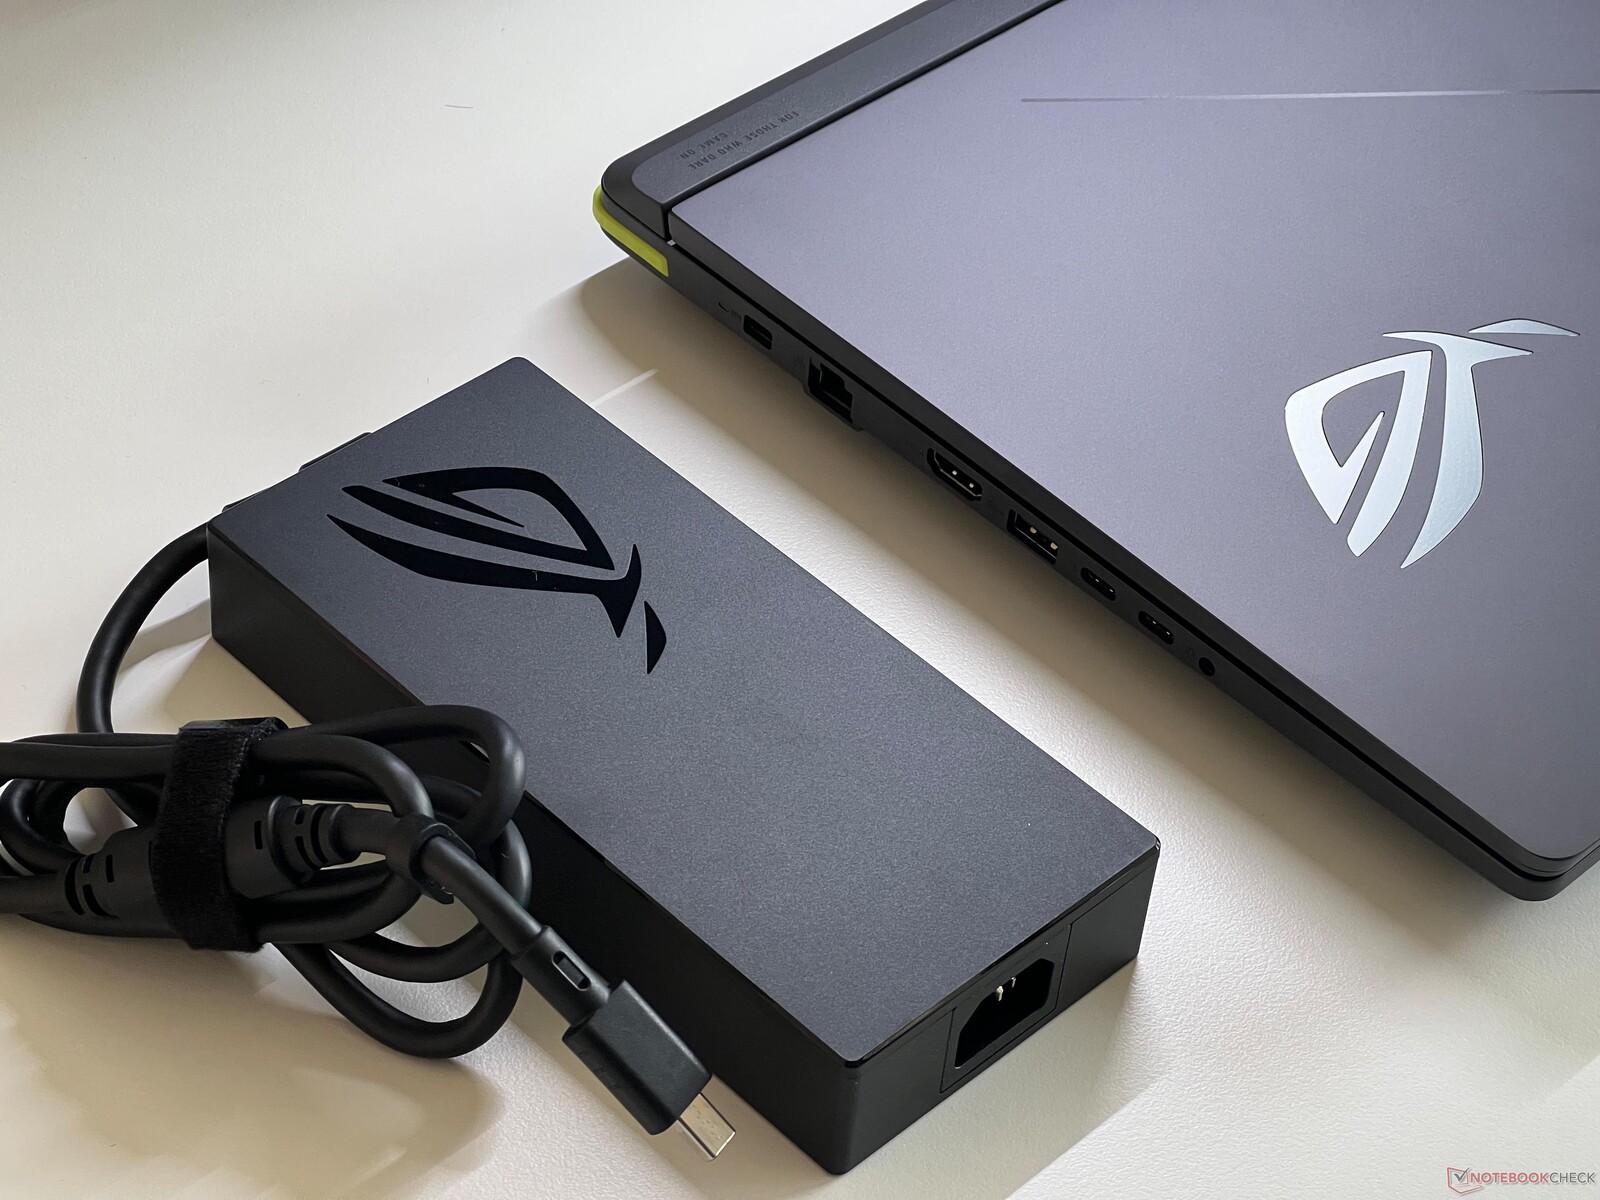
Las diferencias entre nuestros dispositivos de comparación en cuanto a su huella no son muy significativas, ya que todos los portátiles son relativamente grandes. En este sentido, dispositivos como el ROG Zephyrus G16 tienen, por supuesto, ventaja. El peso de nuestra unidad de prueba es de 2,6 kg (~5,7 libras), que también cae en el medio del campo. El cargador de 380 vatios añade otro 1 kg (~2,2 lbs) al peso.
Equipo - Strix G16 con Thunderbolt 5
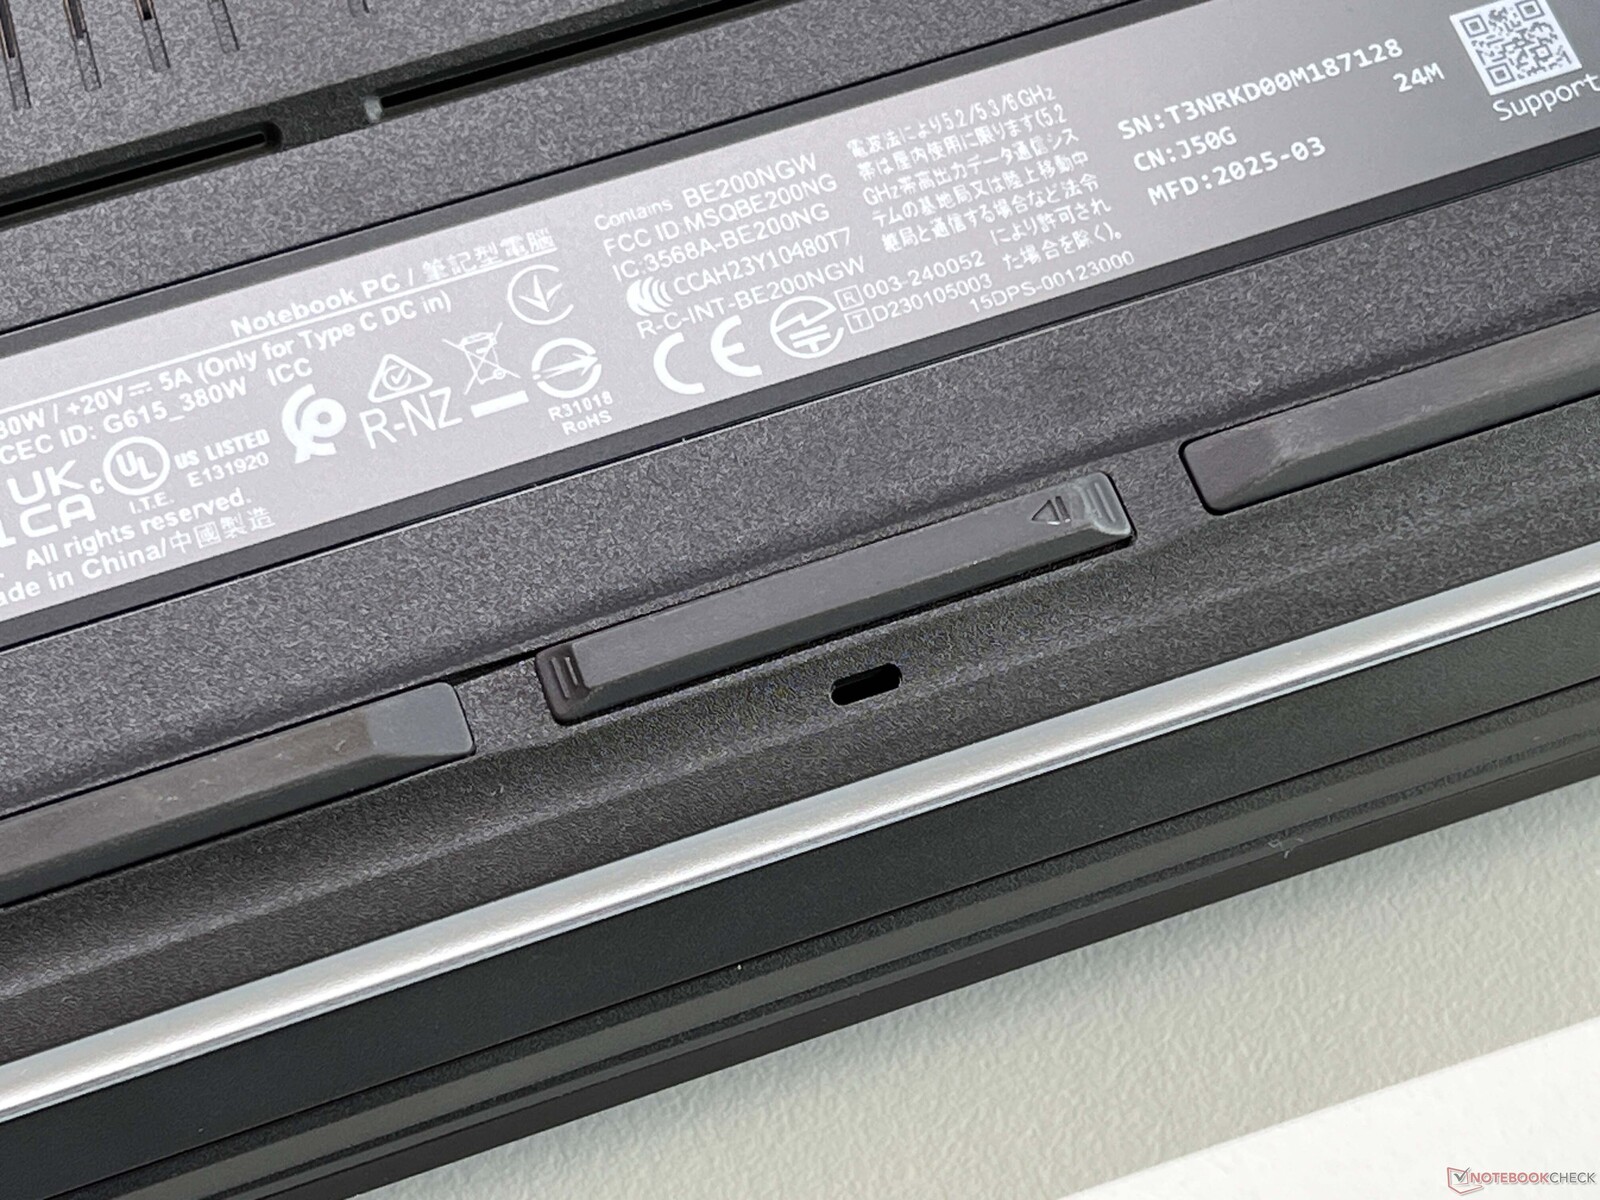
Dado que toda la parte trasera de la caja se utiliza para las aberturas de refrigeración, todas las conexiones se distribuyen por ambos lados. Especialmente con las conexiones de red, la alimentación o las salidas de imagen, esta no siempre es una solución ideal. La Strix G16 ya soporta Thunderbolt 5, y hay suficientes conexiones en general. Aunque no se trata de un portátil Copilot+, funciones como los efectos de estudio para la webcam o los subtítulos en directo siguen siendo compatibles.
Comunicación
Además de la conexión Ethernet (2,5 Gbit/s), también dispone de un moderno módulo Wi-Fi 7 que incluye compatibilidad con Bluetooth 5.4. La velocidad de conexión es muy buena y estable en nuestra prueba estandarizada con el router de referencia Asus.
| Networking | |
| Asus ROG Strix G16 G615 | |
| iperf3 transmit AXE11000 | |
| iperf3 receive AXE11000 | |
| Acer Predator Helios 16 PH16-72 | |
| iperf3 transmit AXE11000 | |
| iperf3 receive AXE11000 | |
| iperf3 transmit AXE11000 6GHz | |
| iperf3 receive AXE11000 6GHz | |
| SCHENKER XMG Neo 16 (Early 24) | |
| iperf3 transmit AXE11000 | |
| iperf3 receive AXE11000 | |
| Asus ROG Strix Scar 16 G634JZR | |
| iperf3 transmit AXE11000 | |
| iperf3 receive AXE11000 | |
| iperf3 transmit AXE11000 6GHz | |
| iperf3 receive AXE11000 6GHz | |
| HP Omen 16 (2024) | |
| iperf3 transmit AXE11000 | |
| iperf3 receive AXE11000 | |
| Lenovo Legion Pro 7 16IRX9H | |
| iperf3 transmit AXE11000 | |
| iperf3 receive AXE11000 | |
| Lenovo Legion Pro 7i 16 Gen 10 | |
| iperf3 transmit AXE11000 | |
| iperf3 receive AXE11000 | |
| iperf3 transmit AXE11000 6GHz | |
| iperf3 receive AXE11000 6GHz | |
Cámara web
La webcam 1080p (sin obturador manual) hace su trabajo, pero las fotos que toma no son nada especial. El módulo IR integrado admite el reconocimiento facial a través de Windows Hello.


Mantenimiento
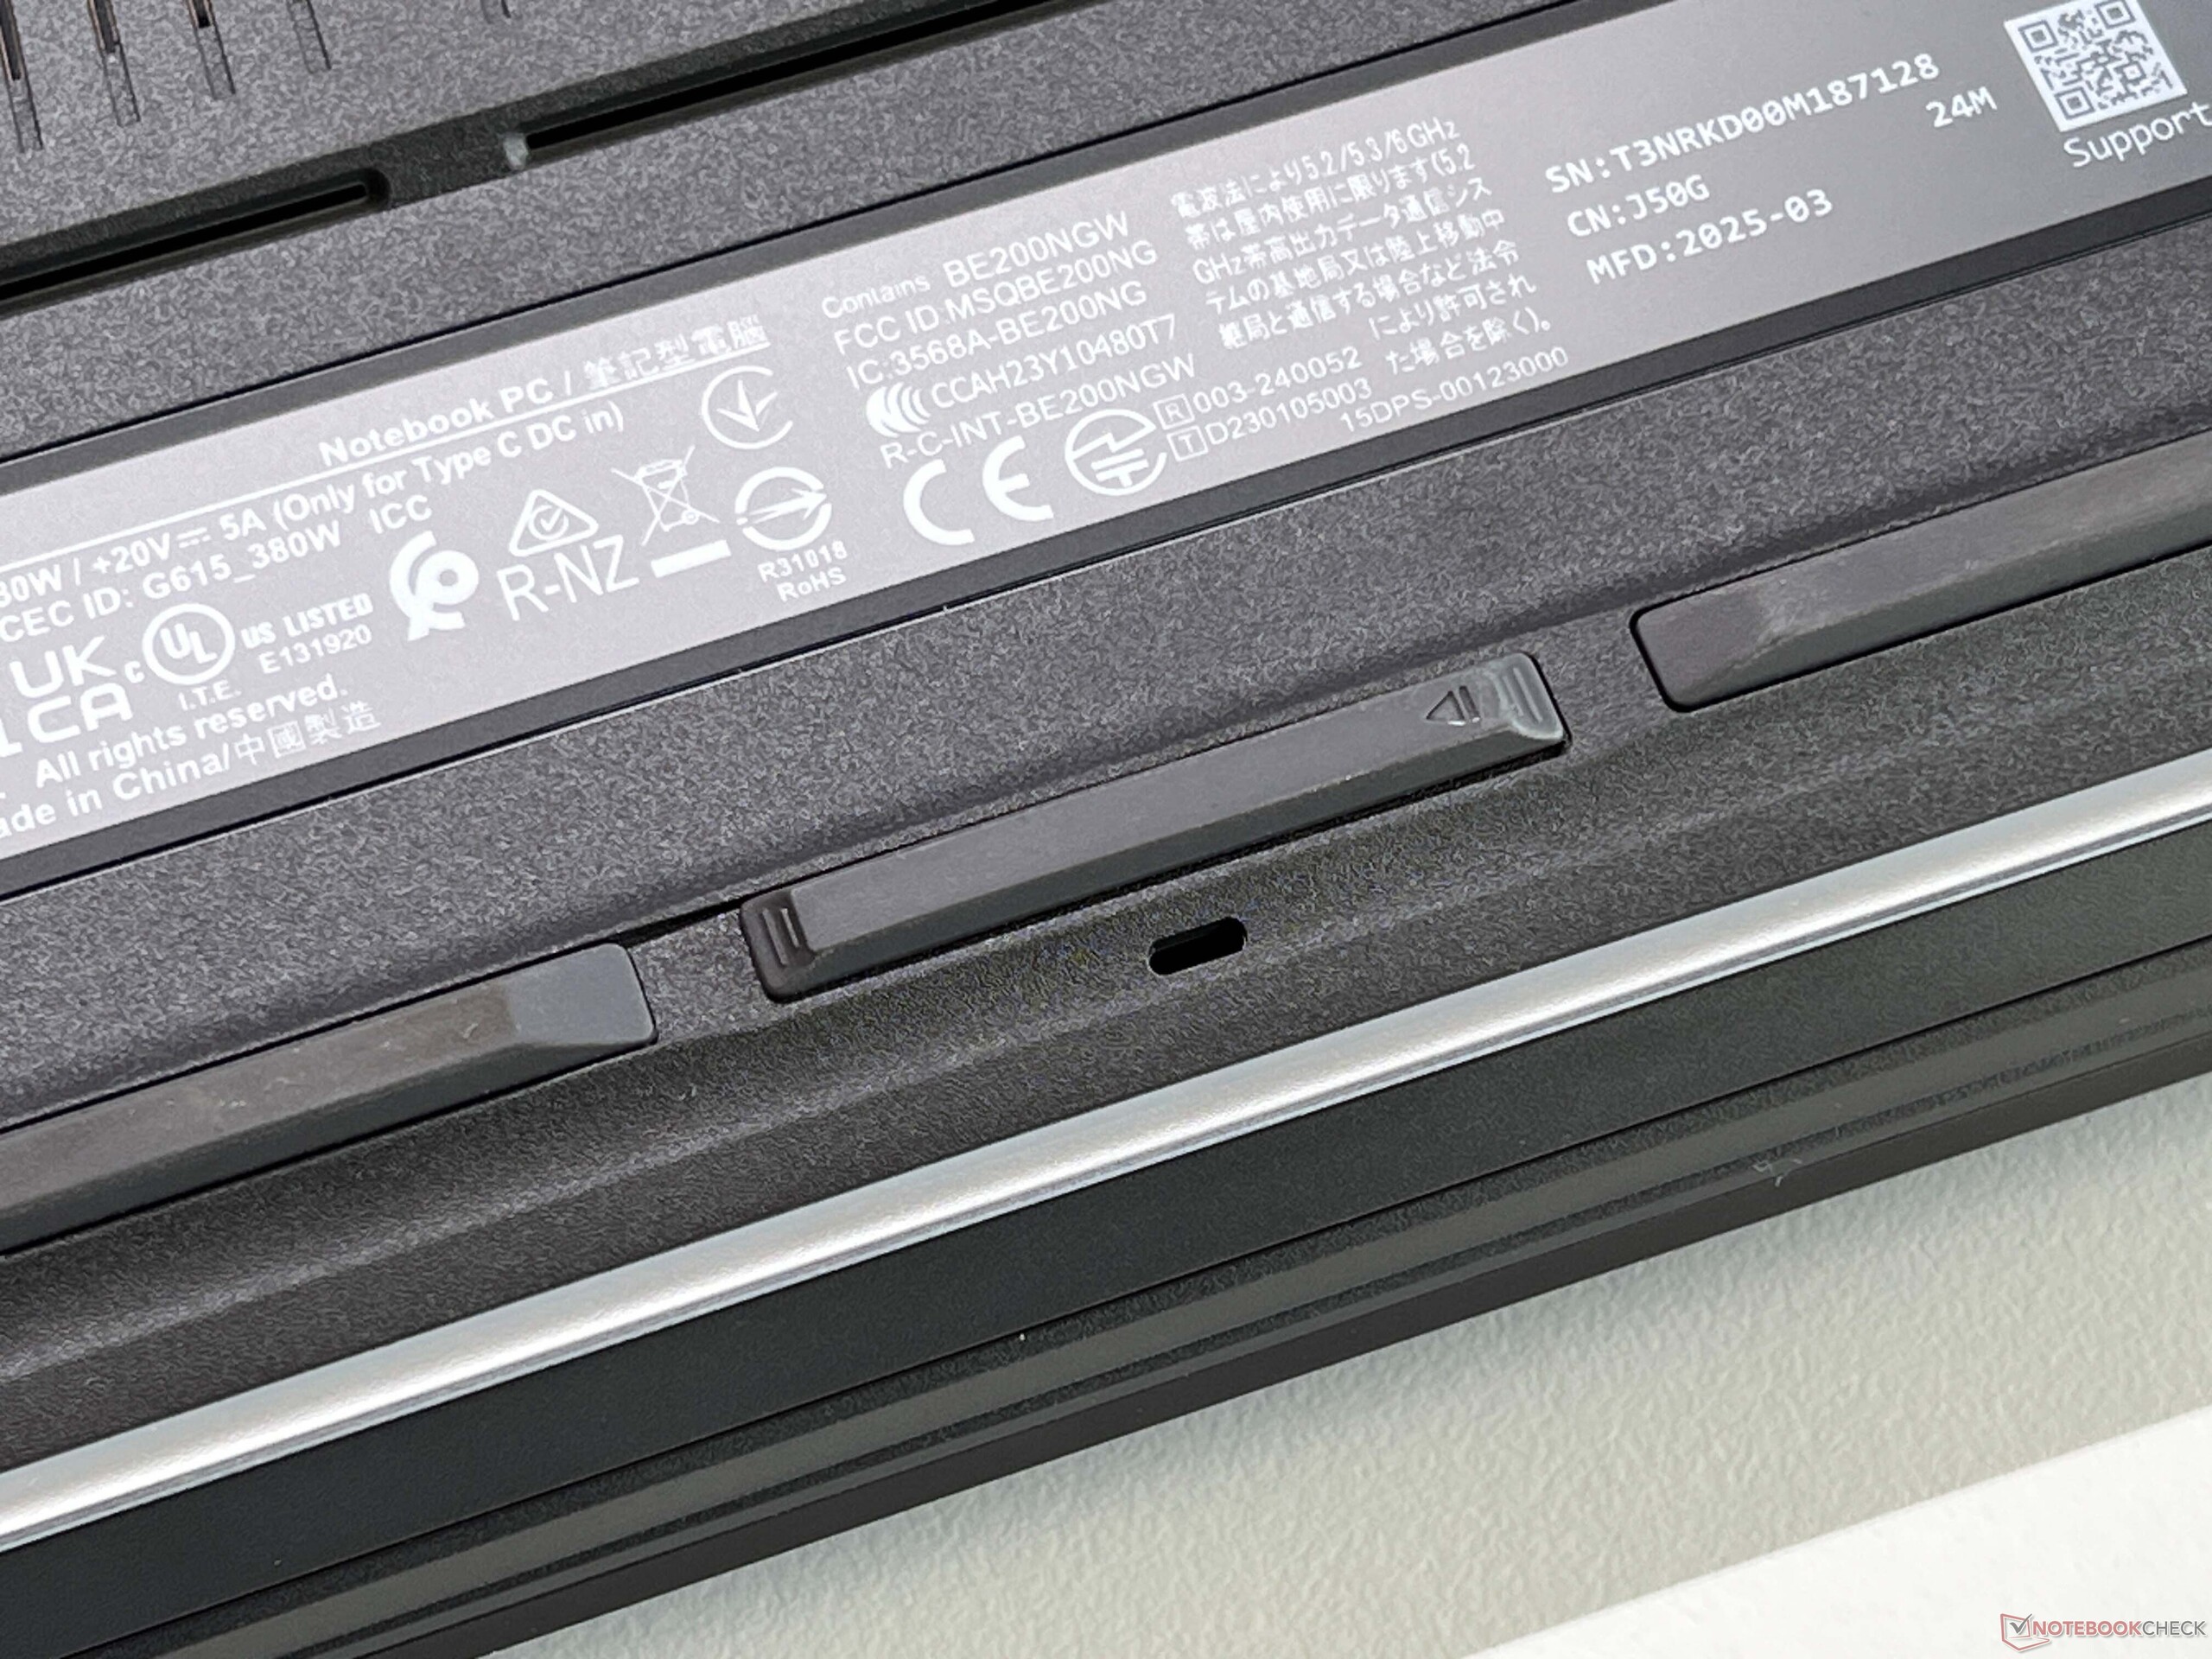
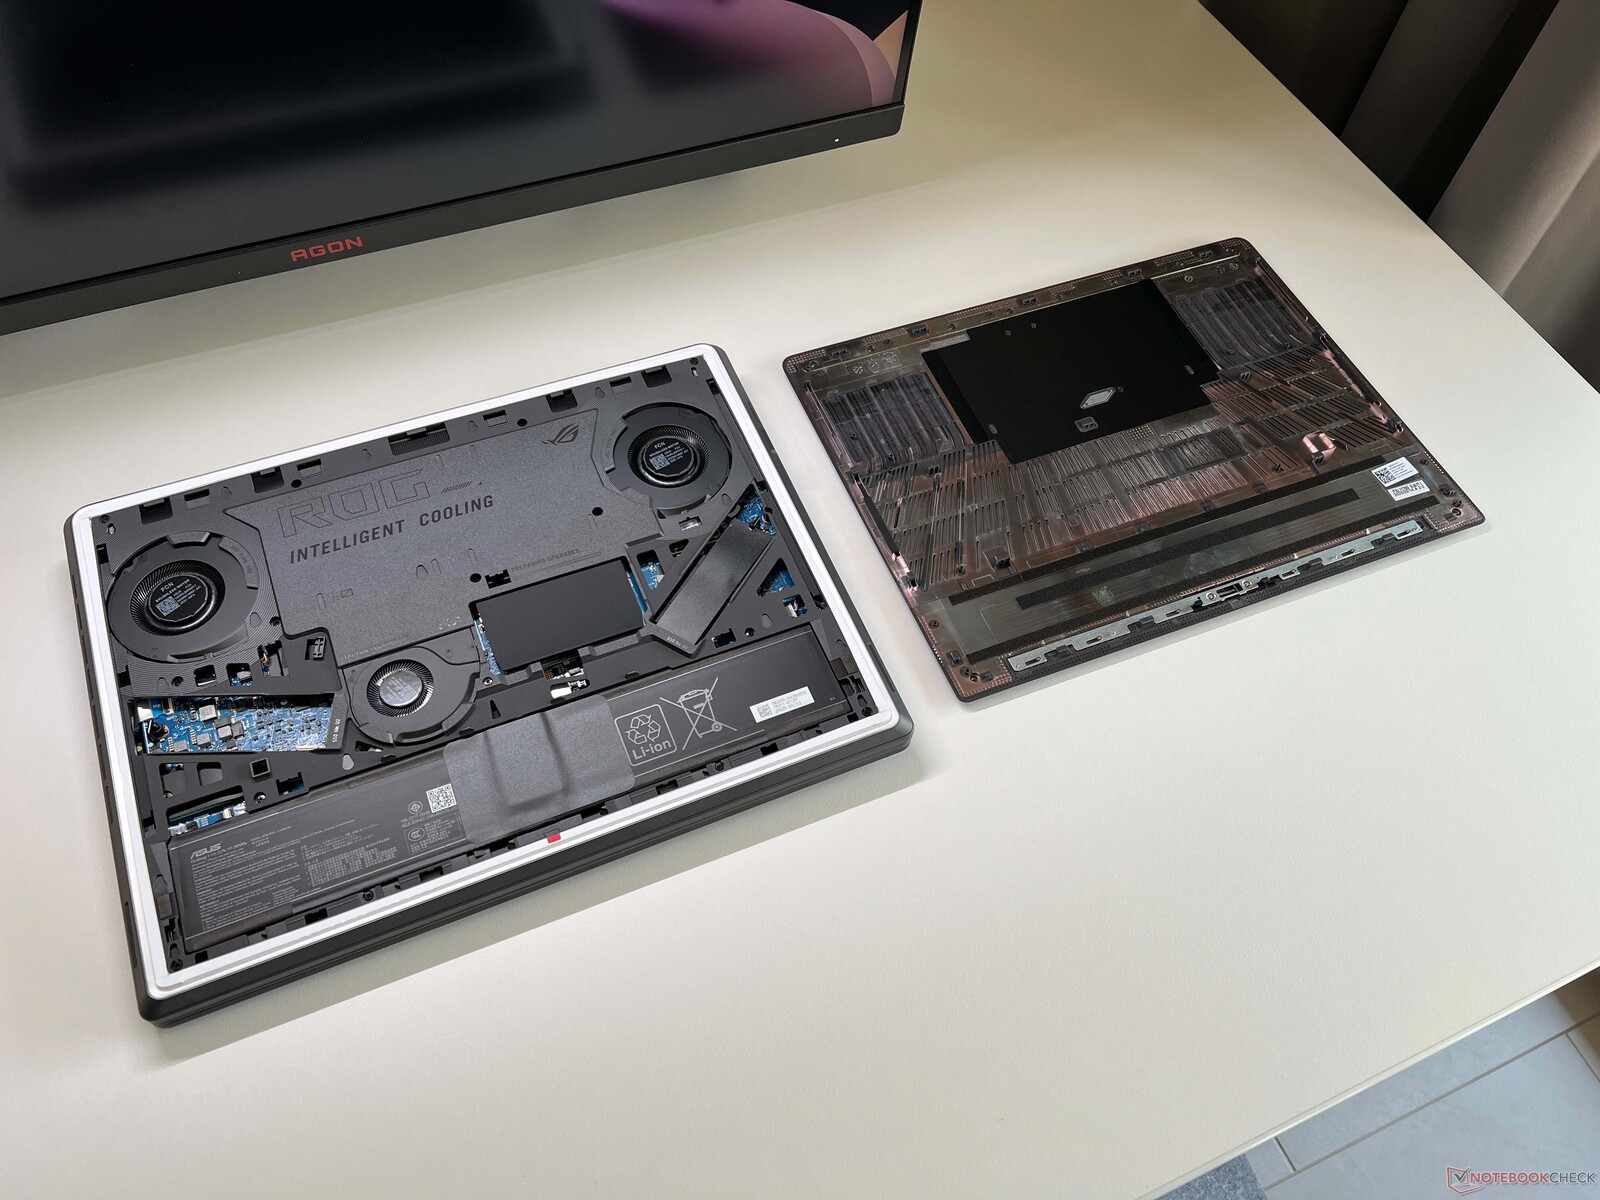
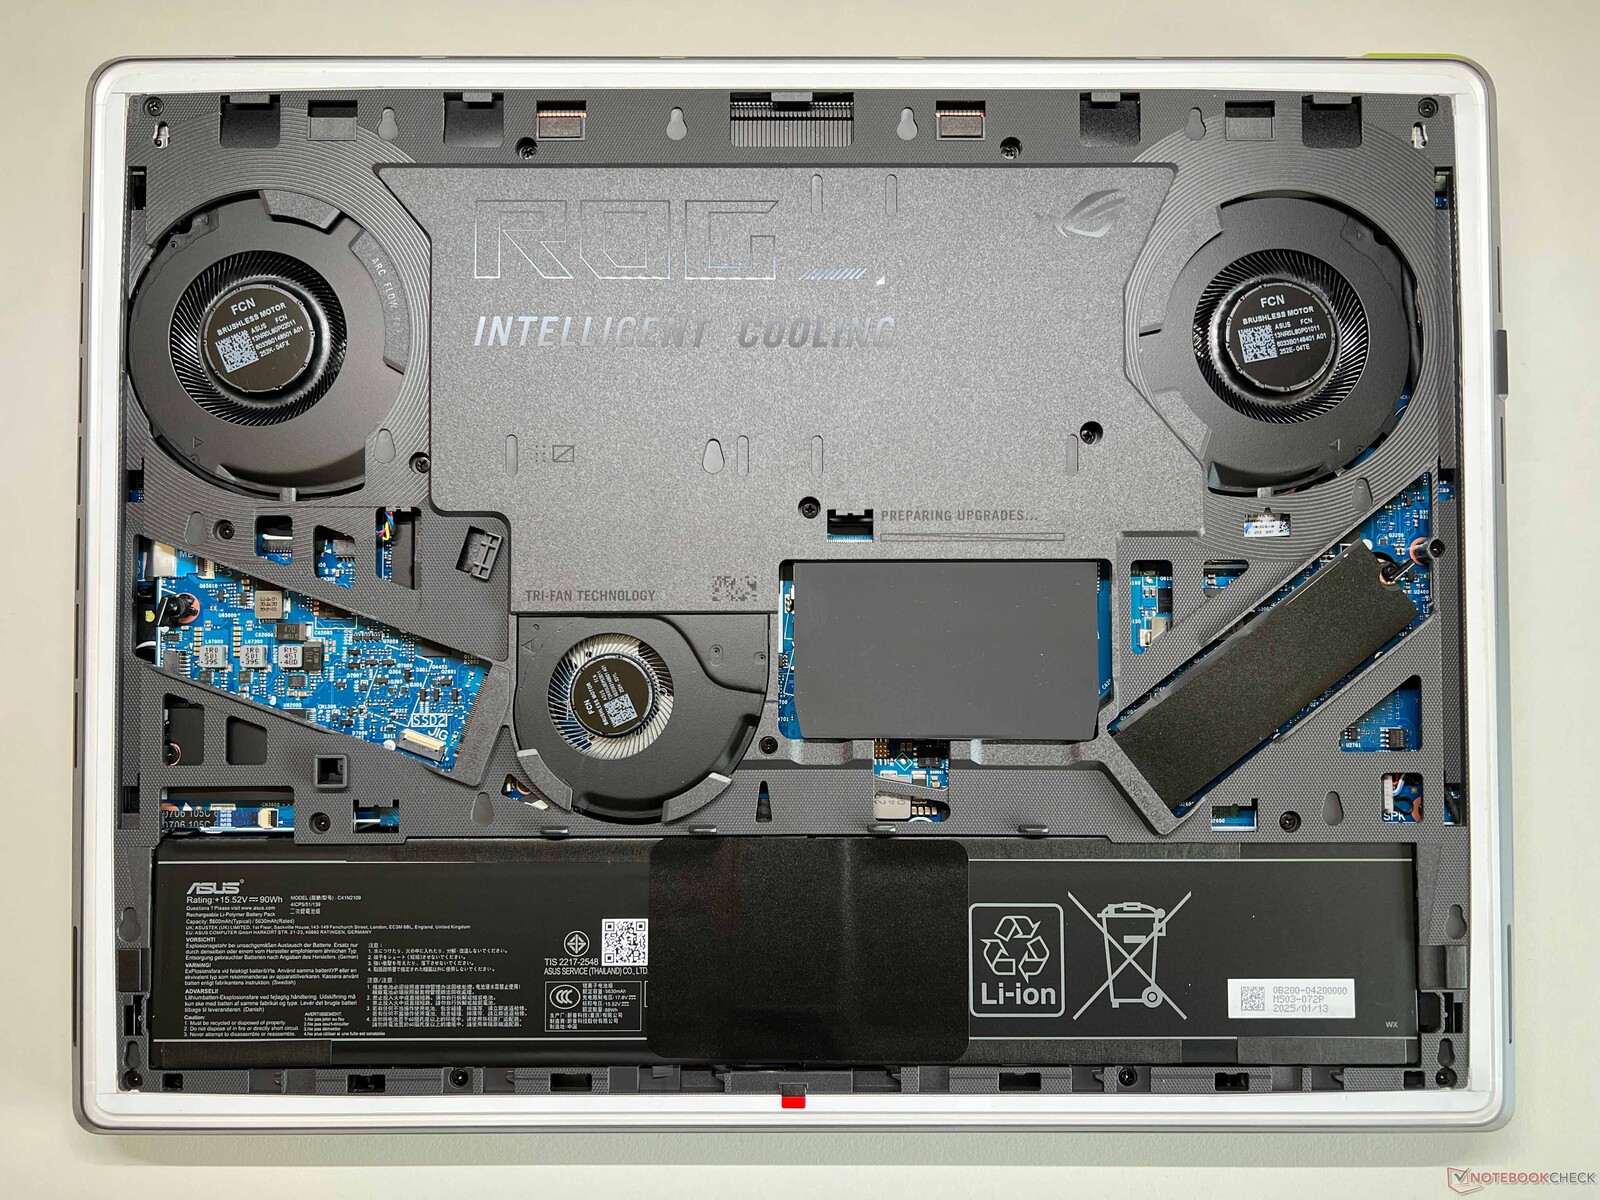
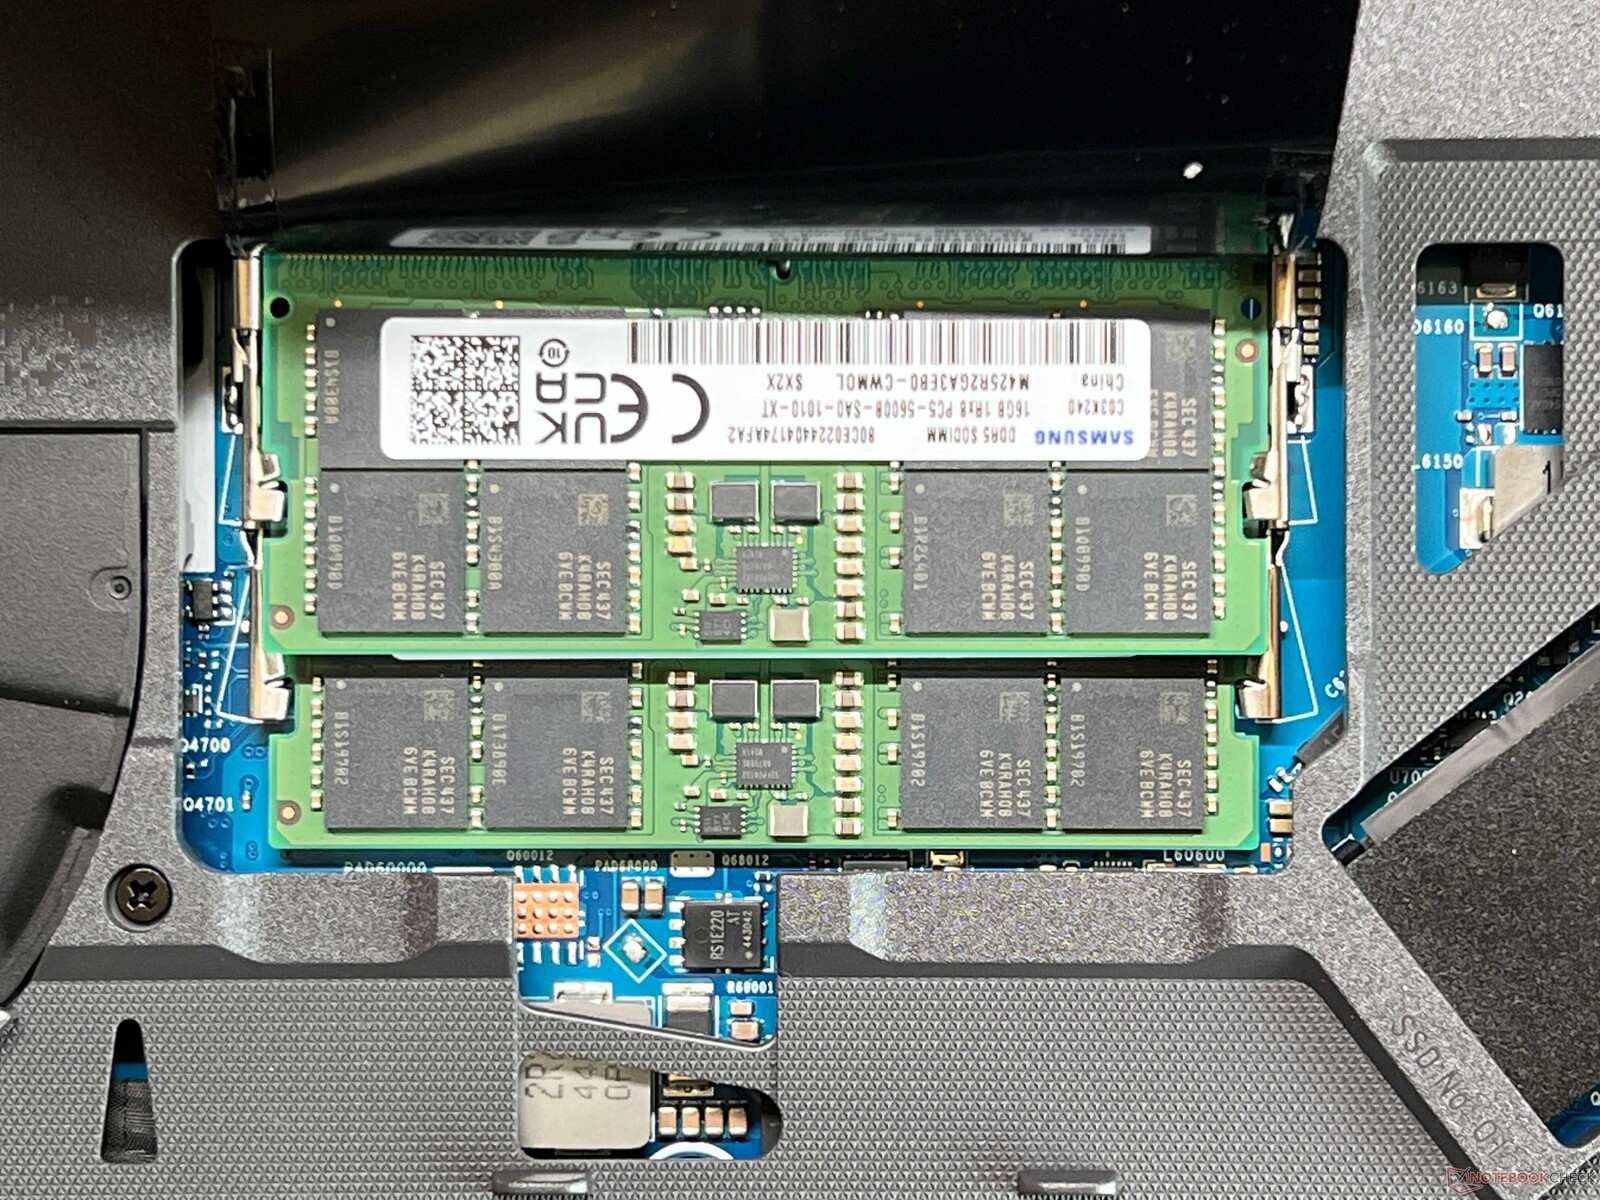
Acceder a los componentes del Strix G16 es extremadamente fácil, ya que se puede abrir fácilmente un cierre de la placa inferior con un pequeño deslizador, lo que permite empujar la placa inferior hacia la parte delantera para extraerla. El interior del portátil está dominado por el sistema de refrigeración con su cámara de vapor y tres ventiladores. El usuario también tiene acceso rápido a las dos ranuras SSD y a las dos ranuras para los módulos RAM.
Sostenibilidad
Asus no proporciona ninguna información sobre el uso de materiales reciclados o la huella de CO2. El embalaje está compuesto principalmente de cartón y papel.
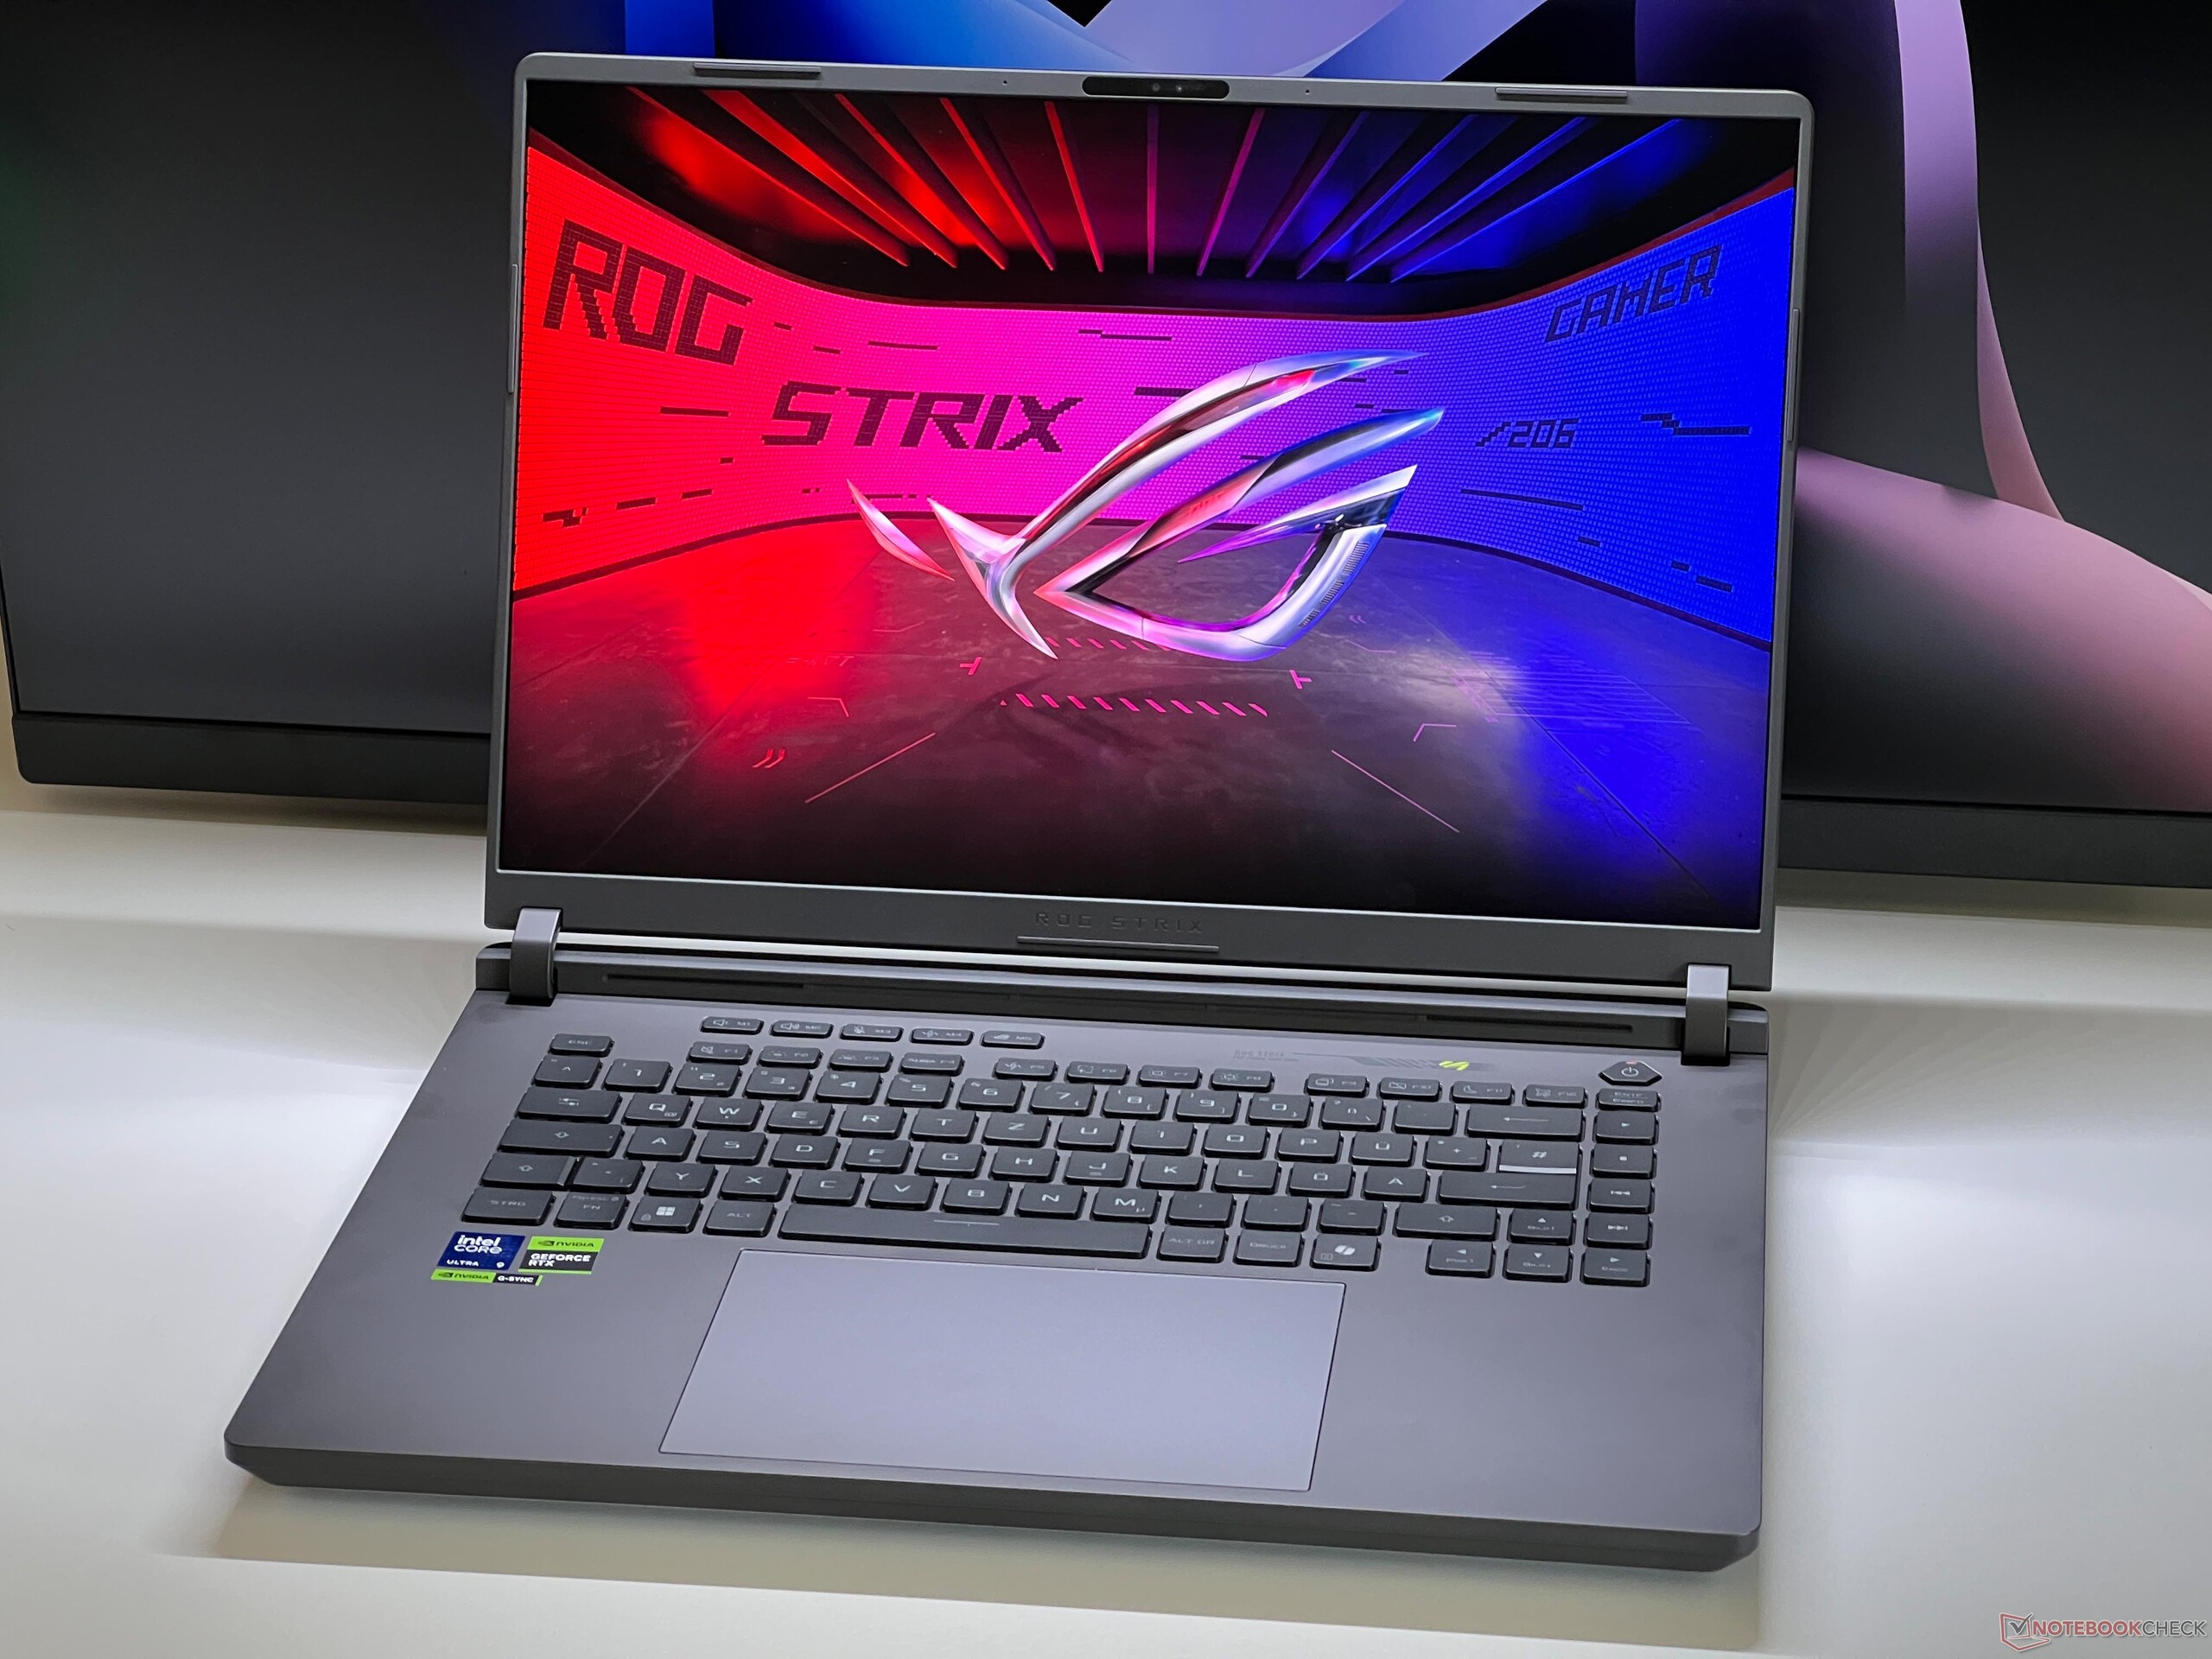
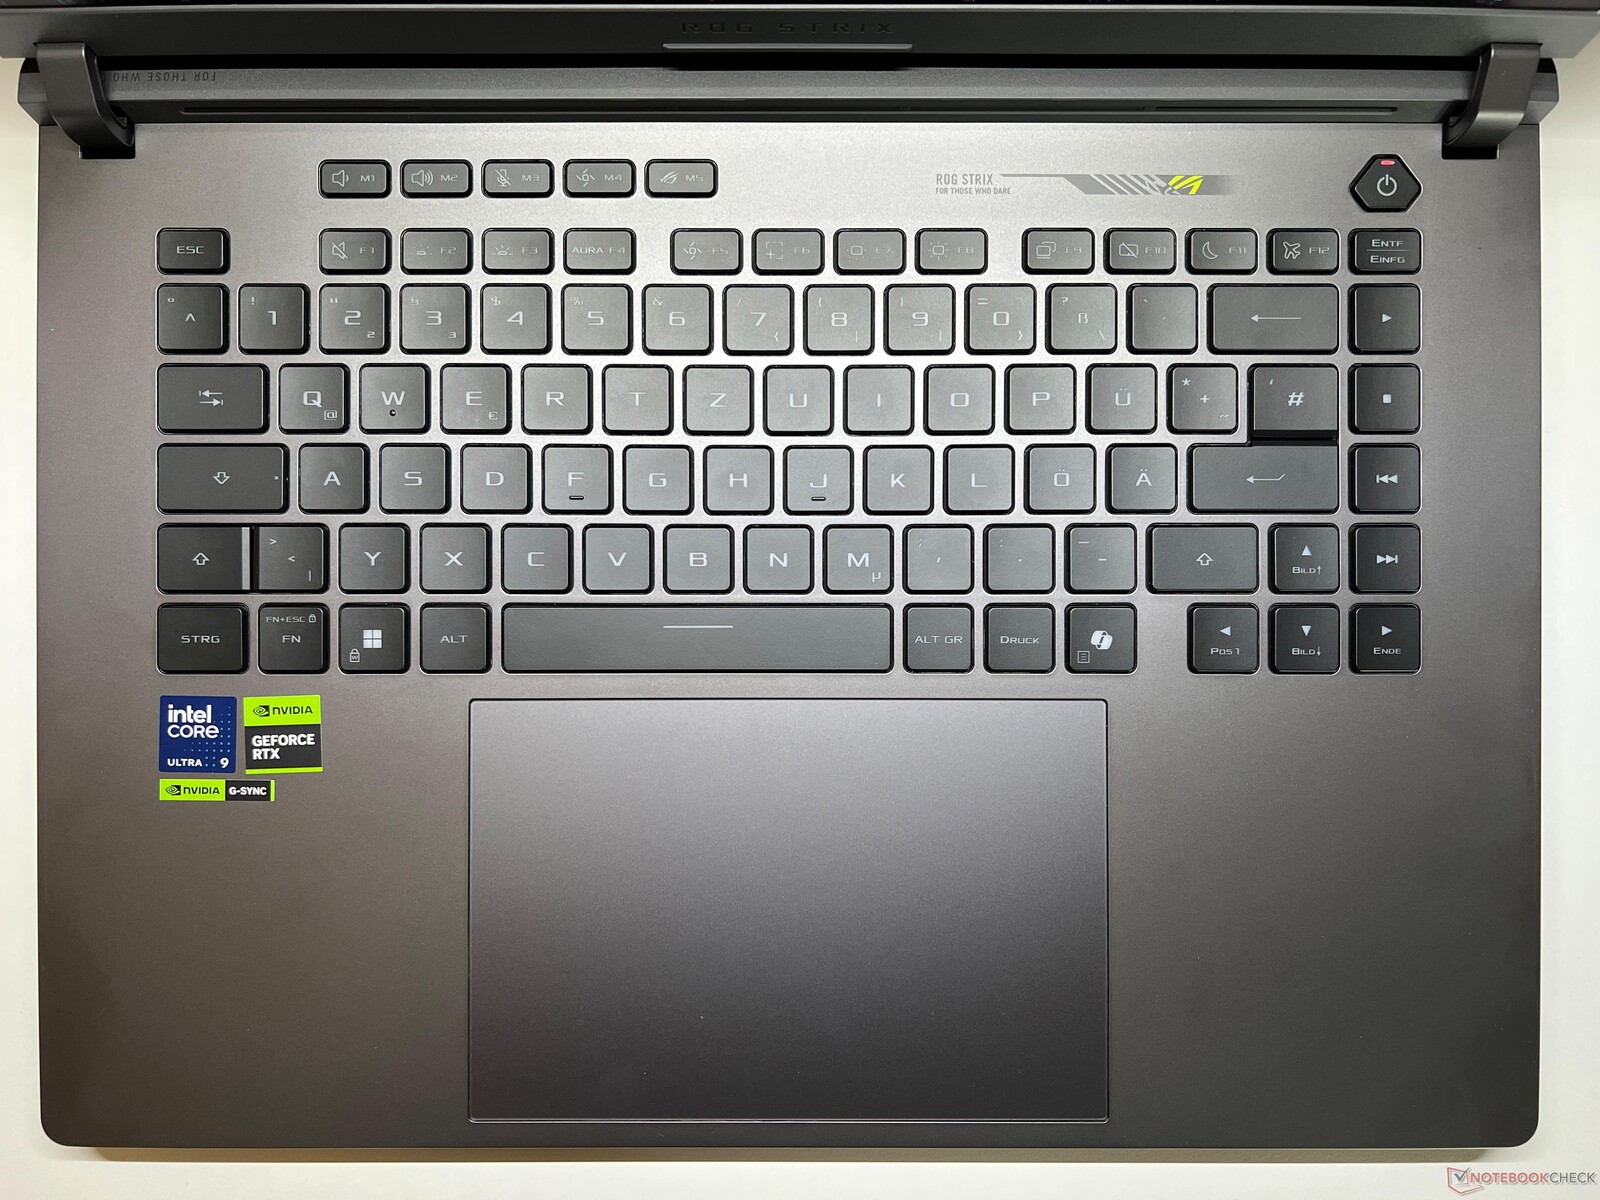
Dispositivos de entrada - Un teclado cómodo
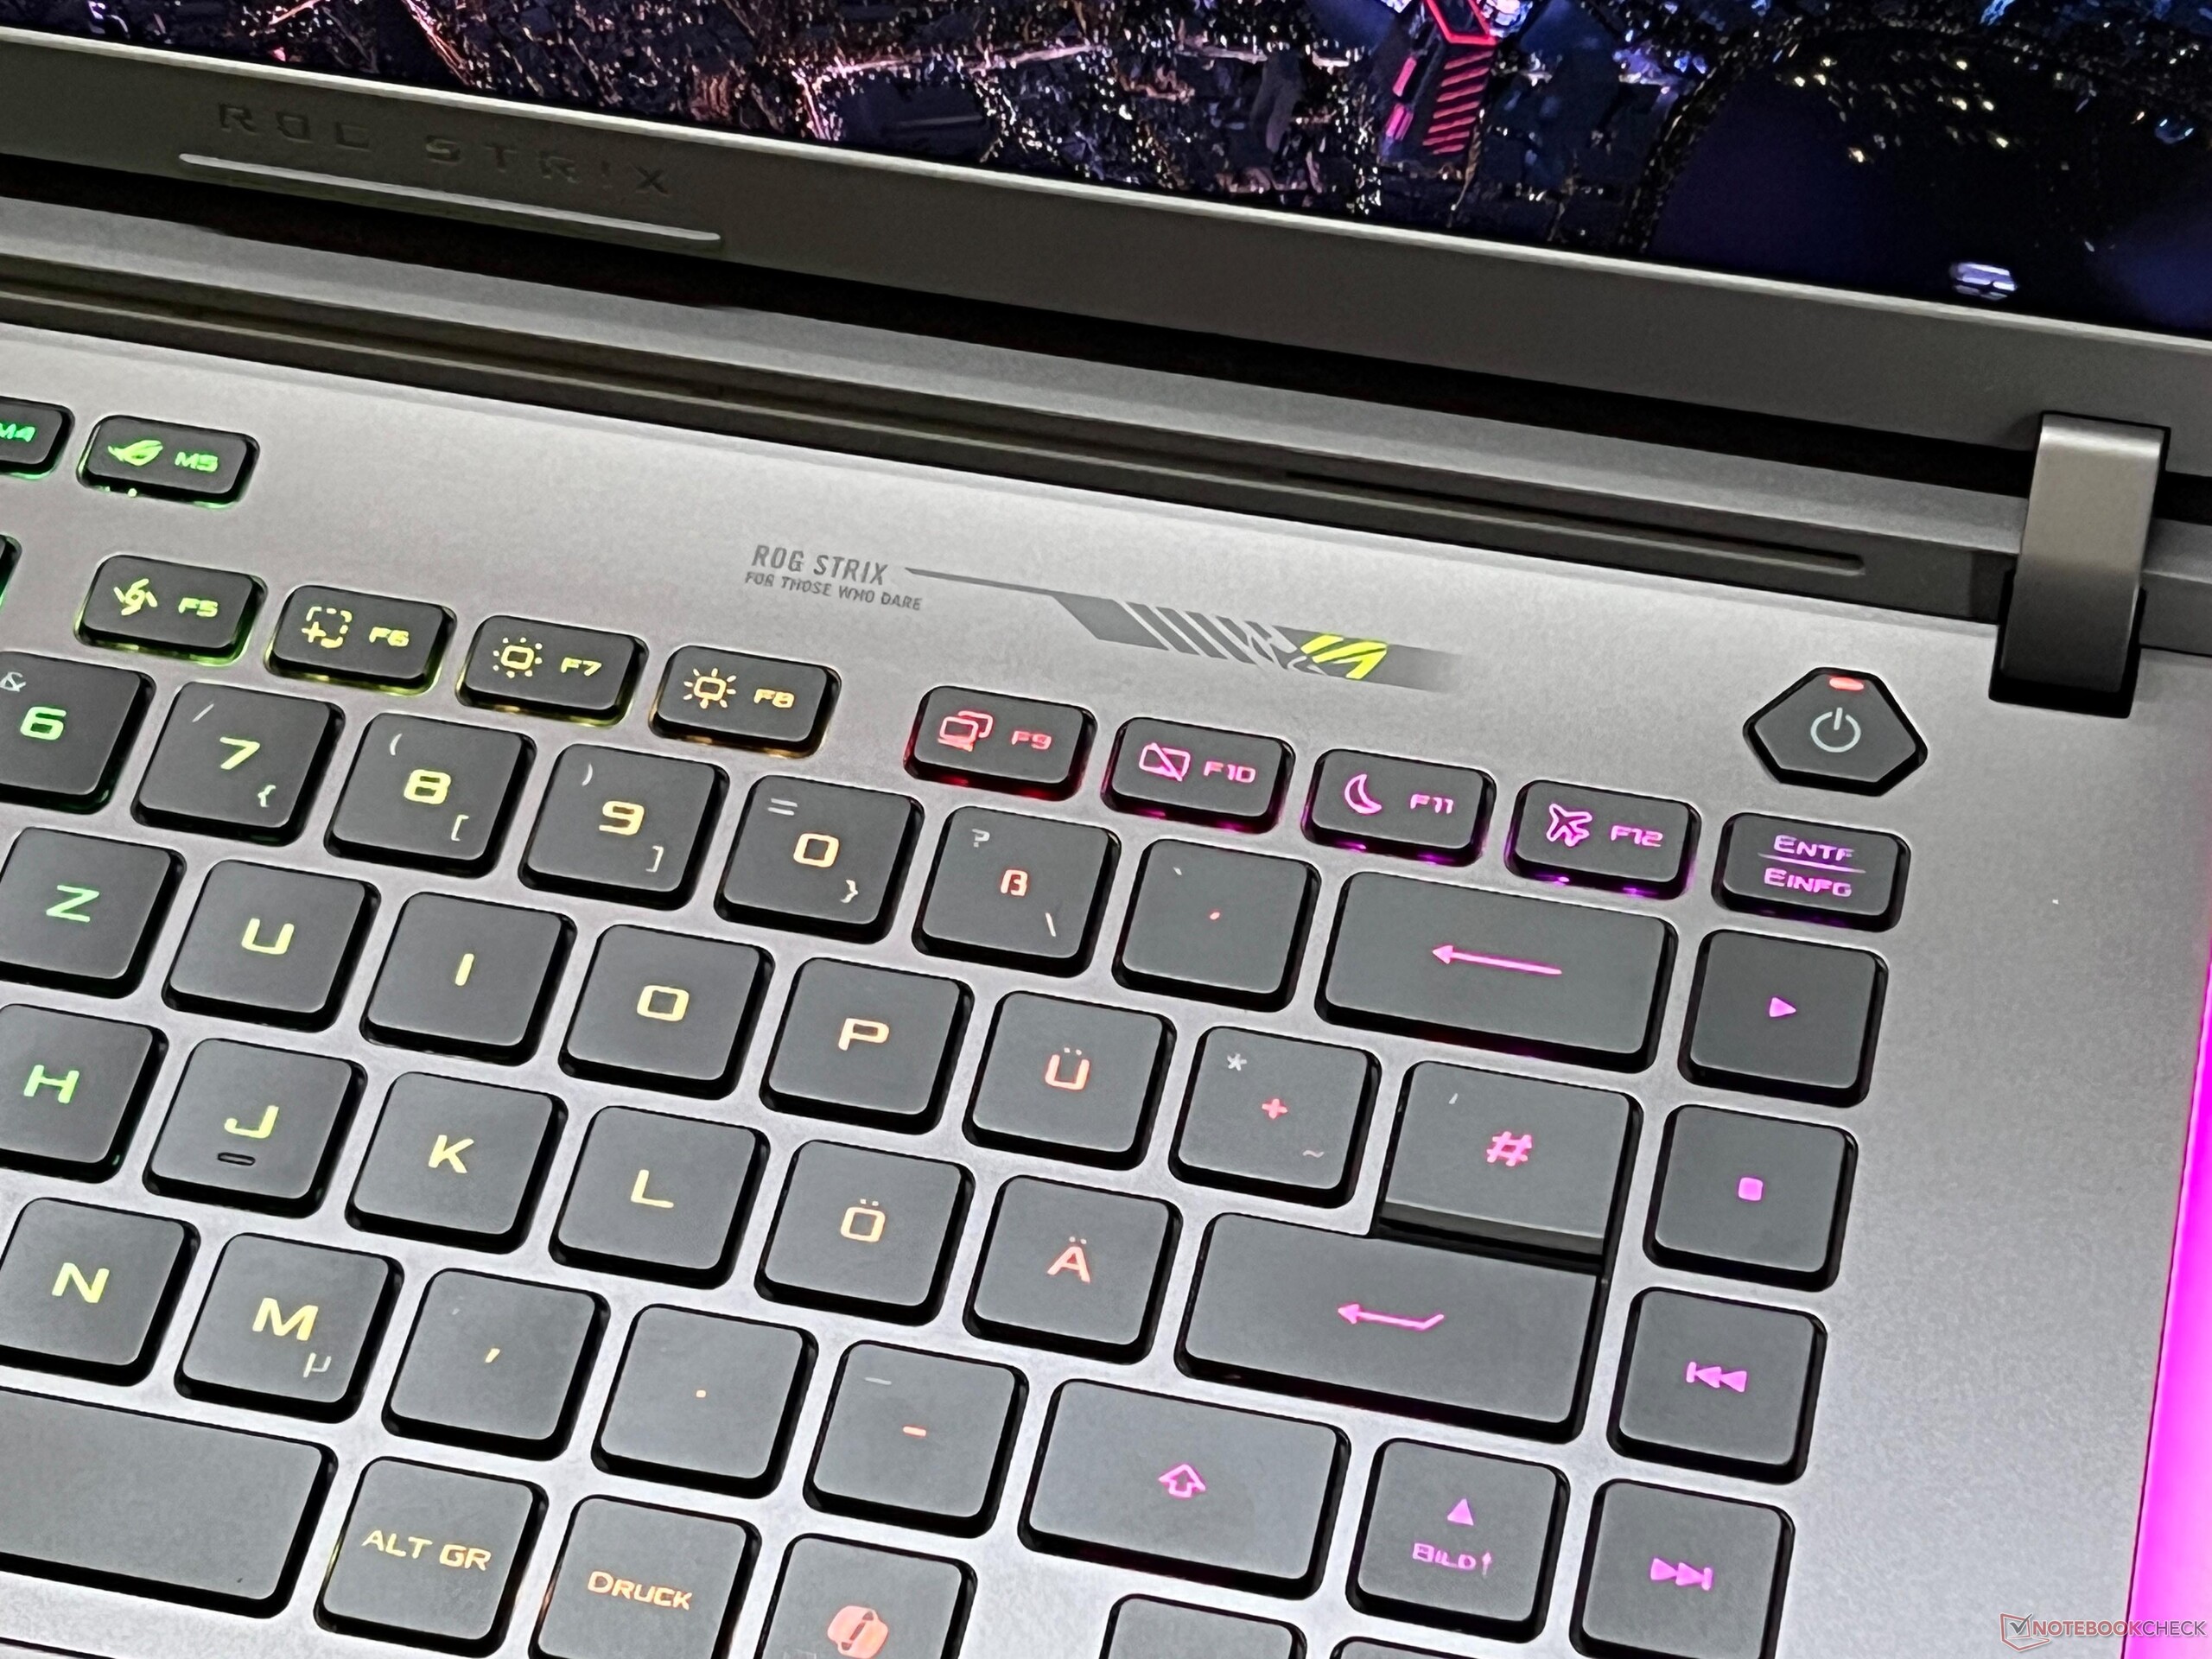
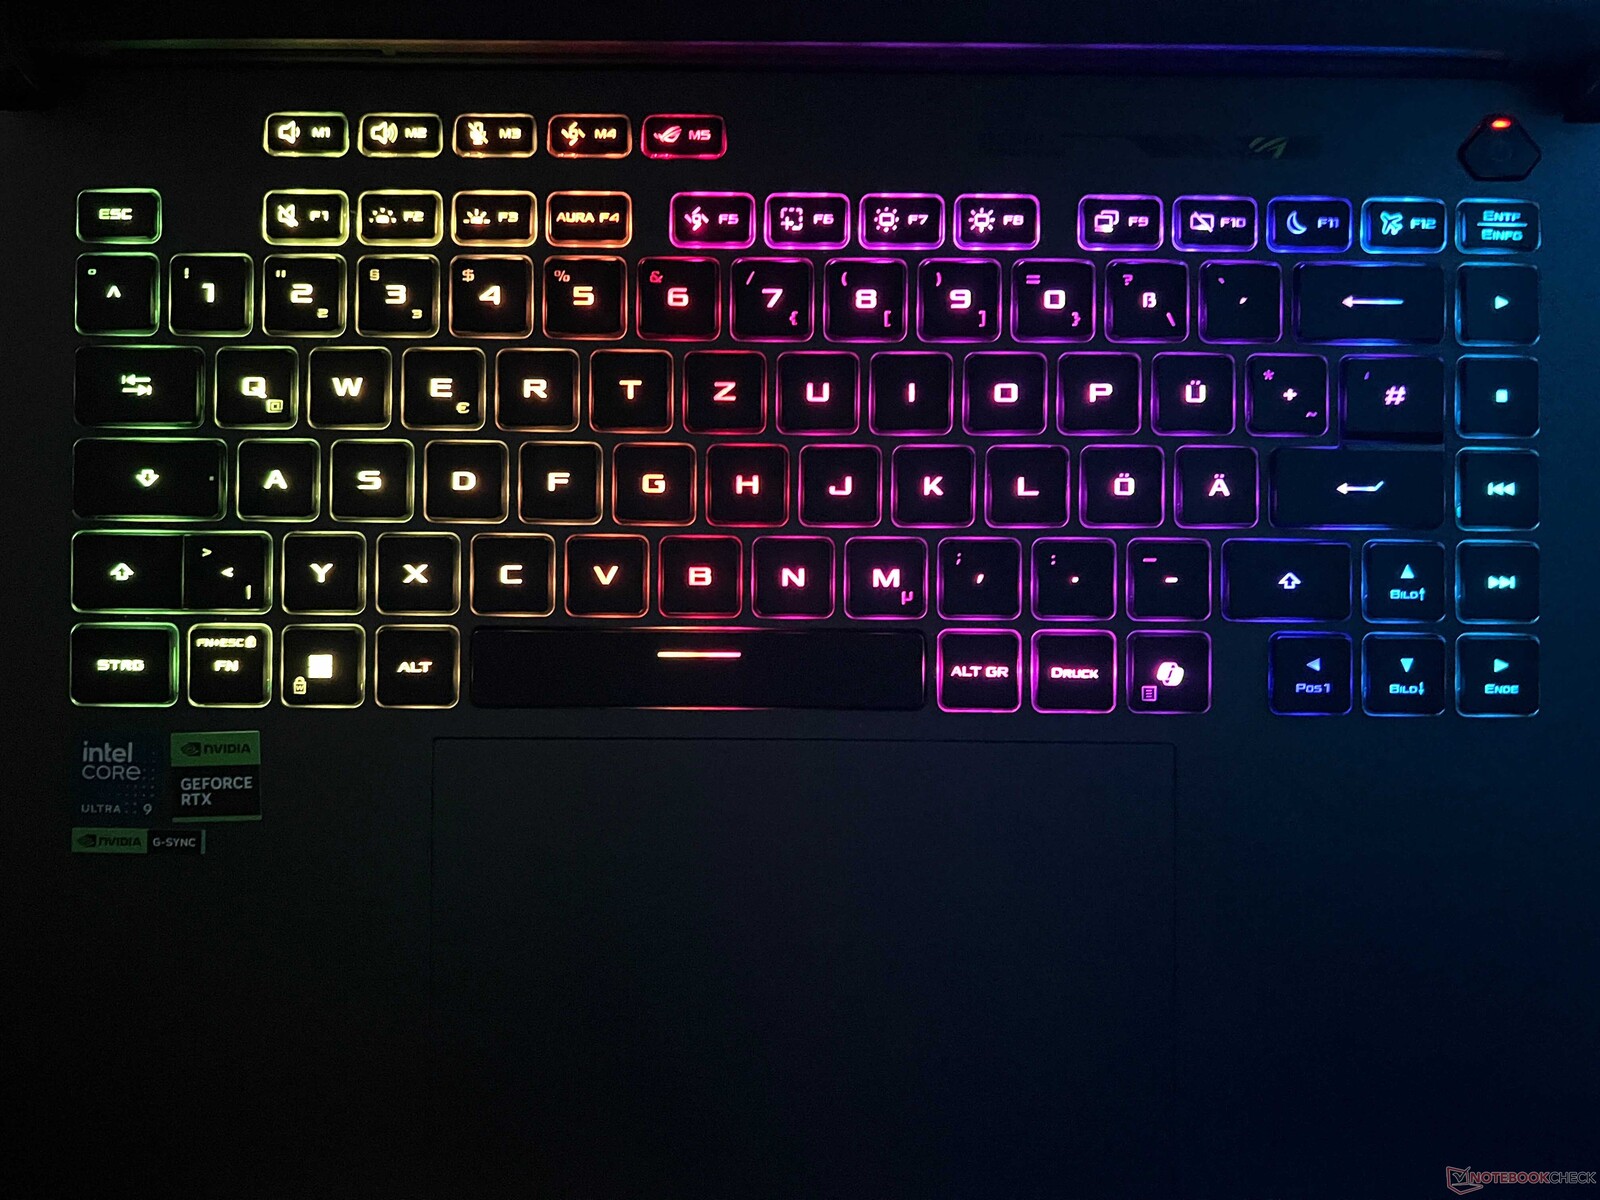
El Strix G16 utiliza un teclado de membrana con un recorrido suficientemente amplio, lo que se traduce en una experiencia general de escritura muy cómoda y silenciosa. Las teclas pueden iluminarse individualmente, lo que, por supuesto, también puede sincronizarse con el resto de la iluminación de la carcasa. La distribución del teclado es muy buena en general, y el tamaño de las teclas de dirección no se ha reducido. Sin embargo, todavía cuesta un poco acostumbrarse a la columna adicional con las teclas para controlar los medios en el lado derecho.
Dado que Asus no incluye aquí un bloque numérico, el gran ClickPad (15 x 9,8 cm, ~5,9 x 3,9 in) se sitúa en el centro de la unidad base. Gracias a sus buenas características de deslizamiento, su manejo funciona sin problemas. Los clics mecánicos de la zona inferior proporcionan una buena respuesta con un sonido de clic sordo y uniforme.
Pantalla - IPS con 240 Hz y G-Sync

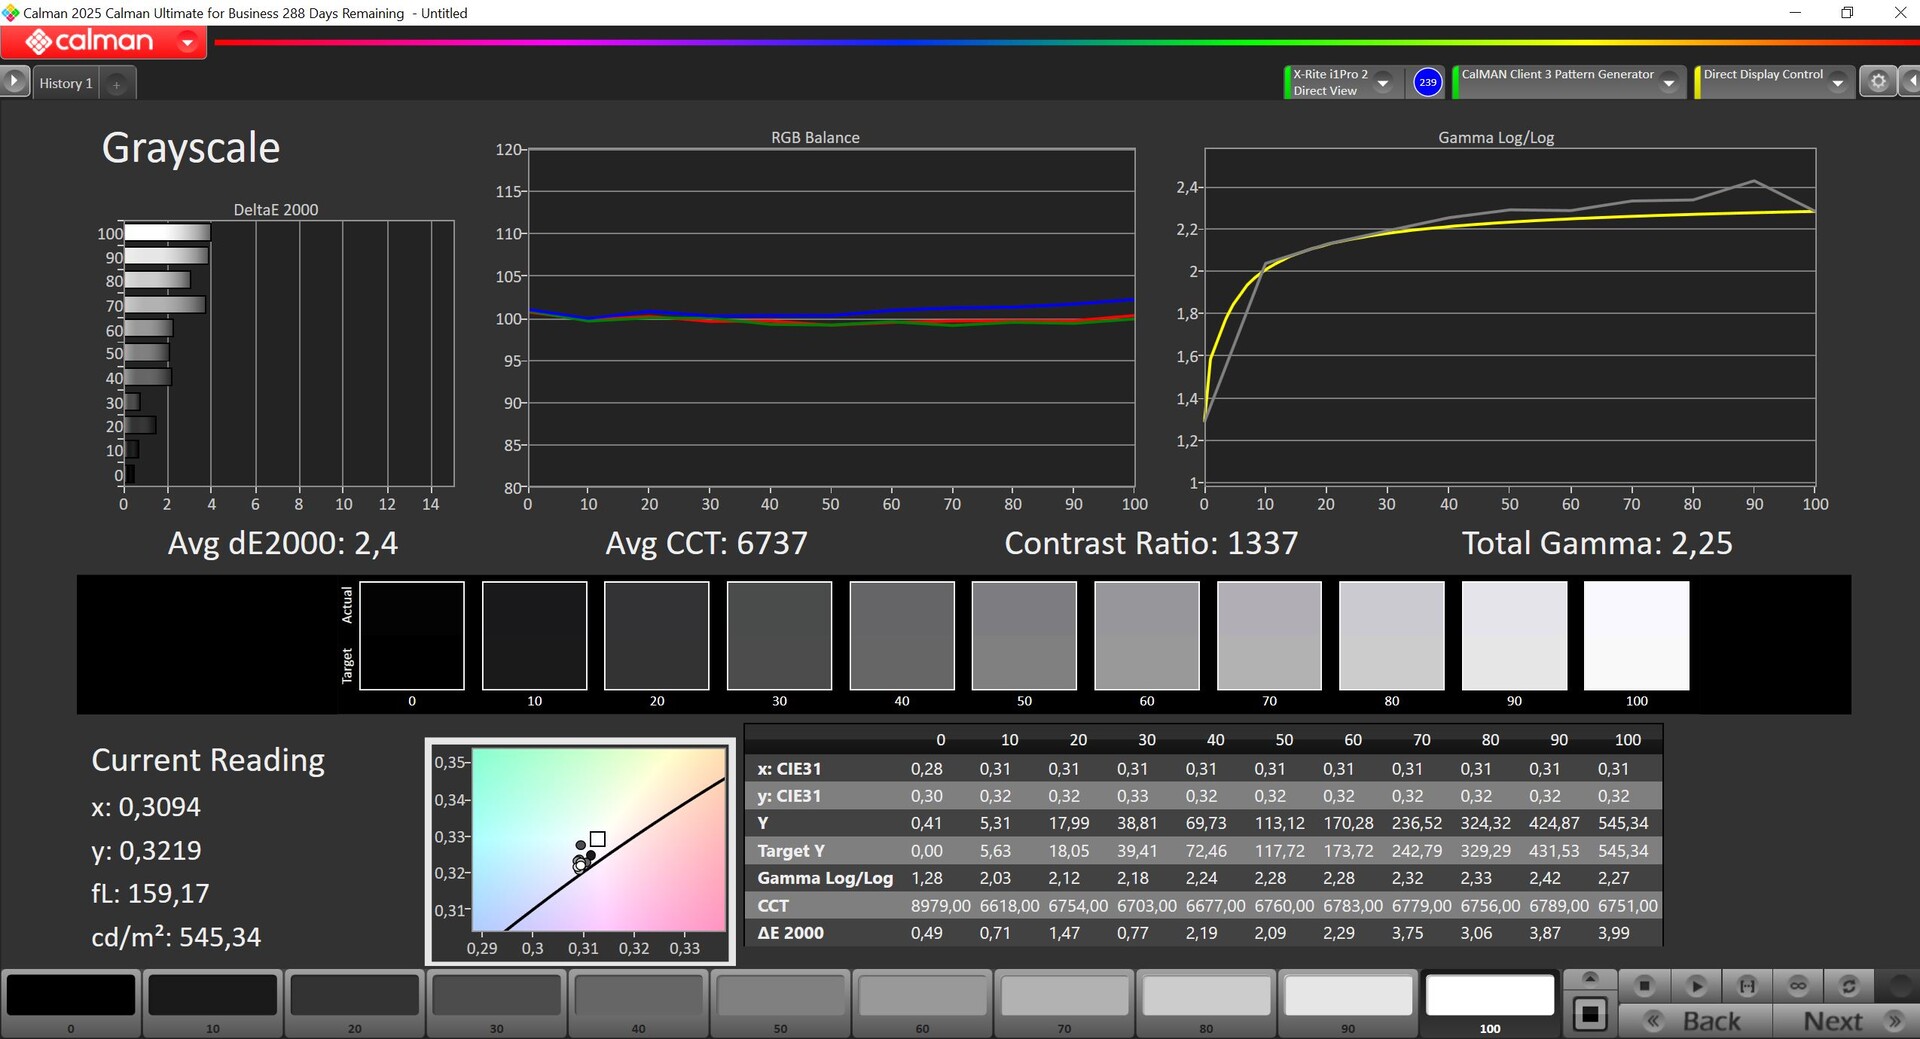
El ROG Strix G16 se ofrece exclusivamente con una gran pantalla IPS de 16 pulgadas con una resolución de 2560x1600 píxeles (16:10, G-Sync). La calidad de imagen subjetiva del panel mate es muy buena. Incluso en las zonas brillantes no hay problemas de impresiones granuladas, pero la relación de contraste es, por supuesto, también menor que en los paneles OLED o Mini-LED. Por otro lado, no hay parpadeo PWM, los tiempos de respuesta son muy rápidos y los movimientos parecen muy suaves gracias a la frecuencia de refresco de 240 Hz. A pleno brillo, se pueden apreciar algunos ligeros halos en las imágenes oscuras. No es compatible con contenidos HDR.
El panel alcanza un brillo medio de ~535 cd/m². Con 0,41 cd/m², el valor de negro es ligeramente elevado, lo que conduce también a una relación de contraste máxima ligeramente inferior.
| |||||||||||||||||||||||||
iluminación: 89 %
Brillo con batería: 545 cd/m²
Contraste: 1329:1 (Negro: 0.41 cd/m²)
ΔE Color 1.6 | 0.5-29.43 Ø4.86, calibrated: 0.8
ΔE Greyscale 2.4 | 0.5-98 Ø5.1
89.1% AdobeRGB 1998 (Argyll 2.2.0 3D)
99.9% sRGB (Argyll 2.2.0 3D)
99.1% Display P3 (Argyll 2.2.0 3D)
Gamma: 2.25
| Asus ROG Strix G16 G615 NE160QDM-NZC, IPS, 2560x1600, 16", 240 Hz | Acer Predator Helios 16 PH16-72 AUO43A8, IPS, 2560x1600, 16", 240 Hz | SCHENKER XMG Neo 16 (Early 24) BOE NE160QDM-NZA, IPS, 2560x1600, 16", 240 Hz | Asus ROG Strix Scar 16 G634JZR BOE NE160QDM-NM7, Mini LED, 2560x1600, 16", 240 Hz | HP Omen 16 (2024) BOE BOE0B7D, IPS, 2560x1440, 16.1", 240 Hz | Lenovo Legion Pro 7 16IRX9H BOE CQ NE16QDM-NZB, IPS, 2560x1600, 16", 240 Hz | Lenovo Legion Pro 7i 16 Gen 10 Samsung ATNA60HU01-0, OLED, 2560x1600, 16", 240 Hz | |
|---|---|---|---|---|---|---|---|
| Display | 2% | -17% | 1% | -18% | -1% | 2% | |
| Display P3 Coverage | 99.1 | 99.82 1% | 70.2 -29% | 99.8 1% | 68.6 -31% | 98.5 -1% | 99.5 0% |
| sRGB Coverage | 99.9 | 100 0% | 98 -2% | 100 0% | 98.6 -1% | 99.9 0% | 100 0% |
| AdobeRGB 1998 Coverage | 89.1 | 94.12 6% | 70.6 -21% | 90.8 2% | 70.6 -21% | 86.7 -3% | 94.4 6% |
| Response Times | -533% | -64% | -40% | -130% | -85% | 94% | |
| Response Time Grey 50% / Grey 80% * | 4.6 ? | 7.2 ? -57% | 11.2 ? -143% | 5 ? -9% | 14.1 ? -207% | 12.6 ? -174% | 0.28 ? 94% |
| Response Time Black / White * | 6.1 ? | 67.6 ? -1008% | 5.1 ? 16% | 10.4 ? -70% | 9.3 ? -52% | 5.8 ? 5% | 0.43 ? 93% |
| PWM Frequency | 2630 | 2040 ? | 1438 ? | ||||
| Screen | 58394% | -41% | 10% | -17% | 12% | -15% | |
| Brightness middle | 545 | 699 28% | 530 -3% | 490 -10% | 292 -46% | 487 -11% | 490.4 -10% |
| Brightness | 536 | 672 25% | 497 -7% | 487 -9% | 291 -46% | 460 -14% | 498 -7% |
| Brightness Distribution | 89 | 92 3% | 85 -4% | 94 6% | 85 -4% | 88 -1% | 97 9% |
| Black Level * | 0.41 | 0.0001 100% | 0.53 -29% | 0.4 2% | 0.24 41% | 0.42 -2% | |
| Contrast | 1329 | 6990000 525859% | 1000 -25% | 1225 -8% | 1217 -8% | 1160 -13% | |
| Colorchecker dE 2000 * | 1.6 | 3.89 -143% | 3.21 -101% | 1.08 32% | 2.36 -48% | 1.12 30% | 3.2 -100% |
| Colorchecker dE 2000 max. * | 4 | 5.51 -38% | 5.8 -45% | 2.38 40% | 4.08 -2% | 2.26 43% | 6.04 -51% |
| Colorchecker dE 2000 calibrated * | 0.8 | 2.17 -171% | 1.44 -80% | 0.9 -13% | 0.93 -16% | 0.54 32% | 0.84 -5% |
| Greyscale dE 2000 * | 2.4 | 5.14 -114% | 4.2 -75% | 1.1 54% | 3 -25% | 1.4 42% | 1 58% |
| Gamma | 2.25 98% | 2.018 109% | 2.226 99% | 2.13 103% | 2.101 105% | 2.242 98% | 2.24 98% |
| CCT | 6737 96% | 7113 91% | 6448 101% | 6724 97% | 5976 109% | 6809 95% | 6373 102% |
| Media total (Programa/Opciones) | 19288% /
37464% | -41% /
-39% | -10% /
1% | -55% /
-33% | -25% /
-5% | 27% /
7% |
* ... más pequeño es mejor
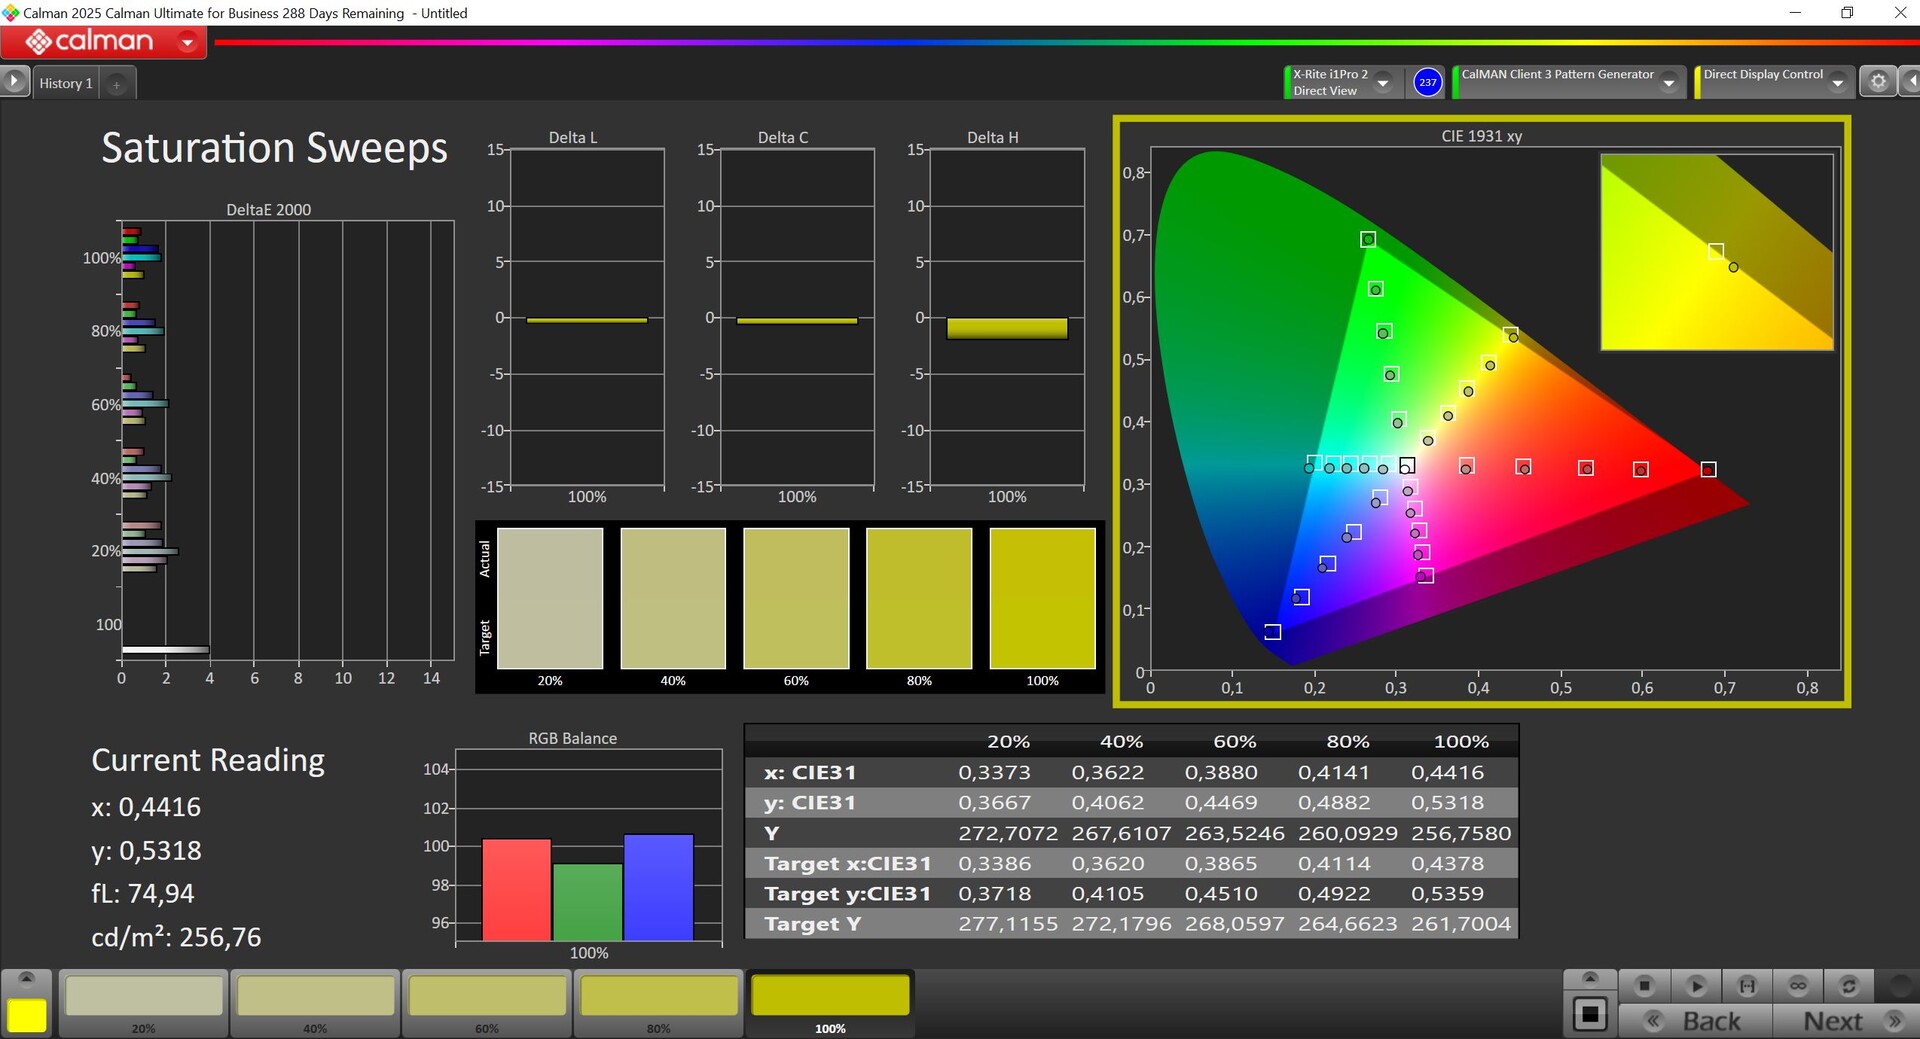


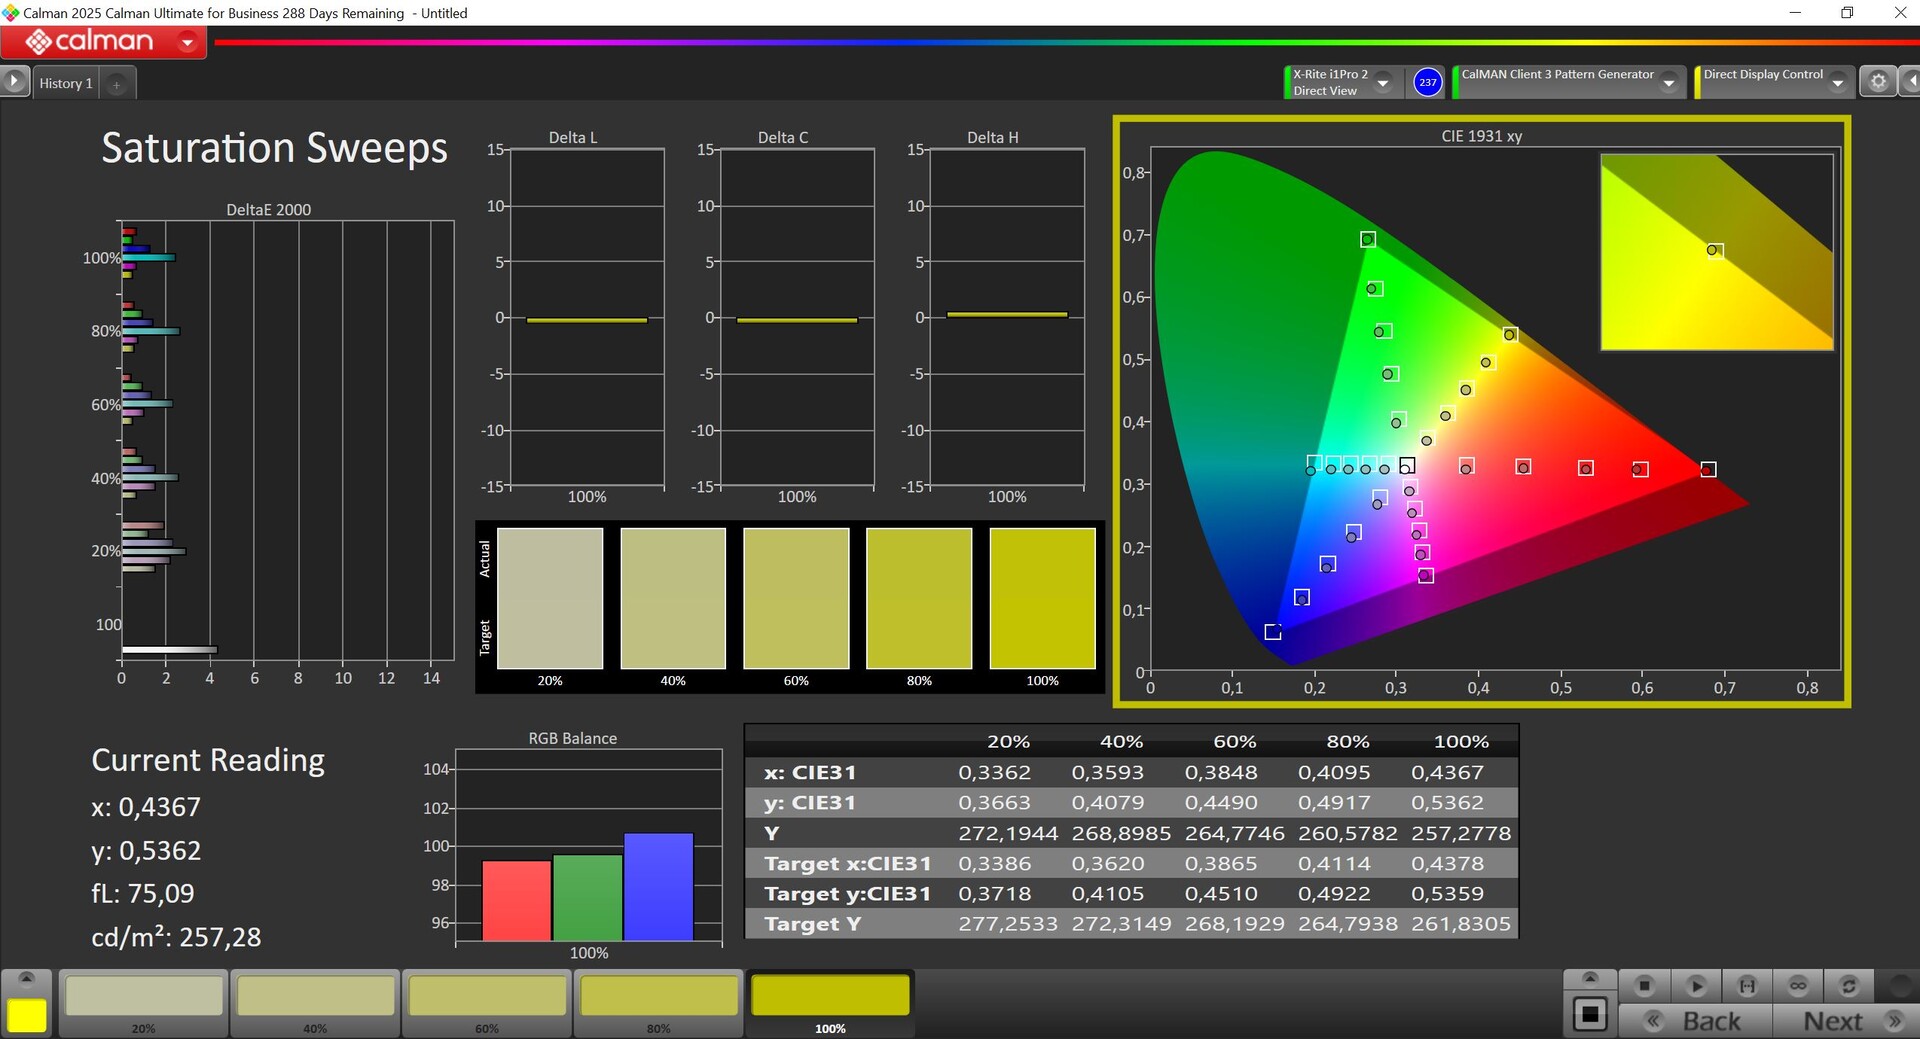


Asus ofrece varios perfiles de color que medimos con el software profesional CalMAN. Todos los perfiles son básicamente muy similares y ya ofrecen una calidad de imagen decente en los respectivos espacios de color (P3 o sRGB), pero sólo podemos aprovechar todo el potencial del panel cuando aplicamos nuestra propia calibración (el perfil correspondiente se puede descargar gratuitamente desde el enlace anterior). Gracias a la cobertura total del espacio de color (P3 y sRGB), también puede utilizar la pantalla para el procesamiento de imágenes sin ningún problema.


Tiempos de respuesta del display
| ↔ Tiempo de respuesta de Negro a Blanco | ||
|---|---|---|
| 6.1 ms ... subida ↗ y bajada ↘ combinada | ↗ 1.6 ms subida | 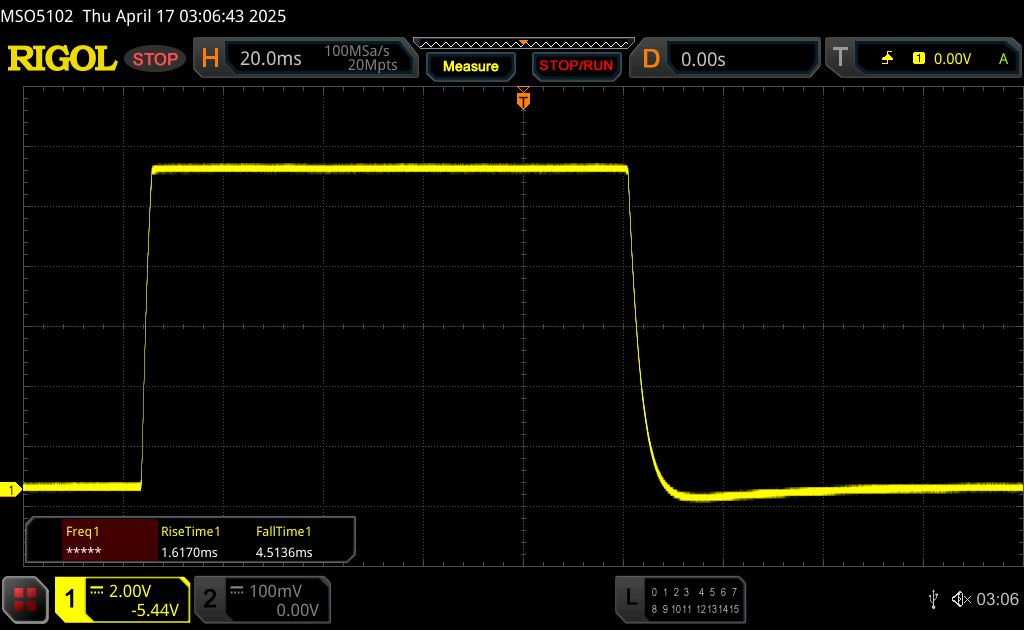 |
| ↘ 4.5 ms bajada | ||
| La pantalla mostró tiempos de respuesta muy rápidos en nuestros tests y debería ser adecuada para juegos frenéticos. En comparación, todos los dispositivos de prueba van de ##min### (mínimo) a 240 (máximo) ms. » 17 % de todos los dispositivos son mejores. Esto quiere decir que el tiempo de respuesta medido es mejor que la media (20.7 ms) de todos los dispositivos testados. | ||
| ↔ Tiempo de respuesta 50% Gris a 80% Gris | ||
| 4.6 ms ... subida ↗ y bajada ↘ combinada | ↗ 2.1 ms subida | 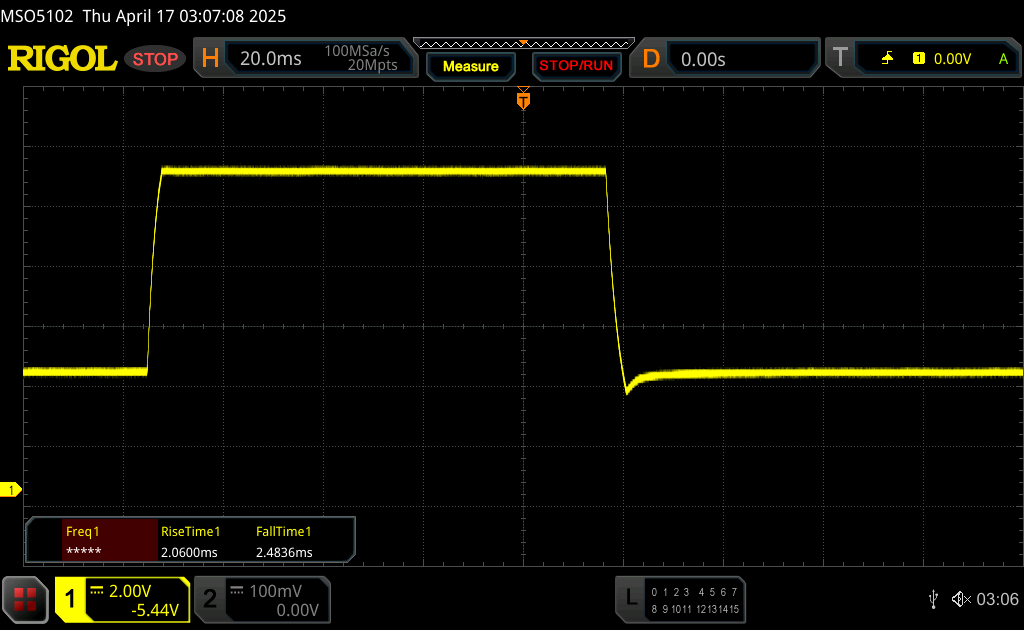 |
| ↘ 2.5 ms bajada | ||
| La pantalla mostró tiempos de respuesta muy rápidos en nuestros tests y debería ser adecuada para juegos frenéticos. En comparación, todos los dispositivos de prueba van de ##min### (mínimo) a 636 (máximo) ms. » 14 % de todos los dispositivos son mejores. Esto quiere decir que el tiempo de respuesta medido es mejor que la media (32.4 ms) de todos los dispositivos testados. | ||
Parpadeo de Pantalla / PWM (Pulse-Width Modulation)
| Parpadeo de Pantalla / PWM no detectado |  | ||
Comparación: 53 % de todos los dispositivos testados no usaron PWM para atenuar el display. Si se usó, medimos una media de 8471 (mínimo: 5 - máxmo: 343500) Hz. | |||


Rendimiento - Portátil Core Ultra 9 y RTX 5080
Condiciones de la prueba
La ROG Strix G16 ofrece los perfiles de energía habituales(Silencioso, Rendimiento, Turbo), así como un modo manual y modos adicionales para la conmutación de la GPU. La siguiente tabla ofrece una visión general de los perfiles. En el funcionamiento diario, puede cambiar fácilmente entre los perfiles con sólo pulsar una tecla. Ejecutamos nuestros benchmarks y mediciones en modo Turbo (modo GPU: Estándar). En funcionamiento con batería, sólo están disponibles los dos perfiles Silencio y Rendimiento.
| Perfil de potencia | CPU TDP | CB24 Multi | GPU TGP | Time Spy Gráficos | Cyberpunk 2077 QHD Ultra | ruido máx. del ventilador |
|---|---|---|---|---|---|---|
| Silencioso | 160/45 vatios | 1.490 puntos | 55 vatios | 11.041 puntos | 43,1 FPS | 36,1 dB(A) |
| Rendimiento | 160/105 vatios | 2.033 puntos | 160 vatios | 20.138 puntos | 91,6 FPS | 49,3 dB(A) |
| Turbo | 175/150 vatios | 2.207 puntose | 175 vatios | 21.571 puntos | 99,5 FPS | 54,2 dB(A) |
| Batería (Rendimiento) | 65/42 vatios | 1.627 puntos | 55 vatios | 9.172 puntos | 32 FPS | 34 dB(A) |
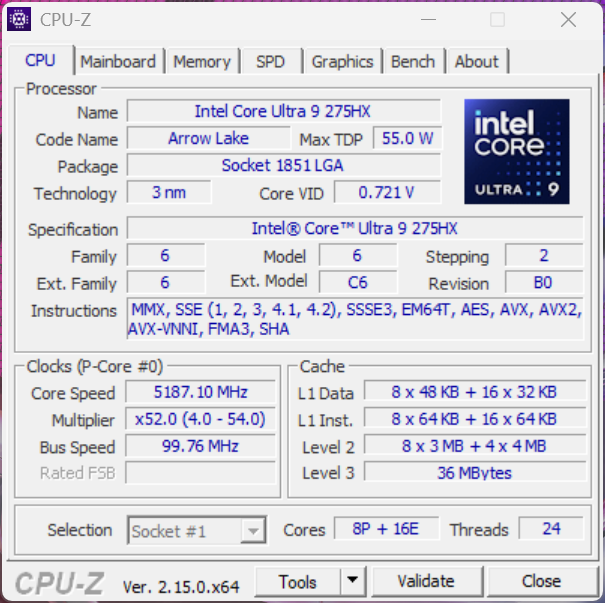
Procesador - Core Ultra 9 275HX
Asus utiliza el nuevo Intel Core Ultra 9 275HX de la generación Arrow Lake, que puede consumir un máximo de 175 vatios antes de nivelarse en 150 vatios. El rendimiento de la CPU es excelente, y el nuevo Stix G16 es capaz de situarse en lo más alto de nuestra comparativa en todos los benchmarks. Sin embargo, la ventaja en comparación con las implementaciones rápidas del antiguo Core i9-14900HX no es particularmente grande.
Cinebench R15 Multi Constant Load Test
Cinebench 2024: CPU Multi Core | CPU Single Core
Cinebench R23: Multi Core | Single Core
Cinebench R20: CPU (Multi Core) | CPU (Single Core)
Cinebench R15: CPU Multi 64Bit | CPU Single 64Bit
Blender: v2.79 BMW27 CPU
7-Zip 18.03: 7z b 4 | 7z b 4 -mmt1
Geekbench 6.4: Multi-Core | Single-Core
Geekbench 5.5: Multi-Core | Single-Core
HWBOT x265 Benchmark v2.2: 4k Preset
LibreOffice : 20 Documents To PDF
R Benchmark 2.5: Overall mean
| CPU Performance Rating | |
| Asus ROG Strix G16 G615 | |
| SCHENKER XMG Neo 16 (Early 24) | |
| Lenovo Legion Pro 7i 16 Gen 10 | |
| Medio Intel Core Ultra 9 275HX | |
| Lenovo Legion Pro 7 16IRX9H | |
| Asus ROG Strix Scar 16 G634JZR | |
| Acer Predator Helios 16 PH16-72 | |
| HP Omen 16 (2024) | |
| Media de la clase Gaming | |
| Cinebench 2024 / CPU Multi Core | |
| Asus ROG Strix G16 G615 | |
| Medio Intel Core Ultra 9 275HX (1913 - 2223, n=4) | |
| Lenovo Legion Pro 7i 16 Gen 10 | |
| SCHENKER XMG Neo 16 (Early 24) | |
| Lenovo Legion Pro 7 16IRX9H | |
| Asus ROG Strix Scar 16 G634JZR | |
| Acer Predator Helios 16 PH16-72 | |
| Media de la clase Gaming (331 - 2223, n=59, últimos 2 años) | |
| HP Omen 16 (2024) | |
| Cinebench 2024 / CPU Single Core | |
| Asus ROG Strix G16 G615 | |
| Medio Intel Core Ultra 9 275HX (130.7 - 138, n=4) | |
| Lenovo Legion Pro 7i 16 Gen 10 | |
| SCHENKER XMG Neo 16 (Early 24) | |
| Lenovo Legion Pro 7 16IRX9H | |
| HP Omen 16 (2024) | |
| Asus ROG Strix Scar 16 G634JZR | |
| Acer Predator Helios 16 PH16-72 | |
| Media de la clase Gaming (68.2 - 138, n=60, últimos 2 años) | |
| Cinebench R23 / Multi Core | |
| Lenovo Legion Pro 7i 16 Gen 10 | |
| SCHENKER XMG Neo 16 (Early 24) | |
| Medio Intel Core Ultra 9 275HX (33449 - 39001, n=7) | |
| Asus ROG Strix G16 G615 | |
| Lenovo Legion Pro 7 16IRX9H | |
| Asus ROG Strix Scar 16 G634JZR | |
| Acer Predator Helios 16 PH16-72 | |
| HP Omen 16 (2024) | |
| Media de la clase Gaming (5668 - 39652, n=148, últimos 2 años) | |
| Cinebench R23 / Single Core | |
| SCHENKER XMG Neo 16 (Early 24) | |
| Lenovo Legion Pro 7 16IRX9H | |
| HP Omen 16 (2024) | |
| Lenovo Legion Pro 7i 16 Gen 10 | |
| Asus ROG Strix Scar 16 G634JZR | |
| Asus ROG Strix G16 G615 | |
| Medio Intel Core Ultra 9 275HX (2126 - 2252, n=7) | |
| Acer Predator Helios 16 PH16-72 | |
| Media de la clase Gaming (1136 - 2252, n=148, últimos 2 años) | |
| Cinebench R20 / CPU (Multi Core) | |
| Lenovo Legion Pro 7i 16 Gen 10 | |
| Medio Intel Core Ultra 9 275HX (13178 - 15517, n=7) | |
| Asus ROG Strix G16 G615 | |
| SCHENKER XMG Neo 16 (Early 24) | |
| Lenovo Legion Pro 7 16IRX9H | |
| Asus ROG Strix Scar 16 G634JZR | |
| Acer Predator Helios 16 PH16-72 | |
| HP Omen 16 (2024) | |
| Media de la clase Gaming (2179 - 15517, n=148, últimos 2 años) | |
| Cinebench R20 / CPU (Single Core) | |
| Asus ROG Strix G16 G615 | |
| HP Omen 16 (2024) | |
| SCHENKER XMG Neo 16 (Early 24) | |
| Medio Intel Core Ultra 9 275HX (811 - 866, n=7) | |
| Asus ROG Strix Scar 16 G634JZR | |
| Lenovo Legion Pro 7 16IRX9H | |
| Lenovo Legion Pro 7i 16 Gen 10 | |
| Acer Predator Helios 16 PH16-72 | |
| Media de la clase Gaming (439 - 866, n=148, últimos 2 años) | |
| Cinebench R15 / CPU Multi 64Bit | |
| Asus ROG Strix G16 G615 | |
| Lenovo Legion Pro 7i 16 Gen 10 | |
| Medio Intel Core Ultra 9 275HX (5044 - 6060, n=7) | |
| SCHENKER XMG Neo 16 (Early 24) | |
| Asus ROG Strix Scar 16 G634JZR | |
| Lenovo Legion Pro 7 16IRX9H | |
| Acer Predator Helios 16 PH16-72 | |
| HP Omen 16 (2024) | |
| Media de la clase Gaming (1537 - 6074, n=151, últimos 2 años) | |
| Cinebench R15 / CPU Single 64Bit | |
| Asus ROG Strix G16 G615 | |
| Lenovo Legion Pro 7i 16 Gen 10 | |
| Medio Intel Core Ultra 9 275HX (317 - 343, n=7) | |
| Asus ROG Strix Scar 16 G634JZR | |
| Lenovo Legion Pro 7 16IRX9H | |
| HP Omen 16 (2024) | |
| SCHENKER XMG Neo 16 (Early 24) | |
| Acer Predator Helios 16 PH16-72 | |
| Media de la clase Gaming (191.9 - 343, n=148, últimos 2 años) | |
| Blender / v2.79 BMW27 CPU | |
| Media de la clase Gaming (81 - 517, n=142, últimos 2 años) | |
| HP Omen 16 (2024) | |
| Acer Predator Helios 16 PH16-72 | |
| Asus ROG Strix Scar 16 G634JZR | |
| Lenovo Legion Pro 7 16IRX9H | |
| SCHENKER XMG Neo 16 (Early 24) | |
| Medio Intel Core Ultra 9 275HX (86 - 102, n=7) | |
| Lenovo Legion Pro 7i 16 Gen 10 | |
| Asus ROG Strix G16 G615 | |
| 7-Zip 18.03 / 7z b 4 | |
| SCHENKER XMG Neo 16 (Early 24) | |
| Lenovo Legion Pro 7 16IRX9H | |
| Asus ROG Strix Scar 16 G634JZR | |
| Asus ROG Strix G16 G615 | |
| Lenovo Legion Pro 7i 16 Gen 10 | |
| Medio Intel Core Ultra 9 275HX (104686 - 122818, n=7) | |
| Acer Predator Helios 16 PH16-72 | |
| HP Omen 16 (2024) | |
| Media de la clase Gaming (23795 - 144064, n=146, últimos 2 años) | |
| 7-Zip 18.03 / 7z b 4 -mmt1 | |
| Asus ROG Strix Scar 16 G634JZR | |
| SCHENKER XMG Neo 16 (Early 24) | |
| Lenovo Legion Pro 7 16IRX9H | |
| HP Omen 16 (2024) | |
| Asus ROG Strix G16 G615 | |
| Acer Predator Helios 16 PH16-72 | |
| Medio Intel Core Ultra 9 275HX (6186 - 7036, n=7) | |
| Lenovo Legion Pro 7i 16 Gen 10 | |
| Media de la clase Gaming (4199 - 7573, n=146, últimos 2 años) | |
| Geekbench 6.4 / Multi-Core | |
| Asus ROG Strix G16 G615 | |
| SCHENKER XMG Neo 16 (Early 24) | |
| Medio Intel Core Ultra 9 275HX (16033 - 21668, n=8) | |
| Lenovo Legion Pro 7i 16 Gen 10 | |
| Asus ROG Strix Scar 16 G634JZR | |
| Lenovo Legion Pro 7 16IRX9H | |
| Acer Predator Helios 16 PH16-72 | |
| HP Omen 16 (2024) | |
| Media de la clase Gaming (5340 - 21668, n=124, últimos 2 años) | |
| Geekbench 6.4 / Single-Core | |
| SCHENKER XMG Neo 16 (Early 24) | |
| HP Omen 16 (2024) | |
| Lenovo Legion Pro 7i 16 Gen 10 | |
| Medio Intel Core Ultra 9 275HX (2917 - 3158, n=8) | |
| Lenovo Legion Pro 7 16IRX9H | |
| Asus ROG Strix Scar 16 G634JZR | |
| Asus ROG Strix G16 G615 | |
| Acer Predator Helios 16 PH16-72 | |
| Media de la clase Gaming (1490 - 3219, n=124, últimos 2 años) | |
| Geekbench 5.5 / Multi-Core | |
| Asus ROG Strix G16 G615 | |
| Medio Intel Core Ultra 9 275HX (21195 - 25855, n=7) | |
| SCHENKER XMG Neo 16 (Early 24) | |
| Lenovo Legion Pro 7i 16 Gen 10 | |
| Asus ROG Strix Scar 16 G634JZR | |
| Acer Predator Helios 16 PH16-72 | |
| Lenovo Legion Pro 7 16IRX9H | |
| HP Omen 16 (2024) | |
| Media de la clase Gaming (4557 - 25855, n=145, últimos 2 años) | |
| Geekbench 5.5 / Single-Core | |
| Asus ROG Strix Scar 16 G634JZR | |
| Lenovo Legion Pro 7i 16 Gen 10 | |
| SCHENKER XMG Neo 16 (Early 24) | |
| Medio Intel Core Ultra 9 275HX (2034 - 2292, n=7) | |
| Asus ROG Strix G16 G615 | |
| HP Omen 16 (2024) | |
| Lenovo Legion Pro 7 16IRX9H | |
| Acer Predator Helios 16 PH16-72 | |
| Media de la clase Gaming (986 - 2423, n=145, últimos 2 años) | |
| HWBOT x265 Benchmark v2.2 / 4k Preset | |
| Asus ROG Strix G16 G615 | |
| Lenovo Legion Pro 7i 16 Gen 10 | |
| Medio Intel Core Ultra 9 275HX (35 - 41.2, n=7) | |
| SCHENKER XMG Neo 16 (Early 24) | |
| Lenovo Legion Pro 7 16IRX9H | |
| Asus ROG Strix Scar 16 G634JZR | |
| Acer Predator Helios 16 PH16-72 | |
| Media de la clase Gaming (7.7 - 42.9, n=146, últimos 2 años) | |
| HP Omen 16 (2024) | |
| LibreOffice / 20 Documents To PDF | |
| Medio Intel Core Ultra 9 275HX (36.9 - 88, n=7) | |
| Asus ROG Strix Scar 16 G634JZR | |
| Media de la clase Gaming (19 - 96.6, n=144, últimos 2 años) | |
| HP Omen 16 (2024) | |
| Asus ROG Strix G16 G615 | |
| Lenovo Legion Pro 7i 16 Gen 10 | |
| Lenovo Legion Pro 7 16IRX9H | |
| SCHENKER XMG Neo 16 (Early 24) | |
| Acer Predator Helios 16 PH16-72 | |
| R Benchmark 2.5 / Overall mean | |
| Media de la clase Gaming (0.3609 - 0.759, n=147, últimos 2 años) | |
| Medio Intel Core Ultra 9 275HX (0.3943 - 0.4568, n=7) | |
| Lenovo Legion Pro 7i 16 Gen 10 | |
| Asus ROG Strix G16 G615 | |
| Lenovo Legion Pro 7 16IRX9H | |
| Acer Predator Helios 16 PH16-72 | |
| HP Omen 16 (2024) | |
| Asus ROG Strix Scar 16 G634JZR | |
| SCHENKER XMG Neo 16 (Early 24) | |
* ... más pequeño es mejor
AIDA64: FP32 Ray-Trace | FPU Julia | CPU SHA3 | CPU Queen | FPU SinJulia | FPU Mandel | CPU AES | CPU ZLib | FP64 Ray-Trace | CPU PhotoWorxx
| Performance Rating | |
| Asus ROG Strix G16 G615 | |
| Lenovo Legion Pro 7i 16 Gen 10 | |
| Medio Intel Core Ultra 9 275HX | |
| SCHENKER XMG Neo 16 (Early 24) | |
| Asus ROG Strix Scar 16 G634JZR | |
| Lenovo Legion Pro 7 16IRX9H | |
| Acer Predator Helios 16 PH16-72 | |
| Media de la clase Gaming | |
| HP Omen 16 (2024) | |
| AIDA64 / FP32 Ray-Trace | |
| Asus ROG Strix G16 G615 | |
| Medio Intel Core Ultra 9 275HX (32615 - 39551, n=7) | |
| Lenovo Legion Pro 7i 16 Gen 10 | |
| SCHENKER XMG Neo 16 (Early 24) | |
| Lenovo Legion Pro 7 16IRX9H | |
| Asus ROG Strix Scar 16 G634JZR | |
| Acer Predator Helios 16 PH16-72 | |
| Media de la clase Gaming (7192 - 81639, n=146, últimos 2 años) | |
| HP Omen 16 (2024) | |
| AIDA64 / FPU Julia | |
| Asus ROG Strix G16 G615 | |
| Medio Intel Core Ultra 9 275HX (166245 - 194867, n=7) | |
| Lenovo Legion Pro 7i 16 Gen 10 | |
| SCHENKER XMG Neo 16 (Early 24) | |
| Lenovo Legion Pro 7 16IRX9H | |
| Asus ROG Strix Scar 16 G634JZR | |
| Acer Predator Helios 16 PH16-72 | |
| Media de la clase Gaming (35040 - 252486, n=146, últimos 2 años) | |
| HP Omen 16 (2024) | |
| AIDA64 / CPU SHA3 | |
| Asus ROG Strix G16 G615 | |
| Medio Intel Core Ultra 9 275HX (7829 - 9482, n=7) | |
| Lenovo Legion Pro 7i 16 Gen 10 | |
| SCHENKER XMG Neo 16 (Early 24) | |
| Lenovo Legion Pro 7 16IRX9H | |
| Asus ROG Strix Scar 16 G634JZR | |
| Acer Predator Helios 16 PH16-72 | |
| Media de la clase Gaming (1728 - 10389, n=146, últimos 2 años) | |
| HP Omen 16 (2024) | |
| AIDA64 / CPU Queen | |
| SCHENKER XMG Neo 16 (Early 24) | |
| Asus ROG Strix Scar 16 G634JZR | |
| Lenovo Legion Pro 7 16IRX9H | |
| Acer Predator Helios 16 PH16-72 | |
| Asus ROG Strix G16 G615 | |
| Lenovo Legion Pro 7i 16 Gen 10 | |
| Medio Intel Core Ultra 9 275HX (125013 - 139608, n=7) | |
| HP Omen 16 (2024) | |
| Media de la clase Gaming (50699 - 200651, n=146, últimos 2 años) | |
| AIDA64 / FPU SinJulia | |
| SCHENKER XMG Neo 16 (Early 24) | |
| Lenovo Legion Pro 7 16IRX9H | |
| Asus ROG Strix Scar 16 G634JZR | |
| Acer Predator Helios 16 PH16-72 | |
| Lenovo Legion Pro 7i 16 Gen 10 | |
| Asus ROG Strix G16 G615 | |
| Medio Intel Core Ultra 9 275HX (12272 - 14112, n=7) | |
| Media de la clase Gaming (5020 - 32988, n=146, últimos 2 años) | |
| HP Omen 16 (2024) | |
| AIDA64 / FPU Mandel | |
| Asus ROG Strix G16 G615 | |
| Medio Intel Core Ultra 9 275HX (87156 - 104057, n=7) | |
| Lenovo Legion Pro 7i 16 Gen 10 | |
| SCHENKER XMG Neo 16 (Early 24) | |
| Lenovo Legion Pro 7 16IRX9H | |
| Asus ROG Strix Scar 16 G634JZR | |
| Acer Predator Helios 16 PH16-72 | |
| Media de la clase Gaming (17585 - 134044, n=146, últimos 2 años) | |
| HP Omen 16 (2024) | |
| AIDA64 / CPU AES | |
| Asus ROG Strix Scar 16 G634JZR | |
| SCHENKER XMG Neo 16 (Early 24) | |
| Lenovo Legion Pro 7 16IRX9H | |
| Asus ROG Strix G16 G615 | |
| Lenovo Legion Pro 7i 16 Gen 10 | |
| Medio Intel Core Ultra 9 275HX (118108 - 134920, n=7) | |
| Acer Predator Helios 16 PH16-72 | |
| Media de la clase Gaming (19065 - 328679, n=146, últimos 2 años) | |
| HP Omen 16 (2024) | |
| AIDA64 / CPU ZLib | |
| SCHENKER XMG Neo 16 (Early 24) | |
| Asus ROG Strix G16 G615 | |
| Lenovo Legion Pro 7 16IRX9H | |
| Medio Intel Core Ultra 9 275HX (1896 - 2220, n=7) | |
| Lenovo Legion Pro 7i 16 Gen 10 | |
| Asus ROG Strix Scar 16 G634JZR | |
| Acer Predator Helios 16 PH16-72 | |
| Media de la clase Gaming (373 - 2531, n=146, últimos 2 años) | |
| HP Omen 16 (2024) | |
| AIDA64 / FP64 Ray-Trace | |
| Asus ROG Strix G16 G615 | |
| Medio Intel Core Ultra 9 275HX (17631 - 21372, n=7) | |
| Lenovo Legion Pro 7i 16 Gen 10 | |
| SCHENKER XMG Neo 16 (Early 24) | |
| Lenovo Legion Pro 7 16IRX9H | |
| Asus ROG Strix Scar 16 G634JZR | |
| Acer Predator Helios 16 PH16-72 | |
| Media de la clase Gaming (3856 - 43430, n=146, últimos 2 años) | |
| HP Omen 16 (2024) | |
| AIDA64 / CPU PhotoWorxx | |
| Lenovo Legion Pro 7i 16 Gen 10 | |
| Medio Intel Core Ultra 9 275HX (47726 - 56613, n=7) | |
| Asus ROG Strix Scar 16 G634JZR | |
| HP Omen 16 (2024) | |
| SCHENKER XMG Neo 16 (Early 24) | |
| Acer Predator Helios 16 PH16-72 | |
| Lenovo Legion Pro 7 16IRX9H | |
| Asus ROG Strix G16 G615 | |
| Media de la clase Gaming (10805 - 60161, n=146, últimos 2 años) | |
Rendimiento del sistema
El rendimiento del sistema es excelente, aunque el rendimiento de todos los competidores es muy similar. No hay problemas con la estabilidad del sistema en nuestra prueba, y el portátil es siempre muy sensible. Durante el cambio de gráficos, hay una breve espera (por ejemplo al iniciar un juego), pero esto es normal.
CrossMark: Overall | Productivity | Creativity | Responsiveness
WebXPRT 3: Overall
WebXPRT 4: Overall
Mozilla Kraken 1.1: Total
| PCMark 10 / Score | |
| Lenovo Legion Pro 7i 16 Gen 10 | |
| Acer Predator Helios 16 PH16-72 | |
| SCHENKER XMG Neo 16 (Early 24) | |
| Medio Intel Core Ultra 9 275HX, Nvidia GeForce RTX 5080 Laptop (8856 - 9153, n=2) | |
| Lenovo Legion Pro 7 16IRX9H | |
| HP Omen 16 (2024) | |
| Asus ROG Strix G16 G615 | |
| Media de la clase Gaming (5776 - 9852, n=131, últimos 2 años) | |
| Asus ROG Strix Scar 16 G634JZR | |
| PCMark 10 / Essentials | |
| Acer Predator Helios 16 PH16-72 | |
| Lenovo Legion Pro 7 16IRX9H | |
| Asus ROG Strix Scar 16 G634JZR | |
| HP Omen 16 (2024) | |
| Lenovo Legion Pro 7i 16 Gen 10 | |
| Medio Intel Core Ultra 9 275HX, Nvidia GeForce RTX 5080 Laptop (11177 - 11215, n=2) | |
| Asus ROG Strix G16 G615 | |
| SCHENKER XMG Neo 16 (Early 24) | |
| Media de la clase Gaming (9057 - 12600, n=131, últimos 2 años) | |
| PCMark 10 / Productivity | |
| SCHENKER XMG Neo 16 (Early 24) | |
| HP Omen 16 (2024) | |
| Lenovo Legion Pro 7 16IRX9H | |
| Acer Predator Helios 16 PH16-72 | |
| Media de la clase Gaming (6662 - 14612, n=131, últimos 2 años) | |
| Lenovo Legion Pro 7i 16 Gen 10 | |
| Medio Intel Core Ultra 9 275HX, Nvidia GeForce RTX 5080 Laptop (9212 - 9590, n=2) | |
| Asus ROG Strix G16 G615 | |
| Asus ROG Strix Scar 16 G634JZR | |
| PCMark 10 / Digital Content Creation | |
| Lenovo Legion Pro 7i 16 Gen 10 | |
| Medio Intel Core Ultra 9 275HX, Nvidia GeForce RTX 5080 Laptop (18305 - 19351, n=2) | |
| Asus ROG Strix G16 G615 | |
| Asus ROG Strix Scar 16 G634JZR | |
| SCHENKER XMG Neo 16 (Early 24) | |
| HP Omen 16 (2024) | |
| Acer Predator Helios 16 PH16-72 | |
| Lenovo Legion Pro 7 16IRX9H | |
| Media de la clase Gaming (6807 - 19351, n=131, últimos 2 años) | |
| CrossMark / Overall | |
| SCHENKER XMG Neo 16 (Early 24) | |
| Lenovo Legion Pro 7 16IRX9H | |
| HP Omen 16 (2024) | |
| Acer Predator Helios 16 PH16-72 | |
| Asus ROG Strix G16 G615 | |
| Medio Intel Core Ultra 9 275HX, Nvidia GeForce RTX 5080 Laptop (2017 - 2165, n=2) | |
| Asus ROG Strix Scar 16 G634JZR | |
| Lenovo Legion Pro 7i 16 Gen 10 | |
| Media de la clase Gaming (1247 - 2344, n=111, últimos 2 años) | |
| CrossMark / Productivity | |
| Lenovo Legion Pro 7 16IRX9H | |
| SCHENKER XMG Neo 16 (Early 24) | |
| HP Omen 16 (2024) | |
| Acer Predator Helios 16 PH16-72 | |
| Asus ROG Strix G16 G615 | |
| Medio Intel Core Ultra 9 275HX, Nvidia GeForce RTX 5080 Laptop (1922 - 2014, n=2) | |
| Lenovo Legion Pro 7i 16 Gen 10 | |
| Asus ROG Strix Scar 16 G634JZR | |
| Media de la clase Gaming (1299 - 2204, n=111, últimos 2 años) | |
| CrossMark / Creativity | |
| SCHENKER XMG Neo 16 (Early 24) | |
| Lenovo Legion Pro 7 16IRX9H | |
| Asus ROG Strix G16 G615 | |
| Acer Predator Helios 16 PH16-72 | |
| Medio Intel Core Ultra 9 275HX, Nvidia GeForce RTX 5080 Laptop (2288 - 2451, n=2) | |
| HP Omen 16 (2024) | |
| Asus ROG Strix Scar 16 G634JZR | |
| Lenovo Legion Pro 7i 16 Gen 10 | |
| Media de la clase Gaming (1275 - 2660, n=111, últimos 2 años) | |
| CrossMark / Responsiveness | |
| Lenovo Legion Pro 7 16IRX9H | |
| HP Omen 16 (2024) | |
| SCHENKER XMG Neo 16 (Early 24) | |
| Acer Predator Helios 16 PH16-72 | |
| Asus ROG Strix G16 G615 | |
| Asus ROG Strix Scar 16 G634JZR | |
| Medio Intel Core Ultra 9 275HX, Nvidia GeForce RTX 5080 Laptop (1597 - 1853, n=2) | |
| Media de la clase Gaming (1030 - 2330, n=111, últimos 2 años) | |
| Lenovo Legion Pro 7i 16 Gen 10 | |
| WebXPRT 3 / Overall | |
| Lenovo Legion Pro 7i 16 Gen 10 | |
| Medio Intel Core Ultra 9 275HX, Nvidia GeForce RTX 5080 Laptop (347 - 359, n=2) | |
| Asus ROG Strix G16 G615 | |
| Lenovo Legion Pro 7 16IRX9H | |
| SCHENKER XMG Neo 16 (Early 24) | |
| Acer Predator Helios 16 PH16-72 | |
| HP Omen 16 (2024) | |
| Asus ROG Strix Scar 16 G634JZR | |
| Media de la clase Gaming (215 - 480, n=126, últimos 2 años) | |
| WebXPRT 4 / Overall | |
| Asus ROG Strix G16 G615 | |
| Medio Intel Core Ultra 9 275HX, Nvidia GeForce RTX 5080 Laptop (333 - 336, n=2) | |
| Lenovo Legion Pro 7i 16 Gen 10 | |
| Lenovo Legion Pro 7 16IRX9H | |
| HP Omen 16 (2024) | |
| Asus ROG Strix Scar 16 G634JZR | |
| SCHENKER XMG Neo 16 (Early 24) | |
| Acer Predator Helios 16 PH16-72 | |
| Media de la clase Gaming (176.4 - 336, n=111, últimos 2 años) | |
| Mozilla Kraken 1.1 / Total | |
| Media de la clase Gaming (405 - 674, n=139, últimos 2 años) | |
| Asus ROG Strix Scar 16 G634JZR | |
| Acer Predator Helios 16 PH16-72 | |
| Lenovo Legion Pro 7 16IRX9H | |
| HP Omen 16 (2024) | |
| SCHENKER XMG Neo 16 (Early 24) | |
| Lenovo Legion Pro 7i 16 Gen 10 | |
| Medio Intel Core Ultra 9 275HX, Nvidia GeForce RTX 5080 Laptop (405 - 408, n=2) | |
| Asus ROG Strix G16 G615 | |
* ... más pequeño es mejor
| PCMark 10 Score | 8856 puntos | |
ayuda | ||
| AIDA64 / Memory Copy | |
| Asus ROG Strix G16 G615 | |
| Lenovo Legion Pro 7i 16 Gen 10 | |
| Medio Intel Core Ultra 9 275HX (74558 - 86549, n=7) | |
| HP Omen 16 (2024) | |
| Acer Predator Helios 16 PH16-72 | |
| SCHENKER XMG Neo 16 (Early 24) | |
| Asus ROG Strix Scar 16 G634JZR | |
| Lenovo Legion Pro 7 16IRX9H | |
| Media de la clase Gaming (21750 - 97515, n=146, últimos 2 años) | |
| AIDA64 / Memory Read | |
| Lenovo Legion Pro 7i 16 Gen 10 | |
| Asus ROG Strix Scar 16 G634JZR | |
| SCHENKER XMG Neo 16 (Early 24) | |
| HP Omen 16 (2024) | |
| Lenovo Legion Pro 7 16IRX9H | |
| Acer Predator Helios 16 PH16-72 | |
| Medio Intel Core Ultra 9 275HX (74094 - 95542, n=7) | |
| Asus ROG Strix G16 G615 | |
| Media de la clase Gaming (22956 - 102937, n=146, últimos 2 años) | |
| AIDA64 / Memory Write | |
| Lenovo Legion Pro 7i 16 Gen 10 | |
| Medio Intel Core Ultra 9 275HX (72929 - 84581, n=7) | |
| HP Omen 16 (2024) | |
| SCHENKER XMG Neo 16 (Early 24) | |
| Asus ROG Strix Scar 16 G634JZR | |
| Acer Predator Helios 16 PH16-72 | |
| Asus ROG Strix G16 G615 | |
| Lenovo Legion Pro 7 16IRX9H | |
| Media de la clase Gaming (22297 - 108954, n=146, últimos 2 años) | |
| AIDA64 / Memory Latency | |
| Medio Intel Core Ultra 9 275HX (108.9 - 125.1, n=7) | |
| Asus ROG Strix G16 G615 | |
| Lenovo Legion Pro 7i 16 Gen 10 | |
| Media de la clase Gaming (59.5 - 259, n=146, últimos 2 años) | |
| HP Omen 16 (2024) | |
| Acer Predator Helios 16 PH16-72 | |
| Asus ROG Strix Scar 16 G634JZR | |
| Lenovo Legion Pro 7 16IRX9H | |
| SCHENKER XMG Neo 16 (Early 24) | |
* ... más pequeño es mejor
Latencias del CPD
En nuestra prueba de latencia estandarizada (navegación por Internet, reproducción de vídeos 4K de YouTube, carga de la CPU), nuestra unidad de prueba con su versión actual de BIOS muestra algunas ligeras limitaciones al utilizar aplicaciones de audio en tiempo real.
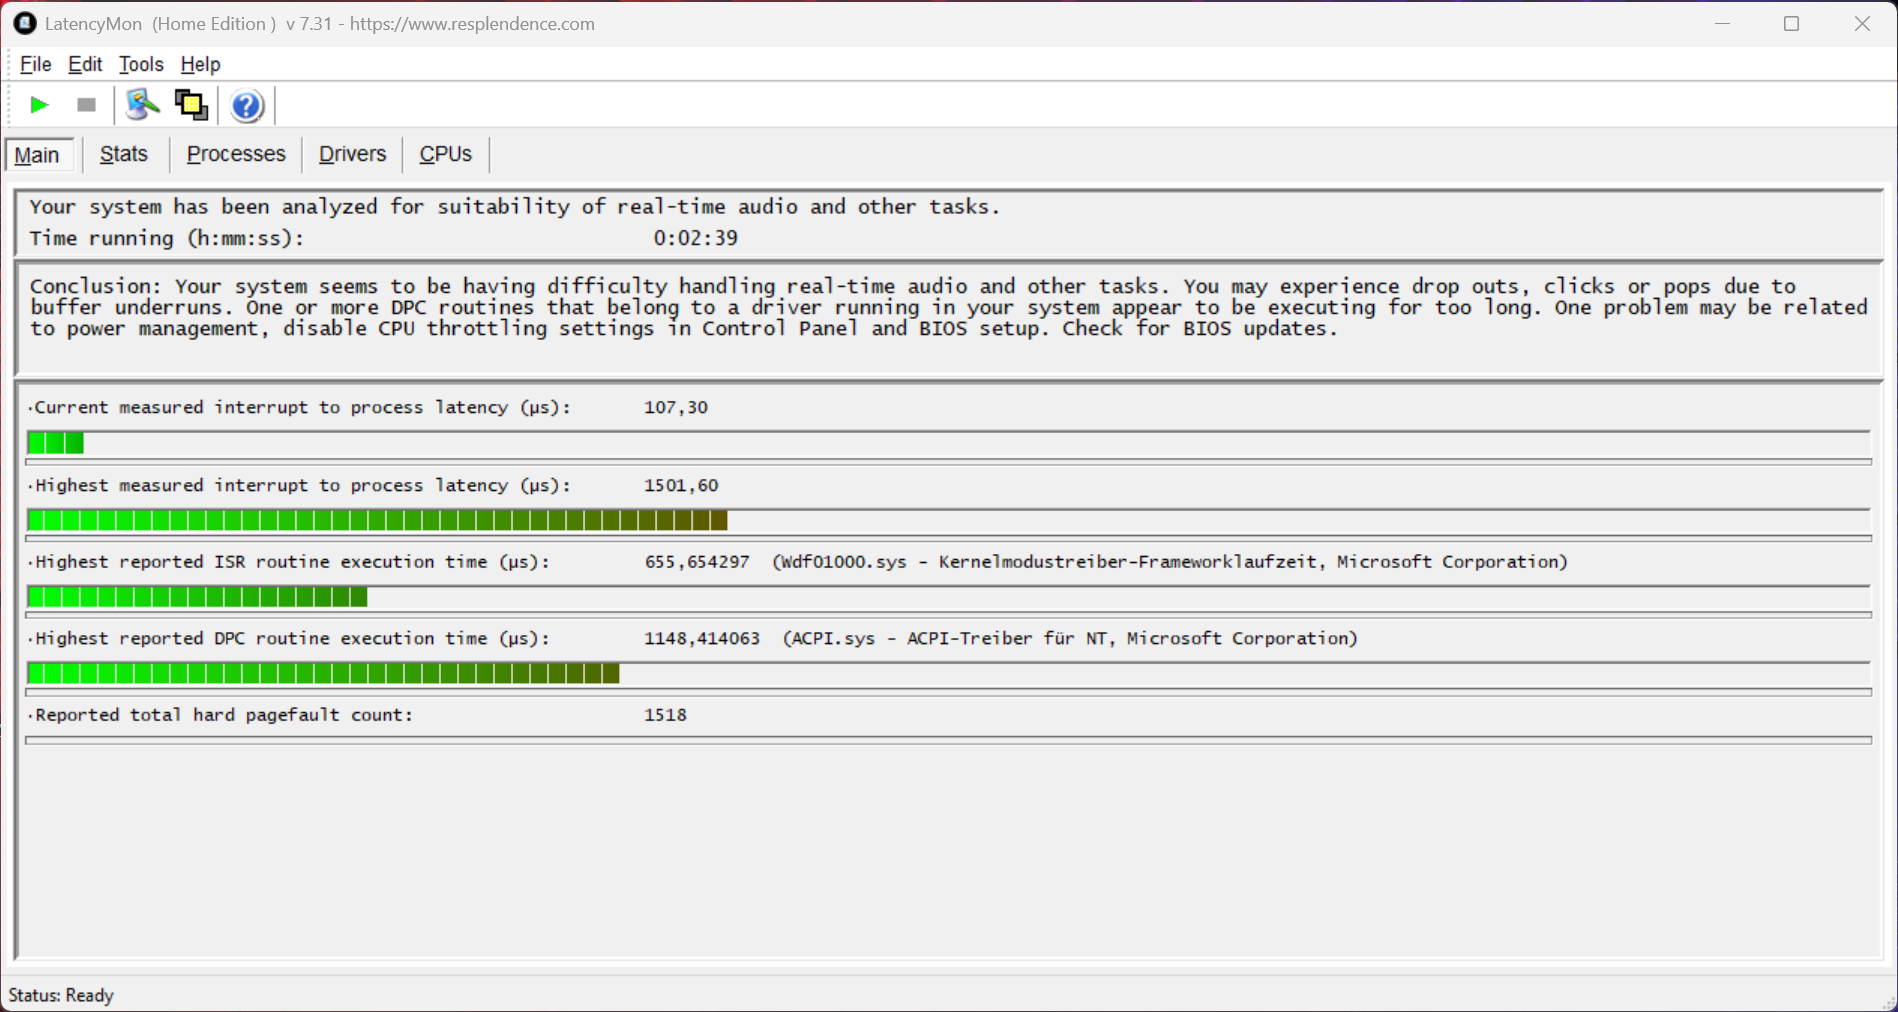
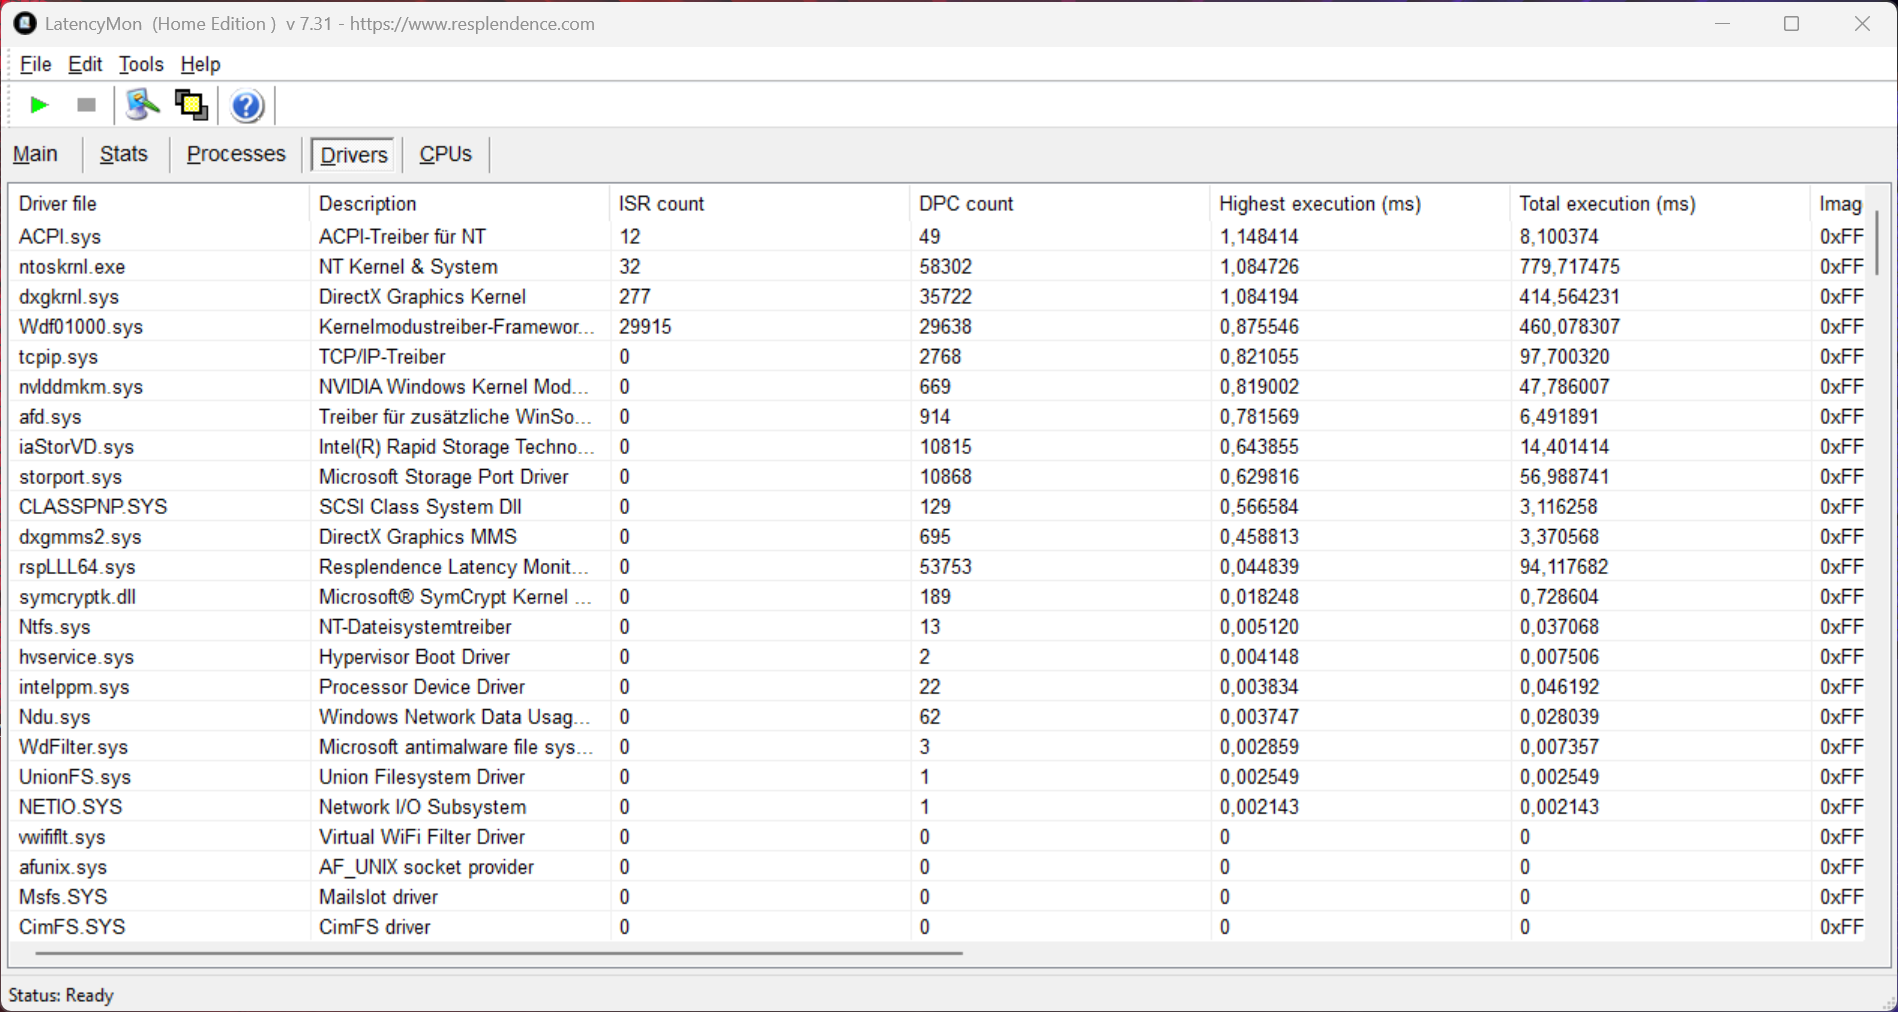
| DPC Latencies / LatencyMon - interrupt to process latency (max), Web, Youtube, Prime95 | |
| Asus ROG Strix Scar 16 G634JZR | |
| SCHENKER XMG Neo 16 (Early 24) | |
| Acer Predator Helios 16 PH16-72 | |
| Asus ROG Strix G16 G615 | |
| Lenovo Legion Pro 7 16IRX9H | |
| HP Omen 16 (2024) | |
| Lenovo Legion Pro 7i 16 Gen 10 | |
* ... más pequeño es mejor
Dispositivos de almacenamiento
Nuestra unidad de prueba utiliza la versión de 1 TB del Micron 2500, con 840 GB aún disponibles para el usuario tras la operación inicial. El rendimiento de la SSD PCIe 4.0 es muy bueno y estable. Con la segunda ranura M.2-2280, la ampliación del almacenamiento se puede hacer fácilmente sin problemas y a un bajo precio. La Strix G16 no es compatible con PCIe 5.0.

* ... más pequeño es mejor
Constant Read Performance: DiskSpd Read Loop, Queue Depth 8
Tarjeta gráfica
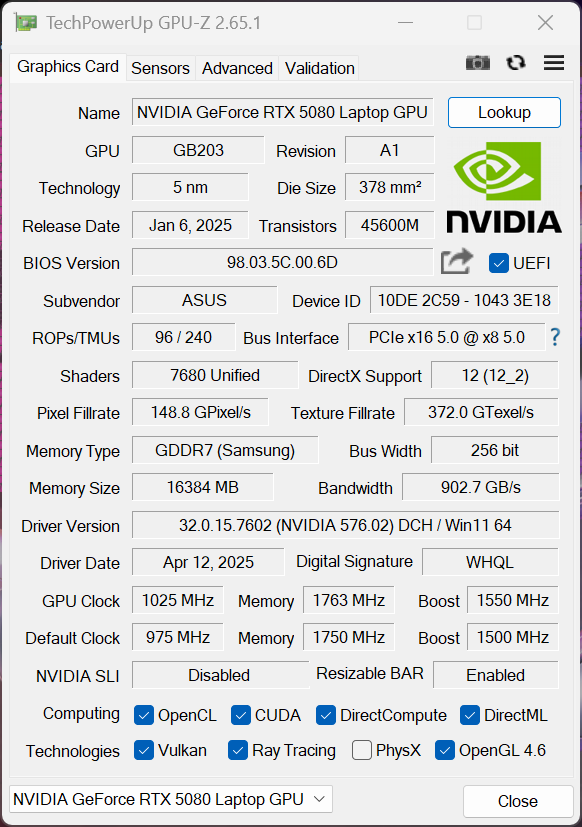
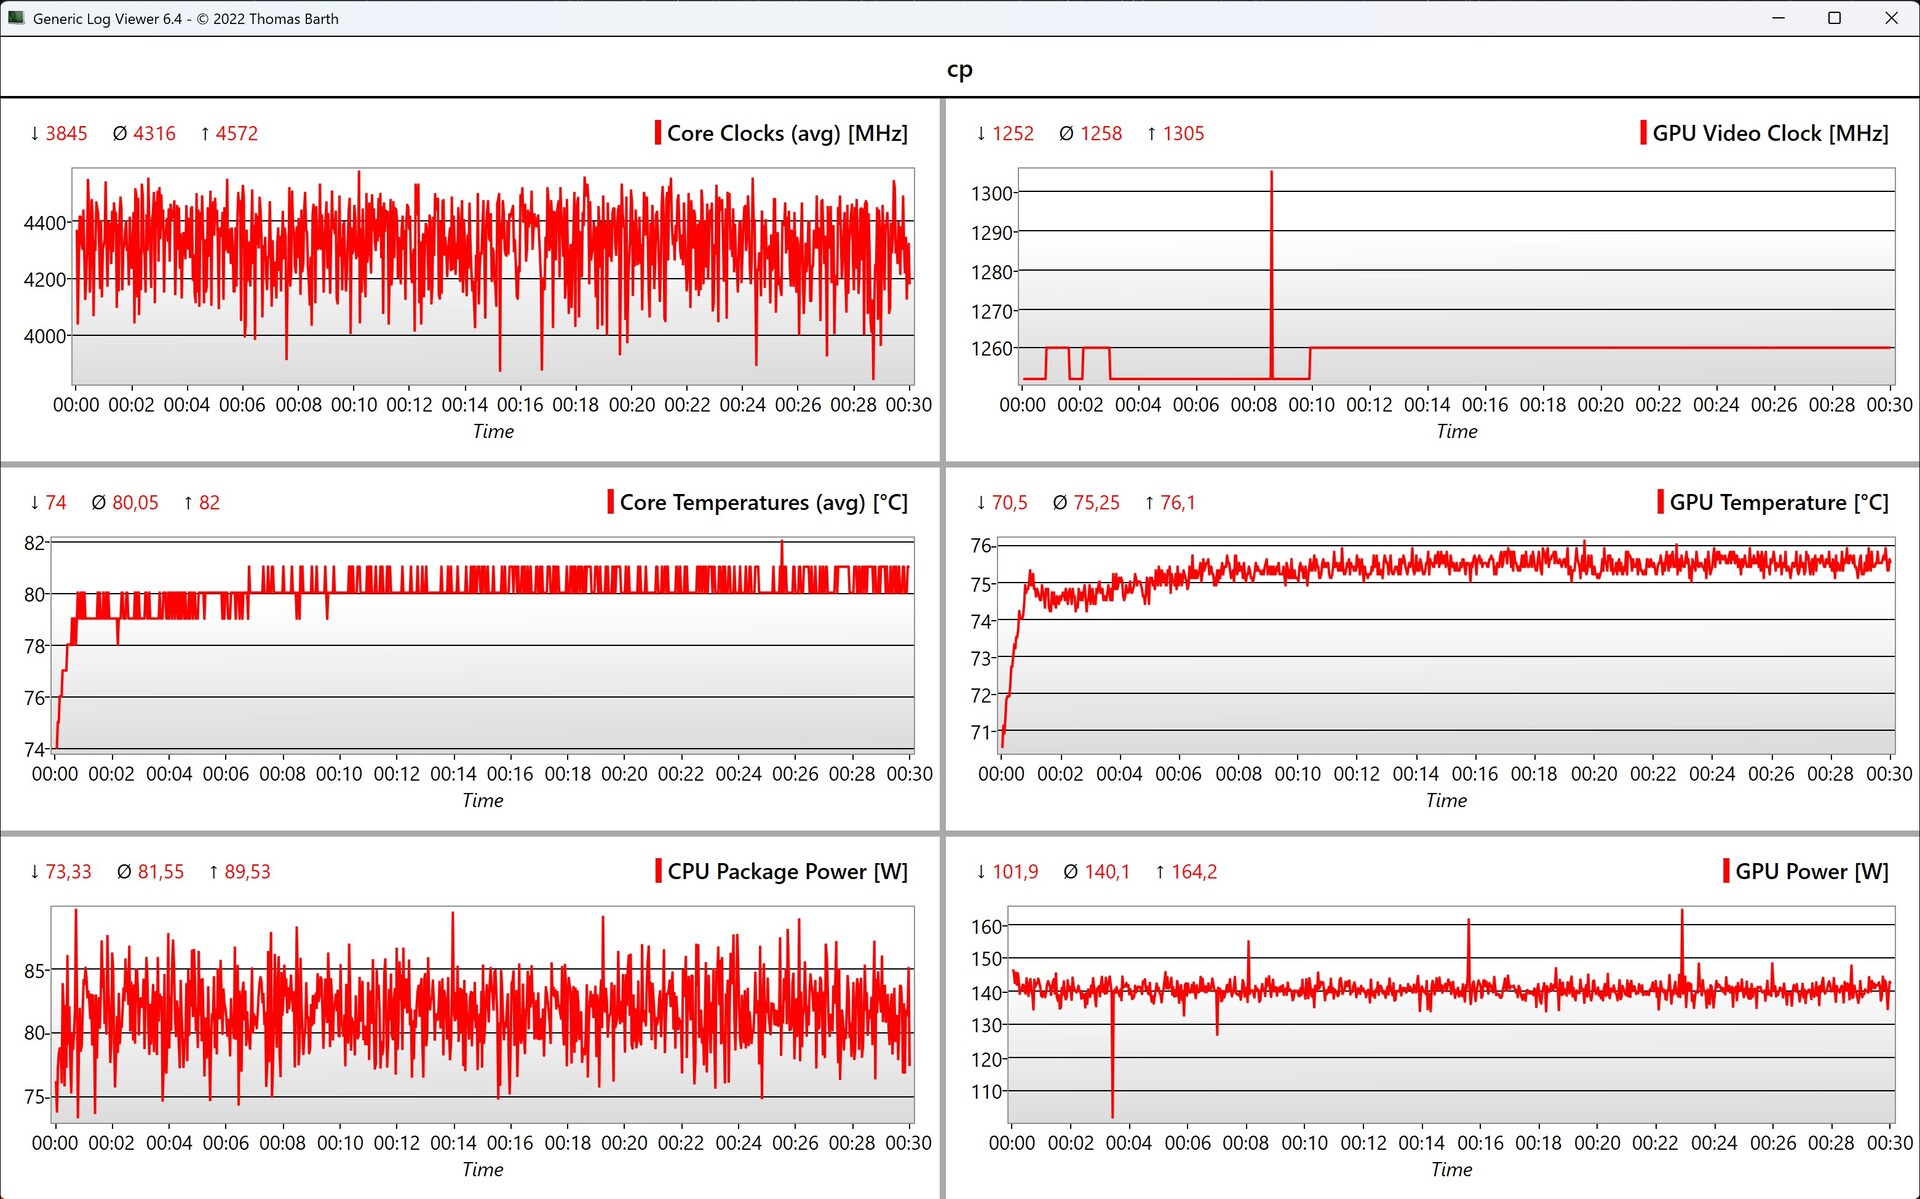
Nuestra unidad de prueba de la Strix G16 está equipada con la nueva GeForce RTX 5080 portátil (16 GB de VRAM), utilizándose aquí la versión más rápida con un TGP máximo de 175 vatios (150 vatios + 25 vatios de Dynamic Boost). Los resultados son ligeramente dispares en los benchmarks sintéticos, y ya hemos visto mejores resultados para la nueva 5080 Laptop, aunque la antigua Portátil RTX 4080 de la ROG Strix SCAR 16 sigue siendo superado. Sin embargo, una actualización del nuevo Portátil 4080 y mucho menos del Portátil 4090 no tendrá realmente ningún sentido. Por otro lado, la ventaja en comparación con el antiguo portátil 3080 Ti es claramente perceptible. Bajo carga constante, el rendimiento de la GPU se mantiene completamente estable.
| 3DMark 11 Performance | 45056 puntos | |
| 3DMark Fire Strike Score | 36371 puntos | |
| 3DMark Time Spy Score | 20753 puntos | |
| 3DMark Steel Nomad Score | 5156 puntos | |
| 3DMark Steel Nomad Light Score | 22259 puntos | |
| 3DMark Steel Nomad Light Unlimited Score | 21869 puntos | |
ayuda | ||
| Blender / v3.3 Classroom OPTIX/RTX | |
| Media de la clase Gaming (10 - 95, n=140, últimos 2 años) | |
| Acer Predator Helios 16 PH16-72 | |
| HP Omen 16 (2024) | |
| Lenovo Legion Pro 7 16IRX9H | |
| Asus ROG Strix Scar 16 G634JZR | |
| SCHENKER XMG Neo 16 (Early 24) | |
| Medio Nvidia GeForce RTX 5080 Laptop (11.6 - 12, n=2) | |
| Asus ROG Strix G16 G615 | |
| Blender / v3.3 Classroom CUDA | |
| Media de la clase Gaming (15 - 156, n=142, últimos 2 años) | |
| HP Omen 16 (2024) | |
| Acer Predator Helios 16 PH16-72 | |
| Asus ROG Strix Scar 16 G634JZR | |
| Lenovo Legion Pro 7 16IRX9H | |
| Asus ROG Strix G16 G615 | |
| Medio Nvidia GeForce RTX 5080 Laptop (18 - 20, n=2) | |
| SCHENKER XMG Neo 16 (Early 24) | |
| Blender / v3.3 Classroom CPU | |
| Media de la clase Gaming (123 - 962, n=147, últimos 2 años) | |
| HP Omen 16 (2024) | |
| Acer Predator Helios 16 PH16-72 | |
| Asus ROG Strix Scar 16 G634JZR | |
| Lenovo Legion Pro 7 16IRX9H | |
| SCHENKER XMG Neo 16 (Early 24) | |
| Medio Nvidia GeForce RTX 5080 Laptop (123 - 148, n=3) | |
| Asus ROG Strix G16 G615 | |
* ... más pequeño es mejor
Rendimiento en juegos
El rendimiento en juegos es muy bueno en general, y el nuevo Portátil RTX 5080 alcanza una cifra muy buena sobre todo en la resolución nativa WQHD. Ya vimos en nuestro análisis de las nuevas GPU GeForce que la 5090 Laptop sólo es realmente capaz de mostrar toda su potencia en la resolución 4K. Con los juegos actuales, el rendimiento en juegos suele estar al nivel del antiguo Portátil RTX 4090, y se puede jugar a todos los juegos modernos sin problemas. Pero también observamos que el Lenovo Legion Pro 7i G10 ofrece un rendimiento de juego ligeramente superior con componentes de núcleo idénticos.
| Cyberpunk 2077 2.2 Phantom Liberty - 1920x1080 Ultra Preset (FSR off) | |
| Lenovo Legion Pro 7i 16 Gen 10 | |
| SCHENKER XMG Neo 16 A25 5080 Engineering Sample | |
| Asus ROG Strix G16 G615 | |
| SCHENKER XMG Neo 16 (Early 24) | |
| Asus ROG Strix Scar 16 G634JZR | |
| Lenovo Legion Pro 7 16IRX9H | |
| Acer Predator Helios 16 PH16-72 | |
| Media de la clase Gaming (6.76 - 158, n=93, últimos 2 años) | |
| HP Omen 16 (2024) | |
| GTA V - 1920x1080 Highest Settings possible AA:4xMSAA + FX AF:16x | |
| SCHENKER XMG Neo 16 A25 5080 Engineering Sample | |
| Asus ROG Strix G16 G615 | |
| SCHENKER XMG Neo 16 (Early 24) | |
| Lenovo Legion Pro 7 16IRX9H | |
| Asus ROG Strix Scar 16 G634JZR | |
| Media de la clase Gaming (12.1 - 168.2, n=125, últimos 2 años) | |
| Acer Predator Helios 16 PH16-72 | |
| HP Omen 16 (2024) | |
Cyberpunk 2077 Ultra FPS Chart
Sin embargo, si desea utilizar los detalles máximos, incluido el trazado de rayos o el trazado de trayectorias (que se ve extremadamente bien), incluso el portátil RTX 5080 llega a sus límites sin necesidad de reescalado. La siguiente tabla lo deja muy claro utilizando los dos juegos Cyberpunk 2077 y Alan Wake 2. Una vez más, el rendimiento puede aumentarse significativamente utilizando la generación de fotogramas múltiples (x4) en los juegos que la admiten.
| Configuración | Cyberpunk 2077 Phantom Liberty RT Overdrive |
Alan Wake 2 Personalizado (Todo Alto/Ultra + PT) |
|---|---|---|
| Nativo | 21,9 FPS | 34,2 FPS |
| Calidad DLSS | 43,1 FPS | 56,9 FPS |
| Rendimiento DLSS | 63,8 FPS | 75 FPS |
| DLSS Calidad MFG x2 | 77,6 FPS | 98,9 FPS |
| DLSS Calidad MFG x4 | 141,2 FPS | 173,9 FPS |
| bajo | medio | alto | ultra | QHD DLSS | QHD | |
|---|---|---|---|---|---|---|
| GTA V (2015) | 164.1 | 156.2 | ||||
| Dota 2 Reborn (2015) | 228 | 201 | 191.6 | 175.5 | ||
| Final Fantasy XV Benchmark (2018) | 234 | 229 | 189.6 | 149.4 | ||
| X-Plane 11.11 (2018) | 135.7 | 136.3 | 110.6 | |||
| Strange Brigade (2018) | 553 | 406 | 386 | 367 | 283 | |
| Baldur's Gate 3 (2023) | 244.8 | 209.1 | 185.4 | 180.3 | 133.1 | |
| Cyberpunk 2077 2.2 Phantom Liberty (2023) | 187.9 | 180.5 | 160.9 | 144.3 | 110.6 | 99.5 |
| Alan Wake 2 (2023) | 112.6 | 76.5 | ||||
| F1 24 (2024) | 318 | 127.5 | 84.5 | |||
| Assassin's Creed Shadows (2025) | 58 | 60 | 50 |
Emisiones - Bajas temperaturas
Emisiones acústicas

Como es habitual, el ruido del ventilador depende significativamente de los perfiles de potencia. En el modo Silencioso, la Strix G16 impresiona como una compañera cotidiana muy silenciosa (con el ventilador a menudo desactivado, 36,1 dB(A) como máximo), pero definitivamente necesitará auriculares en el modo Turbo mientras juega, cuando los ventiladores casi siempre siguen funcionando a unos 30 dB(A) durante el funcionamiento en reposo. Nuestra unidad de prueba no produce ningún otro ruido electrónico.
Ruido
| Ocioso |
| 24 / 30.1 / 30.1 dB(A) |
| Carga |
| 41.1 / 54.2 dB(A) |
 | ||
30 dB silencioso 40 dB(A) audible 50 dB(A) ruidosamente alto |
||
min: | ||
| Asus ROG Strix G16 G615 GeForce RTX 5080 Laptop, Ultra 9 275HX, Micron 2500 1TB MTFDKBA1T0QGN | Acer Predator Helios 16 PH16-72 NVIDIA GeForce RTX 4080 Laptop GPU, i9-14900HX, Micron 3400 2TB MTFDKBA2T0TFH | SCHENKER XMG Neo 16 (Early 24) NVIDIA GeForce RTX 4090 Laptop GPU, i9-14900HX, Samsung 990 Pro 1 TB | Asus ROG Strix Scar 16 G634JZR NVIDIA GeForce RTX 4080 Laptop GPU, i9-14900HX, SK hynix PC801 HFS002TEJ9X101N | HP Omen 16 (2024) NVIDIA GeForce RTX 4080 Laptop GPU, i9-14900HX, SK hynix PC801 HFS001TEJ9X101N | Lenovo Legion Pro 7 16IRX9H NVIDIA GeForce RTX 4080 Laptop GPU, i9-14900HX, SK Hynix HFS001TEJ9X115N | Lenovo Legion Pro 7i 16 Gen 10 GeForce RTX 5080 Laptop, Ultra 9 275HX, SK Hynix HFS001TEJ9X115N | |
|---|---|---|---|---|---|---|---|
| Noise | 1% | -9% | -8% | -5% | -13% | 11% | |
| apagado / medio ambiente * | 24 | 26.1 -9% | 26 -8% | 21.07 12% | 25 -4% | 24 -0% | 22.9 5% |
| Idle Minimum * | 24 | 26.1 -9% | 28 -17% | 29.75 -24% | 29 -21% | 25 -4% | 22.9 5% |
| Idle Average * | 30.1 | 29.4 2% | 29 4% | 29.75 1% | 30 -0% | 30 -0% | 22.9 24% |
| Idle Maximum * | 30.1 | 31.9 -6% | 31 -3% | 29.75 1% | 31 -3% | 45 -50% | 26.3 13% |
| Load Average * | 41.1 | 51 -24% | 54.85 -33% | 46 -12% | 50 -22% | 27.8 32% | |
| Cyberpunk 2077 ultra * | 54.2 | 48.2 11% | 54.2 -0% | ||||
| Load Maximum * | 54.2 | 45.6 16% | 56 -3% | 58 -7% | 47 13% | 56 -3% | 53.9 1% |
| Witcher 3 ultra * | 54 | 57.8 | 47 | 54 |
* ... más pequeño es mejor
Temperaturas
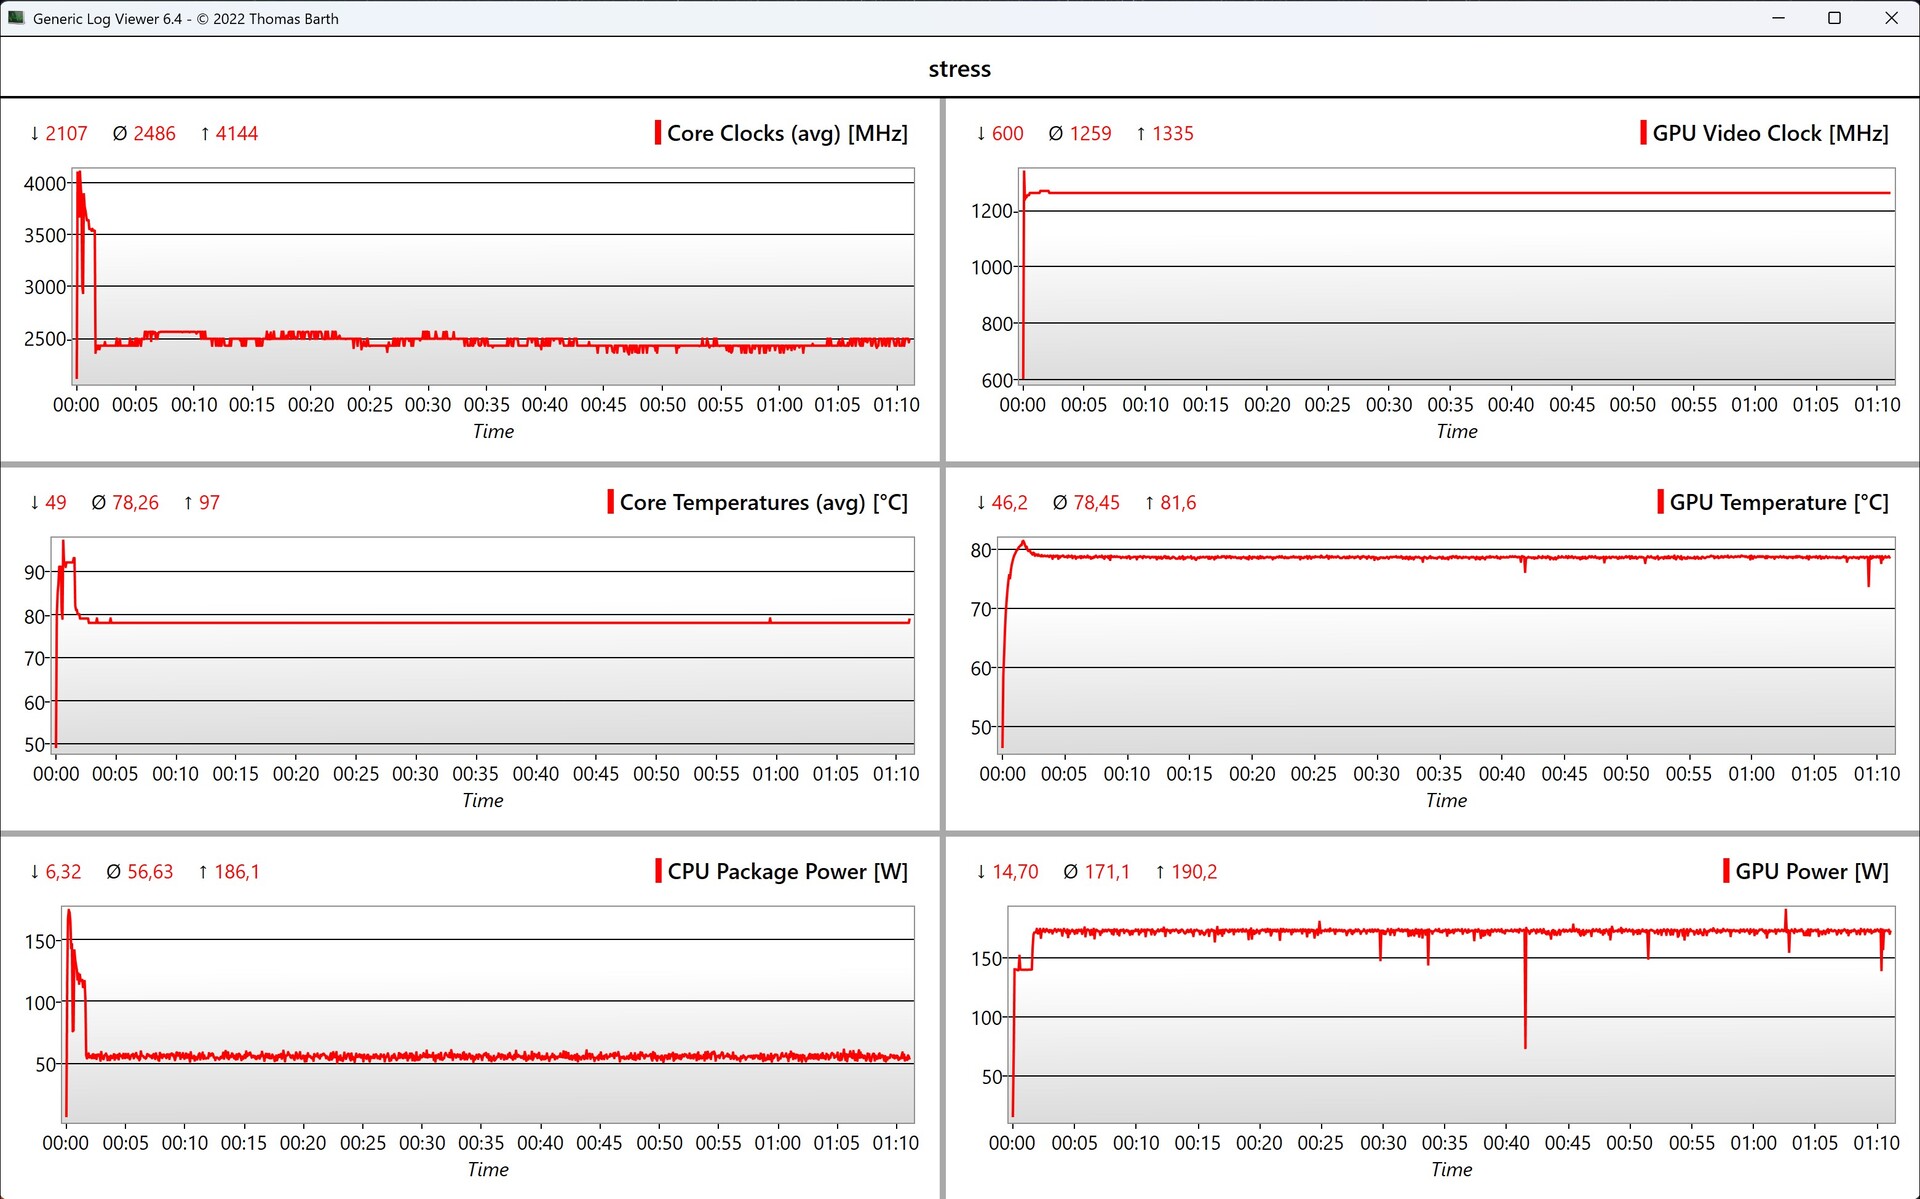
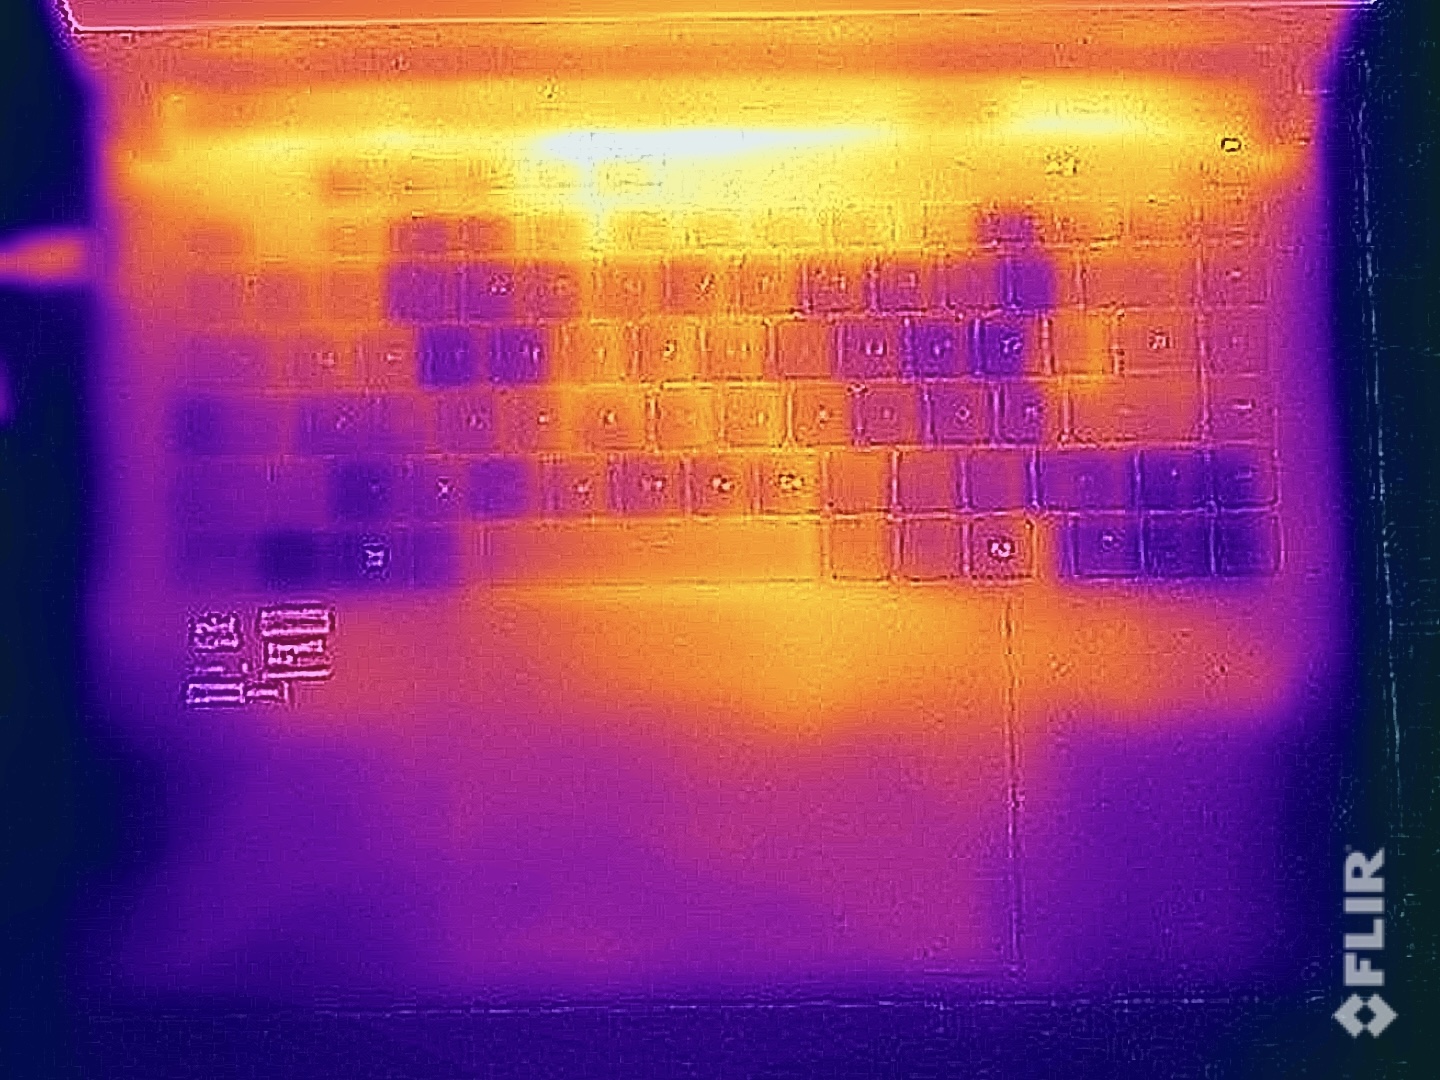
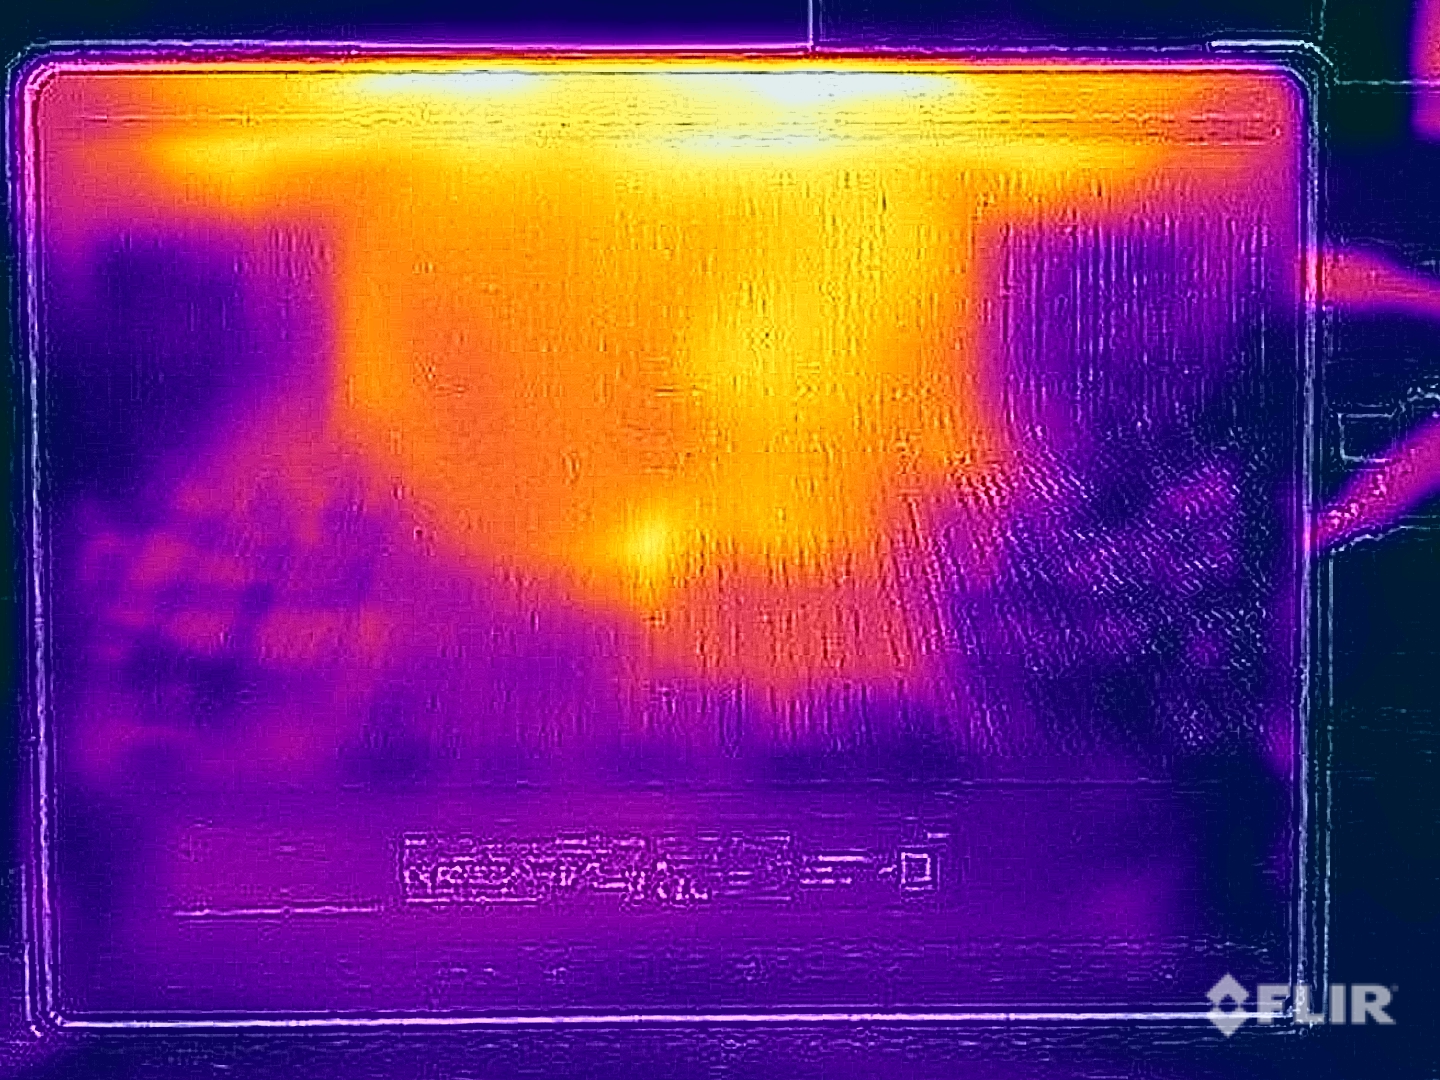
Una ventaja de los ventiladores ruidosos radica en las bajas temperaturas de la superficie, e incluso bajo carga extrema, el dispositivo se mantiene muy fresco, especialmente en la parte superior de la unidad base. Sin embargo, la zona trasera en la parte inferior se calienta bastante (casi 50 °C, 122 °F), por lo que no debería colocar la Strix G16 sobre su regazo. Durante la prueba de estrés, la CPU y la GPU se estabilizan en torno a los 56 y 170 vatios respectivamente (32 y 44 vatios en funcionamiento con batería).
(+) La temperatura máxima en la parte superior es de 39.6 °C / 103 F, frente a la media de 40.4 °C / 105 F, que oscila entre 21.2 y 68.8 °C para la clase Gaming.
(-) El fondo se calienta hasta un máximo de 49.7 °C / 121 F, frente a la media de 43.2 °C / 110 F
(+) En reposo, la temperatura media de la parte superior es de 25.8 °C / 78# F, frente a la media del dispositivo de 33.9 °C / 93 F.
(±) 3: The average temperature for the upper side is 32.5 °C / 91 F, compared to the average of 33.9 °C / 93 F for the class Gaming.
(+) El reposamanos y el panel táctil están a una temperatura inferior a la de la piel, con un máximo de 31.3 °C / 88.3 F y, por tanto, son fríos al tacto.
(-) La temperatura media de la zona del reposamanos de dispositivos similares fue de 28.9 °C / 84 F (-2.4 °C / -4.3 F).
| Asus ROG Strix G16 G615 Intel Core Ultra 9 275HX, Nvidia GeForce RTX 5080 Laptop | Acer Predator Helios 16 PH16-72 Intel Core i9-14900HX, NVIDIA GeForce RTX 4080 Laptop GPU | SCHENKER XMG Neo 16 (Early 24) Intel Core i9-14900HX, NVIDIA GeForce RTX 4090 Laptop GPU | Asus ROG Strix Scar 16 G634JZR Intel Core i9-14900HX, NVIDIA GeForce RTX 4080 Laptop GPU | HP Omen 16 (2024) Intel Core i9-14900HX, NVIDIA GeForce RTX 4080 Laptop GPU | Lenovo Legion Pro 7 16IRX9H Intel Core i9-14900HX, NVIDIA GeForce RTX 4080 Laptop GPU | Lenovo Legion Pro 7i 16 Gen 10 Intel Core Ultra 9 275HX, Nvidia GeForce RTX 5080 Laptop | |
|---|---|---|---|---|---|---|---|
| Heat | -14% | -9% | -18% | -6% | -24% | -9% | |
| Maximum Upper Side * | 39.6 | 37.5 5% | 47 -19% | 47.8 -21% | 47 -19% | 46 -16% | 42.6 -8% |
| Maximum Bottom * | 49.7 | 43.9 12% | 56 -13% | 52.2 -5% | 57 -15% | 49 1% | 41.2 17% |
| Idle Upper Side * | 26.3 | 31 -18% | 27 -3% | 32.4 -23% | 25 5% | 38 -44% | 32.6 -24% |
| Idle Bottom * | 27.3 | 42 -54% | 27 1% | 33 -21% | 26 5% | 37 -36% | 32.4 -19% |
* ... más pequeño es mejor
Altavoces
Los altavoces estéreo hacen un muy buen trabajo y pertenecen a los mejores de nuestro campo de comparación. Sin embargo, siguen siendo incapaces de imponerse al ruido del ventilador mientras juega.
Asus ROG Strix G16 G615 análisis de audio
(+) | los altavoces pueden reproducir a un volumen relativamente alto (#82.2 dB)
Graves 100 - 315 Hz
(±) | lubina reducida - en promedio 7.5% inferior a la mediana
(±) | la linealidad de los graves es media (7.4% delta a frecuencia anterior)
Medios 400 - 2000 Hz
(+) | medios equilibrados - a sólo 2.9% de la mediana
(+) | los medios son lineales (3.6% delta a la frecuencia anterior)
Altos 2 - 16 kHz
(+) | máximos equilibrados - a sólo 2.8% de la mediana
(±) | la linealidad de los máximos es media (8.3% delta a frecuencia anterior)
Total 100 - 16.000 Hz
(+) | el sonido global es lineal (9.4% de diferencia con la mediana)
En comparación con la misma clase
» 3% de todos los dispositivos probados de esta clase eran mejores, 2% similares, 95% peores
» El mejor tuvo un delta de 6%, la media fue 18%, el peor fue ###max##%
En comparación con todos los dispositivos probados
» 3% de todos los dispositivos probados eran mejores, 1% similares, 96% peores
» El mejor tuvo un delta de 4%, la media fue 24%, el peor fue ###max##%
Acer Predator Helios 16 PH16-72 análisis de audio
(±) | la sonoridad del altavoz es media pero buena (81.9 dB)
Graves 100 - 315 Hz
(±) | lubina reducida - en promedio 14.2% inferior a la mediana
(±) | la linealidad de los graves es media (11.7% delta a frecuencia anterior)
Medios 400 - 2000 Hz
(±) | medias más altas - de media 8.3% más altas que la mediana
(±) | la linealidad de los medios es media (8.8% delta respecto a la frecuencia anterior)
Altos 2 - 16 kHz
(+) | máximos equilibrados - a sólo 4.2% de la mediana
(+) | los máximos son lineales (6% delta a la frecuencia anterior)
Total 100 - 16.000 Hz
(±) | la linealidad del sonido global es media (19% de diferencia con la mediana)
En comparación con la misma clase
» 62% de todos los dispositivos probados de esta clase eran mejores, 8% similares, 30% peores
» El mejor tuvo un delta de 6%, la media fue 18%, el peor fue ###max##%
En comparación con todos los dispositivos probados
» 42% de todos los dispositivos probados eran mejores, 7% similares, 50% peores
» El mejor tuvo un delta de 4%, la media fue 24%, el peor fue ###max##%
SCHENKER XMG Neo 16 (Early 24) análisis de audio
(+) | los altavoces pueden reproducir a un volumen relativamente alto (#86 dB)
Graves 100 - 315 Hz
(-) | casi sin bajos - de media 16.3% inferior a la mediana
(±) | la linealidad de los graves es media (8.6% delta a frecuencia anterior)
Medios 400 - 2000 Hz
(+) | medios equilibrados - a sólo 3% de la mediana
(+) | los medios son lineales (3.6% delta a la frecuencia anterior)
Altos 2 - 16 kHz
(+) | máximos equilibrados - a sólo 2.5% de la mediana
(+) | los máximos son lineales (4.9% delta a la frecuencia anterior)
Total 100 - 16.000 Hz
(+) | el sonido global es lineal (12.4% de diferencia con la mediana)
En comparación con la misma clase
» 14% de todos los dispositivos probados de esta clase eran mejores, 3% similares, 83% peores
» El mejor tuvo un delta de 6%, la media fue 18%, el peor fue ###max##%
En comparación con todos los dispositivos probados
» 9% de todos los dispositivos probados eran mejores, 2% similares, 88% peores
» El mejor tuvo un delta de 4%, la media fue 24%, el peor fue ###max##%
Asus ROG Strix Scar 16 G634JZR análisis de audio
(±) | la sonoridad del altavoz es media pero buena (79 dB)
Graves 100 - 315 Hz
(±) | lubina reducida - en promedio 7.1% inferior a la mediana
(±) | la linealidad de los graves es media (9% delta a frecuencia anterior)
Medios 400 - 2000 Hz
(±) | medias más altas - de media 5.5% más altas que la mediana
(+) | los medios son lineales (3.3% delta a la frecuencia anterior)
Altos 2 - 16 kHz
(+) | máximos equilibrados - a sólo 1.4% de la mediana
(+) | los máximos son lineales (2.6% delta a la frecuencia anterior)
Total 100 - 16.000 Hz
(+) | el sonido global es lineal (9.8% de diferencia con la mediana)
En comparación con la misma clase
» 5% de todos los dispositivos probados de esta clase eran mejores, 1% similares, 94% peores
» El mejor tuvo un delta de 6%, la media fue 18%, el peor fue ###max##%
En comparación con todos los dispositivos probados
» 4% de todos los dispositivos probados eran mejores, 1% similares, 96% peores
» El mejor tuvo un delta de 4%, la media fue 24%, el peor fue ###max##%
HP Omen 16 (2024) análisis de audio
(±) | la sonoridad del altavoz es media pero buena (78 dB)
Graves 100 - 315 Hz
(-) | casi sin bajos - de media 15.2% inferior a la mediana
(±) | la linealidad de los graves es media (14.3% delta a frecuencia anterior)
Medios 400 - 2000 Hz
(+) | medios equilibrados - a sólo 4.8% de la mediana
(+) | los medios son lineales (5% delta a la frecuencia anterior)
Altos 2 - 16 kHz
(+) | máximos equilibrados - a sólo 2% de la mediana
(+) | los máximos son lineales (4.1% delta a la frecuencia anterior)
Total 100 - 16.000 Hz
(+) | el sonido global es lineal (14.7% de diferencia con la mediana)
En comparación con la misma clase
» 27% de todos los dispositivos probados de esta clase eran mejores, 7% similares, 66% peores
» El mejor tuvo un delta de 6%, la media fue 18%, el peor fue ###max##%
En comparación con todos los dispositivos probados
» 17% de todos los dispositivos probados eran mejores, 4% similares, 79% peores
» El mejor tuvo un delta de 4%, la media fue 24%, el peor fue ###max##%
Lenovo Legion Pro 7 16IRX9H análisis de audio
(+) | los altavoces pueden reproducir a un volumen relativamente alto (#84 dB)
Graves 100 - 315 Hz
(±) | lubina reducida - en promedio 9% inferior a la mediana
(±) | la linealidad de los graves es media (7.4% delta a frecuencia anterior)
Medios 400 - 2000 Hz
(+) | medios equilibrados - a sólo 2.8% de la mediana
(+) | los medios son lineales (4% delta a la frecuencia anterior)
Altos 2 - 16 kHz
(+) | máximos equilibrados - a sólo 3% de la mediana
(+) | los máximos son lineales (5% delta a la frecuencia anterior)
Total 100 - 16.000 Hz
(+) | el sonido global es lineal (8.4% de diferencia con la mediana)
En comparación con la misma clase
» 1% de todos los dispositivos probados de esta clase eran mejores, 1% similares, 97% peores
» El mejor tuvo un delta de 6%, la media fue 18%, el peor fue ###max##%
En comparación con todos los dispositivos probados
» 2% de todos los dispositivos probados eran mejores, 1% similares, 98% peores
» El mejor tuvo un delta de 4%, la media fue 24%, el peor fue ###max##%
Gestión de la energía - Portátil para juegos con batería de larga duración
Consumo de energía
Durante el funcionamiento en reposo, la Strix G16 es relativamente eficiente, consumiendo un máximo de 18 vatios. Pero esto cambia bajo carga, lo que no es muy sorprendente con los altos límites de potencia. Durante la prueba de estrés, medimos alrededor de 360 vatios durante unos segundos, antes de que el consumo se nivele en torno a los 300 vatios. Puede esperar un valor similar durante los juegos, por lo que el cargador de 380 vatios incluido es completamente suficiente. Con 1,8 vatios, el consumo en modo de espera es demasiado elevado, a pesar de que toda la iluminación ya está desactivada (la tira de luz iluminada produce un efecto pulsante durante el modo de espera por defecto).
| Off / Standby | |
| Ocioso | |
| Carga |
|
Clave:
min: | |
| Asus ROG Strix G16 G615 Ultra 9 275HX, GeForce RTX 5080 Laptop, Micron 2500 1TB MTFDKBA1T0QGN, IPS, 2560x1600, 16" | Acer Predator Helios 16 PH16-72 i9-14900HX, NVIDIA GeForce RTX 4080 Laptop GPU, Micron 3400 2TB MTFDKBA2T0TFH, IPS, 2560x1600, 16" | SCHENKER XMG Neo 16 (Early 24) i9-14900HX, NVIDIA GeForce RTX 4090 Laptop GPU, Samsung 990 Pro 1 TB, IPS, 2560x1600, 16" | Asus ROG Strix Scar 16 G634JZR i9-14900HX, NVIDIA GeForce RTX 4080 Laptop GPU, SK hynix PC801 HFS002TEJ9X101N, Mini LED, 2560x1600, 16" | HP Omen 16 (2024) i9-14900HX, NVIDIA GeForce RTX 4080 Laptop GPU, SK hynix PC801 HFS001TEJ9X101N, IPS, 2560x1440, 16.1" | Lenovo Legion Pro 7 16IRX9H i9-14900HX, NVIDIA GeForce RTX 4080 Laptop GPU, SK Hynix HFS001TEJ9X115N, IPS, 2560x1600, 16" | Lenovo Legion Pro 7i 16 Gen 10 Ultra 9 275HX, GeForce RTX 5080 Laptop, SK Hynix HFS001TEJ9X115N, OLED, 2560x1600, 16" | Medio Nvidia GeForce RTX 5080 Laptop | Media de la clase Gaming | |
|---|---|---|---|---|---|---|---|---|---|
| Power Consumption | -64% | 2% | -5% | -6% | -31% | -75% | -50% | -4% | |
| Idle Minimum * | 10.8 | 31.5 -192% | 6 44% | 10.71 1% | 9 17% | 16 -48% | 36.8 -241% | 23.8 ? -120% | 13.7 ? -27% |
| Idle Average * | 17.7 | 31.5 -78% | 16 10% | 14.75 17% | 16 10% | 21 -19% | 38.8 -119% | 28.3 ? -60% | 19.3 ? -9% |
| Idle Maximum * | 18.8 | 47.5 -153% | 28 -49% | 30 -60% | 35 -86% | 36 -91% | 45.6 -143% | 32.2 ? -71% | 26.9 ? -43% |
| Load Average * | 139.4 | 130 7% | 135 3% | 129 7% | 132 5% | 132.2 5% | 135.8 ? 3% | 102.8 ? 26% | |
| Cyberpunk 2077 ultra * | 295 | 231 22% | 318 -8% | ||||||
| Cyberpunk 2077 ultra external monitor * | 291 | 270 7% | 319 -10% | ||||||
| Load Maximum * | 359.3 | 313 13% | 361 -0% | 307 15% | 285 21% | 360 -0% | 384 -7% | 372 ? -4% | 247 ? 31% |
| Witcher 3 ultra * | 302 | 286 | 150.8 | 267 |
* ... más pequeño es mejor
Power Consumption Cyberpunk / Stress Test
Power Consumption with External Monitor
Duración de las pilas
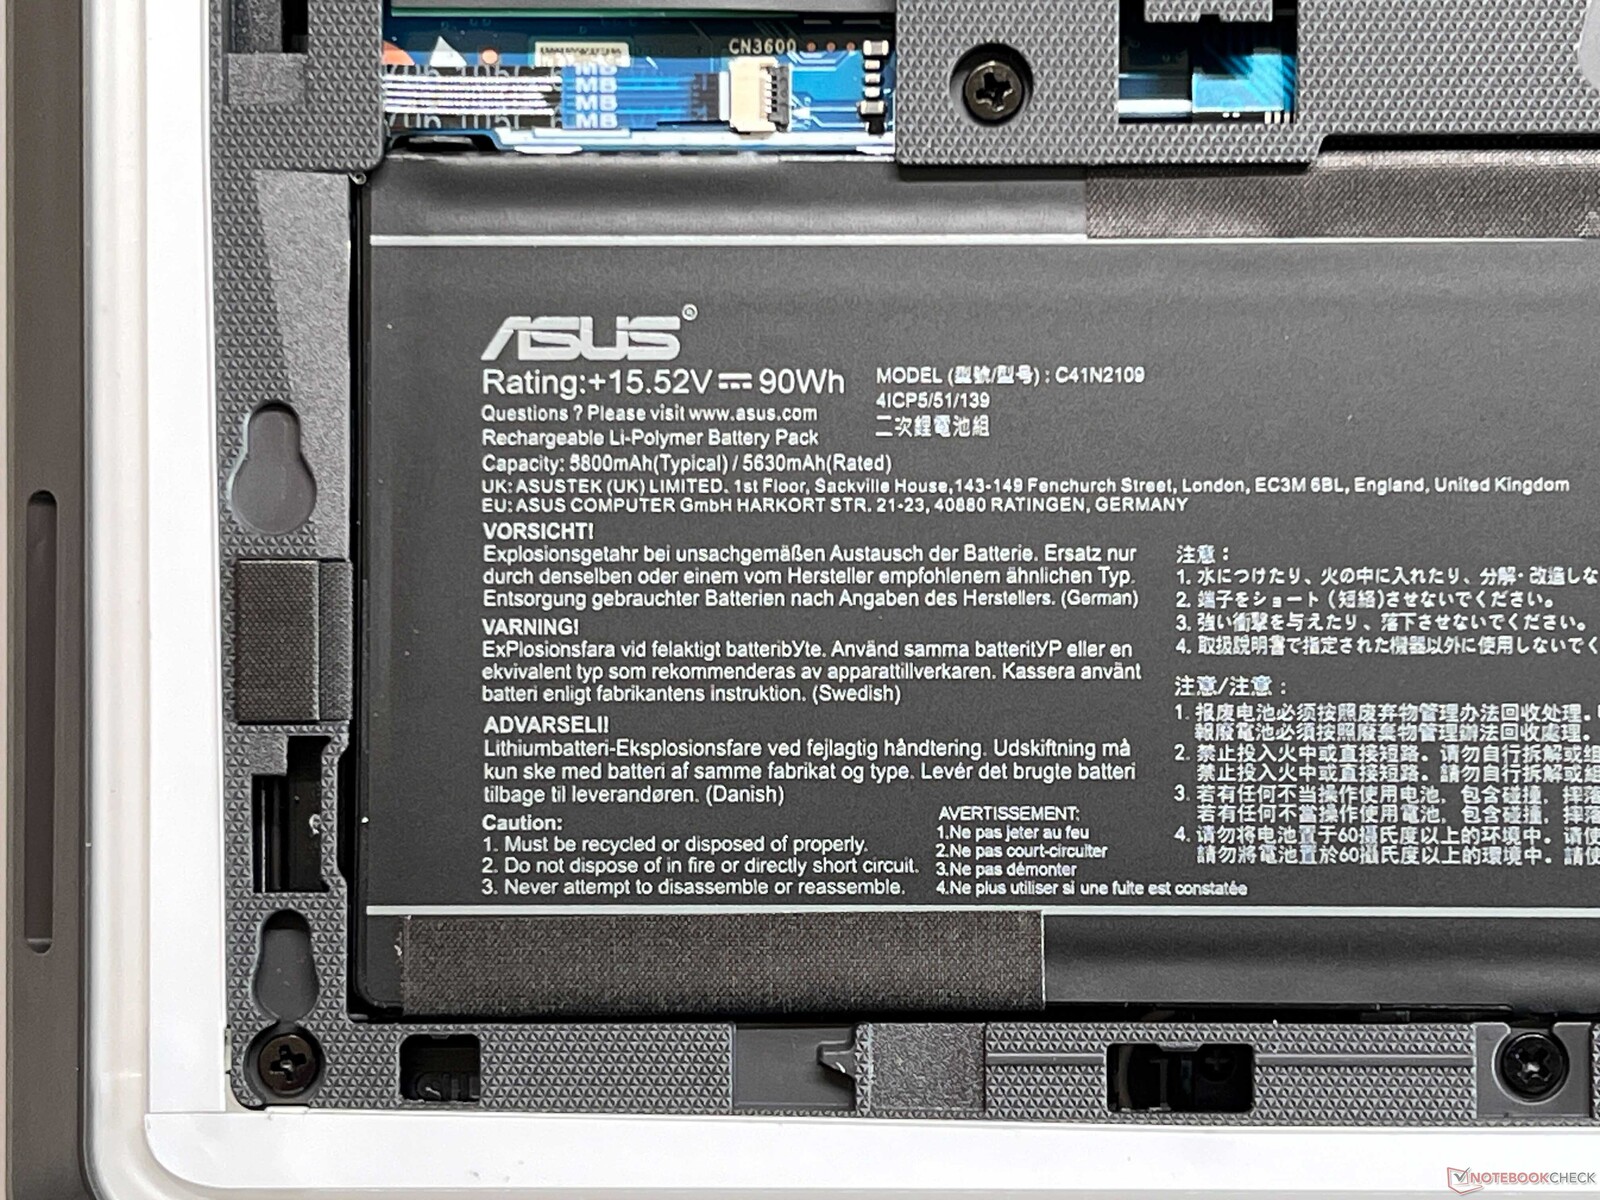
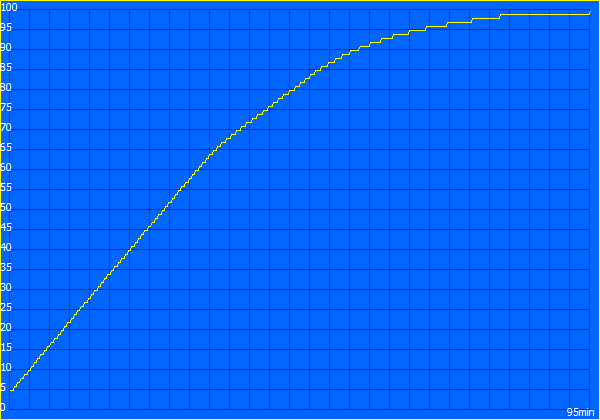
Los portátiles para juegos no son conocidos por su larga duración de batería, pero el Strix G16 (batería de 90 Wh) es una sorpresa positiva y además es capaz de superar a sus competidores. Dura casi 8 horas en nuestra prueba WLAN (6,5h a pleno brillo) y casi 11 horas reproduciendo vídeos. Sin embargo, al jugar, la batería se agota tras unos 48 minutos en nuestra prueba.
| Asus ROG Strix G16 G615 Ultra 9 275HX, GeForce RTX 5080 Laptop, 90 Wh | Acer Predator Helios 16 PH16-72 i9-14900HX, NVIDIA GeForce RTX 4080 Laptop GPU, 90 Wh | SCHENKER XMG Neo 16 (Early 24) i9-14900HX, NVIDIA GeForce RTX 4090 Laptop GPU, 99.8 Wh | Asus ROG Strix Scar 16 G634JZR i9-14900HX, NVIDIA GeForce RTX 4080 Laptop GPU, 90 Wh | HP Omen 16 (2024) i9-14900HX, NVIDIA GeForce RTX 4080 Laptop GPU, 83 Wh | Lenovo Legion Pro 7 16IRX9H i9-14900HX, NVIDIA GeForce RTX 4080 Laptop GPU, 99.9 Wh | Lenovo Legion Pro 7i 16 Gen 10 Ultra 9 275HX, GeForce RTX 5080 Laptop, 99 Wh | Media de la clase Gaming | |
|---|---|---|---|---|---|---|---|---|
| Duración de Batería | -24% | -7% | -27% | -25% | -20% | -38% | -17% | |
| H.264 | 658 | 418 -36% | 451 -31% | 462 ? -30% | ||||
| WiFi v1.3 | 469 | 277 -41% | 350 -25% | 434 -7% | 352 -25% | 373 -20% | 323 -31% | 389 ? -17% |
| Cyberpunk 2077 ultra 150cd | 48 | 45 -6% | ||||||
| Load | 88 | 122 39% | 51 -42% | 48 -45% | 84.3 ? -4% | |||
| Witcher 3 ultra | 57 | 76.3 ? |
Valoración general de Notebookcheck
Asus ROG Strix G16 G615
- 04/25/2025 v8
Andreas Osthoff
 Total Sustainability Score:
 Possible Alternatives in Comparison
Imagen | Modelo | Precio | Peso | Altura | Pantalla |
|---|---|---|---|---|---|
1. 87.3%  | Asus ROG Strix G16 G615 Intel Core Ultra 9 275HX ⎘ Nvidia GeForce RTX 5080 Laptop ⎘ 32 GB Memoría, 1024 GB SSD | Amazon: 1. $1,199.99 ASUS ROG Strix G16 Gaming La... 2. $1,899.00 ASUS ROG Strix G16 (2024) Ga... 3. $1,499.99 ASUS ROG Strix G16 Gaming La... Precio de catálogo: 3299€ | 2.6 kg | 30.8 mm | 16.00" 2560x1600 189 PPI IPS |
2. 86%  | Acer Predator Helios 16 PH16-72 Intel Core i9-14900HX ⎘ NVIDIA GeForce RTX 4080 Laptop GPU ⎘ 32 GB Memoría, 2048 GB SSD | Amazon: 1. $1,469.00 acer Predator Helios Neo 16 ... 2. $2,237.40 acer Predator Helios 16 PH16... 3. $2,577.04 acer Predator Helios 16 PH16... | 2.7 kg | 29.6 mm | 16.00" 2560x1600 189 PPI IPS |
3. 85.5%  | SCHENKER XMG Neo 16 (Early 24) Intel Core i9-14900HX ⎘ NVIDIA GeForce RTX 4090 Laptop GPU ⎘ 32 GB Memoría, 1024 GB SSD | Amazon: 1. $143.00 16.0" for Schenker XMG Neo 1... 2. $150.00 16.0" Screen Replacement for... 3. $145.00 16.0" WQXGA 2560(RGB)×1600 ... Precio de catálogo: 3800 Euro | 2.5 kg | 26.6 mm | 16.00" 2560x1600 189 PPI IPS |
4. 87.6% v7 (old)  | Asus ROG Strix Scar 16 G634JZR Intel Core i9-14900HX ⎘ NVIDIA GeForce RTX 4080 Laptop GPU ⎘ 32 GB Memoría, 2048 GB SSD | Amazon: $2,899.00 Precio de catálogo: 3199 EUR | 2.7 kg | 30.4 mm | 16.00" 2560x1600 189 PPI Mini LED |
5. 86.7% v7 (old)  | HP Omen 16 (2024) Intel Core i9-14900HX ⎘ NVIDIA GeForce RTX 4080 Laptop GPU ⎘ 32 GB Memoría, 1024 GB SSD | Amazon: 1. $1,169.09 HP OMEN 16 inch Laptop, FHD ... 2. $1,329.00 HP Omen 16 Gaming Laptop 16.... 3. $1,164.21 HP OMEN 16 inch Laptop, FHD ... Precio de catálogo: 3200 Euro | 2.4 kg | 23.5 mm | 16.10" 2560x1440 182 PPI IPS |
6. 89.5% v7 (old)  | Lenovo Legion Pro 7 16IRX9H Intel Core i9-14900HX ⎘ NVIDIA GeForce RTX 4080 Laptop GPU ⎘ 32 GB Memoría, 1024 GB SSD | Amazon: Precio de catálogo: 2999 Euro | 2.7 kg | 21.95 mm | 16.00" 2560x1600 189 PPI IPS |
Transparencia
La selección de los dispositivos que se van a reseñar corre a cargo de nuestro equipo editorial. La muestra de prueba fue proporcionada al autor en calidad de préstamo por el fabricante o el minorista a los efectos de esta reseña. El prestamista no tuvo ninguna influencia en esta reseña, ni el fabricante recibió una copia de la misma antes de su publicación. No había ninguna obligación de publicar esta reseña. Nunca aceptamos compensaciones o pagos a cambio de nuestras reseñas. Como empresa de medios independiente, Notebookcheck no está sujeta a la autoridad de fabricantes, minoristas o editores.
Así es como prueba Notebookcheck
Cada año, Notebookcheck revisa de forma independiente cientos de portátiles y smartphones utilizando procedimientos estandarizados para asegurar que todos los resultados son comparables. Hemos desarrollado continuamente nuestros métodos de prueba durante unos 20 años y hemos establecido los estándares de la industria en el proceso. En nuestros laboratorios de pruebas, técnicos y editores experimentados utilizan equipos de medición de alta calidad. Estas pruebas implican un proceso de validación en varias fases. Nuestro complejo sistema de clasificación se basa en cientos de mediciones y puntos de referencia bien fundamentados, lo que mantiene la objetividad.
