

Análisis del portátil Lenovo Legion Pro 7i 16 Gen 10: fuente de alimentación de 400 W casi sin compromisos
Todo el poder.
En lugar de volverse cada vez más delgada, la última Legion Pro 7i 16 es más gruesa este año para exprimir más rendimiento del hardware Intel Arrow Lake y Nvidia Blackwell. Puede que el consumo de energía sea elevado, pero el rendimiento bruto es innegable.Allen Ngo, 👁 Allen Ngo (traducido por DeepL / Ninh Duy) Publicado 🇺🇸 🇫🇷
Veredicto - Arrow Lake vuelve con fuerza para Intel
El Legion Pro 7 16 de 10ª generación es el modelo más refinado de la serie hasta la fecha. A diferencia del último Razer Blade 16, este Lenovo no teme ser más grande o más grueso que su predecesor con el fin de soportar envolventes de mayor potencia y soluciones de refrigeración más potentes. Los cazadores de rendimiento en particular pueden apreciar este enfoque frente a los diseños cada vez más delgados de los competidores que deben equilibrar los niveles de rendimiento de la CPU y la GPU con mucha más delicadeza.
La pantalla también merece elogios por ser uno de los pocos paneles OLED compatibles con altas frecuencias de actualización nativas, Windows VRR, DisplayHDR1000 y G-Sync, todo en uno. El brillo máximo de 1000 nits en modo HDR es más habitual en portátiles con Mini-LED, mientras que la mayoría de los demás paneles OLED son sólo HDR600 o inferiores. La experiencia de visualización es, por tanto, una de las mejores en la categoría de 16 pulgadas para juegos.
Inyectar 400 W en un portátil de 16 pulgadas tiene sus desventajas. Aparte del mayor consumo de energía, alternativas más delgadas y ligeras como el Asus ROG Zephyrus G16 o Razer Blade 16 pueden resultar más atractivas para los viajeros aunque sean ligeramente más lentas. Las temperaturas del núcleo en el Lenovo pueden ser bastante altas cuando se juega a pesar de la gran solución de refrigeración mientras que el ruido del ventilador no es más silencioso que el de los competidores cuando está en modo Rendimiento.
Los compradores que sepan dónde se meten -máximo rendimiento a costa de un mayor tamaño- encontrarán en el Legion Pro 7i Gen 10 una opción potente.
Pro
Contra
Precio y disponibilidad
La configuración RTX 5080 ya se envía directamente desde Lenovo a partir de 3400 dólares, mientras que la configuración RTX 5090 llegará en una fecha posterior.
Índice
- Veredicto - Arrow Lake vuelve con fuerza para Intel
- Especificaciones
- Caso
- Conectividad
- Dispositivos de entrada - Espaciosos y nada extravagantes
- Pantalla - Casi todo lo que pueda desear
- Rendimiento - Lago Arrow con gráficos TGP de 175 W
- Emisiones - Alto sólo cuando es necesario
- Gestión de la energía
- Valoración de Notebookcheck
- Potential Competitors in Comparison
La Legion Pro 7i 16 Gen 10 (o Legion Pro 7 16 G10) sucede a la del año pasado Legion Pro 7i 16 Gen 9 con un diseño totalmente revisado tanto por dentro como por fuera. Casi todo en el modelo actualizado es nuevo, incluyendo la actualización de la CPU de Raptor Lake-HX a Arrow Lake-HX, Nvidia Ada Lovelace a Blackwell, y el aspecto externo y la pantalla.
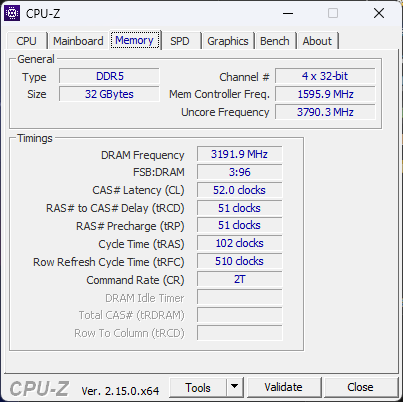
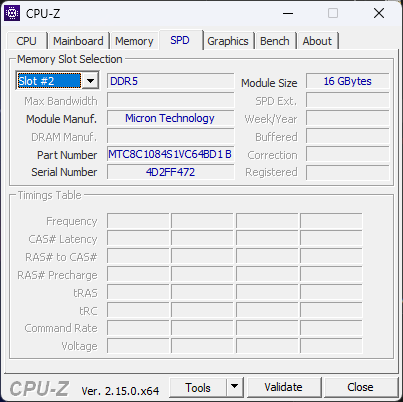
Nuestra unidad de prueba es una configuración de gama alta con la CPU Core Ultra 9 275HX, la GPU GeForce RTX 5080 de 175 W y la pantalla OLED 1600p 240 Hz 16:10 por aproximadamente 3400 USD al por menor. Otras SKU pueden venir con la RTX 5090, RTX 5080 o RTX 5070 Ti en su lugar, mientras que la CPU y la pantalla son las mismas en todos los casos.
Entre los competidores del Legion Pro 7 16 G10 se incluyen otros portátiles para juegos de 16 pulgadas de gama alta como el MSI Vector 16 HX, Asus ROG Zephyrus G16o el Razer Blade 16. Lenovo ofrece una serie para entusiastas aún más costosa llamada Legion Pro 9 16 con características adicionales sobre la Legion Pro 7 16, pero que aún no ha sido renovada para 2025 en el momento de escribir este artículo.
Más opiniones sobre Lenovo:
Especificaciones
Caso
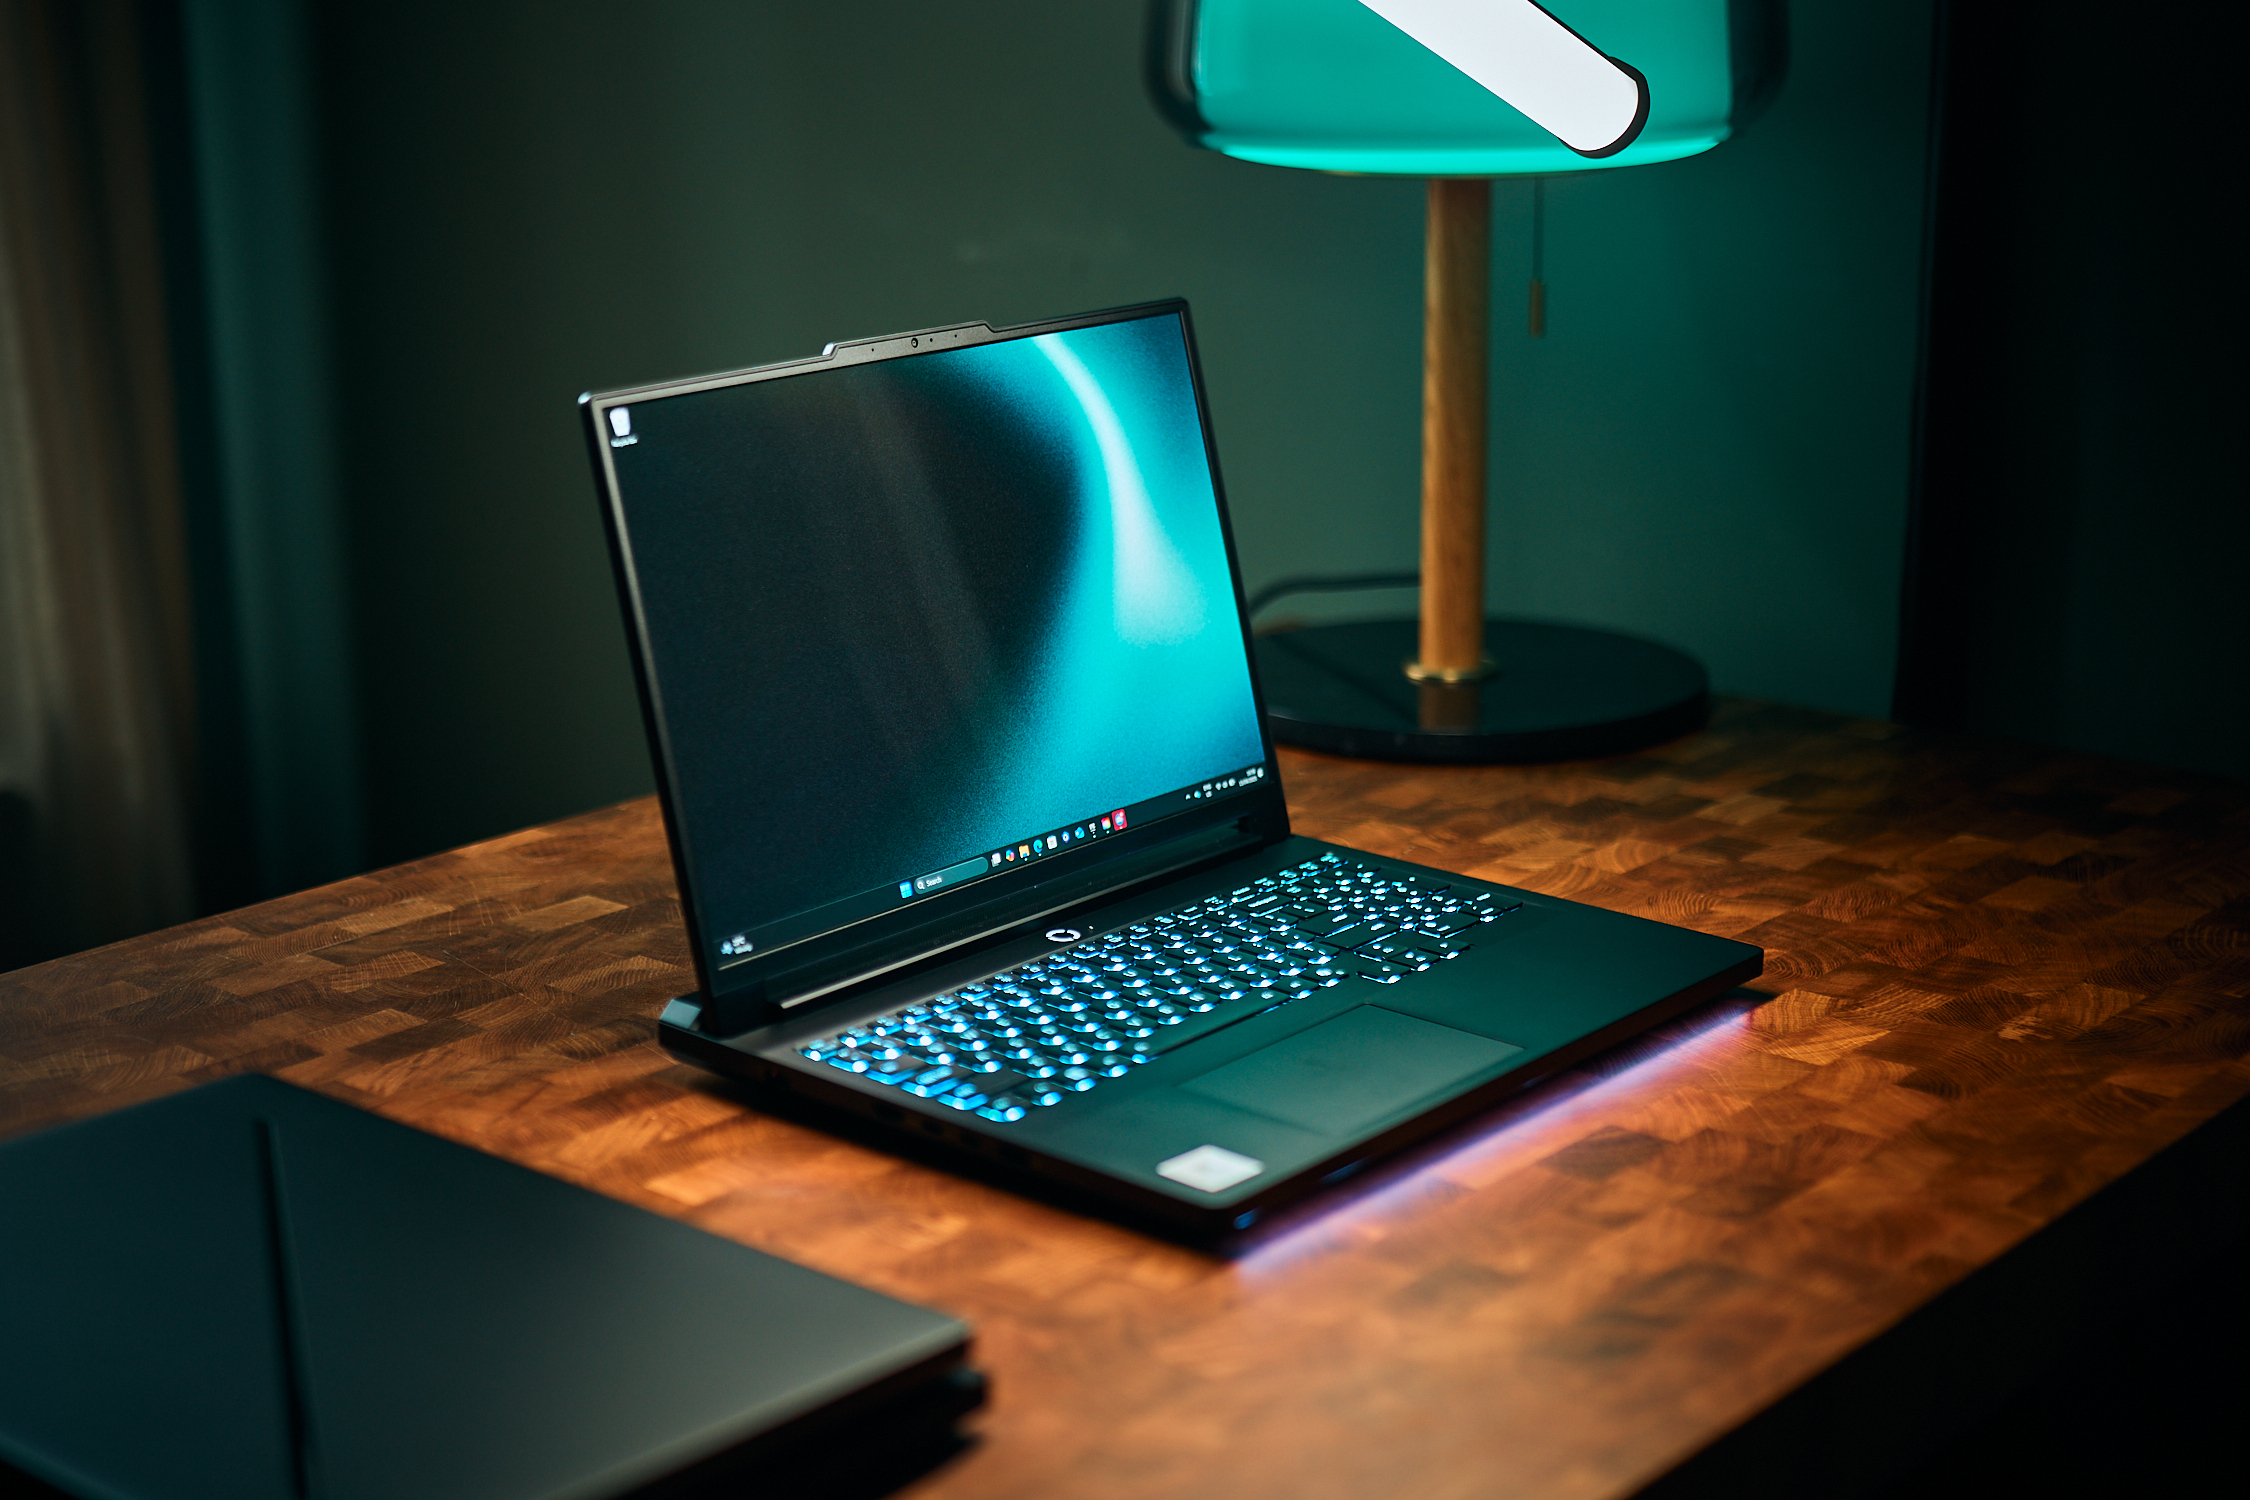
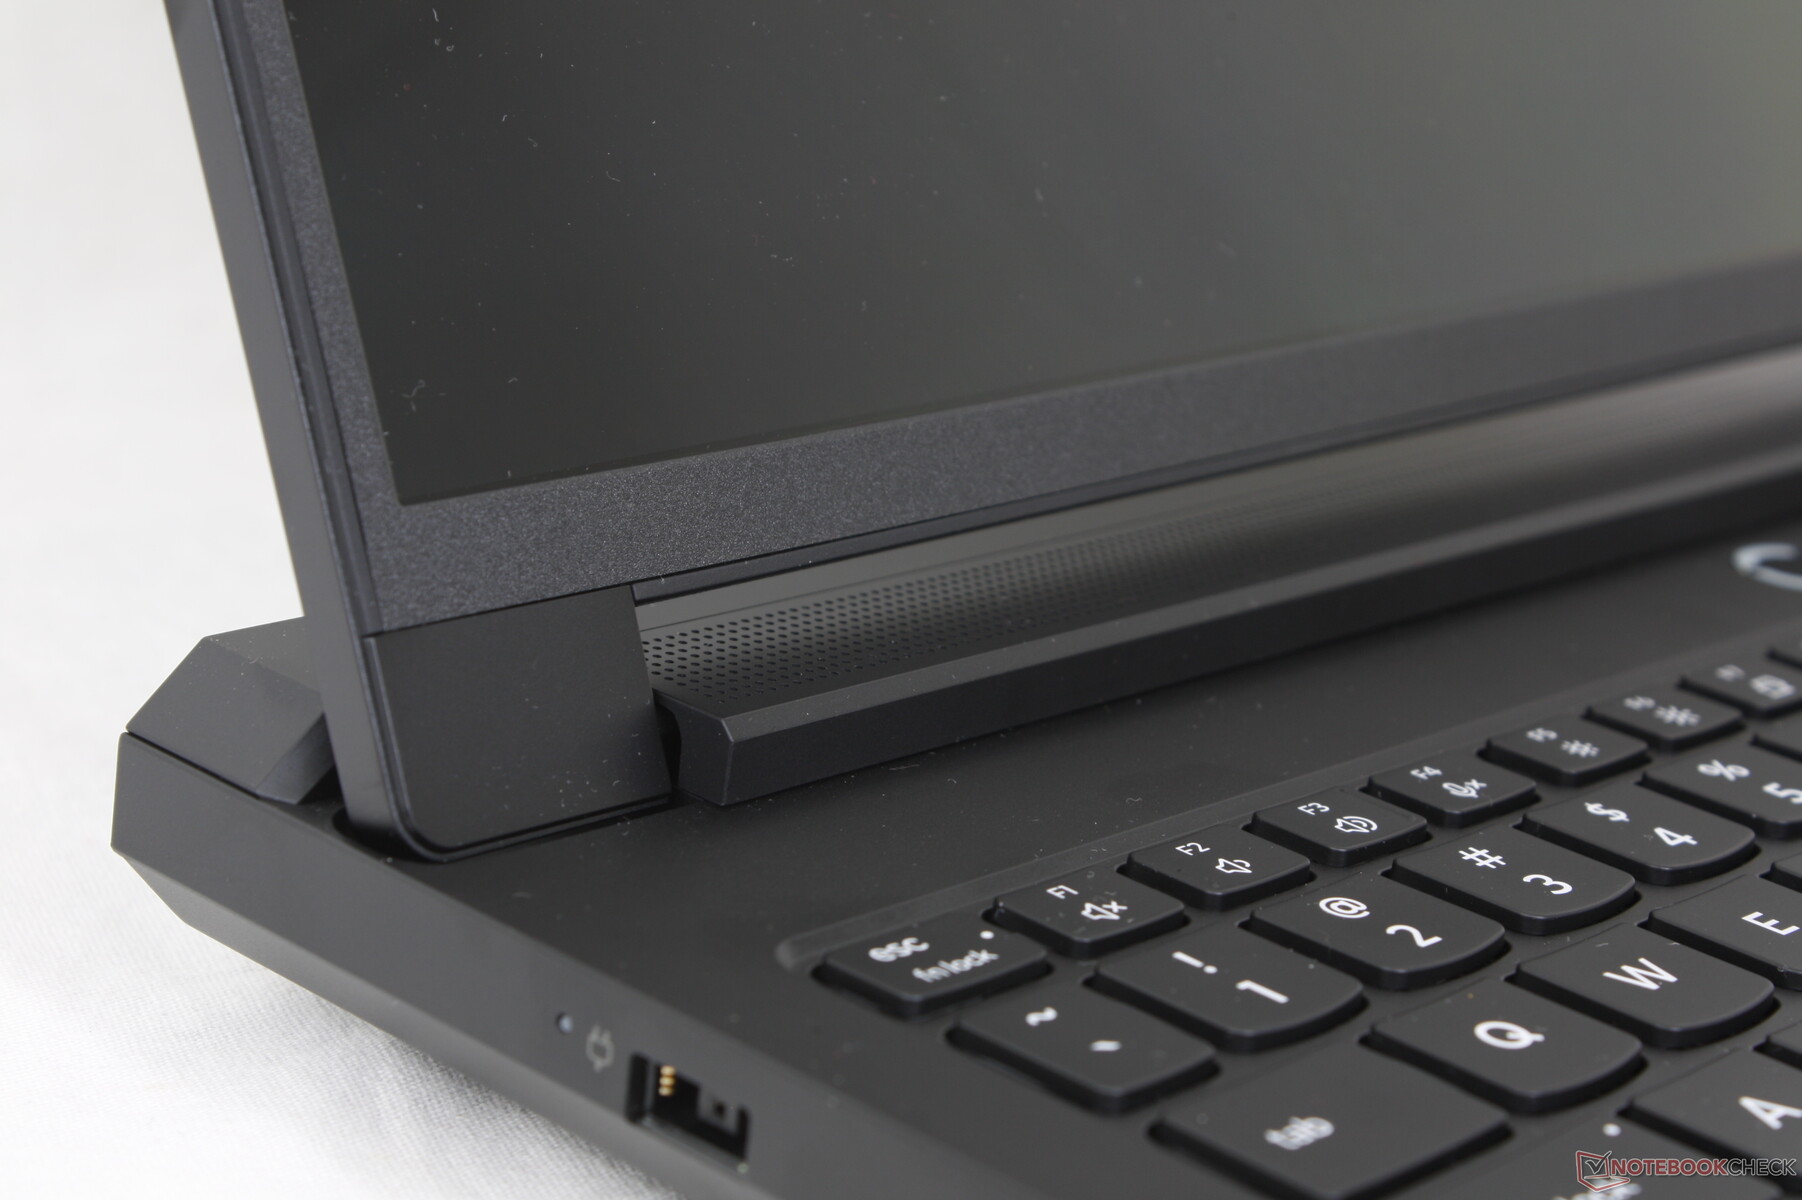
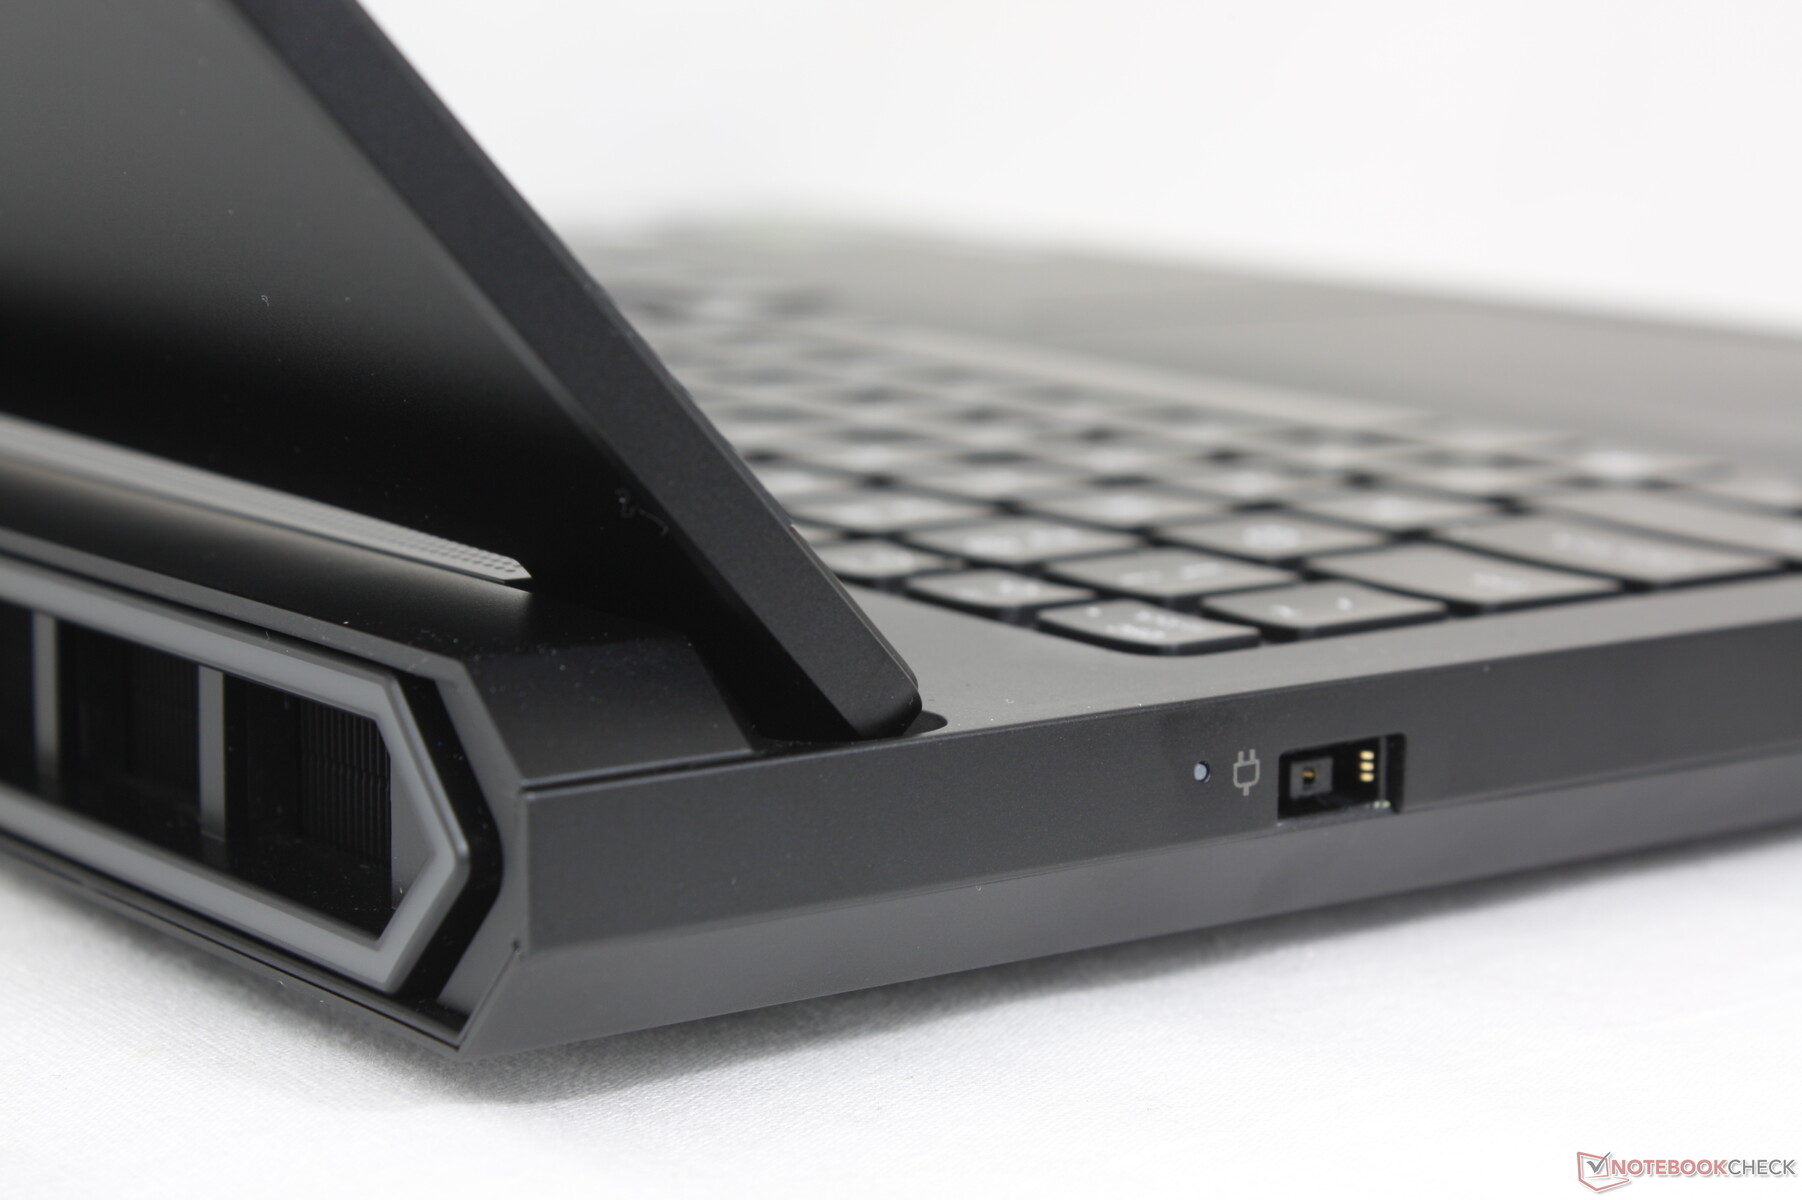
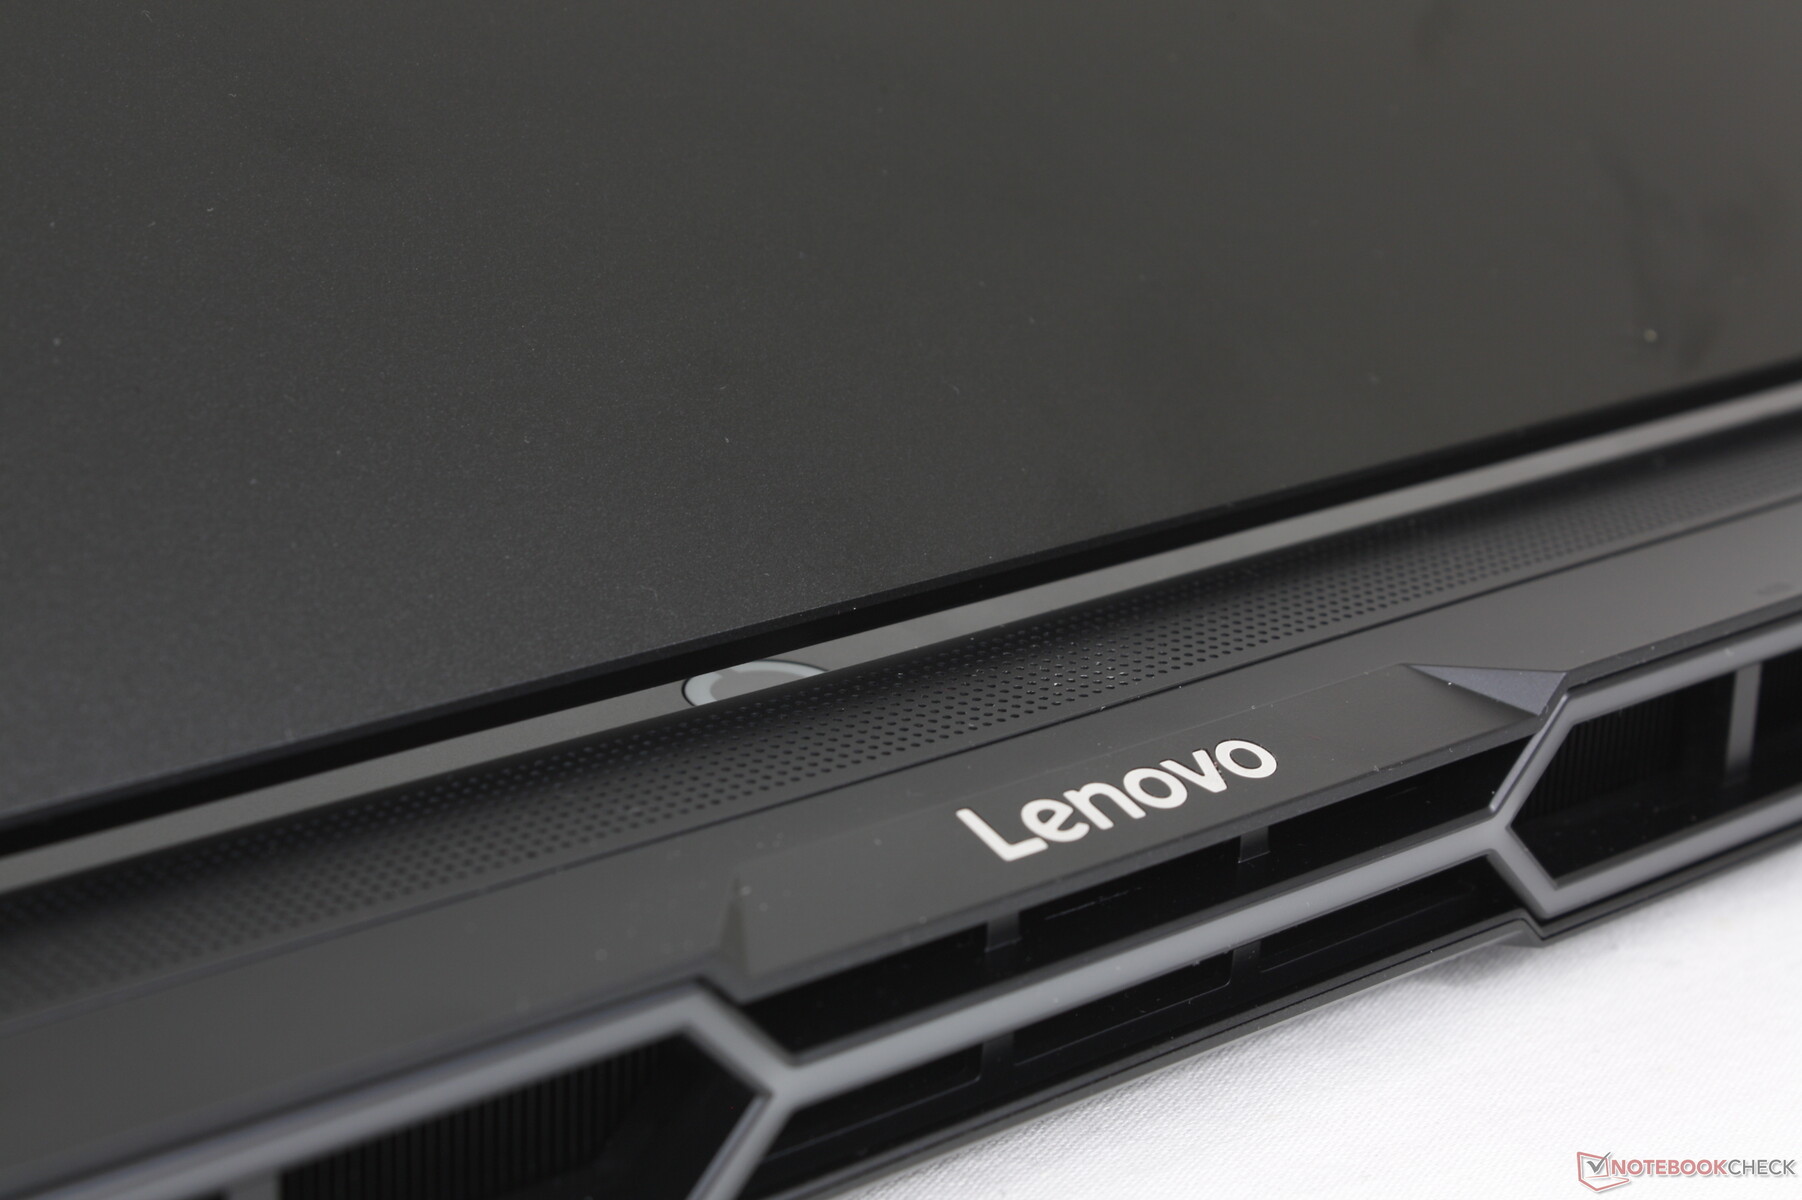
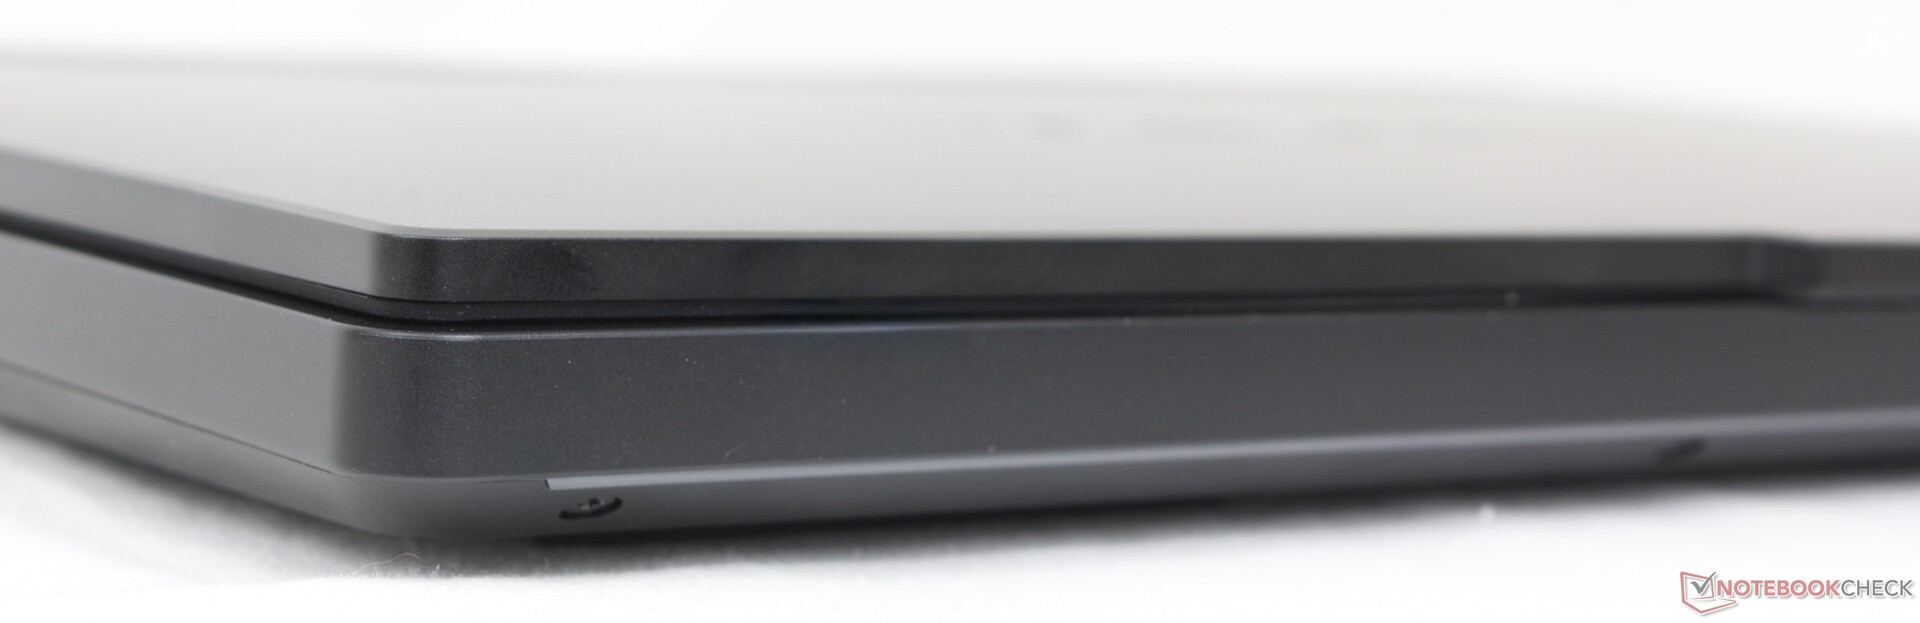
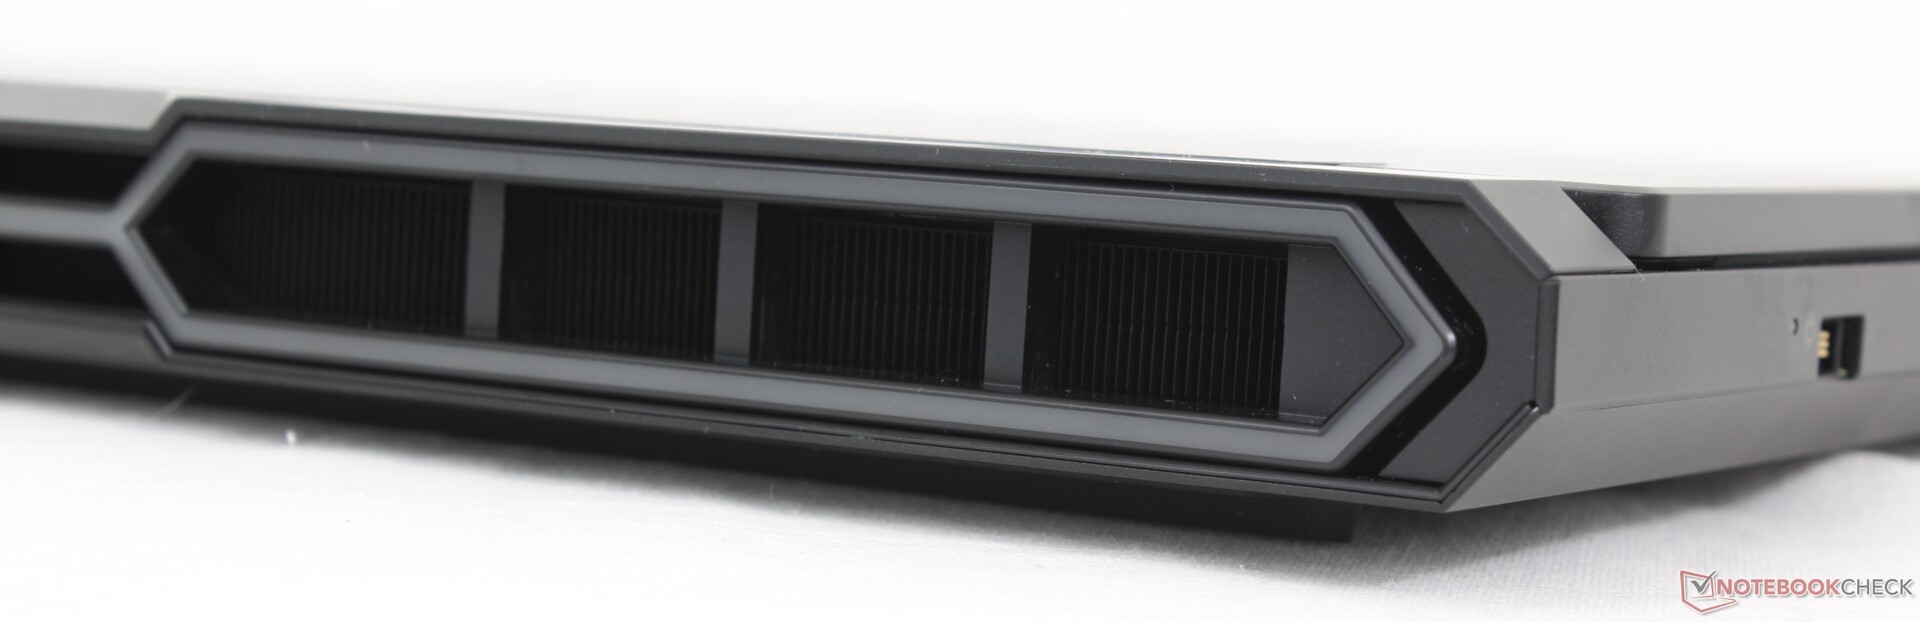
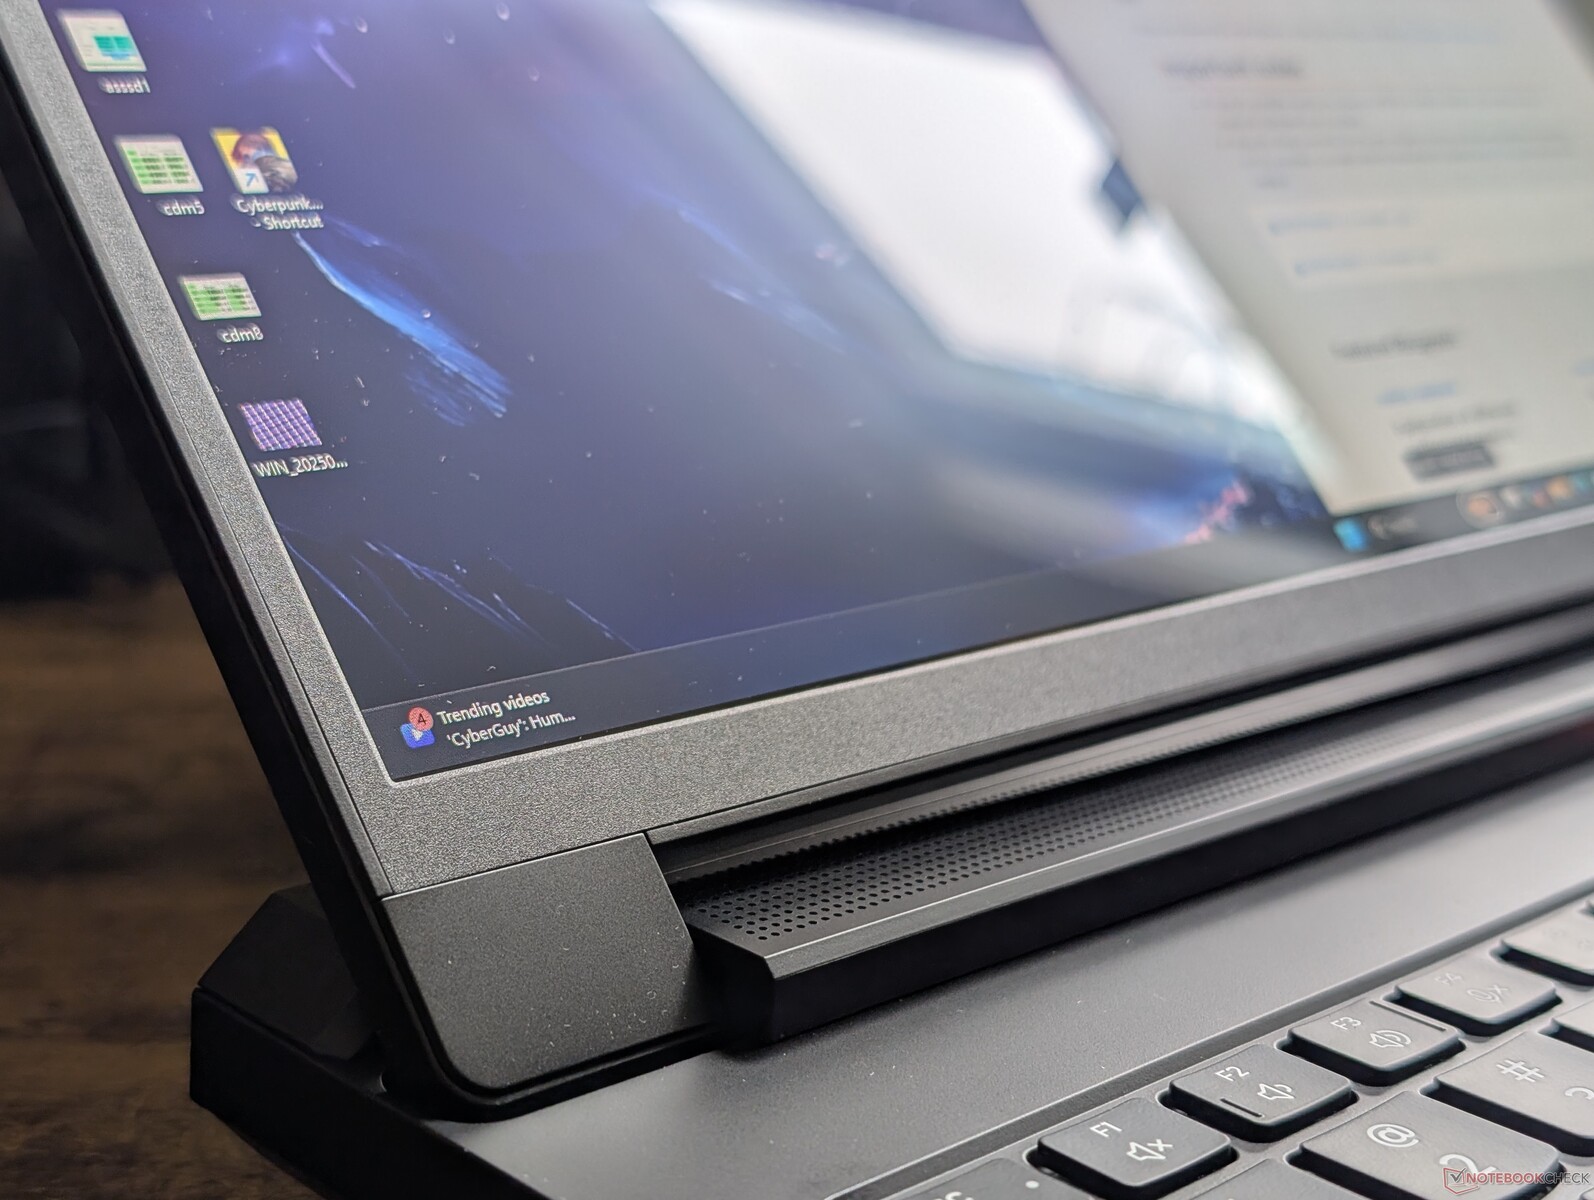
El chasis rediseñado es más nítido, más firme y más "gamer" que antes con sus nuevas barras LED a lo largo de los bordes delantero y trasero. Sin embargo, el enfoque negro azabache, por lo demás oscuro, evita la chabacanería de algunos competidores más brillantes como los modelos multicolores de Alienware o MSI. Es uno de los portátiles para juegos mejor diseñados de Lenovo hasta la fecha, todo sea dicho.
Las huellas dactilares por desgracia se acumulan muy fácilmente en casi todas partes en el portátil totalmente negro al igual que en el Razer Blade 16.
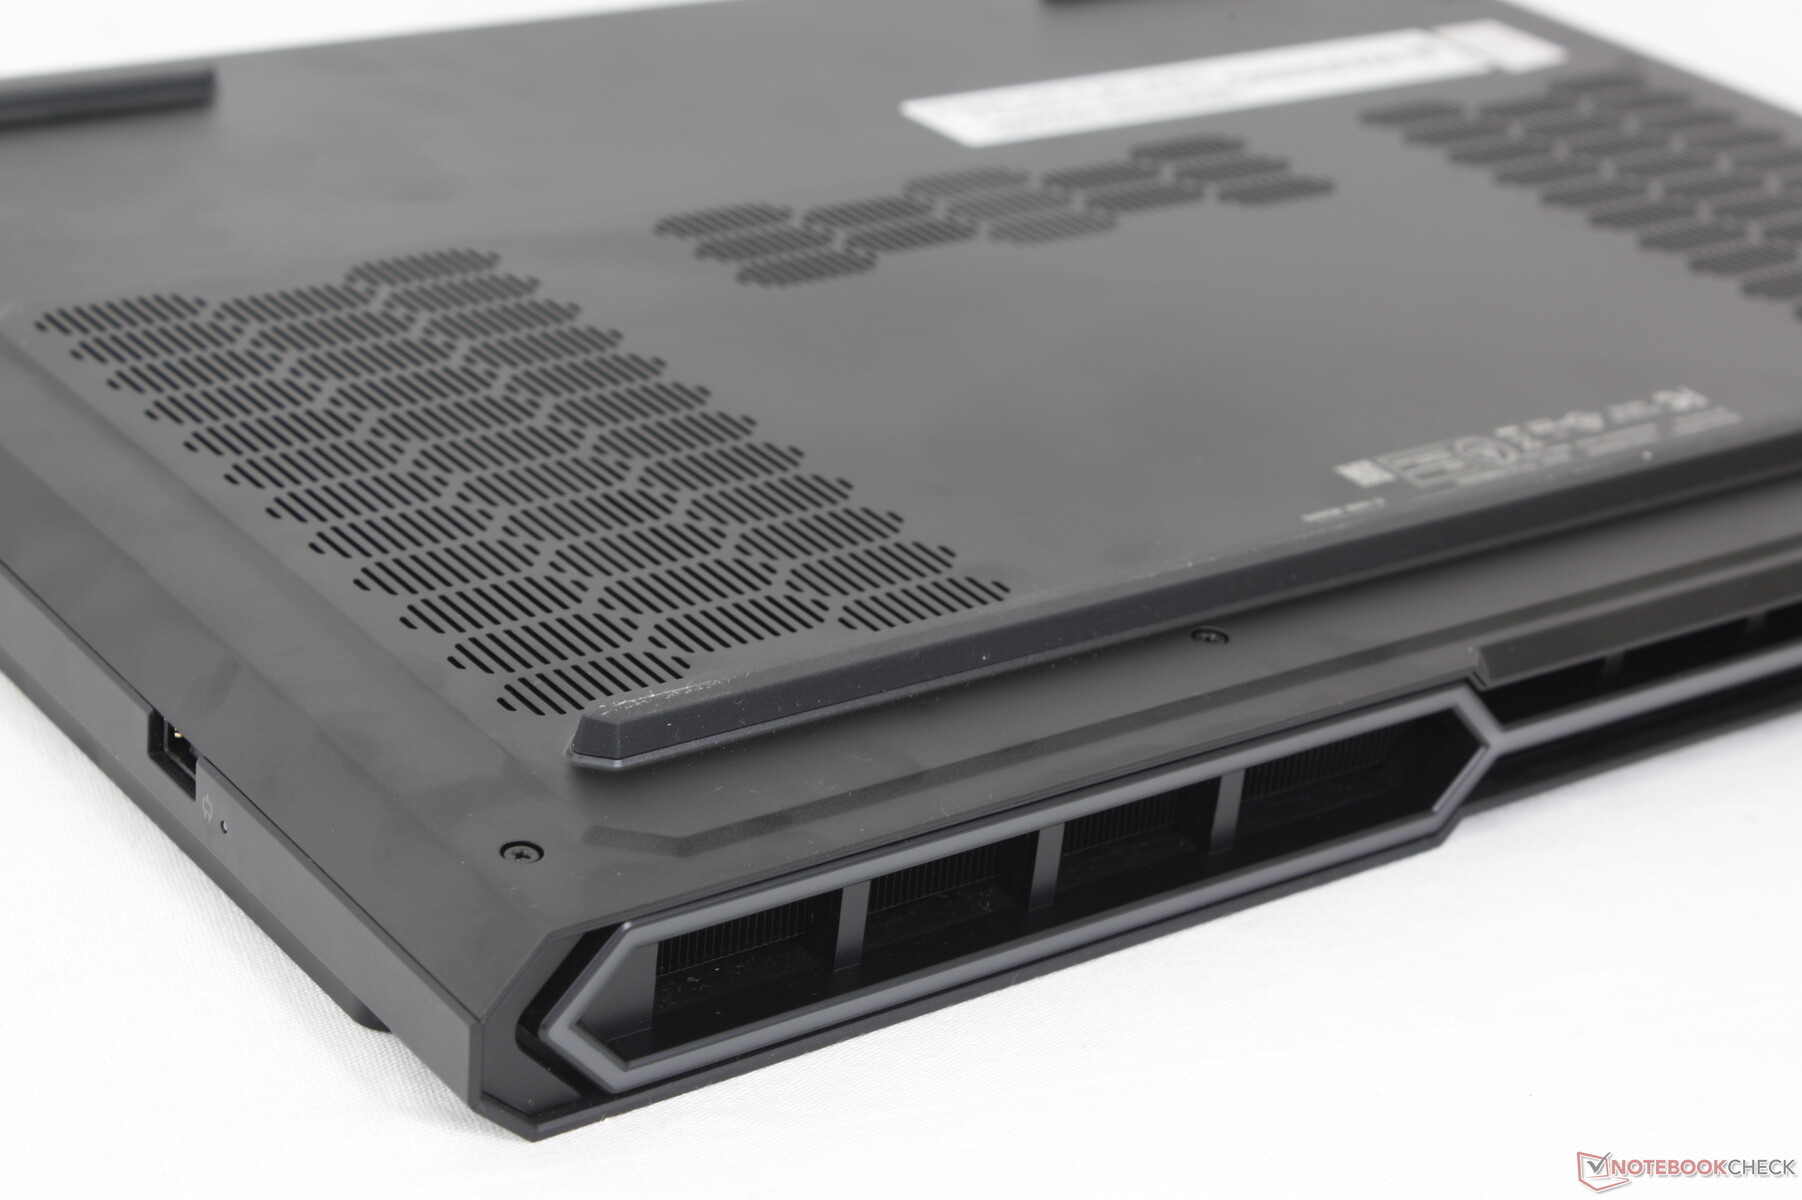
El modelo tiene una huella más grande que el diseño del año pasado debido a la solución de refrigeración ampliada a lo largo de la parte trasera, mientras que el peso y el grosor generales siguen siendo casi los mismos que antes. Ciertamente no es una máquina de juego delgada y ligera como la Blade 16 o la Zephyrus G16, pero sigue siendo más pequeña y ligera que otras alternativas de 16 pulgadas como la MSI Vector 16 HX.
Conectividad
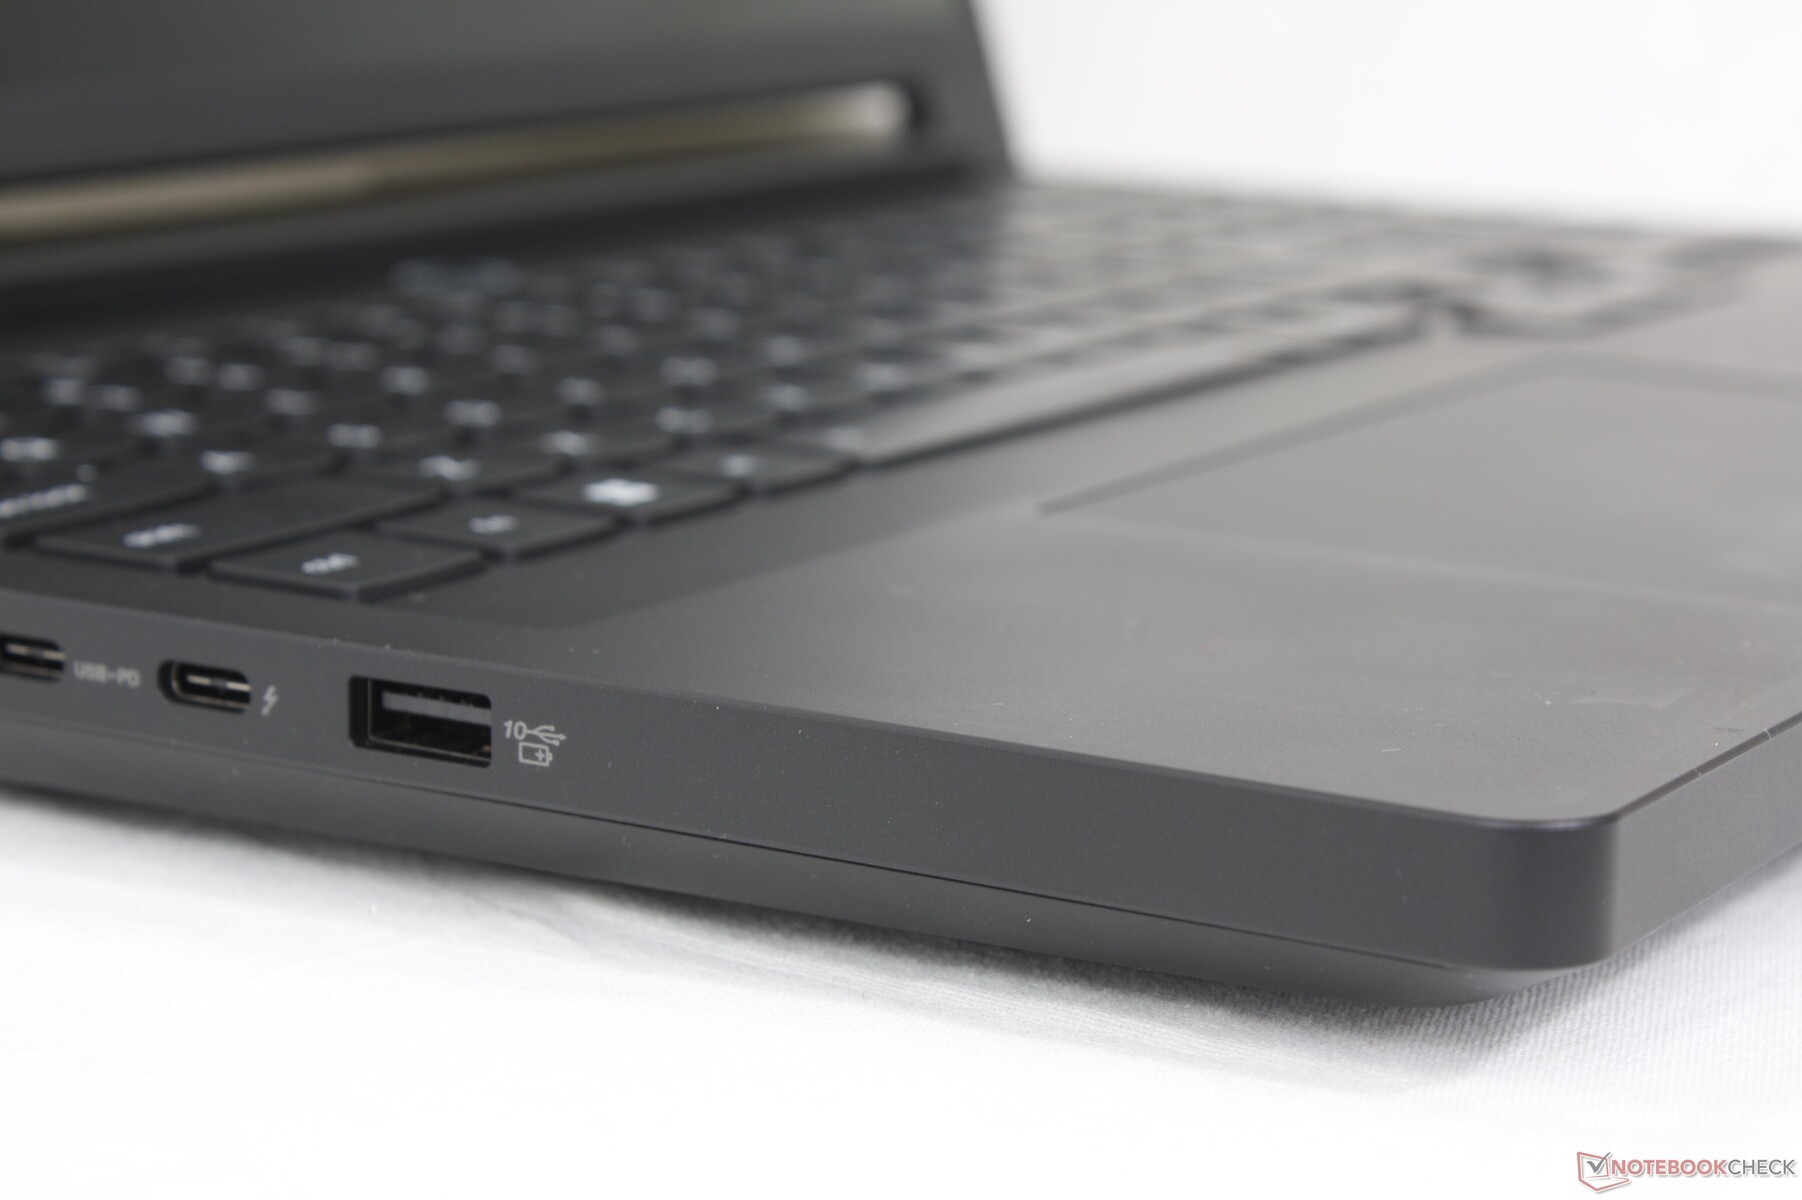
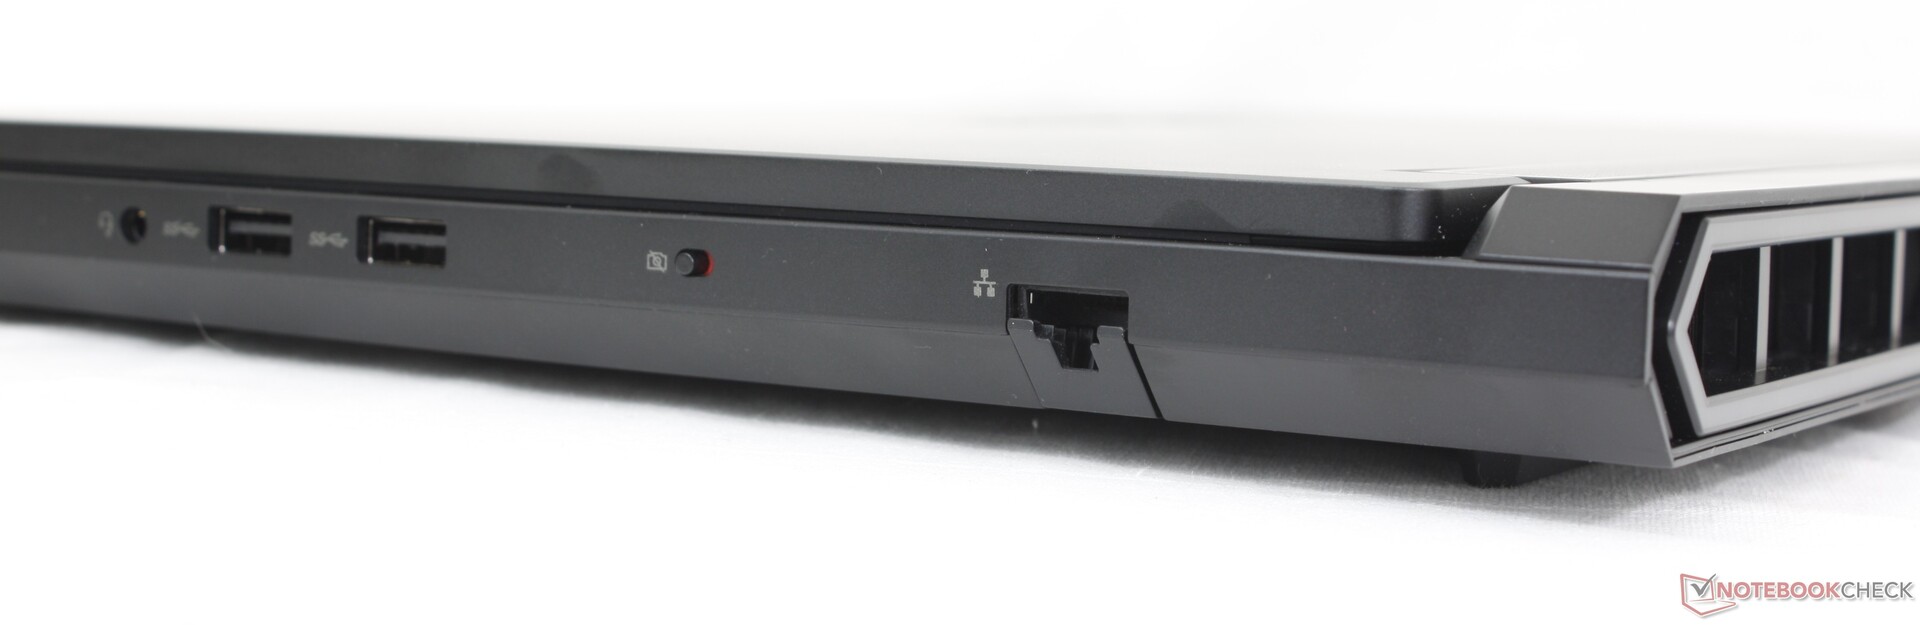
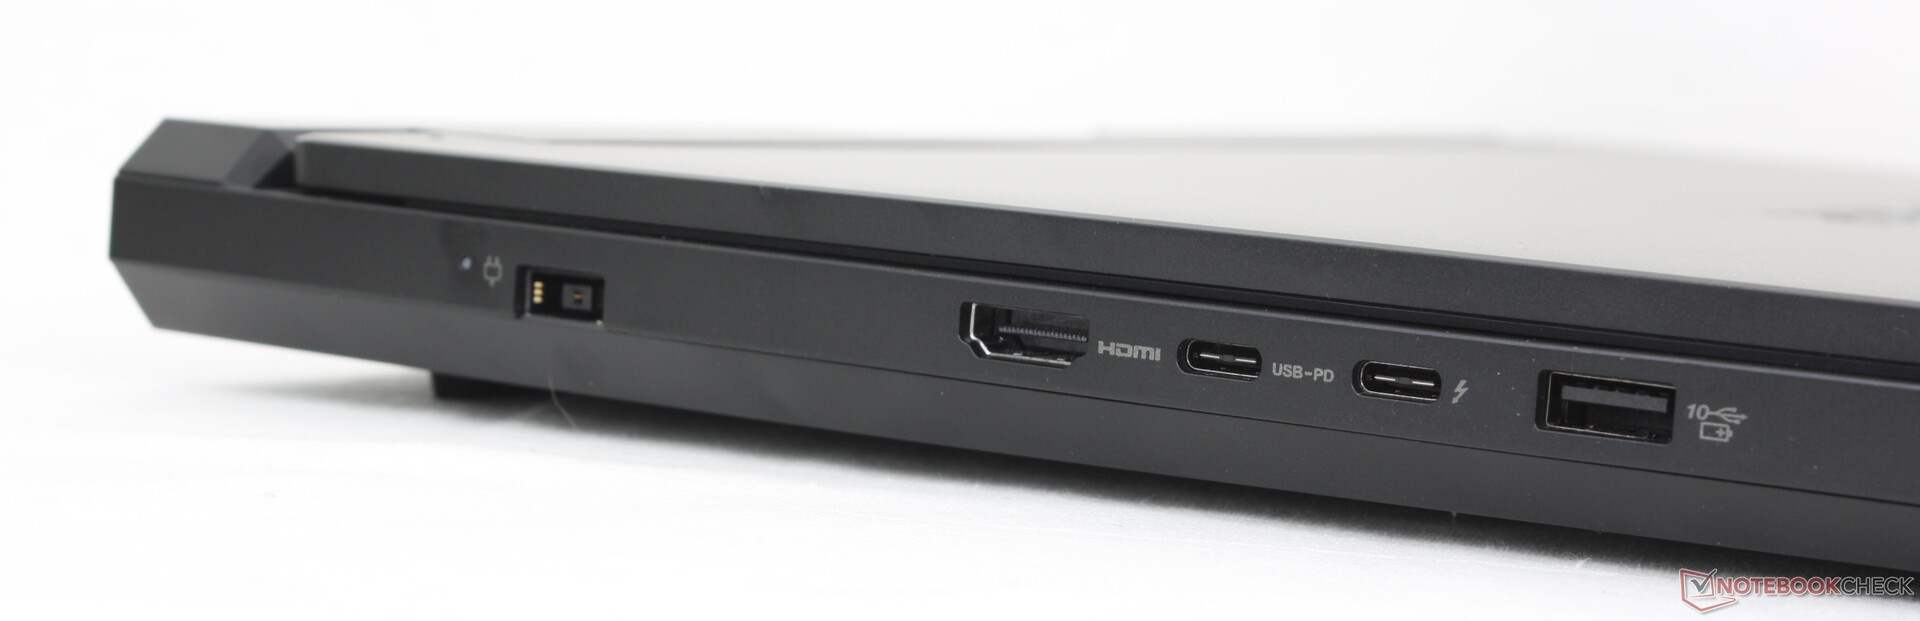
Las opciones y el posicionamiento de los puertos se han revisado por completo en comparación con el año pasado Legion 9 16IRX9 o el Legion 7 16 G9. Atrás han quedado el lector de tarjetas SD integrado y el tercer puerto USB-C en favor de un puerto RJ-45 y un puerto USB-A adicional. Esta vez no hay puertos en la parte trasera para facilitar el acceso.
Hay que tener en cuenta que sólo uno de los dos puertos USB-C admite DisplayPort 2.1 y conectividad Thunderbolt 4, mientras que el otro puerto USB-C (el más alejado del usuario) admite carga PD de 140 W.
Comunicación
La Intel BE200 viene de serie con conectividad Wi-Fi 7 y Bluetooth 5.4.
Cámara web
La cámara web de 5 MP viene de serie con un obturador electrónico y sin sensor de infrarrojos.


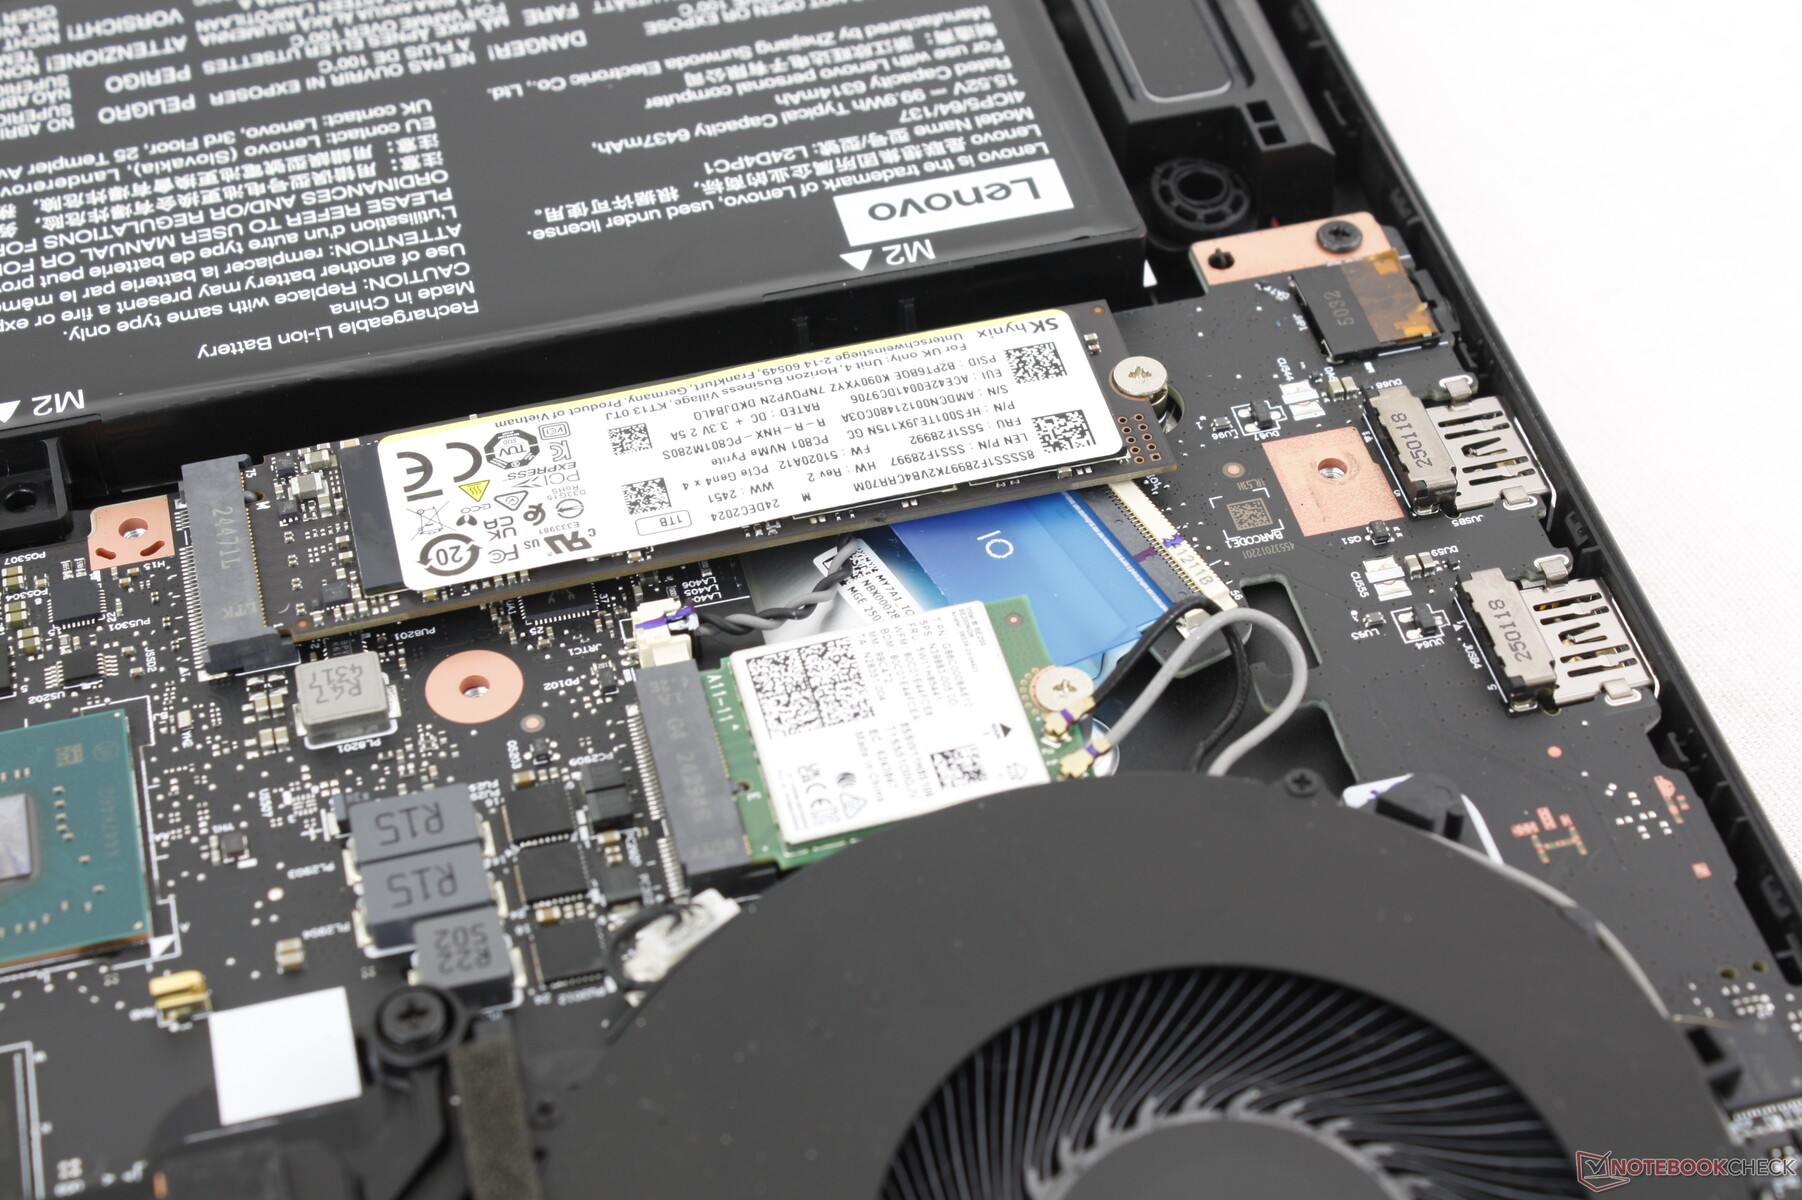
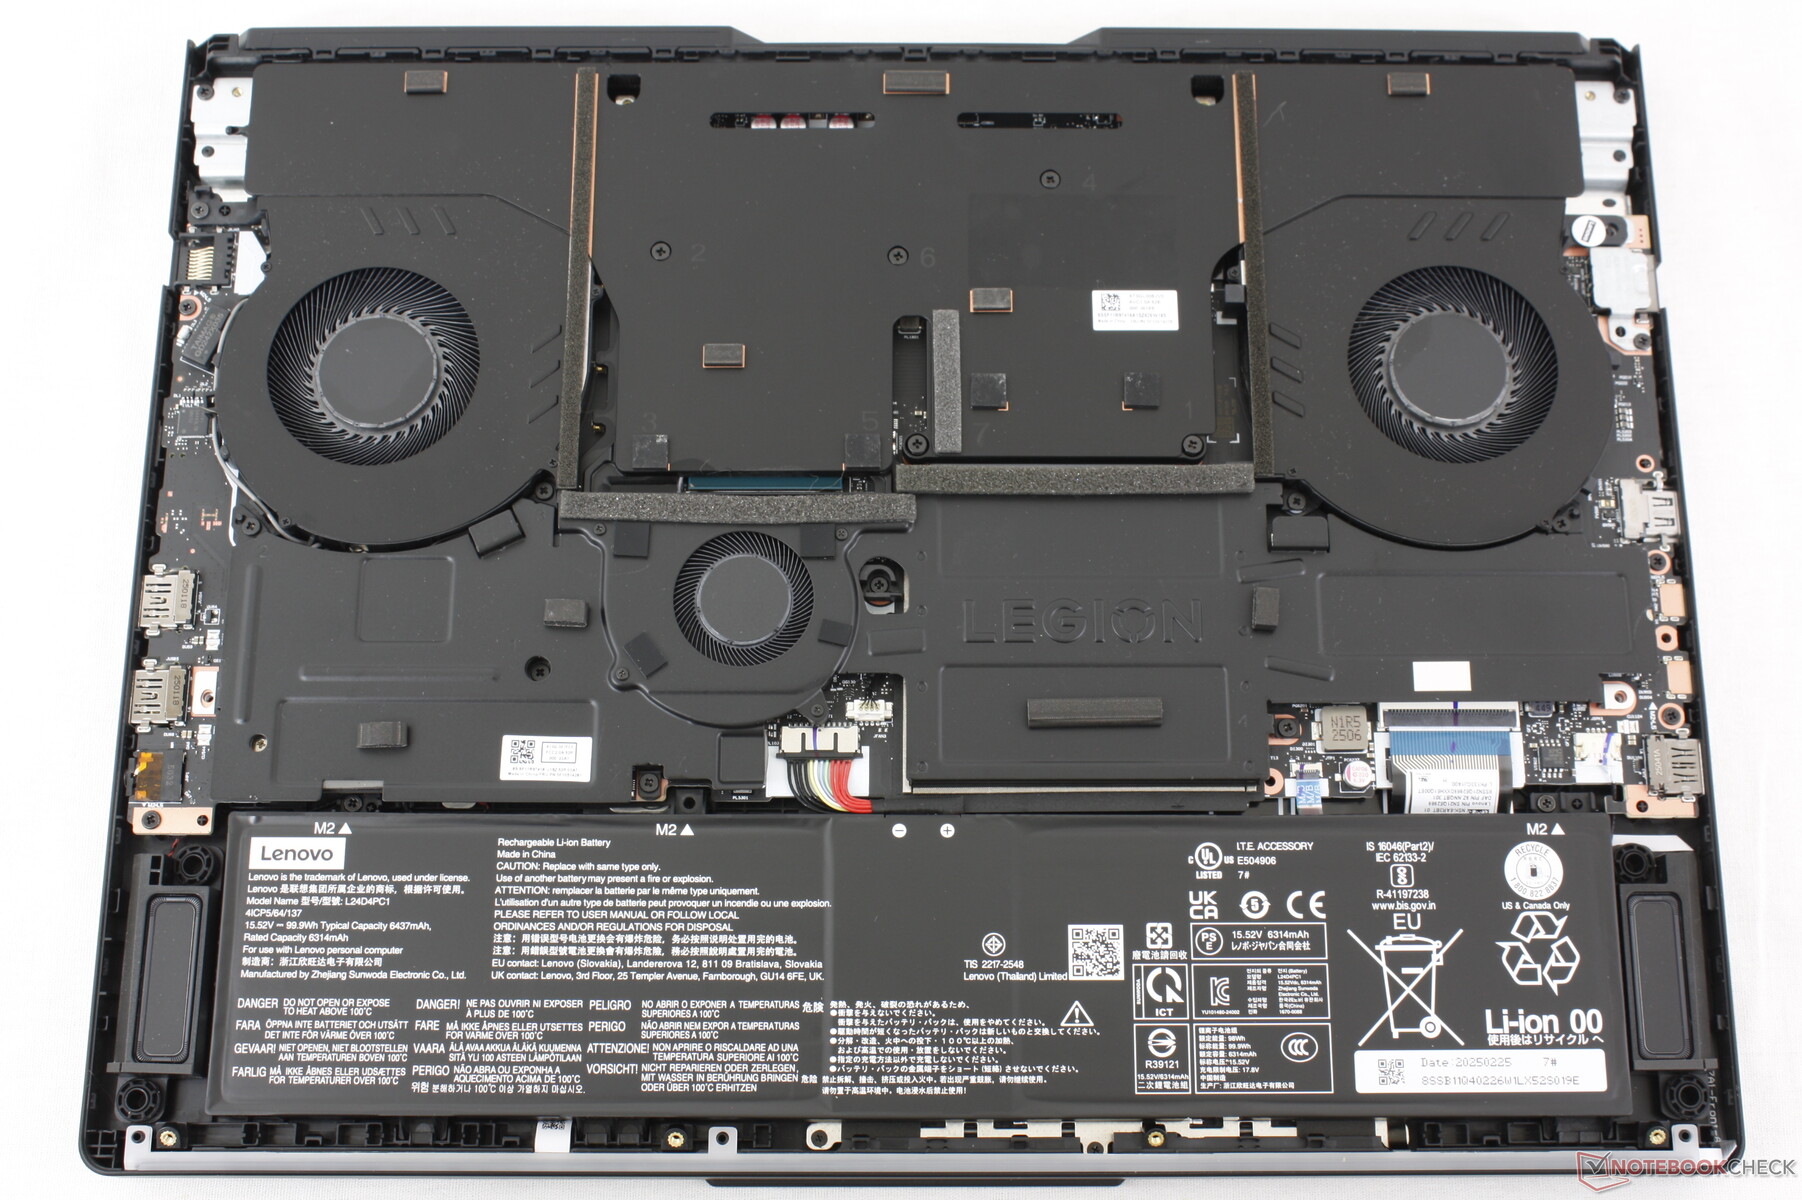
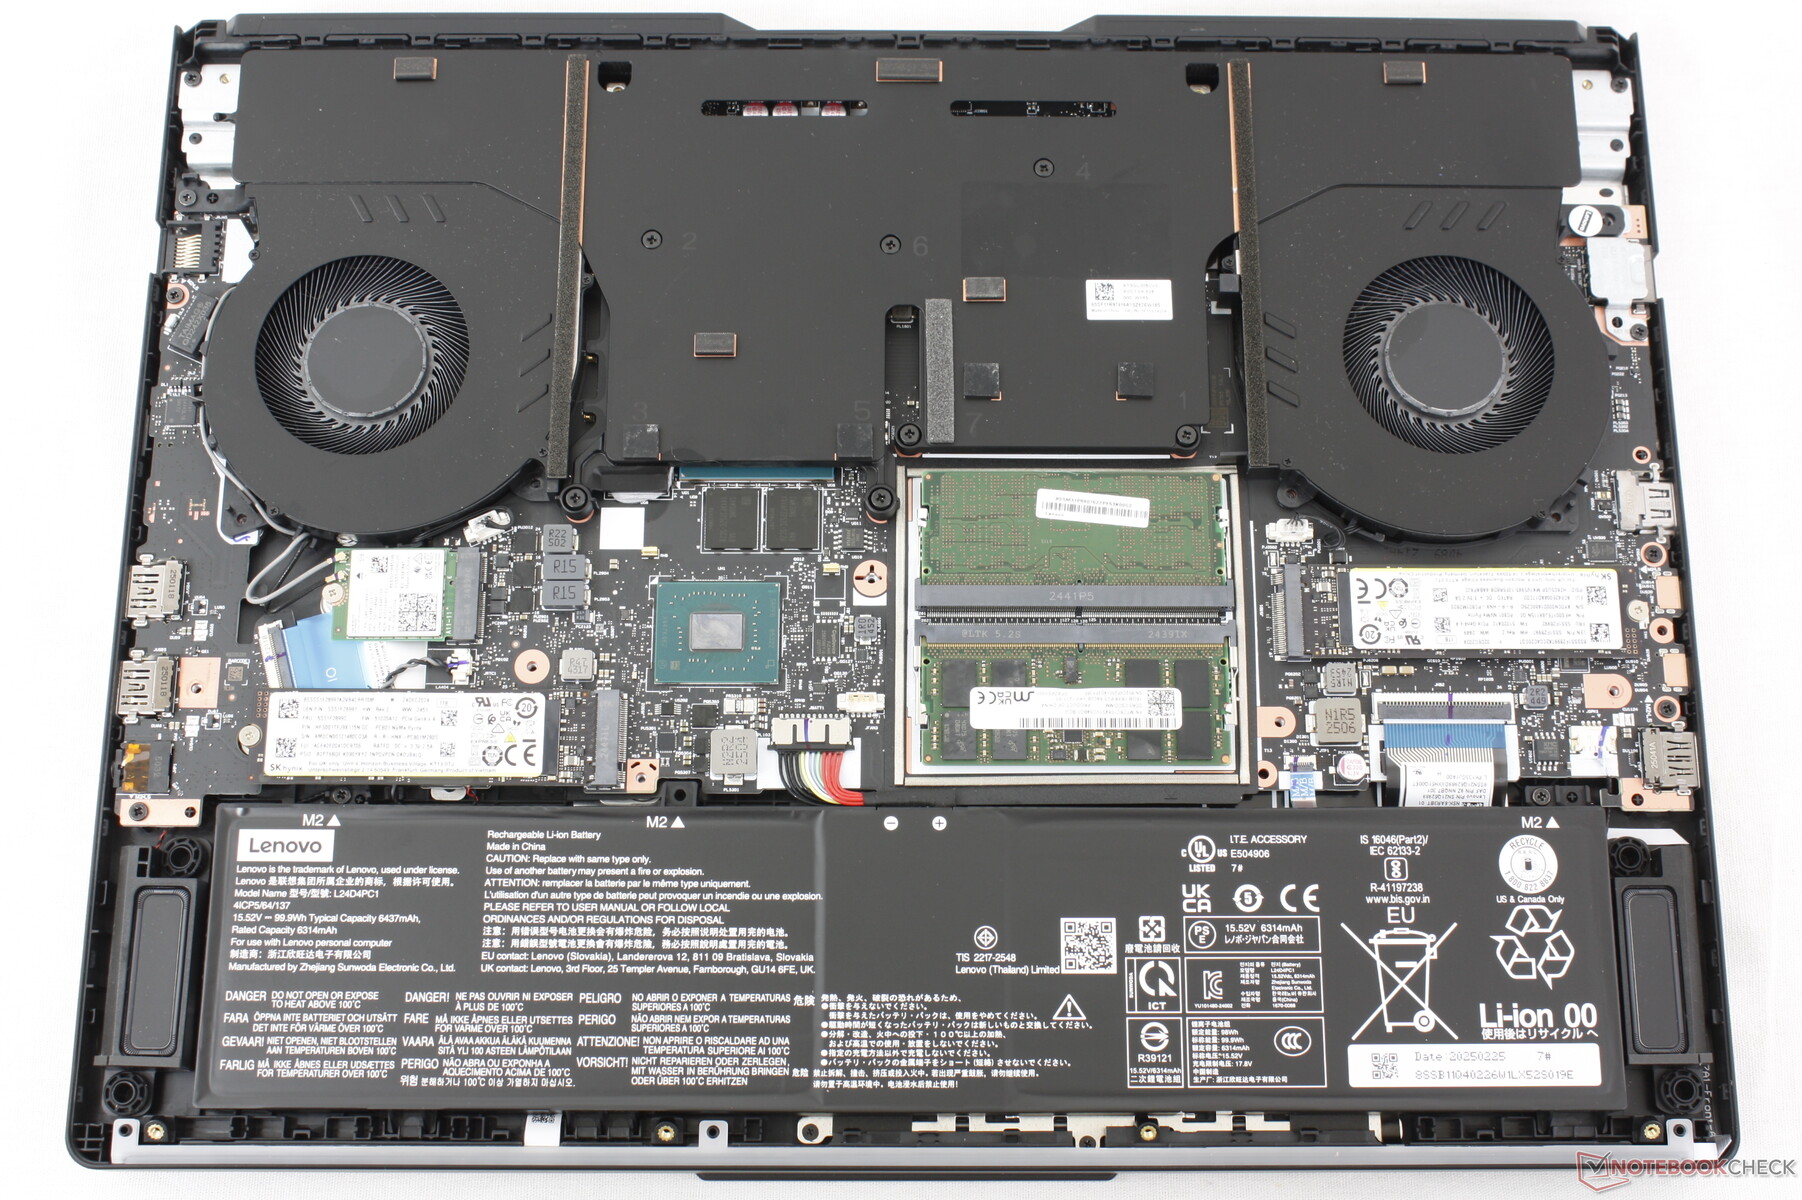
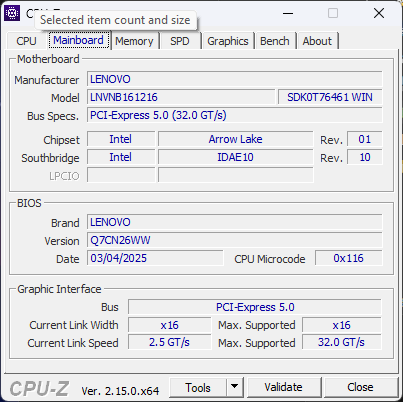
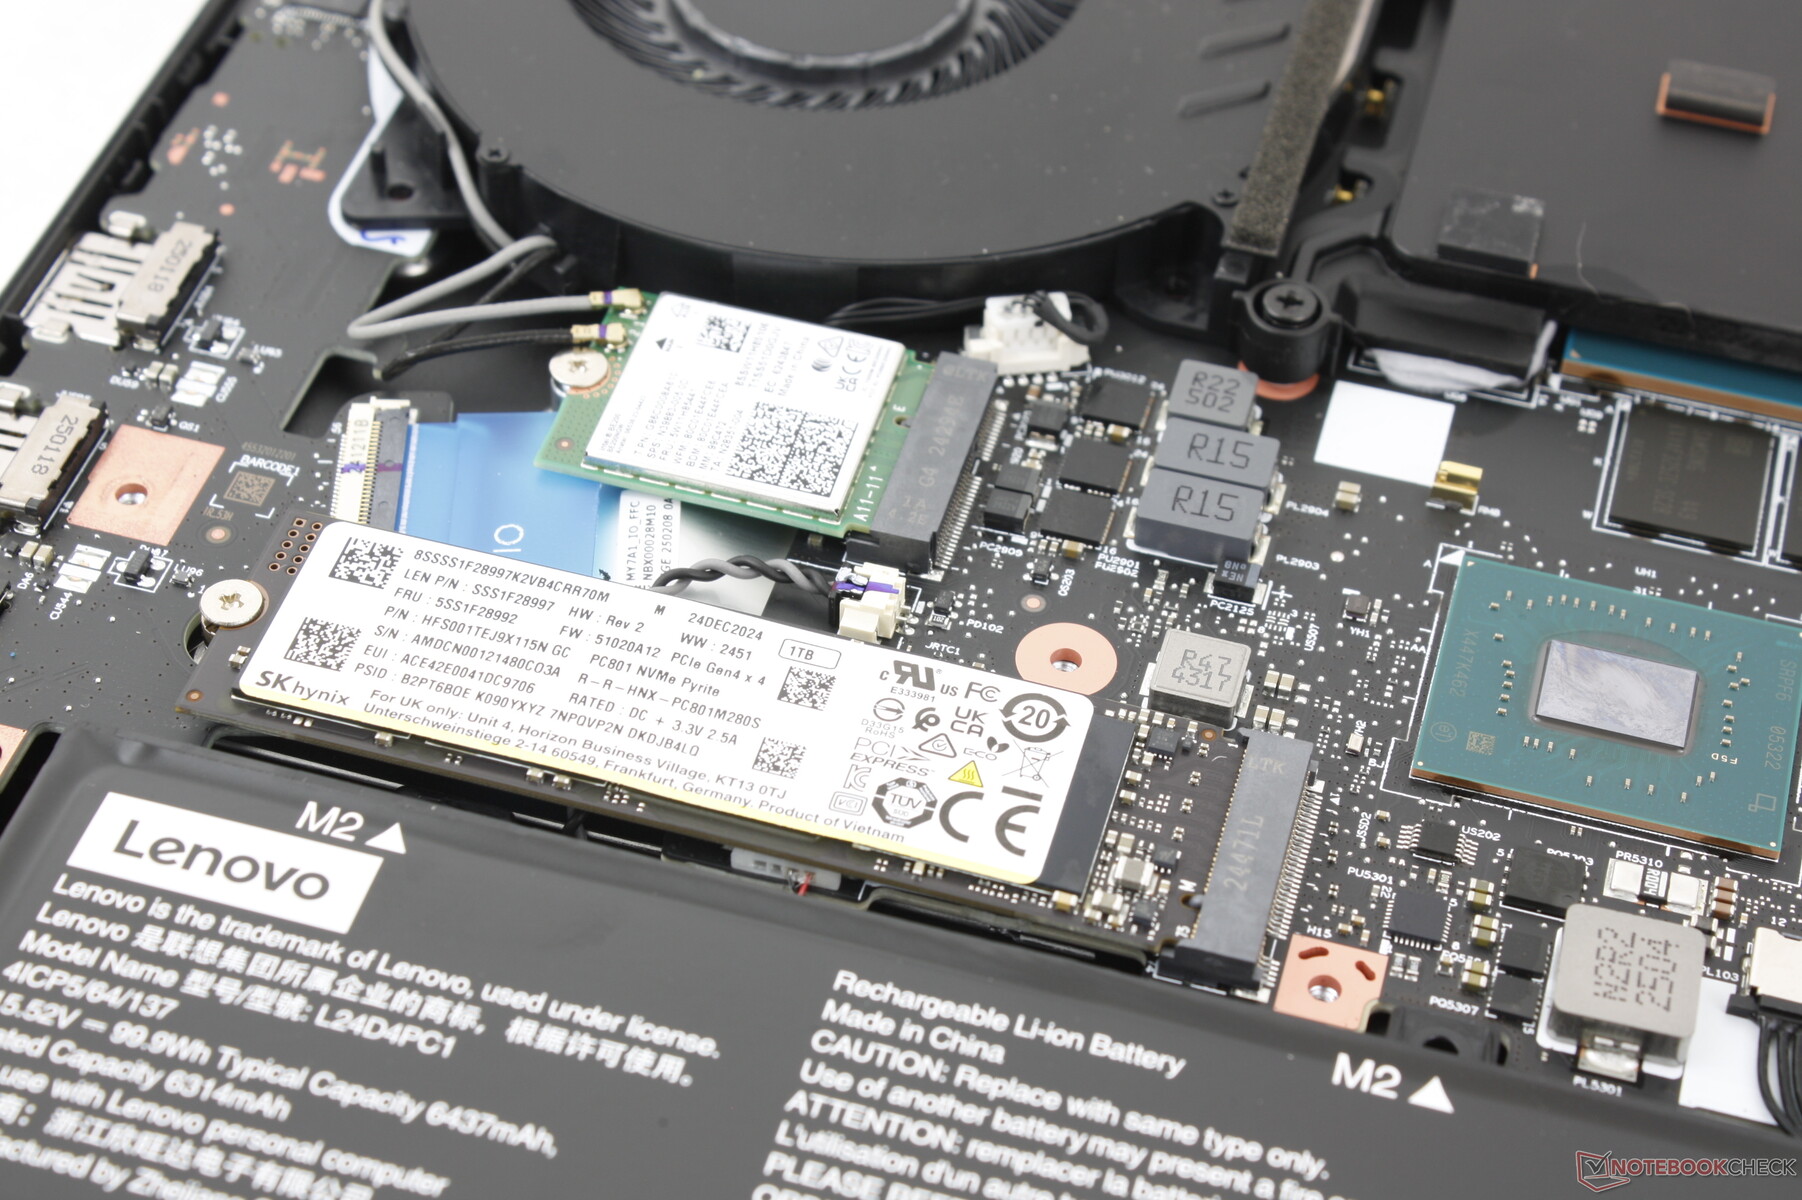
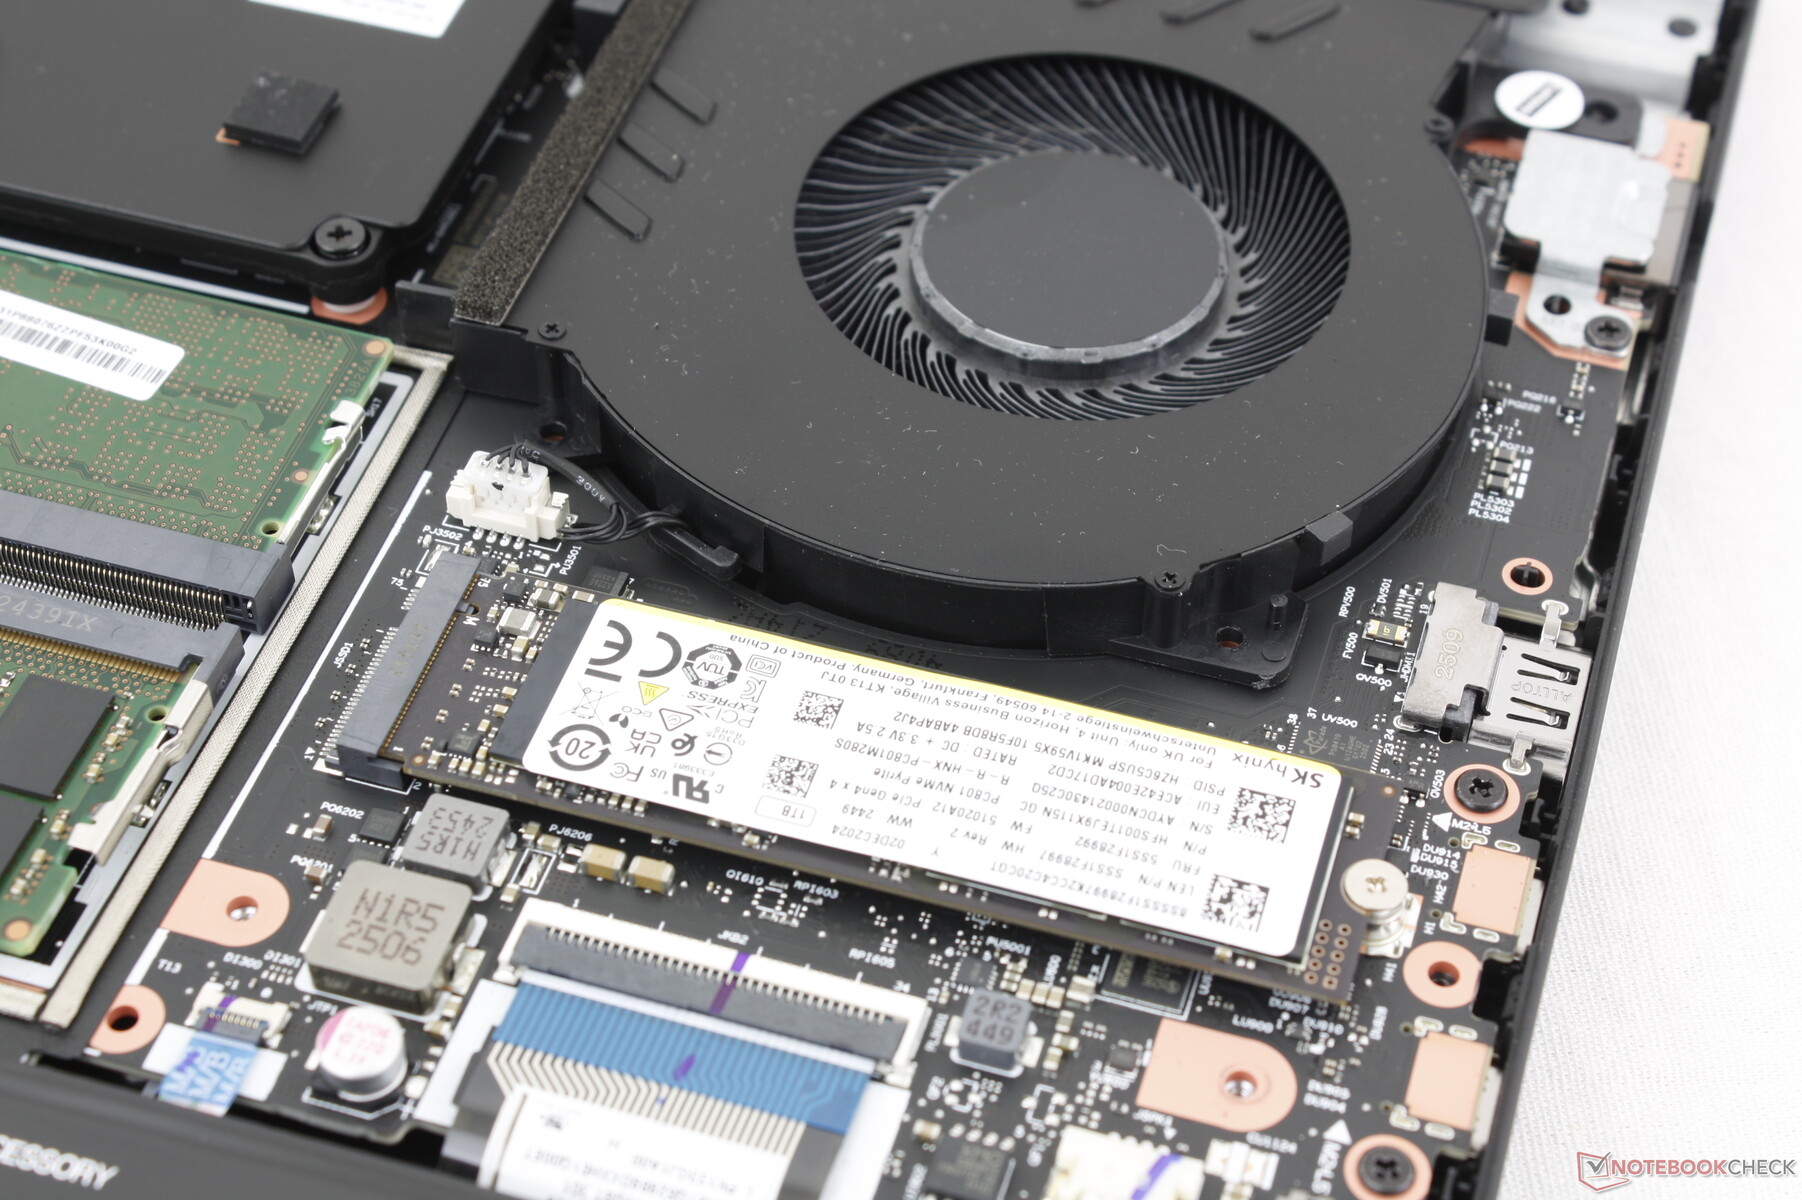
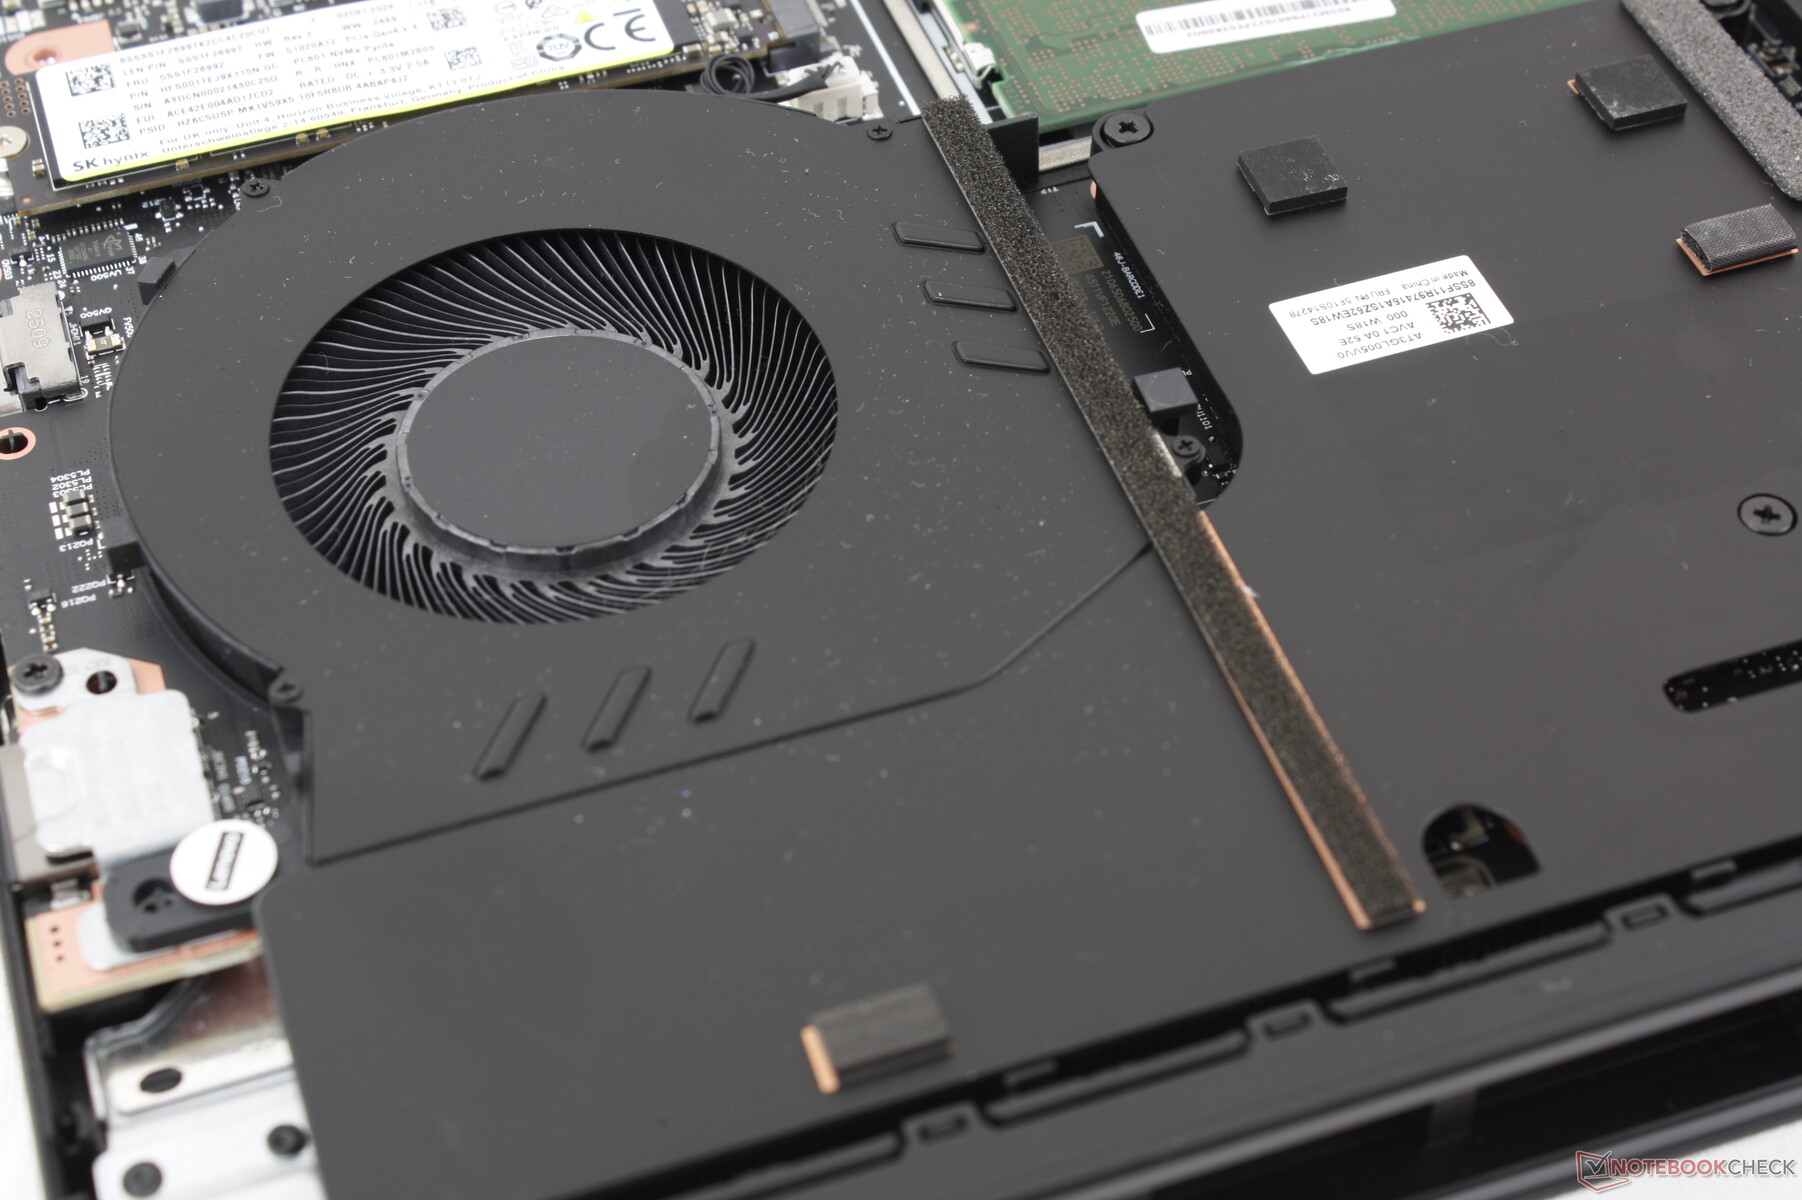
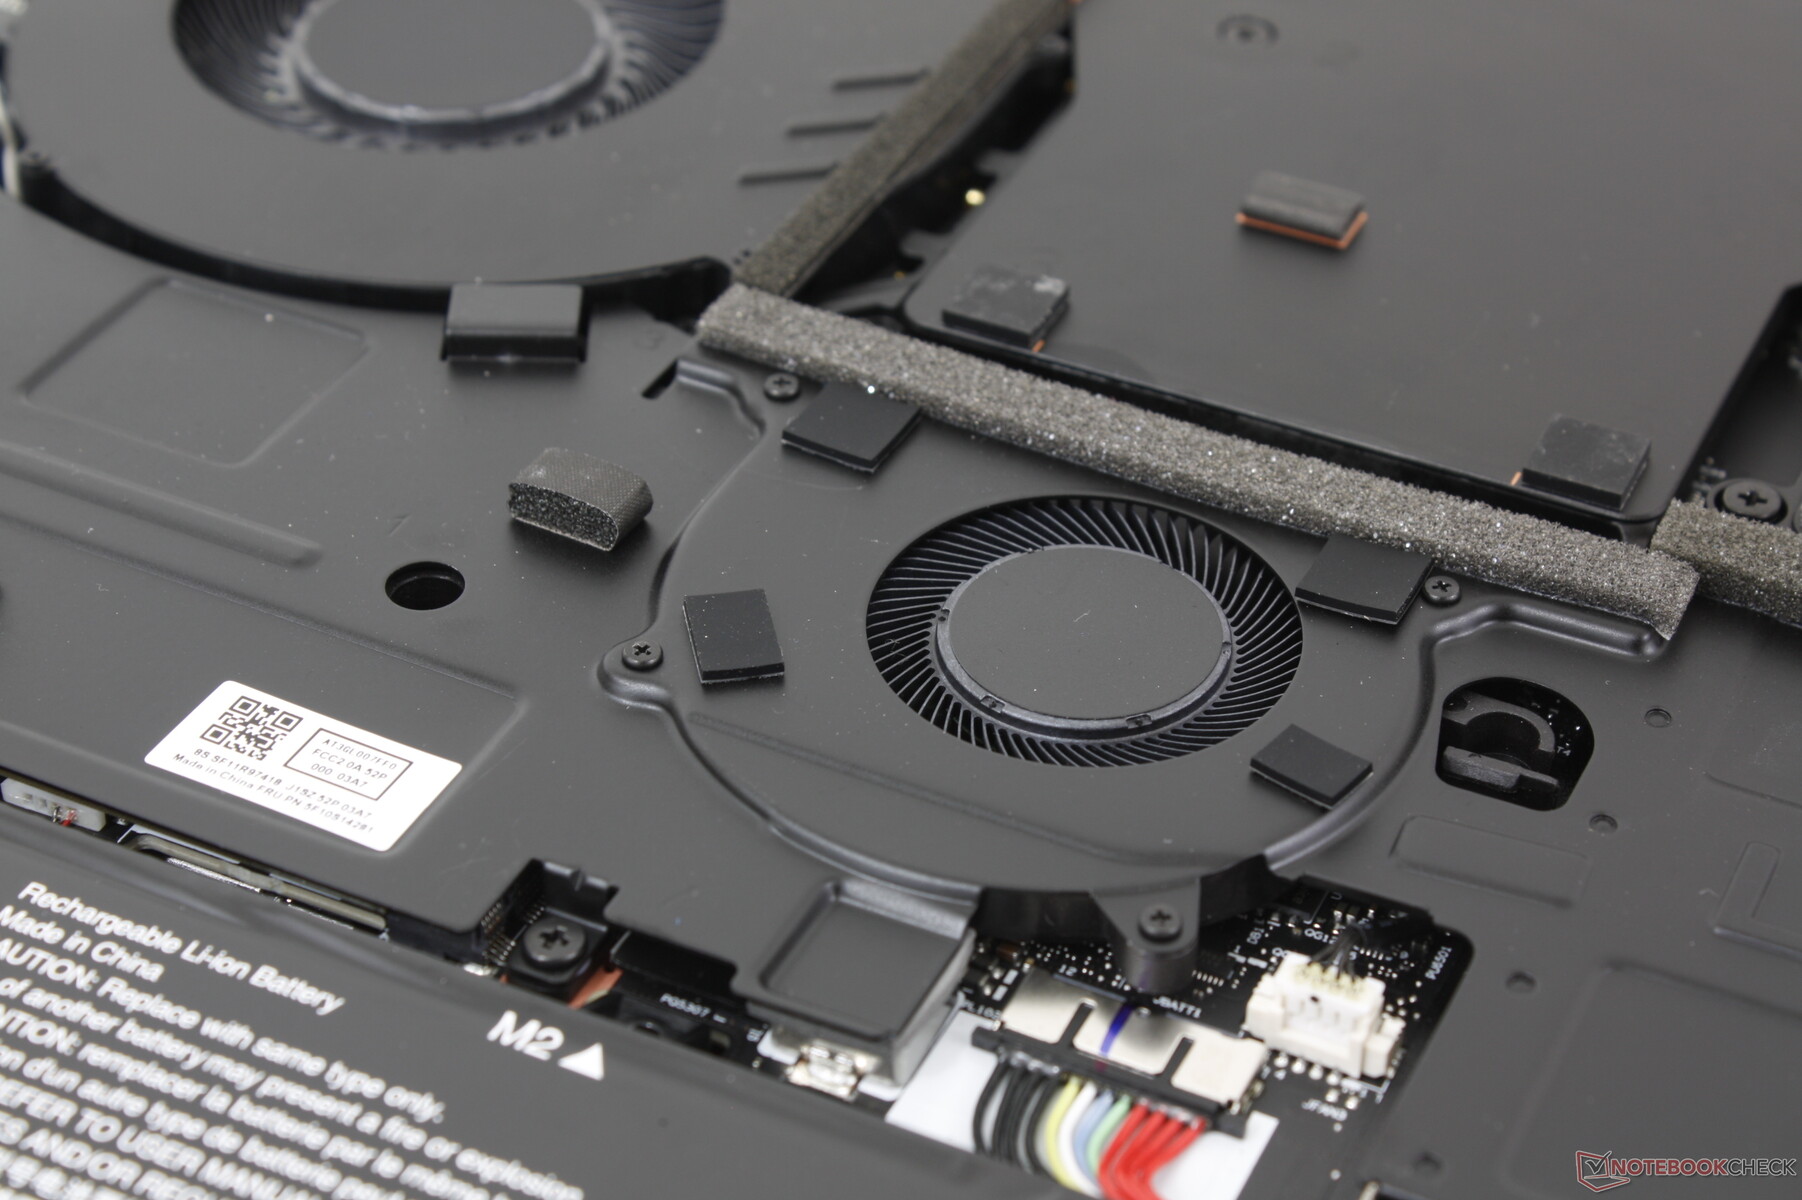
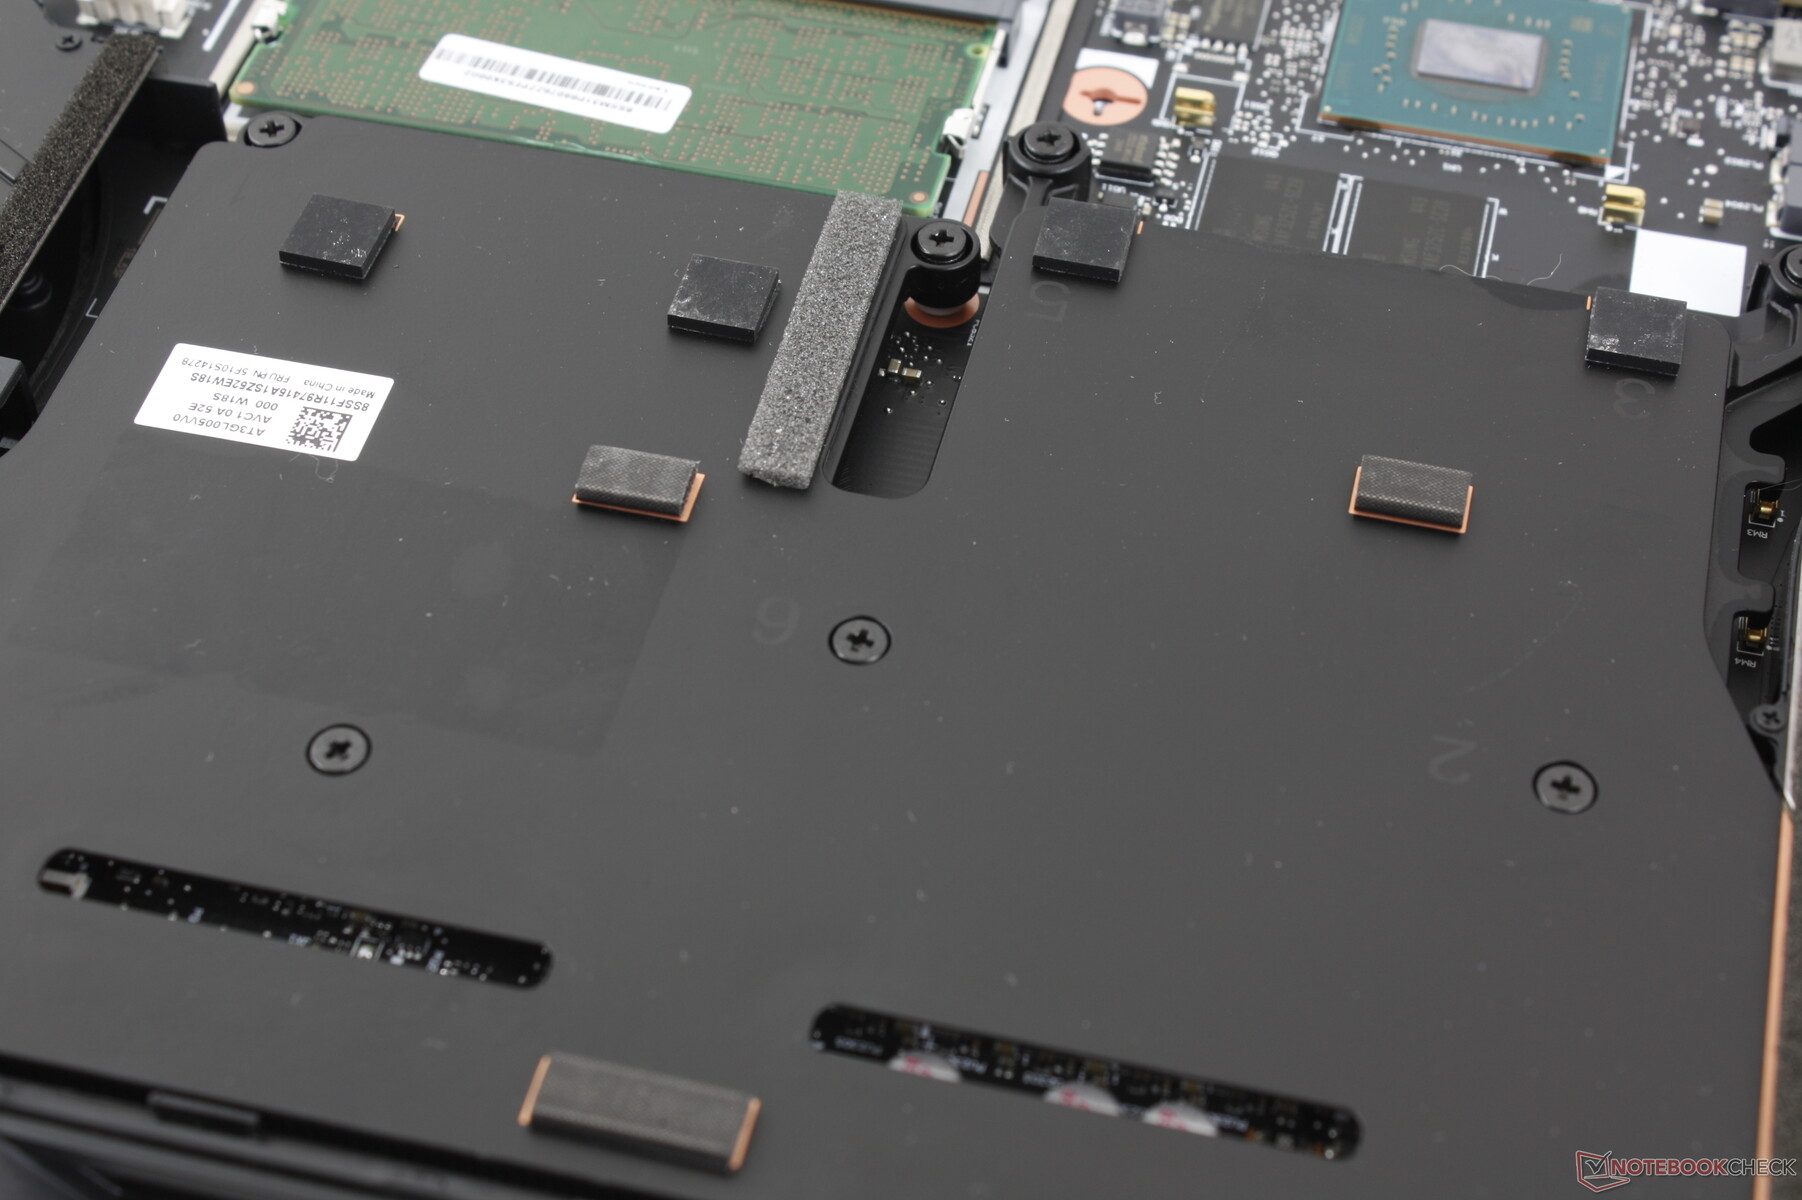
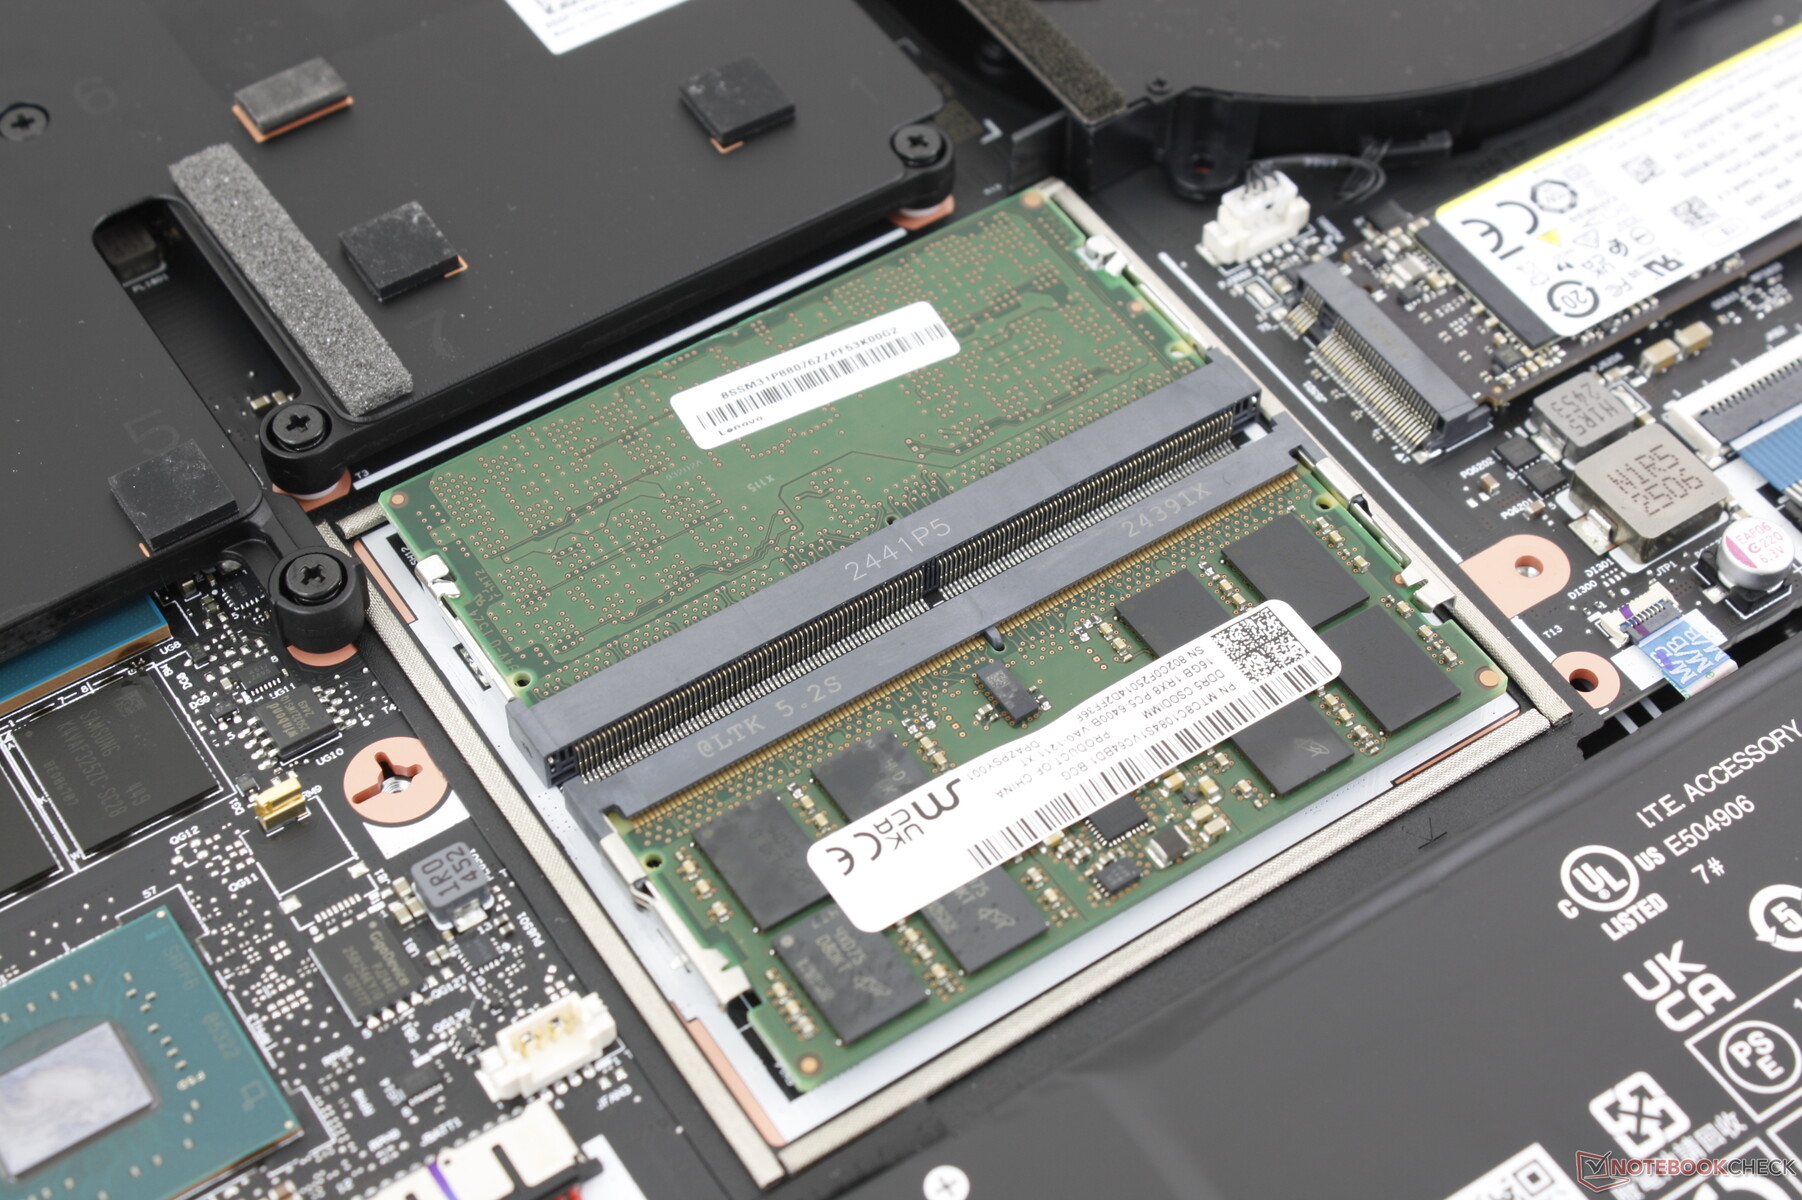
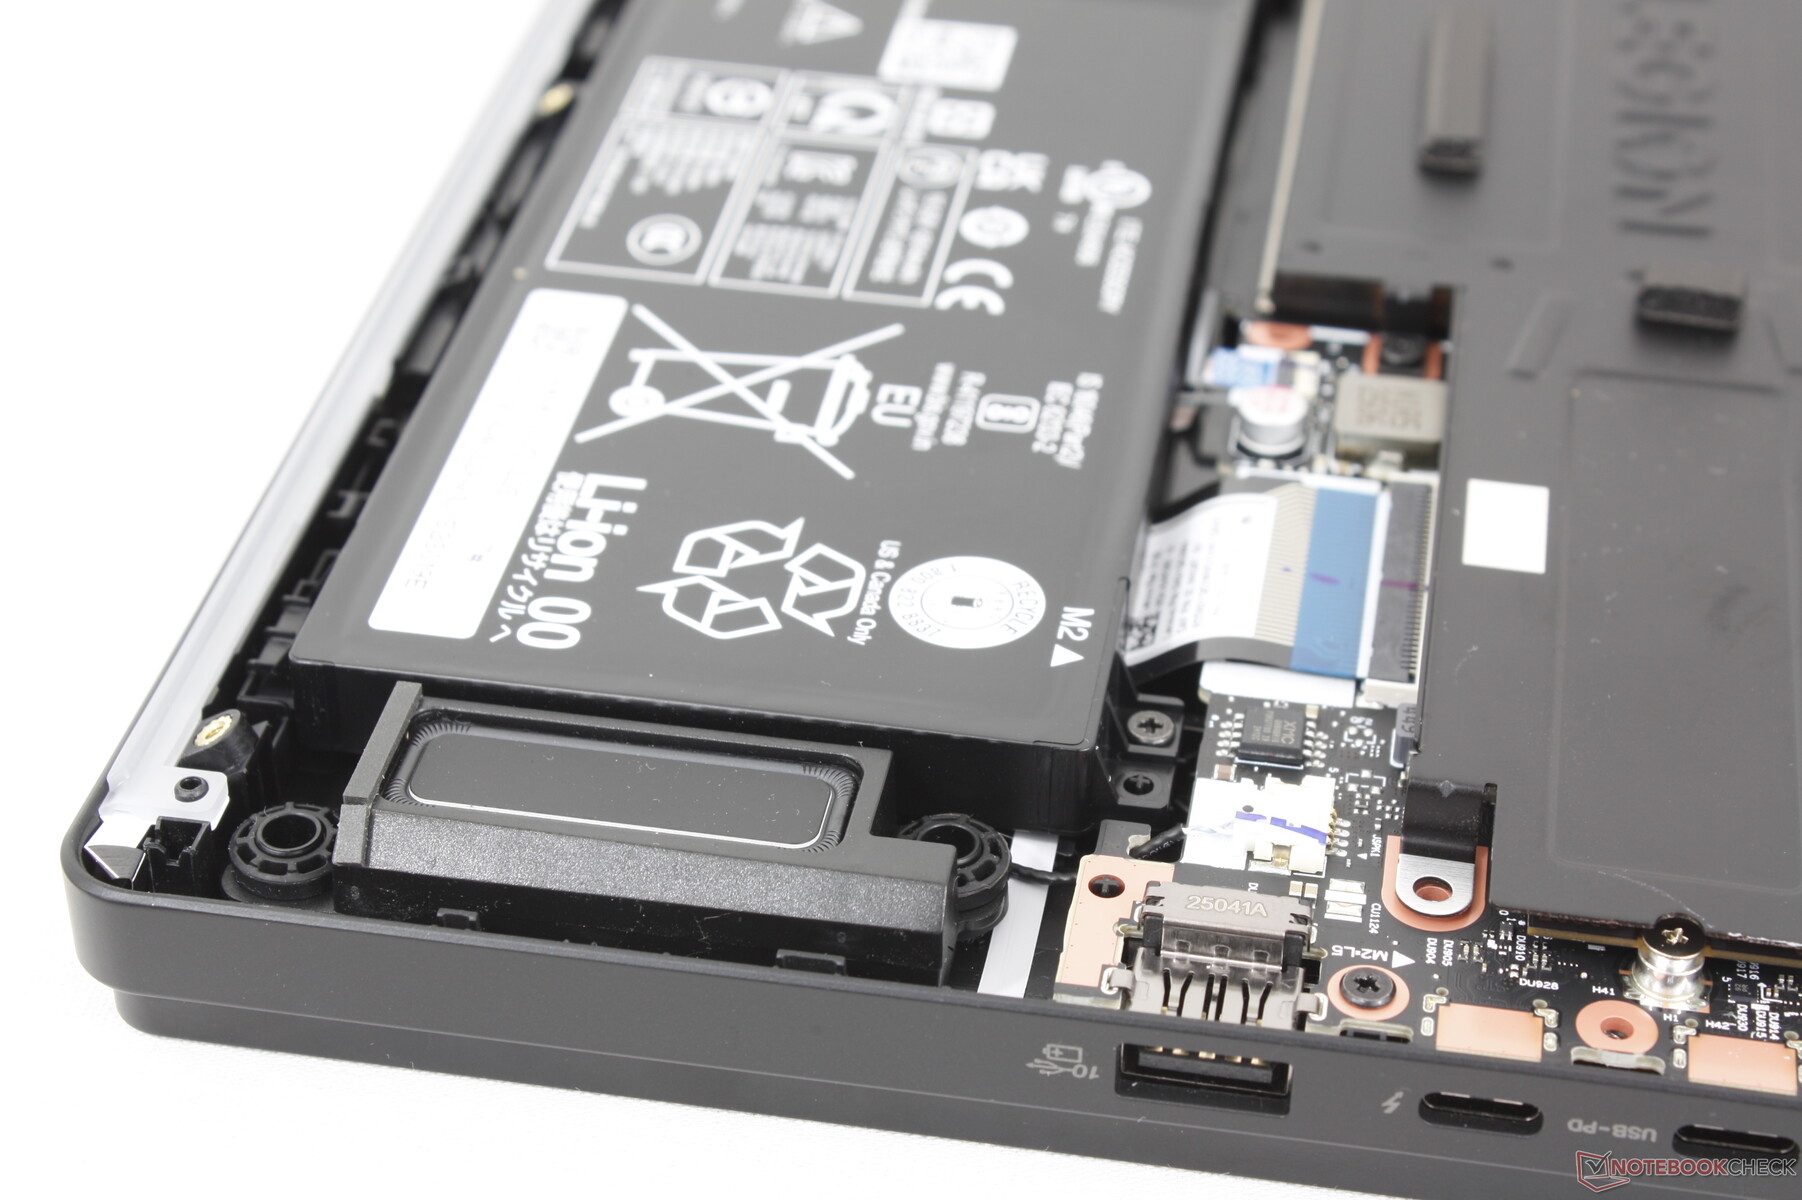
Mantenimiento
El mantenimiento es algo más complicado de lo habitual. A diferencia de lo que ocurre en la mayoría de portátiles, las dos ranuras SODIMM, las dos ranuras SSD M.2 y el módulo WLAN están cubiertos por una gran placa de aluminio, como se muestra a continuación, además de la cubierta exterior. El aparato es sencillo de retirar siempre que los usuarios tengan cuidado de no rasgar el cable plano que conecta el tercer ventilador a la placa base.
Sostenibilidad
Aunque Lenovo tiene un programa de sostenibilidad de CO2, no podemos encontrar información sobre cuánto material reciclado se ha utilizado para fabricar el Legion Pro 7i 16 Gen 10, si es que se ha utilizado alguno. Por lo demás, la caja de venta al público es en su mayor parte de papel y cartón, con un envoltorio compuesto en un 90% de plástico de origen marino.
Accesorios y garantía
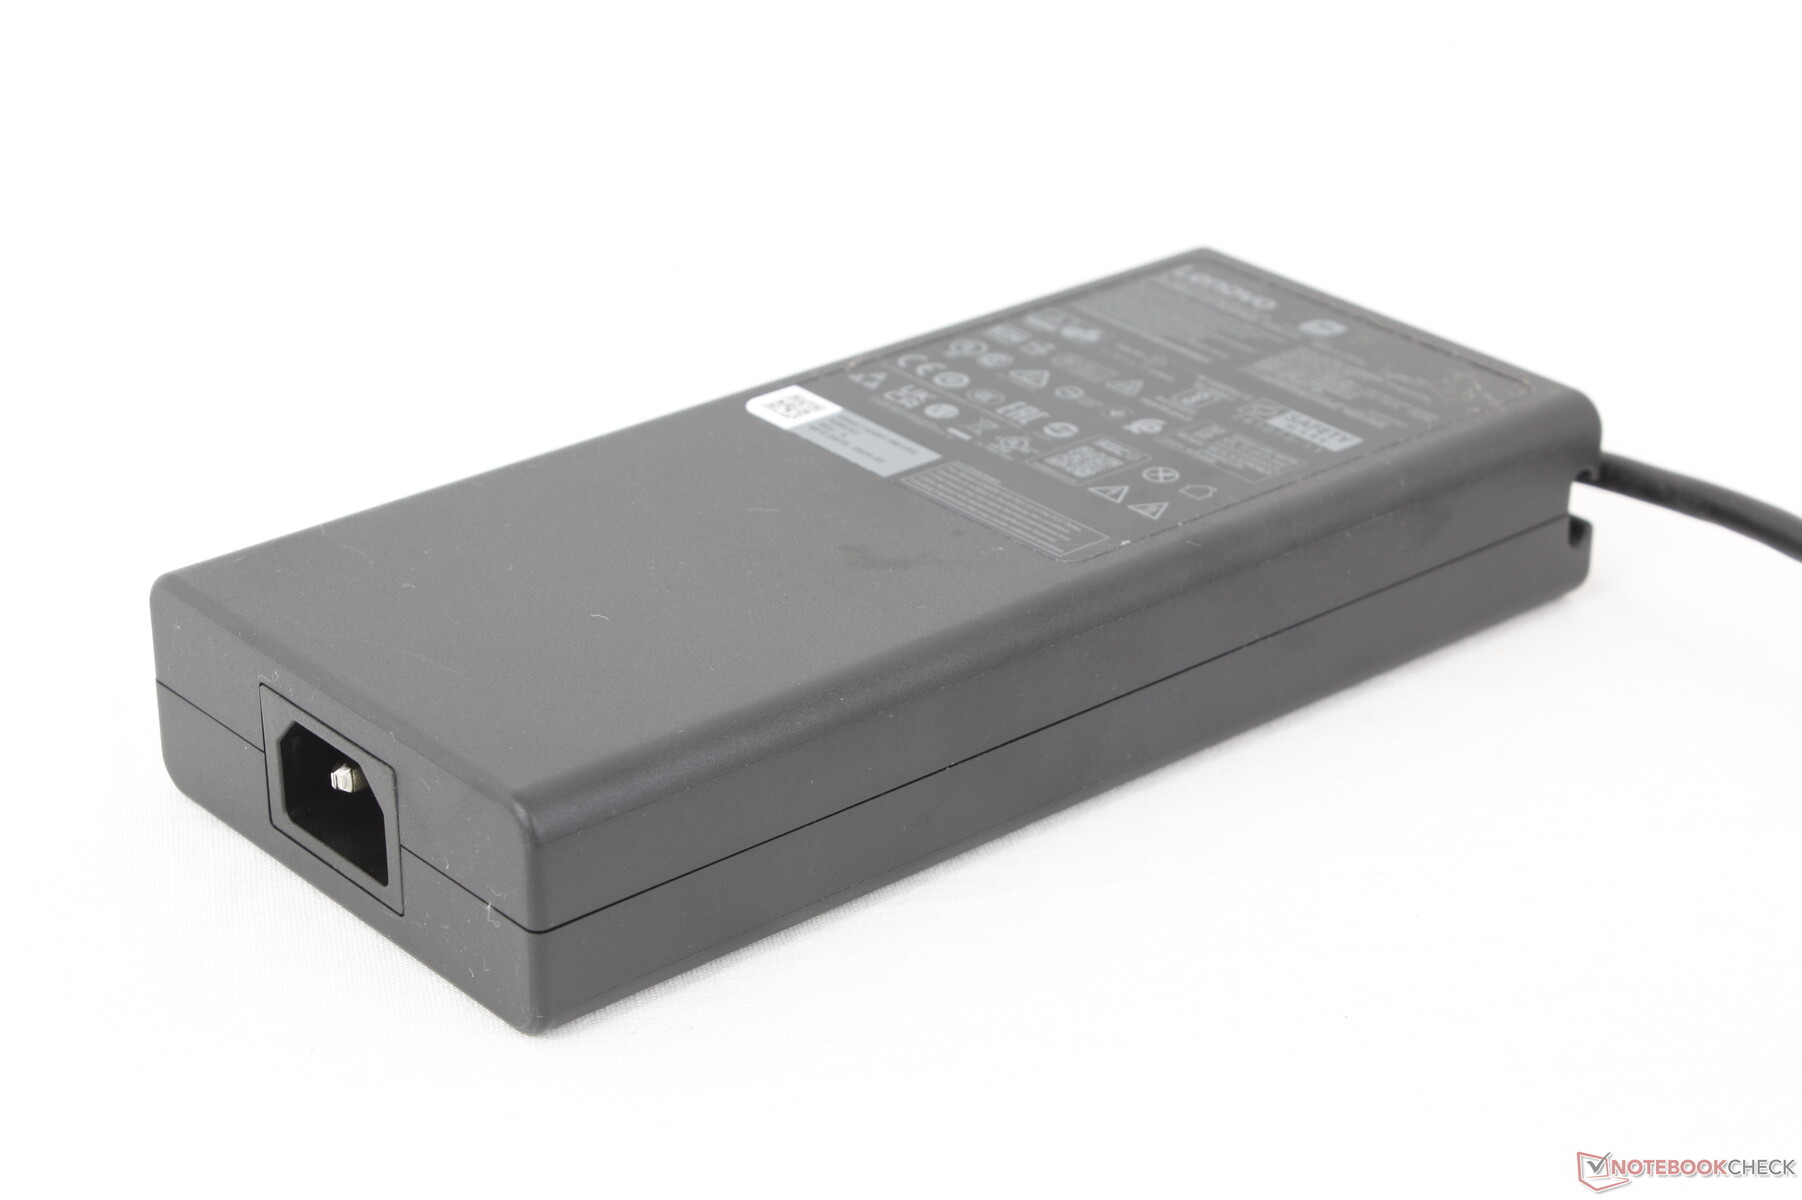
La caja no incluye ningún extra aparte del adaptador de CA de 400 W (!) y la documentación. Se aplica la habitual garantía limitada de un año del fabricante.
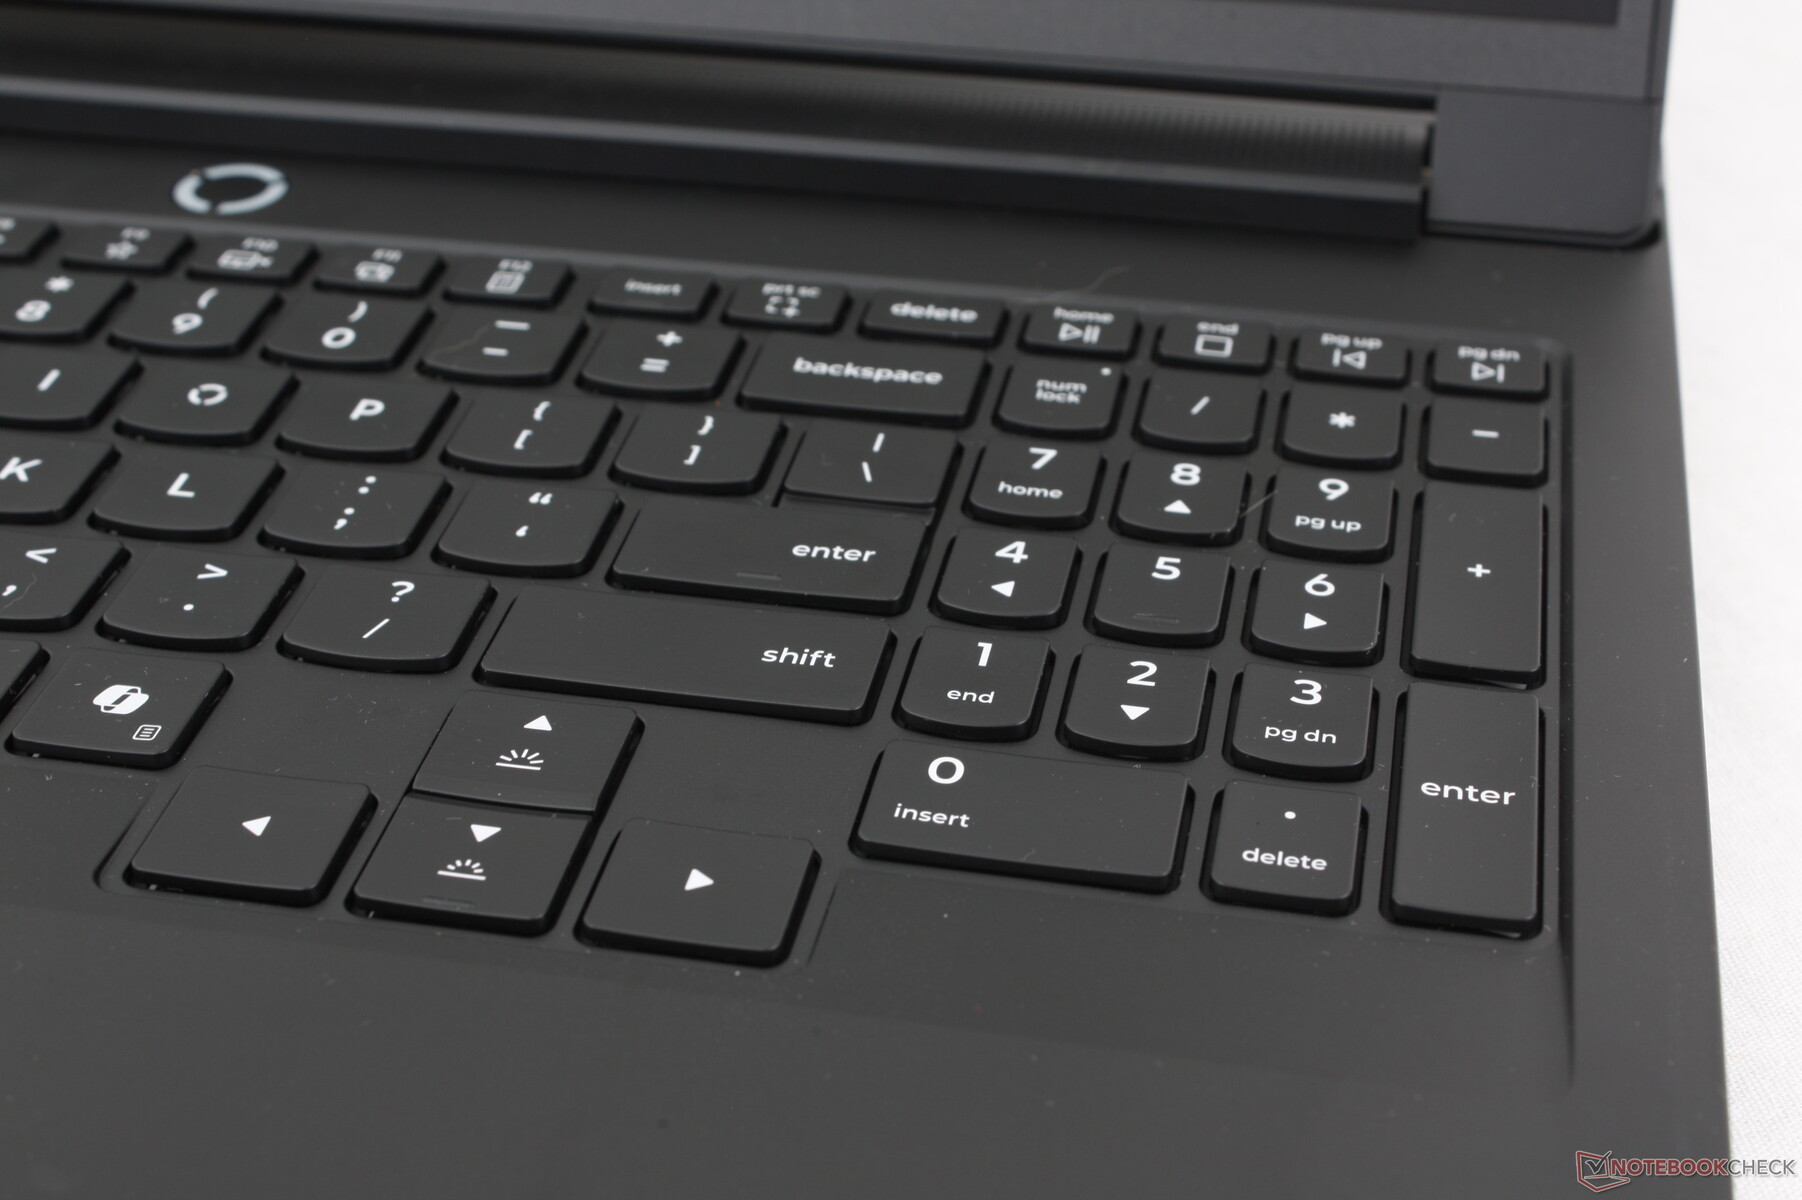
Dispositivos de entrada - Espaciosos y nada extravagantes
Teclado
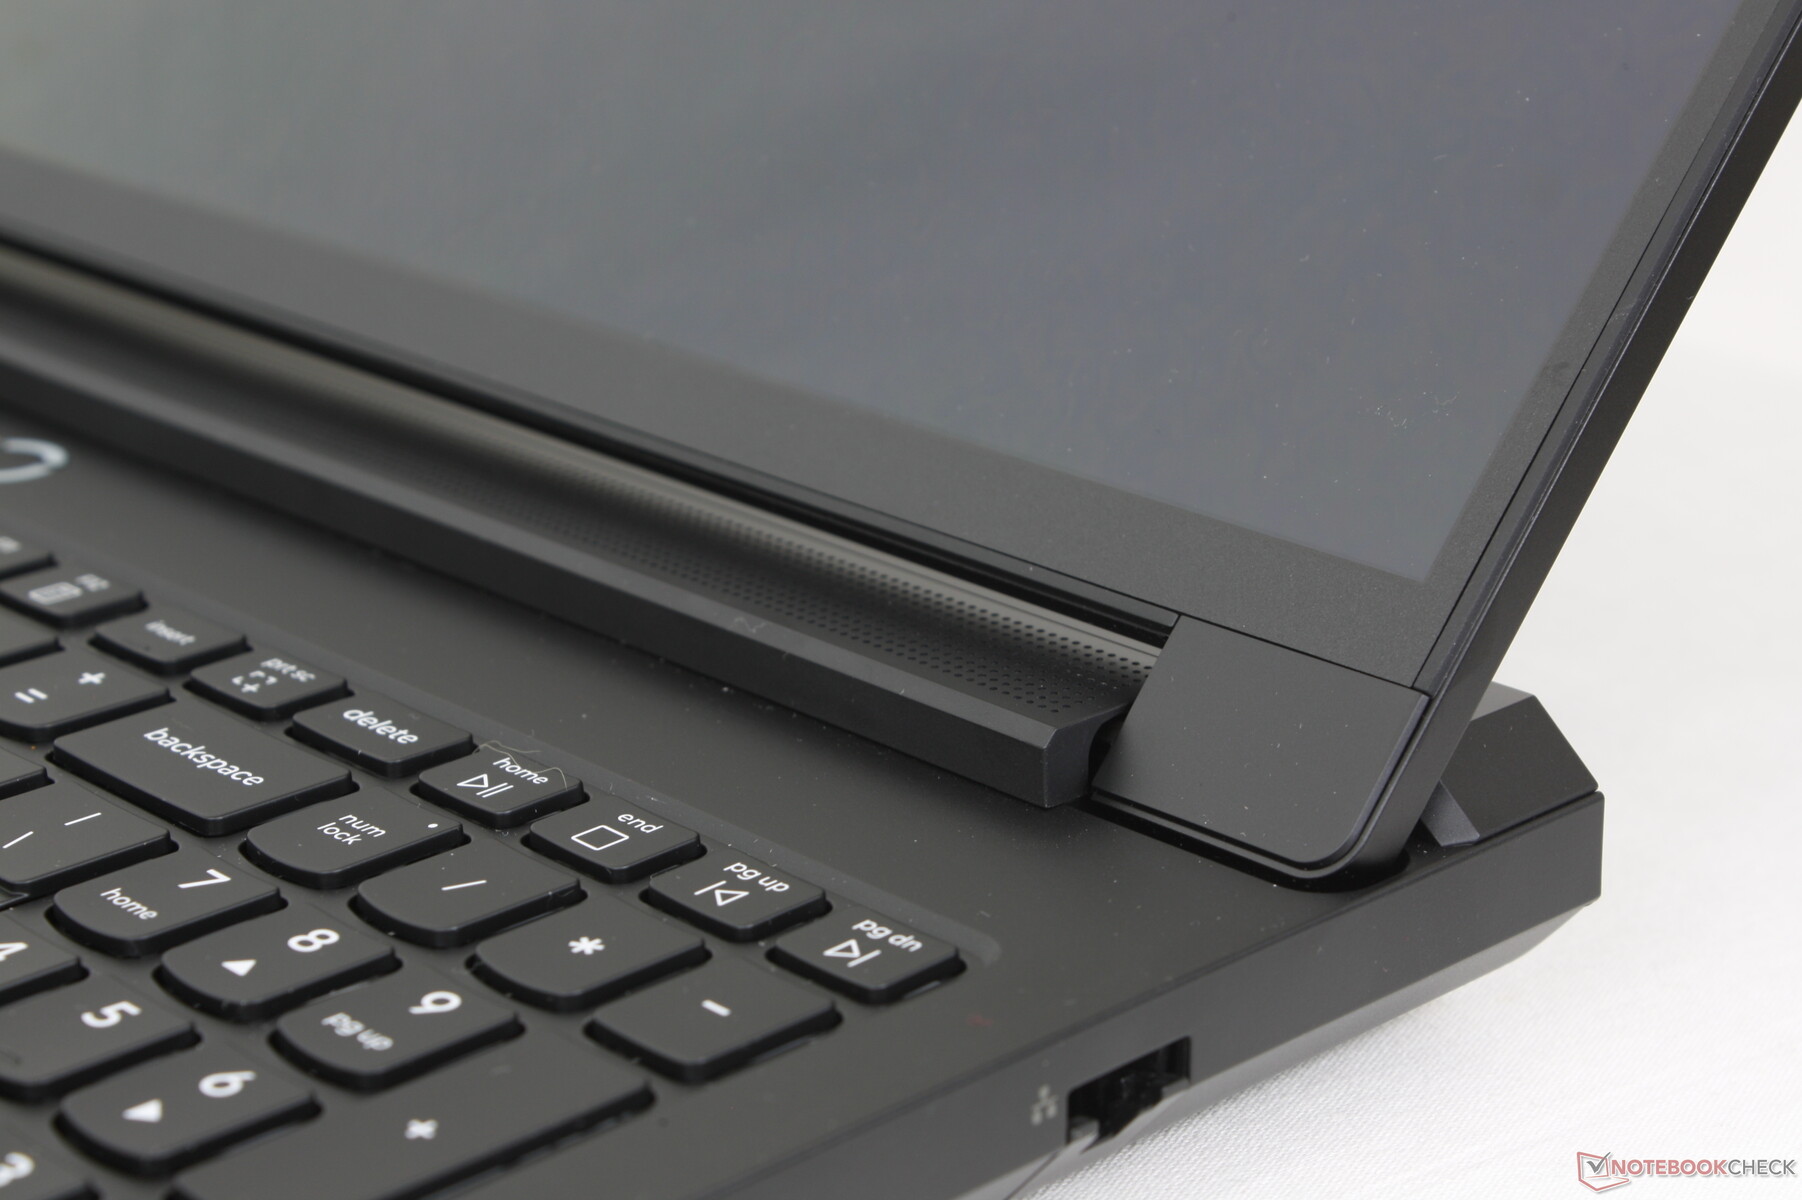
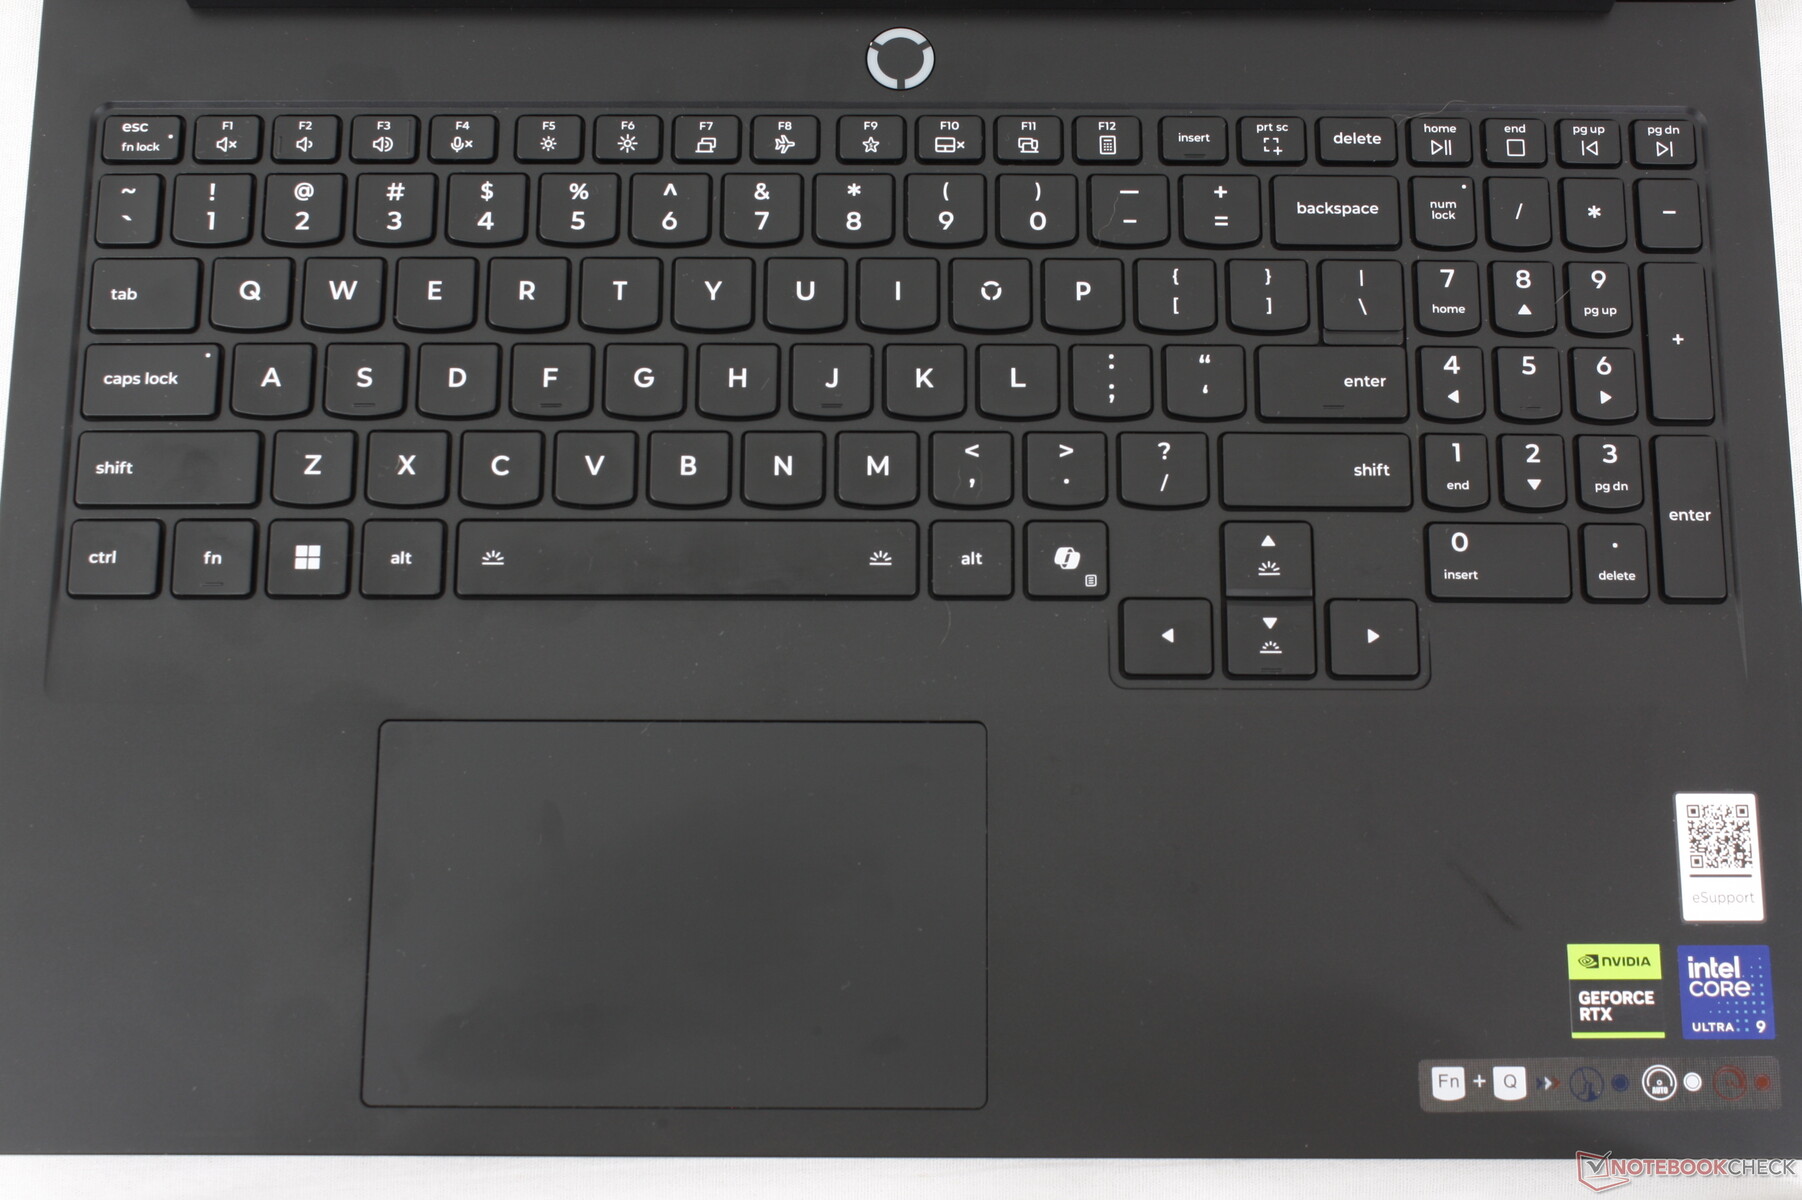
Aparte de algunos ligeros cambios en el tipo de letra, las teclas de membrana siguen siendo esencialmente las mismas que en el Legion 7 16 G9 o Legion 9i 16 para una experiencia de tecleo familiar. El desplazamiento se siente más profundo y con una respuesta más firme que las teclas de la mayoría de los portátiles más delgados, incluido el Blade 16.
Apreciamos las teclas de flecha de tamaño completo, ya que suelen ser más pequeñas y estrechas en muchos otros portátiles para juegos, incluido el Omen Max 16.
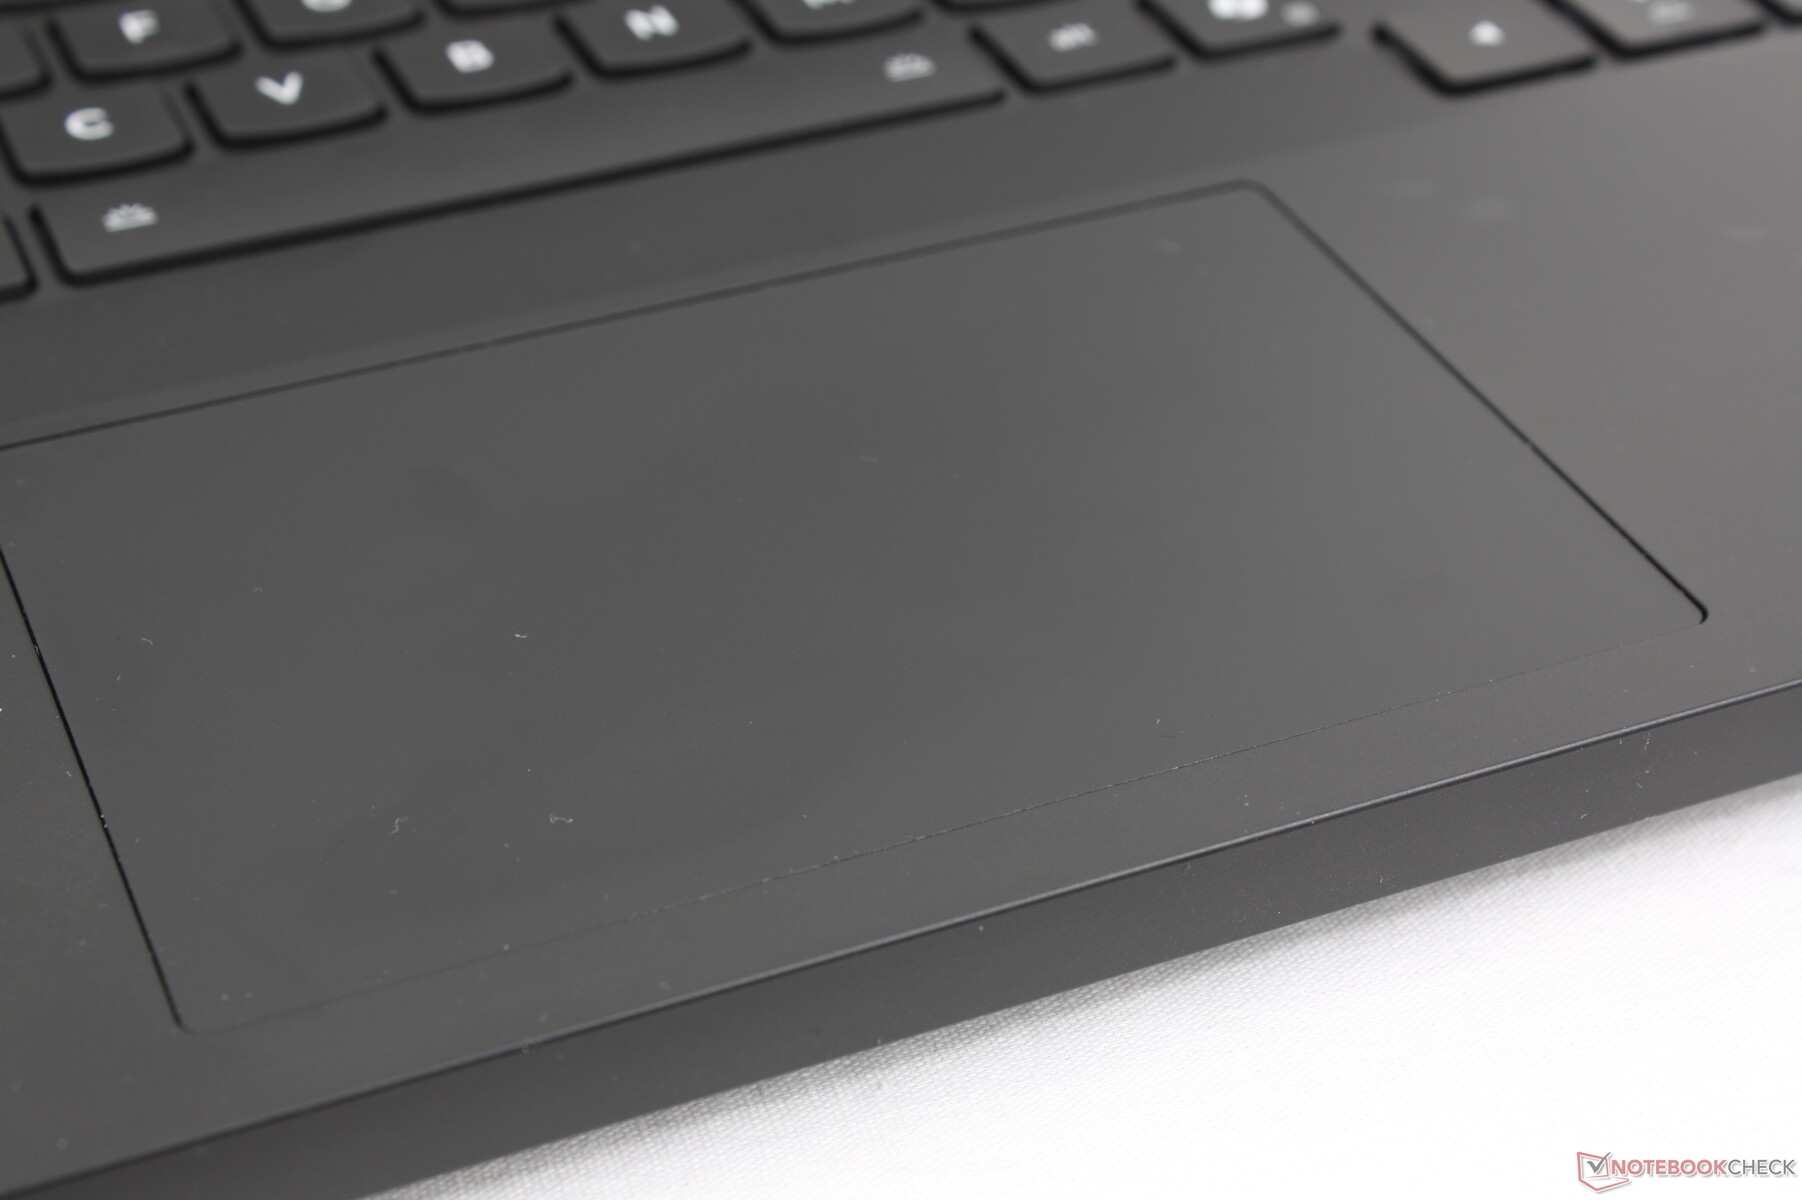
Panel táctil
El tamaño del clickpad es idéntico al del modelo del año pasado, con 12 x 7,5 cm. Nos hubiera gustado que fuera más alto para un mejor control vertical del cursor, pero los movimientos son, no obstante, suaves y precisos sin problemas de fiabilidad. El clic en el clickpad sigue estando, por desgracia, en el lado poco profundo y más suave.

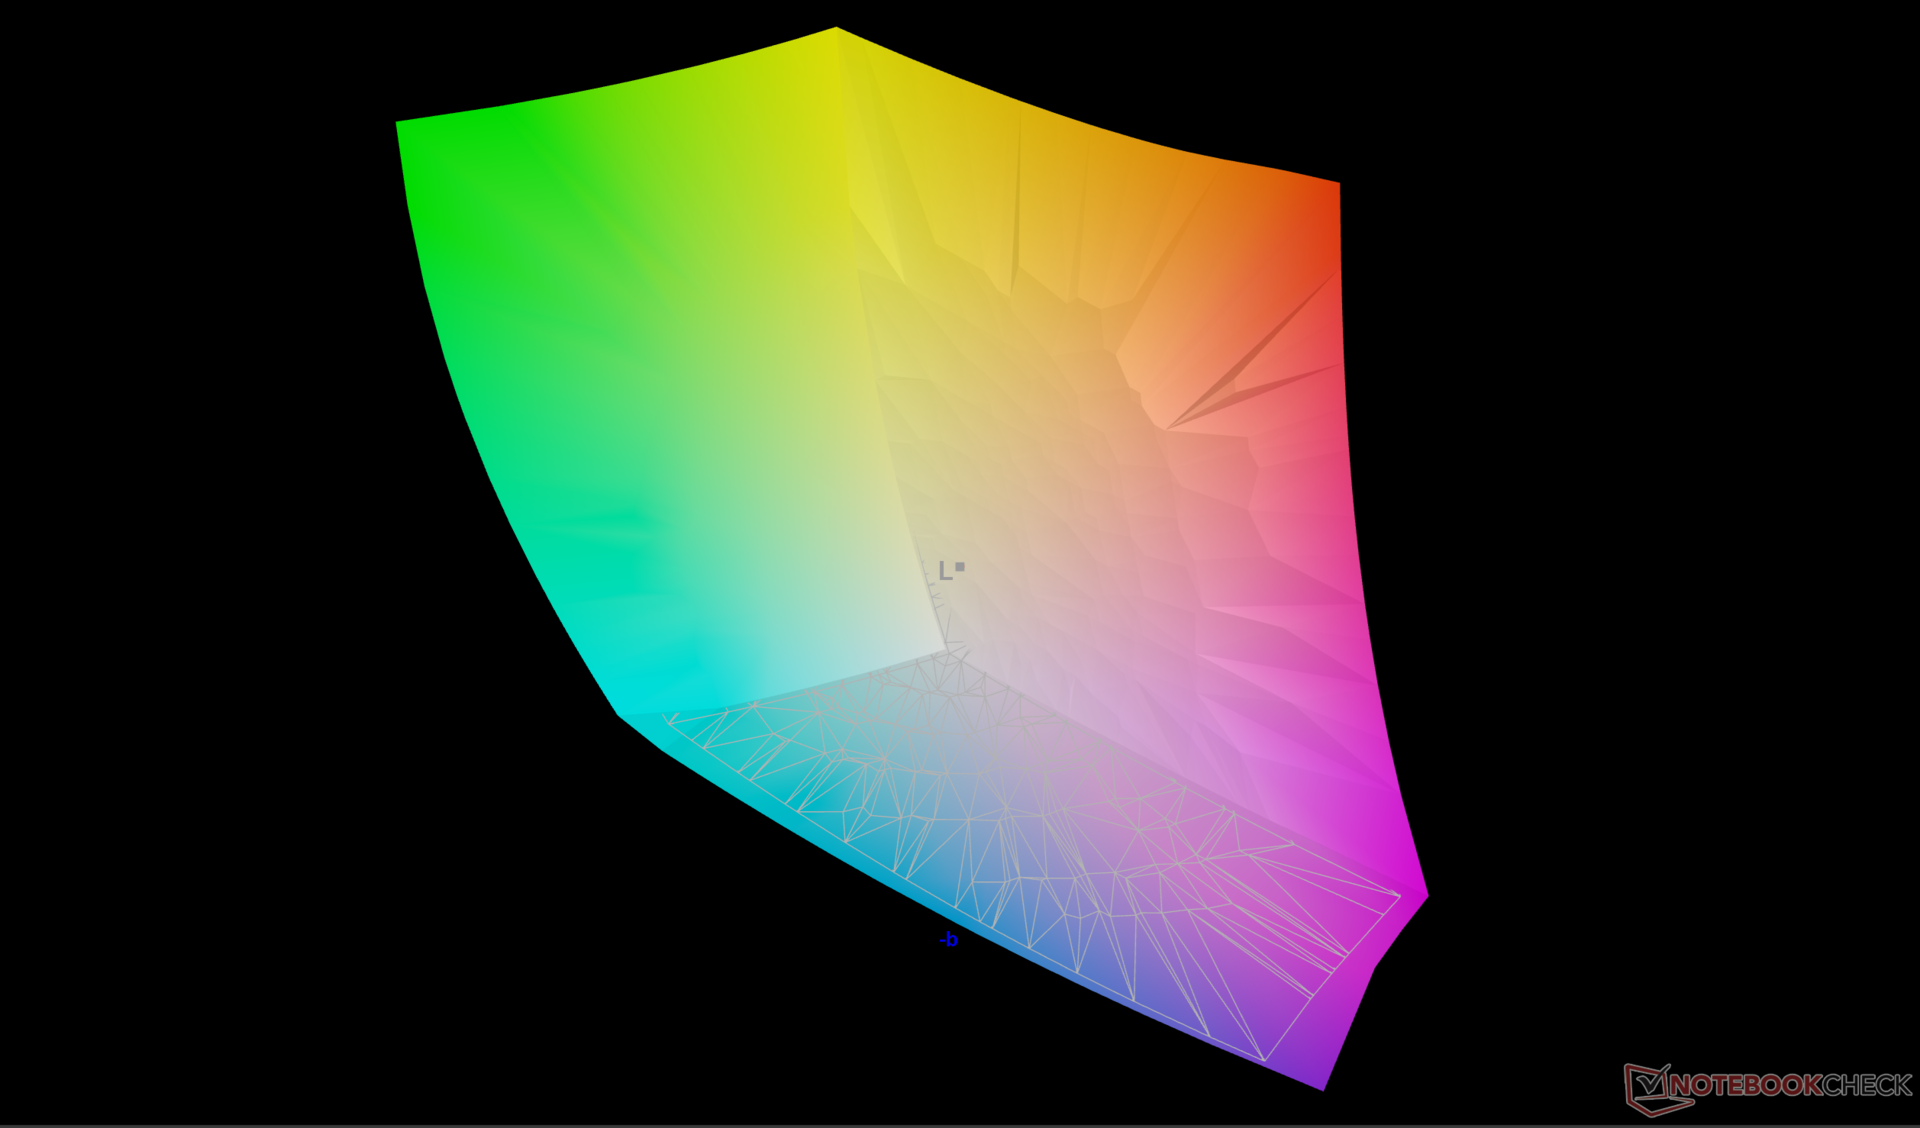
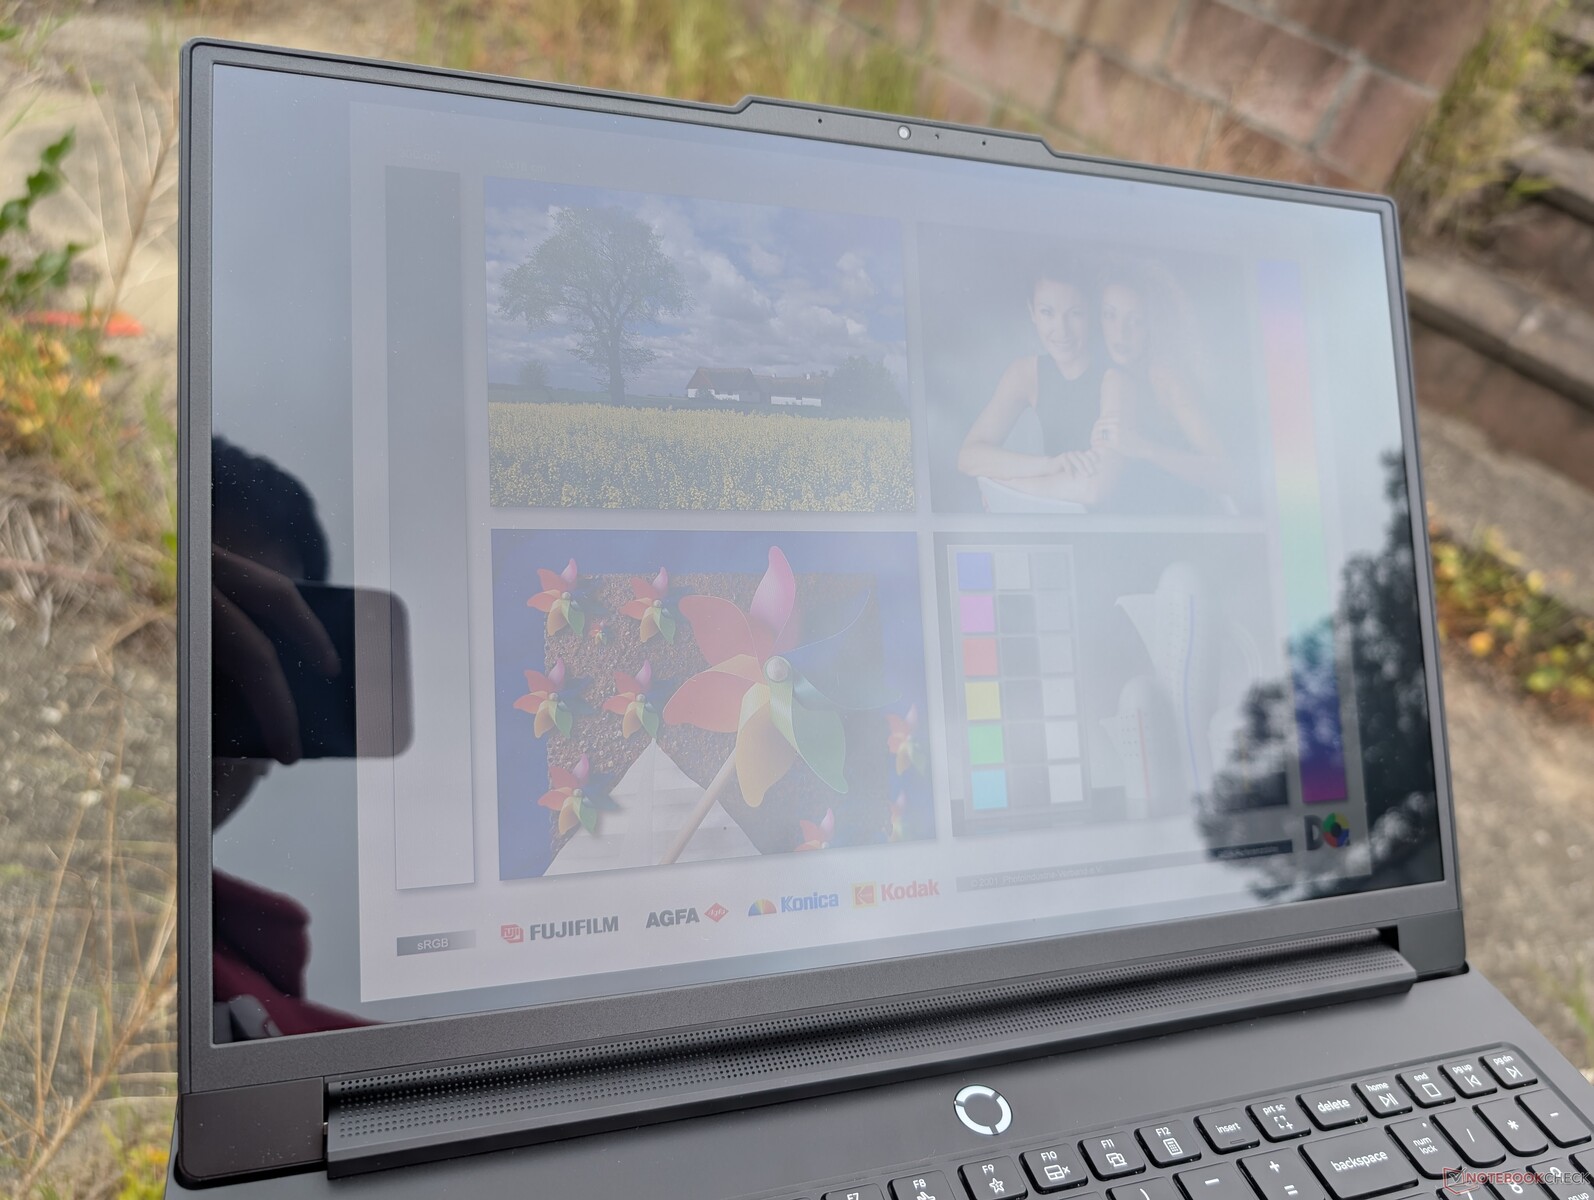
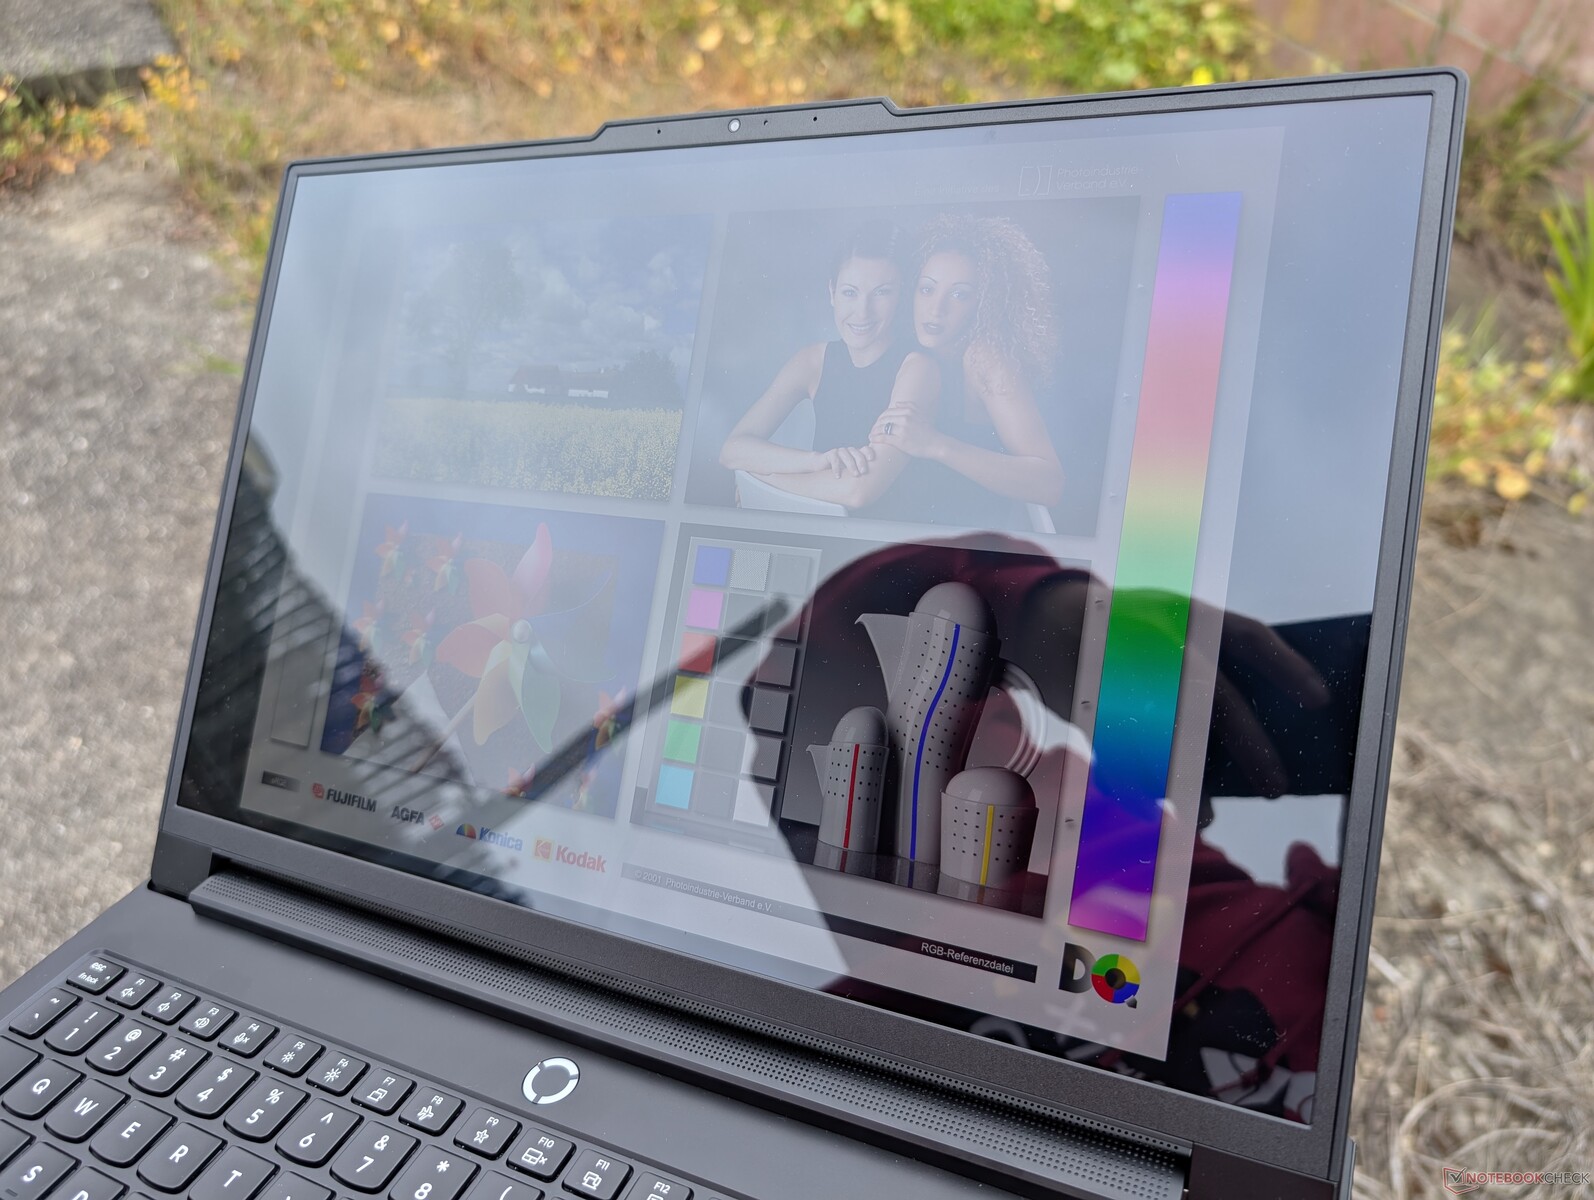
Pantalla - Casi todo lo que pueda desear

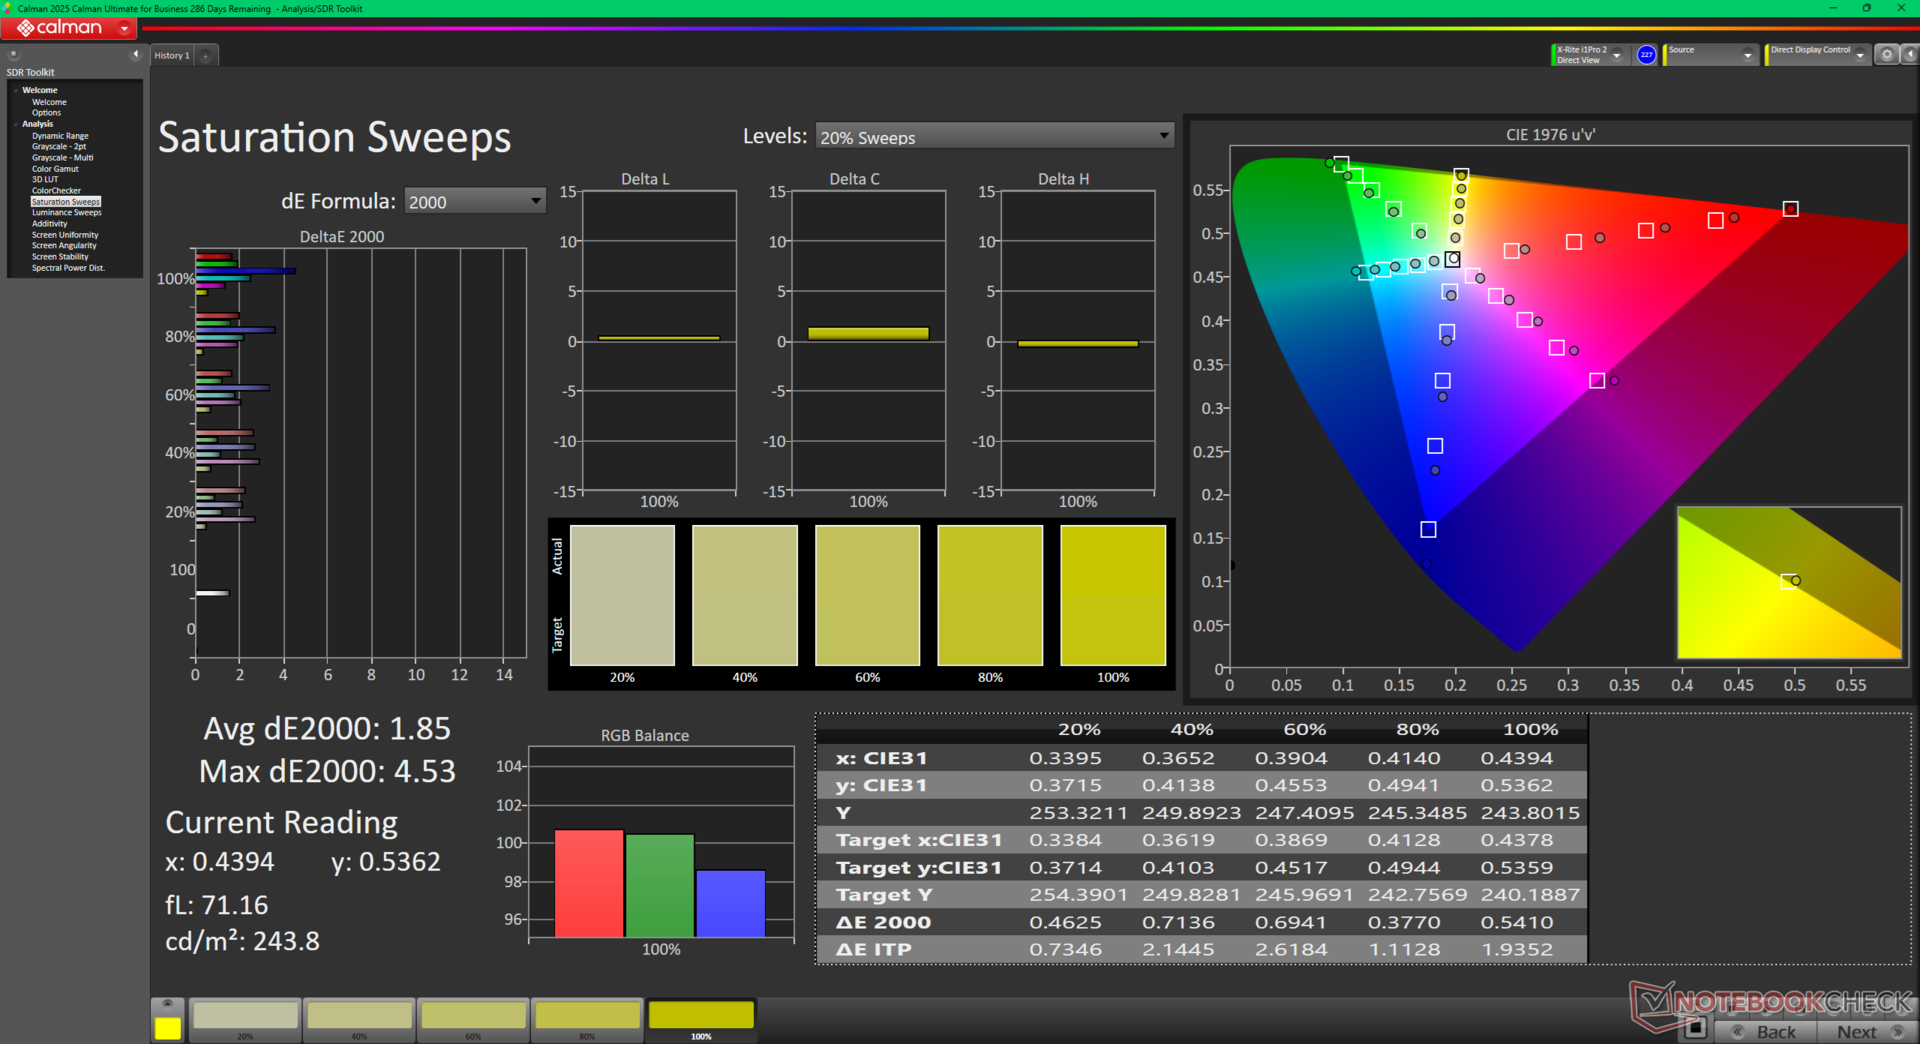
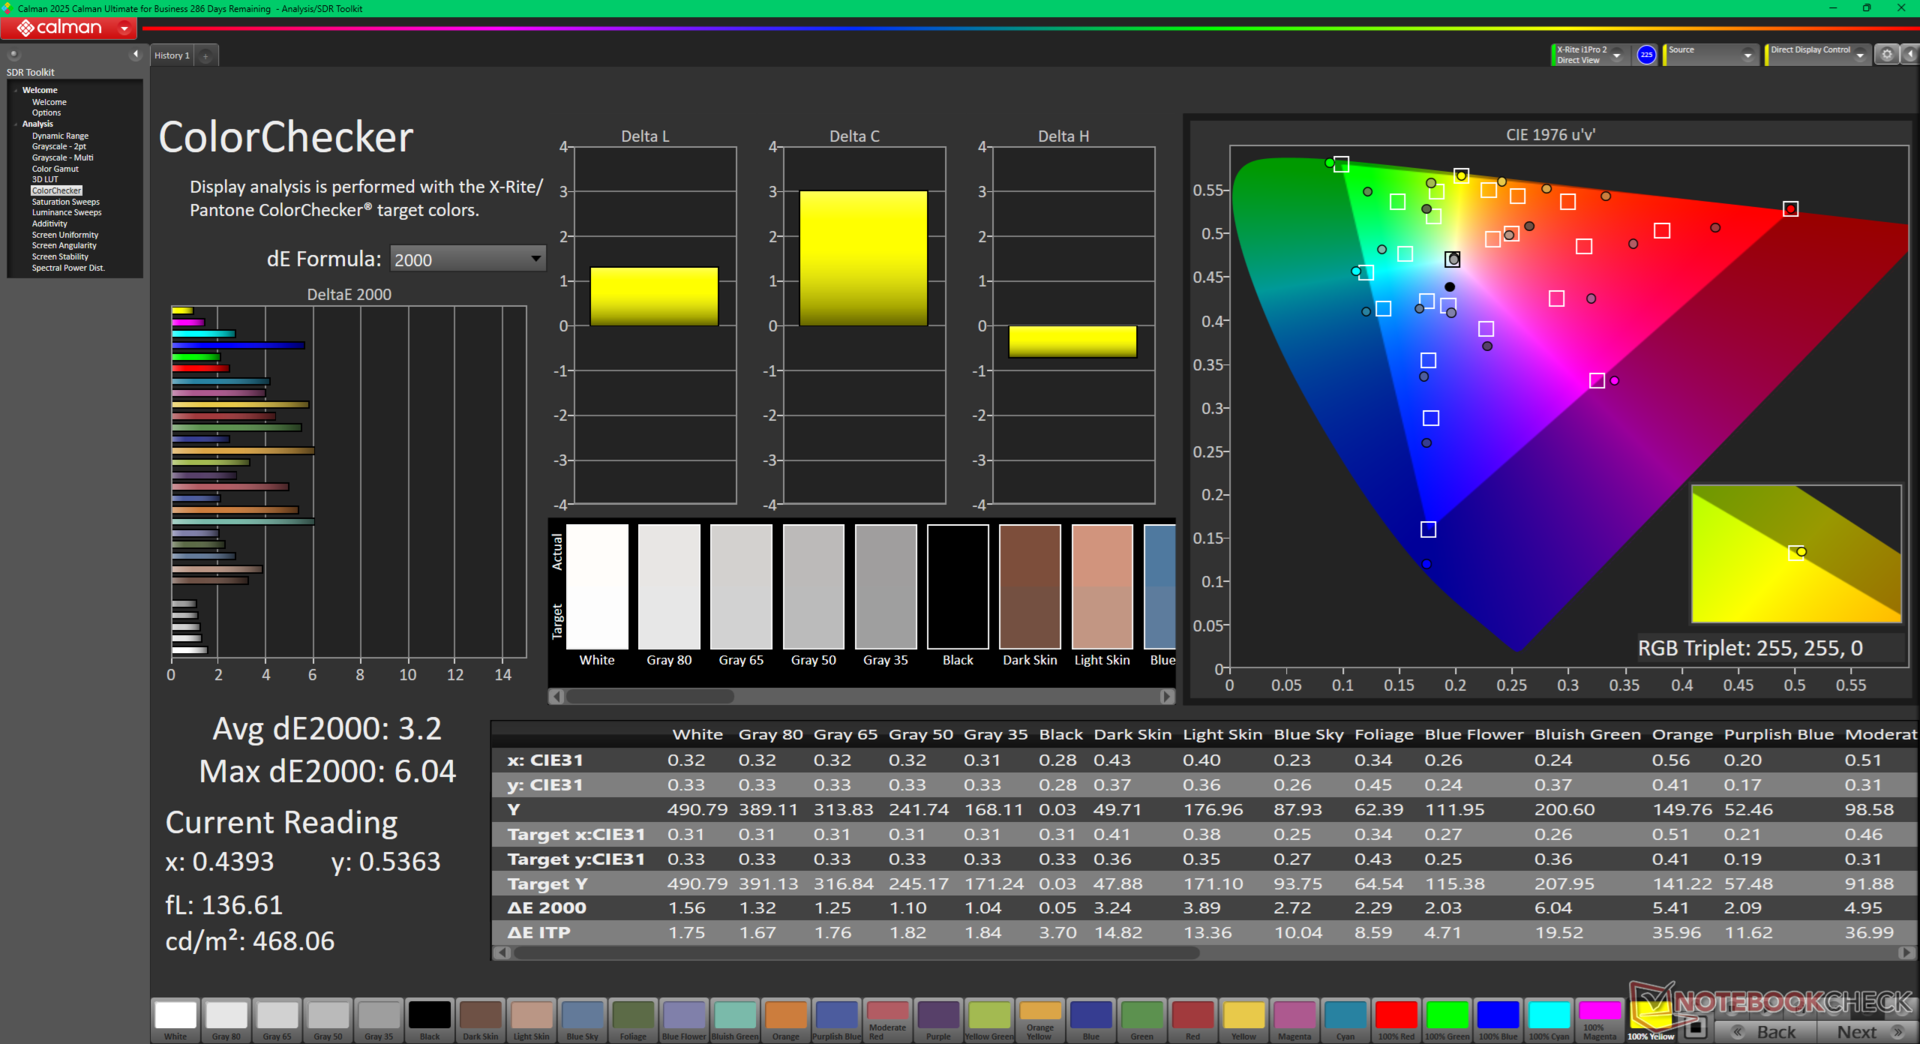
El panel OLED Samsung ATNA60HU01-0 de nuestra unidad Lenovo es muy similar al panel OLED ATNA60DL01-0 del competidor Zephyrus G16. Ambos paneles ofrecen un refresco nativo de 240 Hz, una resolución nativa de 1600p y colores P3. También es compatible con G-Sync y Advanced Optimus para ser un panel de gama alta apto tanto para juegos como para edición de gráficos. Es subjetivamente muy nítido a pesar de no ofrecer ninguna opción 4K.
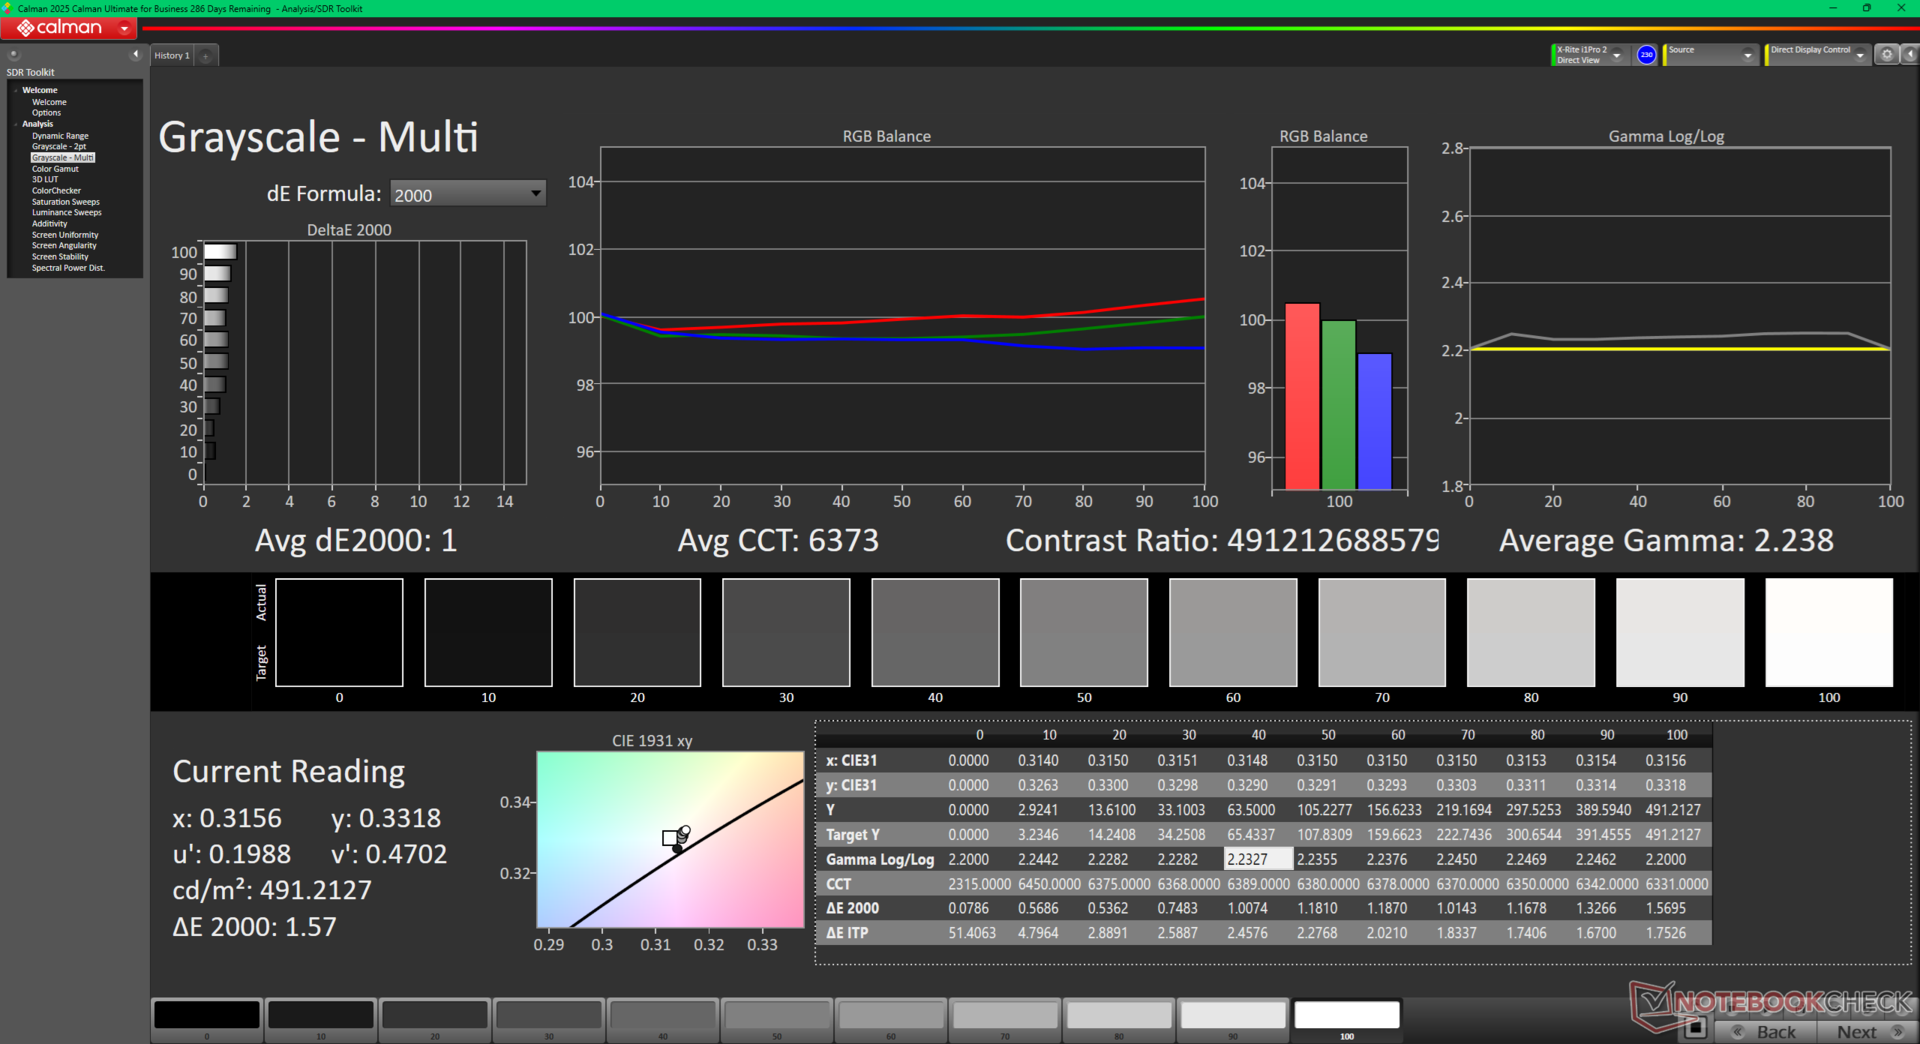
Soporta Windows VRR para ahorrar energía aunque sólo hasta 60 Hz. Podemos confirmar la compatibilidad con DisplayHDR1000 también con un nivel de brillo máximo medido de 970 nits cuando está en modo HDR. Si está en modo SDR, el brillo máximo alcanza en cambio los 500 nits, lo que sigue siendo más brillante que muchos paneles IPS e incluso que el mencionado Zephyrus G16.

| |||||||||||||||||||||||||
iluminación: 97 %
Brillo con batería: 490.4 cd/m²
Contraste: ∞:1 (Negro: 0 cd/m²)
ΔE Color 3.2 | 0.5-29.43 Ø4.86, calibrated: 0.84
ΔE Greyscale 1 | 0.5-98 Ø5.1
94.4% AdobeRGB 1998 (Argyll 2.2.0 3D)
100% sRGB (Argyll 2.2.0 3D)
99.5% Display P3 (Argyll 2.2.0 3D)
Gamma: 2.24
| Lenovo Legion Pro 7i 16 Gen 10 Samsung ATNA60HU01-0, OLED, 2560x1600, 16", 240 Hz | Lenovo Legion 9 16IRX9, RTX 4090 CSOT T3 MNG007ZA2-2, MiniLED, 3200x2000, 16", 165 Hz | Razer Blade 16 2025 RTX 5090 ATNA60DL04-0, OLED, 2560x1600, 16", 240 Hz | Asus ROG Zephyrus G16 GU605MY ATNA60DL01-0, OLED, 2560x1600, 16", 240 Hz | MSI Vector 16 HX A14V Chi Mei N160GME-GTB, IPS, 2560x1600, 16", 240 Hz | Alienware x16 R2 P120F BOE B160QAN, IPS, 2560x1600, 16", 240 Hz | |
|---|---|---|---|---|---|---|
| Display | -4% | -4% | 1% | -5% | -2% | |
| Display P3 Coverage | 99.5 | 95.3 -4% | 96.1 -3% | 99.9 0% | 95.4 -4% | 98.3 -1% |
| sRGB Coverage | 100 | 99.9 0% | 99.9 0% | 100 0% | 99.7 0% | 100 0% |
| AdobeRGB 1998 Coverage | 94.4 | 86.6 -8% | 85 -10% | 96.9 3% | 85.4 -10% | 88.8 -6% |
| Response Times | -2116% | 13% | 10% | -2244% | -1504% | |
| Response Time Grey 50% / Grey 80% * | 0.28 ? | 12.6 ? -4400% | 0.2 ? 29% | 0.22 ? 21% | 5.7 ? -1936% | 3.9 ? -1293% |
| Response Time Black / White * | 0.43 ? | 10 ? -2226% | 0.25 ? 42% | 0.25 ? 42% | 11.4 ? -2551% | 7.8 ? -1714% |
| PWM Frequency | 1438 ? | 5430 278% | 960 ? -33% | 960 ? -33% | ||
| Screen | -46% | -2% | -15% | -52% | -30% | |
| Brightness middle | 490.4 | 631 29% | 391 -20% | 416 -15% | 557.2 14% | 348.4 -29% |
| Brightness | 498 | 664 33% | 393 -21% | 418 -16% | 506 2% | 340 -32% |
| Brightness Distribution | 97 | 91 -6% | 98 1% | 96 -1% | 83 -14% | 90 -7% |
| Black Level * | 0.03 | 0.41 | 0.33 | |||
| Colorchecker dE 2000 * | 3.2 | 2.68 16% | 1.2 62% | 1.6 50% | 2.91 9% | 2.68 16% |
| Colorchecker dE 2000 max. * | 6.04 | 6.41 -6% | 3.2 47% | 2.1 65% | 5.94 2% | 4.14 31% |
| Colorchecker dE 2000 calibrated * | 0.84 | 2.68 -219% | 1.63 -94% | 0.42 50% | ||
| Greyscale dE 2000 * | 1 | 2.71 -171% | 1.8 -80% | 2.7 -170% | 3.8 -280% | 3.4 -240% |
| Gamma | 2.24 98% | 2.27 97% | 2.2 100% | 2.16 102% | 2.23 99% | 2.41 91% |
| CCT | 6373 102% | 6135 106% | 6493 100% | 6331 103% | 6408 101% | 6083 107% |
| Contrast | 21033 | 1359 | 1056 | |||
| Media total (Programa/Opciones) | -722% /
-514% | 2% /
1% | -1% /
-5% | -767% /
-405% | -512% /
-269% |
* ... más pequeño es mejor

La pantalla está decentemente calibrada con respecto a la norma P3, con unos valores medios de escala de grises y deltaE de color de sólo 1,0 y 3,2, respectivamente, lo que significa que para la mayoría no es necesaria una calibración por parte del usuario final.
Tiempos de respuesta del display
| ↔ Tiempo de respuesta de Negro a Blanco | ||
|---|---|---|
| 0.43 ms ... subida ↗ y bajada ↘ combinada | ↗ 0.22 ms subida | 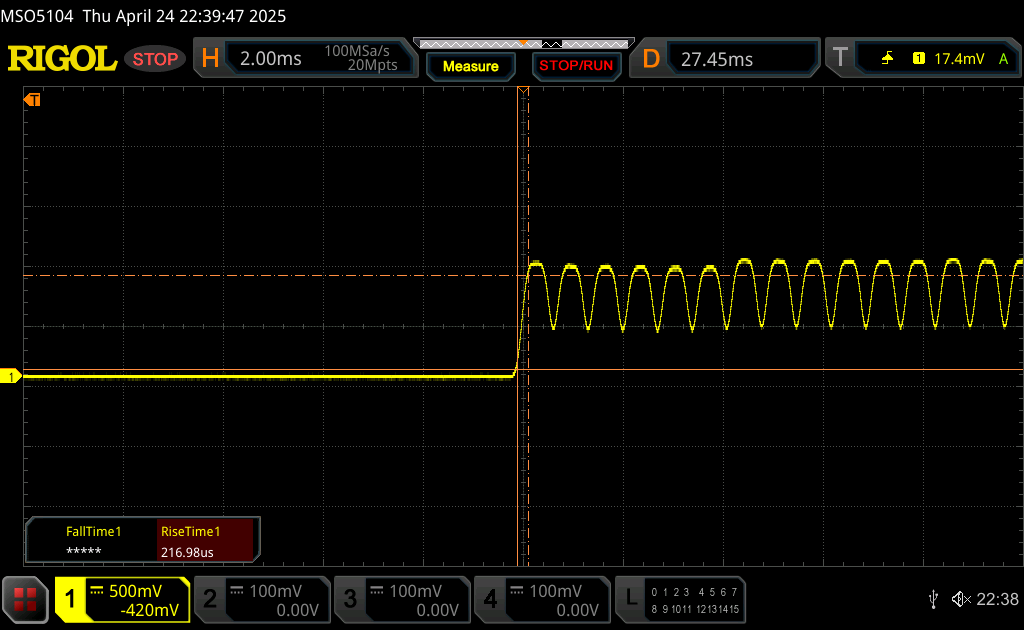 |
| ↘ 0.21 ms bajada | ||
| La pantalla mostró tiempos de respuesta muy rápidos en nuestros tests y debería ser adecuada para juegos frenéticos. En comparación, todos los dispositivos de prueba van de ##min### (mínimo) a 240 (máximo) ms. » 0 % de todos los dispositivos son mejores. Esto quiere decir que el tiempo de respuesta medido es mejor que la media (20.7 ms) de todos los dispositivos testados. | ||
| ↔ Tiempo de respuesta 50% Gris a 80% Gris | ||
| 0.28 ms ... subida ↗ y bajada ↘ combinada | ↗ 0.14 ms subida | 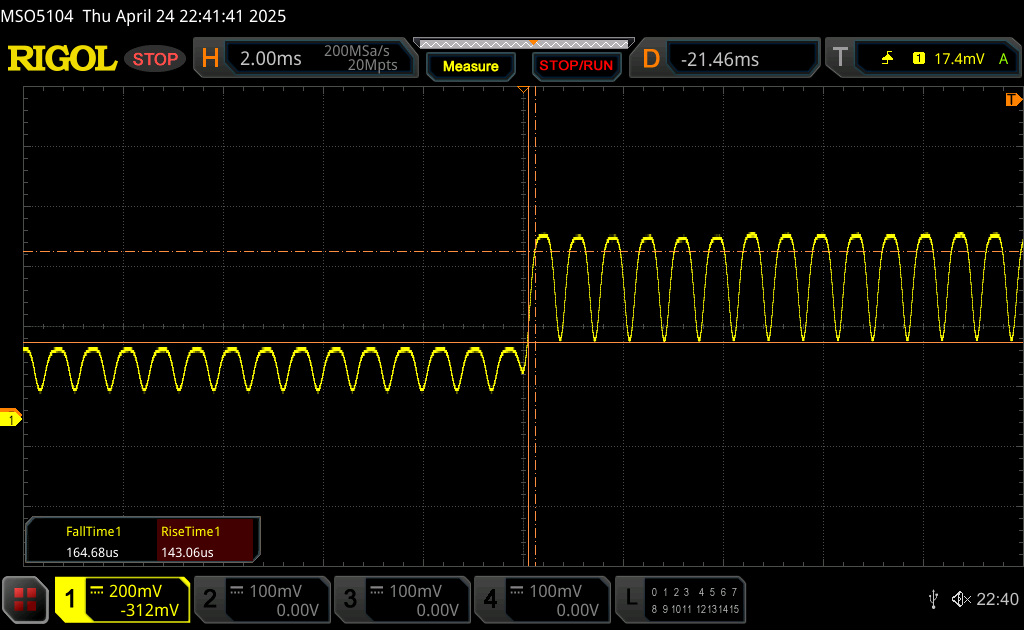 |
| ↘ 0.14 ms bajada | ||
| La pantalla mostró tiempos de respuesta muy rápidos en nuestros tests y debería ser adecuada para juegos frenéticos. En comparación, todos los dispositivos de prueba van de ##min### (mínimo) a 636 (máximo) ms. » 0 % de todos los dispositivos son mejores. Esto quiere decir que el tiempo de respuesta medido es mejor que la media (32.4 ms) de todos los dispositivos testados. | ||
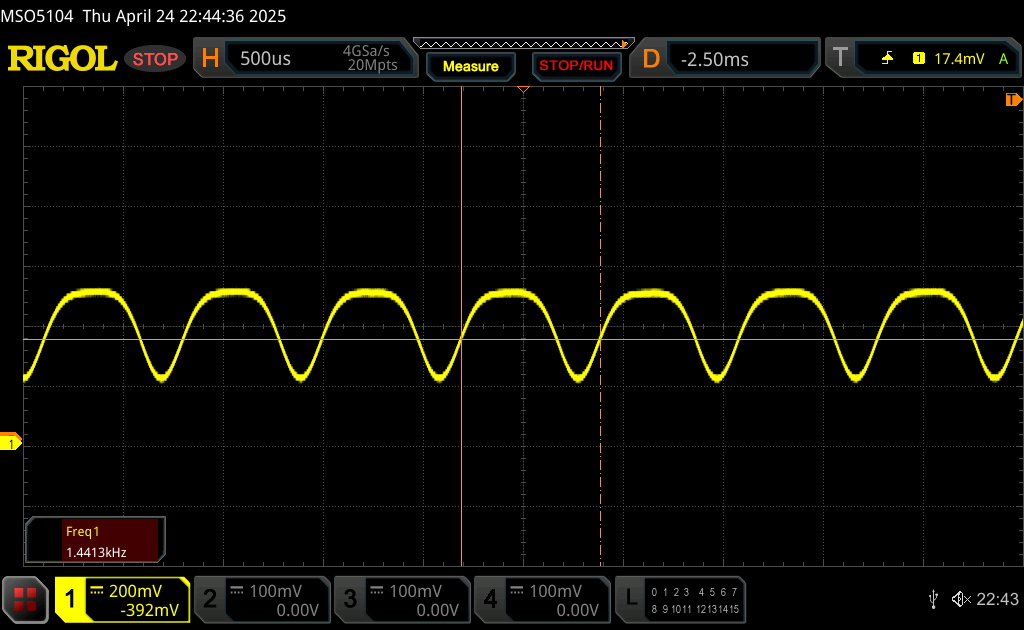
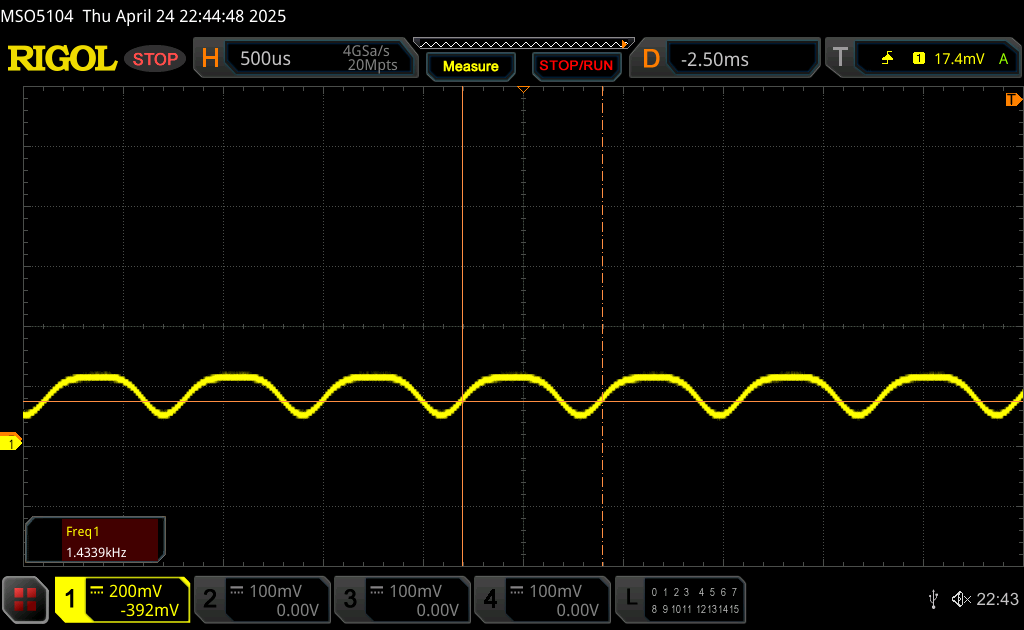
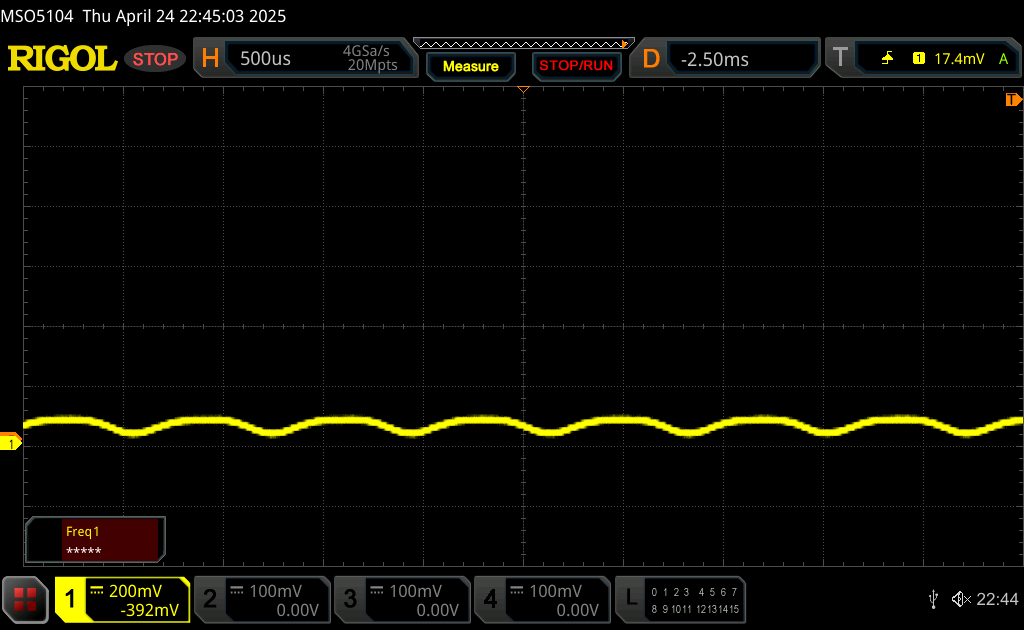
Parpadeo de Pantalla / PWM (Pulse-Width Modulation)
| Parpadeo de Pantalla / PWM detectado | 1438 Hz Amplitude: 29 % | ≤ 100 % de brillo | 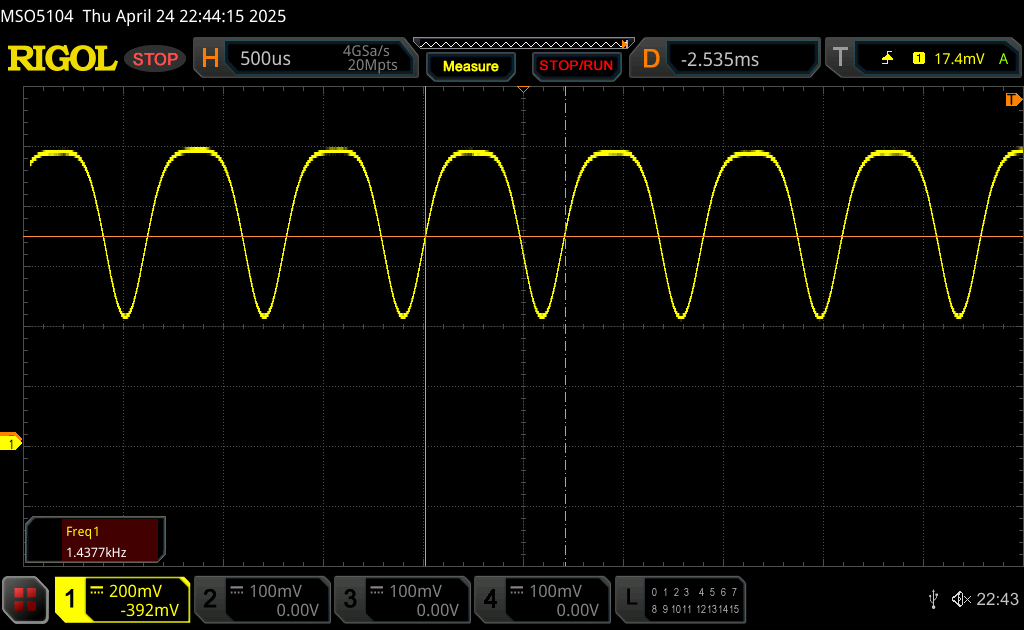 |
La retroiluminación del display parpadea a 1438 Hz (seguramente usa PWM - Pulse-Width Modulation) a un brillo del 100 % e inferior. Sobre este nivel de brillo no debería darse parpadeo / PWM. La frecuencia de 1438 Hz es bastante alta, por lo que la mayoría de gente sensible al parpadeo no debería ver parpadeo o tener fatiga visual. Comparación: 53 % de todos los dispositivos testados no usaron PWM para atenuar el display. Si se usó, medimos una media de 8482 (mínimo: 5 - máxmo: 343500) Hz. | |||

La pantalla de 500 nits puede ser brillante en interiores, pero no fue diseñada para exteriores. Los reflejos de la pantalla brillante siguen siendo inevitables aquí.


Rendimiento - Lago Arrow con gráficos TGP de 175 W
Condiciones de prueba
Configuramos LegionSpace en modo Rendimiento y la GPU en modo discreto antes de ejecutar los puntos de referencia que se muestran a continuación. Se recomienda a los propietarios que se familiaricen con LegionSpace para ajustar aspectos del sistema relacionados con el rendimiento, la GPU o los efectos LED. Mientras tanto, Lenovo Vantage sigue viniendo preinstalado para ajustar aspectos no relacionados con los juegos, como la carga de la batería, la cámara web o el comportamiento del teclado.
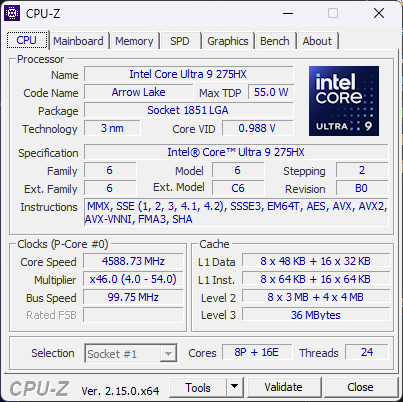
Procesador
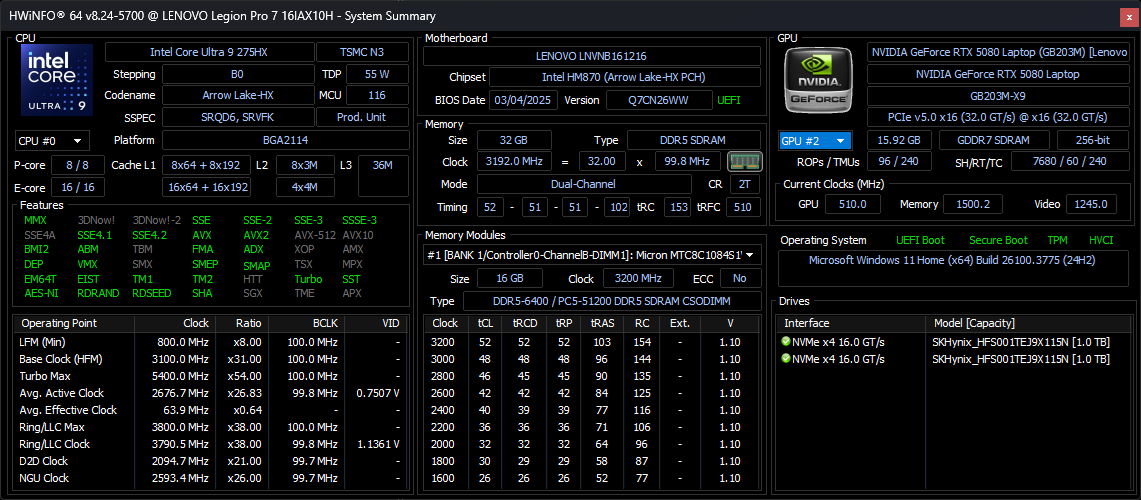
El Core Ultra 9 275HX es uno de los procesadores más rápidos de Intel disponibles en la familia Arrow Lake-HX. Integra la NPU de la serie Meteor Lake-H (como el Core Ultra 9 185H) con el rendimiento de la serie Raptor Lake-HX (como el Core i9-14900HX) para ser lo mejor de ambos mundos mientras que antes los compradores tenían que sacrificar uno por el otro. El rendimiento multihilo en bruto es significativamente más rápido que el del Core Ultra 9 285H o el Ryzen AI 9 HX 370 para estar codo con codo con el buque insignia Ryzen 9 9955HX.
Podría decirse que el inconveniente más notable del nuevo procesador son sus elevados requisitos de energía, como mostrará nuestra sección Gestión de la energía más adelante.
Cinebench R15 Multi Loop
Cinebench R23: Multi Core | Single Core
Cinebench R20: CPU (Multi Core) | CPU (Single Core)
Cinebench R15: CPU Multi 64Bit | CPU Single 64Bit
Blender: v2.79 BMW27 CPU
7-Zip 18.03: 7z b 4 | 7z b 4 -mmt1
Geekbench 6.4: Multi-Core | Single-Core
Geekbench 5.5: Multi-Core | Single-Core
HWBOT x265 Benchmark v2.2: 4k Preset
LibreOffice : 20 Documents To PDF
R Benchmark 2.5: Overall mean
* ... más pequeño es mejor
AIDA64: FP32 Ray-Trace | FPU Julia | CPU SHA3 | CPU Queen | FPU SinJulia | FPU Mandel | CPU AES | CPU ZLib | FP64 Ray-Trace | CPU PhotoWorxx
| Performance Rating | |
| Medio Intel Core Ultra 9 275HX | |
| Lenovo Legion Pro 7i 16 Gen 10 | |
| MSI Vector 16 HX A14V | |
| Lenovo Legion 9 16IRX9, RTX 4090 | |
| Razer Blade 16 2025 RTX 5090 | |
| Asus ROG Zephyrus G16 GU605CX | |
| Alienware x16 R2 P120F | |
| AIDA64 / FP32 Ray-Trace | |
| Medio Intel Core Ultra 9 275HX (32615 - 39551, n=6) | |
| Razer Blade 16 2025 RTX 5090 | |
| Lenovo Legion Pro 7i 16 Gen 10 | |
| MSI Vector 16 HX A14V | |
| Lenovo Legion 9 16IRX9, RTX 4090 | |
| Asus ROG Zephyrus G16 GU605CX | |
| Alienware x16 R2 P120F | |
| AIDA64 / FPU Julia | |
| Medio Intel Core Ultra 9 275HX (166245 - 194867, n=6) | |
| Lenovo Legion Pro 7i 16 Gen 10 | |
| MSI Vector 16 HX A14V | |
| Razer Blade 16 2025 RTX 5090 | |
| Lenovo Legion 9 16IRX9, RTX 4090 | |
| Asus ROG Zephyrus G16 GU605CX | |
| Alienware x16 R2 P120F | |
| AIDA64 / CPU SHA3 | |
| Medio Intel Core Ultra 9 275HX (7829 - 9482, n=6) | |
| Lenovo Legion Pro 7i 16 Gen 10 | |
| MSI Vector 16 HX A14V | |
| Lenovo Legion 9 16IRX9, RTX 4090 | |
| Razer Blade 16 2025 RTX 5090 | |
| Asus ROG Zephyrus G16 GU605CX | |
| Alienware x16 R2 P120F | |
| AIDA64 / CPU Queen | |
| MSI Vector 16 HX A14V | |
| Lenovo Legion Pro 7i 16 Gen 10 | |
| Medio Intel Core Ultra 9 275HX (125013 - 139608, n=6) | |
| Lenovo Legion 9 16IRX9, RTX 4090 | |
| Alienware x16 R2 P120F | |
| Razer Blade 16 2025 RTX 5090 | |
| Asus ROG Zephyrus G16 GU605CX | |
| AIDA64 / FPU SinJulia | |
| Razer Blade 16 2025 RTX 5090 | |
| MSI Vector 16 HX A14V | |
| Lenovo Legion 9 16IRX9, RTX 4090 | |
| Lenovo Legion Pro 7i 16 Gen 10 | |
| Medio Intel Core Ultra 9 275HX (13238 - 14112, n=6) | |
| Alienware x16 R2 P120F | |
| Asus ROG Zephyrus G16 GU605CX | |
| AIDA64 / FPU Mandel | |
| Medio Intel Core Ultra 9 275HX (87156 - 104057, n=6) | |
| Lenovo Legion Pro 7i 16 Gen 10 | |
| Razer Blade 16 2025 RTX 5090 | |
| MSI Vector 16 HX A14V | |
| Lenovo Legion 9 16IRX9, RTX 4090 | |
| Asus ROG Zephyrus G16 GU605CX | |
| Alienware x16 R2 P120F | |
| AIDA64 / CPU AES | |
| MSI Vector 16 HX A14V | |
| Lenovo Legion Pro 7i 16 Gen 10 | |
| Lenovo Legion 9 16IRX9, RTX 4090 | |
| Medio Intel Core Ultra 9 275HX (119356 - 134920, n=6) | |
| Alienware x16 R2 P120F | |
| Razer Blade 16 2025 RTX 5090 | |
| Asus ROG Zephyrus G16 GU605CX | |
| AIDA64 / CPU ZLib | |
| Medio Intel Core Ultra 9 275HX (1898 - 2220, n=6) | |
| MSI Vector 16 HX A14V | |
| Lenovo Legion Pro 7i 16 Gen 10 | |
| Lenovo Legion 9 16IRX9, RTX 4090 | |
| Razer Blade 16 2025 RTX 5090 | |
| Alienware x16 R2 P120F | |
| Asus ROG Zephyrus G16 GU605CX | |
| AIDA64 / FP64 Ray-Trace | |
| Razer Blade 16 2025 RTX 5090 | |
| Medio Intel Core Ultra 9 275HX (17631 - 21372, n=6) | |
| Lenovo Legion Pro 7i 16 Gen 10 | |
| MSI Vector 16 HX A14V | |
| Lenovo Legion 9 16IRX9, RTX 4090 | |
| Asus ROG Zephyrus G16 GU605CX | |
| Alienware x16 R2 P120F | |
| AIDA64 / CPU PhotoWorxx | |
| Asus ROG Zephyrus G16 GU605CX | |
| Lenovo Legion 9 16IRX9, RTX 4090 | |
| Lenovo Legion Pro 7i 16 Gen 10 | |
| Alienware x16 R2 P120F | |
| Medio Intel Core Ultra 9 275HX (47726 - 56613, n=6) | |
| Razer Blade 16 2025 RTX 5090 | |
| MSI Vector 16 HX A14V | |
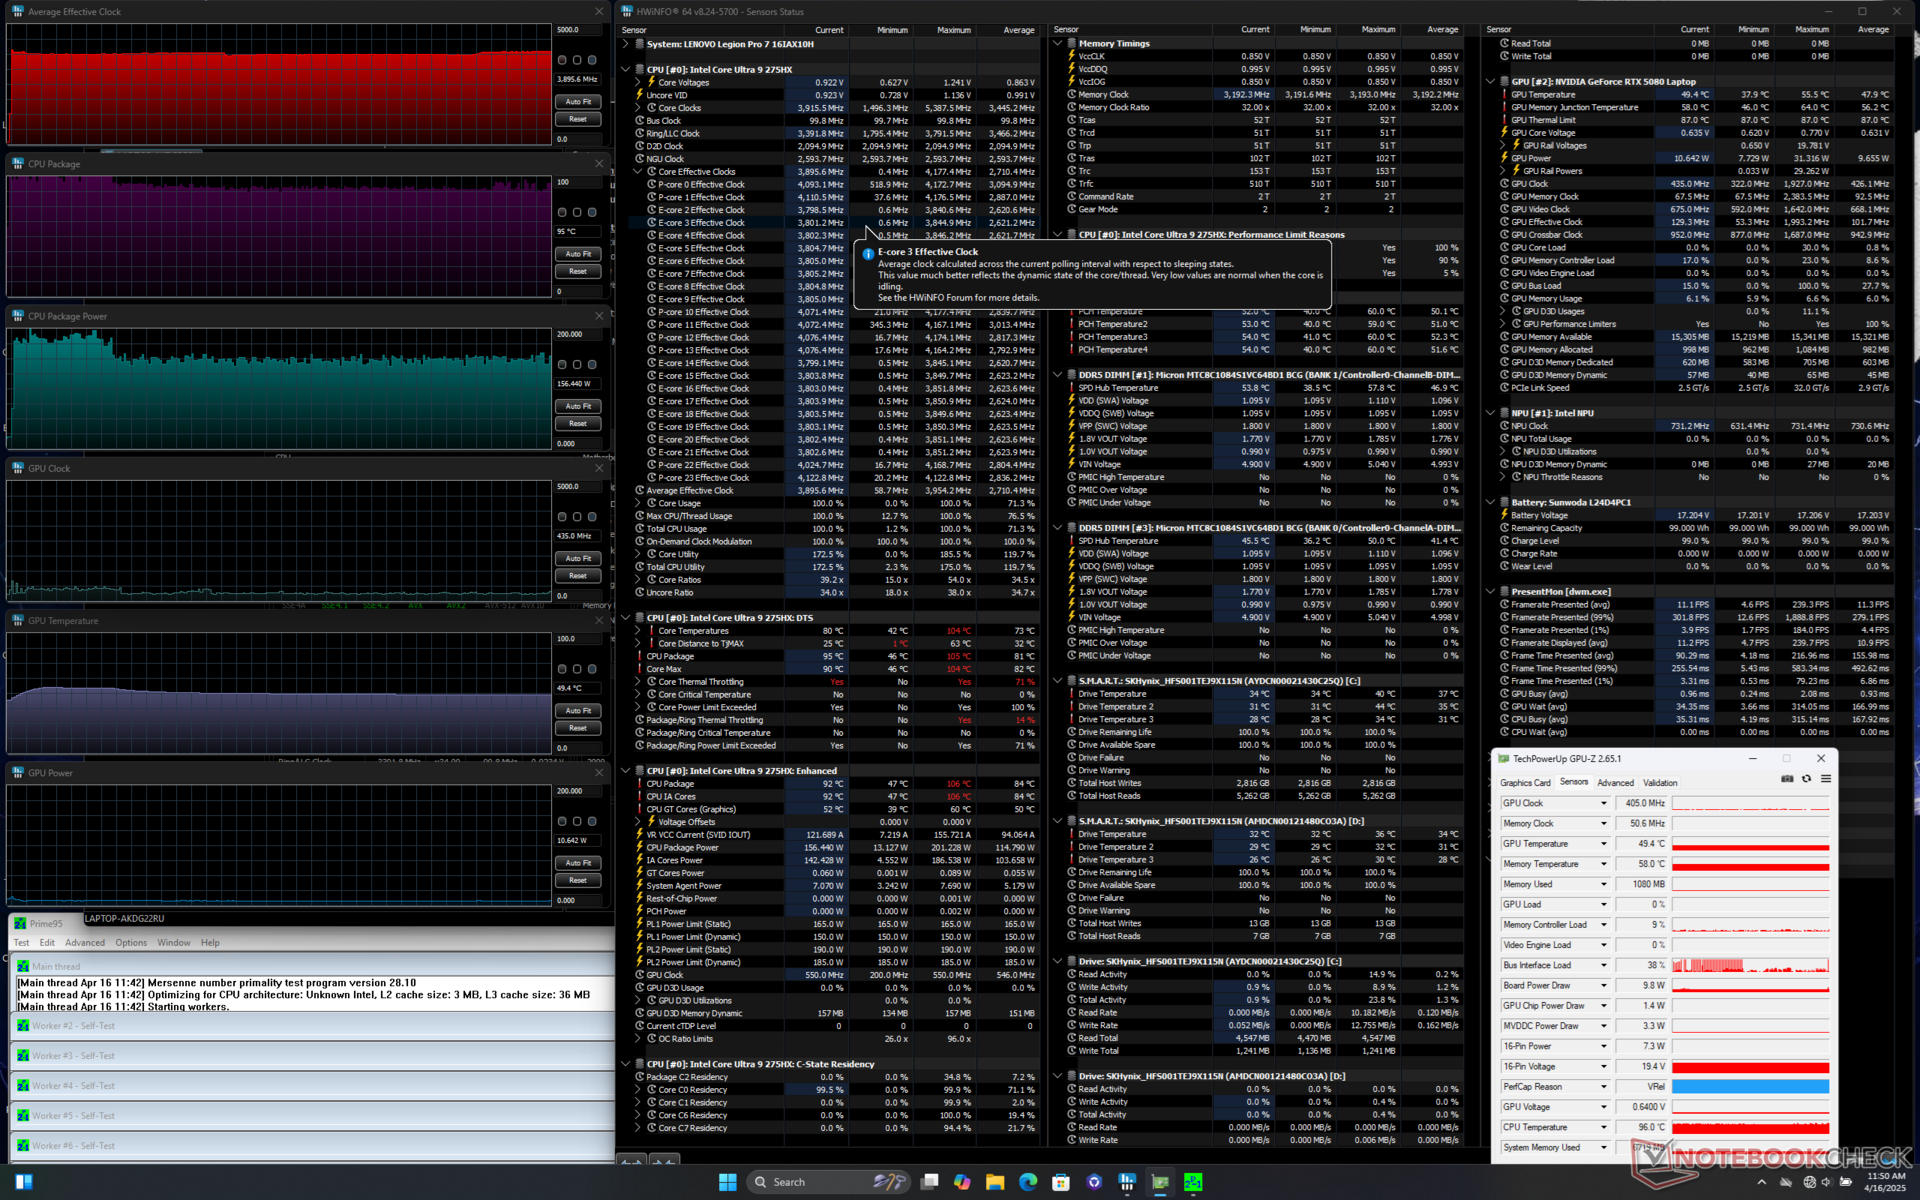
Prueba de estrés
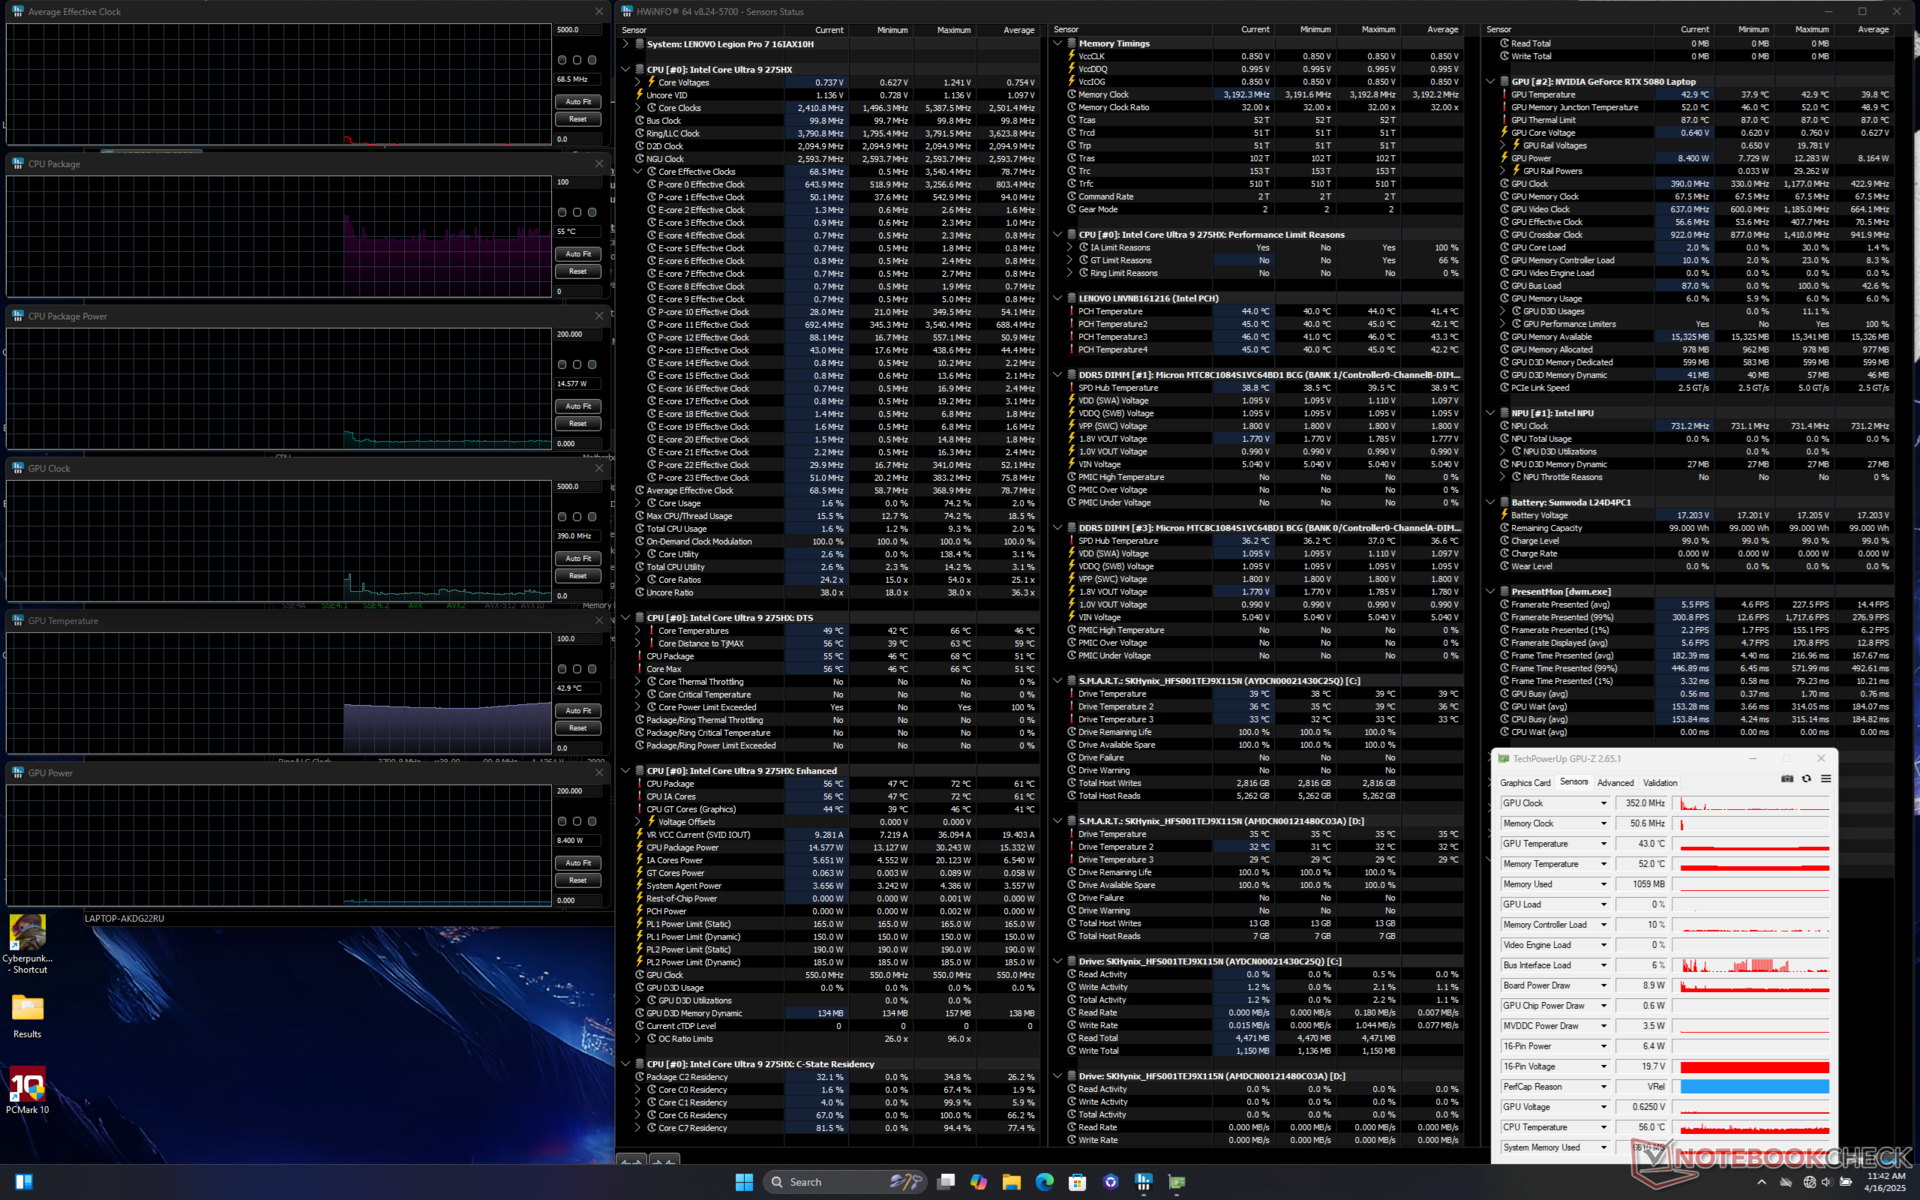
Las temperaturas del núcleo pueden ser muy cálidas, especialmente para la CPU, a pesar de la solución de refrigeración con cámara de vapor sobredimensionada. La CPU se estabilizaría en 3,9 GHz, ~156 W, y 95 C cuando se ejecuta el estrés Prime95 que es aún más caliente que el ya caliente Legion Pro 5 16IRX9 en condiciones similares.
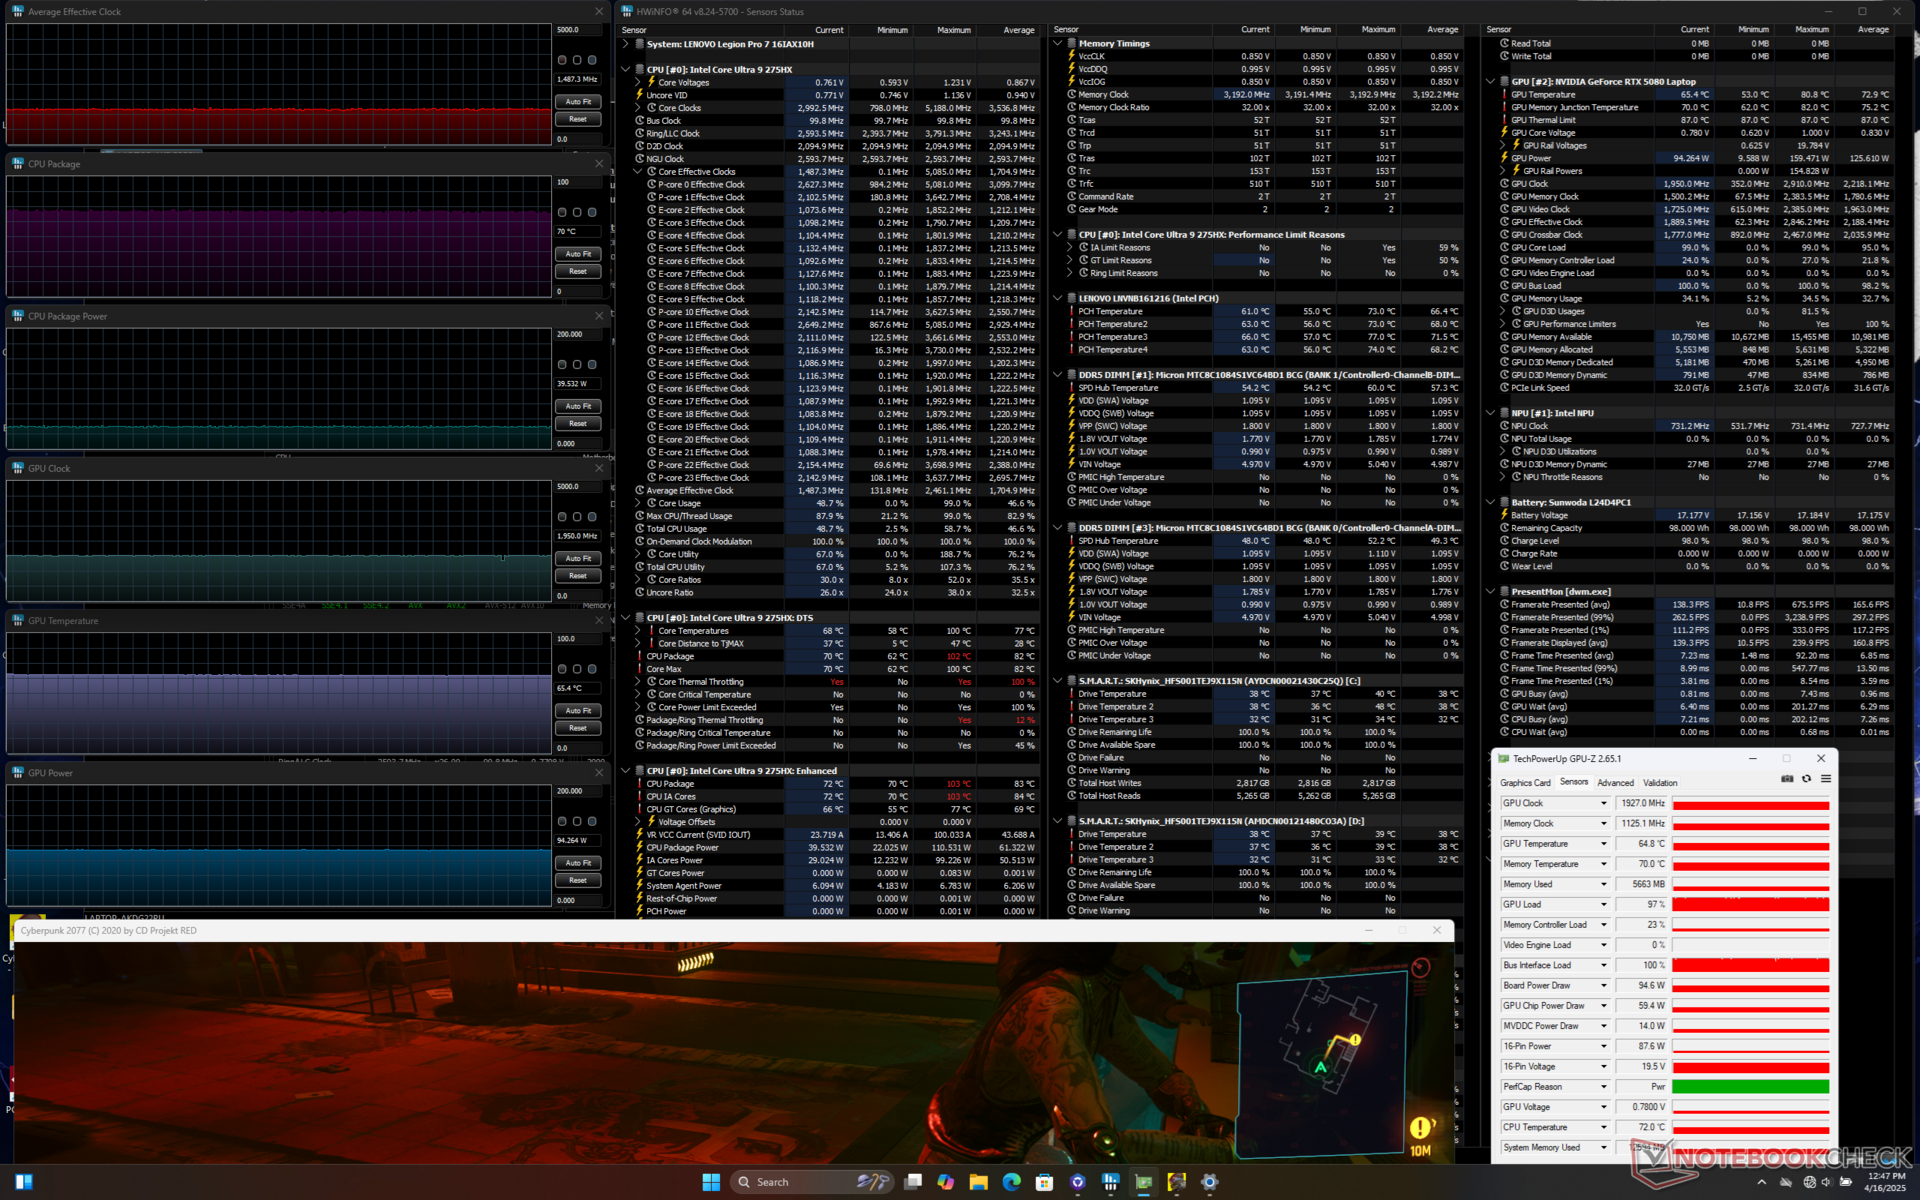
Cuando se ejecuta Cyberpunk 2077 en modo Rendimiento para representar el estrés típico de los juegos, la GPU Nvidia se estabilizaría en 80 C y 155 W mientras que la CPU se estabilizaría en 90 C y 76 W. Bajar al modo Equilibrado disminuye la GPU a sólo 65 C y 95 W y la CPU a sólo 70 C y 40 W con relojes de procesador y memoria más lentos en todos los ámbitos como se muestra en nuestras capturas de pantalla a continuación. El ahorro de energía es, por tanto, bastante significativo entre los perfiles de energía Equilibrado y Rendimiento.
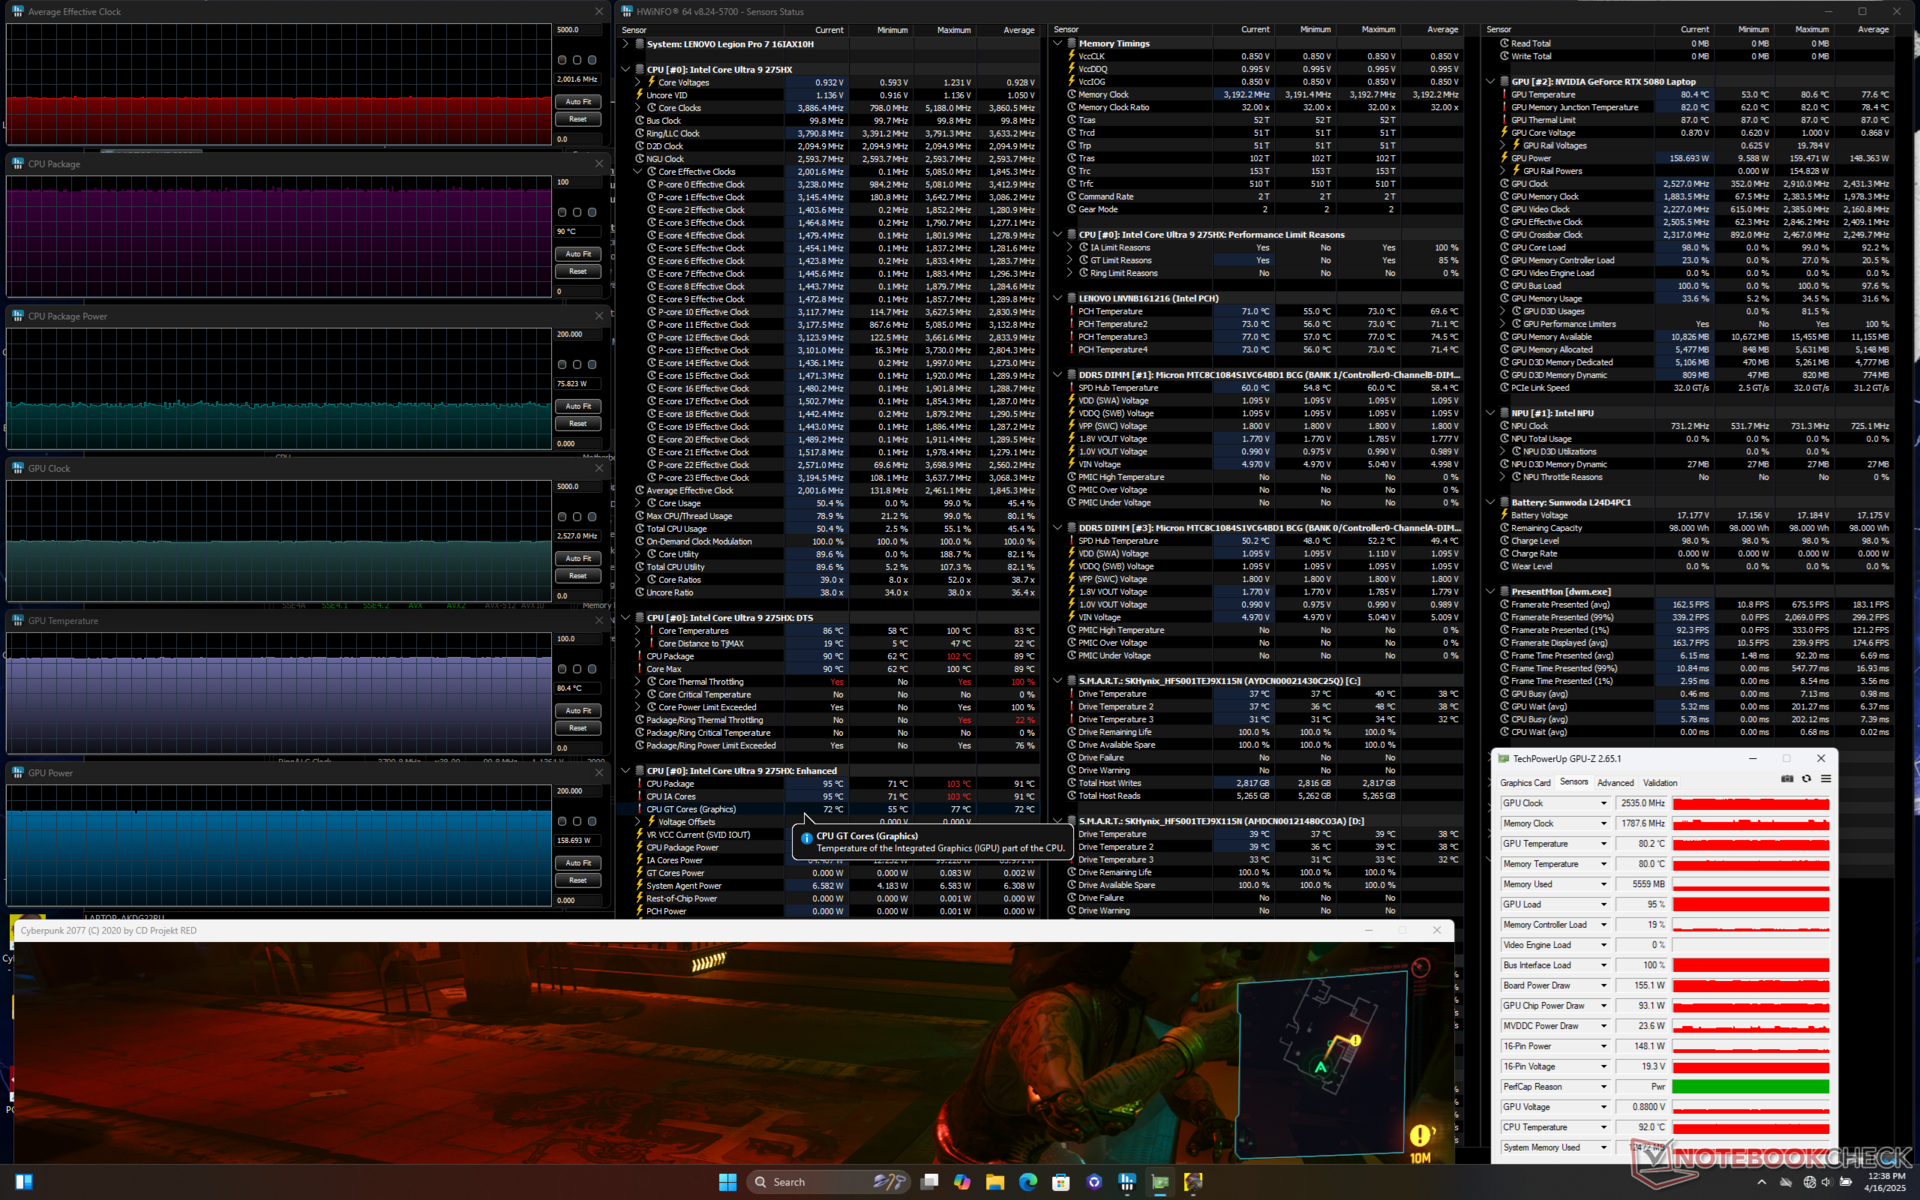
| Reloj medio de la CPU (GHz) | Reloj medio de la GPU (MHz) | Temperatura media dela CPU (°C) | Temperatura media de la GPU (°C) | |
| Sistema en reposo | -- | -- | 55 | 43 |
| Prime95 Stress | 3.9 | -- | 95 | 49 |
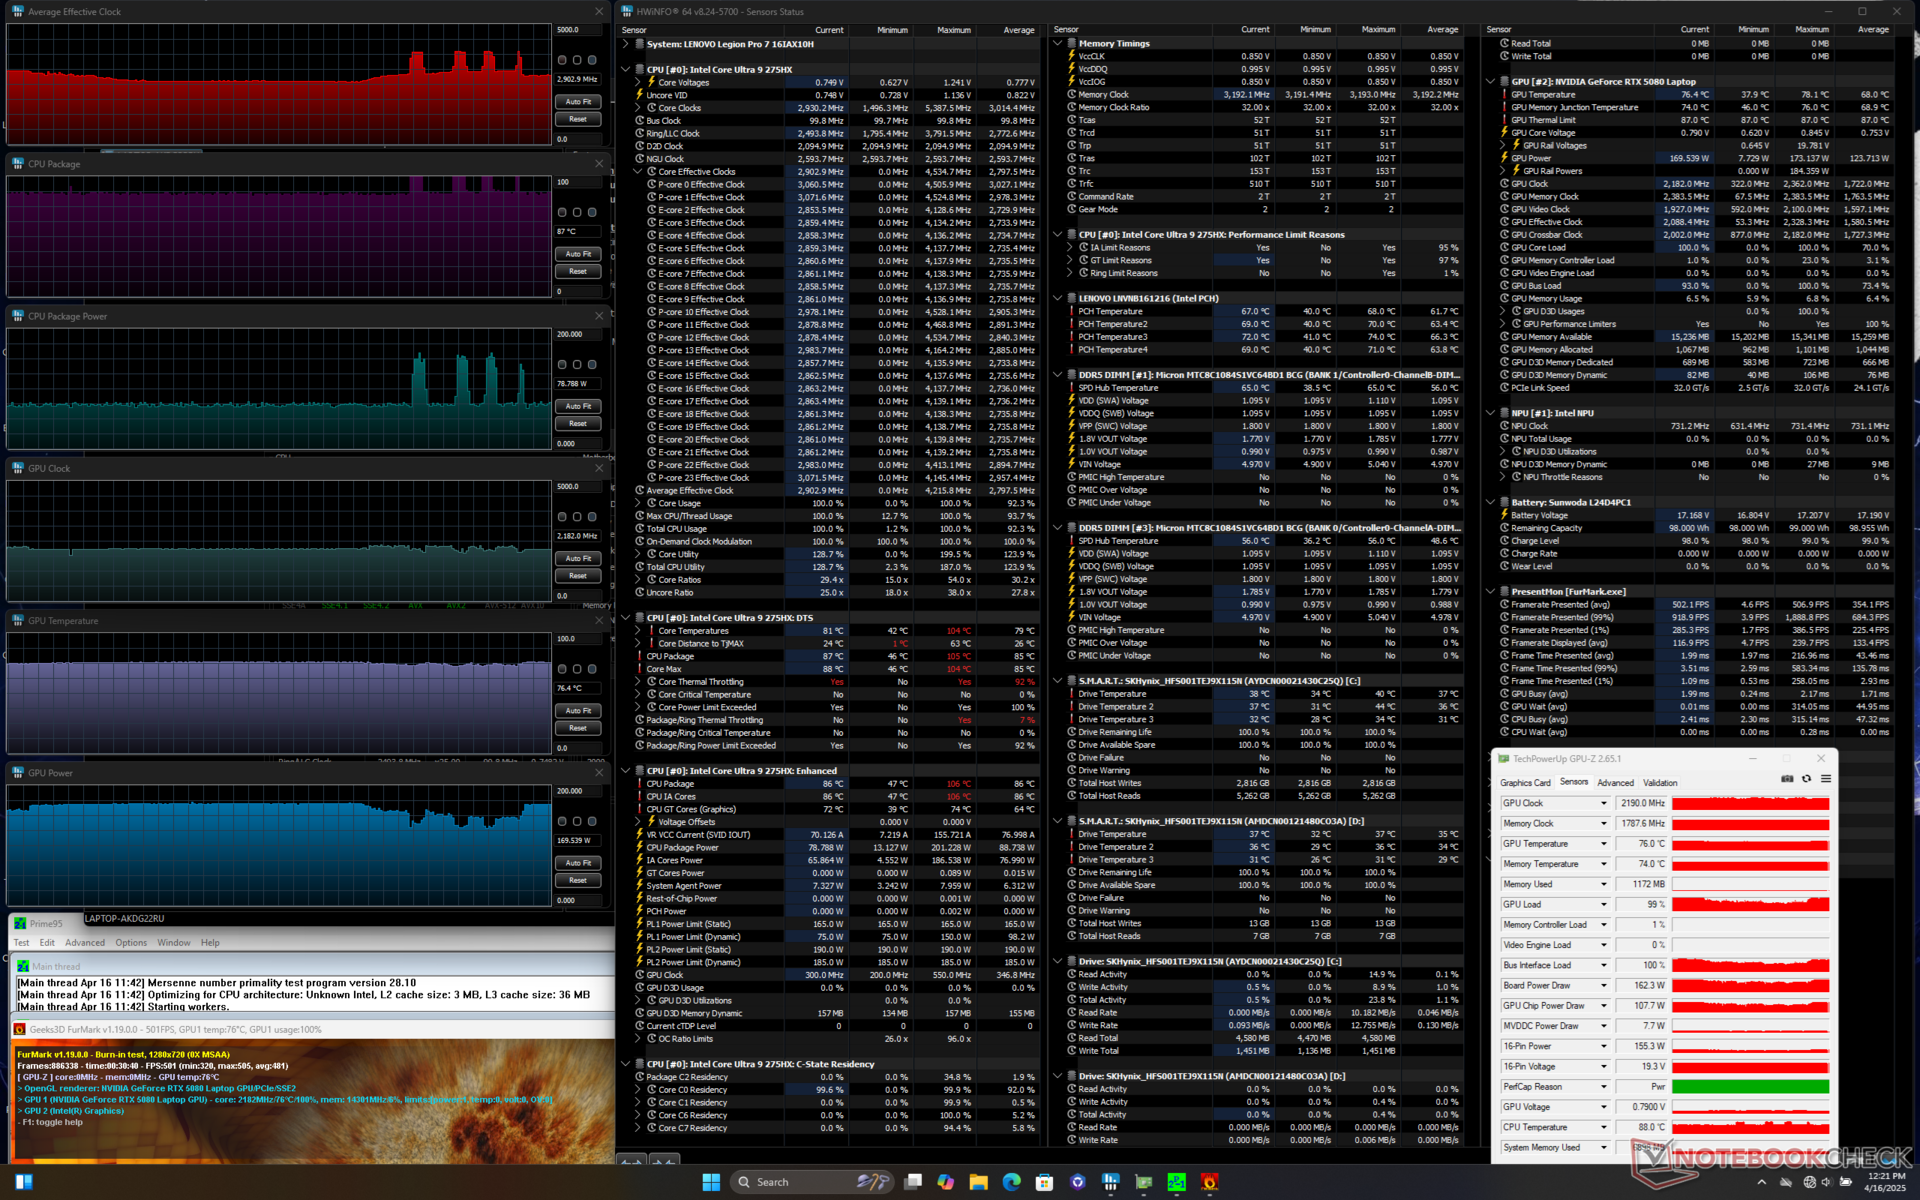
| Prime95 + FurMark Stress | 2.9 | 2190 | 87 | 76 |
| Cyberpunk 2077 Estrés (modo Rendimiento) | 2.0 | 2535 | 90 | 80 |
| Cyberpunk 2077 Estrés (modo Equilibrado) | 1,5 | 1927 | 70 | 65 |
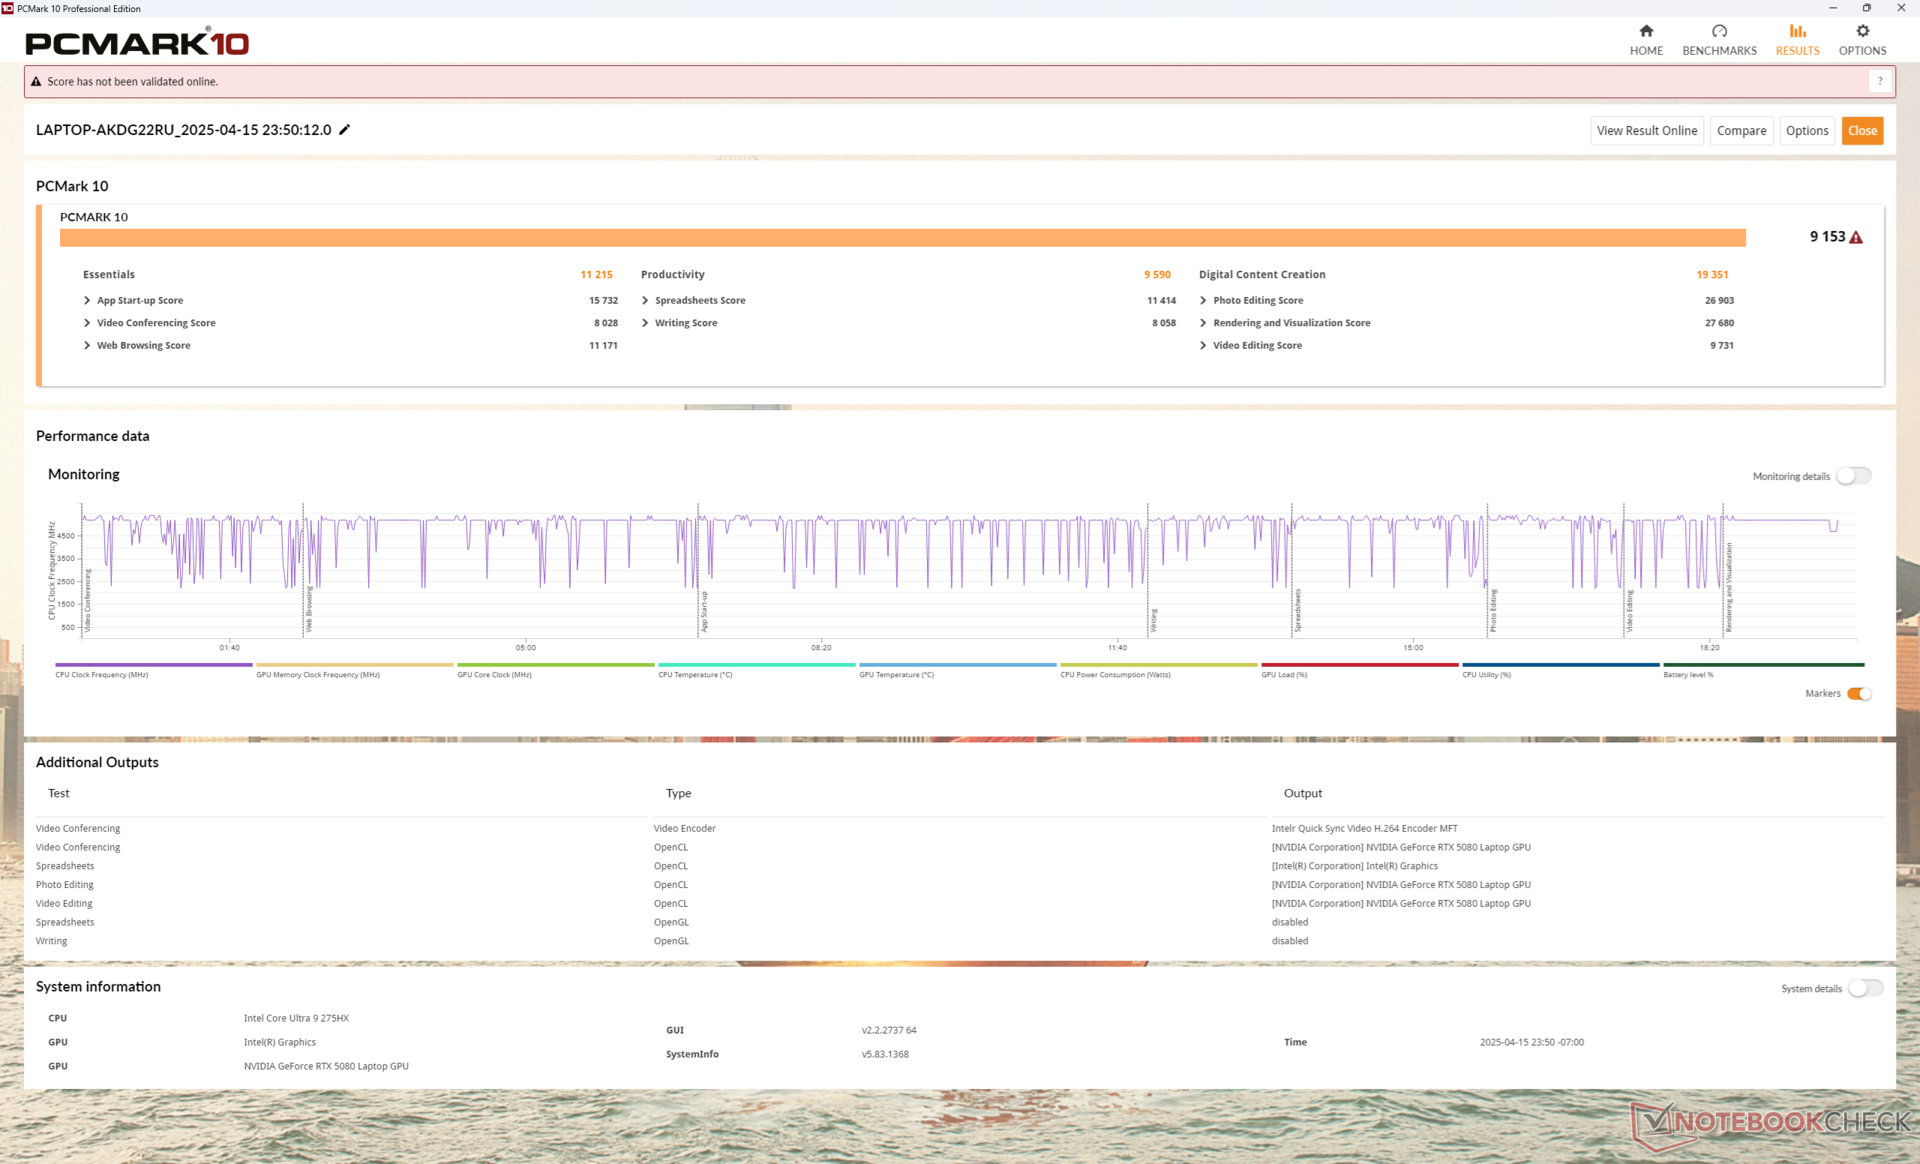
Rendimiento del sistema
La puntuación media en PCMark es superior a la de la mayoría de portátiles RTX 5090 de 16 pulgadas que hemos probado hasta ahora, incluidos el Razer Blade 16 y el Asus ROG Zephyrus G16. Sólo el Schenker Neo 16 A25 es capaz de superar a nuestro sistema Lenovo debido en parte a su CPU Ryzen 9 9955HX y su SSD PCIe5 Samsung 9100 Pro.
CrossMark: Overall | Productivity | Creativity | Responsiveness
WebXPRT 3: Overall
WebXPRT 4: Overall
Mozilla Kraken 1.1: Total
| PCMark 10 / Score | |
| Lenovo Legion Pro 7i 16 Gen 10 | |
| Medio Intel Core Ultra 9 275HX, Nvidia GeForce RTX 5080 Laptop (8856 - 9153, n=2) | |
| Asus ROG Zephyrus G16 GU605CX | |
| MSI Vector 16 HX A14V | |
| Razer Blade 16 2025 RTX 5090 | |
| Lenovo Legion 9 16IRX9, RTX 4090 | |
| Alienware x16 R2 P120F | |
| PCMark 10 / Essentials | |
| MSI Vector 16 HX A14V | |
| Lenovo Legion Pro 7i 16 Gen 10 | |
| Medio Intel Core Ultra 9 275HX, Nvidia GeForce RTX 5080 Laptop (11177 - 11215, n=2) | |
| Lenovo Legion 9 16IRX9, RTX 4090 | |
| Asus ROG Zephyrus G16 GU605CX | |
| Razer Blade 16 2025 RTX 5090 | |
| Alienware x16 R2 P120F | |
| PCMark 10 / Productivity | |
| Asus ROG Zephyrus G16 GU605CX | |
| Razer Blade 16 2025 RTX 5090 | |
| Lenovo Legion 9 16IRX9, RTX 4090 | |
| MSI Vector 16 HX A14V | |
| Lenovo Legion Pro 7i 16 Gen 10 | |
| Medio Intel Core Ultra 9 275HX, Nvidia GeForce RTX 5080 Laptop (9212 - 9590, n=2) | |
| Alienware x16 R2 P120F | |
| PCMark 10 / Digital Content Creation | |
| Lenovo Legion Pro 7i 16 Gen 10 | |
| Medio Intel Core Ultra 9 275HX, Nvidia GeForce RTX 5080 Laptop (18305 - 19351, n=2) | |
| MSI Vector 16 HX A14V | |
| Asus ROG Zephyrus G16 GU605CX | |
| Razer Blade 16 2025 RTX 5090 | |
| Lenovo Legion 9 16IRX9, RTX 4090 | |
| Alienware x16 R2 P120F | |
| CrossMark / Overall | |
| MSI Vector 16 HX A14V | |
| Medio Intel Core Ultra 9 275HX, Nvidia GeForce RTX 5080 Laptop (2017 - 2165, n=2) | |
| Asus ROG Zephyrus G16 GU605CX | |
| Lenovo Legion Pro 7i 16 Gen 10 | |
| Lenovo Legion 9 16IRX9, RTX 4090 | |
| Alienware x16 R2 P120F | |
| CrossMark / Productivity | |
| MSI Vector 16 HX A14V | |
| Medio Intel Core Ultra 9 275HX, Nvidia GeForce RTX 5080 Laptop (1922 - 2014, n=2) | |
| Lenovo Legion Pro 7i 16 Gen 10 | |
| Asus ROG Zephyrus G16 GU605CX | |
| Lenovo Legion 9 16IRX9, RTX 4090 | |
| Alienware x16 R2 P120F | |
| CrossMark / Creativity | |
| MSI Vector 16 HX A14V | |
| Asus ROG Zephyrus G16 GU605CX | |
| Medio Intel Core Ultra 9 275HX, Nvidia GeForce RTX 5080 Laptop (2288 - 2451, n=2) | |
| Lenovo Legion Pro 7i 16 Gen 10 | |
| Lenovo Legion 9 16IRX9, RTX 4090 | |
| Alienware x16 R2 P120F | |
| CrossMark / Responsiveness | |
| MSI Vector 16 HX A14V | |
| Lenovo Legion 9 16IRX9, RTX 4090 | |
| Medio Intel Core Ultra 9 275HX, Nvidia GeForce RTX 5080 Laptop (1597 - 1853, n=2) | |
| Alienware x16 R2 P120F | |
| Asus ROG Zephyrus G16 GU605CX | |
| Lenovo Legion Pro 7i 16 Gen 10 | |
| WebXPRT 3 / Overall | |
| Lenovo Legion Pro 7i 16 Gen 10 | |
| Medio Intel Core Ultra 9 275HX, Nvidia GeForce RTX 5080 Laptop (347 - 359, n=2) | |
| Asus ROG Zephyrus G16 GU605CX | |
| MSI Vector 16 HX A14V | |
| Razer Blade 16 2025 RTX 5090 | |
| Lenovo Legion 9 16IRX9, RTX 4090 | |
| Alienware x16 R2 P120F | |
| WebXPRT 4 / Overall | |
| Medio Intel Core Ultra 9 275HX, Nvidia GeForce RTX 5080 Laptop (333 - 336, n=2) | |
| Lenovo Legion Pro 7i 16 Gen 10 | |
| Asus ROG Zephyrus G16 GU605CX | |
| MSI Vector 16 HX A14V | |
| Razer Blade 16 2025 RTX 5090 | |
| Lenovo Legion 9 16IRX9, RTX 4090 | |
| Alienware x16 R2 P120F | |
| Mozilla Kraken 1.1 / Total | |
| Alienware x16 R2 P120F | |
| Lenovo Legion 9 16IRX9, RTX 4090 | |
| Asus ROG Zephyrus G16 GU605CX | |
| MSI Vector 16 HX A14V | |
| Razer Blade 16 2025 RTX 5090 | |
| Lenovo Legion Pro 7i 16 Gen 10 | |
| Medio Intel Core Ultra 9 275HX, Nvidia GeForce RTX 5080 Laptop (405 - 408, n=2) | |
* ... más pequeño es mejor
| PCMark 10 Score | 9153 puntos | |
ayuda | ||
| AIDA64 / Memory Copy | |
| Asus ROG Zephyrus G16 GU605CX | |
| Razer Blade 16 2025 RTX 5090 | |
| Alienware x16 R2 P120F | |
| Lenovo Legion Pro 7i 16 Gen 10 | |
| Lenovo Legion 9 16IRX9, RTX 4090 | |
| Medio Intel Core Ultra 9 275HX (74558 - 86549, n=6) | |
| MSI Vector 16 HX A14V | |
| AIDA64 / Memory Read | |
| Razer Blade 16 2025 RTX 5090 | |
| Lenovo Legion Pro 7i 16 Gen 10 | |
| MSI Vector 16 HX A14V | |
| Alienware x16 R2 P120F | |
| Medio Intel Core Ultra 9 275HX (74094 - 95542, n=6) | |
| Lenovo Legion 9 16IRX9, RTX 4090 | |
| Asus ROG Zephyrus G16 GU605CX | |
| AIDA64 / Memory Write | |
| Razer Blade 16 2025 RTX 5090 | |
| Lenovo Legion Pro 7i 16 Gen 10 | |
| Lenovo Legion 9 16IRX9, RTX 4090 | |
| Medio Intel Core Ultra 9 275HX (72929 - 84581, n=6) | |
| MSI Vector 16 HX A14V | |
| Asus ROG Zephyrus G16 GU605CX | |
| Alienware x16 R2 P120F | |
| AIDA64 / Memory Latency | |
| Alienware x16 R2 P120F | |
| Asus ROG Zephyrus G16 GU605CX | |
| Medio Intel Core Ultra 9 275HX (108.9 - 125.1, n=6) | |
| Lenovo Legion Pro 7i 16 Gen 10 | |
| Razer Blade 16 2025 RTX 5090 | |
| Lenovo Legion 9 16IRX9, RTX 4090 | |
| MSI Vector 16 HX A14V | |
* ... más pequeño es mejor
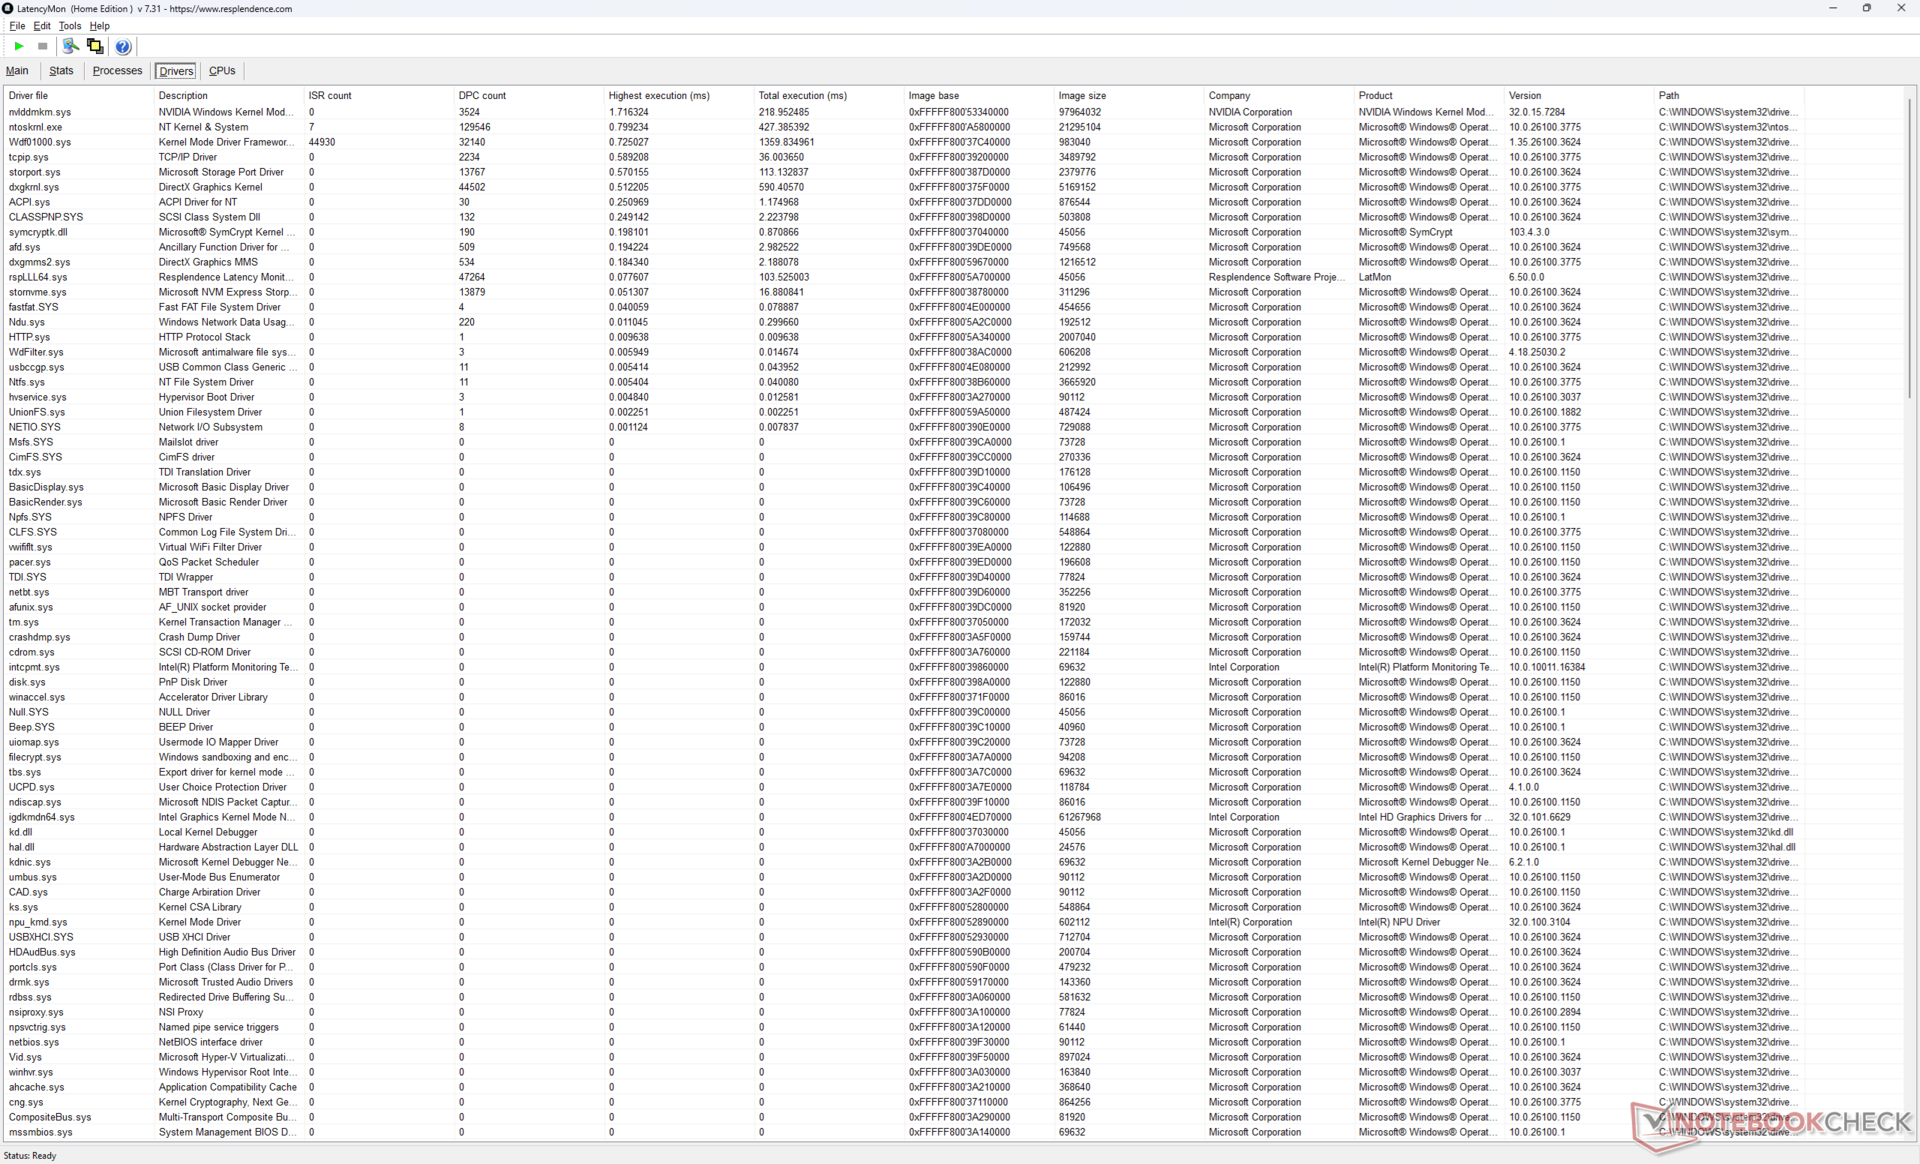
Latencia del CPD
LatencyMon sólo muestra problemas menores de DPC al abrir varias pestañas del navegador de nuestra página de inicio y un único fotograma caído grabado durante nuestra prueba de reproducción de vídeo 4K60.

| DPC Latencies / LatencyMon - interrupt to process latency (max), Web, Youtube, Prime95 | |
| Alienware x16 R2 P120F | |
| Asus ROG Zephyrus G16 GU605CX | |
| Lenovo Legion 9 16IRX9, RTX 4090 | |
| MSI Vector 16 HX A14V | |
| Razer Blade 16 2025 RTX 5090 | |
| Lenovo Legion Pro 7i 16 Gen 10 | |
* ... más pequeño es mejor
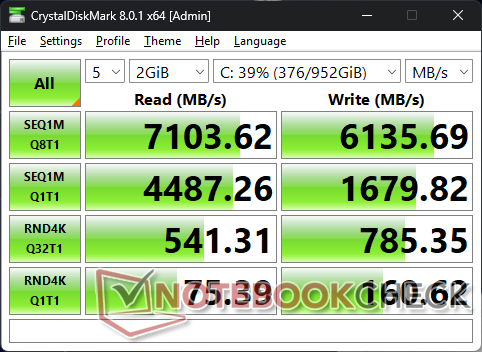
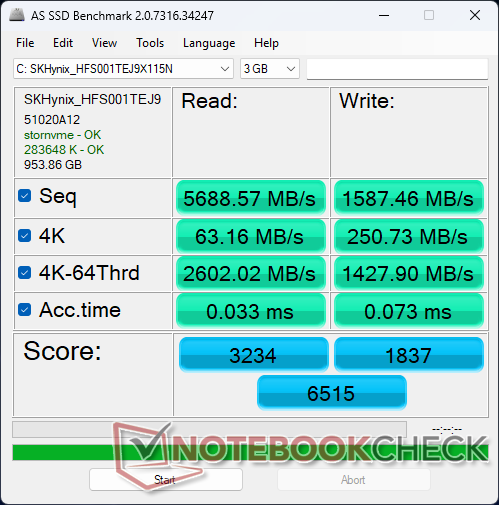
Dispositivos de almacenamiento
El modelo admite hasta dos unidades SSD M.2 2280 con una ranura compatible con unidades PCIe5. Nuestra unidad de prueba, sin embargo, se enviaría únicamente con unidades PCIe4, por lo que no podemos probar la eficacia de una unidad PCIe5. Nuestra unidad PCIe4 SK Hynix funcionaría, no obstante, de forma más estable y a mayor velocidad que la Micron 3400 en el Legion 9 16IRX9 del año pasado.

| Drive Performance Rating - Percent | |
| Alienware x16 R2 P120F | |
| Razer Blade 16 2025 RTX 5090 | |
| Lenovo Legion Pro 7i 16 Gen 10 | |
| Lenovo Legion 9 16IRX9, RTX 4090 | |
| Asus ROG Zephyrus G16 GU605CX | |
| MSI Vector 16 HX A14V | |
* ... más pequeño es mejor
Disk Throttling: DiskSpd Read Loop, Queue Depth 8
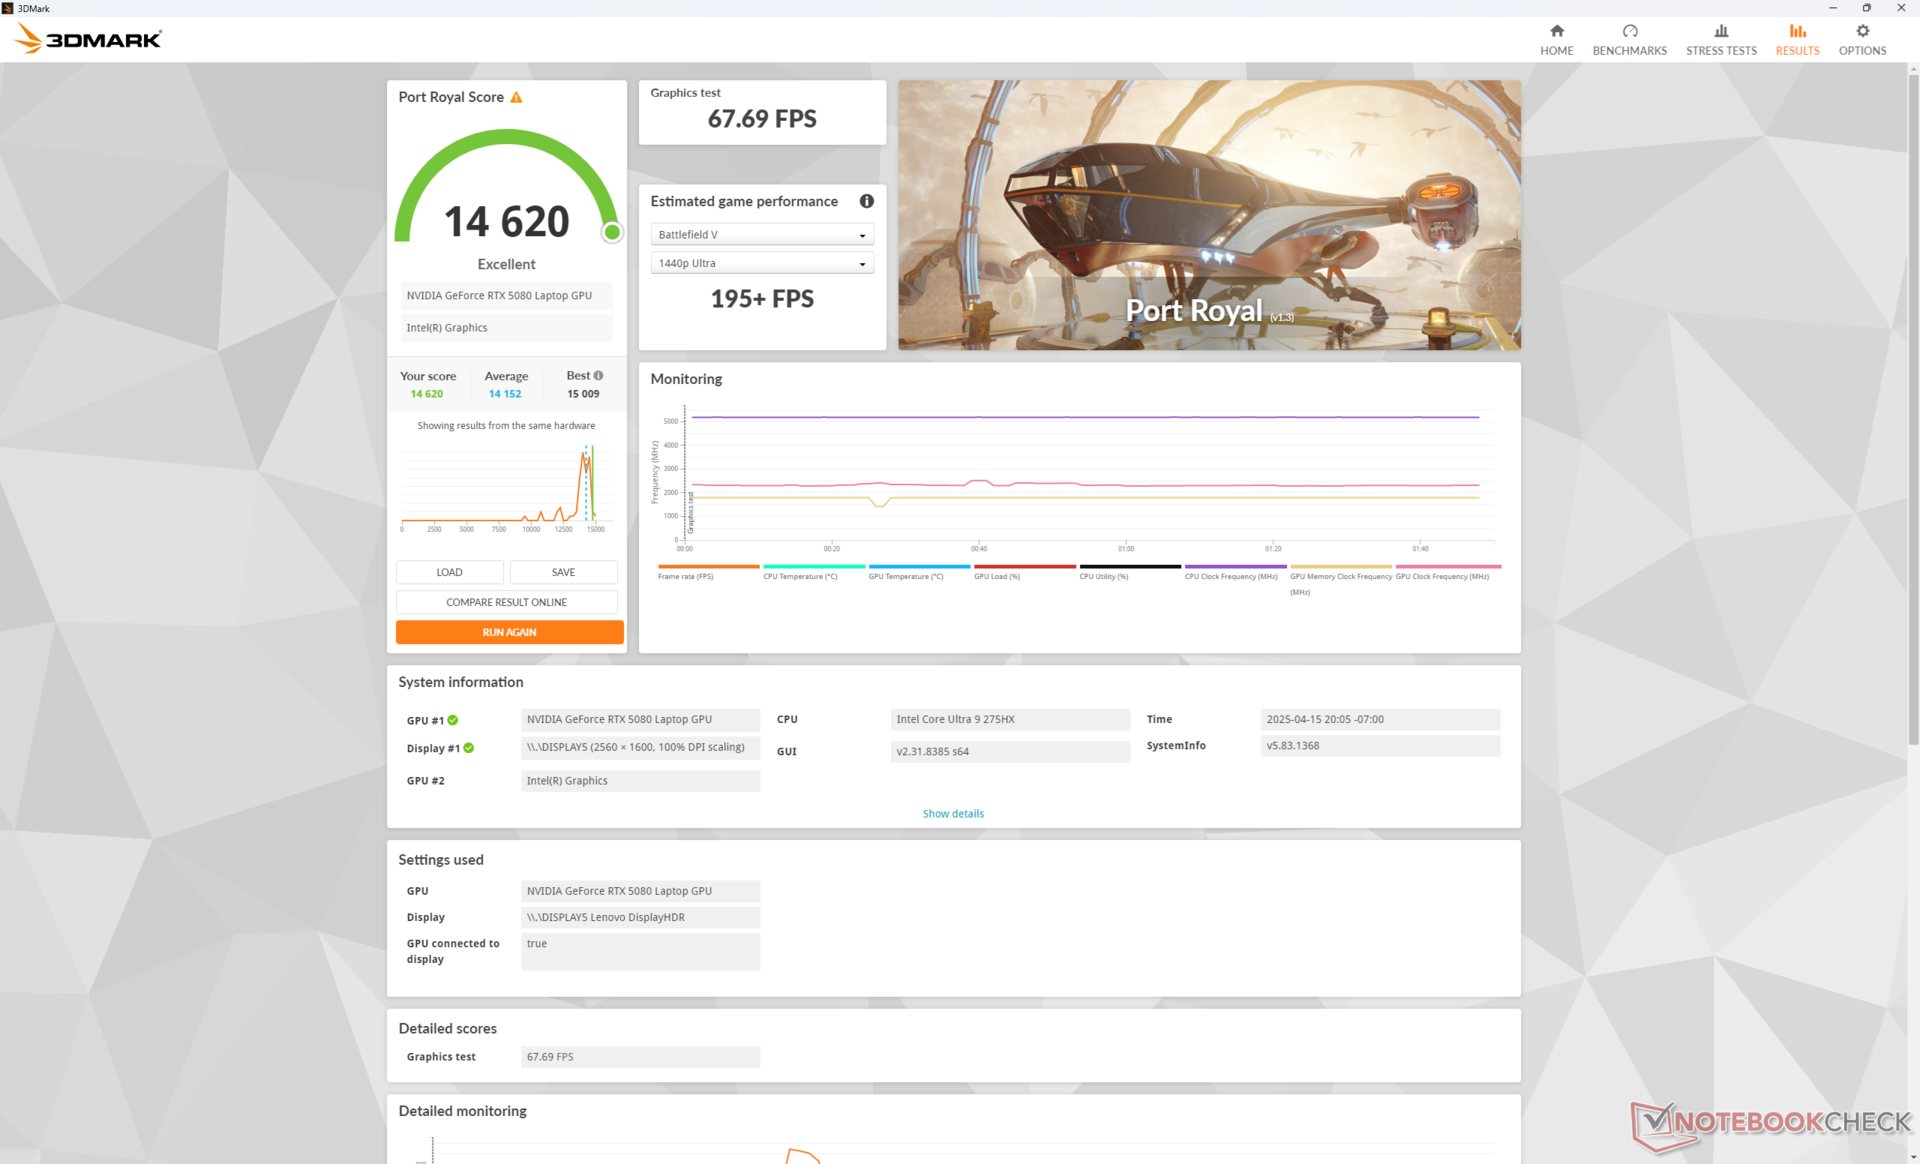
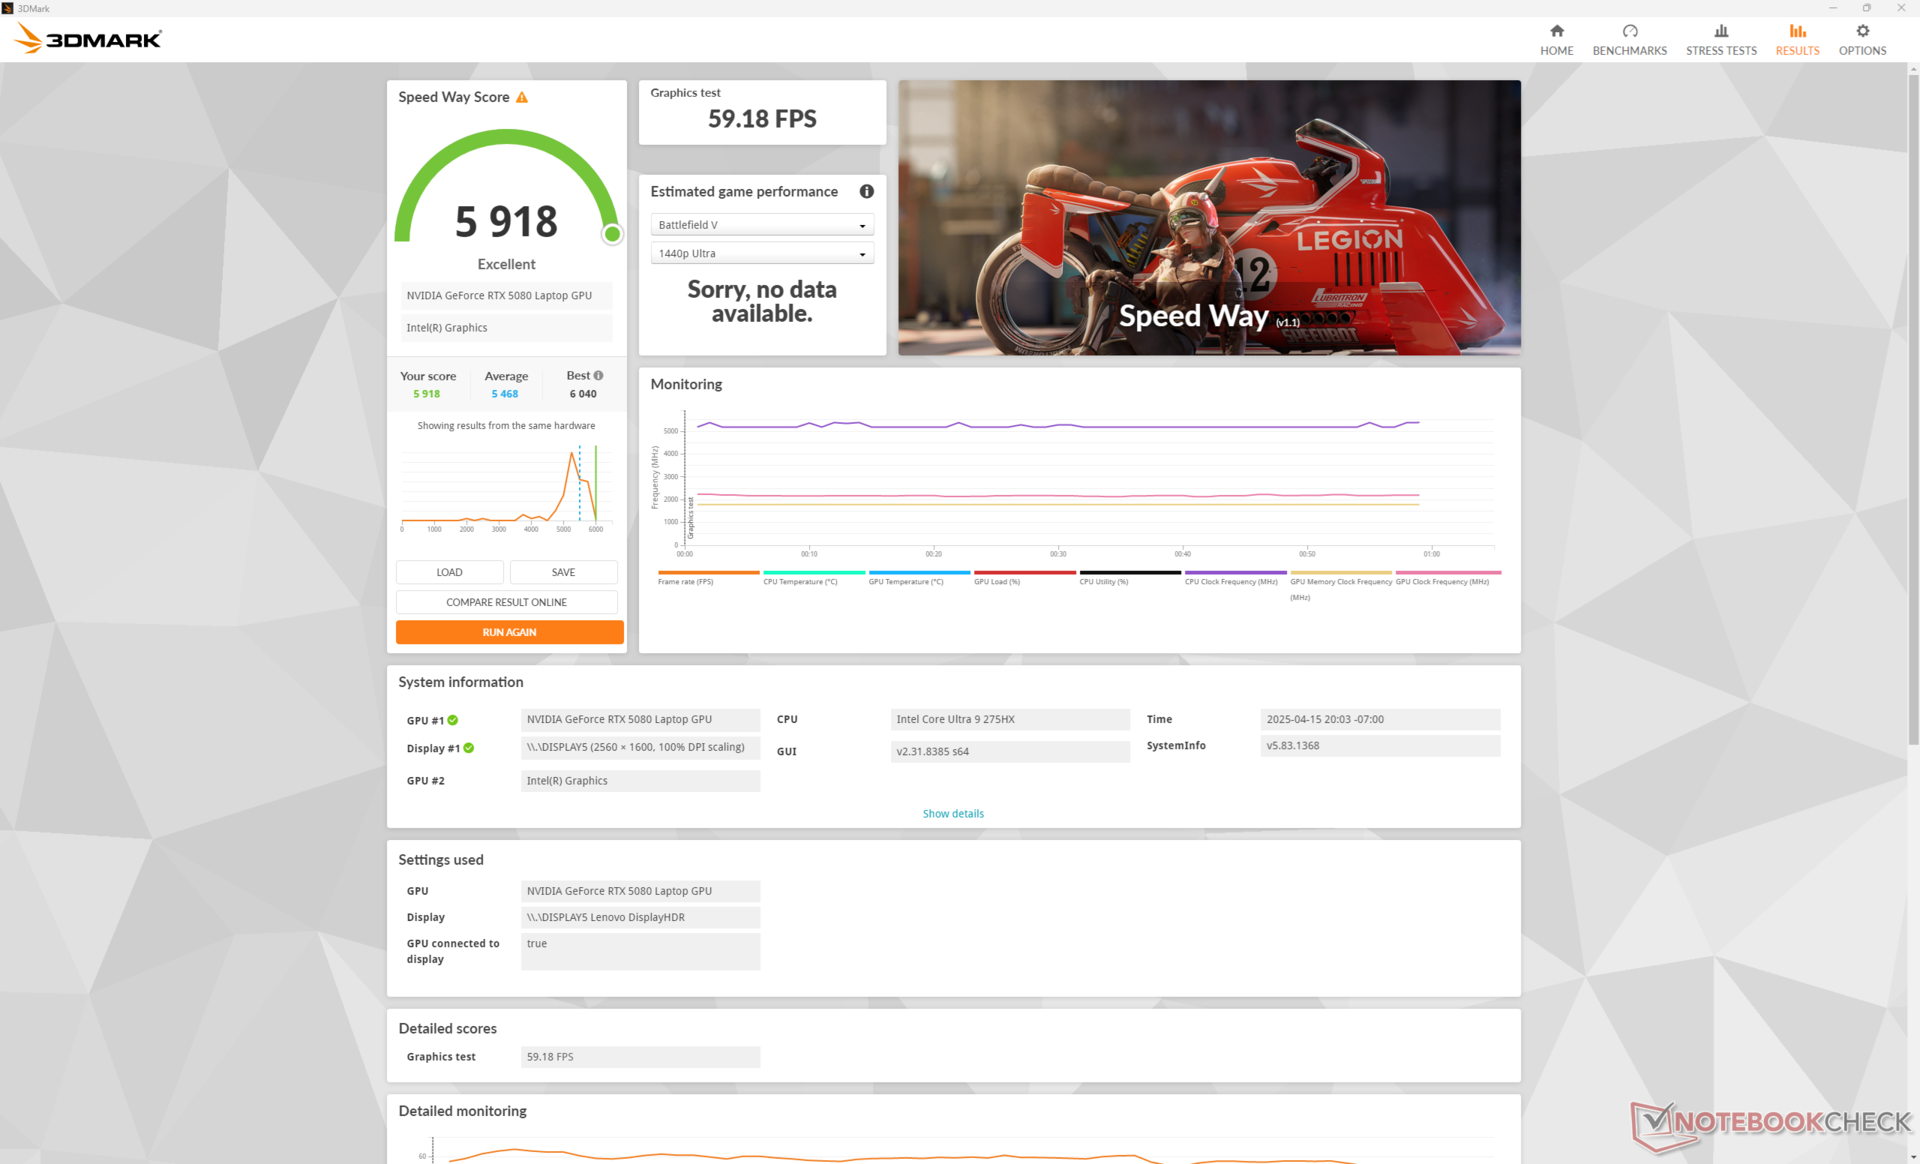
Rendimiento de la GPU
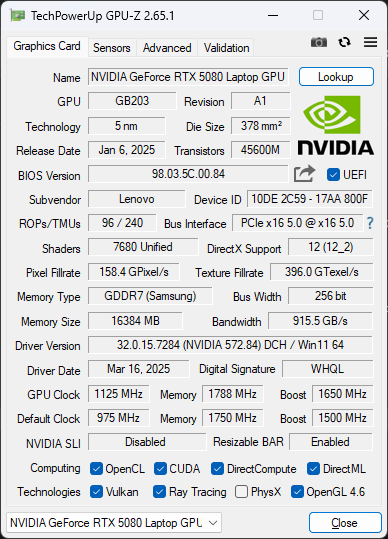
Nuestra reseña completa sobre la móvil GeForce RTX 5080 se puede encontrar aquí para obtener más información sobre la GPU y su rendimiento previsto. Sólo es entre un 10 y un 20 por ciento más rápida que la rTX 4080 móvil de la MSI Vector 16 HX cuando se trata de rasterización, lo que significa que sus principales ventajas residen en cambio en sus núcleos Tensor más eficientes, la compatibilidad con la generación de múltiples fotogramas y la codificación/decodificación 4:2:2.
| Perfil de potencia | Puntuación gráfica | Puntuación física | Puntuación combinada |
| Modo Rendimiento | 49153 | 47850 | 13127 |
| Modo equilibrado | 42534 (-13%) | 47090 (-2%) | 13080 (-0%) |
| Batería | 28253 (-43%) | 26031 (-46%) | 7548 (-43%) |
Jugar en modo Equilibrado en lugar de en modo Rendimiento reduciría el rendimiento gráfico en un 13% aproximadamente.
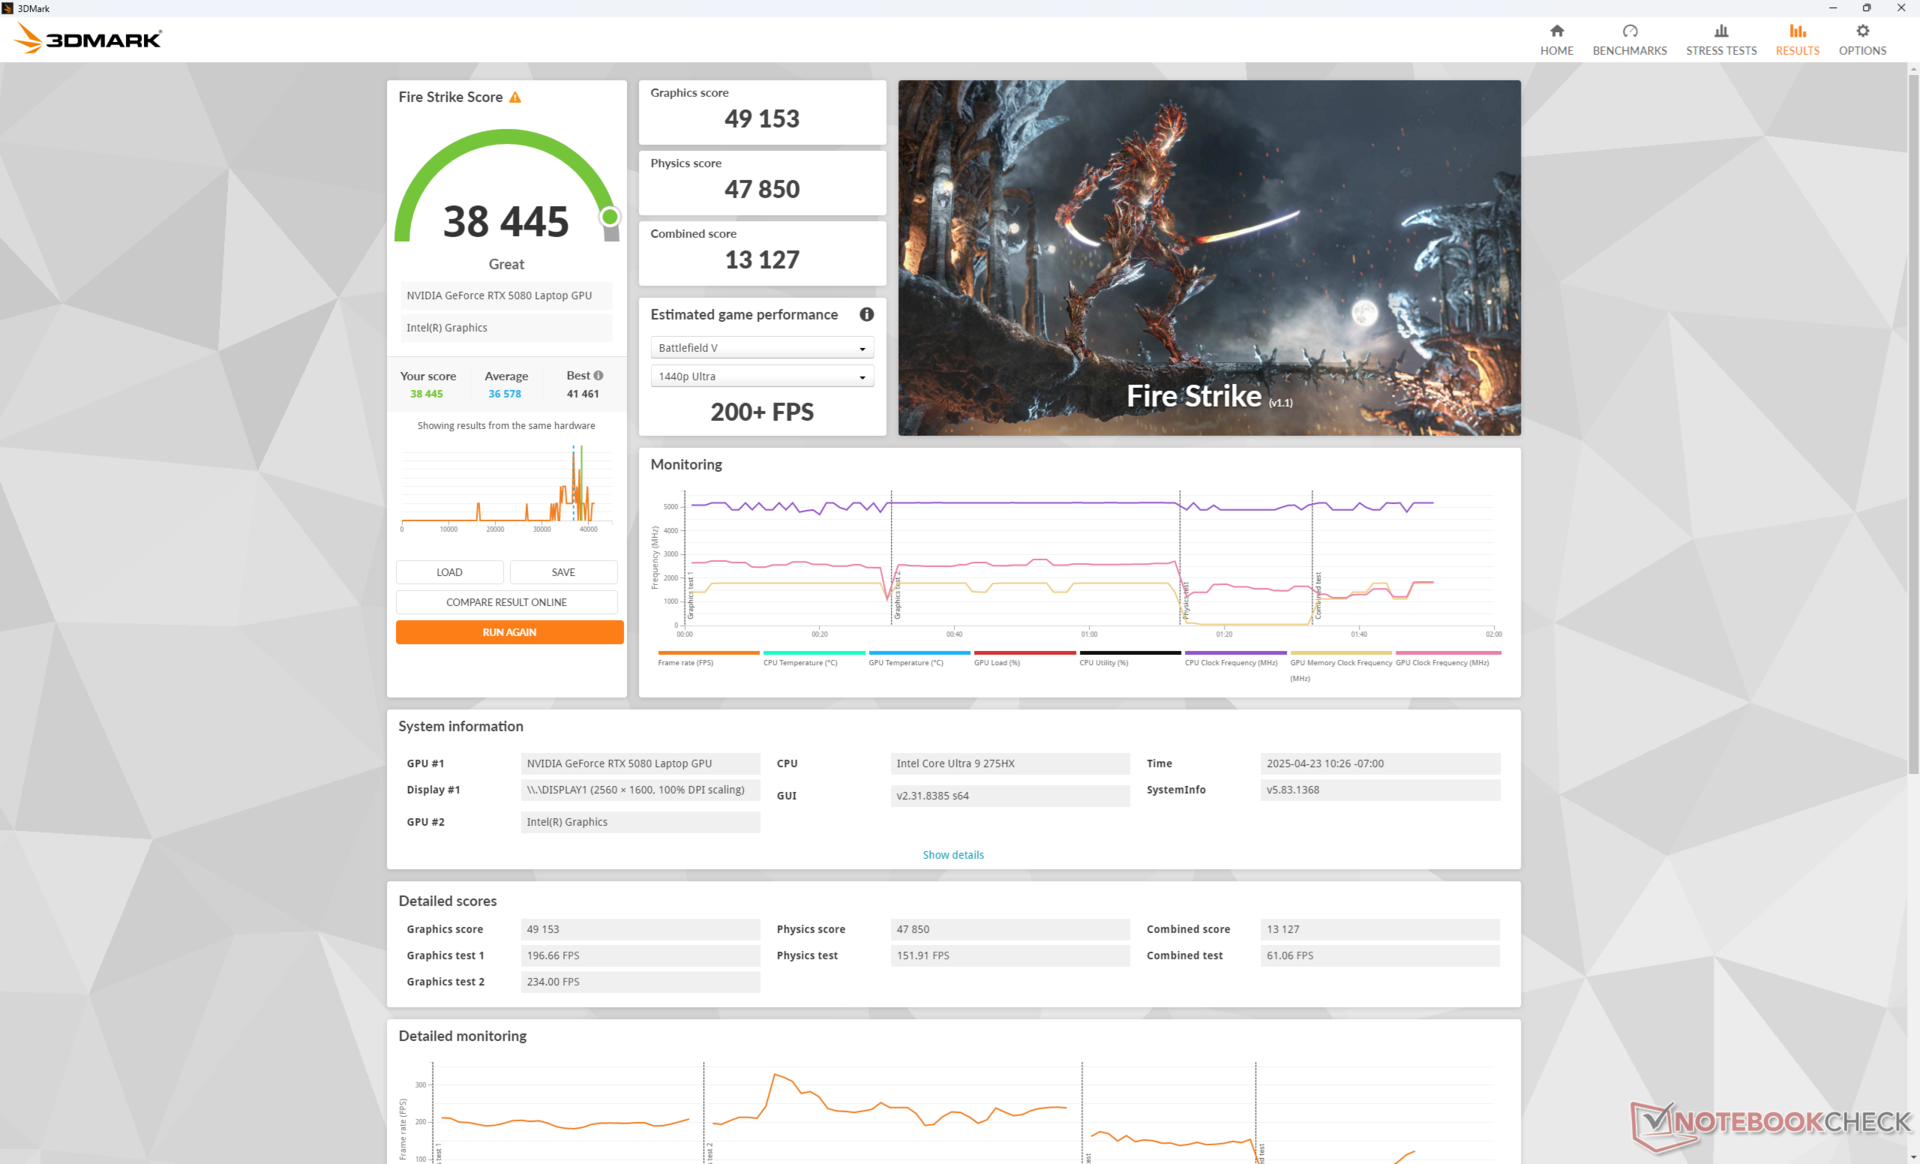
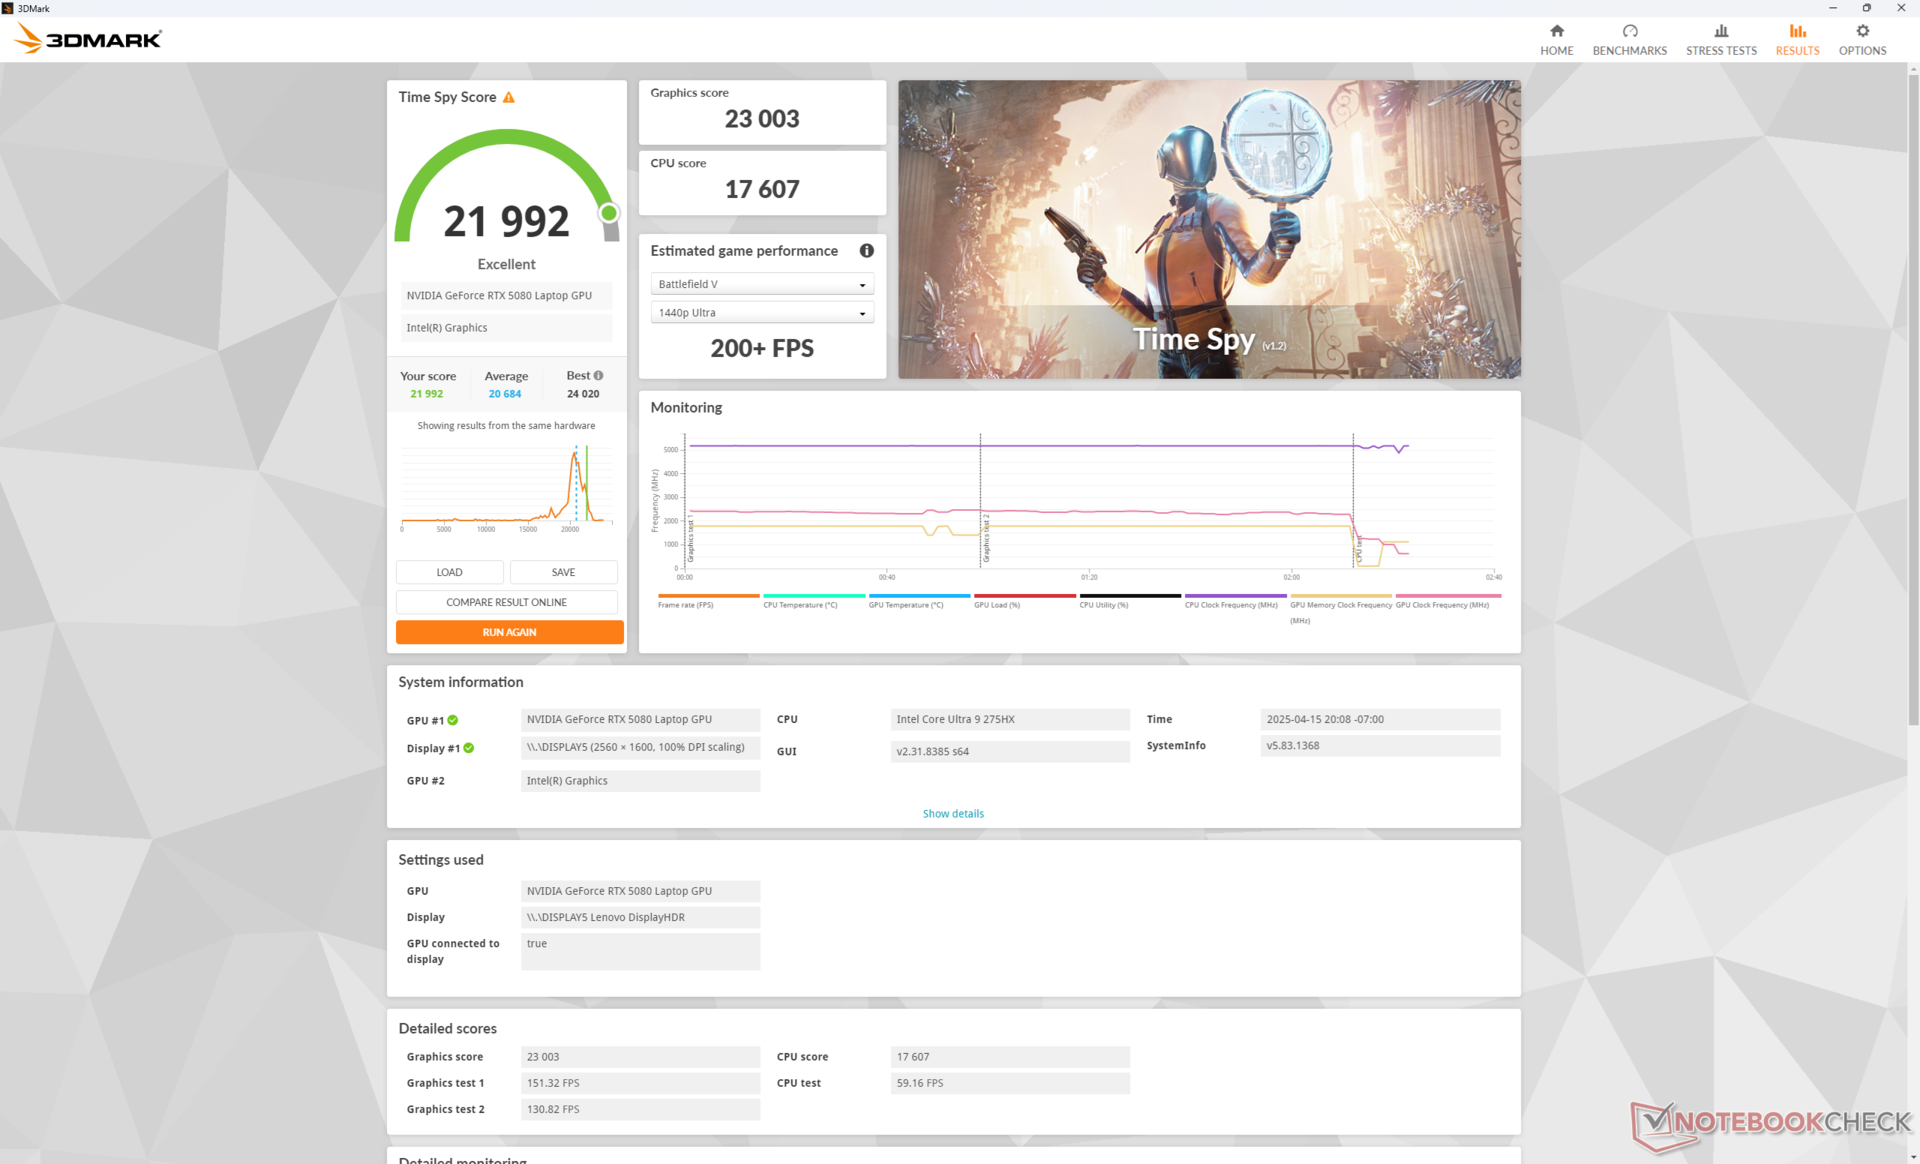
| 3DMark 11 Performance | 51894 puntos | |
| 3DMark Fire Strike Score | 38445 puntos | |
| 3DMark Time Spy Score | 21992 puntos | |
ayuda | ||
* ... más pequeño es mejor
Rendimiento en juegos
La RTX 5080 móvil no es ni de lejos tan potente como la RTX 5080 de sobremesa, que puede manejar juegos 4K con los ajustes máximos con facilidad. Nuestra versión móvil puede tener problemas para jugar en monitores 4K externos incluso con DLSS activo; Black Myth Wukong, por ejemplo, solo alcanza una media de 45 FPS con los ajustes 4K máximos en el modo de calidad DLSS. Para la pantalla OLED 2K nativa, sin embargo, la RTX 5080 móvil encaja a la perfección.
| Cyberpunk 2077 Phantom Liberty Ajustes (Preajuste rápido máximo a 1600p nativos) | Calidad DLSS | Rendimiento DLSS | Calidad DLSS c/ 2x Frame Generation | Calidad DLSS con generación de fotogramas 4x | DLAA |
| FPS medios | 47.4 | 69.1 | 83.4 | 151 | 23 |
Cyberpunk 2077 ultra FPS Chart
| bajo | medio | alto | ultra | QHD DLSS | QHD | 4K DLSS | 4K FSR | 4K | |
|---|---|---|---|---|---|---|---|---|---|
| Dota 2 Reborn (2015) | 240 | 216 | 203 | 188.9 | 182.1 | ||||
| Final Fantasy XV Benchmark (2018) | 210 | 173.1 | 101.3 | ||||||
| X-Plane 11.11 (2018) | 156.6 | 153.7 | 124.5 | 100.7 | |||||
| Strange Brigade (2018) | 481 | 434 | 304 | 169.7 | |||||
| Baldur's Gate 3 (2023) | 276.1 | 250.5 | 220.1 | 211.5 | 155.8 | 132.4 | 81.1 | ||
| Cyberpunk 2077 2.2 Phantom Liberty (2023) | 198.4 | 192 | 172.5 | 156.2 | 119 | 99.8 | 73.4 | 43 | 47.1 |
| Alan Wake 2 (2023) | 135.6 | 131.9 | 124.2 | 83.8 | 43.1 | ||||
| Black Myth: Wukong (2024) | 171 | 128 | 99 | 58 | 62 | 44 | 45 | 26 | |
| Indiana Jones and the Great Circle (2024) | 187.9 | 145.9 | 129.2 | 120.1 | 102.4 | 63.2 | |||
| Monster Hunter Wilds (2025) | 110.1 | 104.4 | 90 | 87.7 | 73.2 | 61.8 | 45.2 | ||
| Assassin's Creed Shadows (2025) | 111 | 104 | 90 | 64 | 65 | 55 | 55 | 40 |
Emisiones - Alto sólo cuando es necesario
Ruido del sistema
El ruido del ventilador alcanza casi el mismo máximo que en el Legion 9 16IRX9 cuando se juega en modo Rendimiento. Por tanto, no es más silencioso que la mayoría de portátiles para juegos a pesar de su tamaño relativamente grande. Por otro lado, los ventiladores se apagan rápidamente y se mantienen a bajas RPM cuando se ejecutan cargas poco exigentes para evitar cualquier comportamiento pulsante incluso en modo Rendimiento. En otras palabras, los ventiladores sólo son ruidosos cuando es necesario.
Tenga en cuenta que jugar en modo Equilibrado reduce significativamente el ruido de los ventiladores de 54 dB(A) a sólo 40 dB(A) por sólo un recorte del 15 por ciento en el rendimiento gráfico como se mencionó anteriormente.
Ruido
| Ocioso |
| 22.9 / 22.9 / 26.3 dB(A) |
| Carga |
| 27.8 / 53.9 dB(A) |
 | ||
30 dB silencioso 40 dB(A) audible 50 dB(A) ruidosamente alto |
||
min: | ||
| Lenovo Legion Pro 7i 16 Gen 10 GeForce RTX 5080 Laptop, Ultra 9 275HX, SK Hynix HFS001TEJ9X115N | Lenovo Legion 9 16IRX9, RTX 4090 NVIDIA GeForce RTX 4090 Laptop GPU, i9-14900HX, Micron 3400 2TB MTFDKBA2T0TFH | Asus ROG Zephyrus G16 GU605CX GeForce RTX 5090 Laptop, Ultra 9 285H, Western Digital PC SN5000S SDEPNSJ-2T00-1006 | Razer Blade 16 2025 RTX 5090 GeForce RTX 5090 Laptop, Ryzen AI 9 HX 370, SSSTC CA6-8D2048 | MSI Vector 16 HX A14V NVIDIA GeForce RTX 4080 Laptop GPU, i9-14900HX, WD PC SN560 SDDPNQE-1T00 | Alienware x16 R2 P120F NVIDIA GeForce RTX 4080 Laptop GPU, Ultra 9 185H, WDC PC SN810 1TB | |
|---|---|---|---|---|---|---|
| Noise | -5% | -16% | -16% | -37% | -7% | |
| apagado / medio ambiente * | 22.9 | 23 -0% | 23.8 -4% | 24.1 -5% | 23.2 -1% | 23.4 -2% |
| Idle Minimum * | 22.9 | 23 -0% | 23.8 -4% | 24.1 -5% | 33.5 -46% | 23.8 -4% |
| Idle Average * | 22.9 | 23 -0% | 27.2 -19% | 30.6 -34% | 33.5 -46% | 28.5 -24% |
| Idle Maximum * | 26.3 | 23 13% | 31.3 -19% | 30.6 -16% | 33.5 -27% | 28.5 -8% |
| Load Average * | 27.8 | 39 -40% | 47.6 -71% | 45.5 -64% | 52.1 -87% | 28.8 -4% |
| Cyberpunk 2077 ultra * | 54.2 | 51.3 5% | 48.2 11% | |||
| Load Maximum * | 53.9 | 55.56 -3% | 53.3 1% | 53.4 1% | 62 -15% | 54.2 -1% |
| Witcher 3 ultra * | 55.32 | 62 | 49.5 |
* ... más pequeño es mejor
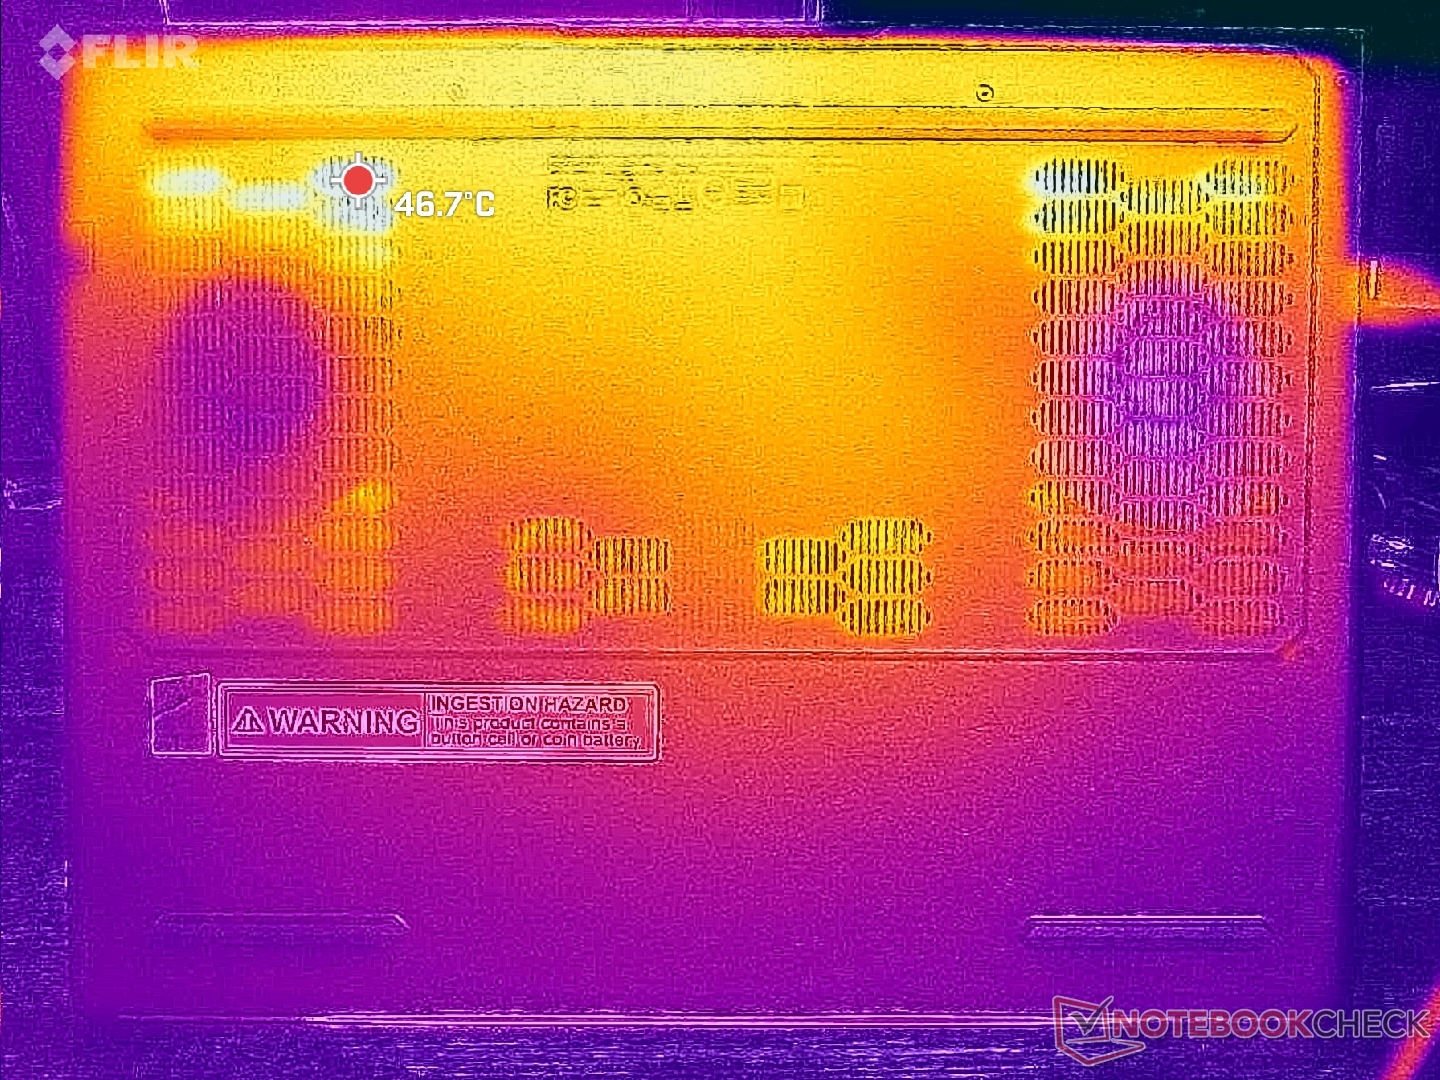
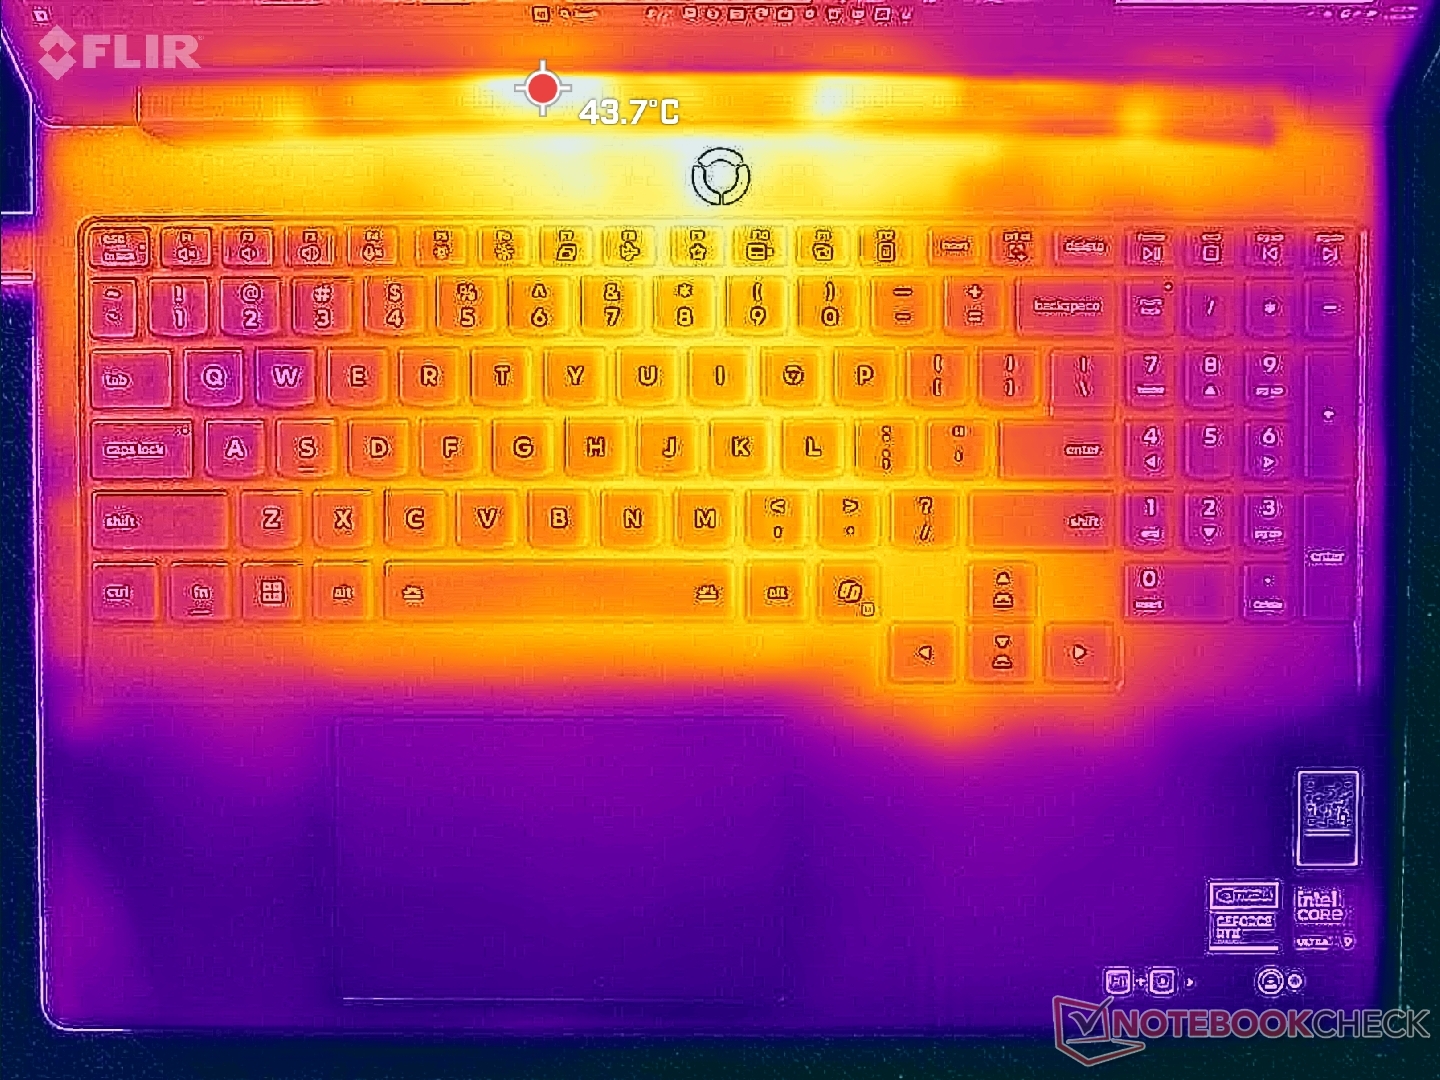
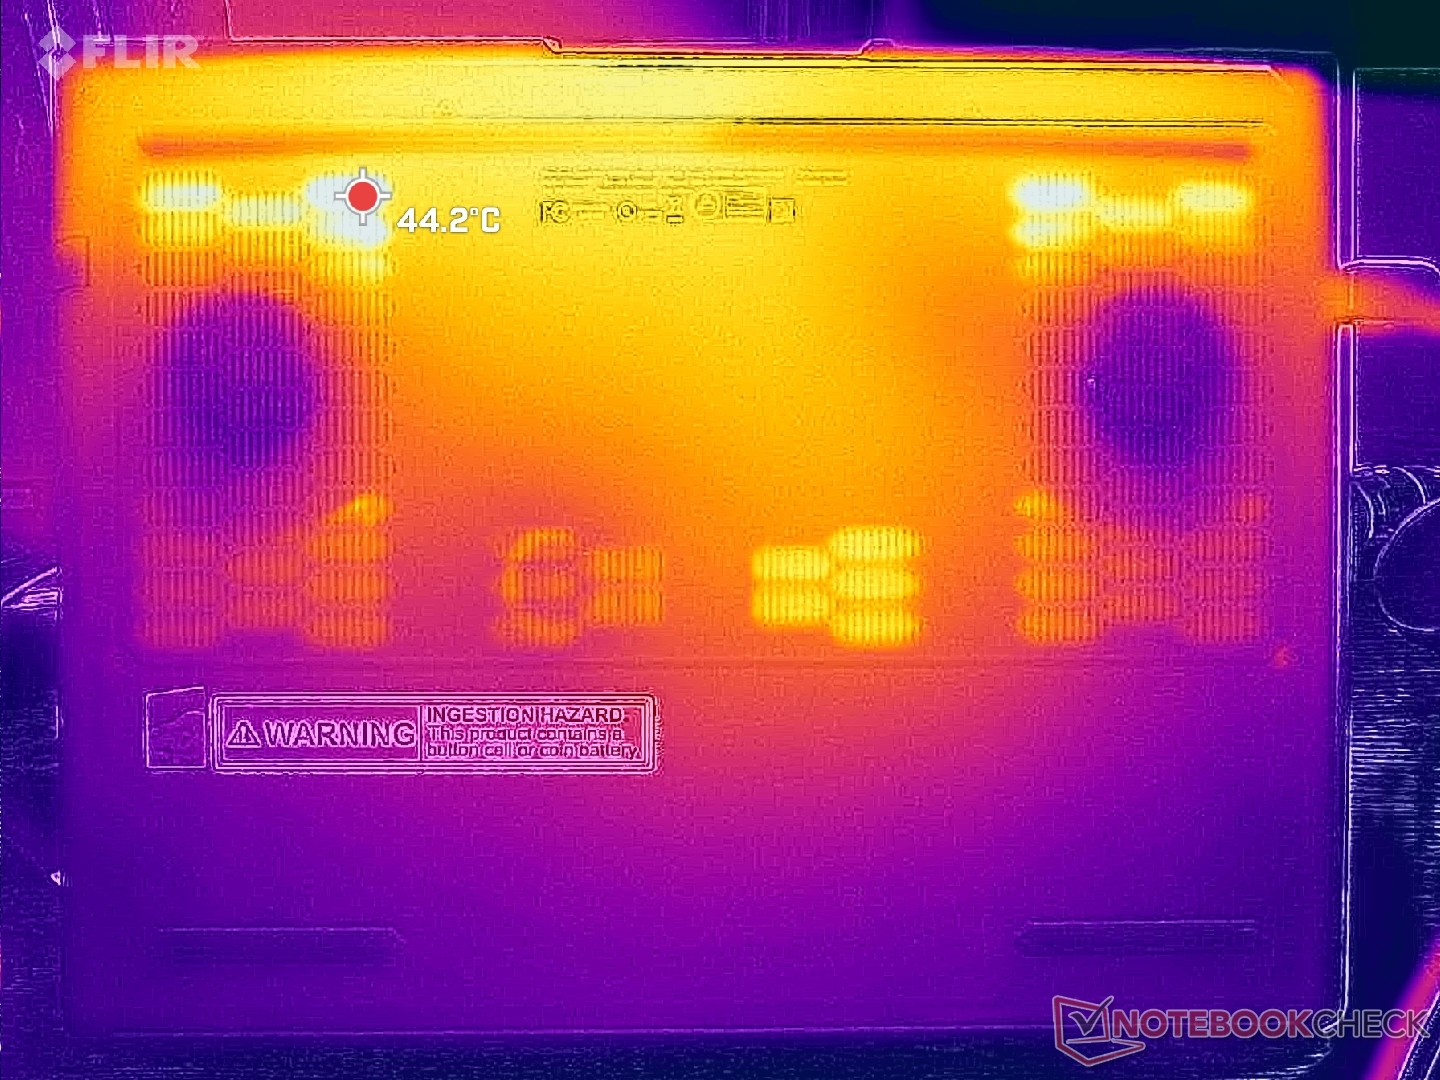
Temperatura
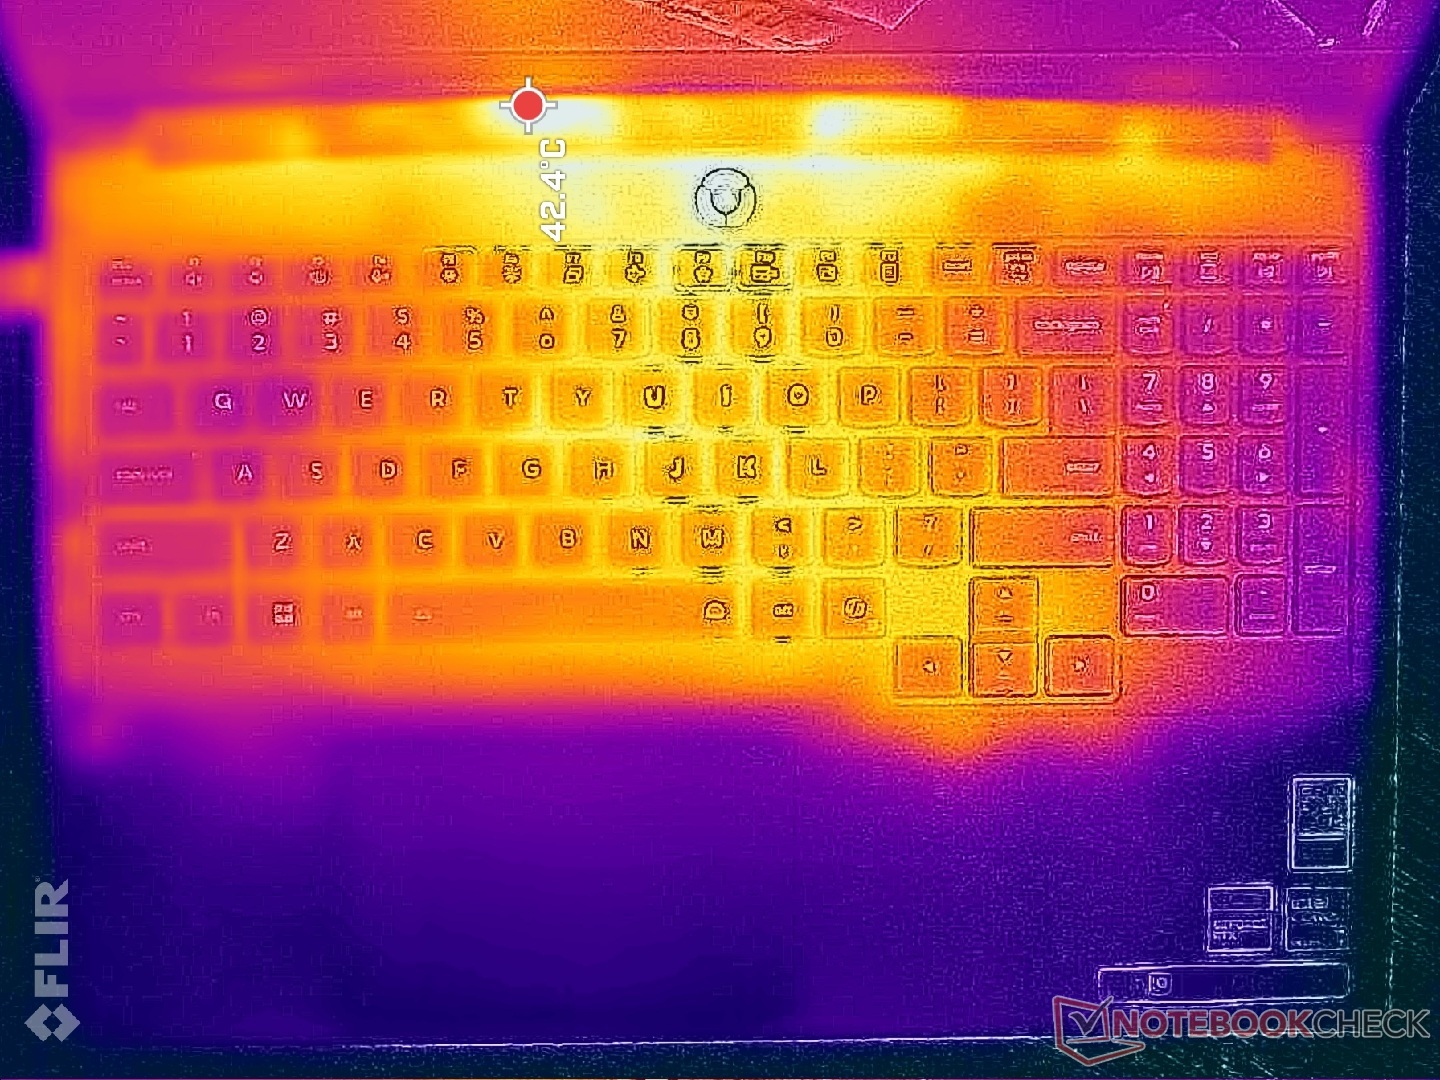
Las temperaturas superficiales no son tan cálidas como en el Blade 16 debido a las rejillas de ventilación más grandes y al diseño trasero extendido del Lenovo. Los puntos calientes en el centro del teclado pueden alcanzar hasta 40 C mientras que las teclas WASD, las teclas de flecha y los reposamanos permanecen más fríos para un juego más cómodo.
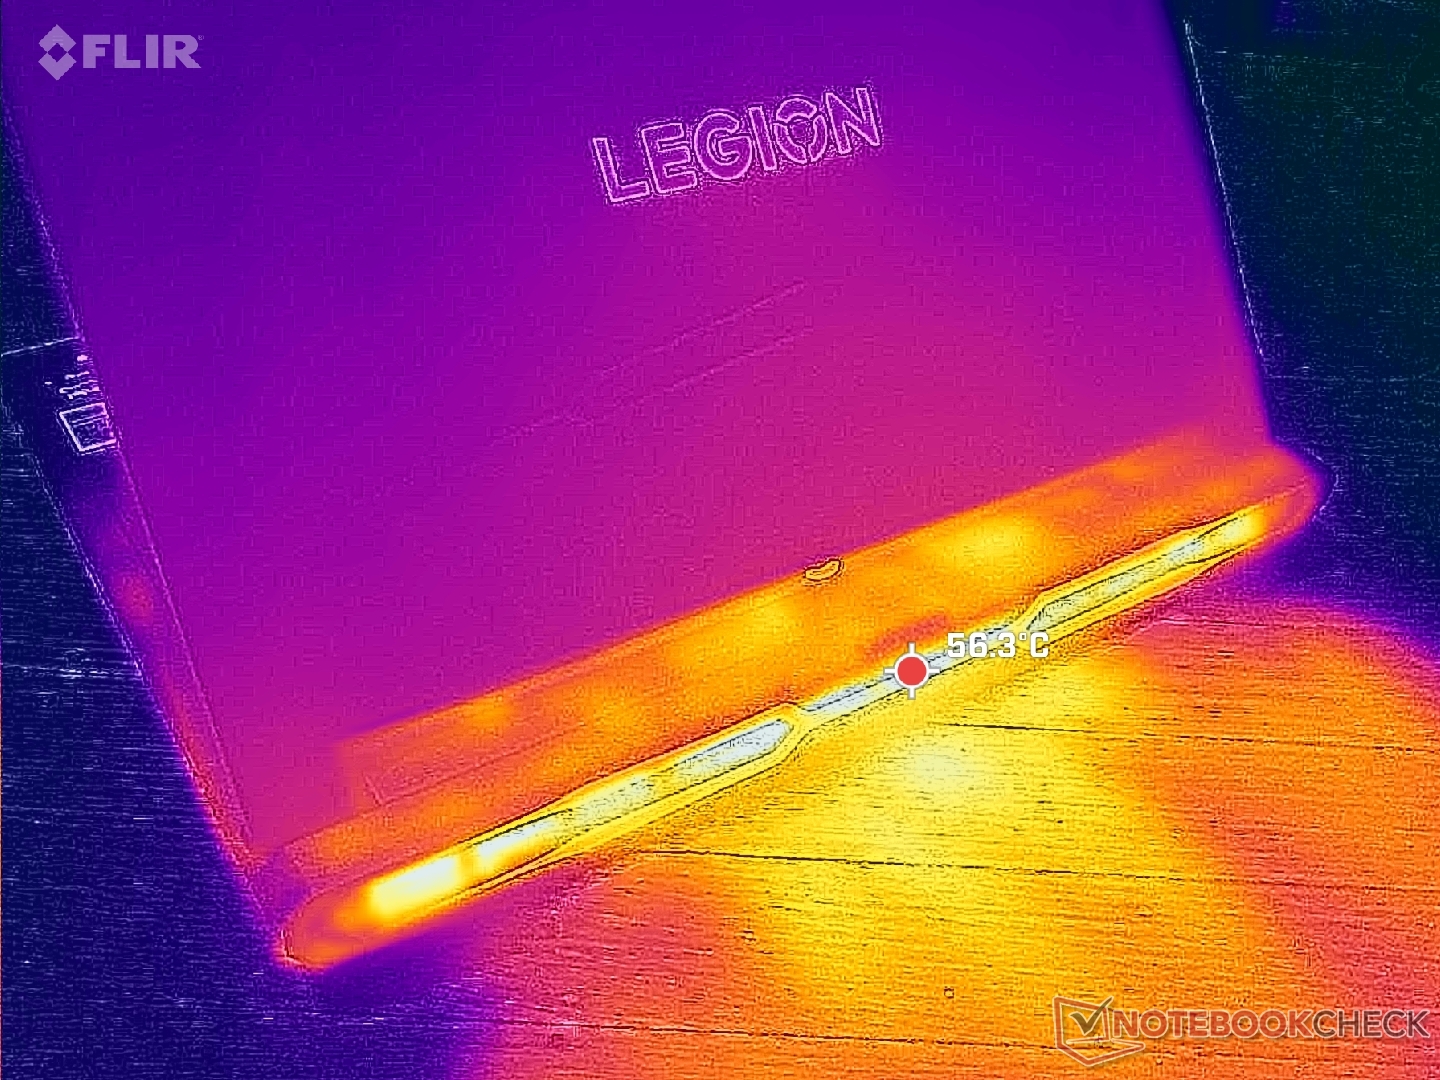
(±) La temperatura máxima en la parte superior es de 42.6 °C / 109 F, frente a la media de 40.4 °C / 105 F, que oscila entre 21.2 y 68.8 °C para la clase Gaming.
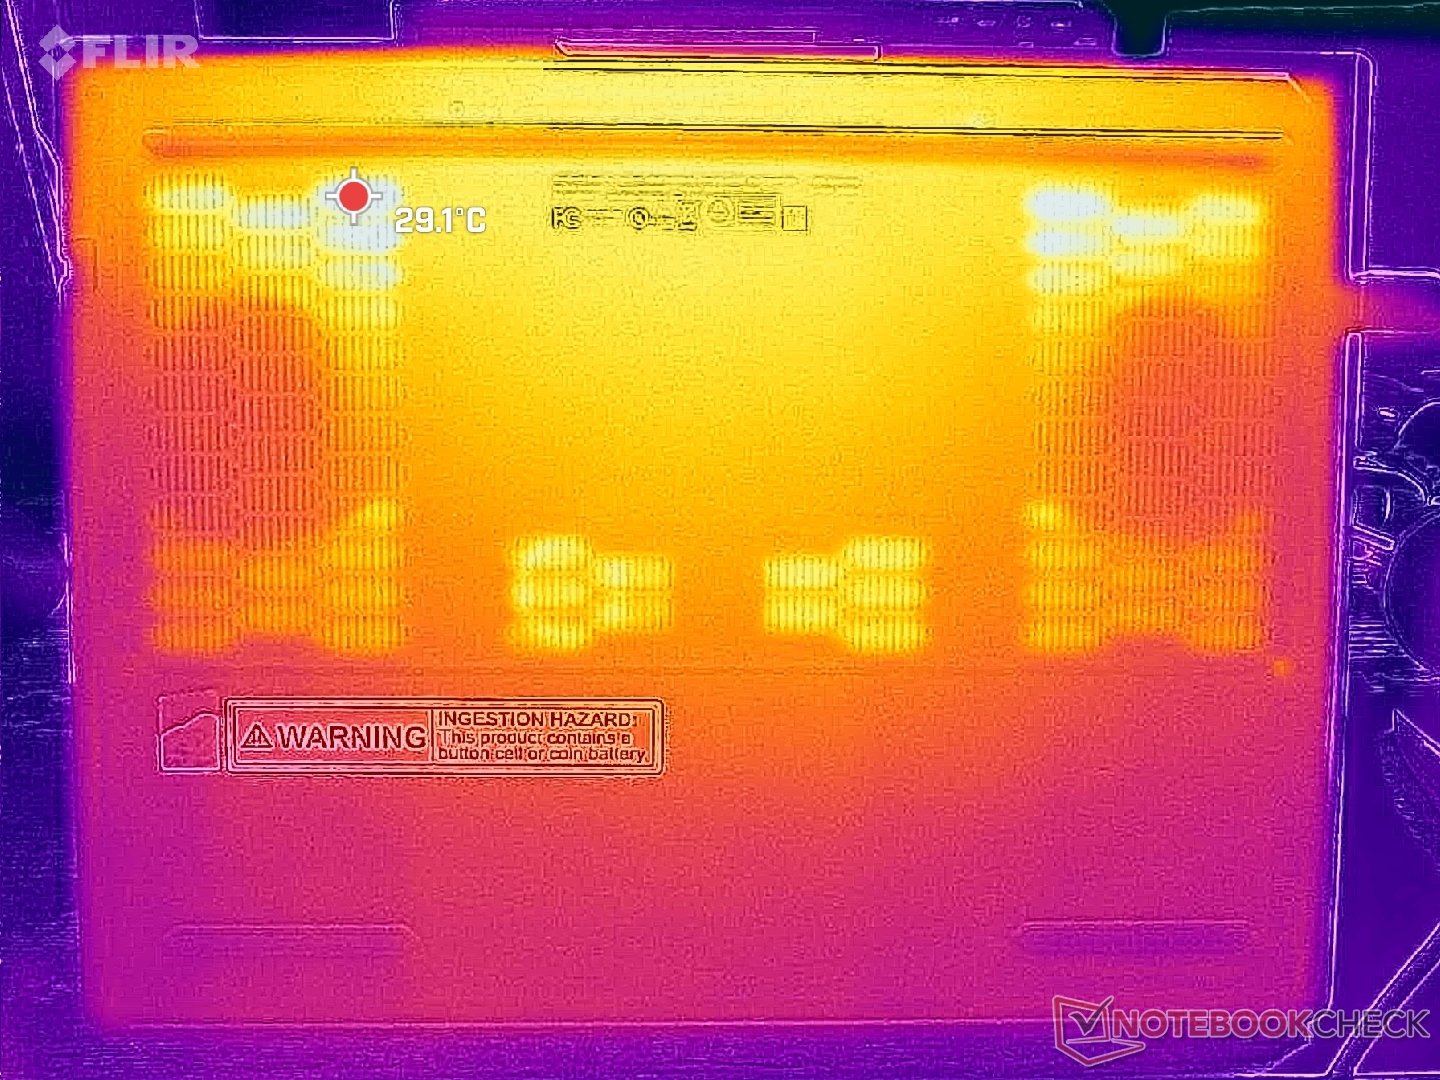
(±) El fondo se calienta hasta un máximo de 41.2 °C / 106 F, frente a la media de 43.2 °C / 110 F
(+) En reposo, la temperatura media de la parte superior es de 27.4 °C / 81# F, frente a la media del dispositivo de 33.9 °C / 93 F.
(±) 3: The average temperature for the upper side is 33.4 °C / 92 F, compared to the average of 33.9 °C / 93 F for the class Gaming.
(+) El reposamanos y el panel táctil están a una temperatura inferior a la de la piel, con un máximo de 25.4 °C / 77.7 F y, por tanto, son fríos al tacto.
(+) La temperatura media de la zona del reposamanos de dispositivos similares fue de 28.9 °C / 84 F (+3.5 °C / 6.3 F).

| Lenovo Legion Pro 7i 16 Gen 10 Intel Core Ultra 9 275HX, Nvidia GeForce RTX 5080 Laptop | Lenovo Legion 9 16IRX9, RTX 4090 Intel Core i9-14900HX, NVIDIA GeForce RTX 4090 Laptop GPU | Asus ROG Zephyrus G16 GU605CX Intel Core Ultra 9 285H, Nvidia GeForce RTX 5090 Laptop | Razer Blade 16 2025 RTX 5090 AMD Ryzen AI 9 HX 370, Nvidia GeForce RTX 5090 Laptop | MSI Vector 16 HX A14V Intel Core i9-14900HX, NVIDIA GeForce RTX 4080 Laptop GPU | Alienware x16 R2 P120F Intel Core Ultra 9 185H, NVIDIA GeForce RTX 4080 Laptop GPU | |
|---|---|---|---|---|---|---|
| Heat | -24% | 8% | -6% | 16% | -16% | |
| Maximum Upper Side * | 42.6 | 56 -31% | 44 -3% | 48.3 -13% | 36.4 15% | 51 -20% |
| Maximum Bottom * | 41.2 | 53 -29% | 44.1 -7% | 53.3 -29% | 35.6 14% | 50.8 -23% |
| Idle Upper Side * | 32.6 | 38 -17% | 26.1 20% | 28.3 13% | 26.6 18% | 36.6 -12% |
| Idle Bottom * | 32.4 | 39 -20% | 25.5 21% | 30.3 6% | 27 17% | 35.2 -9% |
* ... más pequeño es mejor
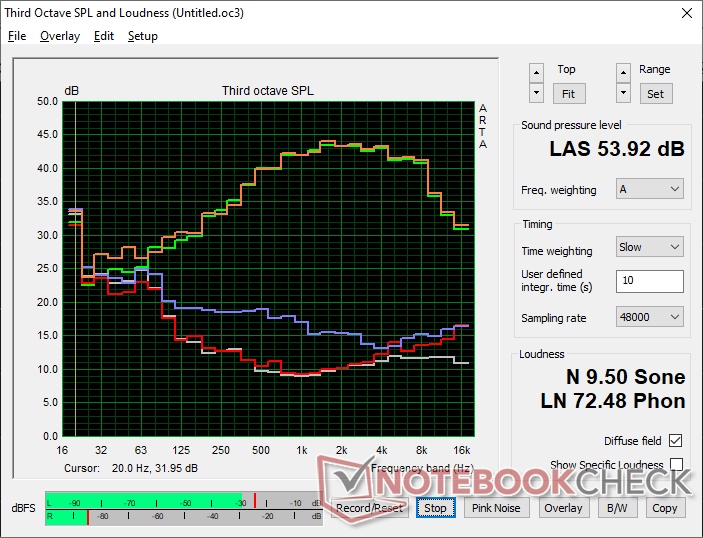
Altavoces
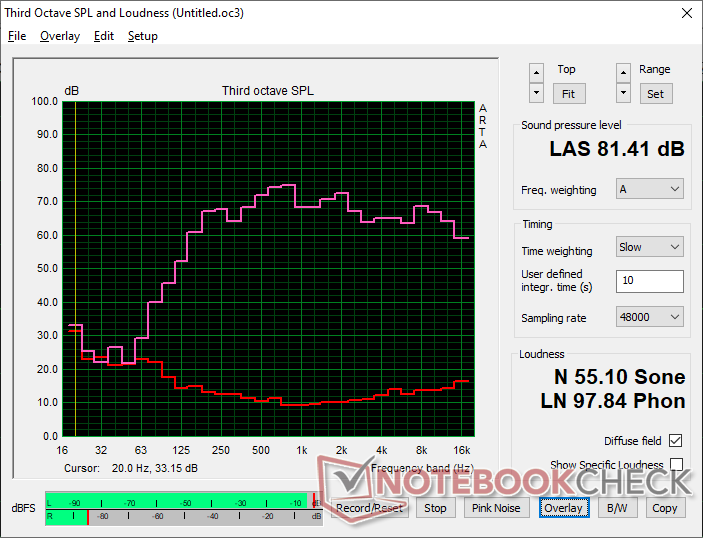
Lenovo Legion Pro 7i 16 Gen 10 análisis de audio
(±) | la sonoridad del altavoz es media pero buena (81.4 dB)
Graves 100 - 315 Hz
(±) | lubina reducida - en promedio 7.6% inferior a la mediana
(±) | la linealidad de los graves es media (9.4% delta a frecuencia anterior)
Medios 400 - 2000 Hz
(+) | medios equilibrados - a sólo 4.1% de la mediana
(+) | los medios son lineales (4.8% delta a la frecuencia anterior)
Altos 2 - 16 kHz
(+) | máximos equilibrados - a sólo 1.9% de la mediana
(+) | los máximos son lineales (4.8% delta a la frecuencia anterior)
Total 100 - 16.000 Hz
(+) | el sonido global es lineal (9.4% de diferencia con la mediana)
En comparación con la misma clase
» 3% de todos los dispositivos probados de esta clase eran mejores, 2% similares, 95% peores
» El mejor tuvo un delta de 6%, la media fue 18%, el peor fue ###max##%
En comparación con todos los dispositivos probados
» 3% de todos los dispositivos probados eran mejores, 1% similares, 96% peores
» El mejor tuvo un delta de 4%, la media fue 24%, el peor fue ###max##%
Apple MacBook Pro 16 2021 M1 Pro análisis de audio
(+) | los altavoces pueden reproducir a un volumen relativamente alto (#84.7 dB)
Graves 100 - 315 Hz
(+) | buen bajo - sólo 3.8% lejos de la mediana
(+) | el bajo es lineal (5.2% delta a la frecuencia anterior)
Medios 400 - 2000 Hz
(+) | medios equilibrados - a sólo 1.3% de la mediana
(+) | los medios son lineales (2.1% delta a la frecuencia anterior)
Altos 2 - 16 kHz
(+) | máximos equilibrados - a sólo 1.9% de la mediana
(+) | los máximos son lineales (2.7% delta a la frecuencia anterior)
Total 100 - 16.000 Hz
(+) | el sonido global es lineal (4.6% de diferencia con la mediana)
En comparación con la misma clase
» 0% de todos los dispositivos probados de esta clase eran mejores, 0% similares, 100% peores
» El mejor tuvo un delta de 5%, la media fue 18%, el peor fue ###max##%
En comparación con todos los dispositivos probados
» 0% de todos los dispositivos probados eran mejores, 0% similares, 100% peores
» El mejor tuvo un delta de 4%, la media fue 24%, el peor fue ###max##%
Gestión de la energía
Consumo de energía
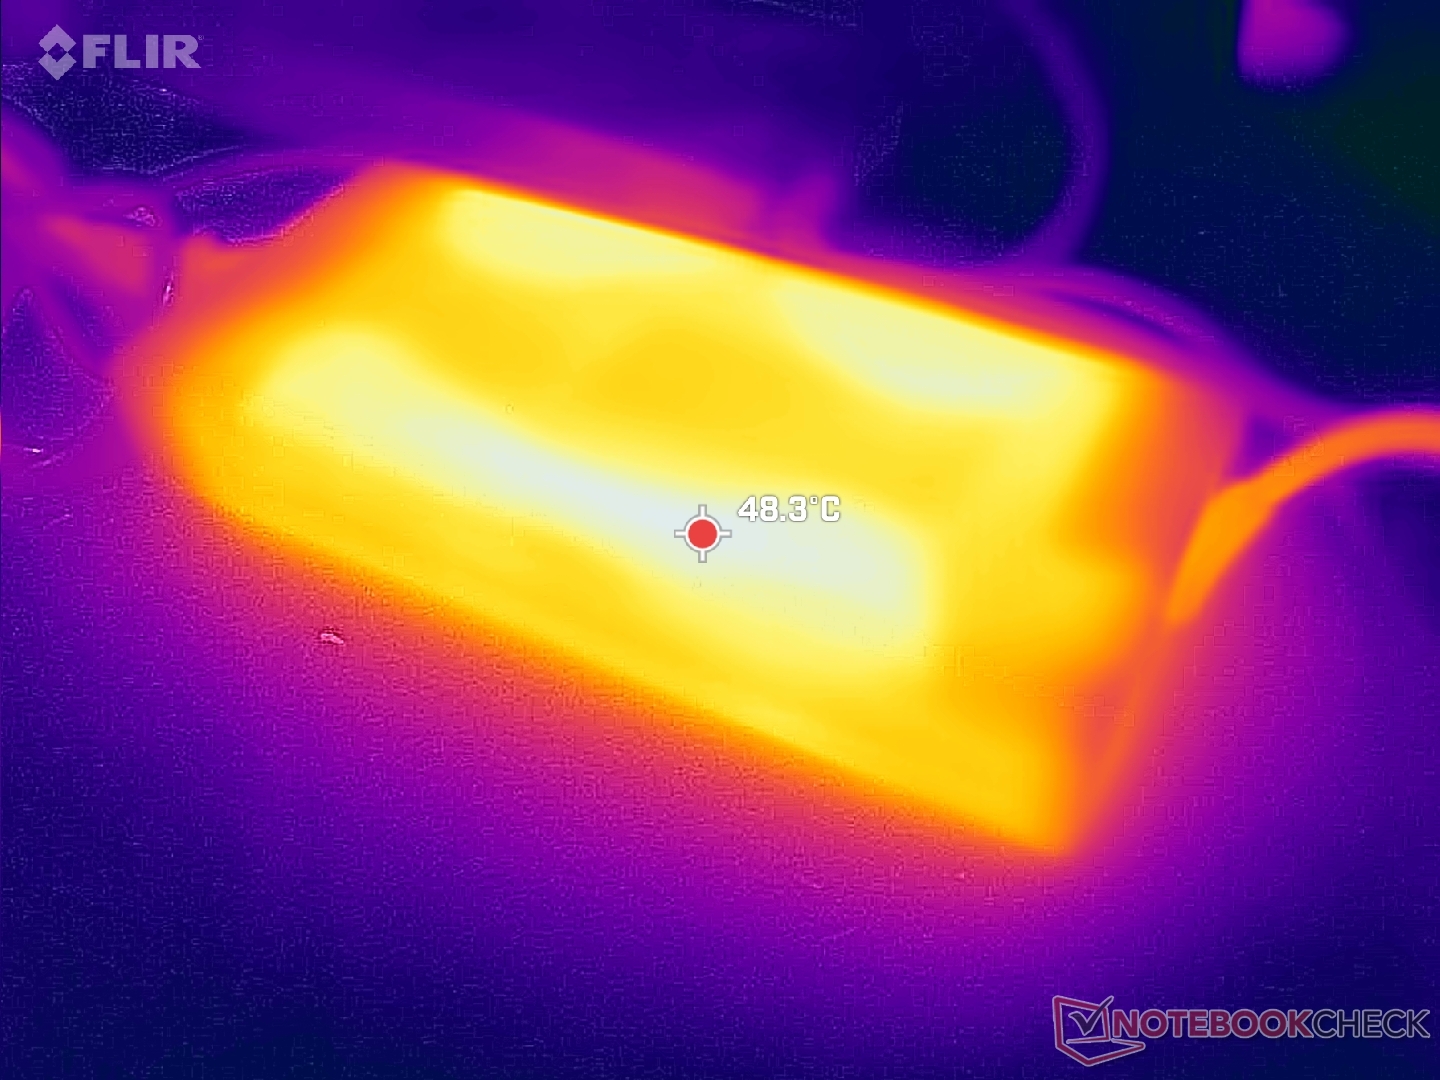
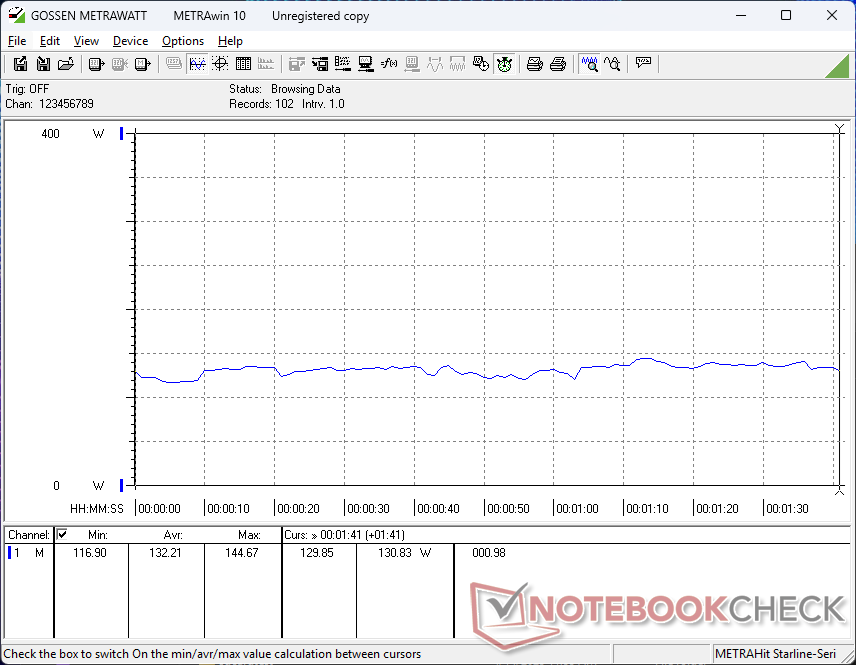
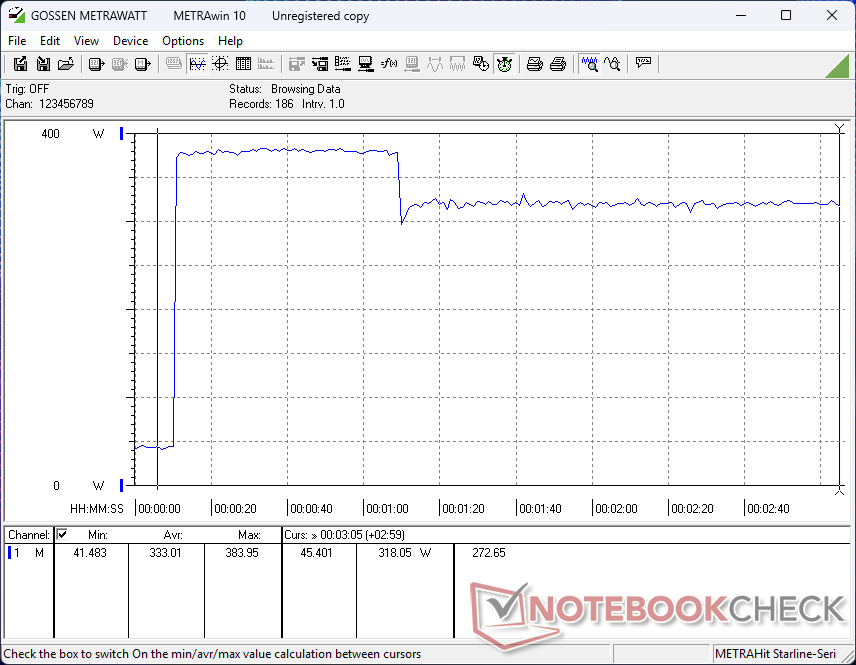
El Legion Pro 7i G10 es uno de los pocos portátiles para juegos que se entrega con un bloque de alimentación de 400 W, ya que la mayoría de los demás suelen tener un máximo de 280 W o 300 W. El consumo de energía es, como era de esperar, bastante elevado y más exigente que el de la mayoría de los demás portátiles para juegos, incluso cuando está en reposo en el escritorio con la configuración de brillo más baja, como muestra la tabla comparativa que aparece a continuación.
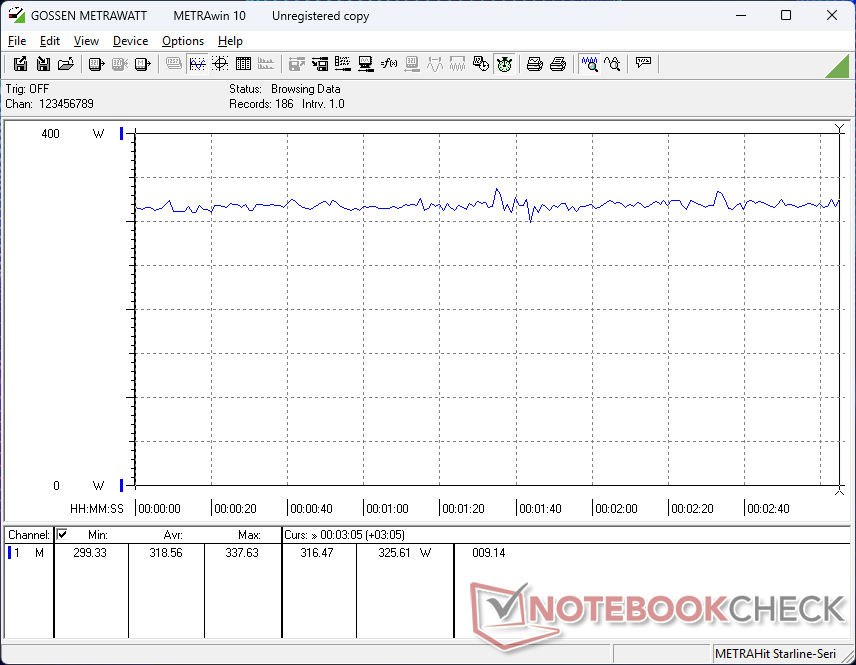
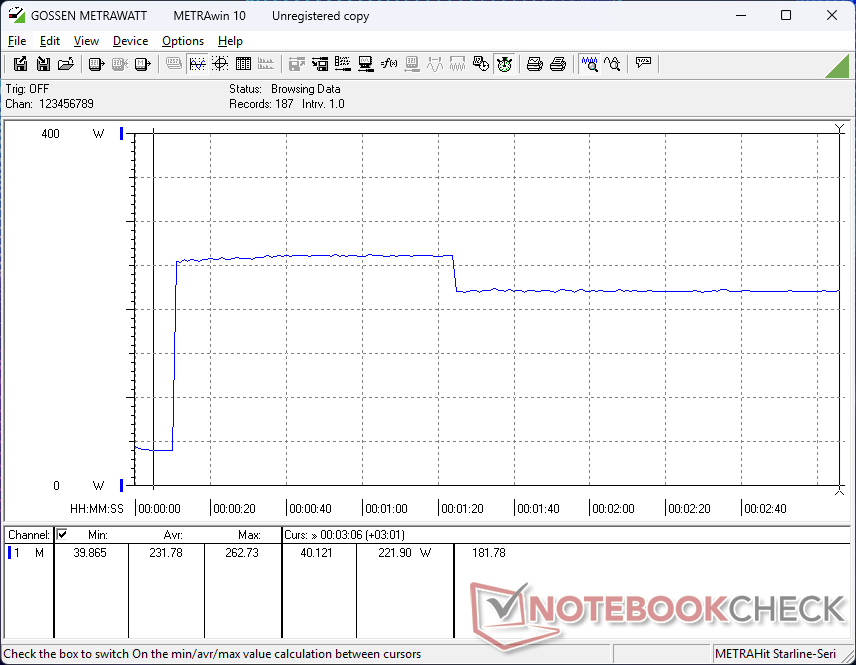
Ejecutar Prime95 consume unos 222 W frente a los sólo 98 W del Razer Blade 16 con tecnología AMD. En otras palabras, nuestro sistema Intel es más de 2,2 veces más exigente que el Razer a la vez que proporciona un aumento de 1,5 veces en el rendimiento multihilo a cambio de un rendimiento por vatio generalmente inferior. Este amplio delta continúa cuando se ejecutan juegos como Cyberpunk 2077 , en el que nuestro Lenovo consumiría alrededor de 320 W en comparación con sólo 178 W en el Razer antes mencionado.
El adaptador de CA de 400 W es previsiblemente grande (19,5 x 8,8 x 3,3 cm) y más pesado (1206 g) que muchos portátiles delgados y ligeros.
| Off / Standby | |
| Ocioso | |
| Carga |
|
Clave:
min: | |
| Lenovo Legion Pro 7i 16 Gen 10 Ultra 9 275HX, GeForce RTX 5080 Laptop, SK Hynix HFS001TEJ9X115N, OLED, 2560x1600, 16" | Lenovo Legion 9 16IRX9, RTX 4090 i9-14900HX, NVIDIA GeForce RTX 4090 Laptop GPU, Micron 3400 2TB MTFDKBA2T0TFH, MiniLED, 3200x2000, 16" | Asus ROG Zephyrus G16 GU605CX Ultra 9 285H, GeForce RTX 5090 Laptop, Western Digital PC SN5000S SDEPNSJ-2T00-1006, OLED, 2560x1600, 16" | Razer Blade 16 2025 RTX 5090 Ryzen AI 9 HX 370, GeForce RTX 5090 Laptop, SSSTC CA6-8D2048, OLED, 2560x1600, 16" | MSI Vector 16 HX A14V i9-14900HX, NVIDIA GeForce RTX 4080 Laptop GPU, WD PC SN560 SDDPNQE-1T00, IPS, 2560x1600, 16" | Alienware x16 R2 P120F Ultra 9 185H, NVIDIA GeForce RTX 4080 Laptop GPU, WDC PC SN810 1TB, IPS, 2560x1600, 16" | |
|---|---|---|---|---|---|---|
| Power Consumption | 28% | 51% | 48% | 31% | 41% | |
| Idle Minimum * | 36.8 | 20.5 44% | 9.4 74% | 10.9 70% | 15.8 57% | 9.9 73% |
| Idle Average * | 38.8 | 27.7 29% | 13.6 65% | 13.5 65% | 23.3 40% | 14.5 63% |
| Idle Maximum * | 45.6 | 32.1 30% | 15.8 65% | 13.7 70% | 30 34% | 33.5 27% |
| Load Average * | 132.2 | 105 21% | 115.4 13% | 120.2 9% | 123.9 6% | 97.5 26% |
| Cyberpunk 2077 ultra external monitor * | 319 | 160.4 50% | 177.6 44% | |||
| Cyberpunk 2077 ultra * | 318 | 164.5 48% | 178.2 44% | |||
| Load Maximum * | 384 | 323 16% | 216.7 44% | 246.1 36% | 306 20% | 315.2 18% |
| Witcher 3 ultra * | 246 | 285 | 230 |
* ... más pequeño es mejor
Power Consumption Cyberpunk / Stress Test
Power Consumption external Monitor
Duración de las pilas
El tiempo de ejecución de WLAN es sólo ligeramente mejor que en el Legion 9 16IRX9 del año pasado, incluso cuando se configura en modo equilibrado e iGPU. Se pueden conseguir mayores tiempos de ejecución con el Razer Blade 16 o el Zephyrus G16 en al menos una o dos horas cada uno.
La carga de vacío a lleno tarda solo 90 minutos con el adaptador de CA incluido. Se admite la carga más lenta mediante USB-C de terceros.
| Lenovo Legion Pro 7i 16 Gen 10 Ultra 9 275HX, GeForce RTX 5080 Laptop, 99 Wh | Lenovo Legion 9 16IRX9, RTX 4090 i9-14900HX, NVIDIA GeForce RTX 4090 Laptop GPU, 99.99 Wh | Asus ROG Zephyrus G16 GU605CX Ultra 9 285H, GeForce RTX 5090 Laptop, 90 Wh | Razer Blade 16 2025 RTX 5090 Ryzen AI 9 HX 370, GeForce RTX 5090 Laptop, 90 Wh | MSI Vector 16 HX A14V i9-14900HX, NVIDIA GeForce RTX 4080 Laptop GPU, 90 Wh | Alienware x16 R2 P120F Ultra 9 185H, NVIDIA GeForce RTX 4080 Laptop GPU, 90 Wh | |
|---|---|---|---|---|---|---|
| Duración de Batería | 80% | 67% | 47% | 39% | -40% | |
| WiFi v1.3 | 323 | 290 -10% | 540 67% | 475 47% | 332 3% | 193 -40% |
| Load | 48 | 129 169% | 84 75% | |||
| H.264 | 294 | 592 | ||||
| Cyberpunk 2077 ultra 150cd | 71 | |||||
| Reader / Idle | 641 |
Valoración de Notebookcheck
Lenovo Legion Pro 7i 16 Gen 10
- 04/25/2025 v8
Allen Ngo
 Total Sustainability Score:
 Potential Competitors in Comparison
Imagen | Modelo | Precio | Peso | Altura | Pantalla |
|---|---|---|---|---|---|
1. 87.5%  | Lenovo Legion Pro 7i 16 Gen 10 Intel Core Ultra 9 275HX ⎘ Nvidia GeForce RTX 5080 Laptop ⎘ 32 GB Memoría, 1024 GB SSD | Amazon: $3,799.95 Precio de catálogo: 4200 USD | 2.6 kg | 26.65 mm | 16.00" 2560x1600 189 PPI OLED |
2. 83.9%  | Lenovo Legion 9 16IRX9, RTX 4090 Intel Core i9-14900HX ⎘ NVIDIA GeForce RTX 4090 Laptop GPU ⎘ 64 GB Memoría, 2048 GB SSD | Amazon: $4,799.00 Precio de catálogo: 4899 Euro | 2.5 kg | 22.7 mm | 16.00" 3200x2000 236 PPI MiniLED |
3. 90%  | Asus ROG Zephyrus G16 GU605CX Intel Core Ultra 9 285H ⎘ Nvidia GeForce RTX 5090 Laptop ⎘ 64 GB Memoría, 2048 GB SSD | Amazon: 1. $20.98 Puccy 2 Pack Film Protector,... 2. $99.99 240W Rectangle Conn Charger ... 3. $1,479.00 ASUS ROG Zephyrus G16 Gaming... Precio de catálogo: 4799€ | 1.9 kg | 17.4 mm | 16.00" 2560x1600 189 PPI OLED |
4. 87%  | Razer Blade 16 2025 RTX 5090 AMD Ryzen AI 9 HX 370 ⎘ Nvidia GeForce RTX 5090 Laptop ⎘ 32 GB Memoría, 2048 GB SSD | Amazon: 1. $4,159.99 Razer Blade 16 Gaming Laptop... 2. $5,495.00 Razer Blade 18 Gaming Laptop... 3. $5,698.00 Razer Blade 16 Gaming Laptop... Precio de catálogo: 4399€ | 2.1 kg | 17.4 mm | 16.00" 2560x1600 189 PPI OLED |
5. 88% v7 (old)  | MSI Vector 16 HX A14V Intel Core i9-14900HX ⎘ NVIDIA GeForce RTX 4080 Laptop GPU ⎘ 32 GB Memoría, 1024 GB SSD | Amazon: 1. $2,419.99 MSI Vector 16 HX 16” 240Hz... 2. $45.99 Smatree Hard EVA Protective ... 3. $59.99 Smatree 16 inch Laptop Sleev... Precio de catálogo: 2700 USD | 2.7 kg | 28.55 mm | 16.00" 2560x1600 189 PPI IPS |
6. 88.4% v7 (old) 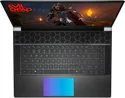 | Alienware x16 R2 P120F Intel Core Ultra 9 185H ⎘ NVIDIA GeForce RTX 4080 Laptop GPU ⎘ 32 GB Memoría, 1024 GB SSD | Amazon: $3,099.99 Precio de catálogo: 3200 USD | 2.7 kg | 18.57 mm | 16.00" 2560x1600 189 PPI IPS |
Transparencia
La selección de los dispositivos que se van a reseñar corre a cargo de nuestro equipo editorial. La muestra de prueba fue proporcionada al autor en calidad de préstamo por el fabricante o el minorista a los efectos de esta reseña. El prestamista no tuvo ninguna influencia en esta reseña, ni el fabricante recibió una copia de la misma antes de su publicación. No había ninguna obligación de publicar esta reseña. Nunca aceptamos compensaciones o pagos a cambio de nuestras reseñas. Como empresa de medios independiente, Notebookcheck no está sujeta a la autoridad de fabricantes, minoristas o editores.
Así es como prueba Notebookcheck
Cada año, Notebookcheck revisa de forma independiente cientos de portátiles y smartphones utilizando procedimientos estandarizados para asegurar que todos los resultados son comparables. Hemos desarrollado continuamente nuestros métodos de prueba durante unos 20 años y hemos establecido los estándares de la industria en el proceso. En nuestros laboratorios de pruebas, técnicos y editores experimentados utilizan equipos de medición de alta calidad. Estas pruebas implican un proceso de validación en varias fases. Nuestro complejo sistema de clasificación se basa en cientos de mediciones y puntos de referencia bien fundamentados, lo que mantiene la objetividad.
