Notebookcheck Logo

Reseña del mini PC GMK NucBox K9: Core Ultra 5 125H con gráficos Arc 7
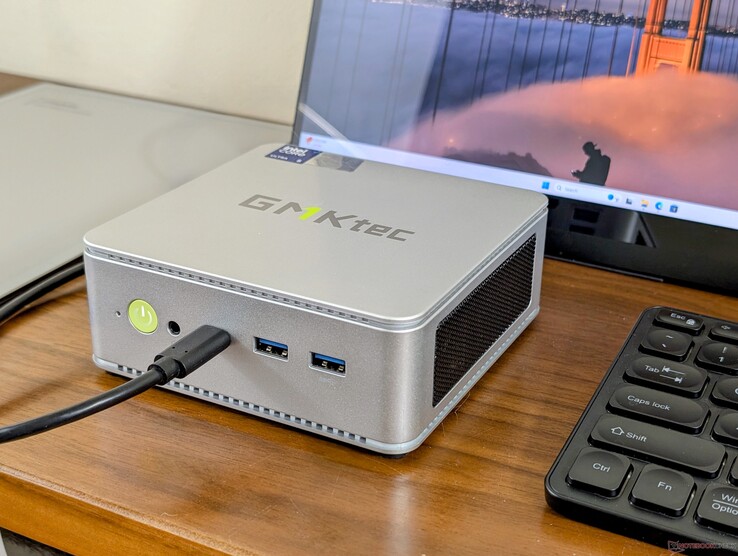
La NucBox K6 es más rápida.

Puede que el Core Ultra 5 125H sea un PC más inteligente, pero eso no significa necesariamente que sea más rápido. El rendimiento bruto se sitúa por detrás del más antiguo y barato Ryzen 7 7840HS por márgenes decentes.
GMKtec NucBox K9
GMKtec NucBox K9

Después de haber revisado el GMK NucBox K6 hace unos meses, ahora estamos listos para abordar el NucBox K9 completo con el nuevo procesador Meteor Lake-H habilitado para IA. Aparte del cambio de CPU de AMD a Intel, sin embargo, el chasis sigue siendo idéntico entre los dos modelos, por lo que recomendamos consultar nuestra reseña sobre el NucBox K6 para saber más sobre las características físicas del sistema.

Nuestra unidad de prueba viene equipada con la CPU Core Ultra 5 125H, una unidad SSD de 1 TB y 32 GB de RAM por aproximadamente 860 dólares o 570 dólares si está en oferta. Los usuarios pueden configurar sin RAM o SSD en absoluto para una configuración barebones, pero la CPU Core Ultra 5 es fija en todas las opciones.

Las alternativas incluyen otros mini PC de alto rendimiento como el Beelink SER8, Bosgame M1o el Geekom AX8 Pro.

Más reseñas de GMKtec:

GMK NucBox K9
Procesador
Intel Core Ultra 5 125H 14 x 3.6 - 4.5 GHz, 45 W PL2 / Short Burst, 45 W PL1 / Sustained, Meteor Lake-H
Adaptador gráfico
Intel Arc 7-Core iGPU, Núcleo: 2200 MHz, DDR5, 31.0.101.5007
Memoría
32 GB 
, Crucial, DDR5-5600, 46-45-45-90, Dual-Channel
Placa base
Intel Meteor Lake-U/P/H PCH
Disco duro
MasonSemi 1TB MC7000, 1024 GB 
Tarjeta de sonido
Intel Meteor Lake-U/P/H PCH - cAVS (Audio, Voice, Speech)
Conexiones
5 USB 3.1 Gen2, 1 Thunderbolt, USB-C Power Delivery (PD), 1 HDMI, 2 DisplayPort, 1 Kensington Lock, Audio Conexiones: 3.5 mm combo
Equipamento de red
Realtek RTL8125 2.5GBe Family Ethernet Controller (10/100/1000/2500MBit/s), Intel Wi-Fi 6 AX201 (a/b/g/h/n = Wi-Fi 4/ac = Wi-Fi 5/ax = Wi-Fi 6/), Bluetooth 5.2
Tamaño
Alto x ancho x profundidad (en mm): 47 x 128 x 126
Sistema Operativo
Microsoft Windows 11 Pro
Características adicionales
12 Meses Garantía
Peso
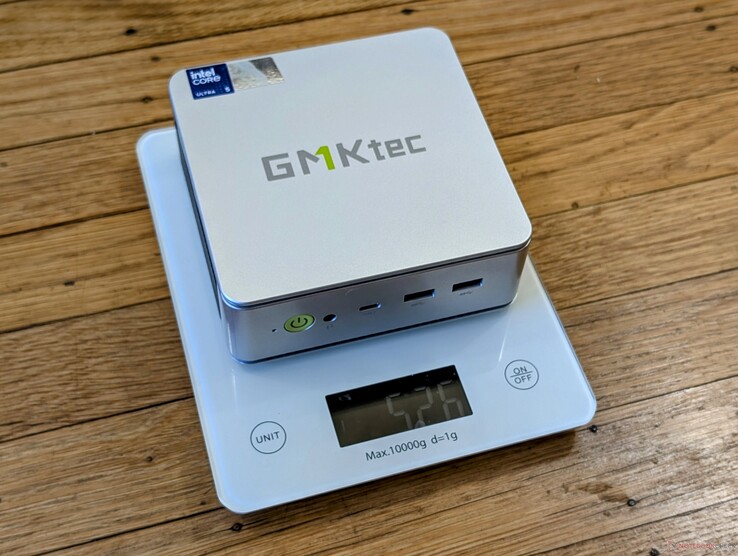
528 g, Suministro de Electricidad: 472 g
Precio
560 USD
Amazon
Nota: El fabricante puede utilizar componentes de diferentes proveedores, incluidos paneles de visualización, unidades o lápices de memoria con especificaciones similares.


Posibles contendientes en la comparación

Valoración
Versión
Fecha
Modelo
Peso
Altura
Tamaño
Resolución
Precio
67.3 %v8
09/2024
GMK NucBox K9
Ultra 5 125H, Arc 7-Core
528 g47 mmx
83.6 %
v7 (old)
v7 (old)
04/2024
GMK NucBox K6
R7 7840HS, Radeon 780M
514 g47 mmx
63.6 %v8
07/2024
GMK NucBox M6
R5 6600H, Radeon 660M
526 g48 mmx
74.9 %v8
07/2024
Beelink SER8
R7 8845HS, Radeon 780M
776 g44.7 mmx

v (old)
12/2022
Beelink SEi12 Core i5-1235U
i5-1235U, Iris Xe G7 80EUs
465 g42 mmx
84.5 %
v7 (old)
v7 (old)
05/2024
BOSGAME M1
R7 7840HS, Radeon 780M
766 g51 mmx

Nota: Recientemente hemos actualizado nuestro sistema de clasificación y los resultados de la versión 8 no son comparables con los de la versión 7. Encontrará más información aquí .

Comparación de tamaños

136 mm 132 mm 51 mm 766 g135 mm 135 mm 44.7 mm 776 g128 mm 127 mm 48 mm 526 g128 mm 126 mm 47 mm 528 g128 mm 126 mm 47 mm 514 g126 mm 113 mm 42 mm 465 g210 mm 148 mm 1 mm 2.9 g

Conectividad - Puertos USB más rápidos

Aunque las opciones de puertos y la posición no han cambiado respecto a la NucBox K6, los puertos USB han sido actualizados. Todos los puertos USB-A son ahora USB4 en lugar de 2.0 o 3.2. Mientras tanto, el puerto USB-C soporta oficialmente Thunderbolt 4.

Los adaptadores de CA USB-C de terceros pueden alimentar el sistema en lugar del adaptador de CA de barril si pueden proporcionar suficiente energía. El rendimiento y la compatibilidad con todos los adaptadores USB-C, sin embargo, no están garantizados.

Comunicación

Un Intel AX201 viene de serie en lugar del MediaTek RZ616 para la conectividad Wi-Fi 6 y Bluetooth 5.2. Wi-Fi 6E y Wi-Fi 7 no se incluyen para ahorrar costes.

Networking
iperf3 transmit AXE11000
GMK NucBox M6
MediaTek Wi-Fi 6E MT7922 160MHz Wireless LAN Card
1531 (1372min - 1639max) MBit/s +86%
Beelink SEi12 Core i5-1235U
Intel Wi-Fi 6 AX201
1491 (1413min - 1572max) MBit/s +81%
BOSGAME M1
MediaTek Wi-Fi 6E MT7922 160MHz Wireless LAN Card
1470 (1310min - 1625max) MBit/s +79%
GMK NucBox K9
Intel Wi-Fi 6 AX201
823 (607min - 901max) MBit/s
Beelink SER8
Intel Wi-Fi 6 AX200
812 (641min - 888max) MBit/s -1%
GMK NucBox K6
MediaTek RZ616
634 (574min - 685max) MBit/s -23%
iperf3 receive AXE11000
BOSGAME M1
MediaTek Wi-Fi 6E MT7922 160MHz Wireless LAN Card
1479 (1255min - 1539max) MBit/s +94%
GMK NucBox M6
MediaTek Wi-Fi 6E MT7922 160MHz Wireless LAN Card
1449 (1247min - 1560max) MBit/s +90%
Beelink SEi12 Core i5-1235U
Intel Wi-Fi 6 AX201
1384 (1200min - 1495max) MBit/s +81%
GMK NucBox K6
MediaTek RZ616
1222 (1074min - 1368max) MBit/s +60%
Beelink SER8
Intel Wi-Fi 6 AX200
784 (679min - 845max) MBit/s +3%
GMK NucBox K9
Intel Wi-Fi 6 AX201
764 (635min - 829max) MBit/s
iperf3 transmit AXE11000 6GHz
BOSGAME M1
MediaTek Wi-Fi 6E MT7922 160MHz Wireless LAN Card
1324 (1090min - 1580max) MBit/s
GMK NucBox K6
MediaTek RZ616
432 (212min - 471max) MBit/s
GMK NucBox M6
MediaTek Wi-Fi 6E MT7922 160MHz Wireless LAN Card
394 (359min - 432max) MBit/s
iperf3 receive AXE11000 6GHz
BOSGAME M1
MediaTek Wi-Fi 6E MT7922 160MHz Wireless LAN Card
1321 (1233min - 1393max) MBit/s
GMK NucBox K6
MediaTek RZ616
984 (937min - 1048max) MBit/s
GMK NucBox M6
MediaTek Wi-Fi 6E MT7922 160MHz Wireless LAN Card
684 (650min - 718max) MBit/s
050100150200250300350400450500550600650700750800850900Tooltip
GMK NucBox K9; iperf3 transmit AXE11000; iperf 3.1.3: Ø824 (607-901)
GMK NucBox K9; iperf3 receive AXE11000; iperf 3.1.3: Ø763 (635-829)

Mantenimiento

Los componentes actualizables son idénticos a los de la NucBox K6.

Sostenibilidad

El fabricante anuncia un sistema de "fabricación sostenible" sin entrar en detalles sobre lo que ello implica. El envase en sí es principalmente de cartón con un poco de envoltorio de plástico.

Accesorios y garantía

La caja de venta al público incluye un soporte de montaje VESA y un cable HDMI junto con la documentación habitual y el adaptador de CA. Se aplica una garantía del fabricante de un año si se adquiere en EE.UU.

Rendimiento - Norma Meteor Lake

Condiciones de prueba

Pusimos Windows en modo Rendimiento antes de ejecutar las pruebas comparativas que se indican a continuación.

Procesador

El rendimiento de la CPU está donde esperamos que esté en relación con otros PC de nuestra base de datos con el mismo Core Ultra 5 125H procesador. La CPU Meteor Lake está codo con codo con la última generación Core i9-13900H lo que suena muy bien sobre el papel hasta que recuerde que el NucBox K6 alimentado por AMD con el antiguo Ryzen 7 7840HS es incluso más rápido que cualquiera de las dos soluciones Intel. Por lo tanto, la falta de una opción Core Ultra 7 es extraña teniendo en cuenta que la NucBox K9 es la caja más nueva.

Aunque se incluye una IA integrada, no es compatible con Co-Pilot+.

Cinebench R15 Multi Loop

0135270405540675810945108012151350148516201755189020252160229524302565Tooltip
GMK NucBox K9 Intel Core Ultra 5 125H: Ø1902 (1827.4-1965.8)
GMK NucBox K6 AMD Ryzen 7 7840HS: Ø2520 (2510.2-2537.27)
GMK NucBox M6 AMD Ryzen 5 6600H: Ø1720 (1708.16-1737.02)
Beelink SER8 AMD Ryzen 7 8845HS: Ø2607 (2586.82-2626.57)
Beelink SEi12 Core i5-1235U Intel Core i5-1235U: Ø1219 (1203.04-1409.15)
BOSGAME M1 AMD Ryzen 7 7840HS: Ø2554 (2501.09-2597.23)
CPU Performance Rating: Percent
Cinebench R23: Multi Core | Single Core
Cinebench R20: CPU (Multi Core) | CPU (Single Core)
Cinebench R15: CPU Multi 64Bit | CPU Single 64Bit
Blender: v2.79 BMW27 CPU
7-Zip 18.03: 7z b 4 | 7z b 4 -mmt1
Geekbench 6.3: Multi-Core | Single-Core
Geekbench 5.5: Multi-Core | Single-Core
HWBOT x265 Benchmark v2.2: 4k Preset
LibreOffice : 20 Documents To PDF
R Benchmark 2.5: Overall mean
CPU Performance Rating
HP Z2 Mini G9-996Q4ET
Intel Core i7-14700K
91.5 pt
Minisforum G7 PT
AMD Ryzen 9 7945HX
91.4 pt
Lenovo ThinkStation P3 Tiny-30H0006AGE
Intel Core i9-14900
90 pt
Beelink SER8
AMD Ryzen 7 8845HS
70.5 pt
GMK NucBox K6
AMD Ryzen 7 7840HS
69.6 pt
Asus ROG NUC 14-90AS0051
Intel Core Ultra 9 185H
69.6 pt
Geekom AE7
AMD Ryzen 9 7940HS
69.6 pt
Geekom AX8 Pro
AMD Ryzen 9 8945H
69.1 pt
Acemagic F2A
Intel Core Ultra 7 155H
67.6 pt
HP Elite Mini 800 G9-5M9X6EA
Intel Core i5-14500
65.9 pt
Geekom XT13 Pro
Intel Core i9-13900H
61.8 pt
GMK NucBox K9 -1!
Intel Core Ultra 5 125H
61.2 pt
HP Pro Mini 400 G9-937U0EA
Intel Core i5-14500T
60.2 pt
Asus NUC 14 Pro
Intel Core Ultra 5 125H
58.1 pt
Medio Intel Core Ultra 5 125H
 
55.8 pt
GMK NucBox M6
AMD Ryzen 5 6600H
54.7 pt
Beelink SEi12 Core i5-1235U -2!
Intel Core i5-1235U
50.7 pt
Newsmay AC8F-POE
Intel Processor N100
19.4 pt
Cinebench R23 / Multi Core
Lenovo ThinkStation P3 Tiny-30H0006AGE
Intel Core i9-14900
31070 Points +139%
HP Z2 Mini G9-996Q4ET
Intel Core i7-14700K
30989 Points +139%
Minisforum G7 PT
AMD Ryzen 9 7945HX
30799 Points +137%
Asus ROG NUC 14-90AS0051
Intel Core Ultra 9 185H
19249 Points +48%
Acemagic F2A
Intel Core Ultra 7 155H
18497 Points +42%
Beelink SER8
AMD Ryzen 7 8845HS
16661 (16363.9min - 16661max) Points +28%
Geekom AE7
AMD Ryzen 9 7940HS
16099 Points +24%
GMK NucBox K6
AMD Ryzen 7 7840HS
15947 (9378.75min - 15947.3max) Points +23%
Geekom AX8 Pro
AMD Ryzen 9 8945H
15516 Points +19%
HP Elite Mini 800 G9-5M9X6EA
Intel Core i5-14500
15012 Points +16%
Asus NUC 14 Pro
Intel Core Ultra 5 125H
14516 Points +12%
GMK NucBox K9
Intel Core Ultra 5 125H
12989 (12625.3min - 12989.4max) Points
Medio Intel Core Ultra 5 125H
  (9194 - 14564, n=6)
12308 Points -5%
Geekom XT13 Pro
Intel Core i9-13900H
11997 Points -8%
HP Pro Mini 400 G9-937U0EA
Intel Core i5-14500T
11790 Points -9%
GMK NucBox M6
AMD Ryzen 5 6600H
10418 (10142.8min - 10418max) Points -20%
Beelink SEi12 Core i5-1235U
Intel Core i5-1235U
8128 (7685.59min - 8128.32max) Points -37%
Newsmay AC8F-POE
Intel Processor N100
1946 Points -85%
Cinebench R23 / Single Core
Lenovo ThinkStation P3 Tiny-30H0006AGE
Intel Core i9-14900
2212 Points +27%
HP Z2 Mini G9-996Q4ET
Intel Core i7-14700K
2167 Points +25%
Minisforum G7 PT
AMD Ryzen 9 7945HX
1957 Points +13%
HP Elite Mini 800 G9-5M9X6EA
Intel Core i5-14500
1917 Points +10%
HP Pro Mini 400 G9-937U0EA
Intel Core i5-14500T
1838 Points +6%
Asus ROG NUC 14-90AS0051
Intel Core Ultra 9 185H
1825 Points +5%
Geekom AX8 Pro
AMD Ryzen 9 8945H
1808 Points +4%
Geekom AE7
AMD Ryzen 9 7940HS
1788 Points +3%
Beelink SER8
AMD Ryzen 7 8845HS
1783 Points +3%
Acemagic F2A
Intel Core Ultra 7 155H
1771 Points +2%
GMK NucBox K6
AMD Ryzen 7 7840HS
1770 Points +2%
GMK NucBox K9
Intel Core Ultra 5 125H
1735 Points
Asus NUC 14 Pro
Intel Core Ultra 5 125H
1721 Points -1%
Geekom XT13 Pro
Intel Core i9-13900H
1719 Points -1%
Medio Intel Core Ultra 5 125H
  (1549 - 1735, n=6)
1668 Points -4%
Beelink SEi12 Core i5-1235U
Intel Core i5-1235U
1610 Points -7%
GMK NucBox M6
AMD Ryzen 5 6600H
1486 Points -14%
Newsmay AC8F-POE
Intel Processor N100
843 Points -51%
Cinebench R20 / CPU (Multi Core)
Minisforum G7 PT
AMD Ryzen 9 7945HX
12210 Points +147%
HP Z2 Mini G9-996Q4ET
Intel Core i7-14700K
11814 Points +139%
Lenovo ThinkStation P3 Tiny-30H0006AGE
Intel Core i9-14900
11291 Points +128%
Asus ROG NUC 14-90AS0051
Intel Core Ultra 9 185H
7513 Points +52%
Acemagic F2A
Intel Core Ultra 7 155H
7188 Points +45%
Beelink SER8
AMD Ryzen 7 8845HS
6431 Points +30%
Geekom AE7
AMD Ryzen 9 7940HS
6321 Points +28%
GMK NucBox K6
AMD Ryzen 7 7840HS
6250 Points +26%
Geekom AX8 Pro
AMD Ryzen 9 8945H
6153 Points +24%
HP Elite Mini 800 G9-5M9X6EA
Intel Core i5-14500
5811 Points +17%
Asus NUC 14 Pro
Intel Core Ultra 5 125H
5617 Points +14%
GMK NucBox K9
Intel Core Ultra 5 125H
4948 Points
Geekom XT13 Pro
Intel Core i9-13900H
4935 Points 0%
Medio Intel Core Ultra 5 125H
  (3673 - 5618, n=6)
4766 Points -4%
HP Pro Mini 400 G9-937U0EA
Intel Core i5-14500T
4319 Points -13%
GMK NucBox M6
AMD Ryzen 5 6600H
4106 Points -17%
Beelink SEi12 Core i5-1235U
Intel Core i5-1235U
3111 Points -37%
Newsmay AC8F-POE
Intel Processor N100
748 Points -85%
Cinebench R20 / CPU (Single Core)
Lenovo ThinkStation P3 Tiny-30H0006AGE
Intel Core i9-14900
846 Points +27%
HP Z2 Mini G9-996Q4ET
Intel Core i7-14700K
840 Points +27%
Minisforum G7 PT
AMD Ryzen 9 7945HX
754 Points +14%
HP Elite Mini 800 G9-5M9X6EA
Intel Core i5-14500
736 Points +11%
HP Pro Mini 400 G9-937U0EA
Intel Core i5-14500T
706 Points +6%
Geekom AX8 Pro
AMD Ryzen 9 8945H
703 Points +6%
Geekom AE7
AMD Ryzen 9 7940HS
700 Points +5%
Asus ROG NUC 14-90AS0051
Intel Core Ultra 9 185H
699 Points +5%
Beelink SER8
AMD Ryzen 7 8845HS
698 Points +5%
GMK NucBox K6
AMD Ryzen 7 7840HS
688 Points +4%
Acemagic F2A
Intel Core Ultra 7 155H
679 Points +2%
GMK NucBox K9
Intel Core Ultra 5 125H
664 Points
Geekom XT13 Pro
Intel Core i9-13900H
649 Points -2%
Medio Intel Core Ultra 5 125H
  (622 - 664, n=6)
643 Points -3%
Asus NUC 14 Pro
Intel Core Ultra 5 125H
622 Points -6%
Beelink SEi12 Core i5-1235U
Intel Core i5-1235U
620 Points -7%
GMK NucBox M6
AMD Ryzen 5 6600H
584 Points -12%
Newsmay AC8F-POE
Intel Processor N100
326 Points -51%
Cinebench R15 / CPU Multi 64Bit
Minisforum G7 PT
AMD Ryzen 9 7945HX
4998 Points +154%
Lenovo ThinkStation P3 Tiny-30H0006AGE
Intel Core i9-14900
4793 Points +144%
HP Z2 Mini G9-996Q4ET
Intel Core i7-14700K
4611 Points +135%
Asus ROG NUC 14-90AS0051
Intel Core Ultra 9 185H
2948 Points +50%
Acemagic F2A
Intel Core Ultra 7 155H
2738 Points +39%
Beelink SER8
AMD Ryzen 7 8845HS
2627 (2586.82min - 2626.57max) Points +34%
Geekom AE7
AMD Ryzen 9 7940HS
2544 Points +29%
GMK NucBox K6
AMD Ryzen 7 7840HS
2537 (2510.2min - 2537.27max) Points +29%
Geekom AX8 Pro
AMD Ryzen 9 8945H
2521 Points +28%
Geekom XT13 Pro
Intel Core i9-13900H
2448 Points +25%
HP Elite Mini 800 G9-5M9X6EA
Intel Core i5-14500
2435 Points +24%
Asus NUC 14 Pro
Intel Core Ultra 5 125H
2141 Points +9%
HP Pro Mini 400 G9-937U0EA
Intel Core i5-14500T
2022 Points +3%
Medio Intel Core Ultra 5 125H
  (1700 - 2245, n=6)
1983 Points +1%
GMK NucBox K9
Intel Core Ultra 5 125H
1966 (1827.4min - 1965.8max) Points
GMK NucBox M6
AMD Ryzen 5 6600H
1737 (1708.16min - 1737.02max) Points -12%
Beelink SEi12 Core i5-1235U
Intel Core i5-1235U
1409 (1203.04min - 1409.15max) Points -28%
Newsmay AC8F-POE
Intel Processor N100
298 Points -85%
Cinebench R15 / CPU Single 64Bit
Lenovo ThinkStation P3 Tiny-30H0006AGE
Intel Core i9-14900
315 Points +25%
HP Z2 Mini G9-996Q4ET
Intel Core i7-14700K
313 Points +25%
Minisforum G7 PT
AMD Ryzen 9 7945HX
309 Points +23%
Geekom AX8 Pro
AMD Ryzen 9 8945H
284 Points +13%
Beelink SER8
AMD Ryzen 7 8845HS
283 Points +13%
Geekom AE7
AMD Ryzen 9 7940HS
281 Points +12%
GMK NucBox K6
AMD Ryzen 7 7840HS
280 Points +12%
HP Elite Mini 800 G9-5M9X6EA
Intel Core i5-14500
273 Points +9%
Asus ROG NUC 14-90AS0051
Intel Core Ultra 9 185H
263 Points +5%
Acemagic F2A
Intel Core Ultra 7 155H
258 Points +3%
HP Pro Mini 400 G9-937U0EA
Intel Core i5-14500T
252 Points 0%
GMK NucBox K9
Intel Core Ultra 5 125H
251 Points
Asus NUC 14 Pro
Intel Core Ultra 5 125H
248 Points -1%
Geekom XT13 Pro
Intel Core i9-13900H
245 Points -2%
Medio Intel Core Ultra 5 125H
  (235 - 251, n=6)
244 Points -3%
GMK NucBox M6
AMD Ryzen 5 6600H
243 Points -3%
Beelink SEi12 Core i5-1235U
Intel Core i5-1235U
231 Points -8%
Newsmay AC8F-POE
Intel Processor N100
138 Points -45%
Blender / v2.79 BMW27 CPU
Newsmay AC8F-POE
Intel Processor N100
1522 Seconds * -514%
Beelink SEi12 Core i5-1235U
Intel Core i5-1235U
390 Seconds * -57%
GMK NucBox M6
AMD Ryzen 5 6600H
293 Seconds * -18%
HP Pro Mini 400 G9-937U0EA
Intel Core i5-14500T
288 Seconds * -16%
Medio Intel Core Ultra 5 125H
  (228 - 364, n=6)
285 Seconds * -15%
Geekom XT13 Pro
Intel Core i9-13900H
261 Seconds * -5%
GMK NucBox K9
Intel Core Ultra 5 125H
248 Seconds *
Asus NUC 14 Pro
Intel Core Ultra 5 125H
228 Seconds * +8%
HP Elite Mini 800 G9-5M9X6EA
Intel Core i5-14500
223 Seconds * +10%
Geekom AX8 Pro
AMD Ryzen 9 8945H
206 Seconds * +17%
GMK NucBox K6
AMD Ryzen 7 7840HS
199 Seconds * +20%
Geekom AE7
AMD Ryzen 9 7940HS
197 Seconds * +21%
Beelink SER8
AMD Ryzen 7 8845HS
191 Seconds * +23%
Acemagic F2A
Intel Core Ultra 7 155H
178 Seconds * +28%
Asus ROG NUC 14-90AS0051
Intel Core Ultra 9 185H
165 Seconds * +33%
Lenovo ThinkStation P3 Tiny-30H0006AGE
Intel Core i9-14900
131 Seconds * +47%
HP Z2 Mini G9-996Q4ET
Intel Core i7-14700K
109 Seconds * +56%
Minisforum G7 PT
AMD Ryzen 9 7945HX
99 Seconds * +60%
7-Zip 18.03 / 7z b 4
Minisforum G7 PT
AMD Ryzen 9 7945HX
131378 MIPS
HP Z2 Mini G9-996Q4ET
Intel Core i7-14700K
117224 MIPS
Lenovo ThinkStation P3 Tiny-30H0006AGE
Intel Core i9-14900
101652 MIPS
Asus ROG NUC 14-90AS0051
Intel Core Ultra 9 185H
72894 MIPS
Geekom AE7
AMD Ryzen 9 7940HS
71631 MIPS
Beelink SER8
AMD Ryzen 7 8845HS
70937 MIPS
GMK NucBox K6
AMD Ryzen 7 7840HS
70782 MIPS
Geekom AX8 Pro
AMD Ryzen 9 8945H
66557 MIPS
Acemagic F2A
Intel Core Ultra 7 155H
66438 MIPS
Geekom XT13 Pro
Intel Core i9-13900H
56068 MIPS
HP Elite Mini 800 G9-5M9X6EA
Intel Core i5-14500
54851 MIPS
GMK NucBox M6
AMD Ryzen 5 6600H
49353 MIPS
HP Pro Mini 400 G9-937U0EA
Intel Core i5-14500T
45820 MIPS
Beelink SEi12 Core i5-1235U
Intel Core i5-1235U
35580 MIPS
Newsmay AC8F-POE
Intel Processor N100
8725 MIPS
Asus NUC 14 Pro
Intel Core Ultra 5 125H
0 MIPS
Medio Intel Core Ultra 5 125H
  (0 - 0, n=2)
0 MIPS
7-Zip 18.03 / 7z b 4 -mmt1
Minisforum G7 PT
AMD Ryzen 9 7945HX
7609 MIPS +52%
Lenovo ThinkStation P3 Tiny-30H0006AGE
Intel Core i9-14900
7276 MIPS +45%
HP Z2 Mini G9-996Q4ET
Intel Core i7-14700K
7040 MIPS +41%
Beelink SER8
AMD Ryzen 7 8845HS
6714 MIPS +34%
Geekom AX8 Pro
AMD Ryzen 9 8945H
6691 MIPS +34%
GMK NucBox K6
AMD Ryzen 7 7840HS
6676 MIPS +33%
Geekom AE7
AMD Ryzen 9 7940HS
6661 MIPS +33%
HP Elite Mini 800 G9-5M9X6EA
Intel Core i5-14500
6198 MIPS +24%
HP Pro Mini 400 G9-937U0EA
Intel Core i5-14500T
5980 MIPS +20%
Geekom XT13 Pro
Intel Core i9-13900H
5828 MIPS +16%
GMK NucBox M6
AMD Ryzen 5 6600H
5720 MIPS +14%
Acemagic F2A
Intel Core Ultra 7 155H
5485 MIPS +10%
Asus ROG NUC 14-90AS0051
Intel Core Ultra 9 185H
5333 MIPS +7%
Beelink SEi12 Core i5-1235U
Intel Core i5-1235U
5192 MIPS +4%
Asus NUC 14 Pro
Intel Core Ultra 5 125H
5136 MIPS +3%
GMK NucBox K9
Intel Core Ultra 5 125H
5004 MIPS
Medio Intel Core Ultra 5 125H
  (4663 - 5136, n=6)
4948 MIPS -1%
Newsmay AC8F-POE
Intel Processor N100
3583 MIPS -28%
Geekbench 6.3 / Multi-Core
HP Z2 Mini G9-996Q4ET
Intel Core i7-14700K
18504 Points +67%
Minisforum G7 PT
AMD Ryzen 9 7945HX
16765 Points +51%
Lenovo ThinkStation P3 Tiny-30H0006AGE
Intel Core i9-14900
15962 Points +44%
Geekom AE7
AMD Ryzen 9 7940HS
13369 Points +21%
Beelink SER8
AMD Ryzen 7 8845HS
13362 Points +21%
Asus ROG NUC 14-90AS0051
Intel Core Ultra 9 185H
13232 Points +19%
GMK NucBox K6
AMD Ryzen 7 7840HS
13184 Points +19%
Geekom AX8 Pro
AMD Ryzen 9 8945H
13162 Points +19%
Acemagic F2A
Intel Core Ultra 7 155H
12385 Points +12%
Asus NUC 14 Pro
Intel Core Ultra 5 125H
11749 Points +6%
Geekom XT13 Pro
Intel Core i9-13900H
11541 Points +4%
Medio Intel Core Ultra 5 125H
  (11087 - 11749, n=6)
11404 Points +3%
GMK NucBox K9
Intel Core Ultra 5 125H
11087 Points
HP Elite Mini 800 G9-5M9X6EA
Intel Core i5-14500
10644 Points -4%
GMK NucBox M6
AMD Ryzen 5 6600H
9240 Points -17%
HP Pro Mini 400 G9-937U0EA
Intel Core i5-14500T
9225 Points -17%
Newsmay AC8F-POE
Intel Processor N100
2780 Points -75%
Geekbench 6.3 / Single-Core
Lenovo ThinkStation P3 Tiny-30H0006AGE
Intel Core i9-14900
3022 Points +32%
HP Z2 Mini G9-996Q4ET
Intel Core i7-14700K
2942 Points +28%
Minisforum G7 PT
AMD Ryzen 9 7945HX
2880 Points +25%
Beelink SER8
AMD Ryzen 7 8845HS
2694 Points +17%
Geekom AE7
AMD Ryzen 9 7940HS
2693 Points +17%
GMK NucBox K6
AMD Ryzen 7 7840HS
2687 Points +17%
Geekom AX8 Pro
AMD Ryzen 9 8945H
2651 Points +15%
HP Elite Mini 800 G9-5M9X6EA
Intel Core i5-14500
2583 Points +12%
HP Pro Mini 400 G9-937U0EA
Intel Core i5-14500T
2546 Points +11%
Asus ROG NUC 14-90AS0051
Intel Core Ultra 9 185H
2485 Points +8%
Geekom XT13 Pro
Intel Core i9-13900H
2415 Points +5%
Acemagic F2A
Intel Core Ultra 7 155H
2410 Points +5%
Asus NUC 14 Pro
Intel Core Ultra 5 125H
2316 Points +1%
GMK NucBox K9
Intel Core Ultra 5 125H
2297 Points
Medio Intel Core Ultra 5 125H
  (2199 - 2316, n=6)
2277 Points -1%
GMK NucBox M6
AMD Ryzen 5 6600H
2042 Points -11%
Newsmay AC8F-POE
Intel Processor N100
1209 Points -47%
Geekbench 5.5 / Multi-Core
HP Z2 Mini G9-996Q4ET
Intel Core i7-14700K
19971 Points +99%
Minisforum G7 PT
AMD Ryzen 9 7945HX
19836 Points +98%
Lenovo ThinkStation P3 Tiny-30H0006AGE
Intel Core i9-14900
17395 Points +74%
Asus ROG NUC 14-90AS0051
Intel Core Ultra 9 185H
13339 Points +33%
Acemagic F2A
Intel Core Ultra 7 155H
12662 Points +26%
Geekom AE7
AMD Ryzen 9 7940HS
12228 Points +22%
Beelink SER8
AMD Ryzen 7 8845HS
12196 Points +22%
Geekom AX8 Pro
AMD Ryzen 9 8945H
11980 Points +20%
GMK NucBox K6
AMD Ryzen 7 7840HS
11769 Points +17%
Geekom XT13 Pro
Intel Core i9-13900H
11536 Points +15%
Asus NUC 14 Pro
Intel Core Ultra 5 125H
10856 Points +8%
HP Elite Mini 800 G9-5M9X6EA
Intel Core i5-14500
10543 Points +5%
Medio Intel Core Ultra 5 125H
  (9696 - 10856, n=6)
10408 Points +4%
GMK NucBox K9
Intel Core Ultra 5 125H
10025 Points
HP Pro Mini 400 G9-937U0EA
Intel Core i5-14500T
9122 Points -9%
GMK NucBox M6
AMD Ryzen 5 6600H
8195 Points -18%
Beelink SEi12 Core i5-1235U
Intel Core i5-1235U
7804 Points -22%
Newsmay AC8F-POE
Intel Processor N100
2332 Points -77%
Geekbench 5.5 / Single-Core
Minisforum G7 PT
AMD Ryzen 9 7945HX
2147 Points +29%
Lenovo ThinkStation P3 Tiny-30H0006AGE
Intel Core i9-14900
2140 Points +28%
HP Z2 Mini G9-996Q4ET
Intel Core i7-14700K
2092 Points +25%
Beelink SER8
AMD Ryzen 7 8845HS
2004 Points +20%
Geekom AX8 Pro
AMD Ryzen 9 8945H
1994 Points +20%
GMK NucBox K6
AMD Ryzen 7 7840HS
1986 Points +19%
Geekom AE7
AMD Ryzen 9 7940HS
1986 Points +19%
HP Elite Mini 800 G9-5M9X6EA
Intel Core i5-14500
1898 Points +14%
Asus ROG NUC 14-90AS0051
Intel Core Ultra 9 185H
1858 Points +11%
HP Pro Mini 400 G9-937U0EA
Intel Core i5-14500T
1838 Points +10%
Acemagic F2A
Intel Core Ultra 7 155H
1746 Points +5%
Geekom XT13 Pro
Intel Core i9-13900H
1708 Points +2%
Asus NUC 14 Pro
Intel Core Ultra 5 125H
1685 Points +1%
GMK NucBox K9
Intel Core Ultra 5 125H
1668 Points
Medio Intel Core Ultra 5 125H
  (1593 - 1699, n=6)
1660 Points 0%
Beelink SEi12 Core i5-1235U
Intel Core i5-1235U
1633 Points -2%
GMK NucBox M6
AMD Ryzen 5 6600H
1513 Points -9%
Newsmay AC8F-POE
Intel Processor N100
975 Points -42%
HWBOT x265 Benchmark v2.2 / 4k Preset
Minisforum G7 PT
AMD Ryzen 9 7945HX
34.6 fps +151%
HP Z2 Mini G9-996Q4ET
Intel Core i7-14700K
32.3 fps +134%
Lenovo ThinkStation P3 Tiny-30H0006AGE
Intel Core i9-14900
31.6 fps +129%
Asus ROG NUC 14-90AS0051
Intel Core Ultra 9 185H
21.8 fps +58%
Beelink SER8
AMD Ryzen 7 8845HS
21.1 fps +53%
Geekom AE7
AMD Ryzen 9 7940HS
20.9 fps +51%
Geekom AX8 Pro
AMD Ryzen 9 8945H
20.6 fps +49%
GMK NucBox K6
AMD Ryzen 7 7840HS
20.5 fps +49%
Acemagic F2A
Intel Core Ultra 7 155H
19.6 fps +42%
HP Elite Mini 800 G9-5M9X6EA
Intel Core i5-14500
16.4 fps +19%
Asus NUC 14 Pro
Intel Core Ultra 5 125H
15.7 fps +14%
Geekom XT13 Pro
Intel Core i9-13900H
14.7 fps +7%
GMK NucBox M6
AMD Ryzen 5 6600H
13.9 fps +1%
GMK NucBox K9
Intel Core Ultra 5 125H
13.8 fps
Medio Intel Core Ultra 5 125H
  (9.7 - 16.7, n=6)
13.4 fps -3%
HP Pro Mini 400 G9-937U0EA
Intel Core i5-14500T
12.7 fps -8%
Beelink SEi12 Core i5-1235U
Intel Core i5-1235U
9.43 fps -32%
Newsmay AC8F-POE
Intel Processor N100
2.12 fps -85%
LibreOffice / 20 Documents To PDF
Newsmay AC8F-POE
Intel Processor N100
100.2 s * -128%
Asus ROG NUC 14-90AS0051
Intel Core Ultra 9 185H
56.2 s * -28%
Asus NUC 14 Pro
Intel Core Ultra 5 125H
55.7 s * -27%
Geekom AE7
AMD Ryzen 9 7940HS
53.7 s * -22%
Medio Intel Core Ultra 5 125H
  (42.7 - 70.9, n=6)
53.4 s * -21%
GMK NucBox M6
AMD Ryzen 5 6600H
52.4 s * -19%
Geekom AX8 Pro
AMD Ryzen 9 8945H
49.8 s * -13%
Minisforum G7 PT
AMD Ryzen 9 7945HX
49.7 s * -13%
Beelink SEi12 Core i5-1235U
Intel Core i5-1235U
48.7 s * -11%
HP Pro Mini 400 G9-937U0EA
Intel Core i5-14500T
48.4 s * -10%
Geekom XT13 Pro
Intel Core i9-13900H
46.8 s * -6%
Beelink SER8
AMD Ryzen 7 8845HS
46.1 s * -5%
HP Elite Mini 800 G9-5M9X6EA
Intel Core i5-14500
46 s * -5%
HP Z2 Mini G9-996Q4ET
Intel Core i7-14700K
44.7 s * -2%
Acemagic F2A
Intel Core Ultra 7 155H
44.5 s * -1%
GMK NucBox K6
AMD Ryzen 7 7840HS
44.1 s * -0%
GMK NucBox K9
Intel Core Ultra 5 125H
44 s *
Lenovo ThinkStation P3 Tiny-30H0006AGE
Intel Core i9-14900
38.2 s * +13%
R Benchmark 2.5 / Overall mean
Newsmay AC8F-POE
Intel Processor N100
0.975 sec * -99%
Beelink SEi12 Core i5-1235U
Intel Core i5-1235U
0.512 sec * -5%
Medio Intel Core Ultra 5 125H
  (0.4898 - 0.53, n=6)
0.506 sec * -3%
GMK NucBox M6
AMD Ryzen 5 6600H
0.4995 sec * -2%
Asus NUC 14 Pro
Intel Core Ultra 5 125H
0.4982 sec * -2%
GMK NucBox K9
Intel Core Ultra 5 125H
0.4898 sec *
Geekom XT13 Pro
Intel Core i9-13900H
0.4693 sec * +4%
Acemagic F2A
Intel Core Ultra 7 155H
0.4652 sec * +5%
Geekom AX8 Pro
AMD Ryzen 9 8945H
0.4576 sec * +7%
Asus ROG NUC 14-90AS0051
Intel Core Ultra 9 185H
0.4489 sec * +8%
HP Pro Mini 400 G9-937U0EA
Intel Core i5-14500T
0.4457 sec * +9%
HP Elite Mini 800 G9-5M9X6EA
Intel Core i5-14500
0.4356 sec * +11%
Geekom AE7
AMD Ryzen 9 7940HS
0.4346 sec * +11%
GMK NucBox K6
AMD Ryzen 7 7840HS
0.4343 sec * +11%
Beelink SER8
AMD Ryzen 7 8845HS
0.4336 sec * +11%
Minisforum G7 PT
AMD Ryzen 9 7945HX
0.406 sec * +17%
Lenovo ThinkStation P3 Tiny-30H0006AGE
Intel Core i9-14900
0.3803 sec * +22%
HP Z2 Mini G9-996Q4ET
Intel Core i7-14700K
0.3788 sec * +23%
CPU Performance Rating: Percent
Cinebench R23: Multi Core | Single Core
Cinebench R20: CPU (Multi Core) | CPU (Single Core)
Cinebench R15: CPU Multi 64Bit | CPU Single 64Bit
Blender: v2.79 BMW27 CPU
7-Zip 18.03: 7z b 4 | 7z b 4 -mmt1
Geekbench 6.3: Multi-Core | Single-Core
Geekbench 5.5: Multi-Core | Single-Core
HWBOT x265 Benchmark v2.2: 4k Preset
LibreOffice : 20 Documents To PDF
R Benchmark 2.5: Overall mean

* ... más pequeño es mejor

Cinebench R15 CPU Multi 64Bit
1966 Points
Cinebench R15 OpenGL 64Bit
144 fps
Cinebench R15 Ref. Match 64Bit
97.8 %
Cinebench R15 CPU Single 64Bit
251 Points
Cinebench R20 CPU (Multi Core)
4948 Points
Cinebench R20 CPU (Single Core)
664 Points
Cinebench R23 Single Core
1735 Points
Cinebench R23 Multi Core
12989 Points
Cinebench 2024 CPU Single Core
102.2 Points
Cinebench 2024 CPU Multi Core
668 Points
ayuda
Performance Rating
Beelink SER8
AMD Ryzen 7 8845HS, Radeon 780M
98.4 pt
BOSGAME M1
AMD Ryzen 7 7840HS, Radeon 780M
97.4 pt
GMK NucBox K6
AMD Ryzen 7 7840HS, Radeon 780M
95.2 pt
GMK NucBox M6
AMD Ryzen 5 6600H, Radeon 660M
60.5 pt
GMK NucBox K9
Intel Core Ultra 5 125H, Arc 7-Core
59.7 pt
Medio Intel Core Ultra 5 125H
 
56.3 pt
Beelink SEi12 Core i5-1235U
Intel Core i5-1235U, Iris Xe G7 80EUs
38.9 pt
AIDA64 / FP32 Ray-Trace
Beelink SER8
AMD Ryzen 7 8845HS, Radeon 780M
26305 KRay/s +145%
BOSGAME M1
AMD Ryzen 7 7840HS, Radeon 780M
26022 KRay/s +142%
GMK NucBox K6
AMD Ryzen 7 7840HS, Radeon 780M
25360 KRay/s +136%
GMK NucBox M6
AMD Ryzen 5 6600H, Radeon 660M
12274 KRay/s +14%
Medio Intel Core Ultra 5 125H
  (8430 - 13639, n=6)
10907 KRay/s +1%
GMK NucBox K9
Intel Core Ultra 5 125H, Arc 7-Core
10755 KRay/s
Beelink SEi12 Core i5-1235U
Intel Core i5-1235U, Iris Xe G7 80EUs
6784 KRay/s -37%
AIDA64 / FPU Julia
Beelink SER8
AMD Ryzen 7 8845HS, Radeon 780M
111508 Points +91%
BOSGAME M1
AMD Ryzen 7 7840HS, Radeon 780M
110752 Points +90%
GMK NucBox K6
AMD Ryzen 7 7840HS, Radeon 780M
107805 Points +85%
GMK NucBox M6
AMD Ryzen 5 6600H, Radeon 660M
76931 Points +32%
GMK NucBox K9
Intel Core Ultra 5 125H, Arc 7-Core
58422 Points
Medio Intel Core Ultra 5 125H
  (43652 - 70880, n=6)
57140 Points -2%
Beelink SEi12 Core i5-1235U
Intel Core i5-1235U, Iris Xe G7 80EUs
34444 Points -41%
AIDA64 / CPU SHA3
Beelink SER8
AMD Ryzen 7 8845HS, Radeon 780M
4933 MB/s +69%
BOSGAME M1
AMD Ryzen 7 7840HS, Radeon 780M
4854 MB/s +66%
GMK NucBox K6
AMD Ryzen 7 7840HS, Radeon 780M
4763 MB/s +63%
GMK NucBox K9
Intel Core Ultra 5 125H, Arc 7-Core
2922 MB/s
Medio Intel Core Ultra 5 125H
  (2047 - 3404, n=6)
2752 MB/s -6%
GMK NucBox M6
AMD Ryzen 5 6600H, Radeon 660M
2650 MB/s -9%
Beelink SEi12 Core i5-1235U
Intel Core i5-1235U, Iris Xe G7 80EUs
1884 MB/s -36%
AIDA64 / CPU Queen
BOSGAME M1
AMD Ryzen 7 7840HS, Radeon 780M
117809 Points +50%
Beelink SER8
AMD Ryzen 7 8845HS, Radeon 780M
115546 Points +47%
GMK NucBox K6
AMD Ryzen 7 7840HS, Radeon 780M
111803 Points +42%
GMK NucBox M6
AMD Ryzen 5 6600H, Radeon 660M
82119 Points +4%
Medio Intel Core Ultra 5 125H
  (77892 - 79986, n=6)
78805 Points 0%
GMK NucBox K9
Intel Core Ultra 5 125H, Arc 7-Core
78797 Points
Beelink SEi12 Core i5-1235U
Intel Core i5-1235U, Iris Xe G7 80EUs
59756 Points -24%
AIDA64 / FPU SinJulia
Beelink SER8
AMD Ryzen 7 8845HS, Radeon 780M
15420 Points +98%
BOSGAME M1
AMD Ryzen 7 7840HS, Radeon 780M
14915 Points +92%
GMK NucBox K6
AMD Ryzen 7 7840HS, Radeon 780M
14721 Points +89%
GMK NucBox M6
AMD Ryzen 5 6600H, Radeon 660M
9739 Points +25%
GMK NucBox K9
Intel Core Ultra 5 125H, Arc 7-Core
7780 Points
Medio Intel Core Ultra 5 125H
  (6588 - 7851, n=6)
7398 Points -5%
Beelink SEi12 Core i5-1235U
Intel Core i5-1235U, Iris Xe G7 80EUs
4644 Points -40%
AIDA64 / FPU Mandel
Beelink SER8
AMD Ryzen 7 8845HS, Radeon 780M
59522 Points +113%
BOSGAME M1
AMD Ryzen 7 7840HS, Radeon 780M
59072 Points +111%
GMK NucBox K6
AMD Ryzen 7 7840HS, Radeon 780M
57534 Points +106%
GMK NucBox M6
AMD Ryzen 5 6600H, Radeon 660M
42406 Points +52%
GMK NucBox K9
Intel Core Ultra 5 125H, Arc 7-Core
27972 Points
Medio Intel Core Ultra 5 125H
  (21210 - 35321, n=6)
27928 Points 0%
Beelink SEi12 Core i5-1235U
Intel Core i5-1235U, Iris Xe G7 80EUs
16394 Points -41%
AIDA64 / CPU AES
Beelink SER8
AMD Ryzen 7 8845HS, Radeon 780M
172642 MB/s +59%
BOSGAME M1
AMD Ryzen 7 7840HS, Radeon 780M
166944 MB/s +54%
GMK NucBox K6
AMD Ryzen 7 7840HS, Radeon 780M
164041 MB/s +51%
GMK NucBox K9
Intel Core Ultra 5 125H, Arc 7-Core
108402 MB/s
GMK NucBox M6
AMD Ryzen 5 6600H, Radeon 660M
104138 MB/s -4%
Beelink SEi12 Core i5-1235U
Intel Core i5-1235U, Iris Xe G7 80EUs
67140 MB/s -38%
Medio Intel Core Ultra 5 125H
  (45524 - 108402, n=6)
64990 MB/s -40%
AIDA64 / CPU ZLib
Beelink SER8
AMD Ryzen 7 8845HS, Radeon 780M
1073 MB/s +27%
BOSGAME M1
AMD Ryzen 7 7840HS, Radeon 780M
1051 MB/s +25%
GMK NucBox K6
AMD Ryzen 7 7840HS, Radeon 780M
1031 MB/s +22%
GMK NucBox K9
Intel Core Ultra 5 125H, Arc 7-Core
844 MB/s
Medio Intel Core Ultra 5 125H
  (594 - 994, n=6)
806 MB/s -5%
GMK NucBox M6
AMD Ryzen 5 6600H, Radeon 660M
660 MB/s -22%
Beelink SEi12 Core i5-1235U
Intel Core i5-1235U, Iris Xe G7 80EUs
633 MB/s -25%
AIDA64 / FP64 Ray-Trace
Beelink SER8
AMD Ryzen 7 8845HS, Radeon 780M
14041 KRay/s +148%
BOSGAME M1
AMD Ryzen 7 7840HS, Radeon 780M
13897 KRay/s +146%
GMK NucBox K6
AMD Ryzen 7 7840HS, Radeon 780M
13642 KRay/s +141%
GMK NucBox M6
AMD Ryzen 5 6600H, Radeon 660M
6588 KRay/s +16%
Medio Intel Core Ultra 5 125H
  (4345 - 7221, n=6)
5677 KRay/s 0%
GMK NucBox K9
Intel Core Ultra 5 125H, Arc 7-Core
5657 KRay/s
Beelink SEi12 Core i5-1235U
Intel Core i5-1235U, Iris Xe G7 80EUs
3532 KRay/s -38%
AIDA64 / CPU PhotoWorxx
Medio Intel Core Ultra 5 125H
  (45724 - 49844, n=6)
47064 MPixel/s +2%
GMK NucBox K9
Intel Core Ultra 5 125H, Arc 7-Core
46296 MPixel/s
BOSGAME M1
AMD Ryzen 7 7840HS, Radeon 780M
41516 MPixel/s -10%
GMK NucBox K6
AMD Ryzen 7 7840HS, Radeon 780M
40760 MPixel/s -12%
Beelink SER8
AMD Ryzen 7 8845HS, Radeon 780M
40489 MPixel/s -13%
GMK NucBox M6
AMD Ryzen 5 6600H, Radeon 660M
29621 MPixel/s -36%
Beelink SEi12 Core i5-1235U
Intel Core i5-1235U, Iris Xe G7 80EUs
29523 MPixel/s -36%

Prueba de estrés

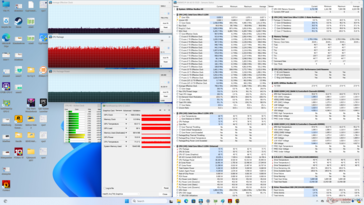
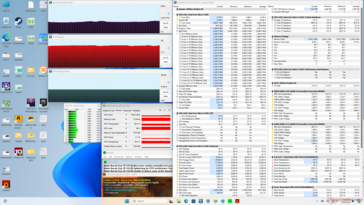
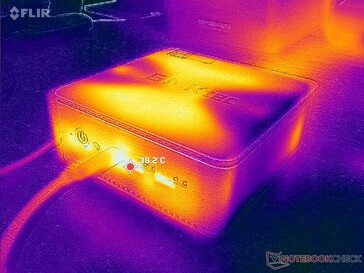
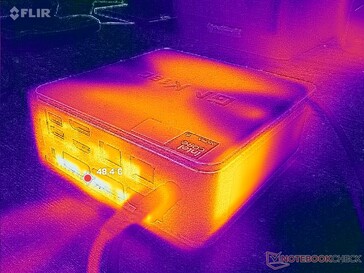
Al iniciar el estrés Prime95, la CPU aumentaría a 2,3 GHz y 45 W y luego mantendría esos valores durante toda la prueba de estrés. La temperatura del núcleo se estabilizaría en 80 C, que es ligeramente más fría que la que registramos en la NucBox K6, más rápida y alimentada por AMD.

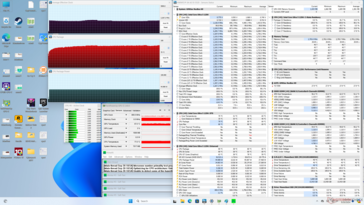
Cuando se ejecuta Cyberpunk 2077 para representar el estrés de juego, la temperatura del núcleo se estabilizaría en 72 C para ser similar a la NucBox K6 a pesar de que la NucBox K9 ejecuta los juegos más lento como nuestra sección de Rendimiento de Juego a continuación mostrará.

Sistema inactivo
Sistema inactivo
La tensión de Cyberpunk 2077
Prime95 estrés
Prime95 estrés
Prime95+Tensión FurMark
Reloj medio de la CPU (GHz) Reloj de la GPU (MHz) Temperatura media de la CPU (°C)
Sistema en reposo -- -- 40
Prime95 Stress 2.3 -- 79
Prime95 + FurMark Stress 2.2 1150 79
Cyberpunk 2077 Estrés 0.9 1600 72

Rendimiento del sistema

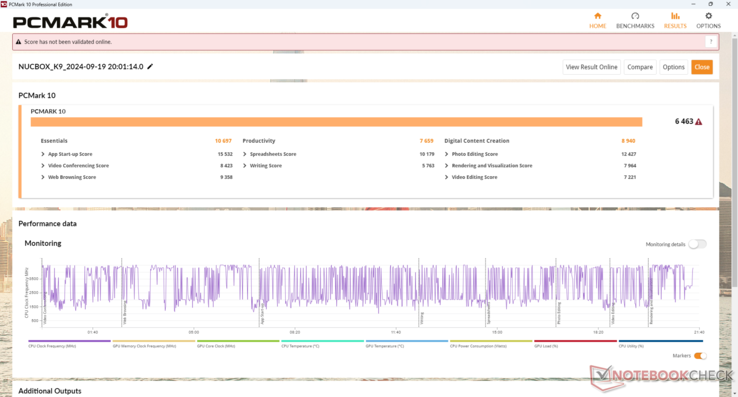
Las puntuaciones de PCMark 10 son generalmente más bajas que en el NucBox K6 especialmente en la subprueba de Productividad donde se favorece el rendimiento multinúcleo
PCMark 10 / Score
Beelink SER8
Radeon 780M, R7 8845HS, Crucial P3 Plus CT1000P3PSSD8
7641 Points +18%
GMK NucBox K6
Radeon 780M, R7 7840HS, MasonSemi 1TB MC7000
7529 Points +16%
BOSGAME M1
Radeon 780M, R7 7840HS
7198 Points +11%
GMK NucBox K9
Arc 7-Core, Ultra 5 125H, MasonSemi 1TB MC7000
6463 Points
Medio Intel Core Ultra 5 125H, Intel Arc 7-Core iGPU
  (6194 - 6463, n=6)
6320 Points -2%
GMK NucBox M6
Radeon 660M, R5 6600H, AirDisk APF 10-512G
6220 Points -4%
Beelink SEi12 Core i5-1235U
Iris Xe G7 80EUs, i5-1235U, Kingston NV1 SNVS/500GCN
5543 Points -14%
PCMark 10 / Essentials
Beelink SER8
Radeon 780M, R7 8845HS, Crucial P3 Plus CT1000P3PSSD8
11570 Points +8%
GMK NucBox K6
Radeon 780M, R7 7840HS, MasonSemi 1TB MC7000
11214 Points +5%
BOSGAME M1
Radeon 780M, R7 7840HS
11211 Points +5%
Beelink SEi12 Core i5-1235U
Iris Xe G7 80EUs, i5-1235U, Kingston NV1 SNVS/500GCN
10845 Points +1%
GMK NucBox K9
Arc 7-Core, Ultra 5 125H, MasonSemi 1TB MC7000
10697 Points
GMK NucBox M6
Radeon 660M, R5 6600H, AirDisk APF 10-512G
10360 Points -3%
Medio Intel Core Ultra 5 125H, Intel Arc 7-Core iGPU
  (9427 - 10697, n=6)
10178 Points -5%
PCMark 10 / Productivity
GMK NucBox K6
Radeon 780M, R7 7840HS, MasonSemi 1TB MC7000
10591 Points +38%
Beelink SER8
Radeon 780M, R7 8845HS, Crucial P3 Plus CT1000P3PSSD8
10457 Points +37%
BOSGAME M1
Radeon 780M, R7 7840HS
9075 Points +18%
GMK NucBox M6
Radeon 660M, R5 6600H, AirDisk APF 10-512G
9059 Points +18%
Medio Intel Core Ultra 5 125H, Intel Arc 7-Core iGPU
  (7042 - 8000, n=6)
7691 Points 0%
GMK NucBox K9
Arc 7-Core, Ultra 5 125H, MasonSemi 1TB MC7000
7659 Points
Beelink SEi12 Core i5-1235U
Iris Xe G7 80EUs, i5-1235U, Kingston NV1 SNVS/500GCN
7354 Points -4%
PCMark 10 / Digital Content Creation
Beelink SER8
Radeon 780M, R7 8845HS, Crucial P3 Plus CT1000P3PSSD8
10009 Points +12%
BOSGAME M1
Radeon 780M, R7 7840HS
9948 Points +11%
GMK NucBox K6
Radeon 780M, R7 7840HS, MasonSemi 1TB MC7000
9752 Points +9%
GMK NucBox K9
Arc 7-Core, Ultra 5 125H, MasonSemi 1TB MC7000
8940 Points
Medio Intel Core Ultra 5 125H, Intel Arc 7-Core iGPU
  (8198 - 9506, n=6)
8775 Points -2%
GMK NucBox M6
Radeon 660M, R5 6600H, AirDisk APF 10-512G
6959 Points -22%
Beelink SEi12 Core i5-1235U
Iris Xe G7 80EUs, i5-1235U, Kingston NV1 SNVS/500GCN
5798 Points -35%
CrossMark / Overall
BOSGAME M1
Radeon 780M, R7 7840HS
1891 Points +16%
Beelink SER8
Radeon 780M, R7 8845HS, Crucial P3 Plus CT1000P3PSSD8
1875 Points +15%
GMK NucBox K6
Radeon 780M, R7 7840HS, MasonSemi 1TB MC7000
1873 Points +15%
Beelink SEi12 Core i5-1235U
Iris Xe G7 80EUs, i5-1235U, Kingston NV1 SNVS/500GCN
1644 Points +1%
GMK NucBox K9
Arc 7-Core, Ultra 5 125H, MasonSemi 1TB MC7000
1633 Points
Medio Intel Core Ultra 5 125H, Intel Arc 7-Core iGPU
  (1522 - 1633, n=5)
1574 Points -4%
GMK NucBox M6
Radeon 660M, R5 6600H, AirDisk APF 10-512G
1521 Points -7%
CrossMark / Productivity
BOSGAME M1
Radeon 780M, R7 7840HS
1823 Points +14%
GMK NucBox K6
Radeon 780M, R7 7840HS, MasonSemi 1TB MC7000
1816 Points +14%
Beelink SER8
Radeon 780M, R7 8845HS, Crucial P3 Plus CT1000P3PSSD8
1802 Points +13%
Beelink SEi12 Core i5-1235U
Iris Xe G7 80EUs, i5-1235U, Kingston NV1 SNVS/500GCN
1676 Points +5%
GMK NucBox K9
Arc 7-Core, Ultra 5 125H, MasonSemi 1TB MC7000
1594 Points
GMK NucBox M6
Radeon 660M, R5 6600H, AirDisk APF 10-512G
1517 Points -5%
Medio Intel Core Ultra 5 125H, Intel Arc 7-Core iGPU
  (1432 - 1594, n=5)
1510 Points -5%
CrossMark / Creativity
BOSGAME M1
Radeon 780M, R7 7840HS
2013 Points +17%
Beelink SER8
Radeon 780M, R7 8845HS, Crucial P3 Plus CT1000P3PSSD8
2009 Points +17%
GMK NucBox K6
Radeon 780M, R7 7840HS, MasonSemi 1TB MC7000
1994 Points +16%
Medio Intel Core Ultra 5 125H, Intel Arc 7-Core iGPU
  (1683 - 1765, n=5)
1729 Points +1%
GMK NucBox K9
Arc 7-Core, Ultra 5 125H, MasonSemi 1TB MC7000
1714 Points
GMK NucBox M6
Radeon 660M, R5 6600H, AirDisk APF 10-512G
1567 Points -9%
Beelink SEi12 Core i5-1235U
Iris Xe G7 80EUs, i5-1235U, Kingston NV1 SNVS/500GCN
1546 Points -10%
CrossMark / Responsiveness
Beelink SEi12 Core i5-1235U
Iris Xe G7 80EUs, i5-1235U, Kingston NV1 SNVS/500GCN
1867 Points +23%
BOSGAME M1
Radeon 780M, R7 7840HS
1749 Points +15%
Beelink SER8
Radeon 780M, R7 8845HS, Crucial P3 Plus CT1000P3PSSD8
1718 Points +13%
GMK NucBox K6
Radeon 780M, R7 7840HS, MasonSemi 1TB MC7000
1706 Points +12%
GMK NucBox K9
Arc 7-Core, Ultra 5 125H, MasonSemi 1TB MC7000
1520 Points
GMK NucBox M6
Radeon 660M, R5 6600H, AirDisk APF 10-512G
1407 Points -7%
Medio Intel Core Ultra 5 125H, Intel Arc 7-Core iGPU
  (1171 - 1520, n=5)
1350 Points -11%
WebXPRT 3 / Overall
Beelink SER8
Radeon 780M, R7 8845HS, Crucial P3 Plus CT1000P3PSSD8
334 Points +27%
GMK NucBox K6
Radeon 780M, R7 7840HS, MasonSemi 1TB MC7000
328 Points +25%
BOSGAME M1
Radeon 780M, R7 7840HS
319 Points +22%
Beelink SEi12 Core i5-1235U
Iris Xe G7 80EUs, i5-1235U, Kingston NV1 SNVS/500GCN
288 Points +10%
GMK NucBox K9
Arc 7-Core, Ultra 5 125H, MasonSemi 1TB MC7000
262 Points
Medio Intel Core Ultra 5 125H, Intel Arc 7-Core iGPU
  (245 - 263, n=6)
255 Points -3%
GMK NucBox M6
Radeon 660M, R5 6600H, AirDisk APF 10-512G
244 Points -7%
WebXPRT 4 / Overall
GMK NucBox K6
Radeon 780M, R7 7840HS, MasonSemi 1TB MC7000
266 Points +15%
Beelink SER8
Radeon 780M, R7 8845HS, Crucial P3 Plus CT1000P3PSSD8
266 Points +15%
BOSGAME M1
Radeon 780M, R7 7840HS
258 Points +12%
Medio Intel Core Ultra 5 125H, Intel Arc 7-Core iGPU
  (227 - 240, n=5)
233 Points +1%
Beelink SEi12 Core i5-1235U
Iris Xe G7 80EUs, i5-1235U, Kingston NV1 SNVS/500GCN
231 Points 0%
GMK NucBox K9
Arc 7-Core, Ultra 5 125H, MasonSemi 1TB MC7000
231 Points
GMK NucBox M6
Radeon 660M, R5 6600H, AirDisk APF 10-512G
193.4 Points -16%
Mozilla Kraken 1.1 / Total
GMK NucBox M6
Radeon 660M, R5 6600H, AirDisk APF 10-512G
604 ms * -7%
Beelink SEi12 Core i5-1235U
Iris Xe G7 80EUs, i5-1235U, Kingston NV1 SNVS/500GCN
586 ms * -4%
Medio Intel Core Ultra 5 125H, Intel Arc 7-Core iGPU
  (560 - 595, n=6)
575 ms * -2%
GMK NucBox K9
Arc 7-Core, Ultra 5 125H, MasonSemi 1TB MC7000
566 ms *
GMK NucBox K6
Radeon 780M, R7 7840HS, MasonSemi 1TB MC7000
534 ms * +6%
BOSGAME M1
Radeon 780M, R7 7840HS
526 ms * +7%
Beelink SER8
Radeon 780M, R7 8845HS, Crucial P3 Plus CT1000P3PSSD8
501 ms * +11%

* ... más pequeño es mejor

PCMark 10 Score
6463 puntos
ayuda
AIDA64 / Memory Copy
Medio Intel Core Ultra 5 125H
  (67482 - 87473, n=6)
77947 MB/s +16%
BOSGAME M1
AMD Ryzen 7 7840HS, Radeon 780M
69508 MB/s +3%
GMK NucBox K6
AMD Ryzen 7 7840HS, Radeon 780M
69281 MB/s +3%
Beelink SER8
AMD Ryzen 7 8845HS, Radeon 780M
68283 MB/s +1%
GMK NucBox K9
Intel Core Ultra 5 125H, Arc 7-Core
67482 MB/s
GMK NucBox M6
AMD Ryzen 5 6600H, Radeon 660M
50886 MB/s -25%
Beelink SEi12 Core i5-1235U
Intel Core i5-1235U, Iris Xe G7 80EUs
43215 MB/s -36%
AIDA64 / Memory Read
Medio Intel Core Ultra 5 125H
  (70520 - 76803, n=6)
74300 MB/s +5%
GMK NucBox K9
Intel Core Ultra 5 125H, Arc 7-Core
70520 MB/s
Beelink SER8
AMD Ryzen 7 8845HS, Radeon 780M
61976 MB/s -12%
BOSGAME M1
AMD Ryzen 7 7840HS, Radeon 780M
61765 MB/s -12%
GMK NucBox K6
AMD Ryzen 7 7840HS, Radeon 780M
61708 MB/s -12%
GMK NucBox M6
AMD Ryzen 5 6600H, Radeon 660M
51684 MB/s -27%
Beelink SEi12 Core i5-1235U
Intel Core i5-1235U, Iris Xe G7 80EUs
46616 MB/s -34%
AIDA64 / Memory Write
BOSGAME M1
AMD Ryzen 7 7840HS, Radeon 780M
86719 MB/s +22%
GMK NucBox K6
AMD Ryzen 7 7840HS, Radeon 780M
86528 MB/s +21%
Beelink SER8
AMD Ryzen 7 8845HS, Radeon 780M
85464 MB/s +20%
GMK NucBox K9
Intel Core Ultra 5 125H, Arc 7-Core
71218 MB/s
Medio Intel Core Ultra 5 125H
  (63162 - 72443, n=6)
70040 MB/s -2%
GMK NucBox M6
AMD Ryzen 5 6600H, Radeon 660M
55160 MB/s -23%
Beelink SEi12 Core i5-1235U
Intel Core i5-1235U, Iris Xe G7 80EUs
46475 MB/s -35%
AIDA64 / Memory Latency
Medio Intel Core Ultra 5 125H
  (127.3 - 184.8, n=6)
145.5 ns * -4%
GMK NucBox K9
Intel Core Ultra 5 125H, Arc 7-Core
140.2 ns *
Beelink SEi12 Core i5-1235U
Intel Core i5-1235U, Iris Xe G7 80EUs
91.6 ns * +35%
BOSGAME M1
AMD Ryzen 7 7840HS, Radeon 780M
89.8 ns * +36%
Beelink SER8
AMD Ryzen 7 8845HS, Radeon 780M
88.9 ns * +37%
GMK NucBox K6
AMD Ryzen 7 7840HS, Radeon 780M
88.1 ns * +37%
GMK NucBox M6
AMD Ryzen 5 6600H, Radeon 660M
85.8 ns * +39%

* ... más pequeño es mejor

Latencia del CPD

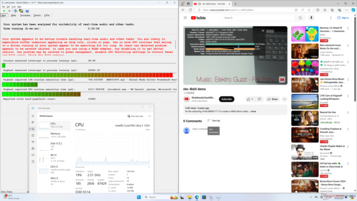
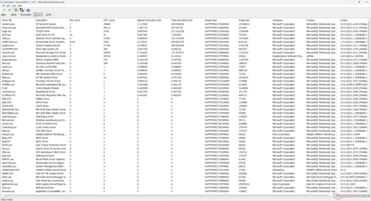
LatencyMon revela problemas de DPC relacionados con ntoskrnl.exe al abrir varias pestañas de nuestra página de inicio. por lo demás, la reproducción de vídeo 4K a 60 FPS es perfecta sin que se registren caídas de fotogramas.

LatencyMon
LatencyMon
Lista de conductores
DPC Latencies / LatencyMon - interrupt to process latency (max), Web, Youtube, Prime95
GMK NucBox K9
Arc 7-Core, Ultra 5 125H, MasonSemi 1TB MC7000
29083.3 μs *
GMK NucBox M6
Radeon 660M, R5 6600H, AirDisk APF 10-512G
15043.9 μs * +48%
GMK NucBox K6
Radeon 780M, R7 7840HS, MasonSemi 1TB MC7000
10561.5 μs * +64%
BOSGAME M1
Radeon 780M, R7 7840HS
1179.5 μs * +96%
Beelink SER8
Radeon 780M, R7 8845HS, Crucial P3 Plus CT1000P3PSSD8
1071.2 μs * +96%
Beelink SEi12 Core i5-1235U
Iris Xe G7 80EUs, i5-1235U, Kingston NV1 SNVS/500GCN
830.3 μs * +97%

* ... más pequeño es mejor

Dispositivos de almacenamiento

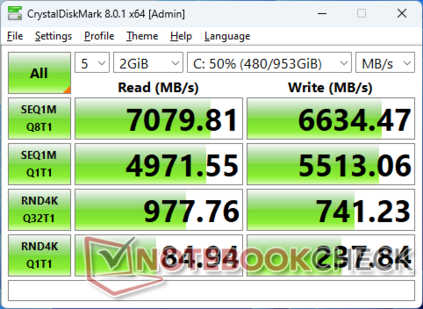
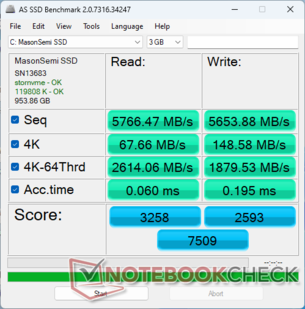
GMK utiliza el mismo 1 TB MasonSemi MC7000 PCIe4 x4 NVMe SSD para sus modelos NucBox K6 y K9. El rendimiento es rápido y comparable al de la serie Samsung PM9A1 que suele encontrarse en los PC de gama alta, a pesar de tratarse de una marca menos conocida. No observamos ninguna ralentización notable del rendimiento al ejecutar DiskSpd en bucle.

MDL 8
MDL 8
AS SSD
AS SSD
MasonSemi 1TB MC7000
CDM 5/6 Read Seq Q32T1: 7068 MB/s
CDM 5/6 Write Seq Q32T1: 6625 MB/s
CDM 5/6 Read 4K Q32T1: 972.6 MB/s
CDM 5/6 Write 4K Q32T1: 755.4 MB/s
CDM 5 Read Seq: 4954 MB/s
CDM 5 Write Seq: 5591 MB/s
CDM 5/6 Read 4K: 86.48 MB/s
CDM 5/6 Write 4K: 230.1 MB/s
Drive Performance Rating - Percent
GMK NucBox K6
MasonSemi 1TB MC7000
86.2 pt
GMK NucBox K9
MasonSemi 1TB MC7000
83.6 pt
Beelink SEi12 Core i5-1235U
Kingston NV1 SNVS/500GCN
64.2 pt
Beelink SER8
Crucial P3 Plus CT1000P3PSSD8
62.4 pt
BOSGAME M1
 
56.8 pt
GMK NucBox M6
AirDisk APF 10-512G
38.8 pt
DiskSpd
seq read
GMK NucBox K9
MasonSemi 1TB MC7000
3783 (3597.81min - 3782.84max) MB/s
GMK NucBox K6
MasonSemi 1TB MC7000
3703 (3243.89min - 3702.94max) MB/s -2%
Beelink SER8
Crucial P3 Plus CT1000P3PSSD8
3106 (3062.47min - 3106.43max) MB/s -18%
BOSGAME M1
 
2533 (2518.88min - 2532.52max) MB/s -33%
Beelink SEi12 Core i5-1235U
Kingston NV1 SNVS/500GCN
2512 (2493.51min - 2511.76max) MB/s -34%
GMK NucBox M6
AirDisk APF 10-512G
2113 (2099.24min - 2112.85max) MB/s -44%
seq write
GMK NucBox K6
MasonSemi 1TB MC7000
5595 (1443.73min - 5595.13max) MB/s +1%
GMK NucBox K9
MasonSemi 1TB MC7000
5556 (1352.45min - 5556.19max) MB/s
Beelink SER8
Crucial P3 Plus CT1000P3PSSD8
4604 (4532.99min - 4603.88max) MB/s -17%
BOSGAME M1
 
3176 (2921.36min - 3176.08max) MB/s -43%
Beelink SEi12 Core i5-1235U
Kingston NV1 SNVS/500GCN
2848 (2821.72min - 2847.93max) MB/s -49%
GMK NucBox M6
AirDisk APF 10-512G
1852 (1762.49min - 1851.99max) MB/s -67%
seq q8 t1 read
GMK NucBox K6
MasonSemi 1TB MC7000
7069 (6459.52min - 7068.99max) MB/s 0%
GMK NucBox K9
MasonSemi 1TB MC7000
7066 (6607.49min - 7066.35max) MB/s
Beelink SER8
Crucial P3 Plus CT1000P3PSSD8
5195 (4594.02min - 5195.39max) MB/s -26%
BOSGAME M1
 
4109 (3651.18min - 4108.53max) MB/s -42%
Beelink SEi12 Core i5-1235U
Kingston NV1 SNVS/500GCN
3632 (3373.44min - 3632.06max) MB/s -49%
GMK NucBox M6
AirDisk APF 10-512G
2536 (2272.68min - 2536.26max) MB/s -64%
seq q8 t1 write
GMK NucBox K6
MasonSemi 1TB MC7000
6669 (1251.16min - 6668.61max) MB/s 0%
GMK NucBox K9
MasonSemi 1TB MC7000
6647 (1260.59min - 6647.13max) MB/s
Beelink SER8
Crucial P3 Plus CT1000P3PSSD8
4725 (4657.36min - 4724.88max) MB/s -29%
BOSGAME M1
 
3187 (3142.8min - 3187.38max) MB/s -52%
Beelink SEi12 Core i5-1235U
Kingston NV1 SNVS/500GCN
2841 (2828.64min - 2841.01max) MB/s -57%
GMK NucBox M6
AirDisk APF 10-512G
1842 (1840.35min - 1842.35max) MB/s -72%
4k q1 t1 read
Beelink SER8
Crucial P3 Plus CT1000P3PSSD8
79.7 (77.93min - 79.74max) MB/s 0%
GMK NucBox K9
MasonSemi 1TB MC7000
79.5 (78.92min - 79.5max) MB/s
Beelink SEi12 Core i5-1235U
Kingston NV1 SNVS/500GCN
79.3 (78.06min - 79.29max) MB/s 0%
GMK NucBox K6
MasonSemi 1TB MC7000
71 (70.41min - 71.02max) MB/s -11%
BOSGAME M1
 
64.4 (64.2min - 64.35max) MB/s -19%
GMK NucBox M6
AirDisk APF 10-512G
54.8 (52.56min - 54.76max) MB/s -31%
4k q1 t1 write
Beelink SEi12 Core i5-1235U
Kingston NV1 SNVS/500GCN
391 (374.32min - 390.86max) MB/s +91%
Beelink SER8
Crucial P3 Plus CT1000P3PSSD8
289 (283.17min - 289.07max) MB/s +41%
BOSGAME M1
 
261 (258.95min - 260.75max) MB/s +27%
GMK NucBox K6
MasonSemi 1TB MC7000
239 (237.67min - 239.17max) MB/s +17%
GMK NucBox M6
AirDisk APF 10-512G
228 (215.43min - 228.32max) MB/s +11%
GMK NucBox K9
MasonSemi 1TB MC7000
205 (173.87min - 205.2max) MB/s
4k q32 t16 read
Beelink SER8
Crucial P3 Plus CT1000P3PSSD8
3139 (3067min - 3138.94max) MB/s +40%
GMK NucBox K6
MasonSemi 1TB MC7000
2463 (2040.37min - 2463.15max) MB/s +10%
GMK NucBox K9
MasonSemi 1TB MC7000
2243 (1941.91min - 2243.48max) MB/s
Beelink SEi12 Core i5-1235U
Kingston NV1 SNVS/500GCN
1942 (1940.61min - 1941.63max) MB/s -13%
GMK NucBox M6
AirDisk APF 10-512G
968 (965.06min - 967.94max) MB/s -57%
BOSGAME M1
 
791 (751.42min - 791.35max) MB/s -65%
4k q32 t16 write
Beelink SER8
Crucial P3 Plus CT1000P3PSSD8
4288 (4275.2min - 4287.55max) MB/s +33%
GMK NucBox K6
MasonSemi 1TB MC7000
3983 (3232.63min - 3982.67max) MB/s +23%
GMK NucBox K9
MasonSemi 1TB MC7000
3232 (3002.64min - 3232.41max) MB/s
BOSGAME M1
 
3112 (3068.44min - 3111.56max) MB/s -4%
Beelink SEi12 Core i5-1235U
Kingston NV1 SNVS/500GCN
2219 (2197.25min - 2218.83max) MB/s -31%
GMK NucBox M6
AirDisk APF 10-512G
795 (753.98min - 794.81max) MB/s -75%
AS SSD
Score Total
GMK NucBox K6
MasonSemi 1TB MC7000
7918 Points +5%
GMK NucBox K9
MasonSemi 1TB MC7000
7509 Points
Beelink SEi12 Core i5-1235U
Kingston NV1 SNVS/500GCN
4619 Points -38%
BOSGAME M1
 
4263 Points -43%
GMK NucBox M6
AirDisk APF 10-512G
2956 Points -61%
Beelink SER8
Crucial P3 Plus CT1000P3PSSD8
2646 Points -65%
Score Read
GMK NucBox K6
MasonSemi 1TB MC7000
3258 Points 0%
GMK NucBox K9
MasonSemi 1TB MC7000
3258 Points
Beelink SEi12 Core i5-1235U
Kingston NV1 SNVS/500GCN
1633 Points -50%
GMK NucBox M6
AirDisk APF 10-512G
1170 Points -64%
BOSGAME M1
 
1146 Points -65%
Beelink SER8
Crucial P3 Plus CT1000P3PSSD8
1108 Points -66%
Score Write
GMK NucBox K6
MasonSemi 1TB MC7000
3000 Points +16%
GMK NucBox K9
MasonSemi 1TB MC7000
2593 Points
BOSGAME M1
 
2547 Points -2%
Beelink SEi12 Core i5-1235U
Kingston NV1 SNVS/500GCN
2278 Points -12%
GMK NucBox M6
AirDisk APF 10-512G
1205 Points -54%
Beelink SER8
Crucial P3 Plus CT1000P3PSSD8
1057 Points -59%
Seq Read
GMK NucBox K6
MasonSemi 1TB MC7000
5825.09 MB/s +1%
GMK NucBox K9
MasonSemi 1TB MC7000
5766.47 MB/s
Beelink SER8
Crucial P3 Plus CT1000P3PSSD8
3913.46 MB/s -32%
BOSGAME M1
 
3438.69 MB/s -40%
Beelink SEi12 Core i5-1235U
Kingston NV1 SNVS/500GCN
3206.84 MB/s -44%
GMK NucBox M6
AirDisk APF 10-512G
2261.02 MB/s -61%
Seq Write
GMK NucBox K6
MasonSemi 1TB MC7000
5783.3 MB/s +2%
GMK NucBox K9
MasonSemi 1TB MC7000
5653.88 MB/s
BOSGAME M1
 
2877.44 MB/s -49%
Beelink SER8
Crucial P3 Plus CT1000P3PSSD8
1944.73 MB/s -66%
GMK NucBox M6
AirDisk APF 10-512G
1730.13 MB/s -69%
Beelink SEi12 Core i5-1235U
Kingston NV1 SNVS/500GCN
463.76 MB/s -92%
4K Read
GMK NucBox K9
MasonSemi 1TB MC7000
67.66 MB/s
GMK NucBox K6
MasonSemi 1TB MC7000
65.5 MB/s -3%
Beelink SEi12 Core i5-1235U
Kingston NV1 SNVS/500GCN
59.54 MB/s -12%
Beelink SER8
Crucial P3 Plus CT1000P3PSSD8
51.6 MB/s -24%
BOSGAME M1
 
48.27 MB/s -29%
GMK NucBox M6
AirDisk APF 10-512G
47.34 MB/s -30%
4K Write
Beelink SEi12 Core i5-1235U
Kingston NV1 SNVS/500GCN
280.94 MB/s +89%
Beelink SER8
Crucial P3 Plus CT1000P3PSSD8
219.02 MB/s +47%
GMK NucBox M6
AirDisk APF 10-512G
200.73 MB/s +35%
GMK NucBox K6
MasonSemi 1TB MC7000
190.06 MB/s +28%
GMK NucBox K9
MasonSemi 1TB MC7000
148.58 MB/s
BOSGAME M1
 
114.69 MB/s -23%
4K-64 Read
GMK NucBox K9
MasonSemi 1TB MC7000
2614.06 MB/s
GMK NucBox K6
MasonSemi 1TB MC7000
2610.4 MB/s 0%
Beelink SEi12 Core i5-1235U
Kingston NV1 SNVS/500GCN
1252.33 MB/s -52%
GMK NucBox M6
AirDisk APF 10-512G
896.13 MB/s -66%
BOSGAME M1
 
754.28 MB/s -71%
Beelink SER8
Crucial P3 Plus CT1000P3PSSD8
664.76 MB/s -75%
4K-64 Write
GMK NucBox K6
MasonSemi 1TB MC7000
2231.47 MB/s +19%
BOSGAME M1
 
2144.62 MB/s +14%
Beelink SEi12 Core i5-1235U
Kingston NV1 SNVS/500GCN
1950.21 MB/s +4%
GMK NucBox K9
MasonSemi 1TB MC7000
1879.53 MB/s
GMK NucBox M6
AirDisk APF 10-512G
831.16 MB/s -56%
Beelink SER8
Crucial P3 Plus CT1000P3PSSD8
643.31 MB/s -66%
Access Time Read
BOSGAME M1
 
0.088 ms * -47%
GMK NucBox K6
MasonSemi 1TB MC7000
0.079 ms * -32%
GMK NucBox M6
AirDisk APF 10-512G
0.077 ms * -28%
Beelink SER8
Crucial P3 Plus CT1000P3PSSD8
0.077 ms * -28%
GMK NucBox K9
MasonSemi 1TB MC7000
0.06 ms *
Beelink SEi12 Core i5-1235U
Kingston NV1 SNVS/500GCN
0.049 ms * +18%
Access Time Write
GMK NucBox M6
AirDisk APF 10-512G
0.351 ms * -80%
GMK NucBox K6
MasonSemi 1TB MC7000
0.196 ms * -1%
GMK NucBox K9
MasonSemi 1TB MC7000
0.195 ms *
Beelink SER8
Crucial P3 Plus CT1000P3PSSD8
0.075 ms * +62%
Beelink SEi12 Core i5-1235U
Kingston NV1 SNVS/500GCN
0.07 ms * +64%
BOSGAME M1
 
0.058 ms * +70%

* ... más pequeño es mejor

Disk Throttling: DiskSpd Read Loop, Queue Depth 8

035571010651420177521302485284031953550390542604615497053255680603563906745Tooltip
GMK NucBox K9 MasonSemi 1TB MC7000; diskspd 2.0.17 f: Ø7053 (6435.53-7074.85)
GMK NucBox K6 MasonSemi 1TB MC7000; diskspd 2.0.17 f: Ø7035 (6458.68-7055.24)

Rendimiento de la GPU

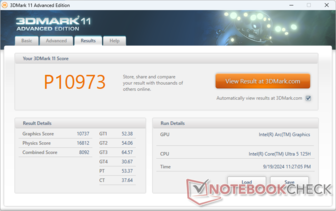
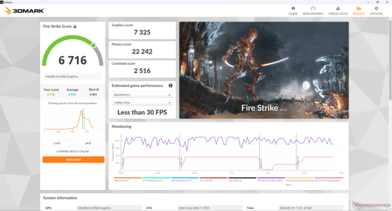
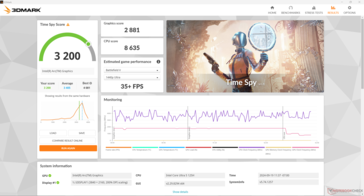
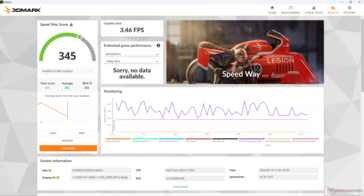
El rendimiento gráfico es ligeramente más lento que el del PC medio de nuestra base de datos con el mismo arc 7 integrado En aproximadamente un 5%. La GPU Arc 8 integrada en los procesadores Core Ultra 7-H y Core Ultra 9-H de gama alta es más rápida que nuestra solución Arc 7 en aproximadamente un 15 por ciento, pero lamentablemente no hay SKU de este tipo disponibles con la NucBox K9. No obstante, el rendimiento general es comparable al de la competencia de última generación Radeon 780M según las pruebas de rendimiento 3DMark.

3DMark 11
3DMark 11
Fire Strike
Fire Strike
Time Spy
Time Spy
Vía rápida
Vía rápida
3DMark Performance Rating - Percent
Beelink SER8
AMD Radeon 780M, AMD Ryzen 7 8845HS
94.5 pt
Framework Laptop 13.5 Core Ultra 7 155H
Intel Arc 8-Core iGPU, Intel Core Ultra 7 155H
94.1 pt
Geekom AE7
AMD Radeon 780M, AMD Ryzen 9 7940HS
93.7 pt
Lenovo ThinkStation P3 Tiny-30H0006AGE
NVIDIA T1000, Intel Core i9-14900
92.9 pt
GMK NucBox K6 -1!
AMD Radeon 780M, AMD Ryzen 7 7840HS
91.9 pt
Geekom AX8 Pro
AMD Radeon 780M, AMD Ryzen 9 8945H
90.2 pt
Asus NUC 14 Pro
Intel Arc 7-Core iGPU, Intel Core Ultra 5 125H
89.1 pt
Medio Intel Arc 7-Core iGPU
 
86.8 pt
GMK NucBox K9
Intel Arc 7-Core iGPU, Intel Core Ultra 5 125H
81.6 pt
Geekom XT13 Pro
Intel Iris Xe Graphics G7 96EUs, Intel Core i9-13900H
57.5 pt
GMK NucBox M6
AMD Radeon 660M, AMD Ryzen 5 6600H
52.9 pt
Beelink SEi12 Core i5-1235U
Intel Iris Xe Graphics G7 80EUs, Intel Core i5-1235U
38.7 pt
HP Pro Mini 400 G9-937U0EA
Intel UHD Graphics 770, Intel Core i5-14500T
26.4 pt
HP Elite Mini 800 G9-5M9X6EA
Intel UHD Graphics 770, Intel Core i5-14500
26.2 pt
Newsmay AC8F-POE
Intel UHD Graphics 24EUs (Alder Lake-N), Intel Processor N100
11.4 pt
3DMark 11 - 1280x720 Performance GPU
Geekom AE7
AMD Radeon 780M, AMD Ryzen 9 7940HS
13824 Points +29%
GMK NucBox K6
AMD Radeon 780M, AMD Ryzen 7 7840HS
13716 Points +28%
Beelink SER8
AMD Radeon 780M, AMD Ryzen 7 8845HS
13673 Points +27%
Geekom AX8 Pro
AMD Radeon 780M, AMD Ryzen 9 8945H
13281 Points +24%
Framework Laptop 13.5 Core Ultra 7 155H
Intel Arc 8-Core iGPU, Intel Core Ultra 7 155H
12739 Points +19%
Lenovo ThinkStation P3 Tiny-30H0006AGE
NVIDIA T1000, Intel Core i9-14900
11793 Points +10%
Asus NUC 14 Pro
Intel Arc 7-Core iGPU, Intel Core Ultra 5 125H
11785 Points +10%
Medio Intel Arc 7-Core iGPU
  (10303 - 12061, n=6)
11314 Points +5%
GMK NucBox K9
Intel Arc 7-Core iGPU, Intel Core Ultra 5 125H
10737 Points
Geekom XT13 Pro
Intel Iris Xe Graphics G7 96EUs, Intel Core i9-13900H
7428 Points -31%
GMK NucBox M6
AMD Radeon 660M, AMD Ryzen 5 6600H
7184 Points -33%
Beelink SEi12 Core i5-1235U
Intel Iris Xe Graphics G7 80EUs, Intel Core i5-1235U
5054 Points -53%
HP Elite Mini 800 G9-5M9X6EA
Intel UHD Graphics 770, Intel Core i5-14500
3428 Points -68%
HP Pro Mini 400 G9-937U0EA
Intel UHD Graphics 770, Intel Core i5-14500T
3422 Points -68%
Newsmay AC8F-POE
Intel UHD Graphics 24EUs (Alder Lake-N), Intel Processor N100
1458 Points -86%
3DMark
1280x720 Cloud Gate Standard Graphics
Beelink SER8
AMD Radeon 780M, AMD Ryzen 7 8845HS
53347 Points +34%
Lenovo ThinkStation P3 Tiny-30H0006AGE
NVIDIA T1000, Intel Core i9-14900
50553 Points +27%
Geekom AE7
AMD Radeon 780M, AMD Ryzen 9 7940HS
49777 Points +25%
Geekom AX8 Pro
AMD Radeon 780M, AMD Ryzen 9 8945H
48166 Points +21%
Framework Laptop 13.5 Core Ultra 7 155H
Intel Arc 8-Core iGPU, Intel Core Ultra 7 155H
42140 Points +6%
Asus NUC 14 Pro
Intel Arc 7-Core iGPU, Intel Core Ultra 5 125H
41975 Points +6%
Medio Intel Arc 7-Core iGPU
  (39695 - 45644, n=4)
41850 Points +5%
GMK NucBox K9
Intel Arc 7-Core iGPU, Intel Core Ultra 5 125H
39695 Points
Geekom XT13 Pro
Intel Iris Xe Graphics G7 96EUs, Intel Core i9-13900H
34469 Points -13%
GMK NucBox M6
AMD Radeon 660M, AMD Ryzen 5 6600H
31849 Points -20%
Beelink SEi12 Core i5-1235U
Intel Iris Xe Graphics G7 80EUs, Intel Core i5-1235U
22363 Points -44%
HP Pro Mini 400 G9-937U0EA
Intel UHD Graphics 770, Intel Core i5-14500T
16983 Points -57%
HP Elite Mini 800 G9-5M9X6EA
Intel UHD Graphics 770, Intel Core i5-14500
16443 Points -59%
Newsmay AC8F-POE
Intel UHD Graphics 24EUs (Alder Lake-N), Intel Processor N100
7970 Points -80%
1920x1080 Fire Strike Graphics
Beelink SER8
AMD Radeon 780M, AMD Ryzen 7 8845HS
8572 Points +17%
Framework Laptop 13.5 Core Ultra 7 155H
Intel Arc 8-Core iGPU, Intel Core Ultra 7 155H
8513 Points +16%
Lenovo ThinkStation P3 Tiny-30H0006AGE
NVIDIA T1000, Intel Core i9-14900
8450 Points +15%
Geekom AE7
AMD Radeon 780M, AMD Ryzen 9 7940HS
8437 Points +15%
GMK NucBox K6
AMD Radeon 780M, AMD Ryzen 7 7840HS
8164 Points +11%
Geekom AX8 Pro
AMD Radeon 780M, AMD Ryzen 9 8945H
8117 Points +11%
Medio Intel Arc 7-Core iGPU
  (7047 - 8531, n=6)
7945 Points +8%
Asus NUC 14 Pro
Intel Arc 7-Core iGPU, Intel Core Ultra 5 125H
7900 Points +8%
GMK NucBox K9
Intel Arc 7-Core iGPU, Intel Core Ultra 5 125H
7325 Points
Geekom XT13 Pro
Intel Iris Xe Graphics G7 96EUs, Intel Core i9-13900H
5845 Points -20%
GMK NucBox M6
AMD Radeon 660M, AMD Ryzen 5 6600H
4984 Points -32%
Beelink SEi12 Core i5-1235U
Intel Iris Xe Graphics G7 80EUs, Intel Core i5-1235U
3939 Points -46%
HP Elite Mini 800 G9-5M9X6EA
Intel UHD Graphics 770, Intel Core i5-14500
2655 Points -64%
HP Pro Mini 400 G9-937U0EA
Intel UHD Graphics 770, Intel Core i5-14500T
2655 Points -64%
Newsmay AC8F-POE
Intel UHD Graphics 24EUs (Alder Lake-N), Intel Processor N100
1122 Points -85%
2560x1440 Time Spy Graphics
Framework Laptop 13.5 Core Ultra 7 155H
Intel Arc 8-Core iGPU, Intel Core Ultra 7 155H
3401 Points +18%
Asus NUC 14 Pro
Intel Arc 7-Core iGPU, Intel Core Ultra 5 125H
3205 Points +11%
Lenovo ThinkStation P3 Tiny-30H0006AGE
NVIDIA T1000, Intel Core i9-14900
3088 Points +7%
Medio Intel Arc 7-Core iGPU
  (2796 - 3319, n=6)
3075 Points +7%
Geekom AE7
AMD Radeon 780M, AMD Ryzen 9 7940HS
2970 Points +3%
Beelink SER8
AMD Radeon 780M, AMD Ryzen 7 8845HS
2917 Points +1%
GMK NucBox K6
AMD Radeon 780M, AMD Ryzen 7 7840HS
2906 Points +1%
GMK NucBox K9
Intel Arc 7-Core iGPU, Intel Core Ultra 5 125H
2881 Points
Geekom AX8 Pro
AMD Radeon 780M, AMD Ryzen 9 8945H
2852 Points -1%
Geekom XT13 Pro
Intel Iris Xe Graphics G7 96EUs, Intel Core i9-13900H
1682 Points -42%
GMK NucBox M6
AMD Radeon 660M, AMD Ryzen 5 6600H
1582 Points -45%
Beelink SEi12 Core i5-1235U
Intel Iris Xe Graphics G7 80EUs, Intel Core i5-1235U
1147 Points -60%
HP Elite Mini 800 G9-5M9X6EA
Intel UHD Graphics 770, Intel Core i5-14500
737 Points -74%
HP Pro Mini 400 G9-937U0EA
Intel UHD Graphics 770, Intel Core i5-14500T
731 Points -75%
Newsmay AC8F-POE
Intel UHD Graphics 24EUs (Alder Lake-N), Intel Processor N100
304 Points -89%
2560x1440 Time Spy Score
Framework Laptop 13.5 Core Ultra 7 155H
Intel Arc 8-Core iGPU, Intel Core Ultra 7 155H
3725 Points +16%
Asus NUC 14 Pro
Intel Arc 7-Core iGPU, Intel Core Ultra 5 125H
3540 Points +11%
Lenovo ThinkStation P3 Tiny-30H0006AGE
NVIDIA T1000, Intel Core i9-14900
3534 Points +10%
Medio Intel Arc 7-Core iGPU
  (3121 - 3658, n=6)
3379 Points +6%
Geekom AE7
AMD Radeon 780M, AMD Ryzen 9 7940HS
3335 Points +4%
Beelink SER8
AMD Radeon 780M, AMD Ryzen 7 8845HS
3274 Points +2%
GMK NucBox K6
AMD Radeon 780M, AMD Ryzen 7 7840HS
3260 Points +2%
Geekom AX8 Pro
AMD Radeon 780M, AMD Ryzen 9 8945H
3206 Points 0%
GMK NucBox K9
Intel Arc 7-Core iGPU, Intel Core Ultra 5 125H
3200 Points
Geekom XT13 Pro
Intel Iris Xe Graphics G7 96EUs, Intel Core i9-13900H
1920 Points -40%
GMK NucBox M6
AMD Radeon 660M, AMD Ryzen 5 6600H
1793 Points -44%
Beelink SEi12 Core i5-1235U
Intel Iris Xe Graphics G7 80EUs, Intel Core i5-1235U
1311 Points -59%
HP Elite Mini 800 G9-5M9X6EA
Intel UHD Graphics 770, Intel Core i5-14500
855 Points -73%
HP Pro Mini 400 G9-937U0EA
Intel UHD Graphics 770, Intel Core i5-14500T
847 Points -74%
Newsmay AC8F-POE
Intel UHD Graphics 24EUs (Alder Lake-N), Intel Processor N100
345 Points -89%
3DMark 11 Performance
10973 puntos
3DMark Cloud Gate Standard Score
28997 puntos
3DMark Fire Strike Score
6716 puntos
3DMark Time Spy Score
3200 puntos
3DMark Steel Nomad Score
581 puntos
ayuda
Blender
v3.3 Classroom OPTIX/RTX
Lenovo ThinkStation P3 Tiny-30H0006AGE
NVIDIA T1000, Intel Core i9-14900
159 Seconds *
v3.3 Classroom CUDA
Lenovo ThinkStation P3 Tiny-30H0006AGE
NVIDIA T1000, Intel Core i9-14900
159 Seconds *
v3.3 Classroom CPU
Newsmay AC8F-POE
Intel UHD Graphics 24EUs (Alder Lake-N), Intel Processor N100
3015 Seconds * -593%
Beelink SEi12 Core i5-1235U
Intel Iris Xe Graphics G7 80EUs, Intel Core i5-1235U
707 Seconds * -63%
Medio Intel Arc 7-Core iGPU
  (391 - 671, n=6)
514 Seconds * -18%
HP Pro Mini 400 G9-937U0EA
Intel UHD Graphics 770, Intel Core i5-14500T
513 Seconds * -18%
GMK NucBox M6
AMD Radeon 660M, AMD Ryzen 5 6600H
497 Seconds * -14%
Framework Laptop 13.5 Core Ultra 7 155H
Intel Arc 8-Core iGPU, Intel Core Ultra 7 155H
451 Seconds * -4%
GMK NucBox K9
Intel Arc 7-Core iGPU, Intel Core Ultra 5 125H
435 Seconds *
Asus NUC 14 Pro
Intel Arc 7-Core iGPU, Intel Core Ultra 5 125H
399 Seconds * +8%
HP Elite Mini 800 G9-5M9X6EA
Intel UHD Graphics 770, Intel Core i5-14500
396 Seconds * +9%
GMK NucBox K6
AMD Radeon 780M, AMD Ryzen 7 7840HS
327 Seconds * +25%
Geekom AX8 Pro
AMD Radeon 780M, AMD Ryzen 9 8945H
326 Seconds * +25%
Geekom AE7
AMD Radeon 780M, AMD Ryzen 9 7940HS
314 Seconds * +28%
Beelink SER8
AMD Radeon 780M, AMD Ryzen 7 8845HS
310 Seconds * +29%
Lenovo ThinkStation P3 Tiny-30H0006AGE
NVIDIA T1000, Intel Core i9-14900
263 Seconds * +40%
v3.3 Classroom oneAPI/Intel
GMK NucBox K9
Intel Arc 7-Core iGPU, Intel Core Ultra 5 125H
308 Seconds *
Medio Intel Arc 7-Core iGPU
  ()
308 Seconds * -0%
Framework Laptop 13.5 Core Ultra 7 155H
Intel Arc 8-Core iGPU, Intel Core Ultra 7 155H
235 Seconds * +24%

* ... más pequeño es mejor

Rendimiento en juegos

Desafortunadamente, el rendimiento en juegos es mucho más lento en comparación con la NucBox K6 aunque los resultados 3DMark anteriores sugieran lo contrario. La mayoría de los títulos probados, incluyendo GTA V, DOTA 2 Reborn, Final Fantasy XV, F1 22 y Baldur's Gate 3 se ejecutan entre un 10 y un 40 por ciento más lentos en nuestra NucBox K9 con procesador Intel. Las velocidades de fotogramas también se tambaleaban al ralentí en Cyberpunk 2077, como muestra nuestro gráfico a continuación.

Performance Rating - Percent
BOSGAME M1 -1!
AMD Ryzen 7 7840HS, AMD Radeon 780M
99.1 pt
Beelink SER8 -1!
AMD Ryzen 7 8845HS, AMD Radeon 780M
97.7 pt
GMK NucBox K6
AMD Ryzen 7 7840HS, AMD Radeon 780M
96.2 pt
GMK NucBox K9
Intel Core Ultra 5 125H, Intel Arc 7-Core iGPU
75.7 pt
GMK NucBox M6 -1!
AMD Ryzen 5 6600H, AMD Radeon 660M
64.7 pt
Beelink SEi12 Core i5-1235U -1!
Intel Core i5-1235U, Intel Iris Xe Graphics G7 80EUs
45.4 pt
GTA V - 1920x1080 Highest Settings possible AA:4xMSAA + FX AF:16x
GMK NucBox K6
AMD Ryzen 7 7840HS, AMD Radeon 780M
26 (2.62min, 17.5P1) fps +105%
GMK NucBox K9
Intel Core Ultra 5 125H, Intel Arc 7-Core iGPU
12.7 (2.89min, 8.93P1) fps
Beelink SEi12 Core i5-1235U
Intel Core i5-1235U, Intel Iris Xe Graphics G7 80EUs
7.41 (3.52min, 4.12P1) fps -42%
Final Fantasy XV Benchmark - 1920x1080 High Quality
BOSGAME M1
AMD Ryzen 7 7840HS, AMD Radeon 780M
30.8 fps +38%
Beelink SER8
AMD Ryzen 7 8845HS, AMD Radeon 780M
29.4 fps +32%
GMK NucBox K6
AMD Ryzen 7 7840HS, AMD Radeon 780M
29.3 fps +31%
GMK NucBox K9
Intel Core Ultra 5 125H, Intel Arc 7-Core iGPU
22.3 fps
GMK NucBox M6
AMD Ryzen 5 6600H, AMD Radeon 660M
17.9 fps -20%
Beelink SEi12 Core i5-1235U
Intel Core i5-1235U, Intel Iris Xe Graphics G7 80EUs
13.5 fps -39%
Strange Brigade - 1920x1080 ultra AA:ultra AF:16
BOSGAME M1
AMD Ryzen 7 7840HS, AMD Radeon 780M
52.1 (5.2min, 33.8P1) fps +20%
Beelink SER8
AMD Ryzen 7 8845HS, AMD Radeon 780M
50.8 (24.5min, 33.9P1) fps +17%
GMK NucBox K6
AMD Ryzen 7 7840HS, AMD Radeon 780M
48.8 (11.1min, 31.1P1) fps +12%
GMK NucBox K9
Intel Core Ultra 5 125H, Intel Arc 7-Core iGPU
43.5 (8.2min, 17.8P1) fps
GMK NucBox M6
AMD Ryzen 5 6600H, AMD Radeon 660M
29.6 (21min, 24.7P1) fps -32%
Beelink SEi12 Core i5-1235U
Intel Core i5-1235U, Intel Iris Xe Graphics G7 80EUs
17.5 (5min, 5P1) fps -60%
Dota 2 Reborn - 1920x1080 ultra (3/3) best looking
Beelink SER8
AMD Ryzen 7 8845HS, AMD Radeon 780M
90.4 (71.8min) fps +23%
BOSGAME M1
AMD Ryzen 7 7840HS, AMD Radeon 780M
88.5 (78.9min) fps +21%
GMK NucBox K6
AMD Ryzen 7 7840HS, AMD Radeon 780M
87.4 (16.1min) fps +19%
GMK NucBox K9
Intel Core Ultra 5 125H, Intel Arc 7-Core iGPU
73.3 (48.5min) fps
GMK NucBox M6
AMD Ryzen 5 6600H, AMD Radeon 660M
60.8 (54.4min) fps -17%
Beelink SEi12 Core i5-1235U
Intel Core i5-1235U, Intel Iris Xe Graphics G7 80EUs
42.2 (39.3min) fps -42%
X-Plane 11.11 - 1920x1080 high (fps_test=3)
GMK NucBox K6
AMD Ryzen 7 7840HS, AMD Radeon 780M
39.7 fps +6%
Beelink SER8
AMD Ryzen 7 8845HS, AMD Radeon 780M
39.6 fps +6%
BOSGAME M1
AMD Ryzen 7 7840HS, AMD Radeon 780M
38.7 fps +4%
GMK NucBox K9
Intel Core Ultra 5 125H, Intel Arc 7-Core iGPU
37.3 fps
GMK NucBox M6
AMD Ryzen 5 6600H, AMD Radeon 660M
33.2 fps -11%
Beelink SEi12 Core i5-1235U
Intel Core i5-1235U, Intel Iris Xe Graphics G7 80EUs
29.5 fps -21%
Far Cry 5 - 1920x1080 Ultra Preset AA:T
BOSGAME M1
AMD Ryzen 7 7840HS, AMD Radeon 780M
47 (41min) fps +34%
Beelink SER8
AMD Ryzen 7 8845HS, AMD Radeon 780M
45 (40min) fps +29%
GMK NucBox K6
AMD Ryzen 7 7840HS, AMD Radeon 780M
43 (38min) fps +23%
GMK NucBox K9
Intel Core Ultra 5 125H, Intel Arc 7-Core iGPU
35 (32min) fps
GMK NucBox M6
AMD Ryzen 5 6600H, AMD Radeon 660M
27 (20min) fps -23%
GTA V
1024x768 Lowest Settings possible
Lenovo ThinkStation P3 Tiny-30H0006AGE
Intel Core i9-14900, NVIDIA T1000
187.4 (1.697min, 200P1) fps +31%
Geekom AX8 Pro
AMD Ryzen 9 8945H, AMD Radeon 780M
169.4 (3.69min, 125P1) fps +18%
Geekom AE7
AMD Ryzen 9 7940HS, AMD Radeon 780M
168 (6.33min, 125P1) fps +17%
GMK NucBox K6
AMD Ryzen 7 7840HS, AMD Radeon 780M
163.4 (2.4min, 100P1) fps +14%
Asus NUC 14 Pro
Intel Core Ultra 5 125H, Intel Arc 7-Core iGPU
156.3 (4.92min, 90.9P1) fps +9%
Framework Laptop 13.5 Core Ultra 7 155H
Intel Core Ultra 7 155H, Intel Arc 8-Core iGPU
144.9 (5.16min, 83.3P1) fps +1%
GMK NucBox K9
Intel Core Ultra 5 125H, Intel Arc 7-Core iGPU
143.6 (5.11min, 83.3P1) fps
Medio Intel Arc 7-Core iGPU
  (116.9 - 156.3, n=6)
138.2 fps -4%
Geekom XT13 Pro
Intel Core i9-13900H, Intel Iris Xe Graphics G7 96EUs
123.5 (30.5min, 66.7P1) fps -14%
Beelink SEi12 Core i5-1235U
Intel Core i5-1235U, Intel Iris Xe Graphics G7 80EUs
117.5 (24.8min, 71.4P1) fps -18%
HP Elite Mini 800 G9-5M9X6EA
Intel Core i5-14500, Intel UHD Graphics 770
102.4 (25.3min, 71.4P1) fps -29%
HP Pro Mini 400 G9-937U0EA
Intel Core i5-14500T, Intel UHD Graphics 770
95 (19.9min, 62.5P1) fps -34%
1920x1080 Lowest Settings possible
Lenovo ThinkStation P3 Tiny-30H0006AGE
Intel Core i9-14900, NVIDIA T1000
187.3 (4.93min, 166.7P1) fps +58%
Framework Laptop 13.5 Core Ultra 7 155H
Intel Core Ultra 7 155H, Intel Arc 8-Core iGPU
131.1 (12.4min, 71.4P1) fps +10%
Asus NUC 14 Pro
Intel Core Ultra 5 125H, Intel Arc 7-Core iGPU
129.8 (58.5min, 90.9P1) fps +9%
Geekom AX8 Pro
AMD Ryzen 9 8945H, AMD Radeon 780M
129.3 (19.9min, 90.9P1) fps +9%
Medio Intel Arc 7-Core iGPU
  (118.7 - 140, n=4)
129.1 fps +9%
Geekom AE7
AMD Ryzen 9 7940HS, AMD Radeon 780M
127.9 (8.4min, 90.9P1) fps +8%
GMK NucBox K6
AMD Ryzen 7 7840HS, AMD Radeon 780M
124.7 (11.8min, 83.3P1) fps +5%
GMK NucBox K9
Intel Core Ultra 5 125H, Intel Arc 7-Core iGPU
118.7 (7.47min, 83.3P1) fps
Geekom XT13 Pro
Intel Core i9-13900H, Intel Iris Xe Graphics G7 96EUs
91.3 (21.4min, 52.6P1) fps -23%
Beelink SEi12 Core i5-1235U
Intel Core i5-1235U, Intel Iris Xe Graphics G7 80EUs
67.2 (25.1min, 45.5P1) fps -43%
HP Elite Mini 800 G9-5M9X6EA
Intel Core i5-14500, Intel UHD Graphics 770
53.9 (29.4min, 40P1) fps -55%
HP Pro Mini 400 G9-937U0EA
Intel Core i5-14500T, Intel UHD Graphics 770
50.2 (16.7min, 38.5P1) fps -58%
1366x768 Normal/Off AF:4x
Lenovo ThinkStation P3 Tiny-30H0006AGE
Intel Core i9-14900, NVIDIA T1000
187.1 (1.566min, 200P1) fps +49%
Geekom AX8 Pro
AMD Ryzen 9 8945H, AMD Radeon 780M
158.3 (4.14min, 111.1P1) fps +26%
Geekom AE7
AMD Ryzen 9 7940HS, AMD Radeon 780M
158 (5.13min, 111.1P1) fps +26%
GMK NucBox K6
AMD Ryzen 7 7840HS, AMD Radeon 780M
153.8 (4.97min, 90.9P1) fps +23%
Asus NUC 14 Pro
Intel Core Ultra 5 125H, Intel Arc 7-Core iGPU
148.8 (4.43min, 83.3P1) fps +19%
Framework Laptop 13.5 Core Ultra 7 155H
Intel Core Ultra 7 155H, Intel Arc 8-Core iGPU
140.1 (8min, 66.7P1) fps +12%
Medio Intel Arc 7-Core iGPU
  (106.4 - 151.6, n=6)
132.6 fps +6%
GMK NucBox K9
Intel Core Ultra 5 125H, Intel Arc 7-Core iGPU
125.5 (15.3min, 76.9P1) fps
Geekom XT13 Pro
Intel Core i9-13900H, Intel Iris Xe Graphics G7 96EUs
105.9 (23.9min, 47.6P1) fps -16%
Beelink SEi12 Core i5-1235U
Intel Core i5-1235U, Intel Iris Xe Graphics G7 80EUs
98.7 (7.72min, 66.7P1) fps -21%
HP Elite Mini 800 G9-5M9X6EA
Intel Core i5-14500, Intel UHD Graphics 770
90.8 (26.7min, 62.5P1) fps -28%
HP Pro Mini 400 G9-937U0EA
Intel Core i5-14500T, Intel UHD Graphics 770
84.7 (20.1min, 58.8P1) fps -33%
1920x1080 Normal/Off AF:4x
Lenovo ThinkStation P3 Tiny-30H0006AGE
Intel Core i9-14900, NVIDIA T1000
185.8 (1.693min, 142.9P1) fps +95%
Geekom AX8 Pro
AMD Ryzen 9 8945H, AMD Radeon 780M
132.3 (12min, 90.9P1) fps +39%
Geekom AE7
AMD Ryzen 9 7940HS, AMD Radeon 780M
130.2 (18.8min, 83.3P1) fps +37%
GMK NucBox K6
AMD Ryzen 7 7840HS, AMD Radeon 780M
128.7 (21.5min, 76.9P1) fps +35%
Framework Laptop 13.5 Core Ultra 7 155H
Intel Core Ultra 7 155H, Intel Arc 8-Core iGPU
119.9 (6.03min, 62.5P1) fps +26%
Asus NUC 14 Pro
Intel Core Ultra 5 125H, Intel Arc 7-Core iGPU
117.6 (36.7min, 83.3P1) fps +24%
Medio Intel Arc 7-Core iGPU
  (95.2 - 128.7, n=4)
114.2 fps +20%
GMK NucBox K9
Intel Core Ultra 5 125H, Intel Arc 7-Core iGPU
95.2 (10.5min, 66.7P1) fps
Geekom XT13 Pro
Intel Core i9-13900H, Intel Iris Xe Graphics G7 96EUs
78.5 (6.01min, 40P1) fps -18%
Beelink SEi12 Core i5-1235U
Intel Core i5-1235U, Intel Iris Xe Graphics G7 80EUs
64.7 (21.2min, 43.5P1) fps -32%
HP Elite Mini 800 G9-5M9X6EA
Intel Core i5-14500, Intel UHD Graphics 770
53.9 (16min, 38.5P1) fps -43%
HP Pro Mini 400 G9-937U0EA
Intel Core i5-14500T, Intel UHD Graphics 770
50.5 (10.2min, 37P1) fps -47%
1920x1080 High/On (Advanced Graphics Off) AA:2xMSAA + FX AF:8x
Lenovo ThinkStation P3 Tiny-30H0006AGE
Intel Core i9-14900, NVIDIA T1000
103.5 (6.88min, 76.9P1) fps +208%
Geekom AX8 Pro
AMD Ryzen 9 8945H, AMD Radeon 780M
65.9 (2.44min, 41.7P1) fps +96%
GMK NucBox K6
AMD Ryzen 7 7840HS, AMD Radeon 780M
65.7 (3.85min, 40P1) fps +96%
Geekom AE7
AMD Ryzen 9 7940HS, AMD Radeon 780M
65.1 (2.93min, 29.4P1) fps +94%
Framework Laptop 13.5 Core Ultra 7 155H
Intel Core Ultra 7 155H, Intel Arc 8-Core iGPU
43.5 (2.85min, 21.7P1) fps +29%
Asus NUC 14 Pro
Intel Core Ultra 5 125H, Intel Arc 7-Core iGPU
39.9 (3.1min, 29.4P1) fps +19%
Medio Intel Arc 7-Core iGPU
  (31 - 39.9, n=6)
35 fps +4%
GMK NucBox K9
Intel Core Ultra 5 125H, Intel Arc 7-Core iGPU
33.6 (6.68min, 22.7P1) fps
Geekom XT13 Pro
Intel Core i9-13900H, Intel Iris Xe Graphics G7 96EUs
22.1 (7.08min, 16.4P1) fps -34%
Beelink SEi12 Core i5-1235U
Intel Core i5-1235U, Intel Iris Xe Graphics G7 80EUs
17.2 (9.35min, 13.5P1) fps -49%
HP Elite Mini 800 G9-5M9X6EA
Intel Core i5-14500, Intel UHD Graphics 770
12.3 (4.52min, 9.35P1) fps -63%
HP Pro Mini 400 G9-937U0EA
Intel Core i5-14500T, Intel UHD Graphics 770
12 (4.17min, 9.17P1) fps -64%
1920x1080 Highest Settings possible AA:4xMSAA + FX AF:16x
Lenovo ThinkStation P3 Tiny-30H0006AGE
Intel Core i9-14900, NVIDIA T1000
50.2 (6.23min, 34.5P1) fps +295%
Geekom AX8 Pro
AMD Ryzen 9 8945H, AMD Radeon 780M
27.7 (13.2min, 18.2P1) fps +118%
GMK NucBox K6
AMD Ryzen 7 7840HS, AMD Radeon 780M
26 (2.62min, 17.5P1) fps +105%
Geekom AE7
AMD Ryzen 9 7940HS, AMD Radeon 780M
23.9 (4.39min, 13P1) fps +88%
Framework Laptop 13.5 Core Ultra 7 155H
Intel Core Ultra 7 155H, Intel Arc 8-Core iGPU
17.5 (2.07min, 12P1) fps +38%
Asus NUC 14 Pro
Intel Core Ultra 5 125H, Intel Arc 7-Core iGPU
16.6 (2.85min, 11.4P1) fps +31%
Medio Intel Arc 7-Core iGPU
  (12.7 - 16.6, n=6)
14.5 fps +14%
GMK NucBox K9
Intel Core Ultra 5 125H, Intel Arc 7-Core iGPU
12.7 (2.89min, 8.93P1) fps
Geekom XT13 Pro
Intel Core i9-13900H, Intel Iris Xe Graphics G7 96EUs
9 (3.72min, 7.14P1) fps -29%
Beelink SEi12 Core i5-1235U
Intel Core i5-1235U, Intel Iris Xe Graphics G7 80EUs
7.41 (3.52min, 4.12P1) fps -42%
HP Elite Mini 800 G9-5M9X6EA
Intel Core i5-14500, Intel UHD Graphics 770
5.34 (2.38min, 2.94P1) fps -58%
Dota 2 Reborn
1280x720 min (0/3) fastest
Lenovo ThinkStation P3 Tiny-30H0006AGE
Intel Core i9-14900, NVIDIA T1000
246.2 (207.1min) fps +152%
Geekom AE7
AMD Ryzen 9 7940HS, AMD Radeon 780M
163 (143.1min) fps +67%
GMK NucBox K6
AMD Ryzen 7 7840HS, AMD Radeon 780M
161.2 (11.9min) fps +65%
Geekom AX8 Pro
AMD Ryzen 9 8945H, AMD Radeon 780M
157.5 (136min) fps +61%
Beelink SER8
AMD Ryzen 7 8845HS, AMD Radeon 780M
151.9 (101.9min) fps +55%
GMK NucBox M6
AMD Ryzen 5 6600H, AMD Radeon 660M
144.9 (123.5min) fps +48%
Geekom XT13 Pro
Intel Core i9-13900H, Intel Iris Xe Graphics G7 96EUs
117.2 (74.5min) fps +20%
HP Elite Mini 800 G9-5M9X6EA
Intel Core i5-14500, Intel UHD Graphics 770
105.8 (73.2min) fps +8%
Framework Laptop 13.5 Core Ultra 7 155H
Intel Core Ultra 7 155H, Intel Arc 8-Core iGPU
102.7 (56.4min) fps +5%
HP Pro Mini 400 G9-937U0EA
Intel Core i5-14500T, Intel UHD Graphics 770
102.4 (80.7min) fps +5%
GMK NucBox K9
Intel Core Ultra 5 125H, Intel Arc 7-Core iGPU
97.7 (67.3min) fps
Asus NUC 14 Pro
Intel Core Ultra 5 125H, Intel Arc 7-Core iGPU
97.1 (61.8min) fps -1%
Medio Intel Arc 7-Core iGPU
  (93.5 - 97.7, n=6)
95.3 fps -2%
Beelink SEi12 Core i5-1235U
Intel Core i5-1235U, Intel Iris Xe Graphics G7 80EUs
93.8 (8.8min) fps -4%
1366x768 med (1/3)
Lenovo ThinkStation P3 Tiny-30H0006AGE
Intel Core i9-14900, NVIDIA T1000
217.7 (183.7min) fps +162%
Beelink SER8
AMD Ryzen 7 8845HS, AMD Radeon 780M
130.1 (91.5min) fps +57%
Geekom AE7
AMD Ryzen 9 7940HS, AMD Radeon 780M
127.9 (105.6min) fps +54%
GMK NucBox K6
AMD Ryzen 7 7840HS, AMD Radeon 780M
124.8 (104.5min) fps +50%
Geekom AX8 Pro
AMD Ryzen 9 8945H, AMD Radeon 780M
116.1 (93.2min) fps +40%
GMK NucBox M6
AMD Ryzen 5 6600H, AMD Radeon 660M
107.9 (92.8min) fps +30%
Beelink SEi12 Core i5-1235U
Intel Core i5-1235U, Intel Iris Xe Graphics G7 80EUs
88.7 (71min) fps +7%
GMK NucBox K9
Intel Core Ultra 5 125H, Intel Arc 7-Core iGPU
83.1 (60.5min) fps
Geekom XT13 Pro
Intel Core i9-13900H, Intel Iris Xe Graphics G7 96EUs
82.9 (52.4min) fps 0%
Medio Intel Arc 7-Core iGPU
  (70.5 - 89.2, n=6)
80.5 fps -3%
Asus NUC 14 Pro
Intel Core Ultra 5 125H, Intel Arc 7-Core iGPU
79.2 (57.5min) fps -5%
HP Elite Mini 800 G9-5M9X6EA
Intel Core i5-14500, Intel UHD Graphics 770
78.4 (32.1min) fps -6%
Framework Laptop 13.5 Core Ultra 7 155H
Intel Core Ultra 7 155H, Intel Arc 8-Core iGPU
76.9 (31.4min) fps -7%
HP Pro Mini 400 G9-937U0EA
Intel Core i5-14500T, Intel UHD Graphics 770
74.4 (58.9min) fps -10%
1920x1080 high (2/3)
Lenovo ThinkStation P3 Tiny-30H0006AGE
Intel Core i9-14900, NVIDIA T1000
150.4 (134.4min) fps +99%
Beelink SER8
AMD Ryzen 7 8845HS, AMD Radeon 780M
98.8 (80.5min) fps +31%
GMK NucBox K6
AMD Ryzen 7 7840HS, AMD Radeon 780M
96.8 (17.4min) fps +28%
Geekom AE7
AMD Ryzen 9 7940HS, AMD Radeon 780M
89.8 (75.7min) fps +19%
Geekom AX8 Pro
AMD Ryzen 9 8945H, AMD Radeon 780M
88 (69.2min) fps +16%
Asus NUC 14 Pro
Intel Core Ultra 5 125H, Intel Arc 7-Core iGPU
75.9 (45.7min) fps 0%
GMK NucBox K9
Intel Core Ultra 5 125H, Intel Arc 7-Core iGPU
75.6 (48.6min) fps
Medio Intel Arc 7-Core iGPU
  (66.3 - 75.9, n=6)
72.6 fps -4%
Geekom XT13 Pro
Intel Core i9-13900H, Intel Iris Xe Graphics G7 96EUs
72.5 (53min) fps -4%
GMK NucBox M6
AMD Ryzen 5 6600H, AMD Radeon 660M
70 (63.6min) fps -7%
Framework Laptop 13.5 Core Ultra 7 155H
Intel Core Ultra 7 155H, Intel Arc 8-Core iGPU
67.2 (36.9min) fps -11%
Beelink SEi12 Core i5-1235U
Intel Core i5-1235U, Intel Iris Xe Graphics G7 80EUs
45.5 (42.6min) fps -40%
HP Elite Mini 800 G9-5M9X6EA
Intel Core i5-14500, Intel UHD Graphics 770
43.9 (24.2min) fps -42%
HP Pro Mini 400 G9-937U0EA
Intel Core i5-14500T, Intel UHD Graphics 770
38 (35.3min) fps -50%
1920x1080 ultra (3/3) best looking
Lenovo ThinkStation P3 Tiny-30H0006AGE
Intel Core i9-14900, NVIDIA T1000
136.5 (120.3min) fps +86%
Beelink SER8
AMD Ryzen 7 8845HS, AMD Radeon 780M
90.4 (71.8min) fps +23%
GMK NucBox K6
AMD Ryzen 7 7840HS, AMD Radeon 780M
87.4 (16.1min) fps +19%
Geekom AE7
AMD Ryzen 9 7940HS, AMD Radeon 780M
83.2 (72.1min) fps +14%
Geekom AX8 Pro
AMD Ryzen 9 8945H, AMD Radeon 780M
81.2 (64.4min) fps +11%
GMK NucBox K9
Intel Core Ultra 5 125H, Intel Arc 7-Core iGPU
73.3 (48.5min) fps
Asus NUC 14 Pro
Intel Core Ultra 5 125H, Intel Arc 7-Core iGPU
72.9 (47.2min) fps -1%
Medio Intel Arc 7-Core iGPU
  (58.7 - 73.3, n=6)
68.9 fps -6%
Geekom XT13 Pro
Intel Core i9-13900H, Intel Iris Xe Graphics G7 96EUs
66.5 (50.4min) fps -9%
Framework Laptop 13.5 Core Ultra 7 155H
Intel Core Ultra 7 155H, Intel Arc 8-Core iGPU
62.1 (35.2min) fps -15%
GMK NucBox M6
AMD Ryzen 5 6600H, AMD Radeon 660M
60.8 (54.4min) fps -17%
Beelink SEi12 Core i5-1235U
Intel Core i5-1235U, Intel Iris Xe Graphics G7 80EUs
42.2 (39.3min) fps -42%
HP Elite Mini 800 G9-5M9X6EA
Intel Core i5-14500, Intel UHD Graphics 770
40.7 (22.6min) fps -44%
HP Pro Mini 400 G9-937U0EA
Intel Core i5-14500T, Intel UHD Graphics 770
35.4 (33.1min) fps -52%
Final Fantasy XV Benchmark
1280x720 Lite Quality
Lenovo ThinkStation P3 Tiny-30H0006AGE
Intel Core i9-14900, NVIDIA T1000
101.3 fps +70%
GMK NucBox K6
AMD Ryzen 7 7840HS, AMD Radeon 780M
80.8 fps +36%
Beelink SER8
AMD Ryzen 7 8845HS, AMD Radeon 780M
79.7 fps +34%
Geekom AX8 Pro
AMD Ryzen 9 8945H, AMD Radeon 780M
77.9 fps +31%
Geekom AE7
AMD Ryzen 9 7940HS, AMD Radeon 780M
75.1 fps +26%
Framework Laptop 13.5 Core Ultra 7 155H
Intel Core Ultra 7 155H, Intel Arc 8-Core iGPU
70 fps +17%
Asus NUC 14 Pro
Intel Core Ultra 5 125H, Intel Arc 7-Core iGPU
60.6 fps +2%
GMK NucBox K9
Intel Core Ultra 5 125H, Intel Arc 7-Core iGPU
59.6 fps
Medio Intel Arc 7-Core iGPU
  (52.1 - 64.8, n=6)
59.2 fps -1%
GMK NucBox M6
AMD Ryzen 5 6600H, AMD Radeon 660M
48.3 fps -19%
Geekom XT13 Pro
Intel Core i9-13900H, Intel Iris Xe Graphics G7 96EUs
46 fps -23%
Beelink SEi12 Core i5-1235U
Intel Core i5-1235U, Intel Iris Xe Graphics G7 80EUs
35.7 fps -40%
HP Elite Mini 800 G9-5M9X6EA
Intel Core i5-14500, Intel UHD Graphics 770
26.2 fps -56%
HP Pro Mini 400 G9-937U0EA
Intel Core i5-14500T, Intel UHD Graphics 770
24.2 fps -59%
1920x1080 Standard Quality
Lenovo ThinkStation P3 Tiny-30H0006AGE
Intel Core i9-14900, NVIDIA T1000
49.3 fps +48%
Beelink SER8
AMD Ryzen 7 8845HS, AMD Radeon 780M
40.2 fps +21%
GMK NucBox K6
AMD Ryzen 7 7840HS, AMD Radeon 780M
39.3 fps +18%
Geekom AX8 Pro
AMD Ryzen 9 8945H, AMD Radeon 780M
38.8 fps +17%
Framework Laptop 13.5 Core Ultra 7 155H
Intel Core Ultra 7 155H, Intel Arc 8-Core iGPU
38 fps +14%
Geekom AE7
AMD Ryzen 9 7940HS, AMD Radeon 780M
36 fps +8%
Asus NUC 14 Pro
Intel Core Ultra 5 125H, Intel Arc 7-Core iGPU
35.4 fps +6%
Medio Intel Arc 7-Core iGPU
  (32.4 - 35.8, n=6)
33.9 fps +2%
GMK NucBox K9
Intel Core Ultra 5 125H, Intel Arc 7-Core iGPU
33.3 fps
Geekom XT13 Pro
Intel Core i9-13900H, Intel Iris Xe Graphics G7 96EUs
25.7 fps -23%
GMK NucBox M6
AMD Ryzen 5 6600H, AMD Radeon 660M
24.7 fps -26%
Beelink SEi12 Core i5-1235U
Intel Core i5-1235U, Intel Iris Xe Graphics G7 80EUs
19.3 fps -42%
HP Elite Mini 800 G9-5M9X6EA
Intel Core i5-14500, Intel UHD Graphics 770
14.3 fps -57%
HP Pro Mini 400 G9-937U0EA
Intel Core i5-14500T, Intel UHD Graphics 770
12.9 fps -61%
1920x1080 High Quality
Lenovo ThinkStation P3 Tiny-30H0006AGE
Intel Core i9-14900, NVIDIA T1000
36.2 fps +62%
Beelink SER8
AMD Ryzen 7 8845HS, AMD Radeon 780M
29.4 fps +32%
GMK NucBox K6
AMD Ryzen 7 7840HS, AMD Radeon 780M
29.3 fps +31%
Geekom AX8 Pro
AMD Ryzen 9 8945H, AMD Radeon 780M
28.5 fps +28%
Geekom AE7
AMD Ryzen 9 7940HS, AMD Radeon 780M
27.5 fps +23%
Framework Laptop 13.5 Core Ultra 7 155H
Intel Core Ultra 7 155H, Intel Arc 8-Core iGPU
27.2 fps +22%
Asus NUC 14 Pro
Intel Core Ultra 5 125H, Intel Arc 7-Core iGPU
25.3 fps +13%
Medio Intel Arc 7-Core iGPU
  (22.2 - 25.3, n=6)
24 fps +8%
GMK NucBox K9
Intel Core Ultra 5 125H, Intel Arc 7-Core iGPU
22.3 fps
Geekom XT13 Pro
Intel Core i9-13900H, Intel Iris Xe Graphics G7 96EUs
18.2 fps -18%
GMK NucBox M6
AMD Ryzen 5 6600H, AMD Radeon 660M
17.9 fps -20%
Beelink SEi12 Core i5-1235U
Intel Core i5-1235U, Intel Iris Xe Graphics G7 80EUs
13.5 fps -39%
HP Elite Mini 800 G9-5M9X6EA
Intel Core i5-14500, Intel UHD Graphics 770
9.38 fps -58%
HP Pro Mini 400 G9-937U0EA
Intel Core i5-14500T, Intel UHD Graphics 770
9.17 fps -59%
X-Plane 11.11
1280x720 low (fps_test=1)
Lenovo ThinkStation P3 Tiny-30H0006AGE
Intel Core i9-14900, NVIDIA T1000
211 fps +270%
GMK NucBox K6
AMD Ryzen 7 7840HS, AMD Radeon 780M
65.9 fps +16%
Beelink SER8
AMD Ryzen 7 8845HS, AMD Radeon 780M
65.9 fps +16%
Geekom AE7
AMD Ryzen 9 7940HS, AMD Radeon 780M
64.4 fps +13%
Geekom AX8 Pro
AMD Ryzen 9 8945H, AMD Radeon 780M
64.2 fps +13%
GMK NucBox K9
Intel Core Ultra 5 125H, Intel Arc 7-Core iGPU
57 fps
Framework Laptop 13.5 Core Ultra 7 155H
Intel Core Ultra 7 155H, Intel Arc 8-Core iGPU
56 fps -2%
GMK NucBox M6
AMD Ryzen 5 6600H, AMD Radeon 660M
51.8 fps -9%
Medio Intel Arc 7-Core iGPU
  (47.1 - 57, n=6)
50.6 fps -11%
Beelink SEi12 Core i5-1235U
Intel Core i5-1235U, Intel Iris Xe Graphics G7 80EUs
48.4 fps -15%
Asus NUC 14 Pro
Intel Core Ultra 5 125H, Intel Arc 7-Core iGPU
47.5 fps -17%
HP Pro Mini 400 G9-937U0EA
Intel Core i5-14500T, Intel UHD Graphics 770
28.5 fps -50%
1920x1080 med (fps_test=2)
Lenovo ThinkStation P3 Tiny-30H0006AGE
Intel Core i9-14900, NVIDIA T1000
145.8 fps +225%
Beelink SER8
AMD Ryzen 7 8845HS, AMD Radeon 780M
47.8 fps +7%
GMK NucBox K6
AMD Ryzen 7 7840HS, AMD Radeon 780M
47.3 fps +6%
Geekom AE7
AMD Ryzen 9 7940HS, AMD Radeon 780M
47.1 fps +5%
Geekom AX8 Pro
AMD Ryzen 9 8945H, AMD Radeon 780M
46.8 fps +4%
GMK NucBox K9
Intel Core Ultra 5 125H, Intel Arc 7-Core iGPU
44.8 fps
Framework Laptop 13.5 Core Ultra 7 155H
Intel Core Ultra 7 155H, Intel Arc 8-Core iGPU
41.6 fps -7%
Medio Intel Arc 7-Core iGPU
  (35.9 - 44.8, n=6)
39.7 fps -11%
GMK NucBox M6
AMD Ryzen 5 6600H, AMD Radeon 660M
38.5 fps -14%
Asus NUC 14 Pro
Intel Core Ultra 5 125H, Intel Arc 7-Core iGPU
38.5 fps -14%
Beelink SEi12 Core i5-1235U
Intel Core i5-1235U, Intel Iris Xe Graphics G7 80EUs
32.8 fps -27%
HP Pro Mini 400 G9-937U0EA
Intel Core i5-14500T, Intel UHD Graphics 770
21.7 fps -52%
1920x1080 high (fps_test=3)
Lenovo ThinkStation P3 Tiny-30H0006AGE
Intel Core i9-14900, NVIDIA T1000
130.1 fps +249%
Geekom AX8 Pro
AMD Ryzen 9 8945H, AMD Radeon 780M
40.1 fps +8%
GMK NucBox K6
AMD Ryzen 7 7840HS, AMD Radeon 780M
39.7 fps +6%
Beelink SER8
AMD Ryzen 7 8845HS, AMD Radeon 780M
39.6 fps +6%
Geekom AE7
AMD Ryzen 9 7940HS, AMD Radeon 780M
39.6 fps +6%
GMK NucBox K9
Intel Core Ultra 5 125H, Intel Arc 7-Core iGPU
37.3 fps
Framework Laptop 13.5 Core Ultra 7 155H
Intel Core Ultra 7 155H, Intel Arc 8-Core iGPU
33.7 fps -10%
Medio Intel Arc 7-Core iGPU
  (31.3 - 37.3, n=6)
33.4 fps -10%
GMK NucBox M6
AMD Ryzen 5 6600H, AMD Radeon 660M
33.2 fps -11%
Asus NUC 14 Pro
Intel Core Ultra 5 125H, Intel Arc 7-Core iGPU
32.9 fps -12%
Beelink SEi12 Core i5-1235U
Intel Core i5-1235U, Intel Iris Xe Graphics G7 80EUs
29.5 fps -21%
HP Pro Mini 400 G9-937U0EA
Intel Core i5-14500T, Intel UHD Graphics 770
18.8 fps -50%
Far Cry 5
1280x720 Low Preset AA:T
Lenovo ThinkStation P3 Tiny-30H0006AGE
Intel Core i9-14900, NVIDIA T1000
127 (102min) fps +79%
Beelink SER8
AMD Ryzen 7 8845HS, AMD Radeon 780M
89 (77min) fps +25%
GMK NucBox K6
AMD Ryzen 7 7840HS, AMD Radeon 780M
86 (75min) fps +21%
GMK NucBox M6
AMD Ryzen 5 6600H, AMD Radeon 660M
71 (62min) fps 0%
GMK NucBox K9
Intel Core Ultra 5 125H, Intel Arc 7-Core iGPU
71 (63min) fps
Framework Laptop 13.5 Core Ultra 7 155H
Intel Core Ultra 7 155H, Intel Arc 8-Core iGPU
62 (11min) fps -13%
Medio Intel Arc 7-Core iGPU
  (37 - 74, n=4)
61.5 fps -13%
1920x1080 Medium Preset AA:T
Lenovo ThinkStation P3 Tiny-30H0006AGE
Intel Core i9-14900, NVIDIA T1000
62 (53min) fps +55%
Beelink SER8
AMD Ryzen 7 8845HS, AMD Radeon 780M
51 (45min) fps +28%
GMK NucBox K6
AMD Ryzen 7 7840HS, AMD Radeon 780M
49 (44min) fps +23%
Framework Laptop 13.5 Core Ultra 7 155H
Intel Core Ultra 7 155H, Intel Arc 8-Core iGPU
42 (26min) fps +5%
GMK NucBox K9
Intel Core Ultra 5 125H, Intel Arc 7-Core iGPU
40 (37min) fps
Medio Intel Arc 7-Core iGPU
  (34 - 41, n=4)
38 fps -5%
GMK NucBox M6
AMD Ryzen 5 6600H, AMD Radeon 660M
33 (29min) fps -17%
1920x1080 High Preset AA:T
Lenovo ThinkStation P3 Tiny-30H0006AGE
Intel Core i9-14900, NVIDIA T1000
57 (48min) fps +54%
Beelink SER8
AMD Ryzen 7 8845HS, AMD Radeon 780M
47 (42min) fps +27%
GMK NucBox K6
AMD Ryzen 7 7840HS, AMD Radeon 780M
45 (41min) fps +22%
Framework Laptop 13.5 Core Ultra 7 155H
Intel Core Ultra 7 155H, Intel Arc 8-Core iGPU
40 (29min) fps +8%
GMK NucBox K9
Intel Core Ultra 5 125H, Intel Arc 7-Core iGPU
37 (34min) fps
Medio Intel Arc 7-Core iGPU
  (31 - 37, n=4)
35 fps -5%
GMK NucBox M6
AMD Ryzen 5 6600H, AMD Radeon 660M
30 (26min) fps -19%
1920x1080 Ultra Preset AA:T
Lenovo ThinkStation P3 Tiny-30H0006AGE
Intel Core i9-14900, NVIDIA T1000
53 (46min) fps +51%
Beelink SER8
AMD Ryzen 7 8845HS, AMD Radeon 780M
45 (40min) fps +29%
GMK NucBox K6
AMD Ryzen 7 7840HS, AMD Radeon 780M
43 (38min) fps +23%
Framework Laptop 13.5 Core Ultra 7 155H
Intel Core Ultra 7 155H, Intel Arc 8-Core iGPU
38 (23min) fps +9%
GMK NucBox K9
Intel Core Ultra 5 125H, Intel Arc 7-Core iGPU
35 (32min) fps
Medio Intel Arc 7-Core iGPU
  (31 - 35, n=3)
33.7 fps -4%
GMK NucBox M6
AMD Ryzen 5 6600H, AMD Radeon 660M
27 (20min) fps -23%
Strange Brigade
1280x720 lowest AF:1
Lenovo ThinkStation P3 Tiny-30H0006AGE
Intel Core i9-14900, NVIDIA T1000
226 (39.2min, 192.3P1) fps +52%
Beelink SER8
AMD Ryzen 7 8845HS, AMD Radeon 780M
173.7 (119.2min, 145.2P1) fps +17%
GMK NucBox K6
AMD Ryzen 7 7840HS, AMD Radeon 780M
167.7 (34.3min, 142.9P1) fps +13%
Framework Laptop 13.5 Core Ultra 7 155H
Intel Core Ultra 7 155H, Intel Arc 8-Core iGPU
162.1 (46.4min, 76.2P1) fps +9%
GMK NucBox K9
Intel Core Ultra 5 125H, Intel Arc 7-Core iGPU
148.6 (45.8min, 118.4P1) fps
Medio Intel Arc 7-Core iGPU
  (133 - 149, n=4)
142.9 fps -4%
GMK NucBox M6
AMD Ryzen 5 6600H, AMD Radeon 660M
120.2 (78.3min, 104.5P1) fps -19%
Beelink SEi12 Core i5-1235U
Intel Core i5-1235U, Intel Iris Xe Graphics G7 80EUs
65.9 (14.2min, 19.7P1) fps -56%
1920x1080 medium AA:medium AF:4
Lenovo ThinkStation P3 Tiny-30H0006AGE
Intel Core i9-14900, NVIDIA T1000
87.2 (73.7min, 77P1) fps +36%
Framework Laptop 13.5 Core Ultra 7 155H
Intel Core Ultra 7 155H, Intel Arc 8-Core iGPU
70.6 (42.7min, 62.5P1) fps +10%
Beelink SER8
AMD Ryzen 7 8845HS, AMD Radeon 780M
68.9 (55.3min, 59.1P1) fps +8%
GMK NucBox K6
AMD Ryzen 7 7840HS, AMD Radeon 780M
67.9 (43.7min, 58.3P1) fps +6%
Medio Intel Arc 7-Core iGPU
  (63 - 69.5, n=4)
66.1 fps +3%
GMK NucBox K9
Intel Core Ultra 5 125H, Intel Arc 7-Core iGPU
63.9 (33.2min, 54.3P1) fps
GMK NucBox M6
AMD Ryzen 5 6600H, AMD Radeon 660M
43 (36.6min, 37.4P1) fps -33%
Beelink SEi12 Core i5-1235U
Intel Core i5-1235U, Intel Iris Xe Graphics G7 80EUs
26.5 (7min, 12.6P1) fps -59%
1920x1080 high AA:high AF:8
Lenovo ThinkStation P3 Tiny-30H0006AGE
Intel Core i9-14900, NVIDIA T1000
69.4 (49.4min, 53.4P1) fps +30%
Framework Laptop 13.5 Core Ultra 7 155H
Intel Core Ultra 7 155H, Intel Arc 8-Core iGPU
59.6 (42.8min, 48.2P1) fps +11%
Beelink SER8
AMD Ryzen 7 8845HS, AMD Radeon 780M
58.7 (43.2min, 45.6P1) fps +10%
GMK NucBox K6
AMD Ryzen 7 7840HS, AMD Radeon 780M
57.9 (7min, 45P1) fps +8%
Medio Intel Arc 7-Core iGPU
  (50 - 57.7, n=4)
53.8 fps +1%
GMK NucBox K9
Intel Core Ultra 5 125H, Intel Arc 7-Core iGPU
53.5 (28.6min, 42P1) fps
GMK NucBox M6
AMD Ryzen 5 6600H, AMD Radeon 660M
35.9 (28.5min, 29.1P1) fps -33%
Beelink SEi12 Core i5-1235U
Intel Core i5-1235U, Intel Iris Xe Graphics G7 80EUs
21.4 (5min, 7.98P1) fps -60%
1920x1080 ultra AA:ultra AF:16
Lenovo ThinkStation P3 Tiny-30H0006AGE
Intel Core i9-14900, NVIDIA T1000
59.9 (44.2min, 47.8P1) fps +38%
Beelink SER8
AMD Ryzen 7 8845HS, AMD Radeon 780M
50.8 (24.5min, 33.9P1) fps +17%
GMK NucBox K6
AMD Ryzen 7 7840HS, AMD Radeon 780M
48.8 (11.1min, 31.1P1) fps +12%
Framework Laptop 13.5 Core Ultra 7 155H
Intel Core Ultra 7 155H, Intel Arc 8-Core iGPU
48.5 (12.8min, 21.5P1) fps +11%
Medio Intel Arc 7-Core iGPU
  (40 - 47.3, n=4)
43.7 fps 0%
GMK NucBox K9
Intel Core Ultra 5 125H, Intel Arc 7-Core iGPU
43.5 (8.2min, 17.8P1) fps
GMK NucBox M6
AMD Ryzen 5 6600H, AMD Radeon 660M
29.6 (21min, 24.7P1) fps -32%
Beelink SEi12 Core i5-1235U
Intel Core i5-1235U, Intel Iris Xe Graphics G7 80EUs
17.5 (5min, 5P1) fps -60%
Tiny Tina's Wonderlands
1280x720 Lowest Preset (DX12)
Lenovo ThinkStation P3 Tiny-30H0006AGE
Intel Core i9-14900, NVIDIA T1000
139.9 fps +57%
GMK NucBox K6
AMD Ryzen 7 7840HS, AMD Radeon 780M
139 fps +56%
Beelink SER8
AMD Ryzen 7 8845HS, AMD Radeon 780M
127.9 fps +44%
GMK NucBox K9
Intel Core Ultra 5 125H, Intel Arc 7-Core iGPU
89 fps
Medio Intel Arc 7-Core iGPU
  ()
89 fps 0%
GMK NucBox M6
AMD Ryzen 5 6600H, AMD Radeon 660M
80.8 fps -9%
Framework Laptop 13.5 Core Ultra 7 155H
Intel Core Ultra 7 155H, Intel Arc 8-Core iGPU
77.4 fps -13%
1920x1080 Low Preset (DX12)
GMK NucBox K6
AMD Ryzen 7 7840HS, AMD Radeon 780M
74.6 fps +47%
Beelink SER8
AMD Ryzen 7 8845HS, AMD Radeon 780M
72.8 fps +44%
Lenovo ThinkStation P3 Tiny-30H0006AGE
Intel Core i9-14900, NVIDIA T1000
69.2 fps +36%
Framework Laptop 13.5 Core Ultra 7 155H
Intel Core Ultra 7 155H, Intel Arc 8-Core iGPU
50.8 fps 0%
GMK NucBox K9
Intel Core Ultra 5 125H, Intel Arc 7-Core iGPU
50.7 fps
Medio Intel Arc 7-Core iGPU
  ()
50.7 fps 0%
GMK NucBox M6
AMD Ryzen 5 6600H, AMD Radeon 660M
40 fps -21%
1920x1080 Medium Preset (DX12)
Lenovo ThinkStation P3 Tiny-30H0006AGE
Intel Core i9-14900, NVIDIA T1000
55.6 fps +41%
Beelink SER8
AMD Ryzen 7 8845HS, AMD Radeon 780M
52.8 fps +34%
GMK NucBox K6
AMD Ryzen 7 7840HS, AMD Radeon 780M
52.2 fps +32%
Framework Laptop 13.5 Core Ultra 7 155H
Intel Core Ultra 7 155H, Intel Arc 8-Core iGPU
44.5 fps +13%
GMK NucBox K9
Intel Core Ultra 5 125H, Intel Arc 7-Core iGPU
39.4 fps
Medio Intel Arc 7-Core iGPU
  ()
39.4 fps 0%
GMK NucBox M6
AMD Ryzen 5 6600H, AMD Radeon 660M
31.3 fps -21%
1920x1080 High Preset (DX12)
Beelink SER8
AMD Ryzen 7 8845HS, AMD Radeon 780M
36.8 fps +37%
GMK NucBox K6
AMD Ryzen 7 7840HS, AMD Radeon 780M
36.6 fps +37%
Lenovo ThinkStation P3 Tiny-30H0006AGE
Intel Core i9-14900, NVIDIA T1000
35.3 fps +32%
Framework Laptop 13.5 Core Ultra 7 155H
Intel Core Ultra 7 155H, Intel Arc 8-Core iGPU
30.7 fps +15%
GMK NucBox K9
Intel Core Ultra 5 125H, Intel Arc 7-Core iGPU
26.8 fps
Medio Intel Arc 7-Core iGPU
  ()
26.8 fps 0%
GMK NucBox M6
AMD Ryzen 5 6600H, AMD Radeon 660M
20.5 fps -24%
1920x1080 Badass Preset (DX12)
Beelink SER8
AMD Ryzen 7 8845HS, AMD Radeon 780M
29.6 fps +32%
GMK NucBox K6
AMD Ryzen 7 7840HS, AMD Radeon 780M
29.5 fps +32%
Lenovo ThinkStation P3 Tiny-30H0006AGE
Intel Core i9-14900, NVIDIA T1000
27.6 fps +23%
Framework Laptop 13.5 Core Ultra 7 155H
Intel Core Ultra 7 155H, Intel Arc 8-Core iGPU
24.2 fps +8%
GMK NucBox K9
Intel Core Ultra 5 125H, Intel Arc 7-Core iGPU
22.4 fps
Medio Intel Arc 7-Core iGPU
  ()
22.4 fps 0%
GMK NucBox M6
AMD Ryzen 5 6600H, AMD Radeon 660M
15.6 fps -30%
F1 22
1280x720 Ultra Low Preset AA:T AF:16x
GMK NucBox K6
AMD Ryzen 7 7840HS, AMD Radeon 780M
170 (137min, 113P1) fps +31%
Beelink SER8
AMD Ryzen 7 8845HS, AMD Radeon 780M
145.7 (108min, 89P1) fps +12%
GMK NucBox K9
Intel Core Ultra 5 125H, Intel Arc 7-Core iGPU
130.2 (112min, 96P1) fps
Medio Intel Arc 7-Core iGPU
  ()
130.2 fps 0%
Framework Laptop 13.5 Core Ultra 7 155H
Intel Core Ultra 7 155H, Intel Arc 8-Core iGPU
120.9 (85min, 73P1) fps -7%
GMK NucBox M6
AMD Ryzen 5 6600H, AMD Radeon 660M
107.3 (86min, 79P1) fps -18%
1920x1080 Low Preset AA:T AF:16x
GMK NucBox K6
AMD Ryzen 7 7840HS, AMD Radeon 780M
99.8 (12min, 70P1) fps +26%
Beelink SER8
AMD Ryzen 7 8845HS, AMD Radeon 780M
99 (86min, 76P1) fps +25%
GMK NucBox K9
Intel Core Ultra 5 125H, Intel Arc 7-Core iGPU
79.4 (63min, 66P1) fps
Medio Intel Arc 7-Core iGPU
  ()
79.4 fps 0%
Framework Laptop 13.5 Core Ultra 7 155H
Intel Core Ultra 7 155H, Intel Arc 8-Core iGPU
73.9 (31min, 45P1) fps -7%
GMK NucBox M6
AMD Ryzen 5 6600H, AMD Radeon 660M
58.3 (43min, 42P1) fps -27%
1920x1080 Medium Preset AA:T AF:16x
GMK NucBox K6
AMD Ryzen 7 7840HS, AMD Radeon 780M
85.9 (67min, 59P1) fps +19%
Beelink SER8
AMD Ryzen 7 8845HS, AMD Radeon 780M
85.9 (73min, 68P1) fps +19%
GMK NucBox K9
Intel Core Ultra 5 125H, Intel Arc 7-Core iGPU
71.9 (61min, 59P1) fps
Medio Intel Arc 7-Core iGPU
  ()
71.9 fps 0%
Framework Laptop 13.5 Core Ultra 7 155H
Intel Core Ultra 7 155H, Intel Arc 8-Core iGPU
68.6 (50min, 44P1) fps -5%
GMK NucBox M6
AMD Ryzen 5 6600H, AMD Radeon 660M
52.3 (41min, 39P1) fps -27%
1920x1080 High Preset AA:T AF:16x
GMK NucBox K6
AMD Ryzen 7 7840HS, AMD Radeon 780M
66.7 (53min, 36P1) fps +26%
Beelink SER8
AMD Ryzen 7 8845HS, AMD Radeon 780M
65.6 (54min, 52P1) fps +24%
Framework Laptop 13.5 Core Ultra 7 155H
Intel Core Ultra 7 155H, Intel Arc 8-Core iGPU
52.9 (36min, 38P1) fps 0%
GMK NucBox K9
Intel Core Ultra 5 125H, Intel Arc 7-Core iGPU
52.9 (46min, 45P1) fps
Medio Intel Arc 7-Core iGPU
  ()
52.9 fps 0%
GMK NucBox M6
AMD Ryzen 5 6600H, AMD Radeon 660M
37.2 (31min, 29P1) fps -30%
Baldur's Gate 3
1280x720 Low Preset
Lenovo ThinkStation P3 Tiny-30H0006AGE
Intel Core i9-14900, NVIDIA T1000
75.9 (36.6min, 56P0.1, 65.8P1) fps +49%
Geekom AE7
AMD Ryzen 9 7940HS, AMD Radeon 780M
67.4 (22.7min, 28.3P0.1, 43.6P1) fps +33%
Beelink SER8
AMD Ryzen 7 8845HS, AMD Radeon 780M
63.4 fps +25%
Geekom AX8 Pro
AMD Ryzen 9 8945H, AMD Radeon 780M
60.8 (21.6min, 28.1P0.1, 35.6P1) fps +20%
Framework Laptop 13.5 Core Ultra 7 155H
Intel Core Ultra 7 155H, Intel Arc 8-Core iGPU
53.9 fps +6%
GMK NucBox K9
Intel Core Ultra 5 125H, Intel Arc 7-Core iGPU
50.8 fps
Asus NUC 14 Pro
Intel Core Ultra 5 125H, Intel Arc 7-Core iGPU
50.2 (27.7min, 29.7P0.1, 32.6P1) fps -1%
Medio Intel Arc 7-Core iGPU
  (45 - 50.8, n=3)
48.7 fps -4%
GMK NucBox M6
AMD Ryzen 5 6600H, AMD Radeon 660M
37.3 fps -27%
Geekom XT13 Pro
Intel Core i9-13900H, Intel Iris Xe Graphics G7 96EUs
28.2 (13.8min, 15.1P0.1, 19.8P1) fps -44%
HP Elite Mini 800 G9-5M9X6EA
Intel Core i5-14500, Intel UHD Graphics 770
16.9 (10.9min, 11.1P0.1, 12.8P1) fps -67%
HP Pro Mini 400 G9-937U0EA
Intel Core i5-14500T, Intel UHD Graphics 770
14.4 (8.68min, 9.6P0.1, 11.1P1) fps -72%
1920x1080 Low Preset
Lenovo ThinkStation P3 Tiny-30H0006AGE
Intel Core i9-14900, NVIDIA T1000
45 (22.4min, 36.9P0.1, 38.2P1) fps +34%
Geekom AE7
AMD Ryzen 9 7940HS, AMD Radeon 780M
42.8 (27.5min, 32.3P0.1, 34.5P1) fps +27%
Beelink SER8
AMD Ryzen 7 8845HS, AMD Radeon 780M
41.6 fps +23%
GMK NucBox K6
AMD Ryzen 7 7840HS, AMD Radeon 780M
40.5 fps +20%
Geekom AX8 Pro
AMD Ryzen 9 8945H, AMD Radeon 780M
38.5 (19.4min, 19.8P0.1, 29.1P1) fps +14%
Framework Laptop 13.5 Core Ultra 7 155H
Intel Core Ultra 7 155H, Intel Arc 8-Core iGPU
36.9 fps +9%
GMK NucBox K9
Intel Core Ultra 5 125H, Intel Arc 7-Core iGPU
33.7 fps
Asus NUC 14 Pro
Intel Core Ultra 5 125H, Intel Arc 7-Core iGPU
33.5 (20.9min, 21P0.1, 23.4P1) fps -1%
Medio Intel Arc 7-Core iGPU
  (29.9 - 33.7, n=4)
31.8 fps -6%
GMK NucBox M6
AMD Ryzen 5 6600H, AMD Radeon 660M
22.9 fps -32%
Geekom XT13 Pro
Intel Core i9-13900H, Intel Iris Xe Graphics G7 96EUs
19.9 (15.5min, 15.6P0.1, 16.4P1) fps -41%
HP Elite Mini 800 G9-5M9X6EA
Intel Core i5-14500, Intel UHD Graphics 770
10.2 (7.83min, 7.9P0.1, 8.15P1) fps -70%
HP Pro Mini 400 G9-937U0EA
Intel Core i5-14500T, Intel UHD Graphics 770
8.87 (6.27min, 6.29P0.1, 6.74P1) fps -74%
1920x1080 Medium Preset
Lenovo ThinkStation P3 Tiny-30H0006AGE
Intel Core i9-14900, NVIDIA T1000
35.2 (20.6min, 26.7P0.1, 30.6P1) fps +26%
Beelink SER8
AMD Ryzen 7 8845HS, AMD Radeon 780M
34.8 fps +25%
GMK NucBox K6
AMD Ryzen 7 7840HS, AMD Radeon 780M
33.7 fps +21%
Geekom AE7
AMD Ryzen 9 7940HS, AMD Radeon 780M
33 (15.6min, 21.4P0.1, 26.3P1) fps +18%
Framework Laptop 13.5 Core Ultra 7 155H
Intel Core Ultra 7 155H, Intel Arc 8-Core iGPU
30.7 fps +10%
Geekom AX8 Pro
AMD Ryzen 9 8945H, AMD Radeon 780M
29.9 (11.8min, 18.6P0.1, 23.5P1) fps +7%
GMK NucBox K9
Intel Core Ultra 5 125H, Intel Arc 7-Core iGPU
27.9 fps
Asus NUC 14 Pro
Intel Core Ultra 5 125H, Intel Arc 7-Core iGPU
25.9 (5.81min, 8.8P0.1, 15.9P1) fps -7%
Medio Intel Arc 7-Core iGPU
  (23.2 - 27.9, n=4)
25.9 fps -7%
Geekom XT13 Pro
Intel Core i9-13900H, Intel Iris Xe Graphics G7 96EUs
15.4 (11.8min, 11.9P0.1, 12.7P1) fps -45%
GMK NucBox M6
AMD Ryzen 5 6600H, AMD Radeon 660M
15.1 fps -46%
HP Elite Mini 800 G9-5M9X6EA
Intel Core i5-14500, Intel UHD Graphics 770
7.86 (5.51min, 5.72P0.1, 6.18P1) fps -72%
HP Pro Mini 400 G9-937U0EA
Intel Core i5-14500T, Intel UHD Graphics 770
6.97 (5.1min, 5.12P0.1, 5.36P1) fps -75%
1920x1080 High Preset
Lenovo ThinkStation P3 Tiny-30H0006AGE
Intel Core i9-14900, NVIDIA T1000
30.2 (10.5min, 12.6P0.1, 26.4P1) fps +25%
Beelink SER8
AMD Ryzen 7 8845HS, AMD Radeon 780M
28.9 fps +19%
GMK NucBox K6
AMD Ryzen 7 7840HS, AMD Radeon 780M
28.1 fps +16%
Framework Laptop 13.5 Core Ultra 7 155H
Intel Core Ultra 7 155H, Intel Arc 8-Core iGPU
26.7 fps +10%
Geekom AE7
AMD Ryzen 9 7940HS, AMD Radeon 780M
25.7 (11min, 11.5P0.1, 14.5P1) fps +6%
Geekom AX8 Pro
AMD Ryzen 9 8945H, AMD Radeon 780M
24.5 (17.7min, 17.7P0.1, 19.8P1) fps +1%
GMK NucBox K9
Intel Core Ultra 5 125H, Intel Arc 7-Core iGPU
24.2 fps
Asus NUC 14 Pro
Intel Core Ultra 5 125H, Intel Arc 7-Core iGPU
22.4 (14min, 14.2P0.1, 15.3P1) fps -7%
Medio Intel Arc 7-Core iGPU
  (19.5 - 24.2, n=4)
22.2 fps -8%
Geekom XT13 Pro
Intel Core i9-13900H, Intel Iris Xe Graphics G7 96EUs
13.5 (11.2min, 11.2P0.1, 11.6P1) fps -44%
GMK NucBox M6
AMD Ryzen 5 6600H, AMD Radeon 660M
13.3 fps -45%
HP Elite Mini 800 G9-5M9X6EA
Intel Core i5-14500, Intel UHD Graphics 770
6.88 (5.24min, 5.26P0.1, 5.41P1) fps -72%
HP Pro Mini 400 G9-937U0EA
Intel Core i5-14500T, Intel UHD Graphics 770
6.12 (4.49min, 4.52P0.1, 4.8P1) fps -75%
1920x1080 Ultra Preset
Lenovo ThinkStation P3 Tiny-30H0006AGE
Intel Core i9-14900, NVIDIA T1000
29.5 (13.3min, 21.5P0.1, 25.7P1) fps +28%
Beelink SER8
AMD Ryzen 7 8845HS, AMD Radeon 780M
28 fps +21%
GMK NucBox K6
AMD Ryzen 7 7840HS, AMD Radeon 780M
27 fps +17%
Framework Laptop 13.5 Core Ultra 7 155H
Intel Core Ultra 7 155H, Intel Arc 8-Core iGPU
25.7 fps +11%
Geekom AE7
AMD Ryzen 9 7940HS, AMD Radeon 780M
24.6 (11.6min, 11.6P0.1, 14.4P1) fps +6%
Geekom AX8 Pro
AMD Ryzen 9 8945H, AMD Radeon 780M
24.4 (8.81min, 15.2P0.1, 19.3P1) fps +6%
GMK NucBox K9
Intel Core Ultra 5 125H, Intel Arc 7-Core iGPU
23.1 fps
Asus NUC 14 Pro
Intel Core Ultra 5 125H, Intel Arc 7-Core iGPU
21.5 (13.6min, 13.7P0.1, 14.1P1) fps -7%
Medio Intel Arc 7-Core iGPU
  (19.5 - 23.1, n=4)
21.5 fps -7%
Geekom XT13 Pro
Intel Core i9-13900H, Intel Iris Xe Graphics G7 96EUs
13 (10.1min, 10.1P0.1, 11P1) fps -44%
GMK NucBox M6
AMD Ryzen 5 6600H, AMD Radeon 660M
12.6 fps -45%
Cyberpunk 2077 2.1 Phantom Liberty
1280x720 Low Preset (FSR off)
GMK NucBox K6
AMD Ryzen 7 7840HS, AMD Radeon 780M
77.4 (28.7min) fps +67%
Lenovo ThinkStation P3 Tiny-30H0006AGE
Intel Core i9-14900, NVIDIA T1000
77.1 (60.4min) fps +66%
Geekom AE7
AMD Ryzen 9 7940HS, AMD Radeon 780M
76.3 (63.4min) fps +64%
Beelink SER8
AMD Ryzen 7 8845HS, AMD Radeon 780M
72.6 (60.1min) fps +56%
Geekom AX8 Pro
AMD Ryzen 9 8945H, AMD Radeon 780M
69 (56.9min) fps +49%
Framework Laptop 13.5 Core Ultra 7 155H
Intel Core Ultra 7 155H, Intel Arc 8-Core iGPU
47.4 (40.3min) fps +2%
GMK NucBox K9
Intel Core Ultra 5 125H, Intel Arc 7-Core iGPU
46.4 (37.7min) fps
Asus NUC 14 Pro
Intel Core Ultra 5 125H, Intel Arc 7-Core iGPU
46.3 (39.2min) fps 0%
Medio Intel Arc 7-Core iGPU
  (45.5 - 46.4, n=3)
46.1 fps -1%
Geekom XT13 Pro
Intel Core i9-13900H, Intel Iris Xe Graphics G7 96EUs
31.8 (24.6min) fps -31%
HP Pro Mini 400 G9-937U0EA
Intel Core i5-14500T, Intel UHD Graphics 770
15.4 (11.7min) fps -67%
HP Elite Mini 800 G9-5M9X6EA
Intel Core i5-14500, Intel UHD Graphics 770
15.1 (4.01min) fps -67%
1920x1080 Low Preset (FSR off)
GMK NucBox K6
AMD Ryzen 7 7840HS, AMD Radeon 780M
46.3 (32.3min) fps +50%
Lenovo ThinkStation P3 Tiny-30H0006AGE
Intel Core i9-14900, NVIDIA T1000
45.1 (36.7min) fps +46%
Geekom AE7
AMD Ryzen 9 7940HS, AMD Radeon 780M
45 (38min) fps +46%
Beelink SER8
AMD Ryzen 7 8845HS, AMD Radeon 780M
43.8 (37.3min) fps +42%
Geekom AX8 Pro
AMD Ryzen 9 8945H, AMD Radeon 780M
41.3 (34.5min) fps +34%
Framework Laptop 13.5 Core Ultra 7 155H
Intel Core Ultra 7 155H, Intel Arc 8-Core iGPU
34.3 (29.3min) fps +11%
GMK NucBox K9
Intel Core Ultra 5 125H, Intel Arc 7-Core iGPU
30.9 (24.8min) fps
Asus NUC 14 Pro
Intel Core Ultra 5 125H, Intel Arc 7-Core iGPU
30.1 (25.8min) fps -3%
Medio Intel Arc 7-Core iGPU
  (23.2 - 30.9, n=5)
28.6 fps -7%
GMK NucBox M6
AMD Ryzen 5 6600H, AMD Radeon 660M
24.3 (20.5min) fps -21%
Geekom XT13 Pro
Intel Core i9-13900H, Intel Iris Xe Graphics G7 96EUs
18.6 (15.4min) fps -40%
HP Elite Mini 800 G9-5M9X6EA
Intel Core i5-14500, Intel UHD Graphics 770
9.13 (7.04min) fps -70%
HP Pro Mini 400 G9-937U0EA
Intel Core i5-14500T, Intel UHD Graphics 770
8.82 (6.82min) fps -71%
1920x1080 Medium Preset (FSR off)
GMK NucBox K6
AMD Ryzen 7 7840HS, AMD Radeon 780M
35.2 (10.9min) fps +40%
Geekom AE7
AMD Ryzen 9 7940HS, AMD Radeon 780M
35.1 (30.5min) fps +39%
Beelink SER8
AMD Ryzen 7 8845HS, AMD Radeon 780M
34.5 (29.8min) fps +37%
Lenovo ThinkStation P3 Tiny-30H0006AGE
Intel Core i9-14900, NVIDIA T1000
34.2 (28.8min) fps +36%
Geekom AX8 Pro
AMD Ryzen 9 8945H, AMD Radeon 780M
31.8 (27.5min) fps +26%
Framework Laptop 13.5 Core Ultra 7 155H
Intel Core Ultra 7 155H, Intel Arc 8-Core iGPU
27.8 (24.1min) fps +10%
Asus NUC 14 Pro
Intel Core Ultra 5 125H, Intel Arc 7-Core iGPU
25.2 (22.3min) fps 0%
GMK NucBox K9
Intel Core Ultra 5 125H, Intel Arc 7-Core iGPU
25.2 (19.2min) fps
Medio Intel Arc 7-Core iGPU
  (19.8 - 25.2, n=5)
23.2 fps -8%
GMK NucBox M6
AMD Ryzen 5 6600H, AMD Radeon 660M
18.1 (15.7min) fps -28%
Geekom XT13 Pro
Intel Core i9-13900H, Intel Iris Xe Graphics G7 96EUs
15 (12.4min) fps -40%
HP Elite Mini 800 G9-5M9X6EA
Intel Core i5-14500, Intel UHD Graphics 770
7.06 (5.79min) fps -72%
HP Pro Mini 400 G9-937U0EA
Intel Core i5-14500T, Intel UHD Graphics 770
6.75 (5.5min) fps -73%
1920x1080 High Preset (FSR off)
Lenovo ThinkStation P3 Tiny-30H0006AGE
Intel Core i9-14900, NVIDIA T1000
28.3 (23.5min) fps +33%
GMK NucBox K6
AMD Ryzen 7 7840HS, AMD Radeon 780M
27.7 (9.25min) fps +30%
Geekom AE7
AMD Ryzen 9 7940HS, AMD Radeon 780M
27.4 (23.1min) fps +29%
Beelink SER8
AMD Ryzen 7 8845HS, AMD Radeon 780M
27.1 (22.6min) fps +27%
Geekom AX8 Pro
AMD Ryzen 9 8945H, AMD Radeon 780M
25.8 (21.7min) fps +21%
Framework Laptop 13.5 Core Ultra 7 155H
Intel Core Ultra 7 155H, Intel Arc 8-Core iGPU
23.4 (20.1min) fps +10%
Asus NUC 14 Pro
Intel Core Ultra 5 125H, Intel Arc 7-Core iGPU
21.7 (18.8min) fps +2%
GMK NucBox K9
Intel Core Ultra 5 125H, Intel Arc 7-Core iGPU
21.3 (14.6min) fps
Medio Intel Arc 7-Core iGPU
  (16.6 - 21.7, n=5)
19.9 fps -7%
Geekom XT13 Pro
Intel Core i9-13900H, Intel Iris Xe Graphics G7 96EUs
13 (11min) fps -39%
GMK NucBox M6
AMD Ryzen 5 6600H, AMD Radeon 660M
11.6 (10min) fps -46%
HP Elite Mini 800 G9-5M9X6EA
Intel Core i5-14500, Intel UHD Graphics 770
6.09 (5.05min) fps -71%
HP Pro Mini 400 G9-937U0EA
Intel Core i5-14500T, Intel UHD Graphics 770
5.86 (4.84min) fps -72%
1920x1080 Ultra Preset (FSR off)
GMK NucBox K6
AMD Ryzen 7 7840HS, AMD Radeon 780M
24.5 (9.31min) fps +30%
Geekom AE7
AMD Ryzen 9 7940HS, AMD Radeon 780M
24.3 (20.4min) fps +29%
Lenovo ThinkStation P3 Tiny-30H0006AGE
Intel Core i9-14900, NVIDIA T1000
23.8 (20min) fps +27%
Beelink SER8
AMD Ryzen 7 8845HS, AMD Radeon 780M
23.4 (19min) fps +24%
Geekom AX8 Pro
AMD Ryzen 9 8945H, AMD Radeon 780M
21.7 (18.2min) fps +15%
Framework Laptop 13.5 Core Ultra 7 155H
Intel Core Ultra 7 155H, Intel Arc 8-Core iGPU
21.1 (17.4min) fps +12%
Asus NUC 14 Pro
Intel Core Ultra 5 125H, Intel Arc 7-Core iGPU
19.6 (16.7min) fps +4%
GMK NucBox K9
Intel Core Ultra 5 125H, Intel Arc 7-Core iGPU
18.8 (10.9min) fps
Medio Intel Arc 7-Core iGPU
  (14.8 - 19.6, n=5)
17.7 fps -6%
Geekom XT13 Pro
Intel Core i9-13900H, Intel Iris Xe Graphics G7 96EUs
11.4 (9.68min) fps -39%
HP Elite Mini 800 G9-5M9X6EA
Intel Core i5-14500, Intel UHD Graphics 770
5.24 (4.41min) fps -72%
HP Pro Mini 400 G9-937U0EA
Intel Core i5-14500T, Intel UHD Graphics 770
5.03 (4.23min) fps -73%

Cyberpunk 2077 ultra FPS Chart

05101520Tooltip
GMK NucBox K9 Ultra 5 125H, Arc 7-Core: Ø18.7 (14.7-20.9)
bajomedioaltoultra
GTA V (2015) 143.6 125.5 33.6 12.7
Dota 2 Reborn (2015) 97.7 83.1 75.6 73.3
Final Fantasy XV Benchmark (2018) 59.6 33.3 22.3
X-Plane 11.11 (2018) 57 44.8 37.3
Far Cry 5 (2018) 71 40 37 35
Strange Brigade (2018) 148.6 63.9 53.5 43.5
Tiny Tina's Wonderlands (2022) 50.7 39.4 26.8 22.4
F1 22 (2022) 79.4 71.9 52.9
Baldur's Gate 3 (2023) 33.7 27.9 24.2 23.1
Cyberpunk 2077 2.1 Phantom Liberty (2023) 30.9 25.2 21.3 18.8

Emisiones - Los ventiladores están siempre encendidos

Ruido del sistema

El ruido del ventilador está siempre presente en la unidad sin importar la carga en pantalla, muy parecido a lo que registramos en la NucBox K6. Simplemente en ralentí en el escritorio ya es de 30 a 36 dB(A) contra un fondo silencioso de 23 dB(A) incluso cuando se establece en el modo de ahorro de energía. Sin embargo, el ruido del ventilador al jugar o ejecutar otras cargas exigentes parece ser más silencioso en el NucBox K9 con unos 44 dB(A) frente a los casi 48 dB(A) del NucBox K6.

Perfil de ruido del ventilador (Blanco: Fondo, Rojo: Sistema en reposo, Azul: 3DMark 06, Naranja: Cyberpunk 2077, Verde: Prime95+Estrés FurMark)

Ruido

Ocioso
29.8 / 35.7 / 35.7 dB(A)
Carga
41.9 / 44 dB(A)
  red to green bar
 
 
30 dB
silencioso
40 dB(A)
audible
50 dB(A)
ruidosamente alto
 
min: dark, med: mid, max: light   Earthworks M23R, Arta (15 cm de distancia)   ruido ambiental: 23 dB(A)
dB(A) 0102030405060708090Deep BassMiddle BassHigh BassLower RangeMidsHigher MidsLower HighsMid HighsUpper HighsSuper Highs2036.43635.732.734.32523.527.225.923.8243122.722.421.92024.64022.124.522.120.6255022.823.221.321.527.86325.523.422.320.226.58026.225.524.823.128.410026.524.719.919.128.812524.222.221.713.42516025.52417.412.625.520025.124.317.714.326.625025.724.824.912.927.3315282824.215.928.24002930.72314.228.950026.825.824.310.727.263026.625.226.110.927.680030.631.929.49.531100037.833.824.49.136.7125033.833.824.29.435.2160034.432.226.19.635.3200033.631.627.39.933.6250032.830.521.510.233.2315031.427.921.210.731.5400027.423.817.811.127.650002823.816.711.328.463002520.716.211.425.1800019.117.112.411.418.91000015.515.112.211.6151250014.815.211.811.513.91600014.214.611.210.613SPL43.841.835.72344N4.13.52.10.44.2median 26.8median 24.8median 21.5median 11.3median 27.6Delta3.65.54.31.44hearing rangehide median Fan NoiseGMK NucBox K9
GMK NucBox K9
Arc 7-Core, Ultra 5 125H, MasonSemi 1TB MC7000
GMK NucBox K6
Radeon 780M, R7 7840HS, MasonSemi 1TB MC7000
GMK NucBox M6
Radeon 660M, R5 6600H, AirDisk APF 10-512G
Beelink SER8
Radeon 780M, R7 8845HS, Crucial P3 Plus CT1000P3PSSD8
Beelink SEi12 Core i5-1235U
Iris Xe G7 80EUs, i5-1235U, Kingston NV1 SNVS/500GCN
BOSGAME M1
Radeon 780M, R7 7840HS
Noise
-2%
-4%
14%
14%
4%
apagado / medio ambiente *
23
23.2
-1%
24.2
-5%
23.6
-3%
23.3
-1%
23.2
-1%
Idle Minimum *
29.8
31.3
-5%
31.9
-7%
28.8
3%
27.8
7%
32
-7%
Idle Average *
35.7
31.3
12%
32
10%
28.8
19%
27.8
22%
32
10%
Idle Maximum *
35.7
33.4
6%
33.8
5%
30.5
15%
27.8
22%
32
10%
Load Average *
41.9
47.5
-13%
48.5
-16%
34.6
17%
32
24%
38.7
8%
Cyberpunk 2077 ultra *
43.8
34.1
22%
Load Maximum *
44
47.7
-8%
48.5
-10%
34.5
22%
39.2
11%
42
5%
Witcher 3 ultra *
43.6
48.5
34.1
41.7

* ... más pequeño es mejor

Temperatura

El adaptador de CA alcanza más de 31 C cuando funciona con cargas exigentes

Las temperaturas de la superficie no son un problema. Las rejillas de ventilación están en cada lado del dispositivo, excepto en la superficie superior, lo que significa que es seguro colocar portátiles y otros objetos pequeños en la parte superior sin impedir el flujo de aire.

Sistema inactivo (frontal)
Sistema inactivo (trasero)
Prime95+Tensión FurMark (frente)
Prime95+Tensión FurMark (trasera)

Gestión de la energía

Consumo de energía

El consumo cuando está en reposo en el escritorio es más alto de lo esperado, alrededor de 11 W incluso en modo de ahorro de energía, en comparación con los 6 W a 8 W de otros modelos como el NucBox M6 o el Beelink SER8. Sin embargo, cuando se ejecutan cargas más exigentes como 3DMark 06 o Cyberpunk 2077, el consumo es notablemente inferior que en el NucBox K6 más rápido.

Hemos podido registrar un consumo máximo de 73 W con el adaptador de CA de barril pequeño-mediano (~14,5 x 6,4 x 3 cm) de 120 W. La gran sobrecarga puede atribuirse al puerto Thunderbolt 4 en caso de que algún monitor o accesorio conectado requiera alimentación adicional.

consumo 3DMark 06
consumo 3DMark 06
Cyberpunk 2077 1080p Ultra consumo
El consumo se dispararía a 71 W al iniciar el estrés Prime95. A partir de entonces, no se producirían caídas importantes, lo que concuerda con nuestras observaciones de la prueba de estrés anterior
Prime95+FurMark tensión iniciada en la marca 10s
Consumo de corriente
Off / Standbydarklight 1.1 / 1.6 Watt
Ociosodarkmidlight 10.9 / 11 / 11.4 Watt
Carga midlight 52.8 / 72.2 Watt
 color bar
Clave: min: dark, med: mid, max: light        Metrahit Energy
GMK NucBox K9
Ultra 5 125H, Arc 7-Core, MasonSemi 1TB MC7000, , x,
GMK NucBox K6
R7 7840HS, Radeon 780M, MasonSemi 1TB MC7000, , x,
GMK NucBox M6
R5 6600H, Radeon 660M, AirDisk APF 10-512G, , x,
Beelink SER8
R7 8845HS, Radeon 780M, Crucial P3 Plus CT1000P3PSSD8, , x,
Beelink SEi12 Core i5-1235U
i5-1235U, Iris Xe G7 80EUs, Kingston NV1 SNVS/500GCN, , x,
BOSGAME M1
R7 7840HS, Radeon 780M, , , x,
Power Consumption
10%
10%
9%
-43%
4%
Idle Minimum *
10.9
6.7
39%
7.9
28%
7.3
33%
15.8
-45%
7.3
33%
Idle Average *
11
7
36%
8
27%
7.3
34%
16.8
-53%
7.3
34%
Idle Maximum *
11.4
7.6
33%
8.3
27%
8.4
26%
17
-49%
8.4
26%
Load Average *
52.8
74.3
-41%
61.5
-16%
68.2
-29%
54.4
-3%
72.7
-38%
Cyberpunk 2077 ultra external monitor *
57.1
Load Maximum *
72.2
85.7
-19%
84.6
-17%
84.3
-17%
119.1
-65%
99.1
-37%
Witcher 3 ultra *
75
47.3
75.1
50.7
80.5

* ... más pequeño es mejor

Power Consumption Prime95+FurMark Stress Test

05101520253035404550556065707580Tooltip
GMK NucBox K9 Ultra 5 125H, Arc 7-Core: Ø72 (71.3-72.6)
GMK NucBox M6 R5 6600H, Radeon 660M: Ø80 (77.6-84.6)

Power Consumption external Monitor

05101520253035404550556065707580Tooltip
GMK NucBox K9 Ultra 5 125H, Arc 7-Core; Prime95 V2810 Stress (external Monitor): Ø70.5 (69.4-71)
GMK NucBox M6 R5 6600H, Radeon 660M; Prime95 V2810 Stress (external Monitor): Ø78.3 (76.1-82.8)
GMK NucBox K9 Ultra 5 125H, Arc 7-Core; Cinebench R15 Multi (external Monitor): Ø62.9 (31.3-65.1)
GMK NucBox M6 R5 6600H, Radeon 660M; Cinebench R15 Multi (external Monitor): Ø75.1 (57.8-78.5)
GMK NucBox K9 Ultra 5 125H, Arc 7-Core; 1280x720 FurMark 1.19 GPU Stress Test (external Monitor): Ø48.5 (47-52.2)
GMK NucBox M6 R5 6600H, Radeon 660M; 1280x720 FurMark 1.19 GPU Stress Test (external Monitor): Ø54.7 (52.9-56.1)
GMK NucBox K9 Ultra 5 125H, Arc 7-Core; Idle 1min (external Monitor): Ø11.1 (10.8-13.9)
GMK NucBox M6 R5 6600H, Radeon 660M; Idle 1min (external Monitor): Ø8.08 (7.75-13.6)
GMK NucBox K9 Ultra 5 125H, Arc 7-Core; Cyberpunk 2077 FHD ultra no FSR (external Monitor): Ø57.1 (56.3-59.8)

Pro

+ fácil mantenimiento; 2x SODIMM + 2x SSD M.2 2280
+ gran rendimiento de las SSD
+ factor de forma compacto
+ precio razonable
+ puertos USB4 completos

Contra

- sigue utilizando el adaptador de CA de barril propietario
- rendimiento gráfico inconsistente
- los ventiladores internos nunca están inactivos
- sin opciones Core Ultra 7
- sólo un puerto USB-C

Veredicto - Más nuevo pero no más rápido

En revisión: GMKtec NucBox K9

Por 570 dólares en oferta con 32 GB de RAM y 1 TB de almacenamiento, el NucBox K9 representa un buen valor si lo comparamos con el Beelink SER8 que actualmente es más caro con 630 dólares en Amazon. El mayor enemigo de GMK es probablemente la propia GMK ya que modelos como el NucBox K6 son a la vez más baratos y más rápidos que el NucBox K9 en lo que es esencialmente el mismo diseño de chasis con las mismas características físicas. En este escenario, casi no hay razón para comprar el NucBox K9 sobre el K6 a menos que si usted prioriza la NPU integrada sobre la potencia bruta de la CPU y la GPU. Incluso el competidor Bosgame M1 es actualmente más barato y más rápido a 500 dólares. Es cierto que el NucBox K9 funciona un poco más silencioso, pero eso es sólo porque el modelo es también un poco más lento para empezar.

El NucBox K9 no es un mal mini PC ni mucho menos, pero su precio más elevado y su rendimiento más lento que el del NucBox K6 más antiguo están destinados a confundir a muchos compradores, especialmente para aquellos que no están interesados en la aceleración de IA.

Más allá de las disparidades de precio y rendimiento entre los modelos NucBox K6 y K9, el diseño de la serie está empezando a mostrar su edad. Competidores como Bosgame tienen diseños de chasis metálicos más resistentes, mientras que Beelink ha rediseñado recientemente su serie SER para ser mucho más profesional e incluso lujosa. La GMK NucBox, en su mayor parte de plástico, funciona lo suficientemente bien, pero puede que ya sea hora de una revisión con materiales de mayor calidad o un mantenimiento potencialmente sin herramientas.

Precio y disponibilidad

La GMKtec NucBox K9 se envía ahora tal y como está configurada en esta reseña en Amazon por 720 $ (después del cupón) o directamente desde el fabricante por 570 dólares. Un SKU barebones también está disponible por $ 400.

Nota: Recientemente hemos actualizado nuestro sistema de clasificación y los resultados de la versión 8 no son comparables con los de la versión 7. Encontrará más información aquí .

GMK NucBox K9 - 10/30/2024 v8
Allen Ngo

Acabado
84 / 98 → 85%
Conectividad
62 / 81 → 76%
Peso
83%
Rendimiento de juegos
46 / 80 → 57%
Rendimiento de la Aplicación
82 / 92 → 89%
Ruido
64%
Médio
49%
67%
Mini PC - media ponderada
CO2 Emissions
No Data
Materials
0%
Packaging
50%
Power Use
68.2%
Repairability
40%
Software Updates
22.3%
Recycle Logo Total Sustainability Score: 30.1%

Transparencia

La selección de los dispositivos que se van a reseñar corre a cargo de nuestro equipo editorial. La muestra de prueba fue proporcionada al autor en calidad de préstamo por el fabricante o el minorista a los efectos de esta reseña. El prestamista no tuvo ninguna influencia en esta reseña, ni el fabricante recibió una copia de la misma antes de su publicación. No había ninguna obligación de publicar esta reseña. Nunca aceptamos compensaciones o pagos a cambio de nuestras reseñas. Como empresa de medios independiente, Notebookcheck no está sujeta a la autoridad de fabricantes, minoristas o editores.

Así es como prueba Notebookcheck

Cada año, Notebookcheck revisa de forma independiente cientos de portátiles y smartphones utilizando procedimientos estandarizados para asegurar que todos los resultados son comparables. Hemos desarrollado continuamente nuestros métodos de prueba durante unos 20 años y hemos establecido los estándares de la industria en el proceso. En nuestros laboratorios de pruebas, técnicos y editores experimentados utilizan equipos de medición de alta calidad. Estas pruebas implican un proceso de validación en varias fases. Nuestro complejo sistema de clasificación se basa en cientos de mediciones y puntos de referencia bien fundamentados, lo que mantiene la objetividad.

Price comparison

Please share our article, every link counts!
Mail Logo
> Análisis y pruebas de ordenadores portátiles y móviles teléfonos > Análisis > Reseña del mini PC GMK NucBox K9: Core Ultra 5 125H con gráficos Arc 7
Allen Ngo, 2024-09-25 (Update: 2024-09-25)