

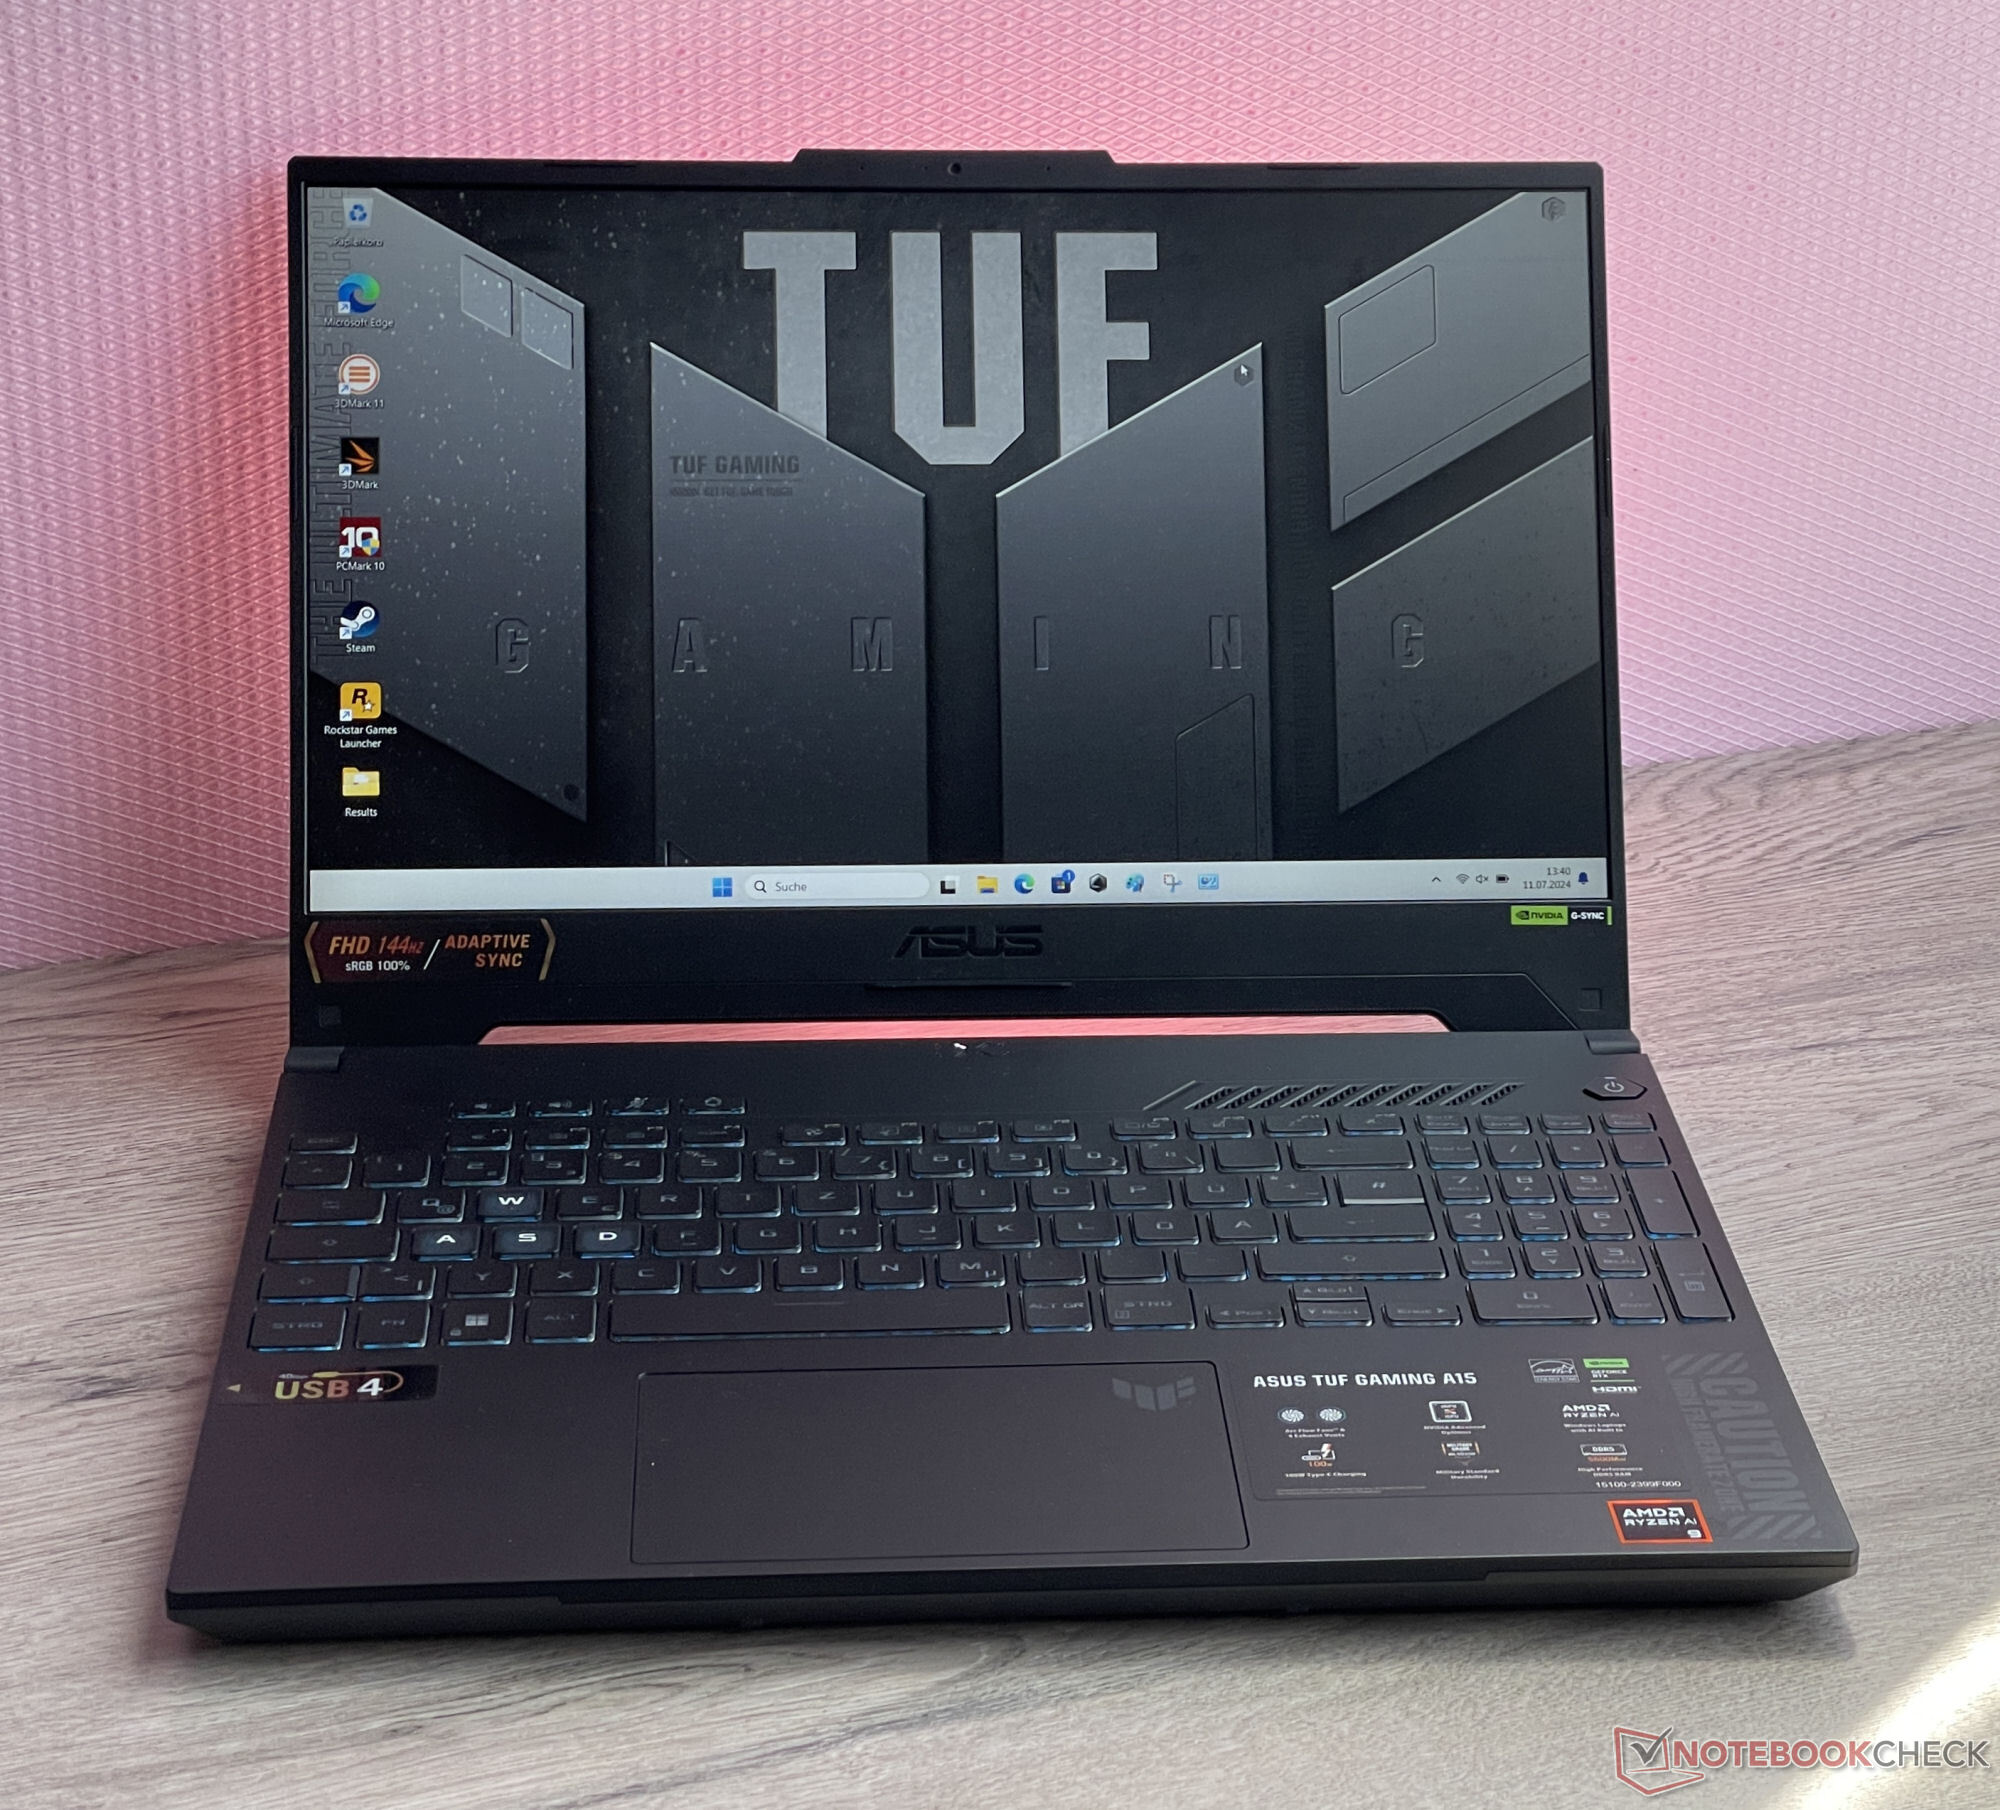
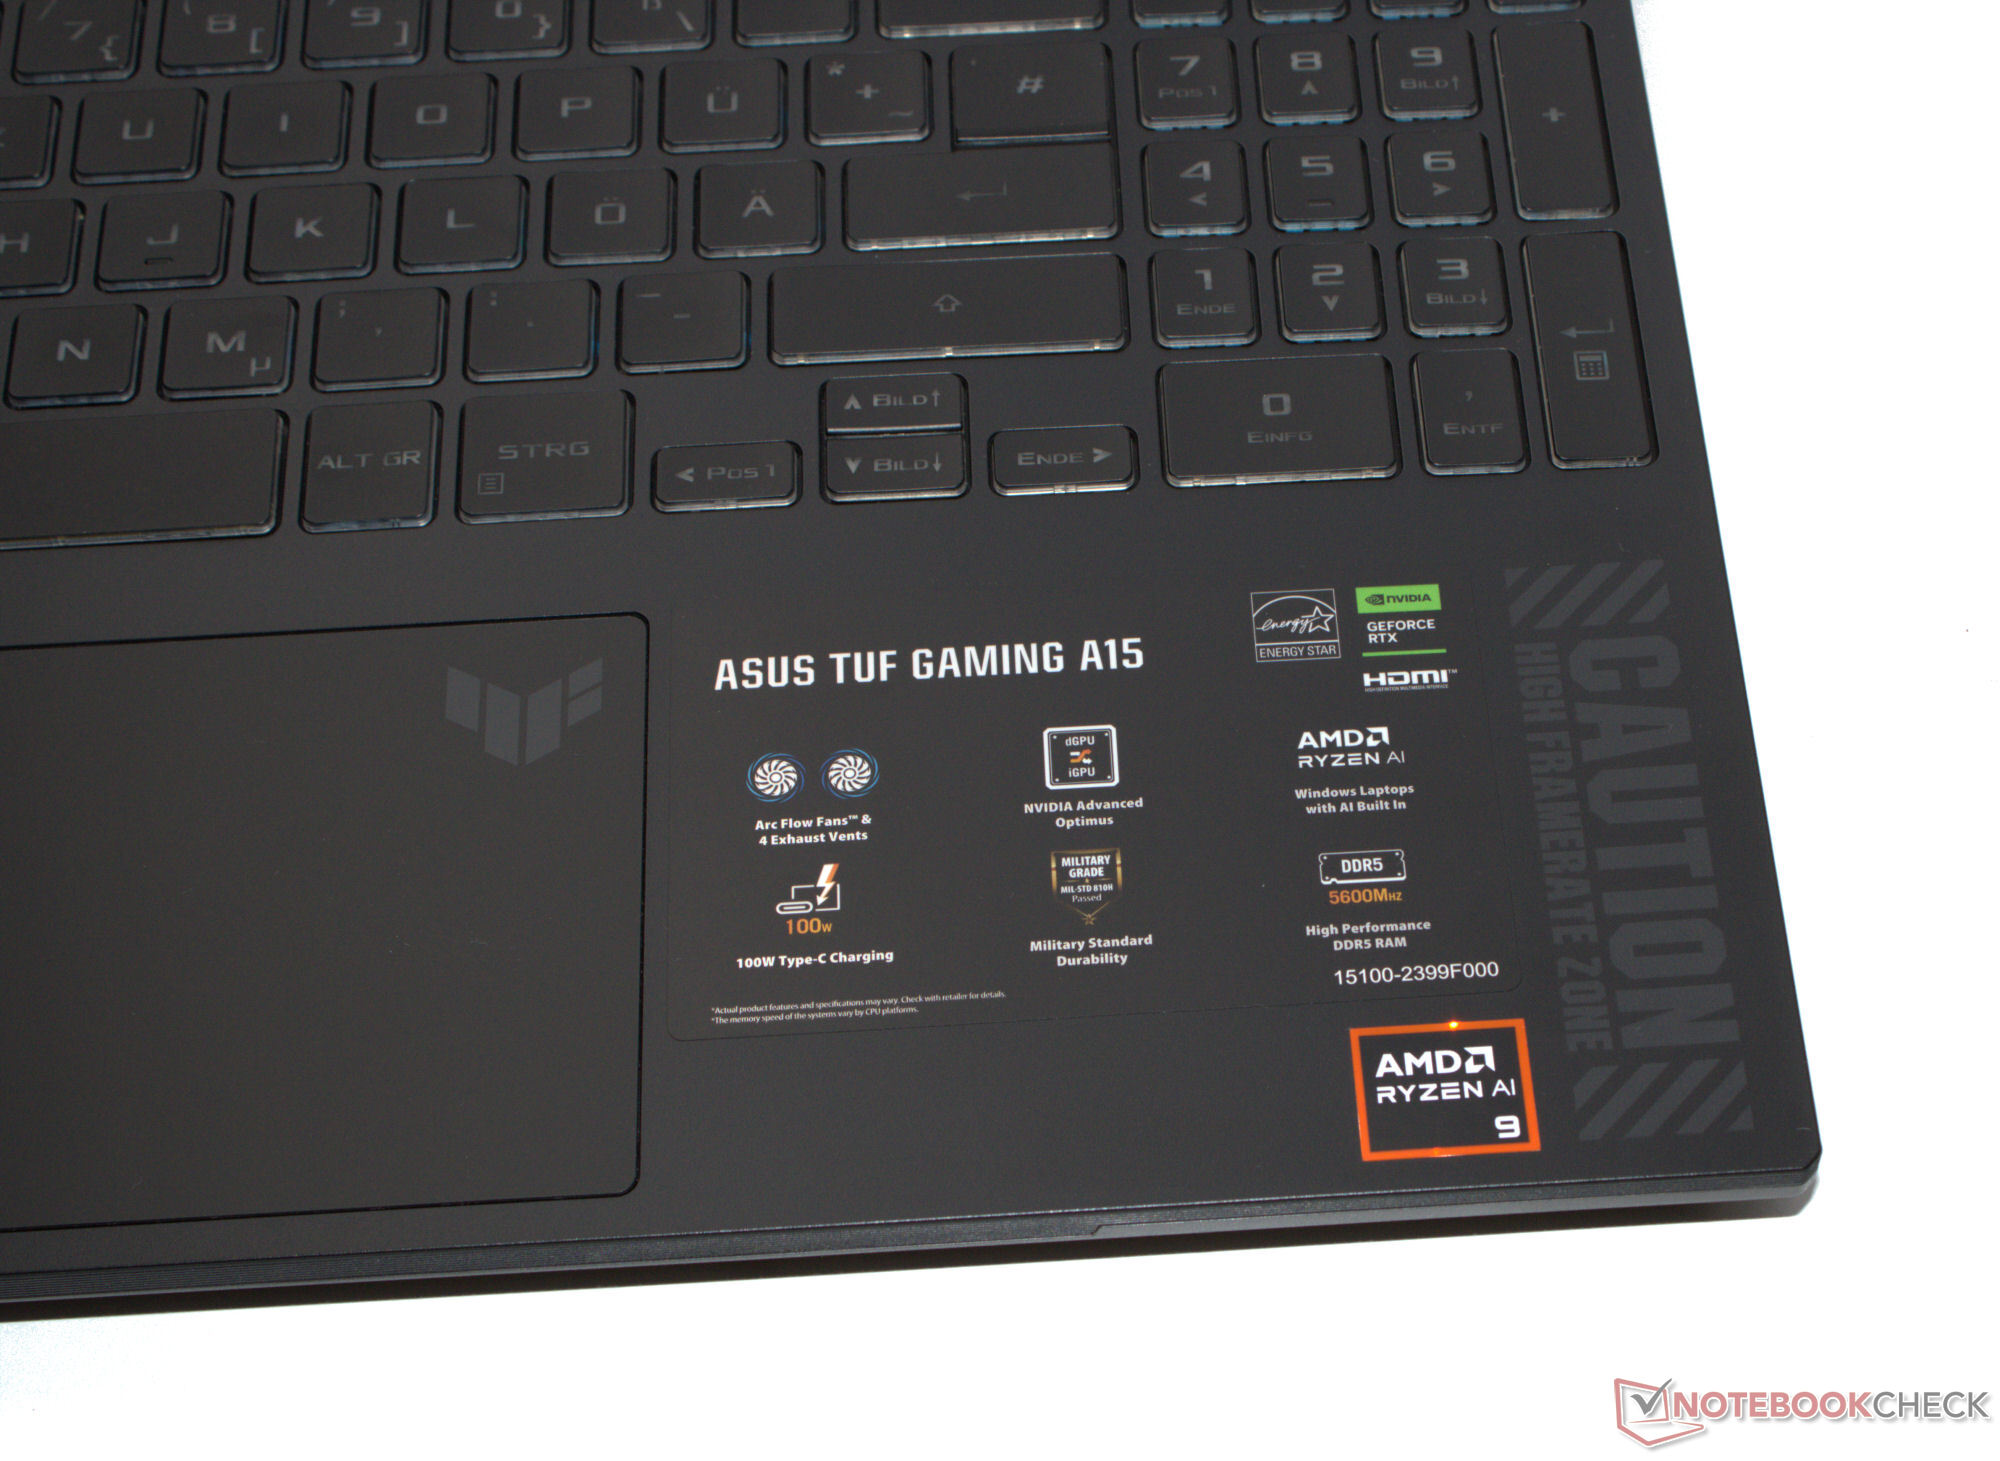
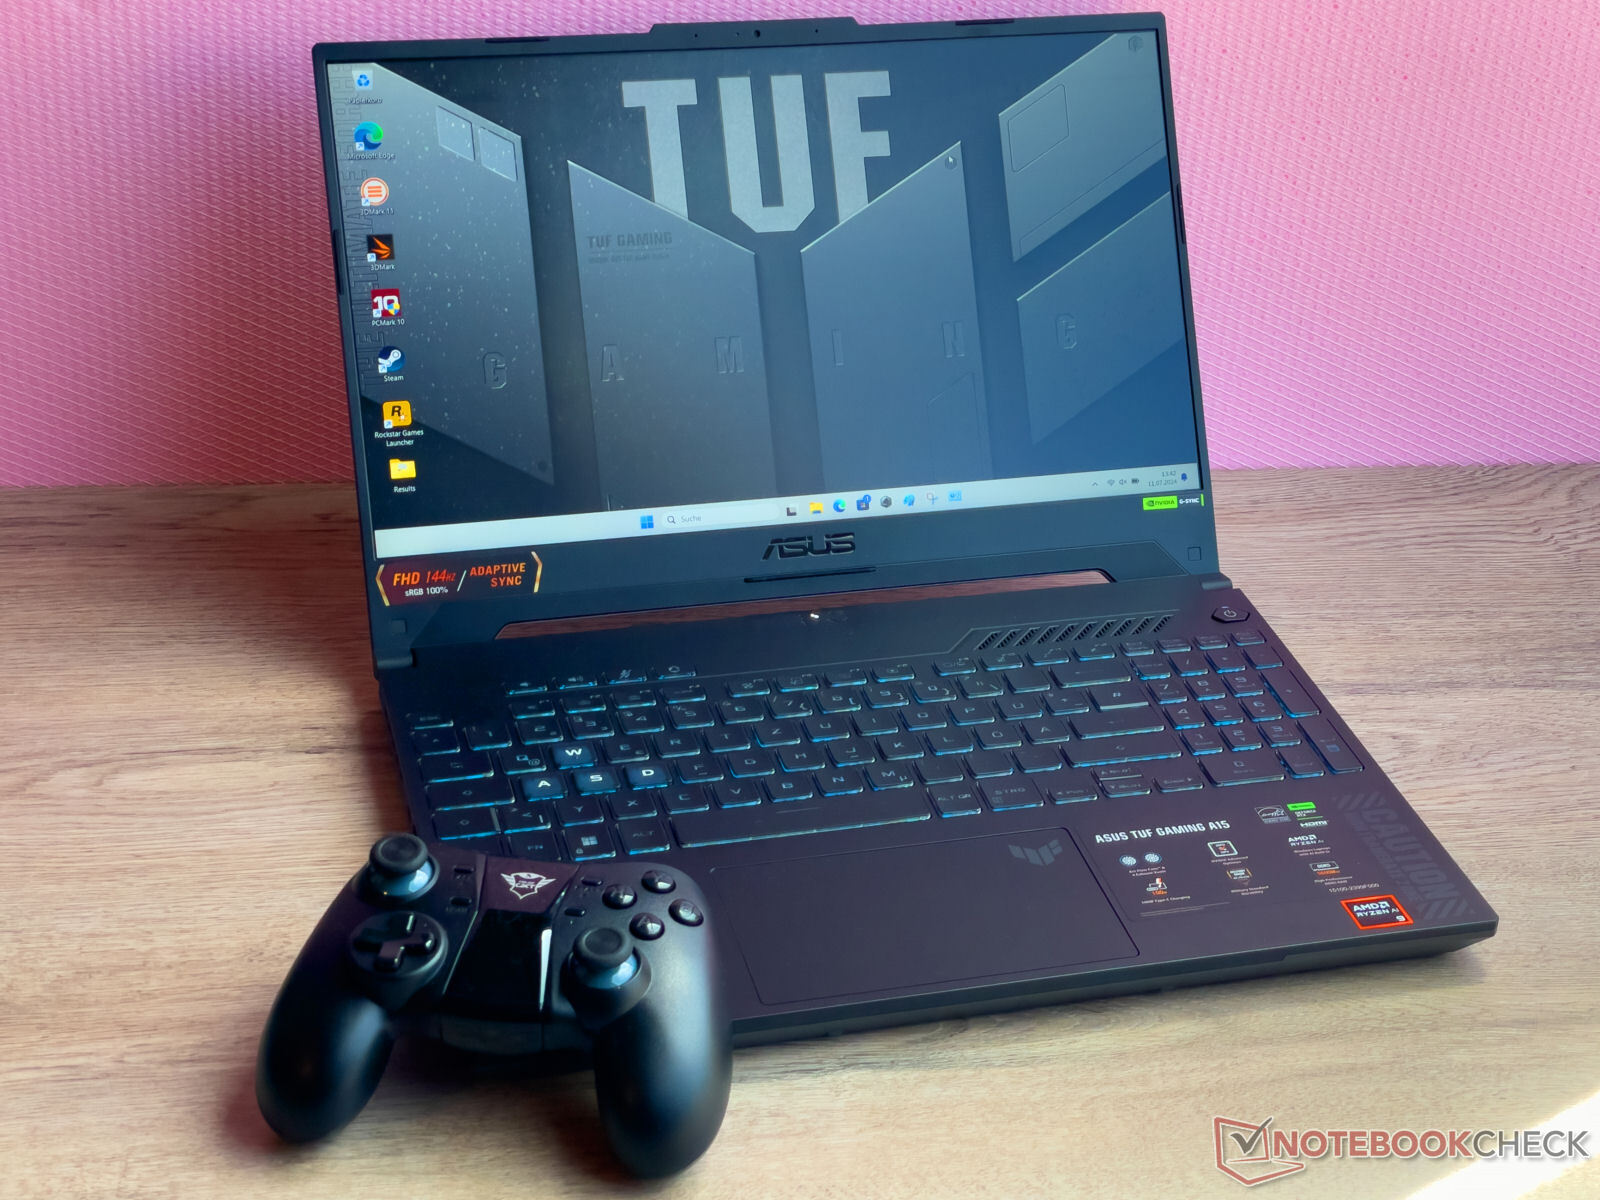
Análisis del Asus TUF Gaming A15 (2024): Potencia RTX 4060, precio moderado, batería de larga duración

"TUF Gaming" es sinónimo de portátiles para juegos en el extremo inferior de la escala de precios: Ryzen 9 8945H, GeForce RTX 4060, 16 GB de RAM, una unidad SSD de 512 GB y un precio que ronda los 1.399 dólares conforman un portátil para juegos de gama media asequible. La competencia puede encontrarse en forma de dispositivos como el Lenovo LOQ 15IRX9el Gigabyte G6X 9KG (2024), el Dell G16, el XMG Core 15 (M24) y el HP Victus 16 (2024).
Es idéntico al modelo hermano del año anterior, el A15 que revisamos el año pasado. La principal diferencia es el cambio de Ryzen 7000 a Ryzen 8000.
Posibles contendientes en la comparación
Valoración | Versión | Fecha | Modelo | Peso | Altura | Tamaño | Resolución | Precio |
|---|---|---|---|---|---|---|---|---|
| 80.3 % | v8 | 07/2024 | Asus TUF Gaming A15 FA507UV R9 8945H, NVIDIA GeForce RTX 4060 Laptop GPU | 2.1 kg | 22.4 mm | 15.60" | 1920x1080 | |
| 79 % | v8 | 07/2024 | Lenovo LOQ 15IRX9 i5-13450HX, NVIDIA GeForce RTX 4060 Laptop GPU | 2.4 kg | 23.9 mm | 15.60" | 1920x1080 | |
| 84.3 % v7 (old) | v7 (old) | 05/2024 | HP Victus 16 (2024) i7-14700HX, NVIDIA GeForce RTX 4060 Laptop GPU | 2.4 kg | 23.9 mm | 16.10" | 1920x1080 | |
| 83.2 % v7 (old) | v7 (old) | 03/2024 | Gigabyte G6X 9KG (2024) i7-13650HX, NVIDIA GeForce RTX 4060 Laptop GPU | 2.6 kg | 25.1 mm | 16.00" | 1920x1200 | |
| 83.7 % | v8 | 06/2024 | SCHENKER XMG Core 15 (M24) R7 8845HS, NVIDIA GeForce RTX 4060 Laptop GPU | 2.1 kg | 21.9 mm | 15.30" | 2560x1600 | |
| 85.5 % v7 (old) | v7 (old) | 02/2024 | Dell G16, i7-13650HX, RTX 4060 i7-13650HX, NVIDIA GeForce RTX 4060 Laptop GPU | 2.8 kg | 25.65 mm | 16.00" | 2560x1600 |
Nota: Recientemente hemos actualizado nuestro sistema de clasificación y los resultados de la versión 8 no son comparables con los de la versión 7. Encontrará más información aquí.
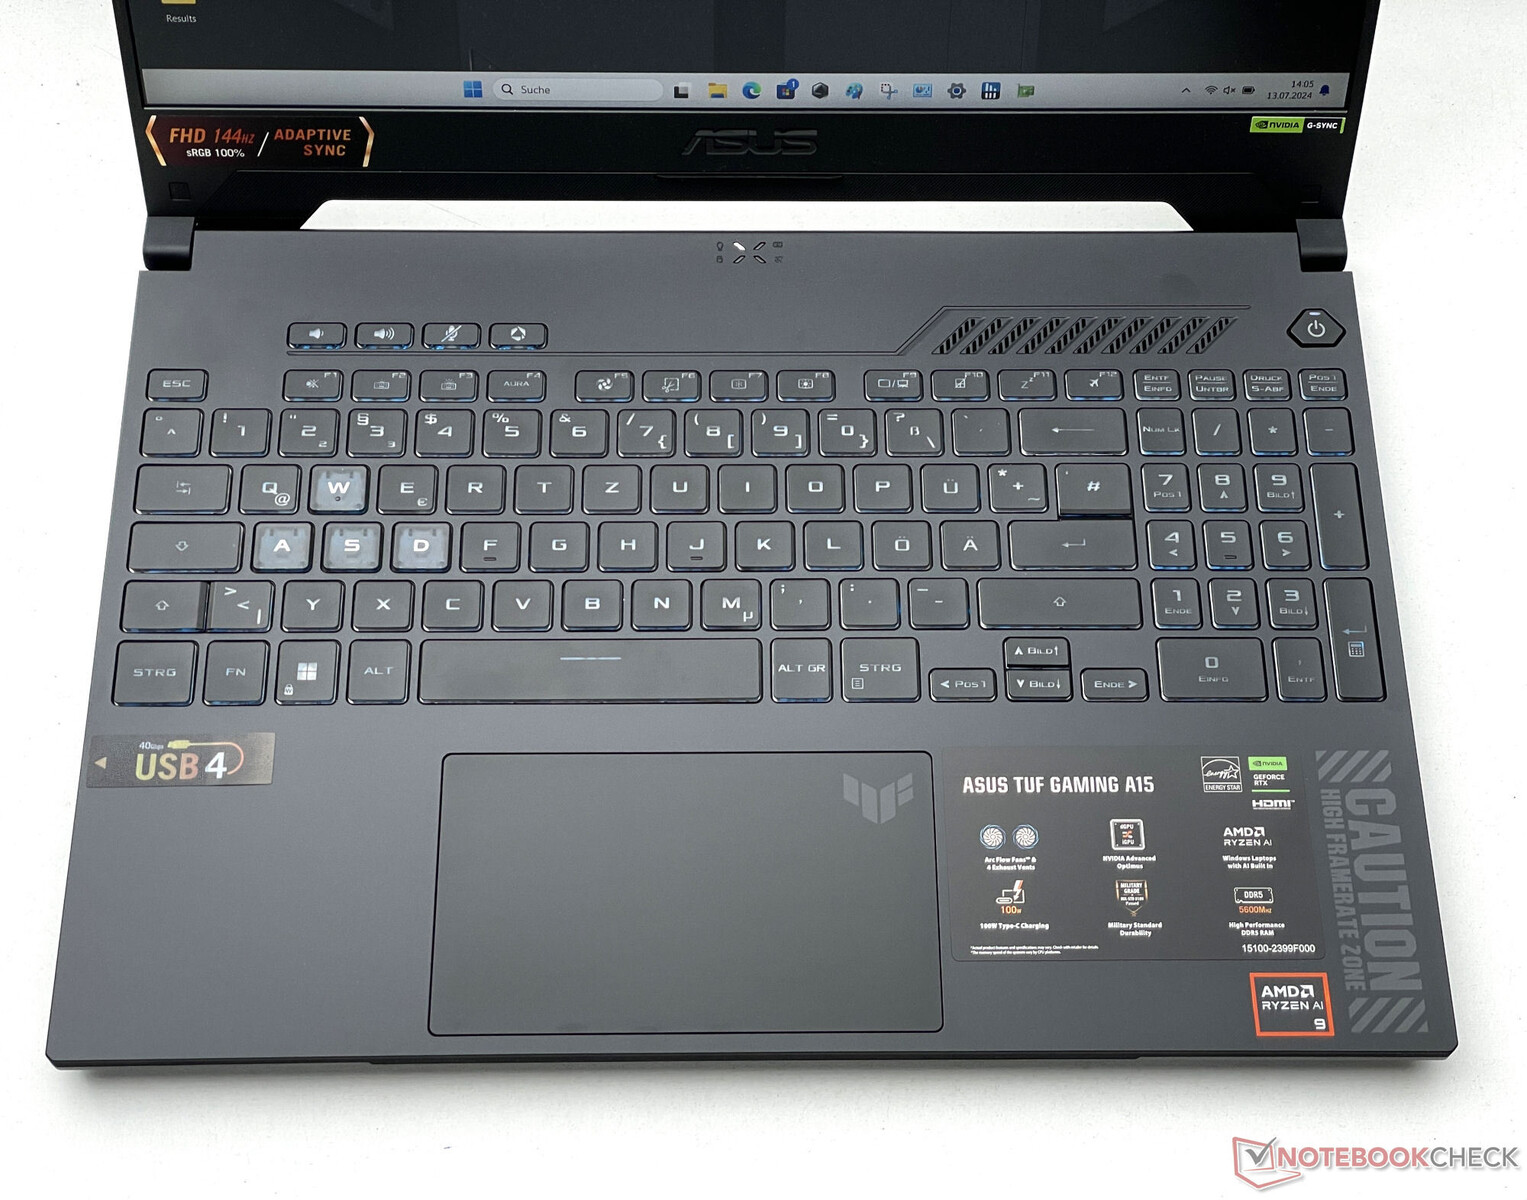
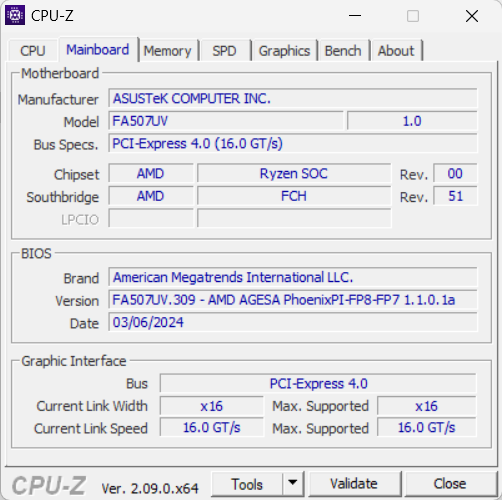
Carcasa y características - Asus TUF y USB 4
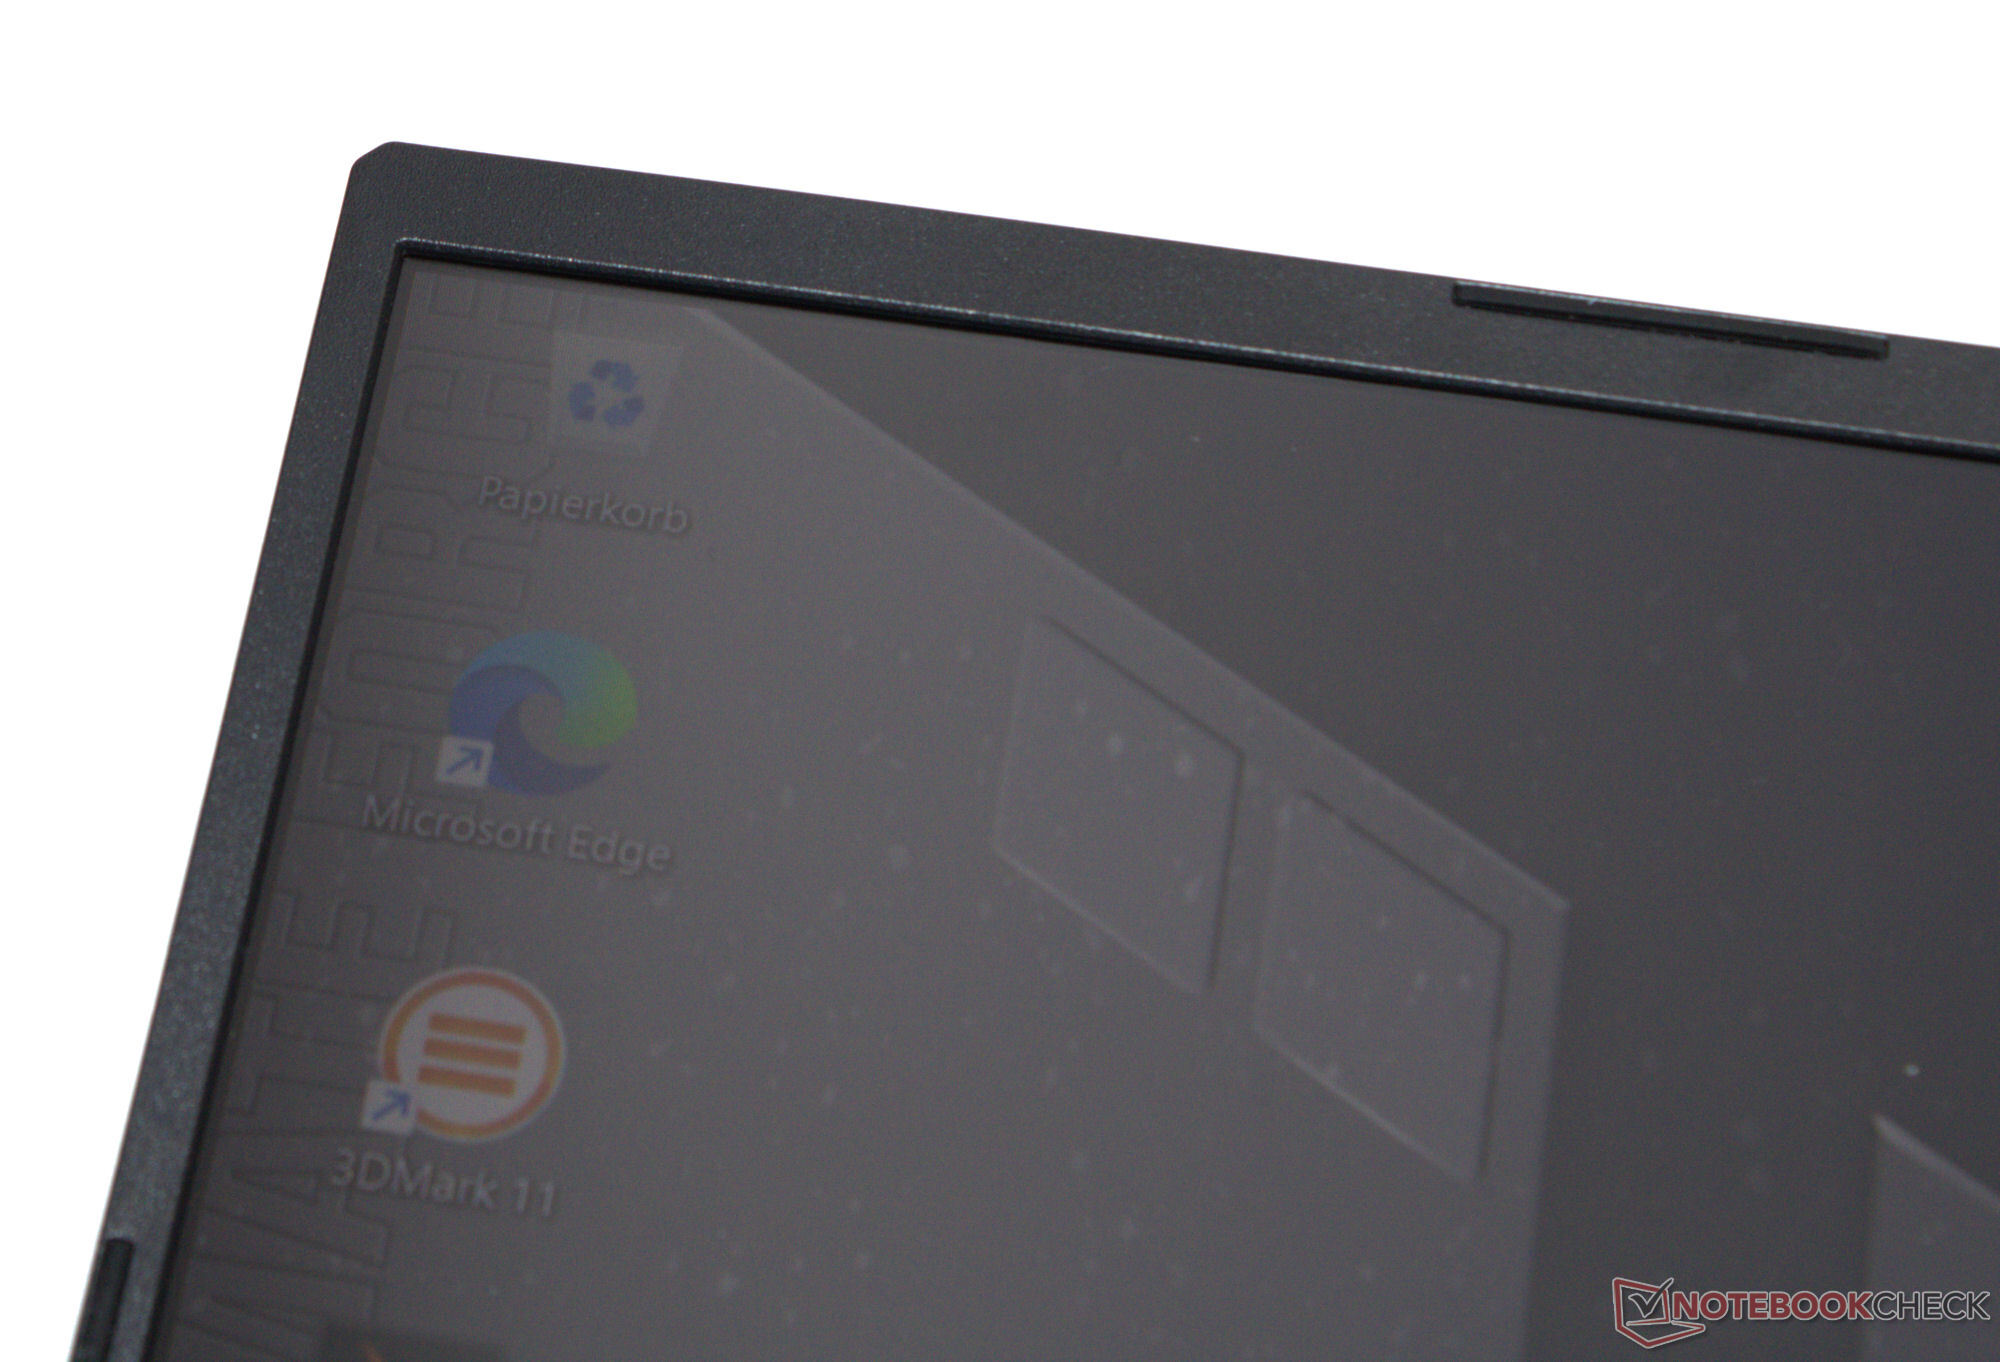
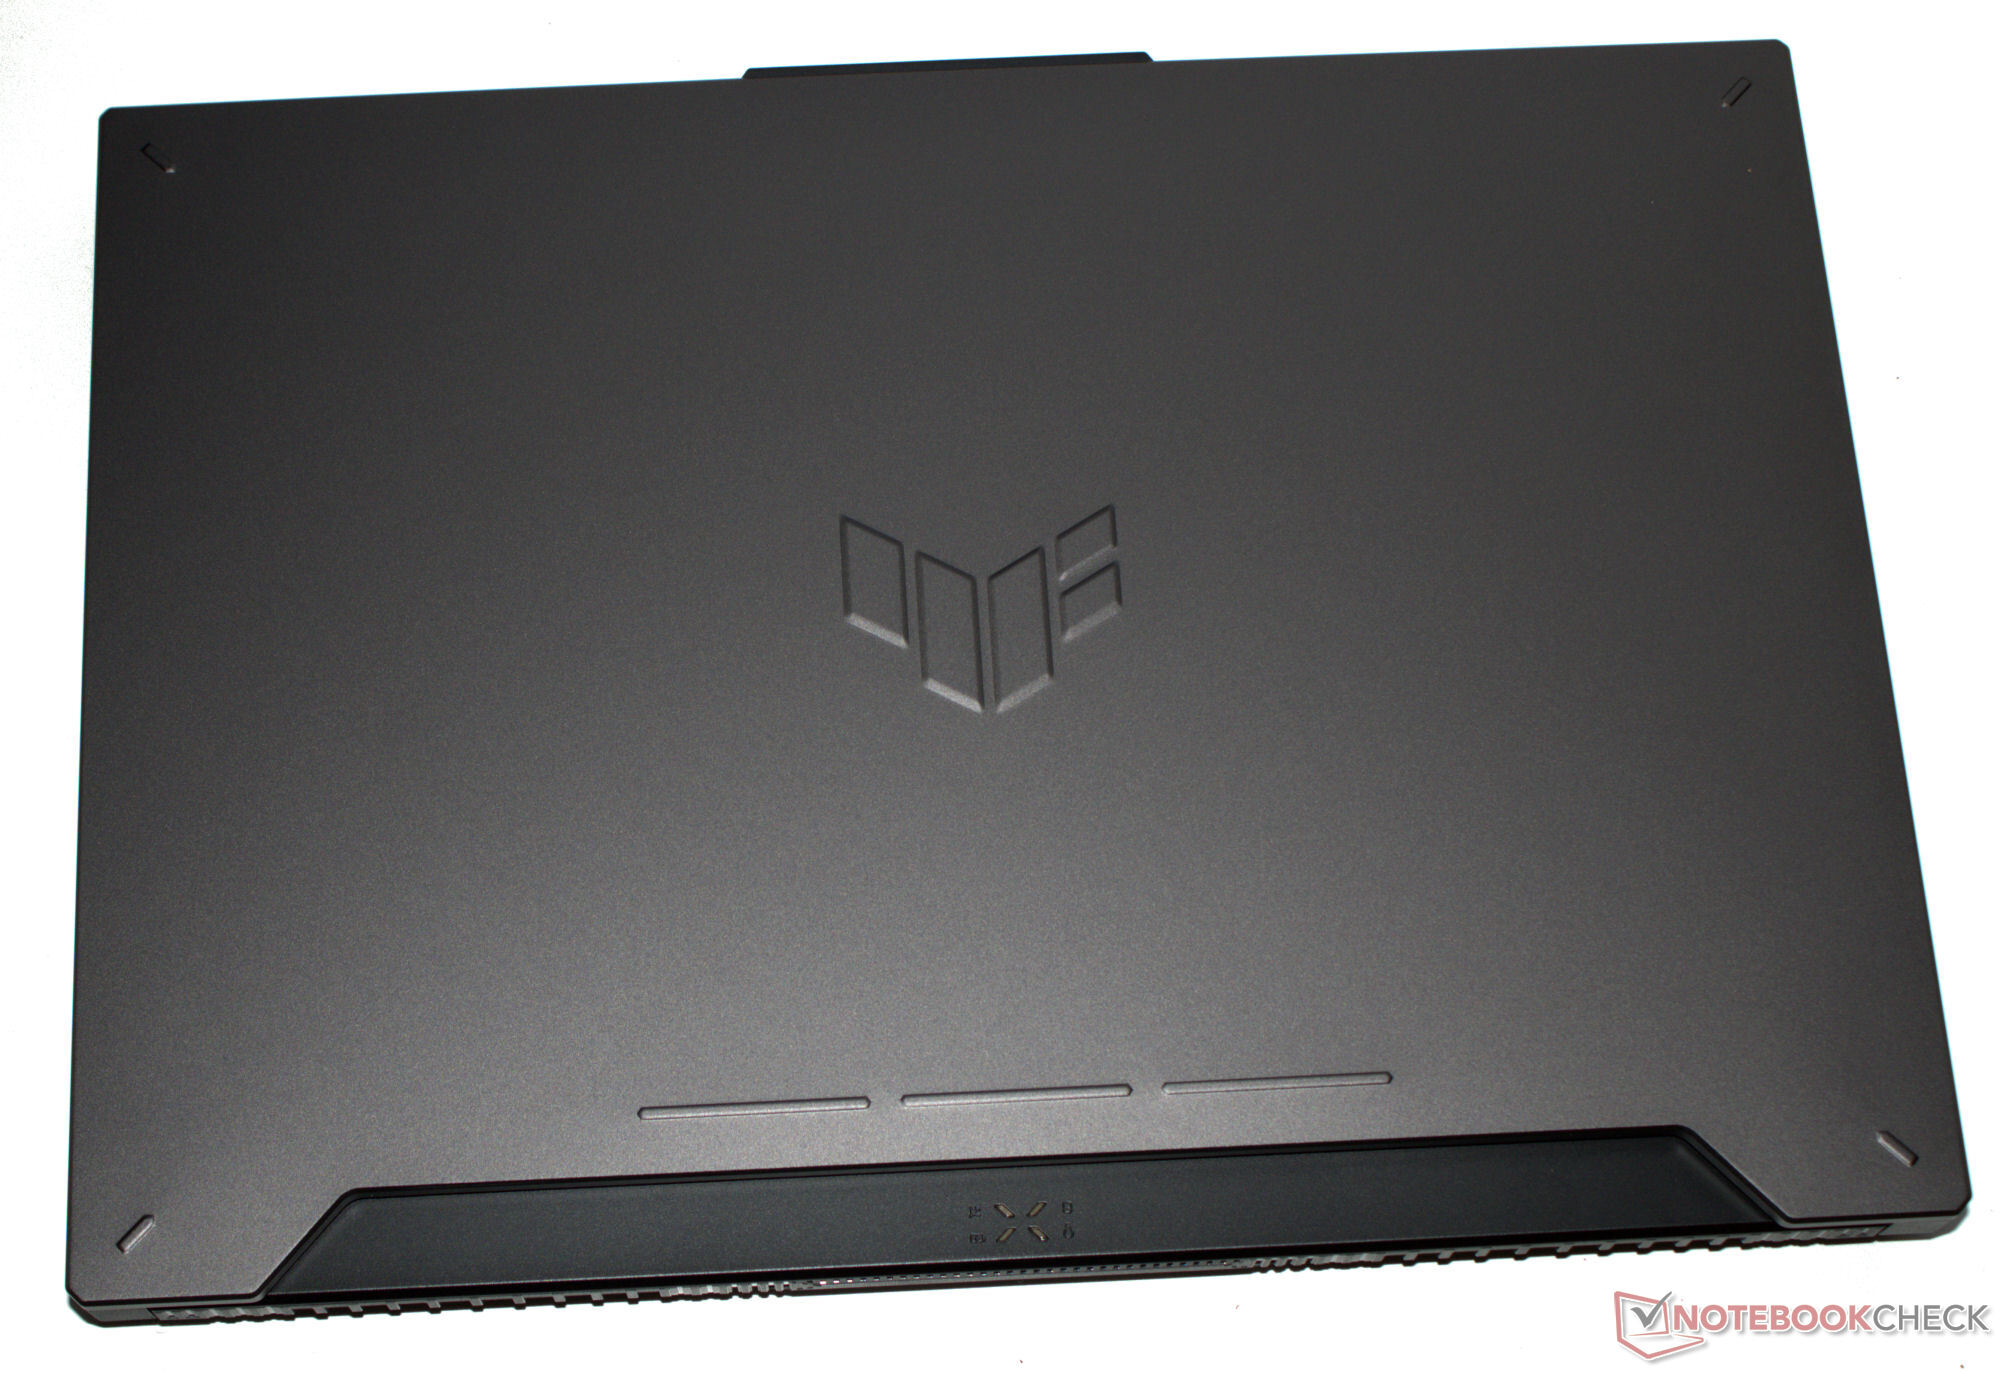
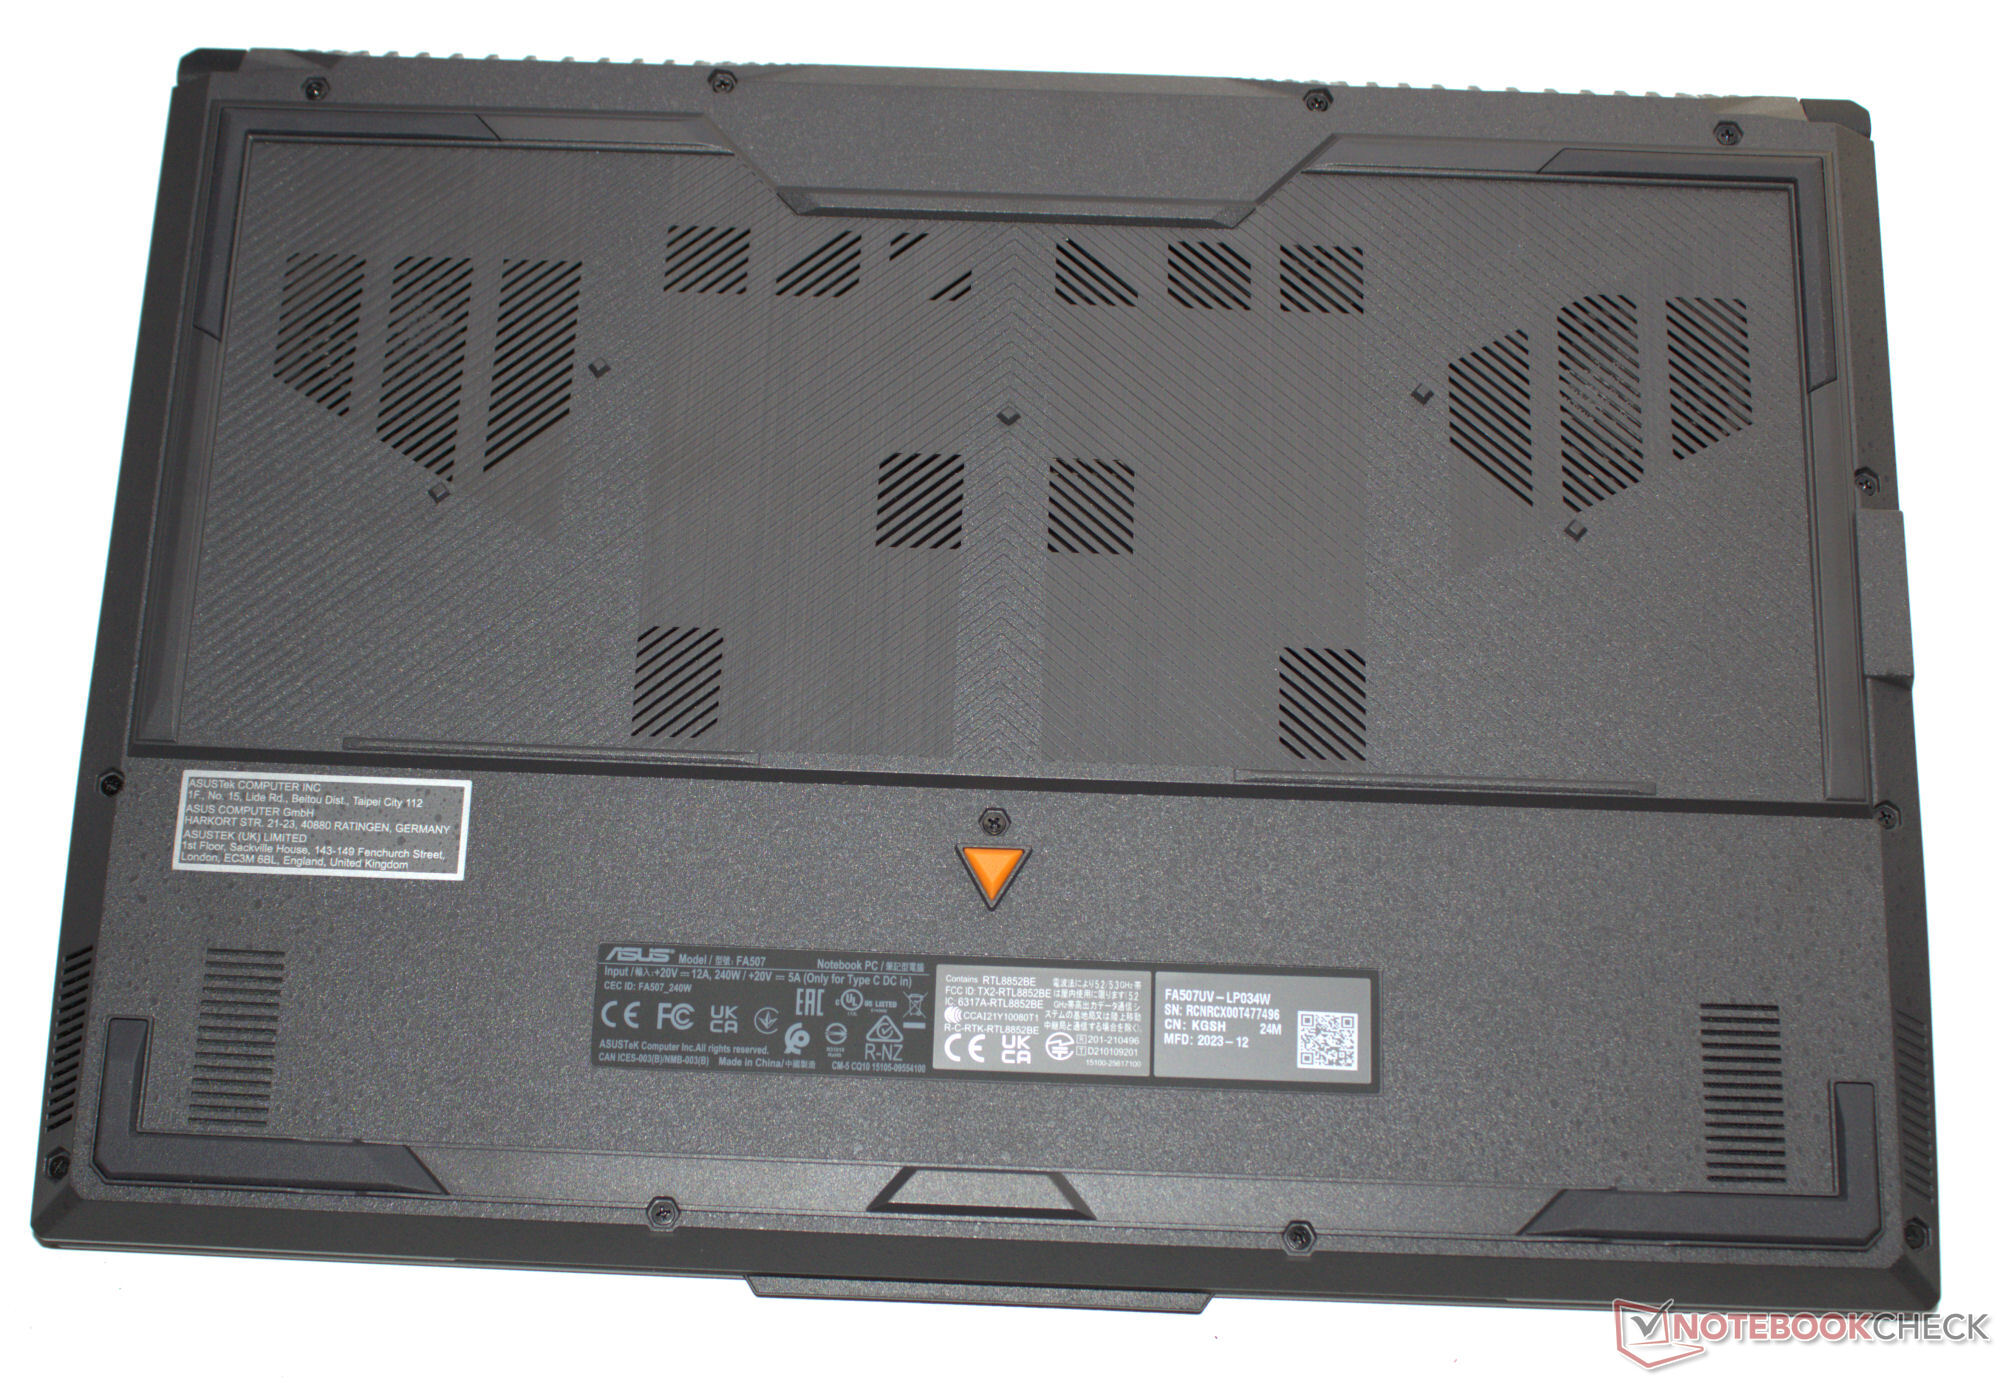
El chasis gris (Mecha Gray), mate y de superficie lisa ya es conocido del la A15 del año pasado. No hay problemas de estabilidad y la unidad base (de plástico) y la tapa (trasera de metal) se pueden girar dentro de unos límites aceptables. La tapa tiene un ángulo máximo de apertura de unos 130 grados.
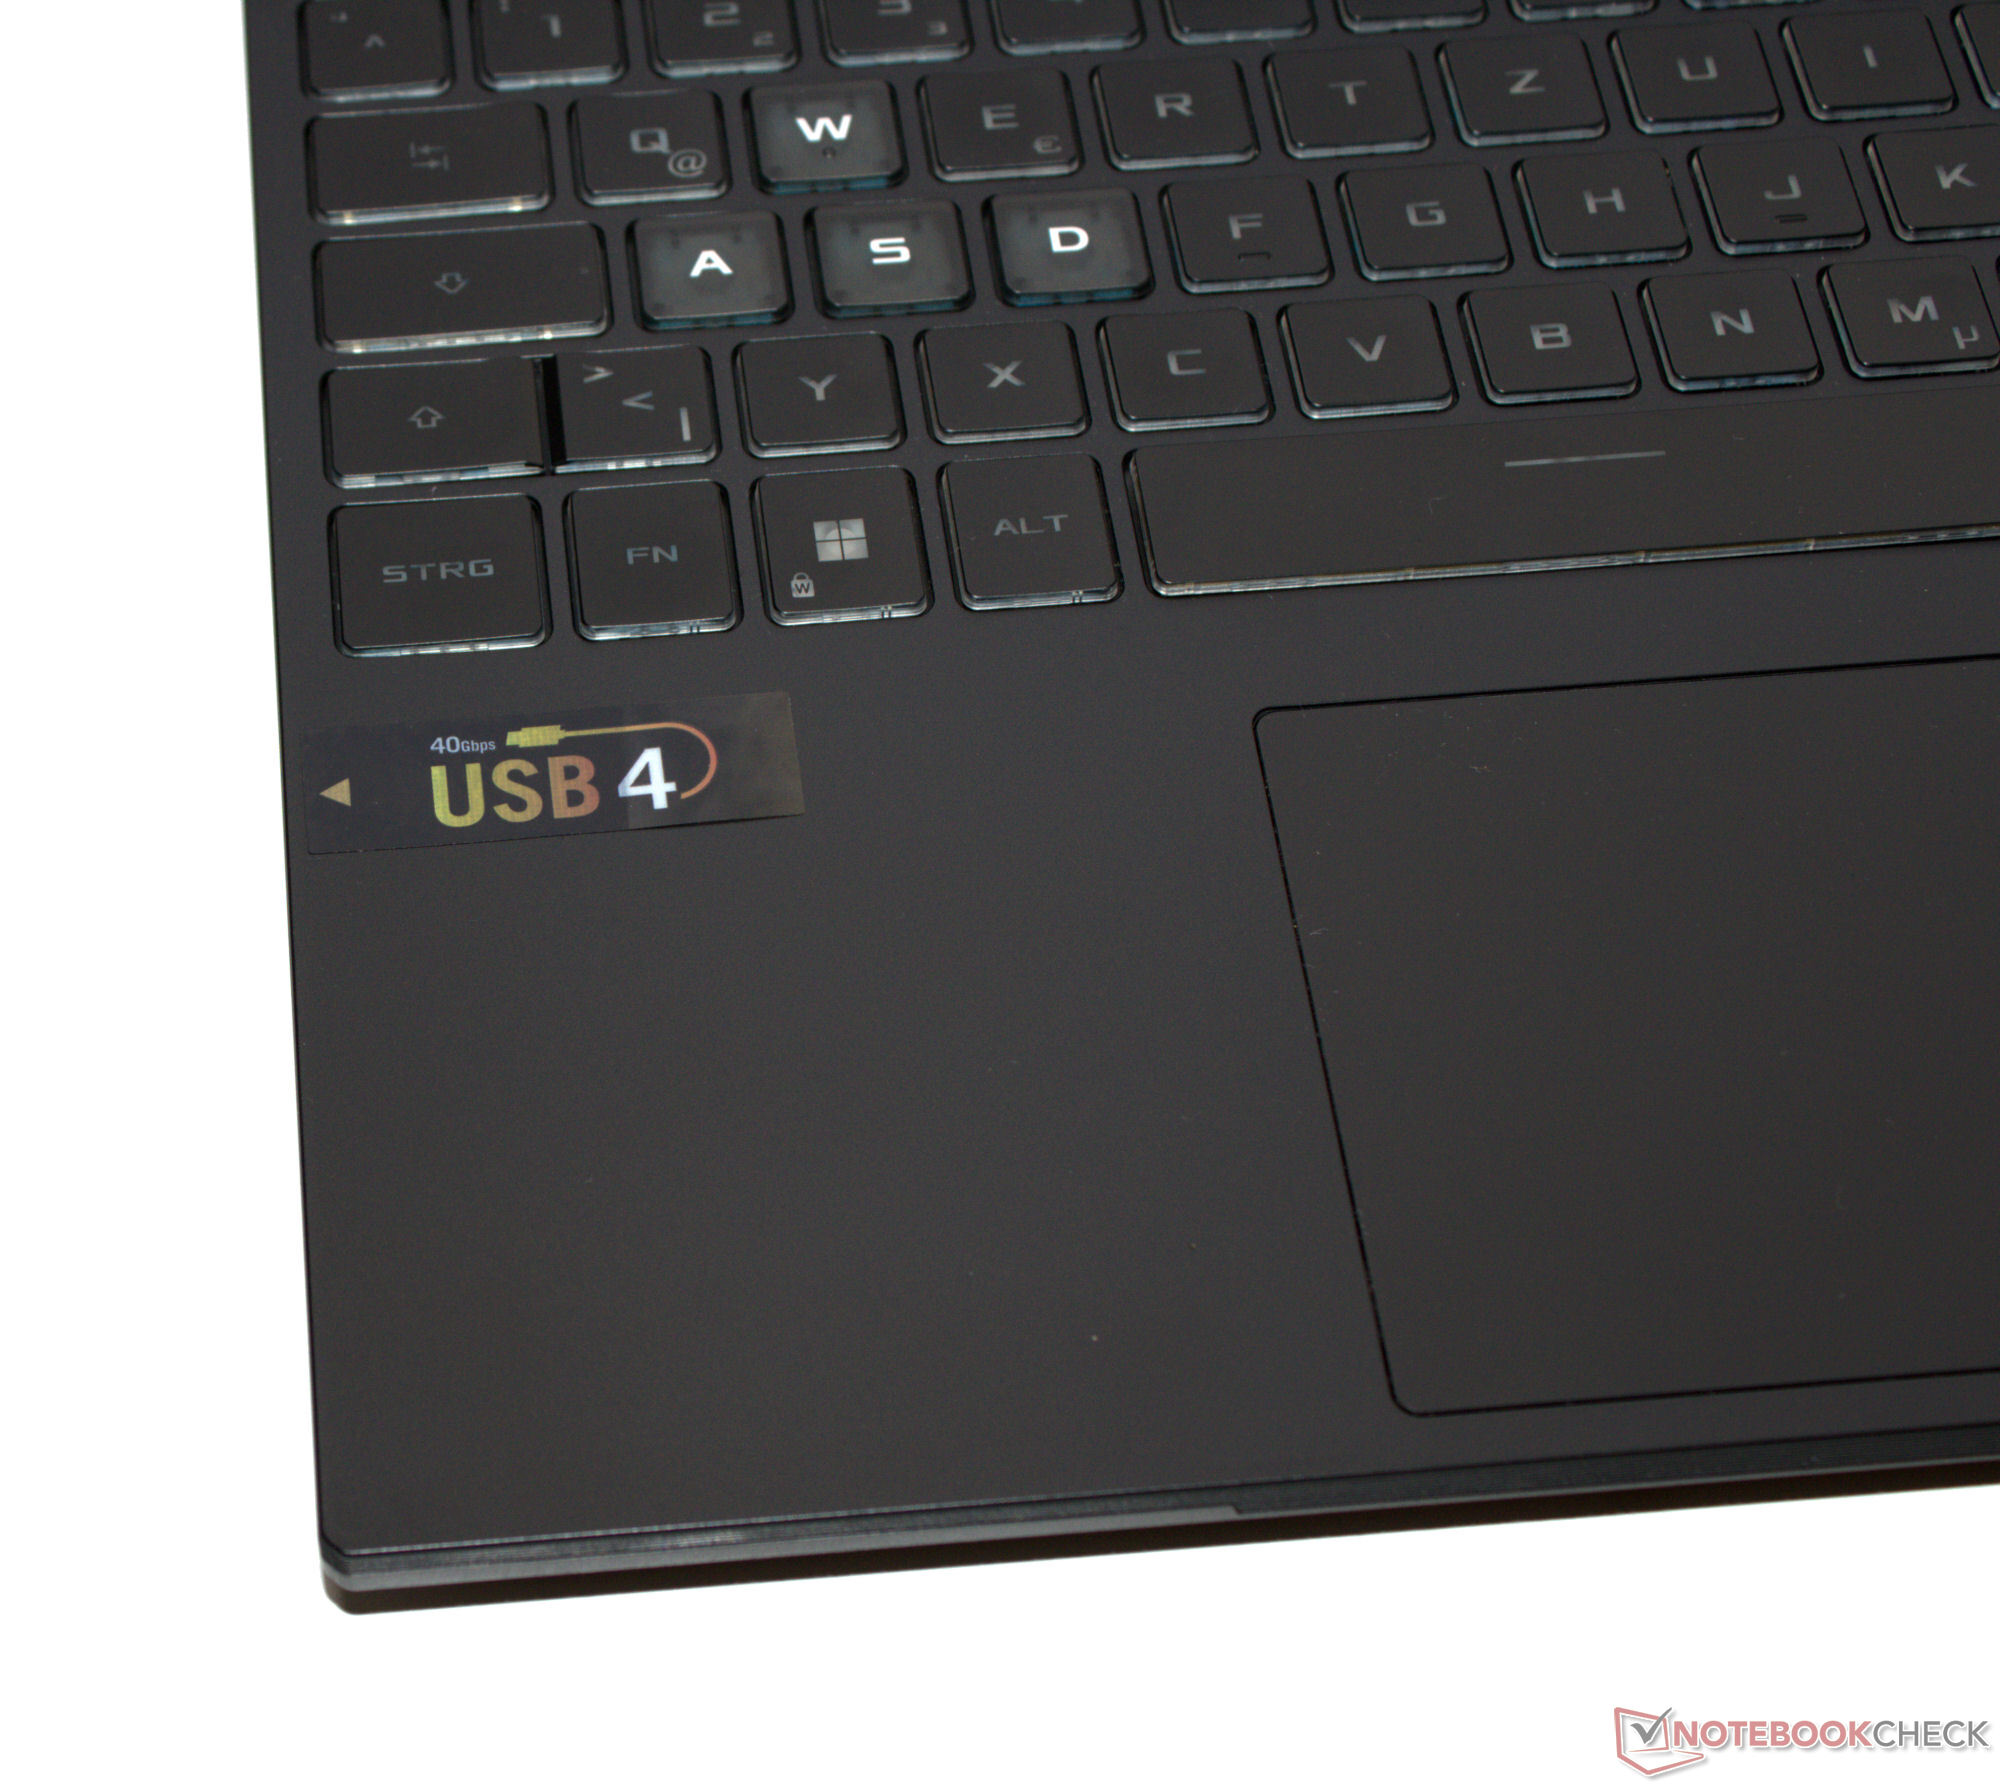
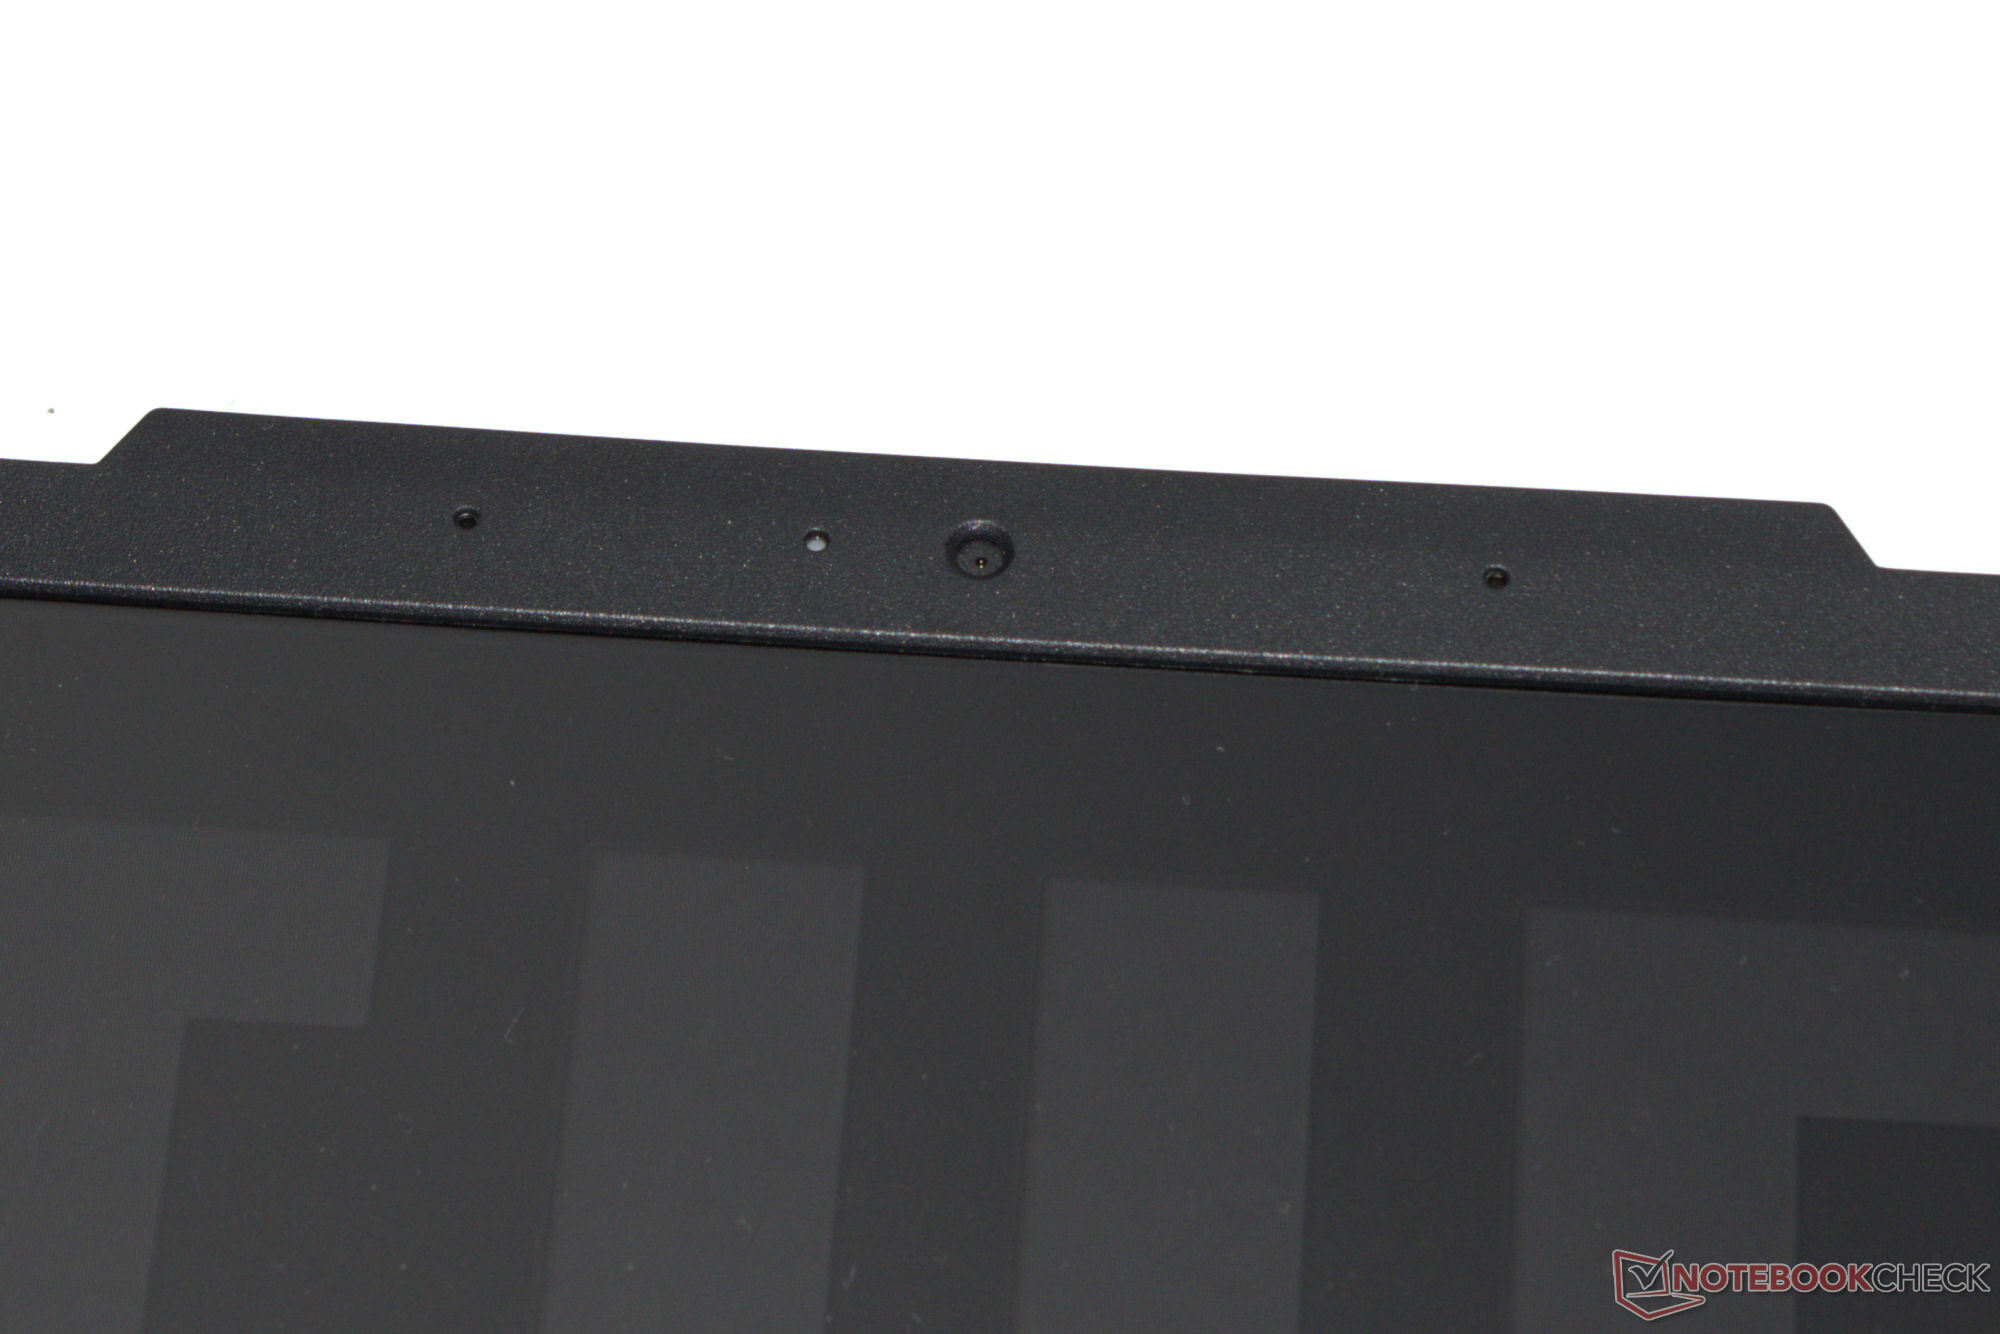
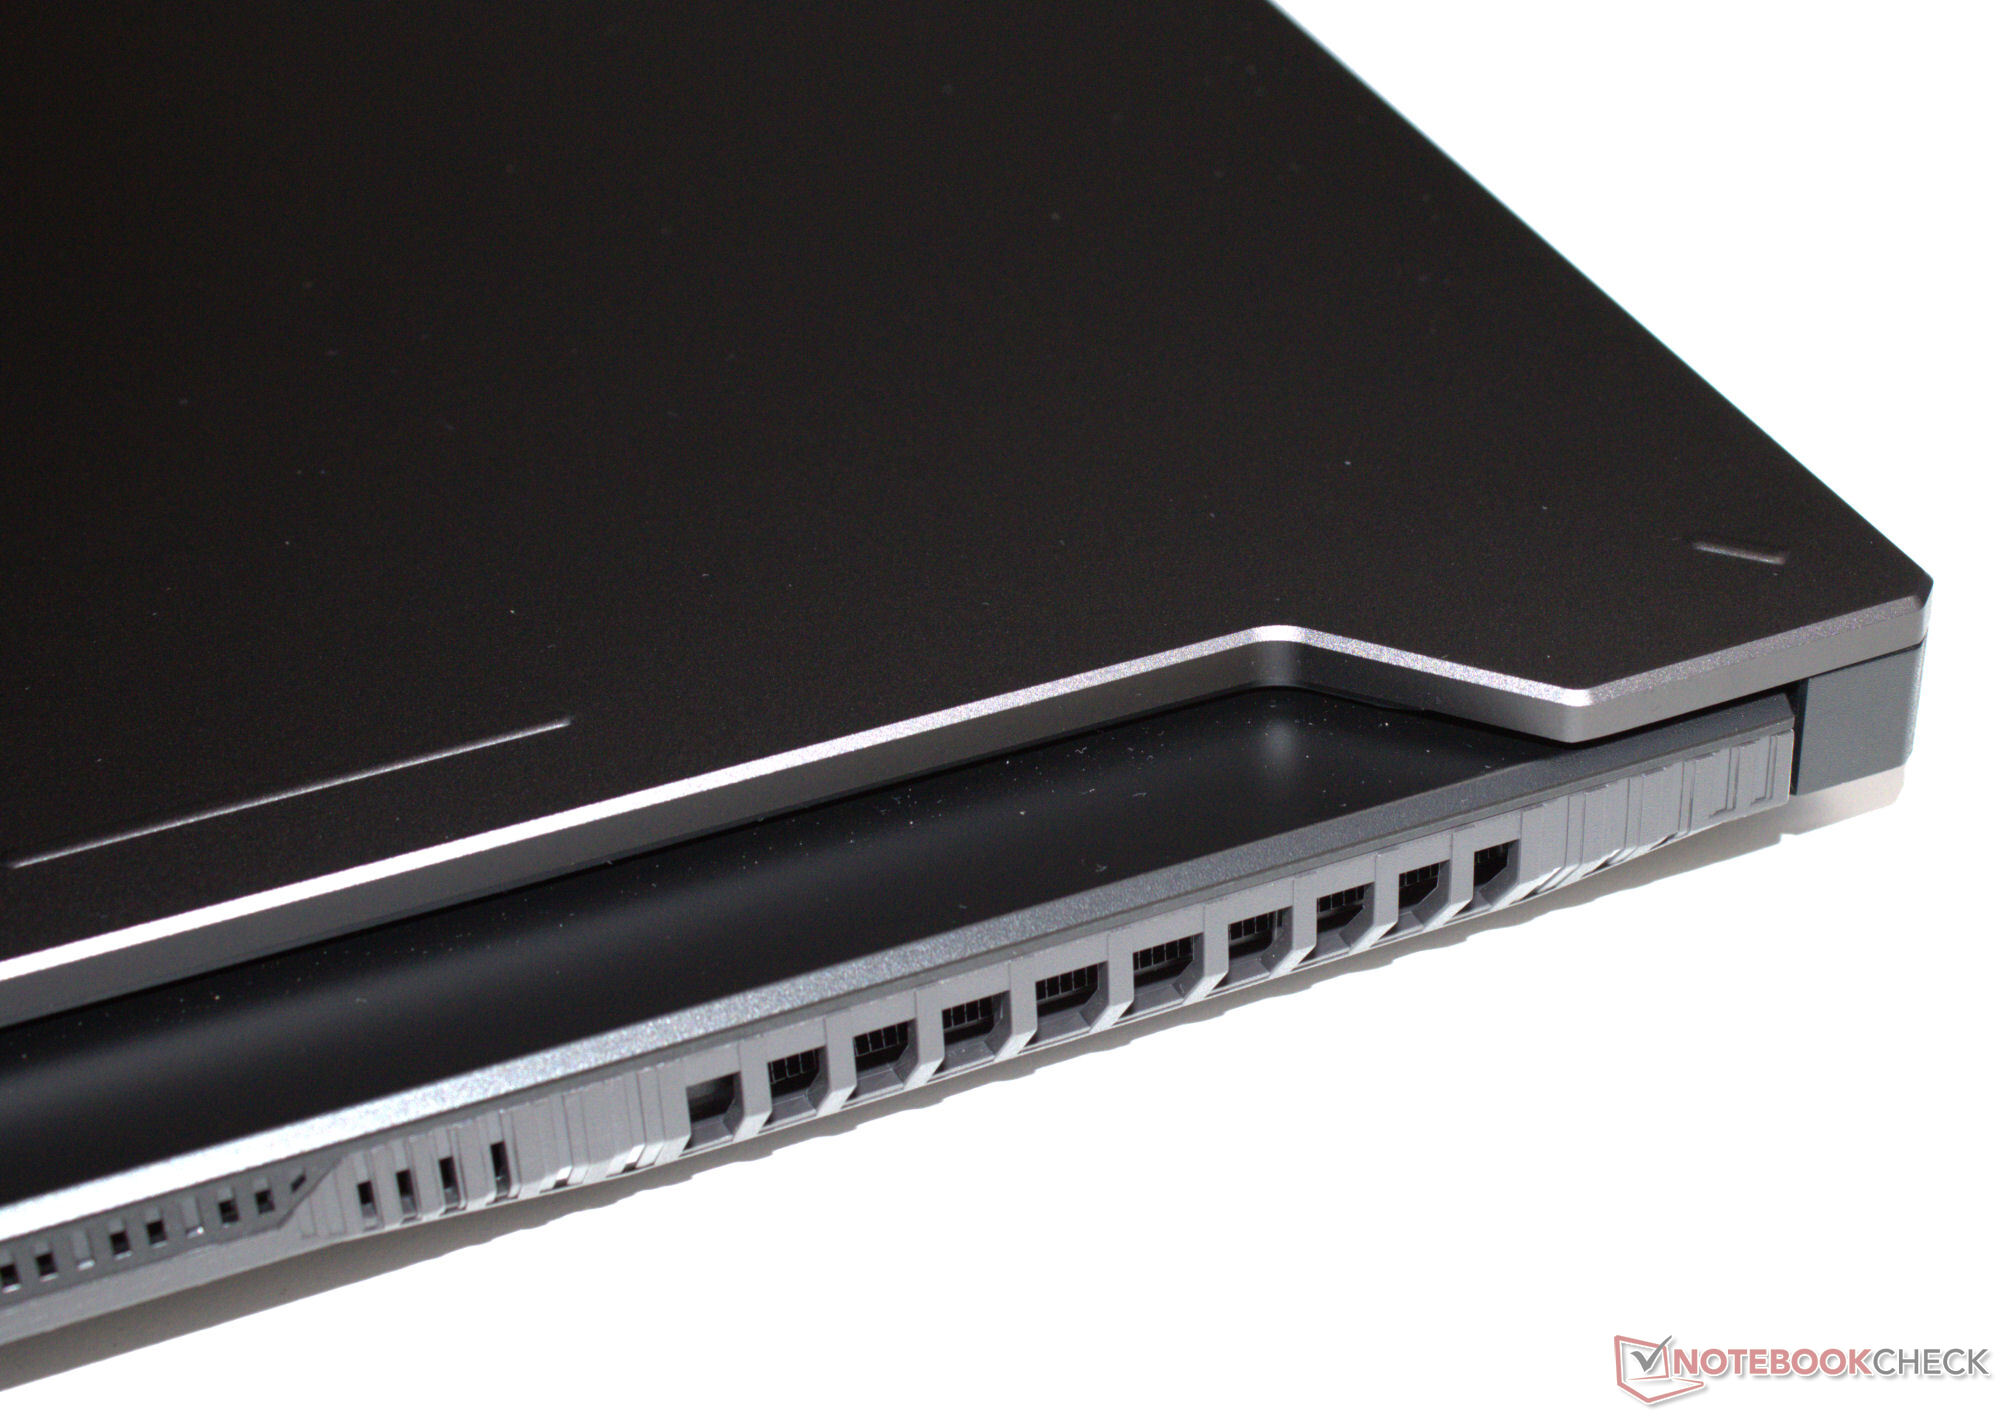
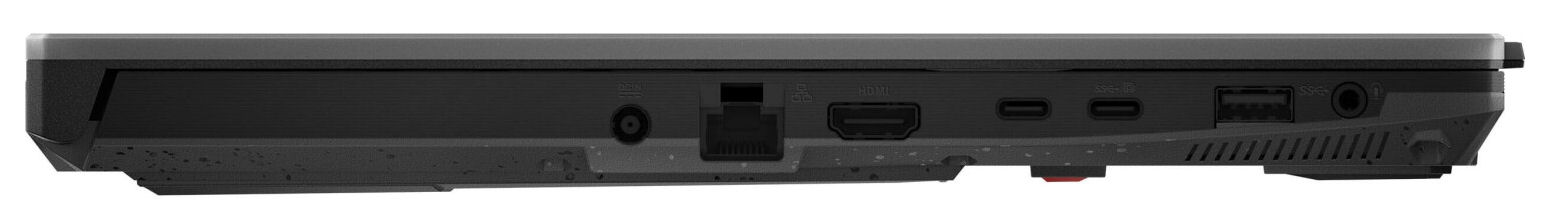
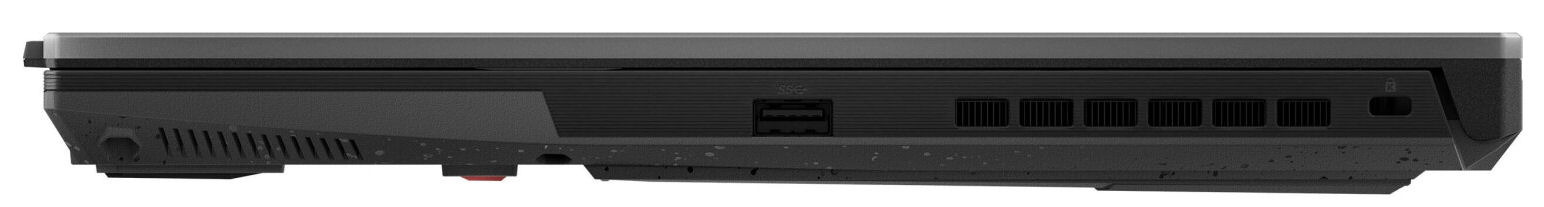
A la mayoría de los puertos se les ha asignado espacio en el lado izquierdo del ordenador. Entre ellos se encuentran dos puertos USB-A (USB 3.2 Gen 1) y dos conectores USB-C (1x USB 3.2 Gen 2, 1x USB 4). Este último soporta DisplayPort Alt Mode y, además, el puerto USB 3.2 ofrece Power Delivery. Esto significa que el TUF tiene tres salidas de vídeo (1x HDMI, 2x DP). Las imágenes producidas por la webcam (0,9 MP, sin obturador) no ganarán ningún premio. El A15 no alberga un lector de tarjetas de memoria.
El ordenador Asus se une a las filas de los portátiles de gama básica que utilizan el chip RTL8852BE de Realtek (WiFi 6). El chip inalámbrico ofrece velocidades de transferencia decentes, pero no alcanza su potencial y no logra alcanzar las velocidades vistas en el módulo de la competencia de Intel. Un controlador Gigabit Ethernet (Realtek RTL8168/8111) se encarga de las conexiones por cable.


Sostenibilidad
Dentro de la caja del portátil, encontrará sobre todo cartón y no mucho plástico. El portátil está alojado en una bolsa de fibra de plástico con una funda transparente que protege la fuente de alimentación de arañazos. Por último, pero no menos importante, también hay un inserto que protege la pantalla de arañazos. En los tres casos, se especifican los plásticos implementados.
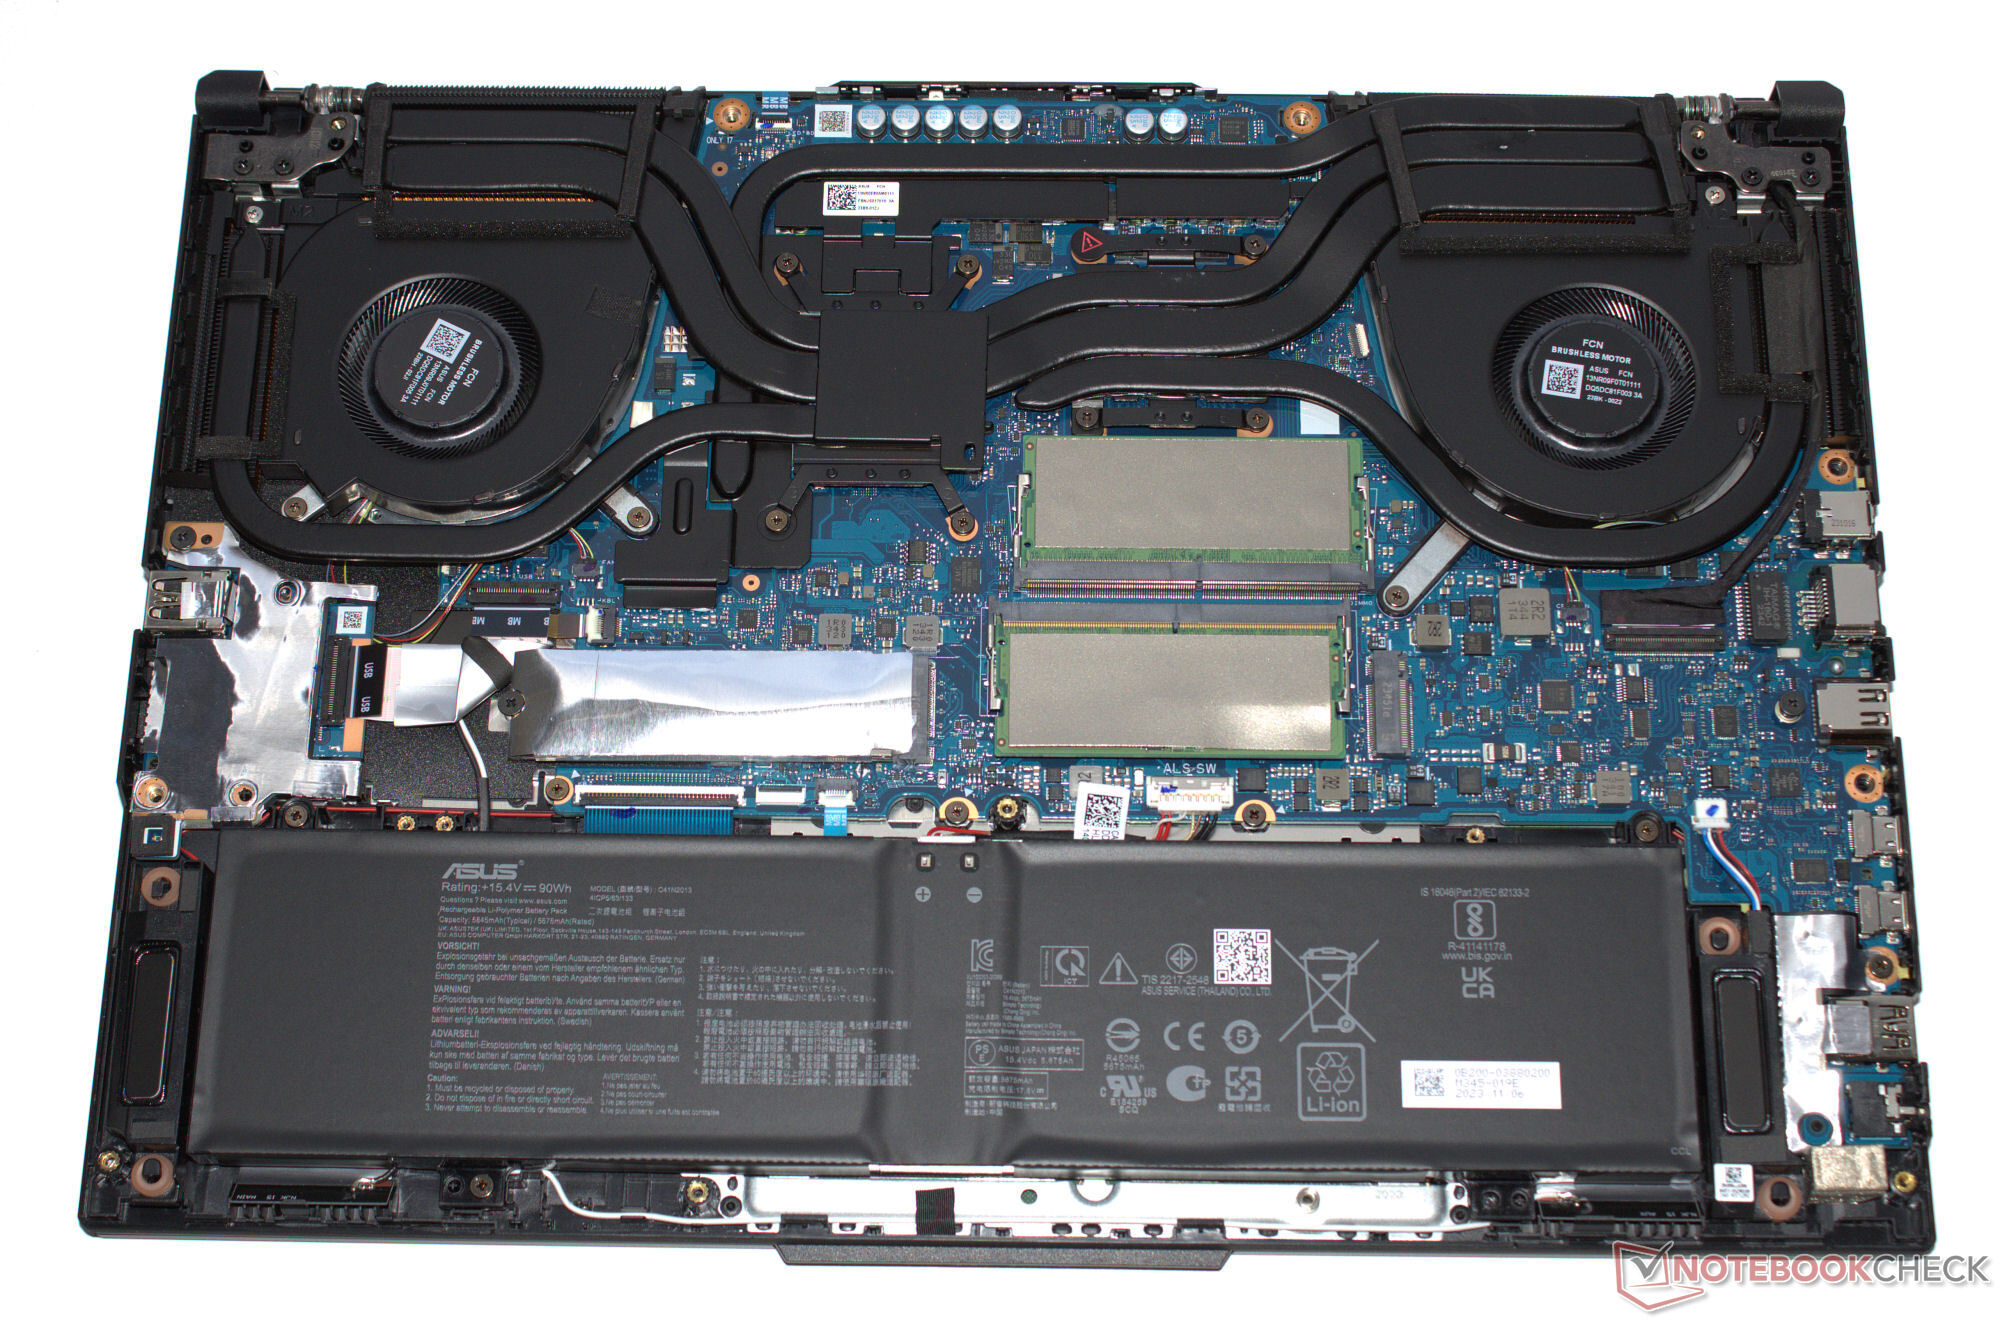
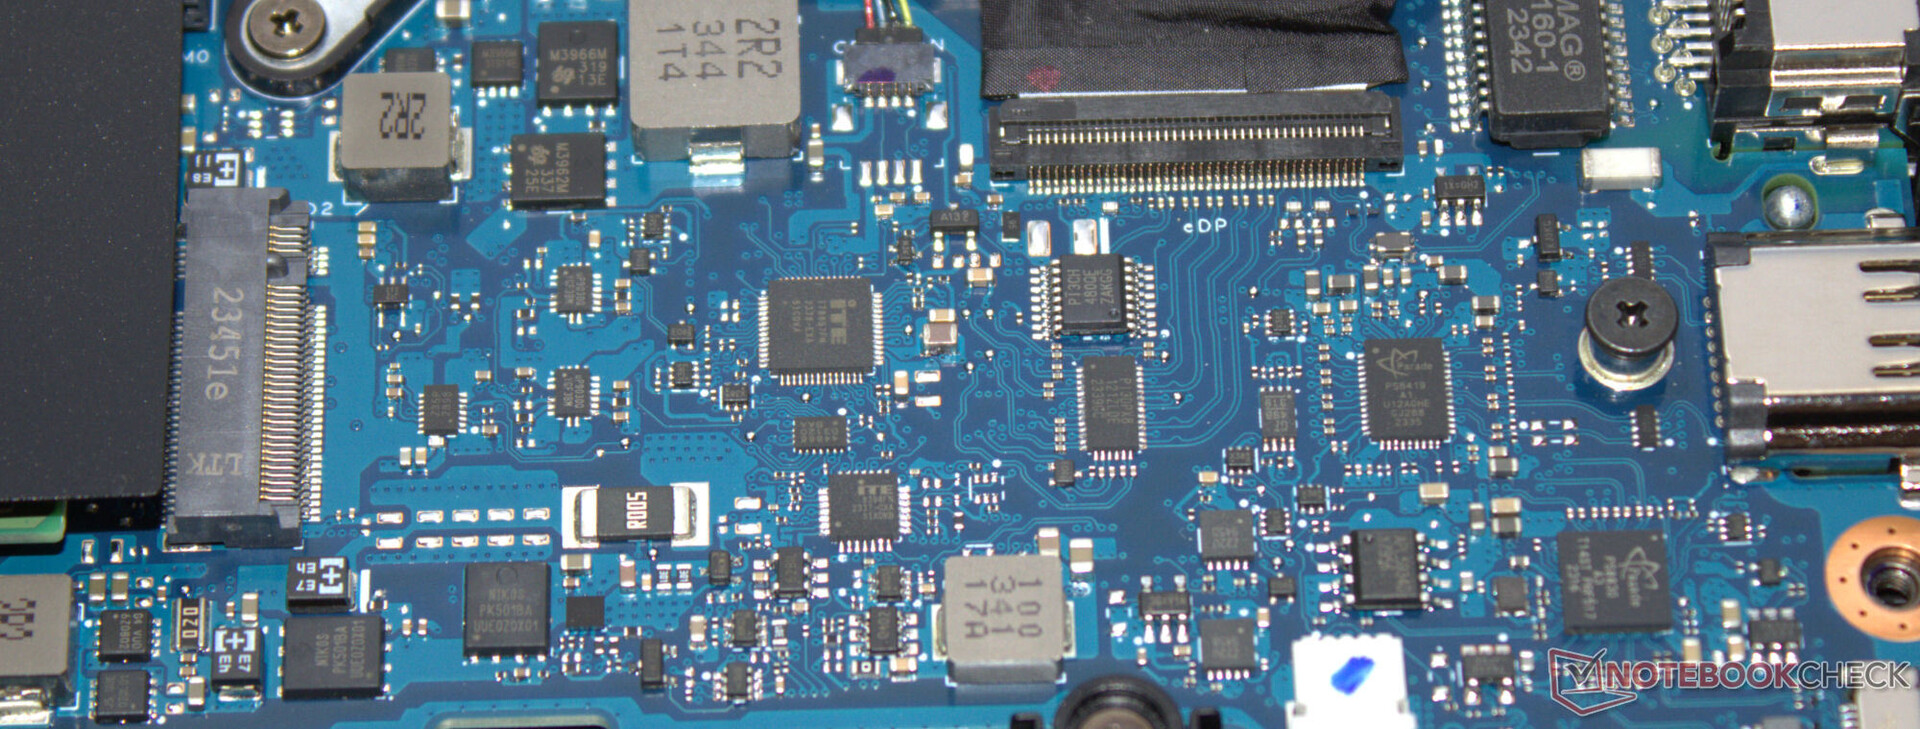
Debería ser fácil realizar reparaciones gracias a la placa base extraíble: todo el hardware es accesible. No nos encontramos con pastillas pegadas en el interior del dispositivo. Las actualizaciones de software no deberían ser un problema en los próximos años. El propio portátil tiene una etiqueta EPEAT bronce https://www.epeat.net/.
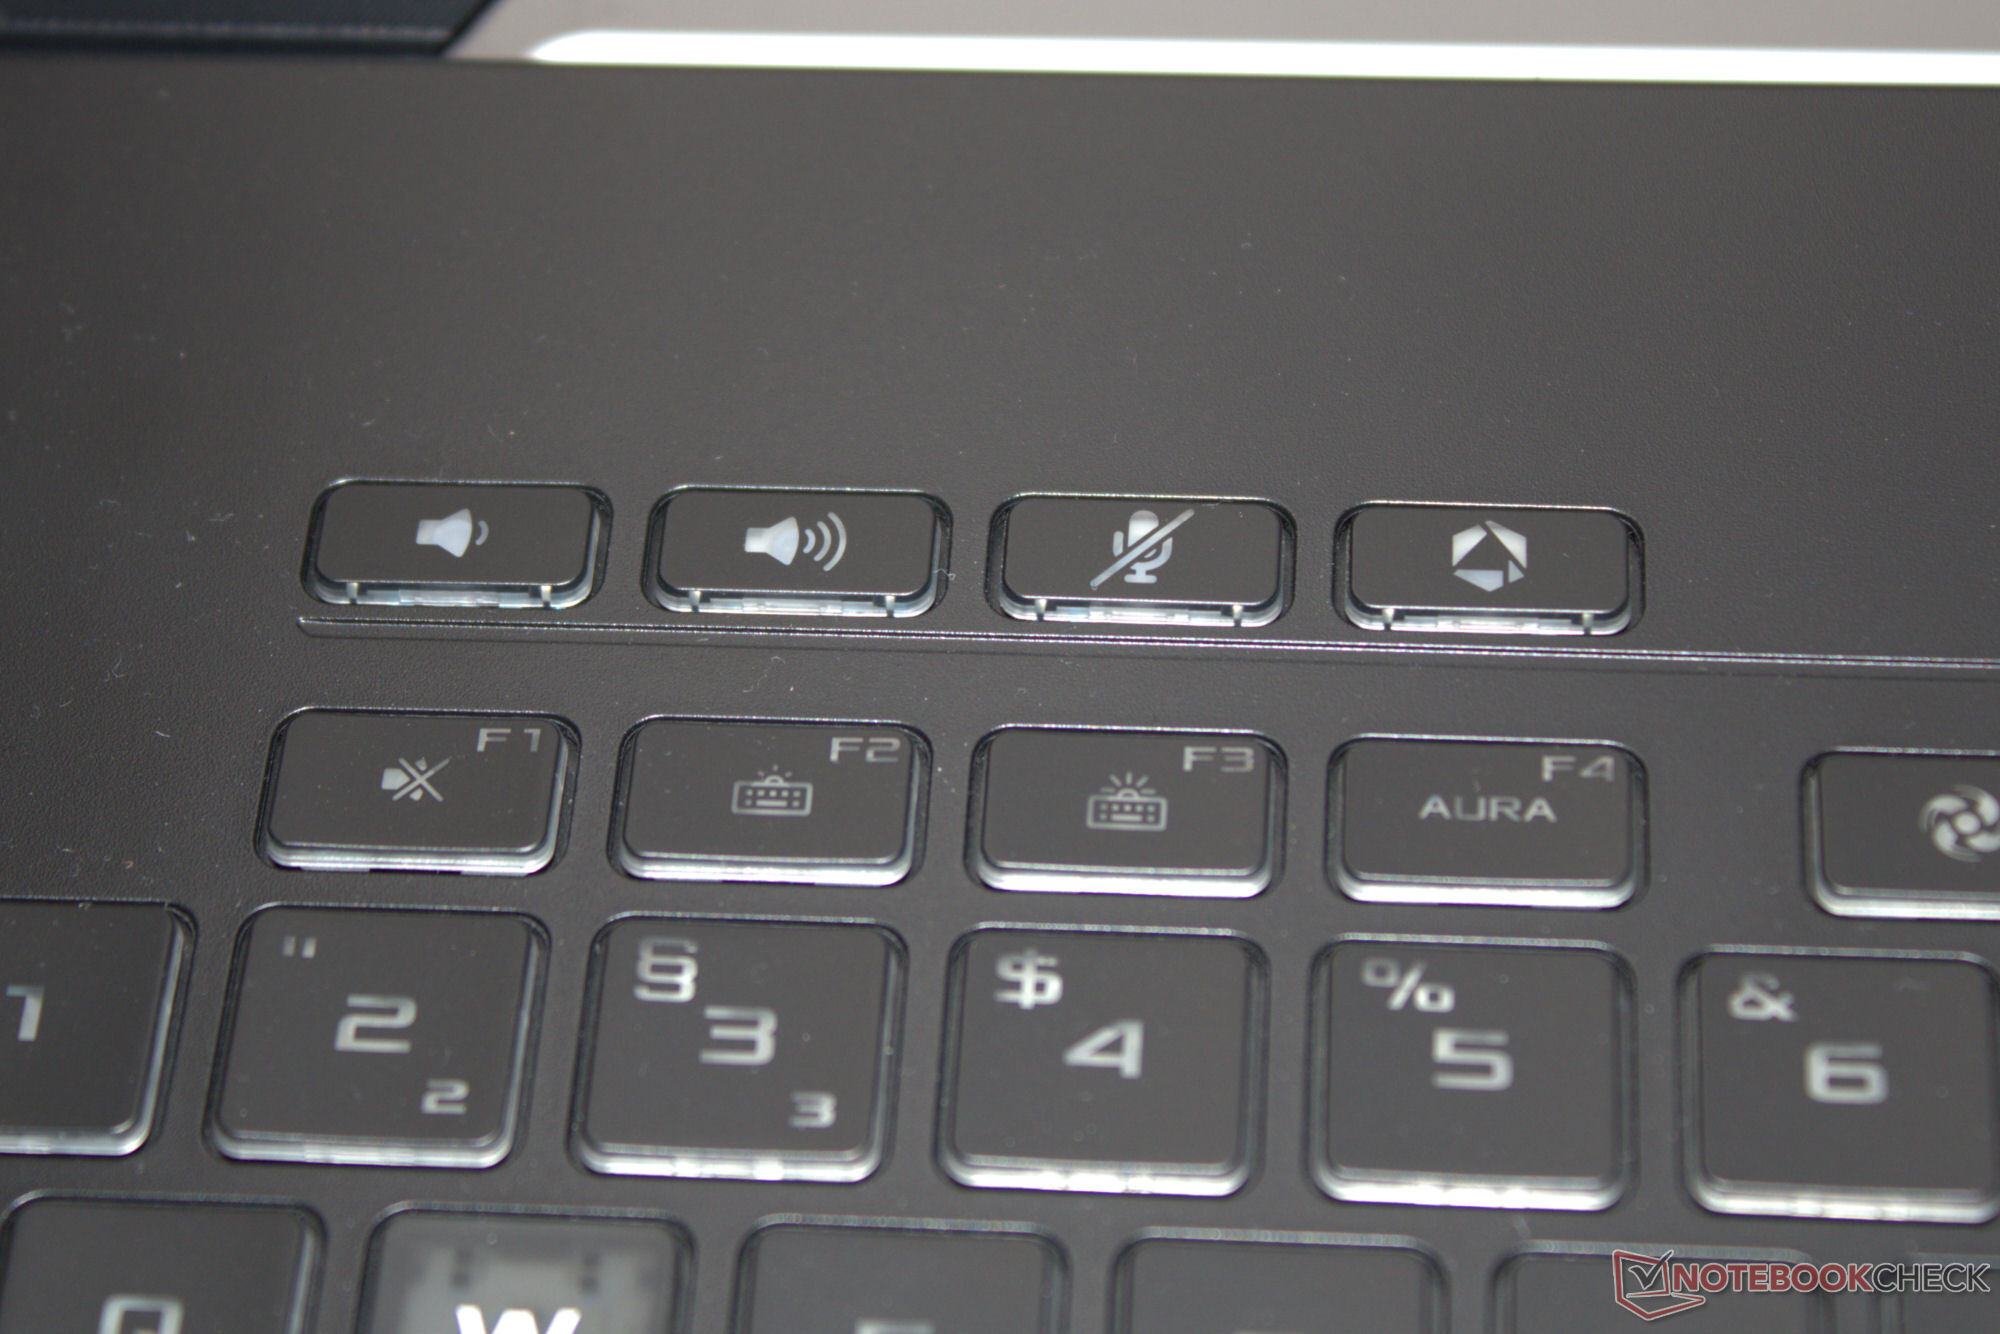
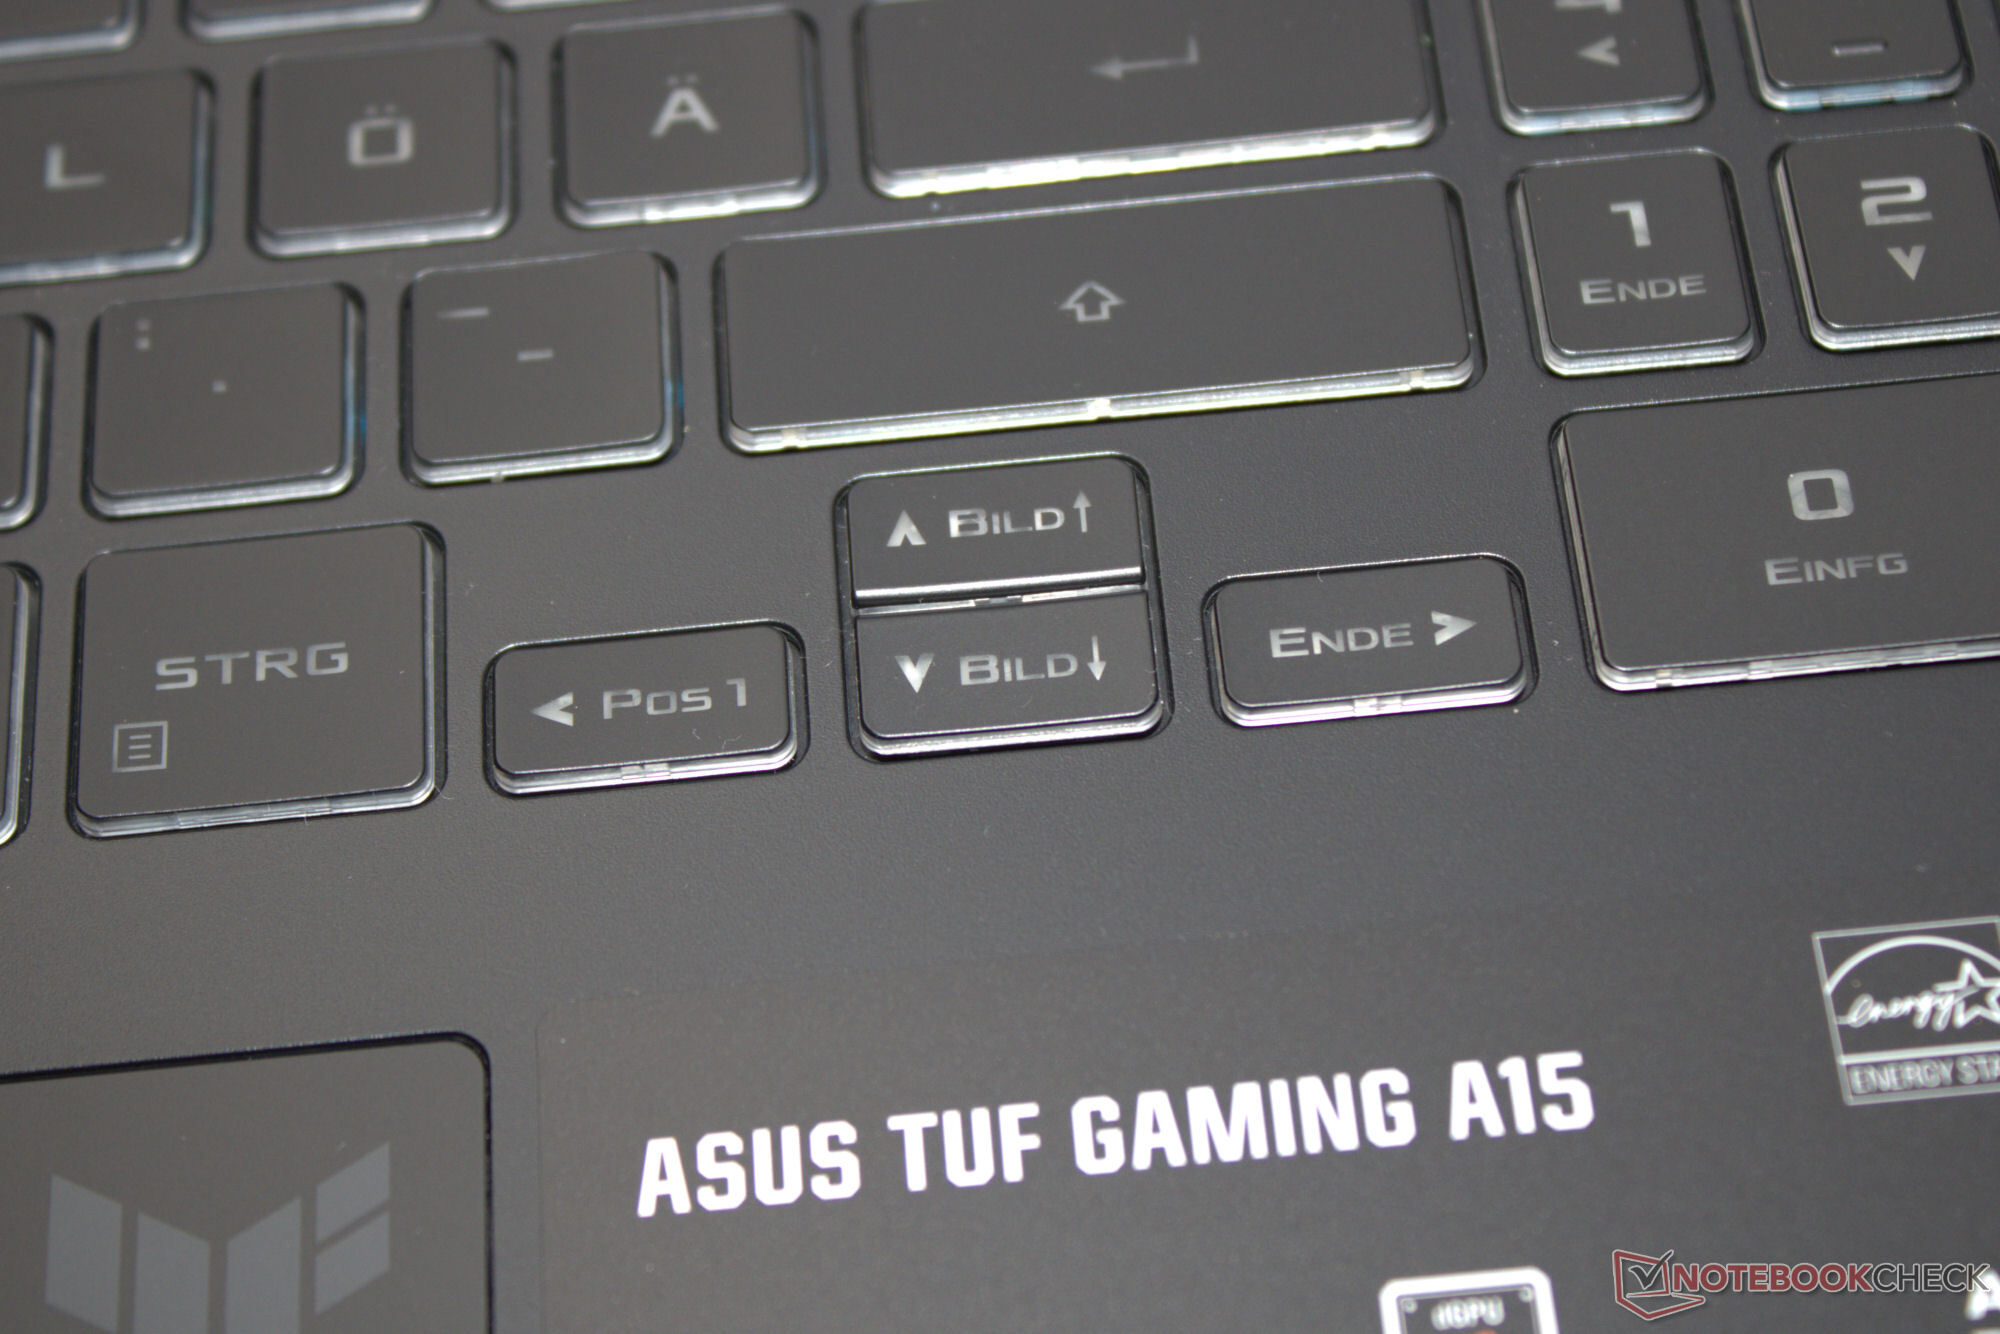
Dispositivos de entrada - El A15 tiene pequeñas teclas de flecha
Asus utiliza toda la anchura del dispositivo para el teclado chiclet retroiluminado (RGB), lo que significa que hay espacio para un teclado numérico. Sus teclas suaves tienen un recorrido medio y un punto de presión definido. La resistencia de las teclas es decente. Al escribir, el teclado no se flexiona. Lo que llama la atención es que la tecla de flecha y la tecla "Intro" son pequeñas y las teclas de control (W, A, S, D) son de otro color. El clickpad multitáctil (de unos 13 x 7,7 cm) tiene un recorrido corto, un punto de presión definido y sirve como ratón de sustitución.
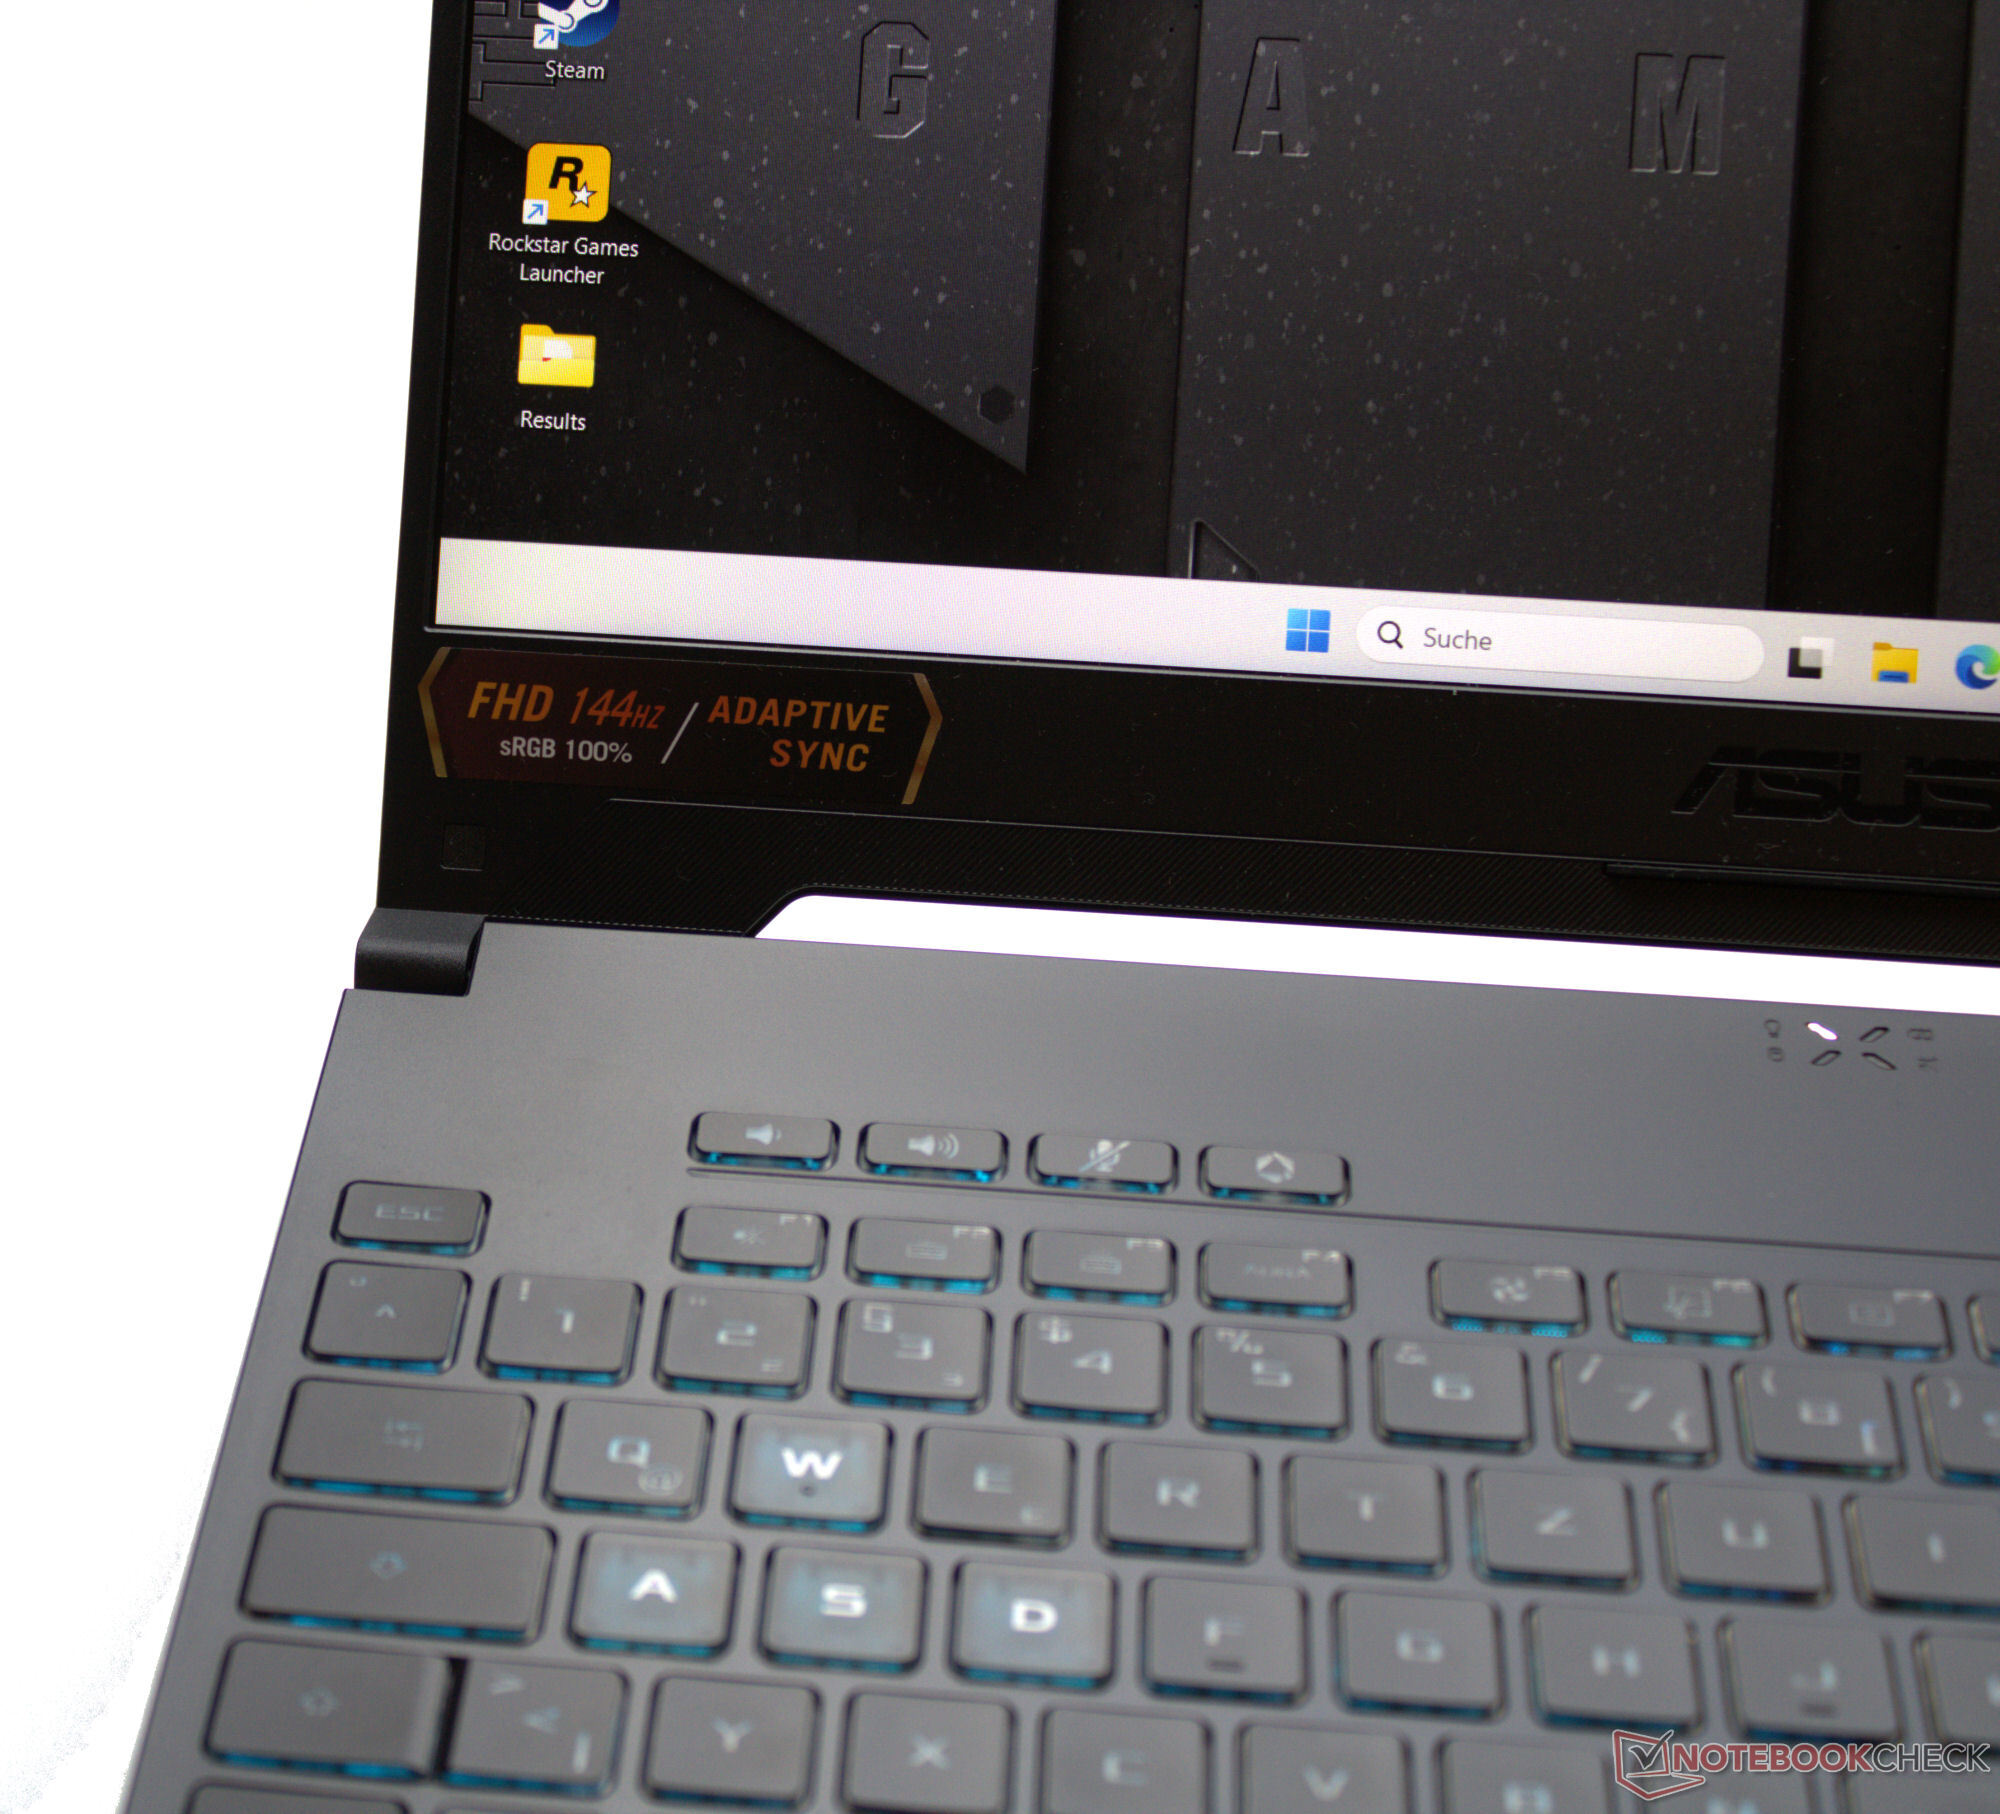
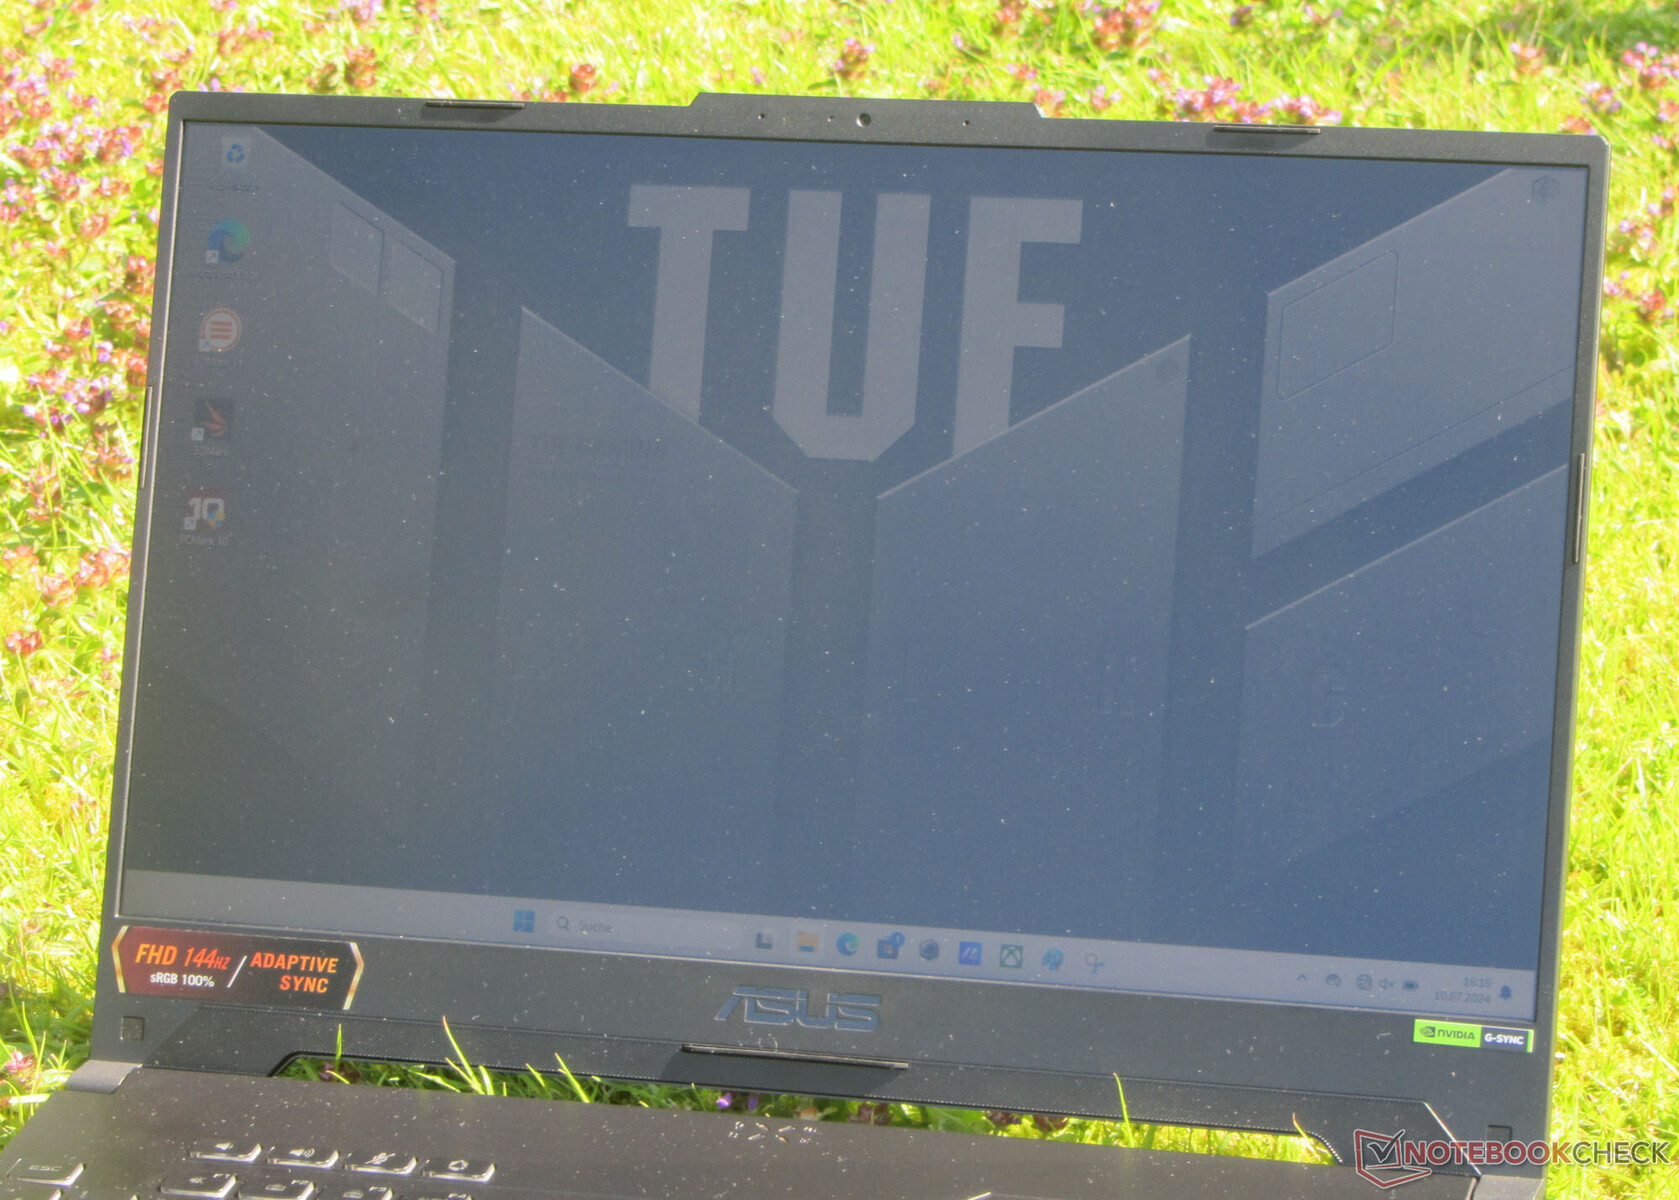
Pantalla - IPS a bordo
Asus ha equipado el dispositivo con una pantalla 16:9, mate, de 15,6 pulgadas (FHD, IPS, 144 Hz, G-Sync) que tiene unos ángulos de visión estables. En lo que respecta al brillo y el contraste, el panel no ofrece las mejores cifras de su clase, pero sigue haciendo lo que debe y esto lo hace predestinado para el uso en interiores. La lectura en exteriores sería posible en cualquier condición que no sea luz solar brillante. No pudimos detectar ningún parpadeo PWM.

| |||||||||||||||||||||||||
iluminación: 90 %
Brillo con batería: 315 cd/m²
Contraste: 1260:1 (Negro: 0.25 cd/m²)
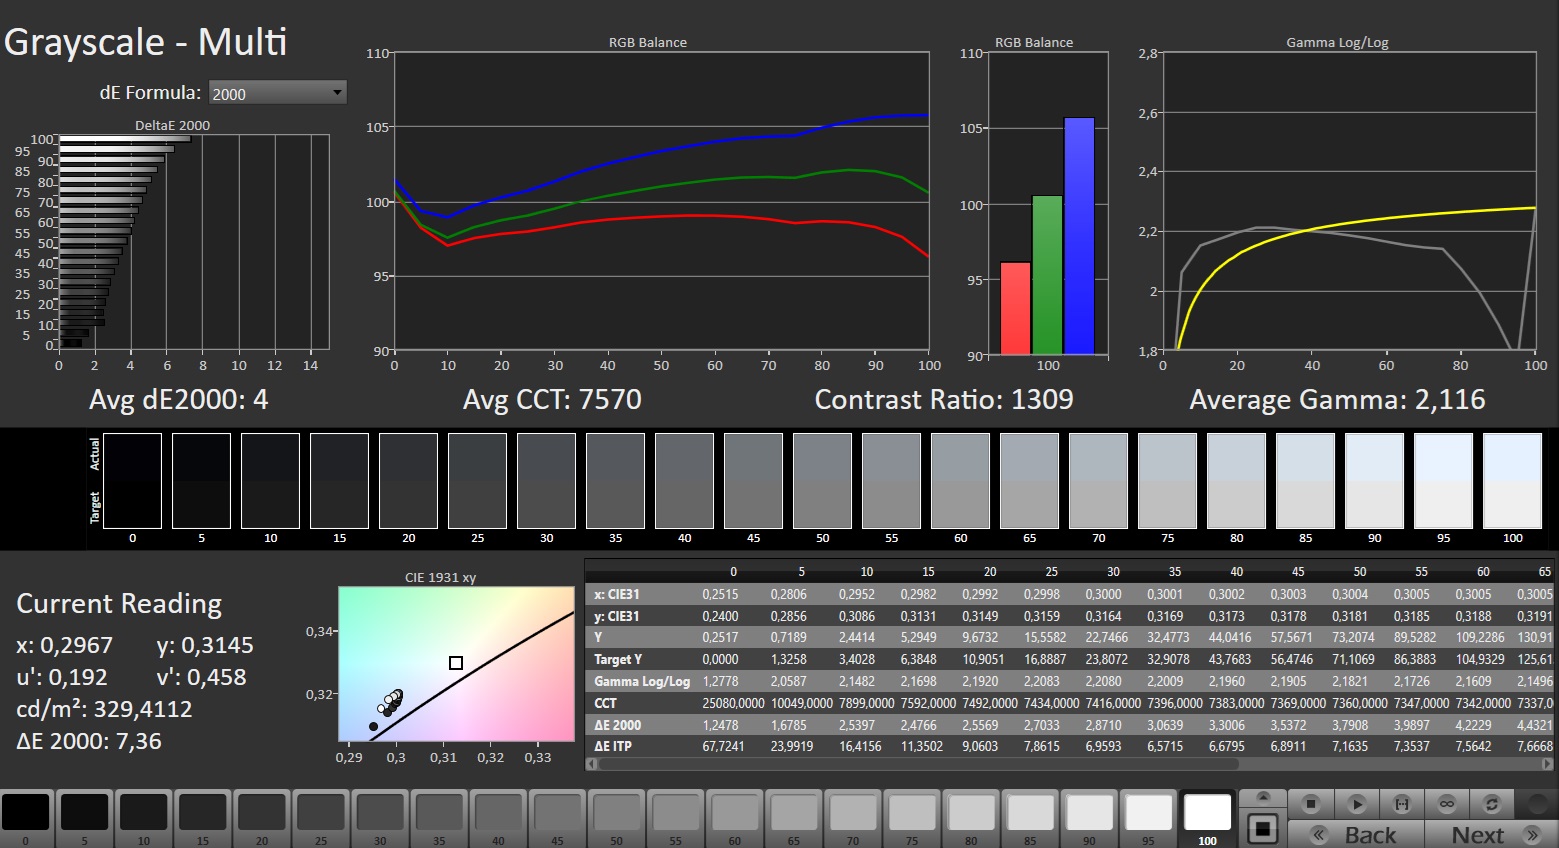
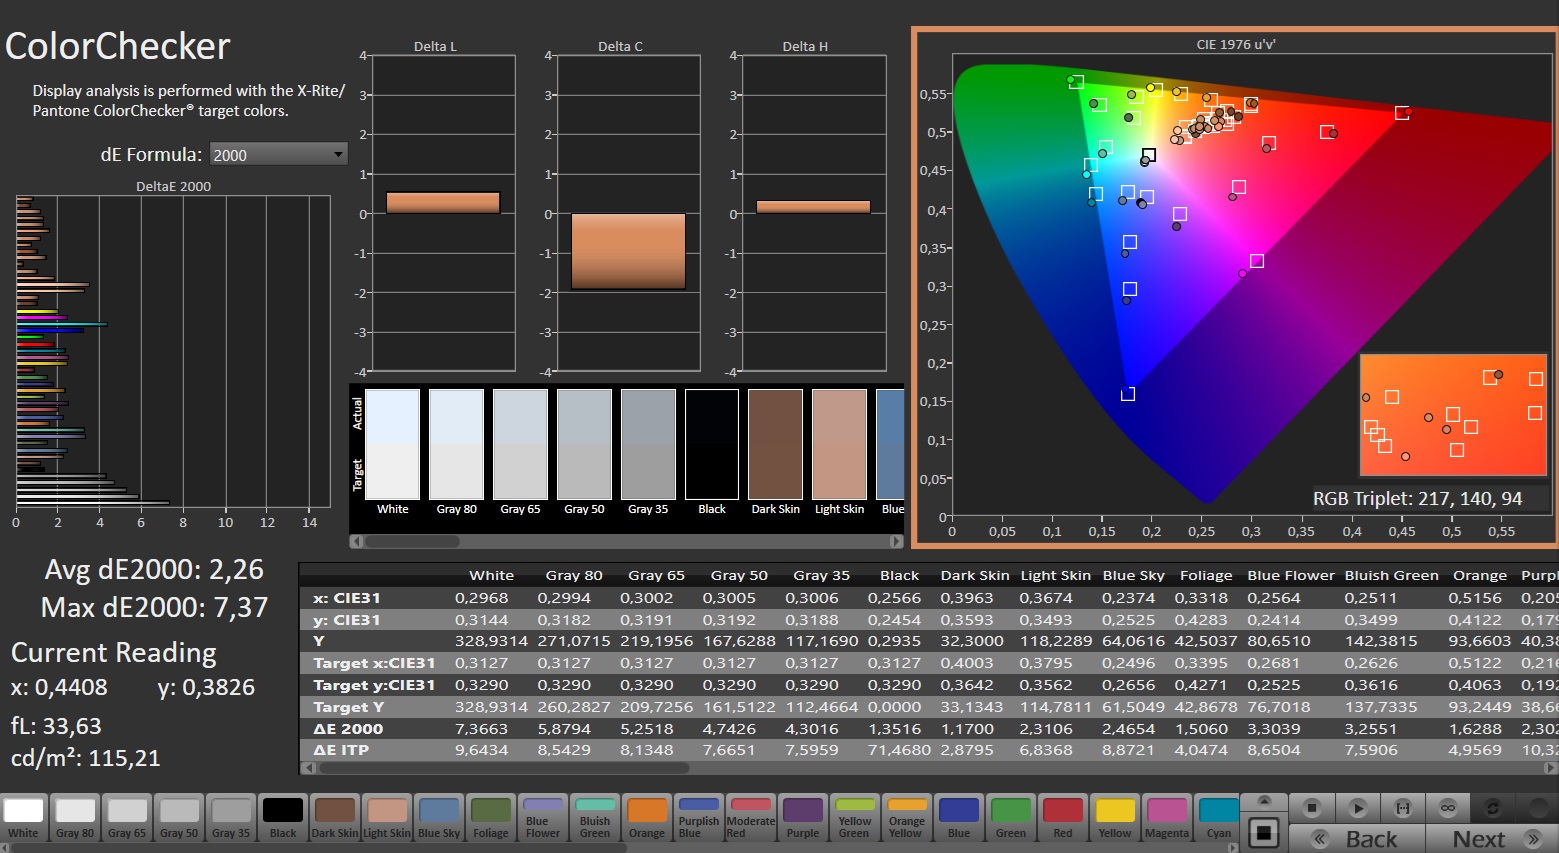
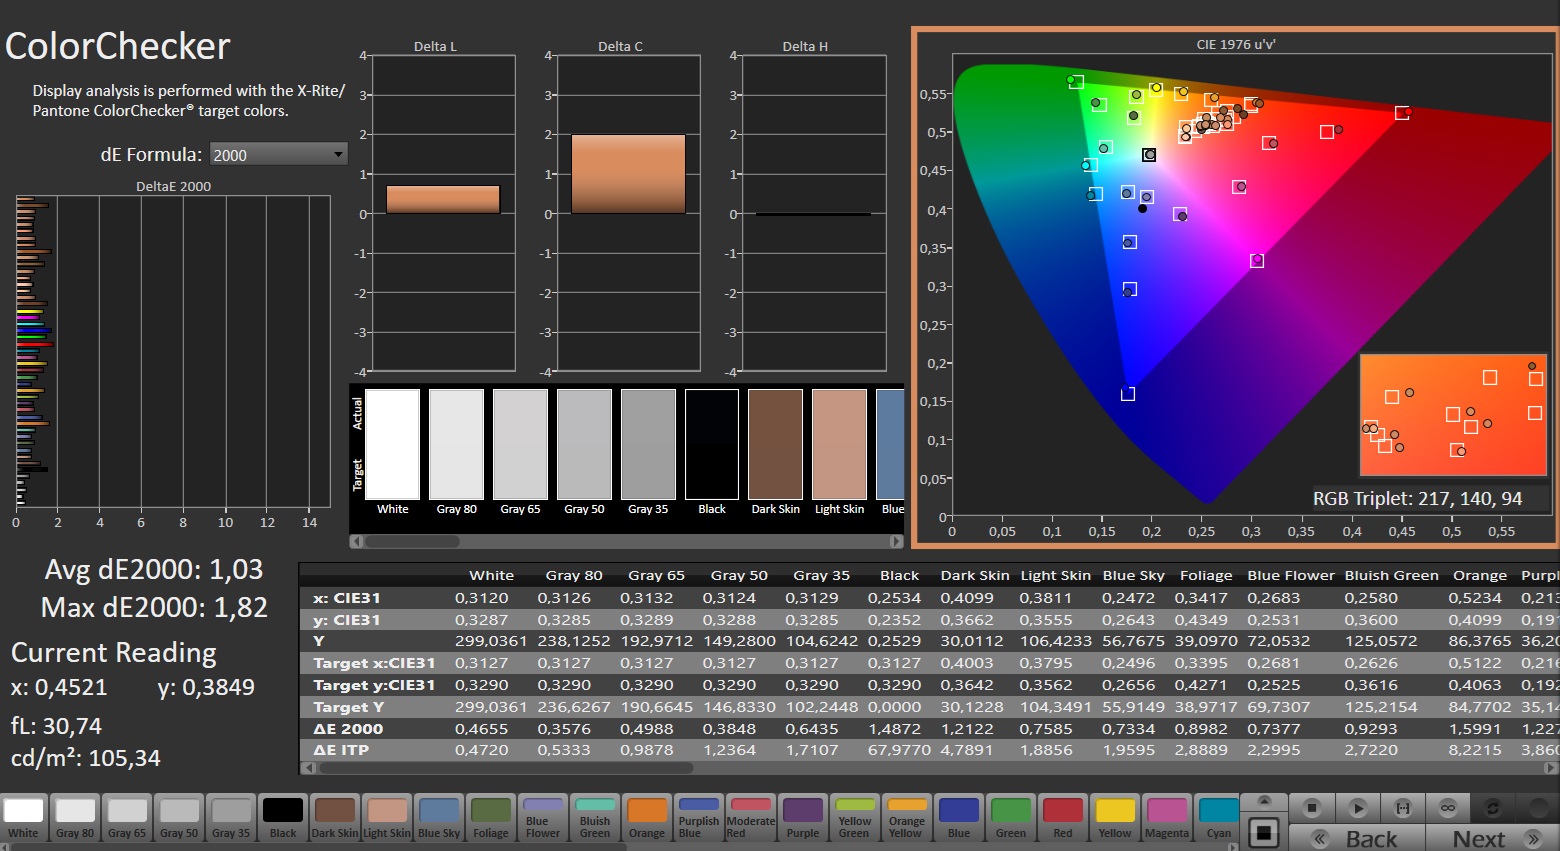
ΔE Color 2.26 | 0.5-29.43 Ø4.87, calibrated: 1.03
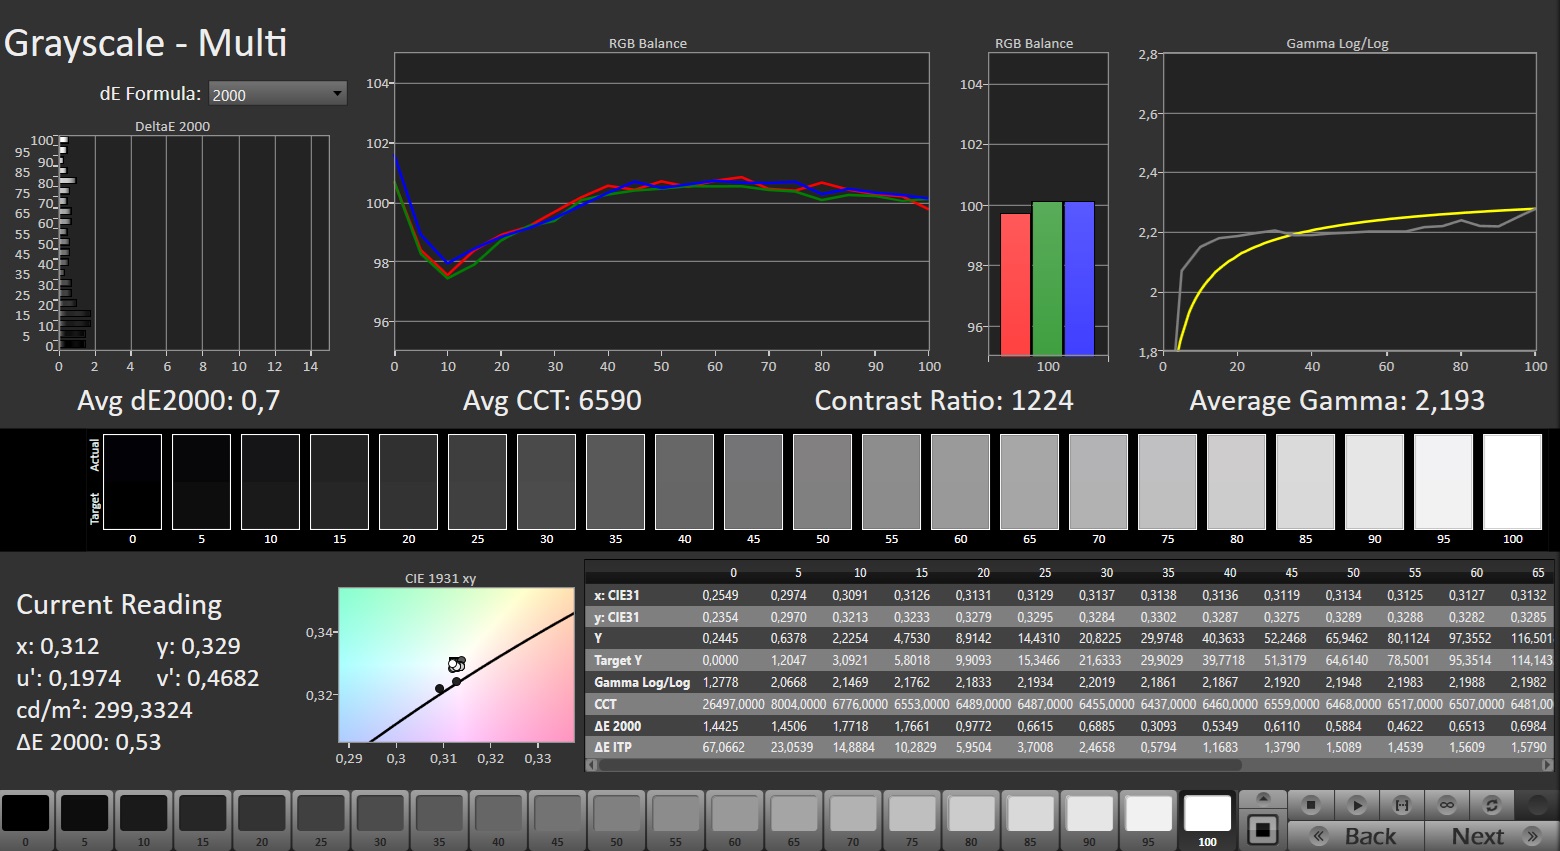
ΔE Greyscale 4 | 0.5-98 Ø5.1
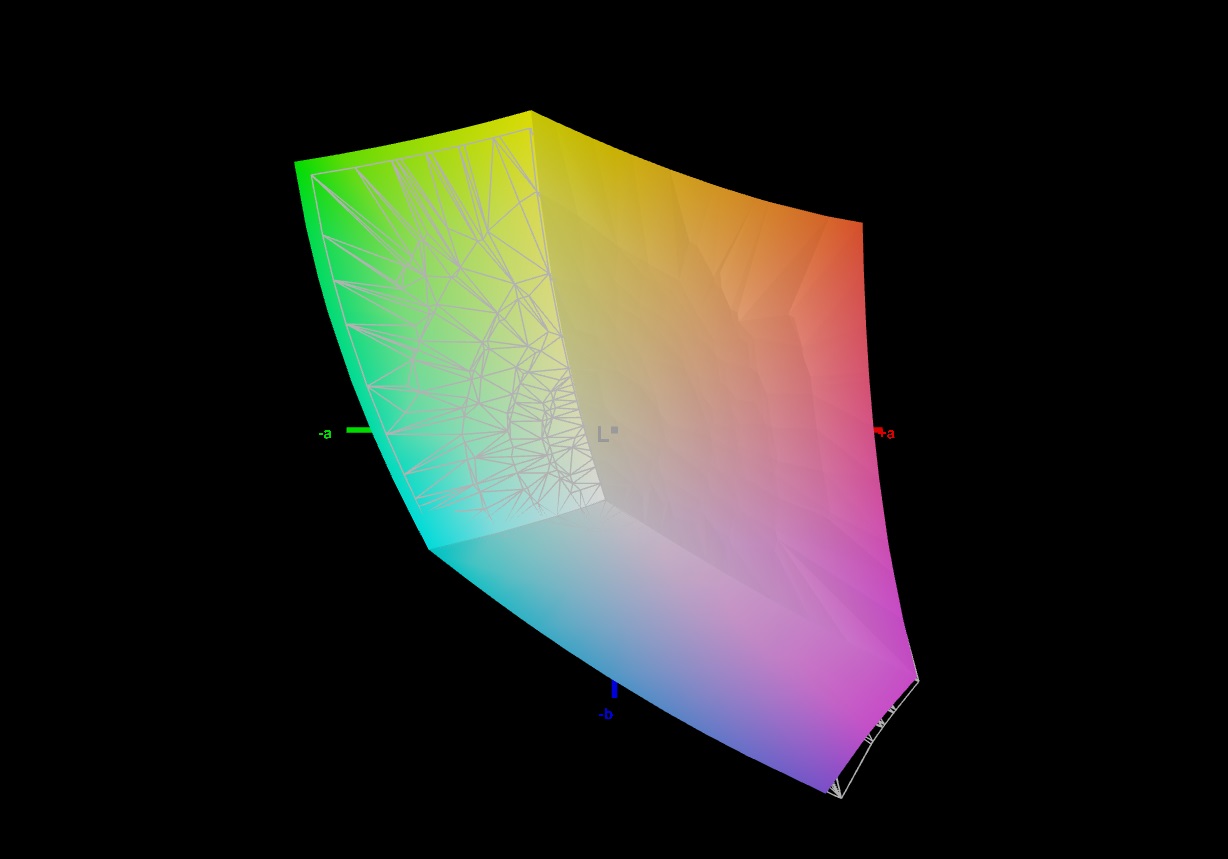
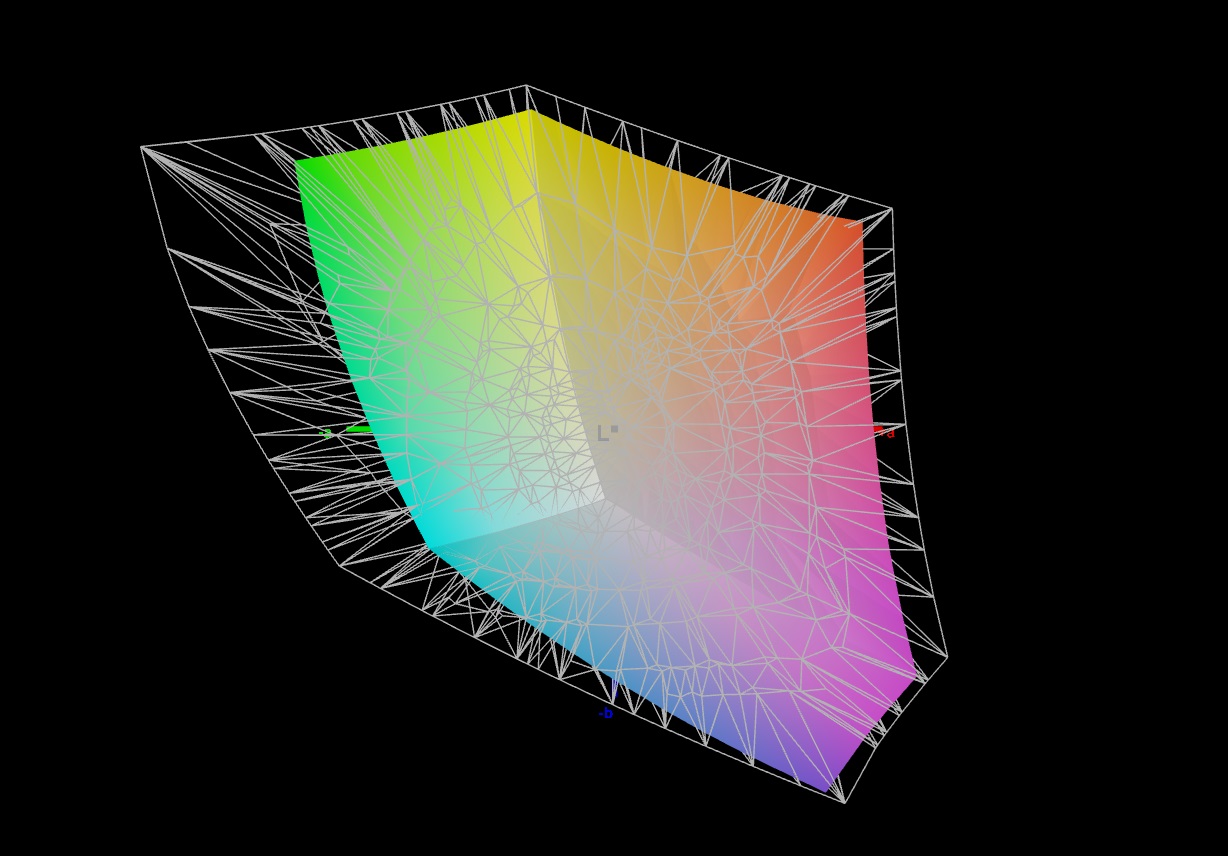
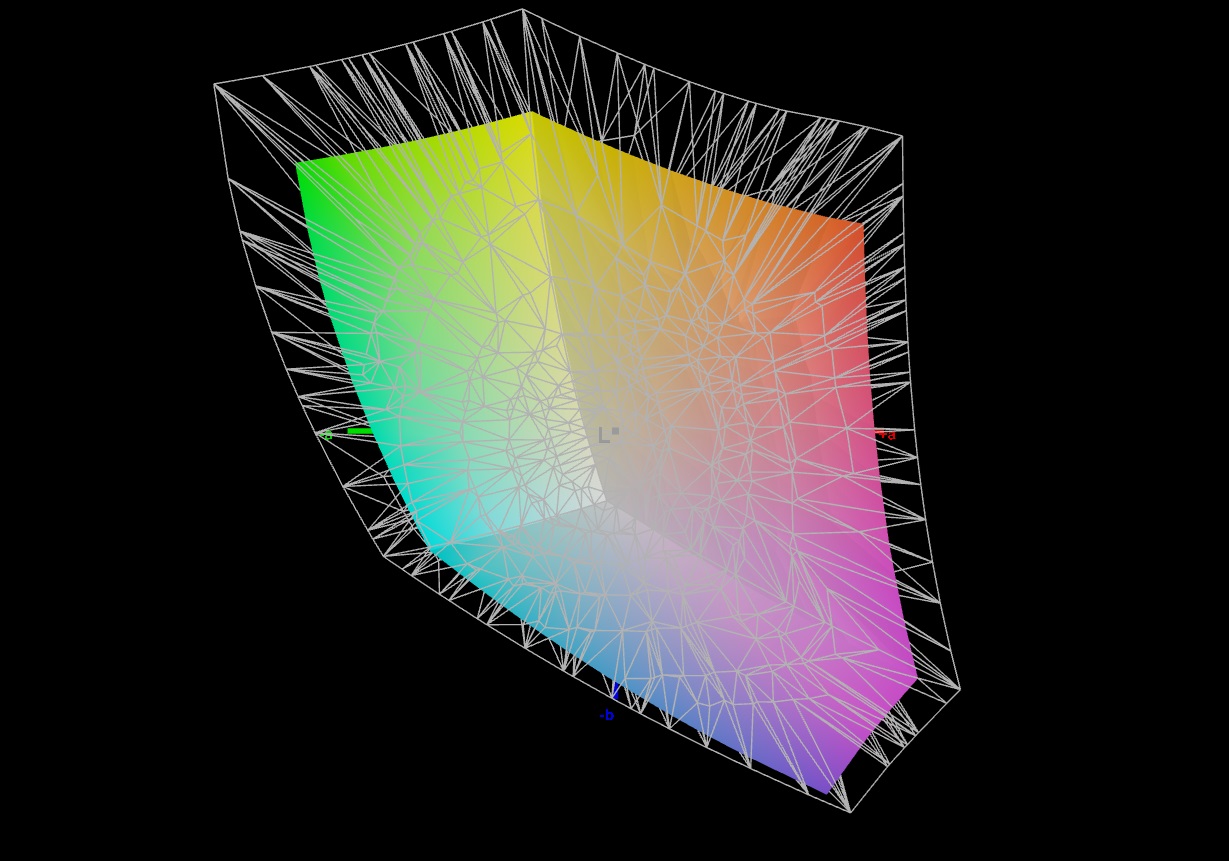
72.7% AdobeRGB 1998 (Argyll 2.2.0 3D)
98.5% sRGB (Argyll 2.2.0 3D)
70.5% Display P3 (Argyll 2.2.0 3D)
Gamma: 2.116
| Asus TUF Gaming A15 FA507UV AU Optronics B156HAN15.H, IPS, 1920x1080, 15.6" | Lenovo LOQ 15IRX9 BOE NJ NE156FHM-NX9, IPS, 1920x1080, 15.6" | HP Victus 16 (2024) Chi Mei CMN163E, IPS, 1920x1080, 16.1" | Gigabyte G6X 9KG (2024) BOE NE160WUM-NX6, IPS, 1920x1200, 16" | SCHENKER XMG Core 15 (M24) BOE NJ NE153QDM-NZ1 (BOE0C8E), IPS, 2560x1600, 15.3" | Dell G16, i7-13650HX, RTX 4060 Chi Mei CMN161D (160GME), IPS, 2560x1600, 16" | Asus TUF A15 FA507 N156HMA-GA1, IPS, 1920x1080, 15.6" | |
|---|---|---|---|---|---|---|---|
| Display | 2% | -40% | -39% | 3% | -3% | -6% | |
| Display P3 Coverage | 70.5 | 73.7 5% | 41.3 -41% | 41.8 -41% | 73.2 4% | 67.5 -4% | 64.9 -8% |
| sRGB Coverage | 98.5 | 99.1 1% | 61.7 -37% | 62.4 -37% | 100 2% | 98.5 0% | 96.5 -2% |
| AdobeRGB 1998 Coverage | 72.7 | 72.6 0% | 42.7 -41% | 43.3 -40% | 74.6 3% | 69.3 -5% | 66.6 -8% |
| Response Times | -16% | 14% | -11% | 65% | 66% | 7% | |
| Response Time Grey 50% / Grey 80% * | 31.7 ? | 42.2 ? -33% | 28.6 ? 10% | 40.5 ? -28% | 9.6 ? 70% | 7.6 ? 76% | 30.4 ? 4% |
| Response Time Black / White * | 22.9 ? | 22.6 ? 1% | 18.7 ? 18% | 21.6 ? 6% | 9.2 ? 60% | 10.4 ? 55% | 20.8 ? 9% |
| PWM Frequency | |||||||
| Screen | 6% | -62% | -54% | 14% | -9% | 18% | |
| Brightness middle | 315 | 306 -3% | 287 -9% | 353 12% | 635 102% | 369 17% | 288 -9% |
| Brightness | 303 | 287 -5% | 288 -5% | 318 5% | 604 99% | 344 14% | 271 -11% |
| Brightness Distribution | 90 | 88 -2% | 86 -4% | 81 -10% | 91 1% | 89 -1% | 91 1% |
| Black Level * | 0.25 | 0.21 16% | 0.19 24% | 0.21 16% | 0.64 -156% | 0.26 -4% | 0.17 32% |
| Contrast | 1260 | 1457 16% | 1511 20% | 1681 33% | 992 -21% | 1419 13% | 1694 34% |
| Colorchecker dE 2000 * | 2.26 | 2.25 -0% | 5.46 -142% | 5.21 -131% | 1.89 16% | 3.04 -35% | 1.9 16% |
| Colorchecker dE 2000 max. * | 7.37 | 4.84 34% | 20.36 -176% | 19.95 -171% | 3.14 57% | 5.56 25% | 3.3 55% |
| Colorchecker dE 2000 calibrated * | 1.03 | 1.45 -41% | 3.52 -242% | 3.61 -250% | 1.14 -11% | 2.35 -128% | 0.9 13% |
| Greyscale dE 2000 * | 4 | 2.4 40% | 4.8 -20% | 3.6 10% | 2.53 37% | 3.38 15% | 2.7 32% |
| Gamma | 2.116 104% | 2.259 97% | 2.108 104% | 2.367 93% | 2.36 93% | 2.47 89% | 2.32 95% |
| CCT | 7570 86% | 6790 96% | 6442 101% | 7138 91% | 6434 101% | 6040 108% | 6535 99% |
| Media total (Programa/Opciones) | -3% /
2% | -29% /
-46% | -35% /
-45% | 27% /
19% | 18% /
3% | 6% /
11% |
* ... más pequeño es mejor
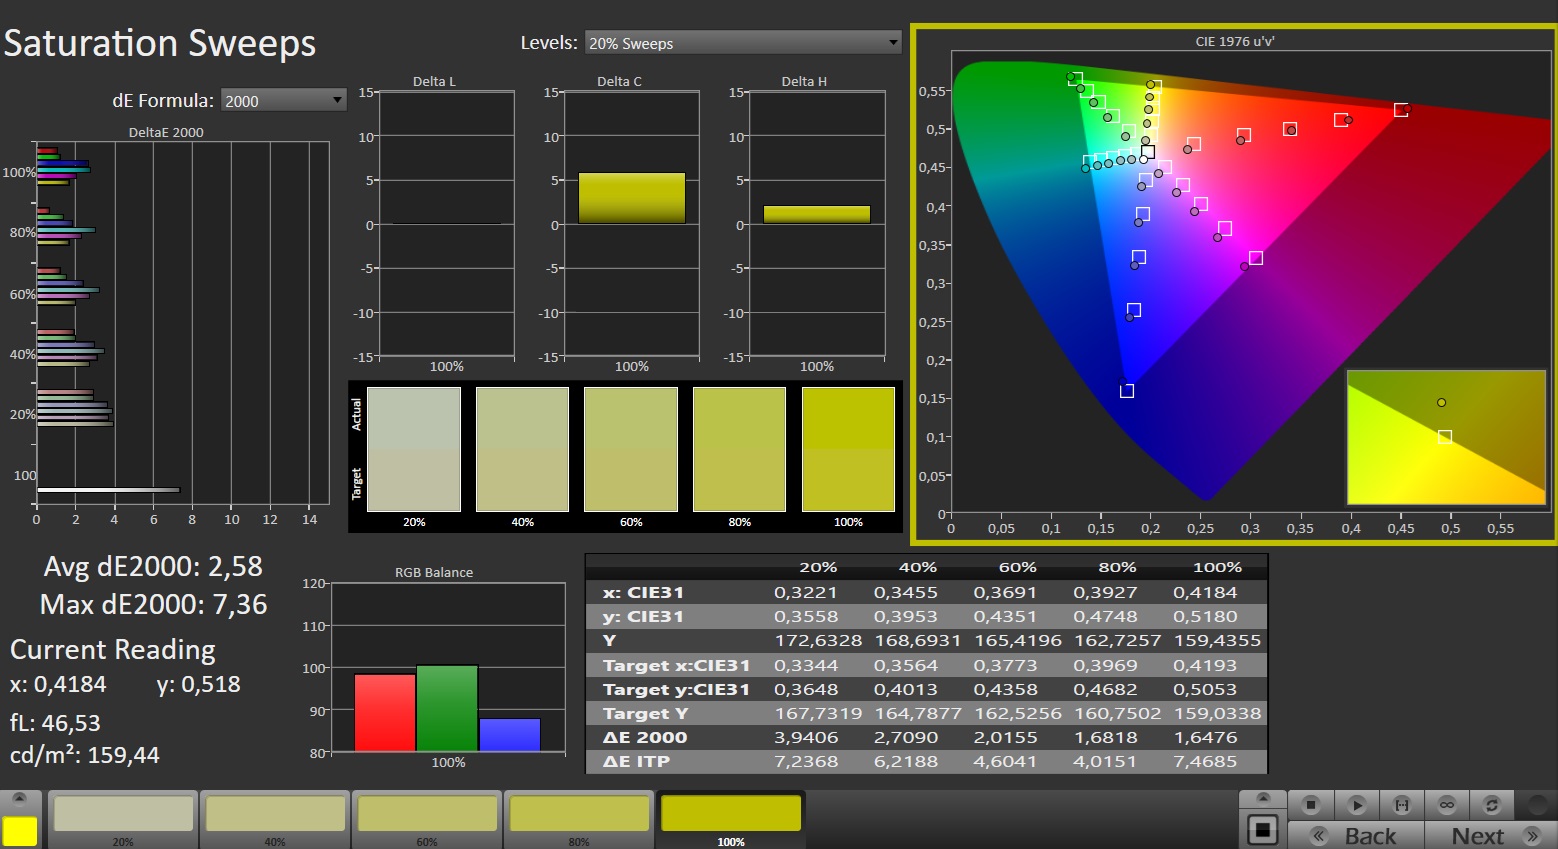
Al sacarlo de la caja, el panel viene con una desviación de color muy baja, de alrededor de 2,26 (objetivo: DeltaE < 3). Un calibrado reduce esta cifra a 1,03. Como ocurre con las pantallas de la mayoría de la competencia, este panel cubre (casi) por completo el espacio de color sRGB, pero no los espacios de color AdobeRGB y DCI P3.
Tiempos de respuesta del display
| ↔ Tiempo de respuesta de Negro a Blanco | ||
|---|---|---|
| 22.9 ms ... subida ↗ y bajada ↘ combinada | ↗ 11.7 ms subida | 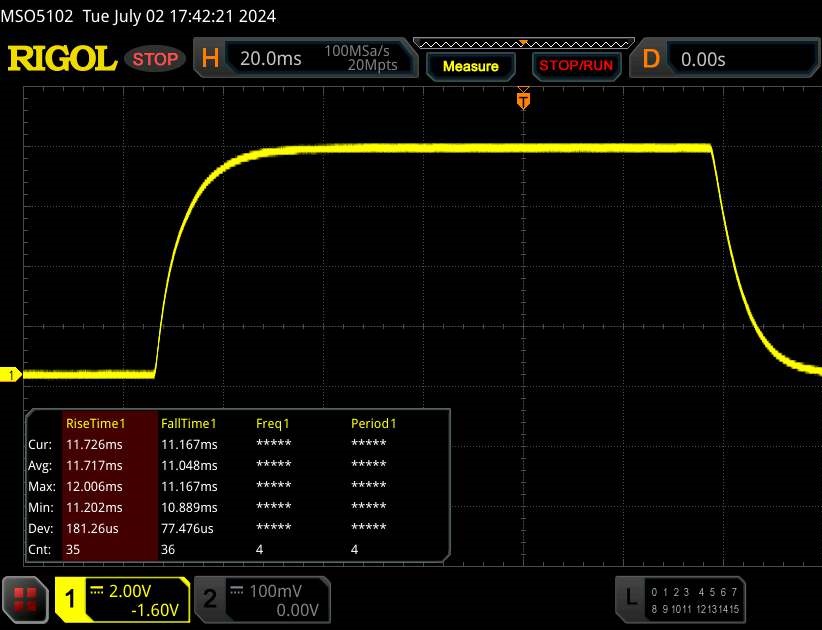 |
| ↘ 11.2 ms bajada | ||
| La pantalla mostró buenos tiempos de respuesta en nuestros tests pero podría ser demasiado lenta para los jugones competitivos. En comparación, todos los dispositivos de prueba van de ##min### (mínimo) a 240 (máximo) ms. » 48 % de todos los dispositivos son mejores. Eso quiere decir que el tiempo de respuesta es peor que la media (20.8 ms) de todos los dispositivos testados. | ||
| ↔ Tiempo de respuesta 50% Gris a 80% Gris | ||
| 31.7 ms ... subida ↗ y bajada ↘ combinada | ↗ 14.7 ms subida | 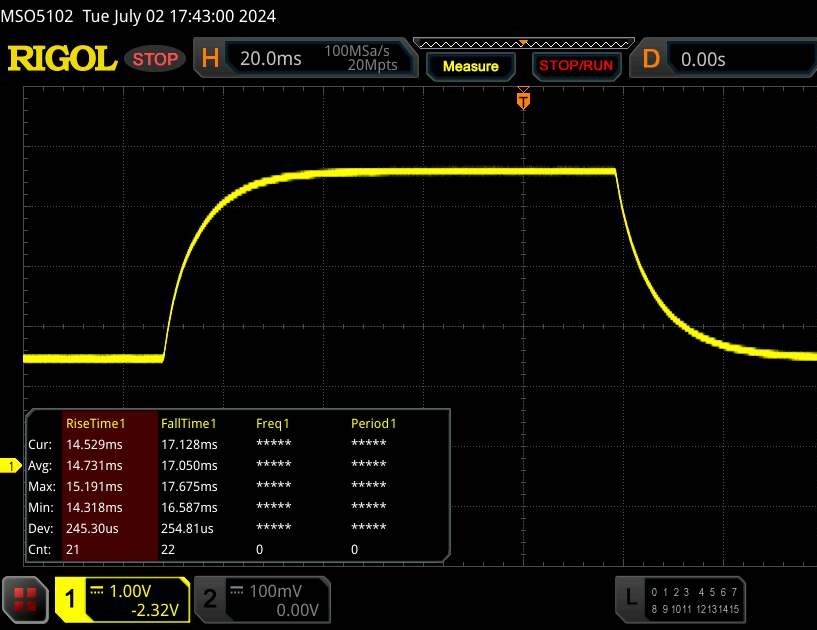 |
| ↘ 17 ms bajada | ||
| La pantalla mostró tiempos de respuesta lentos en nuestros tests y podría ser demasiado lenta para los jugones. En comparación, todos los dispositivos de prueba van de ##min### (mínimo) a 636 (máximo) ms. » 39 % de todos los dispositivos son mejores. Eso quiere decir que el tiempo de respuesta es similar al dispositivo testado medio (32.5 ms). | ||
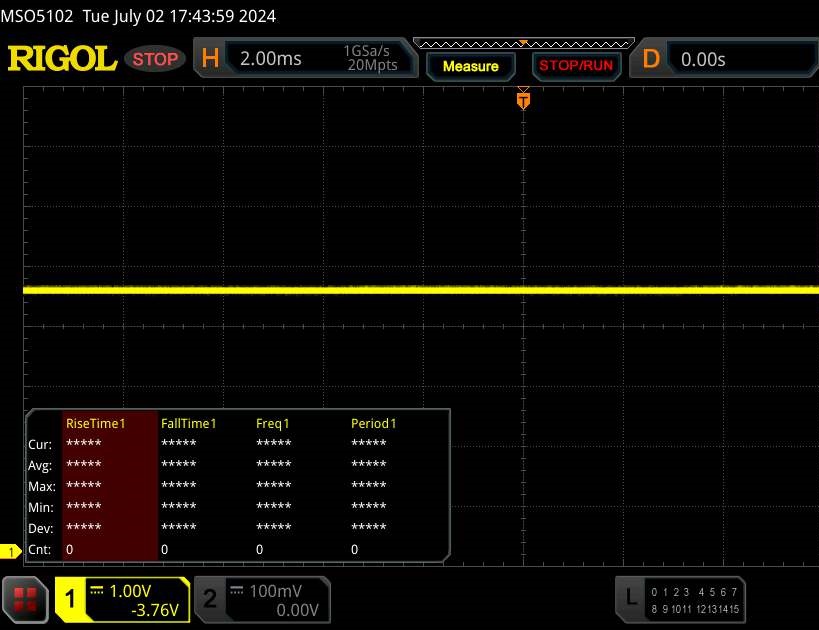
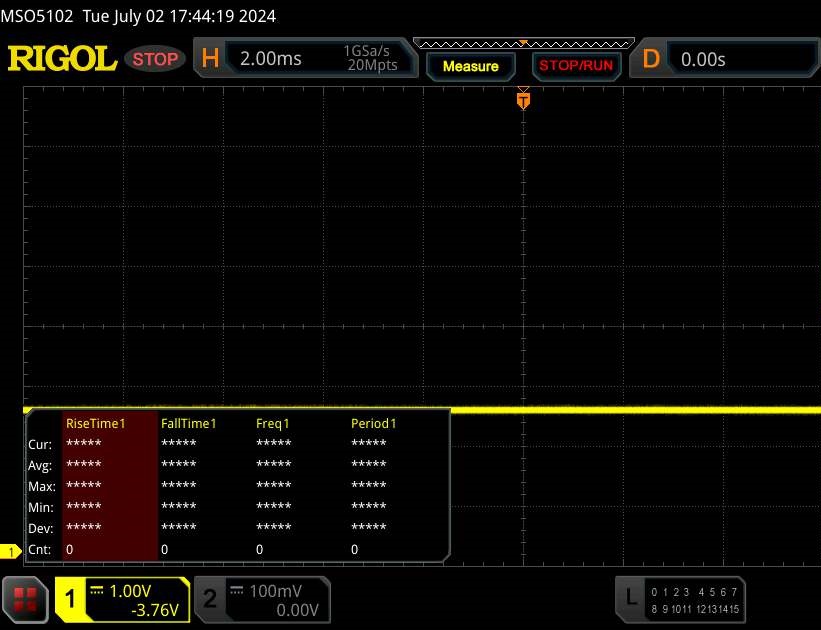
Parpadeo de Pantalla / PWM (Pulse-Width Modulation)
| Parpadeo de Pantalla / PWM no detectado | 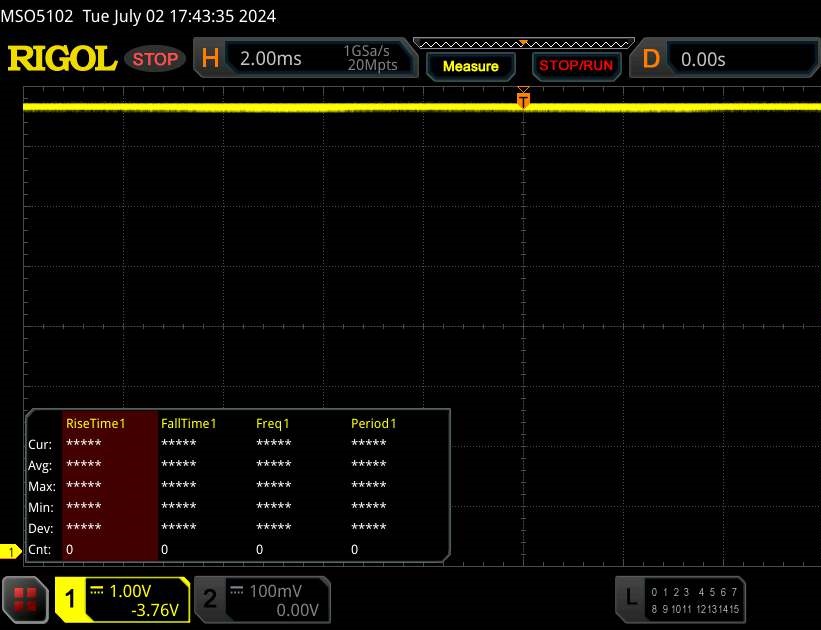 | ||
Comparación: 53 % de todos los dispositivos testados no usaron PWM para atenuar el display. Si se usó, medimos una media de 8516 (mínimo: 5 - máxmo: 343500) Hz. | |||
Rendimiento - Hawk Point y Ada Lovelace impulsan el ordenador
Con el TUF Gaming A15 FA507UV, Asus ofrece un portátil para juegos de gama media en el segmento de precio más bajo. El hardware necesario para las tareas de cálculo procede de AMD (Hawk Point, Zen 4) y Nvidia (Ada Lovelace). El dispositivo de análisis le costará unos 1.399 dólares.
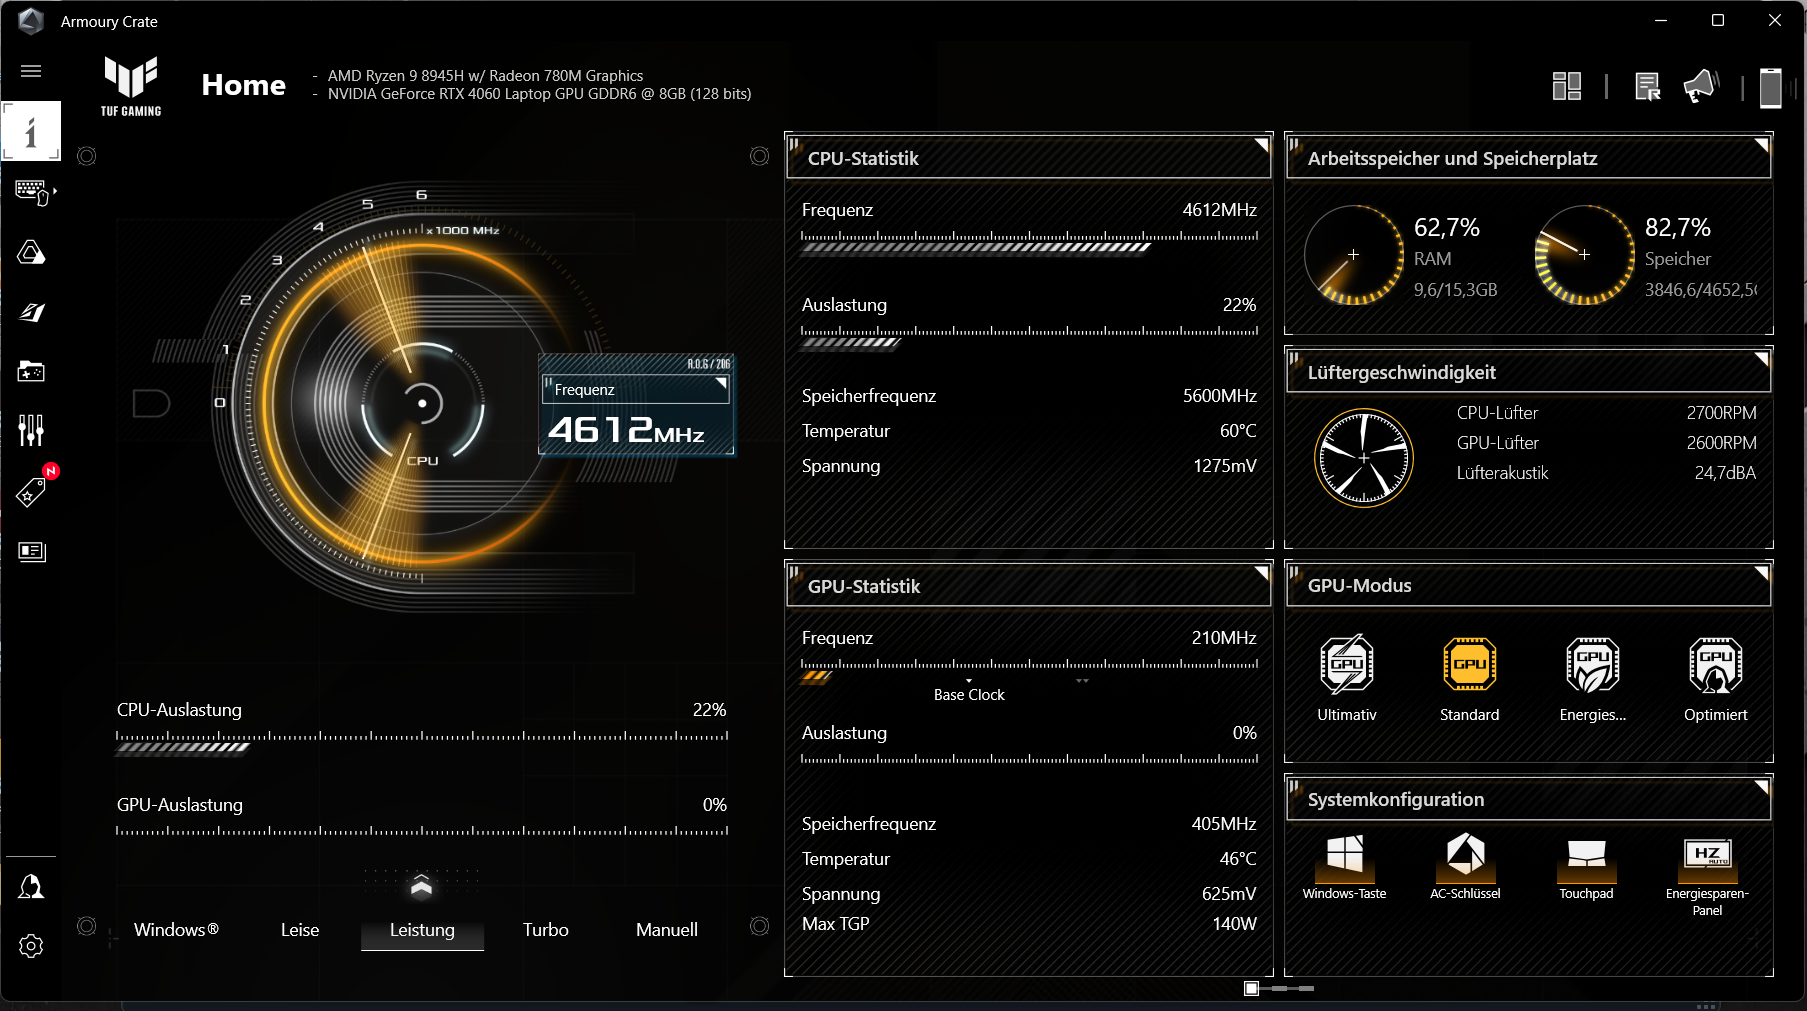
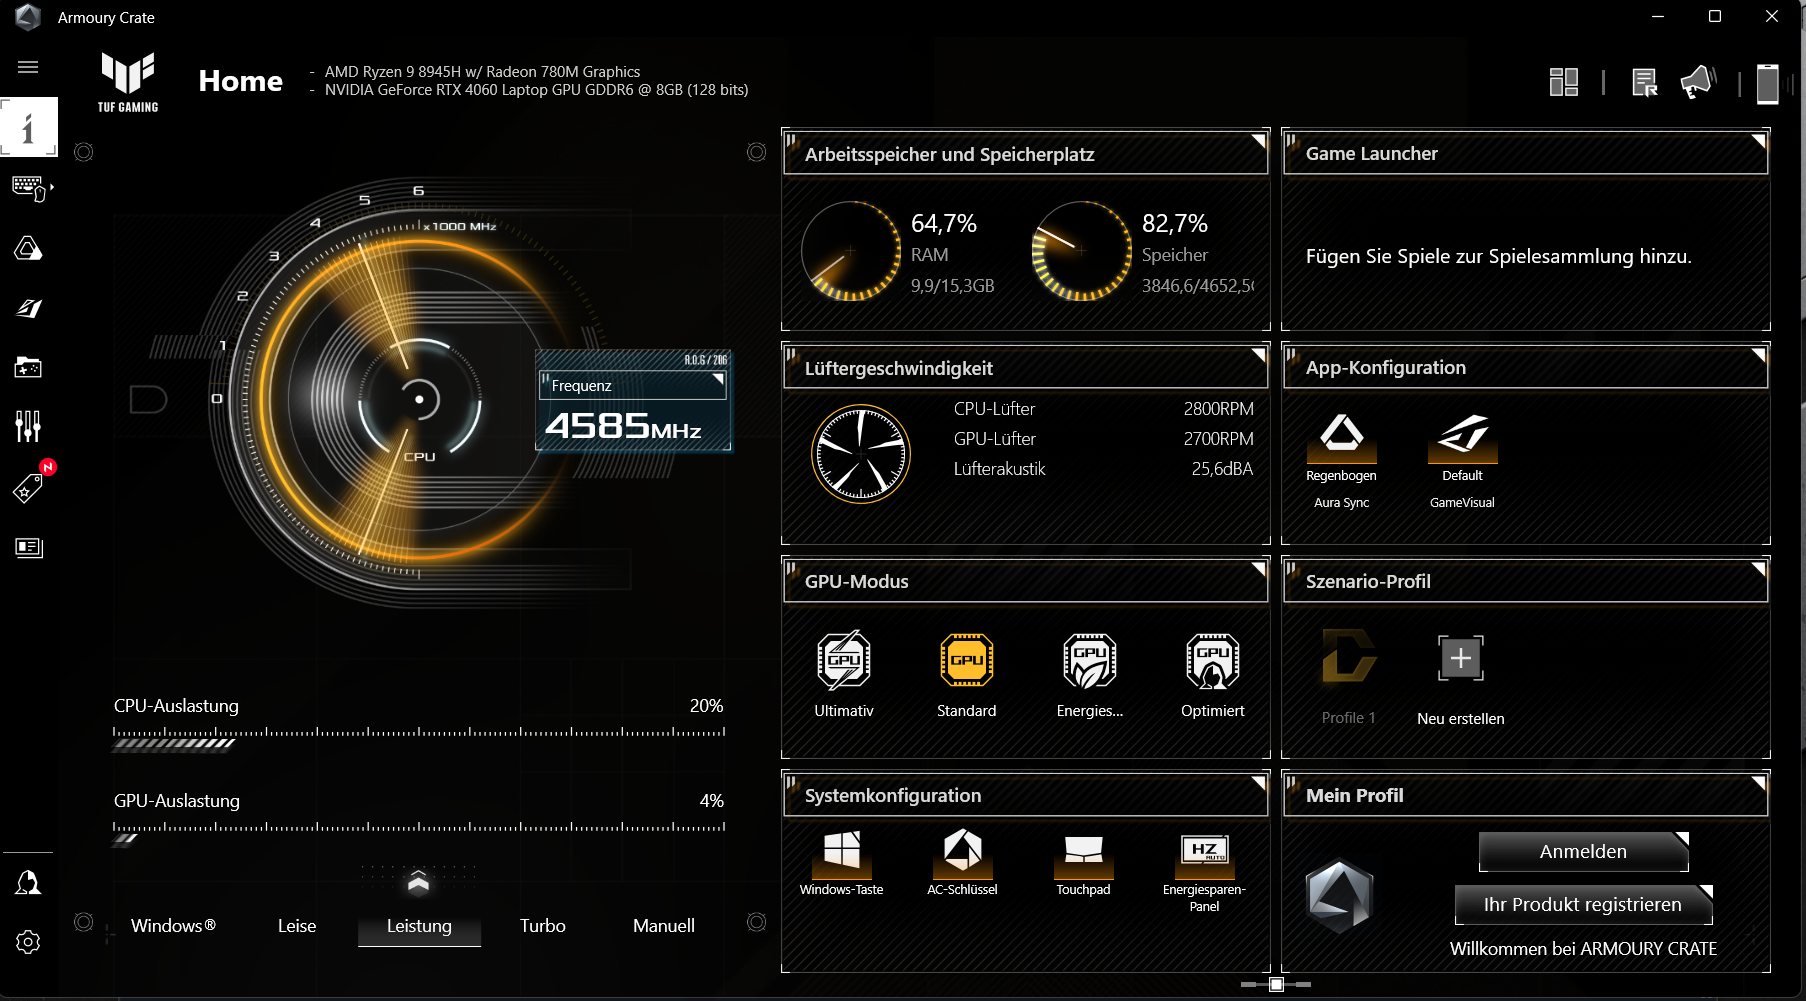
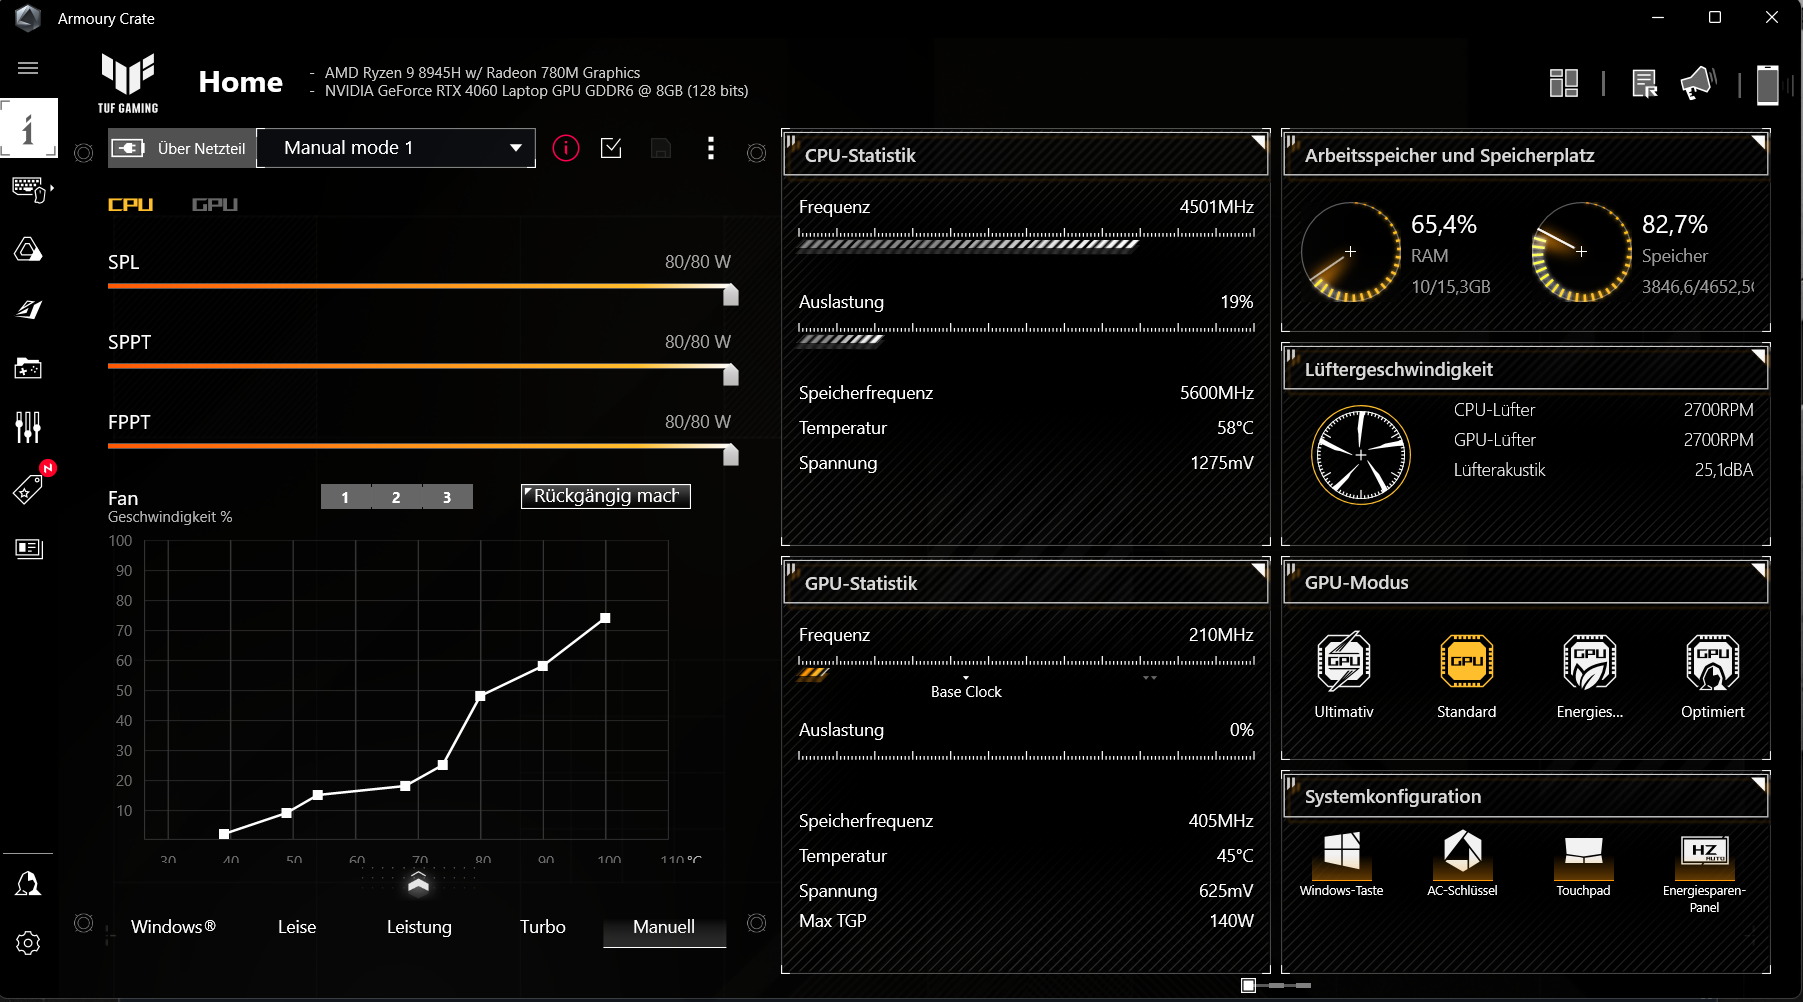
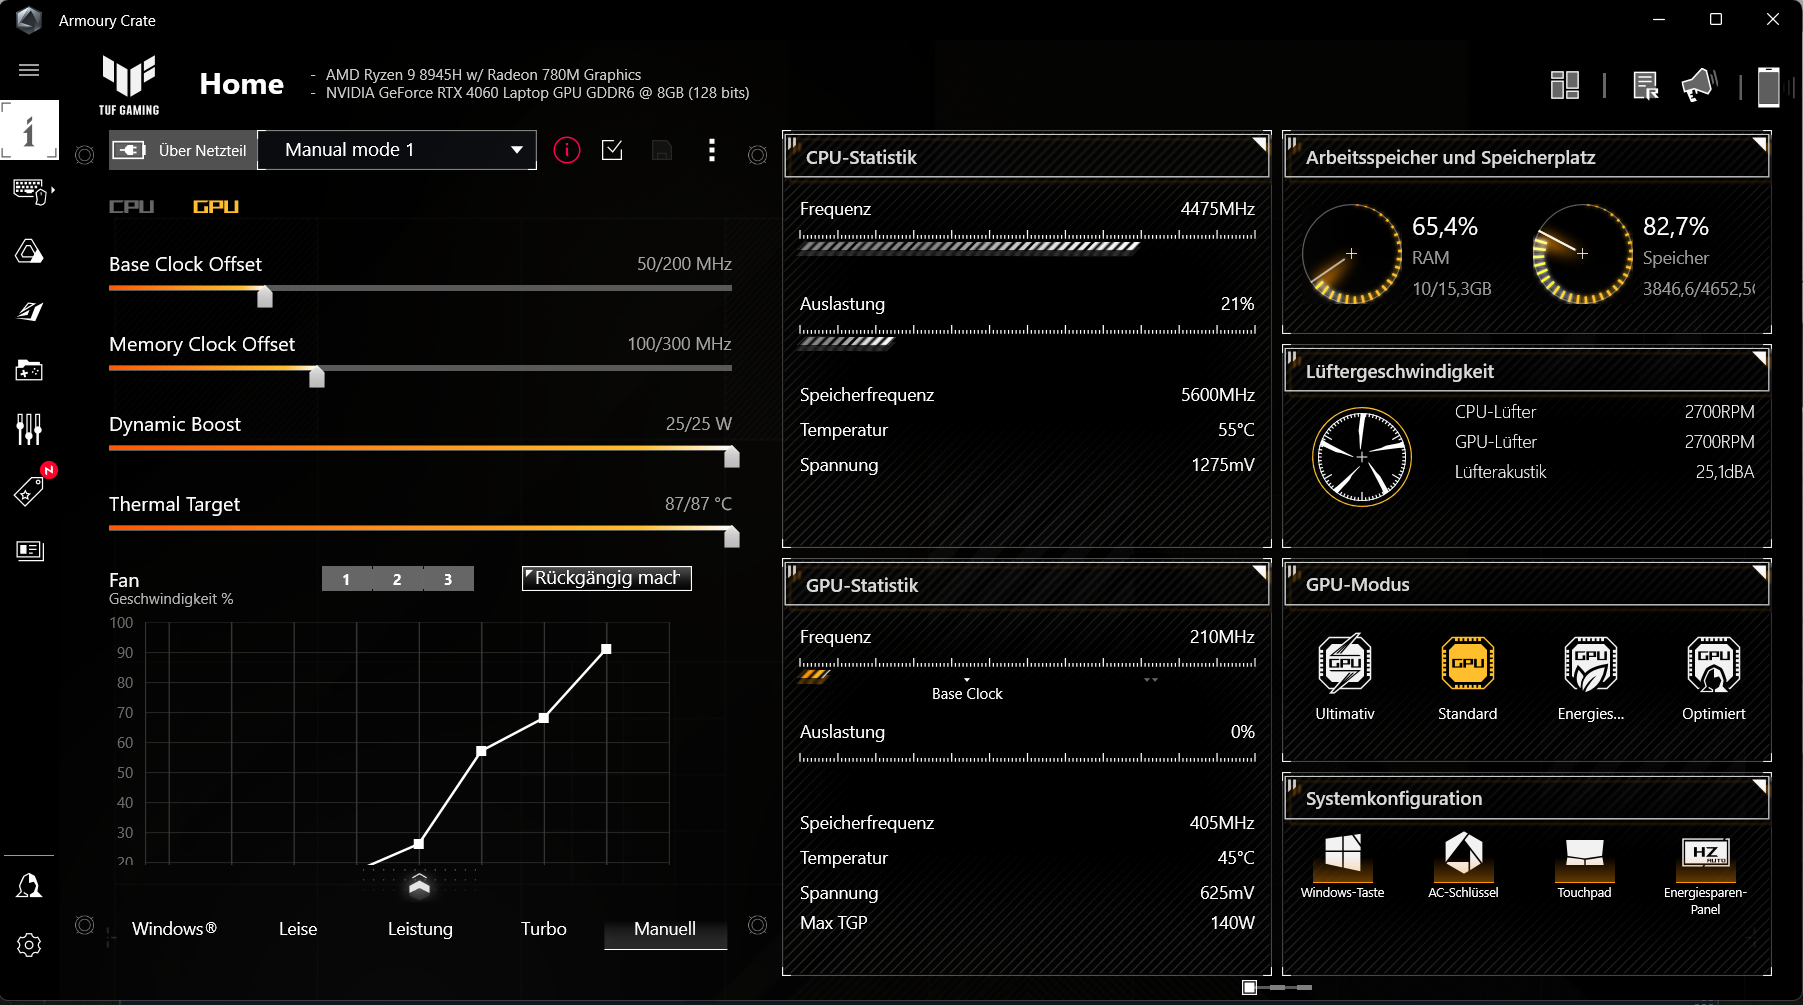
Condiciones de la prueba
El portátil dispone de tres perfiles de rendimiento específicos del fabricante (véase la tabla) que pueden conmutarse mediante la combinación de teclas "Fn" + "F5". Utilizamos los perfiles "Rendimiento" (pruebas de rendimiento) y "Silencioso" (prueba de batería). El modo GPU se configuró como "Estándar". El centro de control del portátil ("Armoury Crate") permite establecer un perfil personalizado ("Manual"), así como definir los límites de potencia, el boost dinámico y las curvas del ventilador.
| Rendimiento | Turbo | Silencioso | |
|---|---|---|---|
| Límite de potencia 1 (HWInfo) | 70 vatios | 80 vatios | 54 vatios |
| Límite de potencia 2 (HWInfo) | 80 vatios | 80 vatios | 65 vatios |
| Ruido (CP 2077 Phantom) | 45 dB(A) | 56 dB(A) | 41 dB(A) |
| Rendimiento (CP 2077 Phantom) | 64fps | 70fps | 56fps |
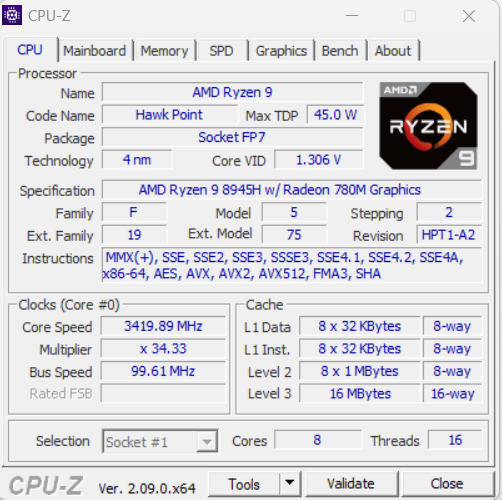
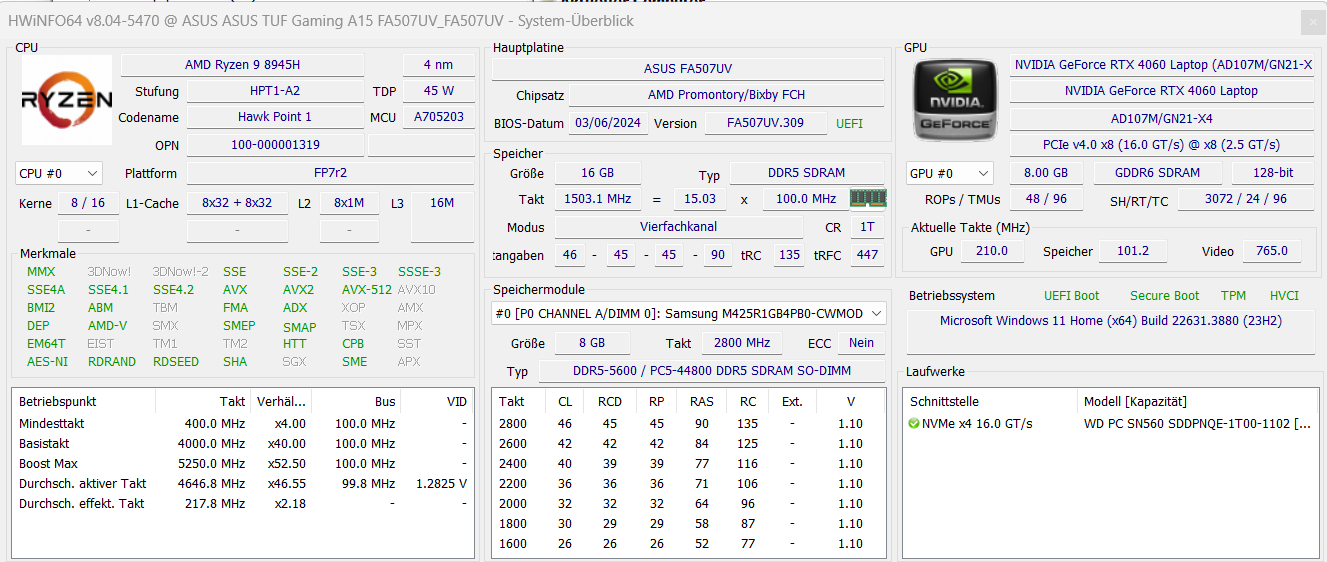
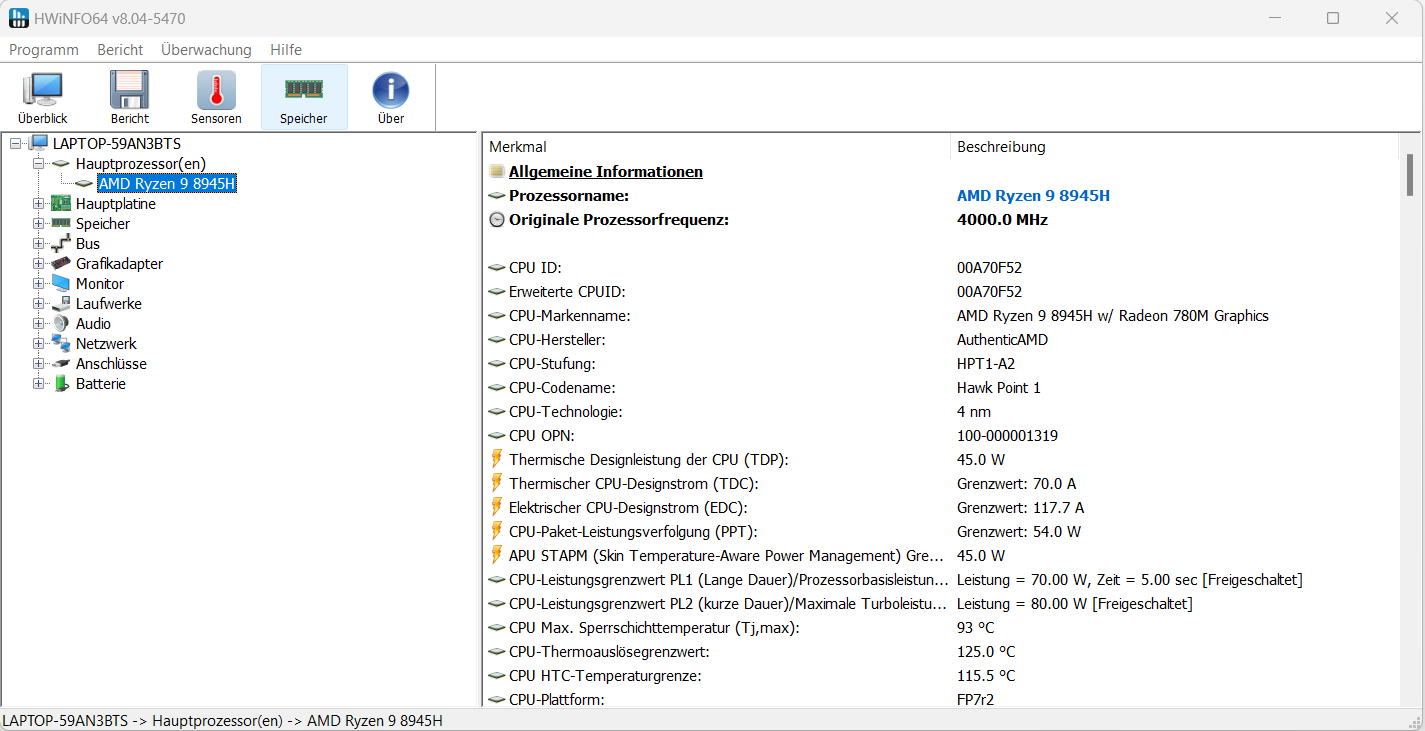
Procesador
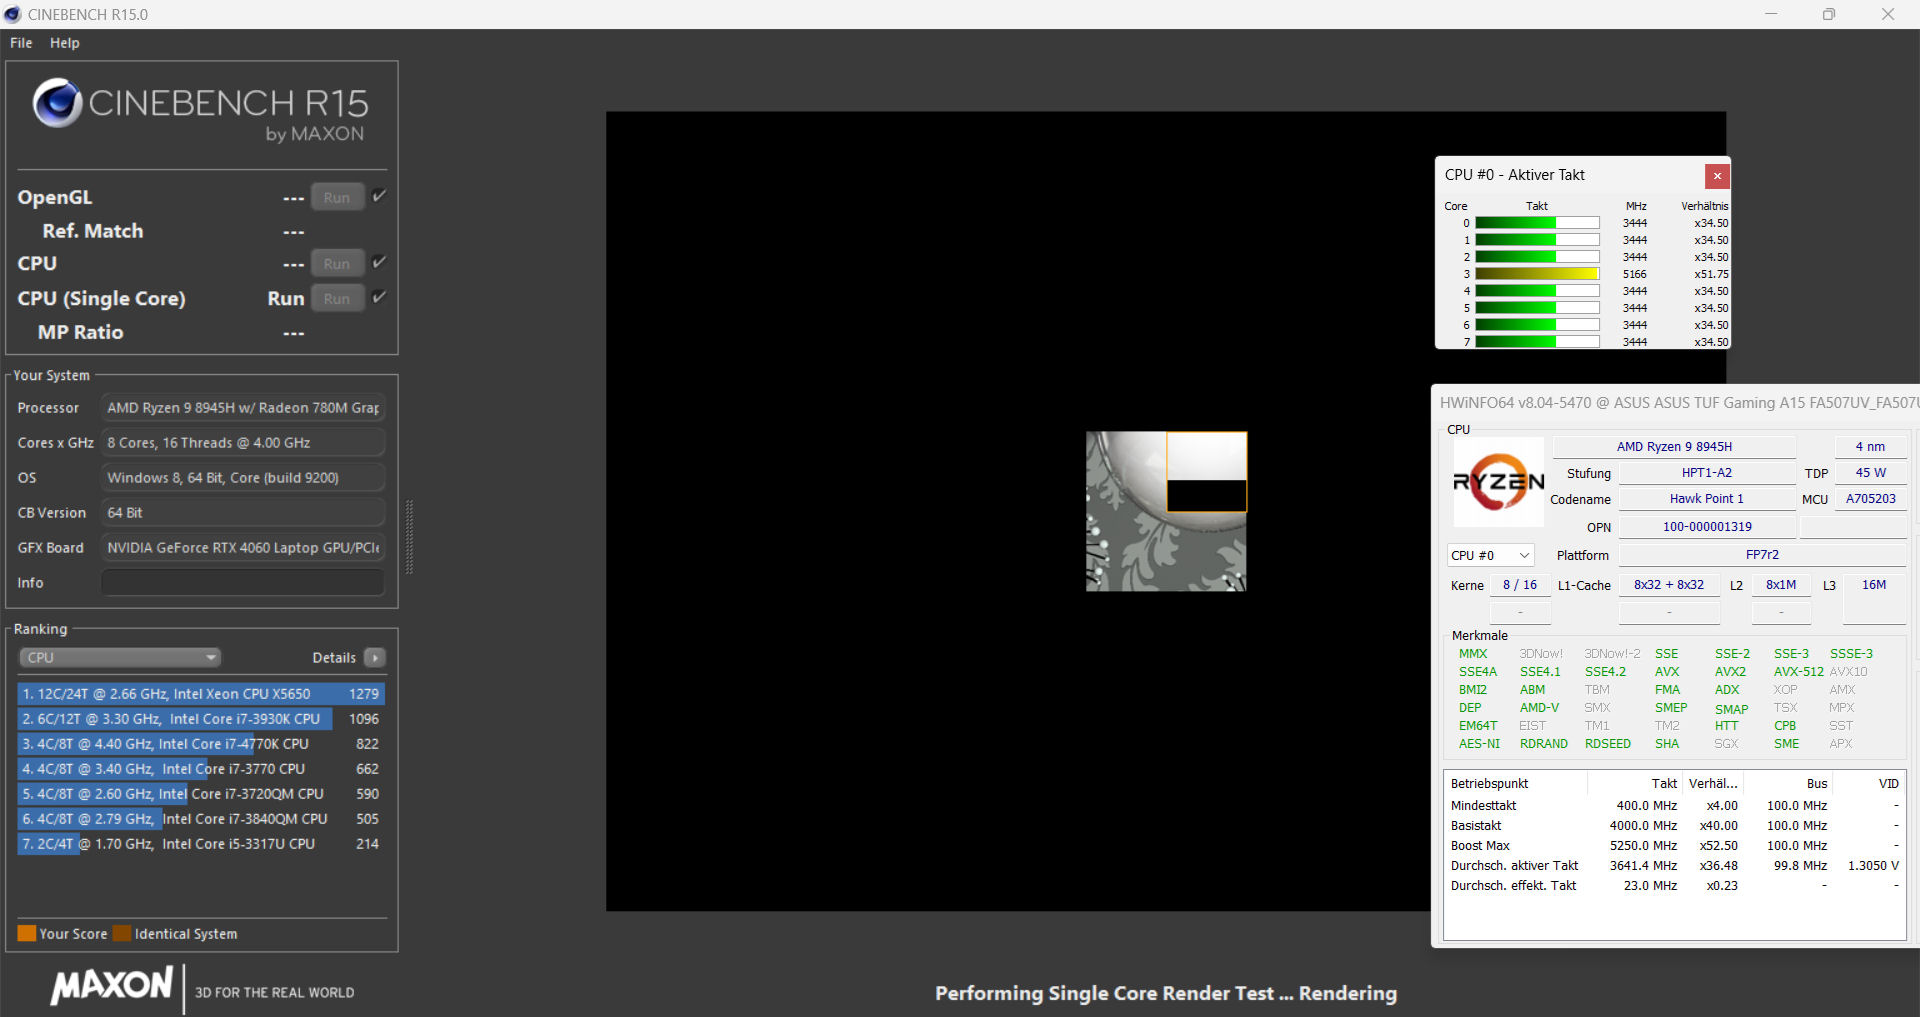
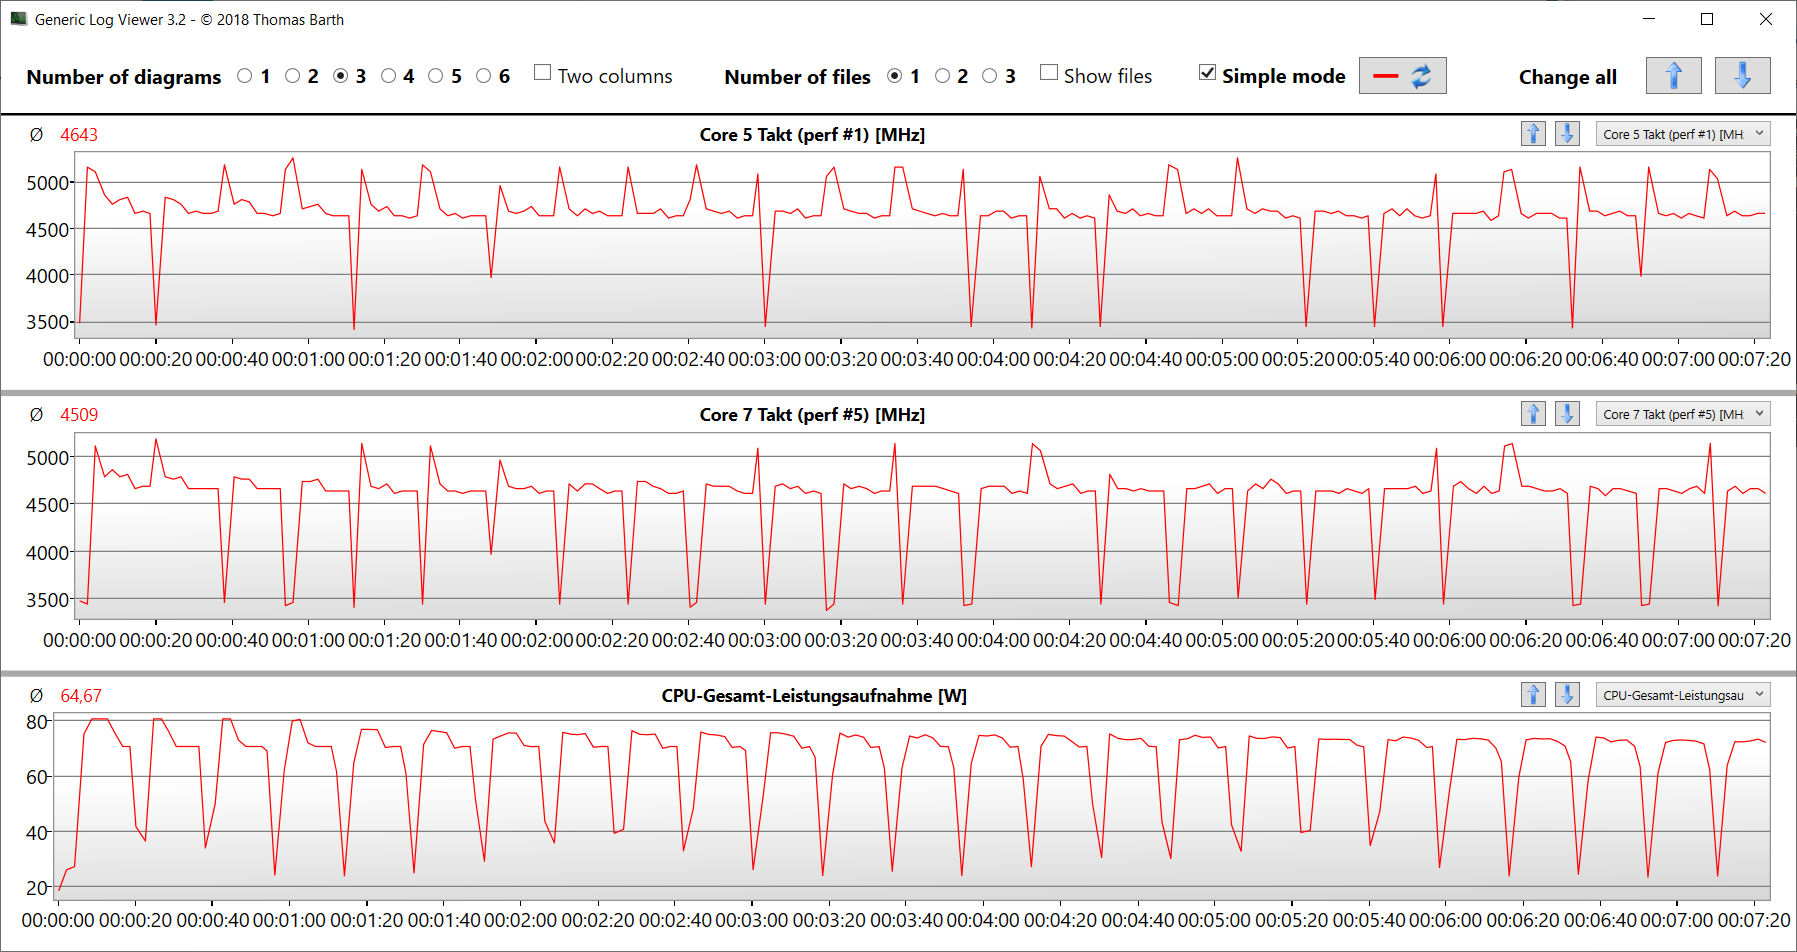
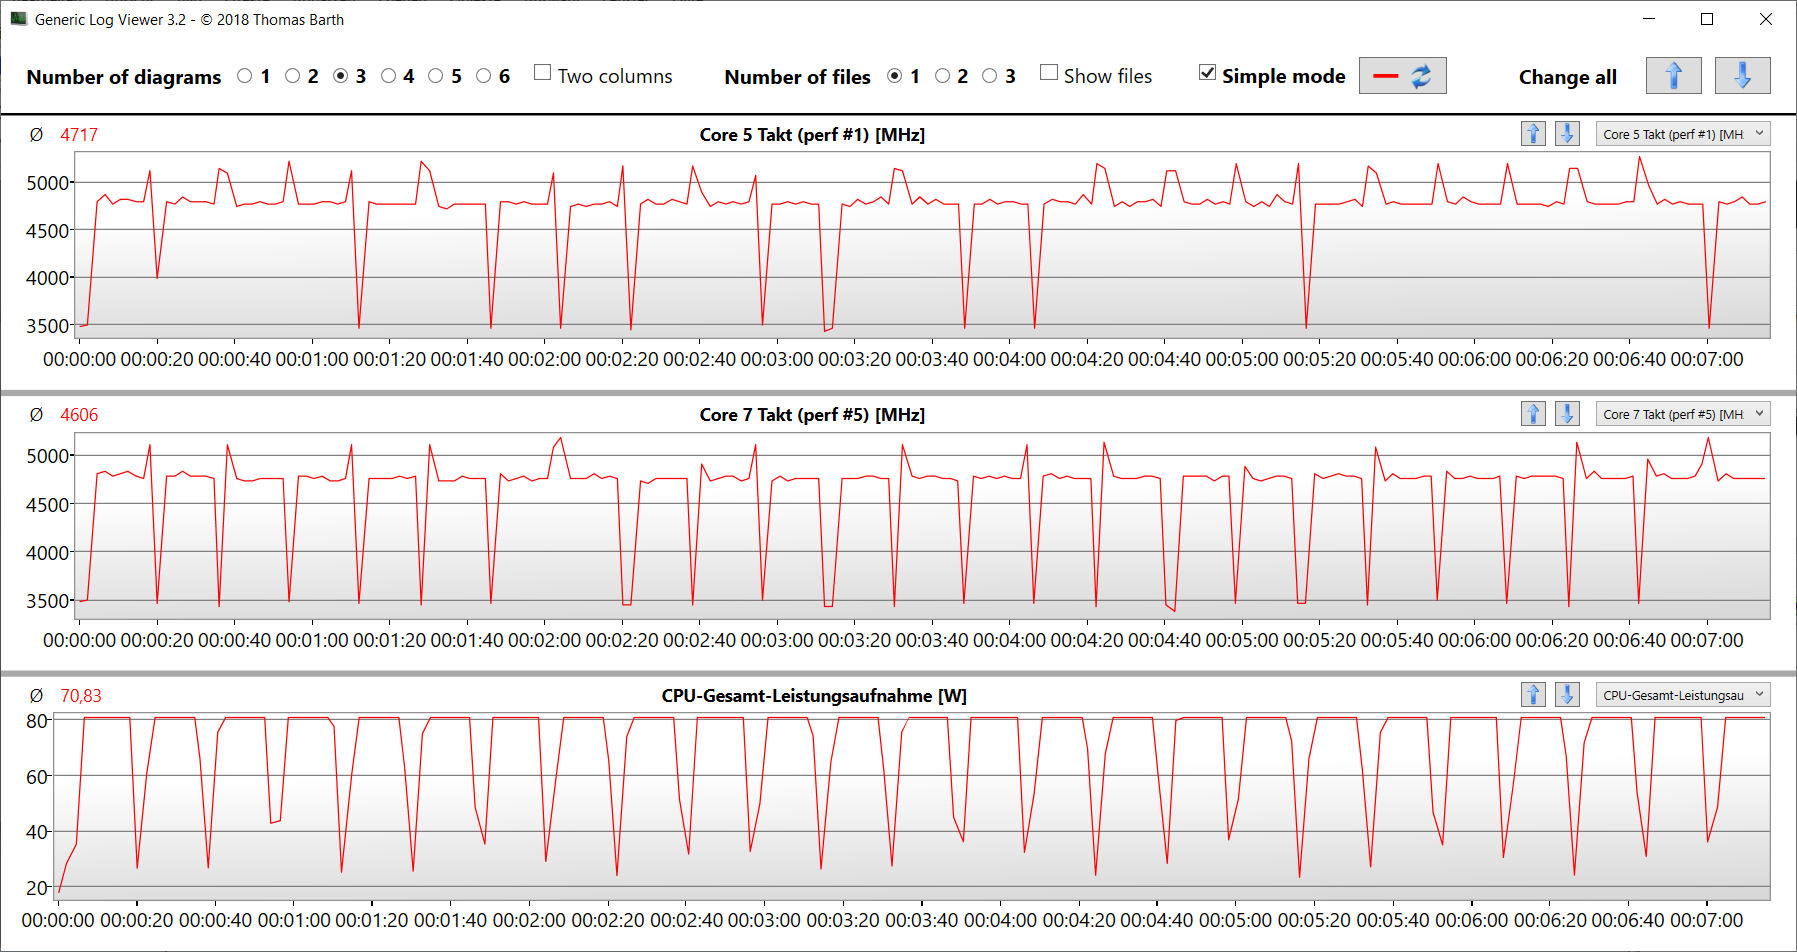
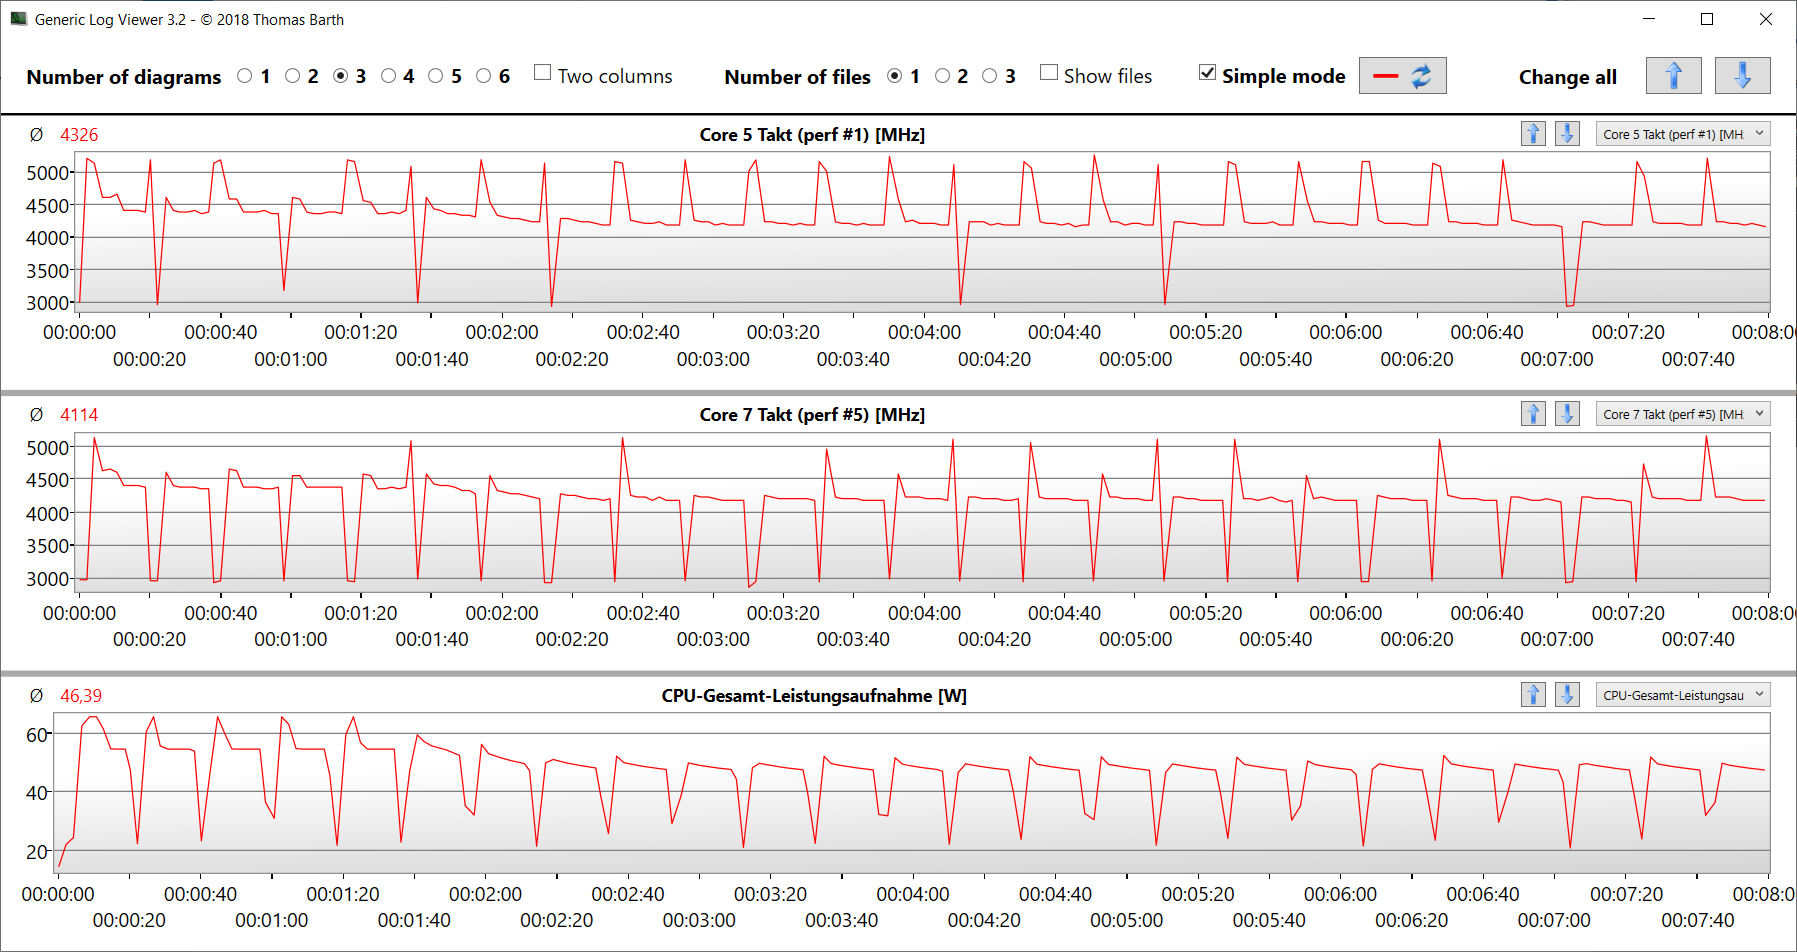
Ryzen 9 8945H (Hawk Point, Zen 4) ofrece ocho núcleos de CPU con un total de 16 hilos a una velocidad de reloj máxima de 5,25 GHz (un núcleo). La CPU responde a una carga multihilo sostenida (bucle CB15) con una velocidad turbo elevada y constante. El rendimiento de la CPU varía con el perfil energético seleccionado y las diferencias son bastante pequeñas. Los resultados del benchmark se sitúan al mismo nivel que un Ryzen 9 8945HS APU.
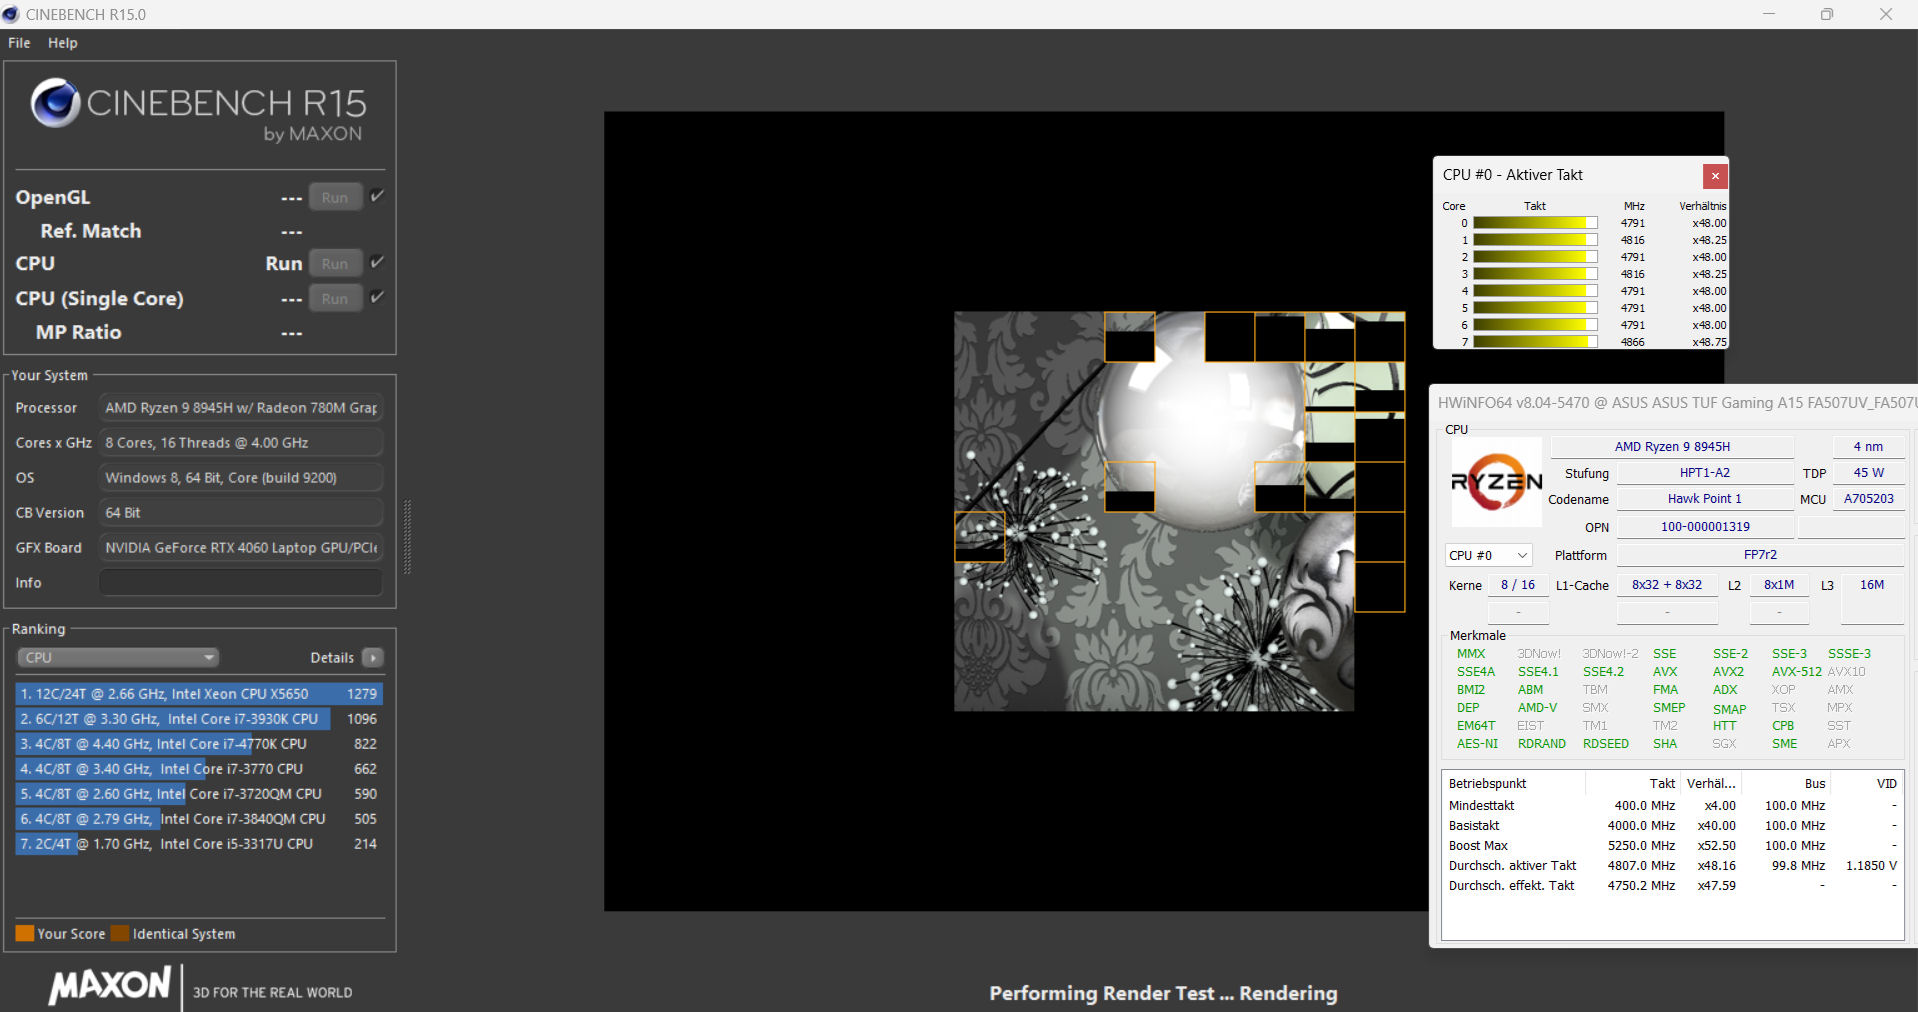
Cinebench R15 Multi Continuous Test
| CPU Performance Rating - Percent | |
| Media de la clase Gaming | |
| HP Victus 16 (2024) | |
| SCHENKER XMG Core 15 (M24) | |
| Dell G16, i7-13650HX, RTX 4060 | |
| Asus TUF Gaming A15 FA507UV | |
| Medio AMD Ryzen 9 8945H | |
| Asus TUF Gaming A15 FA507UV | |
| Gigabyte G6X 9KG (2024) | |
| Lenovo LOQ 15IRX9 | |
| Asus TUF A15 FA507 -2! | |
| Cinebench R20 | |
| CPU (Multi Core) | |
| HP Victus 16 (2024) | |
| Media de la clase Gaming (2179 - 15517, n=151, últimos 2 años) | |
| Dell G16, i7-13650HX, RTX 4060 | |
| Gigabyte G6X 9KG (2024) | |
| SCHENKER XMG Core 15 (M24) | |
| Asus TUF Gaming A15 FA507UV (Turbo) | |
| Medio AMD Ryzen 9 8945H (6859 - 6956, n=2) | |
| Asus TUF Gaming A15 FA507UV | |
| Lenovo LOQ 15IRX9 | |
| Asus TUF A15 FA507 | |
| CPU (Single Core) | |
| Media de la clase Gaming (439 - 866, n=151, últimos 2 años) | |
| Dell G16, i7-13650HX, RTX 4060 | |
| Gigabyte G6X 9KG (2024) | |
| SCHENKER XMG Core 15 (M24) | |
| Asus TUF Gaming A15 FA507UV | |
| Medio AMD Ryzen 9 8945H (638 - 670, n=2) | |
| Lenovo LOQ 15IRX9 | |
| HP Victus 16 (2024) | |
| Asus TUF Gaming A15 FA507UV (Turbo) | |
| Asus TUF A15 FA507 | |
| Cinebench R15 | |
| CPU Multi 64Bit | |
| HP Victus 16 (2024) | |
| Media de la clase Gaming (905 - 6074, n=154, últimos 2 años) | |
| Dell G16, i7-13650HX, RTX 4060 | |
| SCHENKER XMG Core 15 (M24) | |
| Gigabyte G6X 9KG (2024) | |
| Asus TUF Gaming A15 FA507UV (Turbo) | |
| Asus TUF Gaming A15 FA507UV | |
| Medio AMD Ryzen 9 8945H (2605 - 2819, n=3) | |
| Lenovo LOQ 15IRX9 | |
| Asus TUF A15 FA507 | |
| CPU Single 64Bit | |
| Asus TUF Gaming A15 FA507UV | |
| Medio AMD Ryzen 9 8945H (283 - 284, n=2) | |
| Asus TUF Gaming A15 FA507UV (Turbo) | |
| SCHENKER XMG Core 15 (M24) | |
| Media de la clase Gaming (191.9 - 343, n=151, últimos 2 años) | |
| Dell G16, i7-13650HX, RTX 4060 | |
| Gigabyte G6X 9KG (2024) | |
| Asus TUF A15 FA507 | |
| Lenovo LOQ 15IRX9 | |
| HP Victus 16 (2024) | |
| Blender - v2.79 BMW27 CPU | |
| Lenovo LOQ 15IRX9 | |
| Gigabyte G6X 9KG (2024) | |
| Asus TUF A15 FA507 | |
| Asus TUF Gaming A15 FA507UV | |
| Medio AMD Ryzen 9 8945H (178 - 182, n=2) | |
| SCHENKER XMG Core 15 (M24) | |
| Asus TUF Gaming A15 FA507UV (Turbo) | |
| Media de la clase Gaming (81 - 555, n=144, últimos 2 años) | |
| HP Victus 16 (2024) | |
| Dell G16, i7-13650HX, RTX 4060 | |
| Geekbench 6.4 | |
| Multi-Core | |
| HP Victus 16 (2024) (6.2.1) | |
| Media de la clase Gaming (5340 - 21668, n=119, últimos 2 años) | |
| SCHENKER XMG Core 15 (M24) (6.2.1) | |
| Dell G16, i7-13650HX, RTX 4060 (6.2.1) | |
| Gigabyte G6X 9KG (2024) (6.2.1) | |
| Lenovo LOQ 15IRX9 (6.2.1) | |
| Asus TUF Gaming A15 FA507UV (6.2.1) | |
| Medio AMD Ryzen 9 8945H (12638 - 12662, n=2) | |
| Asus TUF Gaming A15 FA507UV (6.2.1 Turbo) | |
| Single-Core | |
| Asus TUF Gaming A15 FA507UV (6.2.1) | |
| Medio AMD Ryzen 9 8945H (2692 - 2711, n=2) | |
| Asus TUF Gaming A15 FA507UV (6.2.1, Turbo) | |
| SCHENKER XMG Core 15 (M24) (6.2.1) | |
| Media de la clase Gaming (1490 - 3219, n=119, últimos 2 años) | |
| Dell G16, i7-13650HX, RTX 4060 (6.2.1) | |
| Gigabyte G6X 9KG (2024) (6.2.1) | |
| Lenovo LOQ 15IRX9 (6.2.1) | |
| HP Victus 16 (2024) (6.2.1) | |
| HWBOT x265 Benchmark v2.2 - 4k Preset | |
| Media de la clase Gaming (6.72 - 42.9, n=148, últimos 2 años) | |
| SCHENKER XMG Core 15 (M24) | |
| Asus TUF Gaming A15 FA507UV (Turbo) | |
| Medio AMD Ryzen 9 8945H (21.9 - 22.4, n=2) | |
| HP Victus 16 (2024) | |
| Asus TUF Gaming A15 FA507UV | |
| Dell G16, i7-13650HX, RTX 4060 | |
| Gigabyte G6X 9KG (2024) | |
| Lenovo LOQ 15IRX9 | |
| Asus TUF A15 FA507 | |
| LibreOffice - 20 Documents To PDF | |
| Lenovo LOQ 15IRX9 (6.3.4.2) | |
| HP Victus 16 (2024) (6.3.4.2) | |
| Dell G16, i7-13650HX, RTX 4060 (6.3.4.2) | |
| Asus TUF A15 FA507 | |
| SCHENKER XMG Core 15 (M24) (6.3.4.2) | |
| Media de la clase Gaming (19 - 96.6, n=147, últimos 2 años) | |
| Asus TUF Gaming A15 FA507UV (6.3.4.2) | |
| Medio AMD Ryzen 9 8945H (44.2 - 47.5, n=2) | |
| Asus TUF Gaming A15 FA507UV (6.3.4.2, Turbo) | |
| Gigabyte G6X 9KG (2024) (6.3.4.2) | |
* ... más pequeño es mejor
AIDA64: FP32 Ray-Trace | FPU Julia | CPU SHA3 | CPU Queen | FPU SinJulia | FPU Mandel | CPU AES | CPU ZLib | FP64 Ray-Trace | CPU PhotoWorxx
| Performance Rating | |
| Asus TUF Gaming A15 FA507UV | |
| Medio AMD Ryzen 9 8945H | |
| SCHENKER XMG Core 15 (M24) | |
| Asus TUF Gaming A15 FA507UV | |
| Media de la clase Gaming | |
| Dell G16, i7-13650HX, RTX 4060 | |
| HP Victus 16 (2024) | |
| Asus TUF A15 FA507 | |
| Gigabyte G6X 9KG (2024) | |
| Lenovo LOQ 15IRX9 | |
| AIDA64 / FP32 Ray-Trace | |
| SCHENKER XMG Core 15 (M24) (v6.92.6600) | |
| Asus TUF Gaming A15 FA507UV (v6.92.6600, Turbo) | |
| Medio AMD Ryzen 9 8945H (28698 - 29423, n=2) | |
| Asus TUF Gaming A15 FA507UV (v6.92.6600) | |
| Media de la clase Gaming (4986 - 81639, n=147, últimos 2 años) | |
| Dell G16, i7-13650HX, RTX 4060 (v6.92.6600) | |
| HP Victus 16 (2024) (v6.92.6600) | |
| Asus TUF A15 FA507 (v6.85.6300) | |
| Lenovo LOQ 15IRX9 (v6.92.6600) | |
| Gigabyte G6X 9KG (2024) (v6.92.6600) | |
| AIDA64 / FPU Julia | |
| SCHENKER XMG Core 15 (M24) (v6.92.6600) | |
| Asus TUF Gaming A15 FA507UV (v6.92.6600, Turbo) | |
| Medio AMD Ryzen 9 8945H (122466 - 125008, n=2) | |
| Asus TUF Gaming A15 FA507UV (v6.92.6600) | |
| Media de la clase Gaming (25360 - 252486, n=147, últimos 2 años) | |
| Asus TUF A15 FA507 (v6.85.6300) | |
| Dell G16, i7-13650HX, RTX 4060 (v6.92.6600) | |
| HP Victus 16 (2024) (v6.92.6600) | |
| Lenovo LOQ 15IRX9 (v6.92.6600) | |
| Gigabyte G6X 9KG (2024) (v6.92.6600) | |
| AIDA64 / CPU SHA3 | |
| Asus TUF Gaming A15 FA507UV (v6.92.6600, Turbo) | |
| SCHENKER XMG Core 15 (M24) (v6.92.6600) | |
| Medio AMD Ryzen 9 8945H (5113 - 5209, n=2) | |
| Asus TUF Gaming A15 FA507UV (v6.92.6600) | |
| Media de la clase Gaming (1339 - 10389, n=147, últimos 2 años) | |
| Dell G16, i7-13650HX, RTX 4060 (v6.92.6600) | |
| HP Victus 16 (2024) (v6.92.6600) | |
| Lenovo LOQ 15IRX9 (v6.92.6600) | |
| Asus TUF A15 FA507 (v6.85.6300) | |
| Gigabyte G6X 9KG (2024) (v6.92.6600) | |
| AIDA64 / CPU Queen | |
| HP Victus 16 (2024) (v6.92.6600) | |
| Asus TUF Gaming A15 FA507UV (v6.92.6600) | |
| Medio AMD Ryzen 9 8945H (124401 - 125950, n=2) | |
| SCHENKER XMG Core 15 (M24) (v6.92.6600) | |
| Asus TUF Gaming A15 FA507UV (v6.92.6600, Turbo) | |
| Media de la clase Gaming (50699 - 200651, n=147, últimos 2 años) | |
| Gigabyte G6X 9KG (2024) (v6.92.6600) | |
| Dell G16, i7-13650HX, RTX 4060 (v6.92.6600) | |
| Asus TUF A15 FA507 (v6.85.6300) | |
| Lenovo LOQ 15IRX9 (v6.92.6600) | |
| AIDA64 / FPU SinJulia | |
| Asus TUF Gaming A15 FA507UV (v6.92.6600, Turbo) | |
| Medio AMD Ryzen 9 8945H (15856 - 15889, n=2) | |
| Asus TUF Gaming A15 FA507UV (v6.92.6600) | |
| SCHENKER XMG Core 15 (M24) (v6.92.6600) | |
| Media de la clase Gaming (4800 - 32988, n=147, últimos 2 años) | |
| Asus TUF A15 FA507 (v6.85.6300) | |
| HP Victus 16 (2024) (v6.92.6600) | |
| Dell G16, i7-13650HX, RTX 4060 (v6.92.6600) | |
| Lenovo LOQ 15IRX9 (v6.92.6600) | |
| Gigabyte G6X 9KG (2024) (v6.92.6600) | |
| AIDA64 / FPU Mandel | |
| SCHENKER XMG Core 15 (M24) (v6.92.6600) | |
| Asus TUF Gaming A15 FA507UV (v6.92.6600, Turbo) | |
| Medio AMD Ryzen 9 8945H (65523 - 67020, n=2) | |
| Asus TUF Gaming A15 FA507UV (v6.92.6600) | |
| Asus TUF A15 FA507 (v6.85.6300) | |
| Media de la clase Gaming (12321 - 134044, n=147, últimos 2 años) | |
| Dell G16, i7-13650HX, RTX 4060 (v6.92.6600) | |
| HP Victus 16 (2024) (v6.92.6600) | |
| Lenovo LOQ 15IRX9 (v6.92.6600) | |
| Gigabyte G6X 9KG (2024) (v6.92.6600) | |
| AIDA64 / CPU AES | |
| Media de la clase Gaming (19065 - 328679, n=147, últimos 2 años) | |
| SCHENKER XMG Core 15 (M24) (v6.92.6600) | |
| Asus TUF Gaming A15 FA507UV (v6.92.6600, Turbo) | |
| Medio AMD Ryzen 9 8945H (90481 - 91871, n=2) | |
| Asus TUF Gaming A15 FA507UV (v6.92.6600) | |
| Dell G16, i7-13650HX, RTX 4060 (v6.92.6600) | |
| HP Victus 16 (2024) (v6.92.6600) | |
| Lenovo LOQ 15IRX9 (v6.92.6600) | |
| Asus TUF A15 FA507 (v6.85.6300) | |
| Gigabyte G6X 9KG (2024) (v6.92.6600) | |
| AIDA64 / CPU ZLib | |
| Media de la clase Gaming (373 - 2531, n=147, últimos 2 años) | |
| Dell G16, i7-13650HX, RTX 4060 (v6.92.6600) | |
| HP Victus 16 (2024) (v6.92.6600) | |
| Asus TUF Gaming A15 FA507UV (v6.92.6600, Turbo) | |
| Medio AMD Ryzen 9 8945H (1150 - 1164, n=2) | |
| Asus TUF Gaming A15 FA507UV (v6.92.6600) | |
| Gigabyte G6X 9KG (2024) (v6.92.6600) | |
| Lenovo LOQ 15IRX9 (v6.92.6600) | |
| SCHENKER XMG Core 15 (M24) (v6.92.6600) | |
| Asus TUF A15 FA507 (v6.85.6300) | |
| AIDA64 / FP64 Ray-Trace | |
| SCHENKER XMG Core 15 (M24) (v6.92.6600) | |
| Asus TUF Gaming A15 FA507UV (v6.92.6600, Turbo) | |
| Medio AMD Ryzen 9 8945H (15513 - 15727, n=2) | |
| Asus TUF Gaming A15 FA507UV (v6.92.6600) | |
| Media de la clase Gaming (2540 - 43430, n=147, últimos 2 años) | |
| Dell G16, i7-13650HX, RTX 4060 (v6.92.6600) | |
| HP Victus 16 (2024) (v6.92.6600) | |
| Asus TUF A15 FA507 (v6.85.6300) | |
| Lenovo LOQ 15IRX9 (v6.92.6600) | |
| Gigabyte G6X 9KG (2024) (v6.92.6600) | |
| AIDA64 / CPU PhotoWorxx | |
| SCHENKER XMG Core 15 (M24) (v6.92.6600) | |
| Media de la clase Gaming (10805 - 60161, n=147, últimos 2 años) | |
| HP Victus 16 (2024) (v6.92.6600) | |
| Gigabyte G6X 9KG (2024) (v6.92.6600) | |
| Lenovo LOQ 15IRX9 (v6.92.6600) | |
| Dell G16, i7-13650HX, RTX 4060 (v6.92.6600) | |
| Asus TUF Gaming A15 FA507UV (v6.92.6600) | |
| Medio AMD Ryzen 9 8945H (33327 - 33410, n=2) | |
| Asus TUF Gaming A15 FA507UV (v6.92.6600, Turbo) | |
| Asus TUF A15 FA507 (v6.85.6300) | |
Rendimiento del sistema
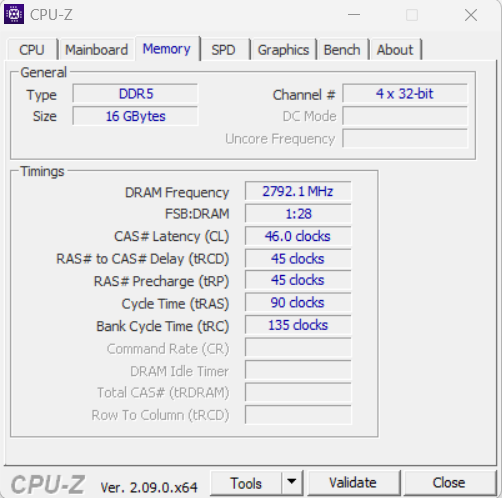
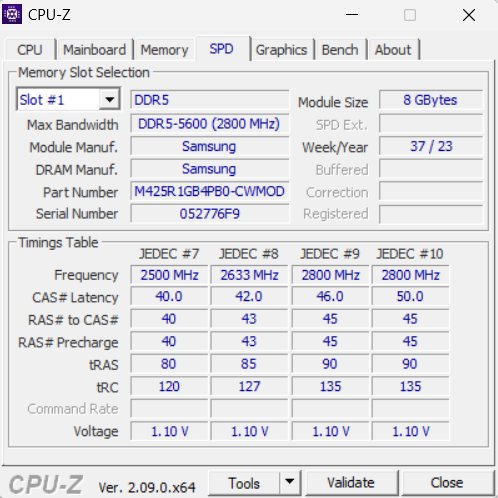
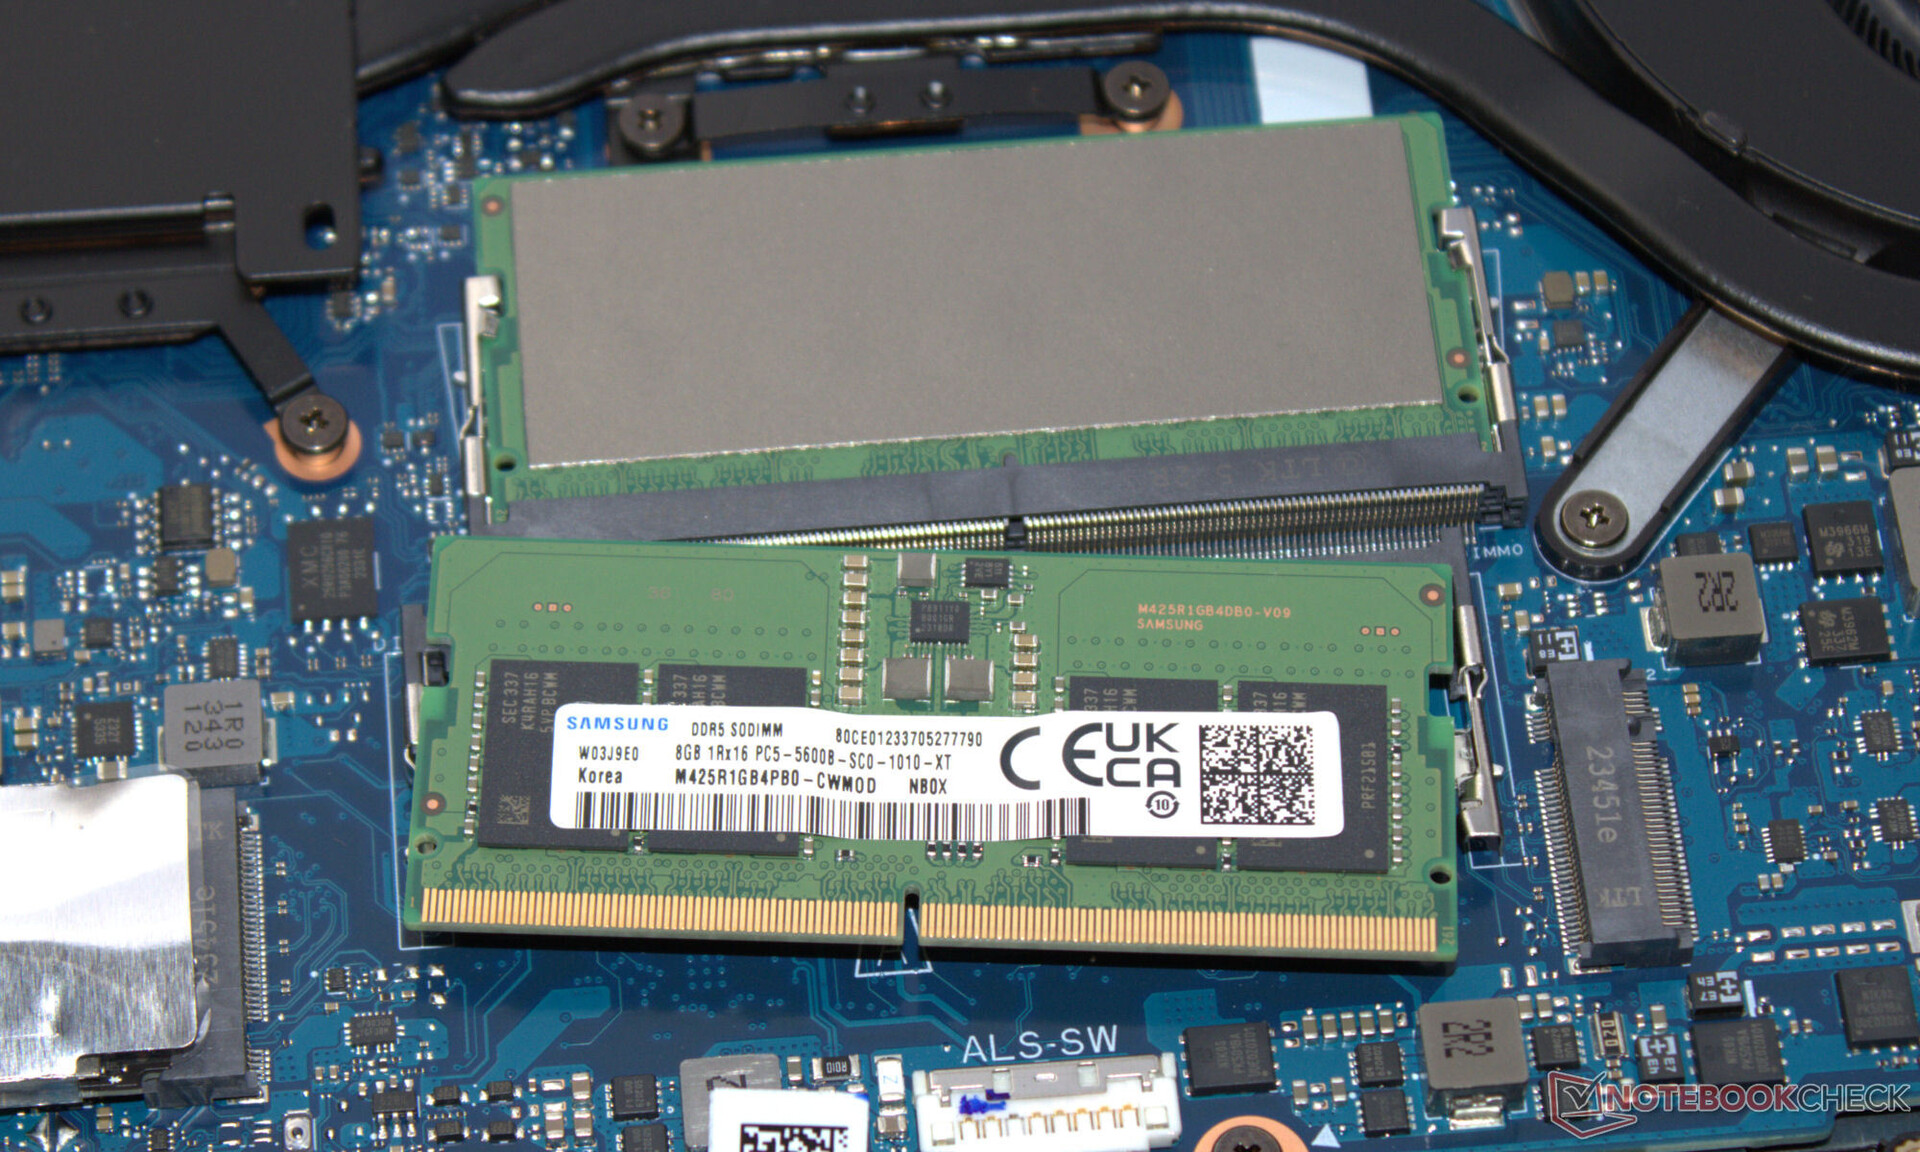
El sistema, que funciona sin problemas, ofrece potencia suficiente para renderizar, transmitir y jugar, lo que confirman los buenos resultados de PC Mark. Las velocidades de transferencia de la RAM están en un nivel normal para una RAM DDR5 5600.
CrossMark: Overall | Productivity | Creativity | Responsiveness
WebXPRT 3: Overall
WebXPRT 4: Overall
Mozilla Kraken 1.1: Total
| PCMark 10 / Score | |
| SCHENKER XMG Core 15 (M24) | |
| Asus TUF Gaming A15 FA507UV | |
| Medio AMD Ryzen 9 8945H, NVIDIA GeForce RTX 4060 Laptop GPU (n=1) | |
| Media de la clase Gaming (5776 - 9852, n=133, últimos 2 años) | |
| Gigabyte G6X 9KG (2024) | |
| HP Victus 16 (2024) | |
| Dell G16, i7-13650HX, RTX 4060 | |
| Asus TUF A15 FA507 | |
| Lenovo LOQ 15IRX9 | |
| PCMark 10 / Essentials | |
| Asus TUF Gaming A15 FA507UV | |
| Medio AMD Ryzen 9 8945H, NVIDIA GeForce RTX 4060 Laptop GPU (n=1) | |
| HP Victus 16 (2024) | |
| Media de la clase Gaming (9057 - 12600, n=133, últimos 2 años) | |
| Asus TUF A15 FA507 | |
| Gigabyte G6X 9KG (2024) | |
| SCHENKER XMG Core 15 (M24) | |
| Dell G16, i7-13650HX, RTX 4060 | |
| Lenovo LOQ 15IRX9 | |
| PCMark 10 / Productivity | |
| SCHENKER XMG Core 15 (M24) | |
| Asus TUF Gaming A15 FA507UV | |
| Medio AMD Ryzen 9 8945H, NVIDIA GeForce RTX 4060 Laptop GPU (n=1) | |
| Gigabyte G6X 9KG (2024) | |
| Dell G16, i7-13650HX, RTX 4060 | |
| HP Victus 16 (2024) | |
| Media de la clase Gaming (6662 - 14612, n=133, últimos 2 años) | |
| Asus TUF A15 FA507 | |
| Lenovo LOQ 15IRX9 | |
| PCMark 10 / Digital Content Creation | |
| SCHENKER XMG Core 15 (M24) | |
| Media de la clase Gaming (6807 - 18475, n=133, últimos 2 años) | |
| Asus TUF Gaming A15 FA507UV | |
| Medio AMD Ryzen 9 8945H, NVIDIA GeForce RTX 4060 Laptop GPU (n=1) | |
| Dell G16, i7-13650HX, RTX 4060 | |
| Gigabyte G6X 9KG (2024) | |
| Lenovo LOQ 15IRX9 | |
| HP Victus 16 (2024) | |
| Asus TUF A15 FA507 | |
| CrossMark / Overall | |
| Gigabyte G6X 9KG (2024) | |
| HP Victus 16 (2024) | |
| Media de la clase Gaming (1247 - 2344, n=114, últimos 2 años) | |
| SCHENKER XMG Core 15 (M24) | |
| Dell G16, i7-13650HX, RTX 4060 | |
| Lenovo LOQ 15IRX9 | |
| Asus TUF Gaming A15 FA507UV | |
| Medio AMD Ryzen 9 8945H, NVIDIA GeForce RTX 4060 Laptop GPU (n=1) | |
| Asus TUF A15 FA507 | |
| CrossMark / Productivity | |
| Gigabyte G6X 9KG (2024) | |
| Media de la clase Gaming (1299 - 2204, n=114, últimos 2 años) | |
| SCHENKER XMG Core 15 (M24) | |
| HP Victus 16 (2024) | |
| Asus TUF Gaming A15 FA507UV | |
| Medio AMD Ryzen 9 8945H, NVIDIA GeForce RTX 4060 Laptop GPU (n=1) | |
| Dell G16, i7-13650HX, RTX 4060 | |
| Lenovo LOQ 15IRX9 | |
| Asus TUF A15 FA507 | |
| CrossMark / Creativity | |
| HP Victus 16 (2024) | |
| SCHENKER XMG Core 15 (M24) | |
| Media de la clase Gaming (1275 - 2660, n=114, últimos 2 años) | |
| Gigabyte G6X 9KG (2024) | |
| Dell G16, i7-13650HX, RTX 4060 | |
| Asus TUF Gaming A15 FA507UV | |
| Medio AMD Ryzen 9 8945H, NVIDIA GeForce RTX 4060 Laptop GPU (n=1) | |
| Lenovo LOQ 15IRX9 | |
| Asus TUF A15 FA507 | |
| CrossMark / Responsiveness | |
| Gigabyte G6X 9KG (2024) | |
| HP Victus 16 (2024) | |
| Lenovo LOQ 15IRX9 | |
| Media de la clase Gaming (1030 - 2330, n=114, últimos 2 años) | |
| Dell G16, i7-13650HX, RTX 4060 | |
| SCHENKER XMG Core 15 (M24) | |
| Asus TUF Gaming A15 FA507UV | |
| Medio AMD Ryzen 9 8945H, NVIDIA GeForce RTX 4060 Laptop GPU (n=1) | |
| Asus TUF A15 FA507 | |
| WebXPRT 3 / Overall | |
| Asus TUF Gaming A15 FA507UV | |
| Medio AMD Ryzen 9 8945H, NVIDIA GeForce RTX 4060 Laptop GPU (n=1) | |
| SCHENKER XMG Core 15 (M24) | |
| Gigabyte G6X 9KG (2024) | |
| Media de la clase Gaming (215 - 480, n=127, últimos 2 años) | |
| Asus TUF A15 FA507 | |
| HP Victus 16 (2024) | |
| Dell G16, i7-13650HX, RTX 4060 | |
| Lenovo LOQ 15IRX9 | |
| WebXPRT 4 / Overall | |
| Media de la clase Gaming (176.4 - 335, n=115, últimos 2 años) | |
| SCHENKER XMG Core 15 (M24) | |
| Asus TUF Gaming A15 FA507UV | |
| Medio AMD Ryzen 9 8945H, NVIDIA GeForce RTX 4060 Laptop GPU (n=1) | |
| Gigabyte G6X 9KG (2024) | |
| HP Victus 16 (2024) | |
| Lenovo LOQ 15IRX9 | |
| Asus TUF A15 FA507 | |
| Mozilla Kraken 1.1 / Total | |
| Asus TUF A15 FA507 | |
| Lenovo LOQ 15IRX9 | |
| HP Victus 16 (2024) | |
| Gigabyte G6X 9KG (2024) | |
| Dell G16, i7-13650HX, RTX 4060 | |
| Asus TUF Gaming A15 FA507UV | |
| Medio AMD Ryzen 9 8945H, NVIDIA GeForce RTX 4060 Laptop GPU (n=1) | |
| Media de la clase Gaming (409 - 674, n=139, últimos 2 años) | |
| SCHENKER XMG Core 15 (M24) | |
* ... más pequeño es mejor
| PCMark 10 Score | 7943 puntos | |
ayuda | ||
| AIDA64 / Memory Copy | |
| SCHENKER XMG Core 15 (M24) | |
| HP Victus 16 (2024) | |
| Media de la clase Gaming (21750 - 97515, n=147, últimos 2 años) | |
| Medio AMD Ryzen 9 8945H (61823 - 63192, n=2) | |
| Asus TUF Gaming A15 FA507UV | |
| Gigabyte G6X 9KG (2024) | |
| Dell G16, i7-13650HX, RTX 4060 | |
| Lenovo LOQ 15IRX9 | |
| Asus TUF A15 FA507 | |
| AIDA64 / Memory Read | |
| HP Victus 16 (2024) | |
| Media de la clase Gaming (22956 - 102937, n=147, últimos 2 años) | |
| Gigabyte G6X 9KG (2024) | |
| Lenovo LOQ 15IRX9 | |
| Dell G16, i7-13650HX, RTX 4060 | |
| Medio AMD Ryzen 9 8945H (61696 - 61810, n=2) | |
| Asus TUF Gaming A15 FA507UV | |
| SCHENKER XMG Core 15 (M24) | |
| Asus TUF A15 FA507 | |
| AIDA64 / Memory Write | |
| SCHENKER XMG Core 15 (M24) | |
| Medio AMD Ryzen 9 8945H (78716 - 79615, n=2) | |
| Asus TUF Gaming A15 FA507UV | |
| Media de la clase Gaming (22297 - 108954, n=147, últimos 2 años) | |
| HP Victus 16 (2024) | |
| Gigabyte G6X 9KG (2024) | |
| Lenovo LOQ 15IRX9 | |
| Dell G16, i7-13650HX, RTX 4060 | |
| Asus TUF A15 FA507 | |
| AIDA64 / Memory Latency | |
| HP Victus 16 (2024) | |
| Media de la clase Gaming (59.5 - 259, n=147, últimos 2 años) | |
| Lenovo LOQ 15IRX9 | |
| Asus TUF Gaming A15 FA507UV | |
| Medio AMD Ryzen 9 8945H (92 - 92.6, n=2) | |
| Dell G16, i7-13650HX, RTX 4060 | |
| Gigabyte G6X 9KG (2024) | |
| SCHENKER XMG Core 15 (M24) | |
| Asus TUF A15 FA507 | |
* ... más pequeño es mejor
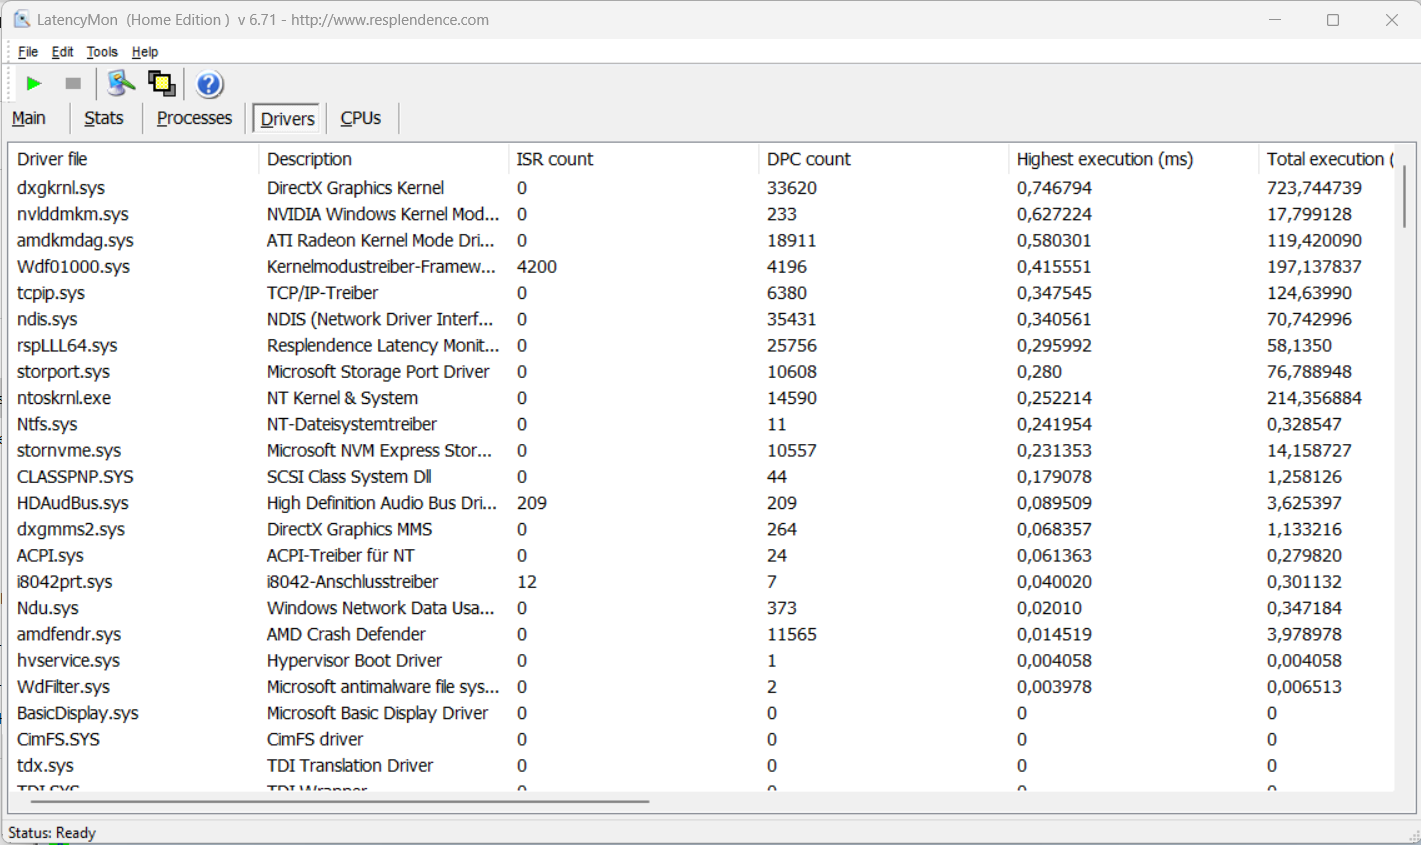
Latencias del CPD
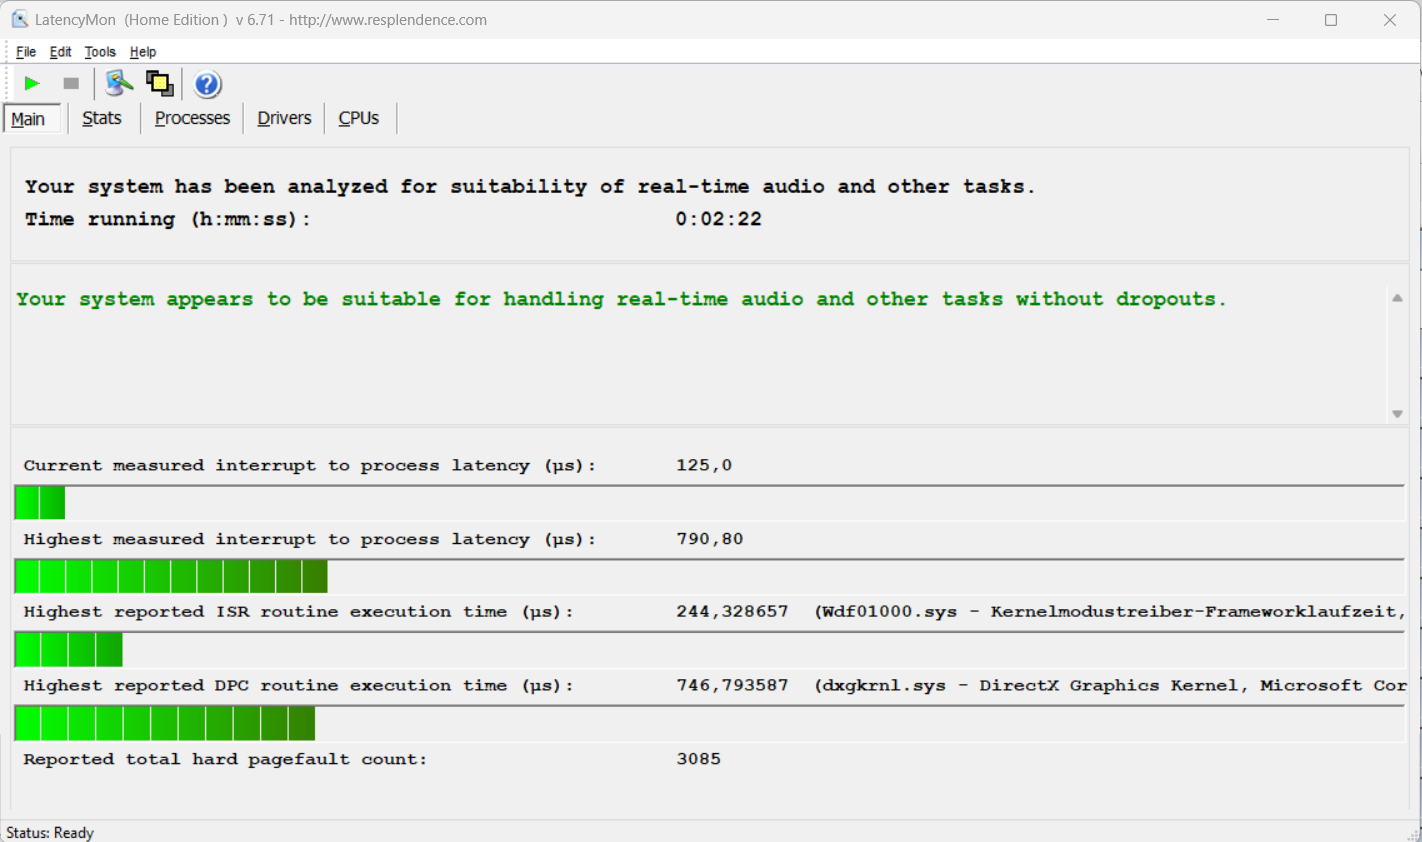
La prueba de latencia (navegación por Internet, reproducción de vídeo 4k, Prime95 de alta carga) no reveló anomalías. El sistema parece estar bien adaptado a la edición de vídeo y audio en tiempo real. Las futuras actualizaciones de software podrían mejorar o empeorar este aspecto.
| DPC Latencies / LatencyMon - interrupt to process latency (max), Web, Youtube, Prime95 | |
| Gigabyte G6X 9KG (2024) | |
| Lenovo LOQ 15IRX9 | |
| SCHENKER XMG Core 15 (M24) | |
| Dell G16, i7-13650HX, RTX 4060 | |
| HP Victus 16 (2024) | |
| Asus TUF Gaming A15 FA507UV | |
* ... más pequeño es mejor
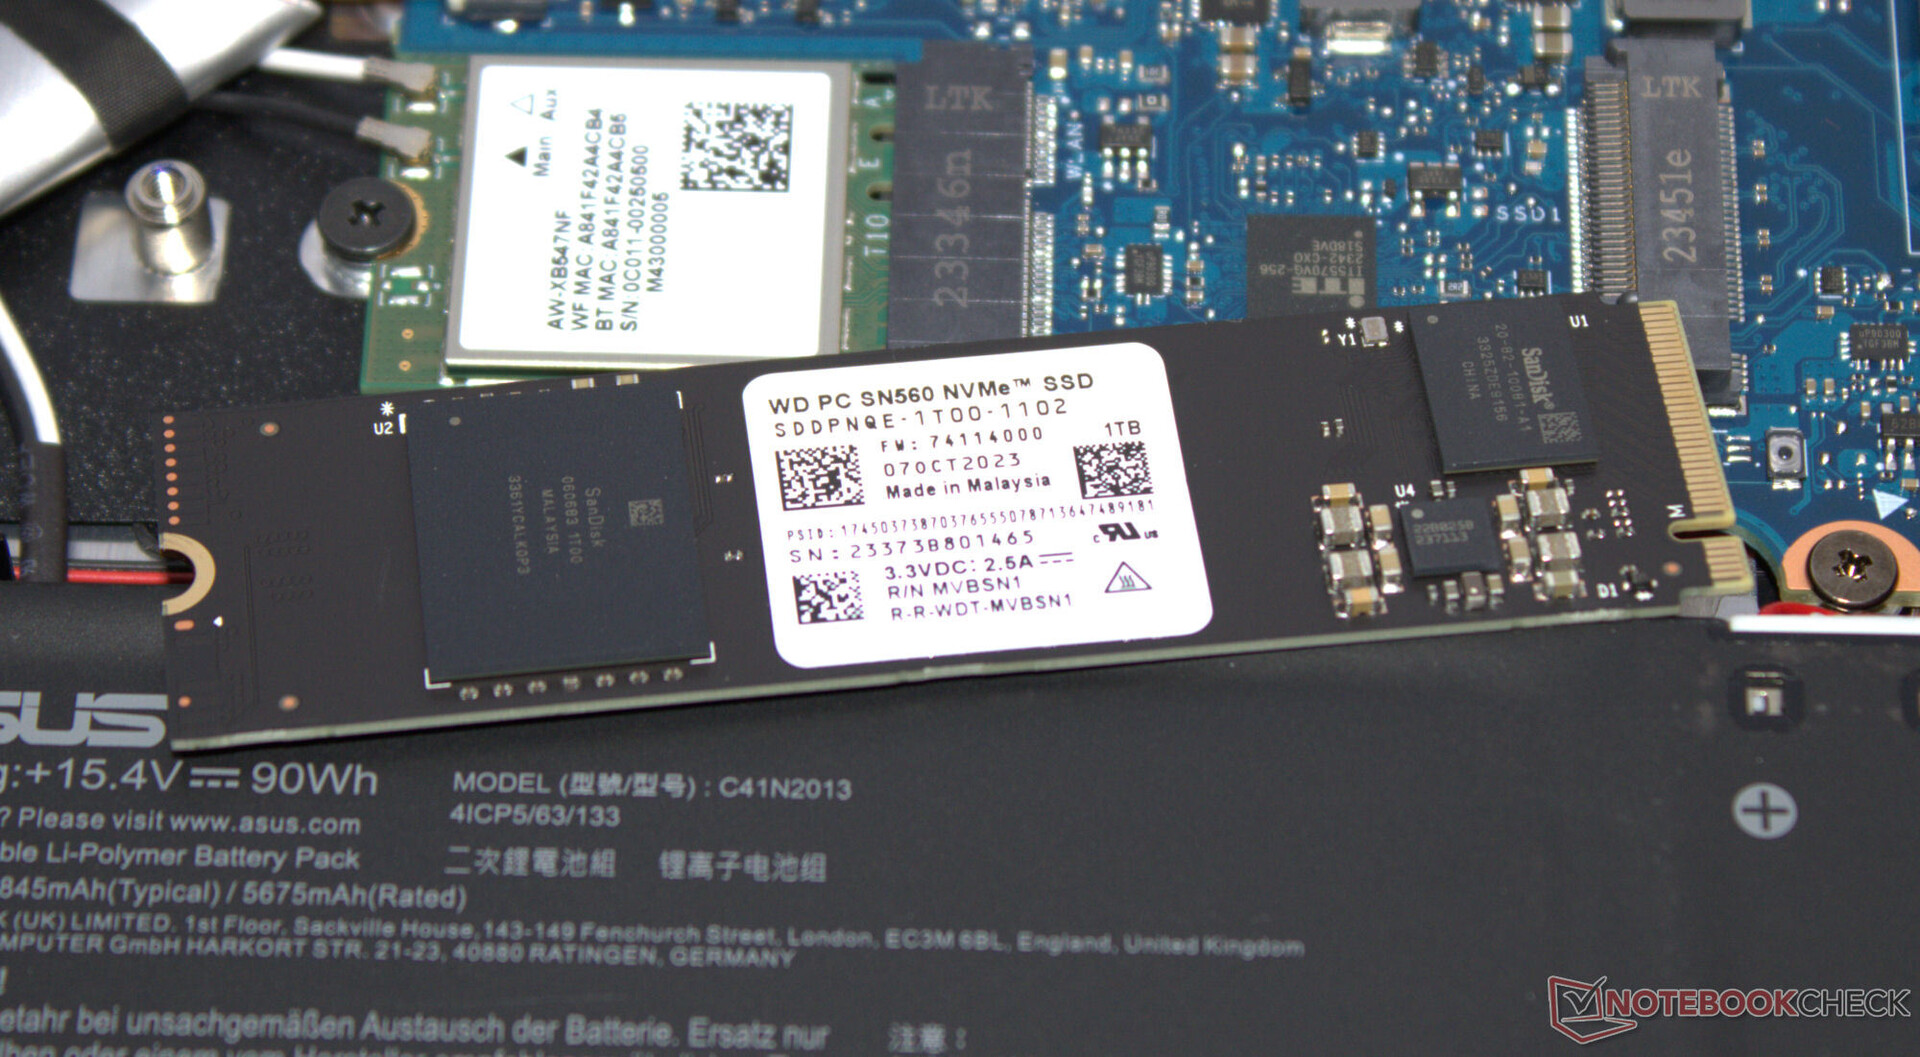
Almacenamiento masivo
En el interior del A15 caben dos SSD PCIe 4 (M.2 2280), una de ellas instalada: El dispositivo de almacenamiento Western Digital (1 TB, M.2 2280) ofrece buenas velocidades de transferencia de datos pero no pertenece a los modelos SSD superiores. En las últimas etapas del bucle DiskSpd, observamos un estrangulamiento inducido térmicamente.

* ... más pequeño es mejor
Continuous Performance Read: DiskSpd Read Loop, Queue Depth 8
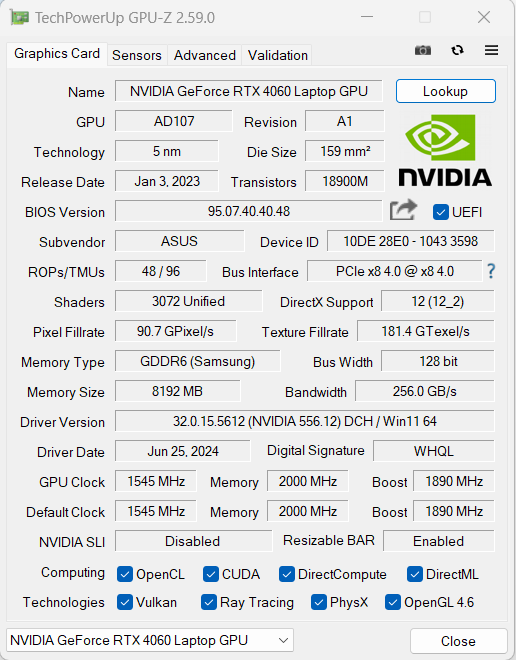
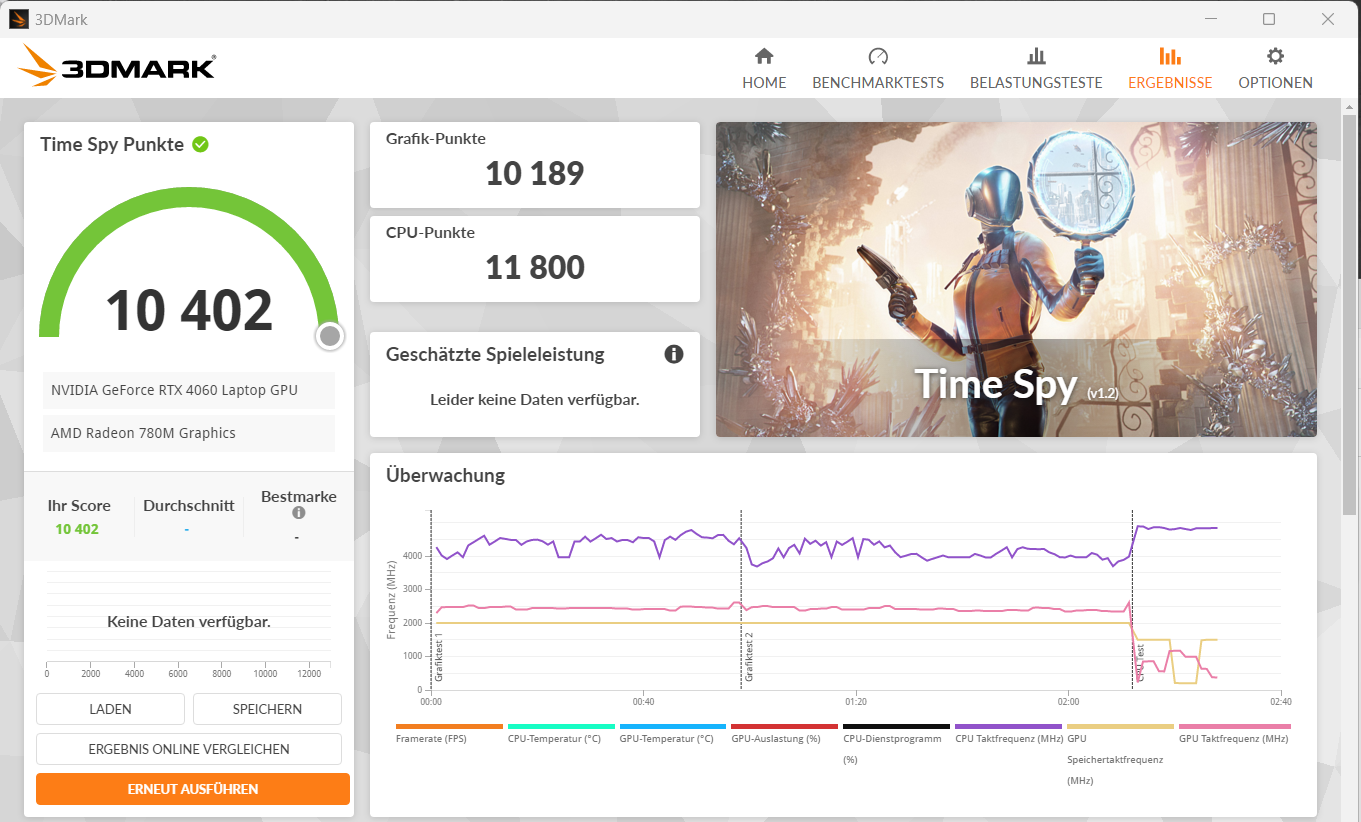
Tarjeta gráfica
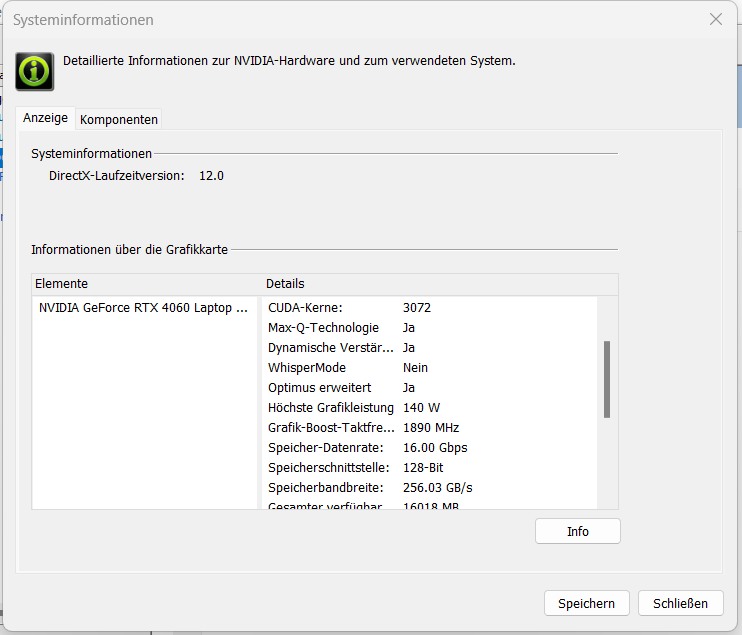
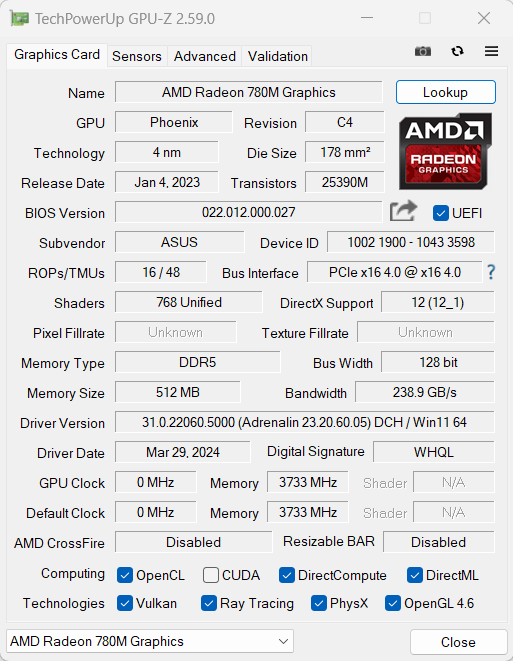
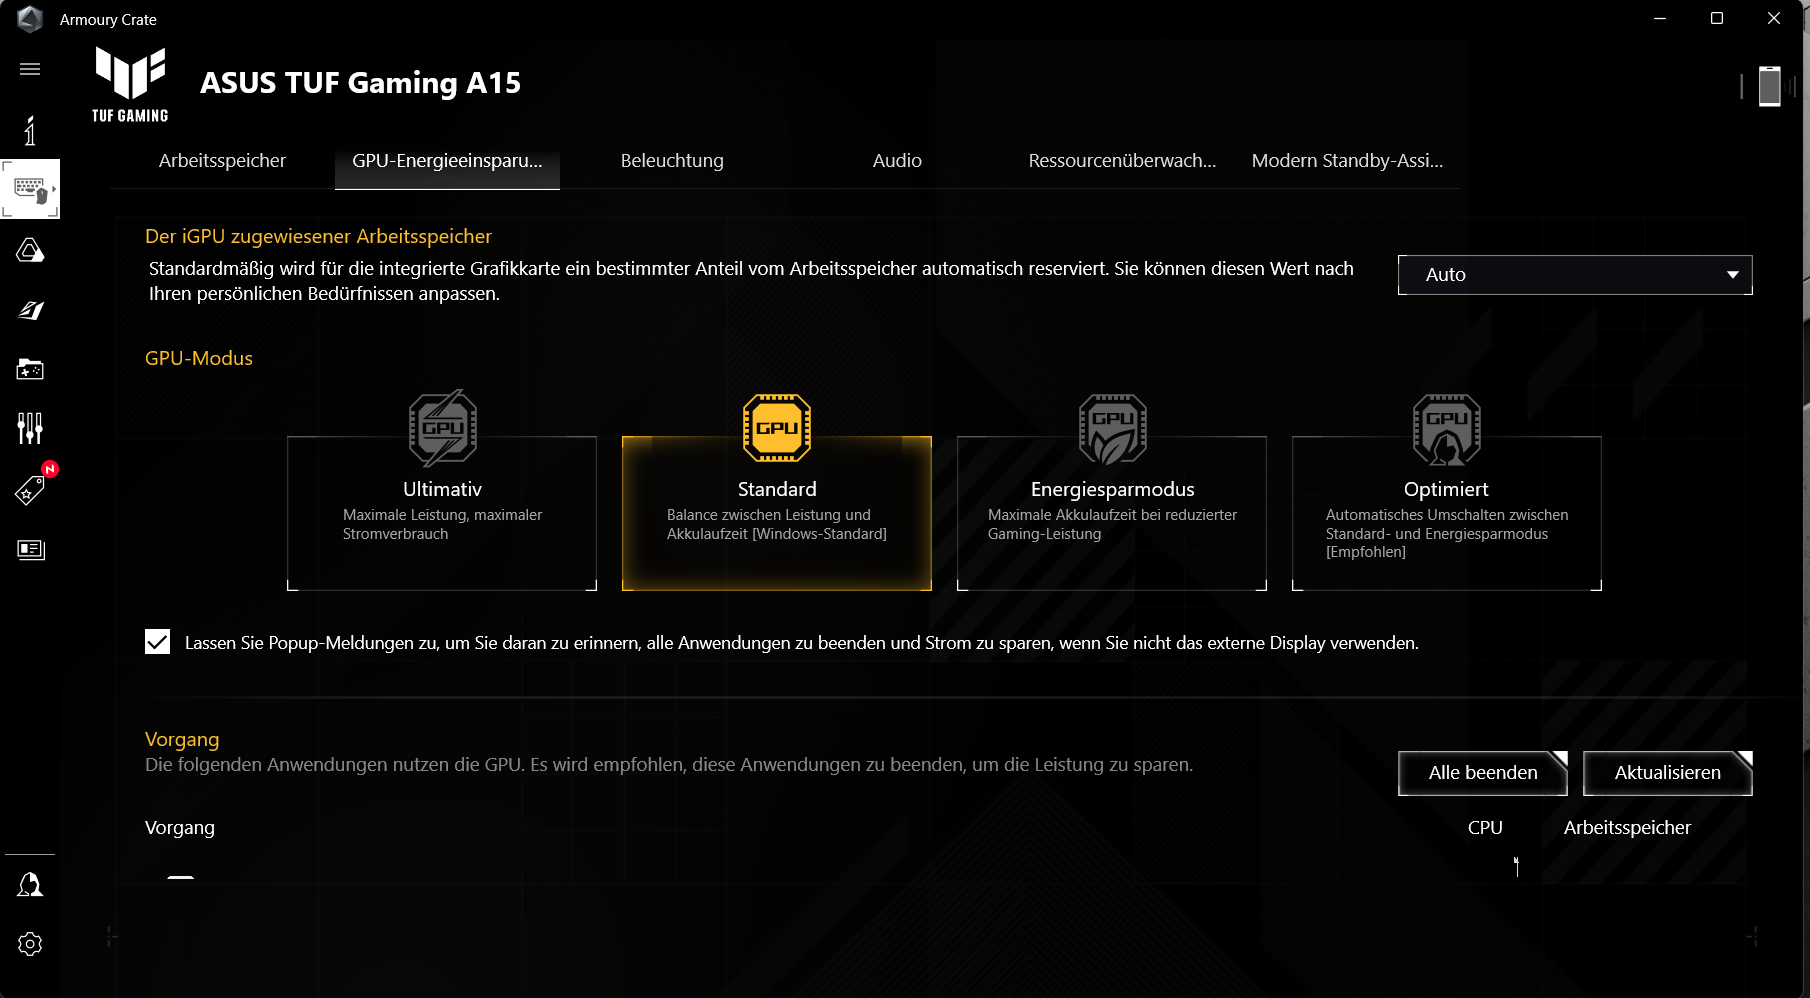
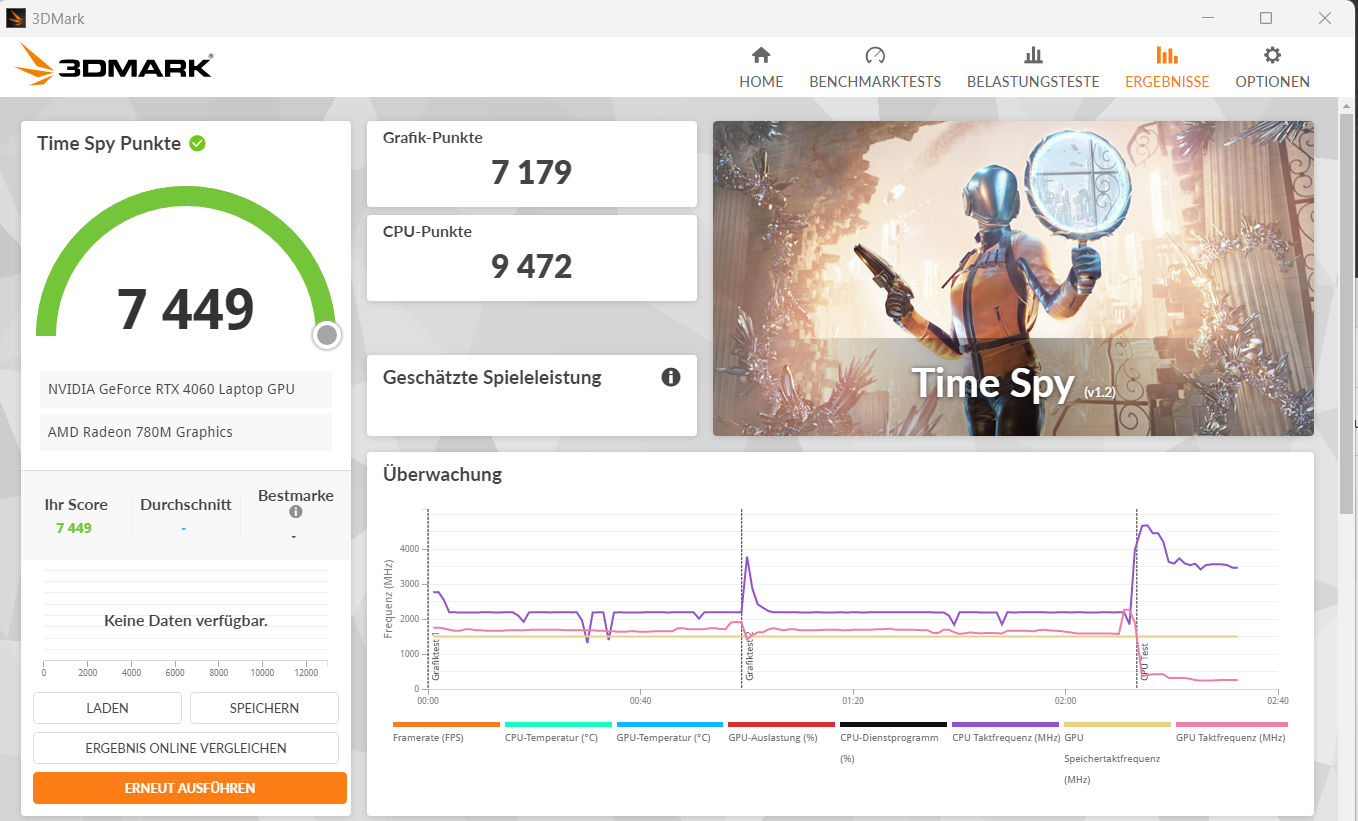
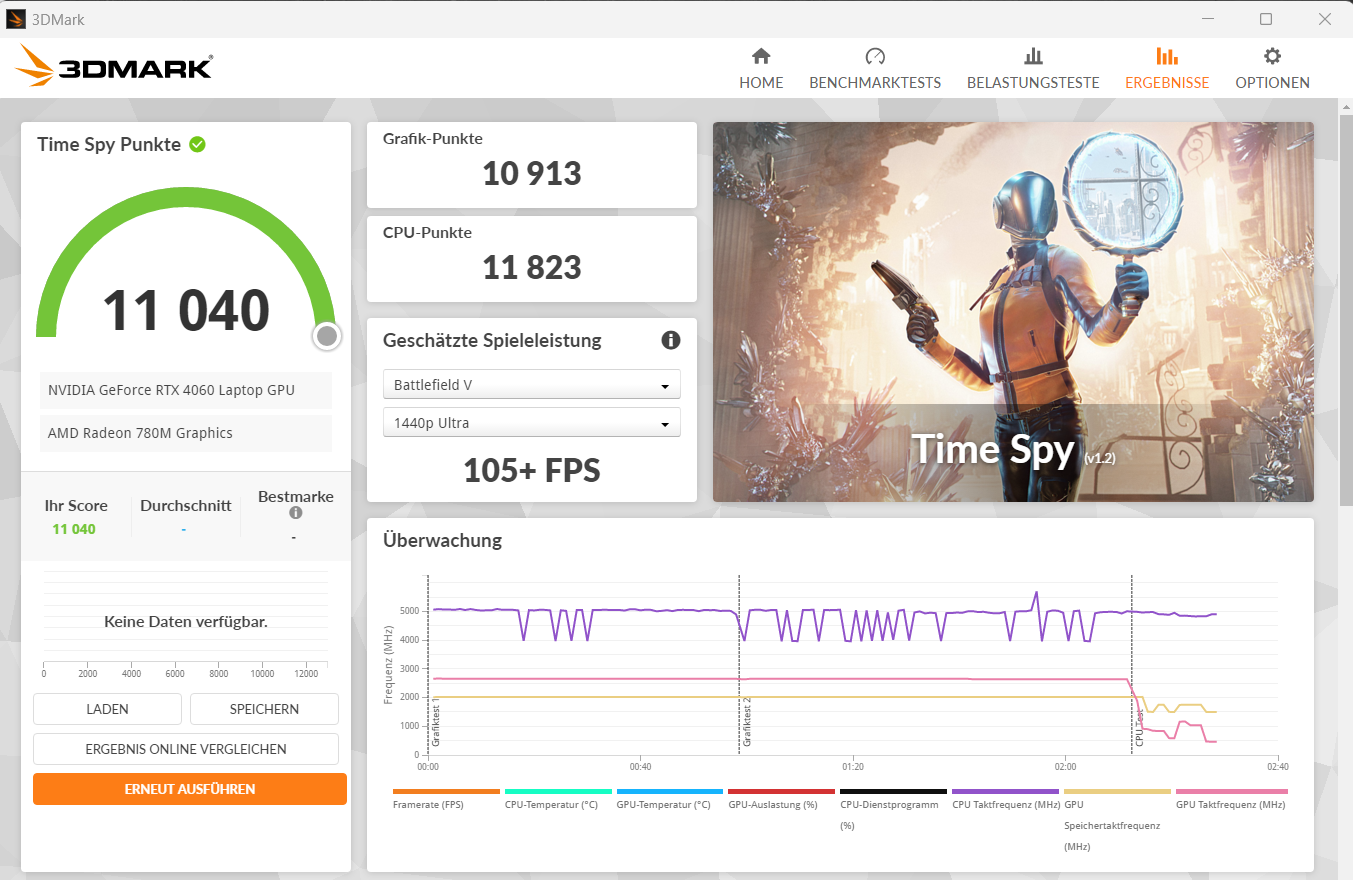
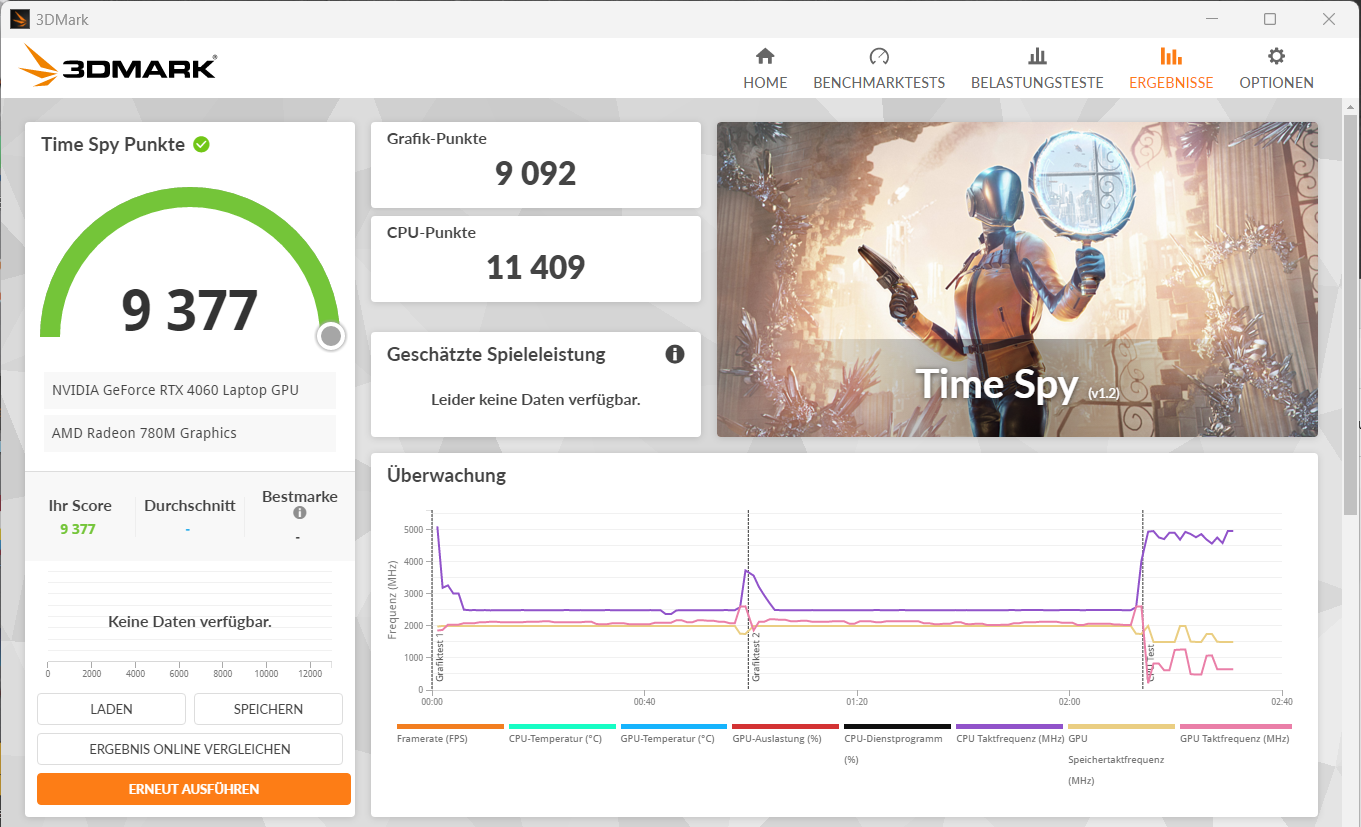
La GeForce RTX 4060 (3.072 sombreadores, bus de 128 bits, 8 GB GDDR6, 140 vatios) está diseñada para juegos FHD con ajustes de altos a máximos. Las puntuaciones de los bancos de pruebas y las velocidades de fotogramas están a la par con la media de la RTX 4060 ("Rendimiento"). En algunos casos, el perfil "Turbo" sólo produce un aumento mínimo. El cambio entre dGPU y Optimus no requiere un reinicio: Optimus avanzado es compatible.
| 3DMark Performance Rating - Percent | |
| Media de la clase Gaming | |
| SCHENKER XMG Core 15 (M24) | |
| Asus TUF Gaming A15 FA507UV | |
| Asus TUF Gaming A15 FA507UV | |
| Dell G16, i7-13650HX, RTX 4060 | |
| Lenovo LOQ 15IRX9 | |
| Gigabyte G6X 9KG (2024) | |
| HP Victus 16 (2024) | |
| Medio NVIDIA GeForce RTX 4060 Laptop GPU | |
| Asus TUF A15 FA507 | |
| 3DMark 11 - 1280x720 Performance GPU | |
| Media de la clase Gaming (10741 - 72178, n=143, últimos 2 años) | |
| SCHENKER XMG Core 15 (M24) | |
| Asus TUF Gaming A15 FA507UV (Turbo) | |
| Asus TUF Gaming A15 FA507UV | |
| Dell G16, i7-13650HX, RTX 4060 | |
| Lenovo LOQ 15IRX9 | |
| Gigabyte G6X 9KG (2024) | |
| HP Victus 16 (2024) | |
| Medio NVIDIA GeForce RTX 4060 Laptop GPU (28136 - 38912, n=57) | |
| Asus TUF A15 FA507 | |
| 3DMark | |
| 1920x1080 Fire Strike Graphics | |
| Media de la clase Gaming (2913 - 56116, n=155, últimos 2 años) | |
| SCHENKER XMG Core 15 (M24) | |
| Asus TUF Gaming A15 FA507UV (Turbo) | |
| Asus TUF Gaming A15 FA507UV | |
| Lenovo LOQ 15IRX9 | |
| Gigabyte G6X 9KG (2024) | |
| Dell G16, i7-13650HX, RTX 4060 | |
| HP Victus 16 (2024) | |
| Medio NVIDIA GeForce RTX 4060 Laptop GPU (20533 - 29656, n=54) | |
| Asus TUF A15 FA507 | |
| 2560x1440 Time Spy Graphics | |
| Media de la clase Gaming (2295 - 24599, n=151, últimos 2 años) | |
| SCHENKER XMG Core 15 (M24) | |
| Asus TUF Gaming A15 FA507UV (Turbo) | |
| Dell G16, i7-13650HX, RTX 4060 | |
| Asus TUF Gaming A15 FA507UV | |
| Medio NVIDIA GeForce RTX 4060 Laptop GPU (7484 - 11451, n=56) | |
| HP Victus 16 (2024) | |
| Gigabyte G6X 9KG (2024) | |
| Lenovo LOQ 15IRX9 | |
| Asus TUF A15 FA507 | |
| 3DMark 06 Standard Score | 55024 puntos | |
| 3DMark 11 Performance | 31639 puntos | |
| 3DMark Fire Strike Score | 25032 puntos | |
| 3DMark Time Spy Score | 10402 puntos | |
| 3DMark Steel Nomad Score | 2200 puntos | |
ayuda | ||
| Geekbench 6.4 | |
| GPU OpenCL | |
| Media de la clase Gaming (4321 - 234213, n=118, últimos 2 años) | |
| Gigabyte G6X 9KG (2024) (6.2.1) | |
| SCHENKER XMG Core 15 (M24) (6.2.1) | |
| HP Victus 16 (2024) (6.2.1) | |
| Asus TUF Gaming A15 FA507UV (6.2.1 Turbo) | |
| Dell G16, i7-13650HX, RTX 4060 (6.2.1) | |
| Asus TUF Gaming A15 FA507UV (6.2.1) | |
| Lenovo LOQ 15IRX9 (6.2.1) | |
| Medio NVIDIA GeForce RTX 4060 Laptop GPU (4321 - 100831, n=40) | |
| GPU Vulkan | |
| SCHENKER XMG Core 15 (M24) (6.2.1) | |
| Asus TUF Gaming A15 FA507UV (6.2.1) | |
| Asus TUF Gaming A15 FA507UV (6.2.1 Turbo) | |
| Gigabyte G6X 9KG (2024) (6.2.1) | |
| Lenovo LOQ 15IRX9 (6.2.1) | |
| HP Victus 16 (2024) (6.2.1) | |
| Media de la clase Gaming (4286 - 231659, n=110, últimos 2 años) | |
| Medio NVIDIA GeForce RTX 4060 Laptop GPU (4286 - 101001, n=36) | |
| Dell G16, i7-13650HX, RTX 4060 (6.2.1) | |
| V-Ray Benchmark Next 4.10 | |
| GPU | |
| SCHENKER XMG Core 15 (M24) (v4.10.07 ) | |
| Media de la clase Gaming (54 - 1317, n=122, últimos 2 años) | |
| Asus TUF Gaming A15 FA507UV (v4.10.07, Turbo) | |
| Gigabyte G6X 9KG (2024) (v4.10.07 ) | |
| Asus TUF Gaming A15 FA507UV (v4.10.07 ) | |
| Medio NVIDIA GeForce RTX 4060 Laptop GPU (483 - 715, n=46) | |
| HP Victus 16 (2024) (v4.10.07 ) | |
| Lenovo LOQ 15IRX9 (v4.10.07 ) | |
| Asus TUF A15 FA507 (v4.10.07 ) | |
| CPU | |
| HP Victus 16 (2024) (v4.10.07 ) | |
| Media de la clase Gaming (5413 - 44129, n=122, últimos 2 años) | |
| Medio NVIDIA GeForce RTX 4060 Laptop GPU (12680 - 32360, n=46) | |
| SCHENKER XMG Core 15 (M24) (v4.10.07 ) | |
| Gigabyte G6X 9KG (2024) (v4.10.07 ) | |
| Asus TUF Gaming A15 FA507UV (v4.10.07, Turbo) | |
| Asus TUF Gaming A15 FA507UV (v4.10.07 ) | |
| Lenovo LOQ 15IRX9 (v4.10.07 ) | |
| Asus TUF A15 FA507 (v4.10.07 ) | |
* ... más pequeño es mejor
| Performance Rating - Percent | |
| Media de la clase Gaming | |
| SCHENKER XMG Core 15 (M24) | |
| Dell G16, i7-13650HX, RTX 4060 | |
| Gigabyte G6X 9KG (2024) | |
| Medio NVIDIA GeForce RTX 4060 Laptop GPU | |
| HP Victus 16 (2024) | |
| Asus TUF Gaming A15 FA507UV | |
| Asus TUF Gaming A15 FA507UV | |
| Lenovo LOQ 15IRX9 | |
| Asus TUF A15 FA507 -1! | |
| Cyberpunk 2077 2.2 Phantom Liberty - 1920x1080 Ultra Preset (FSR off) | |
| SCHENKER XMG Core 15 (M24) (2.12) | |
| Media de la clase Gaming (6.76 - 158, n=90, últimos 2 años) | |
| Asus TUF Gaming A15 FA507UV (2.12) | |
| Asus TUF Gaming A15 FA507UV (2.12, Turbo) | |
| Medio NVIDIA GeForce RTX 4060 Laptop GPU (56.4 - 93.1, n=31) | |
| Lenovo LOQ 15IRX9 (2.02) | |
| Dell G16, i7-13650HX, RTX 4060 (2.11) | |
| Gigabyte G6X 9KG (2024) (2.02) | |
| HP Victus 16 (2024) (2.02) | |
| GTA V - 1920x1080 Highest Settings possible AA:4xMSAA + FX AF:16x | |
| Dell G16, i7-13650HX, RTX 4060 | |
| SCHENKER XMG Core 15 (M24) | |
| Gigabyte G6X 9KG (2024) | |
| Lenovo LOQ 15IRX9 | |
| Media de la clase Gaming (12.1 - 168.2, n=132, últimos 2 años) | |
| HP Victus 16 (2024) | |
| Medio NVIDIA GeForce RTX 4060 Laptop GPU (76.9 - 126.3, n=48) | |
| Asus TUF Gaming A15 FA507UV | |
| Asus TUF Gaming A15 FA507UV (Turbo) | |
| Asus TUF A15 FA507 | |
| Final Fantasy XV Benchmark - 1920x1080 High Quality | |
| Media de la clase Gaming (19.2 - 201, n=144, últimos 2 años) | |
| SCHENKER XMG Core 15 (M24) (1.3) | |
| Asus TUF Gaming A15 FA507UV (1.3, Turbo) | |
| Dell G16, i7-13650HX, RTX 4060 (1.3) | |
| Gigabyte G6X 9KG (2024) (1.3) | |
| Asus TUF Gaming A15 FA507UV (1.3) | |
| Lenovo LOQ 15IRX9 (1.3) | |
| HP Victus 16 (2024) (1.3) | |
| Medio NVIDIA GeForce RTX 4060 Laptop GPU (75.1 - 109.8, n=51) | |
| Asus TUF A15 FA507 (1.3) | |
| Strange Brigade - 1920x1080 ultra AA:ultra AF:16 | |
| Media de la clase Gaming (38.9 - 420, n=140, últimos 2 años) | |
| SCHENKER XMG Core 15 (M24) (1.47.22.14 D3D12) | |
| Dell G16, i7-13650HX, RTX 4060 (1.47.22.14 D3D12) | |
| Asus TUF Gaming A15 FA507UV (1.47.22.14 D3D12, Turbo) | |
| Asus TUF Gaming A15 FA507UV (1.47.22.14 D3D12) | |
| Lenovo LOQ 15IRX9 (1.47.22.14 D3D12) | |
| Gigabyte G6X 9KG (2024) (1.47.22.14 D3D12) | |
| Medio NVIDIA GeForce RTX 4060 Laptop GPU (135.3 - 210, n=50) | |
| HP Victus 16 (2024) (1.47.22.14 D3D12) | |
| Asus TUF A15 FA507 | |
| Dota 2 Reborn - 1920x1080 ultra (3/3) best looking | |
| HP Victus 16 (2024) | |
| Dell G16, i7-13650HX, RTX 4060 | |
| Media de la clase Gaming (65.1 - 220, n=148, últimos 2 años) | |
| Medio NVIDIA GeForce RTX 4060 Laptop GPU (115 - 183.8, n=53) | |
| Gigabyte G6X 9KG (2024) | |
| Lenovo LOQ 15IRX9 | |
| Asus TUF Gaming A15 FA507UV | |
| SCHENKER XMG Core 15 (M24) | |
| Asus TUF Gaming A15 FA507UV (Turbo) | |
| Asus TUF A15 FA507 | |
| X-Plane 11.11 - 1920x1080 high (fps_test=3) | |
| Dell G16, i7-13650HX, RTX 4060 | |
| Gigabyte G6X 9KG (2024) | |
| Media de la clase Gaming (32.8 - 166.2, n=151, últimos 2 años) | |
| Medio NVIDIA GeForce RTX 4060 Laptop GPU (60.7 - 141.1, n=54) | |
| HP Victus 16 (2024) | |
| SCHENKER XMG Core 15 (M24) | |
| Lenovo LOQ 15IRX9 | |
| Asus TUF Gaming A15 FA507UV | |
| Asus TUF Gaming A15 FA507UV (Turbo) | |
| Asus TUF A15 FA507 | |
| Baldur's Gate 3 - 1920x1080 Ultra Preset | |
| Media de la clase Gaming (34.5 - 208, n=57, últimos 2 años) | |
| SCHENKER XMG Core 15 (M24) | |
| Asus TUF Gaming A15 FA507UV | |
| Medio NVIDIA GeForce RTX 4060 Laptop GPU (66.5 - 105.5, n=19) | |
| F1 24 - 1920x1080 Ultra High Preset AA:T AF:16x | |
| Media de la clase Gaming (54.1 - 148, n=19, últimos 2 años) | |
| Medio NVIDIA GeForce RTX 4060 Laptop GPU (47.5 - 61.6, n=10) | |
| Asus TUF Gaming A15 FA507UV (1126333) | |
| Lenovo LOQ 15IRX9 (1122588) | |
| The First Descendant - 1920x1080 Ultra Preset | |
| Medio NVIDIA GeForce RTX 4060 Laptop GPU (67.6 - 69.4, n=3) | |
| Asus TUF Gaming A15 FA507UV | |
| Media de la clase Gaming (15.4 - 80, n=5, últimos 2 años) | |
| Ghost of Tsushima - 1920x1080 Very High Preset AA:T | |
| Asus TUF Gaming A15 FA507UV | |
| Lenovo LOQ 15IRX9 | |
| Medio NVIDIA GeForce RTX 4060 Laptop GPU (55.6 - 63.4, n=5) | |
| Media de la clase Gaming (28.5 - 73.7, n=7, últimos 2 años) | |
| Senua's Saga Hellblade 2 - 1920x1080 High Preset | |
| Media de la clase Gaming (38.4 - 78.8, n=6, últimos 2 años) | |
| Asus TUF Gaming A15 FA507UV | |
| Medio NVIDIA GeForce RTX 4060 Laptop GPU (37.6 - 39.5, n=3) | |
| Lenovo LOQ 15IRX9 | |
| Dragon's Dogma 2 - 1920x1080 High Preset | |
| Media de la clase Gaming (49.5 - 80, n=8, últimos 2 años) | |
| HP Victus 16 (2024) | |
| Lenovo LOQ 15IRX9 | |
| Medio NVIDIA GeForce RTX 4060 Laptop GPU (57.2 - 67.7, n=5) | |
| Asus TUF Gaming A15 FA507UV | |
Cyberpunk 2077 ultra FPS diagram
| bajo | medio | alto | ultra | |
|---|---|---|---|---|
| GTA V (2015) | 182.6 | 177 | 168 | 107.2 |
| Dota 2 Reborn (2015) | 171.5 | 154.9 | 149.3 | 139.5 |
| Final Fantasy XV Benchmark (2018) | 210 | 138.8 | 100.7 | |
| X-Plane 11.11 (2018) | 135.3 | 117.5 | 91.7 | |
| Strange Brigade (2018) | 360 | 263 | 213 | 184.2 |
| Baldur's Gate 3 (2023) | 135 | 107.8 | 95.9 | 93.9 |
| Cyberpunk 2077 2.2 Phantom Liberty (2023) | 122.2 | 96.6 | 82.7 | 76.2 |
| Alone in the Dark (2024) | 159.1 | 150.1 | 143.8 | 126.9 |
| Dragon's Dogma 2 (2024) | 68.1 | 59.9 | ||
| Ghost of Tsushima (2024) | 94.1 | 83.9 | 76.9 | 62.1 |
| Senua's Saga Hellblade 2 (2024) | 66.1 | 55.1 | 39.5 | |
| F1 24 (2024) | 220 | 205 | 169.7 | 56.6 |
| The First Descendant (2024) | 155.5 | 96.8 | 79.1 | 67.6 |
Emisiones y energía - Un portátil para juegos con muy buena duración de batería
Emisiones sonoras
No nos sorprende ni positiva ni negativamente la producción de ruido de la A15. Cyberpunk 2077 hace que el nivel de ruido aumente hasta unos claramente audibles 45 dB(A) ("Rendimiento") y unos muy altos 56 dB(A) ("Turbo"). El modo "Silencioso" es el responsable de unos niveles de ruido moderados con velocidades de fotogramas aún jugables. En situaciones cotidianas (oficina, Internet), los dos ventiladores funcionan a menudo a baja velocidad y ocasionalmente permanecen inmóviles.
Ruido
| Ocioso |
| 25 / 27 / 33 dB(A) |
| Carga |
| 40 / 46 dB(A) |
 | ||
30 dB silencioso 40 dB(A) audible 50 dB(A) ruidosamente alto |
||
min: | ||
| Asus TUF Gaming A15 FA507UV NVIDIA GeForce RTX 4060 Laptop GPU, R9 8945H, WD PC SN560 SDDPNQE-1T00 | Lenovo LOQ 15IRX9 NVIDIA GeForce RTX 4060 Laptop GPU, i5-13450HX, Micron 2400 MTFDKCD1T0QFM | HP Victus 16 (2024) NVIDIA GeForce RTX 4060 Laptop GPU, i7-14700HX, Kioxia XG8 KXG80ZNV512G | Gigabyte G6X 9KG (2024) NVIDIA GeForce RTX 4060 Laptop GPU, i7-13650HX, Gigabyte AG450E1024-SI | SCHENKER XMG Core 15 (M24) NVIDIA GeForce RTX 4060 Laptop GPU, R7 8845HS, Samsung 990 Pro 1 TB | Dell G16, i7-13650HX, RTX 4060 NVIDIA GeForce RTX 4060 Laptop GPU, i7-13650HX, WD PC SN740 SDDPNQD-1T00 | Asus TUF A15 FA507 NVIDIA GeForce RTX 4050 Laptop GPU, R7 7735HS, Micron 2400 MTFDKBA512QFM | |
|---|---|---|---|---|---|---|---|
| Noise | -11% | -6% | -16% | 5% | 12% | 15% | |
| apagado / medio ambiente * | 25 | 25 -0% | 25 -0% | 26 -4% | 23 8% | 23 8% | 23.3 7% |
| Idle Minimum * | 25 | 26 -4% | 28 -12% | 30 -20% | 23 8% | 23 8% | 23.3 7% |
| Idle Average * | 27 | 34 -26% | 29 -7% | 32 -19% | 23 15% | 23 15% | 23.3 14% |
| Idle Maximum * | 33 | 36 -9% | 33 -0% | 35 -6% | 23 30% | 27.96 15% | 23.3 29% |
| Load Average * | 40 | 48 -20% | 45 -13% | 51 -28% | 38.92 3% | 27.96 30% | 29.6 26% |
| Cyberpunk 2077 ultra * | 45 | 48 -7% | 52.06 -16% | ||||
| Load Maximum * | 46 | 50 -9% | 48 -4% | 54 -17% | 52.09 -13% | 47.89 -4% | 43 7% |
| Witcher 3 ultra * | 43 | 51 | 50.96 | 47.89 | 43 |
* ... más pequeño es mejor
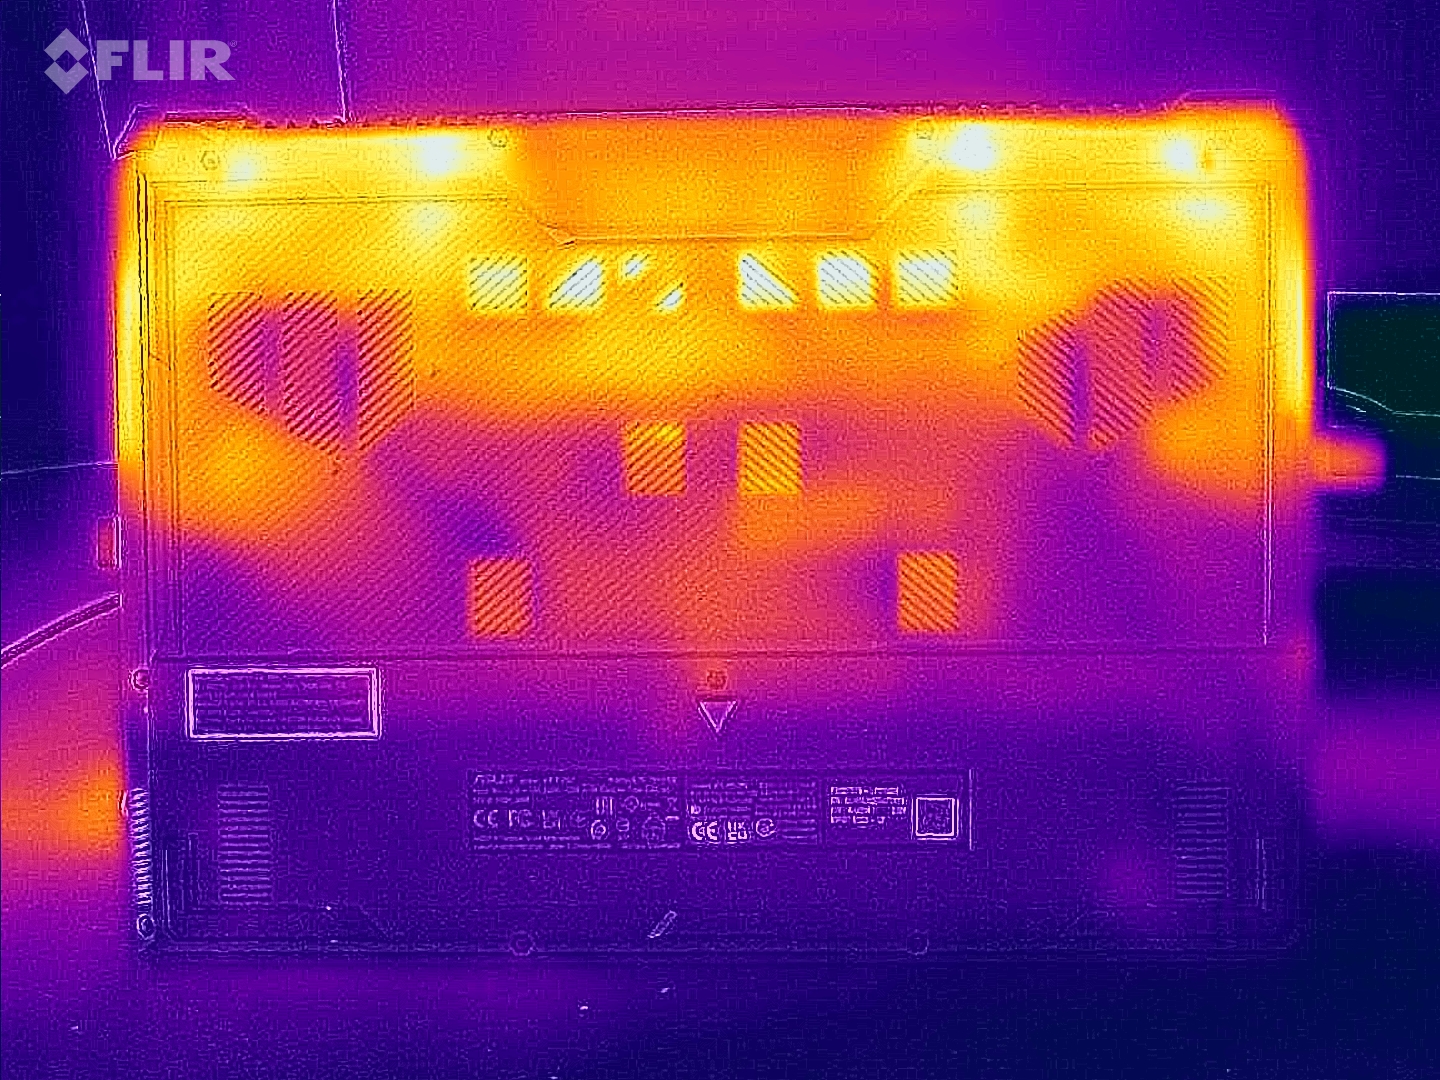
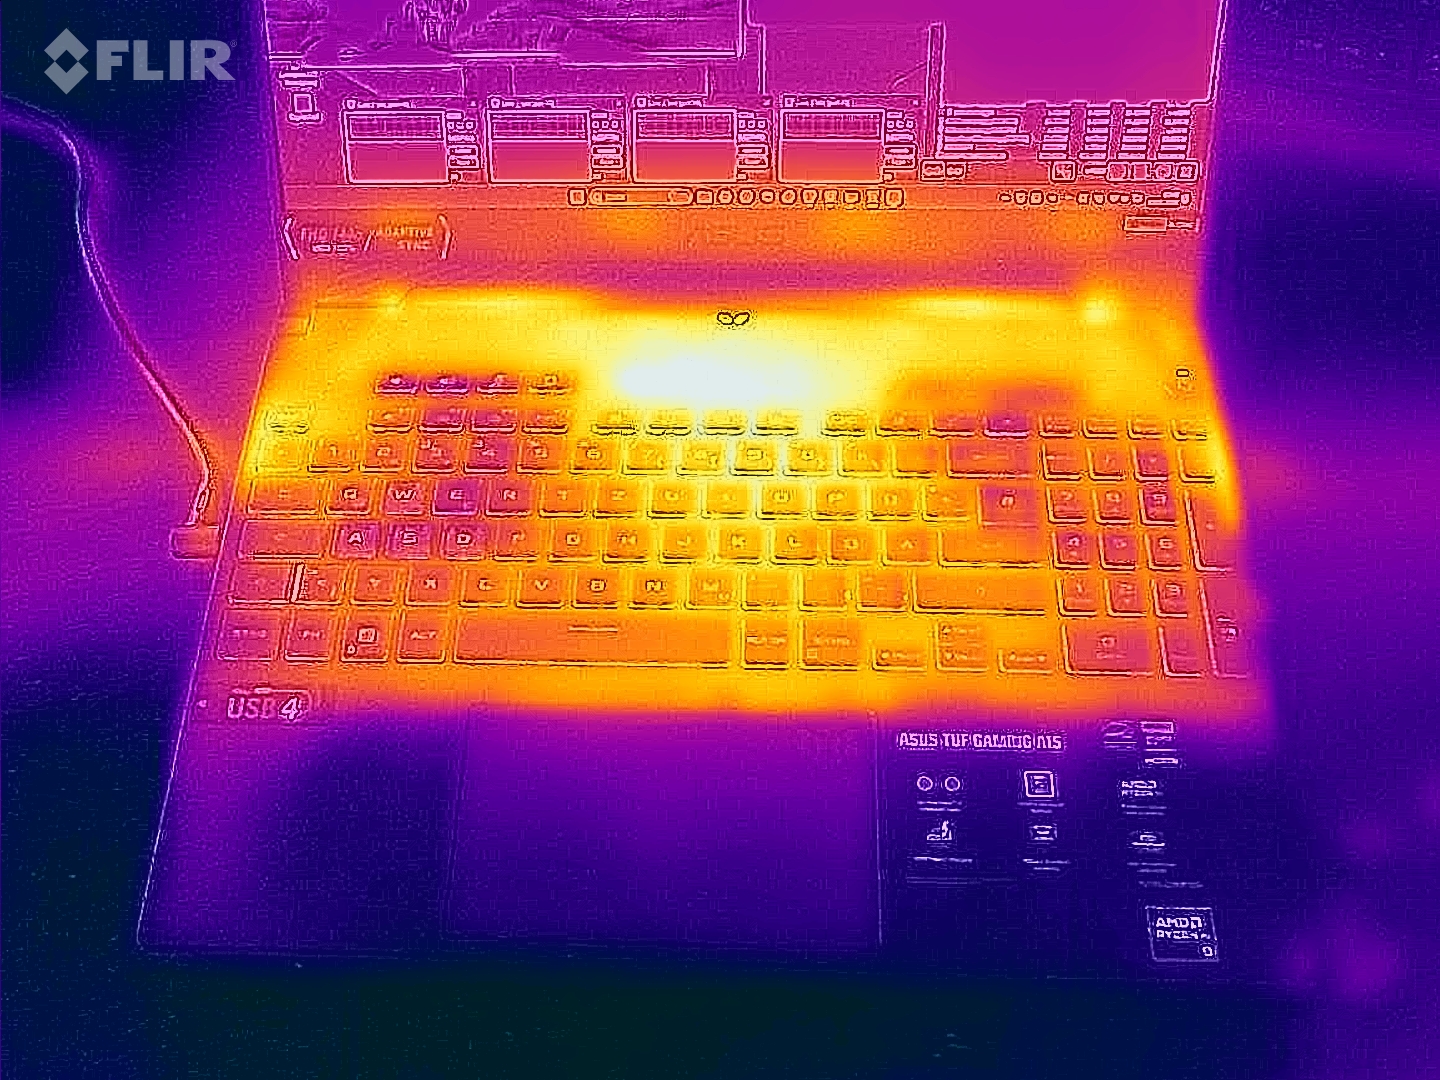
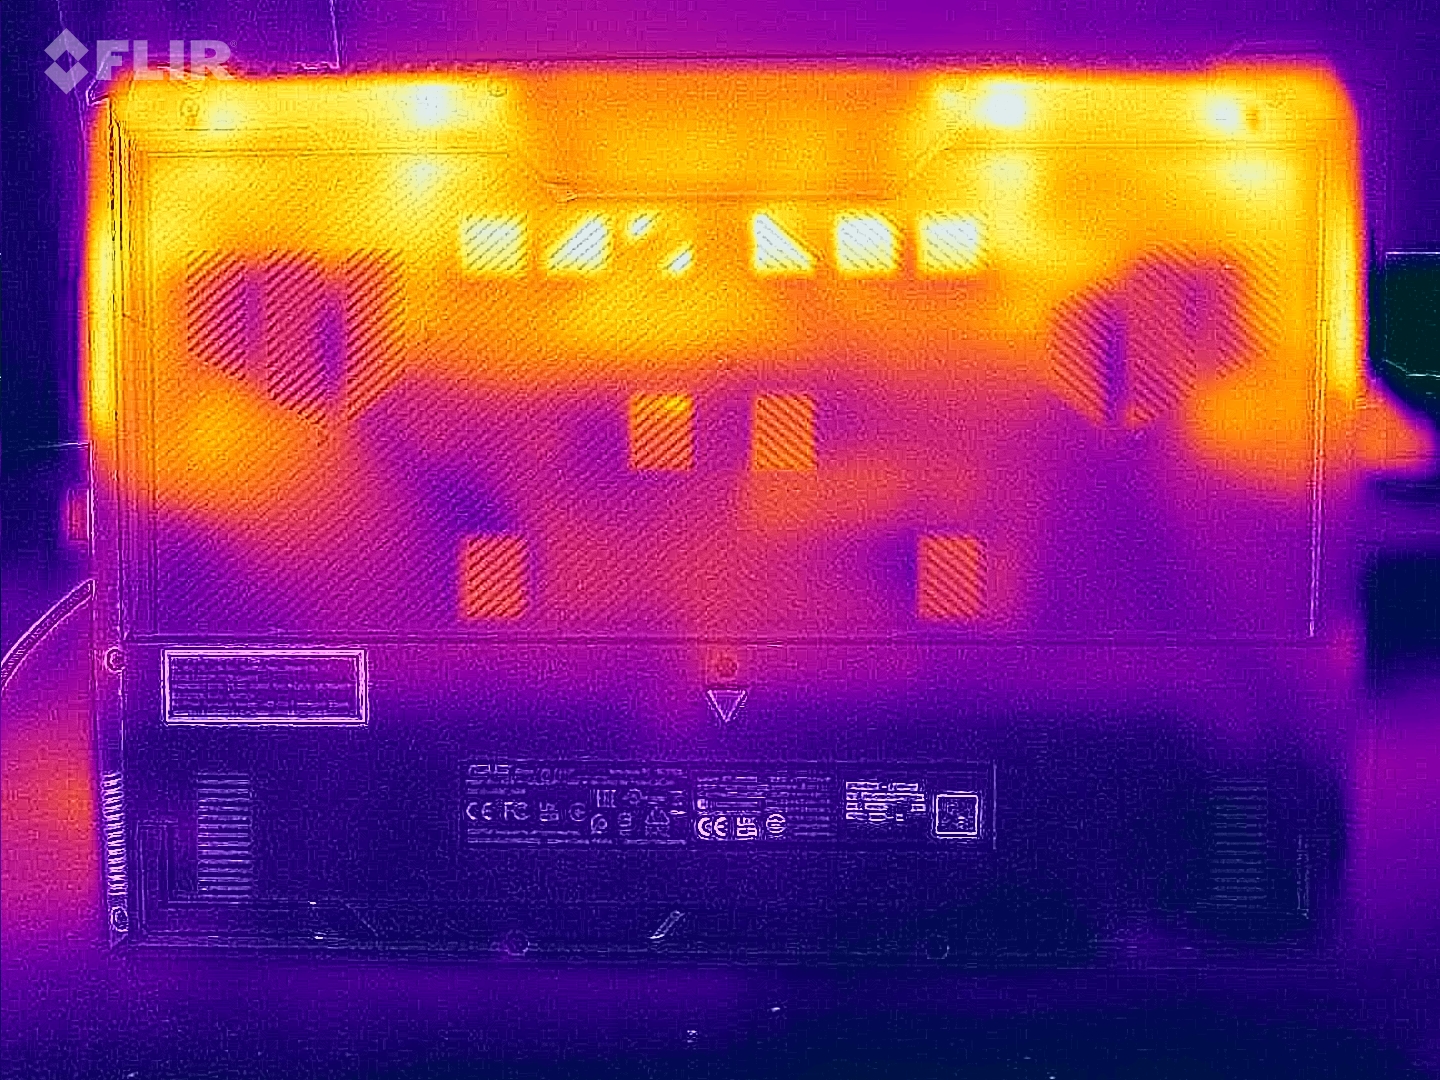
Temperatura
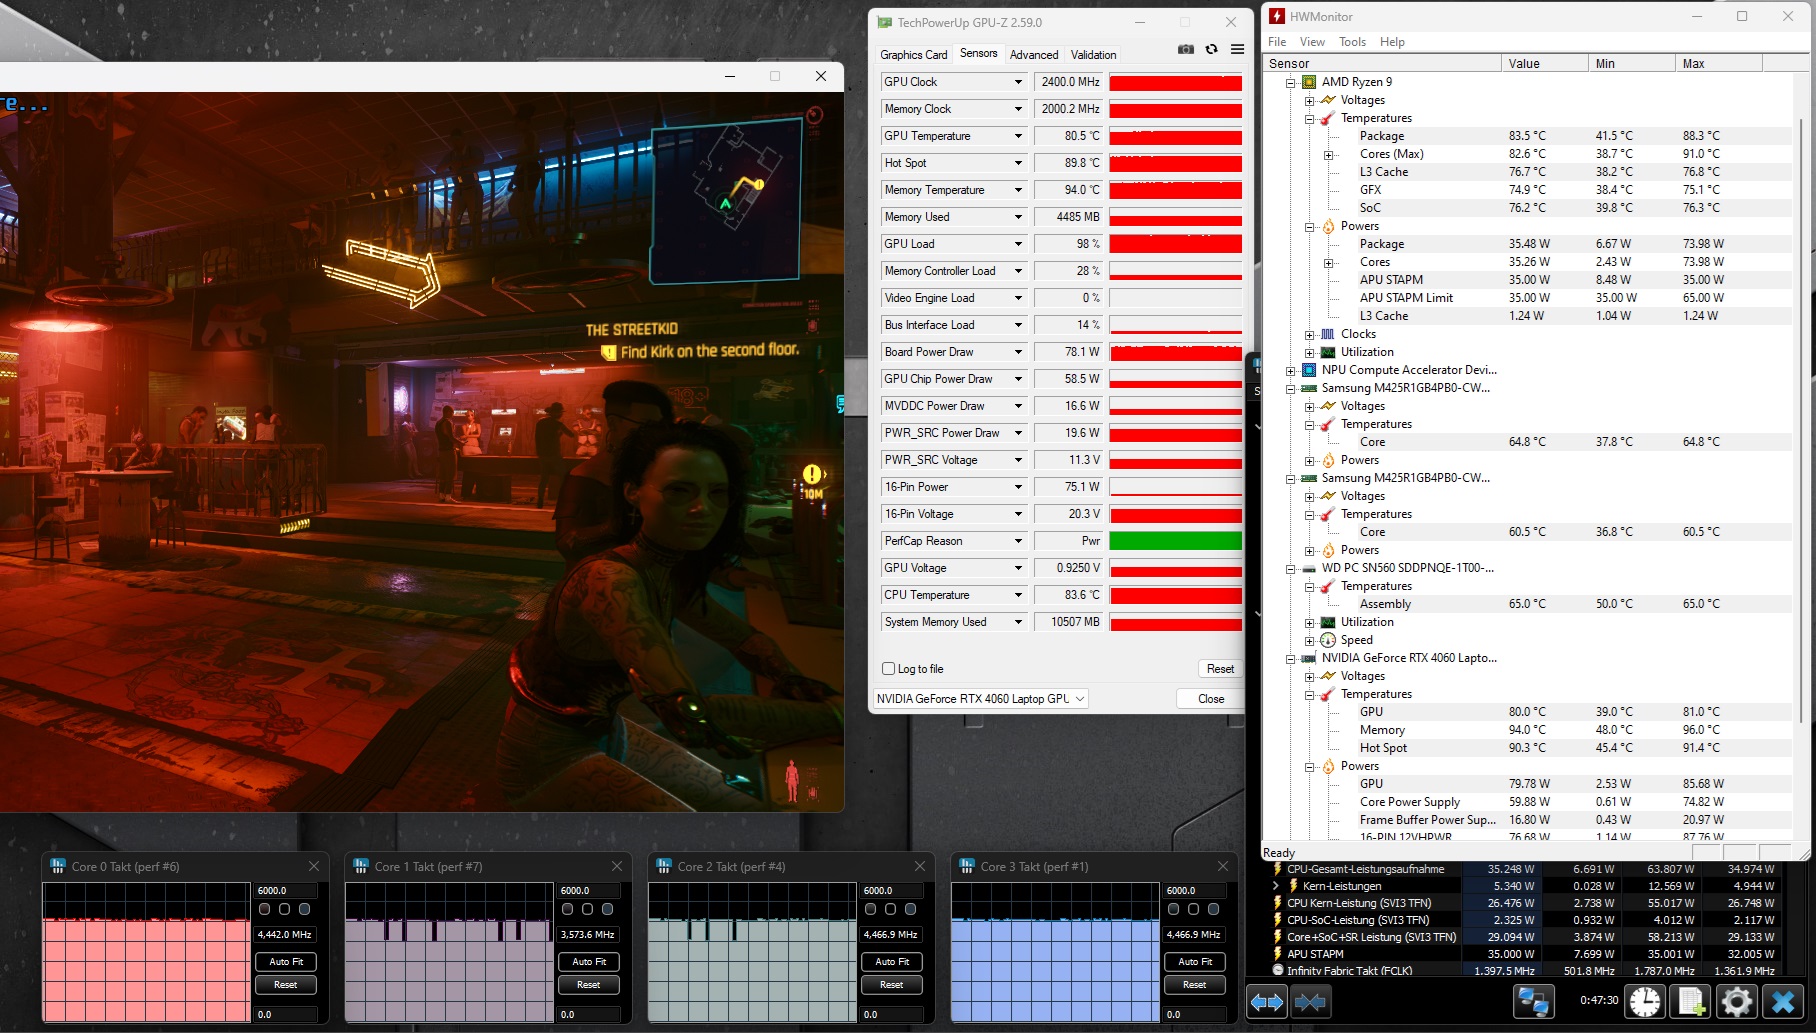
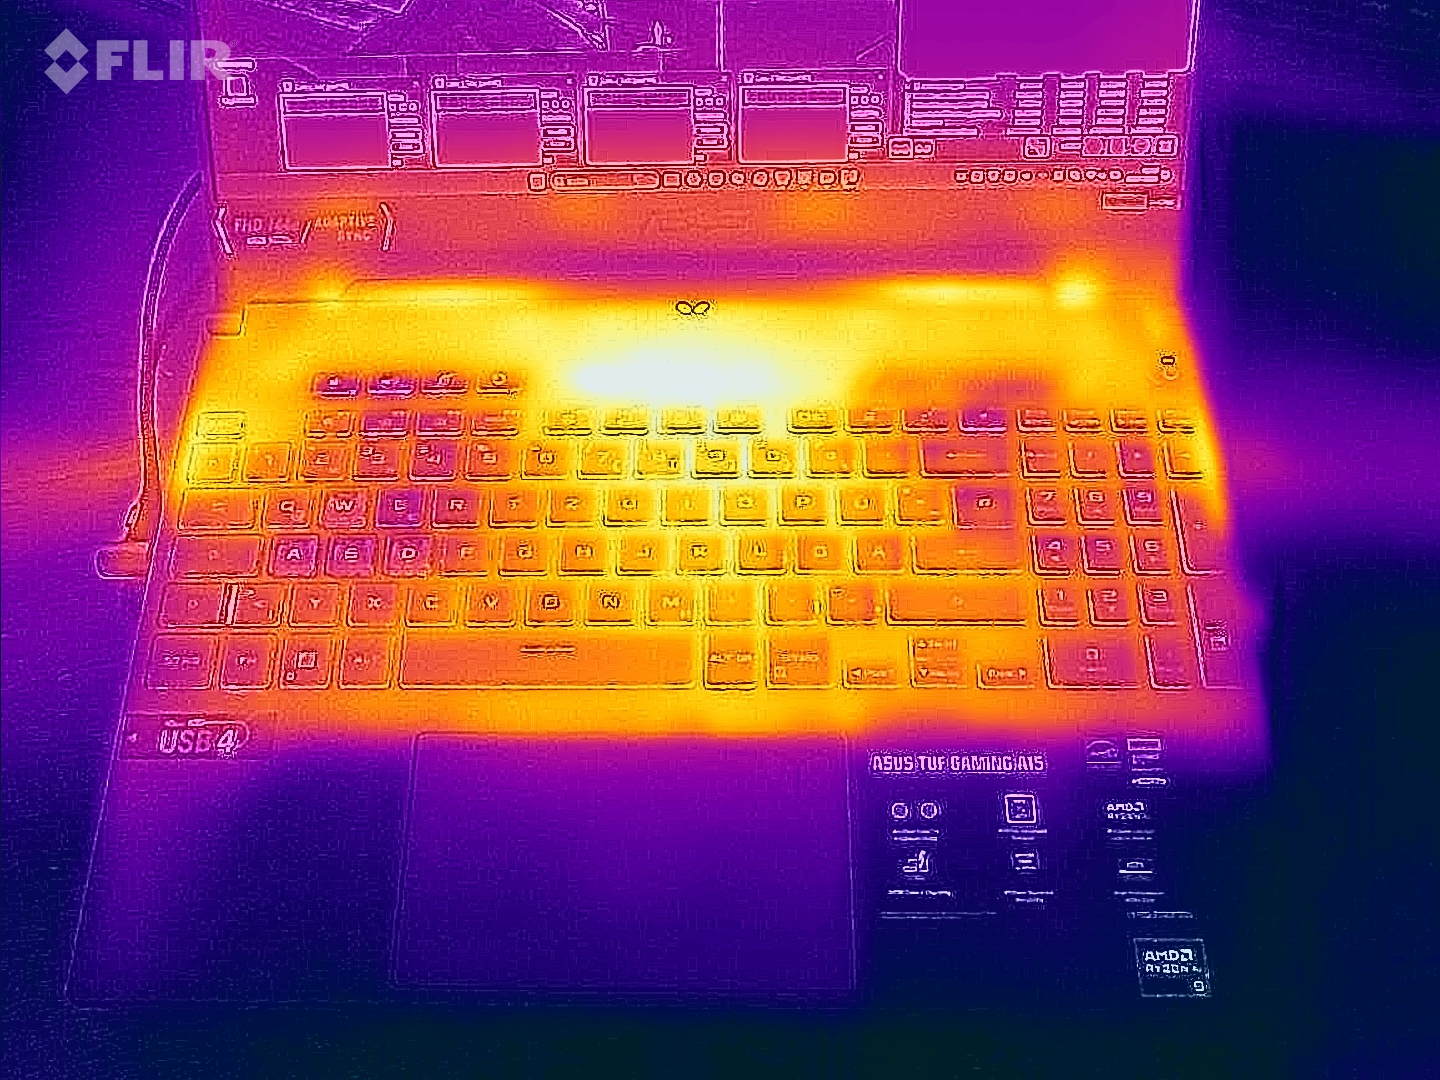
El portátil se calienta notablemente: Cyberpunk y la prueba de estrés provocan temperaturas de más de 50 grados Celsius en algunas zonas. En los casos de uso cotidiano (oficina, Internet), se alcanzan cifras superiores a la media. Las temperaturas del reposamanos se sitúan en un nivel moderado.
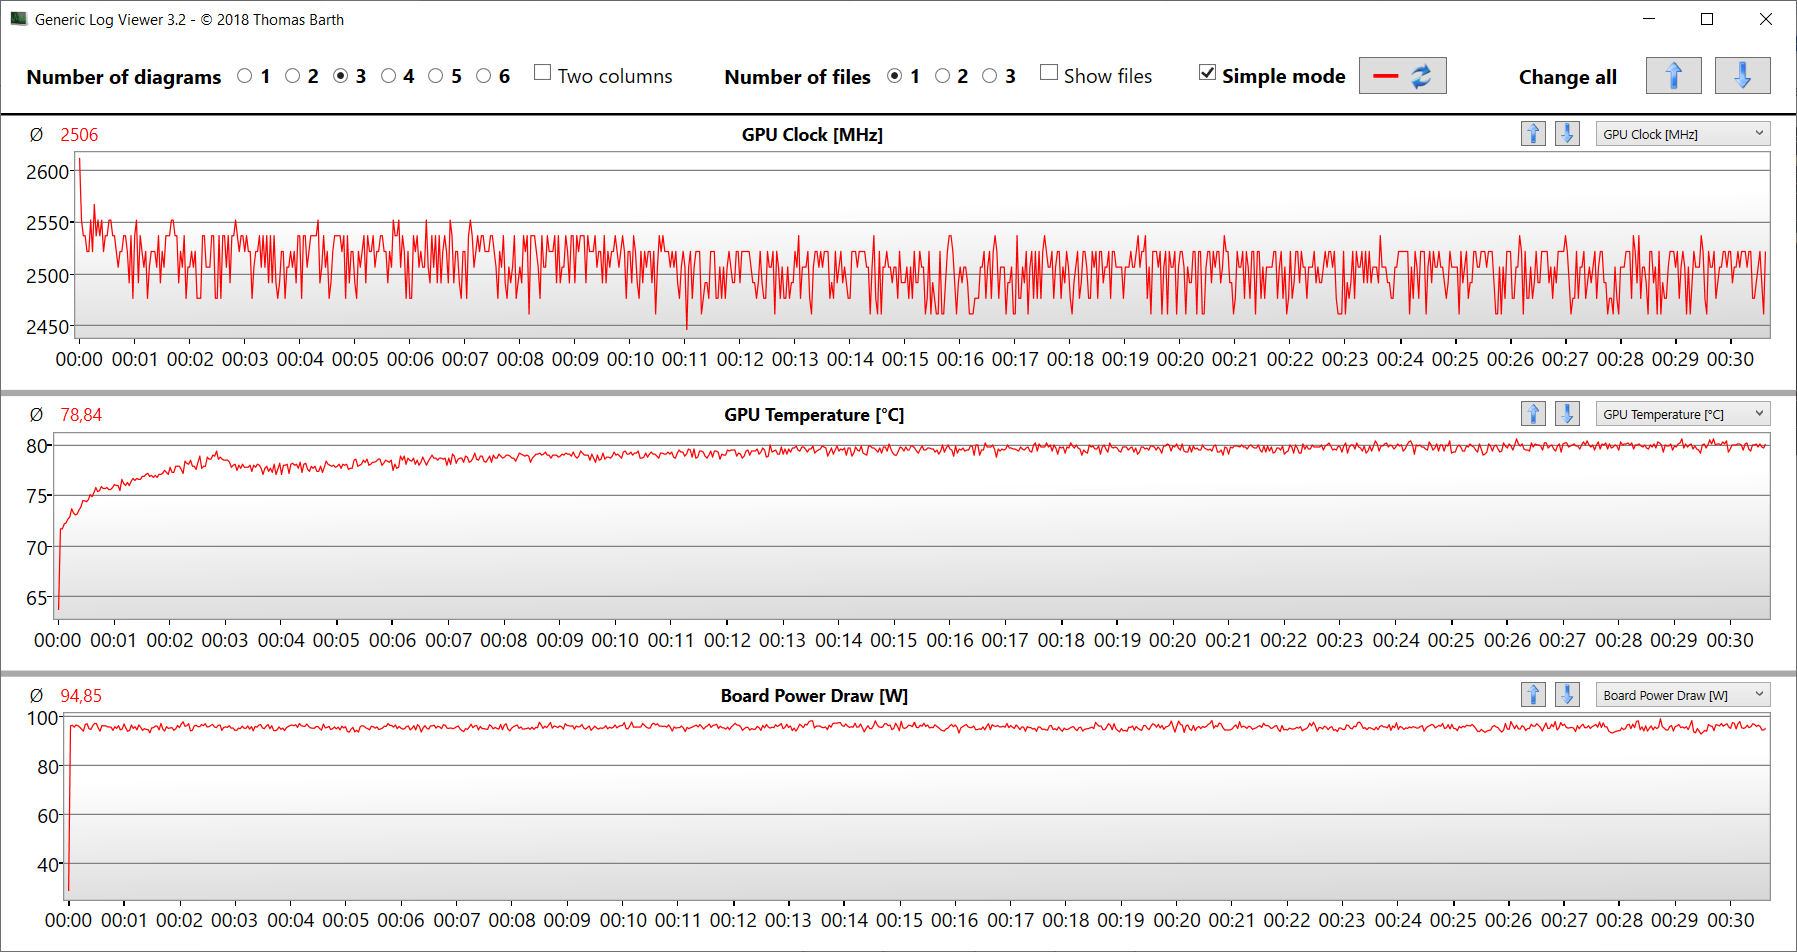
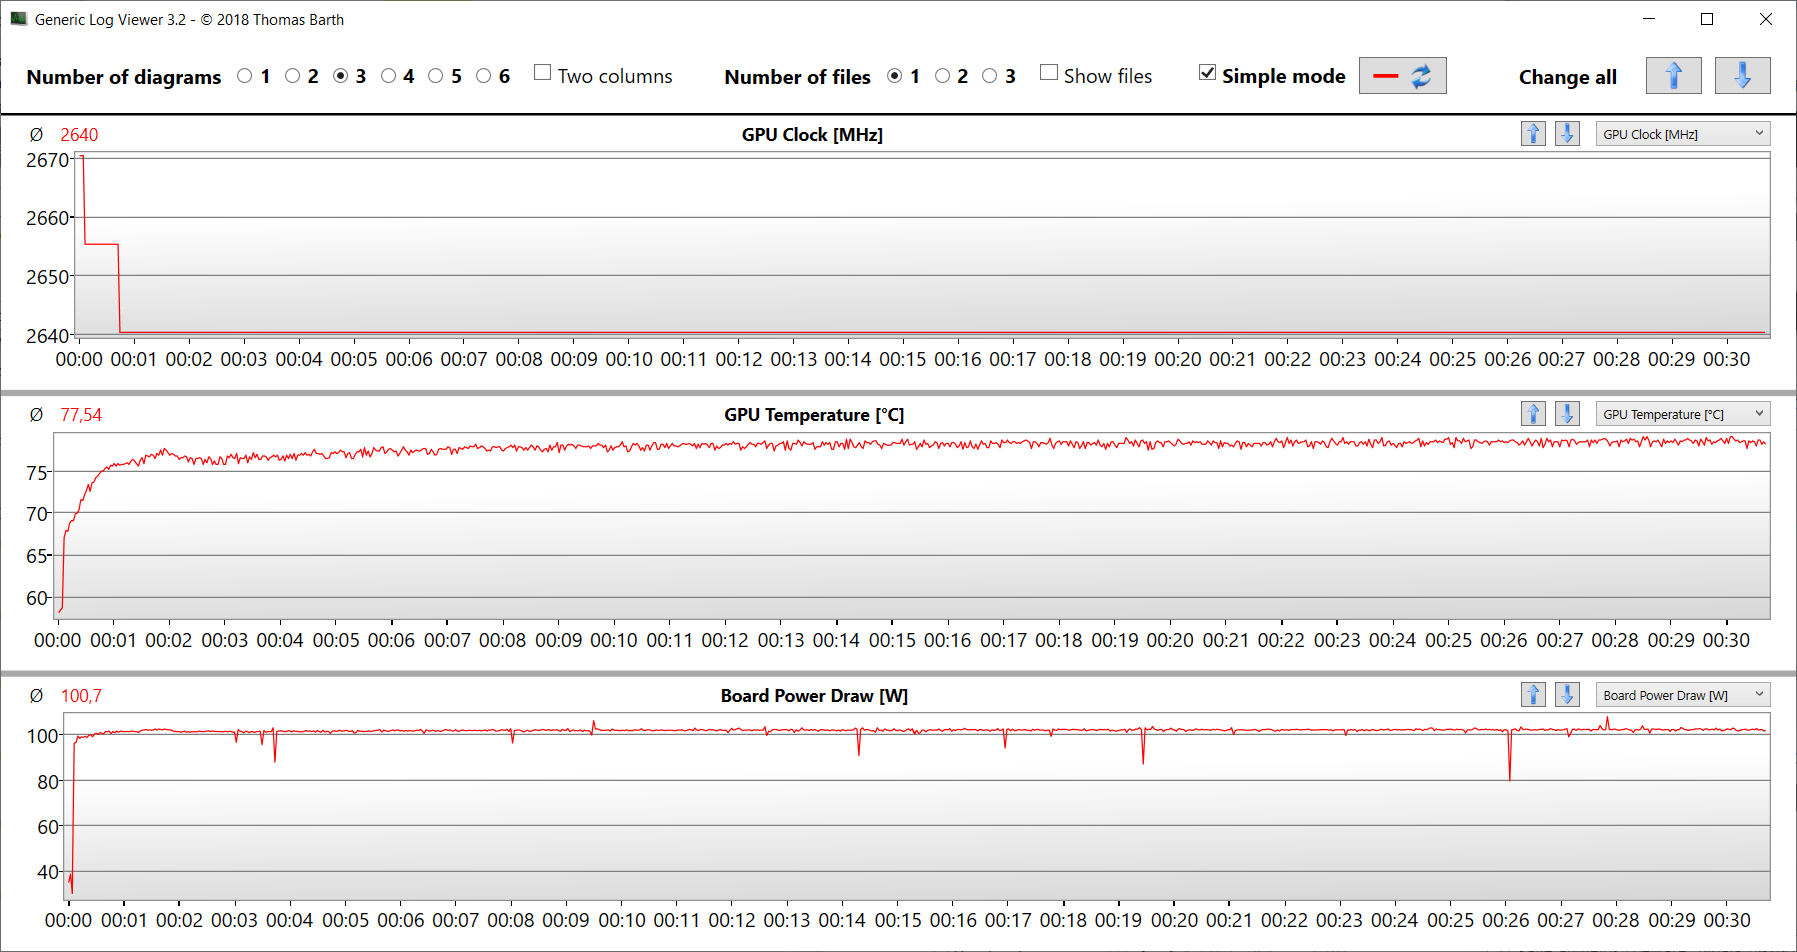
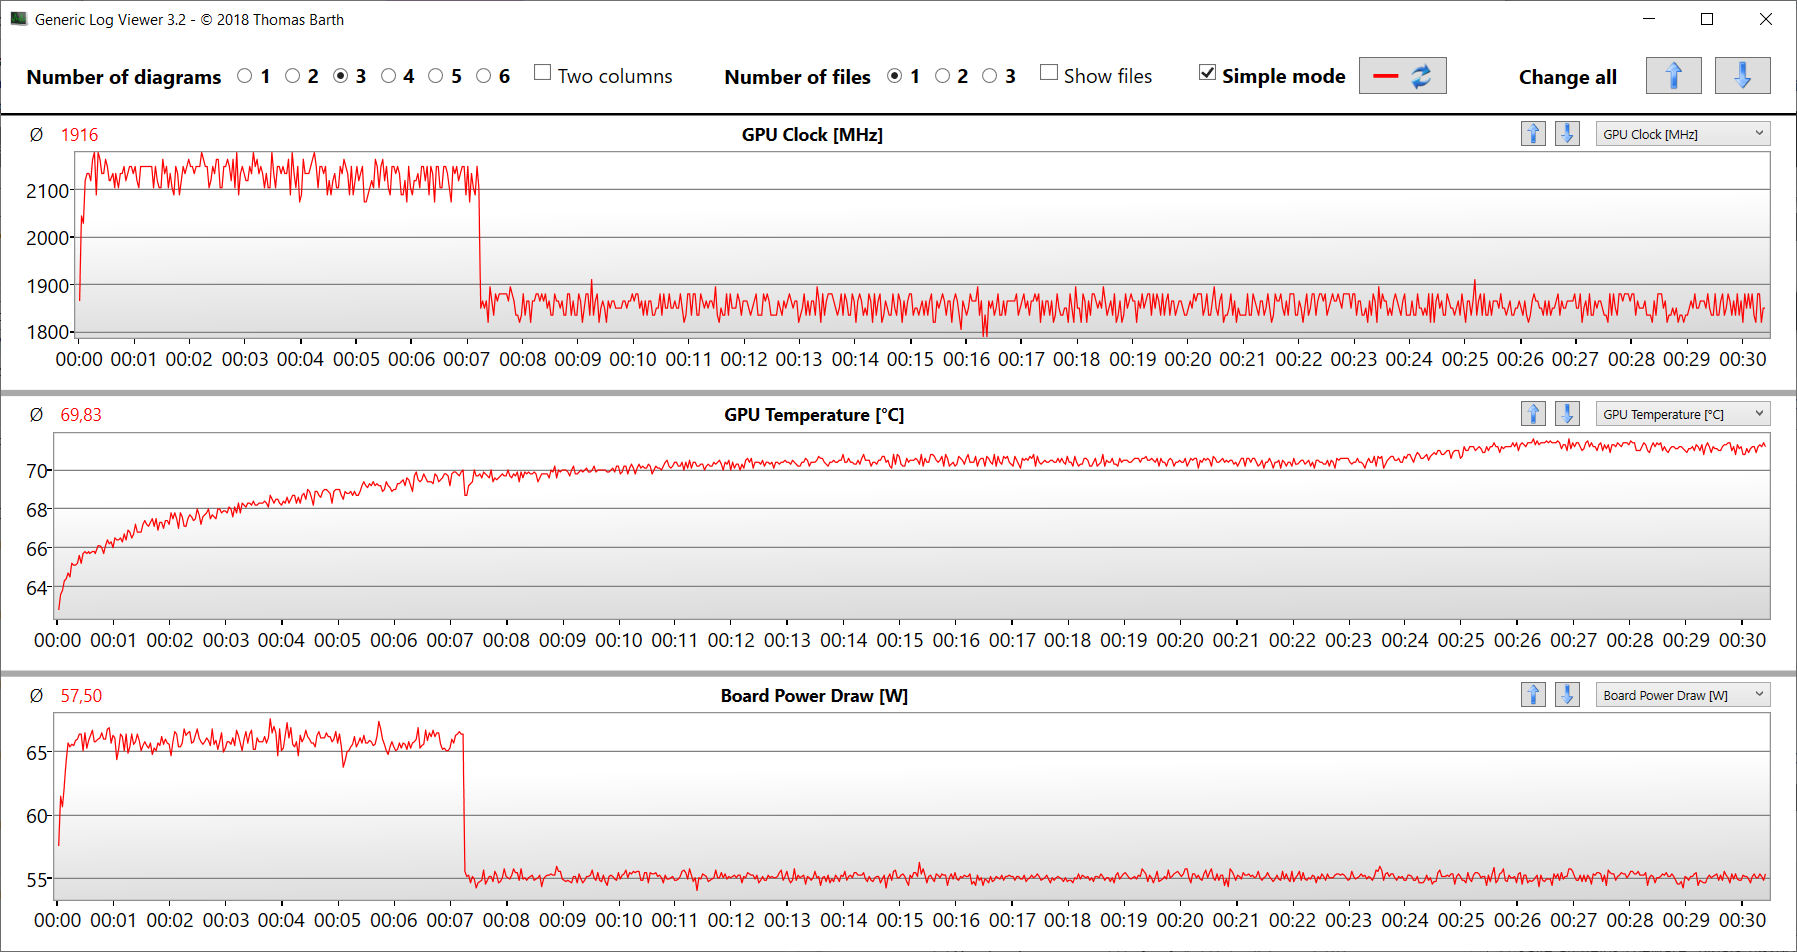
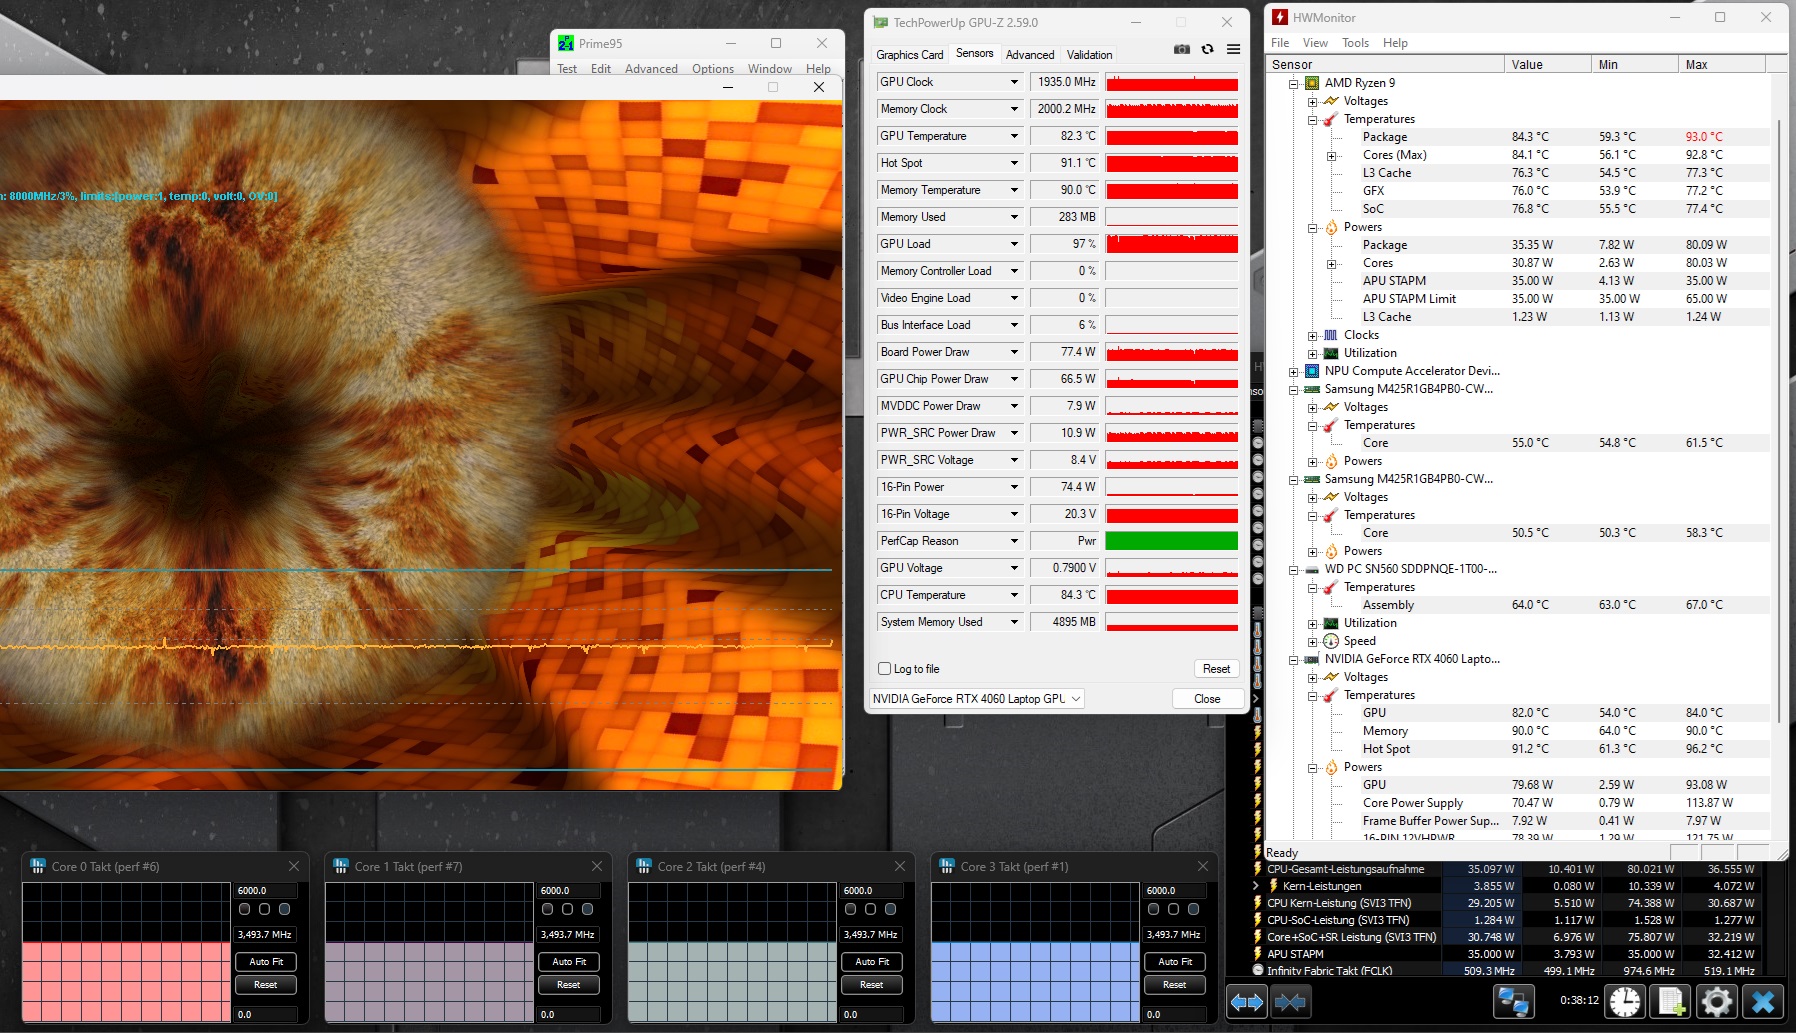
La prueba de estrés en escenarios extremos (Prime95 y Furmark en funcionamiento continuo) comprueba la estabilidad del sistema a plena carga. Las elevadas velocidades de reloj iniciales de la CPU y la GPU descienden en el primer minuto de la prueba a 3,5 GHz (CPU) y 1,9 GHz (GPU), respectivamente, y se mantienen en este nivel.
(-) La temperatura máxima en la parte superior es de 53 °C / 127 F, frente a la media de 40.4 °C / 105 F, que oscila entre 21.2 y 68.8 °C para la clase Gaming.
(-) El fondo se calienta hasta un máximo de 46 °C / 115 F, frente a la media de 43.2 °C / 110 F
(+) En reposo, la temperatura media de la parte superior es de 29.9 °C / 86# F, frente a la media del dispositivo de 33.9 °C / 93 F.
(-) 3: The average temperature for the upper side is 41.9 °C / 107 F, compared to the average of 33.9 °C / 93 F for the class Gaming.
(+) Los reposamanos y el panel táctil alcanzan como máximo la temperatura de la piel (35 °C / 95 F) y, por tanto, no están calientes.
(-) La temperatura media de la zona del reposamanos de dispositivos similares fue de 28.9 °C / 84 F (-6.1 °C / -11 F).
| Asus TUF Gaming A15 FA507UV AMD Ryzen 9 8945H, NVIDIA GeForce RTX 4060 Laptop GPU | Lenovo LOQ 15IRX9 Intel Core i5-13450HX, NVIDIA GeForce RTX 4060 Laptop GPU | HP Victus 16 (2024) Intel Core i7-14700HX, NVIDIA GeForce RTX 4060 Laptop GPU | Gigabyte G6X 9KG (2024) Intel Core i7-13650HX, NVIDIA GeForce RTX 4060 Laptop GPU | SCHENKER XMG Core 15 (M24) AMD Ryzen 7 8845HS, NVIDIA GeForce RTX 4060 Laptop GPU | Dell G16, i7-13650HX, RTX 4060 Intel Core i7-13650HX, NVIDIA GeForce RTX 4060 Laptop GPU | Asus TUF A15 FA507 AMD Ryzen 7 7735HS, NVIDIA GeForce RTX 4050 Laptop GPU | |
|---|---|---|---|---|---|---|---|
| Heat | -5% | 11% | 5% | -14% | -8% | 11% | |
| Maximum Upper Side * | 53 | 47 11% | 50 6% | 41 23% | 52 2% | 49 8% | 48.9 8% |
| Maximum Bottom * | 46 | 58 -26% | 50 -9% | 43 7% | 61 -33% | 58 -26% | 44.6 3% |
| Idle Upper Side * | 32 | 32 -0% | 25 22% | 32 -0% | 35 -9% | 35 -9% | 27.1 15% |
| Idle Bottom * | 34 | 36 -6% | 26 24% | 37 -9% | 39 -15% | 35 -3% | 27.5 19% |
* ... más pequeño es mejor
Altavoces
En general, los altavoces estéreo producen un sonido decente. Los graves podrían ser algo más pronunciados.
Asus TUF Gaming A15 FA507UV análisis de audio
(+) | los altavoces pueden reproducir a un volumen relativamente alto (#82 dB)
Graves 100 - 315 Hz
(±) | lubina reducida - en promedio 6.8% inferior a la mediana
(±) | la linealidad de los graves es media (7.1% delta a frecuencia anterior)
Medios 400 - 2000 Hz
(±) | medias más altas - de media 7.8% más altas que la mediana
(±) | la linealidad de los medios es media (7% delta respecto a la frecuencia anterior)
Altos 2 - 16 kHz
(+) | máximos equilibrados - a sólo 2.4% de la mediana
(±) | la linealidad de los máximos es media (7.6% delta a frecuencia anterior)
Total 100 - 16.000 Hz
(+) | el sonido global es lineal (13.1% de diferencia con la mediana)
En comparación con la misma clase
» 17% de todos los dispositivos probados de esta clase eran mejores, 4% similares, 79% peores
» El mejor tuvo un delta de 6%, la media fue 18%, el peor fue ###max##%
En comparación con todos los dispositivos probados
» 11% de todos los dispositivos probados eran mejores, 3% similares, 86% peores
» El mejor tuvo un delta de 4%, la media fue 24%, el peor fue ###max##%
Lenovo LOQ 15IRX9 análisis de audio
(±) | la sonoridad del altavoz es media pero buena (81 dB)
Graves 100 - 315 Hz
(±) | lubina reducida - en promedio 14.6% inferior a la mediana
(±) | la linealidad de los graves es media (9.6% delta a frecuencia anterior)
Medios 400 - 2000 Hz
(+) | medios equilibrados - a sólo 2.1% de la mediana
(+) | los medios son lineales (3.6% delta a la frecuencia anterior)
Altos 2 - 16 kHz
(±) | máximos más altos - de media 5.9% más altos que la mediana
(±) | la linealidad de los máximos es media (8.2% delta a frecuencia anterior)
Total 100 - 16.000 Hz
(+) | el sonido global es lineal (14.7% de diferencia con la mediana)
En comparación con la misma clase
» 27% de todos los dispositivos probados de esta clase eran mejores, 7% similares, 66% peores
» El mejor tuvo un delta de 6%, la media fue 18%, el peor fue ###max##%
En comparación con todos los dispositivos probados
» 17% de todos los dispositivos probados eran mejores, 4% similares, 79% peores
» El mejor tuvo un delta de 4%, la media fue 24%, el peor fue ###max##%
Consumo de energía
En cuanto al consumo de energía, no hay nada extraño que señalar. Los valores están en un nivel normal para el hardware instalado. Cyberpunk y - más tarde - la prueba de estrés se ejecutaron con un consumo de energía consistente. La fuente de alimentación (240 vatios) tiene el tamaño adecuado.
| Off / Standby | |
| Ocioso | |
| Carga |
|
Clave:
min: | |
Power consumption Cyberpunk / stress test
Power consumption with an extrnal monitor
Duración de las pilas
El dispositivo de 15,6 pulgadas logró una autonomía de 11 horas y 42 minutos en una prueba Wi-Fi en condiciones reales (imagen de la carga al acceder a sitios web ejecutando un script), una cifra excelente. Esto lo pone a la par con el modelo A15 del año pasado.
Pro
Contra
Veredicto - Un todoterreno de los juegos

La atención se centra en los juegos FHD, pero el renderizado y el streaming tampoco presentan problemas al dispositivo. Ryzen 9 8945H y GeForce RTX 4060 proporcionan la potencia necesaria y ambos chips pueden funcionar a velocidades de reloj consistentemente altas. El panel instalado de 15,6 pulgadas (FHD, 144 Hz, G-Sync, sRGB) no presenta debilidades graves.
Con el TUF Gaming A15 FA507UV, Asus ha entregado un portátil para juegos FHD muy completo con una duración de batería impresionante.
En ciertos lugares, el ordenador se calienta notablemente y se vuelve bastante ruidoso. Seleccionando el modo obtendrá un buen compromiso entre rendimiento y ruido y la pérdida de rendimiento resultante no es significativa.
El punto fuerte del A15 es la tremenda duración de su batería: Las cifras reales de casi 12 horas suelen reservarse para los portátiles de oficina o los subportátiles. Es posible alimentar la batería mediante una fuente de alimentación USB-C: uno de los dos puertos USB-C (USB 3.2 Gen 2, USB 4) es compatible con Power Delivery, lo que significa que no tendrá que cargar necesariamente con la fuente de alimentación propietaria.
Una alternativa podría ser el Lenovo LOQ 15IRX9. Ofrece una potencia de cálculo ligeramente inferior, el USB 4 no está a bordo y la duración de la batería es considerablemente peor. Sin embargo, se lleva la palma en cuanto a precio: El LOQ puede ser suyo por sólo 999 dólares.
Precio y disponibilidad
El Asus TUF Gaming A15 FA507UV está actualmente (a fecha de 17.07.24) disponible por unos 1.399 dólares (512 GB SSD) en Amazon.
Nota: Recientemente hemos actualizado nuestro sistema de clasificación y los resultados de la versión 8 no son comparables con los de la versión 7. Encontrará más información aquí.
Asus TUF Gaming A15 FA507UV
- 07/17/2024 v8
Sascha Mölck
 Total Sustainability Score:
 Transparencia
La selección de los dispositivos que se van a reseñar corre a cargo de nuestro equipo editorial. La muestra de prueba fue proporcionada al autor en calidad de préstamo por el fabricante o el minorista a los efectos de esta reseña. El prestamista no tuvo ninguna influencia en esta reseña, ni el fabricante recibió una copia de la misma antes de su publicación. No había ninguna obligación de publicar esta reseña. Nunca aceptamos compensaciones o pagos a cambio de nuestras reseñas. Como empresa de medios independiente, Notebookcheck no está sujeta a la autoridad de fabricantes, minoristas o editores.
Así es como prueba Notebookcheck
Cada año, Notebookcheck revisa de forma independiente cientos de portátiles y smartphones utilizando procedimientos estandarizados para asegurar que todos los resultados son comparables. Hemos desarrollado continuamente nuestros métodos de prueba durante unos 20 años y hemos establecido los estándares de la industria en el proceso. En nuestros laboratorios de pruebas, técnicos y editores experimentados utilizan equipos de medición de alta calidad. Estas pruebas implican un proceso de validación en varias fases. Nuestro complejo sistema de clasificación se basa en cientos de mediciones y puntos de referencia bien fundamentados, lo que mantiene la objetividad.Price comparison

