Notebookcheck Logo
Teaser

Asus NUC 14 Pro+ mini-PC review - Un potencial asesino de sobremesas con sólo 622 gramos

Potencia versátil con capacidades excepcionales.

El Asus NUC 14 Pro+ promete ofrecer un rendimiento impresionante en un formato compacto, con los últimos procesadores y una potencia descomunal. Pero, ¿cómo se comporta en el uso diario? En este análisis, ponemos a prueba el NUC 14 Pro+ para ver si está a la altura de sus promesas y si realmente puede servir como un sustituto válido del ordenador de sobremesa.
Sebastian Bade, 👁 Sebastian Bade (traducido por DeepL / Ninh Duy) Published 🇺🇸 🇩🇪 ...
Mini PC Desktop Intel Meteor Lake Thunderbolt

Veredicto - El alto rendimiento tiene un coste

El Asus NUC 14 Pro+ con Intel Core Ultra 9 185H destaca en muchos aspectos como mini PC compacto. Equipado con un procesador de última generación, ofrece un rendimiento excelente para tareas exigentes, desde la multitarea hasta aplicaciones creativas como la edición de imágenes y vídeo. Visualmente, el Asus NUC 14 Pro+ parece más pequeño que muchos otros mini PC, gracias a su elegante combinación de colores plateado y blanco. Una característica especialmente impresionante es la amplia gama de opciones de conectividad, incluidos dos puertos Thunderbolt 4 preparados para el futuro. El desmontaje sin herramientas de la parte inferior es una elección de diseño inteligente, que permite actualizaciones rápidas y sencillas de la SSD o la RAM.

Un inconveniente es el nivel de ruido bajo cargas altas o medias, que puede ser claramente perceptible dependiendo del escenario de uso. Tendría sentido disponer de un mejor ajuste de la curva del ventilador nada más sacarlo de la caja, sobre todo teniendo en cuenta el precio de compra. Después de todo, la BIOS ofrece una variedad de ajustes que pueden ayudar a mejorar esta cuestión. No obstante, el NUC 14 Pro+ sigue siendo una opción sólida para cualquiera que busque un PC potente que ahorre espacio, ya sea para tareas cotidianas, multimedia o aplicaciones creativas.

Pro

+ estuche resistente y de primera calidad
+ artesanía impecable
+ puertos Thunderbolt 4 duales
+ Intel Core Ultra 9 185H con un rendimiento sin restricciones
+ potente GPU integrada
+ generosa memoria RAM de 32 GB
+ rendimiento SSD consistentemente estable
+ amplias opciones de configuración de la BIOS
+ garantía de 36 meses

Contra

- la unidad de refrigeración funciona eficazmente bajo cargas extremas
- ruido perceptible a carga parcial y completa
- carece de interfaz OCuLink
- el elevado precio

Precio y disponibilidad

Amazon vende el modelo Asus NUC 14 Pro+ que probamos por 1.050 dólares. A partir de 882 dólares, el modelo barebone también está disponible en Amazon. Para una opción más asequible, considere el Asus NUC 14 Pro+ con el Intel Core Ultra 5 125H, con un precio de alrededor de 765 $, y equipado con una SSD de 512 GB y 16 GB de RAM.

Amazon Logo
$670.00
ASUS NUC 14 Pro Tall Barebone with Intel 14thGen Core Ultra 7 155H (NPU Support), up to 96GB DDR5 RAM, Triple Storage, Thunderbolt 4, Wi-Fi 6E & Bluetooth 5.3, Toolless Chassis Access, with VESA Mount
  • $1,050.00
    ASUS NUC 14 Pro+ Full System Mini PC with Intel 14th Gen Core Ultra 9 185H, 32GB DDR5 RAM, 1TB PCIe G4x4 NVMe SSD, Thunderbolt 4, Win 11 Home, Silver Aluminum Chassis, VESA Mount Included
  • $1,099.00
    ASUS NUC 14 Pro AI Mini Pc, Ultra 7 155H (16C/22T, Up to 4.8GHz) Mini Desktop, 32GB DDR5 RAM 1TB PCIe 4 SSD Mini Computer, Intel Arc Gpu/AI GC/AI Boost/AI Ready/Type C 3.2/8K/HDR/My ASUS/BT5.3/WiFi 6E

Posibles contendientes en la comparación

Image
Modelo
Geizhals
Peso
Altura
Display
1.
75.3%
Asus NUC 14 Pro+
Asus NUC 14 Pro+
Intel Core Ultra 9 185H ⎘
Intel Arc 8-Core iGPU ⎘
32 GB Memoría, 1024 GB SSD
Bestpreis 1241.75€ Jacob Elektronik direkt
2. 1241.76€ CSV-Direct.de
3. 1241.77€ Easynotebooks.de
622 g41 mmx
2.
80.8%
Aoostar GEM12
Aoostar GEM12
AMD Ryzen 7 8845HS ⎘
AMD Radeon 780M ⎘
32 GB Memoría, 1024 GB SSD
Listenpreis 649 US-Dollar653 g60 mmx
3.
78.8%
Geekom GT1 Mega
Geekom GT1 Mega
Intel Core Ultra 9 185H ⎘
Intel Arc 8-Core iGPU ⎘
32 GB Memoría, 2048 GB SSD
Listenpreis 1149 EUR
Geizhals Suche
693 g46.9 mmx
4.
78.4%
Geekom AX8 Pro
Geekom AX8 Pro
AMD Ryzen 9 8945H ⎘
AMD Radeon 780M ⎘
32 GB Memoría, 2048 GB SSD
Listenpreis 999 EUR548 g37 mmx
5.
87.5% v7 (old)
Minisforum AtomMan X7 Ti
Intel Core Ultra 9 185H ⎘
Intel Arc 8-Core iGPU ⎘
32 GB Memoría, 1024 GB SSD
Bestpreis 1159€ pclike
2. 1159€ pclike
863 g48.6 mmx
6.
83.4% v7 (old)
Acemagic F2A
Acemagic F2A
Intel Core Ultra 7 155H ⎘
Intel Arc 8-Core iGPU ⎘
32 GB Memoría, 1024 GB SSD
Listenpreis 1199 EUR768 g57 mmx

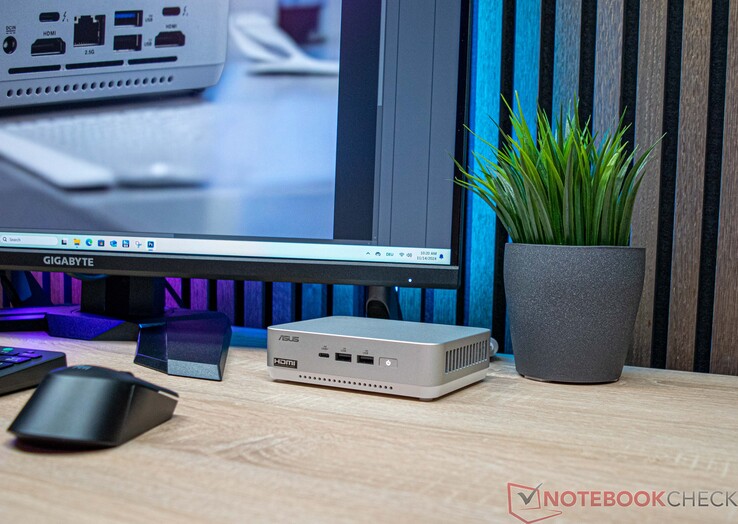
El Asus NUC 14 Pro+ destaca claramente a nivel visual de la serie NUC (Next Unit of Computing), introducida inicialmente por Intel. La pequeña central eléctrica es ligeramente más grande, pero sigue siendo muy compacta, y en esta reseña nos centraremos en la mejor configuración que incluye el Intel Core Ultra 9 185H. Junto con 32 GB de RAM y una unidad SSD de 1 TB, el sistema está listo para ser utilizado de inmediato, aunque su precio de 1.050 dólares está en el lado más alto. Si opta por equipar el dispositivo con su propia RAM y SSD, pagaría menos. Además, el Asus NUC 14 Pro+ está disponible con un procesador Intel Core Ultra 5 125H o Intel Core Ultra 7 155H como opciones alternativas. Estos modelos ligeramente menos potentes siguen siendo lo suficientemente rápidos para las tareas cotidianas.

En el altamente competitivo mercado de los mini PC, Asus se enfrenta a una fuerte competencia de marcas del Lejano Oriente. Empresas como Minisforum, Geekom y Aoostar ofrecen dispositivos similares a precios más competitivos. Echemos un vistazo más de cerca a cómo Asus se mide con estos rivales.

Especificaciones

Asus NUC 14 Pro+
Procesador
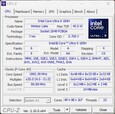
Intel Core Ultra 9 185H 16 x 3.8 - 5.1 GHz, 115 W PL2 / Short Burst, 115 W PL1 / Sustained, Meteor Lake-H
Adaptador gráfico
Intel Arc 8-Core iGPU, Núcleo: 2350 MHz
Memoría
32 GB 
, 5600 MT/s, max 96 GB
Placa base
Intel Meteor Lake-U/P/H PCH
Disco duro
Samsung PM9A1a MZVL21T0HDLU, 1024 GB 
, 875 GB libre
Tarjeta de sonido
Intel Meteor Lake-U/P/H PCH - cAVS (Audio, Voice, Speech)
Conexiones
1 USB 2.0, 4 USB 3.1 Gen2, 2 USB 4.0 40 Gbps, 2 Thunderbolt, 2 HDMI, 2 DisplayPort, 1 Kensington Lock, 1 Docking Station Port
Equipamento de red
Intel Ethernet Controller I226-V (10/2500MBit/s), Intel Wi-Fi 6E AX211 (a/b/g/h/n = Wi-Fi 4/ac = Wi-Fi 5/ax = Wi-Fi 6/ Wi-Fi 6E 6 GHz), Bluetooth 5.3
Tamaño
Alto x ancho x profundidad (en mm): 41 x 144 x 112
Sistema Operativo
Microsoft Windows 11 Pro
Características adicionales
150W Power Adapter, 36 Meses Garantía
Peso
622 g, Suministro de Electricidad: 303 g
Precio
1250 EUR
Note: The manufacturer may use components from different suppliers including display panels, drives or memory sticks with similar specifications.


Asus NUC 14 Pro+
Asus NUC 14 Pro+
Asus NUC 14 Pro+
Asus NUC 14 Pro+
Asus NUC 14 Pro+
Asus NUC 14 Pro+
Asus NUC 14 Pro+
Asus NUC 14 Pro+ con fuente de alimentación (19,5 V; 7,7 A)
Fuente de alimentación (19,5 V; 7,7 A)

Caja - Una sólida mezcla de metal y plástico

Visualmente, el Asus NUC 14 Pro+ se distingue claramente de los conocidos mini PC NUC que comercializa actualmente Asus. La empresa ha optado por una combinación de aluminio y plástico para los materiales. La parte inferior, que también funciona como tapa de mantenimiento, es de plástico, mientras que la parte superior está fabricada en aluminio. En general, la elaboración del pequeño PC es impecable. Tanto visual como tácticamente, no hay nada que criticar del Asus NUC 14 Pro+. En términos de huella, el Asus NUC 14 Pro+ ocupa algo más de espacio que algunos de sus competidores. Sin embargo, con una huella de 14,4 x 11,2 centímetros, su tamaño sigue siendo razonable y debería encajar cómodamente en la mayoría de los escritorios. Además, con el soporte VESA incluido, el Asus NUC 14 Pro+ puede acoplarse directamente a un monitor.

Comparación de tamaños

146 mm 146 mm 57 mm 768 g145 mm 145 mm 48.6 mm 863 g130 mm 130 mm 60 mm 653 g144 mm 112 mm 41 mm 622 g135 mm 132 mm 46.9 mm 693 g117 mm 112 mm 37 mm 548 g210 mm 148 mm 1 mm 2.9 g

Conectividad - Todo lo esencial incluido

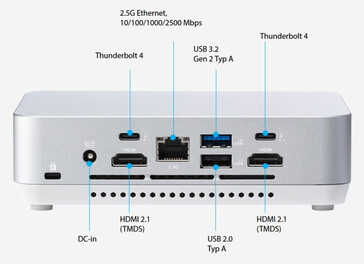
El mini PC ofrece una sólida selección de puertos externos, aunque se queda corto con respecto al Geekom GT1 Mega en cuanto a conexiones totales. Asus ha incluido un total de siete puertos USB, que comprenden cuatro tomas estándar de tipo A y tres puertos de tipo C. Cabe destacar que dos de los puertos USB-C son compatibles con Thunderbolt 4, lo que amplía significativamente el potencial del mini PC para conectar accesorios compatibles. Además, el NUC 14 Pro+ está equipado con dos puertos HDMI y una conexión de red 2,5G. En general, la distribución de las conexiones está bien pensada, proporcionando un buen equilibrio de versatilidad y accesibilidad para una variedad de casos de uso.

Las conexiones externas del Asus NUC 14 Pro+ - frontal (fuente: Asus)
Las conexiones externas del Asus NUC 14 Pro+ - parte trasera (fuente: Asus)
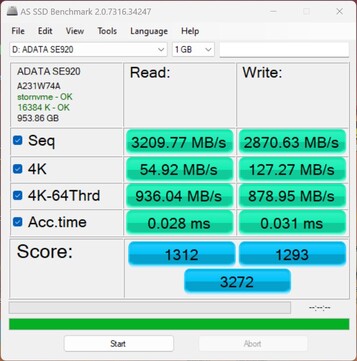
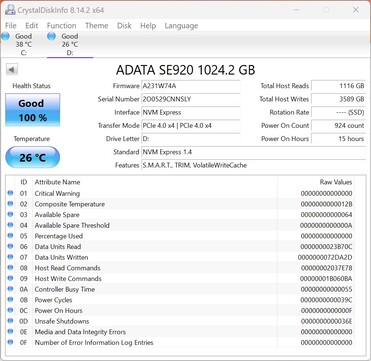
Comprobación del rendimiento con el ADATA SE920 a través de USB4
ADATA SE920 funciona con PCIe 4.0 x4
Connectivity - USB 3.x / USB4 / TB - AS SSD Seq Read Test (1GB)
Minisforum MS-A1
Radeon 780M, Ryzen 7 8700G, Kingston OM8PGP41024Q-A0
3245.45 MB/s
Asus NUC 14 Pro+
Arc 8-Core, Ultra 9 185H, Samsung PM9A1a MZVL21T0HDLU
3209.77 MB/s
Khadas Mind 2
Arc 8-Core, Ultra 7 155H, WD PC SN740 SDDPTQD-1T00
3165.4 MB/s
Average of class Mini PC
  (1611 - 3245, n=4, last 2 years)
2808 MB/s
Geekom GT1 Mega
Arc 8-Core, Ultra 9 185H, Crucial P3 Plus CT2000P3PSSD8
1611.37 MB/s

Comunicación

El módulo WLAN está integrado

El módulo Intel Wi-Fi 6E AX211 incluido en el Asus NUC 14 Pro+ ofrece buenos resultados durante las pruebas. Sin embargo, su rendimiento queda ligeramente por detrás del de sus competidores. Para un rendimiento óptimo, se recomienda utilizar principalmente la banda de frecuencia de 6 GHz para la comunicación inalámbrica. Las pruebas WLAN se realizaron con el router Asus ROG Capture GT AXE11000.

Networking
iperf3 receive AXE11000 6GHz
Acemagic F2A
Intel Wi-Fi 7 BE200 320MHz
1770 (1584min - 1790max) MBit/s +22%
Minisforum AtomMan X7 Ti
Intel Wi-Fi 7 BE200 320MHz
1761 (1734min - 1774max) MBit/s +22%
Geekom AX8 Pro
MediaTek Wi-Fi 6E MT7922 160MHz Wireless LAN Card
1657 (1619min - 1670max) MBit/s +15%
Average Intel Wi-Fi 6E AX211
  (700 - 1857, n=209)
1492 MBit/s +3%
Asus NUC 14 Pro+
Intel Wi-Fi 6E AX211
1446 (1321min - 1486max) MBit/s
Average of class Mini PC
  (684 - 1771, n=52, last 2 years)
1385 MBit/s -4%
Geekom GT1 Mega
Intel Wi-Fi 7 BE200 320MHz
1149 (666min - 1346max) MBit/s -21%
iperf3 transmit AXE11000 6GHz
Geekom AX8 Pro
MediaTek Wi-Fi 6E MT7922 160MHz Wireless LAN Card
1800 (1737min - 1904max) MBit/s +47%
Acemagic F2A
Intel Wi-Fi 7 BE200 320MHz
1615 (767min - 1670max) MBit/s +32%
Minisforum AtomMan X7 Ti
Intel Wi-Fi 7 BE200 320MHz
1562 (1198min - 1713max) MBit/s +28%
Average Intel Wi-Fi 6E AX211
  (632 - 1851, n=210)
1372 MBit/s +12%
Average of class Mini PC
  (394 - 1800, n=52, last 2 years)
1337 MBit/s +9%
Geekom GT1 Mega
Intel Wi-Fi 7 BE200 320MHz
1242 (1110min - 1348max) MBit/s +2%
Asus NUC 14 Pro+
Intel Wi-Fi 6E AX211
1223 (1160min - 1303max) MBit/s
iperf3 receive AXE11000
Minisforum AtomMan X7 Ti
Intel Wi-Fi 7 BE200 320MHz
1599 (802min - 1683max) MBit/s +68%
Average Intel Wi-Fi 6E AX211
  (582 - 1890, n=237)
1377 MBit/s +45%
Geekom AX8 Pro
MediaTek Wi-Fi 6E MT7922 160MHz Wireless LAN Card
979 (962min - 989max) MBit/s +3%
Asus NUC 14 Pro+
Intel Wi-Fi 6E AX211
951 (926min - 965max) MBit/s
Average of class Mini PC
  (192.9 - 1796, n=112, last 2 years)
933 MBit/s -2%
Geekom GT1 Mega
Intel Wi-Fi 7 BE200 320MHz
888 (825min - 926max) MBit/s -7%
Acemagic F2A
Intel Wi-Fi 7 BE200 320MHz
838 (728min - 926max) MBit/s -12%
Aoostar GEM12
Intel Wi-Fi 6 AX200
740 (676min - 758max) MBit/s -22%
iperf3 transmit AXE11000
Minisforum AtomMan X7 Ti
Intel Wi-Fi 7 BE200 320MHz
1566 (904min - 1695max) MBit/s +121%
Average Intel Wi-Fi 6E AX211
  (464 - 1921, n=237)
1235 MBit/s +75%
Geekom AX8 Pro
MediaTek Wi-Fi 6E MT7922 160MHz Wireless LAN Card
966 (921min - 1008max) MBit/s +37%
Average of class Mini PC
  (184.1 - 1776, n=112, last 2 years)
866 MBit/s +22%
Geekom GT1 Mega
Intel Wi-Fi 7 BE200 320MHz
741 (690min - 797max) MBit/s +5%
Aoostar GEM12
Intel Wi-Fi 6 AX200
736 (369min - 756max) MBit/s +4%
Acemagic F2A
Intel Wi-Fi 7 BE200 320MHz
709 (369min - 977max) MBit/s 0%
Asus NUC 14 Pro+
Intel Wi-Fi 6E AX211
707 (666min - 737max) MBit/s
0501001502002503003504004505005506006507007508008509009501000105011001150120012501300135014001450150015501600165017001750180018501900Tooltip
Asus NUC 14 Pro+ Intel Wi-Fi 6E AX211; iperf3 transmit AXE11000 6GHz; iperf 3.1.3: Ø1223 (1160-1303)
Geekom GT1 Mega Intel Wi-Fi 7 BE200 320MHz; iperf3 transmit AXE11000 6GHz; iperf 3.1.3: Ø1242 (1110-1348)
Geekom AX8 Pro MediaTek Wi-Fi 6E MT7922 160MHz Wireless LAN Card; iperf3 transmit AXE11000 6GHz; iperf 3.1.3: Ø1800 (1737-1904)
Asus NUC 14 Pro+ Intel Wi-Fi 6E AX211; iperf3 receive AXE11000 6GHz; iperf 3.1.3: Ø1445 (1321-1486)
Geekom GT1 Mega Intel Wi-Fi 7 BE200 320MHz; iperf3 receive AXE11000 6GHz; iperf 3.1.3: Ø1126 (666-1346)
Geekom AX8 Pro MediaTek Wi-Fi 6E MT7922 160MHz Wireless LAN Card; iperf3 receive AXE11000 6GHz; iperf 3.1.3: Ø1656 (1619-1670)
Asus NUC 14 Pro+ Intel Wi-Fi 6E AX211; iperf3 receive AXE11000; iperf 3.1.3: Ø950 (926-965)
Geekom GT1 Mega Intel Wi-Fi 7 BE200 320MHz; iperf3 receive AXE11000; iperf 3.1.3: Ø887 (825-926)
Geekom AX8 Pro MediaTek Wi-Fi 6E MT7922 160MHz Wireless LAN Card; iperf3 receive AXE11000; iperf 3.1.3: Ø978 (962-989)
Asus NUC 14 Pro+ Intel Wi-Fi 6E AX211; iperf3 transmit AXE11000; iperf 3.1.3: Ø707 (666-737)
Geekom GT1 Mega Intel Wi-Fi 7 BE200 320MHz; iperf3 transmit AXE11000; iperf 3.1.3: Ø741 (690-797)
Geekom AX8 Pro MediaTek Wi-Fi 6E MT7922 160MHz Wireless LAN Card; iperf3 transmit AXE11000; iperf 3.1.3: Ø966 (921-1008)

Accesorios

Con el Asus NUC 14 Pro+ se incluye una fuente de alimentación de 150 vatios, un soporte VESA y el montaje necesario. No se proporcionan otros periféricos como un teclado o un ratón.

Mantenimiento

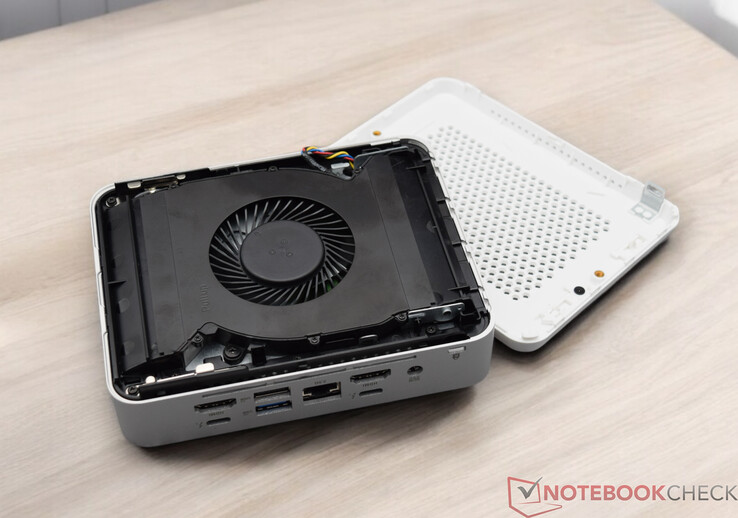
El Asus NUC 14 Pro+ también está disponible en versión barebone, lo que significa que tendrá que instalar la RAM y la SSD usted mismo. Esto es bastante sencillo, ya que la parte inferior puede desmontarse sin necesidad de herramientas. Nuestra muestra de prueba ya tiene una SSD y dos módulos SO-DIMM instalados. Todavía hay espacio para añadir otra SSD, aunque hay que tener en cuenta la longitud total de 42 milímetros.

Asus NUC 14 Pro+ con la parte inferior desmontada
Asus NUC 14 Pro+ con la unidad de refrigeración desplegada
Vista interior del Asus NUC 14 Pro+

Sostenibilidad

Comparado con un ordenador de sobremesa tradicional, el Asus NUC 14 Pro+ es un PC compacto que ofrece importantes ventajas de ahorro energético. Se presenta en una caja pequeña de tamaño adecuado. El mini PC en sí está fabricado principalmente en metal y plástico, aunque no está claro si se han utilizado materiales especialmente reciclados en su construcción. Apreciamos el periodo de garantía de tres años, que es una característica digna de mención.

Rendimiento - Intel Core Ultra 9 185H sin ninguna limitación

El Intel Core Ultra 9 185H es el modelo insignia de Intel de la actual serie Meteor Lake H. Su diseño híbrido ofrece un rendimiento sustancial para las tareas cotidianas al tiempo que mantiene la eficiencia energética cuando no se necesita toda la potencia. El Asus NUC 14 Pro+ con el Intel Core Ultra 7 155Hque cuenta con el mismo número de núcleos, es una opción ligeramente más asequible. Situado más abajo en el espectro, el Asus NUC 14 Pro+ con el procesador Intel Core Ultra 5 125H SoC también se beneficia del diseño híbrido e incluye una NPU. Este modelo es una opción excelente para quienes prioricen la relación precio-rendimiento.

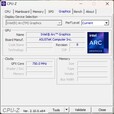
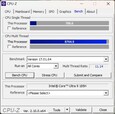
CPU-Z
CPU-Z
CPU-Z
CPU-Z
CPU-Z
CPU-Z
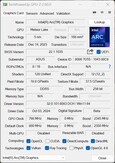
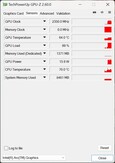
GPU-Z
GPU-Z
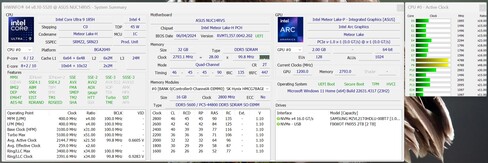
HWiNFO

Condiciones de prueba

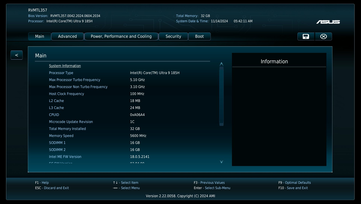
Realizamos todas las pruebas de rendimiento utilizando el perfil de energía Equilibrado y no alteramos el rendimiento del SoC, dejándolo en su estado predeterminado según la configuración de la BIOS (Equilibrado). Las amplias configuraciones de la BIOS son excelentes. Si se compara con los mini PC de marcas como Geekom, Minisforum o Acemagic, Asus destaca claramente en este aspecto. Además de ajustar el consumo de energía de la CPU, los usuarios pueden incluso desactivar puertos USB individuales si es necesario.

Procesador

El modelo superior del Asus NUC 14 Pro+ está alimentado por un Intel Core Ultra 9 185Hque cuenta con 16 núcleos y 22 hilos, ofreciendo un excelente rendimiento multihilo. Asus no restringe el consumo máximo de energía, lo que significa que hasta 115 vatios es teóricamente posible. En las pruebas de estrés, observamos que el sistema puede soportar ráfagas cortas de consumo de energía de hasta 100 vatios. Aunque Asus no aprovecha todo el potencial en este ámbito, el SoC del Asus NUC 14 Pro+ consigue un mayor consumo energético en comparación con otros mini PC. Sin embargo, las diferencias de rendimiento entre los modelos de la competencia son mínimas, por lo que no hay diferencias apreciables.

El Intel Core Ultra 5 125H también se incluyó para comparar el rendimiento. En comparación con el Intel Core Ultra 9 185H, el Intel Core Ultra 5 125H es aproximadamente entre un 10 y un 15 por ciento más lento.

Para más comparaciones y pruebas comparativas detalladas, consulte nuestra tabla comparativa de CPU.

Cinebench R15
Cinebench R15
Cinebench R20
Cinebench R20
Cinebench R23
Cinebench R23
Cinebench 2024
Cinebench 2024
Performance Rating - Percent
Asus NUC 14 Pro+
Intel Core Ultra 9 185H
55.7 pt
Geekom AX8 Pro
AMD Ryzen 9 8945H
55.6 pt
Minisforum AtomMan X7 Ti
Intel Core Ultra 9 185H
55.6 pt
Aoostar GEM12
AMD Ryzen 7 8845HS
55.5 pt
Geekom GT1 Mega
Intel Core Ultra 9 185H
55.1 pt
Acemagic F2A
Intel Core Ultra 7 155H
54.2 pt
Average Intel Core Ultra 5 125H
 
48.9 pt
Cinebench 2024
CPU Multi Core
Minisforum AtomMan X7 Ti
Intel Core Ultra 9 185H
1067 Points +8%
Acemagic F2A
Intel Core Ultra 7 155H
1022 Points +3%
Asus NUC 14 Pro+
Intel Core Ultra 9 185H
991 Points
Aoostar GEM12
AMD Ryzen 7 8845HS
933 Points -6%
Geekom GT1 Mega
Intel Core Ultra 9 185H
924 Points -7%
Geekom AX8 Pro
AMD Ryzen 9 8945H
852 Points -14%
Average Intel Core Ultra 5 125H
  (331 - 815, n=5)
638 Points -36%
CPU Single Core
Minisforum AtomMan X7 Ti
Intel Core Ultra 9 185H
110 Points +3%
Aoostar GEM12
AMD Ryzen 7 8845HS
107 Points 0%
Geekom AX8 Pro
AMD Ryzen 9 8945H
107 Points 0%
Geekom GT1 Mega
Intel Core Ultra 9 185H
107 Points 0%
Asus NUC 14 Pro+
Intel Core Ultra 9 185H
107 Points
Acemagic F2A
Intel Core Ultra 7 155H
106 Points -1%
Average Intel Core Ultra 5 125H
  (97 - 102.2, n=5)
100.2 Points -6%
Cinebench R23
Multi Core
Geekom GT1 Mega
Intel Core Ultra 9 185H
18608 Points +6%
Acemagic F2A
Intel Core Ultra 7 155H
18497 Points +5%
Minisforum AtomMan X7 Ti
Intel Core Ultra 9 185H
18016 Points +2%
Asus NUC 14 Pro+
Intel Core Ultra 9 185H
17615 Points
Aoostar GEM12
AMD Ryzen 7 8845HS
16130 Points -8%
Geekom AX8 Pro
AMD Ryzen 9 8945H
15516 Points -12%
Average Intel Core Ultra 5 125H
  (9194 - 14564, n=6)
12308 Points -30%
Single Core
Minisforum AtomMan X7 Ti
Intel Core Ultra 9 185H
1851 Points +5%
Geekom AX8 Pro
AMD Ryzen 9 8945H
1808 Points +2%
Aoostar GEM12
AMD Ryzen 7 8845HS
1783 Points +1%
Geekom GT1 Mega
Intel Core Ultra 9 185H
1774 Points +1%
Acemagic F2A
Intel Core Ultra 7 155H
1771 Points 0%
Asus NUC 14 Pro+
Intel Core Ultra 9 185H
1764 Points
Average Intel Core Ultra 5 125H
  (1549 - 1735, n=6)
1668 Points -5%
Cinebench R20
CPU (Single Core)
Minisforum AtomMan X7 Ti
Intel Core Ultra 9 185H
715 Points +2%
Geekom AX8 Pro
AMD Ryzen 9 8945H
703 Points 0%
Asus NUC 14 Pro+
Intel Core Ultra 9 185H
702 Points
Geekom GT1 Mega
Intel Core Ultra 9 185H
696 Points -1%
Aoostar GEM12
AMD Ryzen 7 8845HS
691 Points -2%
Acemagic F2A
Intel Core Ultra 7 155H
679 Points -3%
Average Intel Core Ultra 5 125H
  (622 - 664, n=6)
643 Points -8%
CPU (Multi Core)
Minisforum AtomMan X7 Ti
Intel Core Ultra 9 185H
7196 Points +3%
Geekom GT1 Mega
Intel Core Ultra 9 185H
7192 Points +3%
Acemagic F2A
Intel Core Ultra 7 155H
7188 Points +3%
Asus NUC 14 Pro+
Intel Core Ultra 9 185H
6997 Points
Aoostar GEM12
AMD Ryzen 7 8845HS
6346 Points -9%
Geekom AX8 Pro
AMD Ryzen 9 8945H
6153 Points -12%
Average Intel Core Ultra 5 125H
  (3673 - 5618, n=6)
4766 Points -32%
Cinebench R15
CPU Single 64Bit
Geekom AX8 Pro
AMD Ryzen 9 8945H
284 Points +8%
Aoostar GEM12
AMD Ryzen 7 8845HS
279 Points +6%
Minisforum AtomMan X7 Ti
Intel Core Ultra 9 185H
268 Points +2%
Geekom GT1 Mega
Intel Core Ultra 9 185H
262 Points 0%
Asus NUC 14 Pro+
Intel Core Ultra 9 185H
262 Points
Acemagic F2A
Intel Core Ultra 7 155H
258 Points -2%
Average Intel Core Ultra 5 125H
  (235 - 251, n=6)
244 Points -7%
CPU Multi 64Bit
Asus NUC 14 Pro+
Intel Core Ultra 9 185H
2863 Points
Geekom GT1 Mega
Intel Core Ultra 9 185H
2794 Points -2%
Minisforum AtomMan X7 Ti
Intel Core Ultra 9 185H
2746 Points -4%
Acemagic F2A
Intel Core Ultra 7 155H
2738 Points -4%
Aoostar GEM12
AMD Ryzen 7 8845HS
2537 Points -11%
Geekom AX8 Pro
AMD Ryzen 9 8945H
2521 Points -12%
Average Intel Core Ultra 5 125H
  (1700 - 2245, n=6)
1983 Points -31%
Cinebench R11.5
CPU Single 64Bit
Aoostar GEM12
AMD Ryzen 7 8845HS
3.32 Points +5%
Geekom AX8 Pro
AMD Ryzen 9 8945H
3.28 Points +4%
Minisforum AtomMan X7 Ti
Intel Core Ultra 9 185H
3.27 Points +4%
Asus NUC 14 Pro+
Intel Core Ultra 9 185H
3.15 Points
Acemagic F2A
Intel Core Ultra 7 155H
3.13 Points -1%
Geekom GT1 Mega
Intel Core Ultra 9 185H
3.13 Points -1%
Average Intel Core Ultra 5 125H
  (2.86 - 3.03, n=4)
2.94 Points -7%
CPU Multi 64Bit
Asus NUC 14 Pro+
Intel Core Ultra 9 185H
34.81 Points
Geekom GT1 Mega
Intel Core Ultra 9 185H
34.34 Points -1%
Minisforum AtomMan X7 Ti
Intel Core Ultra 9 185H
33.95 Points -2%
Acemagic F2A
Intel Core Ultra 7 155H
33.49 Points -4%
Aoostar GEM12
AMD Ryzen 7 8845HS
29.76 Points -15%
Geekom AX8 Pro
AMD Ryzen 9 8945H
29.14 Points -16%
Average Intel Core Ultra 5 125H
  (21.9 - 27, n=4)
25.6 Points -26%
Cinebench R10
Rendering Single CPUs 64Bit
Geekom AX8 Pro
AMD Ryzen 9 8945H
14451 Points +4%
Minisforum AtomMan X7 Ti
Intel Core Ultra 9 185H
14374 Points +3%
Aoostar GEM12
AMD Ryzen 7 8845HS
14163 Points +2%
Geekom GT1 Mega
Intel Core Ultra 9 185H
13997 Points +1%
Acemagic F2A
Intel Core Ultra 7 155H
13938 Points 0%
Asus NUC 14 Pro+
Intel Core Ultra 9 185H
13892 Points
Average Intel Core Ultra 5 125H
  (12858 - 13281, n=2)
13070 Points -6%
Rendering Multiple CPUs 64Bit
Acemagic F2A
Intel Core Ultra 7 155H
95005 Points +3%
Asus NUC 14 Pro+
Intel Core Ultra 9 185H
92183 Points
Geekom GT1 Mega
Intel Core Ultra 9 185H
91553 Points -1%
Minisforum AtomMan X7 Ti
Intel Core Ultra 9 185H
88902 Points -4%
Aoostar GEM12
AMD Ryzen 7 8845HS
85872 Points -7%
Geekom AX8 Pro
AMD Ryzen 9 8945H
84253 Points -9%
Average Intel Core Ultra 5 125H
  (78788 - 78817, n=2)
78803 Points -15%
Blender - v2.79 BMW27 CPU
Average Intel Core Ultra 5 125H
  (228 - 364, n=6)
285 Seconds * -55%
Geekom AX8 Pro
AMD Ryzen 9 8945H
206 Seconds * -12%
Aoostar GEM12
AMD Ryzen 7 8845HS
197 Seconds * -7%
Geekom GT1 Mega
Intel Core Ultra 9 185H
191 Seconds * -4%
Asus NUC 14 Pro+
Intel Core Ultra 9 185H
184 Seconds *
Acemagic F2A
Intel Core Ultra 7 155H
178 Seconds * +3%
Minisforum AtomMan X7 Ti
Intel Core Ultra 9 185H
171 Seconds * +7%
wPrime 2.10
32m
Average Intel Core Ultra 5 125H
  (4.11 - 9.5, n=3)
6.03 s * -77%
Acemagic F2A
Intel Core Ultra 7 155H
3.523 s * -3%
Asus NUC 14 Pro+
Intel Core Ultra 9 185H
3.411 s *
Geekom GT1 Mega
Intel Core Ultra 9 185H
3.271 s * +4%
Minisforum AtomMan X7 Ti
Intel Core Ultra 9 185H
3.254 s * +5%
Aoostar GEM12
AMD Ryzen 7 8845HS
2.703 s * +21%
Geekom AX8 Pro
AMD Ryzen 9 8945H
2.688 s * +21%
1024m
Minisforum AtomMan X7 Ti
Intel Core Ultra 9 185H
441.275 s * -405%
Average Intel Core Ultra 5 125H
  (149 - 297, n=3)
231 s * -164%
Geekom GT1 Mega
Intel Core Ultra 9 185H
165.075 s * -89%
Acemagic F2A
Intel Core Ultra 7 155H
139.617 s * -60%
Aoostar GEM12
AMD Ryzen 7 8845HS
98.896 s * -13%
Asus NUC 14 Pro+
Intel Core Ultra 9 185H
87.408 s *
Geekom AX8 Pro
AMD Ryzen 9 8945H
74.917 s * +14%
X264 HD Benchmark 4.0
Pass 1
Geekom GT1 Mega
Intel Core Ultra 9 185H
336.5 (329min - 346max) fps +6%
Minisforum AtomMan X7 Ti
Intel Core Ultra 9 185H
335.5 (329min - 340max) fps +6%
Acemagic F2A
Intel Core Ultra 7 155H
325 (323min - 328max) fps +3%
Asus NUC 14 Pro+
Intel Core Ultra 9 185H
317 (310min - 328max) fps
Average Intel Core Ultra 5 125H
  (305 - 309, n=3)
306 fps -3%
Geekom AX8 Pro
AMD Ryzen 9 8945H
300 (299min - 301max) fps -5%
Aoostar GEM12
AMD Ryzen 7 8845HS
289 (286min - 292max) fps -9%
Pass 2
Geekom GT1 Mega
Intel Core Ultra 9 185H
161.5 (159.8min - 163.8max) fps +5%
Minisforum AtomMan X7 Ti
Intel Core Ultra 9 185H
158.2 (157.4min - 158.8max) fps +3%
Acemagic F2A
Intel Core Ultra 7 155H
154.15 (153.8min - 154.3max) fps 0%
Asus NUC 14 Pro+
Intel Core Ultra 9 185H
153.6 (147.8min - 162.3max) fps
Aoostar GEM12
AMD Ryzen 7 8845HS
143.7 (143min - 145.2max) fps -6%
Geekom AX8 Pro
AMD Ryzen 9 8945H
141.2 (141min - 143.9max) fps -8%
Average Intel Core Ultra 5 125H
  (129.6 - 134, n=3)
132 fps -14%
WinRAR - Result
Geekom GT1 Mega
Intel Core Ultra 9 185H
8563 KB/s +10%
Minisforum AtomMan X7 Ti
Intel Core Ultra 9 185H
7940 KB/s +2%
Average Intel Core Ultra 5 125H
  (5594 - 13080, n=4)
7773 KB/s 0%
Asus NUC 14 Pro+
Intel Core Ultra 9 185H
7763 KB/s
Geekom AX8 Pro
AMD Ryzen 9 8945H
7744 KB/s 0%
Acemagic F2A
Intel Core Ultra 7 155H
7723 KB/s -1%
Aoostar GEM12
AMD Ryzen 7 8845HS
7327 KB/s -6%
TrueCrypt
AES Mean 100MB
Geekom AX8 Pro
AMD Ryzen 9 8945H
14.5 GB/s +20%
Aoostar GEM12
AMD Ryzen 7 8845HS
14.4 GB/s +19%
Asus NUC 14 Pro+
Intel Core Ultra 9 185H
12.1 GB/s
Minisforum AtomMan X7 Ti
Intel Core Ultra 9 185H
11.3 GB/s -7%
Geekom GT1 Mega
Intel Core Ultra 9 185H
11 GB/s -9%
Acemagic F2A
Intel Core Ultra 7 155H
10.6 GB/s -12%
Average Intel Core Ultra 5 125H
  (8.8 - 9, n=4)
8.93 GB/s -26%
Twofish Mean 100MB
Asus NUC 14 Pro+
Intel Core Ultra 9 185H
2.3 GB/s
Geekom AX8 Pro
AMD Ryzen 9 8945H
2.1 GB/s -9%
Aoostar GEM12
AMD Ryzen 7 8845HS
2 GB/s -13%
Geekom GT1 Mega
Intel Core Ultra 9 185H
1.9 GB/s -17%
Minisforum AtomMan X7 Ti
Intel Core Ultra 9 185H
1.8 GB/s -22%
Acemagic F2A
Intel Core Ultra 7 155H
1.7 GB/s -26%
Average Intel Core Ultra 5 125H
  (1.2 - 1.4, n=4)
1.35 GB/s -41%
Serpent Mean 100MB
Aoostar GEM12
AMD Ryzen 7 8845HS
1.3 GB/s 0%
Geekom AX8 Pro
AMD Ryzen 9 8945H
1.3 GB/s 0%
Asus NUC 14 Pro+
Intel Core Ultra 9 185H
1.3 GB/s
Minisforum AtomMan X7 Ti
Intel Core Ultra 9 185H
1.1 GB/s -15%
Geekom GT1 Mega
Intel Core Ultra 9 185H
1.1 GB/s -15%
Acemagic F2A
Intel Core Ultra 7 155H
1 GB/s -23%
Average Intel Core Ultra 5 125H
  (0.817 - 0.869, n=4)
0.843 GB/s -35%
Geekbench 5.5
Multi-Core
Geekom GT1 Mega
Intel Core Ultra 9 185H
13763 Points +1%
Asus NUC 14 Pro+
Intel Core Ultra 9 185H
13566 Points
Minisforum AtomMan X7 Ti
Intel Core Ultra 9 185H
13392 Points -1%
Acemagic F2A
Intel Core Ultra 7 155H
12662 Points -7%
Aoostar GEM12
AMD Ryzen 7 8845HS
12143 Points -10%
Geekom AX8 Pro
AMD Ryzen 9 8945H
11980 Points -12%
Average Intel Core Ultra 5 125H
  (9696 - 10856, n=6)
10408 Points -23%
Single-Core
Geekom AX8 Pro
AMD Ryzen 9 8945H
1994 Points +14%
Aoostar GEM12
AMD Ryzen 7 8845HS
1958 Points +12%
Minisforum AtomMan X7 Ti
Intel Core Ultra 9 185H
1856 Points +6%
Geekom GT1 Mega
Intel Core Ultra 9 185H
1852 Points +6%
Acemagic F2A
Intel Core Ultra 7 155H
1746 Points 0%
Asus NUC 14 Pro+
Intel Core Ultra 9 185H
1743 Points
Average Intel Core Ultra 5 125H
  (1593 - 1699, n=6)
1660 Points -5%
Geekbench 5.0
5.0 Multi-Core
Geekom GT1 Mega
Intel Core Ultra 9 185H
13822 Points +1%
Asus NUC 14 Pro+
Intel Core Ultra 9 185H
13736 Points
Minisforum AtomMan X7 Ti
Intel Core Ultra 9 185H
13228 Points -4%
Acemagic F2A
Intel Core Ultra 7 155H
12438 Points -9%
Aoostar GEM12
AMD Ryzen 7 8845HS
12086 Points -12%
Geekom AX8 Pro
AMD Ryzen 9 8945H
11804 Points -14%
Average Intel Core Ultra 5 125H
  (10676 - 10747, n=2)
10712 Points -22%
5.0 Single-Core
Geekom AX8 Pro
AMD Ryzen 9 8945H
1907 Points +13%
Aoostar GEM12
AMD Ryzen 7 8845HS
1900 Points +12%
Minisforum AtomMan X7 Ti
Intel Core Ultra 9 185H
1821 Points +7%
Geekom GT1 Mega
Intel Core Ultra 9 185H
1797 Points +6%
Acemagic F2A
Intel Core Ultra 7 155H
1708 Points +1%
Asus NUC 14 Pro+
Intel Core Ultra 9 185H
1695 Points
Average Intel Core Ultra 5 125H
  (1596 - 1659, n=2)
1628 Points -4%
Geekbench 4.4
64 Bit Single-Core Score
Geekom AX8 Pro
AMD Ryzen 9 8945H
8140 Points +16%
Aoostar GEM12
AMD Ryzen 7 8845HS
8034 Points +14%
Minisforum AtomMan X7 Ti
Intel Core Ultra 9 185H
7602 Points +8%
Geekom GT1 Mega
Intel Core Ultra 9 185H
7516 Points +7%
Asus NUC 14 Pro+
Intel Core Ultra 9 185H
7040 Points
Acemagic F2A
Intel Core Ultra 7 155H
6927 Points -2%
Average Intel Core Ultra 5 125H
  (6734 - 6964, n=3)
6816 Points -3%
64 Bit Multi-Core Score
Geekom GT1 Mega
Intel Core Ultra 9 185H
49924 Points 0%
Asus NUC 14 Pro+
Intel Core Ultra 9 185H
49826 Points
Minisforum AtomMan X7 Ti
Intel Core Ultra 9 185H
47960 Points -4%
Geekom AX8 Pro
AMD Ryzen 9 8945H
47917 Points -4%
Aoostar GEM12
AMD Ryzen 7 8845HS
47777 Points -4%
Acemagic F2A
Intel Core Ultra 7 155H
45250 Points -9%
Average Intel Core Ultra 5 125H
  (38648 - 38793, n=3)
38726 Points -22%
3DMark 11 - 1280x720 Performance Physics
Asus NUC 14 Pro+
Intel Core Ultra 9 185H
22681 Points
Geekom AX8 Pro
AMD Ryzen 9 8945H
22340 Points -2%
Minisforum AtomMan X7 Ti
Intel Core Ultra 9 185H
21875 Points -4%
Aoostar GEM12
AMD Ryzen 7 8845HS
21762 Points -4%
Acemagic F2A
Intel Core Ultra 7 155H
20846 Points -8%
Geekom GT1 Mega
Intel Core Ultra 9 185H
18130 Points -20%
Average Intel Core Ultra 5 125H
  (12766 - 17992, n=8)
16347 Points -28%
7-Zip 18.03
7z b 4
Minisforum AtomMan X7 Ti
Intel Core Ultra 9 185H
71934 MIPS +3%
Geekom GT1 Mega
Intel Core Ultra 9 185H
71050 MIPS +2%
Aoostar GEM12
AMD Ryzen 7 8845HS
70733 MIPS +1%
Asus NUC 14 Pro+
Intel Core Ultra 9 185H
69720 MIPS
Geekom AX8 Pro
AMD Ryzen 9 8945H
66557 MIPS -5%
Acemagic F2A
Intel Core Ultra 7 155H
66438 MIPS -5%
Average Intel Core Ultra 5 125H
  (0 - 0, n=2)
0 MIPS -100%
7z b 4 -mmt1
Geekom AX8 Pro
AMD Ryzen 9 8945H
6691 MIPS +17%
Aoostar GEM12
AMD Ryzen 7 8845HS
6644 MIPS +16%
Asus NUC 14 Pro+
Intel Core Ultra 9 185H
5713 MIPS
Geekom GT1 Mega
Intel Core Ultra 9 185H
5657 MIPS -1%
Minisforum AtomMan X7 Ti
Intel Core Ultra 9 185H
5560 MIPS -3%
Acemagic F2A
Intel Core Ultra 7 155H
5485 MIPS -4%
Average Intel Core Ultra 5 125H
  (4663 - 5136, n=6)
4948 MIPS -13%
HWBOT x265 Benchmark v2.2 - 4k Preset
Minisforum AtomMan X7 Ti
Intel Core Ultra 9 185H
20.9 fps +6%
Geekom AX8 Pro
AMD Ryzen 9 8945H
20.6 fps +5%
Aoostar GEM12
AMD Ryzen 7 8845HS
20.5 fps +4%
Geekom GT1 Mega
Intel Core Ultra 9 185H
20.2 fps +3%
Asus NUC 14 Pro+
Intel Core Ultra 9 185H
19.7 fps
Acemagic F2A
Intel Core Ultra 7 155H
19.6 fps -1%
Average Intel Core Ultra 5 125H
  (9.7 - 16.7, n=6)
13.4 fps -32%
R Benchmark 2.5 - Overall mean
Average Intel Core Ultra 5 125H
  (0.4898 - 0.53, n=6)
0.506 sec * -12%
Acemagic F2A
Intel Core Ultra 7 155H
0.4652 sec * -3%
Minisforum AtomMan X7 Ti
Intel Core Ultra 9 185H
0.4627 sec * -3%
Geekom AX8 Pro
AMD Ryzen 9 8945H
0.4576 sec * -2%
Geekom GT1 Mega
Intel Core Ultra 9 185H
0.4571 sec * -1%
Asus NUC 14 Pro+
Intel Core Ultra 9 185H
0.4504 sec *
Aoostar GEM12
AMD Ryzen 7 8845HS
0.4392 sec * +2%
LibreOffice - 20 Documents To PDF
Average Intel Core Ultra 5 125H
  (42.7 - 70.9, n=6)
53.4 s * -3%
Geekom GT1 Mega
Intel Core Ultra 9 185H
52.1 s * -1%
Asus NUC 14 Pro+
Intel Core Ultra 9 185H
51.8 s *
Geekom AX8 Pro
AMD Ryzen 9 8945H
49.8 s * +4%
Minisforum AtomMan X7 Ti
Intel Core Ultra 9 185H
49.5 s * +4%
Aoostar GEM12
AMD Ryzen 7 8845HS
47.5 s * +8%
Acemagic F2A
Intel Core Ultra 7 155H
44.5 s * +14%
WebXPRT 3 - Overall
Geekom AX8 Pro
AMD Ryzen 9 8945H
309 Points +15%
Aoostar GEM12
AMD Ryzen 7 8845HS
300 Points +12%
Geekom GT1 Mega
Intel Core Ultra 9 185H
286 Points +7%
Acemagic F2A
Intel Core Ultra 7 155H
276 Points +3%
Asus NUC 14 Pro+
Intel Core Ultra 9 185H
268 Points
Minisforum AtomMan X7 Ti
Intel Core Ultra 9 185H
264 Points -1%
Average Intel Core Ultra 5 125H
  (245 - 263, n=6)
255 Points -5%
Mozilla Kraken 1.1 - Total
Average Intel Core Ultra 5 125H
  (560 - 595, n=6)
575 ms * -9%
Acemagic F2A
Intel Core Ultra 7 155H
535 ms * -1%
Minisforum AtomMan X7 Ti
Intel Core Ultra 9 185H
532 ms * -1%
Asus NUC 14 Pro+
Intel Core Ultra 9 185H
528 ms *
Geekom GT1 Mega
Intel Core Ultra 9 185H
518 ms * +2%
Aoostar GEM12
AMD Ryzen 7 8845HS
517 ms * +2%
Geekom AX8 Pro
AMD Ryzen 9 8945H
506 ms * +4%
3DMark
1920x1080 Fire Strike Physics
Asus NUC 14 Pro+
Intel Core Ultra 9 185H
30340 Points
Geekom AX8 Pro
AMD Ryzen 9 8945H
27363 Points -10%
Aoostar GEM12
AMD Ryzen 7 8845HS
26194 Points -14%
Minisforum AtomMan X7 Ti
Intel Core Ultra 9 185H
26038 Points -14%
Acemagic F2A
Intel Core Ultra 7 155H
25043 Points -17%
Geekom GT1 Mega
Intel Core Ultra 9 185H
24366 Points -20%
Average Intel Core Ultra 5 125H
  (16291 - 22978, n=8)
20865 Points -31%
2560x1440 Time Spy CPU
Minisforum AtomMan X7 Ti
Intel Core Ultra 9 185H
11481 Points 0%
Asus NUC 14 Pro+
Intel Core Ultra 9 185H
11428 Points
Geekom AX8 Pro
AMD Ryzen 9 8945H
10844 Points -5%
Aoostar GEM12
AMD Ryzen 7 8845HS
10824 Points -5%
Acemagic F2A
Intel Core Ultra 7 155H
10014 Points -12%
Geekom GT1 Mega
Intel Core Ultra 9 185H
9687 Points -15%
Average Intel Core Ultra 5 125H
  (6216 - 9182, n=8)
8210 Points -28%
Super Pi mod 1.5 XS 1M - 1M
Average Intel Core Ultra 5 125H
  (7.4 - 7.74, n=4)
7.52 s * -10%
Aoostar GEM12
AMD Ryzen 7 8845HS
7.331 s * -7%
Acemagic F2A
Intel Core Ultra 7 155H
7.168 s * -5%
Geekom AX8 Pro
AMD Ryzen 9 8945H
6.962 s * -2%
Asus NUC 14 Pro+
Intel Core Ultra 9 185H
6.84 s *
Geekom GT1 Mega
Intel Core Ultra 9 185H
6.762 s * +1%
Minisforum AtomMan X7 Ti
Intel Core Ultra 9 185H
6.751 s * +1%
Super Pi mod 1.5 XS 2M - 2M
Aoostar GEM12
AMD Ryzen 7 8845HS
18.138 s * -23%
Geekom AX8 Pro
AMD Ryzen 9 8945H
17.404 s * -18%
Average Intel Core Ultra 5 125H
  (16.4 - 17, n=4)
16.6 s * -12%
Acemagic F2A
Intel Core Ultra 7 155H
16.125 s * -9%
Geekom GT1 Mega
Intel Core Ultra 9 185H
14.928 s * -1%
Minisforum AtomMan X7 Ti
Intel Core Ultra 9 185H
14.879 s * -1%
Asus NUC 14 Pro+
Intel Core Ultra 9 185H
14.786 s *
Affinity Photo 2 - Combined (Multi CPU)
Minisforum AtomMan X7 Ti
Intel Core Ultra 9 185H
813 Points +6%
Geekom GT1 Mega
Intel Core Ultra 9 185H
792 Points +3%
Acemagic F2A
Intel Core Ultra 7 155H
770 Points 0%
Asus NUC 14 Pro+
Intel Core Ultra 9 185H
768 Points
Aoostar GEM12
AMD Ryzen 7 8845HS
633 Points -18%
Average Intel Core Ultra 5 125H
  (594 - 615, n=2)
605 Points -21%
Geekom AX8 Pro
AMD Ryzen 9 8945H
603 Points -21%

* ... más pequeño es mejor

Cinebench R10 Rendering Single 32Bit
9767
Cinebench R10 Shading 64Bit
19713 Points
Cinebench R10 Rendering Multiple CPUs 64Bit
92183 Points
Cinebench R10 Rendering Single CPUs 64Bit
13892 Points
Cinebench R10 Shading 32Bit
18259
Cinebench R10 Rendering Multiple CPUs 32Bit
67204
Cinebench R11.5 CPU Single 32Bit
2.72 Points
Cinebench R11.5 CPU Multi 32Bit
30.69 Points
Cinebench R11.5 OpenGL 32Bit
111.95 fps
Cinebench R11.5 CPU Single 64Bit
3.15 Points
Cinebench R11.5 CPU Multi 64Bit
34.81 Points
Cinebench R11.5 OpenGL 64Bit
115.68 fps
Cinebench R15 CPU Single 64Bit
262 Points
Cinebench R15 CPU Multi 64Bit
2863 Points
Cinebench R15 Ref. Match 64Bit
97.8 %
Cinebench R15 OpenGL 64Bit
160.26 fps
Cinebench R20 CPU (Single Core)
702 Points
Cinebench R20 CPU (Multi Core)
6997 Points
Cinebench R23 Multi Core
17615 Points
Cinebench R23 Single Core
1764 Points
Cinebench 2024 CPU Single Core
107 Points
Cinebench 2024 CPU Multi Core
991 Points
ayuda
Performance Rating
Geekom AX8 Pro
AMD Ryzen 9 8945H, Radeon 780M
94.8 pt
Aoostar GEM12
AMD Ryzen 7 8845HS, Radeon 780M
92.3 pt
Minisforum AtomMan X7 Ti
Intel Core Ultra 9 185H, Arc 8-Core
82.5 pt
Acemagic F2A
Intel Core Ultra 7 155H, Arc 8-Core
78.5 pt
Geekom GT1 Mega
Intel Core Ultra 9 185H, Arc 8-Core
75.8 pt
Asus NUC 14 Pro+
Intel Core Ultra 9 185H, Arc 8-Core
73.1 pt
Average of class Mini PC
 
55.7 pt
AIDA64 / FP32 Ray-Trace
Aoostar GEM12
AMD Ryzen 7 8845HS, Radeon 780M
25916 KRay/s +66%
Geekom AX8 Pro
AMD Ryzen 9 8945H, Radeon 780M
24531 KRay/s +57%
Acemagic F2A
Intel Core Ultra 7 155H, Arc 8-Core
17544 KRay/s +13%
Minisforum AtomMan X7 Ti
Intel Core Ultra 9 185H, Arc 8-Core
17312 KRay/s +11%
Asus NUC 14 Pro+
Intel Core Ultra 9 185H, Arc 8-Core
15589 KRay/s
Geekom GT1 Mega
Intel Core Ultra 9 185H, Arc 8-Core
15184 KRay/s -3%
Average of class Mini PC
  (561 - 51004, n=118, last 2 years)
12276 KRay/s -21%
AIDA64 / FPU Julia
Aoostar GEM12
AMD Ryzen 7 8845HS, Radeon 780M
109747 Points +36%
Geekom AX8 Pro
AMD Ryzen 9 8945H, Radeon 780M
106518 Points +32%
Minisforum AtomMan X7 Ti
Intel Core Ultra 9 185H, Arc 8-Core
91112 Points +13%
Acemagic F2A
Intel Core Ultra 7 155H, Arc 8-Core
88829 Points +10%
Asus NUC 14 Pro+
Intel Core Ultra 9 185H, Arc 8-Core
80501 Points
Geekom GT1 Mega
Intel Core Ultra 9 185H, Arc 8-Core
78346 Points -3%
Average of class Mini PC
  (3604 - 214250, n=118, last 2 years)
62123 Points -23%
AIDA64 / CPU SHA3
Aoostar GEM12
AMD Ryzen 7 8845HS, Radeon 780M
4695 MB/s +20%
Geekom AX8 Pro
AMD Ryzen 9 8945H, Radeon 780M
4684 MB/s +20%
Minisforum AtomMan X7 Ti
Intel Core Ultra 9 185H, Arc 8-Core
4343 MB/s +11%
Acemagic F2A
Intel Core Ultra 7 155H, Arc 8-Core
4246 MB/s +9%
Asus NUC 14 Pro+
Intel Core Ultra 9 185H, Arc 8-Core
3909 MB/s
Geekom GT1 Mega
Intel Core Ultra 9 185H, Arc 8-Core
3753 MB/s -4%
Average of class Mini PC
  (225 - 9399, n=118, last 2 years)
2738 MB/s -30%
AIDA64 / CPU Queen
Aoostar GEM12
AMD Ryzen 7 8845HS, Radeon 780M
116083 Points +23%
Geekom AX8 Pro
AMD Ryzen 9 8945H, Radeon 780M
114586 Points +21%
Asus NUC 14 Pro+
Intel Core Ultra 9 185H, Arc 8-Core
94503 Points
Acemagic F2A
Intel Core Ultra 7 155H, Arc 8-Core
89748 Points -5%
Minisforum AtomMan X7 Ti
Intel Core Ultra 9 185H, Arc 8-Core
87291 Points -8%
Geekom GT1 Mega
Intel Core Ultra 9 185H, Arc 8-Core
86969 Points -8%
Average of class Mini PC
  (8172 - 184747, n=118, last 2 years)
77819 Points -18%
AIDA64 / FPU SinJulia
Aoostar GEM12
AMD Ryzen 7 8845HS, Radeon 780M
14876 Points +43%
Geekom AX8 Pro
AMD Ryzen 9 8945H, Radeon 780M
14631 Points +41%
Minisforum AtomMan X7 Ti
Intel Core Ultra 9 185H, Arc 8-Core
10759 Points +3%
Asus NUC 14 Pro+
Intel Core Ultra 9 185H, Arc 8-Core
10406 Points
Geekom GT1 Mega
Intel Core Ultra 9 185H, Arc 8-Core
10289 Points -1%
Acemagic F2A
Intel Core Ultra 7 155H, Arc 8-Core
10247 Points -2%
Average of class Mini PC
  (408 - 29064, n=118, last 2 years)
8454 Points -19%
AIDA64 / FPU Mandel
Aoostar GEM12
AMD Ryzen 7 8845HS, Radeon 780M
58597 Points +48%
Geekom AX8 Pro
AMD Ryzen 9 8945H, Radeon 780M
56505 Points +43%
Acemagic F2A
Intel Core Ultra 7 155H, Arc 8-Core
45718 Points +16%
Minisforum AtomMan X7 Ti
Intel Core Ultra 9 185H, Arc 8-Core
44874 Points +14%
Asus NUC 14 Pro+
Intel Core Ultra 9 185H, Arc 8-Core
39506 Points
Geekom GT1 Mega
Intel Core Ultra 9 185H, Arc 8-Core
38945 Points -1%
Average of class Mini PC
  (1958 - 113499, n=118, last 2 years)
32406 Points -18%
AIDA64 / CPU AES
Geekom AX8 Pro
AMD Ryzen 9 8945H, Radeon 780M
163032 MB/s +117%
Minisforum AtomMan X7 Ti
Intel Core Ultra 9 185H, Arc 8-Core
154066 MB/s +105%
Acemagic F2A
Intel Core Ultra 7 155H, Arc 8-Core
144741 MB/s +92%
Geekom GT1 Mega
Intel Core Ultra 9 185H, Arc 8-Core
138481 MB/s +84%
Aoostar GEM12
AMD Ryzen 7 8845HS, Radeon 780M
85572 MB/s +14%
Average of class Mini PC
  (3691 - 325960, n=118, last 2 years)
85412 MB/s +13%
Asus NUC 14 Pro+
Intel Core Ultra 9 185H, Arc 8-Core
75293 MB/s
AIDA64 / CPU ZLib
Minisforum AtomMan X7 Ti
Intel Core Ultra 9 185H, Arc 8-Core
1233 MB/s +7%
Acemagic F2A
Intel Core Ultra 7 155H, Arc 8-Core
1183 MB/s +2%
Geekom GT1 Mega
Intel Core Ultra 9 185H, Arc 8-Core
1181 MB/s +2%
Asus NUC 14 Pro+
Intel Core Ultra 9 185H, Arc 8-Core
1155 MB/s
Aoostar GEM12
AMD Ryzen 7 8845HS, Radeon 780M
1048 MB/s -9%
Geekom AX8 Pro
AMD Ryzen 9 8945H, Radeon 780M
976 MB/s -15%
Average of class Mini PC
  (74.8 - 2039, n=118, last 2 years)
709 MB/s -39%
AIDA64 / FP64 Ray-Trace
Aoostar GEM12
AMD Ryzen 7 8845HS, Radeon 780M
13875 KRay/s +68%
Geekom AX8 Pro
AMD Ryzen 9 8945H, Radeon 780M
13609 KRay/s +65%
Acemagic F2A
Intel Core Ultra 7 155H, Arc 8-Core
9284 KRay/s +12%
Minisforum AtomMan X7 Ti
Intel Core Ultra 9 185H, Arc 8-Core
9270 KRay/s +12%
Asus NUC 14 Pro+
Intel Core Ultra 9 185H, Arc 8-Core
8272 KRay/s
Geekom GT1 Mega
Intel Core Ultra 9 185H, Arc 8-Core
7925 KRay/s -4%
Average of class Mini PC
  (308 - 26952, n=118, last 2 years)
6564 KRay/s -21%
AIDA64 / CPU PhotoWorxx
Geekom GT1 Mega
Intel Core Ultra 9 185H, Arc 8-Core
47032 MPixel/s +4%
Minisforum AtomMan X7 Ti
Intel Core Ultra 9 185H, Arc 8-Core
45560 MPixel/s +1%
Asus NUC 14 Pro+
Intel Core Ultra 9 185H, Arc 8-Core
45293 MPixel/s
Aoostar GEM12
AMD Ryzen 7 8845HS, Radeon 780M
40245 MPixel/s -11%
Geekom AX8 Pro
AMD Ryzen 9 8945H, Radeon 780M
40114 MPixel/s -11%
Acemagic F2A
Intel Core Ultra 7 155H, Arc 8-Core
33092 MPixel/s -27%
Average of class Mini PC
  (4408 - 50500, n=118, last 2 years)
27624 MPixel/s -39%

Cinebench R15 Prueba multi continua

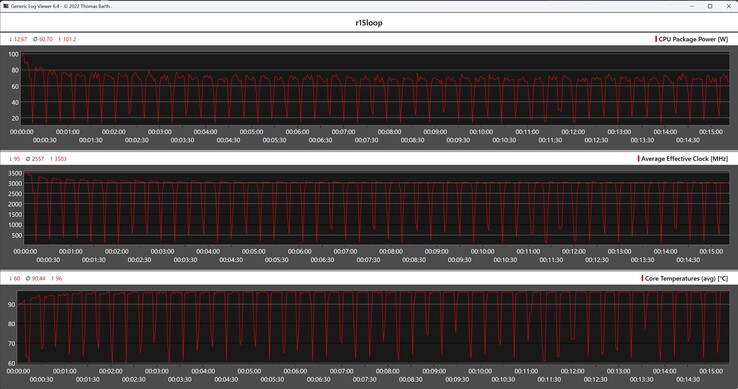
El alto límite de rendimiento del Asus NUC 14 Pro+ es más notable al comienzo de la prueba de resistencia Cinebench R15. Durante la segunda ejecución, se produce una ligera caída del rendimiento, pero esta pérdida se estabiliza y el dispositivo acaba finalmente la prueba de carga con una puntuación media de 2.588 puntos. Sin embargo, el Asus se queda corto cuando se compara con el Minisforum AtomMan X7 Ti y el Acemagic F2Alo que significa que nuestra muestra de prueba se asegura el tercer puesto en esta comparación.

Métricas de la CPU durante el bucle Cinebench R15
01503004506007509001050120013501500165018001950210022502400255027002850Tooltip
Asus NUC 14 Pro+ Intel Core Ultra 9 185H, Intel Core Ultra 9 185H: Ø2588 (2519.69-2910.57)
Aoostar GEM12 AMD Ryzen 7 8845HS, AMD Ryzen 7 8845HS: Ø2530 (2503.13-2552.81)
Geekom GT1 Mega Intel Core Ultra 9 185H, Intel Core Ultra 9 185H: Ø2442 (2286.63-2795.05)
Geekom AX8 Pro AMD Ryzen 9 8945H, AMD Ryzen 9 8945H: Ø2223 (2100.4-2438.43)
Minisforum AtomMan X7 Ti Intel Core Ultra 9 185H, Intel Core Ultra 9 185H: Ø2784 (2721.64-2831.86)
Acemagic F2A Intel Core Ultra 7 155H, Intel Core Ultra 7 155H: Ø2759 (2690.7-2800.92)

Rendimiento del sistema

El Asus NUC 14 Pro+ ilustra claramente que, aunque un buen resultado en las pruebas de rendimiento de la CPU es impresionante, no siempre se traduce en un rendimiento igual de alto en las pruebas del sistema. Las diferencias con competidores más rápidos son relativamente pequeñas, lo que concuerda con nuestra impresión subjetiva durante el periodo de pruebas. Equipado con el Intel Core Ultra 9 185Hel Asus NUC 14 Pro+ ofrece un rendimiento sobresaliente que permanece en gran medida desaprovechado en el uso diario.

PCMark 10 / Score
Geekom AX8 Pro, AMD Ryzen 9 8945H
AMD Radeon 780M, Acer N7000
7553 Points +6%
Minisforum AtomMan X7 Ti, Intel Core Ultra 9 185H
Intel Arc 8-Core iGPU, Kingston OM8PGP41024Q-A0
7510 Points +6%
Aoostar GEM12, AMD Ryzen 7 8845HS
AMD Radeon 780M, Crucial P3 Plus CT1000P3PSSD8
7431 Points +5%
Geekom GT1 Mega, Intel Core Ultra 9 185H
Intel Arc 8-Core iGPU, Crucial P3 Plus CT2000P3PSSD8
7232 Points +2%
Acemagic F2A, Intel Core Ultra 7 155H
Intel Arc 8-Core iGPU, Kingston OM8SEP1024Q-A0
7120 Points 0%
Asus NUC 14 Pro+, Intel Core Ultra 9 185H
Intel Arc 8-Core iGPU, Samsung PM9A1a MZVL21T0HDLU
7103 Points
PCMark 10 / Essentials
Geekom AX8 Pro, AMD Ryzen 9 8945H
AMD Radeon 780M, Acer N7000
11227 Points +11%
Acemagic F2A, Intel Core Ultra 7 155H
Intel Arc 8-Core iGPU, Kingston OM8SEP1024Q-A0
11125 Points +10%
Minisforum AtomMan X7 Ti, Intel Core Ultra 9 185H
Intel Arc 8-Core iGPU, Kingston OM8PGP41024Q-A0
11030 Points +9%
Geekom GT1 Mega, Intel Core Ultra 9 185H
Intel Arc 8-Core iGPU, Crucial P3 Plus CT2000P3PSSD8
10824 Points +7%
Aoostar GEM12, AMD Ryzen 7 8845HS
AMD Radeon 780M, Crucial P3 Plus CT1000P3PSSD8
10822 Points +7%
Asus NUC 14 Pro+, Intel Core Ultra 9 185H
Intel Arc 8-Core iGPU, Samsung PM9A1a MZVL21T0HDLU
10135 Points
PCMark 10 / Productivity
Geekom AX8 Pro, AMD Ryzen 9 8945H
AMD Radeon 780M, Acer N7000
10774 Points +19%
Minisforum AtomMan X7 Ti, Intel Core Ultra 9 185H
Intel Arc 8-Core iGPU, Kingston OM8PGP41024Q-A0
10484 Points +16%
Aoostar GEM12, AMD Ryzen 7 8845HS
AMD Radeon 780M, Crucial P3 Plus CT1000P3PSSD8
10482 Points +16%
Asus NUC 14 Pro+, Intel Core Ultra 9 185H
Intel Arc 8-Core iGPU, Samsung PM9A1a MZVL21T0HDLU
9058 Points
Acemagic F2A, Intel Core Ultra 7 155H
Intel Arc 8-Core iGPU, Kingston OM8SEP1024Q-A0
8901 Points -2%
Geekom GT1 Mega, Intel Core Ultra 9 185H
Intel Arc 8-Core iGPU, Crucial P3 Plus CT2000P3PSSD8
8797 Points -3%
CrossMark / Overall
Aoostar GEM12, AMD Ryzen 7 8845HS
AMD Radeon 780M, Crucial P3 Plus CT1000P3PSSD8
1939 Points +13%
Geekom GT1 Mega, Intel Core Ultra 9 185H
Intel Arc 8-Core iGPU, Crucial P3 Plus CT2000P3PSSD8
1888 Points +10%
Geekom AX8 Pro, AMD Ryzen 9 8945H
AMD Radeon 780M, Acer N7000
1865 Points +9%
Acemagic F2A, Intel Core Ultra 7 155H
Intel Arc 8-Core iGPU, Kingston OM8SEP1024Q-A0
1802 Points +5%
Asus NUC 14 Pro+, Intel Core Ultra 9 185H
Intel Arc 8-Core iGPU, Samsung PM9A1a MZVL21T0HDLU
1713 Points
Minisforum AtomMan X7 Ti, Intel Core Ultra 9 185H
Intel Arc 8-Core iGPU, Kingston OM8PGP41024Q-A0
1675 Points -2%
CrossMark / Responsiveness
Geekom GT1 Mega, Intel Core Ultra 9 185H
Intel Arc 8-Core iGPU, Crucial P3 Plus CT2000P3PSSD8
1864 Points +35%
Aoostar GEM12, AMD Ryzen 7 8845HS
AMD Radeon 780M, Crucial P3 Plus CT1000P3PSSD8
1849 Points +34%
Acemagic F2A, Intel Core Ultra 7 155H
Intel Arc 8-Core iGPU, Kingston OM8SEP1024Q-A0
1700 Points +23%
Geekom AX8 Pro, AMD Ryzen 9 8945H
AMD Radeon 780M, Acer N7000
1583 Points +15%
Minisforum AtomMan X7 Ti, Intel Core Ultra 9 185H
Intel Arc 8-Core iGPU, Kingston OM8PGP41024Q-A0
1378 Points 0%
Asus NUC 14 Pro+, Intel Core Ultra 9 185H
Intel Arc 8-Core iGPU, Samsung PM9A1a MZVL21T0HDLU
1378 Points
CrossMark / Creativity
Geekom AX8 Pro, AMD Ryzen 9 8945H
AMD Radeon 780M, Acer N7000
2057 Points +4%
Aoostar GEM12, AMD Ryzen 7 8845HS
AMD Radeon 780M, Crucial P3 Plus CT1000P3PSSD8
2040 Points +3%
Asus NUC 14 Pro+, Intel Core Ultra 9 185H
Intel Arc 8-Core iGPU, Samsung PM9A1a MZVL21T0HDLU
1984 Points
Geekom GT1 Mega, Intel Core Ultra 9 185H
Intel Arc 8-Core iGPU, Crucial P3 Plus CT2000P3PSSD8
1959 Points -1%
Acemagic F2A, Intel Core Ultra 7 155H
Intel Arc 8-Core iGPU, Kingston OM8SEP1024Q-A0
1929 Points -3%
Minisforum AtomMan X7 Ti, Intel Core Ultra 9 185H
Intel Arc 8-Core iGPU, Kingston OM8PGP41024Q-A0
1883 Points -5%
CrossMark / Productivity
Aoostar GEM12, AMD Ryzen 7 8845HS
AMD Radeon 780M, Crucial P3 Plus CT1000P3PSSD8
1872 Points +18%
Geekom GT1 Mega, Intel Core Ultra 9 185H
Intel Arc 8-Core iGPU, Crucial P3 Plus CT2000P3PSSD8
1827 Points +15%
Geekom AX8 Pro, AMD Ryzen 9 8945H
AMD Radeon 780M, Acer N7000
1786 Points +12%
Acemagic F2A, Intel Core Ultra 7 155H
Intel Arc 8-Core iGPU, Kingston OM8SEP1024Q-A0
1717 Points +8%
Asus NUC 14 Pro+, Intel Core Ultra 9 185H
Intel Arc 8-Core iGPU, Samsung PM9A1a MZVL21T0HDLU
1591 Points
Minisforum AtomMan X7 Ti, Intel Core Ultra 9 185H
Intel Arc 8-Core iGPU, Kingston OM8PGP41024Q-A0
1589 Points 0%
AIDA64 / Memory Copy
Geekom GT1 Mega
Intel Core Ultra 9 185H, Arc 8-Core
73624 MB/s +5%
Minisforum AtomMan X7 Ti
Intel Core Ultra 9 185H, Arc 8-Core
71990 MB/s +3%
Asus NUC 14 Pro+
Intel Core Ultra 9 185H, Arc 8-Core
69929 MB/s
Geekom AX8 Pro
AMD Ryzen 9 8945H, Radeon 780M
68924 MB/s -1%
Aoostar GEM12
AMD Ryzen 7 8845HS, Radeon 780M
67777 MB/s -3%
Acemagic F2A
Intel Core Ultra 7 155H, Arc 8-Core
62397 MB/s -11%
Average of class Mini PC
  (6481 - 89287, n=118, last 2 years)
47240 MB/s -32%
AIDA64 / Memory Read
Geekom GT1 Mega
Intel Core Ultra 9 185H, Arc 8-Core
79371 MB/s +4%
Asus NUC 14 Pro+
Intel Core Ultra 9 185H, Arc 8-Core
76074 MB/s
Minisforum AtomMan X7 Ti
Intel Core Ultra 9 185H, Arc 8-Core
75449 MB/s -1%
Acemagic F2A
Intel Core Ultra 7 155H, Arc 8-Core
64323 MB/s -15%
Geekom AX8 Pro
AMD Ryzen 9 8945H, Radeon 780M
61624 MB/s -19%
Aoostar GEM12
AMD Ryzen 7 8845HS, Radeon 780M
61006 MB/s -20%
Average of class Mini PC
  (6914 - 98398, n=118, last 2 years)
47897 MB/s -37%
AIDA64 / Memory Write
Geekom AX8 Pro
AMD Ryzen 9 8945H, Radeon 780M
87138 MB/s +21%
Aoostar GEM12
AMD Ryzen 7 8845HS, Radeon 780M
86677 MB/s +20%
Asus NUC 14 Pro+
Intel Core Ultra 9 185H, Arc 8-Core
72287 MB/s
Geekom GT1 Mega
Intel Core Ultra 9 185H, Arc 8-Core
72187 MB/s 0%
Minisforum AtomMan X7 Ti
Intel Core Ultra 9 185H, Arc 8-Core
70596 MB/s -2%
Acemagic F2A
Intel Core Ultra 7 155H, Arc 8-Core
65057 MB/s -10%
Average of class Mini PC
  (6862 - 98583, n=118, last 2 years)
51663 MB/s -29%
AIDA64 / Memory Latency
Acemagic F2A
Intel Core Ultra 7 155H, Arc 8-Core
149 ns * -23%
Minisforum AtomMan X7 Ti
Intel Core Ultra 9 185H, Arc 8-Core
146.1 ns * -20%
Geekom GT1 Mega
Intel Core Ultra 9 185H, Arc 8-Core
136.7 ns * -13%
Asus NUC 14 Pro+
Intel Core Ultra 9 185H, Arc 8-Core
121.4 ns *
Average of class Mini PC
  (44.9 - 184.8, n=118, last 2 years)
91.8 ns * +24%
Geekom AX8 Pro
AMD Ryzen 9 8945H, Radeon 780M
91.4 ns * +25%
Aoostar GEM12
AMD Ryzen 7 8845HS, Radeon 780M
88.6 ns * +27%

* ... más pequeño es mejor

Rendimiento de la NPU

La NPU (unidad de procesamiento neuronal) es una característica clave del Intel Core Ultra 9 185H, que permite al SoC manejar tareas de IA con una eficiencia excepcional. La potencia sin límites del procesador permite a la NPU rendir al máximo. Para la comparación del rendimiento, utilizamos la prueba de rendimiento UL Procyon AI Interface Benchmark. Sin embargo, una vez más, el Geekom GT1 Mega sigue siendo un fuerte competidor en este aspecto.

UL Procyon for Windows / Overall Score Integer NPU
Geekom GT1 Mega
Intel Core Ultra 9 185H, Arc 8-Core
529 Points +2%
Asus NUC 14 Pro+
Intel Core Ultra 9 185H, Arc 8-Core
519 Points
Khadas Mind 2
Intel Core Ultra 7 155H, Arc 8-Core
504 Points -3%
Minisforum UH125 Pro
Intel Core Ultra 5 125H, Arc 7-Core
501 Points -3%
Acemagic F2A
Intel Core Ultra 7 155H, Arc 8-Core
499 Points -4%
UL Procyon for Windows / Overall Score Integer GPU
Acer Predator BiFrost Arc A770 OC, 16GB GDDR6
AMD Ryzen 9 7950X, Arc A770
1500 Points +79%
Acer Predator BiFrost Arc A750 OC
AMD Ryzen 9 7950X, Arc A750
1433 Points +71%
Asus NUC 14 Pro+
Intel Core Ultra 9 185H, Arc 8-Core
836 Points
Geekom GT1 Mega
Intel Core Ultra 9 185H, Arc 8-Core
801 Points -4%
Khadas Mind 2
Intel Core Ultra 7 155H, Arc 8-Core
687 Points -18%
Acemagic F2A
Intel Core Ultra 7 155H, Arc 8-Core
684 Points -18%
Minisforum UH125 Pro
Intel Core Ultra 5 125H, Arc 7-Core
547 Points -35%

Latencias del CPD

Los resultados de latencia DPC del Asus NUC 14 Pro+ son mejores que los de otros mini PC. Sin embargo, aún no convence del todo. El aumento de las latencias ya se nota al navegar por Internet con el navegador Edge, aunque no empeoran durante la reproducción de un vídeo de prueba 4K. Sólo durante la breve prueba de estrés con Prime 95 las latencias vuelven a aumentar.

La latencia máxima se produce al abrir varias pestañas del navegador
Latencia máxima al reproducir secuencias de vídeo 4K
Latencia máxima tras diez segundos de Prime95
Conductor clasificado por mayor tiempo de ejecución
DPC Latencies / LatencyMon - interrupt to process latency (max), Web, Youtube, Prime95
Acemagic F2A
Arc 8-Core, Ultra 7 155H, Kingston OM8SEP1024Q-A0
2724 μs * -49%
Minisforum AtomMan X7 Ti
Arc 8-Core, Ultra 9 185H, Kingston OM8PGP41024Q-A0
2069.2 μs * -13%
Geekom AX8 Pro
Radeon 780M, R9 8945H, Acer N7000
1856 μs * -1%
Asus NUC 14 Pro+
Arc 8-Core, Ultra 9 185H, Samsung PM9A1a MZVL21T0HDLU
1831 μs *
Geekom GT1 Mega
Arc 8-Core, Ultra 9 185H, Crucial P3 Plus CT2000P3PSSD8
1145.7 μs * +37%
Aoostar GEM12
Radeon 780M, R7 8845HS, Crucial P3 Plus CT1000P3PSSD8
1001.9 μs * +45%

* ... más pequeño es mejor

Dispositivos de almacenamiento

1 TB SSD
1 TB SSD

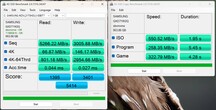
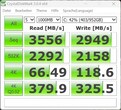
Asus equipa el NUC 14 Pro+ con una unidad SSD Samsung de 1 TB que aprovecha al máximo la interfaz M.2 con PCIe 4.0 x4 para un rendimiento óptimo. Esto garantiza un rendimiento excelente, comparable al Acer N7000 utilizado en el Geekom AX8. Junto con la unidad SSD de 80 mm preinstalada, hay una ranura adicional para unidades SSD de 42 mm. Ambas SSD se refrigeran activamente mediante una unidad situada en la base. La unidad SSD de Samsung rinde bien durante las pruebas de estrés, manteniendo un rendimiento constante sin ninguna caída notable. La comparación con el Acer N7000 sigue siendo muy reñida.

Para más comparaciones y puntos de referencia, consulte nuestra tabla comparativa.

AS SSD
AS SSD
MDL 3
MDL 3
MDL 5
MDL 5
MDL 6
MDL 6
CDI
CDI
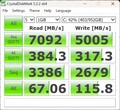
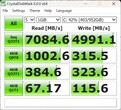
Samsung PM9A1a MZVL21T0HDLU
Sequential Read: 3556 MB/s
Sequential Write: 2949 MB/s
512K Read: 2292 MB/s
512K Write: 2158 MB/s
4K Read: 66.49 MB/s
4K Write: 118.6 MB/s
4K QD32 Read: 379.9 MB/s
4K QD32 Write: 325.5 MB/s
Drive Performance Rating - Percent
Aoostar GEM12
Crucial P3 Plus CT1000P3PSSD8
88.2 pt
Geekom GT1 Mega
Crucial P3 Plus CT2000P3PSSD8
82.6 pt
Geekom AX8 Pro
Acer N7000
63.6 pt
Asus NUC 14 Pro+
Samsung PM9A1a MZVL21T0HDLU
62.8 pt
Minisforum AtomMan X7 Ti
Kingston OM8PGP41024Q-A0
57.1 pt
Acemagic F2A
Kingston OM8SEP1024Q-A0
45.1 pt
Average of class Mini PC
 
45 pt
DiskSpd
seq read
Geekom AX8 Pro
Acer N7000
3921 (3897.31min - 3920.75max) MB/s +13%
Asus NUC 14 Pro+
Samsung PM9A1a MZVL21T0HDLU
3463 (3381.92min - 3463.03max) MB/s
Aoostar GEM12
Crucial P3 Plus CT1000P3PSSD8
3108 (3065.99min - 3107.56max) MB/s -10%
Geekom GT1 Mega
Crucial P3 Plus CT2000P3PSSD8
2734 (2730.27min - 2734.25max) MB/s -21%
Minisforum AtomMan X7 Ti
Kingston OM8PGP41024Q-A0
2315 (2293.84min - 2315.26max) MB/s -33%
Average of class Mini PC
  (233 - 4357, n=118, last 2 years)
2284 MB/s -34%
Acemagic F2A
Kingston OM8SEP1024Q-A0
1674 (1242.56min - 1673.54max) MB/s -52%
seq write
Aoostar GEM12
Crucial P3 Plus CT1000P3PSSD8
4619 (4584.79min - 4619.39max) MB/s +55%
Geekom GT1 Mega
Crucial P3 Plus CT2000P3PSSD8
3976 (425.08min - 3975.57max) MB/s +33%
Geekom AX8 Pro
Acer N7000
3791 (3695.18min - 3790.57max) MB/s +27%
Minisforum AtomMan X7 Ti
Kingston OM8PGP41024Q-A0
3386 (3076.94min - 3385.64max) MB/s +14%
Asus NUC 14 Pro+
Samsung PM9A1a MZVL21T0HDLU
2979 (2849.65min - 2979.21max) MB/s
Average of class Mini PC
  (222 - 5595, n=118, last 2 years)
2438 MB/s -18%
Acemagic F2A
Kingston OM8SEP1024Q-A0
1348 (1117.85min - 1347.87max) MB/s -55%
seq q8 t1 read
Geekom AX8 Pro
Acer N7000
7012 (5624.01min - 7012.25max) MB/s +1%
Asus NUC 14 Pro+
Samsung PM9A1a MZVL21T0HDLU
6962 (5614.59min - 6961.5max) MB/s
Aoostar GEM12
Crucial P3 Plus CT1000P3PSSD8
5213 (4500.71min - 5212.95max) MB/s -25%
Geekom GT1 Mega
Crucial P3 Plus CT2000P3PSSD8
5060 (4781.3min - 5060.16max) MB/s -27%
Minisforum AtomMan X7 Ti
Kingston OM8PGP41024Q-A0
4676 (4310.07min - 4675.81max) MB/s -33%
Average of class Mini PC
  (236 - 8430, n=118, last 2 years)
3694 MB/s -47%
Acemagic F2A
Kingston OM8SEP1024Q-A0
3194 (2810.81min - 3194.17max) MB/s -54%
seq q8 t1 write
Geekom AX8 Pro
Acer N7000
5685 (5389.6min - 5684.54max) MB/s +14%
Asus NUC 14 Pro+
Samsung PM9A1a MZVL21T0HDLU
4971 (4934.6min - 4970.75max) MB/s
Aoostar GEM12
Crucial P3 Plus CT1000P3PSSD8
4754 (4738.27min - 4754.03max) MB/s -4%
Geekom GT1 Mega
Crucial P3 Plus CT2000P3PSSD8
3985 (52.74min - 3985.01max) MB/s -20%
Minisforum AtomMan X7 Ti
Kingston OM8PGP41024Q-A0
3729 (3700.15min - 3728.95max) MB/s -25%
Average of class Mini PC
  (228 - 6669, n=118, last 2 years)
2736 MB/s -45%
Acemagic F2A
Kingston OM8SEP1024Q-A0
2212 (1222.43min - 2212.27max) MB/s -56%
4k q1 t1 read
Aoostar GEM12
Crucial P3 Plus CT1000P3PSSD8
78.7 (78.09min - 78.69max) MB/s +20%
Asus NUC 14 Pro+
Samsung PM9A1a MZVL21T0HDLU
65.8 (64.95min - 65.84max) MB/s
Minisforum AtomMan X7 Ti
Kingston OM8PGP41024Q-A0
63.5 (59.81min - 63.5max) MB/s -3%
Geekom GT1 Mega
Crucial P3 Plus CT2000P3PSSD8
62.5 (62.22min - 62.52max) MB/s -5%
Geekom AX8 Pro
Acer N7000
62.2 (61.55min - 62.23max) MB/s -5%
Average of class Mini PC
  (5.67 - 86.6, n=118, last 2 years)
55.1 MB/s -16%
Acemagic F2A
Kingston OM8SEP1024Q-A0
47.3 (47.07min - 47.31max) MB/s -28%
4k q1 t1 write
Geekom GT1 Mega
Crucial P3 Plus CT2000P3PSSD8
353 (348.24min - 353.16max) MB/s +195%
Aoostar GEM12
Crucial P3 Plus CT1000P3PSSD8
274 (271.38min - 273.89max) MB/s +129%
Average of class Mini PC
  (30.4 - 435, n=118, last 2 years)
195.6 MB/s +64%
Acemagic F2A
Kingston OM8SEP1024Q-A0
187.2 (181.54min - 187.2max) MB/s +57%
Geekom AX8 Pro
Acer N7000
187 (185.73min - 187.04max) MB/s +56%
Minisforum AtomMan X7 Ti
Kingston OM8PGP41024Q-A0
184.4 (177.6min - 184.36max) MB/s +54%
Asus NUC 14 Pro+
Samsung PM9A1a MZVL21T0HDLU
119.6 (116.09min - 119.59max) MB/s
4k q32 t16 read
Aoostar GEM12
Crucial P3 Plus CT1000P3PSSD8
3197 (3174.44min - 3196.85max) MB/s +266%
Geekom GT1 Mega
Crucial P3 Plus CT2000P3PSSD8
2876 (2861.34min - 2875.92max) MB/s +229%
Acemagic F2A
Kingston OM8SEP1024Q-A0
1824 (1239.47min - 1824.09max) MB/s +109%
Geekom AX8 Pro
Acer N7000
1644 (1568.76min - 1643.51max) MB/s +88%
Average of class Mini PC
  (26.1 - 4158, n=118, last 2 years)
1349 MB/s +55%
Minisforum AtomMan X7 Ti
Kingston OM8PGP41024Q-A0
1143 (1091.01min - 1142.98max) MB/s +31%
Asus NUC 14 Pro+
Samsung PM9A1a MZVL21T0HDLU
873 (810.06min - 872.85max) MB/s
4k q32 t16 write
Aoostar GEM12
Crucial P3 Plus CT1000P3PSSD8
3639 (3534.46min - 3639.09max) MB/s +943%
Geekom GT1 Mega
Crucial P3 Plus CT2000P3PSSD8
2822 (709.76min - 2821.52max) MB/s +709%
Acemagic F2A
Kingston OM8SEP1024Q-A0
1434 (1410.26min - 1433.71max) MB/s +311%
Average of class Mini PC
  (30.2 - 4288, n=118, last 2 years)
1282 MB/s +267%
Geekom AX8 Pro
Acer N7000
647 (598.22min - 647.4max) MB/s +85%
Minisforum AtomMan X7 Ti
Kingston OM8PGP41024Q-A0
497 (467.49min - 497.28max) MB/s +42%
Asus NUC 14 Pro+
Samsung PM9A1a MZVL21T0HDLU
349 (343.71min - 348.99max) MB/s
AS SSD
Score Total
Aoostar GEM12
Crucial P3 Plus CT1000P3PSSD8
10021 Points +85%
Geekom GT1 Mega
Crucial P3 Plus CT2000P3PSSD8
8215 Points +52%
Geekom AX8 Pro
Acer N7000
5512 Points +2%
Asus NUC 14 Pro+
Samsung PM9A1a MZVL21T0HDLU
5414 Points
Minisforum AtomMan X7 Ti
Kingston OM8PGP41024Q-A0
4987 Points -8%
Acemagic F2A
Kingston OM8SEP1024Q-A0
4412 Points -19%
Average of class Mini PC
  (181.5 - 10021, n=116, last 2 years)
4101 Points -24%
Score Read
Aoostar GEM12
Crucial P3 Plus CT1000P3PSSD8
3741 Points +168%
Geekom GT1 Mega
Crucial P3 Plus CT2000P3PSSD8
2779 Points +99%
Geekom AX8 Pro
Acer N7000
1793 Points +29%
Acemagic F2A
Kingston OM8SEP1024Q-A0
1561 Points +12%
Average of class Mini PC
  (61 - 3741, n=116, last 2 years)
1527 Points +9%
Minisforum AtomMan X7 Ti
Kingston OM8PGP41024Q-A0
1482 Points +6%
Asus NUC 14 Pro+
Samsung PM9A1a MZVL21T0HDLU
1395 Points
Score Write
Aoostar GEM12
Crucial P3 Plus CT1000P3PSSD8
4371 Points +29%
Geekom GT1 Mega
Crucial P3 Plus CT2000P3PSSD8
3987 Points +17%
Asus NUC 14 Pro+
Samsung PM9A1a MZVL21T0HDLU
3401 Points
Geekom AX8 Pro
Acer N7000
2896 Points -15%
Minisforum AtomMan X7 Ti
Kingston OM8PGP41024Q-A0
2807 Points -17%
Acemagic F2A
Kingston OM8SEP1024Q-A0
2082 Points -39%
Average of class Mini PC
  (88 - 4371, n=116, last 2 years)
1841 Points -46%
Seq Read
Asus NUC 14 Pro+
Samsung PM9A1a MZVL21T0HDLU
5266 MB/s
Geekom AX8 Pro
Acer N7000
4902 MB/s -7%
Aoostar GEM12
Crucial P3 Plus CT1000P3PSSD8
4317 MB/s -18%
Minisforum AtomMan X7 Ti
Kingston OM8PGP41024Q-A0
3779 MB/s -28%
Geekom GT1 Mega
Crucial P3 Plus CT2000P3PSSD8
3587 MB/s -32%
Average of class Mini PC
  (291 - 6620, n=116, last 2 years)
3157 MB/s -40%
Acemagic F2A
Kingston OM8SEP1024Q-A0
3010 MB/s -43%
Seq Write
Aoostar GEM12
Crucial P3 Plus CT1000P3PSSD8
4188 MB/s +39%
Geekom GT1 Mega
Crucial P3 Plus CT2000P3PSSD8
3938 MB/s +31%
Asus NUC 14 Pro+
Samsung PM9A1a MZVL21T0HDLU
3006 MB/s
Geekom AX8 Pro
Acer N7000
2835 MB/s -6%
Acemagic F2A
Kingston OM8SEP1024Q-A0
2369 MB/s -21%
Minisforum AtomMan X7 Ti
Kingston OM8PGP41024Q-A0
2285 MB/s -24%
Average of class Mini PC
  (240 - 5783, n=116, last 2 years)
2202 MB/s -27%
4K Read
Aoostar GEM12
Crucial P3 Plus CT1000P3PSSD8
89.3 MB/s +33%
Geekom GT1 Mega
Crucial P3 Plus CT2000P3PSSD8
83.6 MB/s +25%
Asus NUC 14 Pro+
Samsung PM9A1a MZVL21T0HDLU
66.9 MB/s
Minisforum AtomMan X7 Ti
Kingston OM8PGP41024Q-A0
63.3 MB/s -5%
Geekom AX8 Pro
Acer N7000
59.1 MB/s -12%
Average of class Mini PC
  (6.08 - 104.3, n=116, last 2 years)
58.8 MB/s -12%
Acemagic F2A
Kingston OM8SEP1024Q-A0
41.8 MB/s -38%
4K Write
Geekom GT1 Mega
Crucial P3 Plus CT2000P3PSSD8
314 MB/s +115%
Minisforum AtomMan X7 Ti
Kingston OM8PGP41024Q-A0
238 MB/s +63%
Aoostar GEM12
Crucial P3 Plus CT1000P3PSSD8
221 MB/s +51%
Acemagic F2A
Kingston OM8SEP1024Q-A0
196.9 MB/s +35%
Geekom AX8 Pro
Acer N7000
181.4 MB/s +24%
Average of class Mini PC
  (30.9 - 366, n=116, last 2 years)
175.9 MB/s +20%
Asus NUC 14 Pro+
Samsung PM9A1a MZVL21T0HDLU
146.2 MB/s
4K-64 Read
Aoostar GEM12
Crucial P3 Plus CT1000P3PSSD8
3220 MB/s +302%
Geekom GT1 Mega
Crucial P3 Plus CT2000P3PSSD8
2336 MB/s +192%
Geekom AX8 Pro
Acer N7000
1244 MB/s +55%
Acemagic F2A
Kingston OM8SEP1024Q-A0
1218 MB/s +52%
Average of class Mini PC
  (23.4 - 3220, n=116, last 2 years)
1153 MB/s +44%
Minisforum AtomMan X7 Ti
Kingston OM8PGP41024Q-A0
1041 MB/s +30%
Asus NUC 14 Pro+
Samsung PM9A1a MZVL21T0HDLU
801 MB/s
4K-64 Write
Aoostar GEM12
Crucial P3 Plus CT1000P3PSSD8
3731 MB/s +26%
Geekom GT1 Mega
Crucial P3 Plus CT2000P3PSSD8
3279 MB/s +11%
Asus NUC 14 Pro+
Samsung PM9A1a MZVL21T0HDLU
2955 MB/s
Geekom AX8 Pro
Acer N7000
2431 MB/s -18%
Minisforum AtomMan X7 Ti
Kingston OM8PGP41024Q-A0
2340 MB/s -21%
Acemagic F2A
Kingston OM8SEP1024Q-A0
1649 MB/s -44%
Average of class Mini PC
  (32.8 - 3731, n=116, last 2 years)
1444 MB/s -51%
Access Time Read
Average of class Mini PC
  (0.022 - 0.489, n=116, last 2 years)
0.09752 ms * -122%
Geekom AX8 Pro
Acer N7000
0.079 ms * -80%
Aoostar GEM12
Crucial P3 Plus CT1000P3PSSD8
0.076 ms * -73%
Minisforum AtomMan X7 Ti
Kingston OM8PGP41024Q-A0
0.067 ms * -52%
Acemagic F2A
Kingston OM8SEP1024Q-A0
0.046 ms * -5%
Asus NUC 14 Pro+
Samsung PM9A1a MZVL21T0HDLU
0.044 ms *
Geekom GT1 Mega
Crucial P3 Plus CT2000P3PSSD8
0.027 ms * +39%
Access Time Write
Acemagic F2A
Kingston OM8SEP1024Q-A0
0.126 ms * -367%
Average of class Mini PC
  (0.014 - 0.765, n=116, last 2 years)
0.116 ms * -330%
Geekom AX8 Pro
Acer N7000
0.064 ms * -137%
Asus NUC 14 Pro+
Samsung PM9A1a MZVL21T0HDLU
0.027 ms *
Minisforum AtomMan X7 Ti
Kingston OM8PGP41024Q-A0
0.02 ms * +26%
Aoostar GEM12
Crucial P3 Plus CT1000P3PSSD8
0.017 ms * +37%
Geekom GT1 Mega
Crucial P3 Plus CT2000P3PSSD8
0.014 ms * +48%

* ... más pequeño es mejor

Reading continuous performance:/Disk Throttling: DiskSpd Read Loop, Queue Depth 8

035571010651420177521302485284031953550390542604615497053255680603563906745Tooltip
Asus NUC 14 Pro+ Samsung PM9A1a MZVL21T0HDLU; diskspd 2.0.17 f: Ø6962 (5660.63-7000.13)
Aoostar GEM12 Crucial P3 Plus CT1000P3PSSD8; diskspd 2.0.17 f: Ø5121 (4152.57-5218.34)
Geekom GT1 Mega Crucial P3 Plus CT2000P3PSSD8 ; diskspd 2.0.17 f: Ø5055 (4738.1-5067.7)
Geekom AX8 Pro Acer N7000; diskspd 2.0.17 f: Ø6996 (5972.7-7027.76)
Minisforum AtomMan X7 Ti Kingston OM8PGP41024Q-A0; diskspd 2.0.17 f: Ø4683 (3872.18-4767.25)
Acemagic F2A Kingston OM8SEP1024Q-A0; diskspd 2.0.17 f: Ø1320 (771.89-3141.95)

Tarjeta gráfica

La iGPU del Asus NUC 14 Pro+ se basa en la arquitectura Intel Arc, ahora denominada Intel Arc de 8 núcleos, ofreciendo significativamente más potencia que su predecesora, la Intel Iris Xe G7 con 96 UEs. La iGPU Intel Arc 8-Core es significativamente más competitiva y capaz de competir con la AMD Radeon 780M. Sin embargo, aún no alcanza el nivel de rendimiento de la Geekom GT1 Mega. En tareas como la ejecución de Affinity Photo 2, la iGPU de Intel ofrece un rendimiento excepcional, superando a las soluciones iGPU de AMD. Es importante moderar las expectativas, ya que su rendimiento queda por detrás del de la GPU Nvidia GeForce RTX 4050 para portátiles en comparación.

Para obtener comparaciones y pruebas comparativas más detalladas, consulte nuestra Tabla comparativa de GPU.

3DMark Performance Rating - Percent
Average NVIDIA GeForce RTX 4050 Laptop GPU
 
100 pt
Geekom GT1 Mega
Intel Arc 8-Core iGPU, Intel Core Ultra 9 185H
44.6 pt
Asus NUC 14 Pro+
Intel Arc 8-Core iGPU, Intel Core Ultra 9 185H
43.4 pt
Aoostar GEM12
AMD Radeon 780M, AMD Ryzen 7 8845HS
40.4 pt
Geekom AX8 Pro
AMD Radeon 780M, AMD Ryzen 9 8945H
40.4 pt
Acemagic F2A
Intel Arc 8-Core iGPU, Intel Core Ultra 7 155H
39.9 pt
Minisforum AtomMan X7 Ti
Intel Arc 8-Core iGPU, Intel Core Ultra 9 185H
39.2 pt
3DMark 11 - 1280x720 Performance GPU
Average NVIDIA GeForce RTX 4050 Laptop GPU
  (13339 - 32642, n=38)
28641 Points +118%
Aoostar GEM12
AMD Radeon 780M, AMD Ryzen 7 8845HS
13410 Points +2%
Geekom GT1 Mega
Intel Arc 8-Core iGPU, Intel Core Ultra 9 185H
13309 Points +1%
Geekom AX8 Pro
AMD Radeon 780M, AMD Ryzen 9 8945H
13281 Points +1%
Asus NUC 14 Pro+
Intel Arc 8-Core iGPU, Intel Core Ultra 9 185H
13163 Points
Acemagic F2A
Intel Arc 8-Core iGPU, Intel Core Ultra 7 155H
12085 Points -8%
Minisforum AtomMan X7 Ti
Intel Arc 8-Core iGPU, Intel Core Ultra 9 185H
11691 Points -11%
3DMark
2560x1440 Time Spy Graphics
Average NVIDIA GeForce RTX 4050 Laptop GPU
  (5107 - 9040, n=36)
7812 Points +125%
Geekom GT1 Mega
Intel Arc 8-Core iGPU, Intel Core Ultra 9 185H
3610 Points +4%
Asus NUC 14 Pro+
Intel Arc 8-Core iGPU, Intel Core Ultra 9 185H
3476 Points
Acemagic F2A
Intel Arc 8-Core iGPU, Intel Core Ultra 7 155H
3205 Points -8%
Minisforum AtomMan X7 Ti
Intel Arc 8-Core iGPU, Intel Core Ultra 9 185H
3193 Points -8%
Geekom AX8 Pro
AMD Radeon 780M, AMD Ryzen 9 8945H
2852 Points -18%
Aoostar GEM12
AMD Radeon 780M, AMD Ryzen 7 8845HS
2846 Points -18%
1920x1080 Fire Strike Graphics
Average NVIDIA GeForce RTX 4050 Laptop GPU
  (13591 - 24007, n=36)
21155 Points +152%
Geekom GT1 Mega
Intel Arc 8-Core iGPU, Intel Core Ultra 9 185H
8726 Points +4%
Asus NUC 14 Pro+
Intel Arc 8-Core iGPU, Intel Core Ultra 9 185H
8396 Points
Geekom AX8 Pro
AMD Radeon 780M, AMD Ryzen 9 8945H
8117 Points -3%
Aoostar GEM12
AMD Radeon 780M, AMD Ryzen 7 8845HS
8007 Points -5%
Acemagic F2A
Intel Arc 8-Core iGPU, Intel Core Ultra 7 155H
7710 Points -8%
Minisforum AtomMan X7 Ti
Intel Arc 8-Core iGPU, Intel Core Ultra 9 185H
7599 Points -9%
Unigine Heaven 4.0
Extreme Preset OpenGL
Average NVIDIA GeForce RTX 4050 Laptop GPU
  ()
118.1 fps +235%
Geekom GT1 Mega
Intel Arc 8-Core iGPU, Intel Core Ultra 9 185H
36.4 fps +3%
Asus NUC 14 Pro+
Intel Arc 8-Core iGPU, Intel Core Ultra 9 185H
35.3 fps
Aoostar GEM12
AMD Radeon 780M, AMD Ryzen 7 8845HS
34.6 fps -2%
Acemagic F2A
Intel Arc 8-Core iGPU, Intel Core Ultra 7 155H
31.6 fps -10%
Geekom AX8 Pro
AMD Radeon 780M, AMD Ryzen 9 8945H
30 fps -15%
Minisforum AtomMan X7 Ti
Intel Arc 8-Core iGPU, Intel Core Ultra 9 185H
29.7 fps -16%
Extreme Preset DX11
Average NVIDIA GeForce RTX 4050 Laptop GPU
  ()
114.6 fps +216%
Geekom GT1 Mega
Intel Arc 8-Core iGPU, Intel Core Ultra 9 185H
37.5 fps +3%
Geekom AX8 Pro
AMD Radeon 780M, AMD Ryzen 9 8945H
36.4 fps 0%
Aoostar GEM12
AMD Radeon 780M, AMD Ryzen 7 8845HS
36.3 fps 0%
Asus NUC 14 Pro+
Intel Arc 8-Core iGPU, Intel Core Ultra 9 185H
36.3 fps
Minisforum AtomMan X7 Ti
Intel Arc 8-Core iGPU, Intel Core Ultra 9 185H
33.2 fps -9%
Acemagic F2A
Intel Arc 8-Core iGPU, Intel Core Ultra 7 155H
32.7 fps -10%
Unigine Valley 1.0
1920x1080 Extreme HD DirectX AA:x8
Aoostar GEM12
AMD Radeon 780M, AMD Ryzen 7 8845HS
24.5 fps +26%
Geekom AX8 Pro
AMD Radeon 780M, AMD Ryzen 9 8945H
23.1 fps +18%
Geekom GT1 Mega
Intel Arc 8-Core iGPU, Intel Core Ultra 9 185H
20.1 fps +3%
Asus NUC 14 Pro+
Intel Arc 8-Core iGPU, Intel Core Ultra 9 185H
19.5 fps
Minisforum AtomMan X7 Ti
Intel Arc 8-Core iGPU, Intel Core Ultra 9 185H
18.5 fps -5%
Acemagic F2A
Intel Arc 8-Core iGPU, Intel Core Ultra 7 155H
17.1 fps -12%
1920x1080 Extreme HD Preset OpenGL AA:x8
Minisforum AtomMan X7 Ti
Intel Arc 8-Core iGPU, Intel Core Ultra 9 185H
32.4 fps +53%
Geekom GT1 Mega
Intel Arc 8-Core iGPU, Intel Core Ultra 9 185H
21.9 fps +3%
Asus NUC 14 Pro+
Intel Arc 8-Core iGPU, Intel Core Ultra 9 185H
21.2 fps
Aoostar GEM12
AMD Radeon 780M, AMD Ryzen 7 8845HS
21 fps -1%
Geekom AX8 Pro
AMD Radeon 780M, AMD Ryzen 9 8945H
20.6 fps -3%
Acemagic F2A
Intel Arc 8-Core iGPU, Intel Core Ultra 7 155H
18.3 fps -14%
Unigine Superposition
1280x720 720p Low
Geekom GT1 Mega
Intel Arc 8-Core iGPU, Intel Core Ultra 9 185H
12451 Points +5%
Geekom AX8 Pro
AMD Radeon 780M, AMD Ryzen 9 8945H
12232 Points +3%
Aoostar GEM12
AMD Radeon 780M, AMD Ryzen 7 8845HS
12174 Points +2%
Asus NUC 14 Pro+
Intel Arc 8-Core iGPU, Intel Core Ultra 9 185H
11902 Points
Acemagic F2A
Intel Arc 8-Core iGPU, Intel Core Ultra 7 155H
10491 Points -12%
Minisforum AtomMan X7 Ti
Intel Arc 8-Core iGPU, Intel Core Ultra 9 185H
10102 Points -15%
1920x1080 1080p High
Geekom GT1 Mega
Intel Arc 8-Core iGPU, Intel Core Ultra 9 185H
3948 Points +3%
Asus NUC 14 Pro+
Intel Arc 8-Core iGPU, Intel Core Ultra 9 185H
3836 Points
Aoostar GEM12
AMD Radeon 780M, AMD Ryzen 7 8845HS
3592 Points -6%
Geekom AX8 Pro
AMD Radeon 780M, AMD Ryzen 9 8945H
3559 Points -7%
Acemagic F2A
Intel Arc 8-Core iGPU, Intel Core Ultra 7 155H
3391 Points -12%
Minisforum AtomMan X7 Ti
Intel Arc 8-Core iGPU, Intel Core Ultra 9 185H
3341 Points -13%
1920x1080 1080p Extreme
Geekom GT1 Mega
Intel Arc 8-Core iGPU, Intel Core Ultra 9 185H
2119 Points 0%
Asus NUC 14 Pro+
Intel Arc 8-Core iGPU, Intel Core Ultra 9 185H
2114 Points
Acemagic F2A
Intel Arc 8-Core iGPU, Intel Core Ultra 7 155H
1920 Points -9%
Minisforum AtomMan X7 Ti
Intel Arc 8-Core iGPU, Intel Core Ultra 9 185H
1812 Points -14%
Aoostar GEM12
AMD Radeon 780M, AMD Ryzen 7 8845HS
1737 Points -18%
Geekom AX8 Pro
AMD Radeon 780M, AMD Ryzen 9 8945H
1649 Points -22%
ComputeMark v2.1
1024x600 Normal, Score
Average NVIDIA GeForce RTX 4050 Laptop GPU
  ()
16302 Points +115%
Aoostar GEM12
AMD Radeon 780M, AMD Ryzen 7 8845HS
9494 Points +25%
Geekom AX8 Pro
AMD Radeon 780M, AMD Ryzen 9 8945H
8595 Points +13%
Geekom GT1 Mega
Intel Arc 8-Core iGPU, Intel Core Ultra 9 185H
7963 Points +5%
Asus NUC 14 Pro+
Intel Arc 8-Core iGPU, Intel Core Ultra 9 185H
7594 Points
Acemagic F2A
Intel Arc 8-Core iGPU, Intel Core Ultra 7 155H
7480 Points -2%
Minisforum AtomMan X7 Ti
Intel Arc 8-Core iGPU, Intel Core Ultra 9 185H
6270 Points -17%
1024x600 Normal, Fluid 3DTex
Average NVIDIA GeForce RTX 4050 Laptop GPU
  ()
1319 Points +182%
Geekom GT1 Mega
Intel Arc 8-Core iGPU, Intel Core Ultra 9 185H
492 Points +5%
Geekom AX8 Pro
AMD Radeon 780M, AMD Ryzen 9 8945H
488 Points +4%
Aoostar GEM12
AMD Radeon 780M, AMD Ryzen 7 8845HS
483 Points +3%
Minisforum AtomMan X7 Ti
Intel Arc 8-Core iGPU, Intel Core Ultra 9 185H
469 Points 0%
Asus NUC 14 Pro+
Intel Arc 8-Core iGPU, Intel Core Ultra 9 185H
468 Points
Acemagic F2A
Intel Arc 8-Core iGPU, Intel Core Ultra 7 155H
427 Points -9%
1024x600 Normal, Fluid 2DTexArr
Average NVIDIA GeForce RTX 4050 Laptop GPU
  ()
1284 Points +177%
Geekom GT1 Mega
Intel Arc 8-Core iGPU, Intel Core Ultra 9 185H
487 Points +5%
Aoostar GEM12
AMD Radeon 780M, AMD Ryzen 7 8845HS
481 Points +4%
Asus NUC 14 Pro+
Intel Arc 8-Core iGPU, Intel Core Ultra 9 185H
464 Points
Minisforum AtomMan X7 Ti
Intel Arc 8-Core iGPU, Intel Core Ultra 9 185H
462 Points 0%
Geekom AX8 Pro
AMD Radeon 780M, AMD Ryzen 9 8945H
427 Points -8%
Acemagic F2A
Intel Arc 8-Core iGPU, Intel Core Ultra 7 155H
422 Points -9%
1024x600 Normal, Mandel Vector
Average NVIDIA GeForce RTX 4050 Laptop GPU
  ()
3456 Points +82%
Aoostar GEM12
AMD Radeon 780M, AMD Ryzen 7 8845HS
2477 Points +30%
Geekom AX8 Pro
AMD Radeon 780M, AMD Ryzen 9 8945H
2362 Points +24%
Geekom GT1 Mega
Intel Arc 8-Core iGPU, Intel Core Ultra 9 185H
2039 Points +7%
Acemagic F2A
Intel Arc 8-Core iGPU, Intel Core Ultra 7 155H
1961 Points +3%
Asus NUC 14 Pro+
Intel Arc 8-Core iGPU, Intel Core Ultra 9 185H
1899 Points
Minisforum AtomMan X7 Ti
Intel Arc 8-Core iGPU, Intel Core Ultra 9 185H
1620 Points -15%
1024x600 Normal, Mandel Scalar
Average NVIDIA GeForce RTX 4050 Laptop GPU
  ()
3578 Points +118%
Aoostar GEM12
AMD Radeon 780M, AMD Ryzen 7 8845HS
2519 Points +53%
Geekom AX8 Pro
AMD Radeon 780M, AMD Ryzen 9 8945H
2449 Points +49%
Geekom GT1 Mega
Intel Arc 8-Core iGPU, Intel Core Ultra 9 185H
1701 Points +4%
Asus NUC 14 Pro+
Intel Arc 8-Core iGPU, Intel Core Ultra 9 185H
1643 Points
Acemagic F2A
Intel Arc 8-Core iGPU, Intel Core Ultra 7 155H
1594 Points -3%
Minisforum AtomMan X7 Ti
Intel Arc 8-Core iGPU, Intel Core Ultra 9 185H
1274 Points -22%
1024x600 Normal, QJuliaRayTrace
Average NVIDIA GeForce RTX 4050 Laptop GPU
  ()
6665 Points +114%
Aoostar GEM12
AMD Radeon 780M, AMD Ryzen 7 8845HS
3535 Points +13%
Geekom GT1 Mega
Intel Arc 8-Core iGPU, Intel Core Ultra 9 185H
3244 Points +4%
Asus NUC 14 Pro+
Intel Arc 8-Core iGPU, Intel Core Ultra 9 185H
3121 Points
Acemagic F2A
Intel Arc 8-Core iGPU, Intel Core Ultra 7 155H
3076 Points -1%
Geekom AX8 Pro
AMD Radeon 780M, AMD Ryzen 9 8945H
2868 Points -8%
Minisforum AtomMan X7 Ti
Intel Arc 8-Core iGPU, Intel Core Ultra 9 185H
2444 Points -22%
LuxMark v2.0 64Bit
Room GPUs-only
Average NVIDIA GeForce RTX 4050 Laptop GPU
  ()
2967 Samples/s +297%
Geekom AX8 Pro
AMD Radeon 780M, AMD Ryzen 9 8945H
1068 Samples/s +43%
Aoostar GEM12
AMD Radeon 780M, AMD Ryzen 7 8845HS
801 Samples/s +7%
Asus NUC 14 Pro+
Intel Arc 8-Core iGPU, Intel Core Ultra 9 185H
747 Samples/s
Geekom GT1 Mega
Intel Arc 8-Core iGPU, Intel Core Ultra 9 185H
656 Samples/s -12%
Minisforum AtomMan X7 Ti
Intel Arc 8-Core iGPU, Intel Core Ultra 9 185H
640 Samples/s -14%
Acemagic F2A
Intel Arc 8-Core iGPU, Intel Core Ultra 7 155H
549 Samples/s -27%
Sala GPUs-only
Average NVIDIA GeForce RTX 4050 Laptop GPU
  ()
8036 Samples/s +175%
Asus NUC 14 Pro+
Intel Arc 8-Core iGPU, Intel Core Ultra 9 185H
2927 Samples/s
Geekom GT1 Mega
Intel Arc 8-Core iGPU, Intel Core Ultra 9 185H
2888 Samples/s -1%
Minisforum AtomMan X7 Ti
Intel Arc 8-Core iGPU, Intel Core Ultra 9 185H
2732 Samples/s -7%
Acemagic F2A
Intel Arc 8-Core iGPU, Intel Core Ultra 7 155H
2319 Samples/s -21%
Geekom AX8 Pro
AMD Radeon 780M, AMD Ryzen 9 8945H
2218 Samples/s -24%
Aoostar GEM12
AMD Radeon 780M, AMD Ryzen 7 8845HS
1496 Samples/s -49%
Affinity Photo 2 - Combined (Single / Multi GPU)
Geekom GT1 Mega
Intel Arc 8-Core iGPU, Intel Core Ultra 9 185H
6468 Points +6%
Asus NUC 14 Pro+
Intel Arc 8-Core iGPU, Intel Core Ultra 9 185H
6081 Points
Minisforum AtomMan X7 Ti
Intel Arc 8-Core iGPU, Intel Core Ultra 9 185H
5308 Points -13%
Acemagic F2A
Intel Arc 8-Core iGPU, Intel Core Ultra 7 155H
4928 Points -19%
Geekom AX8 Pro
AMD Radeon 780M, AMD Ryzen 9 8945H
1831 Points -70%
Aoostar GEM12
AMD Radeon 780M, AMD Ryzen 7 8845HS
1709 Points -72%
Asus NUC 14 Pro+, Intel Arc 8-Core iGPU
Ultra 9 185H
Aoostar GEM12, AMD Radeon 780M
R7 8845HS
Geekom GT1 Mega, Intel Arc 8-Core iGPU
Ultra 9 185H
Geekom AX8 Pro, AMD Radeon 780M
R9 8945H
Minisforum AtomMan X7 Ti, Intel Arc 8-Core iGPU
Ultra 9 185H
Acemagic F2A, Intel Arc 8-Core iGPU
Ultra 7 155H
Average of class Mini PC
 
SPECviewperf 2020
244%
4%
237%
-0%
-9%
134%
3840x2160 Medical (medical-03)
6.99
11.2
60%
7.07
1%
12.8
83%
4.23
-39%
5.05
-28%
3840x2160 Energy (energy-03)
4.94
19.9
303%
5
1%
13.3
169%
6.03
22%
4.61
-7%
3840x2160 Creo (creo-03)
18.9
33.4
77%
19.8
5%
35.3
87%
18.5
-2%
17.9
-5%
3840x2160 CATIA (catia-06)
11.2
23.2
107%
11.7
4%
25.1
124%
11.1
-1%
10
-11%
3840x2160 3ds Max (3dsmax-07)
14.8
20.4
38%
15.5
5%
21.1
43%
14.9
1%
12.9
-13%
3840x2160 Siemens NX (snx-04)
5.37
64.1
1094%
5.68
6%
65.7
1123%
6.24
16%
5.7
6%
3840x2160 Maya (maya-06)
37.2
47.7
28%
38.8
4%
49.6
33%
37.7
1%
35.4
-5%
3DMark 05 Standard
50932 puntos
3DMark 06 Standard Score
36407 puntos
3DMark Vantage P Result
42630 puntos
3DMark 11 Performance
13441 puntos
3DMark Ice Storm Standard Score
148268 puntos
3DMark Cloud Gate Standard Score
36112 puntos
3DMark Fire Strike Score
7757 puntos
3DMark Fire Strike Extreme Score
4006 puntos
3DMark Time Spy Score
3881 puntos
3DMark Steel Nomad Score
714 puntos
3DMark Steel Nomad Light Score
3026 puntos
ayuda

Rendimiento en juegos

El rendimiento en juegos del Asus NUC 14 Pro+ en comparación con los dispositivos con tarjetas gráficas dedicadas. Sin embargo, aún es posible jugar si está dispuesto a reducir la configuración de los gráficos. Incluso con detalles reducidos, este mini PC es capaz de ejecutar varios juegos. En comparación con sus rivales, el Geekom GT1 Mega supera a nuestra muestra de prueba, pero la incorporación de una AMD Radeon 780M mejora el rendimiento. Para conseguir un aumento significativo del rendimiento en juegos, una tarjeta gráfica externa sería la solución más eficaz.

Si desea una comparación detallada del rendimiento de la iGPU con varias tarjetas gráficas, consulte nuestra Lista de GPU para juegos.

GTA V
1024x768 Lowest Settings possible
Average NVIDIA GeForce RTX 4050 Laptop GPU
  (163.6 - 186.7, n=14)
181.9 fps +12%
Geekom AX8 Pro
Radeon 780M, R9 8945H, Acer N7000
169.4 (3.69min, 125P1) fps +4%
Geekom GT1 Mega
Arc 8-Core, Ultra 9 185H, Crucial P3 Plus CT2000P3PSSD8
165.2 (3.77min, 100P1) fps +1%
Aoostar GEM12
Radeon 780M, R7 8845HS, Crucial P3 Plus CT1000P3PSSD8
165.1 (4.83min, 125P1) fps +1%
Minisforum AtomMan X7 Ti
Arc 8-Core, Ultra 9 185H, Kingston OM8PGP41024Q-A0
163.6 (4.63min, 111.1P1) fps 0%
Asus NUC 14 Pro+
Arc 8-Core, Ultra 9 185H, Samsung PM9A1a MZVL21T0HDLU
162.9 (3.78min, 111.1P1) fps
Acemagic F2A
Arc 8-Core, Ultra 7 155H, Kingston OM8SEP1024Q-A0
161 (4.76min, 100P1) fps -1%
1920x1080 High/On (Advanced Graphics Off) AA:2xMSAA + FX AF:8x
Average NVIDIA GeForce RTX 4050 Laptop GPU
  (106 - 177.3, n=26)
158.4 fps +290%
Geekom AX8 Pro
Radeon 780M, R9 8945H, Acer N7000
65.9 (2.44min, 41.7P1) fps +62%
Aoostar GEM12
Radeon 780M, R7 8845HS, Crucial P3 Plus CT1000P3PSSD8
65.3 (4.57min, 45.5P1) fps +61%
Geekom GT1 Mega
Arc 8-Core, Ultra 9 185H, Crucial P3 Plus CT2000P3PSSD8
43.5 (3.49min, 32.3P1) fps +7%
Minisforum AtomMan X7 Ti
Arc 8-Core, Ultra 9 185H, Kingston OM8PGP41024Q-A0
41.2 (3.12min, 30.3P1) fps +1%
Asus NUC 14 Pro+
Arc 8-Core, Ultra 9 185H, Samsung PM9A1a MZVL21T0HDLU
40.6 (3.3min, 30.3P1) fps
Acemagic F2A
Arc 8-Core, Ultra 7 155H, Kingston OM8SEP1024Q-A0
31.3 (2.94min, 22.7P1) fps -23%
Dota 2 Reborn
1280x720 min (0/3) fastest
Average NVIDIA GeForce RTX 4050 Laptop GPU
  (113.7 - 196.3, n=34)
164.4 fps +57%
Geekom AX8 Pro
Radeon 780M, R9 8945H, Acer N7000
157.5 (136min) fps +50%
Aoostar GEM12
Radeon 780M, R7 8845HS, Crucial P3 Plus CT1000P3PSSD8
152.7 (134.2min) fps +46%
Geekom GT1 Mega
Arc 8-Core, Ultra 9 185H, Crucial P3 Plus CT2000P3PSSD8
110.5 (63min) fps +6%
Minisforum AtomMan X7 Ti
Arc 8-Core, Ultra 9 185H, Kingston OM8PGP41024Q-A0
106.5 (61min) fps +2%
Asus NUC 14 Pro+
Arc 8-Core, Ultra 9 185H, Samsung PM9A1a MZVL21T0HDLU
104.7 (61.7min) fps
Acemagic F2A
Arc 8-Core, Ultra 7 155H, Kingston OM8SEP1024Q-A0
103.2 (59.8min) fps -1%
1920x1080 high (2/3)
Average NVIDIA GeForce RTX 4050 Laptop GPU
  (79.2 - 191.8, n=35)
141.6 fps +158%
Geekom AX8 Pro
Radeon 780M, R9 8945H, Acer N7000
88 (69.2min) fps +61%
Geekom GT1 Mega
Arc 8-Core, Ultra 9 185H, Crucial P3 Plus CT2000P3PSSD8
87.8 (28.3min) fps +60%
Aoostar GEM12
Radeon 780M, R7 8845HS, Crucial P3 Plus CT1000P3PSSD8
86.6 (72.2min) fps +58%
Minisforum AtomMan X7 Ti
Arc 8-Core, Ultra 9 185H, Kingston OM8PGP41024Q-A0
79 (48.2min) fps +44%
Acemagic F2A
Arc 8-Core, Ultra 7 155H, Kingston OM8SEP1024Q-A0
77.3 (52.5min) fps +41%
Asus NUC 14 Pro+
Arc 8-Core, Ultra 9 185H, Samsung PM9A1a MZVL21T0HDLU
54.8 (35.3min) fps
Cyberpunk 2077 2.1 Phantom Liberty
1920x1080 Low Preset (FSR off)
Average NVIDIA GeForce RTX 4050 Laptop GPU
  (67.2 - 103.1, n=5)
85.1 fps +145%
Aoostar GEM12
Radeon 780M, R7 8845HS, Crucial P3 Plus CT1000P3PSSD8
42.4 (35.7min) fps +22%
Geekom AX8 Pro
Radeon 780M, R9 8945H, Acer N7000
41.3 (34.5min) fps +19%
Geekom GT1 Mega
Arc 8-Core, Ultra 9 185H, Crucial P3 Plus CT2000P3PSSD8
38 (33.3min) fps +10%
Asus NUC 14 Pro+
Arc 8-Core, Ultra 9 185H, Samsung PM9A1a MZVL21T0HDLU
34.7 (30.4min) fps
Minisforum AtomMan X7 Ti
Arc 8-Core, Ultra 9 185H, Kingston OM8PGP41024Q-A0
34.3 (29.1min) fps -1%
Acemagic F2A
Arc 8-Core, Ultra 7 155H, Kingston OM8SEP1024Q-A0
29.5 (24.1min) fps -15%
1920x1080 High Preset (FSR off)
Average NVIDIA GeForce RTX 4050 Laptop GPU
  (42.4 - 75, n=6)
59 fps +145%
Aoostar GEM12
Radeon 780M, R7 8845HS, Crucial P3 Plus CT1000P3PSSD8
26.3 (22.2min) fps +9%
Geekom GT1 Mega
Arc 8-Core, Ultra 9 185H, Crucial P3 Plus CT2000P3PSSD8
26 (22.6min) fps +8%
Geekom AX8 Pro
Radeon 780M, R9 8945H, Acer N7000
25.8 (21.7min) fps +7%
Asus NUC 14 Pro+
Arc 8-Core, Ultra 9 185H, Samsung PM9A1a MZVL21T0HDLU
24.1 (21.1min) fps
Minisforum AtomMan X7 Ti
Arc 8-Core, Ultra 9 185H, Kingston OM8PGP41024Q-A0
24 (20.6min) fps 0%
Acemagic F2A
Arc 8-Core, Ultra 7 155H, Kingston OM8SEP1024Q-A0
20.4 (13.8min) fps -15%
Baldur's Gate 3
1280x720 Low Preset
Average NVIDIA GeForce RTX 4050 Laptop GPU
  ()
148.9 fps +164%
Geekom AX8 Pro
Radeon 780M, R9 8945H, Acer N7000
60.8 (21.6min, 28.1P0.1, 35.6P1) fps +8%
Aoostar GEM12
Radeon 780M, R7 8845HS, Crucial P3 Plus CT1000P3PSSD8
60.3 (21.3min, 36P0.1, 46.1P1) fps +7%
Geekom GT1 Mega
Arc 8-Core, Ultra 9 185H, Crucial P3 Plus CT2000P3PSSD8
57.6 (31.7min, 33.6P0.1, 37.9P1) fps +2%
Asus NUC 14 Pro+
Arc 8-Core, Ultra 9 185H, Samsung PM9A1a MZVL21T0HDLU
56.4 (29min, 30.5P0.1, 37.9P1) fps
1920x1080 High Preset
Average NVIDIA GeForce RTX 4050 Laptop GPU
  (49.8 - 83.5, n=7)
69.8 fps +177%
Geekom GT1 Mega
Arc 8-Core, Ultra 9 185H, Crucial P3 Plus CT2000P3PSSD8
25.4 (13.9min, 14.3P0.1, 16.3P1) fps +1%
Asus NUC 14 Pro+
Arc 8-Core, Ultra 9 185H, Samsung PM9A1a MZVL21T0HDLU
25.2 (14.5min, 14.6P0.1, 16.2P1) fps
Aoostar GEM12
Radeon 780M, R7 8845HS, Crucial P3 Plus CT1000P3PSSD8
24.7 (16.6min, 17.1P0.1, 19.4P1) fps -2%
Geekom AX8 Pro
Radeon 780M, R9 8945H, Acer N7000
24.5 (17.7min, 17.7P0.1, 19.8P1) fps -3%
F1 24
1920x1080 Low Preset AA:T AF:16x
Geekom GT1 Mega
Arc 8-Core, Ultra 9 185H, Crucial P3 Plus CT2000P3PSSD8
84.3 (70min, 66P1) fps +17%
Geekom AX8 Pro
Radeon 780M, R9 8945H, Acer N7000
83.4 (28min, 33P1) fps +16%
Asus NUC 14 Pro+
Arc 8-Core, Ultra 9 185H, Samsung PM9A1a MZVL21T0HDLU
71.8 (59min, 46P1) fps
1920x1080 High Preset AA:T AF:16x
Average NVIDIA GeForce RTX 4050 Laptop GPU
  ()
146 fps +202%
Geekom GT1 Mega
Arc 8-Core, Ultra 9 185H, Crucial P3 Plus CT2000P3PSSD8
54.8 (43min, 45P1) fps +13%
Geekom AX8 Pro
Radeon 780M, R9 8945H, Acer N7000
51.3 (23min, 15P1) fps +6%
Asus NUC 14 Pro+
Arc 8-Core, Ultra 9 185H, Samsung PM9A1a MZVL21T0HDLU
48.4 (40min, 36P1) fps

FPS chart - 30 min Cyberpunk 2077 1920 x 1080 Ultra Preset (FSR off)

05101520Tooltip
Asus NUC 14 Pro+ Ultra 9 185H, Arc 8-Core: Ø20.3 (18.2-21.9)
Aoostar GEM12 R7 8845HS, Radeon 780M: Ø21.7 (20.1-23.3)
Geekom GT1 Mega Ultra 9 185H, Arc 8-Core: Ø22.1 (18.6-24)
Geekom AX8 Pro R9 8945H, Radeon 780M: Ø19.2 (17.9-20.3)
bajomedioaltoultra
GTA V (2015) 162.9 154.1 40.6 15.8
Dota 2 Reborn (2015) 104.7 78 54.8 76
Final Fantasy XV Benchmark (2018) 75.3 40.2 28.6
X-Plane 11.11 (2018) 65.5 49.8 42.2
Baldur's Gate 3 (2023) 37.9 29.7 25.2 24.4
Cyberpunk 2077 2.1 Phantom Liberty (2023) 34.7 28.9 24.1 22
F1 24 (2024) 71.8 64.7 48.4

Prueba de rendimiento del Asus NUC 14 Pro+ con una Nvidia GeForce RTX 4090

Asus NUC 14 Pro+ y Nvidia GeForce RTX 4090
GPU-Z
GPU-Z

Equipado con dos puertos Thunderbolt, el Asus NUC 14 Pro+ admite conexiones de tarjetas gráficas externas. Sin embargo, es importante tener en cuenta la limitación del ancho de banda, ya que una GPU externa sólo puede funcionar a velocidades PCIe 3.0 x4 a través de una conexión USB4. Hemos probado el rendimiento con una Nvidia GeForce RTX 4090 para ver qué tipo de aumento de rendimiento se puede esperar con la tarjeta gráfica de consumo más rápida disponible actualmente.

Durante la prueba, el rendimiento 3D puede ver mejoras significativas en ciertos escenarios. Tanto las pruebas comparativas sintéticas como las de juegos demuestran las ganancias potenciales. Hay una caída notable en el rendimiento en comparación con el uso de la tarjeta gráfica en un PC de sobremesa convencional. Como referencia, comparamos estos resultados con los de la AMD Ryzen 5 9600X emparejada con la Nvidia GeForce RTX 4090. Una posible solución para minimizar la pérdida de rendimiento podría ser una conexión OCuLink, aunque sigue siendo una opción poco frecuente. El Minisforum MS-A1 muestra lo que se puede conseguir con esta configuración.

Performance Rating - Percent
AMD Ryzen 5 9600X
AMD Ryzen 5 9600X
100 pt
Minisforum MS-A1 (Nvidia GeForce RTX 4090 @OCuLink)
AMD Ryzen 7 8700G
89.4 pt
Geekom GT1 Mega (Nvidia GeForce RTX 4090 @USB4)
Intel Core Ultra 9 185H
79.6 pt
Asus NUC 14 Pro+ (Nvidia GeForce RTX 4090 @USB4)
Intel Core Ultra 9 185H
78.2 pt
Khadas Mind 2 (Nvidia GeForce RTX 4090 @USB4)
Intel Core Ultra 7 155H
75.9 pt
3DMark 11 - 1280x720 Performance GPU
AMD Ryzen 5 9600X
AMD Ryzen 5 9600X
104516 Points +694%
Minisforum MS-A1 (Nvidia GeForce RTX 4090 @OCuLink)
AMD Ryzen 7 8700G
98454 Points +648%
Geekom GT1 Mega (Nvidia GeForce RTX 4090 @USB4)
Intel Core Ultra 9 185H
64648 Points +391%
Khadas Mind 2 (Nvidia GeForce RTX 4090 @USB4)
Intel Core Ultra 7 155H
62498 Points +375%
Asus NUC 14 Pro+ (Nvidia GeForce RTX 4090 @USB4)
Intel Core Ultra 9 185H
61826 Points +370%

13163 Points
3DMark
2560x1440 Time Spy Graphics
AMD Ryzen 5 9600X
AMD Ryzen 5 9600X
37161 Points +969%
Minisforum MS-A1 (Nvidia GeForce RTX 4090 @OCuLink)
AMD Ryzen 7 8700G
34984 Points +906%
Geekom GT1 Mega (Nvidia GeForce RTX 4090 @USB4)
Intel Core Ultra 9 185H
28844 Points +730%
Asus NUC 14 Pro+ (Nvidia GeForce RTX 4090 @USB4)
Intel Core Ultra 9 185H
28592 Points +723%
Khadas Mind 2 (Nvidia GeForce RTX 4090 @USB4)
Intel Core Ultra 7 155H
23140 Points +566%

3476 Points
1920x1080 Fire Strike Graphics
AMD Ryzen 5 9600X
AMD Ryzen 5 9600X
78579 Points +836%
Minisforum MS-A1 (Nvidia GeForce RTX 4090 @OCuLink)
AMD Ryzen 7 8700G
76191 Points +807%
Geekom GT1 Mega (Nvidia GeForce RTX 4090 @USB4)
Intel Core Ultra 9 185H
53367 Points +536%
Asus NUC 14 Pro+ (Nvidia GeForce RTX 4090 @USB4)
Intel Core Ultra 9 185H
50990 Points +507%
Khadas Mind 2 (Nvidia GeForce RTX 4090 @USB4)
Intel Core Ultra 7 155H
40417 Points +381%

8396 Points
3840x2160 Fire Strike Ultra Graphics
AMD Ryzen 5 9600X
AMD Ryzen 5 9600X
24915 Points +1148%
Minisforum MS-A1 (Nvidia GeForce RTX 4090 @OCuLink)
AMD Ryzen 7 8700G
23565 Points +1081%
Geekom GT1 Mega (Nvidia GeForce RTX 4090 @USB4)
Intel Core Ultra 9 185H
21506 Points +977%
Asus NUC 14 Pro+ (Nvidia GeForce RTX 4090 @USB4)
Intel Core Ultra 9 185H
21410 Points +973%
Khadas Mind 2 (Nvidia GeForce RTX 4090 @USB4)
Intel Core Ultra 7 155H
17047 Points +754%

1996 Points
Unigine Superposition
1280x720 720p Low
AMD Ryzen 5 9600X
AMD Ryzen 5 9600X
63603 Points +434%
Minisforum MS-A1 (Nvidia GeForce RTX 4090 @OCuLink)
AMD Ryzen 7 8700G
35453 Points +198%
Geekom GT1 Mega (Nvidia GeForce RTX 4090 @USB4)
Intel Core Ultra 9 185H
33318 Points +180%
Asus NUC 14 Pro+ (Nvidia GeForce RTX 4090 @USB4)
Intel Core Ultra 9 185H
30513 Points +156%
Khadas Mind 2 (Nvidia GeForce RTX 4090 @USB4)
Intel Core Ultra 7 155H
28104 Points +136%

11902 Points
1920x1080 1080p High
AMD Ryzen 5 9600X
AMD Ryzen 5 9600X
50230 Points +1209%
Minisforum MS-A1 (Nvidia GeForce RTX 4090 @OCuLink)
AMD Ryzen 7 8700G
32728 Points +753%
Geekom GT1 Mega (Nvidia GeForce RTX 4090 @USB4)
Intel Core Ultra 9 185H
30115 Points +685%
Asus NUC 14 Pro+ (Nvidia GeForce RTX 4090 @USB4)
Intel Core Ultra 9 185H
27938 Points +628%
Khadas Mind 2 (Nvidia GeForce RTX 4090 @USB4)
Intel Core Ultra 7 155H
26890 Points +601%

3836 Points
1920x1080 1080p Extreme
AMD Ryzen 5 9600X
AMD Ryzen 5 9600X
21586 Points +921%
Minisforum MS-A1 (Nvidia GeForce RTX 4090 @OCuLink)
AMD Ryzen 7 8700G
20934 Points +890%
Asus NUC 14 Pro+ (Nvidia GeForce RTX 4090 @USB4)
Intel Core Ultra 9 185H
20260 Points +858%
Geekom GT1 Mega (Nvidia GeForce RTX 4090 @USB4)
Intel Core Ultra 9 185H
19915 Points +842%
Khadas Mind 2 (Nvidia GeForce RTX 4090 @USB4)
Intel Core Ultra 7 155H
19877 Points +840%

2114 Points
3840x2160 4k Optimized
AMD Ryzen 5 9600X
AMD Ryzen 5 9600X
33095 Points
Minisforum MS-A1 (Nvidia GeForce RTX 4090 @OCuLink)
AMD Ryzen 7 8700G
30190 Points
Geekom GT1 Mega (Nvidia GeForce RTX 4090 @USB4)
Intel Core Ultra 9 185H
27686 Points
Asus NUC 14 Pro+ (Nvidia GeForce RTX 4090 @USB4)
Intel Core Ultra 9 185H
27334 Points
Khadas Mind 2 (Nvidia GeForce RTX 4090 @USB4)
Intel Core Ultra 7 155H
25802 Points
7680x4320 8k Optimized
AMD Ryzen 5 9600X
AMD Ryzen 5 9600X
12498 Points
Minisforum MS-A1 (Nvidia GeForce RTX 4090 @OCuLink)
AMD Ryzen 7 8700G
12251 Points
Geekom GT1 Mega (Nvidia GeForce RTX 4090 @USB4)
Intel Core Ultra 9 185H
12132 Points
Khadas Mind 2 (Nvidia GeForce RTX 4090 @USB4)
Intel Core Ultra 7 155H
12050 Points
Asus NUC 14 Pro+ (Nvidia GeForce RTX 4090 @USB4)
Intel Core Ultra 9 185H
12045 Points
Unigine Valley 1.0
1920x1080 Extreme HD DirectX AA:x8
AMD Ryzen 5 9600X
AMD Ryzen 5 9600X
324 fps +1562%
Minisforum MS-A1 (Nvidia GeForce RTX 4090 @OCuLink)
AMD Ryzen 7 8700G
216.1 fps +1008%
Geekom GT1 Mega (Nvidia GeForce RTX 4090 @USB4)
Intel Core Ultra 9 185H
208.7 fps +970%
Asus NUC 14 Pro+ (Nvidia GeForce RTX 4090 @USB4)
Intel Core Ultra 9 185H
196.3 fps +907%
Khadas Mind 2 (Nvidia GeForce RTX 4090 @USB4)
Intel Core Ultra 7 155H
187.1 fps +859%

19.5 fps
1920x1080 Extreme HD Preset OpenGL AA:x8
AMD Ryzen 5 9600X
AMD Ryzen 5 9600X
331.8 fps +1465%
Minisforum MS-A1 (Nvidia GeForce RTX 4090 @OCuLink)
AMD Ryzen 7 8700G
231.7 fps +993%
Asus NUC 14 Pro+ (Nvidia GeForce RTX 4090 @USB4)
Intel Core Ultra 9 185H
224.8 fps +960%
Geekom GT1 Mega (Nvidia GeForce RTX 4090 @USB4)
Intel Core Ultra 9 185H
224.4 fps +958%
Khadas Mind 2 (Nvidia GeForce RTX 4090 @USB4)
Intel Core Ultra 7 155H
200.5 fps +846%

21.2 fps
Unigine Heaven 4.0
Extreme Preset OpenGL
AMD Ryzen 5 9600X
AMD Ryzen 5 9600X
472.4 fps +1238%
Minisforum MS-A1 (Nvidia GeForce RTX 4090 @OCuLink)
AMD Ryzen 7 8700G
441.5 fps +1151%
Geekom GT1 Mega (Nvidia GeForce RTX 4090 @USB4)
Intel Core Ultra 9 185H
386.5 fps +995%
Asus NUC 14 Pro+ (Nvidia GeForce RTX 4090 @USB4)
Intel Core Ultra 9 185H
376.3 fps +966%
Khadas Mind 2 (Nvidia GeForce RTX 4090 @USB4)
Intel Core Ultra 7 155H
372.8 fps +956%

35.3 fps
Extreme Preset DX11
AMD Ryzen 5 9600X
AMD Ryzen 5 9600X
473.9 fps +1206%
Minisforum MS-A1 (Nvidia GeForce RTX 4090 @OCuLink)
AMD Ryzen 7 8700G
422.3 fps +1063%
Khadas Mind 2 (Nvidia GeForce RTX 4090 @USB4)
Intel Core Ultra 7 155H
344.6 fps +849%
Geekom GT1 Mega (Nvidia GeForce RTX 4090 @USB4)
Intel Core Ultra 9 185H
343 fps +845%
Asus NUC 14 Pro+ (Nvidia GeForce RTX 4090 @USB4)
Intel Core Ultra 9 185H
337.2 fps +829%

36.3 fps
ComputeMark v2.1
1024x600 Normal, Score
AMD Ryzen 5 9600X
AMD Ryzen 5 9600X
92222 Points +1114%
Minisforum MS-A1 (Nvidia GeForce RTX 4090 @OCuLink)
AMD Ryzen 7 8700G
90882 Points +1097%
Khadas Mind 2 (Nvidia GeForce RTX 4090 @USB4)
Intel Core Ultra 7 155H
86314 Points +1037%
Geekom GT1 Mega (Nvidia GeForce RTX 4090 @USB4)
Intel Core Ultra 9 185H
83349 Points +998%
Asus NUC 14 Pro+ (Nvidia GeForce RTX 4090 @USB4)
Intel Core Ultra 9 185H
82718 Points +989%

7594 Points
1024x600 Normal, Fluid 3DTex
AMD Ryzen 5 9600X
AMD Ryzen 5 9600X
10756 Points +2198%
Minisforum MS-A1 (Nvidia GeForce RTX 4090 @OCuLink)
AMD Ryzen 7 8700G
10664 Points +2179%
Khadas Mind 2 (Nvidia GeForce RTX 4090 @USB4)
Intel Core Ultra 7 155H
10373 Points +2116%
Geekom GT1 Mega (Nvidia GeForce RTX 4090 @USB4)
Intel Core Ultra 9 185H
9972 Points +2031%
Asus NUC 14 Pro+ (Nvidia GeForce RTX 4090 @USB4)
Intel Core Ultra 9 185H
9947 Points +2025%

468 Points
1024x600 Normal, Fluid 2DTexArr
AMD Ryzen 5 9600X
AMD Ryzen 5 9600X
6948 Points +1397%
Minisforum MS-A1 (Nvidia GeForce RTX 4090 @OCuLink)
AMD Ryzen 7 8700G
6907 Points +1389%
Khadas Mind 2 (Nvidia GeForce RTX 4090 @USB4)
Intel Core Ultra 7 155H
6771 Points +1359%
Geekom GT1 Mega (Nvidia GeForce RTX 4090 @USB4)
Intel Core Ultra 9 185H
6566 Points +1315%
Asus NUC 14 Pro+ (Nvidia GeForce RTX 4090 @USB4)
Intel Core Ultra 9 185H
6478 Points +1296%

464 Points
1024x600 Normal, Mandel Vector
AMD Ryzen 5 9600X
AMD Ryzen 5 9600X
17307 Points +811%
Minisforum MS-A1 (Nvidia GeForce RTX 4090 @OCuLink)
AMD Ryzen 7 8700G
17088 Points +800%
Khadas Mind 2 (Nvidia GeForce RTX 4090 @USB4)
Intel Core Ultra 7 155H
16044 Points +745%
Geekom GT1 Mega (Nvidia GeForce RTX 4090 @USB4)
Intel Core Ultra 9 185H
15583 Points +721%
Asus NUC 14 Pro+ (Nvidia GeForce RTX 4090 @USB4)
Intel Core Ultra 9 185H
15358 Points +709%

1899 Points
1024x600 Normal, Mandel Scalar
AMD Ryzen 5 9600X
AMD Ryzen 5 9600X
22843 Points +1290%
Minisforum MS-A1 (Nvidia GeForce RTX 4090 @OCuLink)
AMD Ryzen 7 8700G
22633 Points +1278%
Khadas Mind 2 (Nvidia GeForce RTX 4090 @USB4)
Intel Core Ultra 7 155H
21302 Points +1197%
Geekom GT1 Mega (Nvidia GeForce RTX 4090 @USB4)
Intel Core Ultra 9 185H
20574 Points +1152%
Asus NUC 14 Pro+ (Nvidia GeForce RTX 4090 @USB4)
Intel Core Ultra 9 185H
20445 Points +1144%

1643 Points
1024x600 Normal, QJuliaRayTrace
AMD Ryzen 5 9600X
AMD Ryzen 5 9600X
34367 Points +1001%
Minisforum MS-A1 (Nvidia GeForce RTX 4090 @OCuLink)
AMD Ryzen 7 8700G
33589 Points +976%
Khadas Mind 2 (Nvidia GeForce RTX 4090 @USB4)
Intel Core Ultra 7 155H
31824 Points +920%
Geekom GT1 Mega (Nvidia GeForce RTX 4090 @USB4)
Intel Core Ultra 9 185H
30654 Points +882%
Asus NUC 14 Pro+ (Nvidia GeForce RTX 4090 @USB4)
Intel Core Ultra 9 185H
30490 Points +877%

3121 Points
Performance Rating - Percent
AMD Ryzen 5 9600X
AMD Ryzen 5 9600X
100 pt
Minisforum MS-A1 (Nvidia GeForce RTX 4090 @OCuLink)
AMD Ryzen 7 8700G
75.5 pt
Geekom GT1 Mega (Nvidia GeForce RTX 4090 @USB4)
Intel Core Ultra 9 185H
42 pt
Asus NUC 14 Pro+ (Nvidia GeForce RTX 4090 @USB4)
Intel Core Ultra 9 185H
38.2 pt
Khadas Mind 2 (Nvidia GeForce RTX 4090 @USB4)
Intel Core Ultra 7 155H
33.7 pt
Cyberpunk 2077 2.1 Phantom Liberty
1280x720 Low Preset (FSR off)
AMD Ryzen 5 9600X
AMD Ryzen 5 9600X
256 (183.7min - 319max) fps +428%
Minisforum MS-A1 (Nvidia GeForce RTX 4090 @OCuLink)
AMD Ryzen 7 8700G
187.3 (143.6min - 225max) fps +286%
Geekom GT1 Mega (Nvidia GeForce RTX 4090 @USB4)
Intel Core Ultra 9 185H
88.9 (67.9min - 123.3max) fps +83%
Khadas Mind 2 (Nvidia GeForce RTX 4090 @USB4)
Intel Core Ultra 7 155H
79.7 (62.5min - 101.2max) fps +64%
Asus NUC 14 Pro+ (Nvidia GeForce RTX 4090 @USB4)
Intel Core Ultra 9 185H
74.1 (55.6min - 105.1max) fps +53%

48.5 (39.4min - 57.8max) fps
1920x1080 Medium Preset (FSR off)
AMD Ryzen 5 9600X
AMD Ryzen 5 9600X
252 (174.7min - 318max) fps +772%
Minisforum MS-A1 (Nvidia GeForce RTX 4090 @OCuLink)
AMD Ryzen 7 8700G
184.9 (141min - 225max) fps +540%
Geekom GT1 Mega (Nvidia GeForce RTX 4090 @USB4)
Intel Core Ultra 9 185H
87.8 (65.1min - 123max) fps +204%
Khadas Mind 2 (Nvidia GeForce RTX 4090 @USB4)
Intel Core Ultra 7 155H
77.5 (58.3min - 109.1max) fps +168%
Asus NUC 14 Pro+ (Nvidia GeForce RTX 4090 @USB4)
Intel Core Ultra 9 185H
71.7 (52.9min - 102.7max) fps +148%

28.9 (25.6min - 33.1max) fps
1920x1080 Ultra Preset (FSR off)
AMD Ryzen 5 9600X
AMD Ryzen 5 9600X
204 (126.1min - 264max) fps +827%
Minisforum MS-A1 (Nvidia GeForce RTX 4090 @OCuLink)
AMD Ryzen 7 8700G
161.8 (107min - 205max) fps +635%
Geekom GT1 Mega (Nvidia GeForce RTX 4090 @USB4)
Intel Core Ultra 9 185H
75 (50.3min - 110.2max) fps +241%
Khadas Mind 2 (Nvidia GeForce RTX 4090 @USB4)
Intel Core Ultra 7 155H
68.8 (46.7min - 98.6max) fps +213%
Asus NUC 14 Pro+ (Nvidia GeForce RTX 4090 @USB4)
Intel Core Ultra 9 185H
61.4 (39.5min - 89max) fps +179%

22 (18.9min - 26max) fps
Baldur's Gate 3
1920x1080 Low Preset
AMD Ryzen 5 9600X
AMD Ryzen 5 9600X
253 (30.2min, 76.7P0.1, 155.7P1 - 431max) fps +568%
Minisforum MS-A1 (Nvidia GeForce RTX 4090 @OCuLink)
AMD Ryzen 7 8700G
200 (109.4min, 129.1P0.1, 154.1P1 - 278max) fps +428%
Geekom GT1 Mega (Nvidia GeForce RTX 4090 @USB4)
Intel Core Ultra 9 185H
189.1 (95.1min, 108.7P0.1, 136.8P1 - 323max) fps +399%
Asus NUC 14 Pro+ (Nvidia GeForce RTX 4090 @USB4)
Intel Core Ultra 9 185H
171.8 (77.1min, 96.4P0.1, 118.1P1 - 312max) fps +353%
Khadas Mind 2 (Nvidia GeForce RTX 4090 @USB4)
Intel Core Ultra 7 155H
142.8 (70.4min, 75.8P0.1, 97.6P1 - 236max) fps +277%

37.9 (22.7min, 23.2P0.1, 26.9P1 - 91.7max) fps
1920x1080 Medium Preset
AMD Ryzen 5 9600X
AMD Ryzen 5 9600X
231 (52.4min, 123P0.1, 150.8P1 - 382max) fps +678%
Minisforum MS-A1 (Nvidia GeForce RTX 4090 @OCuLink)
AMD Ryzen 7 8700G
194.4 (102.5min, 120P0.1, 151.2P1 - 274max) fps +555%
Geekom GT1 Mega (Nvidia GeForce RTX 4090 @USB4)
Intel Core Ultra 9 185H
168.3 (71.8min, 94P0.1, 117.8P1 - 266max) fps +467%
Asus NUC 14 Pro+ (Nvidia GeForce RTX 4090 @USB4)
Intel Core Ultra 9 185H
157.9 (75.9min, 89.1P0.1, 105.9P1 - 265max) fps +432%
Khadas Mind 2 (Nvidia GeForce RTX 4090 @USB4)
Intel Core Ultra 7 155H
114 (35.5min, 44P0.1, 57.3P1 - 219max) fps +284%

29.7 (17.5min, 18.4P0.1, 19.7P1 - 65.1max) fps
1920x1080 Ultra Preset
AMD Ryzen 5 9600X
AMD Ryzen 5 9600X
212 (16.9min, 120.1P0.1, 151.8P1 - 372max) fps +769%
Minisforum MS-A1 (Nvidia GeForce RTX 4090 @OCuLink)
AMD Ryzen 7 8700G
190.9 (107.5min, 129.1P0.1, 148.8P1 - 259max) fps +682%
Geekom GT1 Mega (Nvidia GeForce RTX 4090 @USB4)
Intel Core Ultra 9 185H
151.8 (67.2min, 82P0.1, 101.9P1 - 254max) fps +522%
Asus NUC 14 Pro+ (Nvidia GeForce RTX 4090 @USB4)
Intel Core Ultra 9 185H
146.9 (66.9min, 80.1P0.1, 101.3P1 - 245max) fps +502%
Khadas Mind 2 (Nvidia GeForce RTX 4090 @USB4)
Intel Core Ultra 7 155H
109.2 (29.8min, 38.6P0.1, 55.9P1 - 199max) fps +348%

24.4 (8.14min, 11.8P0.1, 15.7P1 - 98.9max) fps
F1 24
1920x1080 Low Preset AA:T AF:16x
AMD Ryzen 5 9600X
AMD Ryzen 5 9600X
405 (297min, 246P1 - 476max) fps +464%
Minisforum MS-A1 (Nvidia GeForce RTX 4090 @OCuLink)
AMD Ryzen 7 8700G
269 (203min, 181P1 - 313max) fps +275%
Geekom GT1 Mega (Nvidia GeForce RTX 4090 @USB4)
Intel Core Ultra 9 185H
78.1 (43min, 45P1 - 98max) fps +9%
Asus NUC 14 Pro+ (Nvidia GeForce RTX 4090 @USB4)
Intel Core Ultra 9 185H
75.7 (42min, 44P1 - 92max) fps +5%
Khadas Mind 2 (Nvidia GeForce RTX 4090 @USB4)
Intel Core Ultra 7 155H
74.6 (42min, 44P1 - 94max) fps +4%

71.8 (59min, 46P1 - 83max) fps
1920x1080 Medium Preset AA:T AF:16x
AMD Ryzen 5 9600X
AMD Ryzen 5 9600X
421 (328min, 262P1 - 470max) fps +551%
Minisforum MS-A1 (Nvidia GeForce RTX 4090 @OCuLink)
AMD Ryzen 7 8700G
285 (216min, 190P1 - 313max) fps +340%
Geekom GT1 Mega (Nvidia GeForce RTX 4090 @USB4)
Intel Core Ultra 9 185H
74.4 (42min, 44P1 - 86max) fps +15%
Khadas Mind 2 (Nvidia GeForce RTX 4090 @USB4)
Intel Core Ultra 7 155H
72.1 (41min, 43P1 - 85max) fps +11%
Asus NUC 14 Pro+ (Nvidia GeForce RTX 4090 @USB4)
Intel Core Ultra 9 185H
70.5 (41min, 43P1 - 82max) fps +9%

64.7 (52min, 41P1 - 75max) fps
1920x1080 High Preset AA:T AF:16x
AMD Ryzen 5 9600X
AMD Ryzen 5 9600X
401 (305min, 241P1 - 449max) fps +729%
Minisforum MS-A1 (Nvidia GeForce RTX 4090 @OCuLink)
AMD Ryzen 7 8700G
267 (203min, 176P1 - 297max) fps +452%
Geekom GT1 Mega (Nvidia GeForce RTX 4090 @USB4)
Intel Core Ultra 9 185H
61.7 (35min, 37P1 - 75max) fps +27%
Khadas Mind 2 (Nvidia GeForce RTX 4090 @USB4)
Intel Core Ultra 7 155H
60.1 (35min, 36P1 - 74max) fps +24%
Asus NUC 14 Pro+ (Nvidia GeForce RTX 4090 @USB4)
Intel Core Ultra 9 185H
59.7 (35min, 35P1 - 73max) fps +23%

48.4 (40min, 36P1 - 56max) fps
bajomedioaltoultraQHD4K
Dota 2 Reborn (2015) 167.9 154.7 150.5 140 135
Final Fantasy XV Benchmark (2018) 195.5 184.4 158.2 150.6 118.7
X-Plane 11.11 (2018) 92.4 91.9 77.1 67.5
Baldur's Gate 3 (2023) 171.8 157.9 147.5 146.9 133.8 93.8
Cyberpunk 2077 2.1 Phantom Liberty (2023) 73.8 71.7 65.3 61.4 62.8 52.8
F1 24 (2024) 75.7 70.5 59.7 41.7 40.8 39.8

Emisiones - Un arma de doble filo

Ruido del sistema

Asus utiliza un sistema de refrigeración activo en el NUC 14 Pro+, con un ventilador situado en la parte inferior del dispositivo. Sin embargo, hemos observado que la solución de refrigeración alcanza rápidamente sus límites durante la prueba de estrés Cinebench R15. Las emisiones de ruido indican claramente que el único ventilador tiene que trabajar duro para hacer circular suficiente aire fresco a través de la carcasa. Con un nivel de ruido medio de 45,7 dB(A), el Asus NUC 14 Pro+ es claramente audible. Durante la prueba de estrés, registramos un pico de 47,4 dB(A). En modo inactivo, el dispositivo funciona silenciosamente, aunque el ventilador sigue girando.

El perfil del ventilador es ajustable en la BIOS. Para comparar, probamos el sistema tanto en modo susurro como en modo rendimiento. En modo susurro, el nivel máximo de ruido desciende a unos 43 dB(A), lo que lo hace más tolerable para un uso prolongado. Por otro lado, el modo de rendimiento produce un aumento significativo del ruido, con un nivel de presión sonora que alcanza casi los 58 dB(A), lo que no recomendamos para el uso diario.

Ruido

Ocioso
24.7 / 29.6 / 29.8 dB(A)
Carga
45.7 / 47.4 dB(A)
  red to green bar
 
 
30 dB
silencioso
40 dB(A)
audible
50 dB(A)
ruidosamente alto
 
min: dark, med: mid, max: light   Earthworks M23R (15 cm de distancia)   environment noise: 24.6 dB(A)
dB(A) 0102030405060708090Deep BassMiddle BassHigh BassLower RangeMidsHigher MidsLower HighsMid HighsUpper HighsSuper Highs2042.648.63743.23839.942.62542.145.245.344.144.13642.13142.743.237.938.639.139.742.74036.346.128.229.127.434.136.35043.63531.330.230.331.243.66333.635.428.428.424.625.533.68027.333.827.325.721.321.827.310025.527.725.123.120.821.625.512525.325.716.814.611.112.725.316021.121.61813913.221.120024.222.516.815.49.210.324.225023.62314.514.58.89.623.63152523.51515.19.192540027.825.81918.98.6827.850030.328.820.619.78.88.330.363031.53118.618.78.9931.580036.134.122.421.89.69.536.1100035.734.420.220.49.69.835.712503634.617.317.410.411.1361600403819.419.411.210.840200039.337.518.518.61211.339.325003634.315.91612.612.136315037.235.315.7161312.837.2400034.332.114.614.613.613.634.3500028.726.414.514.2141428.763002623.514.514.514.414.526800022.320.514.814.614.614.522.31000019.318.41514.914.814.719.31250016.216.614.614.614.514.516.21600014.915.614.113.914.213.914.9SPL47.445.729.829.624.724.647.4N5.24.61.21.20.50.55.2median 27.8median 26.4median 16.8median 15.4median 11.2median 12.1median 27.8Delta6.96.52.42.42.52.56.9hearing rangehide median Fan NoiseAsus NUC 14 Pro+
Asus NUC 14 Pro+
Ultra 9 185H, Arc 8-Core
Aoostar GEM12
R7 8845HS, Radeon 780M
Geekom GT1 Mega
Ultra 9 185H, Arc 8-Core
Geekom AX8 Pro
R9 8945H, Radeon 780M
Minisforum AtomMan X7 Ti
Ultra 9 185H, Arc 8-Core
Acemagic F2A
Ultra 7 155H, Arc 8-Core
Noise
10%
-2%
1%
1%
3%
off / environment *
24.6
24.3
1%
24.8
-1%
24.9
-1%
24.1
2%
24.9
-1%
Idle Minimum *
24.7
27.5
-11%
25.4
-3%
24.9
-1%
29.8
-21%
25.4
-3%
Idle Average *
29.6
27.6
7%
27.2
8%
24.9
16%
29.9
-1%
25.7
13%
Idle Maximum *
29.8
27.6
7%
27.5
8%
24.9
16%
30
-1%
25.7
14%
Load Average *
45.7
36
21%
50.9
-11%
50.1
-10%
37.3
18%
47.8
-5%
Cyberpunk 2077 ultra *
47.7
35.4
26%
50.8
-6%
50
-5%
Load Maximum *
47.4
38.2
19%
50.9
-7%
50.2
-6%
43.5
8%
49
-3%
Witcher 3 ultra *
35.4
40.2
45.23

* ... más pequeño es mejor

Temperatura

Las temperaturas de la superficie del Asus NUC 14 Pro+ varían considerablemente entre las condiciones de reposo y de carga. La superficie metálica distribuye eficazmente el calor, evitando puntos calientes localizados. Durante la prueba de estrés, el Intel Core Ultra 9 185H puede alcanzar fácilmente temperaturas de 212 °F. El SoC está diseñado para soportar hasta 239 vatios bajo carga continua, aunque este pico no se aprovecha al máximo. A corto plazo, el consumo de energía alcanza un pico ligeramente superior a los 212 vatios, pero bajo carga sostenida, el sistema suele disipar sólo unos 147 vatios. A pesar de ello, el SoC funciona constantemente por encima de los 212 °F, algo que el Intel Core Ultra 9 185H maneja bien. Según las especificaciones técnicas, el procesador está clasificado para funcionar a temperaturas de hasta 230 °F.

Prueba de esfuerzo Prime95, en solitario
Prueba de esfuerzo FurMark, en solitario
Prueba de estrés Prime95 y FurMark
Asus NUC 14 Pro+ durante la prueba de estrés (arriba)
Prueba de resistencia del Asus NUC 14 Pro+ (parte inferior)
Fuente de alimentación durante la prueba de resistencia
 46.2 °C45.1 °C45.6 °C 
 46.2 °C45.8 °C45.7 °C 
 45.7 °C44.9 °C45.7 °C 
Máximo: 46.2 °C
Médio: 45.7 °C
31.6 °C30.3 °C31.4 °C
30.9 °C28.8 °C32.1 °C
30.9 °C33.2 °C33.5 °C
Máximo: 33.5 °C
Médio: 31.4 °C
Conector de corriente  51.6 °C | Temperatura del cuarto 21.9 °C | Fluke t3000FC (calibrated)
(-) The average temperature for the upper side under maximal load is 45.7 °C / 114 F, compared to the average of 32.2 °C / 90 F for the devices in the class Mini PC.
(-) The maximum temperature on the upper side is 46.2 °C / 115 F, compared to the average of 35.7 °C / 96 F, ranging from 24 to 69.5 °C for the class Mini PC.
(+) The bottom heats up to a maximum of 33.5 °C / 92 F, compared to the average of 36.2 °C / 97 F
(±) In idle usage, the average temperature for the upper side is 32 °C / 90 F, compared to the device average of 32.2 °C / 90 F.
(-) 3: The average temperature for the upper side is 39.2 °C / 103 F, compared to the average of 32.2 °C / 90 F for the class Mini PC.

Gestión de la energía

El Asus NUC 14 Pro+ es esencialmente un mini PC asequible que rinde mejor en modo inactivo y bajo carga moderada. Debido a la potencia máxima del procesador, el consumo de energía a corto plazo se dispara significativamente en comparación con otros mini PC. Con algo menos de 145 vatios, nuestra muestra de prueba registra el valor más alto de esta comparación. Cabe destacar que este valor sólo se alcanza durante un breve periodo. La fuente de alimentación, capaz de suministrar hasta 150 vatios, está bien dimensionada para el sistema.

Consumo de corriente
Off / Standbydarklight 0.78 / 1 Watt
Ociosodarkmidlight 4.2 / 7.2 / 13 Watt
Carga midlight 68.5 / 144.9 Watt
 color bar
Clave: min: dark, med: mid, max: light        Metrahit Energy
Asus NUC 14 Pro+
Ultra 9 185H, Arc 8-Core
Aoostar GEM12
R7 8845HS, Radeon 780M
Geekom GT1 Mega
Ultra 9 185H, Arc 8-Core
Geekom AX8 Pro
R9 8945H, Radeon 780M
Minisforum AtomMan X7 Ti
Ultra 9 185H, Arc 8-Core
Acemagic F2A
Ultra 7 155H, Arc 8-Core
Average Intel Arc 8-Core iGPU
 
Average of class Mini PC
 
Power Consumption
-21%
10%
-60%
-24%
-25%
4%
-30%
Idle Minimum *
4.2
8.2
-95%
4.1
2%
14
-233%
8.2
-95%
9.1
-117%
5.41 ?(1.8 - 10.3, n=37)
-29%
Idle Average *
7.2
10
-39%
6.6
8%
15.9
-121%
12.1
-68%
10.3
-43%
8.64 ?(4.2 - 16, n=37)
-20%
Idle Maximum *
13
14.6
-12%
11.3
13%
19.5
-50%
14
-8%
14.4
-11%
12.1 ?(4.5 - 49, n=37)
7%
Load Average *
68.5
73.9
-8%
65.8
4%
76.4
-12%
53.1
22%
54.9
20%
Cyberpunk 2077 ultra external monitor *
74.1
79.9
-8%
69.4
6%
54.3
27%
Load Maximum *
144.9
95.3
34%
104.8
28%
99.1
32%
100.4
31%
110.4
24%

* ... más pequeño es mejor

Efficiency overview

Performance Rating - Percent
Geekom AX8 Pro
AMD Ryzen 9 8945H, Radeon 780M
100 pt
Minisforum AtomMan X7 Ti
Intel Core Ultra 9 185H, Arc 8-Core
92 pt
Geekom GT1 Mega
Intel Core Ultra 9 185H, Arc 8-Core
89.2 pt
Acemagic F2A
Intel Core Ultra 7 155H, Arc 8-Core
83.6 pt
Asus NUC 14 Pro+
Intel Core Ultra 9 185H, Arc 8-Core
79.6 pt
Power Consumption
Cinebench R23 Multi Power Efficiency - external Monitor
Geekom AX8 Pro
AMD Ryzen 9 8945H, Radeon 780M
219 Points per Watt +17%
Minisforum AtomMan X7 Ti
Intel Core Ultra 9 185H, Arc 8-Core
205 Points per Watt +9%
Geekom GT1 Mega
Intel Core Ultra 9 185H, Arc 8-Core
194.8 Points per Watt +4%
Asus NUC 14 Pro+
Intel Core Ultra 9 185H, Arc 8-Core
187.8 Points per Watt
Acemagic F2A
Intel Core Ultra 7 155H, Arc 8-Core
183.7 Points per Watt -2%
Cinebench R23 Single Power Efficiency - external Monitor
Geekom AX8 Pro
AMD Ryzen 9 8945H, Radeon 780M
58.3 Points per Watt +17%
Geekom GT1 Mega
Intel Core Ultra 9 185H, Arc 8-Core
56.7 Points per Watt +13%
Minisforum AtomMan X7 Ti
Intel Core Ultra 9 185H, Arc 8-Core
55.6 Points per Watt +11%
Acemagic F2A
Intel Core Ultra 7 155H, Arc 8-Core
54.2 Points per Watt +8%
Asus NUC 14 Pro+
Intel Core Ultra 9 185H, Arc 8-Core
50 Points per Watt
Cinebench R15 Multi Efficiency (external Monitor)
Geekom AX8 Pro
AMD Ryzen 9 8945H, Radeon 780M
35.9 Points per Watt +48%
Minisforum AtomMan X7 Ti
Intel Core Ultra 9 185H, Arc 8-Core
31.2 Points per Watt +29%
Geekom GT1 Mega
Intel Core Ultra 9 185H, Arc 8-Core
29.2 Points per Watt +21%
Acemagic F2A
Intel Core Ultra 7 155H, Arc 8-Core
26.6 Points per Watt +10%
Asus NUC 14 Pro+
Intel Core Ultra 9 185H, Arc 8-Core
24.2 Points per Watt

Power consumption with external monitor

0102030405060708090100110120130140Tooltip
Asus NUC 14 Pro+ Ultra 9 185H, Arc 8-Core; Idle 1min (external Monitor): Ø7.26 (4.91-13.1)
Geekom GT1 Mega Ultra 9 185H, Arc 8-Core; Idle 1min (external Monitor): Ø6.65 (4.54-11.3)
Geekom AX8 Pro R9 8945H, Radeon 780M; Idle 1min (external Monitor): Ø15.9 (14.3-19.4)
Asus NUC 14 Pro+ Ultra 9 185H, Arc 8-Core; 1280x720 Prime95 28.10 and Furmark 1.25: Ø114.7 (100.9-144.9)
Geekom GT1 Mega Ultra 9 185H, Arc 8-Core; 1280x720 Prime95 28.10 and Furmark 1.25: Ø75.4 (64.2-104.8)
Geekom AX8 Pro R9 8945H, Radeon 780M; 1280x720 Prime95 28.10 and Furmark 1.25: Ø89.4 (87.8-94.6)
Asus NUC 14 Pro+ Ultra 9 185H, Arc 8-Core; Cyberpunk 2077 FHD ultra no FSR - external Monitor: Ø74.1 (62.4-78.7)
Geekom GT1 Mega Ultra 9 185H, Arc 8-Core; Cyberpunk 2077 FHD ultra no FSR - external Monitor: Ø69.4 (66.7-76.7)
Geekom AX8 Pro R9 8945H, Radeon 780M; Cyberpunk 2077 FHD ultra no FSR - external Monitor: Ø54.3 (43.7-67.1)
Asus NUC 14 Pro+ Ultra 9 185H, Arc 8-Core; 3DMark06 Return To Proxycon: Ø68.5 (60-97.6)
Geekom GT1 Mega Ultra 9 185H, Arc 8-Core; 3DMark06 Return To Proxycon: Ø65.8 (59-72.8)
Geekom AX8 Pro R9 8945H, Radeon 780M; 3DMark06 Return To Proxycon: Ø76.5 (55.7-96.2)

Power consumption with external monitor

0102030405060708090100110120130140Tooltip
Asus NUC 14 Pro+ Ultra 9 185H, Arc 8-Core; Prime95 V2810 Stress (external Monitor): Ø104.2 (91.4-142.7)
Geekom GT1 Mega Ultra 9 185H, Arc 8-Core; Prime95 V2810 Stress (external Monitor): Ø75.6 (62.9-104.6)
Geekom AX8 Pro R9 8945H, Radeon 780M; Prime95 V2810 Stress (external Monitor): Ø75.9 (72.6-96)
Asus NUC 14 Pro+ Ultra 9 185H, Arc 8-Core; Cinebench R15 Multi (external Monitor): Ø118.5 (109.4-137.5)
Geekom GT1 Mega Ultra 9 185H, Arc 8-Core; Cinebench R15 Multi (external Monitor): Ø95.8 (95-96.5)
Geekom AX8 Pro R9 8945H, Radeon 780M; Cinebench R15 Multi (external Monitor): Ø70.3 (63.2-83)
Asus NUC 14 Pro+ Ultra 9 185H, Arc 8-Core; Cinebench R23 Single (external Monitor): Ø35.3 (25.6-81.6)
Geekom GT1 Mega Ultra 9 185H, Arc 8-Core; Cinebench R23 Single (external Monitor): Ø31.3 (15.7-81.3)
Geekom AX8 Pro R9 8945H, Radeon 780M; Cinebench R23 Single (external Monitor): Ø31 (25.6-51.4)
Asus NUC 14 Pro+ Ultra 9 185H, Arc 8-Core; Cinebench R23 Multi (external Monitor): Ø93.8 (87.6-109.2)
Geekom GT1 Mega Ultra 9 185H, Arc 8-Core; Cinebench R23 Multi (external Monitor): Ø95.5 (94-96.6)
Geekom AX8 Pro R9 8945H, Radeon 780M; Cinebench R23 Multi (external Monitor): Ø70.9 (66.8-89.8)
Asus NUC 14 Pro+ Ultra 9 185H, Arc 8-Core; 1280x720 FurMark 1.19 GPU Stress Test (external Monitor): Ø56.6 (55.1-70.1)
Geekom GT1 Mega Ultra 9 185H, Arc 8-Core; 1280x720 FurMark 1.19 GPU Stress Test (external Monitor): Ø58.2 (56.2-74.2)
Geekom AX8 Pro R9 8945H, Radeon 780M; 1280x720 FurMark 1.19 GPU Stress Test (external Monitor): Ø85.7 (73.1-99.9)

Valoración de Notebookcheck

El rendimiento del Asus NUC 14 Pro+ es notable, con tecnología de vanguardia y una amplia gama de opciones de conectividad. El Intel Core Ultra 9 185H proporciona un rendimiento excelente para aplicaciones ofimáticas y facilidad para manejar tareas multimedia que requieren mucha potencia. El único inconveniente es el sistema de refrigeración, ocasionalmente ruidoso, que se hace notar incluso con una carga moderada.
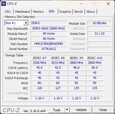
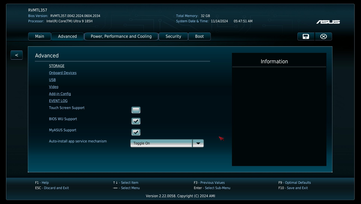
Asus NUC 14 Pro+ - 11/14/2024 v8
Sebastian Bade

Acabado
84 / 98 → 85%
Conectividad
62 / 81 → 77%
Peso
81%
Rendimiento de juegos
49 / 80 → 62%
Rendimiento de la Aplicación
82 / 92 → 90%
Workstation
32%
AI Performance
83%
Temperatura
86%
Ruido
73%
Médio
55%
75%
Mini PC - media ponderada
CO2 Emissions
No Data
Materials
25%
Packaging
25%
Power Use
74.9%
Repairability
30%
Software Updates
50%
Recycle Logo Total Sustainability Score: 34.2%

Transparency

The selection of devices to be reviewed is made by our editorial team. The test sample was provided to the author as a loan by the manufacturer or retailer for the purpose of this review. The lender had no influence on this review, nor did the manufacturer receive a copy of this review before publication. There was no obligation to publish this review. We never accept compensation or payment in return for our reviews. As an independent media company, Notebookcheck is not subjected to the authority of manufacturers, retailers or publishers.

This is how Notebookcheck is testing

Every year, Notebookcheck independently reviews hundreds of laptops and smartphones using standardized procedures to ensure that all results are comparable. We have continuously developed our test methods for around 20 years and set industry standards in the process. In our test labs, high-quality measuring equipment is utilized by experienced technicians and editors. These tests involve a multi-stage validation process. Our complex rating system is based on hundreds of well-founded measurements and benchmarks, which maintains objectivity. Further information on our test methods can be found here.

Please share our article, every link counts!
> Análisis y pruebas de ordenadores portátiles y móviles teléfonos > Análisis > Asus NUC 14 Pro+ mini-PC review - Un potencial asesino de sobremesas con sólo 622 gramos
Sebastian Bade, 2024-11-17 (Update: 2024-11-17)