Notebookcheck Logo

KFA2 GeForce RTX 2060 Super (1-Click OC) - Review del modelo Custom RTX 2060 Super Series

RGB no es necesario!

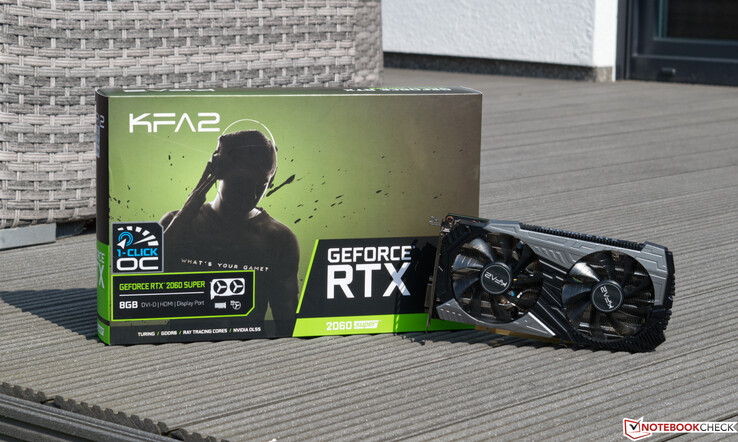
Tras el lanzamiento de las tarjetas gráficas Super de Nvidia, los fabricantes han lanzado sus propias versiones de las nuevas tarjetas GeForce. A continuación le presentamos el modelo de KFA2. En esta revisión se intenta determinar si el KFA 2 GeForce RTX 2060 Super 1-Click OC vale la pena o si el diseño de referencia de Nvidia es la mejor opción.
KFA2 GeForce RTX 2060 Super (1-Click OC)
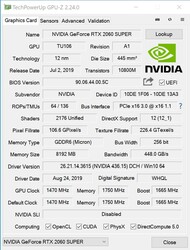
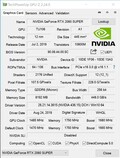
GPU-Z
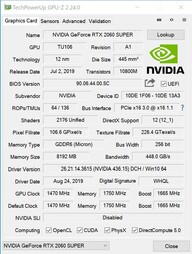
GPU-Z
Puertos KFA2 GeForce RTX 2060S

Nvidia ha añadido "Super" al nombre de sus modelos de la familia RTX. Como Nvidia ya nos ha suministrado una tarjeta de prueba de diseño de referencia, estamos familiarizados con el nivel de rendimiento de la GeForce RTX 2060 Super. KFA2 es un popular proveedor de terceros que desde entonces ha ajustado su cartera y ha lanzado un RTX 2060 Super personalizado. Además, nuestra muestra contiene el descriptor 1-Click OC. Con la herramienta propia de KFA2 "Xtreme Tuner", la tarjeta puede ser overclockeada ligeramente en unos pocos clics. Más sobre eso más adelante.

La KFA2 GeForce RTX 2060S es una tarjeta gráfica con 8 GB de VRAM que la hace significativamente más resistente al futuro que su predecesora. En este último, los escasos 6 GB de VRAM eran a menudo un factor importante a considerar y se encontraron con críticas antes de una compra potencial.

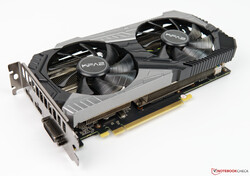
El PCB de la tarjeta KFA2 difiere significativamente del diseño de referencia de Nvidia. El conector de alimentación de 8 patillas vuelve a su antigua posición y, por lo tanto, ya no aumenta artificialmente la longitud de la tarjeta. Para los propietarios de maletas más compactas, esto puede ser una ventaja. Las dimensiones de las dos tarjetas son casi idénticas. Sin embargo, el modelo de KFA2 pesa alrededor de 300 gramos (~0.66 lb) menos que el de Nvidia. La solución de refrigeración con sus dos ventiladores recuerda a la edición Founders. Sin embargo, debido a la gran diferencia en términos de peso, es probable que la solución de refrigeración de Nvidia sea significativamente más potente. En nuestra sección de evaluación comparativa se indicará si esto conlleva o no desventajas para la KFA2 RTX 2060S.

En el momento de la prueba, la KFA2 GeForce RTX 2060 Super 1-Click OC se puede comprar por poco menos de 390 euros (~$432), lo que la hace alrededor de 40 euros (~$44) más barata que la edición Founders de Nvidia. El fabricante no ha optado por incluir ningún caramelo de ojo RGB, lo que no es necesariamente una gran pérdida. En cuanto a las salidas, el KFA2 carece de un segundo puerto DisplayPort y de un puerto tipo C. Así, los usuarios se quedan con 1x HDMI 2.0b, 1x DisplayPort 1.4 y 1x puerto DVI. Esto debería ser suficiente para la mayoría de los casos de uso. Internamente, la tarjeta gráfica requiere una conexión de alimentación de 8 pines, al igual que la edición Founders. Con 175 vatios, el consumo de la KFA2 también coincide con el diseño de referencia.

KFA2 GeForce RTX 2060 Super (1-Click OC)

Especificaciones detalladas de Turing

Especificaciones RTX 2060 RTX 2060S KFA2 RTX 2060S RTX 2070 RTX 2070S RTX 2080 RTX 2080S RTX 2080 Ti Titan RTX
Chip TU106 TU106 TU106 TU106 TU104 TU104 TU104 TU102 TU102
Fabricado 12 nm 12 nm12 nm 12 nm 12 nm 12 nm 12 nm 12 nm 12 nm
Shader 1.920 2.176 2.176 2.304 2.560 2.944 3.072 4.352 4.608
Texture Units 120 136 136 144 160 184 192 272 288
Tensor Cores 240 272 272 288 320 368 384 544 572
RT Cores 30 34 34 36 40 46 48 68 72
Base GPU 1.365 MHz 1.470 MHz 1.470 MHz 1.410 MHz 1.605 MHz 1.515 MHz 1.650 MHz 1.350 MHz 1.350 MHz
Boost GPU 1.680 MHz 1.650 MHz 1.665 MHz 1.620 MHz 1.770 MHz 1.710 MHz 1.815 MHz 1.545 MHz 1.770 MHz
Bus de memoria 192 Bit 256 Bit 256 Bit 256 Bit 256 Bit 256 Bit 256 Bit 352 Bit 384 Bit
Ancho de banda de memoria 336 GB/s 448 GB/s< 448 GB/s 448 GB/s 448 GB/s 448 GB/s 496,1 GB/s 616 GB/s 672 GB/s
Tamaño de la memoria 6 GB GDDR6 8 GB GDDR6 8 GB GDDR6 8 GB GDDR6 8 GB GDDR6 8 GB GDDR6 8 GB GDDR6 11 GB GDDR6 24 GB GDDR6
Corriente (vatios) 160 W 175 W 175 W 175 W 215 W 215 W 250 W 250 W 280 W

Configuración de la prueba - Basado en Ryzen 9 3900X

Nuestra configuración de prueba se basa en la última plataforma AMD y contiene el MSI MEG X570 Godlike. La CPU, un AMD Ryzen 9 3900X, ofrece un gran rendimiento de CPU y un AIO (BeQuiet Silent Loop 280mm) se encarga de la refrigeración. Los 16 GB de RAM provienen de G-Skill y funcionan a una frecuencia de 3.600 MHz. Utilizamos el Acer Predator XB321HK como pantalla. Gracias al soporte de UHD, no nos limita en nuestras pruebas. Queremos agradecer a AMD por proporcionarnos la plataforma de pruebas.

Realizamos los benchmarks abajo usando la siguiente configuración:

  • Corsair Carbide Air 540 ATX Cube
  • AMD Ryzen 9 3900X
  • KFA2 GeForce RTX 2060 Super 1-Click-OC (Nvidia 436.15 driver)
  • MSI MEG X570 Godlike (BIOS 1.20, Parametrizaciones estándar, XMP 1 for DDR4-3600 CL16)
  • Fuente de alimentación Antec de 1200 vatios
  • Kit de memoria G-Skill Trident Z Royal Gold DDR4-3600 de 2 x 8 GB, ajustado a DDR4-3600 CL16-16-16-36
  • Corsair MP600 2TB M.2 PCIe 4.0 SSD
  • Crucial MX500 2TB (para juegos)

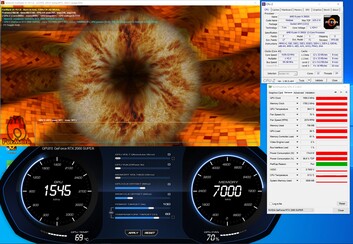
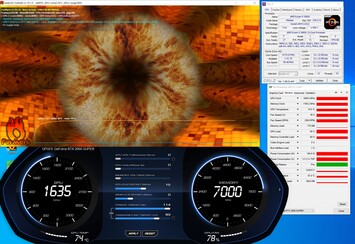
Velocidades de reloj de la Nvidia GeForce RTX 2060S

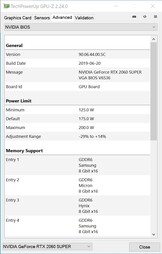
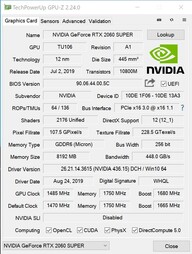
Como muestra la tabla anterior, Nvidia ha elevado ligeramente el reloj base de la GeForce RTX 2060S (1.470 MHz). Al mismo tiempo, la velocidad del reloj de aumento de 1.665 MHz es ligeramente inferior a la del RTX 2060. En este caso, nuestro modelo de prueba difiere de la edición Founders, ya que esta última sólo ofrece una aceleración de la GPU de 1.650 MHz. Sin embargo, en la práctica, este valor a menudo se supera con creces, por lo que la tarjeta gráfica de KFA2 no puede garantizar una ventaja en este ámbito. El límite de potencia de la tarjeta gráfica se ha fijado en 175 vatios, por lo que equivale al valor especificado por Nvidia. Se puede aumentar en un 14 por ciento, mientras que la Edición Fundadores permite un máximo del 22 por ciento. La KFA2 GeForce RTX 2060 Super casi siempre funcionaba a una velocidad de reloj de más de 1.800 MHz antes de alcanzar el PT (objetivo de potencia) y limitar las velocidades de reloj. El VRAM tiene una capacidad de 8 GB y una velocidad de reloj efectiva de 14 GHz, lo que lo hace tan rápido como el VRAM del no Super RTX 2060.

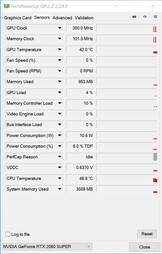
GPU-Z
GPU-Z
GPU-Z
GPU-Z
GPU-Z
GPU-Z
GPU-Z (1-Click-OC)
GPU-Z (1-Click-OC)

Benchmarks sintéticos

Antes de echar un vistazo al rendimiento de los juegos, primero queremos centrarnos en los resultados de las pruebas de referencia sintéticas. En general, la KFA2 GeForce RTX 2060 Super es tan rápida como el modelo de referencia de Nvidia. Los dos candidatos están muy cerca en todas nuestras pruebas. Sin embargo, nuestra muestra de prueba pierde en una comparación directa con la DMAE. En nuestras pruebas sintéticas, el AMD Radeon RX 5700 XT fue ligeramente más rápido. Para la versión no Super de RTX 2060, utilizamos un MSI RTX 2060 Gaming Z 6G. Dependiendo de la prueba, era entre un 10 y un 20 por ciento más lento que la variante Super más rápida.

Performance Rating - Percent
Nvidia Titan RTX
100 pt
MSI RTX 2080 Gaming X Trio
81.3 pt
Nvidia GeForce RTX 2070 Super
73.9 pt
AMD Radeon VII
71.7 pt
MSI RTX 2070 Gaming Z 8G
69.5 pt
AMD Radeon RX 5700 XT
68.6 pt
Nvidia GeForce RTX 2060 Super
66.4 pt
KFA2 GeForce RTX 2060 Super
66.1 pt
AMD Radeon RX 5700
61.8 pt
AMD Radeon RX Vega 64 -4!
61.6 pt
MSI RTX 2060 Gaming Z 6G
57.5 pt
3DMark
1920x1080 Fire Strike Graphics
Nvidia Titan RTX
34780 Points +61%
MSI RTX 2080 Gaming X Trio
27620 Points +28%
AMD Radeon VII
27476 Points +27%
AMD Radeon RX 5700 XT
25383 Points +18%
Nvidia GeForce RTX 2070 Super
24151 Points +12%
MSI RTX 2070 Gaming Z 8G
22999 Points +7%
AMD Radeon RX 5700
22457 Points +4%
AMD Radeon RX Vega 64
22338 Points +4%
Nvidia GeForce RTX 2060 Super
21970 Points +2%
KFA2 GeForce RTX 2060 Super
21563 Points
MSI RTX 2060 Gaming Z 6G
19338 Points -10%
Fire Strike Extreme Graphics
Nvidia Titan RTX
17179 Points +66%
AMD Radeon VII
13388 Points +29%
MSI RTX 2080 Gaming X Trio
13355 Points +29%
AMD Radeon RX 5700 XT
12209 Points +18%
Nvidia GeForce RTX 2070 Super
11634 Points +12%
MSI RTX 2070 Gaming Z 8G
11021 Points +6%
AMD Radeon RX 5700
10876 Points +5%
AMD Radeon RX Vega 64
10758 Points +4%
Nvidia GeForce RTX 2060 Super
10481 Points +1%
KFA2 GeForce RTX 2060 Super
10368 Points
MSI RTX 2060 Gaming Z 6G
9097 Points -12%
3840x2160 Fire Strike Ultra Graphics
Nvidia Titan RTX
8625 Points +68%
AMD Radeon VII
6837 Points +33%
MSI RTX 2080 Gaming X Trio
6513 Points +27%
AMD Radeon RX 5700 XT
5955 Points +16%
Nvidia GeForce RTX 2070 Super
5786 Points +13%
MSI RTX 2070 Gaming Z 8G
5450 Points +6%
AMD Radeon RX Vega 64
5441 Points +6%
AMD Radeon RX 5700
5292 Points +3%
Nvidia GeForce RTX 2060 Super
5175 Points +1%
KFA2 GeForce RTX 2060 Super
5137 Points
MSI RTX 2060 Gaming Z 6G
4244 Points -17%
2560x1440 Time Spy Graphics
Nvidia Titan RTX
14216 Points +63%
MSI RTX 2080 Gaming X Trio
11294 Points +30%
Nvidia GeForce RTX 2070 Super
10094 Points +16%
MSI RTX 2070 Gaming Z 8G
9236 Points +6%
AMD Radeon VII
8803 Points +1%
Nvidia GeForce RTX 2060 Super
8795 Points +1%
KFA2 GeForce RTX 2060 Super
8699 Points
AMD Radeon RX 5700 XT
8673 Points 0%
MSI RTX 2060 Gaming Z 6G
7732 Points -11%
AMD Radeon RX 5700
7675 Points -12%
AMD Radeon RX Vega 64
7183 Points -17%
3DMark 11 - 1280x720 Performance GPU
Nvidia Titan RTX
43461 Points +49%
MSI RTX 2080 Gaming X Trio
37989 Points +30%
AMD Radeon VII
37881 Points +30%
AMD Radeon RX 5700 XT
35715 Points +23%
Nvidia GeForce RTX 2070 Super
33293 Points +14%
AMD Radeon RX 5700
31570 Points +8%
MSI RTX 2070 Gaming Z 8G
31260 Points +7%
Nvidia GeForce RTX 2060 Super
29605 Points +2%
AMD Radeon RX Vega 64
29285 Points 0%
KFA2 GeForce RTX 2060 Super
29148 Points
MSI RTX 2060 Gaming Z 6G
26413 Points -9%
Unigine Heaven 4.0
Extreme Preset OpenGL
Nvidia Titan RTX
203.4 fps +54%
MSI RTX 2080 Gaming X Trio
161.4 fps +22%
Nvidia GeForce RTX 2070 Super
153.5 fps +16%
MSI RTX 2070 Gaming Z 8G
139 fps +5%
Nvidia GeForce RTX 2060 Super
132.3 fps 0%
KFA2 GeForce RTX 2060 Super
132.3 fps
MSI RTX 2060 Gaming Z 6G
115.8 fps -12%
AMD Radeon RX 5700 XT
110.2 fps -17%
AMD Radeon VII
109 fps -18%
AMD Radeon RX 5700
100.7 fps -24%
Extreme Preset DX11
Nvidia Titan RTX
207.2 fps +48%
MSI RTX 2080 Gaming X Trio
176.5 fps +26%
Nvidia GeForce RTX 2070 Super
160.1 fps +14%
MSI RTX 2070 Gaming Z 8G
149.3 fps +6%
Nvidia GeForce RTX 2060 Super
141.7 fps +1%
KFA2 GeForce RTX 2060 Super
140.4 fps
AMD Radeon VII
140.3 fps 0%
AMD Radeon RX 5700 XT
132.5 fps -6%
MSI RTX 2060 Gaming Z 6G
124.1 fps -12%
AMD Radeon RX 5700
119.9 fps -15%
Unigine Valley 1.0
1920x1080 Extreme HD DirectX AA:x8
Nvidia Titan RTX
135 fps +22%
MSI RTX 2080 Gaming X Trio
119.6 fps +8%
Nvidia GeForce RTX 2070 Super
113.7 fps +2%
MSI RTX 2070 Gaming Z 8G
111.5 fps 0%
KFA2 GeForce RTX 2060 Super
111 fps
AMD Radeon VII
108.5 fps -2%
Nvidia GeForce RTX 2060 Super
106.9 fps -4%
AMD Radeon RX 5700 XT
106.3 fps -4%
AMD Radeon RX 5700
99.3 fps -11%
MSI RTX 2060 Gaming Z 6G
91.2 fps -18%
1920x1080 Extreme HD Preset OpenGL AA:x8
Nvidia Titan RTX
139.2 fps +43%
MSI RTX 2080 Gaming X Trio
110.5 fps +13%
Nvidia GeForce RTX 2070 Super
105.6 fps +8%
MSI RTX 2070 Gaming Z 8G
101 fps +3%
Nvidia GeForce RTX 2060 Super
98.3 fps +1%
KFA2 GeForce RTX 2060 Super
97.6 fps
AMD Radeon RX 5700 XT
89.1 fps -9%
MSI RTX 2060 Gaming Z 6G
83.6 fps -14%
AMD Radeon RX 5700
82.7 fps -15%
AMD Radeon VII
81.3 fps -17%
3DMark 05 Standard
52832 puntos
3DMark 06 Standard Score
44419 puntos
3DMark Vantage P Result
70863 puntos
3DMark 11 Performance
25443 puntos
3DMark Ice Storm Standard Score
186278 puntos
3DMark Cloud Gate Standard Score
52783 puntos
3DMark Fire Strike Score
20086 puntos
3DMark Fire Strike Extreme Score
10259 puntos
3DMark Time Spy Score
9064 puntos
ayuda

Benchmarks de juego

The Witcher 3 tiempos de fotogramas (Ultra)
The Witcher 3 progresión de fotogramas (Ultra)

The gaming tests also show that KFA2 and the Founders Edition of the RTX 2060S are on an equal footing. Due to the faster processor, the KFA2 has a slight advantage in our gaming tests. Since the AMD Ryzen 7 2700X has a clear disadvantage compared to the Intel, an upgrade of our test setup was in order. Now, with the AMD Ryzen 9 3900X, the system is almost on par with the faster processor and the Ryzen 9 3900X is better suited to future applications thanks to its 12 cores. The graphics card, of course, also profits from the higher single-thread performance and the higher clock speeds. All in all, the KFA2 GeForce RTX 2060S is almost 6 percent faster. Even the MSI GeForce RTX 2070 Gaming Z 8G and the AMD Radeon RX 5700 XT are within reach and only marginally outperform our KFA2 sample.

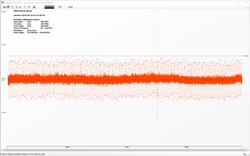
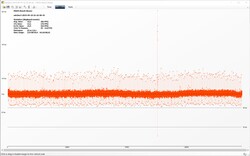
The frametimes and the frame progression of our test card are unremarkable. There are spikes as well as dips. However, since they are only short-lived, stuttering is not an issue. Our data stems from the game The Witcher 3 (Ultra preset). On average, our KFA2 model achieved 81.7 FPS, which translates to a very good gaming experience. While the Founders Edition of the RTX 2060S achieved a slightly better result of 82.7 fps, the differences are unlikely to be noticeable during day-to-day use.

The Witcher 3 progresión de fotogramas Ultra

05101520253035404550556065707580Tooltip
KFA2 GeForce RTX 2060 Super GeForce RTX 2060 Super (Desktop), R9 3900X, Corsair MP600: Ø81.7 (78-84)
Performance Rating - Percent
Nvidia Titan RTX -42!
NVIDIA Titan RTX, R7 2700X, ADATA Premier Pro SP900NS38 512 GB
98.2 pt
MSI RTX 2080 Gaming X Trio -3!
GeForce RTX 2080 (Desktop), R7 2700X
90.1 pt
Nvidia GeForce RTX 2070 Super
GeForce RTX 2070 Super (Desktop), R7 2700X
83.7 pt
AMD Radeon RX 5700 XT -10!
Radeon RX 5700 XT (Desktop), R7 2700X
79 pt
MSI RTX 2070 Gaming Z 8G -3!
GeForce RTX 2070 (Desktop), R7 2700X
78.8 pt
KFA2 GeForce RTX 2060 Super -2!
GeForce RTX 2060 Super (Desktop), R9 3900X, Corsair MP600
78.7 pt
AMD Radeon VII -36!
Radeon VII, R7 2700X
75.5 pt
Nvidia GeForce RTX 2060 Super
GeForce RTX 2060 Super (Desktop), R7 2700X
74.4 pt
AMD Radeon RX 5700 -11!
Radeon RX 5700 (Desktop), R7 2700X
71.9 pt
AMD Radeon RX Vega 64 -27!
RX Vega 64, R7 2700X
69.5 pt
MSI RTX 2060 Gaming Z 6G -20!
GeForce RTX 2060 (Desktop), R7 2700X
67.3 pt
Call of Duty Black Ops 4
1920x1080 Very High / On
Nvidia Titan RTX
NVIDIA Titan RTX, R7 2700X, ADATA Premier Pro SP900NS38 512 GB
200 (159min - 238max) fps +40%
MSI RTX 2080 Gaming X Trio
GeForce RTX 2080 (Desktop), R7 2700X
177 (140min - 204max) fps +24%
AMD Radeon RX Vega 64
RX Vega 64, R7 2700X
166.2 (125min - 210max) fps +16%
Nvidia GeForce RTX 2070 Super
GeForce RTX 2070 Super (Desktop), R7 2700X
163 (102min - 201max) fps +14%
MSI RTX 2070 Gaming Z 8G
GeForce RTX 2070 (Desktop), R7 2700X
153 (116min - 189max) fps +7%
AMD Radeon VII
Radeon VII, R7 2700X
146 (115min - 198max) fps +2%
Nvidia GeForce RTX 2060 Super
GeForce RTX 2060 Super (Desktop), R7 2700X
146 (111min - 180max) fps +2%
KFA2 GeForce RTX 2060 Super
GeForce RTX 2060 Super (Desktop), R9 3900X, Corsair MP600
143 (104min - 181max) fps
AMD Radeon RX 5700 XT
Radeon RX 5700 XT (Desktop), R7 2700X
135 (59min - 186max) fps -6%
MSI RTX 2060 Gaming Z 6G
GeForce RTX 2060 (Desktop), R7 2700X
133 (60min - 170max) fps -7%
AMD Radeon RX 5700
Radeon RX 5700 (Desktop), R7 2700X
114 fps -20%
3840x2160 Very High / On
Nvidia Titan RTX
NVIDIA Titan RTX, R7 2700X, ADATA Premier Pro SP900NS38 512 GB
88 (66min - 109max) fps +90%
MSI RTX 2080 Gaming X Trio
GeForce RTX 2080 (Desktop), R7 2700X
64 (48min - 79max) fps +39%
AMD Radeon RX Vega 64
RX Vega 64, R7 2700X
58.8 (43min - 78max) fps +27%
AMD Radeon VII
Radeon VII, R7 2700X
58.1 (39min - 74max) fps +26%
AMD Radeon RX 5700 XT
Radeon RX 5700 XT (Desktop), R7 2700X
55.7 (23min - 73max) fps +21%
Nvidia GeForce RTX 2070 Super
GeForce RTX 2070 Super (Desktop), R7 2700X
54.5 (34min - 74max) fps +18%
AMD Radeon RX 5700
Radeon RX 5700 (Desktop), R7 2700X
53 (34min - 71max) fps +15%
Nvidia GeForce RTX 2060 Super
GeForce RTX 2060 Super (Desktop), R7 2700X
48.6 (35min - 63max) fps +5%
MSI RTX 2070 Gaming Z 8G
GeForce RTX 2070 (Desktop), R7 2700X
47.4 (31min - 64max) fps +3%
KFA2 GeForce RTX 2060 Super
GeForce RTX 2060 Super (Desktop), R9 3900X, Corsair MP600
46.2 (32min - 60max) fps
MSI RTX 2060 Gaming Z 6G
GeForce RTX 2060 (Desktop), R7 2700X
39.7 (25min - 55max) fps -14%
2560x1440 Very High / On
AMD Radeon RX 5700 XT
Radeon RX 5700 XT (Desktop), R7 2700X
126 (92min - 157max) fps +33%
MSI RTX 2080 Gaming X Trio
GeForce RTX 2080 (Desktop), R7 2700X
123 (90min - 152max) fps +29%
Nvidia GeForce RTX 2070 Super
GeForce RTX 2070 Super (Desktop), R7 2700X
118 (88min - 149max) fps +24%
MSI RTX 2070 Gaming Z 8G
GeForce RTX 2070 (Desktop), R7 2700X
104.7 (74min - 128max) fps +10%
AMD Radeon RX 5700
Radeon RX 5700 (Desktop), R7 2700X
102 (29min - 142max) fps +7%
Nvidia GeForce RTX 2060 Super
GeForce RTX 2060 Super (Desktop), R7 2700X
96 (61min - 120max) fps +1%
KFA2 GeForce RTX 2060 Super
GeForce RTX 2060 Super (Desktop), R9 3900X, Corsair MP600
95 (69min - 118max) fps
Assassin´s Creed Odyssey
1920x1080 Ultra High Preset
Nvidia Titan RTX
NVIDIA Titan RTX, R7 2700X, ADATA Premier Pro SP900NS38 512 GB
79 fps +30%
MSI RTX 2080 Gaming X Trio
GeForce RTX 2080 (Desktop), R7 2700X
68 fps +11%
MSI RTX 2070 Gaming Z 8G
GeForce RTX 2070 (Desktop), R7 2700X
64 (30min - 111max) fps +5%
Nvidia GeForce RTX 2070 Super
GeForce RTX 2070 Super (Desktop), R7 2700X
64 fps +5%
AMD Radeon VII
Radeon VII, R7 2700X
63 fps +3%
AMD Radeon RX 5700 XT
Radeon RX 5700 XT (Desktop), R7 2700X
62 fps +2%
Nvidia GeForce RTX 2060 Super
GeForce RTX 2060 Super (Desktop), R7 2700X
61 fps 0%
KFA2 GeForce RTX 2060 Super
GeForce RTX 2060 Super (Desktop), R9 3900X, Corsair MP600
61 fps
AMD Radeon RX 5700
Radeon RX 5700 (Desktop), R7 2700X
60 fps -2%
MSI RTX 2060 Gaming Z 6G
GeForce RTX 2060 (Desktop), R7 2700X
56 fps -8%
AMD Radeon RX Vega 64
RX Vega 64, R7 2700X
50 (25min - 75max) fps -18%
3840x2160 Ultra High Preset
Nvidia Titan RTX
NVIDIA Titan RTX, R7 2700X, ADATA Premier Pro SP900NS38 512 GB
52 fps +44%
AMD Radeon VII
Radeon VII, R7 2700X
44 fps +22%
MSI RTX 2080 Gaming X Trio
GeForce RTX 2080 (Desktop), R7 2700X
41 fps +14%
Nvidia GeForce RTX 2070 Super
GeForce RTX 2070 Super (Desktop), R7 2700X
39 fps +8%
MSI RTX 2070 Gaming Z 8G
GeForce RTX 2070 (Desktop), R7 2700X
36 (25min - 63max) fps 0%
KFA2 GeForce RTX 2060 Super
GeForce RTX 2060 Super (Desktop), R9 3900X, Corsair MP600
36 fps
AMD Radeon RX 5700 XT
Radeon RX 5700 XT (Desktop), R7 2700X
35 fps -3%
Nvidia GeForce RTX 2060 Super
GeForce RTX 2060 Super (Desktop), R7 2700X
34 fps -6%
AMD Radeon RX 5700
Radeon RX 5700 (Desktop), R7 2700X
31 fps -14%
AMD Radeon RX Vega 64
RX Vega 64, R7 2700X
29 (5min - 64max) fps -19%
MSI RTX 2060 Gaming Z 6G
GeForce RTX 2060 (Desktop), R7 2700X
28 fps -22%
2560x1440 Ultra High Preset
MSI RTX 2080 Gaming X Trio
GeForce RTX 2080 (Desktop), R7 2700X
58 fps +12%
Nvidia GeForce RTX 2070 Super
GeForce RTX 2070 Super (Desktop), R7 2700X
56 fps +8%
MSI RTX 2070 Gaming Z 8G
GeForce RTX 2070 (Desktop), R7 2700X
53 (33min - 95max) fps +2%
AMD Radeon RX 5700 XT
Radeon RX 5700 XT (Desktop), R7 2700X
53 fps +2%
Nvidia GeForce RTX 2060 Super
GeForce RTX 2060 Super (Desktop), R7 2700X
52 fps 0%
KFA2 GeForce RTX 2060 Super
GeForce RTX 2060 Super (Desktop), R9 3900X, Corsair MP600
52 fps
AMD Radeon RX 5700
Radeon RX 5700 (Desktop), R7 2700X
51 fps -2%
FIFA 19
1920x1080 Ultra Preset AA:4x MS
KFA2 GeForce RTX 2060 Super
GeForce RTX 2060 Super (Desktop), R9 3900X, Corsair MP600
320 (301min - 354max) fps
AMD Radeon RX Vega 64
RX Vega 64, R7 2700X
287.8 (267min - 331max) fps -10%
AMD Radeon RX 5700 XT
Radeon RX 5700 XT (Desktop), R7 2700X
276 (236min - 297max) fps -14%
AMD Radeon RX 5700
Radeon RX 5700 (Desktop), R7 2700X
270 (253min - 295max) fps -16%
Nvidia GeForce RTX 2070 Super
GeForce RTX 2070 Super (Desktop), R7 2700X
255 (237min - 267max) fps -20%
Nvidia Titan RTX
NVIDIA Titan RTX, R7 2700X, ADATA Premier Pro SP900NS38 512 GB
251 (233min - 258max) fps -22%
MSI RTX 2080 Gaming X Trio
GeForce RTX 2080 (Desktop), R7 2700X
228 (218min - 235max) fps -29%
AMD Radeon VII
Radeon VII, R7 2700X
227 (225min - 229max) fps -29%
MSI RTX 2070 Gaming Z 8G
GeForce RTX 2070 (Desktop), R7 2700X
218.4 (212min - 233max) fps -32%
Nvidia GeForce RTX 2060 Super
GeForce RTX 2060 Super (Desktop), R7 2700X
216 (206min - 230max) fps -32%
MSI RTX 2060 Gaming Z 6G
GeForce RTX 2060 (Desktop), R7 2700X
186.2 (176min - 203max) fps -42%
3840x2160 Ultra Preset AA:4x MS
Nvidia Titan RTX
NVIDIA Titan RTX, R7 2700X, ADATA Premier Pro SP900NS38 512 GB
213 (203min - 231max) fps +11%
AMD Radeon VII
Radeon VII, R7 2700X
208 (198min - 217max) fps +8%
MSI RTX 2080 Gaming X Trio
GeForce RTX 2080 (Desktop), R7 2700X
203 (196min - 219max) fps +6%
KFA2 GeForce RTX 2060 Super
GeForce RTX 2060 Super (Desktop), R9 3900X, Corsair MP600
192 (179min - 214max) fps
AMD Radeon RX 5700 XT
Radeon RX 5700 XT (Desktop), R7 2700X
186 (171min - 206max) fps -3%
Nvidia GeForce RTX 2060 Super
GeForce RTX 2060 Super (Desktop), R7 2700X
176 (170min - 187max) fps -8%
MSI RTX 2070 Gaming Z 8G
GeForce RTX 2070 (Desktop), R7 2700X
174 (171min - 178max) fps -9%
Nvidia GeForce RTX 2070 Super
GeForce RTX 2070 Super (Desktop), R7 2700X
172 (168min - 178max) fps -10%
AMD Radeon RX 5700
Radeon RX 5700 (Desktop), R7 2700X
164 (149min - 180max) fps -15%
AMD Radeon RX Vega 64
RX Vega 64, R7 2700X
161.4 (148min - 181max) fps -16%
MSI RTX 2060 Gaming Z 6G
GeForce RTX 2060 (Desktop), R7 2700X
151.2 (146min - 155max) fps -21%
2560x1440 Ultra Preset AA:4x MS
KFA2 GeForce RTX 2060 Super
GeForce RTX 2060 Super (Desktop), R9 3900X, Corsair MP600
306 (260min - 341max) fps
AMD Radeon RX 5700 XT
Radeon RX 5700 XT (Desktop), R7 2700X
273 (254min - 300max) fps -11%
AMD Radeon RX 5700
Radeon RX 5700 (Desktop), R7 2700X
267 (252min - 294max) fps -13%
Nvidia GeForce RTX 2070 Super
GeForce RTX 2070 Super (Desktop), R7 2700X
255 (242min - 268max) fps -17%
MSI RTX 2080 Gaming X Trio
GeForce RTX 2080 (Desktop), R7 2700X
212 (205min - 237max) fps -31%
Nvidia GeForce RTX 2060 Super
GeForce RTX 2060 Super (Desktop), R7 2700X
211 (206min - 228max) fps -31%
MSI RTX 2070 Gaming Z 8G
GeForce RTX 2070 (Desktop), R7 2700X
210.5 (190min - 234max) fps -31%
Forza Horizon 4
1920x1080 Ultra Preset AA:2xMS
MSI RTX 2080 Gaming X Trio
GeForce RTX 2080 (Desktop), R7 2700X
139 fps +8%
AMD Radeon RX 5700 XT
Radeon RX 5700 XT (Desktop), R7 2700X
138 fps +7%
Nvidia Titan RTX
NVIDIA Titan RTX, R7 2700X, ADATA Premier Pro SP900NS38 512 GB
132 fps +2%
AMD Radeon VII
Radeon VII, R7 2700X
130 fps +1%
Nvidia GeForce RTX 2070 Super
GeForce RTX 2070 Super (Desktop), R7 2700X
129 fps 0%
KFA2 GeForce RTX 2060 Super
GeForce RTX 2060 Super (Desktop), R9 3900X, Corsair MP600
129 fps
AMD Radeon RX Vega 64
RX Vega 64, R7 2700X
121 fps -6%
AMD Radeon RX 5700
Radeon RX 5700 (Desktop), R7 2700X
118 fps -9%
MSI RTX 2070 Gaming Z 8G
GeForce RTX 2070 (Desktop), R7 2700X
113 fps -12%
Nvidia GeForce RTX 2060 Super
GeForce RTX 2060 Super (Desktop), R7 2700X
110 fps -15%
MSI RTX 2060 Gaming Z 6G
GeForce RTX 2060 (Desktop), R7 2700X
105 fps -19%
3840x2160 Ultra Preset AA:2xMS
Nvidia Titan RTX
NVIDIA Titan RTX, R7 2700X, ADATA Premier Pro SP900NS38 512 GB
90 fps +27%
MSI RTX 2080 Gaming X Trio
GeForce RTX 2080 (Desktop), R7 2700X
84 fps +18%
AMD Radeon RX 5700 XT
Radeon RX 5700 XT (Desktop), R7 2700X
79 fps +11%
AMD Radeon VII
Radeon VII, R7 2700X
77 fps +8%
Nvidia GeForce RTX 2070 Super
GeForce RTX 2070 Super (Desktop), R7 2700X
76 fps +7%
KFA2 GeForce RTX 2060 Super
GeForce RTX 2060 Super (Desktop), R9 3900X, Corsair MP600
71 fps
AMD Radeon RX 5700
Radeon RX 5700 (Desktop), R7 2700X
70 fps -1%
MSI RTX 2070 Gaming Z 8G
GeForce RTX 2070 (Desktop), R7 2700X
65 fps -8%
AMD Radeon RX Vega 64
RX Vega 64, R7 2700X
62 fps -13%
Nvidia GeForce RTX 2060 Super
GeForce RTX 2060 Super (Desktop), R7 2700X
62 fps -13%
MSI RTX 2060 Gaming Z 6G
GeForce RTX 2060 (Desktop), R7 2700X
59 fps -17%
2560x1440 Ultra Preset AA:2xMS
AMD Radeon RX 5700 XT
Radeon RX 5700 XT (Desktop), R7 2700X
119 fps +13%
MSI RTX 2080 Gaming X Trio
GeForce RTX 2080 (Desktop), R7 2700X
118 fps +12%
Nvidia GeForce RTX 2070 Super
GeForce RTX 2070 Super (Desktop), R7 2700X
108 fps +3%
KFA2 GeForce RTX 2060 Super
GeForce RTX 2060 Super (Desktop), R9 3900X, Corsair MP600
105 fps
AMD Radeon RX 5700
Radeon RX 5700 (Desktop), R7 2700X
103 fps -2%
MSI RTX 2070 Gaming Z 8G
GeForce RTX 2070 (Desktop), R7 2700X
93 fps -11%
Nvidia GeForce RTX 2060 Super
GeForce RTX 2060 Super (Desktop), R7 2700X
90 fps -14%
F1 2018
1920x1080 Ultra High Preset AA:T AF:16x
Nvidia Titan RTX
NVIDIA Titan RTX, R7 2700X, ADATA Premier Pro SP900NS38 512 GB
143 (117min - 164max) fps +15%
MSI RTX 2080 Gaming X Trio
GeForce RTX 2080 (Desktop), R7 2700X
142 (119min - 162max) fps +15%
AMD Radeon VII
Radeon VII, R7 2700X
133 (106min - 154max) fps +7%
Nvidia GeForce RTX 2070 Super
GeForce RTX 2070 Super (Desktop), R7 2700X
133 (115min - 151max) fps +7%
MSI RTX 2070 Gaming Z 8G
GeForce RTX 2070 (Desktop), R7 2700X
127 (108min - 143max) fps +2%
KFA2 GeForce RTX 2060 Super
GeForce RTX 2060 Super (Desktop), R9 3900X, Corsair MP600
124 (112min - 136max) fps
Nvidia GeForce RTX 2060 Super
GeForce RTX 2060 Super (Desktop), R7 2700X
122 (110min - 136max) fps -2%
MSI RTX 2060 Gaming Z 6G
GeForce RTX 2060 (Desktop), R7 2700X
112 (103min - 124max) fps -10%
AMD Radeon RX Vega 64
RX Vega 64, R7 2700X
86 (68min - 108max) fps -31%
3840x2160 Ultra High Preset AA:T AF:16x
Nvidia Titan RTX
NVIDIA Titan RTX, R7 2700X, ADATA Premier Pro SP900NS38 512 GB
99 (89min - 109max) fps +62%
MSI RTX 2080 Gaming X Trio
GeForce RTX 2080 (Desktop), R7 2700X
78 (69min - 89max) fps +28%
AMD Radeon VII
Radeon VII, R7 2700X
71 (63min - 82max) fps +16%
Nvidia GeForce RTX 2070 Super
GeForce RTX 2070 Super (Desktop), R7 2700X
70 (62min - 78max) fps +15%
MSI RTX 2070 Gaming Z 8G
GeForce RTX 2070 (Desktop), R7 2700X
65 (55min - 73max) fps +7%
KFA2 GeForce RTX 2060 Super
GeForce RTX 2060 Super (Desktop), R9 3900X, Corsair MP600
61 (55min - 68max) fps
Nvidia GeForce RTX 2060 Super
GeForce RTX 2060 Super (Desktop), R7 2700X
60 (54min - 66max) fps -2%
MSI RTX 2060 Gaming Z 6G
GeForce RTX 2060 (Desktop), R7 2700X
55 (49min - 61max) fps -10%
AMD Radeon RX Vega 64
RX Vega 64, R7 2700X
49 (42min - 55max) fps -20%
2560x1440 Ultra High Preset AA:T AF:16x
MSI RTX 2080 Gaming X Trio
GeForce RTX 2080 (Desktop), R7 2700X
120 (106min - 132max) fps +25%
Nvidia GeForce RTX 2070 Super
GeForce RTX 2070 Super (Desktop), R7 2700X
112 (75min - 124max) fps +17%
MSI RTX 2070 Gaming Z 8G
GeForce RTX 2070 (Desktop), R7 2700X
101 (51min - 112max) fps +5%
Nvidia GeForce RTX 2060 Super
GeForce RTX 2060 Super (Desktop), R7 2700X
99 (88min - 110max) fps +3%
KFA2 GeForce RTX 2060 Super
GeForce RTX 2060 Super (Desktop), R9 3900X, Corsair MP600
96 (45min - 111max) fps
Monster Hunter World
1920x1080 Highest Preset (Image Quality High)
Nvidia Titan RTX
NVIDIA Titan RTX, R7 2700X, ADATA Premier Pro SP900NS38 512 GB
136 (95min - 157max) fps +56%
MSI RTX 2080 Gaming X Trio
GeForce RTX 2080 (Desktop), R7 2700X
115 (90min - 146max) fps +32%
Nvidia GeForce RTX 2070 Super
GeForce RTX 2070 Super (Desktop), R7 2700X
108 (82min - 137max) fps +24%
MSI RTX 2070 Gaming Z 8G
GeForce RTX 2070 (Desktop), R7 2700X
97.7 (75min - 117max) fps +12%
AMD Radeon VII
Radeon VII, R7 2700X
94 (75min - 119max) fps +8%
Nvidia GeForce RTX 2060 Super
GeForce RTX 2060 Super (Desktop), R7 2700X
93 (75min - 110max) fps +7%
AMD Radeon RX 5700 XT
Radeon RX 5700 XT (Desktop), R7 2700X
91 (76min - 109max) fps +5%
KFA2 GeForce RTX 2060 Super
GeForce RTX 2060 Super (Desktop), R9 3900X, Corsair MP600
87 (70min - 108max) fps
MSI RTX 2060 Gaming Z 6G
GeForce RTX 2060 (Desktop), R7 2700X
86 (67min - 105max) fps -1%
AMD Radeon RX Vega 64
RX Vega 64, R7 2700X
85.2 (61min - 109max) fps -2%
AMD Radeon RX 5700
Radeon RX 5700 (Desktop), R7 2700X
81 (68min - 99max) fps -7%
3840x2160 Highest Preset (Image Quality High)
Nvidia Titan RTX
NVIDIA Titan RTX, R7 2700X, ADATA Premier Pro SP900NS38 512 GB
54 (46min - 64max) fps +29%
KFA2 GeForce RTX 2060 Super
GeForce RTX 2060 Super (Desktop), R9 3900X, Corsair MP600
41.8 (35min - 51max) fps
MSI RTX 2080 Gaming X Trio
GeForce RTX 2080 (Desktop), R7 2700X
38.6 (33min - 46max) fps -8%
Nvidia GeForce RTX 2070 Super
GeForce RTX 2070 Super (Desktop), R7 2700X
35 (30min - 40max) fps -16%
AMD Radeon VII
Radeon VII, R7 2700X
33.5 (29min - 41max) fps -20%
MSI RTX 2070 Gaming Z 8G
GeForce RTX 2070 (Desktop), R7 2700X
32.3 (28min - 38max) fps -23%
AMD Radeon RX 5700 XT
Radeon RX 5700 XT (Desktop), R7 2700X
29.6 (27min - 34max) fps -29%
AMD Radeon RX Vega 64
RX Vega 64, R7 2700X
28.9 (26min - 34max) fps -31%
Nvidia GeForce RTX 2060 Super
GeForce RTX 2060 Super (Desktop), R7 2700X
28.4 (24min - 33max) fps -32%
AMD Radeon RX 5700
Radeon RX 5700 (Desktop), R7 2700X
27.8 (25min - 32max) fps -33%
MSI RTX 2060 Gaming Z 6G
GeForce RTX 2060 (Desktop), R7 2700X
27.5 (24min - 32max) fps -34%
2560x1440 Highest Preset (Image Quality High)
KFA2 GeForce RTX 2060 Super
GeForce RTX 2060 Super (Desktop), R9 3900X, Corsair MP600
79 (63min - 94max) fps
MSI RTX 2080 Gaming X Trio
GeForce RTX 2080 (Desktop), R7 2700X
78 (62min - 97max) fps -1%
Nvidia GeForce RTX 2070 Super
GeForce RTX 2070 Super (Desktop), R7 2700X
71 (56min - 81max) fps -10%
MSI RTX 2070 Gaming Z 8G
GeForce RTX 2070 (Desktop), R7 2700X
65.5 (55min - 78max) fps -17%
AMD Radeon RX 5700 XT
Radeon RX 5700 XT (Desktop), R7 2700X
58.7 (51min - 68max) fps -26%
Nvidia GeForce RTX 2060 Super
GeForce RTX 2060 Super (Desktop), R7 2700X
56.2 (47min - 66max) fps -29%
AMD Radeon RX 5700
Radeon RX 5700 (Desktop), R7 2700X
54.2 (48min - 63max) fps -31%
Far Cry 5
1920x1080 Ultra Preset AA:T
KFA2 GeForce RTX 2060 Super
GeForce RTX 2060 Super (Desktop), R9 3900X, Corsair MP600
108 (87min - 136max) fps
MSI RTX 2080 Gaming X Trio
GeForce RTX 2080 (Desktop), R7 2700X
107 (82min - 145max) fps -1%
Nvidia Titan RTX
NVIDIA Titan RTX, R7 2700X, ADATA Premier Pro SP900NS38 512 GB
103 (77min - 137max) fps -5%
MSI RTX 2070 Gaming Z 8G
GeForce RTX 2070 (Desktop), R7 2700X
103 (78min - 136max) fps -5%
AMD Radeon RX Vega 64
RX Vega 64, R7 2700X
99 (78min - 124max) fps -8%
Nvidia GeForce RTX 2060 Super
GeForce RTX 2060 Super (Desktop), R7 2700X
99 (75min - 131max) fps -8%
Nvidia GeForce RTX 2070 Super
GeForce RTX 2070 Super (Desktop), R7 2700X
99 (76min - 132max) fps -8%
AMD Radeon RX 5700 XT
Radeon RX 5700 XT (Desktop), R7 2700X
96 (75min - 127max) fps -11%
MSI RTX 2060 Gaming Z 6G
GeForce RTX 2060 (Desktop), R7 2700X
94 (72min - 124max) fps -13%
AMD Radeon VII
Radeon VII, R7 2700X
91 (70min - 120max) fps -16%
AMD Radeon RX 5700
Radeon RX 5700 (Desktop), R7 2700X
84 (59min - 114max) fps -22%
3840x2160 Ultra Preset AA:T
Nvidia Titan RTX
NVIDIA Titan RTX, R7 2700X, ADATA Premier Pro SP900NS38 512 GB
75 (61min - 89max) fps +67%
MSI RTX 2080 Gaming X Trio
GeForce RTX 2080 (Desktop), R7 2700X
59 (53min - 71max) fps +31%
AMD Radeon VII
Radeon VII, R7 2700X
59 (50min - 75max) fps +31%
Nvidia GeForce RTX 2070 Super
GeForce RTX 2070 Super (Desktop), R7 2700X
54 (48min - 65max) fps +20%
AMD Radeon RX 5700 XT
Radeon RX 5700 XT (Desktop), R7 2700X
51 (44min - 66max) fps +13%
MSI RTX 2070 Gaming Z 8G
GeForce RTX 2070 (Desktop), R7 2700X
48 (41min - 57max) fps +7%
Nvidia GeForce RTX 2060 Super
GeForce RTX 2060 Super (Desktop), R7 2700X
45 (40min - 55max) fps 0%
AMD Radeon RX 5700
Radeon RX 5700 (Desktop), R7 2700X
45 (38min - 58max) fps 0%
KFA2 GeForce RTX 2060 Super
GeForce RTX 2060 Super (Desktop), R9 3900X, Corsair MP600
45 (40min - 56max) fps
AMD Radeon RX Vega 64
RX Vega 64, R7 2700X
44 (37min - 56max) fps -2%
MSI RTX 2060 Gaming Z 6G
GeForce RTX 2060 (Desktop), R7 2700X
41 (37min - 49max) fps -9%
2560x1440 Ultra Preset AA:T
MSI RTX 2080 Gaming X Trio
GeForce RTX 2080 (Desktop), R7 2700X
99 (80min - 122max) fps +16%
Nvidia GeForce RTX 2070 Super
GeForce RTX 2070 Super (Desktop), R7 2700X
91 (75min - 111max) fps +7%
AMD Radeon RX 5700 XT
Radeon RX 5700 XT (Desktop), R7 2700X
89 (75min - 104max) fps +5%
MSI RTX 2070 Gaming Z 8G
GeForce RTX 2070 (Desktop), R7 2700X
88 (77min - 102max) fps +4%
KFA2 GeForce RTX 2060 Super
GeForce RTX 2060 Super (Desktop), R9 3900X, Corsair MP600
85 (73min - 101max) fps
Nvidia GeForce RTX 2060 Super
GeForce RTX 2060 Super (Desktop), R7 2700X
83 (70min - 98max) fps -2%
AMD Radeon RX 5700
Radeon RX 5700 (Desktop), R7 2700X
80 (65min - 93max) fps -6%
The Crew 2
1920x1080 Ultra Preset
Nvidia Titan RTX
NVIDIA Titan RTX, R7 2700X, ADATA Premier Pro SP900NS38 512 GB
60 fps 0%
MSI RTX 2060 Gaming Z 6G
GeForce RTX 2060 (Desktop), R7 2700X
60 fps 0%
MSI RTX 2070 Gaming Z 8G
GeForce RTX 2070 (Desktop), R7 2700X
60 fps 0%
MSI RTX 2080 Gaming X Trio
GeForce RTX 2080 (Desktop), R7 2700X
60 fps 0%
AMD Radeon VII
Radeon VII, R7 2700X
60 fps 0%
Nvidia GeForce RTX 2060 Super
GeForce RTX 2060 Super (Desktop), R7 2700X
60 fps 0%
Nvidia GeForce RTX 2070 Super
GeForce RTX 2070 Super (Desktop), R7 2700X
60 fps 0%
AMD Radeon RX 5700
Radeon RX 5700 (Desktop), R7 2700X
60 fps 0%
AMD Radeon RX 5700 XT
Radeon RX 5700 XT (Desktop), R7 2700X
60 fps 0%
KFA2 GeForce RTX 2060 Super
GeForce RTX 2060 Super (Desktop), R9 3900X, Corsair MP600
60 fps
3840x2160 Ultra Preset
Nvidia Titan RTX
NVIDIA Titan RTX, R7 2700X, ADATA Premier Pro SP900NS38 512 GB
60 fps +62%
MSI RTX 2080 Gaming X Trio
GeForce RTX 2080 (Desktop), R7 2700X
60 fps +62%
Nvidia GeForce RTX 2070 Super
GeForce RTX 2070 Super (Desktop), R7 2700X
43.8 fps +18%
AMD Radeon RX 5700 XT
Radeon RX 5700 XT (Desktop), R7 2700X
43.2 fps +17%
MSI RTX 2070 Gaming Z 8G
GeForce RTX 2070 (Desktop), R7 2700X
42.4 fps +15%
AMD Radeon VII
Radeon VII, R7 2700X
41 fps +11%
AMD Radeon RX 5700
Radeon RX 5700 (Desktop), R7 2700X
39.4 fps +6%
Nvidia GeForce RTX 2060 Super
GeForce RTX 2060 Super (Desktop), R7 2700X
38.7 fps +5%
KFA2 GeForce RTX 2060 Super
GeForce RTX 2060 Super (Desktop), R9 3900X, Corsair MP600
37 fps
MSI RTX 2060 Gaming Z 6G
GeForce RTX 2060 (Desktop), R7 2700X
35.3 fps -5%
2560x1440 Ultra Preset
MSI RTX 2070 Gaming Z 8G
GeForce RTX 2070 (Desktop), R7 2700X
60 fps 0%
MSI RTX 2080 Gaming X Trio
GeForce RTX 2080 (Desktop), R7 2700X
60 fps 0%
Nvidia GeForce RTX 2070 Super
GeForce RTX 2070 Super (Desktop), R7 2700X
60 fps 0%
AMD Radeon RX 5700
Radeon RX 5700 (Desktop), R7 2700X
60 fps 0%
AMD Radeon RX 5700 XT
Radeon RX 5700 XT (Desktop), R7 2700X
60 fps 0%
KFA2 GeForce RTX 2060 Super
GeForce RTX 2060 Super (Desktop), R9 3900X, Corsair MP600
60 fps
Nvidia GeForce RTX 2060 Super
GeForce RTX 2060 Super (Desktop), R7 2700X
59.8 fps 0%
Assassin´s Creed Origins
1920x1080 Ultra High Preset
Nvidia Titan RTX
NVIDIA Titan RTX, R7 2700X, ADATA Premier Pro SP900NS38 512 GB
87 fps 0%
KFA2 GeForce RTX 2060 Super
GeForce RTX 2060 Super (Desktop), R9 3900X, Corsair MP600
87 fps
MSI RTX 2080 Gaming X Trio
GeForce RTX 2080 (Desktop), R7 2700X
86 fps -1%
MSI RTX 2070 Gaming Z 8G
GeForce RTX 2070 (Desktop), R7 2700X
83 fps -5%
Nvidia GeForce RTX 2070 Super
GeForce RTX 2070 Super (Desktop), R7 2700X
81 fps -7%
Nvidia GeForce RTX 2060 Super
GeForce RTX 2060 Super (Desktop), R7 2700X
80 fps -8%
MSI RTX 2060 Gaming Z 6G
GeForce RTX 2060 (Desktop), R7 2700X
78 fps -10%
AMD Radeon RX Vega 64
RX Vega 64, R7 2700X
63 fps -28%
AMD Radeon VII
Radeon VII, R7 2700X
63 fps -28%
AMD Radeon RX 5700
Radeon RX 5700 (Desktop), R7 2700X
63 fps -28%
AMD Radeon RX 5700 XT
Radeon RX 5700 XT (Desktop), R7 2700X
63 fps -28%
3840x2160 Ultra High Preset
Nvidia Titan RTX
NVIDIA Titan RTX, R7 2700X, ADATA Premier Pro SP900NS38 512 GB
65 fps +48%
MSI RTX 2080 Gaming X Trio
GeForce RTX 2080 (Desktop), R7 2700X
52 fps +18%
AMD Radeon VII
Radeon VII, R7 2700X
49 fps +11%
Nvidia GeForce RTX 2070 Super
GeForce RTX 2070 Super (Desktop), R7 2700X
48 fps +9%
MSI RTX 2070 Gaming Z 8G
GeForce RTX 2070 (Desktop), R7 2700X
46 fps +5%
KFA2 GeForce RTX 2060 Super
GeForce RTX 2060 Super (Desktop), R9 3900X, Corsair MP600
44 fps
Nvidia GeForce RTX 2060 Super
GeForce RTX 2060 Super (Desktop), R7 2700X
43 fps -2%
MSI RTX 2060 Gaming Z 6G
GeForce RTX 2060 (Desktop), R7 2700X
39 fps -11%
AMD Radeon RX 5700 XT
Radeon RX 5700 XT (Desktop), R7 2700X
39 fps -11%
AMD Radeon RX 5700
Radeon RX 5700 (Desktop), R7 2700X
35 fps -20%
AMD Radeon RX Vega 64
RX Vega 64, R7 2700X
33 fps -25%
2560x1440 Ultra High Preset
MSI RTX 2080 Gaming X Trio
GeForce RTX 2080 (Desktop), R7 2700X
79 fps +14%
Nvidia GeForce RTX 2070 Super
GeForce RTX 2070 Super (Desktop), R7 2700X
73 fps +6%
MSI RTX 2070 Gaming Z 8G
GeForce RTX 2070 (Desktop), R7 2700X
71 fps +3%
KFA2 GeForce RTX 2060 Super
GeForce RTX 2060 Super (Desktop), R9 3900X, Corsair MP600
69 fps
Nvidia GeForce RTX 2060 Super
GeForce RTX 2060 Super (Desktop), R7 2700X
68 fps -1%
AMD Radeon RX 5700 XT
Radeon RX 5700 XT (Desktop), R7 2700X
61 fps -12%
AMD Radeon RX 5700
Radeon RX 5700 (Desktop), R7 2700X
56 fps -19%
Kingdom Come: Deliverance
1920x1080 Ultra High Preset
Nvidia Titan RTX
NVIDIA Titan RTX, R7 2700X, ADATA Premier Pro SP900NS38 512 GB
79 (61min - 108max) fps +11%
MSI RTX 2080 Gaming X Trio
GeForce RTX 2080 (Desktop), R7 2700X
78 (53min - 100max) fps +10%
Nvidia GeForce RTX 2070 Super
GeForce RTX 2070 Super (Desktop), R7 2700X
78 (55min - 106max) fps +10%
MSI RTX 2070 Gaming Z 8G
GeForce RTX 2070 (Desktop), R7 2700X
77.9 (58min - 99max) fps +10%
Nvidia GeForce RTX 2060 Super
GeForce RTX 2060 Super (Desktop), R7 2700X
77 (50min - 100max) fps +8%
AMD Radeon RX 5700 XT
Radeon RX 5700 XT (Desktop), R7 2700X
73 (56min - 102max) fps +3%
AMD Radeon RX Vega 64
RX Vega 64, R7 2700X
72.9 (55min - 90max) fps +3%
AMD Radeon VII
Radeon VII, R7 2700X
71 (51min - 95max) fps 0%
KFA2 GeForce RTX 2060 Super
GeForce RTX 2060 Super (Desktop), R9 3900X, Corsair MP600
71 (53min - 93max) fps
MSI RTX 2060 Gaming Z 6G
GeForce RTX 2060 (Desktop), R7 2700X
70 (50min - 83max) fps -1%
AMD Radeon RX 5700
Radeon RX 5700 (Desktop), R7 2700X
64 (49min - 85max) fps -10%
3840x2160 Ultra High Preset
Nvidia Titan RTX
NVIDIA Titan RTX, R7 2700X, ADATA Premier Pro SP900NS38 512 GB
49 (41min - 56max) fps +64%
MSI RTX 2080 Gaming X Trio
GeForce RTX 2080 (Desktop), R7 2700X
39.1 (32min - 44max) fps +31%
AMD Radeon RX Vega 64
RX Vega 64, R7 2700X
36.5 (31min - 40max) fps +22%
Nvidia GeForce RTX 2070 Super
GeForce RTX 2070 Super (Desktop), R7 2700X
35.4 (30min - 40max) fps +18%
AMD Radeon VII
Radeon VII, R7 2700X
30.8 (25min - 35max) fps +3%
MSI RTX 2070 Gaming Z 8G
GeForce RTX 2070 (Desktop), R7 2700X
30.7 (26min - 34max) fps +3%
Nvidia GeForce RTX 2060 Super
GeForce RTX 2060 Super (Desktop), R7 2700X
30 (24min - 34max) fps 0%
KFA2 GeForce RTX 2060 Super
GeForce RTX 2060 Super (Desktop), R9 3900X, Corsair MP600
29.9 (24min - 34max) fps
AMD Radeon RX 5700 XT
Radeon RX 5700 XT (Desktop), R7 2700X
29.6 (24min - 34max) fps -1%
AMD Radeon RX 5700
Radeon RX 5700 (Desktop), R7 2700X
26.2 (22min - 29max) fps -12%
MSI RTX 2060 Gaming Z 6G
GeForce RTX 2060 (Desktop), R7 2700X
25 (21min - 29max) fps -16%
2560x1440 Ultra High Preset
MSI RTX 2080 Gaming X Trio
GeForce RTX 2080 (Desktop), R7 2700X
70 (55min - 83max) fps +24%
Nvidia GeForce RTX 2070 Super
GeForce RTX 2070 Super (Desktop), R7 2700X
65 (52min - 80max) fps +15%
AMD Radeon RX 5700 XT
Radeon RX 5700 XT (Desktop), R7 2700X
59 (49min - 68max) fps +4%
Nvidia GeForce RTX 2060 Super
GeForce RTX 2060 Super (Desktop), R7 2700X
58.1 (47min - 69max) fps +3%
MSI RTX 2070 Gaming Z 8G
GeForce RTX 2070 (Desktop), R7 2700X
58 (44min - 68max) fps +2%
KFA2 GeForce RTX 2060 Super
GeForce RTX 2060 Super (Desktop), R9 3900X, Corsair MP600
56.6 (42min - 67max) fps
AMD Radeon RX 5700
Radeon RX 5700 (Desktop), R7 2700X
52.2 (43min - 60max) fps -8%
Fortnite
1920x1080 Epic Preset
Nvidia GeForce RTX 2070 Super
GeForce RTX 2070 Super (Desktop), R7 2700X
168 (148min - 200max) fps +23%
Nvidia GeForce RTX 2060 Super
GeForce RTX 2060 Super (Desktop), R7 2700X
159 (133min - 195max) fps +16%
MSI RTX 2080 Gaming X Trio
GeForce RTX 2080 (Desktop), R7 2700X
147 (115min - 180max) fps +7%
AMD Radeon RX 5700 XT
Radeon RX 5700 XT (Desktop), R7 2700X
143 (123min - 167max) fps +4%
MSI RTX 2060 Gaming Z 6G
GeForce RTX 2060 (Desktop), R7 2700X
141 (118min - 156max) fps +3%
KFA2 GeForce RTX 2060 Super
GeForce RTX 2060 Super (Desktop), R9 3900X, Corsair MP600
137 (129min - 146max) fps
MSI RTX 2070 Gaming Z 8G
GeForce RTX 2070 (Desktop), R7 2700X
135.6 (111min - 161max) fps -1%
Nvidia Titan RTX
NVIDIA Titan RTX, R7 2700X, ADATA Premier Pro SP900NS38 512 GB
134 (100min - 197max) fps -2%
AMD Radeon RX 5700
Radeon RX 5700 (Desktop), R7 2700X
118 (98min - 132max) fps -14%
AMD Radeon VII
Radeon VII, R7 2700X
114 (97min - 125max) fps -17%
3840x2160 Epic Preset
Nvidia Titan RTX
NVIDIA Titan RTX, R7 2700X, ADATA Premier Pro SP900NS38 512 GB
74 (59min - 87max) fps +59%
MSI RTX 2080 Gaming X Trio
GeForce RTX 2080 (Desktop), R7 2700X
66 (58min - 71max) fps +42%
Nvidia GeForce RTX 2070 Super
GeForce RTX 2070 Super (Desktop), R7 2700X
58.1 (56min - 60max) fps +25%
MSI RTX 2070 Gaming Z 8G
GeForce RTX 2070 (Desktop), R7 2700X
53.2 (46min - 60max) fps +14%
Nvidia GeForce RTX 2060 Super
GeForce RTX 2060 Super (Desktop), R7 2700X
49.5 (46min - 55max) fps +6%
KFA2 GeForce RTX 2060 Super
GeForce RTX 2060 Super (Desktop), R9 3900X, Corsair MP600
46.6 (44min - 49max) fps
AMD Radeon RX 5700 XT
Radeon RX 5700 XT (Desktop), R7 2700X
45.4 (39min - 49max) fps -3%
AMD Radeon VII
Radeon VII, R7 2700X
44.4 (40min - 50max) fps -5%
AMD Radeon RX 5700
Radeon RX 5700 (Desktop), R7 2700X
39.1 (37min - 42max) fps -16%
MSI RTX 2060 Gaming Z 6G
GeForce RTX 2060 (Desktop), R7 2700X
38 (32min - 42max) fps -18%
2560x1440 Epic Preset
MSI RTX 2080 Gaming X Trio
GeForce RTX 2080 (Desktop), R7 2700X
128 (113min - 139max) fps +35%
Nvidia GeForce RTX 2070 Super
GeForce RTX 2070 Super (Desktop), R7 2700X
117 (105min - 137max) fps +23%
MSI RTX 2070 Gaming Z 8G
GeForce RTX 2070 (Desktop), R7 2700X
100.2 (88min - 118max) fps +5%
Nvidia GeForce RTX 2060 Super
GeForce RTX 2060 Super (Desktop), R7 2700X
100 (92min - 115max) fps +5%
KFA2 GeForce RTX 2060 Super
GeForce RTX 2060 Super (Desktop), R9 3900X, Corsair MP600
95 (89min - 100max) fps
AMD Radeon RX 5700 XT
Radeon RX 5700 XT (Desktop), R7 2700X
93 (83min - 103max) fps -2%
AMD Radeon RX 5700
Radeon RX 5700 (Desktop), R7 2700X
77 (72min - 86max) fps -19%
Final Fantasy XV Benchmark
1920x1080 High Quality
Nvidia Titan RTX
NVIDIA Titan RTX, R7 2700X, ADATA Premier Pro SP900NS38 512 GB
112 (65min - 172max) fps +40%
MSI RTX 2080 Gaming X Trio
GeForce RTX 2080 (Desktop), R7 2700X
96.1 fps +20%
Nvidia GeForce RTX 2070 Super
GeForce RTX 2070 Super (Desktop), R7 2700X
89 (45min - 141max) fps +11%
MSI RTX 2070 Gaming Z 8G
GeForce RTX 2070 (Desktop), R7 2700X
83.5 (36min - 125max) fps +4%
KFA2 GeForce RTX 2060 Super
GeForce RTX 2060 Super (Desktop), R9 3900X, Corsair MP600
80 (53min - 120max) fps
Nvidia GeForce RTX 2060 Super
GeForce RTX 2060 Super (Desktop), R7 2700X
79 (36min - 121max) fps -1%
MSI RTX 2060 Gaming Z 6G
GeForce RTX 2060 (Desktop), R7 2700X
72.6 (31min - 114max) fps -9%
AMD Radeon RX 5700 XT
Radeon RX 5700 XT (Desktop), R7 2700X
69 (34min - 112max) fps -14%
AMD Radeon RX 5700
Radeon RX 5700 (Desktop), R7 2700X
59.6 (18min - 102max) fps -25%
AMD Radeon RX Vega 64
RX Vega 64, R7 2700X
58.5 (23min - 92max) fps -27%
AMD Radeon RX Vega 64
RX Vega 64, R7 2700X
58.5 (23min - 92max) fps -27%
3840x2160 High Quality
Nvidia Titan RTX
NVIDIA Titan RTX, R7 2700X, ADATA Premier Pro SP900NS38 512 GB
58 (39min - 87max) fps +66%
MSI RTX 2080 Gaming X Trio
GeForce RTX 2080 (Desktop), R7 2700X
44.2 fps +27%
Nvidia GeForce RTX 2070 Super
GeForce RTX 2070 Super (Desktop), R7 2700X
40.6 (17min - 58max) fps +16%
MSI RTX 2070 Gaming Z 8G
GeForce RTX 2070 (Desktop), R7 2700X
38.2 (21min - 56max) fps +9%
Nvidia GeForce RTX 2060 Super
GeForce RTX 2060 Super (Desktop), R7 2700X
35 (19min - 53max) fps 0%
KFA2 GeForce RTX 2060 Super
GeForce RTX 2060 Super (Desktop), R9 3900X, Corsair MP600
34.9 (23min - 50max) fps
AMD Radeon RX 5700 XT
Radeon RX 5700 XT (Desktop), R7 2700X
32.8 (6min - 51max) fps -6%
MSI RTX 2060 Gaming Z 6G
GeForce RTX 2060 (Desktop), R7 2700X
30.8 (13min - 45max) fps -12%
AMD Radeon RX 5700
Radeon RX 5700 (Desktop), R7 2700X
28.9 (18min - 45max) fps -17%
AMD Radeon RX Vega 64
RX Vega 64, R7 2700X
27.9 (20min - 42max) fps -20%
AMD Radeon RX Vega 64
RX Vega 64, R7 2700X
27.9 (20min - 42max) fps -20%
Destiny 2
1920x1080 Highest Preset AA:SM AF:16x
Nvidia Titan RTX
NVIDIA Titan RTX, R7 2700X, ADATA Premier Pro SP900NS38 512 GB
154 fps +2%
KFA2 GeForce RTX 2060 Super
GeForce RTX 2060 Super (Desktop), R9 3900X, Corsair MP600
151 (125P1) fps
MSI RTX 2070 Gaming Z 8G
GeForce RTX 2070 (Desktop), R7 2700X
150 fps -1%
MSI RTX 2080 Gaming X Trio
GeForce RTX 2080 (Desktop), R7 2700X
146.1 fps -3%
Nvidia GeForce RTX 2060 Super
GeForce RTX 2060 Super (Desktop), R7 2700X
145 (110.5P1) fps -4%
Nvidia GeForce RTX 2070 Super
GeForce RTX 2070 Super (Desktop), R7 2700X
142 (106.4P1) fps -6%
AMD Radeon RX 5700 XT
Radeon RX 5700 XT (Desktop), R7 2700X
142 (101P1) fps -6%
AMD Radeon RX 5700
Radeon RX 5700 (Desktop), R7 2700X
132 (101P1) fps -13%
AMD Radeon VII
Radeon VII, R7 2700X
112 fps -26%
MSI RTX 2060 Gaming Z 6G
GeForce RTX 2060 (Desktop), R7 2700X
103 (42.1P1) fps -32%
3840x2160 Highest Preset AA:SM AF:16x
Nvidia Titan RTX
NVIDIA Titan RTX, R7 2700X, ADATA Premier Pro SP900NS38 512 GB
94 fps +69%
MSI RTX 2080 Gaming X Trio
GeForce RTX 2080 (Desktop), R7 2700X
72.4 fps +30%
Nvidia GeForce RTX 2070 Super
GeForce RTX 2070 Super (Desktop), R7 2700X
65 (57.5P1) fps +17%
MSI RTX 2070 Gaming Z 8G
GeForce RTX 2070 (Desktop), R7 2700X
59.1 fps +6%
AMD Radeon RX 5700 XT
Radeon RX 5700 XT (Desktop), R7 2700X
56.5 (51P1) fps +2%
KFA2 GeForce RTX 2060 Super
GeForce RTX 2060 Super (Desktop), R9 3900X, Corsair MP600
55.5 (49.5P1) fps
Nvidia GeForce RTX 2060 Super
GeForce RTX 2060 Super (Desktop), R7 2700X
54.7 (48.5P1) fps -1%
AMD Radeon VII
Radeon VII, R7 2700X
51 fps -8%
MSI RTX 2060 Gaming Z 6G
GeForce RTX 2060 (Desktop), R7 2700X
49.7 (38.2P1) fps -10%
AMD Radeon RX 5700
Radeon RX 5700 (Desktop), R7 2700X
49.1 (42.2P1) fps -12%
2560x1440 Highest Preset AA:SM AF:16x
MSI RTX 2080 Gaming X Trio
GeForce RTX 2080 (Desktop), R7 2700X
130.5 fps +24%
Nvidia GeForce RTX 2070 Super
GeForce RTX 2070 Super (Desktop), R7 2700X
119 (93.5P1) fps +13%
MSI RTX 2070 Gaming Z 8G
GeForce RTX 2070 (Desktop), R7 2700X
109.9 fps +5%
AMD Radeon RX 5700 XT
Radeon RX 5700 XT (Desktop), R7 2700X
106 (90.1P1) fps +1%
KFA2 GeForce RTX 2060 Super
GeForce RTX 2060 Super (Desktop), R9 3900X, Corsair MP600
105 (91.7P1) fps
Nvidia GeForce RTX 2060 Super
GeForce RTX 2060 Super (Desktop), R7 2700X
103 (85.5P1) fps -2%
AMD Radeon RX 5700
Radeon RX 5700 (Desktop), R7 2700X
92 (77.5P1) fps -12%
Far Cry Primal
1920x1080 Ultra Preset AA:SM
AMD Radeon RX Vega 64
RX Vega 64, R7 2700X
96 (67min - 113max) fps +5%
MSI RTX 2070 Gaming Z 8G
GeForce RTX 2070 (Desktop), R7 2700X
94 (64min - 110max) fps +3%
AMD Radeon VII
Radeon VII, R7 2700X
94 (67min - 112max) fps +3%
MSI RTX 2060 Gaming Z 6G
GeForce RTX 2060 (Desktop), R7 2700X
91 (66min - 109max) fps 0%
AMD Radeon RX 5700
Radeon RX 5700 (Desktop), R7 2700X
91 (64min - 108max) fps 0%
KFA2 GeForce RTX 2060 Super
GeForce RTX 2060 Super (Desktop), R9 3900X, Corsair MP600
91 (62min - 107max) fps
MSI RTX 2080 Gaming X Trio
GeForce RTX 2080 (Desktop), R7 2700X
90 (65min - 107max) fps -1%
Nvidia GeForce RTX 2060 Super
GeForce RTX 2060 Super (Desktop), R7 2700X
90 (65min - 106max) fps -1%
Nvidia GeForce RTX 2070 Super
GeForce RTX 2070 Super (Desktop), R7 2700X
90 (64min - 106max) fps -1%
AMD Radeon RX 5700 XT
Radeon RX 5700 XT (Desktop), R7 2700X
89 (60min - 106max) fps -2%
Nvidia Titan RTX
NVIDIA Titan RTX, R7 2700X, ADATA Premier Pro SP900NS38 512 GB
88 (63min - 105max) fps -3%
3840x2160 High Preset AA:SM
Nvidia Titan RTX
NVIDIA Titan RTX, R7 2700X, ADATA Premier Pro SP900NS38 512 GB
88 (72min - 99max) fps +57%
MSI RTX 2080 Gaming X Trio
GeForce RTX 2080 (Desktop), R7 2700X
71 (65min - 78max) fps +27%
AMD Radeon VII
Radeon VII, R7 2700X
69 (61min - 76max) fps +23%
Nvidia GeForce RTX 2070 Super
GeForce RTX 2070 Super (Desktop), R7 2700X
64 (59min - 71max) fps +14%
MSI RTX 2070 Gaming Z 8G
GeForce RTX 2070 (Desktop), R7 2700X
59 (54min - 64max) fps +5%
AMD Radeon RX 5700 XT
Radeon RX 5700 XT (Desktop), R7 2700X
59 (53min - 63max) fps +5%
KFA2 GeForce RTX 2060 Super
GeForce RTX 2060 Super (Desktop), R9 3900X, Corsair MP600
56 (52min - 62max) fps
Nvidia GeForce RTX 2060 Super
GeForce RTX 2060 Super (Desktop), R7 2700X
55 (50min - 61max) fps -2%
AMD Radeon RX 5700
Radeon RX 5700 (Desktop), R7 2700X
52 (47min - 56max) fps -7%
MSI RTX 2060 Gaming Z 6G
GeForce RTX 2060 (Desktop), R7 2700X
50 (46min - 55max) fps -11%
AMD Radeon RX Vega 64
RX Vega 64, R7 2700X
49 (45min - 54max) fps -12%
The Witcher 3
1920x1080 Ultra Graphics & Postprocessing (HBAO+)
Nvidia Titan RTX
NVIDIA Titan RTX, R7 2700X, ADATA Premier Pro SP900NS38 512 GB
128 (111min - 142max) fps +54%
MSI RTX 2080 Gaming X Trio
GeForce RTX 2080 (Desktop), R7 2700X
109 (94min - 120max) fps +31%
Nvidia GeForce RTX 2070 Super
GeForce RTX 2070 Super (Desktop), R7 2700X
97 (83min - 109max) fps +17%
AMD Radeon RX 5700 XT
Radeon RX 5700 XT (Desktop), R7 2700X
92 (79min - 99max) fps +11%
MSI RTX 2070 Gaming Z 8G
GeForce RTX 2070 (Desktop), R7 2700X
89.9 (81min - 101max) fps +8%
KFA2 GeForce RTX 2060 Super
GeForce RTX 2060 Super (Desktop), R9 3900X, Corsair MP600
83 (73min - 96max) fps
AMD Radeon RX 5700
Radeon RX 5700 (Desktop), R7 2700X
80 (70min - 87max) fps -4%
Nvidia GeForce RTX 2060 Super
GeForce RTX 2060 Super (Desktop), R7 2700X
79 (67min - 89max) fps -5%
AMD Radeon RX Vega 64
RX Vega 64, R7 2700X
77 (67min - 84max) fps -7%
AMD Radeon VII
Radeon VII, R7 2700X
75 (65min - 83max) fps -10%
MSI RTX 2060 Gaming Z 6G
GeForce RTX 2060 (Desktop), R7 2700X
72.7 (61min - 82max) fps -12%
3840x2160 High Graphics & Postprocessing (Nvidia HairWorks Off)
Nvidia Titan RTX
NVIDIA Titan RTX, R7 2700X, ADATA Premier Pro SP900NS38 512 GB
102 (90min - 110max) fps +76%
MSI RTX 2080 Gaming X Trio
GeForce RTX 2080 (Desktop), R7 2700X
78 (69min - 87max) fps +34%
Nvidia GeForce RTX 2070 Super
GeForce RTX 2070 Super (Desktop), R7 2700X
68 (61min - 74max) fps +17%
MSI RTX 2070 Gaming Z 8G
GeForce RTX 2070 (Desktop), R7 2700X
64.3 (59min - 70max) fps +11%
KFA2 GeForce RTX 2060 Super
GeForce RTX 2060 Super (Desktop), R9 3900X, Corsair MP600
58.1 (52min - 67max) fps
Nvidia GeForce RTX 2060 Super
GeForce RTX 2060 Super (Desktop), R7 2700X
57 (51min - 62max) fps -2%
AMD Radeon VII
Radeon VII, R7 2700X
54.3 (50min - 59max) fps -7%
AMD Radeon RX 5700 XT
Radeon RX 5700 XT (Desktop), R7 2700X
52.1 (47min - 57max) fps -10%
MSI RTX 2060 Gaming Z 6G
GeForce RTX 2060 (Desktop), R7 2700X
51.3 (44min - 58max) fps -12%
AMD Radeon RX Vega 64
RX Vega 64, R7 2700X
49.1 (44min - 54max) fps -15%
AMD Radeon RX 5700
Radeon RX 5700 (Desktop), R7 2700X
46.8 (42min - 51max) fps -19%
Watch Dogs 2
1920x1080 Ultra Preset
Nvidia Titan RTX
NVIDIA Titan RTX, R7 2700X, ADATA Premier Pro SP900NS38 512 GB
100 (75min - 119max) fps +37%
MSI RTX 2080 Gaming X Trio
GeForce RTX 2080 (Desktop), R7 2700X
86.6 (70min - 99max) fps +19%
Nvidia GeForce RTX 2070 Super
GeForce RTX 2070 Super (Desktop), R7 2700X
80 (61min - 91max) fps +10%
MSI RTX 2070 Gaming Z 8G
GeForce RTX 2070 (Desktop), R7 2700X
76 (59min - 87max) fps +4%
Nvidia GeForce RTX 2060 Super
GeForce RTX 2060 Super (Desktop), R7 2700X
74 (60min - 84max) fps +1%
KFA2 GeForce RTX 2060 Super
GeForce RTX 2060 Super (Desktop), R9 3900X, Corsair MP600
73 (59min - 87max) fps
AMD Radeon RX Vega 64
RX Vega 64, R7 2700X
68.2 (56min - 78max) fps -7%
MSI RTX 2060 Gaming Z 6G
GeForce RTX 2060 (Desktop), R7 2700X
66 (51min - 75max) fps -10%
AMD Radeon VII
Radeon VII, R7 2700X
55 fps -25%
3840x2160 High Preset
Nvidia Titan RTX
NVIDIA Titan RTX, R7 2700X, ADATA Premier Pro SP900NS38 512 GB
70 (63min - 78max) fps +63%
MSI RTX 2080 Gaming X Trio
GeForce RTX 2080 (Desktop), R7 2700X
54.8 (49min - 61max) fps +27%
Nvidia GeForce RTX 2070 Super
GeForce RTX 2070 Super (Desktop), R7 2700X
49.7 (46min - 55max) fps +16%
MSI RTX 2070 Gaming Z 8G
GeForce RTX 2070 (Desktop), R7 2700X
45.9 (42min - 51max) fps +7%
Nvidia GeForce RTX 2060 Super
GeForce RTX 2060 Super (Desktop), R7 2700X
43.1 (39min - 48max) fps 0%
KFA2 GeForce RTX 2060 Super
GeForce RTX 2060 Super (Desktop), R9 3900X, Corsair MP600
43 (38min - 48max) fps
AMD Radeon VII
Radeon VII, R7 2700X
39 fps -9%
MSI RTX 2060 Gaming Z 6G
GeForce RTX 2060 (Desktop), R7 2700X
38.5 (35min - 43max) fps -10%
AMD Radeon RX Vega 64
RX Vega 64, R7 2700X
36.9 (32min - 42max) fps -14%
Battlefield 1
1920x1080 Ultra Preset AA:T
Nvidia Titan RTX
NVIDIA Titan RTX, R7 2700X, ADATA Premier Pro SP900NS38 512 GB
154.2 (141min - 162max) fps
Nvidia GeForce RTX 2070 Super
GeForce RTX 2070 Super (Desktop), R7 2700X
154 (139min - 171max) fps
MSI RTX 2080 Gaming X Trio
GeForce RTX 2080 (Desktop), R7 2700X
147 (126min - 157max) fps
AMD Radeon RX Vega 64
RX Vega 64, R7 2700X
145.1 (131min - 167max) fps
Nvidia GeForce RTX 2060 Super
GeForce RTX 2060 Super (Desktop), R7 2700X
143 (126min - 154max) fps
MSI RTX 2070 Gaming Z 8G
GeForce RTX 2070 (Desktop), R7 2700X
141.3 (126min - 152max) fps
AMD Radeon VII
Radeon VII, R7 2700X
138 (127min - 144max) fps
MSI RTX 2060 Gaming Z 6G
GeForce RTX 2060 (Desktop), R7 2700X
133 (120min - 147max) fps
3840x2160 High Preset AA:T
Nvidia Titan RTX
NVIDIA Titan RTX, R7 2700X, ADATA Premier Pro SP900NS38 512 GB
111.8 (104min - 118max) fps
MSI RTX 2080 Gaming X Trio
GeForce RTX 2080 (Desktop), R7 2700X
88 (79min - 93max) fps
AMD Radeon VII
Radeon VII, R7 2700X
82 fps
Nvidia GeForce RTX 2070 Super
GeForce RTX 2070 Super (Desktop), R7 2700X
82 (72min - 87max) fps
MSI RTX 2070 Gaming Z 8G
GeForce RTX 2070 (Desktop), R7 2700X
75.7 (66min - 79max) fps
Nvidia GeForce RTX 2060 Super
GeForce RTX 2060 Super (Desktop), R7 2700X
68 (58min - 72max) fps
AMD Radeon RX Vega 64
RX Vega 64, R7 2700X
65.2 (58min - 71max) fps
MSI RTX 2060 Gaming Z 6G
GeForce RTX 2060 (Desktop), R7 2700X
59.8 (56min - 63max) fps
The Division
1920x1080 Ultra Preset AF:16x
Nvidia Titan RTX
NVIDIA Titan RTX, R7 2700X, ADATA Premier Pro SP900NS38 512 GB
163 fps +70%
MSI RTX 2080 Gaming X Trio
GeForce RTX 2080 (Desktop), R7 2700X
131.1 fps +37%
AMD Radeon RX 5700 XT
Radeon RX 5700 XT (Desktop), R7 2700X
126 fps +32%
AMD Radeon RX 5700
Radeon RX 5700 (Desktop), R7 2700X
116.8 fps +22%
Nvidia GeForce RTX 2070 Super
GeForce RTX 2070 Super (Desktop), R7 2700X
116 fps +21%
MSI RTX 2070 Gaming Z 8G
GeForce RTX 2070 (Desktop), R7 2700X
113.2 fps +18%
Nvidia GeForce RTX 2060 Super
GeForce RTX 2060 Super (Desktop), R7 2700X
106.1 fps +11%
AMD Radeon RX Vega 64
RX Vega 64, R7 2700X
102.3 fps +7%
KFA2 GeForce RTX 2060 Super
GeForce RTX 2060 Super (Desktop), R9 3900X, Corsair MP600
95.7 fps
MSI RTX 2060 Gaming Z 6G
GeForce RTX 2060 (Desktop), R7 2700X
95 fps -1%
AMD Radeon VII
Radeon VII, R7 2700X
91 fps -5%
3840x2160 High Preset AF:8x
Nvidia Titan RTX
NVIDIA Titan RTX, R7 2700X, ADATA Premier Pro SP900NS38 512 GB
91 fps +69%
MSI RTX 2080 Gaming X Trio
GeForce RTX 2080 (Desktop), R7 2700X
71.7 fps +33%
AMD Radeon RX 5700 XT
Radeon RX 5700 XT (Desktop), R7 2700X
62.3 fps +15%
Nvidia GeForce RTX 2070 Super
GeForce RTX 2070 Super (Desktop), R7 2700X
61.8 fps +14%
AMD Radeon VII
Radeon VII, R7 2700X
60 fps +11%
MSI RTX 2070 Gaming Z 8G
GeForce RTX 2070 (Desktop), R7 2700X
58.6 fps +9%
AMD Radeon RX 5700
Radeon RX 5700 (Desktop), R7 2700X
55.9 fps +4%
Nvidia GeForce RTX 2060 Super
GeForce RTX 2060 Super (Desktop), R7 2700X
54.5 fps +1%
KFA2 GeForce RTX 2060 Super
GeForce RTX 2060 Super (Desktop), R9 3900X, Corsair MP600
54 fps
AMD Radeon RX Vega 64
RX Vega 64, R7 2700X
50.6 fps -6%
MSI RTX 2060 Gaming Z 6G
GeForce RTX 2060 (Desktop), R7 2700X
49 fps -9%
For Honor
1920x1080 Extreme Preset AA:T AF:16x
Nvidia Titan RTX
NVIDIA Titan RTX, R7 2700X, ADATA Premier Pro SP900NS38 512 GB
213 (107min - 286max) fps +58%
MSI RTX 2080 Gaming X Trio
GeForce RTX 2080 (Desktop), R7 2700X
169.7 (120min - 227max) fps +26%
AMD Radeon RX 5700 XT
Radeon RX 5700 XT (Desktop), R7 2700X
156.4 (113min - 227max) fps +16%
Nvidia GeForce RTX 2070 Super
GeForce RTX 2070 Super (Desktop), R7 2700X
152.5 (84min - 204max) fps +13%
AMD Radeon RX 5700
Radeon RX 5700 (Desktop), R7 2700X
143.5 (103min - 201max) fps +6%
MSI RTX 2070 Gaming Z 8G
GeForce RTX 2070 (Desktop), R7 2700X
141.6 (95min - 199max) fps +5%
KFA2 GeForce RTX 2060 Super
GeForce RTX 2060 Super (Desktop), R9 3900X, Corsair MP600
135.2 (79min - 192max) fps
Nvidia GeForce RTX 2060 Super
GeForce RTX 2060 Super (Desktop), R7 2700X
133.9 (88min - 191max) fps -1%
AMD Radeon RX Vega 64
RX Vega 64, R7 2700X
127.7 (106min - 167max) fps -6%
MSI RTX 2060 Gaming Z 6G
GeForce RTX 2060 (Desktop), R7 2700X
122 (72min - 171max) fps -10%
AMD Radeon VII
Radeon VII, R7 2700X
121 fps -11%
3840x2160 High Preset AA:T AF:8x
Nvidia Titan RTX
NVIDIA Titan RTX, R7 2700X, ADATA Premier Pro SP900NS38 512 GB
101 (68min - 127max) fps +72%
MSI RTX 2080 Gaming X Trio
GeForce RTX 2080 (Desktop), R7 2700X
76.8 (56min - 96max) fps +31%
Nvidia GeForce RTX 2070 Super
GeForce RTX 2070 Super (Desktop), R7 2700X
69 (43min - 83max) fps +18%
AMD Radeon VII
Radeon VII, R7 2700X
64 fps +9%
AMD Radeon RX 5700 XT
Radeon RX 5700 XT (Desktop), R7 2700X
63.5 (94min - 75max) fps +8%
MSI RTX 2070 Gaming Z 8G
GeForce RTX 2070 (Desktop), R7 2700X
63.2 (46min - 76max) fps +8%
KFA2 GeForce RTX 2060 Super
GeForce RTX 2060 Super (Desktop), R9 3900X, Corsair MP600
58.6 (43min - 71max) fps
Nvidia GeForce RTX 2060 Super
GeForce RTX 2060 Super (Desktop), R7 2700X
58.3 (43min - 71max) fps -1%
AMD Radeon RX 5700
Radeon RX 5700 (Desktop), R7 2700X
56.7 (46min - 67max) fps -3%
MSI RTX 2060 Gaming Z 6G
GeForce RTX 2060 (Desktop), R7 2700X
53 (39min - 63max) fps -10%
AMD Radeon RX Vega 64
RX Vega 64, R7 2700X
49 (40min - 58max) fps -16%
Ghost Recon Wildlands
1920x1080 Ultra Preset AA:T AF:16x
Nvidia Titan RTX
NVIDIA Titan RTX, R7 2700X, ADATA Premier Pro SP900NS38 512 GB
86 (70min - 96max) fps +39%
MSI RTX 2080 Gaming X Trio
GeForce RTX 2080 (Desktop), R7 2700X
73.9 (44min - 83max) fps +19%
Nvidia GeForce RTX 2070 Super
GeForce RTX 2070 Super (Desktop), R7 2700X
67.8 (53min - 76max) fps +9%
AMD Radeon RX 5700 XT
Radeon RX 5700 XT (Desktop), R7 2700X
64.8 (50min - 76max) fps +5%
MSI RTX 2070 Gaming Z 8G
GeForce RTX 2070 (Desktop), R7 2700X
64.1 (55min - 73max) fps +3%
Nvidia GeForce RTX 2060 Super
GeForce RTX 2060 Super (Desktop), R7 2700X
62.4 (40min - 72max) fps +1%
KFA2 GeForce RTX 2060 Super
GeForce RTX 2060 Super (Desktop), R9 3900X, Corsair MP600
62 (51min - 70max) fps
AMD Radeon RX 5700
Radeon RX 5700 (Desktop), R7 2700X
60.4 (50min - 69max) fps -3%
MSI RTX 2060 Gaming Z 6G
GeForce RTX 2060 (Desktop), R7 2700X
56 (49min - 63max) fps -10%
AMD Radeon RX Vega 64
RX Vega 64, R7 2700X
53 (43min - 60max) fps -15%
AMD Radeon VII
Radeon VII, R7 2700X
49 fps -21%
3840x2160 Ultra Preset AA:T AF:16x
Nvidia Titan RTX
NVIDIA Titan RTX, R7 2700X, ADATA Premier Pro SP900NS38 512 GB
49 (42min - 55max) fps +58%
MSI RTX 2080 Gaming X Trio
GeForce RTX 2080 (Desktop), R7 2700X
38.9 (34min - 44max) fps +25%
Nvidia GeForce RTX 2070 Super
GeForce RTX 2070 Super (Desktop), R7 2700X
35.3 (30min - 40max) fps +14%
AMD Radeon RX 5700 XT
Radeon RX 5700 XT (Desktop), R7 2700X
34.7 (28min - 40max) fps +12%
MSI RTX 2070 Gaming Z 8G
GeForce RTX 2070 (Desktop), R7 2700X
32.6 (28min - 37max) fps +5%
AMD Radeon RX 5700
Radeon RX 5700 (Desktop), R7 2700X
31.4 (24min - 36max) fps +1%
Nvidia GeForce RTX 2060 Super
GeForce RTX 2060 Super (Desktop), R7 2700X
31 (27min - 35max) fps 0%
KFA2 GeForce RTX 2060 Super
GeForce RTX 2060 Super (Desktop), R9 3900X, Corsair MP600
31 (26min - 35max) fps
Doom
1920x1080 Ultra Preset AA:SM
KFA2 GeForce RTX 2060 Super
GeForce RTX 2060 Super (Desktop), R9 3900X, Corsair MP600
169 (76min - 200max) fps
Nvidia Titan RTX
NVIDIA Titan RTX, R7 2700X, ADATA Premier Pro SP900NS38 512 GB
144 (97min - 198max) fps -15%
Nvidia GeForce RTX 2060 Super
GeForce RTX 2060 Super (Desktop), R7 2700X
142 (95min - 195max) fps -16%
MSI RTX 2080 Gaming X Trio
GeForce RTX 2080 (Desktop), R7 2700X
140.3 (101min - 196max) fps -17%
MSI RTX 2070 Gaming Z 8G
GeForce RTX 2070 (Desktop), R7 2700X
139.6 (104min - 195max) fps -17%
MSI RTX 2060 Gaming Z 6G
GeForce RTX 2060 (Desktop), R7 2700X
139.5 (94min - 195max) fps -17%
Nvidia GeForce RTX 2070 Super
GeForce RTX 2070 Super (Desktop), R7 2700X
137 (96min - 194max) fps -19%
3840x2160 High Preset AA:FX
Nvidia Titan RTX
NVIDIA Titan RTX, R7 2700X, ADATA Premier Pro SP900NS38 512 GB
140 (102min - 184max) fps +79%
MSI RTX 2080 Gaming X Trio
GeForce RTX 2080 (Desktop), R7 2700X
117.7 (87min - 151max) fps +51%
Nvidia GeForce RTX 2070 Super
GeForce RTX 2070 Super (Desktop), R7 2700X
105 (86min - 134max) fps +35%
MSI RTX 2070 Gaming Z 8G
GeForce RTX 2070 (Desktop), R7 2700X
91.1 (76min - 116max) fps +17%
Nvidia GeForce RTX 2060 Super
GeForce RTX 2060 Super (Desktop), R7 2700X
86 (69min - 107max) fps +10%
MSI RTX 2060 Gaming Z 6G
GeForce RTX 2060 (Desktop), R7 2700X
78.7 (66min - 98max) fps +1%
KFA2 GeForce RTX 2060 Super
GeForce RTX 2060 Super (Desktop), R9 3900X, Corsair MP600
78 (66min - 104max) fps
GTA V
1920x1080 Highest Settings possible AA:4xMSAA + FX AF:16x
Nvidia Titan RTX
NVIDIA Titan RTX, R7 2700X, ADATA Premier Pro SP900NS38 512 GB
125.1 fps +39%
MSI RTX 2080 Gaming X Trio
GeForce RTX 2080 (Desktop), R7 2700X
116 (6.8min, 83.3P1 - 147max) fps +29%
AMD Radeon VII
Radeon VII, R7 2700X
115 fps +28%
MSI RTX 2070 Gaming Z 8G
GeForce RTX 2070 (Desktop), R7 2700X
107.5 fps +19%
MSI RTX 2060 Gaming Z 6G
GeForce RTX 2060 (Desktop), R7 2700X
100.5 fps +12%
KFA2 GeForce RTX 2060 Super
GeForce RTX 2060 Super (Desktop), R9 3900X, Corsair MP600
90 (5.65min, 58.8P1 - 181max) fps
Nvidia GeForce RTX 2060 Super
GeForce RTX 2060 Super (Desktop), R7 2700X
85 (6.02min, 58.8P1 - 158max) fps -6%
Nvidia GeForce RTX 2070 Super
GeForce RTX 2070 Super (Desktop), R7 2700X
84 (6.27min, 55.6P1 - 167max) fps -7%
AMD Radeon RX 5700
Radeon RX 5700 (Desktop), R7 2700X
83 (6.93min, 52.6P1 - 165max) fps -8%
AMD Radeon RX 5700 XT
Radeon RX 5700 XT (Desktop), R7 2700X
81 (22min, 52.6P1 - 163max) fps -10%
3840x2160 High/On (Advanced Graphics Off) AA:FX AF:8x
Nvidia Titan RTX
NVIDIA Titan RTX, R7 2700X, ADATA Premier Pro SP900NS38 512 GB
140.6 fps +58%
Nvidia GeForce RTX 2070 Super
GeForce RTX 2070 Super (Desktop), R7 2700X
102 (2.69min, 76.9P1 - 255max) fps +15%
AMD Radeon RX 5700 XT
Radeon RX 5700 XT (Desktop), R7 2700X
90 (14.2min, 71.4P1 - 270max) fps +1%
MSI RTX 2080 Gaming X Trio
GeForce RTX 2080 (Desktop), R7 2700X
89 (9.54min, 62.5P1 - 139max) fps 0%
KFA2 GeForce RTX 2060 Super
GeForce RTX 2060 Super (Desktop), R9 3900X, Corsair MP600
89 (32min, 66.7P1 - 161max) fps
Nvidia GeForce RTX 2060 Super
GeForce RTX 2060 Super (Desktop), R7 2700X
83 fps -7%
AMD Radeon RX 5700
Radeon RX 5700 (Desktop), R7 2700X
82 (13.1min, 66.7P1 - 128max) fps -8%
AMD Radeon VII
Radeon VII, R7 2700X
81 fps -9%
MSI RTX 2070 Gaming Z 8G
GeForce RTX 2070 (Desktop), R7 2700X
79.9 fps -10%
MSI RTX 2060 Gaming Z 6G
GeForce RTX 2060 (Desktop), R7 2700X
66.7 fps -25%
Battlefield 4 - 3840x2160 High Preset
Nvidia Titan RTX
NVIDIA Titan RTX, R7 2700X, ADATA Premier Pro SP900NS38 512 GB
159 fps +69%
MSI RTX 2080 Gaming X Trio
GeForce RTX 2080 (Desktop), R7 2700X
125.4 (111min - 151max) fps +33%
Nvidia GeForce RTX 2070 Super
GeForce RTX 2070 Super (Desktop), R7 2700X
114 (99min - 150max) fps +21%
MSI RTX 2070 Gaming Z 8G
GeForce RTX 2070 (Desktop), R7 2700X
102.3 fps +9%
KFA2 GeForce RTX 2060 Super
GeForce RTX 2060 Super (Desktop), R9 3900X, Corsair MP600
94 (84min - 112max) fps
AMD Radeon RX Vega 64
RX Vega 64, R7 2700X
77 (70min - 92max) fps -18%
AMD Radeon VII
Radeon VII, R7 2700X
70.4 (57min - 86max) fps -25%
Nvidia GeForce RTX 2060 Super
GeForce RTX 2060 Super (Desktop), R7 2700X
65 (54min - 79max) fps -31%
MSI RTX 2060 Gaming Z 6G
GeForce RTX 2060 (Desktop), R7 2700X
55.4 (48min - 67max) fps -41%
Hitman 2
1920x1080 Ultra AF:16x
KFA2 GeForce RTX 2060 Super
GeForce RTX 2060 Super (Desktop), R9 3900X, Corsair MP600
84 (58min - 119max) fps
AMD Radeon VII
Radeon VII, R7 2700X
82 (60min - 116max) fps -2%
AMD Radeon RX 5700 XT
Radeon RX 5700 XT (Desktop), R7 2700X
81 (61min - 121max) fps -4%
AMD Radeon RX 5700
Radeon RX 5700 (Desktop), R7 2700X
80 (61min - 117max) fps -5%
MSI RTX 2060 Gaming Z 6G
GeForce RTX 2060 (Desktop), R7 2700X
79.9 (61min - 117max) fps -5%
MSI RTX 2080 Gaming X Trio
GeForce RTX 2080 (Desktop), R7 2700X
79 (60min - 114max) fps -6%
Nvidia GeForce RTX 2060 Super
GeForce RTX 2060 Super (Desktop), R7 2700X
79 (56min - 111max) fps -6%
AMD Radeon RX Vega 64
RX Vega 64, R7 2700X
78.2 (58min - 110max) fps -7%
MSI RTX 2070 Gaming Z 8G
GeForce RTX 2070 (Desktop), R7 2700X
77.9 (60min - 112max) fps -7%
Nvidia GeForce RTX 2070 Super
GeForce RTX 2070 Super (Desktop), R7 2700X
77 (58min - 110max) fps -8%
Nvidia Titan RTX
NVIDIA Titan RTX, R7 2700X, ADATA Premier Pro SP900NS38 512 GB
75 (55min - 107max) fps -11%
3840x2160 Ultra AF:16x
Nvidia Titan RTX
NVIDIA Titan RTX, R7 2700X, ADATA Premier Pro SP900NS38 512 GB
75 (54min - 106max) fps +93%
MSI RTX 2080 Gaming X Trio
GeForce RTX 2080 (Desktop), R7 2700X
60 (46min - 71max) fps +54%
Nvidia GeForce RTX 2070 Super
GeForce RTX 2070 Super (Desktop), R7 2700X
60 (43min - 76max) fps +54%
AMD Radeon VII
Radeon VII, R7 2700X
52.9 (45min - 61max) fps +36%
AMD Radeon RX 5700 XT
Radeon RX 5700 XT (Desktop), R7 2700X
52.3 (43min - 66max) fps +34%
AMD Radeon RX Vega 64
RX Vega 64, R7 2700X
47.4 (41min - 55max) fps +22%
MSI RTX 2070 Gaming Z 8G
GeForce RTX 2070 (Desktop), R7 2700X
47.3 (38min - 57max) fps +22%
AMD Radeon RX 5700
Radeon RX 5700 (Desktop), R7 2700X
46.6 (36min - 57max) fps +20%
Nvidia GeForce RTX 2060 Super
GeForce RTX 2060 Super (Desktop), R7 2700X
45 (36min - 54max) fps +16%
MSI RTX 2060 Gaming Z 6G
GeForce RTX 2060 (Desktop), R7 2700X
40.7 (35min - 50max) fps +5%
KFA2 GeForce RTX 2060 Super
GeForce RTX 2060 Super (Desktop), R9 3900X, Corsair MP600
38.9 (32min - 46max) fps
2560x1440 Ultra AF:16x
MSI RTX 2080 Gaming X Trio
GeForce RTX 2080 (Desktop), R7 2700X
80 (60min - 111max) fps +11%
AMD Radeon RX 5700 XT
Radeon RX 5700 XT (Desktop), R7 2700X
80 (59min - 111max) fps +11%
AMD Radeon RX 5700
Radeon RX 5700 (Desktop), R7 2700X
78 (59min - 102max) fps +8%
Nvidia GeForce RTX 2070 Super
GeForce RTX 2070 Super (Desktop), R7 2700X
77 (60min - 109max) fps +7%
MSI RTX 2070 Gaming Z 8G
GeForce RTX 2070 (Desktop), R7 2700X
75.8 (59min - 104max) fps +5%
Nvidia GeForce RTX 2060 Super
GeForce RTX 2060 Super (Desktop), R7 2700X
75 (57min - 105max) fps +4%
KFA2 GeForce RTX 2060 Super
GeForce RTX 2060 Super (Desktop), R9 3900X, Corsair MP600
72 (57min - 92max) fps
Battlefield V
1920x1080 Ultra Preset
Nvidia Titan RTX
NVIDIA Titan RTX, R7 2700X, ADATA Premier Pro SP900NS38 512 GB
160.4 (129min - 168max) fps +20%
MSI RTX 2080 Gaming X Trio
GeForce RTX 2080 (Desktop), R7 2700X
145 (79min - 185max) fps +8%
AMD Radeon RX Vega 64
RX Vega 64, R7 2700X
138.7 (112min - 194max) fps +4%
KFA2 GeForce RTX 2060 Super
GeForce RTX 2060 Super (Desktop), R9 3900X, Corsair MP600
134 (75min - 197max) fps
AMD Radeon VII
Radeon VII, R7 2700X
127 (94min - 187max) fps -5%
MSI RTX 2070 Gaming Z 8G
GeForce RTX 2070 (Desktop), R7 2700X
126.8 (69min - 171max) fps -5%
MSI RTX 2060 Gaming Z 6G
GeForce RTX 2060 (Desktop), R7 2700X
119.1 (94min - 167max) fps -11%
AMD Radeon RX 5700 XT
Radeon RX 5700 XT (Desktop), R7 2700X
105 (81min - 150max) fps -22%
AMD Radeon RX 5700
Radeon RX 5700 (Desktop), R7 2700X
97 (76min - 140max) fps -28%
Nvidia GeForce RTX 2070 Super
GeForce RTX 2070 Super (Desktop), R7 2700X
95 (77min - 133max) fps -29%
Nvidia GeForce RTX 2060 Super
GeForce RTX 2060 Super (Desktop), R7 2700X
87 (56min - 121max) fps -35%
3840x2160 Ultra Preset
Nvidia Titan RTX
NVIDIA Titan RTX, R7 2700X, ADATA Premier Pro SP900NS38 512 GB
97.3 (62min - 147max) fps +60%
MSI RTX 2080 Gaming X Trio
GeForce RTX 2080 (Desktop), R7 2700X
76 (54min - 115max) fps +25%
AMD Radeon VII
Radeon VII, R7 2700X
73 (59min - 115max) fps +20%
MSI RTX 2070 Gaming Z 8G
GeForce RTX 2070 (Desktop), R7 2700X
62.6 (46min - 93max) fps +3%
KFA2 GeForce RTX 2060 Super
GeForce RTX 2060 Super (Desktop), R9 3900X, Corsair MP600
61 (48min - 98max) fps
AMD Radeon RX Vega 64
RX Vega 64, R7 2700X
60.3 (49min - 98max) fps -1%
AMD Radeon RX 5700 XT
Radeon RX 5700 XT (Desktop), R7 2700X
59.5 (49min - 92max) fps -2%
AMD Radeon RX 5700
Radeon RX 5700 (Desktop), R7 2700X
53.5 (44min - 83max) fps -12%
MSI RTX 2060 Gaming Z 6G
GeForce RTX 2060 (Desktop), R7 2700X
53.1 (43min - 80max) fps -13%
Nvidia GeForce RTX 2070 Super
GeForce RTX 2070 Super (Desktop), R7 2700X
50.9 (41min - 73max) fps -17%
Nvidia GeForce RTX 2060 Super
GeForce RTX 2060 Super (Desktop), R7 2700X
46.5 (30min - 67max) fps -24%
2560x1440 Ultra Preset
MSI RTX 2080 Gaming X Trio
GeForce RTX 2080 (Desktop), R7 2700X
125 (98min - 175max) fps +20%
KFA2 GeForce RTX 2060 Super
GeForce RTX 2060 Super (Desktop), R9 3900X, Corsair MP600
104 (66min - 160max) fps
MSI RTX 2070 Gaming Z 8G
GeForce RTX 2070 (Desktop), R7 2700X
103.1 (62min - 149max) fps -1%
AMD Radeon RX 5700 XT
Radeon RX 5700 XT (Desktop), R7 2700X
89 (70min - 130max) fps -14%
AMD Radeon RX 5700
Radeon RX 5700 (Desktop), R7 2700X
81 (64min - 122max) fps -22%
Nvidia GeForce RTX 2070 Super
GeForce RTX 2070 Super (Desktop), R7 2700X
78 (65min - 110max) fps -25%
Nvidia GeForce RTX 2060 Super
GeForce RTX 2060 Super (Desktop), R7 2700X
71 (45min - 101max) fps -32%
Farming Simulator 19
1920x1080 Very High Preset
KFA2 GeForce RTX 2060 Super
GeForce RTX 2060 Super (Desktop), R9 3900X, Corsair MP600
143 (125min - 194max) fps
Nvidia Titan RTX
NVIDIA Titan RTX, R7 2700X, ADATA Premier Pro SP900NS38 512 GB
125 (106min - 167max) fps -13%
MSI RTX 2080 Gaming X Trio
GeForce RTX 2080 (Desktop), R7 2700X
124 (109min - 167max) fps -13%
MSI RTX 2060 Gaming Z 6G
GeForce RTX 2060 (Desktop), R7 2700X
122.4 (108min - 163max) fps -14%
Nvidia GeForce RTX 2070 Super
GeForce RTX 2070 Super (Desktop), R7 2700X
121 (107min - 161max) fps -15%
MSI RTX 2070 Gaming Z 8G
GeForce RTX 2070 (Desktop), R7 2700X
120.7 (108min - 159max) fps -16%
Nvidia GeForce RTX 2060 Super
GeForce RTX 2060 Super (Desktop), R7 2700X
118 (106min - 156max) fps -17%
AMD Radeon RX 5700 XT
Radeon RX 5700 XT (Desktop), R7 2700X
116 (101min - 151max) fps -19%
AMD Radeon VII
Radeon VII, R7 2700X
111 (99min - 144max) fps -22%
AMD Radeon RX Vega 64
RX Vega 64, R7 2700X
100 (72min - 144max) fps -30%
AMD Radeon RX 5700
Radeon RX 5700 (Desktop), R7 2700X
94 (76min - 121max) fps -34%
3840x2160 Very High Preset
Nvidia Titan RTX
NVIDIA Titan RTX, R7 2700X, ADATA Premier Pro SP900NS38 512 GB
112 (89min - 160max) fps +67%
MSI RTX 2080 Gaming X Trio
GeForce RTX 2080 (Desktop), R7 2700X
83 (63min - 149max) fps +24%
Nvidia GeForce RTX 2070 Super
GeForce RTX 2070 Super (Desktop), R7 2700X
76 (56min - 135max) fps +13%
MSI RTX 2070 Gaming Z 8G
GeForce RTX 2070 (Desktop), R7 2700X
72 (55min - 125max) fps +7%
KFA2 GeForce RTX 2060 Super
GeForce RTX 2060 Super (Desktop), R9 3900X, Corsair MP600
67 (50min - 121max) fps
Nvidia GeForce RTX 2060 Super
GeForce RTX 2060 Super (Desktop), R7 2700X
65 (48min - 114max) fps -3%
MSI RTX 2060 Gaming Z 6G
GeForce RTX 2060 (Desktop), R7 2700X
54.9 (42min - 98max) fps -18%
AMD Radeon RX 5700 XT
Radeon RX 5700 XT (Desktop), R7 2700X
53.2 (39min - 102max) fps -21%
AMD Radeon VII
Radeon VII, R7 2700X
51.1 (38min - 94max) fps -24%
AMD Radeon RX 5700
Radeon RX 5700 (Desktop), R7 2700X
46.2 (35min - 91max) fps -31%
AMD Radeon RX Vega 64
RX Vega 64, R7 2700X
41.5 (33min - 69max) fps -38%
2560x1440 Very High Preset
MSI RTX 2080 Gaming X Trio
GeForce RTX 2080 (Desktop), R7 2700X
123 (109min - 166max) fps +4%
MSI RTX 2070 Gaming Z 8G
GeForce RTX 2070 (Desktop), R7 2700X
118.4 (101min - 160max) fps 0%
Nvidia GeForce RTX 2070 Super
GeForce RTX 2070 Super (Desktop), R7 2700X
118 (95min - 158max) fps 0%
KFA2 GeForce RTX 2060 Super
GeForce RTX 2060 Super (Desktop), R9 3900X, Corsair MP600
118 (93min - 179max) fps
Nvidia GeForce RTX 2060 Super
GeForce RTX 2060 Super (Desktop), R7 2700X
111 (91min - 154max) fps -6%
AMD Radeon RX 5700 XT
Radeon RX 5700 XT (Desktop), R7 2700X
93 (73min - 145max) fps -21%
AMD Radeon RX 5700
Radeon RX 5700 (Desktop), R7 2700X
87 (68min - 140max) fps -26%
Darksiders III
1920x1080 Epic
Nvidia Titan RTX
NVIDIA Titan RTX, R7 2700X, ADATA Premier Pro SP900NS38 512 GB
131 (69min - 164max) fps +9%
MSI RTX 2080 Gaming X Trio
GeForce RTX 2080 (Desktop), R7 2700X
129 (66min - 164max) fps +8%
Nvidia GeForce RTX 2070 Super
GeForce RTX 2070 Super (Desktop), R7 2700X
127 (67min - 150max) fps +6%
MSI RTX 2070 Gaming Z 8G
GeForce RTX 2070 (Desktop), R7 2700X
121.1 (67min - 144max) fps +1%
AMD Radeon RX 5700 XT
Radeon RX 5700 XT (Desktop), R7 2700X
121 (52min - 160max) fps +1%
KFA2 GeForce RTX 2060 Super
GeForce RTX 2060 Super (Desktop), R9 3900X, Corsair MP600
120 (74min - 135max) fps
AMD Radeon VII
Radeon VII, R7 2700X
119 (58min - 142max) fps -1%
MSI RTX 2060 Gaming Z 6G
GeForce RTX 2060 (Desktop), R7 2700X
110 (71min - 125max) fps -8%
Nvidia GeForce RTX 2060 Super
GeForce RTX 2060 Super (Desktop), R7 2700X
108 (63min - 126max) fps -10%
AMD Radeon RX 5700
Radeon RX 5700 (Desktop), R7 2700X
103 (49min - 123max) fps -14%
AMD Radeon RX Vega 64
RX Vega 64, R7 2700X
99.4 (48min - 116max) fps -17%
3840x2160 Epic
Nvidia Titan RTX
NVIDIA Titan RTX, R7 2700X, ADATA Premier Pro SP900NS38 512 GB
74 (57min - 84max) fps +74%
MSI RTX 2080 Gaming X Trio
GeForce RTX 2080 (Desktop), R7 2700X
57.6 (47min - 65max) fps +36%
Nvidia GeForce RTX 2070 Super
GeForce RTX 2070 Super (Desktop), R7 2700X
51.3 (42min - 58max) fps +21%
MSI RTX 2070 Gaming Z 8G
GeForce RTX 2070 (Desktop), R7 2700X
45.9 (40min - 52max) fps +8%
AMD Radeon VII
Radeon VII, R7 2700X
44.2 (35min - 50max) fps +4%
KFA2 GeForce RTX 2060 Super
GeForce RTX 2060 Super (Desktop), R9 3900X, Corsair MP600
42.5 (35min - 48max) fps
AMD Radeon RX 5700 XT
Radeon RX 5700 XT (Desktop), R7 2700X
41.7 (34min - 47max) fps -2%
Nvidia GeForce RTX 2060 Super
GeForce RTX 2060 Super (Desktop), R7 2700X
41.6 (33min - 47max) fps -2%
AMD Radeon RX 5700
Radeon RX 5700 (Desktop), R7 2700X
37.1 (31min - 42max) fps -13%
AMD Radeon RX Vega 64
RX Vega 64, R7 2700X
35.8 (31min - 40max) fps -16%
MSI RTX 2060 Gaming Z 6G
GeForce RTX 2060 (Desktop), R7 2700X
34.9 (31min - 40max) fps -18%
Just Cause 4
1920x1080 Very High / On AA:SM AF:16x
Nvidia Titan RTX
NVIDIA Titan RTX, R7 2700X, ADATA Premier Pro SP900NS38 512 GB
151 (144min - 159max) fps +47%
MSI RTX 2080 Gaming X Trio
GeForce RTX 2080 (Desktop), R7 2700X
123 (115min - 131max) fps +19%
Nvidia GeForce RTX 2070 Super
GeForce RTX 2070 Super (Desktop), R7 2700X
114 (106min - 121max) fps +11%
AMD Radeon RX 5700 XT
Radeon RX 5700 XT (Desktop), R7 2700X
106 (99min - 120max) fps +3%
MSI RTX 2070 Gaming Z 8G
GeForce RTX 2070 (Desktop), R7 2700X
105.5 (97min - 112max) fps +2%
KFA2 GeForce RTX 2060 Super
GeForce RTX 2060 Super (Desktop), R9 3900X, Corsair MP600
103 (95min - 107max) fps
Nvidia GeForce RTX 2060 Super
GeForce RTX 2060 Super (Desktop), R7 2700X
102 (94min - 109max) fps -1%
AMD Radeon VII
Radeon VII, R7 2700X
101 (93min - 113max) fps -2%
MSI RTX 2060 Gaming Z 6G
GeForce RTX 2060 (Desktop), R7 2700X
93 (86min - 103max) fps -10%
AMD Radeon RX Vega 64
RX Vega 64, R7 2700X
92.3 (85min - 101max) fps -10%
AMD Radeon RX 5700
Radeon RX 5700 (Desktop), R7 2700X
88 (27min - 102max) fps -15%
3840x2160 Very High / On AA:SM AF:16x
Nvidia Titan RTX
NVIDIA Titan RTX, R7 2700X, ADATA Premier Pro SP900NS38 512 GB
67 (63min - 72max) fps +63%
MSI RTX 2080 Gaming X Trio
GeForce RTX 2080 (Desktop), R7 2700X
50 (47min - 53max) fps +22%
Nvidia GeForce RTX 2070 Super
GeForce RTX 2070 Super (Desktop), R7 2700X
48.6 (45min - 51max) fps +19%
AMD Radeon VII
Radeon VII, R7 2700X
45.7 (42min - 49max) fps +11%
AMD Radeon RX 5700 XT
Radeon RX 5700 XT (Desktop), R7 2700X
44.1 (40min - 47max) fps +8%
MSI RTX 2070 Gaming Z 8G
GeForce RTX 2070 (Desktop), R7 2700X
43.2 (36min - 47max) fps +5%
Nvidia GeForce RTX 2060 Super
GeForce RTX 2060 Super (Desktop), R7 2700X
41 (38min - 44max) fps 0%
KFA2 GeForce RTX 2060 Super
GeForce RTX 2060 Super (Desktop), R9 3900X, Corsair MP600
41 (38min - 44max) fps
AMD Radeon RX 5700
Radeon RX 5700 (Desktop), R7 2700X
39.2 (36min - 42max) fps -4%
MSI RTX 2060 Gaming Z 6G
GeForce RTX 2060 (Desktop), R7 2700X
37.4 (30min - 41max) fps -9%
AMD Radeon RX Vega 64
RX Vega 64, R7 2700X
36.4 (33min - 41max) fps -11%
2560x1440 Very High / On AA:SM AF:16x
MSI RTX 2080 Gaming X Trio
GeForce RTX 2080 (Desktop), R7 2700X
88 (81min - 92max) fps +22%
Nvidia GeForce RTX 2070 Super
GeForce RTX 2070 Super (Desktop), R7 2700X
86 (79min - 90max) fps +19%
AMD Radeon RX 5700 XT
Radeon RX 5700 XT (Desktop), R7 2700X
84 (77min - 89max) fps +17%
MSI RTX 2070 Gaming Z 8G
GeForce RTX 2070 (Desktop), R7 2700X
75.4 (70min - 81max) fps +5%
Nvidia GeForce RTX 2060 Super
GeForce RTX 2060 Super (Desktop), R7 2700X
75 (70min - 80max) fps +4%
AMD Radeon RX 5700
Radeon RX 5700 (Desktop), R7 2700X
73 (67min - 78max) fps +1%
KFA2 GeForce RTX 2060 Super
GeForce RTX 2060 Super (Desktop), R9 3900X, Corsair MP600
72 (67min - 76max) fps
Apex Legends
1920x1080 Maximum Settings AA:TS AF:16x
MSI RTX 2070 Gaming Z 8G
GeForce RTX 2070 (Desktop), R7 2700X
144 (143min - 145max) fps 0%
MSI RTX 2080 Gaming X Trio
GeForce RTX 2080 (Desktop), R7 2700X
144 (142min - 145max) fps 0%
Nvidia GeForce RTX 2060 Super
GeForce RTX 2060 Super (Desktop), R7 2700X
144 (143min - 145max) fps 0%
Nvidia GeForce RTX 2070 Super
GeForce RTX 2070 Super (Desktop), R7 2700X
144 (143min - 145max) fps 0%
AMD Radeon RX 5700 XT
Radeon RX 5700 XT (Desktop), R7 2700X
144 (143min - 145max) fps 0%
KFA2 GeForce RTX 2060 Super
GeForce RTX 2060 Super (Desktop), R9 3900X, Corsair MP600
144 (143min - 145max) fps
AMD Radeon RX 5700
Radeon RX 5700 (Desktop), R7 2700X
142 (136min - 145max) fps -1%
MSI RTX 2060 Gaming Z 6G
GeForce RTX 2060 (Desktop), R7 2700X
139 (126min - 145max) fps -3%
AMD Radeon RX Vega 64
RX Vega 64, R7 2700X
131 (122min - 144max) fps -9%
3840x2160 Maximum Settings AA:TS AF:16x
MSI RTX 2080 Gaming X Trio
GeForce RTX 2080 (Desktop), R7 2700X
82 (60min - 87max) fps +26%
MSI RTX 2070 Gaming Z 8G
GeForce RTX 2070 (Desktop), R7 2700X
80 (73min - 93max) fps +23%
Nvidia GeForce RTX 2070 Super
GeForce RTX 2070 Super (Desktop), R7 2700X
78 (67min - 94max) fps +20%
AMD Radeon RX 5700 XT
Radeon RX 5700 XT (Desktop), R7 2700X
65 (56min - 85max) fps 0%
KFA2 GeForce RTX 2060 Super
GeForce RTX 2060 Super (Desktop), R9 3900X, Corsair MP600
65 (57min - 82max) fps
Nvidia GeForce RTX 2060 Super
GeForce RTX 2060 Super (Desktop), R7 2700X
63 (57min - 77max) fps -3%
AMD Radeon RX 5700
Radeon RX 5700 (Desktop), R7 2700X
57.2 (49min - 75max) fps -12%
AMD Radeon RX Vega 64
RX Vega 64, R7 2700X
52.1 (46min - 65max) fps -20%
MSI RTX 2060 Gaming Z 6G
GeForce RTX 2060 (Desktop), R7 2700X
52 (48min - 60max) fps -20%
2560x1440 Maximum Settings AA:TS AF:16x
MSI RTX 2070 Gaming Z 8G
GeForce RTX 2070 (Desktop), R7 2700X
138 (129min - 145max) fps +19%
MSI RTX 2080 Gaming X Trio
GeForce RTX 2080 (Desktop), R7 2700X
138 (109min - 145max) fps +19%
Nvidia GeForce RTX 2070 Super
GeForce RTX 2070 Super (Desktop), R7 2700X
132 (122min - 145max) fps +14%
AMD Radeon RX 5700 XT
Radeon RX 5700 XT (Desktop), R7 2700X
117 (104min - 143max) fps +1%
KFA2 GeForce RTX 2060 Super
GeForce RTX 2060 Super (Desktop), R9 3900X, Corsair MP600
116 (109min - 133max) fps
Nvidia GeForce RTX 2060 Super
GeForce RTX 2060 Super (Desktop), R7 2700X
112 (103min - 132max) fps -3%
AMD Radeon RX 5700
Radeon RX 5700 (Desktop), R7 2700X
104 (91min - 127max) fps -10%
MSI RTX 2060 Gaming Z 6G
GeForce RTX 2060 (Desktop), R7 2700X
98 (91min - 110max) fps -16%
AMD Radeon RX Vega 64
RX Vega 64, R7 2700X
93 (86min - 111max) fps -20%
Far Cry New Dawn
1920x1080 Ultra Preset
KFA2 GeForce RTX 2060 Super
GeForce RTX 2060 Super (Desktop), R9 3900X, Corsair MP600
96 (68min - 141max) fps
MSI RTX 2080 Gaming X Trio
GeForce RTX 2080 (Desktop), R7 2700X
92 (65min - 147max) fps -4%
MSI RTX 2070 Gaming Z 8G
GeForce RTX 2070 (Desktop), R7 2700X
90 (65min - 138max) fps -6%
MSI RTX 2060 Gaming Z 6G
GeForce RTX 2060 (Desktop), R7 2700X
88 (66min - 125max) fps -8%
Nvidia GeForce RTX 2070 Super
GeForce RTX 2070 Super (Desktop), R7 2700X
87 (63min - 135max) fps -9%
AMD Radeon RX Vega 64
RX Vega 64, R7 2700X
85 (62min - 130max) fps -11%
Nvidia GeForce RTX 2060 Super
GeForce RTX 2060 Super (Desktop), R7 2700X
85 (63min - 134max) fps -11%
AMD Radeon VII
Radeon VII, R7 2700X
83 (59min - 128max) fps -14%
AMD Radeon RX 5700
Radeon RX 5700 (Desktop), R7 2700X
83 (60min - 132max) fps -14%
AMD Radeon RX 5700 XT
Radeon RX 5700 XT (Desktop), R7 2700X
79 (58min - 120max) fps -18%
3840x2160 Ultra Preset
MSI RTX 2080 Gaming X Trio
GeForce RTX 2080 (Desktop), R7 2700X
62 (52min - 76max) fps +29%
AMD Radeon VII
Radeon VII, R7 2700X
61 (50min - 80max) fps +27%
Nvidia GeForce RTX 2070 Super
GeForce RTX 2070 Super (Desktop), R7 2700X
58 (48min - 72max) fps +21%
AMD Radeon RX 5700 XT
Radeon RX 5700 XT (Desktop), R7 2700X
56 (47min - 73max) fps +17%
MSI RTX 2070 Gaming Z 8G
GeForce RTX 2070 (Desktop), R7 2700X
51 (43min - 61max) fps +6%
AMD Radeon RX 5700
Radeon RX 5700 (Desktop), R7 2700X
51 (42min - 67max) fps +6%
Nvidia GeForce RTX 2060 Super
GeForce RTX 2060 Super (Desktop), R7 2700X
50 (41min - 62max) fps +4%
KFA2 GeForce RTX 2060 Super
GeForce RTX 2060 Super (Desktop), R9 3900X, Corsair MP600
48 (40min - 59max) fps
AMD Radeon RX Vega 64
RX Vega 64, R7 2700X
47 (38min - 60max) fps -2%
MSI RTX 2060 Gaming Z 6G
GeForce RTX 2060 (Desktop), R7 2700X
42 (35min - 52max) fps -12%
2560x1440 Ultra Preset
MSI RTX 2080 Gaming X Trio
GeForce RTX 2080 (Desktop), R7 2700X
89 (65min - 129max) fps +7%
Nvidia GeForce RTX 2070 Super
GeForce RTX 2070 Super (Desktop), R7 2700X
86 (61min - 125max) fps +4%
AMD Radeon VII
Radeon VII, R7 2700X
83 (59min - 127max) fps 0%
KFA2 GeForce RTX 2060 Super
GeForce RTX 2060 Super (Desktop), R9 3900X, Corsair MP600
83 (68min - 107max) fps
MSI RTX 2070 Gaming Z 8G
GeForce RTX 2070 (Desktop), R7 2700X
82 (64min - 110max) fps -1%
AMD Radeon RX 5700 XT
Radeon RX 5700 XT (Desktop), R7 2700X
80 (58min - 122max) fps -4%
AMD Radeon RX Vega 64
RX Vega 64, R7 2700X
79 (61min - 110max) fps -5%
Nvidia GeForce RTX 2060 Super
GeForce RTX 2060 Super (Desktop), R7 2700X
79 (60min - 111max) fps -5%
AMD Radeon RX 5700
Radeon RX 5700 (Desktop), R7 2700X
79 (59min - 118max) fps -5%
MSI RTX 2060 Gaming Z 6G
GeForce RTX 2060 (Desktop), R7 2700X
76 (61min - 95max) fps -8%
Metro Exodus
1920x1080 Ultra Quality AF:16x
MSI RTX 2080 Gaming X Trio
GeForce RTX 2080 (Desktop), R7 2700X
74.2 (38min - 122max) fps +28%
Nvidia GeForce RTX 2070 Super
GeForce RTX 2070 Super (Desktop), R7 2700X
67.8 (36min - 110max) fps +17%
AMD Radeon VII
Radeon VII, R7 2700X
67.2 (36min - 104max) fps +16%
AMD Radeon RX 5700 XT
Radeon RX 5700 XT (Desktop), R7 2700X
61 (36.09min - 86.1max) fps +5%
MSI RTX 2070 Gaming Z 8G
GeForce RTX 2070 (Desktop), R7 2700X
60.4 (32min - 94max) fps +4%
Nvidia GeForce RTX 2060 Super
GeForce RTX 2060 Super (Desktop), R7 2700X
58.9 (32min - 92max) fps +2%
AMD Radeon RX 5700
Radeon RX 5700 (Desktop), R7 2700X
58.6 (32.67min - 85.8max) fps +1%
KFA2 GeForce RTX 2060 Super
GeForce RTX 2060 Super (Desktop), R9 3900X, Corsair MP600
58 (32min - 87max) fps
AMD Radeon RX Vega 64
RX Vega 64, R7 2700X
56.4 (30min - 87max) fps -3%
MSI RTX 2060 Gaming Z 6G
GeForce RTX 2060 (Desktop), R7 2700X
52.7 (29min - 82max) fps -9%
3840x2160 Ultra Quality AF:16x
AMD Radeon RX Vega 64
RX Vega 64, R7 2700X
45.7 (26min - 67max) fps +52%
MSI RTX 2080 Gaming X Trio
GeForce RTX 2080 (Desktop), R7 2700X
38.6 (25min - 58max) fps +29%
AMD Radeon VII
Radeon VII, R7 2700X
37.4 (25min - 50max) fps +25%
Nvidia GeForce RTX 2070 Super
GeForce RTX 2070 Super (Desktop), R7 2700X
35 (23min - 51max) fps +17%
MSI RTX 2070 Gaming Z 8G
GeForce RTX 2070 (Desktop), R7 2700X
31.9 (21min - 45max) fps +6%
KFA2 GeForce RTX 2060 Super
GeForce RTX 2060 Super (Desktop), R9 3900X, Corsair MP600
30 (19min - 41max) fps
Nvidia GeForce RTX 2060 Super
GeForce RTX 2060 Super (Desktop), R7 2700X
29.7 (20min - 42max) fps -1%
AMD Radeon RX 5700 XT
Radeon RX 5700 XT (Desktop), R7 2700X
29.6 (20.7min - 36.64max) fps -1%
AMD Radeon RX 5700
Radeon RX 5700 (Desktop), R7 2700X
28.6 (19.67min - 36.24max) fps -5%
MSI RTX 2060 Gaming Z 6G
GeForce RTX 2060 (Desktop), R7 2700X
26.3 (17min - 38max) fps -12%
2560x1440 Ultra Quality AF:16x
MSI RTX 2080 Gaming X Trio
GeForce RTX 2080 (Desktop), R7 2700X
59.6 (34min - 93max) fps +30%
AMD Radeon VII
Radeon VII, R7 2700X
55.8 (33min - 81max) fps +21%
AMD Radeon RX 5700 XT
Radeon RX 5700 XT (Desktop), R7 2700X
54.5 (31.85min - 78.06max) fps +18%
Nvidia GeForce RTX 2070 Super
GeForce RTX 2070 Super (Desktop), R7 2700X
54.3 (32min - 83max) fps +18%
MSI RTX 2070 Gaming Z 8G
GeForce RTX 2070 (Desktop), R7 2700X
50.3 (30min - 76max) fps +9%
AMD Radeon RX 5700
Radeon RX 5700 (Desktop), R7 2700X
48.4 (28.7min - 68.51max) fps +5%
Nvidia GeForce RTX 2060 Super
GeForce RTX 2060 Super (Desktop), R7 2700X
46.5 (28min - 69max) fps +1%
KFA2 GeForce RTX 2060 Super
GeForce RTX 2060 Super (Desktop), R9 3900X, Corsair MP600
46 (28min - 67max) fps
AMD Radeon RX Vega 64
RX Vega 64, R7 2700X
45.7 (26min - 46max) fps -1%
MSI RTX 2060 Gaming Z 6G
GeForce RTX 2060 (Desktop), R7 2700X
41.5 (25min - 61max) fps -10%
Anthem
1920x1080 Ultra Preset
KFA2 GeForce RTX 2060 Super
GeForce RTX 2060 Super (Desktop), R9 3900X, Corsair MP600
109 (91min - 129max) fps
MSI RTX 2080 Gaming X Trio
GeForce RTX 2080 (Desktop), R7 2700X
97 (77min - 137max) fps -11%
AMD Radeon RX Vega 64
RX Vega 64, R7 2700X
93 (76min - 118max) fps -15%
Nvidia GeForce RTX 2070 Super
GeForce RTX 2070 Super (Desktop), R7 2700X
93 (76min - 135max) fps -15%
MSI RTX 2070 Gaming Z 8G
GeForce RTX 2070 (Desktop), R7 2700X
91 (75min - 115max) fps -17%
AMD Radeon VII
Radeon VII, R7 2700X
90.5 (70min - 125max) fps -17%
Nvidia GeForce RTX 2060 Super
GeForce RTX 2060 Super (Desktop), R7 2700X
89 (68min - 126max) fps -18%
MSI RTX 2060 Gaming Z 6G
GeForce RTX 2060 (Desktop), R7 2700X
88 (56min - 109max) fps -19%
AMD Radeon RX 5700 XT
Radeon RX 5700 XT (Desktop), R7 2700X
88 (69min - 121max) fps -19%
AMD Radeon RX 5700
Radeon RX 5700 (Desktop), R7 2700X
86 (65min - 122max) fps -21%
2560x1440 Ultra Preset
MSI RTX 2080 Gaming X Trio
GeForce RTX 2080 (Desktop), R7 2700X
89 (49min - 116max) fps +13%
AMD Radeon RX 5700 XT
Radeon RX 5700 XT (Desktop), R7 2700X
84 (69min - 100max) fps +6%
AMD Radeon VII
Radeon VII, R7 2700X
82.8 (69min - 98max) fps +5%
Nvidia GeForce RTX 2070 Super
GeForce RTX 2070 Super (Desktop), R7 2700X
81 (60min - 107max) fps +3%
KFA2 GeForce RTX 2060 Super
GeForce RTX 2060 Super (Desktop), R9 3900X, Corsair MP600
79 (68min - 94max) fps
MSI RTX 2070 Gaming Z 8G
GeForce RTX 2070 (Desktop), R7 2700X
77.1 (64min - 95max) fps -2%
AMD Radeon RX 5700
Radeon RX 5700 (Desktop), R7 2700X
76 (65min - 87max) fps -4%
AMD Radeon RX Vega 64
RX Vega 64, R7 2700X
73 (62min - 85max) fps -8%
Nvidia GeForce RTX 2060 Super
GeForce RTX 2060 Super (Desktop), R7 2700X
72 (36min - 91max) fps -9%
MSI RTX 2060 Gaming Z 6G
GeForce RTX 2060 (Desktop), R7 2700X
66 (57min - 79max) fps -16%
Dirt Rally 2.0
1920x1080 Ultra Preset AA:T AF:16x
KFA2 GeForce RTX 2060 Super
GeForce RTX 2060 Super (Desktop), R9 3900X, Corsair MP600
124 (109min - 135max) fps
AMD Radeon RX 5700 XT
Radeon RX 5700 XT (Desktop), R7 2700X
120 (109min - 136max) fps -3%
Nvidia GeForce RTX 2070 Super
GeForce RTX 2070 Super (Desktop), R7 2700X
115 (107min - 127max) fps -7%
MSI RTX 2080 Gaming X Trio
GeForce RTX 2080 (Desktop), R7 2700X
109 (101min - 120max) fps -12%
AMD Radeon VII
Radeon VII, R7 2700X
106.5 (99min - 121max) fps -14%
AMD Radeon RX 5700
Radeon RX 5700 (Desktop), R7 2700X
103 (83min - 119max) fps -17%
MSI RTX 2070 Gaming Z 8G
GeForce RTX 2070 (Desktop), R7 2700X
93.2 (86min - 104max) fps -25%
Nvidia GeForce RTX 2060 Super
GeForce RTX 2060 Super (Desktop), R7 2700X
93 (77min - 111max) fps -25%
AMD Radeon RX Vega 64
RX Vega 64, R7 2700X
89.7 (82min - 100max) fps -28%
MSI RTX 2060 Gaming Z 6G
GeForce RTX 2060 (Desktop), R7 2700X
84.4 (77min - 93max) fps -32%
3840x2160 Ultra Preset AA:T AF:16x
MSI RTX 2080 Gaming X Trio
GeForce RTX 2080 (Desktop), R7 2700X
56.7 (53min - 63max) fps +1%
KFA2 GeForce RTX 2060 Super
GeForce RTX 2060 Super (Desktop), R9 3900X, Corsair MP600
56 (48min - 63max) fps
Nvidia GeForce RTX 2070 Super
GeForce RTX 2070 Super (Desktop), R7 2700X
53.8 (50min - 59max) fps -4%
AMD Radeon VII
Radeon VII, R7 2700X
52.5 (48min - 57max) fps -6%
AMD Radeon RX 5700 XT
Radeon RX 5700 XT (Desktop), R7 2700X
49.9 (46min - 55max) fps -11%
MSI RTX 2070 Gaming Z 8G
GeForce RTX 2070 (Desktop), R7 2700X
45.9 (43min - 50max) fps -18%
AMD Radeon RX 5700
Radeon RX 5700 (Desktop), R7 2700X
43.4 (40min - 48max) fps -22%
Nvidia GeForce RTX 2060 Super
GeForce RTX 2060 Super (Desktop), R7 2700X
42.8 (39min - 51max) fps -24%
AMD Radeon RX Vega 64
RX Vega 64, R7 2700X
41.5 (38min - 46max) fps -26%
MSI RTX 2060 Gaming Z 6G
GeForce RTX 2060 (Desktop), R7 2700X
39.9 (37min - 44max) fps -29%
2560x1440 Ultra Preset AA:T AF:16x
KFA2 GeForce RTX 2060 Super
GeForce RTX 2060 Super (Desktop), R9 3900X, Corsair MP600
95 (86min - 104max) fps
Nvidia GeForce RTX 2070 Super
GeForce RTX 2070 Super (Desktop), R7 2700X
88 (83min - 97max) fps -7%
AMD Radeon RX 5700 XT
Radeon RX 5700 XT (Desktop), R7 2700X
88 (82min - 98max) fps -7%
MSI RTX 2080 Gaming X Trio
GeForce RTX 2080 (Desktop), R7 2700X
87 (82min - 95max) fps -8%
AMD Radeon VII
Radeon VII, R7 2700X
83.3 (78min - 91max) fps -12%
AMD Radeon RX 5700
Radeon RX 5700 (Desktop), R7 2700X
77 (69min - 88max) fps -19%
MSI RTX 2070 Gaming Z 8G
GeForce RTX 2070 (Desktop), R7 2700X
73.8 (70min - 81max) fps -22%
Nvidia GeForce RTX 2060 Super
GeForce RTX 2060 Super (Desktop), R7 2700X
71 (62min - 83max) fps -25%
AMD Radeon RX Vega 64
RX Vega 64, R7 2700X
69.3 (65min - 76max) fps -27%
MSI RTX 2060 Gaming Z 6G
GeForce RTX 2060 (Desktop), R7 2700X
64.9 (60min - 72max) fps -32%
The Division 2
1920x1080 Ultra Preset
MSI RTX 2080 Gaming X Trio
GeForce RTX 2080 (Desktop), R7 2700X
106 fps +25%
MSI RTX 2070 Gaming Z 8G
GeForce RTX 2070 (Desktop), R7 2700X
95 fps +12%
Nvidia GeForce RTX 2070 Super
GeForce RTX 2070 Super (Desktop), R7 2700X
90 fps +6%
AMD Radeon RX 5700 XT
Radeon RX 5700 XT (Desktop), R7 2700X
88 (30.2min, 50P1) fps +4%
MSI RTX 2060 Gaming Z 6G
GeForce RTX 2060 (Desktop), R7 2700X
85 fps 0%
Nvidia GeForce RTX 2060 Super
GeForce RTX 2060 Super (Desktop), R7 2700X
85 fps 0%
KFA2 GeForce RTX 2060 Super
GeForce RTX 2060 Super (Desktop), R9 3900X, Corsair MP600
85 fps
AMD Radeon RX Vega 64
RX Vega 64, R7 2700X
78 fps -8%
AMD Radeon RX 5700
Radeon RX 5700 (Desktop), R7 2700X
78 (14.6min, 42.2P1) fps -8%
3840x2160 Ultra Preset
MSI RTX 2080 Gaming X Trio
GeForce RTX 2080 (Desktop), R7 2700X
50 fps +56%
MSI RTX 2070 Gaming Z 8G
GeForce RTX 2070 (Desktop), R7 2700X
40 fps +25%
Nvidia GeForce RTX 2070 Super
GeForce RTX 2070 Super (Desktop), R7 2700X
39 fps +22%
AMD Radeon RX 5700 XT
Radeon RX 5700 XT (Desktop), R7 2700X
34.1 (16.9min, 21.4P1) fps +7%
MSI RTX 2060 Gaming Z 6G
GeForce RTX 2060 (Desktop), R7 2700X
33 fps +3%
AMD Radeon RX Vega 64
RX Vega 64, R7 2700X
32 fps 0%
Nvidia GeForce RTX 2060 Super
GeForce RTX 2060 Super (Desktop), R7 2700X
32 fps 0%
KFA2 GeForce RTX 2060 Super
GeForce RTX 2060 Super (Desktop), R9 3900X, Corsair MP600
32 fps
AMD Radeon RX 5700
Radeon RX 5700 (Desktop), R7 2700X
30 (2.5min, 24.3P1) fps -6%
2560x1440 Ultra Preset
MSI RTX 2080 Gaming X Trio
GeForce RTX 2080 (Desktop), R7 2700X
85 fps +44%
MSI RTX 2070 Gaming Z 8G
GeForce RTX 2070 (Desktop), R7 2700X
69 fps +17%
Nvidia GeForce RTX 2070 Super
GeForce RTX 2070 Super (Desktop), R7 2700X
69 fps +17%
AMD Radeon RX 5700 XT
Radeon RX 5700 XT (Desktop), R7 2700X
64 (33.2min, 45.2P1) fps +8%
MSI RTX 2060 Gaming Z 6G
GeForce RTX 2060 (Desktop), R7 2700X
60 fps +2%
Nvidia GeForce RTX 2060 Super
GeForce RTX 2060 Super (Desktop), R7 2700X
59 fps 0%
KFA2 GeForce RTX 2060 Super
GeForce RTX 2060 Super (Desktop), R9 3900X, Corsair MP600
59 fps
AMD Radeon RX Vega 64
RX Vega 64, R7 2700X
58 fps -2%
AMD Radeon RX 5700
Radeon RX 5700 (Desktop), R7 2700X
56.9 (22.8min, 39.8P1) fps -4%
Anno 1800
3840x2160 Ultra Graphics Quality (DX11)
MSI RTX 2080 Gaming X Trio
GeForce RTX 2080 (Desktop), R7 2700X
32.3 (30min - 35max) fps +15%
Nvidia GeForce RTX 2070 Super
GeForce RTX 2070 Super (Desktop), R7 2700X
30.4 (24min - 34max) fps +8%
KFA2 GeForce RTX 2060 Super
GeForce RTX 2060 Super (Desktop), R9 3900X, Corsair MP600
28.2 (24min - 32max) fps
MSI RTX 2070 Gaming Z 8G
GeForce RTX 2070 (Desktop), R7 2700X
25.5 (24min - 29max) fps -10%
AMD Radeon RX 5700 XT
Radeon RX 5700 XT (Desktop), R7 2700X
25.5 (24min - 28max) fps -10%
Nvidia GeForce RTX 2060 Super
GeForce RTX 2060 Super (Desktop), R7 2700X
25 (24min - 27max) fps -11%
AMD Radeon RX 5700
Radeon RX 5700 (Desktop), R7 2700X
20.4 (19min - 23max) fps -28%
MSI RTX 2060 Gaming Z 6G
GeForce RTX 2060 (Desktop), R7 2700X
19.8 (16min - 23max) fps -30%
AMD Radeon RX Vega 64
RX Vega 64, R7 2700X
14.8 (14min - 16max) fps -48%
1920x1080 Ultra Graphics Quality (DX11)
MSI RTX 2080 Gaming X Trio
GeForce RTX 2080 (Desktop), R7 2700X
43.3 (38min - 59max) fps +19%
Nvidia GeForce RTX 2070 Super
GeForce RTX 2070 Super (Desktop), R7 2700X
42.1 (36min - 45max) fps +15%
AMD Radeon RX 5700 XT
Radeon RX 5700 XT (Desktop), R7 2700X
40.9 (35min - 53max) fps +12%
MSI RTX 2070 Gaming Z 8G
GeForce RTX 2070 (Desktop), R7 2700X
40.6 (35min - 49max) fps +11%
MSI RTX 2060 Gaming Z 6G
GeForce RTX 2060 (Desktop), R7 2700X
40.3 (36min - 46max) fps +10%
Nvidia GeForce RTX 2060 Super
GeForce RTX 2060 Super (Desktop), R7 2700X
40.3 (30min - 55max) fps +10%
AMD Radeon RX 5700
Radeon RX 5700 (Desktop), R7 2700X
38.9 (33min - 48max) fps +7%
KFA2 GeForce RTX 2060 Super
GeForce RTX 2060 Super (Desktop), R9 3900X, Corsair MP600
36.5 (30min - 42max) fps
AMD Radeon RX Vega 64
RX Vega 64, R7 2700X
33.1 (31min - 35max) fps -9%
2560x1440 Ultra Graphics Quality (DX11)
MSI RTX 2080 Gaming X Trio
GeForce RTX 2080 (Desktop), R7 2700X
42.8 (37min - 53max) fps +34%
Nvidia GeForce RTX 2070 Super
GeForce RTX 2070 Super (Desktop), R7 2700X
39.3 (30min - 39max) fps +23%
AMD Radeon RX 5700 XT
Radeon RX 5700 XT (Desktop), R7 2700X
38.6 (34min - 45max) fps +21%
MSI RTX 2070 Gaming Z 8G
GeForce RTX 2070 (Desktop), R7 2700X
37.8 (31min - 45max) fps +18%
Nvidia GeForce RTX 2060 Super
GeForce RTX 2060 Super (Desktop), R7 2700X
37.5 (31min - 47max) fps +17%
AMD Radeon RX 5700
Radeon RX 5700 (Desktop), R7 2700X
37 (33min - 41max) fps +16%
MSI RTX 2060 Gaming Z 6G
GeForce RTX 2060 (Desktop), R7 2700X
34 (27min - 38max) fps +6%
KFA2 GeForce RTX 2060 Super
GeForce RTX 2060 Super (Desktop), R9 3900X, Corsair MP600
32 (27min - 37max) fps
AMD Radeon RX Vega 64
RX Vega 64, R7 2700X
24.1 (22min - 26max) fps -25%
Rage 2
3840x2160 Ultra Preset (Resolution Scale Off)
MSI RTX 2080 Gaming X Trio
GeForce RTX 2080 (Desktop), R7 2700X
44.7 (37.5P1) fps +25%
Nvidia GeForce RTX 2070 Super
GeForce RTX 2070 Super (Desktop), R7 2700X
37.5 (32.3P1) fps +5%
KFA2 GeForce RTX 2060 Super
GeForce RTX 2060 Super (Desktop), R9 3900X, Corsair MP600
35.8 (29.4P1) fps
MSI RTX 2070 Gaming Z 8G
GeForce RTX 2070 (Desktop), R7 2700X
35.7 (30.7P1) fps 0%
AMD Radeon RX 5700 XT
Radeon RX 5700 XT (Desktop), R7 2700X
34.7 (32.4P1) fps -3%
Nvidia GeForce RTX 2060 Super
GeForce RTX 2060 Super (Desktop), R7 2700X
33.8 (23.9P1) fps -6%
AMD Radeon RX Vega 64
RX Vega 64, R7 2700X
33.5 (24.9P1) fps -6%
AMD Radeon RX 5700
Radeon RX 5700 (Desktop), R7 2700X
32.4 (24.9P1) fps -9%
MSI RTX 2060 Gaming Z 6G
GeForce RTX 2060 (Desktop), R7 2700X
29.8 (23.8P1) fps -17%
1920x1080 Ultra Preset (Resolution Scale Off)
MSI RTX 2080 Gaming X Trio
GeForce RTX 2080 (Desktop), R7 2700X
131 (64.4P1) fps +17%
Nvidia GeForce RTX 2070 Super
GeForce RTX 2070 Super (Desktop), R7 2700X
118 (71P1) fps +5%
KFA2 GeForce RTX 2060 Super
GeForce RTX 2060 Super (Desktop), R9 3900X, Corsair MP600
112 (92.6P1) fps
MSI RTX 2070 Gaming Z 8G
GeForce RTX 2070 (Desktop), R7 2700X
109 (59.4P1) fps -3%
AMD Radeon RX Vega 64
RX Vega 64, R7 2700X
106 (92.4P1) fps -5%
Nvidia GeForce RTX 2060 Super
GeForce RTX 2060 Super (Desktop), R7 2700X
104 (65.1P1) fps -7%
AMD Radeon RX 5700 XT
Radeon RX 5700 XT (Desktop), R7 2700X
103 (94.3P1) fps -8%
MSI RTX 2060 Gaming Z 6G
GeForce RTX 2060 (Desktop), R7 2700X
94 (47.1P1) fps -16%
2560x1440 Ultra Preset (Resolution Scale Off)
MSI RTX 2080 Gaming X Trio
GeForce RTX 2080 (Desktop), R7 2700X
89 (47.6P1) fps +22%
Nvidia GeForce RTX 2070 Super
GeForce RTX 2070 Super (Desktop), R7 2700X
77 (47.8P1) fps +5%
KFA2 GeForce RTX 2060 Super
GeForce RTX 2060 Super (Desktop), R9 3900X, Corsair MP600
73 (65.8P1) fps
MSI RTX 2070 Gaming Z 8G
GeForce RTX 2070 (Desktop), R7 2700X
71 (45.4P1) fps -3%
AMD Radeon RX Vega 64
RX Vega 64, R7 2700X
69 (61.6P1) fps -5%
Nvidia GeForce RTX 2060 Super
GeForce RTX 2060 Super (Desktop), R7 2700X
69 (42.7P1) fps -5%
AMD Radeon RX 5700 XT
Radeon RX 5700 XT (Desktop), R7 2700X
68 (64.1P1) fps -7%
AMD Radeon RX 5700
Radeon RX 5700 (Desktop), R7 2700X
65 (59.2P1) fps -11%
MSI RTX 2060 Gaming Z 6G
GeForce RTX 2060 (Desktop), R7 2700X
64 (51.8P1) fps -12%
F1 2019
3840x2160 Ultra High Preset AA:T AF:16x
Nvidia GeForce RTX 2070 Super
GeForce RTX 2070 Super (Desktop), R7 2700X
69 (61min - 77max) fps +19%
AMD Radeon RX 5700 XT
Radeon RX 5700 XT (Desktop), R7 2700X
67 (60min - 74max) fps +16%
AMD Radeon RX 5700
Radeon RX 5700 (Desktop), R7 2700X
59 (53min - 64max) fps +2%
Nvidia GeForce RTX 2060 Super
GeForce RTX 2060 Super (Desktop), R7 2700X
58 (51min - 66max) fps 0%
KFA2 GeForce RTX 2060 Super
GeForce RTX 2060 Super (Desktop), R9 3900X, Corsair MP600
58 (52min - 64max) fps
AMD Radeon RX Vega 64
RX Vega 64, R7 2700X
54 (49min - 59max) fps -7%
1920x1080 Ultra High Preset AA:T AF:16x
AMD Radeon RX 5700 XT
Radeon RX 5700 XT (Desktop), R7 2700X
140 (120min - 156max) fps +14%
Nvidia GeForce RTX 2070 Super
GeForce RTX 2070 Super (Desktop), R7 2700X
137 (120min - 153max) fps +11%
AMD Radeon RX Vega 64
RX Vega 64, R7 2700X
124 (113min - 135max) fps +1%
AMD Radeon RX 5700
Radeon RX 5700 (Desktop), R7 2700X
124 (107min - 140max) fps +1%
KFA2 GeForce RTX 2060 Super
GeForce RTX 2060 Super (Desktop), R9 3900X, Corsair MP600
123 (109min - 136max) fps
Nvidia GeForce RTX 2060 Super
GeForce RTX 2060 Super (Desktop), R7 2700X
121 (108min - 136max) fps -2%
2560x1440 Ultra High Preset AA:T AF:16x
Nvidia GeForce RTX 2070 Super
GeForce RTX 2070 Super (Desktop), R7 2700X
111 (100min - 125max) fps +14%
AMD Radeon RX 5700 XT
Radeon RX 5700 XT (Desktop), R7 2700X
109 (95min - 120max) fps +12%
AMD Radeon RX 5700
Radeon RX 5700 (Desktop), R7 2700X
99 (86min - 110max) fps +2%
KFA2 GeForce RTX 2060 Super
GeForce RTX 2060 Super (Desktop), R9 3900X, Corsair MP600
97 (86min - 106max) fps
Nvidia GeForce RTX 2060 Super
GeForce RTX 2060 Super (Desktop), R7 2700X
95 (86min - 107max) fps -2%
AMD Radeon RX Vega 64
RX Vega 64, R7 2700X
93 (85min - 102max) fps -4%
bajomedioaltoultraQHD4K
BioShock Infinite (2013) 391.6 340.4 318.3 184
Battlefield 4 (2013) 200 199 199 180 94
GTA V (2015) 178 172 160 90 89
The Witcher 3 (2015) 373 258 160 83 58.1
Dota 2 Reborn (2015) 166.2 151.9 146.2 136.6 116.3
Rainbow Six Siege (2015) 448 351 278 245 113
Rise of the Tomb Raider (2016) 316 216 156 129 53.5
Far Cry Primal (2016) 116 107 98 91 56
The Division (2016) 294.2 225.2 116.6 95.7 54
Doom (2016) 190 183 174 169 78
Overwatch (2016) 300 300 298 212 117
Deus Ex Mankind Divided (2016) 128.5 119.9 101.8 65.4 40.7
Dishonored 2 (2016) 119 119 119 113 60
Watch Dogs 2 (2016) 154 136 103 73 43
For Honor (2017) 341.5 183.2 175.2 135.2 58.6
Ghost Recon Wildlands (2017) 166 115 106 62 44
Rocket League (2017) 238 237 235 138
Dirt 4 (2017) 281 218 188 129 75
Playerunknown's Battlegrounds (PUBG) (2017) 165 130 130 118 50.4
Destiny 2 (2017) 179 179 171 151 105 55.5
Assassin´s Creed Origins (2017) 143 112 103 87 69 44
Call of Duty WWII (2017) 226 221 143 125 104 66
Fortnite (2018) 424 316 171 137 95 46.6
Final Fantasy XV Benchmark (2018) 178 112 80 34.9
Kingdom Come: Deliverance (2018) 136 124 104 71 56.6 29.9
X-Plane 11.11 (2018) 127 114 92 79
Far Cry 5 (2018) 142 119 115 108 85 45
The Crew 2 (2018) 60 60 60 60 60 37
Monster Hunter World (2018) 123 114 111 87 79 41.8
F1 2018 (2018) 265 213 173 124 96 61
Shadow of the Tomb Raider (2018) 147 121 114 104 70 37
FIFA 19 (2018) 364 361 318 320 306 192
Forza Horizon 4 (2018) 193 167 159 129 105 71
Assassin´s Creed Odyssey (2018) 132 105 88 61 52 36
Call of Duty Black Ops 4 (2018) 284 163 154 143 95 46.2
Hitman 2 (2018) 98 93 86 84 72 38.9
Battlefield V (2018) 183 160 145 134 104 61
Farming Simulator 19 (2018) 248 181 156 143 118 67
Darksiders III (2018) 248 151 132 120 83 42.5
Just Cause 4 (2018) 193 144 110 103 72 41
Apex Legends (2019) 144 144 144 144 116 65
Far Cry New Dawn (2019) 129 111 107 96 83 48
Metro Exodus (2019) 139 93 70 58 46 30
Anthem (2019) 120 118 111 109 79 43.7
Dirt Rally 2.0 (2019) 268 211 192 124 95 56
The Division 2 (2019) 201 143 116 85 59 32
Anno 1800 (2019) 103 102 74 36.5 32 28.2
Rage 2 (2019) 248 135 114 112 73 35.8
F1 2019 (2019) 221 196 170 123 97 58

Rendimiento de cálculo

El rendimiento de cálculo de la GeForce RTX 2060S de KFA2 es similar al de la tarjeta Nvidia de referencia. Sin embargo, la tarjeta KFA2 se beneficia de una CPU más rápida en las pruebas SPECviewperf, ya que nuestra tarjeta a menudo supera a su homóloga de Nvidia en estas pruebas particulares. Sin embargo, nuestra tarjeta de prueba es inferior a la MSI RTX 2070 Gaming Z 8G. La ventaja de rendimiento sobre la GeForce RTX 2060 de MSI es de alrededor del 20 por ciento. En este caso, el rendimiento de los modelos AMD muestra fluctuaciones significativas. Aunque ambas tarjetas lograron superar a la GeForce RTX 2080 en algunas pruebas, el rendimiento de las dos tarjetas AMD disminuyó significativamente en otras pruebas individuales e incluso se quedó muy por detrás de las tarjetas de la familia RTX de Nvidia.

LuxMark v2.0 64Bit
Room GPUs-only
Nvidia Titan RTX
NVIDIA Titan RTX, R7 2700X, ADATA Premier Pro SP900NS38 512 GB
4643 Samples/s +42%
AMD Radeon VII
Radeon VII, R7 2700X
3477 Samples/s +6%
MSI RTX 2080 Gaming X Trio
GeForce RTX 2080 (Desktop), R7 2700X
3453 Samples/s +5%
Nvidia GeForce RTX 2070 Super
GeForce RTX 2070 Super (Desktop), R7 2700X
3404 Samples/s +4%
MSI RTX 2070 Gaming Z 8G
GeForce RTX 2070 (Desktop), R7 2700X
3300 Samples/s +1%
KFA2 GeForce RTX 2060 Super
GeForce RTX 2060 Super (Desktop), R9 3900X, Corsair MP600
3278 Samples/s
Nvidia GeForce RTX 2060 Super
GeForce RTX 2060 Super (Desktop), R7 2700X
3274 Samples/s 0%
MSI RTX 2060 Gaming Z 6G
GeForce RTX 2060 (Desktop), R7 2700X
2586 Samples/s -21%
AMD Radeon RX 5700 XT
Radeon RX 5700 XT (Desktop), R7 2700X
2104 Samples/s -36%
AMD Radeon RX 5700
Radeon RX 5700 (Desktop), R7 2700X
1856 Samples/s -43%
Sala GPUs-only
Nvidia Titan RTX
NVIDIA Titan RTX, R7 2700X, ADATA Premier Pro SP900NS38 512 GB
10799 Samples/s +54%
MSI RTX 2080 Gaming X Trio
GeForce RTX 2080 (Desktop), R7 2700X
7928 Samples/s +13%
Nvidia GeForce RTX 2070 Super
GeForce RTX 2070 Super (Desktop), R7 2700X
7594 Samples/s +8%
MSI RTX 2070 Gaming Z 8G
GeForce RTX 2070 (Desktop), R7 2700X
7179 Samples/s +2%
KFA2 GeForce RTX 2060 Super
GeForce RTX 2060 Super (Desktop), R9 3900X, Corsair MP600
7010 Samples/s
Nvidia GeForce RTX 2060 Super
GeForce RTX 2060 Super (Desktop), R7 2700X
6980 Samples/s 0%
AMD Radeon VII
Radeon VII, R7 2700X
6869 Samples/s -2%
AMD Radeon RX 5700 XT
Radeon RX 5700 XT (Desktop), R7 2700X
6188 Samples/s -12%
MSI RTX 2060 Gaming Z 6G
GeForce RTX 2060 (Desktop), R7 2700X
5655 Samples/s -19%
AMD Radeon RX 5700
Radeon RX 5700 (Desktop), R7 2700X
5312 Samples/s -24%
ComputeMark v2.1
1024x600 Normal, QJuliaRayTrace
Nvidia Titan RTX
NVIDIA Titan RTX, R7 2700X, ADATA Premier Pro SP900NS38 512 GB
9418 Points +79%
MSI RTX 2080 Gaming X Trio
GeForce RTX 2080 (Desktop), R7 2700X
7283 Points +38%
Nvidia GeForce RTX 2070 Super
GeForce RTX 2070 Super (Desktop), R7 2700X
6155 Points +17%
AMD Radeon VII
Radeon VII, R7 2700X
5878 Points +12%
AMD Radeon RX 5700 XT
Radeon RX 5700 XT (Desktop), R7 2700X
5761 Points +9%
MSI RTX 2070 Gaming Z 8G
GeForce RTX 2070 (Desktop), R7 2700X
5747 Points +9%
Nvidia GeForce RTX 2060 Super
GeForce RTX 2060 Super (Desktop), R7 2700X
5271 Points 0%
KFA2 GeForce RTX 2060 Super
GeForce RTX 2060 Super (Desktop), R9 3900X, Corsair MP600
5270 Points
MSI RTX 2060 Gaming Z 6G
GeForce RTX 2060 (Desktop), R7 2700X
4903 Points -7%
AMD Radeon RX 5700
Radeon RX 5700 (Desktop), R7 2700X
4703 Points -11%
1024x600 Normal, Mandel Scalar
AMD Radeon VII
Radeon VII, R7 2700X
6312 Points +99%
Nvidia Titan RTX
NVIDIA Titan RTX, R7 2700X, ADATA Premier Pro SP900NS38 512 GB
5977 Points +89%
AMD Radeon RX 5700 XT
Radeon RX 5700 XT (Desktop), R7 2700X
4869 Points +54%
MSI RTX 2080 Gaming X Trio
GeForce RTX 2080 (Desktop), R7 2700X
4526 Points +43%
AMD Radeon RX 5700
Radeon RX 5700 (Desktop), R7 2700X
4043 Points +28%
Nvidia GeForce RTX 2070 Super
GeForce RTX 2070 Super (Desktop), R7 2700X
3782 Points +19%
MSI RTX 2070 Gaming Z 8G
GeForce RTX 2070 (Desktop), R7 2700X
3514 Points +11%
Nvidia GeForce RTX 2060 Super
GeForce RTX 2060 Super (Desktop), R7 2700X
3185 Points +1%
KFA2 GeForce RTX 2060 Super
GeForce RTX 2060 Super (Desktop), R9 3900X, Corsair MP600
3169 Points
MSI RTX 2060 Gaming Z 6G
GeForce RTX 2060 (Desktop), R7 2700X
2982 Points -6%
1024x600 Normal, Mandel Vector
Nvidia Titan RTX
NVIDIA Titan RTX, R7 2700X, ADATA Premier Pro SP900NS38 512 GB
4944 Points +68%
AMD Radeon VII
Radeon VII, R7 2700X
4714 Points +60%
AMD Radeon RX 5700 XT
Radeon RX 5700 XT (Desktop), R7 2700X
4246 Points +44%
MSI RTX 2080 Gaming X Trio
GeForce RTX 2080 (Desktop), R7 2700X
3892 Points +32%
AMD Radeon RX 5700
Radeon RX 5700 (Desktop), R7 2700X
3532 Points +20%
Nvidia GeForce RTX 2070 Super
GeForce RTX 2070 Super (Desktop), R7 2700X
3358 Points +14%
MSI RTX 2070 Gaming Z 8G
GeForce RTX 2070 (Desktop), R7 2700X
3169 Points +7%
KFA2 GeForce RTX 2060 Super
GeForce RTX 2060 Super (Desktop), R9 3900X, Corsair MP600
2948 Points
Nvidia GeForce RTX 2060 Super
GeForce RTX 2060 Super (Desktop), R7 2700X
2939 Points 0%
MSI RTX 2060 Gaming Z 6G
GeForce RTX 2060 (Desktop), R7 2700X
2800 Points -5%
1024x600 Normal, Fluid 2DTexArr
Nvidia Titan RTX
NVIDIA Titan RTX, R7 2700X, ADATA Premier Pro SP900NS38 512 GB
3691 Points +76%
MSI RTX 2080 Gaming X Trio
GeForce RTX 2080 (Desktop), R7 2700X
2482 Points +18%
Nvidia GeForce RTX 2070 Super
GeForce RTX 2070 Super (Desktop), R7 2700X
2331 Points +11%
AMD Radeon VII
Radeon VII, R7 2700X
2248 Points +7%
MSI RTX 2070 Gaming Z 8G
GeForce RTX 2070 (Desktop), R7 2700X
2221 Points +6%
KFA2 GeForce RTX 2060 Super
GeForce RTX 2060 Super (Desktop), R9 3900X, Corsair MP600
2101 Points
Nvidia GeForce RTX 2060 Super
GeForce RTX 2060 Super (Desktop), R7 2700X
2064 Points -2%
AMD Radeon RX 5700 XT
Radeon RX 5700 XT (Desktop), R7 2700X
1960 Points -7%
AMD Radeon RX 5700
Radeon RX 5700 (Desktop), R7 2700X
1810 Points -14%
MSI RTX 2060 Gaming Z 6G
GeForce RTX 2060 (Desktop), R7 2700X
1801 Points -14%
1024x600 Normal, Fluid 3DTex
Nvidia Titan RTX
NVIDIA Titan RTX, R7 2700X, ADATA Premier Pro SP900NS38 512 GB
3877 Points +69%
AMD Radeon VII
Radeon VII, R7 2700X
3646 Points +59%
MSI RTX 2080 Gaming X Trio
GeForce RTX 2080 (Desktop), R7 2700X
2588 Points +13%
Nvidia GeForce RTX 2070 Super
GeForce RTX 2070 Super (Desktop), R7 2700X
2456 Points +7%
MSI RTX 2070 Gaming Z 8G
GeForce RTX 2070 (Desktop), R7 2700X
2380 Points +4%
AMD Radeon RX 5700 XT
Radeon RX 5700 XT (Desktop), R7 2700X
2349 Points +3%
AMD Radeon RX 5700
Radeon RX 5700 (Desktop), R7 2700X
2294 Points 0%
KFA2 GeForce RTX 2060 Super
GeForce RTX 2060 Super (Desktop), R9 3900X, Corsair MP600
2290 Points
Nvidia GeForce RTX 2060 Super
GeForce RTX 2060 Super (Desktop), R7 2700X
2289 Points 0%
MSI RTX 2060 Gaming Z 6G
GeForce RTX 2060 (Desktop), R7 2700X
1889 Points -18%
1024x600 Normal, Score
Nvidia Titan RTX
NVIDIA Titan RTX, R7 2700X, ADATA Premier Pro SP900NS38 512 GB
27907 Points +77%
AMD Radeon VII
Radeon VII, R7 2700X
22798 Points +45%
MSI RTX 2080 Gaming X Trio
GeForce RTX 2080 (Desktop), R7 2700X
20771 Points +32%
AMD Radeon RX 5700 XT
Radeon RX 5700 XT (Desktop), R7 2700X
19184 Points +22%
Nvidia GeForce RTX 2070 Super
GeForce RTX 2070 Super (Desktop), R7 2700X
18083 Points +15%
MSI RTX 2070 Gaming Z 8G
GeForce RTX 2070 (Desktop), R7 2700X
17031 Points +8%
AMD Radeon RX 5700
Radeon RX 5700 (Desktop), R7 2700X
16383 Points +4%
KFA2 GeForce RTX 2060 Super
GeForce RTX 2060 Super (Desktop), R9 3900X, Corsair MP600
15776 Points
Nvidia GeForce RTX 2060 Super
GeForce RTX 2060 Super (Desktop), R7 2700X
15749 Points 0%
MSI RTX 2060 Gaming Z 6G
GeForce RTX 2060 (Desktop), R7 2700X
14375 Points -9%
SPECviewperf 13
Solidworks (sw-04)
Nvidia Titan RTX
NVIDIA Titan RTX, R7 2700X, ADATA Premier Pro SP900NS38 512 GB
132.9 fps +49%
AMD Radeon RX 5700 XT
Radeon RX 5700 XT (Desktop), R7 2700X
114.4 fps +28%
AMD Radeon RX 5700
Radeon RX 5700 (Desktop), R7 2700X
101.8 fps +14%
MSI RTX 2080 Gaming X Trio
GeForce RTX 2080 (Desktop), R7 2700X
100.3 fps +13%
AMD Radeon VII
Radeon VII, R7 2700X
95.1 fps +7%
Nvidia GeForce RTX 2070 Super
GeForce RTX 2070 Super (Desktop), R7 2700X
93.3 fps +5%
KFA2 GeForce RTX 2060 Super
GeForce RTX 2060 Super (Desktop), R9 3900X, Corsair MP600
89.1 fps
MSI RTX 2070 Gaming Z 8G
GeForce RTX 2070 (Desktop), R7 2700X
86.7 fps -3%
MSI RTX 2060 Gaming Z 6G
GeForce RTX 2060 (Desktop), R7 2700X
83.4 fps -6%
Nvidia GeForce RTX 2060 Super
GeForce RTX 2060 Super (Desktop), R7 2700X
75.7 fps -15%
Siemens NX (snx-03)
Nvidia Titan RTX
NVIDIA Titan RTX, R7 2700X, ADATA Premier Pro SP900NS38 512 GB
462.4 fps +2885%
AMD Radeon RX 5700 XT
Radeon RX 5700 XT (Desktop), R7 2700X
61.3 fps +296%
AMD Radeon RX 5700
Radeon RX 5700 (Desktop), R7 2700X
60.5 fps +291%
AMD Radeon VII
Radeon VII, R7 2700X
37.03 fps +139%
MSI RTX 2080 Gaming X Trio
GeForce RTX 2080 (Desktop), R7 2700X
21.7 fps +40%
Nvidia GeForce RTX 2070 Super
GeForce RTX 2070 Super (Desktop), R7 2700X
20.71 fps +34%
MSI RTX 2070 Gaming Z 8G
GeForce RTX 2070 (Desktop), R7 2700X
15.6 fps +1%
KFA2 GeForce RTX 2060 Super
GeForce RTX 2060 Super (Desktop), R9 3900X, Corsair MP600
15.49 fps
Nvidia GeForce RTX 2060 Super
GeForce RTX 2060 Super (Desktop), R7 2700X
15.46 fps 0%
MSI RTX 2060 Gaming Z 6G
GeForce RTX 2060 (Desktop), R7 2700X
14.99 fps -3%
Showcase (showcase-02)
Nvidia Titan RTX
NVIDIA Titan RTX, R7 2700X, ADATA Premier Pro SP900NS38 512 GB
192 fps +68%
AMD Radeon RX 5700 XT
Radeon RX 5700 XT (Desktop), R7 2700X
137.6 fps +20%
Nvidia GeForce RTX 2070 Super
GeForce RTX 2070 Super (Desktop), R7 2700X
127.3 fps +11%
AMD Radeon RX 5700
Radeon RX 5700 (Desktop), R7 2700X
127 fps +11%
Nvidia GeForce RTX 2060 Super
GeForce RTX 2060 Super (Desktop), R7 2700X
116.8 fps +2%
KFA2 GeForce RTX 2060 Super
GeForce RTX 2060 Super (Desktop), R9 3900X, Corsair MP600
114.6 fps
MSI RTX 2060 Gaming Z 6G
GeForce RTX 2060 (Desktop), R7 2700X
101.6 fps -11%
Medical (medical-02)
Nvidia Titan RTX
NVIDIA Titan RTX, R7 2700X, ADATA Premier Pro SP900NS38 512 GB
89.3 fps +64%
AMD Radeon RX 5700 XT
Radeon RX 5700 XT (Desktop), R7 2700X
82.8 fps +52%
AMD Radeon VII
Radeon VII, R7 2700X
77.9 fps +43%
MSI RTX 2080 Gaming X Trio
GeForce RTX 2080 (Desktop), R7 2700X
71 fps +30%
AMD Radeon RX 5700
Radeon RX 5700 (Desktop), R7 2700X
67.5 fps +24%
Nvidia GeForce RTX 2070 Super
GeForce RTX 2070 Super (Desktop), R7 2700X
63.8 fps +17%
MSI RTX 2070 Gaming Z 8G
GeForce RTX 2070 (Desktop), R7 2700X
57.7 fps +6%
KFA2 GeForce RTX 2060 Super
GeForce RTX 2060 Super (Desktop), R9 3900X, Corsair MP600
54.6 fps
Nvidia GeForce RTX 2060 Super
GeForce RTX 2060 Super (Desktop), R7 2700X
54.5 fps 0%
MSI RTX 2060 Gaming Z 6G
GeForce RTX 2060 (Desktop), R7 2700X
49.1 fps -10%
Maya (maya-05)
Nvidia Titan RTX
NVIDIA Titan RTX, R7 2700X, ADATA Premier Pro SP900NS38 512 GB
367.8 fps +37%
Nvidia GeForce RTX 2070 Super
GeForce RTX 2070 Super (Desktop), R7 2700X
290.4 fps +8%
MSI RTX 2070 Gaming Z 8G
GeForce RTX 2070 (Desktop), R7 2700X
275.3 fps +2%
KFA2 GeForce RTX 2060 Super
GeForce RTX 2060 Super (Desktop), R9 3900X, Corsair MP600
269.3 fps
Nvidia GeForce RTX 2060 Super
GeForce RTX 2060 Super (Desktop), R7 2700X
262.4 fps -3%
MSI RTX 2060 Gaming Z 6G
GeForce RTX 2060 (Desktop), R7 2700X
247 fps -8%
AMD Radeon RX 5700 XT
Radeon RX 5700 XT (Desktop), R7 2700X
220.3 fps -18%
AMD Radeon VII
Radeon VII, R7 2700X
212.6 fps -21%
AMD Radeon RX 5700
Radeon RX 5700 (Desktop), R7 2700X
185.2 fps -31%
Energy (energy-02)
Nvidia Titan RTX
NVIDIA Titan RTX, R7 2700X, ADATA Premier Pro SP900NS38 512 GB
51.9 fps +137%
AMD Radeon VII
Radeon VII, R7 2700X
35.05 fps +60%
AMD Radeon RX 5700 XT
Radeon RX 5700 XT (Desktop), R7 2700X
26.82 fps +23%
AMD Radeon RX 5700
Radeon RX 5700 (Desktop), R7 2700X
24.55 fps +12%
Nvidia GeForce RTX 2070 Super
GeForce RTX 2070 Super (Desktop), R7 2700X
23.76 fps +9%
MSI RTX 2070 Gaming Z 8G
GeForce RTX 2070 (Desktop), R7 2700X
22.33 fps +2%
KFA2 GeForce RTX 2060 Super
GeForce RTX 2060 Super (Desktop), R9 3900X, Corsair MP600
21.88 fps
Nvidia GeForce RTX 2060 Super
GeForce RTX 2060 Super (Desktop), R7 2700X
21.81 fps 0%
MSI RTX 2060 Gaming Z 6G
GeForce RTX 2060 (Desktop), R7 2700X
7.62 fps -65%
Creo (creo-02)
Nvidia Titan RTX
NVIDIA Titan RTX, R7 2700X, ADATA Premier Pro SP900NS38 512 GB
307.6 fps +71%
MSI RTX 2080 Gaming X Trio
GeForce RTX 2080 (Desktop), R7 2700X
220.3 fps +22%
MSI RTX 2070 Gaming Z 8G
GeForce RTX 2070 (Desktop), R7 2700X
184.2 fps +2%
KFA2 GeForce RTX 2060 Super
GeForce RTX 2060 Super (Desktop), R9 3900X, Corsair MP600
180.4 fps
Nvidia GeForce RTX 2060 Super
GeForce RTX 2060 Super (Desktop), R7 2700X
172.5 fps -4%
Nvidia GeForce RTX 2070 Super
GeForce RTX 2070 Super (Desktop), R7 2700X
171 fps -5%
MSI RTX 2060 Gaming Z 6G
GeForce RTX 2060 (Desktop), R7 2700X
169.8 fps -6%
AMD Radeon RX 5700 XT
Radeon RX 5700 XT (Desktop), R7 2700X
157 fps -13%
AMD Radeon RX 5700
Radeon RX 5700 (Desktop), R7 2700X
116.7 fps -35%
AMD Radeon VII
Radeon VII, R7 2700X
115.7 fps -36%
Catia (catia-05)
Nvidia Titan RTX
NVIDIA Titan RTX, R7 2700X, ADATA Premier Pro SP900NS38 512 GB
260.4 fps +126%
AMD Radeon RX 5700 XT
Radeon RX 5700 XT (Desktop), R7 2700X
242.8 fps +111%
AMD Radeon VII
Radeon VII, R7 2700X
239.2 fps +108%
AMD Radeon RX 5700
Radeon RX 5700 (Desktop), R7 2700X
209.2 fps +82%
Nvidia GeForce RTX 2070 Super
GeForce RTX 2070 Super (Desktop), R7 2700X
146.3 fps +27%
MSI RTX 2070 Gaming Z 8G
GeForce RTX 2070 (Desktop), R7 2700X
118.6 fps +3%
KFA2 GeForce RTX 2060 Super
GeForce RTX 2060 Super (Desktop), R9 3900X, Corsair MP600
115.2 fps
Nvidia GeForce RTX 2060 Super
GeForce RTX 2060 Super (Desktop), R7 2700X
114.6 fps -1%
MSI RTX 2060 Gaming Z 6G
GeForce RTX 2060 (Desktop), R7 2700X
108.2 fps -6%
3ds Max (3dsmax-06)
Nvidia Titan RTX
NVIDIA Titan RTX, R7 2700X, ADATA Premier Pro SP900NS38 512 GB
268.7 fps +39%
Nvidia GeForce RTX 2070 Super
GeForce RTX 2070 Super (Desktop), R7 2700X
212.4 fps +10%
MSI RTX 2070 Gaming Z 8G
GeForce RTX 2070 (Desktop), R7 2700X
207.3 fps +7%
Nvidia GeForce RTX 2060 Super
GeForce RTX 2060 Super (Desktop), R7 2700X
199.4 fps +3%
KFA2 GeForce RTX 2060 Super
GeForce RTX 2060 Super (Desktop), R9 3900X, Corsair MP600
193.2 fps
MSI RTX 2060 Gaming Z 6G
GeForce RTX 2060 (Desktop), R7 2700X
184.4 fps -5%
AMD Radeon RX 5700 XT
Radeon RX 5700 XT (Desktop), R7 2700X
175.6 fps -9%
AMD Radeon VII
Radeon VII, R7 2700X
168.5 fps -13%
AMD Radeon RX 5700
Radeon RX 5700 (Desktop), R7 2700X
157 fps -19%
SPECviewperf 12
1900x1060 Solidworks (sw-03)
Nvidia Titan RTX
NVIDIA Titan RTX, R7 2700X, ADATA Premier Pro SP900NS38 512 GB
139.6 fps +121%
AMD Radeon RX 5700 XT
Radeon RX 5700 XT (Desktop), R7 2700X
89.6 fps +42%
AMD Radeon RX 5700
Radeon RX 5700 (Desktop), R7 2700X
79.2 fps +25%
AMD Radeon VII
Radeon VII, R7 2700X
75.9 fps +20%
MSI RTX 2080 Gaming X Trio
GeForce RTX 2080 (Desktop), R7 2700X
70.1 fps +11%
Nvidia GeForce RTX 2070 Super
GeForce RTX 2070 Super (Desktop), R7 2700X
65.4 fps +3%
KFA2 GeForce RTX 2060 Super
GeForce RTX 2060 Super (Desktop), R9 3900X, Corsair MP600
63.3 fps
MSI RTX 2070 Gaming Z 8G
GeForce RTX 2070 (Desktop), R7 2700X
60.6 fps -4%
Nvidia GeForce RTX 2060 Super
GeForce RTX 2060 Super (Desktop), R7 2700X
58.9 fps -7%
MSI RTX 2060 Gaming Z 6G
GeForce RTX 2060 (Desktop), R7 2700X
57.6 fps -9%
1900x1060 Siemens NX (snx-02)
Nvidia Titan RTX
NVIDIA Titan RTX, R7 2700X, ADATA Premier Pro SP900NS38 512 GB
256.3 fps +2880%
AMD Radeon RX 5700 XT
Radeon RX 5700 XT (Desktop), R7 2700X
35.27 fps +310%
AMD Radeon RX 5700
Radeon RX 5700 (Desktop), R7 2700X
33.5 fps +290%
AMD Radeon VII
Radeon VII, R7 2700X
20.54 fps +139%
MSI RTX 2080 Gaming X Trio
GeForce RTX 2080 (Desktop), R7 2700X
12.08 fps +40%
Nvidia GeForce RTX 2070 Super
GeForce RTX 2070 Super (Desktop), R7 2700X
11.44 fps +33%
MSI RTX 2070 Gaming Z 8G
GeForce RTX 2070 (Desktop), R7 2700X
8.63 fps 0%
KFA2 GeForce RTX 2060 Super
GeForce RTX 2060 Super (Desktop), R9 3900X, Corsair MP600
8.6 fps
Nvidia GeForce RTX 2060 Super
GeForce RTX 2060 Super (Desktop), R7 2700X
8.57 fps 0%
MSI RTX 2060 Gaming Z 6G
GeForce RTX 2060 (Desktop), R7 2700X
8.35 fps -3%
1900x1060 Showcase (showcase-01)
Nvidia Titan RTX
NVIDIA Titan RTX, R7 2700X, ADATA Premier Pro SP900NS38 512 GB
191.6 fps +67%
AMD Radeon RX 5700 XT
Radeon RX 5700 XT (Desktop), R7 2700X
137.8 fps +20%
Nvidia GeForce RTX 2070 Super
GeForce RTX 2070 Super (Desktop), R7 2700X
128.2 fps +12%
AMD Radeon RX 5700
Radeon RX 5700 (Desktop), R7 2700X
126.9 fps +10%
Nvidia GeForce RTX 2060 Super
GeForce RTX 2060 Super (Desktop), R7 2700X
116.9 fps +2%
KFA2 GeForce RTX 2060 Super
GeForce RTX 2060 Super (Desktop), R9 3900X, Corsair MP600
114.9 fps
MSI RTX 2060 Gaming Z 6G
GeForce RTX 2060 (Desktop), R7 2700X
101 fps -12%
1900x1060 Medical (medical-01)
Nvidia Titan RTX
NVIDIA Titan RTX, R7 2700X, ADATA Premier Pro SP900NS38 512 GB
87 fps +129%
AMD Radeon VII
Radeon VII, R7 2700X
52.3 fps +38%
AMD Radeon RX 5700 XT
Radeon RX 5700 XT (Desktop), R7 2700X
46.9 fps +23%
MSI RTX 2080 Gaming X Trio
GeForce RTX 2080 (Desktop), R7 2700X
44.89 fps +18%
Nvidia GeForce RTX 2070 Super
GeForce RTX 2070 Super (Desktop), R7 2700X
42.65 fps +12%
AMD Radeon RX 5700
Radeon RX 5700 (Desktop), R7 2700X
40.97 fps +8%
MSI RTX 2070 Gaming Z 8G
GeForce RTX 2070 (Desktop), R7 2700X
39.61 fps +4%
Nvidia GeForce RTX 2060 Super
GeForce RTX 2060 Super (Desktop), R7 2700X
38 fps 0%
KFA2 GeForce RTX 2060 Super
GeForce RTX 2060 Super (Desktop), R9 3900X, Corsair MP600
38 fps
MSI RTX 2060 Gaming Z 6G
GeForce RTX 2060 (Desktop), R7 2700X
35.22 fps -7%
1900x1060 Maya (maya-04)
KFA2 GeForce RTX 2060 Super
GeForce RTX 2060 Super (Desktop), R9 3900X, Corsair MP600
160 fps
MSI RTX 2080 Gaming X Trio
GeForce RTX 2080 (Desktop), R7 2700X
148.7 fps -7%
Nvidia GeForce RTX 2060 Super
GeForce RTX 2060 Super (Desktop), R7 2700X
146.3 fps -9%
MSI RTX 2070 Gaming Z 8G
GeForce RTX 2070 (Desktop), R7 2700X
146.2 fps -9%
Nvidia Titan RTX
NVIDIA Titan RTX, R7 2700X, ADATA Premier Pro SP900NS38 512 GB
132.8 fps -17%
MSI RTX 2060 Gaming Z 6G
GeForce RTX 2060 (Desktop), R7 2700X
127.4 fps -20%
Nvidia GeForce RTX 2070 Super
GeForce RTX 2070 Super (Desktop), R7 2700X
125.1 fps -22%
AMD Radeon VII
Radeon VII, R7 2700X
88.1 fps -45%
AMD Radeon RX 5700 XT
Radeon RX 5700 XT (Desktop), R7 2700X
86.5 fps -46%
AMD Radeon RX 5700
Radeon RX 5700 (Desktop), R7 2700X
73.3 fps -54%
1900x1060 Energy (energy-01)
Nvidia Titan RTX
NVIDIA Titan RTX, R7 2700X, ADATA Premier Pro SP900NS38 512 GB
28.12 fps +162%
AMD Radeon VII
Radeon VII, R7 2700X
16.63 fps +55%
AMD Radeon RX 5700 XT
Radeon RX 5700 XT (Desktop), R7 2700X
12.72 fps +18%
MSI RTX 2080 Gaming X Trio
GeForce RTX 2080 (Desktop), R7 2700X
12.52 fps +17%
Nvidia GeForce RTX 2070 Super
GeForce RTX 2070 Super (Desktop), R7 2700X
11.96 fps +11%
AMD Radeon RX 5700
Radeon RX 5700 (Desktop), R7 2700X
11.53 fps +7%
MSI RTX 2070 Gaming Z 8G
GeForce RTX 2070 (Desktop), R7 2700X
11.27 fps +5%
Nvidia GeForce RTX 2060 Super
GeForce RTX 2060 Super (Desktop), R7 2700X
11.07 fps +3%
KFA2 GeForce RTX 2060 Super
GeForce RTX 2060 Super (Desktop), R9 3900X, Corsair MP600
10.74 fps
MSI RTX 2060 Gaming Z 6G
GeForce RTX 2060 (Desktop), R7 2700X
9.19 fps -14%
1900x1060 Creo (creo-01)
Nvidia Titan RTX
NVIDIA Titan RTX, R7 2700X, ADATA Premier Pro SP900NS38 512 GB
106.3 fps +133%
AMD Radeon RX 5700 XT
Radeon RX 5700 XT (Desktop), R7 2700X
66.9 fps +47%
AMD Radeon RX 5700
Radeon RX 5700 (Desktop), R7 2700X
60.2 fps +32%
AMD Radeon VII
Radeon VII, R7 2700X
55.4 fps +22%
MSI RTX 2080 Gaming X Trio
GeForce RTX 2080 (Desktop), R7 2700X
52.5 fps +15%
Nvidia GeForce RTX 2070 Super
GeForce RTX 2070 Super (Desktop), R7 2700X
47.4 fps +4%
MSI RTX 2070 Gaming Z 8G
GeForce RTX 2070 (Desktop), R7 2700X
45.67 fps 0%
KFA2 GeForce RTX 2060 Super
GeForce RTX 2060 Super (Desktop), R9 3900X, Corsair MP600
45.58 fps
MSI RTX 2060 Gaming Z 6G
GeForce RTX 2060 (Desktop), R7 2700X
44.45 fps -2%
Nvidia GeForce RTX 2060 Super
GeForce RTX 2060 Super (Desktop), R7 2700X
43.87 fps -4%
1900x1060 Catia (catia-04)
Nvidia Titan RTX
NVIDIA Titan RTX, R7 2700X, ADATA Premier Pro SP900NS38 512 GB
178.1 fps +124%
AMD Radeon VII
Radeon VII, R7 2700X
159.1 fps +100%
AMD Radeon RX 5700 XT
Radeon RX 5700 XT (Desktop), R7 2700X
158.8 fps +100%
AMD Radeon RX 5700
Radeon RX 5700 (Desktop), R7 2700X
135.7 fps +71%
MSI RTX 2080 Gaming X Trio
GeForce RTX 2080 (Desktop), R7 2700X
109.4 fps +38%
Nvidia GeForce RTX 2070 Super
GeForce RTX 2070 Super (Desktop), R7 2700X
96.3 fps +21%
MSI RTX 2070 Gaming Z 8G
GeForce RTX 2070 (Desktop), R7 2700X
81.9 fps +3%
KFA2 GeForce RTX 2060 Super
GeForce RTX 2060 Super (Desktop), R9 3900X, Corsair MP600
79.4 fps
Nvidia GeForce RTX 2060 Super
GeForce RTX 2060 Super (Desktop), R7 2700X
77.1 fps -3%
MSI RTX 2060 Gaming Z 6G
GeForce RTX 2060 (Desktop), R7 2700X
74.8 fps -6%
1900x1060 3ds Max (3dsmax-05)
Nvidia Titan RTX
NVIDIA Titan RTX, R7 2700X, ADATA Premier Pro SP900NS38 512 GB
268.2 fps +39%
MSI RTX 2080 Gaming X Trio
GeForce RTX 2080 (Desktop), R7 2700X
234.1 fps +21%
Nvidia GeForce RTX 2070 Super
GeForce RTX 2070 Super (Desktop), R7 2700X
211.8 fps +10%
MSI RTX 2070 Gaming Z 8G
GeForce RTX 2070 (Desktop), R7 2700X
207.2 fps +7%
Nvidia GeForce RTX 2060 Super
GeForce RTX 2060 Super (Desktop), R7 2700X
201.5 fps +4%
KFA2 GeForce RTX 2060 Super
GeForce RTX 2060 Super (Desktop), R9 3900X, Corsair MP600
193 fps
MSI RTX 2060 Gaming Z 6G
GeForce RTX 2060 (Desktop), R7 2700X
183.6 fps -5%
AMD Radeon RX 5700 XT
Radeon RX 5700 XT (Desktop), R7 2700X
173.8 fps -10%
AMD Radeon VII
Radeon VII, R7 2700X
166.9 fps -14%
AMD Radeon RX 5700
Radeon RX 5700 (Desktop), R7 2700X
155.7 fps -19%
SiSoft Sandra 2016
Image Processing
AMD Radeon VII
Radeon VII, R7 2700X
2800 MPix/s +150%
MSI RTX 2080 Gaming X Trio
GeForce RTX 2080 (Desktop), R7 2700X
1380 MPix/s +23%
Nvidia GeForce RTX 2070 Super
GeForce RTX 2070 Super (Desktop), R7 2700X
1250 MPix/s +12%
MSI RTX 2070 Gaming Z 8G
GeForce RTX 2070 (Desktop), R7 2700X
1150 MPix/s +3%
KFA2 GeForce RTX 2060 Super
GeForce RTX 2060 Super (Desktop), R9 3900X, Corsair MP600
1120 MPix/s
Nvidia GeForce RTX 2060 Super
GeForce RTX 2060 Super (Desktop), R7 2700X
1110 MPix/s -1%
AMD Radeon RX 5700 XT
Radeon RX 5700 XT (Desktop), R7 2700X
919 MPix/s -18%
MSI RTX 2060 Gaming Z 6G
GeForce RTX 2060 (Desktop), R7 2700X
912 MPix/s -19%
AMD Radeon RX 5700
Radeon RX 5700 (Desktop), R7 2700X
775 MPix/s -31%
GP Cryptography (Higher Security AES256+SHA2-512)
MSI RTX 2080 Gaming X Trio
GeForce RTX 2080 (Desktop), R7 2700X
101.8 GB/s +36%
AMD Radeon VII
Radeon VII, R7 2700X
99.2 GB/s +33%
Nvidia GeForce RTX 2070 Super
GeForce RTX 2070 Super (Desktop), R7 2700X
88.4 GB/s +18%
MSI RTX 2070 Gaming Z 8G
GeForce RTX 2070 (Desktop), R7 2700X
75.4 GB/s +1%
Nvidia GeForce RTX 2060 Super
GeForce RTX 2060 Super (Desktop), R7 2700X
74.6 GB/s 0%
KFA2 GeForce RTX 2060 Super
GeForce RTX 2060 Super (Desktop), R9 3900X, Corsair MP600
74.6 GB/s
MSI RTX 2060 Gaming Z 6G
GeForce RTX 2060 (Desktop), R7 2700X
63.8 GB/s -14%
GP Financial Analysis (FP High/Double Precision)
AMD Radeon VII
Radeon VII, R7 2700X
1130 KOPT/s +963%
MSI RTX 2080 Gaming X Trio
GeForce RTX 2080 (Desktop), R7 2700X
159.4 KOPT/s +50%
Nvidia GeForce RTX 2070 Super
GeForce RTX 2070 Super (Desktop), R7 2700X
124.7 KOPT/s +17%
MSI RTX 2070 Gaming Z 8G
GeForce RTX 2070 (Desktop), R7 2700X
121.3 KOPT/s +14%
KFA2 GeForce RTX 2060 Super
GeForce RTX 2060 Super (Desktop), R9 3900X, Corsair MP600
106.3 KOPT/s
Nvidia GeForce RTX 2060 Super
GeForce RTX 2060 Super (Desktop), R7 2700X
105.3 KOPT/s -1%
MSI RTX 2060 Gaming Z 6G
GeForce RTX 2060 (Desktop), R7 2700X
99.1 KOPT/s -7%
AMD Radeon RX 5700 XT
Radeon RX 5700 XT (Desktop), R7 2700X
24 KOPT/s -77%
AMD Radeon RX 5700
Radeon RX 5700 (Desktop), R7 2700X
20.81 KOPT/s -80%

Emisiones de la GeForce RTX 2060 Super KFA2

KFA2 GeForce RTX 2060 Super durante la prueba de esfuerzo (PT al 100%)

Nuestra tarjeta de prueba KFA2 se adhiere a las especificaciones de Nvidia. En cuanto a números específicos, la KFA2 GeForce RTX 2060S tiene que conformarse con un presupuesto de potencia de 175 vatios. Dicho esto, KFA2 ha limitado el margen para el overclocking manual estableciendo el valor máximo de PT (potencia objetivo) a sólo el 14 por ciento. Por su parte, el modelo de referencia de Nvidia acepta un valor de hasta el 22 por ciento. Durante el uso diario, esto no afecta al rendimiento de la tarjeta gráfica.

Ambas tarjetas comparten una solución de refrigeración similar, ya que KFA2 también utiliza dos ventiladores axiales de 90 mm. Dejan de girar en escenarios 2D, lo que permite un funcionamiento silencioso, al menos de la tarjeta gráfica. Esta es una gran ventaja, ya que Nvidia no ofrece tal opción para sus tarjetas de referencia. Al mirar más de cerca las cartas y tenerlas en nuestras manos, la gran discrepancia de peso se hace evidente. Mientras que Nvidia confía en una unidad de cámara de vapor para su edición Founders, KFA2 utiliza un diseño de tubo de calor para su modelo, lo que no es necesariamente una desventaja. Durante la prueba de esfuerzo FurMark, la tarjeta KFA2 incluso permaneció ligeramente más fría que las tarjetas de referencia con 69 °C (~156 °F) e incluso con el PT más alto, la temperatura sólo aumenta en 5 °C (~9 °F) hasta un total de 74 °C (~165 °F). Los ventiladores giran un poco más rápido y emiten ruidos silenciosos bajo carga.

En términos de consumo de energía, hay muchas fluctuaciones debido a nuestra nueva plataforma de pruebas. Durante la inactividad, se consumen unos 93,8 vatios. Este valor aumenta bajo carga y pudimos registrar un consumo de energía de alrededor de 315 vatios de la configuración de la prueba sin mostrar durante nuestra prueba de esfuerzo. Sin embargo, como muestran los valores de la GPU-Z, ambas tarjetas superan el consumo especificado por el fabricante en unos 175 W. Con el PT ajustado al 114%, la KFA2 permite un consumo máximo de 199,5 vatios. Los 25 vatios adicionales coinciden con nuestras mediciones del sistema en su conjunto. El consumo medio durante nuestra prueba de esfuerzo con el citado PT del 114% es de 340 vatios. En un escenario de juego, el sistema sólo consume un poco menos de energía, consumiendo un promedio de 331 vatios.

Con el fin de simular un entorno real, todas las pruebas se realizaron con un caso cerrado.

Consumo de la configuración de la prueba (Idle)
Consumo de la configuración de la prueba (FurMark PT 100 por ciento)
Consumo de la configuración de la prueba (FurMark PT 114 por ciento)
Consumo de la configuración de prueba (durante el juego - The Witcher 3 Ultra preset)
Prueba de esfuerzo FurMark (PT 100 por ciento)
Prueba de esfuerzo FurMark (PT 114 por ciento)
 
 
Power Consumption
1920x1080 The Witcher 3 ultra (external Monitor)
Nvidia Titan RTX
NVIDIA Titan RTX, R7 2700X, ADATA Premier Pro SP900NS38 512 GB
437.4 (432min - 452max) Watt * -32%
AMD Radeon RX Vega 64
RX Vega 64, R7 2700X (Idle: 74.3 W)
408 Watt * -23%
MSI RTX 2080 Gaming X Trio
GeForce RTX 2080 (Desktop), R7 2700X (Idle: 87.78 W)
404.7 (389min - 421max) Watt * -22%
AMD Radeon RX 5700 XT
Radeon RX 5700 XT (Desktop), R7 2700X (Idle: 69.8 W)
348.7 (341min - 359max) Watt * -5%
Nvidia GeForce RTX 2070 Super
GeForce RTX 2070 Super (Desktop), R7 2700X (96.8 fps, Idle: 80.5 W)
344.7 (335min - 370max) Watt * -4%
MSI RTX 2070 Gaming Z 8G
GeForce RTX 2070 (Desktop), R7 2700X (Idle: 73.3 W)
342.9 (329min - 355max) Watt * -3%
AMD Radeon VII
Radeon VII, R7 2700X (Idle: 81.39 W)
339 (306min - 359max) Watt * -2%
KFA2 GeForce RTX 2060 Super
GeForce RTX 2060 Super (Desktop), R9 3900X, Corsair MP600 (81.7 fps, Idle: 93.8 W)
331.4 (322min - 345max) Watt *
Nvidia GeForce RTX 2060 Super
GeForce RTX 2060 Super (Desktop), R7 2700X (82.7 fps, Idle: 77.12 W)
298.2 (293min - 322max) Watt * +10%
AMD Radeon RX 5700
Radeon RX 5700 (Desktop), R7 2700X (84.2 fps, Idle: 64.5 W)
295.9 (284min - 304max) Watt * +11%
MSI RTX 2060 Gaming Z 6G
GeForce RTX 2060 (Desktop), R7 2700X (Idle: 74.66 W)
288.8 (284min - 299max) Watt * +13%
1280x720 FurMark 1.19 GPU Stress Test (external Monitor)
AMD Radeon VII
Radeon VII, R7 2700X (Idle: 81.39 W)
417.8 (399min - 446max) Watt * -33%
MSI RTX 2080 Gaming X Trio
GeForce RTX 2080 (Desktop), R7 2700X
402.2 (320min - 423max) Watt * -28%
MSI RTX 2070 Gaming Z 8G
GeForce RTX 2070 (Desktop), R7 2700X (Idle: 73.3 W)
343 (336min - 382max) Watt * -9%
AMD Radeon RX 5700 XT
Radeon RX 5700 XT (Desktop), R7 2700X (239 fps, Idle: 69.8 W)
326.6 (313min - 351max) Watt * -4%
Nvidia GeForce RTX 2070 Super
GeForce RTX 2070 Super (Desktop), R7 2700X (283 fps, Idle: 80.5 W)
326 (315min - 348max) Watt * -3%
KFA2 GeForce RTX 2060 Super
GeForce RTX 2060 Super (Desktop), R9 3900X, Corsair MP600 (234 fps, Idle: 93.8 W)
315.3 (310min - 344max) Watt *
MSI RTX 2060 Gaming Z 6G
GeForce RTX 2060 (Desktop), R7 2700X (Idle: 74.66 W)
295.2 (148min - 331max) Watt * +6%
Nvidia GeForce RTX 2060 Super
GeForce RTX 2060 Super (Desktop), R7 2700X (237 fps, Idle: 77.12 W)
281.4 (275min - 321max) Watt * +11%
AMD Radeon RX 5700
Radeon RX 5700 (Desktop), R7 2700X (207 fps, Idle: 64.5 W)
280.5 (271min - 312max) Watt * +11%

* ... más pequeño es mejor

Overclocking - Innecesario, en su mayor parte

GPU-Z (1-Click OC)
GPU-Z (1-Click OC)
GPU-Z (overclocking manual)

Nuestro modelo KFA2 tiene el apéndice 1-Click OC, lo que significa que la tarjeta gráfica puede ser overclocked con sólo unos pocos clics. Los usuarios sólo tienen que instalar la herramienta Xtreme Tuner y ya están preparados. Una vez activada la opción 1-Click OC, el PT aumenta al 114% y el reloj base de la GPU pasa de 1.470 a 1.485 MHz. El reloj de aumento se incrementa a 1.680 MHz. Debido a que este valor es excedido regularmente bajo carga, el overclock en sí mismo es difícil de notar. La única cosa que notamos en la opción 1-Click OC es un reloj de aumento más estable, que se deriva del hecho de que la tarjeta gráfica puede trabajar con un mayor presupuesto de potencia de 199,5 vatios.

Hacemos overclocking de la tarjeta gráfica manualmente sin la opción 1-Click OC también y conseguimos una velocidad de reloj de la GPU de +100 MHz. También hicimos overclocking en el VRAM y alcanzamos un plus de 900 MHz. Esto mejoró ligeramente los resultados de 3DMark 11 y 3DMark Fire Strike. Dicho esto, el overclock manual no produjo un aumento notable en términos de rendimiento, por lo que recomendamos a los usuarios que dejen la tarjeta en su estado predeterminado.

3DMark 11 (GPU + 100 MHz, VRAM + 900 MHz)
3DMark Fire Strike (GPU + 100 MHz, VRAM + 900 MHz)

Pro

+ lo suficientemente rápido para FHD, QHD y WQHD
+ 8 GB GDDR6
+ arquitectura moderna
+ DLSS + Trazado de rayos
+ eficiente
+ relativamente silencioso bajo carga
+ modo fan-stop para escenarios 2D
+ precio
+ el conector de alimentación no aumenta artificialmente la longitud de la tarjeta

Contra

- bajo potencial de overclock
- Opción OC de 1 clic con sólo 15 MHz
- sólo 1 DisplayPort

Veredicto - A prueba de futuro gracias a 8 GB de VRAM

La KFA2 GeForce RTX 2060 Super 1-Click OC - cortesía de KFA2

Con la KFA2 GeForce RTX 2060 Super, su fabricante ofrece una de las tarjetas gráficas más baratas del mercado. A partir de este artículo, nuestro dispositivo se puede comprar por unos 390 Euros (~$432), que son 40 Euros (~$44) menos que la edición Founders de Nvidia. Sin embargo, como ambos aceleradores de píxeles funcionan a la misma velocidad, los clientes no tienen que hacer concesiones cuando se trata de rendimiento. Dicho esto, los consumidores tampoco deberían esperar poder sacar más rendimiento del modelo KFA2, ya que también está limitado por una BIOS de 175 vatios. La versión OC 1-click viene sin ninguna iluminación LED y se supone que está dirigida a los clientes que prefieren su PC sin luces navideñas. La falta de iluminación LED puede incluso ser una ventaja, ya que la tarjeta gráfica tiene más potencia a su disposición después de tener en cuenta el consumo de los dos ventiladores.

Con 8 GB de GDDR6 VRAM, la tarjeta gráfica es adecuada para todos los juegos actuales. El rendimiento es suficiente tanto para Full-HD como para WQHD, aunque 32 imágenes por segundo en el Anno 1800 son menos de lo que nos gustaría ver. Al reducir algunos de los ajustes gráficos por debajo de "max", las velocidades de fotogramas en este juego se elevan a un nivel más jugable. Lo mismo ocurre con las resoluciones más altas, ya que tienden a reservarse para tarjetas más rápidas y no reflejan la audiencia objetivo del RTX 2060S.

La KFA2 GeForce RTX 2060 Super obtuvo buenos resultados en nuestra revisión general y obtuvo mejores resultados que el modelo de diseño de referencia a pesar de que el refrigerador era más modesto. El modo de parada del ventilador para uso en 2D es una ventaja, ya que no sólo permite que la tarjeta gráfica conserve energía, sino que también permite un funcionamiento silencioso.

La KFA2 GeForce RTX 2060 Super brilla con un rendimiento sólido y temperaturas ligeramente inferiores a las de las tarjetas de referencia de Nvidia bajo carga. Si usted puede vivir sin dulces de ojo RGB, esta tarjeta gráfica es una buena opción.

En comparación con la Edición Fundadores, esta tarjeta puede ser una oferta más atractiva y con un precio muy por debajo de 400 euros (~$444), tentar a más compradores potenciales. Aquellos que quieran gastar menos tendrán que sacrificar las funciones de RTX, ya que el RTX 2060S es el modelo básico. Aunque una GeForce GTX 1660 Ti es un poco más barata, es un poco más lenta y sólo ofrece 6 GB de VRAM.

Benchmarks of all GeForce RTX 2060 Super Graphics Cards

Benchmarks

Performance Rating - 3DMark 11 + Fire Strike + Time Spy
8.3 pt (25%)
0.05426 -99%
...
7.75 -7%
AMD Radeon RX Vega 56
7.77 -7%
NVIDIA GeForce RTX 2070 Super Max-Q
7.81 -6%
7.97 -4%
8.01 -4%
8.01 -4%
NVIDIA GeForce RTX 3060
8.12 -2%
AMD Radeon RX 5600 XT (Desktop)
8.25 -1%
8.26 -1%
NVIDIA GeForce RTX 2060 Super (Desktop)
8.32
8.42 1%
8.62 4%
8.68 4%
8.74 5%
8.8 6%
AMD Radeon RX 5700 (Desktop)
8.89 7%
9.03 9%
9.22 11%
9.52 14%
...
NVIDIA GeForce RTX 5090
33.3 300%
0%
100%
Restrict / Search: Model: Max. age: years
3DMark - 3DMark Time Spy Score
min: 7971     de promedio: 8980     mediana: 9049 (24%)     max: 9626 Points
3DMark - 3DMark Time Spy Graphics
min: 8396     de promedio: 8644     mediana: 8686 (18%)     max: 8795 Points
112 -99%
...
8003 -7%
AMD Radeon RX 5700 (Desktop)
8045 -7%
8057 -7%
8189 -5%
8210 -5%
NVIDIA GeForce RTX 2070 Super Mobile
8238 -5%
8316 -4%
NVIDIA GeForce RTX 3060
8558 -1%
AMD Radeon RX 5700 XT (Desktop)
8574 -1%
NVIDIA GeForce RTX 2060 Super (Desktop)
8644
8689 1%
8700 1%
AMD Radeon VII
8780 2%
8798 2%
8952 4%
8989 4%
9033 5%
9097 5%
9164 6%
...
NVIDIA GeForce RTX 5090
46337 436%
0%
100%
Restrict / Search: Model: Max. age: years
3DMark - 3DMark Ice Storm Unlimited Graphics
min: 420457     de promedio: 541340     mediana: 495174 (50%)     max: 748837 Points
3DMark - 3DMark Ice Storm Extreme Graphics
min: 279097     de promedio: 356714     mediana: 363178 (43%)     max: 428325 Points
3DMark - 3DMark Cloud Gate Score
min: 34869     de promedio: 56877     mediana: 54558 (52%)     max: 72946 Points
3DMark - 3DMark Cloud Gate Graphics
min: 110523     de promedio: 121848     mediana: 121804 (30%)     max: 129072 Points
3DMark - 3DMark Fire Strike Standard Score
min: 18073     de promedio: 20681     mediana: 20260 (31%)     max: 22711 Points
3DMark - 3DMark Fire Strike Standard Graphics
min: 20522     de promedio: 22051     mediana: 22243 (20%)     max: 22764 Points
3DMark - 3DMark Ice Storm Graphics
min: 319401     de promedio: 426212     mediana: 426038 (47%)     max: 535249 Points
3DMark - 3DMark Wild Life Unlimited
56346 Points (28%)
3DMark - 3DMark Night Raid
min: 42462     de promedio: 53532     mediana: 51021 (48%)     max: 70055 Points
3DMark - 3DMark Night Raid Graphics Score
min: 88428     de promedio: 96660     mediana: 96580 (37%)     max: 107362 Points
3DMark 11 - 3DM11 Performance Score
min: 22211     de promedio: 26700     mediana: 25745 (31%)     max: 30486 Points
3DMark 11 - 3DM11 Performance GPU
min: 29148     de promedio: 29742     mediana: 29668 (23%)     max: 30342 Points
171.8 -99%
...
28106 -6%
NVIDIA GeForce RTX 3060
28359 -5%
28461 -4%
28484 -4%
28692 -4%
AMD Radeon RX Vega 56
29086 -2%
NVIDIA GeForce RTX 2070 Super Mobile
29416 -1%
29447 -1%
29663 0%
NVIDIA GeForce RTX 2060 Super (Desktop)
29742
29866 0%
30407 2%
30499 3%
AMD Radeon RX 5700 (Desktop)
31059 4%
31142 5%
AMD Radeon RX 5600 XT (Desktop)
31158 5%
31788 7%
32331 9%
32662 10%
...
NVIDIA GeForce RTX 5090
129772 336%
0%
100%
Restrict / Search: Model: Max. age: years
3DMark Vantage
3DM Vant. Perf. total +
3DMark Vantage - 3DM Vant. Perf. total
min: 62079     de promedio: 81585     mediana: 83630.5 (24%)     max: 97000 Points
3DM Vant. Perf. GPU no PhysX +
3DMark Vantage - 3DM Vant. Perf. GPU no PhysX
min: 62993     de promedio: 80958     mediana: 83179.5 (45%)     max: 94481 Points
62 -100%
...
AMD Radeon RX 5600 XT (Desktop)
76171 -6%
76250 -6%
NVIDIA GeForce RTX 2080 Super Mobile
77180 -5%
77533 -4%
77766 -4%
79140 -2%
80330 -1%
80346 -1%
80643 0%
NVIDIA GeForce RTX 2060 Super (Desktop)
80958
AMD Radeon RX 5700 XT (Desktop)
80992 0%
82368 2%
4x NVIDIA RTX A6000
83834 4%
85013 5%
NVIDIA GeForce RTX 3060
85087 5%
85672 6%
86536 7%
87880 9%
AMD Radeon RX 5700 (Desktop)
88563 9%
...
173912 115%
0%
100%
Restrict / Search: Model: Max. age: years
3DMark 05 - 3DMark 05 - Standard
min: 42852     de promedio: 68470     mediana: 70361.5 (77%)     max: 90304 Points
133.4 -100%
...
62003 -9%
AMD Radeon RX 5700 XT (Desktop)
62077 -9%
NVIDIA Titan RTX
62178 -9%
AMD Radeon RX 6800
62576 -9%
62847 -8%
Nvidia RTX A2000
63697 -7%
NVIDIA GeForce RTX 3060
65489 -4%
NVIDIA Titan X Pascal
67108 -2%
68054 -1%
NVIDIA GeForce RTX 2060 Super (Desktop)
68470
68614 0%
AMD Radeon RX 5700 (Desktop)
68621 0%
Intel Arc B580
68656 0%
Intel Arc A380
69490 1%
69623 2%
69854 2%
70267 3%
70383 3%
AMD Radeon RX 6750 XT
70829 3%
...
87172 27%
0%
100%
Restrict / Search: Model: Max. age: years
3DMark 06 3DMark 06 - Standard 1280x1024 +
3DMark 06
min: 34682     de promedio: 54261     mediana: 56641 (74%)     max: 69078 Points
Unigine Valley 1.0 - Unigine Valley 1.0 DX
min: 106.9     de promedio: 111.3     mediana: 112 (34%)     max: 114.1 fps
Blender - Blender 3.3 Classroom CUDA *
56 Seconds (8%)
Blender - Blender 3.3 Classroom OPTIX *
32 Seconds (12%)
SPECviewperf 12
specvp12 sw-03 +
SPECviewperf 12 - specvp12 sw-03
min: 54.7     de promedio: 66.7     mediana: 63.3 (16%)     max: 79.7 fps
specvp12 snx-02 +
SPECviewperf 12 - specvp12 snx-02
min: 8.57     de promedio: 9.5     mediana: 9.2 (1%)     max: 11.1 fps
specvp12 showcase-01 +
SPECviewperf 12 - specvp12 showcase-01
min: 114     de promedio: 118.6     mediana: 116.9 (20%)     max: 126 fps
specvp12 mediacal-01 +
SPECviewperf 12 - specvp12 mediacal-01
min: 34.46     de promedio: 47.1     mediana: 38 (10%)     max: 75.4 fps
specvp12 maya-04 +
SPECviewperf 12 - specvp12 maya-04
min: 146.3     de promedio: 174.5     mediana: 160 (44%)     max: 209 fps
specvp12 energy-01 +
SPECviewperf 12 - specvp12 energy-01
min: 10.57     de promedio: 11.3     mediana: 11.1 (10%)     max: 12.7 fps
specvp12 creo-01 +
SPECviewperf 12 - specvp12 creo-01
min: 43.87     de promedio: 52.6     mediana: 50.9 (20%)     max: 63.8 fps
specvp12 catia-04 +
SPECviewperf 12 - specvp12 catia-04
min: 76.4     de promedio: 81.4     mediana: 79.4 (13%)     max: 89.5 fps
specvp12 3dsmax-05 +
SPECviewperf 12 - specvp12 3dsmax-05
min: 190     de promedio: 204.1     mediana: 201.5 (30%)     max: 220 fps
SPECviewperf 13 specvp13 sw-04 +
SPECviewperf 13 - specvp13 sw-04
min: 75.7     de promedio: 98.5     mediana: 89.1 (24%)     max: 126 fps
specvp13 snx-03 +
SPECviewperf 13 - specvp13 snx-03
min: 15.46     de promedio: 17.1     mediana: 16.8 (2%)     max: 19.8 fps
specvp13 showcase-02 +
SPECviewperf 13 - specvp13 showcase-02
min: 111     de promedio: 117.1     mediana: 116.8 (20%)     max: 122 fps
specvp13 medical-02 +
SPECviewperf 13 - specvp13 medical-02
min: 49.9     de promedio: 53.5     mediana: 54.4 (9%)     max: 54.6 fps
specvp13 maya-05 +
SPECviewperf 13 - specvp13 maya-05
min: 262.4     de promedio: 277.3     mediana: 269.3 (31%)     max: 298 fps
specvp13 energy-02 +
SPECviewperf 13 - specvp13 energy-02
min: 21.81     de promedio: 21.9     mediana: 21.9 (7%)     max: 22.04 fps
specvp13 creo-02 +
SPECviewperf 13 - specvp13 creo-02
min: 172.5     de promedio: 190.4     mediana: 186 (27%)     max: 210 fps
specvp13 catia-05 +
SPECviewperf 13 - specvp13 catia-05
min: 114     de promedio: 117     mediana: 115.2 (13%)     max: 122 fps
specvp13 3dsmax-06 +
SPECviewperf 13 - specvp13 3dsmax-06
min: 186     de promedio: 202.5     mediana: 199.4 (31%)     max: 218 fps
SPECviewperf 2020 specvp2020 solidworks-05 4k +
SPECviewperf 2020 - specvp2020 solidworks-05 4k
91.5 fps (22%)
specvp2020 snx-04 4k +
SPECviewperf 2020 - specvp2020 snx-04 4k
min: 12.88     de promedio: 14.1     mediana: 14 (1%)     max: 15.3 fps
specvp2020 medical-03 4k +
SPECviewperf 2020 - specvp2020 medical-03 4k
min: 8.58     de promedio: 9.5     mediana: 9.7 (6%)     max: 10.3 fps
specvp2020 maya-06 4k +
SPECviewperf 2020 - specvp2020 maya-06 4k
min: 154     de promedio: 160.7     mediana: 162 (23%)     max: 166 fps
specvp2020 energy-03 4k +
SPECviewperf 2020 - specvp2020 energy-03 4k
min: 22.9     de promedio: 23.1     mediana: 23.1 (3%)     max: 23.24 fps
specvp2020 creo-03 4k +
SPECviewperf 2020 - specvp2020 creo-03 4k
min: 66.2     de promedio: 74.5     mediana: 77.2 (35%)     max: 80.2 fps
specvp2020 catia-06 4k +
SPECviewperf 2020 - specvp2020 catia-06 4k
min: 29.13     de promedio: 30.2     mediana: 30.5 (20%)     max: 31 fps
specvp2020 3dsmax-07 4k +
SPECviewperf 2020 - specvp2020 3dsmax-07 4k
min: 59.4     de promedio: 61.5     mediana: 62 (21%)     max: 63.1 fps
Geekbench 6.4 - Geekbench 6.4 GPU OpenCL
91500 puntos (24%)
Geekbench 6.4 - Geekbench 6.4 GPU Vulkan
89920 puntos (22%)
LuxMark v2.0 64Bit - LuxMark v2.0 Room GPU
min: 3274     de promedio: 3276     mediana: 3276 (12%)     max: 3278 Samples/s
LuxMark v2.0 64Bit - LuxMark v2.0 Sala GPU
min: 6980     de promedio: 6995     mediana: 6995 (12%)     max: 7010 Samples/s
ComputeMark v2.1 - ComputeMark v2.1 Result
min: 15749     de promedio: 15955     mediana: 15776 (13%)     max: 16340 puntos
Power Consumption - Furmark Stress Test Power Consumption - external Monitor *
min: 235     de promedio: 289.7     mediana: 305 (41%)     max: 315.3 Watt
020406080100120140160180200220240260280300Tooltip
Power Consumption - The Witcher 3 Power Consumption - external Monitor *
min: 246     de promedio: 303.5     mediana: 311 (43%)     max: 331.4 Watt
020406080100120140160180200220240260280300320340Tooltip
Power Consumption - Power Efficiency - Witcher 3 ultra external Monitor
min: 0.2505     de promedio: 0.3     mediana: 0.3 (22%)     max: 0.3455 fps per Watt
Power Consumption - Cyberpunk 2077 Power Consumption - external Monitor *
395 Watt (50%)
0255075100125150175200225250275300325350375400425Tooltip
Clock Speed - GPU Clock Witcher 3 ultra
1830 MHz (72%)
Clock Speed - GPU Clock Speed Furmark
min: 1500     de promedio: 1508     mediana: 1507.5 (60%)     max: 1515 MHz
- Gama de valores de las pruebas para esta tarjeta gráfica
red legend - Valores medios de las pruebas para esta tarjeta gráfica
* A menor número, mayor rendimiento

v1.29
log 03. 04:45:30

#0 ran 2s before starting gpusingle class +0s ... 0s

#1 no ids found in url (should be separated by "_") +0s ... 0s

#2 not redirecting to Ajax server +0s ... 0s

#3 did not recreate cache, as it is less than 5 days old! Created at Tue, 01 Apr 2025 09:15:03 +0200 +0.001s ... 0.001s

#4 getting avg benchmarks for device 9893 +0.016s ... 0.017s

#5 got single benchmarks 9893 +0.026s ... 0.043s

#6 got avg benchmarks for devices +0s ... 0.043s

#7 min, max, avg, median took s +0.932s ... 0.975s

#8 return log +0s ... 0.975s

Pruebas de juegos

Los siguientes benchmarks se derivan de nuestros benchmarks de los portátiles de análisis. El rendimiento depende de la memoria gráfica utilizada, velocidad de reloj, procesador, configuración del sistema, controladores y sistemas operativos. Así que los resultados no tienen que ser representativos de todos los portátiles con esta GPU. Para información más detallada sobre los resultados del benchmark, haga clic en el número de fps.

Assassin's Creed Shadows

Assassin's Creed Shadows

2025
bajo 1920x1080
29  fps    + Comparar
medio 1920x1080
25  fps    + Comparar
alto 1920x1080
20  fps    + Comparar
ultra 1920x1080
13  fps    + Comparar
» No jugable la mayor parte de los portátiles probados.
bajo 1920x1080
281  fps    + Comparar + 📈 Graph
medio 1920x1080
189.1  fps    + Comparar + 📈 Graph
alto 1920x1080
113.4  fps    + Comparar + 📈 Graph
QHD 2560x1440
71.6  fps    + Comparar + 📈 Graph
4K 3840x2160
32.9  fps    + Comparar + 📈 Graph
» Jugable con todos los portátiles probados en ajustes de detalle alto.
bajo 1920x1080
51.9  fps    + Comparar
medio 1920x1080
43.2  fps    + Comparar
ultra 1920x1080
33.2  fps    + Comparar
QHD 2560x1440
25.2  fps    + Comparar
QHD DLSS 2560x1440
35  fps    + Comparar
» Jugable con todos los portátiles probados en ajustes de detalle medio.
bajo 1920x1080
104.9  fps    + Comparar + 📈 Graph
medio 1920x1080
79.2  fps    + Comparar + 📈 Graph
alto 1920x1080
65.6  fps    + Comparar + 📈 Graph
ultra 1920x1080
46.1  fps    + Comparar + 📈 Graph
QHD 2560x1440
32.6  fps    + Comparar + 📈 Graph
4K 3840x2160
17.7  fps    + Comparar + 📈 Graph
4K DLSS 3840x2160
17  fps    + Comparar + 📈 Graph
QHD DLSS 2560x1440
46  fps    + Comparar + 📈 Graph
» Jugable con todos los portátiles probados en ajustes de detalle ultra.
Stalker 2

Stalker 2

2024
bajo 1920x1080
53.2  fps    + Comparar + 📈 Graph
medio 1920x1080
47.1  fps    + Comparar + 📈 Graph
alto 1920x1080
40.1  fps    + Comparar + 📈 Graph
ultra 1920x1080
33.7  fps    + Comparar + 📈 Graph
QHD 2560x1440
24.5  fps    + Comparar + 📈 Graph
» Jugable con todos los portátiles probados en ajustes de detalle alto.
Additional Benchmarks
Low Preset 1280x720
77.2
Epic Preset DLSS 1920x1080
43.6
bajo 1920x1080
70  fps    + Comparar
medio 1920x1080
66  fps    + Comparar
alto 1920x1080
41  fps    + Comparar
ultra 1920x1080
40  fps    + Comparar
QHD 2560x1440
27  fps    + Comparar
QHD DLSS 2560x1440
42  fps    + Comparar
» Jugable con todos los portátiles probados en ajustes de detalle ultra.
Additional Benchmarks
Minimum Preset 1280x720
113
bajo 1920x1080
117.1  fps    + Comparar + 📈 Graph
medio 1920x1080
78  fps    + Comparar + 📈 Graph
alto 1920x1080
53.9  fps    + Comparar + 📈 Graph
ultra 1920x1080
39.6  fps    + Comparar + 📈 Graph
QHD 2560x1440
28.8  fps    + Comparar + 📈 Graph
4K 3840x2160
15.9  fps    + Comparar + 📈 Graph
4K DLSS 3840x2160
21.9  fps    + Comparar + 📈 Graph
QHD DLSS 2560x1440
36  fps    + Comparar + 📈 Graph
» Jugable con todos los portátiles probados en ajustes de detalle ultra.
Additional Benchmarks
Low Preset 1280x720
161.1
bajo 1920x1080
100.2  fps    + Comparar + 📈 Graph
medio 1920x1080
84.1  fps    + Comparar + 📈 Graph
alto 1920x1080
73.4  fps    + Comparar + 📈 Graph
ultra 1920x1080
67.9  fps    + Comparar + 📈 Graph
QHD 2560x1440
51.3  fps    + Comparar + 📈 Graph
4K 3840x2160
28.9  fps    + Comparar + 📈 Graph
4K DLSS 3840x2160
44  fps    + Comparar + 📈 Graph
QHD DLSS 2560x1440
71.3  fps    + Comparar + 📈 Graph
» Jugable con todos los portátiles probados en ajustes de detalle ultra.
Additional Benchmarks
Low Preset TAA 1280x720
135.5
bajo 1920x1080
58.9  fps    + Comparar + 📈 Graph
medio 1920x1080
58.3  fps    + Comparar + 📈 Graph
alto 1920x1080
48.3  fps    + Comparar + 📈 Graph
ultra 1920x1080
44.3  fps    + Comparar + 📈 Graph
QHD 2560x1440
30.7  fps    + Comparar + 📈 Graph
QHD DLSS 2560x1440
43.9  fps    + Comparar + 📈 Graph
» Jugable con todos los portátiles probados en ajustes de detalle ultra.
Additional Benchmarks
Low Preset (Super Resolution off) 1280x720
95.2
bajo 1920x1080
78.1  fps    + Comparar + 📈 Graph
medio 1920x1080
65.4  fps    + Comparar + 📈 Graph
alto 1920x1080
62  fps    + Comparar + 📈 Graph
ultra 1920x1080
56.7  fps    + Comparar + 📈 Graph
QHD 2560x1440
39.5  fps    + Comparar + 📈 Graph
4K 3840x2160
21.1  fps    + Comparar + 📈 Graph
4K DLSS 3840x2160
33.4  fps    + Comparar + 📈 Graph
QHD DLSS 2560x1440
56  fps    + Comparar + 📈 Graph
» Jugable con todos los portátiles probados en ajustes de detalle ultra.
Additional Benchmarks
Low Preset TAA 1280x720
107.2
bajo 1920x1080 cinem.
37.6  fps    + Comparar + 📈 Graph
medio 1920x1080 cinem.
34.4  fps    + Comparar + 📈 Graph
alto 1920x1080 cinem.
30.3  fps    + Comparar + 📈 Graph
ultra 1920x1080 cinem.
24.4  fps    + Comparar + 📈 Graph
QHD 2560x1440 cinem.
16.6  fps    + Comparar + 📈 Graph
QHD DLSS 2560x1440 cinem.
24.9  fps    + Comparar + 📈 Graph
» Jugable con todos los portátiles probados en ajustes de detalle bajo.
Additional Benchmarks
low 1280x720 cinem.
52.2
ultra DLSS 1920x1080 cinem.
33.4
bajo 1920x1080
64  fps    + Comparar
medio 1920x1080
48  fps    + Comparar
alto 1920x1080
37  fps    + Comparar
ultra 1920x1080
19  fps    + Comparar
QHD 2560x1440
14  fps    + Comparar
4K 3840x2160
7  fps    + Comparar
4K DLSS 3840x2160
15  fps    + Comparar
QHD DLSS 2560x1440
16  fps    + Comparar
» Jugable con todos los portátiles probados en ajustes de detalle alto.
Additional Benchmarks
low TSR 100 1280x720
102
bajo 1920x1080
171.7  fps    + Comparar + 📈 Graph
medio 1920x1080
119.5  fps    + Comparar + 📈 Graph
alto 1920x1080
98.6  fps    + Comparar + 📈 Graph
ultra 1920x1080
86.6  fps    + Comparar + 📈 Graph
QHD 2560x1440
55.9  fps    + Comparar + 📈 Graph
4K 3840x2160
28  fps    + Comparar + 📈 Graph
» Jugable con todos los portátiles probados en ajustes de detalle ultra.
Additional Benchmarks
Very Low Preset 1280x720
298
bajo 1920x1080
140.8  fps    + Comparar + 📈 Graph
medio 1920x1080
85.2  fps    + Comparar + 📈 Graph
alto 1920x1080
68.4  fps    + Comparar + 📈 Graph
ultra 1920x1080
56.1  fps    + Comparar + 📈 Graph
QHD 2560x1440
36.1  fps    + Comparar + 📈 Graph
4K 3840x2160
19.4  fps    + Comparar + 📈 Graph
4K DLSS 3840x2160
19.3  fps    + Comparar + 📈 Graph
» Jugable con todos los portátiles probados en ajustes de detalle ultra.
Additional Benchmarks
Low Preset 1280x720
191.1
Ultra Preset + Ultra Ray Tracing + DLSS Quality 2560x1440
33.9
F1 24

F1 24

2024
bajo 1920x1080
240  fps    + Comparar
medio 1920x1080
201  fps    + Comparar
alto 1920x1080
148.3  fps    + Comparar
ultra 1920x1080
45.5  fps    + Comparar
QHD 2560x1440
28.8  fps    + Comparar
4K 3840x2160
13.9  fps    + Comparar
4K DLSS 3840x2160
25.1  fps    + Comparar
» Jugable con todos los portátiles probados en ajustes de detalle ultra.
Additional Benchmarks
Ultra High Preset + Quality DLSS 16xAF 2560x1440
47.5
bajo 1920x1080
50.7  fps    + Comparar + 📈 Graph
medio 1920x1080
40.7  fps    + Comparar + 📈 Graph
alto 1920x1080
30.3  fps    + Comparar + 📈 Graph
QHD 2560x1440
20.7  fps    + Comparar + 📈 Graph
4K 3840x2160
10  fps    + Comparar + 📈 Graph
4K DLSS 3840x2160
20.3  fps    + Comparar + 📈 Graph
QHD DLSS 2560x1440
32.7  fps    + Comparar + 📈 Graph
» Jugable con todos los portátiles probados en ajustes de detalle medio.
bajo 1920x1080
87  fps    + Comparar + 📈 Graph
medio 1920x1080
69.7  fps    + Comparar + 📈 Graph
alto 1920x1080
64.2  fps    + Comparar + 📈 Graph
ultra 1920x1080
52.2  fps    + Comparar + 📈 Graph
QHD 2560x1440
39.5  fps    + Comparar + 📈 Graph
4K 3840x2160
22.5  fps    + Comparar + 📈 Graph
4K DLSS 3840x2160
32.4  fps    + Comparar + 📈 Graph
QHD DLSS 2560x1440
53.5  fps    + Comparar + 📈 Graph
» Jugable con todos los portátiles probados en ajustes de detalle ultra.
bajo 1920x1080
61.5  fps    + Comparar + 📈 Graph
alto 1920x1080
55.8  fps    + Comparar + 📈 Graph
QHD 2560x1440
42  fps    + Comparar + 📈 Graph
4K 3840x2160
25.8  fps    + Comparar + 📈 Graph
4K DLSS 3840x2160
30.2  fps    + Comparar + 📈 Graph
4K FSR 3840x2160
27.7  fps    + Comparar + 📈 Graph
» Jugable con todos los portátiles probados en ajustes de detalle alto.
Additional Benchmarks
Low Preset 1280x720
81.9
bajo 1920x1080
93.1  fps    + Comparar + 📈 Graph
medio 1920x1080
82.5  fps    + Comparar + 📈 Graph
alto 1920x1080
56.6  fps    + Comparar + 📈 Graph
ultra 1920x1080
55.2  fps    + Comparar + 📈 Graph
QHD 2560x1440
41.4  fps    + Comparar + 📈 Graph
4K 3840x2160
24.3  fps    + Comparar + 📈 Graph
4K DLSS 3840x2160
34  fps    + Comparar + 📈 Graph
4K FSR 3840x2160
30  fps    + Comparar + 📈 Graph
» Jugable con todos los portátiles probados en ajustes de detalle ultra.
Additional Benchmarks
Very Low Preset 1280x720
138.1
bajo 1920x1080
223  fps    + Comparar + 📈 Graph
medio 1920x1080
178.9  fps    + Comparar + 📈 Graph
alto 1920x1080
149.9  fps    + Comparar + 📈 Graph
ultra 1920x1080
84.7  fps    + Comparar + 📈 Graph
QHD 2560x1440
41.6  fps    + Comparar + 📈 Graph
4K 3840x2160
12.2  fps    + Comparar + 📈 Graph
4K DLSS 3840x2160
26.6  fps    + Comparar + 📈 Graph
4K FSR 3840x2160
36.7  fps    + Comparar + 📈 Graph
» Jugable con todos los portátiles probados en ajustes de detalle ultra.
Additional Benchmarks
Low Preset 1280x720
318
bajo 1920x1080
241  fps    + Comparar + 📈 Graph
medio 1920x1080
186.7  fps    + Comparar + 📈 Graph
alto 1920x1080
162.2  fps    + Comparar + 📈 Graph
ultra 1920x1080
131.1  fps    + Comparar + 📈 Graph
QHD 2560x1440
85.9  fps    + Comparar + 📈 Graph
4K 3840x2160
42.5  fps    + Comparar + 📈 Graph
» Jugable con todos los portátiles probados en ajustes de detalle ultra.
Additional Benchmarks
Very Low Preset 1280x720
298
bajo 1920x1080
103  fps    + Comparar
medio 1920x1080
90  fps    + Comparar
alto 1920x1080
73  fps    + Comparar
ultra 1920x1080
56  fps    + Comparar
QHD 2560x1440
43  fps    + Comparar
4K 3840x2160
26  fps    + Comparar
4K DLSS 3840x2160
40  fps    + Comparar
4K FSR 3840x2160
37  fps    + Comparar
» Jugable con todos los portátiles probados en ajustes de detalle ultra.
Additional Benchmarks
Low Preset TAA 1280x720
128
bajo 1920x1080
124.5  fps    + Comparar + 📈 Graph
medio 1920x1080
92.5  fps    + Comparar + 📈 Graph
alto 1920x1080
79.5  fps    + Comparar + 📈 Graph
ultra 1920x1080
77.8  fps    + Comparar + 📈 Graph
QHD 2560x1440
54.1  fps    + Comparar + 📈 Graph
4K 3840x2160
26.6  fps    + Comparar + 📈 Graph
» Jugable con todos los portátiles probados en ajustes de detalle ultra.
Additional Benchmarks
Low Preset 1280x720
174.9
bajo 1920x1080
67.3  fps    + Comparar + 📈 Graph
medio 1920x1080
57.8  fps    + Comparar + 📈 Graph
alto 1920x1080
48.7  fps    + Comparar + 📈 Graph
ultra 1920x1080
40.8  fps    + Comparar + 📈 Graph
QHD 2560x1440
31.5  fps    + Comparar + 📈 Graph
4K 3840x2160
19  fps    + Comparar + 📈 Graph
4K DLSS 3840x2160
28.2  fps    + Comparar + 📈 Graph
4K FSR 3840x2160
23.5  fps    + Comparar + 📈 Graph
» Jugable con todos los portátiles probados en ajustes de detalle ultra.
Additional Benchmarks
Max. Performance 1280x720
110.6
Palworld

Palworld

2024
bajo 1920x1080
124.7  fps    + Comparar + 📈 Graph
medio 1920x1080
105  fps    + Comparar + 📈 Graph
alto 1920x1080
82  fps    + Comparar + 📈 Graph
ultra 1920x1080
75.1  fps    + Comparar + 📈 Graph
QHD 2560x1440
51.5  fps    + Comparar + 📈 Graph
4K 3840x2160
25.9  fps    + Comparar + 📈 Graph
4K DLSS 3840x2160
40.2  fps    + Comparar + 📈 Graph
» Jugable con todos los portátiles probados en ajustes de detalle ultra.
Additional Benchmarks
Very Low Preset 1280x720
236
medio 1920x1080
359  fps    + Comparar + 📈 Graph
alto 1920x1080
359  fps    + Comparar + 📈 Graph
ultra 1920x1080
359  fps    + Comparar + 📈 Graph
QHD 2560x1440
313  fps    + Comparar + 📈 Graph
4K 3840x2160
155.2  fps    + Comparar + 📈 Graph
» Jugable con todos los portátiles probados en ajustes de detalle ultra.
bajo 1920x1080
204  fps    + Comparar + 📈 Graph
medio 1920x1080
182  fps    + Comparar + 📈 Graph
alto 1920x1080
159.6  fps    + Comparar + 📈 Graph
ultra 1920x1080
107.8  fps    + Comparar + 📈 Graph
QHD 2560x1440
61.5  fps    + Comparar + 📈 Graph
4K 3840x2160
26.2  fps    + Comparar + 📈 Graph
4K DLSS 3840x2160
57.9  fps    + Comparar + 📈 Graph
» Jugable con todos los portátiles probados en ajustes de detalle ultra.
bajo 1920x1080
220  fps    + Comparar + 📈 Graph
medio 1920x1080
158.3  fps    + Comparar + 📈 Graph
alto 1920x1080
139.7  fps    + Comparar + 📈 Graph
ultra 1920x1080
106.9  fps    + Comparar + 📈 Graph
QHD 2560x1440
65.4  fps    + Comparar + 📈 Graph
4K 3840x2160
30.1  fps    + Comparar + 📈 Graph
» Jugable con todos los portátiles probados en ajustes de detalle ultra.
Additional Benchmarks
Low Preset 1280x720
325
Epic Preset + Epic RTX Global Illumination 1920x1080
97.6
bajo 1920x1080
53  fps    + Comparar
medio 1920x1080
49  fps    + Comparar
alto 1920x1080
43  fps    + Comparar
ultra 1920x1080
33  fps    + Comparar
QHD 2560x1440
22  fps    + Comparar
4K 3840x2160
11  fps    + Comparar
4K DLSS 3840x2160
20  fps    + Comparar
» Jugable con todos los portátiles probados en ajustes de detalle alto.
Additional Benchmarks
Low Preset TAA 1280x720
81
bajo 1920x1080
95  fps    + Comparar
medio 1920x1080
87  fps    + Comparar
alto 1920x1080
65  fps    + Comparar
ultra 1920x1080
61  fps    + Comparar
QHD 2560x1440
43  fps    + Comparar
4K 3840x2160
25  fps    + Comparar
» Jugable con todos los portátiles probados en ajustes de detalle ultra.
Additional Benchmarks
Minimum Preset 1280x720
153
bajo 1920x1080
122.3  fps    + Comparar + 📈 Graph
medio 1920x1080
89.6  fps    + Comparar + 📈 Graph
alto 1920x1080
81.4  fps    + Comparar + 📈 Graph
ultra 1920x1080
73  fps    + Comparar + 📈 Graph
QHD 2560x1440
53.6  fps    + Comparar + 📈 Graph
4K 3840x2160
29.7  fps    + Comparar + 📈 Graph
4K DLSS 3840x2160
44  fps    + Comparar + 📈 Graph
» Jugable con todos los portátiles probados en ajustes de detalle ultra.
Additional Benchmarks
Ultra Low Preset LowAA 1280x720
239
bajo 1920x1080
55.6  fps    + Comparar + 📈 Graph
medio 1920x1080
49.2  fps    + Comparar + 📈 Graph
alto 1920x1080
47  fps    + Comparar + 📈 Graph
QHD 2560x1440
29.3  fps    + Comparar + 📈 Graph
4K 3840x2160
14.8  fps    + Comparar + 📈 Graph
» Jugable con todos los portátiles probados en ajustes de detalle alto.
Additional Benchmarks
Low Preset 1280x720
88
High Preset + High Ray Tracing 1920x1080
4.9
bajo 1920x1080
73.9  fps    + Comparar + 📈 Graph
medio 1920x1080
62.3  fps    + Comparar + 📈 Graph
alto 1920x1080
44.9  fps    + Comparar + 📈 Graph
ultra 1920x1080
30.7  fps    + Comparar + 📈 Graph
QHD 2560x1440
20.6  fps    + Comparar + 📈 Graph
4K 3840x2160
10.4  fps    + Comparar + 📈 Graph
4K DLSS 3840x2160
20.7  fps    + Comparar + 📈 Graph
» Jugable con todos los portátiles probados en ajustes de detalle alto.
Additional Benchmarks
Low Preset 1280x720
114.2
bajo 1920x1080
352  fps    + Comparar
medio 1920x1080
230.7  fps    + Comparar
alto 1920x1080
132.3  fps    + Comparar
ultra 1920x1080
103.3  fps    + Comparar
QHD 2560x1440
70.5  fps    + Comparar
4K 3840x2160
35.6  fps    + Comparar
» Jugable con todos los portátiles probados en ajustes de detalle ultra.
Additional Benchmarks
Low Preset 1280x720
525.1
bajo 1920x1080
102  fps    + Comparar
medio 1920x1080
94  fps    + Comparar
alto 1920x1080
89  fps    + Comparar
ultra 1920x1080
71  fps    + Comparar
QHD 2560x1440
54  fps    + Comparar
4K 3840x2160
32  fps    + Comparar
4K DLSS 3840x2160
44  fps    + Comparar
» Jugable con todos los portátiles probados en ajustes de detalle ultra.
Additional Benchmarks
Low Preset (Adaptive Quality Off) 1280x720
146
bajo 1920x1080
217  fps    + Comparar + 📈 Graph
medio 1920x1080
199.1  fps    + Comparar + 📈 Graph
alto 1920x1080
167.7  fps    + Comparar + 📈 Graph
ultra 1920x1080
146.9  fps    + Comparar + 📈 Graph
QHD 2560x1440
111.5  fps    + Comparar + 📈 Graph
4K 3840x2160
67.4  fps    + Comparar + 📈 Graph
» Jugable con todos los portátiles probados en ajustes de detalle ultra.
Additional Benchmarks
Low Preset 1280x720
319
bajo 1920x1080
320  fps    + Comparar + 📈 Graph
medio 1920x1080
285  fps    + Comparar + 📈 Graph
alto 1920x1080
202  fps    + Comparar + 📈 Graph
ultra 1920x1080
148.8  fps    + Comparar + 📈 Graph
QHD 2560x1440
99.2  fps    + Comparar + 📈 Graph
4K 3840x2160
46.2  fps    + Comparar + 📈 Graph
» Jugable con todos los portátiles probados en ajustes de detalle ultra.
Additional Benchmarks
Low Preset 1280x720
343
bajo 1920x1080
90.7  fps    + Comparar
medio 1920x1080
73.2  fps    + Comparar
alto 1920x1080
64.1  fps    + Comparar
ultra 1920x1080
59.2  fps    + Comparar
QHD 2560x1440
38.9  fps    + Comparar
4K 3840x2160
19.3  fps    + Comparar
» Jugable con todos los portátiles probados en ajustes de detalle ultra.
Additional Benchmarks
Low Preset (FSR off) 1280x720
140.3
Steam Deck 1280x800
153.5
30min Start Ultra Preset (FSR off) 1920x1080
61.8
bajo 1920x1080
159.6  fps    + Comparar + 📈 Graph
medio 1920x1080
103  fps    + Comparar + 📈 Graph
alto 1920x1080
84.7  fps    + Comparar + 📈 Graph
ultra 1920x1080
70.7  fps    + Comparar + 📈 Graph
QHD 2560x1440
48.5  fps    + Comparar + 📈 Graph
4K 3840x2160
25.7  fps    + Comparar + 📈 Graph
» Jugable con todos los portátiles probados en ajustes de detalle ultra.
Additional Benchmarks
Low Preset 1280x720
312
Lies of P

Lies of P

2023
bajo 1920x1080
153.5  fps    + Comparar + 📈 Graph
medio 1920x1080
137.6  fps    + Comparar + 📈 Graph
alto 1920x1080
118.7  fps    + Comparar + 📈 Graph
ultra 1920x1080
105  fps    + Comparar + 📈 Graph
QHD 2560x1440
69.2  fps    + Comparar + 📈 Graph
4K 3840x2160
34.9  fps    + Comparar + 📈 Graph
4K DLSS 3840x2160
55.7  fps    + Comparar + 📈 Graph
» Jugable con todos los portátiles probados en ajustes de detalle ultra.
Additional Benchmarks
Low Preset 1280x720
251
Starfield

Starfield

2023
bajo 1920x1080
54.9  fps    + Comparar + 📈 Graph
medio 1920x1080
48.1  fps    + Comparar + 📈 Graph
alto 1920x1080
39.9  fps    + Comparar + 📈 Graph
ultra 1920x1080
35.7  fps    + Comparar + 📈 Graph
QHD 2560x1440
29  fps    + Comparar + 📈 Graph
4K 3840x2160
18.6  fps    + Comparar + 📈 Graph
» Jugable con todos los portátiles probados en ajustes de detalle ultra.
Additional Benchmarks
Low Preset 1280x720
69.8
bajo 1920x1080
119.5  fps    + Comparar + 📈 Graph
medio 1920x1080
115.7  fps    + Comparar + 📈 Graph
alto 1920x1080
107.3  fps    + Comparar + 📈 Graph
ultra 1920x1080
88.6  fps    + Comparar + 📈 Graph
QHD 2560x1440
65.6  fps    + Comparar + 📈 Graph
4K 3840x2160
37.9  fps    + Comparar + 📈 Graph
» Jugable con todos los portátiles probados en ajustes de detalle ultra.
Additional Benchmarks
Low Preset 1280x720
119.4
bajo 1920x1080
49.6  fps    + Comparar + 📈 Graph
alto 1920x1080
41.7  fps    + Comparar + 📈 Graph
ultra 1920x1080
32  fps    + Comparar + 📈 Graph
QHD 2560x1440
21.4  fps    + Comparar + 📈 Graph
4K 3840x2160
12  fps    + Comparar + 📈 Graph
» Jugable con todos los portátiles probados en ajustes de detalle alto.
Additional Benchmarks
Low 1280x720
79.4
bajo 1920x1080
122  fps    + Comparar + 📈 Graph
medio 1920x1080
114.4  fps    + Comparar + 📈 Graph
alto 1920x1080
105  fps    + Comparar + 📈 Graph
ultra 1920x1080
89.3  fps    + Comparar + 📈 Graph
QHD 2560x1440
63.8  fps    + Comparar + 📈 Graph
4K 3840x2160
33.8  fps    + Comparar + 📈 Graph
» Jugable con todos los portátiles probados en ajustes de detalle ultra.
Additional Benchmarks
Low Preset 1280x720
192.2
bajo 1920x1080
78.4  fps    + Comparar + 📈 Graph
medio 1920x1080
68.6  fps    + Comparar + 📈 Graph
alto 1920x1080
55.7  fps    + Comparar + 📈 Graph
ultra 1920x1080
49.2  fps    + Comparar + 📈 Graph
QHD 2560x1440
39.9  fps    + Comparar + 📈 Graph
4K 3840x2160
25.6  fps    + Comparar + 📈 Graph
» Jugable con todos los portátiles probados en ajustes de detalle ultra.
Additional Benchmarks
Very Low Preset 1280x720
104.9
Very High Preset + Very High Raytracing TAA 1920x1080
31.7
F1 23

F1 23

2023
bajo 1920x1080
269  fps    + Comparar
medio 1920x1080
237  fps    + Comparar
alto 1920x1080
162.2  fps    + Comparar
ultra 1920x1080
46  fps    + Comparar
QHD 2560x1440
28.9  fps    + Comparar
4K 3840x2160
13.7  fps    + Comparar
4K DLSS 3840x2160
24.6  fps    + Comparar
» Jugable con todos los portátiles probados en ajustes de detalle ultra.
Additional Benchmarks
Ultra Low Preset TAA 1280x720
414
Diablo 4

Diablo 4

2023
bajo 1920x1080
231  fps    + Comparar + 📈 Graph
medio 1920x1080
196.1  fps    + Comparar + 📈 Graph
alto 1920x1080
172.9  fps    + Comparar + 📈 Graph
ultra 1920x1080
141.6  fps    + Comparar + 📈 Graph
QHD 2560x1440
94  fps    + Comparar + 📈 Graph
4K 3840x2160
47  fps    + Comparar + 📈 Graph
» Jugable con todos los portátiles probados en ajustes de detalle ultra.
Additional Benchmarks
Low Preset 1280x720
382
bajo 1920x1080
72  fps    + Comparar + 📈 Graph
medio 1920x1080
62.2  fps    + Comparar + 📈 Graph
alto 1920x1080
57.1  fps    + Comparar + 📈 Graph
ultra 1920x1080
54.2  fps    + Comparar + 📈 Graph
QHD 2560x1440
33.7  fps    + Comparar + 📈 Graph
4K 3840x2160
16.8  fps    + Comparar + 📈 Graph
» Jugable con todos los portátiles probados en ajustes de detalle ultra.
Additional Benchmarks
Low Preset 1280x720
122.7
Epic Preset + Ray Tracing 1920x1080
41.6
bajo 1920x1080
226  fps    + Comparar + 📈 Graph
medio 1920x1080
191.6  fps    + Comparar + 📈 Graph
alto 1920x1080
138  fps    + Comparar + 📈 Graph
ultra 1920x1080
101.2  fps    + Comparar + 📈 Graph
QHD 2560x1440
68.7  fps    + Comparar + 📈 Graph
4K 3840x2160
33.7  fps    + Comparar + 📈 Graph
» Jugable con todos los portátiles probados en ajustes de detalle ultra.
Additional Benchmarks
Low Preset Low TAA 1280x720
333
bajo 1920x1080
86.8  fps    + Comparar + 📈 Graph
medio 1920x1080
70.1  fps    + Comparar + 📈 Graph
alto 1920x1080
61.6  fps    + Comparar + 📈 Graph
ultra 1920x1080
45.2  fps    + Comparar + 📈 Graph
QHD 2560x1440
29.1  fps    + Comparar + 📈 Graph
4K 3840x2160
12.7  fps    + Comparar + 📈 Graph
» Jugable con todos los portátiles probados en ajustes de detalle ultra.
Additional Benchmarks
Low Preset 1280x720
127.5
bajo 1920x1080
117.6  fps    + Comparar + 📈 Graph
medio 1920x1080
94.5  fps    + Comparar + 📈 Graph
alto 1920x1080
82.2  fps    + Comparar + 📈 Graph
» Jugable con todos los portátiles probados en ajustes de detalle alto.
Additional Benchmarks
Prioritize Performance Preset 1280x720
178.5
bajo 1920x1080
154.2  fps    + Comparar
medio 1920x1080
131.7  fps    + Comparar
alto 1920x1080
100.7  fps    + Comparar
ultra 1920x1080
101.4  fps    + Comparar
QHD 2560x1440
73.5  fps    + Comparar
4K 3840x2160
41.1  fps    + Comparar
» Jugable con todos los portátiles probados en ajustes de detalle ultra.
Additional Benchmarks
Minimum Settings 1280x720
256
bajo 1920x1080
94.5  fps    + Comparar + 📈 Graph
medio 1920x1080
78.4  fps    + Comparar + 📈 Graph
alto 1920x1080
74.9  fps    + Comparar + 📈 Graph
ultra 1920x1080
72.7  fps    + Comparar + 📈 Graph
QHD 2560x1440
54.5  fps    + Comparar + 📈 Graph
4K 3840x2160
32.3  fps    + Comparar + 📈 Graph
» Jugable con todos los portátiles probados en ajustes de detalle ultra.
Additional Benchmarks
Ultra Low Preset 1280x720
125.5
bajo 1920x1080
168.3  fps    + Comparar + 📈 Graph
medio 1920x1080
124.3  fps    + Comparar + 📈 Graph
alto 1920x1080
72.7  fps    + Comparar + 📈 Graph
ultra 1920x1080
58.1  fps    + Comparar + 📈 Graph
QHD 2560x1440
43.6  fps    + Comparar + 📈 Graph
4K 3840x2160
25.6  fps    + Comparar + 📈 Graph
» Jugable con todos los portátiles probados en ajustes de detalle ultra.
Additional Benchmarks
Low Preset 1280x720
253
Returnal

Returnal

2023
bajo 1920x1080
93  fps    + Comparar
medio 1920x1080
89  fps    + Comparar
alto 1920x1080
79  fps    + Comparar
ultra 1920x1080
68  fps    + Comparar
QHD 2560x1440
49  fps    + Comparar
4K 3840x2160
28  fps    + Comparar
» Jugable con todos los portátiles probados en ajustes de detalle ultra.
Additional Benchmarks
Low Preset 1280x720
125
Epic Preset + Epic Ray-Tracing 1920x1080
53
Epic Preset + Epic Ray-Tracing 3840x2160
19
bajo 1920x1080
124.5  fps    + Comparar + 📈 Graph
medio 1920x1080
91.5  fps    + Comparar + 📈 Graph
alto 1920x1080
68.8  fps    + Comparar + 📈 Graph
ultra 1920x1080
58.1  fps    + Comparar + 📈 Graph
QHD 2560x1440
40.7  fps    + Comparar + 📈 Graph
4K 3840x2160
21.6  fps    + Comparar + 📈 Graph
» Jugable con todos los portátiles probados en ajustes de detalle ultra.
Additional Benchmarks
Low Preset Low TAA 1280x720
167.5
Ultra Preset + Full Ray Tracing High TAA 1920x1080
36.9
Ultra Preset + Full Ray Tracing High TAA 3840x2160
13.9
bajo 1920x1080
79.4  fps    + Comparar + 📈 Graph
medio 1920x1080
75.3  fps    + Comparar + 📈 Graph
alto 1920x1080
66  fps    + Comparar + 📈 Graph
ultra 1920x1080
64.8  fps    + Comparar + 📈 Graph
QHD 2560x1440
42.6  fps    + Comparar + 📈 Graph
4K 3840x2160
22  fps    + Comparar + 📈 Graph
» Jugable con todos los portátiles probados en ajustes de detalle ultra.
Additional Benchmarks
Low Preset TAA 1280x720
124.8
bajo 1920x1080
191.8  fps    + Comparar + 📈 Graph
medio 1920x1080
153.3  fps    + Comparar + 📈 Graph
alto 1920x1080
125.8  fps    + Comparar + 📈 Graph
ultra 1920x1080
100.2  fps    + Comparar + 📈 Graph
QHD 2560x1440
71.3  fps    + Comparar + 📈 Graph
4K 3840x2160
40.3  fps    + Comparar + 📈 Graph
» Jugable con todos los portátiles probados en ajustes de detalle ultra.
Additional Benchmarks
Low Preset / Off 1280x720
288
RT Ultra Preset / On FXAA 1920x1080
22.1
bajo 1920x1080
221  fps    + Comparar + 📈 Graph
medio 1920x1080
137.7  fps    + Comparar + 📈 Graph
alto 1920x1080
105.1  fps    + Comparar + 📈 Graph
ultra 1920x1080
86.2  fps    + Comparar + 📈 Graph
QHD 2560x1440
51.2  fps    + Comparar + 📈 Graph
4K 3840x2160
19.4  fps    + Comparar + 📈 Graph
» Jugable con todos los portátiles probados en ajustes de detalle ultra.
Additional Benchmarks
Low Preset 1280x720
331
bajo 1920x1080
134.8  fps    + Comparar
medio 1920x1080
92.2  fps    + Comparar
alto 1920x1080
58.7  fps    + Comparar
ultra 1920x1080
57.7  fps    + Comparar
QHD 2560x1440
42.9  fps    + Comparar
4K 3840x2160
25.1  fps    + Comparar
» Jugable con todos los portátiles probados en ajustes de detalle ultra.
Additional Benchmarks
Low Preset (without FSR Upscaling) 1280x720
195.2
Ultra Preset (without FSR Upscaling) + Full Ray-Tracing 1920x1080
37.5
bajo 1920x1080
138.1  fps    + Comparar + 📈 Graph
medio 1920x1080
121.4  fps    + Comparar + 📈 Graph
alto 1920x1080
99.3  fps    + Comparar + 📈 Graph
ultra 1920x1080
83.9  fps    + Comparar + 📈 Graph
QHD 2560x1440
59.9  fps    + Comparar + 📈 Graph
4K 3840x2160
32.4  fps    + Comparar + 📈 Graph
» Jugable con todos los portátiles probados en ajustes de detalle ultra.
Additional Benchmarks
Low Preset 1280x720
177.7
bajo 1920x1080
115.8  fps    + Comparar + 📈 Graph
medio 1920x1080
108.1  fps    + Comparar + 📈 Graph
alto 1920x1080
101.1  fps    + Comparar + 📈 Graph
ultra 1920x1080
97.8  fps    + Comparar + 📈 Graph
QHD 2560x1440
67.8  fps    + Comparar + 📈 Graph
4K 3840x2160
35.1  fps    + Comparar + 📈 Graph
» Jugable con todos los portátiles probados en ajustes de detalle ultra.
Additional Benchmarks
Very Low Preset 1280x720
165.8
Very High Preset + Ray-Tracing TAA 1920x0180
39.5
bajo 1920x1080
112  fps    + Comparar
medio 1920x1080
90 100 ~ 95 fps    + Comparar
alto 1920x1080
69 73 ~ 71 fps    + Comparar
ultra 1920x1080
68 68 ~ 68 fps    + Comparar
QHD 2560x1440
47 48 ~ 48 fps    + Comparar
4K 3840x2160
28 30 ~ 29 fps    + Comparar
4K DLSS 3840x2160
46 47 ~ 47 fps    + Comparar
» Jugable con todos los portátiles probados en ajustes de detalle ultra.
Additional Benchmarks
Basic Quality Preset T2X SMAA 1280x720
162
bajo 1920x1080
75.7  fps    + Comparar + 📈 Graph
medio 1920x1080
72.6  fps    + Comparar + 📈 Graph
alto 1920x1080
69.7  fps    + Comparar + 📈 Graph
ultra 1920x1080
65.3  fps    + Comparar + 📈 Graph
QHD 2560x1440
50.5  fps    + Comparar + 📈 Graph
4K 3840x2160
21.8  fps    + Comparar + 📈 Graph
» Jugable con todos los portátiles probados en ajustes de detalle ultra.
Additional Benchmarks
Low Preset 1280x720
98.7
bajo 1920x1080
97.9  fps    + Comparar + 📈 Graph
medio 1920x1080
74.2  fps    + Comparar + 📈 Graph
alto 1920x1080
54.8  fps    + Comparar + 📈 Graph
ultra 1920x1080
41.6  fps    + Comparar + 📈 Graph
QHD 2560x1440
29.2  fps    + Comparar + 📈 Graph
4K 3840x2160
16.4  fps    + Comparar + 📈 Graph
» Jugable con todos los portátiles probados en ajustes de detalle ultra.
Additional Benchmarks
Low Preset 1280x720
135.2
FIFA 23

FIFA 23

2022
bajo 1920x1080
266  fps    + Comparar + 📈 Graph
medio 1920x1080
238  fps    + Comparar + 📈 Graph
alto 1920x1080
165.9  fps    + Comparar + 📈 Graph
ultra 1920x1080
161  fps    + Comparar + 📈 Graph
QHD 2560x1440
117.9  fps    + Comparar + 📈 Graph
4K 3840x2160
71.4  fps    + Comparar + 📈 Graph
» Jugable con todos los portátiles probados en ajustes de detalle ultra.
Additional Benchmarks
Low Rendering Quality 1280x720
341
bajo 1920x1080
135.6 137.2 ~ 136 fps    + Comparar + 📈 Graph
medio 1920x1080
103.2 103.8 ~ 104 fps    + Comparar + 📈 Graph
alto 1920x1080
82 84.5 ~ 83 fps    + Comparar + 📈 Graph
ultra 1920x1080
63.1 65.1 ~ 64 fps    + Comparar + 📈 Graph
QHD 2560x1440
42.8 44 ~ 43 fps    + Comparar + 📈 Graph
4K 3840x2160
19.9 20 ~ 20 fps    + Comparar + 📈 Graph
» Jugable con todos los portátiles probados en ajustes de detalle ultra.
Additional Benchmarks
Low Preset 1280x720
196.8
F1 22

F1 22

2022
bajo 1920x1080
230 249 273 ~ 251 fps    + Comparar
medio 1920x1080
212 222 241 ~ 225 fps    + Comparar
alto 1920x1080
157.2 163.1 174.8 ~ 165 fps    + Comparar
ultra 1920x1080
47.1 48.5 51.5 ~ 49 fps    + Comparar
QHD 2560x1440
30.1 30.3 32 ~ 31 fps    + Comparar
4K 3840x2160
14.7 14.7 15.4 ~ 15 fps    + Comparar
» Jugable con todos los portátiles probados en ajustes de detalle ultra.
Additional Benchmarks
Ultra Low Preset 16xAF TAA 1280x720
290
402
463
bajo 1920x1080
307  fps    + Comparar + 📈 Graph
medio 1920x1080
169.3  fps    + Comparar + 📈 Graph
alto 1920x1080
155.7  fps    + Comparar + 📈 Graph
ultra 1920x1080
146.9  fps    + Comparar + 📈 Graph
QHD 2560x1440
99.9  fps    + Comparar + 📈 Graph
4K 3840x2160
50.9  fps    + Comparar + 📈 Graph
» Jugable con todos los portátiles probados en ajustes de detalle ultra.
Additional Benchmarks
Low Preset 1280x720
388
bajo 1920x1080
124.4 138.8 ~ 132 fps    + Comparar + 📈 Graph
medio 1920x1080
122.9 127.5 ~ 125 fps    + Comparar + 📈 Graph
alto 1920x1080
122.1 124.9 ~ 124 fps    + Comparar + 📈 Graph
ultra 1920x1080
121.3 124.1 ~ 123 fps    + Comparar + 📈 Graph
QHD 2560x1440
76.3 78.8 ~ 78 fps    + Comparar + 📈 Graph
4K 3840x2160
37 38.8 ~ 38 fps    + Comparar + 📈 Graph
» Jugable con todos los portátiles probados en ajustes de detalle ultra.
Additional Benchmarks
Lowest Settings 1280x720
202
259
Highest Settings + Maximum Ray Tracing 1920x1080
41.6
43.7
bajo 1920x1080
148.9 162 165.8 ~ 159 fps    + Comparar
medio 1920x1080
122.3 130.7 133.1 ~ 129 fps    + Comparar
alto 1920x1080
87.9 89.3 91.2 ~ 89 fps    + Comparar
ultra 1920x1080
69.8 70.5 71.7 ~ 71 fps    + Comparar
QHD 2560x1440
48.5 49.1 49.5 ~ 49 fps    + Comparar
4K 3840x2160
26 26.2 26.3 ~ 26 fps    + Comparar
» Jugable con todos los portátiles probados en ajustes de detalle ultra.
Additional Benchmarks
Lowest Preset (DX12) 1280x720
261
302
bajo 1920x1080
78.5 97.3 ~ 88 fps    + Comparar
medio 1920x1080
77.5 79.7 ~ 79 fps    + Comparar
alto 1920x1080
69.5 71.7 ~ 71 fps    + Comparar
ultra 1920x1080
61.1 63 ~ 62 fps    + Comparar
QHD 2560x1440
38.5 40.6 ~ 40 fps    + Comparar
4K 3840x2160
18.4 19.2 ~ 19 fps    + Comparar
» Jugable con todos los portátiles probados en ajustes de detalle ultra.
Additional Benchmarks
Low Preset 1280x720
78.6
145.2
Ray Tracing Ultra Preset (DLSS off) 1920x1080
22.5
25.4
Ray Tracing Ultra Preset (DLSS off) 3840x2160
4.1
Elex 2

Elex 2

2022
bajo 1920x1080
87.3  fps    + Comparar + 📈 Graph
medio 1920x1080
83.3  fps    + Comparar + 📈 Graph
alto 1920x1080
74.7  fps    + Comparar + 📈 Graph
ultra 1920x1080
67.9  fps    + Comparar + 📈 Graph
QHD 2560x1440
49.7  fps    + Comparar + 📈 Graph
4K 3840x2160
28  fps    + Comparar + 📈 Graph
» Jugable con todos los portátiles probados en ajustes de detalle ultra.
Additional Benchmarks
Low / Off 1280x720
101
bajo 1920x1080
196.3 212.8 289 ~ 233 fps    + Comparar
medio 1920x1080
154.9 169.2 215 ~ 180 fps    + Comparar
alto 1920x1080
130.2 140.7 171.6 ~ 148 fps    + Comparar
ultra 1920x1080
94.7 106.4 125.5 ~ 109 fps    + Comparar
QHD 2560x1440
75.9 85.7 96.5 ~ 86 fps    + Comparar
4K 3840x2160
48.6 55.1 57.5 ~ 54 fps    + Comparar
» Jugable con todos los portátiles probados en ajustes de detalle ultra.
Additional Benchmarks
Low Preset 1280x720
213.3
344
bajo 1920x1080
59.9  fps    + Comparar + 📈 Graph
medio 1920x1080
59.9  fps    + Comparar + 📈 Graph
alto 1920x1080
59.7  fps    + Comparar + 📈 Graph
ultra 1920x1080
59.9  fps    + Comparar + 📈 Graph
QHD 2560x1440
59.8  fps    + Comparar + 📈 Graph
4K 3840x2160
56.9  fps    + Comparar + 📈 Graph
» Jugable con todos los portátiles probados en ajustes de detalle ultra.
bajo 1920x1080
109  fps    + Comparar + 📈 Graph
medio 1920x1080
64.4  fps    + Comparar + 📈 Graph
alto 1920x1080
54.1 59.8 ~ 57 fps    + Comparar + 📈 Graph
QHD 2560x1440
38 41.3 ~ 40 fps    + Comparar + 📈 Graph
4K 3840x2160
20.4 21.5 ~ 21 fps    + Comparar + 📈 Graph
» Jugable con todos los portátiles probados en ajustes de detalle alto.
Additional Benchmarks
Low Quality 1280x720
145
High Quality Raytracing 1920x1080
47
bajo 1920x1080
171  fps    + Comparar
medio 1920x1080
148  fps    + Comparar
alto 1920x1080
146  fps    + Comparar
ultra 1920x1080
119  fps    + Comparar
QHD 2560x1440
78  fps    + Comparar
4K 3840x2160
34  fps    + Comparar
» Jugable con todos los portátiles probados en ajustes de detalle ultra.
Additional Benchmarks
Ultra Low Preset (with Fixed Resolution Quality) 1280x720
291
bajo 1920x1080
113 120.7 122.5 ~ 119 fps    + Comparar + 📈 Graph
medio 1920x1080
93.1 103 106.9 ~ 101 fps    + Comparar + 📈 Graph
alto 1920x1080
75.4 83.3 86.2 ~ 82 fps    + Comparar + 📈 Graph
ultra 1920x1080
52.3 55.3 58.3 61.9 ~ 57 fps    + Comparar + 📈 Graph
QHD 2560x1440
42.4 45.1 47.2 48.9 ~ 46 fps    + Comparar + 📈 Graph
4K 3840x2160
29.6 30 31 31.8 ~ 31 fps    + Comparar + 📈 Graph
» Jugable con todos los portátiles probados en ajustes de detalle ultra.
Additional Benchmarks
Low Preset 1280x720
160
174.7
medio 1920x1080
112  fps    + Comparar + 📈 Graph
alto 1920x1080
88.2  fps    + Comparar + 📈 Graph
ultra 1920x1080
84 87.3 ~ 86 fps    + Comparar + 📈 Graph
QHD 2560x1440
63.5 67.9 ~ 66 fps    + Comparar + 📈 Graph
4K 3840x2160
35.6 67.9 ~ 52 fps    + Comparar + 📈 Graph
» Jugable con todos los portátiles probados en ajustes de detalle ultra.
Additional Benchmarks
Low Preset 1920x1080
120
bajo 1280x720
277  fps    + Comparar + 📈 Graph
medio 1920x1080
222  fps    + Comparar + 📈 Graph
alto 1920x1080
171  fps    + Comparar + 📈 Graph
ultra 1920x1080
147  fps    + Comparar + 📈 Graph
QHD 2560x1440
112  fps    + Comparar + 📈 Graph
4K 3840x2160
68.3  fps    + Comparar + 📈 Graph
» Jugable con todos los portátiles probados en ajustes de detalle ultra.
Additional Benchmarks
Low Preset 1920x1080
297
bajo 1280x720
102  fps    + Comparar + 📈 Graph
medio 1920x1080
112  fps    + Comparar + 📈 Graph
alto 1920x1080
94.7  fps    + Comparar + 📈 Graph
ultra 1920x1080
80.9  fps    + Comparar + 📈 Graph
QHD 2560x1440
61.3  fps    + Comparar + 📈 Graph
4K 3840x2160
36.5  fps    + Comparar + 📈 Graph
» Jugable con todos los portátiles probados en ajustes de detalle ultra.
Additional Benchmarks
Low Preset 1920x1080
99.1
Ultra Preset + Ray Tracing 1920x1080
66
bajo 1280x720
200 230 245 ~ 225 fps    + Comparar
medio 1920x1080
115 125 131 ~ 124 fps    + Comparar
alto 1920x1080
102 108 115 ~ 108 fps    + Comparar
ultra 1920x1080
62 65 67 68 ~ 66 fps    + Comparar
QHD 2560x1440
52 56 57 ~ 55 fps    + Comparar
4K 3840x2160
36 39 39 ~ 38 fps    + Comparar
» Jugable con todos los portátiles probados en ajustes de detalle ultra.
Additional Benchmarks
Low Preset 1920x1080
142
164
bajo 1280x720
102  fps    + Comparar + 📈 Graph
medio 1920x1080
109  fps    + Comparar + 📈 Graph
alto 1920x1080
90.3  fps    + Comparar + 📈 Graph
ultra 1920x1080
82  fps    + Comparar + 📈 Graph
QHD 2560x1440
59.2  fps    + Comparar + 📈 Graph
4K 3840x2160
33.3  fps    + Comparar + 📈 Graph
» Jugable con todos los portátiles probados en ajustes de detalle ultra.
Additional Benchmarks
Low Preset 1920x1080
95.6
bajo 1280x720
190  fps    + Comparar
medio 1920x1080
123  fps    + Comparar
alto 1920x1080
102  fps    + Comparar
ultra 1920x1080
92  fps    + Comparar
QHD 2560x1440
66  fps    + Comparar
4K 3840x2160
36  fps    + Comparar
» Jugable con todos los portátiles probados en ajustes de detalle ultra.
Additional Benchmarks
Low Preset 1920x1080
148
bajo 1280x720
134 140 ~ 137 fps    + Comparar
medio 1920x1080
125 136 ~ 131 fps    + Comparar
alto 1920x1080
122 135 ~ 129 fps    + Comparar
ultra 1920x1080
122 130 ~ 126 fps    + Comparar
QHD 2560x1440
84 87 ~ 86 fps    + Comparar
4K 3840x2160
45 47 ~ 46 fps    + Comparar
» Jugable con todos los portátiles probados en ajustes de detalle ultra.
Additional Benchmarks
Low Preset 1920x1080
128
205
Ultra Preset + Ultra Ray-Tracing 1920x1080
54
54
medio 1920x1080
190  fps    + Comparar + 📈 Graph
alto 1920x1080
173  fps    + Comparar + 📈 Graph
ultra 1920x1080
156  fps    + Comparar + 📈 Graph
QHD 2560x1440
103  fps    + Comparar + 📈 Graph
4K 3840x2160
52.9  fps    + Comparar + 📈 Graph
» Jugable con todos los portátiles probados en ajustes de detalle ultra.
Additional Benchmarks
Low Preset (DX12) 1920x1080
271
Far Cry 6

Far Cry 6

2021
bajo 1280x720
161 198 204 ~ 188 fps    + Comparar + 📈 Graph
medio 1920x1080
121 125.4 128.2 ~ 125 fps    + Comparar + 📈 Graph
alto 1920x1080
107.1 108 108.8 ~ 108 fps    + Comparar + 📈 Graph
ultra 1920x1080
90.9 93 94.6 ~ 93 fps    + Comparar + 📈 Graph
QHD 2560x1440
65.9 67.4 68 ~ 67 fps    + Comparar + 📈 Graph
4K 3840x2160
5.6 12.2 37 ~ 18 fps    + Comparar + 📈 Graph
» Jugable con todos los portátiles probados en ajustes de detalle ultra.
Additional Benchmarks
Low Graphics Quality 1920x1080
138
153.3
Ultra Graphics Quality + HD Textures + DXR TAA 1920x1080
73
47.7
medio 1920x1080
93.7  fps    + Comparar + 📈 Graph
alto 1920x1080
90.3  fps    + Comparar + 📈 Graph
QHD 2560x1440
89.7  fps    + Comparar + 📈 Graph
4K 3840x2160
85.1  fps    + Comparar + 📈 Graph
» Jugable con todos los portátiles probados en ajustes de detalle alto.
Additional Benchmarks
Low Preset 1920x1080
97.4
New World

New World

2021
bajo 1280x720
173  fps    + Comparar + 📈 Graph
medio 1920x1080
110  fps    + Comparar + 📈 Graph
alto 1920x1080
102  fps    + Comparar + 📈 Graph
ultra 1920x1080
89.8  fps    + Comparar + 📈 Graph
QHD 2560x1440
60.1  fps    + Comparar + 📈 Graph
4K 3840x2160
31.4  fps    + Comparar + 📈 Graph
» Jugable con todos los portátiles probados en ajustes de detalle ultra.
Deathloop

Deathloop

2021
bajo 1280x720
119  fps    + Comparar + 📈 Graph
medio 1920x1080
102  fps    + Comparar + 📈 Graph
alto 1920x1080
86.9  fps    + Comparar + 📈 Graph
ultra 1920x1080
69  fps    + Comparar + 📈 Graph
QHD 2560x1440
46.8  fps    + Comparar + 📈 Graph
4K 3840x2160
27.4  fps    + Comparar + 📈 Graph
» Jugable con todos los portátiles probados en ajustes de detalle ultra.
Additional Benchmarks
Low Preset 1920x1080
110
F1 2021

F1 2021

2021
bajo 1280x720
231 429 525 549 ~ 434 fps    + Comparar
medio 1920x1080
209 241 266 271 ~ 247 fps    + Comparar
alto 1920x1080
178 194 215 219 ~ 202 fps    + Comparar
ultra 1920x1080
93.6 97.9 104.2 104.3 ~ 100 fps    + Comparar
QHD 2560x1440
67.7 71.6 74.6 75.1 ~ 72 fps    + Comparar
4K 3840x2160
38.1 40.2 40.9 41 ~ 40 fps    + Comparar
» Jugable con todos los portátiles probados en ajustes de detalle ultra.
bajo 1280x720
144  fps    + Comparar + 📈 Graph
medio 1920x1080
144  fps    + Comparar + 📈 Graph
alto 1920x1080
144  fps    + Comparar + 📈 Graph
QHD 2560x1440
143  fps    + Comparar + 📈 Graph
4K 3840x2160
108  fps    + Comparar + 📈 Graph
» Jugable con todos los portátiles probados en ajustes de detalle alto.
Additional Benchmarks
Low Preset 1920x1080
144
Days Gone

Days Gone

2021
bajo 1280x720
195  fps    + Comparar + 📈 Graph
medio 1920x1080
132  fps    + Comparar + 📈 Graph
alto 1920x1080
117  fps    + Comparar + 📈 Graph
ultra 1920x1080
87.1  fps    + Comparar + 📈 Graph
QHD 2560x1440
63.7  fps    + Comparar + 📈 Graph
4K 3840x2160
36.2  fps    + Comparar + 📈 Graph
» Jugable con todos los portátiles probados en ajustes de detalle ultra.
Additional Benchmarks
Low Preset 1920x1080
156
bajo 1280x720
104  fps    + Comparar + 📈 Graph
ultra 1920x1080
101  fps    + Comparar + 📈 Graph
QHD 2560x1440
99.6  fps    + Comparar + 📈 Graph
4K 3840x2160
76.7  fps    + Comparar + 📈 Graph
» Jugable con todos los portátiles probados en ajustes de detalle ultra.
bajo 1280x720
322  fps    + Comparar + 📈 Graph
medio 1920x1080
163  fps    + Comparar + 📈 Graph
alto 1920x1080
148  fps    + Comparar + 📈 Graph
ultra 1920x1080
129  fps    + Comparar + 📈 Graph
QHD 2560x1440
85.1  fps    + Comparar + 📈 Graph
4K 3840x2160
42.6  fps    + Comparar + 📈 Graph
» Jugable con todos los portátiles probados en ajustes de detalle ultra.
Additional Benchmarks
Ray Tracing Preset 1920x1080
82.2
Outriders

Outriders

2021
bajo 1280x720
118  fps    + Comparar + 📈 Graph
medio 1920x1080
142  fps    + Comparar + 📈 Graph
alto 1920x1080
114  fps    + Comparar + 📈 Graph
ultra 1920x1080
95.1 99.8 ~ 97 fps    + Comparar + 📈 Graph
QHD 2560x1440
66.4 67.2 ~ 67 fps    + Comparar + 📈 Graph
4K 3840x2160
35.4 36.1 ~ 36 fps    + Comparar + 📈 Graph
» Jugable con todos los portátiles probados en ajustes de detalle ultra.
Hitman 3

Hitman 3

2021
bajo 1280x720
247  fps    + Comparar
medio 1920x1080
135  fps    + Comparar
alto 1920x1080
128  fps    + Comparar
ultra 1920x1080
122  fps    + Comparar
QHD 2560x1440
85  fps    + Comparar
4K 3840x2160
46  fps    + Comparar
» Jugable con todos los portátiles probados en ajustes de detalle ultra.
bajo 1280x720
110  fps    + Comparar + 📈 Graph
medio 1920x1080
74.7  fps    + Comparar + 📈 Graph
alto 1920x1080
62.6  fps    + Comparar + 📈 Graph
ultra 1920x1080
52.1 54.2 ~ 53 fps    + Comparar + 📈 Graph
QHD 2560x1440
35.3 35.7 ~ 36 fps    + Comparar + 📈 Graph
4K 3840x2160
17.3 17.5 ~ 17 fps    + Comparar + 📈 Graph
» Jugable con todos los portátiles probados en ajustes de detalle ultra.
Additional Benchmarks
Low Preset 1920x1080
86.6
Ray Tracing Ultra Preset (DLSS off) 1920x1080
21.3
bajo 1280x720
124  fps    + Comparar
medio 1920x1080
87  fps    + Comparar
alto 1920x1080
75  fps    + Comparar
ultra 1920x1080
56 57 ~ 57 fps    + Comparar
QHD 2560x1440
49 49 ~ 49 fps    + Comparar
4K 3840x2160
39  fps    + Comparar
» Jugable con todos los portátiles probados en ajustes de detalle ultra.
bajo 1280x720
99  fps    + Comparar + 📈 Graph
medio 1920x1080
94.1  fps    + Comparar + 📈 Graph
alto 1920x1080
97.7  fps    + Comparar + 📈 Graph
ultra 1920x1080
84.3  fps    + Comparar + 📈 Graph
QHD 2560x1440
58.1  fps    + Comparar + 📈 Graph
4K 3840x2160
30.4  fps    + Comparar + 📈 Graph
» Jugable con todos los portátiles probados en ajustes de detalle ultra.
bajo 1280x720
181  fps    + Comparar + 📈 Graph
medio 1920x1080
118  fps    + Comparar + 📈 Graph
alto 1920x1080
91.3  fps    + Comparar + 📈 Graph
ultra 1920x1080
73  fps    + Comparar + 📈 Graph
QHD 2560x1440
53.2  fps    + Comparar + 📈 Graph
4K 3840x2160
17.3  fps    + Comparar + 📈 Graph
» Jugable con todos los portátiles probados en ajustes de detalle ultra.
Additional Benchmarks
Highest Settings + Ultra Ray Tracing 1920x1080
44.7
bajo 1280x720
112  fps    + Comparar
medio 1920x1080
81  fps    + Comparar
alto 1920x1080
68  fps    + Comparar
ultra 1920x1080
61  fps    + Comparar
QHD 2560x1440
47  fps    + Comparar
4K 3840x2160
29  fps    + Comparar
» Jugable con todos los portátiles probados en ajustes de detalle ultra.
Dirt 5

Dirt 5

2020
bajo 1280x720
148  fps    + Comparar
medio 1920x1080
88.9  fps    + Comparar
alto 1920x1080
70.8  fps    + Comparar
ultra 1920x1080
60  fps    + Comparar
QHD 2560x1440
50.4  fps    + Comparar
4K 3840x2160
34.3  fps    + Comparar
» Jugable con todos los portátiles probados en ajustes de detalle ultra.
bajo 1280x720
118  fps    + Comparar + 📈 Graph
medio 1920x1080
104  fps    + Comparar + 📈 Graph
alto 1920x1080
90.4  fps    + Comparar + 📈 Graph
ultra 1920x1080
59.1  fps    + Comparar + 📈 Graph
QHD 2560x1440
43.7  fps    + Comparar + 📈 Graph
4K 3840x2160
24.7  fps    + Comparar + 📈 Graph
» Jugable con todos los portátiles probados en ajustes de detalle ultra.
Additional Benchmarks
Ultra Preset + Ultra Ray Tracing (DX12) 1920x1080
33.7
FIFA 21

FIFA 21

2020
bajo 1280x720
228  fps    + Comparar + 📈 Graph
medio 1920x1080
229  fps    + Comparar + 📈 Graph
alto 1920x1080
216  fps    + Comparar + 📈 Graph
ultra 1920x1080
215  fps    + Comparar + 📈 Graph
QHD 2560x1440
212  fps    + Comparar + 📈 Graph
4K 3840x2160
181  fps    + Comparar + 📈 Graph
» Jugable con todos los portátiles probados en ajustes de detalle ultra.
bajo 1280x720
320 435 ~ 378 fps    + Comparar + 📈 Graph
medio 1920x1080
275 288 ~ 282 fps    + Comparar + 📈 Graph
alto 1920x1080
237 245 ~ 241 fps    + Comparar + 📈 Graph
ultra 1920x1080
228 229 ~ 229 fps    + Comparar + 📈 Graph
QHD 2560x1440
147 152 ~ 150 fps    + Comparar + 📈 Graph
4K 3840x2160
83 86.8 ~ 85 fps    + Comparar + 📈 Graph
» Jugable con todos los portátiles probados en ajustes de detalle ultra.
bajo 1280x720
147  fps    + Comparar
medio 1920x1080
105  fps    + Comparar
alto 1920x1080
97  fps    + Comparar
QHD 2560x1440
67  fps    + Comparar
4K 3840x2160
35  fps    + Comparar
» Jugable con todos los portátiles probados en ajustes de detalle alto.
bajo 1280x720
144.5  fps    + Comparar
medio 1920x1080
104.2  fps    + Comparar
alto 1920x1080
89.4  fps    + Comparar
ultra 1920x1080
74.4 90.1 ~ 82 fps    + Comparar + 📈 Graph
QHD 2560x1440
72.8 74.3 ~ 74 fps    + Comparar + 📈 Graph
4K 3840x2160
41.6 44.6 ~ 43 fps    + Comparar + 📈 Graph
» Jugable con todos los portátiles probados en ajustes de detalle ultra.
bajo 1280x720
246  fps    + Comparar + 📈 Graph
medio 1920x1080
143  fps    + Comparar + 📈 Graph
alto 1920x1080
74.4  fps    + Comparar + 📈 Graph
ultra 1920x1080
60.7  fps    + Comparar + 📈 Graph
QHD 2560x1440
46  fps    + Comparar + 📈 Graph
4K 3840x2160
24.6  fps    + Comparar + 📈 Graph
» Jugable con todos los portátiles probados en ajustes de detalle ultra.
bajo 1280x720
75.2  fps    + Comparar
medio 1920x1080
66.2 68.5 ~ 67 fps    + Comparar + 📈 Graph
alto 1920x1080
52.9 54.7 ~ 54 fps    + Comparar + 📈 Graph
ultra 1920x1080
38.1 39.2 ~ 39 fps    + Comparar + 📈 Graph
QHD 2560x1440
29.7 30.7 ~ 30 fps    + Comparar + 📈 Graph
4K 3840x2160
17.4 18.7 ~ 18 fps    + Comparar + 📈 Graph
» Jugable con todos los portátiles probados en ajustes de detalle ultra.
bajo 1280x720
149  fps    + Comparar
medio 1920x1080
102  fps    + Comparar
alto 1920x1080
85  fps    + Comparar
ultra 1920x1080
69  fps    + Comparar
QHD 2560x1440
54  fps    + Comparar
4K 3840x2160
31  fps    + Comparar
» Jugable con todos los portátiles probados en ajustes de detalle ultra.
bajo 1280x720
190  fps    + Comparar
medio 1920x1080
127  fps    + Comparar
alto 1920x1080
118  fps    + Comparar
ultra 1920x1080
114  fps    + Comparar
QHD 2560x1440
80.6  fps    + Comparar
4K 3840x2160
45.1  fps    + Comparar
» Jugable con todos los portátiles probados en ajustes de detalle ultra.
F1 2020

F1 2020

2020
bajo 1280x720
228 274 453 494 ~ 362 fps    + Comparar
medio 1920x1080
191 218 244 257 ~ 228 fps    + Comparar
alto 1920x1080
174 179 195.2 204 ~ 188 fps    + Comparar
ultra 1920x1080
127 127 135.9 140.2 ~ 133 fps    + Comparar
QHD 2560x1440
95.6 96.4 100.7 102.8 ~ 99 fps    + Comparar
4K 3840x2160
55.2 55.8 56.8 57.4 ~ 56 fps    + Comparar
» Jugable con todos los portátiles probados en ajustes de detalle ultra.
Valorant

Valorant

2020
bajo 1280x720
345 345 ~ 345 fps    + Comparar
medio 1920x1080
298 298 ~ 298 fps    + Comparar
alto 1920x1080
293 293 ~ 293 fps    + Comparar
QHD 2560x1440
268 268 ~ 268 fps    + Comparar
4K 3840x2160
210 210 221 ~ 214 fps    + Comparar
» Jugable con todos los portátiles probados en ajustes de detalle alto.
bajo 1280x720
323.7  fps    + Comparar
medio 1920x1080
199.3  fps    + Comparar
alto 1920x1080
134.5  fps    + Comparar
ultra 1920x1080
92  fps    + Comparar
QHD 2560x1440
63.7  fps    + Comparar
4K 3840x2160
34  fps    + Comparar
» Jugable con todos los portátiles probados en ajustes de detalle ultra.
bajo 1280x720
235  fps    + Comparar
medio 1920x1080
202  fps    + Comparar
alto 1920x1080
181  fps    + Comparar
ultra 1920x1080
180  fps    + Comparar
QHD 2560x1440
114  fps    + Comparar
4K 3840x2160
58.7  fps    + Comparar
» Jugable con todos los portátiles probados en ajustes de detalle ultra.
bajo 1280x720
252  fps    + Comparar
medio 1920x1080
137  fps    + Comparar
alto 1920x1080
105  fps    + Comparar
QHD 2560x1440
71  fps    + Comparar
4K 3840x2160
33.1  fps    + Comparar
» Jugable con todos los portátiles probados en ajustes de detalle alto.
bajo 1280x720
121  fps    + Comparar
medio 1920x1080
120  fps    + Comparar
alto 1920x1080
117  fps    + Comparar
ultra 1920x1080
98  fps    + Comparar
QHD 2560x1440
77.7  fps    + Comparar
4K 3840x2160
37.8  fps    + Comparar
» Jugable con todos los portátiles probados en ajustes de detalle ultra.
Fall Guys

Fall Guys

2020
alto 1920x1080
59.6  fps    + Comparar + 📈 Graph
QHD 2560x1440
59.6  fps    + Comparar + 📈 Graph
4K 3840x2160
59.6  fps    + Comparar + 📈 Graph
» Jugable con todos los portátiles probados en ajustes de detalle alto.
bajo 1280x720
145  fps    + Comparar
medio 1920x1080
106  fps    + Comparar
alto 1920x1080
72  fps    + Comparar
ultra 1920x1080
46.5  fps    + Comparar
QHD 2560x1440
37.6  fps    + Comparar
4K 3840x2160
24.1  fps    + Comparar
» Jugable con todos los portátiles probados en ajustes de detalle ultra.
medio 1920x1080
122  fps    + Comparar
alto 1920x1080
121  fps    + Comparar
ultra 1920x1080
114  fps    + Comparar
QHD 2560x1440
82  fps    + Comparar
4K 3840x2160
41.6  fps    + Comparar
» Jugable con todos los portátiles probados en ajustes de detalle ultra.
bajo 1280x720
100 115 ~ 108 fps    + Comparar
medio 1920x1080
96 110 ~ 103 fps    + Comparar
alto 1920x1080
89 101 ~ 95 fps    + Comparar
ultra 1920x1080
81 92 ~ 87 fps    + Comparar
QHD 2560x1440
66 74 ~ 70 fps    + Comparar
4K 3840x2160
39.3 42.9 ~ 41 fps    + Comparar
» Jugable con todos los portátiles probados en ajustes de detalle ultra.
bajo 1280x720
187  fps    + Comparar
medio 1920x1080
141  fps    + Comparar
alto 1920x1080
125  fps    + Comparar
ultra 1920x1080
109  fps    + Comparar
QHD 2560x1440
80  fps    + Comparar
4K 3840x2160
46  fps    + Comparar
» Jugable con todos los portátiles probados en ajustes de detalle ultra.
Additional Benchmarks
Maximum Settings with Raytracing T2X Filmic SMAA 1920x1080
93
Maximum Settings with Raytracing T2X Filmic SMAA 3840x2160
32.7
GRID 2019

GRID 2019

2019
bajo 1280x720
169 170 ~ 170 fps    + Comparar
medio 1920x1080
165 165 ~ 165 fps    + Comparar
alto 1920x1080
132 133 ~ 133 fps    + Comparar
ultra 1920x1080
85 90 ~ 88 fps    + Comparar
QHD 2560x1440
65 75 ~ 70 fps    + Comparar
4K 3840x2160
42.9 46 ~ 44 fps    + Comparar
» Jugable con todos los portátiles probados en ajustes de detalle ultra.
bajo 1280x720
147  fps    + Comparar
medio 1920x1080
102  fps    + Comparar
alto 1920x1080
95  fps    + Comparar
ultra 1920x1080
71  fps    + Comparar
QHD 2560x1440
53  fps    + Comparar
4K 3840x2160
30  fps    + Comparar
» Jugable con todos los portátiles probados en ajustes de detalle ultra.
FIFA 20

FIFA 20

2019
bajo 1280x720
269 289 ~ 279 fps    + Comparar
medio 1920x1080
263 265 ~ 264 fps    + Comparar
alto 1920x1080
252 267 ~ 260 fps    + Comparar
ultra 1920x1080
248 265 ~ 257 fps    + Comparar
QHD 2560x1440
244 253 ~ 249 fps    + Comparar
4K 3840x2160
178 190 ~ 184 fps    + Comparar
» Jugable con todos los portátiles probados en ajustes de detalle ultra.
bajo 1280x720
137.1 144 238 247 ~ 192 fps    + Comparar
medio 1920x1080
111.2 119.7 144.1 146.9 ~ 130 fps    + Comparar
alto 1920x1080
84.3 88.5 96.2 98 ~ 92 fps    + Comparar
ultra 1920x1080
68.6 68.7 73.3 74.1 ~ 71 fps    + Comparar
QHD 2560x1440
48.8 49.3 51 51.7 ~ 50 fps    + Comparar
4K 3840x2160
26.3 27.4 27.6 27.8 ~ 27 fps    + Comparar
» Jugable con todos los portátiles probados en ajustes de detalle ultra.
Additional Benchmarks
Very Low Overall Quality (DX11) 1920x1080
210
Control

Control

2019
bajo 1280x720
237 239 240 ~ 239 fps    + Comparar + 📈 Graph
medio 1920x1080
105 108 112.2 ~ 108 fps    + Comparar + 📈 Graph
alto 1920x1080
78 80 82.9 ~ 80 fps    + Comparar + 📈 Graph
QHD 2560x1440
51.9 52.1 53.1 ~ 52 fps    + Comparar + 📈 Graph
4K 3840x2160
24.6 25.7 25.9 ~ 25 fps    + Comparar + 📈 Graph
» Jugable con todos los portátiles probados en ajustes de detalle alto.
Additional Benchmarks
High Quality Preset & High Ray Tracing Preset (DX12) 1920x1080
46.6
45.9
47.2
F1 2019

F1 2019

2019
bajo 1280x720
204 221 ~ 213 fps    + Comparar
medio 1920x1080
185 196 ~ 191 fps    + Comparar
alto 1920x1080
150 170 ~ 160 fps    + Comparar
ultra 1920x1080
121 123 ~ 122 fps    + Comparar
QHD 2560x1440
95 97 ~ 96 fps    + Comparar
4K 3840x2160
58 58 ~ 58 fps    + Comparar
» Jugable con todos los portátiles probados en ajustes de detalle ultra.
bajo 1280x720
239.8  fps    + Comparar
medio 1920x1080
138.5  fps    + Comparar
alto 1920x1080
98.2  fps    + Comparar
ultra 1920x1080
69  fps    + Comparar
QHD 2560x1440
43.9  fps    + Comparar
4K 3840x2160
21.5  fps    + Comparar
» Jugable con todos los portátiles probados en ajustes de detalle ultra.
Rage 2

Rage 2

2019
bajo 1280x720
226 248 ~ 237 fps    + Comparar
medio 1920x1080
126 135 ~ 131 fps    + Comparar
alto 1920x1080
107 114 ~ 111 fps    + Comparar
ultra 1920x1080
104 112 ~ 108 fps    + Comparar
QHD 2560x1440
69 73 ~ 71 fps    + Comparar
4K 3840x2160
33.8 35.8 ~ 35 fps    + Comparar
» Jugable con todos los portátiles probados en ajustes de detalle ultra.
Anno 1800

Anno 1800

2019
bajo 1280x720
103 124 ~ 114 fps    + Comparar
medio 1920x1080
102 116 ~ 109 fps    + Comparar
alto 1920x1080
74 95 ~ 85 fps    + Comparar
ultra 1920x1080
36.5 40.3 ~ 38 fps    + Comparar
QHD 2560x1440
32 37.5 ~ 35 fps    + Comparar
4K 3840x2160
25 28.2 ~ 27 fps    + Comparar
» Jugable con todos los portátiles probados en ajustes de detalle ultra.
bajo 1280x720
179 201 ~ 190 fps    + Comparar
medio 1920x1080
140 143 ~ 142 fps    + Comparar
alto 1920x1080
114 116 ~ 115 fps    + Comparar
ultra 1920x1080
85 85 ~ 85 fps    + Comparar
QHD 2560x1440
59 59 ~ 59 fps    + Comparar
4K 3840x2160
32 32 ~ 32 fps    + Comparar
» Jugable con todos los portátiles probados en ajustes de detalle ultra.
bajo 1280x720
215 268 ~ 242 fps    + Comparar
medio 1920x1080
177 211 ~ 194 fps    + Comparar
alto 1920x1080
158 192 ~ 175 fps    + Comparar
ultra 1920x1080
93 124 ~ 109 fps    + Comparar
QHD 2560x1440
71 95 ~ 83 fps    + Comparar
4K 3840x2160
42.8 56 ~ 49 fps    + Comparar
» Jugable con todos los portátiles probados en ajustes de detalle ultra.
Anthem

Anthem

2019
bajo 1280x720
101 120 ~ 111 fps    + Comparar
medio 1920x1080
96 118 ~ 107 fps    + Comparar
alto 1920x1080
92 111 ~ 102 fps    + Comparar
ultra 1920x1080
89 109 ~ 99 fps    + Comparar
QHD 2560x1440
72 79 ~ 76 fps    + Comparar
4K 3840x2160
41 43.7 ~ 42 fps    + Comparar
» Jugable con todos los portátiles probados en ajustes de detalle ultra.
bajo 1280x720
112 129 197 197 ~ 159 fps    + Comparar + 📈 Graph
medio 1920x1080
98 111 142 144 ~ 124 fps    + Comparar + 📈 Graph
alto 1920x1080
95 107 132 134 ~ 117 fps    + Comparar + 📈 Graph
ultra 1920x1080
85 96 120 121 ~ 106 fps    + Comparar + 📈 Graph
QHD 2560x1440
79 83 91 92 ~ 86 fps    + Comparar + 📈 Graph
4K 3840x2160
48 49 49 50 ~ 49 fps    + Comparar + 📈 Graph
» Jugable con todos los portátiles probados en ajustes de detalle ultra.
bajo 1280x720
126.9 139 226 240 ~ 183 fps    + Comparar
medio 1920x1080
93 95.3 112.9 117 ~ 105 fps    + Comparar
alto 1920x1080
70 72.1 83.3 86.6 ~ 78 fps    + Comparar
ultra 1920x1080
58 58.9 64.9 67.4 ~ 62 fps    + Comparar
QHD 2560x1440
46 46.5 51.4 52.2 ~ 49 fps    + Comparar
4K 3840x2160
29.7 30 31.8 32.2 ~ 31 fps    + Comparar
» Jugable con todos los portátiles probados en ajustes de detalle ultra.
Additional Benchmarks
Ultra Quality DXR 16xAF 1920x1080
50.1
50
53.3
bajo 1280x720
144 144 ~ 144 fps    + Comparar
medio 1920x1080
144 144 ~ 144 fps    + Comparar
alto 1920x1080
144 144 ~ 144 fps    + Comparar
ultra 1920x1080
144 144 ~ 144 fps    + Comparar
QHD 2560x1440
112 116 ~ 114 fps    + Comparar
4K 3840x2160
63 65 ~ 64 fps    + Comparar
» Jugable con todos los portátiles probados en ajustes de detalle ultra.
bajo 1280x720
192 193 ~ 193 fps    + Comparar
medio 1920x1080
143 144 ~ 144 fps    + Comparar
alto 1920x1080
109 110 ~ 110 fps    + Comparar
ultra 1920x1080
102 103 ~ 103 fps    + Comparar
QHD 2560x1440
72 75 ~ 74 fps    + Comparar
4K 3840x2160
41 41 ~ 41 fps    + Comparar
» Jugable con todos los portátiles probados en ajustes de detalle ultra.
bajo 1280x720
158 248 ~ 203 fps    + Comparar
medio 1920x1080
114 151 ~ 133 fps    + Comparar
alto 1920x1080
108 132 ~ 120 fps    + Comparar
ultra 1920x1080
108 120 ~ 114 fps    + Comparar
QHD 2560x1440
82 83 ~ 83 fps    + Comparar
4K 3840x2160
41.6 42.5 ~ 42 fps    + Comparar
» Jugable con todos los portátiles probados en ajustes de detalle ultra.
bajo 1280x720
146 168 183 ~ 166 fps    + Comparar
medio 1920x1080
108 117 160 ~ 128 fps    + Comparar
alto 1920x1080
94 101 145 ~ 113 fps    + Comparar
ultra 1920x1080
87 93 134 ~ 105 fps    + Comparar
QHD 2560x1440
71 74 104 ~ 83 fps    + Comparar
4K 3840x2160
46.5 48.2 61 ~ 52 fps    + Comparar
» Jugable con todos los portátiles probados en ajustes de detalle ultra.
Additional Benchmarks
Ultra Preset DXR 1920x1080
70
73
65
bajo 1280x720
187 248 ~ 218 fps    + Comparar
medio 1920x1080
147 181 ~ 164 fps    + Comparar
alto 1920x1080
128 156 ~ 142 fps    + Comparar
ultra 1920x1080
118 143 ~ 131 fps    + Comparar
QHD 2560x1440
111 118 ~ 115 fps    + Comparar
4K 3840x2160
65 67 ~ 66 fps    + Comparar
» Jugable con todos los portátiles probados en ajustes de detalle ultra.
Hitman 2

Hitman 2

2018
bajo 1280x720
87 98 ~ 93 fps    + Comparar
medio 1920x1080
86 93 ~ 90 fps    + Comparar
alto 1920x1080
78 86 ~ 82 fps    + Comparar
ultra 1920x1080
79 84 ~ 82 fps    + Comparar
QHD 2560x1440
72 75 ~ 74 fps    + Comparar
4K 3840x2160
38.9 45 ~ 42 fps    + Comparar
» Jugable con todos los portátiles probados en ajustes de detalle ultra.
bajo 1280x720
222 284 ~ 253 fps    + Comparar
medio 1920x1080
163 163 ~ 163 fps    + Comparar
alto 1920x1080
154 158 ~ 156 fps    + Comparar
ultra 1920x1080
143 146 ~ 145 fps    + Comparar
QHD 2560x1440
95 96 ~ 96 fps    + Comparar
4K 3840x2160
46.2 48.6 ~ 47 fps    + Comparar
» Jugable con todos los portátiles probados en ajustes de detalle ultra.
bajo 1280x720
107 132 ~ 120 fps    + Comparar
medio 1920x1080
97 105 ~ 101 fps    + Comparar
alto 1920x1080
81 88 ~ 85 fps    + Comparar
ultra 1920x1080
61 61 ~ 61 fps    + Comparar
QHD 2560x1440
52 52 ~ 52 fps    + Comparar
4K 3840x2160
34 36 ~ 35 fps    + Comparar
» Jugable con todos los portátiles probados en ajustes de detalle ultra.
bajo 1280x720
164 193 ~ 179 fps    + Comparar
medio 1920x1080
137 167 ~ 152 fps    + Comparar
alto 1920x1080
134 159 ~ 147 fps    + Comparar
ultra 1920x1080
110 129 ~ 120 fps    + Comparar
QHD 2560x1440
90 105 ~ 98 fps    + Comparar
4K 3840x2160
62 71 ~ 67 fps    + Comparar
» Jugable con todos los portátiles probados en ajustes de detalle ultra.
FIFA 19

FIFA 19

2018
bajo 1280x720
246 364 ~ 305 fps    + Comparar
medio 1920x1080
237 361 ~ 299 fps    + Comparar
alto 1920x1080
223 318 ~ 271 fps    + Comparar
ultra 1920x1080
216 320 ~ 268 fps    + Comparar
QHD 2560x1440
211 306 ~ 259 fps    + Comparar
4K 3840x2160
176 192 ~ 184 fps    + Comparar
» Jugable con todos los portátiles probados en ajustes de detalle ultra.
bajo 1280x720
125 147 281 295 ~ 212 fps    + Comparar
medio 1920x1080
106 121 135.2 137.5 ~ 125 fps    + Comparar
alto 1920x1080
104 114 120.7 122.7 ~ 115 fps    + Comparar
ultra 1920x1080
96 104 109.3 111.4 ~ 105 fps    + Comparar
QHD 2560x1440
69 70 74.3 75.7 ~ 72 fps    + Comparar
4K 3840x2160
36 37 39.6 40.2 ~ 38 fps    + Comparar
» Jugable con todos los portátiles probados en ajustes de detalle ultra.
Additional Benchmarks
Lowest Preset 1920x1080
220
Strange Brigade

Strange Brigade

2018
bajo 1280x720
366 534 558 ~ 486 fps    + Comparar
medio 1920x1080
217 228 234 ~ 226 fps    + Comparar
alto 1920x1080
169 183.9 186.6 ~ 180 fps    + Comparar
ultra 1920x1080
140 155.9 159 ~ 152 fps    + Comparar
QHD 2560x1440
105 114.4 115.6 ~ 112 fps    + Comparar
4K 3840x2160
60.6 64.5 64.7 ~ 63 fps    + Comparar
» Jugable con todos los portátiles probados en ajustes de detalle ultra.
F1 2018

F1 2018

2018
bajo 1280x720
228 265 ~ 247 fps    + Comparar
medio 1920x1080
196 213 ~ 205 fps    + Comparar
alto 1920x1080
160 173 ~ 167 fps    + Comparar
ultra 1920x1080
122 124 ~ 123 fps    + Comparar
QHD 2560x1440
96 99 ~ 98 fps    + Comparar
4K 3840x2160
60 61 ~ 61 fps    + Comparar
» Jugable con todos los portátiles probados en ajustes de detalle ultra.
bajo 1280x720
123 139 ~ 131 fps    + Comparar
medio 1920x1080
114 123 ~ 119 fps    + Comparar
alto 1920x1080
111 118 ~ 115 fps    + Comparar
ultra 1920x1080
87 93 ~ 90 fps    + Comparar
QHD 2560x1440
56.2 79 ~ 68 fps    + Comparar
4K 3840x2160
28.4 41.8 ~ 35 fps    + Comparar
» Jugable con todos los portátiles probados en ajustes de detalle ultra.
bajo 1280x720
60 60 ~ 60 fps    + Comparar
medio 1920x1080
60 60 ~ 60 fps    + Comparar
alto 1920x1080
60 60 ~ 60 fps    + Comparar
ultra 1920x1080
60 60 ~ 60 fps    + Comparar
QHD 2560x1440
59.8 60 ~ 60 fps    + Comparar
4K 3840x2160
37 38.7 ~ 38 fps    + Comparar
» Jugable con todos los portátiles probados en ajustes de detalle ultra.
Far Cry 5

Far Cry 5

2018
bajo 1280x720
121 142 236 240 ~ 185 fps    + Comparar + 📈 Graph
medio 1920x1080
108 119 150 152 ~ 132 fps    + Comparar + 📈 Graph
alto 1920x1080
104 115 137 139 ~ 124 fps    + Comparar + 📈 Graph
ultra 1920x1080
99 108 128 130 ~ 116 fps    + Comparar + 📈 Graph
QHD 2560x1440
83 85 90 91 ~ 87 fps    + Comparar + 📈 Graph
4K 3840x2160
45 45 47 47 ~ 46 fps    + Comparar + 📈 Graph
» Jugable con todos los portátiles probados en ajustes de detalle ultra.
Additional Benchmarks
Low Preset TAA 1920x1080
175
bajo 1280x720
101 127 224 227 ~ 170 fps    + Comparar
medio 1920x1080
92 114 198.6 204 ~ 152 fps    + Comparar
alto 1920x1080
77 92 152.9 158.2 ~ 120 fps    + Comparar
4K 3840x2160
67 79 128.7 131.9 ~ 102 fps    + Comparar
» Jugable con todos los portátiles probados en ajustes de detalle alto.
bajo 1280x720
136 156 ~ 146 fps    + Comparar
medio 1920x1080
124 136 ~ 130 fps    + Comparar
alto 1920x1080
104 111 ~ 108 fps    + Comparar
ultra 1920x1080
71 77 ~ 74 fps    + Comparar
QHD 2560x1440
56.6 58.1 ~ 57 fps    + Comparar
4K 3840x2160
29.9 30 ~ 30 fps    + Comparar
» Jugable con todos los portátiles probados en ajustes de detalle ultra.
bajo 1280x720
159 178 225 227 ~ 197 fps    + Comparar
medio 1920x1080
109 112 122.2 124.4 ~ 117 fps    + Comparar
alto 1920x1080
79 80 92.7 93.8 ~ 86 fps    + Comparar
QHD 2560x1440
67.9 68 ~ 68 fps    + Comparar
4K 3840x2160
34.9 35 38 38 ~ 36 fps    + Comparar
» Jugable con todos los portátiles probados en ajustes de detalle alto.
Fortnite

Fortnite

2018
bajo 1280x720
280 424 ~ 352 fps    + Comparar
medio 1920x1080
216 316 ~ 266 fps    + Comparar
alto 1920x1080
171 179 ~ 175 fps    + Comparar
ultra 1920x1080
137 159 ~ 148 fps    + Comparar
QHD 2560x1440
95 100 ~ 98 fps    + Comparar
4K 3840x2160
46.6 49.5 ~ 48 fps    + Comparar
» Jugable con todos los portátiles probados en ajustes de detalle ultra.
bajo 1280x720
226 243 ~ 235 fps    + Comparar
medio 1920x1080
221 232 ~ 227 fps    + Comparar
alto 1920x1080
143 155 ~ 149 fps    + Comparar
ultra 1920x1080
125 135 ~ 130 fps    + Comparar
QHD 2560x1440
104 107 ~ 106 fps    + Comparar
4K 3840x2160
66 68 ~ 67 fps    + Comparar
» Jugable con todos los portátiles probados en ajustes de detalle ultra.
bajo 1280x720
109 143 ~ 126 fps    + Comparar
medio 1920x1080
96 112 ~ 104 fps    + Comparar
alto 1920x1080
93 103 ~ 98 fps    + Comparar
ultra 1920x1080
80 87 ~ 84 fps    + Comparar
QHD 2560x1440
68 69 ~ 69 fps    + Comparar
4K 3840x2160
43 44 ~ 44 fps    + Comparar
» Jugable con todos los portátiles probados en ajustes de detalle ultra.
Destiny 2

Destiny 2

2017
bajo 1280x720
151 179 ~ 165 fps    + Comparar
medio 1920x1080
149 179 ~ 164 fps    + Comparar
alto 1920x1080
149 171 ~ 160 fps    + Comparar
ultra 1920x1080
145 151 ~ 148 fps    + Comparar
QHD 2560x1440
103 105 ~ 104 fps    + Comparar
4K 3840x2160
54.7 55.5 ~ 55 fps    + Comparar
» Jugable con todos los portátiles probados en ajustes de detalle ultra.
bajo 1280x720
165 198 ~ 182 fps    + Comparar
medio 1920x1080
130 164 ~ 147 fps    + Comparar
alto 1920x1080
130 155 ~ 143 fps    + Comparar
ultra 1920x1080
118 128 ~ 123 fps    + Comparar
4K 3840x2160
48.4 50.4 ~ 49 fps    + Comparar
» Jugable con todos los portátiles probados en ajustes de detalle ultra.
Additional Benchmarks
Medium Preset 1366x768
192
136
Dirt 4

Dirt 4

2017
bajo 1280x720
281 295 ~ 288 fps    + Comparar
medio 1920x1080
218 235 ~ 227 fps    + Comparar
alto 1920x1080
188 203 ~ 196 fps    + Comparar
ultra 1920x1080
125 129 ~ 127 fps    + Comparar
4K 3840x2160
74 75 ~ 75 fps    + Comparar
» Jugable con todos los portátiles probados en ajustes de detalle ultra.
Additional Benchmarks
Medium Preset 4xAF 1366x768
239
221
bajo 1280x720
238 249 ~ 244 fps    + Comparar
medio 1920x1080
237 247 ~ 242 fps    + Comparar
alto 1920x1080
235 244 ~ 240 fps    + Comparar
4K 3840x2160
138 138 ~ 138 fps    + Comparar
» Jugable con todos los portátiles probados en ajustes de detalle alto.
Additional Benchmarks
Performance 1920x1080
248
237
bajo 1280x720
152.6 166 ~ 159 fps    + Comparar
medio 1920x1080
113.6 115 ~ 114 fps    + Comparar
alto 1920x1080
106 106.8 ~ 106 fps    + Comparar
ultra 1920x1080
62 62.4 ~ 62 fps    + Comparar
4K 3840x2160
43.5 44 ~ 44 fps    + Comparar
» Jugable con todos los portátiles probados en ajustes de detalle ultra.
Additional Benchmarks
Medium Preset FXAA 1366x768
125.7
133
Ultra Preset 16xAF TAA 3840x2160
31
31
For Honor

For Honor

2017
bajo 1280x720
253.1 341.5 ~ 297 fps    + Comparar
medio 1920x1080
180.2 183.2 ~ 182 fps    + Comparar
alto 1920x1080
173.2 175.2 ~ 174 fps    + Comparar
ultra 1920x1080
133.9 135.2 ~ 135 fps    + Comparar
4K 3840x2160
58.3 58.6 ~ 58 fps    + Comparar
» Jugable con todos los portátiles probados en ajustes de detalle ultra.
Additional Benchmarks
Medium Preset 4xAF TAA 1366x768
236.8
272.3
Extreme Preset 16xAF TAA 3840x2160
47.5
47.9
bajo 1280x720
140 154 ~ 147 fps    + Comparar
medio 1366x768
124 136 ~ 130 fps    + Comparar
alto 1920x1080
102 103 ~ 103 fps    + Comparar
ultra 1920x1080
73 74 ~ 74 fps    + Comparar
4K 3840x2160
43 43.1 ~ 43 fps    + Comparar
» Jugable con todos los portátiles probados en ajustes de detalle ultra.
Additional Benchmarks
Medium Preset 1920x1080
120
130
bajo 1280x720
119 119.5 ~ 119 fps    + Comparar
medio 1366x768
119 119.2 ~ 119 fps    + Comparar
alto 1920x1080
118.4 119 ~ 119 fps    + Comparar
ultra 1920x1080
112.8 113 ~ 113 fps    + Comparar
4K 3840x2160
60 61.4 ~ 61 fps    + Comparar
» Jugable con todos los portátiles probados en ajustes de detalle ultra.
Additional Benchmarks
Medium Preset TXAA 1920x1080
118.9
119
bajo 1280x720
193  fps    + Comparar
medio 1366x768
175  fps    + Comparar
alto 1920x1080
157  fps    + Comparar
ultra 1920x1080
143  fps    + Comparar
4K 3840x2160
68  fps    + Comparar
» Jugable con todos los portátiles probados en ajustes de detalle ultra.
Additional Benchmarks
Medium Preset FXAA 1920x1080
174
Ultra Preset TAA 3840x2160
64
bajo 1280x720
128.5 145.8 ~ 137 fps    + Comparar
medio 1366x768
119.9 136.7 ~ 128 fps    + Comparar
alto 1920x1080
101.8 111.2 ~ 107 fps    + Comparar
ultra 1920x1080
65.4 66.9 ~ 66 fps    + Comparar
4K 3840x2160
40.7 41.3 ~ 41 fps    + Comparar
» Jugable con todos los portátiles probados en ajustes de detalle ultra.
Additional Benchmarks
Medium Preset 2xAF 1920x1080
130.8
117.8
Overwatch

Overwatch

2016
bajo 1280x720
300 300 ~ 300 fps    + Comparar
medio 1366x768
300 300 ~ 300 fps    + Comparar
alto 1920x1080
298 298 ~ 298 fps    + Comparar
ultra 1920x1080
212 213 ~ 213 fps    + Comparar
4K 3840x2160
117 118 ~ 118 fps    + Comparar
» Jugable con todos los portátiles probados en ajustes de detalle ultra.
Additional Benchmarks
Medium (Render Scale 100 %) 2xAF FXAA 1920x1080
300
300
Epic (Render Scale 100 %) 16xAF SMAA 3820x2160
73
73
Epic (Render Scale 100 %) 16xAF SMAA 2560x1440
142
141
Doom

Doom

2016
bajo 1280x720
148 190 ~ 169 fps    + Comparar
medio 1366x768
153 183 ~ 168 fps    + Comparar
alto 1920x1080
145 174 ~ 160 fps    + Comparar
ultra 1920x1080
142 169 ~ 156 fps    + Comparar
4K 3840x2160
78 86 ~ 82 fps    + Comparar
» Jugable con todos los portátiles probados en ajustes de detalle ultra.
Additional Benchmarks
Medium Preset 1920x1080
158
181
bajo 1280x720
279.5 294.2 ~ 287 fps    + Comparar
medio 1366x768
225.2 229.1 ~ 227 fps    + Comparar
alto 1920x1080
116.6 132.3 ~ 124 fps    + Comparar
ultra 1920x1080
95.7 106.1 ~ 101 fps    + Comparar
4K 3840x2160
54 54.5 ~ 54 fps    + Comparar
» Jugable con todos los portátiles probados en ajustes de detalle ultra.
Additional Benchmarks
Medium Preset 4xAF 1920x1080
166.6
148.1
Low Preset 1xAF 1920x1080
231.7
203.4
Ultra Preset 16xAF 3840x2160
45.7
45.5
bajo 1280x720
116 120 ~ 118 fps    + Comparar
medio 1920x1080
107 107 ~ 107 fps    + Comparar
alto 1920x1080
98 98 ~ 98 fps    + Comparar
ultra 1920x1080
90 91 ~ 91 fps    + Comparar
4K 3840x2160
55 56 ~ 56 fps    + Comparar
» Jugable con todos los portátiles probados en ajustes de detalle ultra.
Additional Benchmarks
Low Preset 1920x1080
116
113
Ultra Preset + HD Textures SMAA 3840x2160
47
48
bajo 1024x768
255 316 ~ 286 fps    + Comparar
medio 1366x768
186 216 ~ 201 fps    + Comparar
alto 1920x1080
150 156 ~ 153 fps    + Comparar
ultra 1920x1080
125 129 ~ 127 fps    + Comparar
4K 3840x2160
53.4 53.5 ~ 53 fps    + Comparar
» Jugable con todos los portátiles probados en ajustes de detalle ultra.
bajo 1024x768
304.6 448 ~ 376 fps    + Comparar
medio 1366x768
260.4 351 ~ 306 fps    + Comparar
alto 1920x1080
246.8 278 ~ 262 fps    + Comparar
ultra 1920x1080
228.7 245 ~ 237 fps    + Comparar
4K 3840x2160
113 114.5 ~ 114 fps    + Comparar
» Jugable con todos los portátiles probados en ajustes de detalle ultra.
Additional Benchmarks
Ultra Preset 16xAF TAA 3840x2160
94.2
94
bajo 1280x720
133.7 166.2 295.9 307.7 ~ 226 fps    + Comparar
medio 1366x768
122.6 151.9 257.6 273.7 ~ 201 fps    + Comparar
alto 1920x1080
116.8 146.2 252.8 259.9 ~ 194 fps    + Comparar
ultra 1920x1080
109.8 136.6 233.5 241.3 ~ 180 fps    + Comparar
4K 3840x2160
105.1 116.3 125.6 126.9 ~ 118 fps    + Comparar
» Jugable con todos los portátiles probados en ajustes de detalle ultra.
bajo 1024x768
306 373 452 478 ~ 402 fps    + Comparar + 📈 Graph
medio 1366x768
237 258 287 303 ~ 271 fps    + Comparar + 📈 Graph
alto 1920x1080
149 160 166 179.1 ~ 164 fps    + Comparar + 📈 Graph
ultra 1920x1080
79 83 85 85.8 91.1 ~ 85 fps    + Comparar + 📈 Graph
4K 3840x2160
57 58.1 59.2 61 ~ 59 fps    + Comparar + 📈 Graph
» Jugable con todos los portátiles probados en ajustes de detalle ultra.
Additional Benchmarks
Ultra Graphics & Postprocessing (HBAO+) 3840x2160
38.6
38.4
39.2
42.3
Medium Graphics & Postprocessing 1920x1080
204
GTA V

GTA V

2015
bajo 1024x768
169 178 187.4 187.8 ~ 181 fps    + Comparar
medio 1366x768
162 172 187.5 187.8 ~ 177 fps    + Comparar
alto 1920x1080
144 160 187.2 187.2 ~ 170 fps    + Comparar
ultra 1920x1080
85 90 118.1 122.7 ~ 104 fps    + Comparar
QHD 2560x1440
85.9 86.9 ~ 86 fps    + Comparar
4K 3840x2160
82.5 83 83 89 ~ 84 fps    + Comparar
» Jugable con todos los portátiles probados en ajustes de detalle ultra.
Additional Benchmarks
Highest Settings possible 16xAF 4xMSAA + FXAA 3840x2160
43
43.2
Normal/Off 4xAF 1920x1080
187.5
187.7
Lowest Settings possible 1920x1080
187.5
187.8
bajo 1024x768
200 200 ~ 200 fps    + Comparar
medio 1366x768
199 200 ~ 200 fps    + Comparar
alto 1366x768
199 200 ~ 200 fps    + Comparar
ultra 1920x1080
180 190 ~ 185 fps    + Comparar
4K 3840x2160
65 94 ~ 80 fps    + Comparar
» Jugable con todos los portátiles probados en ajustes de detalle ultra.
bajo 1280x720
314.9 391.6 ~ 353 fps    + Comparar
medio 1366x768
282.6 340.4 ~ 312 fps    + Comparar
alto 1366x768
261.7 318.3 ~ 290 fps    + Comparar
ultra 1920x1080
172.3 184 ~ 178 fps    + Comparar
» Jugable con todos los portátiles probados en ajustes de detalle ultra.
bajomedioaltoultraQHD4K
Assassin's Creed Shadows29252013
Civilization 7281189.1113.471.632.9
Monster Hunter Wilds51.943.233.225.2
Kingdom Come Deliverance 2104.979.265.646.132.617.7
Stalker 253.247.140.133.724.5
Call of Duty Black Ops 67066414027
Until Dawn117.17853.939.628.815.9
God of War Ragnarök100.284.173.467.951.328.9
Final Fantasy XVI58.958.348.344.330.7
Space Marine 278.165.46256.739.521.1
Star Wars Outlaws37.634.430.324.416.6
Black Myth: Wukong64483719147
Once Human171.7119.598.686.655.928
The First Descendant140.885.268.456.136.119.4
F1 24240201148.345.528.813.9
Senua's Saga Hellblade 250.740.730.320.710
Ghost of Tsushima8769.764.252.239.522.5
Dragon's Dogma 261.555.84225.8
Horizon Forbidden West93.182.556.655.241.424.3
Alone in the Dark223178.9149.984.741.612.2
Last Epoch241186.7162.2131.185.942.5
Skull & Bones1039073564326
Helldivers 2124.592.579.577.854.126.6
Enshrouded67.357.848.740.831.519
Palworld124.71058275.151.525.9
Prince of Persia The Lost Crown359359359313155.2
Ready or Not204182159.6107.861.526.2
The Finals220158.3139.7106.965.430.1
Avatar Frontiers of Pandora534943332211
Call of Duty Modern Warfare 3 2023958765614325
EA Sports WRC122.389.681.47353.629.7
Alan Wake 255.649.24729.314.8
Lords of the Fallen73.962.344.930.720.610.4
Total War Pharaoh352230.7132.3103.370.535.6
Assassin's Creed Mirage1029489715432
EA Sports FC 24217199.1167.7146.9111.567.4
Counter-Strike 2320285202148.899.246.2
Cyberpunk 2077 2.2 Phantom Liberty90.773.264.159.238.919.3
Baldur's Gate 3159.610384.770.748.525.7
Lies of P153.5137.6118.710569.234.9
Starfield54.948.139.935.72918.6
Armored Core 6119.5115.7107.388.665.637.9
Immortals of Aveum49.641.73221.412
Atlas Fallen122114.410589.363.833.8
Ratchet & Clank Rift Apart78.468.655.749.239.925.6
F1 23269237162.24628.913.7
Diablo 4231196.1172.9141.69447
Star Wars Jedi Survivor7262.257.154.233.716.8
Dead Island 2226191.6138101.268.733.7
The Last of Us86.870.161.645.229.112.7
Resident Evil 4 Remake117.694.582.2
Company of Heroes 3154.2131.7100.7101.473.541.1
Sons of the Forest94.578.474.972.754.532.3
Atomic Heart168.3124.372.758.143.625.6
Returnal938979684928
Hogwarts Legacy124.591.568.858.140.721.6
Dead Space Remake79.475.36664.842.622
The Witcher 3 v4.00191.8153.3125.8100.271.340.3
High On Life221137.7105.186.251.219.4
The Callisto Protocol134.892.258.757.742.925.1
Need for Speed Unbound138.1121.499.383.959.932.4
Spider-Man Miles Morales115.8108.1101.197.867.835.1
Call of Duty Modern Warfare 2 20221129571684829
Uncharted Legacy of Thieves Collection75.772.669.765.350.521.8
A Plague Tale Requiem97.974.254.841.629.216.4
FIFA 23266238165.9161117.971.4
The Quarry13610483644320
F1 22251225165493115
Vampire Bloodhunt307169.3155.7146.999.950.9
Ghostwire Tokyo1321251241237838
Tiny Tina's Wonderlands15912989714926
Cyberpunk 2077 1.6887971624019
Elex 287.383.374.767.949.728
GRID Legends2331801481098654
Elden Ring59.959.959.759.959.856.9
Dying Light 210964.4574021
Rainbow Six Extraction1711481461197834
God of War11910182574631
Halo Infinite11288.2866652
Farming Simulator 2227722217114711268.3
Battlefield 204210211294.780.961.336.5
Forza Horizon 5225124108665538
Call of Duty Vanguard10210990.38259.233.3
Riders Republic190123102926636
Guardians of the Galaxy1371311291268646
Back 4 Blood19017315610352.9
Far Cry 6188125108936718
Alan Wake Remastered93.790.389.785.1
New World17311010289.860.131.4
Deathloop11910286.96946.827.4
F1 20214342472021007240
Monster Hunter Stories 2144144144143108
Days Gone19513211787.163.736.2
Mass Effect Legendary Edition10410199.676.7
Resident Evil Village32216314812985.142.6
Outriders118142114976736
Hitman 32471351281228546
Cyberpunk 2077 1.011074.762.6533617
Immortals Fenyx Rising1248775574939
Yakuza Like a Dragon9994.197.784.358.130.4
Call of Duty Black Ops Cold War18111891.37353.217.3
Assassin´s Creed Valhalla1128168614729
Dirt 514888.970.86050.434.3
Watch Dogs Legion11810490.459.143.724.7
FIFA 21228229216215212181
Star Wars Squadrons37828224122915085
Mafia Definitive Edition147105976735
Serious Sam 4144.5104.289.4827443
Crysis Remastered24614374.460.74624.6
Flight Simulator 202075.26754393018
Horizon Zero Dawn14910285695431
Death Stranding19012711811480.645.1
F1 20203622281881339956
Valorant345298293268214
Gears Tactics323.7199.3134.59263.734
Doom Eternal23520218118011458.7
Hunt Showdown2521371057133.1
Escape from Tarkov1211201179877.737.8
Fall Guys59.659.659.6
Red Dead Redemption 21451067246.537.624.1
Star Wars Jedi Fallen Order1221211148241.6
Need for Speed Heat10810395877041
Call of Duty Modern Warfare 20191871411251098046
GRID 2019170165133887044
Ghost Recon Breakpoint14710295715330
FIFA 20279264260257249184
Borderlands 319213092715027
Control239108805225
F1 20192131911601229658
Total War: Three Kingdoms239.8138.598.26943.921.5
Rage 22371311111087135
Anno 180011410985383527
The Division 2190142115855932
Dirt Rally 2.02421941751098349
Anthem111107102997642
Far Cry New Dawn1591241171068649
Metro Exodus18310578624931
Apex Legends14414414414411464
Just Cause 41931441101037441
Darksiders III2031331201148342
Battlefield V1661281131058352
Farming Simulator 1921816414213111566
Hitman 2939082827442
Call of Duty Black Ops 42531631561459647
Assassin´s Creed Odyssey12010185615235
Forza Horizon 41791521471209867
FIFA 19305299271268259184
Shadow of the Tomb Raider2121251151057238
Strange Brigade48622618015211263
F1 20182472051671239861
Monster Hunter World131119115906835
The Crew 2606060606038
Far Cry 51851321241168746
X-Plane 11.11170152120102
Kingdom Come: Deliverance146130108745730
Final Fantasy XV Benchmark197117866836
Fortnite3522661751489848
Call of Duty WWII23522714913010667
Assassin´s Creed Origins12610498846944
Destiny 216516416014810455
Playerunknown's Battlegrounds (PUBG)18214714312349
Dirt 428822719612775
Rocket League244242240138
Ghost Recon Wildlands1591141066244
For Honor29718217413558
Watch Dogs 21471301037443
Dishonored 211911911911361
Battlefield 119317515714368
Deus Ex Mankind Divided1371281076641
Overwatch300300298213118
Doom16916816015682
The Division28722712410154
Far Cry Primal118107989156
Rise of the Tomb Raider28620115312753
Rainbow Six Siege376306262237114
Dota 2 Reborn226201194180118
The Witcher 34022711648559
GTA V1811771701048684
Battlefield 420020020018580
BioShock Infinite353312290178
< 30 fps
< 60 fps
< 120 fps
≥ 120 fps
1
10
48
115
1
11
71
93
1
23
88
66
3
35
86
40
16
63
72
7
59
84
23
6

Para ver más juegos jugables y una lista de todos los juegos y tarjetas gráficas visita nuestroListado de juegos

v1.29
log 03. 04:45:32

#0 ran 3s before starting gpusingle class +0s ... 0s

#1 no ids found in url (should be separated by "_") +0s ... 0s

#2 not redirecting to Ajax server +0s ... 0s

#3 did not recreate cache, as it is less than 5 days old! Created at Tue, 01 Apr 2025 09:15:03 +0200 +0.001s ... 0.001s

#4 before gaming benchmark output +0.001s ... 0.002s

#5 Got 1667 rows for game benchmarks. +0.115s ... 0.117s

#6 composed SQL query for gamebenchmarks +0s ... 0.117s

#7 got data and put it in $dataArray +0.106s ... 0.223s

#8 benchmarks composed for output. +1.856s ... 2.079s

#9 return log +0.007s ... 2.086s

Please share our article, every link counts!
Mail Logo
> Análisis y pruebas de ordenadores portátiles y móviles teléfonos > Análisis > KFA2 GeForce RTX 2060 Super (1-Click OC) - Review del modelo Custom RTX 2060 Super Series
Sebastian Bade, 2019-09-17 (Update: 2019-09-17)