Notebookcheck Logo

Análisis del convertible 2 en 1 Dell Inspiron 14 7435: Ryzen 5 7530U para usuarios con presupuesto ajustado
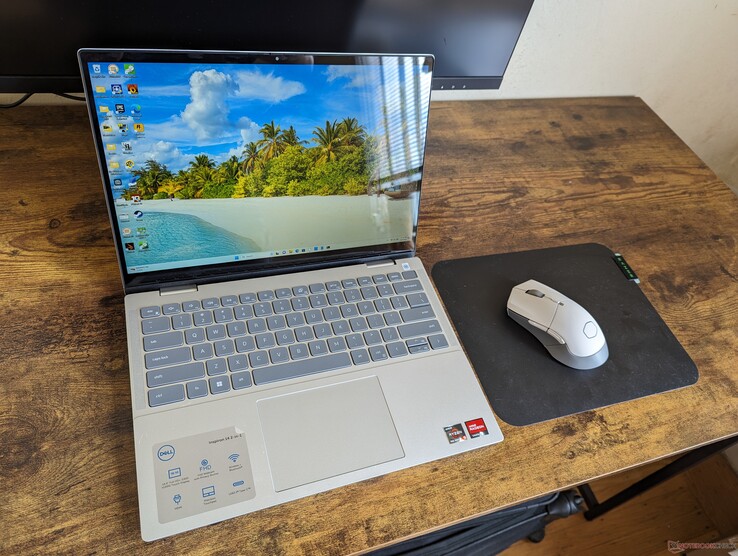
convertible AMD de 14 pulgadas por 550 dólares.

El Inspiron 14 7435 2 en 1 cuesta la mitad que muchas alternativas populares con bisagras de 360 grados. Por supuesto, hay recortes, pero a los usuarios domésticos ocasionales o a los estudiantes probablemente no les importarán muchas de las características que faltan.
2023 Dell Inspiron 14 7435 2 en 1

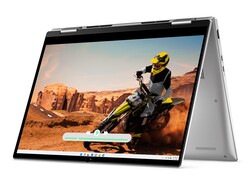
El Inspiron 14 7435 2 en 1 es la versión AMD del Inspiron 14 7430 2 en 1 basado en Intel. Sustituye directamente al Inspiron 14 7420 2 en 1 con mejoras internas y externas.

Nuestra configuración de análisis específica es una SKU de gama baja con la CPU Ryzen 5 7530U y 8 GB de RAM LPDDR4x-4266 soldada por solo 550 USD. También hay disponible una versión superior con el doble de RAM y la CPU Ryzen 7 7730U, pero todas las configuraciones vienen con la misma pantalla táctil IPS de 1200p y gráficos Radeon Vega integrados.

La competencia incluye otros convertibles económicos como el Acer Aspire 5 Spin 14,Lenovo IdeaPad Flex 7io HP Pavilion x360 14. Existe una versión de 16 pulgadas de este modelo denominada Inspiron 16 7635 2 en 1.

Más opiniones sobre Dell:

Dell Inspiron 14 7435 2-in-1 (Inspiron Serie)
Procesador
AMD Ryzen 5 7530U 6 x 2 - 4.5 GHz, 34 W PL2 / Short Burst, 20 W PL1 / Sustained, Barcelo-U Refresh
Adaptador gráfico
AMD Radeon RX Vega 7 - 512 MB VRAM, Memoría: 2133 MHz, LPDDR4x, 31.0.12044.19001
Memoría
8 GB 
, LPDDR4X, 4266 MHz, Dual-Channel
pantalla
14.00 pulgadas 16:10, 1920 x 1200 pixels 162 PPI, 10-point capacitive, LG Philips 140WU2, IPS, Dell P/N: TDVNC, Controller: LGD06F9, lustroso: si, 60 Hz
Placa base
AMD Promontory/Bixby FCH
Tarjeta de sonido
AMD Zen - Audio Processor - HD Audio Controller
Conexiones
1 USB 3.0, 2 USB 3.1 Gen2, USB-C Power Delivery (PD), 1 HDMI, 2 DisplayPort, Audio Conexiones: 3.5 mm headset, Card Reader: SD, 1 Lector de Huellas Digitales, Sensores: Accelerometer
Equipamento de red
MediaTek Wi-Fi 6E MT7922 160MHz Wireless LAN Card (a/b/g/n = Wi-Fi 4/ac = Wi-Fi 5/ax = Wi-Fi 6/ Wi-Fi 6E 6 GHz), Bluetooth 5.2
Tamaño
Alto x ancho x profundidad (en mm): 18.6 x 314 x 226.6
Battería
54 Wh Litio-Polimero
Sistema Operativo
Microsoft Windows 11 Home
Camera
Webcam: 1080p30
Primary Camera: 2.1 MPix
Características adicionales
Altavoces: Stereo, Teclado: Chiclet, Luz de Teclado: si, MyDell, Dell Update, Digital Delivery, 12 Meses Garantía
Peso
1.586 kg, Suministro de Electricidad: 273 g
Precio
550 USD
Note: The manufacturer may use components from different suppliers including display panels, drives or memory sticks with similar specifications.


Comparaison avec les concurrents potentiels

Valoración
Fecha
Modelo
Peso
Altura
Tamaño
Resolución
Price
84.5 %
v7 (old)
08/2023
Dell Inspiron 14 7435 2-in-1
R5 7530U, Vega 7
1.6 kg18.6 mm14.00"1920x1200
83.7 %
v7 (old)
06/2022
Dell Inspiron 14 7420 2-in-1
i7-1255U, Iris Xe G7 96EUs
1.6 kg17.86 mm14.00"1920x1200
83.2 %
v7 (old)
12/2022
Lenovo IdeaPad Flex 7i 14IAU7
i7-1255U, Iris Xe G7 96EUs
1.5 kg18.9 mm14.00"2240x1400
82.2 %
v7 (old)
06/2023
Acer Aspire 5 Spin 14
i5-1335U, Iris Xe G7 80EUs
1.6 kg17.99 mm14.00"1920x1200
87.5 %
v7 (old)
05/2022
LG Gram 14T90P
i5-1135G7, Iris Xe G7 80EUs
1.2 kg17 mm14.00"1900x1200
81.8 %
v7 (old)
07/2021
HP Pavilion x360 14-dy0157ng
i5-1135G7, Iris Xe G7 80EUs
1.5 kg19.9 mm14.00"1920x1080

Caja - Altavoces y bisagras revisados

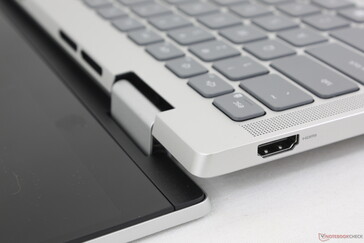
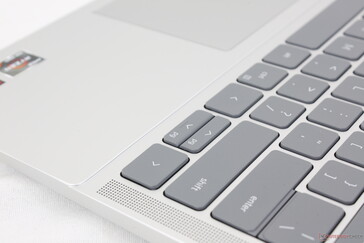
Aunque parece idéntico al 2022 Inspiron 14 7620 2 en 1 a primera vista, se aprecian varias diferencias al examinarlo más de cerca. En primer lugar, se han eliminado los tan cacareados reposamanos de Mylar en favor de más plástico ABS. Se suponía que el material especial protegería los reposamanos y el clickpad de la acumulación de grasa, pero al final resultó ser innecesario en un portátil económico como este. En segundo lugar, las bisagras han sido rediseñadas para ser ligeramente más grandes y planas, lo que debería mejorar la longevidad. Por último, los altavoces se han desplazado de las esquinas frontales del chasis a los bordes del teclado, de modo que ahora miran directamente hacia arriba, hacia el usuario.

La rigidez del chasis sigue siendo prácticamente la misma que antes debido a sus esqueletos similares y a la elección de los materiales plásticos.

Las dimensiones y el peso son casi idénticos a los del modelo del año pasado a pesar de todos los cambios externos e internos. Esto no es necesariamente malo, ya que el modelo sigue siendo comparable a alternativas como el Pavilion x360 14 o el IdeaPad Flex 14 7i, pero Dell podría haber hecho un esfuerzo adicional para que el Inspiron fuera aún más portátil y lucrativo para los compradores potenciales.

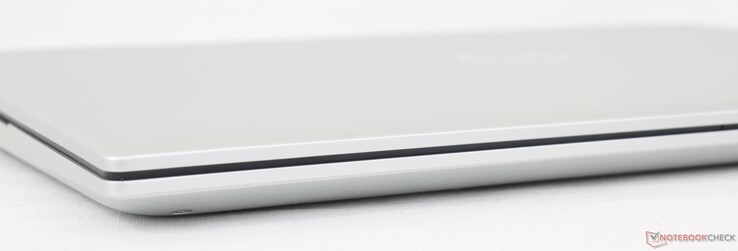
Las opciones de color incluyen plata platino o azul lavanda
Las superficies de plástico PCR mate ocultan bien las huellas dactilares
El diseño de las bisagras ha cambiado año tras año
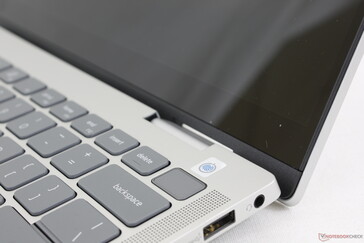
El botón de encendido con huella dactilar es poco común en los portátiles económicos
No más reposamanos protegidos con Mylar para ahorrar costes
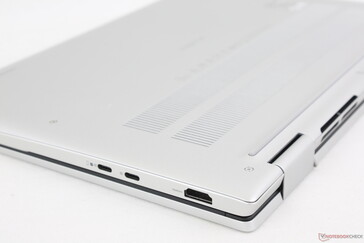
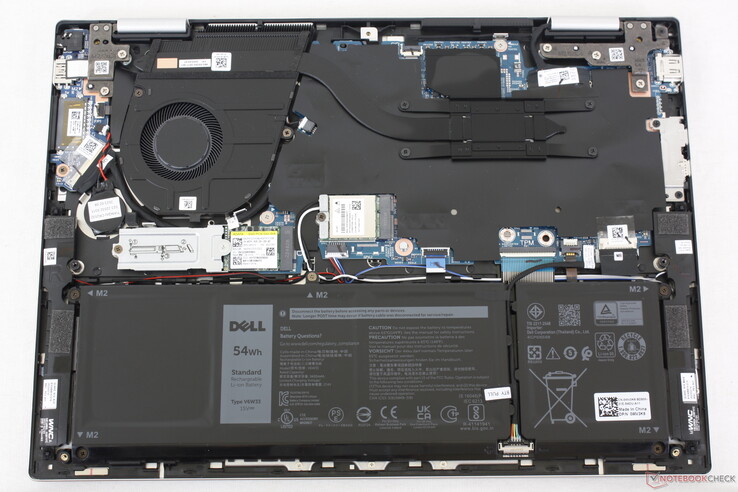
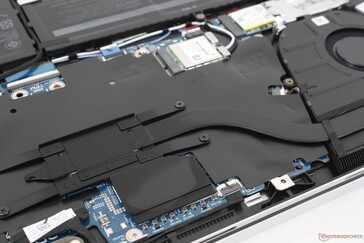
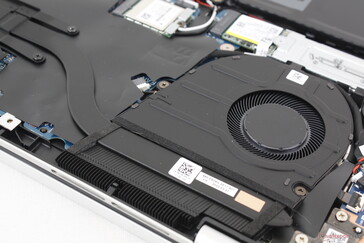
El panel inferior se puede desmontar muy fácilmente para un mantenimiento rápido

Comparaison des tailles

322 mm 209 mm 19.9 mm 1.5 kg318.2 mm 225.5 mm 17.99 mm 1.6 kg314 mm 226.6 mm 18.6 mm 1.6 kg313.1 mm 224.9 mm 18.9 mm 1.5 kg314 mm 227.5 mm 17.86 mm 1.6 kg314 mm 220 mm 17 mm 1.2 kg297 mm 210 mm 1 mm 5.7 g

Conectividad

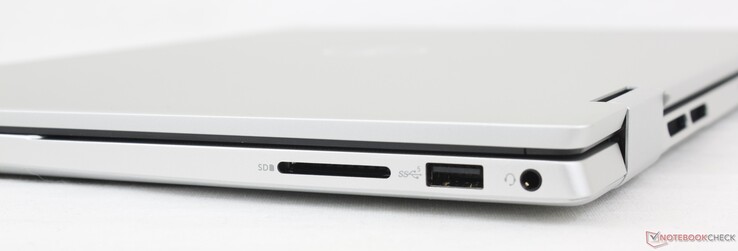
Las opciones de puerto son comparables a las del IdeaPad Flex 5i 14 y Pavilion x360 14 con ligeras diferencias en el número de puertos USB. Hay que tener en cuenta que los puertos USB-C de nuestra configuración AMD carecen de soporte Thunderbolt a diferencia del Inspiron 7430 2 en 1 Intel.

Frontal: Sin puertos
Derecha: Lector de tarjetas SD, USB-A 4.2 Gen. 1, auriculares de 3,5 mm
Trasero: Sin puertos
Izquierda: HDMI 1.4, 2x USB-C 3.2 Gen. 2 con Power Delivery + DisplayPort

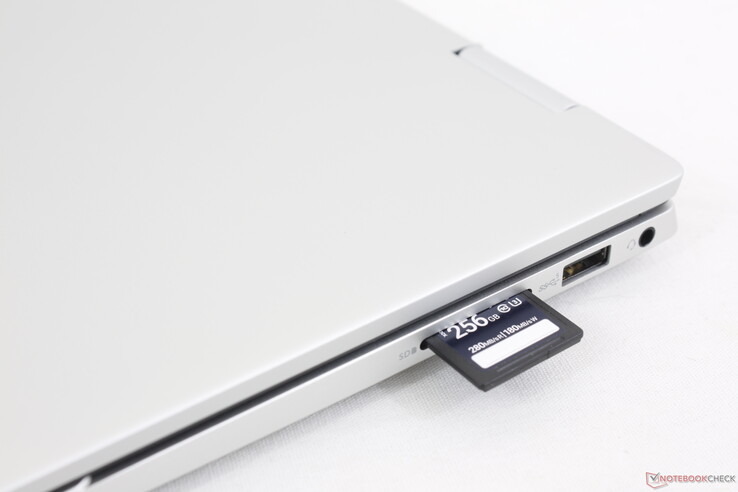
Lector de tarjetas SD

Las tasas de transferencia del lector de tarjetas SD integrado han mejorado ligeramente de ~20 MB/s en el Inspiron 7420 del año pasado a ~35 MB/s en nuestro último modelo. Aun así, los lectores SD de modelos de la competencia como el IdeaPad Flex 7i o Pavilion x360 14 son mucho más rápidos, más del doble.

La tarjeta SD totalmente insertada sobresale aproximadamente la mitad de su longitud para un transporte inseguro
SD Card Reader
average JPG Copy Test (av. of 3 runs)
Lenovo IdeaPad Flex 7i 14IAU7
Intel Core i7-1255U (Toshiba Exceria Pro SDXC 64 GB UHS-II)
82.8 MB/s +156%
HP Pavilion x360 14-dy0157ng
Intel Core i5-1135G7 (Toshiba Exceria Pro M501 microSDXC 64GB)
75.3 MB/s +132%
LG Gram 14T90P
Intel Core i5-1135G7 (AV Pro V60)
69.5 MB/s +115%
Dell Inspiron 14 7435 2-in-1
AMD Ryzen 5 7530U (PNY EliteX-Pro60 V60 256 GB)
32.4 MB/s
Dell Inspiron 14 7420 2-in-1
Intel Core i7-1255U (Toshiba Exceria Pro SDXC 64 GB UHS-II)
20.91 MB/s -35%
maximum AS SSD Seq Read Test (1GB)
Lenovo IdeaPad Flex 7i 14IAU7
Intel Core i7-1255U (Toshiba Exceria Pro SDXC 64 GB UHS-II)
89.3 MB/s +142%
LG Gram 14T90P
Intel Core i5-1135G7 (AV Pro V60)
85.8 MB/s +133%
HP Pavilion x360 14-dy0157ng
Intel Core i5-1135G7 (Toshiba Exceria Pro M501 microSDXC 64GB)
85.4 MB/s +131%
Dell Inspiron 14 7435 2-in-1
AMD Ryzen 5 7530U (PNY EliteX-Pro60 V60 256 GB)
36.9 MB/s
Dell Inspiron 14 7420 2-in-1
Intel Core i7-1255U (Toshiba Exceria Pro SDXC 64 GB UHS-II)
27.43 MB/s -26%

Comunicación

Nos sorprende ver soporte Wi-Fi6E en nuestra configuración base. Las tasas de transferencia son estables cuando se empareja a nuestra red Asus AXE11000 de 6 GHz, pero las tasas de recepción son definitivamente más lentas de lo esperado en casi la mitad en comparación con los portátiles con Intel AX211.

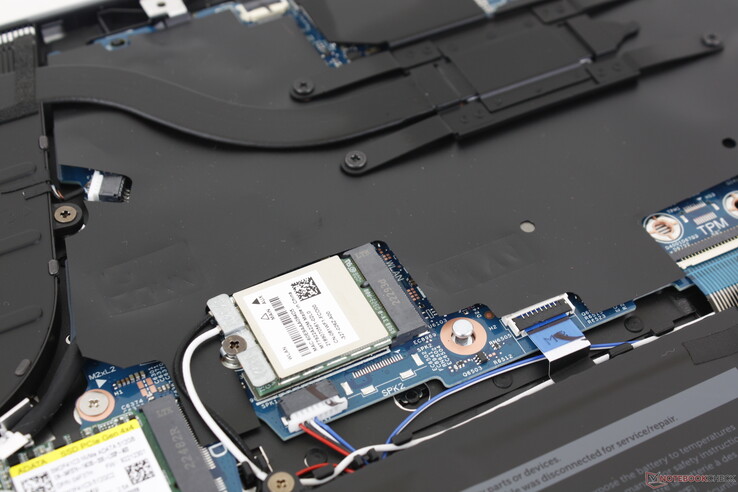
Módulo WLAN MediaTek MT7922 extraíble
Networking
iperf3 transmit AX12
HP Pavilion x360 14-dy0157ng
Wireless AC-9461
360 (181min - 385max) MBit/s
iperf3 receive AX12
HP Pavilion x360 14-dy0157ng
Wireless AC-9461
335 (325min - 338max) MBit/s
iperf3 transmit AXE11000
Acer Aspire 5 Spin 14
Intel Wi-Fi 6E AX211
1485 (1353min - 1603max) MBit/s 0%
Dell Inspiron 14 7435 2-in-1
MediaTek Wi-Fi 6E MT7922 160MHz Wireless LAN Card
1483 (1384min - 1668max) MBit/s
Lenovo IdeaPad Flex 7i 14IAU7
Intel Wi-Fi 6E AX211
1169 (810min - 1309max) MBit/s -21%
LG Gram 14T90P
Intel Wi-Fi 6 AX201
925 (771min - 1040max) MBit/s -38%
iperf3 receive AXE11000
Acer Aspire 5 Spin 14
Intel Wi-Fi 6E AX211
1639 (1609min - 1664max) MBit/s +93%
LG Gram 14T90P
Intel Wi-Fi 6 AX201
1239 (1160min - 1313max) MBit/s +46%
Lenovo IdeaPad Flex 7i 14IAU7
Intel Wi-Fi 6E AX211
1185 (925min - 1268max) MBit/s +40%
Dell Inspiron 14 7435 2-in-1
MediaTek Wi-Fi 6E MT7922 160MHz Wireless LAN Card
848 (799min - 928max) MBit/s
iperf3 transmit AXE11000 6GHz
Dell Inspiron 14 7435 2-in-1
MediaTek Wi-Fi 6E MT7922 160MHz Wireless LAN Card
1569 (1418min - 1823max) MBit/s
Acer Aspire 5 Spin 14
Intel Wi-Fi 6E AX211
1559 (1137min - 1638max) MBit/s -1%
Lenovo IdeaPad Flex 7i 14IAU7
Intel Wi-Fi 6E AX211
1341 (1077min - 1432max) MBit/s -15%
Dell Inspiron 14 7420 2-in-1
Intel Wi-Fi 6E AX211
1283 (1220min - 1318max) MBit/s -18%
iperf3 receive AXE11000 6GHz
Acer Aspire 5 Spin 14
Intel Wi-Fi 6E AX211
1726 (1691min - 1745max) MBit/s +101%
Dell Inspiron 14 7420 2-in-1
Intel Wi-Fi 6E AX211
1412 (1379min - 1476max) MBit/s +64%
Lenovo IdeaPad Flex 7i 14IAU7
Intel Wi-Fi 6E AX211
1345 (1294min - 1408max) MBit/s +56%
Dell Inspiron 14 7435 2-in-1
MediaTek Wi-Fi 6E MT7922 160MHz Wireless LAN Card
860 (788min - 971max) MBit/s
05010015020025030035040045050055060065070075080085090095010001050110011501200125013001350140014501500155016001650Tooltip
Dell Inspiron 14 7435 2-in-1; iperf3 transmit AXE11000; iperf 3.1.3: Ø1483 (1384-1668)
Dell Inspiron 14 7435 2-in-1; iperf3 receive AXE11000; iperf 3.1.3: Ø848 (799-928)

Cámara web

Dell no ha hecho cambios en la webcam de 2 MP o 1080p. Se incluye un obturador de privacidad mientras que el IR sigue omitiéndose para ahorrar costes.
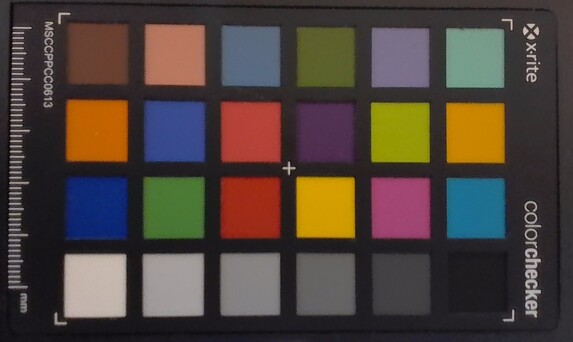
ColorChecker
5.7 ∆E
10.2 ∆E
8.1 ∆E
7.6 ∆E
10.2 ∆E
10.6 ∆E
8.6 ∆E
6.8 ∆E
10.8 ∆E
6.3 ∆E
11.5 ∆E
8.4 ∆E
7.5 ∆E
10.1 ∆E
9.4 ∆E
12.4 ∆E
8.7 ∆E
8.5 ∆E
15.5 ∆E
12.3 ∆E
9.7 ∆E
8.7 ∆E
7.2 ∆E
8.1 ∆E
ColorChecker Dell Inspiron 14 7435 2-in-1: 9.3 ∆E min: 5.72 - max: 15.48 ∆E

Mantenimiento

Dell ha hecho un cambio importante en la placa base en comparación con el diseño del año pasado: La RAM ahora está soldada en lugar de conectada a un zócalo, como muestran las imágenes de abajo. Aunque es una pena, la RAM soldada es común en otros convertibles económicos como el IdeaPad Flex 7 o elAcer Aspire 5 Spin 14.

Inspiron 14 7435 2 en 1
Inspiron 14 7420 2 en 1 para comparar

Accesorios y garantía

No hay más extras en la caja que el adaptador de CA y la documentación. Se aplica la habitual garantía limitada de un año del fabricante.

Dispositivos de entrada - Se acabó el Mylar

Teclado y panel táctil

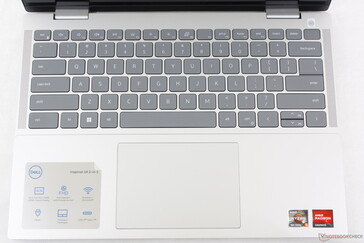
Aunque la experiencia de escritura con el teclado sigue siendo la misma que en el Inspiron 14 7420el diseño del clickpad ha cambiado debido a la eliminación de la capa de Mylar. Ahora tiene una apariencia más tradicional mientras mantiene la superficie original de 11,5 x 8 cm. Por desgracia, la respuesta al hacer clic no ha mejorado, ya que todavía se siente esponjoso y un poco demasiado superficial.

El mismo teclado resistente a salpicaduras que en el Inspiron 14 7420 2 en 1, pero con nuevas rejillas de altavoces en los bordes
Dell ha abandonado el clickpad en forma de U del modelo del año pasado por uno más tradicional
Retroiluminación blanca de dos niveles de serie
Teclas de flecha estrechas

Pantalla - 60 Hz, 45% NTSC, 1200p, 16:10

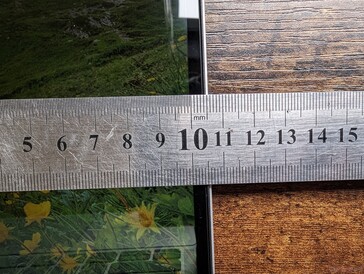
El modelo de este año viene con el panel IPS LG Philips 140WU2 para sustituir al panel BOE NV14N42 del Inspiron 14 9420 2 en 1 del año pasado. Por lo demás, los atributos principales son casi idénticos para una experiencia de visualización similar entre ambos. La estrecha gama de colores, los tiempos de respuesta medios y la mediocre relación de contraste son habituales en este rango de precios.

Un aspecto que merecía más atención es el escaso brillo de la pantalla táctil. El bajo rango de 200 nits es suficiente para entornos de interior, pero nuestras expectativas son mayores para los convertibles, ya que es más probable que los propietarios los utilicen cuando viajan o en condiciones exteriores más luminosas. Si la visibilidad en exteriores es una preocupación, entonces los compradores potenciales deberían considerar el más caro XPS 13 9315 2 en 1 que es 2 veces más brillante que nuestro Inspiron.

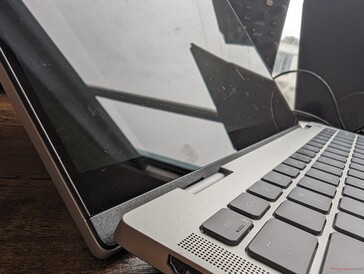
Protección de cristal de borde a borde
Biseles laterales estrechos
No hay problemas importantes de sangrado desigual de la retroiluminación
Nítida matriz de subpíxeles RGB sin problemas de granulado
220.7
cd/m²
224.5
cd/m²
226.3
cd/m²
207.4
cd/m²
231.8
cd/m²
213.5
cd/m²
202.7
cd/m²
218.2
cd/m²
201.3
cd/m²
Temperatura del cuarto
LG Philips 140WU2 tested with X-Rite i1Pro 2
Máximo: 231.8 cd/m² (Nits) Médio: 216.3 cd/m² Minimum: 13.5 cd/m²
iluminación: 87 %
Brillo con batería: 231.8 cd/m²
Contraste: 859:1 (Negro: 0.27 cd/m²)
ΔE Color 6.59 | 0.5-29.43 Ø4.91, calibrated: 3.94
ΔE Greyscale 4.5 | 0.5-98 Ø5.2
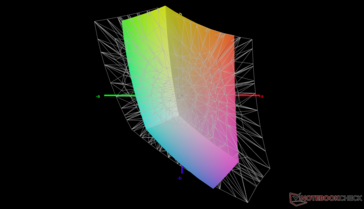
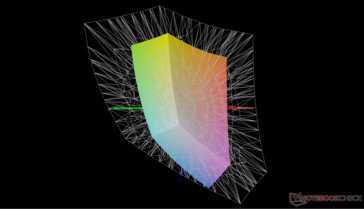
45.8% AdobeRGB 1998 (Argyll 2.2.0 3D)
64.4% sRGB (Argyll 2.2.0 3D)
44.4% Display P3 (Argyll 2.2.0 3D)
Gamma: 2.17
Dell Inspiron 14 7435 2-in-1
LG Philips 140WU2, IPS, 1920x1200, 14"
Dell Inspiron 14 7420 2-in-1
BOE NV14N42, IPS, 1920x1200, 14"
Lenovo IdeaPad Flex 7i 14IAU7
BOE CQ NV140DRM-162, IPS, 2240x1400, 14"
Acer Aspire 5 Spin 14
BOE CQ NV140WUM-N41, IPS, 1920x1200, 14"
LG Gram 14T90P
LG Philips LP140WU1-SPA1, IPS, 1900x1200, 14"
HP Pavilion x360 14-dy0157ng
Chi Mei N140HCA-E5B, IPS, 1920x1080, 14"
Display
-13%
56%
-12%
89%
-3%
Display P3 Coverage
44.4
38.6
-13%
69.8
57%
38.5
-13%
98.8
123%
42.7
-4%
sRGB Coverage
64.4
56.2
-13%
98
52%
57.3
-11%
100
55%
63.7
-1%
AdobeRGB 1998 Coverage
45.8
39.9
-13%
72.2
58%
39.8
-13%
44.2
-3%
Response Times
-24%
-101%
-23%
-90%
-39%
Response Time Grey 50% / Grey 80% *
19.6 ?(13.6, 16)
27.2 ?(14, 13.2)
-39%
44.4 ?(24.8, 19.6)
-127%
29 ?(13, 16)
-48%
44 ?(21.2, 22.8)
-124%
32 ?(15, 17)
-63%
Response Time Black / White *
19.3 ?(10.6, 8.7)
20.8 ?(11.6, 9.2)
-8%
33.6 ?(18.8, 14.8)
-74%
19 ?(10, 9)
2%
30 ?(15.2, 14.8)
-55%
22 ?(12, 10)
-14%
PWM Frequency
Screen
-6%
31%
12%
34%
39%
Brightness middle
231.8
269.4
16%
317.3
37%
249
7%
305.5
32%
269
16%
Brightness
216
260
20%
301
39%
235
9%
289
34%
241
12%
Brightness Distribution
87
89
2%
90
3%
85
-2%
87
0%
82
-6%
Black Level *
0.27
0.41
-52%
0.22
19%
0.27
-0%
0.27
-0%
0.11
59%
Contrast
859
657
-24%
1442
68%
922
7%
1131
32%
2445
185%
Colorchecker dE 2000 *
6.59
6.53
1%
3.99
39%
5
24%
3.31
50%
5.68
14%
Colorchecker dE 2000 max. *
16.83
19.76
-17%
9.34
45%
8.32
51%
6.12
64%
9.61
43%
Colorchecker dE 2000 calibrated *
3.94
3.13
21%
0.6
85%
5.06
-28%
Greyscale dE 2000 *
4.5
5.4
-20%
6.9
-53%
2.86
36%
1.9
58%
4.95
-10%
Gamma
2.17 101%
2.05 107%
2.19 100%
2.19 100%
2.04 108%
2.17 101%
CCT
6110 106%
6007 108%
6161 106%
6419 101%
6706 97%
6628 98%
Color Space (Percent of AdobeRGB 1998)
44.2
Color Space (Percent of sRGB)
63.7
Media total (Programa/Opciones)
-14% / -10%
-5% / 18%
-8% / 2%
11% / 22%
-1% / 18%

* ... más pequeño es mejor

frente a sRGB
frente a sRGB
vs. P3
vs. P3

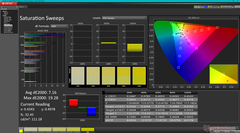
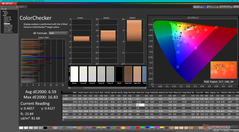
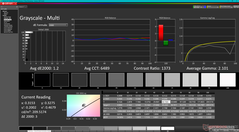
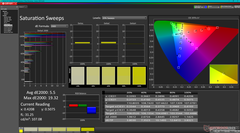
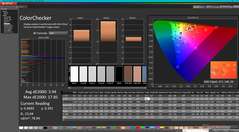
La temperatura de color es ligeramente demasiado cálida al sacarlo de la caja. Una calibración con nuestro colorímetro X-Rite soluciona este problema para obtener colores más precisos en general. Sin embargo, ten en cuenta que los colores seguirán siendo imprecisos en los niveles de saturación más altos debido a la limitada cobertura sRGB mencionada anteriormente.

Escala de grises antes del calibrado
Barridos de saturación antes de la calibración
ColorChecker antes de la calibración
Escala de grises después del calibrado
Barridos de saturación tras la calibración
ColorChecker después de la calibración

Tiempos de respuesta del display

Los tiempos de respuesta del display muestran lo rápido que puede cambiar la pantalla de un color al siguiente. Tiempos lentos de respuesta pueden llevar a imágenes persistentes alrededor de objetos en movimiento o a displays borrosos. Particularmente los aficionados a los juegos 3D frenéticos deberían usar una pantalla con tiempos de respuesta rápidos.
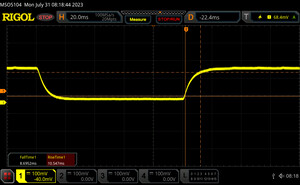
       Tiempo de respuesta de Negro a Blanco
19.3 ms ... subida ↗ y bajada ↘ combinada↗ 10.6 ms subida
↘ 8.7 ms bajada
La pantalla mostró buenos tiempos de respuesta en nuestros tests pero podría ser demasiado lenta para los jugones competitivos.
En comparación, todos los dispositivos de prueba van de ##min### (mínimo) a 240 (máximo) ms. » 39 % de todos los dispositivos son mejores.
Eso quiere decir que el tiempo de respuesta es similar al dispositivo testado medio (20.9 ms).
       Tiempo de respuesta 50% Gris a 80% Gris
19.6 ms ... subida ↗ y bajada ↘ combinada↗ 13.6 ms subida
↘ 16 ms bajada
La pantalla mostró buenos tiempos de respuesta en nuestros tests pero podría ser demasiado lenta para los jugones competitivos.
En comparación, todos los dispositivos de prueba van de ##min### (mínimo) a 636 (máximo) ms. » 29 % de todos los dispositivos son mejores.
Esto quiere decir que el tiempo de respuesta medido es mejor que la media (32.8 ms) de todos los dispositivos testados.

Parpadeo de Pantalla / PWM (Pulse-Width Modulation)

Para atenuar el brillo de pantalla algunos portátiles están encendiendo y apagando la retroiluminación muy rápidamente. Esto se hace a una frecuencia que no debiera detectarse a simple vista. Si la frecuencia es demasiado lenta, la gente sensible podría experimentar problemas visuales, dolores de cabeza e incluso ver parpadeos.
Parpadeo de Pantalla / PWM no detectado

Comparación: 53 % de todos los dispositivos testados no usaron PWM para atenuar el display. Si se usó, medimos una media de 8715 (mínimo: 5 - máxmo: 343500) Hz.

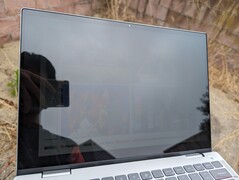
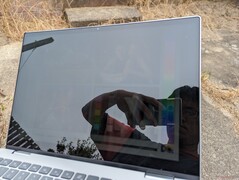
El resplandor es notable incluso cuando se usa el portátil en interiores o a la sombra. La tenue retroiluminación es incapaz de superar gran parte del resplandor de la capa brillante, lo que afecta gravemente a la visibilidad en exteriores.

Al aire libre en un día nublado
Al aire libre, a la sombra
Al aire libre en un día nublado
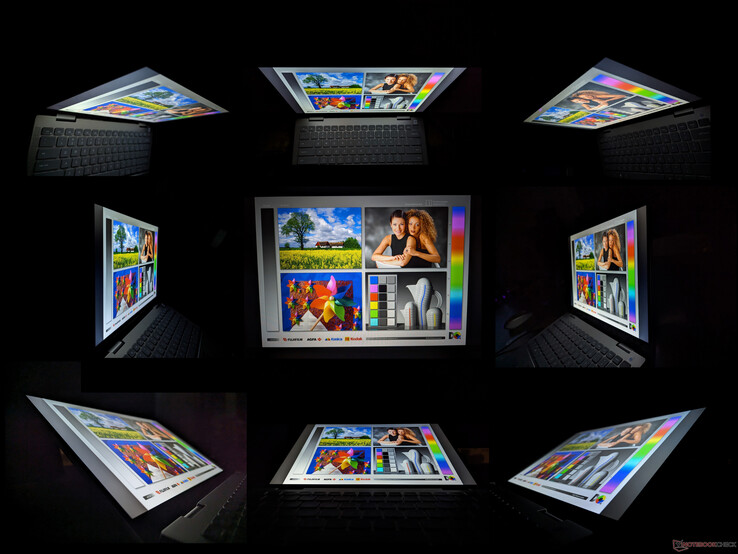
Amplios ángulos de visión IPS para los modos vertical y horizontal. El contraste y los colores se degradan si se ve desde ángulos extremos

Rendimiento - AMD Zen 3 At Heart


Condiciones de ensayo

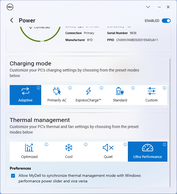
Configuramos nuestra unidad en modo Rendimiento a través del software MyDell antes de ejecutar los benchmarks que se muestran a continuación. Convenientemente, los perfiles de energía de MyDell están sincronizados con los perfiles de energía de Windows, a diferencia de la mayoría de modelos de fabricantes de la competencia.

Perfiles de energía MyDell
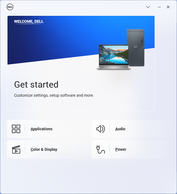
Pantalla de inicio de MyDell
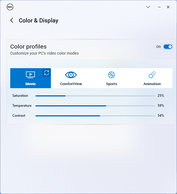
Perfiles de color predefinidos
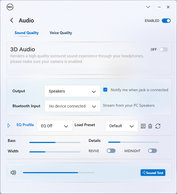
Ajustes de audio y ecualizador

Procesador

El 6-core Ryzen 5 7530U tiene un rendimiento casi idéntico alRyzen 5 6600U ya que ambos están basados en la arquitectura Zen 3. El rendimiento general es comparable al de la gama media Core i5-1335U que se encuentra en modelos como elAcer Aspire 5 Spin 14 mientras que está muy por encima de cualquier solución Core i3 móvil. AMD ha ajustado esta CPU para que sea competitiva frente a la serie Core i5 tanto en rendimiento como en precio.

La actualización a la CPU de 8 núcleos Ryzen 7 7730U se espera que aumente el rendimiento multihilo entre un 30 y un 40 por ciento, según el tiempo que hemos pasado con el Asus Zenbook 14.

Cinebench R15 Multi Loop

075150225300375450525600675750825900975105011251200127513501425Tooltip
Dell Inspiron 14 7435 2-in-1 AMD Ryzen 5 7530U: Ø1242 (1217.69-1302.59)
Dell Inspiron 14 7420 2-in-1 Intel Core i7-1255U: Ø1118 (1067.98-1158.61)
Lenovo IdeaPad Flex 7i 14IAU7 Intel Core i7-1255U: Ø1099 (1057.61-1376.89)
Acer Aspire 5 Spin 14 Intel Core i5-1335U: Ø1156 (1075.82-1441.15)
LG Gram 14T90P Intel Core i5-1135G7: Ø686 (665.48-795.81)
HP Pavilion x360 14-dy0157ng Intel Core i5-1135G7: Ø584 (529.91-688.22)
CPU Performance Rating: Percent
Cinebench R23: Multi Core | Single Core
Cinebench R20: CPU (Multi Core) | CPU (Single Core)
Cinebench R15: CPU Multi 64Bit | CPU Single 64Bit
Blender: v2.79 BMW27 CPU
7-Zip 18.03: 7z b 4 | 7z b 4 -mmt1
Geekbench 5.5: Multi-Core | Single-Core
HWBOT x265 Benchmark v2.2: 4k Preset
LibreOffice : 20 Documents To PDF
R Benchmark 2.5: Overall mean
CPU Performance Rating
Lenovo Yoga 9 14IRP G8
Intel Core i7-1360P
84 pt
Lenovo Yoga 7-14ARB G7
AMD Ryzen 7 6800U
77.7 pt
Lenovo ThinkPad X1 Yoga G8 i7-1355U -1!
Intel Core i7-1355U
76.5 pt
Dell Latitude 9440 2-in-1 -1!
Intel Core i7-1365U
76.4 pt
MSI Summit E14 Flip Evo A12MT
Intel Core i7-1260P
74.8 pt
Morefine M600, 6600U
AMD Ryzen 5 6600U
66 pt
Dell Inspiron 14 7420 2-in-1
Intel Core i7-1255U
64.5 pt
Acer Aspire 5 Spin 14
Intel Core i5-1335U
64.4 pt
Average AMD Ryzen 5 7530U
 
63.6 pt
Dell Inspiron 14 7435 2-in-1
AMD Ryzen 5 7530U
63.5 pt
Lenovo IdeaPad Flex 5 14IAU7-82R7007TGE
Intel Core i3-1215U
51.8 pt
Lenovo ThinkBook 14s Yoga ITL 20WE0023GE
Intel Core i7-1165G7
48.1 pt
HP Pavilion x360 14-dy0157ng
Intel Core i5-1135G7
41.2 pt
Cinebench R23 / Multi Core
Lenovo Yoga 9 14IRP G8
Intel Core i7-1360P
11922 Points +41%
Lenovo Yoga 7-14ARB G7
AMD Ryzen 7 6800U
11741 Points +39%
Lenovo ThinkPad X1 Yoga G8 i7-1355U
Intel Core i7-1355U
9796 (8611.14min - 9795.8max) Points +16%
Dell Latitude 9440 2-in-1
Intel Core i7-1365U
9576 (7962.38min - 9576.21max) Points +13%
MSI Summit E14 Flip Evo A12MT
Intel Core i7-1260P
9214 (8849.33min - 9213.81max) Points +9%
Morefine M600, 6600U
AMD Ryzen 5 6600U
8491 Points 0%
Average AMD Ryzen 5 7530U
  (6931 - 9347, n=8)
8479 Points 0%
Dell Inspiron 14 7435 2-in-1
AMD Ryzen 5 7530U
8476 (7306.45min - 8475.87max) Points
Acer Aspire 5 Spin 14
Intel Core i5-1335U
7783 Points -8%
Dell Inspiron 14 7420 2-in-1
Intel Core i7-1255U
7385 (7081.74min - 7384.56max) Points -13%
Lenovo IdeaPad Flex 5 14IAU7-82R7007TGE
Intel Core i3-1215U
5802 Points -32%
Lenovo ThinkBook 14s Yoga ITL 20WE0023GE
Intel Core i7-1165G7
4298 Points -49%
HP Pavilion x360 14-dy0157ng
Intel Core i5-1135G7
4029 Points -52%
Cinebench R23 / Single Core
Dell Latitude 9440 2-in-1
Intel Core i7-1365U
1883 Points +33%
Lenovo Yoga 9 14IRP G8
Intel Core i7-1360P
1877 Points +32%
Lenovo ThinkPad X1 Yoga G8 i7-1355U
Intel Core i7-1355U
1797 Points +26%
Dell Inspiron 14 7420 2-in-1
Intel Core i7-1255U
1775 Points +25%
MSI Summit E14 Flip Evo A12MT
Intel Core i7-1260P
1753 Points +23%
Lenovo IdeaPad Flex 5 14IAU7-82R7007TGE
Intel Core i3-1215U
1581 Points +11%
Acer Aspire 5 Spin 14
Intel Core i5-1335U
1565 Points +10%
Lenovo Yoga 7-14ARB G7
AMD Ryzen 7 6800U
1518 Points +7%
Lenovo ThinkBook 14s Yoga ITL 20WE0023GE
Intel Core i7-1165G7
1488 Points +5%
Average AMD Ryzen 5 7530U
  (1371 - 1470, n=8)
1438 Points +1%
Dell Inspiron 14 7435 2-in-1
AMD Ryzen 5 7530U
1421 Points
Morefine M600, 6600U
AMD Ryzen 5 6600U
1420 Points 0%
HP Pavilion x360 14-dy0157ng
Intel Core i5-1135G7
1359 Points -4%
Cinebench R20 / CPU (Multi Core)
Lenovo Yoga 7-14ARB G7
AMD Ryzen 7 6800U
4574 Points +49%
Lenovo Yoga 9 14IRP G8
Intel Core i7-1360P
4472 Points +45%
Lenovo ThinkPad X1 Yoga G8 i7-1355U
Intel Core i7-1355U
3797 Points +23%
Dell Latitude 9440 2-in-1
Intel Core i7-1365U
3667 Points +19%
MSI Summit E14 Flip Evo A12MT
Intel Core i7-1260P
3515 Points +14%
Morefine M600, 6600U
AMD Ryzen 5 6600U
3419 Points +11%
Average AMD Ryzen 5 7530U
  (2833 - 3655, n=8)
3304 Points +7%
Dell Inspiron 14 7435 2-in-1
AMD Ryzen 5 7530U
3080 Points
Acer Aspire 5 Spin 14
Intel Core i5-1335U
3041 Points -1%
Dell Inspiron 14 7420 2-in-1
Intel Core i7-1255U
2870 Points -7%
Lenovo IdeaPad Flex 5 14IAU7-82R7007TGE
Intel Core i3-1215U
2198 Points -29%
Lenovo ThinkBook 14s Yoga ITL 20WE0023GE
Intel Core i7-1165G7
1715 Points -44%
HP Pavilion x360 14-dy0157ng
Intel Core i5-1135G7
979 Points -68%
Cinebench R20 / CPU (Single Core)
Lenovo Yoga 9 14IRP G8
Intel Core i7-1360P
727 Points +30%
Dell Latitude 9440 2-in-1
Intel Core i7-1365U
719 Points +29%
Lenovo ThinkPad X1 Yoga G8 i7-1355U
Intel Core i7-1355U
706 Points +26%
Dell Inspiron 14 7420 2-in-1
Intel Core i7-1255U
682 Points +22%
MSI Summit E14 Flip Evo A12MT
Intel Core i7-1260P
681 Points +22%
Lenovo IdeaPad Flex 5 14IAU7-82R7007TGE
Intel Core i3-1215U
606 Points +8%
Lenovo Yoga 7-14ARB G7
AMD Ryzen 7 6800U
597 Points +7%
Acer Aspire 5 Spin 14
Intel Core i5-1335U
595 Points +6%
Lenovo ThinkBook 14s Yoga ITL 20WE0023GE
Intel Core i7-1165G7
569 Points +2%
Average AMD Ryzen 5 7530U
  (528 - 574, n=8)
561 Points 0%
Dell Inspiron 14 7435 2-in-1
AMD Ryzen 5 7530U
559 Points
Morefine M600, 6600U
AMD Ryzen 5 6600U
558 Points 0%
HP Pavilion x360 14-dy0157ng
Intel Core i5-1135G7
467 Points -16%
Cinebench R15 / CPU Multi 64Bit
Lenovo Yoga 9 14IRP G8
Intel Core i7-1360P
2115 (1611.41min - 2114.84max) Points +62%
Lenovo Yoga 7-14ARB G7
AMD Ryzen 7 6800U
1978.53 (1657.55min, 1658.26P1 - 1978.53max) Points +52%
Lenovo ThinkPad X1 Yoga G8 i7-1355U
Intel Core i7-1355U
1612 (1261.75min - 1611.54max) Points +24%
Dell Latitude 9440 2-in-1
Intel Core i7-1365U
1504 (1217.51min - 1503.93max) Points +15%
Average AMD Ryzen 5 7530U
  (1289 - 1599, n=8)
1447 Points +11%
Acer Aspire 5 Spin 14
Intel Core i5-1335U
1441 Points +11%
MSI Summit E14 Flip Evo A12MT
Intel Core i7-1260P
1394 (1302.3min - 1394.12max) Points +7%
Morefine M600, 6600U
AMD Ryzen 5 6600U
1361 Points +4%
Dell Inspiron 14 7435 2-in-1
AMD Ryzen 5 7530U
1303 (1217.69min - 1302.59max) Points
Dell Inspiron 14 7420 2-in-1
Intel Core i7-1255U
1159 (1067.98min - 1158.61max) Points -11%
Lenovo IdeaPad Flex 5 14IAU7-82R7007TGE
Intel Core i3-1215U
832 (719.93min - 831.53max) Points -36%
Lenovo ThinkBook 14s Yoga ITL 20WE0023GE
Intel Core i7-1165G7
791 Points -39%
HP Pavilion x360 14-dy0157ng
Intel Core i5-1135G7
688 Points -47%
Cinebench R15 / CPU Single 64Bit
Lenovo Yoga 9 14IRP G8
Intel Core i7-1360P
271 Points +18%
Dell Latitude 9440 2-in-1
Intel Core i7-1365U
268 Points +17%
Lenovo ThinkPad X1 Yoga G8 i7-1355U
Intel Core i7-1355U
264 Points +15%
Dell Inspiron 14 7420 2-in-1
Intel Core i7-1255U
251 Points +10%
MSI Summit E14 Flip Evo A12MT
Intel Core i7-1260P
245 Points +7%
Lenovo Yoga 7-14ARB G7
AMD Ryzen 7 6800U
243 Points +6%
Average AMD Ryzen 5 7530U
  (213 - 237, n=8)
230 Points 0%
Dell Inspiron 14 7435 2-in-1
AMD Ryzen 5 7530U
229 Points
Lenovo IdeaPad Flex 5 14IAU7-82R7007TGE
Intel Core i3-1215U
227 Points -1%
Morefine M600, 6600U
AMD Ryzen 5 6600U
227 Points -1%
Acer Aspire 5 Spin 14
Intel Core i5-1335U
222 Points -3%
Lenovo ThinkBook 14s Yoga ITL 20WE0023GE
Intel Core i7-1165G7
199 Points -13%
HP Pavilion x360 14-dy0157ng
Intel Core i5-1135G7
197 Points -14%
Blender / v2.79 BMW27 CPU
HP Pavilion x360 14-dy0157ng
Intel Core i5-1135G7
766 Seconds * -112%
Lenovo ThinkBook 14s Yoga ITL 20WE0023GE
Intel Core i7-1165G7
681 Seconds * -89%
Lenovo IdeaPad Flex 5 14IAU7-82R7007TGE
Intel Core i3-1215U
645 Seconds * -79%
Dell Inspiron 14 7420 2-in-1
Intel Core i7-1255U
416 Seconds * -15%
Morefine M600, 6600U
AMD Ryzen 5 6600U
415 Seconds * -15%
Acer Aspire 5 Spin 14
Intel Core i5-1335U
404 Seconds * -12%
Average AMD Ryzen 5 7530U
  (330 - 469, n=7)
377 Seconds * -4%
Dell Inspiron 14 7435 2-in-1
AMD Ryzen 5 7530U
361 Seconds *
MSI Summit E14 Flip Evo A12MT
Intel Core i7-1260P
315 Seconds * +13%
Lenovo Yoga 9 14IRP G8
Intel Core i7-1360P
289 Seconds * +20%
Lenovo Yoga 7-14ARB G7
AMD Ryzen 7 6800U
272 Seconds * +25%
7-Zip 18.03 / 7z b 4
Lenovo Yoga 7-14ARB G7
AMD Ryzen 7 6800U
53934 MIPS +47%
Lenovo Yoga 9 14IRP G8
Intel Core i7-1360P
47518 MIPS +30%
MSI Summit E14 Flip Evo A12MT
Intel Core i7-1260P
46108 MIPS +26%
Morefine M600, 6600U
AMD Ryzen 5 6600U
44320 MIPS +21%
Lenovo ThinkPad X1 Yoga G8 i7-1355U
Intel Core i7-1355U
41541 MIPS +13%
Dell Latitude 9440 2-in-1
Intel Core i7-1365U
40377 MIPS +10%
Average AMD Ryzen 5 7530U
  (32204 - 42364, n=7)
37957 MIPS +3%
Dell Inspiron 14 7435 2-in-1
AMD Ryzen 5 7530U
36687 MIPS
Acer Aspire 5 Spin 14
Intel Core i5-1335U
34435 MIPS -6%
Dell Inspiron 14 7420 2-in-1
Intel Core i7-1255U
29874 MIPS -19%
Lenovo IdeaPad Flex 5 14IAU7-82R7007TGE
Intel Core i3-1215U
24893 MIPS -32%
Lenovo ThinkBook 14s Yoga ITL 20WE0023GE
Intel Core i7-1165G7
21320 MIPS -42%
HP Pavilion x360 14-dy0157ng
Intel Core i5-1135G7
18948 MIPS -48%
7-Zip 18.03 / 7z b 4 -mmt1
Dell Latitude 9440 2-in-1
Intel Core i7-1365U
5866 MIPS +12%
Lenovo Yoga 9 14IRP G8
Intel Core i7-1360P
5863 MIPS +12%
Lenovo ThinkPad X1 Yoga G8 i7-1355U
Intel Core i7-1355U
5670 MIPS +8%
Dell Inspiron 14 7420 2-in-1
Intel Core i7-1255U
5529 MIPS +6%
Lenovo Yoga 7-14ARB G7
AMD Ryzen 7 6800U
5511 MIPS +5%
Morefine M600, 6600U
AMD Ryzen 5 6600U
5486 MIPS +5%
MSI Summit E14 Flip Evo A12MT
Intel Core i7-1260P
5359 MIPS +2%
Lenovo ThinkBook 14s Yoga ITL 20WE0023GE
Intel Core i7-1165G7
5350 MIPS +2%
Average AMD Ryzen 5 7530U
  (5113 - 5544, n=7)
5328 MIPS +2%
Dell Inspiron 14 7435 2-in-1
AMD Ryzen 5 7530U
5238 MIPS
Acer Aspire 5 Spin 14
Intel Core i5-1335U
5063 MIPS -3%
Lenovo IdeaPad Flex 5 14IAU7-82R7007TGE
Intel Core i3-1215U
4934 MIPS -6%
HP Pavilion x360 14-dy0157ng
Intel Core i5-1135G7
4842 MIPS -8%
Geekbench 5.5 / Multi-Core
Lenovo Yoga 9 14IRP G8
Intel Core i7-1360P
10785 Points +66%
MSI Summit E14 Flip Evo A12MT
Intel Core i7-1260P
10370 Points +60%
Lenovo ThinkPad X1 Yoga G8 i7-1355U
Intel Core i7-1355U
9096 Points +40%
Lenovo Yoga 7-14ARB G7
AMD Ryzen 7 6800U
8935 Points +38%
Dell Latitude 9440 2-in-1
Intel Core i7-1365U
8272 Points +28%
Acer Aspire 5 Spin 14
Intel Core i5-1335U
7856 Points +21%
Morefine M600, 6600U
AMD Ryzen 5 6600U
7658 Points +18%
Dell Inspiron 14 7420 2-in-1
Intel Core i7-1255U
6778 Points +5%
Dell Inspiron 14 7435 2-in-1
AMD Ryzen 5 7530U
6479 Points
Average AMD Ryzen 5 7530U
  (5475 - 6648, n=7)
6121 Points -6%
Lenovo IdeaPad Flex 5 14IAU7-82R7007TGE
Intel Core i3-1215U
6015 Points -7%
Lenovo ThinkBook 14s Yoga ITL 20WE0023GE
Intel Core i7-1165G7
4946 Points -24%
HP Pavilion x360 14-dy0157ng
Intel Core i5-1135G7
4873 Points -25%
Geekbench 5.5 / Single-Core
Dell Latitude 9440 2-in-1
Intel Core i7-1365U
1841 Points +24%
Lenovo Yoga 9 14IRP G8
Intel Core i7-1360P
1790 Points +20%
Lenovo ThinkPad X1 Yoga G8 i7-1355U
Intel Core i7-1355U
1771 Points +19%
MSI Summit E14 Flip Evo A12MT
Intel Core i7-1260P
1737 Points +17%
Acer Aspire 5 Spin 14
Intel Core i5-1335U
1700 Points +14%
Dell Inspiron 14 7420 2-in-1
Intel Core i7-1255U
1640 Points +10%
Lenovo IdeaPad Flex 5 14IAU7-82R7007TGE
Intel Core i3-1215U
1572 Points +6%
Lenovo Yoga 7-14ARB G7
AMD Ryzen 7 6800U
1555 Points +5%
Lenovo ThinkBook 14s Yoga ITL 20WE0023GE
Intel Core i7-1165G7
1525 Points +3%
Morefine M600, 6600U
AMD Ryzen 5 6600U
1504 Points +1%
Dell Inspiron 14 7435 2-in-1
AMD Ryzen 5 7530U
1486 Points
Average AMD Ryzen 5 7530U
  (1393 - 1498, n=7)
1464 Points -1%
HP Pavilion x360 14-dy0157ng
Intel Core i5-1135G7
1422 Points -4%
HWBOT x265 Benchmark v2.2 / 4k Preset
Lenovo Yoga 7-14ARB G7
AMD Ryzen 7 6800U
14.2 fps +30%
Lenovo Yoga 9 14IRP G8
Intel Core i7-1360P
13 fps +19%
MSI Summit E14 Flip Evo A12MT
Intel Core i7-1260P
12.9 fps +18%
Morefine M600, 6600U
AMD Ryzen 5 6600U
11.7 fps +7%
Dell Inspiron 14 7435 2-in-1
AMD Ryzen 5 7530U
10.9 fps
Dell Latitude 9440 2-in-1
Intel Core i7-1365U
10.3 fps -6%
Average AMD Ryzen 5 7530U
  (8.17 - 11.6, n=7)
10.3 fps -6%
Lenovo ThinkPad X1 Yoga G8 i7-1355U
Intel Core i7-1355U
10.2 fps -6%
Acer Aspire 5 Spin 14
Intel Core i5-1335U
9.1 fps -17%
Dell Inspiron 14 7420 2-in-1
Intel Core i7-1255U
8.73 fps -20%
Lenovo ThinkBook 14s Yoga ITL 20WE0023GE
Intel Core i7-1165G7
5.55 fps -49%
Lenovo IdeaPad Flex 5 14IAU7-82R7007TGE
Intel Core i3-1215U
5.33 fps -51%
HP Pavilion x360 14-dy0157ng
Intel Core i5-1135G7
5.04 fps -54%
LibreOffice / 20 Documents To PDF
Lenovo Yoga 7-14ARB G7
AMD Ryzen 7 6800U
54.9 s * -11%
Lenovo IdeaPad Flex 5 14IAU7-82R7007TGE
Intel Core i3-1215U
53.7 s * -8%
Morefine M600, 6600U
AMD Ryzen 5 6600U
53 s * -7%
HP Pavilion x360 14-dy0157ng
Intel Core i5-1135G7
52.2 s * -5%
Average AMD Ryzen 5 7530U
  (44.6 - 58.1, n=7)
52 s * -5%
Dell Inspiron 14 7435 2-in-1
AMD Ryzen 5 7530U
49.5 s *
Dell Inspiron 14 7420 2-in-1
Intel Core i7-1255U
49.3 s * -0%
MSI Summit E14 Flip Evo A12MT
Intel Core i7-1260P
49.3 s * -0%
Acer Aspire 5 Spin 14
Intel Core i5-1335U
48.6 s * +2%
Lenovo ThinkPad X1 Yoga G8 i7-1355U
Intel Core i7-1355U
48.3 s * +2%
Lenovo ThinkBook 14s Yoga ITL 20WE0023GE
Intel Core i7-1165G7
48.2 s * +3%
Lenovo Yoga 9 14IRP G8
Intel Core i7-1360P
47.5 s * +4%
Dell Latitude 9440 2-in-1
Intel Core i7-1365U
47.5 s * +4%
R Benchmark 2.5 / Overall mean
HP Pavilion x360 14-dy0157ng
Intel Core i5-1135G7
0.619 sec * -17%
Lenovo ThinkBook 14s Yoga ITL 20WE0023GE
Intel Core i7-1165G7
0.559 sec * -6%
Lenovo IdeaPad Flex 5 14IAU7-82R7007TGE
Intel Core i3-1215U
0.547 sec * -4%
Average AMD Ryzen 5 7530U
  (0.515 - 0.567, n=7)
0.533 sec * -1%
Dell Inspiron 14 7435 2-in-1
AMD Ryzen 5 7530U
0.527 sec *
Acer Aspire 5 Spin 14
Intel Core i5-1335U
0.515 sec * +2%
Morefine M600, 6600U
AMD Ryzen 5 6600U
0.511 sec * +3%
Lenovo Yoga 7-14ARB G7
AMD Ryzen 7 6800U
0.508 sec * +4%
MSI Summit E14 Flip Evo A12MT
Intel Core i7-1260P
0.4787 sec * +9%
Dell Inspiron 14 7420 2-in-1
Intel Core i7-1255U
0.4688 sec * +11%
Lenovo ThinkPad X1 Yoga G8 i7-1355U
Intel Core i7-1355U
0.4668 sec * +11%
Lenovo Yoga 9 14IRP G8
Intel Core i7-1360P
0.46 sec * +13%
Dell Latitude 9440 2-in-1
Intel Core i7-1365U
0.4582 sec * +13%
CPU Performance Rating: Percent
Cinebench R23: Multi Core | Single Core
Cinebench R20: CPU (Multi Core) | CPU (Single Core)
Cinebench R15: CPU Multi 64Bit | CPU Single 64Bit
Blender: v2.79 BMW27 CPU
7-Zip 18.03: 7z b 4 | 7z b 4 -mmt1
Geekbench 5.5: Multi-Core | Single-Core
HWBOT x265 Benchmark v2.2: 4k Preset
LibreOffice : 20 Documents To PDF
R Benchmark 2.5: Overall mean

* ... más pequeño es mejor

Blender
v3.3 Classroom HIP/AMD
Average AMD Radeon RX Vega 7
  (570 - 1215, n=12)
791 Seconds * -11%
Dell Inspiron 14 7435 2-in-1
AMD Radeon RX Vega 7, AMD Ryzen 5 7530U
712 Seconds *
Lenovo Yoga 7-14ARB G7
AMD Radeon 680M, AMD Ryzen 7 6800U
346 Seconds * +51%
v3.3 Classroom CPU
Lenovo IdeaPad Flex 5 14IAU7-82R7007TGE
Intel UHD Graphics 64EUs (Alder Lake 12th Gen), Intel Core i3-1215U
1253 Seconds * -67%
Dell Inspiron 14 7435 2-in-1
AMD Radeon RX Vega 7, AMD Ryzen 5 7530U
752 Seconds *
Acer Aspire 5 Spin 14
Intel Iris Xe Graphics G7 80EUs, Intel Core i5-1335U
750 Seconds * -0%
Average AMD Radeon RX Vega 7
  (556 - 878, n=24)
702 Seconds * +7%
Dell Latitude 9440 2-in-1
Intel Iris Xe Graphics G7 96EUs, Intel Core i7-1365U
660 Seconds * +12%
Lenovo ThinkPad X1 Yoga G8 i7-1355U
Intel Iris Xe Graphics G7 96EUs, Intel Core i7-1355U
628 Seconds * +16%
Lenovo Yoga 9 14IRP G8
Intel Iris Xe Graphics G7 96EUs, Intel Core i7-1360P
527 Seconds * +30%
Lenovo Yoga 7-14ARB G7
AMD Radeon 680M, AMD Ryzen 7 6800U
504 Seconds * +33%

* ... más pequeño es mejor

Cinebench R15 CPU Multi 64Bit
1303 Points
Cinebench R15 OpenGL 64Bit
101.9 fps
Cinebench R15 Ref. Match 64Bit
97.9 %
Cinebench R15 CPU Single 64Bit
229 Points
Cinebench R20 CPU (Multi Core)
3080 Points
Cinebench R20 CPU (Single Core)
559 Points
Cinebench R23 Single Core
1421 Points
Cinebench R23 Multi Core
8476 Points
ayuda
Performance Rating
Average AMD Ryzen 5 7530U
 
90.7 pt
Dell Inspiron 14 7435 2-in-1
AMD Ryzen 5 7530U, Vega 7
85.3 pt
Lenovo IdeaPad Flex 7i 14IAU7
Intel Core i7-1255U, Iris Xe G7 96EUs
76.3 pt
Acer Aspire 5 Spin 14
Intel Core i5-1335U, Iris Xe G7 80EUs
75.7 pt
LG Gram 14T90P
Intel Core i5-1135G7, Iris Xe G7 80EUs
68.8 pt
HP Pavilion x360 14-dy0157ng
Intel Core i5-1135G7, Iris Xe G7 80EUs
54.8 pt
Dell Inspiron 14 7420 2-in-1
Intel Core i7-1255U, Iris Xe G7 96EUs
54 pt
AIDA64 / FP32 Ray-Trace
Average AMD Ryzen 5 7530U
  (8845 - 10970, n=7)
9684 KRay/s +5%
Dell Inspiron 14 7435 2-in-1
AMD Ryzen 5 7530U, Vega 7
9263 KRay/s
Lenovo IdeaPad Flex 7i 14IAU7
Intel Core i7-1255U, Iris Xe G7 96EUs
7411 KRay/s -20%
Acer Aspire 5 Spin 14
Intel Core i5-1335U, Iris Xe G7 80EUs
6960 KRay/s -25%
LG Gram 14T90P
Intel Core i5-1135G7, Iris Xe G7 80EUs
6871 KRay/s -26%
HP Pavilion x360 14-dy0157ng
Intel Core i5-1135G7, Iris Xe G7 80EUs
5329 KRay/s -42%
Dell Inspiron 14 7420 2-in-1
Intel Core i7-1255U, Iris Xe G7 96EUs
4313 KRay/s -53%
AIDA64 / FPU Julia
Average AMD Ryzen 5 7530U
  (57481 - 68384, n=7)
61842 Points +5%
Dell Inspiron 14 7435 2-in-1
AMD Ryzen 5 7530U, Vega 7
59173 Points
Lenovo IdeaPad Flex 7i 14IAU7
Intel Core i7-1255U, Iris Xe G7 96EUs
37832 Points -36%
Acer Aspire 5 Spin 14
Intel Core i5-1335U, Iris Xe G7 80EUs
34374 Points -42%
LG Gram 14T90P
Intel Core i5-1135G7, Iris Xe G7 80EUs
27981 Points -53%
HP Pavilion x360 14-dy0157ng
Intel Core i5-1135G7, Iris Xe G7 80EUs
22393 Points -62%
Dell Inspiron 14 7420 2-in-1
Intel Core i7-1255U, Iris Xe G7 96EUs
19813 Points -67%
AIDA64 / CPU SHA3
Average AMD Ryzen 5 7530U
  (1923 - 2323, n=7)
2088 MB/s +6%
Lenovo IdeaPad Flex 7i 14IAU7
Intel Core i7-1255U, Iris Xe G7 96EUs
1974 MB/s 0%
Dell Inspiron 14 7435 2-in-1
AMD Ryzen 5 7530U, Vega 7
1968 MB/s
LG Gram 14T90P
Intel Core i5-1135G7, Iris Xe G7 80EUs
1884 MB/s -4%
Acer Aspire 5 Spin 14
Intel Core i5-1335U, Iris Xe G7 80EUs
1819 MB/s -8%
HP Pavilion x360 14-dy0157ng
Intel Core i5-1135G7, Iris Xe G7 80EUs
1519 MB/s -23%
Dell Inspiron 14 7420 2-in-1
Intel Core i7-1255U, Iris Xe G7 96EUs
1358 MB/s -31%
AIDA64 / CPU Queen
Dell Inspiron 14 7435 2-in-1
AMD Ryzen 5 7530U, Vega 7
75448 Points
Average AMD Ryzen 5 7530U
  (68103 - 78105, n=7)
73792 Points -2%
Lenovo IdeaPad Flex 7i 14IAU7
Intel Core i7-1255U, Iris Xe G7 96EUs
65846 Points -13%
Dell Inspiron 14 7420 2-in-1
Intel Core i7-1255U, Iris Xe G7 96EUs
61460 Points -19%
Acer Aspire 5 Spin 14
Intel Core i5-1335U, Iris Xe G7 80EUs
60992 Points -19%
LG Gram 14T90P
Intel Core i5-1135G7, Iris Xe G7 80EUs
46251 Points -39%
HP Pavilion x360 14-dy0157ng
Intel Core i5-1135G7, Iris Xe G7 80EUs
44661 Points -41%
AIDA64 / FPU SinJulia
Average AMD Ryzen 5 7530U
  (8277 - 9248, n=7)
8688 Points +1%
Dell Inspiron 14 7435 2-in-1
AMD Ryzen 5 7530U, Vega 7
8566 Points
Lenovo IdeaPad Flex 7i 14IAU7
Intel Core i7-1255U, Iris Xe G7 96EUs
4802 Points -44%
Dell Inspiron 14 7420 2-in-1
Intel Core i7-1255U, Iris Xe G7 96EUs
4476 Points -48%
LG Gram 14T90P
Intel Core i5-1135G7, Iris Xe G7 80EUs
4421 Points -48%
Acer Aspire 5 Spin 14
Intel Core i5-1335U, Iris Xe G7 80EUs
4368 Points -49%
HP Pavilion x360 14-dy0157ng
Intel Core i5-1135G7, Iris Xe G7 80EUs
3736 Points -56%
AIDA64 / FPU Mandel
Average AMD Ryzen 5 7530U
  (31632 - 37624, n=7)
34058 Points +5%
Dell Inspiron 14 7435 2-in-1
AMD Ryzen 5 7530U, Vega 7
32517 Points
Lenovo IdeaPad Flex 7i 14IAU7
Intel Core i7-1255U, Iris Xe G7 96EUs
18918 Points -42%
LG Gram 14T90P
Intel Core i5-1135G7, Iris Xe G7 80EUs
16839 Points -48%
Acer Aspire 5 Spin 14
Intel Core i5-1335U, Iris Xe G7 80EUs
16723 Points -49%
HP Pavilion x360 14-dy0157ng
Intel Core i5-1135G7, Iris Xe G7 80EUs
14130 Points -57%
Dell Inspiron 14 7420 2-in-1
Intel Core i7-1255U, Iris Xe G7 96EUs
11759 Points -64%
AIDA64 / CPU AES
Acer Aspire 5 Spin 14
Intel Core i5-1335U, Iris Xe G7 80EUs
65997 MB/s +95%
LG Gram 14T90P
Intel Core i5-1135G7, Iris Xe G7 80EUs
64809 MB/s +91%
Average AMD Ryzen 5 7530U
  (33314 - 92360, n=7)
56469 MB/s +67%
HP Pavilion x360 14-dy0157ng
Intel Core i5-1135G7, Iris Xe G7 80EUs
54358 MB/s +60%
Lenovo IdeaPad Flex 7i 14IAU7
Intel Core i7-1255U, Iris Xe G7 96EUs
38889 MB/s +15%
Dell Inspiron 14 7435 2-in-1
AMD Ryzen 5 7530U, Vega 7
33883 MB/s
Dell Inspiron 14 7420 2-in-1
Intel Core i7-1255U, Iris Xe G7 96EUs
31067 MB/s -8%
AIDA64 / CPU ZLib
Acer Aspire 5 Spin 14
Intel Core i5-1335U, Iris Xe G7 80EUs
608 MB/s +16%
Lenovo IdeaPad Flex 7i 14IAU7
Intel Core i7-1255U, Iris Xe G7 96EUs
577 MB/s +10%
Average AMD Ryzen 5 7530U
  (503 - 612, n=7)
545 MB/s +4%
Dell Inspiron 14 7420 2-in-1
Intel Core i7-1255U, Iris Xe G7 96EUs
527 MB/s 0%
Dell Inspiron 14 7435 2-in-1
AMD Ryzen 5 7530U, Vega 7
526 MB/s
LG Gram 14T90P
Intel Core i5-1135G7, Iris Xe G7 80EUs
340 MB/s -35%
HP Pavilion x360 14-dy0157ng
Intel Core i5-1135G7, Iris Xe G7 80EUs
268 MB/s -49%
AIDA64 / FP64 Ray-Trace
Average AMD Ryzen 5 7530U
  (4593 - 5738, n=7)
5059 KRay/s +4%
Dell Inspiron 14 7435 2-in-1
AMD Ryzen 5 7530U, Vega 7
4875 KRay/s
Lenovo IdeaPad Flex 7i 14IAU7
Intel Core i7-1255U, Iris Xe G7 96EUs
3968 KRay/s -19%
LG Gram 14T90P
Intel Core i5-1135G7, Iris Xe G7 80EUs
3602 KRay/s -26%
Acer Aspire 5 Spin 14
Intel Core i5-1335U, Iris Xe G7 80EUs
3592 KRay/s -26%
HP Pavilion x360 14-dy0157ng
Intel Core i5-1135G7, Iris Xe G7 80EUs
2901 KRay/s -40%
Dell Inspiron 14 7420 2-in-1
Intel Core i7-1255U, Iris Xe G7 96EUs
2474 KRay/s -49%
AIDA64 / CPU PhotoWorxx
Lenovo IdeaPad Flex 7i 14IAU7
Intel Core i7-1255U, Iris Xe G7 96EUs
42913 MPixel/s +159%
LG Gram 14T90P
Intel Core i5-1135G7, Iris Xe G7 80EUs
40663 MPixel/s +145%
Acer Aspire 5 Spin 14
Intel Core i5-1335U, Iris Xe G7 80EUs
39233 MPixel/s +137%
HP Pavilion x360 14-dy0157ng
Intel Core i5-1135G7, Iris Xe G7 80EUs
24181 MPixel/s +46%
Dell Inspiron 14 7420 2-in-1
Intel Core i7-1255U, Iris Xe G7 96EUs
20801 MPixel/s +25%
Dell Inspiron 14 7435 2-in-1
AMD Ryzen 5 7530U, Vega 7
16583 MPixel/s
Average AMD Ryzen 5 7530U
  (9832 - 19525, n=7)
14538 MPixel/s -12%

Rendimiento del sistema

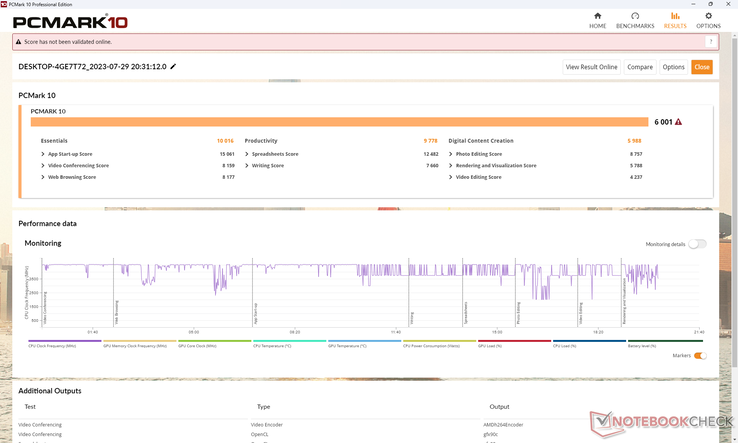
Las puntuaciones PCMark son superiores a las de la mayoría de subportátiles económicos, especialmente en la subprueba de productividad. Sospechamos que esto podría deberse a la configuración de 6 núcleos/12 hilos del procesador, que puede tener una mayor influencia en el benchmark que las configuraciones P-core y E-Core de las CPUs Intel.
PCMark 10 Estándar
PCMark 10 Estándar
PCMark 10 / Score
Dell Inspiron 14 7435 2-in-1
Vega 7, R5 7530U
6001 Points
Average AMD Ryzen 5 7530U, AMD Radeon RX Vega 7
  (5686 - 6209, n=7)
5930 Points -1%
Lenovo IdeaPad Flex 7i 14IAU7
Iris Xe G7 96EUs, i7-1255U, Samsung PM9B1 512GB MZAL4512HBLU
5505 Points -8%
Dell Inspiron 14 7420 2-in-1
Iris Xe G7 96EUs, i7-1255U, WDC PC SN530 SDBPMPZ-512G
5271 Points -12%
Acer Aspire 5 Spin 14
Iris Xe G7 80EUs, i5-1335U, Micron 2450 512GB MTFDKBA512TFK
5216 Points -13%
LG Gram 14T90P
Iris Xe G7 80EUs, i5-1135G7, Samsung SSD PM981a MZVLB512HBJQ
4681 Points -22%
HP Pavilion x360 14-dy0157ng
Iris Xe G7 80EUs, i5-1135G7, Toshiba KBG40ZNV512G
4646 Points -23%
PCMark 10 / Essentials
Lenovo IdeaPad Flex 7i 14IAU7
Iris Xe G7 96EUs, i7-1255U, Samsung PM9B1 512GB MZAL4512HBLU
11166 Points +11%
Average AMD Ryzen 5 7530U, AMD Radeon RX Vega 7
  (10016 - 11242, n=7)
10608 Points +6%
Acer Aspire 5 Spin 14
Iris Xe G7 80EUs, i5-1335U, Micron 2450 512GB MTFDKBA512TFK
10342 Points +3%
Dell Inspiron 14 7420 2-in-1
Iris Xe G7 96EUs, i7-1255U, WDC PC SN530 SDBPMPZ-512G
10249 Points +2%
Dell Inspiron 14 7435 2-in-1
Vega 7, R5 7530U
10016 Points
LG Gram 14T90P
Iris Xe G7 80EUs, i5-1135G7, Samsung SSD PM981a MZVLB512HBJQ
9872 Points -1%
HP Pavilion x360 14-dy0157ng
Iris Xe G7 80EUs, i5-1135G7, Toshiba KBG40ZNV512G
9753 Points -3%
PCMark 10 / Productivity
Dell Inspiron 14 7435 2-in-1
Vega 7, R5 7530U
9778 Points
Average AMD Ryzen 5 7530U, AMD Radeon RX Vega 7
  (8983 - 9967, n=7)
9514 Points -3%
Lenovo IdeaPad Flex 7i 14IAU7
Iris Xe G7 96EUs, i7-1255U, Samsung PM9B1 512GB MZAL4512HBLU
7070 Points -28%
Acer Aspire 5 Spin 14
Iris Xe G7 80EUs, i5-1335U, Micron 2450 512GB MTFDKBA512TFK
6626 Points -32%
Dell Inspiron 14 7420 2-in-1
Iris Xe G7 96EUs, i7-1255U, WDC PC SN530 SDBPMPZ-512G
6530 Points -33%
LG Gram 14T90P
Iris Xe G7 80EUs, i5-1135G7, Samsung SSD PM981a MZVLB512HBJQ
6475 Points -34%
HP Pavilion x360 14-dy0157ng
Iris Xe G7 80EUs, i5-1135G7, Toshiba KBG40ZNV512G
6371 Points -35%
PCMark 10 / Digital Content Creation
Dell Inspiron 14 7435 2-in-1
Vega 7, R5 7530U
5988 Points
Dell Inspiron 14 7420 2-in-1
Iris Xe G7 96EUs, i7-1255U, WDC PC SN530 SDBPMPZ-512G
5938 Points -1%
Lenovo IdeaPad Flex 7i 14IAU7
Iris Xe G7 96EUs, i7-1255U, Samsung PM9B1 512GB MZAL4512HBLU
5735 Points -4%
Average AMD Ryzen 5 7530U, AMD Radeon RX Vega 7
  (4941 - 6093, n=7)
5626 Points -6%
Acer Aspire 5 Spin 14
Iris Xe G7 80EUs, i5-1335U, Micron 2450 512GB MTFDKBA512TFK
5619 Points -6%
HP Pavilion x360 14-dy0157ng
Iris Xe G7 80EUs, i5-1135G7, Toshiba KBG40ZNV512G
4382 Points -27%
LG Gram 14T90P
Iris Xe G7 80EUs, i5-1135G7, Samsung SSD PM981a MZVLB512HBJQ
4356 Points -27%
CrossMark / Overall
Acer Aspire 5 Spin 14
Iris Xe G7 80EUs, i5-1335U, Micron 2450 512GB MTFDKBA512TFK
1599 Points +31%
Lenovo IdeaPad Flex 7i 14IAU7
Iris Xe G7 96EUs, i7-1255U, Samsung PM9B1 512GB MZAL4512HBLU
1475 Points +21%
Dell Inspiron 14 7420 2-in-1
Iris Xe G7 96EUs, i7-1255U, WDC PC SN530 SDBPMPZ-512G
1454 Points +19%
LG Gram 14T90P
Iris Xe G7 80EUs, i5-1135G7, Samsung SSD PM981a MZVLB512HBJQ
1293 Points +6%
Average AMD Ryzen 5 7530U, AMD Radeon RX Vega 7
  (1029 - 1336, n=6)
1228 Points 0%
Dell Inspiron 14 7435 2-in-1
Vega 7, R5 7530U
1222 Points
CrossMark / Productivity
Acer Aspire 5 Spin 14
Iris Xe G7 80EUs, i5-1335U, Micron 2450 512GB MTFDKBA512TFK
1638 Points +29%
Dell Inspiron 14 7420 2-in-1
Iris Xe G7 96EUs, i7-1255U, WDC PC SN530 SDBPMPZ-512G
1463 Points +16%
Lenovo IdeaPad Flex 7i 14IAU7
Iris Xe G7 96EUs, i7-1255U, Samsung PM9B1 512GB MZAL4512HBLU
1431 Points +13%
LG Gram 14T90P
Iris Xe G7 80EUs, i5-1135G7, Samsung SSD PM981a MZVLB512HBJQ
1332 Points +5%
Average AMD Ryzen 5 7530U, AMD Radeon RX Vega 7
  (1115 - 1370, n=6)
1275 Points +1%
Dell Inspiron 14 7435 2-in-1
Vega 7, R5 7530U
1266 Points
CrossMark / Creativity
Lenovo IdeaPad Flex 7i 14IAU7
Iris Xe G7 96EUs, i7-1255U, Samsung PM9B1 512GB MZAL4512HBLU
1623 Points +28%
Dell Inspiron 14 7420 2-in-1
Iris Xe G7 96EUs, i7-1255U, WDC PC SN530 SDBPMPZ-512G
1523 Points +20%
Acer Aspire 5 Spin 14
Iris Xe G7 80EUs, i5-1335U, Micron 2450 512GB MTFDKBA512TFK
1483 Points +17%
Average AMD Ryzen 5 7530U, AMD Radeon RX Vega 7
  (992 - 1390, n=6)
1268 Points 0%
Dell Inspiron 14 7435 2-in-1
Vega 7, R5 7530U
1264 Points
LG Gram 14T90P
Iris Xe G7 80EUs, i5-1135G7, Samsung SSD PM981a MZVLB512HBJQ
1261 Points 0%
CrossMark / Responsiveness
Acer Aspire 5 Spin 14
Iris Xe G7 80EUs, i5-1335U, Micron 2450 512GB MTFDKBA512TFK
1868 Points +88%
LG Gram 14T90P
Iris Xe G7 80EUs, i5-1135G7, Samsung SSD PM981a MZVLB512HBJQ
1275 Points +28%
Dell Inspiron 14 7420 2-in-1
Iris Xe G7 96EUs, i7-1255U, WDC PC SN530 SDBPMPZ-512G
1239 Points +24%
Lenovo IdeaPad Flex 7i 14IAU7
Iris Xe G7 96EUs, i7-1255U, Samsung PM9B1 512GB MZAL4512HBLU
1212 Points +22%
Dell Inspiron 14 7435 2-in-1
Vega 7, R5 7530U
996 Points
Average AMD Ryzen 5 7530U, AMD Radeon RX Vega 7
  (900 - 1096, n=6)
996 Points 0%
PCMark 10 Score
6001 puntos
ayuda
AIDA64 / Memory Copy
LG Gram 14T90P
Intel Core i5-1135G7, Iris Xe G7 80EUs
63578 MB/s +82%
Lenovo IdeaPad Flex 7i 14IAU7
Intel Core i7-1255U, Iris Xe G7 96EUs
62255 MB/s +78%
Acer Aspire 5 Spin 14
Intel Core i5-1335U, Iris Xe G7 80EUs
56470 MB/s +61%
HP Pavilion x360 14-dy0157ng
Intel Core i5-1135G7, Iris Xe G7 80EUs
40141 MB/s +15%
Dell Inspiron 14 7420 2-in-1
Intel Core i7-1255U, Iris Xe G7 96EUs
39797 MB/s +14%
Dell Inspiron 14 7435 2-in-1
AMD Ryzen 5 7530U, Vega 7
34992 MB/s
Average AMD Ryzen 5 7530U
  (20155 - 42853, n=7)
31487 MB/s -10%
AIDA64 / Memory Read
LG Gram 14T90P
Intel Core i5-1135G7, Iris Xe G7 80EUs
60917 MB/s +59%
Lenovo IdeaPad Flex 7i 14IAU7
Intel Core i7-1255U, Iris Xe G7 96EUs
59288 MB/s +55%
HP Pavilion x360 14-dy0157ng
Intel Core i5-1135G7, Iris Xe G7 80EUs
46871 MB/s +22%
Acer Aspire 5 Spin 14
Intel Core i5-1335U, Iris Xe G7 80EUs
46501 MB/s +21%
Dell Inspiron 14 7420 2-in-1
Intel Core i7-1255U, Iris Xe G7 96EUs
43119 MB/s +13%
Dell Inspiron 14 7435 2-in-1
AMD Ryzen 5 7530U, Vega 7
38318 MB/s
Average AMD Ryzen 5 7530U
  (23068 - 40094, n=7)
34081 MB/s -11%
AIDA64 / Memory Write
Acer Aspire 5 Spin 14
Intel Core i5-1335U, Iris Xe G7 80EUs
72584 MB/s +89%
LG Gram 14T90P
Intel Core i5-1135G7, Iris Xe G7 80EUs
66778 MB/s +74%
Lenovo IdeaPad Flex 7i 14IAU7
Intel Core i7-1255U, Iris Xe G7 96EUs
65440 MB/s +70%
HP Pavilion x360 14-dy0157ng
Intel Core i5-1135G7, Iris Xe G7 80EUs
46521 MB/s +21%
Dell Inspiron 14 7420 2-in-1
Intel Core i7-1255U, Iris Xe G7 96EUs
44372 MB/s +15%
Dell Inspiron 14 7435 2-in-1
AMD Ryzen 5 7530U, Vega 7
38436 MB/s
Average AMD Ryzen 5 7530U
  (22954 - 41838, n=7)
32074 MB/s -17%
AIDA64 / Memory Latency
Dell Inspiron 14 7435 2-in-1
AMD Ryzen 5 7530U, Vega 7
110.8 ns *
Acer Aspire 5 Spin 14
Intel Core i5-1335U, Iris Xe G7 80EUs
104.2 ns * +6%
Average AMD Ryzen 5 7530U
  (88.1 - 110.8, n=7)
101.4 ns * +8%
Lenovo IdeaPad Flex 7i 14IAU7
Intel Core i7-1255U, Iris Xe G7 96EUs
96.6 ns * +13%
LG Gram 14T90P
Intel Core i5-1135G7, Iris Xe G7 80EUs
89.6 ns * +19%
HP Pavilion x360 14-dy0157ng
Intel Core i5-1135G7, Iris Xe G7 80EUs
73.1 ns * +34%
Dell Inspiron 14 7420 2-in-1
Intel Core i7-1255U, Iris Xe G7 96EUs
0 ns * +100%

* ... más pequeño es mejor

Latencia del CPD

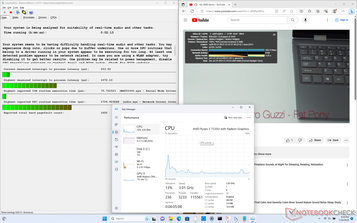
LatencyMon revela problemas menores de CPD al abrir varias pestañas de nuestra página de inicio. por lo demás, la reproducción de vídeo 4K a 60 FPS es perfecta y no se registran caídas de fotogramas.

LatencyMon
LatencyMon
Lista de controladores
DPC Latencies / LatencyMon - interrupt to process latency (max), Web, Youtube, Prime95
Acer Aspire 5 Spin 14
Iris Xe G7 80EUs, i5-1335U, Micron 2450 512GB MTFDKBA512TFK
1156.5 μs * -8%
Dell Inspiron 14 7435 2-in-1
Vega 7, R5 7530U
1072.1 μs *
LG Gram 14T90P
Iris Xe G7 80EUs, i5-1135G7, Samsung SSD PM981a MZVLB512HBJQ
1051.3 μs * +2%
HP Pavilion x360 14-dy0157ng
Iris Xe G7 80EUs, i5-1135G7, Toshiba KBG40ZNV512G
1004 μs * +6%
Lenovo IdeaPad Flex 7i 14IAU7
Iris Xe G7 96EUs, i7-1255U, Samsung PM9B1 512GB MZAL4512HBLU
831.6 μs * +22%
Dell Inspiron 14 7420 2-in-1
Iris Xe G7 96EUs, i7-1255U, WDC PC SN530 SDBPMPZ-512G
640.5 μs * +40%

* ... más pequeño es mejor

Dispositivos de almacenamiento

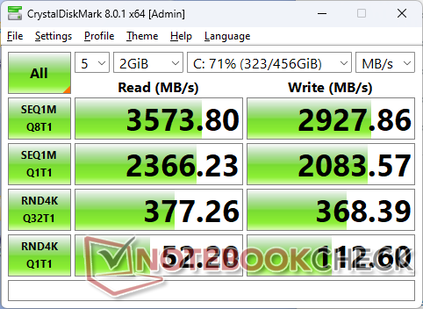
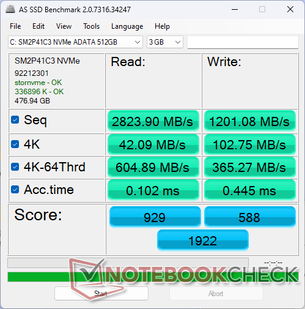
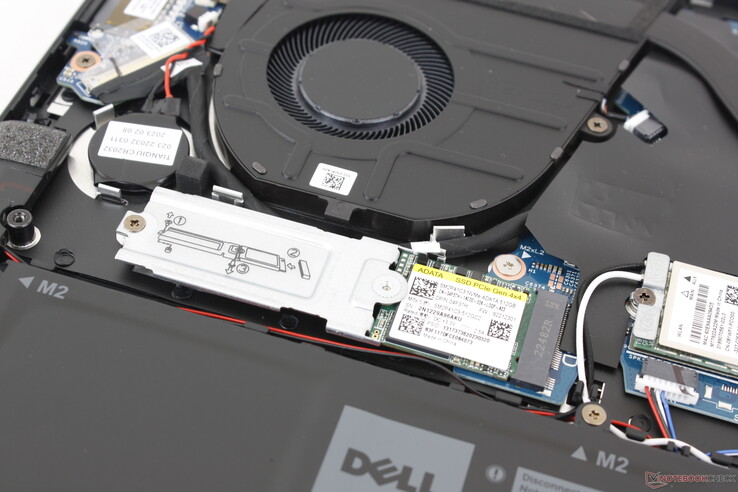
Nuestra unidad de prueba se entrega con un modelo económico de 512 GB ADATA SM2P41C3 PCIe4 x4 NVMe SSD que ofrece velocidades de lectura y escritura de hasta 3600 MB/s y 3000 MB/s, respectivamente. Se equilibra bien con la CPU Ryzen 5 ya que los SSD superrápidos son poco beneficiosos para el público objetivo de usuarios domésticos ocasionales o estudiantes.

No hay opciones de SSD secundario interno, a diferencia del más caroLG Gram 14T90P convertible.

MDL 8
MDL 8
AS SSD
AS SSD
La unidad se entrega con una unidad SSD M.2 2230 corta, pero también admite unidades 2280 completas
CDM 5/6 Read Seq Q32T1: 3562 MB/s
CDM 5/6 Write Seq Q32T1: 3186 MB/s
CDM 5/6 Read 4K Q32T1: 360.9 MB/s
CDM 5/6 Write 4K Q32T1: 347.2 MB/s
CDM 5 Read Seq: 2323 MB/s
CDM 5 Write Seq: 2108 MB/s
CDM 5/6 Read 4K: 51.04 MB/s
CDM 5/6 Write 4K: 111.6 MB/s
Drive Performance Rating - Percent
Acer Aspire 5 Spin 14
Micron 2450 512GB MTFDKBA512TFK
87.9 pt
LG Gram 14T90P
Samsung SSD PM981a MZVLB512HBJQ
80.7 pt
Lenovo IdeaPad Flex 7i 14IAU7
Samsung PM9B1 512GB MZAL4512HBLU
64.5 pt
HP Pavilion x360 14-dy0157ng
Toshiba KBG40ZNV512G
57.2 pt
Dell Inspiron 14 7420 2-in-1
WDC PC SN530 SDBPMPZ-512G
47.2 pt
Dell Inspiron 14 7435 2-in-1
 
43.8 pt
DiskSpd
seq read
Lenovo IdeaPad Flex 7i 14IAU7
Samsung PM9B1 512GB MZAL4512HBLU
2418 (2357.73min - 2418.23max) MB/s +19%
Acer Aspire 5 Spin 14
Micron 2450 512GB MTFDKBA512TFK
2107 (1985.81min - 2107.03max) MB/s +4%
Dell Inspiron 14 7435 2-in-1
 
2029 (2014.9min - 2029.34max) MB/s
LG Gram 14T90P
Samsung SSD PM981a MZVLB512HBJQ
1954 (1946.79min - 1954.13max) MB/s -4%
HP Pavilion x360 14-dy0157ng
Toshiba KBG40ZNV512G
1896 (1874.22min - 1895.81max) MB/s -7%
Dell Inspiron 14 7420 2-in-1
WDC PC SN530 SDBPMPZ-512G
1624 (1613.47min - 1624.14max) MB/s -20%
seq write
Acer Aspire 5 Spin 14
Micron 2450 512GB MTFDKBA512TFK
3147 (3111.96min - 3146.57max) MB/s +77%
LG Gram 14T90P
Samsung SSD PM981a MZVLB512HBJQ
2145 (2141.52min - 2144.76max) MB/s +20%
Dell Inspiron 14 7435 2-in-1
 
1781 (1739.05min - 1780.9max) MB/s
Lenovo IdeaPad Flex 7i 14IAU7
Samsung PM9B1 512GB MZAL4512HBLU
1775 (1719.16min - 1775.03max) MB/s 0%
Dell Inspiron 14 7420 2-in-1
WDC PC SN530 SDBPMPZ-512G
1561 (1529.87min - 1561.35max) MB/s -12%
HP Pavilion x360 14-dy0157ng
Toshiba KBG40ZNV512G
1481 (1382.02min - 1480.8max) MB/s -17%
seq q8 t1 read
Acer Aspire 5 Spin 14
Micron 2450 512GB MTFDKBA512TFK
3634 (3074.84min - 3633.94max) MB/s +23%
Lenovo IdeaPad Flex 7i 14IAU7
Samsung PM9B1 512GB MZAL4512HBLU
3581 (3146.78min - 3580.89max) MB/s +21%
LG Gram 14T90P
Samsung SSD PM981a MZVLB512HBJQ
3439 (3068.19min - 3438.7max) MB/s +16%
Dell Inspiron 14 7435 2-in-1
 
2966 (2651.58min - 2965.58max) MB/s
Dell Inspiron 14 7420 2-in-1
WDC PC SN530 SDBPMPZ-512G
2458 (2302.47min - 2458.28max) MB/s -17%
HP Pavilion x360 14-dy0157ng
Toshiba KBG40ZNV512G
2406 (2140.14min - 2406.49max) MB/s -19%
seq q8 t1 write
Acer Aspire 5 Spin 14
Micron 2450 512GB MTFDKBA512TFK
3274 (2963.01min - 3274.24max) MB/s +41%
LG Gram 14T90P
Samsung SSD PM981a MZVLB512HBJQ
2859 (2840.59min - 2858.57max) MB/s +23%
Lenovo IdeaPad Flex 7i 14IAU7
Samsung PM9B1 512GB MZAL4512HBLU
2375 (2249.52min - 2374.81max) MB/s +2%
Dell Inspiron 14 7435 2-in-1
 
2327 (2260.82min - 2327.17max) MB/s
Dell Inspiron 14 7420 2-in-1
WDC PC SN530 SDBPMPZ-512G
1629 (1616.9min - 1629.37max) MB/s -30%
HP Pavilion x360 14-dy0157ng
Toshiba KBG40ZNV512G
1470 (1437.6min - 1469.68max) MB/s -37%
4k q1 t1 read
Lenovo IdeaPad Flex 7i 14IAU7
Samsung PM9B1 512GB MZAL4512HBLU
72.2 (70.23min - 72.18max) MB/s +65%
HP Pavilion x360 14-dy0157ng
Toshiba KBG40ZNV512G
60.6 (59.66min - 60.6max) MB/s +39%
Acer Aspire 5 Spin 14
Micron 2450 512GB MTFDKBA512TFK
60 (54.84min - 60.04max) MB/s +37%
LG Gram 14T90P
Samsung SSD PM981a MZVLB512HBJQ
53.8 (53.34min - 53.8max) MB/s +23%
Dell Inspiron 14 7420 2-in-1
WDC PC SN530 SDBPMPZ-512G
47 (39.28min - 47.04max) MB/s +8%
Dell Inspiron 14 7435 2-in-1
 
43.7 (43.3min - 43.67max) MB/s
4k q1 t1 write
Acer Aspire 5 Spin 14
Micron 2450 512GB MTFDKBA512TFK
398 (289.3min - 398.01max) MB/s +257%
HP Pavilion x360 14-dy0157ng
Toshiba KBG40ZNV512G
208 (204.31min - 207.5max) MB/s +87%
LG Gram 14T90P
Samsung SSD PM981a MZVLB512HBJQ
196.9 (195.54min - 196.91max) MB/s +77%
Dell Inspiron 14 7420 2-in-1
WDC PC SN530 SDBPMPZ-512G
157.7 (134.91min - 157.72max) MB/s +42%
Lenovo IdeaPad Flex 7i 14IAU7
Samsung PM9B1 512GB MZAL4512HBLU
122.5 (117.12min - 122.45max) MB/s +10%
Dell Inspiron 14 7435 2-in-1
 
111.4 (103.31min - 111.38max) MB/s
4k q32 t16 read
Acer Aspire 5 Spin 14
Micron 2450 512GB MTFDKBA512TFK
1577 (1573.42min - 1577.23max) MB/s +127%
HP Pavilion x360 14-dy0157ng
Toshiba KBG40ZNV512G
1371 (1202.08min - 1370.81max) MB/s +98%
LG Gram 14T90P
Samsung SSD PM981a MZVLB512HBJQ
1152 (1150.98min - 1152.19max) MB/s +66%
Dell Inspiron 14 7435 2-in-1
 
694 (668.2min - 694.47max) MB/s
Lenovo IdeaPad Flex 7i 14IAU7
Samsung PM9B1 512GB MZAL4512HBLU
590 (581.23min - 589.77max) MB/s -15%
Dell Inspiron 14 7420 2-in-1
WDC PC SN530 SDBPMPZ-512G
490 (485.05min - 490.43max) MB/s -29%
4k q32 t16 write
Acer Aspire 5 Spin 14
Micron 2450 512GB MTFDKBA512TFK
2760 (1274.42min - 2759.52max) MB/s +613%
LG Gram 14T90P
Samsung SSD PM981a MZVLB512HBJQ
2105 (1782.39min - 2104.55max) MB/s +444%
HP Pavilion x360 14-dy0157ng
Toshiba KBG40ZNV512G
765 (718.87min - 764.99max) MB/s +98%
Dell Inspiron 14 7420 2-in-1
WDC PC SN530 SDBPMPZ-512G
397 (392.9min - 396.6max) MB/s +3%
Dell Inspiron 14 7435 2-in-1
 
387 (371.4min - 387.31max) MB/s
Lenovo IdeaPad Flex 7i 14IAU7
Samsung PM9B1 512GB MZAL4512HBLU
316 (312.19min - 315.56max) MB/s -18%
AS SSD
Score Total
LG Gram 14T90P
Samsung SSD PM981a MZVLB512HBJQ
5307 Points +176%
Acer Aspire 5 Spin 14
Micron 2450 512GB MTFDKBA512TFK
4882 Points +154%
Lenovo IdeaPad Flex 7i 14IAU7
Samsung PM9B1 512GB MZAL4512HBLU
3355 Points +75%
HP Pavilion x360 14-dy0157ng
Toshiba KBG40ZNV512G
3221 Points +68%
Dell Inspiron 14 7420 2-in-1
WDC PC SN530 SDBPMPZ-512G
2174 Points +13%
Dell Inspiron 14 7435 2-in-1
 
1922 Points
Score Read
LG Gram 14T90P
Samsung SSD PM981a MZVLB512HBJQ
2013 Points +117%
Acer Aspire 5 Spin 14
Micron 2450 512GB MTFDKBA512TFK
1780 Points +92%
HP Pavilion x360 14-dy0157ng
Toshiba KBG40ZNV512G
1512 Points +63%
Lenovo IdeaPad Flex 7i 14IAU7
Samsung PM9B1 512GB MZAL4512HBLU
1032 Points +11%
Dell Inspiron 14 7420 2-in-1
WDC PC SN530 SDBPMPZ-512G
988 Points +6%
Dell Inspiron 14 7435 2-in-1
 
929 Points
Score Write
LG Gram 14T90P
Samsung SSD PM981a MZVLB512HBJQ
2279 Points +288%
Acer Aspire 5 Spin 14
Micron 2450 512GB MTFDKBA512TFK
2172 Points +269%
Lenovo IdeaPad Flex 7i 14IAU7
Samsung PM9B1 512GB MZAL4512HBLU
1853 Points +215%
HP Pavilion x360 14-dy0157ng
Toshiba KBG40ZNV512G
975 Points +66%
Dell Inspiron 14 7420 2-in-1
WDC PC SN530 SDBPMPZ-512G
711 Points +21%
Dell Inspiron 14 7435 2-in-1
 
588 Points
Seq Read
Lenovo IdeaPad Flex 7i 14IAU7
Samsung PM9B1 512GB MZAL4512HBLU
3019.8 MB/s +7%
Acer Aspire 5 Spin 14
Micron 2450 512GB MTFDKBA512TFK
2921.98 MB/s +3%
LG Gram 14T90P
Samsung SSD PM981a MZVLB512HBJQ
2833.91 MB/s 0%
Dell Inspiron 14 7435 2-in-1
 
2823.9 MB/s
Dell Inspiron 14 7420 2-in-1
WDC PC SN530 SDBPMPZ-512G
2131.97 MB/s -25%
HP Pavilion x360 14-dy0157ng
Toshiba KBG40ZNV512G
2027 MB/s -28%
Seq Write
Acer Aspire 5 Spin 14
Micron 2450 512GB MTFDKBA512TFK
2881.87 MB/s +140%
LG Gram 14T90P
Samsung SSD PM981a MZVLB512HBJQ
2394.6 MB/s +99%
Lenovo IdeaPad Flex 7i 14IAU7
Samsung PM9B1 512GB MZAL4512HBLU
1415.26 MB/s +18%
Dell Inspiron 14 7420 2-in-1
WDC PC SN530 SDBPMPZ-512G
1298.95 MB/s +8%
Dell Inspiron 14 7435 2-in-1
 
1201.08 MB/s
HP Pavilion x360 14-dy0157ng
Toshiba KBG40ZNV512G
1057 MB/s -12%
4K Read
Acer Aspire 5 Spin 14
Micron 2450 512GB MTFDKBA512TFK
82.37 MB/s +96%
Lenovo IdeaPad Flex 7i 14IAU7
Samsung PM9B1 512GB MZAL4512HBLU
69.97 MB/s +66%
LG Gram 14T90P
Samsung SSD PM981a MZVLB512HBJQ
63.09 MB/s +50%
HP Pavilion x360 14-dy0157ng
Toshiba KBG40ZNV512G
52.7 MB/s +25%
Dell Inspiron 14 7420 2-in-1
WDC PC SN530 SDBPMPZ-512G
45.44 MB/s +8%
Dell Inspiron 14 7435 2-in-1
 
42.09 MB/s
4K Write
Acer Aspire 5 Spin 14
Micron 2450 512GB MTFDKBA512TFK
346.54 MB/s +237%
Dell Inspiron 14 7420 2-in-1
WDC PC SN530 SDBPMPZ-512G
208.37 MB/s +103%
Lenovo IdeaPad Flex 7i 14IAU7
Samsung PM9B1 512GB MZAL4512HBLU
185.07 MB/s +80%
LG Gram 14T90P
Samsung SSD PM981a MZVLB512HBJQ
135.82 MB/s +32%
HP Pavilion x360 14-dy0157ng
Toshiba KBG40ZNV512G
133.5 MB/s +30%
Dell Inspiron 14 7435 2-in-1
 
102.75 MB/s
4K-64 Read
LG Gram 14T90P
Samsung SSD PM981a MZVLB512HBJQ
1666.06 MB/s +175%
Acer Aspire 5 Spin 14
Micron 2450 512GB MTFDKBA512TFK
1405.56 MB/s +132%
HP Pavilion x360 14-dy0157ng
Toshiba KBG40ZNV512G
1257 MB/s +108%
Dell Inspiron 14 7420 2-in-1
WDC PC SN530 SDBPMPZ-512G
729.23 MB/s +21%
Lenovo IdeaPad Flex 7i 14IAU7
Samsung PM9B1 512GB MZAL4512HBLU
659.72 MB/s +9%
Dell Inspiron 14 7435 2-in-1
 
604.89 MB/s
4K-64 Write
LG Gram 14T90P
Samsung SSD PM981a MZVLB512HBJQ
1903.56 MB/s +421%
Acer Aspire 5 Spin 14
Micron 2450 512GB MTFDKBA512TFK
1537.5 MB/s +321%
Lenovo IdeaPad Flex 7i 14IAU7
Samsung PM9B1 512GB MZAL4512HBLU
1526.56 MB/s +318%
HP Pavilion x360 14-dy0157ng
Toshiba KBG40ZNV512G
736 MB/s +101%
Dell Inspiron 14 7420 2-in-1
WDC PC SN530 SDBPMPZ-512G
382.87 MB/s +5%
Dell Inspiron 14 7435 2-in-1
 
365.27 MB/s
Access Time Read
Acer Aspire 5 Spin 14
Micron 2450 512GB MTFDKBA512TFK
0.116 ms * -14%
Dell Inspiron 14 7435 2-in-1
 
0.102 ms *
Dell Inspiron 14 7420 2-in-1
WDC PC SN530 SDBPMPZ-512G
0.08 ms * +22%
Lenovo IdeaPad Flex 7i 14IAU7
Samsung PM9B1 512GB MZAL4512HBLU
0.072 ms * +29%
HP Pavilion x360 14-dy0157ng
Toshiba KBG40ZNV512G
0.068 ms * +33%
LG Gram 14T90P
Samsung SSD PM981a MZVLB512HBJQ
0.052 ms * +49%
Access Time Write
Dell Inspiron 14 7435 2-in-1
 
0.445 ms *
HP Pavilion x360 14-dy0157ng
Toshiba KBG40ZNV512G
0.182 ms * +59%
Acer Aspire 5 Spin 14
Micron 2450 512GB MTFDKBA512TFK
0.166 ms * +63%
Dell Inspiron 14 7420 2-in-1
WDC PC SN530 SDBPMPZ-512G
0.152 ms * +66%
Lenovo IdeaPad Flex 7i 14IAU7
Samsung PM9B1 512GB MZAL4512HBLU
0.1 ms * +78%
LG Gram 14T90P
Samsung SSD PM981a MZVLB512HBJQ
0.083 ms * +81%

* ... más pequeño es mejor

Disk Throttling: DiskSpd Read Loop, Queue Depth 8

01503004506007509001050120013501500165018001950210022502400255027002850Tooltip
Dell Inspiron 14 7435 2-in-1: Ø2913 (2630.86-2932.04)

Rendimiento de la GPU - Radeon RX Vega antigua

Los Ryzen 5 7530U y Ryzen 7 7730U funcionan con gráficos integrados Radeon RX Vega integrados en lugar de las nuevas Radeon 680M o 780M lo que es una pena, ya que las nuevas soluciones pueden ser de 2 a 2,5 veces más rápidas. Aparte de juegos poco exigentes como Dota 2 Reborn, el sistema no puede con títulos modernos, especialmente si tenemos en cuenta sus limitados 8 GB de RAM. F1 22, por ejemplo, sólo funcionaba con ajustes muy bajos, ya que con ajustes más altos se bloqueaba.

Las frecuencias de cuadro caían periódicamente a mediados de los 50 antes de volver a subir a los 60 cuando estaba en ralentí Witcher 3. Las caídas se producían a intervalos constantes, como muestra nuestro gráfico de FPS de abajo, lo que sugiere una mala gestión de las aplicaciones activas en segundo plano.

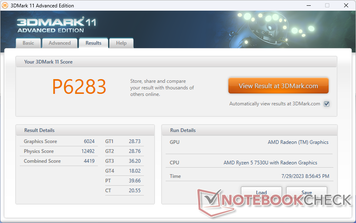
El rendimiento general se reduce en aproximadamente un 10 por ciento si se ejecuta en modo equilibrado como se muestra en nuestra tabla 3DMark 11 a continuación.

Perfil de energíaPuntuación gráficaPuntuación físicaPuntuación combinada
Batería5798 (-4%)11906 (-5%)4161 (-6%)
Equilibrada5472 (-9%)10908 (-13%)4195 (-5%)
Rendimiento6024124924419


3DMark 11
3DMark 11
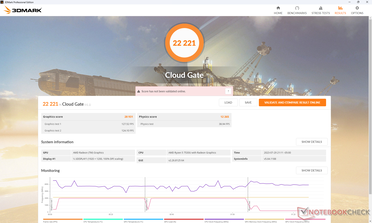
Cloud Gate
Cloud Gate
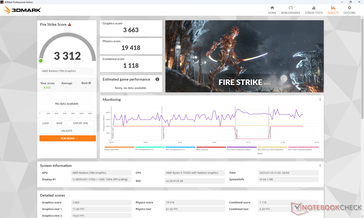
Fire Strike
Fire Strike
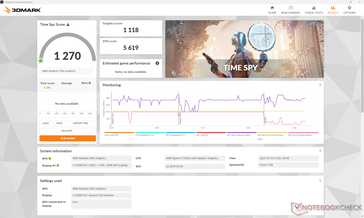
Time Spy
Time Spy
3DMark Performance Rating - Percent
Lenovo Yoga 7-14ARB G7
AMD Radeon 680M, AMD Ryzen 7 6800U
100 pt
Lenovo Yoga 9 14IRP G8 -1!
Intel Iris Xe Graphics G7 96EUs, Intel Core i7-1360P
75.5 pt
Dell Latitude 9440 2-in-1 -1!
Intel Iris Xe Graphics G7 96EUs, Intel Core i7-1365U
69.5 pt
MSI Summit E14 Flip Evo A12MT
Intel Iris Xe Graphics G7 96EUs, Intel Core i7-1260P
68.2 pt
Lenovo ThinkPad X1 Yoga G8 i7-1355U -1!
Intel Iris Xe Graphics G7 96EUs, Intel Core i7-1355U
67 pt
Acer Aspire 5 Spin 14
Intel Iris Xe Graphics G7 80EUs, Intel Core i5-1335U
57.3 pt
HP Pavilion x360 14-dy0157ng
Intel Iris Xe Graphics G7 80EUs, Intel Core i5-1135G7
56.3 pt
Dell Inspiron 14 7435 2-in-1
AMD Radeon RX Vega 7, AMD Ryzen 5 7530U
55.9 pt
Dell Inspiron 14 7420 2-in-1
Intel Iris Xe Graphics G7 96EUs, Intel Core i7-1255U
55.3 pt
Lenovo ThinkBook 14s Yoga ITL 20WE0023GE
Intel Iris Xe Graphics G7 96EUs, Intel Core i7-1165G7
54 pt
Average AMD Radeon RX Vega 7
 
47.3 pt
Lenovo IdeaPad Flex 5 14IAU7-82R7007TGE
Intel UHD Graphics 64EUs (Alder Lake 12th Gen), Intel Core i3-1215U
44.9 pt
3DMark 11 - 1280x720 Performance GPU
Lenovo Yoga 7-14ARB G7
AMD Radeon 680M, AMD Ryzen 7 6800U
9507 Points +58%
Lenovo Yoga 9 14IRP G8
Intel Iris Xe Graphics G7 96EUs, Intel Core i7-1360P
7222 Points +20%
Dell Latitude 9440 2-in-1
Intel Iris Xe Graphics G7 96EUs, Intel Core i7-1365U
6490 Points +8%
Lenovo ThinkPad X1 Yoga G8 i7-1355U
Intel Iris Xe Graphics G7 96EUs, Intel Core i7-1355U
6218 Points +3%
MSI Summit E14 Flip Evo A12MT
Intel Iris Xe Graphics G7 96EUs, Intel Core i7-1260P
6186 Points +3%
Lenovo ThinkBook 14s Yoga ITL 20WE0023GE
Intel Iris Xe Graphics G7 96EUs, Intel Core i7-1165G7
6046 Points 0%
Dell Inspiron 14 7435 2-in-1
AMD Radeon RX Vega 7, AMD Ryzen 5 7530U
6024 Points
HP Pavilion x360 14-dy0157ng
Intel Iris Xe Graphics G7 80EUs, Intel Core i5-1135G7
5808 Points -4%
Dell Inspiron 14 7420 2-in-1
Intel Iris Xe Graphics G7 96EUs, Intel Core i7-1255U
5800 Points -4%
Acer Aspire 5 Spin 14
Intel Iris Xe Graphics G7 80EUs, Intel Core i5-1335U
5476 Points -9%
Average AMD Radeon RX Vega 7
  (3353 - 6249, n=58)
5054 Points -16%
Lenovo IdeaPad Flex 5 14IAU7-82R7007TGE
Intel UHD Graphics 64EUs (Alder Lake 12th Gen), Intel Core i3-1215U
4215 Points -30%
3DMark
1280x720 Cloud Gate Standard Graphics
Lenovo Yoga 7-14ARB G7
AMD Radeon 680M, AMD Ryzen 7 6800U
44970 Points +55%
Dell Inspiron 14 7435 2-in-1
AMD Radeon RX Vega 7, AMD Ryzen 5 7530U
28931 Points
MSI Summit E14 Flip Evo A12MT
Intel Iris Xe Graphics G7 96EUs, Intel Core i7-1260P
27600 Points -5%
Acer Aspire 5 Spin 14
Intel Iris Xe Graphics G7 80EUs, Intel Core i5-1335U
25702 Points -11%
HP Pavilion x360 14-dy0157ng
Intel Iris Xe Graphics G7 80EUs, Intel Core i5-1135G7
24558 Points -15%
Lenovo ThinkBook 14s Yoga ITL 20WE0023GE
Intel Iris Xe Graphics G7 96EUs, Intel Core i7-1165G7
23633 Points -18%
Average AMD Radeon RX Vega 7
  (13713 - 31437, n=43)
23324 Points -19%
Dell Inspiron 14 7420 2-in-1
Intel Iris Xe Graphics G7 96EUs, Intel Core i7-1255U
23151 Points -20%
Lenovo IdeaPad Flex 5 14IAU7-82R7007TGE
Intel UHD Graphics 64EUs (Alder Lake 12th Gen), Intel Core i3-1215U
20374 Points -30%
1920x1080 Fire Strike Graphics
Lenovo Yoga 7-14ARB G7
AMD Radeon 680M, AMD Ryzen 7 6800U
7279 Points +99%
Lenovo Yoga 9 14IRP G8
Intel Iris Xe Graphics G7 96EUs, Intel Core i7-1360P
5601 Points +53%
MSI Summit E14 Flip Evo A12MT
Intel Iris Xe Graphics G7 96EUs, Intel Core i7-1260P
5515 Points +51%
Lenovo ThinkPad X1 Yoga G8 i7-1355U
Intel Iris Xe Graphics G7 96EUs, Intel Core i7-1355U
5359 Points +46%
Dell Latitude 9440 2-in-1
Intel Iris Xe Graphics G7 96EUs, Intel Core i7-1365U
5340 Points +46%
Acer Aspire 5 Spin 14
Intel Iris Xe Graphics G7 80EUs, Intel Core i5-1335U
4526 Points +24%
HP Pavilion x360 14-dy0157ng
Intel Iris Xe Graphics G7 80EUs, Intel Core i5-1135G7
4143 Points +13%
Dell Inspiron 14 7420 2-in-1
Intel Iris Xe Graphics G7 96EUs, Intel Core i7-1255U
3887 Points +6%
Lenovo ThinkBook 14s Yoga ITL 20WE0023GE
Intel Iris Xe Graphics G7 96EUs, Intel Core i7-1165G7
3750 Points +2%
Dell Inspiron 14 7435 2-in-1
AMD Radeon RX Vega 7, AMD Ryzen 5 7530U
3663 Points
Lenovo IdeaPad Flex 5 14IAU7-82R7007TGE
Intel UHD Graphics 64EUs (Alder Lake 12th Gen), Intel Core i3-1215U
3447 Points -6%
Average AMD Radeon RX Vega 7
  (1772 - 4037, n=62)
3189 Points -13%
2560x1440 Time Spy Graphics
Lenovo Yoga 7-14ARB G7
AMD Radeon 680M, AMD Ryzen 7 6800U
2449 Points +119%
Lenovo Yoga 9 14IRP G8
Intel Iris Xe Graphics G7 96EUs, Intel Core i7-1360P
1805 Points +61%
MSI Summit E14 Flip Evo A12MT
Intel Iris Xe Graphics G7 96EUs, Intel Core i7-1260P
1730 Points +55%
Dell Latitude 9440 2-in-1
Intel Iris Xe Graphics G7 96EUs, Intel Core i7-1365U
1637 Points +46%
Lenovo ThinkPad X1 Yoga G8 i7-1355U
Intel Iris Xe Graphics G7 96EUs, Intel Core i7-1355U
1517 Points +36%
Dell Inspiron 14 7420 2-in-1
Intel Iris Xe Graphics G7 96EUs, Intel Core i7-1255U
1351 Points +21%
HP Pavilion x360 14-dy0157ng
Intel Iris Xe Graphics G7 80EUs, Intel Core i5-1135G7
1289 Points +15%
Acer Aspire 5 Spin 14
Intel Iris Xe Graphics G7 80EUs, Intel Core i5-1335U
1281 Points +15%
Lenovo ThinkBook 14s Yoga ITL 20WE0023GE
Intel Iris Xe Graphics G7 96EUs, Intel Core i7-1165G7
1184 Points +6%
Dell Inspiron 14 7435 2-in-1
AMD Radeon RX Vega 7, AMD Ryzen 5 7530U
1118 Points
Lenovo IdeaPad Flex 5 14IAU7-82R7007TGE
Intel UHD Graphics 64EUs (Alder Lake 12th Gen), Intel Core i3-1215U
1045 Points -7%
Average AMD Radeon RX Vega 7
  (496 - 1249, n=57)
991 Points -11%
3DMark 11 Performance
6283 puntos
3DMark Cloud Gate Standard Score
22221 puntos
3DMark Fire Strike Score
3312 puntos
3DMark Time Spy Score
1270 puntos
ayuda
Final Fantasy XV Benchmark
1280x720 Lite Quality
Lenovo Yoga 7-14ARB G7
AMD Ryzen 7 6800U, AMD Radeon 680M
68.5 fps +95%
Dell Latitude 9440 2-in-1
Intel Core i7-1365U, Intel Iris Xe Graphics G7 96EUs
46.7 fps +33%
Lenovo Yoga 9 14IRP G8
Intel Core i7-1360P, Intel Iris Xe Graphics G7 96EUs
46.4 fps +32%
MSI Summit E14 Flip Evo A12MT
Intel Core i7-1260P, Intel Iris Xe Graphics G7 96EUs
44.4 fps +26%
Lenovo ThinkPad X1 Yoga G8 i7-1355U
Intel Core i7-1355U, Intel Iris Xe Graphics G7 96EUs
40.5 fps +15%
Acer Aspire 5 Spin 14
Intel Core i5-1335U, Intel Iris Xe Graphics G7 80EUs
38.7 fps +10%
Dell Inspiron 14 7435 2-in-1
AMD Ryzen 5 7530U, AMD Radeon RX Vega 7
35.1 fps
Dell Inspiron 14 7420 2-in-1
Intel Core i7-1255U, Intel Iris Xe Graphics G7 96EUs
34.2 fps -3%
Lenovo IdeaPad Flex 5 14IAU7-82R7007TGE
Intel Core i3-1215U, Intel UHD Graphics 64EUs (Alder Lake 12th Gen)
30.6 fps -13%
Average AMD Radeon RX Vega 7
  (17.1 - 41.1, n=40)
30.4 fps -13%
HP Pavilion x360 14-dy0157ng
Intel Core i5-1135G7, Intel Iris Xe Graphics G7 80EUs
29.4 fps -16%
1920x1080 Standard Quality
Lenovo Yoga 7-14ARB G7
AMD Ryzen 7 6800U, AMD Radeon 680M
34 fps +94%
MSI Summit E14 Flip Evo A12MT
Intel Core i7-1260P, Intel Iris Xe Graphics G7 96EUs
24.8 fps +42%
Lenovo Yoga 9 14IRP G8
Intel Core i7-1360P, Intel Iris Xe Graphics G7 96EUs
24.8 fps +42%
Dell Latitude 9440 2-in-1
Intel Core i7-1365U, Intel Iris Xe Graphics G7 96EUs
24.5 fps +40%
Lenovo ThinkPad X1 Yoga G8 i7-1355U
Intel Core i7-1355U, Intel Iris Xe Graphics G7 96EUs
23.9 fps +37%
Acer Aspire 5 Spin 14
Intel Core i5-1335U, Intel Iris Xe Graphics G7 80EUs
21.5 fps +23%
Dell Inspiron 14 7420 2-in-1
Intel Core i7-1255U, Intel Iris Xe Graphics G7 96EUs
17.6 fps +1%
Dell Inspiron 14 7435 2-in-1
AMD Ryzen 5 7530U, AMD Radeon RX Vega 7
17.5 fps
Lenovo IdeaPad Flex 5 14IAU7-82R7007TGE
Intel Core i3-1215U, Intel UHD Graphics 64EUs (Alder Lake 12th Gen)
16.5 fps -6%
Average AMD Radeon RX Vega 7
  (8.9 - 20.3, n=40)
15.4 fps -12%
HP Pavilion x360 14-dy0157ng
Intel Core i5-1135G7, Intel Iris Xe Graphics G7 80EUs
14.8 fps -15%
1920x1080 High Quality
MSI Summit E14 Flip Evo A12MT
Intel Core i7-1260P, Intel Iris Xe Graphics G7 96EUs
24.8 fps +105%
Lenovo Yoga 9 14IRP G8
Intel Core i7-1360P, Intel Iris Xe Graphics G7 96EUs
24.8 fps +105%
Lenovo Yoga 7-14ARB G7
AMD Ryzen 7 6800U, AMD Radeon 680M
24.2 fps +100%
Dell Latitude 9440 2-in-1
Intel Core i7-1365U, Intel Iris Xe Graphics G7 96EUs
17.1 fps +41%
Lenovo ThinkPad X1 Yoga G8 i7-1355U
Intel Core i7-1355U, Intel Iris Xe Graphics G7 96EUs
16.2 fps +34%
Acer Aspire 5 Spin 14
Intel Core i5-1335U, Intel Iris Xe Graphics G7 80EUs
14.9 fps +23%
Dell Inspiron 14 7420 2-in-1
Intel Core i7-1255U, Intel Iris Xe Graphics G7 96EUs
12.5 fps +3%
Dell Inspiron 14 7435 2-in-1
AMD Ryzen 5 7530U, AMD Radeon RX Vega 7
12.1 fps
Lenovo IdeaPad Flex 5 14IAU7-82R7007TGE
Intel Core i3-1215U, Intel UHD Graphics 64EUs (Alder Lake 12th Gen)
11.3 fps -7%
HP Pavilion x360 14-dy0157ng
Intel Core i5-1135G7, Intel Iris Xe Graphics G7 80EUs
10.6 fps -12%
Average AMD Radeon RX Vega 7
  (5.85 - 14.3, n=37)
10.5 fps -13%
GTA V
1024x768 Lowest Settings possible
Lenovo Yoga 7-14ARB G7
AMD Ryzen 7 6800U, AMD Radeon 680M
131.1 (6.99min, 76.9P1) fps +22%
MSI Summit E14 Flip Evo A12MT
Intel Core i7-1260P, Intel Iris Xe Graphics G7 96EUs
121.6 (21.4min, 71.4P1) fps +13%
Lenovo Yoga 9 14IRP G8
Intel Core i7-1360P, Intel Iris Xe Graphics G7 96EUs
118 (14.5min, 71.4P1) fps +10%
Acer Aspire 5 Spin 14
Intel Core i5-1335U, Intel Iris Xe Graphics G7 80EUs
113.1 (23.8min, 62.5P1) fps +5%
Dell Latitude 9440 2-in-1
Intel Core i7-1365U, Intel Iris Xe Graphics G7 96EUs
111.4 (16min, 66.7P1) fps +3%
Dell Inspiron 14 7435 2-in-1
AMD Ryzen 5 7530U, AMD Radeon RX Vega 7
107.7 (9.5min, 66.7P1) fps
Lenovo ThinkPad X1 Yoga G8 i7-1355U
Intel Core i7-1355U, Intel Iris Xe Graphics G7 96EUs
100.1 (11.6min, 41.7P1) fps -7%
Lenovo IdeaPad Flex 5 14IAU7-82R7007TGE
Intel Core i3-1215U, Intel UHD Graphics 64EUs (Alder Lake 12th Gen)
92.6 (2.97min, 50P1) fps -14%
Average AMD Radeon RX Vega 7
  (43.1 - 140.7, n=35)
89.5 fps -17%
Dell Inspiron 14 7420 2-in-1
Intel Core i7-1255U, Intel Iris Xe Graphics G7 96EUs
83.7 (21min, 52.6P1) fps -22%
HP Pavilion x360 14-dy0157ng
Intel Core i5-1135G7, Intel Iris Xe Graphics G7 80EUs
69.3 (10.2min, 43.5P1) fps -36%
1920x1080 Lowest Settings possible
MSI Summit E14 Flip Evo A12MT
Intel Core i7-1260P, Intel Iris Xe Graphics G7 96EUs
90.5 (15.4min, 58.8P1) fps +36%
Dell Latitude 9440 2-in-1
Intel Core i7-1365U, Intel Iris Xe Graphics G7 96EUs
87.1 (19.6min, 55.6P1) fps +31%
Acer Aspire 5 Spin 14
Intel Core i5-1335U, Intel Iris Xe Graphics G7 80EUs
83.6 (15.6min, 52.6P1) fps +26%
Lenovo ThinkPad X1 Yoga G8 i7-1355U
Intel Core i7-1355U, Intel Iris Xe Graphics G7 96EUs
80.9 (16.3min, 45.5P1) fps +22%
Dell Inspiron 14 7435 2-in-1
AMD Ryzen 5 7530U, AMD Radeon RX Vega 7
66.4 (3.73min, 43.5P1) fps
Average AMD Radeon RX Vega 7
  (25.1 - 81.3, n=27)
56.2 fps -15%
Dell Inspiron 14 7420 2-in-1
Intel Core i7-1255U, Intel Iris Xe Graphics G7 96EUs
55 (10.6min, 38.5P1) fps -17%
HP Pavilion x360 14-dy0157ng
Intel Core i5-1135G7, Intel Iris Xe Graphics G7 80EUs
54.2 (13min, 34.5P1) fps -18%
1920x1080 Normal/Off AF:4x
MSI Summit E14 Flip Evo A12MT
Intel Core i7-1260P, Intel Iris Xe Graphics G7 96EUs
81.1 (20.9min, 50P1) fps +25%
Acer Aspire 5 Spin 14
Intel Core i5-1335U, Intel Iris Xe Graphics G7 80EUs
79.4 (13.3min, 43.5P1) fps +23%
Dell Latitude 9440 2-in-1
Intel Core i7-1365U, Intel Iris Xe Graphics G7 96EUs
77.9 (18.3min, 50P1) fps +20%
Lenovo ThinkPad X1 Yoga G8 i7-1355U
Intel Core i7-1355U, Intel Iris Xe Graphics G7 96EUs
76.8 (17.3min, 34.5P1) fps +19%
Dell Inspiron 14 7435 2-in-1
AMD Ryzen 5 7530U, AMD Radeon RX Vega 7
64.8 (3.74min, 41.7P1) fps
Lenovo IdeaPad Flex 5 14IAU7-82R7007TGE
Intel Core i3-1215U, Intel UHD Graphics 64EUs (Alder Lake 12th Gen)
63.3 (6.03min, 37P1) fps -2%
Average AMD Radeon RX Vega 7
  (26.3 - 82.7, n=28)
57.1 fps -12%
Dell Inspiron 14 7420 2-in-1
Intel Core i7-1255U, Intel Iris Xe Graphics G7 96EUs
49 (18.8min, 33.3P1) fps -24%
HP Pavilion x360 14-dy0157ng
Intel Core i5-1135G7, Intel Iris Xe Graphics G7 80EUs
47.9 (11.3min, 28.6P1) fps -26%
1920x1080 High/On (Advanced Graphics Off) AA:2xMSAA + FX AF:8x
Lenovo Yoga 7-14ARB G7
AMD Ryzen 7 6800U, AMD Radeon 680M
49.5 (0.668min, 32.3P1) fps +93%
Dell Latitude 9440 2-in-1
Intel Core i7-1365U, Intel Iris Xe Graphics G7 96EUs
26 (12.7min, 19.2P1) fps +1%
Dell Inspiron 14 7435 2-in-1
AMD Ryzen 5 7530U, AMD Radeon RX Vega 7
25.7 (1.789min, 15.9P1) fps
Lenovo Yoga 9 14IRP G8
Intel Core i7-1360P, Intel Iris Xe Graphics G7 96EUs
25.1 (9.38min, 18.5P1) fps -2%
Lenovo ThinkPad X1 Yoga G8 i7-1355U
Intel Core i7-1355U, Intel Iris Xe Graphics G7 96EUs
23.4 (8.09min, 14.7P1) fps -9%
Average AMD Radeon RX Vega 7
  (11.3 - 32.2, n=36)
22.7 fps -12%
Acer Aspire 5 Spin 14
Intel Core i5-1335U, Intel Iris Xe Graphics G7 80EUs
21.8 (7.39min, 15.9P1) fps -15%
MSI Summit E14 Flip Evo A12MT
Intel Core i7-1260P, Intel Iris Xe Graphics G7 96EUs
20.5 (8.09min, 14.9P1) fps -20%
HP Pavilion x360 14-dy0157ng
Intel Core i5-1135G7, Intel Iris Xe Graphics G7 80EUs
17.1 (4.41min, 12.7P1) fps -33%
Lenovo IdeaPad Flex 5 14IAU7-82R7007TGE
Intel Core i3-1215U, Intel UHD Graphics 64EUs (Alder Lake 12th Gen)
17.1 (2.41min, 8.13P1) fps -33%
Dell Inspiron 14 7420 2-in-1
Intel Core i7-1255U, Intel Iris Xe Graphics G7 96EUs
14.2 (6.51min, 10.8P1) fps -45%
1920x1080 Highest Settings possible AA:4xMSAA + FX AF:16x
Lenovo Yoga 7-14ARB G7
AMD Ryzen 7 6800U, AMD Radeon 680M
23.5 (1.5min, 16.4P1) fps +130%
Dell Latitude 9440 2-in-1
Intel Core i7-1365U, Intel Iris Xe Graphics G7 96EUs
10.9 (5.87min, 8.62P1) fps +7%
Lenovo Yoga 9 14IRP G8
Intel Core i7-1360P, Intel Iris Xe Graphics G7 96EUs
10.7 (4.92min, 7.09P1) fps +5%
Dell Inspiron 14 7435 2-in-1
AMD Ryzen 5 7530U, AMD Radeon RX Vega 7
10.2 (0.566min, 6.94P1) fps
Lenovo ThinkPad X1 Yoga G8 i7-1355U
Intel Core i7-1355U, Intel Iris Xe Graphics G7 96EUs
10 (3.39min, 5.56P1) fps -2%
Average AMD Radeon RX Vega 7
  (5.09 - 15, n=34)
10 fps -2%
MSI Summit E14 Flip Evo A12MT
Intel Core i7-1260P, Intel Iris Xe Graphics G7 96EUs
9.75 (4.7min, 7.46P1) fps -4%
Acer Aspire 5 Spin 14
Intel Core i5-1335U, Intel Iris Xe Graphics G7 80EUs
9.39 (4.15min, 5.56P1) fps -8%
HP Pavilion x360 14-dy0157ng
Intel Core i5-1135G7, Intel Iris Xe Graphics G7 80EUs
7.43 (2.23min, 6.1P1) fps -27%
Lenovo IdeaPad Flex 5 14IAU7-82R7007TGE
Intel Core i3-1215U, Intel UHD Graphics 64EUs (Alder Lake 12th Gen)
7.41 (1.574min, 5.18P1) fps -27%
Dell Inspiron 14 7420 2-in-1
Intel Core i7-1255U, Intel Iris Xe Graphics G7 96EUs
6.31 (3.22min, 4.13P1) fps -38%
The Witcher 3
1024x768 Low Graphics & Postprocessing
Lenovo Yoga 7-14ARB G7
AMD Ryzen 7 6800U, AMD Radeon 680M
126 fps +66%
Lenovo Yoga 9 14IRP G8
Intel Core i7-1360P, Intel Iris Xe Graphics G7 96EUs
108 fps +42%
Dell Latitude 9440 2-in-1
Intel Core i7-1365U, Intel Iris Xe Graphics G7 96EUs
97.7 (80min) fps +29%
MSI Summit E14 Flip Evo A12MT
Intel Core i7-1260P, Intel Iris Xe Graphics G7 96EUs
96.9 (58min) fps +28%
Lenovo ThinkPad X1 Yoga G8 i7-1355U
Intel Core i7-1355U, Intel Iris Xe Graphics G7 96EUs
96.8 (48min) fps +27%
Acer Aspire 5 Spin 14
Intel Core i5-1335U, Intel Iris Xe Graphics G7 80EUs
81.4 (65min) fps +7%
Dell Inspiron 14 7420 2-in-1
Intel Core i7-1255U, Intel Iris Xe Graphics G7 96EUs
78.2 (43min) fps +3%
Dell Inspiron 14 7435 2-in-1
AMD Ryzen 5 7530U, AMD Radeon RX Vega 7
76 (69min) fps
Lenovo ThinkBook 14s Yoga ITL 20WE0023GE
Intel Core i7-1165G7, Intel Iris Xe Graphics G7 96EUs
64.7 fps -15%
HP Pavilion x360 14-dy0157ng
Intel Core i5-1135G7, Intel Iris Xe Graphics G7 80EUs
63.1 (3.62min, 9.3P0.1, 25.9P1) fps -17%
Average AMD Radeon RX Vega 7
  (25.5 - 105.8, n=50)
58.1 fps -24%
Lenovo IdeaPad Flex 5 14IAU7-82R7007TGE
Intel Core i3-1215U, Intel UHD Graphics 64EUs (Alder Lake 12th Gen)
51 fps -33%
1920x1080 High Graphics & Postprocessing (Nvidia HairWorks Off)
Lenovo Yoga 7-14ARB G7
AMD Ryzen 7 6800U, AMD Radeon 680M
43 fps +100%
Lenovo Yoga 9 14IRP G8
Intel Core i7-1360P, Intel Iris Xe Graphics G7 96EUs
37 fps +72%
Lenovo ThinkPad X1 Yoga G8 i7-1355U
Intel Core i7-1355U, Intel Iris Xe Graphics G7 96EUs
35.9 (32min) fps +67%
MSI Summit E14 Flip Evo A12MT
Intel Core i7-1260P, Intel Iris Xe Graphics G7 96EUs
34.7 (30min) fps +61%
Dell Latitude 9440 2-in-1
Intel Core i7-1365U, Intel Iris Xe Graphics G7 96EUs
34.2 (32min) fps +59%
Acer Aspire 5 Spin 14
Intel Core i5-1335U, Intel Iris Xe Graphics G7 80EUs
27.3 (23min) fps +27%
Dell Inspiron 14 7420 2-in-1
Intel Core i7-1255U, Intel Iris Xe Graphics G7 96EUs
25.3 (23min) fps +18%
HP Pavilion x360 14-dy0157ng
Intel Core i5-1135G7, Intel Iris Xe Graphics G7 80EUs
23.9 (9.98min, 11.8P0.1, 18.5P1) fps +11%
Dell Inspiron 14 7435 2-in-1
AMD Ryzen 5 7530U, AMD Radeon RX Vega 7
21.5 (20min) fps
Lenovo ThinkBook 14s Yoga ITL 20WE0023GE
Intel Core i7-1165G7, Intel Iris Xe Graphics G7 96EUs
20.9 fps -3%
Lenovo IdeaPad Flex 5 14IAU7-82R7007TGE
Intel Core i3-1215U, Intel UHD Graphics 64EUs (Alder Lake 12th Gen)
20 fps -7%
Average AMD Radeon RX Vega 7
  (8.96 - 26.2, n=49)
18.1 fps -16%
1920x1080 Ultra Graphics & Postprocessing (HBAO+)
Lenovo Yoga 7-14ARB G7
AMD Ryzen 7 6800U, AMD Radeon 680M
25.4 (19min, 24P1) fps +75%
MSI Summit E14 Flip Evo A12MT
Intel Core i7-1260P, Intel Iris Xe Graphics G7 96EUs
15.8 (14min) fps +9%
Dell Latitude 9440 2-in-1
Intel Core i7-1365U, Intel Iris Xe Graphics G7 96EUs
15.2 (14min) fps +5%
Lenovo Yoga 9 14IRP G8
Intel Core i7-1360P, Intel Iris Xe Graphics G7 96EUs
14.8 (14min, 14P1) fps +2%
Dell Inspiron 14 7435 2-in-1
AMD Ryzen 5 7530U, AMD Radeon RX Vega 7
14.5 (13min) fps
HP Pavilion x360 14-dy0157ng
Intel Core i5-1135G7, Intel Iris Xe Graphics G7 80EUs
13.4 (6.67min, 7.01P0.1, 11P1) fps -8%
Acer Aspire 5 Spin 14
Intel Core i5-1335U, Intel Iris Xe Graphics G7 80EUs
12.9 (11min) fps -11%
Dell Inspiron 14 7420 2-in-1
Intel Core i7-1255U, Intel Iris Xe Graphics G7 96EUs
12.3 (11min) fps -15%
Average AMD Radeon RX Vega 7
  (6.5 - 15.8, n=42)
11.9 fps -18%
Lenovo ThinkBook 14s Yoga ITL 20WE0023GE
Intel Core i7-1165G7, Intel Iris Xe Graphics G7 96EUs
11.7 fps -19%
Lenovo ThinkPad X1 Yoga G8 i7-1355U
Intel Core i7-1355U, Intel Iris Xe Graphics G7 96EUs
10.2 (8min) fps -30%
Lenovo IdeaPad Flex 5 14IAU7-82R7007TGE
Intel Core i3-1215U, Intel UHD Graphics 64EUs (Alder Lake 12th Gen)
10 fps -31%
F1 22 - 1280x720 Ultra Low Preset AA:T AF:16x
Dell Latitude 9440 2-in-1
Intel Core i7-1365U, Intel Iris Xe Graphics G7 96EUs
79.4 (64min, 63P1) fps +27%
Lenovo ThinkPad X1 Yoga G8 i7-1355U
Intel Core i7-1355U, Intel Iris Xe Graphics G7 96EUs
72.2 (38min, 43P1) fps +15%
Average AMD Radeon RX Vega 7
  (43.6 - 80.8, n=11)
64.5 fps +3%
Dell Inspiron 14 7435 2-in-1
AMD Ryzen 5 7530U, AMD Radeon RX Vega 7
62.7 (41min, 47P1) fps
Dota 2 Reborn
1280x720 min (0/3) fastest
Lenovo Yoga 9 14IRP G8
Intel Core i7-1360P, Intel Iris Xe Graphics G7 96EUs
124.3 (96.8min) fps +16%
MSI Summit E14 Flip Evo A12MT
Intel Core i7-1260P, Intel Iris Xe Graphics G7 96EUs
122.1 (94.6min) fps +14%
Lenovo Yoga 7-14ARB G7
AMD Ryzen 7 6800U, AMD Radeon 680M
114.6 (100.4min) fps +7%
Lenovo ThinkPad X1 Yoga G8 i7-1355U
Intel Core i7-1355U, Intel Iris Xe Graphics G7 96EUs
112.7 (87.1min) fps +5%
Dell Latitude 9440 2-in-1
Intel Core i7-1365U, Intel Iris Xe Graphics G7 96EUs
108.8 (86.4min) fps +1%
Dell Inspiron 14 7420 2-in-1
Intel Core i7-1255U, Intel Iris Xe Graphics G7 96EUs
108.7 (86.2min) fps +1%
Dell Inspiron 14 7435 2-in-1
AMD Ryzen 5 7530U, AMD Radeon RX Vega 7
107.4 (91.5min) fps
Lenovo IdeaPad Flex 5 14IAU7-82R7007TGE
Intel Core i3-1215U, Intel UHD Graphics 64EUs (Alder Lake 12th Gen)
100.7 (79.2min) fps -6%
Average AMD Radeon RX Vega 7
  (32.9 - 137.7, n=58)
99 fps -8%
Acer Aspire 5 Spin 14
Intel Core i5-1335U, Intel Iris Xe Graphics G7 80EUs
98.5 (79.8min) fps -8%
HP Pavilion x360 14-dy0157ng
Intel Core i5-1135G7, Intel Iris Xe Graphics G7 80EUs
78.7 (48.6min) fps -27%
Lenovo ThinkBook 14s Yoga ITL 20WE0023GE
Intel Core i7-1165G7, Intel Iris Xe Graphics G7 96EUs
78.1 (47.8min) fps -27%
1366x768 med (1/3)
Lenovo Yoga 7-14ARB G7
AMD Ryzen 7 6800U, AMD Radeon 680M
97.6 (84.4min) fps +12%
MSI Summit E14 Flip Evo A12MT
Intel Core i7-1260P, Intel Iris Xe Graphics G7 96EUs
93.5 (73.6min) fps +7%
Lenovo ThinkPad X1 Yoga G8 i7-1355U
Intel Core i7-1355U, Intel Iris Xe Graphics G7 96EUs
91.3 (72.2min) fps +5%
Lenovo Yoga 9 14IRP G8
Intel Core i7-1360P, Intel Iris Xe Graphics G7 96EUs
91.1 (72.5min) fps +4%
Dell Inspiron 14 7435 2-in-1
AMD Ryzen 5 7530U, AMD Radeon RX Vega 7
87.3 (70min) fps
Dell Latitude 9440 2-in-1
Intel Core i7-1365U, Intel Iris Xe Graphics G7 96EUs
85.1 (66.6min) fps -3%
Dell Inspiron 14 7420 2-in-1
Intel Core i7-1255U, Intel Iris Xe Graphics G7 96EUs
76.7 (62.4min) fps -12%
Average AMD Radeon RX Vega 7
  (32.7 - 107.8, n=58)
76.7 fps -12%
Acer Aspire 5 Spin 14
Intel Core i5-1335U, Intel Iris Xe Graphics G7 80EUs
76 (59.8min) fps -13%
Lenovo IdeaPad Flex 5 14IAU7-82R7007TGE
Intel Core i3-1215U, Intel UHD Graphics 64EUs (Alder Lake 12th Gen)
74.6 (57.5min) fps -15%
Lenovo ThinkBook 14s Yoga ITL 20WE0023GE
Intel Core i7-1165G7, Intel Iris Xe Graphics G7 96EUs
54.9 (40.7min) fps -37%
HP Pavilion x360 14-dy0157ng
Intel Core i5-1135G7, Intel Iris Xe Graphics G7 80EUs
46 (28.9min) fps -47%
1920x1080 high (2/3)
Lenovo Yoga 7-14ARB G7
AMD Ryzen 7 6800U, AMD Radeon 680M
74 (65.1min) fps +48%
Lenovo Yoga 9 14IRP G8
Intel Core i7-1360P, Intel Iris Xe Graphics G7 96EUs
68.9 (57.6min) fps +38%
Dell Latitude 9440 2-in-1
Intel Core i7-1365U, Intel Iris Xe Graphics G7 96EUs
66.5 (54.4min) fps +33%
MSI Summit E14 Flip Evo A12MT
Intel Core i7-1260P, Intel Iris Xe Graphics G7 96EUs
66.2 (58.1min) fps +33%
Lenovo ThinkPad X1 Yoga G8 i7-1355U
Intel Core i7-1355U, Intel Iris Xe Graphics G7 96EUs
51.4 (42.8min) fps +3%
Dell Inspiron 14 7420 2-in-1
Intel Core i7-1255U, Intel Iris Xe Graphics G7 96EUs
51.3 (45.6min) fps +3%
Acer Aspire 5 Spin 14
Intel Core i5-1335U, Intel Iris Xe Graphics G7 80EUs
49.9 (45.5min) fps 0%
Dell Inspiron 14 7435 2-in-1
AMD Ryzen 5 7530U, AMD Radeon RX Vega 7
49.9 (44.5min) fps
Lenovo IdeaPad Flex 5 14IAU7-82R7007TGE
Intel Core i3-1215U, Intel UHD Graphics 64EUs (Alder Lake 12th Gen)
47.9 (44min) fps -4%
Average AMD Radeon RX Vega 7
  (25.1 - 62.1, n=58)
44.8 fps -10%
Lenovo ThinkBook 14s Yoga ITL 20WE0023GE
Intel Core i7-1165G7, Intel Iris Xe Graphics G7 96EUs
36.6 (28.4min) fps -27%
HP Pavilion x360 14-dy0157ng
Intel Core i5-1135G7, Intel Iris Xe Graphics G7 80EUs
33.1 (21.9min) fps -34%
1920x1080 ultra (3/3) best looking
Lenovo ThinkPad X1 Yoga G8 i7-1355U
Intel Core i7-1355U, Intel Iris Xe Graphics G7 96EUs
65.6 (39.8min) fps +39%
Lenovo Yoga 7-14ARB G7
AMD Ryzen 7 6800U, AMD Radeon 680M
64.2 (56.1min) fps +36%
Lenovo Yoga 9 14IRP G8
Intel Core i7-1360P, Intel Iris Xe Graphics G7 96EUs
62.7 (53.2min) fps +33%
MSI Summit E14 Flip Evo A12MT
Intel Core i7-1260P, Intel Iris Xe Graphics G7 96EUs
59.8 (52.3min) fps +27%
Dell Latitude 9440 2-in-1
Intel Core i7-1365U, Intel Iris Xe Graphics G7 96EUs
57.8 (49.3min) fps +23%
Dell Inspiron 14 7435 2-in-1
AMD Ryzen 5 7530U, AMD Radeon RX Vega 7
47.1 (41.1min) fps
Dell Inspiron 14 7420 2-in-1
Intel Core i7-1255U, Intel Iris Xe Graphics G7 96EUs
46.7 (41.8min) fps -1%
Acer Aspire 5 Spin 14
Intel Core i5-1335U, Intel Iris Xe Graphics G7 80EUs
45.5 (41.4min) fps -3%
Lenovo IdeaPad Flex 5 14IAU7-82R7007TGE
Intel Core i3-1215U, Intel UHD Graphics 64EUs (Alder Lake 12th Gen)
43.9 (40.1min) fps -7%
Average AMD Radeon RX Vega 7
  (23.3 - 58.2, n=58)
41.9 fps -11%
Lenovo ThinkBook 14s Yoga ITL 20WE0023GE
Intel Core i7-1165G7, Intel Iris Xe Graphics G7 96EUs
34.6 (26.2min) fps -27%
HP Pavilion x360 14-dy0157ng
Intel Core i5-1135G7, Intel Iris Xe Graphics G7 80EUs
31.3 (21.7min) fps -34%
Strange Brigade
1280x720 lowest AF:1
Lenovo Yoga 7-14ARB G7
AMD Ryzen 7 6800U, AMD Radeon 680M
140.5 (68.9min, 108.3P1) fps +77%
Lenovo Yoga 9 14IRP G8
Intel Core i7-1360P, Intel Iris Xe Graphics G7 96EUs
102.3 (22.1min, 39.6P1) fps +29%
MSI Summit E14 Flip Evo A12MT
Intel Core i7-1260P, Intel Iris Xe Graphics G7 96EUs
95.2 (21min, 35.4P1) fps +20%
Dell Latitude 9440 2-in-1
Intel Core i7-1365U, Intel Iris Xe Graphics G7 96EUs
90.3 (20.1min, 30.2P1) fps +14%
Lenovo ThinkPad X1 Yoga G8 i7-1355U
Intel Core i7-1355U, Intel Iris Xe Graphics G7 96EUs
83.5 (10.5min, 27.4P1) fps +5%
Dell Inspiron 14 7435 2-in-1
AMD Ryzen 5 7530U, AMD Radeon RX Vega 7
79.5 (13.7min, 68.3P1) fps
Dell Inspiron 14 7420 2-in-1
Intel Core i7-1255U, Intel Iris Xe Graphics G7 96EUs
75.3 (17.6min, 23.1P1) fps -5%
HP Pavilion x360 14-dy0157ng
Intel Core i5-1135G7, Intel Iris Xe Graphics G7 80EUs
71 (13.3min, 22.4P1) fps -11%
Average AMD Radeon RX Vega 7
  (34.8 - 95.3, n=41)
70.4 fps -11%
Lenovo IdeaPad Flex 5 14IAU7-82R7007TGE
Intel Core i3-1215U, Intel UHD Graphics 64EUs (Alder Lake 12th Gen)
67.4 (14.7min, 21P1) fps -15%
Acer Aspire 5 Spin 14
Intel Core i5-1335U, Intel Iris Xe Graphics G7 80EUs
67 (15.4min, 24.5P1) fps -16%
1920x1080 medium AA:medium AF:4
Lenovo Yoga 7-14ARB G7
AMD Ryzen 7 6800U, AMD Radeon 680M
58.4 (43.4min, 50P1) fps +86%
MSI Summit E14 Flip Evo A12MT
Intel Core i7-1260P, Intel Iris Xe Graphics G7 96EUs
44.5 (18.2min, 24.6P1) fps +42%
Lenovo Yoga 9 14IRP G8
Intel Core i7-1360P, Intel Iris Xe Graphics G7 96EUs
43.7 (10.2min, 24P1) fps +39%
Dell Latitude 9440 2-in-1
Intel Core i7-1365U, Intel Iris Xe Graphics G7 96EUs
40.5 (14.4min, 22P1) fps +29%
Lenovo ThinkPad X1 Yoga G8 i7-1355U
Intel Core i7-1355U, Intel Iris Xe Graphics G7 96EUs
36.6 (9.3min, 19.9P1) fps +17%
Dell Inspiron 14 7435 2-in-1
AMD Ryzen 5 7530U, AMD Radeon RX Vega 7
31.4 (7.9min, 26.8P1) fps
Dell Inspiron 14 7420 2-in-1
Intel Core i7-1255U, Intel Iris Xe Graphics G7 96EUs
30.2 (11.1min, 17.4P1) fps -4%
Lenovo IdeaPad Flex 5 14IAU7-82R7007TGE
Intel Core i3-1215U, Intel UHD Graphics 64EUs (Alder Lake 12th Gen)
29.9 (6.6min, 16.4P1) fps -5%
Acer Aspire 5 Spin 14
Intel Core i5-1335U, Intel Iris Xe Graphics G7 80EUs
29.2 (10.3min, 15P1) fps -7%
HP Pavilion x360 14-dy0157ng
Intel Core i5-1135G7, Intel Iris Xe Graphics G7 80EUs
28.6 (6.5min, 8.29P1) fps -9%
Average AMD Radeon RX Vega 7
  (13.4 - 36.1, n=41)
27.1 fps -14%
1920x1080 high AA:high AF:8
Lenovo Yoga 7-14ARB G7
AMD Ryzen 7 6800U, AMD Radeon 680M
48.1 (20.7min, 36.9P1) fps +88%
MSI Summit E14 Flip Evo A12MT
Intel Core i7-1260P, Intel Iris Xe Graphics G7 96EUs
35.8 (13.8min, 18.3P1) fps +40%
Lenovo Yoga 9 14IRP G8
Intel Core i7-1360P, Intel Iris Xe Graphics G7 96EUs
35 (10.1min, 16P1) fps +37%
Dell Latitude 9440 2-in-1
Intel Core i7-1365U, Intel Iris Xe Graphics G7 96EUs
31.9 (8.5min, 17.4P1) fps +25%
Lenovo ThinkPad X1 Yoga G8 i7-1355U
Intel Core i7-1355U, Intel Iris Xe Graphics G7 96EUs
29 (5.6min, 9.1P1) fps +13%
Dell Inspiron 14 7435 2-in-1
AMD Ryzen 5 7530U, AMD Radeon RX Vega 7
25.6 (5min, 10.1P1) fps
Dell Inspiron 14 7420 2-in-1
Intel Core i7-1255U, Intel Iris Xe Graphics G7 96EUs
25.2 (9.2min, 13.9P1) fps -2%
Acer Aspire 5 Spin 14
Intel Core i5-1335U, Intel Iris Xe Graphics G7 80EUs
23.6 (6.3min, 8.44P1) fps -8%
Lenovo IdeaPad Flex 5 14IAU7-82R7007TGE
Intel Core i3-1215U, Intel UHD Graphics 64EUs (Alder Lake 12th Gen)
23.3 (5.9min, 8.59P1) fps -9%
HP Pavilion x360 14-dy0157ng
Intel Core i5-1135G7, Intel Iris Xe Graphics G7 80EUs
23.1 (5.3min, 6.14P1) fps -10%
Average AMD Radeon RX Vega 7
  (11.5 - 30.1, n=41)
22.7 fps -11%
1920x1080 ultra AA:ultra AF:16
Lenovo Yoga 7-14ARB G7
AMD Ryzen 7 6800U, AMD Radeon 680M
41.8 (21.9min, 23.8P1) fps +87%
MSI Summit E14 Flip Evo A12MT
Intel Core i7-1260P, Intel Iris Xe Graphics G7 96EUs
29 (7.9min, 11.3P1) fps +30%
Lenovo Yoga 9 14IRP G8
Intel Core i7-1360P, Intel Iris Xe Graphics G7 96EUs
28.3 (5.4min, 9.07P1) fps +27%
Dell Latitude 9440 2-in-1
Intel Core i7-1365U, Intel Iris Xe Graphics G7 96EUs
25.8 (5.1min, 8.07P1) fps +16%
Lenovo ThinkPad X1 Yoga G8 i7-1355U
Intel Core i7-1355U, Intel Iris Xe Graphics G7 96EUs
22.7 (5min, 5P1) fps +2%
Dell Inspiron 14 7435 2-in-1
AMD Ryzen 5 7530U, AMD Radeon RX Vega 7
22.3 (5min, 8.57P1) fps
Dell Inspiron 14 7420 2-in-1
Intel Core i7-1255U, Intel Iris Xe Graphics G7 96EUs
20.4 (5.3min, 7.35P1) fps -9%
Average AMD Radeon RX Vega 7
  (9.9 - 25.5, n=39)
19.4 fps -13%
HP Pavilion x360 14-dy0157ng
Intel Core i5-1135G7, Intel Iris Xe Graphics G7 80EUs
19.1 (5min, 5P1) fps -14%
Acer Aspire 5 Spin 14
Intel Core i5-1335U, Intel Iris Xe Graphics G7 80EUs
19 (5min, 5P1) fps -15%
Lenovo IdeaPad Flex 5 14IAU7-82R7007TGE
Intel Core i3-1215U, Intel UHD Graphics 64EUs (Alder Lake 12th Gen)
fps -100%
Cyberpunk 2077 1.6
1280x720 Low Preset
Dell Latitude 9440 2-in-1
Intel Core i7-1365U, Intel Iris Xe Graphics G7 96EUs
36.2 (5min) fps +13%
Dell Inspiron 14 7435 2-in-1
AMD Ryzen 5 7530U, AMD Radeon RX Vega 7
32.1 (8.1min) fps
Lenovo ThinkPad X1 Yoga G8 i7-1355U
Intel Core i7-1355U, Intel Iris Xe Graphics G7 96EUs
30 (14.4min) fps -7%
Average AMD Radeon RX Vega 7
  (18.1 - 35.8, n=5)
29.9 fps -7%
1920x1080 Low Preset
Lenovo Yoga 7-14ARB G7
AMD Ryzen 7 6800U, AMD Radeon 680M
34 fps +109%
MSI Summit E14 Flip Evo A12MT
Intel Core i7-1260P, Intel Iris Xe Graphics G7 96EUs
22.6 (15.2min) fps +39%
Dell Latitude 9440 2-in-1
Intel Core i7-1365U, Intel Iris Xe Graphics G7 96EUs
21.9 (8.5min) fps +34%
Dell Inspiron 14 7420 2-in-1
Intel Core i7-1255U, Intel Iris Xe Graphics G7 96EUs
17.6 (11.1min) fps +8%
Average AMD Radeon RX Vega 7
  (10 - 20.9, n=4)
16.9 fps +4%
Lenovo ThinkPad X1 Yoga G8 i7-1355U
Intel Core i7-1355U, Intel Iris Xe Graphics G7 96EUs
16.8 (8.2min) fps +3%
Dell Inspiron 14 7435 2-in-1
AMD Ryzen 5 7530U, AMD Radeon RX Vega 7
16.3 (6.9min) fps
1920x1080 Medium Preset
Lenovo Yoga 7-14ARB G7
AMD Ryzen 7 6800U, AMD Radeon 680M
26 fps +103%
MSI Summit E14 Flip Evo A12MT
Intel Core i7-1260P, Intel Iris Xe Graphics G7 96EUs
19.1 (14min) fps +49%
Dell Latitude 9440 2-in-1
Intel Core i7-1365U, Intel Iris Xe Graphics G7 96EUs
18.2 (13.3min) fps +42%
Dell Inspiron 14 7420 2-in-1
Intel Core i7-1255U, Intel Iris Xe Graphics G7 96EUs
14.6 (10.1min) fps +14%
Average AMD Radeon RX Vega 7
  (11.6 - 16.2, n=4)
14 fps +9%
Lenovo ThinkPad X1 Yoga G8 i7-1355U
Intel Core i7-1355U, Intel Iris Xe Graphics G7 96EUs
13.7 (7.5min) fps +7%
Dell Inspiron 14 7435 2-in-1
AMD Ryzen 5 7530U, AMD Radeon RX Vega 7
12.8 (3.3min) fps
1920x1080 High Preset
Lenovo Yoga 7-14ARB G7
AMD Ryzen 7 6800U, AMD Radeon 680M
19 fps +113%
MSI Summit E14 Flip Evo A12MT
Intel Core i7-1260P, Intel Iris Xe Graphics G7 96EUs
14.5 (10.5min) fps +63%
Dell Latitude 9440 2-in-1
Intel Core i7-1365U, Intel Iris Xe Graphics G7 96EUs
14.1 (10.7min) fps +58%
Dell Inspiron 14 7420 2-in-1
Intel Core i7-1255U, Intel Iris Xe Graphics G7 96EUs
10.9 (8.4min) fps +22%
Lenovo ThinkPad X1 Yoga G8 i7-1355U
Intel Core i7-1355U, Intel Iris Xe Graphics G7 96EUs
10.3 (6.3min) fps +16%
Average AMD Radeon RX Vega 7
  (8.5 - 11.4, n=4)
9.83 fps +10%
Dell Inspiron 14 7435 2-in-1
AMD Ryzen 5 7530U, AMD Radeon RX Vega 7
8.9 (2.6min) fps
1920x1080 Ultra Preset
Lenovo Yoga 7-14ARB G7
AMD Ryzen 7 6800U, AMD Radeon 680M
15 fps +124%
MSI Summit E14 Flip Evo A12MT
Intel Core i7-1260P, Intel Iris Xe Graphics G7 96EUs
11.6 (7.9min) fps +73%
Dell Latitude 9440 2-in-1
Intel Core i7-1365U, Intel Iris Xe Graphics G7 96EUs
11.2 (7.9min) fps +67%
Lenovo ThinkPad X1 Yoga G8 i7-1355U
Intel Core i7-1355U, Intel Iris Xe Graphics G7 96EUs
9.2 (4.9min) fps +37%
Average AMD Radeon RX Vega 7
  (6.7 - 8.5, n=3)
7.9 fps +18%
Dell Inspiron 14 7420 2-in-1
Intel Core i7-1255U, Intel Iris Xe Graphics G7 96EUs
7.4 (5.2min) fps +10%
Dell Inspiron 14 7435 2-in-1
AMD Ryzen 5 7530U, AMD Radeon RX Vega 7
6.7 (1.1min) fps
Tiny Tina's Wonderlands - 1280x720 Lowest Preset (DX12)
Average AMD Radeon RX Vega 7
  (49.7 - 70.4, n=7)
57 fps +4%
Dell Inspiron 14 7435 2-in-1
AMD Ryzen 5 7530U, AMD Radeon RX Vega 7
54.6 fps
Dell Latitude 9440 2-in-1
Intel Core i7-1365U, Intel Iris Xe Graphics G7 96EUs
47.9 fps -12%
Lenovo ThinkPad X1 Yoga G8 i7-1355U
Intel Core i7-1355U, Intel Iris Xe Graphics G7 96EUs
41.1 fps -25%
X-Plane 11.11
1280x720 low (fps_test=1)
Lenovo Yoga 9 14IRP G8
Intel Core i7-1360P, Intel Iris Xe Graphics G7 96EUs
59.2 fps +58%
Dell Latitude 9440 2-in-1
Intel Core i7-1365U, Intel Iris Xe Graphics G7 96EUs
58.4 fps +56%
Lenovo Yoga 7-14ARB G7
AMD Ryzen 7 6800U, AMD Radeon 680M
54.6 fps +46%
Dell Inspiron 14 7420 2-in-1
Intel Core i7-1255U, Intel Iris Xe Graphics G7 96EUs
52.4 fps +40%
MSI Summit E14 Flip Evo A12MT
Intel Core i7-1260P, Intel Iris Xe Graphics G7 96EUs
47.8 fps +28%
Lenovo ThinkPad X1 Yoga G8 i7-1355U
Intel Core i7-1355U, Intel Iris Xe Graphics G7 96EUs
46.2 fps +24%
Lenovo ThinkBook 14s Yoga ITL 20WE0023GE
Intel Core i7-1165G7, Intel Iris Xe Graphics G7 96EUs
40.9 fps +9%
Average AMD Radeon RX Vega 7
  (24.7 - 53.4, n=56)
39.3 fps +5%
HP Pavilion x360 14-dy0157ng
Intel Core i5-1135G7, Intel Iris Xe Graphics G7 80EUs
38.7 fps +3%
Dell Inspiron 14 7435 2-in-1
AMD Ryzen 5 7530U, AMD Radeon RX Vega 7
37.4 fps
Acer Aspire 5 Spin 14
Intel Core i5-1335U, Intel Iris Xe Graphics G7 80EUs
30 fps -20%
Lenovo IdeaPad Flex 5 14IAU7-82R7007TGE
Intel Core i3-1215U, Intel UHD Graphics 64EUs (Alder Lake 12th Gen)
29.1 fps -22%
1920x1080 med (fps_test=2)
Lenovo Yoga 9 14IRP G8
Intel Core i7-1360P, Intel Iris Xe Graphics G7 96EUs
44.1 fps +49%
Dell Latitude 9440 2-in-1
Intel Core i7-1365U, Intel Iris Xe Graphics G7 96EUs
43 fps +46%
Lenovo Yoga 7-14ARB G7
AMD Ryzen 7 6800U, AMD Radeon 680M
41.9 fps +42%
Dell Inspiron 14 7420 2-in-1
Intel Core i7-1255U, Intel Iris Xe Graphics G7 96EUs
39.2 fps +33%
MSI Summit E14 Flip Evo A12MT
Intel Core i7-1260P, Intel Iris Xe Graphics G7 96EUs
34.9 fps +18%
Lenovo ThinkPad X1 Yoga G8 i7-1355U
Intel Core i7-1355U, Intel Iris Xe Graphics G7 96EUs
34.4 fps +17%
Lenovo ThinkBook 14s Yoga ITL 20WE0023GE
Intel Core i7-1165G7, Intel Iris Xe Graphics G7 96EUs
33.3 fps +13%
HP Pavilion x360 14-dy0157ng
Intel Core i5-1135G7, Intel Iris Xe Graphics G7 80EUs
31.6 fps +7%
Average AMD Radeon RX Vega 7
  (19.3 - 40.3, n=56)
30.5 fps +3%
Dell Inspiron 14 7435 2-in-1
AMD Ryzen 5 7530U, AMD Radeon RX Vega 7
29.5 fps
Lenovo IdeaPad Flex 5 14IAU7-82R7007TGE
Intel Core i3-1215U, Intel UHD Graphics 64EUs (Alder Lake 12th Gen)
24.9 fps -16%
Acer Aspire 5 Spin 14
Intel Core i5-1335U, Intel Iris Xe Graphics G7 80EUs
21 fps -29%
1920x1080 high (fps_test=3)
Lenovo Yoga 9 14IRP G8
Intel Core i7-1360P, Intel Iris Xe Graphics G7 96EUs
38.6 fps +46%
Dell Latitude 9440 2-in-1
Intel Core i7-1365U, Intel Iris Xe Graphics G7 96EUs
37.4 fps +42%
Lenovo Yoga 7-14ARB G7
AMD Ryzen 7 6800U, AMD Radeon 680M
36.2 fps +37%
Dell Inspiron 14 7420 2-in-1
Intel Core i7-1255U, Intel Iris Xe Graphics G7 96EUs
35.4 fps +34%
MSI Summit E14 Flip Evo A12MT
Intel Core i7-1260P, Intel Iris Xe Graphics G7 96EUs
32.1 fps +22%
Lenovo ThinkPad X1 Yoga G8 i7-1355U
Intel Core i7-1355U, Intel Iris Xe Graphics G7 96EUs
31.4 fps +19%
Lenovo ThinkBook 14s Yoga ITL 20WE0023GE
Intel Core i7-1165G7, Intel Iris Xe Graphics G7 96EUs
30.2 fps +14%
HP Pavilion x360 14-dy0157ng
Intel Core i5-1135G7, Intel Iris Xe Graphics G7 80EUs
27.4 fps +4%
Average AMD Radeon RX Vega 7
  (17.4 - 35.7, n=56)
27.2 fps +3%
Dell Inspiron 14 7435 2-in-1
AMD Ryzen 5 7530U, AMD Radeon RX Vega 7
26.4 fps
Lenovo IdeaPad Flex 5 14IAU7-82R7007TGE
Intel Core i3-1215U, Intel UHD Graphics 64EUs (Alder Lake 12th Gen)
23.3 fps -12%
Acer Aspire 5 Spin 14
Intel Core i5-1335U, Intel Iris Xe Graphics G7 80EUs
20.5 fps -22%

Witcher 3 FPS Chart

0510152025303540455055606570Tooltip
bajomedioaltoultra
GTA V (2015) 107.7 25.7 10.2
The Witcher 3 (2015) 76 21.5 14.5
Dota 2 Reborn (2015) 107.4 87.3 49.9 47.1
Final Fantasy XV Benchmark (2018) 35.1 17.5 12.1
X-Plane 11.11 (2018) 37.4 29.5 26.4
Strange Brigade (2018) 79.5 31.4 25.6 22.3
Cyberpunk 2077 1.6 (2022) 16.3 12.8 8.9 6.7
Tiny Tina's Wonderlands (2022) 26.5
F1 22 (2022)

Emisiones

Ruido del sistema

El ventilador interno tiende a pulsar entre ralentí y 33.3 dB(A) cuando se navega por la web o se hace streaming de vídeo. Los aumentos en el ruido del ventilador tienden a ser repentinos y bruscos en vez de graduales, lo que desafortunadamente hace que el ruido sea más notable.

Cargas altas consistentes como juegos inducirían un ruido de ventilador de casi 41 dB(A) si está en modo Rendimiento. Si está en modo Equilibrado, el ruido del ventilador baja ligeramente a 39.8 dB(A).

En nuestra unidad de pruebas notamos un leve zumbido de la bobina o ruido electrónico, por lo que nunca es realmente silencioso, ni siquiera cuando el ventilador está en reposo. El bajo rango de 40 dB(A) es más silencioso que el Acer Aspire 5 Spin 14 mientras que es más ruidoso que elLG Gram 14T90P.

El tubo de calor es ligeramente más largo que en el modelo del año pasado debido a la eliminación de las ranuras SODIMM
La solución de refrigeración consiste en un único ventilador de ~45 mm y un tubo de calor
Perfil de ruido del ventilador (Blanco: Fondo, Rojo: Sistema inactivo, Azul: 3DMark 06, Naranja: Witcher 3 verde: Prime95+FurMark estrés)

Ruido

Ocioso
23.2 / 23.2 / 23.2 dB(A)
Carga
33 / 41.3 dB(A)
  red to green bar
 
 
30 dB
silencioso
40 dB(A)
audible
50 dB(A)
ruidosamente alto
 
min: dark, med: mid, max: light   Earthworks M23R, Arta (15 cm de distancia)   environment noise: 22.8 dB(A)
dB(A) 0102030405060708090Deep BassMiddle BassHigh BassLower RangeMidsHigher MidsLower HighsMid HighsUpper HighsSuper Highs2038.74137.234.233.1252838.224.525.227.93126.133.320.921.423.24026.72621.521.223.15022.823.722.820.321.76322.422.821.219.221.98025.322.818.218.922.310018.117.916.2151712519.416.914.414.316.916019.315.612.412.116.720018.214.911.611.217.52502017.412.711.719.531521.518.114.113.122.840024.818.411.811.222.450023.719.611.310.322.363023.21710.410.721.880023.517.69.59.222.3100026.319.19.69.324.6125028.420.59.79.527.4160030.121.29.99.729200029.421.410.19.928.5250032.924.810.310.431.6315031.823.51110.830.4400030.323.111.41128.8500028.720.511.911.427.3630027.214.711.911.524.2800022.314.312.511.620.3100001914.812.811.816.91250016.216.513.41214.31600018.120.313.51212.6SPL40.93323.222.839.5N3.31.60.50.42.9median 23.5median 18.1median 11.8median 11.2median 22.3Delta4.72.21.515.1hearing rangehide median Fan NoiseDell Inspiron 14 7435 2-in-1
Dell Inspiron 14 7435 2-in-1
Vega 7, R5 7530U
Dell Inspiron 14 7420 2-in-1
Iris Xe G7 96EUs, i7-1255U, WDC PC SN530 SDBPMPZ-512G
Lenovo IdeaPad Flex 7i 14IAU7
Iris Xe G7 96EUs, i7-1255U, Samsung PM9B1 512GB MZAL4512HBLU
Acer Aspire 5 Spin 14
Iris Xe G7 80EUs, i5-1335U, Micron 2450 512GB MTFDKBA512TFK
LG Gram 14T90P
Iris Xe G7 80EUs, i5-1135G7, Samsung SSD PM981a MZVLB512HBJQ
HP Pavilion x360 14-dy0157ng
Iris Xe G7 80EUs, i5-1135G7, Toshiba KBG40ZNV512G
Noise
-3%
1%
-22%
0%
-10%
off / environment *
22.8
23.1
-1%
23.3
-2%
26
-14%
25.4
-11%
27
-18%
Idle Minimum *
23.2
24.7
-6%
23.3
-0%
27.7
-19%
25.5
-10%
27
-16%
Idle Average *
23.2
24.7
-6%
23.3
-0%
27.7
-19%
25.5
-10%
27
-16%
Idle Maximum *
23.2
24.7
-6%
23.3
-0%
29.7
-28%
25.5
-10%
27
-16%
Load Average *
33
27.7
16%
34.3
-4%
46.3
-40%
28.3
14%
38.3
-16%
Witcher 3 ultra *
40.9
45.1
-10%
37.8
8%
35
14%
Load Maximum *
41.3
45.1
-9%
37.8
8%
45.4
-10%
35
15%
33.2
20%

* ... más pequeño es mejor

Temperatura

Las temperaturas superficiales son más frescas que las que registramos en el Inspiron 14 7620 2 en 1 del año pasado. Bajo carga, por ejemplo, los puntos calientes de la parte superior e inferior se acercarían a sólo 36 C y 39 C, respectivamente, comparados con los 46 C del modelo del año pasado. El alto rango de 30 C es comparable a modelos como el IdeaPad Flex 7i 14.

El adaptador de corriente también funcionaría más fresco a unos 36 C en lugar de 46 C.

Escape trasero
Escape trasero
El adaptador de CA apenas se calienta bajo carga
Carga Máx.
 35 °C35.2 °C32.2 °C 
 34.2 °C34.8 °C27.2 °C 
 25.6 °C24.4 °C23 °C 
Máximo: 35.2 °C
Médio: 30.2 °C
33 °C36 °C38.2 °C
24.6 °C29.2 °C35.8 °C
22.2 °C22.4 °C23.4 °C
Máximo: 38.2 °C
Médio: 29.4 °C
Conector de corriente  38 °C | Temperatura del cuarto 20 °C | Fluke 62 Mini IR Thermometer
(+) The average temperature for the upper side under maximal load is 30.2 °C / 86 F, compared to the average of 30.3 °C / 87 F for the devices in the class Convertible.
(+) The maximum temperature on the upper side is 35.2 °C / 95 F, compared to the average of 35.4 °C / 96 F, ranging from 19.6 to 60 °C for the class Convertible.
(+) The bottom heats up to a maximum of 38.2 °C / 101 F, compared to the average of 36.8 °C / 98 F
(+) In idle usage, the average temperature for the upper side is 28.7 °C / 84 F, compared to the device average of 30.3 °C / 87 F.
(+) The palmrests and touchpad are cooler than skin temperature with a maximum of 26.6 °C / 79.9 F and are therefore cool to the touch.
(±) The average temperature of the palmrest area of similar devices was 28 °C / 82.4 F (+1.4 °C / 2.5 F).
Sistema inactivo (arriba)
Sistema inactivo (abajo)
Tensión Prime95+FurMark (arriba)
Tensión Prime95+FurMark (abajo)
Dell Inspiron 14 7435 2-in-1
AMD Ryzen 5 7530U, AMD Radeon RX Vega 7
Dell Inspiron 14 7420 2-in-1
Intel Core i7-1255U, Intel Iris Xe Graphics G7 96EUs
Lenovo IdeaPad Flex 7i 14IAU7
Intel Core i7-1255U, Intel Iris Xe Graphics G7 96EUs
Acer Aspire 5 Spin 14
Intel Core i5-1335U, Intel Iris Xe Graphics G7 80EUs
LG Gram 14T90P
Intel Core i5-1135G7, Intel Iris Xe Graphics G7 80EUs
HP Pavilion x360 14-dy0157ng
Intel Core i5-1135G7, Intel Iris Xe Graphics G7 80EUs
Heat
-2%
11%
-14%
3%
-2%
Maximum Upper Side *
35.2
38.2
-9%
35.4
-1%
41.7
-18%
41.6
-18%
38.9
-11%
Maximum Bottom *
38.2
45.6
-19%
38.8
-2%
54.4
-42%
46.2
-21%
40.3
-5%
Idle Upper Side *
31.2
27.4
12%
22.6
28%
30.4
3%
22.6
28%
31.8
-2%
Idle Bottom *
30.4
28.4
7%
24.2
20%
29.8
2%
23.2
24%
27.4
10%

* ... más pequeño es mejor

Prueba de resistencia

Al ejecutar Prime95, la CPU aumentaba a 3,8 GHz y 34 W durante solo un par de segundos antes de caer y estabilizarse en 2,7 GHz y 20 W. La temperatura del núcleo se mantenía relativamente fría a 66 C incluso bajo carga, comparable a la del Inspiron 14 7420 2 en 1 con tecnología Intel en condiciones similares. Sospechamos que los modelos Ryzen 7 o Core i7 de gama más alta se calentarían más de lo que registramos en nuestra configuración Ryzen 5 básica.

Sistema inactivo
Sistema inactivo
Witcher 3 estrés
Witcher 3 estrés
Estrés Prime95
Estrés Prime95
Prime95+Tensión FurMark
RelojCPU (GHz) Reloj GPU (MHz) Temperatura media CPU (°C)
Sistema en reposo -- -- 44
Prime95 Stress 2.7 -- 66
Prime95+ FurMark Stress 2.9 1050 60
Witcher 3 Estrés 0,8 1900 58

Altavoces

El ruido rosa al volumen máximo muestra un volumen ligeramente más alto pero sin mejoras en la reproducción de graves. Sin embargo, para un subportátil económico, la calidad de audio sigue siendo respetable
Los altavoces estéreo ahora miran hacia arriba en lugar de hacia abajo
dB(A) 0102030405060708090Deep BassMiddle BassHigh BassLower RangeMidsHigher MidsLower HighsMid HighsUpper HighsSuper Highs2038.237.238.22529.524.529.53123.820.923.84021.721.521.75022.422.822.46322.421.222.48026.918.226.910037.816.237.812544.414.444.416048.612.448.620053.811.653.825055.512.755.531560.814.160.840068.511.868.550072.511.372.563073.410.473.480068.99.568.9100071.19.671.1125073.19.773.11600779.977200074.210.174.2250068.310.368.3315070.21170.2400066.611.466.6500068.611.968.663006911.969800069.312.569.31000072.612.872.61250069.413.469.41600067.713.567.7SPL83.823.283.8N600.560median 68.9median 11.8median 68.9Delta61.5626.325.821.422.12624.925.127.622.532.523.448.72655.818.860.922.167.2267019.372.317.674.217.774.319.575.31571.711.871.311.27410.574.21072.710.17210.67210.97511.374.811.671.71269.71269.612.371.112.669.61270.111.269.824.784.70.666.6median 12median 71.73.42.2hearing rangehide median Pink NoiseDell Inspiron 14 7435 2-in-1Apple MacBook Pro 16 2021 M1 Pro
Diagrama de frecuencia en comparación (¡las casillas de verificación se pueden marcar y desmarcar!)
Dell Inspiron 14 7435 2-in-1 audio analysis

(+) | speakers can play relatively loud (83.8 dB)
Bass 100 - 315 Hz
(-) | nearly no bass - on average 18.8% lower than median
(±) | linearity of bass is average (9.9% delta to prev. frequency)
Mids 400 - 2000 Hz
(+) | balanced mids - only 3.5% away from median
(+) | mids are linear (6.1% delta to prev. frequency)
Highs 2 - 16 kHz
(+) | balanced highs - only 1.2% away from median
(+) | highs are linear (4.4% delta to prev. frequency)
Overall 100 - 16.000 Hz
(+) | overall sound is linear (12.3% difference to median)
Compared to same class
» 12% of all tested devices in this class were better, 3% similar, 85% worse
» The best had a delta of 6%, average was 21%, worst was 57%
Compared to all devices tested
» 8% of all tested devices were better, 2% similar, 89% worse
» The best had a delta of 4%, average was 25%, worst was 134%

Apple MacBook Pro 16 2021 M1 Pro audio analysis

(+) | speakers can play relatively loud (84.7 dB)
Bass 100 - 315 Hz
(+) | good bass - only 3.8% away from median
(+) | bass is linear (5.2% delta to prev. frequency)
Mids 400 - 2000 Hz
(+) | balanced mids - only 1.3% away from median
(+) | mids are linear (2.1% delta to prev. frequency)
Highs 2 - 16 kHz
(+) | balanced highs - only 1.9% away from median
(+) | highs are linear (2.7% delta to prev. frequency)
Overall 100 - 16.000 Hz
(+) | overall sound is linear (4.6% difference to median)
Compared to same class
» 0% of all tested devices in this class were better, 0% similar, 100% worse
» The best had a delta of 5%, average was 18%, worst was 45%
Compared to all devices tested
» 0% of all tested devices were better, 0% similar, 100% worse
» The best had a delta of 4%, average was 25%, worst was 134%

Gestión de la energía

Consumo de energía

El consumo de energía es comparable al del Inspiron 14 7420 con tecnología Intel durante cargas poco exigentes, pero es sistemáticamente superior cuando se ejecutan cargas más exigentes como juegos. Esto sugiere que la GPU AMD integrada es ligeramente menos eficiente energéticamente que las Iris Xe 96 EU de la competencia, mientras que el rendimiento por vatio de la CPU es más similar.

Podemos medir un consumo máximo de 56 W del pequeño (11.1 x 5.1 x 2.8 cm) adaptador USB-C de 65 W cuando la CPU está al 100% de uso. Sin embargo, esta tasa dura muy poco como muestran nuestras capturas de pantalla a continuación debido al limitado potencial Turbo Boost del sistema.

consumo 3DMark 06
consumo 3DMark 06
Witcher 3 consumo de energía 1080p Ultra
El consumo se disparaba a 56 W al iniciar el estrés Prime95 antes de estabilizarse inmediatamente en 37 W
Prime95+FurMark tensión iniciada en la marca 10s
Consumo de corriente
Off / Standbydarklight 0.42 / 0.55 Watt
Ociosodarkmidlight 5.3 / 9.1 / 9.4 Watt
Carga midlight 54.9 / 55.8 Watt
 color bar
Clave: min: dark, med: mid, max: light        Metrahit Energy
Dell Inspiron 14 7435 2-in-1
R5 7530U, Vega 7, , IPS, 1920x1200, 14"
Dell Inspiron 14 7420 2-in-1
i7-1255U, Iris Xe G7 96EUs, WDC PC SN530 SDBPMPZ-512G, IPS, 1920x1200, 14"
Lenovo IdeaPad Flex 7i 14IAU7
i7-1255U, Iris Xe G7 96EUs, Samsung PM9B1 512GB MZAL4512HBLU, IPS, 2240x1400, 14"
Acer Aspire 5 Spin 14
i5-1335U, Iris Xe G7 80EUs, Micron 2450 512GB MTFDKBA512TFK, IPS, 1920x1200, 14"
LG Gram 14T90P
i5-1135G7, Iris Xe G7 80EUs, Samsung SSD PM981a MZVLB512HBJQ, IPS, 1900x1200, 14"
HP Pavilion x360 14-dy0157ng
i5-1135G7, Iris Xe G7 80EUs, Toshiba KBG40ZNV512G, IPS, 1920x1080, 14"
Power Consumption
6%
-10%
12%
24%
33%
Idle Minimum *
5.3
5.2
2%
7.1
-34%
4.3
19%
2.8
47%
4
25%
Idle Average *
9.1
8.2
10%
11
-21%
5.8
36%
5.5
40%
6.7
26%
Idle Maximum *
9.4
9.9
-5%
11.4
-21%
8.8
6%
6.4
32%
8.2
13%
Load Average *
54.9
44.4
19%
43.7
20%
44
20%
45.4
17%
29.6
46%
Witcher 3 ultra *
45
35
22%
35.1
22%
41.5
8%
34
24%
29.6
34%
Load Maximum *
55.8
62.5
-12%
71
-27%
67
-20%
65.9
-18%
26.7
52%

* ... más pequeño es mejor

Power Consumption Witcher 3 / Stresstest

051015202530354045505560Tooltip
Dell Inspiron 14 7435 2-in-1 R5 7530U, Vega 7; Witcher 3 ultra: Ø45 (41.4-49.7)
Dell Inspiron 14 7420 2-in-1 i7-1255U, Iris Xe G7 96EUs; Witcher 3 ultra: Ø35 (33.3-46)
Dell Inspiron 14 7435 2-in-1 R5 7530U, Vega 7; 1280x720 Prime95 28.10 and Furmark 1.25: Ø37.8 (36.5-53.1)
Dell Inspiron 14 7420 2-in-1 i7-1255U, Iris Xe G7 96EUs; 1280x720 Prime95 28.10 and Furmark 1.25: Ø41.3 (37.5-61.5)
Dell Inspiron 14 7435 2-in-1 R5 7530U, Vega 7; Idle 150cd/m2: Ø6.87 (6.3-8.7)

Power Consumption external Monitor

0510152025303540455055Tooltip
Dell Inspiron 14 7435 2-in-1 R5 7530U, Vega 7; Prime95 V2810 Stress (external Monitor): Ø37 (36.3-46.6)
Dell Inspiron 14 7420 2-in-1 i7-1255U, Iris Xe G7 96EUs; Prime95 V2810 Stress (external Monitor): Ø41.8 (37.5-59.5)
Dell Inspiron 14 7435 2-in-1 R5 7530U, Vega 7; Cinebench R15 Multi (external Monitor): Ø32.2 (31.5-45.5)
Dell Inspiron 14 7420 2-in-1 i7-1255U, Iris Xe G7 96EUs; Cinebench R15 Multi (external Monitor): Ø51.6 (37.2-57.3)
Dell Inspiron 14 7435 2-in-1 R5 7530U, Vega 7; 1280x720 FurMark 1.19 GPU Stress Test (external Monitor): Ø33.3 (32.5-43.2)
Dell Inspiron 14 7420 2-in-1 i7-1255U, Iris Xe G7 96EUs; 1280x720 FurMark 1.19 GPU Stress Test (external Monitor): Ø35.9 (32.8-58.3)
Dell Inspiron 14 7435 2-in-1 R5 7530U, Vega 7; 1920x1080 The Witcher 3 ultra (external Monitor): Ø39.1 (38.3-39.7)
Dell Inspiron 14 7420 2-in-1 i7-1255U, Iris Xe G7 96EUs; 1920x1080 The Witcher 3 ultra (external Monitor): Ø31.8 (30.9-43.2)
Dell Inspiron 14 7435 2-in-1 R5 7530U, Vega 7; Idle 1min (external Monitor): Ø6.05 (5.4-9.44)

Duración de la batería

Adaptador de CA
Adaptador de CA

Las duraciones han aumentado notablemente año tras año a pesar de no haber cambios en la capacidad de la batería. Hemos sido capaces de registrar 11 horas de navegación WLAN real en nuestra unidad con tecnología AMD, frente a las 7,5 horas del modelo con tecnología Intel del año pasado. El Inspiron 14 7435 2-en-1 es posteriormente más duradero que muchos otros subportátiles en su rango de precios.

Cargarlo de vacío a lleno tarda unas dos horas.

Tiempo de Ejecución de la Batería
Ocioso (sin WLAN, min brillo)
19h 52min
WiFi Websurfing
11h 08min
Carga (máximo brillo)
2h 00min
Dell Inspiron 14 7435 2-in-1
R5 7530U, Vega 7, 54 Wh
Dell Inspiron 14 7420 2-in-1
i7-1255U, Iris Xe G7 96EUs, 54 Wh
Lenovo IdeaPad Flex 7i 14IAU7
i7-1255U, Iris Xe G7 96EUs, 59 Wh
Acer Aspire 5 Spin 14
i5-1335U, Iris Xe G7 80EUs, 54.6 Wh
LG Gram 14T90P
i5-1135G7, Iris Xe G7 80EUs, 72 Wh
HP Pavilion x360 14-dy0157ng
i5-1135G7, Iris Xe G7 80EUs, 43 Wh
Duración de Batería
-15%
-32%
-1%
12%
-22%
Reader / Idle
1192
954
-20%
1059
-11%
WiFi v1.3
668
455
-32%
453
-32%
664
-1%
728
9%
427
-36%
Load
120
127
6%
138
15%
97
-19%
H.264
535

Pro

+ bisagras y altavoces actualizados
+ Conectividad Wi-Fi 6E
+ buena duración de la batería
+ barato

Contra

- la respuesta del clickpad podría ser más firme
- colores limitados y brillo tenue
- sin opciones de CPU Zen 3+ o Zen 4
- RAM soldada

Veredicto - Buen rendimiento para el precio, pero la pantalla podría mejorar un poco

En revisión: Dell Inspiron 14 7435 2 en 1. Unidad de prueba proporcionada por Dell

Desde el punto de vista del rendimiento, nuestro Inspiron 14 7435 2 en 1 con Ryzen 5 de 550 dólares rinde tan bien como el Inspiron 14 7430 2 en 1 con Core i5 de 800 dólares sin comprometer la duración de la batería, la calidad de la pantalla, los altavoces u otras características físicas. Si la compatibilidad con Thunderbolt no es una de tus prioridades, puedes ahorrarte casi 200 dólares si eliges AMD en lugar de Intel para este modelo en concreto.

La configuración Ryzen 5 está perfectamente ajustada para rendir tan bien como la configuración Core i5 por cientos de dólares menos. Las costosas actualizaciones de RAM y la tenue pantalla táctil, sin embargo, rebajan un poco el modelo.

La RAM soldada es un gran inconveniente para el modelo de este año porque una simple actualización de 8 GB a 16 GB cuesta 150 dólares extra como mínimo. Para lo que se supone que es un convertible económico, la costosa actualización puede desanimar al público objetivo. Por lo demás, los cambios en los altavoces, el clickpad y las bisagras son mejoras bienvenidas.

Nos encantaría que las futuras revisiones incorporasen opciones de pantalla táctil más brillantes para mejorar la visibilidad en exteriores. La pantalla actual de 250 nits limita el modelo a entornos de interior, lo que es lamentable, ya que los compradores pueden querer utilizar el convertible de 14 pulgadas sobre la marcha. Esta característica daría al Inspiron 14 7435 2 en 1 una notable ventaja frente a competidores como el Acer Aspire 5 Spin 14, Lenovo IdeaPad Flex 7io HP Pavilion x360 14.

Precio y disponibilidad

Dell ya está distribuyendo su Inspiron 14 7435 2 en 1 a partir de 549 USD para nuestra configuración Ryzen 5 analizada hasta 699 USD para la configuración Ryzen 7. Alternativamente, el Intel Inspiron 14 7430 2 en 1 comienza en $799 para la configuración Core i5.

Dell Inspiron 14 7435 2-in-1 - 08/08/2023 v7 (old)
Allen Ngo

Acabado
84 / 98 → 86%
Teclado
79%
Ratón
75%
Conectividad
0 / 75 → 0%
Peso
68 / 20-75 → 87%
Battería
89%
Pantalla
75%
Rendimiento de juegos
66 / 78 → 85%
Rendimiento de la Aplicación
93 / 85 → 100%
Temperatura
94%
Ruido
94%
Audio
83 / 91 → 91%
Cámara
43 / 85 → 51%
Médio
79%
85%
Convertible - media ponderada

Transparency

The selection of devices to be reviewed is made by our editorial team. The test sample was provided to the author as a loan by the manufacturer or retailer for the purpose of this review. The lender had no influence on this review, nor did the manufacturer receive a copy of this review before publication. There was no obligation to publish this review. We never accept compensation or payment in return for our reviews. As an independent media company, Notebookcheck is not subjected to the authority of manufacturers, retailers or publishers.

This is how Notebookcheck is testing

Every year, Notebookcheck independently reviews hundreds of laptops and smartphones using standardized procedures to ensure that all results are comparable. We have continuously developed our test methods for around 20 years and set industry standards in the process. In our test labs, high-quality measuring equipment is utilized by experienced technicians and editors. These tests involve a multi-stage validation process. Our complex rating system is based on hundreds of well-founded measurements and benchmarks, which maintains objectivity. Further information on our test methods can be found here.

Price comparison

Please share our article, every link counts!
Mail Logo
> Análisis y pruebas de ordenadores portátiles y móviles teléfonos > Análisis > Análisis del convertible 2 en 1 Dell Inspiron 14 7435: Ryzen 5 7530U para usuarios con presupuesto ajustado
Allen Ngo, 2023-08- 9 (Update: 2023-08- 9)