

Análisis del convertible MSI Summit E13 AI Evo: Graves problemas de ralentización con Core Ultra 7
Demasiado rápido para manejarlo.
El último Summit E13 A1MTG muestra lo que ocurre cuando se coloca una CPU Core Ultra-H en un portátil diseñado originalmente para un procesador de la serie Core-U. Sobre el papel puede parecer muy rápido, pero hay que prestar atención a la ralentización posterior y a los niveles de temperatura.Allen Ngo, 👁 Allen Ngo (traducido por DeepL / Ninh Duy) Publicado 🇺🇸 🇫🇷 ...
Veredicto - Un paso adelante y dos atrás
El Summit E13 AI Evo A1MTG puede sentirse como un downgrade en comparación con su predecesor. Suena bien sobre el papel con su CPU Core Ultra H, pero en la práctica el procesador se ralentiza mucho más rápida y bruscamente que la mayoría de portátiles con la misma opción de CPU, ya que el Summit E13 se diseñó originalmente para procesadores ULV Core de la serie U. El modelo más reciente es sin duda más rápido que la versión original de 2021, pero la diferencia no es tan amplia como podría haber sido dada nuestra experiencia con otros portátiles Core Ultra H como el Portátil Marco 13.5. Aspectos como la duración de la batería y la temperatura del núcleo también se resienten del cambio de procesador.
Otros cambios decepcionantes incluyen menos puertos USB-C y la eliminación del lector MicroSD. Incluso la pantalla IPS base se ha rebajado de 120 Hz a solo 60 Hz sin mejoras en los lentos tiempos de respuesta blanco-negro.
Puede que haya llegado el momento de rediseñar el chasis ahora que el Summit E13 se acerca a los cuatro años. El procesador Core Ultra-H ayuda a separar el modelo de MSI de otros convertibles de 13 pulgadas, pero su implementación podría haberse manejado mejor mejorando primero la solución de refrigeración para soportar las mayores exigencias de la CPU. Tanto las temperaturas superiores a la media como el ruido del ventilador son indicativos de una solución de refrigeración que lucha por mantener a flote el nuevo procesador.
Pro
Contra
Precio y disponibilidad
Amazon está ofreciendo actualmente el Summit E13 AI Evo con el Core Ultra 7, 16 GB de RAM LPDDR5, y 1 TB SSD como se revisó por $1100.
Posibles contendientes en la comparación
Imagen | Modelo | Precio | Peso | Altura | Pantalla |
|---|---|---|---|---|---|
1. 78.6% 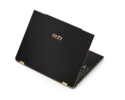 | MSI Summit E13 AI Evo A1MTG Intel Core Ultra 7 155H ⎘ Intel Arc 8-Core iGPU ⎘ 16 GB Memoría, 1024 GB SSD | Amazon: $1,099.00 Precio de catálogo: 1100 USD | 1.3 kg | 16.2 mm | 13.30" 1920x1200 170 PPI IPS |
2. 86.9% v7 (old) 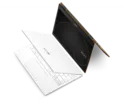 | MSI Summit E13 Flip Evo A11MT Intel Core i7-1185G7 ⎘ Intel Iris Xe Graphics G7 96EUs ⎘ 32 GB Memoría, 1024 GB SSD | Amazon: 1. $969.99 MSI Summit E13 Flip Evo (202... 2. $899.00 MSI Summit E13 Flip Evo Prof... 3. $849.00 MSI Summit E13 Flip EVO Prof... Precio de catálogo: 1900 USD | 1.4 kg | 14.9 mm | 13.40" 1920x1200 169 PPI IPS |
3. 87% v7 (old)  | Lenovo Yoga Book 9 13IMU9 Intel Core Ultra 7 155U ⎘ Intel Graphics 4-Core iGPU (Arc) ⎘ 16 GB Memoría | Amazon: $1,699.00 Precio de catálogo: 2000 USD | 1.4 kg | 15.95 mm | 13.30" 2880x1800 255 PPI OLED |
4. 88.1% v7 (old)  | Lenovo ThinkPad L13 Yoga G4 i7-1355U Intel Core i7-1355U ⎘ Intel Iris Xe Graphics G7 96EUs ⎘ 16 GB Memoría, 512 GB SSD | Amazon: 1. $899.98 Lenovo ThinkPad T14 Gen 5 Bu... 2. $1,369.00 Lenovo ThinkPad T14 G4 Home ... 3. $23.95 mCover Case Compatible ONLY ... Precio de catálogo: 1589 USD | 1.4 kg | 17.1 mm | 13.30" 1920x1200 170 PPI IPS |
5. 90.3% v7 (old)  | HP Elite Dragonfly Folio 13.5 G3 Intel Core i7-1265U ⎘ Intel Iris Xe Graphics G7 96EUs ⎘ 16 GB Memoría, 512 GB SSD | Amazon: 1. $19.99 New Slim 65W USB C Laptop Ch... 2. $39.99 Smatree Hard EVA Protective ... 3. $34.99 Broonel Black Leather Folio ... Precio de catálogo: 3900 USD | 1.4 kg | 17.8 mm | 13.50" 1920x1280 171 PPI IPS |
6. 89% v7 (old)  | Dell Latitude 9330 Intel Core i7-1260U ⎘ Intel Iris Xe Graphics G7 96EUs ⎘ 16 GB Memoría | Amazon: 1. $25.99 65W USB C Charger Genuine Re... 2. $42.93 Berfea Protective Cover Case... 3. $36.77 Dell Laptop Charger 90W Watt... | 1.2 kg | 14.1 mm | 13.30" 2560x1600 227 PPI IPS |
Índice
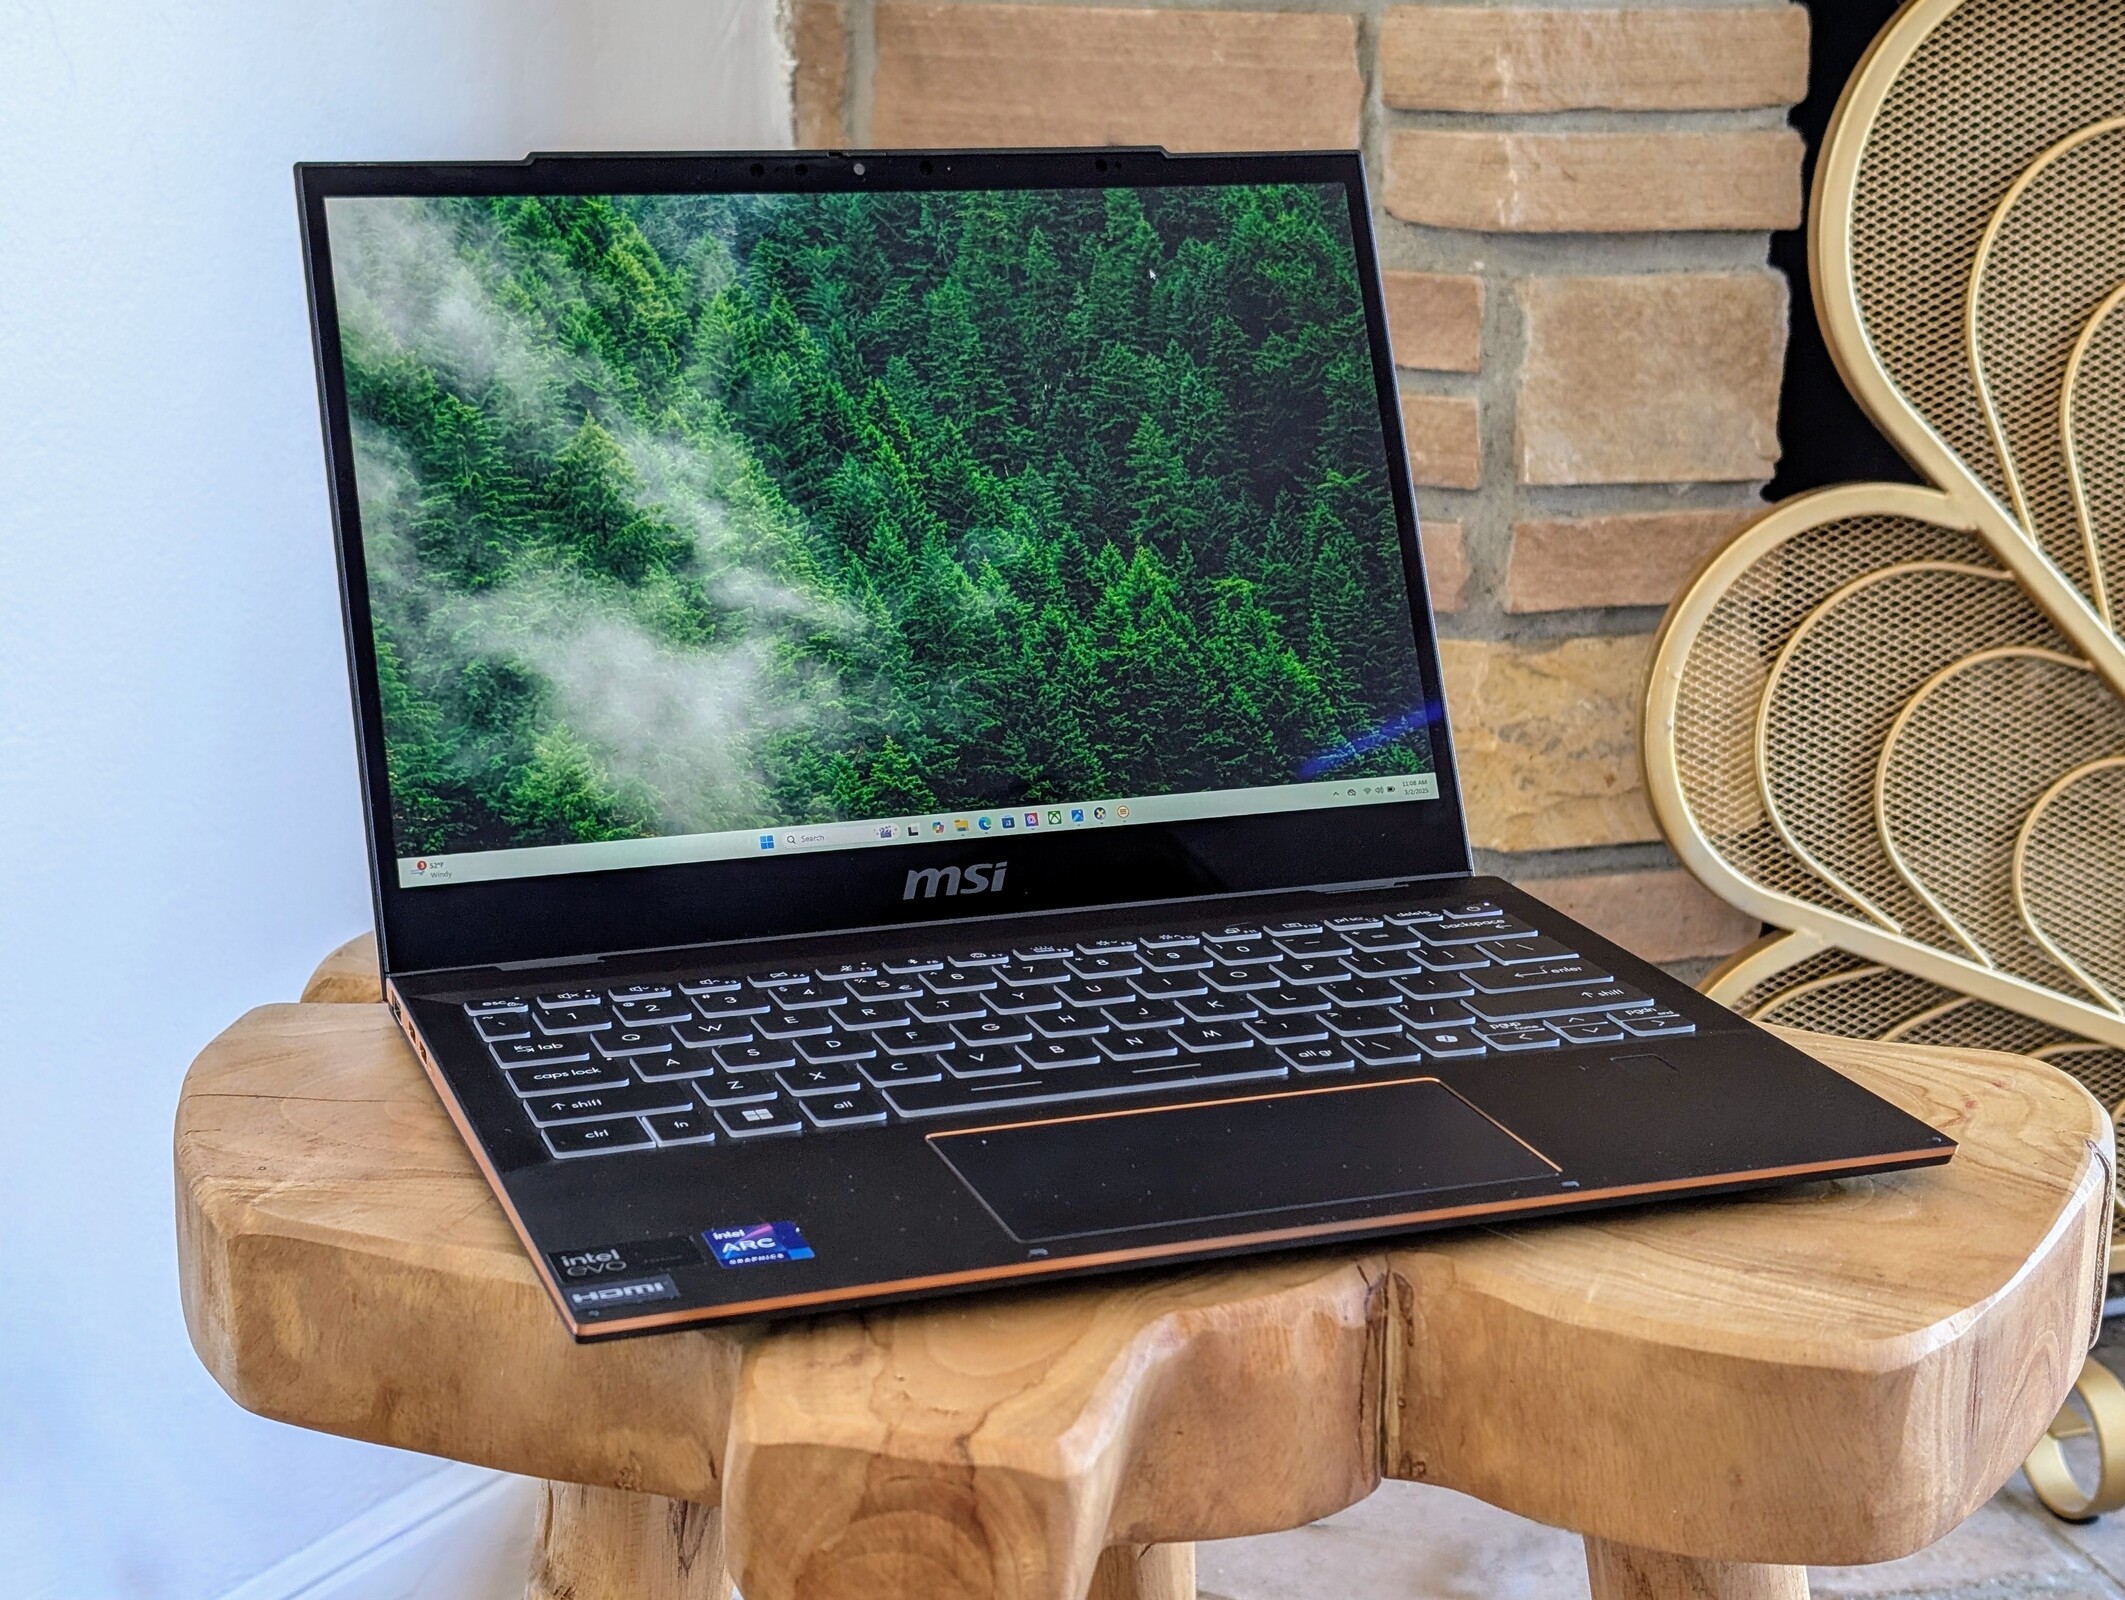
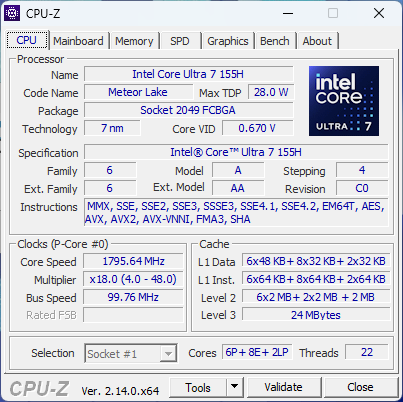
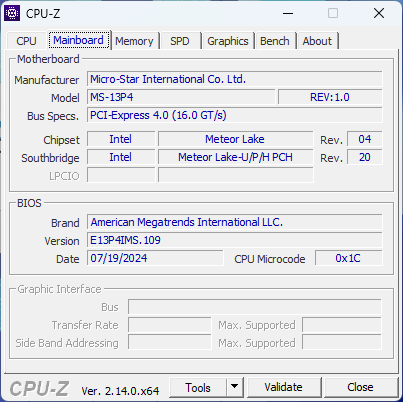
El 2024 Summit E13 AI Evo A1MTG es la versión actualizada del 2021 Summit E13 Flip Evo. Aunque se ha eliminado el apodo "Flip", el modelo sigue siendo un 2 en 1 con el mismo factor de forma que su predecesor. Viene con un procesador Intel Core Meteor Lake-H más reciente que sustituye a la opción Tiger Lake-U más antigua del modelo 2021.
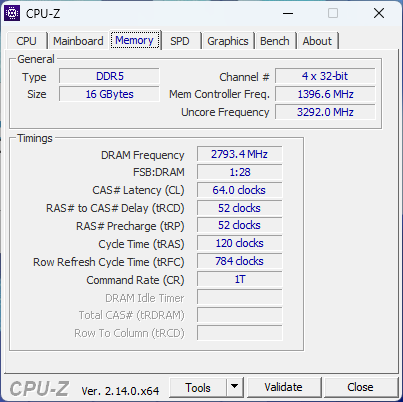
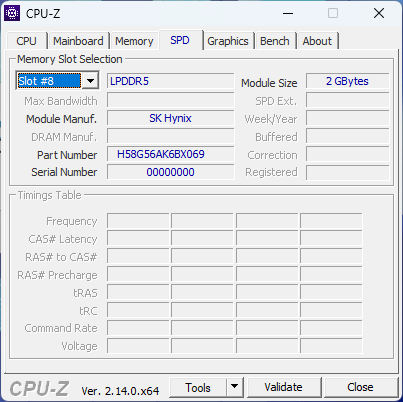
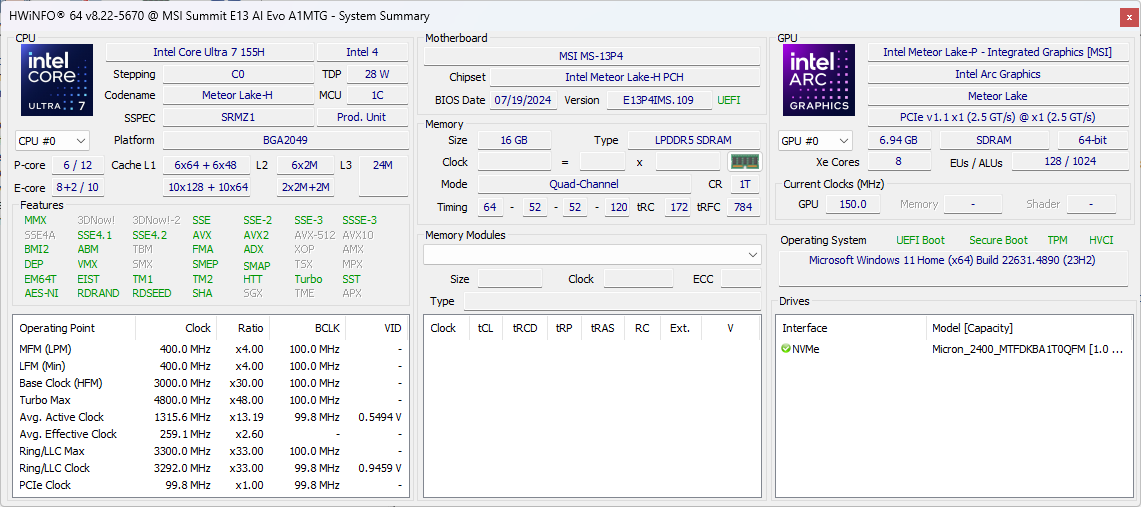
Nuestra unidad de prueba está equipada con la CPU Core Ultra 7 155H, 16 GB de RAM LPDDR5-5600 y una unidad SSD de 1 TB por aproximadamente 1.100 dólares. Otras SKU pueden ofrecer 32 GB de RAM LPDDR5-6400 o el Core Ultra 5 125H, más lento, pero la pantalla táctil IPS de 1200p parece fija en toda la gama.
Entre los competidores se incluyen otros subportátiles de oficina de 13 pulgadas como el Dell Latitude 9330, HP Elite Dragonfly Folio, o Lenovo ThinkPad L13 Yoga G4.
Más opiniones sobre MSI:
Especificaciones
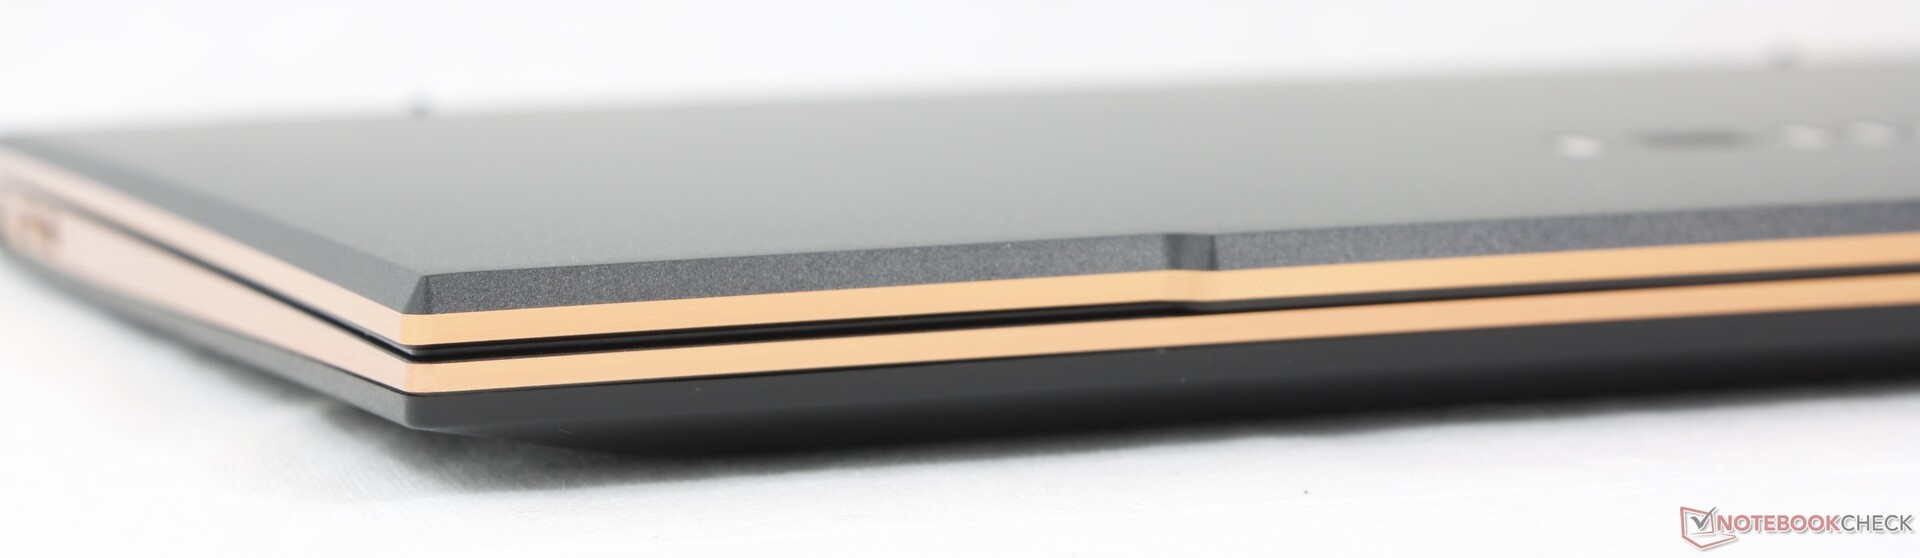
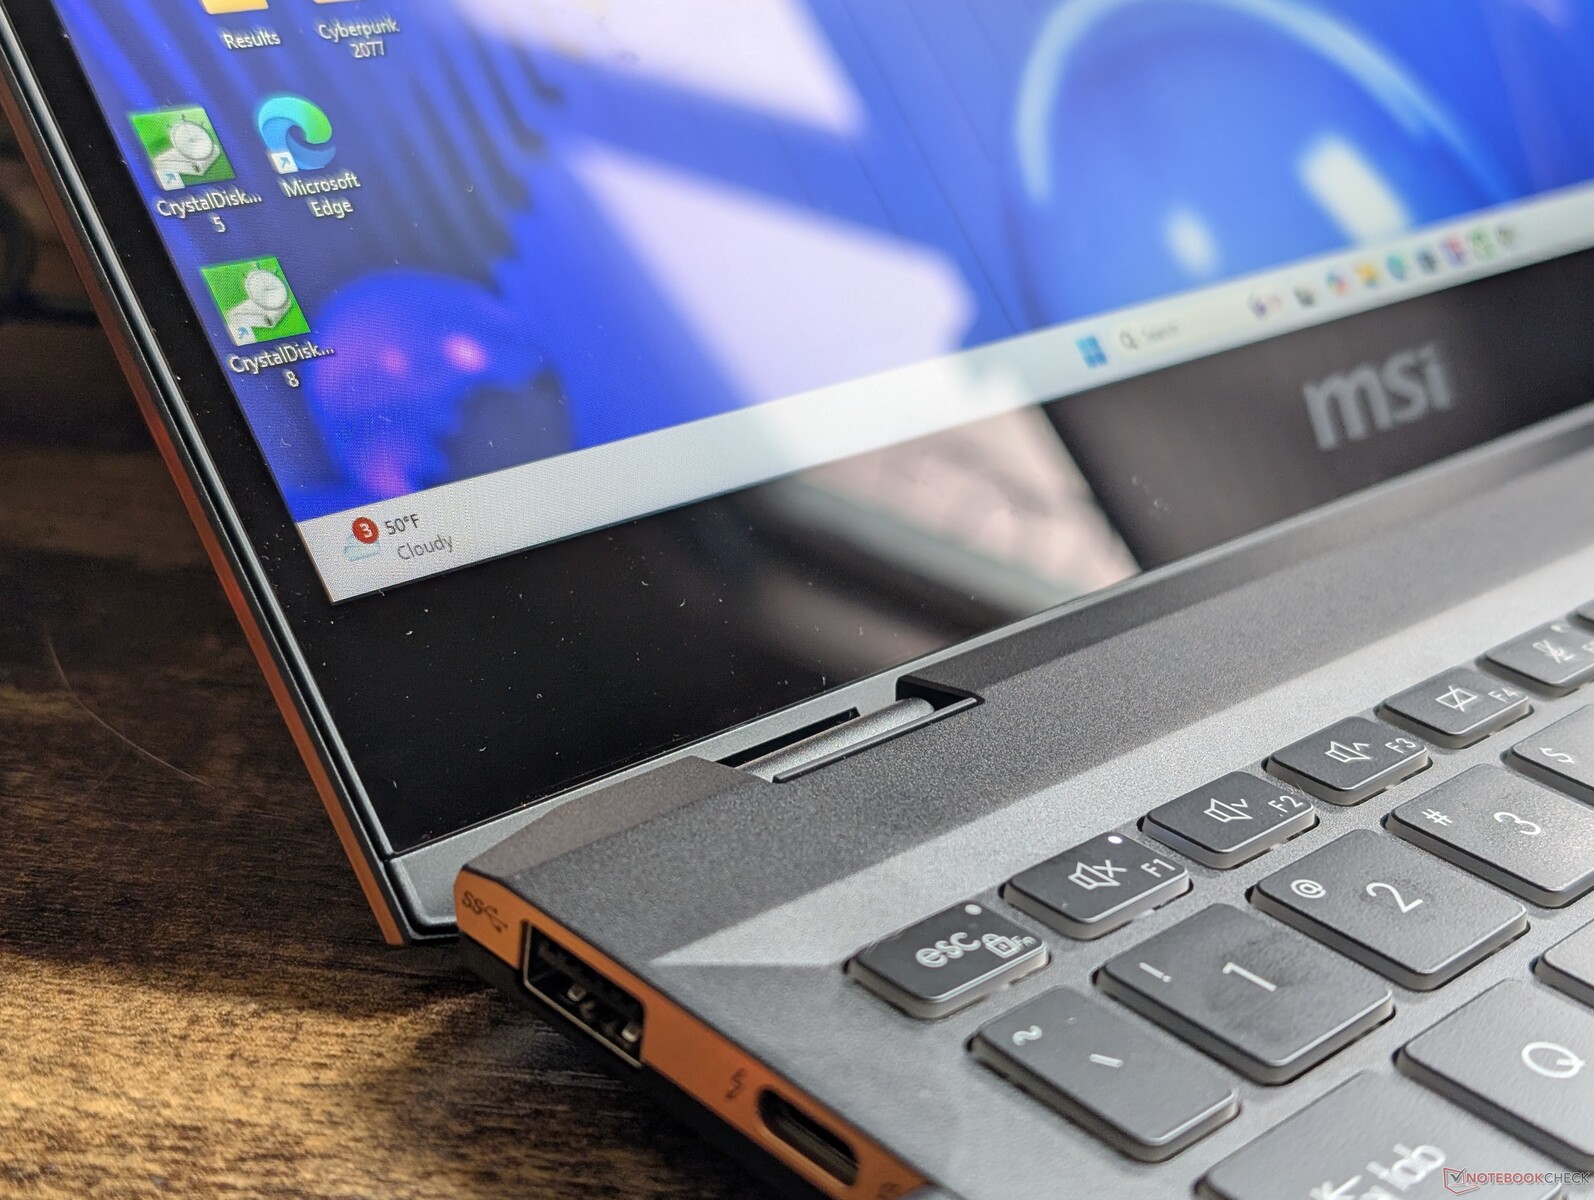
Maletín - Embellecedores dorados
El Summit E13 2024 lleva puertos diferentes y un nuevo obturador para la webcam en comparación con la versión 2021. Por lo demás, los chasis son idénticos sin grandes cambios entre ellos tanto externa como internamente.

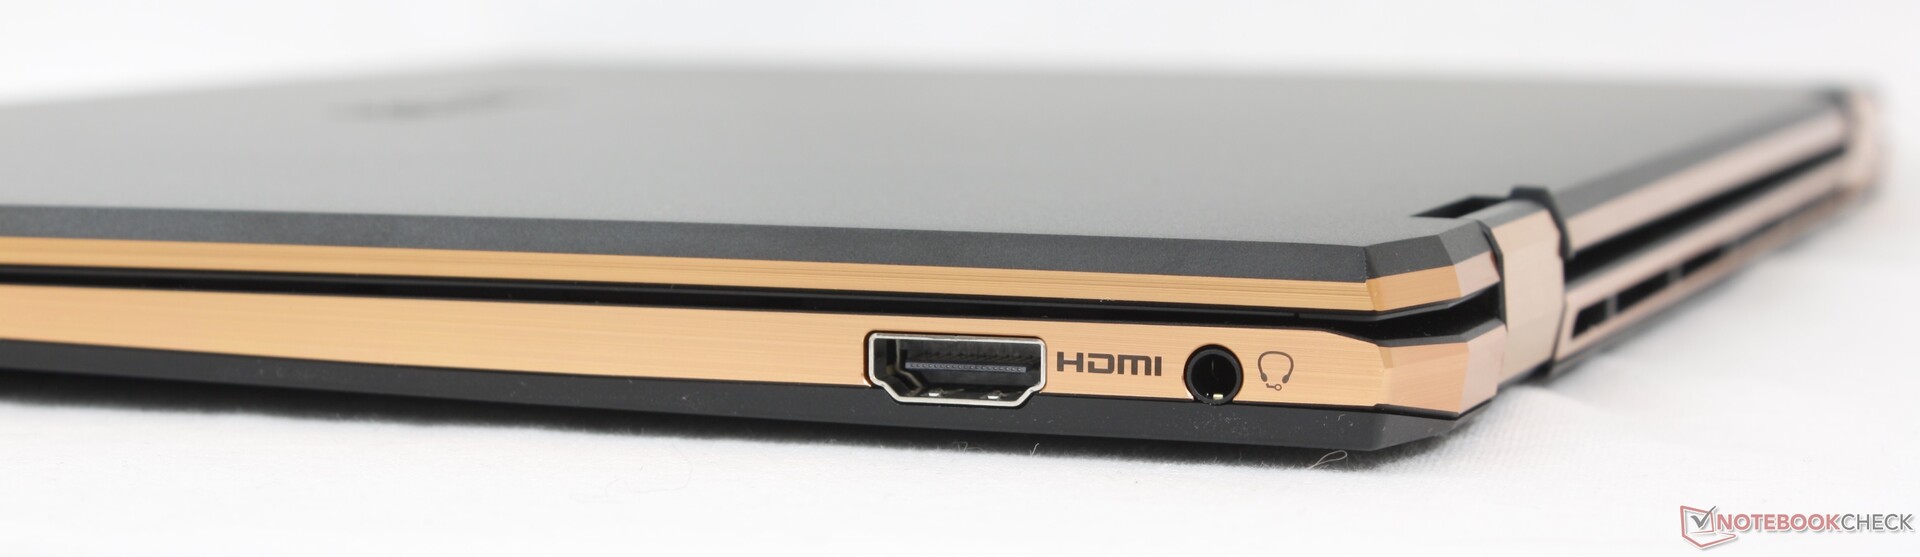
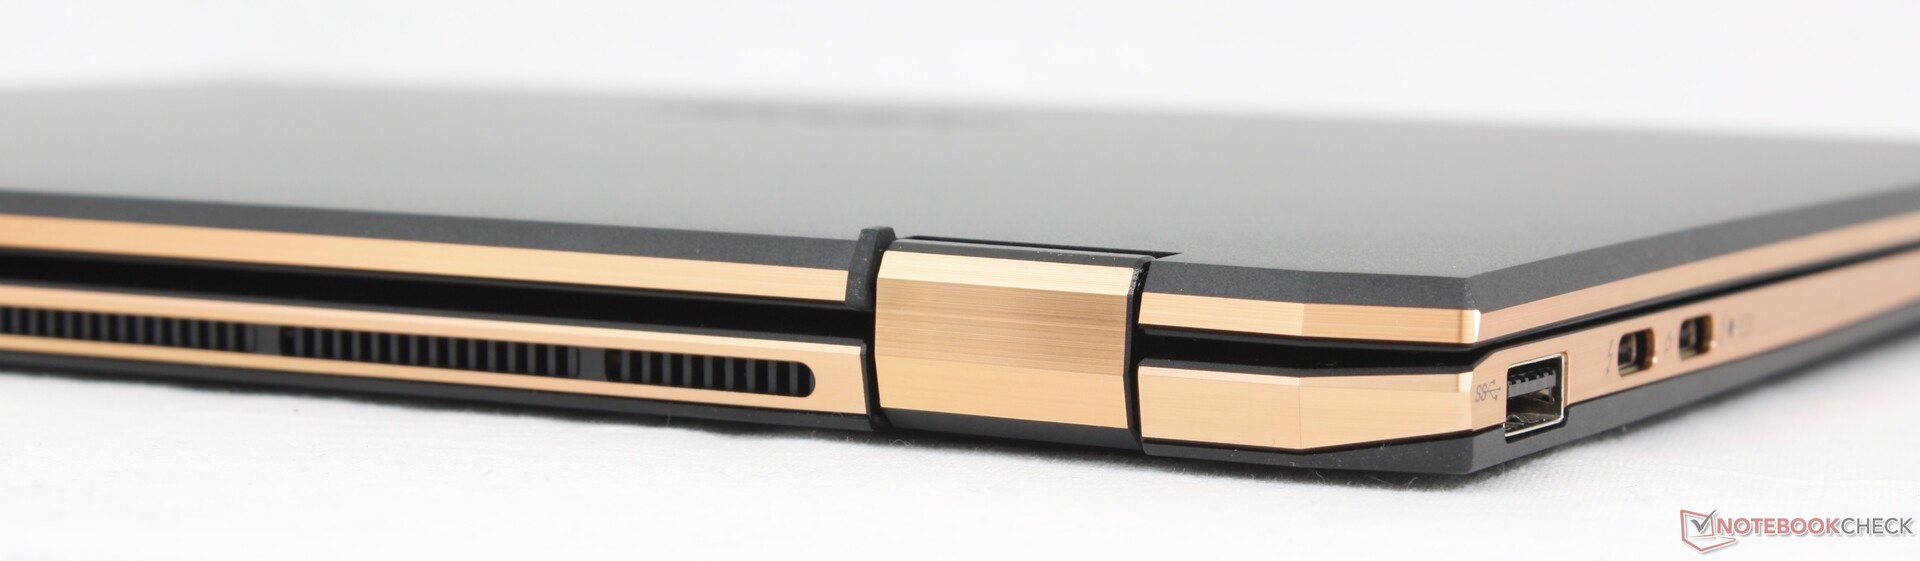
Conectividad - Nuevos puertos este año
Las opciones de puerto han cambiado respecto al modelo 2021 y no necesariamente para mejor. Uno de los puertos USB-C se ha eliminado en favor del HDMI mientras que el lector MicroSD se ha descartado por completo.

Comunicación
| Networking | |
| iperf3 transmit AX12 | |
| MSI Summit E13 Flip Evo A11MT | |
| iperf3 receive AX12 | |
| MSI Summit E13 Flip Evo A11MT | |
| iperf3 transmit AXE11000 | |
| Lenovo ThinkPad L13 Yoga G4 i7-1355U | |
| HP Elite Dragonfly Folio 13.5 G3 | |
| Dell Latitude 9330 | |
| Lenovo Yoga Book 9 13IMU9 | |
| MSI Summit E13 AI Evo A1MTG | |
| iperf3 receive AXE11000 | |
| Lenovo ThinkPad L13 Yoga G4 i7-1355U | |
| Lenovo Yoga Book 9 13IMU9 | |
| HP Elite Dragonfly Folio 13.5 G3 | |
| Dell Latitude 9330 | |
| MSI Summit E13 AI Evo A1MTG | |
| iperf3 transmit AXE11000 6GHz | |
| HP Elite Dragonfly Folio 13.5 G3 | |
| Dell Latitude 9330 | |
| MSI Summit E13 AI Evo A1MTG | |
| Lenovo Yoga Book 9 13IMU9 | |
| iperf3 receive AXE11000 6GHz | |
| HP Elite Dragonfly Folio 13.5 G3 | |
| MSI Summit E13 AI Evo A1MTG | |
| Dell Latitude 9330 | |
| Lenovo Yoga Book 9 13IMU9 | |
Cámara web
La cámara web sigue siendo la misma a 1080p o 2 MP sólo con soporte IR.


Mantenimiento
El mantenimiento es similar al del modelo 2021 hasta incluso la disposición de la placa base según el vídeo de mantenimiento de LaptopMedia. La memoria RAM no es ampliable y sólo admite hasta una unidad SSD M.2 2280.
Sostenibilidad
MSI no anuncia ninguna medida de sostenibilidad durante la fabricación. Por lo demás, la caja de venta al público es en su mayor parte de papel y cartón, con un envoltorio de plástico para el adaptador de CA.
Accesorios y garantía
La caja de venta al público incluye el lápiz óptico activo MSI Pen 2, además del adaptador de CA y la documentación. Se aplica la garantía limitada habitual del fabricante de un año si se adquiere en EE.UU.
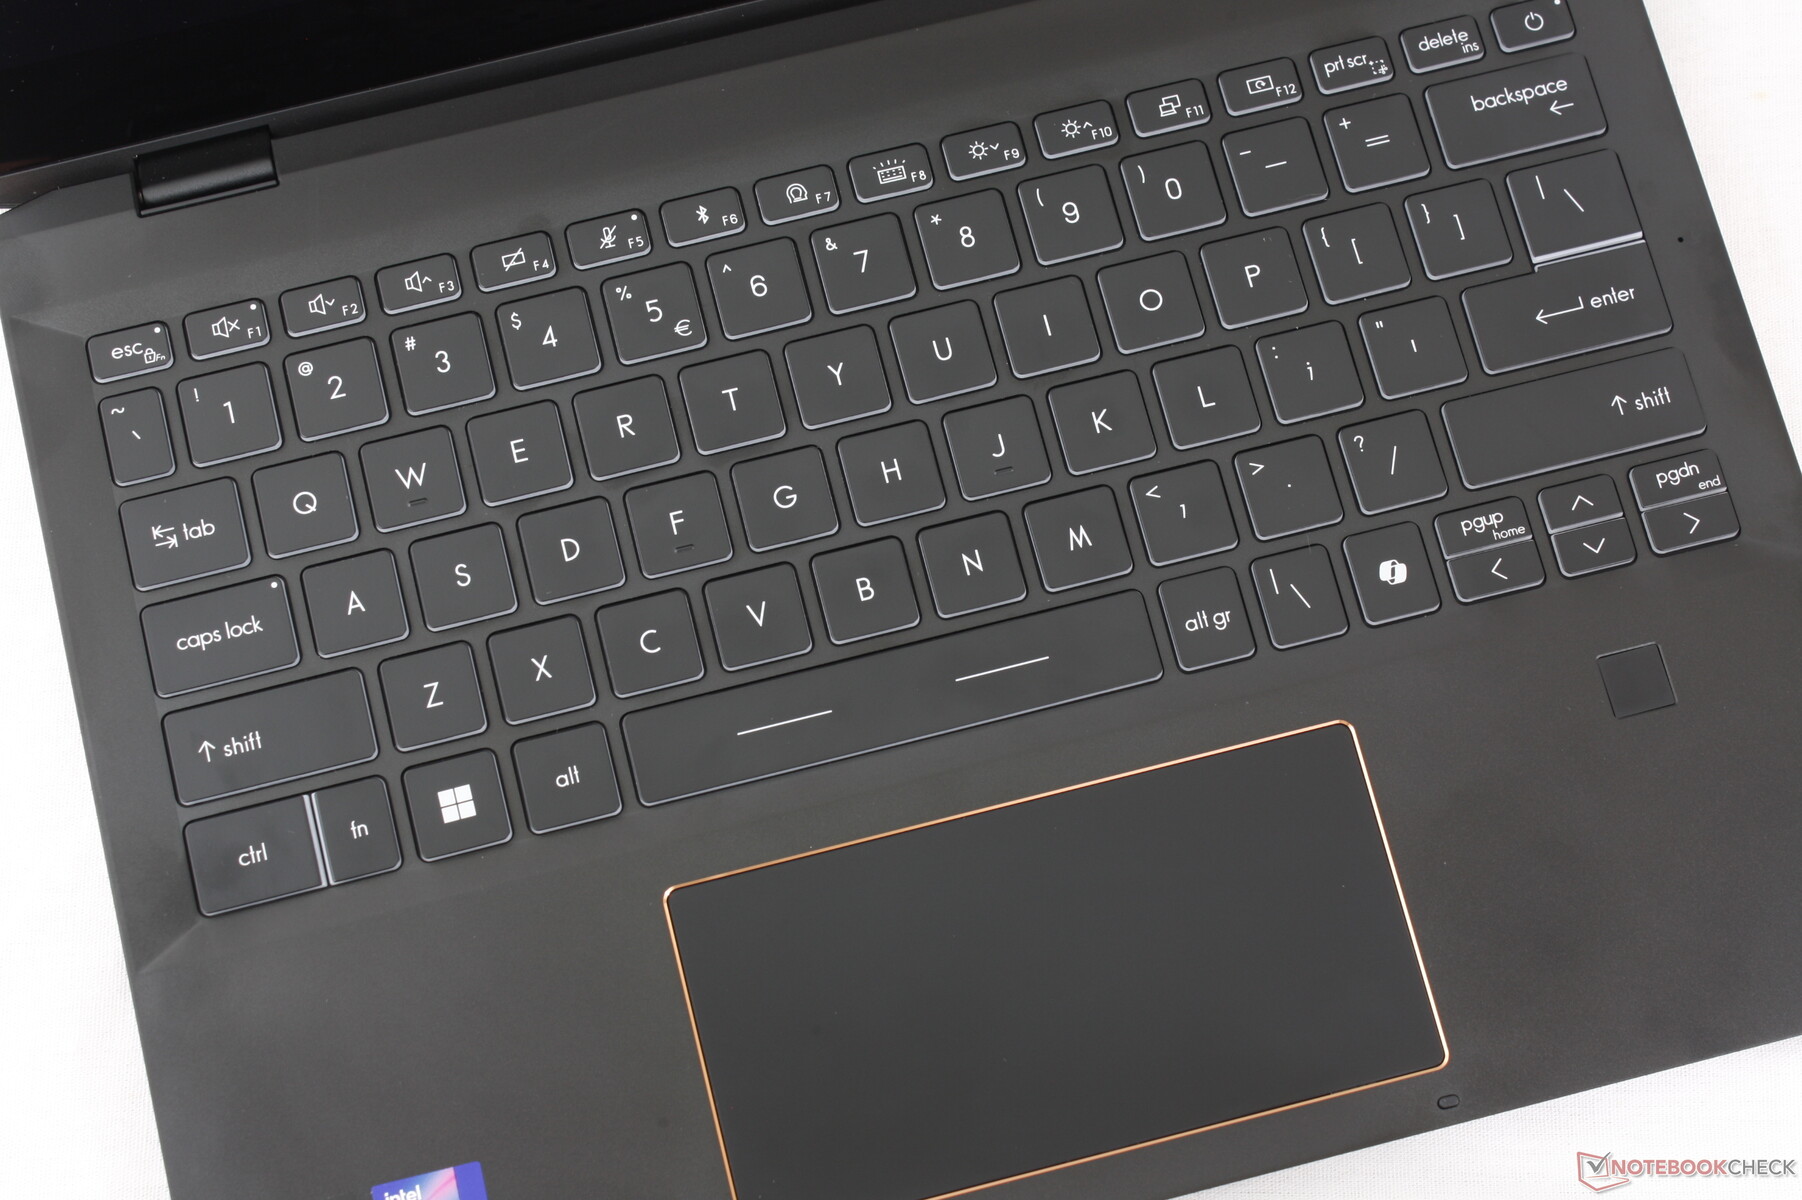
Dispositivos de entrada
El teclado y el clickpad no han cambiado en tamaño general ni en respuesta para ofrecer la misma experiencia de escritura que el modelo de 2021. La novedad de este año es la tecla Co-Pilot dedicada y las teclas Fn y Ctrl ligeramente revisadas. Por desgracia, las pequeñas teclas RePág, AvPág y de flecha siguen siendo muy estrechas, esponjosas y, en general, poco fiables.
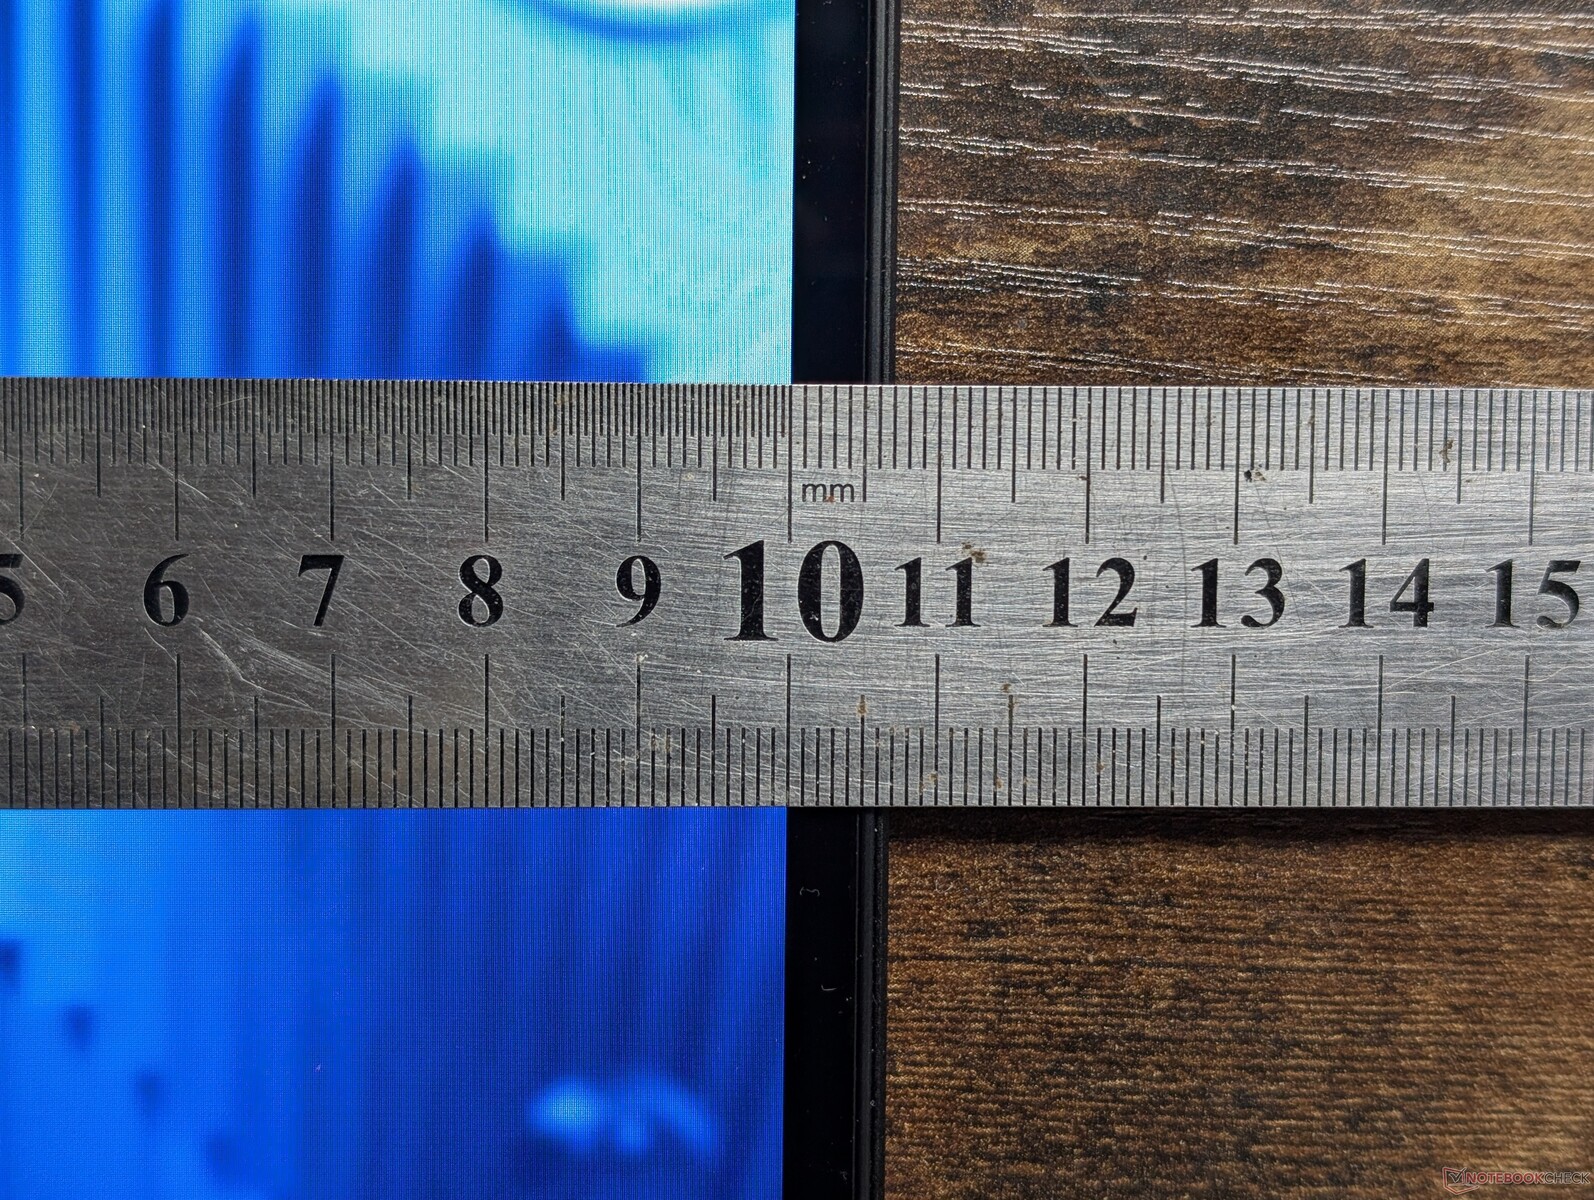
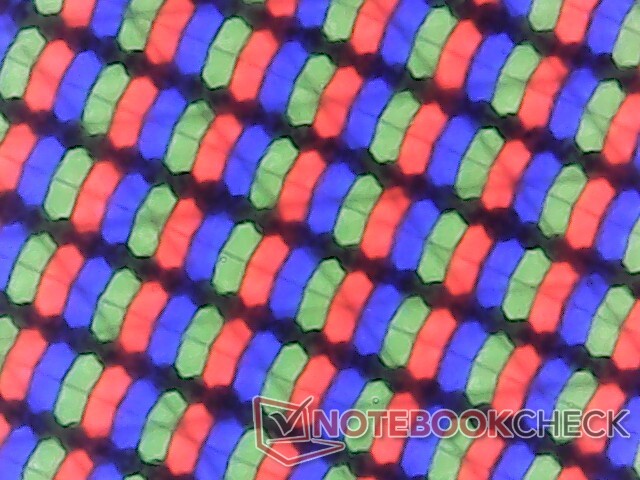
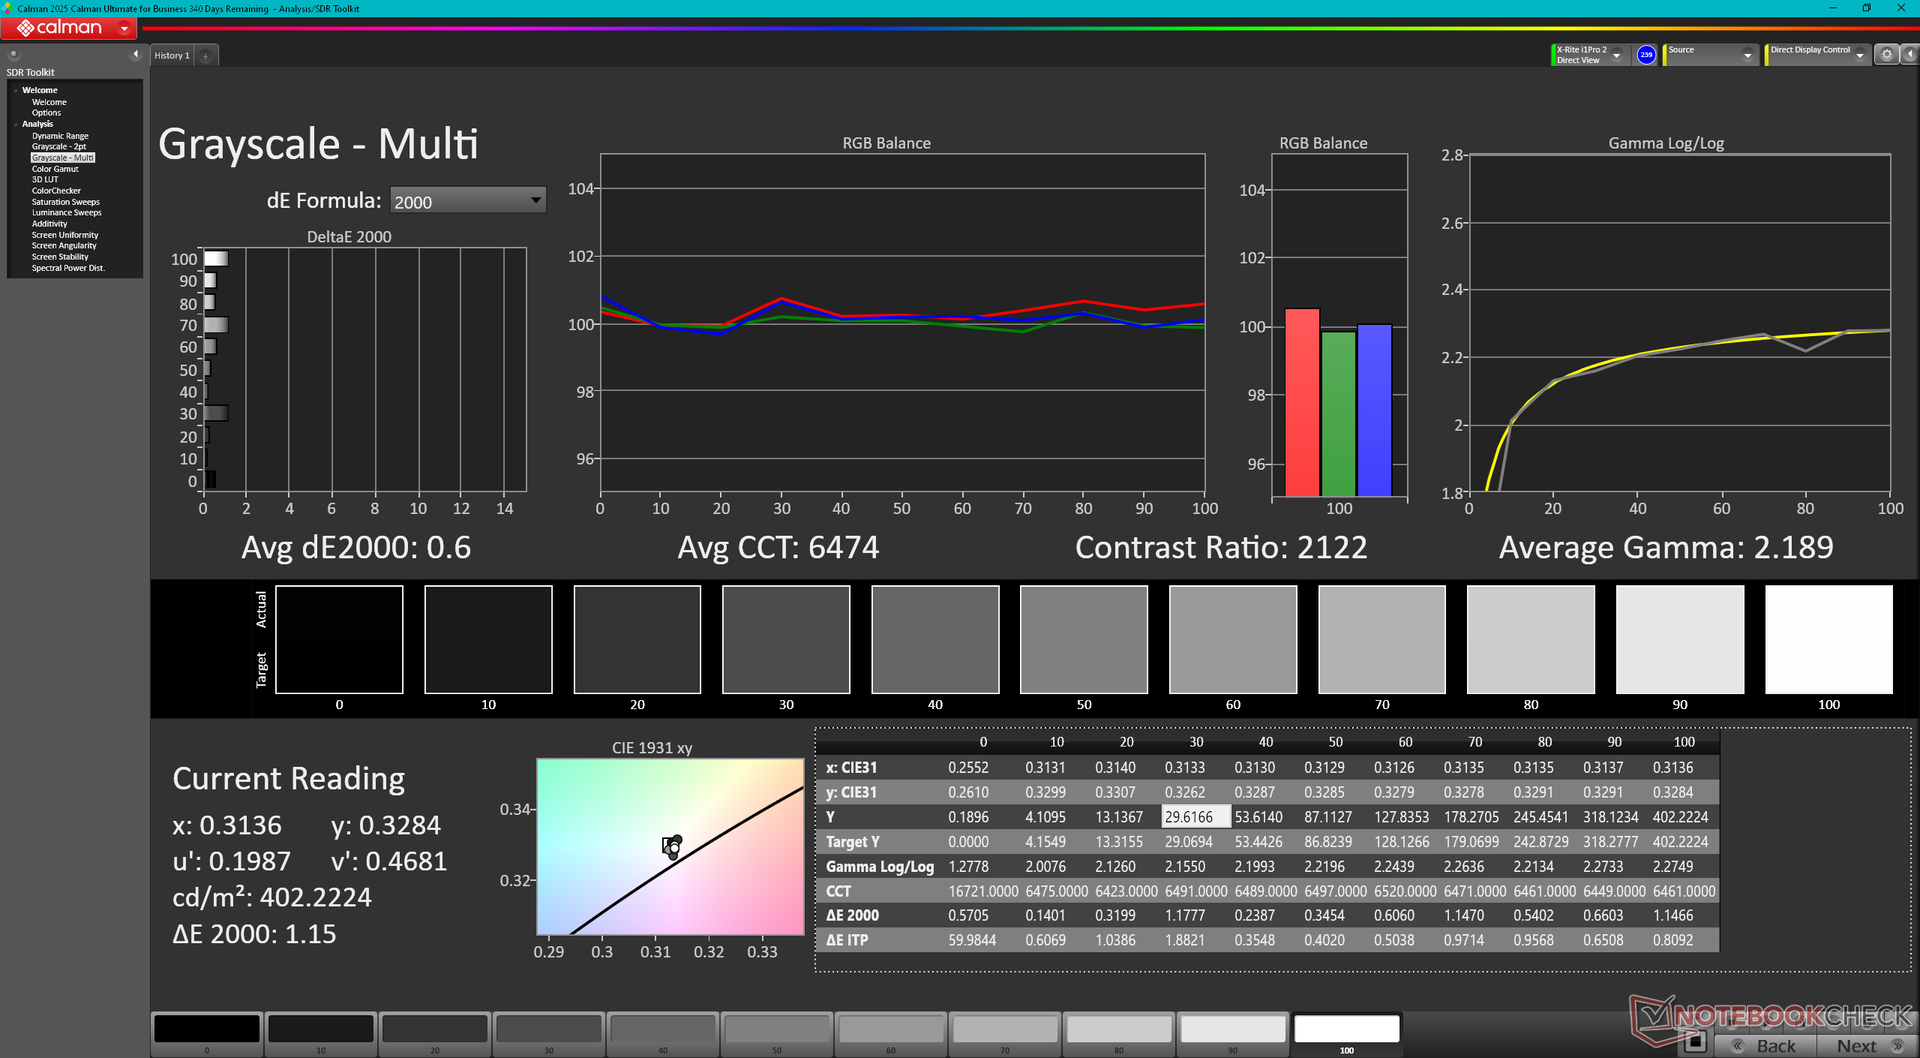
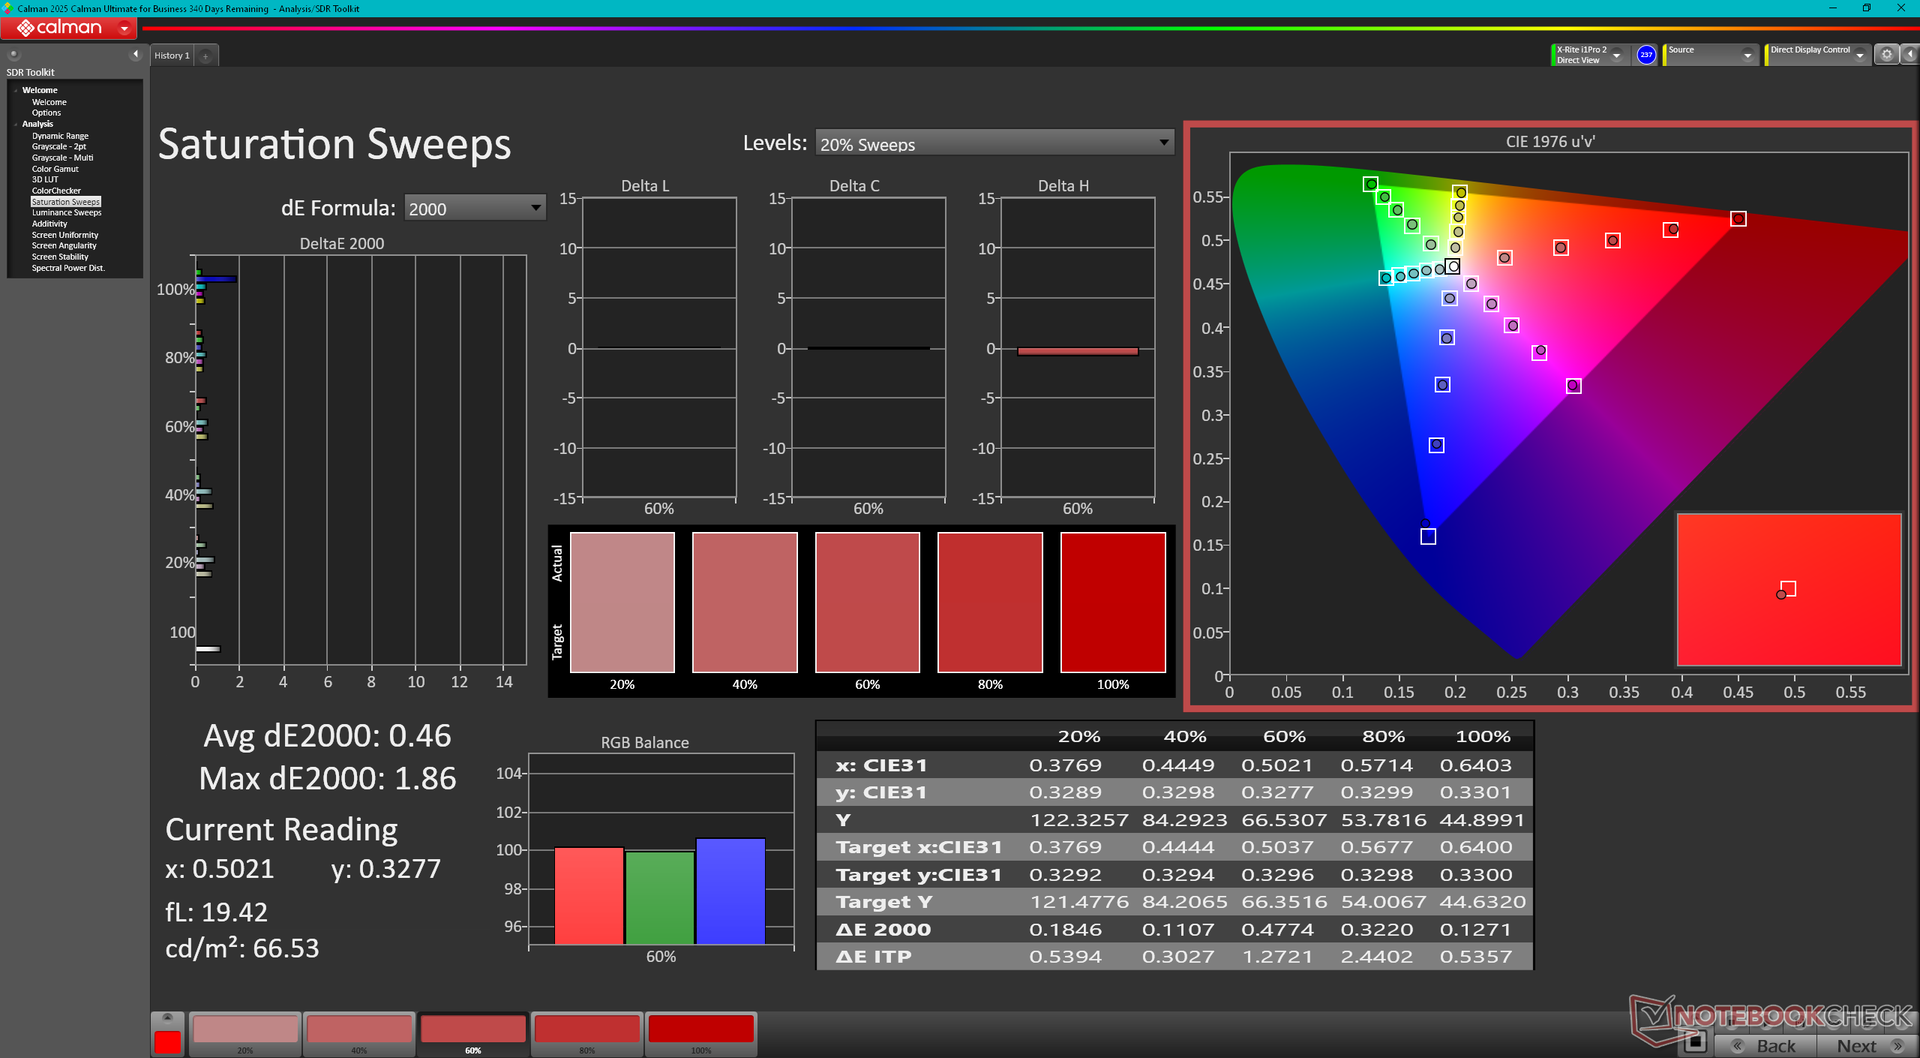
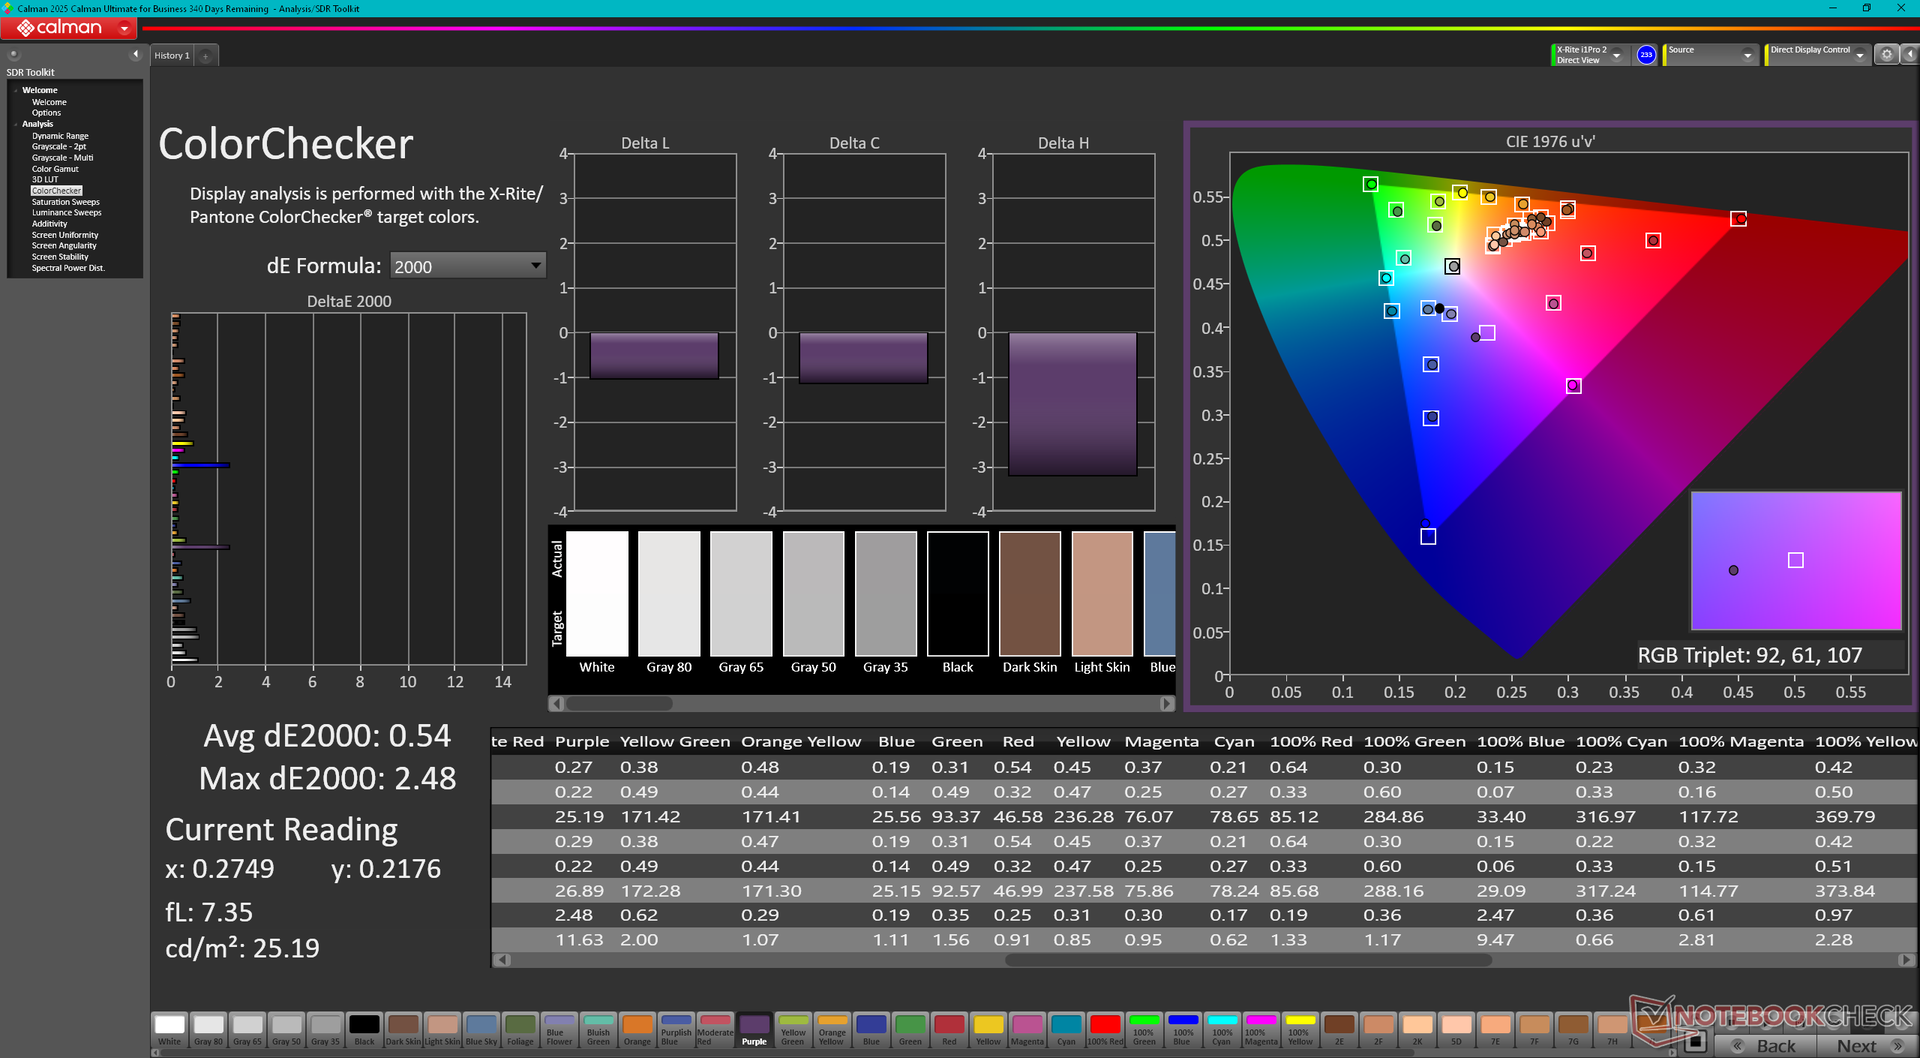
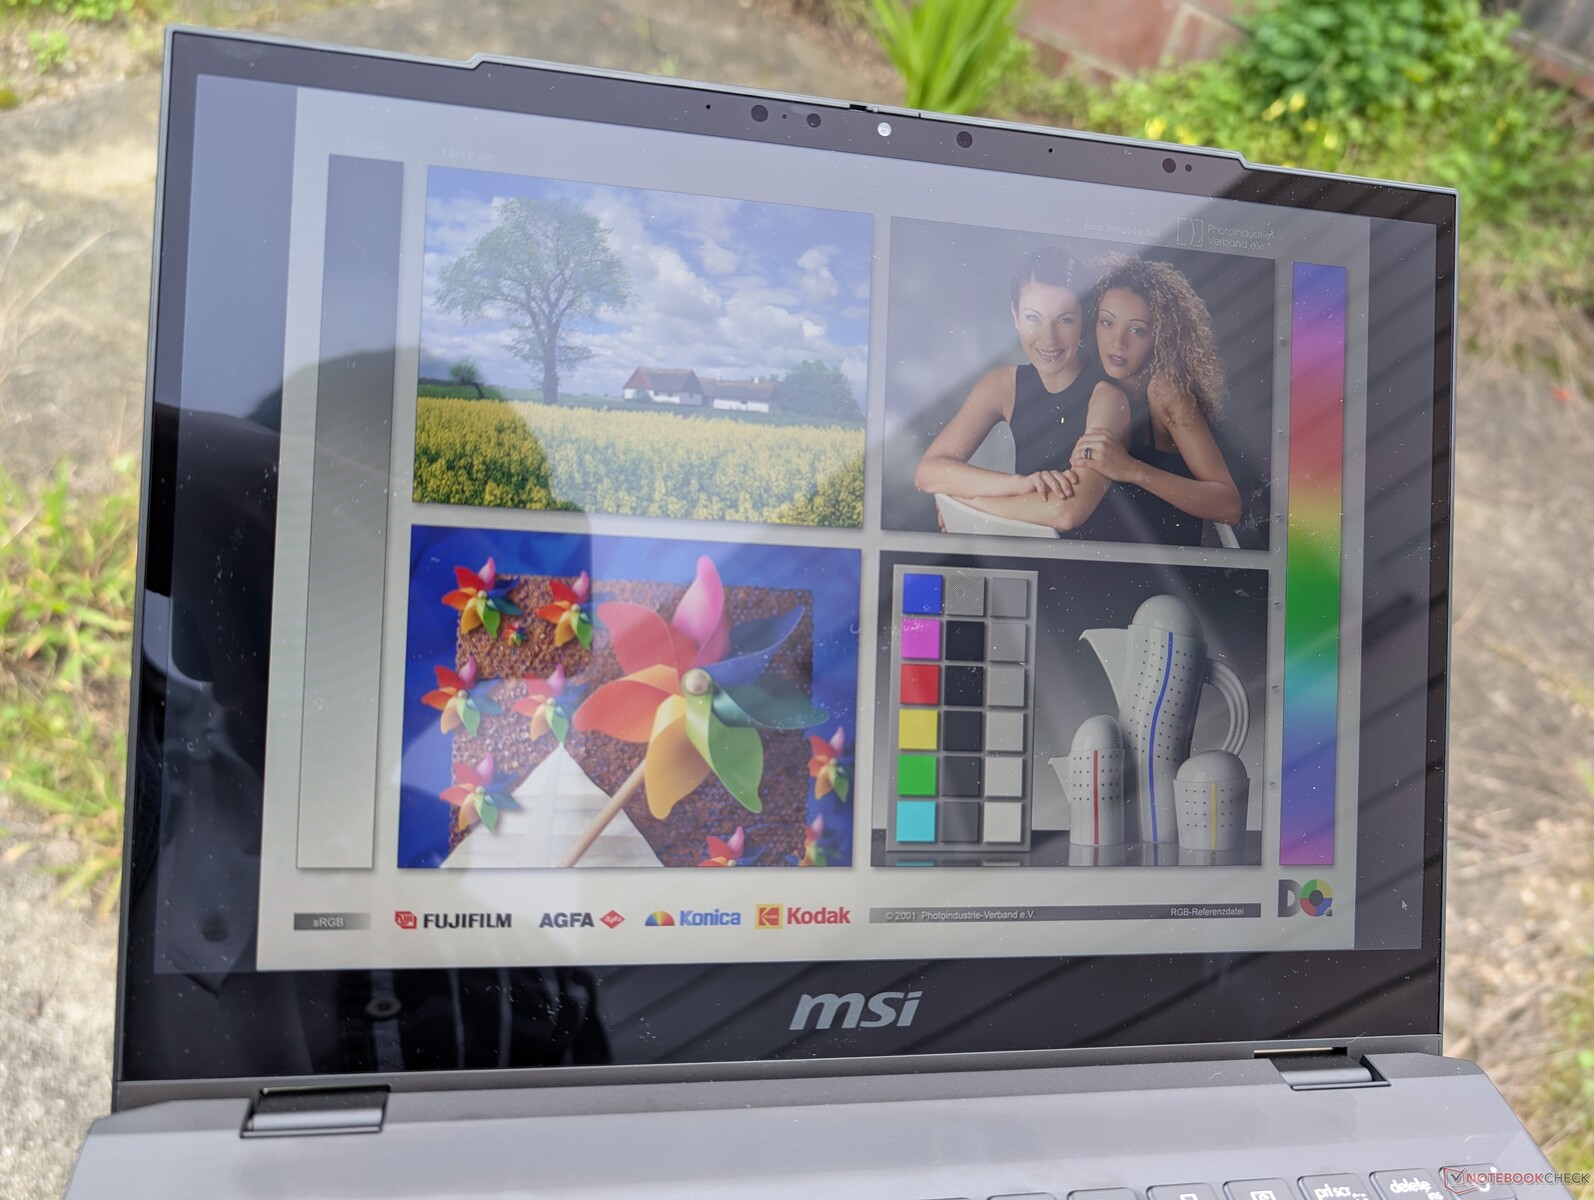
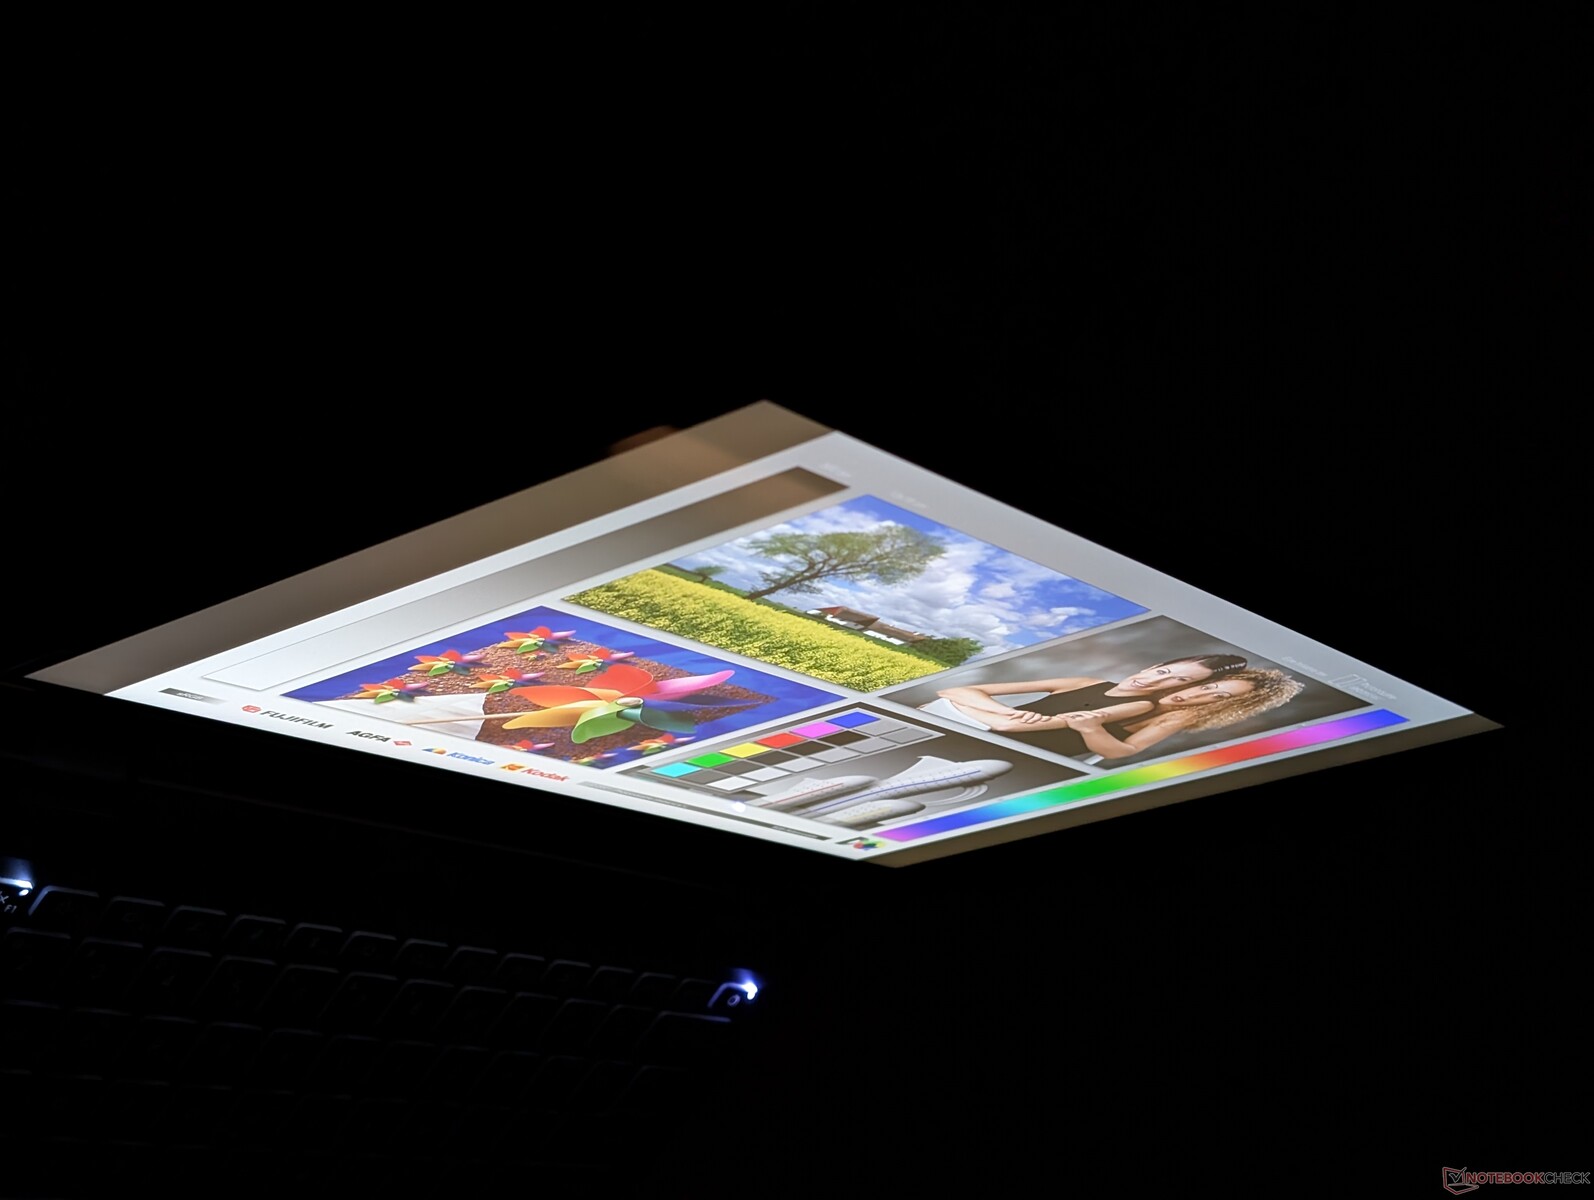
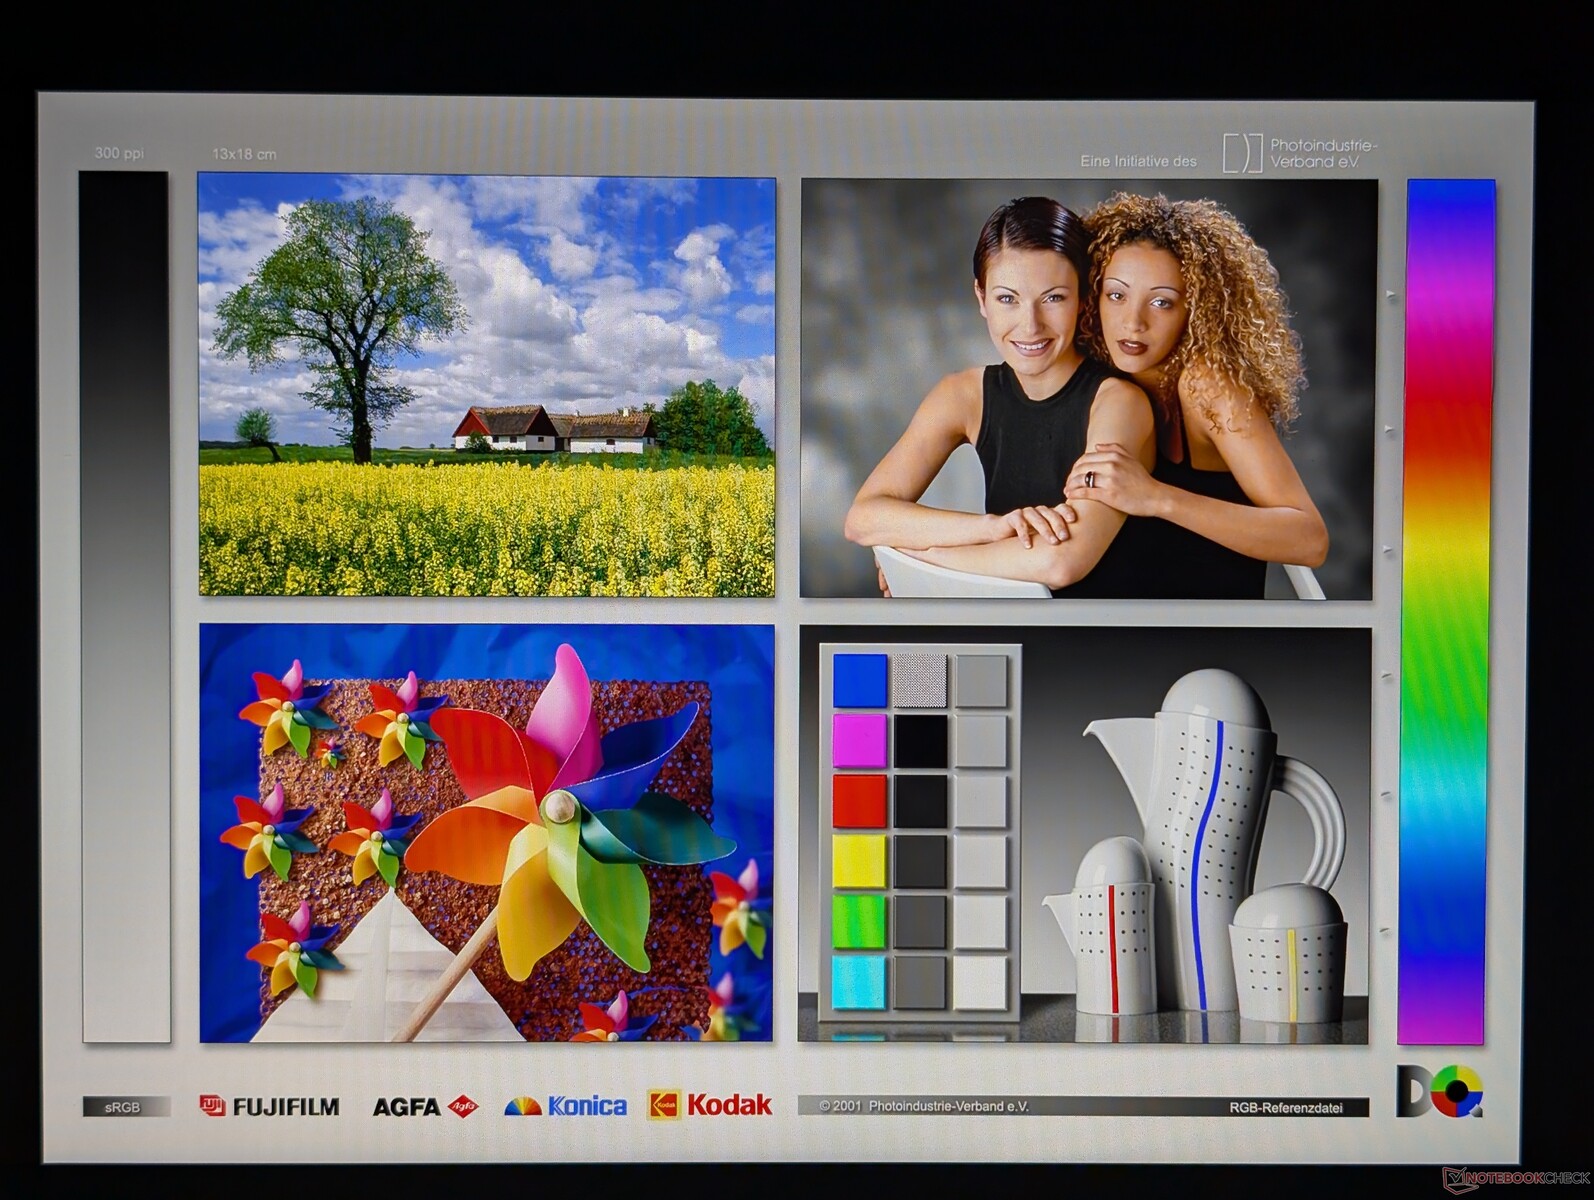
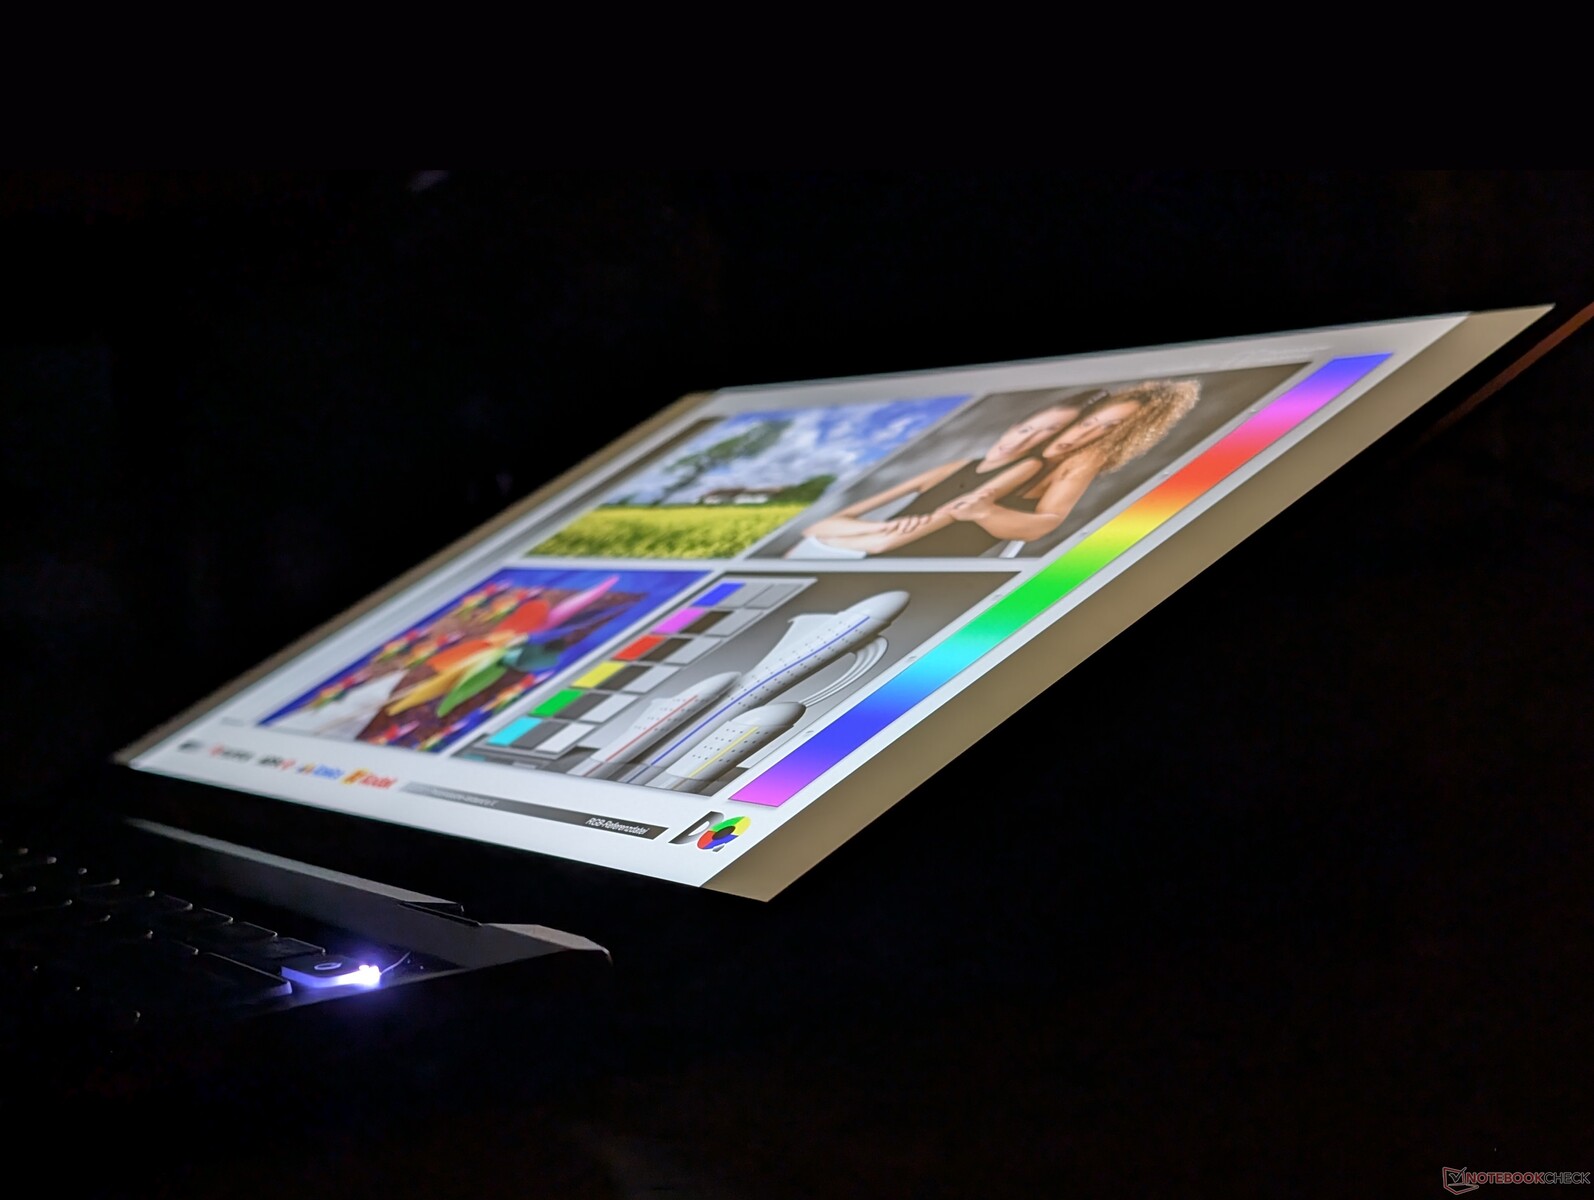
Pantalla - Sólo regular para el precio
Nuestra unidad utiliza un panel Chi Mei de 60 Hz en lugar del panel Sharp de 120 Hz del modelo 2021. El panel Chi Mei ofrece colores sRGB similares pero con niveles de contraste ligeramente inferiores. Los tiempos de respuesta blanco-negro y gris-gris siguen siendo muy lentos incluso para los estándares de los no jugadores.
| |||||||||||||||||||||||||
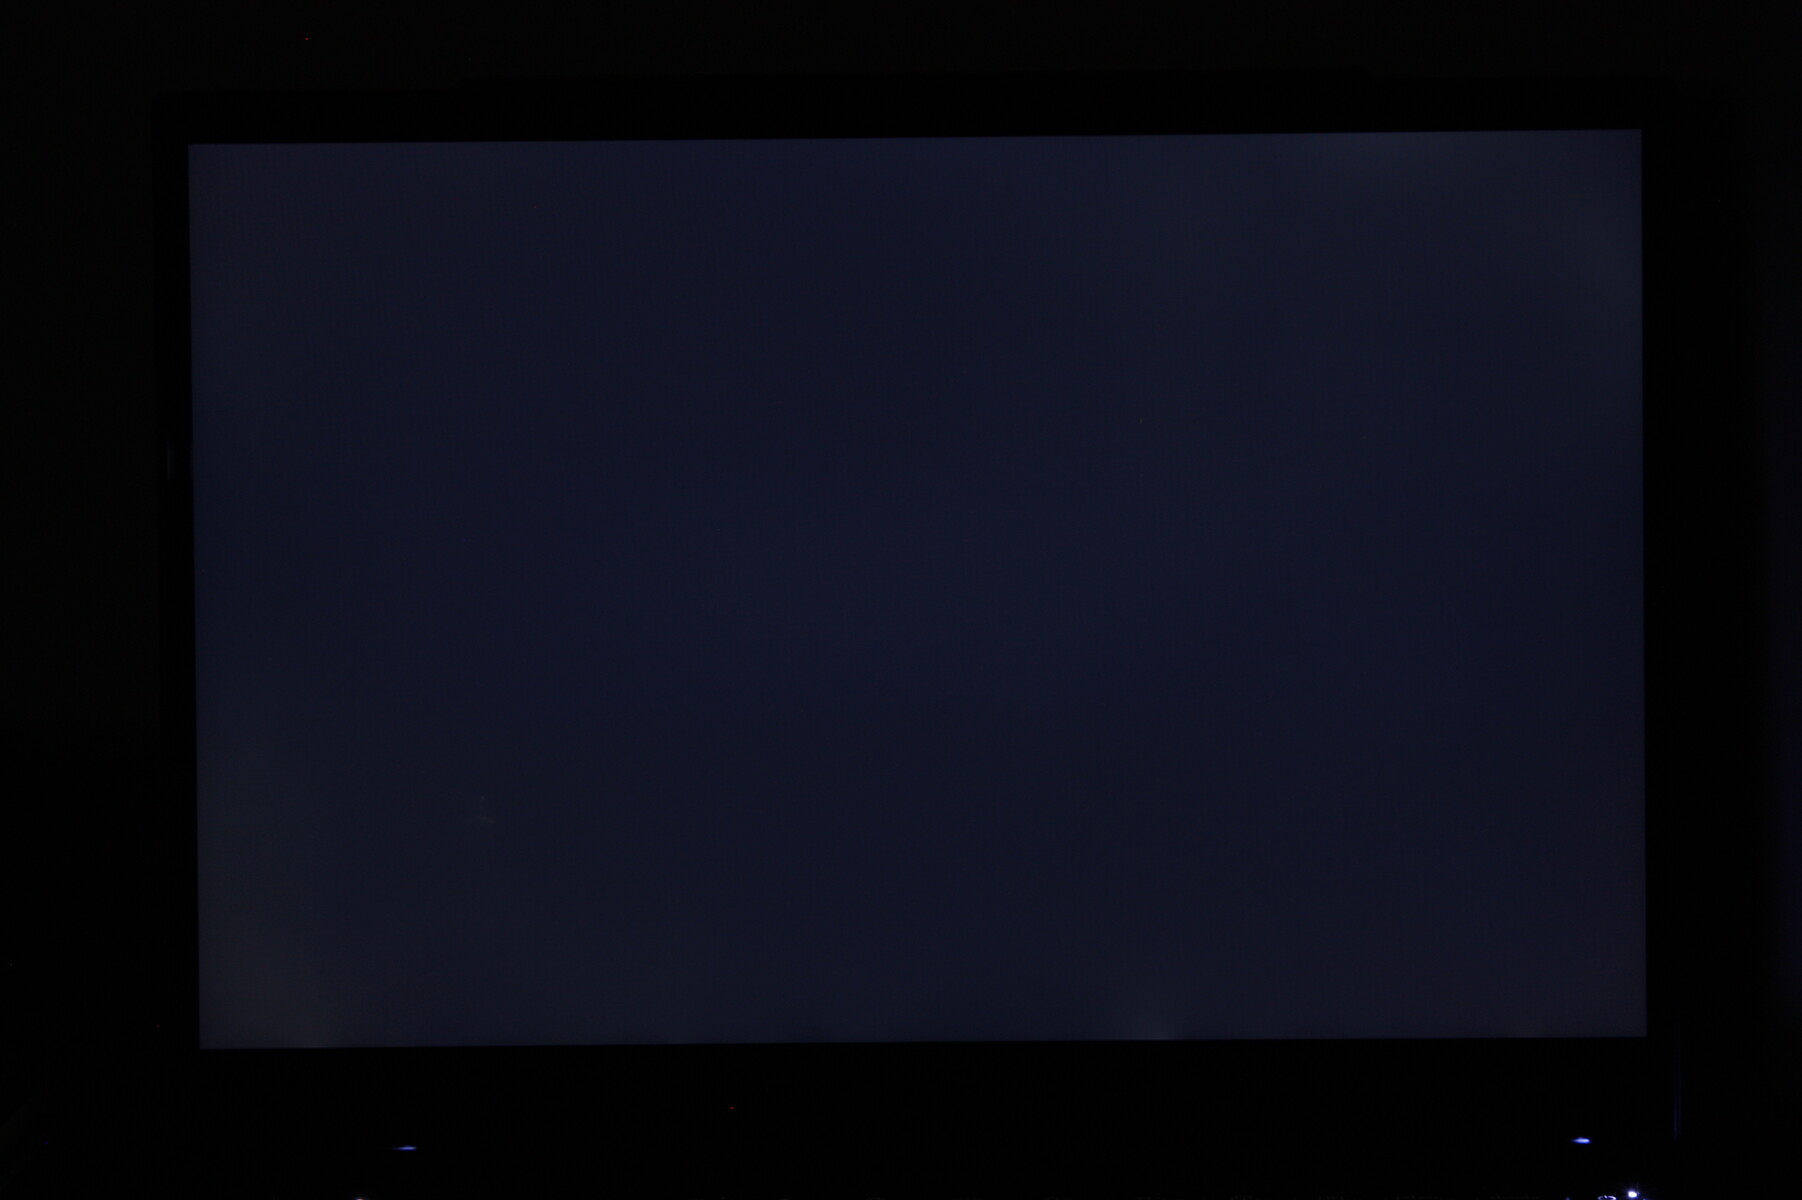
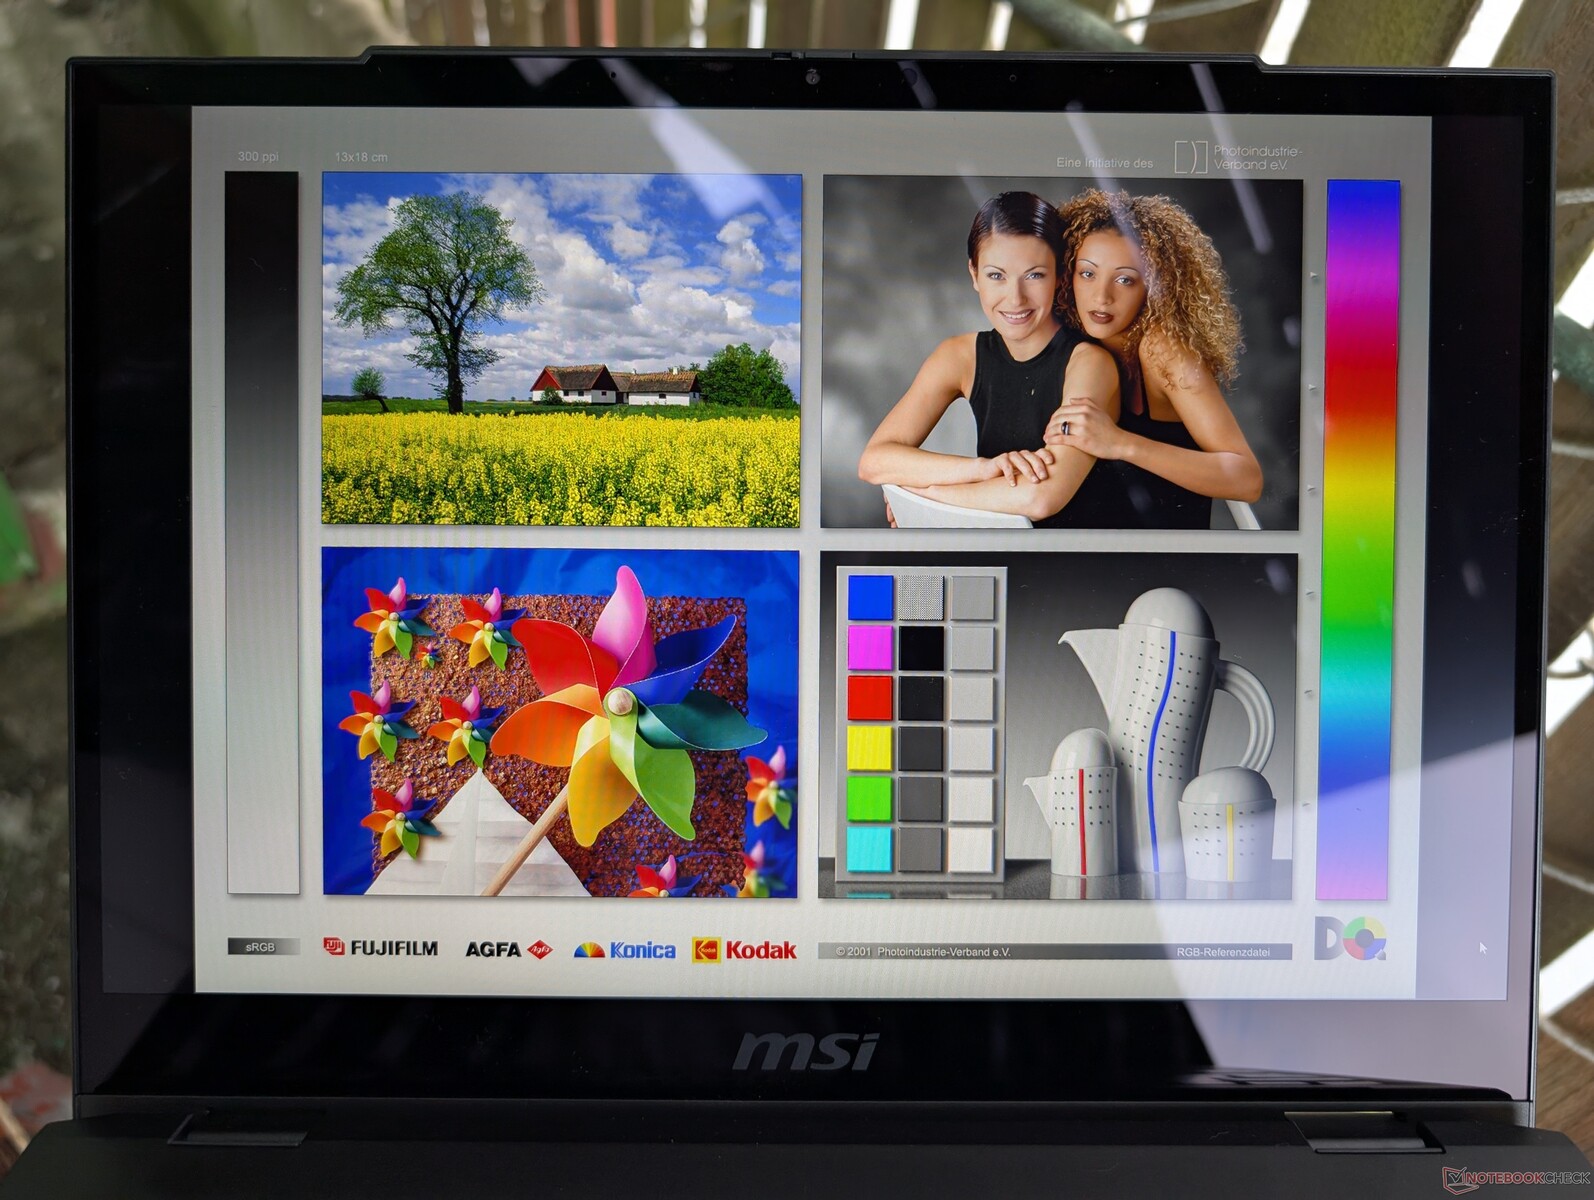
iluminación: 88 %
Brillo con batería: 405.2 cd/m²
Contraste: 1192:1 (Negro: 0.34 cd/m²)
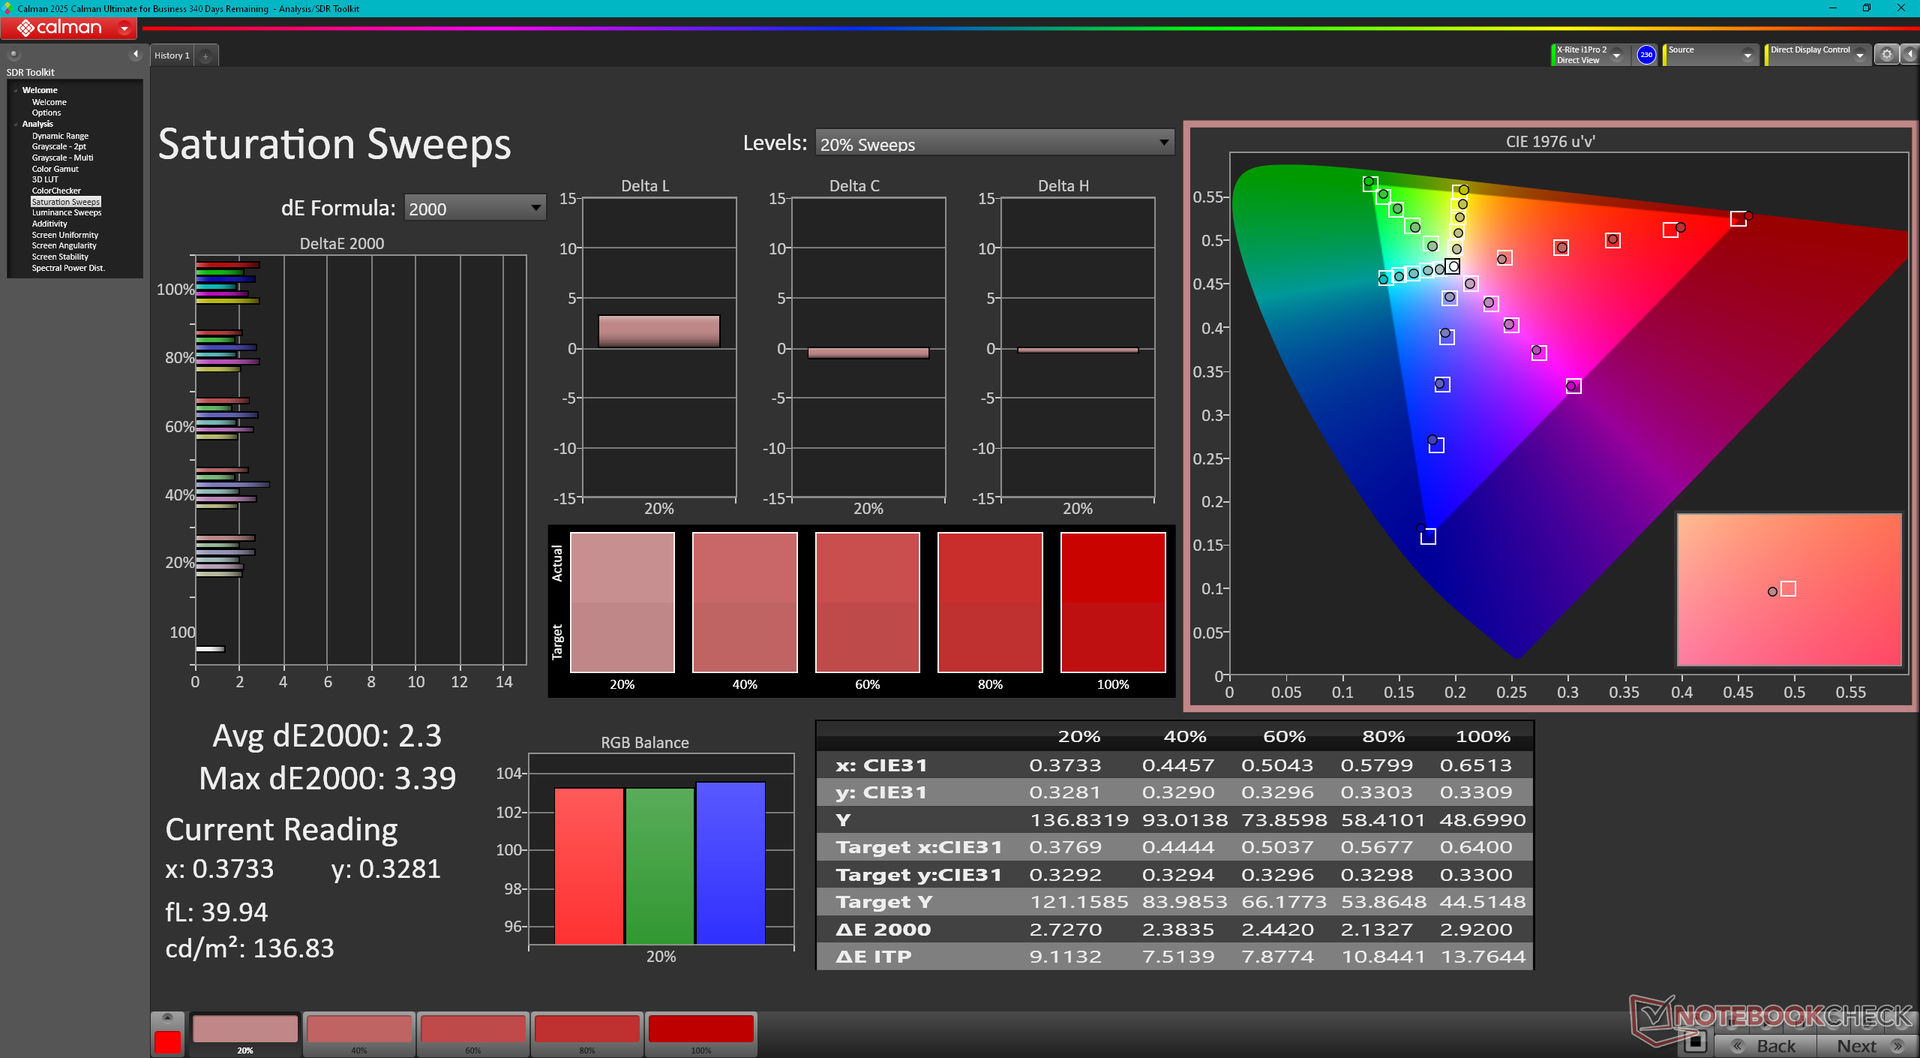
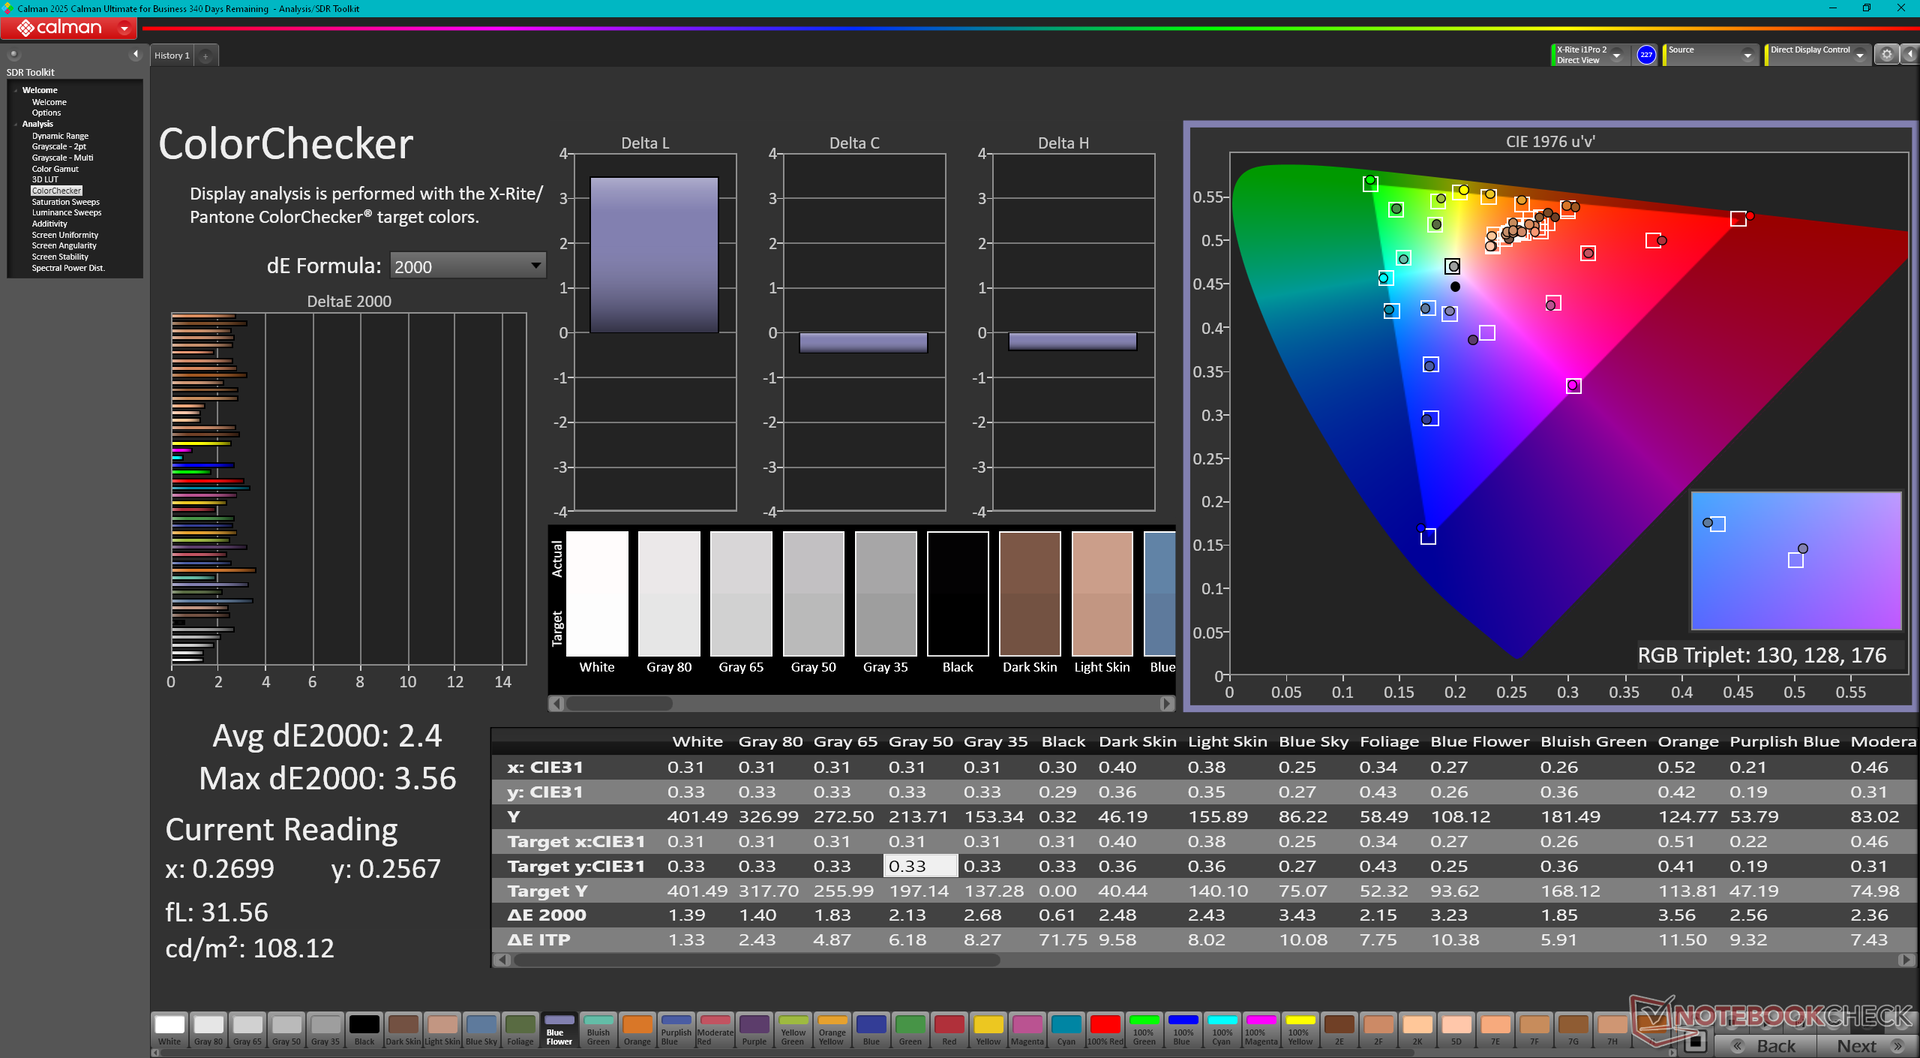
ΔE Color 2.4 | 0.5-29.43 Ø4.86, calibrated: 0.54
ΔE Greyscale 1.9 | 0.5-98 Ø5.1
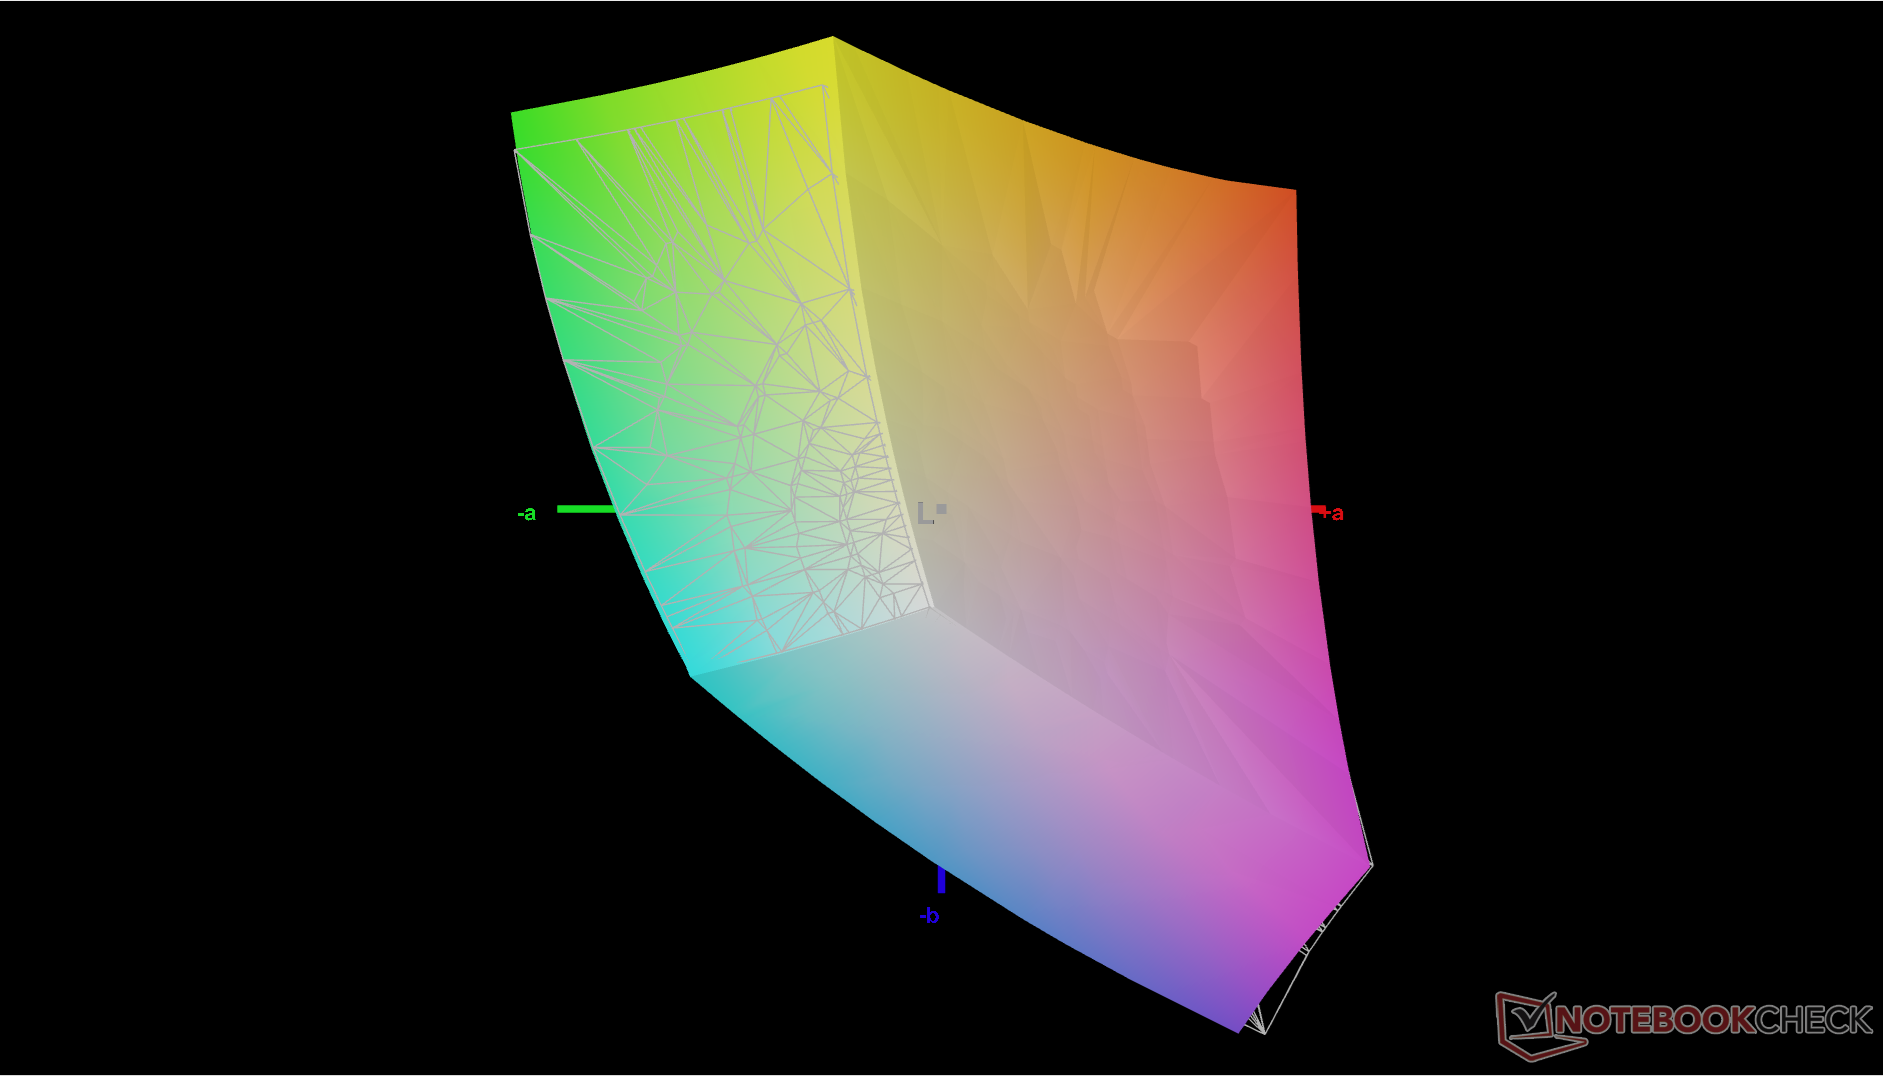
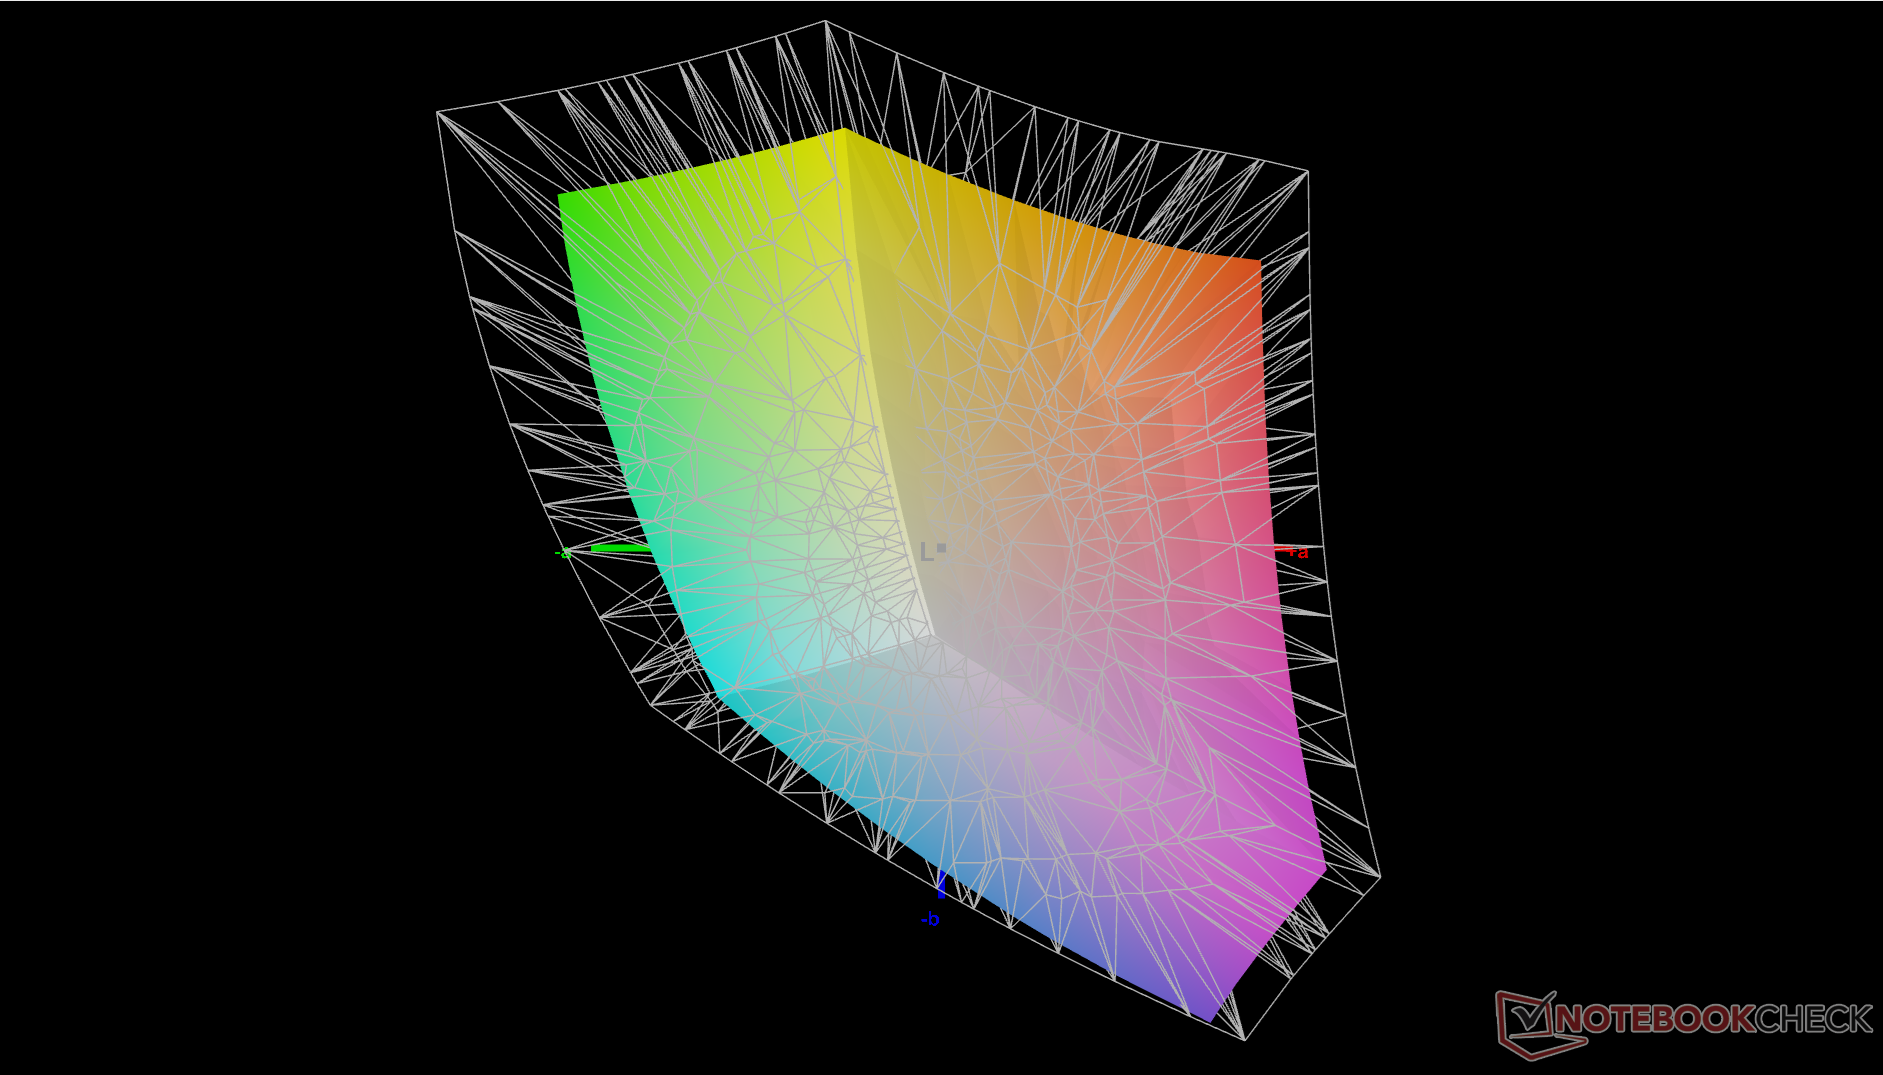
73.1% AdobeRGB 1998 (Argyll 2.2.0 3D)
98.6% sRGB (Argyll 2.2.0 3D)
71.6% Display P3 (Argyll 2.2.0 3D)
Gamma: 2
| MSI Summit E13 AI Evo A1MTG CMN13C6, IPS, 1920x1200, 13.3", 60 Hz | MSI Summit E13 Flip Evo A11MT Sharp LQ134N1JW53, IPS, 1920x1200, 13.4", 120 Hz | Lenovo Yoga Book 9 13IMU9 SDC ATNA33AA02-0, OLED, 2880x1800, 13.3", 60 Hz | Lenovo ThinkPad L13 Yoga G4 i7-1355U NV133WUM-N61, IPS, 1920x1200, 13.3", 60 Hz | HP Elite Dragonfly Folio 13.5 G3 Chi Mei CMN13C0, IPS, 1920x1280, 13.5", 60 Hz | Dell Latitude 9330 AU Optronics B133QAA, IPS, 2560x1600, 13.3", 60 Hz | |
|---|---|---|---|---|---|---|
| Display | -2% | 24% | -0% | -3% | 5% | |
| Display P3 Coverage | 71.6 | 69.8 -3% | 99.7 39% | 71.6 0% | 68.3 -5% | 77.8 9% |
| sRGB Coverage | 98.6 | 98.8 0% | 100 1% | 99.8 1% | 98.6 0% | 99.9 1% |
| AdobeRGB 1998 Coverage | 73.1 | 70.6 -3% | 97 33% | 71.9 -2% | 70.2 -4% | 77.5 6% |
| Response Times | -16% | 96% | 52% | -19% | -29% | |
| Response Time Grey 50% / Grey 80% * | 60 ? | 64 ? -7% | 1.88 ? 97% | 27.3 ? 54% | 66.8 ? -11% | 67.6 ? -13% |
| Response Time Black / White * | 35.1 ? | 44 ? -25% | 2.1 ? 94% | 17.9 ? 49% | 44.4 ? -26% | 50.4 ? -44% |
| PWM Frequency | 60 ? | |||||
| Screen | -3% | -34% | -25% | -6% | -12% | |
| Brightness middle | 405.2 | 551.3 36% | 362.6 -11% | 278.1 -31% | 369.5 -9% | 542.3 34% |
| Brightness | 372 | 517 39% | 368 -1% | 280 -25% | 350 -6% | 516 39% |
| Brightness Distribution | 88 | 91 3% | 97 10% | 92 5% | 87 -1% | 85 -3% |
| Black Level * | 0.34 | 0.37 -9% | 0.34 -0% | 0.24 29% | 0.38 -12% | |
| Contrast | 1192 | 1490 25% | 818 -31% | 1540 29% | 1427 20% | |
| Colorchecker dE 2000 * | 2.4 | 1.45 40% | 4.66 -94% | 2.6 -8% | 2.3 4% | 3.18 -33% |
| Colorchecker dE 2000 max. * | 3.56 | 2.86 20% | 7.25 -104% | 4.81 -35% | 4.34 -22% | 6.05 -70% |
| Colorchecker dE 2000 calibrated * | 0.54 | 1.7 -215% | 0.56 -4% | 0.51 6% | 0.6 -11% | 0.67 -24% |
| Greyscale dE 2000 * | 1.9 | 1.3 32% | 2.6 -37% | 3.9 -105% | 3.1 -63% | 3.1 -63% |
| Gamma | 2 110% | 2.14 103% | 2.2 100% | 2.29 96% | 2.1 105% | 2.08 106% |
| CCT | 6503 100% | 6580 99% | 6055 107% | 5877 111% | 6248 104% | 6140 106% |
| Color Space (Percent of AdobeRGB 1998) | 65 | |||||
| Color Space (Percent of sRGB) | 99 | |||||
| Media total (Programa/Opciones) | -7% /
-5% | 29% /
2% | 9% /
-9% | -9% /
-7% | -12% /
-11% |
* ... más pequeño es mejor
La pantalla puede estar decentemente calibrada al sacarla de la caja, pero nuestra propia calibración X-Rite mejoraría aún más los colores. Los valores DeltaE medios de escala de grises y color pueden ser tan bajos como 0,6 y 0,54, respectivamente.

Tiempos de respuesta del display
| ↔ Tiempo de respuesta de Negro a Blanco | ||
|---|---|---|
| 35.1 ms ... subida ↗ y bajada ↘ combinada | ↗ 17 ms subida | 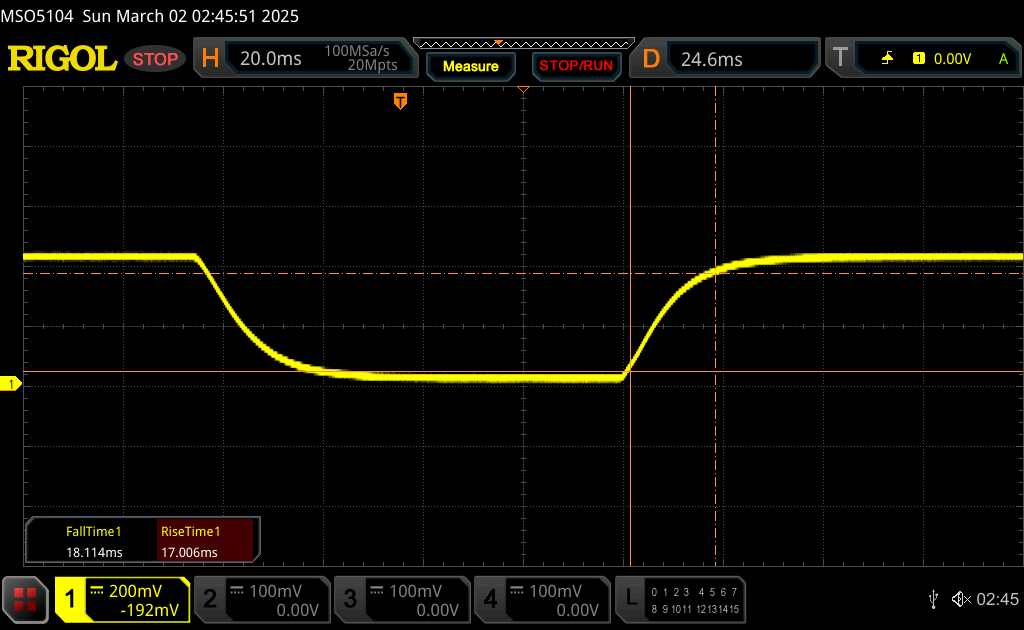 |
| ↘ 18.1 ms bajada | ||
| La pantalla mostró tiempos de respuesta lentos en nuestros tests y podría ser demasiado lenta para los jugones. En comparación, todos los dispositivos de prueba van de ##min### (mínimo) a 240 (máximo) ms. » 92 % de todos los dispositivos son mejores. Eso quiere decir que el tiempo de respuesta es peor que la media (20.7 ms) de todos los dispositivos testados. | ||
| ↔ Tiempo de respuesta 50% Gris a 80% Gris | ||
| 60 ms ... subida ↗ y bajada ↘ combinada | ↗ 27.2 ms subida |  |
| ↘ 32.8 ms bajada | ||
| La pantalla mostró tiempos de respuesta lentos en nuestros tests y podría ser demasiado lenta para los jugones. En comparación, todos los dispositivos de prueba van de ##min### (mínimo) a 636 (máximo) ms. » 95 % de todos los dispositivos son mejores. Eso quiere decir que el tiempo de respuesta es peor que la media (32.4 ms) de todos los dispositivos testados. | ||
Parpadeo de Pantalla / PWM (Pulse-Width Modulation)
| Parpadeo de Pantalla / PWM no detectado | 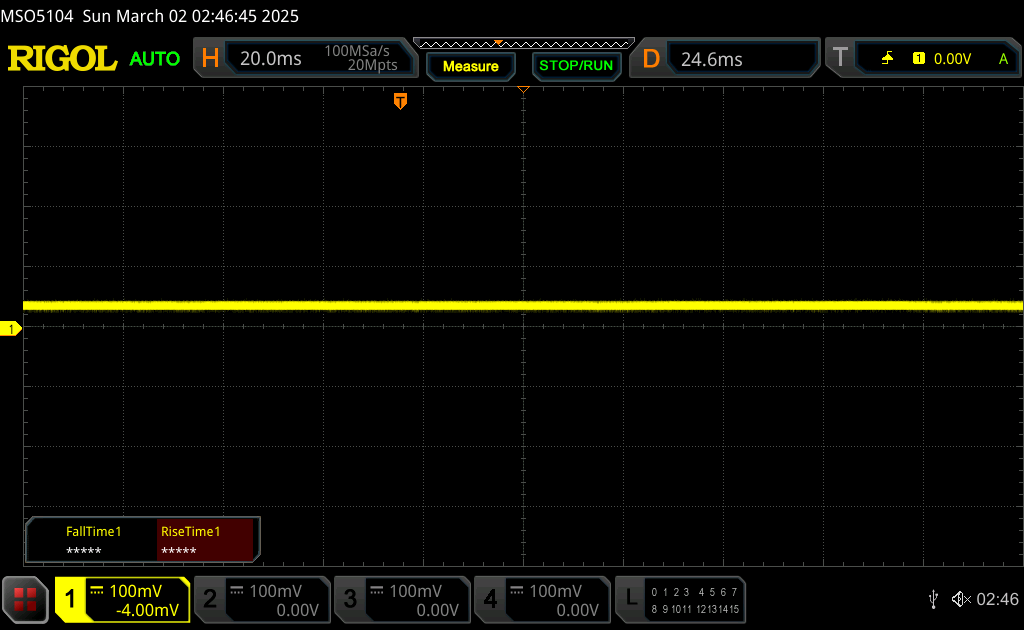 | ||
Comparación: 53 % de todos los dispositivos testados no usaron PWM para atenuar el display. Si se usó, medimos una media de 8482 (mínimo: 5 - máxmo: 343500) Hz. | |||
Rendimiento - Core Ultra-H es demasiado para manejar
Condiciones de prueba
Pusimos Windows en modo Rendimiento y el Centro MSI en modo Rendimiento extremo antes de ejecutar las pruebas comparativas que se indican a continuación.
Procesador
El rendimiento bruto multihilo de la CPU caería más de un 20 por ciento tras sólo el primer bucle en nuestra prueba de estrés CineBench R15 xT. En consecuencia, nuestro sistema rendiría aproximadamente un 20 por ciento menos que el portátil medio de nuestra base de datos equipado con el mismo Core Ultra 7 155H procesador.
Cinebench R15 Multi Loop
Cinebench R23: Multi Core | Single Core
Cinebench R20: CPU (Multi Core) | CPU (Single Core)
Cinebench R15: CPU Multi 64Bit | CPU Single 64Bit
Blender: v2.79 BMW27 CPU
7-Zip 18.03: 7z b 4 | 7z b 4 -mmt1
Geekbench 6.4: Multi-Core | Single-Core
Geekbench 5.5: Multi-Core | Single-Core
HWBOT x265 Benchmark v2.2: 4k Preset
LibreOffice : 20 Documents To PDF
R Benchmark 2.5: Overall mean
| Geekbench 6.4 / Multi-Core | |
| Asus ROG Flow Z13 GZ302EA-RU073W | |
| Medio Intel Core Ultra 7 155H (7732 - 13656, n=55) | |
| Framework Laptop 13.5 Ryzen 7 7840U | |
| MSI Prestige 13 AI Plus Evo A2VMG | |
| MSI Summit E13 AI Evo A1MTG | |
| Lenovo Yoga Book 9 13IMU9 | |
| Lenovo ThinkPad L13 Yoga G4 i7-1355U | |
| Geekbench 6.4 / Single-Core | |
| Asus ROG Flow Z13 GZ302EA-RU073W | |
| MSI Prestige 13 AI Plus Evo A2VMG | |
| Framework Laptop 13.5 Ryzen 7 7840U | |
| Lenovo ThinkPad L13 Yoga G4 i7-1355U | |
| Medio Intel Core Ultra 7 155H (1901 - 2473, n=52) | |
| Lenovo Yoga Book 9 13IMU9 | |
| MSI Summit E13 AI Evo A1MTG | |
* ... más pequeño es mejor
AIDA64: FP32 Ray-Trace | FPU Julia | CPU SHA3 | CPU Queen | FPU SinJulia | FPU Mandel | CPU AES | CPU ZLib | FP64 Ray-Trace | CPU PhotoWorxx
| Performance Rating | |
| Medio Intel Core Ultra 7 155H | |
| MSI Summit E13 AI Evo A1MTG | |
| Lenovo Yoga Book 9 13IMU9 | |
| MSI Summit E13 Flip Evo A11MT | |
| HP Elite Dragonfly Folio 13.5 G3 | |
| Lenovo ThinkPad L13 Yoga G4 i7-1355U | |
| Dell Latitude 9330 | |
| AIDA64 / FP32 Ray-Trace | |
| Medio Intel Core Ultra 7 155H (6670 - 18470, n=50) | |
| MSI Summit E13 AI Evo A1MTG | |
| Lenovo Yoga Book 9 13IMU9 | |
| MSI Summit E13 Flip Evo A11MT | |
| Dell Latitude 9330 | |
| HP Elite Dragonfly Folio 13.5 G3 | |
| Lenovo ThinkPad L13 Yoga G4 i7-1355U | |
| AIDA64 / FPU Julia | |
| Medio Intel Core Ultra 7 155H (40905 - 93181, n=50) | |
| MSI Summit E13 AI Evo A1MTG | |
| Lenovo Yoga Book 9 13IMU9 | |
| HP Elite Dragonfly Folio 13.5 G3 | |
| Dell Latitude 9330 | |
| Lenovo ThinkPad L13 Yoga G4 i7-1355U | |
| MSI Summit E13 Flip Evo A11MT | |
| AIDA64 / CPU SHA3 | |
| Medio Intel Core Ultra 7 155H (1940 - 4436, n=50) | |
| MSI Summit E13 AI Evo A1MTG | |
| Lenovo Yoga Book 9 13IMU9 | |
| MSI Summit E13 Flip Evo A11MT | |
| Dell Latitude 9330 | |
| Lenovo ThinkPad L13 Yoga G4 i7-1355U | |
| HP Elite Dragonfly Folio 13.5 G3 | |
| AIDA64 / CPU Queen | |
| Medio Intel Core Ultra 7 155H (64698 - 94181, n=50) | |
| MSI Summit E13 AI Evo A1MTG | |
| HP Elite Dragonfly Folio 13.5 G3 | |
| Lenovo ThinkPad L13 Yoga G4 i7-1355U | |
| MSI Summit E13 Flip Evo A11MT | |
| Dell Latitude 9330 | |
| Lenovo Yoga Book 9 13IMU9 | |
| AIDA64 / FPU SinJulia | |
| Medio Intel Core Ultra 7 155H (5639 - 10647, n=50) | |
| MSI Summit E13 AI Evo A1MTG | |
| Lenovo Yoga Book 9 13IMU9 | |
| MSI Summit E13 Flip Evo A11MT | |
| HP Elite Dragonfly Folio 13.5 G3 | |
| Lenovo ThinkPad L13 Yoga G4 i7-1355U | |
| Dell Latitude 9330 | |
| AIDA64 / FPU Mandel | |
| Medio Intel Core Ultra 7 155H (18236 - 47685, n=50) | |
| MSI Summit E13 AI Evo A1MTG | |
| Lenovo Yoga Book 9 13IMU9 | |
| MSI Summit E13 Flip Evo A11MT | |
| HP Elite Dragonfly Folio 13.5 G3 | |
| Dell Latitude 9330 | |
| Lenovo ThinkPad L13 Yoga G4 i7-1355U | |
| AIDA64 / CPU AES | |
| Medio Intel Core Ultra 7 155H (45713 - 152179, n=50) | |
| MSI Summit E13 Flip Evo A11MT | |
| MSI Summit E13 AI Evo A1MTG | |
| Lenovo Yoga Book 9 13IMU9 | |
| HP Elite Dragonfly Folio 13.5 G3 | |
| Lenovo ThinkPad L13 Yoga G4 i7-1355U | |
| Dell Latitude 9330 | |
| AIDA64 / CPU ZLib | |
| Medio Intel Core Ultra 7 155H (557 - 1250, n=50) | |
| MSI Summit E13 AI Evo A1MTG | |
| Lenovo Yoga Book 9 13IMU9 | |
| HP Elite Dragonfly Folio 13.5 G3 | |
| Lenovo ThinkPad L13 Yoga G4 i7-1355U | |
| Dell Latitude 9330 | |
| MSI Summit E13 Flip Evo A11MT | |
| AIDA64 / FP64 Ray-Trace | |
| Medio Intel Core Ultra 7 155H (3569 - 9802, n=50) | |
| MSI Summit E13 AI Evo A1MTG | |
| Lenovo Yoga Book 9 13IMU9 | |
| MSI Summit E13 Flip Evo A11MT | |
| Dell Latitude 9330 | |
| HP Elite Dragonfly Folio 13.5 G3 | |
| Lenovo ThinkPad L13 Yoga G4 i7-1355U | |
| AIDA64 / CPU PhotoWorxx | |
| Medio Intel Core Ultra 7 155H (32719 - 54223, n=50) | |
| Lenovo Yoga Book 9 13IMU9 | |
| HP Elite Dragonfly Folio 13.5 G3 | |
| MSI Summit E13 AI Evo A1MTG | |
| MSI Summit E13 Flip Evo A11MT | |
| Dell Latitude 9330 | |
| Lenovo ThinkPad L13 Yoga G4 i7-1355U | |
Prueba de estrés
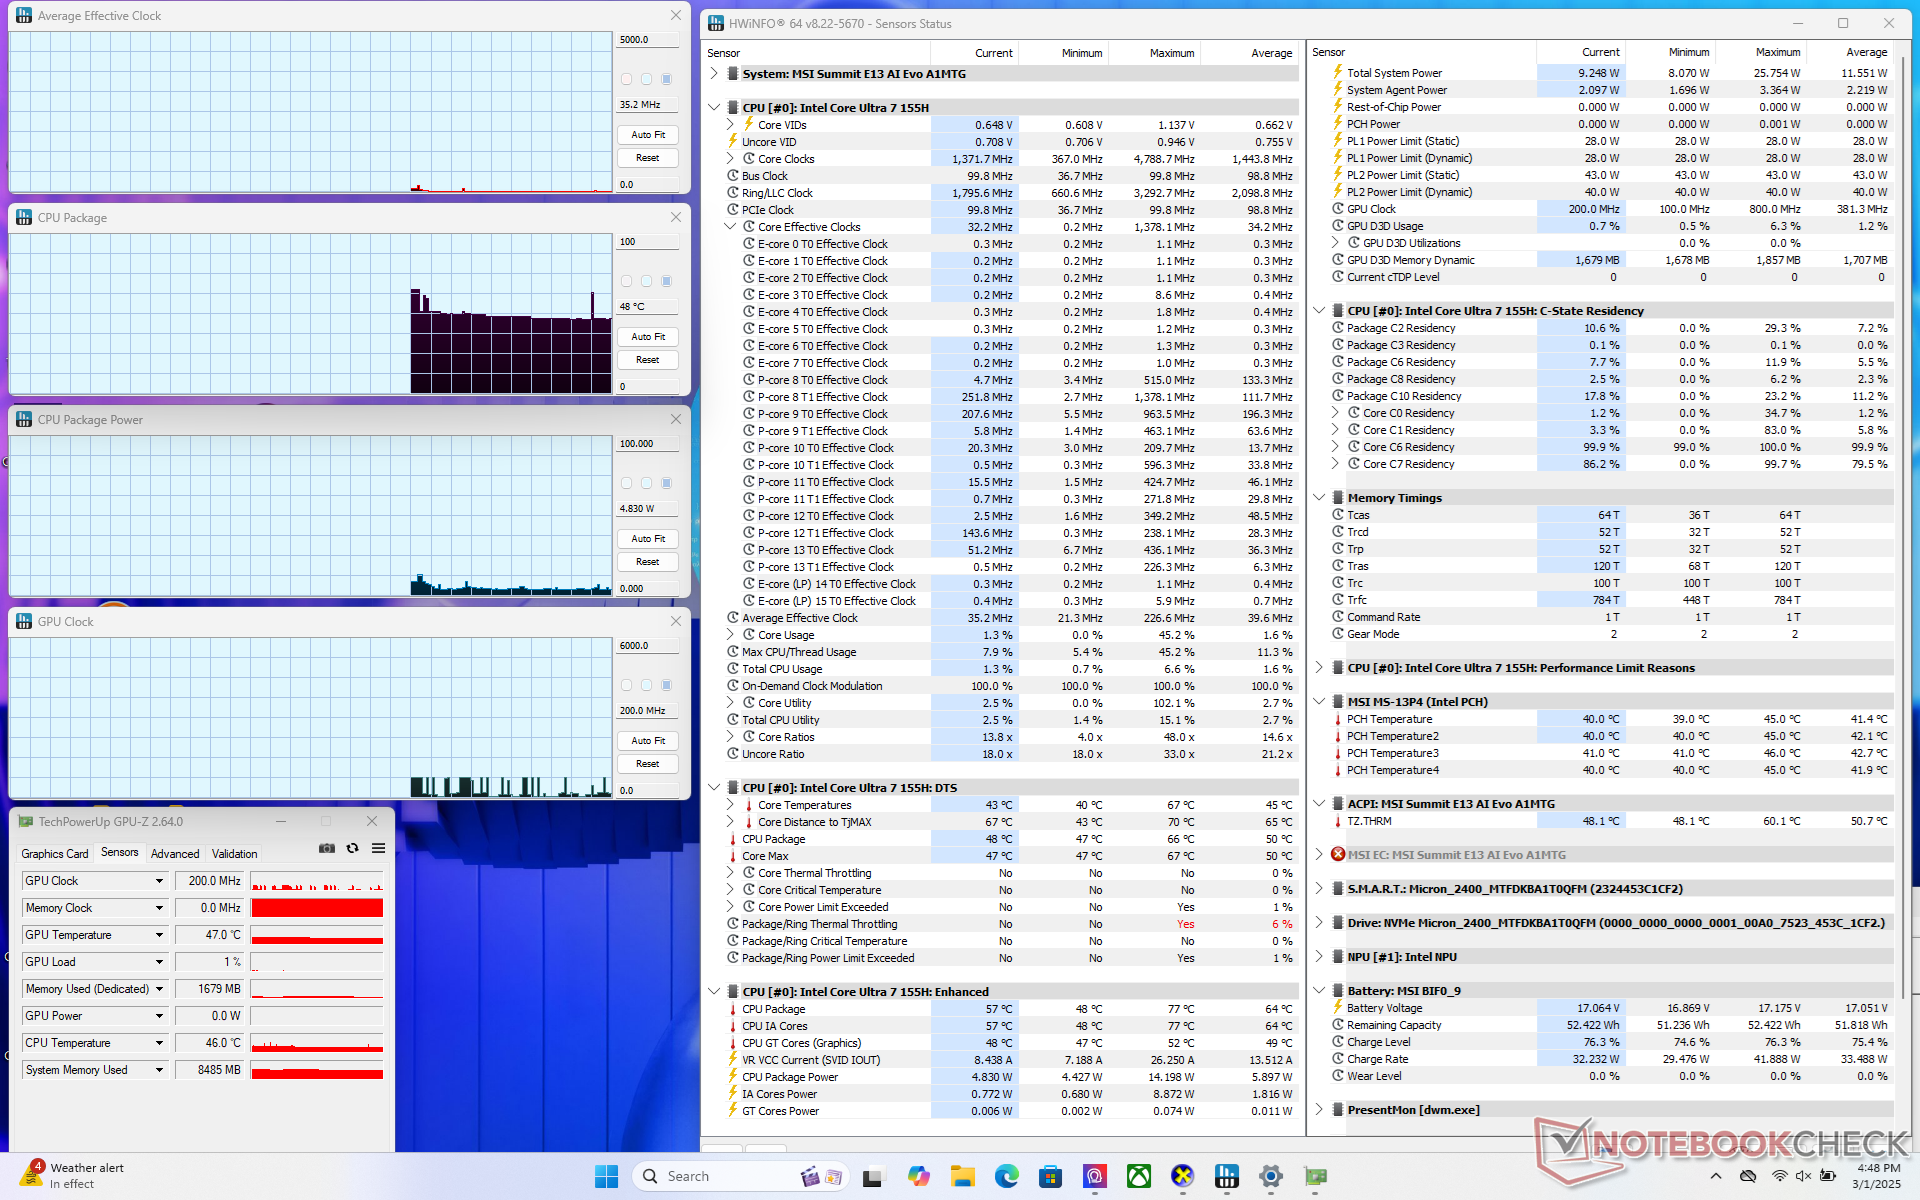
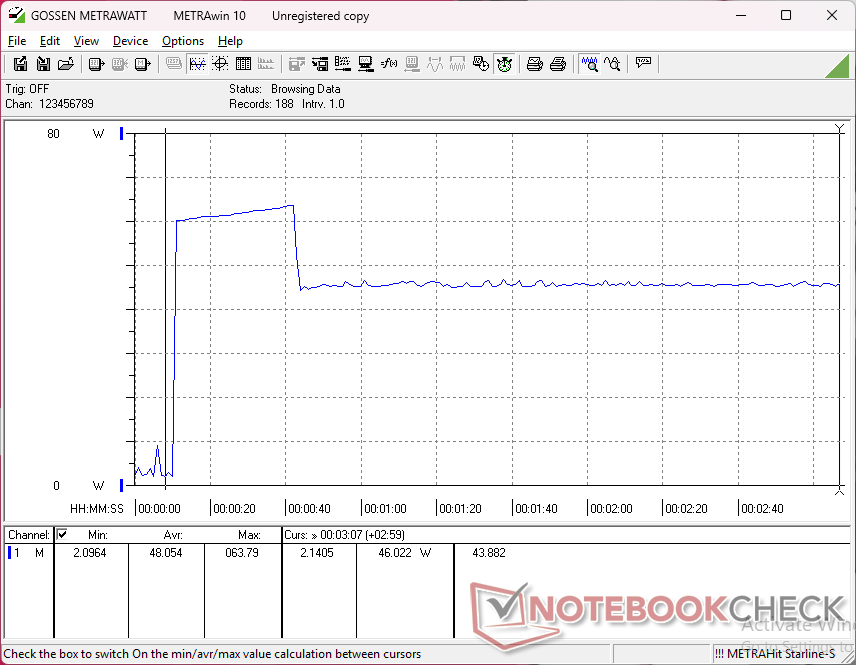
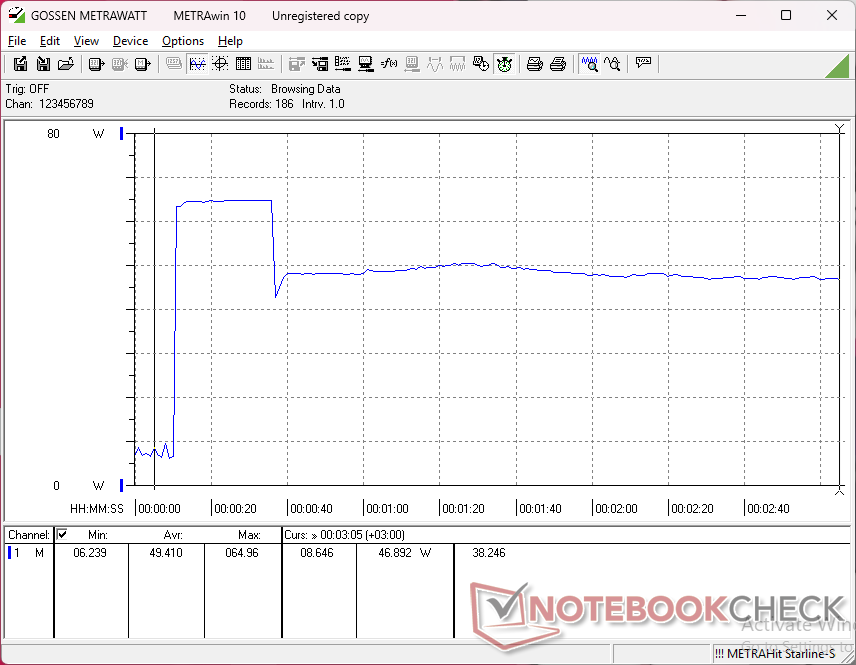
Al ejecutar Prime95, la CPU aumentaría a 2,1 GHz y 41 W hasta alcanzar una temperatura del núcleo de 84 C unos instantes después. Después se estabilizaría a 1,3 GHz y 28 W para mantener una temperatura del núcleo de 81 C con Cooler Boost activado. La temperatura del núcleo aumentaría sólo unos pocos grados si Cooler Boost está desactivado.
Cuando se ejecuta Cyberpunk 2077, la velocidad de reloj de la GPU sería relativamente inestable como se muestra en la captura de pantalla a continuación, incluso cuando está en ralentí en el juego. Esto refleja las tasas de fotogramas inestables como se indica en la sección Rendimiento de la GPU a continuación. La temperatura del núcleo sería muy alta también en 87 C o más de 10 C más caliente que en el modelo 2021.
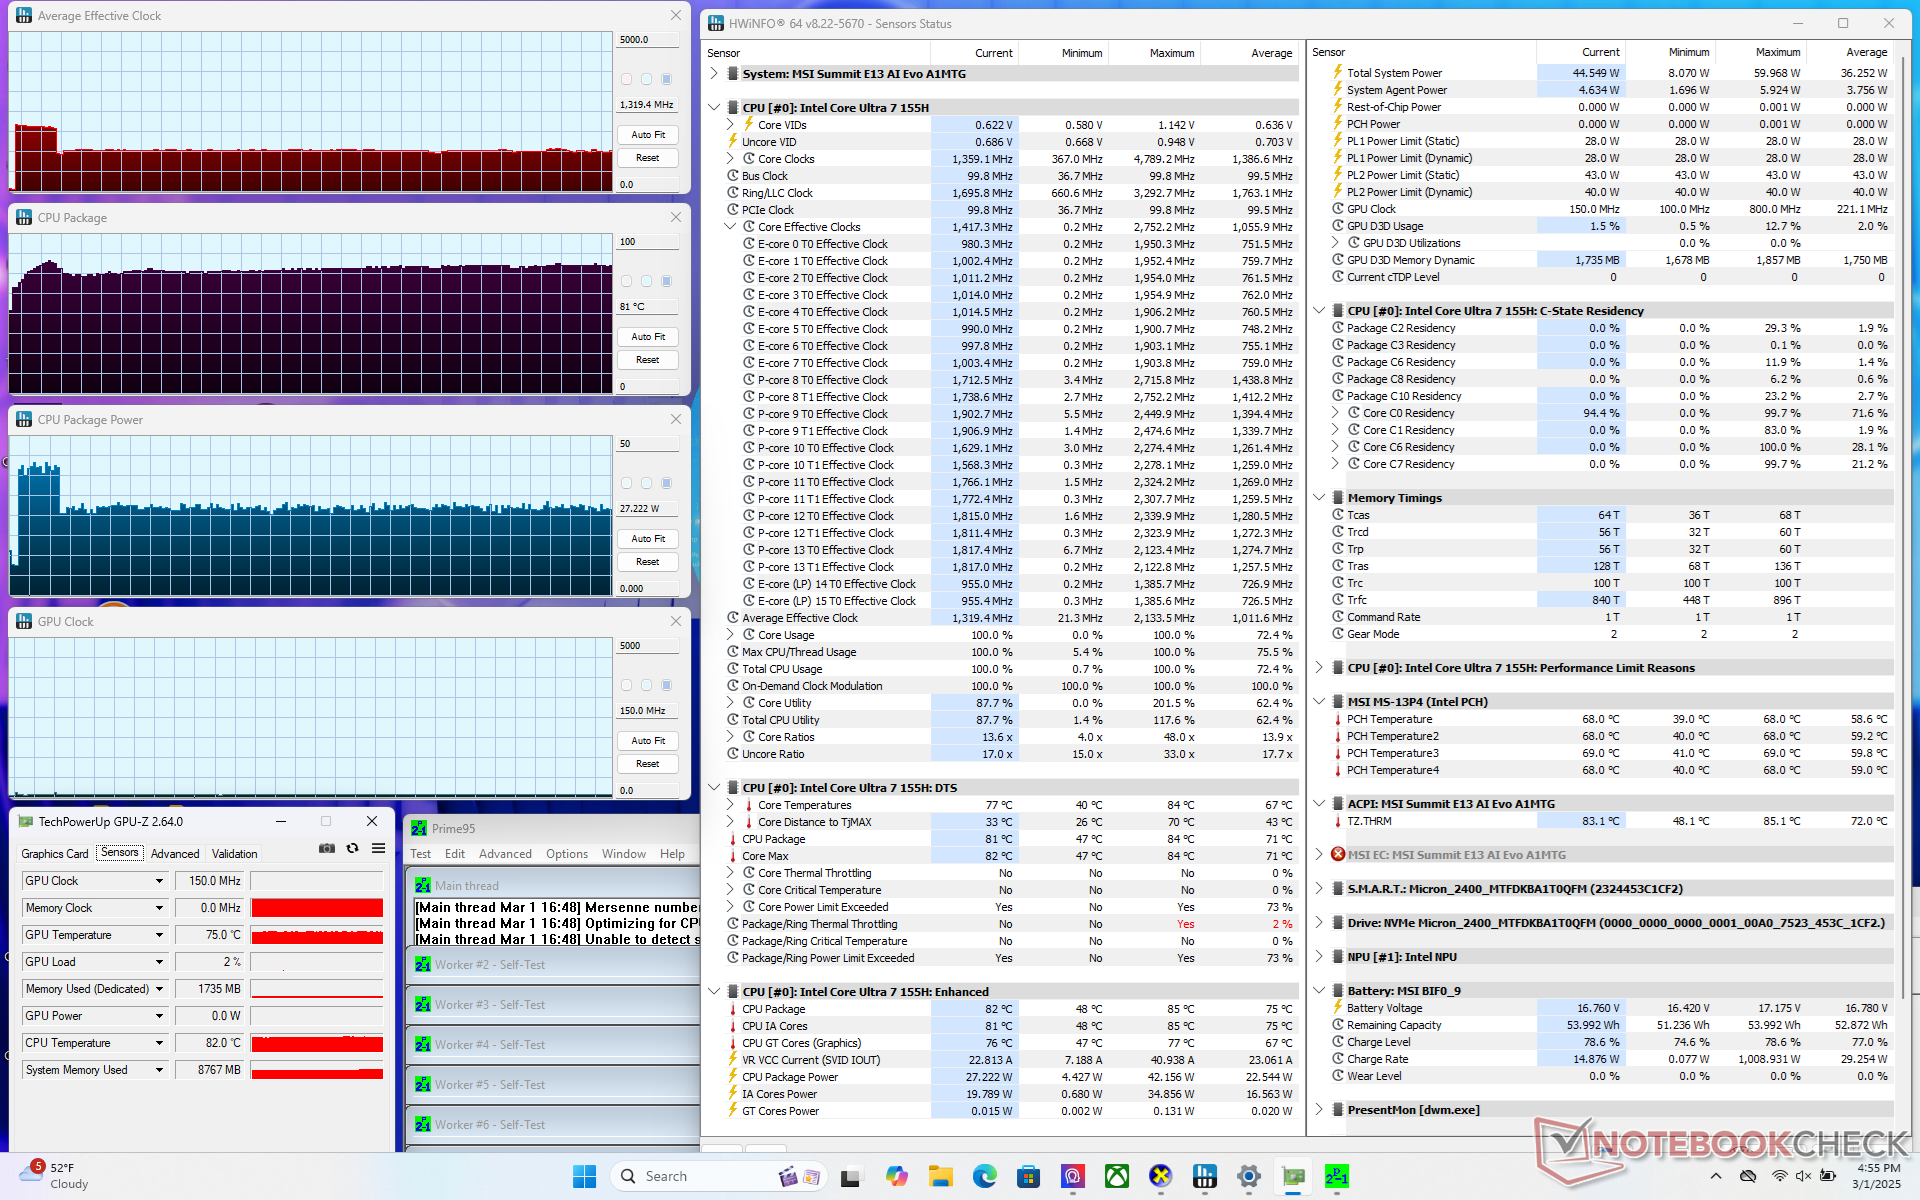
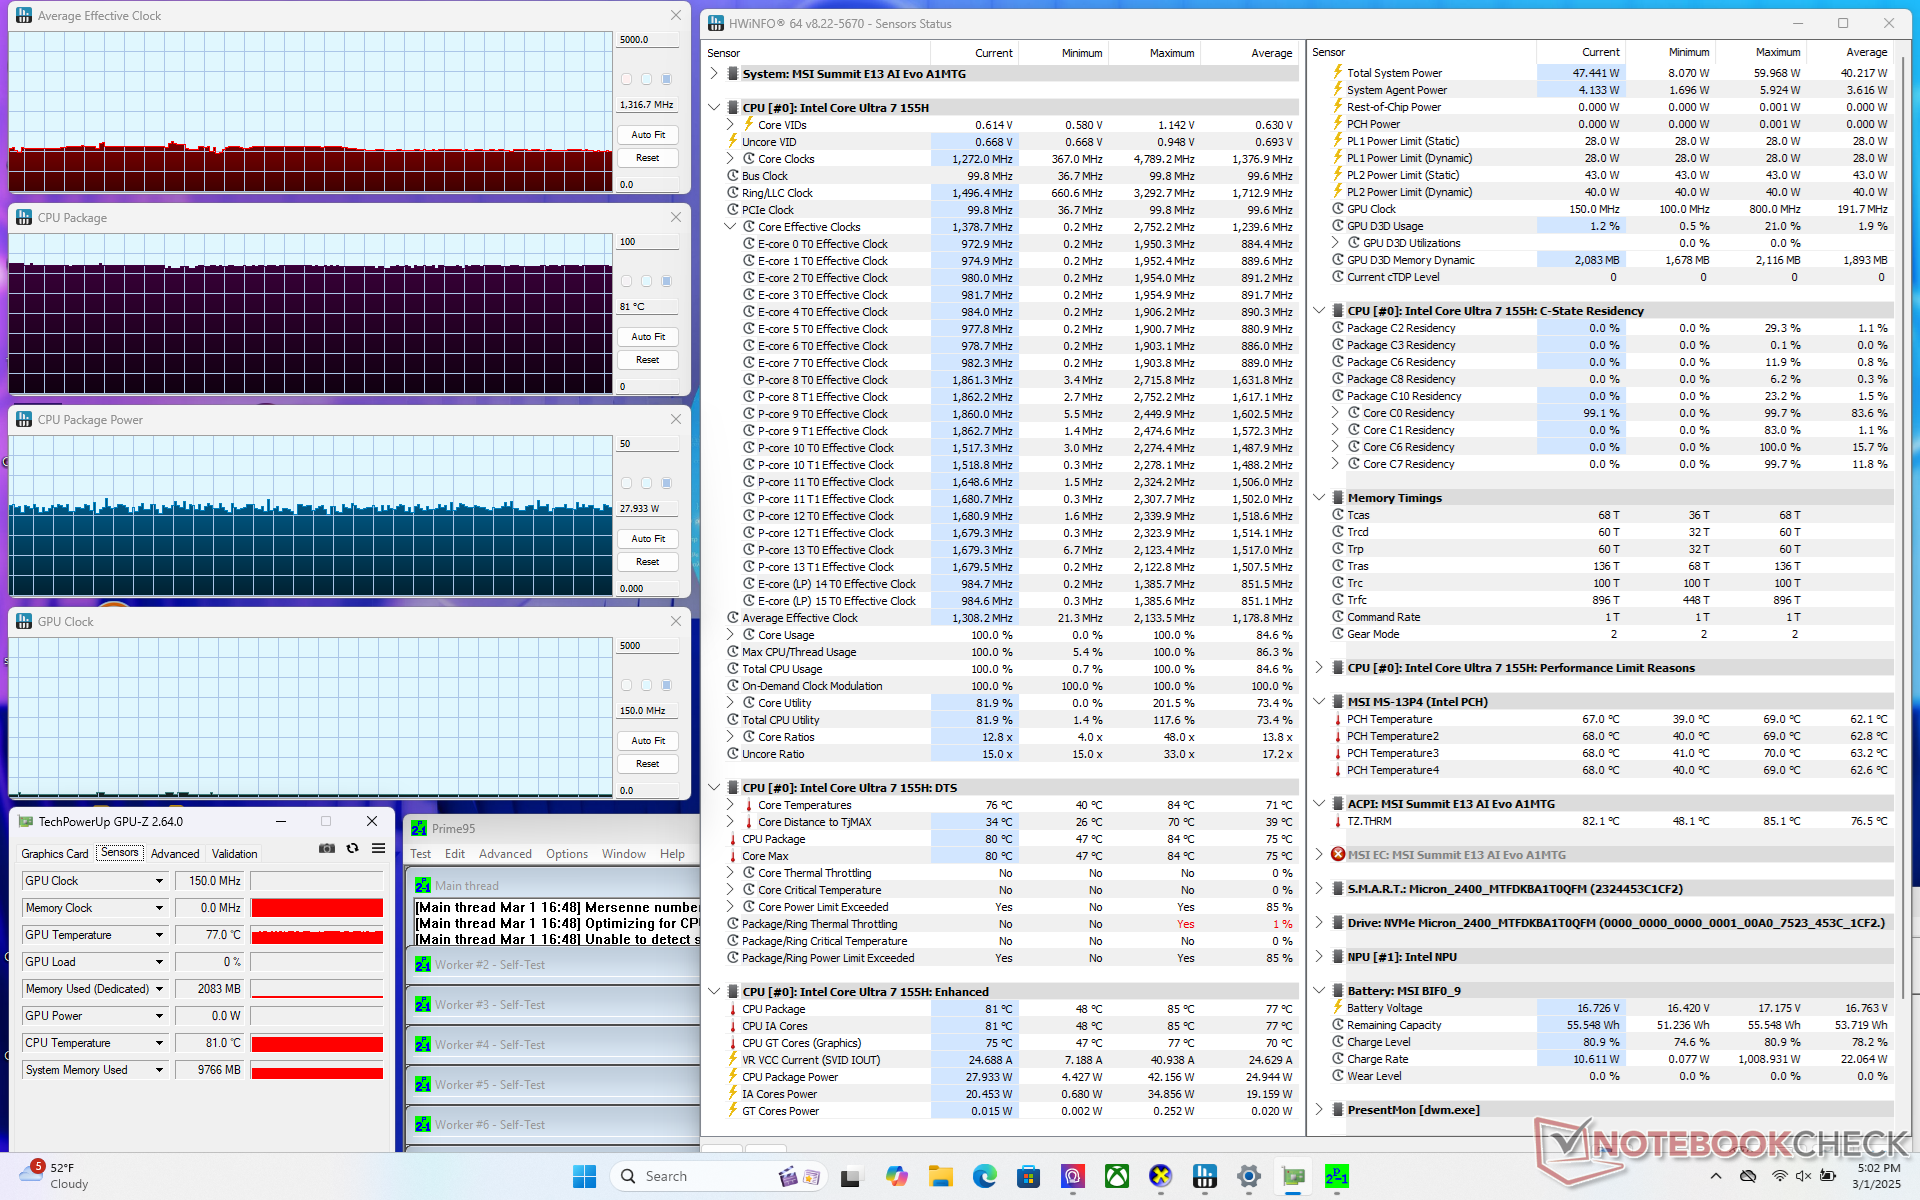
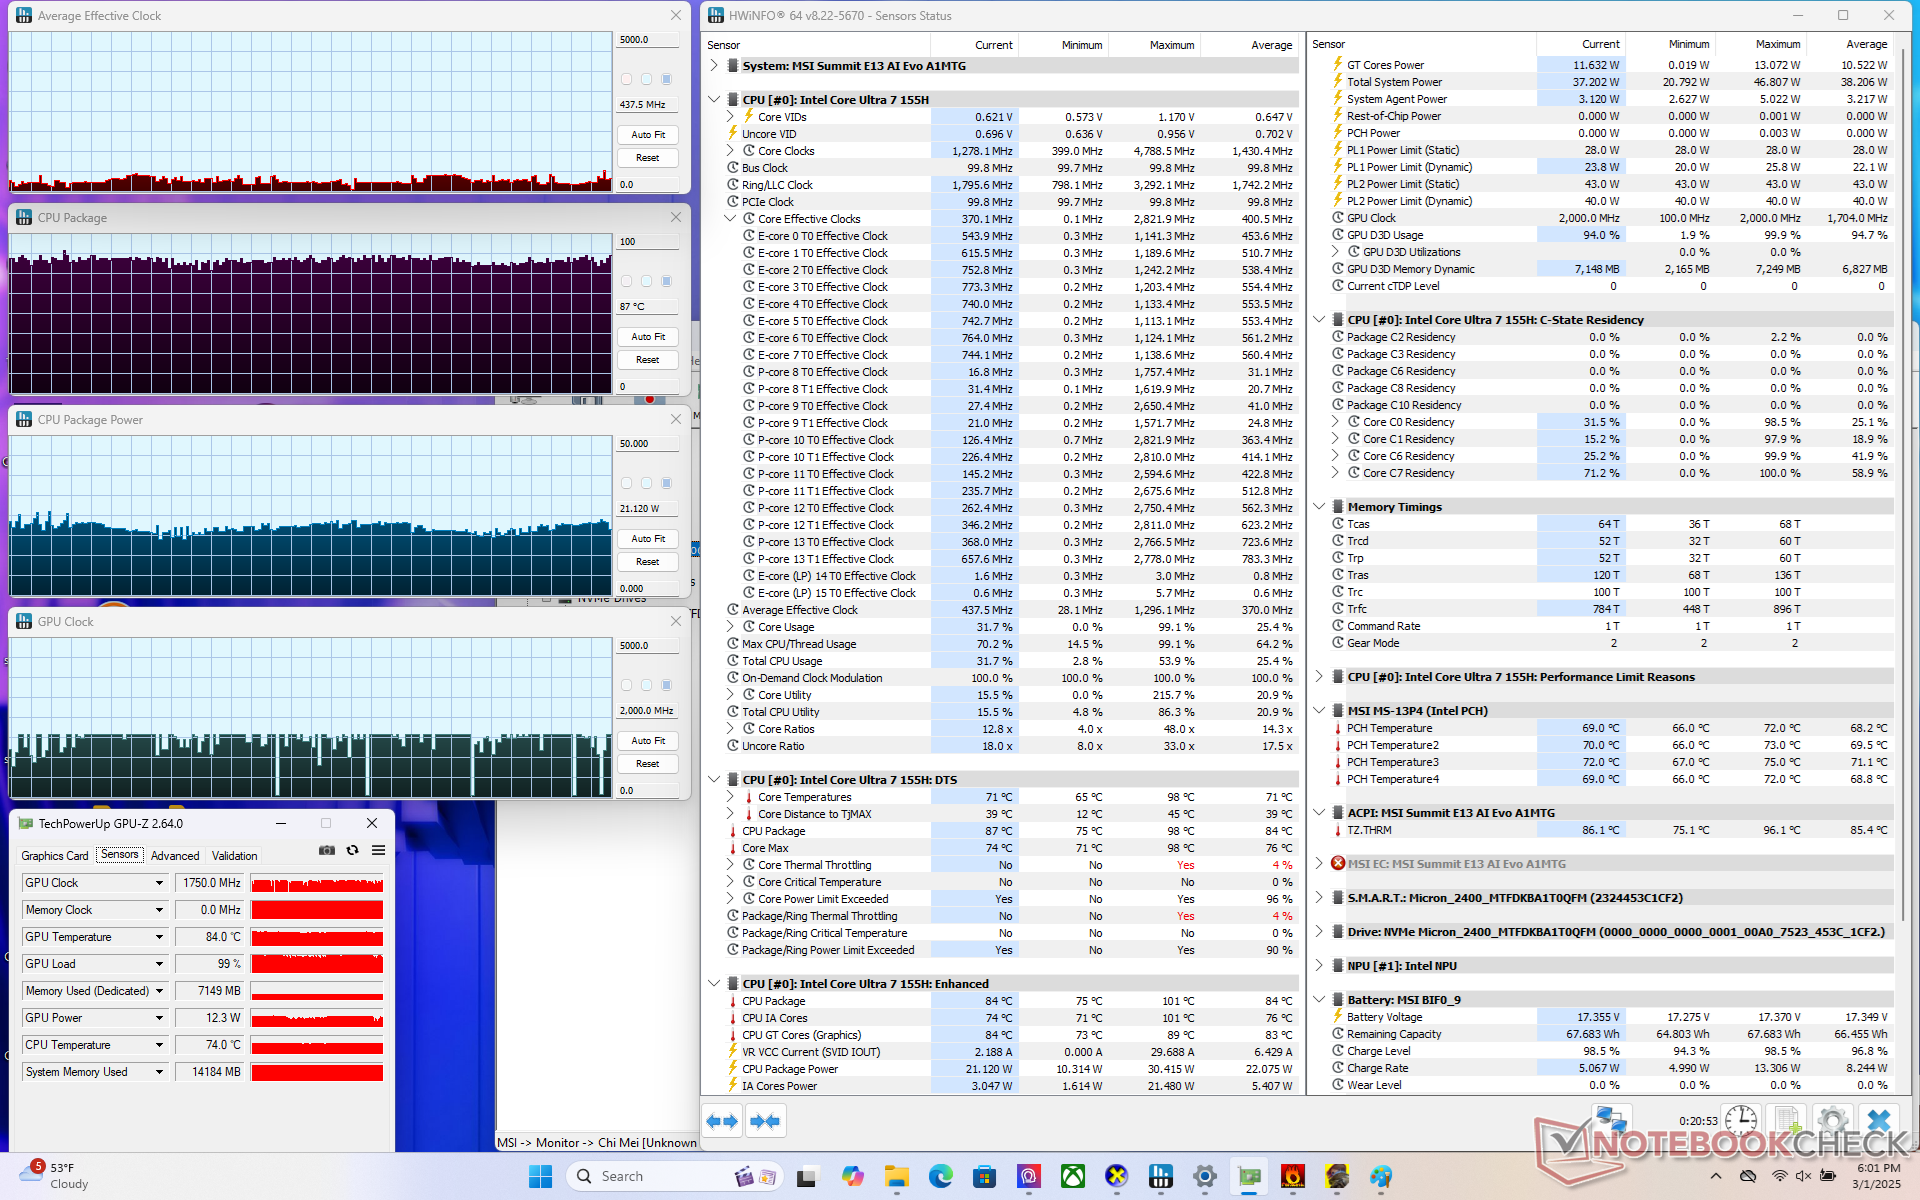
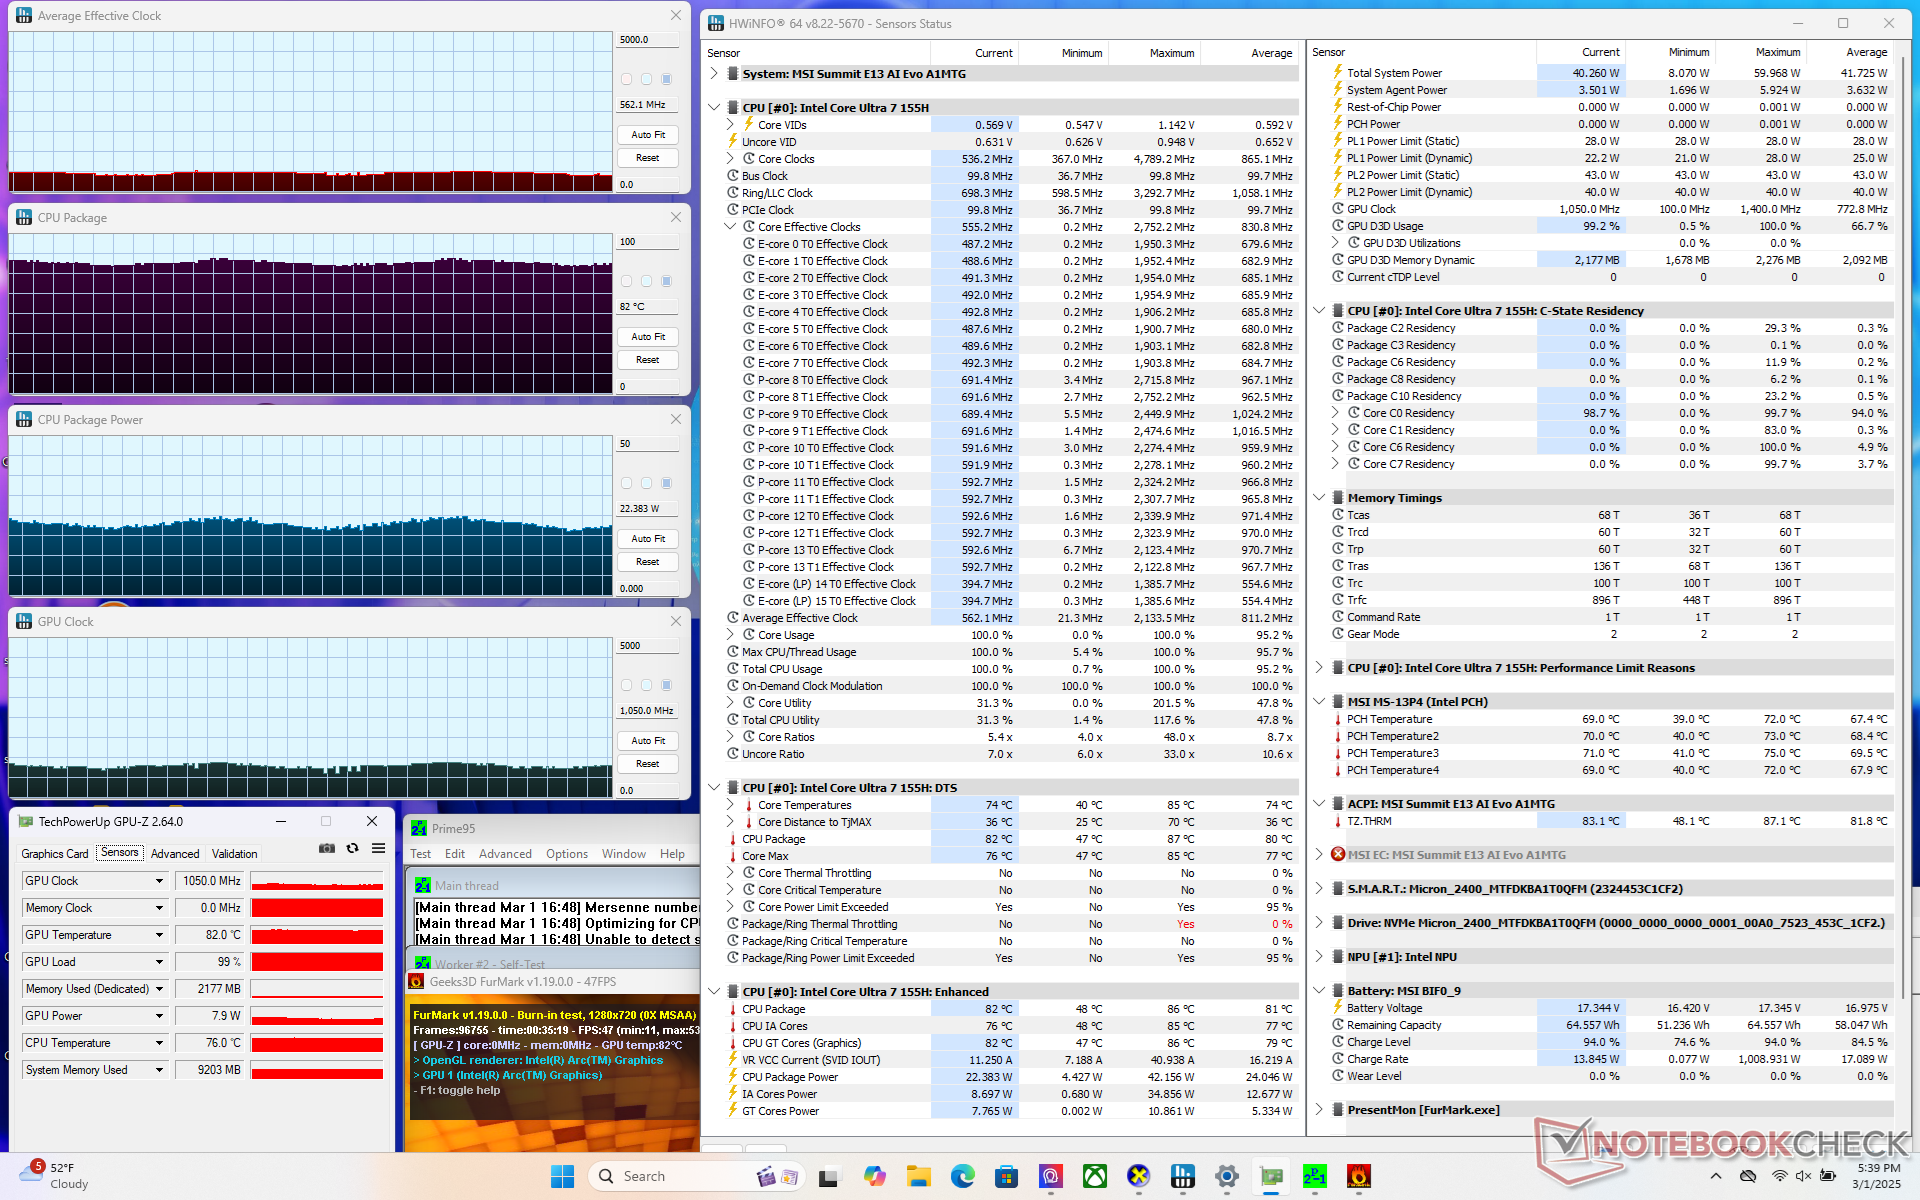
| Reloj medio de la CPU (GHz) | Reloj de la GPU (MHz) | Temperatura media de la CPU (°C) | |
| Sistema en reposo | -- | -- | 48 |
| Estrés Prime95 (Cooler Boost On) | 1.3 | -- | 81 |
| Estrés Prime95 (Cooler Boost Off) | 1.3 | -- | 81 |
| Estrés de Prime95 + FurMark | 0.6 | 1050 | 82 |
| Cyberpunk 2077 Estrés | 0.4 | ~2000 | 87 |
Rendimiento del sistema
CrossMark: Overall | Productivity | Creativity | Responsiveness
WebXPRT 3: Overall
WebXPRT 4: Overall
Mozilla Kraken 1.1: Total
| PCMark 10 / Score | |
| Medio Intel Core Ultra 7 155H, Intel Arc 8-Core iGPU (4809 - 7529, n=34) | |
| Lenovo Yoga Book 9 13IMU9 | |
| Lenovo ThinkPad L13 Yoga G4 i7-1355U | |
| HP Elite Dragonfly Folio 13.5 G3 | |
| Dell Latitude 9330 | |
| MSI Summit E13 AI Evo A1MTG | |
| MSI Summit E13 Flip Evo A11MT | |
| PCMark 10 / Essentials | |
| HP Elite Dragonfly Folio 13.5 G3 | |
| Lenovo ThinkPad L13 Yoga G4 i7-1355U | |
| Lenovo Yoga Book 9 13IMU9 | |
| Medio Intel Core Ultra 7 155H, Intel Arc 8-Core iGPU (7605 - 11289, n=34) | |
| Dell Latitude 9330 | |
| MSI Summit E13 Flip Evo A11MT | |
| MSI Summit E13 AI Evo A1MTG | |
| PCMark 10 / Productivity | |
| Medio Intel Core Ultra 7 155H, Intel Arc 8-Core iGPU (6042 - 10591, n=34) | |
| Lenovo Yoga Book 9 13IMU9 | |
| Lenovo ThinkPad L13 Yoga G4 i7-1355U | |
| HP Elite Dragonfly Folio 13.5 G3 | |
| Dell Latitude 9330 | |
| MSI Summit E13 Flip Evo A11MT | |
| MSI Summit E13 AI Evo A1MTG | |
| PCMark 10 / Digital Content Creation | |
| Medio Intel Core Ultra 7 155H, Intel Arc 8-Core iGPU (4985 - 10709, n=34) | |
| Lenovo Yoga Book 9 13IMU9 | |
| MSI Summit E13 AI Evo A1MTG | |
| Lenovo ThinkPad L13 Yoga G4 i7-1355U | |
| HP Elite Dragonfly Folio 13.5 G3 | |
| Dell Latitude 9330 | |
| MSI Summit E13 Flip Evo A11MT | |
| CrossMark / Overall | |
| Medio Intel Core Ultra 7 155H, Intel Arc 8-Core iGPU (1366 - 1903, n=34) | |
| MSI Summit E13 AI Evo A1MTG | |
| HP Elite Dragonfly Folio 13.5 G3 | |
| Lenovo ThinkPad L13 Yoga G4 i7-1355U | |
| Lenovo Yoga Book 9 13IMU9 | |
| CrossMark / Productivity | |
| Medio Intel Core Ultra 7 155H, Intel Arc 8-Core iGPU (1291 - 1798, n=33) | |
| HP Elite Dragonfly Folio 13.5 G3 | |
| MSI Summit E13 AI Evo A1MTG | |
| Lenovo ThinkPad L13 Yoga G4 i7-1355U | |
| Lenovo Yoga Book 9 13IMU9 | |
| CrossMark / Creativity | |
| Medio Intel Core Ultra 7 155H, Intel Arc 8-Core iGPU (1519 - 1929, n=33) | |
| MSI Summit E13 AI Evo A1MTG | |
| HP Elite Dragonfly Folio 13.5 G3 | |
| Lenovo ThinkPad L13 Yoga G4 i7-1355U | |
| Lenovo Yoga Book 9 13IMU9 | |
| CrossMark / Responsiveness | |
| HP Elite Dragonfly Folio 13.5 G3 | |
| MSI Summit E13 AI Evo A1MTG | |
| Medio Intel Core Ultra 7 155H, Intel Arc 8-Core iGPU (939 - 1802, n=33) | |
| Lenovo Yoga Book 9 13IMU9 | |
| Lenovo ThinkPad L13 Yoga G4 i7-1355U | |
| WebXPRT 3 / Overall | |
| Lenovo ThinkPad L13 Yoga G4 i7-1355U | |
| HP Elite Dragonfly Folio 13.5 G3 | |
| MSI Summit E13 AI Evo A1MTG | |
| Medio Intel Core Ultra 7 155H, Intel Arc 8-Core iGPU (252 - 299, n=34) | |
| Lenovo Yoga Book 9 13IMU9 | |
| MSI Summit E13 Flip Evo A11MT | |
| Dell Latitude 9330 | |
| WebXPRT 4 / Overall | |
| Lenovo ThinkPad L13 Yoga G4 i7-1355U | |
| Medio Intel Core Ultra 7 155H, Intel Arc 8-Core iGPU (166.4 - 309, n=29) | |
| Lenovo Yoga Book 9 13IMU9 | |
| HP Elite Dragonfly Folio 13.5 G3 | |
| Dell Latitude 9330 | |
| MSI Summit E13 AI Evo A1MTG | |
| Mozilla Kraken 1.1 / Total | |
| MSI Summit E13 Flip Evo A11MT | |
| Dell Latitude 9330 | |
| HP Elite Dragonfly Folio 13.5 G3 | |
| Lenovo Yoga Book 9 13IMU9 | |
| MSI Summit E13 AI Evo A1MTG | |
| Medio Intel Core Ultra 7 155H, Intel Arc 8-Core iGPU (517 - 614, n=35) | |
| Lenovo ThinkPad L13 Yoga G4 i7-1355U | |
* ... más pequeño es mejor
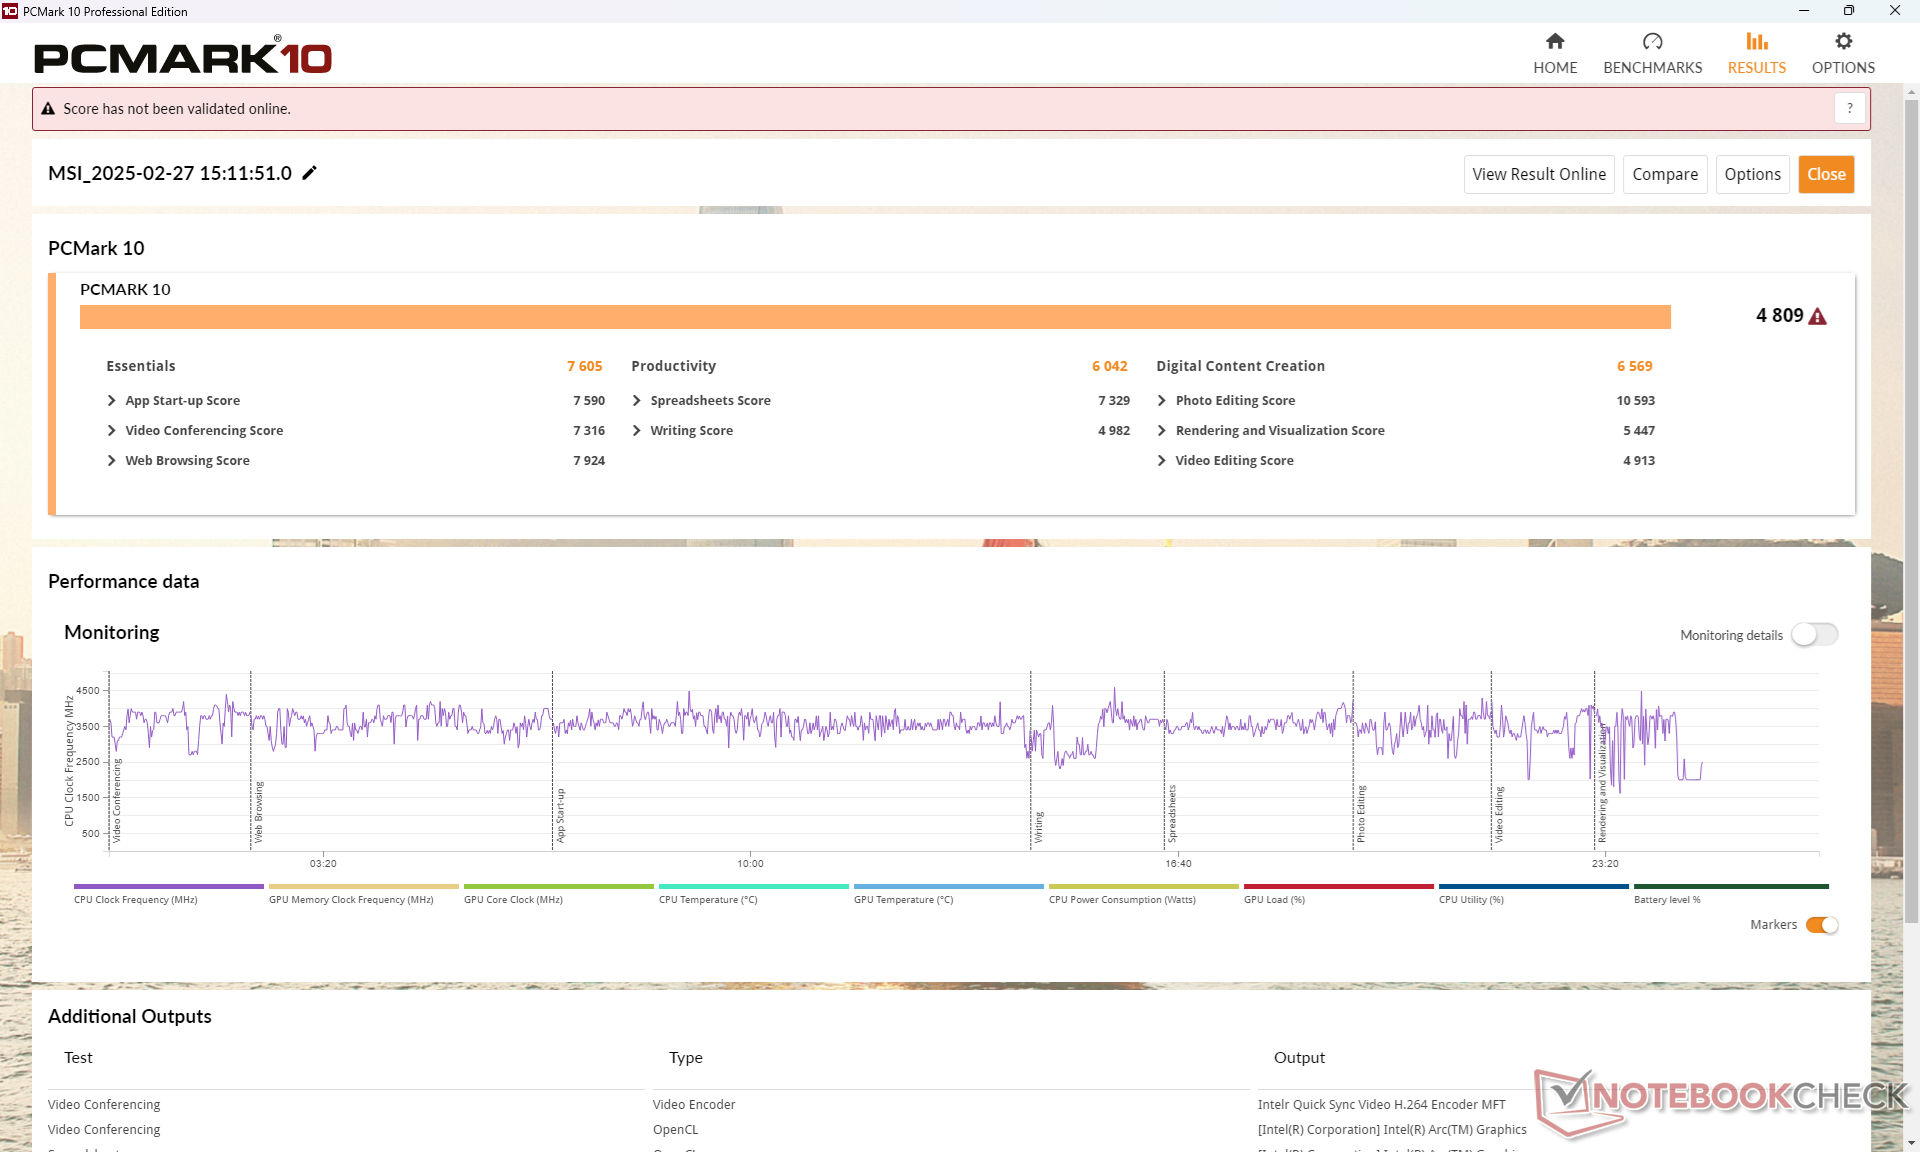
| PCMark 10 Score | 4809 puntos | |
ayuda | ||
| AIDA64 / Memory Copy | |
| Medio Intel Core Ultra 7 155H (62397 - 96791, n=50) | |
| Lenovo Yoga Book 9 13IMU9 | |
| MSI Summit E13 AI Evo A1MTG | |
| Dell Latitude 9330 | |
| HP Elite Dragonfly Folio 13.5 G3 | |
| Lenovo ThinkPad L13 Yoga G4 i7-1355U | |
| MSI Summit E13 Flip Evo A11MT | |
| AIDA64 / Memory Read | |
| Medio Intel Core Ultra 7 155H (60544 - 90647, n=50) | |
| MSI Summit E13 AI Evo A1MTG | |
| HP Elite Dragonfly Folio 13.5 G3 | |
| Lenovo Yoga Book 9 13IMU9 | |
| Dell Latitude 9330 | |
| MSI Summit E13 Flip Evo A11MT | |
| Lenovo ThinkPad L13 Yoga G4 i7-1355U | |
| AIDA64 / Memory Write | |
| HP Elite Dragonfly Folio 13.5 G3 | |
| MSI Summit E13 AI Evo A1MTG | |
| Medio Intel Core Ultra 7 155H (58692 - 93451, n=50) | |
| Lenovo ThinkPad L13 Yoga G4 i7-1355U | |
| Dell Latitude 9330 | |
| Lenovo Yoga Book 9 13IMU9 | |
| MSI Summit E13 Flip Evo A11MT | |
| AIDA64 / Memory Latency | |
| Lenovo Yoga Book 9 13IMU9 | |
| Medio Intel Core Ultra 7 155H (116.2 - 233, n=50) | |
| MSI Summit E13 AI Evo A1MTG | |
| HP Elite Dragonfly Folio 13.5 G3 | |
| Dell Latitude 9330 | |
| Lenovo ThinkPad L13 Yoga G4 i7-1355U | |
| MSI Summit E13 Flip Evo A11MT | |
* ... más pequeño es mejor
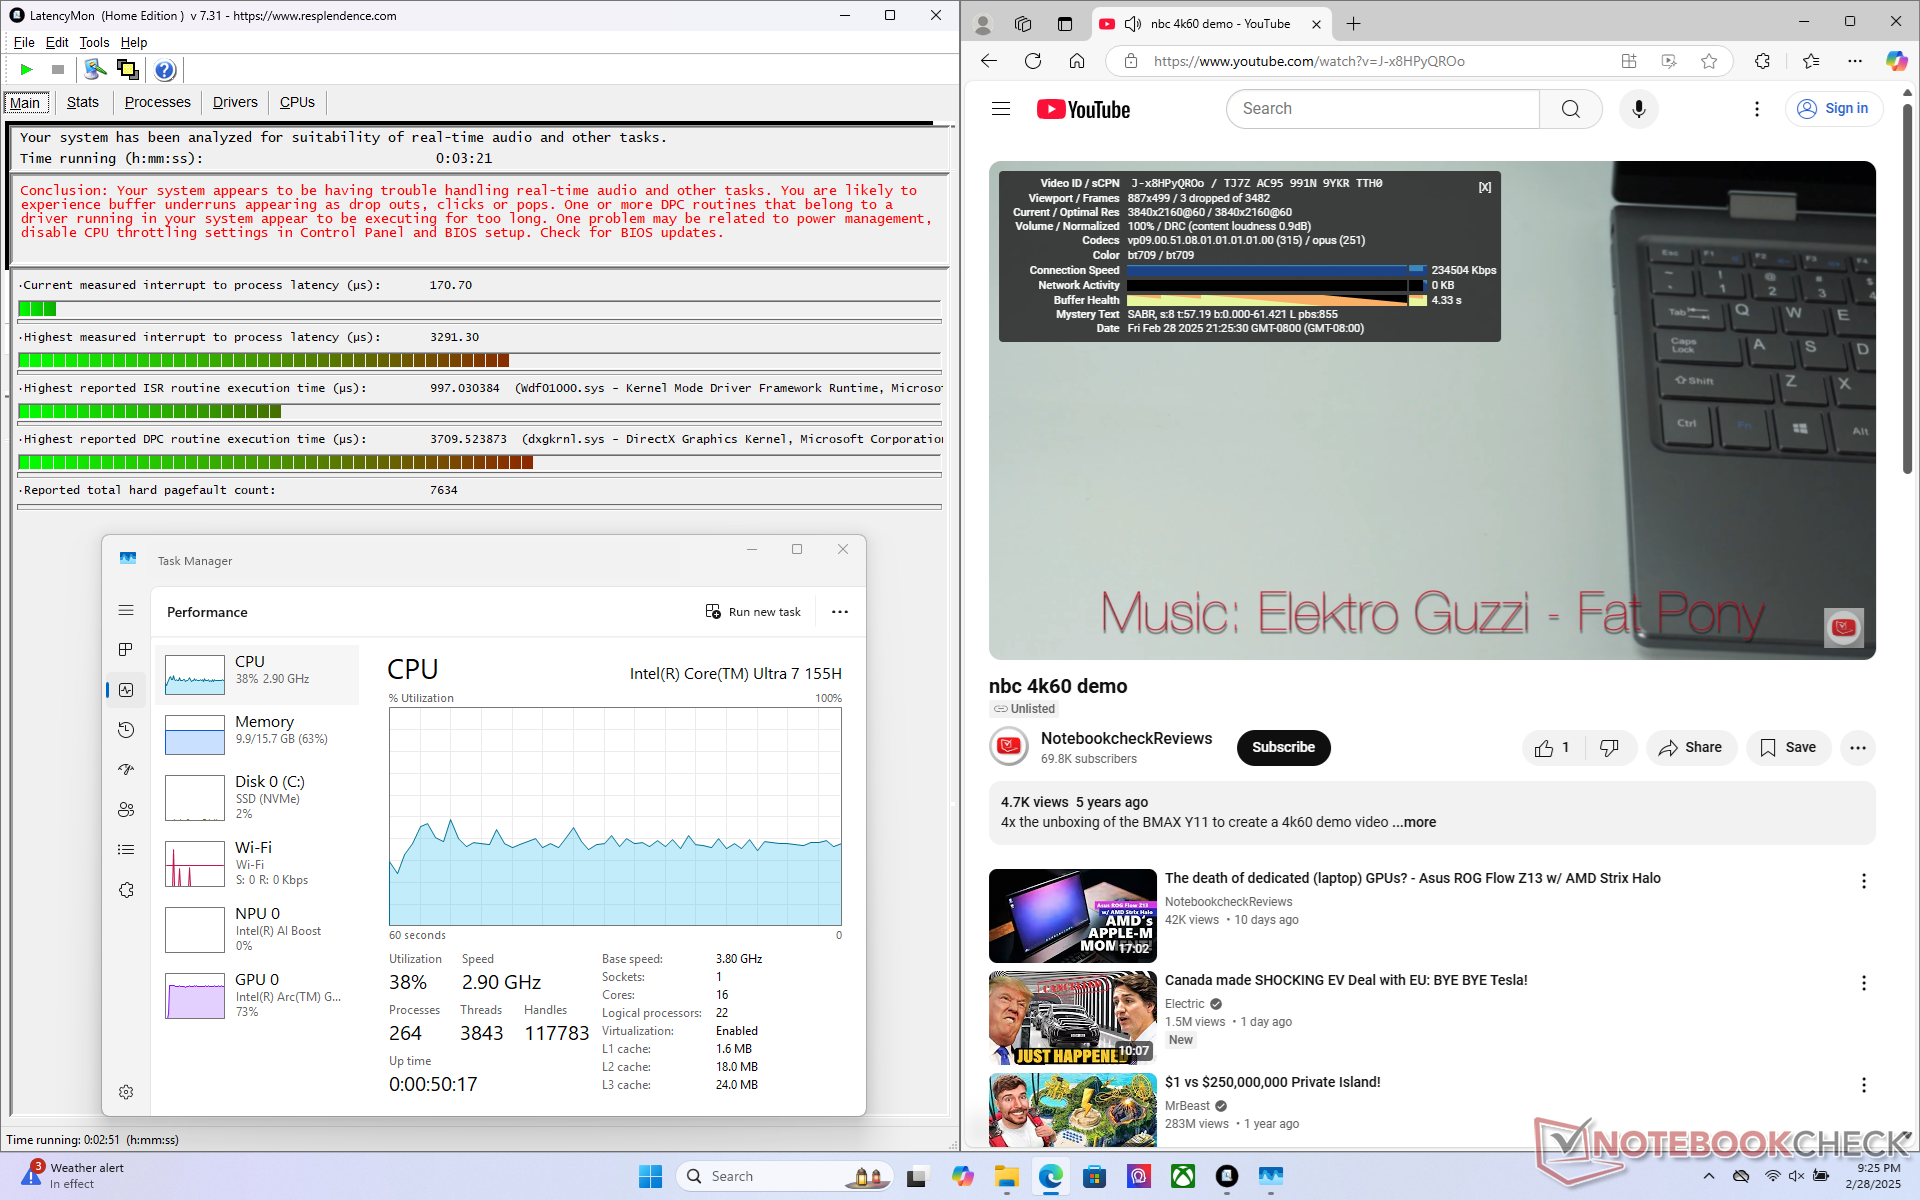
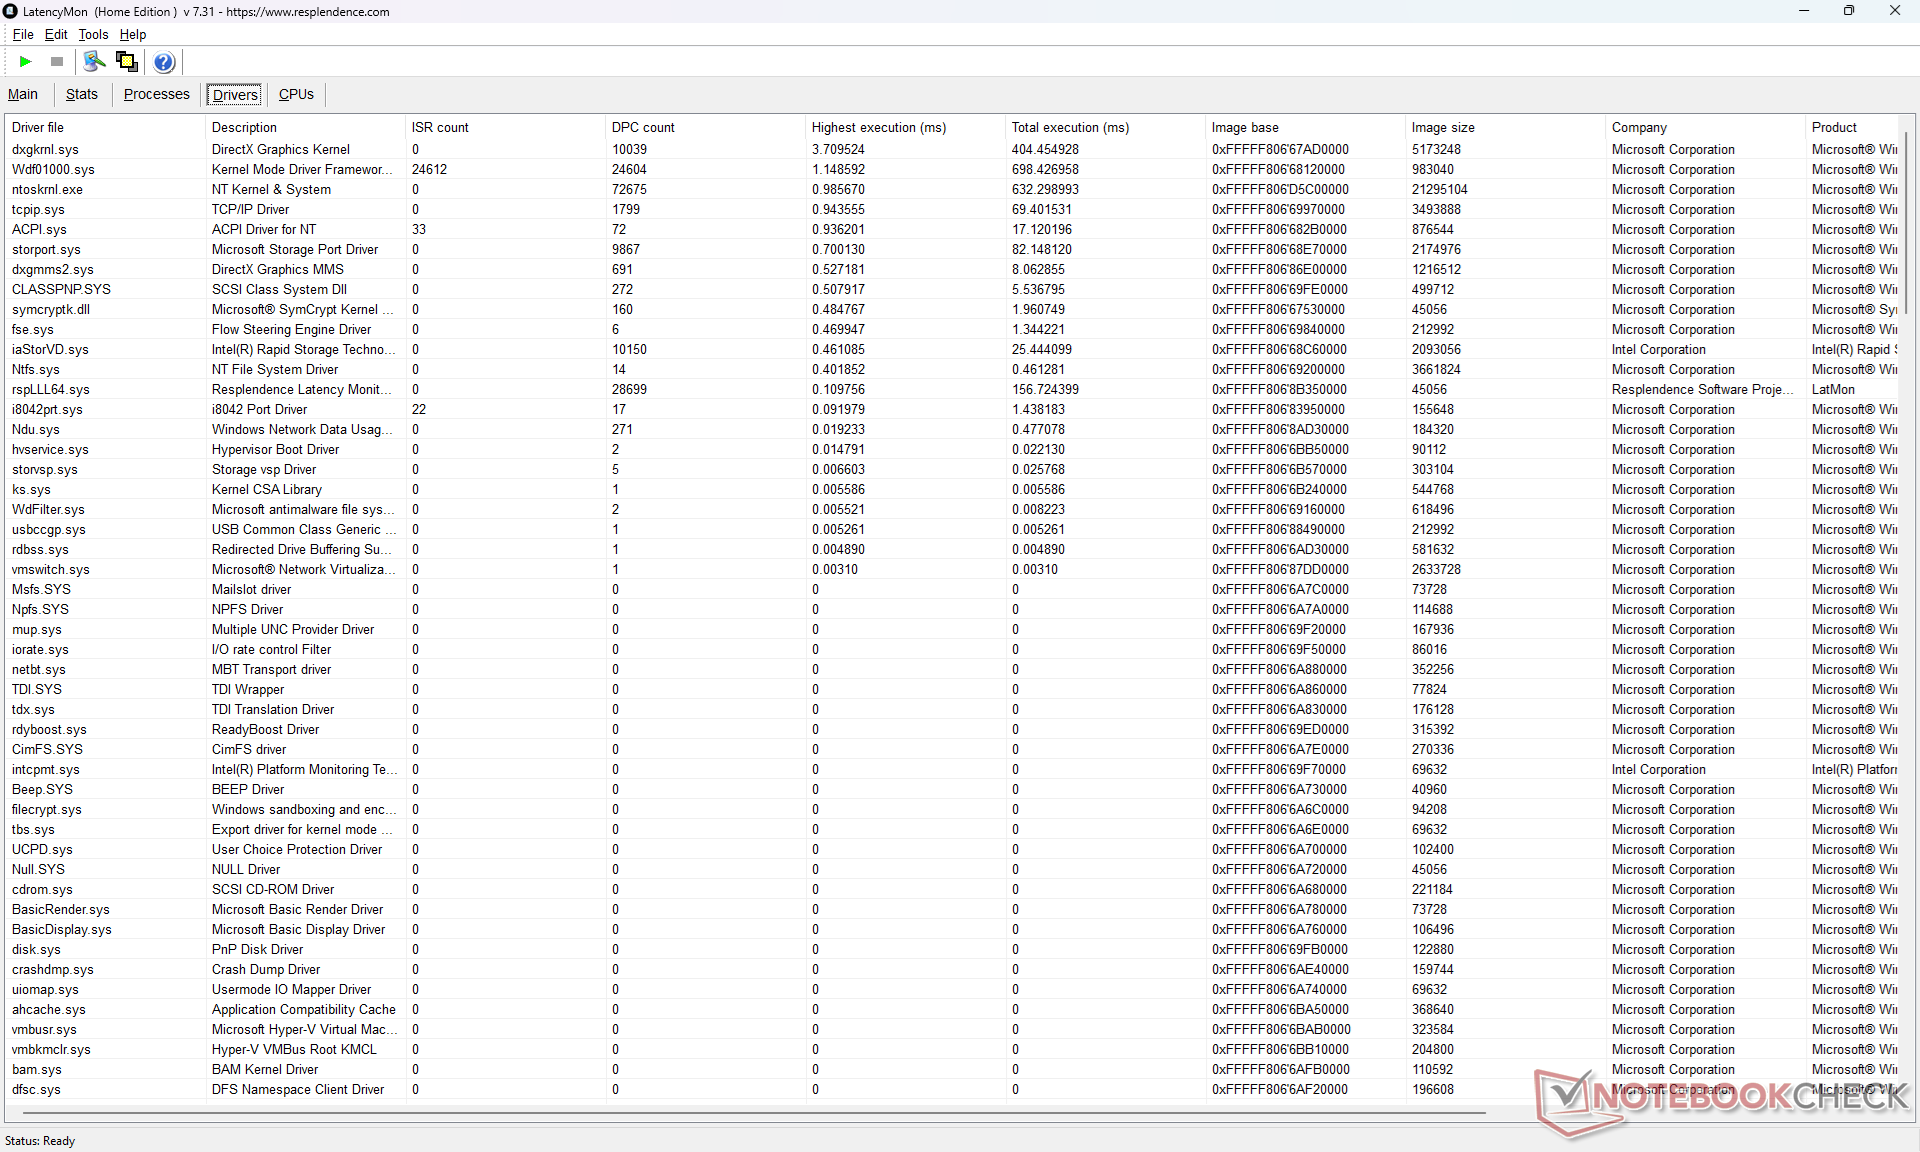
Latencia del CPD
LatencyMon revela problemas de CPD al abrir varias pestañas del navegador de nuestra página principal. la reproducción de vídeo 4K60 es imperfecta pero sigue siendo fluida, con sólo 3 fotogramas caídos durante el inicio de la prueba.
| DPC Latencies / LatencyMon - interrupt to process latency (max), Web, Youtube, Prime95 | |
| Dell Latitude 9330 | |
| HP Elite Dragonfly Folio 13.5 G3 | |
| MSI Summit E13 AI Evo A1MTG | |
| MSI Summit E13 Flip Evo A11MT | |
| Lenovo ThinkPad L13 Yoga G4 i7-1355U | |
| Lenovo Yoga Book 9 13IMU9 | |
* ... más pequeño es mejor
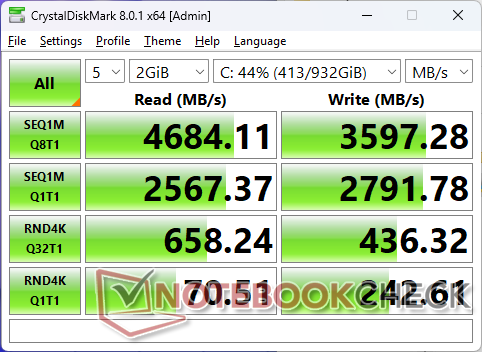
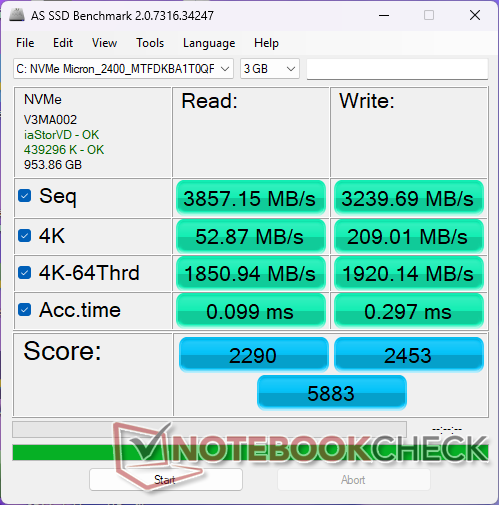
Dispositivos de almacenamiento
El Micron 2400 PCIe4 x4 NVMe SSD se estrangula bajo estrés. Al ejecutar DiskSpd en bucle, por ejemplo, las tasas de transferencia alcanzaban ~4300 MB/s antes de caer a solo ~2600 MB/s tras unos 5 minutos de prueba.

* ... más pequeño es mejor
Disk Throttling: DiskSpd Read Loop, Queue Depth 8
Rendimiento de la GPU
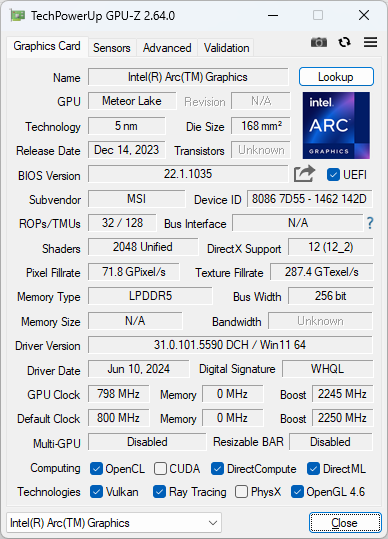
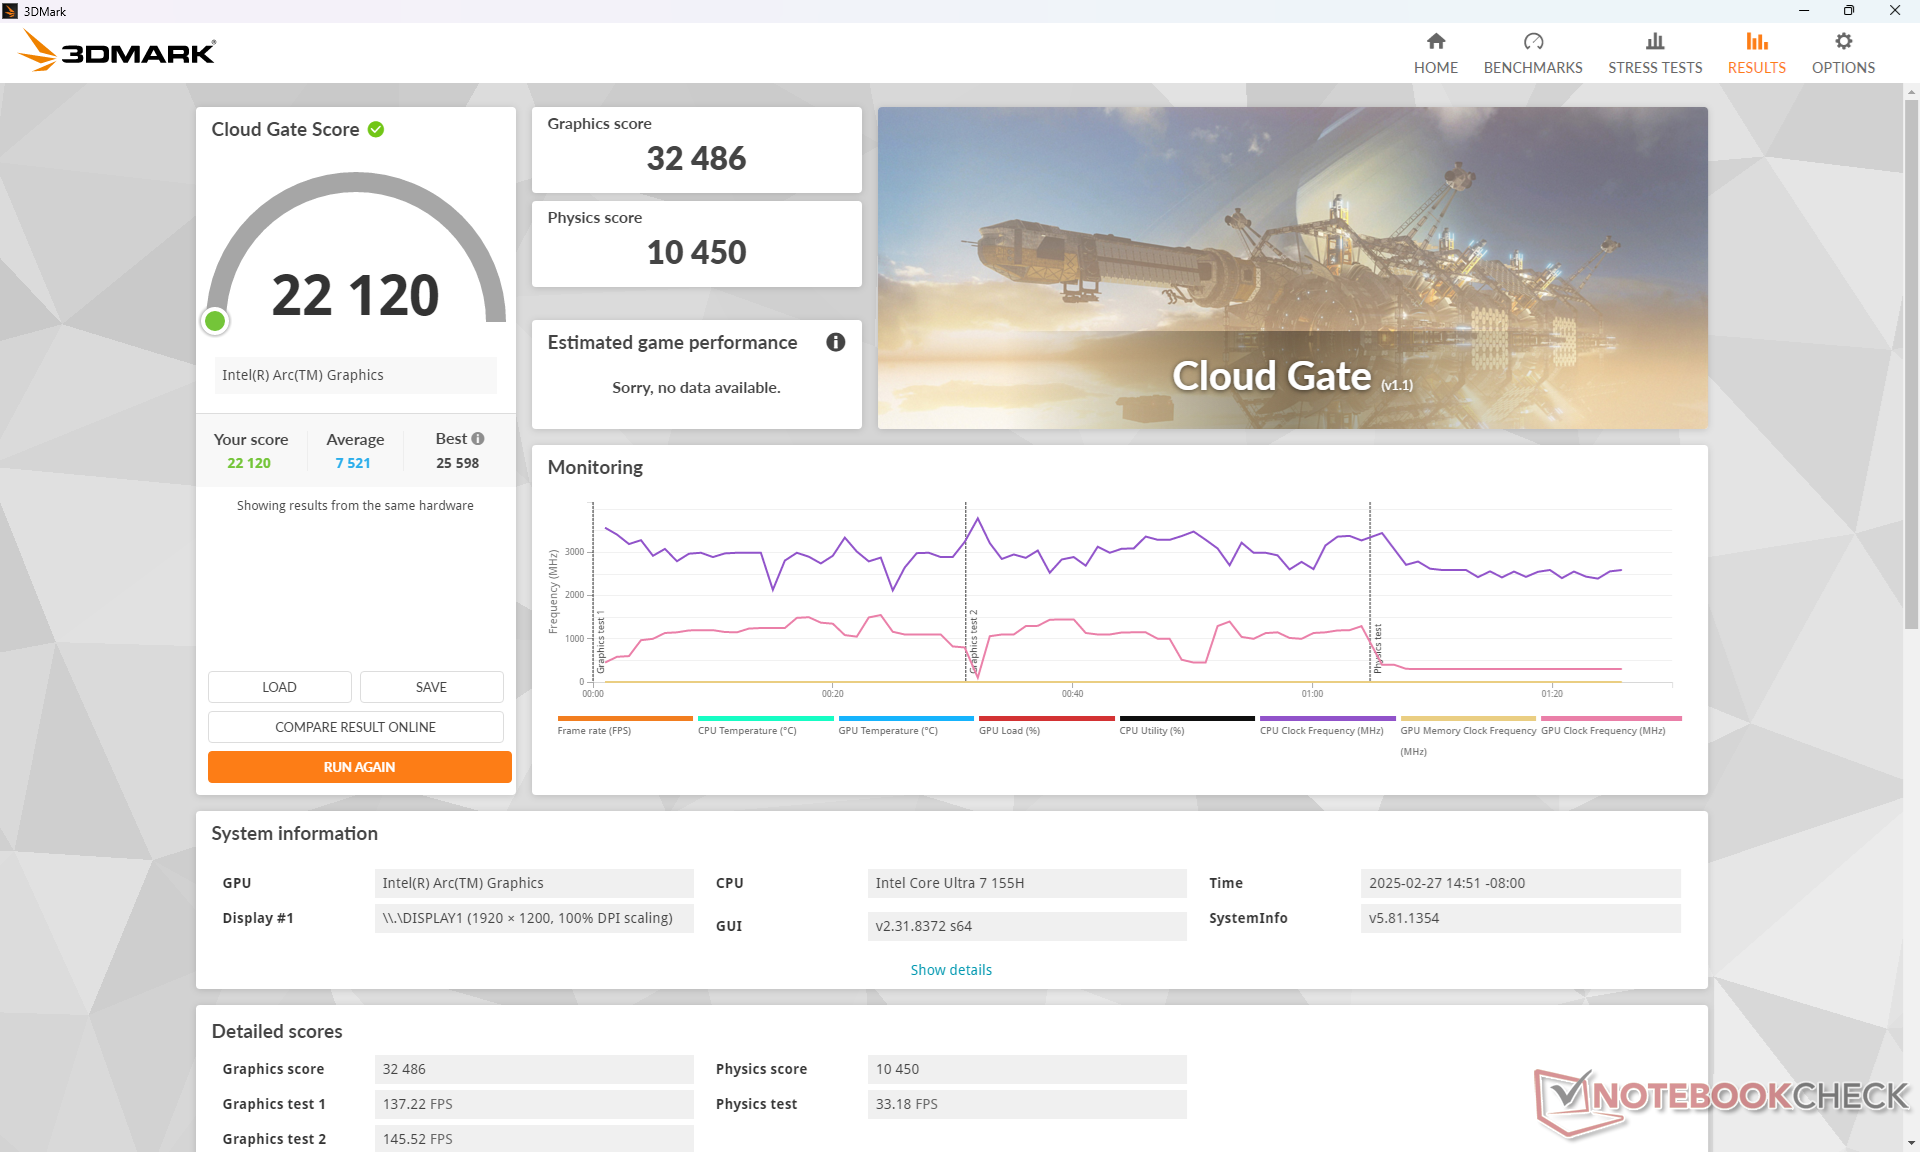
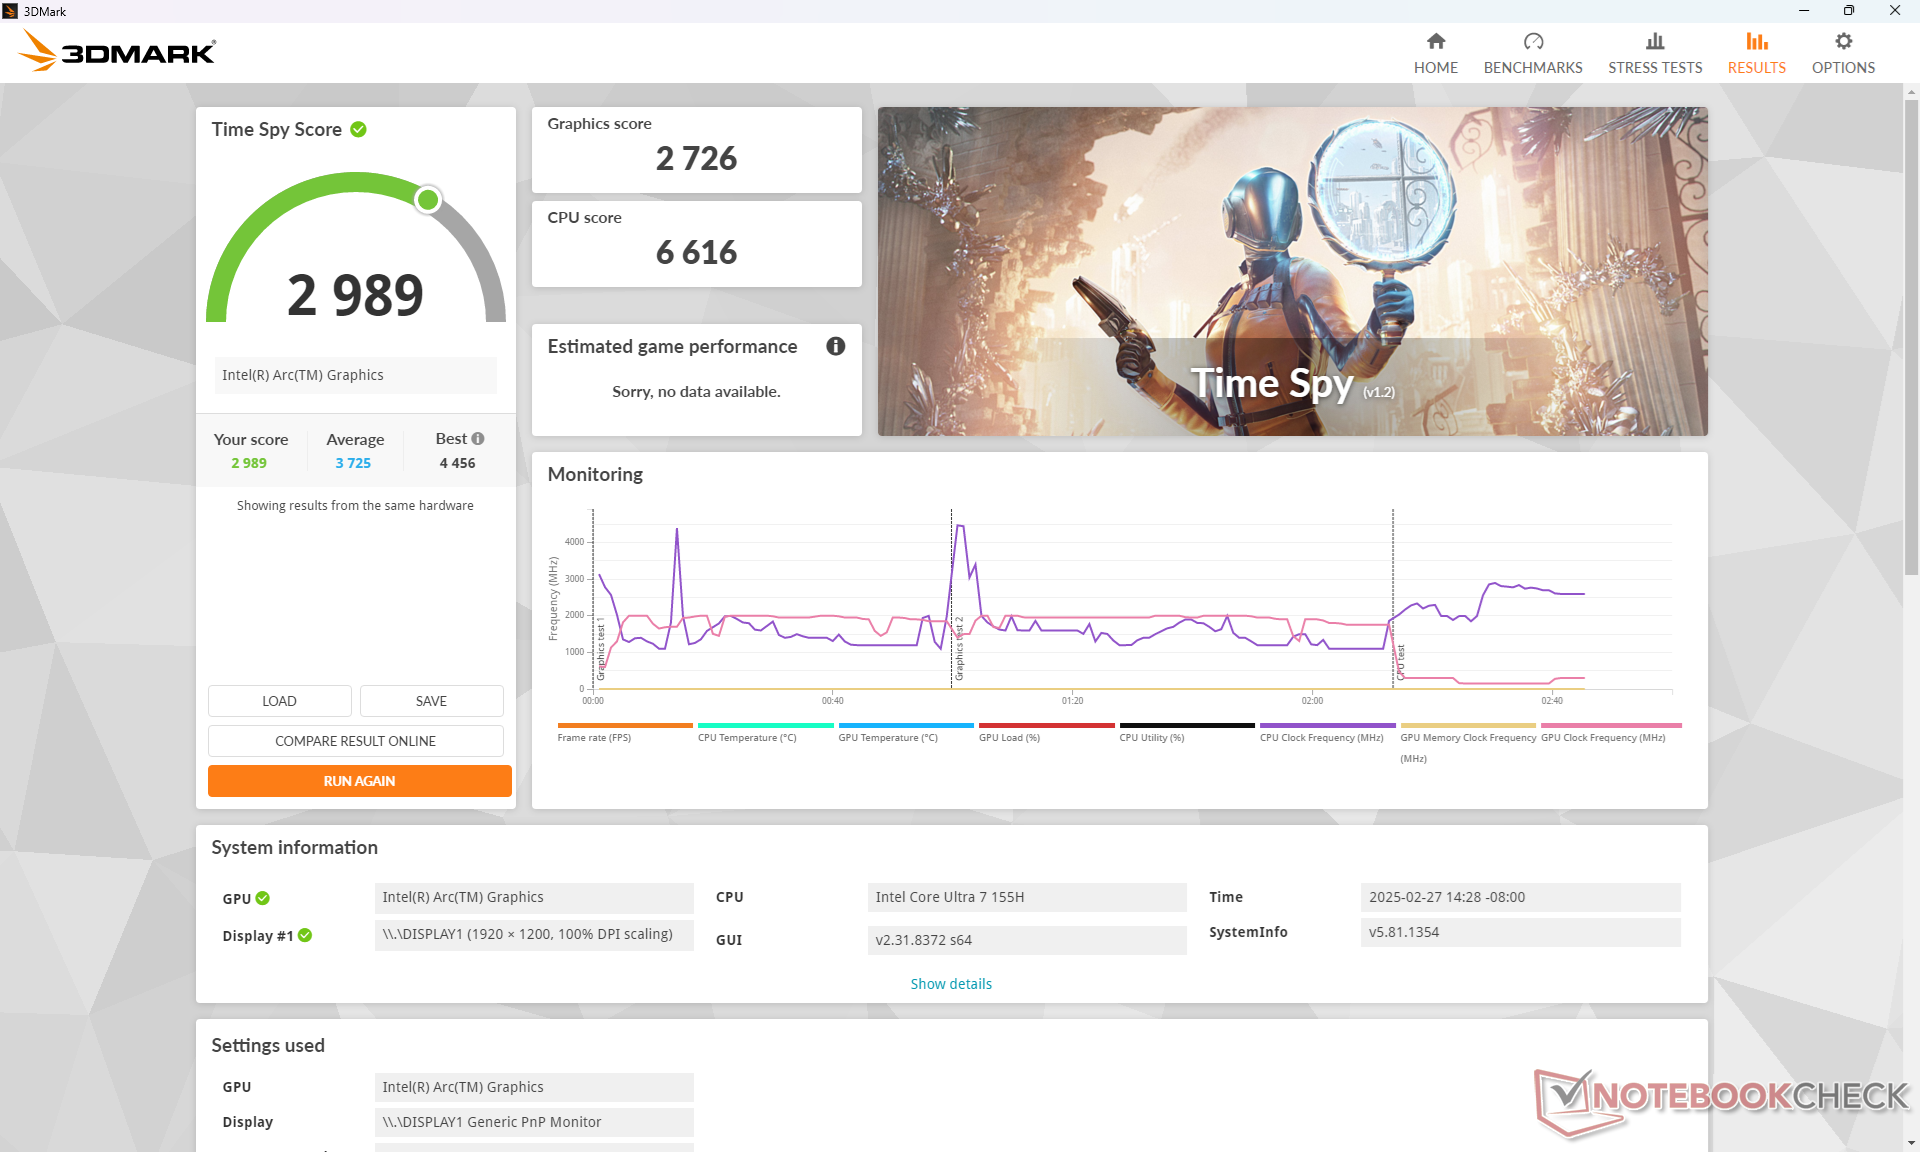
El rendimiento más lento de lo esperado de la CPU mencionado anteriormente ha llevado a un rendimiento gráfico más lento de lo esperado. El Arc 8 de nuestro MSI rinden entre un 15 y un 25 por ciento más lento que la media de los portátiles de nuestra base de datos con los mismos gráficos integrados, según las pruebas de rendimiento 3DMark.
F1 22 y Cyberpunk 2077 se bloqueaban cuando los ajustes se ponían en Alto o Ultra.
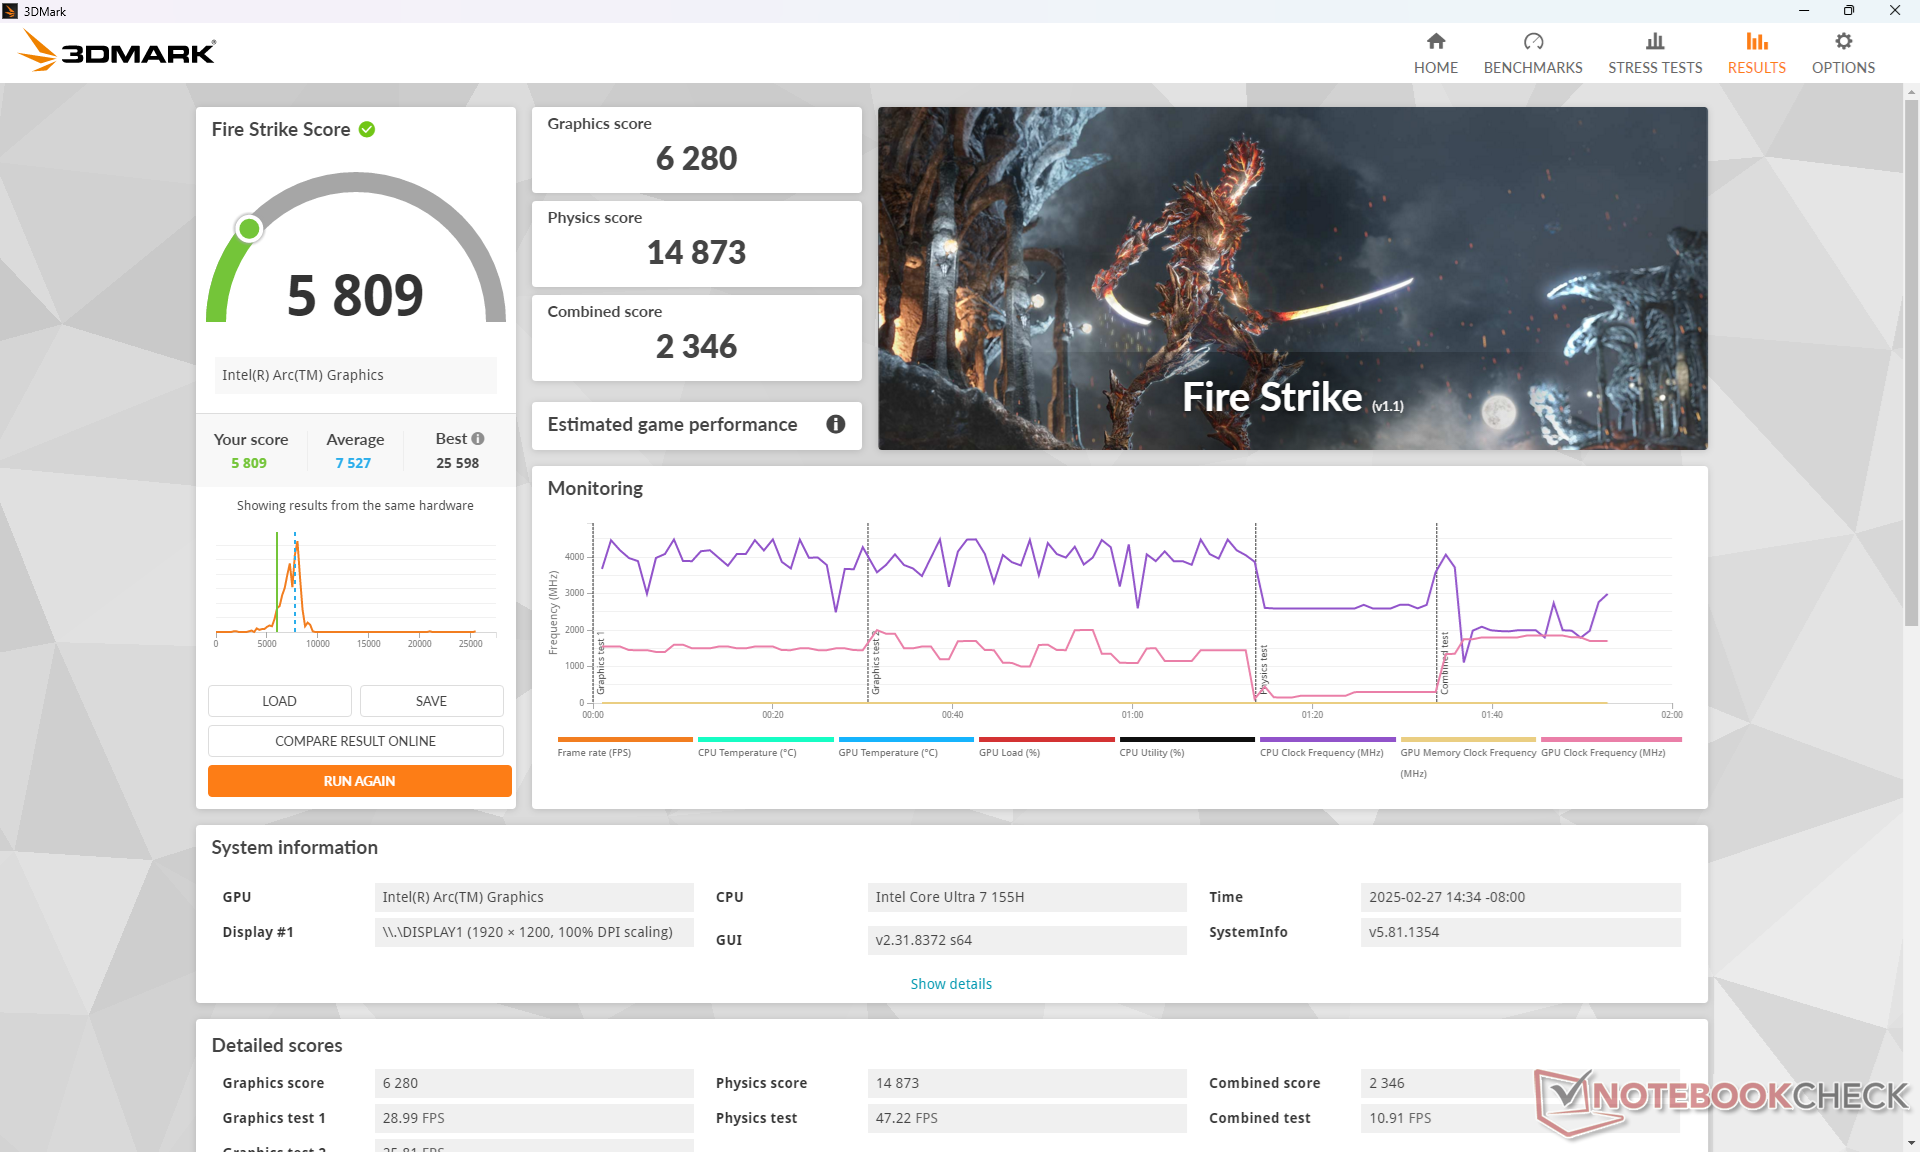
| Perfil de potencia | Puntuación gráfica | Puntuación física | Puntuación combinada |
| Modo Rendimiento | 6280 | 14873 | 2346 |
| Modo equilibrado | 5786 (-8%) | 9842 (-34%) | 1685 (-28%) |
| Batería | 5196 (-17%) | 15031 (-0%) | 2267 (-3%) |
Ejecutar en modo equilibrado puede afectar al rendimiento de la CPU de forma bastante significativa según nuestra tabla de resultados Fire Strike anterior.
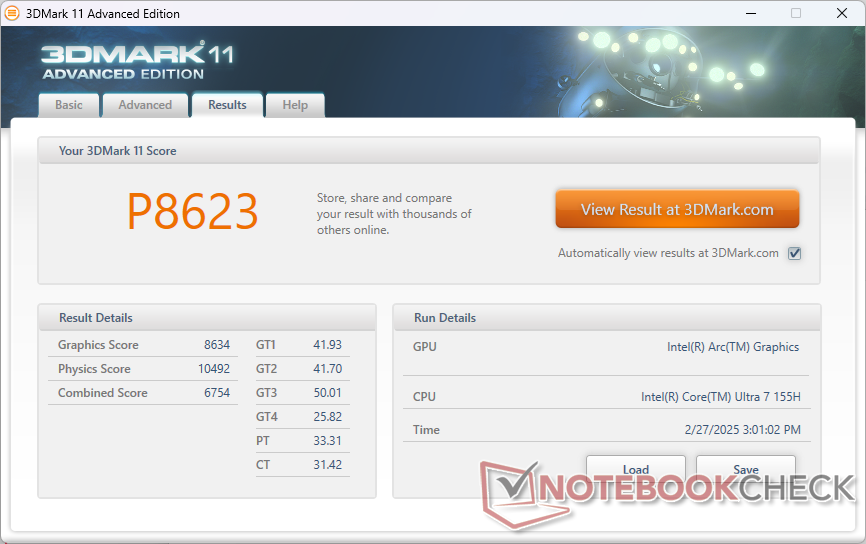
| 3DMark 11 Performance | 8623 puntos | |
| 3DMark Cloud Gate Standard Score | 22120 puntos | |
| 3DMark Fire Strike Score | 5809 puntos | |
| 3DMark Time Spy Score | 2989 puntos | |
ayuda | ||
* ... más pequeño es mejor
Rendimiento en juegos
El rendimiento en juegos es pobre. Además de los déficits de CPU y GPU mencionados anteriormente, los notables problemas de ghosting y tartamudeo pueden distraer incluso al ejecutar títulos poco exigentes como DOTA 2 Reborn.
| Cyberpunk 2077 2.2 Phantom Liberty | |
| 1280x720 Low Preset (FSR off) | |
| MSI Prestige 13 AI Plus Evo A2VMG | |
| Medio Intel Arc 8-Core iGPU (34.5 - 58, n=18) | |
| MSI Summit E13 AI Evo A1MTG | |
| Lenovo Yoga Book 9 13IMU9 | |
| 1920x1080 Low Preset (FSR off) | |
| Asus ROG Flow Z13 GZ302EA-RU073W | |
| MSI Prestige 13 AI Plus Evo A2VMG | |
| Medio Intel Arc 8-Core iGPU (11.3 - 38, n=36) | |
| MSI Summit E13 AI Evo A1MTG | |
| Lenovo Yoga Book 9 13IMU9 | |
| 1920x1080 Medium Preset (FSR off) | |
| Asus ROG Flow Z13 GZ302EA-RU073W | |
| MSI Prestige 13 AI Plus Evo A2VMG | |
| Medio Intel Arc 8-Core iGPU (9.42 - 31.4, n=34) | |
| MSI Summit E13 AI Evo A1MTG | |
| Lenovo Yoga Book 9 13IMU9 | |
| 1920x1080 High Preset (FSR off) | |
| Asus ROG Flow Z13 GZ302EA-RU073W | |
| MSI Prestige 13 AI Plus Evo A2VMG | |
| Medio Intel Arc 8-Core iGPU (7.3 - 27.6, n=34) | |
| Lenovo Yoga Book 9 13IMU9 | |
| 1920x1080 Ultra Preset (FSR off) | |
| Asus ROG Flow Z13 GZ302EA-RU073W | |
| MSI Prestige 13 AI Plus Evo A2VMG | |
| Medio Intel Arc 8-Core iGPU (13 - 24.7, n=26) | |
| Lenovo Yoga Book 9 13IMU9 | |
Cyberpunk 2077 ultra FPS Chart
| bajo | medio | alto | ultra | |
|---|---|---|---|---|
| GTA V (2015) | 50.6 | 51.1 | 23.9 | 12 |
| Dota 2 Reborn (2015) | 93.2 | 83.5 | 65.2 | 63 |
| Final Fantasy XV Benchmark (2018) | 49.2 | 29.4 | 20.7 | |
| X-Plane 11.11 (2018) | 46.2 | 37.5 | 31.4 | |
| Strange Brigade (2018) | 131.2 | 61.3 | 45.7 | 33.9 |
| Tiny Tina's Wonderlands (2022) | 41.5 | 31.7 | 22 | 17.7 |
| F1 22 (2022) | 57.8 | 53.5 | ||
| Baldur's Gate 3 (2023) | 22.8 | 19.5 | 16.8 | 16.3 |
| Cyberpunk 2077 2.2 Phantom Liberty (2023) | 28.3 | 23.4 |
Emisiones
Ruido del sistema
El ruido del ventilador es silencioso cuando sólo se navega o se hace streaming, pero aumenta con bastante rapidez cuando se introducen cargas más elevadas. Además, el ruido es relativamente agudo, por lo que cualquier cambio en las RPM tiende a notarse. Los ventiladores son más ruidosos que en la mayoría de los demás portátiles profesionales de 13 pulgadas cuando se ejecutan cargas exigentes como juegos, debido a que la CPU Core Ultra-H es más exigente.
Ruido
| Ocioso |
| 24.1 / 24.8 / 26.5 dB(A) |
| Carga |
| 39.3 / 49.1 dB(A) |
 | ||
30 dB silencioso 40 dB(A) audible 50 dB(A) ruidosamente alto |
||
min: | ||
| MSI Summit E13 AI Evo A1MTG Arc 8-Core, Ultra 7 155H, Micron 2400 MTFDKBA1T0QFM | MSI Summit E13 Flip Evo A11MT Iris Xe G7 96EUs, i7-1185G7, Phison 1TB SM2801T24GKBB4S-E162 | Lenovo Yoga Book 9 13IMU9 Graphics 4-Core, Ultra 7 155U | Lenovo ThinkPad L13 Yoga G4 i7-1355U Iris Xe G7 96EUs, i7-1355U, Samsung PM9B1 512GB MZAL4512HBLU | HP Elite Dragonfly Folio 13.5 G3 Iris Xe G7 96EUs, i7-1265U, Samsung PM9A1 MZVL2512HCJQ | Dell Latitude 9330 Iris Xe G7 96EUs, i7-1260U | |
|---|---|---|---|---|---|---|
| Noise | 0% | 16% | 11% | 11% | 9% | |
| apagado / medio ambiente * | 24 | 24.5 -2% | 23.3 3% | 23.1 4% | 24.6 -3% | 23 4% |
| Idle Minimum * | 24.1 | 24.7 -2% | 23.3 3% | 23.4 3% | 24.6 -2% | 23 5% |
| Idle Average * | 24.8 | 24.7 -0% | 23.3 6% | 23.4 6% | 24.6 1% | 23.1 7% |
| Idle Maximum * | 26.5 | 26.4 -0% | 24.6 7% | 23.4 12% | 24.6 7% | 23.1 13% |
| Load Average * | 39.3 | 37.8 4% | 26.2 33% | 33.9 14% | 27.8 29% | 37.1 6% |
| Cyberpunk 2077 ultra * | 45 | |||||
| Load Maximum * | 49.1 | 48.8 1% | 27.3 44% | 36.9 25% | 33.4 32% | 40.5 18% |
| Witcher 3 ultra * | 41.4 | 27.3 | 36.9 | 33.4 | 40.6 |
* ... más pequeño es mejor
Temperatura
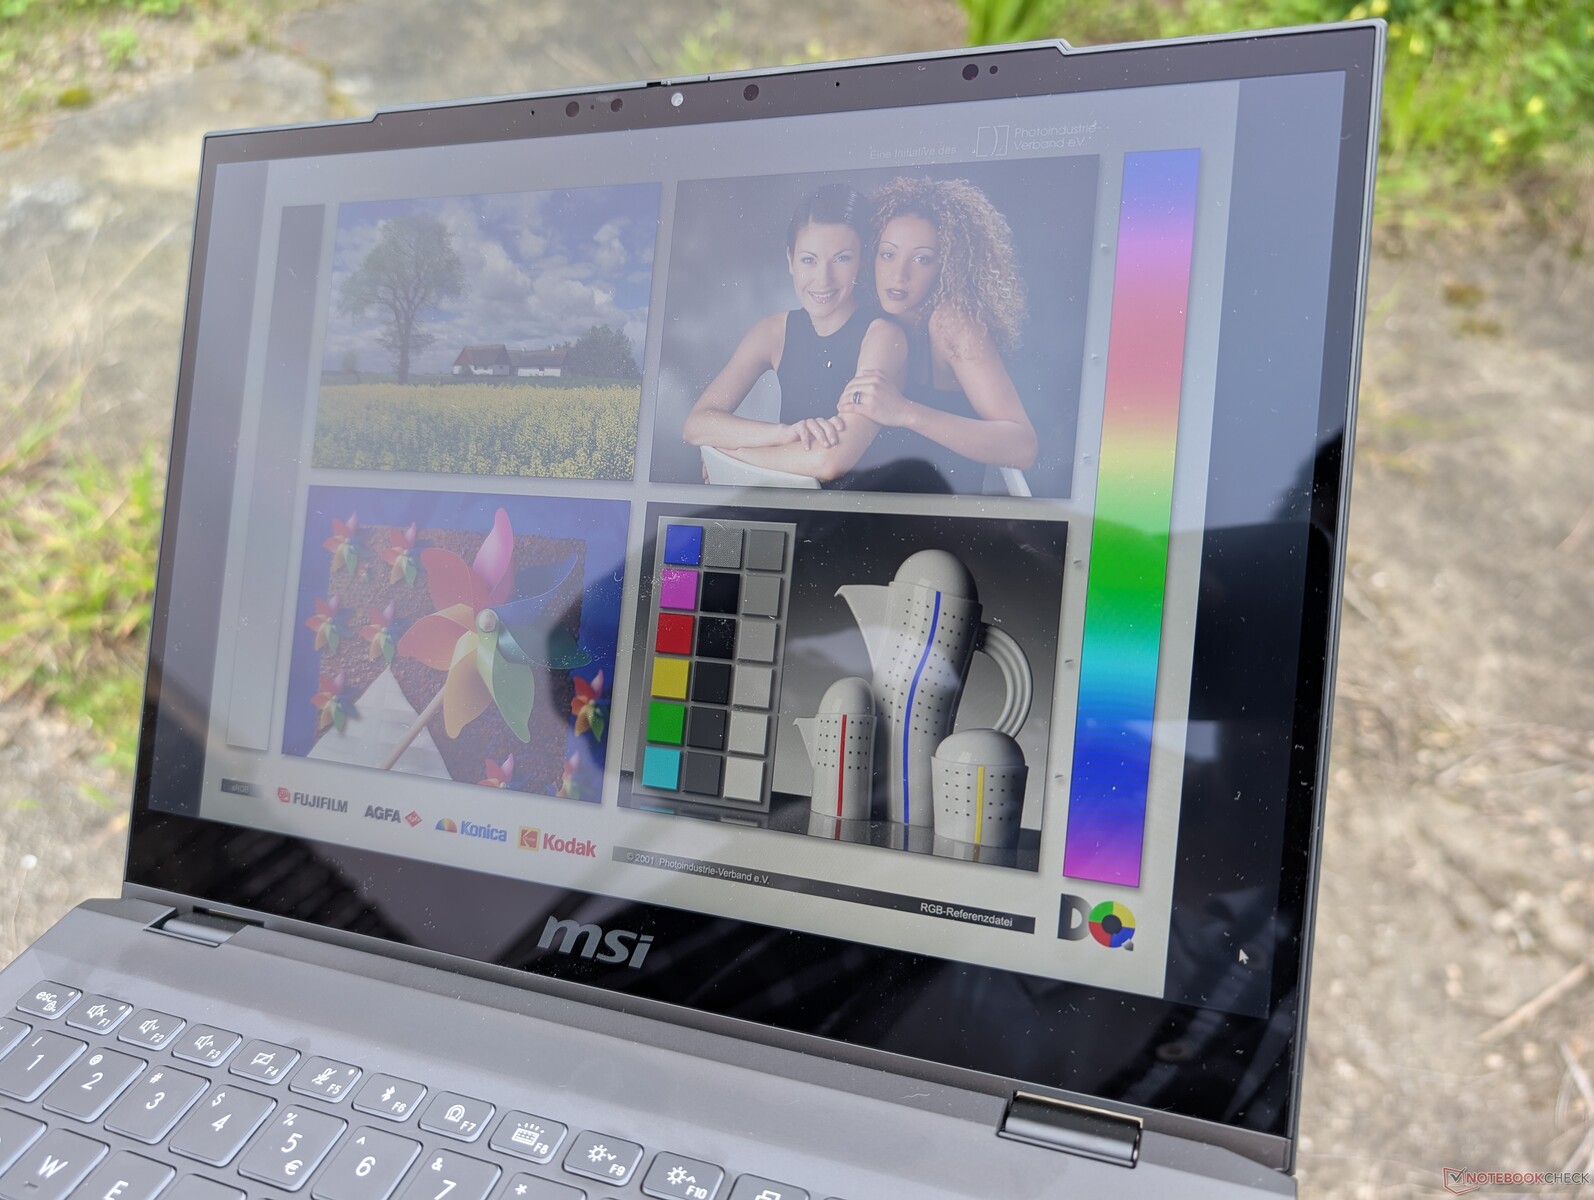
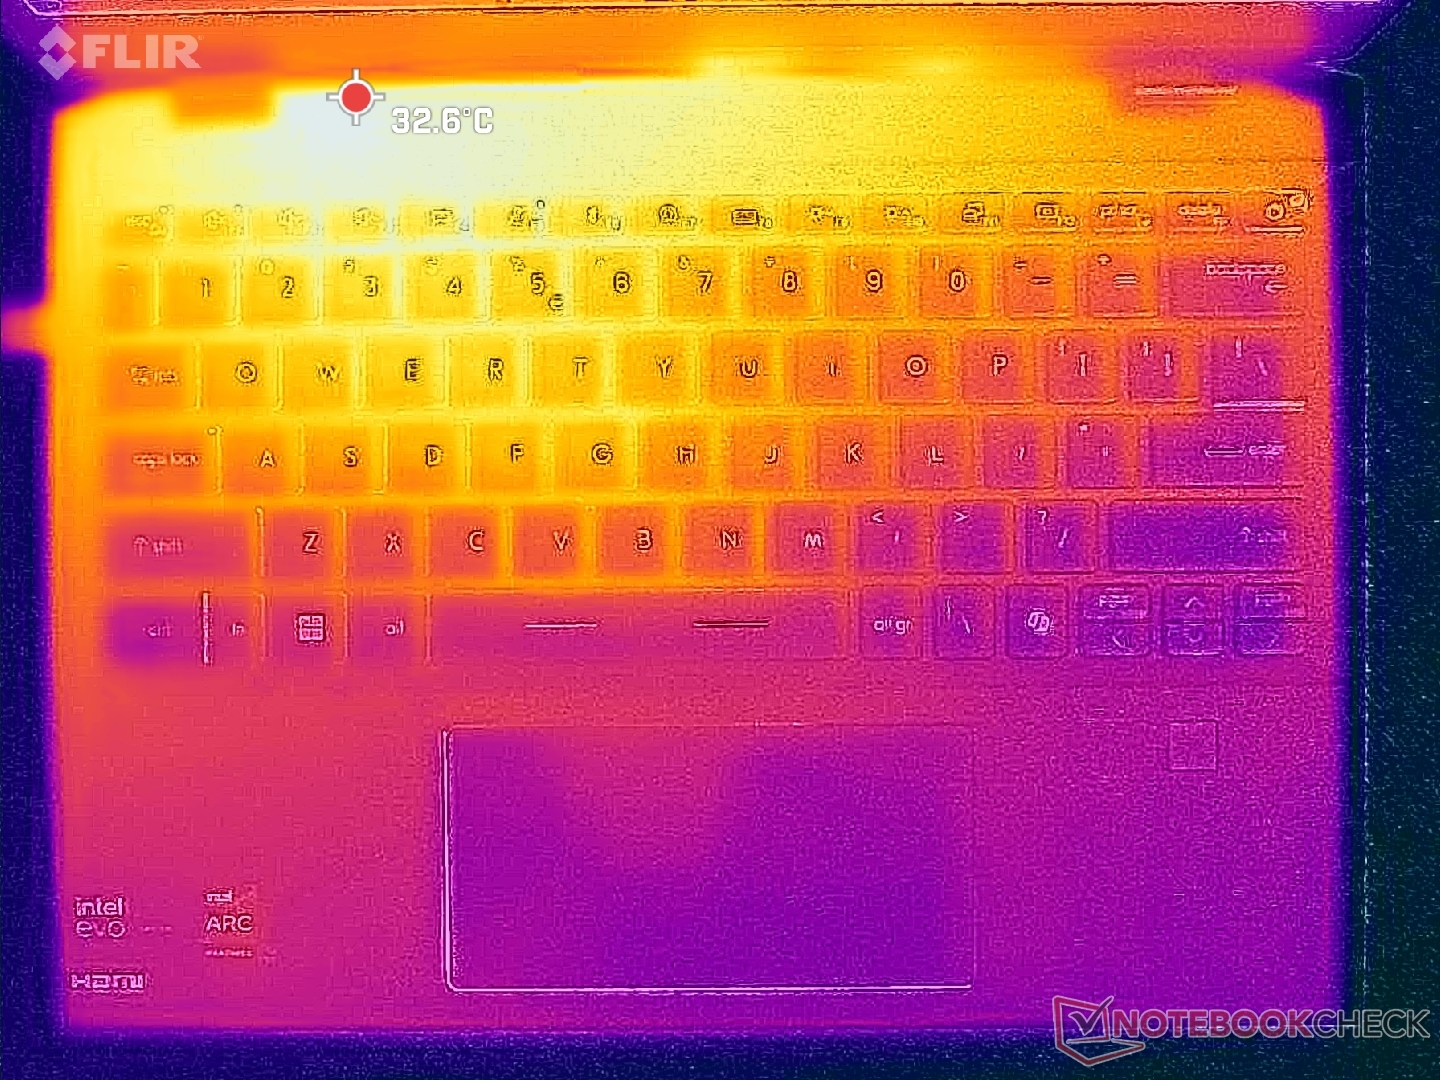
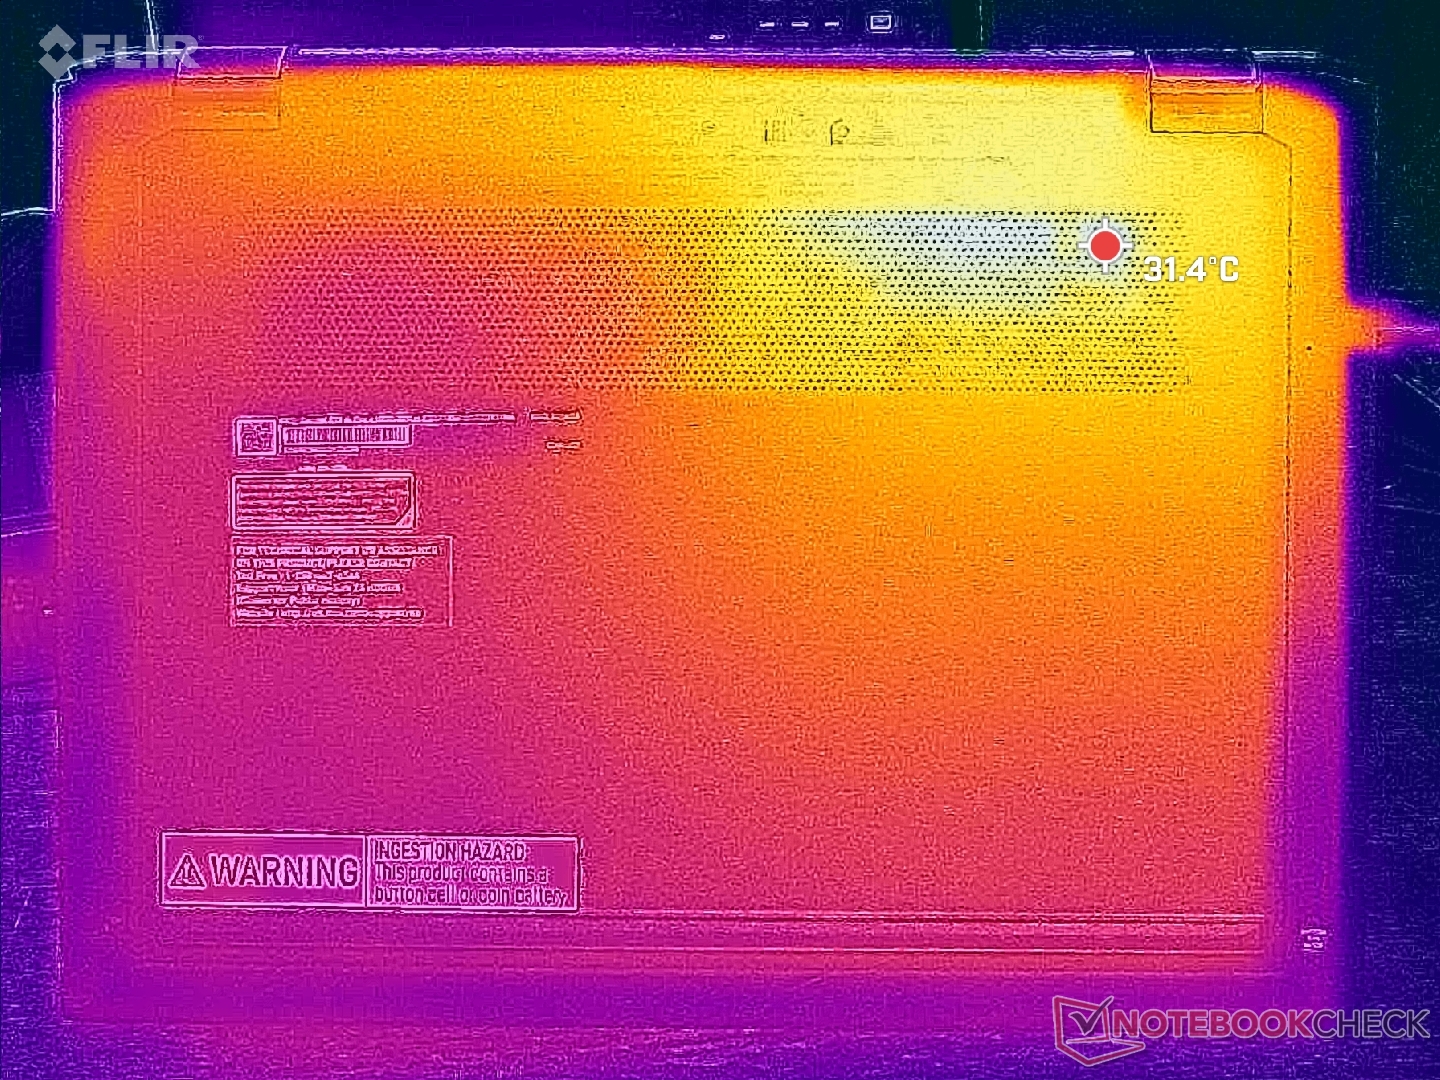
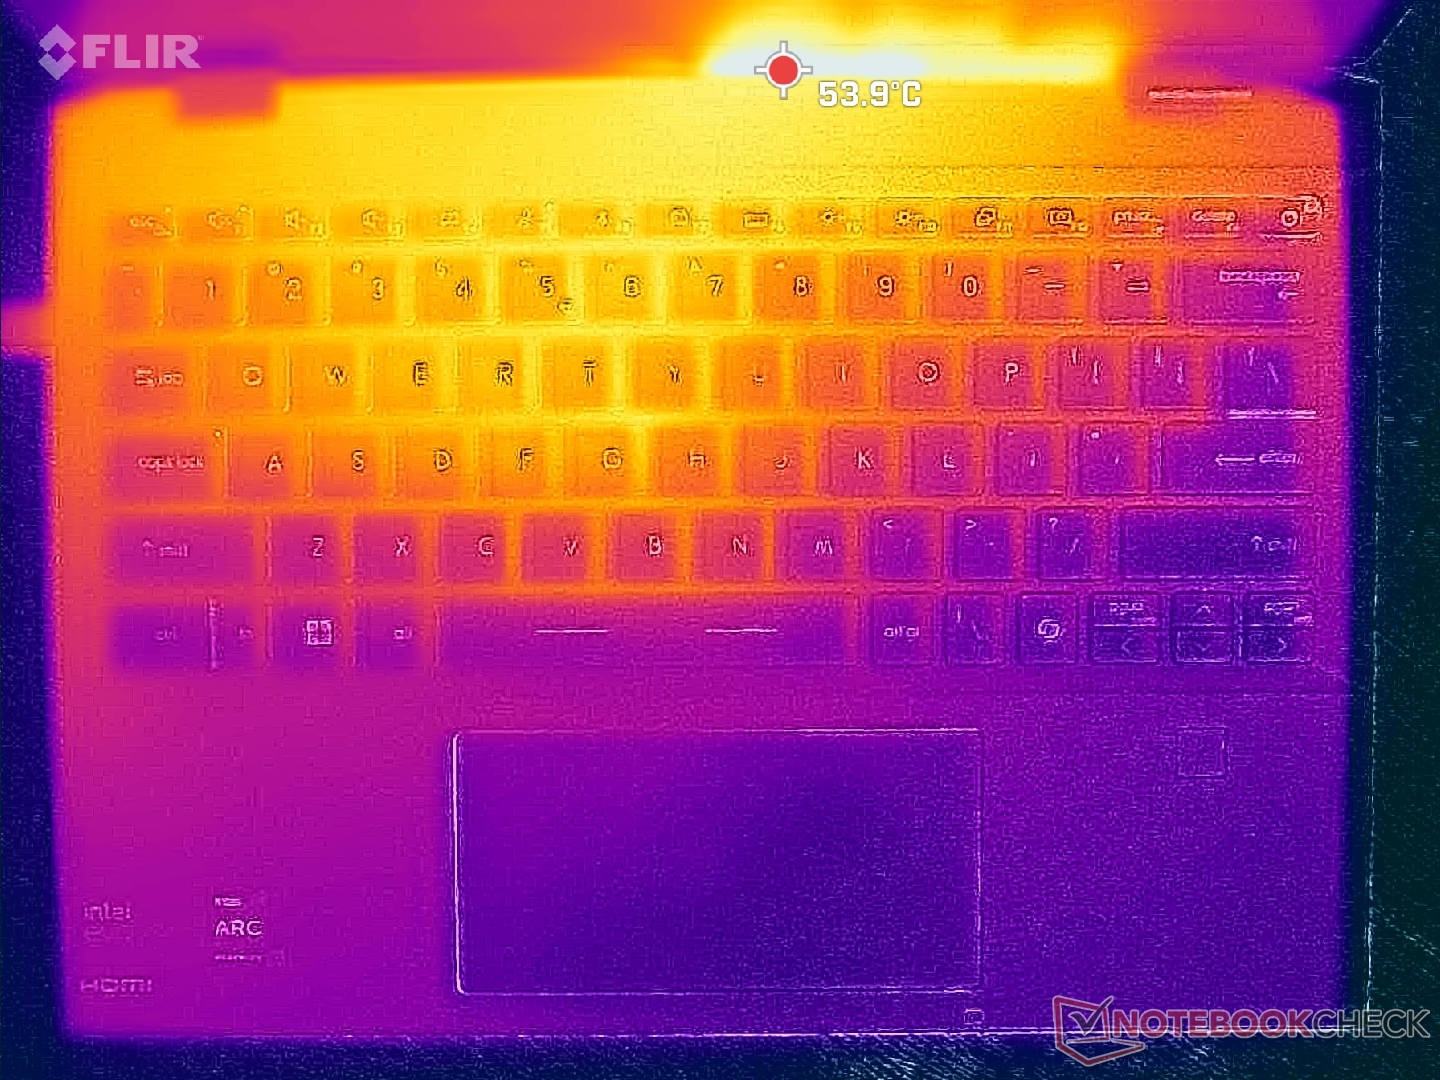
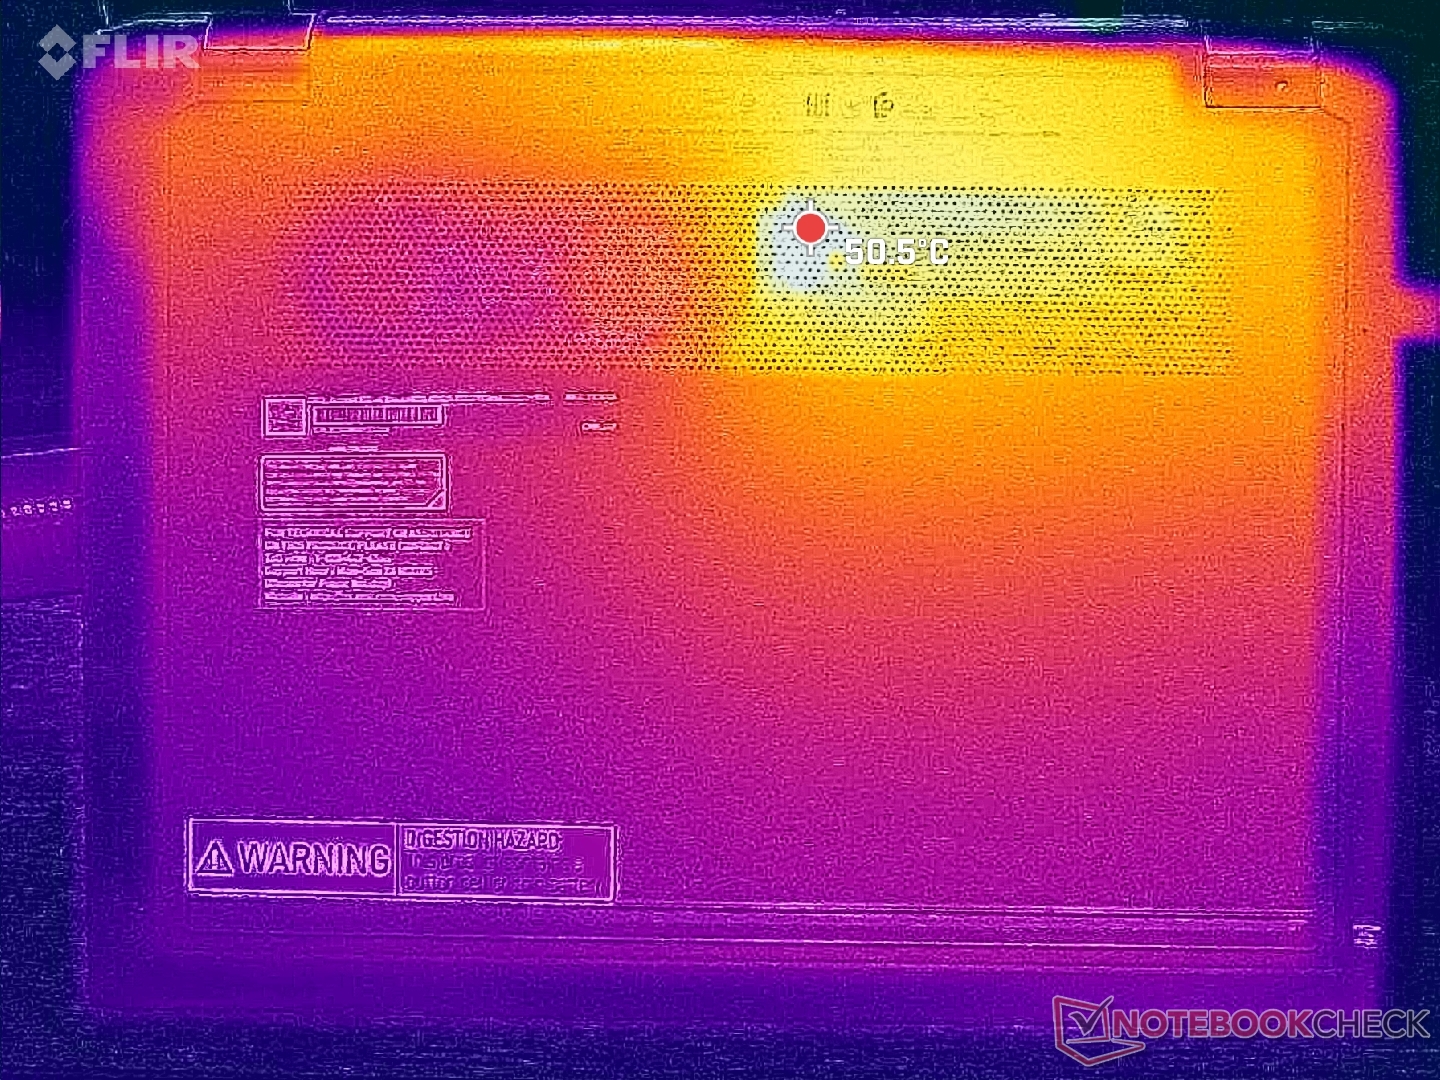
Las temperaturas de la superficie son muy cálidas incluso cuando está simplemente al ralentí en el escritorio. Los puntos calientes oscilarían entre los 36 C en ralentí hasta más de 45 C cuando se ejecutan cargas exigentes, lo que resulta más cálido que en la mayoría de los demás convertibles de 13 pulgadas.
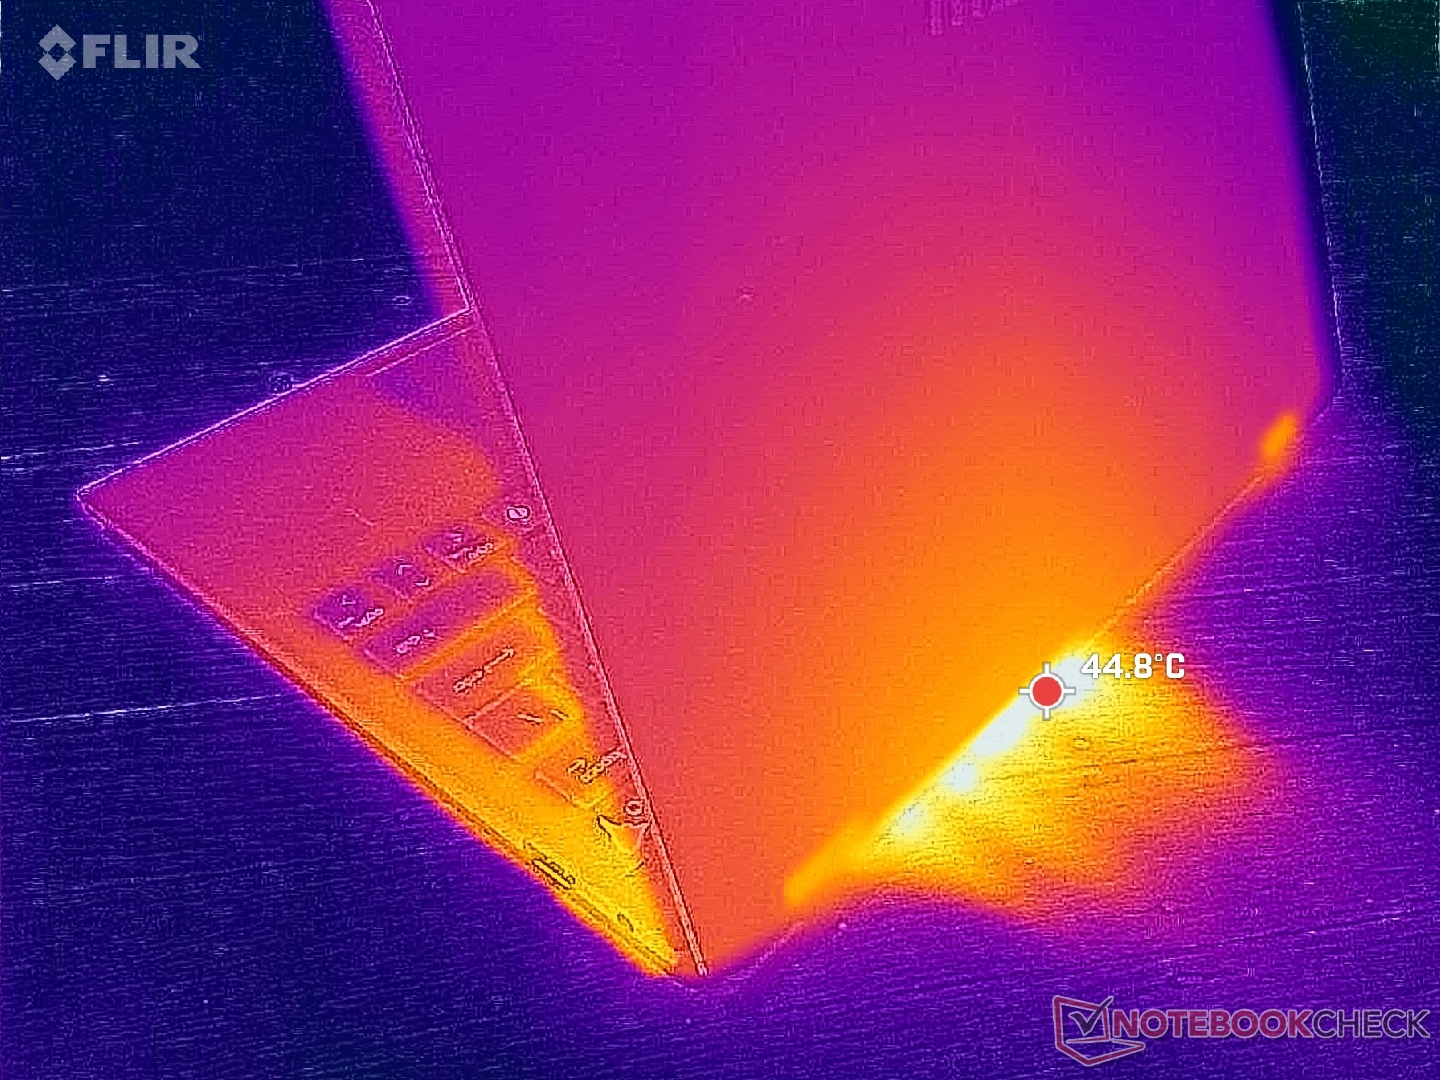
(-) La temperatura máxima en la parte superior es de 45.2 °C / 113 F, frente a la media de 35.4 °C / 96 F, que oscila entre 19.6 y 60 °C para la clase Convertible.
(±) El fondo se calienta hasta un máximo de 44.8 °C / 113 F, frente a la media de 36.8 °C / 98 F
(+) En reposo, la temperatura media de la parte superior es de 30.1 °C / 86# F, frente a la media del dispositivo de 30.2 °C / 86 F.
(+) El reposamanos y el panel táctil están a una temperatura inferior a la de la piel, con un máximo de 28.8 °C / 83.8 F y, por tanto, son fríos al tacto.
(±) La temperatura media de la zona del reposamanos de dispositivos similares fue de 28 °C / 82.4 F (-0.8 °C / -1.4 F).
| MSI Summit E13 AI Evo A1MTG Intel Core Ultra 7 155H, Intel Arc 8-Core iGPU | MSI Summit E13 Flip Evo A11MT Intel Core i7-1185G7, Intel Iris Xe Graphics G7 96EUs | Lenovo Yoga Book 9 13IMU9 Intel Core Ultra 7 155U, Intel Graphics 4-Core iGPU (Arc) | Lenovo ThinkPad L13 Yoga G4 i7-1355U Intel Core i7-1355U, Intel Iris Xe Graphics G7 96EUs | HP Elite Dragonfly Folio 13.5 G3 Intel Core i7-1265U, Intel Iris Xe Graphics G7 96EUs | Dell Latitude 9330 Intel Core i7-1260U, Intel Iris Xe Graphics G7 96EUs | |
|---|---|---|---|---|---|---|
| Heat | -7% | 10% | 6% | 28% | 12% | |
| Maximum Upper Side * | 45.2 | 52 -15% | 39.2 13% | 38.4 15% | 32.8 27% | 40.6 10% |
| Maximum Bottom * | 44.8 | 57.4 -28% | 41 8% | 46 -3% | 33.4 25% | 50.2 -12% |
| Idle Upper Side * | 34.8 | 30.4 13% | 32.2 7% | 31.2 10% | 24.6 29% | 25 28% |
| Idle Bottom * | 35.8 | 34.2 4% | 31.6 12% | 34.8 3% | 24.6 31% | 27.6 23% |
* ... más pequeño es mejor
Altavoces
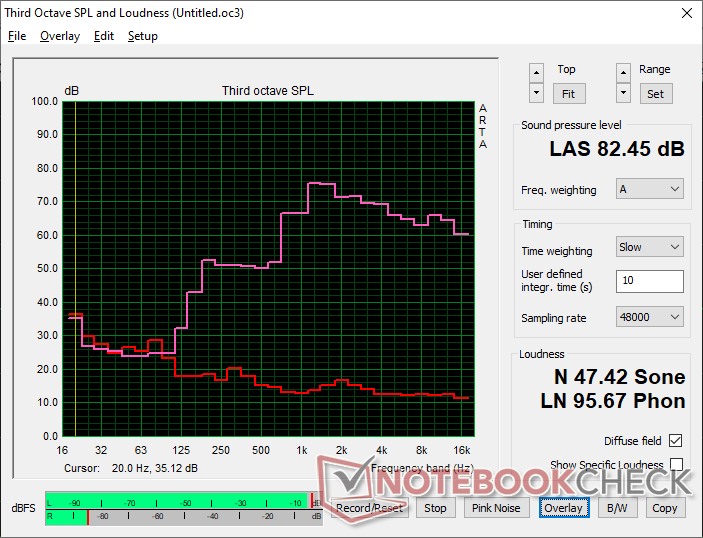
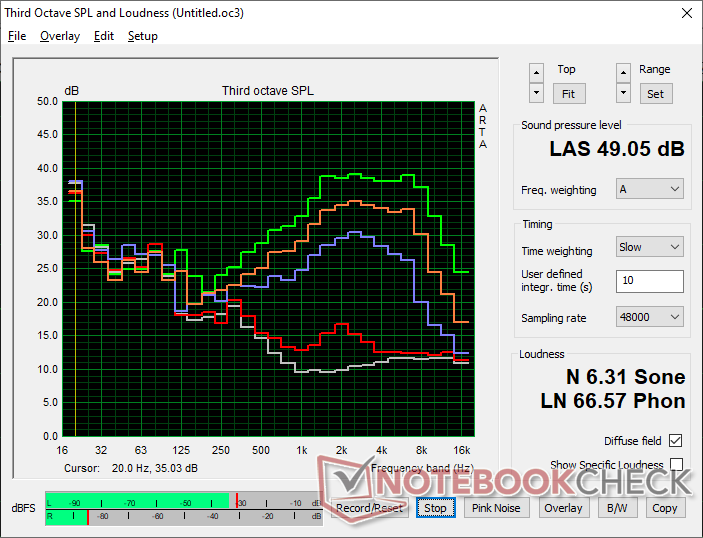
MSI Summit E13 AI Evo A1MTG análisis de audio
(+) | los altavoces pueden reproducir a un volumen relativamente alto (#82.5 dB)
Graves 100 - 315 Hz
(-) | casi sin bajos - de media 21.9% inferior a la mediana
(±) | la linealidad de los graves es media (9.9% delta a frecuencia anterior)
Medios 400 - 2000 Hz
(±) | medios reducidos - de media 9.2% inferior a la mediana
(±) | la linealidad de los medios es media (7.6% delta respecto a la frecuencia anterior)
Altos 2 - 16 kHz
(+) | máximos equilibrados - a sólo 3.2% de la mediana
(+) | los máximos son lineales (3.3% delta a la frecuencia anterior)
Total 100 - 16.000 Hz
(±) | la linealidad del sonido global es media (21.4% de diferencia con la mediana)
En comparación con la misma clase
» 55% de todos los dispositivos probados de esta clase eran mejores, 12% similares, 33% peores
» El mejor tuvo un delta de 6%, la media fue 20%, el peor fue ###max##%
En comparación con todos los dispositivos probados
» 57% de todos los dispositivos probados eran mejores, 7% similares, 35% peores
» El mejor tuvo un delta de 4%, la media fue 24%, el peor fue ###max##%
Apple MacBook Pro 16 2021 M1 Pro análisis de audio
(+) | los altavoces pueden reproducir a un volumen relativamente alto (#84.7 dB)
Graves 100 - 315 Hz
(+) | buen bajo - sólo 3.8% lejos de la mediana
(+) | el bajo es lineal (5.2% delta a la frecuencia anterior)
Medios 400 - 2000 Hz
(+) | medios equilibrados - a sólo 1.3% de la mediana
(+) | los medios son lineales (2.1% delta a la frecuencia anterior)
Altos 2 - 16 kHz
(+) | máximos equilibrados - a sólo 1.9% de la mediana
(+) | los máximos son lineales (2.7% delta a la frecuencia anterior)
Total 100 - 16.000 Hz
(+) | el sonido global es lineal (4.6% de diferencia con la mediana)
En comparación con la misma clase
» 0% de todos los dispositivos probados de esta clase eran mejores, 0% similares, 100% peores
» El mejor tuvo un delta de 5%, la media fue 18%, el peor fue ###max##%
En comparación con todos los dispositivos probados
» 0% de todos los dispositivos probados eran mejores, 0% similares, 100% peores
» El mejor tuvo un delta de 4%, la media fue 24%, el peor fue ###max##%
Gestión de la energía
Consumo de energía
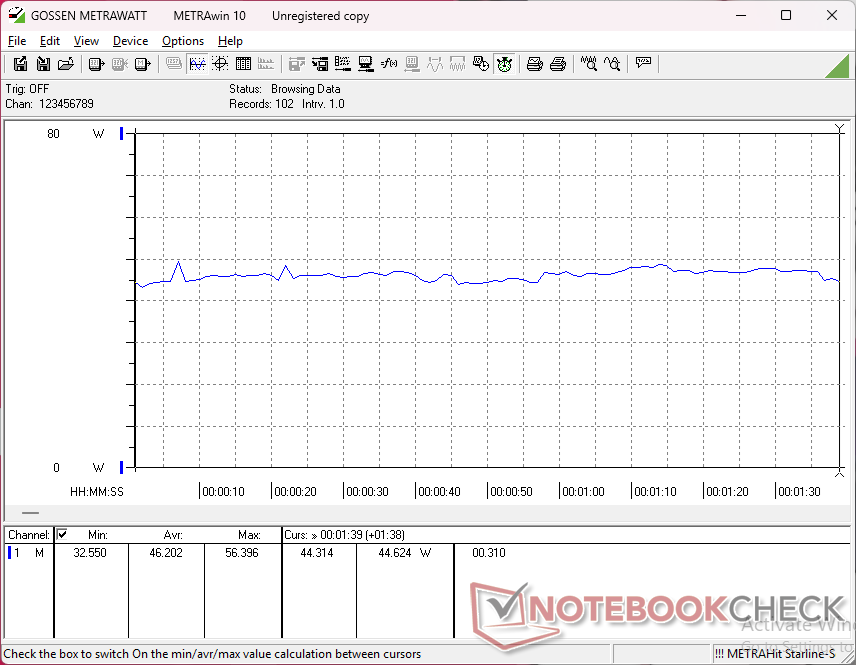
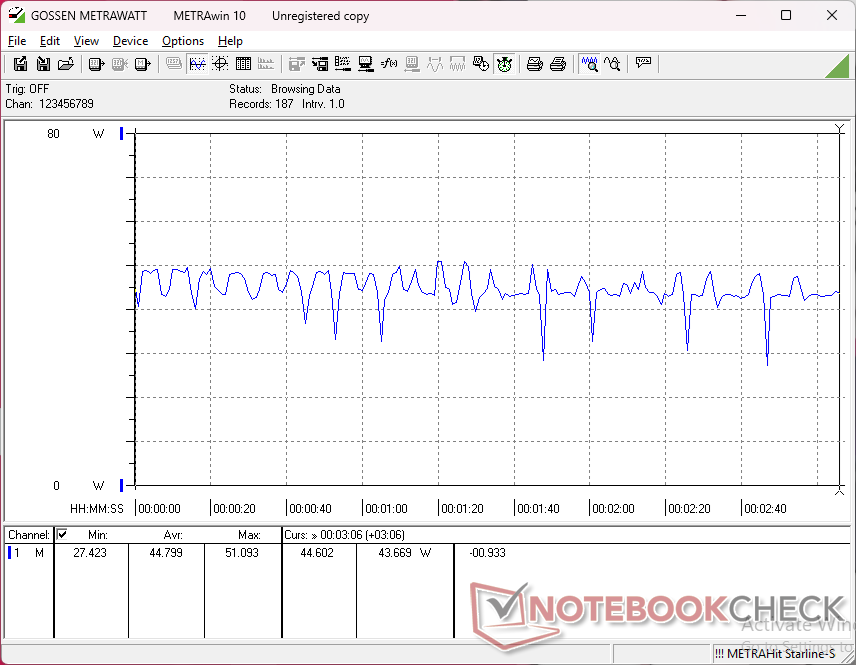
El consumo de energía puede ser inestable cuando se ejecutan cargas de GPU exigentes como Cyberpunk 2077 , lo que concuerda con los tartamudeos de la velocidad de fotogramas señalados anteriormente. Esto contrasta con el Marco 13.5 que viene con exactamente la misma CPU Core Ultra 7 155H pero con un consumo mucho más estable bajo carga.
| Off / Standby | |
| Ocioso | |
| Carga |
|
Clave:
min: | |
| MSI Summit E13 AI Evo A1MTG Ultra 7 155H, Arc 8-Core, Micron 2400 MTFDKBA1T0QFM, IPS, 1920x1200, 13.3" | MSI Summit E13 Flip Evo A11MT i7-1185G7, Iris Xe G7 96EUs, Phison 1TB SM2801T24GKBB4S-E162, IPS, 1920x1200, 13.4" | Lenovo Yoga Book 9 13IMU9 Ultra 7 155U, Graphics 4-Core, , OLED, 2880x1800, 13.3" | Lenovo ThinkPad L13 Yoga G4 i7-1355U i7-1355U, Iris Xe G7 96EUs, Samsung PM9B1 512GB MZAL4512HBLU, IPS, 1920x1200, 13.3" | HP Elite Dragonfly Folio 13.5 G3 i7-1265U, Iris Xe G7 96EUs, Samsung PM9A1 MZVL2512HCJQ, IPS, 1920x1280, 13.5" | Dell Latitude 9330 i7-1260U, Iris Xe G7 96EUs, , IPS, 2560x1600, 13.3" | |
|---|---|---|---|---|---|---|
| Power Consumption | -52% | -116% | -59% | -26% | -40% | |
| Idle Minimum * | 2.3 | 4.8 -109% | 7.1 -209% | 5.5 -139% | 3.4 -48% | 4.7 -104% |
| Idle Average * | 4.8 | 8.4 -75% | 9.1 -90% | 8.3 -73% | 4.9 -2% | 8.2 -71% |
| Idle Maximum * | 5 | 8.6 -72% | 18.4 -268% | 9.1 -82% | 9.3 -86% | 8.4 -68% |
| Load Average * | 46.2 | 47.1 -2% | 51.3 -11% | 49.9 -8% | 41.9 9% | 36.8 20% |
| Cyberpunk 2077 ultra external monitor * | 41.9 | |||||
| Cyberpunk 2077 ultra * | 44.8 | |||||
| Load Maximum * | 65 | 65.9 -1% | 65.5 -1% | 60 8% | 67.5 -4% | 49.9 23% |
| Witcher 3 ultra * | 51.6 | 41.5 | 42.4 | 36.4 | 30.4 |
* ... más pequeño es mejor
Power Consumption Cyberpunk / Stress Test
Power Consumption external Monitor
Duración de las pilas
La autonomía WLAN es un par de horas más corta que en el Summit E13 más antiguo, pero sigue siendo buena en general, con casi 9,5 horas de uso en condiciones reales.
| MSI Summit E13 AI Evo A1MTG Ultra 7 155H, Arc 8-Core, 70 Wh | MSI Summit E13 Flip Evo A11MT i7-1185G7, Iris Xe G7 96EUs, 70 Wh | Lenovo Yoga Book 9 13IMU9 Ultra 7 155U, Graphics 4-Core, 80 Wh | Lenovo ThinkPad L13 Yoga G4 i7-1355U i7-1355U, Iris Xe G7 96EUs, 46 Wh | HP Elite Dragonfly Folio 13.5 G3 i7-1265U, Iris Xe G7 96EUs, 53 Wh | Dell Latitude 9330 i7-1260U, Iris Xe G7 96EUs, 50 Wh | |
|---|---|---|---|---|---|---|
| Duración de Batería | 18% | 7% | -35% | -1% | -1% | |
| WiFi v1.3 | 568 | 672 18% | 608 7% | 371 -35% | 565 -1% | 564 -1% |
| Reader / Idle | 1267 | 1637 | 923 | |||
| Load | 109 | 158 | 140 |
Valoración de Notebookcheck
MSI Summit E13 AI Evo A1MTG
- 03/04/2025 v8
Allen Ngo
 Total Sustainability Score:
 Transparencia
Nuestro equipo editorial se encarga de seleccionar los dispositivos que se someten a revisión. La muestra de prueba fue adquirida libremente por el autor a sus expensas. El prestamista no influyó en esta reseña, ni el fabricante recibió una copia de la misma antes de su publicación. No había ninguna obligación de publicar esta reseña. Nunca aceptamos compensaciones o pagos a cambio de nuestras reseñas. Como empresa de medios independiente, Notebookcheck no está sujeta a la autoridad de fabricantes, minoristas o editores.
Así es como prueba Notebookcheck
Cada año, Notebookcheck revisa de forma independiente cientos de portátiles y smartphones utilizando procedimientos estandarizados para asegurar que todos los resultados son comparables. Hemos desarrollado continuamente nuestros métodos de prueba durante unos 20 años y hemos establecido los estándares de la industria en el proceso. En nuestros laboratorios de pruebas, técnicos y editores experimentados utilizan equipos de medición de alta calidad. Estas pruebas implican un proceso de validación en varias fases. Nuestro complejo sistema de clasificación se basa en cientos de mediciones y puntos de referencia bien fundamentados, lo que mantiene la objetividad.
