

Análisis del portátil MSI Katana A17 AI: Gráficos potentes defraudados por una pantalla débil
La pantalla base 1080p deja mucho que desear.
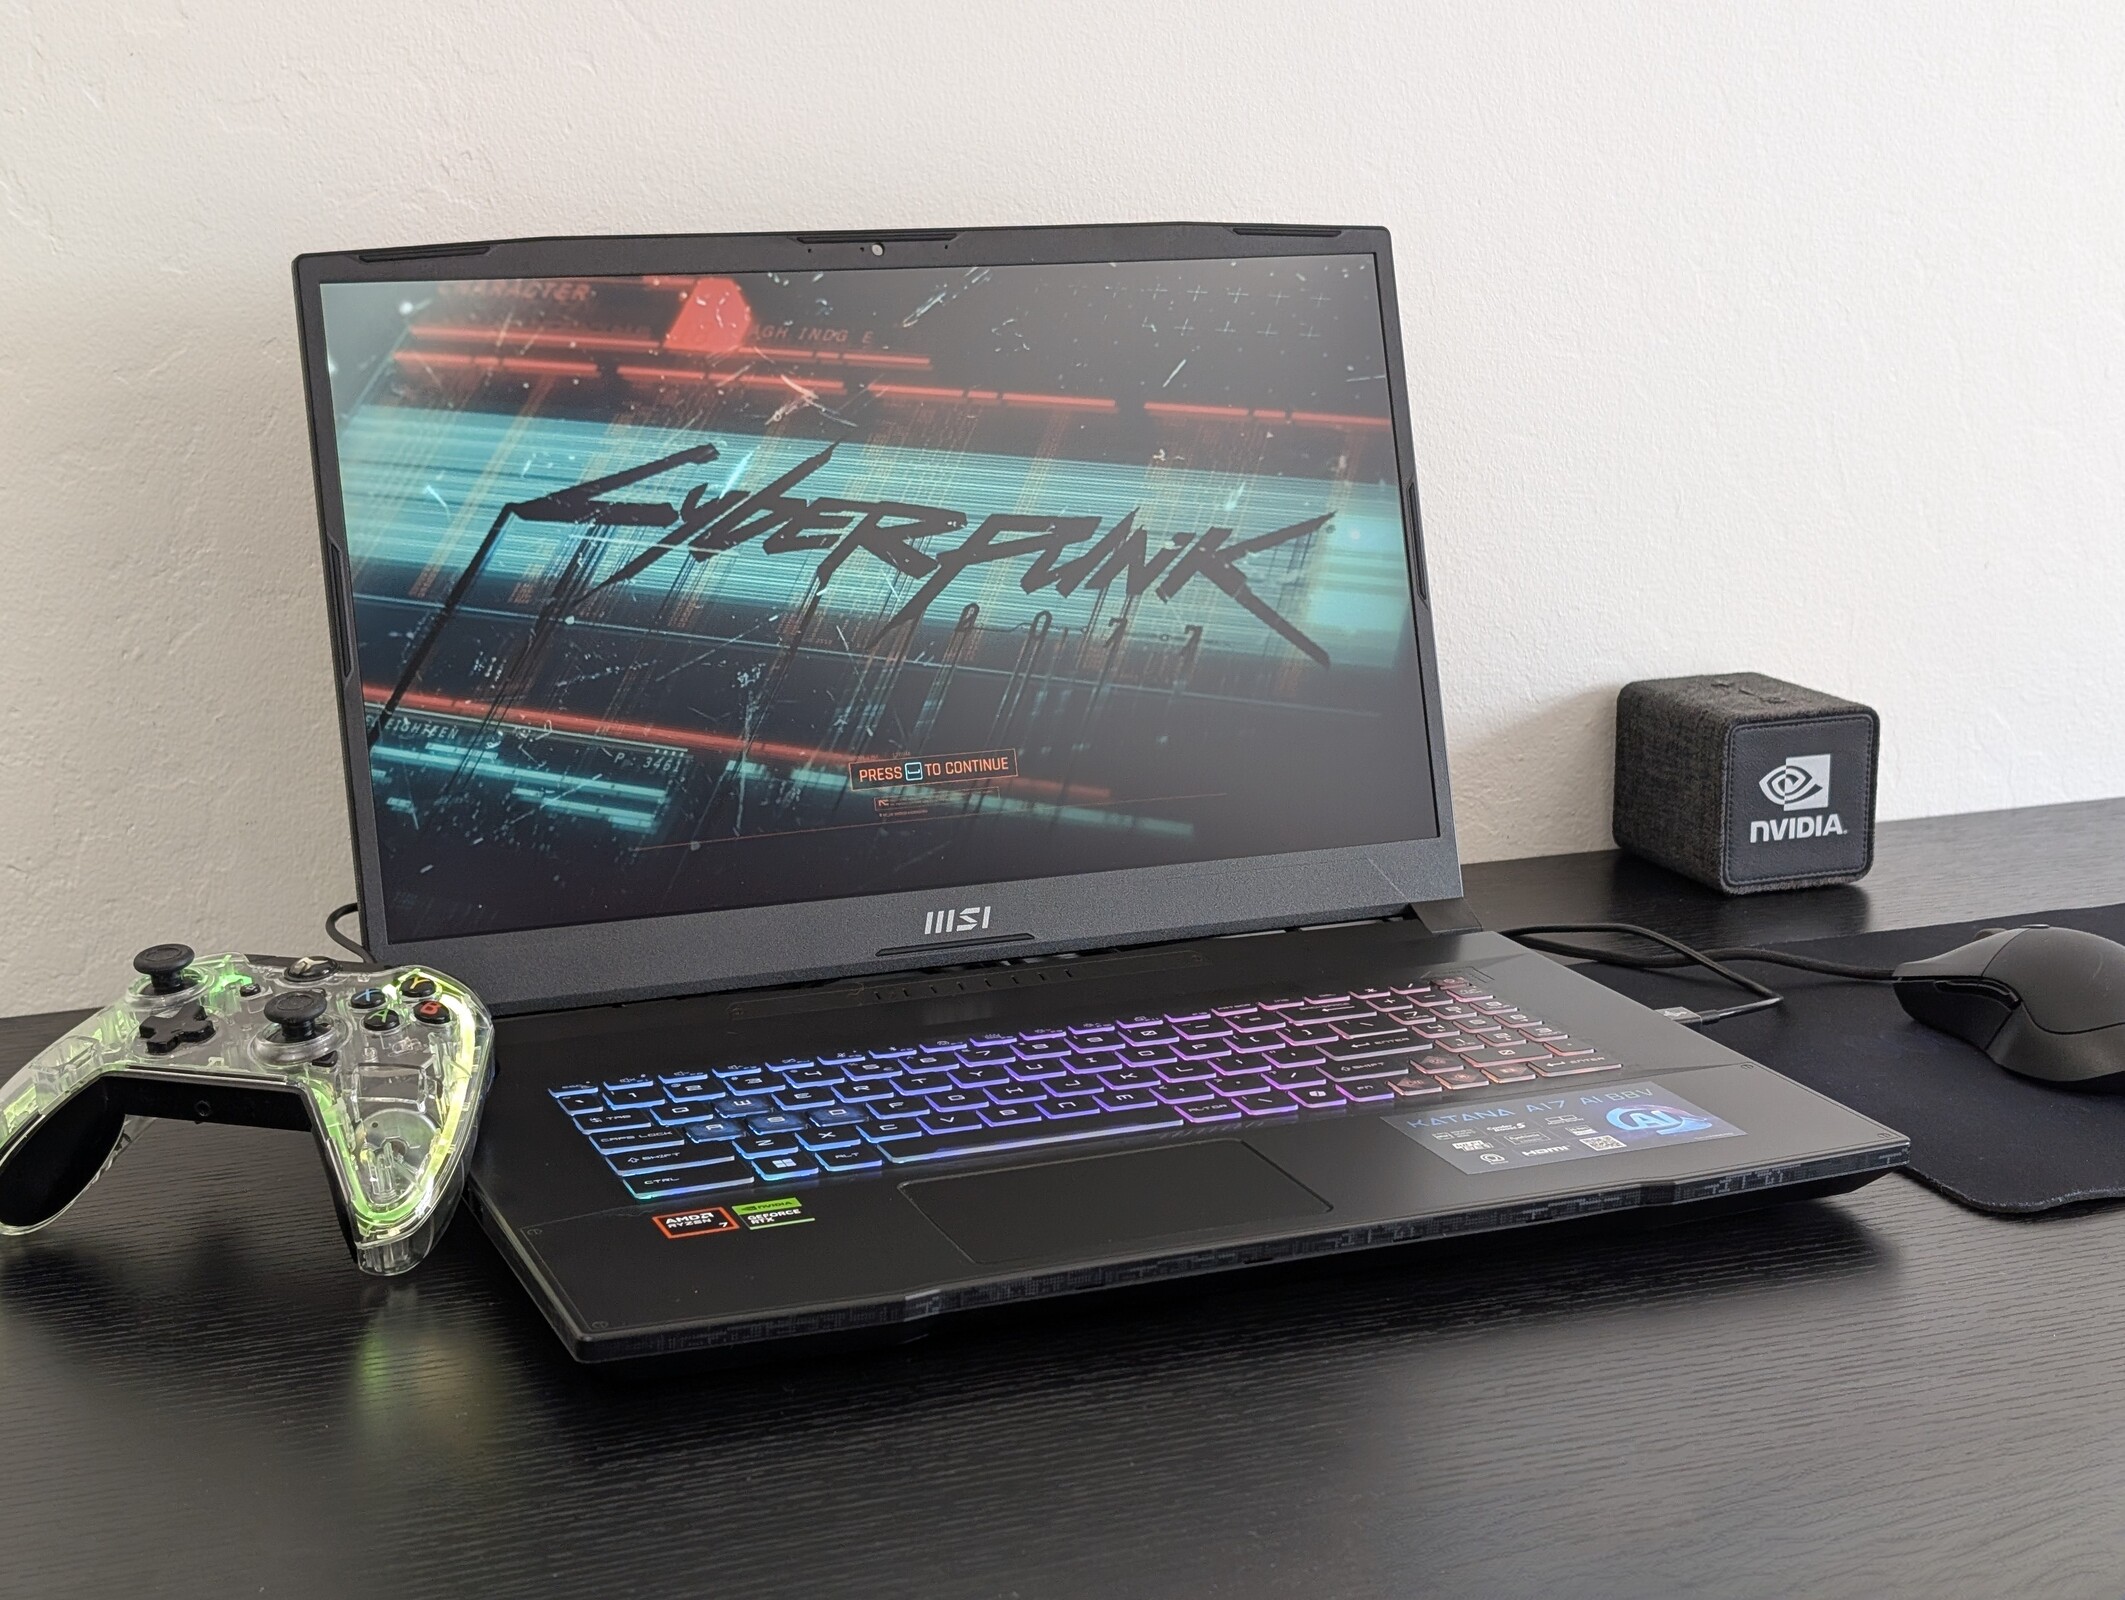
El Katana A17 es una alternativa más barata a las series GE, GS o GT, sin dejar de ofrecer un excelente rendimiento gráfico con su GPU RTX 4070 de 105 W GeForce. Por desgracia, su panel 1080p carece de colores sRGB completos, tiempos de respuesta rápidos y compatibilidad con G-Sync.Allen Ngo, 👁 Allen Ngo (traducido por DeepL / Ninh Duy) Publicado 🇺🇸 🇫🇷 ...
Veredicto - Genial para jugar si puede evitar la opción de pantalla más barata
Como uno de los portátiles para juegos más asequibles de MSI, el Katana A17 prescinde de lujosos LED y materiales metálicos en favor de un diseño de plástico más básico, al tiempo que conserva altas frecuencias de actualización nativas y opciones de GPU como la GeForce RTX 4070. Para los jugadores básicos con presupuestos más ajustados, la GPU probablemente tenga prioridad sobre otros aspectos y el Katana A17 cumple en ese frente al tiempo que ofrece unos niveles de ruido de ventilador decentes y un teclado cómodo para las tareas ajenas al juego.
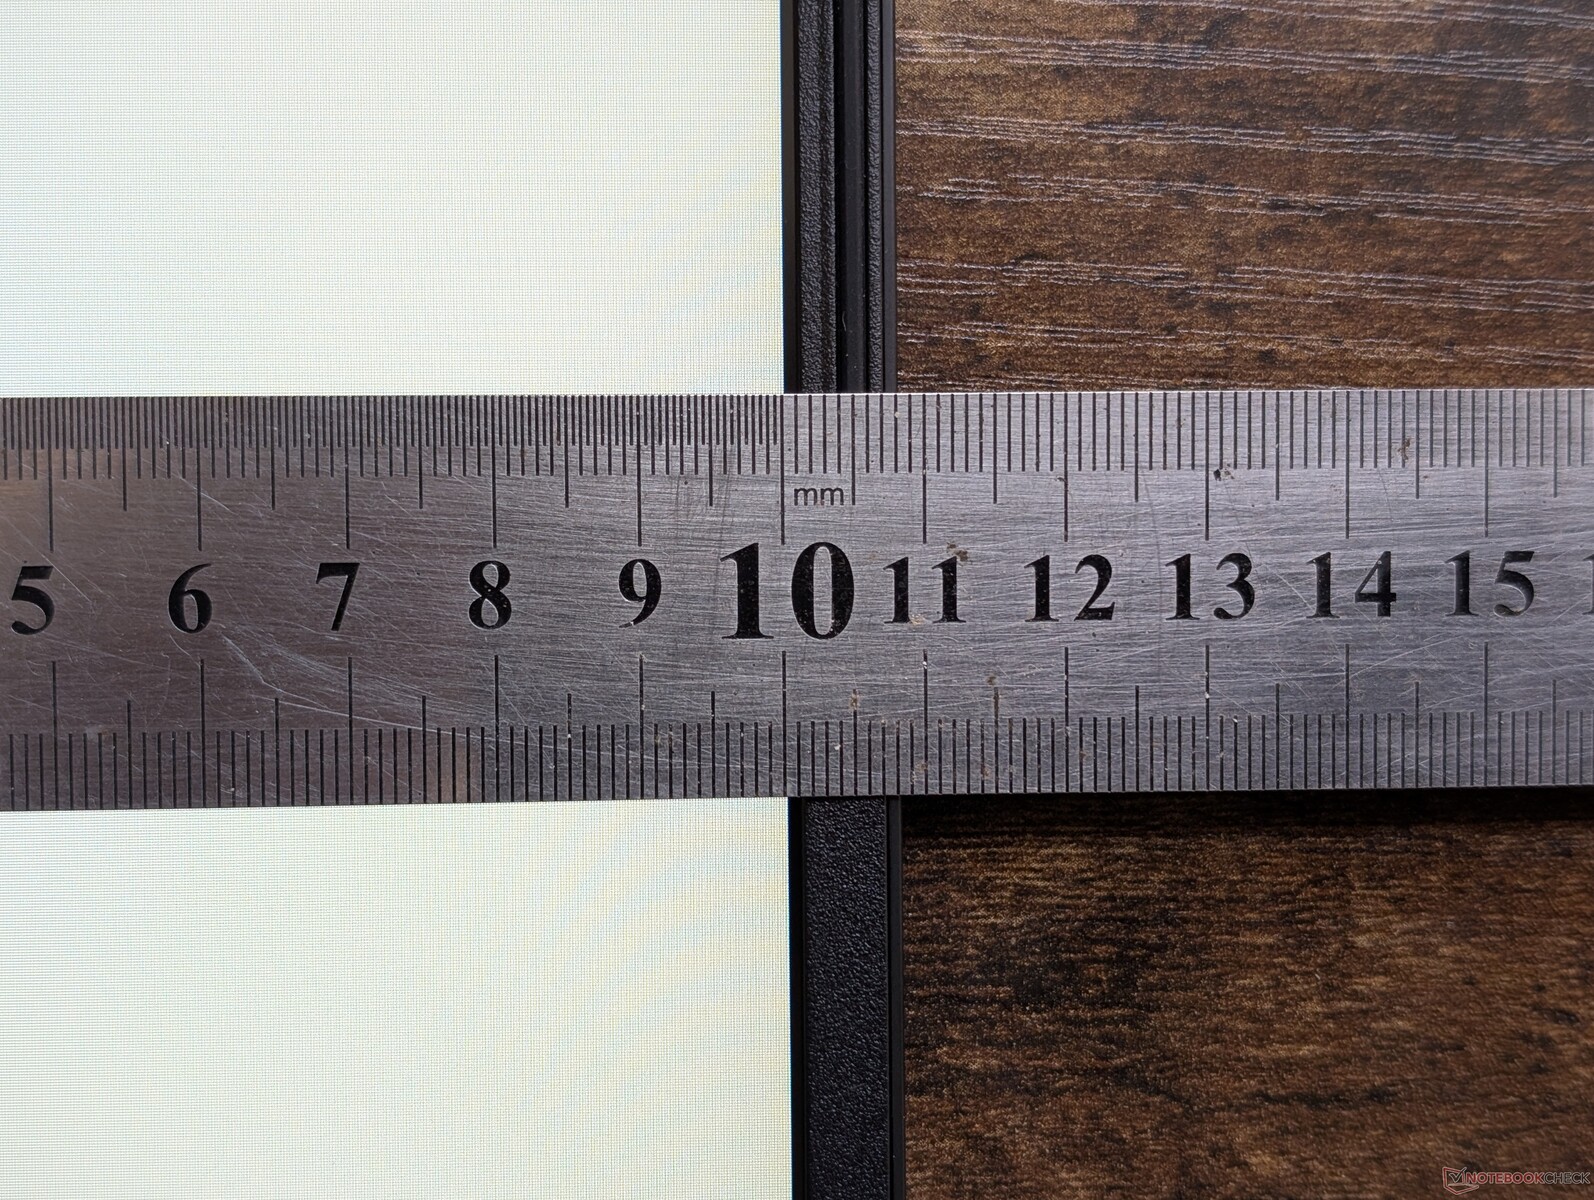
Las esquinas recortadas, sin embargo, pueden ser un poco profundas. Más notablemente, la duración de la batería es corta y la pantalla 1080p144 ofrece colores y brillo pobres para una experiencia de visualización menos que estelar. La opción 1440p240 aborda este problema directamente, pero no está disponible con la configuración Ryzen 7, ya que en su lugar está vinculada a la CPU Ryzen 9, lo que significa que los usuarios tendrán que pagar un extra de 400 dólares sólo por la mejor pantalla. Cuando se tiene en cuenta que el Ryzen 9 8945HS no ofrece casi ningún beneficio sobre el Ryzen 7 8845HS, la configuración QHD parecerá excesivamente cara especialmente cuando la gama más alta Serie GS de MSI puede encontrarse por aproximadamente el mismo precio.
Pro
Contra
Precio y disponibilidad
Amazon no está ofreciendo nuestra configuración de revisión Ryzen 7 FHD en este momento. En su lugar, la configuración Ryzen 9 QHD está disponible por $1800 USD.
Posibles contendientes en la comparación
Imagen | Modelo | Precio | Peso | Altura | Pantalla |
|---|---|---|---|---|---|
1. 78.6%  | MSI Katana A17 AI B8VG AMD Ryzen 7 8845HS ⎘ NVIDIA GeForce RTX 4070 Laptop GPU ⎘ 32 GB Memoría, 1024 GB SSD | Amazon: $1,099.00 Precio de catálogo: 1400 USD | 2.7 kg | 25.2 mm | 17.30" 1920x1080 127 PPI IPS |
2. 80.4%  | HP Omen 17-db0079ng AMD Ryzen 7 8845HS ⎘ NVIDIA GeForce RTX 4070 Laptop GPU ⎘ 32 GB Memoría, 1024 GB SSD | Amazon: 1. $69.88 230W AC Charger fit for HP O... 2. $1,699.00 HP Omen 17 Gaming Laptop 17.... 3. $1,999.00 OMEN by HP 2019 17-Inch Gami... Precio de catálogo: 1900€ | 2.8 kg | 30.1 mm | 17.30" 2560x1440 170 PPI IPS |
3. 85.6% v7 (old)  | Asus TUF Gaming A17 FA707XI-NS94 AMD Ryzen 9 7940HS ⎘ NVIDIA GeForce RTX 4070 Laptop GPU ⎘ 16 GB Memoría, 1024 GB SSD | Amazon: $1,983.68 Precio de catálogo: 1400 USD | 2.5 kg | 25.4 mm | 17.30" 1920x1080 127 PPI IPS |
4. 87.2% v7 (old)  | Acer Nitro 17 AN17-51-71ER Intel Core i7-13700H ⎘ NVIDIA GeForce RTX 4060 Laptop GPU ⎘ 16 GB Memoría, 1024 GB SSD | Amazon: 1. $96.99 LCDOLED Compatible with Acer... 2. $128.88 POBRIDA Replacement for Acer... 3. $15.98 Deal4GO CPU Cooling Fan 23.Q... Precio de catálogo: 1900€ | 3 kg | 30.3 mm | 17.30" 2560x1440 170 PPI |
5. 86.3% v7 (old)  | MSI Pulse 17 B13VGK Intel Core i7-13700H ⎘ NVIDIA GeForce RTX 4070 Laptop GPU ⎘ 16 GB Memoría, 1024 GB SSD | Amazon: 1. $64.99 240W 20V 12A AC Adapter for ... 2. $2,053.04 Msi Pulse15B13VGK-287US Gami... 3. $17.99 HSSDTECH DC Power Jack Charg... Precio de catálogo: 2500€ | 2.7 kg | 27.2 mm | 17.30" 1920x1080 127 PPI IPS |
6. 85.2% v7 (old)  | Lenovo Legion 5 17ACH6H-82JY0003GE AMD Ryzen 5 5600H ⎘ NVIDIA GeForce RTX 3060 Laptop GPU ⎘ 16 GB Memoría, 512 GB SSD | Amazon: 1. $91.50 EM EMAJOR TECH New Screen Re... 2. $95.11 EM EMAJOR TECH New Screen Re... 3. $91.50 EM EMAJOR TECH New Screen Re... Precio de catálogo: 1810 EUR | 3.1 kg | 24.3 mm | 17.30" 1920x1080 127 PPI IPS |
Índice
- Veredicto - Genial para jugar si puede evitar la opción de pantalla más barata
- Especificaciones
- Maletín - Todo de plástico
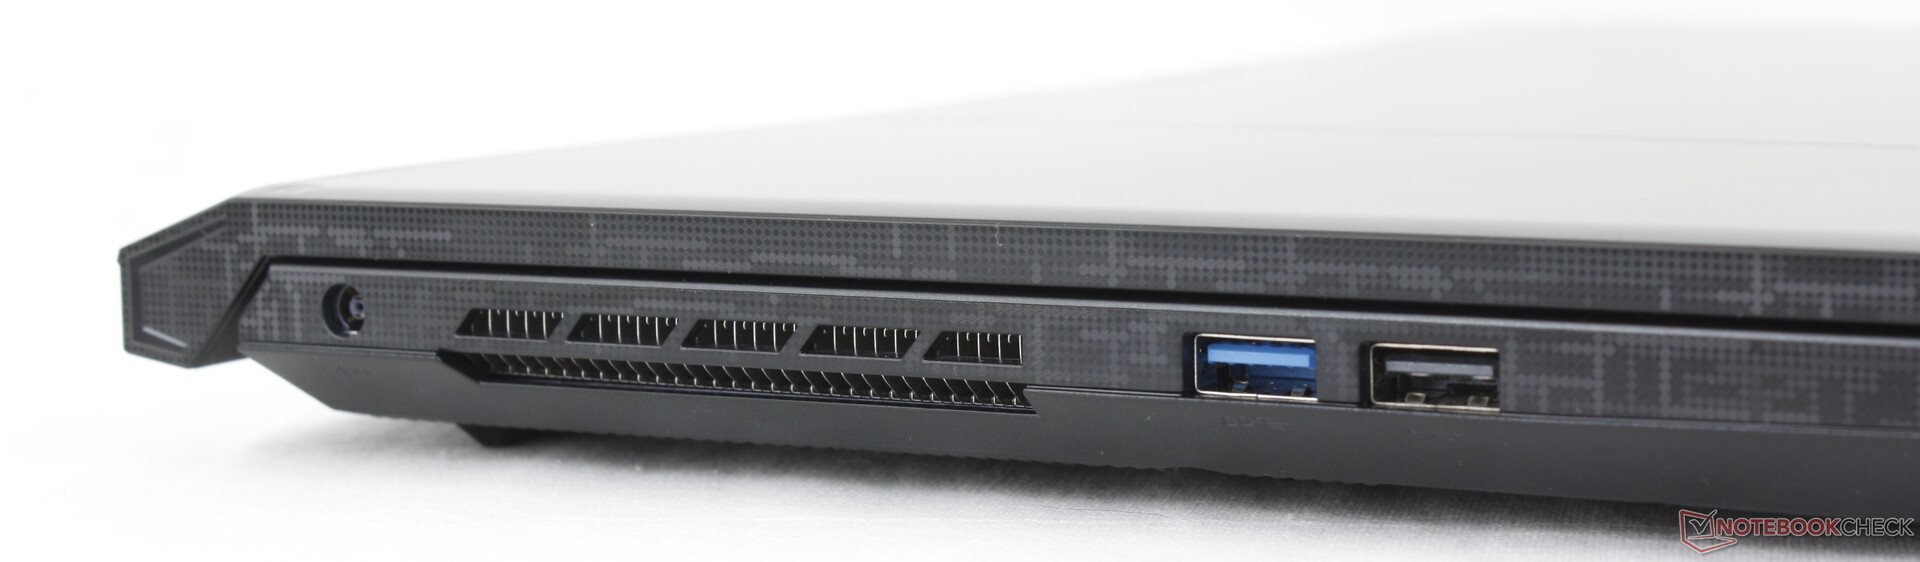
- Conectividad
- Pantalla - Tasa de refresco decente pero con colores pobres
- Rendimiento - Mayor rendimiento por vatio con AMD Zen 4
- Emisiones
- Gestión de la energía - Gran rendimiento por vatio pero con escasa duración de la batería
- Valoración de Notebookcheck
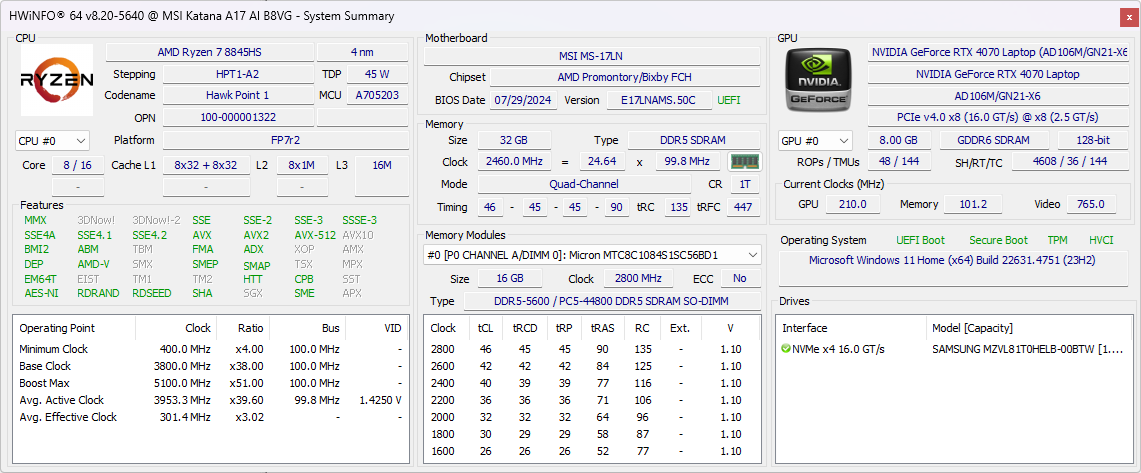
La Katana A17, orientada al presupuesto, es la versión AMD más reciente de la Katana 17 del año pasado, alimentada por Intel. Para mantener los precios bajo control, utiliza CPU de la serie Zen 4 en lugar de la última Zen 5.
Nuestra unidad de prueba es una configuración de gama media con la CPU Ryzen 7 8845HS, la GPU GeForce RTX 4070 y una pantalla de 17,3 pulgadas 1080p144 por aproximadamente 1.400 dólares. Las SKU inferiores pueden venir con la RTX 4060 o 4050 en su lugar, mientras que las SKU de gama más alta vienen con la Ryzen 9 8945HS y una pantalla de 1440p240 Hz. Existe una versión de 15 pulgadas de este modelo denominada Katana A15.
Entre las alternativas al Katana A17 se incluyen otros portátiles para juegos orientados al presupuesto como el Asus TUF Gaming A17, Acer Nitro 17, o Lenovo Legion 5.
Más opiniones sobre MSI:
Especificaciones
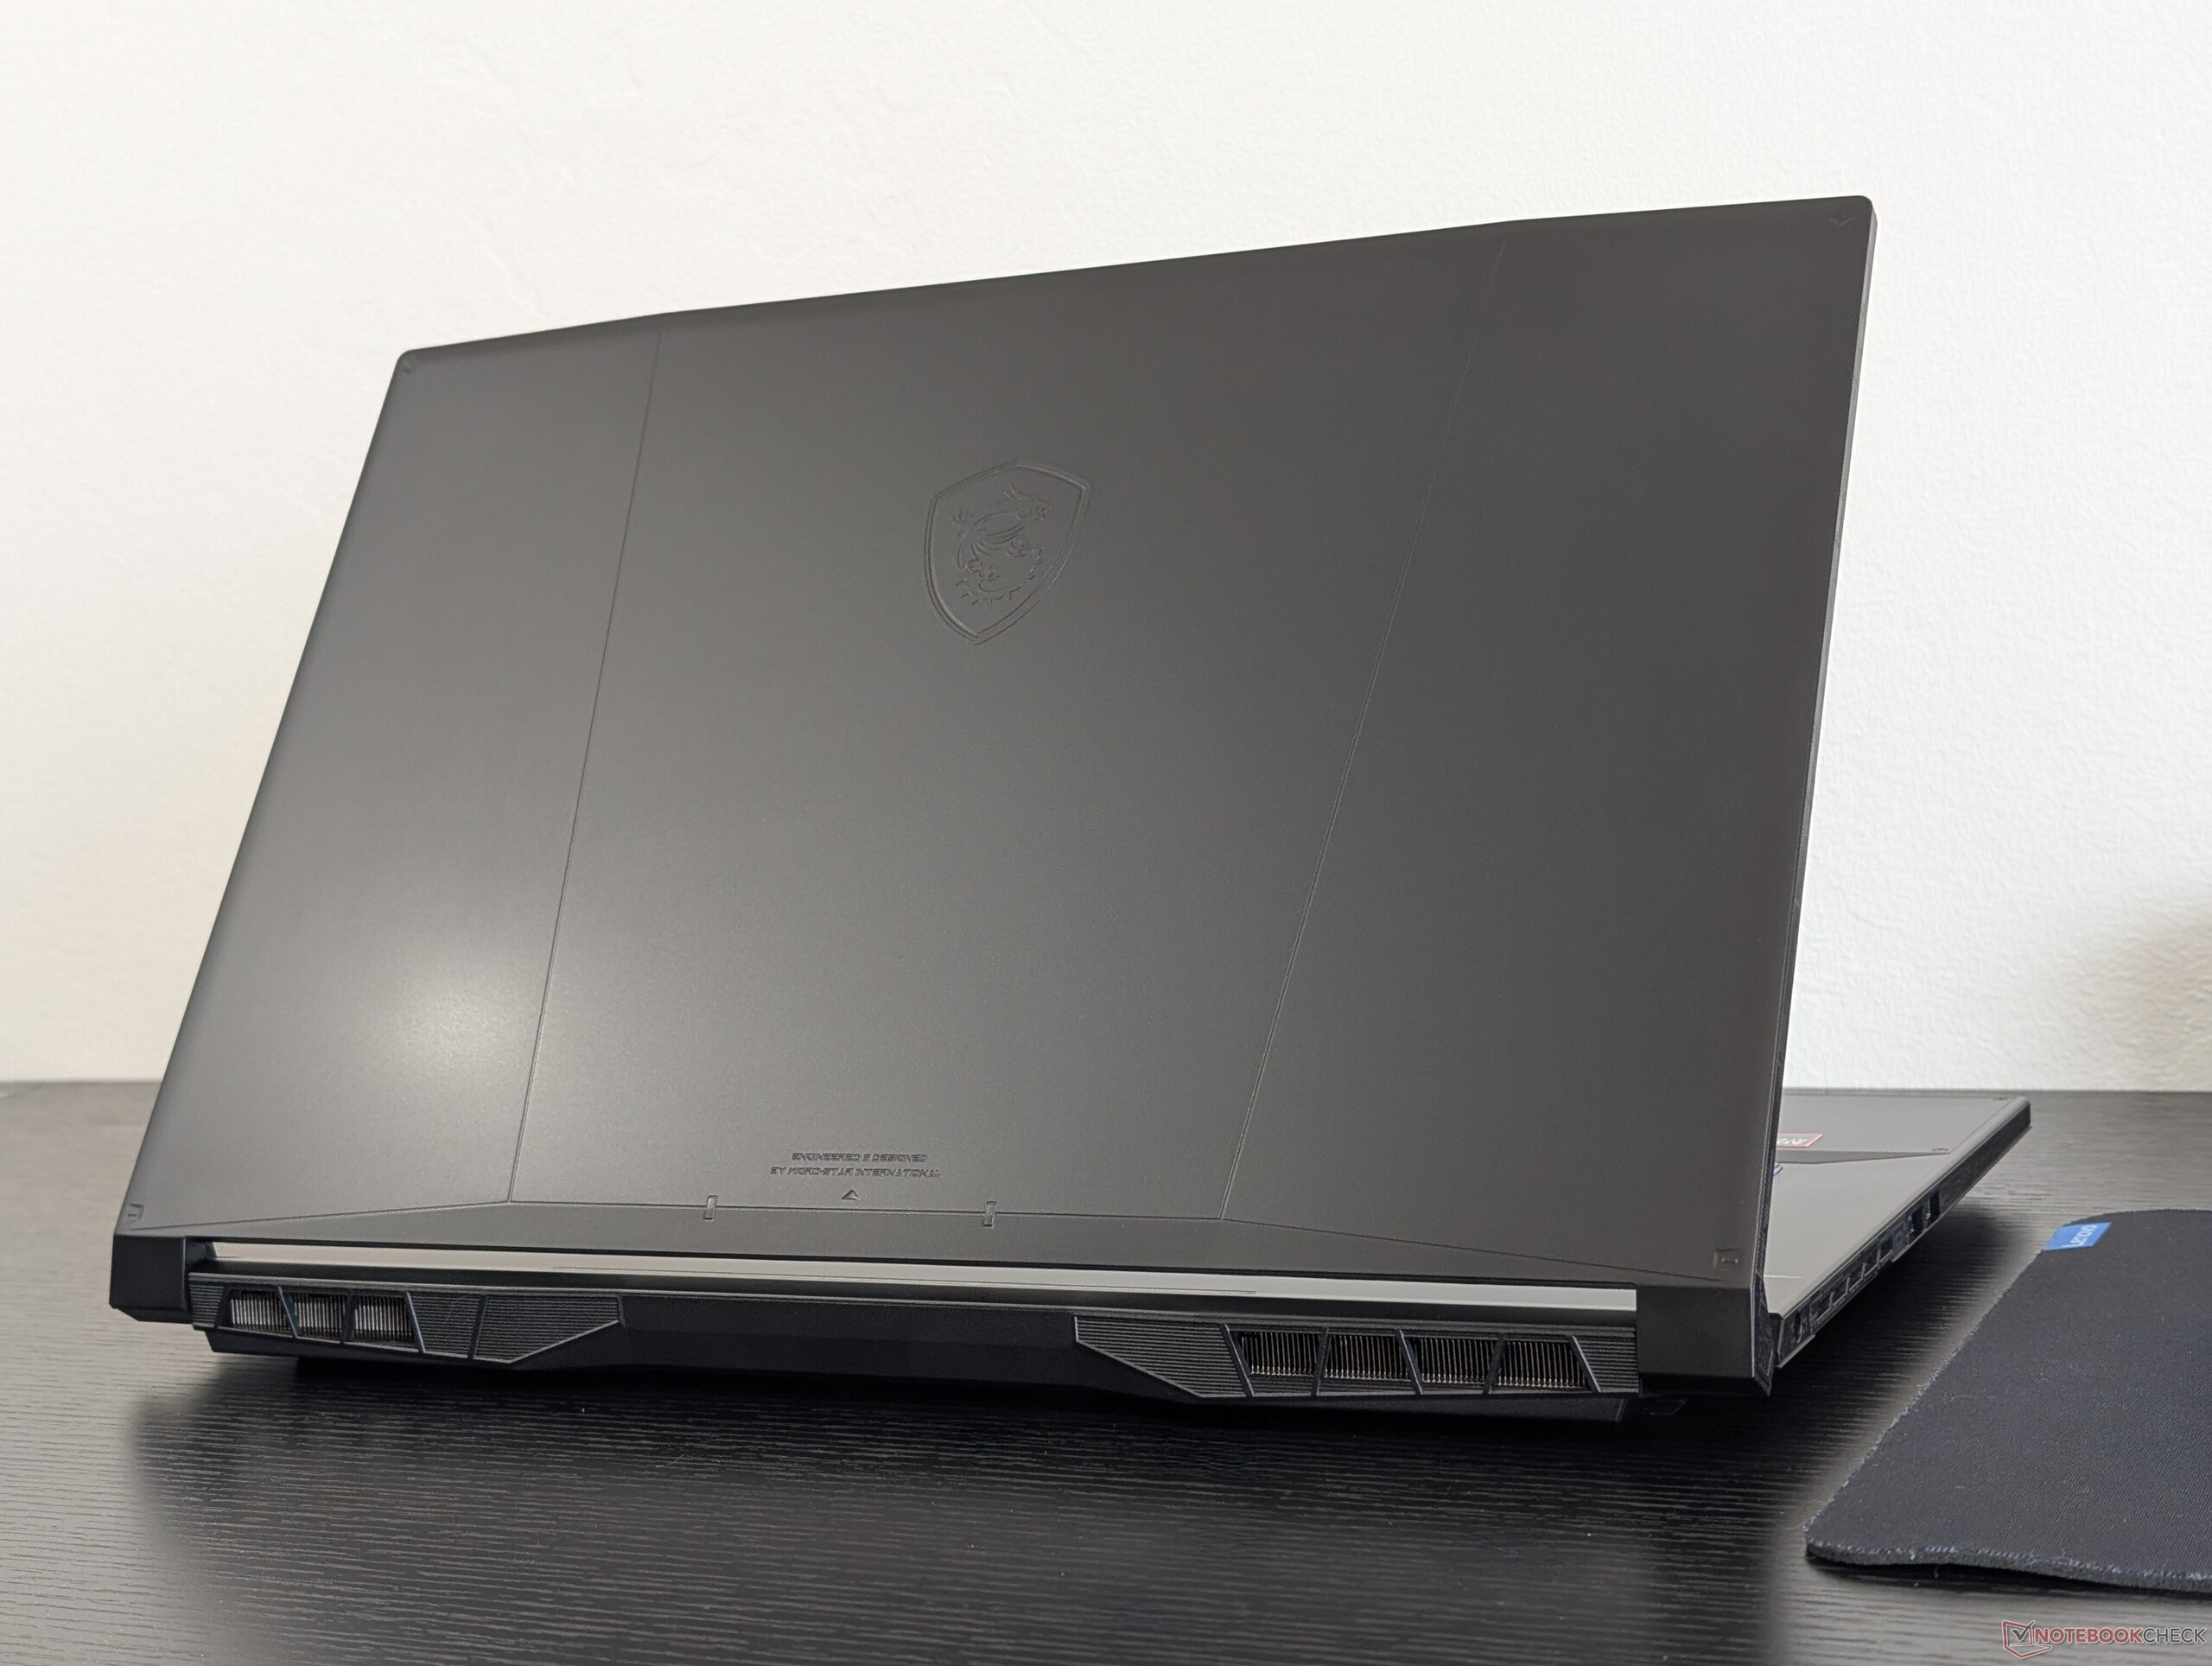
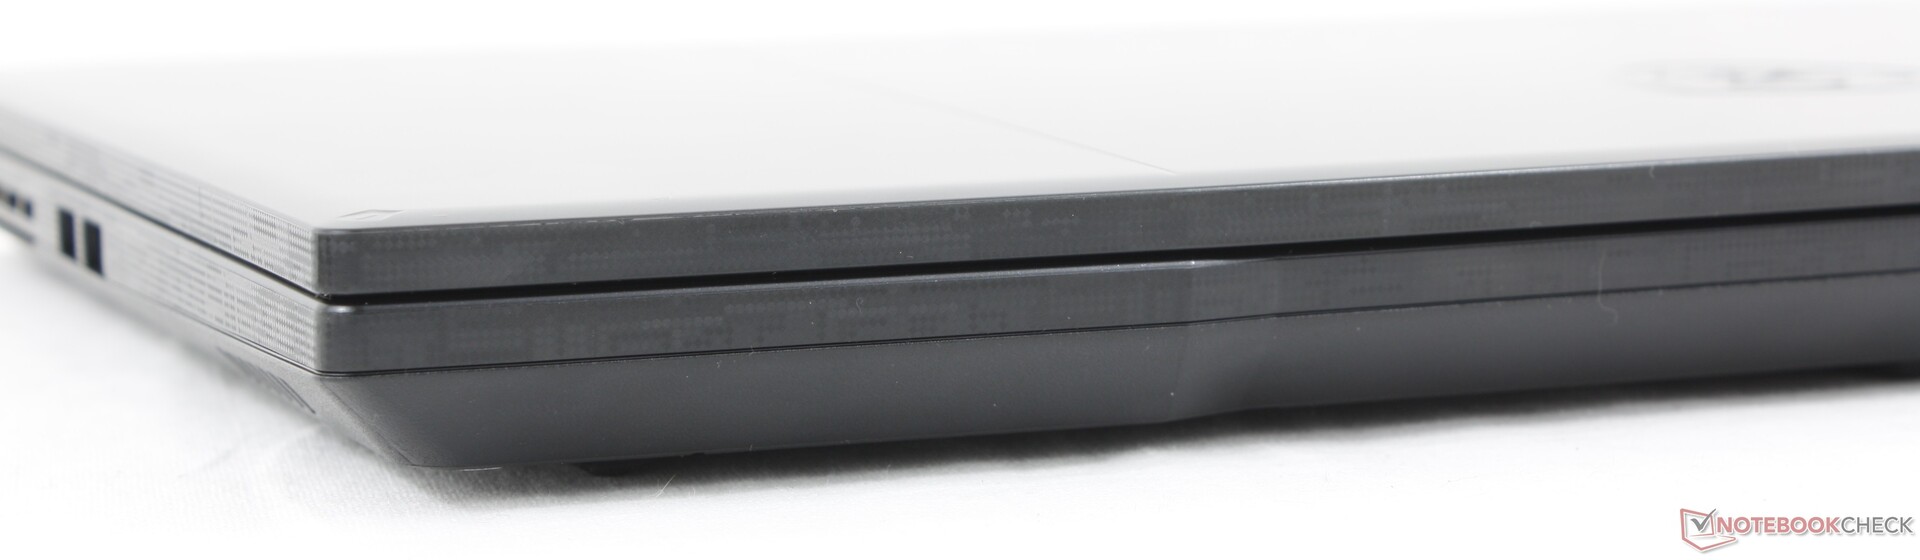
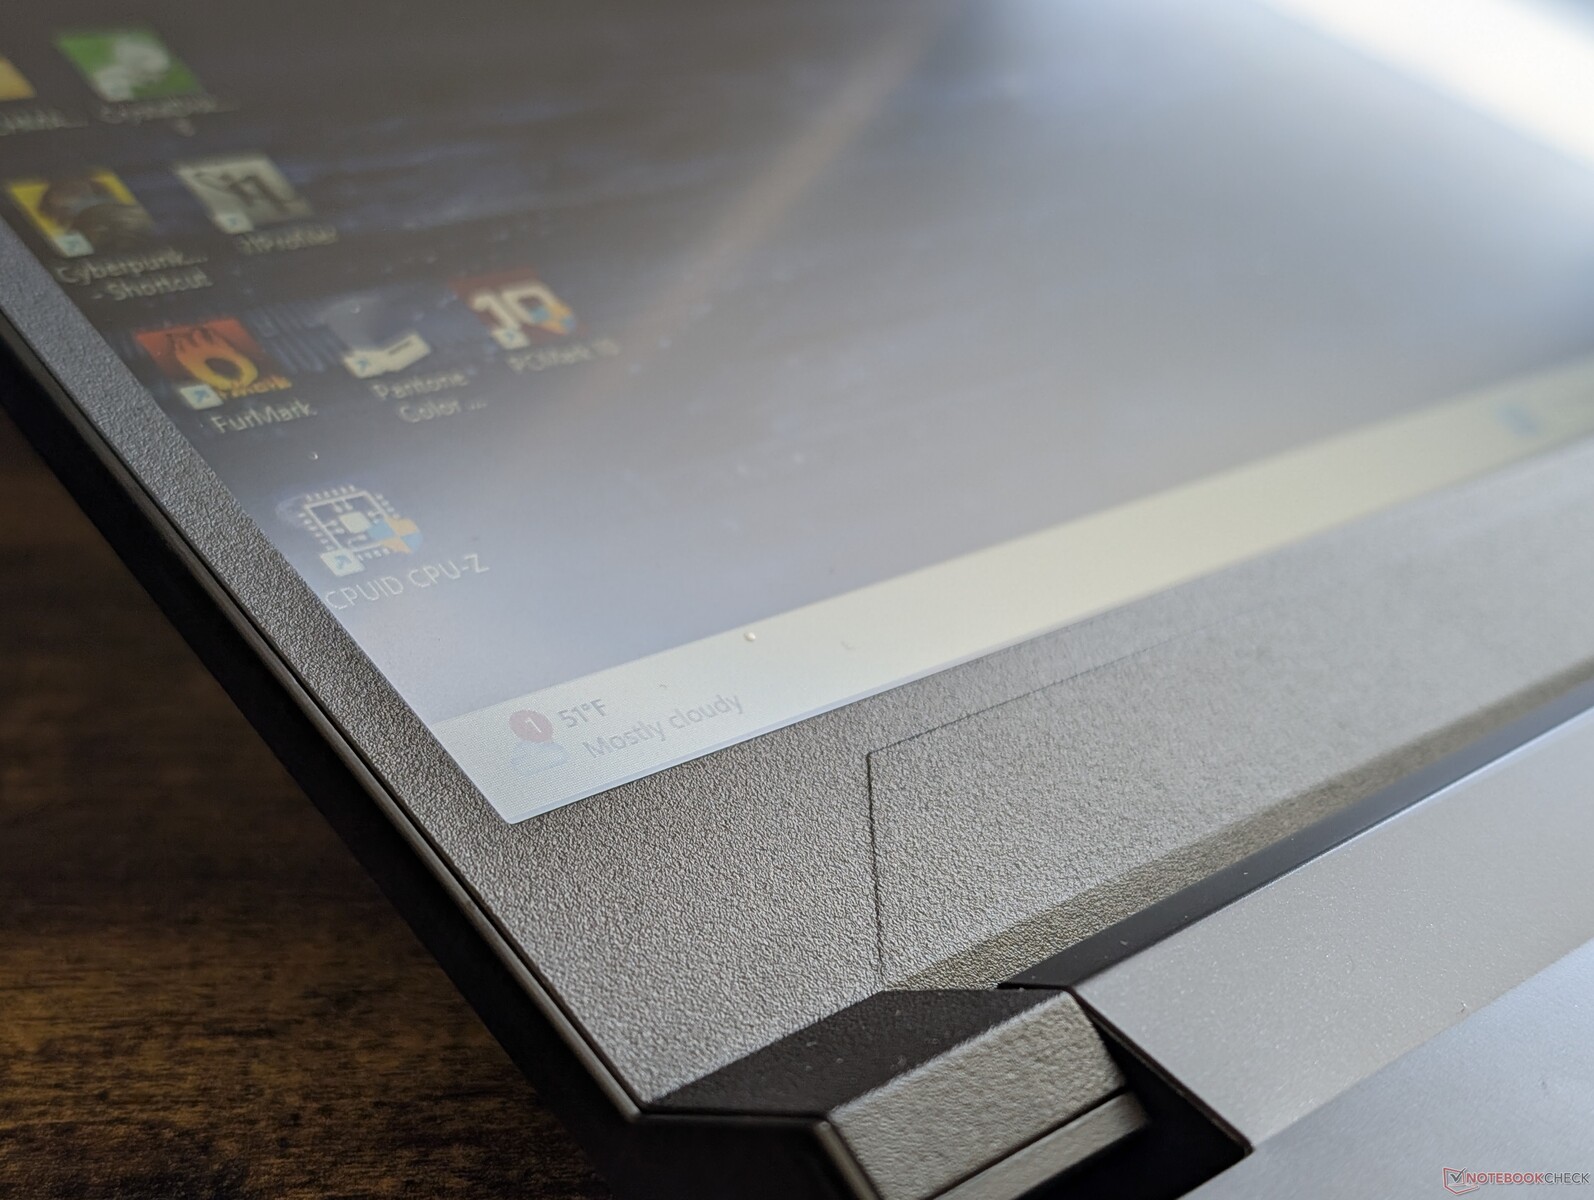
Maletín - Todo de plástico
El chasis no ha cambiado con respecto al modelo Katana 17 de 2023, por lo que lleva el mismo esqueleto de plástico ABS, teclado y opciones de conectividad que antes. En comparación, los modelos de gama más alta de las series GT o GS utilizan más aleaciones metálicas para conseguir un aspecto más lujoso. Sin duda, las bisagras podrían ser más rígidas en futuras iteraciones de la Katana A17.
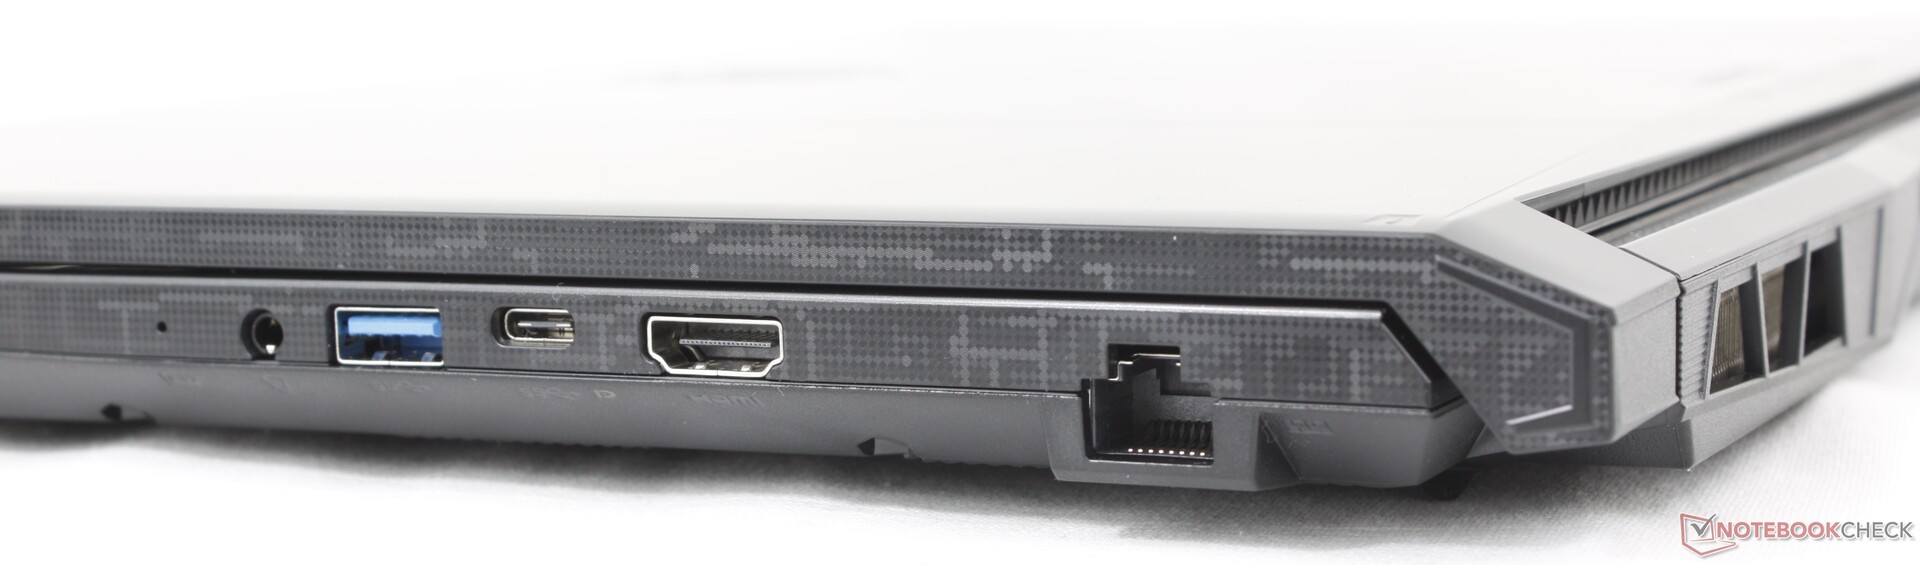
Conectividad
Comunicación
| Networking | |
| iperf3 transmit AX12 | |
| Lenovo Legion 5 17ACH6H-82JY0003GE | |
| iperf3 receive AX12 | |
| Lenovo Legion 5 17ACH6H-82JY0003GE | |
| iperf3 transmit AXE11000 | |
| Acer Nitro 17 AN17-51-71ER | |
| MSI Pulse 17 B13VGK | |
| MSI Katana A17 AI B8VG | |
| Asus TUF Gaming A17 FA707XI-NS94 | |
| HP Omen 17-db0079ng | |
| iperf3 receive AXE11000 | |
| MSI Pulse 17 B13VGK | |
| Acer Nitro 17 AN17-51-71ER | |
| MSI Katana A17 AI B8VG | |
| HP Omen 17-db0079ng | |
| Asus TUF Gaming A17 FA707XI-NS94 | |
| iperf3 transmit AXE11000 6GHz | |
| MSI Katana A17 AI B8VG | |
| iperf3 receive AXE11000 6GHz | |
| MSI Katana A17 AI B8VG | |
Cámara web
El modelo integra una cámara web de baja calidad de 720p o 1 MP sin obturador de privacidad ni infrarrojos. En cambio, la cámara puede desactivarse electrónicamente con una tecla de acceso directo.


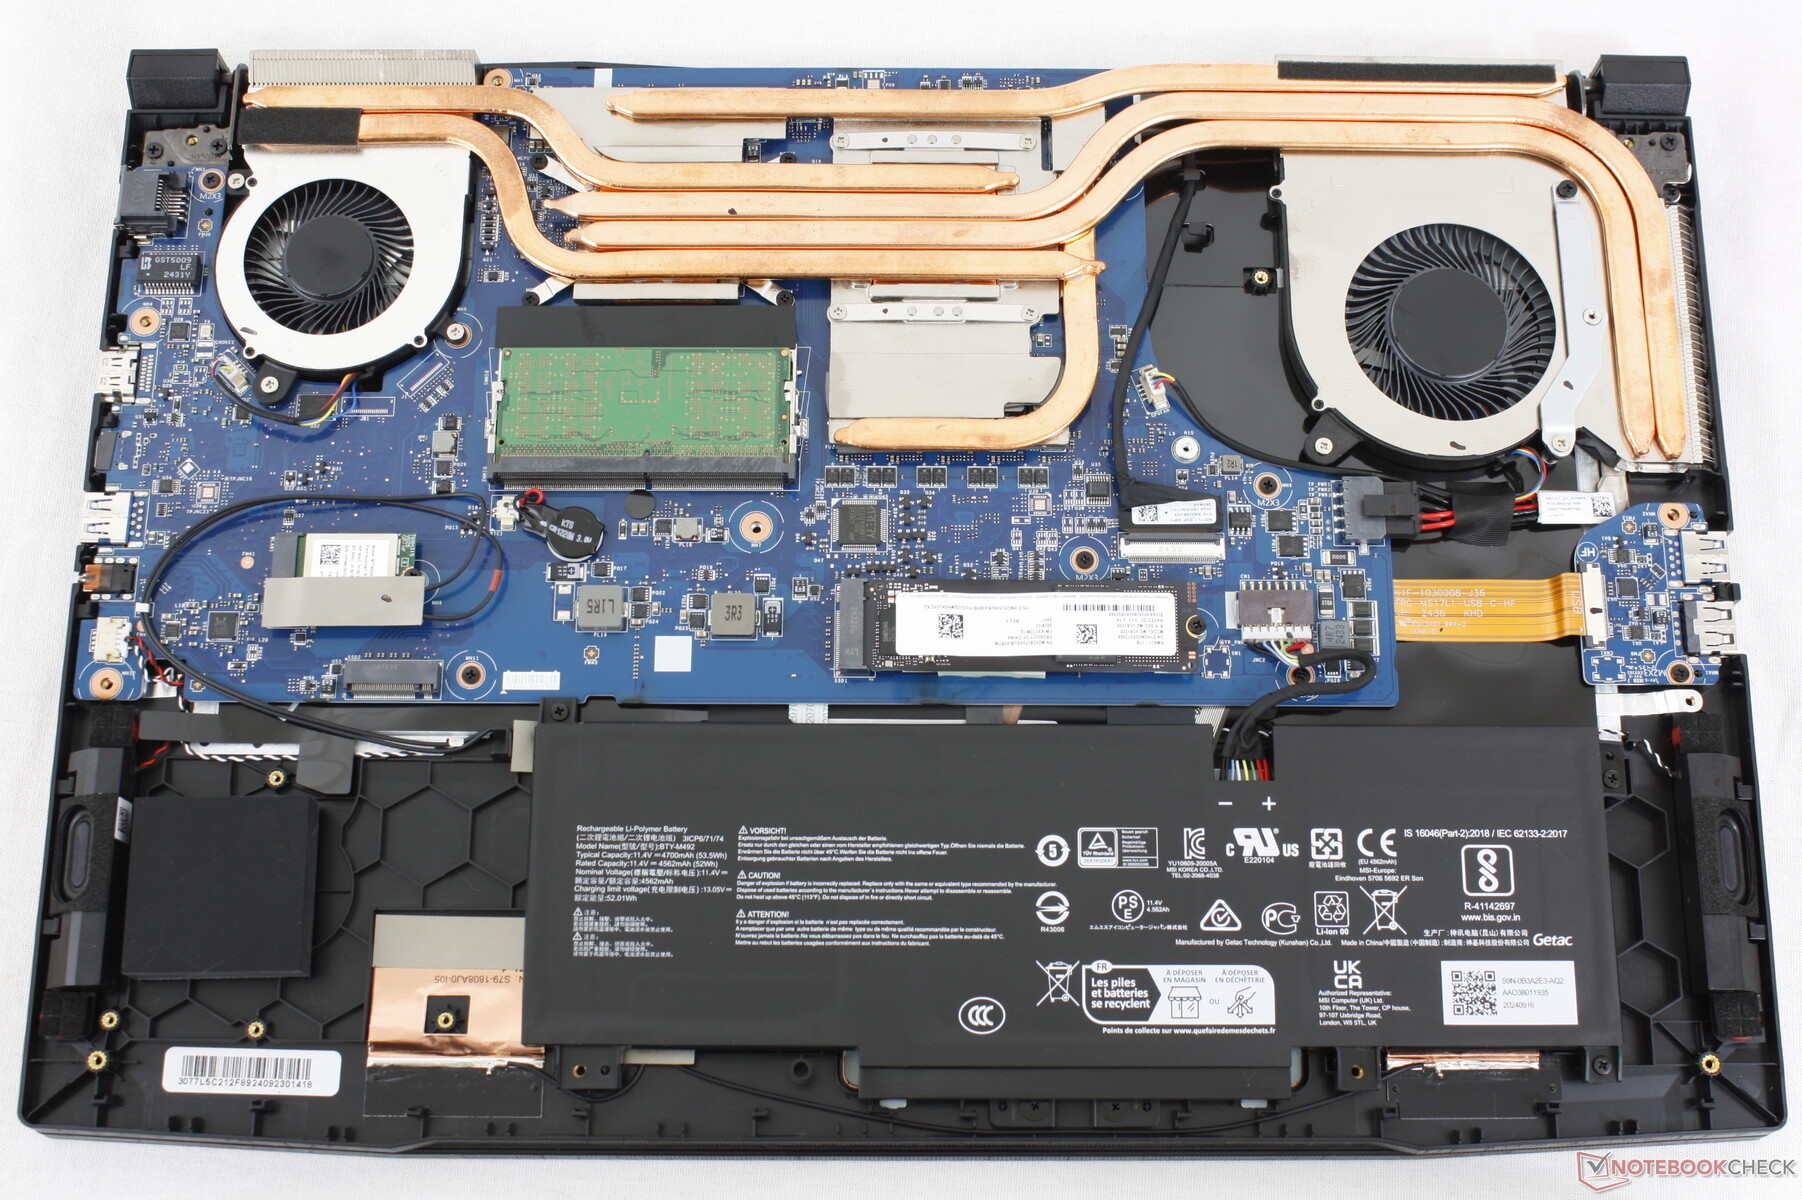
Mantenimiento
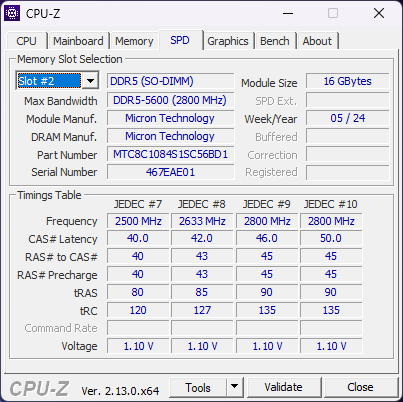
El panel inferior está asegurado por 13 tornillos Phillips para un mantenimiento relativamente sencillo. Tenga en cuenta que hay que romper una pegatina antimanipulación para acceder a la placa base. Una vez dentro, los usuarios dispondrán de 2 ranuras M.2 2280, 2 ranuras SODIMM y el módulo WLAN extraíble.
Sostenibilidad
MSI no anuncia ninguna declaración de sostenibilidad para la serie Katana A17. Por lo demás, el embalaje es mayoritariamente de cartón con algún envoltorio protector de plástico.
Accesorios y garantía
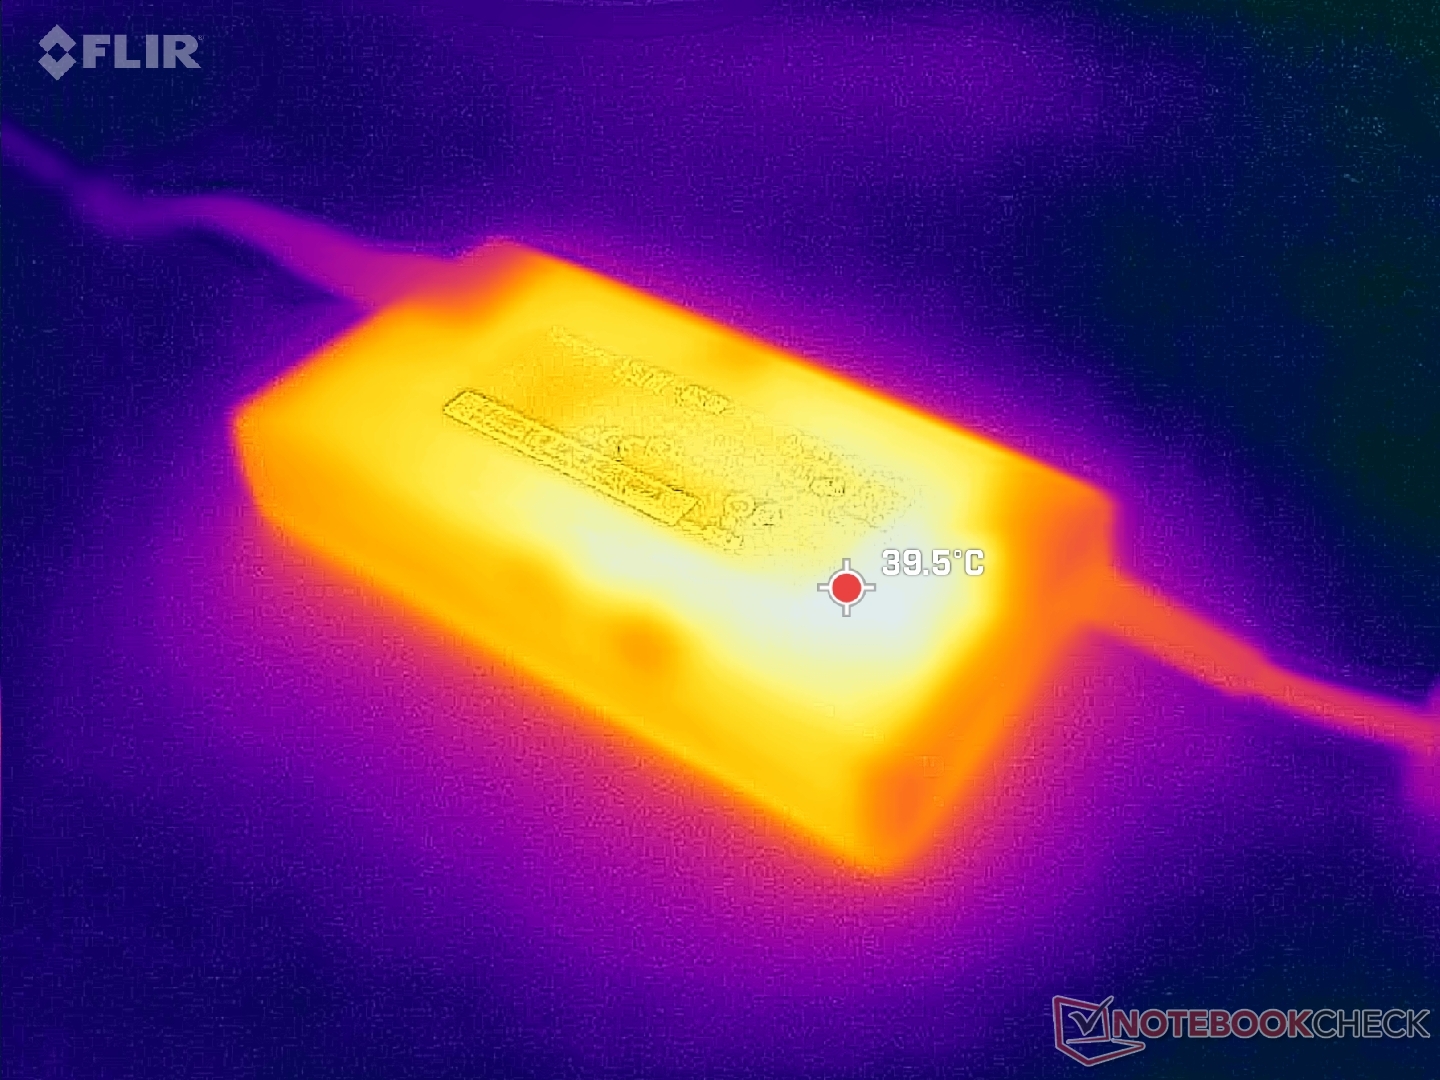
No hay más extras en la caja que el adaptador de CA de 200 W y la documentación. Se aplica la habitual garantía limitada de un año del fabricante.
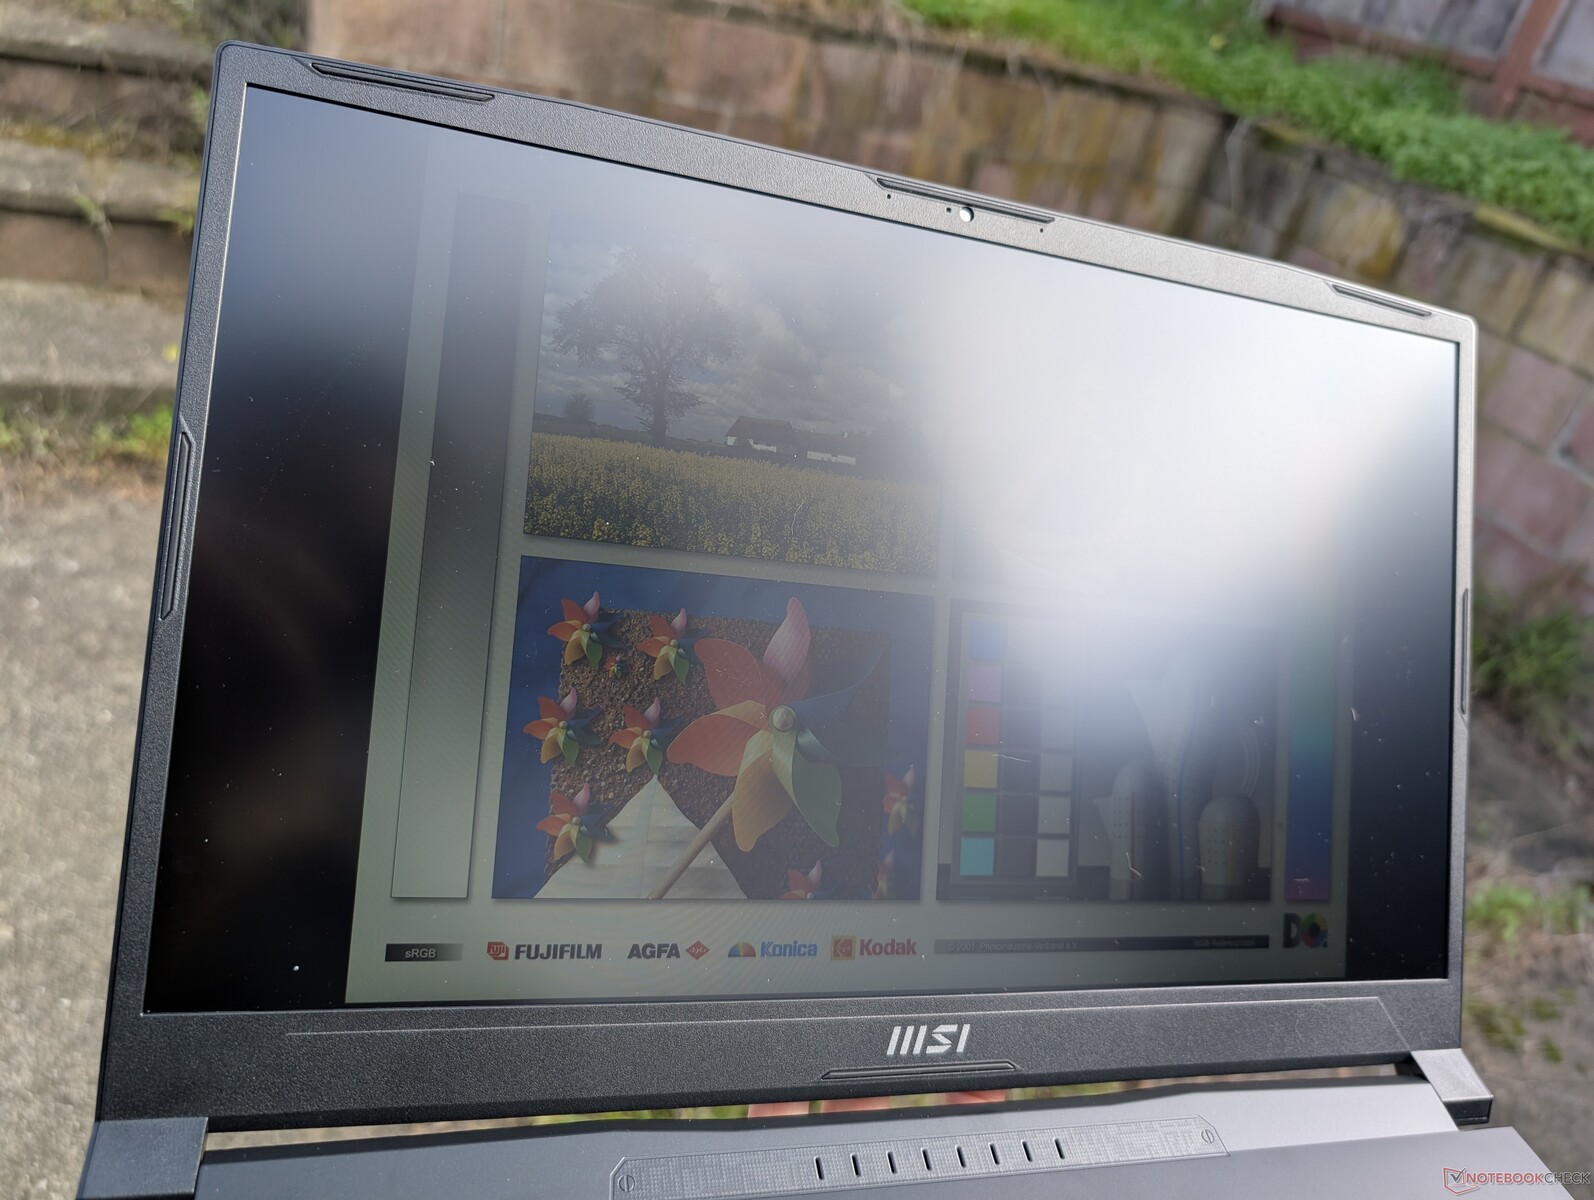
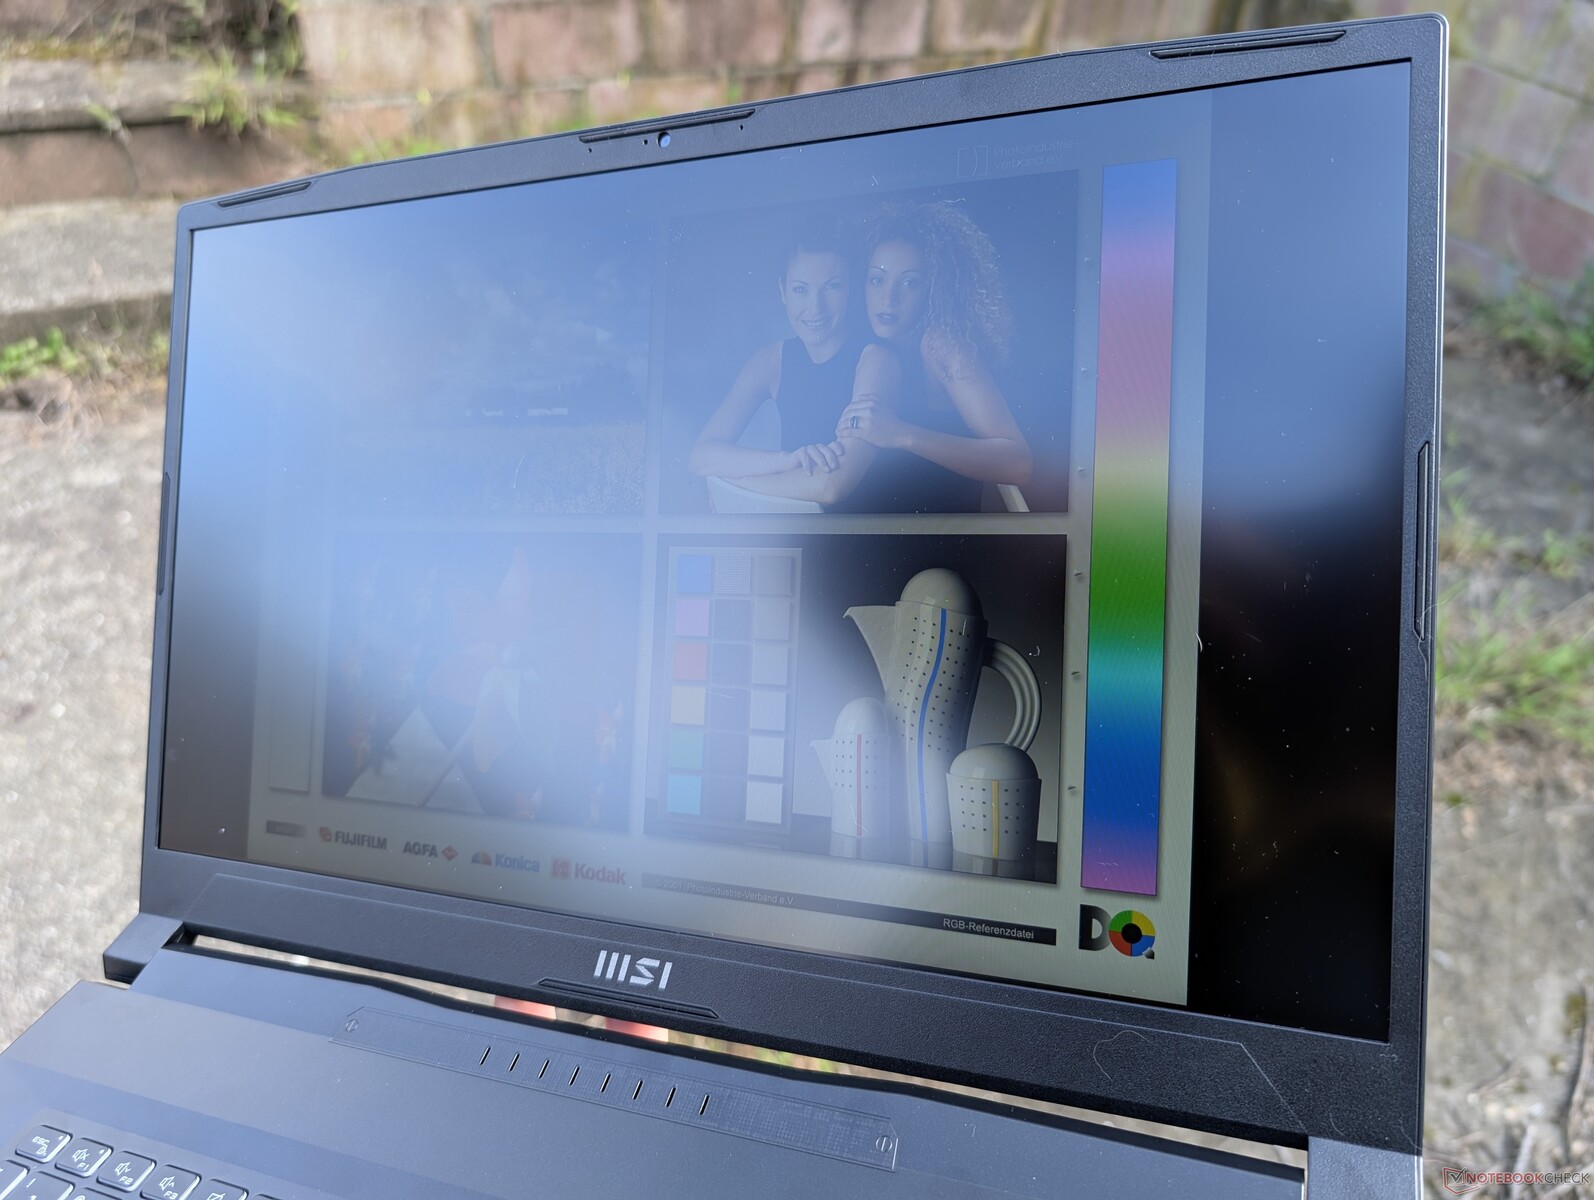
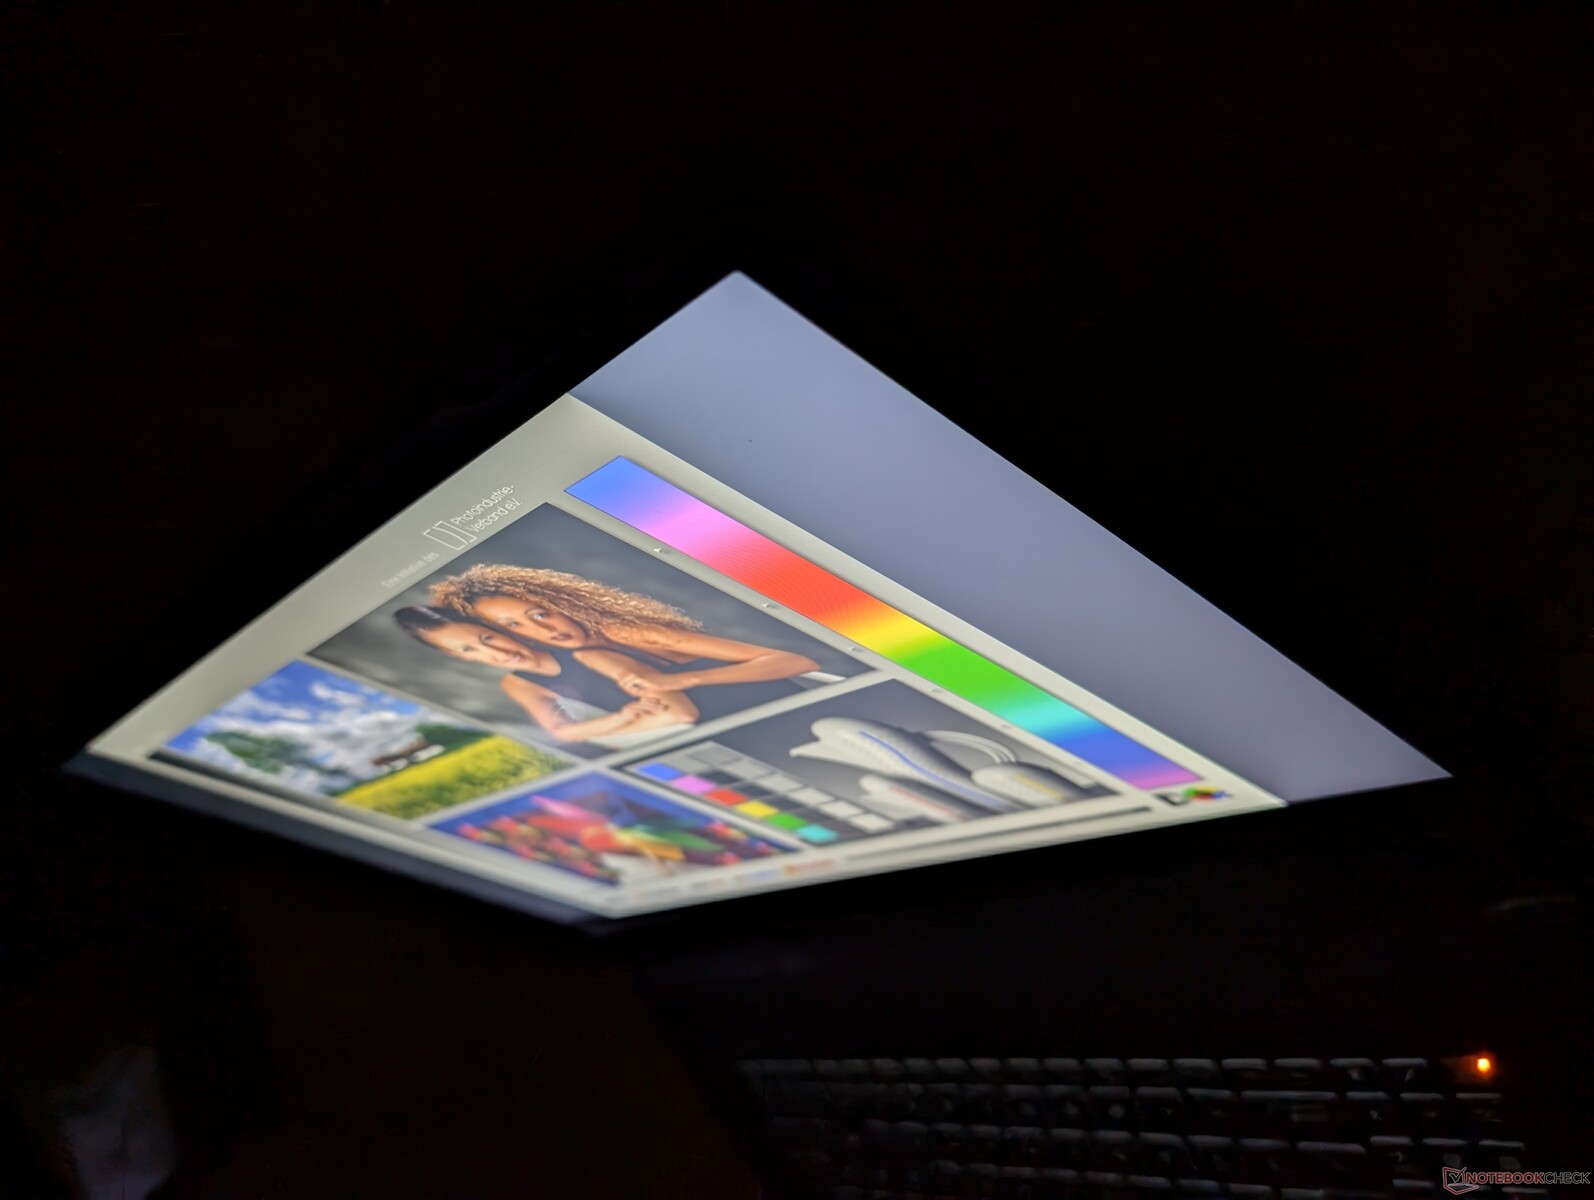
Pantalla - Tasa de refresco decente pero con colores pobres
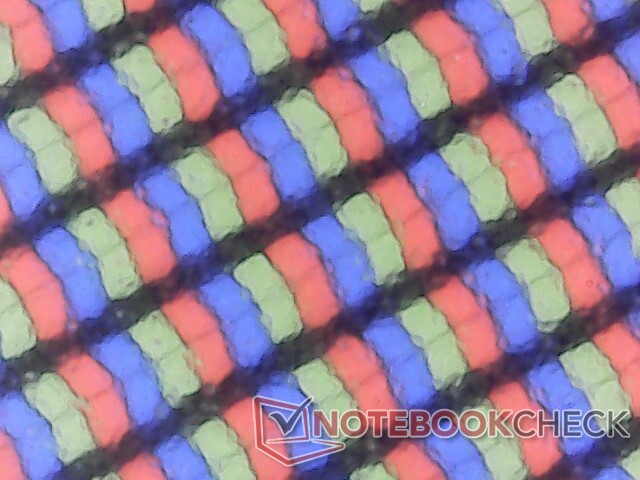
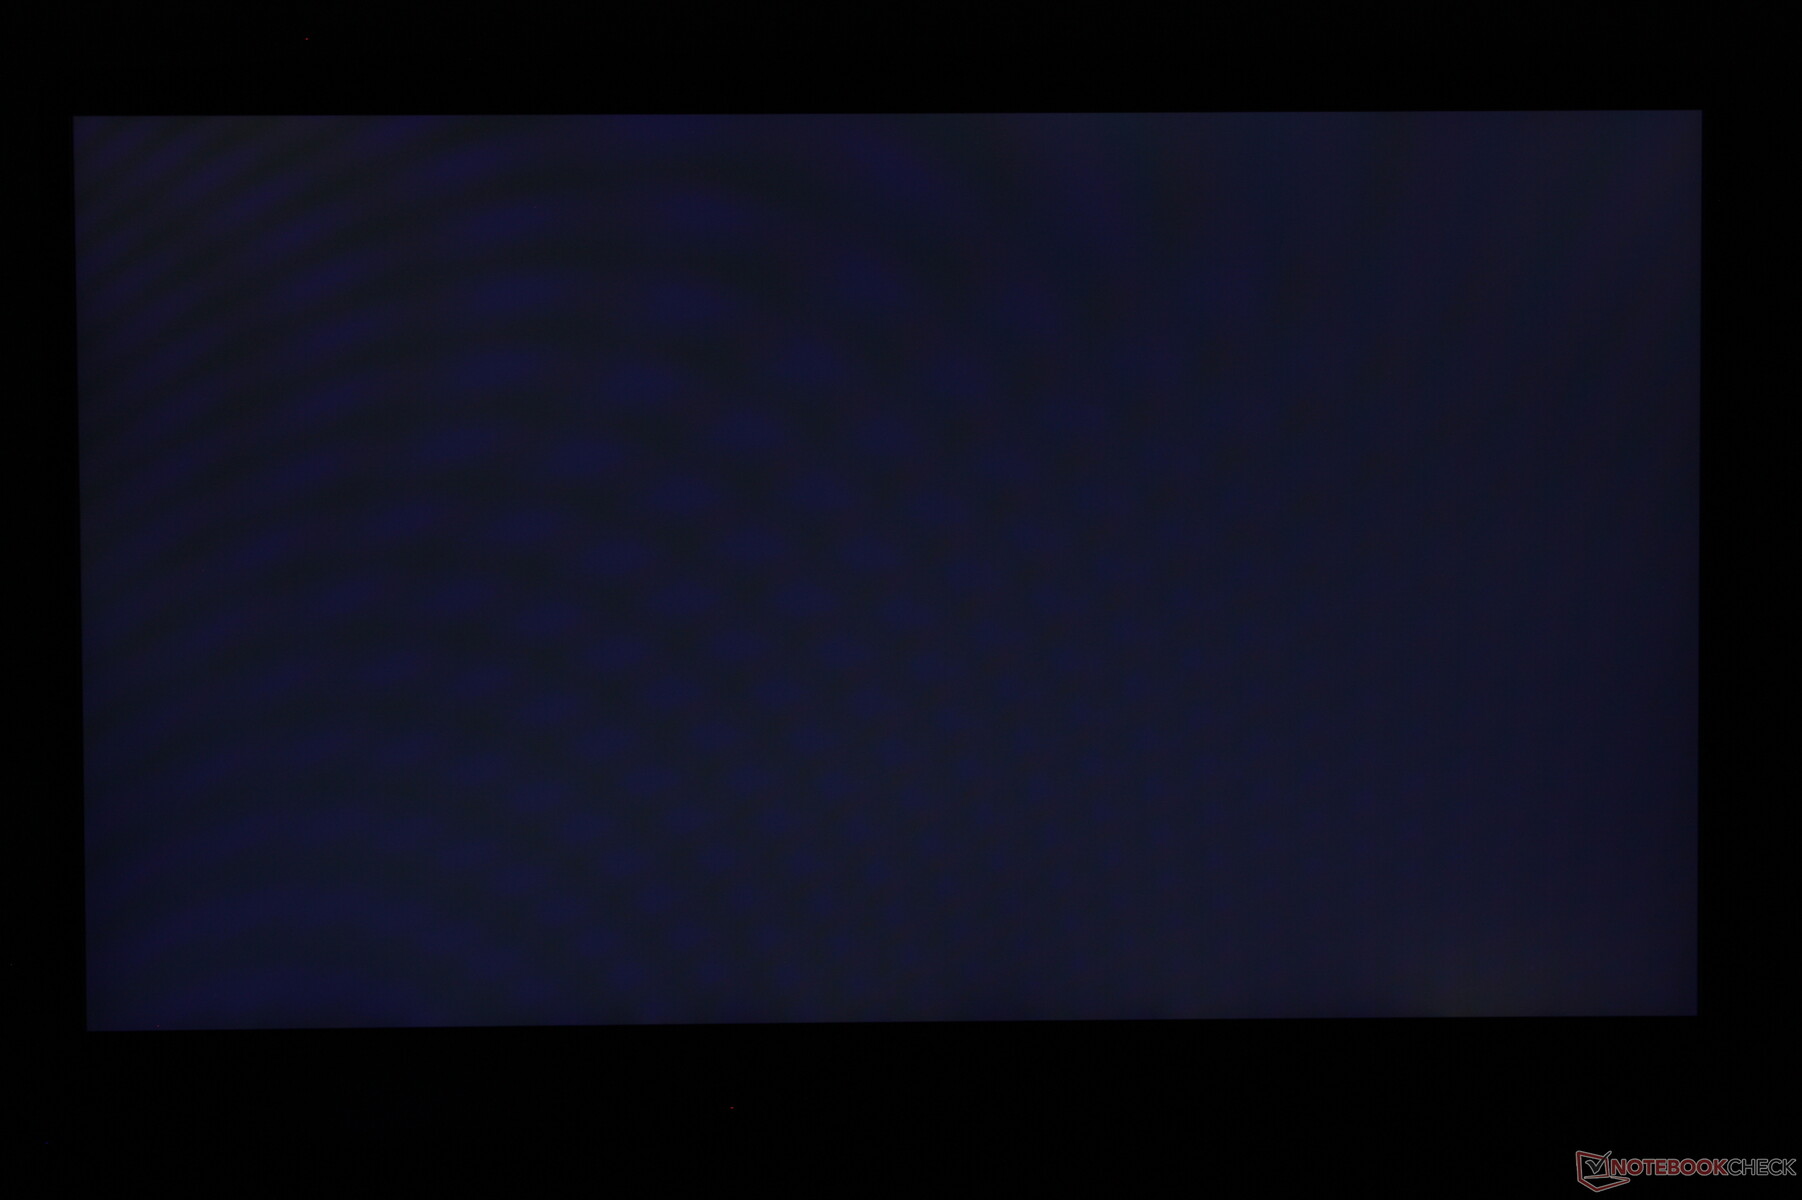
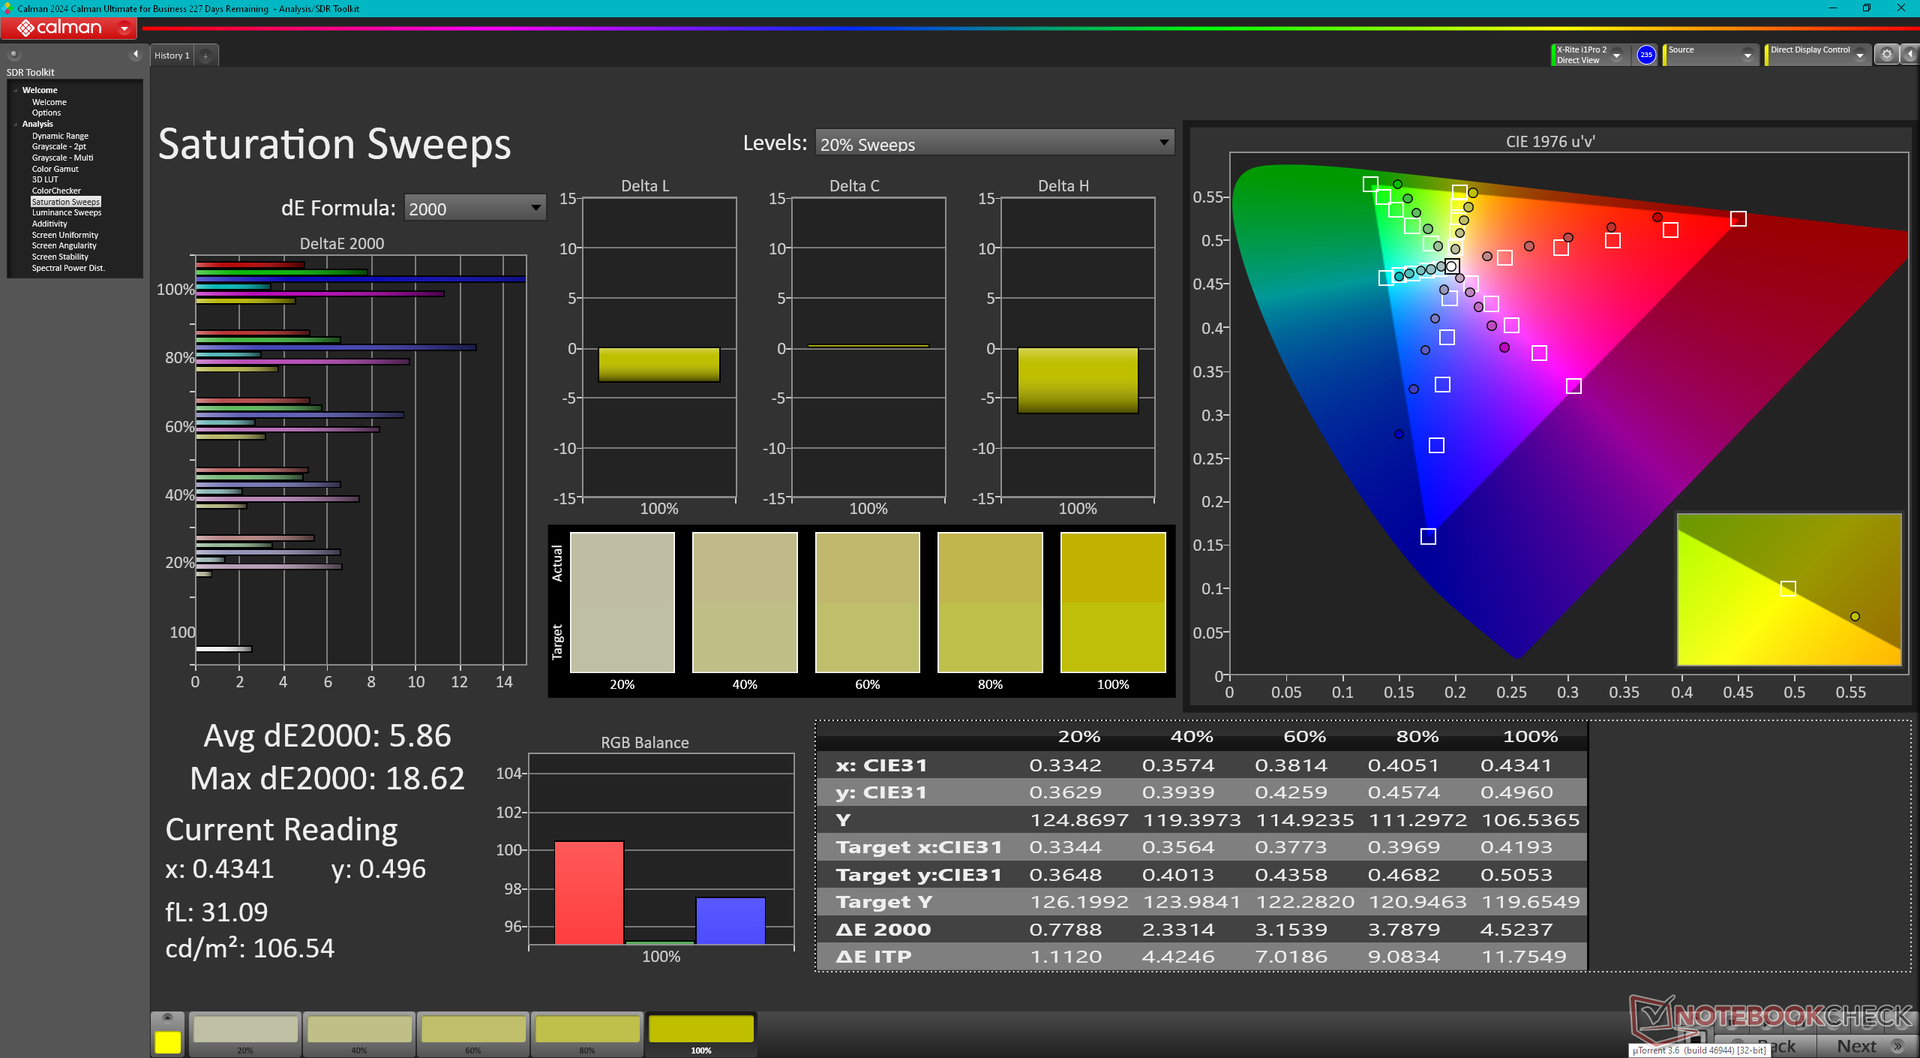
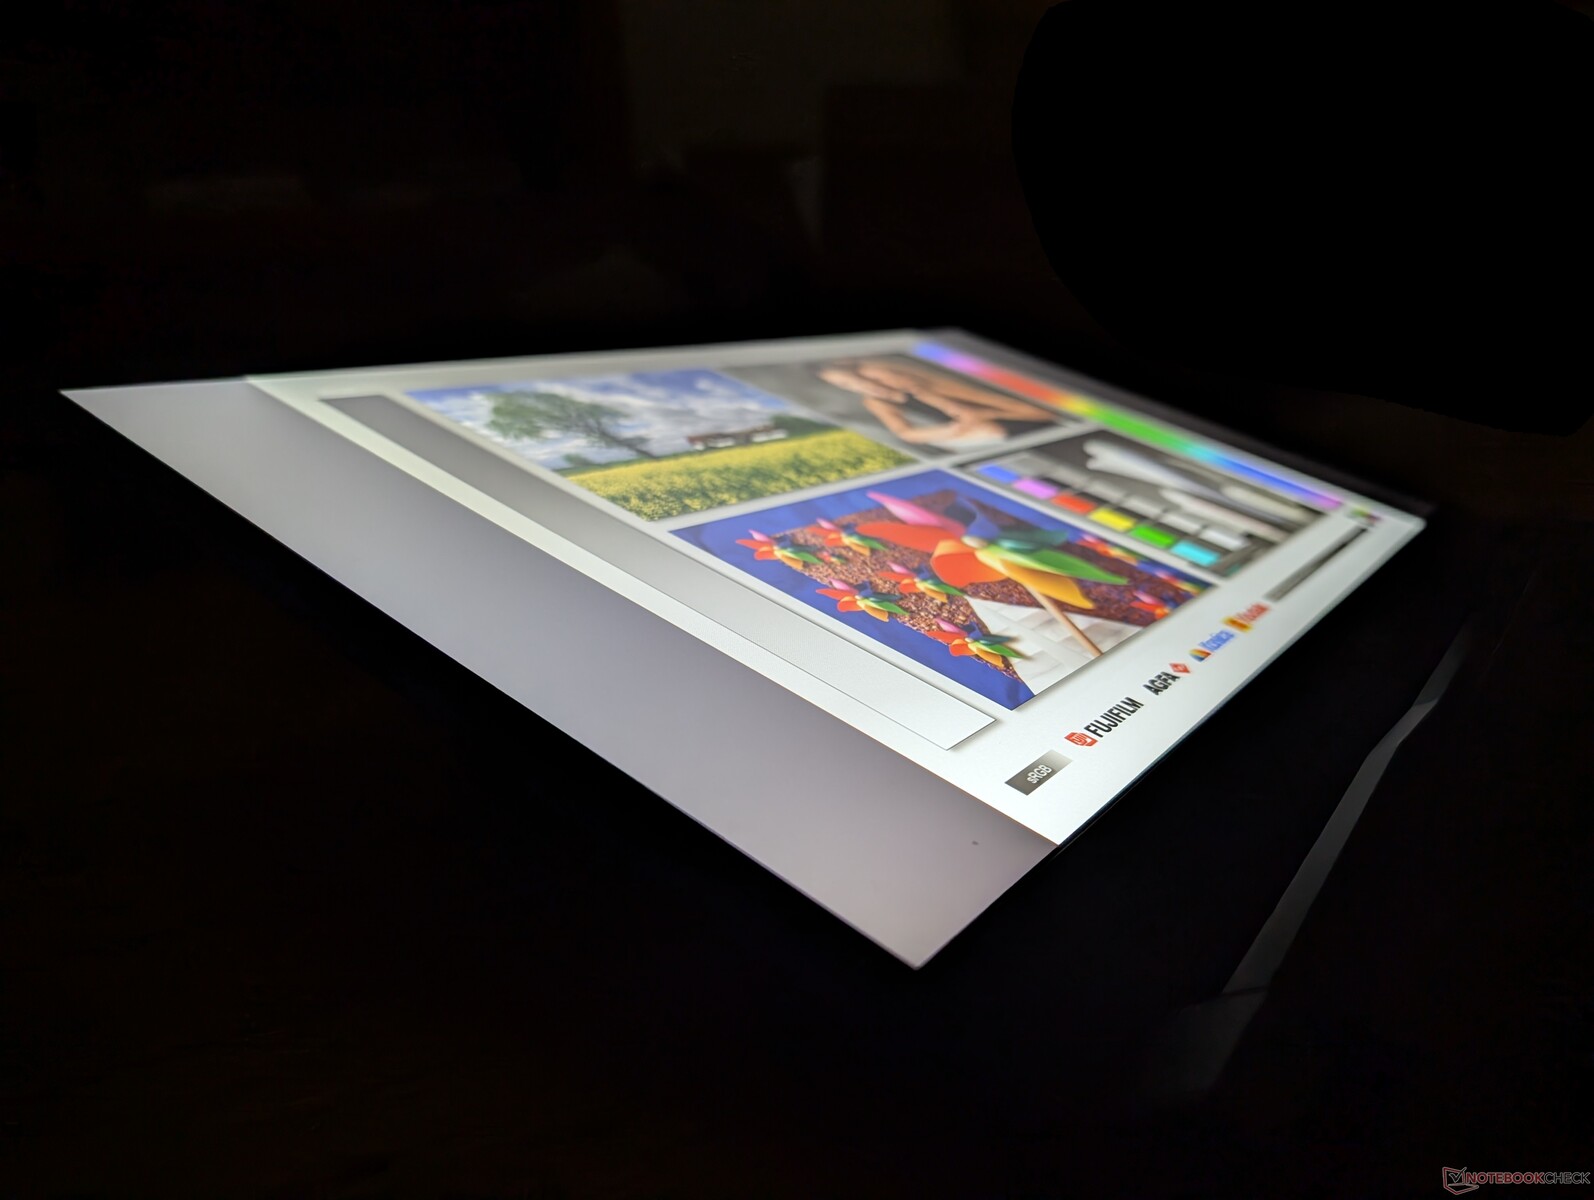
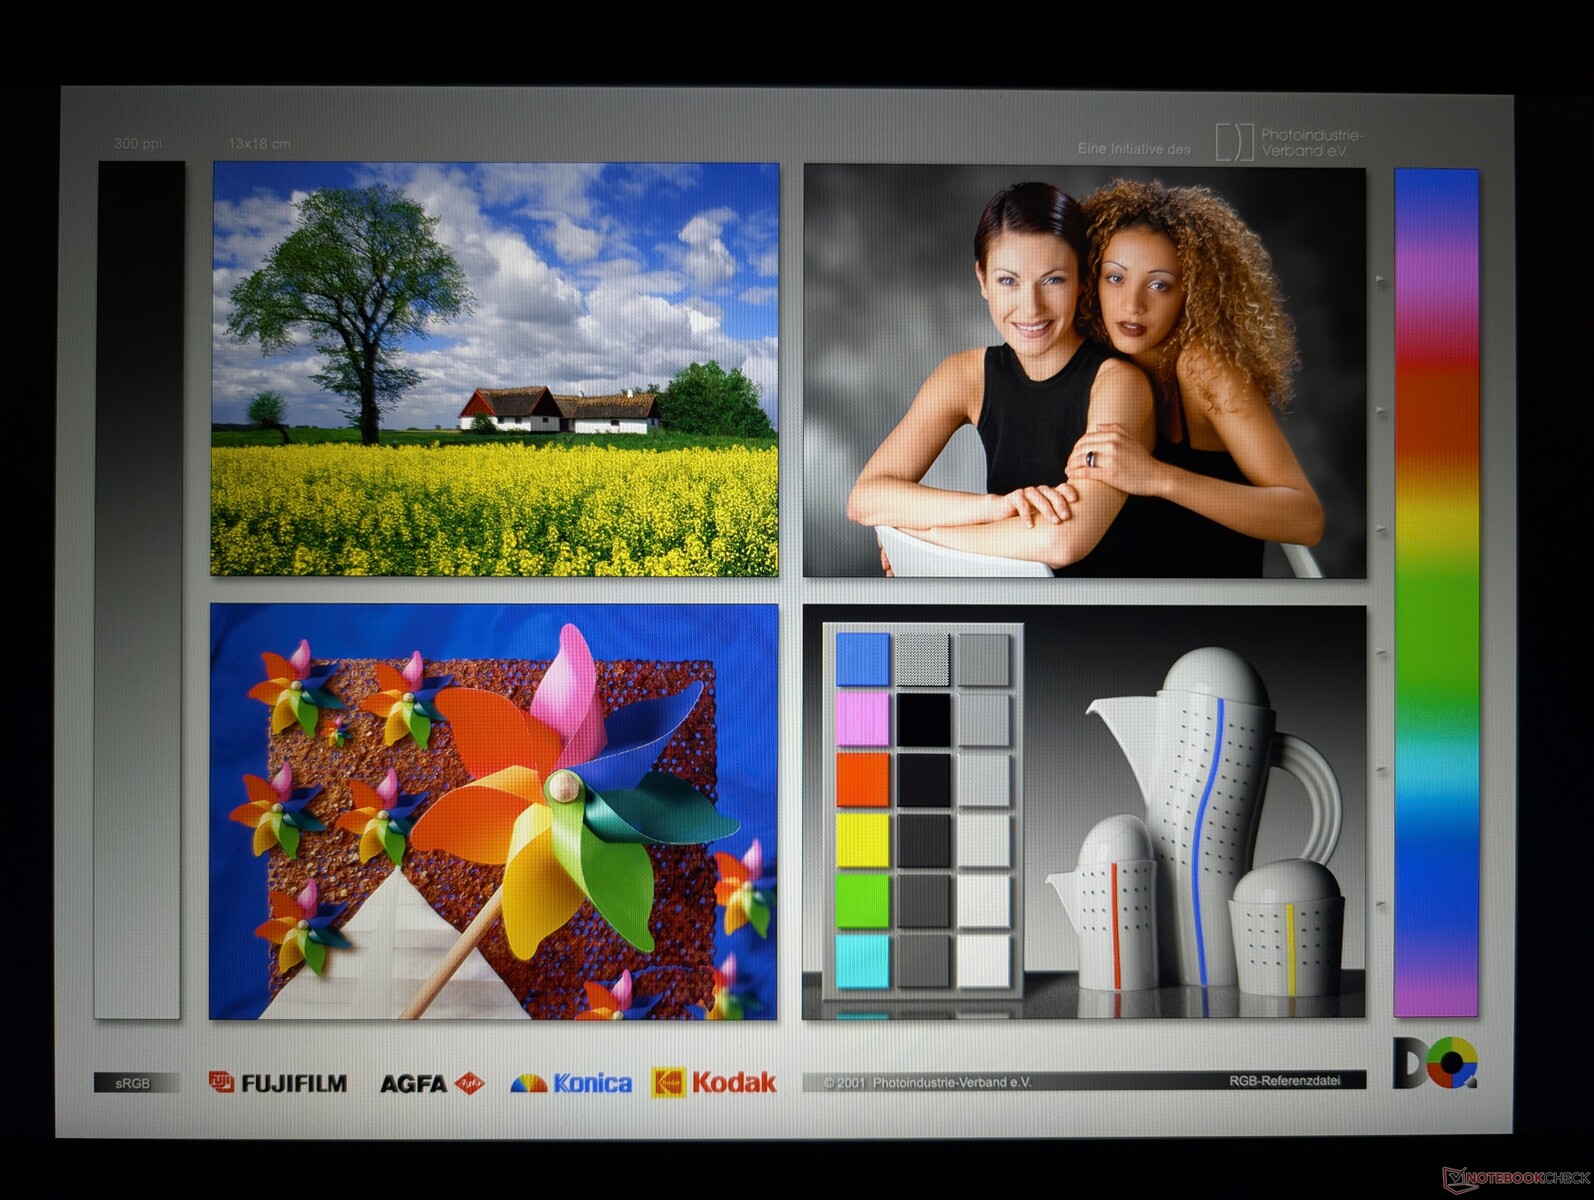
No deje que la rápida frecuencia de refresco de 144 Hz le engañe, ya que la pantalla es, por lo demás, poco impresionante. El brillo, los tiempos de respuesta y la cobertura de color son tenues, medios y estrechos, respectivamente, para representar a un panel económico. Incluso subjetivamente los colores y el efecto fantasma son notablemente inferiores a las pantallas más suaves de modelos más caros como el Lenovo Legion 5 17 o el Serie GT de MSI. Al menos la calidad de imagen es limpia y sin grandes problemas de sangrado de retroiluminación o granulado.
Tenga en cuenta que este mismo panel AU Optronics B173HAN04.9 también aparece en el competidor Asus TUF Gaming A17. Se espera que la configuración más cara de 1440p240Hz ofrezca colores y características mucho mejores.
| |||||||||||||||||||||||||
iluminación: 83 %
Brillo con batería: 244.5 cd/m²
Contraste: 1111:1 (Negro: 0.22 cd/m²)
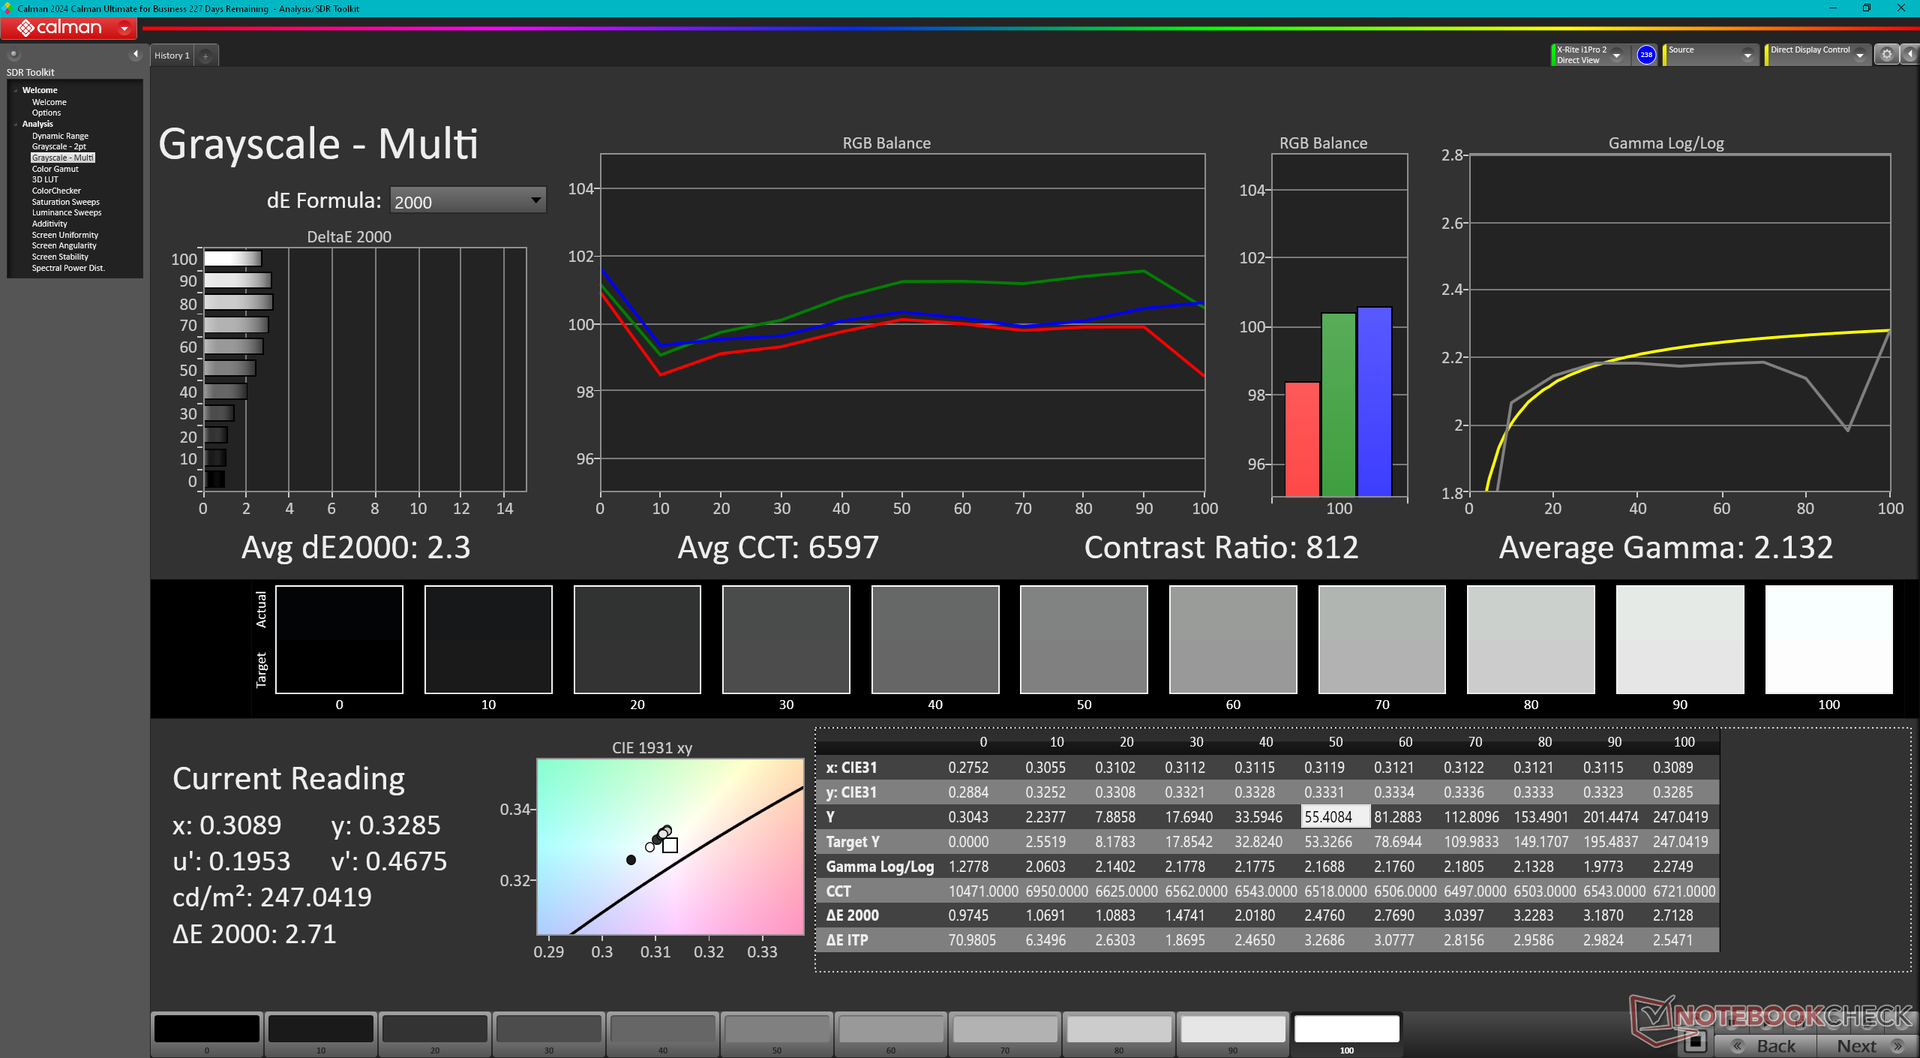
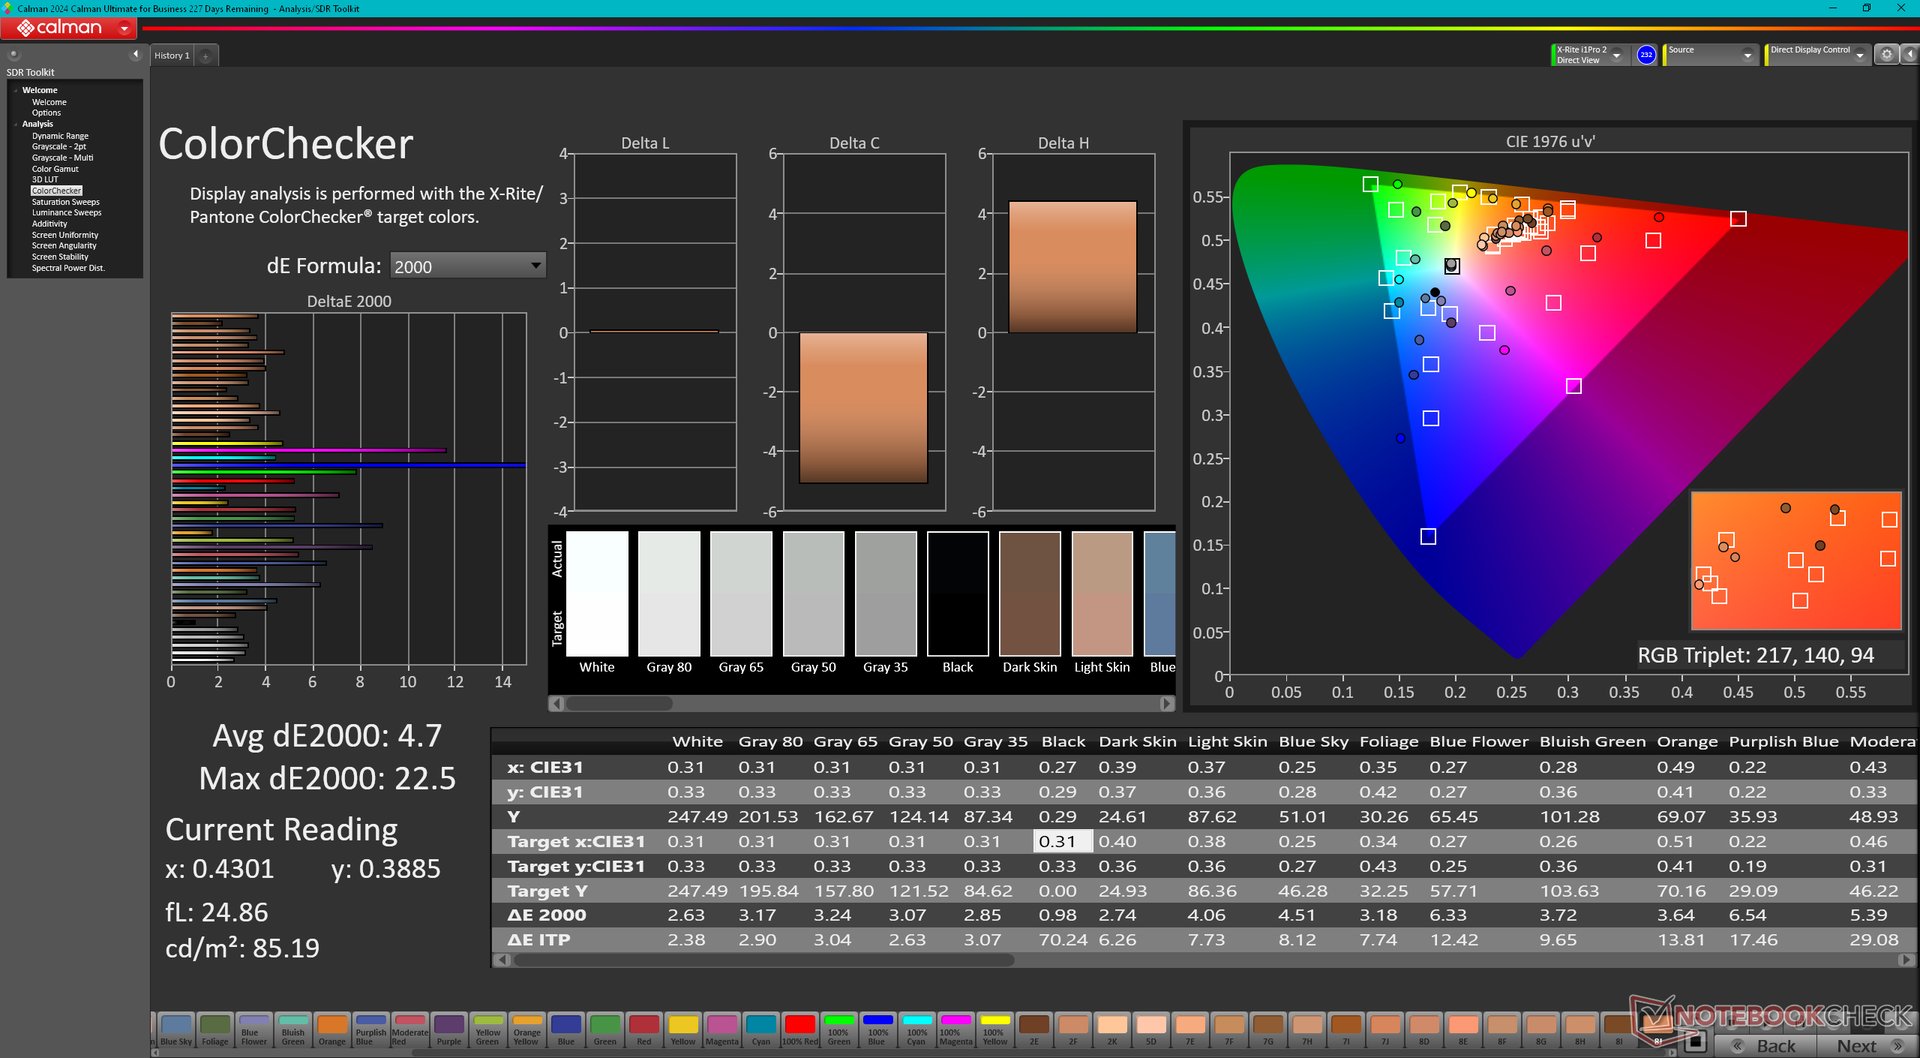
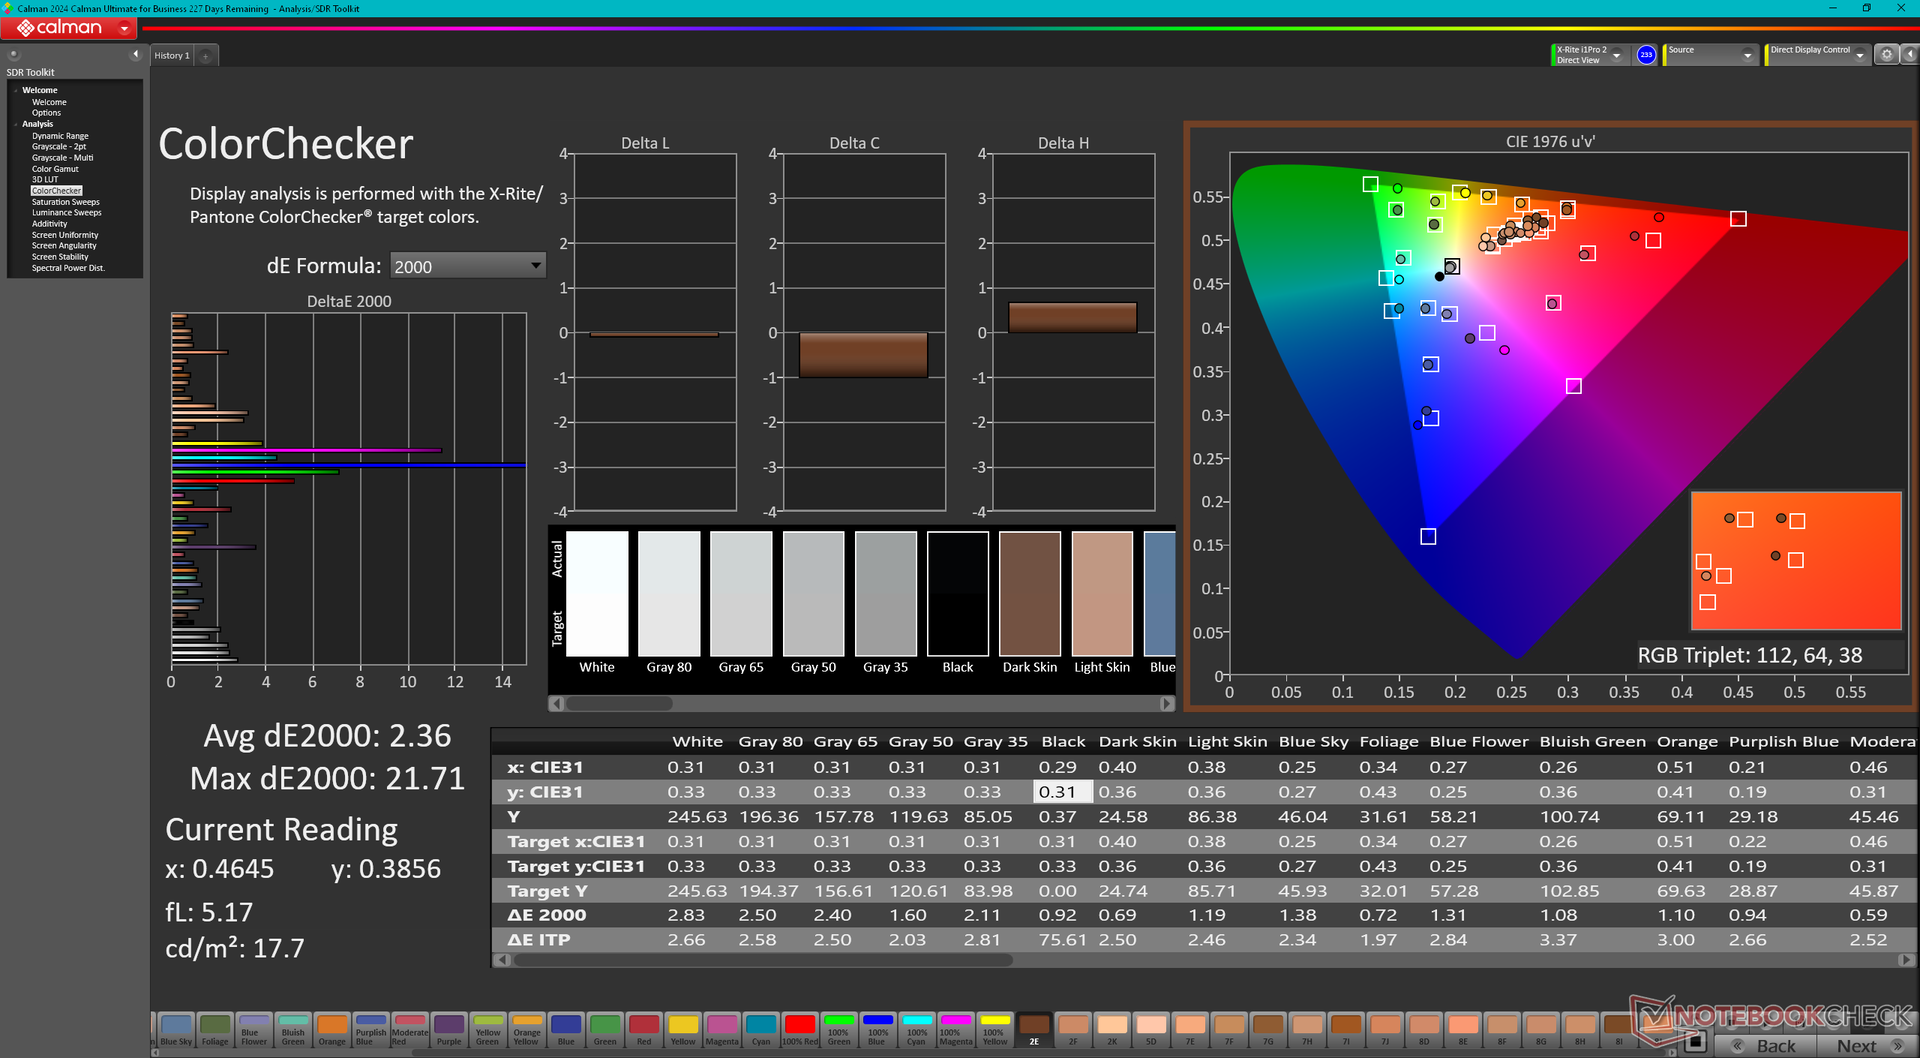
ΔE Color 4.7 | 0.5-29.43 Ø4.87, calibrated: 2.36
ΔE Greyscale 2.3 | 0.5-98 Ø5.1
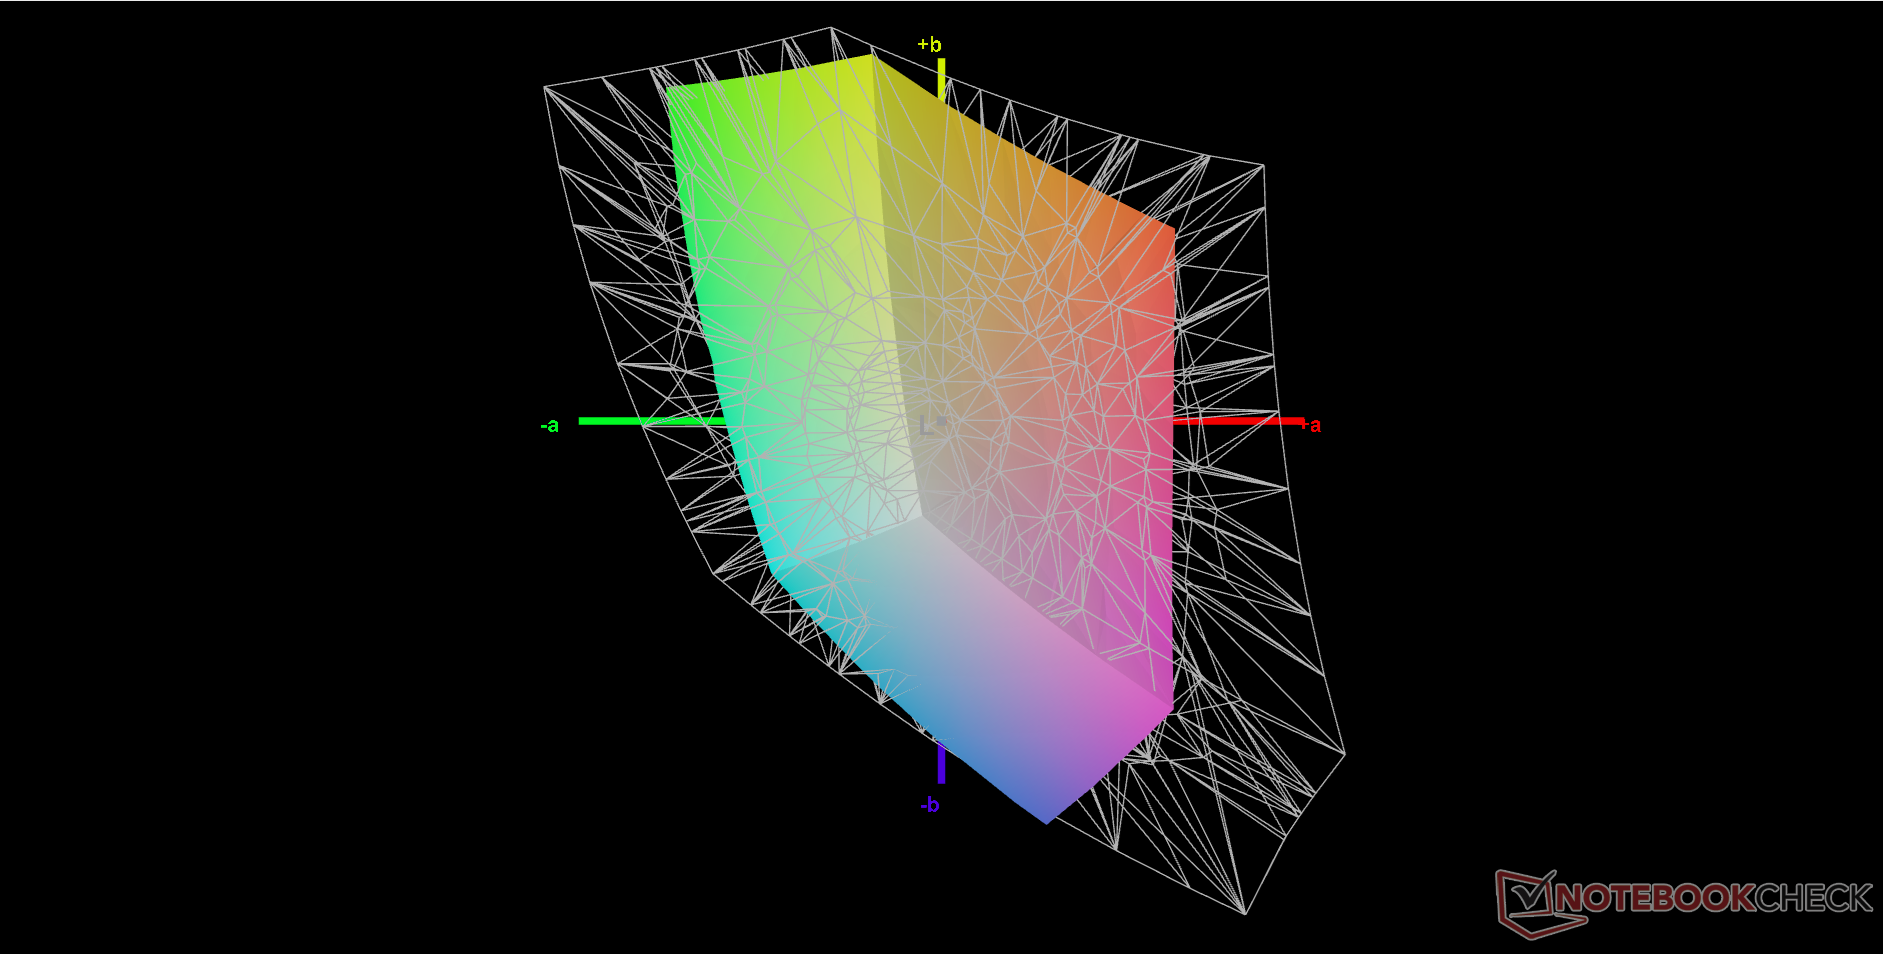
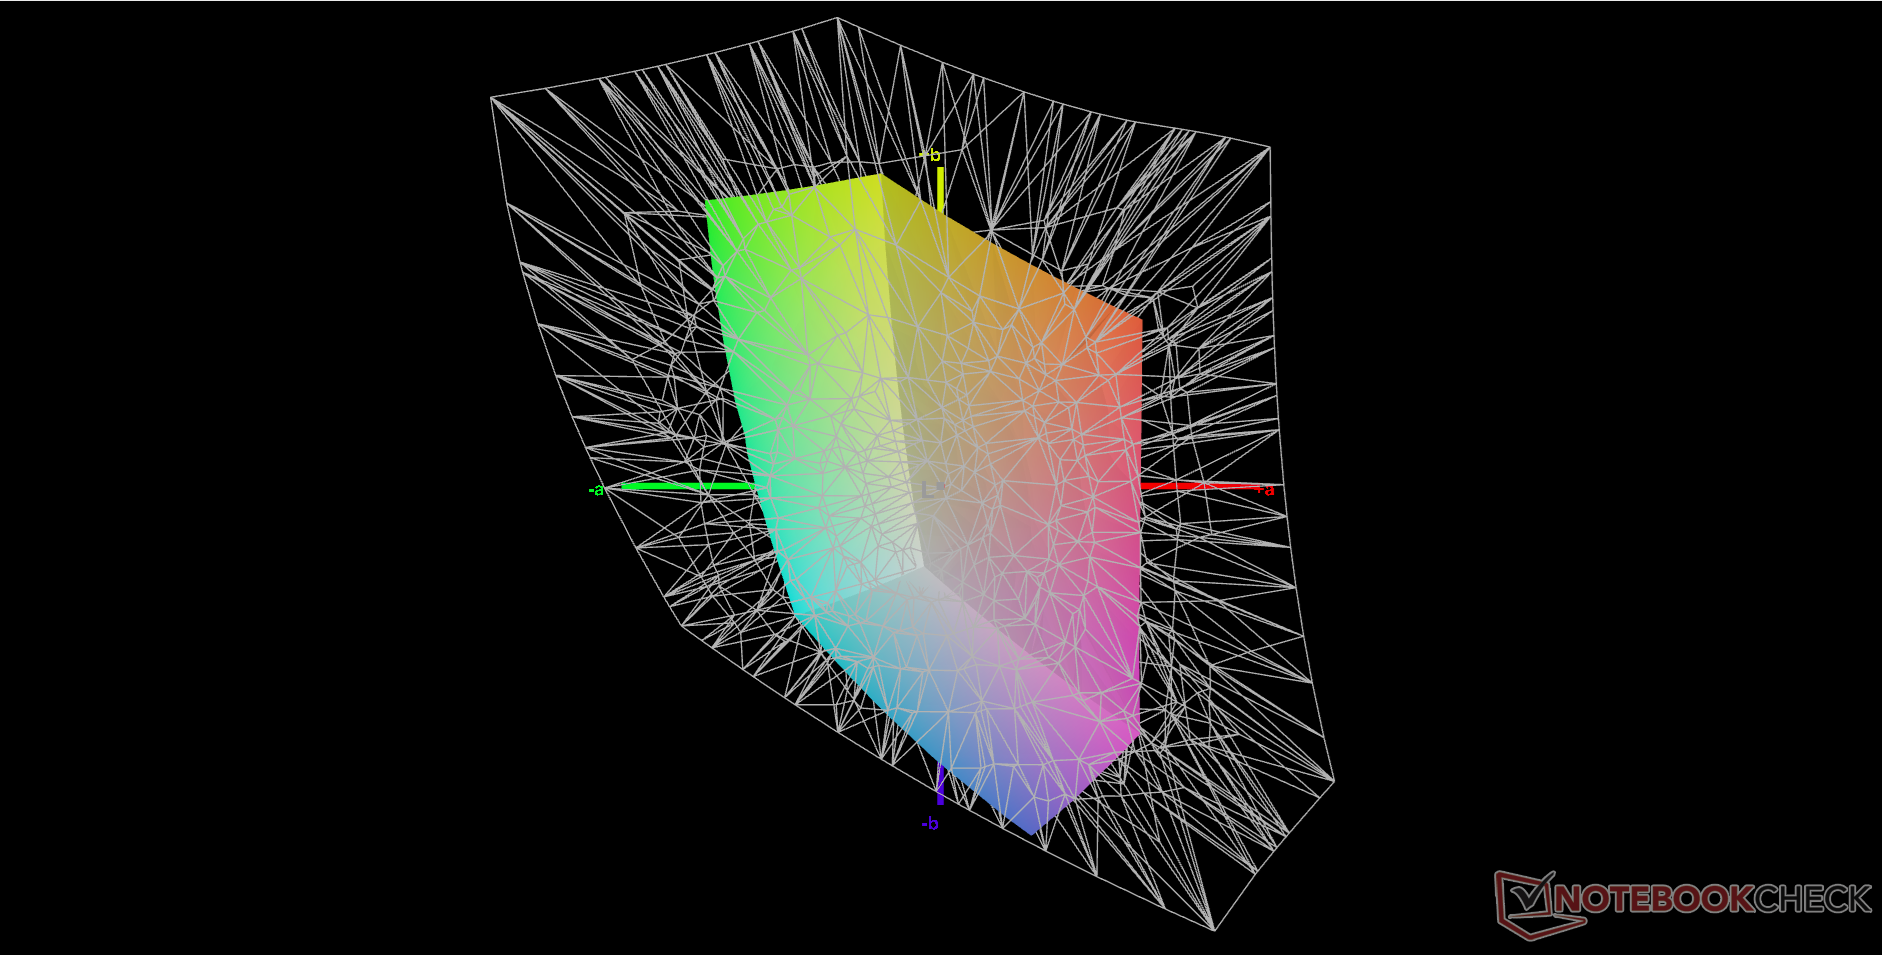
41.1% AdobeRGB 1998 (Argyll 2.2.0 3D)
59.3% sRGB (Argyll 2.2.0 3D)
39.8% Display P3 (Argyll 2.2.0 3D)
Gamma: 2.13
| MSI Katana A17 AI B8VG AU Optronics B173HAN04.9, IPS, 1920x1080, 17.3", 144 Hz | HP Omen 17-db0079ng BOE0B67, IPS, 2560x1440, 17.3", 240 Hz | Asus TUF Gaming A17 FA707XI-NS94 AU Optronics B173HAN04.9, IPS, 1920x1080, 17.3", 144 Hz | Acer Nitro 17 AN17-51-71ER BOE0B7C NE173QHM-NY6, , 2560x1440, 17.3", 165 Hz | MSI Pulse 17 B13VGK AU Optronics B173HAN04.9, IPS, 1920x1080, 17.3", 144 Hz | Lenovo Legion 5 17ACH6H-82JY0003GE LEN173FHD, IPS, 1920x1080, 17.3", 144 Hz | |
|---|---|---|---|---|---|---|
| Display | 64% | 0% | 108% | -3% | 63% | |
| Display P3 Coverage | 39.8 | 66.2 66% | 39.7 0% | 98.3 147% | 38.4 -4% | 64.8 63% |
| sRGB Coverage | 59.3 | 95.5 61% | 59.1 0% | 100 69% | 57.5 -3% | 97.2 64% |
| AdobeRGB 1998 Coverage | 41.1 | 68.1 66% | 41 0% | 85.7 109% | 39.7 -3% | 66.7 62% |
| Response Times | 60% | -18% | 60% | 2% | 57% | |
| Response Time Grey 50% / Grey 80% * | 30.8 ? | 14.4 ? 53% | 39 ? -27% | 14.8 ? 52% | 31.2 ? -1% | 15 ? 51% |
| Response Time Black / White * | 24.6 ? | 8.3 ? 66% | 26.9 ? -9% | 8 ? 67% | 23.6 ? 4% | 9 ? 63% |
| PWM Frequency | ||||||
| Screen | 25% | 4% | -14% | 11% | 29% | |
| Brightness middle | 244.5 | 363 48% | 255.9 5% | 361 48% | 254 4% | 323 32% |
| Brightness | 234 | 341 46% | 248 6% | 326 39% | 250 7% | 305 30% |
| Brightness Distribution | 83 | 84 1% | 91 10% | 87 5% | 91 10% | 89 7% |
| Black Level * | 0.22 | 0.38 -73% | 0.21 5% | 0.6 -173% | 0.14 36% | 0.25 -14% |
| Contrast | 1111 | 955 -14% | 1219 10% | 602 -46% | 1814 63% | 1292 16% |
| Colorchecker dE 2000 * | 4.7 | 1.74 63% | 4.51 4% | 3.83 19% | 4.52 4% | 1.87 60% |
| Colorchecker dE 2000 max. * | 22.5 | 5.39 76% | 20.77 8% | 5.71 75% | 21.22 6% | 4.84 78% |
| Colorchecker dE 2000 calibrated * | 2.36 | 1.43 39% | 1.82 23% | 3.48 -47% | 4.52 -92% | 0.92 61% |
| Greyscale dE 2000 * | 2.3 | 1.3 43% | 3.2 -39% | 3.29 -43% | 1 57% | 2.57 -12% |
| Gamma | 2.13 103% | 2.235 98% | 2.08 106% | 2.29 96% | 2.44 90% | 2.42 91% |
| CCT | 6597 99% | 6346 102% | 6054 107% | 6679 97% | 6502 100% | 7012 93% |
| Media total (Programa/Opciones) | 50% /
39% | -5% /
-0% | 51% /
23% | 3% /
6% | 50% /
40% |
* ... más pequeño es mejor
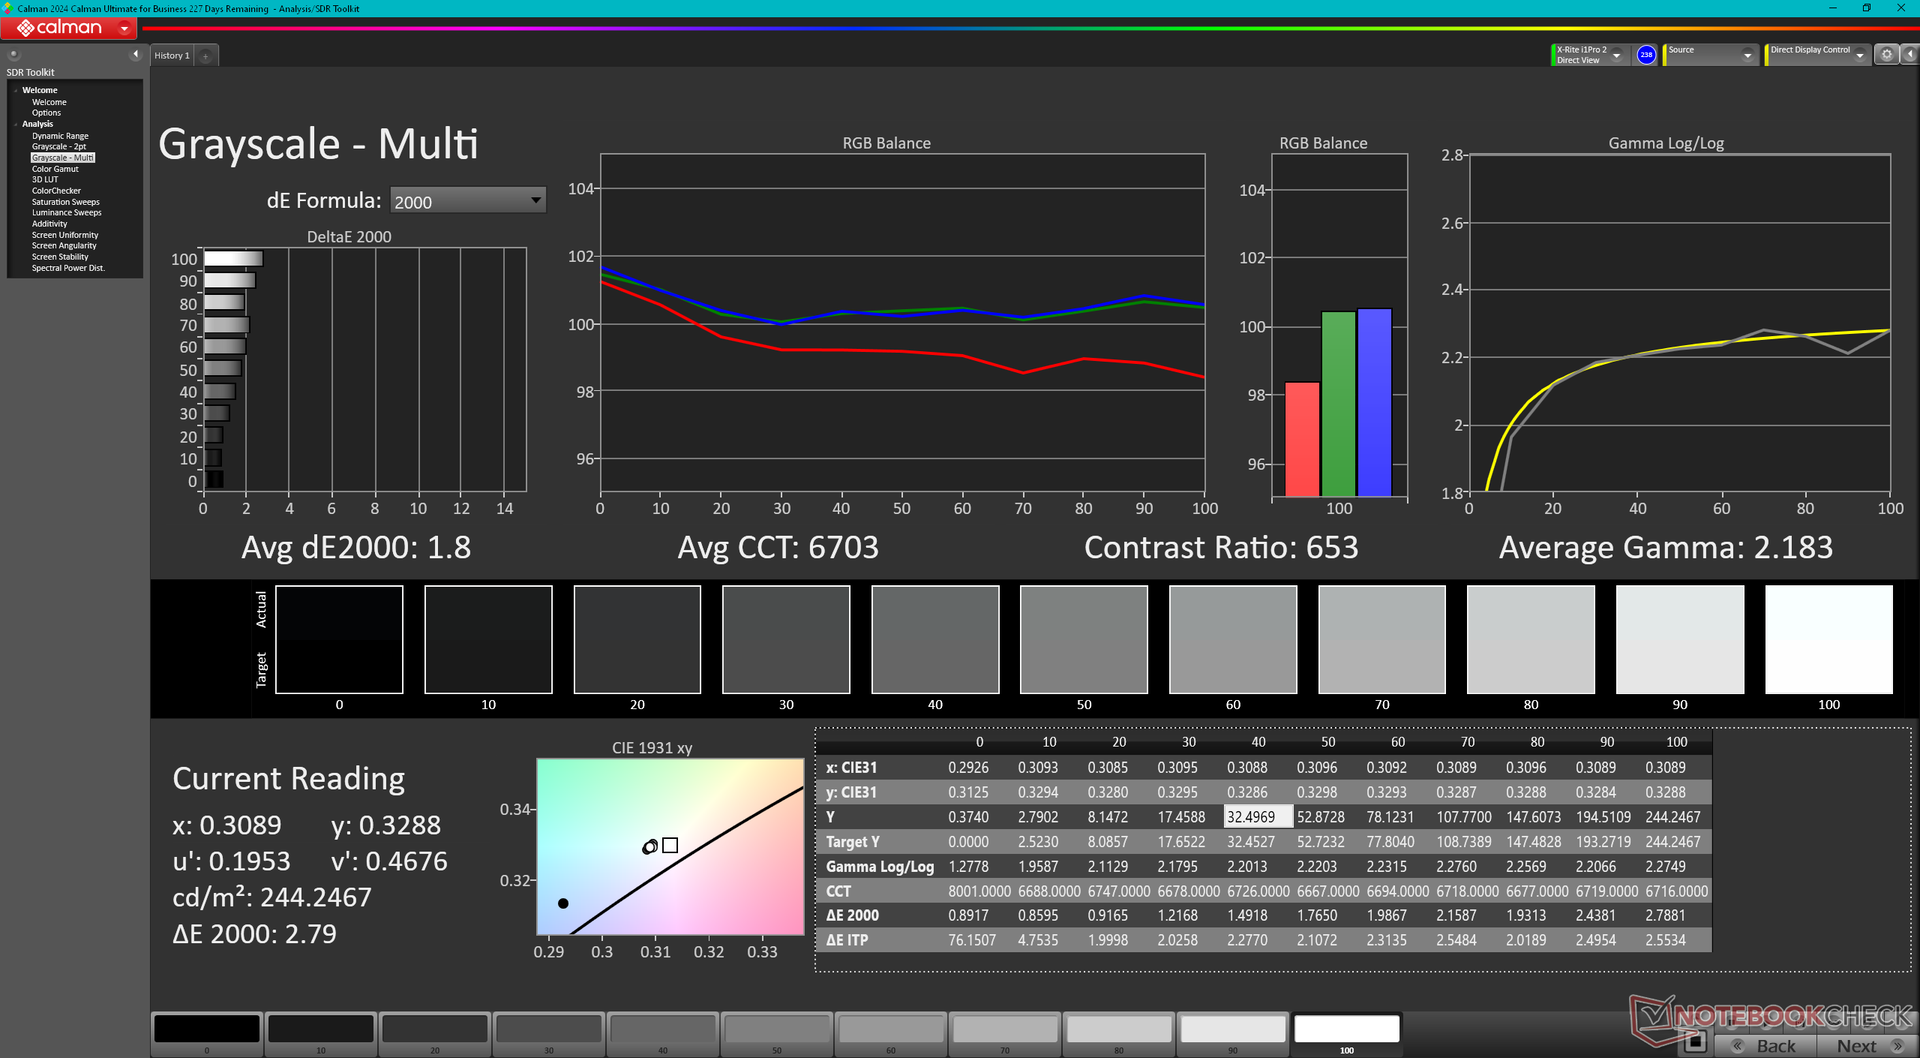
La escala de grises es decente nada más sacarlo de la caja, mientras que la precisión del color podría mejorarse. Calibrando nosotros mismos el panel mejoraríamos los valores medios de escala de grises y deltaE del color de 2,3 a 1,8 y de 4,7 a 2,36, respectivamente. Nuestro perfil ICM calibrado está disponible para su descarga gratuita más arriba.

Tiempos de respuesta del display
| ↔ Tiempo de respuesta de Negro a Blanco | ||
|---|---|---|
| 24.6 ms ... subida ↗ y bajada ↘ combinada | ↗ 12.7 ms subida | 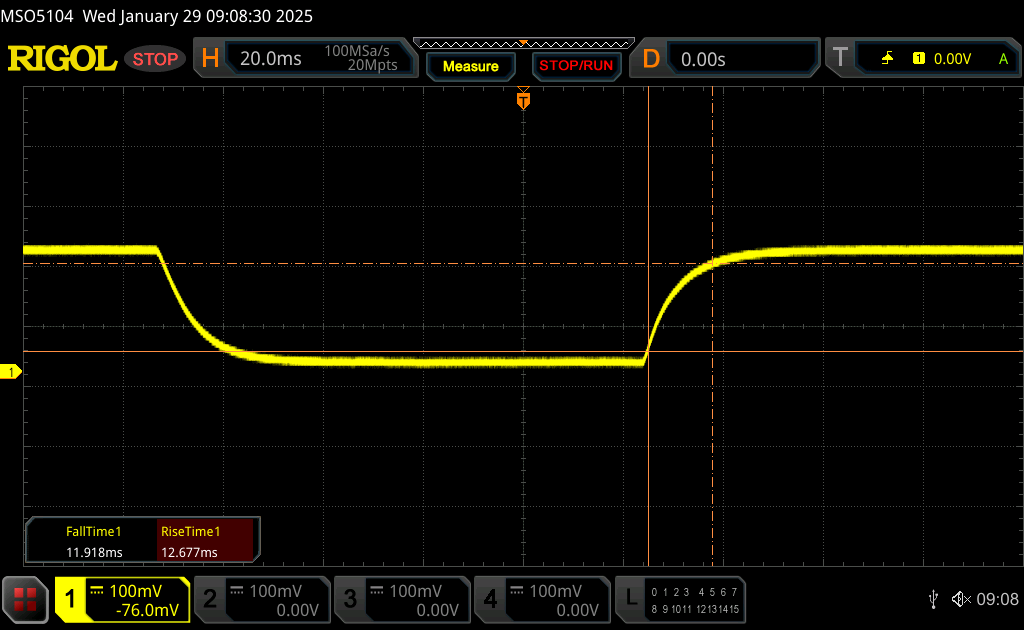 |
| ↘ 11.9 ms bajada | ||
| La pantalla mostró buenos tiempos de respuesta en nuestros tests pero podría ser demasiado lenta para los jugones competitivos. En comparación, todos los dispositivos de prueba van de ##min### (mínimo) a 240 (máximo) ms. » 55 % de todos los dispositivos son mejores. Eso quiere decir que el tiempo de respuesta es peor que la media (20.8 ms) de todos los dispositivos testados. | ||
| ↔ Tiempo de respuesta 50% Gris a 80% Gris | ||
| 30.8 ms ... subida ↗ y bajada ↘ combinada | ↗ 14.4 ms subida | 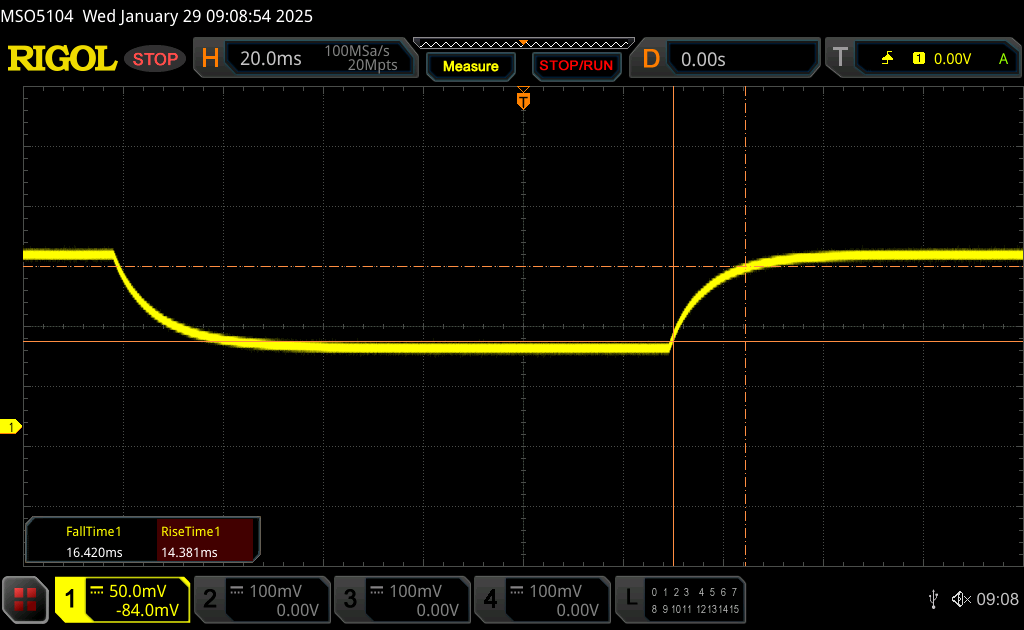 |
| ↘ 16.4 ms bajada | ||
| La pantalla mostró tiempos de respuesta lentos en nuestros tests y podría ser demasiado lenta para los jugones. En comparación, todos los dispositivos de prueba van de ##min### (mínimo) a 636 (máximo) ms. » 38 % de todos los dispositivos son mejores. Eso quiere decir que el tiempo de respuesta es similar al dispositivo testado medio (32.5 ms). | ||
Parpadeo de Pantalla / PWM (Pulse-Width Modulation)
| Parpadeo de Pantalla / PWM no detectado | 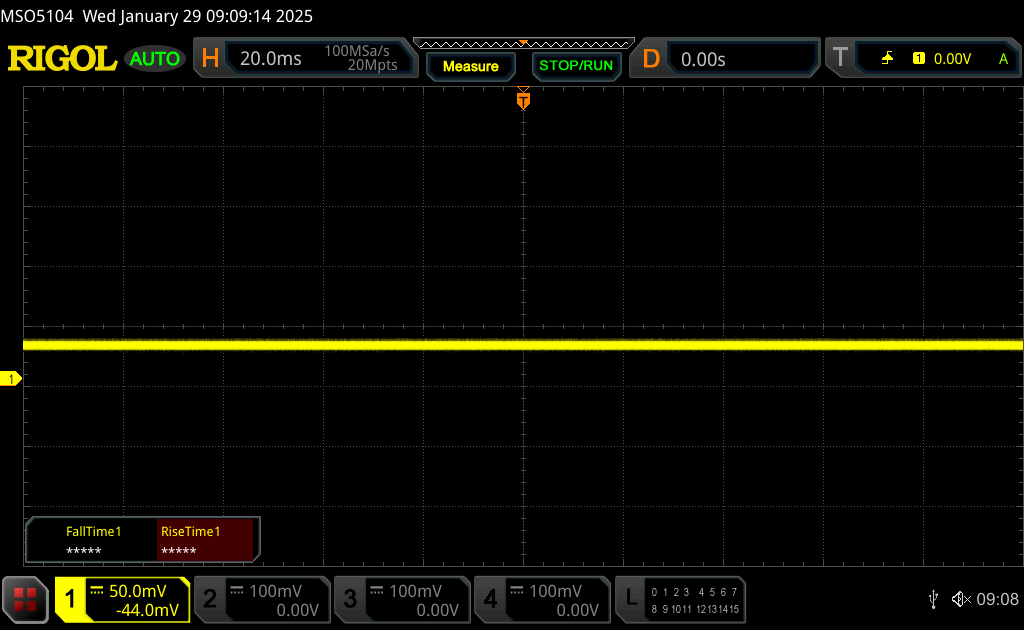 | ||
Comparación: 53 % de todos los dispositivos testados no usaron PWM para atenuar el display. Si se usó, medimos una media de 8519 (mínimo: 5 - máxmo: 343500) Hz. | |||

Rendimiento - Mayor rendimiento por vatio con AMD Zen 4
Condiciones de prueba
Configuramos Windows y el Centro MSI en modo Rendimiento antes de ejecutar las pruebas comparativas que se indican a continuación. También configuramos el sistema en modo GPU discreta en lugar de MSHybrid. Los propietarios deben familiarizarse con el Centro MSI ya que muchos ajustes clave se conmutan aquí.
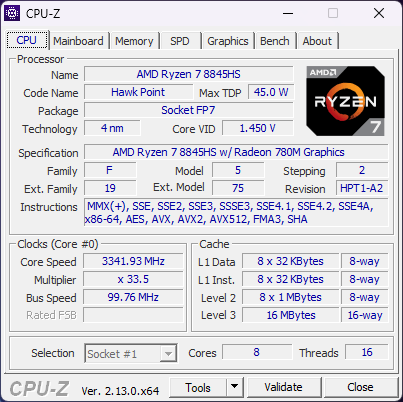
Procesador
El Ryzen 7 8845HS es más comparable al Core i7-12700H ambos combinan muy bien con la RTX 4070 móvil. La actualización al Ryzen 9 8945HS sólo se espera que proporcione ganancias muy marginales de hasta un 5 por ciento basado en nuestro tiempo con el Katana A15.
Cinebench R15 Multi Loop
Cinebench R23: Multi Core | Single Core
Cinebench R20: CPU (Multi Core) | CPU (Single Core)
Cinebench R15: CPU Multi 64Bit | CPU Single 64Bit
Blender: v2.79 BMW27 CPU
7-Zip 18.03: 7z b 4 | 7z b 4 -mmt1
Geekbench 6.4: Multi-Core | Single-Core
Geekbench 5.5: Multi-Core | Single-Core
HWBOT x265 Benchmark v2.2: 4k Preset
LibreOffice : 20 Documents To PDF
R Benchmark 2.5: Overall mean
| Geekbench 6.4 / Multi-Core | |
| Eurocom Raptor X17 Core i9-14900HX | |
| MSI Katana A17 AI B8VG | |
| Medio AMD Ryzen 7 8845HS (11073 - 14014, n=16) | |
| HP Omen 17-db0079ng | |
| Asus TUF Gaming A17 FA707XI-NS94 | |
| Acer Nitro 17 AN17-41-R9LN | |
| Geekbench 6.4 / Single-Core | |
| Eurocom Raptor X17 Core i9-14900HX | |
| Asus TUF Gaming A17 FA707XI-NS94 | |
| MSI Katana A17 AI B8VG | |
| Medio AMD Ryzen 7 8845HS (2510 - 2698, n=14) | |
| HP Omen 17-db0079ng | |
| Acer Nitro 17 AN17-41-R9LN | |
Cinebench R23: Multi Core | Single Core
Cinebench R20: CPU (Multi Core) | CPU (Single Core)
Cinebench R15: CPU Multi 64Bit | CPU Single 64Bit
Blender: v2.79 BMW27 CPU
7-Zip 18.03: 7z b 4 | 7z b 4 -mmt1
Geekbench 6.4: Multi-Core | Single-Core
Geekbench 5.5: Multi-Core | Single-Core
HWBOT x265 Benchmark v2.2: 4k Preset
LibreOffice : 20 Documents To PDF
R Benchmark 2.5: Overall mean
* ... más pequeño es mejor
AIDA64: FP32 Ray-Trace | FPU Julia | CPU SHA3 | CPU Queen | FPU SinJulia | FPU Mandel | CPU AES | CPU ZLib | FP64 Ray-Trace | CPU PhotoWorxx
| Performance Rating | |
| Asus TUF Gaming A17 FA707XI-NS94 | |
| HP Omen 17-db0079ng | |
| MSI Katana A17 AI B8VG | |
| Medio AMD Ryzen 7 8845HS | |
| Acer Nitro 17 AN17-51-71ER | |
| MSI Pulse 17 B13VGK | |
| Lenovo Legion 5 17ACH6H-82JY0003GE | |
| AIDA64 / FP32 Ray-Trace | |
| Asus TUF Gaming A17 FA707XI-NS94 | |
| HP Omen 17-db0079ng | |
| MSI Katana A17 AI B8VG | |
| Medio AMD Ryzen 7 8845HS (23708 - 29544, n=12) | |
| MSI Pulse 17 B13VGK | |
| Acer Nitro 17 AN17-51-71ER | |
| Lenovo Legion 5 17ACH6H-82JY0003GE | |
| AIDA64 / FPU Julia | |
| Asus TUF Gaming A17 FA707XI-NS94 | |
| HP Omen 17-db0079ng | |
| MSI Katana A17 AI B8VG | |
| Medio AMD Ryzen 7 8845HS (99659 - 125873, n=12) | |
| MSI Pulse 17 B13VGK | |
| Acer Nitro 17 AN17-51-71ER | |
| Lenovo Legion 5 17ACH6H-82JY0003GE | |
| AIDA64 / CPU SHA3 | |
| Asus TUF Gaming A17 FA707XI-NS94 | |
| HP Omen 17-db0079ng | |
| MSI Katana A17 AI B8VG | |
| Medio AMD Ryzen 7 8845HS (4332 - 5180, n=12) | |
| Acer Nitro 17 AN17-51-71ER | |
| MSI Pulse 17 B13VGK | |
| Lenovo Legion 5 17ACH6H-82JY0003GE | |
| AIDA64 / CPU Queen | |
| Asus TUF Gaming A17 FA707XI-NS94 | |
| MSI Katana A17 AI B8VG | |
| Medio AMD Ryzen 7 8845HS (109458 - 124695, n=12) | |
| HP Omen 17-db0079ng | |
| Acer Nitro 17 AN17-51-71ER | |
| MSI Pulse 17 B13VGK | |
| Lenovo Legion 5 17ACH6H-82JY0003GE | |
| AIDA64 / FPU SinJulia | |
| Asus TUF Gaming A17 FA707XI-NS94 | |
| MSI Katana A17 AI B8VG | |
| HP Omen 17-db0079ng | |
| Medio AMD Ryzen 7 8845HS (14062 - 15519, n=12) | |
| MSI Pulse 17 B13VGK | |
| Acer Nitro 17 AN17-51-71ER | |
| Lenovo Legion 5 17ACH6H-82JY0003GE | |
| AIDA64 / FPU Mandel | |
| Asus TUF Gaming A17 FA707XI-NS94 | |
| HP Omen 17-db0079ng | |
| MSI Katana A17 AI B8VG | |
| Medio AMD Ryzen 7 8845HS (53436 - 67367, n=12) | |
| MSI Pulse 17 B13VGK | |
| Acer Nitro 17 AN17-51-71ER | |
| Lenovo Legion 5 17ACH6H-82JY0003GE | |
| AIDA64 / CPU AES | |
| Acer Nitro 17 AN17-51-71ER | |
| Lenovo Legion 5 17ACH6H-82JY0003GE | |
| Medio AMD Ryzen 7 8845HS (64515 - 172642, n=12) | |
| Asus TUF Gaming A17 FA707XI-NS94 | |
| HP Omen 17-db0079ng | |
| MSI Katana A17 AI B8VG | |
| MSI Pulse 17 B13VGK | |
| AIDA64 / CPU ZLib | |
| Acer Nitro 17 AN17-51-71ER | |
| MSI Pulse 17 B13VGK | |
| Asus TUF Gaming A17 FA707XI-NS94 | |
| HP Omen 17-db0079ng | |
| MSI Katana A17 AI B8VG | |
| Medio AMD Ryzen 7 8845HS (627 - 1080, n=12) | |
| Lenovo Legion 5 17ACH6H-82JY0003GE | |
| AIDA64 / FP64 Ray-Trace | |
| Asus TUF Gaming A17 FA707XI-NS94 | |
| HP Omen 17-db0079ng | |
| MSI Katana A17 AI B8VG | |
| Medio AMD Ryzen 7 8845HS (12361 - 15911, n=12) | |
| MSI Pulse 17 B13VGK | |
| Acer Nitro 17 AN17-51-71ER | |
| Lenovo Legion 5 17ACH6H-82JY0003GE | |
| AIDA64 / CPU PhotoWorxx | |
| HP Omen 17-db0079ng | |
| MSI Katana A17 AI B8VG | |
| Medio AMD Ryzen 7 8845HS (33192 - 41668, n=12) | |
| MSI Pulse 17 B13VGK | |
| Acer Nitro 17 AN17-51-71ER | |
| Asus TUF Gaming A17 FA707XI-NS94 | |
| Lenovo Legion 5 17ACH6H-82JY0003GE | |
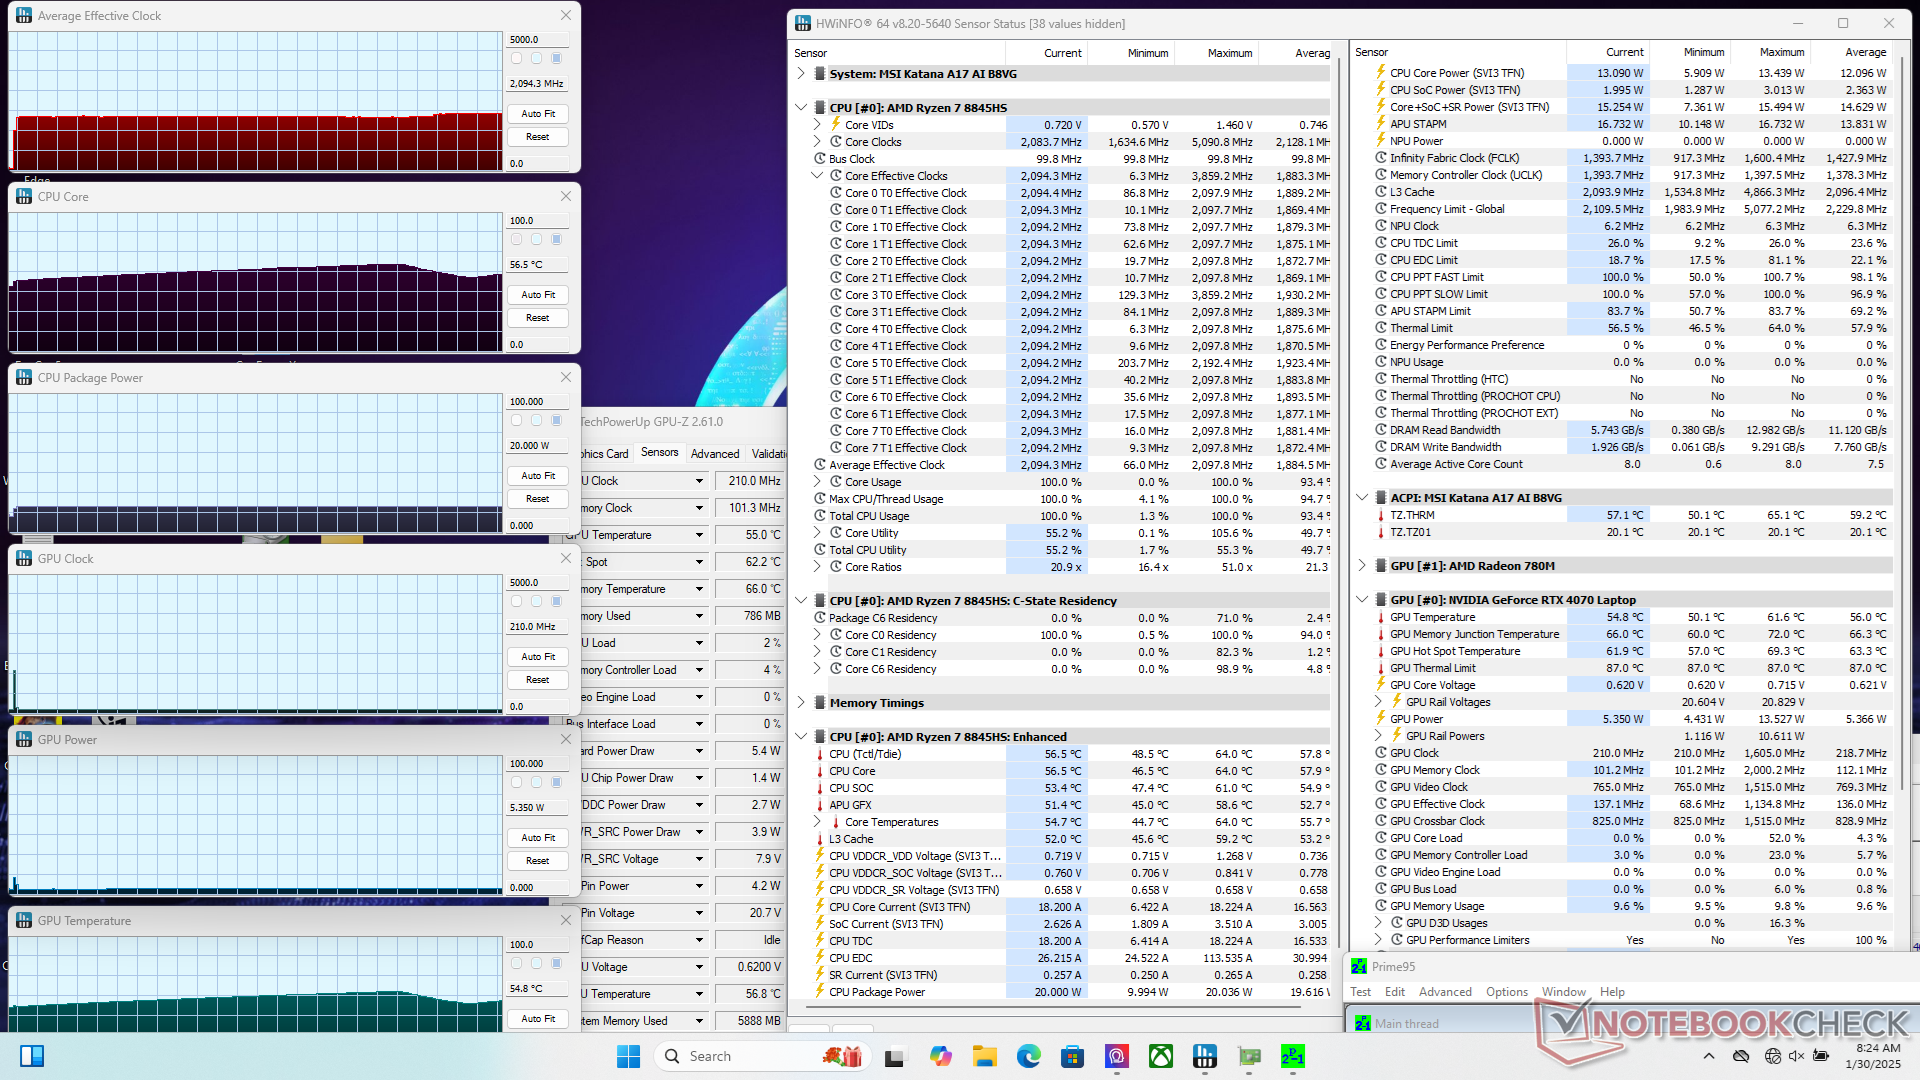
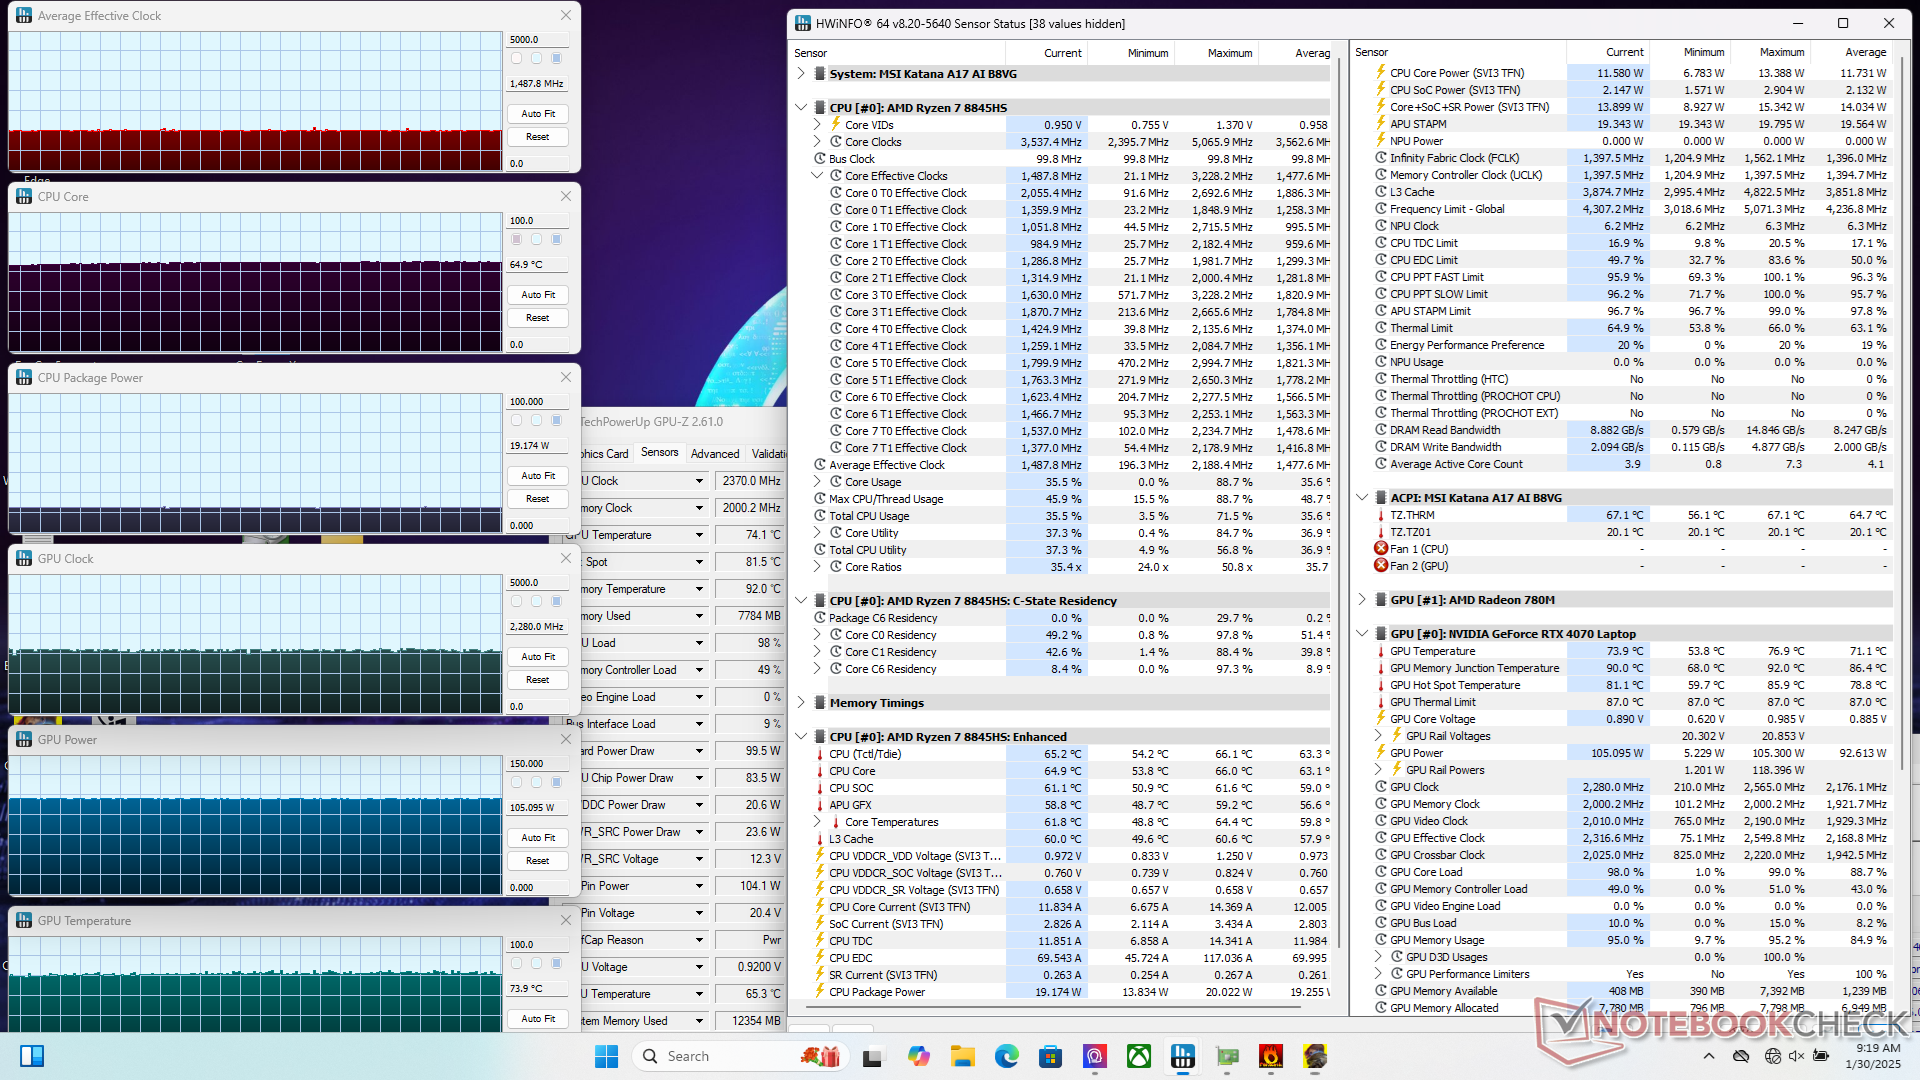
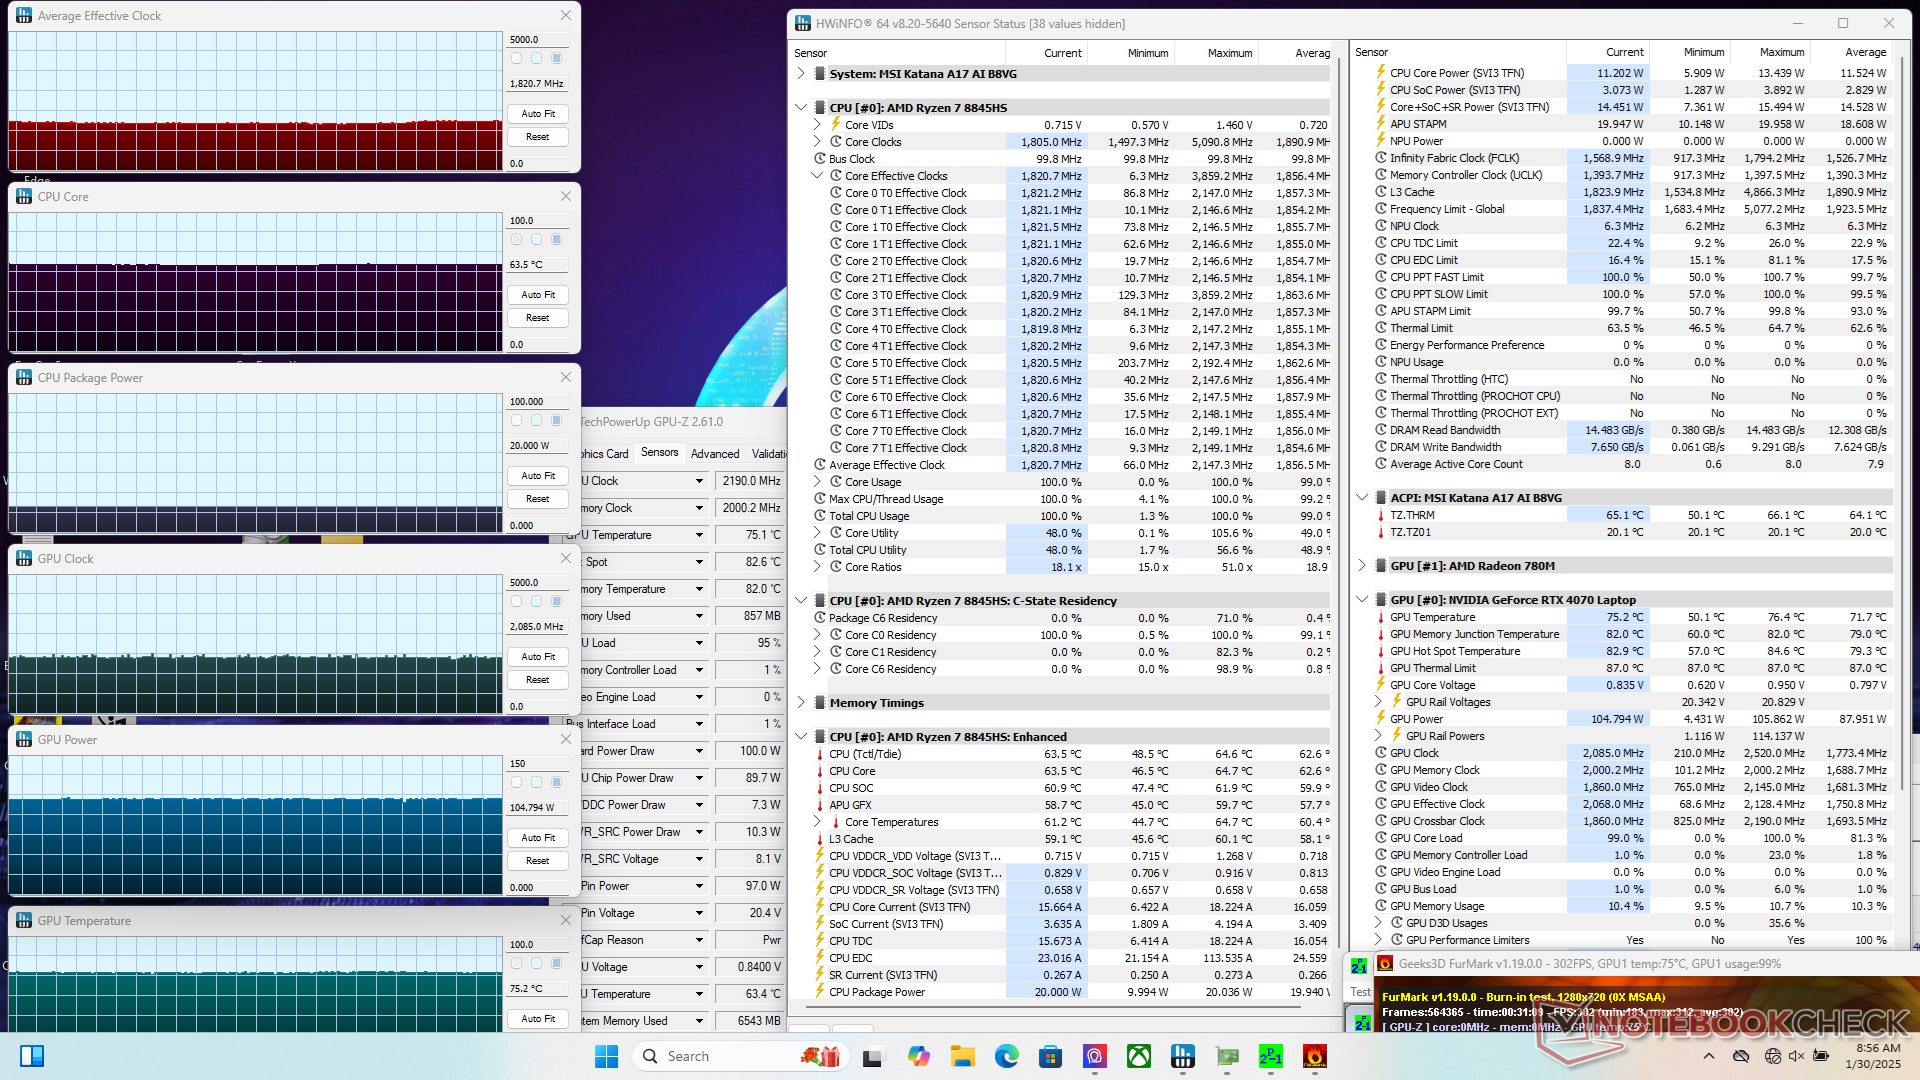
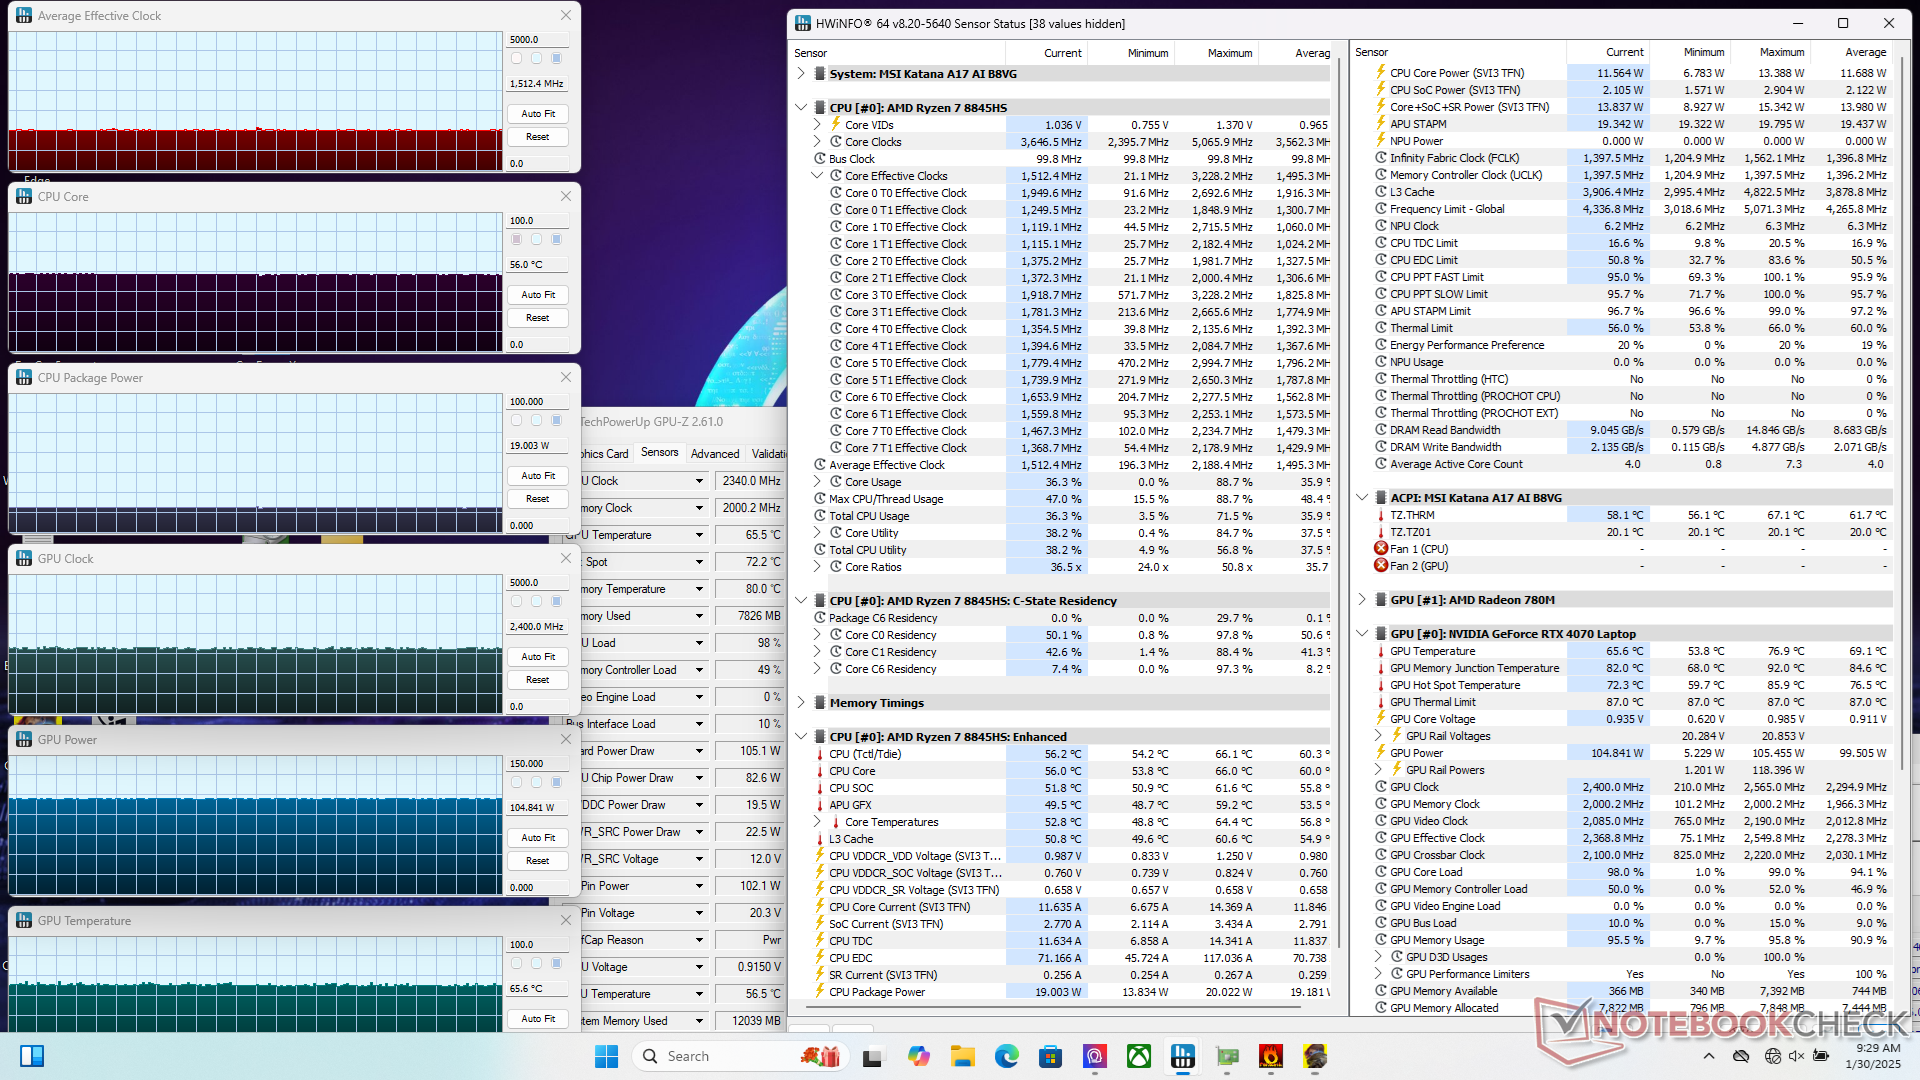
Prueba de estrés
La CPU mantendría una velocidad de reloj y un consumo de energía del paquete de 2,0 GHz y 20 W, respectivamente, al iniciar el estrés Prime95. Las temperaturas de la CPU y la GPU también se mantendrían relativamente frescas para un portátil de juegos, a sólo ~65 C cada una, al ejecutar cargas exigentes como los juegos. En comparación, la CPU y la GPU del Maingear ML-16 se estabilizarían a temperaturas mucho más cálidas de ~100 C y 85 C, respectivamente, cuando se encuentran en condiciones similares.
Tenga en cuenta que el modo Cooler Boost (es decir, el modo de ventilador máximo) no tiene un impacto importante en el rendimiento de los juegos, como muestran nuestras capturas de pantalla a continuación. Sin embargo, pasar al modo Equilibrado pone un tope más bajo a la velocidad de reloj de la GPU. Estos resultados coinciden con lo que hemos observado también en otros portátiles MSI para juegos.
El consumo de energía de la GPU bajaría de 100 W a sólo 65 W si se cambia del modo Rendimiento al modo Equilibrado.
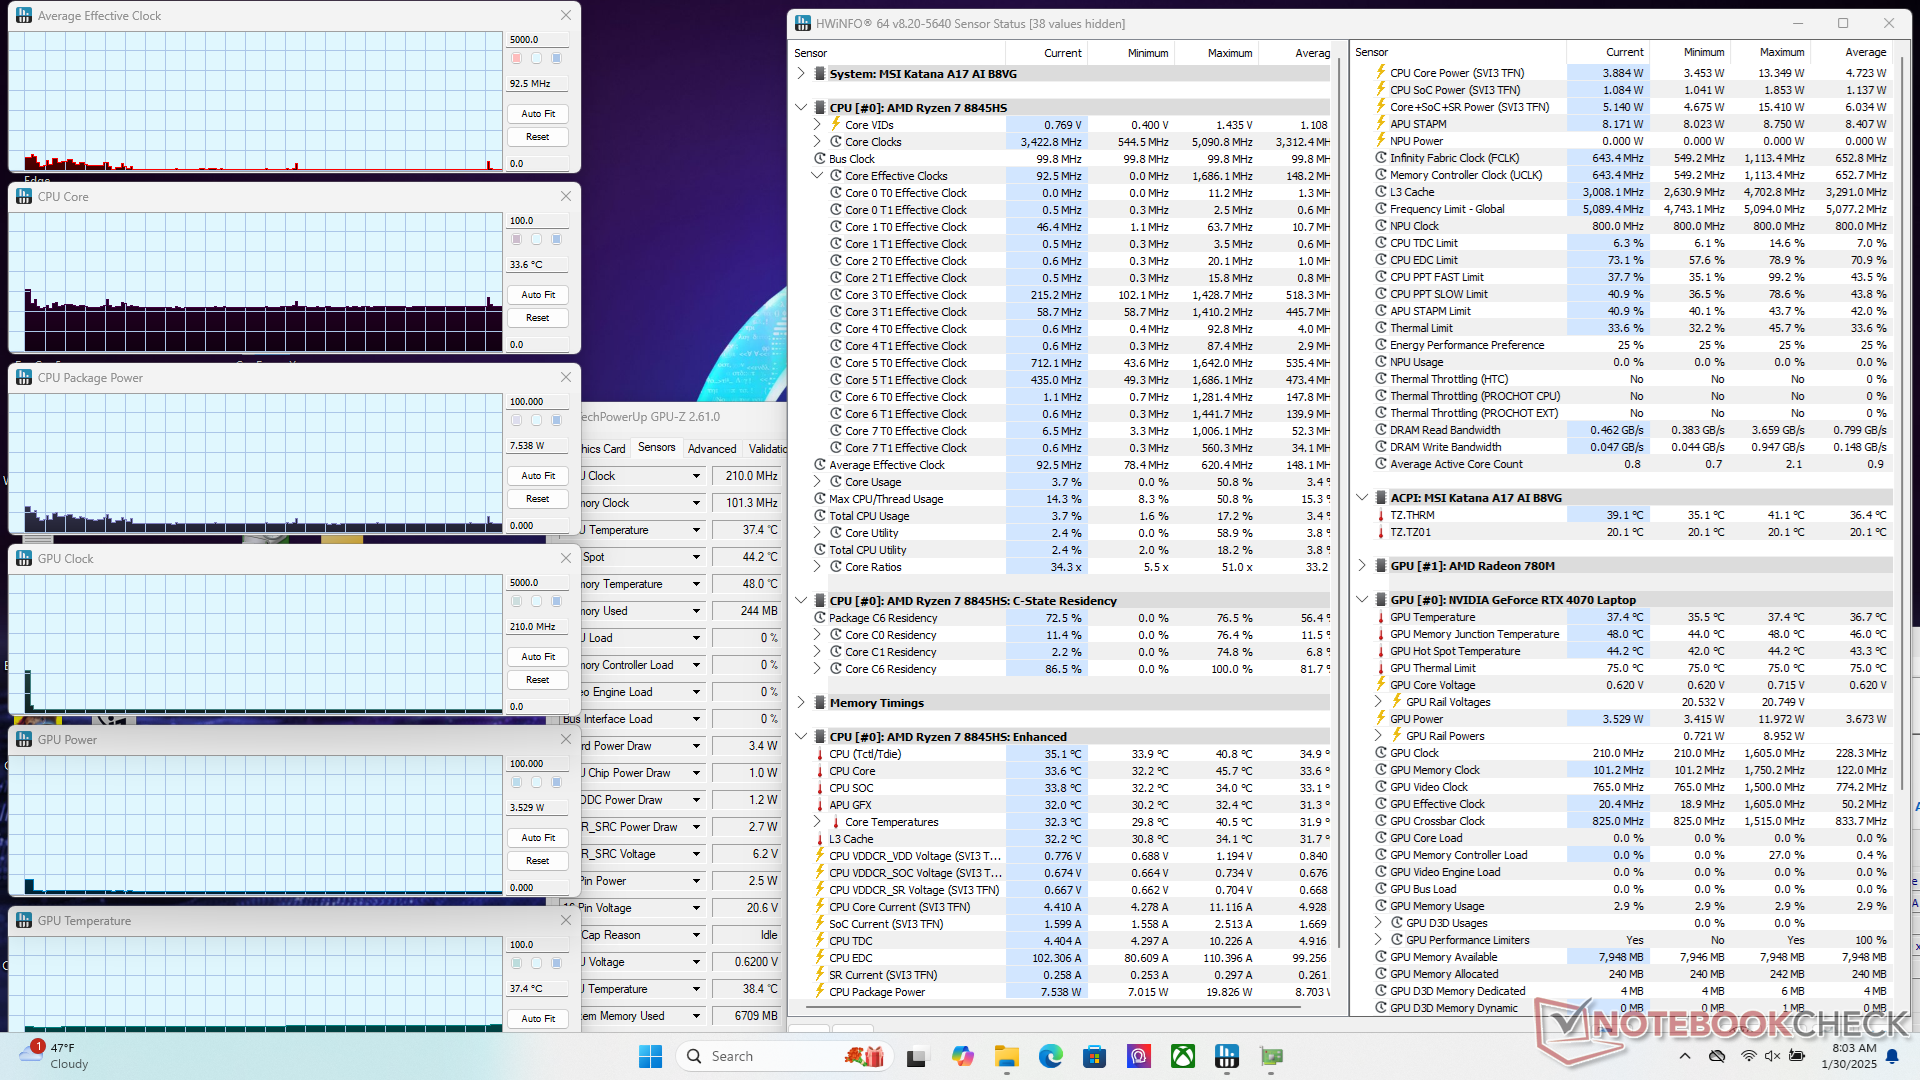
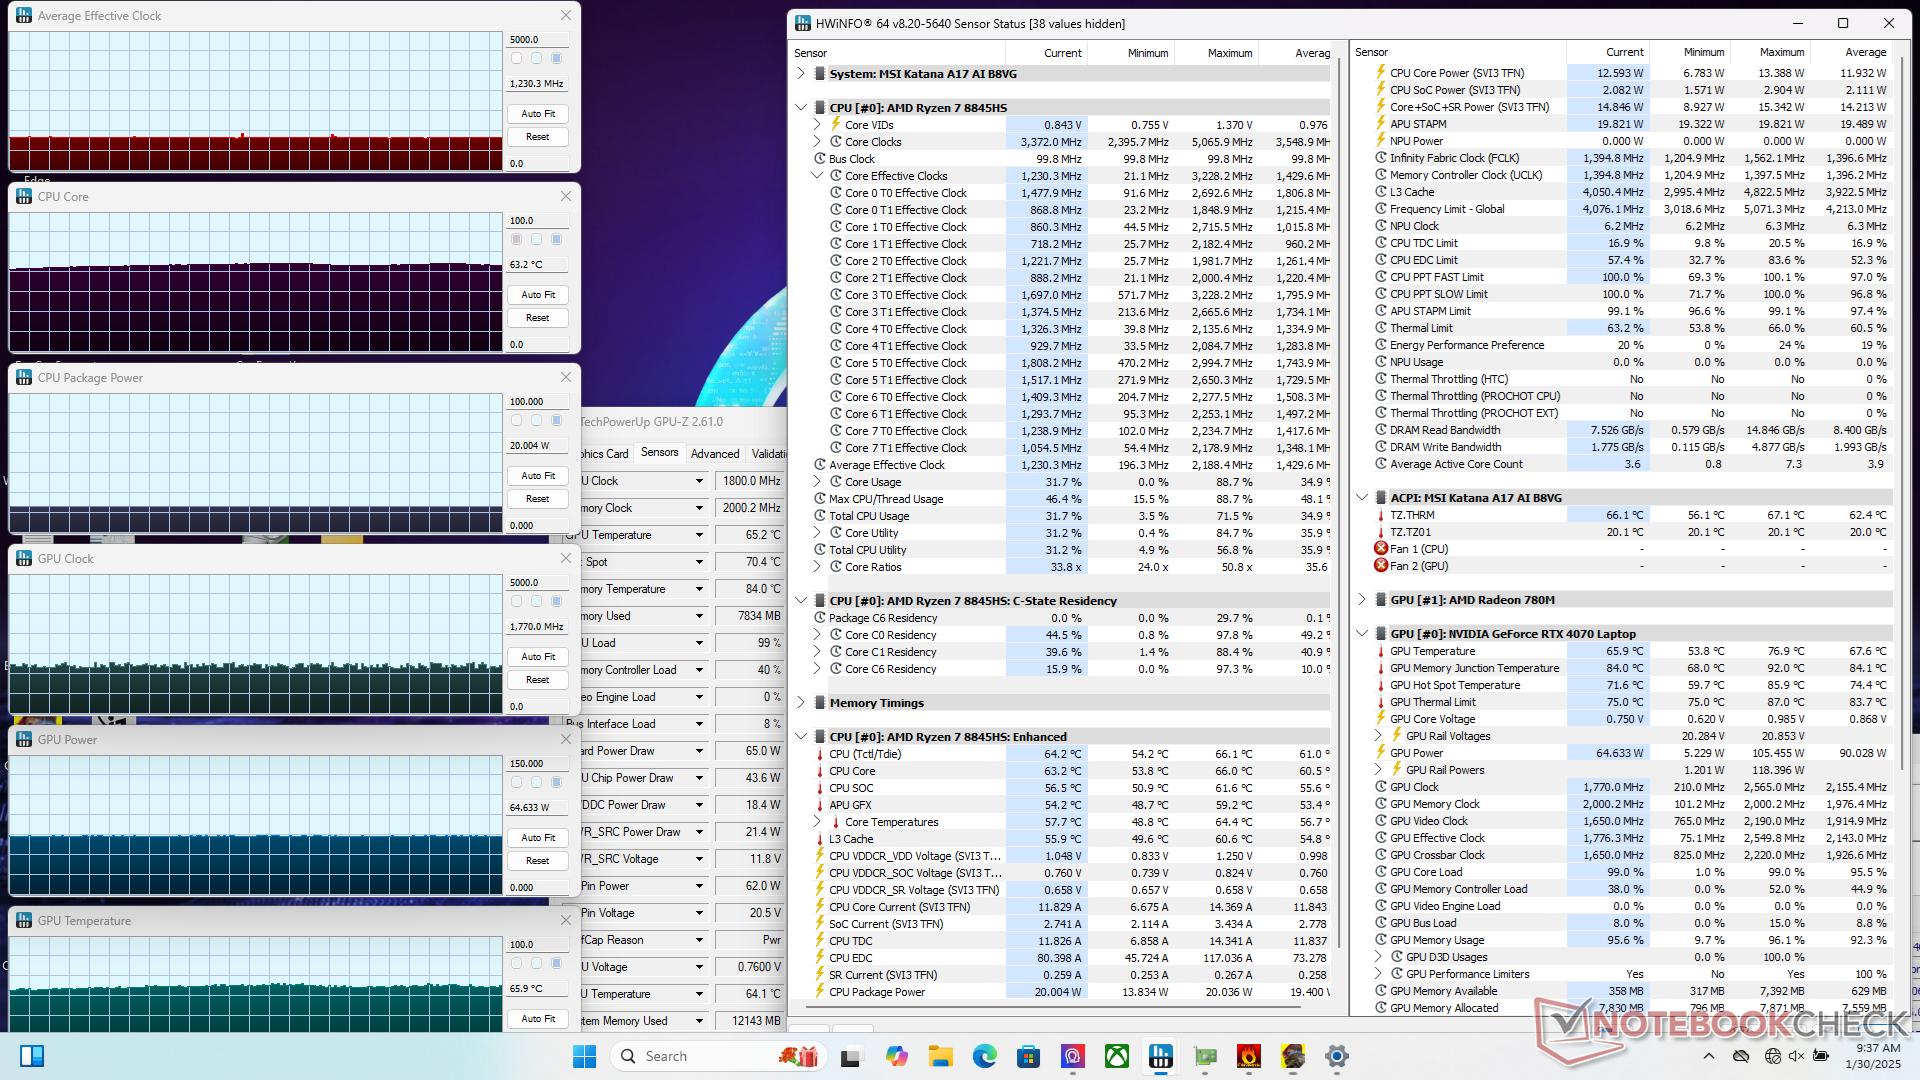
| Reloj medio de la CPU (GHz) | Reloj medio de la GPU (MHz) | Temperatura media dela CPU (°C) | Temperatura media de la GPU (°C) | |
| Sistema en reposo | -- | -- | 34 | 37 |
| Prime95 Stress | 2.0 | -- | 57 | 55 |
| Estrés Prime95 + FurMark | 1.8 | 2190 | 64 | 75 |
| Estrés Cyberpunk 2077 (perfil equilibrado) | 1.2 | 1800 | 63 | 66 |
| Cyberpunk 2077 Stress (Cooler Boost off) | 1.5 | 2370 | 65 | 74 |
| Cyberpunk 2077 Stress (Cooler Boost activado) | 1.5 | 2340 | 56 | 66 |
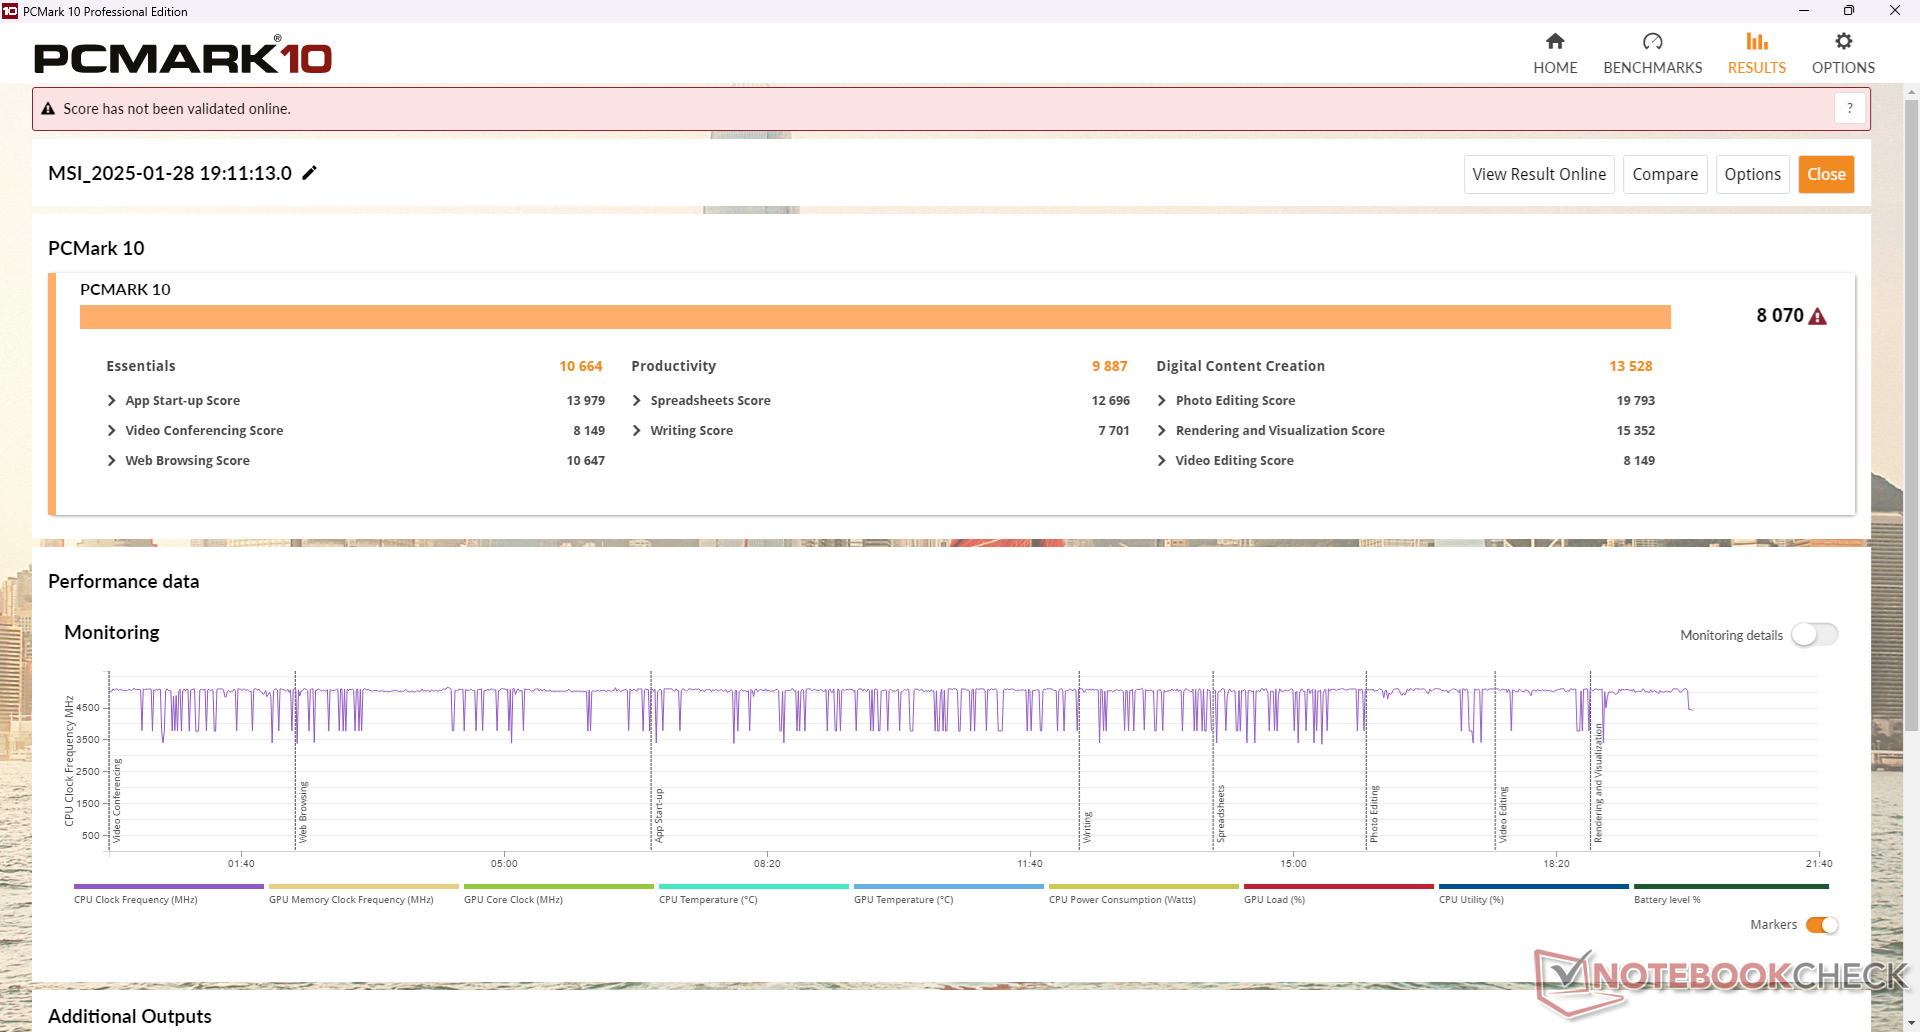
Rendimiento del sistema
Las puntuaciones de PCMark son superiores a las de la antigua Katana 17, especialmente en la subprueba de Creación de contenidos digitales, debido a nuestra GPU mucho más rápida. Por otro lado, nuestra puntuación en la subprueba de Productividad, que requiere mucho procesador, es sólo ligeramente superior. Los resultados coinciden con lo que hemos observado en nuestras pruebas comparativas de CPU y GPU. El rendimiento de la RAM también es mucho mayor en esta ocasión.
CrossMark: Overall | Productivity | Creativity | Responsiveness
WebXPRT 3: Overall
WebXPRT 4: Overall
Mozilla Kraken 1.1: Total
| PCMark 10 / Score | |
| Asus TUF Gaming A17 FA707XI-NS94 | |
| MSI Katana A17 AI B8VG | |
| Medio AMD Ryzen 7 8845HS, NVIDIA GeForce RTX 4070 Laptop GPU (7800 - 8070, n=2) | |
| HP Omen 17-db0079ng | |
| MSI Pulse 17 B13VGK | |
| Acer Nitro 17 AN17-51-71ER | |
| Lenovo Legion 5 17ACH6H-82JY0003GE | |
| PCMark 10 / Essentials | |
| Asus TUF Gaming A17 FA707XI-NS94 | |
| MSI Katana A17 AI B8VG | |
| Medio AMD Ryzen 7 8845HS, NVIDIA GeForce RTX 4070 Laptop GPU (10499 - 10664, n=2) | |
| HP Omen 17-db0079ng | |
| MSI Pulse 17 B13VGK | |
| Acer Nitro 17 AN17-51-71ER | |
| Lenovo Legion 5 17ACH6H-82JY0003GE | |
| PCMark 10 / Productivity | |
| MSI Pulse 17 B13VGK | |
| HP Omen 17-db0079ng | |
| Medio AMD Ryzen 7 8845HS, NVIDIA GeForce RTX 4070 Laptop GPU (9887 - 10202, n=2) | |
| MSI Katana A17 AI B8VG | |
| Asus TUF Gaming A17 FA707XI-NS94 | |
| Lenovo Legion 5 17ACH6H-82JY0003GE | |
| Acer Nitro 17 AN17-51-71ER | |
| PCMark 10 / Digital Content Creation | |
| Asus TUF Gaming A17 FA707XI-NS94 | |
| MSI Katana A17 AI B8VG | |
| Medio AMD Ryzen 7 8845HS, NVIDIA GeForce RTX 4070 Laptop GPU (12023 - 13528, n=2) | |
| HP Omen 17-db0079ng | |
| Acer Nitro 17 AN17-51-71ER | |
| MSI Pulse 17 B13VGK | |
| Lenovo Legion 5 17ACH6H-82JY0003GE | |
| CrossMark / Overall | |
| MSI Pulse 17 B13VGK | |
| Asus TUF Gaming A17 FA707XI-NS94 | |
| MSI Katana A17 AI B8VG | |
| Medio AMD Ryzen 7 8845HS, NVIDIA GeForce RTX 4070 Laptop GPU (1531 - 1790, n=2) | |
| Acer Nitro 17 AN17-51-71ER | |
| HP Omen 17-db0079ng | |
| Lenovo Legion 5 17ACH6H-82JY0003GE | |
| CrossMark / Productivity | |
| MSI Pulse 17 B13VGK | |
| Asus TUF Gaming A17 FA707XI-NS94 | |
| MSI Katana A17 AI B8VG | |
| Medio AMD Ryzen 7 8845HS, NVIDIA GeForce RTX 4070 Laptop GPU (1488 - 1720, n=2) | |
| Acer Nitro 17 AN17-51-71ER | |
| HP Omen 17-db0079ng | |
| Lenovo Legion 5 17ACH6H-82JY0003GE | |
| CrossMark / Creativity | |
| MSI Pulse 17 B13VGK | |
| Asus TUF Gaming A17 FA707XI-NS94 | |
| MSI Katana A17 AI B8VG | |
| Medio AMD Ryzen 7 8845HS, NVIDIA GeForce RTX 4070 Laptop GPU (1683 - 1932, n=2) | |
| Acer Nitro 17 AN17-51-71ER | |
| HP Omen 17-db0079ng | |
| Lenovo Legion 5 17ACH6H-82JY0003GE | |
| CrossMark / Responsiveness | |
| MSI Pulse 17 B13VGK | |
| Acer Nitro 17 AN17-51-71ER | |
| MSI Katana A17 AI B8VG | |
| Asus TUF Gaming A17 FA707XI-NS94 | |
| Medio AMD Ryzen 7 8845HS, NVIDIA GeForce RTX 4070 Laptop GPU (1255 - 1603, n=2) | |
| HP Omen 17-db0079ng | |
| Lenovo Legion 5 17ACH6H-82JY0003GE | |
| WebXPRT 3 / Overall | |
| Asus TUF Gaming A17 FA707XI-NS94 | |
| MSI Katana A17 AI B8VG | |
| Medio AMD Ryzen 7 8845HS, NVIDIA GeForce RTX 4070 Laptop GPU (275 - 312, n=2) | |
| HP Omen 17-db0079ng | |
| MSI Pulse 17 B13VGK | |
| Lenovo Legion 5 17ACH6H-82JY0003GE | |
| Acer Nitro 17 AN17-51-71ER | |
| WebXPRT 4 / Overall | |
| Asus TUF Gaming A17 FA707XI-NS94 | |
| MSI Katana A17 AI B8VG | |
| Medio AMD Ryzen 7 8845HS, NVIDIA GeForce RTX 4070 Laptop GPU (n=1) | |
| MSI Pulse 17 B13VGK | |
| Acer Nitro 17 AN17-51-71ER | |
| Mozilla Kraken 1.1 / Total | |
| Lenovo Legion 5 17ACH6H-82JY0003GE | |
| Acer Nitro 17 AN17-51-71ER | |
| HP Omen 17-db0079ng | |
| MSI Pulse 17 B13VGK | |
| Medio AMD Ryzen 7 8845HS, NVIDIA GeForce RTX 4070 Laptop GPU (500 - 564, n=2) | |
| MSI Katana A17 AI B8VG | |
| Asus TUF Gaming A17 FA707XI-NS94 | |
* ... más pequeño es mejor
| PCMark 10 Score | 8070 puntos | |
ayuda | ||
| AIDA64 / Memory Copy | |
| MSI Katana A17 AI B8VG | |
| HP Omen 17-db0079ng | |
| Medio AMD Ryzen 7 8845HS (61459 - 71873, n=12) | |
| MSI Pulse 17 B13VGK | |
| Asus TUF Gaming A17 FA707XI-NS94 | |
| Acer Nitro 17 AN17-51-71ER | |
| Lenovo Legion 5 17ACH6H-82JY0003GE | |
| AIDA64 / Memory Read | |
| MSI Pulse 17 B13VGK | |
| Acer Nitro 17 AN17-51-71ER | |
| Asus TUF Gaming A17 FA707XI-NS94 | |
| MSI Katana A17 AI B8VG | |
| HP Omen 17-db0079ng | |
| Medio AMD Ryzen 7 8845HS (49866 - 61976, n=12) | |
| Lenovo Legion 5 17ACH6H-82JY0003GE | |
| AIDA64 / Memory Write | |
| MSI Katana A17 AI B8VG | |
| HP Omen 17-db0079ng | |
| Medio AMD Ryzen 7 8845HS (68425 - 93239, n=12) | |
| Asus TUF Gaming A17 FA707XI-NS94 | |
| Acer Nitro 17 AN17-51-71ER | |
| MSI Pulse 17 B13VGK | |
| Lenovo Legion 5 17ACH6H-82JY0003GE | |
| AIDA64 / Memory Latency | |
| Acer Nitro 17 AN17-51-71ER | |
| HP Omen 17-db0079ng | |
| MSI Katana A17 AI B8VG | |
| Medio AMD Ryzen 7 8845HS (82.5 - 117, n=12) | |
| MSI Pulse 17 B13VGK | |
| Asus TUF Gaming A17 FA707XI-NS94 | |
| Lenovo Legion 5 17ACH6H-82JY0003GE | |
* ... más pequeño es mejor
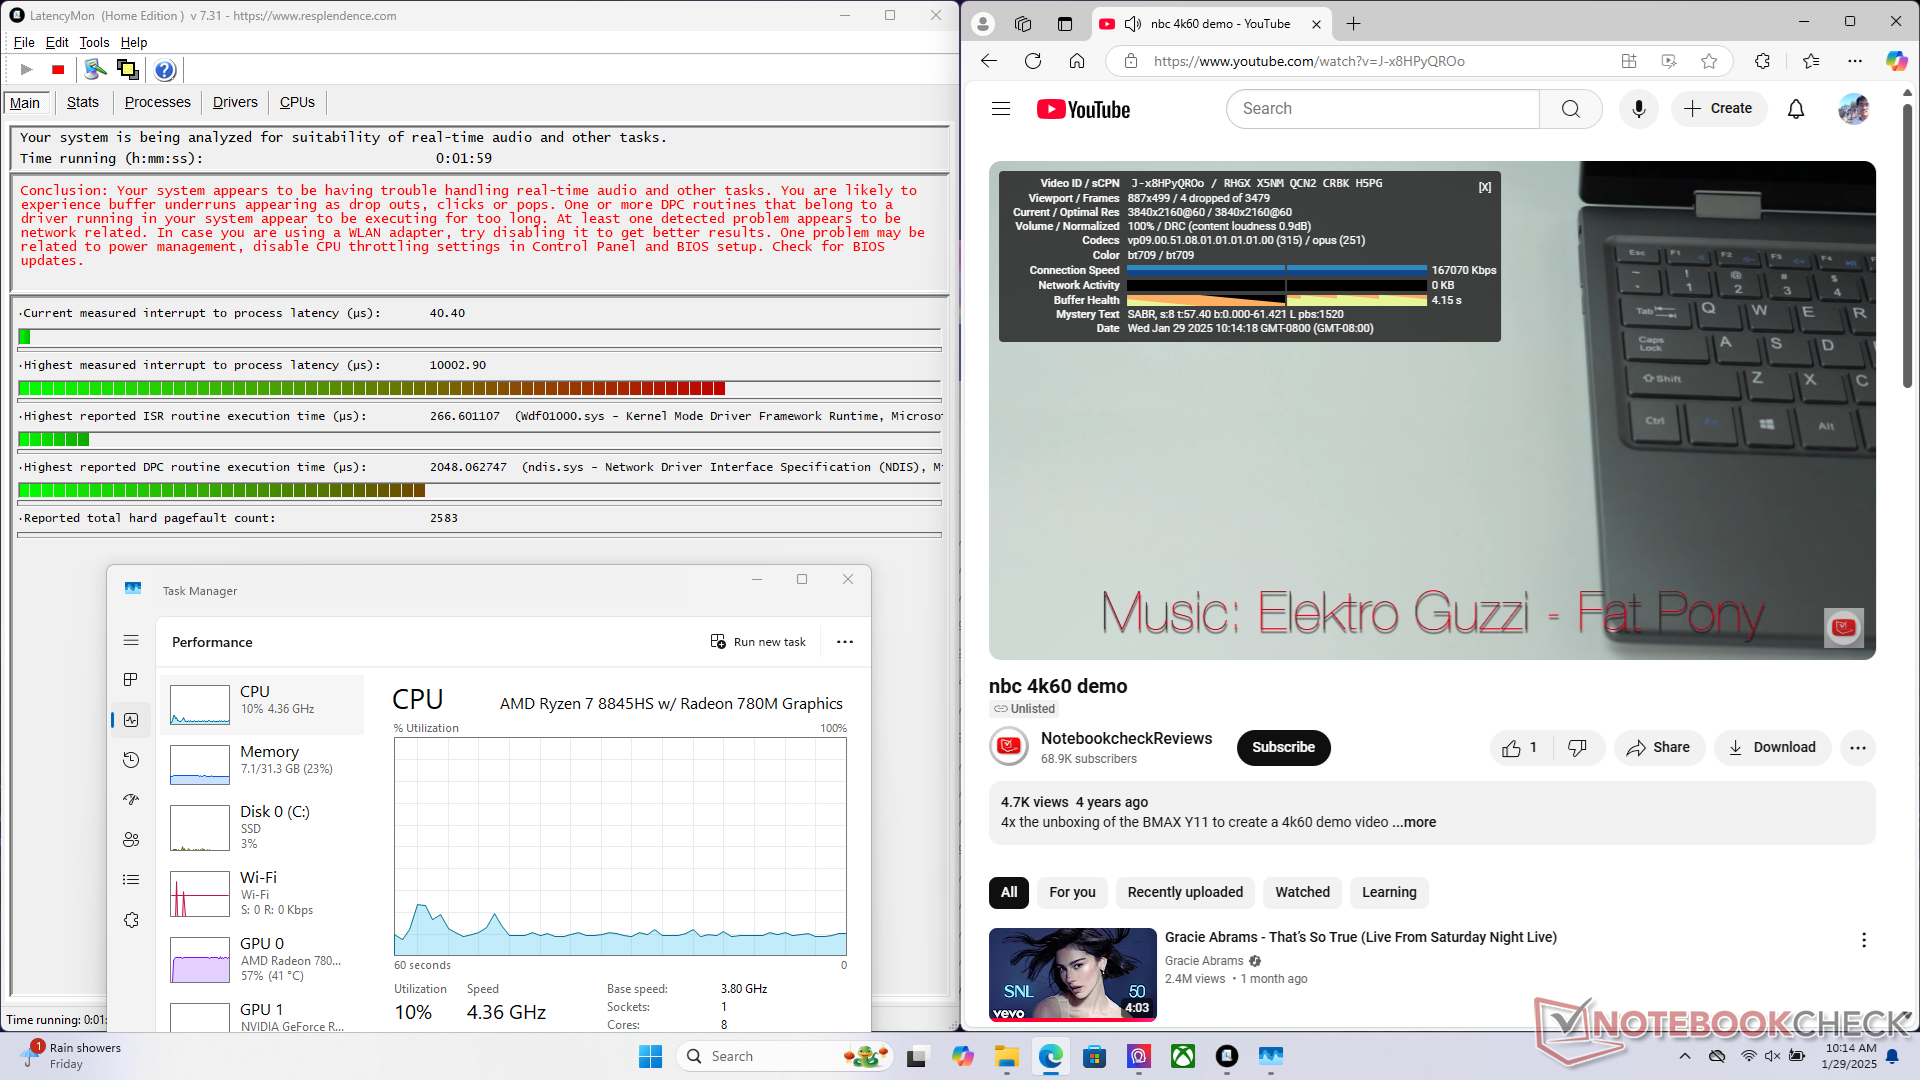
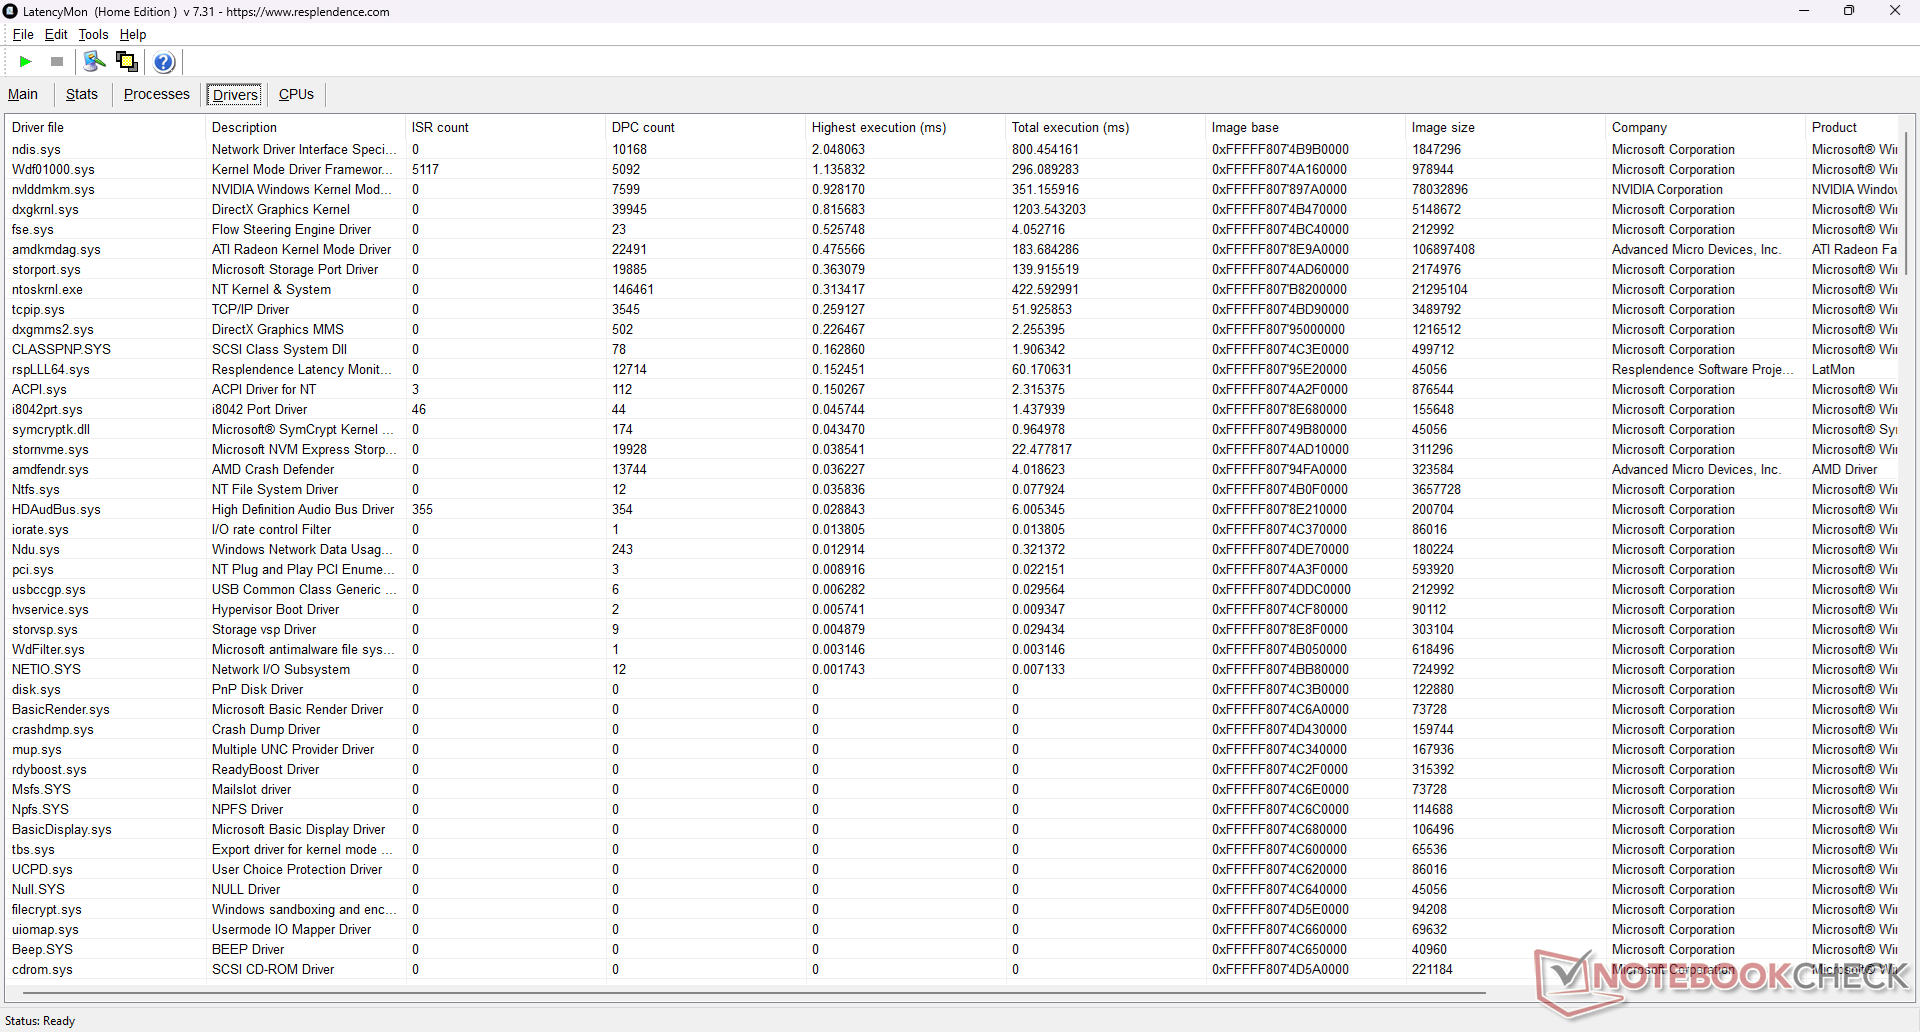
Latencia del CPD
LatencyMon revela problemas de latencia del CPD al abrir varias pestañas del navegador de nuestra página principal. Además, la reproducción de vídeo 4K60 es imperfecta con 4 fotogramas caídos registrados durante un lapso de tiempo de 60 segundos, incluso cuando se configura en modo iGPU.
| DPC Latencies / LatencyMon - interrupt to process latency (max), Web, Youtube, Prime95 | |
| MSI Katana A17 AI B8VG | |
| HP Omen 17-db0079ng | |
| Asus TUF Gaming A17 FA707XI-NS94 | |
| Lenovo Legion 5 17ACH6H-82JY0003GE | |
| Acer Nitro 17 AN17-51-71ER | |
| MSI Pulse 17 B13VGK | |
* ... más pequeño es mejor
Dispositivos de almacenamiento
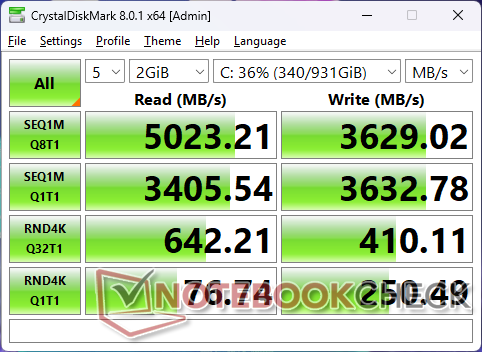
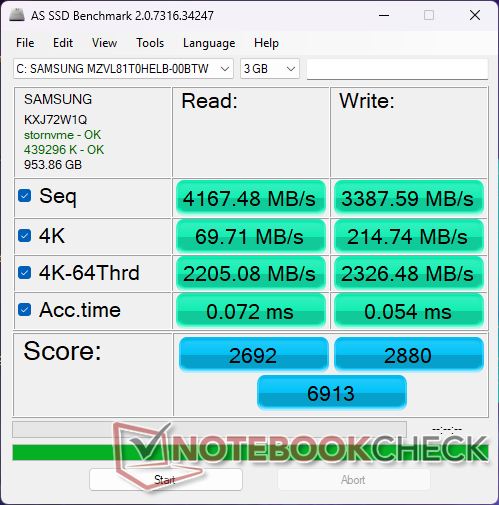
El Samsung PM9C1 es una unidad SSD NVMe PCIe4 x4 de gama media que ofrece velocidades de transferencia de hasta 5000 MB/s. Desgraciadamente, esta velocidad máxima sólo es sostenible durante un minuto más o menos antes de caer de forma constante al bajo rango de los 3000 MB/s.

| Drive Performance Rating - Percent | |
| Acer Nitro 17 AN17-51-71ER -1! | |
| MSI Katana A17 AI B8VG | |
| MSI Pulse 17 B13VGK | |
| HP Omen 17-db0079ng | |
| Asus TUF Gaming A17 FA707XI-NS94 | |
| Lenovo Legion 5 17ACH6H-82JY0003GE | |
* ... más pequeño es mejor
Disk Throttling: DiskSpd Read Loop, Queue Depth 8
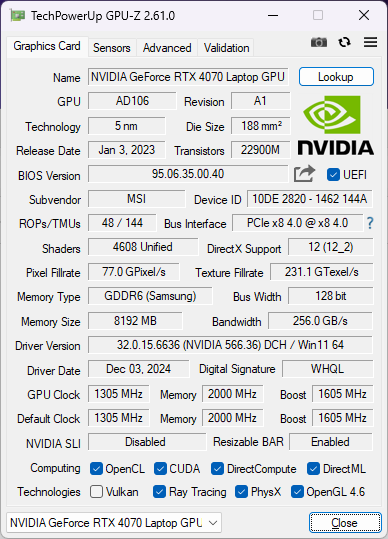
Rendimiento de la GPU - 105 W GeForce RTX 4070
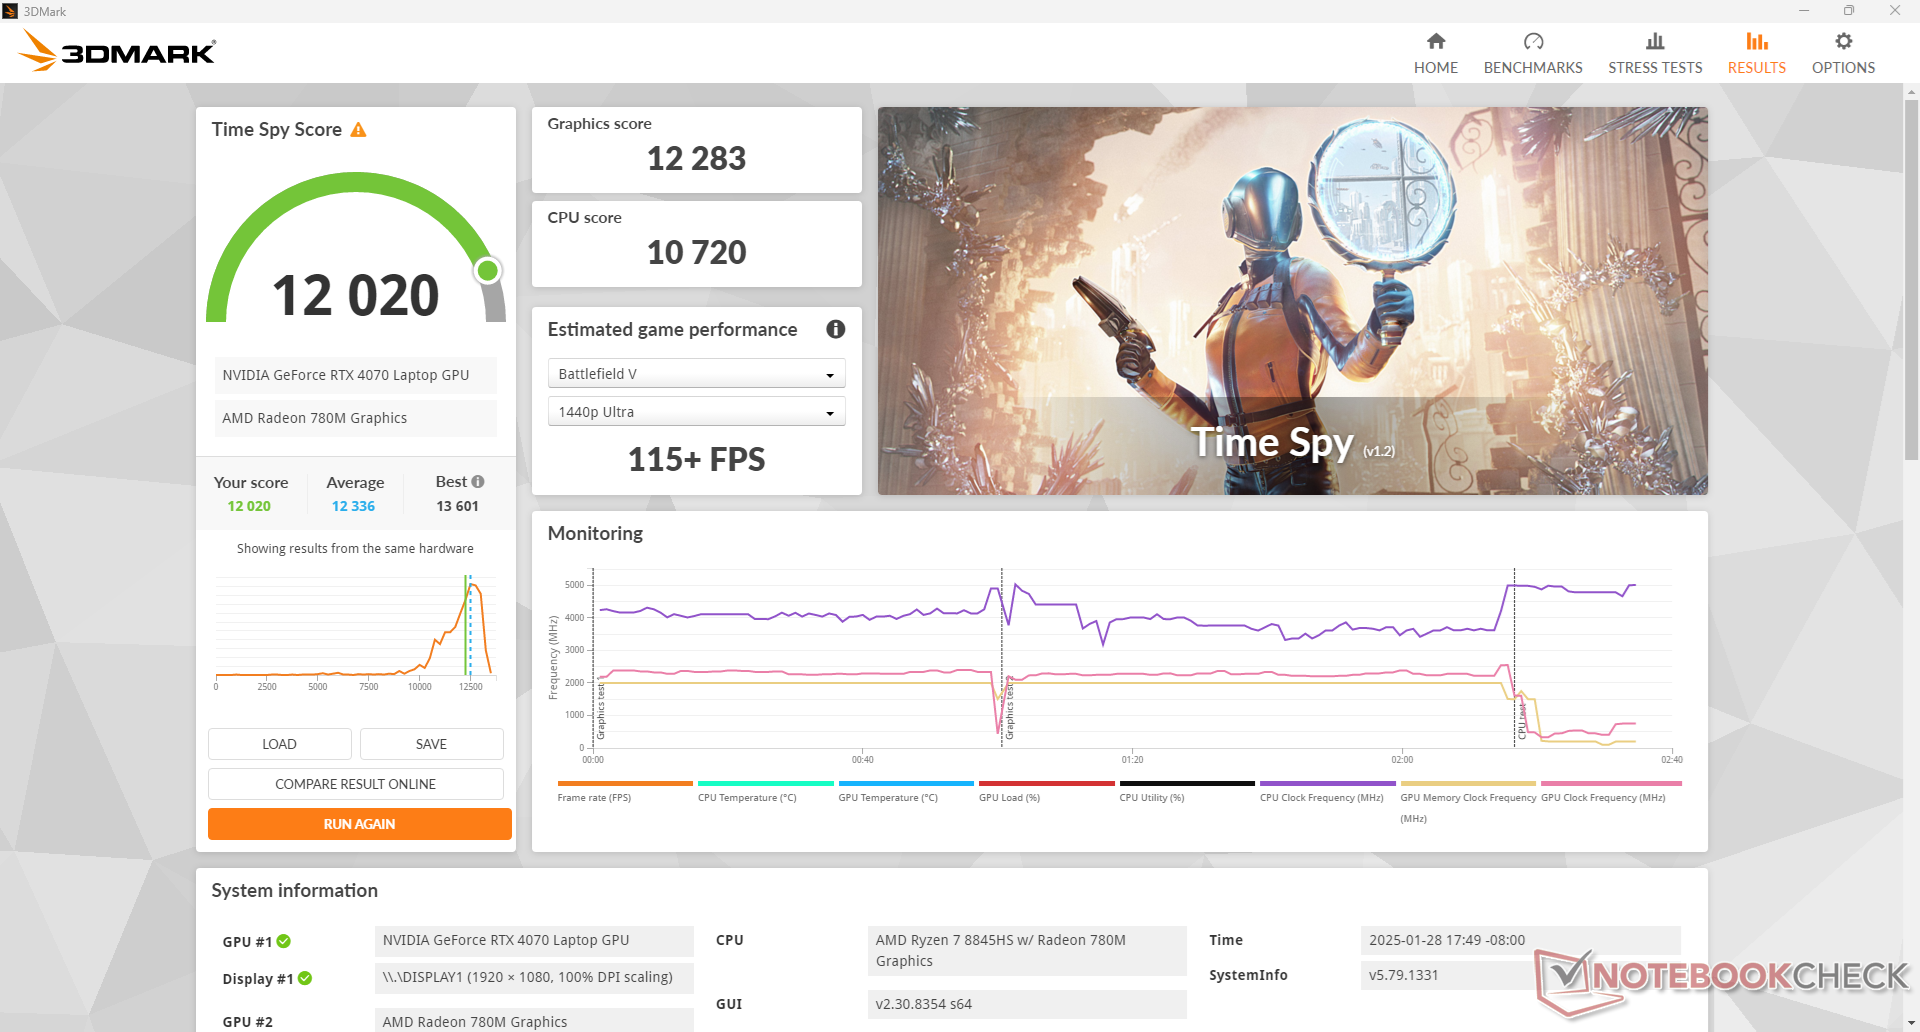
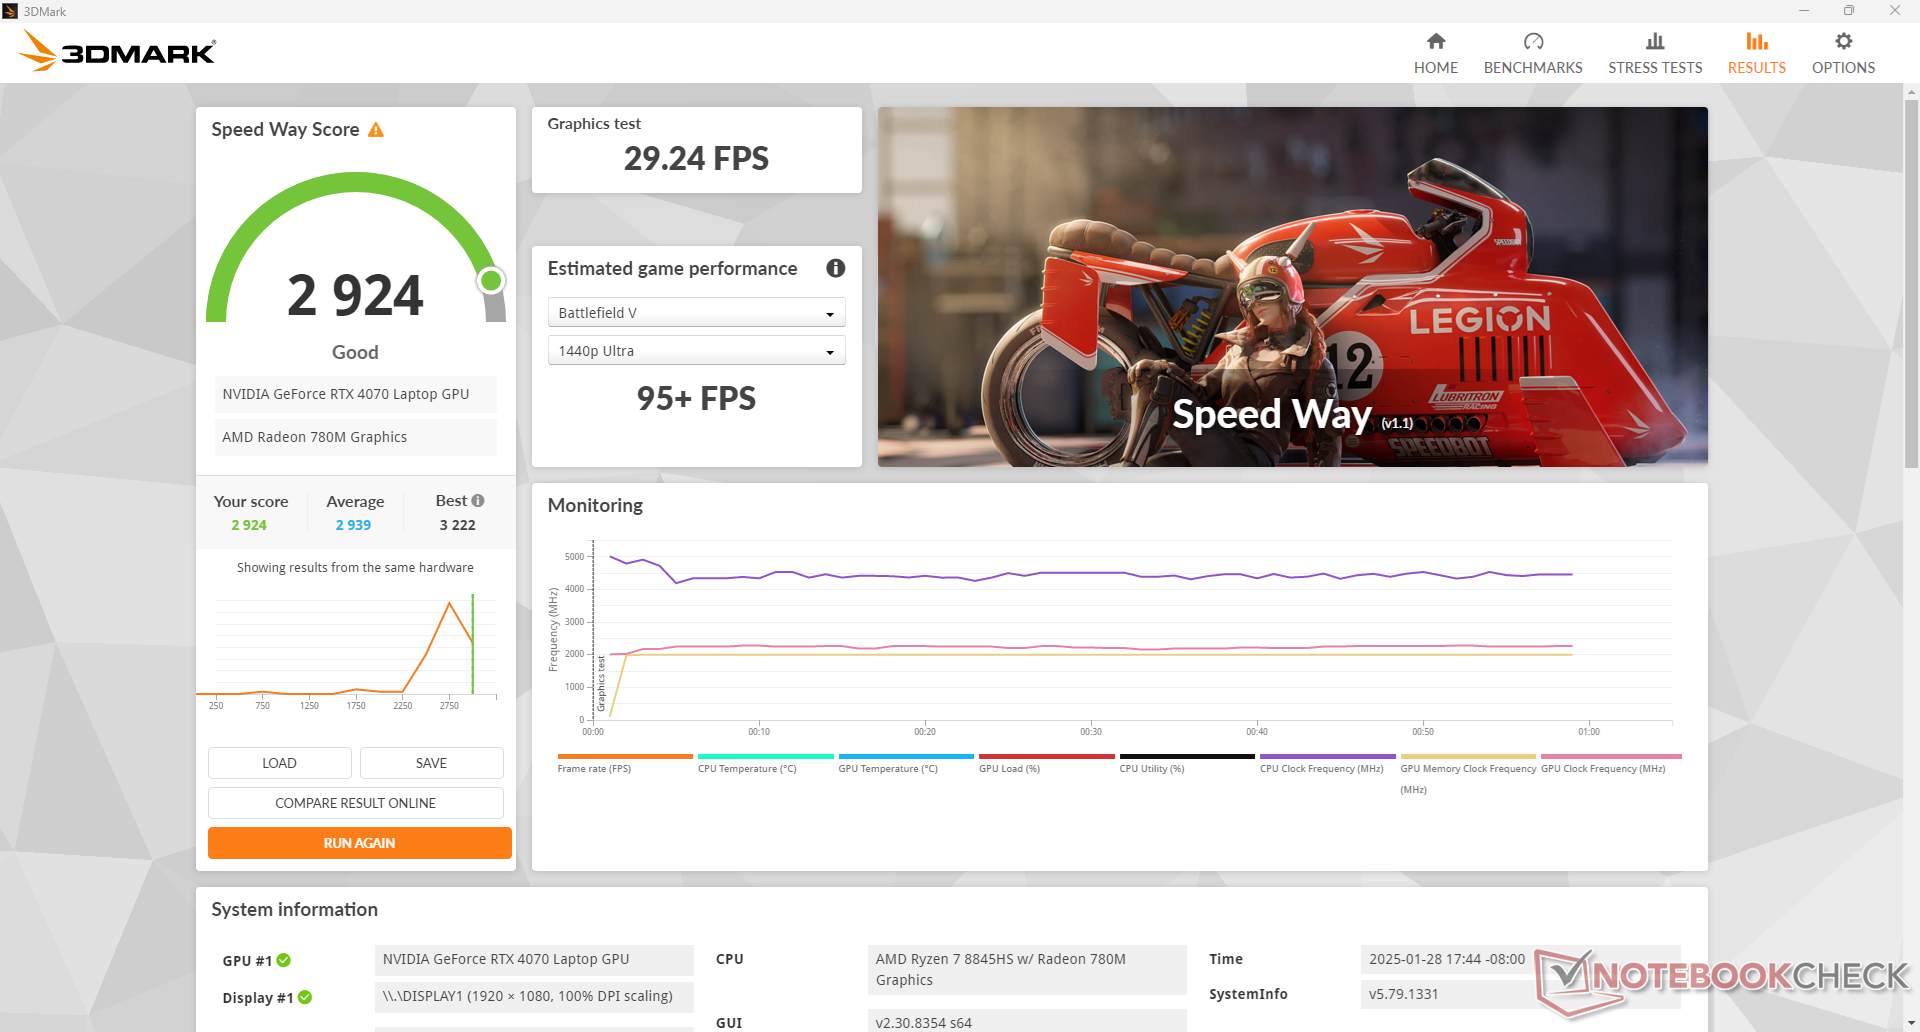
El rendimiento gráfico es entre un 5 y un 15 por ciento más rápido que el del portátil medio de nuestra base de datos equipado con la misma GeForce RTX 4070 Lo que es estupendo de ver en un modelo orientado al presupuesto como el Katana A17. Sin embargo, tenga en cuenta que la RTX 4070 móvil lleva mucha menos VRAM que la rTX 4070 de sobremesa lo que puede repercutir en el rendimiento en ajustes de texturas o resoluciones más altas.
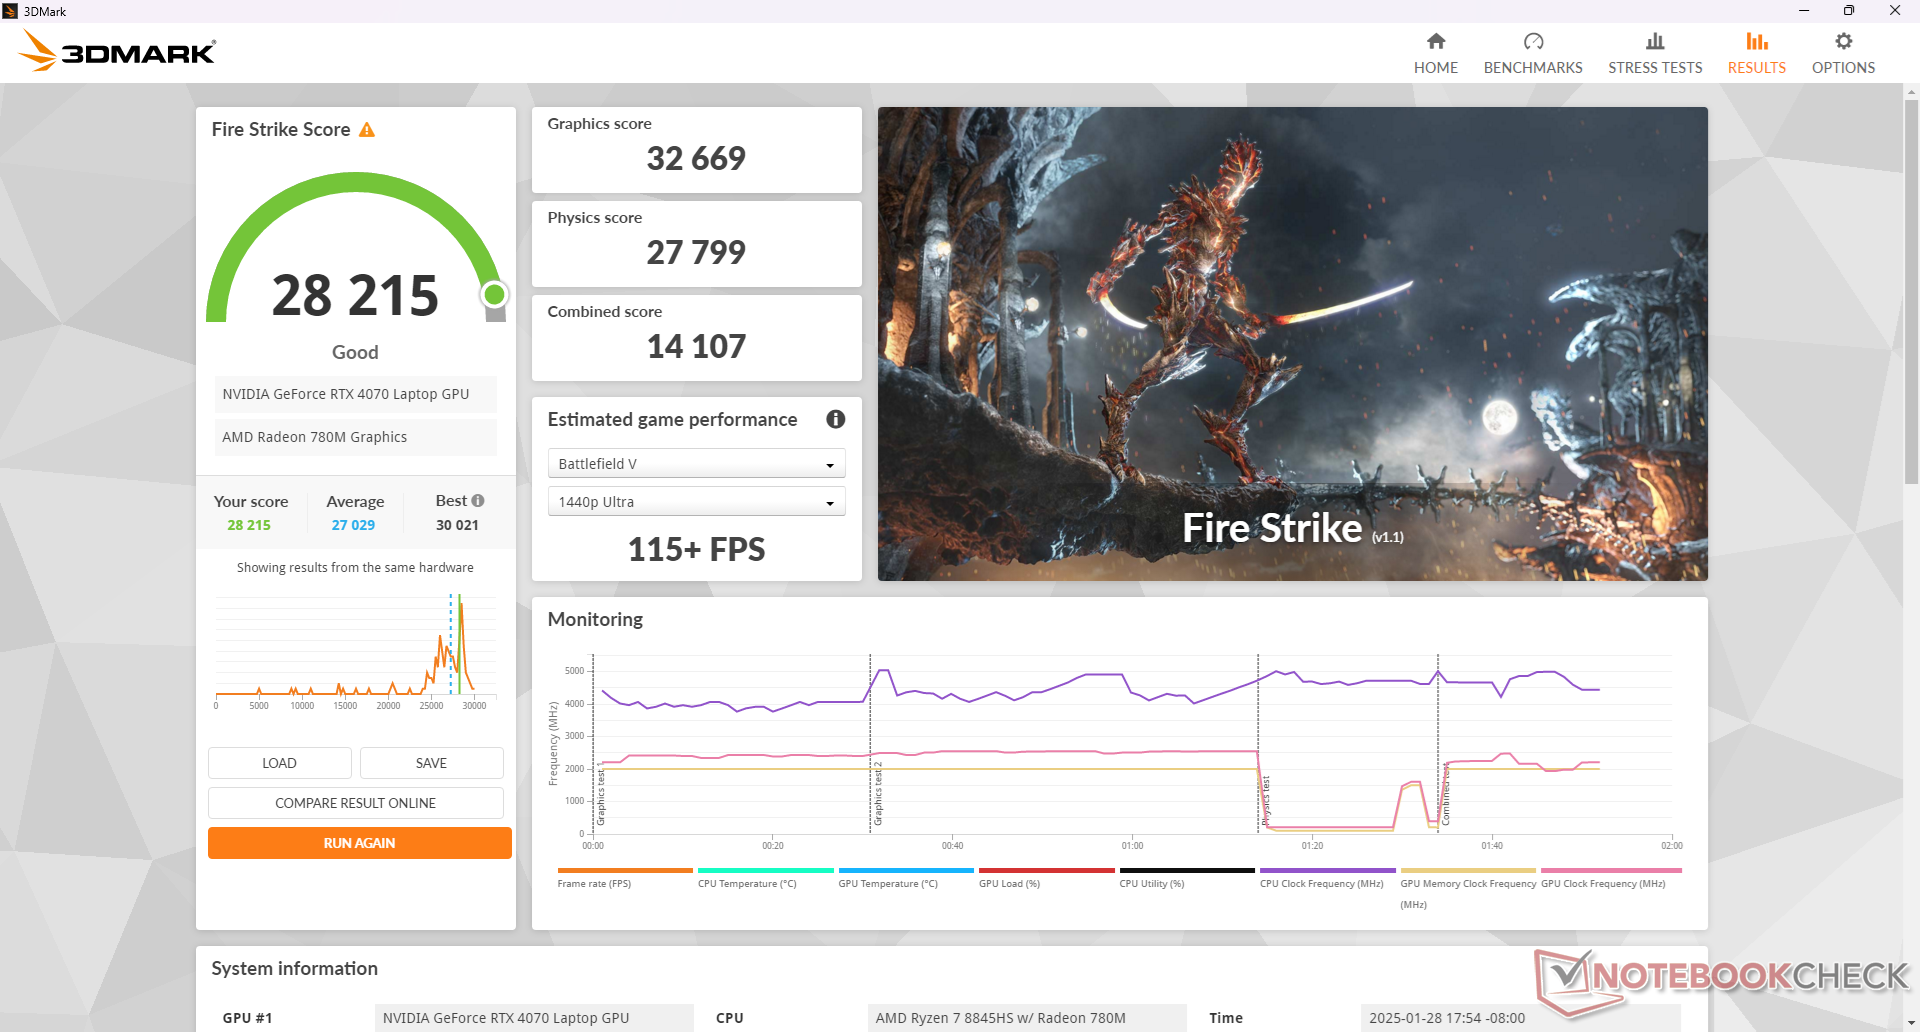
| Perfil de potencia | Puntuación gráfica | Puntuación física | Puntuación combinada |
| Modo Rendimiento | 32669 | 27799 | 14107 |
| Modo equilibrado | 27310 (-16%) | 28029 (-1%) | 11927 (-15%) |
| Batería | 16481 (-50%) | 20600 (-26%) | 4877 (-65%) |
Ejecutar en modo equilibrado afecta al rendimiento gráfico en algo más del 15% y el déficit se hace aún mayor si se ejecuta con energía de la batería, como muestra nuestra tabla de resultados Fire Strike anterior.
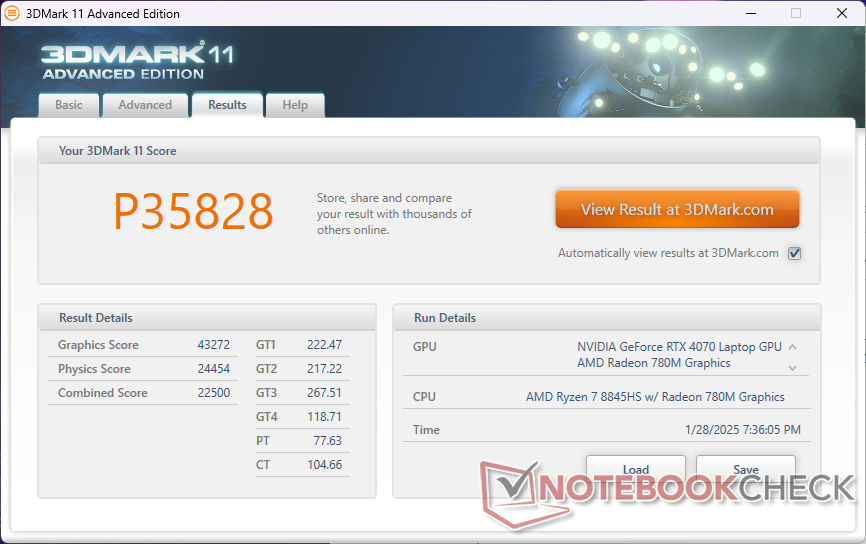
| 3DMark 11 Performance | 35828 puntos | |
| 3DMark Cloud Gate Standard Score | 63840 puntos | |
| 3DMark Fire Strike Score | 28215 puntos | |
| 3DMark Time Spy Score | 12020 puntos | |
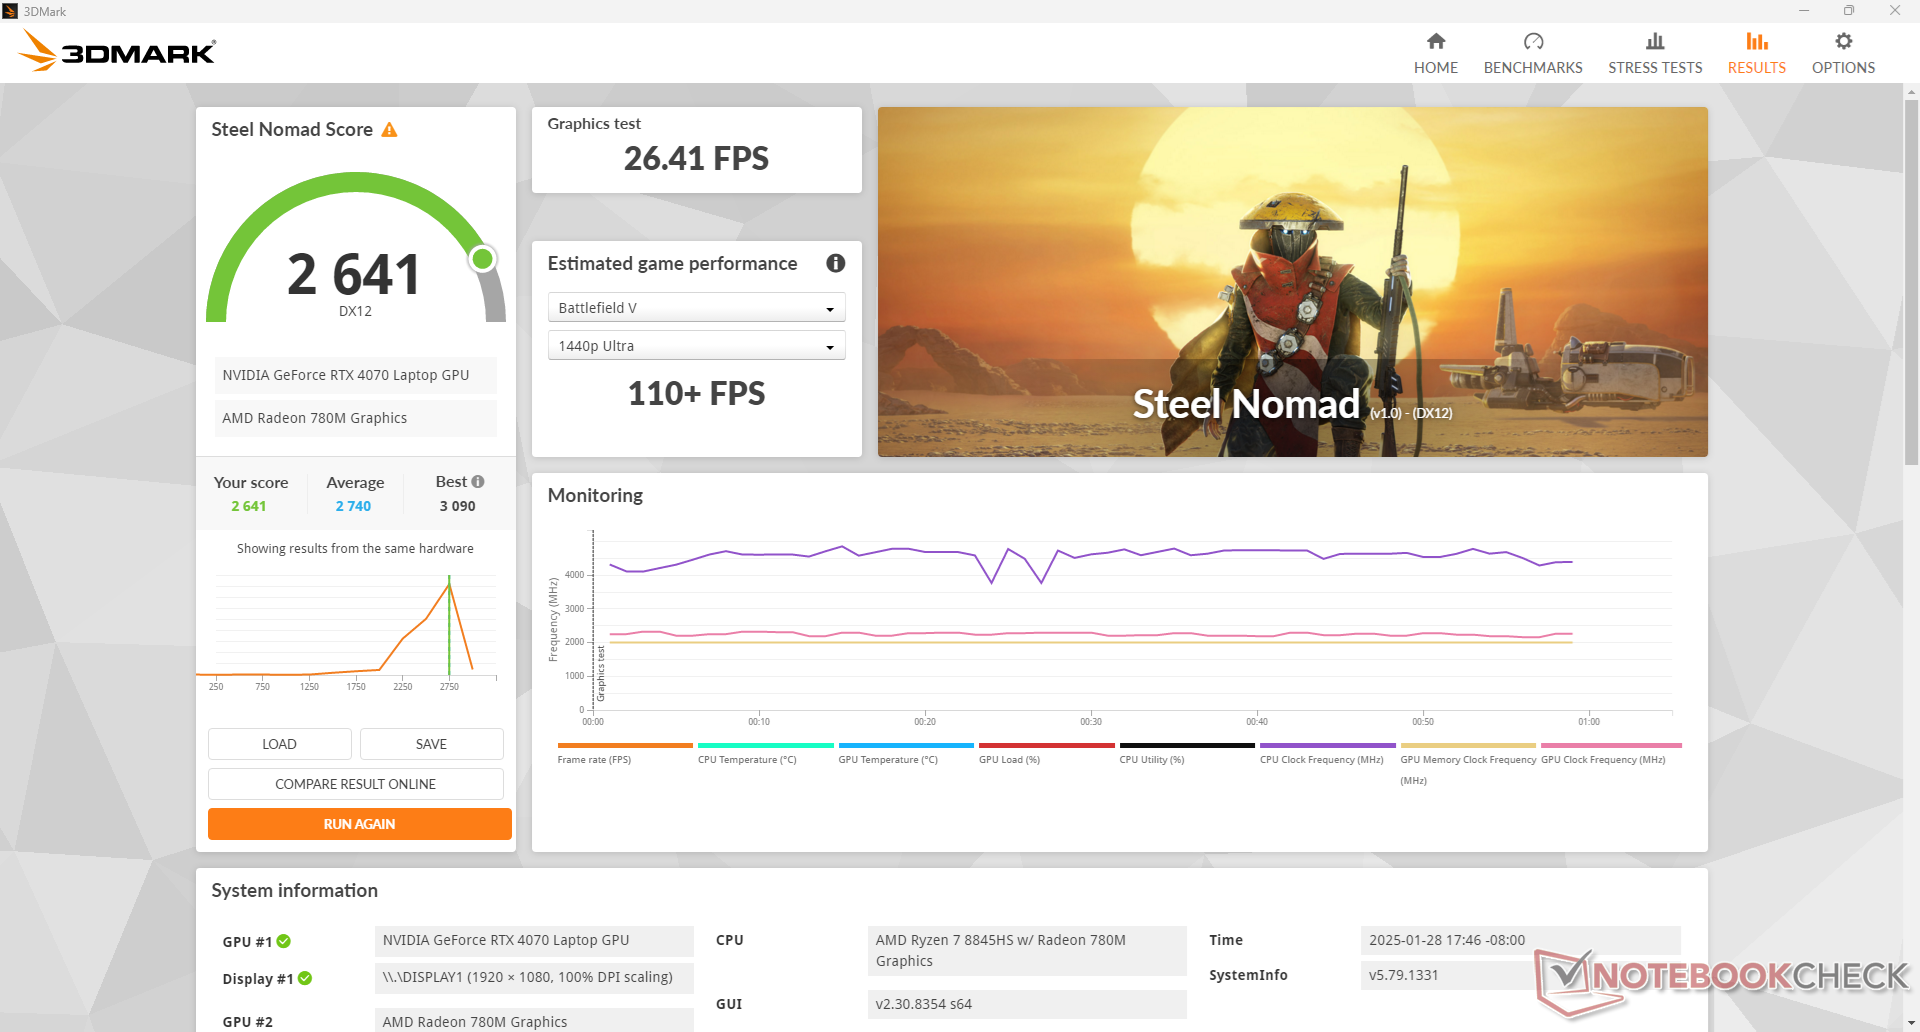
| 3DMark Steel Nomad Score | 2641 puntos | |
ayuda | ||
* ... más pequeño es mejor
Rendimiento en juegos
La RTX 4070 móvil es suficiente para jugar en ajustes de Alto a Máximo con la pantalla interna de 1080p o 1440p. Se recomienda activar DLSS si se intenta alcanzar unos 144 FPS estables para aprovechar al máximo la frecuencia de actualización de 144 Hz del panel 1080p. Extrañamente, Strange Brigade fallaba al lanzarse incluso después de reinstalarlo y de múltiples intentos.
| Cyberpunk 2077 2.2 Phantom Liberty | |
| 1280x720 Low Preset (FSR off) | |
| Eurocom Raptor X17 Core i9-14900HX | |
| Asus TUF Gaming A17 FA707XI-NS94 | |
| Medio NVIDIA GeForce RTX 4070 Laptop GPU (119.8 - 175.5, n=17) | |
| MSI Katana A17 AI B8VG | |
| 1920x1080 Low Preset (FSR off) | |
| Eurocom Raptor X17 Core i9-14900HX | |
| Asus TUF Gaming A17 FA707XI-NS94 | |
| MSI Katana A17 AI B8VG | |
| Medio NVIDIA GeForce RTX 4070 Laptop GPU (43.1 - 156.6, n=27) | |
| 1920x1080 Medium Preset (FSR off) | |
| Eurocom Raptor X17 Core i9-14900HX | |
| MSI Katana A17 AI B8VG | |
| Asus TUF Gaming A17 FA707XI-NS94 | |
| Medio NVIDIA GeForce RTX 4070 Laptop GPU (81.6 - 124.5, n=29) | |
| 1920x1080 High Preset (FSR off) | |
| Eurocom Raptor X17 Core i9-14900HX | |
| MSI Katana A17 AI B8VG | |
| Asus TUF Gaming A17 FA707XI-NS94 | |
| Medio NVIDIA GeForce RTX 4070 Laptop GPU (74.7 - 103.6, n=30) | |
| 1920x1080 Ultra Preset (FSR off) | |
| Eurocom Raptor X17 Core i9-14900HX | |
| Asus TUF Gaming A17 FA707XI-NS94 | |
| MSI Katana A17 AI B8VG | |
| Medio NVIDIA GeForce RTX 4070 Laptop GPU (30.7 - 90.7, n=38) | |
| Tiny Tina's Wonderlands | |
| 1280x720 Lowest Preset (DX12) | |
| KFA2 GeForce RTX 4070 EX Gamer | |
| Medio NVIDIA GeForce RTX 4070 Laptop GPU (277 - 345, n=4) | |
| MSI Katana A17 AI B8VG | |
| 1920x1080 Low Preset (DX12) | |
| KFA2 GeForce RTX 4070 EX Gamer | |
| MSI Katana A17 AI B8VG | |
| Medio NVIDIA GeForce RTX 4070 Laptop GPU (98.1 - 283, n=14) | |
| MSI Katana 17 B13VFK | |
| 1920x1080 Medium Preset (DX12) | |
| KFA2 GeForce RTX 4070 EX Gamer | |
| MSI Katana A17 AI B8VG | |
| Medio NVIDIA GeForce RTX 4070 Laptop GPU (92.5 - 231, n=14) | |
| MSI Katana 17 B13VFK | |
| 1920x1080 High Preset (DX12) | |
| KFA2 GeForce RTX 4070 EX Gamer | |
| MSI Katana A17 AI B8VG | |
| Medio NVIDIA GeForce RTX 4070 Laptop GPU (74.3 - 151.4, n=14) | |
| MSI Katana 17 B13VFK | |
| 1920x1080 Badass Preset (DX12) | |
| KFA2 GeForce RTX 4070 EX Gamer | |
| Asus TUF Gaming A17 FA707XI-NS94 | |
| MSI Katana A17 AI B8VG | |
| Medio NVIDIA GeForce RTX 4070 Laptop GPU (58.6 - 115.9, n=17) | |
| MSI Katana 17 B13VFK | |
Cyberpunk 2077 ultra FPS Chart
| bajo | medio | alto | ultra | |
|---|---|---|---|---|
| GTA V (2015) | 184 | 179.8 | 171.1 | 120 |
| Dota 2 Reborn (2015) | 168.4 | 154 | 149.1 | 143.1 |
| Final Fantasy XV Benchmark (2018) | 218 | 162.2 | 120.1 | |
| X-Plane 11.11 (2018) | 88.9 | 82 | 66.2 | |
| Far Cry 5 (2018) | 158 | 139 | 133 | 124 |
| Tiny Tina's Wonderlands (2022) | 245.9 | 199.6 | 138.7 | 107.7 |
| F1 22 (2022) | 256 | 252 | 216 | 81.9 |
| Baldur's Gate 3 (2023) | 162.6 | 139.3 | 122.4 | 121.4 |
| Cyberpunk 2077 2.2 Phantom Liberty (2023) | 135.1 | 119.1 | 101 | 85.5 |
Emisiones
Ruido del sistema
El ruido del ventilador es en general más silencioso que el que registramos en el Katana 17 más antiguo. Más concretamente, nuestra Katana A17 es capaz de mantenerse más silenciosa durante más tiempo antes de estancarse en niveles de ruido similares a los anteriores.
Tenga en cuenta que hay una diferencia significativa en el nivel de ruido cuando se juega con Cooler Boost desactivado en lugar de activado (51 dB(A) frente a 60 dB(A)) aunque sus diferencias de rendimiento son extremadamente menores. Por lo tanto, se recomienda jugar con Cooler Boost desactivado para la mayoría de los escenarios.

Ruido
| Ocioso |
| 23.9 / 24.1 / 24.2 dB(A) |
| Carga |
| 24 / 59.8 dB(A) |
 | ||
30 dB silencioso 40 dB(A) audible 50 dB(A) ruidosamente alto |
||
min: | ||
| MSI Katana A17 AI B8VG NVIDIA GeForce RTX 4070 Laptop GPU, R7 8845HS, Samsung PM9C1 MZVL81T0HELB-00BTW | HP Omen 17-db0079ng NVIDIA GeForce RTX 4070 Laptop GPU, R7 8845HS, WD PC SN560 SDDPNQE-1T00 | Asus TUF Gaming A17 FA707XI-NS94 NVIDIA GeForce RTX 4070 Laptop GPU, R9 7940HS, WD PC SN560 SDDPNQE-1T00 | Acer Nitro 17 AN17-51-71ER NVIDIA GeForce RTX 4060 Laptop GPU, i7-13700H, Samsung PM9A1 MZVL21T0HCLR | MSI Pulse 17 B13VGK NVIDIA GeForce RTX 4070 Laptop GPU, i7-13700H, Micron 2400 MTFDKBA1T0QFM | Lenovo Legion 5 17ACH6H-82JY0003GE GeForce RTX 3060 Laptop GPU, R5 5600H, Samsung PM991a MZALQ512HBLU | |
|---|---|---|---|---|---|---|
| Noise | -19% | -21% | -13% | -2% | -14% | |
| apagado / medio ambiente * | 23.5 | 25 -6% | 27.9 -19% | 24 -2% | 24 -2% | 25 -6% |
| Idle Minimum * | 23.9 | 25 -5% | 28.5 -19% | 24 -0% | 24 -0% | 25 -5% |
| Idle Average * | 24.1 | 29 -20% | 29.8 -24% | 24 -0% | 24 -0% | 25 -4% |
| Idle Maximum * | 24.2 | 33 -36% | 29.8 -23% | 32.32 -34% | 24 1% | 30.5 -26% |
| Load Average * | 24 | 45 -88% | 34.8 -45% | 35.18 -47% | 32.49 -35% | 37.5 -56% |
| Cyberpunk 2077 ultra * | 51.2 | 48 6% | ||||
| Load Maximum * | 59.8 | 52 13% | 57.3 4% | 54.78 8% | 46.51 22% | 51 15% |
| Witcher 3 ultra * | 57.1 | 54.78 | 46.51 |
* ... más pequeño es mejor
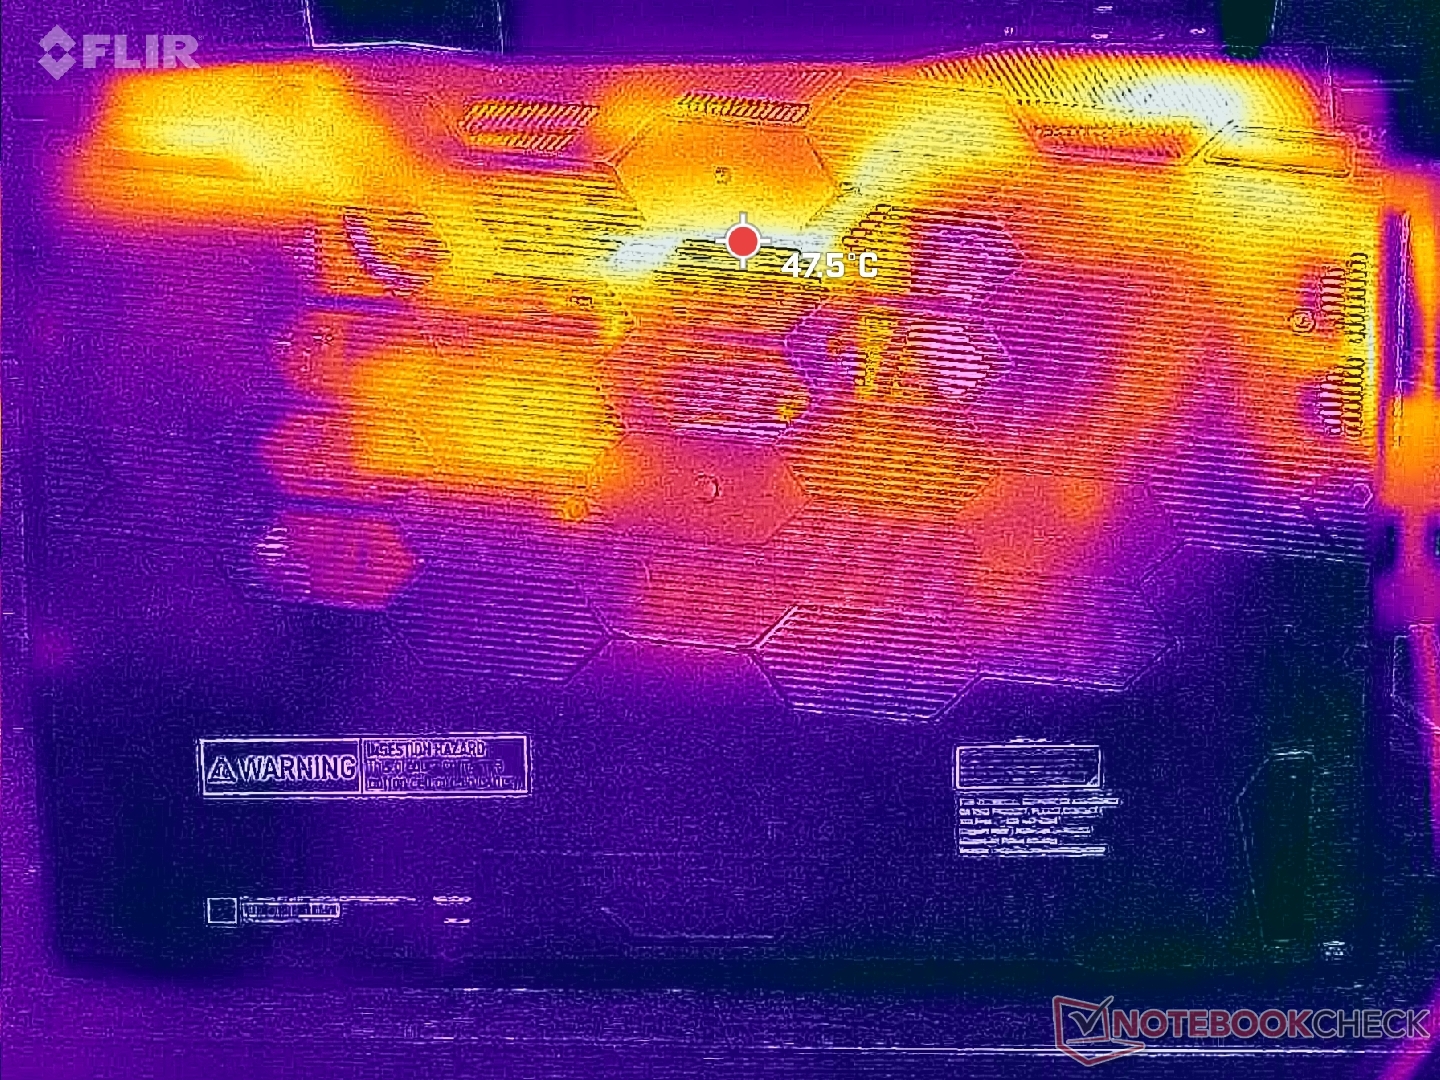
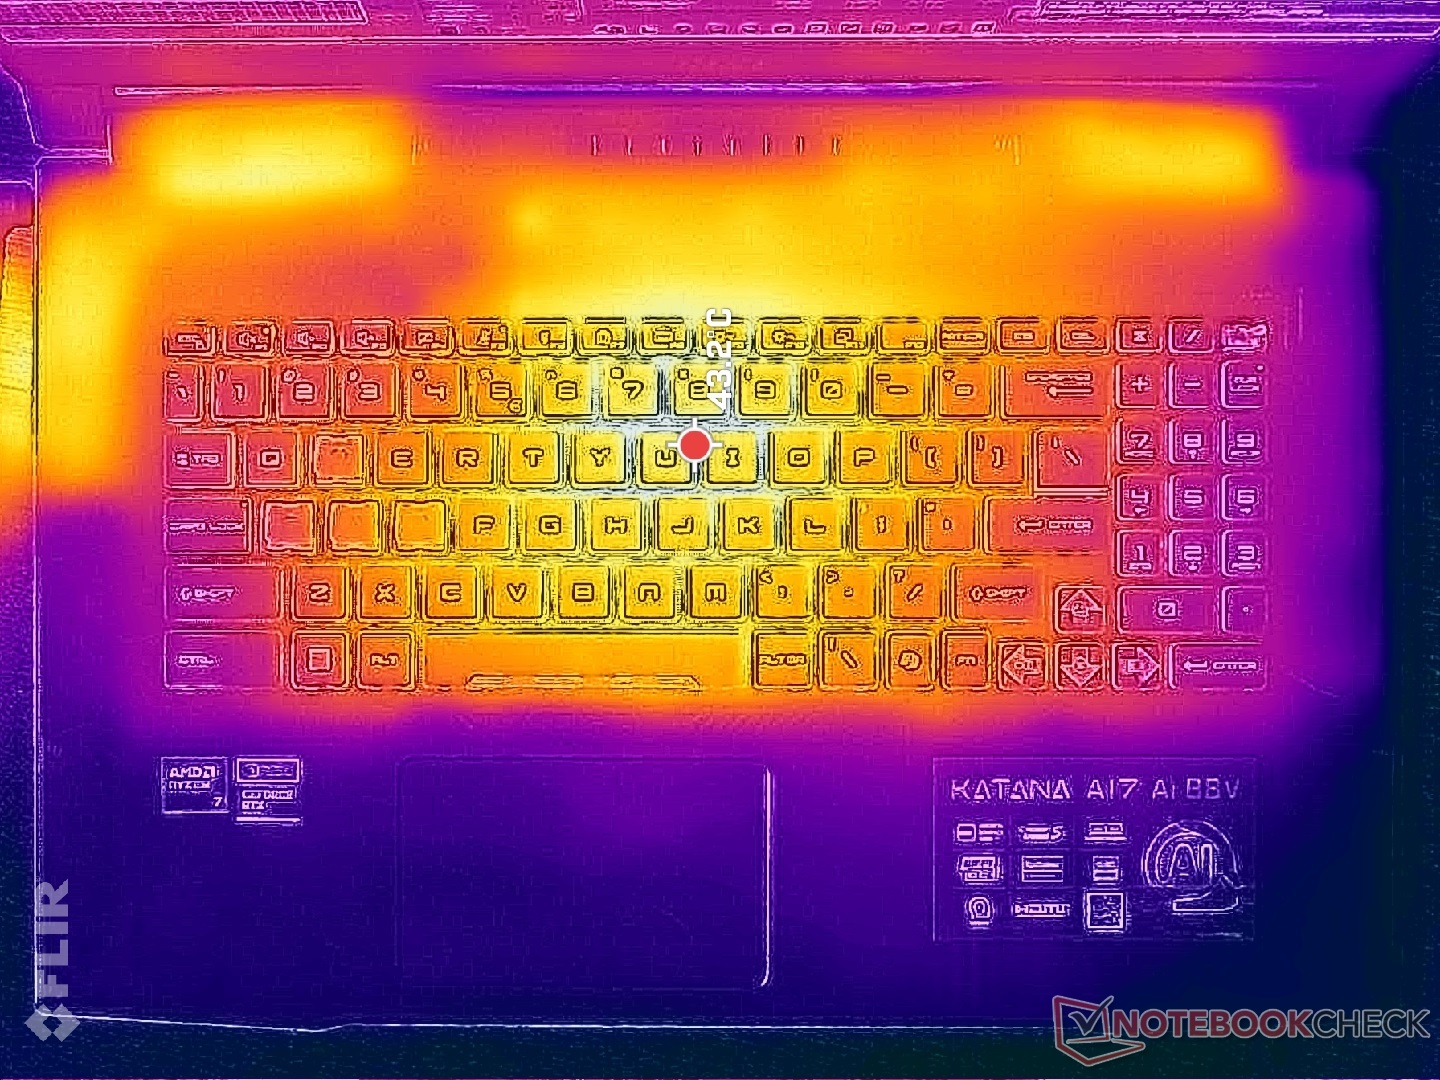
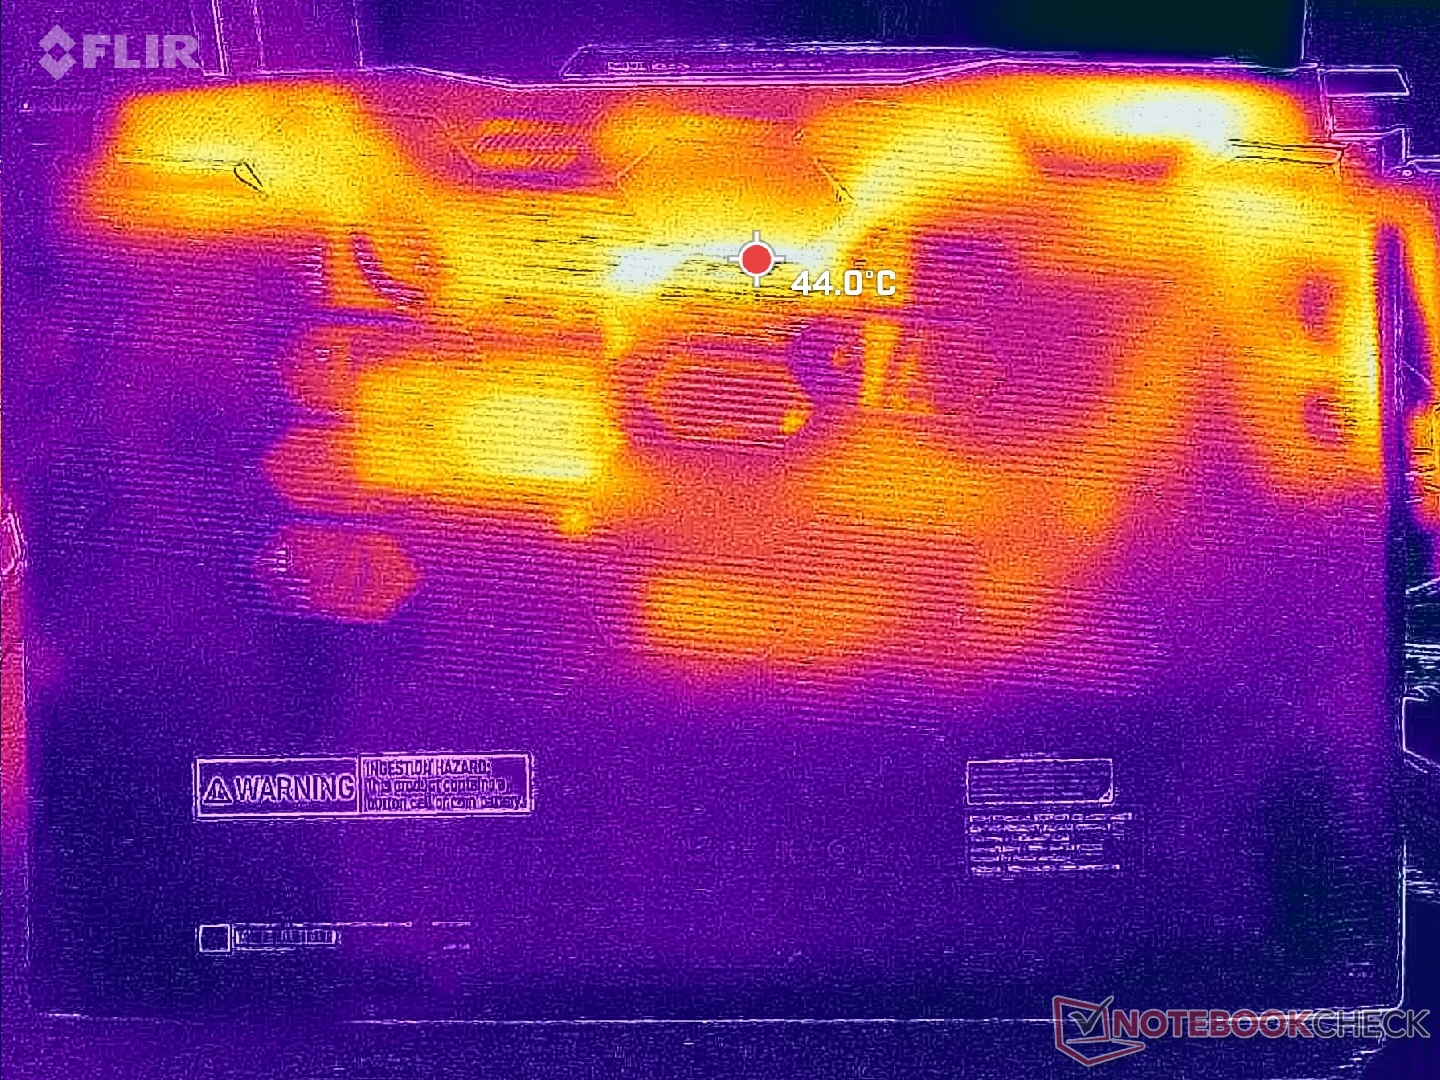
Temperatura
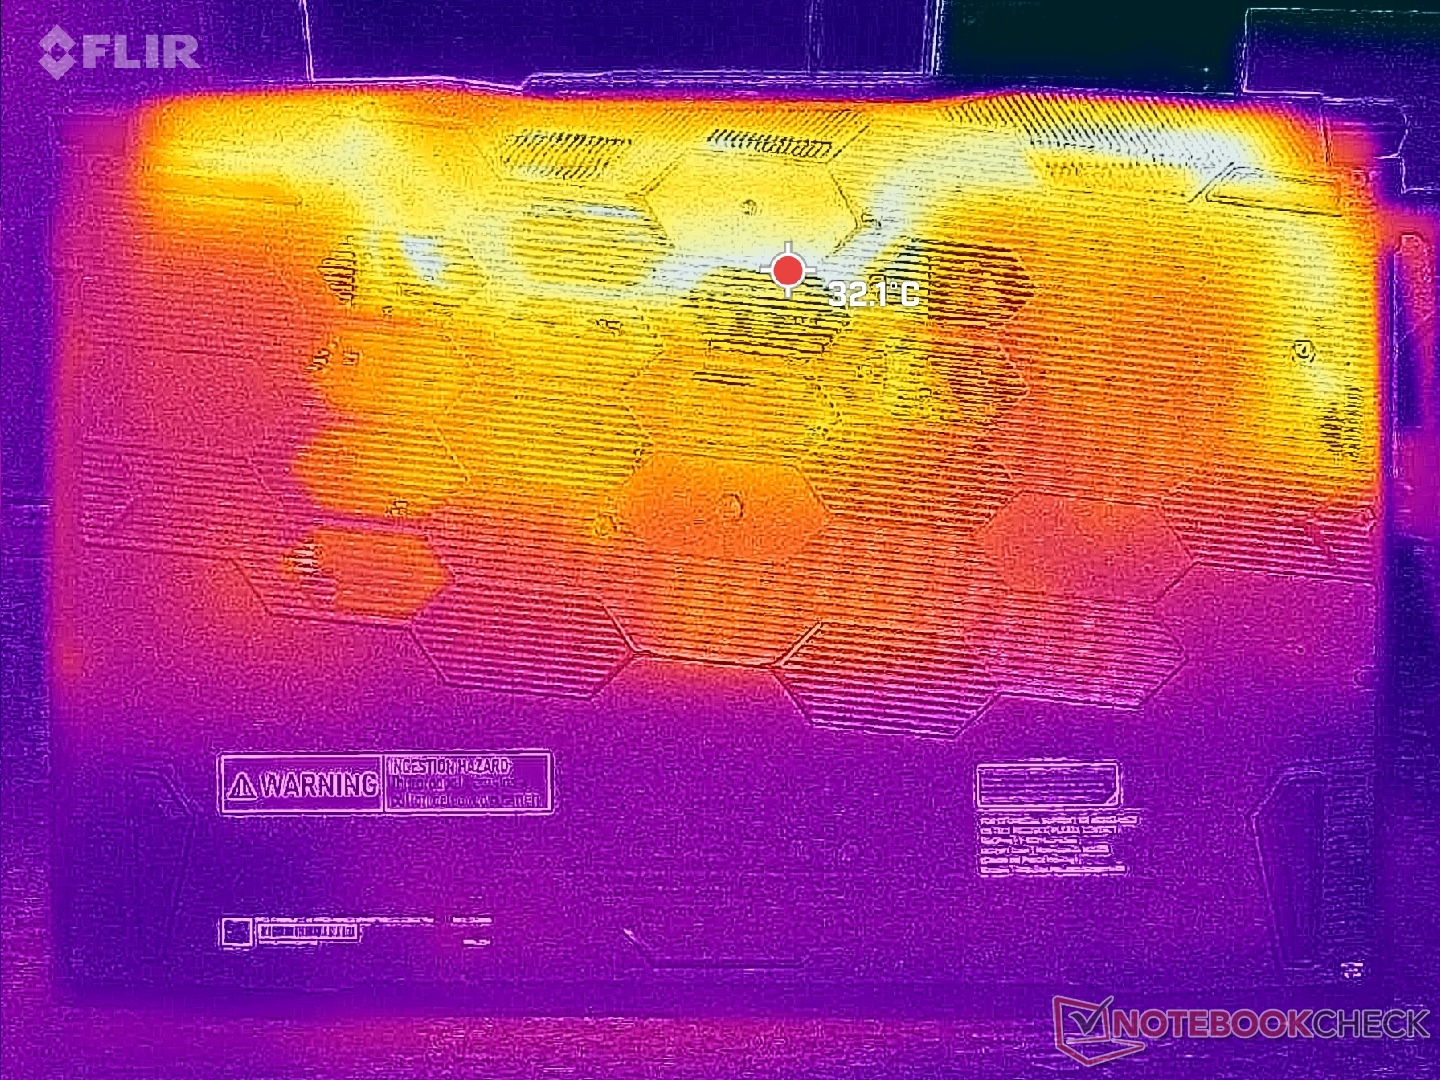
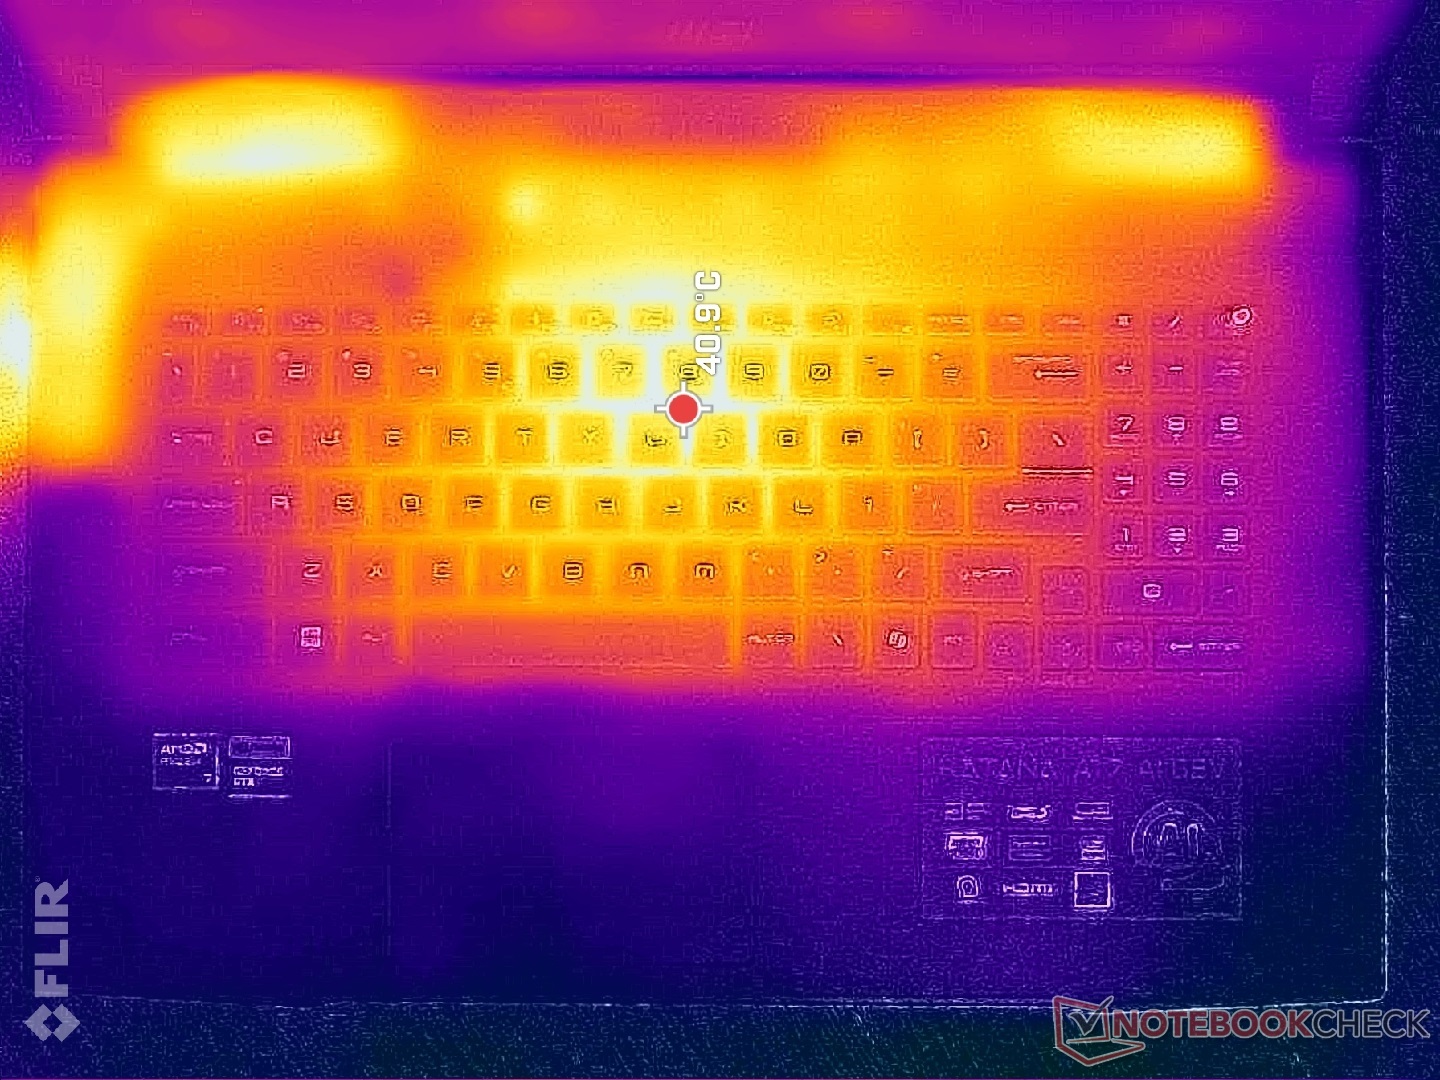
Las temperaturas de la superficie son más cálidas en el centro del teclado, donde se minimiza el contacto con las palmas y los dedos al jugar. Los resultados son comparables a los del Asus TUF Gaming A17 que viene con opciones similares de CPU y GPU.
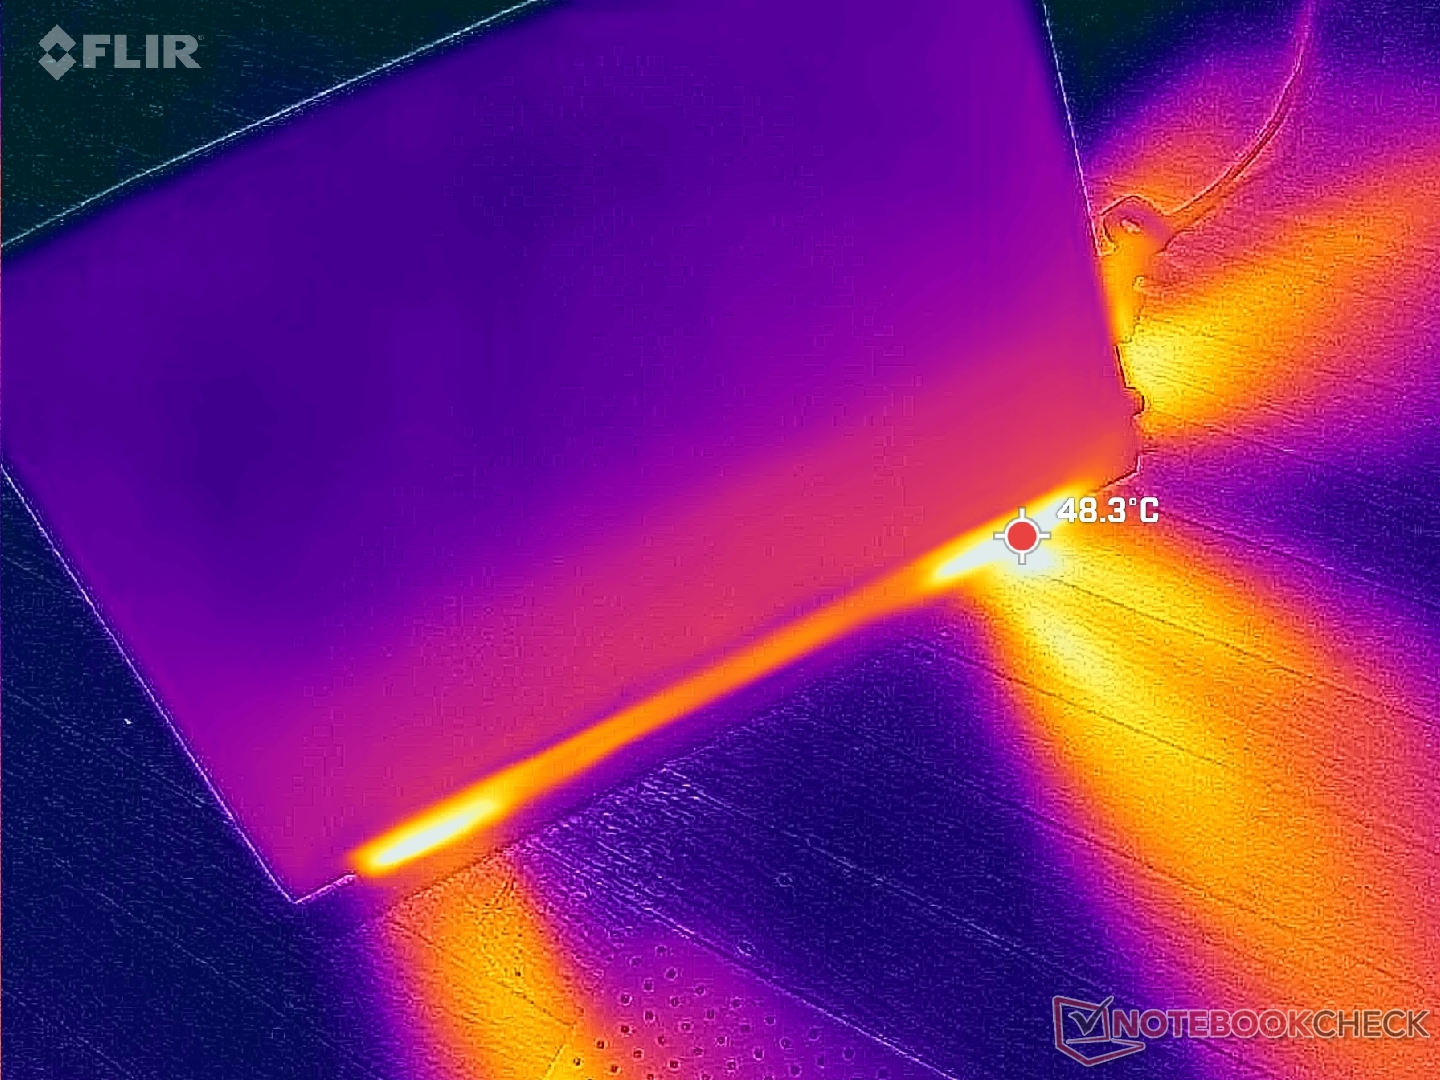
(±) La temperatura máxima en la parte superior es de 42 °C / 108 F, frente a la media de 40.4 °C / 105 F, que oscila entre 21.2 y 68.8 °C para la clase Gaming.
(±) El fondo se calienta hasta un máximo de 41.4 °C / 107 F, frente a la media de 43.2 °C / 110 F
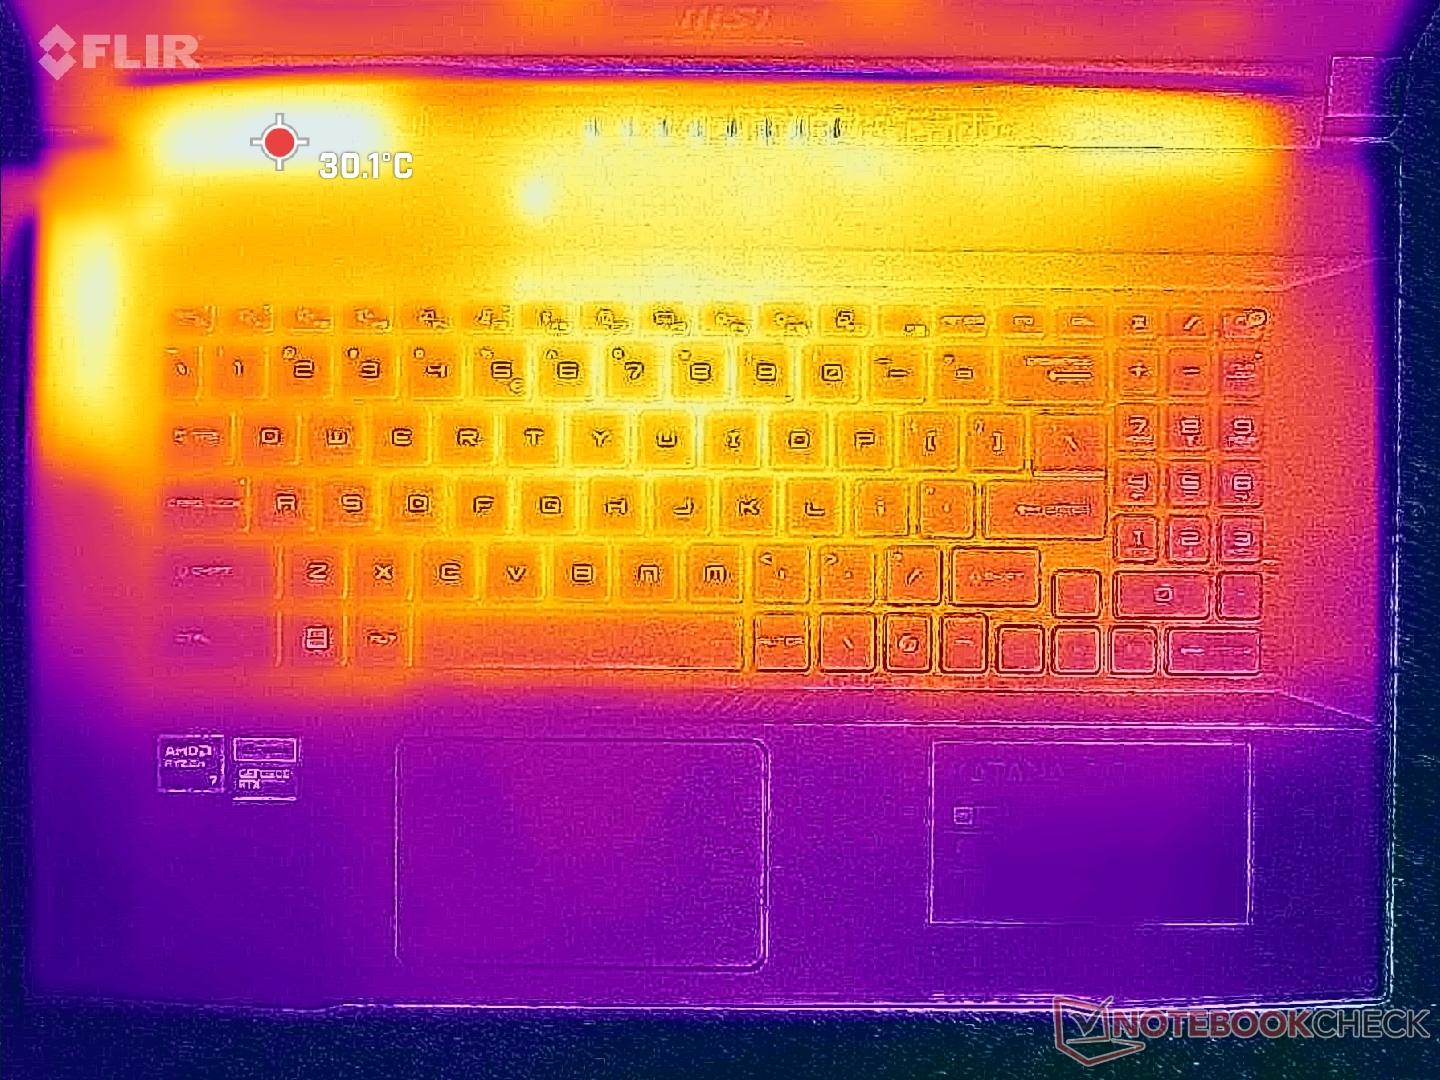
(+) En reposo, la temperatura media de la parte superior es de 26.5 °C / 80# F, frente a la media del dispositivo de 33.9 °C / 93 F.
(+) 3: The average temperature for the upper side is 30.3 °C / 87 F, compared to the average of 33.9 °C / 93 F for the class Gaming.
(+) El reposamanos y el panel táctil están a una temperatura inferior a la de la piel, con un máximo de 22.4 °C / 72.3 F y, por tanto, son fríos al tacto.
(+) La temperatura media de la zona del reposamanos de dispositivos similares fue de 28.9 °C / 84 F (+6.5 °C / 11.7 F).
| MSI Katana A17 AI B8VG AMD Ryzen 7 8845HS, NVIDIA GeForce RTX 4070 Laptop GPU | HP Omen 17-db0079ng AMD Ryzen 7 8845HS, NVIDIA GeForce RTX 4070 Laptop GPU | Asus TUF Gaming A17 FA707XI-NS94 AMD Ryzen 9 7940HS, NVIDIA GeForce RTX 4070 Laptop GPU | Acer Nitro 17 AN17-51-71ER Intel Core i7-13700H, NVIDIA GeForce RTX 4060 Laptop GPU | MSI Pulse 17 B13VGK Intel Core i7-13700H, NVIDIA GeForce RTX 4070 Laptop GPU | Lenovo Legion 5 17ACH6H-82JY0003GE AMD Ryzen 5 5600H, NVIDIA GeForce RTX 3060 Laptop GPU | |
|---|---|---|---|---|---|---|
| Heat | 9% | 20% | -6% | -3% | -3% | |
| Maximum Upper Side * | 42 | 44 -5% | 40 5% | 46 -10% | 48 -14% | 42.2 -0% |
| Maximum Bottom * | 41.4 | 45 -9% | 33.6 19% | 51 -23% | 50 -21% | 50.9 -23% |
| Idle Upper Side * | 32.6 | 26 20% | 26.6 18% | 34 -4% | 30 8% | 34.3 -5% |
| Idle Bottom * | 38.2 | 27 29% | 24.4 36% | 33 14% | 33 14% | 32 16% |
* ... más pequeño es mejor
Altavoces
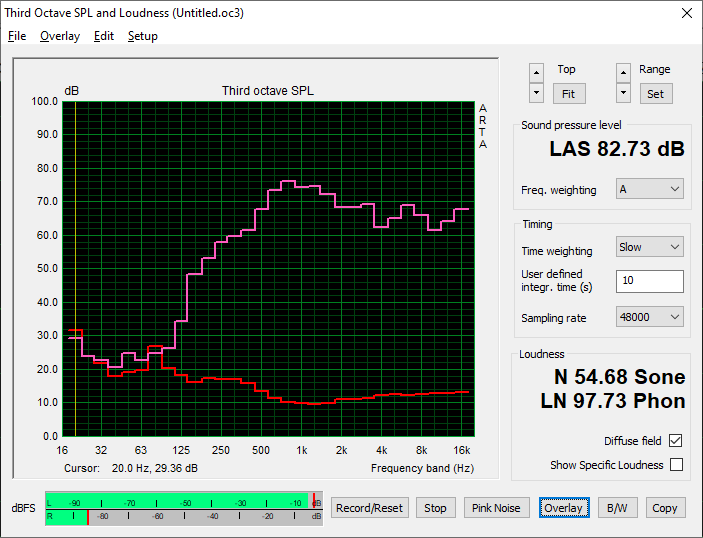
MSI Katana A17 AI B8VG análisis de audio
(+) | los altavoces pueden reproducir a un volumen relativamente alto (#82.7 dB)
Graves 100 - 315 Hz
(-) | casi sin bajos - de media 19.3% inferior a la mediana
(±) | la linealidad de los graves es media (10.9% delta a frecuencia anterior)
Medios 400 - 2000 Hz
(±) | medias más altas - de media 6.3% más altas que la mediana
(+) | los medios son lineales (5.8% delta a la frecuencia anterior)
Altos 2 - 16 kHz
(+) | máximos equilibrados - a sólo 2.5% de la mediana
(+) | los máximos son lineales (5.9% delta a la frecuencia anterior)
Total 100 - 16.000 Hz
(±) | la linealidad del sonido global es media (16.2% de diferencia con la mediana)
En comparación con la misma clase
» 38% de todos los dispositivos probados de esta clase eran mejores, 7% similares, 55% peores
» El mejor tuvo un delta de 6%, la media fue 18%, el peor fue ###max##%
En comparación con todos los dispositivos probados
» 24% de todos los dispositivos probados eran mejores, 5% similares, 71% peores
» El mejor tuvo un delta de 4%, la media fue 24%, el peor fue ###max##%
Apple MacBook Pro 16 2021 M1 Pro análisis de audio
(+) | los altavoces pueden reproducir a un volumen relativamente alto (#84.7 dB)
Graves 100 - 315 Hz
(+) | buen bajo - sólo 3.8% lejos de la mediana
(+) | el bajo es lineal (5.2% delta a la frecuencia anterior)
Medios 400 - 2000 Hz
(+) | medios equilibrados - a sólo 1.3% de la mediana
(+) | los medios son lineales (2.1% delta a la frecuencia anterior)
Altos 2 - 16 kHz
(+) | máximos equilibrados - a sólo 1.9% de la mediana
(+) | los máximos son lineales (2.7% delta a la frecuencia anterior)
Total 100 - 16.000 Hz
(+) | el sonido global es lineal (4.6% de diferencia con la mediana)
En comparación con la misma clase
» 0% de todos los dispositivos probados de esta clase eran mejores, 0% similares, 100% peores
» El mejor tuvo un delta de 5%, la media fue 18%, el peor fue ###max##%
En comparación con todos los dispositivos probados
» 0% de todos los dispositivos probados eran mejores, 0% similares, 100% peores
» El mejor tuvo un delta de 4%, la media fue 24%, el peor fue ###max##%
Gestión de la energía - Gran rendimiento por vatio pero con escasa duración de la batería
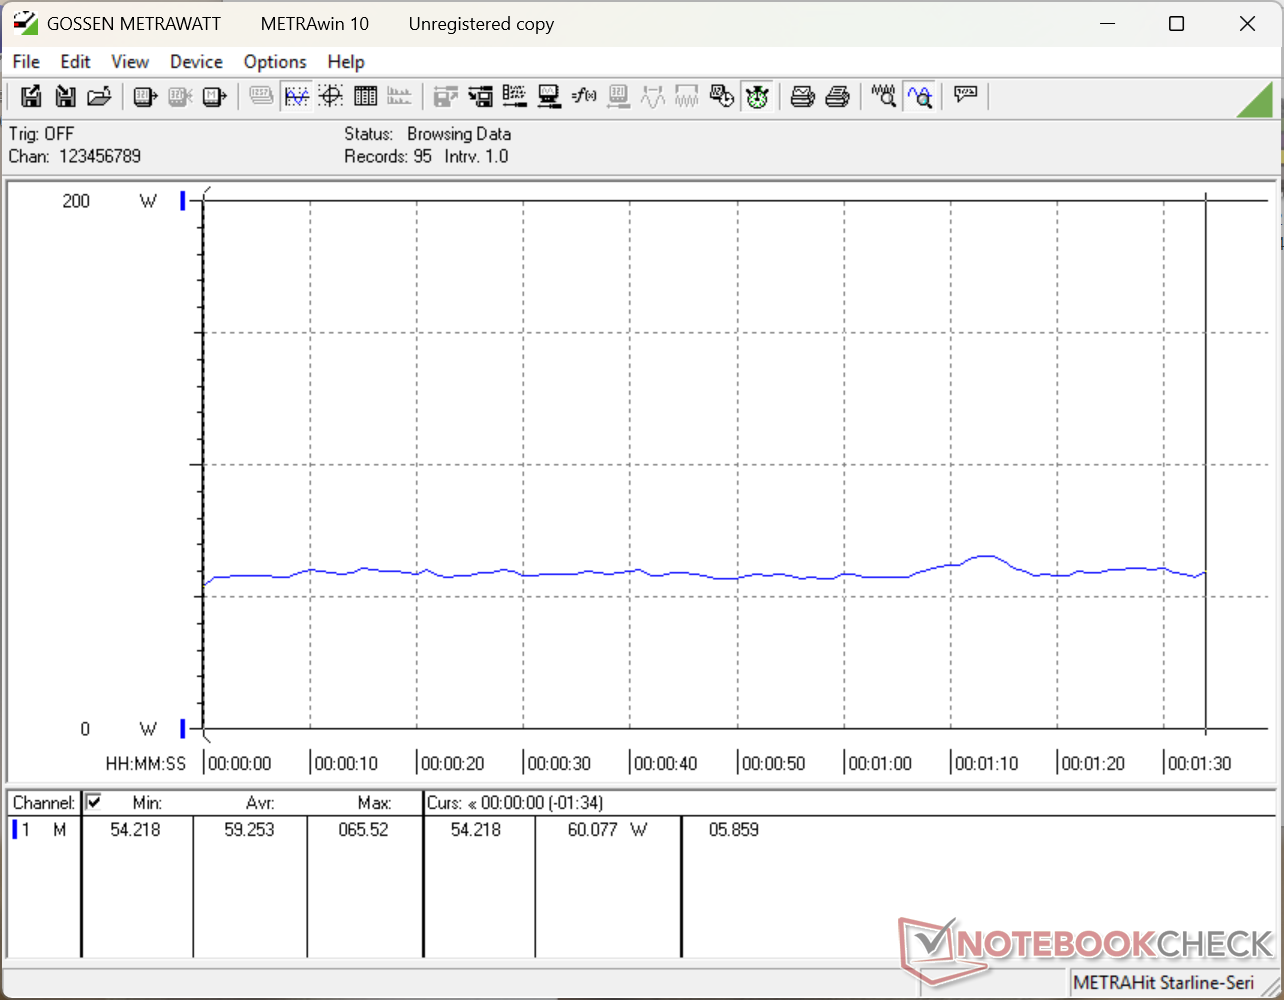
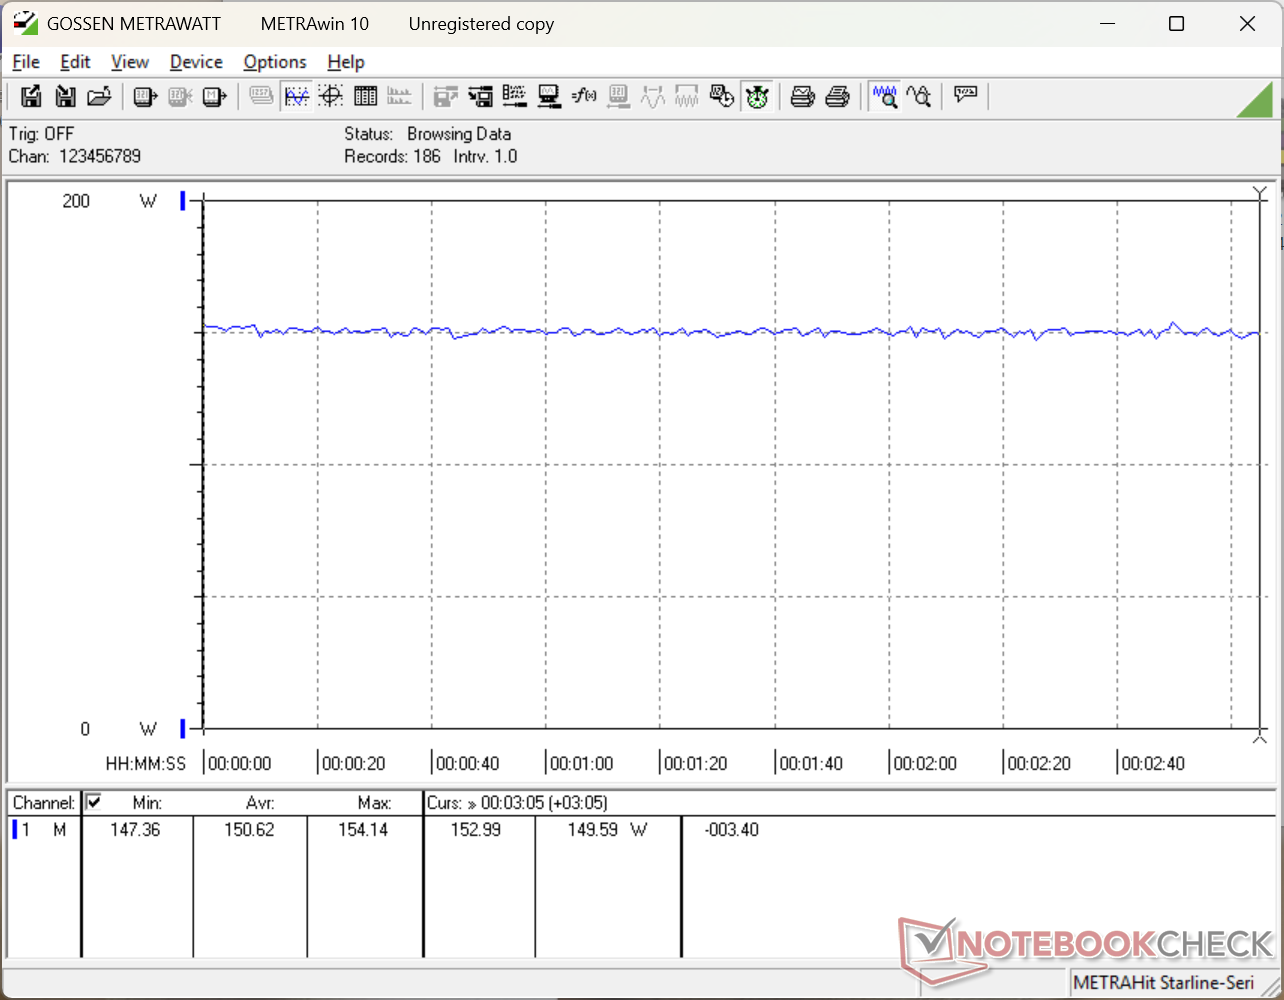
Consumo de energía
El consumo total está muy cerca del que registramos en el Katana 17 a pesar de que nuestro Katana A17 ofrece aproximadamente el mismo rendimiento de CPU pero con un rendimiento gráfico hasta un 20 por ciento más rápido. El rendimiento por vatio es por tanto mayor especialmente cuando se trata del Ryzen 7 7 8845HS frente al Core i7-13620H.
| Off / Standby | |
| Ocioso | |
| Carga |
|
Clave:
min: | |
| MSI Katana A17 AI B8VG R7 8845HS, NVIDIA GeForce RTX 4070 Laptop GPU, Samsung PM9C1 MZVL81T0HELB-00BTW, IPS, 1920x1080, 17.3" | HP Omen 17-db0079ng R7 8845HS, NVIDIA GeForce RTX 4070 Laptop GPU, WD PC SN560 SDDPNQE-1T00, IPS, 2560x1440, 17.3" | Asus TUF Gaming A17 FA707XI-NS94 R9 7940HS, NVIDIA GeForce RTX 4070 Laptop GPU, WD PC SN560 SDDPNQE-1T00, IPS, 1920x1080, 17.3" | Acer Nitro 17 AN17-51-71ER i7-13700H, NVIDIA GeForce RTX 4060 Laptop GPU, Samsung PM9A1 MZVL21T0HCLR, , 2560x1440, 17.3" | MSI Pulse 17 B13VGK i7-13700H, NVIDIA GeForce RTX 4070 Laptop GPU, Micron 2400 MTFDKBA1T0QFM, IPS, 1920x1080, 17.3" | Lenovo Legion 5 17ACH6H-82JY0003GE R5 5600H, GeForce RTX 3060 Laptop GPU, Samsung PM991a MZALQ512HBLU, IPS, 1920x1080, 17.3" | |
|---|---|---|---|---|---|---|
| Power Consumption | -6% | -11% | -3% | 12% | -38% | |
| Idle Minimum * | 15.4 | 6 61% | 6.2 60% | 8.3 46% | 9 42% | 15.6 -1% |
| Idle Average * | 16.8 | 12 29% | 21.8 -30% | 13.5 20% | 10.2 39% | 20.7 -23% |
| Idle Maximum * | 17.1 | 18 -5% | 22 -29% | 14.8 13% | 10.8 37% | 22.9 -34% |
| Load Average * | 59.3 | 71 -20% | 59.2 -0% | 77 -30% | 72 -21% | 134 -126% |
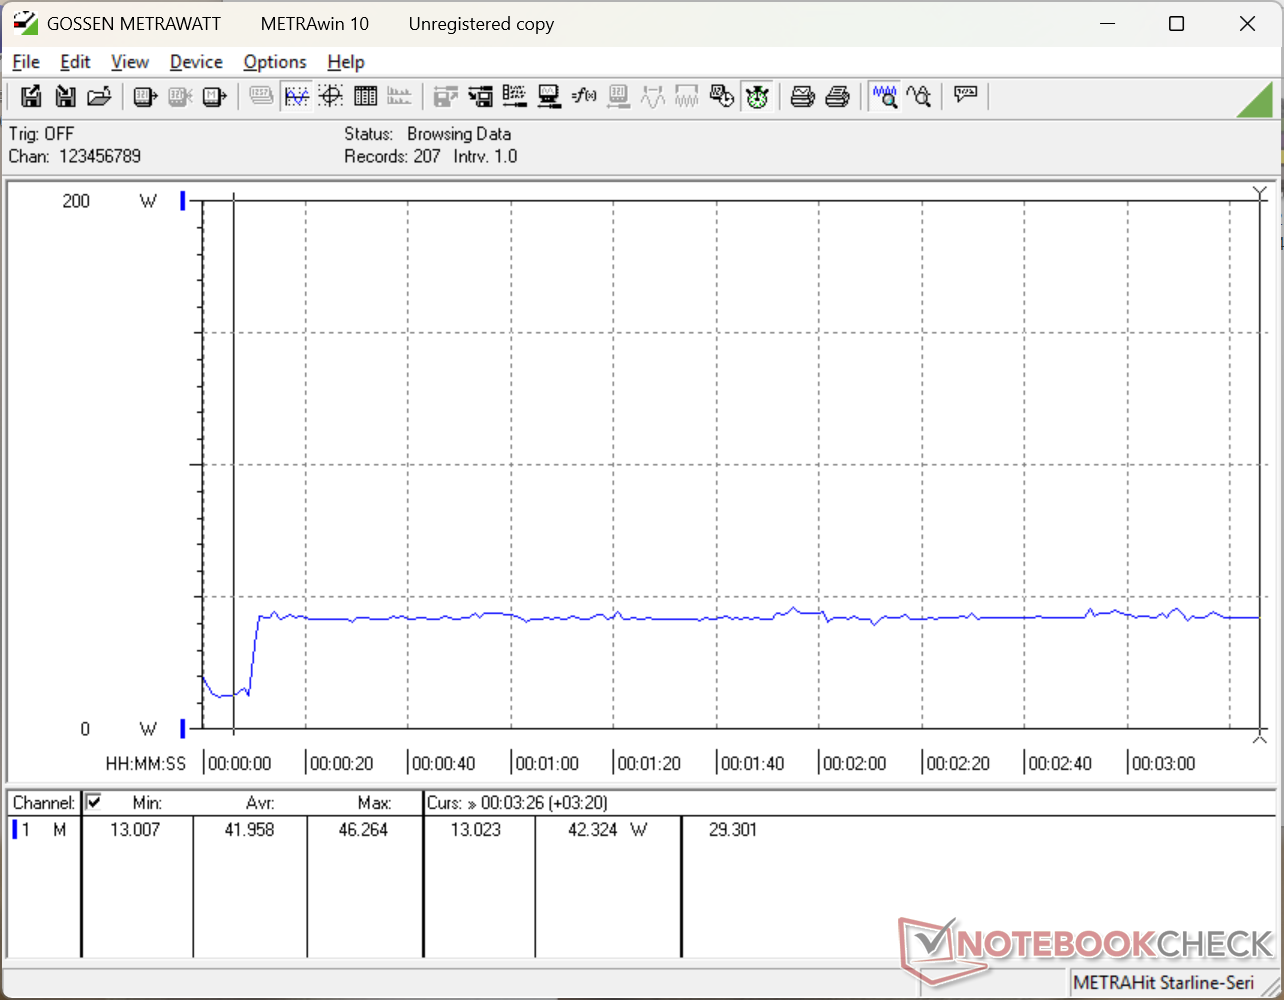
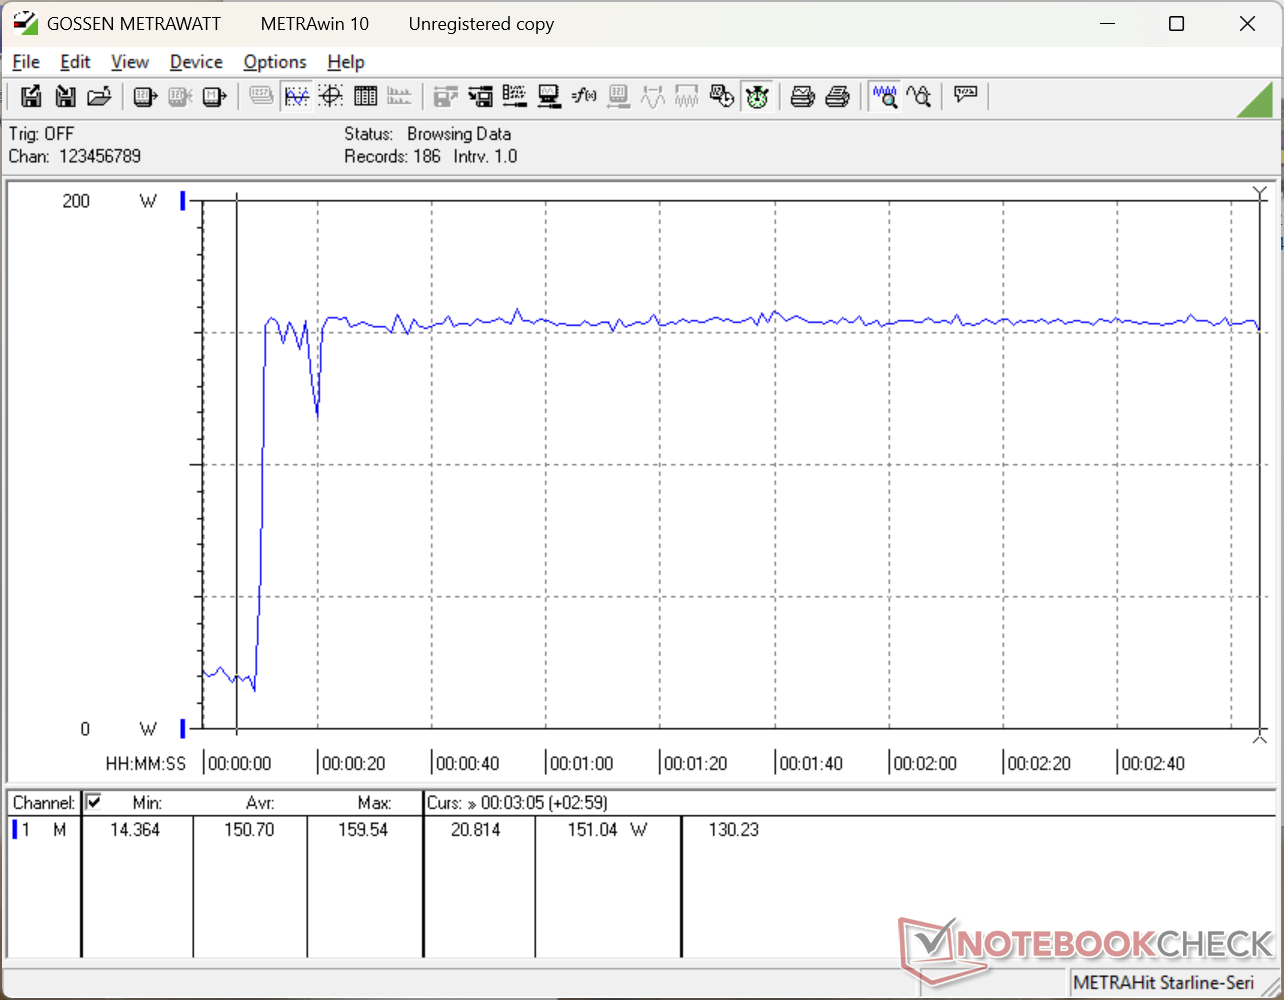
| Cyberpunk 2077 ultra external monitor * | 147.4 | 191.8 -30% | ||||
| Cyberpunk 2077 ultra * | 150.6 | 197 -31% | ||||
| Load Maximum * | 160 | 228 -43% | 247.8 -55% | 263 -64% | 221 -38% | 170 -6% |
| Witcher 3 ultra * | 189.7 | 154 | 130 | 135 |
* ... más pequeño es mejor
Power Consumption Cyberpunk / Stress Test
Power Consumption external Monitor
Duración de las pilas
La capacidad de la batería es pequeña, de sólo 53 Wh, por lo que la autonomía suele ser menor que en la mayoría de portátiles para juegos, incluso cuando se configura en modo iGPU.
| MSI Katana A17 AI B8VG R7 8845HS, NVIDIA GeForce RTX 4070 Laptop GPU, 53.5 Wh | HP Omen 17-db0079ng R7 8845HS, NVIDIA GeForce RTX 4070 Laptop GPU, 83 Wh | Asus TUF Gaming A17 FA707XI-NS94 R9 7940HS, NVIDIA GeForce RTX 4070 Laptop GPU, 90 Wh | Acer Nitro 17 AN17-51-71ER i7-13700H, NVIDIA GeForce RTX 4060 Laptop GPU, 90 Wh | MSI Pulse 17 B13VGK i7-13700H, NVIDIA GeForce RTX 4070 Laptop GPU, 90 Wh | Lenovo Legion 5 17ACH6H-82JY0003GE R5 5600H, GeForce RTX 3060 Laptop GPU, 80 Wh | |
|---|---|---|---|---|---|---|
| Duración de Batería | 131% | 132% | 109% | 128% | 11% | |
| WiFi v1.3 | 236 | 544 131% | 548 132% | 494 109% | 537 128% | 263 11% |
| H.264 | 462 | 413 | 212 | |||
| Cyberpunk 2077 ultra 150cd | 59 | |||||
| Reader / Idle | 1180 | 331 | ||||
| Load | 103 | 131 | 111 | |||
| Witcher 3 ultra | 151 |
Valoración de Notebookcheck
MSI Katana A17 AI B8VG
- 02/03/2025 v8
Allen Ngo
 Total Sustainability Score:
 Transparencia
La selección de los dispositivos que se van a reseñar corre a cargo de nuestro equipo editorial. La muestra de prueba fue proporcionada al autor en calidad de préstamo por el fabricante o el minorista a los efectos de esta reseña. El prestamista no tuvo ninguna influencia en esta reseña, ni el fabricante recibió una copia de la misma antes de su publicación. No había ninguna obligación de publicar esta reseña. Nunca aceptamos compensaciones o pagos a cambio de nuestras reseñas. Como empresa de medios independiente, Notebookcheck no está sujeta a la autoridad de fabricantes, minoristas o editores.
Así es como prueba Notebookcheck
Cada año, Notebookcheck revisa de forma independiente cientos de portátiles y smartphones utilizando procedimientos estandarizados para asegurar que todos los resultados son comparables. Hemos desarrollado continuamente nuestros métodos de prueba durante unos 20 años y hemos establecido los estándares de la industria en el proceso. En nuestros laboratorios de pruebas, técnicos y editores experimentados utilizan equipos de medición de alta calidad. Estas pruebas implican un proceso de validación en varias fases. Nuestro complejo sistema de clasificación se basa en cientos de mediciones y puntos de referencia bien fundamentados, lo que mantiene la objetividad.
