Análisis del portátil Schenker XMG Evo 15 (M24) - Ultrabook alemán con pantalla brillante y excelentes opciones de mantenimiento
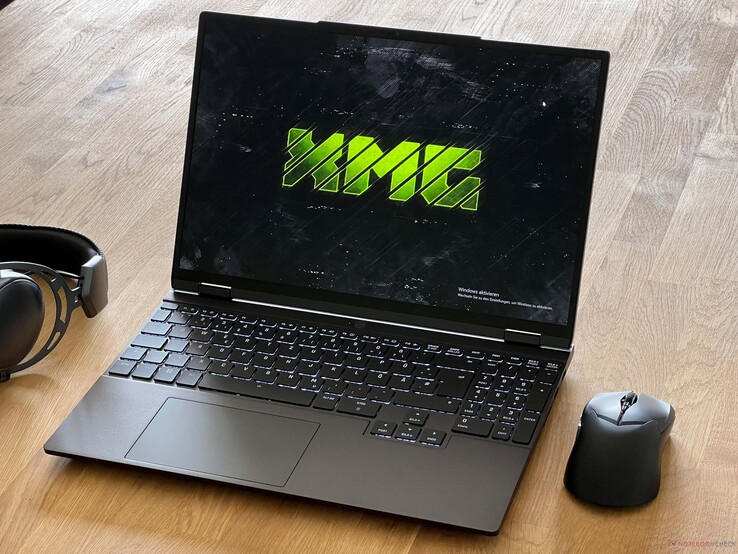
Hasta ahora, los portátiles XMG se habían dirigido principalmente a jugadores y clientes con necesidad de tarjetas gráficas dedicadas rápidas. Con los nuevos modelos XMG Evo (14 y 15 pulgadas), el fabricante alemán lanza ahora también dos ultrabooks sin GPU dedicada. Las carcasas son más compactas, pero al mismo tiempo no hay que renunciar a amplias opciones de mantenimiento. El fabricante también ofrece a los clientes la posibilidad de elegir entre las CPU Ryzen 8000 de AMD (a partir de 1.049 euros) o los chips Meteor Lake de Intel (a partir de 1.199 euros), lo que, según Schenker, no supone grandes diferencias de rendimiento. La pantalla es siempre un panel WQHD mate (2.560 x 1.600 píxeles) con un brillo de 500 nits y una frecuencia de 240 Hz.
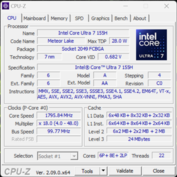
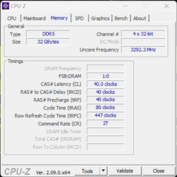
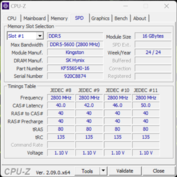
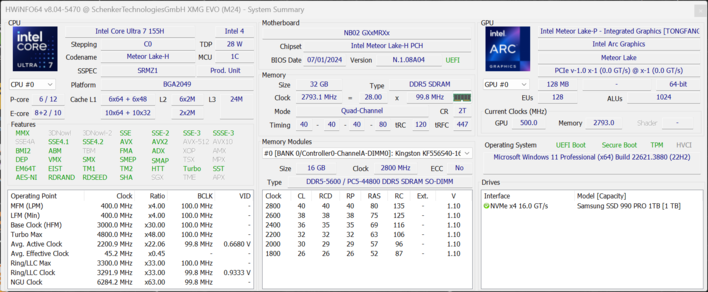
Probamos el nuevo XMG Evo 15 (M24) con Intel Core Ultra 7 155H incluyendo la iGPU Arc Graphics en combinación con 32 GB de RAM (DDR5-5600) y la versión de 1 TB del Samsung 990 Pro. En esta configuración (incluida la preinstalación de Windows 11), el precio es de 1.400 euros.
Posibles contendientes en la comparación
Valoración | Versión | Fecha | Modelo | Peso | Altura | Tamaño | Resolución | Precio |
|---|---|---|---|---|---|---|---|---|
| 84.7 % | v8 | 08/2024 | SCHENKER XMG Evo 15 (M24) Ultra 7 155H, Arc 8-Core | 1.7 kg | 19.9 mm | 15.30" | 2560x1600 | |
| 82.1 % | v8 | 07/2024 | Dell Inspiron 16 7640 2-in-1 Ultra 7 155H, Arc 8-Core | 2.1 kg | 18.99 mm | 16.00" | 2560x1600 | |
| 76.7 % | v8 | 07/2024 | Medion S10 OLED Ultra 7 155H, Arc 8-Core | 1.6 kg | 17.8 mm | 16.00" | 3840x2400 | |
| 89.7 % v7 (old) | v7 (old) | 04/2024 | Xiaomi RedmiBook Pro 16 2024 Ultra 7 155H, Arc 8-Core | 1.9 kg | 15.9 mm | 16.00" | 3072x1920 | |
| 87.9 % v7 (old) | v7 (old) | 05/2024 | Lenovo IdeaPad Pro 5 16IMH G9 Ultra 7 155H, Arc 8-Core | 1.9 kg | 17.5 mm | 16.00" | 2560x1600 | |
| 89.9 % v7 (old) | v7 (old) | 05/2024 | Lenovo ThinkPad T16 G2 21K70035GE R7 7840U, Radeon 780M | 1.8 kg | 23.8 mm | 16.00" | 1920x1200 |
Nota: Recientemente hemos actualizado nuestro sistema de clasificación y los resultados de la versión 8 no son comparables con los de la versión 7. Encontrará más información aquí.
Top 10 Análisis
» Top 10 Portátiles Multimedia
» Top 10 Portátiles de Juego
» Top 10 Portátiles de Juego ligeros
» Top 10 Portátiles Asequibles de Oficina/Empresa
» Top 10 Portátiles de Juego Ligeros
» Top 10 Portátiles de Oficina/Empresa Premium
» Top 10 Estaciones de Trabajo
» Top 10 Subportátiles
» Top 10 Ultrabooks
» Top 10 Convertibles
» Top 10 Tablets
» Top 10 Tablets Windows
» Top 10 Tablets de menos de 250 Euros
» Top 10 Phablets (>5.5")
» Top 10 Smartphones
» Top 10 Smartphones (≤5")
» Top 10 Smartphones de menos de 300 Euros
» Top 10 Smartphones de menos de 120 Euros
» Top 10 Portátiles de menos de 1000 Euros
» Top 10 Portátiles de menos de 500 Euros
» Top 10 Portátiles de menos de 300 Euros
» Los Mejores Displays de Portátiles Analizados por Notebookcheck
Caja - Cubierta de aluminio resistente
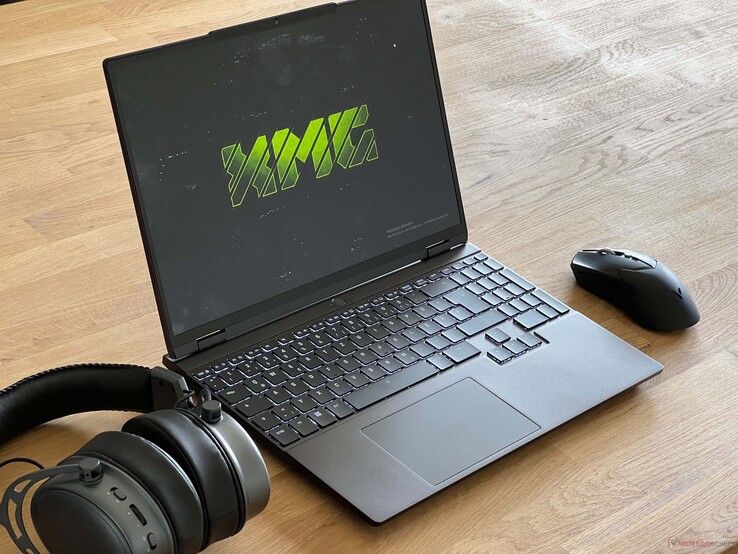
El XMG Evo 15 cuenta con un chasis de aluminio negro, que es algo similar al del XMG Fusion 15 gamer. Sin embargo, el Evo 15 es más compacto (especialmente más delgado) y también prescinde de las rejillas de refrigeración a ambos lados. En general, el portátil tiene un aspecto muy sencillo y también puede utilizarse en un entorno profesional sin problemas; si se desea, el portátil también puede pedirse sin logotipo en la tapa de la pantalla. Sin embargo, las superficies de aluminio son bastante sensibles a las huellas dactilares y deben limpiarse con regularidad.
En términos de calidad, el nuevo Evo 15 rinde bien, ya que la mano de obra es muy buena y el portátil causa una impresión general de alta calidad. La unidad base es muy estable y sólo se abolla un poco en la zona central del teclado si se pone la mano sobre ella. La tapa de la pantalla también es estable y no podemos provocar ninguna distorsión de la imagen. El ángulo máximo de apertura es de 180 grados y las bisagras mantienen la pantalla firmemente en su posición, aparte de un ligero rebote, pero abrirla con una mano también es posible sin problemas gracias a la ligera joroba de la cámara.
Con un grosor de aproximadamente 2 cm, el Evo 15 no es el portátil más delgado, pero tampoco aspira a serlo. Sin embargo, su tamaño es notablemente más compacto que el de sus competidores de 16 pulgadas. Con un peso de alrededor de 1,7 kg, también es uno de los modelos más ligeros de nuestra comparativa. La fuente de alimentación de 100 vatios pesa 513 gramos, pero esto incluye el largo cable de alimentación (1,8 + 1,5 metros).
Características - Thunderbolt 4 y USB 2.0
Los puertos están repartidos entre las dos zonas laterales traseras y la parte posterior. En principio, están disponibles todos los estándares modernos, incluido Thunderbolt 4 (o USB 4.0 en el modelo AMD) y también hay suficientes puertos USB, pero no sabemos qué hace un puerto USB 2.0 en un portátil moderno. Al menos sólo hay uno de ellos, los otros dos cumplen con el estándar USB 3.2 Gen1.
Lector de tarjetas SD
Junto con nuestra tarjeta de referencia (Angelbird AV Pro V60), el lector de tarjetas SD completo alcanza velocidades de transferencia de hasta 90 MB/s y ~50 MB/s al copiar datos. En general, se trata de resultados algo por debajo de la media.
| SD Card Reader | |
| average JPG Copy Test (av. of 3 runs) | |
| SCHENKER XMG Evo 15 (M24) (ADATA V90) | |
| SCHENKER XMG Evo 15 (M24) (Angelbird AV Pro V60) | |
| Media de la clase Multimedia (18.4 - 201, n=56, últimos 2 años) | |
| Lenovo IdeaPad Pro 5 16IMH G9 (Angelbird AV Pro V60) | |
| Dell Inspiron 16 7640 2-in-1 (Toshiba Exceria Pro SDXC 64 GB UHS-II) | |
| maximum AS SSD Seq Read Test (1GB) | |
| SCHENKER XMG Evo 15 (M24) (ADATA V90) | |
| SCHENKER XMG Evo 15 (M24) (Angelbird AV Pro V60) | |
| Media de la clase Multimedia (25.8 - 266, n=56, últimos 2 años) | |
| Lenovo IdeaPad Pro 5 16IMH G9 (Angelbird AV Pro V60) | |
| Dell Inspiron 16 7640 2-in-1 (Toshiba Exceria Pro SDXC 64 GB UHS-II) | |
Comunicación
El Evo 15 es uno de los pocos portátiles multimedia modernos que sigue disponiendo de una conexión de red Gigabit RJ45. El módulo AX211 de Intel también está disponible para redes inalámbricas (Wi-Fi 6E). Junto con nuestro router de referencia de Asus, las tasas de transferencia fueron buenas y no tuvimos problemas con la señal Wi-Fi durante la prueba.
| Networking | |
| SCHENKER XMG Evo 15 (M24) | |
| iperf3 transmit AXE11000 | |
| iperf3 receive AXE11000 | |
| Dell Inspiron 16 7640 2-in-1 | |
| iperf3 transmit AXE11000 | |
| iperf3 receive AXE11000 | |
| iperf3 transmit AXE11000 6GHz | |
| iperf3 receive AXE11000 6GHz | |
| Medion S10 OLED | |
| iperf3 transmit AXE11000 | |
| iperf3 receive AXE11000 | |
| Xiaomi RedmiBook Pro 16 2024 | |
| iperf3 transmit AXE11000 | |
| iperf3 receive AXE11000 | |
| Lenovo IdeaPad Pro 5 16IMH G9 | |
| iperf3 transmit AXE11000 | |
| iperf3 receive AXE11000 | |
| Lenovo ThinkPad T16 G2 21K70035GE | |
| iperf3 transmit AXE11000 | |
| iperf3 receive AXE11000 | |
| iperf3 transmit AXE11000 6GHz | |
| iperf3 receive AXE11000 6GHz | |
Cámara web
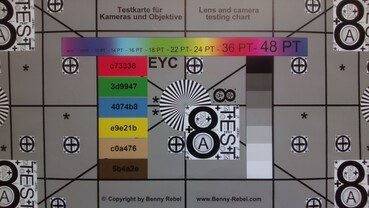
En el borde superior de la pantalla hay integrada una cámara de 2 MP con obturador mecánico que ofrece una calidad de imagen media. También es compatible con los efectos de Microsoft Studio y la cámara IR adicional permite el reconocimiento facial a través de Windows Hello.

Accesorios
Además de la fuente de alimentación de 100 vatios, el volumen de suministro también incluye una memoria USB con controladores y una gran alfombrilla de ratón XMG de tela.
Mantenimiento
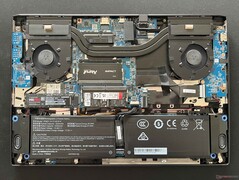
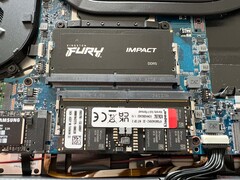
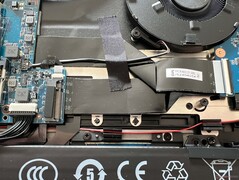
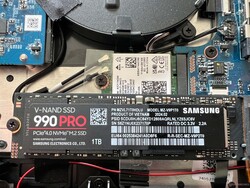
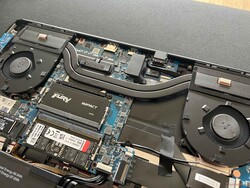
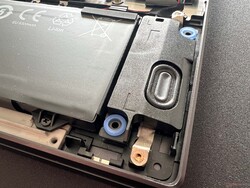
Ahora llegamos a un aspecto destacado del Evo 15, las opciones de mantenimiento. Tras retirar la cubierta inferior (que se sujeta con tornillos Phillips normales), puede acceder a los ventiladores y a la batería atornillada, así como a las dos ranuras SO-DIMM para la RAM y a las dos ranuras M.2 2280 SSD; las actualizaciones son, por tanto, un juego de niños. El módulo WLAN también puede sustituirse en caso necesario.
Sostenibilidad
La página del producto de Schenker carece de información sobre las emisiones de CO2 generadas durante la fabricación de los portátiles. El embalaje es en gran parte de cartón y plástico. Hablaremos del consumo de energía más adelante, pero el consumo en modo de espera de 1,4 vatios es demasiado elevado.
Dispositivos de entrada - Teclado grande con teclado numérico
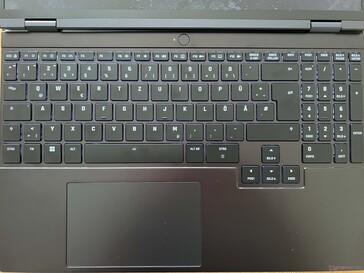
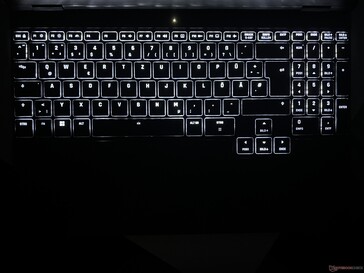
El teclado ocupa todo el ancho de la unidad base y también ofrece un teclado numérico dedicado, aunque estas teclas son algo más estrechas. Sin embargo, las teclas de dirección no tienen un tamaño reducido. La experiencia general de escritura es cómoda e incluso los textos largos no suponen ningún problema, aunque los portátiles de negocios como el ThinkPad T16 siguen ofreciendo ventajas en este aspecto. Además, las teclas más grandes en particular son bastante ruidosas y se sienten un poco raquíticas. Basándose en una encuesta realizada entre sus clientes, Schenker ha decidido no instalar una tecla dedicada al copiloto. La retroiluminación blanca ofrece actualmente dos niveles de intensidad, pero pronto se lanzará una actualización que ofrecerá entonces cuatro niveles de intensidad.
Con unas dimensiones de 12,3 x 7,7 cm, el ClickPad ofrece espacio suficiente para las entradas y el control del puntero, pero está claramente desplazado hacia la izquierda, lo que requiere algún tiempo para acostumbrarse. El pad puede pulsarse en la zona inferior, pero esto produce un sonido fuerte y barato.
Pantalla - IPS con 240 Hz
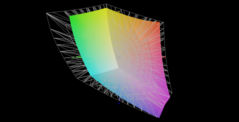
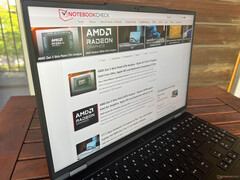
Schenker utiliza el conocido panel WQHD con 240 Hz del Fusion 15, por lo que se trata de un panel IPS mate con una resolución de 2.560 x 1.600 píxeles. La impresión subjetiva de la imagen es excelente, ya que todo el contenido es muy nítido y la reproducción del color también es buena, aunque, por supuesto, no se pueden esperar los colores brillantes de los paneles OLED. Tampoco hay parpadeo PWM, pero los tiempos de respuesta siguen siendo muy rápidos. A pesar de la superficie mate, ni siquiera las superficies brillantes aparecen granuladas y los movimientos son muy suaves gracias a la alta frecuencia. También es compatible con la sincronización adaptativa, pero no lleva instalado un sensor de brillo.
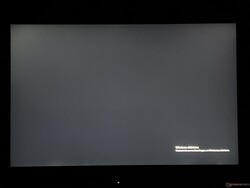
El brillo está especificado en 500 cd/m², pero nuestro dispositivo de pruebas logró un resultado significativamente mejor con una media de 585 cd/m². Sin embargo, se resiente el valor de negro, que es de 0,61 cd/m², y hace que el contenido negro aparezca más bien gris oscuro. Además, la relación de contraste máxima es de sólo ~1.000:1.
| |||||||||||||||||||||||||
iluminación: 93 %
Brillo con batería: 608 cd/m²
Contraste: 997:1 (Negro: 0.61 cd/m²)
ΔE Color 2.1 | 0.5-29.43 Ø4.87, calibrated: 1.2
ΔE Greyscale 2.7 | 0.5-98 Ø5.1
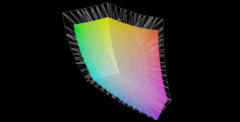
74.2% AdobeRGB 1998 (Argyll 2.2.0 3D)
100% sRGB (Argyll 2.2.0 3D)
73.6% Display P3 (Argyll 2.2.0 3D)
Gamma: 2.2
| SCHENKER XMG Evo 15 (M24) NE153QDM-NZ1, IPS, 2560x1600, 15.3", 240 Hz | Dell Inspiron 16 7640 2-in-1 AU Optronics B160QAT, Mini-LED, 2560x1600, 16", 90 Hz | Medion S10 OLED Samsung SDC4174, OLED, 3840x2400, 16", 60 Hz | Xiaomi RedmiBook Pro 16 2024 TL160MDMP03_0, IPS, 3072x1920, 16", 165 Hz | Lenovo IdeaPad Pro 5 16IMH G9 NE160QDM-NY2, IPS, 2560x1600, 16", 120 Hz | Lenovo ThinkPad T16 G2 21K70035GE B160UAN01.K, IPS LED, 1920x1200, 16", Hz | |
|---|---|---|---|---|---|---|
| Display | 20% | 23% | 18% | -10% | 2% | |
| Display P3 Coverage | 73.6 | 99.4 35% | 99.9 36% | 98.8 34% | 63.3 -14% | 75.9 3% |
| sRGB Coverage | 100 | 100 0% | 100 0% | 100 0% | 95.2 -5% | 98.2 -2% |
| AdobeRGB 1998 Coverage | 74.2 | 92.5 25% | 98.6 33% | 89.9 21% | 65.3 -12% | 77.2 4% |
| Response Times | -527% | 71% | -437% | -141% | -548% | |
| Response Time Grey 50% / Grey 80% * | 4.6 ? | 15.4 ? -235% | 1.7 ? 63% | 39.2 ? -752% | 15 ? -226% | 40.8 ? -787% |
| Response Time Black / White * | 6.6 ? | 60.6 ? -818% | 1.4 ? 79% | 14.6 ? -121% | 10.3 ? -56% | 26.9 ? -308% |
| PWM Frequency | 2753.7 ? | 60 ? | ||||
| Screen | 3% | 329% | -8% | -12% | -31% | |
| Brightness middle | 608 | 413 -32% | 307 -50% | 520 -14% | 368 -39% | 446 -27% |
| Brightness | 585 | 409 -30% | 307 -48% | 510 -13% | 368 -37% | 425 -27% |
| Brightness Distribution | 93 | 97 4% | 96 3% | 93 0% | 91 -2% | 91 -2% |
| Black Level * | 0.61 | 0.14 77% | 0.01 98% | 0.35 43% | 0.31 49% | 0.28 54% |
| Contrast | 997 | 2950 196% | 30700 2979% | 1486 49% | 1187 19% | 1593 60% |
| Colorchecker dE 2000 * | 2.1 | 3.48 -66% | 2.1 -0% | 2.9 -38% | 2.4 -14% | 3.7 -76% |
| Colorchecker dE 2000 max. * | 4.3 | 6.97 -62% | 4.87 -13% | 6.2 -44% | 6.5 -51% | 8.8 -105% |
| Colorchecker dE 2000 calibrated * | 1.2 | 2.08 -73% | 1.1 8% | 0.8 33% | 1.6 -33% | |
| Greyscale dE 2000 * | 2.7 | 4.5 -67% | 0.9 67% | 4.3 -59% | 4.5 -67% | 6 -122% |
| Gamma | 2.2 100% | 2.15 102% | 2.197 100% | 2.19 100% | 2.21 100% | 2.2 100% |
| CCT | 6168 105% | 6446 101% | 6513 100% | 7422 88% | 6324 103% | 6499 100% |
| Media total (Programa/Opciones) | -168% /
-75% | 141% /
227% | -142% /
-63% | -54% /
-30% | -192% /
-98% |
* ... más pequeño es mejor
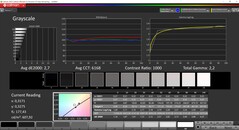
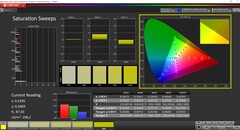
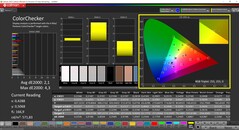
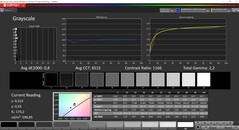
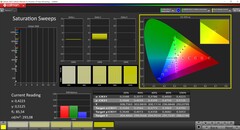
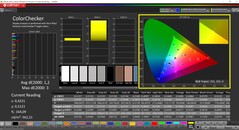
Medimos el panel con el software profesional CalMAN (X-Rite i1 Pro2) y puede descargar un perfil precalibrado del fabricante en el Centro de control, que también utilizamos para la medición. Sin embargo, la temperatura de color aquí es un poco demasiado cálida y también hay algunos valores para los colores y la escala de grises que superan el valor objetivo de 3. Con nuestra propia calibración (el perfil está disponible para su descarga gratuita más arriba), podemos mejorar significativamente la pantalla y todos los valores están dentro del rango objetivo. Junto con la cobertura sRGB completa, el Evo 15 es, por tanto, también adecuado para editar imágenes/vídeos sin restricciones.
Tiempos de respuesta del display
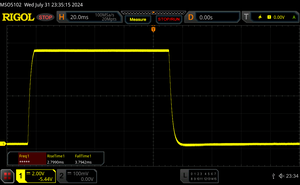
| ↔ Tiempo de respuesta de Negro a Blanco | ||
|---|---|---|
| 6.6 ms ... subida ↗ y bajada ↘ combinada | ↗ 2.8 ms subida | |
| ↘ 3.8 ms bajada | ||
| La pantalla mostró tiempos de respuesta muy rápidos en nuestros tests y debería ser adecuada para juegos frenéticos. En comparación, todos los dispositivos de prueba van de ##min### (mínimo) a 240 (máximo) ms. » 18 % de todos los dispositivos son mejores. Esto quiere decir que el tiempo de respuesta medido es mejor que la media (20.8 ms) de todos los dispositivos testados. | ||
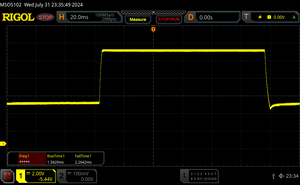
| ↔ Tiempo de respuesta 50% Gris a 80% Gris | ||
| 4.6 ms ... subida ↗ y bajada ↘ combinada | ↗ 1.3 ms subida | |
| ↘ 2.3 ms bajada | ||
| La pantalla mostró tiempos de respuesta muy rápidos en nuestros tests y debería ser adecuada para juegos frenéticos. En comparación, todos los dispositivos de prueba van de ##min### (mínimo) a 636 (máximo) ms. » 13 % de todos los dispositivos son mejores. Esto quiere decir que el tiempo de respuesta medido es mejor que la media (32.5 ms) de todos los dispositivos testados. | ||
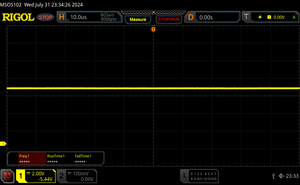
Parpadeo de Pantalla / PWM (Pulse-Width Modulation)
| Parpadeo de Pantalla / PWM no detectado | |||
Comparación: 53 % de todos los dispositivos testados no usaron PWM para atenuar el display. Si se usó, medimos una media de 8516 (mínimo: 5 - máxmo: 343500) Hz. | |||
Rendimiento - Meteor Lake y hasta 96 GB de RAM
El XMG Evo 15 está equipado con el AMD Ryzen 7 8845HS o el Intel Core Ultra 7 155H en nuestro dispositivo de prueba. Las dos ranuras de RAM permiten hasta 96 GB de RAM DDR5, pero la frecuencia está limitada de 5600 a 4800 MHz cuando se utilizan módulos de 48 GB debido a restricciones térmicas.
Condiciones de la prueba
El Centro de Control preinstalado ofrece tres perfiles de energía diferentes (Equilibrado, Enthusiast y Overboost), que también se pueden cambiar cómodamente mediante la combinación de teclas Fn+F3. Hemos realizado los puntos de referencia y las mediciones con el perfil Enthusiast estándar. Hemos resumido los valores de rendimiento de los tres perfiles en la siguiente tabla:
| Perfil energético | TDP de la CPU | TDP de la CPU (batería) | CB R23 Multi | Time Spy Gráficos | max. Volumen del ventilador |
|---|---|---|---|---|---|
| Equilibrada | 35 vatios | 25 vatios | 12.759 puntos | 2.623 puntos | 35,4 dB(A) |
| Enthusiast | 45 vatios | 35 vatios | 14.957 puntos | 3.690 puntos | 40,4 dB(A) |
| Overboost | 70 vatios | 35 vatios | 18.790 puntos | 3.633 puntos | 48,1 dB(A) |
Procesador - Core Ultra 7 155H
El Intel Core Ultra 7 155H se utiliza actualmente en muchos portátiles, pero el XMG Evo 15 es uno de los pocos modelos que no tiene un límite de potencia aumentado a corto plazo. En el modo Entusiasta, el consumo es de 45 vatios y este valor se mantiene constante (esto también se aplica a los otros perfiles de rendimiento con 70 y 35 vatios) y no hay pérdida de rendimiento bajo carga continua. En modo entusiasta, el rendimiento ya es muy bueno, pero si necesita aún más potencia, puede utilizar fácilmente el modo overboost (+25% de rendimiento multinúcleo). En modo batería, sin embargo, el consumo máximo desciende a 35 vatios, lo que se traduce en una reducción del rendimiento del 15%. Encontrará más pruebas de rendimiento de la CPU en nuestra sección de tecnología.
Cinebench R15 Multi loop
Cinebench R23: Multi Core | Single Core
Cinebench R20: CPU (Multi Core) | CPU (Single Core)
Cinebench R15: CPU Multi 64Bit | CPU Single 64Bit
Blender: v2.79 BMW27 CPU
7-Zip 18.03: 7z b 4 | 7z b 4 -mmt1
Geekbench 6.4: Multi-Core | Single-Core
Geekbench 5.5: Multi-Core | Single-Core
HWBOT x265 Benchmark v2.2: 4k Preset
LibreOffice : 20 Documents To PDF
R Benchmark 2.5: Overall mean
| CPU Performance Rating | |
| Lenovo IdeaPad Pro 5 16IMH G9 | |
| Xiaomi RedmiBook Pro 16 2024 | |
| Media de la clase Multimedia | |
| Dell Inspiron 16 7640 2-in-1 | |
| SCHENKER XMG Evo 15 (M24) | |
| Medion S10 OLED | |
| Medio Intel Core Ultra 7 155H | |
| Lenovo ThinkPad T16 G2 21K70035GE | |
| Cinebench R23 / Multi Core | |
| Lenovo IdeaPad Pro 5 16IMH G9 | |
| Xiaomi RedmiBook Pro 16 2024 | |
| Media de la clase Multimedia (4861 - 30789, n=96, últimos 2 años) | |
| Dell Inspiron 16 7640 2-in-1 | |
| Medion S10 OLED | |
| Medio Intel Core Ultra 7 155H (9769 - 19007, n=52) | |
| SCHENKER XMG Evo 15 (M24) | |
| Lenovo ThinkPad T16 G2 21K70035GE | |
| Cinebench R23 / Single Core | |
| Media de la clase Multimedia (878 - 2290, n=87, últimos 2 años) | |
| Medion S10 OLED | |
| Lenovo IdeaPad Pro 5 16IMH G9 | |
| Xiaomi RedmiBook Pro 16 2024 | |
| Dell Inspiron 16 7640 2-in-1 | |
| SCHENKER XMG Evo 15 (M24) | |
| Medio Intel Core Ultra 7 155H (1496 - 1815, n=52) | |
| Lenovo ThinkPad T16 G2 21K70035GE | |
| Cinebench R20 / CPU (Multi Core) | |
| Lenovo IdeaPad Pro 5 16IMH G9 | |
| Xiaomi RedmiBook Pro 16 2024 | |
| Dell Inspiron 16 7640 2-in-1 | |
| Medion S10 OLED | |
| Media de la clase Multimedia (1887 - 11924, n=80, últimos 2 años) | |
| Medio Intel Core Ultra 7 155H (3798 - 7409, n=50) | |
| SCHENKER XMG Evo 15 (M24) | |
| Lenovo ThinkPad T16 G2 21K70035GE | |
| Cinebench R20 / CPU (Single Core) | |
| Lenovo IdeaPad Pro 5 16IMH G9 | |
| Medion S10 OLED | |
| SCHENKER XMG Evo 15 (M24) | |
| Lenovo ThinkPad T16 G2 21K70035GE | |
| Media de la clase Multimedia (341 - 853, n=80, últimos 2 años) | |
| Xiaomi RedmiBook Pro 16 2024 | |
| Dell Inspiron 16 7640 2-in-1 | |
| Medio Intel Core Ultra 7 155H (601 - 696, n=50) | |
| Cinebench R15 / CPU Multi 64Bit | |
| Xiaomi RedmiBook Pro 16 2024 | |
| Lenovo IdeaPad Pro 5 16IMH G9 | |
| Dell Inspiron 16 7640 2-in-1 | |
| Media de la clase Multimedia (856 - 5224, n=87, últimos 2 años) | |
| Medio Intel Core Ultra 7 155H (1932 - 2880, n=56) | |
| Medion S10 OLED | |
| SCHENKER XMG Evo 15 (M24) | |
| Lenovo ThinkPad T16 G2 21K70035GE | |
| Cinebench R15 / CPU Single 64Bit | |
| Lenovo IdeaPad Pro 5 16IMH G9 | |
| Lenovo ThinkPad T16 G2 21K70035GE | |
| SCHENKER XMG Evo 15 (M24) | |
| Media de la clase Multimedia (99.6 - 323, n=82, últimos 2 años) | |
| Medion S10 OLED | |
| Xiaomi RedmiBook Pro 16 2024 | |
| Dell Inspiron 16 7640 2-in-1 | |
| Medio Intel Core Ultra 7 155H (99.6 - 268, n=52) | |
| Blender / v2.79 BMW27 CPU | |
| Media de la clase Multimedia (100 - 557, n=80, últimos 2 años) | |
| Lenovo ThinkPad T16 G2 21K70035GE | |
| Medio Intel Core Ultra 7 155H (175 - 381, n=47) | |
| Dell Inspiron 16 7640 2-in-1 | |
| SCHENKER XMG Evo 15 (M24) | |
| Medion S10 OLED | |
| Lenovo IdeaPad Pro 5 16IMH G9 | |
| Xiaomi RedmiBook Pro 16 2024 | |
| 7-Zip 18.03 / 7z b 4 | |
| Lenovo IdeaPad Pro 5 16IMH G9 | |
| Xiaomi RedmiBook Pro 16 2024 | |
| Dell Inspiron 16 7640 2-in-1 | |
| SCHENKER XMG Evo 15 (M24) | |
| Media de la clase Multimedia (29095 - 130368, n=75, últimos 2 años) | |
| Medio Intel Core Ultra 7 155H (41739 - 70254, n=50) | |
| Medion S10 OLED | |
| Lenovo ThinkPad T16 G2 21K70035GE | |
| 7-Zip 18.03 / 7z b 4 -mmt1 | |
| Lenovo ThinkPad T16 G2 21K70035GE | |
| Media de la clase Multimedia (3398 - 7545, n=75, últimos 2 años) | |
| SCHENKER XMG Evo 15 (M24) | |
| Medion S10 OLED | |
| Xiaomi RedmiBook Pro 16 2024 | |
| Lenovo IdeaPad Pro 5 16IMH G9 | |
| Dell Inspiron 16 7640 2-in-1 | |
| Medio Intel Core Ultra 7 155H (4594 - 5621, n=50) | |
| Geekbench 6.4 / Multi-Core | |
| Media de la clase Multimedia (4983 - 25760, n=77, últimos 2 años) | |
| Xiaomi RedmiBook Pro 16 2024 | |
| Lenovo IdeaPad Pro 5 16IMH G9 | |
| SCHENKER XMG Evo 15 (M24) | |
| Medio Intel Core Ultra 7 155H (7732 - 13656, n=55) | |
| Dell Inspiron 16 7640 2-in-1 | |
| Medion S10 OLED | |
| Lenovo ThinkPad T16 G2 21K70035GE | |
| Geekbench 6.4 / Single-Core | |
| Media de la clase Multimedia (1534 - 3927, n=73, últimos 2 años) | |
| Lenovo ThinkPad T16 G2 21K70035GE | |
| SCHENKER XMG Evo 15 (M24) | |
| Medion S10 OLED | |
| Lenovo IdeaPad Pro 5 16IMH G9 | |
| Xiaomi RedmiBook Pro 16 2024 | |
| Medio Intel Core Ultra 7 155H (1901 - 2473, n=52) | |
| Dell Inspiron 16 7640 2-in-1 | |
| Geekbench 5.5 / Multi-Core | |
| Xiaomi RedmiBook Pro 16 2024 | |
| Lenovo IdeaPad Pro 5 16IMH G9 | |
| Dell Inspiron 16 7640 2-in-1 | |
| Media de la clase Multimedia (4652 - 23059, n=79, últimos 2 años) | |
| Medio Intel Core Ultra 7 155H (10017 - 13556, n=52) | |
| SCHENKER XMG Evo 15 (M24) | |
| Medion S10 OLED | |
| Lenovo ThinkPad T16 G2 21K70035GE | |
| Geekbench 5.5 / Single-Core | |
| Media de la clase Multimedia (891 - 2555, n=79, últimos 2 años) | |
| SCHENKER XMG Evo 15 (M24) | |
| Lenovo IdeaPad Pro 5 16IMH G9 | |
| Xiaomi RedmiBook Pro 16 2024 | |
| Medion S10 OLED | |
| Dell Inspiron 16 7640 2-in-1 | |
| Lenovo ThinkPad T16 G2 21K70035GE | |
| Medio Intel Core Ultra 7 155H (1462 - 1824, n=52) | |
| HWBOT x265 Benchmark v2.2 / 4k Preset | |
| Lenovo IdeaPad Pro 5 16IMH G9 | |
| Xiaomi RedmiBook Pro 16 2024 | |
| Dell Inspiron 16 7640 2-in-1 | |
| SCHENKER XMG Evo 15 (M24) | |
| Media de la clase Multimedia (5.26 - 34.3, n=74, últimos 2 años) | |
| Medion S10 OLED | |
| Medio Intel Core Ultra 7 155H (9.93 - 21.2, n=50) | |
| Lenovo ThinkPad T16 G2 21K70035GE | |
| LibreOffice / 20 Documents To PDF | |
| Media de la clase Multimedia (23.9 - 146.7, n=76, últimos 2 años) | |
| Medio Intel Core Ultra 7 155H (37.5 - 79.2, n=49) | |
| Medion S10 OLED | |
| Xiaomi RedmiBook Pro 16 2024 | |
| Dell Inspiron 16 7640 2-in-1 | |
| Lenovo ThinkPad T16 G2 21K70035GE | |
| SCHENKER XMG Evo 15 (M24) | |
| Lenovo IdeaPad Pro 5 16IMH G9 | |
| R Benchmark 2.5 / Overall mean | |
| Dell Inspiron 16 7640 2-in-1 | |
| Medio Intel Core Ultra 7 155H (0.4457 - 0.53, n=49) | |
| Media de la clase Multimedia (0.3604 - 0.947, n=74, últimos 2 años) | |
| Lenovo ThinkPad T16 G2 21K70035GE | |
| Xiaomi RedmiBook Pro 16 2024 | |
| Medion S10 OLED | |
| Lenovo IdeaPad Pro 5 16IMH G9 | |
| SCHENKER XMG Evo 15 (M24) | |
* ... más pequeño es mejor
AIDA64: FP32 Ray-Trace | FPU Julia | CPU SHA3 | CPU Queen | FPU SinJulia | FPU Mandel | CPU AES | CPU ZLib | FP64 Ray-Trace | CPU PhotoWorxx
| Performance Rating | |
| Lenovo ThinkPad T16 G2 21K70035GE | |
| Lenovo IdeaPad Pro 5 16IMH G9 | |
| Xiaomi RedmiBook Pro 16 2024 | |
| Media de la clase Multimedia | |
| Dell Inspiron 16 7640 2-in-1 | |
| SCHENKER XMG Evo 15 (M24) | |
| Medion S10 OLED | |
| Medio Intel Core Ultra 7 155H | |
| AIDA64 / FP32 Ray-Trace | |
| Lenovo ThinkPad T16 G2 21K70035GE | |
| Lenovo IdeaPad Pro 5 16IMH G9 | |
| Media de la clase Multimedia (5121 - 50388, n=73, últimos 2 años) | |
| Medion S10 OLED | |
| Dell Inspiron 16 7640 2-in-1 | |
| Xiaomi RedmiBook Pro 16 2024 | |
| Medio Intel Core Ultra 7 155H (6670 - 18470, n=50) | |
| SCHENKER XMG Evo 15 (M24) | |
| AIDA64 / FPU Julia | |
| Lenovo ThinkPad T16 G2 21K70035GE | |
| Lenovo IdeaPad Pro 5 16IMH G9 | |
| Xiaomi RedmiBook Pro 16 2024 | |
| Medion S10 OLED | |
| Media de la clase Multimedia (14528 - 201874, n=74, últimos 2 años) | |
| Dell Inspiron 16 7640 2-in-1 | |
| SCHENKER XMG Evo 15 (M24) | |
| Medio Intel Core Ultra 7 155H (40905 - 93181, n=50) | |
| AIDA64 / CPU SHA3 | |
| Lenovo IdeaPad Pro 5 16IMH G9 | |
| Lenovo ThinkPad T16 G2 21K70035GE | |
| Xiaomi RedmiBook Pro 16 2024 | |
| Media de la clase Multimedia (1188 - 8623, n=74, últimos 2 años) | |
| Medion S10 OLED | |
| Dell Inspiron 16 7640 2-in-1 | |
| SCHENKER XMG Evo 15 (M24) | |
| Medio Intel Core Ultra 7 155H (1940 - 4436, n=50) | |
| AIDA64 / CPU Queen | |
| Lenovo ThinkPad T16 G2 21K70035GE | |
| Dell Inspiron 16 7640 2-in-1 | |
| Media de la clase Multimedia (21547 - 181505, n=74, últimos 2 años) | |
| Xiaomi RedmiBook Pro 16 2024 | |
| Lenovo IdeaPad Pro 5 16IMH G9 | |
| Medio Intel Core Ultra 7 155H (64698 - 94181, n=50) | |
| SCHENKER XMG Evo 15 (M24) | |
| Medion S10 OLED | |
| AIDA64 / FPU SinJulia | |
| Lenovo ThinkPad T16 G2 21K70035GE | |
| Lenovo IdeaPad Pro 5 16IMH G9 | |
| Dell Inspiron 16 7640 2-in-1 | |
| Xiaomi RedmiBook Pro 16 2024 | |
| Media de la clase Multimedia (1240 - 28794, n=74, últimos 2 años) | |
| SCHENKER XMG Evo 15 (M24) | |
| Medio Intel Core Ultra 7 155H (5639 - 10647, n=50) | |
| Medion S10 OLED | |
| AIDA64 / FPU Mandel | |
| Lenovo ThinkPad T16 G2 21K70035GE | |
| Lenovo IdeaPad Pro 5 16IMH G9 | |
| Medion S10 OLED | |
| Media de la clase Multimedia (9903 - 105740, n=73, últimos 2 años) | |
| Xiaomi RedmiBook Pro 16 2024 | |
| Dell Inspiron 16 7640 2-in-1 | |
| SCHENKER XMG Evo 15 (M24) | |
| Medio Intel Core Ultra 7 155H (18236 - 47685, n=50) | |
| AIDA64 / CPU AES | |
| SCHENKER XMG Evo 15 (M24) | |
| Lenovo IdeaPad Pro 5 16IMH G9 | |
| Medio Intel Core Ultra 7 155H (45713 - 152179, n=50) | |
| Media de la clase Multimedia (26066 - 169946, n=74, últimos 2 años) | |
| Lenovo ThinkPad T16 G2 21K70035GE | |
| Dell Inspiron 16 7640 2-in-1 | |
| Xiaomi RedmiBook Pro 16 2024 | |
| Medion S10 OLED | |
| AIDA64 / CPU ZLib | |
| Lenovo IdeaPad Pro 5 16IMH G9 | |
| Xiaomi RedmiBook Pro 16 2024 | |
| Dell Inspiron 16 7640 2-in-1 | |
| Medion S10 OLED | |
| Media de la clase Multimedia (440 - 2022, n=74, últimos 2 años) | |
| Medio Intel Core Ultra 7 155H (557 - 1250, n=50) | |
| SCHENKER XMG Evo 15 (M24) | |
| Lenovo ThinkPad T16 G2 21K70035GE | |
| AIDA64 / FP64 Ray-Trace | |
| Lenovo ThinkPad T16 G2 21K70035GE | |
| Lenovo IdeaPad Pro 5 16IMH G9 | |
| Media de la clase Multimedia (2759 - 26875, n=74, últimos 2 años) | |
| Medion S10 OLED | |
| Dell Inspiron 16 7640 2-in-1 | |
| Xiaomi RedmiBook Pro 16 2024 | |
| SCHENKER XMG Evo 15 (M24) | |
| Medio Intel Core Ultra 7 155H (3569 - 9802, n=50) | |
| AIDA64 / CPU PhotoWorxx | |
| Lenovo IdeaPad Pro 5 16IMH G9 | |
| Xiaomi RedmiBook Pro 16 2024 | |
| Medio Intel Core Ultra 7 155H (32719 - 54223, n=50) | |
| SCHENKER XMG Evo 15 (M24) | |
| Dell Inspiron 16 7640 2-in-1 | |
| Media de la clase Multimedia (12860 - 58844, n=74, últimos 2 años) | |
| Medion S10 OLED | |
| Lenovo ThinkPad T16 G2 21K70035GE | |
Rendimiento del sistema
El rendimiento general del sistema es excelente y el Evo 15 es un sistema muy rápido en el uso diario. Tampoco tuvimos problemas con la estabilidad del sistema durante nuestro periodo de pruebas.
CrossMark: Overall | Productivity | Creativity | Responsiveness
WebXPRT 3: Overall
WebXPRT 4: Overall
Mozilla Kraken 1.1: Total
| PCMark 10 / Score | |
| SCHENKER XMG Evo 15 (M24) | |
| Lenovo IdeaPad Pro 5 16IMH G9 | |
| Dell Inspiron 16 7640 2-in-1 | |
| Xiaomi RedmiBook Pro 16 2024 | |
| Media de la clase Multimedia (4325 - 8670, n=70, últimos 2 años) | |
| Medio Intel Core Ultra 7 155H, Intel Arc 8-Core iGPU (4809 - 7529, n=34) | |
| Lenovo ThinkPad T16 G2 21K70035GE | |
| Medion S10 OLED | |
| PCMark 10 / Essentials | |
| Lenovo IdeaPad Pro 5 16IMH G9 | |
| SCHENKER XMG Evo 15 (M24) | |
| Dell Inspiron 16 7640 2-in-1 | |
| Xiaomi RedmiBook Pro 16 2024 | |
| Media de la clase Multimedia (8025 - 12420, n=70, últimos 2 años) | |
| Medio Intel Core Ultra 7 155H, Intel Arc 8-Core iGPU (7605 - 11289, n=34) | |
| Lenovo ThinkPad T16 G2 21K70035GE | |
| Medion S10 OLED | |
| PCMark 10 / Productivity | |
| Media de la clase Multimedia (6089 - 10615, n=70, últimos 2 años) | |
| Lenovo IdeaPad Pro 5 16IMH G9 | |
| Lenovo ThinkPad T16 G2 21K70035GE | |
| SCHENKER XMG Evo 15 (M24) | |
| Dell Inspiron 16 7640 2-in-1 | |
| Medio Intel Core Ultra 7 155H, Intel Arc 8-Core iGPU (6042 - 10591, n=34) | |
| Xiaomi RedmiBook Pro 16 2024 | |
| Medion S10 OLED | |
| PCMark 10 / Digital Content Creation | |
| SCHENKER XMG Evo 15 (M24) | |
| Xiaomi RedmiBook Pro 16 2024 | |
| Lenovo IdeaPad Pro 5 16IMH G9 | |
| Dell Inspiron 16 7640 2-in-1 | |
| Media de la clase Multimedia (3651 - 13548, n=70, últimos 2 años) | |
| Medio Intel Core Ultra 7 155H, Intel Arc 8-Core iGPU (4985 - 10709, n=34) | |
| Medion S10 OLED | |
| Lenovo ThinkPad T16 G2 21K70035GE | |
| CrossMark / Overall | |
| SCHENKER XMG Evo 15 (M24) | |
| Xiaomi RedmiBook Pro 16 2024 | |
| Media de la clase Multimedia (866 - 2255, n=81, últimos 2 años) | |
| Dell Inspiron 16 7640 2-in-1 | |
| Medion S10 OLED | |
| Medio Intel Core Ultra 7 155H, Intel Arc 8-Core iGPU (1366 - 1903, n=34) | |
| Lenovo ThinkPad T16 G2 21K70035GE | |
| Lenovo IdeaPad Pro 5 16IMH G9 | |
| CrossMark / Productivity | |
| SCHENKER XMG Evo 15 (M24) | |
| Xiaomi RedmiBook Pro 16 2024 | |
| Medion S10 OLED | |
| Media de la clase Multimedia (913 - 2050, n=81, últimos 2 años) | |
| Dell Inspiron 16 7640 2-in-1 | |
| Medio Intel Core Ultra 7 155H, Intel Arc 8-Core iGPU (1291 - 1798, n=33) | |
| Lenovo ThinkPad T16 G2 21K70035GE | |
| Lenovo IdeaPad Pro 5 16IMH G9 | |
| CrossMark / Creativity | |
| Media de la clase Multimedia (907 - 2795, n=81, últimos 2 años) | |
| Xiaomi RedmiBook Pro 16 2024 | |
| Dell Inspiron 16 7640 2-in-1 | |
| SCHENKER XMG Evo 15 (M24) | |
| Lenovo IdeaPad Pro 5 16IMH G9 | |
| Medio Intel Core Ultra 7 155H, Intel Arc 8-Core iGPU (1519 - 1929, n=33) | |
| Medion S10 OLED | |
| Lenovo ThinkPad T16 G2 21K70035GE | |
| CrossMark / Responsiveness | |
| SCHENKER XMG Evo 15 (M24) | |
| Xiaomi RedmiBook Pro 16 2024 | |
| Medion S10 OLED | |
| Media de la clase Multimedia (605 - 2094, n=81, últimos 2 años) | |
| Medio Intel Core Ultra 7 155H, Intel Arc 8-Core iGPU (939 - 1802, n=33) | |
| Dell Inspiron 16 7640 2-in-1 | |
| Lenovo ThinkPad T16 G2 21K70035GE | |
| Lenovo IdeaPad Pro 5 16IMH G9 | |
| WebXPRT 3 / Overall | |
| Media de la clase Multimedia (136.4 - 545, n=81, últimos 2 años) | |
| Lenovo IdeaPad Pro 5 16IMH G9 | |
| Dell Inspiron 16 7640 2-in-1 | |
| SCHENKER XMG Evo 15 (M24) | |
| Xiaomi RedmiBook Pro 16 2024 | |
| Medio Intel Core Ultra 7 155H, Intel Arc 8-Core iGPU (252 - 299, n=34) | |
| Lenovo ThinkPad T16 G2 21K70035GE | |
| Medion S10 OLED | |
| WebXPRT 4 / Overall | |
| Media de la clase Multimedia (133.2 - 353, n=75, últimos 2 años) | |
| SCHENKER XMG Evo 15 (M24) | |
| Lenovo IdeaPad Pro 5 16IMH G9 | |
| Dell Inspiron 16 7640 2-in-1 | |
| Xiaomi RedmiBook Pro 16 2024 | |
| Medio Intel Core Ultra 7 155H, Intel Arc 8-Core iGPU (166.4 - 309, n=29) | |
| Medion S10 OLED | |
| Lenovo ThinkPad T16 G2 21K70035GE | |
| Mozilla Kraken 1.1 / Total | |
| Medion S10 OLED | |
| Medion S10 OLED | |
| Lenovo ThinkPad T16 G2 21K70035GE | |
| Medio Intel Core Ultra 7 155H, Intel Arc 8-Core iGPU (517 - 614, n=35) | |
| SCHENKER XMG Evo 15 (M24) | |
| Dell Inspiron 16 7640 2-in-1 | |
| Xiaomi RedmiBook Pro 16 2024 | |
| Lenovo IdeaPad Pro 5 16IMH G9 | |
| Media de la clase Multimedia (254 - 1016, n=86, últimos 2 años) | |
* ... más pequeño es mejor
| PCMark 10 Score | 7331 puntos | |
ayuda | ||
| AIDA64 / Memory Copy | |
| Lenovo IdeaPad Pro 5 16IMH G9 | |
| Xiaomi RedmiBook Pro 16 2024 | |
| Medio Intel Core Ultra 7 155H (62397 - 96791, n=50) | |
| Dell Inspiron 16 7640 2-in-1 | |
| Media de la clase Multimedia (21158 - 104459, n=74, últimos 2 años) | |
| SCHENKER XMG Evo 15 (M24) | |
| Lenovo ThinkPad T16 G2 21K70035GE | |
| Medion S10 OLED | |
| AIDA64 / Memory Read | |
| Lenovo IdeaPad Pro 5 16IMH G9 | |
| Xiaomi RedmiBook Pro 16 2024 | |
| Medio Intel Core Ultra 7 155H (60544 - 90647, n=50) | |
| SCHENKER XMG Evo 15 (M24) | |
| Medion S10 OLED | |
| Dell Inspiron 16 7640 2-in-1 | |
| Media de la clase Multimedia (24312 - 125604, n=74, últimos 2 años) | |
| Lenovo ThinkPad T16 G2 21K70035GE | |
| AIDA64 / Memory Write | |
| Lenovo ThinkPad T16 G2 21K70035GE | |
| Dell Inspiron 16 7640 2-in-1 | |
| Lenovo IdeaPad Pro 5 16IMH G9 | |
| Medio Intel Core Ultra 7 155H (58692 - 93451, n=50) | |
| Media de la clase Multimedia (23679 - 117933, n=74, últimos 2 años) | |
| SCHENKER XMG Evo 15 (M24) | |
| Xiaomi RedmiBook Pro 16 2024 | |
| Medion S10 OLED | |
| AIDA64 / Memory Latency | |
| Dell Inspiron 16 7640 2-in-1 | |
| Medio Intel Core Ultra 7 155H (116.2 - 233, n=50) | |
| Medion S10 OLED | |
| Xiaomi RedmiBook Pro 16 2024 | |
| Lenovo IdeaPad Pro 5 16IMH G9 | |
| SCHENKER XMG Evo 15 (M24) | |
| Lenovo ThinkPad T16 G2 21K70035GE | |
| Media de la clase Multimedia (7 - 346, n=74, últimos 2 años) | |
* ... más pequeño es mejor
Latencias del CPD
En nuestra prueba de latencia estandarizada (navegación por Internet, reproducción 4K de YouTube, carga de la CPU), el dispositivo de prueba con la versión actual de la BIOS muestra ligeras limitaciones para el uso de aplicaciones de audio en tiempo real.
| DPC Latencies / LatencyMon - interrupt to process latency (max), Web, Youtube, Prime95 | |
| Medion S10 OLED | |
| SCHENKER XMG Evo 15 (M24) | |
| Dell Inspiron 16 7640 2-in-1 | |
| Lenovo IdeaPad Pro 5 16IMH G9 | |
| Lenovo ThinkPad T16 G2 21K70035GE | |
| Xiaomi RedmiBook Pro 16 2024 | |
* ... más pequeño es mejor
Almacenamiento masivo
El XMG Evo 15 (M24) ofrece dos ranuras M.2-2280, que se conectan a través de PCIe 4.0 y también admiten una matriz RAID (0/1). El Evo está equipado de serie con un WD Blue SN580 de 500 GB, pero nuestro dispositivo de pruebas está equipado con la versión de 1 TB del Samsung 990 Pro, que es un SSD extremadamente rápido con velocidades de transferencia de hasta 7 GB/s. Además, el rendimiento se mantiene completamente estable incluso bajo una carga prolongada, lo que no es nada habitual. Tras el arranque inicial, el usuario dispone de 878 GB. Encontrará más pruebas comparativas de SSD aquí.
* ... más pequeño es mejor
Continuous read: DiskSpd Read Loop, Queue Depth 8
Tarjeta gráfica - Intel Arc Graphics
La Evo 15 utiliza la tecnología integrada Gráficos Arc del procesador Intel, aunque se trata de la versión rápida con 8 núcleos Xe. La iGPU se beneficia de la configuración de RAM de doble canal, y en comparación con los competidores con RAM 7467 más rápida (p. ej. RedmiBook Pro 16 o IdeaPad Pro 5 16), el rendimiento gráfico en los puntos de referencia sintéticos es sólo marginalmente inferior en general. El Radeon 780M apenas se ve superada en los puntos de referencia. En las tablas de GPU, también hemos incluido la Schenker Via 14 Pro con la Radeon 780M, ya que debería ofrecer un rendimiento comparable al de la XMG Evo 15 con un procesador AMD.
La actual GPU Intel es una buena opción para el uso multimedia cotidiano y las actualizaciones de los controladores de los últimos meses también han mejorado el rendimiento en juegos y, en general, no hay sorpresas aquí. En términos de rendimiento real en juegos, sin embargo, Arc Graphics pierde su ventaja y las iGPU se sitúan finalmente al mismo nivel de rendimiento.
El rendimiento gráfico se mantiene constante bajo carga constante, pero el rendimiento cae alrededor de un 26% en modo batería. Encontrará más pruebas comparativas de GPU en nuestra sección de tecnología.
| 3DMark 11 Performance | 13430 puntos | |
| 3DMark Fire Strike Score | 7941 puntos | |
| 3DMark Time Spy Score | 4067 puntos | |
| 3DMark Steel Nomad Score | 757 puntos | |
| 3DMark Steel Nomad Light Score | 3248 puntos | |
ayuda | ||
| Blender / v3.3 Classroom CPU | |
| Medio Intel Arc 8-Core iGPU (294 - 692, n=41) | |
| Media de la clase Multimedia (160 - 1042, n=80, últimos 2 años) | |
| Lenovo ThinkPad T16 G2 21K70035GE | |
| Dell Inspiron 16 7640 2-in-1 | |
| SCHENKER XMG Evo 15 (M24) | |
| Medion S10 OLED | |
| Xiaomi RedmiBook Pro 16 2024 | |
| Lenovo IdeaPad Pro 5 16IMH G9 | |
| Blender / v3.3 Classroom oneAPI/Intel | |
| Media de la clase Multimedia (203 - 401, n=5, últimos 2 años) | |
| Medio Intel Arc 8-Core iGPU (208 - 309, n=16) | |
| Dell Inspiron 16 7640 2-in-1 | |
* ... más pequeño es mejor
| The Witcher 3 - 1920x1080 Ultra Graphics & Postprocessing (HBAO+) | |
| Media de la clase Multimedia (11 - 143.2, n=62, últimos 2 años) | |
| SCHENKER XMG Evo 15 (M24) | |
| Lenovo IdeaPad Pro 5 16IMH G9 | |
| Xiaomi RedmiBook Pro 16 2024 | |
| Lenovo ThinkPad T16 G2 21K70035GE | |
| Dell Inspiron 16 7640 2-in-1 | |
| GTA V - 1920x1080 Highest Settings possible AA:4xMSAA + FX AF:16x | |
| Media de la clase Multimedia (9.38 - 141.6, n=77, últimos 2 años) | |
| SCHENKER VIA 14 Pro (M24) | |
| Lenovo ThinkPad T16 G2 21K70035GE | |
| SCHENKER XMG Evo 15 (M24) | |
| Lenovo IdeaPad Pro 5 16IMH G9 | |
| Xiaomi RedmiBook Pro 16 2024 | |
| Medion S10 OLED | |
Cyberpunk 2077 Ultra FPS chart
| bajo | medio | alto | ultra | |
|---|---|---|---|---|
| GTA V (2015) | 169.3 | 160.2 | 44.7 | 17.8 |
| The Witcher 3 (2015) | 152 | 93 | 49 | 26 |
| Dota 2 Reborn (2015) | 107.4 | 90.8 | 83.3 | 80.5 |
| Final Fantasy XV Benchmark (2018) | 77 | 40.3 | 29.2 | |
| X-Plane 11.11 (2018) | 54 | 40.4 | 35.8 | |
| Far Cry 5 (2018) | 77 | 43 | 41 | 38 |
| Strange Brigade (2018) | 171 | 73 | 62 | 52 |
| F1 22 (2022) | 96.1 | 87 | 65.2 | 16.9 |
| Baldur's Gate 3 (2023) | 40.3 | 31.1 | 27.5 | 26.2 |
| Cyberpunk 2077 2.2 Phantom Liberty (2023) | 37.9 | 31.4 | 26.7 | 23.7 |
| Total War Pharaoh (2023) | 101.4 | 77.6 | 58.9 | 52 |
Emisiones - Silencio en la vida cotidiana
Emisiones sonoras
La refrigeración del Evo 15 suele estar desactivada o ser muy silenciosa en ralentí o con poca carga. Si somete el portátil a más carga, dependerá del perfil de energía activa. En modo Enthusiast, el máximo es de 40,4 dB(A), y en modo Equilibrado y modo Batería, el máximo es de 35,4 dB(A). Si desea utilizar toda la potencia del procesador en modo Overboost, la refrigeración se vuelve significativamente más ruidosa con un máximo de 48,1 dB(A). Una vez finalizada la fase de carga, los ventiladores vuelven a reducir su velocidad muy rápidamente (en todos los perfiles). No hubo otros ruidos electrónicos en nuestro dispositivo de prueba Evo 15.
Ruido
| Ocioso |
| 24.7 / 24.7 / 28.9 dB(A) |
| Carga |
| 32.7 / 40.4 dB(A) |
 | ||
30 dB silencioso 40 dB(A) audible 50 dB(A) ruidosamente alto |
||
min: | ||
| SCHENKER XMG Evo 15 (M24) Arc 8-Core, Ultra 7 155H, Samsung 990 Pro 1 TB | Dell Inspiron 16 7640 2-in-1 Arc 8-Core, Ultra 7 155H, Micron 2550 1TB | Medion S10 OLED Arc 8-Core, Ultra 7 155H, Phison PS5019-E19 SSO1TBITC4-E19-V7 | Xiaomi RedmiBook Pro 16 2024 Arc 8-Core, Ultra 7 155H, YMTC PC300-1TB | Lenovo IdeaPad Pro 5 16IMH G9 Arc 8-Core, Ultra 7 155H, Samsung PM9C1a MZAL81T0HDLB | Lenovo ThinkPad T16 G2 21K70035GE Radeon 780M, R7 7840U, SK hynix PC801 HFS001TEJ9X162N | |
|---|---|---|---|---|---|---|
| Noise | -4% | -9% | 4% | -6% | 8% | |
| apagado / medio ambiente * | 24.7 | 22.9 7% | 25 -1% | 24.4 1% | 24.1 2% | 24.5 1% |
| Idle Minimum * | 24.7 | 22.9 7% | 26 -5% | 24.4 1% | 24.1 2% | 24.5 1% |
| Idle Average * | 24.7 | 22.9 7% | 27 -9% | 24.4 1% | 24.1 2% | 24.5 1% |
| Idle Maximum * | 28.9 | 25 13% | 28 3% | 24.4 16% | 28.2 2% | 24.5 15% |
| Load Average * | 32.7 | 45.1 -38% | 43 -31% | 32 2% | 44.4 -36% | 26.6 19% |
| Cyberpunk 2077 ultra * | 40.4 | 44.9 -11% | 42 -4% | |||
| Load Maximum * | 40.4 | 44.9 -11% | 48 -19% | 39.7 2% | 44.4 -10% | 35.5 12% |
| Witcher 3 ultra * | 30.6 | 36.5 | 37.2 |
* ... más pequeño es mejor
Temperatura
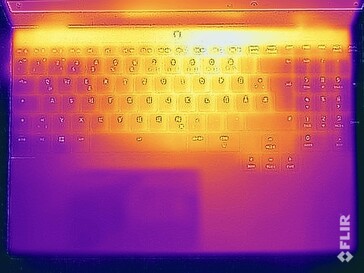
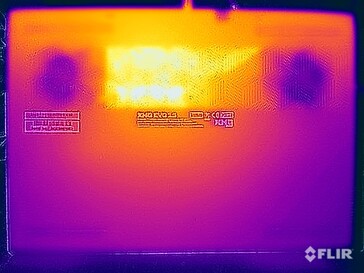
La carcasa de aluminio de la Evo 15 se mantiene muy fría con poca carga y no hay problemas incluso bajo carga. La parte inferior puede alcanzar casi 50 °C en casos extremos, pero el punto caliente está en la parte inferior, en la zona media trasera. El dispositivo puede utilizarse incluso sobre los muslos. La zona del teclado permanece bastante más fría en general, incluso bajo carga, y no hay restricciones al escribir. En la prueba de estrés, el procesador se mantiene constante en su valor TDP especificado.
(±) La temperatura máxima en la parte superior es de 41.7 °C / 107 F, frente a la media de 36.9 °C / 98 F, que oscila entre 21.1 y 71 °C para la clase Multimedia.
(-) El fondo se calienta hasta un máximo de 49.6 °C / 121 F, frente a la media de 39.2 °C / 103 F
(+) En reposo, la temperatura media de la parte superior es de 29.5 °C / 85# F, frente a la media del dispositivo de 31.3 °C / 88 F.
(±) 3: The average temperature for the upper side is 34.3 °C / 94 F, compared to the average of 31.3 °C / 88 F for the class Multimedia.
(+) Los reposamanos y el panel táctil alcanzan como máximo la temperatura de la piel (32 °C / 89.6 F) y, por tanto, no están calientes.
(-) La temperatura media de la zona del reposamanos de dispositivos similares fue de 28.8 °C / 83.8 F (-3.2 °C / -5.8 F).
| SCHENKER XMG Evo 15 (M24) Intel Core Ultra 7 155H, Intel Arc 8-Core iGPU | Dell Inspiron 16 7640 2-in-1 Intel Core Ultra 7 155H, Intel Arc 8-Core iGPU | Medion S10 OLED Intel Core Ultra 7 155H, Intel Arc 8-Core iGPU | Xiaomi RedmiBook Pro 16 2024 Intel Core Ultra 7 155H, Intel Arc 8-Core iGPU | Lenovo IdeaPad Pro 5 16IMH G9 Intel Core Ultra 7 155H, Intel Arc 8-Core iGPU | Lenovo ThinkPad T16 G2 21K70035GE AMD Ryzen 7 7840U, AMD Radeon 780M | |
|---|---|---|---|---|---|---|
| Heat | -1% | -12% | 10% | 19% | 4% | |
| Maximum Upper Side * | 41.7 | 46.8 -12% | 55 -32% | 40.3 3% | 36.3 13% | 48.7 -17% |
| Maximum Bottom * | 49.6 | 45.6 8% | 55 -11% | 45.9 7% | 39.1 21% | 52 -5% |
| Idle Upper Side * | 31.1 | 32.2 -4% | 32 -3% | 26.3 15% | 24.9 20% | 26.4 15% |
| Idle Bottom * | 33.1 | 31.4 5% | 33 -0% | 27.9 16% | 26.1 21% | 26.3 21% |
* ... más pequeño es mejor
Altavoz
El Evo 15 ofrece dos altavoces estéreo que proporcionan una calidad de sonido decente. Aunque hay portátiles multimedia con mejores sistemas de sonido (que también tienen más altavoces), el Evo es uno de los mejores modelos en esta disciplina dentro del grupo de comparación. El sonido es claro y nítido en general, con el único bajón perceptible en los graves.
SCHENKER XMG Evo 15 (M24) análisis de audio
(+) | los altavoces pueden reproducir a un volumen relativamente alto (#85.6 dB)
Graves 100 - 315 Hz
(-) | casi sin bajos - de media 17.9% inferior a la mediana
(±) | la linealidad de los graves es media (11.6% delta a frecuencia anterior)
Medios 400 - 2000 Hz
(+) | medios equilibrados - a sólo 3.7% de la mediana
(+) | los medios son lineales (4.5% delta a la frecuencia anterior)
Altos 2 - 16 kHz
(+) | máximos equilibrados - a sólo 2.2% de la mediana
(+) | los máximos son lineales (6.5% delta a la frecuencia anterior)
Total 100 - 16.000 Hz
(+) | el sonido global es lineal (11.8% de diferencia con la mediana)
En comparación con la misma clase
» 15% de todos los dispositivos probados de esta clase eran mejores, 4% similares, 81% peores
» El mejor tuvo un delta de 5%, la media fue 18%, el peor fue ###max##%
En comparación con todos los dispositivos probados
» 7% de todos los dispositivos probados eran mejores, 2% similares, 91% peores
» El mejor tuvo un delta de 4%, la media fue 24%, el peor fue ###max##%
Dell Inspiron 16 7640 2-in-1 análisis de audio
(+) | los altavoces pueden reproducir a un volumen relativamente alto (#84 dB)
Graves 100 - 315 Hz
(±) | lubina reducida - en promedio 13.9% inferior a la mediana
(±) | la linealidad de los graves es media (14% delta a frecuencia anterior)
Medios 400 - 2000 Hz
(+) | medios equilibrados - a sólo 3.6% de la mediana
(+) | los medios son lineales (3.6% delta a la frecuencia anterior)
Altos 2 - 16 kHz
(+) | máximos equilibrados - a sólo 4.5% de la mediana
(+) | los máximos son lineales (2.8% delta a la frecuencia anterior)
Total 100 - 16.000 Hz
(+) | el sonido global es lineal (12% de diferencia con la mediana)
En comparación con la misma clase
» 11% de todos los dispositivos probados de esta clase eran mejores, 4% similares, 85% peores
» El mejor tuvo un delta de 6%, la media fue 20%, el peor fue ###max##%
En comparación con todos los dispositivos probados
» 8% de todos los dispositivos probados eran mejores, 2% similares, 90% peores
» El mejor tuvo un delta de 4%, la media fue 24%, el peor fue ###max##%
Medion S10 OLED análisis de audio
(+) | los altavoces pueden reproducir a un volumen relativamente alto (#85 dB)
Graves 100 - 315 Hz
(-) | casi sin bajos - de media 17.3% inferior a la mediana
(±) | la linealidad de los graves es media (9.5% delta a frecuencia anterior)
Medios 400 - 2000 Hz
(+) | medios equilibrados - a sólo 4.3% de la mediana
(+) | los medios son lineales (4.3% delta a la frecuencia anterior)
Altos 2 - 16 kHz
(+) | máximos equilibrados - a sólo 1.2% de la mediana
(+) | los máximos son lineales (5% delta a la frecuencia anterior)
Total 100 - 16.000 Hz
(+) | el sonido global es lineal (12.9% de diferencia con la mediana)
En comparación con la misma clase
» 21% de todos los dispositivos probados de esta clase eran mejores, 4% similares, 74% peores
» El mejor tuvo un delta de 5%, la media fue 18%, el peor fue ###max##%
En comparación con todos los dispositivos probados
» 11% de todos los dispositivos probados eran mejores, 3% similares, 87% peores
» El mejor tuvo un delta de 4%, la media fue 24%, el peor fue ###max##%
Xiaomi RedmiBook Pro 16 2024 análisis de audio
(+) | los altavoces pueden reproducir a un volumen relativamente alto (#83.8 dB)
Graves 100 - 315 Hz
(±) | lubina reducida - en promedio 13.6% inferior a la mediana
(±) | la linealidad de los graves es media (7.9% delta a frecuencia anterior)
Medios 400 - 2000 Hz
(±) | medias más altas - de media 5.3% más altas que la mediana
(+) | los medios son lineales (5% delta a la frecuencia anterior)
Altos 2 - 16 kHz
(+) | máximos equilibrados - a sólo 2.8% de la mediana
(+) | los máximos son lineales (5.3% delta a la frecuencia anterior)
Total 100 - 16.000 Hz
(+) | el sonido global es lineal (13% de diferencia con la mediana)
En comparación con la misma clase
» 22% de todos los dispositivos probados de esta clase eran mejores, 5% similares, 74% peores
» El mejor tuvo un delta de 5%, la media fue 18%, el peor fue ###max##%
En comparación con todos los dispositivos probados
» 11% de todos los dispositivos probados eran mejores, 2% similares, 86% peores
» El mejor tuvo un delta de 4%, la media fue 24%, el peor fue ###max##%
Lenovo IdeaPad Pro 5 16IMH G9 análisis de audio
(±) | la sonoridad del altavoz es media pero buena (81.1 dB)
Graves 100 - 315 Hz
(-) | casi sin bajos - de media 22.3% inferior a la mediana
(±) | la linealidad de los graves es media (10.5% delta a frecuencia anterior)
Medios 400 - 2000 Hz
(+) | medios equilibrados - a sólo 2.6% de la mediana
(+) | los medios son lineales (4.6% delta a la frecuencia anterior)
Altos 2 - 16 kHz
(+) | máximos equilibrados - a sólo 1.2% de la mediana
(+) | los máximos son lineales (3.9% delta a la frecuencia anterior)
Total 100 - 16.000 Hz
(+) | el sonido global es lineal (13.9% de diferencia con la mediana)
En comparación con la misma clase
» 27% de todos los dispositivos probados de esta clase eran mejores, 4% similares, 69% peores
» El mejor tuvo un delta de 5%, la media fue 18%, el peor fue ###max##%
En comparación con todos los dispositivos probados
» 14% de todos los dispositivos probados eran mejores, 4% similares, 82% peores
» El mejor tuvo un delta de 4%, la media fue 24%, el peor fue ###max##%
Lenovo ThinkPad T16 G2 21K70035GE análisis de audio
(±) | la sonoridad del altavoz es media pero buena (75.1 dB)
Graves 100 - 315 Hz
(-) | casi sin bajos - de media 23.9% inferior a la mediana
(±) | la linealidad de los graves es media (13.8% delta a frecuencia anterior)
Medios 400 - 2000 Hz
(+) | medios equilibrados - a sólo 3.9% de la mediana
(+) | los medios son lineales (6.9% delta a la frecuencia anterior)
Altos 2 - 16 kHz
(+) | máximos equilibrados - a sólo 2.1% de la mediana
(+) | los máximos son lineales (4.2% delta a la frecuencia anterior)
Total 100 - 16.000 Hz
(±) | la linealidad del sonido global es media (19.9% de diferencia con la mediana)
En comparación con la misma clase
» 39% de todos los dispositivos probados de esta clase eran mejores, 9% similares, 52% peores
» El mejor tuvo un delta de 7%, la media fue 21%, el peor fue ###max##%
En comparación con todos los dispositivos probados
» 48% de todos los dispositivos probados eran mejores, 7% similares, 44% peores
» El mejor tuvo un delta de 4%, la media fue 24%, el peor fue ###max##%
Gestión de la energía
Consumo de energía
La pantalla grande y brillante repercute en el consumo de energía y medimos un máximo de algo menos de 14 vatios en modo inactivo. Tanto en juegos como en la prueba de estrés, el consumo es de 76-78 vatios y se mantiene absolutamente estable, por lo que la fuente de alimentación de 100 vatios es completamente suficiente. En el perfil Overboost, medimos un máximo de 107,9 vatios, por lo que la fuente de alimentación no tiene más margen para cargar la batería, por ejemplo. Sin embargo, aquí tampoco se aprovecha la batería. Como ya hemos mencionado, el consumo en modo de espera de 1,4 vatios es demasiado elevado.
| Off / Standby | |
| Ocioso | |
| Carga |
|
Clave:
min: | |
| SCHENKER XMG Evo 15 (M24) Ultra 7 155H, Arc 8-Core, Samsung 990 Pro 1 TB, IPS, 2560x1600, 15.3" | Dell Inspiron 16 7640 2-in-1 Ultra 7 155H, Arc 8-Core, Micron 2550 1TB, Mini-LED, 2560x1600, 16" | Medion S10 OLED Ultra 7 155H, Arc 8-Core, Phison PS5019-E19 SSO1TBITC4-E19-V7, OLED, 3840x2400, 16" | Xiaomi RedmiBook Pro 16 2024 Ultra 7 155H, Arc 8-Core, YMTC PC300-1TB, IPS, 3072x1920, 16" | Lenovo IdeaPad Pro 5 16IMH G9 Ultra 7 155H, Arc 8-Core, Samsung PM9C1a MZAL81T0HDLB, IPS, 2560x1600, 16" | Lenovo ThinkPad T16 G2 21K70035GE R7 7840U, Radeon 780M, SK hynix PC801 HFS001TEJ9X162N, IPS LED, 1920x1200, 16" | Medio Intel Arc 8-Core iGPU | Media de la clase Multimedia | |
|---|---|---|---|---|---|---|---|---|
| Power Consumption | 3% | 10% | 1% | 20% | 40% | 20% | -4% | |
| Idle Minimum * | 7.7 | 6.1 21% | 7 9% | 4.2 45% | 3.5 55% | 3.7 52% | 5.34 ? 31% | 6.86 ? 11% |
| Idle Average * | 13.2 | 13.5 -2% | 10 24% | 11.6 12% | 9.6 27% | 7.2 45% | 8.54 ? 35% | 11.5 ? 13% |
| Idle Maximum * | 13.7 | 13.8 -1% | 19 -39% | 12.3 10% | 9.9 28% | 8.7 36% | 11.9 ? 13% | 13.5 ? 1% |
| Load Average * | 76.2 | 63.6 17% | 52 32% | 61.9 19% | 62.7 18% | 44.1 42% | 54 ? 29% | 71.4 ? 6% |
| Cyberpunk 2077 ultra * | 76.7 | 67 13% | 53.2 31% | |||||
| Cyberpunk 2077 ultra external monitor * | 72.7 | 64.6 11% | 49.2 32% | |||||
| Load Maximum * | 78.1 | 109.7 -40% | 95 -22% | 140.6 -80% | 101.2 -30% | 58.2 25% | 84.9 ? -9% | 116.6 ? -49% |
| Witcher 3 ultra * | 57 | 55.8 | 50.9 |
* ... más pequeño es mejor
Powr consumption Cyberpunk / Stress test
Power consumption with the external monitor
Duración de las pilas
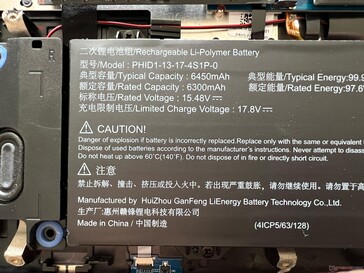
Schenker instala una batería masiva de 99,8 Wh en el Evo 15, lo que conduce a buenos tiempos de ejecución en general a pesar de la pantalla hambrienta de energía, aunque el Medion S10 ofrece aún más resistencia. En la prueba WLAN con 150 cd/m² (corresponde al 58% del brillo máximo en el dispositivo de prueba), medimos 10:25 horas a 60 Hz y 08:25 horas a 240 Hz. Con el brillo al máximo, la autonomía cae a 8 horas (60 Hz) o 6:39 horas (240 Hz), por lo que sin duda debería reducir la frecuencia en modo batería.
La prueba de vídeo dura algo más de 12 horas y bajo carga, el peor escenario es de 2:14 horas. Una carga completa tarda unos largos 165 minutos cuando el aparato está encendido (80% tras 130 minutos) y no hay función de carga rápida.
| SCHENKER XMG Evo 15 (M24) Ultra 7 155H, Arc 8-Core, 99.9 Wh | Dell Inspiron 16 7640 2-in-1 Ultra 7 155H, Arc 8-Core, 90 Wh | Medion S10 OLED Ultra 7 155H, Arc 8-Core, 70 Wh | Xiaomi RedmiBook Pro 16 2024 Ultra 7 155H, Arc 8-Core, 99 Wh | Lenovo IdeaPad Pro 5 16IMH G9 Ultra 7 155H, Arc 8-Core, 84 Wh | Lenovo ThinkPad T16 G2 21K70035GE R7 7840U, Radeon 780M, 52.5 Wh | Media de la clase Multimedia | |
|---|---|---|---|---|---|---|---|
| Duración de Batería | -11% | -30% | 43% | 1% | -27% | -1% | |
| H.264 | 729 | 1308 79% | 957 31% | 864 ? 19% | |||
| WiFi v1.3 | 625 | 686 10% | 436 -30% | 983 57% | 756 21% | 658 5% | 645 ? 3% |
| Load | 134 | 93 -31% | 124 -7% | 68 -49% | 56 -58% | 99 ? -26% |
Pro
Contra
Veredicto - Uno de los mejores portátiles multimedia sin dGPU
Con el nuevo XMG Evo 15 (M24), el fabricante alemán Schenker lanza un buen portátil multimedia sin tarjeta gráfica dedicada. No es el portátil más delgado del mercado, pero el Evo 15 no aspira a serlo. Por otro lado, dispone de muy buenas opciones de mantenimiento y tanto la RAM (máx. 96 GB) como la capacidad de la SSD (2 ranuras M.2-2280) se pueden ampliar fácilmente. También hay suficientes puertos, aunque nos preguntamos cómo un viejo puerto USB 2.0 consiguió hacerse un hueco en el dispositivo. Sin embargo, como hay un montón de otros puertos USB rápidos (Intel con Thunderbolt 4, AMD con USB 4.0), esto no es un gran problema. Tampoco hay mucho de lo que quejarse en lo que respecta a los dispositivos de entrada y los altavoces.
Cuando se trata de la pantalla, se pueden reconocer las raíces de juego y la relación con el XMG Fusion 15 pero esto no es una desventaja. El panel IPS mate ofrece una alta resolución y una frecuencia rápida de 240 Hz. Además, no hay PWM y los tiempos de respuesta también son rápidos. El brillo es muy bueno con casi 600 cd/m², lo que a su vez afecta al nivel de negro y, por tanto, a la relación de contraste. Quien espere unos negros intensos como los de un panel OLED quedará definitivamente decepcionado. Tras la calibración, la precisión del color es excelente y gracias a la cobertura sRGB completa, el panel también es adecuado para la edición de imágenes. La gran batería de 99,8 Wh puede compensar bien el consumo de energía de la pantalla y, en general, la resistencia lejos del enchufe es decente.
Excelentes opciones de mantenimiento, pantalla IPS brillante con colores precisos y buenos valores de rendimiento con perfiles de energía coherentes: El nuevo Schenker XMG Evo 15 es un interesante portátil multimedia sin tarjeta gráfica dedicada que está disponible tanto con procesadores AMD como Intel y no tiene puntos débiles reales.
El rendimiento del Evo 15 con el procesador Intel es muy bueno en general y sobre todo estable, ya que no existen límites de potencia absurdamente altos a corto plazo. Si necesita un mayor rendimiento, puede utilizar el modo Overboost, pero tendrá que soportar ventiladores más ruidosos. En general, sin embargo, el Evo 15 es un compañero muy silencioso, especialmente para las tareas cotidianas.
Con todos estos aspectos positivos, el nuevo Evo 15 casi no tiene rival en el mercado. La cuestión sigue siendo si debe elegir el modelo Intel o el AMD. Aunque el modelo AMD sólo tiene USB 4.0 en lugar de Thunderbolt 4, el fabricante afirma que el rendimiento (a pesar de los límites de potencia ligeramente inferiores del Ryzen 7 8845HS) es comparable. Tampoco esperamos grandes diferencias en la duración de la batería, lo que nos lleva a preguntarnos por qué los clientes deberían pagar 150 euros más por el procesador Intel. El modelo de AMD, que comienza en 1.049 euros, ofrece definitivamente una mejor relación precio-rendimiento.
Precio y disponibilidad
El nuevo Schenker XMG Evo 15 (M24) ya puede encargarse a Bestware. El modelo AMD comienza en 1.049 euros, la versión Intel en 1.199 euros.
Nota: Recientemente hemos actualizado nuestro sistema de clasificación y los resultados de la versión 8 no son comparables con los de la versión 7. Encontrará más información aquí.
SCHENKER XMG Evo 15 (M24)
- 07/31/2024 v8
Andreas Osthoff
Transparencia
La selección de los dispositivos que se van a reseñar corre a cargo de nuestro equipo editorial. La muestra de prueba fue proporcionada al autor en calidad de préstamo por el fabricante o el minorista a los efectos de esta reseña. El prestamista no tuvo ninguna influencia en esta reseña, ni el fabricante recibió una copia de la misma antes de su publicación. No había ninguna obligación de publicar esta reseña. Nunca aceptamos compensaciones o pagos a cambio de nuestras reseñas. Como empresa de medios independiente, Notebookcheck no está sujeta a la autoridad de fabricantes, minoristas o editores.
Así es como prueba Notebookcheck
Cada año, Notebookcheck revisa de forma independiente cientos de portátiles y smartphones utilizando procedimientos estandarizados para asegurar que todos los resultados son comparables. Hemos desarrollado continuamente nuestros métodos de prueba durante unos 20 años y hemos establecido los estándares de la industria en el proceso. En nuestros laboratorios de pruebas, técnicos y editores experimentados utilizan equipos de medición de alta calidad. Estas pruebas implican un proceso de validación en varias fases. Nuestro complejo sistema de clasificación se basa en cientos de mediciones y puntos de referencia bien fundamentados, lo que mantiene la objetividad.















 Total Sustainability Score:


