

Mini-LED en un convertible de 16 pulgadas: Análisis del Dell Inspiron 16 7640 2 en 1

El Inspiron 16 7640 2 en 1 de 2024 sucede al Inspiron 16 7630 2 en 1 de 2023 con componentes internos Intel de 14ª generación actualizados y varios cambios externos. Quizás lo más notable es que el modelo de este año incluye una pantalla táctil mini-LED de 1600p a 90 Hz que sustituye a la pantalla táctil OLED de 2400p del Inspiron 16 7630 2 en 1. Mientras tanto, la pantalla táctil IPS de 60 Hz y 1200p del Inspiron 16 7635 2 en 1 ha regresado en algunas SKU de gama baja.
Nuestra unidad de prueba es una configuración de gama alta con la CPU Core Ultra 7 155H Meteor Lake-H y gráficos Arc 8 integrados por aproximadamente $1000 USD. Una opción de gama más baja con el Core Ultra 5 125U está disponible con el antiguo panel IPS de 60 Hz 1200p por 200 dólares menos, pero no hay opciones de GPU discreta en ninguno de los casos. Curiosamente, el Inspiron 16 7640 2 en 1 es uno de los pocos convertibles con opciones de procesador Core-U y Core-H, ya que la mayoría ofrecen sólo uno pero no el otro.
No hay SKUs AMD Zen 4 disponibles en el momento de escribir este artículo. Si las hubiera en el futuro, es probable que estén bajo el nombre de modelo Inspiron 16 7645 2 en 1, que sucedería al Inspiron 16 7635 2 en 1 basado en AMD.
Entre los competidores del Inspiron 16 7640 2 en 1 se incluyen otros convertibles de 16 pulgadas de gama media a media-alta como el HP Envy x360 2 en 1 16 o el Lenovo Yoga 7 2 en 1 16. El Dell, sin embargo, es único con su opción mini-LED.
Más opiniones sobre Dell:
Posibles contendientes en la comparación
Valoración | Versión | Fecha | Modelo | Peso | Altura | Tamaño | Resolución | Precio |
|---|---|---|---|---|---|---|---|---|
| 82.1 % | v8 | 07/2024 | Dell Inspiron 16 7640 2-in-1 Ultra 7 155H, Arc 8-Core | 2.1 kg | 18.99 mm | 16.00" | 2560x1600 | |
| 83.4 % | v8 | 06/2024 | Dell Inspiron 16 Plus 7640 Ultra 7 155H, NVIDIA GeForce RTX 4060 Laptop GPU | 2.2 kg | 19.9 mm | 16.00" | 2560x1600 | |
| 87.2 % v7 (old) | v7 (old) | 05/2024 | HP Envy x360 2-in-1 16-ad0097nr R7 8840HS, Radeon 780M | 1.8 kg | 18.3 mm | 16.00" | 2880x1800 | |
| 87.9 % v7 (old) | v7 (old) | 05/2024 | Lenovo IdeaPad Pro 5 16IMH G9 Ultra 7 155H, Arc 8-Core | 1.9 kg | 17.5 mm | 16.00" | 2560x1600 | |
| 88.7 % v7 (old) | v7 (old) | 02/2024 | HP Pavilion Plus 16-ab0456tx i7-13700H, GeForce RTX 3050 6GB Laptop GPU | 1.9 kg | 19.9 mm | 16.00" | 2560x1600 | |
| 87.6 % v7 (old) | v7 (old) | 11/2023 | Asus VivoBook Pro 16 K6602VU i9-13900H, NVIDIA GeForce RTX 4050 Laptop GPU | 1.9 kg | 19 mm | 16.00" | 3200x2000 |
Nota: Hemos actualizado nuestro sistema de evaluación y los resultados de la versión 8 no se pueden comparar con los de la versión 7. Más información aquí verfügbar.
Nota: Recientemente hemos actualizado nuestro sistema de clasificación y los resultados de la versión 8 no son comparables con los de la versión 7. Encontrará más información aquí .
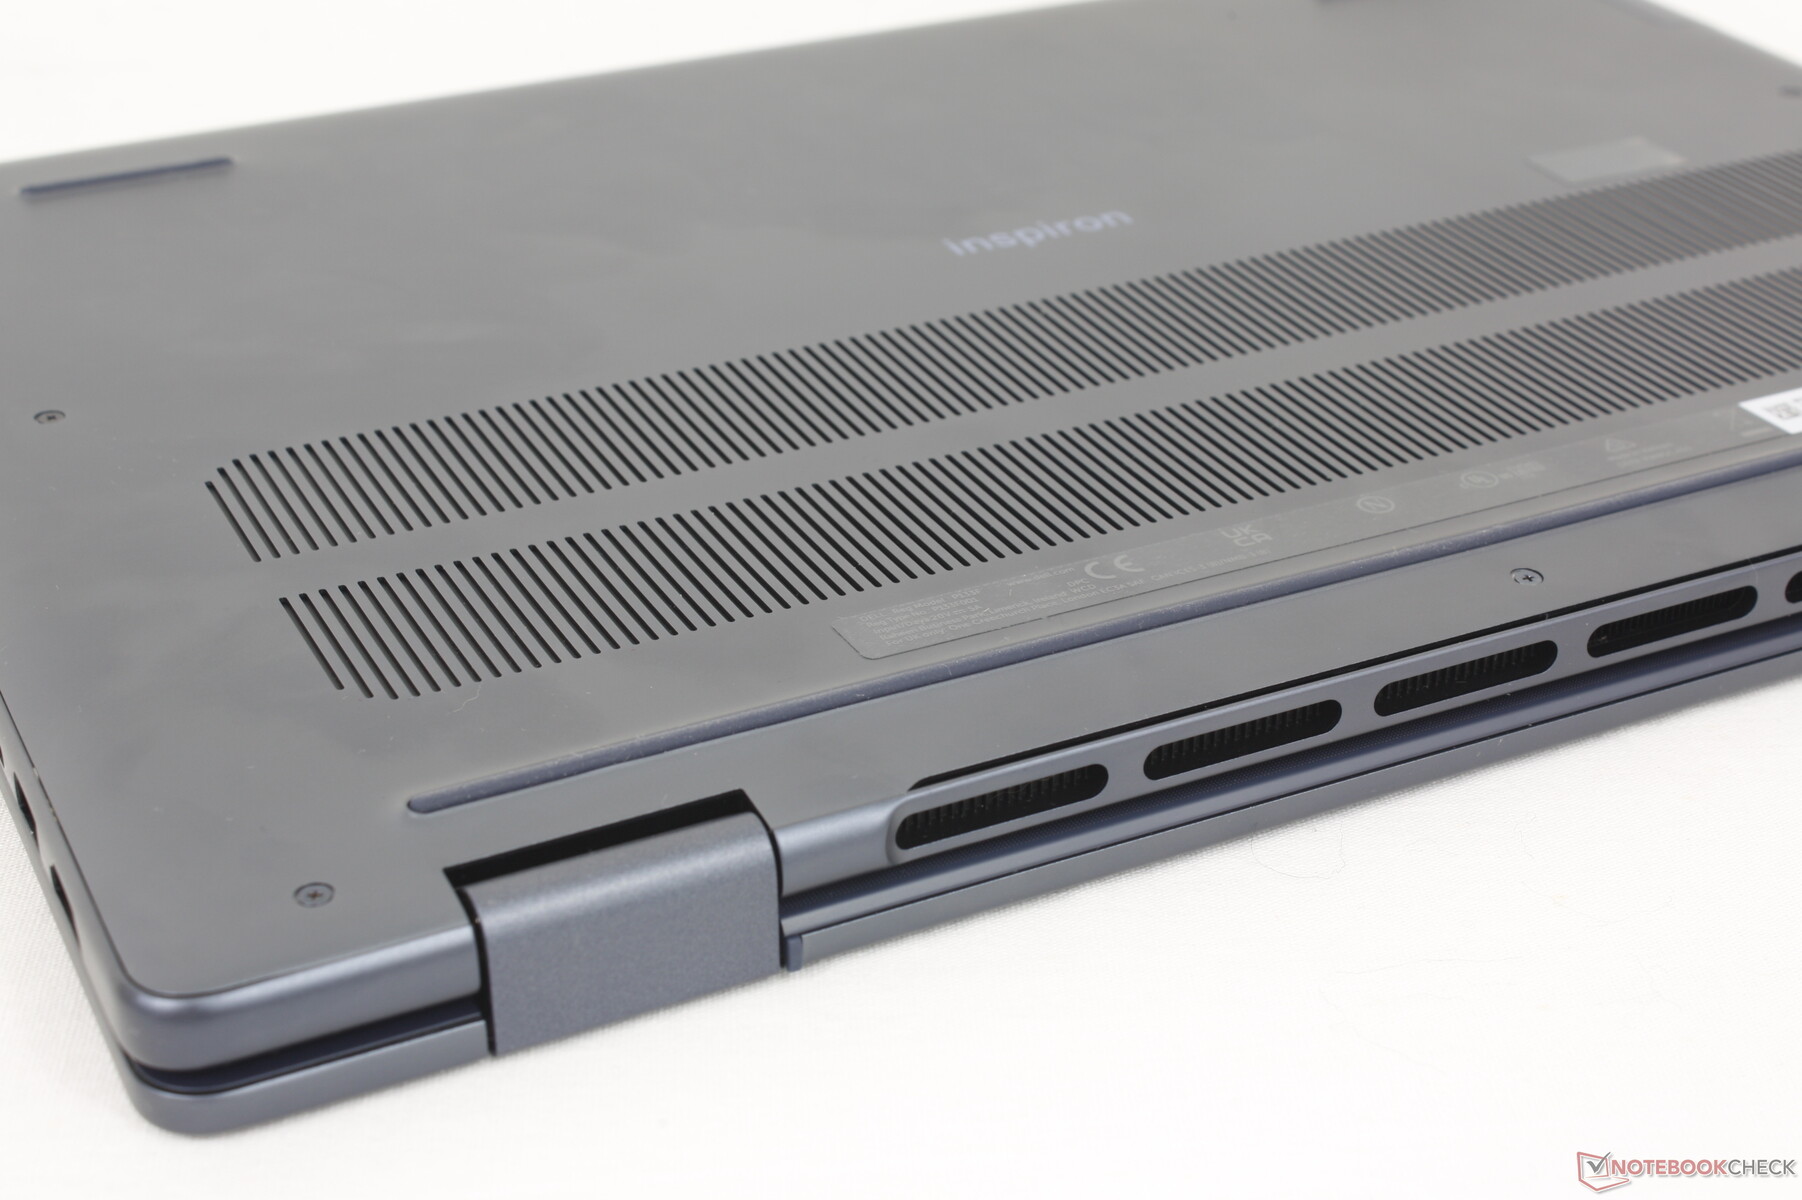
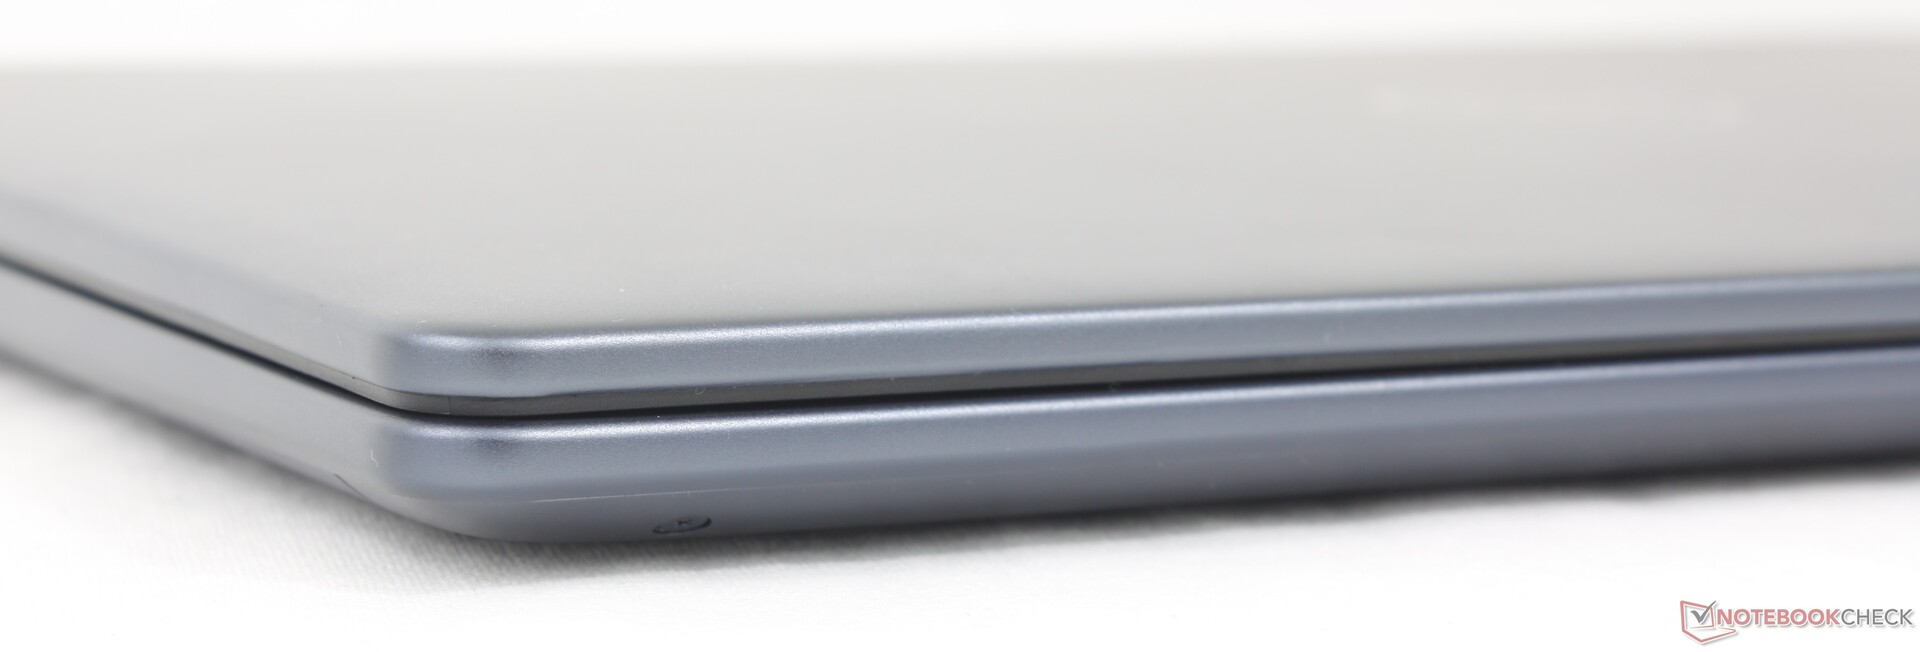
Maletín - Robusto pero pesado
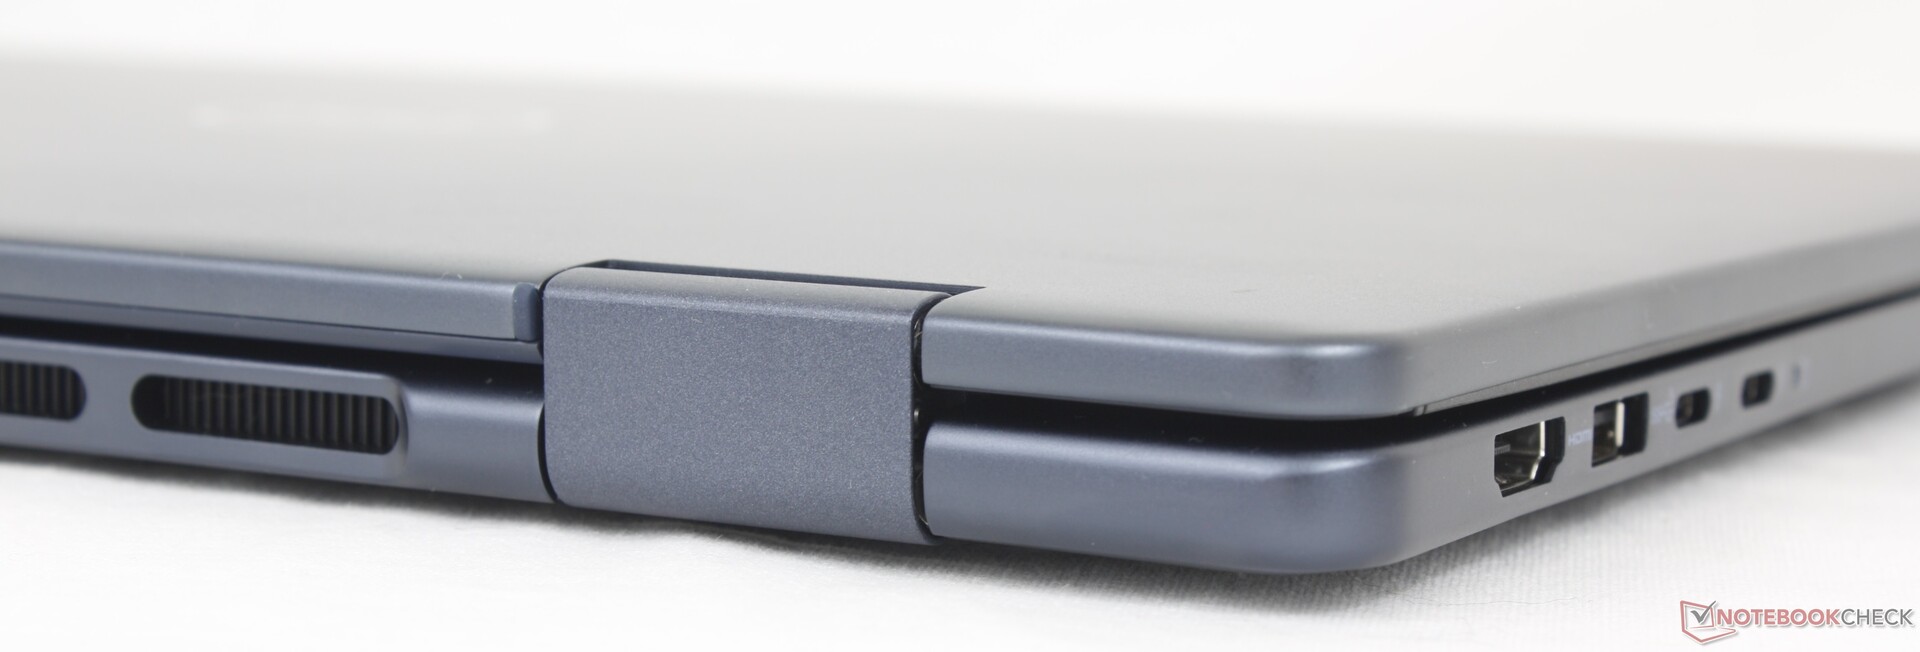
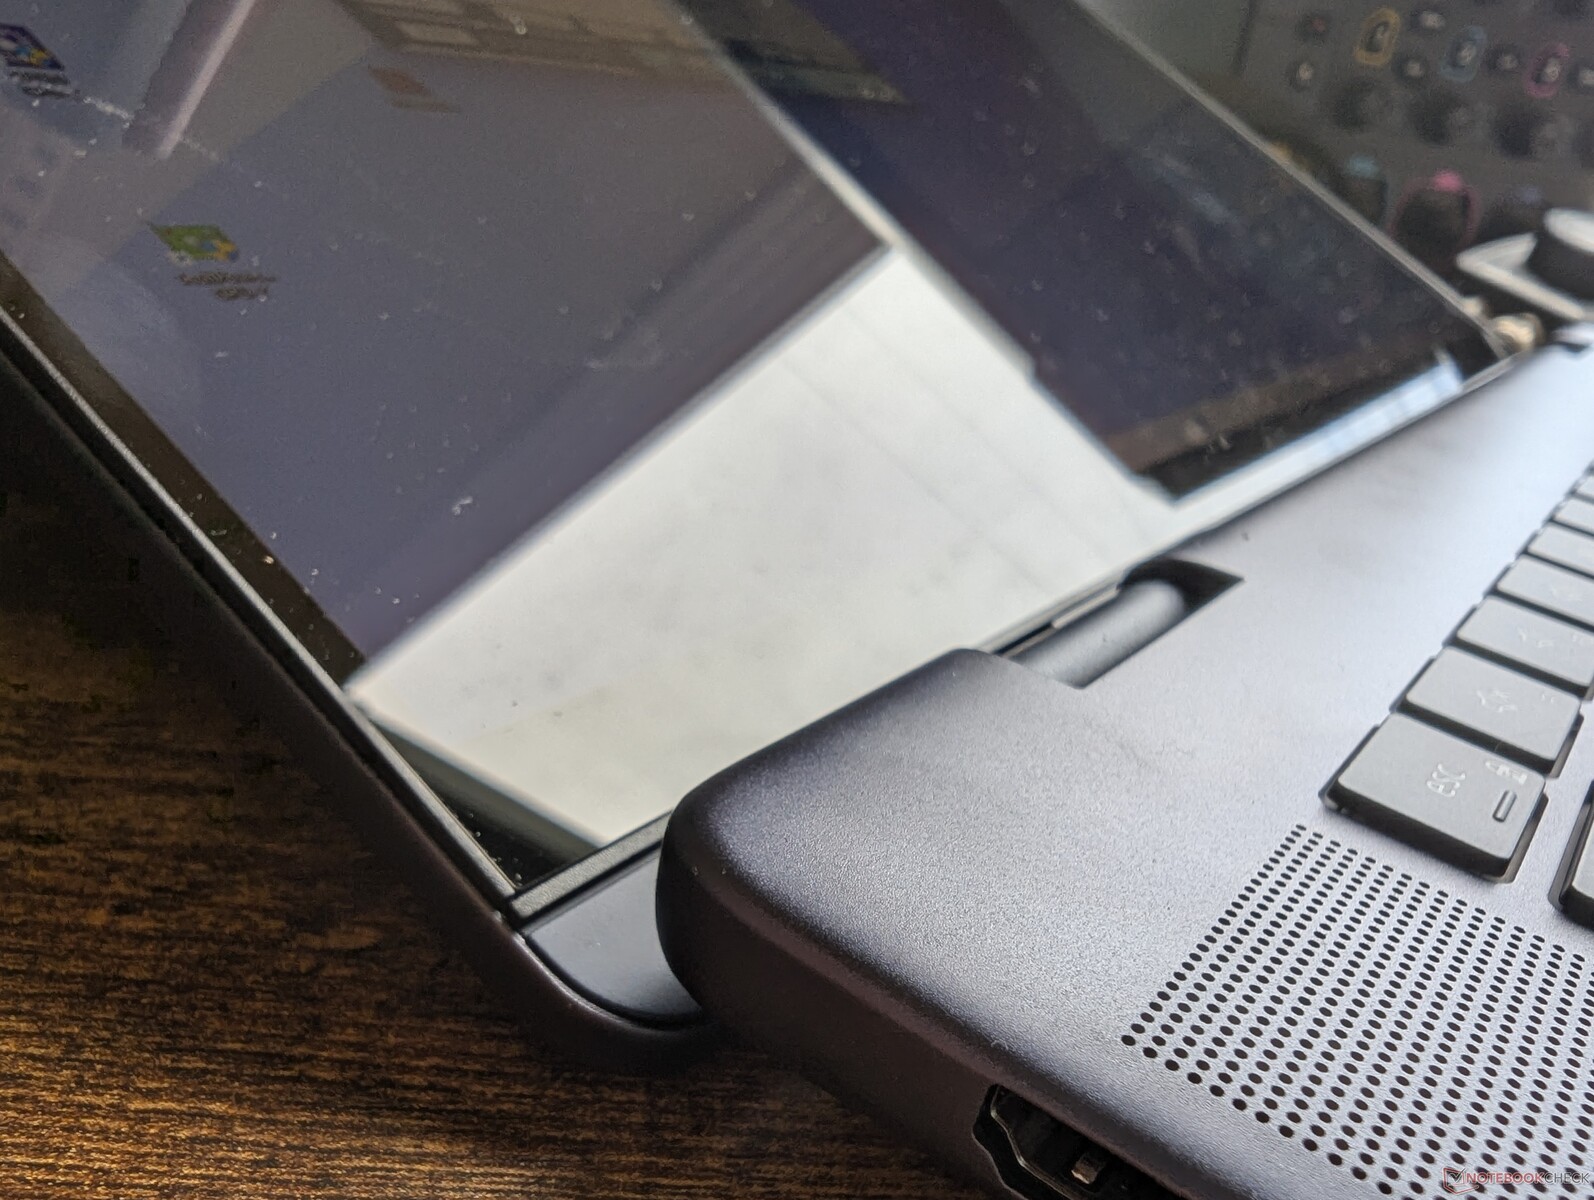
Hay varios cambios exteriores con respecto al modelo saliente. En primer lugar, la parte del reposamuñecas ya no está elevada para lograr un borde más limpio entre ésta y la cubierta del teclado. En segundo lugar, las rejillas de ventilación a lo largo de la parte inferior y el borde trasero se han rediseñado para ser ligeramente más grandes. En tercer lugar, el propio borde trasero es más atrevido para una apariencia más cuadrada.
Aparte de los cambios estéticos mencionados, los materiales del chasis siguen siendo los mismos que antes, sin grandes mejoras en cuanto a rigidez o calidad. La tapa y la base siguen siendo de aluminio y plástico, respectivamente, con una buena resistencia a la torsión y a las depresiones para unas primeras impresiones sólidas, especialmente para un modelo de gama media. No nos preocupa tanto la calidad de construcción del modelo como lo pesado que resulta utilizarlo en modo tableta.
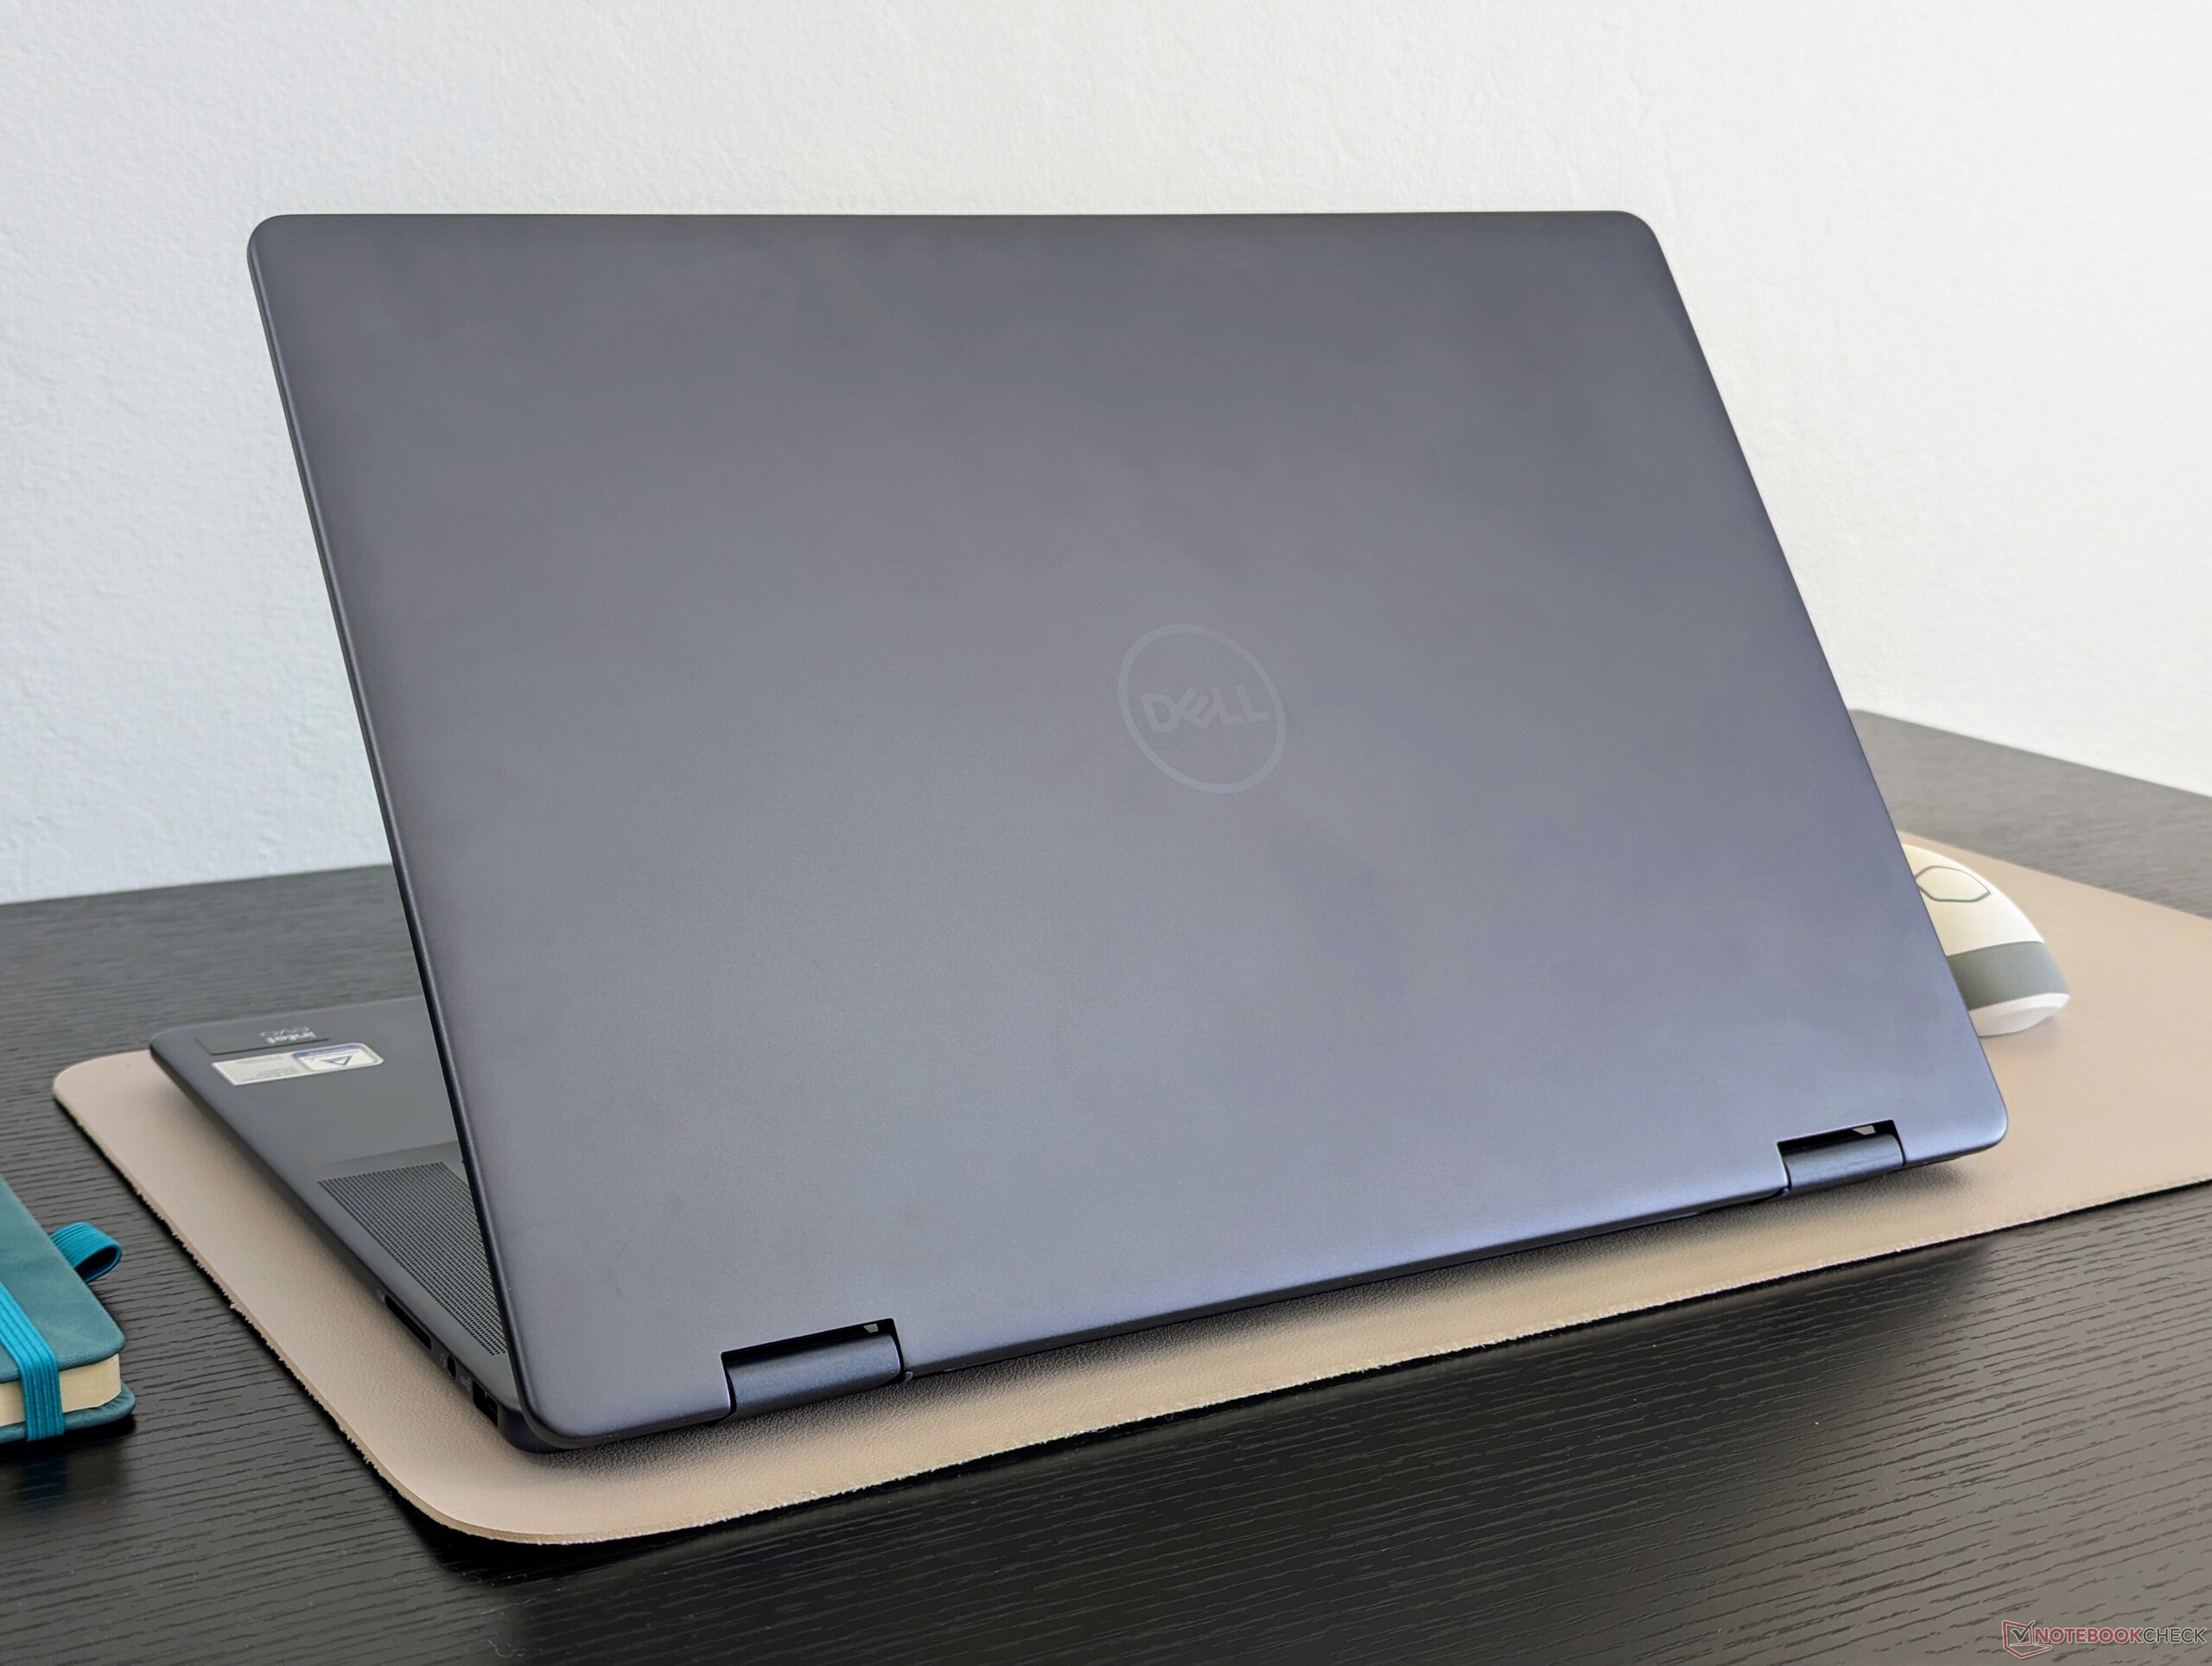
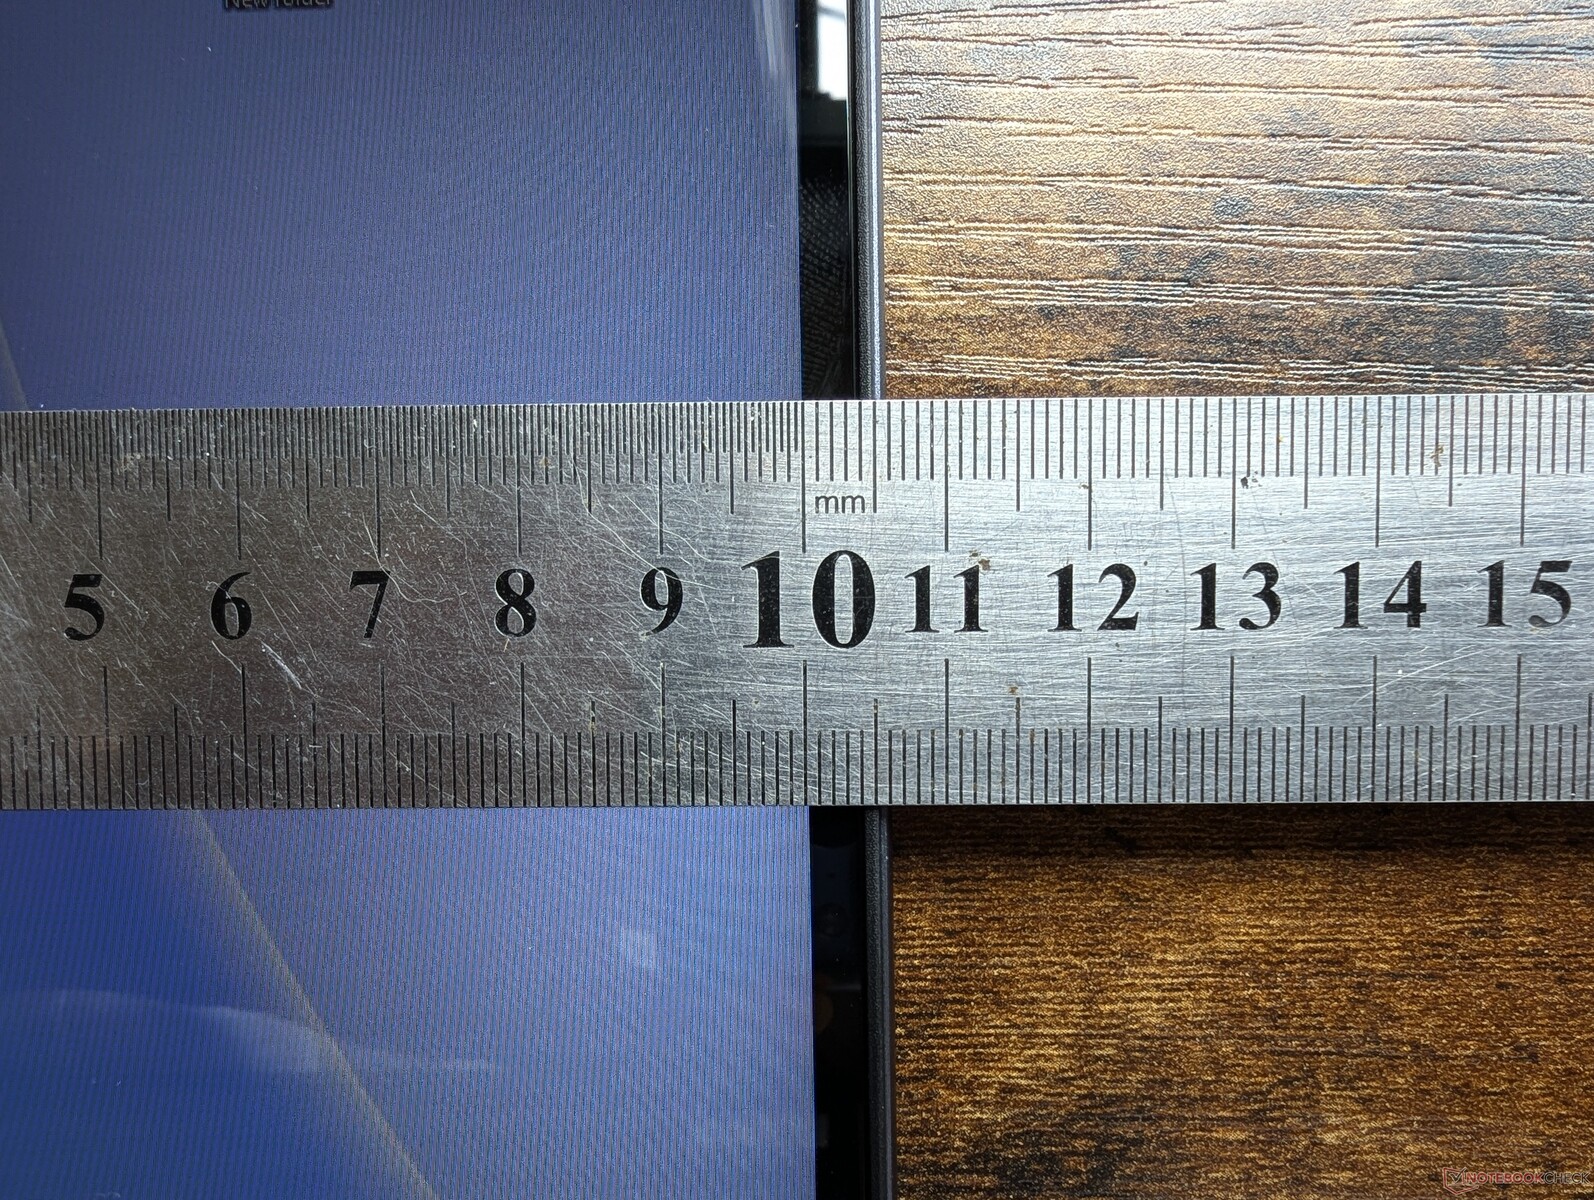
Tanto las dimensiones como el peso son casi exactamente los mismos que los modelos 2023 Inspiron 16 7630 2 en 1 y 2024 Inspiron 16 Plus 7640 clamshell a pesar de que este último incluye una opción de GPU discreta. Habríamos preferido un diseño más ligero ya que el HP Envy x360 16 de 16 pulgadas y el Samsung Galaxy Book4 Pro 360 son cada uno notablemente más ligeros que nuestro Dell. Aunque un convertible de 16 pulgadas va a ser relativamente pesado sea como sea, el Inspiron 16 7640 2 en 1 es probablemente uno de los peores del grupo para viajar.
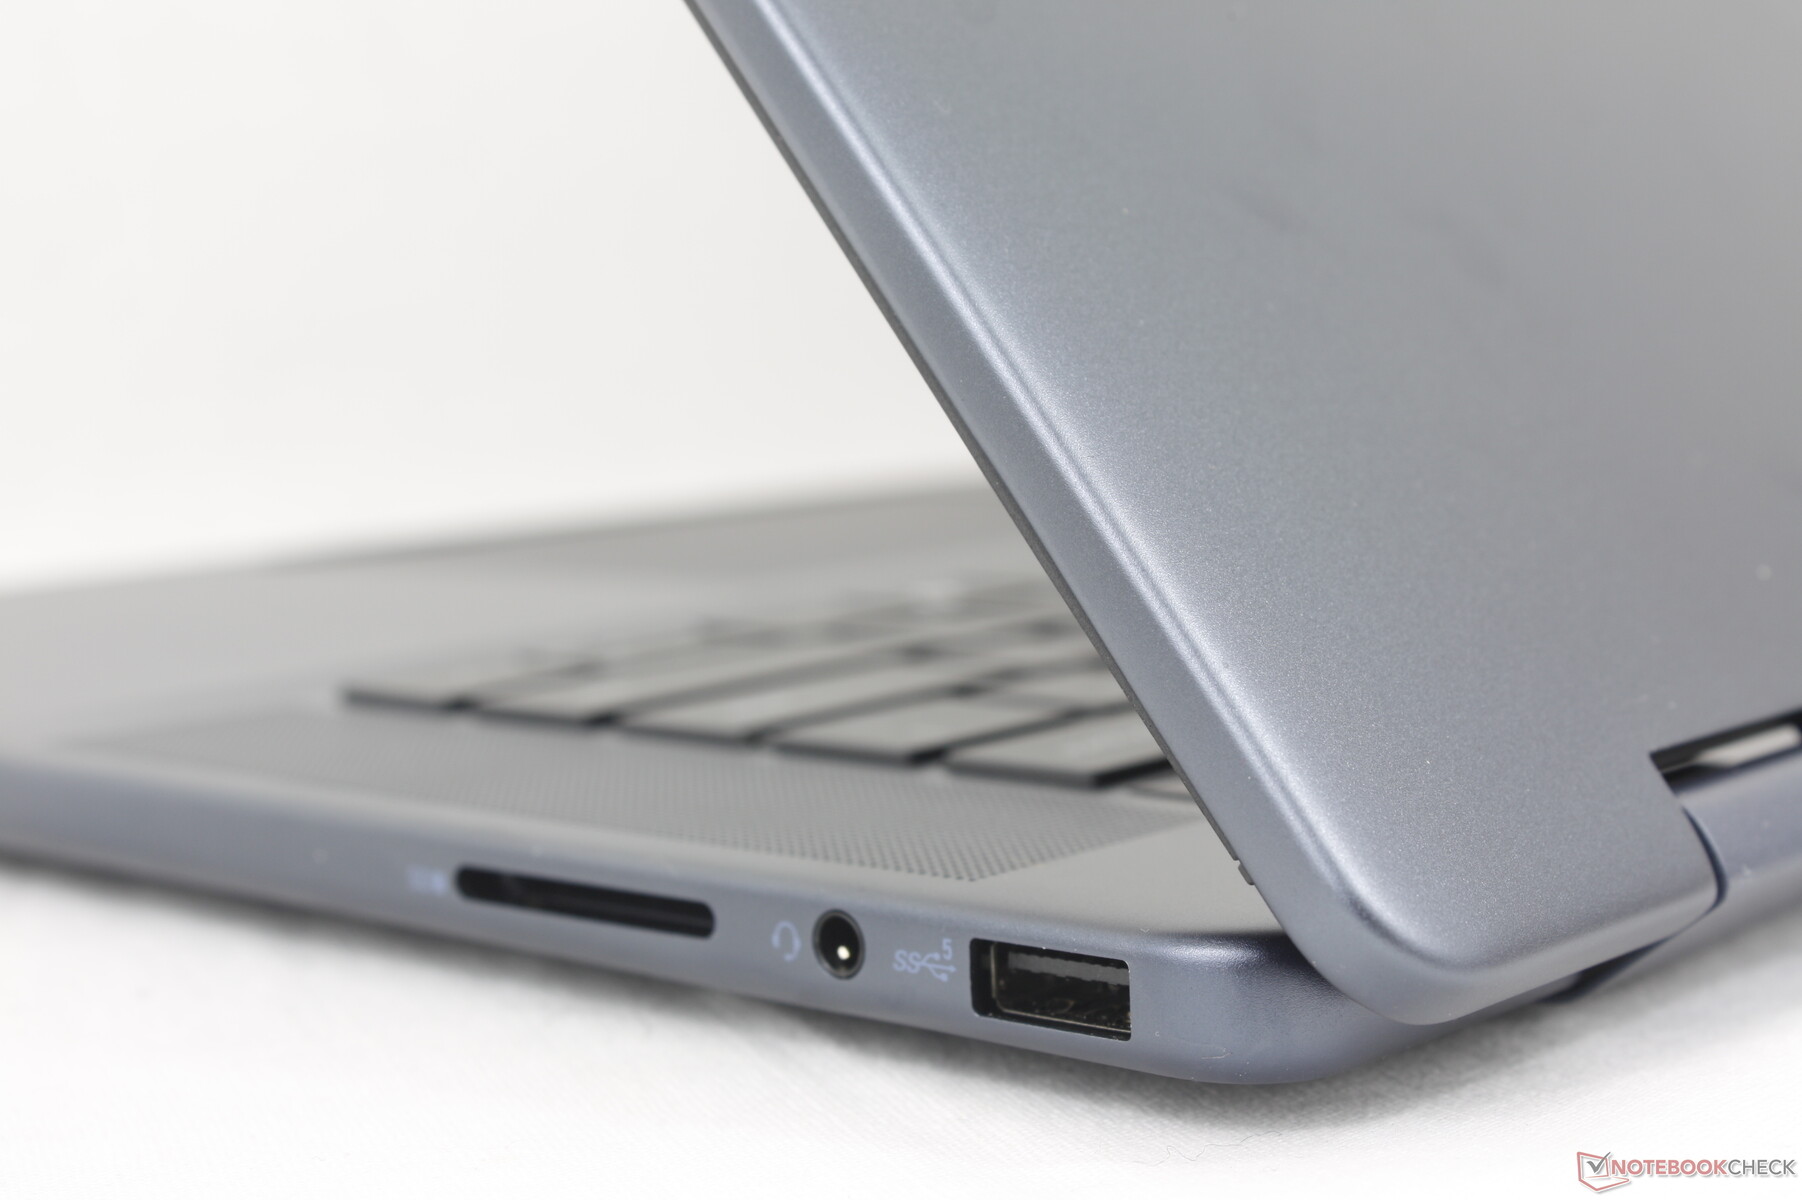

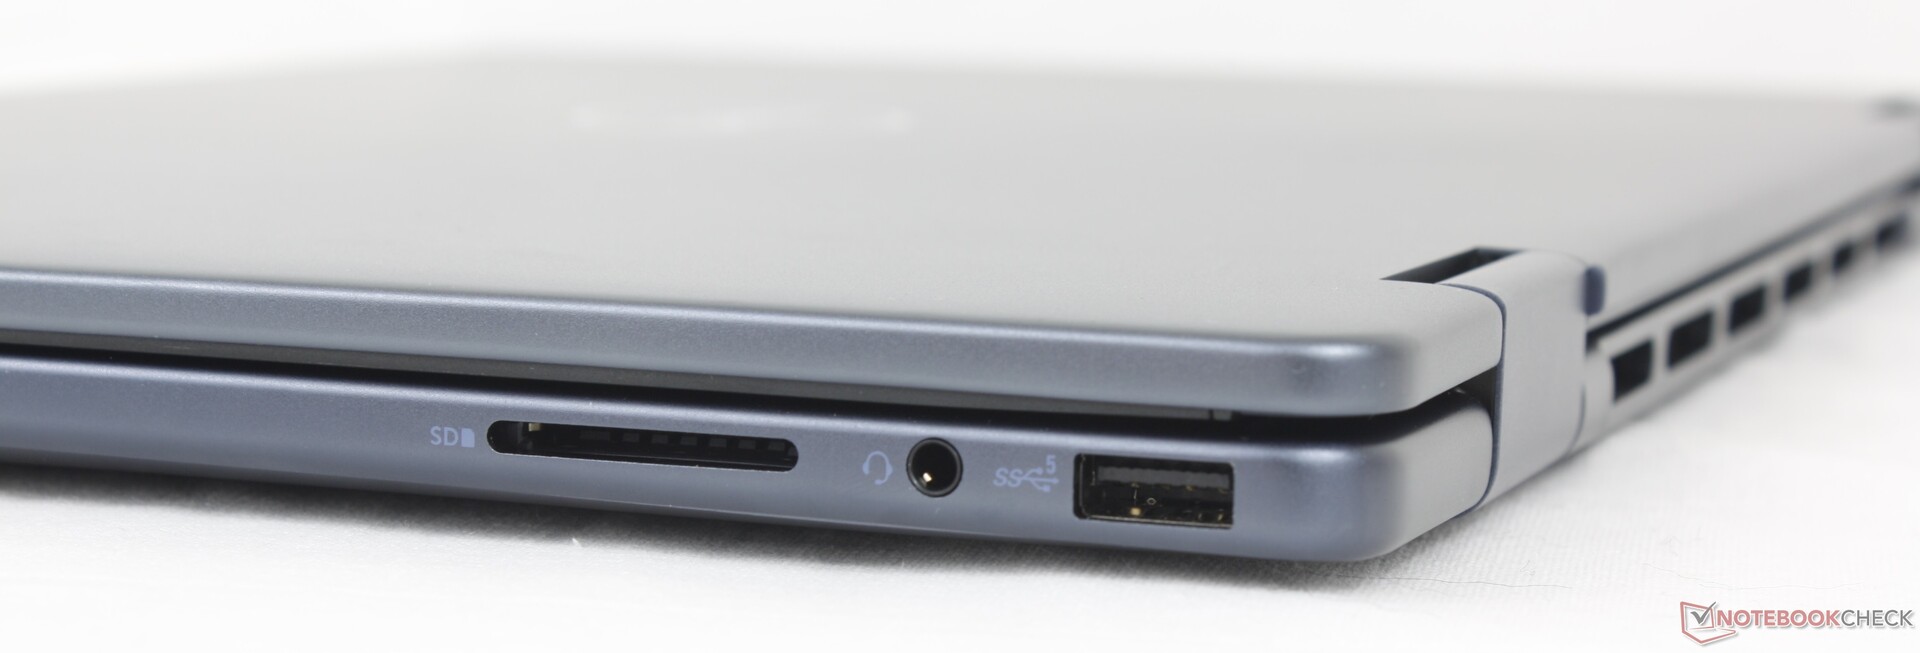
Conectividad
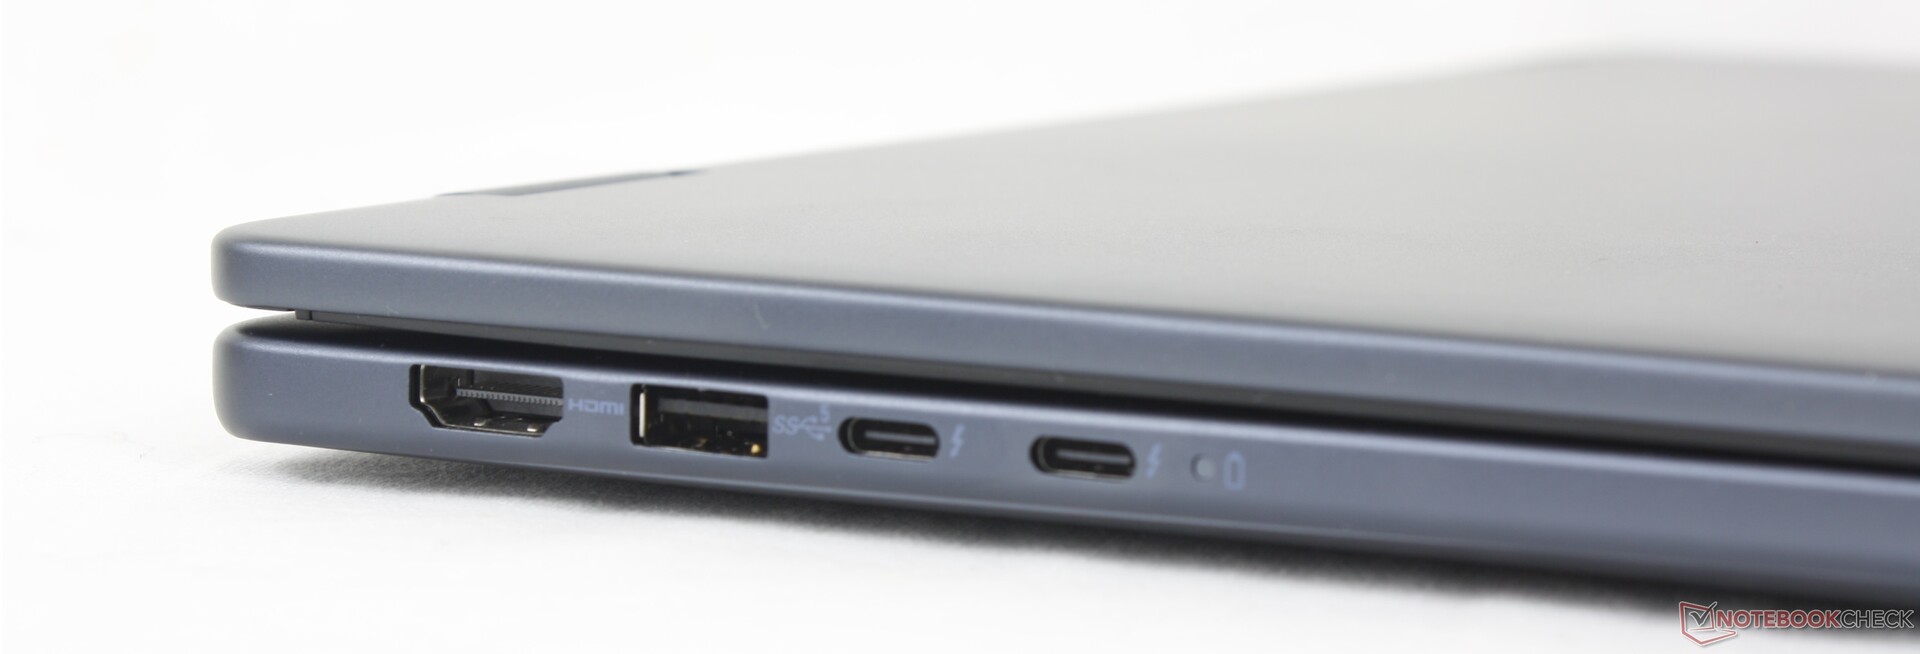
Las opciones de puerto y la posición siguen siendo idénticas a las del Inspiron 16 7635 2 en 1 o 7630 2 en 1 a pesar de los numerosos cambios exteriores. Tenga en cuenta que Thunderbolt 4 vuelve a estar disponible solo en las SKU de Intel y que el puerto HDMI sigue siendo solo la versión 1.4.
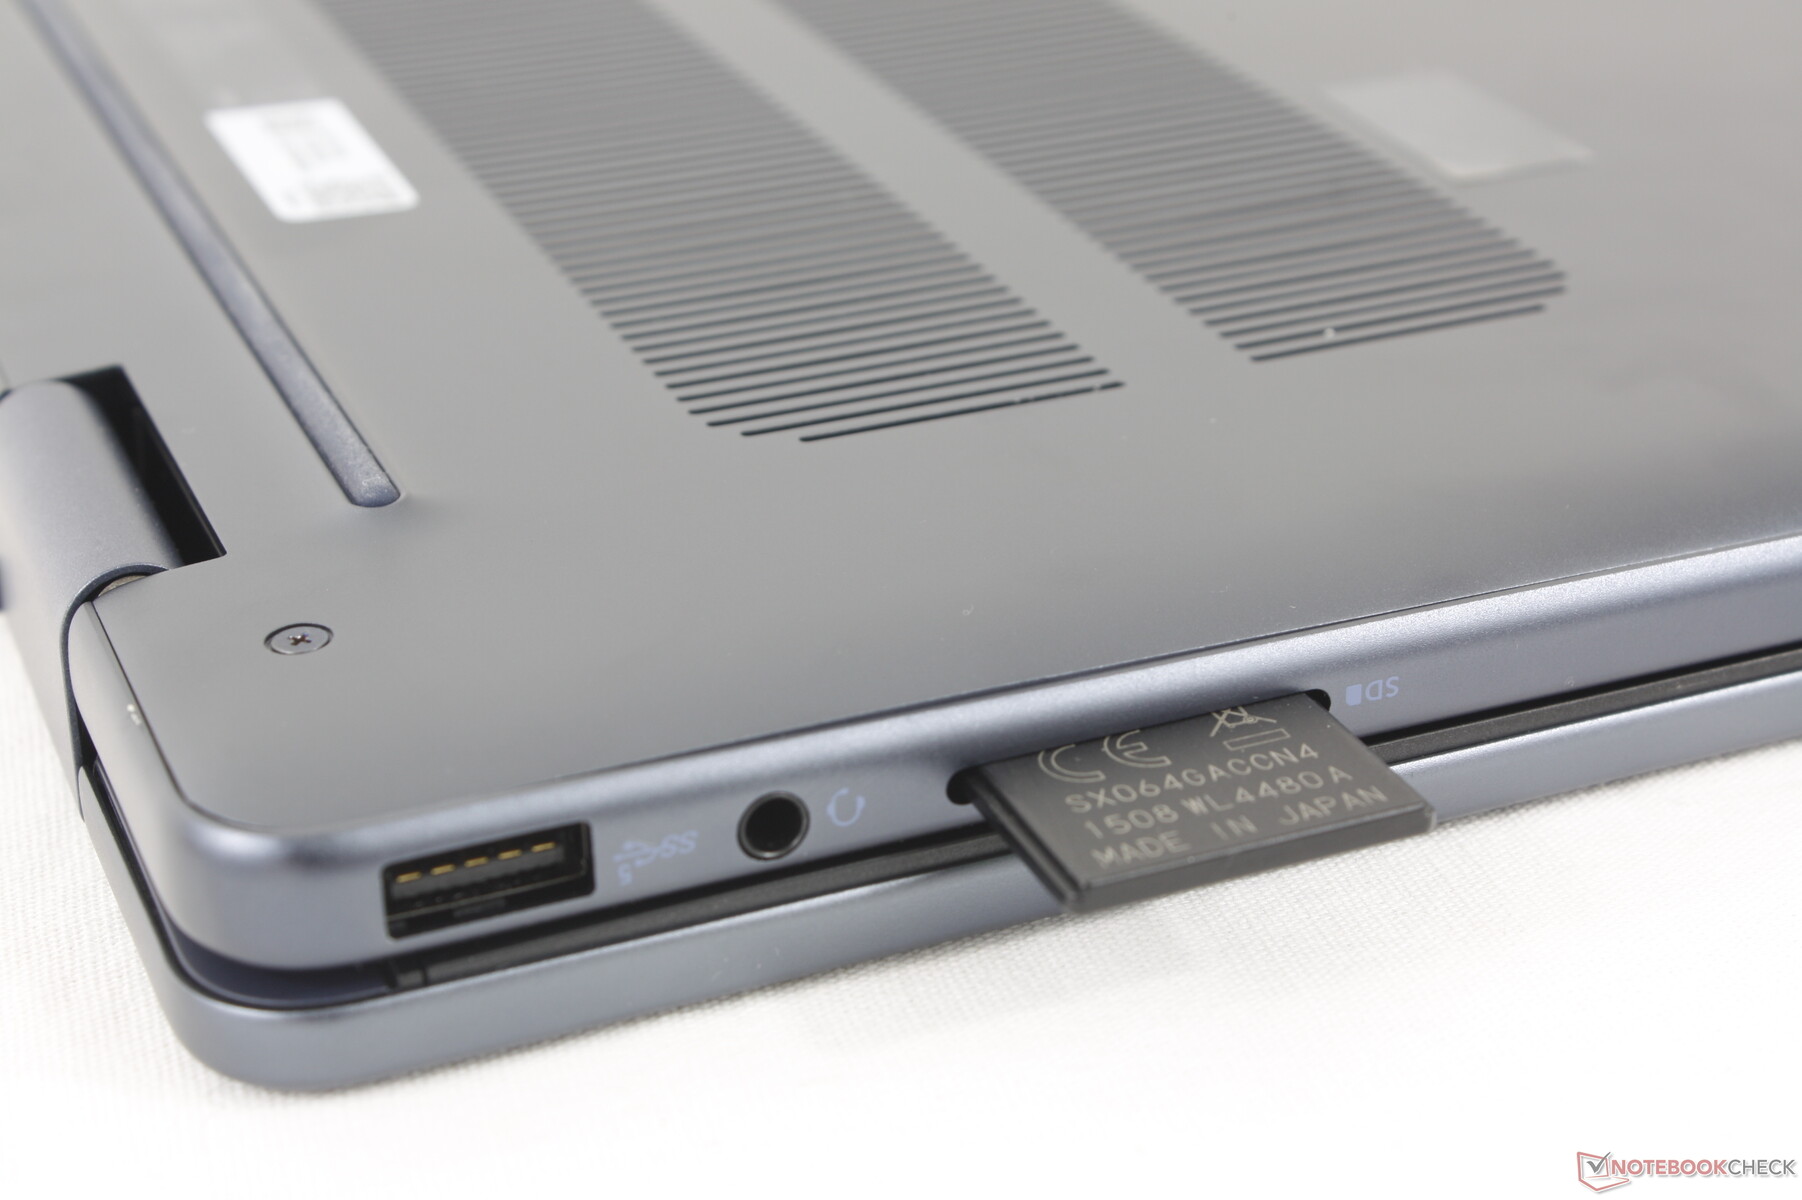
Lector de tarjetas SD
Las velocidades de transferencia con el lector de tarjetas SD integrado no han mejorado respecto al modelo del año pasado, con algo menos de 30 MB/s. los clamshells de 16 pulgadas como el Lenovo IdeaPad Pro 5 16 pueden ser más de 2 veces más rápidos y el XPS 16 es aún más rápido. Los usuarios que dependen de las tarjetas SD pueden apreciar el práctico lector de tarjetas integrado en el Inspiron, pero también es probable que se sientan decepcionados por la lentitud de las velocidades.
| SD Card Reader | |
| average JPG Copy Test (av. of 3 runs) | |
| Samsung Galaxy Book4 Pro 360 (Angelbird AV Pro V60) | |
| Lenovo IdeaPad Pro 5 16IMH G9 (Angelbird AV Pro V60) | |
| Dell Inspiron 16 7635 2-in-1 (PNY EliteX-Pro60 V60 256 GB) | |
| Dell Inspiron 16 7640 2-in-1 (Toshiba Exceria Pro SDXC 64 GB UHS-II) | |
| Dell Inspiron 16 Plus 7640 (Angelbird AV Pro V60) | |
| maximum AS SSD Seq Read Test (1GB) | |
| Lenovo IdeaPad Pro 5 16IMH G9 (Angelbird AV Pro V60) | |
| Samsung Galaxy Book4 Pro 360 (Angelbird AV Pro V60) | |
| Dell Inspiron 16 7635 2-in-1 (PNY EliteX-Pro60 V60 256 GB) | |
| Dell Inspiron 16 7640 2-in-1 (Toshiba Exceria Pro SDXC 64 GB UHS-II) | |
| Dell Inspiron 16 Plus 7640 (Angelbird AV Pro V60) | |
Comunicación
El modelo viene con el mismo módulo WLAN Intel AX211 que se encuentra en el Inspiron 16 7640 clamshell para conectividad Wi-Fi 6E y Bluetooth 5.3. El rendimiento es estable cuando se empareja con nuestro router de prueba Asus AXE11000, pero las velocidades de transferencia en la red de 6 GHz podrían haber sido más rápidas.
Cámara web
La cámara web de 2 MP viene de serie una vez más con un sensor de infrarrojos y un obturador físico.


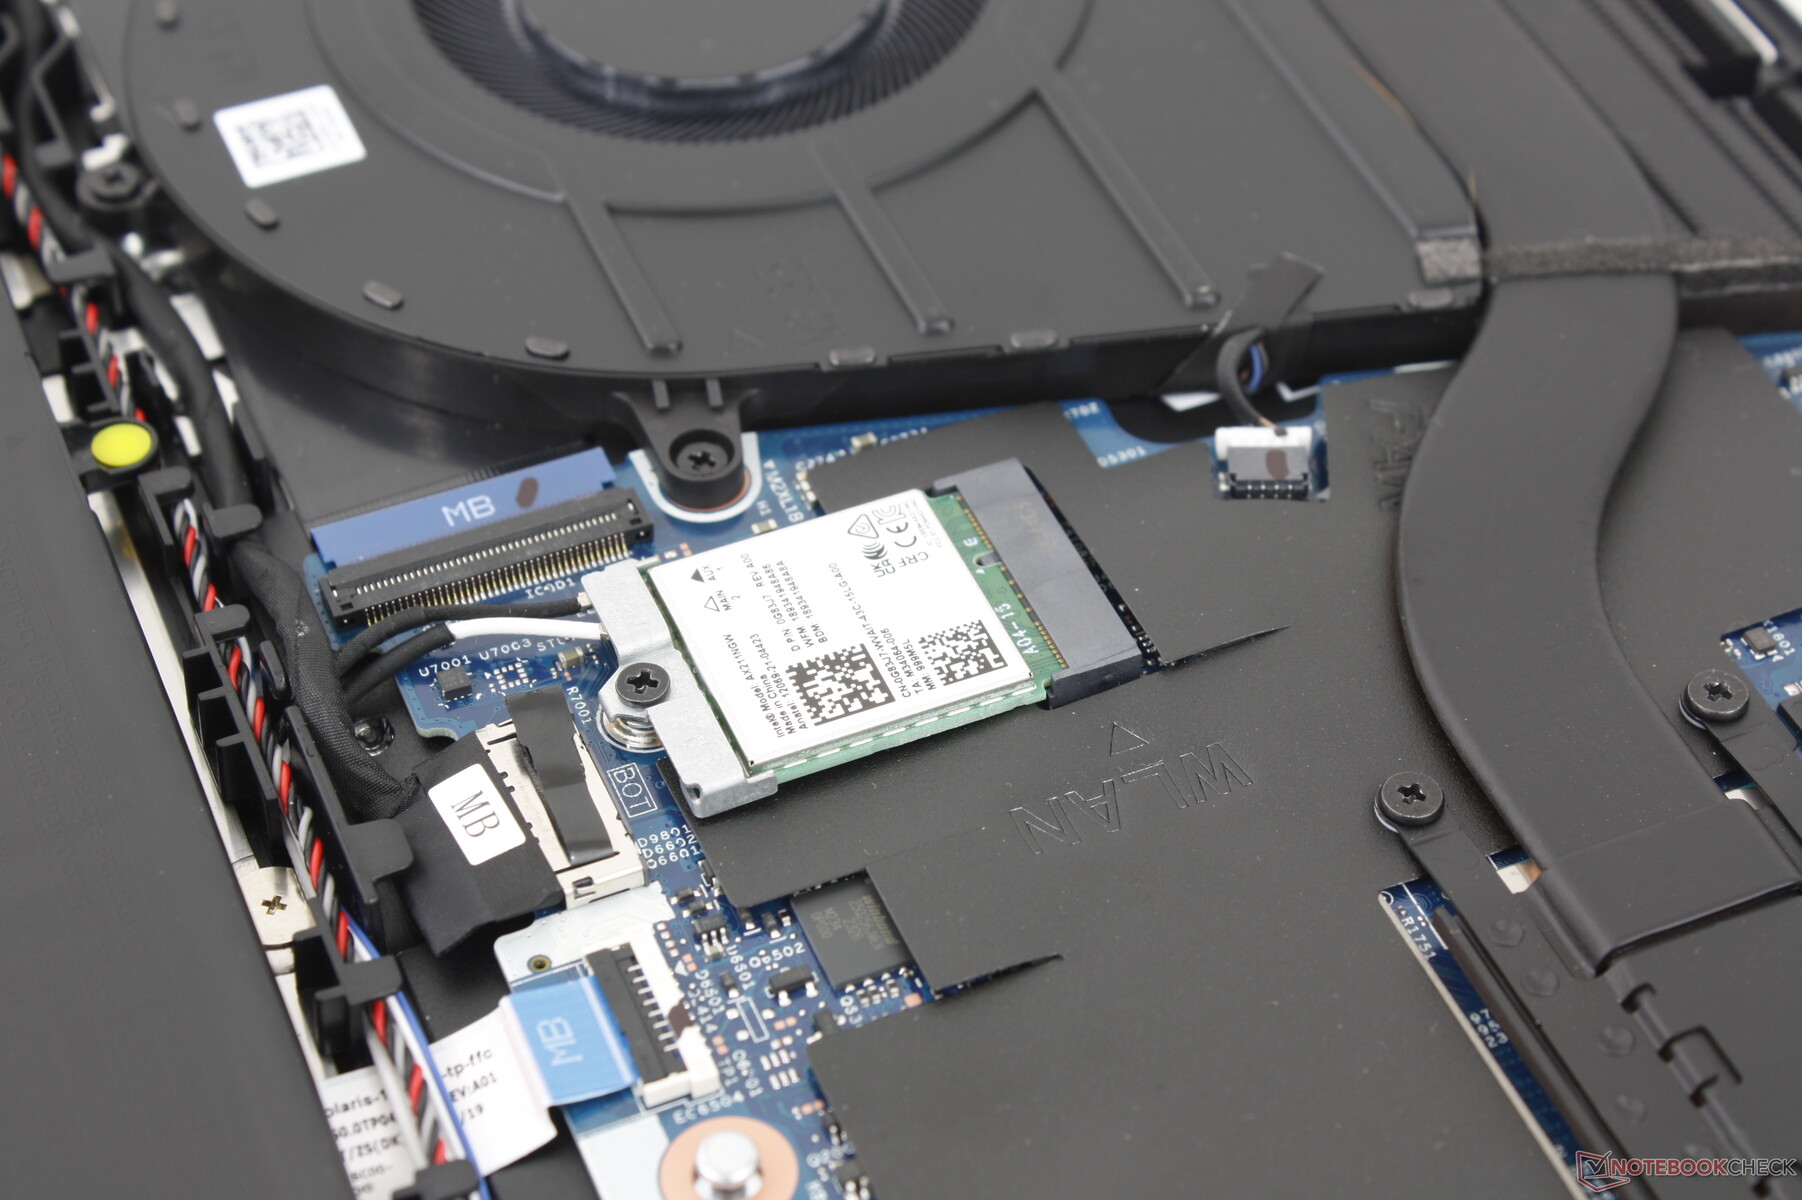
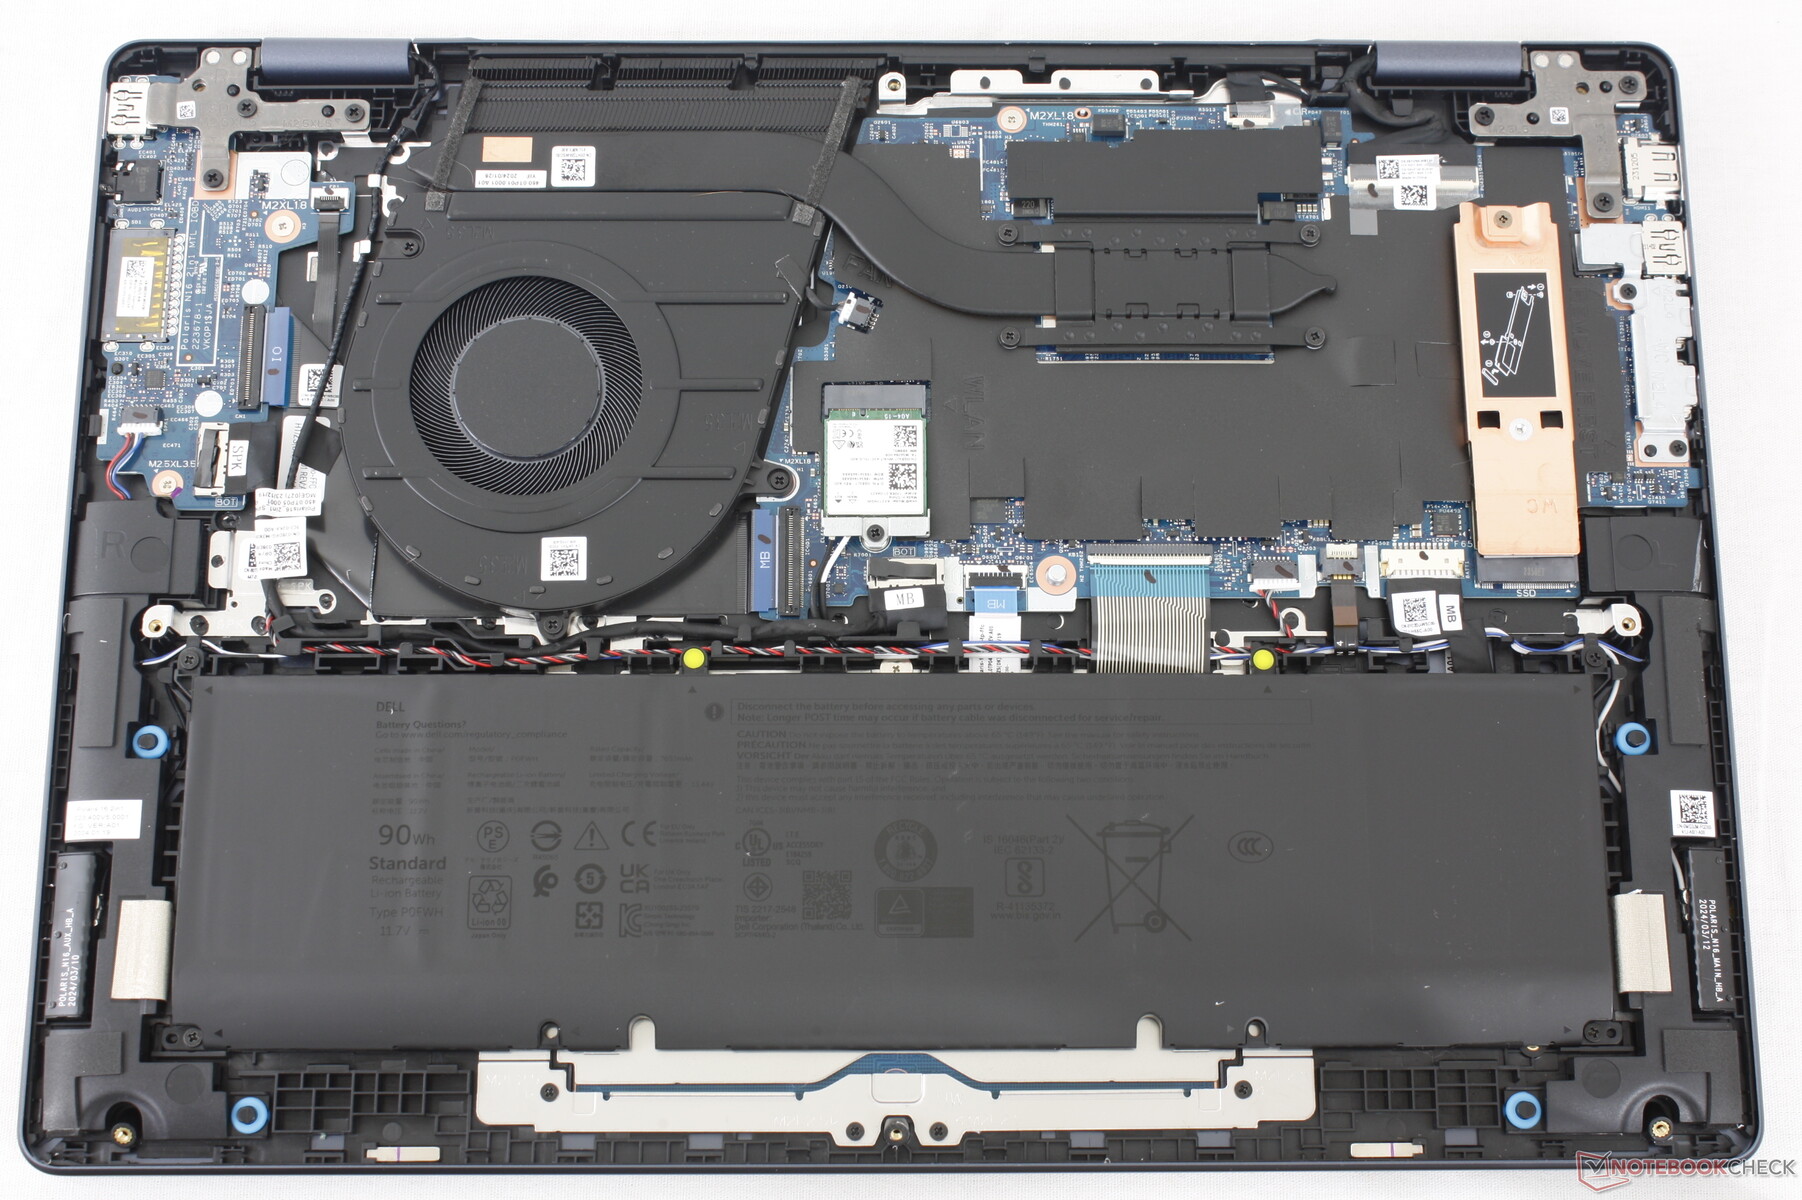
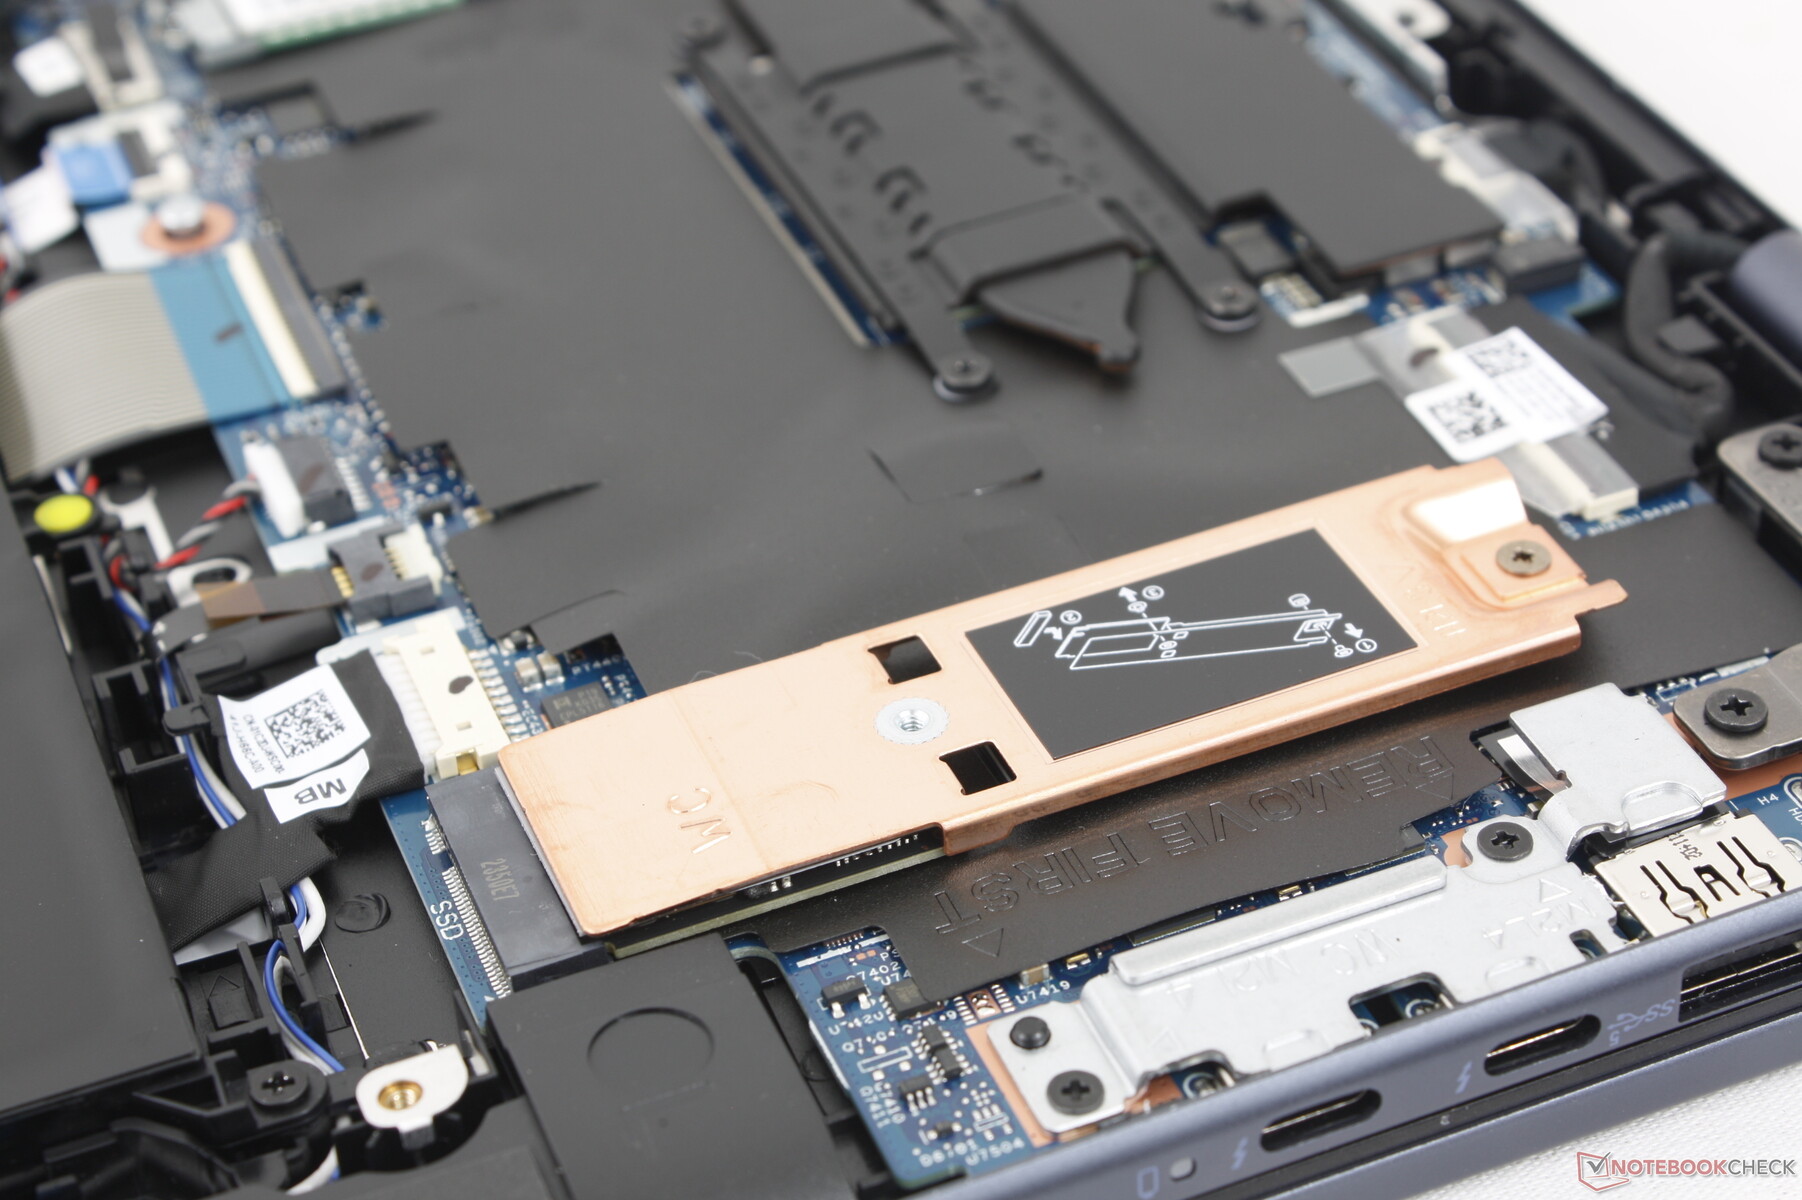
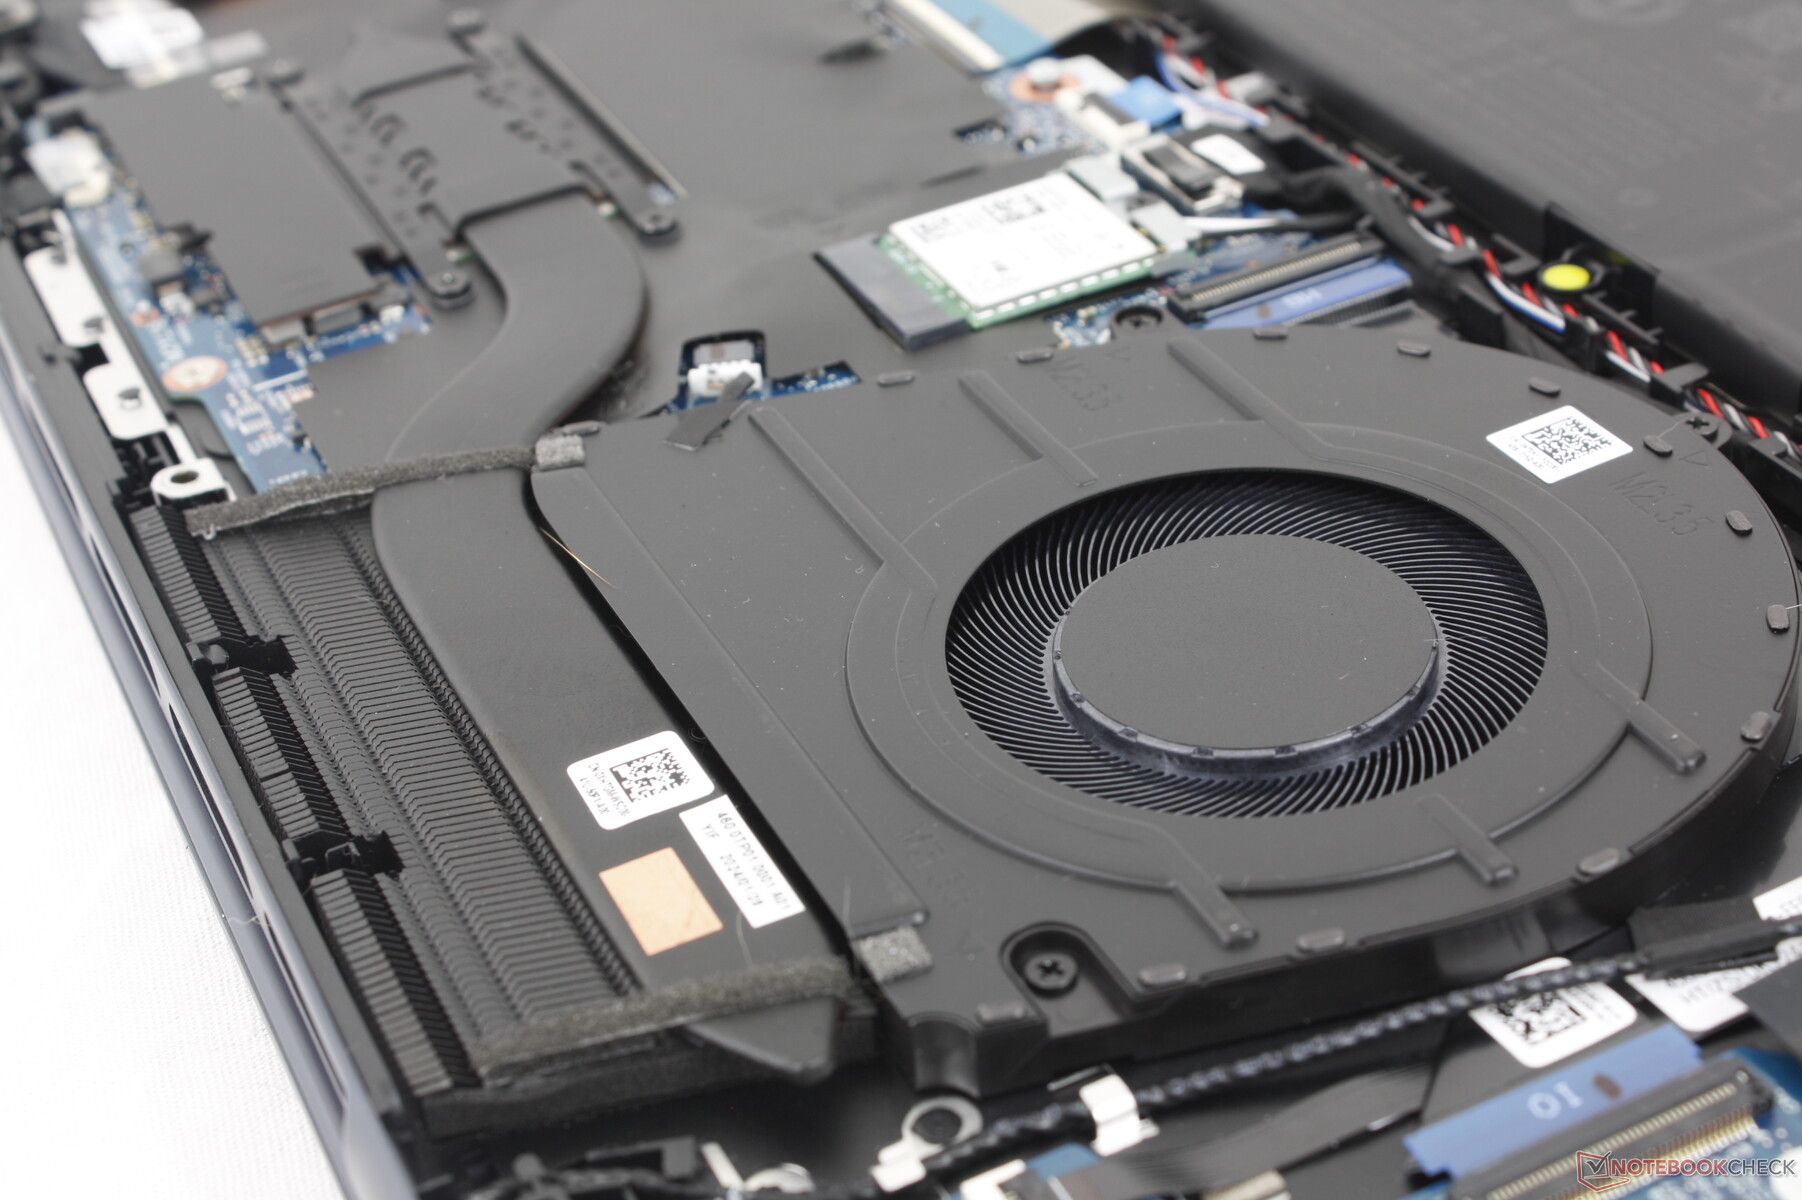
Mantenimiento
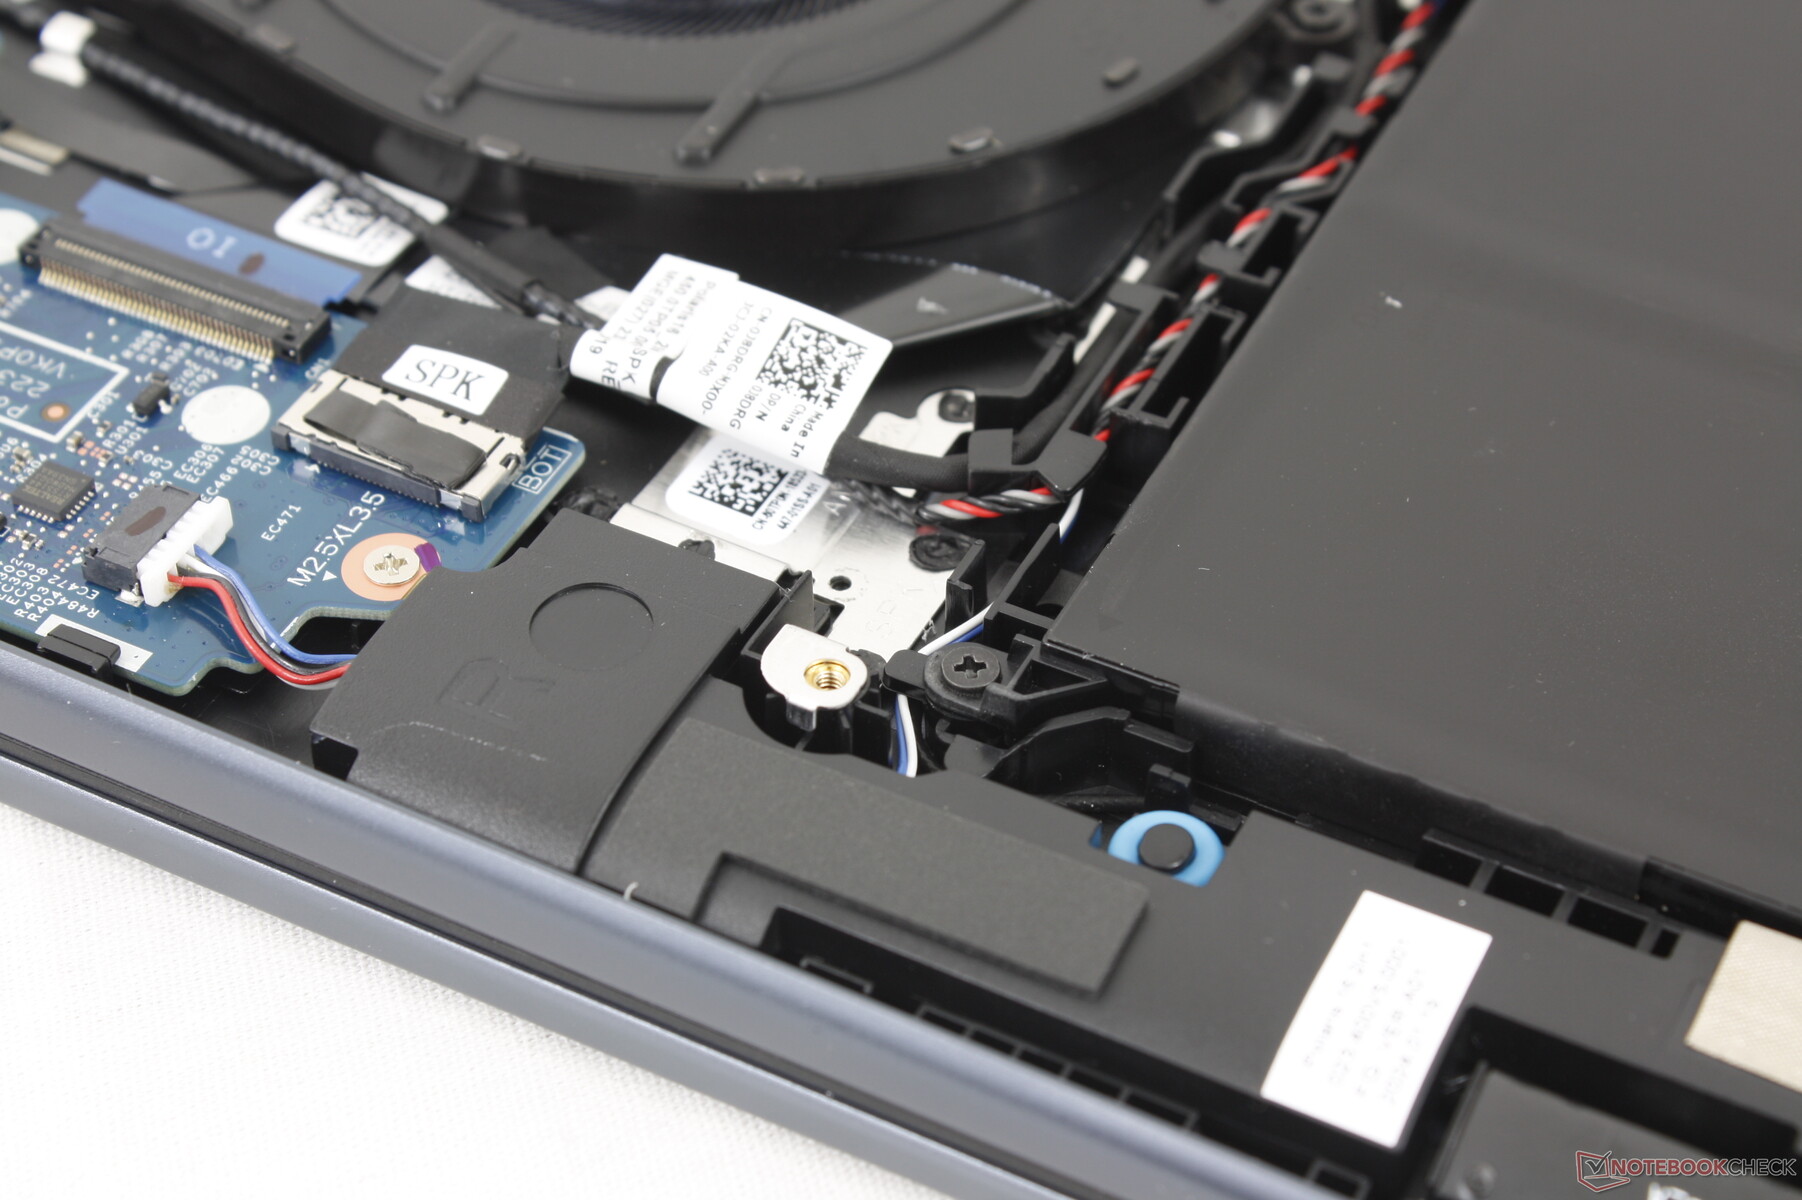
Hay varias diferencias internas entre nuestro modelo y el Inspiron 16 7635 2 en 1 del año pasado. La SSD en particular ha sido reposicionada para hacer espacio para el ventilador más grande y la batería, mientras que el tubo de calor es ahora ligeramente más grueso para compensar la menor longitud. Las SSD secundarias siguen sin ser compatibles y la RAM no es actualizable por el usuario.

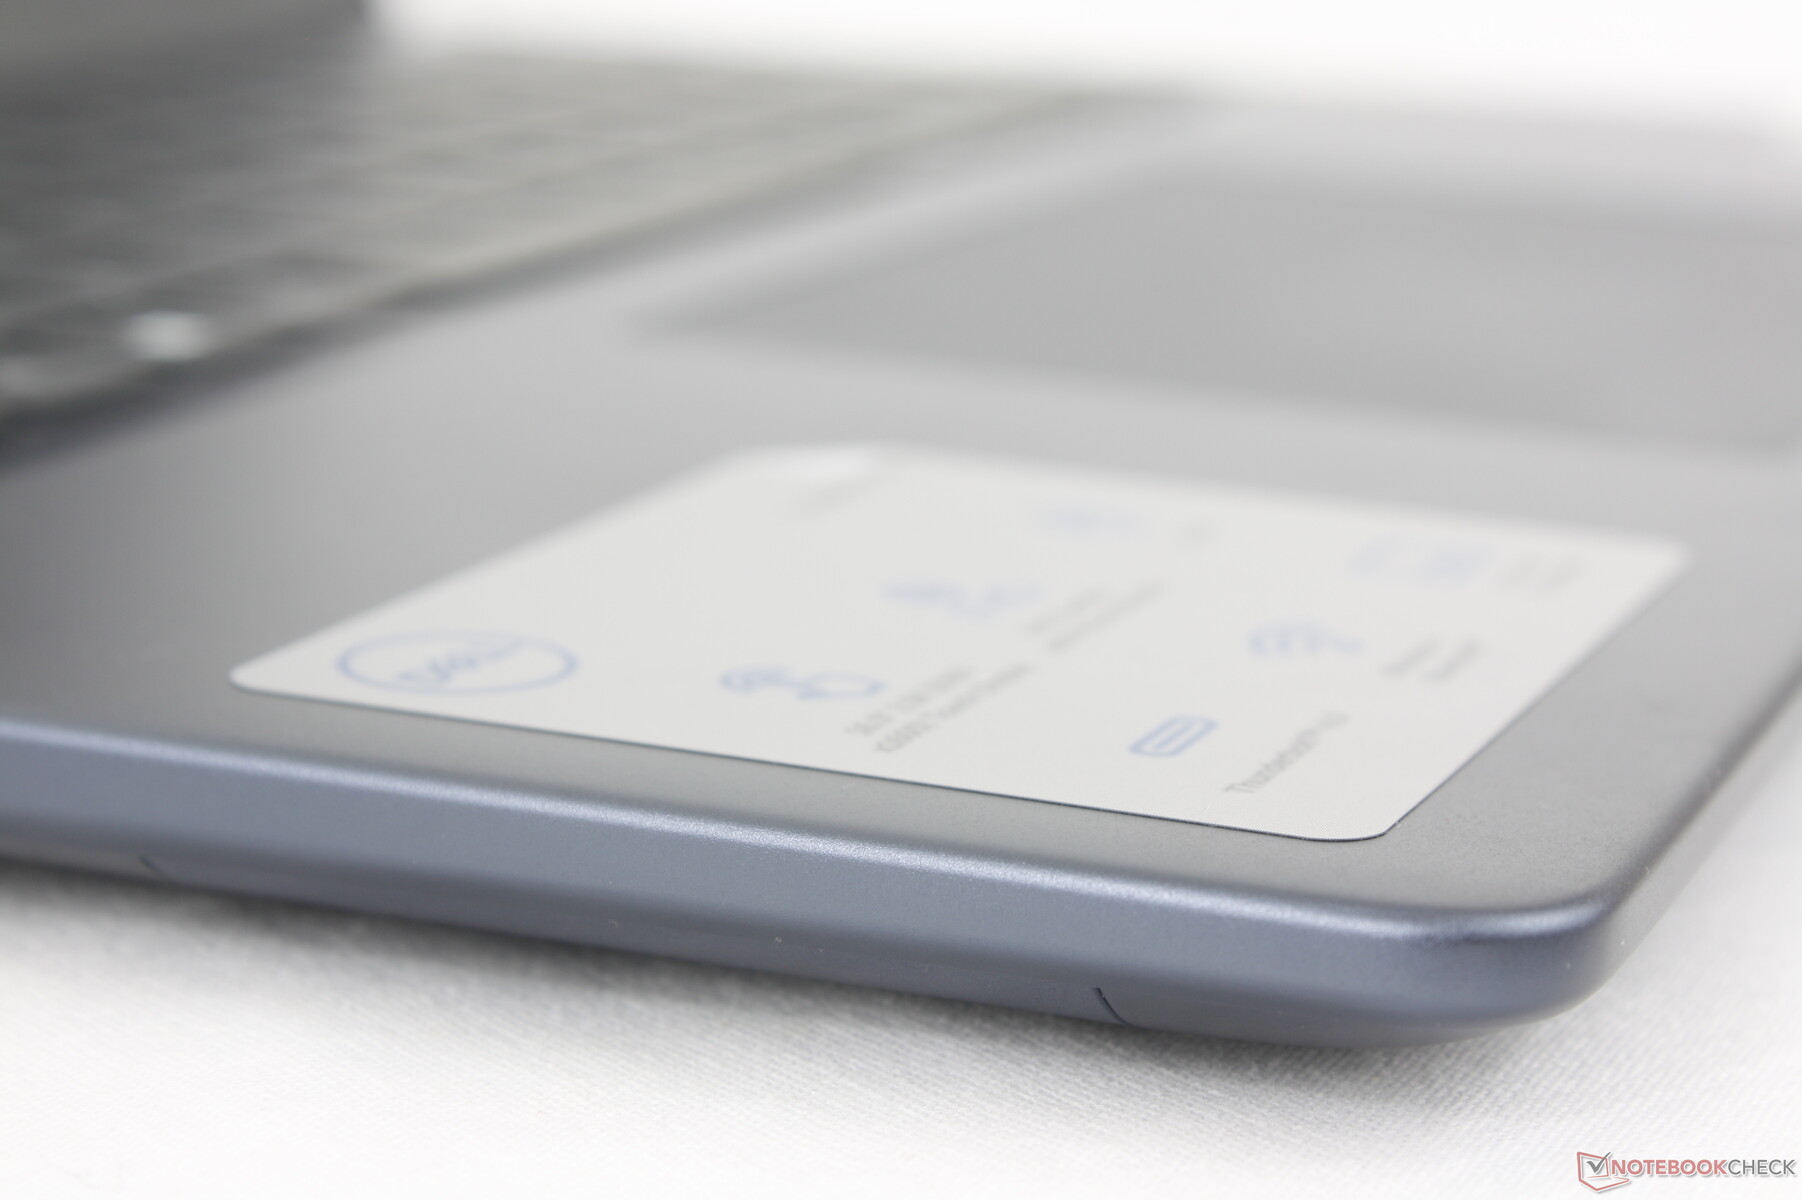
Accesorios y garantía
La caja de venta incluye un lápiz óptico activo (PN5122W) además de la documentación y el adaptador de CA. Se aplica la garantía limitada estándar de un año si se adquiere en EE.UU.
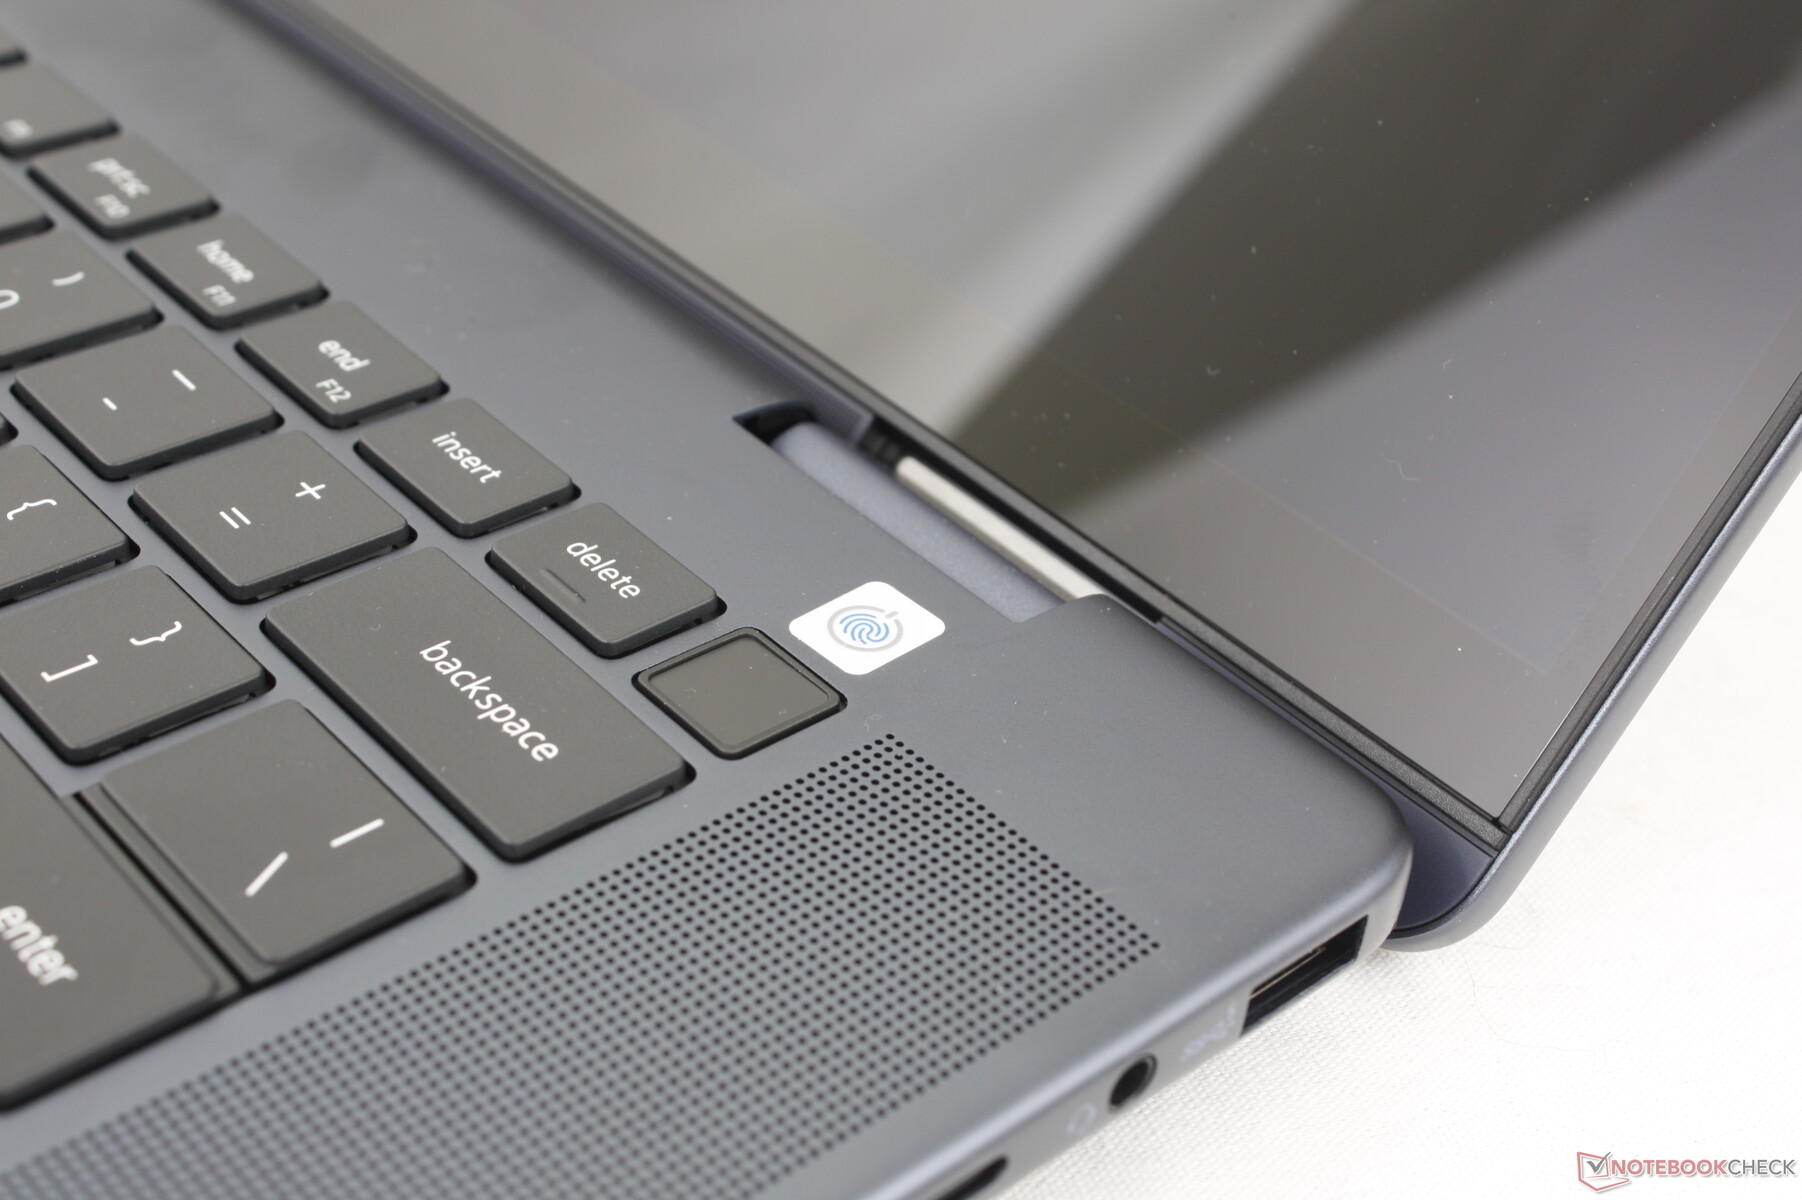
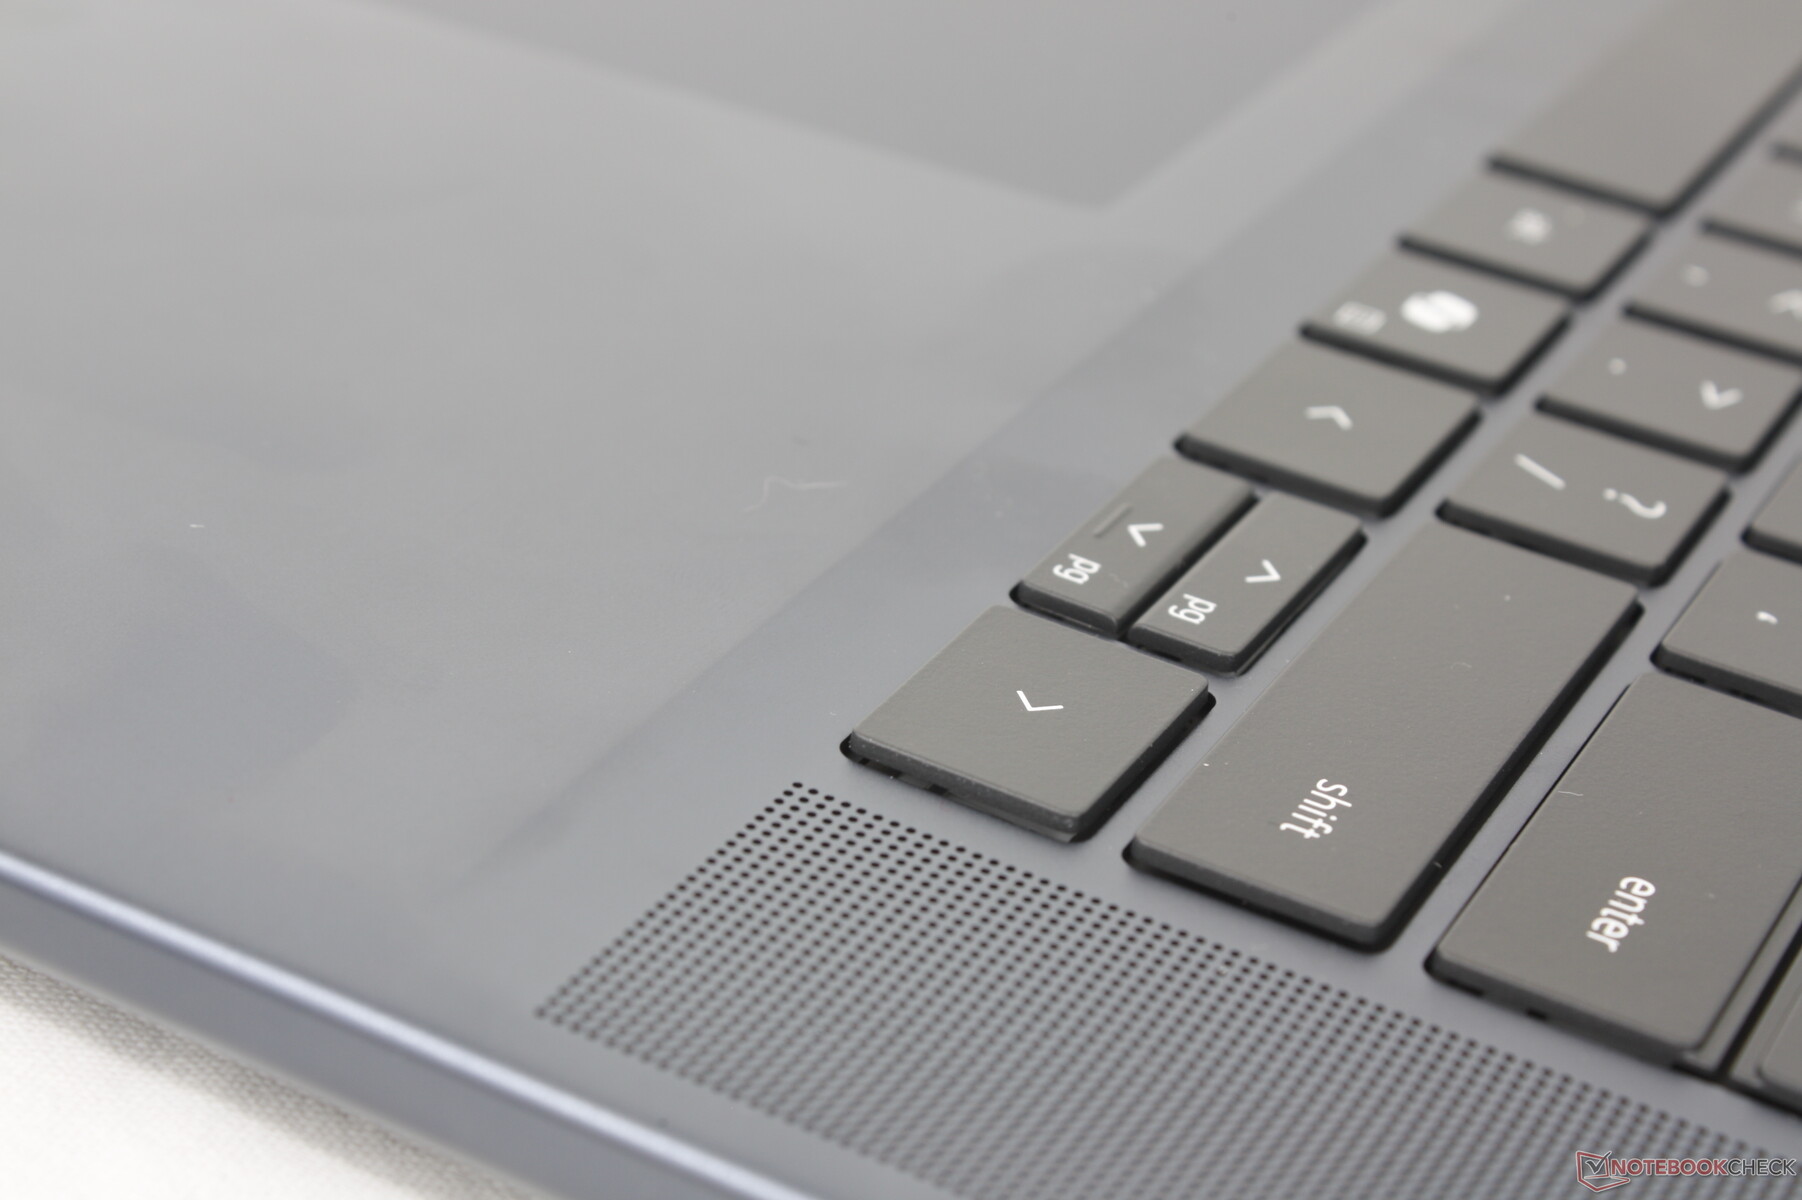
Dispositivos de entrada - Buenos pero todavía un poco esponjosos
Teclado y panel táctil
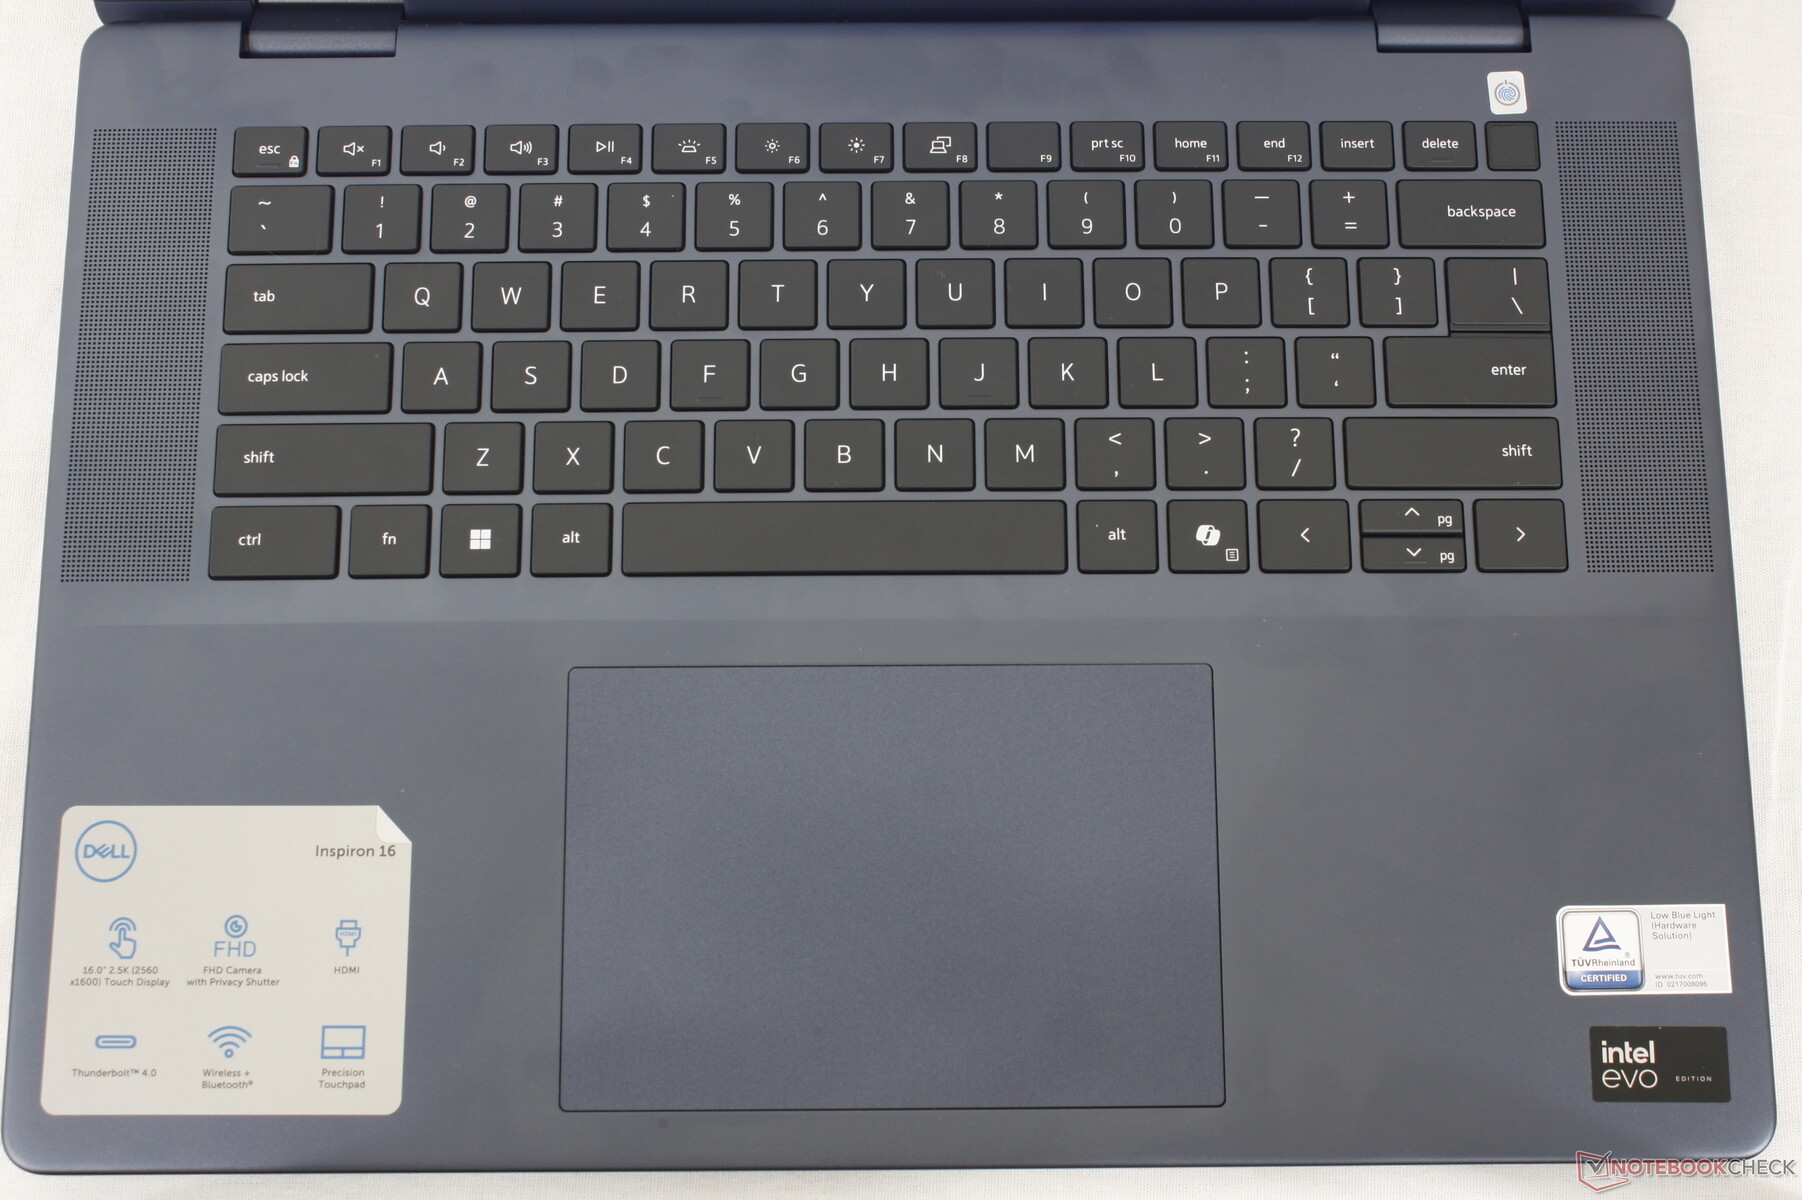
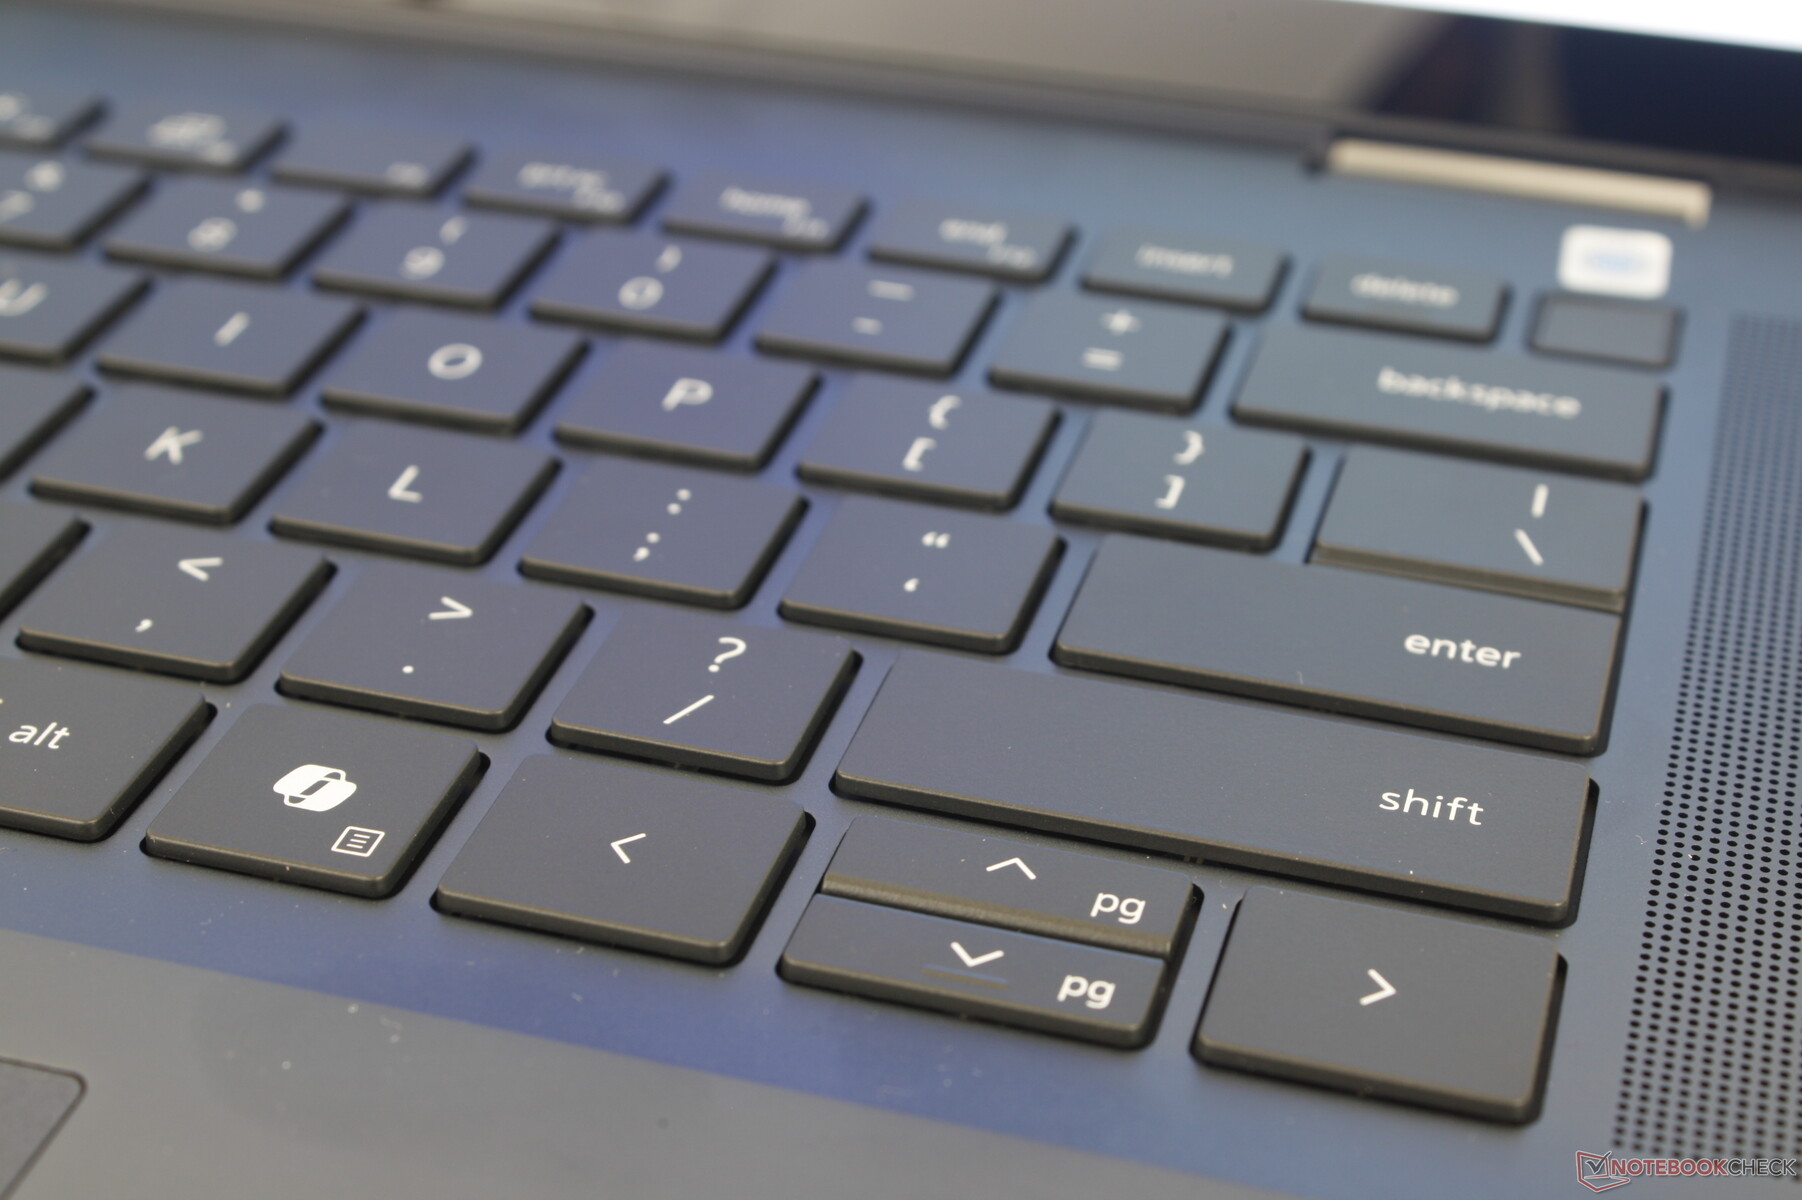
El teclado y el touchpad no han cambiado con respecto a la serie Inspiron 7630 2 en 1 a pesar de todos los cambios físicos en otras partes del chasis. Hay un par de diferencias menores como el botón de encendido ligeramente más pequeño en nuestro modelo más reciente y la introducción de la tecla dedicada Co-Pilot, pero todo, desde el tamaño del clickpad (13,3 x 9 cm) y la respuesta de las teclas, es idéntico al modelo del año pasado. Habría estado bien ver mejoras en este aspecto, ya que seguimos encontrando las teclas y el clickpad del Inspiron más esponjosos y con una respuesta menos satisfactoria que las teclas y el clickpad de la serie Envy de HP.

Pantalla - 2.5K Mini-LED HDR600
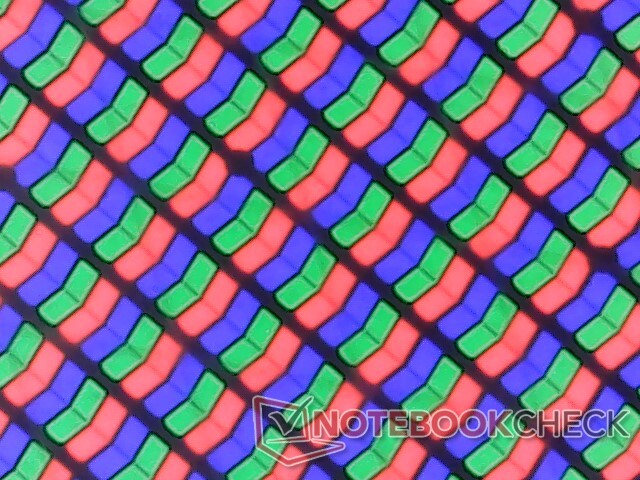
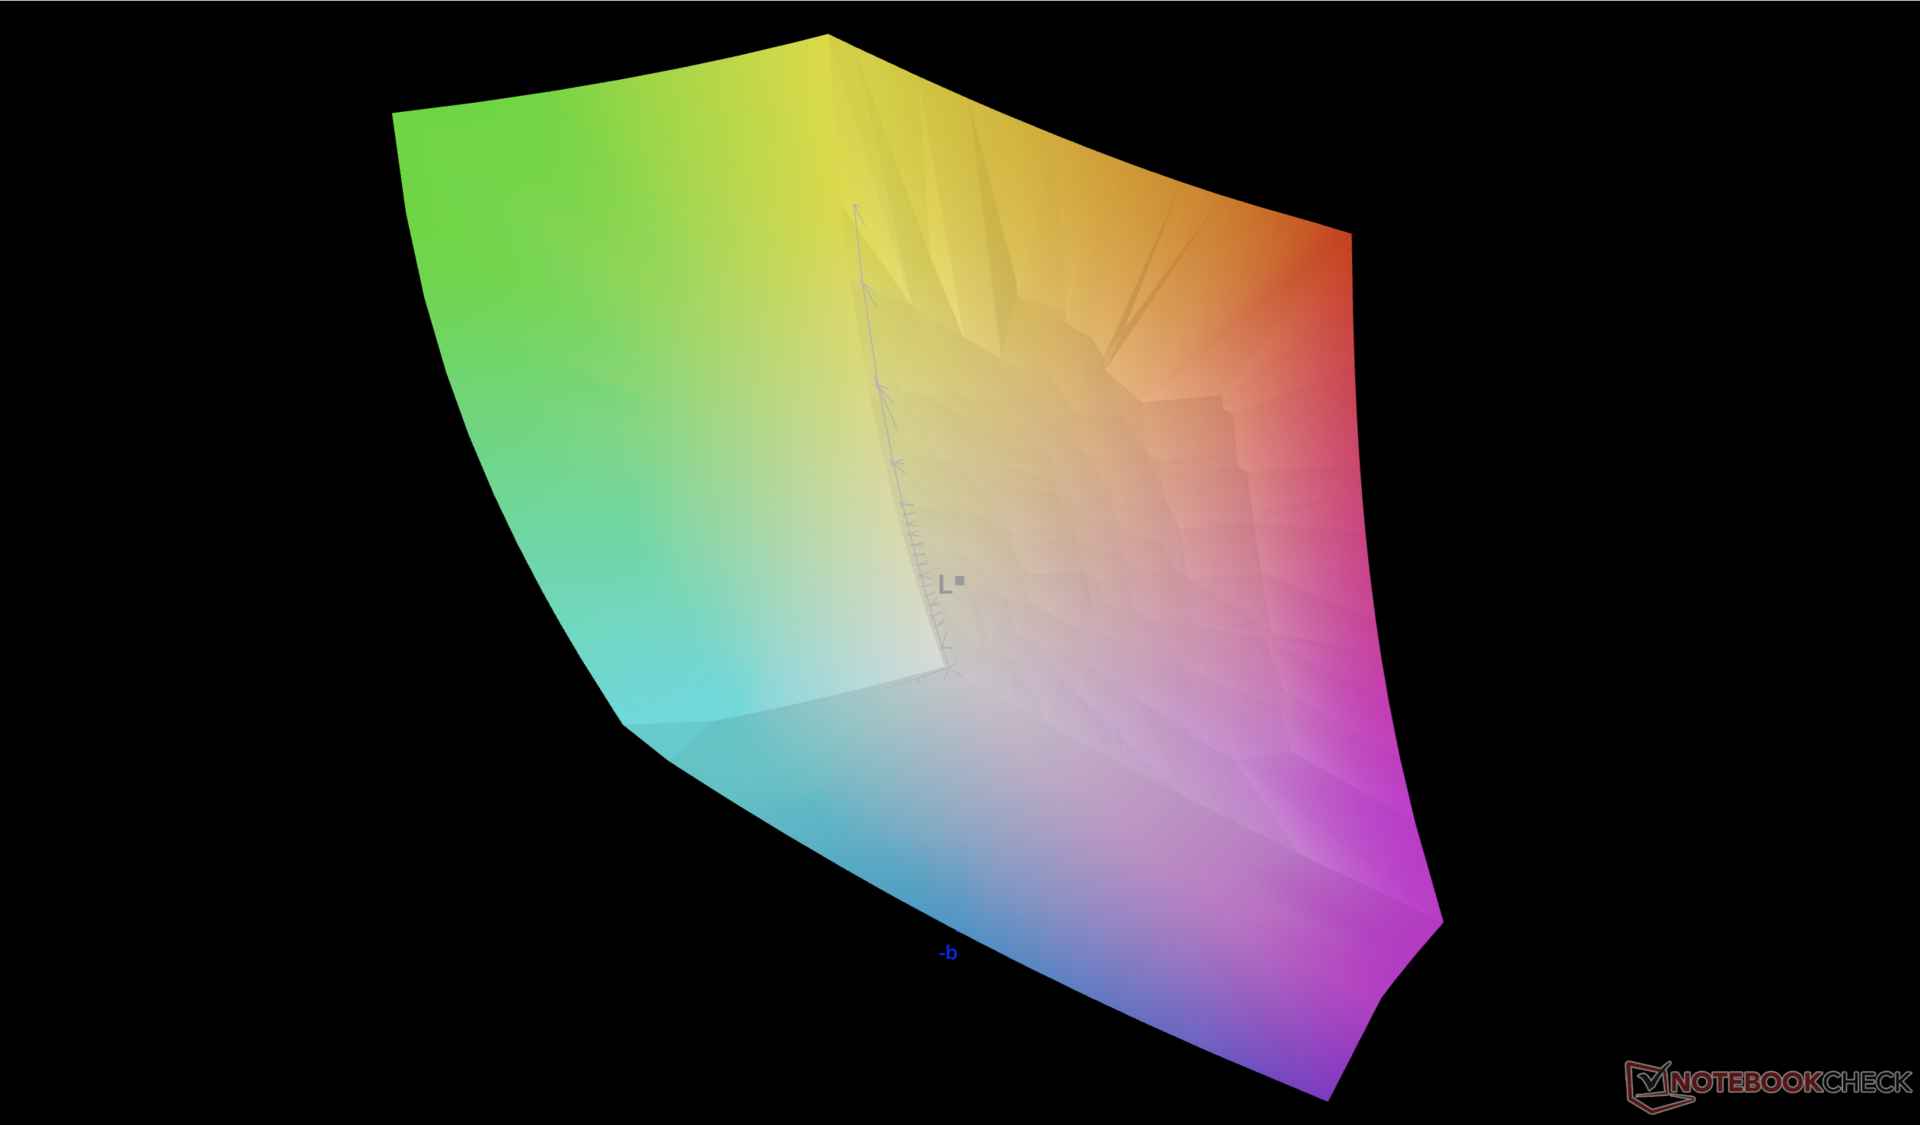
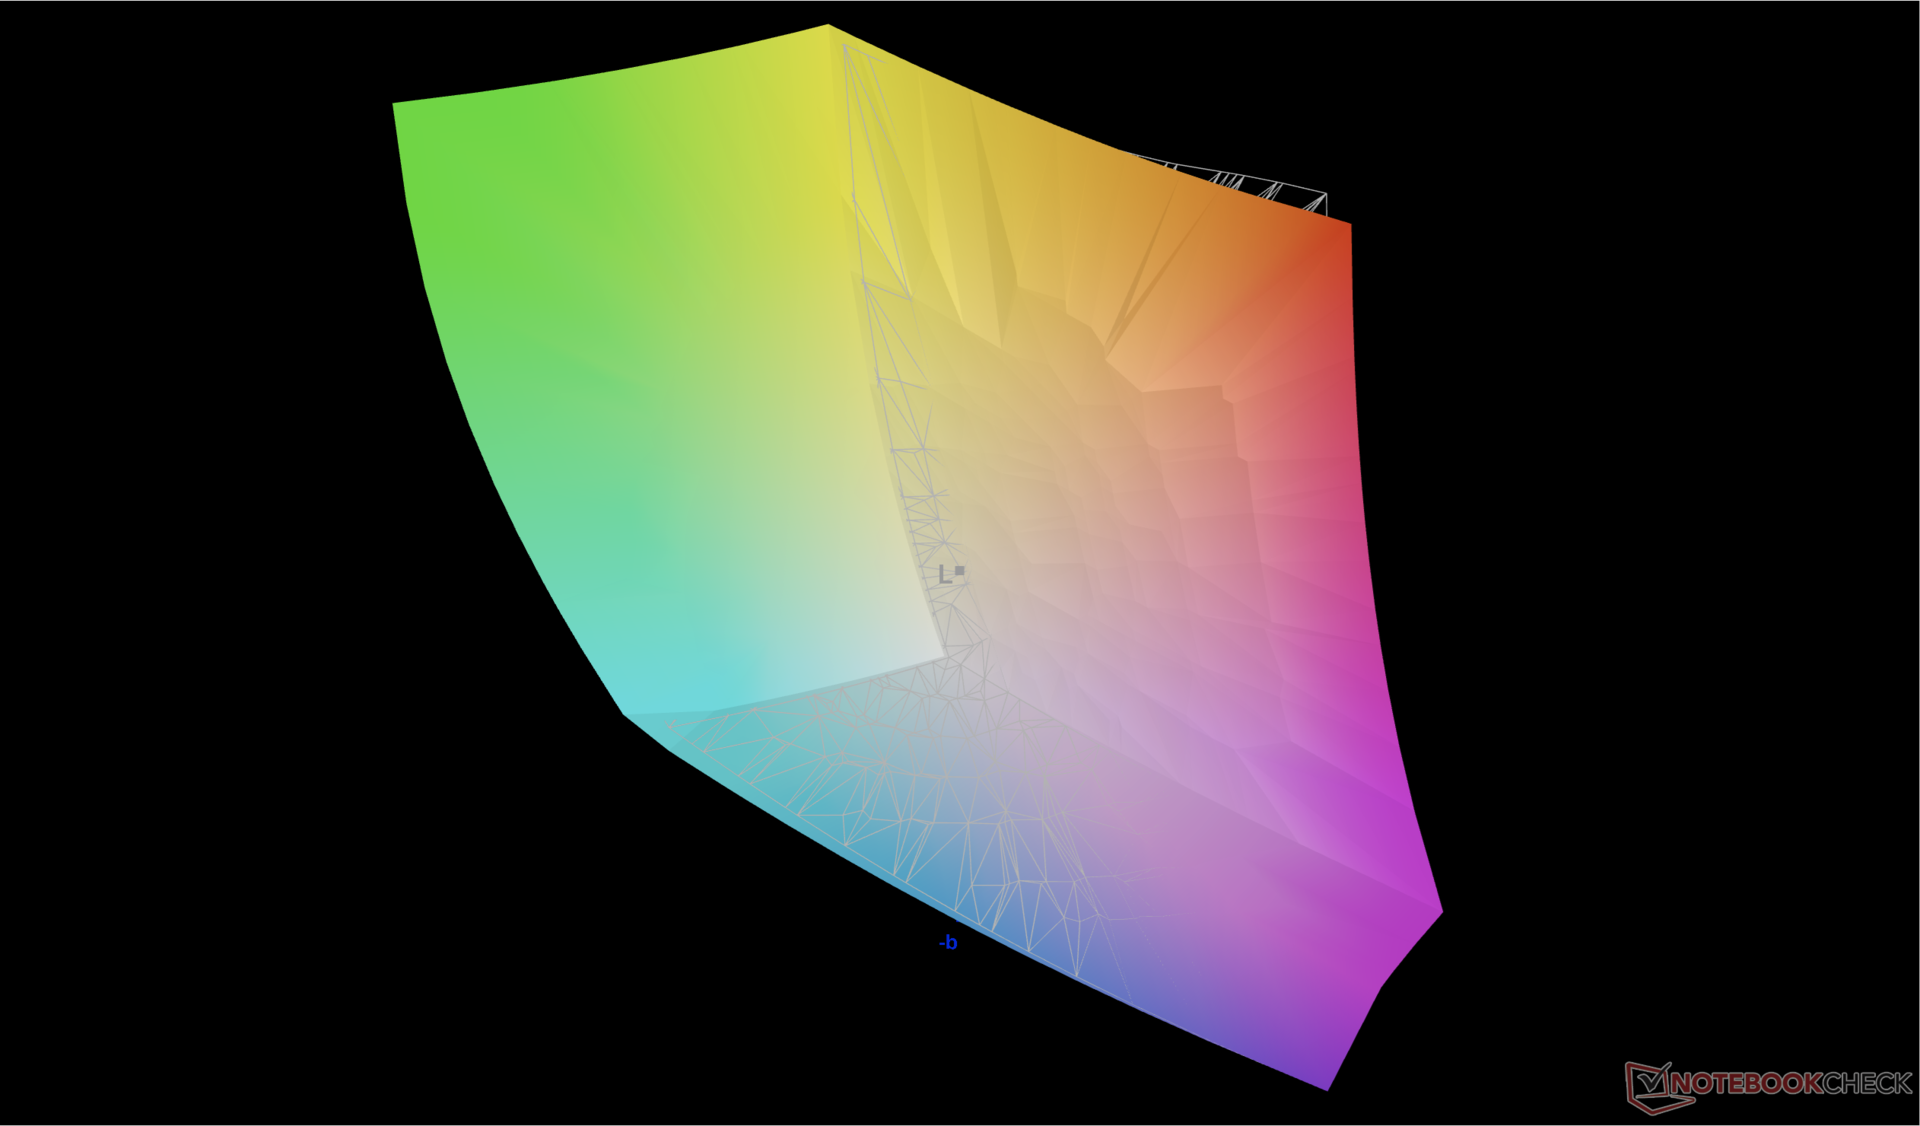
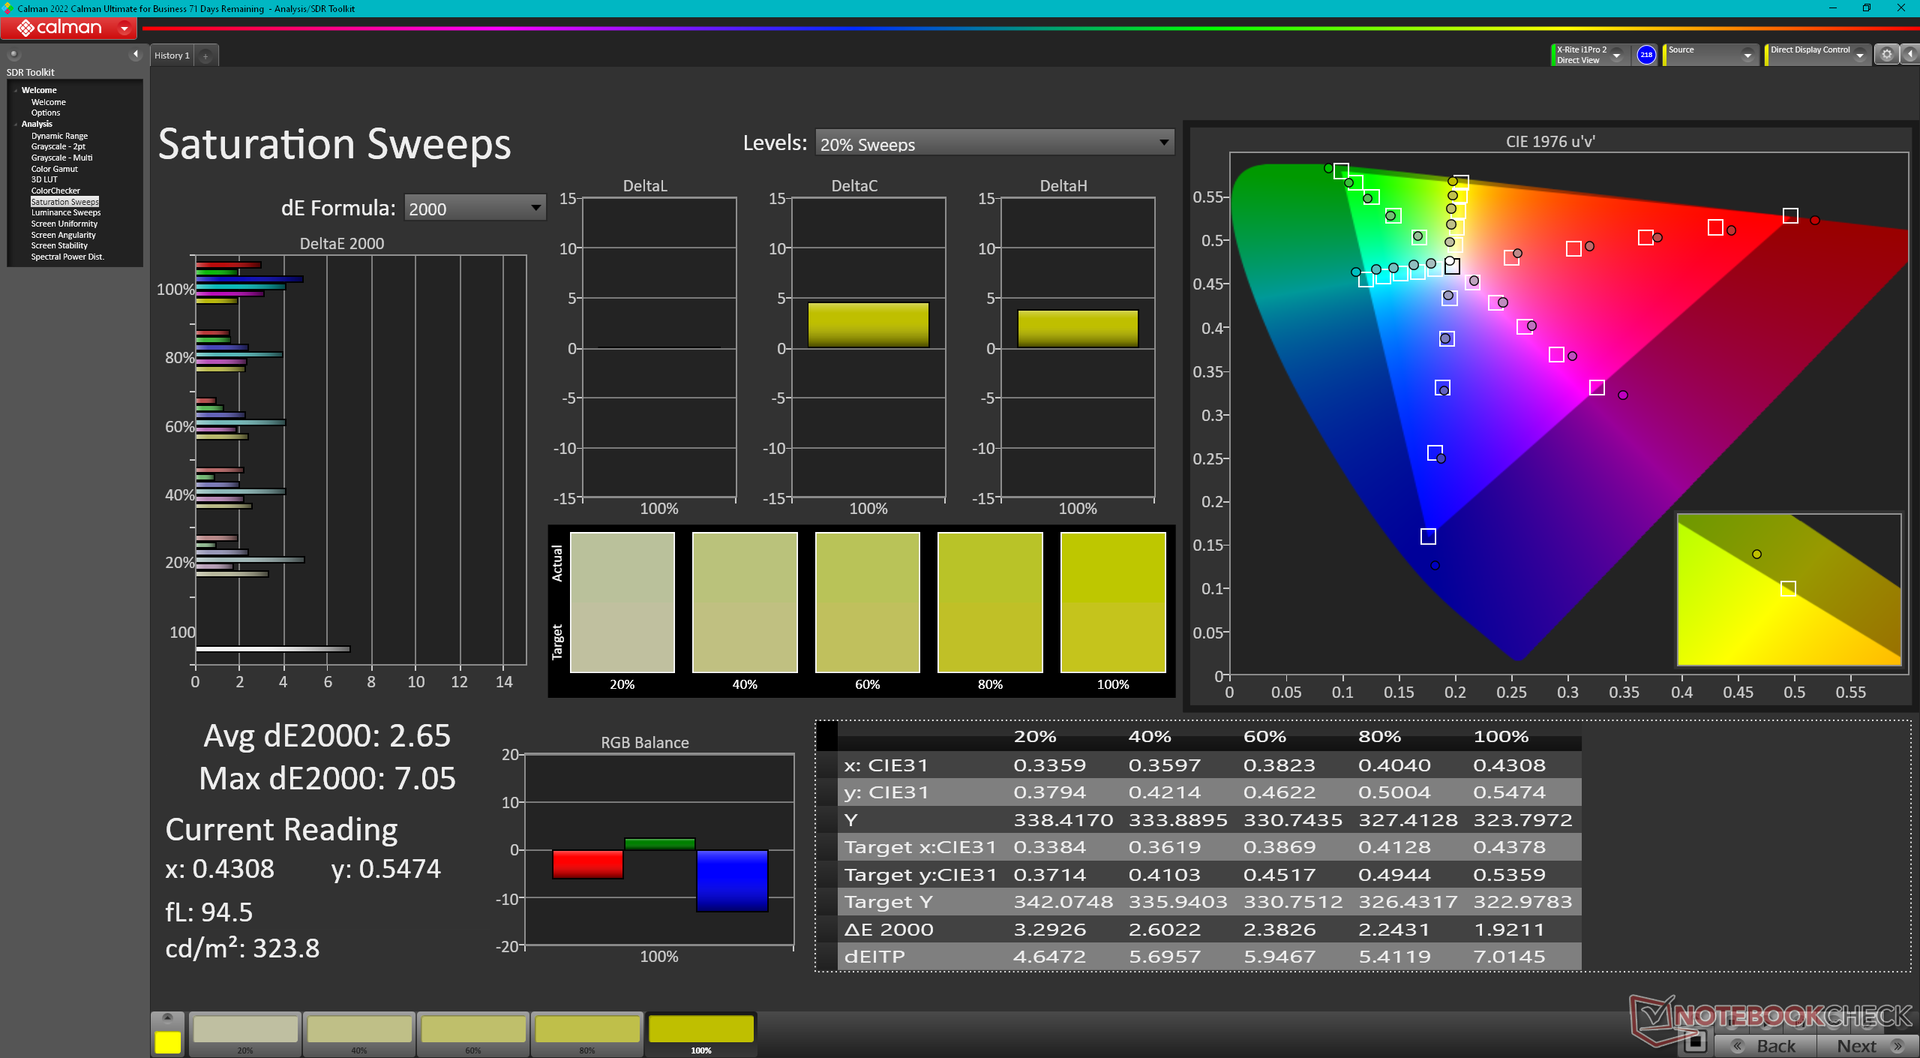
El panel Mini-LED opcional es un punto de venta clave para el 2 en 1 Inspiron 16 de este año. Aunque puede que no ofrezca 4K y HDR1000 como en algunos portátiles para juegos extremos, su resolución de 2,5K y su compatibilidad con HDR600 siguen siendo impresionantes para un convertible de 16 pulgadas que se vende por unos 1.000 dólares. Los usuarios siguen obteniendo la misma excelente relación de contraste de 3000:1 y colores DCI-P3 completos que en la mayoría de los paneles mini-LED de portátiles más caros.
Tanto los colores como el brillo se ajustan automáticamente a sRGB y 400 nits como máximo, respectivamente, cuando el HDR está desactivado. Al activar el HDR se cambia el perfil de color a DCI-P3 y se eleva el brillo máximo a 663 nits al reproducir contenidos HDR.
La frecuencia de refresco nativa de 90 Hz es respetable, pero el panel carece de compatibilidad con la sincronización adaptativa y la frecuencia de refresco variable de Windows para ahorrar energía.
| |||||||||||||||||||||||||
iluminación: 97 %
Brillo con batería: 413 cd/m²
Contraste: 2950:1 (Negro: 0.14 cd/m²)
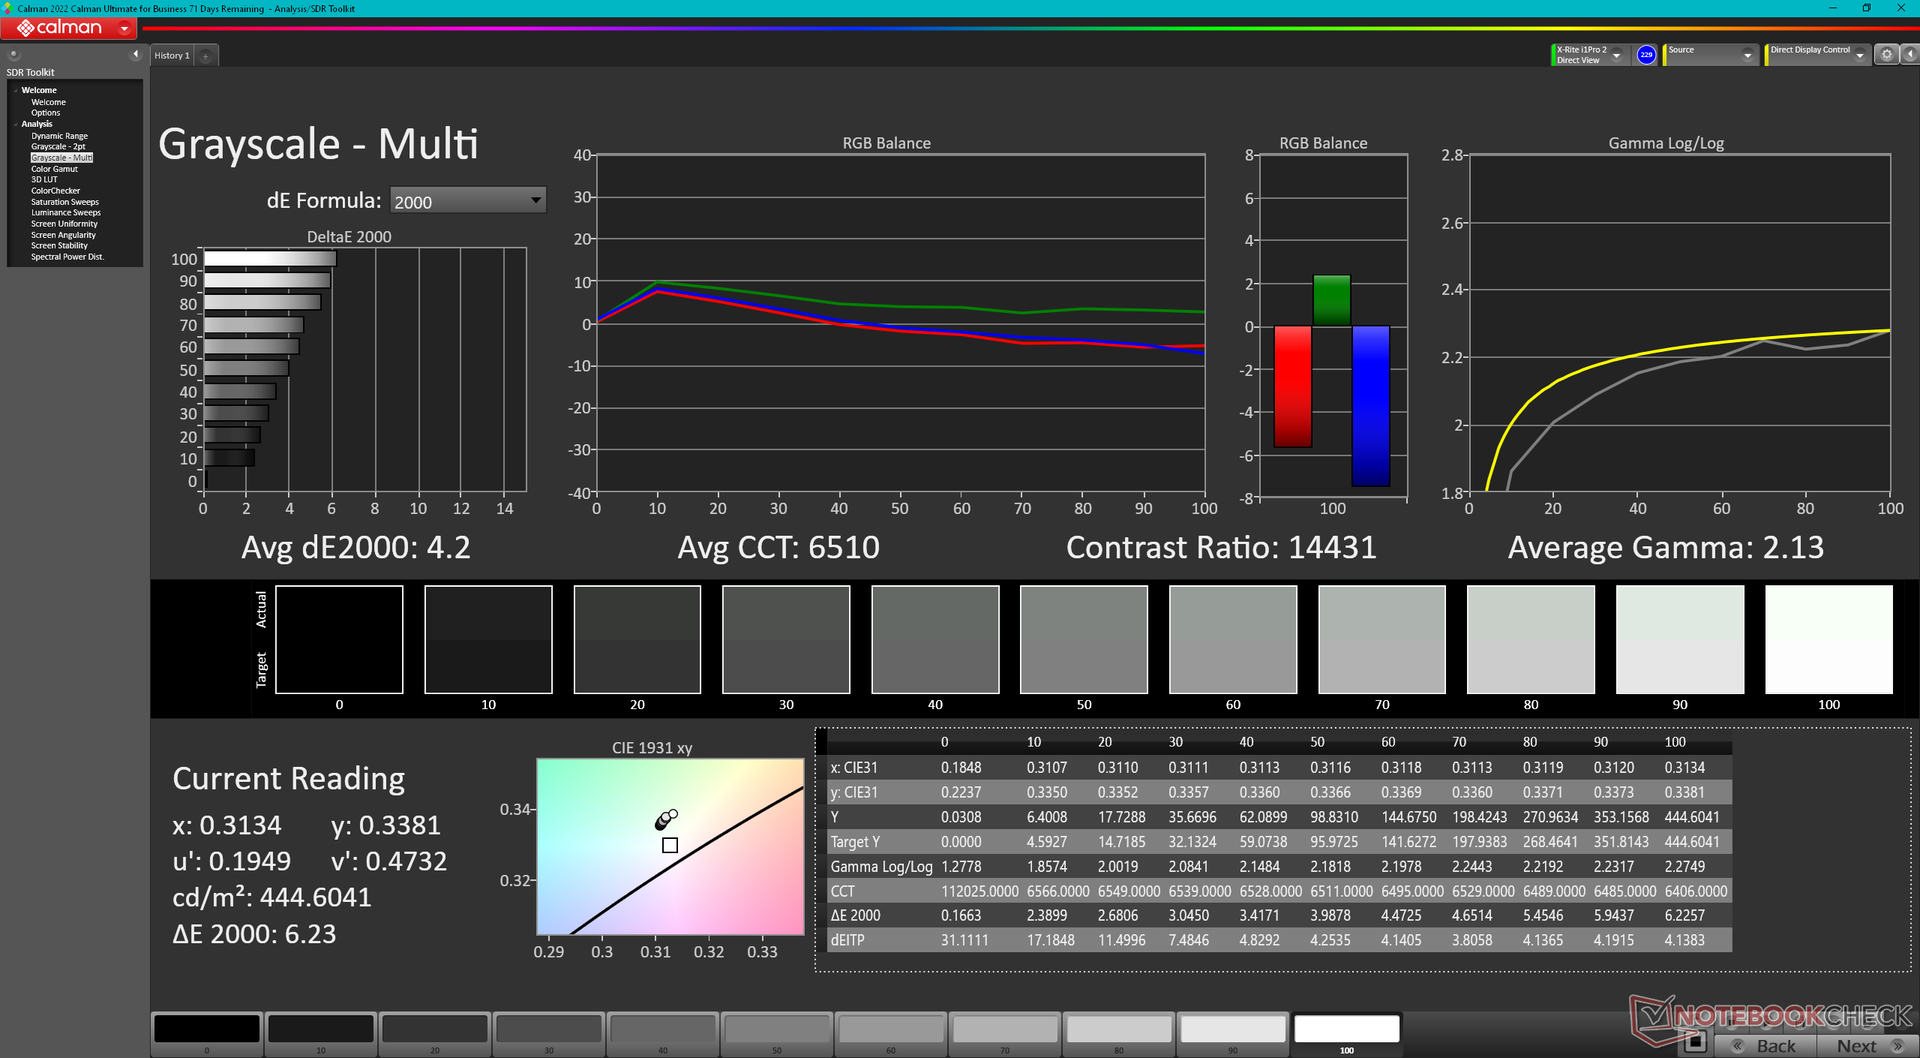
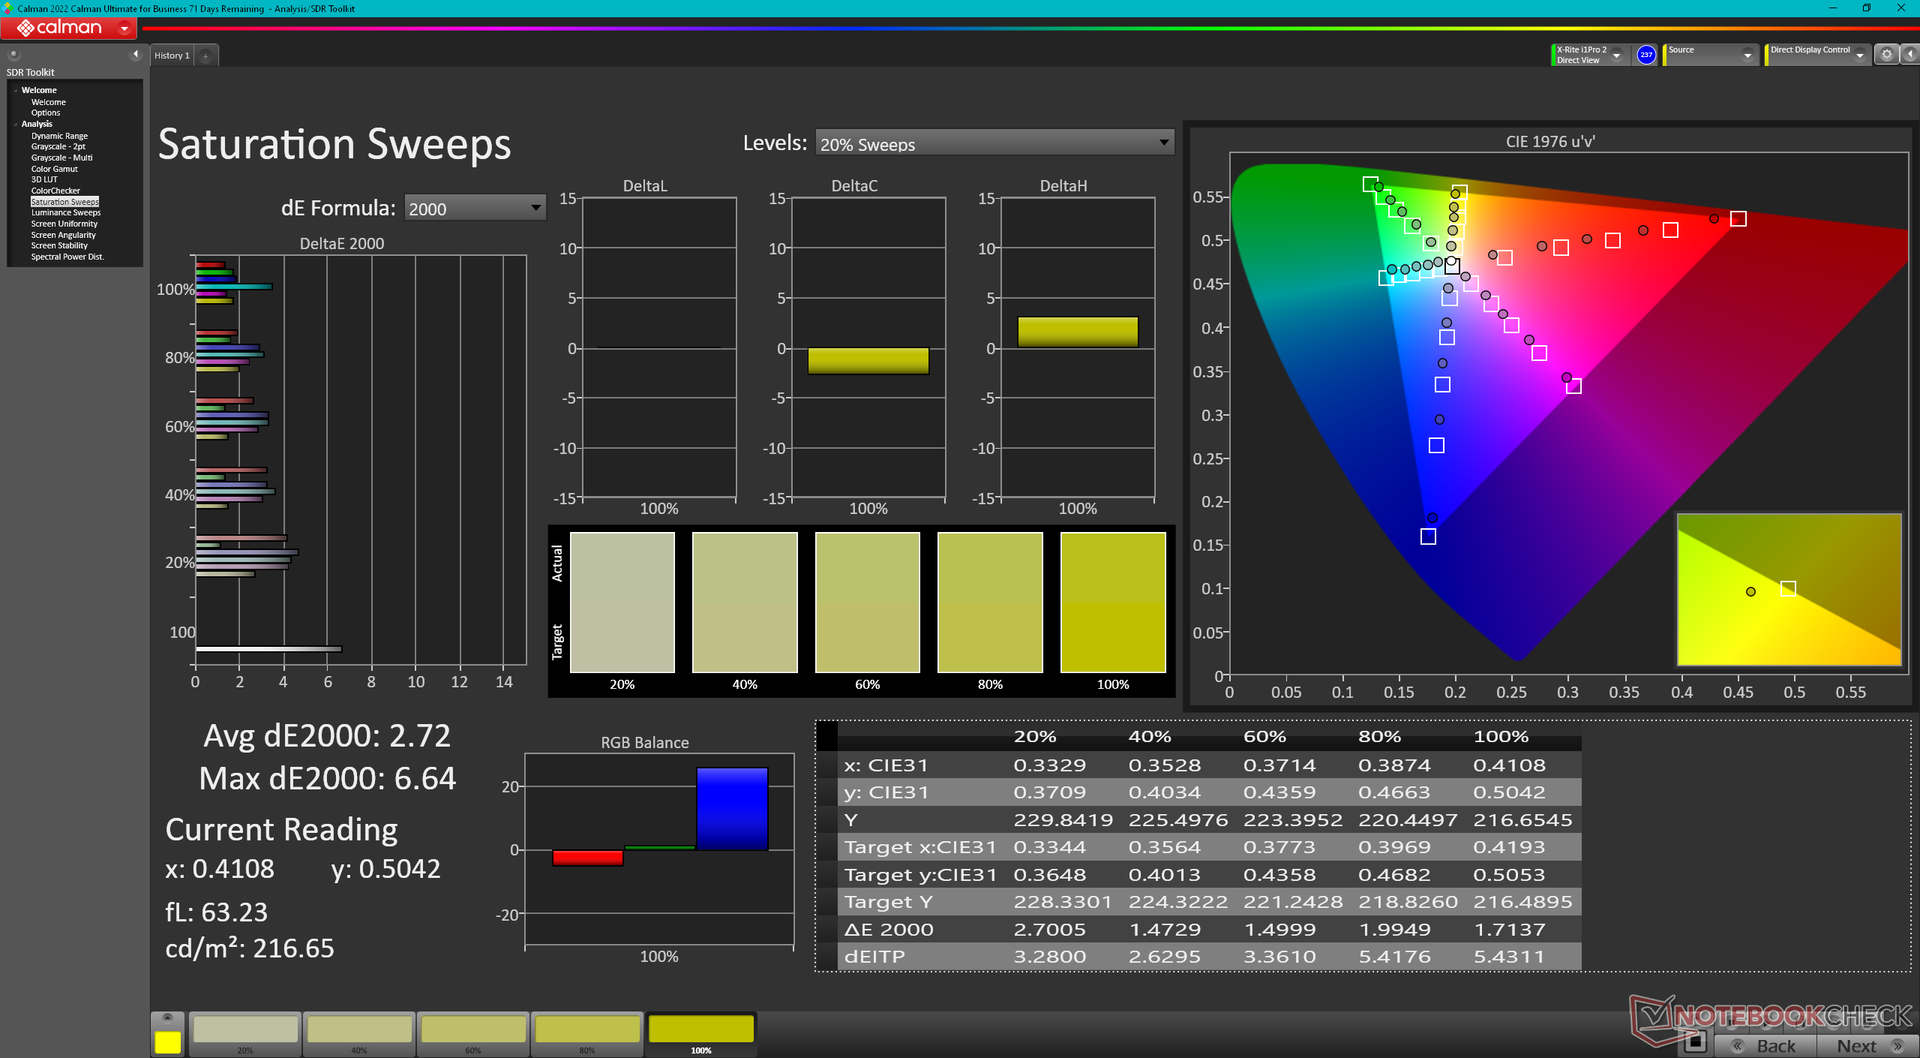
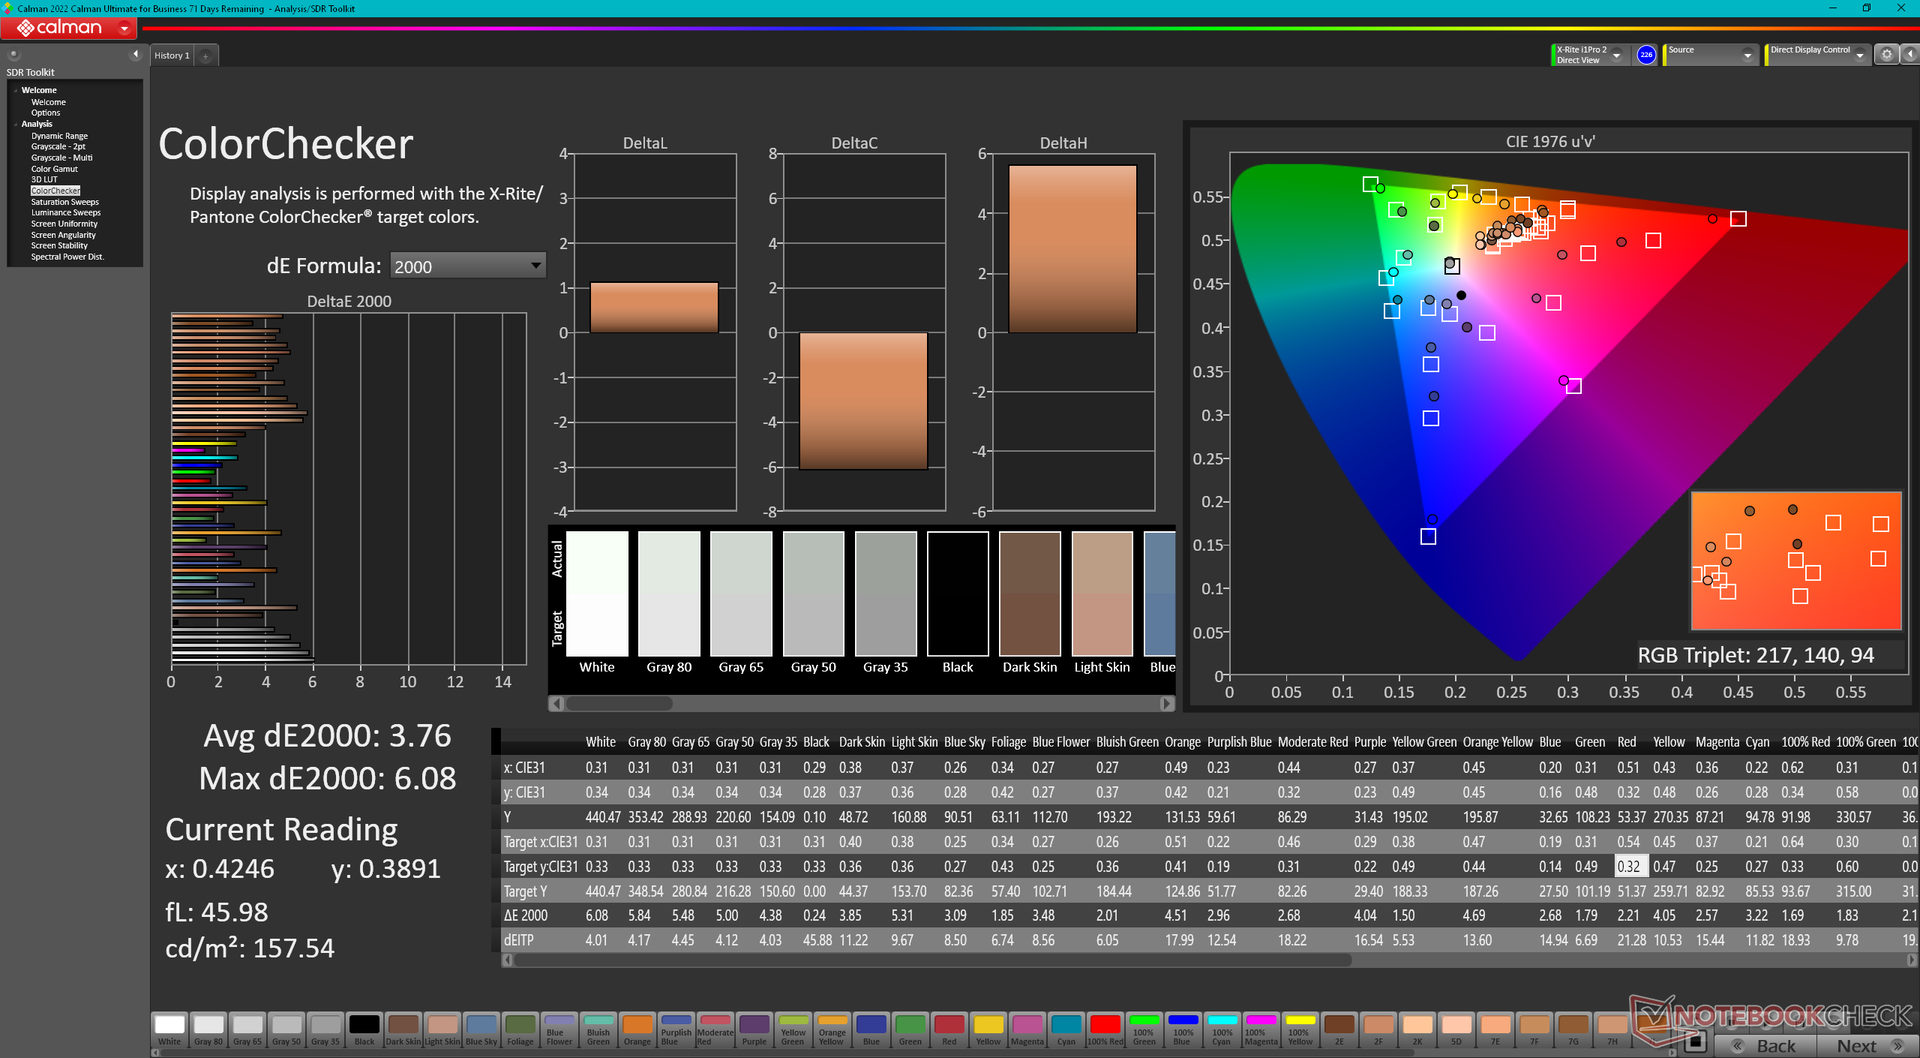
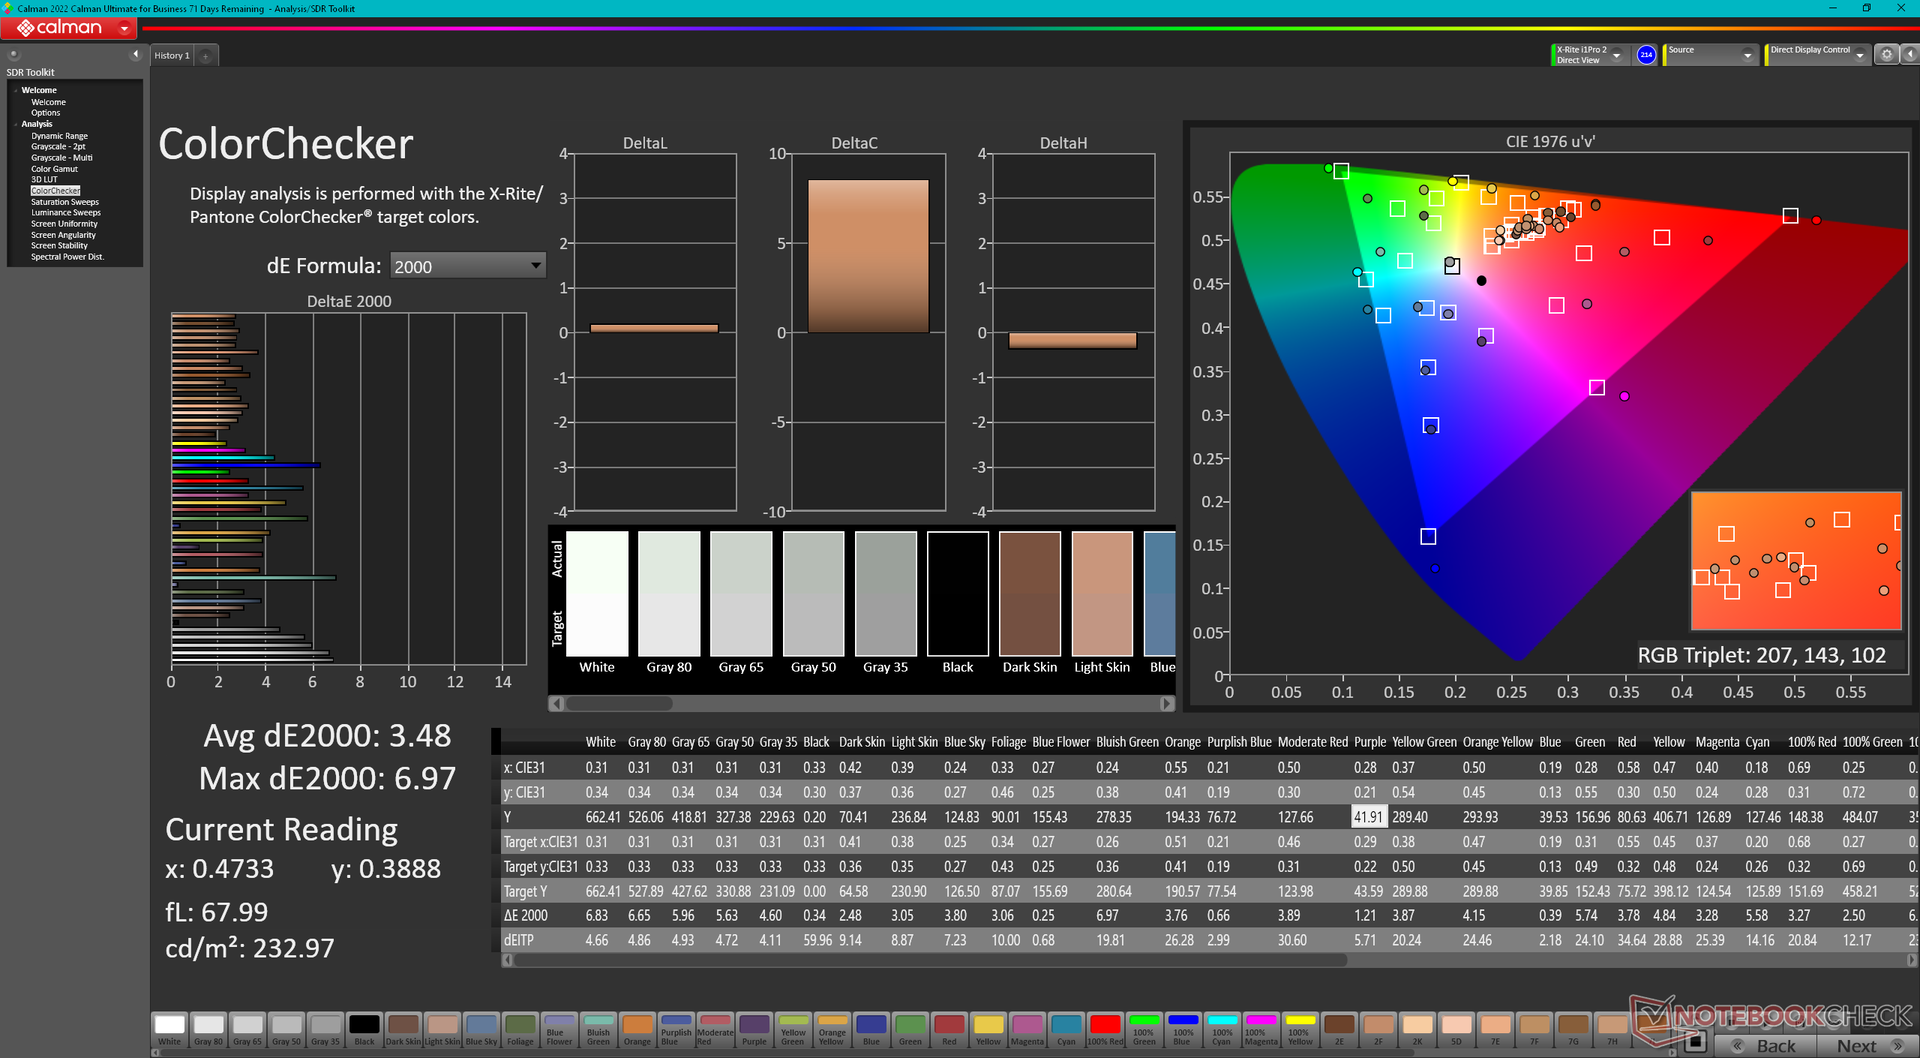
ΔE Color 3.48 | 0.5-29.43 Ø4.87
ΔE Greyscale 4.5 | 0.5-98 Ø5.1
92.5% AdobeRGB 1998 (Argyll 2.2.0 3D)
100% sRGB (Argyll 2.2.0 3D)
99.4% Display P3 (Argyll 2.2.0 3D)
Gamma: 2.15
| Dell Inspiron 16 7640 2-in-1 AU Optronics B160QAT, Mini-LED, 2560x1600, 16", 90 Hz | Dell Inspiron 16 Plus 7640 AU Optronics B160QAN, IPS, 2560x1600, 16", 120 Hz | Dell Inspiron 16 7635 2-in-1 Chi Mei 160JCA, IPS, 1920x1200, 16", 60 Hz | HP Envy x360 2-in-1 16-ad0097nr Samsung SDC41A6, OLED, 2880x1800, 16", 120 Hz | Lenovo IdeaPad Pro 5 16IMH G9 NE160QDM-NY2, IPS, 2560x1600, 16", 120 Hz | Samsung Galaxy Book4 Pro 360 ATNA60CL09-0, OLED, 2880x1800, 16", 120 Hz | |
|---|---|---|---|---|---|---|
| Display | -14% | -20% | 1% | -23% | 2% | |
| Display P3 Coverage | 99.4 | 76 -24% | 67.4 -32% | 99.6 0% | 63.3 -36% | 99.9 1% |
| sRGB Coverage | 100 | 99.8 0% | 98.2 -2% | 100 0% | 95.2 -5% | 100 0% |
| AdobeRGB 1998 Coverage | 92.5 | 76.7 -17% | 69.5 -25% | 96.5 4% | 65.3 -29% | 96.6 4% |
| Response Times | 3% | -5% | 37% | 43% | 35% | |
| Response Time Grey 50% / Grey 80% * | 15.4 ? | 25.6 ? -66% | 27.6 ? -79% | 0.8 ? 95% | 15 ? 3% | 0.49 ? 97% |
| Response Time Black / White * | 60.6 ? | 17.6 ? 71% | 18.2 ? 70% | 0.89 ? 99% | 10.3 ? 83% | 0.67 ? 99% |
| PWM Frequency | 2753.7 ? | 491.8 ? -82% | 240 ? -91% | |||
| Screen | -5% | -25% | 10% | -21% | 33% | |
| Brightness middle | 413 | 314.7 -24% | 301.3 -27% | 399.4 -3% | 368 -11% | 387 -6% |
| Brightness | 409 | 291 -29% | 269 -34% | 405 -1% | 368 -10% | 392 -4% |
| Brightness Distribution | 97 | 89 -8% | 79 -19% | 98 1% | 91 -6% | 98 1% |
| Black Level * | 0.14 | 0.28 -100% | 0.28 -100% | 0.31 -121% | ||
| Contrast | 2950 | 1124 -62% | 1076 -64% | 1187 -60% | ||
| Colorchecker dE 2000 * | 3.48 | 1.62 53% | 3.1 11% | 4.05 -16% | 2.4 31% | 1 71% |
| Colorchecker dE 2000 max. * | 6.97 | 2.94 58% | 5.5 21% | 6.69 4% | 6.5 7% | 1.9 73% |
| Greyscale dE 2000 * | 4.5 | 1.3 71% | 3.9 13% | 1.1 76% | 4.5 -0% | 1.7 62% |
| Gamma | 2.15 102% | 2.26 97% | 2.19 100% | 2.27 97% | 2.21 100% | 2.25 98% |
| CCT | 6446 101% | 6385 102% | 6186 105% | 6419 101% | 6324 103% | 6325 103% |
| Colorchecker dE 2000 calibrated * | 1.08 | 0.49 | 1.02 | 0.8 | ||
| Media total (Programa/Opciones) | -5% /
-6% | -17% /
-21% | 16% /
15% | -0% /
-12% | 23% /
26% |
* ... más pequeño es mejor
La pantalla es razonablemente precisa para un PC de gama media, con unos valores DeltaE medios de escala de grises y color de 4,2 y 3,76, respectivamente. Estos valores se mantienen relativamente estables cuando se activa también el HDR, que cambia automáticamente el sistema a los colores DCI-P3. En cualquier caso, la temperatura de color es ligeramente demasiado fría en torno a 6500K.

Tiempos de respuesta del display
| ↔ Tiempo de respuesta de Negro a Blanco | ||
|---|---|---|
| 60.6 ms ... subida ↗ y bajada ↘ combinada | ↗ 56.2 ms subida | 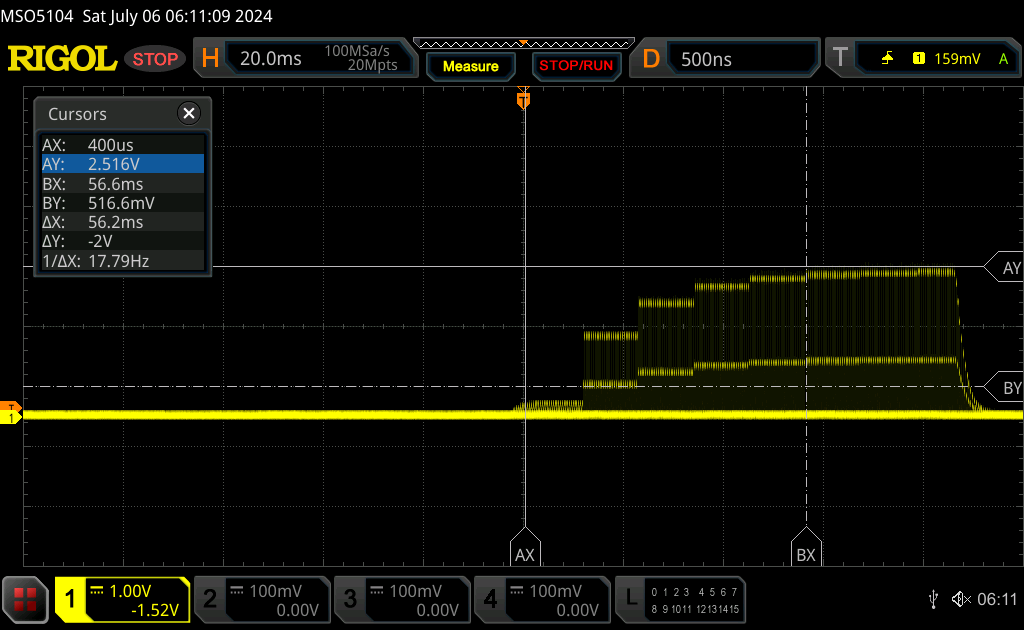 |
| ↘ 4.4 ms bajada | ||
| La pantalla mostró tiempos de respuesta lentos en nuestros tests y podría ser demasiado lenta para los jugones. En comparación, todos los dispositivos de prueba van de ##min### (mínimo) a 240 (máximo) ms. » 100 % de todos los dispositivos son mejores. Eso quiere decir que el tiempo de respuesta es peor que la media (20.8 ms) de todos los dispositivos testados. | ||
| ↔ Tiempo de respuesta 50% Gris a 80% Gris | ||
| 15.4 ms ... subida ↗ y bajada ↘ combinada | ↗ 8.6 ms subida | 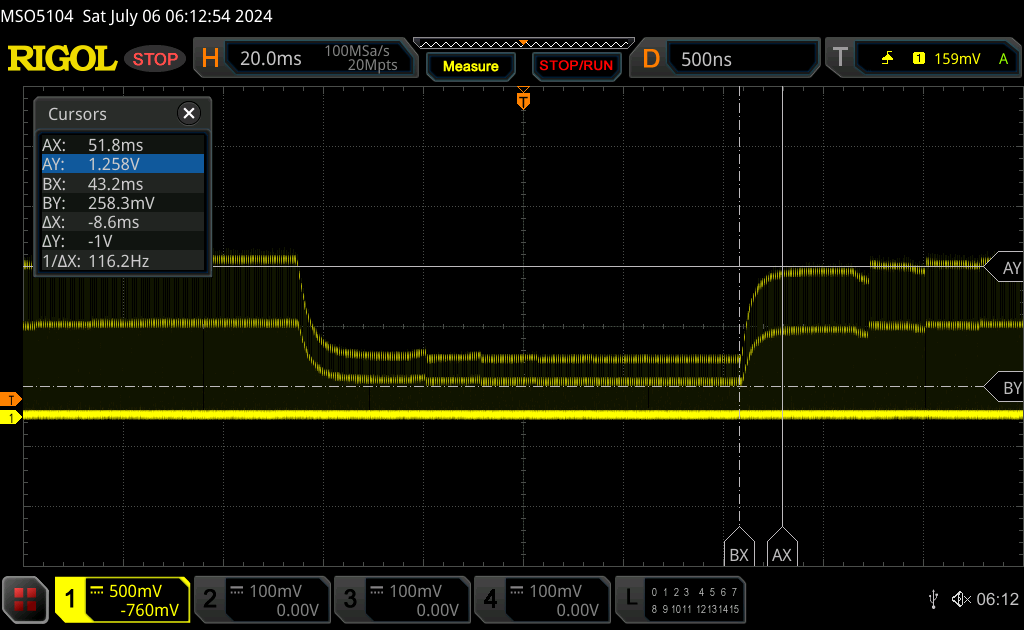 |
| ↘ 6.8 ms bajada | ||
| La pantalla mostró buenos tiempos de respuesta en nuestros tests pero podría ser demasiado lenta para los jugones competitivos. En comparación, todos los dispositivos de prueba van de ##min### (mínimo) a 636 (máximo) ms. » 27 % de todos los dispositivos son mejores. Esto quiere decir que el tiempo de respuesta medido es mejor que la media (32.5 ms) de todos los dispositivos testados. | ||
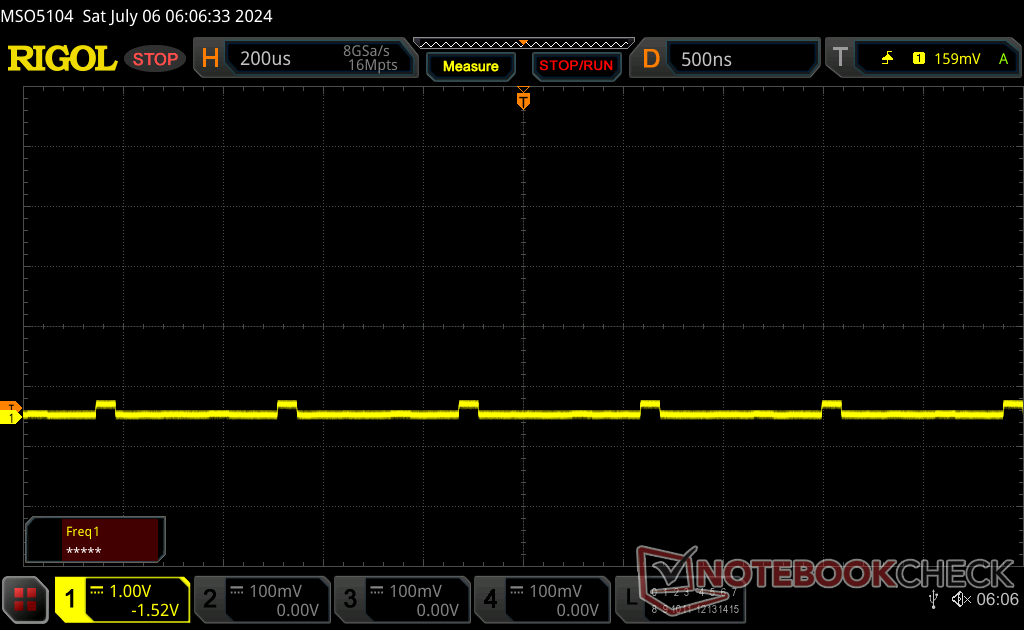
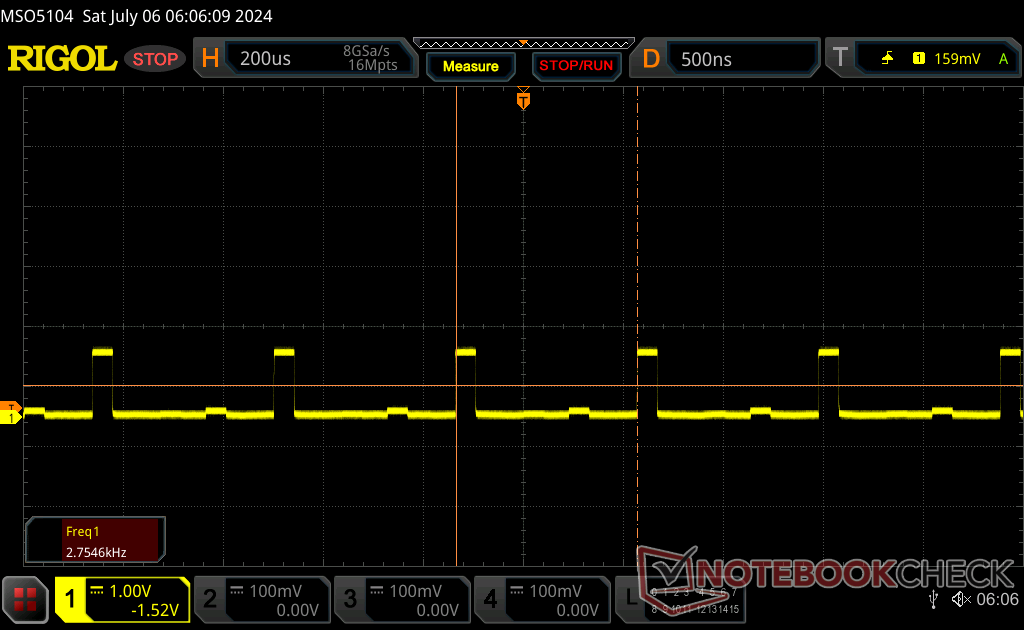
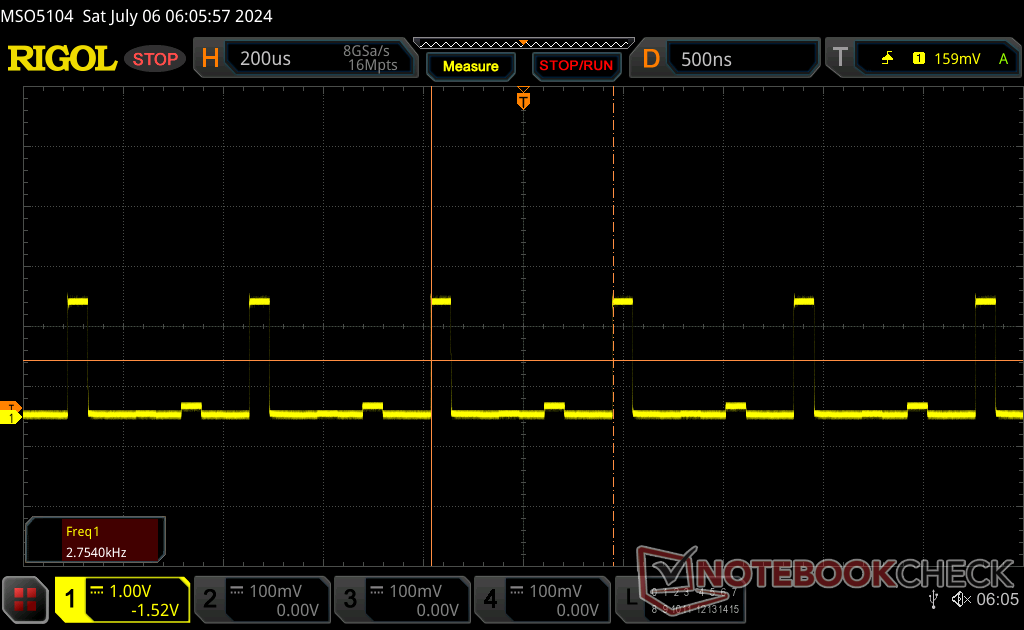
Parpadeo de Pantalla / PWM (Pulse-Width Modulation)
| Parpadeo de Pantalla / PWM detectado | 2753.7 Hz | ≤ 100 % de brillo | 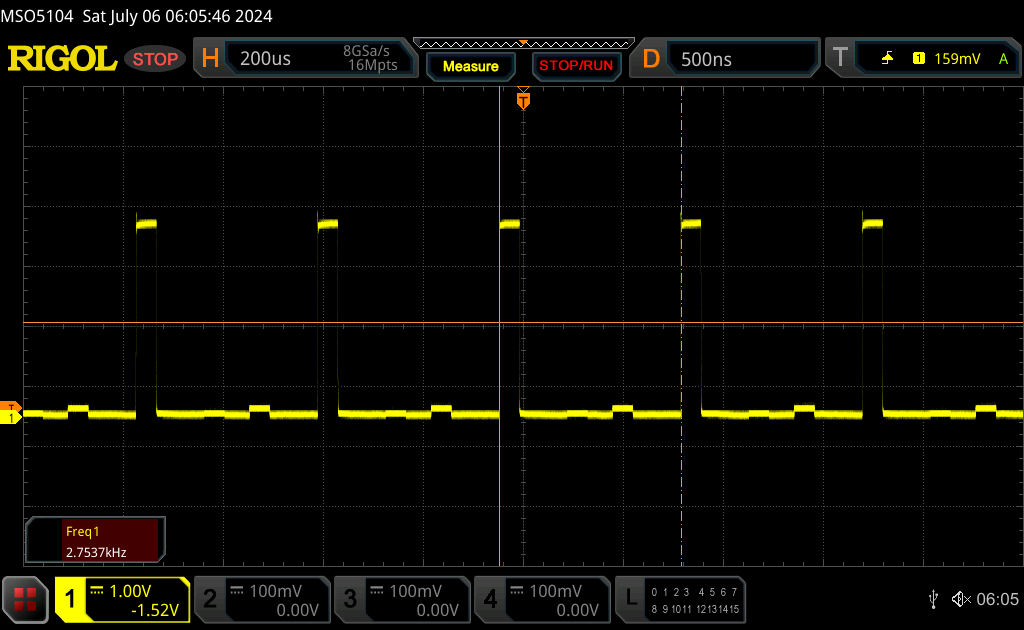 |
La retroiluminación del display parpadea a 2753.7 Hz (seguramente usa PWM - Pulse-Width Modulation) a un brillo del 100 % e inferior. Sobre este nivel de brillo no debería darse parpadeo / PWM. La frecuencia de 2753.7 Hz es bastante alta, por lo que la mayoría de gente sensible al parpadeo no debería ver parpadeo o tener fatiga visual. Comparación: 53 % de todos los dispositivos testados no usaron PWM para atenuar el display. Si se usó, medimos una media de 8516 (mínimo: 5 - máxmo: 343500) Hz. | |||
La modulación por ancho de pulso o parpadeo está presente en todos los niveles de brillo a una frecuencia constante de 2753 Hz. Este comportamiento es de esperar de un panel mini-LED y la frecuencia es, afortunadamente, lo suficientemente rápida como para ser imperceptible para la mayoría de los espectadores.

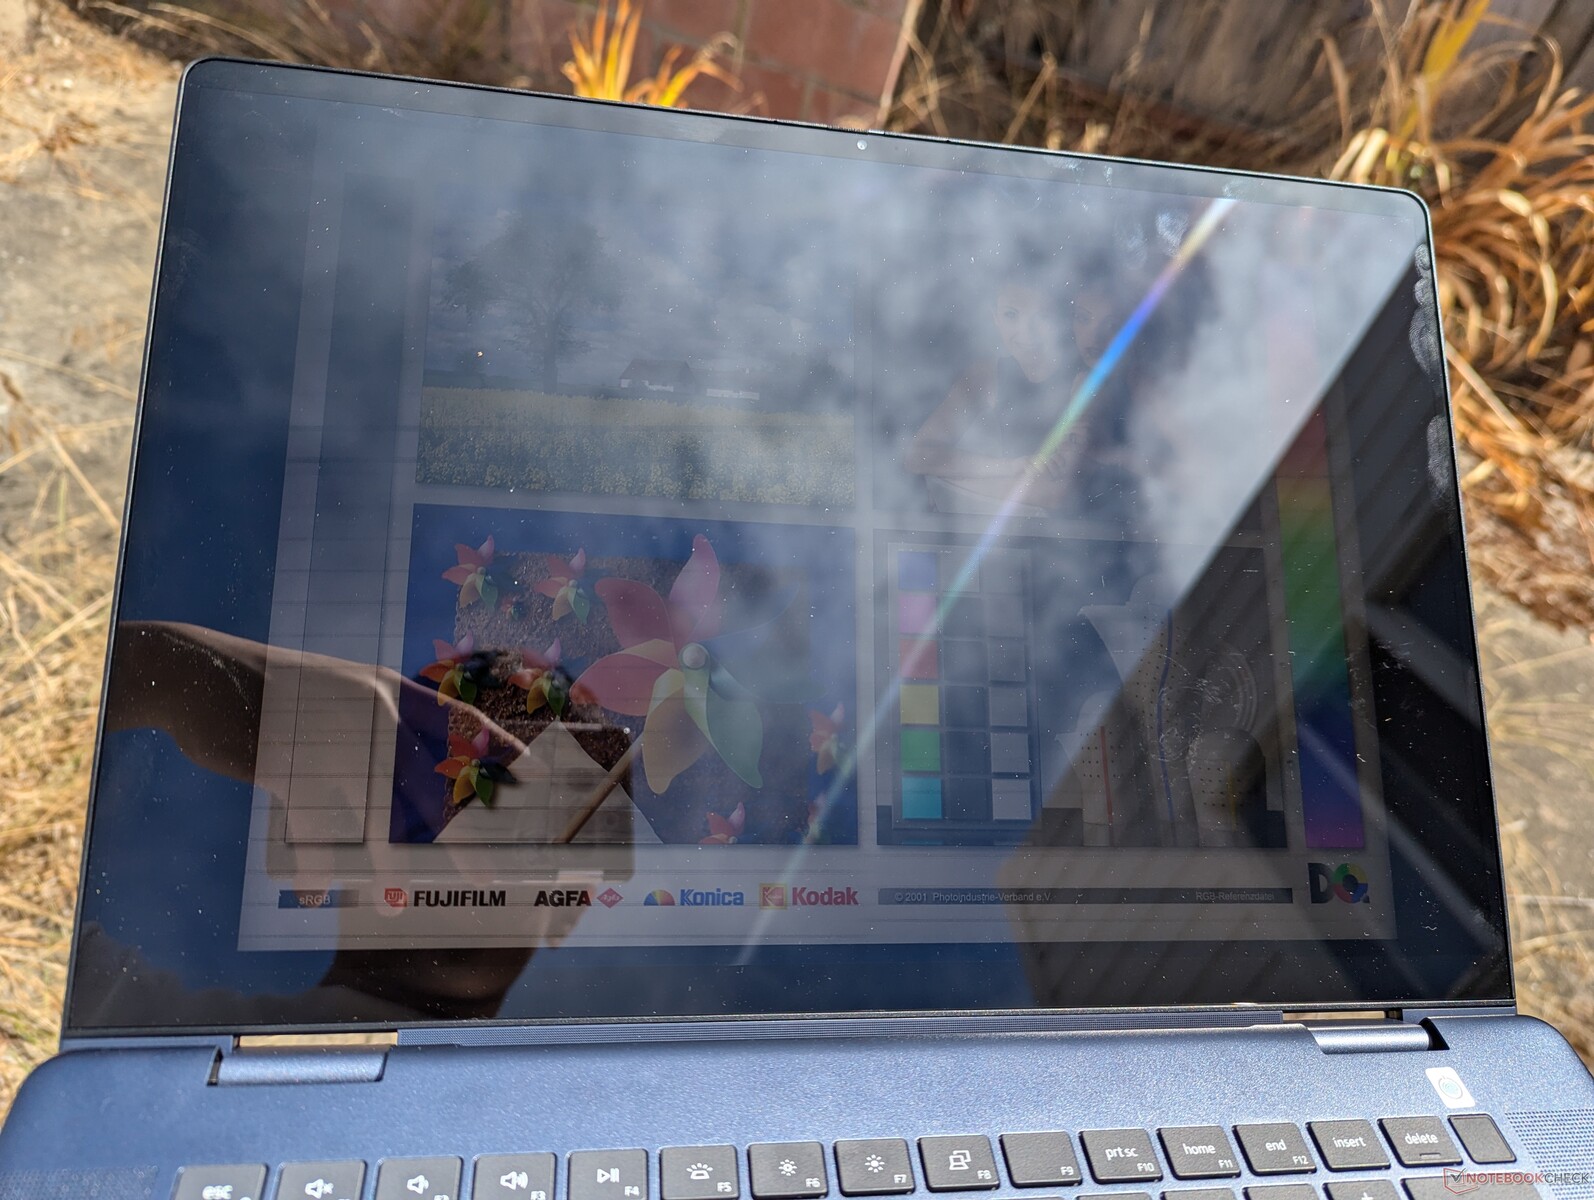
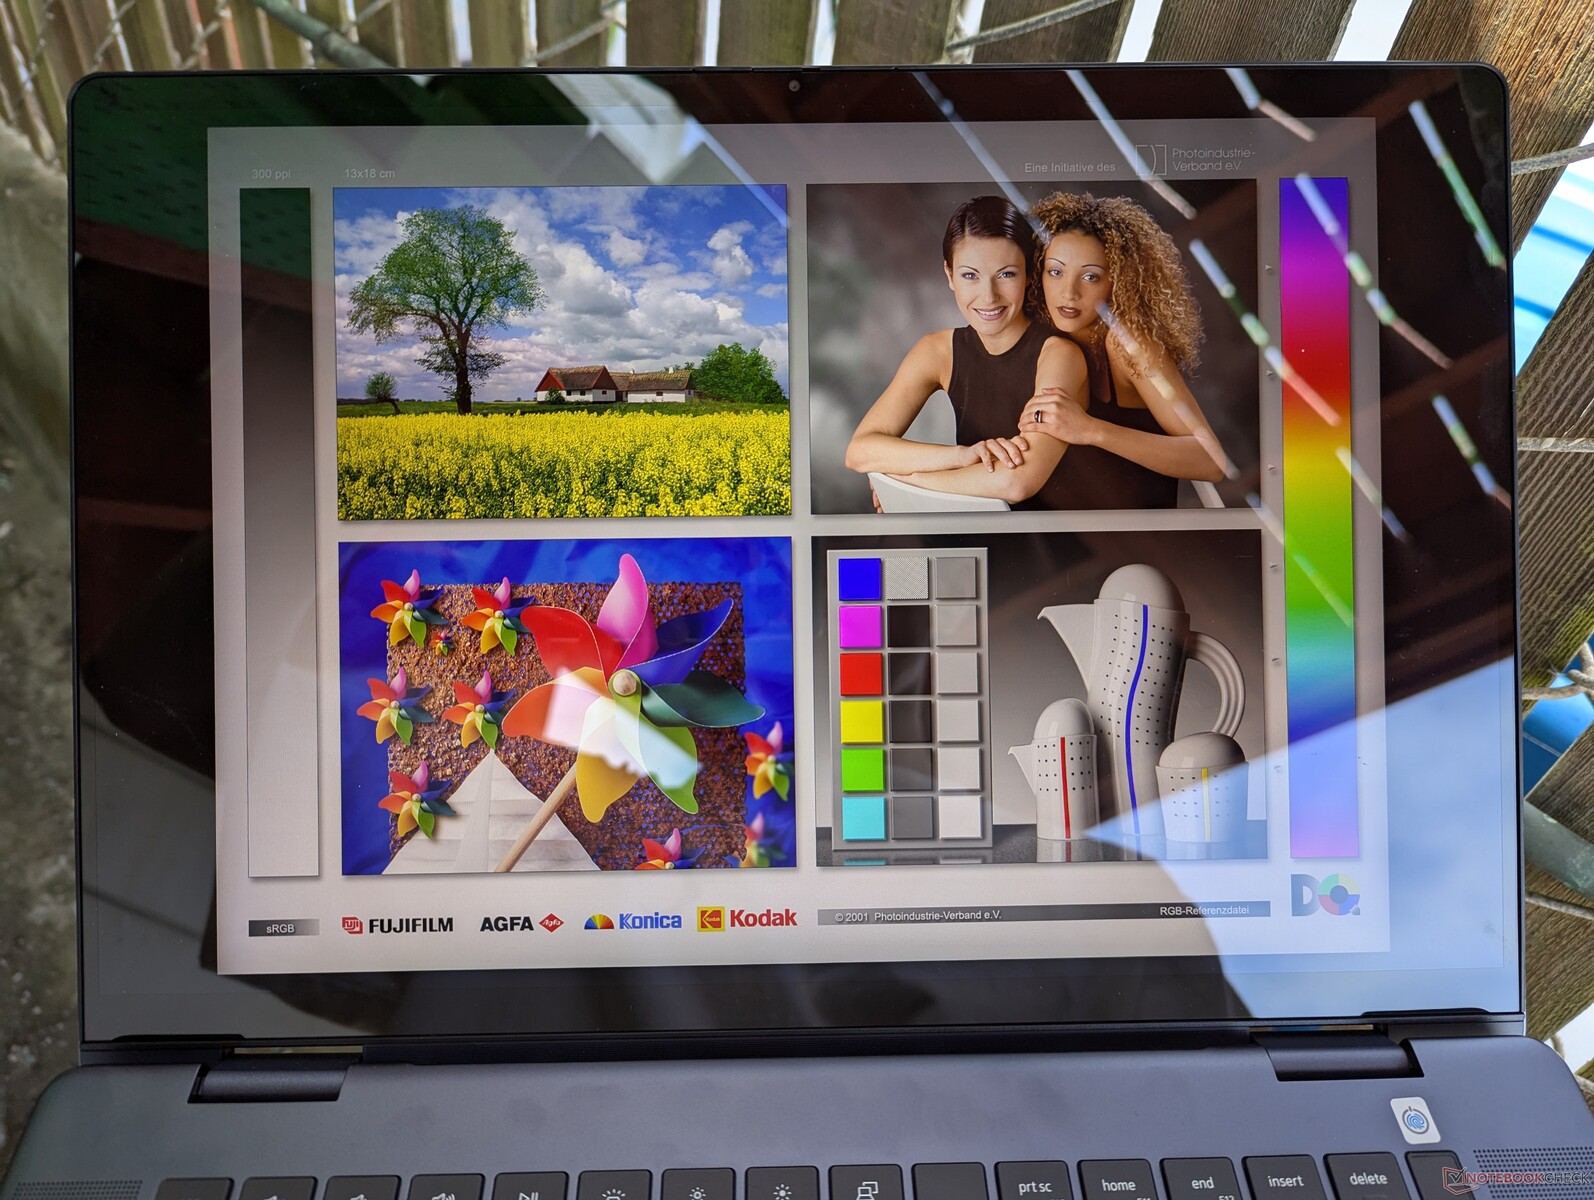
Con 400 nits en modo SDR o 600 nits en modo HDR, la pantalla es más brillante que tanto la opción IPS base como la opción OLED del modelo saliente. Sin embargo, el Inspiron 16 2 en 1 sigue sin ser lo suficientemente brillante para las condiciones al aire libre, donde el deslumbramiento se convierte rápidamente en un problema. Se podría pensar que activar el HDR puede aliviar el problema, ya que eleva el techo de brillo, pero tenga en cuenta que el modo HDR de Windows no está disponible con la batería.

Prestaciones - Rápido para un descapotable
Condiciones de prueba
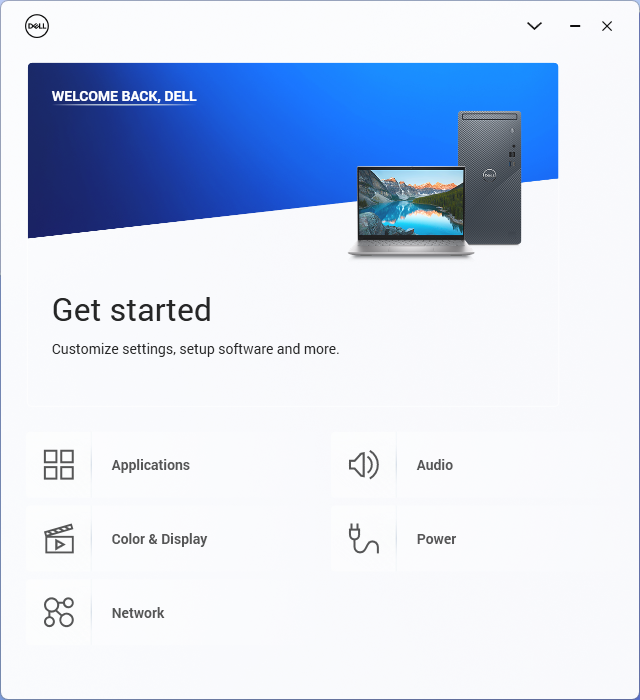
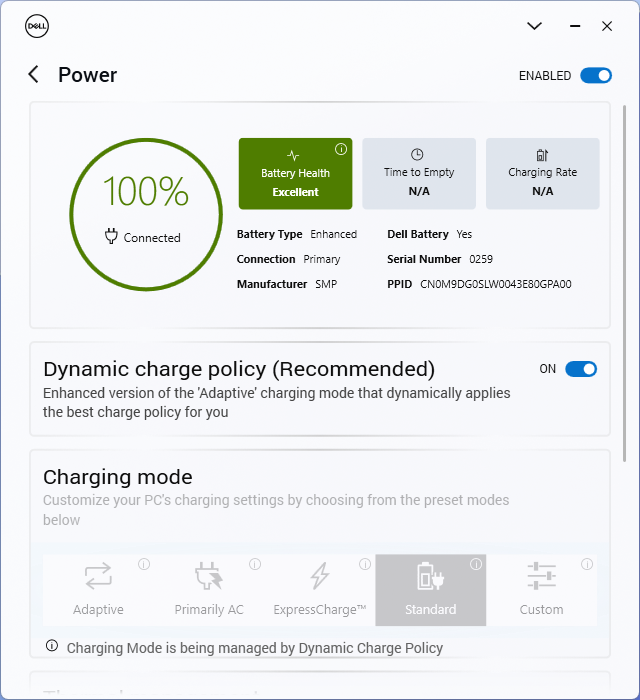
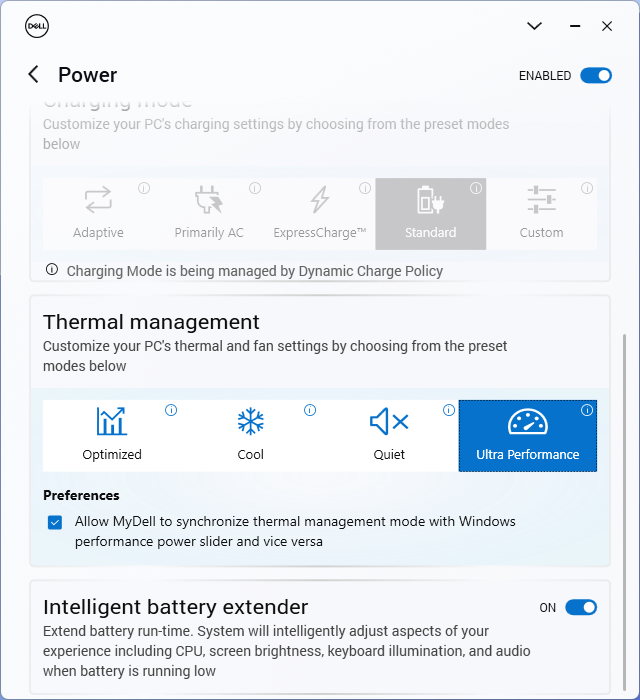
Pusimos el MyDell en modo Rendimiento antes de ejecutar los puntos de referencia que se muestran a continuación. El software dispone de un práctico conmutador para sincronizar los perfiles de energía de Dell con los perfiles de energía de Windows para que el cambio entre los ajustes de energía sea un proceso más sencillo.
Procesador
Tener una CPU Core serie H en un factor de forma convertible a veces puede ser preocupante ya que el fabricante puede underclockear su rendimiento. Afortunadamente, este no parece ser el caso del Inspiron 16 7640 2 en 1 ya que su Core Ultra 7 155H rinde dentro del 5 por ciento del PC medio de nuestra base de datos equipado con el mismo procesador. Esto convierte al modelo de Dell en uno de los convertibles más rápidos en la categoría de tamaño de 16 pulgadas superando a opciones de alto rendimiento como el Ryzen 7 8840HS del HP Envy x360 16 2 en 1. También vale la pena señalar que esta misma CPU también se puede encontrar en muchos portátiles para juegos, lo que demuestra que este convertible de Dell no se anda con tonterías cuando se trata del rendimiento del procesador.
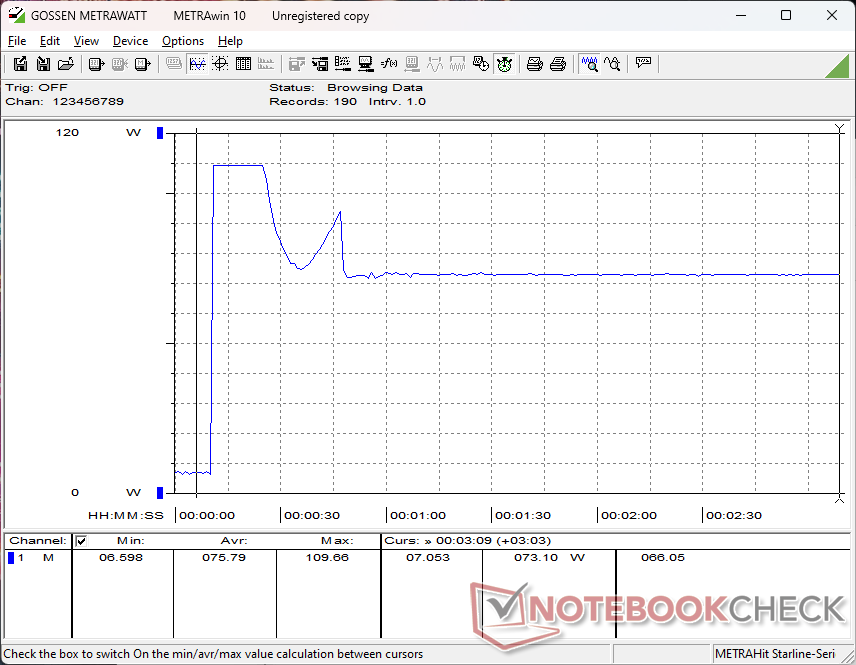
La sostenibilidad de Turbo Boost es buena pero no perfecta. Al ejecutar CineBench R15 xT en bucle, nuestra puntuación inicial de 2680 puntos caía aproximadamente un 15 por ciento después de sólo tres ejecuciones. los clamshells de 16 pulgadas como el Lenovo IdeaPad Pro 5 16 o el Inspiron 16 Plus 7640 con la misma CPU son capaces de mantener velocidades de reloj Turbo Boost más altas durante más tiempo, como muestra el gráfico siguiente.
Conformarse con la gama baja Core Ultra 5 125U se espera que afecte significativamente al rendimiento multihilo en un 40 por ciento basándonos en nuestro tiempo con el Lenovo Yoga 7 2 en 1 16. Sin embargo, la opción de la serie Core U todavía podría ser ideal para aquellos que prefieren la duración de la batería sobre el rendimiento bruto.
Cinebench R15 Multi Loop
Cinebench R23: Multi Core | Single Core
Cinebench R20: CPU (Multi Core) | CPU (Single Core)
Cinebench R15: CPU Multi 64Bit | CPU Single 64Bit
Blender: v2.79 BMW27 CPU
7-Zip 18.03: 7z b 4 | 7z b 4 -mmt1
Geekbench 6.4: Multi-Core | Single-Core
Geekbench 5.5: Multi-Core | Single-Core
HWBOT x265 Benchmark v2.2: 4k Preset
LibreOffice : 20 Documents To PDF
R Benchmark 2.5: Overall mean
* ... más pequeño es mejor
AIDA64: FP32 Ray-Trace | FPU Julia | CPU SHA3 | CPU Queen | FPU SinJulia | FPU Mandel | CPU AES | CPU ZLib | FP64 Ray-Trace | CPU PhotoWorxx
| Performance Rating | |
| Lenovo IdeaPad Pro 5 16IMH G9 | |
| HP Envy x360 2-in-1 16-ad0097nr | |
| Dell Inspiron 16 7640 2-in-1 | |
| Dell Inspiron 16 Plus 7640 | |
| Medio Intel Core Ultra 7 155H | |
| Dell Inspiron 16 7635 2-in-1 | |
| Samsung Galaxy Book4 Pro 360 | |
| AIDA64 / FP32 Ray-Trace | |
| HP Envy x360 2-in-1 16-ad0097nr | |
| Lenovo IdeaPad Pro 5 16IMH G9 | |
| Dell Inspiron 16 7640 2-in-1 | |
| Dell Inspiron 16 Plus 7640 | |
| Medio Intel Core Ultra 7 155H (6670 - 18470, n=50) | |
| Dell Inspiron 16 7635 2-in-1 | |
| Samsung Galaxy Book4 Pro 360 | |
| AIDA64 / FPU Julia | |
| Lenovo IdeaPad Pro 5 16IMH G9 | |
| HP Envy x360 2-in-1 16-ad0097nr | |
| Dell Inspiron 16 7640 2-in-1 | |
| Dell Inspiron 16 Plus 7640 | |
| Medio Intel Core Ultra 7 155H (40905 - 93181, n=50) | |
| Dell Inspiron 16 7635 2-in-1 | |
| Samsung Galaxy Book4 Pro 360 | |
| AIDA64 / CPU SHA3 | |
| Lenovo IdeaPad Pro 5 16IMH G9 | |
| HP Envy x360 2-in-1 16-ad0097nr | |
| Dell Inspiron 16 7640 2-in-1 | |
| Dell Inspiron 16 Plus 7640 | |
| Medio Intel Core Ultra 7 155H (1940 - 4436, n=50) | |
| Samsung Galaxy Book4 Pro 360 | |
| Dell Inspiron 16 7635 2-in-1 | |
| AIDA64 / CPU Queen | |
| HP Envy x360 2-in-1 16-ad0097nr | |
| Dell Inspiron 16 7640 2-in-1 | |
| Dell Inspiron 16 Plus 7640 | |
| Lenovo IdeaPad Pro 5 16IMH G9 | |
| Medio Intel Core Ultra 7 155H (64698 - 94181, n=50) | |
| Samsung Galaxy Book4 Pro 360 | |
| Dell Inspiron 16 7635 2-in-1 | |
| AIDA64 / FPU SinJulia | |
| HP Envy x360 2-in-1 16-ad0097nr | |
| Lenovo IdeaPad Pro 5 16IMH G9 | |
| Dell Inspiron 16 7640 2-in-1 | |
| Dell Inspiron 16 Plus 7640 | |
| Medio Intel Core Ultra 7 155H (5639 - 10647, n=50) | |
| Dell Inspiron 16 7635 2-in-1 | |
| Samsung Galaxy Book4 Pro 360 | |
| AIDA64 / FPU Mandel | |
| HP Envy x360 2-in-1 16-ad0097nr | |
| Lenovo IdeaPad Pro 5 16IMH G9 | |
| Dell Inspiron 16 7640 2-in-1 | |
| Dell Inspiron 16 Plus 7640 | |
| Dell Inspiron 16 7635 2-in-1 | |
| Medio Intel Core Ultra 7 155H (18236 - 47685, n=50) | |
| Samsung Galaxy Book4 Pro 360 | |
| AIDA64 / CPU AES | |
| Lenovo IdeaPad Pro 5 16IMH G9 | |
| Medio Intel Core Ultra 7 155H (45713 - 152179, n=50) | |
| Dell Inspiron 16 7640 2-in-1 | |
| HP Envy x360 2-in-1 16-ad0097nr | |
| Dell Inspiron 16 Plus 7640 | |
| Samsung Galaxy Book4 Pro 360 | |
| Dell Inspiron 16 7635 2-in-1 | |
| AIDA64 / CPU ZLib | |
| Lenovo IdeaPad Pro 5 16IMH G9 | |
| Dell Inspiron 16 Plus 7640 | |
| Dell Inspiron 16 7640 2-in-1 | |
| Medio Intel Core Ultra 7 155H (557 - 1250, n=50) | |
| HP Envy x360 2-in-1 16-ad0097nr | |
| Samsung Galaxy Book4 Pro 360 | |
| Dell Inspiron 16 7635 2-in-1 | |
| AIDA64 / FP64 Ray-Trace | |
| HP Envy x360 2-in-1 16-ad0097nr | |
| Lenovo IdeaPad Pro 5 16IMH G9 | |
| Dell Inspiron 16 7640 2-in-1 | |
| Dell Inspiron 16 Plus 7640 | |
| Medio Intel Core Ultra 7 155H (3569 - 9802, n=50) | |
| Dell Inspiron 16 7635 2-in-1 | |
| Samsung Galaxy Book4 Pro 360 | |
| AIDA64 / CPU PhotoWorxx | |
| Lenovo IdeaPad Pro 5 16IMH G9 | |
| Medio Intel Core Ultra 7 155H (32719 - 54223, n=50) | |
| Samsung Galaxy Book4 Pro 360 | |
| Dell Inspiron 16 7640 2-in-1 | |
| Dell Inspiron 16 Plus 7640 | |
| HP Envy x360 2-in-1 16-ad0097nr | |
| Dell Inspiron 16 7635 2-in-1 | |
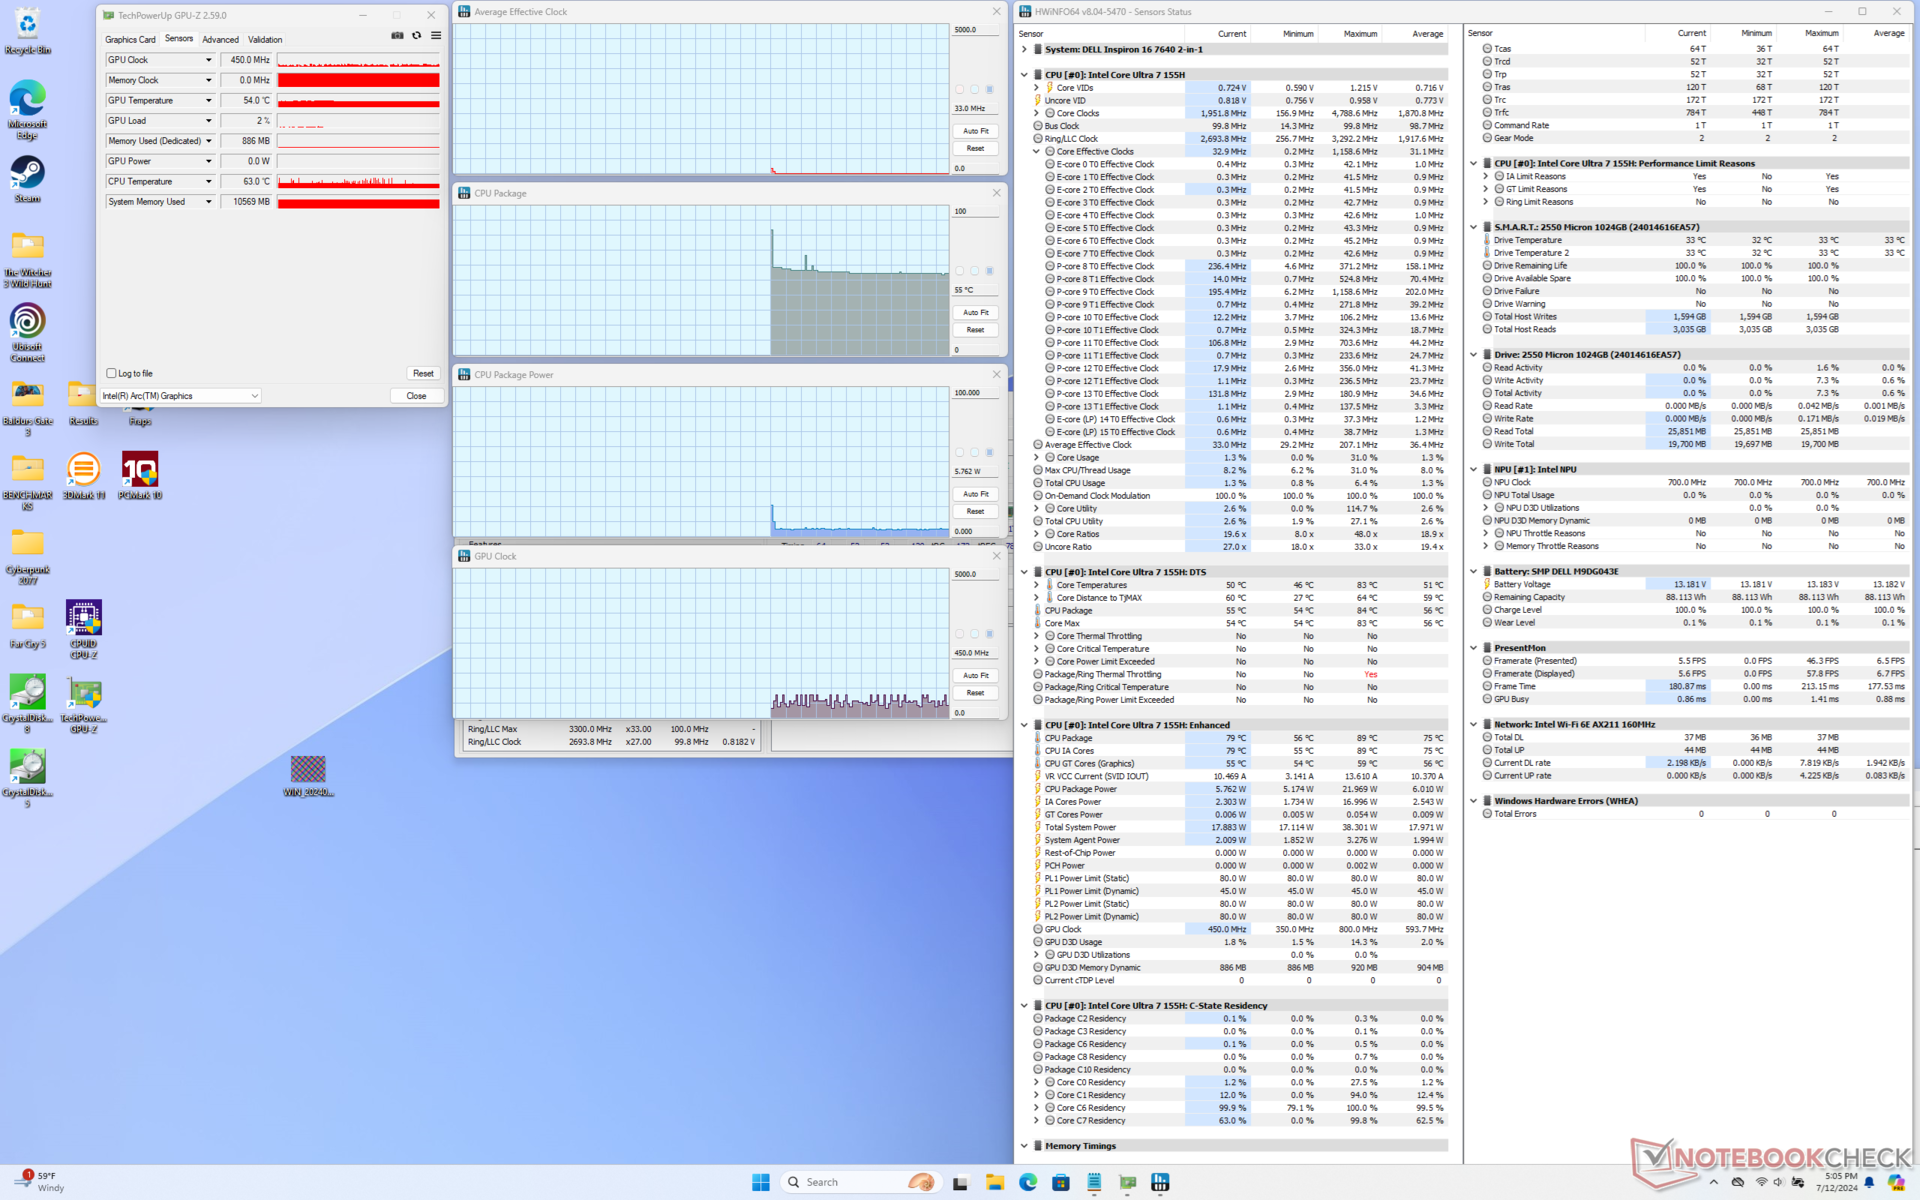
Prueba de estrés
La CPU aumentaría a 3,2 GHz y 88 W durando sólo unos segundos antes de alcanzar una temperatura del núcleo muy alta de 109 C (¡!). A continuación, bajaría rápidamente a sólo 2,3 GHz y 44 W para mantener una temperatura del núcleo más fría de 86 C. Los rangos de temperatura son, sin embargo, más cálidos que los que registramos en el Inspiron 16 7635 2 en 1, particularmente al ejecutar juegos, donde nuestra CPU se estabilizaría en el rango alto de 90 C en comparación con el rango de 70 C en el antiguo Inspiron 16 7635 2 en 1. Esta diferencia también contribuiría a las temperaturas superficiales más cálidas en general como se muestra en nuestra sección de Temperatura a continuación.
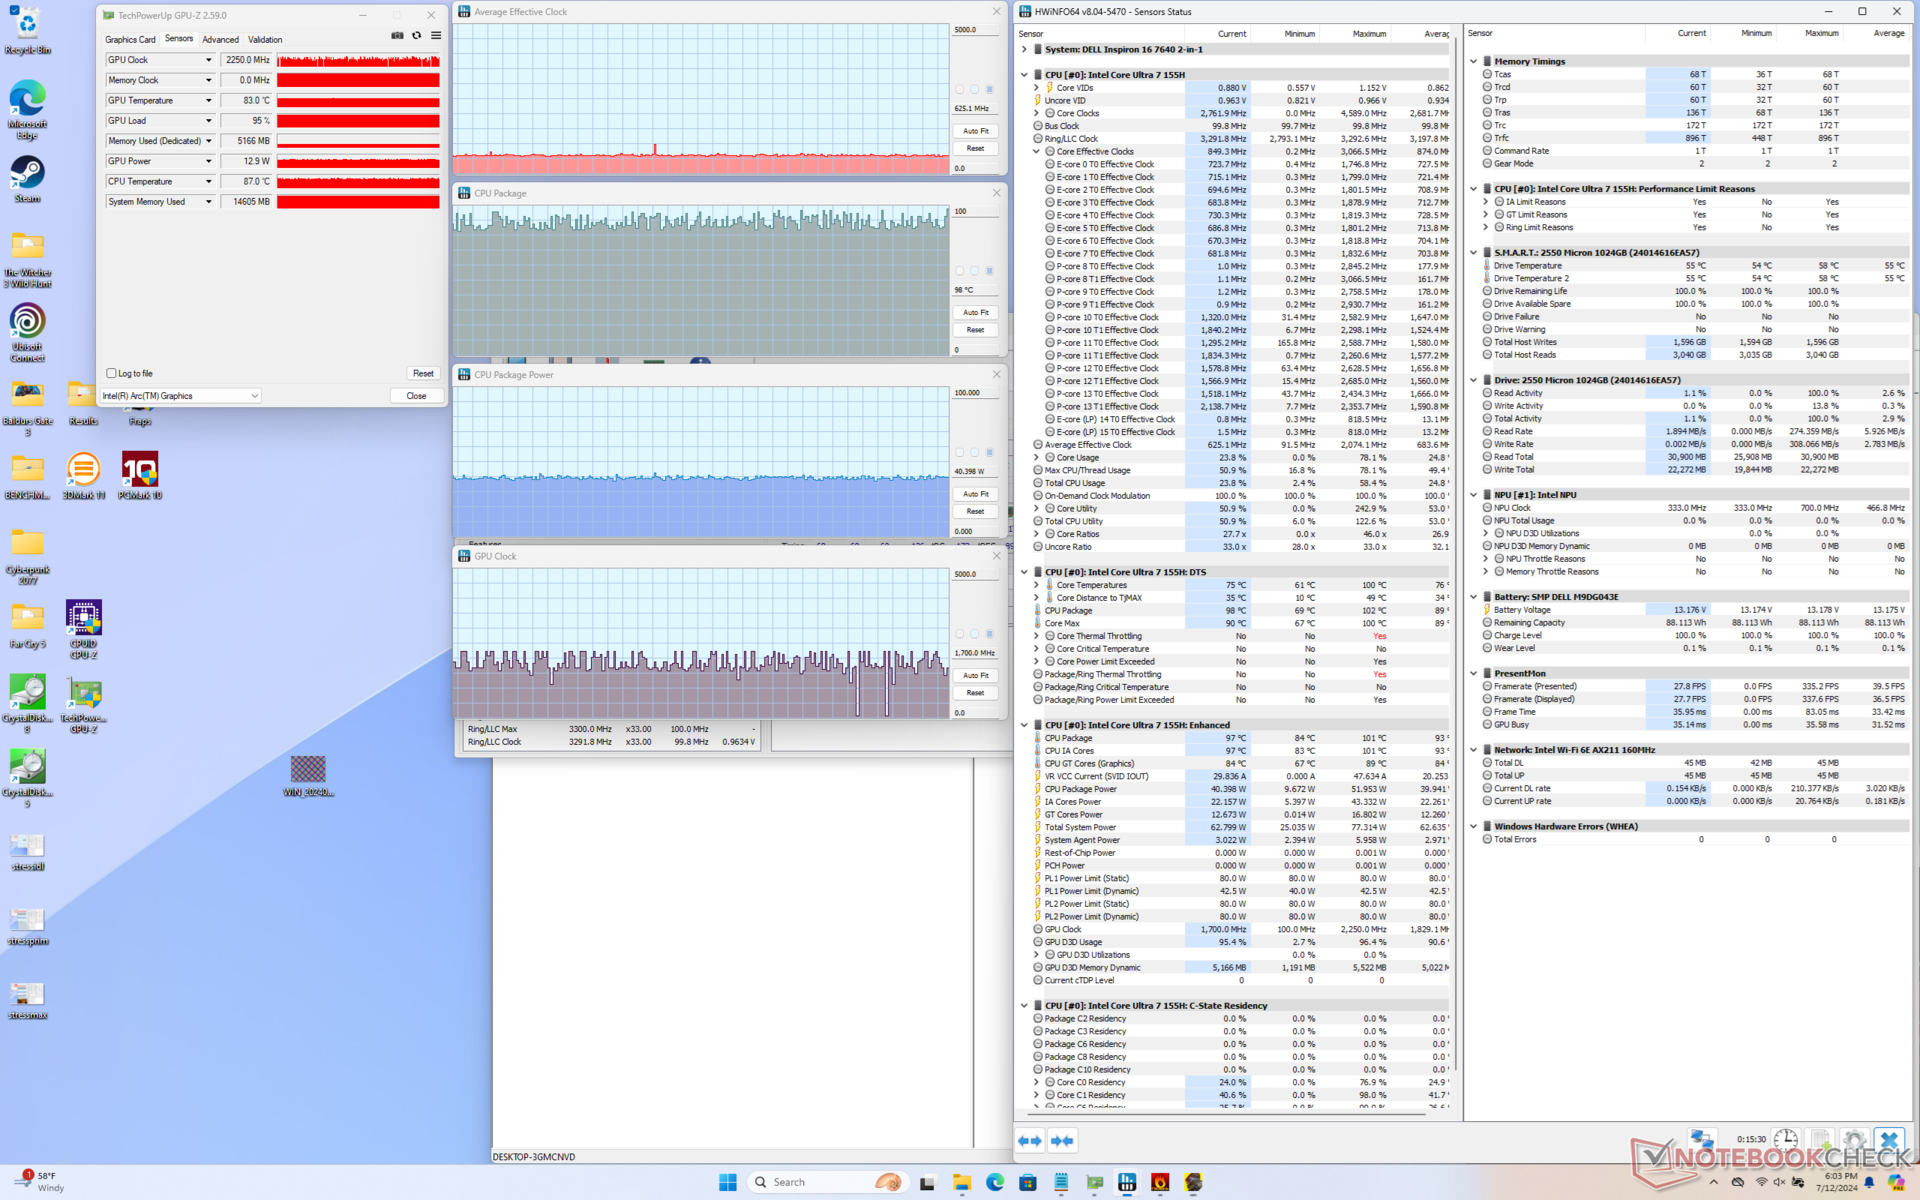
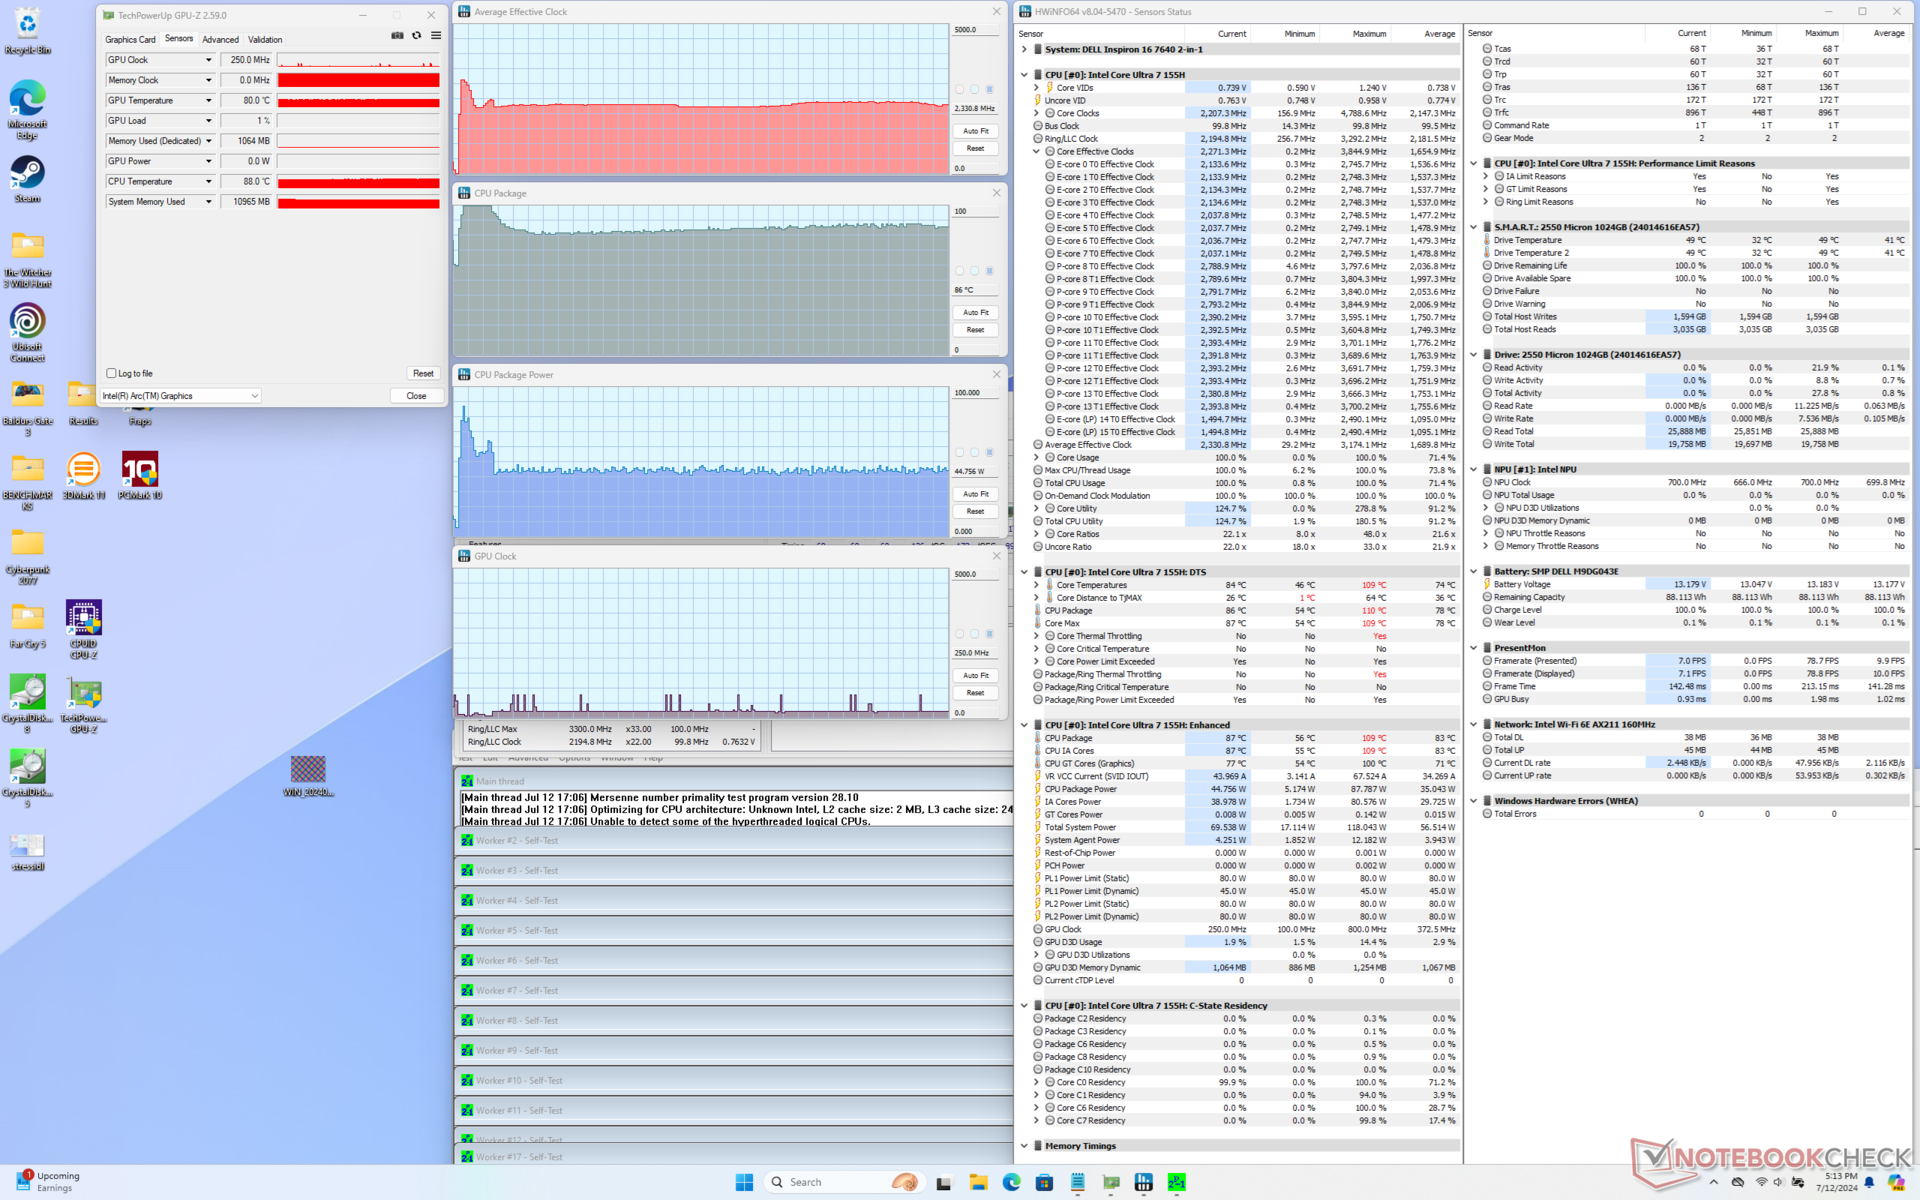
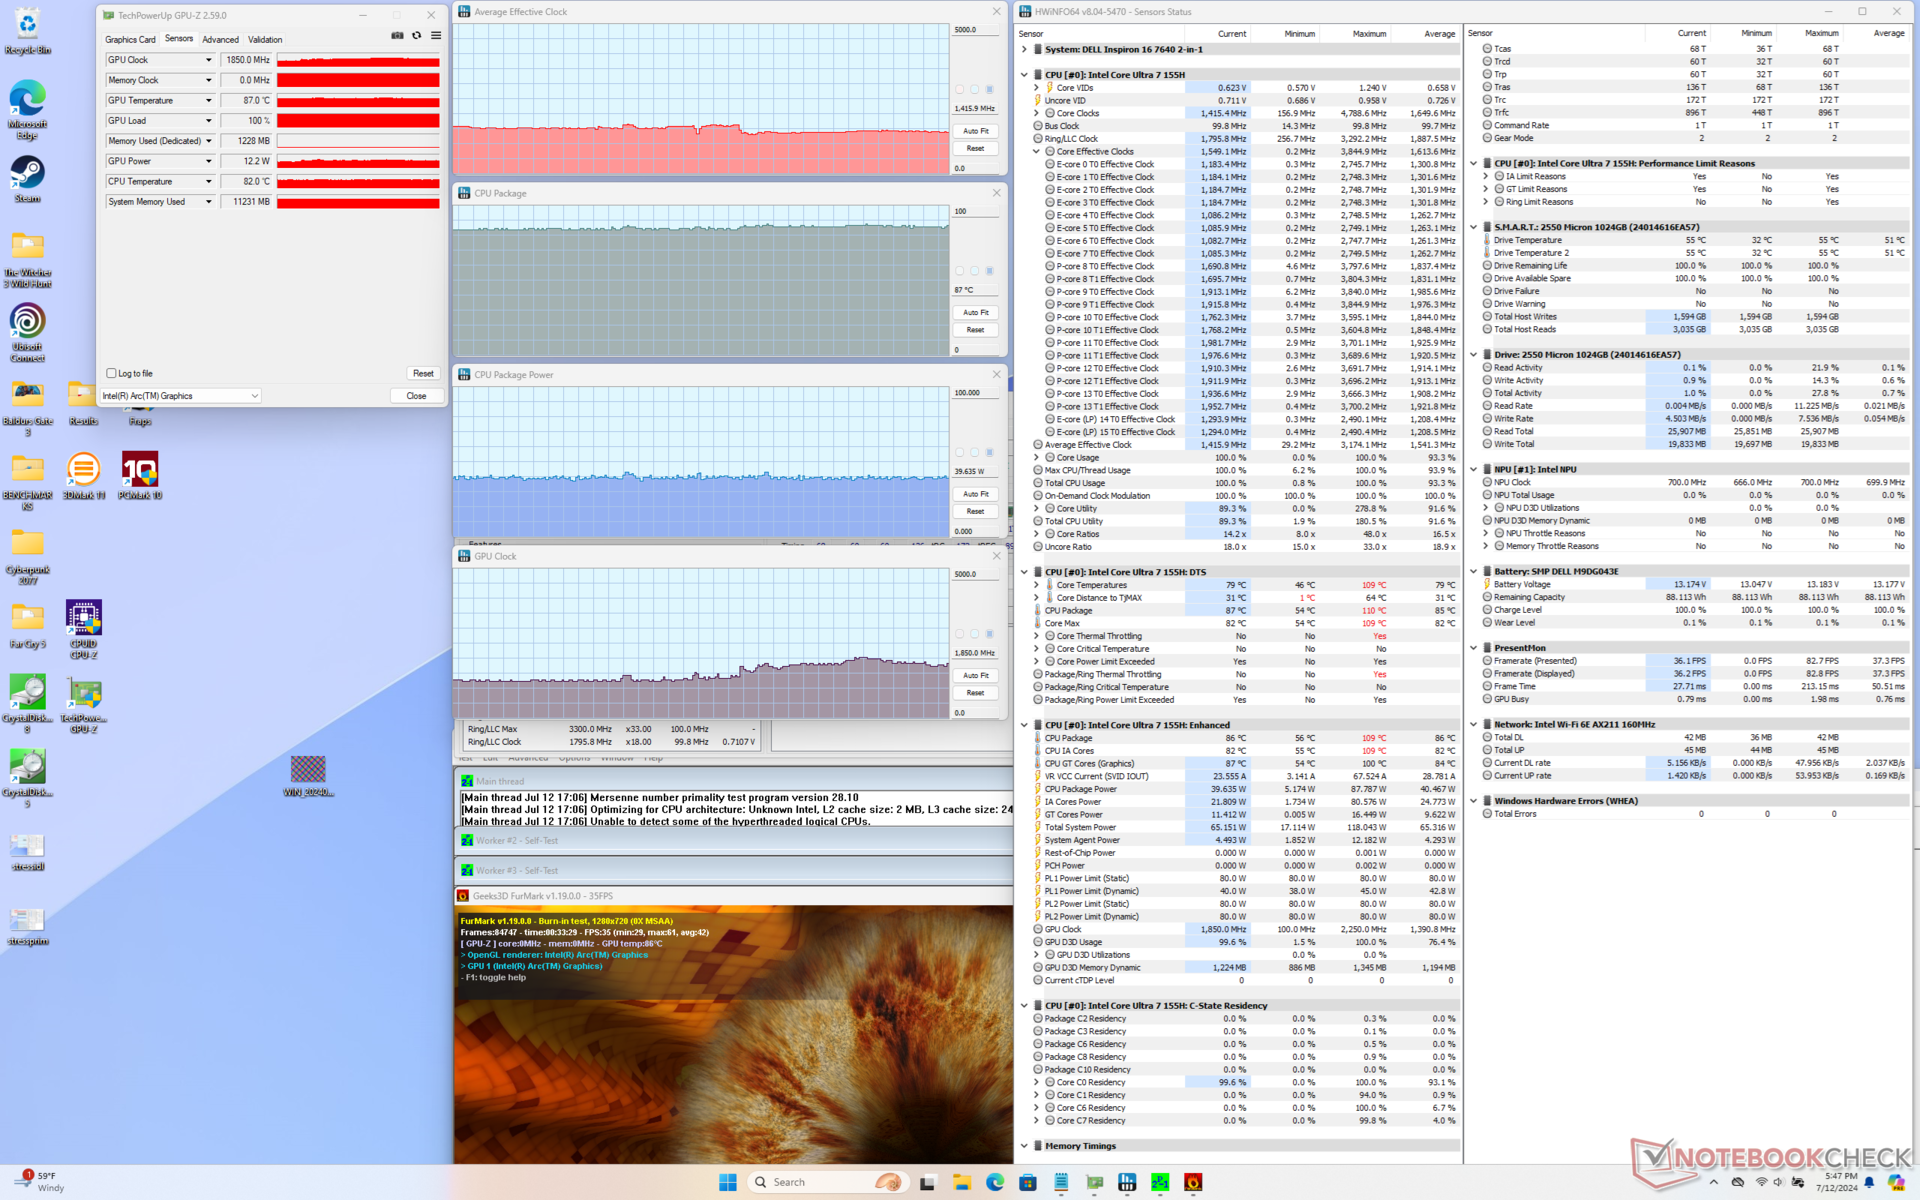
| Reloj medio de la CPU (GHz) | Reloj de la GPU (MHz) | Temperatura media de la CPU (°C) | |
| Sistema en reposo | -- | -- | 55 |
| Prime95 Stress | 2.3 | -- | 86 |
| Prime95+ FurMark Stress | 1.4 | 1250 - 1850 | 87 |
| Cyberpunk 2077 Estrés | 0,6 | 1650 - 2250 | 90 - 98 |
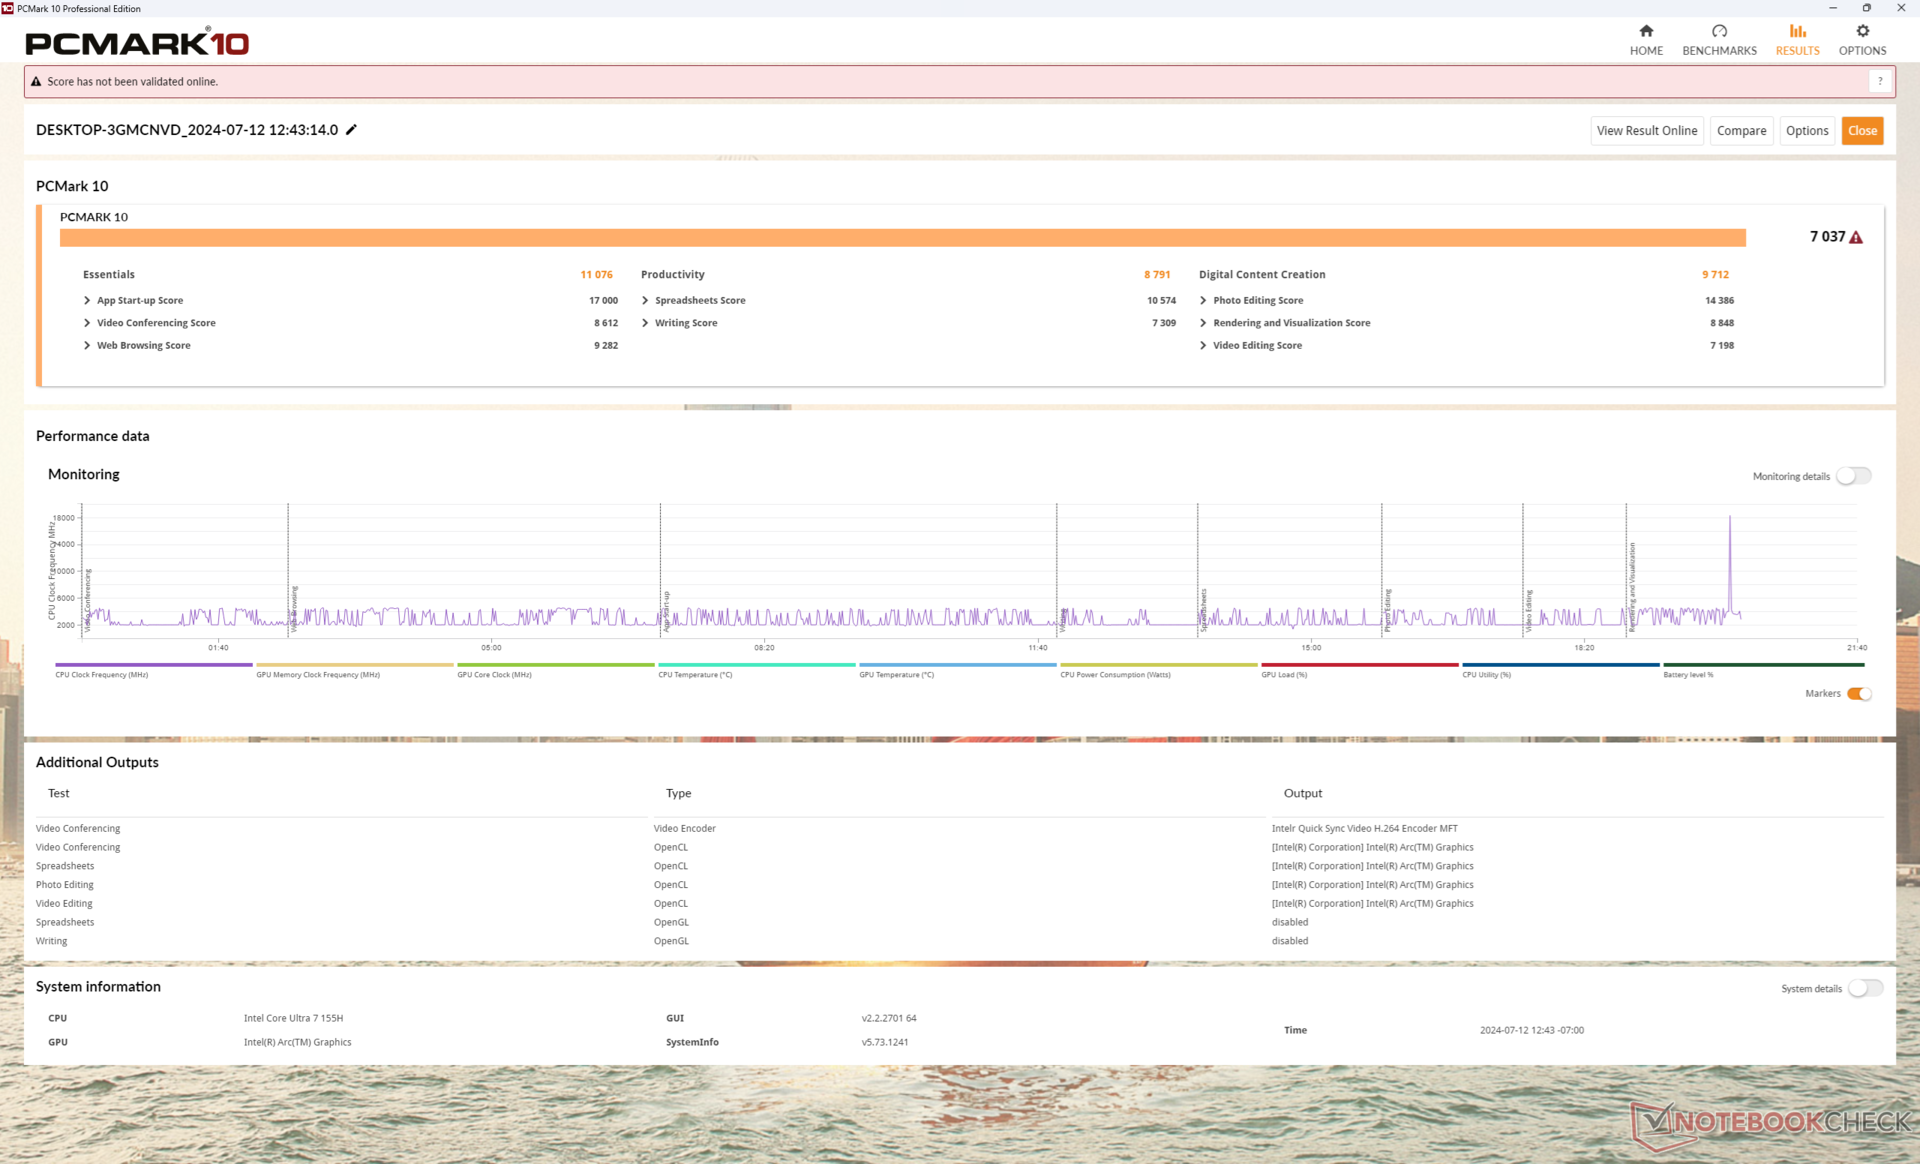
Rendimiento del sistema
Los resultados de PCMark son excelentes y comparables a los de otras máquinas de nuestra base de datos que llevan la misma CPU y GPU integrada. Nuestra puntuación media para el Dell es una de las más altas de cualquier convertible de 16 pulgadas, pero las alternativas con GPU discreta como el HP Spectre x360 16 seguirán ofreciendo un rendimiento gráfico más rápido.
CrossMark: Overall | Productivity | Creativity | Responsiveness
WebXPRT 3: Overall
WebXPRT 4: Overall
Mozilla Kraken 1.1: Total
| PCMark 10 / Score | |
| Lenovo IdeaPad Pro 5 16IMH G9 | |
| Dell Inspiron 16 Plus 7640 | |
| Dell Inspiron 16 7640 2-in-1 | |
| HP Envy x360 2-in-1 16-ad0097nr | |
| Medio Intel Core Ultra 7 155H, Intel Arc 8-Core iGPU (4809 - 7529, n=34) | |
| Samsung Galaxy Book4 Pro 360 | |
| Dell Inspiron 16 7635 2-in-1 | |
| PCMark 10 / Essentials | |
| Lenovo IdeaPad Pro 5 16IMH G9 | |
| Dell Inspiron 16 7640 2-in-1 | |
| Dell Inspiron 16 7635 2-in-1 | |
| Samsung Galaxy Book4 Pro 360 | |
| HP Envy x360 2-in-1 16-ad0097nr | |
| Medio Intel Core Ultra 7 155H, Intel Arc 8-Core iGPU (7605 - 11289, n=34) | |
| Dell Inspiron 16 Plus 7640 | |
| PCMark 10 / Productivity | |
| HP Envy x360 2-in-1 16-ad0097nr | |
| Dell Inspiron 16 7635 2-in-1 | |
| Lenovo IdeaPad Pro 5 16IMH G9 | |
| Dell Inspiron 16 7640 2-in-1 | |
| Medio Intel Core Ultra 7 155H, Intel Arc 8-Core iGPU (6042 - 10591, n=34) | |
| Dell Inspiron 16 Plus 7640 | |
| Samsung Galaxy Book4 Pro 360 | |
| PCMark 10 / Digital Content Creation | |
| Dell Inspiron 16 Plus 7640 | |
| Lenovo IdeaPad Pro 5 16IMH G9 | |
| Dell Inspiron 16 7640 2-in-1 | |
| Medio Intel Core Ultra 7 155H, Intel Arc 8-Core iGPU (4985 - 10709, n=34) | |
| HP Envy x360 2-in-1 16-ad0097nr | |
| Samsung Galaxy Book4 Pro 360 | |
| Dell Inspiron 16 7635 2-in-1 | |
| CrossMark / Overall | |
| Dell Inspiron 16 7640 2-in-1 | |
| Dell Inspiron 16 Plus 7640 | |
| Medio Intel Core Ultra 7 155H, Intel Arc 8-Core iGPU (1366 - 1903, n=34) | |
| HP Envy x360 2-in-1 16-ad0097nr | |
| Samsung Galaxy Book4 Pro 360 | |
| Lenovo IdeaPad Pro 5 16IMH G9 | |
| Dell Inspiron 16 7635 2-in-1 | |
| CrossMark / Productivity | |
| Dell Inspiron 16 7640 2-in-1 | |
| HP Envy x360 2-in-1 16-ad0097nr | |
| Dell Inspiron 16 Plus 7640 | |
| Medio Intel Core Ultra 7 155H, Intel Arc 8-Core iGPU (1291 - 1798, n=33) | |
| Samsung Galaxy Book4 Pro 360 | |
| Lenovo IdeaPad Pro 5 16IMH G9 | |
| Dell Inspiron 16 7635 2-in-1 | |
| CrossMark / Creativity | |
| Dell Inspiron 16 Plus 7640 | |
| Dell Inspiron 16 7640 2-in-1 | |
| Lenovo IdeaPad Pro 5 16IMH G9 | |
| Medio Intel Core Ultra 7 155H, Intel Arc 8-Core iGPU (1519 - 1929, n=33) | |
| HP Envy x360 2-in-1 16-ad0097nr | |
| Samsung Galaxy Book4 Pro 360 | |
| Dell Inspiron 16 7635 2-in-1 | |
| CrossMark / Responsiveness | |
| Samsung Galaxy Book4 Pro 360 | |
| Medio Intel Core Ultra 7 155H, Intel Arc 8-Core iGPU (939 - 1802, n=33) | |
| Dell Inspiron 16 7640 2-in-1 | |
| HP Envy x360 2-in-1 16-ad0097nr | |
| Dell Inspiron 16 Plus 7640 | |
| Lenovo IdeaPad Pro 5 16IMH G9 | |
| Dell Inspiron 16 7635 2-in-1 | |
| WebXPRT 3 / Overall | |
| HP Envy x360 2-in-1 16-ad0097nr | |
| Dell Inspiron 16 Plus 7640 | |
| Lenovo IdeaPad Pro 5 16IMH G9 | |
| Dell Inspiron 16 7640 2-in-1 | |
| Medio Intel Core Ultra 7 155H, Intel Arc 8-Core iGPU (252 - 299, n=34) | |
| Dell Inspiron 16 7635 2-in-1 | |
| Samsung Galaxy Book4 Pro 360 | |
| WebXPRT 4 / Overall | |
| Lenovo IdeaPad Pro 5 16IMH G9 | |
| Dell Inspiron 16 7640 2-in-1 | |
| Dell Inspiron 16 Plus 7640 | |
| Medio Intel Core Ultra 7 155H, Intel Arc 8-Core iGPU (166.4 - 309, n=29) | |
| HP Envy x360 2-in-1 16-ad0097nr | |
| Samsung Galaxy Book4 Pro 360 | |
| Dell Inspiron 16 7635 2-in-1 | |
| Mozilla Kraken 1.1 / Total | |
| Dell Inspiron 16 7635 2-in-1 | |
| Samsung Galaxy Book4 Pro 360 | |
| Medio Intel Core Ultra 7 155H, Intel Arc 8-Core iGPU (517 - 614, n=35) | |
| HP Envy x360 2-in-1 16-ad0097nr | |
| Dell Inspiron 16 7640 2-in-1 | |
| Dell Inspiron 16 Plus 7640 | |
| Lenovo IdeaPad Pro 5 16IMH G9 | |
* ... más pequeño es mejor
| PCMark 10 Score | 7037 puntos | |
ayuda | ||
| AIDA64 / Memory Copy | |
| Lenovo IdeaPad Pro 5 16IMH G9 | |
| Samsung Galaxy Book4 Pro 360 | |
| Medio Intel Core Ultra 7 155H (62397 - 96791, n=50) | |
| Dell Inspiron 16 7640 2-in-1 | |
| HP Envy x360 2-in-1 16-ad0097nr | |
| Dell Inspiron 16 Plus 7640 | |
| Dell Inspiron 16 7635 2-in-1 | |
| AIDA64 / Memory Read | |
| Lenovo IdeaPad Pro 5 16IMH G9 | |
| Medio Intel Core Ultra 7 155H (60544 - 90647, n=50) | |
| Dell Inspiron 16 Plus 7640 | |
| Samsung Galaxy Book4 Pro 360 | |
| Dell Inspiron 16 7640 2-in-1 | |
| HP Envy x360 2-in-1 16-ad0097nr | |
| Dell Inspiron 16 7635 2-in-1 | |
| AIDA64 / Memory Write | |
| HP Envy x360 2-in-1 16-ad0097nr | |
| Dell Inspiron 16 7640 2-in-1 | |
| Lenovo IdeaPad Pro 5 16IMH G9 | |
| Medio Intel Core Ultra 7 155H (58692 - 93451, n=50) | |
| Samsung Galaxy Book4 Pro 360 | |
| Dell Inspiron 16 Plus 7640 | |
| Dell Inspiron 16 7635 2-in-1 | |
| AIDA64 / Memory Latency | |
| Dell Inspiron 16 7640 2-in-1 | |
| Medio Intel Core Ultra 7 155H (116.2 - 233, n=50) | |
| Lenovo IdeaPad Pro 5 16IMH G9 | |
| Samsung Galaxy Book4 Pro 360 | |
| HP Envy x360 2-in-1 16-ad0097nr | |
| Dell Inspiron 16 Plus 7640 | |
| Dell Inspiron 16 7635 2-in-1 | |
* ... más pequeño es mejor
Latencia del CPD
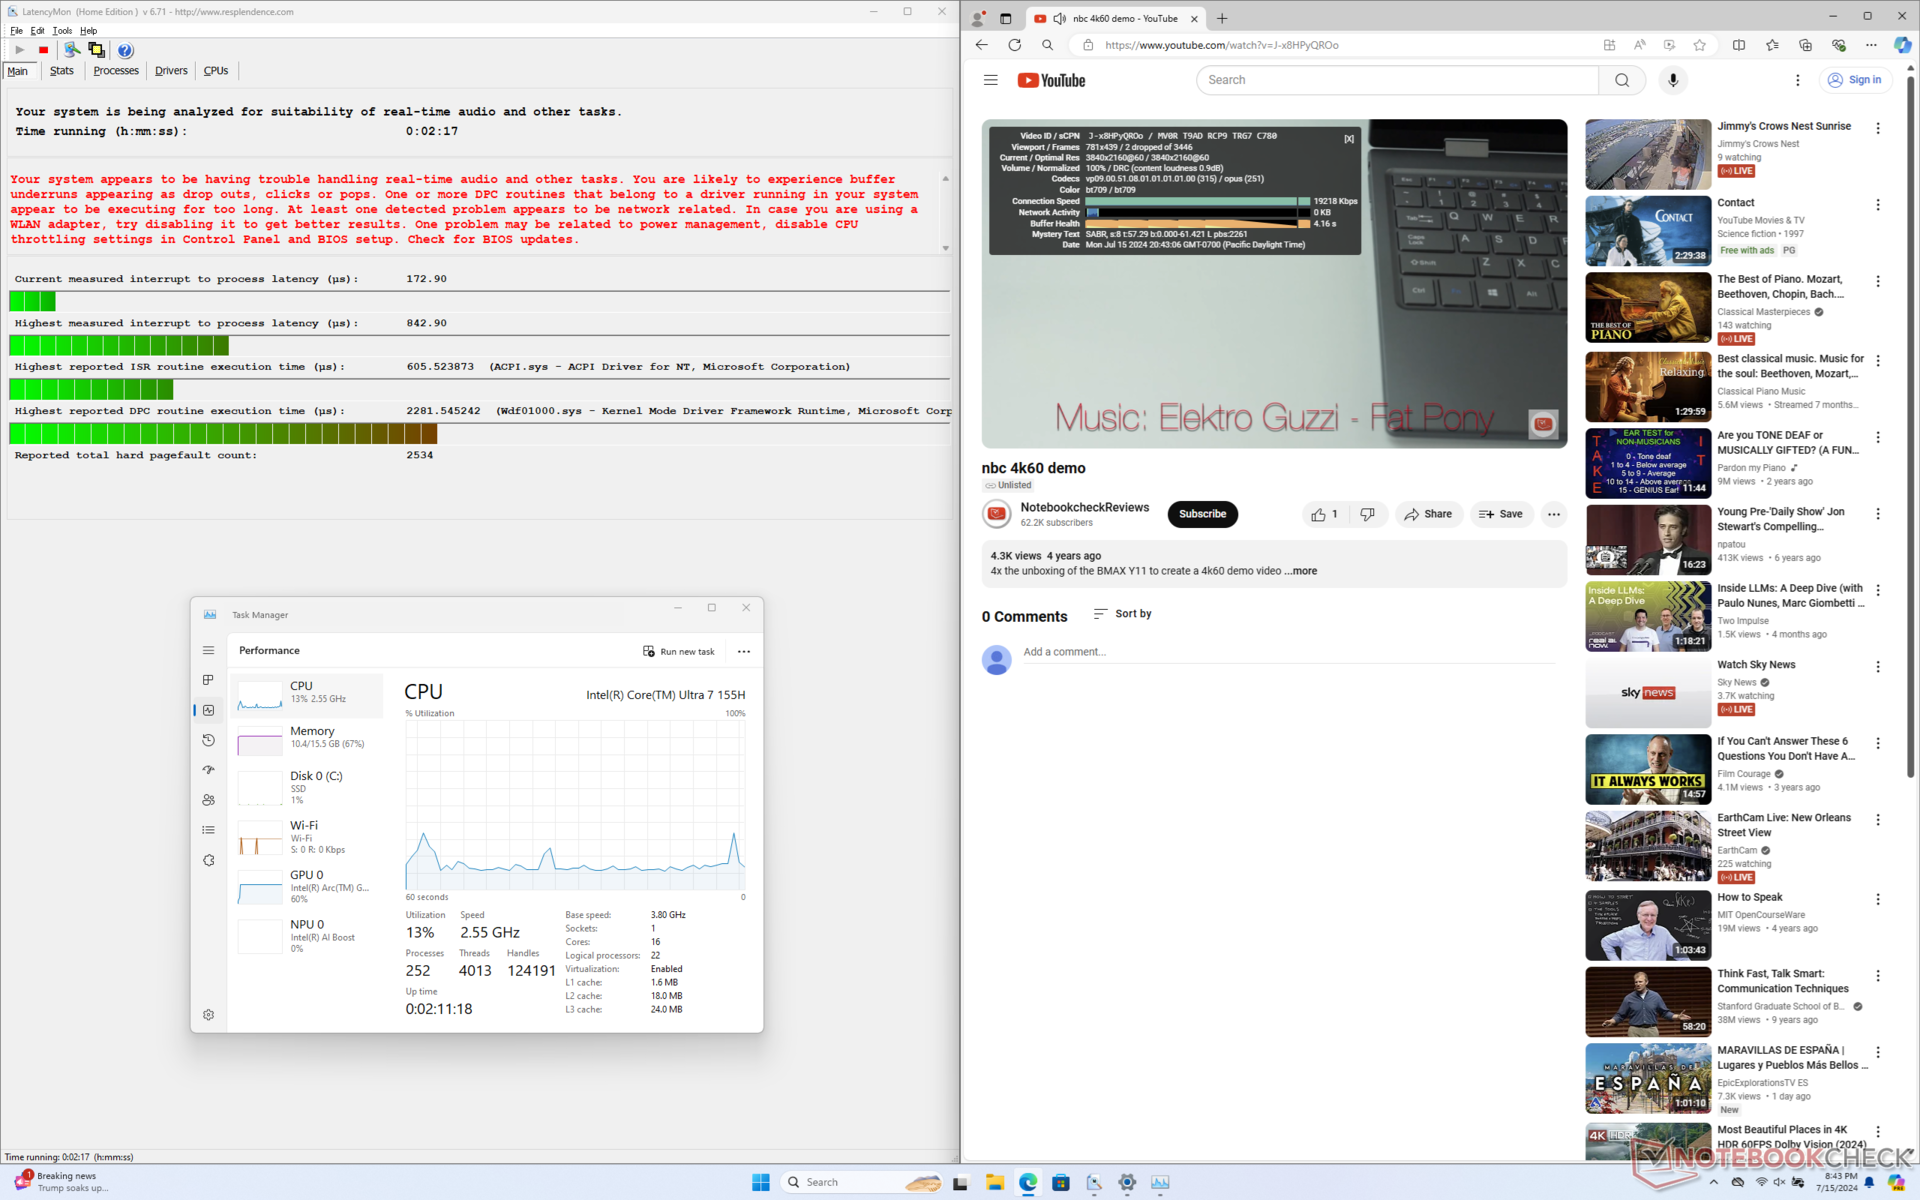
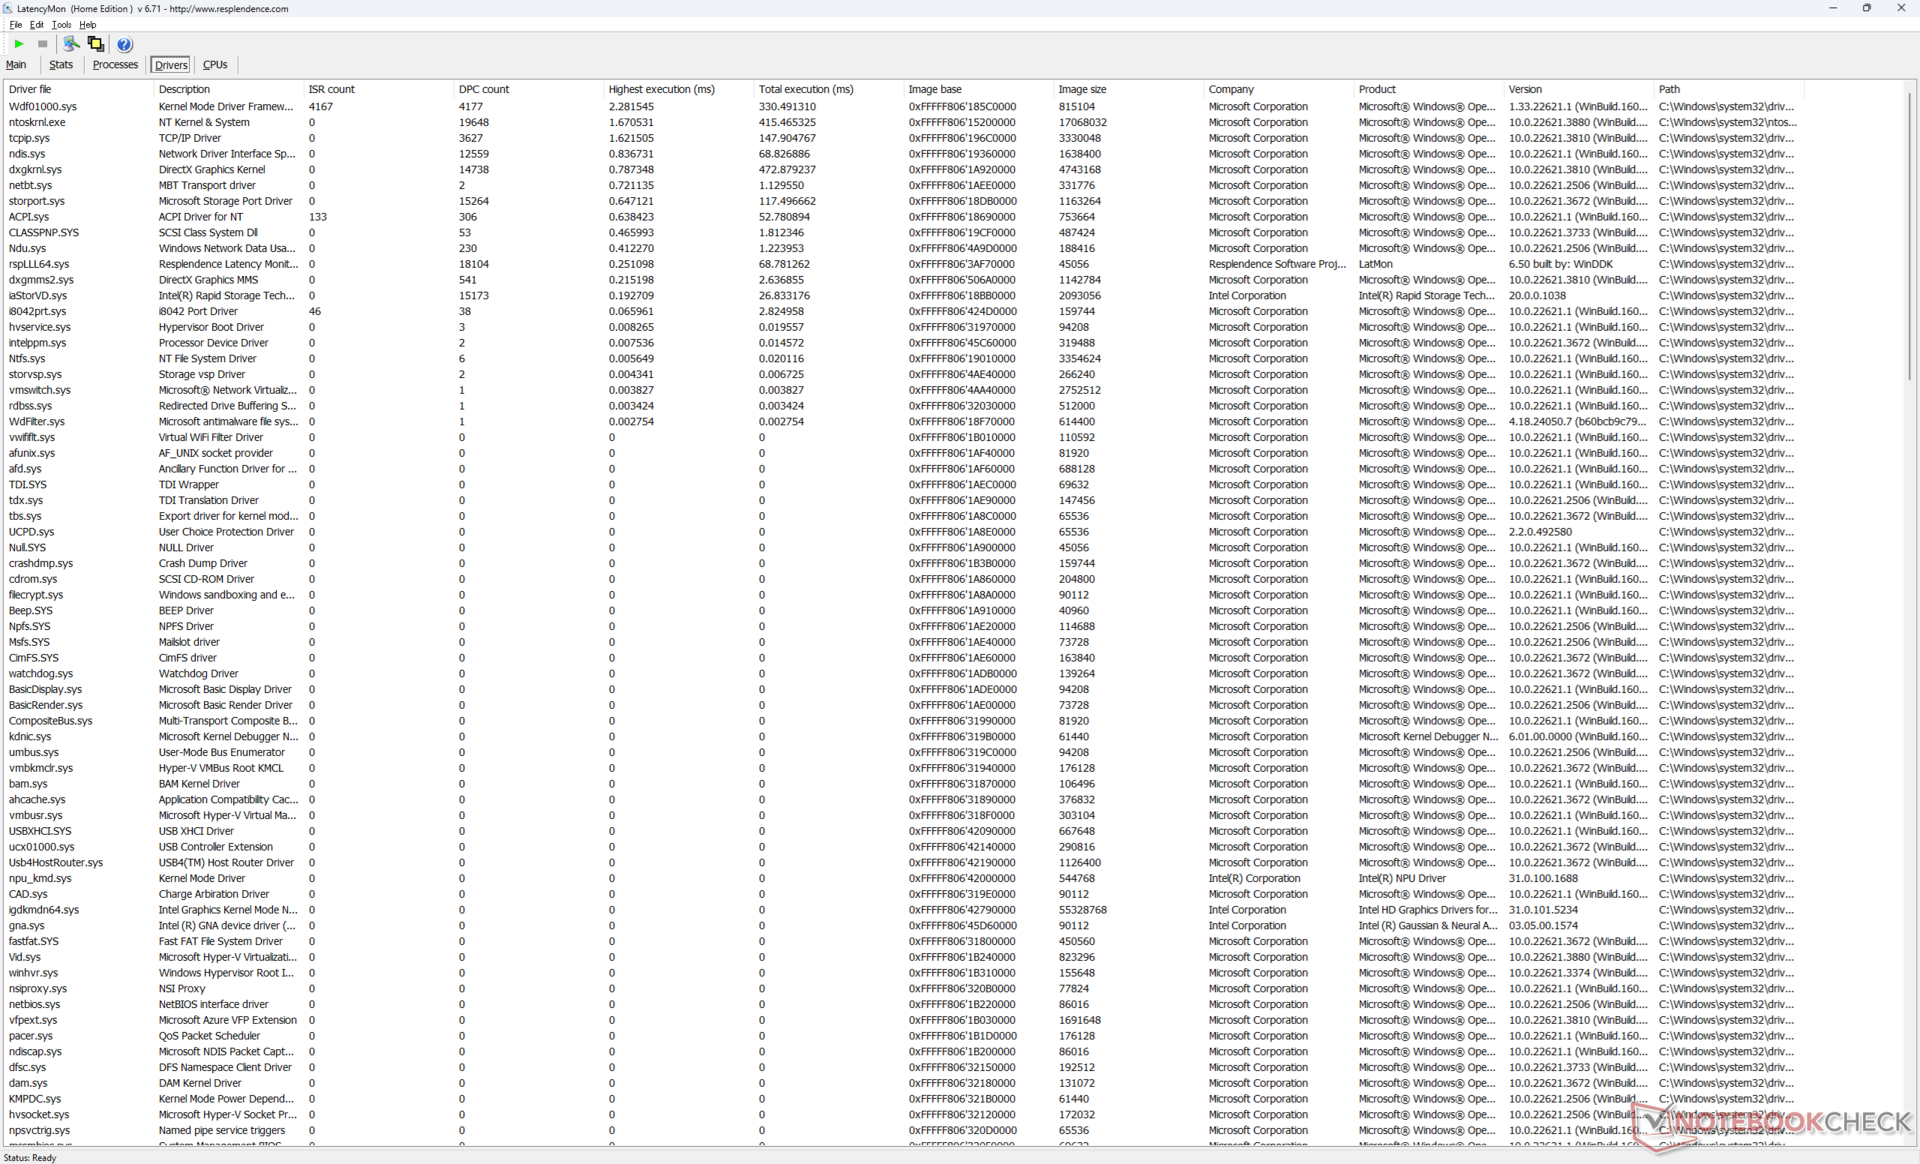
LatencyMon revela problemas menores de DPC al abrir varias pestañas del navegador de nuestra página principal. También registramos 2 fotogramas caídos durante una prueba de vídeo 4K60 de un minuto de duración, cuando lo ideal sería que hubiera 0. Las discrepancias son, afortunadamente, lo suficientemente menores como para ser esencialmente imperceptibles durante el uso real.
| DPC Latencies / LatencyMon - interrupt to process latency (max), Web, Youtube, Prime95 | |
| Samsung Galaxy Book4 Pro 360 | |
| HP Envy x360 2-in-1 16-ad0097nr | |
| Dell Inspiron 16 7640 2-in-1 | |
| Lenovo IdeaPad Pro 5 16IMH G9 | |
| Dell Inspiron 16 Plus 7640 | |
| Dell Inspiron 16 7635 2-in-1 | |
* ... más pequeño es mejor
Dispositivos de almacenamiento
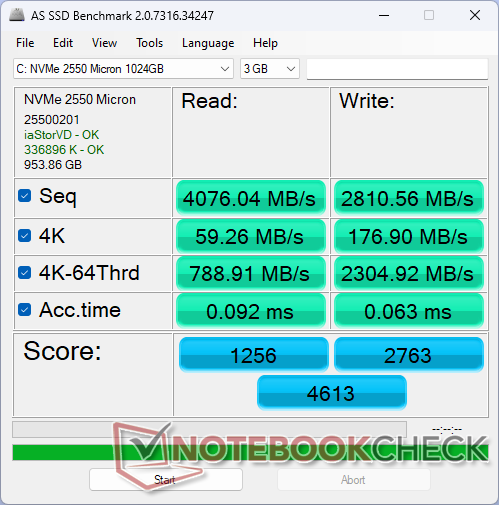
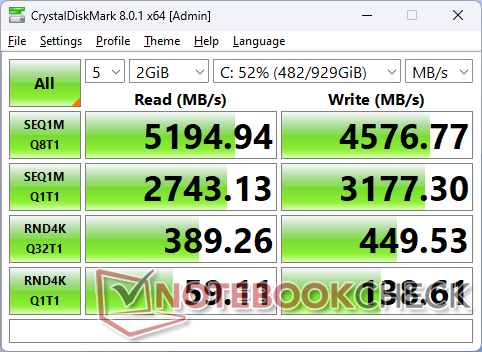
Dell adquiere sus unidades SSD de varios proveedores para su serie Inspiron, entre ellos Kioxia, SK Hynix y Micron. Nuestra unidad de prueba específica se entrega con el Micron 2550 que es una SSD PCIe4 NVMe de gama media capaz de alcanzar velocidades de lectura de hasta 5200 MB/s. Unidades más caras como la Samsung PM9A1 pueden alcanzar más de 7000 MB/s en comparación, pero la Micron 2550 es suficiente y apropiada para un modelo de gama media como nuestra Inspiron 16 2 en 1.
Las tasas de transferencia son muy superiores a las del Kioxia BG5 del Inspiron 16 7635 2 en 1 del año pasado por amplios márgenes, incluso después de tener en cuenta cualquier ralentización cuando se somete a estrés.

* ... más pequeño es mejor
Disk Throttling: DiskSpd Read Loop, Queue Depth 8
Rendimiento de la GPU
El rendimiento gráfico es bastante bueno y uno de los más rápidos para un convertible sin recurrir a opciones discretas. El Arc 8 GPU es comparable a la Radeon 780M y muy por delante de las antiguas Iris Xe 96 UE o las Radeon RX Vega en más del doble en muchos casos. La Radeon RX Vega 7 del 2 en 1 Inspiron 16 7635 del año pasado, por ejemplo, se queda casi un 60% por detrás.
Los usuarios que exijan un rendimiento a nivel de juego y aceleración CUDA pueden considerar el Spectre x360 16 con el procesador GeForce RTX 4050 que es otro aumento de gráficos 2x sobre el Arc 8. Por supuesto, el Spectre también es significativamente más caro que nuestro Dell.
Tenga en cuenta que la GPU Arc 8 sólo está disponible con la configuración Core Ultra 7 155H. Optar por el Core Ultra 5 125U en su lugar significará conformarse con el Arc 4 lo que implica una disminución significativa del 40 al 45 por ciento en el rendimiento gráfico.
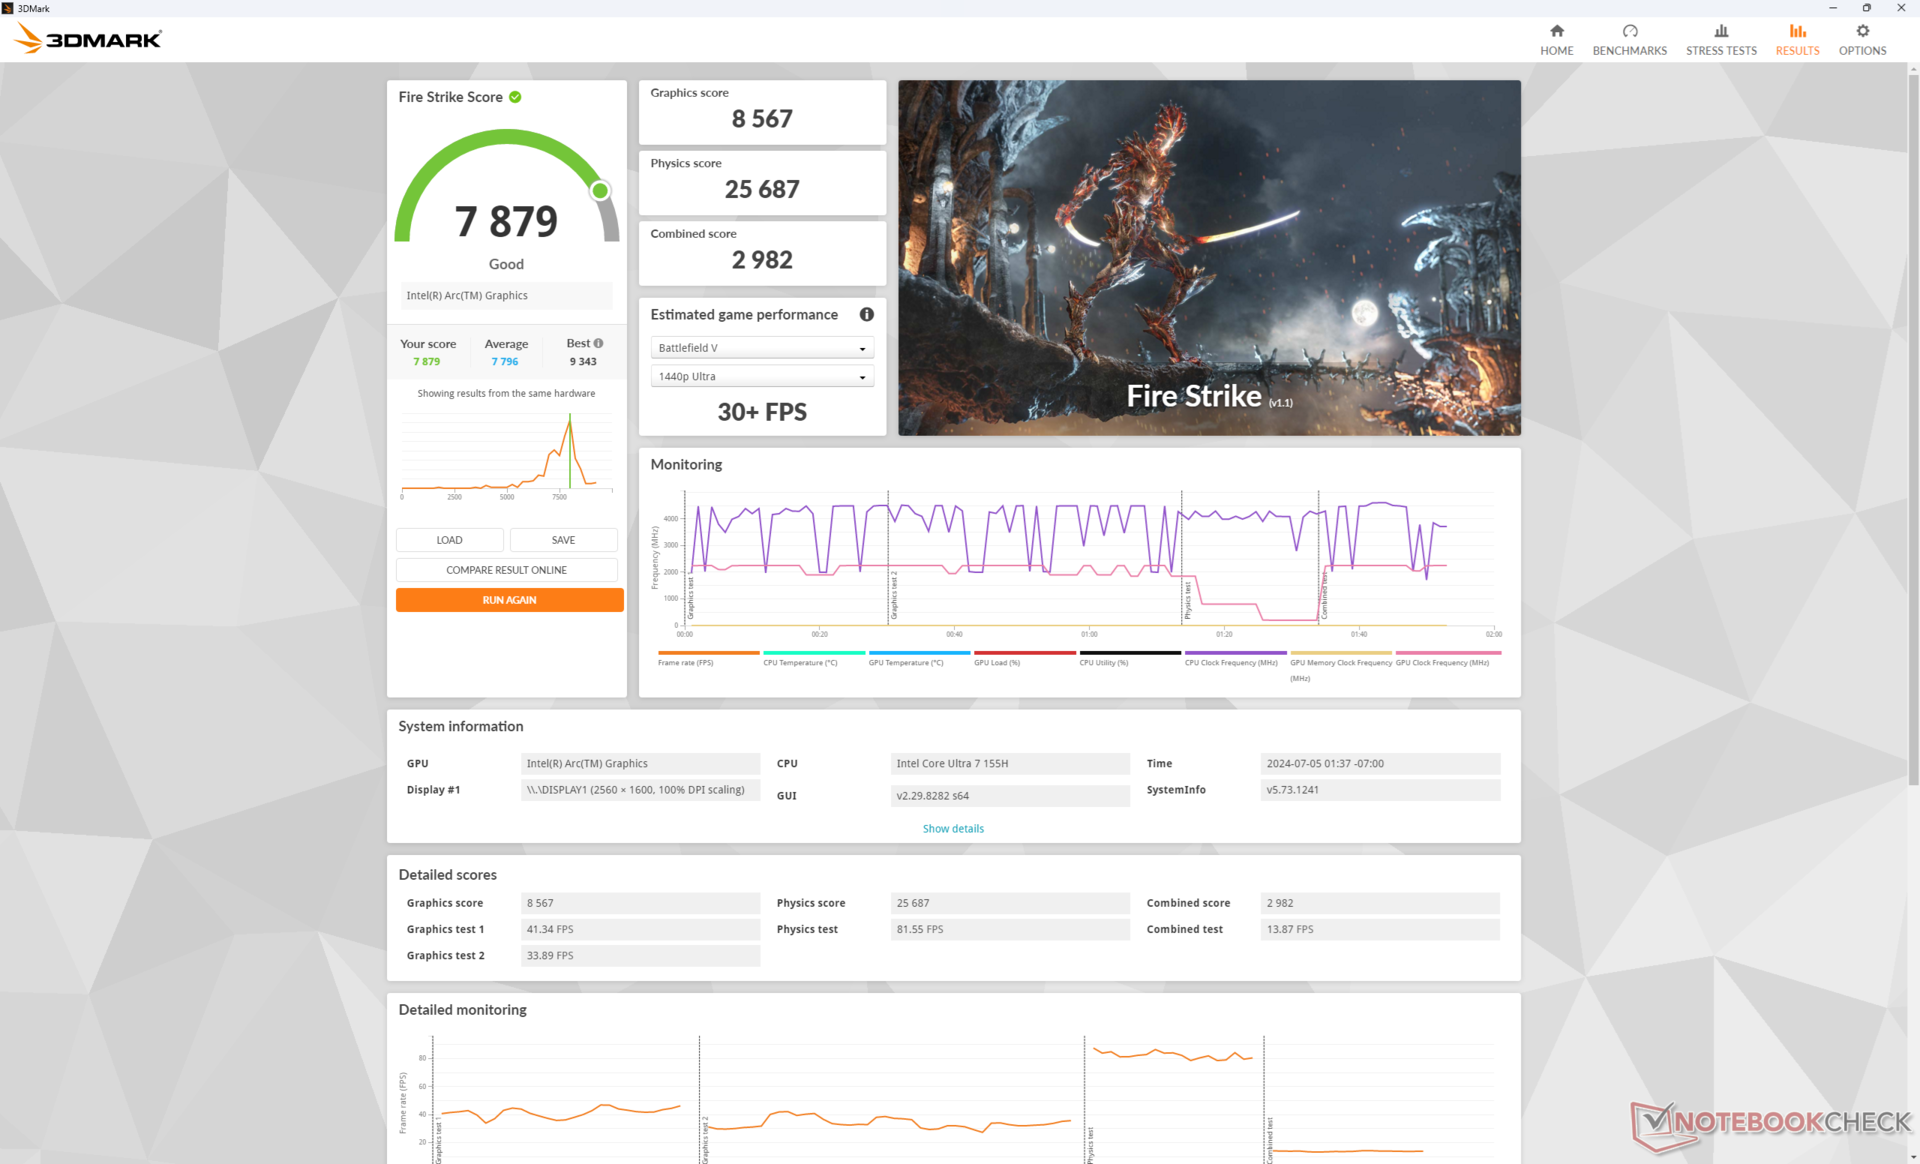
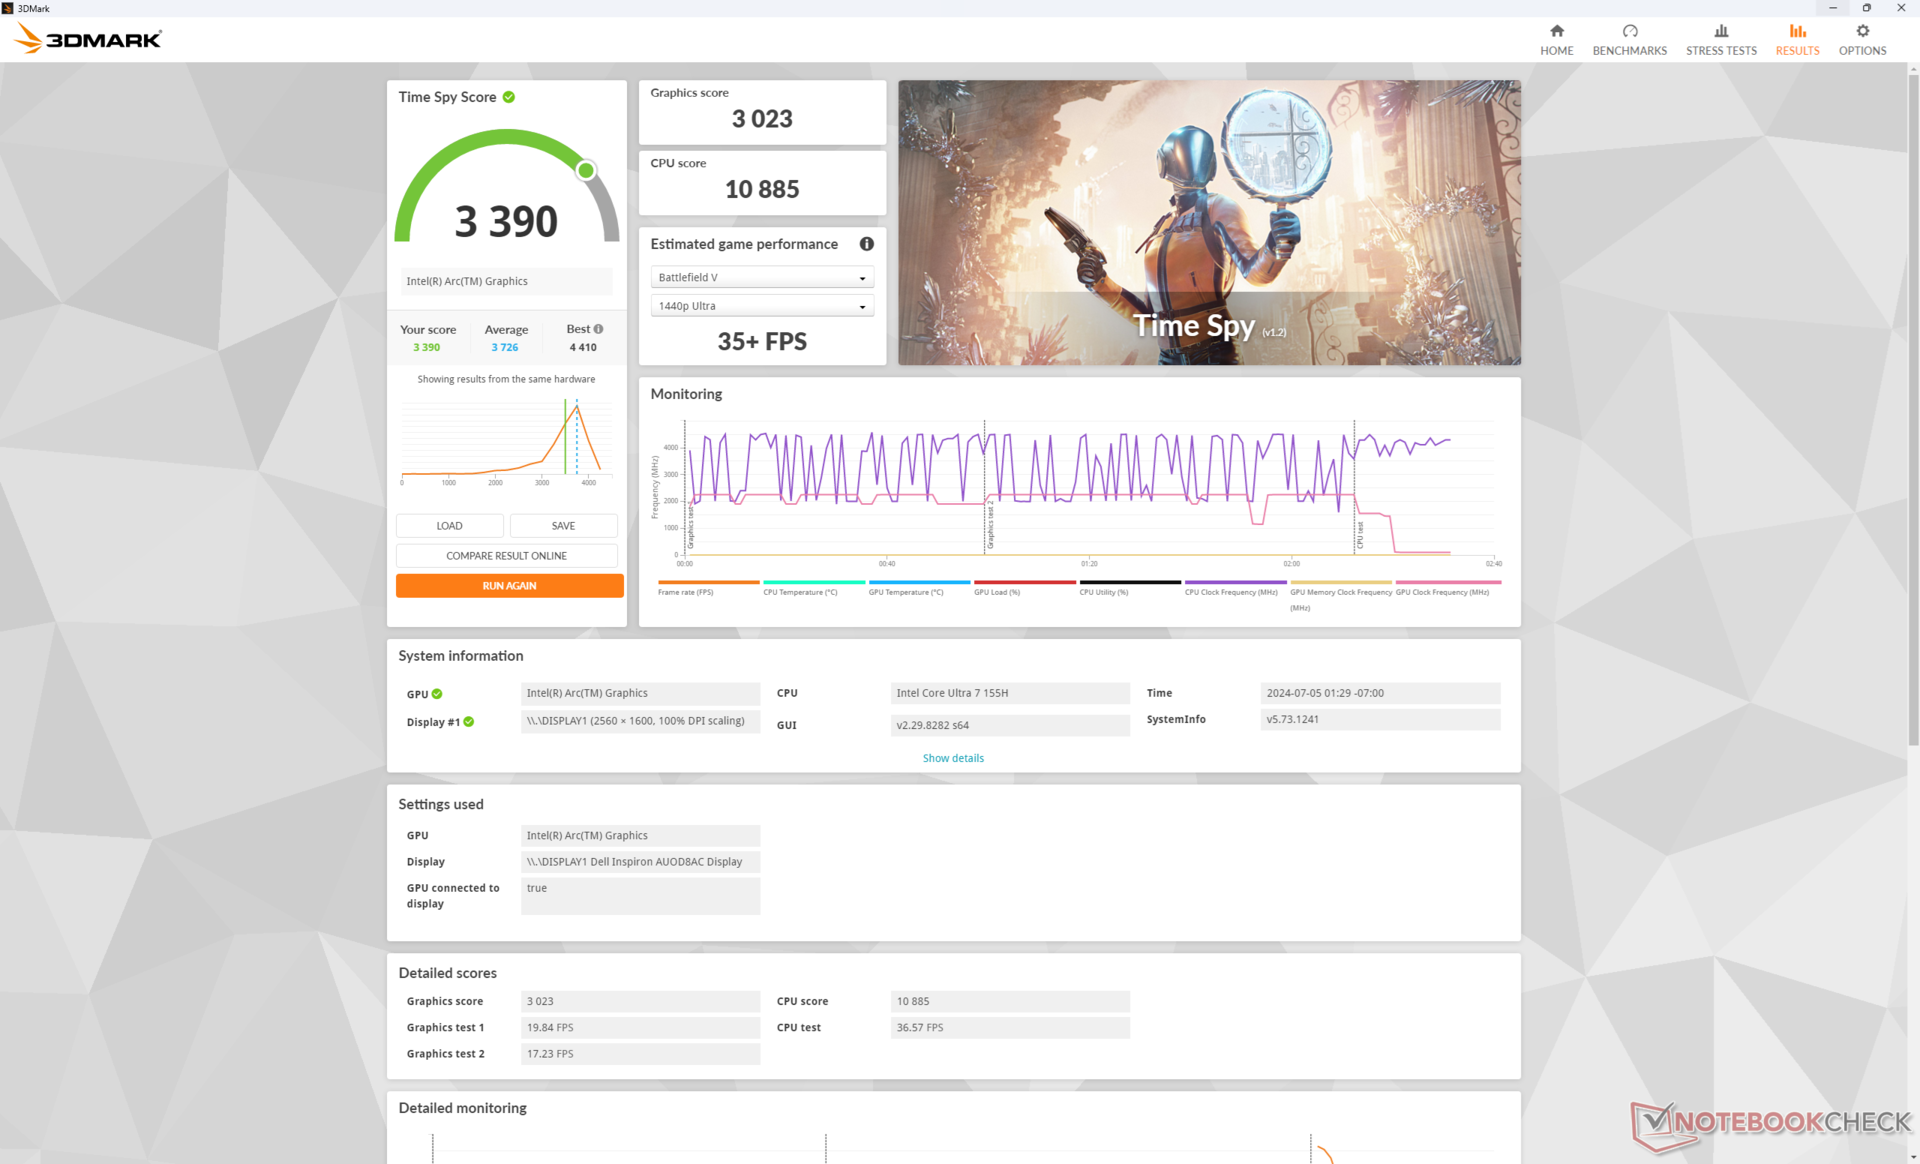
| Perfil de potencia | Fire Strike Puntuación gráfica | Fire Strike Puntuación física | Puntuación combinada |
| Modo de rendimiento | 8567 | 25687 | 2982 |
| Modo equilibrado | 8640 (-0%) | 26567 (-0%) | 2781 (-7%) |
| Batería | 7734 (-10%) | 25155 (-2%) | 2886 (-3%) |
Funcionar en modo equilibrado tendría un impacto mínimo en el rendimiento, como mucho, según nuestros resultados de Fire Strike en la tabla anterior. El déficit de rendimiento cuando se ejecuta en energía de la batería es menor de lo esperado con sólo un 10 por ciento para una buena coherencia entre los diferentes modos de energía.
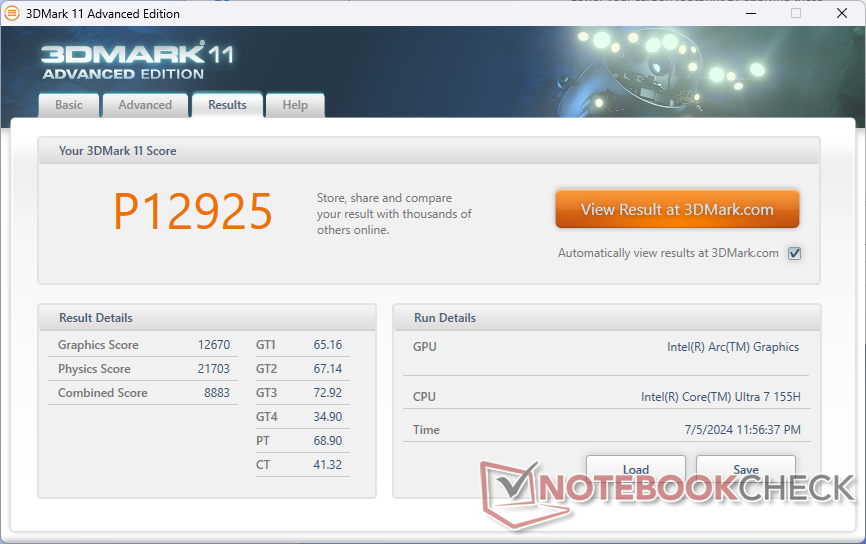
| 3DMark 11 Performance | 12925 puntos | |
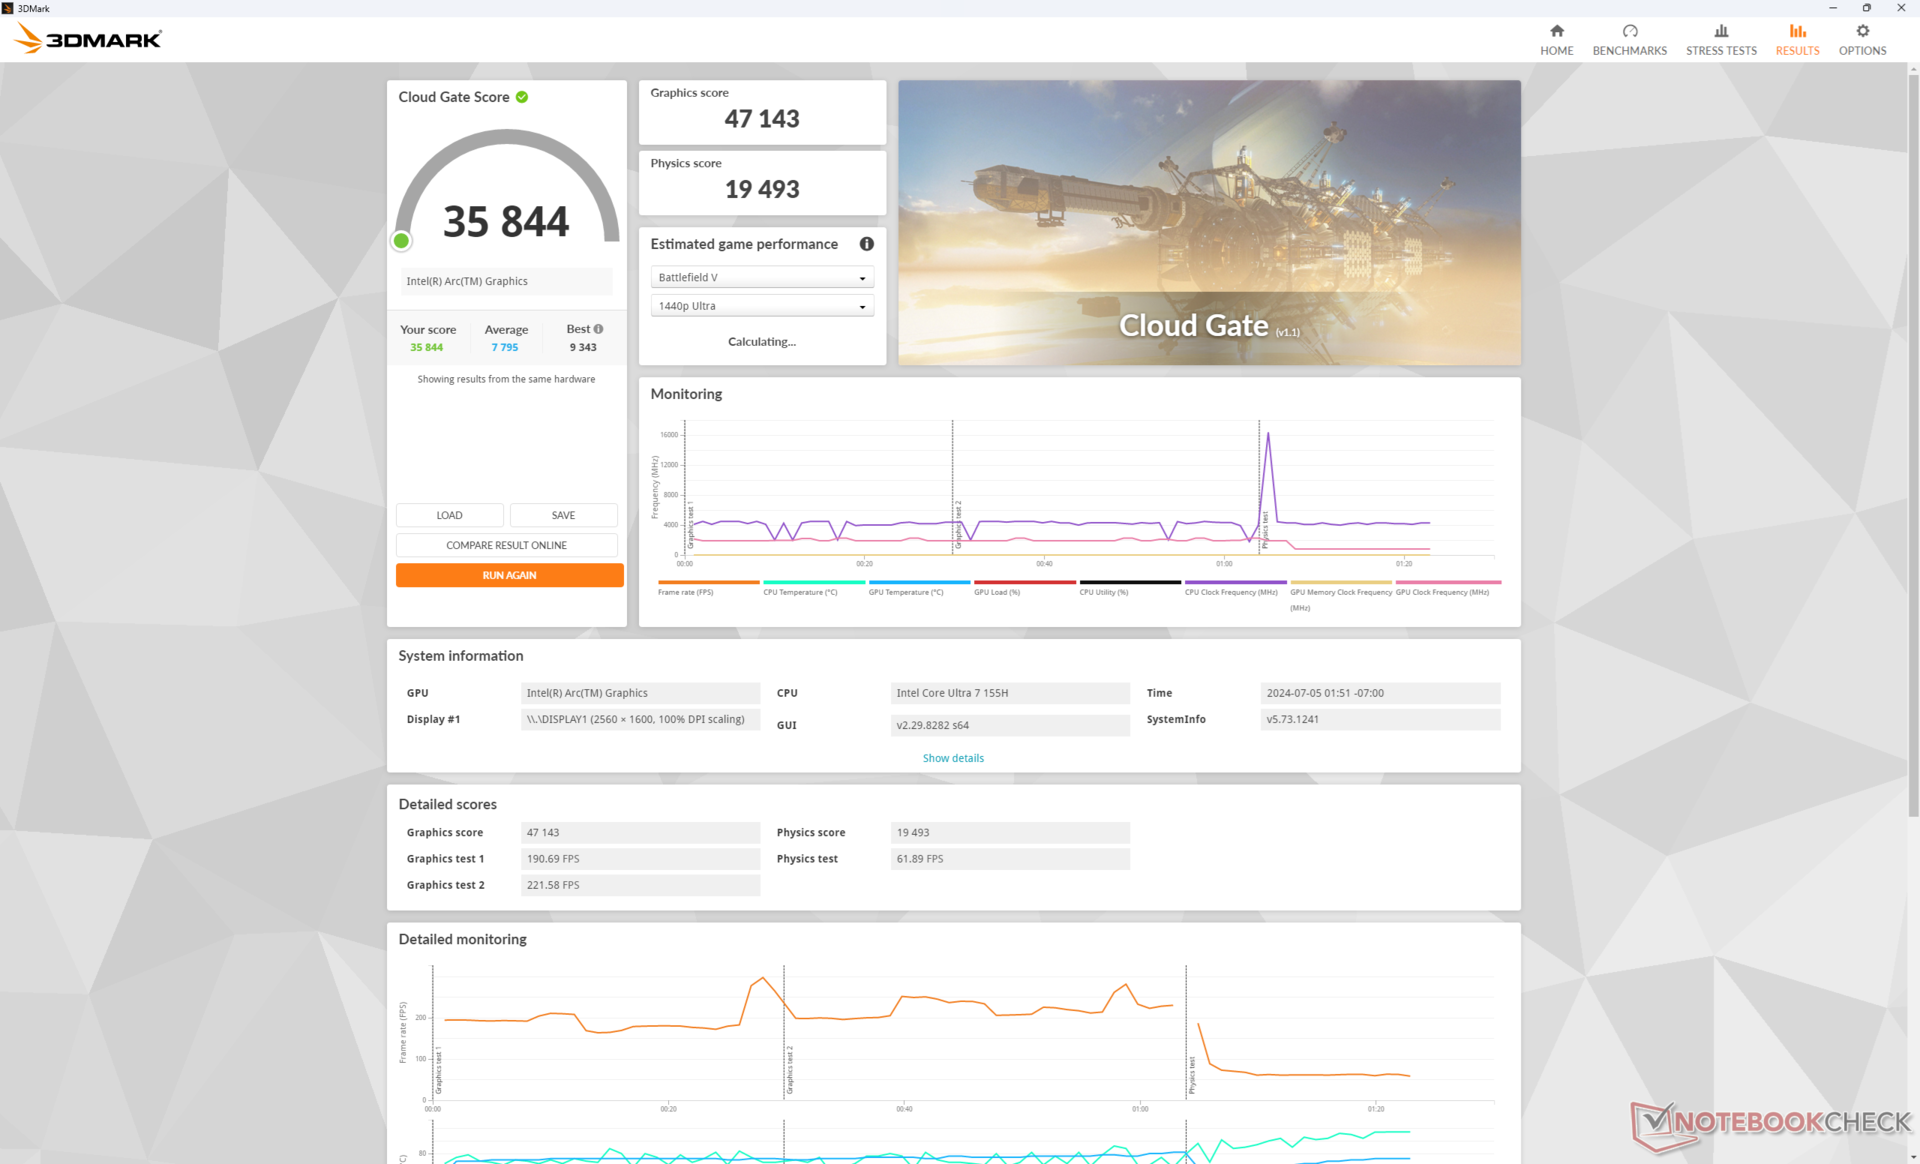
| 3DMark Cloud Gate Standard Score | 35844 puntos | |
| 3DMark Fire Strike Score | 7879 puntos | |
| 3DMark Time Spy Score | 3390 puntos | |
ayuda | ||
* ... más pequeño es mejor
| The Witcher 3 - 1920x1080 Ultra Graphics & Postprocessing (HBAO+) | |
| Dell Inspiron 16 Plus 7640 | |
| HP Envy x360 2-in-1 16-ad0097nr | |
| Lenovo IdeaPad Pro 5 16IMH G9 | |
| Dell Inspiron 16 7640 2-in-1 | |
| Samsung Galaxy Book4 Pro 360 | |
| Dell Inspiron 16 7635 2-in-1 | |
| Final Fantasy XV Benchmark - 1920x1080 High Quality | |
| Dell Inspiron 16 Plus 7640 | |
| Lenovo IdeaPad Pro 5 16IMH G9 | |
| Dell Inspiron 16 7640 2-in-1 | |
| HP Envy x360 2-in-1 16-ad0097nr | |
| Samsung Galaxy Book4 Pro 360 | |
| Dell Inspiron 16 7635 2-in-1 | |
| Strange Brigade - 1920x1080 ultra AA:ultra AF:16 | |
| Dell Inspiron 16 Plus 7640 | |
| Lenovo IdeaPad Pro 5 16IMH G9 | |
| Dell Inspiron 16 7640 2-in-1 | |
| HP Envy x360 2-in-1 16-ad0097nr | |
| Samsung Galaxy Book4 Pro 360 | |
| Dell Inspiron 16 7635 2-in-1 | |
| Dota 2 Reborn - 1920x1080 ultra (3/3) best looking | |
| Dell Inspiron 16 Plus 7640 | |
| Lenovo IdeaPad Pro 5 16IMH G9 | |
| Dell Inspiron 16 7640 2-in-1 | |
| HP Envy x360 2-in-1 16-ad0097nr | |
| Samsung Galaxy Book4 Pro 360 | |
| Dell Inspiron 16 7635 2-in-1 | |
| X-Plane 11.11 - 1920x1080 high (fps_test=3) | |
| Dell Inspiron 16 Plus 7640 | |
| Dell Inspiron 16 7640 2-in-1 | |
| Lenovo IdeaPad Pro 5 16IMH G9 | |
| Samsung Galaxy Book4 Pro 360 | |
| HP Envy x360 2-in-1 16-ad0097nr | |
| Dell Inspiron 16 7635 2-in-1 | |
| Far Cry 5 - 1920x1080 Ultra Preset AA:T | |
| Dell Inspiron 16 Plus 7640 | |
| Lenovo IdeaPad Pro 5 16IMH G9 | |
| Dell Inspiron 16 7640 2-in-1 | |
| HP Envy x360 2-in-1 16-ad0097nr | |
Cyberpunk 2077 ultra FPS Chart
| bajo | medio | alto | ultra | |
|---|---|---|---|---|
| The Witcher 3 (2015) | 141.5 | 81.2 | 44.5 | 23.9 |
| Dota 2 Reborn (2015) | 101.5 | 93.3 | 77.8 | 78 |
| Final Fantasy XV Benchmark (2018) | 65 | 36.5 | 26.8 | |
| X-Plane 11.11 (2018) | 50.8 | 40.8 | 40.1 | |
| Far Cry 5 (2018) | 68 | 38 | 36 | 34 |
| Strange Brigade (2018) | 145.6 | 71.8 | 55.4 | 45.4 |
| Tiny Tina's Wonderlands (2022) | 49.2 | 37.3 | 26.4 | 21.2 |
| F1 22 (2022) | 68.8 | 65.6 | ||
| Baldur's Gate 3 (2023) | 30.8 | 27.4 | 23.7 | 22 |
| Cyberpunk 2077 2.2 Phantom Liberty (2023) | 31 | 26.3 | 21.9 |
Emisiones
Ruido del sistema - Fuerte y orgulloso
Sin grandes cambios en la solución de refrigeración respecto al modelo 2023 a pesar de nuestro procesador más exigente, el ventilador interno tendrá que funcionar tan fuerte o más que antes y eso es exactamente lo que hemos registrado en nuestras pruebas. El ventilador del Inspiron 16 7640 2 en 1 se acelera más fácilmente, pasando de silencioso a ruidoso cuando se introducen cargas más pesadas. Por ejemplo, somos capaces de registrar un ruido del ventilador de 45 dB(A) a menos de la mitad de la primera escena del benchmark 3DMark 06 mientras que el Inspiron 16 7635 2 en 1 alcanzaría un máximo de 40 dB(A). Ejecutar juegos también resultaría en un ruido de ventilador de 45 dB(A) haciendo de nuestro Dell uno de los convertibles de 16 pulgadas más ruidosos del mercado.

Ruido
| Ocioso |
| 22.9 / 22.9 / 25 dB(A) |
| Carga |
| 45.1 / 44.9 dB(A) |
 | ||
30 dB silencioso 40 dB(A) audible 50 dB(A) ruidosamente alto |
||
min: | ||
| Dell Inspiron 16 7640 2-in-1 Arc 8-Core, Ultra 7 155H, Micron 2550 1TB | Dell Inspiron 16 Plus 7640 NVIDIA GeForce RTX 4060 Laptop GPU, Ultra 7 155H, SK hynix BC901 HFS001TEJ4X164N | Dell Inspiron 16 7635 2-in-1 Vega 7, R5 7530U, Kioxia BG5 KBG50ZNS512G | HP Envy x360 2-in-1 16-ad0097nr Radeon 780M, R7 8840HS, KIOXIA BG5 KBG50ZNV1T02 | Lenovo IdeaPad Pro 5 16IMH G9 Arc 8-Core, Ultra 7 155H, Samsung PM9C1a MZAL81T0HDLB | Samsung Galaxy Book4 Pro 360 Arc 7-Core, Ultra 5 125H, Samsung PM9B1 512GB MZVL4512HBLU | |
|---|---|---|---|---|---|---|
| Noise | 2% | 2% | 10% | -4% | 2% | |
| apagado / medio ambiente * | 22.9 | 23.8 -4% | 23.6 -3% | 22.9 -0% | 24.1 -5% | 24.1 -5% |
| Idle Minimum * | 22.9 | 24.2 -6% | 23.6 -3% | 23 -0% | 24.1 -5% | 24.1 -5% |
| Idle Average * | 22.9 | 24.2 -6% | 23.6 -3% | 23 -0% | 24.1 -5% | 24.1 -5% |
| Idle Maximum * | 25 | 24.2 3% | 23.6 6% | 23 8% | 28.2 -13% | 26.4 -6% |
| Load Average * | 45.1 | 28.9 36% | 40.3 11% | 23.8 47% | 44.4 2% | 35.2 22% |
| Cyberpunk 2077 ultra * | 44.9 | |||||
| Load Maximum * | 44.9 | 51 -14% | 44.2 2% | 43.8 2% | 44.4 1% | 39.2 13% |
| Witcher 3 ultra * | 51 | 44.2 | 43.8 | 36.5 | 38.5 |
* ... más pequeño es mejor
Temperatura
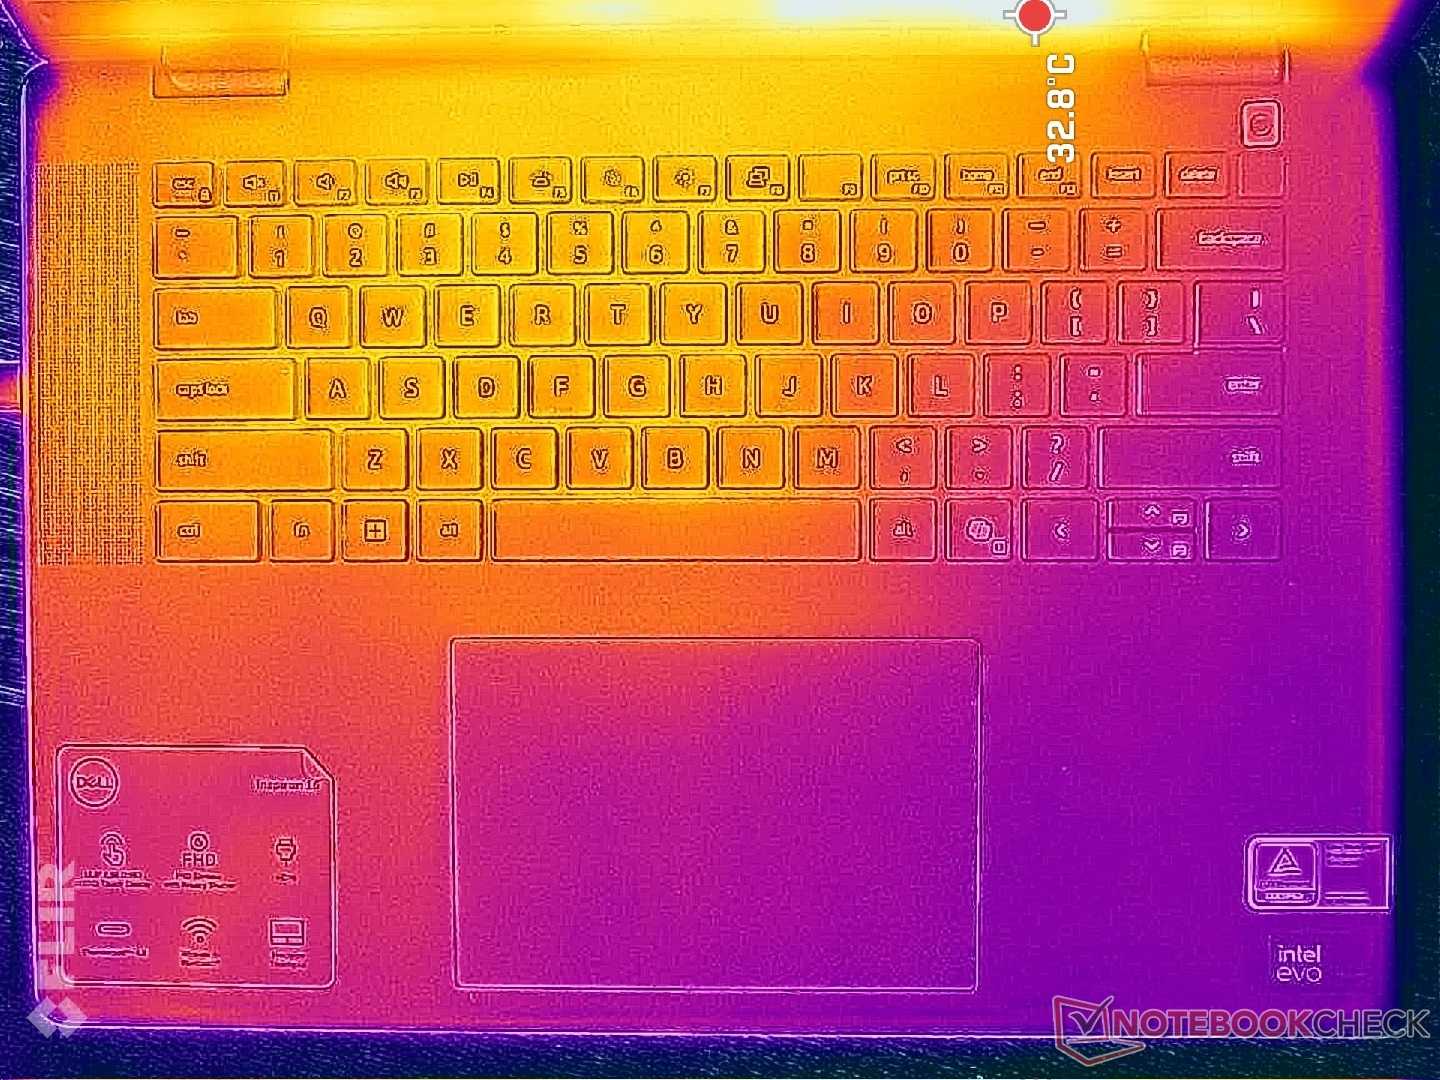
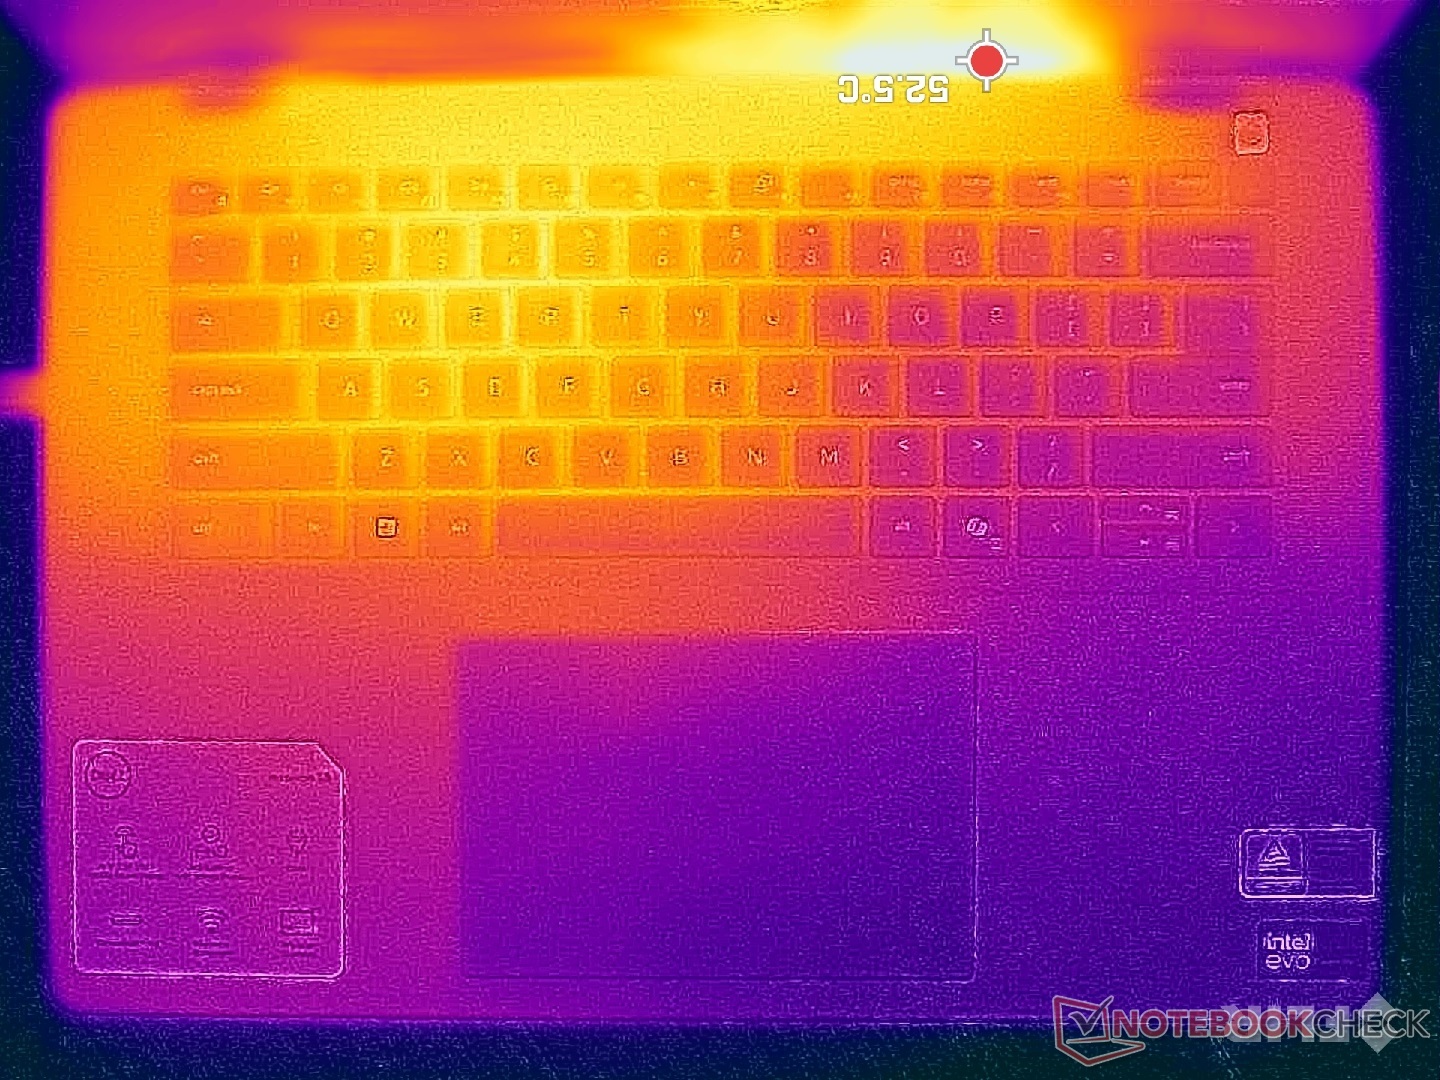
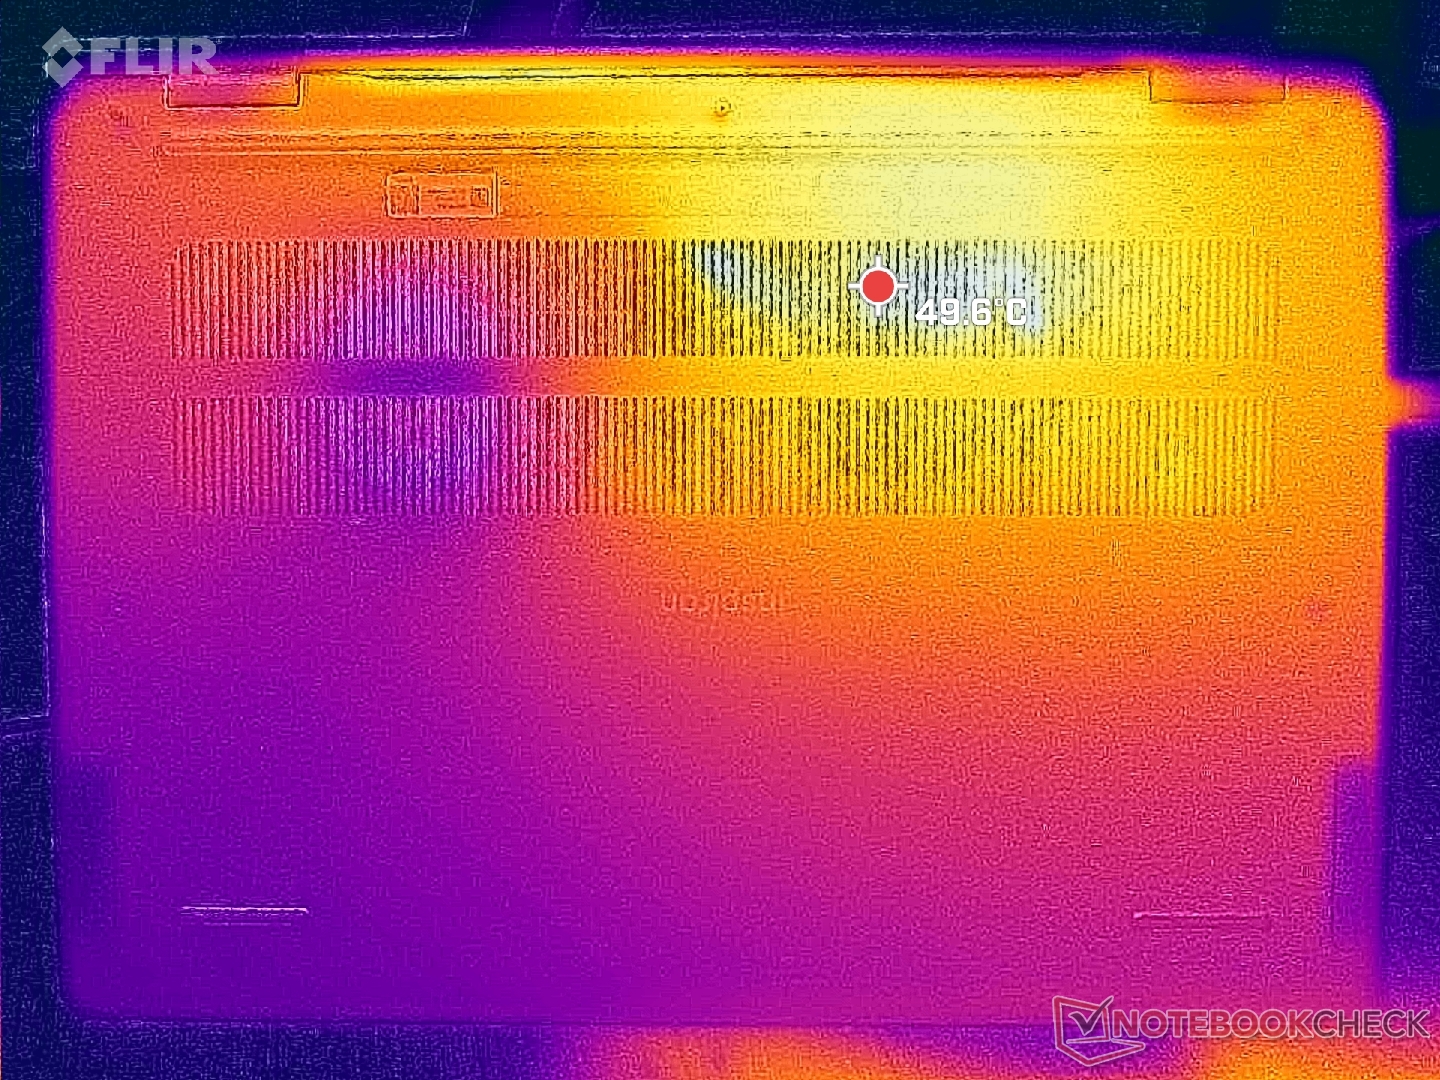
Las temperaturas superficiales vuelven a ser más cálidas en la mitad izquierda del chasis que en la derecha debido a la solución de refrigeración asimétrica. Esta vez, sin embargo, las temperaturas medias pueden ser mucho más cálidas que antes debido a la CPU Core serie H más potente. Los puntos calientes de nuestra unidad, por ejemplo, pueden alcanzar los 47 C tanto en la cubierta C como en la D en comparación con los escasos 39 C a 42 C del modelo del año pasado. Estos puntos están afortunadamente hacia la parte trasera de la unidad donde es menos probable que los dedos toquen.
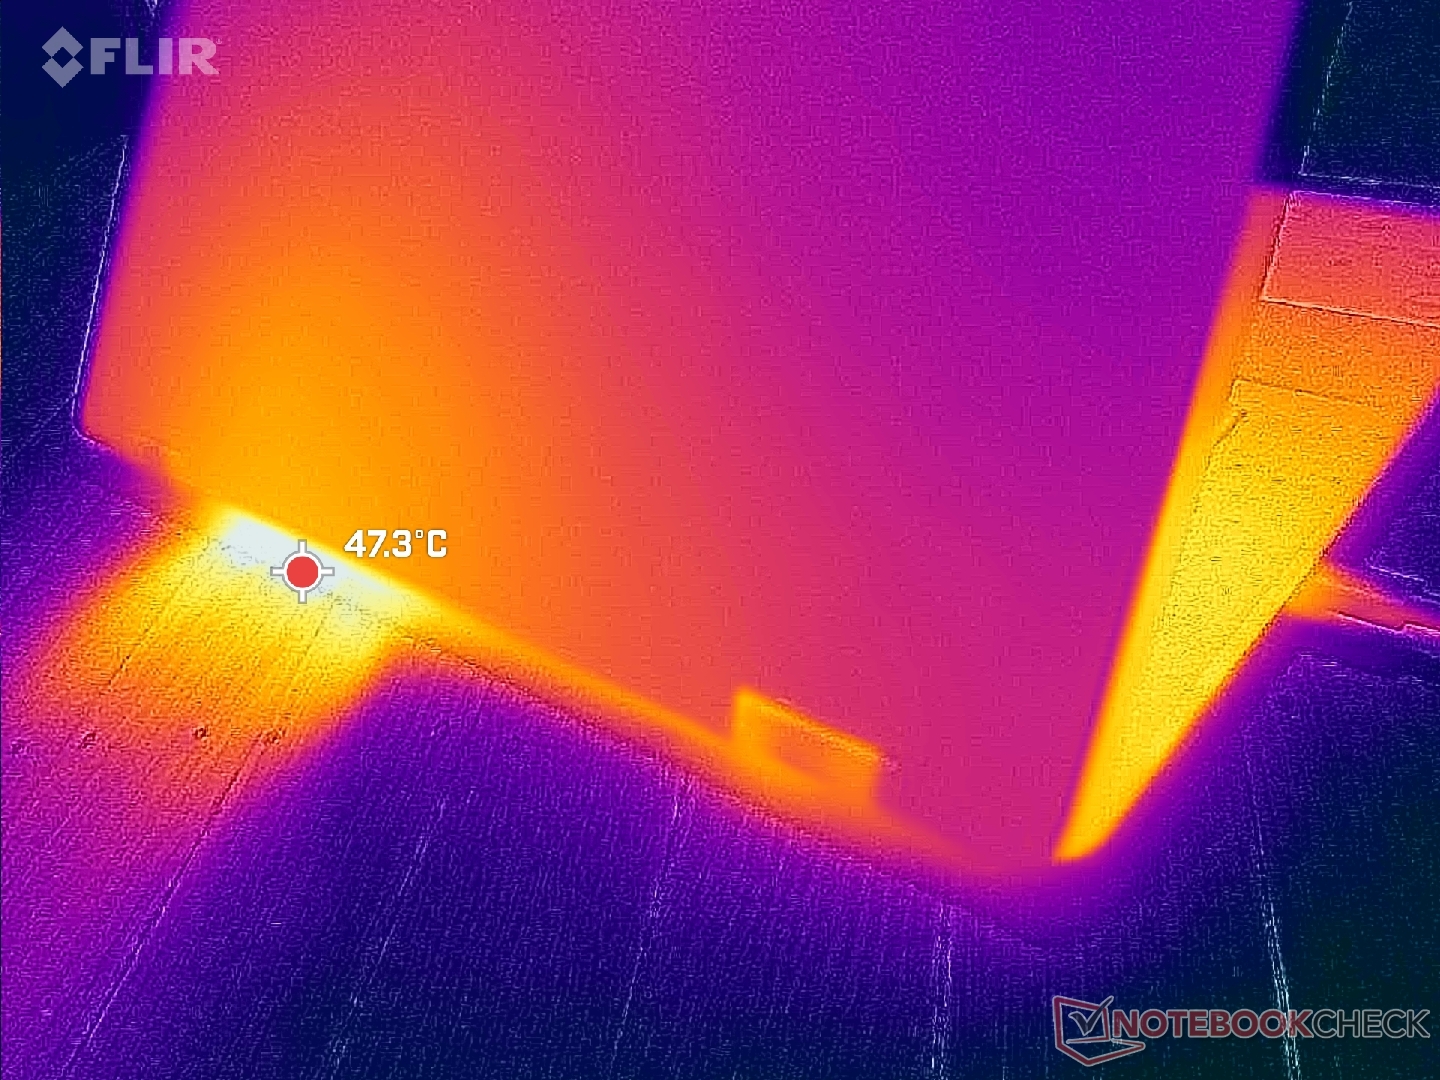
(-) La temperatura máxima en la parte superior es de 46.8 °C / 116 F, frente a la media de 35.3 °C / 96 F, que oscila entre 19.6 y 60 °C para la clase Convertible.
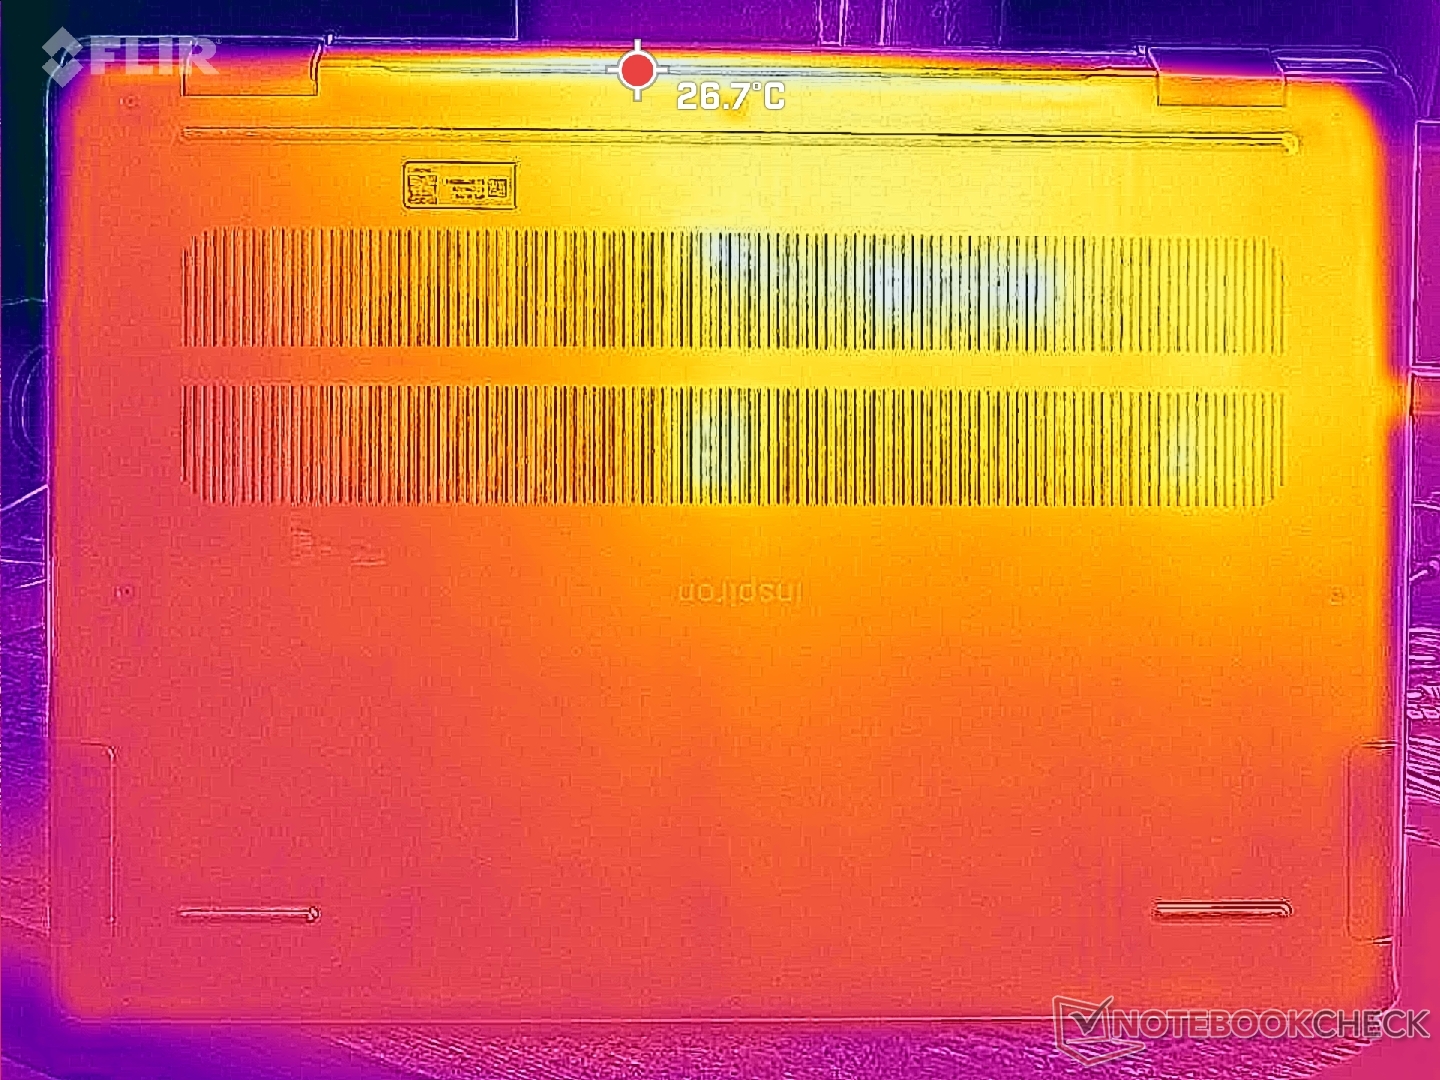
(-) El fondo se calienta hasta un máximo de 45.6 °C / 114 F, frente a la media de 36.8 °C / 98 F
(+) En reposo, la temperatura media de la parte superior es de 29.9 °C / 86# F, frente a la media del dispositivo de 30.3 °C / 87 F.
(+) Los reposamanos y el panel táctil alcanzan como máximo la temperatura de la piel (33.8 °C / 92.8 F) y, por tanto, no están calientes.
(-) La temperatura media de la zona del reposamanos de dispositivos similares fue de 28 °C / 82.4 F (-5.8 °C / -10.4 F).
| Dell Inspiron 16 7640 2-in-1 Intel Core Ultra 7 155H, Intel Arc 8-Core iGPU | Dell Inspiron 16 Plus 7640 Intel Core Ultra 7 155H, NVIDIA GeForce RTX 4060 Laptop GPU | Dell Inspiron 16 7635 2-in-1 AMD Ryzen 5 7530U, AMD Radeon RX Vega 7 | HP Envy x360 2-in-1 16-ad0097nr AMD Ryzen 7 8840HS, AMD Radeon 780M | Lenovo IdeaPad Pro 5 16IMH G9 Intel Core Ultra 7 155H, Intel Arc 8-Core iGPU | Samsung Galaxy Book4 Pro 360 Intel Core Ultra 5 125H, Intel Arc 7-Core iGPU | |
|---|---|---|---|---|---|---|
| Heat | 3% | 11% | 8% | 19% | 18% | |
| Maximum Upper Side * | 46.8 | 43.4 7% | 41.6 11% | 42.6 9% | 36.3 22% | 38.6 18% |
| Maximum Bottom * | 45.6 | 41.6 9% | 39 14% | 47.8 -5% | 39.1 14% | 39.2 14% |
| Idle Upper Side * | 32.2 | 32.8 -2% | 29.4 9% | 27.4 15% | 24.9 23% | 25.2 22% |
| Idle Bottom * | 31.4 | 32.4 -3% | 28.6 9% | 27.8 11% | 26.1 17% | 25.7 18% |
* ... más pequeño es mejor
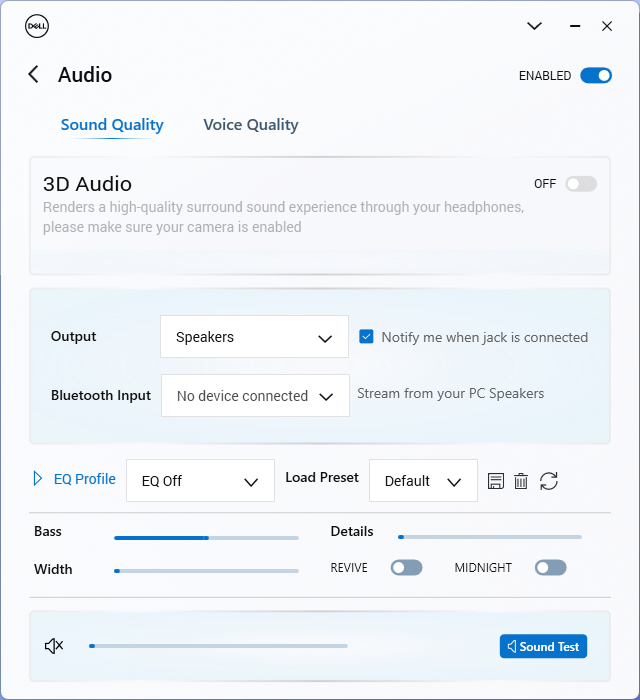
Altavoces
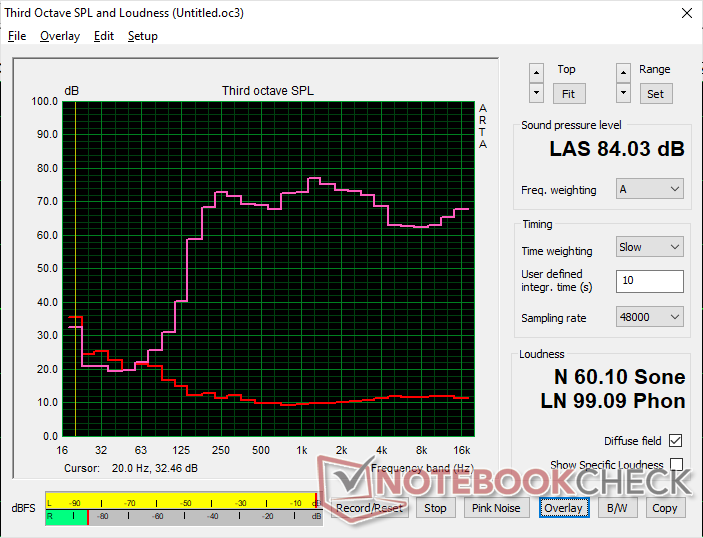
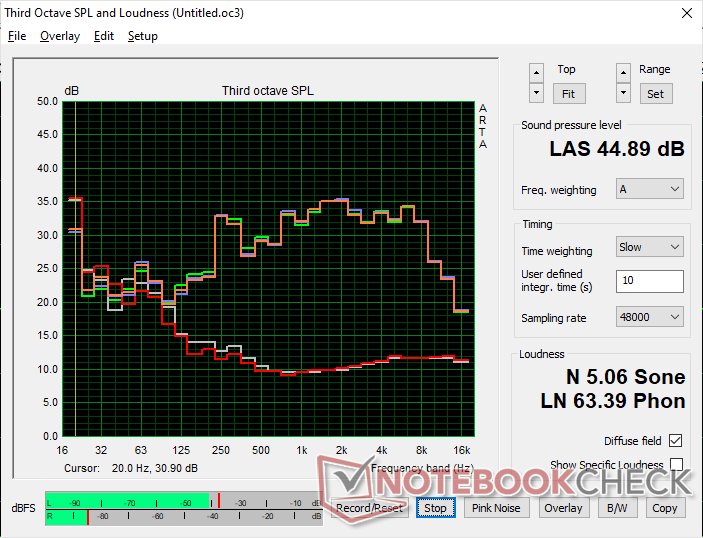
Dell Inspiron 16 7640 2-in-1 análisis de audio
(+) | los altavoces pueden reproducir a un volumen relativamente alto (#84 dB)
Graves 100 - 315 Hz
(±) | lubina reducida - en promedio 13.9% inferior a la mediana
(±) | la linealidad de los graves es media (14% delta a frecuencia anterior)
Medios 400 - 2000 Hz
(+) | medios equilibrados - a sólo 3.6% de la mediana
(+) | los medios son lineales (3.6% delta a la frecuencia anterior)
Altos 2 - 16 kHz
(+) | máximos equilibrados - a sólo 4.5% de la mediana
(+) | los máximos son lineales (2.8% delta a la frecuencia anterior)
Total 100 - 16.000 Hz
(+) | el sonido global es lineal (12% de diferencia con la mediana)
En comparación con la misma clase
» 11% de todos los dispositivos probados de esta clase eran mejores, 4% similares, 85% peores
» El mejor tuvo un delta de 6%, la media fue 20%, el peor fue ###max##%
En comparación con todos los dispositivos probados
» 8% de todos los dispositivos probados eran mejores, 2% similares, 90% peores
» El mejor tuvo un delta de 4%, la media fue 24%, el peor fue ###max##%
Apple MacBook Pro 16 2021 M1 Pro análisis de audio
(+) | los altavoces pueden reproducir a un volumen relativamente alto (#84.7 dB)
Graves 100 - 315 Hz
(+) | buen bajo - sólo 3.8% lejos de la mediana
(+) | el bajo es lineal (5.2% delta a la frecuencia anterior)
Medios 400 - 2000 Hz
(+) | medios equilibrados - a sólo 1.3% de la mediana
(+) | los medios son lineales (2.1% delta a la frecuencia anterior)
Altos 2 - 16 kHz
(+) | máximos equilibrados - a sólo 1.9% de la mediana
(+) | los máximos son lineales (2.7% delta a la frecuencia anterior)
Total 100 - 16.000 Hz
(+) | el sonido global es lineal (4.6% de diferencia con la mediana)
En comparación con la misma clase
» 0% de todos los dispositivos probados de esta clase eran mejores, 0% similares, 100% peores
» El mejor tuvo un delta de 5%, la media fue 18%, el peor fue ###max##%
En comparación con todos los dispositivos probados
» 0% de todos los dispositivos probados eran mejores, 0% similares, 100% peores
» El mejor tuvo un delta de 4%, la media fue 24%, el peor fue ###max##%
Gestión de la energía - Core-H y Mini-LED pueden ser exigentes
Consumo de energía
El ralentí en el escritorio demanda entre 6 W y 14 W dependiendo del ajuste de brillo, lo que supone varios vatios más que lo que registramos en el Inspiron 16 7635 2 en 1. Por supuesto, tanto la CPU serie H más exigente como el panel mini-LED de mayor resolución son responsables del consumo generalmente superior.
El consumo es de nuevo superior al del Inspiron 16 7635 2 en 1 en más de un 40 por ciento cuando se ejecutan aplicaciones más exigentes como juegos. Sin embargo, con un aumento del rendimiento de la GPU de más del doble con respecto a la RX Vega 7, el aumento del consumo debería merecer la pena para la mayoría de los usuarios. Una conclusión similar puede hacerse también para las tareas intensivas de la CPU cuando se ejecuta Prime95. Si la duración de la batería es más deseable que el rendimiento, es de esperar que optar por la configuración Core Ultra 5 125U, más barata y lenta, ahorre mucha energía en este sentido.
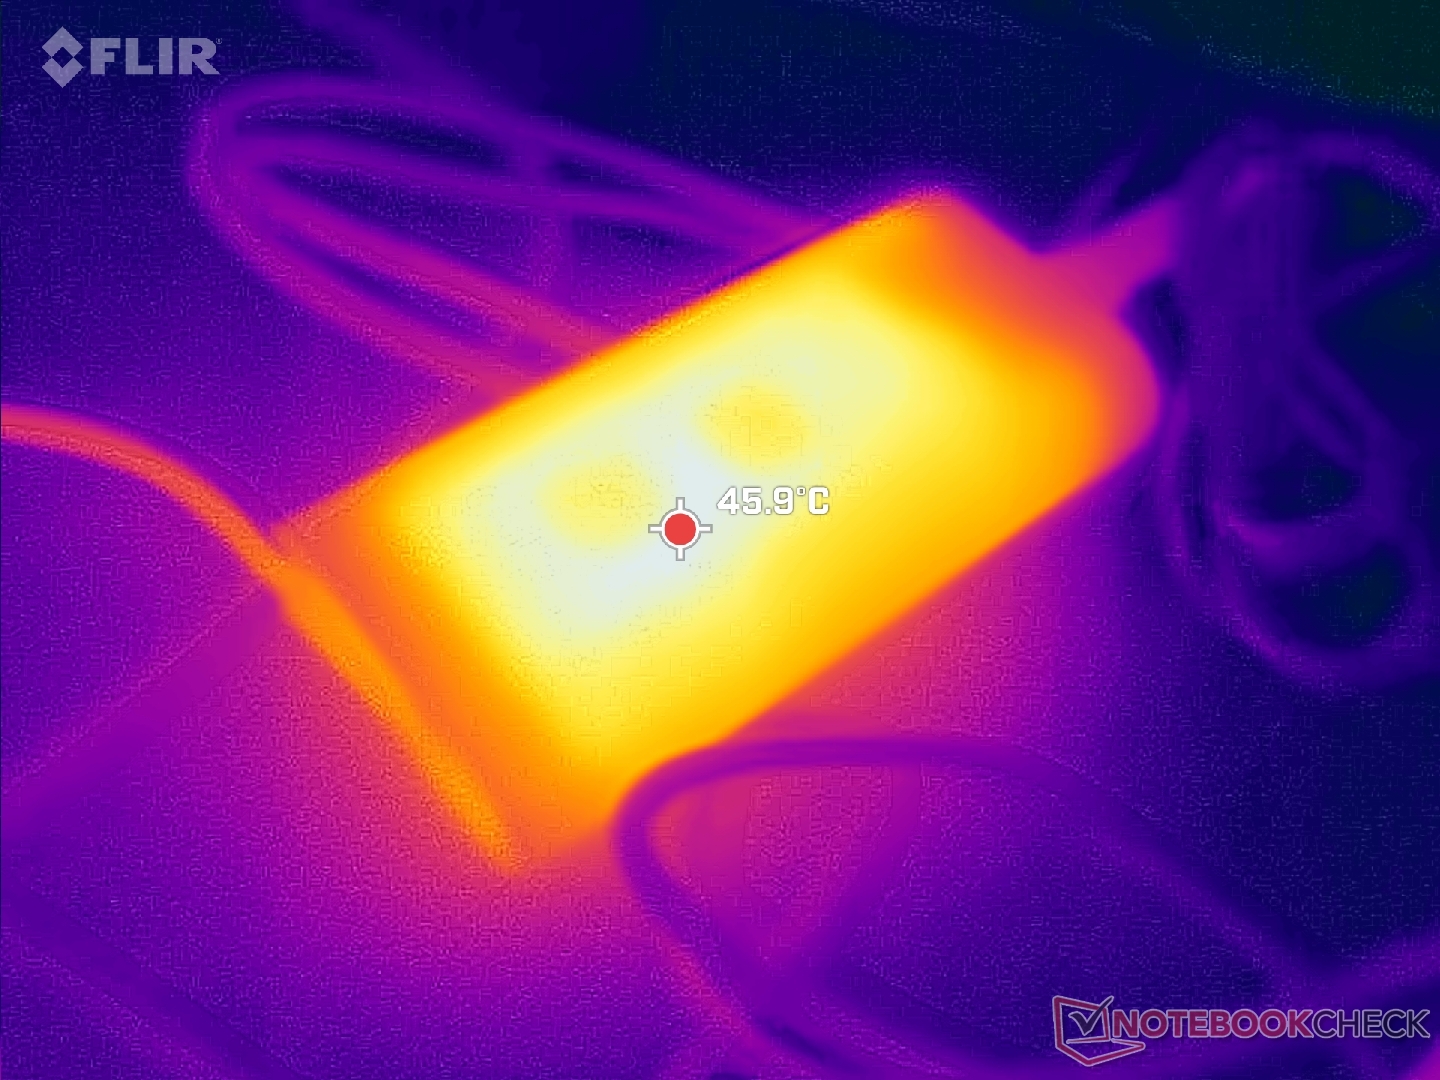
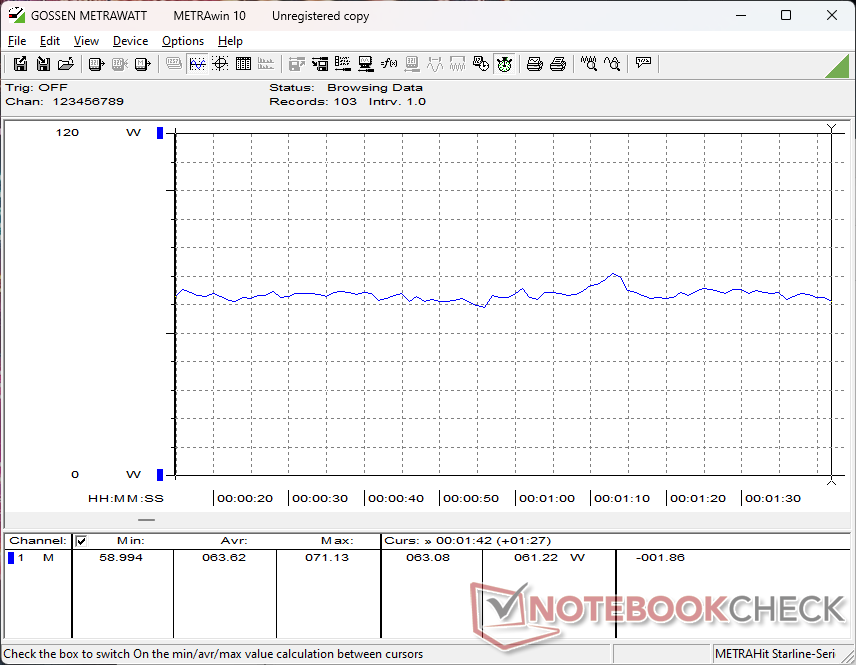
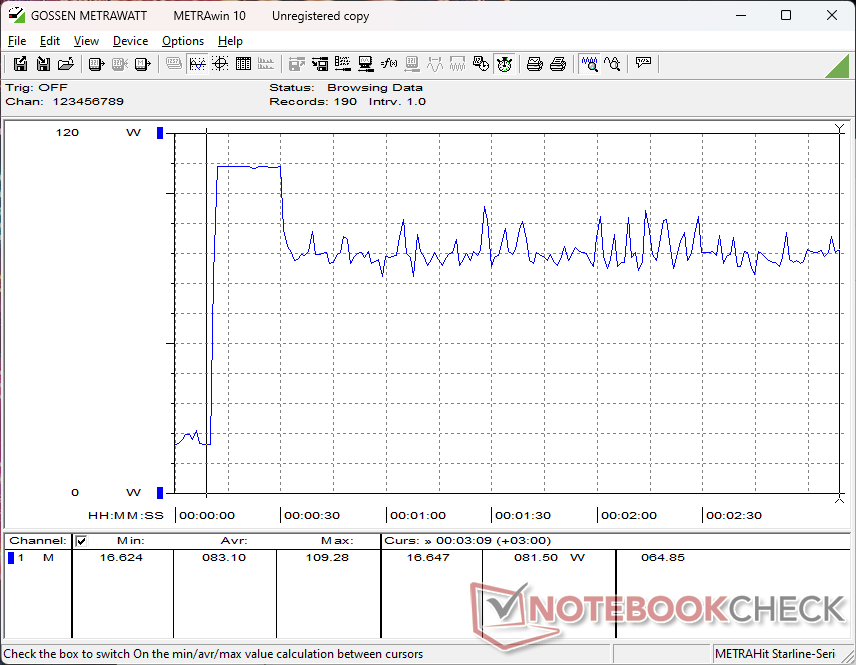
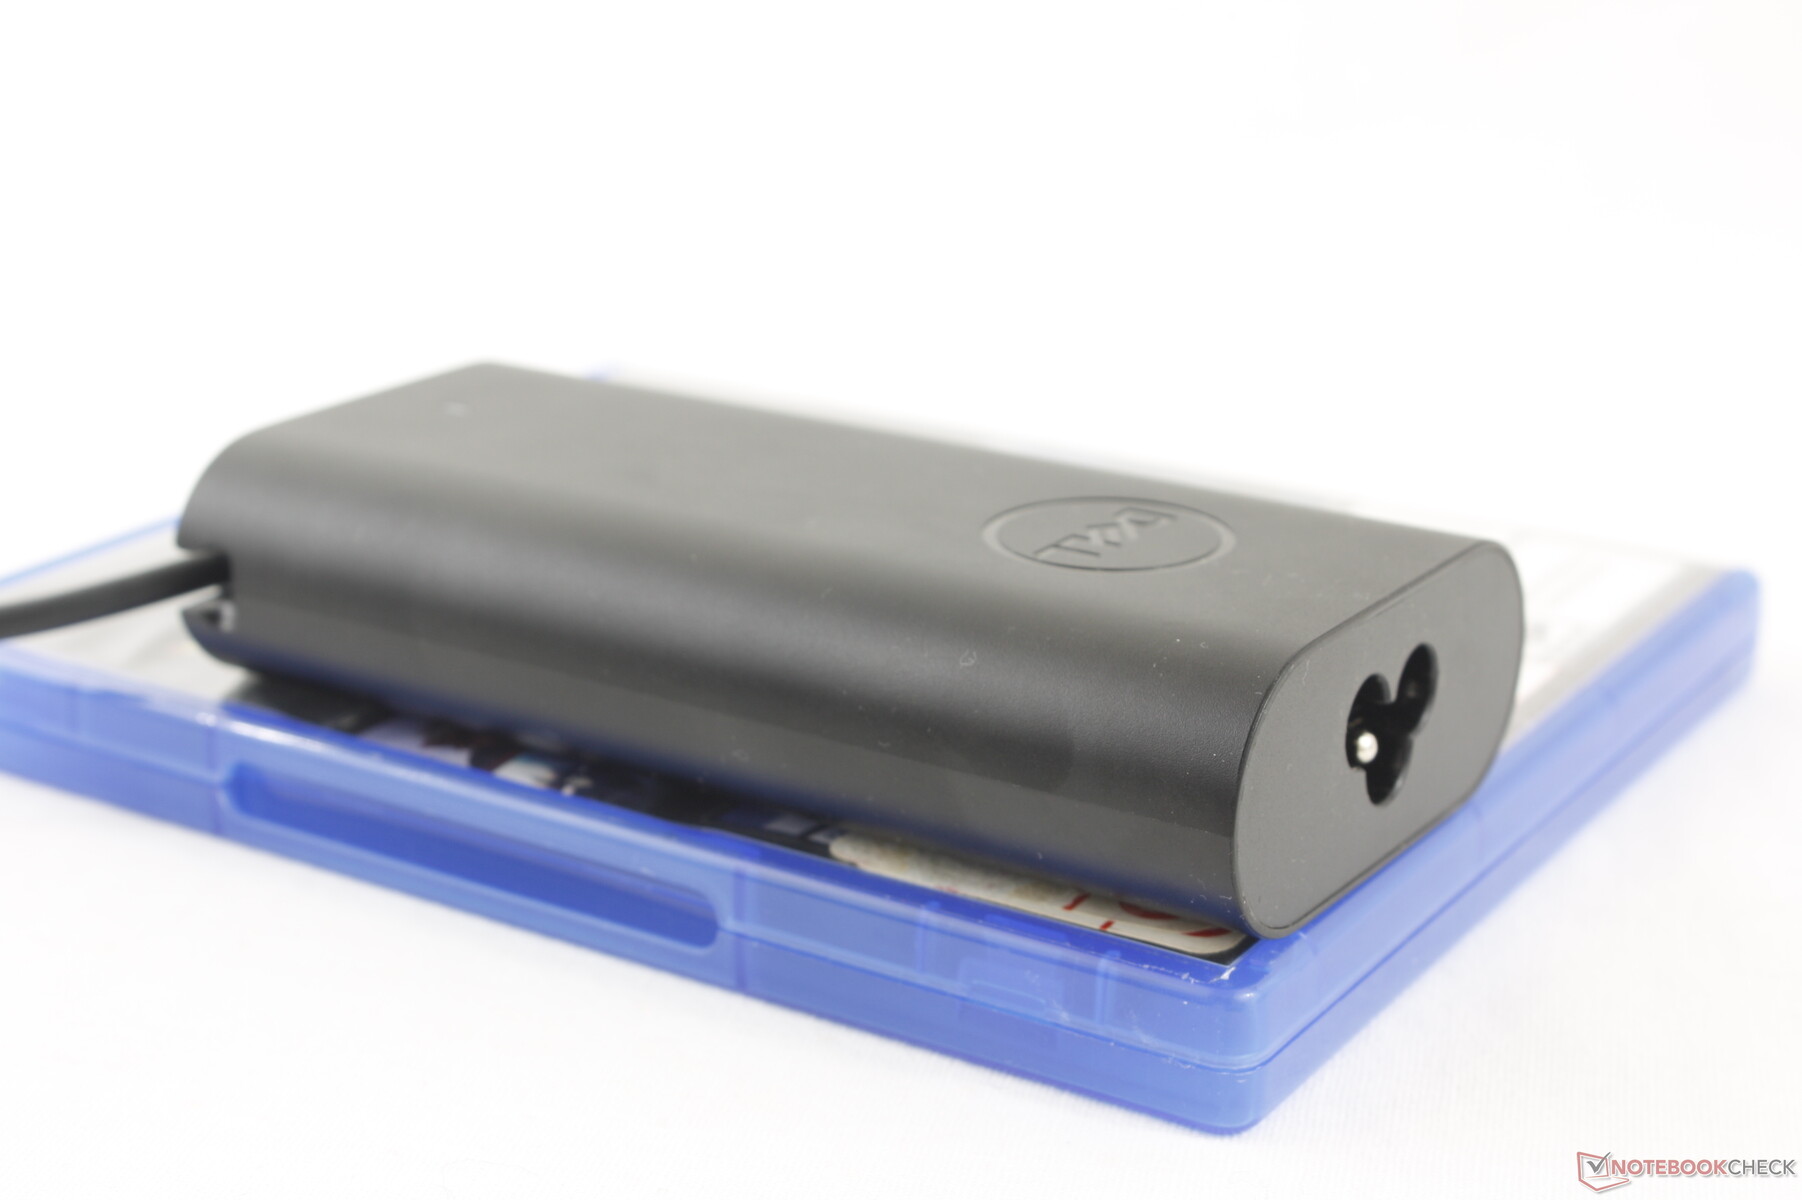
Hemos podido registrar un consumo máximo de 110 W a pesar de que el adaptador de CA USB-C pequeño-mediano (~12,2 x 5,9 x 2,7 cm) solo tiene una capacidad nominal de 100 W. Este consumo máximo es solo temporal, como muestra nuestro gráfico de abajo, debido a las limitaciones térmicas. No obstante, es muy superior al que registramos en el Inspiron 16 7635 2 en 1 debido al mayor potencial Turbo Boost de la CPU Core serie H.

| Off / Standby | |
| Ocioso | |
| Carga |
|
Clave:
min: | |
| Dell Inspiron 16 7640 2-in-1 Ultra 7 155H, Arc 8-Core, Micron 2550 1TB, Mini-LED, 2560x1600, 16" | Dell Inspiron 16 Plus 7640 Ultra 7 155H, NVIDIA GeForce RTX 4060 Laptop GPU, SK hynix BC901 HFS001TEJ4X164N, IPS, 2560x1600, 16" | Dell Inspiron 16 7635 2-in-1 R5 7530U, Vega 7, Kioxia BG5 KBG50ZNS512G, IPS, 1920x1200, 16" | HP Envy x360 2-in-1 16-ad0097nr R7 8840HS, Radeon 780M, KIOXIA BG5 KBG50ZNV1T02, OLED, 2880x1800, 16" | Lenovo IdeaPad Pro 5 16IMH G9 Ultra 7 155H, Arc 8-Core, Samsung PM9C1a MZAL81T0HDLB, IPS, 2560x1600, 16" | Samsung Galaxy Book4 Pro 360 Ultra 5 125H, Arc 7-Core, Samsung PM9B1 512GB MZVL4512HBLU, OLED, 2880x1800, 16" | |
|---|---|---|---|---|---|---|
| Power Consumption | 7% | 35% | 26% | 22% | 44% | |
| Idle Minimum * | 6.1 | 4.2 31% | 4.8 21% | 5 18% | 3.5 43% | 3 51% |
| Idle Average * | 13.5 | 6.9 49% | 7.6 44% | 6.2 54% | 9.6 29% | 6.3 53% |
| Idle Maximum * | 13.8 | 15.2 -10% | 8.7 37% | 14.7 -7% | 9.9 28% | 6.5 53% |
| Load Average * | 63.6 | 70.4 -11% | 47.1 26% | 49.9 22% | 62.7 1% | 49.3 22% |
| Cyberpunk 2077 ultra external monitor * | 64.6 | |||||
| Cyberpunk 2077 ultra * | 67 | |||||
| Load Maximum * | 109.7 | 137.4 -25% | 56.4 49% | 65 41% | 101.2 8% | 65.5 40% |
| Witcher 3 ultra * | 115.9 | 46.6 | 54.5 | 55.8 | 45.9 |
* ... más pequeño es mejor
Power Consumption Cyberpunk / Stress Test
Power Consumption external Monitor
Duración de las pilas
El paquete de baterías de 90 Wh es mayor que el de 64 Wh del Inspiron 16 7635 2 en 1 del año pasado. Aún así, los tiempos de ejecución son más cortos en casi tres horas durante nuestra prueba de navegación debido a la pantalla más exigente y la CPU como se mencionó anteriormente. Las diferencias de tiempo de ejecución se mantienen incluso cuando las pantallas se ajustan a un nivel de brillo idéntico de 150 nits.
La carga del gran paquete de baterías desde vacío hasta su capacidad total es relativamente lenta, de unas 2,5 horas, en comparación con las 1,5 horas de la mayoría de los demás Ultrabooks.
| Dell Inspiron 16 7640 2-in-1 Ultra 7 155H, Arc 8-Core, 90 Wh | Dell Inspiron 16 Plus 7640 Ultra 7 155H, NVIDIA GeForce RTX 4060 Laptop GPU, 90 Wh | Dell Inspiron 16 7635 2-in-1 R5 7530U, Vega 7, 64 Wh | HP Envy x360 2-in-1 16-ad0097nr R7 8840HS, Radeon 780M, 68 Wh | Lenovo IdeaPad Pro 5 16IMH G9 Ultra 7 155H, Arc 8-Core, 84 Wh | Samsung Galaxy Book4 Pro 360 Ultra 5 125H, Arc 7-Core, 76 Wh | |
|---|---|---|---|---|---|---|
| Duración de Batería | 16% | 23% | -12% | -9% | 0% | |
| Reader / Idle | 1310 | 1560 19% | 935 -29% | |||
| WiFi v1.3 | 686 | 799 16% | 869 27% | 459 -33% | 756 10% | 531 -23% |
| Load | 93 | 114 23% | 116 25% | 68 -27% | 114 23% | |
| H.264 | 957 | 881 |
Pro
Contra
Veredicto - Grande en tamaño y rendimiento
El Inspiron 16 7640 2 en 1 tiene varios puntos fuertes. En primer lugar, su rendimiento con el Core Ultra 7 155H es de primera categoría, especialmente en comparación con otros convertibles de 16 pulgadas que funcionan con gráficos integrados. Se trata de una CPU de clase gaming sin mayores problemas de ralentización y debería fulgurar a través de cualquier contenido o aplicaciones multitarea que pueda lanzar a la máquina. En segundo lugar, el panel mini-LED consolida el modelo como un reproductor multimedia de gama alta con un práctico factor de forma 2 en 1 y un lápiz activo.
El Inspiron 16 7640 2 en 1 es grande y está al mando. Aunque su rendimiento y pantalla son impresionantes para su precio, los usuarios lo pagan con un chasis voluminoso y una menor duración de la batería.
Un mayor rendimiento y unas pantallas más brillantes tienen el coste previsible de un mayor consumo de energía. Los componentes más exigentes generan más calor, lo que se traduce en un mayor ruido del ventilador y una menor autonomía que en el modelo del año pasado. Las diferencias tampoco son menores, como demuestran nuestras pruebas y mediciones anteriores.
Además, no se puede ignorar el gran tamaño y el elevado peso del modelo. Existen convertibles de 16 pulgadas más ligeros, como el LG Gram 16 2 en 1 o el Samsung Galaxy Book4 Pro 360 para una experiencia más fácil de transportar. El Dell es más grande y pesado que incluso el HP Spectre x360 16 que ofrece notablemente gráficos discretos GeForce.
No obstante, el Inspiron 16 7640 2 en 1 sigue siendo atractivo a pesar de sus defectos por su razonable precio de venta de 1000 dólares. Sobresale en cuanto a velocidad y calidad de imagen frente a otros portátiles del mismo rango de precio.
Precio y disponibilidad
La configuración básica con el Core Ultra 5 125U y la pantalla táctil IPS estándar de 1200p parte de los 800 dólares, mientras que la configuración Core Ultra 7 155H y mini-LED de 2,5K, como la analizada, se comercializa actualmente por 1000 dólares.
Nota: Hemos actualizado nuestro sistema de evaluación y los resultados de la versión 8 no se pueden comparar con los de la versión 7. Más información aquí verfügbar.
Nota: Recientemente hemos actualizado nuestro sistema de clasificación y los resultados de la versión 8 no son comparables con los de la versión 7. Encontrará más información aquí .
Dell Inspiron 16 7640 2-in-1
- 07/19/2024 v8
Allen Ngo
 Total Sustainability Score:
 Transparencia
La selección de los dispositivos que se van a reseñar corre a cargo de nuestro equipo editorial. La muestra de prueba fue proporcionada al autor en calidad de préstamo por el fabricante o el minorista a los efectos de esta reseña. El prestamista no tuvo ninguna influencia en esta reseña, ni el fabricante recibió una copia de la misma antes de su publicación. No había ninguna obligación de publicar esta reseña. Nunca aceptamos compensaciones o pagos a cambio de nuestras reseñas. Como empresa de medios independiente, Notebookcheck no está sujeta a la autoridad de fabricantes, minoristas o editores.
Así es como prueba Notebookcheck
Cada año, Notebookcheck revisa de forma independiente cientos de portátiles y smartphones utilizando procedimientos estandarizados para asegurar que todos los resultados son comparables. Hemos desarrollado continuamente nuestros métodos de prueba durante unos 20 años y hemos establecido los estándares de la industria en el proceso. En nuestros laboratorios de pruebas, técnicos y editores experimentados utilizan equipos de medición de alta calidad. Estas pruebas implican un proceso de validación en varias fases. Nuestro complejo sistema de clasificación se basa en cientos de mediciones y puntos de referencia bien fundamentados, lo que mantiene la objetividad.Price comparison

