Notebookcheck Logo

Análisis del Acer Nitro 14 (2024): Portátil compacto para juegos con RTX 4060 y batería de larga duración
Coherente.

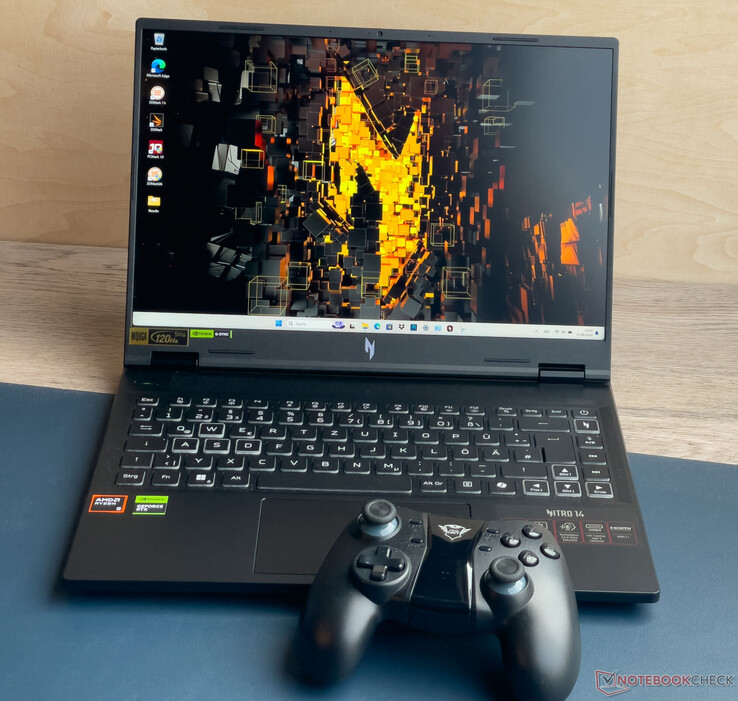
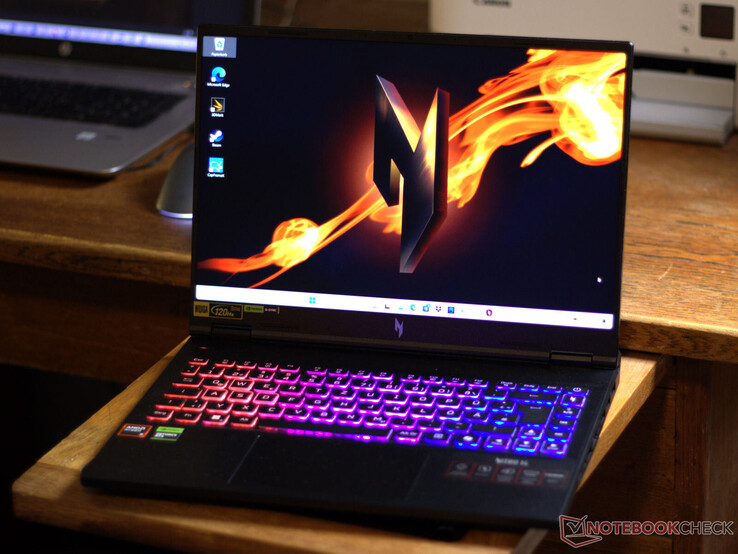
Un Ryzen 5 8645HS, una GeForce RTX 4060 y 16 GB de RAM ofrecen potencia de juego de gama media y garantizan una gran duración de la batería. El hardware del portátil se completa con un panel 16:10 de 14,5 pulgadas (2,5K, 120 Hz y compatibilidad con G-Sync) y un puerto USB4. El paquete completo está disponible por 1.449 euros (unos 1.600 dólares).

Después de revisar recientemente el Acer Predator Helios Neo 14un potente portátil para juegos de 14,5 pulgadas, ahora tenemos en nuestras manos el Nitro 14, un portátil Acer más asequible que comparte en gran medida el mismo diseño. Mientras que el Predator es un portátil de gama alta, el Nitro está más dirigido al segmento de gama media. Esto es evidente en el punto de precio del portátil de 1.449 euros (1.600 dólares) y en su coherente hardware, que cuenta con un Ryzen 5 8645HS (Hawk Point), una GeForce RTX 4060, 16 GB de RAM, una SSD de 512 GB y una pantalla de 2,5K.

El Nitro 14 compite con modelos de la talla del HP Omen Transcend 14el Lenovo LOQ 15IRX9el Razer Blade 14el Asus TUF Gaming A15 FA507UVy el XMG Core 15 (M24).

Acer Nitro 14 AN14-41-R3MX (Nitro 14 Serie)
Procesador
AMD Ryzen 5 8645HS 6 x 4.3 - 5 GHz, 100 W PL2 / Short Burst, 90 W PL1 / Sustained, Hawk Point-HS (Zen 4)
Adaptador gráfico
NVIDIA GeForce RTX 4060 Laptop GPU - 8 GB VRAM, Núcleo: 2010 MHz, Memoría: 1975 MHz, 110 W TDP ( including 50 W Dynamic Boost), GDDR6, 32.0.15.6081, Advanced Optimus
Memoría
16 GB 
, LPDDR5X, Dual-channel mode, onboard, no memory slots
pantalla
14.50 pulgadas 16:10, 2560 x 1600 pixels 208 PPI, AU Optronics B145QAN01.J, IPS, G-Sync, lustroso: no, 120 Hz, Adaptive Sync
Placa base
AMD Promontory/Bixby FCH
Disco duro
Micron 3500 MTFDKBA512TGD, 512 GB 
, M.2-2280, PCIe 4, 410 GB libre
Tarjeta de sonido
AMD Zen - Audio Processor - HD Audio Controller
Conexiones
3 USB 3.1 Gen2, 1 USB 4.0 40 Gbps, USB-C Power Delivery (PD), 1 HDMI, 2 DisplayPort, 1 Kensington Lock, Audio Conexiones: Combo audio jack, Card Reader: MicroSD, TPM 2.0
Equipamento de red
MediaTek Wi-Fi 6E MT7922 160MHz Wireless LAN Card (a/b/g/n = Wi-Fi 4/ac = Wi-Fi 5/ax = Wi-Fi 6/ Wi-Fi 6E 6 GHz), Bluetooth 5.2
Tamaño
Alto x ancho x profundidad (en mm): 22.84 x 324.12 x 255.9
Battería
76 Wh, 4930 mAh Litio-Polimero
Sistema Operativo
Microsoft Windows 11 Home
Camera
Webcam: HD
Primary Camera: 0.9 MPix
Características adicionales
Altavoces: Stereo, Teclado: Chiclet, Luz de Teclado: si, McAfee, Acer LiveArt, Acer QuickPanel, Acer documents, Acer Jumpstart, Acer Product Registration, Acer Purified Voice Console, 24 Meses Garantía
Peso
1.983 kg, Suministro de Electricidad: 789 g
Precio
1450 Euro
Amazon
Note: The manufacturer may use components from different suppliers including display panels, drives or memory sticks with similar specifications.


Posibles contendientes en la comparación

Valoración
Version
Fecha
Modelo
Peso
Altura
Tamaño
Resolución
Price
80.3 %v8
09/2024
Acer Nitro 14 AN14-41-R3MX
R5 8645HS, NVIDIA GeForce RTX 4060 Laptop GPU
2 kg22.84 mm14.50"2560x1600
89.7 %
v7 (old)
v7 (old)
02/2024
Razer Blade 14 RZ09-0508
R9 8945HS, NVIDIA GeForce RTX 4070 Laptop GPU
1.9 kg17.99 mm14.00"2560x1600
79 %v8
07/2024
Lenovo LOQ 15IRX9
i5-13450HX, NVIDIA GeForce RTX 4060 Laptop GPU
2.4 kg23.9 mm15.60"1920x1080
80.3 %v8
07/2024
Asus TUF Gaming A15 FA507UV
R9 8945H, NVIDIA GeForce RTX 4060 Laptop GPU
2.1 kg22.4 mm15.60"1920x1080
83.7 %v8
06/2024
SCHENKER XMG Core 15 (M24)
R7 8845HS, NVIDIA GeForce RTX 4060 Laptop GPU
2.1 kg21.9 mm15.30"2560x1600
88.5 %
v7 (old)
v7 (old)
03/2024
HP Omen Transcend 14-fb0014
Ultra 7 155H, NVIDIA GeForce RTX 4060 Laptop GPU
1.6 kg18 mm14.00"2880x1800
80.5 %v8
08/2024
Acer Predator Helios Neo 14 (2024)
Ultra 9 185H, NVIDIA GeForce RTX 4070 Laptop GPU
1.9 kg20.9 mm14.50"3072x1920

Nota: Recientemente hemos actualizado nuestro sistema de clasificación y los resultados de la versión 8 no son comparables con los de la versión 7. Encontrará más información aquí .

Carcasa - Acer no ha enlucido la Nitro con LEDs

Acer ha emparejado una unidad base de plástico con una tapa de aluminio. Esta última parece ser bastante susceptible a las huellas dactilares. Aunque la sección de la base sólo se puede girar ligeramente, la tapa muestra más flexibilidad. Pero esto no provoca ninguna distorsión de la imagen, ni siquiera cuando se aplica presión a la parte posterior de la tapa. Las bisagras son capaces de mantener la pantalla firmemente en su posición, y la pantalla no se tambalea mucho después de ser ajustada. El portátil se puede abrir con una mano, hasta un ángulo de aproximadamente 155 grados. Acer ha entregado un chasis decente en general.

Como se ha mencionado, el Nitro comparte en su mayor parte el mismo diseño exterior que el Helios Neo 14. Este último es unos 2 mm (0,08 pulgadas) más delgado, pero por lo demás las diferencias son principalmente cosméticas. El chasis del Nitro es en su mayor parte de un tono que Acer denomina Negro Obsidiana, y sólo las rejillas de ventilación traseras lucen un resalte naranja. El Nitro no ofrece superficies texturizadas ni estampados como los que se encuentran en el Neo 14. Acer tampoco ha adornado los dos portátiles con tiras de LED.

Acer Nitro 14 AN14-41

El Nitro es el dispositivo más voluminoso entre los portátiles de 14 pulgadas de nuestra comparativa. Su peso es comparable al de sus competidores. El HP Omen Transcend 14 es una elección sólida si la compacidad y el peso son cruciales.

Comparación de tamaños

359.86 mm 258.7 mm 23.9 mm 2.4 kg354 mm 251 mm 22.4 mm 2.1 kg342.5 mm 245 mm 21.9 mm 2.1 kg324.12 mm 255.9 mm 22.84 mm 2 kg324.12 mm 255.4 mm 20.9 mm 1.9 kg313 mm 233 mm 18 mm 1.6 kg310.7 mm 228 mm 17.99 mm 1.9 kg297 mm 210 mm 1 mm 5.7 g

Especificaciones - USB4 completo con Power Delivery

Acer ha optado por una conectividad USB rápida: el puerto USB-C de la derecha y los dos puertos USB-A son compatibles con USB 3.2 Gen 2, mientras que el otro puerto USB-C es compatible con USB4. Ambos conectores USB-C ofrecen Power Delivery y DisplayPort Alt Mode, lo que da a la Nitro un total de tres salidas de vídeo (HDMI, 2x DisplayPort). Las zonas adyacentes al reposamanos pueden mantenerse libres de cables en su mayor parte porque todos los puertos están situados en el centro, tanto en el lado izquierdo como en el derecho. Otra elección de diseño encomiable es que cada lado cuenta con un puerto USB-A y otro USB-C.

Lado izquierdo: Ranura de seguridad para un candado de cable, puerto de alimentación, USB 3.2 Gen 2 (USB-A), USB4 (USB-C; Power Delivery, DP Alt Mode), toma de audio combo
Lado derecho: Ranura para tarjetas microSD, USB 3.2 Gen 2 (USB-C; Power Delivery, DP Alt Mode), USB 3.2 Gen 2 (USB-A), HDMI

Lector de tarjetas SD

Al parecer, Acer consideró necesario incluir un lector de tarjetas microSD, pero eligió un modelo muy lento, como demostraron nuestras pruebas con nuestra tarjeta de referencia AV PRO microSD 128 GB V60. Comparando las tasas de transferencia con las alcanzadas por el Asus ROG Zephyrus G14 demuestra lo que podría haber sido posible.

SD Card Reader
average JPG Copy Test (av. of 3 runs)
Asus ROG Zephyrus G14 2024 GA403U
AMD Ryzen 9 8945HS (Angelbird AV Pro V60)
154 MB/s +637%
Average of class Gaming
  (19 - 202, n=87, last 2 years)
95.9 MB/s +359%
SCHENKER XMG Core 15 (M24)
AMD Ryzen 7 8845HS
38.3 (33.53min - 39.96max) MB/s +83%
Acer Predator Helios Neo 14 (2024)
Intel Core Ultra 9 185H (AV PRO microSD 128 GB V60)
26 MB/s +24%
Acer Nitro 14 AN14-41-R3MX
AMD Ryzen 5 8645HS (AV PRO microSD 128 GB V60)
20.9 MB/s
maximum AS SSD Seq Read Test (1GB)
Asus ROG Zephyrus G14 2024 GA403U
AMD Ryzen 9 8945HS (Angelbird AV Pro V60)
193.6 MB/s +433%
Average of class Gaming
  (25.8 - 269, n=88, last 2 years)
120 MB/s +231%
SCHENKER XMG Core 15 (M24)
AMD Ryzen 7 8845HS
41.86 MB/s +15%
Acer Nitro 14 AN14-41-R3MX
AMD Ryzen 5 8645HS (AV PRO microSD 128 GB V60)
36.3 MB/s
Acer Predator Helios Neo 14 (2024)
Intel Core Ultra 9 185H (AV PRO microSD 128 GB V60)
27 MB/s -26%

Conectividad

El módulo inalámbrico aloja un chip MediaTek MT7922 Wi-Fi 6E, que alcanzó excelentes velocidades de transmisión de datos en condiciones óptimas (es decir, sin dispositivos Wi-Fi en los alrededores, corta distancia entre el portátil y el punto de acceso), pero sólo al recibir datos. Las velocidades de transmisión sólo fueron aproximadamente la mitad de las de recepción. El módulo también es compatible con Bluetooth 5.2. El Nitro no tiene puerto Gigabit Ethernet integrado.

Networking
iperf3 transmit AXE11000
Razer Blade 14 RZ09-0508
Qualcomm FastConnect 7800
1499 (1396min - 1560max) MBit/s +65%
Average MediaTek Wi-Fi 6E MT7922 160MHz Wireless LAN Card
  (358 - 1785, n=55)
1279 MBit/s +41%
Average of class Gaming
  (469 - 1843, n=148, last 2 years)
1230 MBit/s +35%
Acer Predator Helios Neo 14 (2024)
Killer Wi-Fi 6E AX1675i 160MHz Wireless Network Adapter
1222 (552min - 1457max) MBit/s +34%
SCHENKER XMG Core 15 (M24)
Intel Wi-Fi 6E AX210
1208 (557min - 1301max) MBit/s +33%
HP Omen Transcend 14-fb0014
Intel Wi-Fi 7 BE200 320MHz
1200 (623min - 1313max) MBit/s +32%
Acer Nitro 14 AN14-41-R3MX
MediaTek Wi-Fi 6E MT7922 160MHz Wireless LAN Card
910 (395min - 1257max) MBit/s
Lenovo LOQ 15IRX9
Realtek RTL8852BE
830 (747min - 873max) MBit/s -9%
Asus TUF Gaming A15 FA507UV
Realtek RTL8852BE
806 (513min - 843max) MBit/s -11%
iperf3 receive AXE11000
Acer Nitro 14 AN14-41-R3MX
MediaTek Wi-Fi 6E MT7922 160MHz Wireless LAN Card
1720 (1610min - 1757max) MBit/s
Acer Predator Helios Neo 14 (2024)
Killer Wi-Fi 6E AX1675i 160MHz Wireless Network Adapter
1691 (1653min - 1732max) MBit/s -2%
Razer Blade 14 RZ09-0508
Qualcomm FastConnect 7800
1612 (1575min - 1677max) MBit/s -6%
SCHENKER XMG Core 15 (M24)
Intel Wi-Fi 6E AX210
1433 (616min - 1532max) MBit/s -17%
HP Omen Transcend 14-fb0014
Intel Wi-Fi 7 BE200 320MHz
1418 (1323min - 1497max) MBit/s -18%
Average MediaTek Wi-Fi 6E MT7922 160MHz Wireless LAN Card
  (707 - 1775, n=55)
1397 MBit/s -19%
Average of class Gaming
  (680 - 1890, n=148, last 2 years)
1392 MBit/s -19%
Lenovo LOQ 15IRX9
Realtek RTL8852BE
975 (950min - 986max) MBit/s -43%
Asus TUF Gaming A15 FA507UV
Realtek RTL8852BE
956 (936min - 974max) MBit/s -44%
iperf3 transmit AXE11000 6GHz
Average of class Gaming
  (648 - 1878, n=68, last 2 years)
1429 MBit/s +98%
Razer Blade 14 RZ09-0508
Qualcomm FastConnect 7800
1428 (709min - 1473max) MBit/s +98%
Average MediaTek Wi-Fi 6E MT7922 160MHz Wireless LAN Card
  (394 - 1800, n=38)
1399 MBit/s +93%
HP Omen Transcend 14-fb0014
Intel Wi-Fi 7 BE200 320MHz
1298 (1188min - 1389max) MBit/s +80%
Acer Nitro 14 AN14-41-R3MX
MediaTek Wi-Fi 6E MT7922 160MHz Wireless LAN Card
723 (400min - 1373max) MBit/s
iperf3 receive AXE11000 6GHz
Acer Nitro 14 AN14-41-R3MX
MediaTek Wi-Fi 6E MT7922 160MHz Wireless LAN Card
1749 (1698min - 1769max) MBit/s
Razer Blade 14 RZ09-0508
Qualcomm FastConnect 7800
1521 (1486min - 1559max) MBit/s -13%
Average of class Gaming
  (853 - 1788, n=68, last 2 years)
1488 MBit/s -15%
Average MediaTek Wi-Fi 6E MT7922 160MHz Wireless LAN Card
  (684 - 1771, n=39)
1433 MBit/s -18%
HP Omen Transcend 14-fb0014
Intel Wi-Fi 7 BE200 320MHz
1402 (1366min - 1423max) MBit/s -20%
0501001502002503003504004505005506006507007508008509009501000105011001150120012501300135014001450150015501600165017001750Tooltip
Acer Nitro 14 AN14-41-R3MX MediaTek Wi-Fi 6E MT7922 160MHz Wireless LAN Card; iperf3 transmit AXE11000; iperf 3.1.3: Ø910 (395-1257)
Razer Blade 14 RZ09-0508 Qualcomm FastConnect 7800; iperf3 transmit AXE11000; iperf 3.1.3: Ø1499 (1396-1560)
Lenovo LOQ 15IRX9 Realtek RTL8852BE; iperf3 transmit AXE11000; iperf 3.1.3: Ø830 (747-873)
Asus TUF Gaming A15 FA507UV Realtek RTL8852BE; iperf3 transmit AXE11000; iperf 3.1.3: Ø806 (513-843)
SCHENKER XMG Core 15 (M24) Intel Wi-Fi 6E AX210; iperf3 transmit AXE11000; iperf 3.1.3: Ø1189 (557-1301)
HP Omen Transcend 14-fb0014 Intel Wi-Fi 7 BE200 320MHz; iperf3 transmit AXE11000; iperf 3.1.3: Ø1179 (623-1313)
Acer Predator Helios Neo 14 (2024) Killer Wi-Fi 6E AX1675i 160MHz Wireless Network Adapter; iperf3 transmit AXE11000; iperf 3.1.3: Ø1203 (552-1457)
Acer Nitro 14 AN14-41-R3MX MediaTek Wi-Fi 6E MT7922 160MHz Wireless LAN Card; iperf3 receive AXE11000; iperf 3.1.3: Ø1720 (1610-1757)
Razer Blade 14 RZ09-0508 Qualcomm FastConnect 7800; iperf3 receive AXE11000; iperf 3.1.3: Ø1612 (1575-1677)
Lenovo LOQ 15IRX9 Realtek RTL8852BE; iperf3 receive AXE11000; iperf 3.1.3: Ø974 (950-986)
Asus TUF Gaming A15 FA507UV Realtek RTL8852BE; iperf3 receive AXE11000; iperf 3.1.3: Ø956 (936-974)
SCHENKER XMG Core 15 (M24) Intel Wi-Fi 6E AX210; iperf3 receive AXE11000; iperf 3.1.3: Ø1411 (616-1532)
HP Omen Transcend 14-fb0014 Intel Wi-Fi 7 BE200 320MHz; iperf3 receive AXE11000; iperf 3.1.3: Ø1418 (1323-1497)
Acer Predator Helios Neo 14 (2024) Killer Wi-Fi 6E AX1675i 160MHz Wireless Network Adapter; iperf3 receive AXE11000; iperf 3.1.3: Ø1690 (1653-1732)

Cámara web

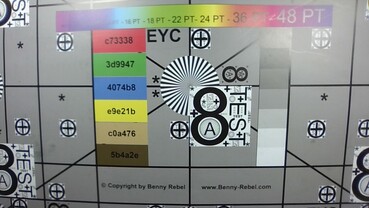
No espere crear ningún arte utilizando la webcam de 0,9MP, dada su baja resolución y la escasa precisión del color. La cámara tampoco cuenta con obturador mecánico ni interruptor de encendido/apagado.
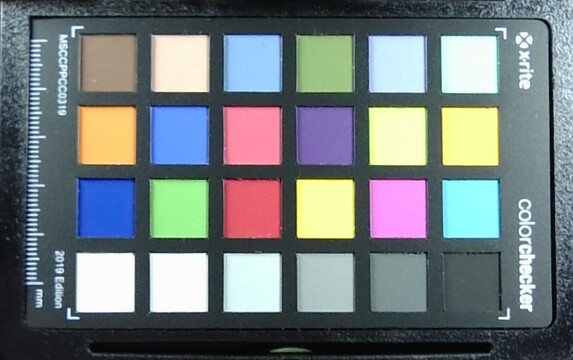
ColorChecker
27.2 ∆E
25.1 ∆E
25.1 ∆E
29 ∆E
32.8 ∆E
26.3 ∆E
22.9 ∆E
26.2 ∆E
19.2 ∆E
19.7 ∆E
21.2 ∆E
26.4 ∆E
14.2 ∆E
26.5 ∆E
18.5 ∆E
18 ∆E
23 ∆E
34 ∆E
1.8 ∆E
11.3 ∆E
23.9 ∆E
25.7 ∆E
26.3 ∆E
14.5 ∆E
ColorChecker Acer Nitro 14 AN14-41-R3MX: 22.45 ∆E min: 1.76 - max: 34.02 ∆E

Accesorios

Aparte de la documentación habitual, como la guía de inicio rápido y la información sobre la garantía, el portátil no viene con ningún otro accesorio.

Mantenimiento

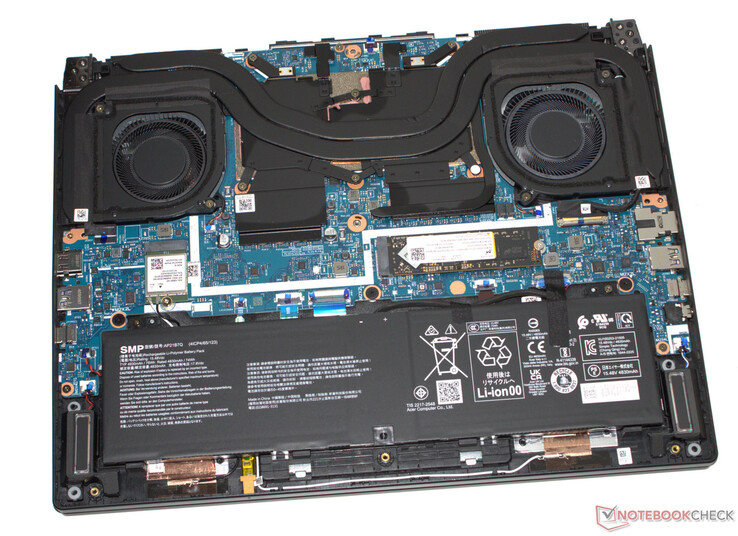
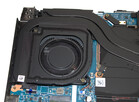
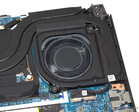
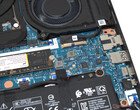
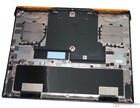
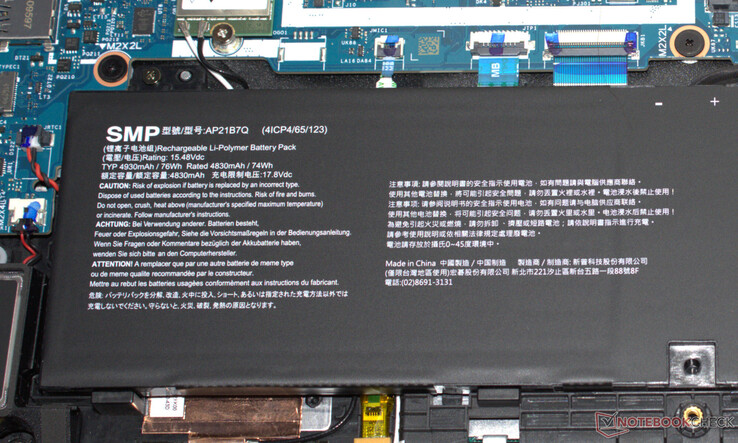
Para retirar la placa inferior, comience por aflojar todos los tornillos de la parte inferior. A continuación, en la parte superior del portátil, separe la barra de plástico situada detrás de la pantalla. Además de un palillo plano o un spudger, una uña también puede ser una herramienta útil para este paso. Tenga cuidado al volver a colocar la barra posteriormente, ya que hay muchos clips de plástico pequeños y fáciles de romper. Por último, utilice las herramientas mencionadas para soltar la placa inferior. Otra cosa a tener en cuenta es que las rejillas de escape traseras forman parte de la cubierta inferior. Una vez retirada la placa, tendrá acceso a la SSD PCIe 4.0 M.2-2280, el módulo Wi-Fi junto con las antenas, los ventiladores y la batería. No hay ranuras de memoria porque la RAM está soldada.

Hardware Acer Nitro 14 AN14-41
 

Sostenibilidad

Acer proporciona información sobre la huella de carbono en https://www.acer.com/us-en/sustainability/product-carbon-footprint#laptops para muchos de sus productos, pero el Nitro 14 aún no es uno de ellos. Su embalaje contiene una cantidad relativamente pequeña de plástico: una bolsa transparente para el cargador, una bolsa de tela PET para el portátil y un inserto de PP para proteger la pantalla. Para el resto del embalaje se utiliza cartón. Según la información impresa, la caja y todos los elementos de cartón están hechos de material reciclado. Las reparaciones y el mantenimiento son posibles gracias a la placa inferior extraíble. Las actualizaciones de software tampoco deberían ser un problema en los próximos años.

Garantía

Acer ofrece una garantía de dos años (por correo) para el portátil de 14,5 pulgadas en Alemania. Ampliar el periodo de garantía a tres años costará unos 100 euros (110 dólares). Sin embargo, los términos y condiciones de la garantía pueden variar según la región.

Dispositivos de entrada - El portátil Acer ofrece un teclado retroiluminado RGB

Teclado

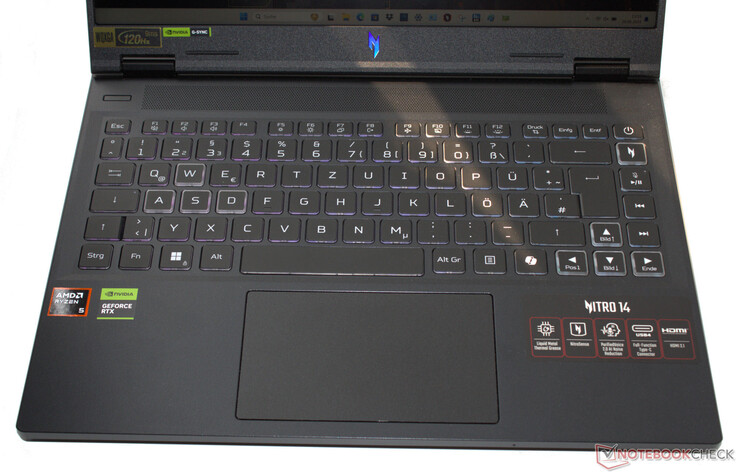
Las teclas de flecha y WASD destacan visualmente en el teclado chiclet, pero su iluminación no es personalizable individualmente. El teclado sólo admite tres zonas de iluminación y carece de iluminación por tecla. Un aspecto positivo es que las teclas de flecha son de tamaño normal. Además, todas las teclas tienen un recorrido corto y un punto de accionamiento claro. La resistencia de las teclas también es satisfactoria. El teclado se tambalea ligeramente, pero esto no afecta significativamente a la experiencia de escritura.

Panel táctil

La Nitro 14 incorpora un clickpad multitáctil de 12 x 7 cm (4,7 x 2,8 pulg.), con un recorrido corto y un punto de clic bien definido. Su superficie lisa permite que los dedos se deslicen sin esfuerzo. El clickpad puede desactivarse en caso necesario.

Teclado Acer Nitro 14 AN14-41

Pantalla - Brillante panel IPS con cobertura sRGB

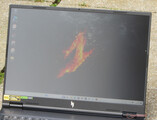
Con una diagonal de 14,5 pulgadas, la pantalla tiene un tamaño poco común, pero ofrece la misma altura que una pantalla 16:9 de 15,6 pulgadas gracias a su relación de aspecto 16:10. El panel IPS de 120 Hz con una resolución de 2.560 x 1.600 cuenta con un amplio ángulo de visión, compatibilidad con G-Sync, ausencia de parpadeo PWM y un brillo bastante elevado. La pantalla es perfectamente legible en exteriores, aunque el sol no debe brillar demasiado. Acer también ofrece una opción de pantalla WUXGA (1.920 x 1.200 píxeles) para el Nitro 14.

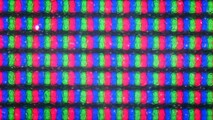
Conjunto de píxeles
Conjunto de píxeles
Apenas hay sangrado de retroiluminación
Al aire libre
Al aire libre
Ángulo de visión
Ángulo de visión
388
cd/m²
402
cd/m²
389
cd/m²
371
cd/m²
415
cd/m²
398
cd/m²
385
cd/m²
406
cd/m²
398
cd/m²
Temperatura del cuarto
AU Optronics B145QAN01.J tested with X-Rite i1Pro 3
Máximo: 415 cd/m² (Nits) Médio: 394.7 cd/m² Minimum: 26 cd/m²
iluminación: 89 %
Brillo con batería: 415 cd/m²
Contraste: 1221:1 (Negro: 0.34 cd/m²)
ΔE Color 4.5 | 0.5-29.43 Ø4.91, calibrated: 1.8
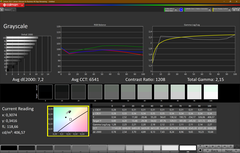
ΔE Greyscale 7.2 | 0.5-98 Ø5.2
74.7% AdobeRGB 1998 (Argyll 2.2.0 3D)
97.6% sRGB (Argyll 2.2.0 3D)
72.7% Display P3 (Argyll 2.2.0 3D)
Gamma: 2.15
Acer Nitro 14 AN14-41-R3MX
AU Optronics B145QAN01.J, IPS, 2560x1600, 14.5", 120 Hz
Razer Blade 14 RZ09-0508
TL140ADXP04-0, IPS, 2560x1600, 14", 240 Hz
Lenovo LOQ 15IRX9
BOE NJ NE156FHM-NX9, IPS, 1920x1080, 15.6", 144 Hz
Asus TUF Gaming A15 FA507UV
AU Optronics B156HAN15.H, IPS, 1920x1080, 15.6", 144 Hz
SCHENKER XMG Core 15 (M24)
BOE NJ NE153QDM-NZ1 (BOE0C8E), IPS, 2560x1600, 15.3", 240 Hz
HP Omen Transcend 14-fb0014
Samsung SDC4197, OLED, 2880x1800, 14", 120 Hz
Acer Predator Helios Neo 14 (2024)
BOE CQ NE145F8M-NY1, IPS, 3072x1920, 14.5", 165 Hz
Display
16%
0%
-2%
1%
23%
-8%
Display P3 Coverage
72.7
96.9
33%
73.7
1%
70.5
-3%
73.2
1%
99.6
37%
65
-11%
sRGB Coverage
97.6
99.8
2%
99.1
2%
98.5
1%
100
2%
100
2%
95.3
-2%
AdobeRGB 1998 Coverage
74.7
85
14%
72.6
-3%
72.7
-3%
74.6
0%
96.1
29%
66.8
-11%
Response Times
59%
-71%
-49%
48%
95%
68%
Response Time Grey 50% / Grey 80% *
22.3 ?(10, 12.3)
6 ?(2.8, 3.2)
73%
42.2 ?(19.1, 23.1)
-89%
31.7 ?(14.7, 17)
-42%
9.6 ?(4.6, 5)
57%
0.86 ?(0.45, 0.41)
96%
5.4 ?(2.5, 2.9)
76%
Response Time Black / White *
14.8 ?(8.4, 6.4)
8.3 ?(5, 4.3)
44%
22.6 ?(11.2, 11.4)
-53%
22.9 ?(11.7, 11.2)
-55%
9.2 ?(4.6, 4.6)
38%
0.99 ?(0.46, 0.53)
93%
5.9 ?(1.9, 4)
60%
PWM Frequency
479 ?(100)
Screen
30%
22%
17%
26%
25%
15%
Brightness middle
415
484.1
17%
306
-26%
315
-24%
635
53%
386.3
-7%
450
8%
Brightness
395
466
18%
287
-27%
303
-23%
604
53%
389
-2%
433
10%
Brightness Distribution
89
89
0%
88
-1%
90
1%
91
2%
98
10%
87
-2%
Black Level *
0.34
0.38
-12%
0.21
38%
0.25
26%
0.64
-88%
0.45
-32%
Contrast
1221
1274
4%
1457
19%
1260
3%
992
-19%
1000
-18%
Colorchecker dE 2000 *
4.5
2.23
50%
2.25
50%
2.26
50%
1.89
58%
4.03
10%
2.26
50%
Colorchecker dE 2000 max. *
10.7
4.57
57%
4.84
55%
7.37
31%
3.14
71%
6.69
37%
7.5
30%
Colorchecker dE 2000 calibrated *
1.8
0.74
59%
1.45
19%
1.03
43%
1.14
37%
1.07
41%
1.21
33%
Greyscale dE 2000 *
7.2
1.6
78%
2.4
67%
4
44%
2.53
65%
1.2
83%
3.2
56%
Gamma
2.15 102%
2.24 98%
2.259 97%
2.116 104%
2.36 93%
2.25 98%
2.214 99%
CCT
6541 99%
6816 95%
6790 96%
7570 86%
6434 101%
6280 104%
6121 106%
Media total (Programa/Opciones)
35% / 31%
-16% / 4%
-11% / 4%
25% / 24%
48% / 36%
25% / 18%

* ... más pequeño es mejor

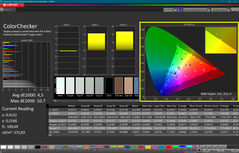
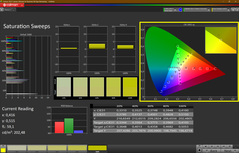
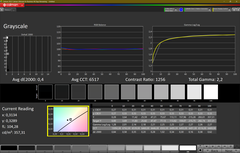
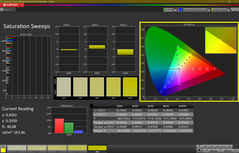
La pantalla tiene una reproducción del color decente -pero no excelente- nada más sacarla de la caja. Con una diferencia de color media de alrededor de 4,5, la pantalla no alcanzó lo que se considera bueno (Delta E < 3). El calibrado redujo el Delta E a un buen valor de 1,8. El panel es capaz de reproducir casi toda la gama sRGB, pero no AdobeRGB y DCI-P3. Esto es similar a las pantallas de la mayoría de los competidores. Sólo los paneles del Omen Transcend 14 y el Blade 14 ofrecen una cobertura DCI-P3 completa.

El perfil de color que hemos creado puede descargarse y utilizarse gratuitamente. Encontrará un enlace de descarga en el infobox relativo a la pantalla.

CalMAN - Verificador de color
CalMAN - Escala de grises
CalMAN - Saturación
CalMAN - Saturación
CalMAN - Comprobador de color (calibrado)
CalMAN - Escala de grises (calibrada)
CalMAN - Saturación (calibrada)
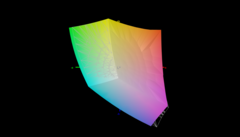
Nitro vs. sRGB
Nitro vs. sRGB
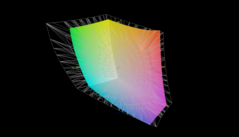
Nitro frente a AdobeRGB
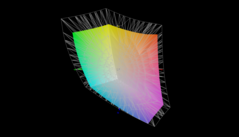
Nitro vs. DCI-P3
Nitro vs. DCI-P3

Tiempos de respuesta del display

Los tiempos de respuesta del display muestran lo rápido que puede cambiar la pantalla de un color al siguiente. Tiempos lentos de respuesta pueden llevar a imágenes persistentes alrededor de objetos en movimiento o a displays borrosos. Particularmente los aficionados a los juegos 3D frenéticos deberían usar una pantalla con tiempos de respuesta rápidos.
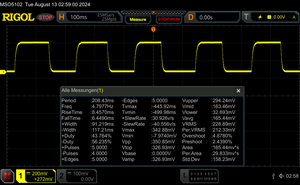
       Tiempo de respuesta de Negro a Blanco
14.8 ms ... subida ↗ y bajada ↘ combinada↗ 8.4 ms subida
↘ 6.4 ms bajada
La pantalla mostró buenos tiempos de respuesta en nuestros tests pero podría ser demasiado lenta para los jugones competitivos.
En comparación, todos los dispositivos de prueba van de ##min### (mínimo) a 240 (máximo) ms. » 32 % de todos los dispositivos son mejores.
Esto quiere decir que el tiempo de respuesta medido es mejor que la media (20.9 ms) de todos los dispositivos testados.
       Tiempo de respuesta 50% Gris a 80% Gris
22.3 ms ... subida ↗ y bajada ↘ combinada↗ 10 ms subida
↘ 12.3 ms bajada
La pantalla mostró buenos tiempos de respuesta en nuestros tests pero podría ser demasiado lenta para los jugones competitivos.
En comparación, todos los dispositivos de prueba van de ##min### (mínimo) a 636 (máximo) ms. » 30 % de todos los dispositivos son mejores.
Esto quiere decir que el tiempo de respuesta medido es mejor que la media (32.8 ms) de todos los dispositivos testados.

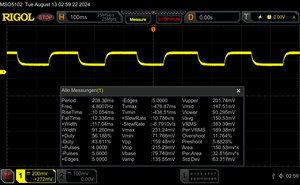
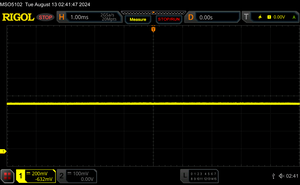
Parpadeo de Pantalla / PWM (Pulse-Width Modulation)

Para atenuar el brillo de pantalla algunos portátiles están encendiendo y apagando la retroiluminación muy rápidamente. Esto se hace a una frecuencia que no debiera detectarse a simple vista. Si la frecuencia es demasiado lenta, la gente sensible podría experimentar problemas visuales, dolores de cabeza e incluso ver parpadeos.
Parpadeo de Pantalla / PWM no detectado

Comparación: 53 % de todos los dispositivos testados no usaron PWM para atenuar el display. Si se usó, medimos una media de 8715 (mínimo: 5 - máxmo: 343500) Hz.

0% de luminosidad
0% de luminosidad
20% de luminosidad
20% de luminosidad
40% de luminosidad
40% de luminosidad
60% de luminosidad
60% de luminosidad
80% de luminosidad
80% de luminosidad
100% de luminosidad
100% de luminosidad

Rendimiento: AMD se encuentra con Nvidia

El Acer Nitro es un portátil para juegos de gama media portátil y compacto. La potencia necesaria la proporciona una CPU Hawk Point (Ryzen 7 o Ryzen 5) y una GPU Ada Lovelace (RTX 4050 o RTX 4060 disponibles). Con un precio de casi 1.450 euros (1.600 dólares), nuestra unidad de análisis está equipada con un Ryzen 5 8645HS y GeForce RTX 4060. El modelo base de la gama cuesta aproximadamente 1.400 euros (1.550 dólares).

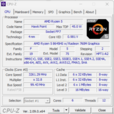
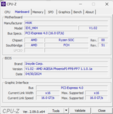
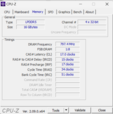
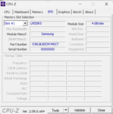
CPU-Z
CPU-Z
CPU-Z
CPU-Z
CPU-Z
Nvidia Systeminfo
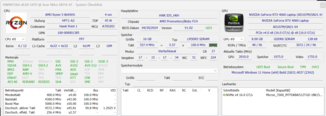
GPU-Z
GPU-Z
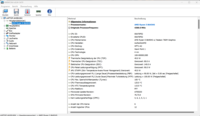
HWInfo
HWInfo


Condiciones de la prueba

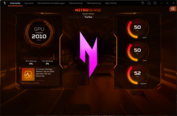
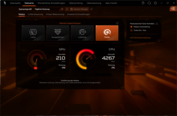
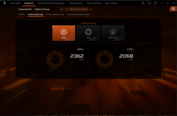
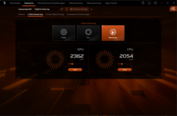
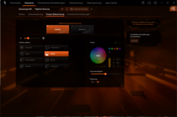
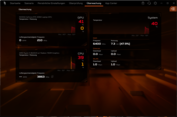
Cuatro modos de energía (ver tabla) están disponibles cuando el portátil está enchufado, sólo dos de los cuales (Equilibrado, Eco) son seleccionables en batería. Utilizamos los modos Turbo y Eco para nuestros benchmarks y pruebas de batería, respectivamente. Puede cambiar entre los modos pulsando un botón situado encima del teclado o utilizando el software NitroSense, que funciona como centro de control del portátil. Un LED indica el modo en uso.

Nota: Los modos Turbo y Rendimiento sólo están disponibles cuando el nivel de carga de la batería es de al menos el 40%. En caso contrario, sólo puede utilizarse el modo Equilibrado.

Plan de alimentación PL1 PL2 CB R23 Multi TGP Time Spy Gráficos CP 2077 QHD/Ultra Prueba de estrés Ruido máx. del ventilador
Silencioso 50 W 100 W 12.607 puntos 65 W 8.782 puntos 38,2 FPS CPU: 58°C
GPU: 64°C
40,79 dB(A)
Equilibrada 70 W 100 W 13.231 puntos 75 W 9.419 puntos 38,8 FPS CPU: 60°C
GPU: 64°C
45,61 dB(A)
Rendimiento 80 W 100 W 13.242 puntos 90 W 10.088 puntos 40,7 FPS CPU: 60°C
GPU: 70°C
50,83 dB(A)
Turbo 90 W 100 W 13.220 puntos 105 W 10.799 puntos 45,6 FPS CPU: 76°C
GPU: 86°C
56,98 dB(A)
NitroSense
NitroSense
NitroSense
NitroSense
NitroSense
NitroSense
NitroSense
NitroSense

Procesador

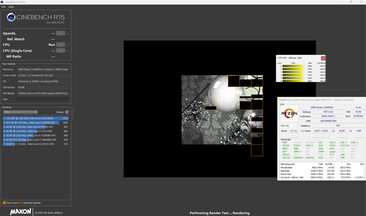
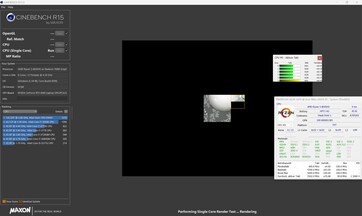
El basado en Zen 4 Ryzen 5 8645HS ofrece 6 núcleos de CPU con un total de 12 hilos, capaces de funcionar hasta a 5 GHz (un solo núcleo). El procesador consiguió funcionar constantemente a una velocidad de reloj turbo elevada bajo una carga multihilo sostenida (es decir, el bucle Cinebench R15). Los tres modos disponibles al conectarlo ofrecieron más o menos los mismos resultados, mientras que el modo silencioso disminuyó ligeramente el rendimiento del procesador. Los resultados del benchmark están en línea con las expectativas. El Ryzen 5 7640HSque comparte el mismo diseño, se incluye aquí a modo de comparación.

Las CPU de los portátiles de la competencia cuentan con más núcleos que la APU Ryzen 5 y, por tanto, ofrecen un rendimiento multihilo considerablemente mejor. Sin embargo, sólo hay una pequeña diferencia en el rendimiento monohilo.

Multihilo (enchufado)
Monohilo (enchufado)

Cinebench R15 Multi Sustained load

01503004506007509001050120013501500165018001950210022502400255027002850Tooltip
Acer Nitro 14 AN14-41-R3MX AMD Ryzen 5 8645HS: Ø2060 (2048.66-2093.94)
Razer Blade 14 RZ09-0508 AMD Ryzen 9 8945HS: Ø2758 (2712.05-2774.89)
Lenovo LOQ 15IRX9 Intel Core i5-13450HX: Ø2170 (2104.93-2503.76)
Asus TUF Gaming A15 FA507UV AMD Ryzen 9 8945H: Ø2688 (2638-2777.2)
SCHENKER XMG Core 15 (M24) AMD Ryzen 7 8845HS: Ø2849 (2832.66-2908.03)
HP Omen Transcend 14-fb0014 Intel Core Ultra 7 155H: Ø2510 (2462.6-2628.12)
Acer Predator Helios Neo 14 (2024) Intel Core Ultra 9 185H: Ø2619 (2486.48-2745.37)
Lazo CB15 (Turbo)
Lazo CB15 (Turbo)
Lazo CB15 (Rendimiento)
Lazo CB15 (equilibrado)
Bucle CB15 (silencioso)
CPU Performance Rating - Percent
Average of class Gaming
 
84.1 pt
SCHENKER XMG Core 15 (M24)
AMD Ryzen 7 8845HS
78.4 pt
Acer Predator Helios Neo 14 (2024)
Intel Core Ultra 9 185H
77.6 pt
Razer Blade 14 RZ09-0508
AMD Ryzen 9 8945HS
77.4 pt
Asus TUF Gaming A15 FA507UV
AMD Ryzen 9 8945H
77.1 pt
HP Omen Transcend 14-fb0014
Intel Core Ultra 7 155H
70.9 pt
Lenovo LOQ 15IRX9
Intel Core i5-13450HX
66.5 pt
Acer Nitro 14 AN14-41-R3MX
AMD Ryzen 5 8645HS
66.3 pt
Lenovo LOQ 15APH8 Ryzen 5
AMD Ryzen 5 7640HS
66.3 pt
Average AMD Ryzen 5 8645HS
 
66.3 pt
Cinebench R23
Multi Core
Average of class Gaming
  (5668 - 36249, n=190, last 2 years)
21953 Points +66%
SCHENKER XMG Core 15 (M24)
AMD Ryzen 7 8845HS
18037 Points +36%
Acer Predator Helios Neo 14 (2024)
Intel Core Ultra 9 185H
17787 Points +35%
Asus TUF Gaming A15 FA507UV
AMD Ryzen 9 8945H
17423 Points +32%
Razer Blade 14 RZ09-0508
AMD Ryzen 9 8945HS
17376 (17195.6min - 17375.9max) Points +31%
Lenovo LOQ 15IRX9
Intel Core i5-13450HX
16797 Points +27%
HP Omen Transcend 14-fb0014
Intel Core Ultra 7 155H
16758 (15790min - 16758.1max) Points +27%
Acer Nitro 14 AN14-41-R3MX
AMD Ryzen 5 8645HS
13220 Points
Average AMD Ryzen 5 8645HS
  ()
13220 Points 0%
Lenovo LOQ 15APH8 Ryzen 5
AMD Ryzen 5 7640HS
13029 Points -1%
Single Core
Average of class Gaming
  (1136 - 2235, n=189, last 2 years)
1893 Points +10%
Acer Predator Helios Neo 14 (2024)
Intel Core Ultra 9 185H
1883 Points +10%
Asus TUF Gaming A15 FA507UV
AMD Ryzen 9 8945H
1814 Points +6%
Razer Blade 14 RZ09-0508
AMD Ryzen 9 8945HS
1805 Points +5%
SCHENKER XMG Core 15 (M24)
AMD Ryzen 7 8845HS
1775 Points +4%
Lenovo LOQ 15APH8 Ryzen 5
AMD Ryzen 5 7640HS
1715 Points 0%
Acer Nitro 14 AN14-41-R3MX
AMD Ryzen 5 8645HS
1714 Points
Average AMD Ryzen 5 8645HS
  ()
1714 Points 0%
Lenovo LOQ 15IRX9
Intel Core i5-13450HX
1710 Points 0%
HP Omen Transcend 14-fb0014
Intel Core Ultra 7 155H
1666 Points -3%
Cinebench R20
CPU (Multi Core)
Average of class Gaming
  (2179 - 13832, n=187, last 2 years)
8336 Points +63%
SCHENKER XMG Core 15 (M24)
AMD Ryzen 7 8845HS
7026 Points +37%
Acer Predator Helios Neo 14 (2024)
Intel Core Ultra 9 185H
6910 Points +35%
Asus TUF Gaming A15 FA507UV
AMD Ryzen 9 8945H
6859 Points +34%
Razer Blade 14 RZ09-0508
AMD Ryzen 9 8945HS
6785 Points +32%
Lenovo LOQ 15IRX9
Intel Core i5-13450HX
6532 Points +28%
HP Omen Transcend 14-fb0014
Intel Core Ultra 7 155H
6529 Points +27%
Acer Nitro 14 AN14-41-R3MX
AMD Ryzen 5 8645HS
5121 Points
Average AMD Ryzen 5 8645HS
  ()
5121 Points 0%
Lenovo LOQ 15APH8 Ryzen 5
AMD Ryzen 5 7640HS
5044 Points -2%
CPU (Single Core)
Acer Predator Helios Neo 14 (2024)
Intel Core Ultra 9 185H
733 Points +10%
Average of class Gaming
  (439 - 856, n=187, last 2 years)
727 Points +9%
Razer Blade 14 RZ09-0508
AMD Ryzen 9 8945HS
698 Points +4%
SCHENKER XMG Core 15 (M24)
AMD Ryzen 7 8845HS
690 Points +3%
Asus TUF Gaming A15 FA507UV
AMD Ryzen 9 8945H
670 Points 0%
Acer Nitro 14 AN14-41-R3MX
AMD Ryzen 5 8645HS
668 Points
Average AMD Ryzen 5 8645HS
  ()
668 Points 0%
Lenovo LOQ 15APH8 Ryzen 5
AMD Ryzen 5 7640HS
667 Points 0%
Lenovo LOQ 15IRX9
Intel Core i5-13450HX
652 Points -2%
HP Omen Transcend 14-fb0014
Intel Core Ultra 7 155H
644 Points -4%
Cinebench R15
CPU Multi 64Bit
Average of class Gaming
  (905 - 5663, n=194, last 2 years)
3433 Points +64%
SCHENKER XMG Core 15 (M24)
AMD Ryzen 7 8845HS
2908 (2832.66min - 2908.03max) Points +39%
Asus TUF Gaming A15 FA507UV
AMD Ryzen 9 8945H
2777 Points +33%
Razer Blade 14 RZ09-0508
AMD Ryzen 9 8945HS
2775 (2712.05min - 2774.89max) Points +33%
Acer Predator Helios Neo 14 (2024)
Intel Core Ultra 9 185H
2745 Points +31%
HP Omen Transcend 14-fb0014
Intel Core Ultra 7 155H
2628 (2462.6min - 2628.12max) Points +26%
Lenovo LOQ 15IRX9
Intel Core i5-13450HX
2503 Points +20%
Acer Nitro 14 AN14-41-R3MX
AMD Ryzen 5 8645HS
2094 Points
Average AMD Ryzen 5 8645HS
  ()
2094 Points 0%
Lenovo LOQ 15APH8 Ryzen 5
AMD Ryzen 5 7640HS
2079 (1932.37min - 2078.89max) Points -1%
CPU Single 64Bit
Asus TUF Gaming A15 FA507UV
AMD Ryzen 9 8945H
284 Points +5%
Razer Blade 14 RZ09-0508
AMD Ryzen 9 8945HS
281 Points +4%
Acer Predator Helios Neo 14 (2024)
Intel Core Ultra 9 185H
281 Points +4%
SCHENKER XMG Core 15 (M24)
AMD Ryzen 7 8845HS
280 Points +4%
Average of class Gaming
  (191.9 - 318, n=191, last 2 years)
278 Points +3%
Lenovo LOQ 15APH8 Ryzen 5
AMD Ryzen 5 7640HS
271 Points 0%
Acer Nitro 14 AN14-41-R3MX
AMD Ryzen 5 8645HS
270 Points
Average AMD Ryzen 5 8645HS
  ()
270 Points 0%
HP Omen Transcend 14-fb0014
Intel Core Ultra 7 155H
253 Points -6%
Lenovo LOQ 15IRX9
Intel Core i5-13450HX
239 Points -11%
Blender - v2.79 BMW27 CPU
Lenovo LOQ 15APH8 Ryzen 5
AMD Ryzen 5 7640HS
245 Seconds * -2%
Acer Nitro 14 AN14-41-R3MX
AMD Ryzen 5 8645HS
241 Seconds *
Average AMD Ryzen 5 8645HS
  ()
241 Seconds * -0%
Lenovo LOQ 15IRX9
Intel Core i5-13450HX
229 Seconds * +5%
HP Omen Transcend 14-fb0014
Intel Core Ultra 7 155H
195 Seconds * +19%
Razer Blade 14 RZ09-0508
AMD Ryzen 9 8945HS
186 Seconds * +23%
Asus TUF Gaming A15 FA507UV
AMD Ryzen 9 8945H
182 Seconds * +24%
SCHENKER XMG Core 15 (M24)
AMD Ryzen 7 8845HS
179 Seconds * +26%
Acer Predator Helios Neo 14 (2024)
Intel Core Ultra 9 185H
177 Seconds * +27%
Average of class Gaming
  (87 - 555, n=182, last 2 years)
169.7 Seconds * +30%
7-Zip 18.03
7z b 4
Average of class Gaming
  (23795 - 140932, n=186, last 2 years)
85566 MIPS +54%
SCHENKER XMG Core 15 (M24)
AMD Ryzen 7 8845HS
74664 MIPS +34%
Asus TUF Gaming A15 FA507UV
AMD Ryzen 9 8945H
73222 MIPS +32%
Razer Blade 14 RZ09-0508
AMD Ryzen 9 8945HS
72821 MIPS +31%
Acer Predator Helios Neo 14 (2024)
Intel Core Ultra 9 185H
71752 MIPS +29%
HP Omen Transcend 14-fb0014
Intel Core Ultra 7 155H
63817 MIPS +15%
Lenovo LOQ 15IRX9
Intel Core i5-13450HX
59026 MIPS +6%
Acer Nitro 14 AN14-41-R3MX
AMD Ryzen 5 8645HS
55608 MIPS
Average AMD Ryzen 5 8645HS
  ()
55608 MIPS 0%
Lenovo LOQ 15APH8 Ryzen 5
AMD Ryzen 5 7640HS
54954 MIPS -1%
7z b 4 -mmt1
Asus TUF Gaming A15 FA507UV
AMD Ryzen 9 8945H
6615 MIPS +7%
SCHENKER XMG Core 15 (M24)
AMD Ryzen 7 8845HS
6571 MIPS +6%
Razer Blade 14 RZ09-0508
AMD Ryzen 9 8945HS
6505 MIPS +5%
Lenovo LOQ 15APH8 Ryzen 5
AMD Ryzen 5 7640HS
6465 MIPS +4%
Average of class Gaming
  (4199 - 7581, n=186, last 2 years)
6318 MIPS +2%
Acer Nitro 14 AN14-41-R3MX
AMD Ryzen 5 8645HS
6190 MIPS
Average AMD Ryzen 5 8645HS
  ()
6190 MIPS 0%
Acer Predator Helios Neo 14 (2024)
Intel Core Ultra 9 185H
5519 MIPS -11%
Lenovo LOQ 15IRX9
Intel Core i5-13450HX
5370 MIPS -13%
HP Omen Transcend 14-fb0014
Intel Core Ultra 7 155H
5054 MIPS -18%
Geekbench 6.3
Multi-Core
Average of class Gaming
  (5340 - 19665, n=112, last 2 years)
14207 Points +31%
Acer Predator Helios Neo 14 (2024)
Intel Core Ultra 9 185H
14039 Points +29%
SCHENKER XMG Core 15 (M24)
AMD Ryzen 7 8845HS
14014 Points +29%
Razer Blade 14 RZ09-0508
AMD Ryzen 9 8945HS
13715 Points +26%
HP Omen Transcend 14-fb0014
Intel Core Ultra 7 155H
13313 Points +22%
Lenovo LOQ 15IRX9
Intel Core i5-13450HX
12684 Points +17%
Asus TUF Gaming A15 FA507UV
AMD Ryzen 9 8945H
12662 Points +16%
Lenovo LOQ 15APH8 Ryzen 5
AMD Ryzen 5 7640HS
10936 Points 0%
Acer Nitro 14 AN14-41-R3MX
AMD Ryzen 5 8645HS
10882 Points
Average AMD Ryzen 5 8645HS
  ()
10882 Points 0%
Single-Core
Asus TUF Gaming A15 FA507UV
AMD Ryzen 9 8945H
2711 Points +5%
SCHENKER XMG Core 15 (M24)
AMD Ryzen 7 8845HS
2686 Points +5%
Razer Blade 14 RZ09-0508
AMD Ryzen 9 8945HS
2684 Points +4%
Average of class Gaming
  (1490 - 3129, n=112, last 2 years)
2651 Points +3%
Lenovo LOQ 15APH8 Ryzen 5
AMD Ryzen 5 7640HS
2620 Points +2%
Acer Nitro 14 AN14-41-R3MX
AMD Ryzen 5 8645HS
2570 Points
Average AMD Ryzen 5 8645HS
  ()
2570 Points 0%
Acer Predator Helios Neo 14 (2024)
Intel Core Ultra 9 185H
2490 Points -3%
HP Omen Transcend 14-fb0014
Intel Core Ultra 7 155H
2386 Points -7%
Lenovo LOQ 15IRX9
Intel Core i5-13450HX
2381 Points -7%
Geekbench 5.5
Multi-Core
Average of class Gaming
  (4557 - 23194, n=187, last 2 years)
15073 Points +60%
Acer Predator Helios Neo 14 (2024)
Intel Core Ultra 9 185H
13613 Points +45%
HP Omen Transcend 14-fb0014
Intel Core Ultra 7 155H
13119 Points +39%
SCHENKER XMG Core 15 (M24)
AMD Ryzen 7 8845HS
12726 Points +35%
Razer Blade 14 RZ09-0508
AMD Ryzen 9 8945HS
12368 Points +31%
Lenovo LOQ 15IRX9
Intel Core i5-13450HX
12005 Points +27%
Asus TUF Gaming A15 FA507UV
AMD Ryzen 9 8945H
11949 Points +27%
Acer Nitro 14 AN14-41-R3MX
AMD Ryzen 5 8645HS
9420 Points
Average AMD Ryzen 5 8645HS
  ()
9420 Points 0%
Lenovo LOQ 15APH8 Ryzen 5
AMD Ryzen 5 7640HS
9355 Points -1%
Single-Core
Asus TUF Gaming A15 FA507UV
AMD Ryzen 9 8945H
1991 Points +4%
SCHENKER XMG Core 15 (M24)
AMD Ryzen 7 8845HS
1971 Points +3%
Razer Blade 14 RZ09-0508
AMD Ryzen 9 8945HS
1965 Points +3%
Lenovo LOQ 15APH8 Ryzen 5
AMD Ryzen 5 7640HS
1941 Points +1%
Acer Nitro 14 AN14-41-R3MX
AMD Ryzen 5 8645HS
1915 Points
Average AMD Ryzen 5 8645HS
  ()
1915 Points 0%
Average of class Gaming
  (986 - 2210, n=187, last 2 years)
1897 Points -1%
Acer Predator Helios Neo 14 (2024)
Intel Core Ultra 9 185H
1873 Points -2%
HP Omen Transcend 14-fb0014
Intel Core Ultra 7 155H
1741 Points -9%
Lenovo LOQ 15IRX9
Intel Core i5-13450HX
1696 Points -11%
HWBOT x265 Benchmark v2.2 - 4k Preset
Average of class Gaming
  (6.72 - 38.9, n=186, last 2 years)
23.6 fps +37%
SCHENKER XMG Core 15 (M24)
AMD Ryzen 7 8845HS
22.7 fps +32%
Razer Blade 14 RZ09-0508
AMD Ryzen 9 8945HS
22.2 fps +29%
Asus TUF Gaming A15 FA507UV
AMD Ryzen 9 8945H
21.9 fps +27%
Acer Predator Helios Neo 14 (2024)
Intel Core Ultra 9 185H
20.1 fps +17%
HP Omen Transcend 14-fb0014
Intel Core Ultra 7 155H
19.3 fps +12%
Lenovo LOQ 15IRX9
Intel Core i5-13450HX
17.5 fps +2%
Acer Nitro 14 AN14-41-R3MX
AMD Ryzen 5 8645HS
17.2 fps
Average AMD Ryzen 5 8645HS
  ()
17.2 fps 0%
Lenovo LOQ 15APH8 Ryzen 5
AMD Ryzen 5 7640HS
16.7 fps -3%
LibreOffice - 20 Documents To PDF
Lenovo LOQ 15IRX9
Intel Core i5-13450HX
59.3 s * -44%
SCHENKER XMG Core 15 (M24)
AMD Ryzen 7 8845HS
49.2 s * -20%
Razer Blade 14 RZ09-0508
AMD Ryzen 9 8945HS
48.4 s * -18%
Average of class Gaming
  (31.4 - 199, n=183, last 2 years)
48.1 s * -17%
Asus TUF Gaming A15 FA507UV
AMD Ryzen 9 8945H
47.5 s * -16%
HP Omen Transcend 14-fb0014
Intel Core Ultra 7 155H
45.1 s * -10%
Lenovo LOQ 15APH8 Ryzen 5
AMD Ryzen 5 7640HS
42.5 s * -3%
Acer Nitro 14 AN14-41-R3MX
AMD Ryzen 5 8645HS
41.1 s *
Average AMD Ryzen 5 8645HS
  ()
41.1 s * -0%
Acer Predator Helios Neo 14 (2024)
Intel Core Ultra 9 185H
38.4 s * +7%
R Benchmark 2.5 - Overall mean
Lenovo LOQ 15IRX9
Intel Core i5-13450HX
0.4838 sec * -8%
HP Omen Transcend 14-fb0014
Intel Core Ultra 7 155H
0.4637 sec * -3%
Acer Nitro 14 AN14-41-R3MX
AMD Ryzen 5 8645HS
0.4483 sec *
Average AMD Ryzen 5 8645HS
  ()
0.4483 sec * -0%
Acer Predator Helios Neo 14 (2024)
Intel Core Ultra 9 185H
0.4424 sec * +1%
Lenovo LOQ 15APH8 Ryzen 5
AMD Ryzen 5 7640HS
0.4399 sec * +2%
SCHENKER XMG Core 15 (M24)
AMD Ryzen 7 8845HS
0.4383 sec * +2%
Average of class Gaming
  (0.3609 - 0.759, n=187, last 2 years)
0.4368 sec * +3%
Asus TUF Gaming A15 FA507UV
AMD Ryzen 9 8945H
0.4298 sec * +4%
Razer Blade 14 RZ09-0508
AMD Ryzen 9 8945HS
0.4294 sec * +4%

* ... más pequeño es mejor

Cinebench R15 CPU Multi 64Bit
2094 Points
Cinebench R15 OpenGL 64Bit
116.3 fps
Cinebench R15 Ref. Match 64Bit
99.6 %
Cinebench R15 CPU Single 64Bit
270 Points
Cinebench R20 CPU (Single Core)
668 Points
Cinebench R20 CPU (Multi Core)
5121 Points
Cinebench R23 Multi Core
13220 Points
Cinebench R23 Single Core
1714 Points
Cinebench 2024 CPU Multi Core
727 Points
Cinebench 2024 CPU Single Core
99.7 Points
ayuda
Performance Rating
Razer Blade 14 RZ09-0508
AMD Ryzen 9 8945HS, NVIDIA GeForce RTX 4070 Laptop GPU
92.8 pt
Asus TUF Gaming A15 FA507UV
AMD Ryzen 9 8945H, NVIDIA GeForce RTX 4060 Laptop GPU
91.6 pt
SCHENKER XMG Core 15 (M24)
AMD Ryzen 7 8845HS, NVIDIA GeForce RTX 4060 Laptop GPU
91.6 pt
Average of class Gaming
 
85.8 pt
Acer Predator Helios Neo 14 (2024)
Intel Core Ultra 9 185H, NVIDIA GeForce RTX 4070 Laptop GPU
72.2 pt
Acer Nitro 14 AN14-41-R3MX
AMD Ryzen 5 8645HS, NVIDIA GeForce RTX 4060 Laptop GPU
70.2 pt
Average AMD Ryzen 5 8645HS
 
70.2 pt
HP Omen Transcend 14-fb0014
Intel Core Ultra 7 155H, NVIDIA GeForce RTX 4060 Laptop GPU
67.8 pt
Lenovo LOQ 15IRX9
Intel Core i5-13450HX, NVIDIA GeForce RTX 4060 Laptop GPU
60.3 pt
AIDA64 / FP32 Ray-Trace
SCHENKER XMG Core 15 (M24)
AMD Ryzen 7 8845HS, NVIDIA GeForce RTX 4060 Laptop GPU
29544 KRay/s +33%
Razer Blade 14 RZ09-0508
AMD Ryzen 9 8945HS, NVIDIA GeForce RTX 4070 Laptop GPU
28836 KRay/s +30%
Asus TUF Gaming A15 FA507UV
AMD Ryzen 9 8945H, NVIDIA GeForce RTX 4060 Laptop GPU
28698 KRay/s +29%
Acer Nitro 14 AN14-41-R3MX
AMD Ryzen 5 8645HS, NVIDIA GeForce RTX 4060 Laptop GPU
22261 KRay/s
Average AMD Ryzen 5 8645HS
  ()
22261 KRay/s 0%
Average of class Gaming
  (4986 - 60169, n=183, last 2 years)
21914 KRay/s -2%
Acer Predator Helios Neo 14 (2024)
Intel Core Ultra 9 185H, NVIDIA GeForce RTX 4070 Laptop GPU
17300 KRay/s -22%
HP Omen Transcend 14-fb0014
Intel Core Ultra 7 155H, NVIDIA GeForce RTX 4060 Laptop GPU
15430 KRay/s -31%
Lenovo LOQ 15IRX9
Intel Core i5-13450HX, NVIDIA GeForce RTX 4060 Laptop GPU
13747 KRay/s -38%
AIDA64 / FPU Julia
SCHENKER XMG Core 15 (M24)
AMD Ryzen 7 8845HS, NVIDIA GeForce RTX 4060 Laptop GPU
125873 Points +32%
Razer Blade 14 RZ09-0508
AMD Ryzen 9 8945HS, NVIDIA GeForce RTX 4070 Laptop GPU
122633 Points +29%
Asus TUF Gaming A15 FA507UV
AMD Ryzen 9 8945H, NVIDIA GeForce RTX 4060 Laptop GPU
122466 Points +28%
Average of class Gaming
  (25360 - 252486, n=183, last 2 years)
106726 Points +12%
Acer Nitro 14 AN14-41-R3MX
AMD Ryzen 5 8645HS, NVIDIA GeForce RTX 4060 Laptop GPU
95329 Points
Average AMD Ryzen 5 8645HS
  ()
95329 Points 0%
Acer Predator Helios Neo 14 (2024)
Intel Core Ultra 9 185H, NVIDIA GeForce RTX 4070 Laptop GPU
88782 Points -7%
HP Omen Transcend 14-fb0014
Intel Core Ultra 7 155H, NVIDIA GeForce RTX 4060 Laptop GPU
80482 Points -16%
Lenovo LOQ 15IRX9
Intel Core i5-13450HX, NVIDIA GeForce RTX 4060 Laptop GPU
71834 Points -25%
AIDA64 / CPU SHA3
SCHENKER XMG Core 15 (M24)
AMD Ryzen 7 8845HS, NVIDIA GeForce RTX 4060 Laptop GPU
5180 MB/s +38%
Asus TUF Gaming A15 FA507UV
AMD Ryzen 9 8945H, NVIDIA GeForce RTX 4060 Laptop GPU
5113 MB/s +36%
Razer Blade 14 RZ09-0508
AMD Ryzen 9 8945HS, NVIDIA GeForce RTX 4070 Laptop GPU
5077 MB/s +35%
Average of class Gaming
  (1339 - 10389, n=183, last 2 years)
4910 MB/s +31%
Acer Predator Helios Neo 14 (2024)
Intel Core Ultra 9 185H, NVIDIA GeForce RTX 4070 Laptop GPU
4087 MB/s +9%
Acer Nitro 14 AN14-41-R3MX
AMD Ryzen 5 8645HS, NVIDIA GeForce RTX 4060 Laptop GPU
3756 MB/s
Average AMD Ryzen 5 8645HS
  ()
3756 MB/s 0%
HP Omen Transcend 14-fb0014
Intel Core Ultra 7 155H, NVIDIA GeForce RTX 4060 Laptop GPU
3698 MB/s -2%
Lenovo LOQ 15IRX9
Intel Core i5-13450HX, NVIDIA GeForce RTX 4060 Laptop GPU
3530 MB/s -6%
AIDA64 / CPU Queen
Asus TUF Gaming A15 FA507UV
AMD Ryzen 9 8945H, NVIDIA GeForce RTX 4060 Laptop GPU
125950 Points +30%
Razer Blade 14 RZ09-0508
AMD Ryzen 9 8945HS, NVIDIA GeForce RTX 4070 Laptop GPU
125044 Points +29%
SCHENKER XMG Core 15 (M24)
AMD Ryzen 7 8845HS, NVIDIA GeForce RTX 4060 Laptop GPU
124695 Points +28%
Average of class Gaming
  (50699 - 200651, n=183, last 2 years)
117145 Points +21%
Acer Nitro 14 AN14-41-R3MX
AMD Ryzen 5 8645HS, NVIDIA GeForce RTX 4060 Laptop GPU
97072 Points
Average AMD Ryzen 5 8645HS
  ()
97072 Points 0%
HP Omen Transcend 14-fb0014
Intel Core Ultra 7 155H, NVIDIA GeForce RTX 4060 Laptop GPU
87166 Points -10%
Acer Predator Helios Neo 14 (2024)
Intel Core Ultra 9 185H, NVIDIA GeForce RTX 4070 Laptop GPU
86970 Points -10%
Lenovo LOQ 15IRX9
Intel Core i5-13450HX, NVIDIA GeForce RTX 4060 Laptop GPU
86148 Points -11%
AIDA64 / FPU SinJulia
Asus TUF Gaming A15 FA507UV
AMD Ryzen 9 8945H, NVIDIA GeForce RTX 4060 Laptop GPU
15856 Points +38%
Razer Blade 14 RZ09-0508
AMD Ryzen 9 8945HS, NVIDIA GeForce RTX 4070 Laptop GPU
15661 Points +36%
SCHENKER XMG Core 15 (M24)
AMD Ryzen 7 8845HS, NVIDIA GeForce RTX 4060 Laptop GPU
15519 Points +35%
Average of class Gaming
  (4800 - 32988, n=183, last 2 years)
13258 Points +15%
Acer Nitro 14 AN14-41-R3MX
AMD Ryzen 5 8645HS, NVIDIA GeForce RTX 4060 Laptop GPU
11484 Points
Average AMD Ryzen 5 8645HS
  ()
11484 Points 0%
Acer Predator Helios Neo 14 (2024)
Intel Core Ultra 9 185H, NVIDIA GeForce RTX 4070 Laptop GPU
11336 Points -1%
HP Omen Transcend 14-fb0014
Intel Core Ultra 7 155H, NVIDIA GeForce RTX 4060 Laptop GPU
10200 Points -11%
Lenovo LOQ 15IRX9
Intel Core i5-13450HX, NVIDIA GeForce RTX 4060 Laptop GPU
9344 Points -19%
AIDA64 / FPU Mandel
SCHENKER XMG Core 15 (M24)
AMD Ryzen 7 8845HS, NVIDIA GeForce RTX 4060 Laptop GPU
67367 Points +31%
Razer Blade 14 RZ09-0508
AMD Ryzen 9 8945HS, NVIDIA GeForce RTX 4070 Laptop GPU
65746 Points +27%
Asus TUF Gaming A15 FA507UV
AMD Ryzen 9 8945H, NVIDIA GeForce RTX 4060 Laptop GPU
65523 Points +27%
Average of class Gaming
  (12321 - 134044, n=183, last 2 years)
53700 Points +4%
Acer Nitro 14 AN14-41-R3MX
AMD Ryzen 5 8645HS, NVIDIA GeForce RTX 4060 Laptop GPU
51591 Points
Average AMD Ryzen 5 8645HS
  ()
51591 Points 0%
Acer Predator Helios Neo 14 (2024)
Intel Core Ultra 9 185H, NVIDIA GeForce RTX 4070 Laptop GPU
43997 Points -15%
HP Omen Transcend 14-fb0014
Intel Core Ultra 7 155H, NVIDIA GeForce RTX 4060 Laptop GPU
39208 Points -24%
Lenovo LOQ 15IRX9
Intel Core i5-13450HX, NVIDIA GeForce RTX 4060 Laptop GPU
34956 Points -32%
AIDA64 / CPU AES
Average of class Gaming
  (19065 - 328679, n=183, last 2 years)
109216 MB/s +110%
SCHENKER XMG Core 15 (M24)
AMD Ryzen 7 8845HS, NVIDIA GeForce RTX 4060 Laptop GPU
92092 MB/s +77%
Razer Blade 14 RZ09-0508
AMD Ryzen 9 8945HS, NVIDIA GeForce RTX 4070 Laptop GPU
90828 MB/s +74%
Asus TUF Gaming A15 FA507UV
AMD Ryzen 9 8945H, NVIDIA GeForce RTX 4060 Laptop GPU
90481 MB/s +74%
Acer Predator Helios Neo 14 (2024)
Intel Core Ultra 9 185H, NVIDIA GeForce RTX 4070 Laptop GPU
87147 MB/s +67%
HP Omen Transcend 14-fb0014
Intel Core Ultra 7 155H, NVIDIA GeForce RTX 4060 Laptop GPU
76827 MB/s +47%
Lenovo LOQ 15IRX9
Intel Core i5-13450HX, NVIDIA GeForce RTX 4060 Laptop GPU
70330 MB/s +35%
Acer Nitro 14 AN14-41-R3MX
AMD Ryzen 5 8645HS, NVIDIA GeForce RTX 4060 Laptop GPU
52088 MB/s
Average AMD Ryzen 5 8645HS
  ()
52088 MB/s 0%
AIDA64 / CPU ZLib
Average of class Gaming
  (373 - 2409, n=183, last 2 years)
1367 MB/s +57%
Acer Predator Helios Neo 14 (2024)
Intel Core Ultra 9 185H, NVIDIA GeForce RTX 4070 Laptop GPU
1197 MB/s +37%
Asus TUF Gaming A15 FA507UV
AMD Ryzen 9 8945H, NVIDIA GeForce RTX 4060 Laptop GPU
1150 MB/s +32%
Razer Blade 14 RZ09-0508
AMD Ryzen 9 8945HS, NVIDIA GeForce RTX 4070 Laptop GPU
1135 MB/s +30%
HP Omen Transcend 14-fb0014
Intel Core Ultra 7 155H, NVIDIA GeForce RTX 4060 Laptop GPU
1064 MB/s +22%
Lenovo LOQ 15IRX9
Intel Core i5-13450HX, NVIDIA GeForce RTX 4060 Laptop GPU
1002 MB/s +15%
Acer Nitro 14 AN14-41-R3MX
AMD Ryzen 5 8645HS, NVIDIA GeForce RTX 4060 Laptop GPU
871 MB/s
Average AMD Ryzen 5 8645HS
  ()
871 MB/s 0%
SCHENKER XMG Core 15 (M24)
AMD Ryzen 7 8845HS, NVIDIA GeForce RTX 4060 Laptop GPU
788 MB/s -10%
AIDA64 / FP64 Ray-Trace
SCHENKER XMG Core 15 (M24)
AMD Ryzen 7 8845HS, NVIDIA GeForce RTX 4060 Laptop GPU
15911 KRay/s +31%
Razer Blade 14 RZ09-0508
AMD Ryzen 9 8945HS, NVIDIA GeForce RTX 4070 Laptop GPU
15588 KRay/s +28%
Asus TUF Gaming A15 FA507UV
AMD Ryzen 9 8945H, NVIDIA GeForce RTX 4060 Laptop GPU
15513 KRay/s +28%
Acer Nitro 14 AN14-41-R3MX
AMD Ryzen 5 8645HS, NVIDIA GeForce RTX 4060 Laptop GPU
12148 KRay/s
Average AMD Ryzen 5 8645HS
  ()
12148 KRay/s 0%
Average of class Gaming
  (2540 - 31796, n=183, last 2 years)
11803 KRay/s -3%
Acer Predator Helios Neo 14 (2024)
Intel Core Ultra 9 185H, NVIDIA GeForce RTX 4070 Laptop GPU
8976 KRay/s -26%
HP Omen Transcend 14-fb0014
Intel Core Ultra 7 155H, NVIDIA GeForce RTX 4060 Laptop GPU
8056 KRay/s -34%
Lenovo LOQ 15IRX9
Intel Core i5-13450HX, NVIDIA GeForce RTX 4060 Laptop GPU
7428 KRay/s -39%
AIDA64 / CPU PhotoWorxx
HP Omen Transcend 14-fb0014
Intel Core Ultra 7 155H, NVIDIA GeForce RTX 4060 Laptop GPU
54223 MPixel/s +56%
Acer Predator Helios Neo 14 (2024)
Intel Core Ultra 9 185H, NVIDIA GeForce RTX 4070 Laptop GPU
45768 MPixel/s +32%
SCHENKER XMG Core 15 (M24)
AMD Ryzen 7 8845HS, NVIDIA GeForce RTX 4060 Laptop GPU
41668 MPixel/s +20%
Razer Blade 14 RZ09-0508
AMD Ryzen 9 8945HS, NVIDIA GeForce RTX 4070 Laptop GPU
40815 MPixel/s +17%
Average of class Gaming
  (10805 - 60161, n=184, last 2 years)
40243 MPixel/s +16%
Lenovo LOQ 15IRX9
Intel Core i5-13450HX, NVIDIA GeForce RTX 4060 Laptop GPU
36764 MPixel/s +6%
Acer Nitro 14 AN14-41-R3MX
AMD Ryzen 5 8645HS, NVIDIA GeForce RTX 4060 Laptop GPU
34742 MPixel/s
Average AMD Ryzen 5 8645HS
  ()
34742 MPixel/s 0%
Asus TUF Gaming A15 FA507UV
AMD Ryzen 9 8945H, NVIDIA GeForce RTX 4060 Laptop GPU
33410 MPixel/s -4%

Rendimiento del sistema

El sistema se siente suave y proporciona un amplio rendimiento para juegos, renderizado y streaming. Así lo confirman los magníficos resultados obtenidos en nuestras pruebas de rendimiento del sistema. Dicho esto, las tasas de transferencia ofrecidas por los 16 GB de memoria estuvieron a veces por debajo de lo que es capaz la RAM LPDDR5X, lo que puede deberse al controlador de memoria de AMD. La memoria está soldada y no se puede actualizar.

PCMark 10 / Score
SCHENKER XMG Core 15 (M24)
NVIDIA GeForce RTX 4060 Laptop GPU, R7 8845HS, Samsung 990 Pro 1 TB
8822 Points +18%
Razer Blade 14 RZ09-0508
NVIDIA GeForce RTX 4070 Laptop GPU, R9 8945HS, Samsung PM9A1 MZVL21T0HCLR
8312 Points +12%
Asus TUF Gaming A15 FA507UV
NVIDIA GeForce RTX 4060 Laptop GPU, R9 8945H, WD PC SN560 SDDPNQE-1T00
7943 Points +7%
Average of class Gaming
  (5776 - 9852, n=164, last 2 years)
7803 Points +5%
Acer Predator Helios Neo 14 (2024)
NVIDIA GeForce RTX 4070 Laptop GPU, Ultra 9 185H, SK Hynix PC801 HFS001TEJ9X125N
7490 Points 0%
Acer Nitro 14 AN14-41-R3MX
NVIDIA GeForce RTX 4060 Laptop GPU, R5 8645HS, Micron 3500 MTFDKBA512TGD
7453 Points
Average AMD Ryzen 5 8645HS, NVIDIA GeForce RTX 4060 Laptop GPU
  ()
7453 Points 0%
HP Omen Transcend 14-fb0014
NVIDIA GeForce RTX 4060 Laptop GPU, Ultra 7 155H, WDC PC SN810 1TB
6962 Points -7%
Lenovo LOQ 15IRX9
NVIDIA GeForce RTX 4060 Laptop GPU, i5-13450HX, Micron 2400 MTFDKCD1T0QFM
6929 Points -7%
PCMark 10 / Essentials
Razer Blade 14 RZ09-0508
NVIDIA GeForce RTX 4070 Laptop GPU, R9 8945HS, Samsung PM9A1 MZVL21T0HCLR
11290 Points +14%
Asus TUF Gaming A15 FA507UV
NVIDIA GeForce RTX 4060 Laptop GPU, R9 8945H, WD PC SN560 SDDPNQE-1T00
10873 Points +10%
Average of class Gaming
  (9057 - 12334, n=163, last 2 years)
10833 Points +10%
Acer Predator Helios Neo 14 (2024)
NVIDIA GeForce RTX 4070 Laptop GPU, Ultra 9 185H, SK Hynix PC801 HFS001TEJ9X125N
10752 Points +9%
SCHENKER XMG Core 15 (M24)
NVIDIA GeForce RTX 4060 Laptop GPU, R7 8845HS, Samsung 990 Pro 1 TB
10061 Points +2%
Acer Nitro 14 AN14-41-R3MX
NVIDIA GeForce RTX 4060 Laptop GPU, R5 8645HS, Micron 3500 MTFDKBA512TGD
9861 Points
Average AMD Ryzen 5 8645HS, NVIDIA GeForce RTX 4060 Laptop GPU
  ()
9861 Points 0%
HP Omen Transcend 14-fb0014
NVIDIA GeForce RTX 4060 Laptop GPU, Ultra 7 155H, WDC PC SN810 1TB
9850 Points 0%
Lenovo LOQ 15IRX9
NVIDIA GeForce RTX 4060 Laptop GPU, i5-13450HX, Micron 2400 MTFDKCD1T0QFM
9379 Points -5%
PCMark 10 / Productivity
SCHENKER XMG Core 15 (M24)
NVIDIA GeForce RTX 4060 Laptop GPU, R7 8845HS, Samsung 990 Pro 1 TB
14612 Points +47%
Razer Blade 14 RZ09-0508
NVIDIA GeForce RTX 4070 Laptop GPU, R9 8945HS, Samsung PM9A1 MZVL21T0HCLR
10332 Points +4%
Asus TUF Gaming A15 FA507UV
NVIDIA GeForce RTX 4060 Laptop GPU, R9 8945H, WD PC SN560 SDDPNQE-1T00
10269 Points +3%
Acer Nitro 14 AN14-41-R3MX
NVIDIA GeForce RTX 4060 Laptop GPU, R5 8645HS, Micron 3500 MTFDKBA512TGD
9972 Points
Average AMD Ryzen 5 8645HS, NVIDIA GeForce RTX 4060 Laptop GPU
  ()
9972 Points 0%
Average of class Gaming
  (6662 - 14612, n=163, last 2 years)
9904 Points -1%
HP Omen Transcend 14-fb0014
NVIDIA GeForce RTX 4060 Laptop GPU, Ultra 7 155H, WDC PC SN810 1TB
9477 Points -5%
Acer Predator Helios Neo 14 (2024)
NVIDIA GeForce RTX 4070 Laptop GPU, Ultra 9 185H, SK Hynix PC801 HFS001TEJ9X125N
9330 Points -6%
Lenovo LOQ 15IRX9
NVIDIA GeForce RTX 4060 Laptop GPU, i5-13450HX, Micron 2400 MTFDKCD1T0QFM
8800 Points -12%
PCMark 10 / Digital Content Creation
Razer Blade 14 RZ09-0508
NVIDIA GeForce RTX 4070 Laptop GPU, R9 8945HS, Samsung PM9A1 MZVL21T0HCLR
13363 Points +17%
SCHENKER XMG Core 15 (M24)
NVIDIA GeForce RTX 4060 Laptop GPU, R7 8845HS, Samsung 990 Pro 1 TB
12674 Points +11%
Asus TUF Gaming A15 FA507UV
NVIDIA GeForce RTX 4060 Laptop GPU, R9 8945H, WD PC SN560 SDDPNQE-1T00
12182 Points +7%
Average of class Gaming
  (6703 - 18475, n=163, last 2 years)
12134 Points +6%
Acer Nitro 14 AN14-41-R3MX
NVIDIA GeForce RTX 4060 Laptop GPU, R5 8645HS, Micron 3500 MTFDKBA512TGD
11428 Points
Average AMD Ryzen 5 8645HS, NVIDIA GeForce RTX 4060 Laptop GPU
  ()
11428 Points 0%
Acer Predator Helios Neo 14 (2024)
NVIDIA GeForce RTX 4070 Laptop GPU, Ultra 9 185H, SK Hynix PC801 HFS001TEJ9X125N
11369 Points -1%
Lenovo LOQ 15IRX9
NVIDIA GeForce RTX 4060 Laptop GPU, i5-13450HX, Micron 2400 MTFDKCD1T0QFM
10937 Points -4%
HP Omen Transcend 14-fb0014
NVIDIA GeForce RTX 4060 Laptop GPU, Ultra 7 155H, WDC PC SN810 1TB
9811 Points -14%
CrossMark / Overall
Acer Predator Helios Neo 14 (2024)
NVIDIA GeForce RTX 4070 Laptop GPU, Ultra 9 185H, SK Hynix PC801 HFS001TEJ9X125N
1917 Points +9%
Average of class Gaming
  (1247 - 2344, n=145, last 2 years)
1910 Points +8%
SCHENKER XMG Core 15 (M24)
NVIDIA GeForce RTX 4060 Laptop GPU, R7 8845HS, Samsung 990 Pro 1 TB
1889 Points +7%
Razer Blade 14 RZ09-0508
NVIDIA GeForce RTX 4070 Laptop GPU, R9 8945HS, Samsung PM9A1 MZVL21T0HCLR
1830 Points +4%
Lenovo LOQ 15IRX9
NVIDIA GeForce RTX 4060 Laptop GPU, i5-13450HX, Micron 2400 MTFDKCD1T0QFM
1804 Points +2%
Asus TUF Gaming A15 FA507UV
NVIDIA GeForce RTX 4060 Laptop GPU, R9 8945H, WD PC SN560 SDDPNQE-1T00
1800 Points +2%
Acer Nitro 14 AN14-41-R3MX
NVIDIA GeForce RTX 4060 Laptop GPU, R5 8645HS, Micron 3500 MTFDKBA512TGD
1765 Points
Average AMD Ryzen 5 8645HS, NVIDIA GeForce RTX 4060 Laptop GPU
  ()
1765 Points 0%
HP Omen Transcend 14-fb0014
NVIDIA GeForce RTX 4060 Laptop GPU, Ultra 7 155H, WDC PC SN810 1TB
1540 Points -13%
CrossMark / Productivity
Acer Predator Helios Neo 14 (2024)
NVIDIA GeForce RTX 4070 Laptop GPU, Ultra 9 185H, SK Hynix PC801 HFS001TEJ9X125N
1849 Points +7%
Average of class Gaming
  (1299 - 2204, n=145, last 2 years)
1809 Points +4%
SCHENKER XMG Core 15 (M24)
NVIDIA GeForce RTX 4060 Laptop GPU, R7 8845HS, Samsung 990 Pro 1 TB
1789 Points +3%
Razer Blade 14 RZ09-0508
NVIDIA GeForce RTX 4070 Laptop GPU, R9 8945HS, Samsung PM9A1 MZVL21T0HCLR
1783 Points +3%
Asus TUF Gaming A15 FA507UV
NVIDIA GeForce RTX 4060 Laptop GPU, R9 8945H, WD PC SN560 SDDPNQE-1T00
1761 Points +1%
Acer Nitro 14 AN14-41-R3MX
NVIDIA GeForce RTX 4060 Laptop GPU, R5 8645HS, Micron 3500 MTFDKBA512TGD
1736 Points
Average AMD Ryzen 5 8645HS, NVIDIA GeForce RTX 4060 Laptop GPU
  ()
1736 Points 0%
Lenovo LOQ 15IRX9
NVIDIA GeForce RTX 4060 Laptop GPU, i5-13450HX, Micron 2400 MTFDKCD1T0QFM
1728 Points 0%
HP Omen Transcend 14-fb0014
NVIDIA GeForce RTX 4060 Laptop GPU, Ultra 7 155H, WDC PC SN810 1TB
1436 Points -17%
CrossMark / Creativity
SCHENKER XMG Core 15 (M24)
NVIDIA GeForce RTX 4060 Laptop GPU, R7 8845HS, Samsung 990 Pro 1 TB
2102 Points +15%
Average of class Gaming
  (1275 - 2660, n=145, last 2 years)
2097 Points +15%
Acer Predator Helios Neo 14 (2024)
NVIDIA GeForce RTX 4070 Laptop GPU, Ultra 9 185H, SK Hynix PC801 HFS001TEJ9X125N
2008 Points +10%
Razer Blade 14 RZ09-0508
NVIDIA GeForce RTX 4070 Laptop GPU, R9 8945HS, Samsung PM9A1 MZVL21T0HCLR
1935 Points +6%
Asus TUF Gaming A15 FA507UV
NVIDIA GeForce RTX 4060 Laptop GPU, R9 8945H, WD PC SN560 SDDPNQE-1T00
1918 Points +5%
Lenovo LOQ 15IRX9
NVIDIA GeForce RTX 4060 Laptop GPU, i5-13450HX, Micron 2400 MTFDKCD1T0QFM
1904 Points +4%
Acer Nitro 14 AN14-41-R3MX
NVIDIA GeForce RTX 4060 Laptop GPU, R5 8645HS, Micron 3500 MTFDKBA512TGD
1823 Points
Average AMD Ryzen 5 8645HS, NVIDIA GeForce RTX 4060 Laptop GPU
  ()
1823 Points 0%
HP Omen Transcend 14-fb0014
NVIDIA GeForce RTX 4060 Laptop GPU, Ultra 7 155H, WDC PC SN810 1TB
1813 Points -1%
CrossMark / Responsiveness
Acer Predator Helios Neo 14 (2024)
NVIDIA GeForce RTX 4070 Laptop GPU, Ultra 9 185H, SK Hynix PC801 HFS001TEJ9X125N
1856 Points +10%
Lenovo LOQ 15IRX9
NVIDIA GeForce RTX 4060 Laptop GPU, i5-13450HX, Micron 2400 MTFDKCD1T0QFM
1748 Points +4%
Average of class Gaming
  (1030 - 2330, n=145, last 2 years)
1709 Points +2%
Acer Nitro 14 AN14-41-R3MX
NVIDIA GeForce RTX 4060 Laptop GPU, R5 8645HS, Micron 3500 MTFDKBA512TGD
1681 Points
Average AMD Ryzen 5 8645HS, NVIDIA GeForce RTX 4060 Laptop GPU
  ()
1681 Points 0%
Razer Blade 14 RZ09-0508
NVIDIA GeForce RTX 4070 Laptop GPU, R9 8945HS, Samsung PM9A1 MZVL21T0HCLR
1672 Points -1%
SCHENKER XMG Core 15 (M24)
NVIDIA GeForce RTX 4060 Laptop GPU, R7 8845HS, Samsung 990 Pro 1 TB
1613 Points -4%
Asus TUF Gaming A15 FA507UV
NVIDIA GeForce RTX 4060 Laptop GPU, R9 8945H, WD PC SN560 SDDPNQE-1T00
1593 Points -5%
HP Omen Transcend 14-fb0014
NVIDIA GeForce RTX 4060 Laptop GPU, Ultra 7 155H, WDC PC SN810 1TB
1165 Points -31%
WebXPRT 3 / Overall
Razer Blade 14 RZ09-0508
NVIDIA GeForce RTX 4070 Laptop GPU, R9 8945HS, Samsung PM9A1 MZVL21T0HCLR
324 Points +10%
Asus TUF Gaming A15 FA507UV
NVIDIA GeForce RTX 4060 Laptop GPU, R9 8945H, WD PC SN560 SDDPNQE-1T00
308 Points +4%
SCHENKER XMG Core 15 (M24)
NVIDIA GeForce RTX 4060 Laptop GPU, R7 8845HS, Samsung 990 Pro 1 TB
305 Points +3%
Average of class Gaming
  (215 - 480, n=161, last 2 years)
304 Points +3%
Acer Nitro 14 AN14-41-R3MX
NVIDIA GeForce RTX 4060 Laptop GPU, R5 8645HS, Micron 3500 MTFDKBA512TGD
295 Points
Average AMD Ryzen 5 8645HS, NVIDIA GeForce RTX 4060 Laptop GPU
  ()
295 Points 0%
Acer Predator Helios Neo 14 (2024)
NVIDIA GeForce RTX 4070 Laptop GPU, Ultra 9 185H, SK Hynix PC801 HFS001TEJ9X125N
287 Points -3%
HP Omen Transcend 14-fb0014
NVIDIA GeForce RTX 4060 Laptop GPU, Ultra 7 155H, WDC PC SN810 1TB
274 Points -7%
Lenovo LOQ 15IRX9
NVIDIA GeForce RTX 4060 Laptop GPU, i5-13450HX, Micron 2400 MTFDKCD1T0QFM
262 Points -11%
WebXPRT 4 / Overall
Razer Blade 14 RZ09-0508
NVIDIA GeForce RTX 4070 Laptop GPU, R9 8945HS, Samsung PM9A1 MZVL21T0HCLR
269 Points +8%
Average of class Gaming
  (176.4 - 328, n=150, last 2 years)
267 Points +8%
SCHENKER XMG Core 15 (M24)
NVIDIA GeForce RTX 4060 Laptop GPU, R7 8845HS, Samsung 990 Pro 1 TB
264 Points +6%
Asus TUF Gaming A15 FA507UV
NVIDIA GeForce RTX 4060 Laptop GPU, R9 8945H, WD PC SN560 SDDPNQE-1T00
263 Points +6%
Acer Predator Helios Neo 14 (2024)
NVIDIA GeForce RTX 4070 Laptop GPU, Ultra 9 185H, SK Hynix PC801 HFS001TEJ9X125N
260 Points +5%
Acer Nitro 14 AN14-41-R3MX
NVIDIA GeForce RTX 4060 Laptop GPU, R5 8645HS, Micron 3500 MTFDKBA512TGD
248 Points
Average AMD Ryzen 5 8645HS, NVIDIA GeForce RTX 4060 Laptop GPU
  ()
248 Points 0%
Lenovo LOQ 15IRX9
NVIDIA GeForce RTX 4060 Laptop GPU, i5-13450HX, Micron 2400 MTFDKCD1T0QFM
243 Points -2%
HP Omen Transcend 14-fb0014
NVIDIA GeForce RTX 4060 Laptop GPU, Ultra 7 155H, WDC PC SN810 1TB
236 Points -5%
Mozilla Kraken 1.1 / Total
HP Omen Transcend 14-fb0014
NVIDIA GeForce RTX 4060 Laptop GPU, Ultra 7 155H, WDC PC SN810 1TB
585 ms * -7%
Lenovo LOQ 15IRX9
NVIDIA GeForce RTX 4060 Laptop GPU, i5-13450HX, Micron 2400 MTFDKCD1T0QFM
550 ms * -1%
Acer Nitro 14 AN14-41-R3MX
NVIDIA GeForce RTX 4060 Laptop GPU, R5 8645HS, Micron 3500 MTFDKBA512TGD
547 ms *
Average AMD Ryzen 5 8645HS, NVIDIA GeForce RTX 4060 Laptop GPU
  ()
547 ms * -0%
Acer Predator Helios Neo 14 (2024)
NVIDIA GeForce RTX 4070 Laptop GPU, Ultra 9 185H, SK Hynix PC801 HFS001TEJ9X125N
508 ms * +7%
Asus TUF Gaming A15 FA507UV
NVIDIA GeForce RTX 4060 Laptop GPU, R9 8945H, WD PC SN560 SDDPNQE-1T00
505 ms * +8%
Average of class Gaming
  (421 - 674, n=176, last 2 years)
502 ms * +8%
SCHENKER XMG Core 15 (M24)
NVIDIA GeForce RTX 4060 Laptop GPU, R7 8845HS, Samsung 990 Pro 1 TB
496 ms * +9%
Razer Blade 14 RZ09-0508
NVIDIA GeForce RTX 4070 Laptop GPU, R9 8945HS, Samsung PM9A1 MZVL21T0HCLR
488 ms * +11%

* ... más pequeño es mejor

PCMark 10 Score
7453 puntos
ayuda
AIDA64 / Memory Copy
HP Omen Transcend 14-fb0014
Intel Core Ultra 7 155H, NVIDIA GeForce RTX 4060 Laptop GPU
92565 MB/s +30%
Acer Predator Helios Neo 14 (2024)
Intel Core Ultra 9 185H, NVIDIA GeForce RTX 4070 Laptop GPU
84317 MB/s +19%
Acer Nitro 14 AN14-41-R3MX
AMD Ryzen 5 8645HS, NVIDIA GeForce RTX 4060 Laptop GPU
70963 MB/s
Average AMD Ryzen 5 8645HS
  ()
70963 MB/s 0%
SCHENKER XMG Core 15 (M24)
AMD Ryzen 7 8845HS, NVIDIA GeForce RTX 4060 Laptop GPU
69523 MB/s -2%
Razer Blade 14 RZ09-0508
AMD Ryzen 9 8945HS, NVIDIA GeForce RTX 4070 Laptop GPU
68755 MB/s -3%
Average of class Gaming
  (21842 - 94222, n=183, last 2 years)
65434 MB/s -8%
Asus TUF Gaming A15 FA507UV
AMD Ryzen 9 8945H, NVIDIA GeForce RTX 4060 Laptop GPU
61823 MB/s -13%
Lenovo LOQ 15IRX9
Intel Core i5-13450HX, NVIDIA GeForce RTX 4060 Laptop GPU
58673 MB/s -17%
AIDA64 / Memory Read
HP Omen Transcend 14-fb0014
Intel Core Ultra 7 155H, NVIDIA GeForce RTX 4060 Laptop GPU
90647 MB/s +80%
Acer Predator Helios Neo 14 (2024)
Intel Core Ultra 9 185H, NVIDIA GeForce RTX 4070 Laptop GPU
76163 MB/s +51%
Average of class Gaming
  (23681 - 99713, n=183, last 2 years)
69366 MB/s +38%
Lenovo LOQ 15IRX9
Intel Core i5-13450HX, NVIDIA GeForce RTX 4060 Laptop GPU
68109 MB/s +35%
Asus TUF Gaming A15 FA507UV
AMD Ryzen 9 8945H, NVIDIA GeForce RTX 4060 Laptop GPU
61696 MB/s +22%
Razer Blade 14 RZ09-0508
AMD Ryzen 9 8945HS, NVIDIA GeForce RTX 4070 Laptop GPU
61429 MB/s +22%
SCHENKER XMG Core 15 (M24)
AMD Ryzen 7 8845HS, NVIDIA GeForce RTX 4060 Laptop GPU
61095 MB/s +21%
Acer Nitro 14 AN14-41-R3MX
AMD Ryzen 5 8645HS, NVIDIA GeForce RTX 4060 Laptop GPU
50393 MB/s
Average AMD Ryzen 5 8645HS
  ()
50393 MB/s 0%
AIDA64 / Memory Write
Acer Nitro 14 AN14-41-R3MX
AMD Ryzen 5 8645HS, NVIDIA GeForce RTX 4060 Laptop GPU
92912 MB/s
Average AMD Ryzen 5 8645HS
  ()
92912 MB/s 0%
SCHENKER XMG Core 15 (M24)
AMD Ryzen 7 8845HS, NVIDIA GeForce RTX 4060 Laptop GPU
87466 MB/s -6%
Razer Blade 14 RZ09-0508
AMD Ryzen 9 8945HS, NVIDIA GeForce RTX 4070 Laptop GPU
87253 MB/s -6%
Asus TUF Gaming A15 FA507UV
AMD Ryzen 9 8945H, NVIDIA GeForce RTX 4060 Laptop GPU
78716 MB/s -15%
HP Omen Transcend 14-fb0014
Intel Core Ultra 7 155H, NVIDIA GeForce RTX 4060 Laptop GPU
75414 MB/s -19%
Average of class Gaming
  (22986 - 108954, n=183, last 2 years)
67198 MB/s -28%
Lenovo LOQ 15IRX9
Intel Core i5-13450HX, NVIDIA GeForce RTX 4060 Laptop GPU
59981 MB/s -35%
Acer Predator Helios Neo 14 (2024)
Intel Core Ultra 9 185H, NVIDIA GeForce RTX 4070 Laptop GPU
51880 MB/s -44%
AIDA64 / Memory Latency
HP Omen Transcend 14-fb0014
Intel Core Ultra 7 155H, NVIDIA GeForce RTX 4060 Laptop GPU
152.5 ns * -44%
Acer Predator Helios Neo 14 (2024)
Intel Core Ultra 9 185H, NVIDIA GeForce RTX 4070 Laptop GPU
144.3 ns * -36%
Acer Nitro 14 AN14-41-R3MX
AMD Ryzen 5 8645HS, NVIDIA GeForce RTX 4060 Laptop GPU
106.2 ns *
Average AMD Ryzen 5 8645HS
  ()
106.2 ns * -0%
Razer Blade 14 RZ09-0508
AMD Ryzen 9 8945HS, NVIDIA GeForce RTX 4070 Laptop GPU
95.4 ns * +10%
Lenovo LOQ 15IRX9
Intel Core i5-13450HX, NVIDIA GeForce RTX 4060 Laptop GPU
94.2 ns * +11%
Average of class Gaming
  (59.5 - 259, n=183, last 2 years)
93.7 ns * +12%
Asus TUF Gaming A15 FA507UV
AMD Ryzen 9 8945H, NVIDIA GeForce RTX 4060 Laptop GPU
92.6 ns * +13%
SCHENKER XMG Core 15 (M24)
AMD Ryzen 7 8845HS, NVIDIA GeForce RTX 4060 Laptop GPU
85.6 ns * +19%

* ... más pequeño es mejor

Latencia del CPD

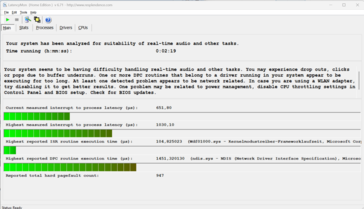
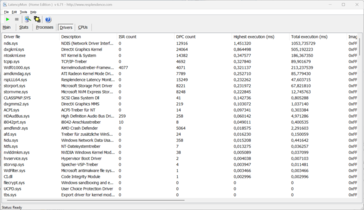
El Nitro 14 parece tener problemas para manejar el procesamiento de vídeo y audio en tiempo real debido a problemas relacionados con los controladores. Pero es posible que futuras actualizaciones mejoren la situación.

Monitor de latencia
Monitor de latencia
Monitor de latencia
Monitor de latencia
DPC Latencies / LatencyMon - interrupt to process latency (max), Web, Youtube, Prime95
Lenovo LOQ 15IRX9
NVIDIA GeForce RTX 4060 Laptop GPU, i5-13450HX, Micron 2400 MTFDKCD1T0QFM
1689.3 μs * -64%
SCHENKER XMG Core 15 (M24)
NVIDIA GeForce RTX 4060 Laptop GPU, R7 8845HS, Samsung 990 Pro 1 TB
1051.8 μs * -2%
Acer Nitro 14 AN14-41-R3MX
NVIDIA GeForce RTX 4060 Laptop GPU, R5 8645HS, Micron 3500 MTFDKBA512TGD
1030.1 μs *
Acer Predator Helios Neo 14 (2024)
NVIDIA GeForce RTX 4070 Laptop GPU, Ultra 9 185H, SK Hynix PC801 HFS001TEJ9X125N
864.8 μs * +16%
Asus TUF Gaming A15 FA507UV
NVIDIA GeForce RTX 4060 Laptop GPU, R9 8945H, WD PC SN560 SDDPNQE-1T00
790.8 μs * +23%
Razer Blade 14 RZ09-0508
NVIDIA GeForce RTX 4070 Laptop GPU, R9 8945HS, Samsung PM9A1 MZVL21T0HCLR
752.9 μs * +27%
HP Omen Transcend 14-fb0014
NVIDIA GeForce RTX 4060 Laptop GPU, Ultra 7 155H, WDC PC SN810 1TB
638.9 μs * +38%

* ... más pequeño es mejor

Almacenamiento masivo

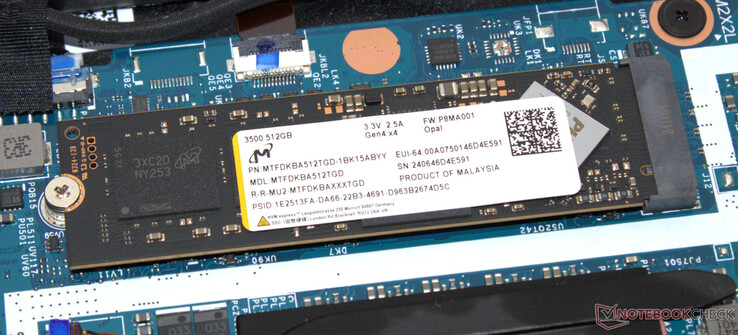
Con sólo 512 GB, la cantidad de almacenamiento que ofrece la unidad SSD PCIe 4.0 M.2-2280 parece algo exigua. Los consumidores deberían poder esperar más de un portátil para juegos que cuesta unos 1.450 euros (1.600 dólares). Se observó estrangulamiento térmico cuando ejecutamos DiskSpd en bucle. No hay ranura para una unidad de almacenamiento adicional.

Una unidad SSD PCIe 4.0 sirve como unidad del sistema.
Micron 3500 MTFDKBA512TGD
CDM 5/6 Read Seq Q32T1: 7098 MB/s
CDM 5/6 Write Seq Q32T1: 5601 MB/s
CDM 5/6 Read 4K Q32T1: 589.2 MB/s
CDM 5/6 Write 4K Q32T1: 385.8 MB/s
CDM 5 Read Seq: 3909 MB/s
CDM 5 Write Seq: 4962 MB/s
CDM 5/6 Read 4K: 68.87 MB/s
CDM 5/6 Write 4K: 129.8 MB/s
Drive Performance Rating - Percent
Acer Predator Helios Neo 14 (2024)
SK Hynix PC801 HFS001TEJ9X125N
93.5 pt
Acer Nitro 14 AN14-41-R3MX
Micron 3500 MTFDKBA512TGD
87.3 pt
Average Micron 3500 MTFDKBA512TGD
 
87.3 pt
Razer Blade 14 RZ09-0508
Samsung PM9A1 MZVL21T0HCLR
82.1 pt
SCHENKER XMG Core 15 (M24)
Samsung 990 Pro 1 TB
72.7 pt
Average of class Gaming
 
71.9 pt
Lenovo LOQ 15IRX9
Micron 2400 MTFDKCD1T0QFM
63 pt
Asus TUF Gaming A15 FA507UV
WD PC SN560 SDDPNQE-1T00
60.3 pt
HP Omen Transcend 14-fb0014
WDC PC SN810 1TB
50.5 pt
DiskSpd
seq read
Acer Nitro 14 AN14-41-R3MX
Micron 3500 MTFDKBA512TGD
5416 (5365.77min - 5416.39max) MB/s
Average Micron 3500 MTFDKBA512TGD
  ()
5416 MB/s 0%
Acer Predator Helios Neo 14 (2024)
SK Hynix PC801 HFS001TEJ9X125N
5314 (5307.13min - 5313.55max) MB/s -2%
Razer Blade 14 RZ09-0508
Samsung PM9A1 MZVL21T0HCLR
4284 (4262.33min - 4283.64max) MB/s -21%
Average of class Gaming
  (1319 - 7045, n=165, last 2 years)
3475 MB/s -36%
HP Omen Transcend 14-fb0014
WDC PC SN810 1TB
3464 (3425.98min - 3464.29max) MB/s -36%
SCHENKER XMG Core 15 (M24)
Samsung 990 Pro 1 TB
3390 (3342.47min - 3389.7max) MB/s -37%
Asus TUF Gaming A15 FA507UV
WD PC SN560 SDDPNQE-1T00
2943 (2931.61min - 2942.92max) MB/s -46%
Lenovo LOQ 15IRX9
Micron 2400 MTFDKCD1T0QFM
2364 (2348.18min - 2364.12max) MB/s -56%
seq write
Acer Nitro 14 AN14-41-R3MX
Micron 3500 MTFDKBA512TGD
5380 (5179.97min - 5380.18max) MB/s
Average Micron 3500 MTFDKBA512TGD
  ()
5380 MB/s 0%
Acer Predator Helios Neo 14 (2024)
SK Hynix PC801 HFS001TEJ9X125N
5300 (5260.88min - 5299.6max) MB/s -1%
Razer Blade 14 RZ09-0508
Samsung PM9A1 MZVL21T0HCLR
4262 (4248.51min - 4262.12max) MB/s -21%
SCHENKER XMG Core 15 (M24)
Samsung 990 Pro 1 TB
4209 (4104.55min - 4209.16max) MB/s -22%
Average of class Gaming
  (535 - 9307, n=165, last 2 years)
3812 MB/s -29%
Asus TUF Gaming A15 FA507UV
WD PC SN560 SDDPNQE-1T00
3126 (3069.81min - 3126.43max) MB/s -42%
Lenovo LOQ 15IRX9
Micron 2400 MTFDKCD1T0QFM
3103 (3061.84min - 3102.82max) MB/s -42%
HP Omen Transcend 14-fb0014
WDC PC SN810 1TB
2767 (2730.91min - 2767.11max) MB/s -49%
seq q8 t1 read
Acer Predator Helios Neo 14 (2024)
SK Hynix PC801 HFS001TEJ9X125N
7150 (6584.05min - 7150.03max) MB/s +1%
Acer Nitro 14 AN14-41-R3MX
Micron 3500 MTFDKBA512TGD
7111 (6679.91min - 7110.64max) MB/s
Average Micron 3500 MTFDKBA512TGD
  ()
7111 MB/s 0%
SCHENKER XMG Core 15 (M24)
Samsung 990 Pro 1 TB
7058 (5789.19min - 7057.97max) MB/s -1%
HP Omen Transcend 14-fb0014
WDC PC SN810 1TB
6984 (6240.18min - 6983.73max) MB/s -2%
Razer Blade 14 RZ09-0508
Samsung PM9A1 MZVL21T0HCLR
6665 (5818.34min - 6664.54max) MB/s -6%
Average of class Gaming
  (2594 - 16089, n=165, last 2 years)
6323 MB/s -11%
Asus TUF Gaming A15 FA507UV
WD PC SN560 SDDPNQE-1T00
4869 (4298.53min - 4868.87max) MB/s -32%
Lenovo LOQ 15IRX9
Micron 2400 MTFDKCD1T0QFM
4611 (4173.71min - 4610.79max) MB/s -35%
seq q8 t1 write
SCHENKER XMG Core 15 (M24)
Samsung 990 Pro 1 TB
6898 (6891.45min - 6898.33max) MB/s +20%
Acer Predator Helios Neo 14 (2024)
SK Hynix PC801 HFS001TEJ9X125N
6519 (6480.83min - 6519.17max) MB/s +13%
Acer Nitro 14 AN14-41-R3MX
Micron 3500 MTFDKBA512TGD
5758 (5487.97min - 5757.94max) MB/s
Average Micron 3500 MTFDKBA512TGD
  ()
5758 MB/s 0%
Razer Blade 14 RZ09-0508
Samsung PM9A1 MZVL21T0HCLR
4947 (4938.37min - 4947.18max) MB/s -14%
Average of class Gaming
  (539 - 14571, n=165, last 2 years)
4851 MB/s -16%
HP Omen Transcend 14-fb0014
WDC PC SN810 1TB
4454 (4349.91min - 4453.83max) MB/s -23%
Lenovo LOQ 15IRX9
Micron 2400 MTFDKCD1T0QFM
3612 (3558.24min - 3612.04max) MB/s -37%
Asus TUF Gaming A15 FA507UV
WD PC SN560 SDDPNQE-1T00
3140 (3055.76min - 3139.87max) MB/s -45%
4k q1 t1 read
Razer Blade 14 RZ09-0508
Samsung PM9A1 MZVL21T0HCLR
80.7 (80.42min - 80.74max) MB/s +9%
SCHENKER XMG Core 15 (M24)
Samsung 990 Pro 1 TB
78.5 (76.33min - 78.49max) MB/s +6%
Acer Predator Helios Neo 14 (2024)
SK Hynix PC801 HFS001TEJ9X125N
78.3 (78.02min - 78.33max) MB/s +6%
Acer Nitro 14 AN14-41-R3MX
Micron 3500 MTFDKBA512TGD
74 (73.27min - 73.98max) MB/s
Average Micron 3500 MTFDKBA512TGD
  ()
74 MB/s 0%
Average of class Gaming
  (30.6 - 95.9, n=165, last 2 years)
66 MB/s -11%
HP Omen Transcend 14-fb0014
WDC PC SN810 1TB
63.8 (62.98min - 63.76max) MB/s -14%
Asus TUF Gaming A15 FA507UV
WD PC SN560 SDDPNQE-1T00
62.9 (61.89min - 62.92max) MB/s -15%
Lenovo LOQ 15IRX9
Micron 2400 MTFDKCD1T0QFM
54.4 (52.28min - 54.35max) MB/s -26%
4k q1 t1 write
Acer Predator Helios Neo 14 (2024)
SK Hynix PC801 HFS001TEJ9X125N
268 (265.39min - 267.72max) MB/s +9%
Lenovo LOQ 15IRX9
Micron 2400 MTFDKCD1T0QFM
266 (259.13min - 265.64max) MB/s +9%
Acer Nitro 14 AN14-41-R3MX
Micron 3500 MTFDKBA512TGD
245 (244.33min - 245.28max) MB/s
Average Micron 3500 MTFDKBA512TGD
  ()
245 MB/s 0%
Asus TUF Gaming A15 FA507UV
WD PC SN560 SDDPNQE-1T00
229 (227.99min - 229max) MB/s -7%
Average of class Gaming
  (78 - 397, n=165, last 2 years)
224 MB/s -9%
Razer Blade 14 RZ09-0508
Samsung PM9A1 MZVL21T0HCLR
200 (199.46min - 200.48max) MB/s -18%
SCHENKER XMG Core 15 (M24)
Samsung 990 Pro 1 TB
159.2 (158.4min - 159.24max) MB/s -35%
HP Omen Transcend 14-fb0014
WDC PC SN810 1TB
85 (82.48min - 84.96max) MB/s -65%
4k q32 t16 read
Acer Predator Helios Neo 14 (2024)
SK Hynix PC801 HFS001TEJ9X125N
4820 (4785.11min - 4819.55max) MB/s +41%
Razer Blade 14 RZ09-0508
Samsung PM9A1 MZVL21T0HCLR
4177 (4169.76min - 4176.77max) MB/s +22%
Acer Nitro 14 AN14-41-R3MX
Micron 3500 MTFDKBA512TGD
3415 (3402.14min - 3415.39max) MB/s
Average Micron 3500 MTFDKBA512TGD
  ()
3415 MB/s 0%
Lenovo LOQ 15IRX9
Micron 2400 MTFDKCD1T0QFM
2852 (1702.21min - 2851.88max) MB/s -16%
Average of class Gaming
  (417 - 6172, n=165, last 2 years)
2571 MB/s -25%
Asus TUF Gaming A15 FA507UV
WD PC SN560 SDDPNQE-1T00
1544 (1272.83min - 1543.53max) MB/s -55%
SCHENKER XMG Core 15 (M24)
Samsung 990 Pro 1 TB
1192 (1160.39min - 1192.45max) MB/s -65%
HP Omen Transcend 14-fb0014
WDC PC SN810 1TB
417 (370.38min - 417.19max) MB/s -88%
4k q32 t16 write
Razer Blade 14 RZ09-0508
Samsung PM9A1 MZVL21T0HCLR
3555 (3541.25min - 3554.79max) MB/s +8%
Acer Nitro 14 AN14-41-R3MX
Micron 3500 MTFDKBA512TGD
3297 (3221.64min - 3296.5max) MB/s
Average Micron 3500 MTFDKBA512TGD
  ()
3297 MB/s 0%
Acer Predator Helios Neo 14 (2024)
SK Hynix PC801 HFS001TEJ9X125N
3091 (3068.4min - 3091.44max) MB/s -6%
Lenovo LOQ 15IRX9
Micron 2400 MTFDKCD1T0QFM
2535 (2457.97min - 2535.38max) MB/s -23%
Average of class Gaming
  (162.3 - 4869, n=165, last 2 years)
2137 MB/s -35%
Asus TUF Gaming A15 FA507UV
WD PC SN560 SDDPNQE-1T00
2038 (1836.85min - 2038.27max) MB/s -38%
SCHENKER XMG Core 15 (M24)
Samsung 990 Pro 1 TB
489 (473.86min - 489.4max) MB/s -85%
HP Omen Transcend 14-fb0014
WDC PC SN810 1TB
162.3 (149.98min - 162.25max) MB/s -95%
AS SSD
Score Total
Razer Blade 14 RZ09-0508
Samsung PM9A1 MZVL21T0HCLR
8530 Points +2%
Acer Predator Helios Neo 14 (2024)
SK Hynix PC801 HFS001TEJ9X125N
8486 Points +1%
Acer Nitro 14 AN14-41-R3MX
Micron 3500 MTFDKBA512TGD
8388 Points
Average Micron 3500 MTFDKBA512TGD
  ()
8388 Points 0%
Average of class Gaming
  (2271 - 13854, n=156, last 2 years)
6746 Points -20%
SCHENKER XMG Core 15 (M24)
Samsung 990 Pro 1 TB
6614 Points -21%
Lenovo LOQ 15IRX9
Micron 2400 MTFDKCD1T0QFM
5947 Points -29%
Asus TUF Gaming A15 FA507UV
WD PC SN560 SDDPNQE-1T00
5043 Points -40%
HP Omen Transcend 14-fb0014
WDC PC SN810 1TB
4112 Points -51%
Score Read
Razer Blade 14 RZ09-0508
Samsung PM9A1 MZVL21T0HCLR
3201 Points +6%
Acer Nitro 14 AN14-41-R3MX
Micron 3500 MTFDKBA512TGD
3034 Points
Average Micron 3500 MTFDKBA512TGD
  ()
3034 Points 0%
Acer Predator Helios Neo 14 (2024)
SK Hynix PC801 HFS001TEJ9X125N
2908 Points -4%
Average of class Gaming
  (776 - 4721, n=156, last 2 years)
2446 Points -19%
Lenovo LOQ 15IRX9
Micron 2400 MTFDKCD1T0QFM
2363 Points -22%
SCHENKER XMG Core 15 (M24)
Samsung 990 Pro 1 TB
1873 Points -38%
Asus TUF Gaming A15 FA507UV
WD PC SN560 SDDPNQE-1T00
1749 Points -42%
HP Omen Transcend 14-fb0014
WDC PC SN810 1TB
1211 Points -60%
Score Write
Acer Predator Helios Neo 14 (2024)
SK Hynix PC801 HFS001TEJ9X125N
4106 Points +7%
SCHENKER XMG Core 15 (M24)
Samsung 990 Pro 1 TB
3848 Points 0%
Acer Nitro 14 AN14-41-R3MX
Micron 3500 MTFDKBA512TGD
3834 Points
Average Micron 3500 MTFDKBA512TGD
  ()
3834 Points 0%
Razer Blade 14 RZ09-0508
Samsung PM9A1 MZVL21T0HCLR
3766 Points -2%
Average of class Gaming
  (515 - 7208, n=156, last 2 years)
3112 Points -19%
Asus TUF Gaming A15 FA507UV
WD PC SN560 SDDPNQE-1T00
2449 Points -36%
HP Omen Transcend 14-fb0014
WDC PC SN810 1TB
2416 Points -37%
Lenovo LOQ 15IRX9
Micron 2400 MTFDKCD1T0QFM
2414 Points -37%
Seq Read
Average Micron 3500 MTFDKBA512TGD
  ()
5708 MB/s 0%
Acer Nitro 14 AN14-41-R3MX
Micron 3500 MTFDKBA512TGD
5707.94 MB/s
Acer Predator Helios Neo 14 (2024)
SK Hynix PC801 HFS001TEJ9X125N
5686.51 MB/s 0%
Razer Blade 14 RZ09-0508
Samsung PM9A1 MZVL21T0HCLR
5406.99 MB/s -5%
SCHENKER XMG Core 15 (M24)
Samsung 990 Pro 1 TB
5283 MB/s -7%
HP Omen Transcend 14-fb0014
WDC PC SN810 1TB
5251.35 MB/s -8%
Average of class Gaming
  (2260 - 12763, n=156, last 2 years)
4945 MB/s -13%
Asus TUF Gaming A15 FA507UV
WD PC SN560 SDDPNQE-1T00
4260.13 MB/s -25%
Lenovo LOQ 15IRX9
Micron 2400 MTFDKCD1T0QFM
3796.49 MB/s -33%
Seq Write
Acer Predator Helios Neo 14 (2024)
SK Hynix PC801 HFS001TEJ9X125N
5335.07 MB/s +5%
Average Micron 3500 MTFDKBA512TGD
  ()
5088 MB/s 0%
Acer Nitro 14 AN14-41-R3MX
Micron 3500 MTFDKBA512TGD
5087.5 MB/s
Razer Blade 14 RZ09-0508
Samsung PM9A1 MZVL21T0HCLR
3947.85 MB/s -22%
Average of class Gaming
  (495 - 11316, n=156, last 2 years)
3760 MB/s -26%
SCHENKER XMG Core 15 (M24)
Samsung 990 Pro 1 TB
3646 MB/s -28%
Asus TUF Gaming A15 FA507UV
WD PC SN560 SDDPNQE-1T00
3100.95 MB/s -39%
Lenovo LOQ 15IRX9
Micron 2400 MTFDKCD1T0QFM
3051.23 MB/s -40%
HP Omen Transcend 14-fb0014
WDC PC SN810 1TB
2228.73 MB/s -56%
4K Read
SCHENKER XMG Core 15 (M24)
Samsung 990 Pro 1 TB
76.7 MB/s +13%
Razer Blade 14 RZ09-0508
Samsung PM9A1 MZVL21T0HCLR
70.54 MB/s +4%
Acer Predator Helios Neo 14 (2024)
SK Hynix PC801 HFS001TEJ9X125N
70.28 MB/s +4%
Average Micron 3500 MTFDKBA512TGD
  ()
67.7 MB/s 0%
Acer Nitro 14 AN14-41-R3MX
Micron 3500 MTFDKBA512TGD
67.69 MB/s
Average of class Gaming
  (27.8 - 112.1, n=156, last 2 years)
65.2 MB/s -4%
HP Omen Transcend 14-fb0014
WDC PC SN810 1TB
61.7 MB/s -9%
Asus TUF Gaming A15 FA507UV
WD PC SN560 SDDPNQE-1T00
56.75 MB/s -16%
Lenovo LOQ 15IRX9
Micron 2400 MTFDKCD1T0QFM
53.84 MB/s -20%
4K Write
Acer Predator Helios Neo 14 (2024)
SK Hynix PC801 HFS001TEJ9X125N
231.27 MB/s +18%
Lenovo LOQ 15IRX9
Micron 2400 MTFDKCD1T0QFM
226.41 MB/s +16%
Average of class Gaming
  (108.8 - 512, n=156, last 2 years)
213 MB/s +9%
Average Micron 3500 MTFDKBA512TGD
  ()
195.6 MB/s 0%
Acer Nitro 14 AN14-41-R3MX
Micron 3500 MTFDKBA512TGD
195.58 MB/s
Asus TUF Gaming A15 FA507UV
WD PC SN560 SDDPNQE-1T00
187.56 MB/s -4%
HP Omen Transcend 14-fb0014
WDC PC SN810 1TB
176.41 MB/s -10%
SCHENKER XMG Core 15 (M24)
Samsung 990 Pro 1 TB
172.3 MB/s -12%
Razer Blade 14 RZ09-0508
Samsung PM9A1 MZVL21T0HCLR
160.87 MB/s -18%
4K-64 Read
Razer Blade 14 RZ09-0508
Samsung PM9A1 MZVL21T0HCLR
2589.53 MB/s +8%
Average Micron 3500 MTFDKBA512TGD
  ()
2396 MB/s 0%
Acer Nitro 14 AN14-41-R3MX
Micron 3500 MTFDKBA512TGD
2395.57 MB/s
Acer Predator Helios Neo 14 (2024)
SK Hynix PC801 HFS001TEJ9X125N
2268.99 MB/s -5%
Lenovo LOQ 15IRX9
Micron 2400 MTFDKCD1T0QFM
1929.3 MB/s -19%
Average of class Gaming
  (451 - 3475, n=156, last 2 years)
1881 MB/s -21%
SCHENKER XMG Core 15 (M24)
Samsung 990 Pro 1 TB
1268 MB/s -47%
Asus TUF Gaming A15 FA507UV
WD PC SN560 SDDPNQE-1T00
1266.17 MB/s -47%
HP Omen Transcend 14-fb0014
WDC PC SN810 1TB
623.99 MB/s -74%
4K-64 Write
Acer Predator Helios Neo 14 (2024)
SK Hynix PC801 HFS001TEJ9X125N
3341.31 MB/s +7%
SCHENKER XMG Core 15 (M24)
Samsung 990 Pro 1 TB
3311 MB/s +6%
Razer Blade 14 RZ09-0508
Samsung PM9A1 MZVL21T0HCLR
3210.51 MB/s +3%
Average Micron 3500 MTFDKBA512TGD
  ()
3130 MB/s 0%
Acer Nitro 14 AN14-41-R3MX
Micron 3500 MTFDKBA512TGD
3129.92 MB/s
Average of class Gaming
  (277 - 5909, n=156, last 2 years)
2527 MB/s -19%
HP Omen Transcend 14-fb0014
WDC PC SN810 1TB
2016.6 MB/s -36%
Asus TUF Gaming A15 FA507UV
WD PC SN560 SDDPNQE-1T00
1951.29 MB/s -38%
Lenovo LOQ 15IRX9
Micron 2400 MTFDKCD1T0QFM
1882 MB/s -40%
Access Time Read
HP Omen Transcend 14-fb0014
WDC PC SN810 1TB
0.077 ms * -12%
Acer Nitro 14 AN14-41-R3MX
Micron 3500 MTFDKBA512TGD
0.069 ms *
Average Micron 3500 MTFDKBA512TGD
  ()
0.069 ms * -0%
Asus TUF Gaming A15 FA507UV
WD PC SN560 SDDPNQE-1T00
0.063 ms * +9%
Average of class Gaming
  (0.016 - 0.379, n=155, last 2 years)
0.05576 ms * +19%
Razer Blade 14 RZ09-0508
Samsung PM9A1 MZVL21T0HCLR
0.05 ms * +28%
Acer Predator Helios Neo 14 (2024)
SK Hynix PC801 HFS001TEJ9X125N
0.038 ms * +45%
SCHENKER XMG Core 15 (M24)
Samsung 990 Pro 1 TB
0.033 ms * +52%
Lenovo LOQ 15IRX9
Micron 2400 MTFDKCD1T0QFM
0.033 ms * +52%
Access Time Write
Lenovo LOQ 15IRX9
Micron 2400 MTFDKCD1T0QFM
0.097 ms * -341%
Razer Blade 14 RZ09-0508
Samsung PM9A1 MZVL21T0HCLR
0.076 ms * -245%
HP Omen Transcend 14-fb0014
WDC PC SN810 1TB
0.061 ms * -177%
Average of class Gaming
  (0.011 - 1.028, n=156, last 2 years)
0.04728 ms * -115%
SCHENKER XMG Core 15 (M24)
Samsung 990 Pro 1 TB
0.023 ms * -5%
Acer Nitro 14 AN14-41-R3MX
Micron 3500 MTFDKBA512TGD
0.022 ms *
Average Micron 3500 MTFDKBA512TGD
  ()
0.022 ms * -0%
Asus TUF Gaming A15 FA507UV
WD PC SN560 SDDPNQE-1T00
0.02 ms * +9%
Acer Predator Helios Neo 14 (2024)
SK Hynix PC801 HFS001TEJ9X125N
0.018 ms * +18%

* ... más pequeño es mejor

Sustained load Read: DiskSpd Read Loop, Queue Depth 8

036072010801440180021602520288032403600396043204680504054005760612064806840Tooltip
Acer Nitro 14 AN14-41-R3MX Micron 3500 MTFDKBA512TGD; diskspd 2.0.17 f: Ø4897 (2664.56-7113.33)
Razer Blade 14 RZ09-0508 Samsung PM9A1 MZVL21T0HCLR; diskspd 2.0.17 f: Ø6666 (6339.59-6688.24)
Lenovo LOQ 15IRX9 Micron 2400 MTFDKCD1T0QFM; diskspd 2.0.17 f: Ø3364 (2261.87-4608.28)
Asus TUF Gaming A15 FA507UV WD PC SN560 SDDPNQE-1T00; diskspd 2.0.17 f: Ø4300 (3774.46-4795.98)
SCHENKER XMG Core 15 (M24) Samsung 990 Pro 1 TB; diskspd 2.0.17 f: Ø7120 (6339.48-7142.87)
HP Omen Transcend 14-fb0014 WDC PC SN810 1TB; diskspd 2.0.17 f: Ø6954 (5929.58-6981.51)
Acer Predator Helios Neo 14 (2024) SK Hynix PC801 HFS001TEJ9X125N; diskspd 2.0.17 f: Ø7138 (6705.65-7150.45)

Tarjeta gráfica

La GeForce RTX 4060, que ofrece 3.072 unidades de sombreado, un bus de 128 bits y 8 GB de GDDR6, es una tarjeta de gama media baja en la actual línea de GPU móviles de Nvidia. Acer ha especificado la TGP en 110 vatios, por debajo de la TGP máxima de 140 vatios establecida por Nvidia. Los resultados de los benchmarks producidos por la Nitro 14 están ligeramente por encima de la media de lo que hemos visto de la RTX 4060. La diferencia de rendimiento entre los cuatro modos de potencia no es demasiado significativa. El cambio entre los modos dGPU y Optimus no requiere reinicio; también admite Optimus avanzado.

Nómada de acero (Turbo, enchufado)
Nómada de acero (Rendimiento, enchufado)
Nómada de acero (equilibrado, enchufado)
Nómada de acero (equilibrado, en batería)
Nómada de acero (silencioso, enchufado)
3DMark Performance Rating - Percent
Razer Blade 14 RZ09-0508
NVIDIA GeForce RTX 4070 Laptop GPU, AMD Ryzen 9 8945HS
100 pt
Average of class Gaming
 
97.3 pt
SCHENKER XMG Core 15 (M24)
NVIDIA GeForce RTX 4060 Laptop GPU, AMD Ryzen 7 8845HS
87.7 pt
Acer Nitro 14 AN14-41-R3MX
NVIDIA GeForce RTX 4060 Laptop GPU, AMD Ryzen 5 8645HS
83.8 pt
Asus TUF Gaming A15 FA507UV
NVIDIA GeForce RTX 4060 Laptop GPU, AMD Ryzen 9 8945H
81.1 pt
Acer Predator Helios Neo 14 (2024)
NVIDIA GeForce RTX 4070 Laptop GPU, Intel Core Ultra 9 185H
79.5 pt
Lenovo LOQ 15IRX9
NVIDIA GeForce RTX 4060 Laptop GPU, Intel Core i5-13450HX
78.5 pt
Average NVIDIA GeForce RTX 4060 Laptop GPU
 
76.9 pt
HP Omen Transcend 14-fb0014
NVIDIA GeForce RTX 4060 Laptop GPU, Intel Core Ultra 7 155H
62.4 pt
3DMark 11 - 1280x720 Performance GPU
Razer Blade 14 RZ09-0508
NVIDIA GeForce RTX 4070 Laptop GPU, AMD Ryzen 9 8945HS
44315 Points +17%
Average of class Gaming
  (1029 - 72178, n=183, last 2 years)
43810 Points +16%
SCHENKER XMG Core 15 (M24)
NVIDIA GeForce RTX 4060 Laptop GPU, AMD Ryzen 7 8845HS
38912 Points +3%
Acer Nitro 14 AN14-41-R3MX
NVIDIA GeForce RTX 4060 Laptop GPU, AMD Ryzen 5 8645HS
37827 Points
Asus TUF Gaming A15 FA507UV
NVIDIA GeForce RTX 4060 Laptop GPU, AMD Ryzen 9 8945H
36493 Points -4%
Acer Predator Helios Neo 14 (2024)
NVIDIA GeForce RTX 4070 Laptop GPU, Intel Core Ultra 9 185H
36209 Points -4%
Lenovo LOQ 15IRX9
NVIDIA GeForce RTX 4060 Laptop GPU, Intel Core i5-13450HX
35608 Points -6%
Average NVIDIA GeForce RTX 4060 Laptop GPU
  (28136 - 38912, n=56)
34832 Points -8%
HP Omen Transcend 14-fb0014
NVIDIA GeForce RTX 4060 Laptop GPU, Intel Core Ultra 7 155H
29246 Points -23%
3DMark
1920x1080 Fire Strike Graphics
Razer Blade 14 RZ09-0508
NVIDIA GeForce RTX 4070 Laptop GPU, AMD Ryzen 9 8945HS
33451 Points +19%
Average of class Gaming
  (781 - 53059, n=194, last 2 years)
31415 Points +11%
SCHENKER XMG Core 15 (M24)
NVIDIA GeForce RTX 4060 Laptop GPU, AMD Ryzen 7 8845HS
29656 Points +5%
Acer Nitro 14 AN14-41-R3MX
NVIDIA GeForce RTX 4060 Laptop GPU, AMD Ryzen 5 8645HS
28191 Points
Asus TUF Gaming A15 FA507UV
NVIDIA GeForce RTX 4060 Laptop GPU, AMD Ryzen 9 8945H
28015 Points -1%
Lenovo LOQ 15IRX9
NVIDIA GeForce RTX 4060 Laptop GPU, Intel Core i5-13450HX
27026 Points -4%
Acer Predator Helios Neo 14 (2024)
NVIDIA GeForce RTX 4070 Laptop GPU, Intel Core Ultra 9 185H
26653 Points -5%
Average NVIDIA GeForce RTX 4060 Laptop GPU
  (20533 - 29656, n=53)
25748 Points -9%
HP Omen Transcend 14-fb0014
NVIDIA GeForce RTX 4060 Laptop GPU, Intel Core Ultra 7 155H
20867 Points -26%
2560x1440 Time Spy Graphics
Razer Blade 14 RZ09-0508
NVIDIA GeForce RTX 4070 Laptop GPU, AMD Ryzen 9 8945HS
13215 Points +22%
Average of class Gaming
  (224 - 22717, n=189, last 2 years)
13118 Points +21%
SCHENKER XMG Core 15 (M24)
NVIDIA GeForce RTX 4060 Laptop GPU, AMD Ryzen 7 8845HS
11451 Points +6%
Acer Nitro 14 AN14-41-R3MX
NVIDIA GeForce RTX 4060 Laptop GPU, AMD Ryzen 5 8645HS
10799 Points
Asus TUF Gaming A15 FA507UV
NVIDIA GeForce RTX 4060 Laptop GPU, AMD Ryzen 9 8945H
10189 Points -6%
Acer Predator Helios Neo 14 (2024)
NVIDIA GeForce RTX 4070 Laptop GPU, Intel Core Ultra 9 185H
10182 Points -6%
Average NVIDIA GeForce RTX 4060 Laptop GPU
  (7484 - 11451, n=55)
9936 Points -8%
Lenovo LOQ 15IRX9
NVIDIA GeForce RTX 4060 Laptop GPU, Intel Core i5-13450HX
9830 Points -9%
HP Omen Transcend 14-fb0014
NVIDIA GeForce RTX 4060 Laptop GPU, Intel Core Ultra 7 155H
7758 Points -28%
3DMark 06 Standard Score
50749 puntos
3DMark 11 Performance
29555 puntos
3DMark Fire Strike Score
23835 puntos
3DMark Time Spy Score
10280 puntos
3DMark Steel Nomad Score
2351 puntos
ayuda
Blender
v3.3 Classroom OPTIX/RTX
Lenovo LOQ 15IRX9
NVIDIA GeForce RTX 4060 Laptop GPU, Intel Core i5-13450HX
25 Seconds * -19%
HP Omen Transcend 14-fb0014
NVIDIA GeForce RTX 4060 Laptop GPU, Intel Core Ultra 7 155H
24 Seconds * -14%
Average NVIDIA GeForce RTX 4060 Laptop GPU
  (19 - 28, n=52)
23 Seconds * -10%
Asus TUF Gaming A15 FA507UV
NVIDIA GeForce RTX 4060 Laptop GPU, AMD Ryzen 9 8945H
21 Seconds * -0%
Acer Predator Helios Neo 14 (2024)
NVIDIA GeForce RTX 4070 Laptop GPU, Intel Core Ultra 9 185H
21 Seconds * -0%
Acer Nitro 14 AN14-41-R3MX
NVIDIA GeForce RTX 4060 Laptop GPU, AMD Ryzen 5 8645HS
21 Seconds *
Average of class Gaming
  (9 - 95, n=179, last 2 years)
20.9 Seconds * -0%
SCHENKER XMG Core 15 (M24)
NVIDIA GeForce RTX 4060 Laptop GPU, AMD Ryzen 7 8845HS
19 Seconds * +10%
Razer Blade 14 RZ09-0508
NVIDIA GeForce RTX 4070 Laptop GPU, AMD Ryzen 9 8945HS
18 Seconds * +14%
v3.3 Classroom CUDA
HP Omen Transcend 14-fb0014
NVIDIA GeForce RTX 4060 Laptop GPU, Intel Core Ultra 7 155H
48 Seconds * -23%
Lenovo LOQ 15IRX9
NVIDIA GeForce RTX 4060 Laptop GPU, Intel Core i5-13450HX
44 Seconds * -13%
Average NVIDIA GeForce RTX 4060 Laptop GPU
  (39 - 53, n=52)
43.2 Seconds * -11%
Asus TUF Gaming A15 FA507UV
NVIDIA GeForce RTX 4060 Laptop GPU, AMD Ryzen 9 8945H
41 Seconds * -5%
SCHENKER XMG Core 15 (M24)
NVIDIA GeForce RTX 4060 Laptop GPU, AMD Ryzen 7 8845HS
39 Seconds * -0%
Acer Nitro 14 AN14-41-R3MX
NVIDIA GeForce RTX 4060 Laptop GPU, AMD Ryzen 5 8645HS
39 Seconds *
Average of class Gaming
  (16 - 175, n=185, last 2 years)
36.9 Seconds * +5%
Acer Predator Helios Neo 14 (2024)
NVIDIA GeForce RTX 4070 Laptop GPU, Intel Core Ultra 9 185H
34 Seconds * +13%
Razer Blade 14 RZ09-0508
NVIDIA GeForce RTX 4070 Laptop GPU, AMD Ryzen 9 8945HS
32 Seconds * +18%
v3.3 Classroom CPU
Lenovo LOQ 15IRX9
NVIDIA GeForce RTX 4060 Laptop GPU, Intel Core i5-13450HX
397 Seconds * -2%
Acer Nitro 14 AN14-41-R3MX
NVIDIA GeForce RTX 4060 Laptop GPU, AMD Ryzen 5 8645HS
389 Seconds *
HP Omen Transcend 14-fb0014
NVIDIA GeForce RTX 4060 Laptop GPU, Intel Core Ultra 7 155H
338 Seconds * +13%
Average NVIDIA GeForce RTX 4060 Laptop GPU
  (189 - 452, n=52)
311 Seconds * +20%
Acer Predator Helios Neo 14 (2024)
NVIDIA GeForce RTX 4070 Laptop GPU, Intel Core Ultra 9 185H
306 Seconds * +21%
Average of class Gaming
  (138 - 962, n=188, last 2 years)
294 Seconds * +24%
Razer Blade 14 RZ09-0508
NVIDIA GeForce RTX 4070 Laptop GPU, AMD Ryzen 9 8945HS
293 Seconds * +25%
Asus TUF Gaming A15 FA507UV
NVIDIA GeForce RTX 4060 Laptop GPU, AMD Ryzen 9 8945H
293 Seconds * +25%
SCHENKER XMG Core 15 (M24)
NVIDIA GeForce RTX 4060 Laptop GPU, AMD Ryzen 7 8845HS
288 Seconds * +26%
Geekbench 5.5
OpenCL Score
Average of class Gaming
  (5039 - 237138, n=189, last 2 years)
127541 Points +16%
Acer Predator Helios Neo 14 (2024)
NVIDIA GeForce RTX 4070 Laptop GPU, Intel Core Ultra 9 185H
120905 Points +10%
Razer Blade 14 RZ09-0508
NVIDIA GeForce RTX 4070 Laptop GPU, AMD Ryzen 9 8945HS
112385 Points +2%
SCHENKER XMG Core 15 (M24)
NVIDIA GeForce RTX 4060 Laptop GPU, AMD Ryzen 7 8845HS
112141 Points +2%
Acer Nitro 14 AN14-41-R3MX
NVIDIA GeForce RTX 4060 Laptop GPU, AMD Ryzen 5 8645HS
110101 Points
Asus TUF Gaming A15 FA507UV
NVIDIA GeForce RTX 4060 Laptop GPU, AMD Ryzen 9 8945H
109099 Points -1%
Lenovo LOQ 15IRX9
NVIDIA GeForce RTX 4060 Laptop GPU, Intel Core i5-13450HX
104333 Points -5%
Average NVIDIA GeForce RTX 4060 Laptop GPU
  (5039 - 112238, n=52)
99381 Points -10%
HP Omen Transcend 14-fb0014
NVIDIA GeForce RTX 4060 Laptop GPU, Intel Core Ultra 7 155H
88991 Points -19%
Vulkan Score 5.5
Acer Predator Helios Neo 14 (2024)
NVIDIA GeForce RTX 4070 Laptop GPU, Intel Core Ultra 9 185H
101409 Points +21%
Asus TUF Gaming A15 FA507UV
NVIDIA GeForce RTX 4060 Laptop GPU, AMD Ryzen 9 8945H
87612 Points +5%
SCHENKER XMG Core 15 (M24)
NVIDIA GeForce RTX 4060 Laptop GPU, AMD Ryzen 7 8845HS
85280 Points +2%
Acer Nitro 14 AN14-41-R3MX
NVIDIA GeForce RTX 4060 Laptop GPU, AMD Ryzen 5 8645HS
83715 Points
Lenovo LOQ 15IRX9
NVIDIA GeForce RTX 4060 Laptop GPU, Intel Core i5-13450HX
74517 Points -11%
HP Omen Transcend 14-fb0014
NVIDIA GeForce RTX 4060 Laptop GPU, Intel Core Ultra 7 155H
73606 Points -12%
Average of class Gaming
  (7995 - 163089, n=120, last 2 years)
72712 Points -13%
Average NVIDIA GeForce RTX 4060 Laptop GPU
  (28838 - 87612, n=30)
62733 Points -25%
Geekbench 6.3
GPU OpenCL
Average of class Gaming
  (4321 - 207373, n=111, last 2 years)
116410 Points +20%
Razer Blade 14 RZ09-0508
NVIDIA GeForce RTX 4070 Laptop GPU, AMD Ryzen 9 8945HS
113775 Points +17%
Acer Predator Helios Neo 14 (2024)
NVIDIA GeForce RTX 4070 Laptop GPU, Intel Core Ultra 9 185H
105575 Points +9%
Acer Nitro 14 AN14-41-R3MX
NVIDIA GeForce RTX 4060 Laptop GPU, AMD Ryzen 5 8645HS
97025 Points
SCHENKER XMG Core 15 (M24)
NVIDIA GeForce RTX 4060 Laptop GPU, AMD Ryzen 7 8845HS
96625 Points 0%
Asus TUF Gaming A15 FA507UV
NVIDIA GeForce RTX 4060 Laptop GPU, AMD Ryzen 9 8945H
93345 Points -4%
Lenovo LOQ 15IRX9
NVIDIA GeForce RTX 4060 Laptop GPU, Intel Core i5-13450HX
90435 Points -7%
Average NVIDIA GeForce RTX 4060 Laptop GPU
  (4321 - 100831, n=39)
90125 Points -7%
HP Omen Transcend 14-fb0014
NVIDIA GeForce RTX 4060 Laptop GPU, Intel Core Ultra 7 155H
76604 Points -21%
GPU Vulkan
Acer Predator Helios Neo 14 (2024)
NVIDIA GeForce RTX 4070 Laptop GPU, Intel Core Ultra 9 185H
107258 Points +6%
Acer Nitro 14 AN14-41-R3MX
NVIDIA GeForce RTX 4060 Laptop GPU, AMD Ryzen 5 8645HS
101001 Points
SCHENKER XMG Core 15 (M24)
NVIDIA GeForce RTX 4060 Laptop GPU, AMD Ryzen 7 8845HS
96989 Points -4%
Asus TUF Gaming A15 FA507UV
NVIDIA GeForce RTX 4060 Laptop GPU, AMD Ryzen 9 8945H
96439 Points -5%
Lenovo LOQ 15IRX9
NVIDIA GeForce RTX 4060 Laptop GPU, Intel Core i5-13450HX
91034 Points -10%
Average of class Gaming
  (4286 - 196201, n=106, last 2 years)
82352 Points -18%
HP Omen Transcend 14-fb0014
NVIDIA GeForce RTX 4060 Laptop GPU, Intel Core Ultra 7 155H
79942 Points -21%
Average NVIDIA GeForce RTX 4060 Laptop GPU
  (4286 - 101001, n=35)
65274 Points -35%
Razer Blade 14 RZ09-0508
NVIDIA GeForce RTX 4070 Laptop GPU, AMD Ryzen 9 8945HS
19700 Points -80%
V-Ray 5 Benchmark
GPU RTX
Average of class Gaming
  (171 - 3824, n=113, last 2 years)
2190 mpaths +22%
Razer Blade 14 RZ09-0508
NVIDIA GeForce RTX 4070 Laptop GPU, AMD Ryzen 9 8945HS
1834 mpaths +3%
Acer Nitro 14 AN14-41-R3MX
NVIDIA GeForce RTX 4060 Laptop GPU, AMD Ryzen 5 8645HS
1789 mpaths
Asus TUF Gaming A15 FA507UV
NVIDIA GeForce RTX 4060 Laptop GPU, AMD Ryzen 9 8945H
1752 mpaths -2%
Acer Predator Helios Neo 14 (2024)
NVIDIA GeForce RTX 4070 Laptop GPU, Intel Core Ultra 9 185H
1752 mpaths -2%
Average NVIDIA GeForce RTX 4060 Laptop GPU
  (1387 - 1817, n=28)
1711 mpaths -4%
Lenovo LOQ 15IRX9
NVIDIA GeForce RTX 4060 Laptop GPU, Intel Core i5-13450HX
1664 mpaths -7%
HP Omen Transcend 14-fb0014
NVIDIA GeForce RTX 4060 Laptop GPU, Intel Core Ultra 7 155H
1515 mpaths -15%
GPU CUDA
Average of class Gaming
  (120 - 2797, n=115, last 2 years)
1574 mpaths +22%
Acer Nitro 14 AN14-41-R3MX
NVIDIA GeForce RTX 4060 Laptop GPU, AMD Ryzen 5 8645HS
1294 mpaths
Acer Predator Helios Neo 14 (2024)
NVIDIA GeForce RTX 4070 Laptop GPU, Intel Core Ultra 9 185H
1278 mpaths -1%
Razer Blade 14 RZ09-0508
NVIDIA GeForce RTX 4070 Laptop GPU, AMD Ryzen 9 8945HS
1274 mpaths -2%
Asus TUF Gaming A15 FA507UV
NVIDIA GeForce RTX 4060 Laptop GPU, AMD Ryzen 9 8945H
1205 mpaths -7%
Lenovo LOQ 15IRX9
NVIDIA GeForce RTX 4060 Laptop GPU, Intel Core i5-13450HX
1199 mpaths -7%
Average NVIDIA GeForce RTX 4060 Laptop GPU
  (957 - 1294, n=29)
1170 mpaths -10%
HP Omen Transcend 14-fb0014
NVIDIA GeForce RTX 4060 Laptop GPU, Intel Core Ultra 7 155H
985 mpaths -24%
CPU
Average of class Gaming
  (3562 - 26944, n=117, last 2 years)
15137 mpaths +64%
Average NVIDIA GeForce RTX 4060 Laptop GPU
  (8364 - 21065, n=28)
12813 mpaths +39%
Acer Predator Helios Neo 14 (2024)
NVIDIA GeForce RTX 4070 Laptop GPU, Intel Core Ultra 9 185H
12747 mpaths +38%
Asus TUF Gaming A15 FA507UV
NVIDIA GeForce RTX 4060 Laptop GPU, AMD Ryzen 9 8945H
12370 mpaths +34%
Razer Blade 14 RZ09-0508
NVIDIA GeForce RTX 4070 Laptop GPU, AMD Ryzen 9 8945HS
12010 mpaths +30%
HP Omen Transcend 14-fb0014
NVIDIA GeForce RTX 4060 Laptop GPU, Intel Core Ultra 7 155H
11717 mpaths +27%
Lenovo LOQ 15IRX9
NVIDIA GeForce RTX 4060 Laptop GPU, Intel Core i5-13450HX
10813 mpaths +17%
Acer Nitro 14 AN14-41-R3MX
NVIDIA GeForce RTX 4060 Laptop GPU, AMD Ryzen 5 8645HS
9235 mpaths
V-Ray Benchmark Next 4.10
GPU
Acer Nitro 14 AN14-41-R3MX
NVIDIA GeForce RTX 4060 Laptop GPU, AMD Ryzen 5 8645HS
715 mpaths
Average of class Gaming
  (54 - 1334, n=151, last 2 years)
713 mpaths 0%
SCHENKER XMG Core 15 (M24)
NVIDIA GeForce RTX 4060 Laptop GPU, AMD Ryzen 7 8845HS
704 mpaths -2%
Asus TUF Gaming A15 FA507UV
NVIDIA GeForce RTX 4060 Laptop GPU, AMD Ryzen 9 8945H
648 mpaths -9%
Average NVIDIA GeForce RTX 4060 Laptop GPU
  (483 - 715, n=45)
632 mpaths -12%
Acer Predator Helios Neo 14 (2024)
NVIDIA GeForce RTX 4070 Laptop GPU, Intel Core Ultra 9 185H
627 mpaths -12%
Lenovo LOQ 15IRX9
NVIDIA GeForce RTX 4060 Laptop GPU, Intel Core i5-13450HX
617 mpaths -14%
CPU
Average of class Gaming
  (5413 - 37629, n=151, last 2 years)
21537 ksamples +62%
Average NVIDIA GeForce RTX 4060 Laptop GPU
  (12680 - 32360, n=45)
19596 ksamples +47%
SCHENKER XMG Core 15 (M24)
NVIDIA GeForce RTX 4060 Laptop GPU, AMD Ryzen 7 8845HS
18555 ksamples +40%
Acer Predator Helios Neo 14 (2024)
NVIDIA GeForce RTX 4070 Laptop GPU, Intel Core Ultra 9 185H
18470 ksamples +39%
Asus TUF Gaming A15 FA507UV
NVIDIA GeForce RTX 4060 Laptop GPU, AMD Ryzen 9 8945H
17955 ksamples +35%
Lenovo LOQ 15IRX9
NVIDIA GeForce RTX 4060 Laptop GPU, Intel Core i5-13450HX
16391 ksamples +23%
Acer Nitro 14 AN14-41-R3MX
NVIDIA GeForce RTX 4060 Laptop GPU, AMD Ryzen 5 8645HS
13288 ksamples

* ... más pequeño es mejor

Rendimiento en juegos

El portátil puede aprovechar toda la resolución de la pantalla cuando ejecuta juegos con ajustes de altos a máximos. El hardware interior consiguió en la mayoría de los casos ofrecer velocidades de fotogramas superiores a lo que la RTX 4060 puede hacer de media. No obstante, en juegos que requieren un uso intensivo de la CPU, como Dota 2 Reborn, GTA V y X-Plane 11, los resultados fueron inferiores a la media de la RTX 4060. La generación de fotogramas y DLSS3 permiten ejecutar los juegos a resoluciones más altas con los ajustes al máximo y el trazado de rayos activado, pero esto sólo es posible en los juegos compatibles con estas funciones de la GPU. Un acaparador de hardware como Black Myth: Wukong lleva a la Nitro 14 a sus límites, lo que obliga a bajar los ajustes.

Performance Rating - Percent
Average of class Gaming
 
98.2 pt
SCHENKER XMG Core 15 (M24)
AMD Ryzen 7 8845HS, NVIDIA GeForce RTX 4060 Laptop GPU
92.7 pt
Razer Blade 14 RZ09-0508 -1!
AMD Ryzen 9 8945HS, NVIDIA GeForce RTX 4070 Laptop GPU
90 pt
Average NVIDIA GeForce RTX 4060 Laptop GPU
 
86.4 pt
Lenovo LOQ 15IRX9
Intel Core i5-13450HX, NVIDIA GeForce RTX 4060 Laptop GPU
85.6 pt
Asus TUF Gaming A15 FA507UV
AMD Ryzen 9 8945H, NVIDIA GeForce RTX 4060 Laptop GPU
85.6 pt
Acer Predator Helios Neo 14 (2024)
Intel Core Ultra 9 185H, NVIDIA GeForce RTX 4070 Laptop GPU
82 pt
Acer Nitro 14 AN14-41-R3MX
AMD Ryzen 5 8645HS, NVIDIA GeForce RTX 4060 Laptop GPU
81.1 pt
HP Omen Transcend 14-fb0014
Intel Core Ultra 7 155H, NVIDIA GeForce RTX 4060 Laptop GPU
71.9 pt
Cyberpunk 2077 2.1 Phantom Liberty - 1920x1080 Ultra Preset (FSR off)
SCHENKER XMG Core 15 (M24)
AMD Ryzen 7 8845HS, NVIDIA GeForce RTX 4060 Laptop GPU
93.1 (78.7min) fps +23%
Razer Blade 14 RZ09-0508
AMD Ryzen 9 8945HS, NVIDIA GeForce RTX 4070 Laptop GPU
88.6 (53.5min) fps +17%
Average of class Gaming
  (6.76 - 144.7, n=80, last 2 years)
86.5 fps +14%
Asus TUF Gaming A15 FA507UV
AMD Ryzen 9 8945H, NVIDIA GeForce RTX 4060 Laptop GPU
76.2 (63.3min) fps +1%
Acer Nitro 14 AN14-41-R3MX
AMD Ryzen 5 8645HS, NVIDIA GeForce RTX 4060 Laptop GPU
75.8 (63.1min) fps
Acer Predator Helios Neo 14 (2024)
Intel Core Ultra 9 185H, NVIDIA GeForce RTX 4070 Laptop GPU
72.4 (59.8min) fps -4%
Average NVIDIA GeForce RTX 4060 Laptop GPU
  (56.4 - 93.1, n=30)
71.5 fps -6%
Lenovo LOQ 15IRX9
Intel Core i5-13450HX, NVIDIA GeForce RTX 4060 Laptop GPU
71.4 (40.1min) fps -6%
HP Omen Transcend 14-fb0014
Intel Core Ultra 7 155H, NVIDIA GeForce RTX 4060 Laptop GPU
56.7 (31.1min) fps -25%
GTA V - 1920x1080 Highest Settings possible AA:4xMSAA + FX AF:16x
SCHENKER XMG Core 15 (M24)
AMD Ryzen 7 8845HS, NVIDIA GeForce RTX 4060 Laptop GPU
116.7 (5.3min, 76.9P1) fps +16%
Average of class Gaming
  (12.1 - 167.7, n=170, last 2 years)
113.7 fps +13%
Lenovo LOQ 15IRX9
Intel Core i5-13450HX, NVIDIA GeForce RTX 4060 Laptop GPU
112.6 (5.45min, 76.9P1) fps +12%
Razer Blade 14 RZ09-0508
AMD Ryzen 9 8945HS, NVIDIA GeForce RTX 4070 Laptop GPU
109.9 (8.22min, 76.9P1) fps +9%
Average NVIDIA GeForce RTX 4060 Laptop GPU
  (76.9 - 126.3, n=47)
107.6 fps +7%
Asus TUF Gaming A15 FA507UV
AMD Ryzen 9 8945H, NVIDIA GeForce RTX 4060 Laptop GPU
107.2 (4.45min, 76.9P1) fps +7%
Acer Predator Helios Neo 14 (2024)
Intel Core Ultra 9 185H, NVIDIA GeForce RTX 4070 Laptop GPU
104.8 (4.53min, 71.4P1) fps +4%
Acer Nitro 14 AN14-41-R3MX
AMD Ryzen 5 8645HS, NVIDIA GeForce RTX 4060 Laptop GPU
100.6 (7.3min, 71.4P1) fps
HP Omen Transcend 14-fb0014
Intel Core Ultra 7 155H, NVIDIA GeForce RTX 4060 Laptop GPU
96.7 (4.16min, 62.5P1) fps -4%
Final Fantasy XV Benchmark - 1920x1080 High Quality
Razer Blade 14 RZ09-0508
AMD Ryzen 9 8945HS, NVIDIA GeForce RTX 4070 Laptop GPU
121.5 fps +15%
Average of class Gaming
  (19.2 - 201, n=182, last 2 years)
119.9 fps +13%
SCHENKER XMG Core 15 (M24)
AMD Ryzen 7 8845HS, NVIDIA GeForce RTX 4060 Laptop GPU
107.2 fps +1%
Acer Nitro 14 AN14-41-R3MX
AMD Ryzen 5 8645HS, NVIDIA GeForce RTX 4060 Laptop GPU
106 fps
Acer Predator Helios Neo 14 (2024)
Intel Core Ultra 9 185H, NVIDIA GeForce RTX 4070 Laptop GPU
104.6 fps -1%
Asus TUF Gaming A15 FA507UV
AMD Ryzen 9 8945H, NVIDIA GeForce RTX 4060 Laptop GPU
100.7 fps -5%
Lenovo LOQ 15IRX9
Intel Core i5-13450HX, NVIDIA GeForce RTX 4060 Laptop GPU
99.9 fps -6%
Average NVIDIA GeForce RTX 4060 Laptop GPU
  (75.1 - 109.8, n=50)
97.3 fps -8%
HP Omen Transcend 14-fb0014
Intel Core Ultra 7 155H, NVIDIA GeForce RTX 4060 Laptop GPU
83.2 fps -22%
Strange Brigade - 1920x1080 ultra AA:ultra AF:16
Average of class Gaming
  (38.9 - 421, n=179, last 2 years)
229 fps +19%
SCHENKER XMG Core 15 (M24)
AMD Ryzen 7 8845HS, NVIDIA GeForce RTX 4060 Laptop GPU
204 (141.8min, 149.7P1) fps +6%
Acer Nitro 14 AN14-41-R3MX
AMD Ryzen 5 8645HS, NVIDIA GeForce RTX 4060 Laptop GPU
193.2 (28.8min, 141.1P1) fps
Asus TUF Gaming A15 FA507UV
AMD Ryzen 9 8945H, NVIDIA GeForce RTX 4060 Laptop GPU
184.2 (41min, 136.6P1) fps -5%
Acer Predator Helios Neo 14 (2024)
Intel Core Ultra 9 185H, NVIDIA GeForce RTX 4070 Laptop GPU
183 (33.8min, 138.5P1) fps -5%
Lenovo LOQ 15IRX9
Intel Core i5-13450HX, NVIDIA GeForce RTX 4060 Laptop GPU
182.7 (43.5min, 133.1P1) fps -5%
Average NVIDIA GeForce RTX 4060 Laptop GPU
  (135.3 - 210, n=49)
181.3 fps -6%
HP Omen Transcend 14-fb0014
Intel Core Ultra 7 155H, NVIDIA GeForce RTX 4060 Laptop GPU
151.1 (81.6min, 109.2P1) fps -22%
Dota 2 Reborn - 1920x1080 ultra (3/3) best looking
Average of class Gaming
  (65.1 - 220, n=187, last 2 years)
151.2 fps +25%
Average NVIDIA GeForce RTX 4060 Laptop GPU
  (115 - 183.8, n=52)
145 fps +20%
Lenovo LOQ 15IRX9
Intel Core i5-13450HX, NVIDIA GeForce RTX 4060 Laptop GPU
141 (122.7min) fps +17%
Asus TUF Gaming A15 FA507UV
AMD Ryzen 9 8945H, NVIDIA GeForce RTX 4060 Laptop GPU
139.5 (122.4min) fps +16%
Razer Blade 14 RZ09-0508
AMD Ryzen 9 8945HS, NVIDIA GeForce RTX 4070 Laptop GPU
136.1 (119min) fps +13%
SCHENKER XMG Core 15 (M24)
AMD Ryzen 7 8845HS, NVIDIA GeForce RTX 4060 Laptop GPU
135.2 (117.4min) fps +12%
Acer Predator Helios Neo 14 (2024)
Intel Core Ultra 9 185H, NVIDIA GeForce RTX 4070 Laptop GPU
130.8 (114.6min) fps +9%
HP Omen Transcend 14-fb0014
Intel Core Ultra 7 155H, NVIDIA GeForce RTX 4060 Laptop GPU
121.1 (104.5min) fps 0%
Acer Nitro 14 AN14-41-R3MX
AMD Ryzen 5 8645HS, NVIDIA GeForce RTX 4060 Laptop GPU
120.5 (104.4min) fps
X-Plane 11.11 - 1920x1080 high (fps_test=3)
Average of class Gaming
  (32.8 - 166.2, n=194, last 2 years)
108.4 fps +48%
Average NVIDIA GeForce RTX 4060 Laptop GPU
  (60.7 - 141.1, n=53)
102.1 fps +39%
SCHENKER XMG Core 15 (M24)
AMD Ryzen 7 8845HS, NVIDIA GeForce RTX 4060 Laptop GPU
97.2 fps +32%
Lenovo LOQ 15IRX9
Intel Core i5-13450HX, NVIDIA GeForce RTX 4060 Laptop GPU
92.2 fps +26%
Asus TUF Gaming A15 FA507UV
AMD Ryzen 9 8945H, NVIDIA GeForce RTX 4060 Laptop GPU
91.7 fps +25%
HP Omen Transcend 14-fb0014
Intel Core Ultra 7 155H, NVIDIA GeForce RTX 4060 Laptop GPU
79.5 fps +8%
Acer Predator Helios Neo 14 (2024)
Intel Core Ultra 9 185H, NVIDIA GeForce RTX 4070 Laptop GPU
78 fps +6%
Razer Blade 14 RZ09-0508
AMD Ryzen 9 8945HS, NVIDIA GeForce RTX 4070 Laptop GPU
76.8 fps +5%
Acer Nitro 14 AN14-41-R3MX
AMD Ryzen 5 8645HS, NVIDIA GeForce RTX 4060 Laptop GPU
73.4 fps
Baldur's Gate 3
1920x1080 Ultra Preset
Acer Predator Helios Neo 14 (2024)
Intel Core Ultra 9 185H, NVIDIA GeForce RTX 4070 Laptop GPU
107.9 (57.2min, 71.4P0.1, 87.3P1) fps +7%
SCHENKER XMG Core 15 (M24)
AMD Ryzen 7 8845HS, NVIDIA GeForce RTX 4060 Laptop GPU
105.5 fps +5%
Average of class Gaming
  (34.5 - 208, n=45, last 2 years)
103.5 fps +3%
Acer Nitro 14 AN14-41-R3MX
AMD Ryzen 5 8645HS, NVIDIA GeForce RTX 4060 Laptop GPU
100.4 (33.6min, 83P0.1, 88.8P1) fps
Asus TUF Gaming A15 FA507UV
AMD Ryzen 9 8945H, NVIDIA GeForce RTX 4060 Laptop GPU
93.9 (67.7min, 75.2P0.1, 79P1) fps -6%
Average NVIDIA GeForce RTX 4060 Laptop GPU
  (66.5 - 105.5, n=18)
84.6 fps -16%
HP Omen Transcend 14-fb0014
Intel Core Ultra 7 155H, NVIDIA GeForce RTX 4060 Laptop GPU
73.2 fps -27%
Razer Blade 14 RZ09-0508
AMD Ryzen 9 8945HS, NVIDIA GeForce RTX 4070 Laptop GPU
71.3 fps -29%
2560x1440 Ultra Preset
Average of class Gaming
  (44 - 155.2, n=34, last 2 years)
82.2 fps +31%
Acer Predator Helios Neo 14 (2024)
Intel Core Ultra 9 185H, NVIDIA GeForce RTX 4070 Laptop GPU
75.5 (53.9min, 60P0.1, 63.9P1) fps +20%
SCHENKER XMG Core 15 (M24)
AMD Ryzen 7 8845HS, NVIDIA GeForce RTX 4060 Laptop GPU
72.2 fps +15%
Acer Nitro 14 AN14-41-R3MX
AMD Ryzen 5 8645HS, NVIDIA GeForce RTX 4060 Laptop GPU
62.8 (48.8min, 49.9P0.1, 52.6P1) fps
Average NVIDIA GeForce RTX 4060 Laptop GPU
  (45.2 - 72.2, n=14)
58.2 fps -7%
Razer Blade 14 RZ09-0508
AMD Ryzen 9 8945HS, NVIDIA GeForce RTX 4070 Laptop GPU
54.4 fps -13%
HP Omen Transcend 14-fb0014
Intel Core Ultra 7 155H, NVIDIA GeForce RTX 4060 Laptop GPU
48.9 fps -22%
Far Cry 5
1920x1080 Ultra Preset AA:T
Average of class Gaming
  (34 - 218, n=101, last 2 years)
131 fps +27%
SCHENKER XMG Core 15 (M24)
AMD Ryzen 7 8845HS, NVIDIA GeForce RTX 4060 Laptop GPU
128 fps +24%
Razer Blade 14 RZ09-0508
AMD Ryzen 9 8945HS, NVIDIA GeForce RTX 4070 Laptop GPU
123 (95min) fps +19%
Average NVIDIA GeForce RTX 4060 Laptop GPU
  (95 - 148, n=34)
121.8 fps +18%
HP Omen Transcend 14-fb0014
Intel Core Ultra 7 155H, NVIDIA GeForce RTX 4060 Laptop GPU
107 (86min) fps +4%
HP Omen Transcend 14-fb0014
Intel Core Ultra 7 155H, NVIDIA GeForce RTX 4060 Laptop GPU
107 (86min) fps +4%
Acer Nitro 14 AN14-41-R3MX
AMD Ryzen 5 8645HS, NVIDIA GeForce RTX 4060 Laptop GPU
103 (76min) fps
2560x1440 Ultra Preset AA:T
Average of class Gaming
  (71 - 194, n=80, last 2 years)
119.6 fps +25%
Razer Blade 14 RZ09-0508
AMD Ryzen 9 8945HS, NVIDIA GeForce RTX 4070 Laptop GPU
114 (93min) fps +19%
SCHENKER XMG Core 15 (M24)
AMD Ryzen 7 8845HS, NVIDIA GeForce RTX 4060 Laptop GPU
108 fps +13%
Acer Nitro 14 AN14-41-R3MX
AMD Ryzen 5 8645HS, NVIDIA GeForce RTX 4060 Laptop GPU
96 (74min) fps
Average NVIDIA GeForce RTX 4060 Laptop GPU
  (71 - 111, n=26)
94.9 fps -1%
HP Omen Transcend 14-fb0014
Intel Core Ultra 7 155H, NVIDIA GeForce RTX 4060 Laptop GPU
80 (70min) fps -17%
HP Omen Transcend 14-fb0014
Intel Core Ultra 7 155H, NVIDIA GeForce RTX 4060 Laptop GPU
80 (70min) fps -17%
F1 24
1920x1080 Ultra High Preset AA:T AF:16x
Average of class Gaming
  (54.1 - 127, n=14, last 2 years)
78.2 fps +28%
Acer Predator Helios Neo 14 (2024)
Intel Core Ultra 9 185H, NVIDIA GeForce RTX 4070 Laptop GPU
64.7 (53min, 51P1) fps +6%
Acer Nitro 14 AN14-41-R3MX
AMD Ryzen 5 8645HS, NVIDIA GeForce RTX 4060 Laptop GPU
60.9 (50min, 49P1) fps
Asus TUF Gaming A15 FA507UV
AMD Ryzen 9 8945H, NVIDIA GeForce RTX 4060 Laptop GPU
56.6 (46min, 46P1) fps -7%
Average NVIDIA GeForce RTX 4060 Laptop GPU
  (47.5 - 60.9, n=9)
56.1 fps -8%
Lenovo LOQ 15IRX9
Intel Core i5-13450HX, NVIDIA GeForce RTX 4060 Laptop GPU
54.1 (44min, 43P1) fps -11%
2560x1440 Ultra High Preset AA:T AF:16x
Average of class Gaming
  (36.7 - 84.7, n=12, last 2 years)
55.8 fps +44%
Acer Predator Helios Neo 14 (2024)
Intel Core Ultra 9 185H, NVIDIA GeForce RTX 4070 Laptop GPU
41.1 (33min, 33P1) fps +6%
Acer Nitro 14 AN14-41-R3MX
AMD Ryzen 5 8645HS, NVIDIA GeForce RTX 4060 Laptop GPU
38.8 (31min, 31P1) fps
Average NVIDIA GeForce RTX 4060 Laptop GPU
  (24.3 - 38.8, n=6)
34.3 fps -12%
2560x1440 Ultra High Preset + Quality DLSS AF:16x
Average of class Gaming
  (59.2 - 129.5, n=9, last 2 years)
78.4 fps +29%
Acer Predator Helios Neo 14 (2024)
Intel Core Ultra 9 185H, NVIDIA GeForce RTX 4070 Laptop GPU
65.2 (53min, 52P1) fps +7%
Acer Nitro 14 AN14-41-R3MX
AMD Ryzen 5 8645HS, NVIDIA GeForce RTX 4060 Laptop GPU
61 (43min, 49P1) fps
Average NVIDIA GeForce RTX 4060 Laptop GPU
  (48.6 - 61, n=3)
56.3 fps -8%

Durante un periodo de 30 minutos, Cyberpunk 2077: Phantom Liberty mantuvo unas tasas de imágenes por segundo bastante estables con los ajustes al máximo y FHD, sin caídas de rendimiento observables.

Cyberpunk 2077 ultra FPS chart

0510152025303540455055606570Tooltip
Acer Nitro 14 AN14-41-R3MX R5 8645HS, NVIDIA GeForce RTX 4060 Laptop GPU: Ø71.1 (66.2-71.8)
Lenovo LOQ 15IRX9 i5-13450HX, NVIDIA GeForce RTX 4060 Laptop GPU: Ø65.1 (61.4-65.8)
Asus TUF Gaming A15 FA507UV R9 8945H, NVIDIA GeForce RTX 4060 Laptop GPU: Ø66.8 (63.8-67.8)
Acer Predator Helios Neo 14 (2024) Ultra 9 185H, NVIDIA GeForce RTX 4070 Laptop GPU: Ø68.5 (58.4-71.3)
Cyberpunk 2077 (Turbo)
bajomedioaltoultraQHD DLSSQHD
GTA V (2015) 178.1 173.9 160.3 100.6 86.8
Dota 2 Reborn (2015) 147.5 142.9 125.6 120.5
Final Fantasy XV Benchmark (2018) 189.5 143.4 106 78.1
X-Plane 11.11 (2018) 109.4 96.1 73.4
Far Cry 5 (2018) 133 115 111 103 96
Strange Brigade (2018) 326 272 222 193.2 129.4
Baldur's Gate 3 (2023) 144.6 116.8 103.3 100.4 62.8
Cyberpunk 2077 2.1 Phantom Liberty (2023) 124.8 101.3 86.6 75.8 45.6
F1 24 (2024) 184.4 193.8 171.9 60.9 38.8
Black Myth: Wukong (2024) 62 48 27 30 19

Emisiones - El portátil para juegos de Acer sólo se calienta moderadamente

Emisiones sonoras

Ejecutar Cyberpunk 2077 en modo Turbo elevó la emisión de ruido del portátil hasta los 57 dB(A). Cambiar a los otros modos de energía redujo el ruido del ventilador a niveles más moderados. El modo silencioso destaca entre las opciones: ofrecía un nivel de ruido mucho más bajo con sólo una modesta caída de la velocidad de fotogramas. En general, el portátil es bastante silencioso cuando no está a plena carga. Los ventiladores no suelen girar en ralentí.

Es probable que Acer aún tenga mucho margen para optimizar el control de los ventiladores. Cuando se observan las temperaturas en relación con los niveles de ruido durante nuestra prueba de estrés y la prueba Cyberpunk, los ventiladores parecen capaces de proporcionar una refrigeración suficiente incluso a bajas velocidades.

Ruido

Ocioso
24.3 / 24.3 / 24.3 dB(A)
Carga
33.1 / 57 dB(A)
  red to green bar
 
 
30 dB
silencioso
40 dB(A)
audible
50 dB(A)
ruidosamente alto
 
min: dark, med: mid, max: light   Earthworks M23R, Arta (15 cm de distancia)   environment noise: 24.3 dB(A)
dB(A) 0102030405060708090Deep BassMiddle BassHigh BassLower RangeMidsHigher MidsLower HighsMid HighsUpper HighsSuper Highs2026.72341.42529.926.237.13123.919.234.14029.82629.15025.922.728.26325.318.829.78023.71630.810021.315.529.512524.818.832.916023.216.434.320023.614.536.42502413.3383152412.539.940025.713.141.950024.712.241.463027.311.345.780025.510.946.2100022.811.144.5125022.711.245.7160021.611.947.2200021.412.246.2250017.512.443.8315014.612.641.1400014.612.743.6500014.412.446.1630013.212.748.4800013.312.943.11000012.712.4391250013.613.338.11600013.512.732.2SPL33.124.457N1.70.611.9median 21.6median 12.6median 41.9Delta5.40.84.7hearing rangehide median Fan NoiseAcer Nitro 14 AN14-41-R3MX
Acer Nitro 14 AN14-41-R3MX
NVIDIA GeForce RTX 4060 Laptop GPU, R5 8645HS, Micron 3500 MTFDKBA512TGD
Razer Blade 14 RZ09-0508
NVIDIA GeForce RTX 4070 Laptop GPU, R9 8945HS, Samsung PM9A1 MZVL21T0HCLR
Lenovo LOQ 15IRX9
NVIDIA GeForce RTX 4060 Laptop GPU, i5-13450HX, Micron 2400 MTFDKCD1T0QFM
Asus TUF Gaming A15 FA507UV
NVIDIA GeForce RTX 4060 Laptop GPU, R9 8945H, WD PC SN560 SDDPNQE-1T00
SCHENKER XMG Core 15 (M24)
NVIDIA GeForce RTX 4060 Laptop GPU, R7 8845HS, Samsung 990 Pro 1 TB
HP Omen Transcend 14-fb0014
NVIDIA GeForce RTX 4060 Laptop GPU, Ultra 7 155H, WDC PC SN810 1TB
Acer Predator Helios Neo 14 (2024)
NVIDIA GeForce RTX 4070 Laptop GPU, Ultra 9 185H, SK Hynix PC801 HFS001TEJ9X125N
Noise
0%
-16%
-5%
3%
4%
-16%
off / environment *
24.3
24.3
-0%
25
-3%
25
-3%
23
5%
24.5
-1%
24
1%
Idle Minimum *
24.3
25
-3%
26
-7%
25
-3%
23
5%
24.7
-2%
29
-19%
Idle Average *
24.3
25
-3%
34
-40%
27
-11%
23
5%
24.7
-2%
31
-28%
Idle Maximum *
24.3
25
-3%
36
-48%
33
-36%
23
5%
24.7
-2%
36
-48%
Load Average *
33.1
33
-0%
48
-45%
40
-21%
38.92
-18%
25.2
24%
47
-42%
Cyberpunk 2077 ultra *
57.1
48
16%
45
21%
52.06
9%
50
12%
Load Maximum *
57
51.9
9%
50
12%
46
19%
52.09
9%
52
9%
52
9%
Witcher 3 ultra *
49.5
50.96
47

* ... más pequeño es mejor

Temperatura

Bajo carga (es decir, ejecutando nuestra prueba de estrés o Cyberpunk), la temperatura media de la superficie del portátil se calentó moderadamente como mucho, con algunos puntos superando los 40°C (104°F). No obstante, el reposamanos se mantuvo bastante fresco en todo momento. Las temperaturas de la superficie no fueron problemáticas en el uso diario.

 31.1 °C43.5 °C30.8 °C 
 32.2 °C43.2 °C33 °C 
 26.1 °C27.4 °C28.1 °C 
Máximo: 43.5 °C
Médio: 32.8 °C
39.4 °C46.3 °C31.7 °C
33.6 °C45.2 °C31.9 °C
26.5 °C26 °C26.3 °C
Máximo: 46.3 °C
Médio: 34.1 °C
Conector de corriente  37.6 °C | Temperatura del cuarto 23.7 °C | Fluke 62 Max+
(±) The average temperature for the upper side under maximal load is 32.8 °C / 91 F, compared to the average of 33.9 °C / 93 F for the devices in the class Gaming.
(±) The maximum temperature on the upper side is 43.5 °C / 110 F, compared to the average of 40.5 °C / 105 F, ranging from 21.2 to 68.8 °C for the class Gaming.
(-) The bottom heats up to a maximum of 46.3 °C / 115 F, compared to the average of 43.2 °C / 110 F
(+) In idle usage, the average temperature for the upper side is 27.6 °C / 82 F, compared to the device average of 33.9 °C / 93 F.
(±) 3: The average temperature for the upper side is 32.4 °C / 90 F, compared to the average of 33.9 °C / 93 F for the class Gaming.
(+) The palmrests and touchpad are cooler than skin temperature with a maximum of 28.1 °C / 82.6 F and are therefore cool to the touch.
(±) The average temperature of the palmrest area of similar devices was 28.9 °C / 84 F (+0.8 °C / 1.4 F).
Acer Nitro 14 AN14-41-R3MX
AMD Ryzen 5 8645HS, NVIDIA GeForce RTX 4060 Laptop GPU
Razer Blade 14 RZ09-0508
AMD Ryzen 9 8945HS, NVIDIA GeForce RTX 4070 Laptop GPU
Lenovo LOQ 15IRX9
Intel Core i5-13450HX, NVIDIA GeForce RTX 4060 Laptop GPU
Asus TUF Gaming A15 FA507UV
AMD Ryzen 9 8945H, NVIDIA GeForce RTX 4060 Laptop GPU
SCHENKER XMG Core 15 (M24)
AMD Ryzen 7 8845HS, NVIDIA GeForce RTX 4060 Laptop GPU
HP Omen Transcend 14-fb0014
Intel Core Ultra 7 155H, NVIDIA GeForce RTX 4060 Laptop GPU
Acer Predator Helios Neo 14 (2024)
Intel Core Ultra 9 185H, NVIDIA GeForce RTX 4070 Laptop GPU
Heat
-5%
-13%
-9%
-23%
14%
-15%
Maximum Upper Side *
43.5
41.8
4%
47
-8%
53
-22%
52
-20%
41.2
5%
57
-31%
Maximum Bottom *
46.3
42.2
9%
58
-25%
46
1%
61
-32%
39
16%
55
-19%
Idle Upper Side *
30.4
34.8
-14%
32
-5%
32
-5%
35
-15%
26.2
14%
32
-5%
Idle Bottom *
31.3
37.4
-19%
36
-15%
34
-9%
39
-25%
25.4
19%
33
-5%

* ... más pequeño es mejor

Prueba de esfuerzo

El Nitro durante la prueba de resistencia.

Para nuestro escenario de prueba de estrés extremo, ejecutamos Prime95 y FurMark durante un periodo prolongado para evaluar la estabilidad del sistema a plena carga. El reloj de la CPU cayó de 3,6 GHz a 2,8 GHz durante la duración de la prueba, mientras que el reloj de la GPU aumentó de aproximadamente 2 GHz a 2,2 GHz.

Reloj de la CPU (GHz) Reloj de la GPU (MHz) Temperatura media dela CPU (°C) Temperatura media de la GPU (°C)
Sistema en reposo 3,6 210 34 36
Estrés Prime95 4,6 210 87 49
Prime95 + FurMark estrés 3,3 2.100 76 86
Cyberpunk 2077 estrés 4,2 2.700 73 82

Altavoces

Los altavoces estéreo producen un sonido decente pero carecen de graves. Probablemente obtendrá una mejor experiencia de audio con altavoces externos o auriculares.

dB(A) 0102030405060708090Deep BassMiddle BassHigh BassLower RangeMidsHigher MidsLower HighsMid HighsUpper HighsSuper Highs202323.42526.225.83119.220.5402626.85022.721.56318.821.3801619.410015.526.812518.832.716016.43620014.542.425013.345.331512.549.940013.158.450012.259.563011.365.180010.968.7100011.162.8125011.260.5160011.961.3200012.264.8250012.464.6315012.662.3400012.757.3500012.464.2630012.775.6800012.970.41000012.468.91250013.371.51600012.765.3SPL24.479.6N0.642.6median 12.6median 62.3Delta0.88.125.924.825.924.123.424.120.628.220.62616.52629.822.129.827.823.827.818.112.318.125.719.725.731.514.931.547114758.316.558.365.914.765.96812.46867.510.967.5739.27372.77.872.7688.76866.68.666.669.1969.168.69.868.665.610.165.663.81163.866.211.266.264.111.764.163.411.863.464.41264.462.912.162.962.112.162.163.412.563.458.611.158.679.12379.147.90.447.9median 64.4median 11.2median 64.44.61.94.6hearing rangehide median Pink NoiseAcer Nitro 14 AN14-41-R3MXSCHENKER XMG Core 15 (M24)
Diagrama de frecuencia en comparación (¡las casillas de verificación se pueden marcar y desmarcar!)
Acer Nitro 14 AN14-41-R3MX audio analysis

(±) | speaker loudness is average but good (79.6 dB)
Bass 100 - 315 Hz
(-) | nearly no bass - on average 23.5% lower than median
(±) | linearity of bass is average (10.2% delta to prev. frequency)
Mids 400 - 2000 Hz
(+) | balanced mids - only 2.7% away from median
(±) | linearity of mids is average (7.9% delta to prev. frequency)
Highs 2 - 16 kHz
(±) | higher highs - on average 5.3% higher than median
(±) | linearity of highs is average (9.4% delta to prev. frequency)
Overall 100 - 16.000 Hz
(±) | linearity of overall sound is average (20% difference to median)
Compared to same class
» 68% of all tested devices in this class were better, 7% similar, 25% worse
» The best had a delta of 6%, average was 18%, worst was 132%
Compared to all devices tested
» 48% of all tested devices were better, 8% similar, 44% worse
» The best had a delta of 4%, average was 25%, worst was 134%

SCHENKER XMG Core 15 (M24) audio analysis

(±) | speaker loudness is average but good (79.12 dB)
Bass 100 - 315 Hz
(-) | nearly no bass - on average 16.7% lower than median
(-) | bass is not linear (15.7% delta to prev. frequency)
Mids 400 - 2000 Hz
(+) | balanced mids - only 4.5% away from median
(+) | mids are linear (4.4% delta to prev. frequency)
Highs 2 - 16 kHz
(+) | balanced highs - only 1% away from median
(+) | highs are linear (2.7% delta to prev. frequency)
Overall 100 - 16.000 Hz
(+) | overall sound is linear (13.7% difference to median)
Compared to same class
» 20% of all tested devices in this class were better, 6% similar, 74% worse
» The best had a delta of 6%, average was 18%, worst was 132%
Compared to all devices tested
» 13% of all tested devices were better, 3% similar, 84% worse
» The best had a delta of 4%, average was 25%, worst was 134%

Gestión de la energía - La Nitro 14 tiene una duración de batería soberbia

Consumo de energía

El consumo de energía del Nitro 14 es bastante típico para el hardware que lleva en su interior. Merece elogios por tener el menor uso de energía en reposo entre los dispositivos de nuestra comparación. El consumo de energía se mantuvo en un nivel constante durante toda la prueba de estrés y la prueba Cyberpunk. El cargador de 230 vatios incluido es lo suficientemente potente para el portátil.

Consumo de corriente
Off / Standbydarklight 0.1 / 0.2 Watt
Ociosodarkmidlight 8 / 10.9 / 11.9 Watt
Carga midlight 61.8 / 195.1 Watt
 color bar
Clave: min: dark, med: mid, max: light        Metrahit Energy
Acer Nitro 14 AN14-41-R3MX
R5 8645HS, NVIDIA GeForce RTX 4060 Laptop GPU, Micron 3500 MTFDKBA512TGD, IPS, 2560x1600, 14.5"
Razer Blade 14 RZ09-0508
R9 8945HS, NVIDIA GeForce RTX 4070 Laptop GPU, Samsung PM9A1 MZVL21T0HCLR, IPS, 2560x1600, 14"
Lenovo LOQ 15IRX9
i5-13450HX, NVIDIA GeForce RTX 4060 Laptop GPU, Micron 2400 MTFDKCD1T0QFM, IPS, 1920x1080, 15.6"
Asus TUF Gaming A15 FA507UV
R9 8945H, NVIDIA GeForce RTX 4060 Laptop GPU, WD PC SN560 SDDPNQE-1T00, IPS, 1920x1080, 15.6"
SCHENKER XMG Core 15 (M24)
R7 8845HS, NVIDIA GeForce RTX 4060 Laptop GPU, Samsung 990 Pro 1 TB, IPS, 2560x1600, 15.3"
HP Omen Transcend 14-fb0014
Ultra 7 155H, NVIDIA GeForce RTX 4060 Laptop GPU, WDC PC SN810 1TB, OLED, 2880x1800, 14"
Acer Predator Helios Neo 14 (2024)
Ultra 9 185H, NVIDIA GeForce RTX 4070 Laptop GPU, SK Hynix PC801 HFS001TEJ9X125N, IPS, 3072x1920, 14.5"
Average NVIDIA GeForce RTX 4060 Laptop GPU
 
Average of class Gaming
 
Power Consumption
-100%
-42%
-9%
-22%
-26%
-18%
-45%
-74%
Idle Minimum *
8
20.9
-161%
13
-63%
7
12%
9.3
-16%
9.1
-14%
6
25%
11.6 ?(3 - 33, n=47)
-45%
Idle Average *
10.9
25.6
-135%
18
-65%
12
-10%
12.9
-18%
12.6
-16%
11
-1%
16.1 ?(6.9 - 35, n=47)
-48%
Idle Maximum *
11.9
32.1
-170%
24
-102%
18
-51%
12.8
-8%
27.4
-130%
21
-76%
20.4 ?(7.6 - 45, n=47)
-71%
Load Average *
61.8
72.7
-18%
85
-38%
70
-13%
63.5
-3%
93
-50%
93.1 ?(59 - 190, n=46)
-51%
Cyberpunk 2077 ultra *
151.3
155.7
-3%
146.8
3%
147.9
2%
Cyberpunk 2077 ultra external monitor *
147.9
150.9
-2%
146.2
1%
146.3
1%
Load Maximum *
195.1
228.4
-17%
232
-19%
206
-6%
286
-47%
135.3
31%
252
-29%
210 ?(99 - 364, n=47)
-8%
Witcher 3 ultra *
182.1
167
118.9

* ... más pequeño es mejor

Power consumption Cyberpunk / Stress test

0102030405060708090100110120130140150160170180190Tooltip
Acer Nitro 14 AN14-41-R3MX; 1280x720 Prime95 28.10 and Furmark 1.25: Ø156.9 (149.6-195.1)
Acer Nitro 14 AN14-41-R3MX; Idle 150cd/m2: Ø11 (7.33-15.3)
Acer Nitro 14 AN14-41-R3MX; Cyberpunk 2077 FHD ultra no FSR 150cd: Ø151.3 (138.9-172.1)

Power consumption with external monitor

0102030405060708090100110120130140150Tooltip
Acer Nitro 14 AN14-41-R3MX; Prime95 V2810 Stress (external Monitor): Ø114.2 (110.9-115.8)
Acer Nitro 14 AN14-41-R3MX; Cinebench R23 Multi (external Monitor): Ø99.4 (77.6-103.8)
Acer Nitro 14 AN14-41-R3MX; 1280x720 FurMark 1.19 GPU Stress Test (external Monitor): Ø143.1 (122.9-151.2)
Acer Nitro 14 AN14-41-R3MX; Idle 1min (external Monitor): Ø19.5 (11.4-28.3)
Acer Nitro 14 AN14-41-R3MX; Cyberpunk 2077 FHD ultra no FSR (external Monitor): Ø147.9 (144.9-151.7)

Duración de las pilas

En nuestra prueba Wi-Fi (acceso a sitios web utilizando un script) y de vídeo (reproducción del cortometraje Big Buck Bunny, codificado en H.264, en bucle a FHD), el Nitro 14 consiguió durar 10h 5min y 13h 57min, respectivamente. Se trata de unos resultados excelentes que la mayoría de los portátiles de oficina no pueden alcanzar. Sin embargo, el portátil Acer no pudo alcanzar el nivel del Asus A15 y el XMG Core 15 (M24)ya que estos dos dispositivos tienen baterías de mayor capacidad.

La batería tiene una capacidad de 76 Wh.
Tiempo de Ejecución de la Batería
Ocioso (sin WLAN, min brillo)
18h 01min
WiFi Websurfing (Edge 127)
10h 05min
Big Buck Bunny H.264 1080p
13h 57min
Carga (máximo brillo)
2h 14min
Acer Nitro 14 AN14-41-R3MX
R5 8645HS, NVIDIA GeForce RTX 4060 Laptop GPU, 76 Wh
Razer Blade 14 RZ09-0508
R9 8945HS, NVIDIA GeForce RTX 4070 Laptop GPU, 68 Wh
Lenovo LOQ 15IRX9
i5-13450HX, NVIDIA GeForce RTX 4060 Laptop GPU, 60 Wh
Asus TUF Gaming A15 FA507UV
R9 8945H, NVIDIA GeForce RTX 4060 Laptop GPU, 90 Wh
SCHENKER XMG Core 15 (M24)
R7 8845HS, NVIDIA GeForce RTX 4060 Laptop GPU, 99.8 Wh
HP Omen Transcend 14-fb0014
Ultra 7 155H, NVIDIA GeForce RTX 4060 Laptop GPU, 71 Wh
Acer Predator Helios Neo 14 (2024)
Ultra 9 185H, NVIDIA GeForce RTX 4070 Laptop GPU, 76 Wh
Average of class Gaming
 
Duración de Batería
-44%
-47%
16%
11%
-36%
-25%
-43%
Reader / Idle
1081
480
-56%
622
-42%
808
-25%
H.264
837
608
-27%
555
-34%
WiFi v1.3
605
428
-29%
320
-47%
702
16%
889
47%
517
-15%
519
-14%
Load
134
72
-46%
151
13%
66
-51%
100
-25%

Pro

+ Brillante pantalla de 2,5K con relación de aspecto 16:10 (120 Hz, G-Sync, sRGB)
+ relativamente ligero y compacto para un portátil de juegos
+ baja emisión de calor
+ Teclado retroiluminado RGB
+ compuesto térmico de metal líquido
+ USB4
+ Compatibilidad con Power Delivery
+ excelente duración de las pilas

Contra

- almacenamiento escaso (512 GB)
- sólo una ranura SSD
- memoria no sustituible/ampliable
- lector de tarjetas lento

Veredicto - Coherente portátil para juegos de gama media

El Acer Nitro 14 AN14-41-R3MX ha sido amablemente cedido por Acer Alemania.

La Nitro 14 presume de una excelente portabilidad gracias a su diseño compacto, su bajo peso (aprox. 2 kg, o 4,4 lb) y una duración realista de la batería de 10 a 14 horas. La batería puede cargarse con un adaptador USB-C porque los dos puertos USB-C (USB 3.2 Gen 2 y USB4) admiten Power Delivery, lo que le permite dejar el cargador propietario en casa.

El Acer Nitro 14 es un portátil para juegos de gama media coherente con un factor de forma compacto.

El Ryzen 5 8645HS y GeForce RTX 4060 ofrecen la potencia necesaria para juegos QHD, renderizado y streaming, con ambos chips capaces de funcionar de forma consistente a altas velocidades de reloj. Aunque el portátil no se calienta demasiado, produce mucho ruido. Activar el modo silencioso ayuda a reducir el nivel de ruido y sólo supone una pequeña pérdida de rendimiento. La brillante pantalla 16:10 de 14,5 pulgadas (2.560 x 1.600, IPS, 120 Hz, sRGB, compatible con G-Sync) encaja bien en el diseño del portátil.

Pasando a sus aspectos negativos: Aunque la ágil SSD PCIe 4.0 del dispositivo ayuda a mantener los tiempos de carga cortos, la cantidad de almacenamiento (512 GB) es escasa en nuestra opinión; teniendo en cuenta el precio de 1.450 euros (1.600 dólares), los consumidores deberían poder esperar 1 TB de almacenamiento. También existe la opción de utilizar una tarjeta de memoria, pero Acer ha incluido un lento lector de tarjetas. La memoria RAM soldada no se puede actualizar en absoluto.

Una alternativa al Nitro 14 es el XMG Core 15 (M24). Este portátil ofrece más rendimiento, memoria actualizable, una segunda ranura SSD y una duración de batería superior. Sin embargo, carece de puerto USB4 y también produce mucho más calor que el Nitro 14.

Precio y disponibilidad

En Alemania, el Acer Nitro 14 AN14-41-R3MX está disponible por 1.449 euros (unos 1.600 dólares) en Notebooksbilliger.de. Para los lectores de EE.UU., Amazon.com tiene un modelo similar (con una CPU Ryzen 7 pero una pantalla WUXGA) a la venta por 1.200 dólares.

Nota: Recientemente hemos actualizado nuestro sistema de clasificación y los resultados de la versión 8 no son comparables con los de la versión 7. Encontrará más información aquí .

Acer Nitro 14 AN14-41-R3MX - 08/24/2024 v8
Sascha Mölck

Acabado
76 / 98 → 77%
Teclado
81%
Ratón
83%
Conectividad
65 / 80 → 81%
Peso
63 / 10-68 → 92%
Battería
88 / 95 → 93%
Pantalla
80%
Rendimiento de juegos
82%
Rendimiento de la Aplicación
85%
AI Performance
94%
Temperatura
89 / 95 → 94%
Ruido
65 / 90 → 73%
Audio
71%
Cámara
30 / 75 → 40%
Médio
66%
80%
Gaming - media ponderada
CO2 Emissions
No Data
Materials
50%
Packaging
50%
Power Use
87.7%
Repairability
70%
Software Updates
22.3%
Recycle Logo Total Sustainability Score: 46.7%

Transparency

The selection of devices to be reviewed is made by our editorial team. The test sample was provided to the author as a loan by the manufacturer or retailer for the purpose of this review. The lender had no influence on this review, nor did the manufacturer receive a copy of this review before publication. There was no obligation to publish this review. We never accept compensation or payment in return for our reviews. As an independent media company, Notebookcheck is not subjected to the authority of manufacturers, retailers or publishers.

This is how Notebookcheck is testing

Every year, Notebookcheck independently reviews hundreds of laptops and smartphones using standardized procedures to ensure that all results are comparable. We have continuously developed our test methods for around 20 years and set industry standards in the process. In our test labs, high-quality measuring equipment is utilized by experienced technicians and editors. These tests involve a multi-stage validation process. Our complex rating system is based on hundreds of well-founded measurements and benchmarks, which maintains objectivity. Further information on our test methods can be found here.

Price comparison

Please share our article, every link counts!
Mail Logo
> Análisis y pruebas de ordenadores portátiles y móviles teléfonos > Análisis > Análisis del Acer Nitro 14 (2024): Portátil compacto para juegos con RTX 4060 y batería de larga duración
Sascha Mölck, 2024-09- 5 (Update: 2024-09- 5)