

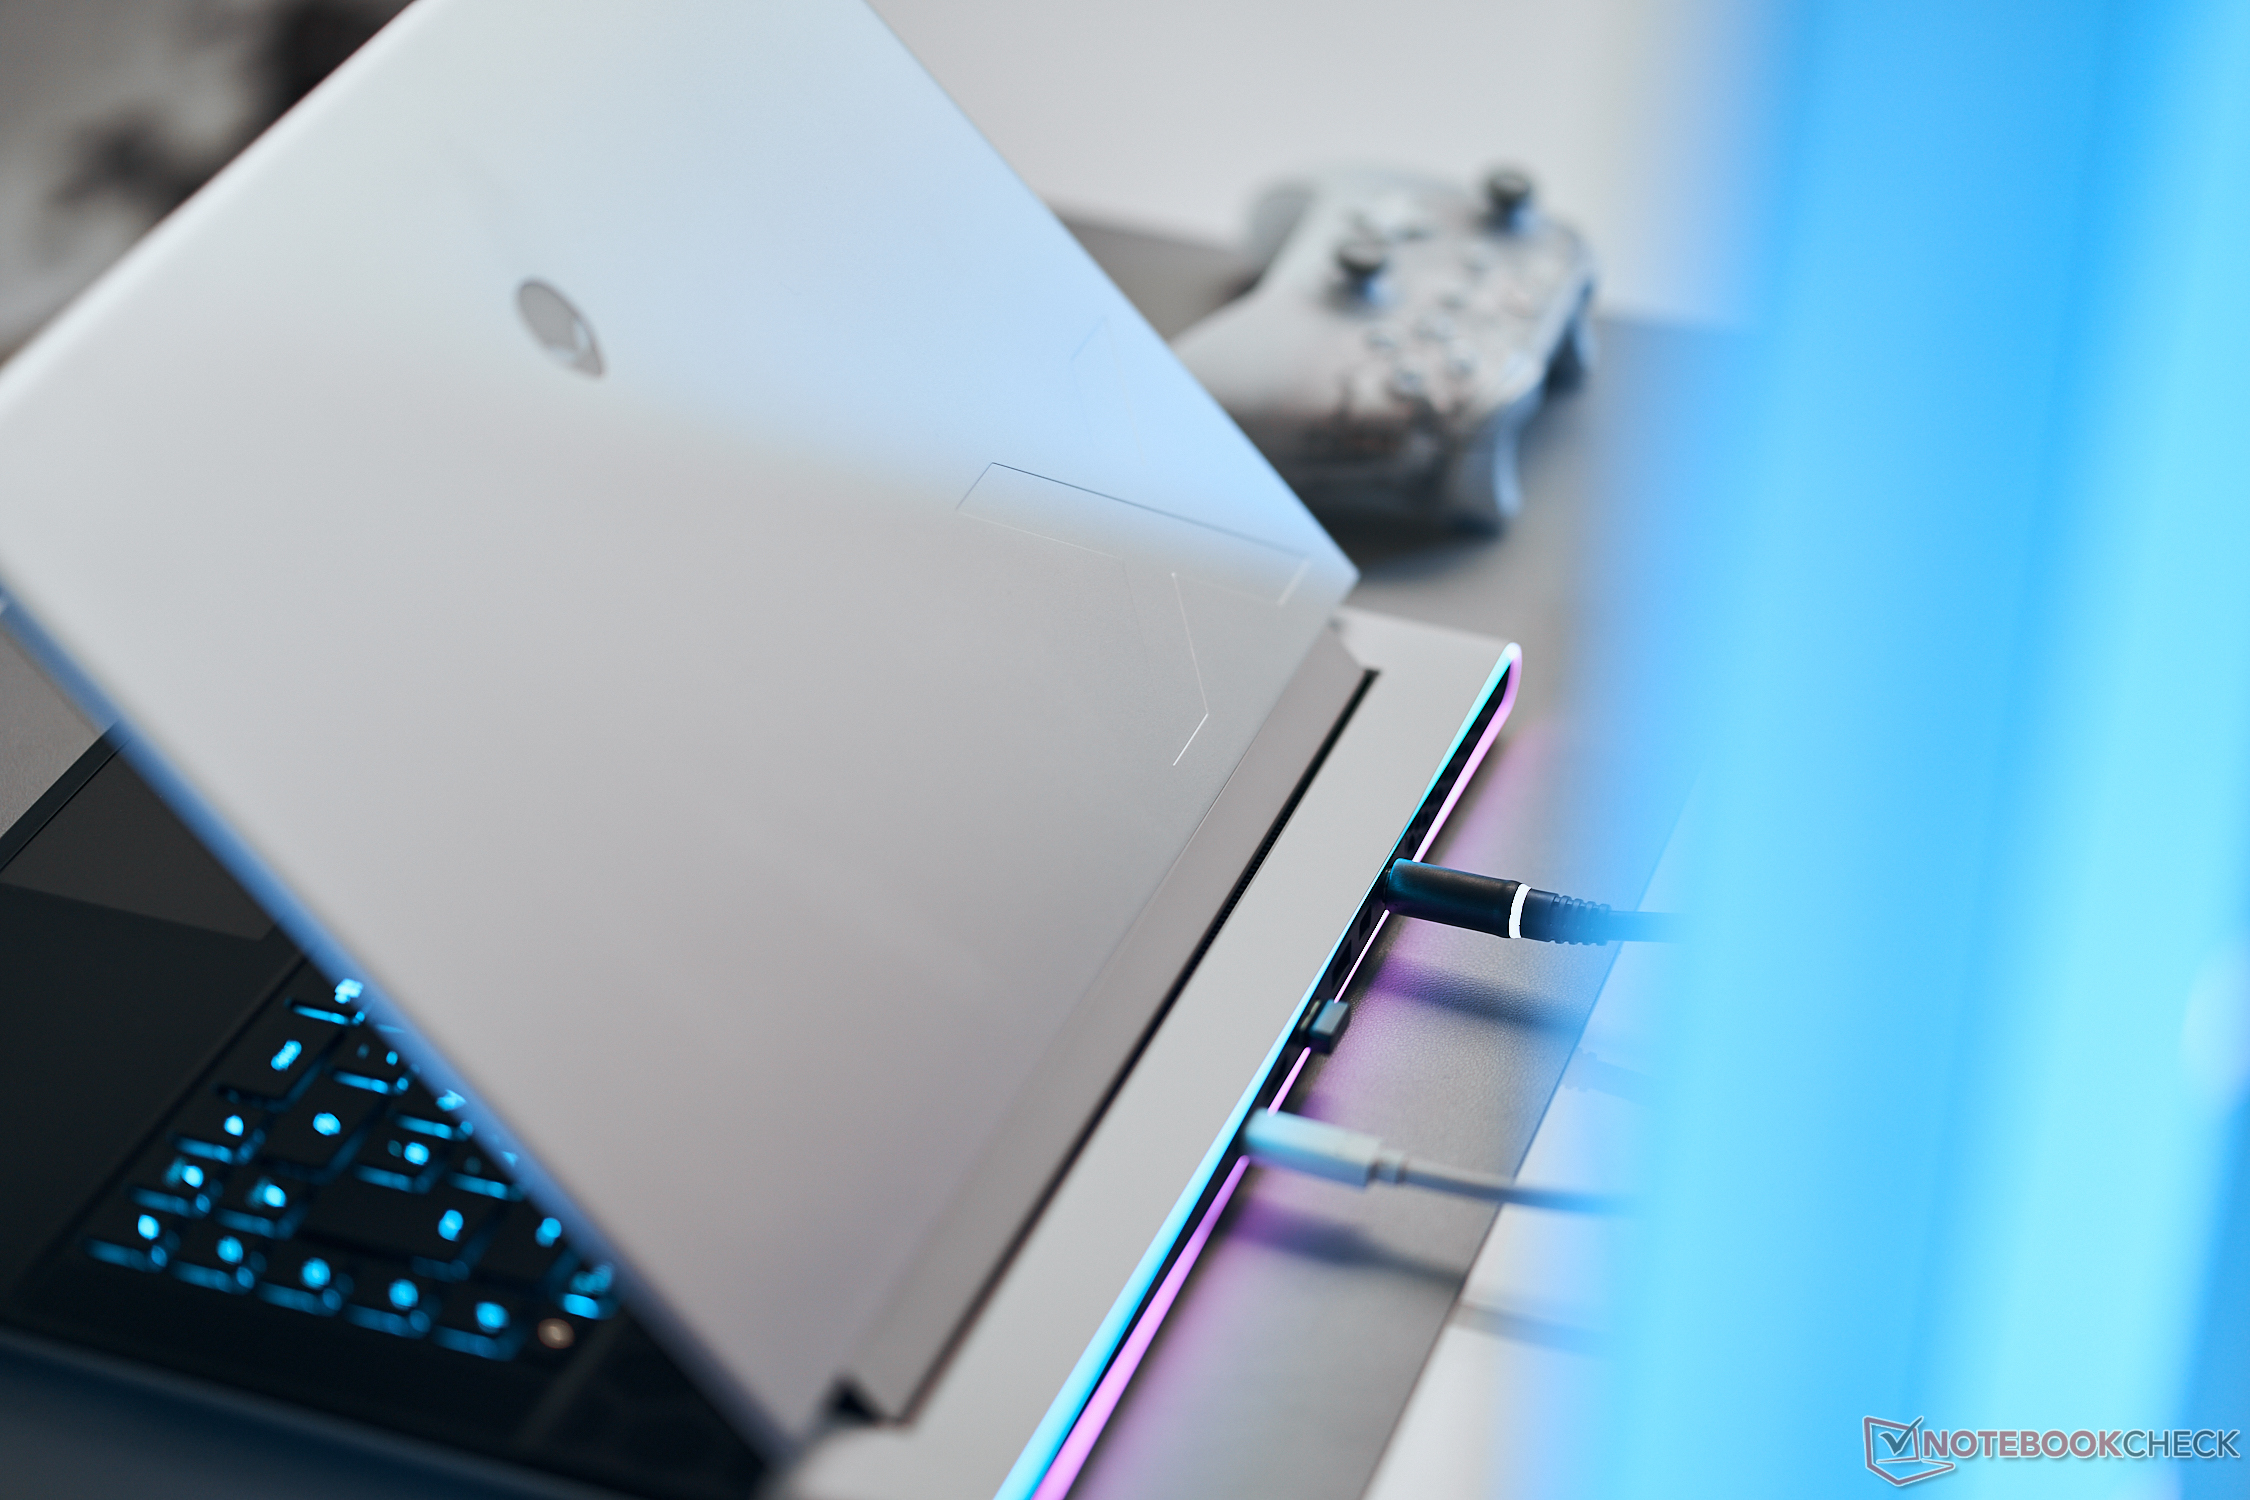
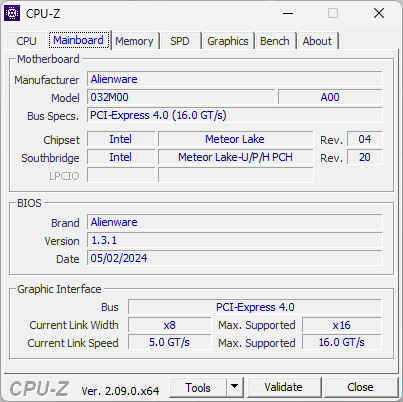
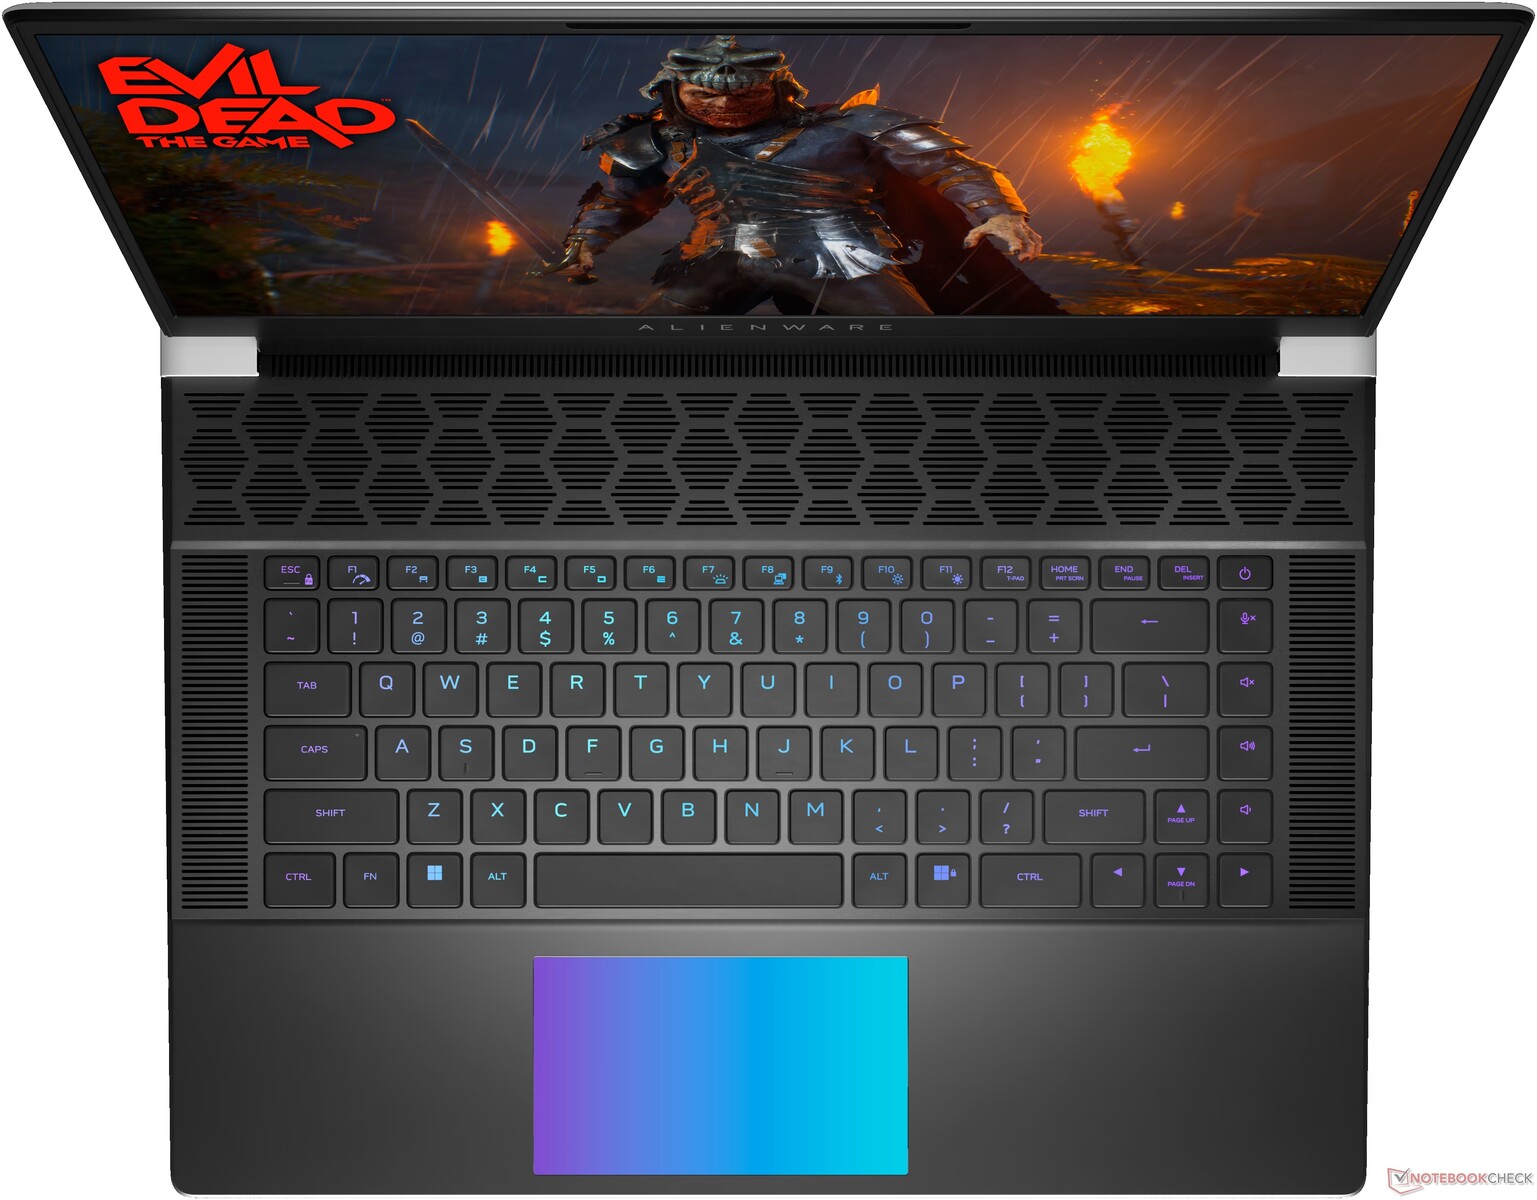
Análisis del portátil Alienware x16 R2: Un paso atrás respecto al x16 R1

La serie ultradelgada Alienware x16 se lanzó a finales del año pasado con el debut de la Alienware x16 R1. Para 2024, la serie se ha renovado con el x16 R2. El modelo más reciente cambia las antiguas opciones de procesador Raptor Lake-H por opciones Meteor Lake-H preparadas para IA, mientras que todo lo demás sigue siendo esencialmente igual que el diseño original del x16 R1. Por lo tanto, recomendamos consultar nuestro análisis del x16 R1 ya que la mayoría de nuestros comentarios existentes siguen siendo válidos para el x16 R2, visualmente idéntico. Cualquier diferencia notable será señalada en esta revisión.
Nuestra unidad en revisión es una configuración de gama alta con la CPU Core Ultra 9 185H, GPU GeForce RTX 4080 de 175 W, pantalla 1600p de 240 Hz y teclas mecánicas CherryMX de perfil ultrabajo por aproximadamente 3200 USD. Otras SKU incluyen teclas normales de membrana y, en su lugar, la Core Ultra 7 155H con gráficos GeForce RTX 4060, 4070 o 4090 y pantalla IPS 1200p 480 Hz.
Las alternativas al Alienware x16 R2 incluyen otros portátiles para juegos de 16 pulgadas de gama alta como el Razer Blade 16,Asus ROG Strix Scar 16,Lenovo Legion Pro 7 16, o MSI Vector 16 HX.
Más opiniones sobre Dell:
Posibles contendientes en la comparación
Valoración | Fecha | Modelo | Peso | Altura | Tamaño | Resolución | Precio |
|---|---|---|---|---|---|---|---|
| 88.4 % v7 (old) | 05/2024 | Alienware x16 R2 P120F Ultra 9 185H, NVIDIA GeForce RTX 4080 Laptop GPU | 2.7 kg | 18.57 mm | 16.00" | 2560x1600 | |
| 88.4 % v7 (old) | 06/2023 | Alienware x16 R1 i9-13900HK, NVIDIA GeForce RTX 4080 Laptop GPU | 2.6 kg | 18.57 mm | 16.00" | 2560x1600 | |
| 90.2 % v7 (old) | 03/2024 | Alienware m16 R2 Ultra 7 155H, NVIDIA GeForce RTX 4070 Laptop GPU | 2.5 kg | 23.5 mm | 16.00" | 2560x1600 | |
| 87.6 % v7 (old) | 04/2024 | Asus ROG Strix Scar 16 G634JZR i9-14900HX, NVIDIA GeForce RTX 4080 Laptop GPU | 2.7 kg | 30.4 mm | 16.00" | 2560x1600 | |
| 89.5 % v7 (old) | 03/2024 | Lenovo Legion Pro 7 16IRX9H i9-14900HX, NVIDIA GeForce RTX 4080 Laptop GPU | 2.7 kg | 21.95 mm | 16.00" | 2560x1600 | |
| 88 % v7 (old) | 02/2024 | MSI Vector 16 HX A14V i9-14900HX, NVIDIA GeForce RTX 4080 Laptop GPU | 2.7 kg | 28.55 mm | 16.00" | 2560x1600 |
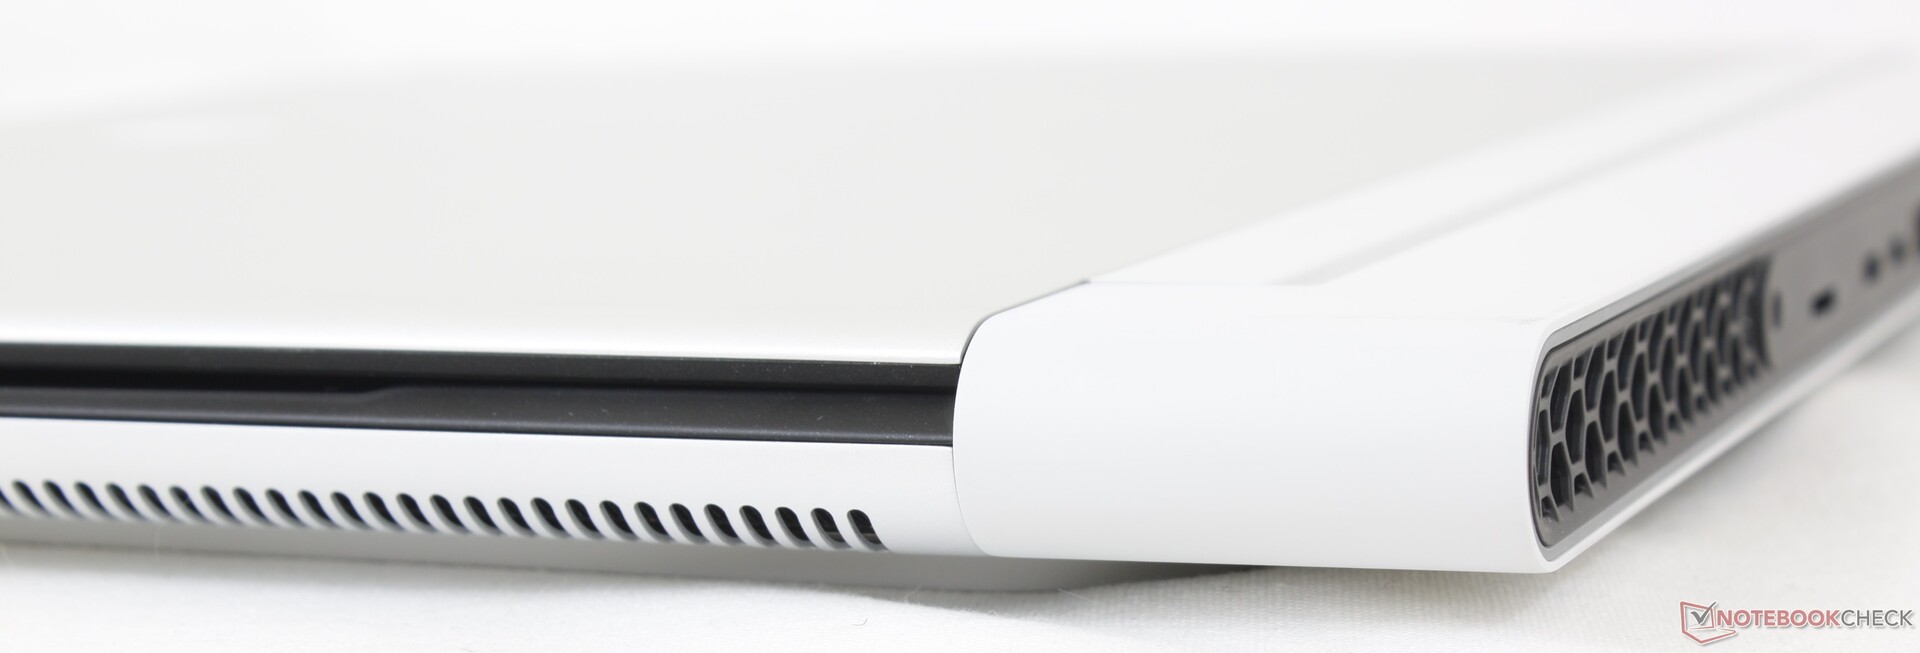
Caso - Sin cambios externos
Conectividad


Lector de tarjetas SD
Curiosamente, el lector MicroSD de nuestro x16 R2 no presentaba ninguno de los problemas de velocidad de transferencia que experimentamos en el x16 R1 del año pasado.
| SD Card Reader | |
| average JPG Copy Test (av. of 3 runs) | |
| Alienware x16 R2 P120F (AV PRO microSD 128 GB V60) | |
| MSI Vector 16 HX A14V (Toshiba Exceria Pro SDXC 64 GB UHS-II) | |
| Alienware m16 R2 (AV PRO microSD 128 GB V60) | |
| Alienware x16 R1 (AV PRO microSD 128 GB V60) | |
| maximum AS SSD Seq Read Test (1GB) | |
| Alienware x16 R2 P120F (AV PRO microSD 128 GB V60) | |
| Alienware x16 R1 (AV PRO microSD 128 GB V60) | |
| Alienware m16 R2 (AV PRO microSD 128 GB V60) | |
| MSI Vector 16 HX A14V (Toshiba Exceria Pro SDXC 64 GB UHS-II) | |
Comunicación
Dell ha actualizado el módulo WLAN de la actualización de este año para que sea compatible con Wi-Fi 7.
Cámara web


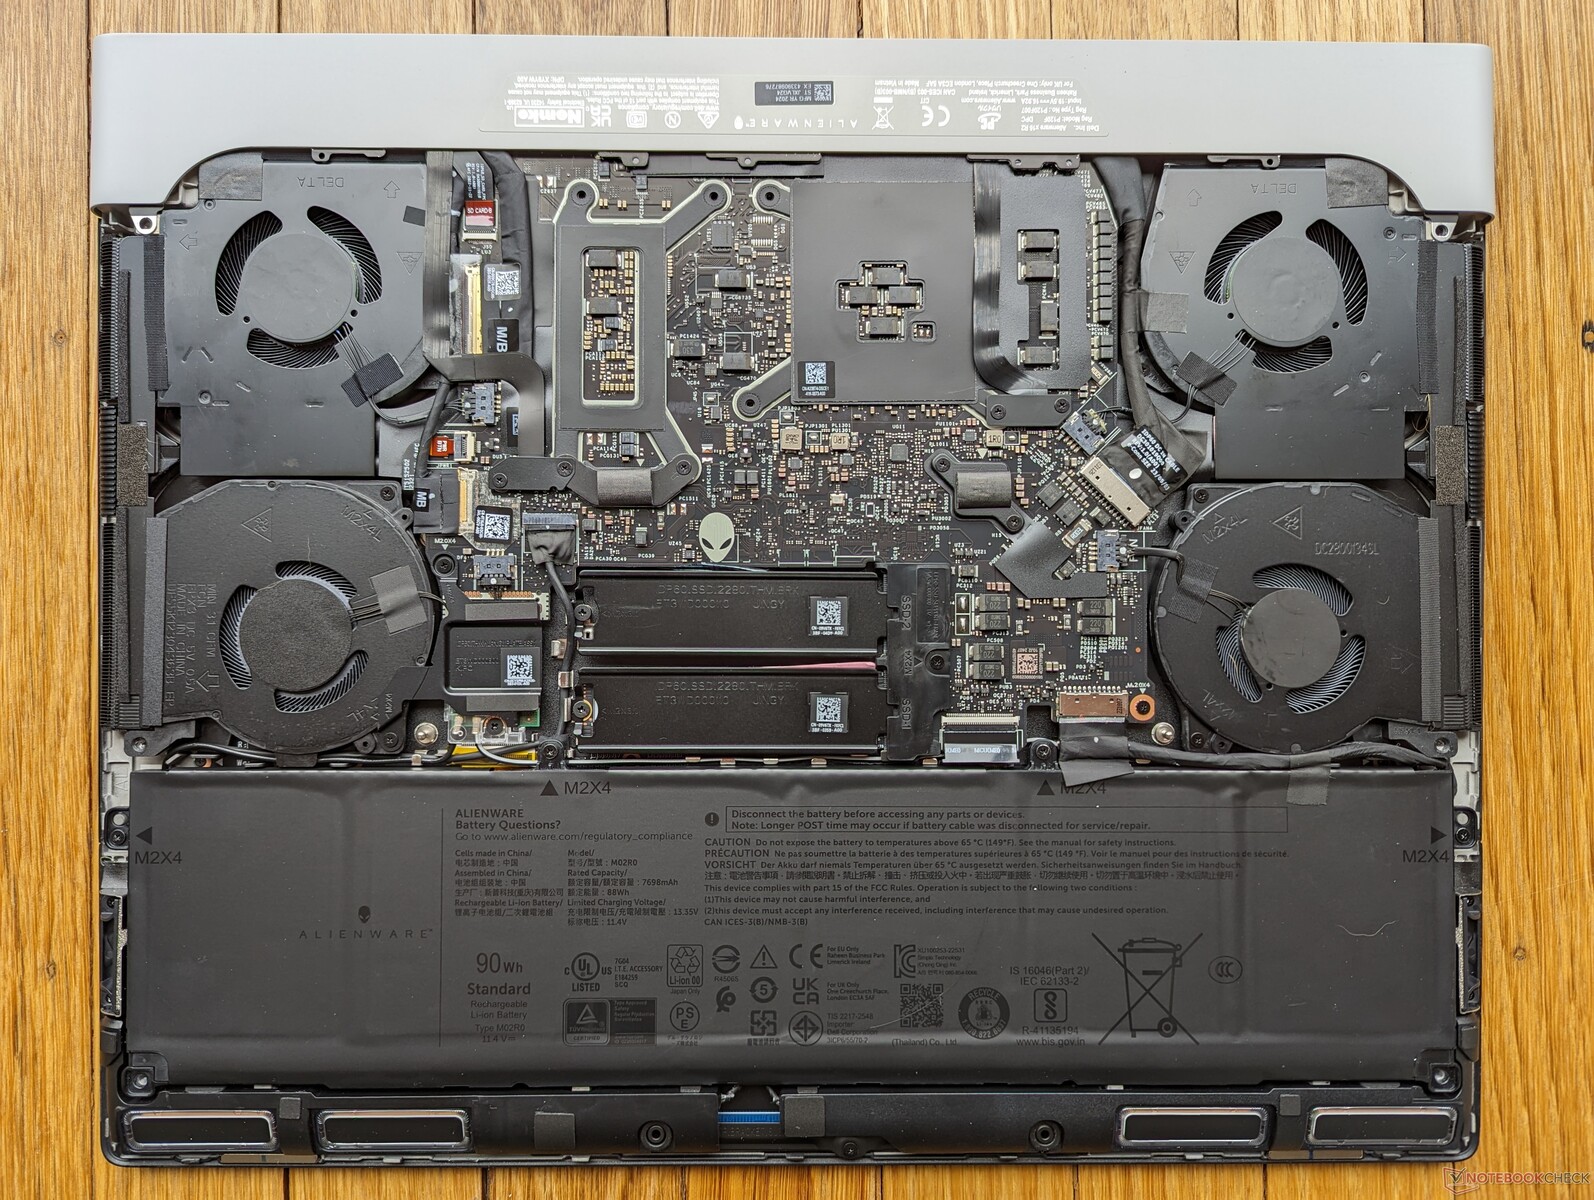
Mantenimiento

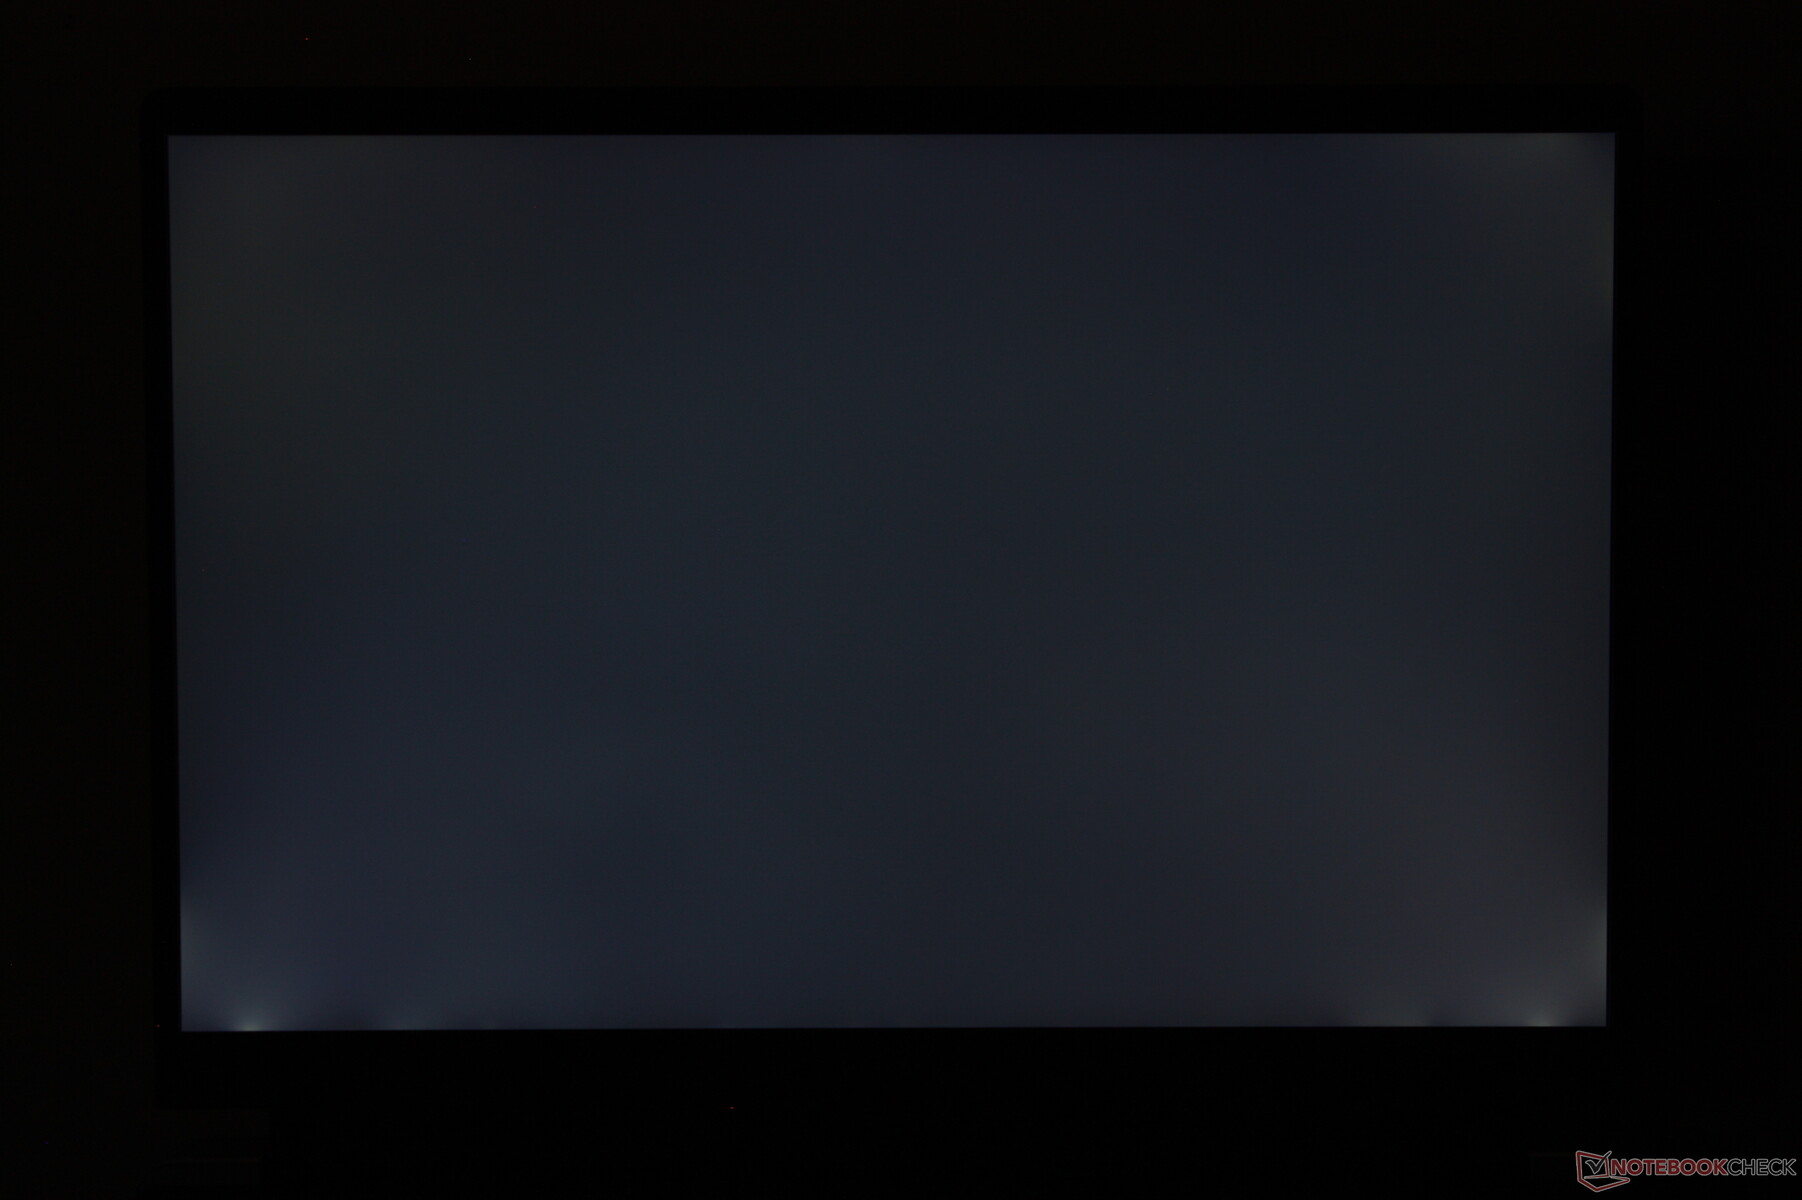
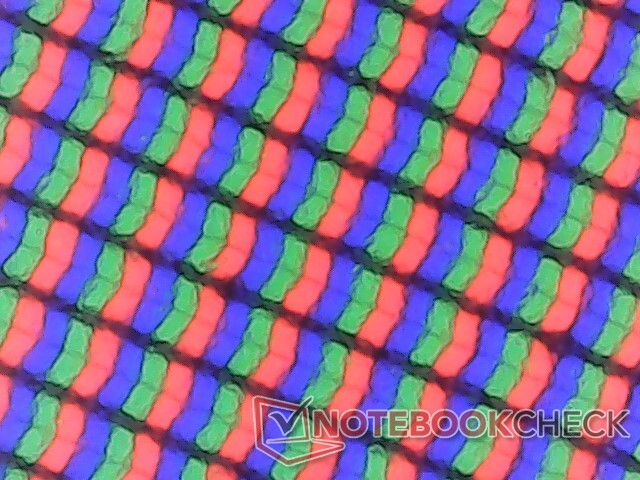
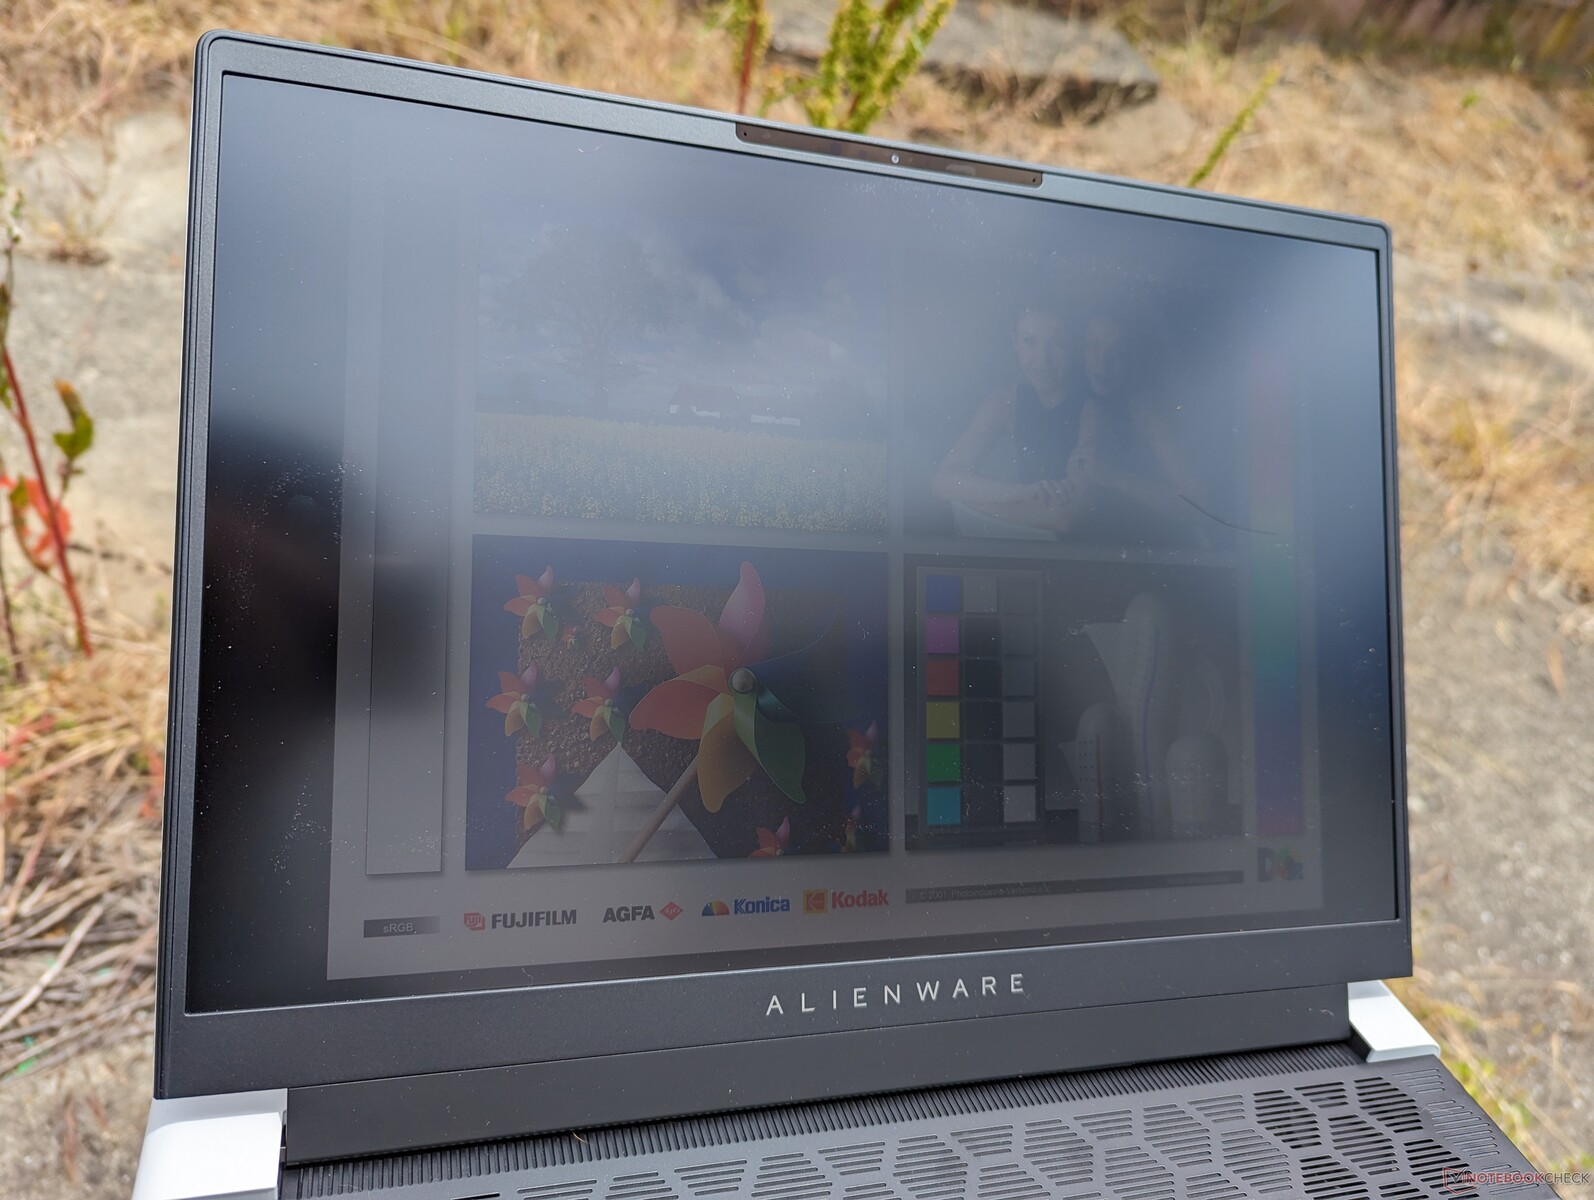
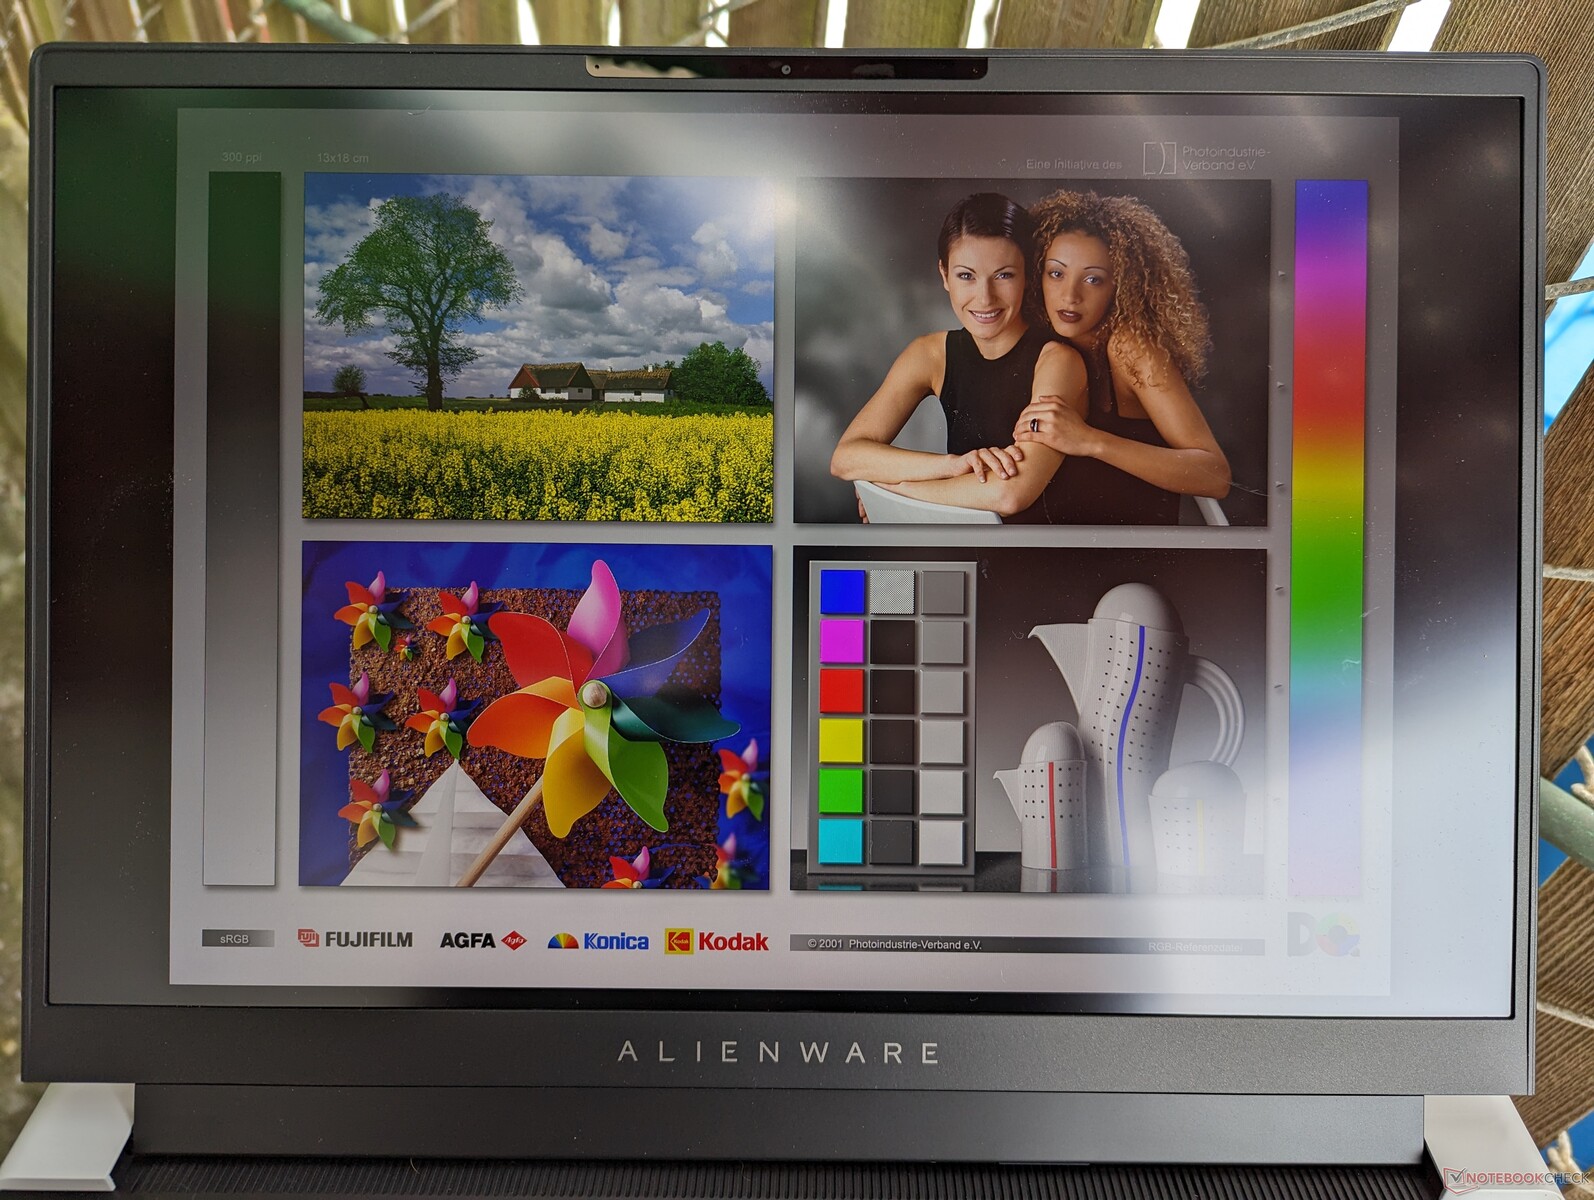
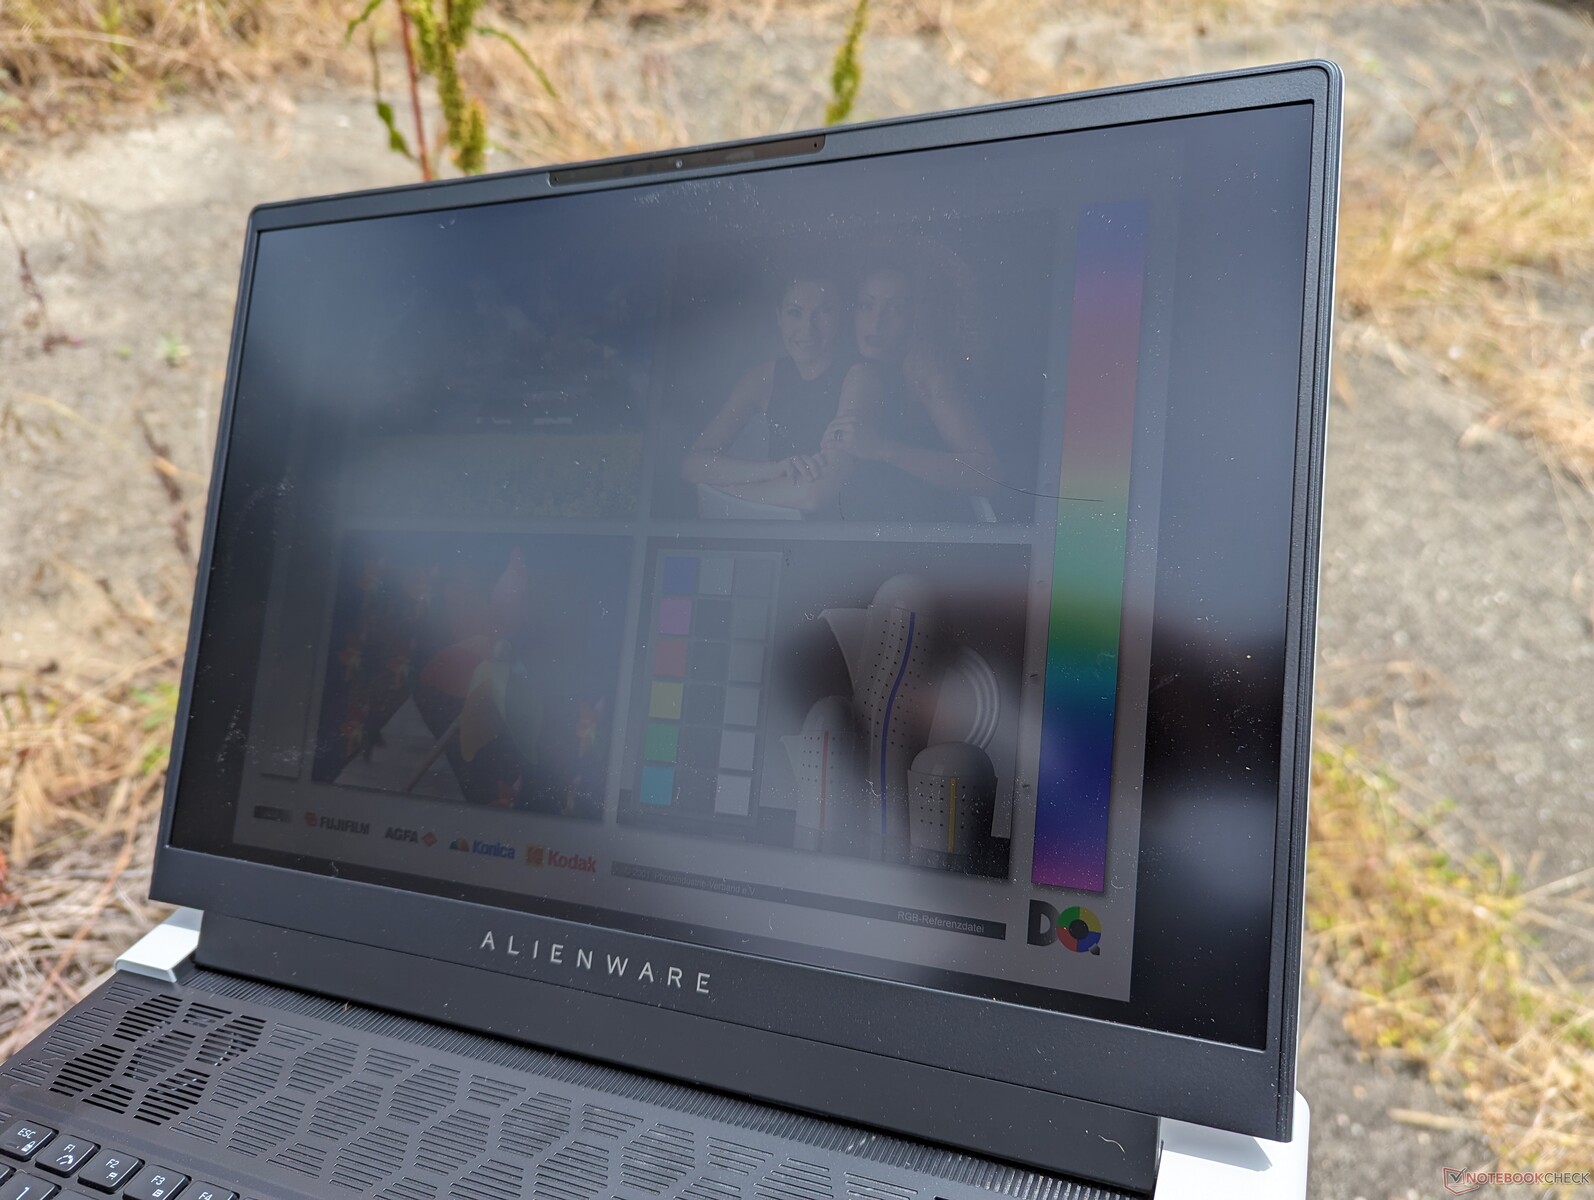
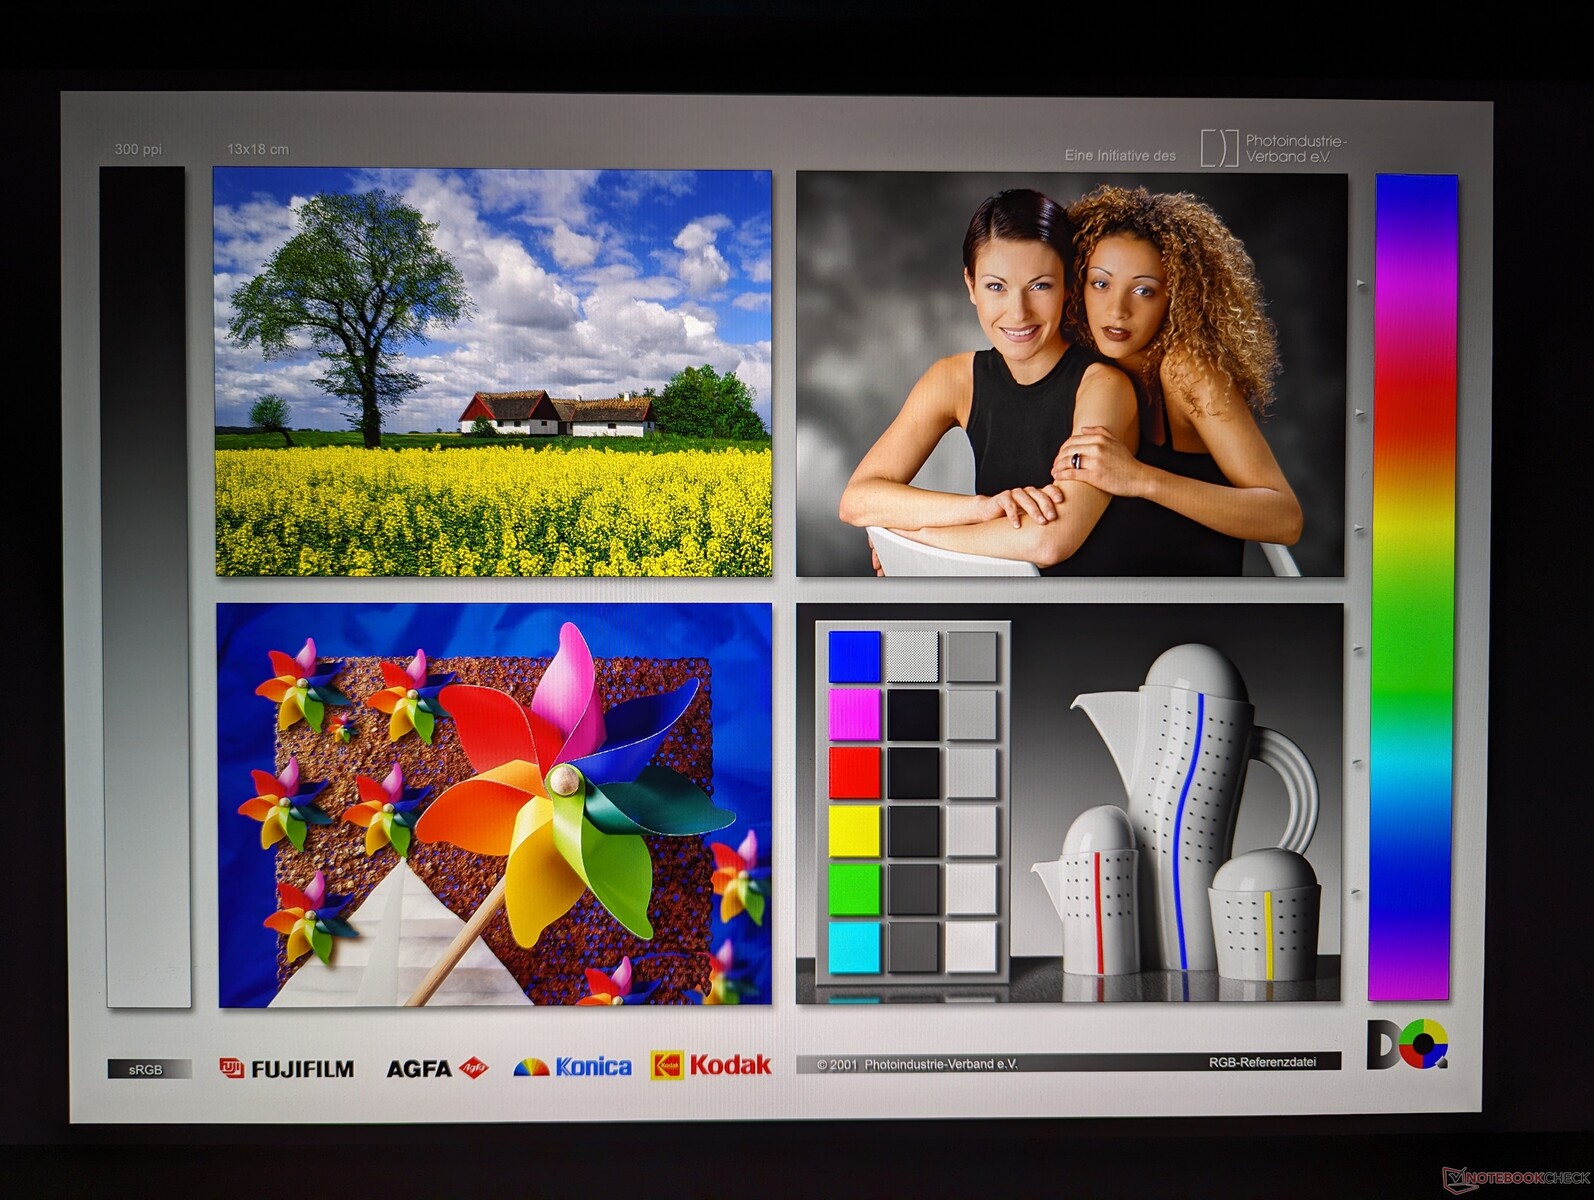
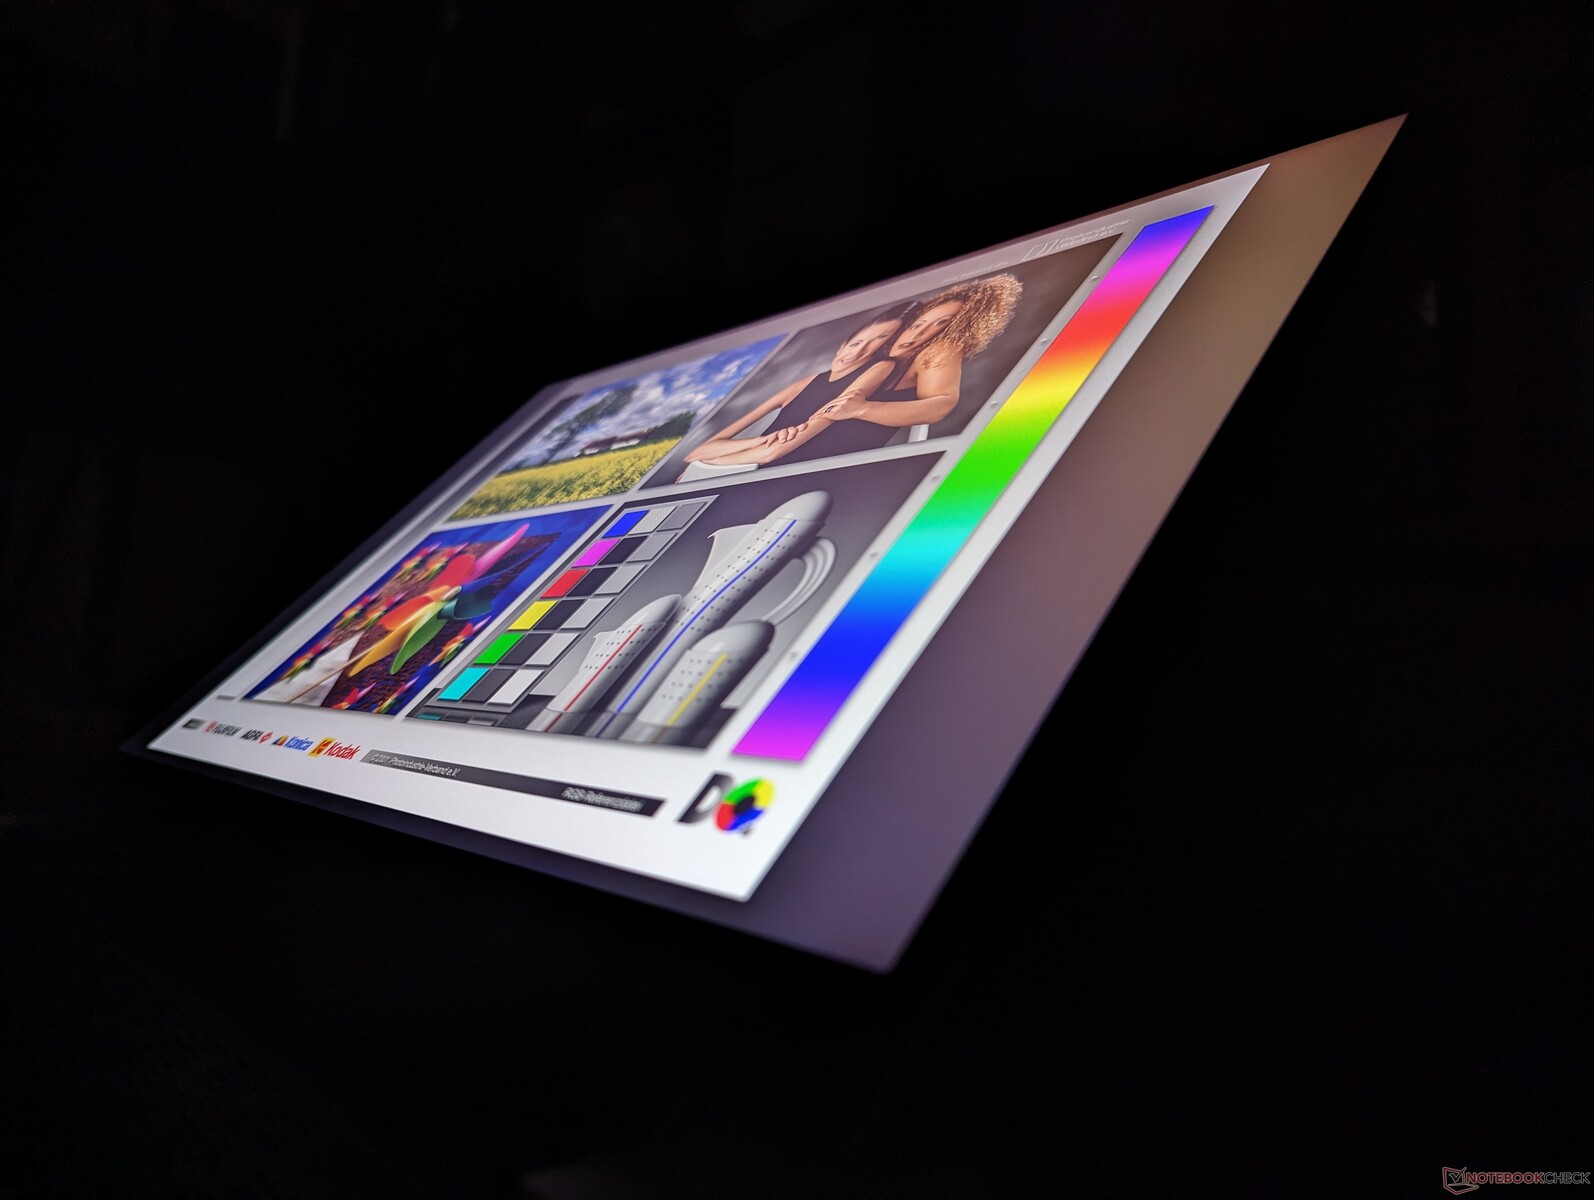
Pantalla - No más opción de 165 Hz
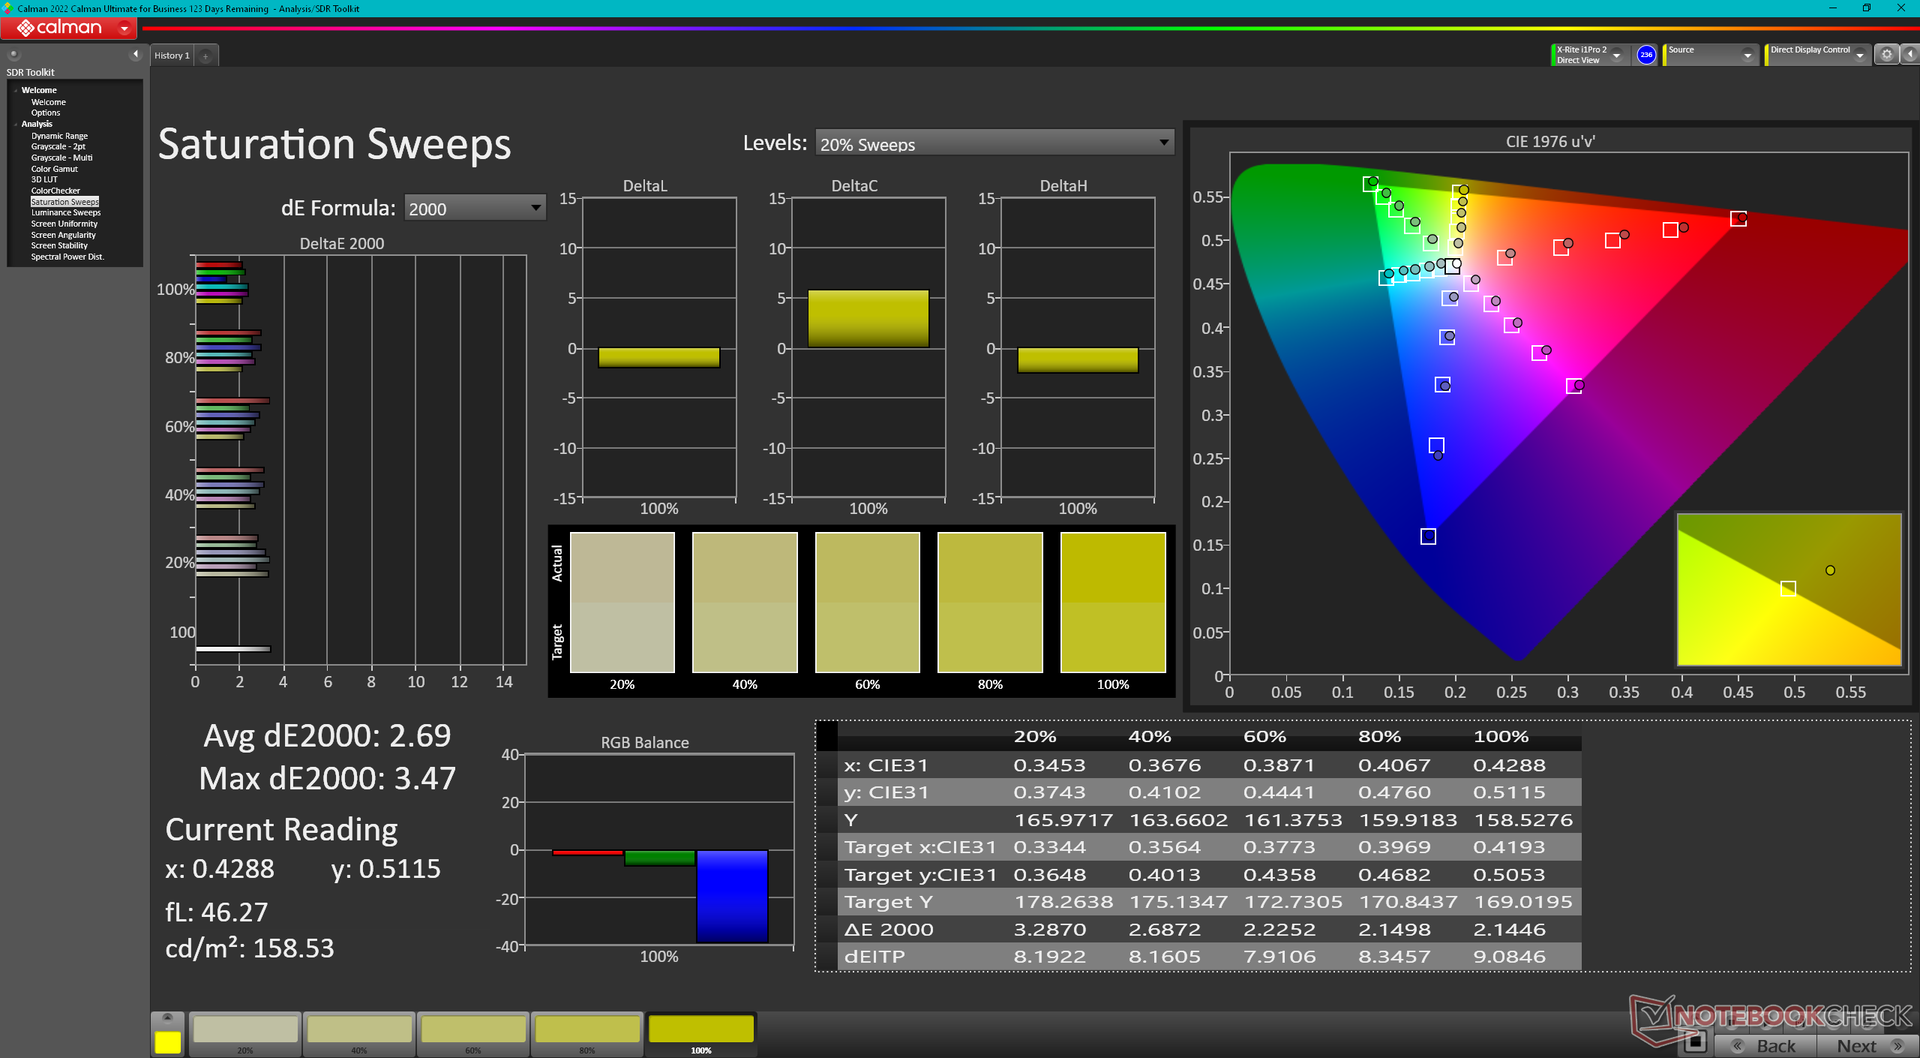
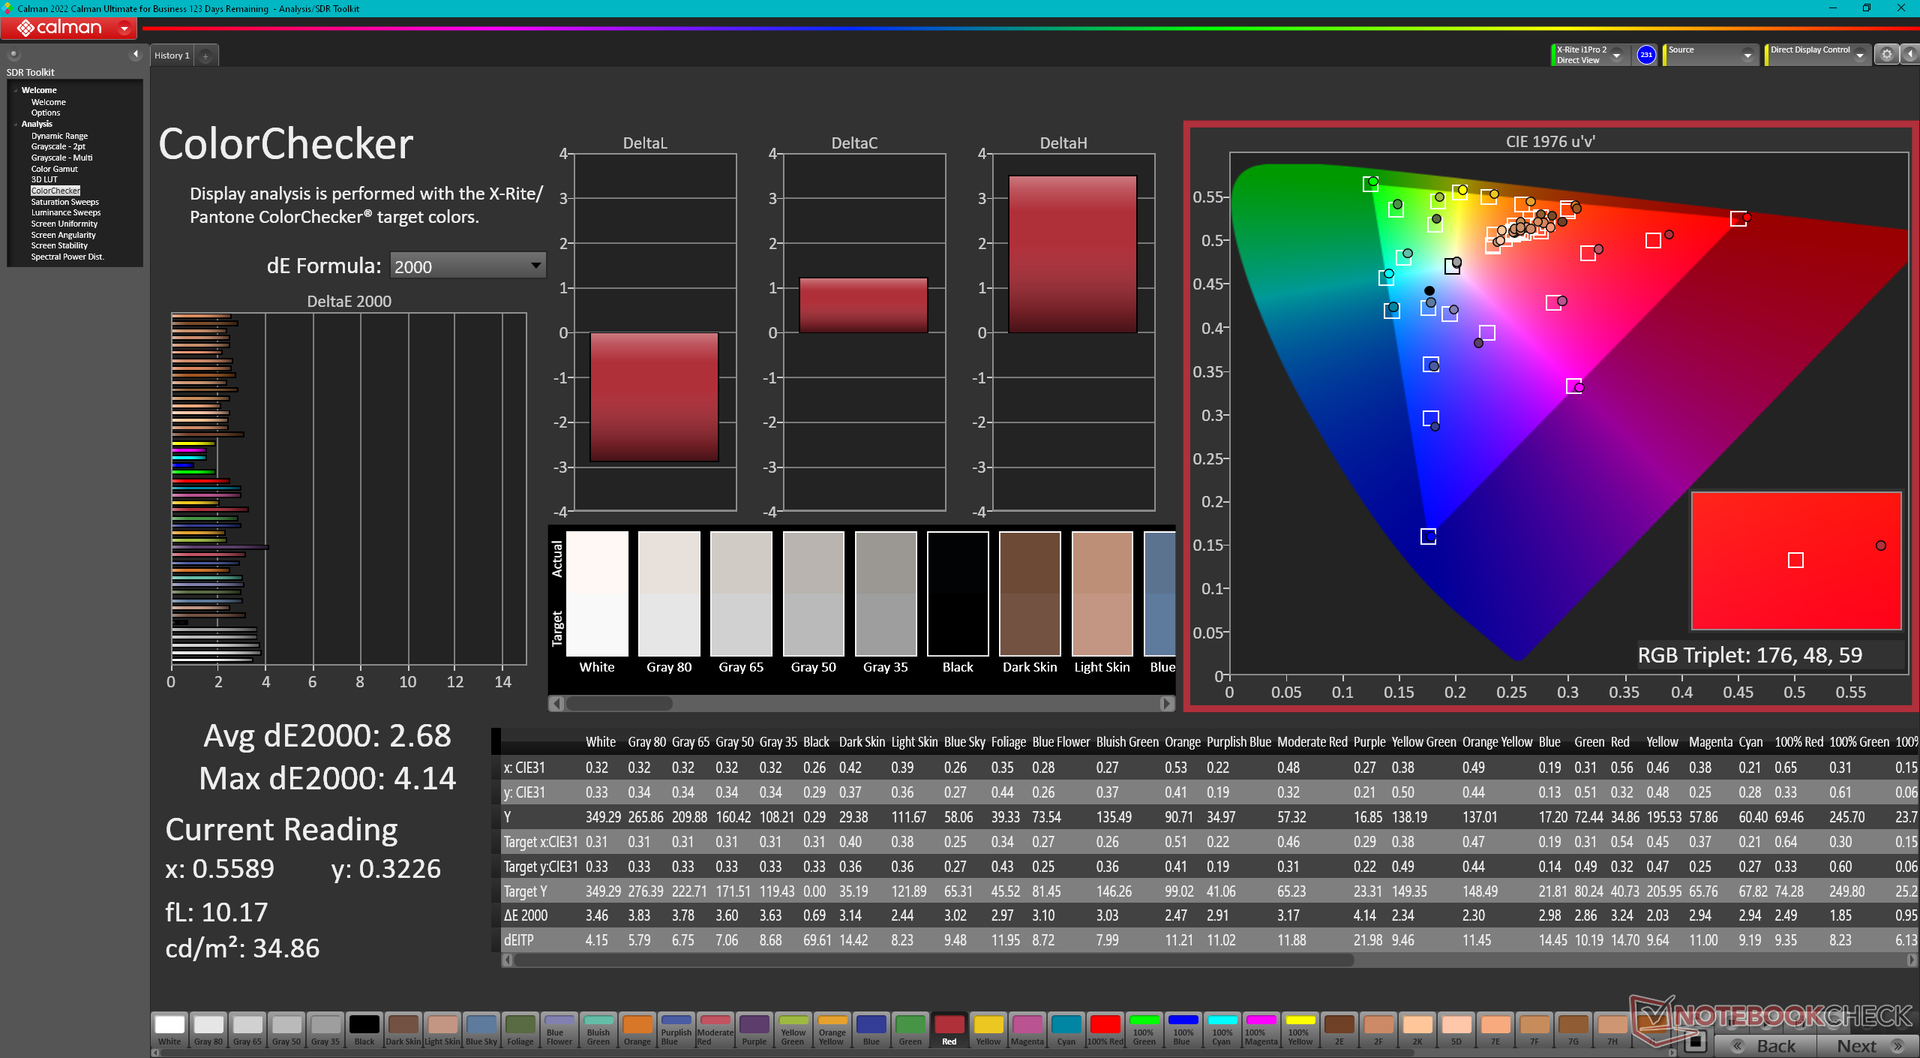
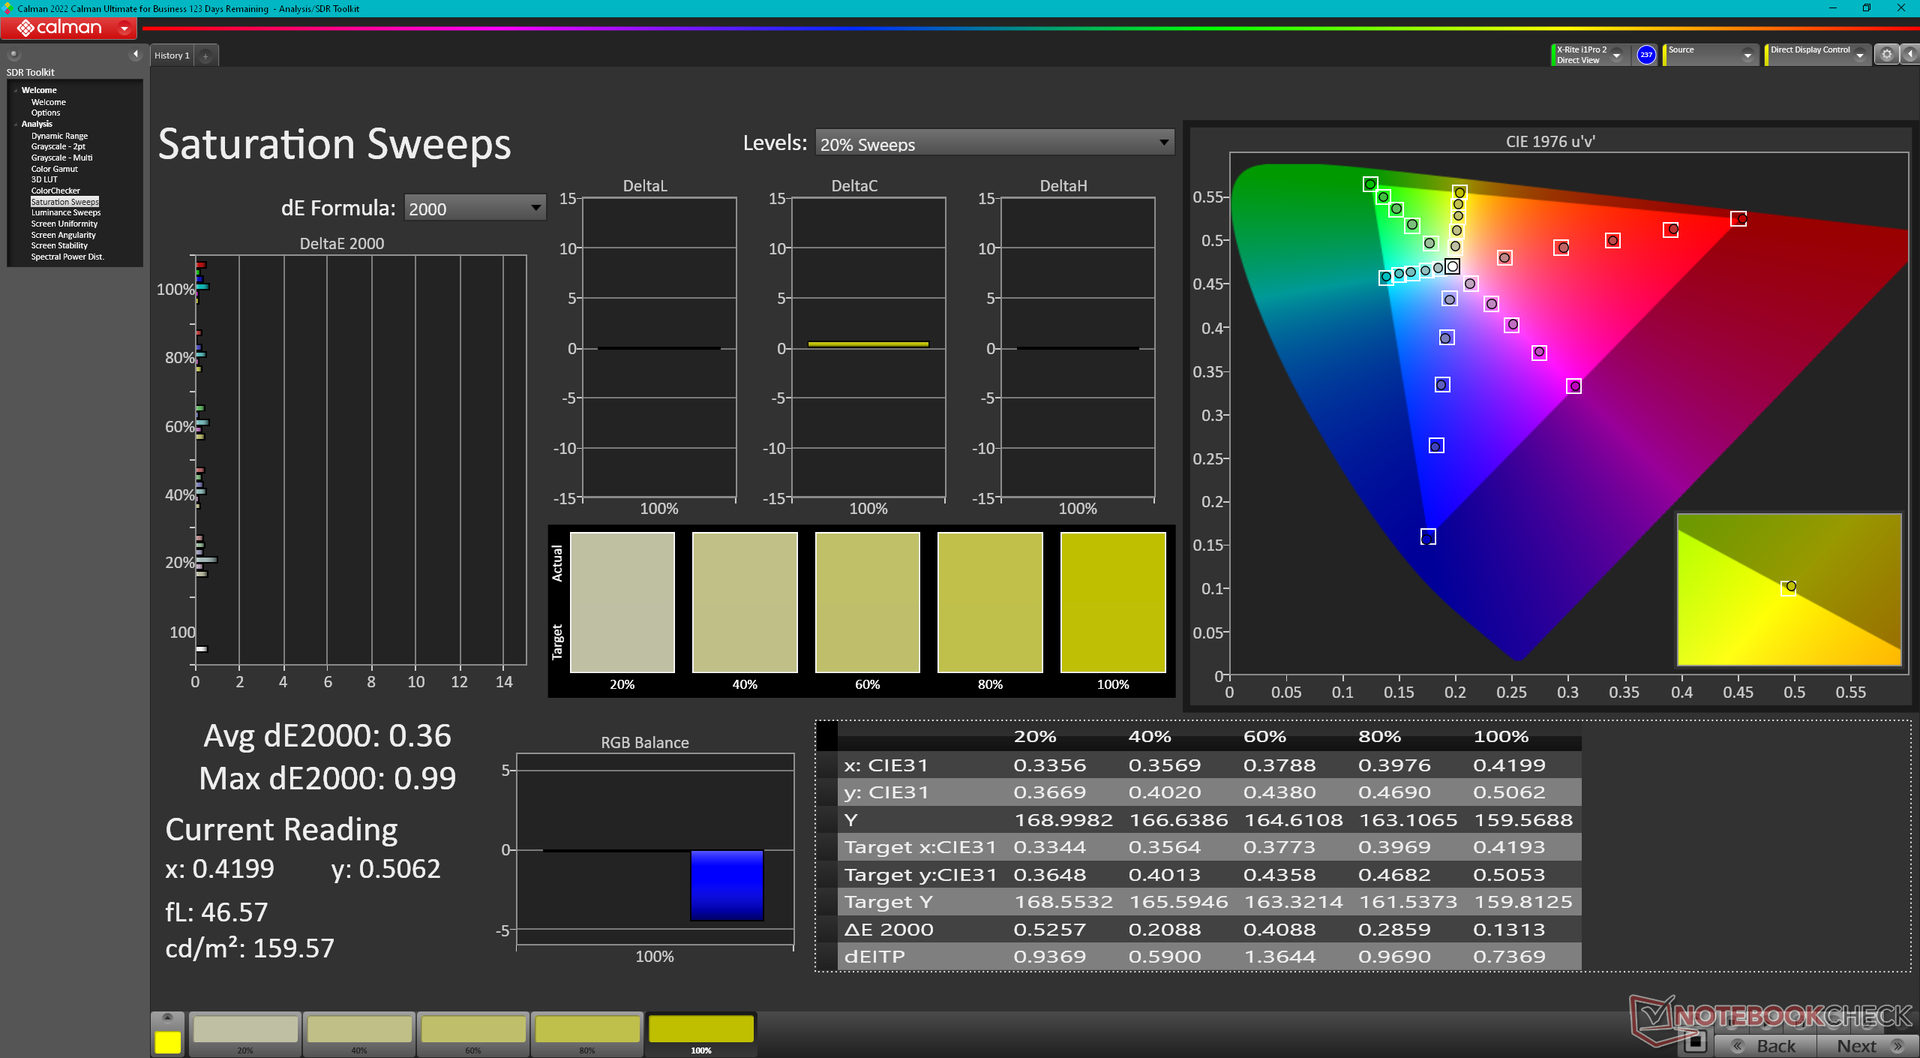
Dell ha cambiado el panel BOE NE16NZ4 del x16 R1 del año pasado por el BOE B160QAN del x16 R2 de este año. Sin embargo, los dos paneles son por lo demás casi idénticos en cuanto a reproducción del color, tiempos de respuesta, niveles de brillo y contraste para una experiencia de visualización esencialmente idéntica.
La frecuencia de actualización nativa puede ajustarse a 240 Hz o 60 Hz sin opciones variables. G-Sync sólo es compatible cuando se configura en modo dGPU y no en modo Optimus.
Los usuarios pueden configurar entre dos pantallas como se muestra a continuación mientras que el x16 R1 tenía tres:
- 2560 x 1600, 240 Hz, 100% DCI-P3, G-Sync, Optimus avanzado
- 1920 x 1200, 480 Hz, 100% DCI-P3, G-Sync, Optimus avanzado
| |||||||||||||||||||||||||
iluminación: 90 %
Brillo con batería: 348.4 cd/m²
Contraste: 1056:1 (Negro: 0.33 cd/m²)
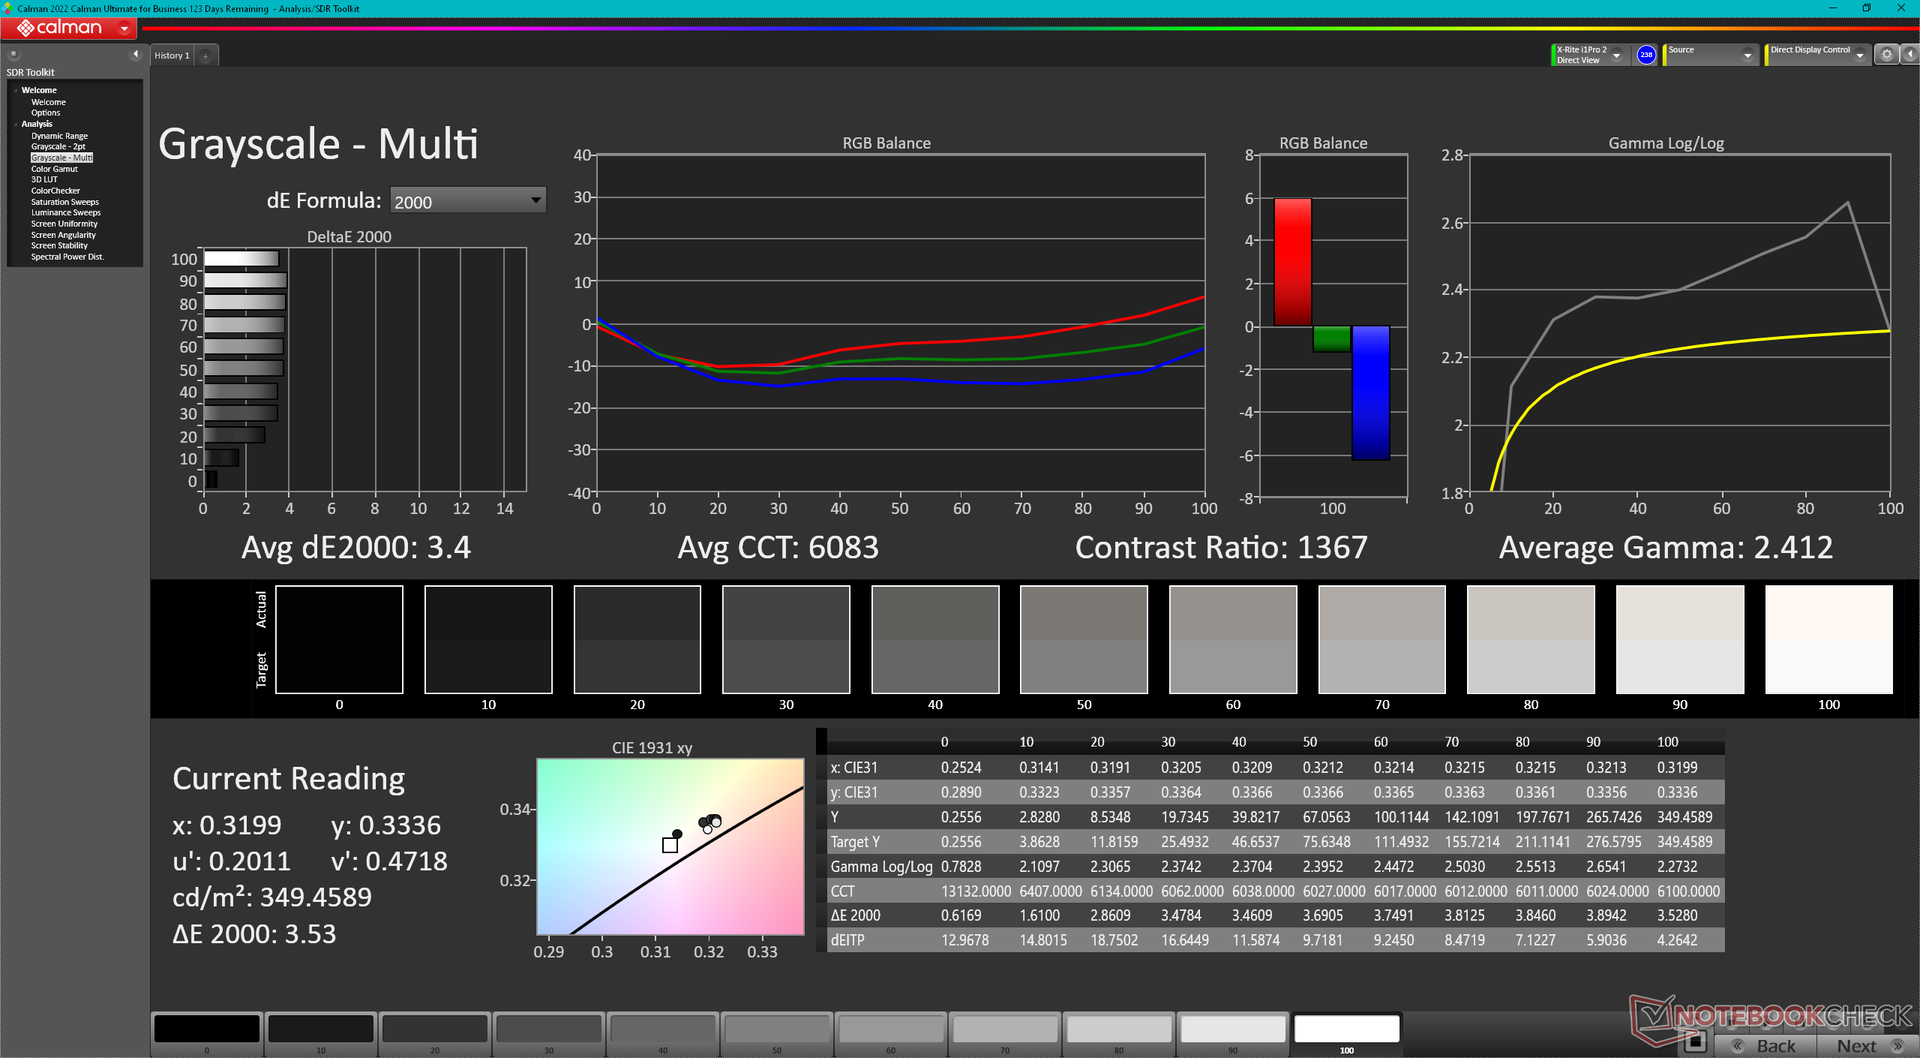
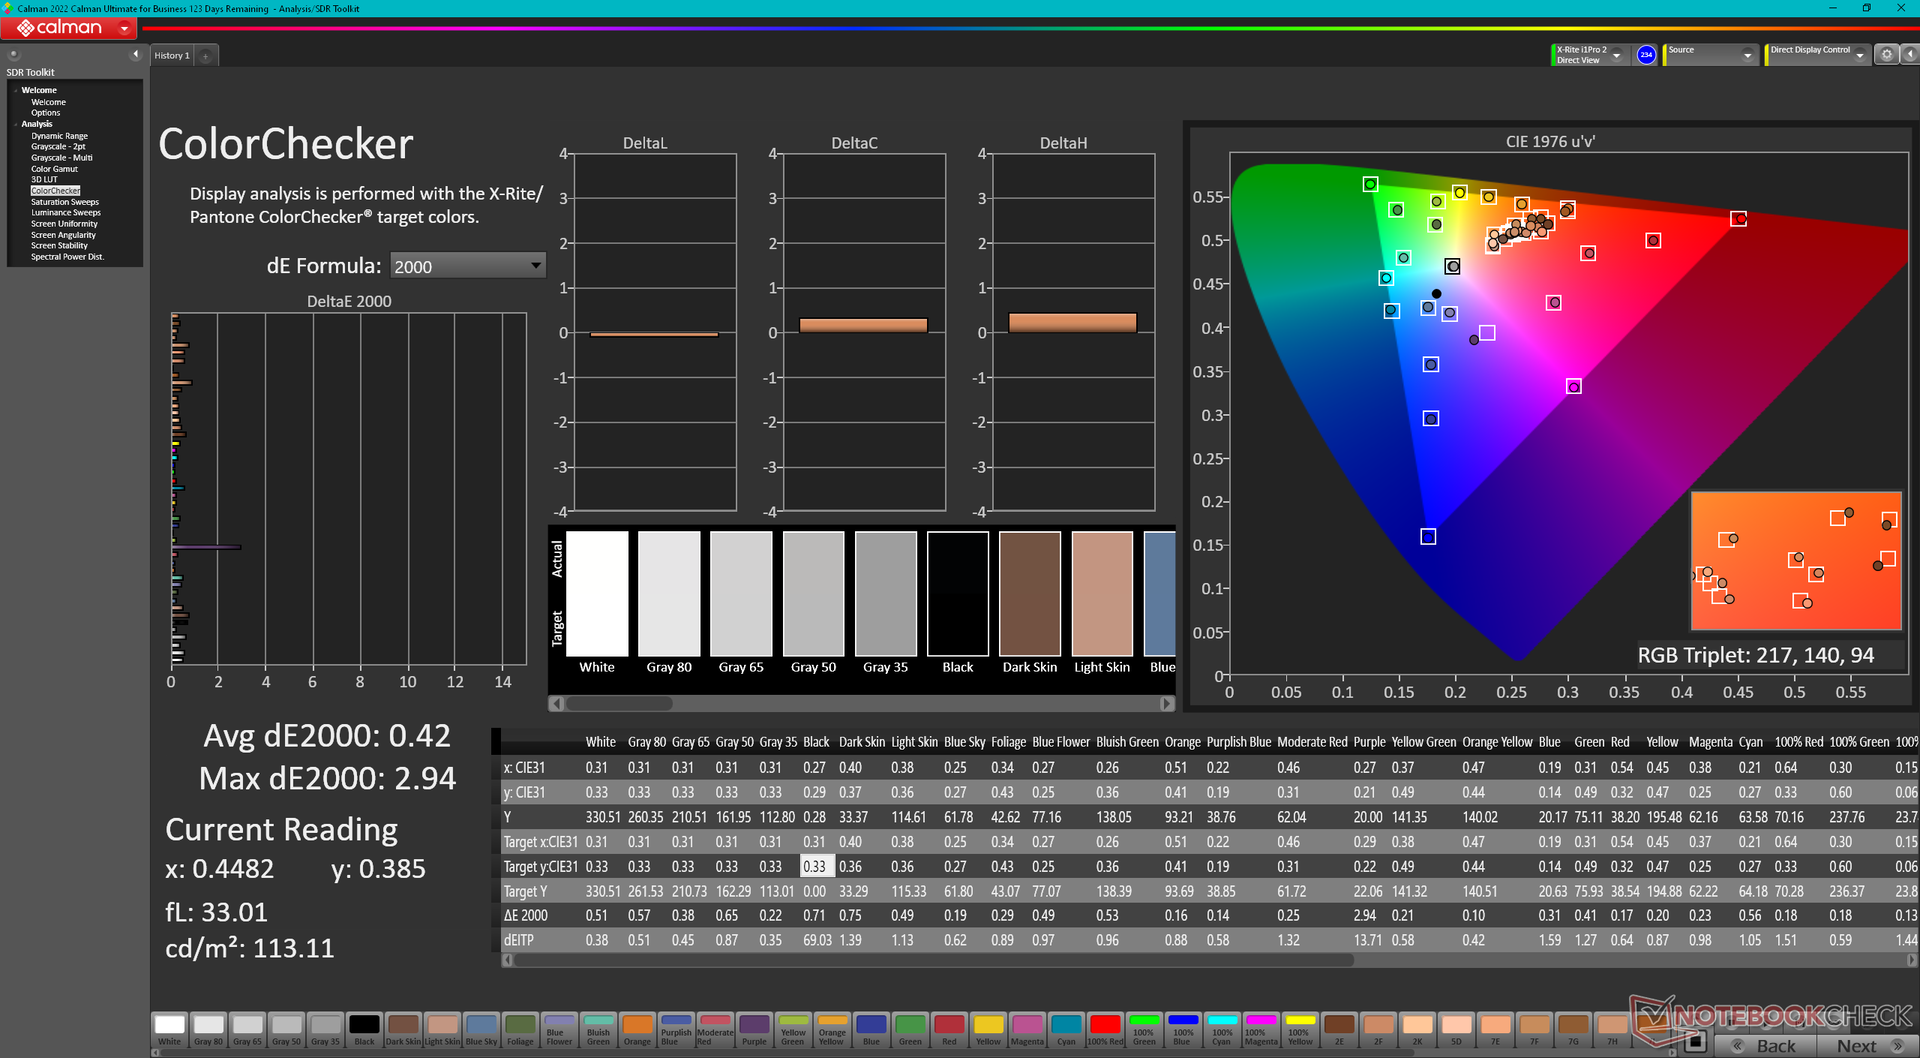
ΔE Color 2.68 | 0.5-29.43 Ø4.87, calibrated: 0.42
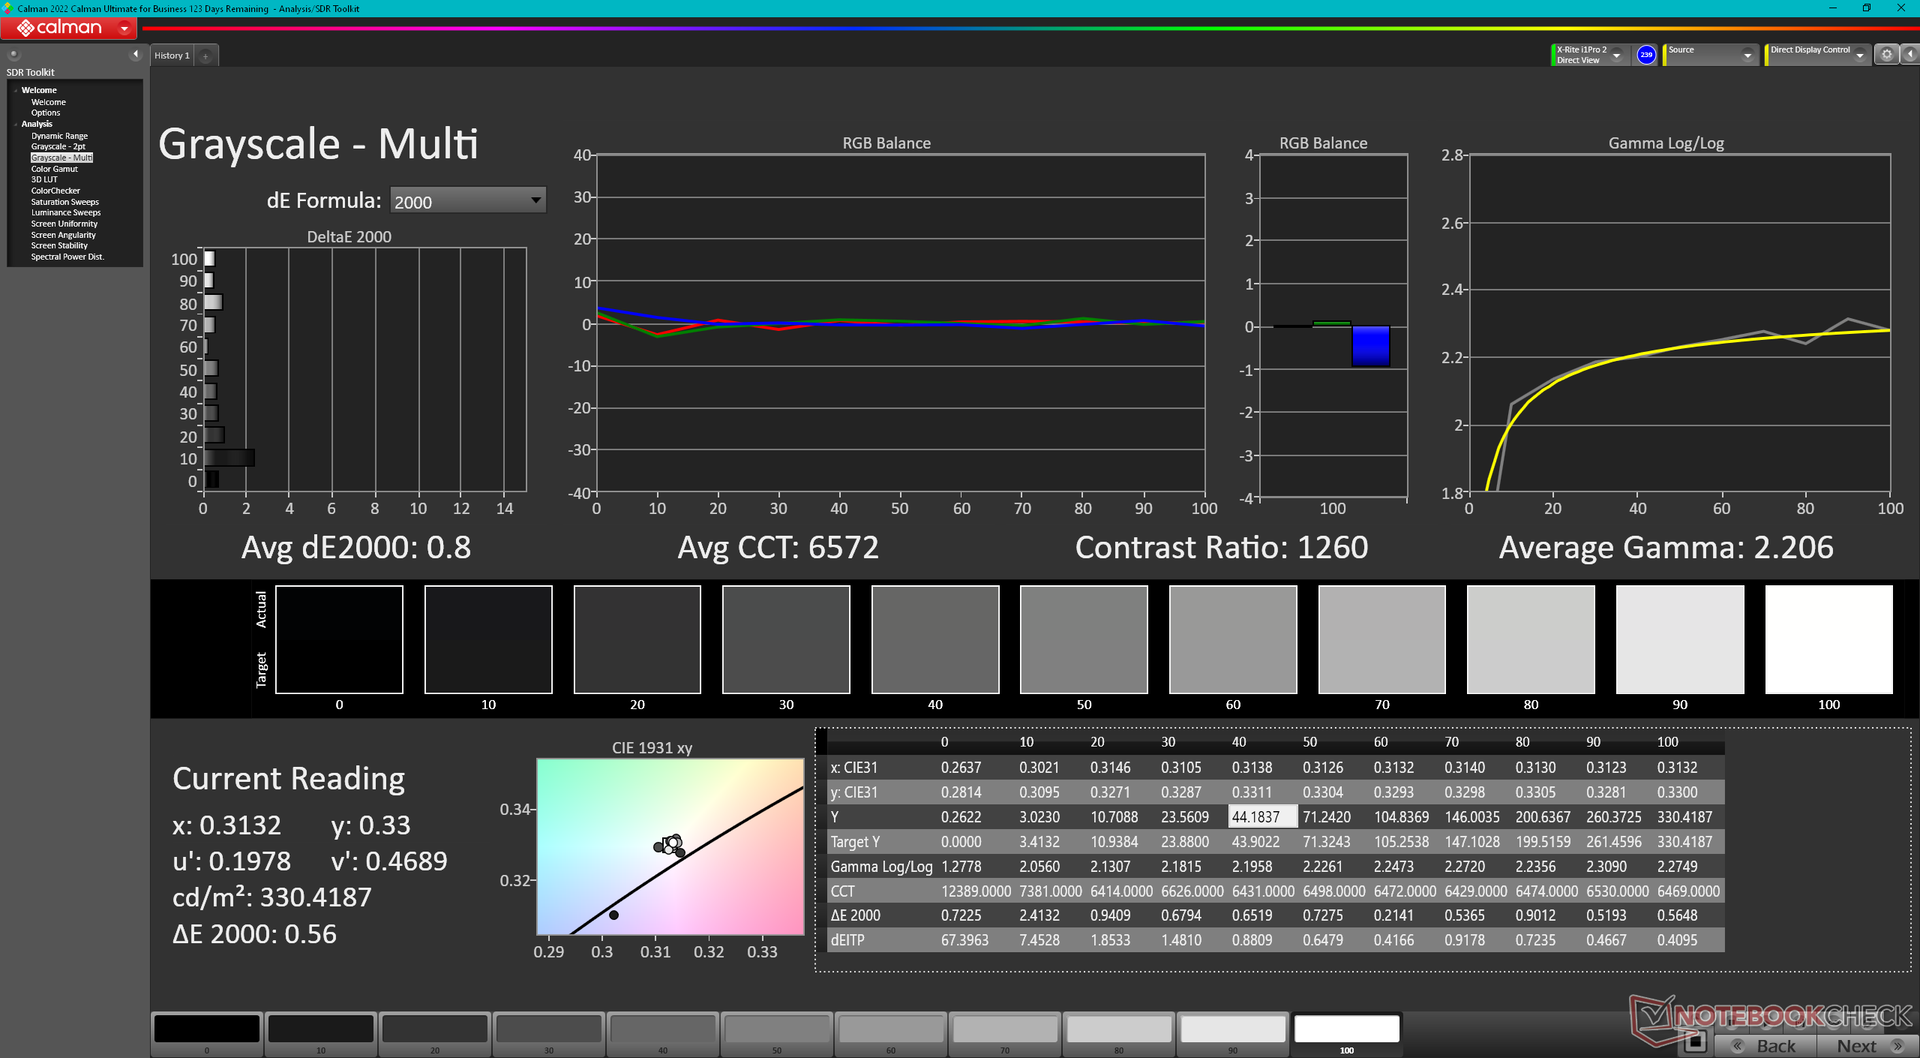
ΔE Greyscale 3.4 | 0.5-98 Ø5.1
88.8% AdobeRGB 1998 (Argyll 2.2.0 3D)
100% sRGB (Argyll 2.2.0 3D)
98.3% Display P3 (Argyll 2.2.0 3D)
Gamma: 2.41
| Alienware x16 R2 P120F BOE B160QAN, IPS, 2560x1600, 16" | Alienware x16 R1 BOE NE16NZ4, IPS, 2560x1600, 16" | Alienware m16 R2 BOE NE16NYH, IPS, 2560x1600, 16" | Asus ROG Strix Scar 16 G634JZR BOE NE160QDM-NM7, Mini LED, 2560x1600, 16" | Lenovo Legion Pro 7 16IRX9H BOE CQ NE16QDM-NZB, IPS, 2560x1600, 16" | MSI Vector 16 HX A14V Chi Mei N160GME-GTB, IPS, 2560x1600, 16" | |
|---|---|---|---|---|---|---|
| Display | 0% | -16% | 1% | -1% | -2% | |
| Display P3 Coverage | 98.3 | 99.2 1% | 71 -28% | 99.8 2% | 98.5 0% | 95.4 -3% |
| sRGB Coverage | 100 | 100 0% | 100 0% | 100 0% | 99.9 0% | 99.7 0% |
| AdobeRGB 1998 Coverage | 88.8 | 88.6 0% | 71.4 -20% | 90.8 2% | 86.7 -2% | 85.4 -4% |
| Response Times | -32% | -29% | -31% | -99% | -46% | |
| Response Time Grey 50% / Grey 80% * | 3.9 ? | 5.1 ? -31% | 5.7 ? -46% | 5 ? -28% | 12.6 ? -223% | 5.7 ? -46% |
| Response Time Black / White * | 7.8 ? | 10.3 ? -32% | 8.7 ? -12% | 10.4 ? -33% | 5.8 ? 26% | 11.4 ? -46% |
| PWM Frequency | 2040 ? | |||||
| Screen | -13% | 5% | 16% | 21% | -27% | |
| Brightness middle | 348.4 | 302.2 -13% | 345.8 -1% | 490 41% | 487 40% | 557.2 60% |
| Brightness | 340 | 285 -16% | 337 -1% | 487 43% | 460 35% | 506 49% |
| Brightness Distribution | 90 | 89 -1% | 87 -3% | 94 4% | 88 -2% | 83 -8% |
| Black Level * | 0.33 | 0.26 21% | 0.3 9% | 0.4 -21% | 0.42 -27% | 0.41 -24% |
| Contrast | 1056 | 1162 10% | 1153 9% | 1225 16% | 1160 10% | 1359 29% |
| Colorchecker dE 2000 * | 2.68 | 1.63 39% | 1.99 26% | 1.08 60% | 1.12 58% | 2.91 -9% |
| Colorchecker dE 2000 max. * | 4.14 | 4.13 -0% | 3.52 15% | 2.38 43% | 2.26 45% | 5.94 -43% |
| Colorchecker dE 2000 calibrated * | 0.42 | 1.17 -179% | 0.62 -48% | 0.9 -114% | 0.54 -29% | 1.63 -288% |
| Greyscale dE 2000 * | 3.4 | 2.5 26% | 2.1 38% | 1.1 68% | 1.4 59% | 3.8 -12% |
| Gamma | 2.41 91% | 2.23 99% | 2.32 95% | 2.13 103% | 2.242 98% | 2.23 99% |
| CCT | 6083 107% | 6590 99% | 6369 102% | 6724 97% | 6809 95% | 6408 101% |
| Media total (Programa/Opciones) | -15% /
-13% | -13% /
-4% | -5% /
6% | -26% /
-1% | -25% /
-25% |
* ... más pequeño es mejor
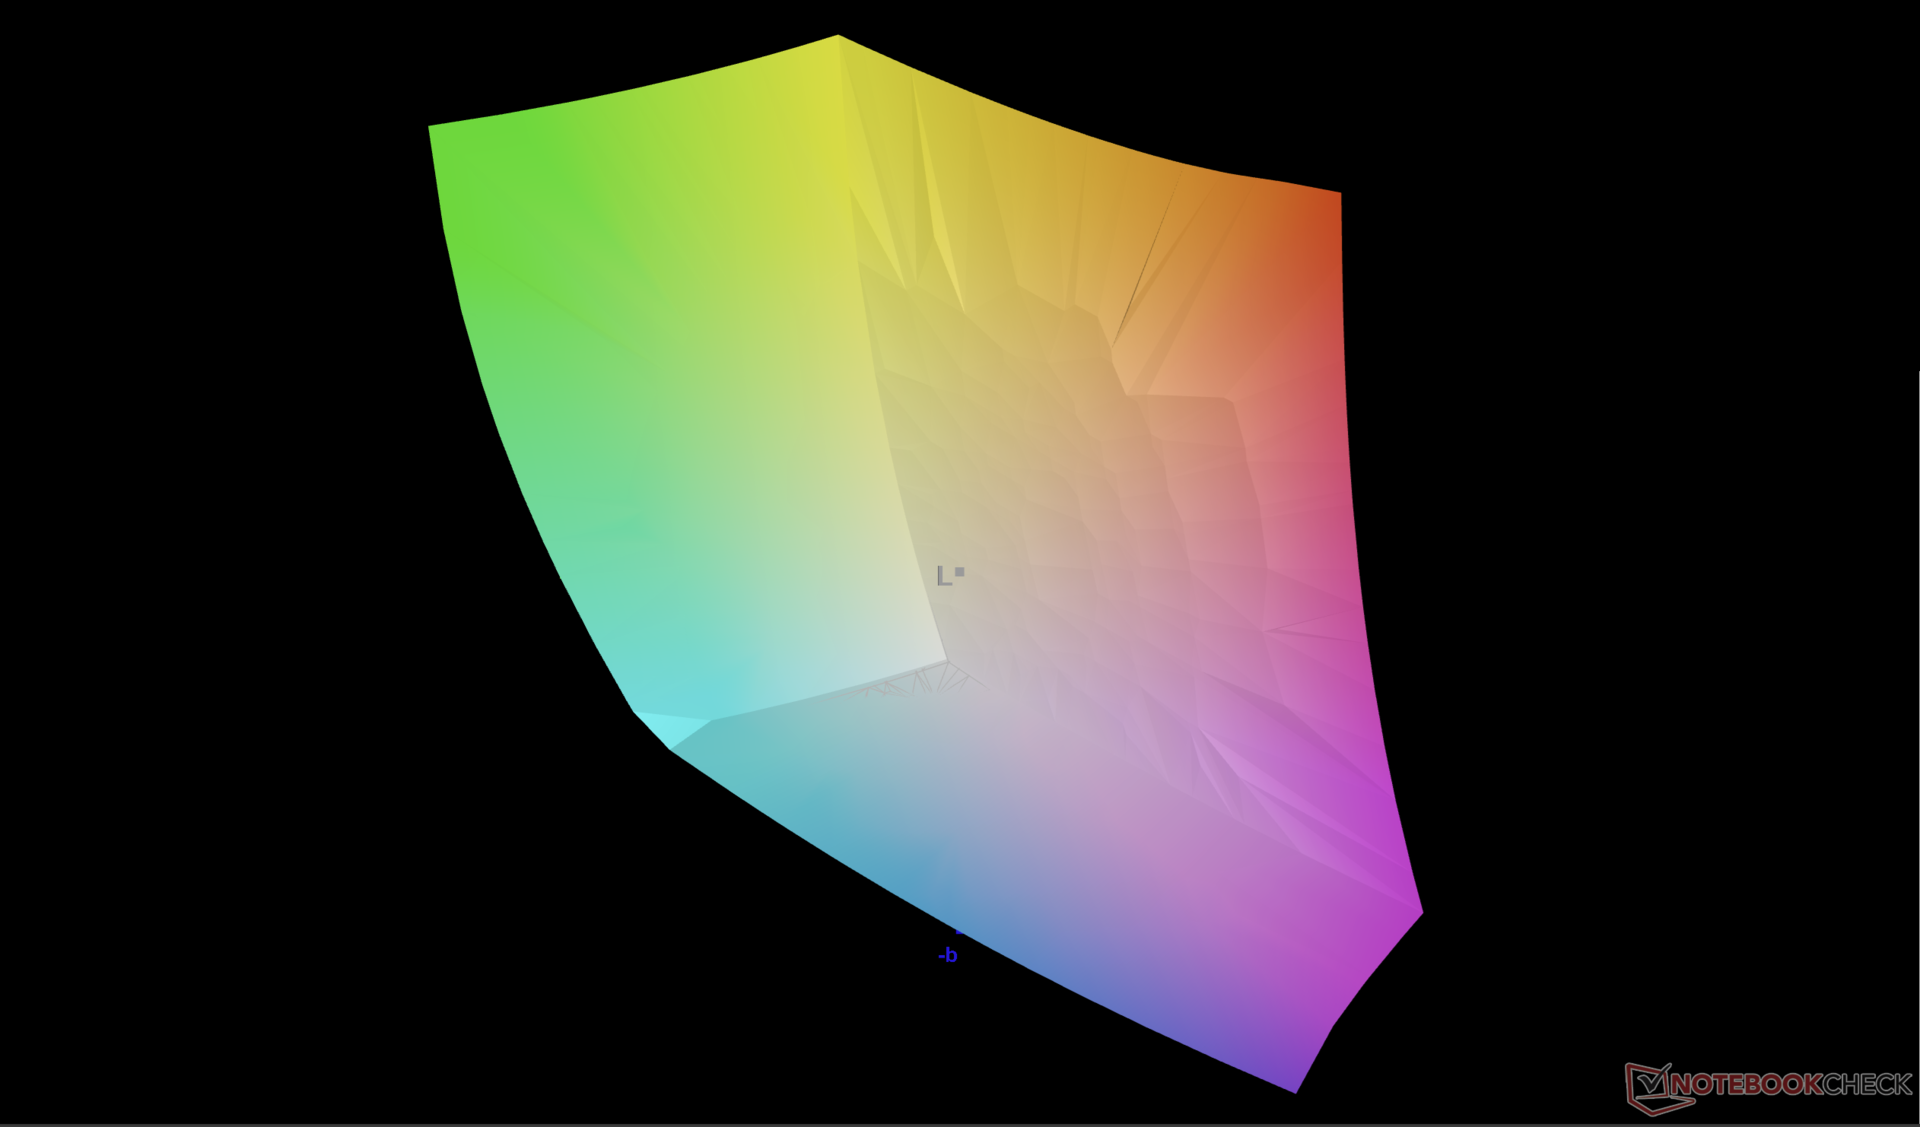
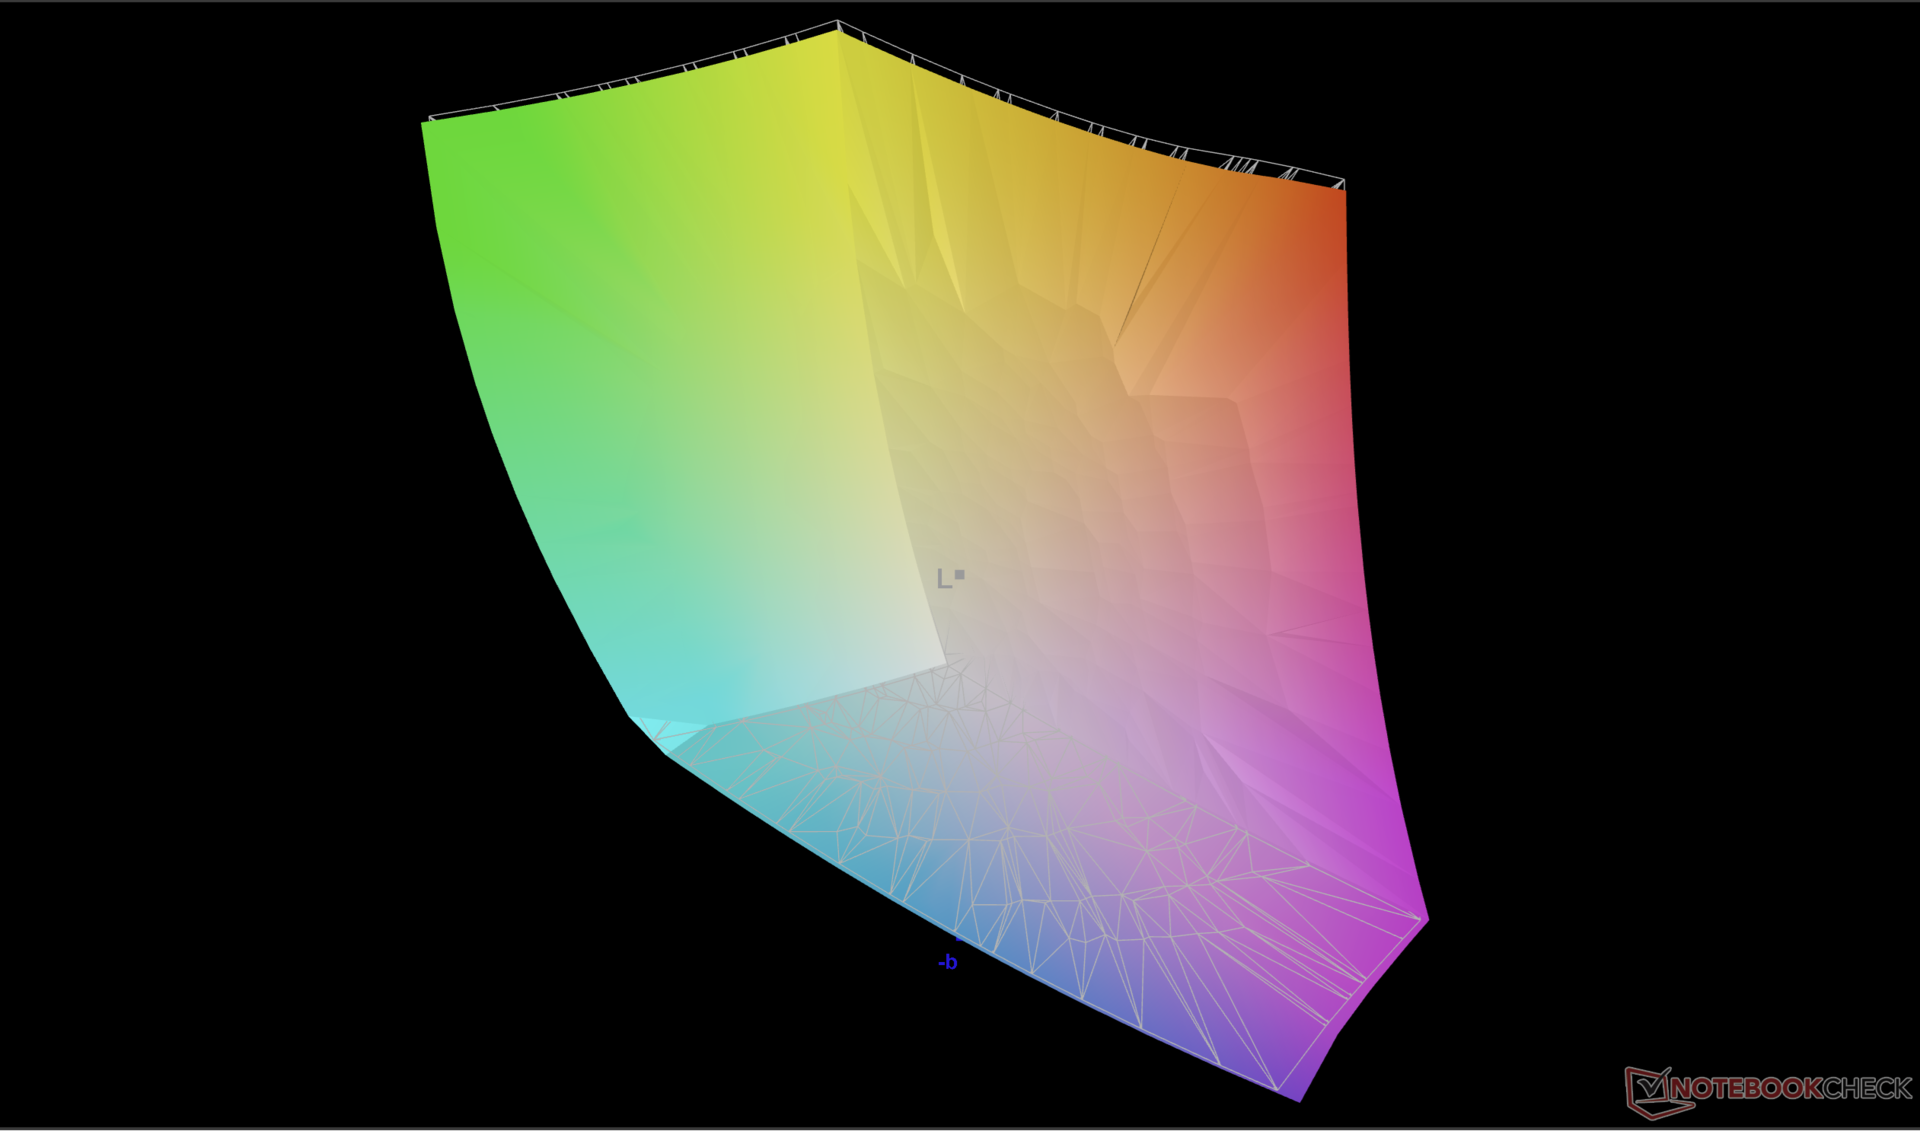
La pantalla está configurada por defecto en sRGB aunque admite todos los colores P3. No obstante, está decentemente calibrada aunque con una temperatura de color ligeramente demasiado cálida.
Tiempos de respuesta del display
| ↔ Tiempo de respuesta de Negro a Blanco | ||
|---|---|---|
| 7.8 ms ... subida ↗ y bajada ↘ combinada | ↗ 3.9 ms subida | 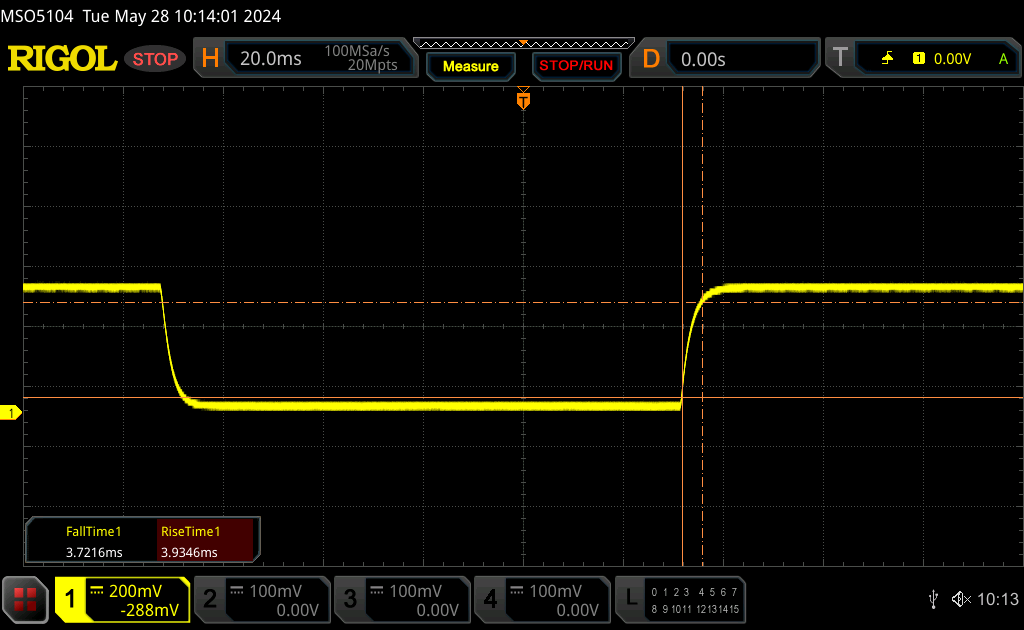 |
| ↘ 3.7 ms bajada | ||
| La pantalla mostró tiempos de respuesta muy rápidos en nuestros tests y debería ser adecuada para juegos frenéticos. En comparación, todos los dispositivos de prueba van de ##min### (mínimo) a 240 (máximo) ms. » 19 % de todos los dispositivos son mejores. Esto quiere decir que el tiempo de respuesta medido es mejor que la media (20.8 ms) de todos los dispositivos testados. | ||
| ↔ Tiempo de respuesta 50% Gris a 80% Gris | ||
| 3.9 ms ... subida ↗ y bajada ↘ combinada | ↗ 1.7 ms subida | 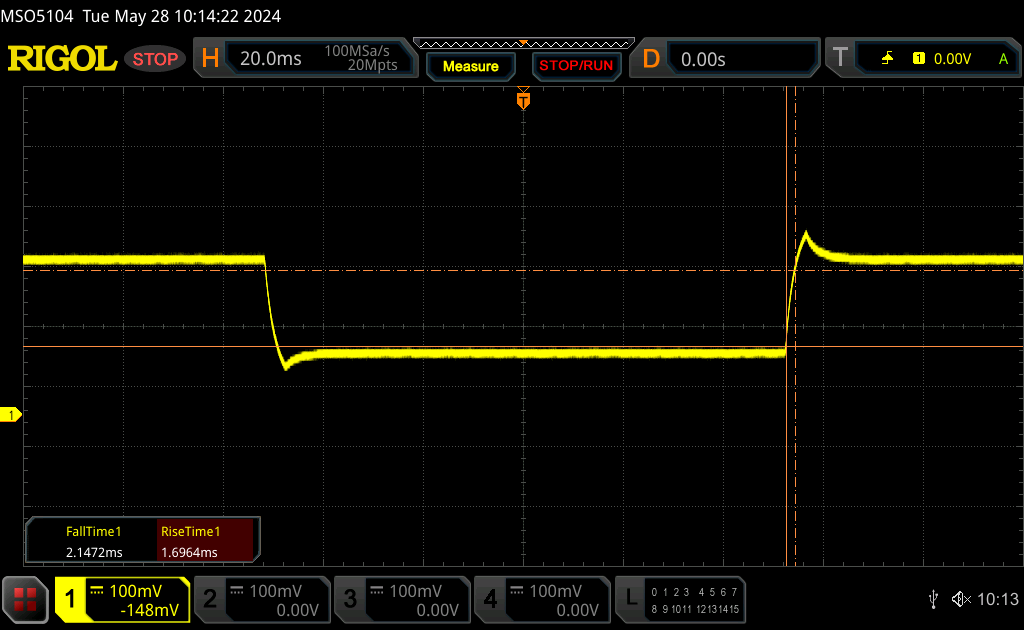 |
| ↘ 2.2 ms bajada | ||
| La pantalla mostró tiempos de respuesta muy rápidos en nuestros tests y debería ser adecuada para juegos frenéticos. En comparación, todos los dispositivos de prueba van de ##min### (mínimo) a 636 (máximo) ms. » 12 % de todos los dispositivos son mejores. Esto quiere decir que el tiempo de respuesta medido es mejor que la media (32.5 ms) de todos los dispositivos testados. | ||
Parpadeo de Pantalla / PWM (Pulse-Width Modulation)
| Parpadeo de Pantalla / PWM no detectado | 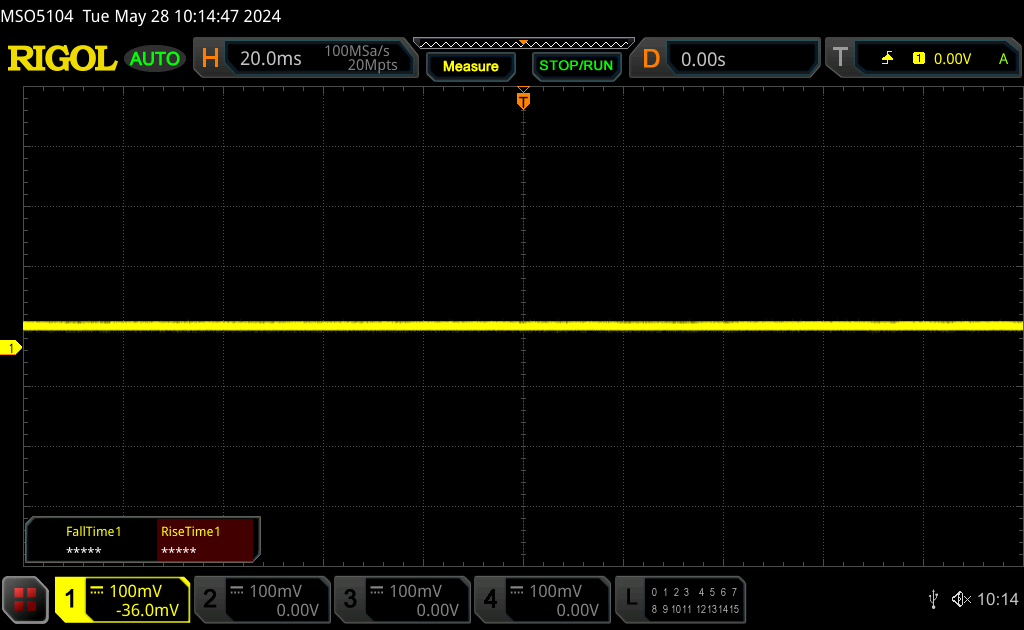 | ||
Comparación: 53 % de todos los dispositivos testados no usaron PWM para atenuar el display. Si se usó, medimos una media de 8516 (mínimo: 5 - máxmo: 343500) Hz. | |||
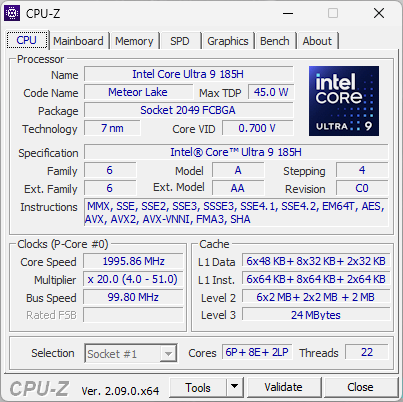
Rendimiento - Core Ultra 9 185H vs. Core i9-13900HK
Condiciones de prueba
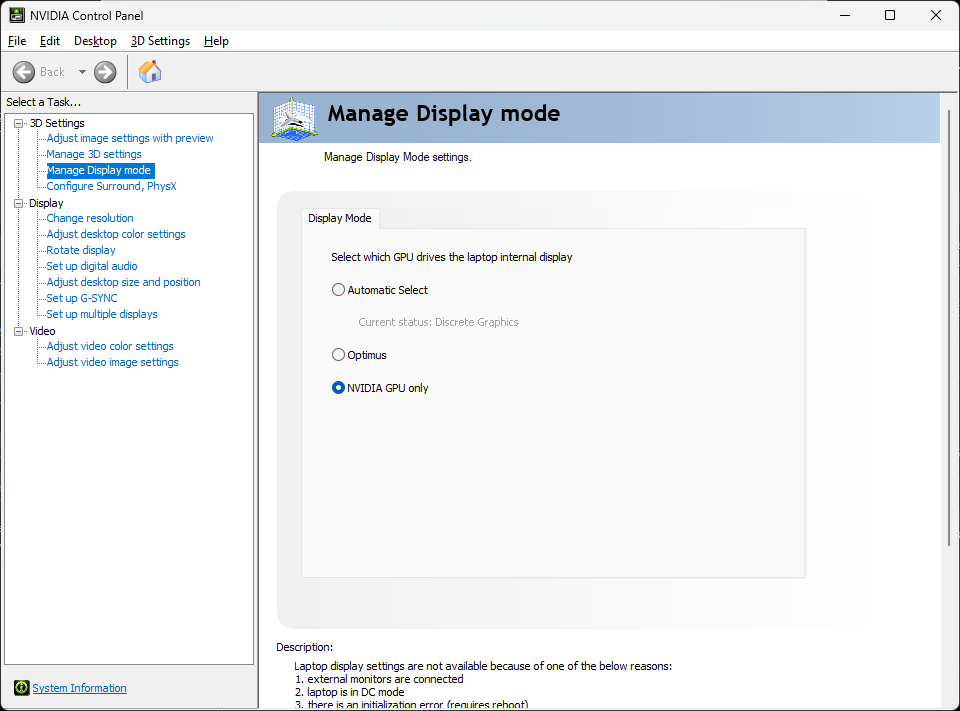
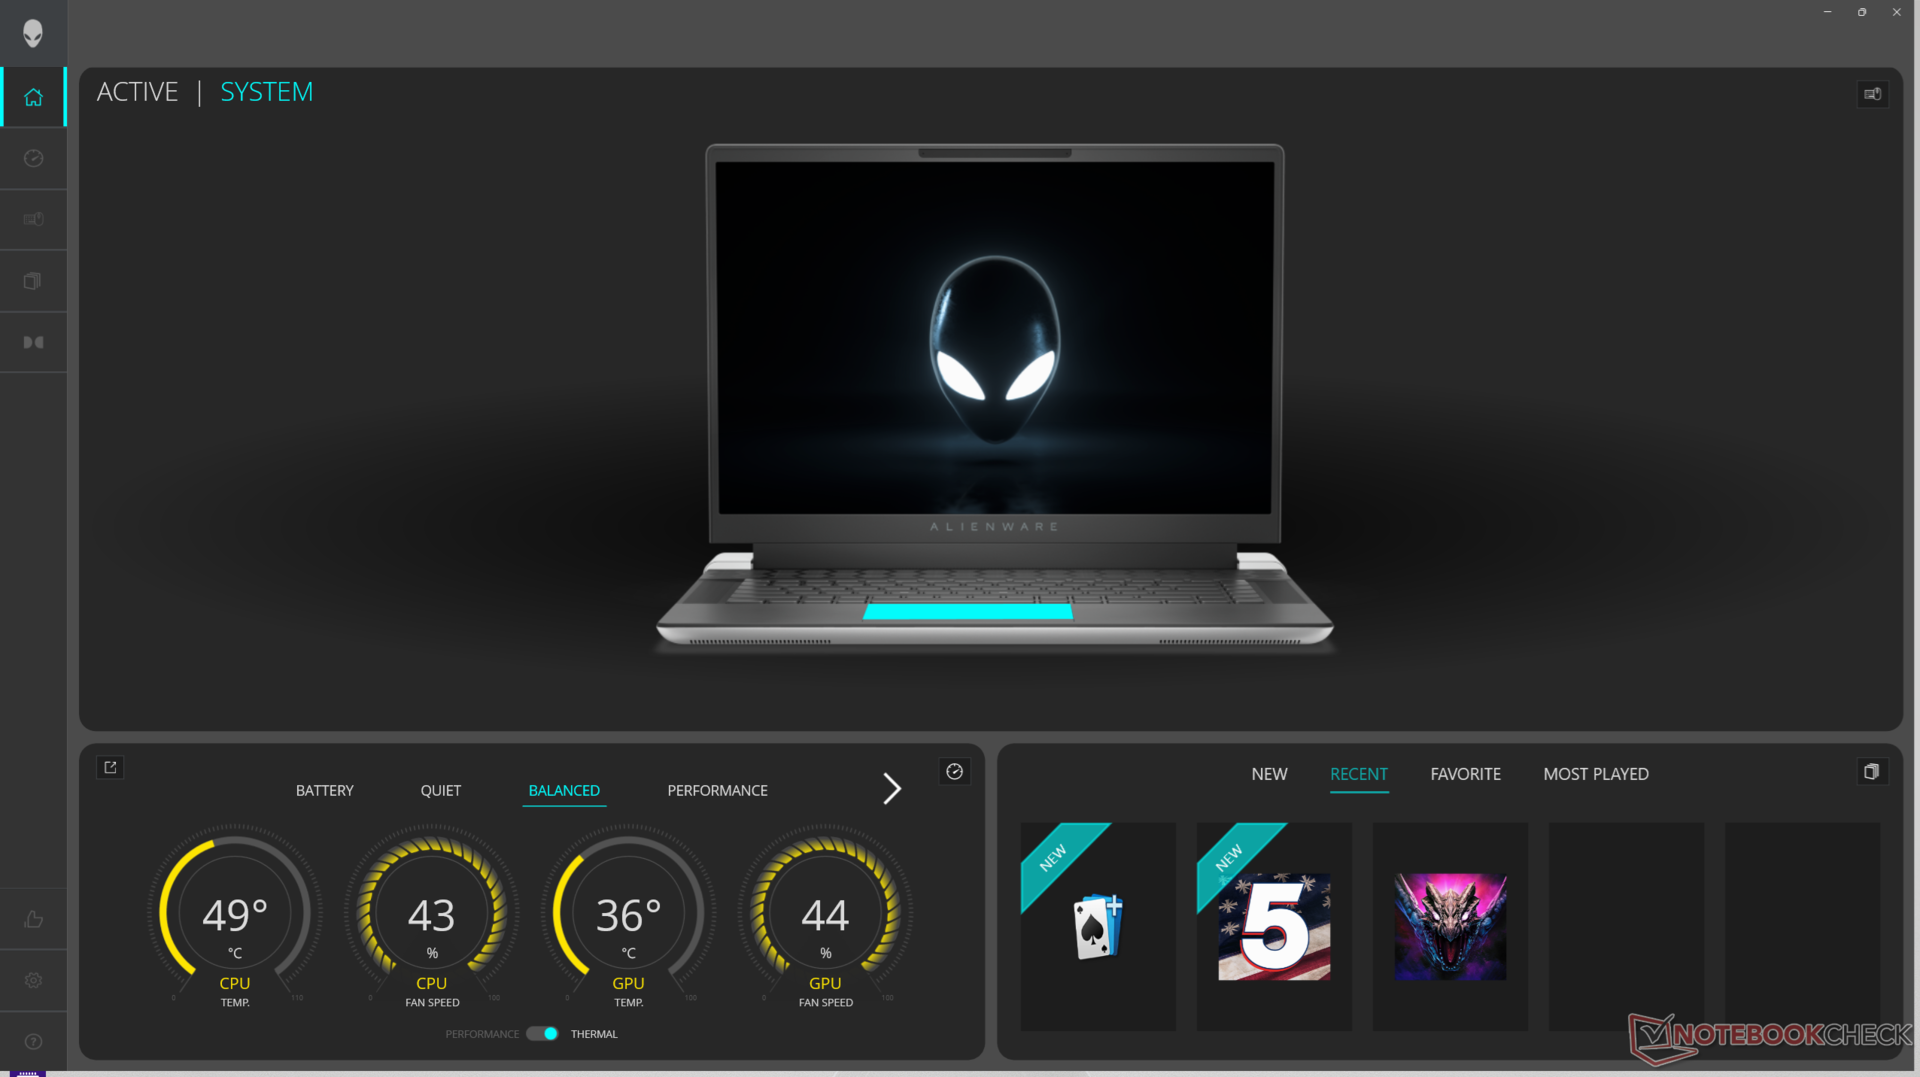
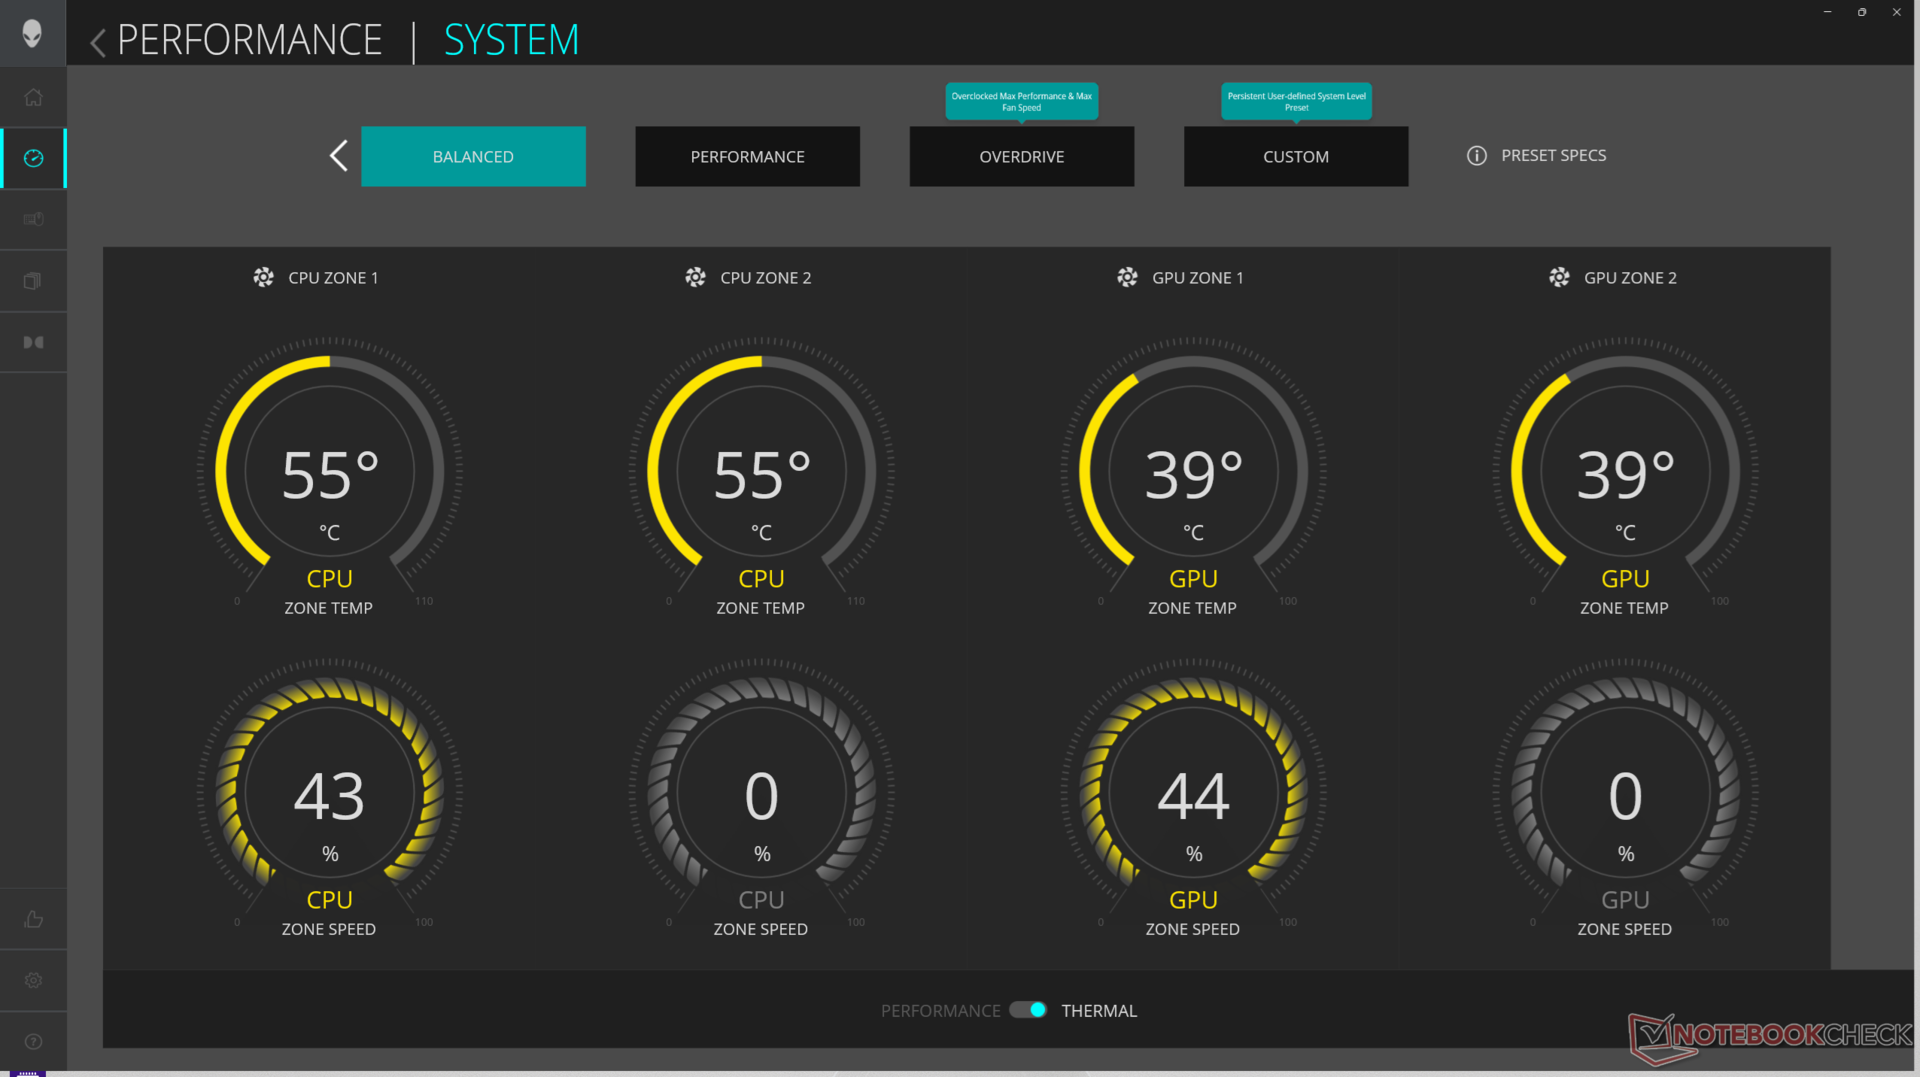
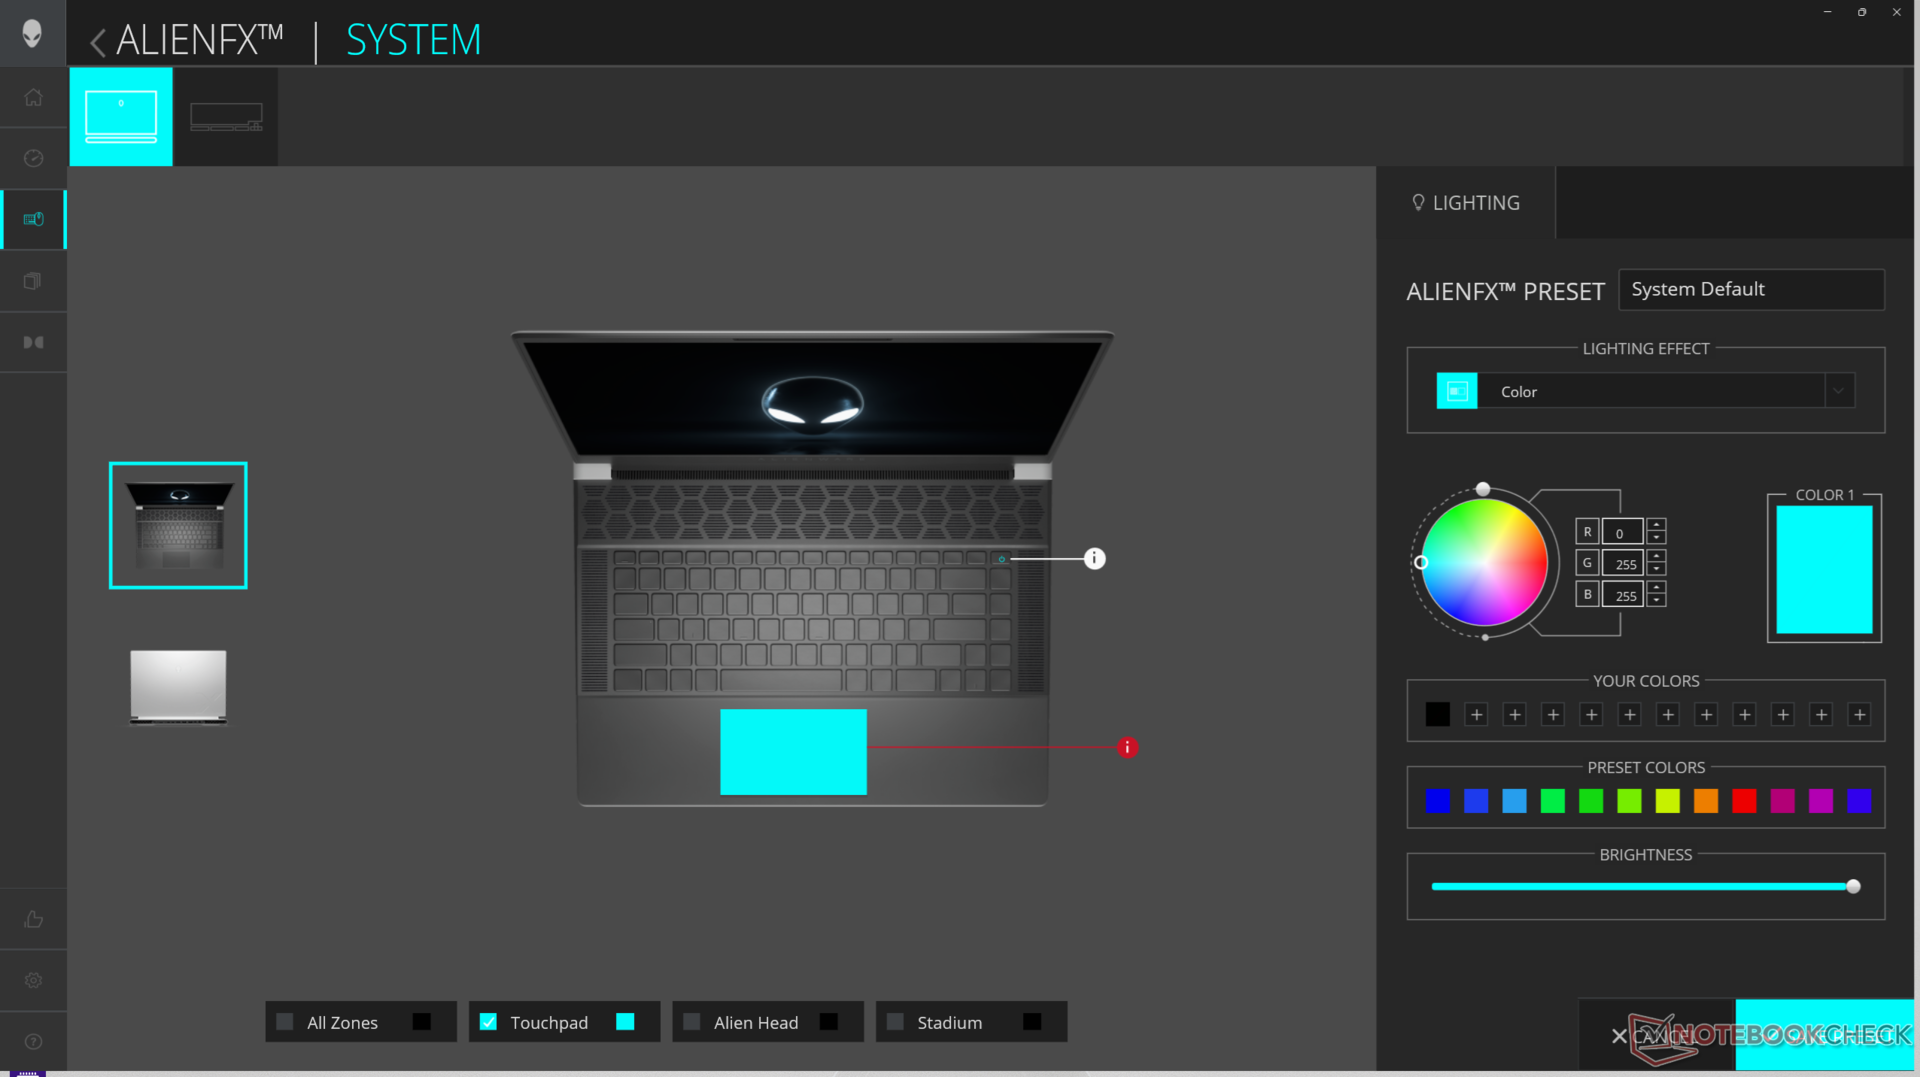
Pusimos el Centro de Comandos Alienware en modo Overdrive y los gráficos en modo dGPU para obtener los mejores resultados posibles en los benchmarks. Se recomienda a los propietarios que se familiaricen con el Centro de Comandos, ya que es el centro neurálgico para ajustar los efectos de iluminación RGB y los perfiles de rendimiento.
El panel de control de Nvidia no ofrece el modo "sólo iGPU", como muestra la captura de pantalla anterior.
Procesador
El Core Ultra 9 185H es aproximadamente entre un 5 y un 10 por ciento y entre un 15 y un 20 por ciento más lento que el Core i9-13900HK en el x16 R1 del año pasado cuando se trata de aplicaciones multihilo y monohilo, respectivamente. Curiosamente, al pasar al Core Ultra 7 155H no se espera que afecte al rendimiento en ningún margen significativo en nuestro tiempo con el Alienware m16 R2 como se muestra en la tabla de comparación a continuación.
Las opciones Raptor Lake-HX como el Core i9-14900HX no están disponibles en la serie Alienware x16 probablemente debido a limitaciones térmicas ya que estos procesadores requieren más potencia que la serie Meteor Lake-H. Estas opciones habrían ofrecido un rendimiento significativamente más rápido que el Core i9-13900HK o el Core Ultra 9 185H.
Cinebench R15 Multi Loop
Cinebench R23: Multi Core | Single Core
Cinebench R20: CPU (Multi Core) | CPU (Single Core)
Cinebench R15: CPU Multi 64Bit | CPU Single 64Bit
Blender: v2.79 BMW27 CPU
7-Zip 18.03: 7z b 4 | 7z b 4 -mmt1
Geekbench 6.4: Multi-Core | Single-Core
Geekbench 5.5: Multi-Core | Single-Core
HWBOT x265 Benchmark v2.2: 4k Preset
LibreOffice : 20 Documents To PDF
R Benchmark 2.5: Overall mean
* ... más pequeño es mejor
AIDA64: FP32 Ray-Trace | FPU Julia | CPU SHA3 | CPU Queen | FPU SinJulia | FPU Mandel | CPU AES | CPU ZLib | FP64 Ray-Trace | CPU PhotoWorxx
| Performance Rating | |
| MSI Vector 16 HX A14V | |
| Lenovo Legion Pro 7 16IRX9H | |
| Asus ROG Strix Scar 16 G634JZR | |
| Alienware x16 R2 P120F | |
| Alienware x16 R1 | |
| Alienware m16 R2 | |
| Medio Intel Core Ultra 9 185H | |
| AIDA64 / FP32 Ray-Trace | |
| MSI Vector 16 HX A14V | |
| Lenovo Legion Pro 7 16IRX9H | |
| Asus ROG Strix Scar 16 G634JZR | |
| Alienware x16 R2 P120F | |
| Alienware m16 R2 | |
| Alienware x16 R1 | |
| Medio Intel Core Ultra 9 185H (9220 - 18676, n=19) | |
| AIDA64 / FPU Julia | |
| MSI Vector 16 HX A14V | |
| Lenovo Legion Pro 7 16IRX9H | |
| Asus ROG Strix Scar 16 G634JZR | |
| Alienware x16 R2 P120F | |
| Alienware m16 R2 | |
| Alienware x16 R1 | |
| Medio Intel Core Ultra 9 185H (48865 - 96463, n=19) | |
| AIDA64 / CPU SHA3 | |
| Lenovo Legion Pro 7 16IRX9H | |
| MSI Vector 16 HX A14V | |
| Asus ROG Strix Scar 16 G634JZR | |
| Alienware x16 R2 P120F | |
| Alienware m16 R2 | |
| Alienware x16 R1 | |
| Medio Intel Core Ultra 9 185H (2394 - 4534, n=19) | |
| AIDA64 / CPU Queen | |
| Asus ROG Strix Scar 16 G634JZR | |
| Lenovo Legion Pro 7 16IRX9H | |
| MSI Vector 16 HX A14V | |
| Alienware x16 R1 | |
| Alienware x16 R2 P120F | |
| Medio Intel Core Ultra 9 185H (66785 - 95241, n=19) | |
| Alienware m16 R2 | |
| AIDA64 / FPU SinJulia | |
| Lenovo Legion Pro 7 16IRX9H | |
| MSI Vector 16 HX A14V | |
| Asus ROG Strix Scar 16 G634JZR | |
| Alienware x16 R1 | |
| Alienware x16 R2 P120F | |
| Alienware m16 R2 | |
| Medio Intel Core Ultra 9 185H (7255 - 11392, n=19) | |
| AIDA64 / FPU Mandel | |
| MSI Vector 16 HX A14V | |
| Lenovo Legion Pro 7 16IRX9H | |
| Asus ROG Strix Scar 16 G634JZR | |
| Alienware x16 R2 P120F | |
| Alienware m16 R2 | |
| Alienware x16 R1 | |
| Medio Intel Core Ultra 9 185H (24004 - 48020, n=19) | |
| AIDA64 / CPU AES | |
| Asus ROG Strix Scar 16 G634JZR | |
| Lenovo Legion Pro 7 16IRX9H | |
| MSI Vector 16 HX A14V | |
| Medio Intel Core Ultra 9 185H (53116 - 154066, n=19) | |
| Alienware x16 R2 P120F | |
| Alienware m16 R2 | |
| Alienware x16 R1 | |
| AIDA64 / CPU ZLib | |
| Lenovo Legion Pro 7 16IRX9H | |
| MSI Vector 16 HX A14V | |
| Asus ROG Strix Scar 16 G634JZR | |
| Alienware x16 R2 P120F | |
| Alienware x16 R1 | |
| Alienware m16 R2 | |
| Medio Intel Core Ultra 9 185H (678 - 1341, n=19) | |
| AIDA64 / FP64 Ray-Trace | |
| MSI Vector 16 HX A14V | |
| Lenovo Legion Pro 7 16IRX9H | |
| Asus ROG Strix Scar 16 G634JZR | |
| Alienware x16 R2 P120F | |
| Alienware x16 R1 | |
| Alienware m16 R2 | |
| Medio Intel Core Ultra 9 185H (4428 - 10078, n=19) | |
| AIDA64 / CPU PhotoWorxx | |
| Alienware x16 R2 P120F | |
| Asus ROG Strix Scar 16 G634JZR | |
| Alienware x16 R1 | |
| MSI Vector 16 HX A14V | |
| Medio Intel Core Ultra 9 185H (44547 - 53918, n=19) | |
| Lenovo Legion Pro 7 16IRX9H | |
| Alienware m16 R2 | |
Prueba de estrés
Las temperaturas del núcleo entre la CPU y la GPU son igual de cálidas que las que registramos en el x16 R1. La CPU en particular sigue estabilizándose en casi 100 C (!) cuando se ejecuta Prime95 mientras que la GPU se estabiliza en el rango medio de 80 C cuando se ejecuta Witcher 3. Curiosamente, la velocidad de reloj de la GPU ha bajado en general en comparación con el x16 R1. La GPU oscilaría entre 2100 y 2325 MHz dependiendo del perfil de potencia en comparación con los 2460 MHz del x16 R1 original. El consumo de energía de la placa también sería menor en el modelo x16 R2 más reciente (150 W frente a 165 W). Estos hallazgos se correlacionan con el rendimiento gráfico generalmente más lento en la sección Rendimiento de la GPU a continuación.
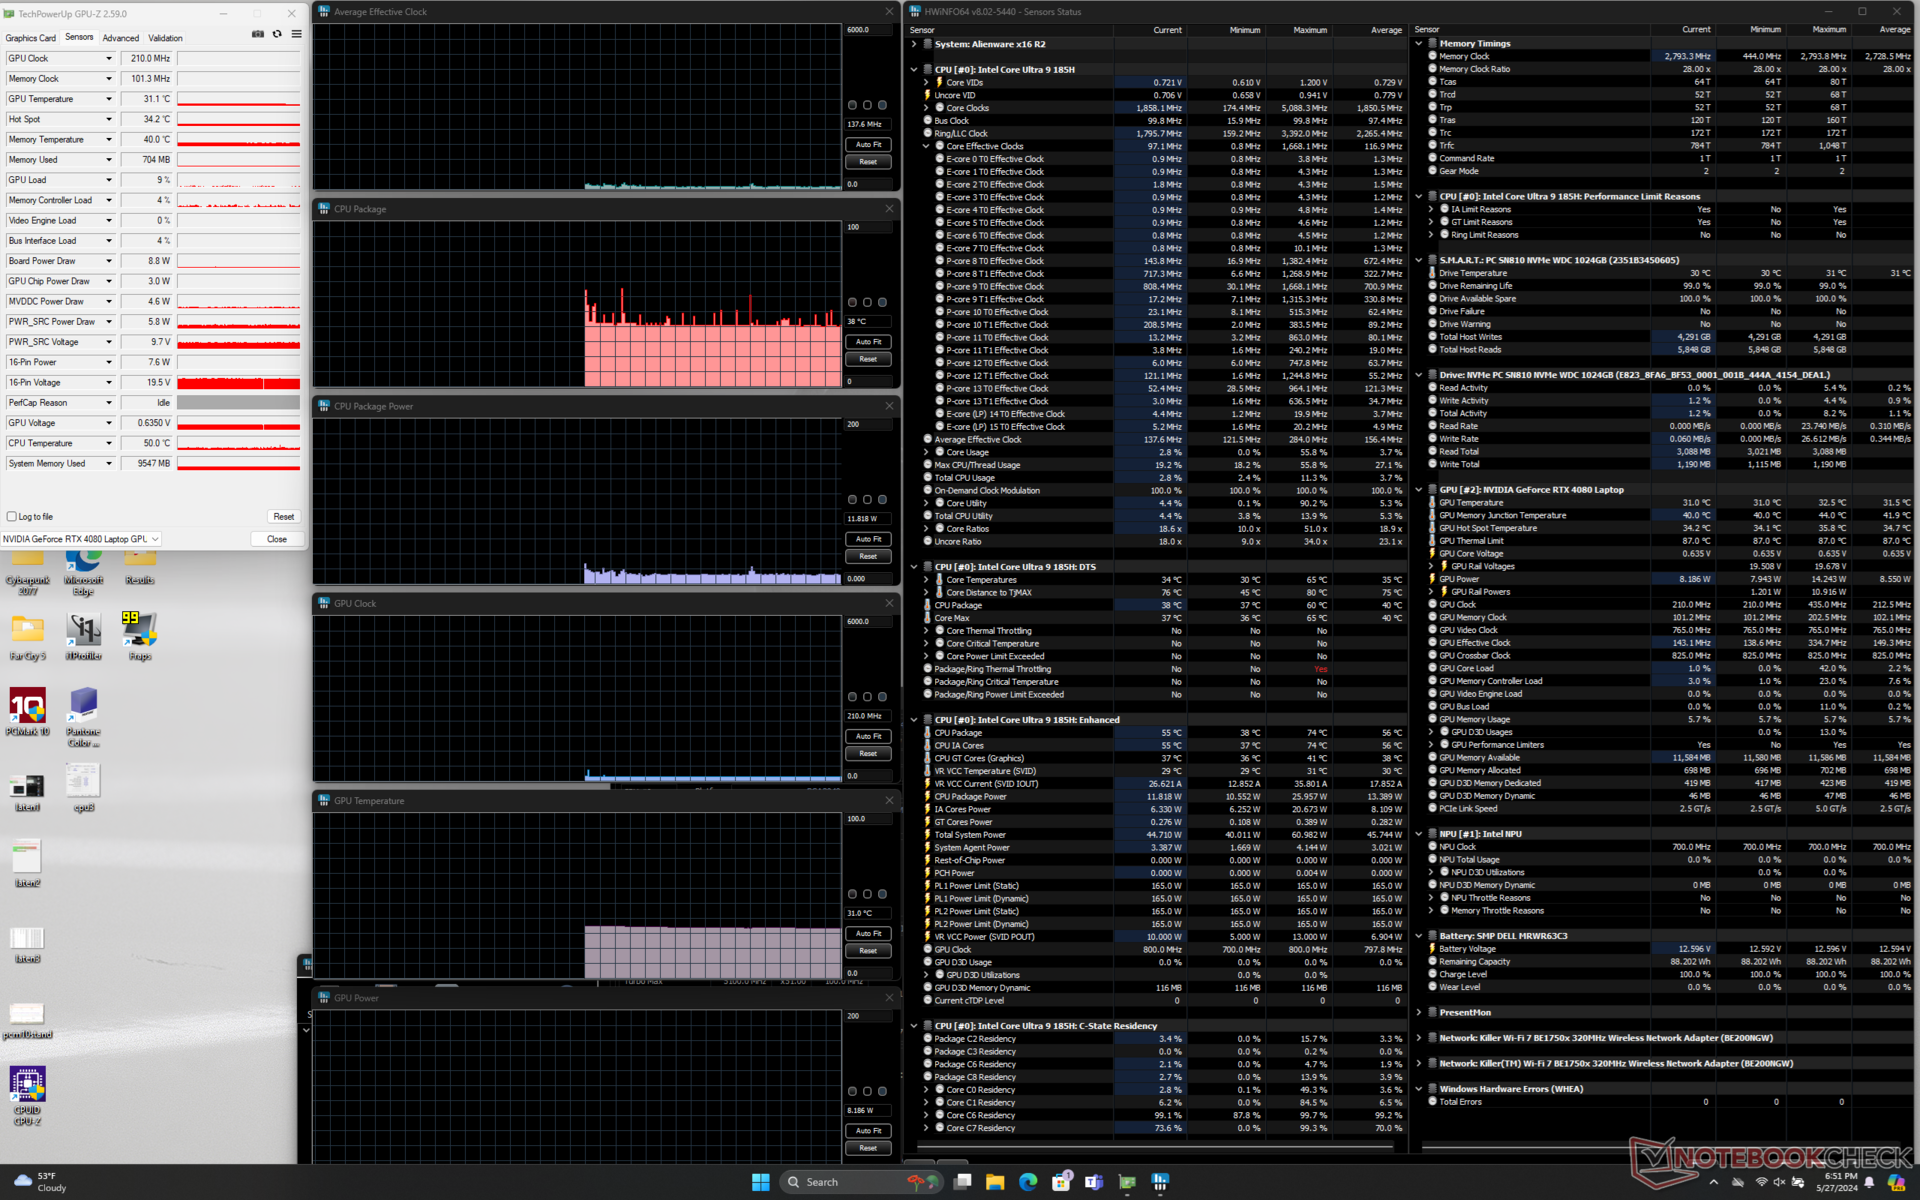
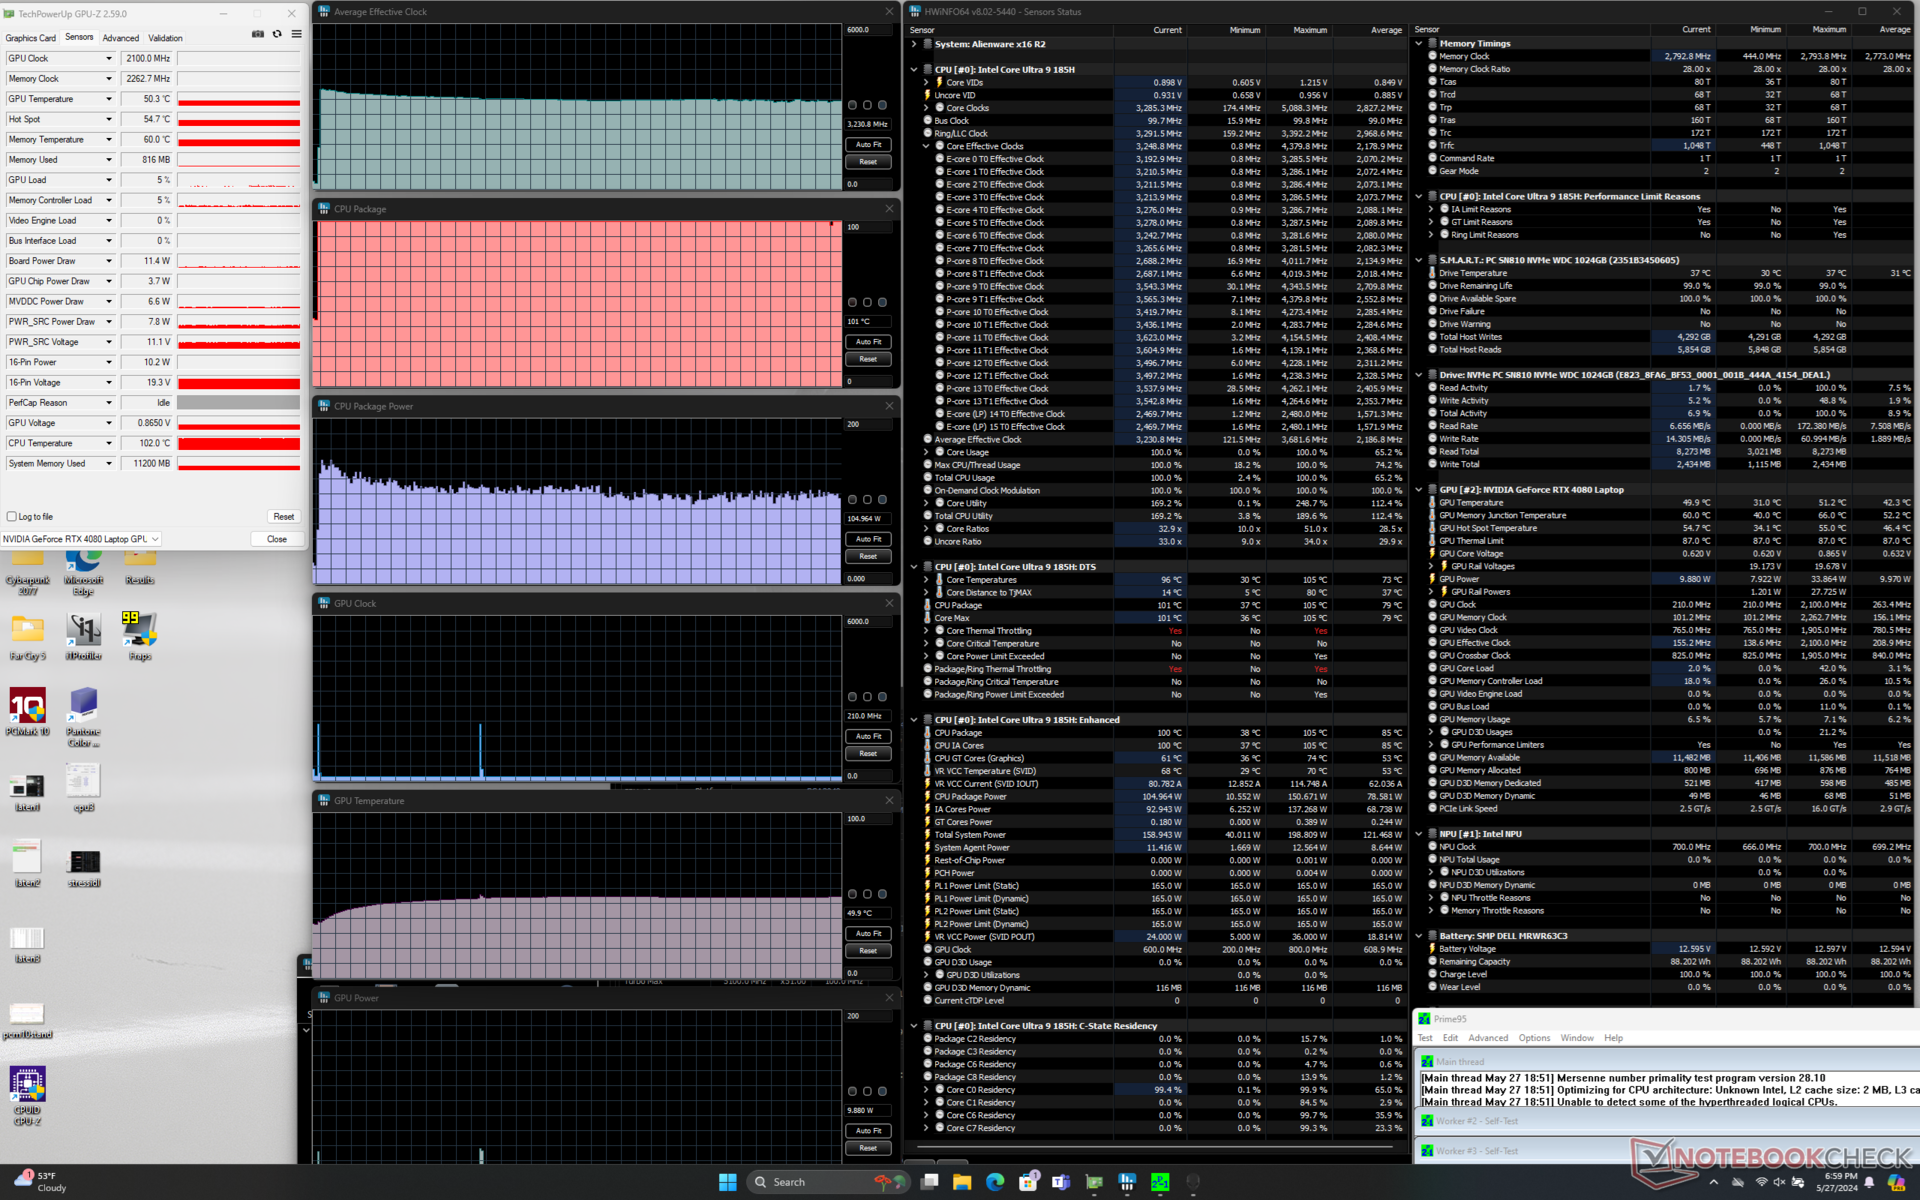
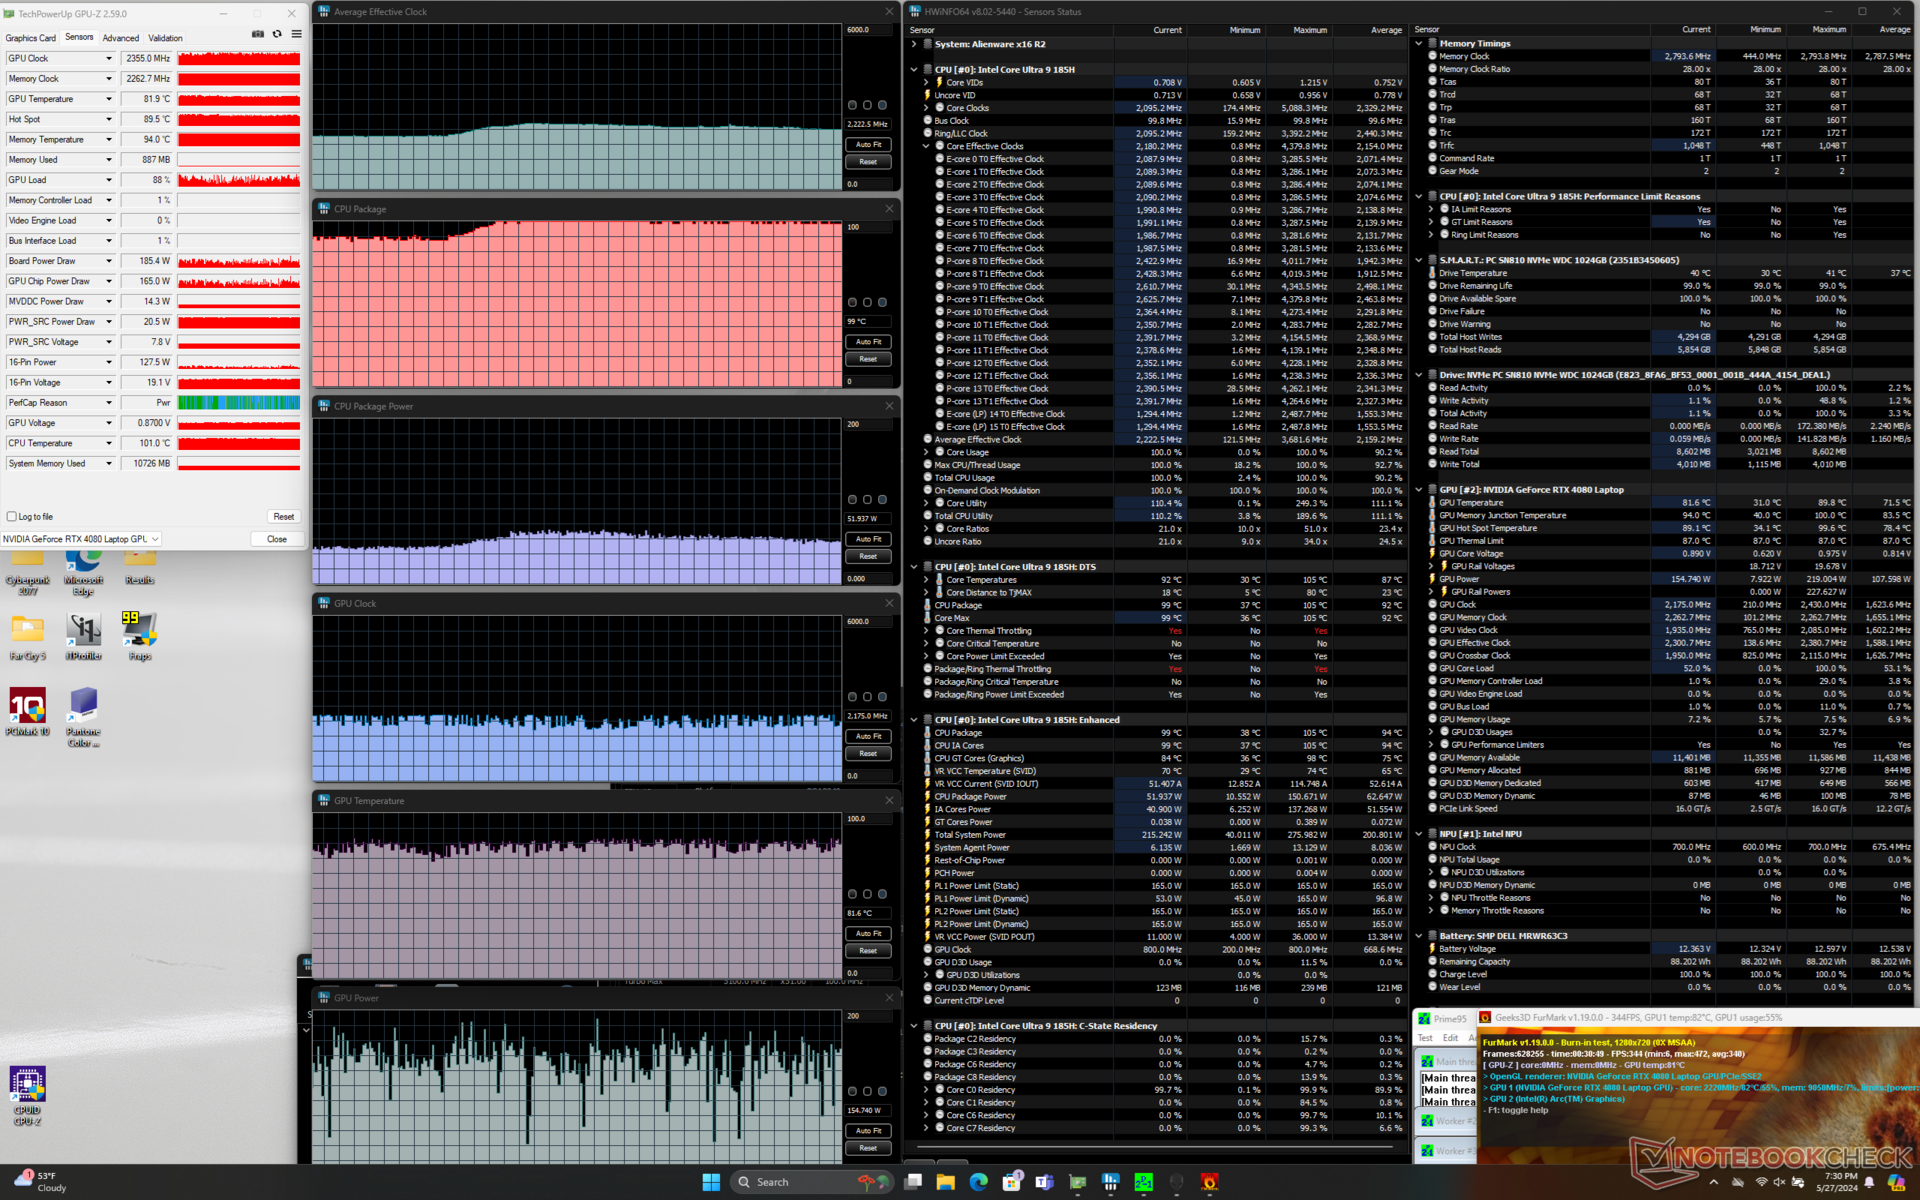

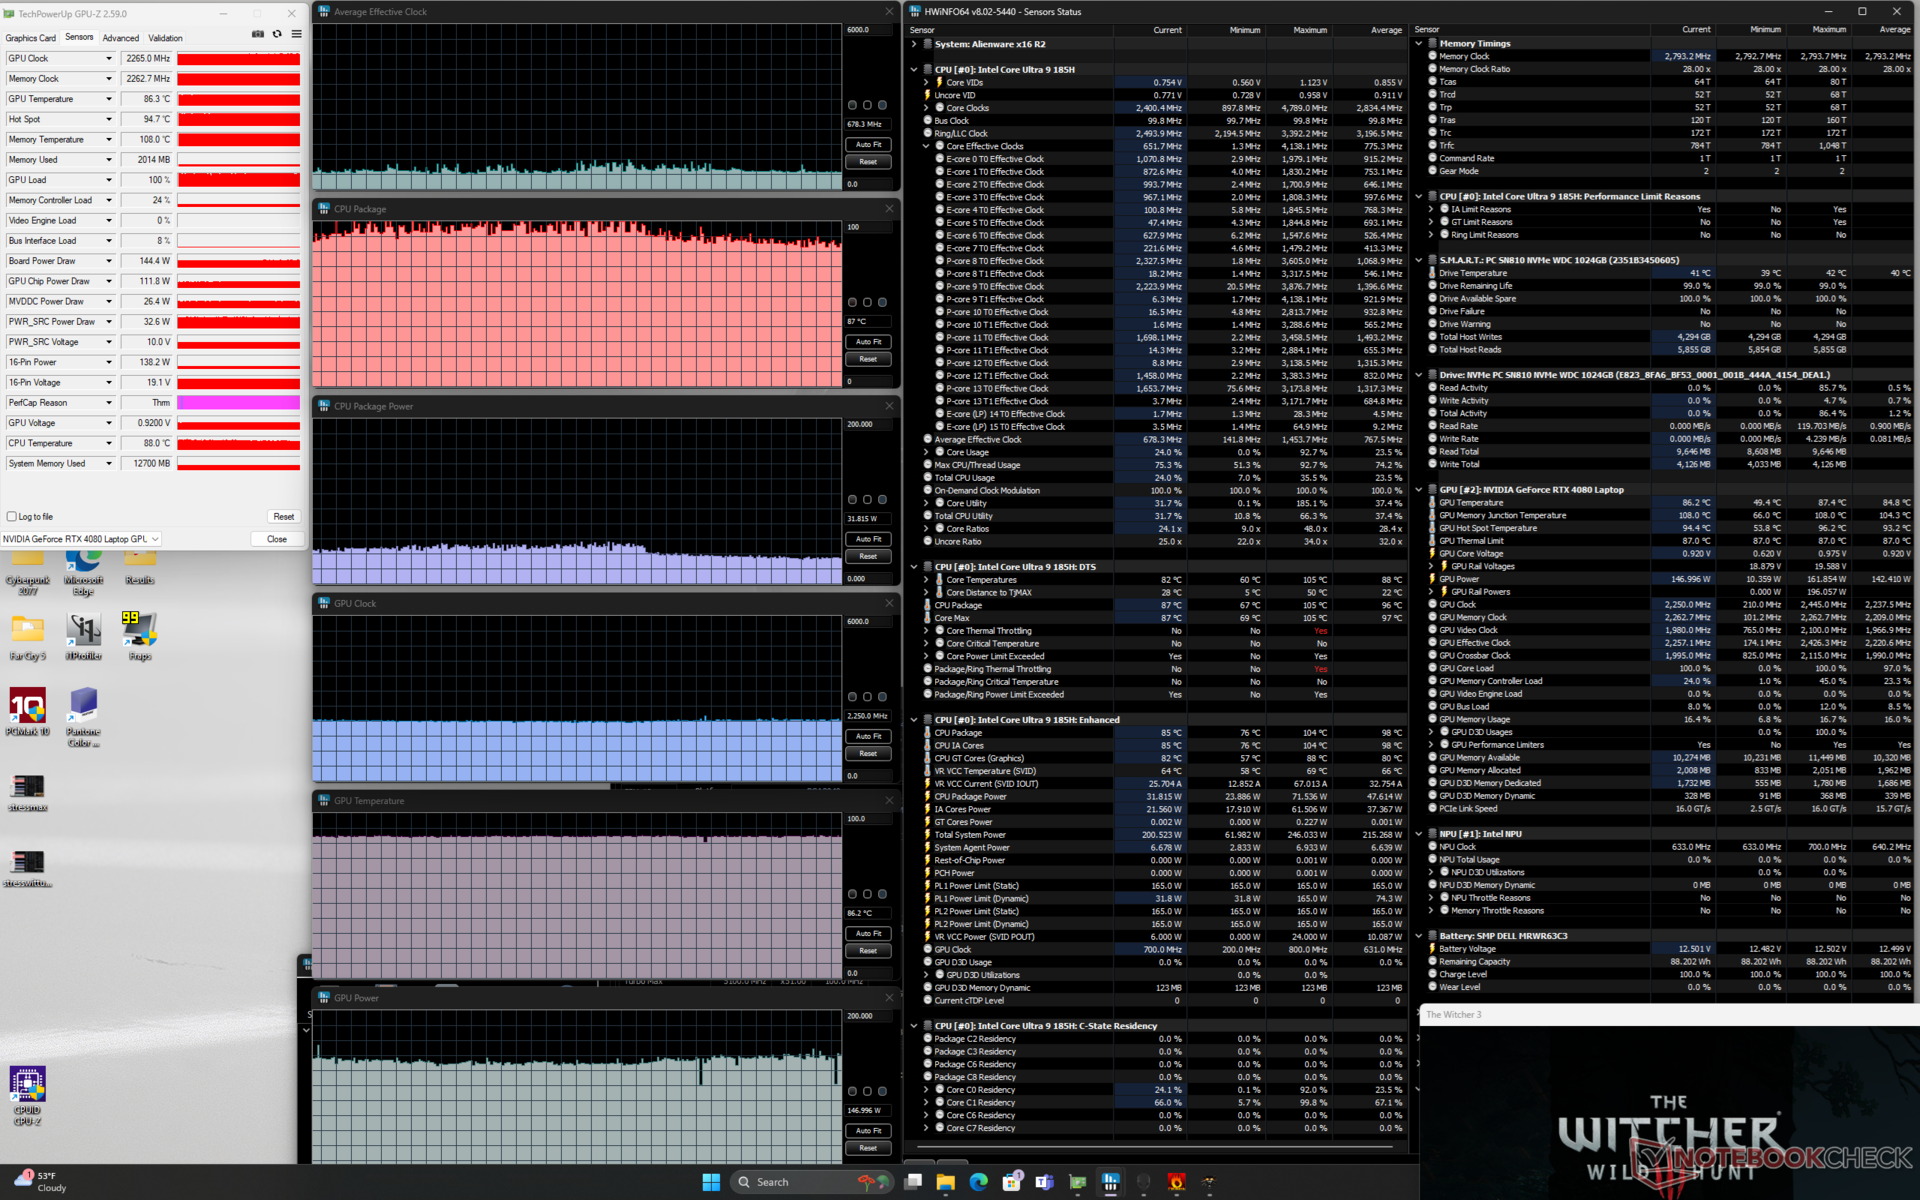
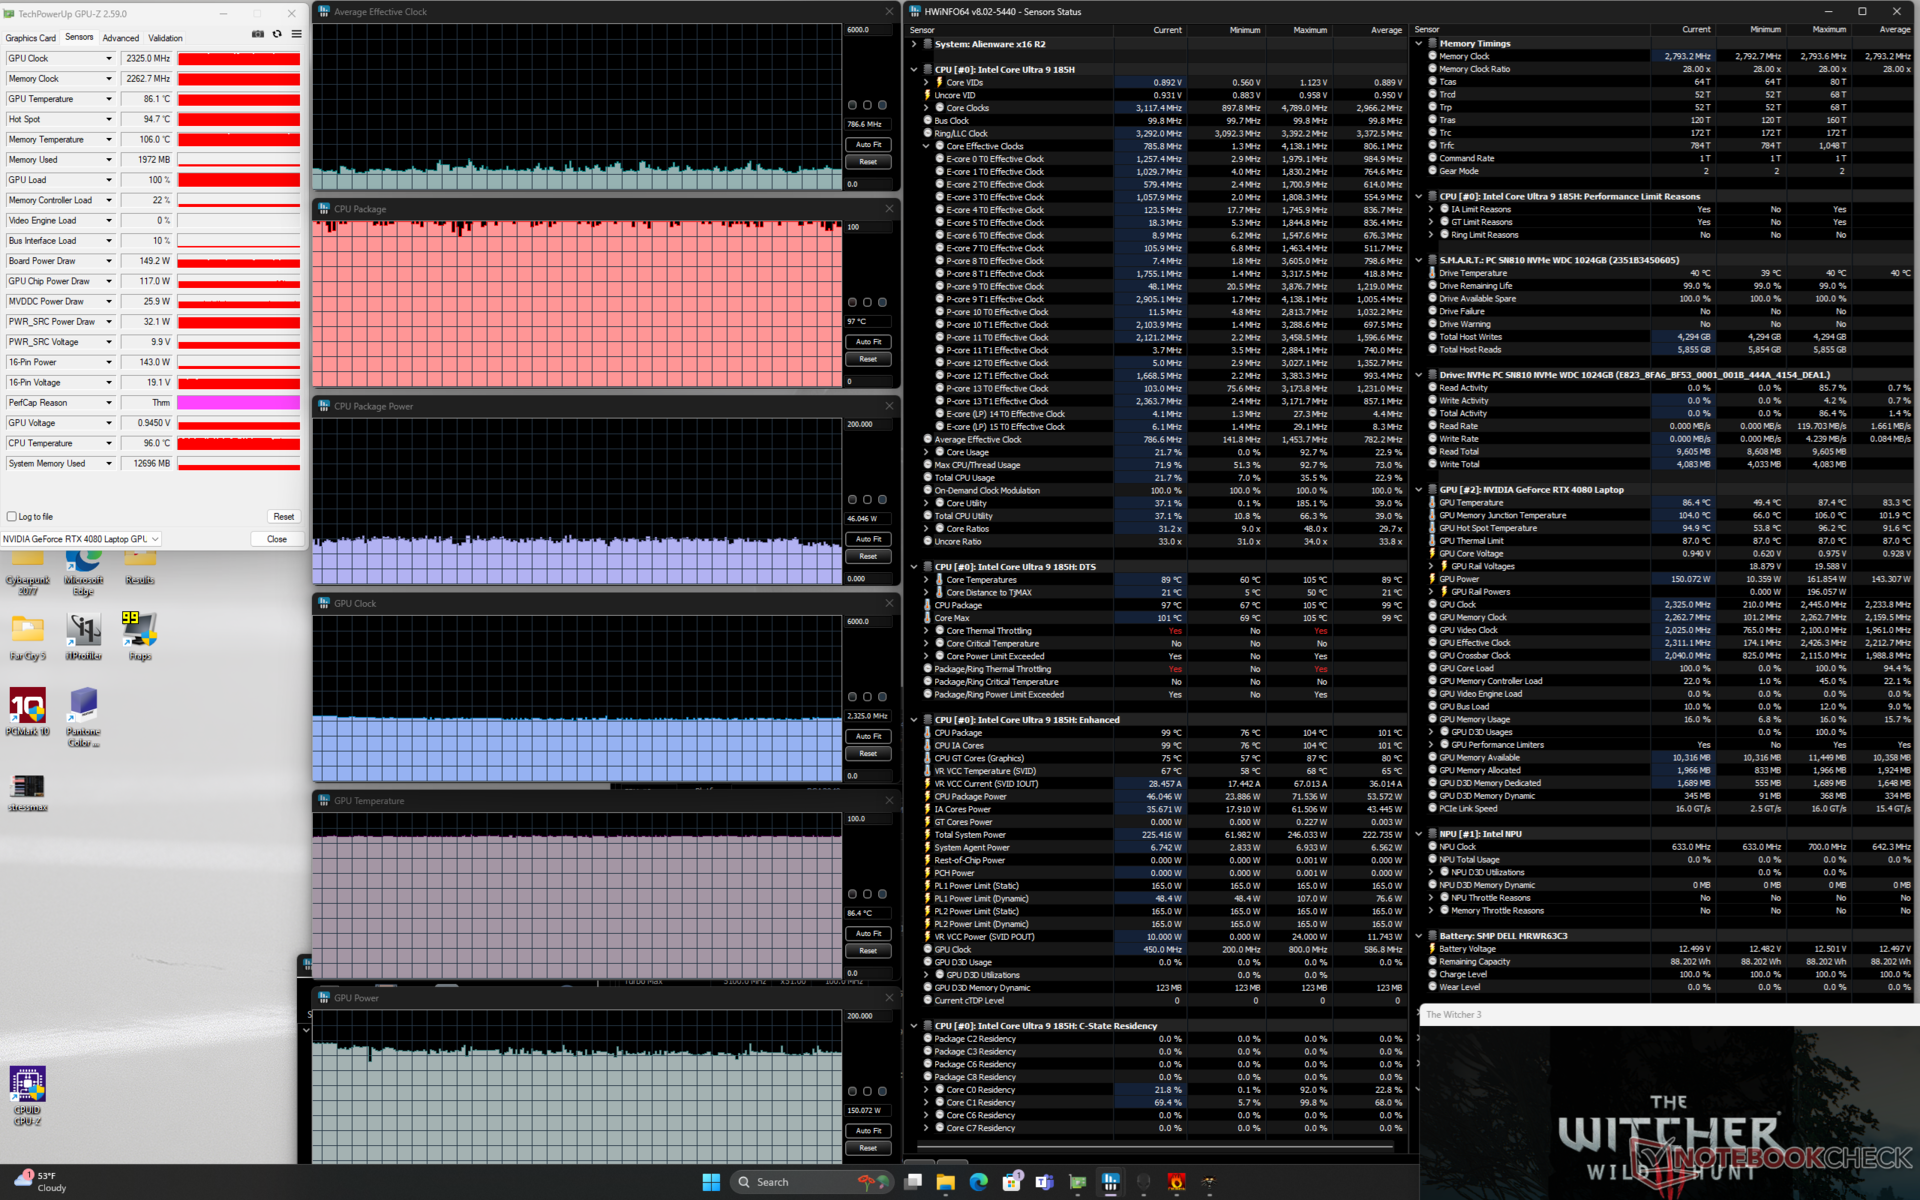
| Reloj medio de la CPU (GHz) | Reloj medio de la GPU (MHz) | Temperatura media dela CPU (°C) | Temperatura media de la GPU (°C) | |
| Sistema en reposo | -- | -- | 38 | 31 |
| Prime95 Stress | 3.2 | -- | 101 | 50 |
| Estrés Prime95+ FurMark | 2,2 | 2175 | 99 | 82 |
| Witcher 3 Estrés (modoequilibrado) | 0,7 | 2100 | 99 | 86 |
| Witcher 3 Estrés (modoRendimiento) | 0,7 | 2250 | 87 | 86 |
| Witcher 3 Tensión (modoOverdrive) | 0.8 | 2325 | 97 | 86 |
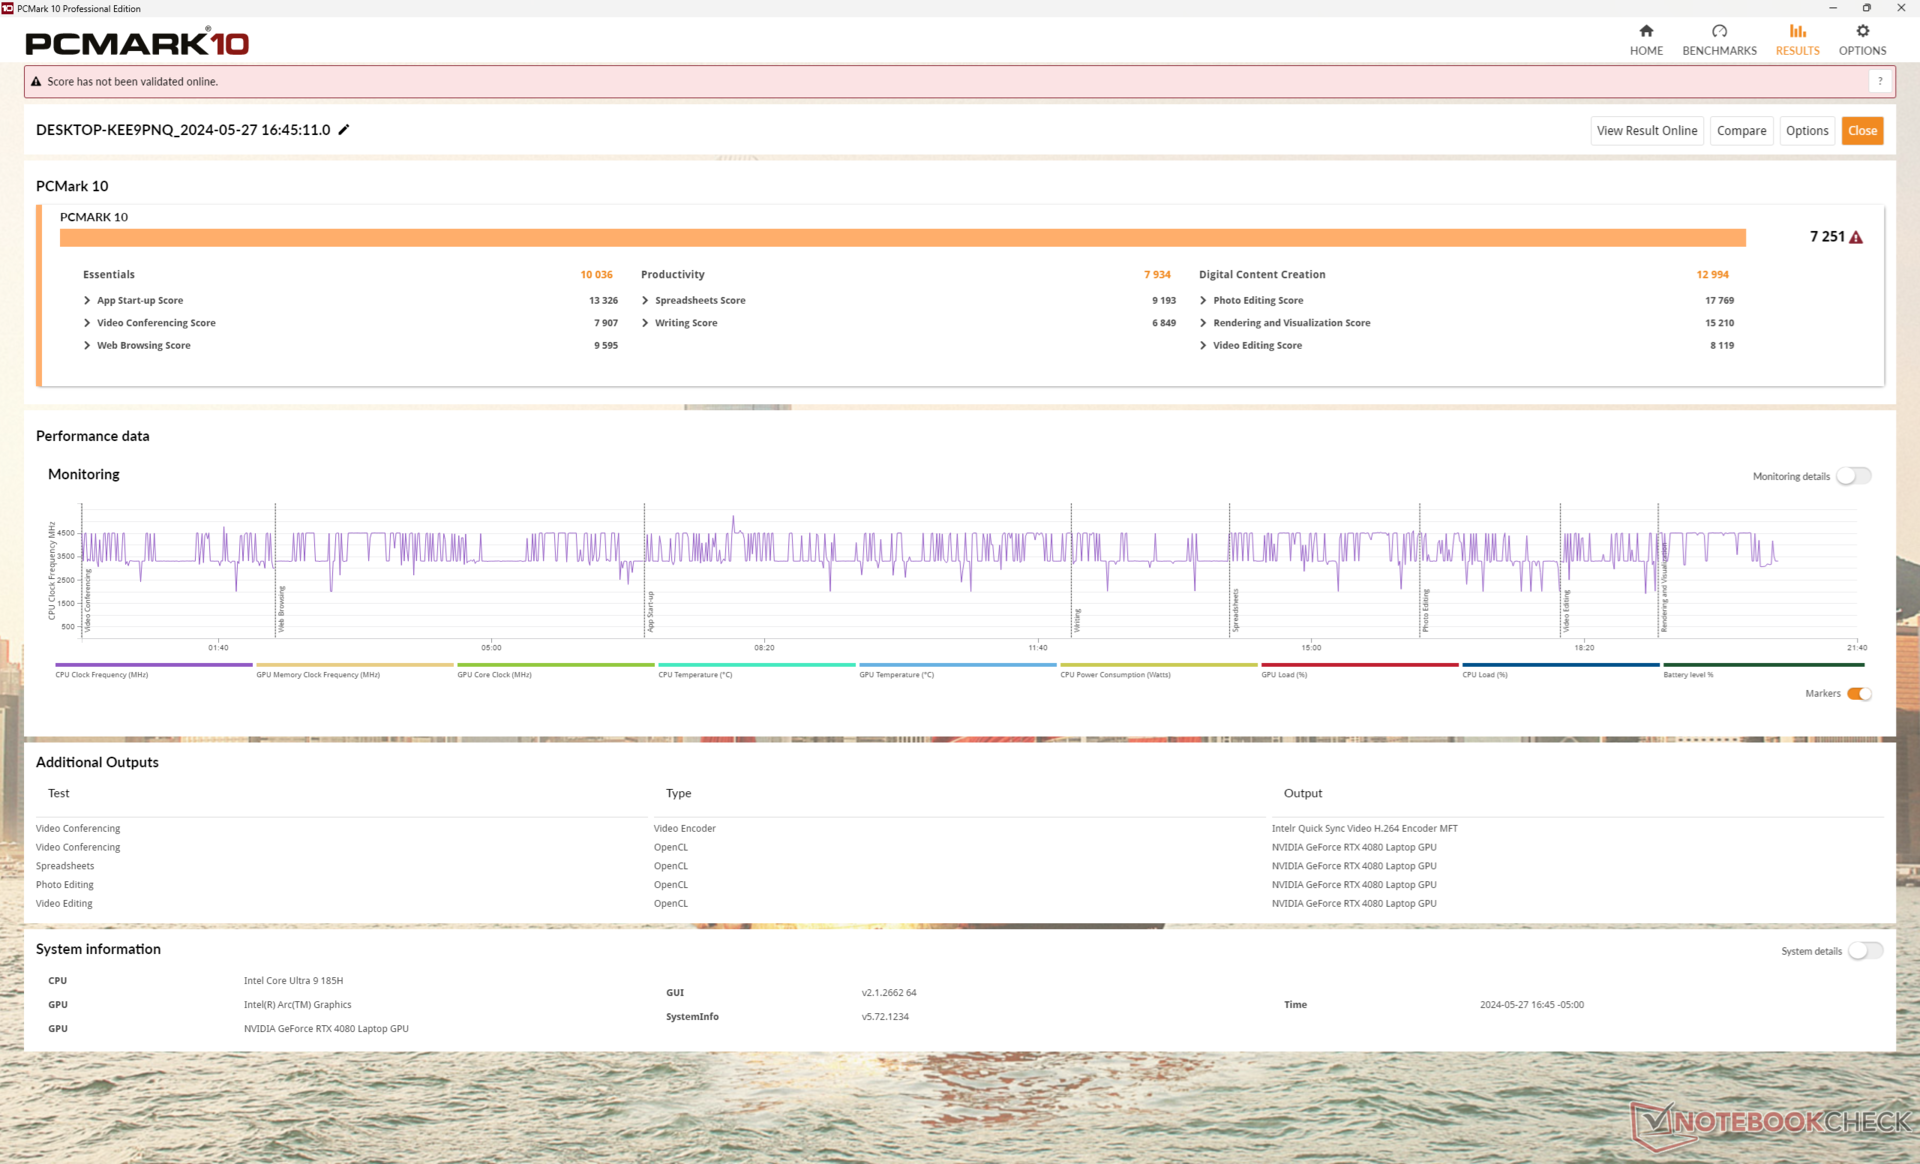
Rendimiento del sistema
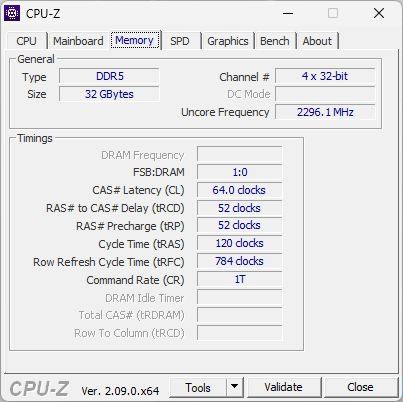
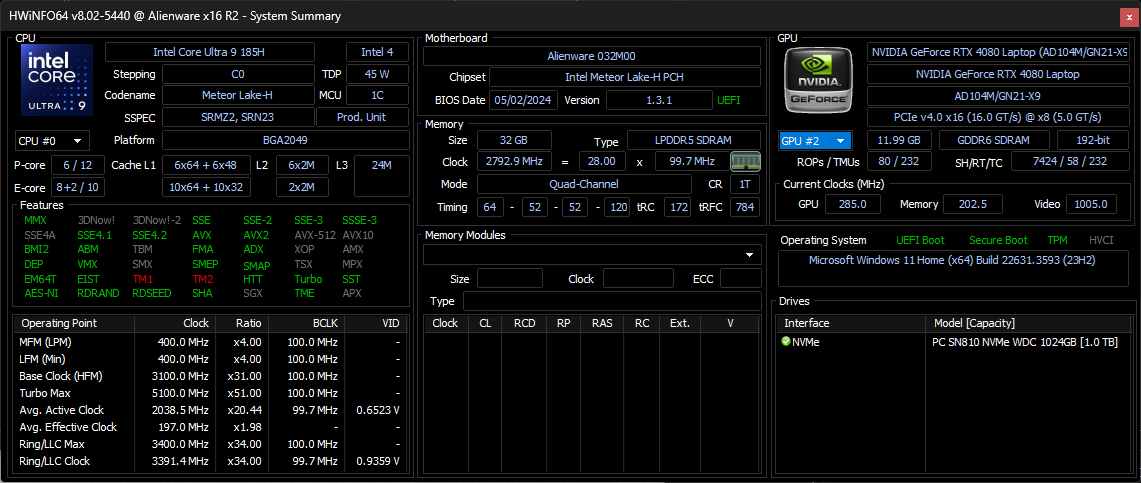
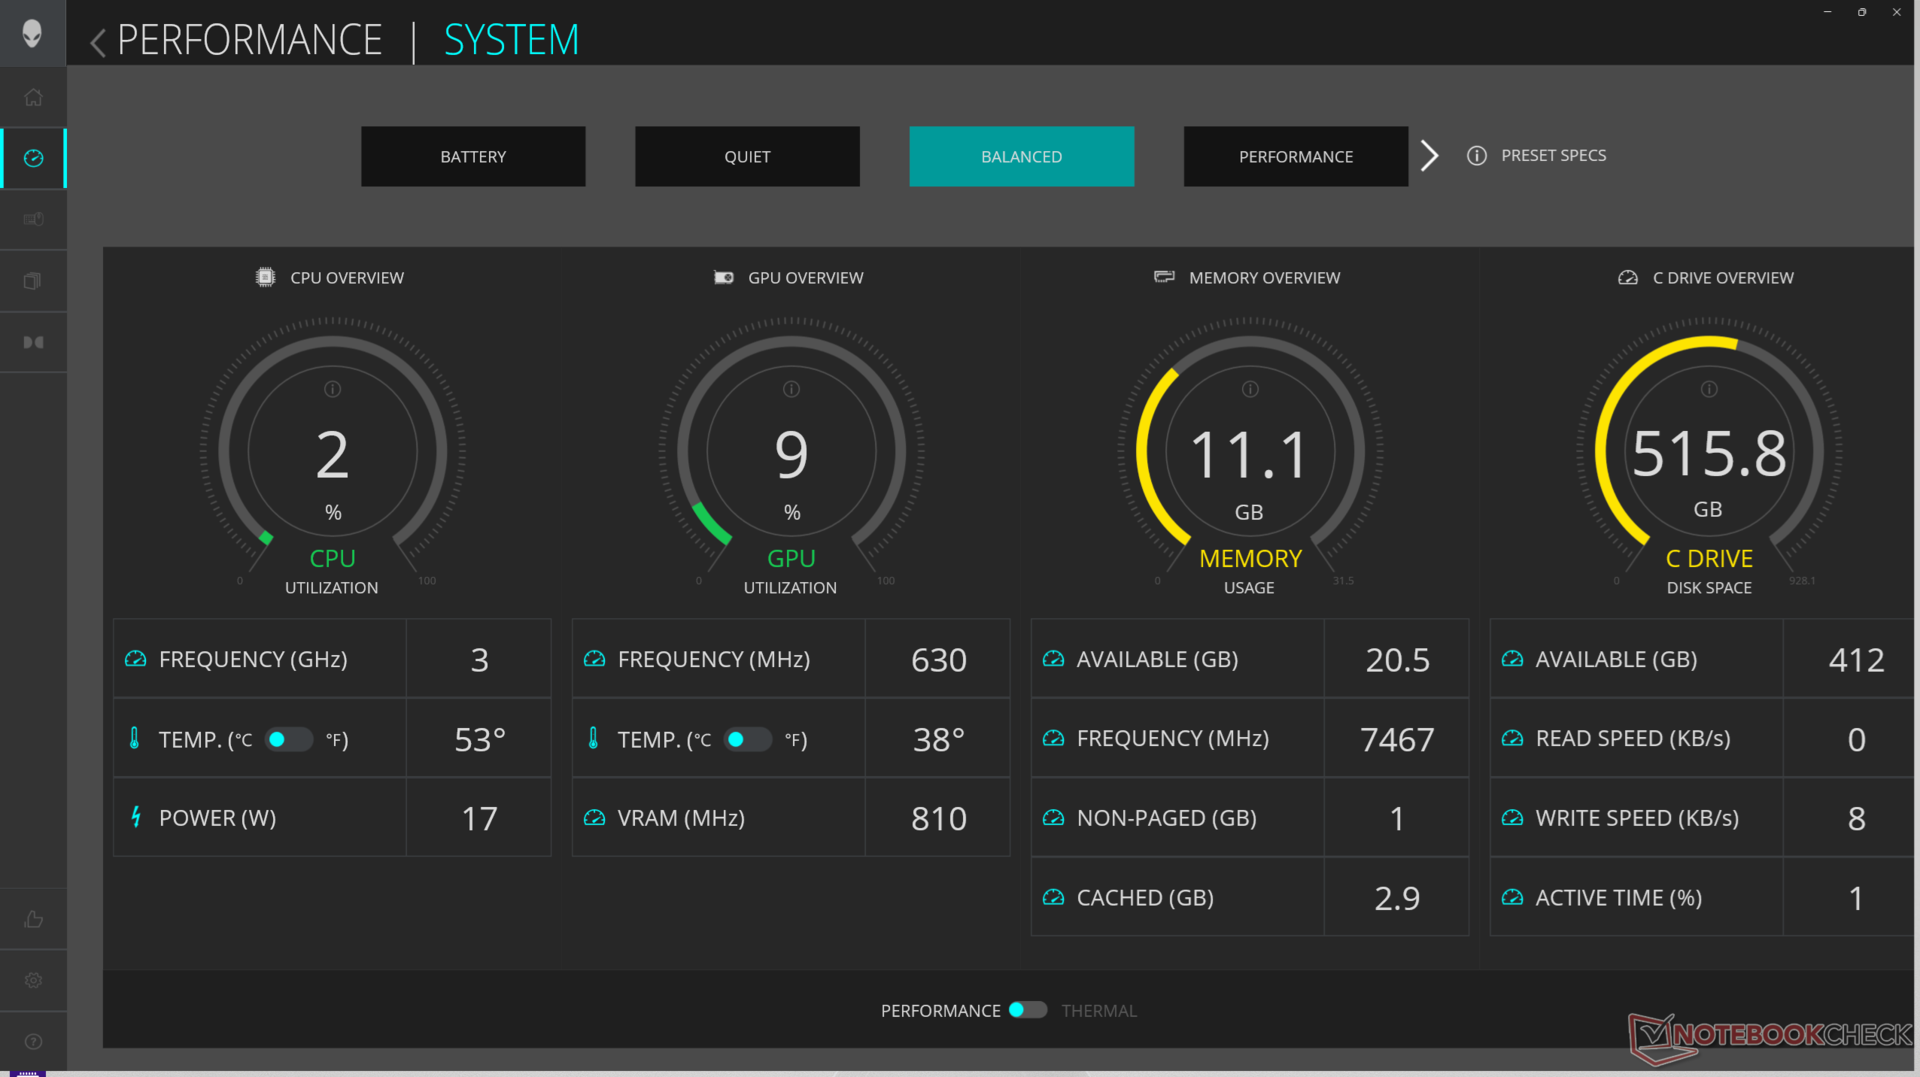
Los resultados de PCMark son prácticamente los mismos, si no inferiores, que antes. Mientras tanto, la RAM es ligeramente más rápida este año (7467 MT/s frente a 6000 MT/s) para unos resultados de copia/lectura de AIDA64 ligeramente superiores pero unos resultados de escritura y latencia más lentos.
CrossMark: Overall | Productivity | Creativity | Responsiveness
WebXPRT 3: Overall
WebXPRT 4: Overall
Mozilla Kraken 1.1: Total
| PCMark 10 / Score | |
| Lenovo Legion Pro 7 16IRX9H | |
| MSI Vector 16 HX A14V | |
| Alienware x16 R1 | |
| Alienware m16 R2 | |
| Asus ROG Strix Scar 16 G634JZR | |
| Alienware x16 R2 P120F | |
| Medio Intel Core Ultra 9 185H, NVIDIA GeForce RTX 4080 Laptop GPU (n=1) | |
| PCMark 10 / Essentials | |
| Lenovo Legion Pro 7 16IRX9H | |
| Asus ROG Strix Scar 16 G634JZR | |
| MSI Vector 16 HX A14V | |
| Alienware x16 R1 | |
| Alienware m16 R2 | |
| Alienware x16 R2 P120F | |
| Medio Intel Core Ultra 9 185H, NVIDIA GeForce RTX 4080 Laptop GPU (n=1) | |
| PCMark 10 / Productivity | |
| Lenovo Legion Pro 7 16IRX9H | |
| Alienware x16 R1 | |
| MSI Vector 16 HX A14V | |
| Alienware m16 R2 | |
| Alienware x16 R2 P120F | |
| Medio Intel Core Ultra 9 185H, NVIDIA GeForce RTX 4080 Laptop GPU (n=1) | |
| Asus ROG Strix Scar 16 G634JZR | |
| PCMark 10 / Digital Content Creation | |
| Asus ROG Strix Scar 16 G634JZR | |
| MSI Vector 16 HX A14V | |
| Lenovo Legion Pro 7 16IRX9H | |
| Alienware x16 R1 | |
| Alienware m16 R2 | |
| Alienware x16 R2 P120F | |
| Medio Intel Core Ultra 9 185H, NVIDIA GeForce RTX 4080 Laptop GPU (n=1) | |
| CrossMark / Overall | |
| Lenovo Legion Pro 7 16IRX9H | |
| MSI Vector 16 HX A14V | |
| Asus ROG Strix Scar 16 G634JZR | |
| Alienware x16 R1 | |
| Alienware m16 R2 | |
| Alienware x16 R2 P120F | |
| Medio Intel Core Ultra 9 185H, NVIDIA GeForce RTX 4080 Laptop GPU (n=1) | |
| CrossMark / Productivity | |
| Lenovo Legion Pro 7 16IRX9H | |
| MSI Vector 16 HX A14V | |
| Asus ROG Strix Scar 16 G634JZR | |
| Alienware x16 R1 | |
| Alienware m16 R2 | |
| Alienware x16 R2 P120F | |
| Medio Intel Core Ultra 9 185H, NVIDIA GeForce RTX 4080 Laptop GPU (n=1) | |
| CrossMark / Creativity | |
| Lenovo Legion Pro 7 16IRX9H | |
| MSI Vector 16 HX A14V | |
| Asus ROG Strix Scar 16 G634JZR | |
| Alienware x16 R1 | |
| Alienware m16 R2 | |
| Alienware x16 R2 P120F | |
| Medio Intel Core Ultra 9 185H, NVIDIA GeForce RTX 4080 Laptop GPU (n=1) | |
| CrossMark / Responsiveness | |
| Lenovo Legion Pro 7 16IRX9H | |
| MSI Vector 16 HX A14V | |
| Alienware x16 R1 | |
| Asus ROG Strix Scar 16 G634JZR | |
| Alienware x16 R2 P120F | |
| Medio Intel Core Ultra 9 185H, NVIDIA GeForce RTX 4080 Laptop GPU (n=1) | |
| Alienware m16 R2 | |
| WebXPRT 3 / Overall | |
| Lenovo Legion Pro 7 16IRX9H | |
| MSI Vector 16 HX A14V | |
| Asus ROG Strix Scar 16 G634JZR | |
| Alienware x16 R1 | |
| Alienware m16 R2 | |
| Alienware x16 R2 P120F | |
| Medio Intel Core Ultra 9 185H, NVIDIA GeForce RTX 4080 Laptop GPU (n=1) | |
| WebXPRT 4 / Overall | |
| Lenovo Legion Pro 7 16IRX9H | |
| Asus ROG Strix Scar 16 G634JZR | |
| MSI Vector 16 HX A14V | |
| Alienware x16 R1 | |
| Alienware m16 R2 | |
| Alienware x16 R2 P120F | |
| Medio Intel Core Ultra 9 185H, NVIDIA GeForce RTX 4080 Laptop GPU (n=1) | |
| Mozilla Kraken 1.1 / Total | |
| Alienware x16 R2 P120F | |
| Medio Intel Core Ultra 9 185H, NVIDIA GeForce RTX 4080 Laptop GPU (n=1) | |
| Alienware m16 R2 | |
| Alienware x16 R1 | |
| MSI Vector 16 HX A14V | |
| Asus ROG Strix Scar 16 G634JZR | |
| Lenovo Legion Pro 7 16IRX9H | |
* ... más pequeño es mejor
| PCMark 10 Score | 7251 puntos | |
ayuda | ||
| AIDA64 / Memory Copy | |
| Alienware x16 R2 P120F | |
| Medio Intel Core Ultra 9 185H (69929 - 95718, n=19) | |
| Asus ROG Strix Scar 16 G634JZR | |
| Lenovo Legion Pro 7 16IRX9H | |
| MSI Vector 16 HX A14V | |
| Alienware x16 R1 | |
| Alienware m16 R2 | |
| AIDA64 / Memory Read | |
| Asus ROG Strix Scar 16 G634JZR | |
| Lenovo Legion Pro 7 16IRX9H | |
| MSI Vector 16 HX A14V | |
| Alienware x16 R2 P120F | |
| Medio Intel Core Ultra 9 185H (64619 - 87768, n=19) | |
| Alienware m16 R2 | |
| Alienware x16 R1 | |
| AIDA64 / Memory Write | |
| Alienware x16 R1 | |
| Asus ROG Strix Scar 16 G634JZR | |
| MSI Vector 16 HX A14V | |
| Alienware x16 R2 P120F | |
| Medio Intel Core Ultra 9 185H (51114 - 93871, n=19) | |
| Lenovo Legion Pro 7 16IRX9H | |
| Alienware m16 R2 | |
| AIDA64 / Memory Latency | |
| Medio Intel Core Ultra 9 185H (121.4 - 259, n=19) | |
| Alienware x16 R2 P120F | |
| Alienware m16 R2 | |
| Alienware x16 R1 | |
| MSI Vector 16 HX A14V | |
| Asus ROG Strix Scar 16 G634JZR | |
| Lenovo Legion Pro 7 16IRX9H | |
* ... más pequeño es mejor
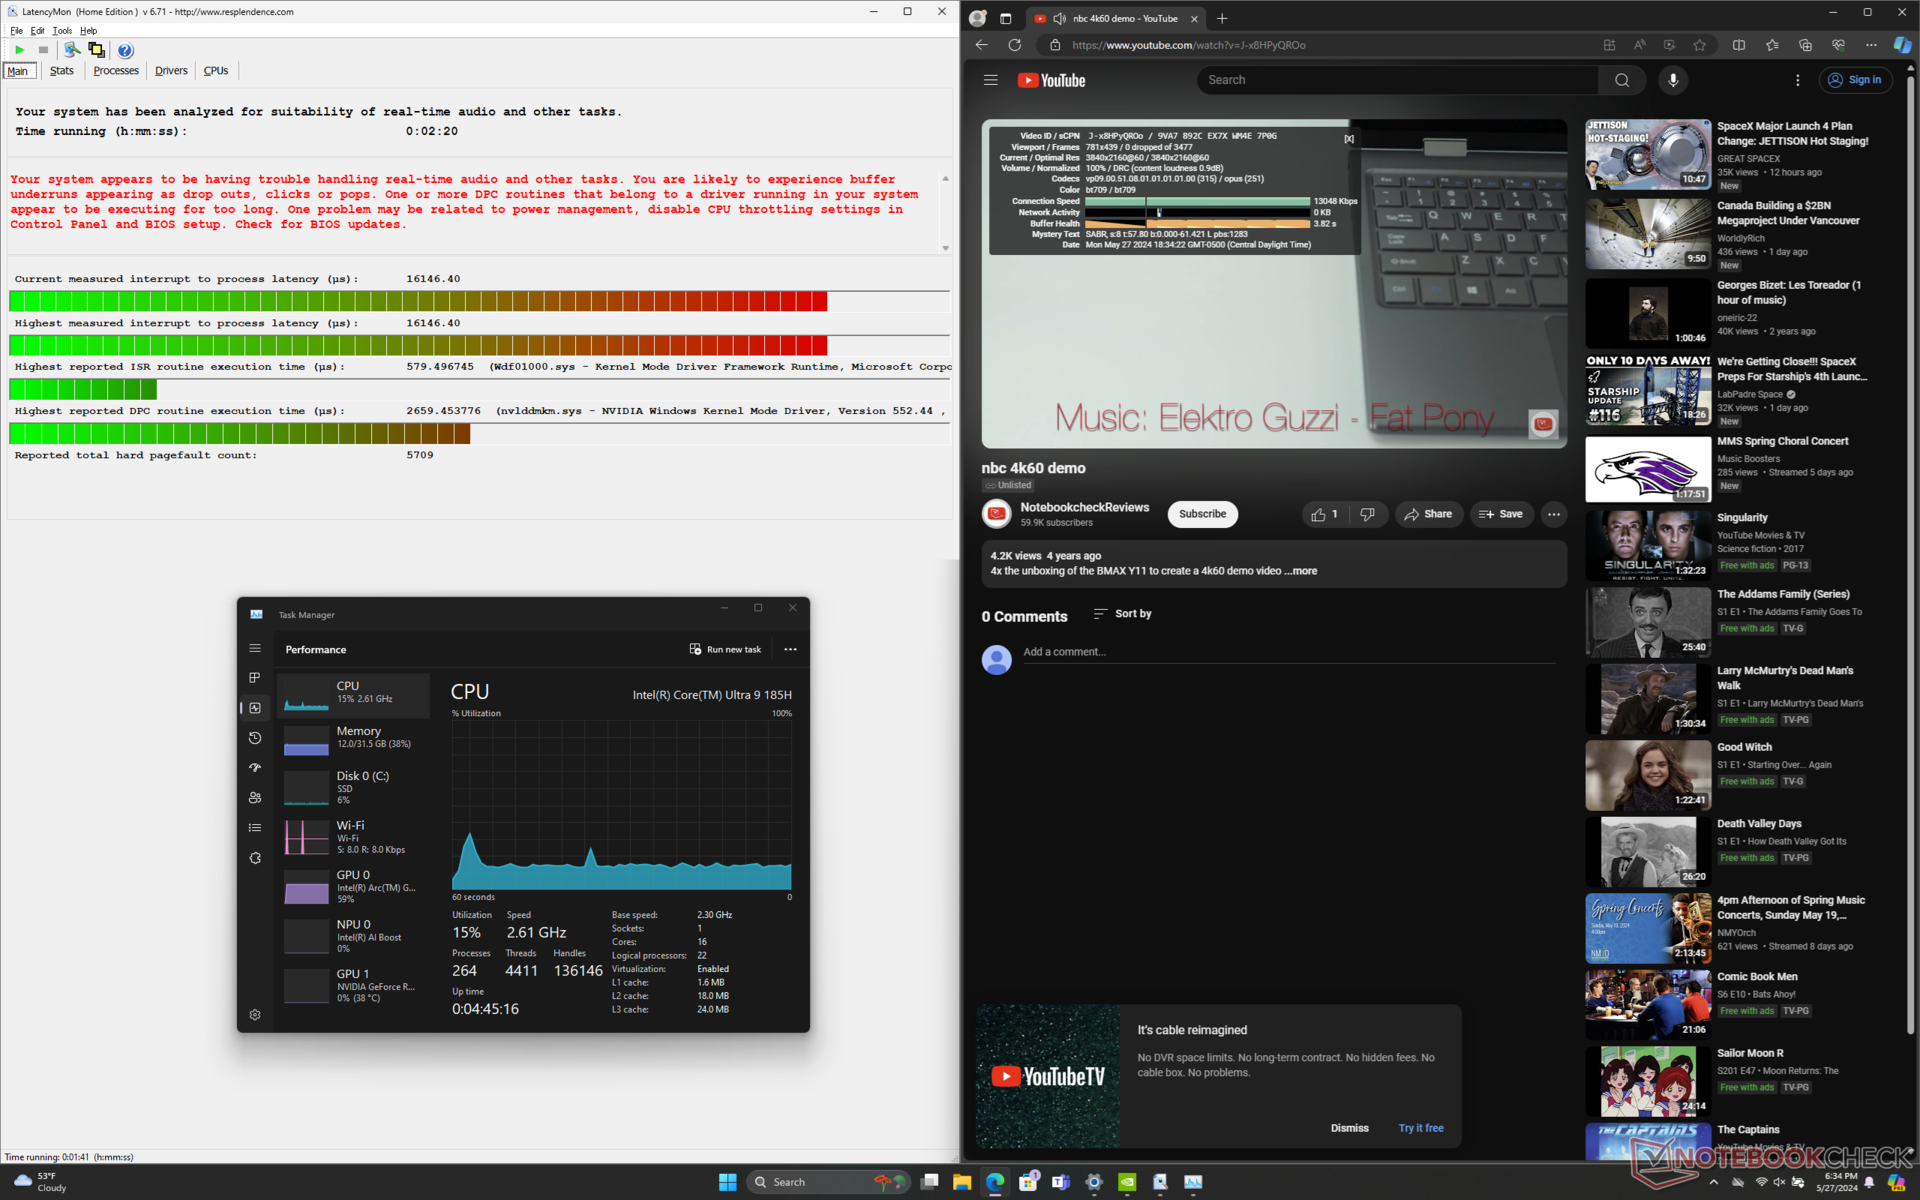
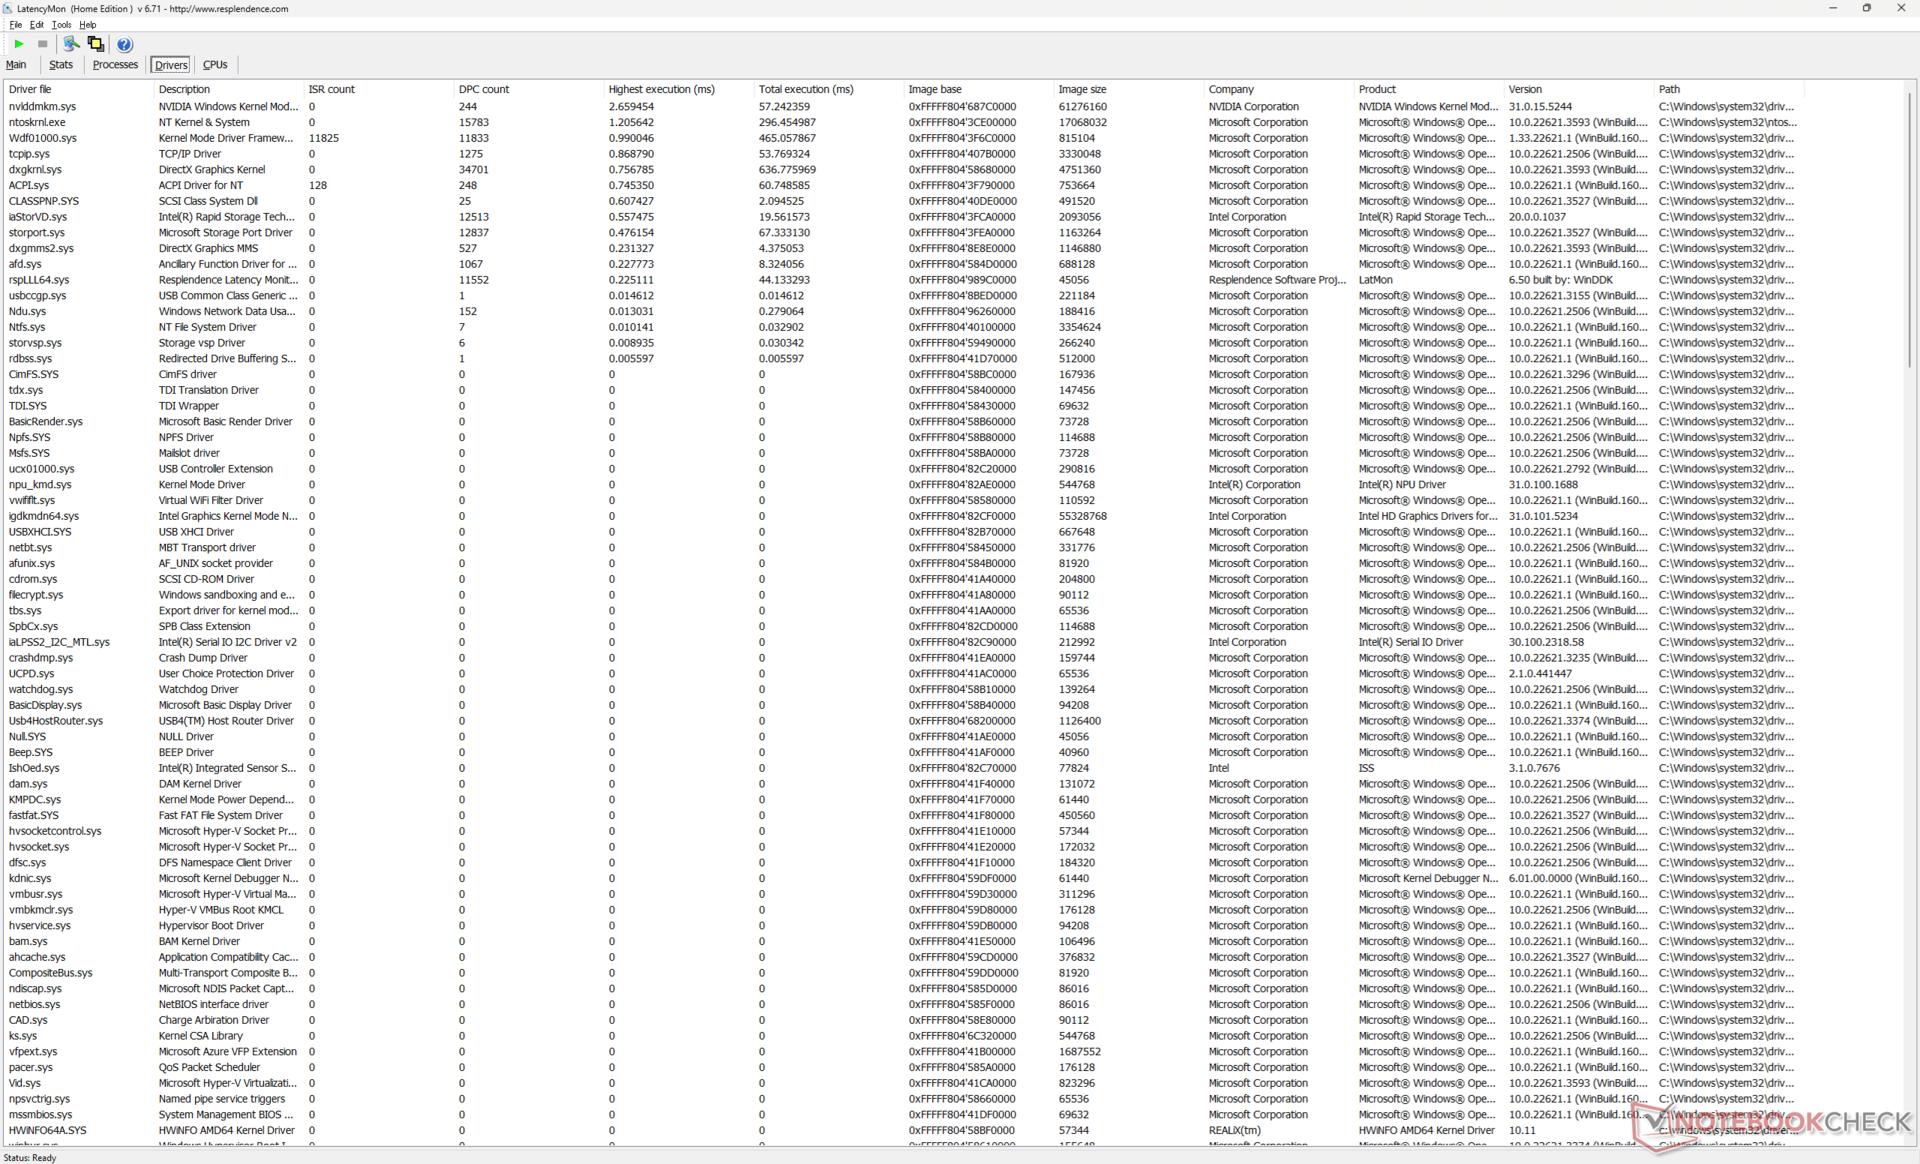
Latencia del CPD
LatencyMon revela notables problemas de CPD al abrir varias pestañas del navegador de nuestra página de inicio, incluso después de múltiples reintentos en el modo Optimus. No experimentamos tales problemas en el x16 R1 original. por lo demás, la reproducción de vídeo 4K a 60 FPS es perfecta sin que se registre ninguna caída de fotogramas.
| DPC Latencies / LatencyMon - interrupt to process latency (max), Web, Youtube, Prime95 | |
| Alienware x16 R2 P120F | |
| Asus ROG Strix Scar 16 G634JZR | |
| Alienware m16 R2 | |
| MSI Vector 16 HX A14V | |
| Alienware x16 R1 | |
| Lenovo Legion Pro 7 16IRX9H | |
* ... más pequeño es mejor
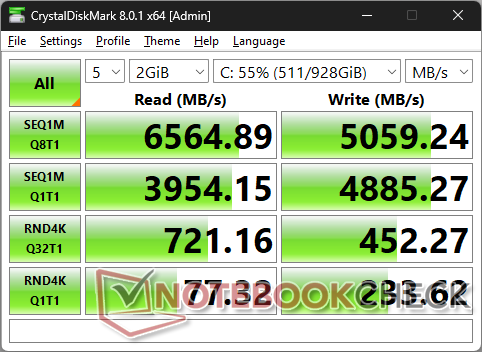
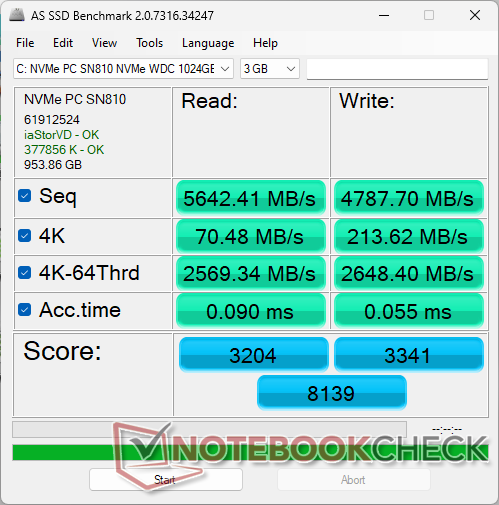
Dispositivos de almacenamiento
Nuestra unidad de prueba se entrega con el WDC PC SN810 en lugar de la SK Hynix PC801 del modelo del año pasado. La unidad Western Digital puede mantener velocidades de transferencia máximas durante más tiempo que la SK Hynix, como muestra nuestro gráfico de bucle DiskSpd que aparece a continuación, pero las velocidades de escritura son en general más lentas.

| Drive Performance Rating - Percent | |
| Lenovo Legion Pro 7 16IRX9H | |
| Alienware x16 R1 | |
| Alienware x16 R2 P120F | |
| Alienware m16 R2 | |
| Asus ROG Strix Scar 16 G634JZR | |
| MSI Vector 16 HX A14V | |
* ... más pequeño es mejor
Disk Throttling: DiskSpd Read Loop, Queue Depth 8
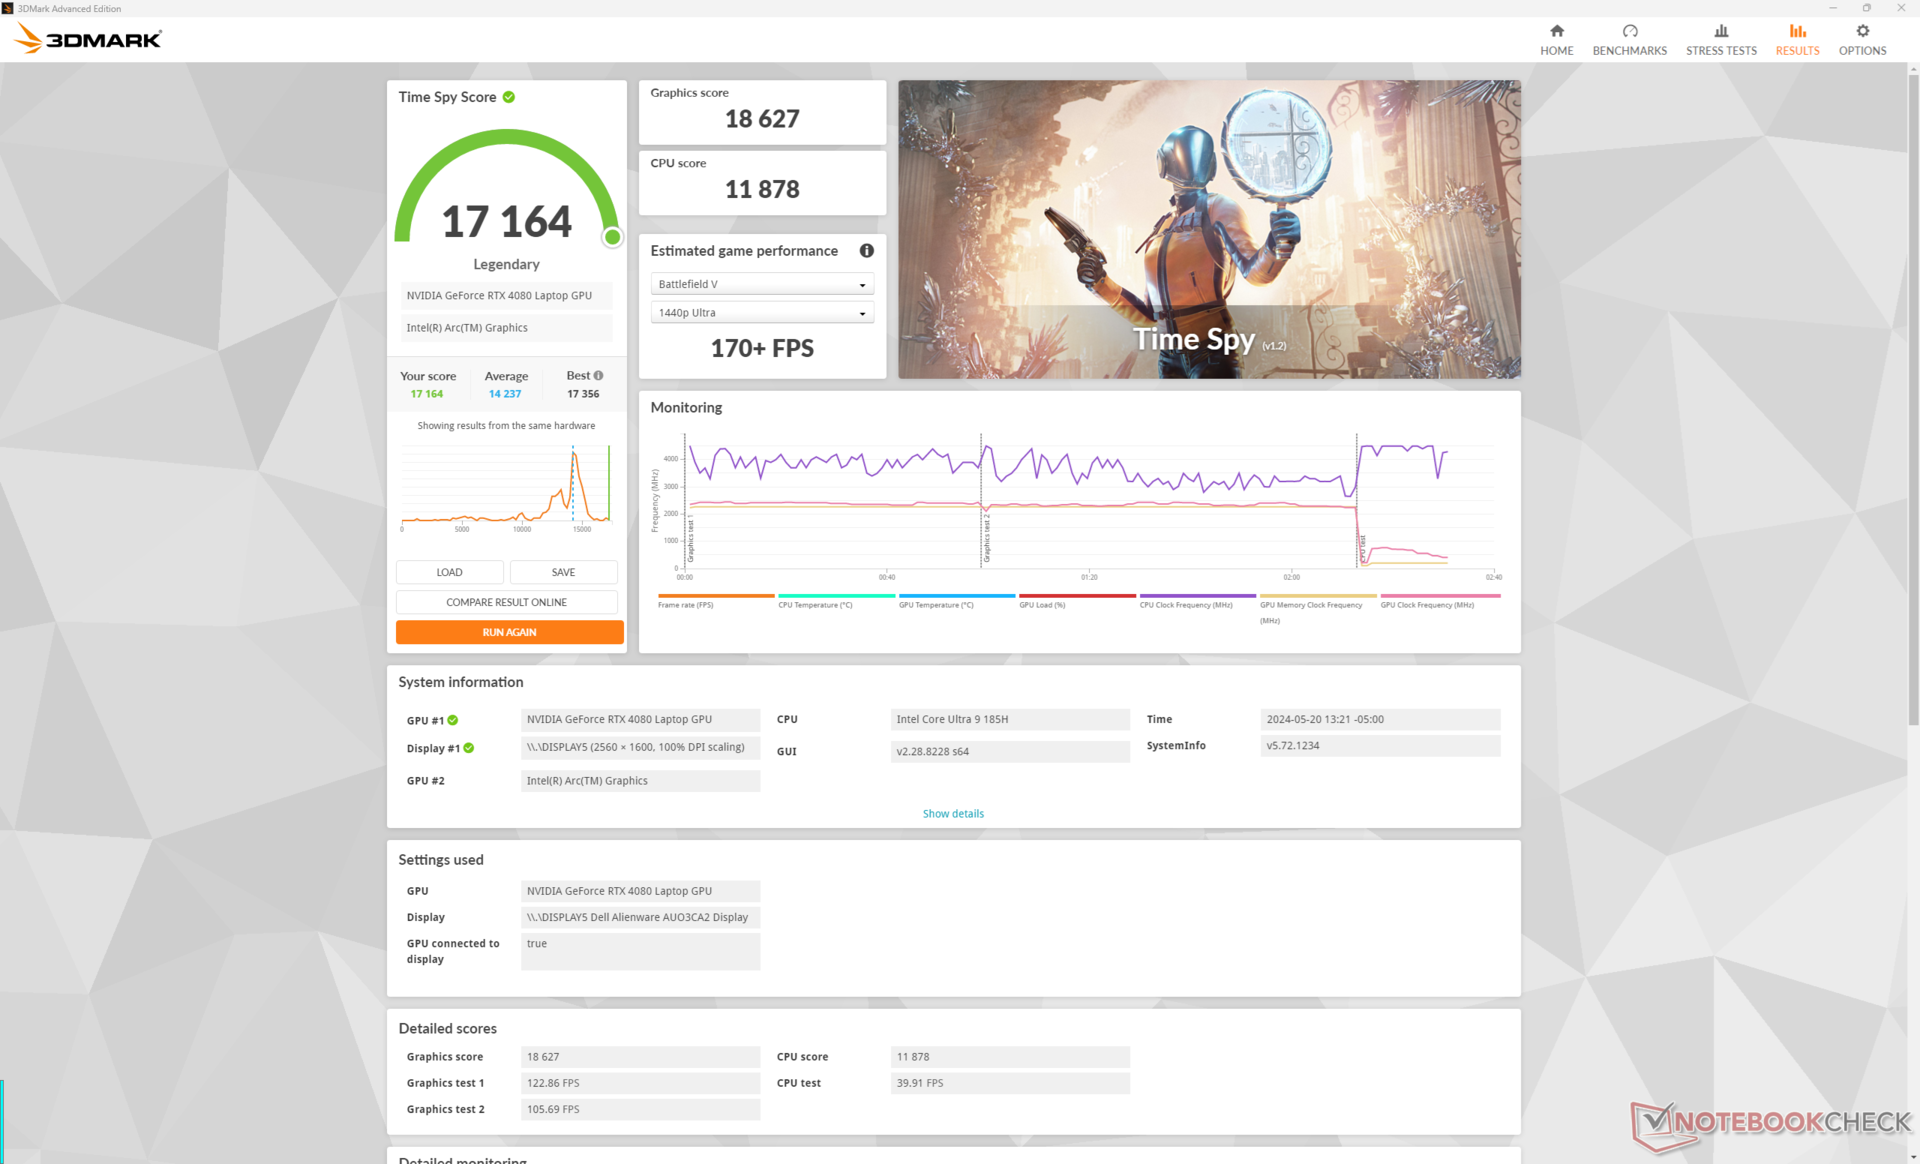
Rendimiento de la GPU
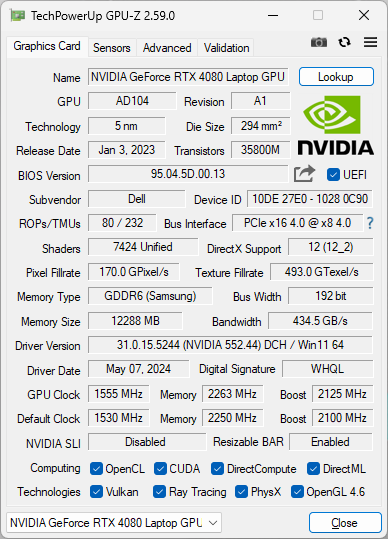
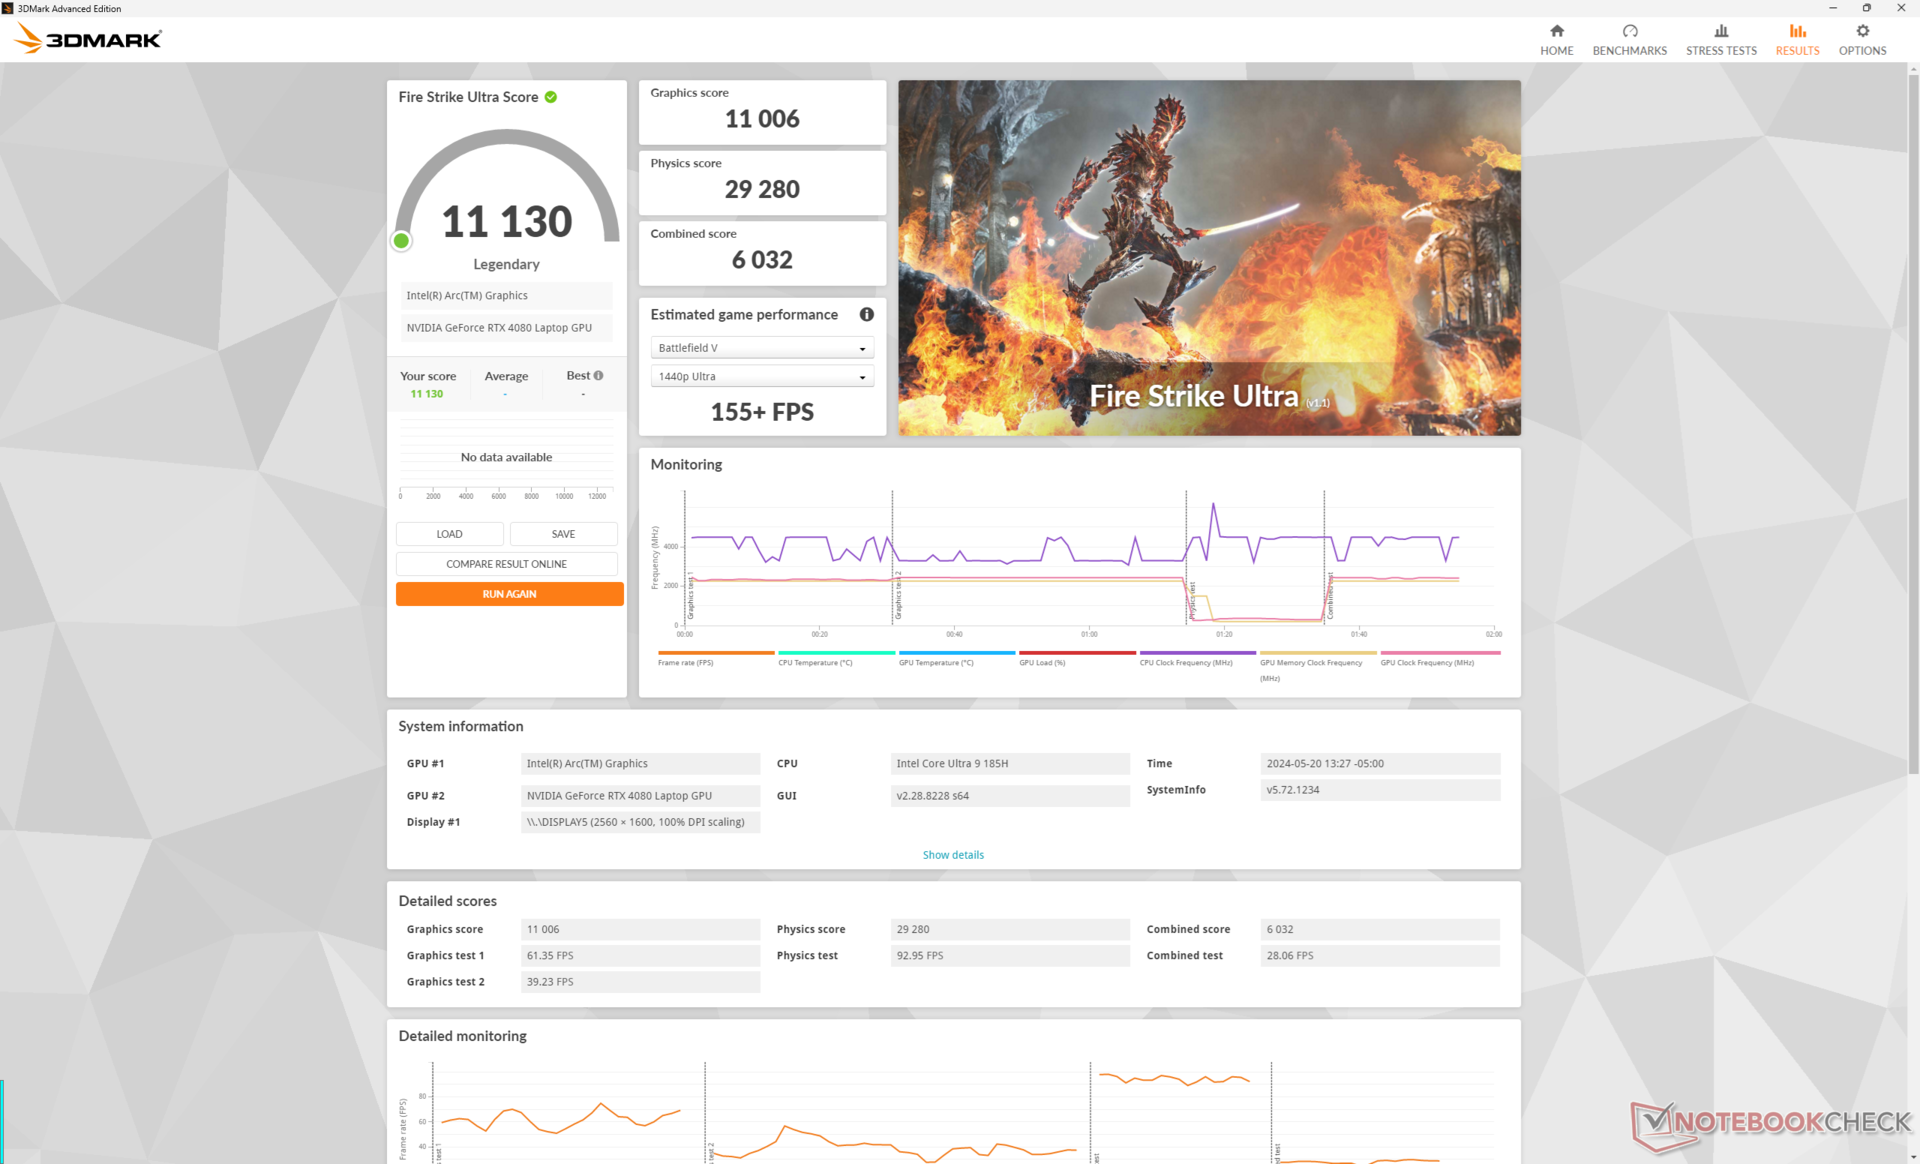
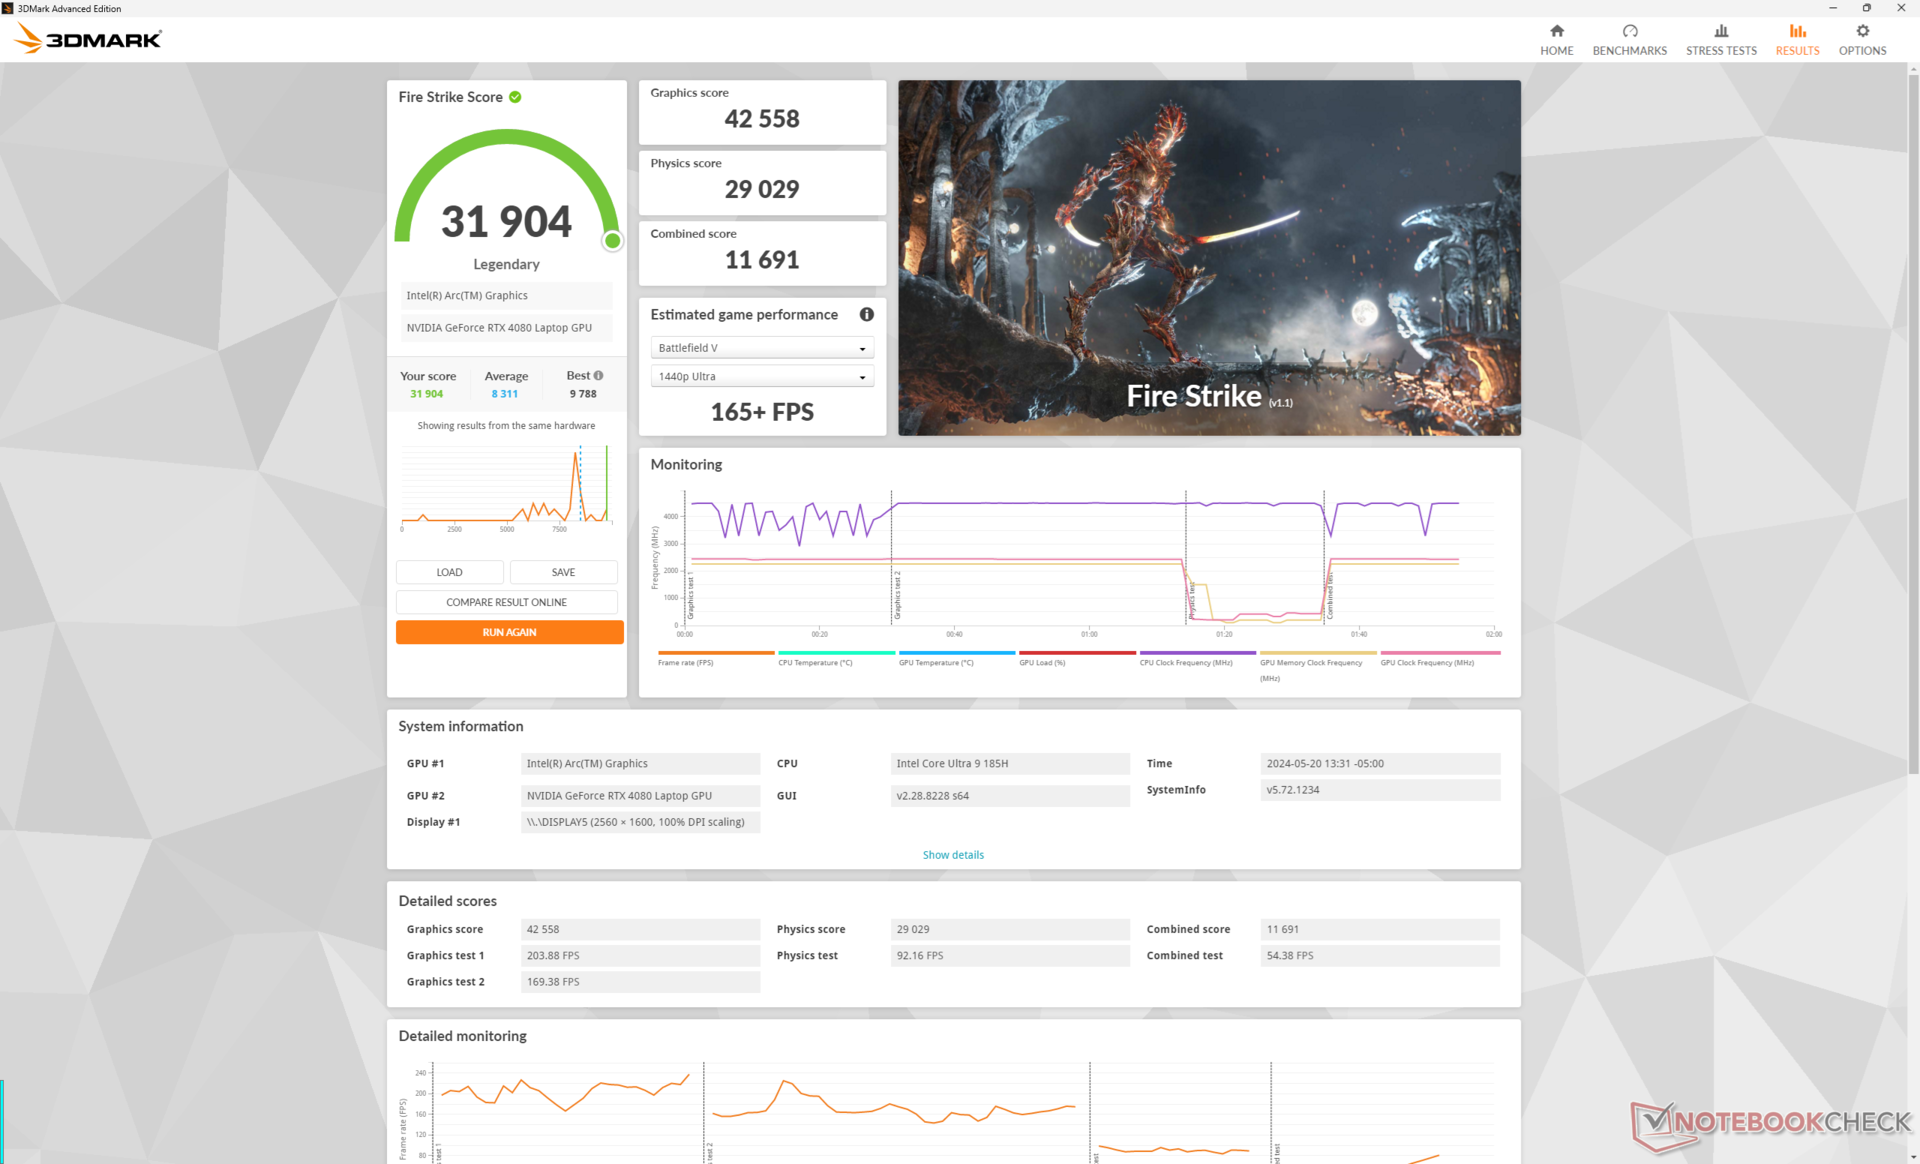
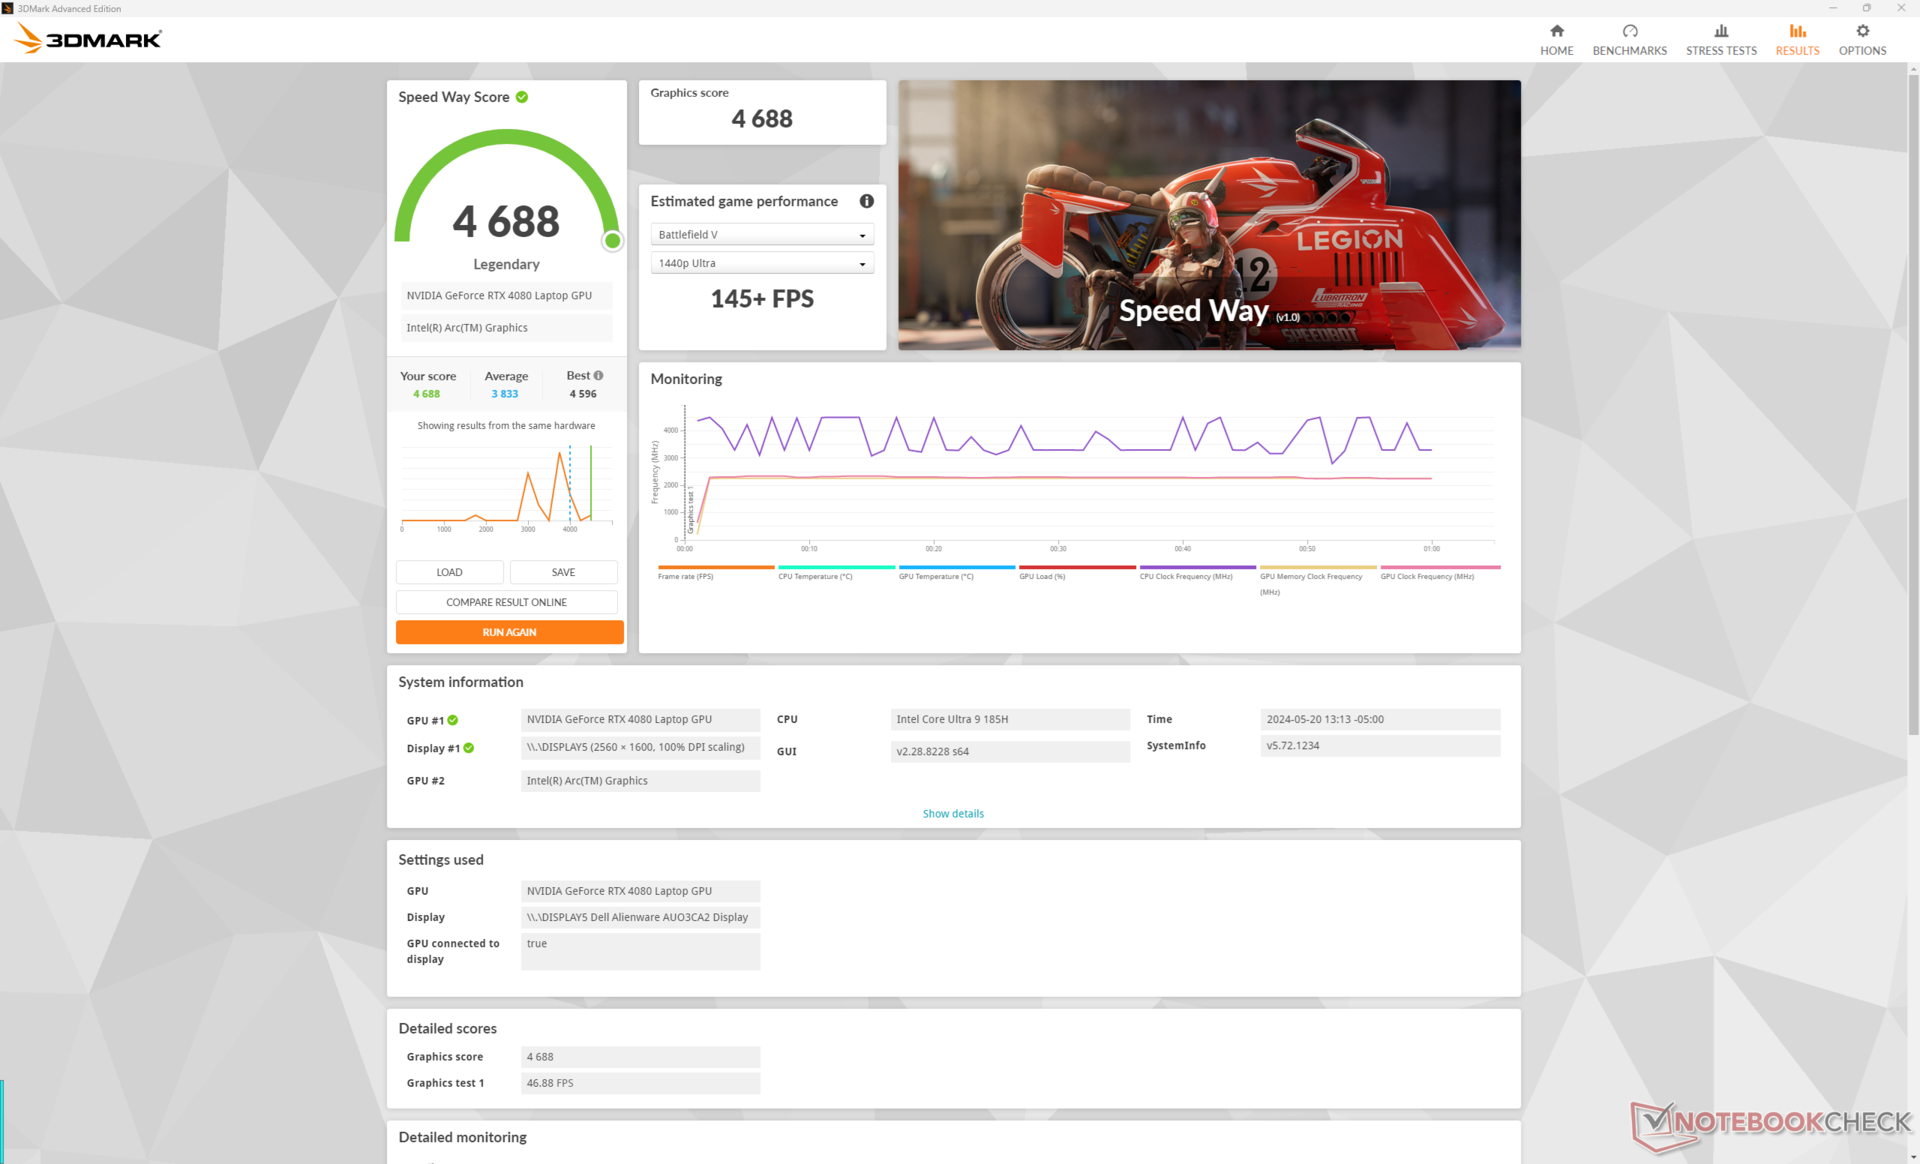
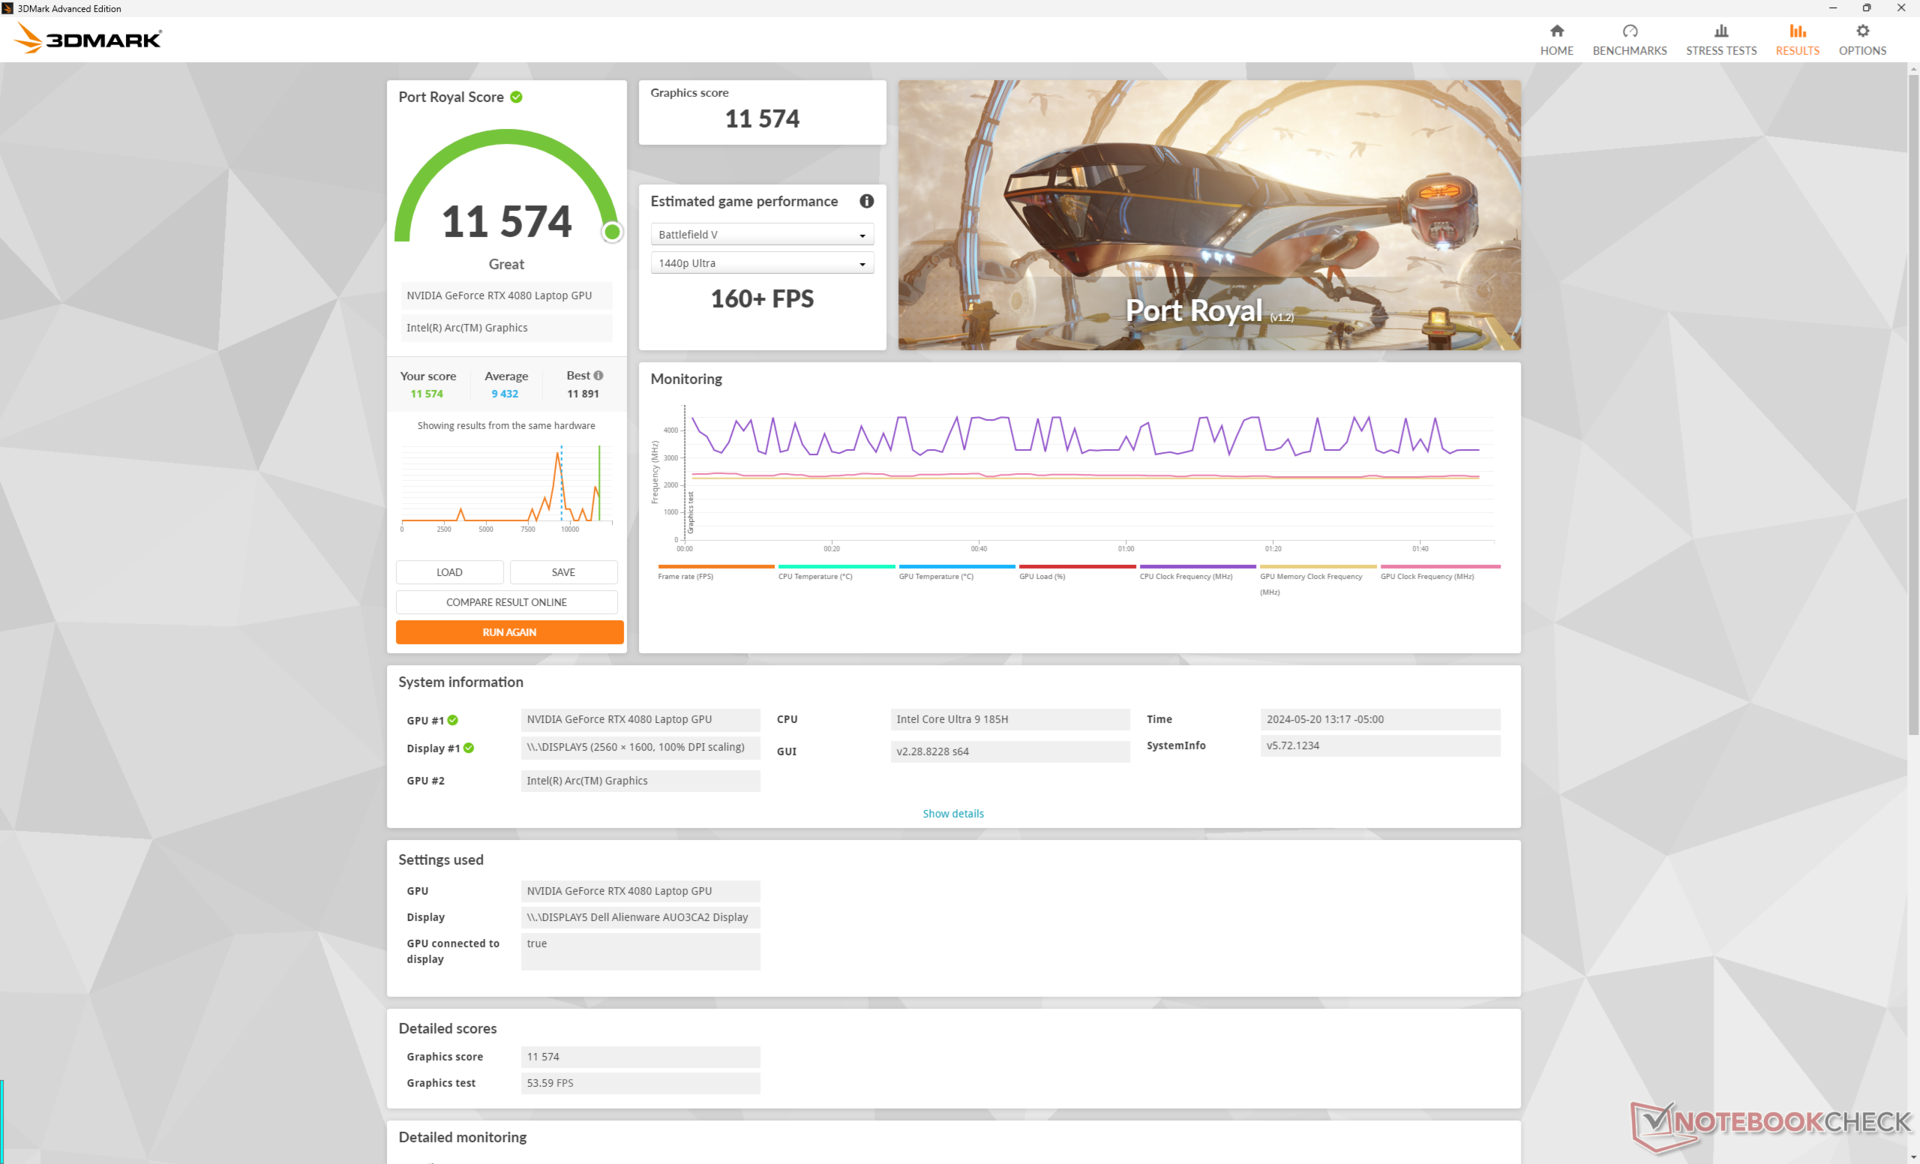
Los 175 W móvil GeForce RTX 4080 GPU sigue siendo la misma aunque con puntuaciones 3DMark que son aproximadamente un 5 por ciento más lentas que las que registramos en la x16 R1. La actualización a la RTX 4090 se espera que mejore el rendimiento en sólo un 5 a 15 por ciento, mientras que la actualización a la configuración RTX 4070 o 4060 reducirá el rendimiento hasta en un 30 y un 45 por ciento, respectivamente.
| Perfil de potencia | Puntuación de gráficos | Puntuación física | Puntuación combinada |
| Modo Overdrive | 42558 | 29029 | 11691 |
| Modo Rendimiento | 40773 (-4%) | 26070 (-10%) | 12450 (-7%) |
| Modo equilibrado | 40593 (-5%) | 26746 (-8%) | 12237 (-5%) |
| Batería | 21754 (-49%) | 25880 (-11%) | 9863 (-16%) |
Ejecutar el sistema en modo Rendimiento en lugar de en modo Overdrive tendrá un ligero impacto en el rendimiento general, como se muestra en nuestra tabla de resultados Fire Strike anterior. Curiosamente, la diferencia entre los modos Rendimiento y Equilibrado es comparativamente mucho menor.
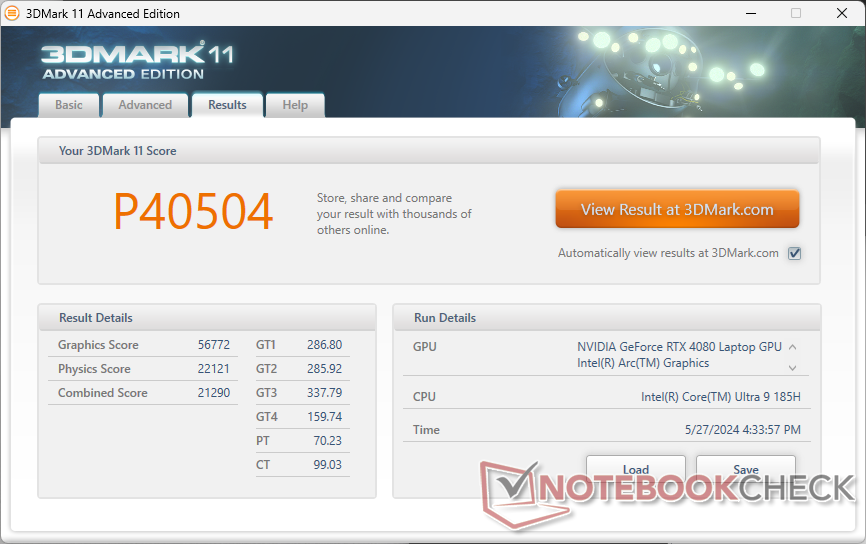
| 3DMark 11 Performance | 40504 puntos | |
| 3DMark Fire Strike Score | 31904 puntos | |
| 3DMark Time Spy Score | 17164 puntos | |
ayuda | ||
* ... más pequeño es mejor
Rendimiento en juegos
Decepcionantemente, el rendimiento en los juegos sería consistentemente más lento que lo que registramos en el x16 R1 en alrededor de 5 a 15 por ciento. Los deltas más amplios ocurrirían en resoluciones más bajas mientras que los deltas más pequeños ocurrirían en resoluciones más altas que es constante con los resultados más lentos del funcionamiento crudo de la CPU cuando está comparado al Core i9-14900HK observado arriba.
| Baldur's Gate 3 | |
| 1920x1080 Ultra Preset | |
| Alienware x16 R2 P120F | |
| Medio NVIDIA GeForce RTX 4080 Laptop GPU (111.8 - 181.2, n=6) | |
| Alienware m16 R2 | |
| Framework Laptop 16 | |
| 2560x1440 Ultra Preset | |
| Alienware x16 R2 P120F | |
| Medio NVIDIA GeForce RTX 4080 Laptop GPU (88.3 - 129.3, n=6) | |
| Alienware m16 R2 | |
| Framework Laptop 16 | |
| 3840x2160 Ultra Preset | |
| Alienware x16 R2 P120F | |
| Medio NVIDIA GeForce RTX 4080 Laptop GPU (48.8 - 68.4, n=4) | |
| Alienware m16 R2 | |
| Framework Laptop 16 | |
| 3840x2160 Ultra Preset + Quality DLSS | |
| Alienware x16 R2 P120F | |
| Medio NVIDIA GeForce RTX 4080 Laptop GPU (90.9 - 104.4, n=2) | |
| Cyberpunk 2077 2.2 Phantom Liberty | |
| 1920x1080 Ultra Preset (FSR off) | |
| Medio NVIDIA GeForce RTX 4080 Laptop GPU (83.9 - 127.1, n=13) | |
| Alienware x16 R2 P120F | |
| Alienware m16 R2 | |
| Framework Laptop 16 | |
| 2560x1440 Ultra Preset (FSR off) | |
| Medio NVIDIA GeForce RTX 4080 Laptop GPU (56.2 - 86.3, n=17) | |
| Alienware x16 R2 P120F | |
| Alienware m16 R2 | |
| Framework Laptop 16 | |
| 3840x2160 Ultra Preset (FSR off) | |
| Medio NVIDIA GeForce RTX 4080 Laptop GPU (25.8 - 39.8, n=7) | |
| Alienware x16 R2 P120F | |
| Alienware m16 R2 | |
| Framework Laptop 16 | |
| 1920x1080 Ray Tracing Ultra Preset (DLSS off) | |
| Alienware x16 R2 P120F | |
| Medio NVIDIA GeForce RTX 4080 Laptop GPU (43.8 - 67.2, n=12) | |
| Alienware m16 R2 | |
| Framework Laptop 16 | |
| 3840x2160 Ray Tracing Ultra Preset (DLSS off, no Path Tracing) | |
| Medio NVIDIA GeForce RTX 4080 Laptop GPU (16 - 20, n=4) | |
| Alienware x16 R2 P120F | |
| Alienware m16 R2 | |
Witcher 3 FPS Chart
| bajo | medio | alto | ultra | QHD | 4K DLSS | 4K | |
|---|---|---|---|---|---|---|---|
| The Witcher 3 (2015) | 364.4 | 340.7 | 292.1 | 166.3 | 118.5 | ||
| Dota 2 Reborn (2015) | 155.7 | 142 | 139.2 | 133 | 127.9 | ||
| Final Fantasy XV Benchmark (2018) | 188 | 169.3 | 139.8 | 120.8 | 70.2 | ||
| X-Plane 11.11 (2018) | 134 | 117.4 | 89.3 | 78 | |||
| Far Cry 5 (2018) | 137 | 127 | 122 | 114 | 114 | 91 | |
| Strange Brigade (2018) | 427 | 336 | 317 | 293 | 226 | 112.9 | |
| Tiny Tina's Wonderlands (2022) | 220.8 | 199.6 | 166.7 | 144.5 | 99 | 50.1 | |
| F1 22 (2022) | 219 | 211 | 185.7 | 108.5 | 65.6 | 36.6 | |
| Baldur's Gate 3 (2023) | 186.8 | 172.9 | 161.2 | 159.4 | 124.3 | 104.4 | 65 |
| Cyberpunk 2077 2.2 Phantom Liberty (2023) | 121.5 | 118.7 | 109 | 99.7 | 75.4 | 32.5 |
Emisiones
Ruido del sistema
Los ventiladores del x16 R2 son capaces de permanecer más silenciosos durante periodos más largos antes de necesitar aumentar la velocidad y el ruido. Por lo demás, el techo de ruido es similar al que registramos en el x16 R1 en unos 50 dB(A) y 54 dB(A) cuando se juega en modo Rendimiento y modo Overdrive, respectivamente. Tenga en cuenta que el ruido del ventilador al jugar en modo Equilibrado sería exactamente el mismo que el del modo Rendimiento, lo que concuerda con nuestros resultados 3DMark anteriores.
Ruido
| Ocioso |
| 23.8 / 28.5 / 28.5 dB(A) |
| Carga |
| 28.8 / 54.2 dB(A) |
 | ||
30 dB silencioso 40 dB(A) audible 50 dB(A) ruidosamente alto |
||
min: | ||
| Alienware x16 R2 P120F NVIDIA GeForce RTX 4080 Laptop GPU, Ultra 9 185H, WDC PC SN810 1TB | Alienware x16 R1 NVIDIA GeForce RTX 4080 Laptop GPU, i9-13900HK, SK hynix PC801 HFS001TEJ9X101N | Alienware m16 R2 NVIDIA GeForce RTX 4070 Laptop GPU, Ultra 7 155H, Samsung PM9A1 MZVL21T0HCLR | Asus ROG Strix Scar 16 G634JZR NVIDIA GeForce RTX 4080 Laptop GPU, i9-14900HX, SK hynix PC801 HFS002TEJ9X101N | Lenovo Legion Pro 7 16IRX9H NVIDIA GeForce RTX 4080 Laptop GPU, i9-14900HX, SK Hynix HFS001TEJ9X115N | MSI Vector 16 HX A14V NVIDIA GeForce RTX 4080 Laptop GPU, i9-14900HX, WD PC SN560 SDDPNQE-1T00 | |
|---|---|---|---|---|---|---|
| Noise | -2% | -3% | -20% | -22% | -28% | |
| apagado / medio ambiente * | 23.4 | 22.7 3% | 24.7 -6% | 21.07 10% | 24 -3% | 23.2 1% |
| Idle Minimum * | 23.8 | 23.1 3% | 25.3 -6% | 29.75 -25% | 25 -5% | 33.5 -41% |
| Idle Average * | 28.5 | 25.8 9% | 25.3 11% | 29.75 -4% | 30 -5% | 33.5 -18% |
| Idle Maximum * | 28.5 | 25.8 9% | 25.3 11% | 29.75 -4% | 45 -58% | 33.5 -18% |
| Load Average * | 28.8 | 39.3 -36% | 31.7 -10% | 54.85 -90% | 50 -74% | 52.1 -81% |
| Witcher 3 ultra * | 49.5 | 49.9 -1% | 53.8 -9% | 57.8 -17% | 54 -9% | 62 -25% |
| Load Maximum * | 54.2 | 54.8 -1% | 62 -14% | 58 -7% | 56 -3% | 62 -14% |
* ... más pequeño es mejor
Temperatura
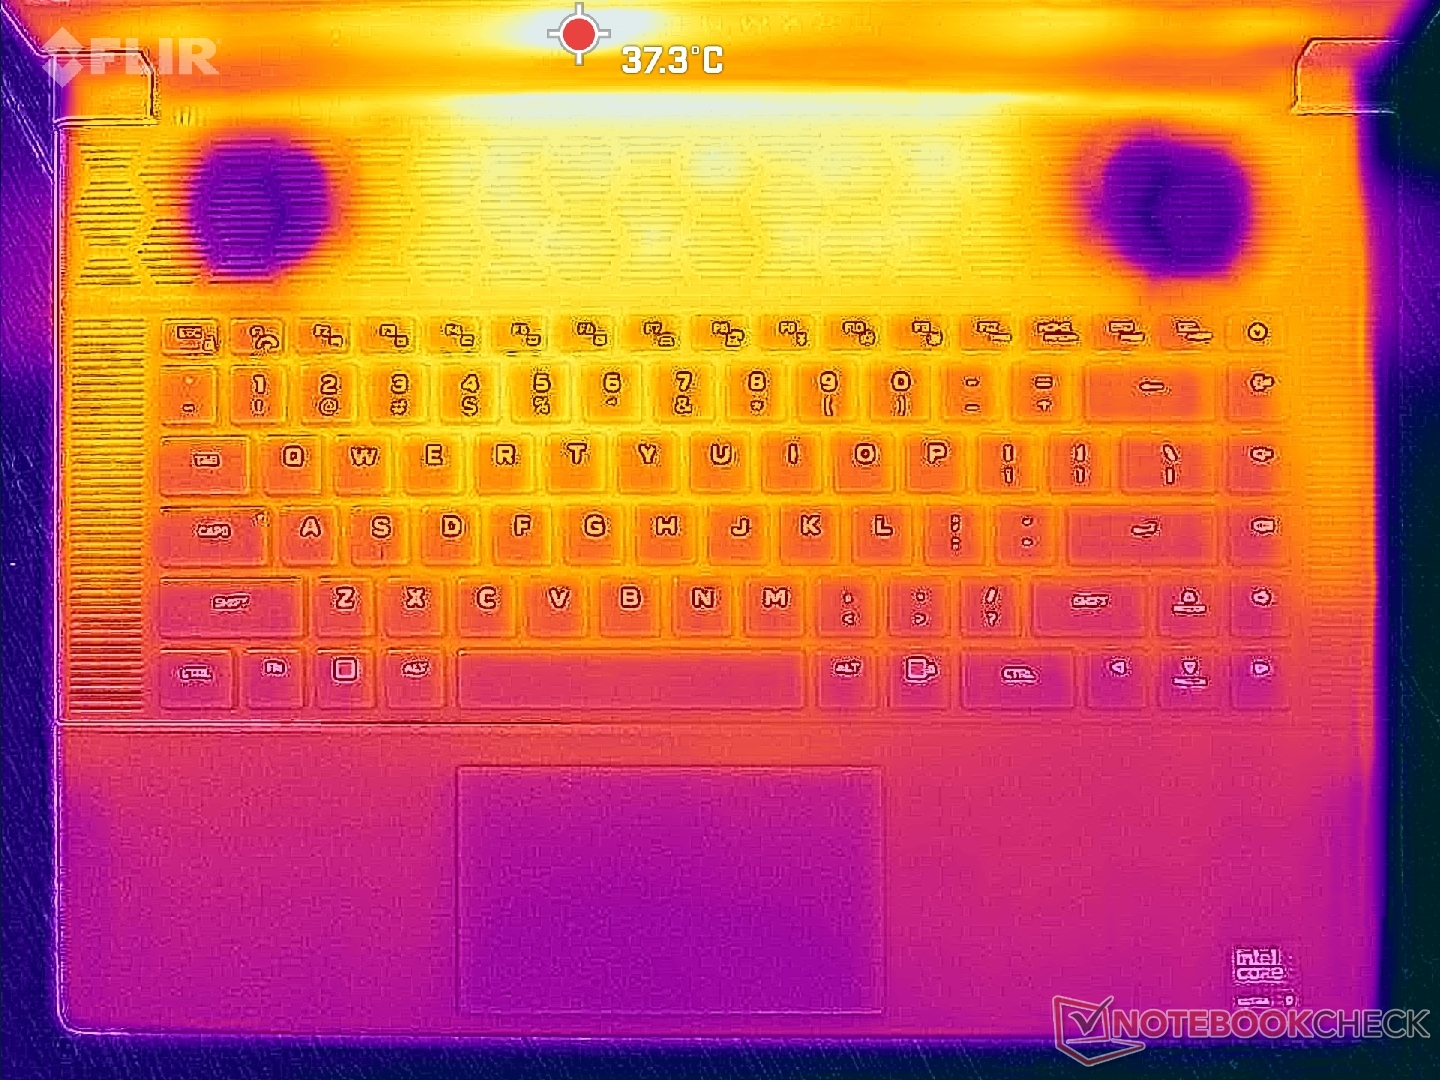
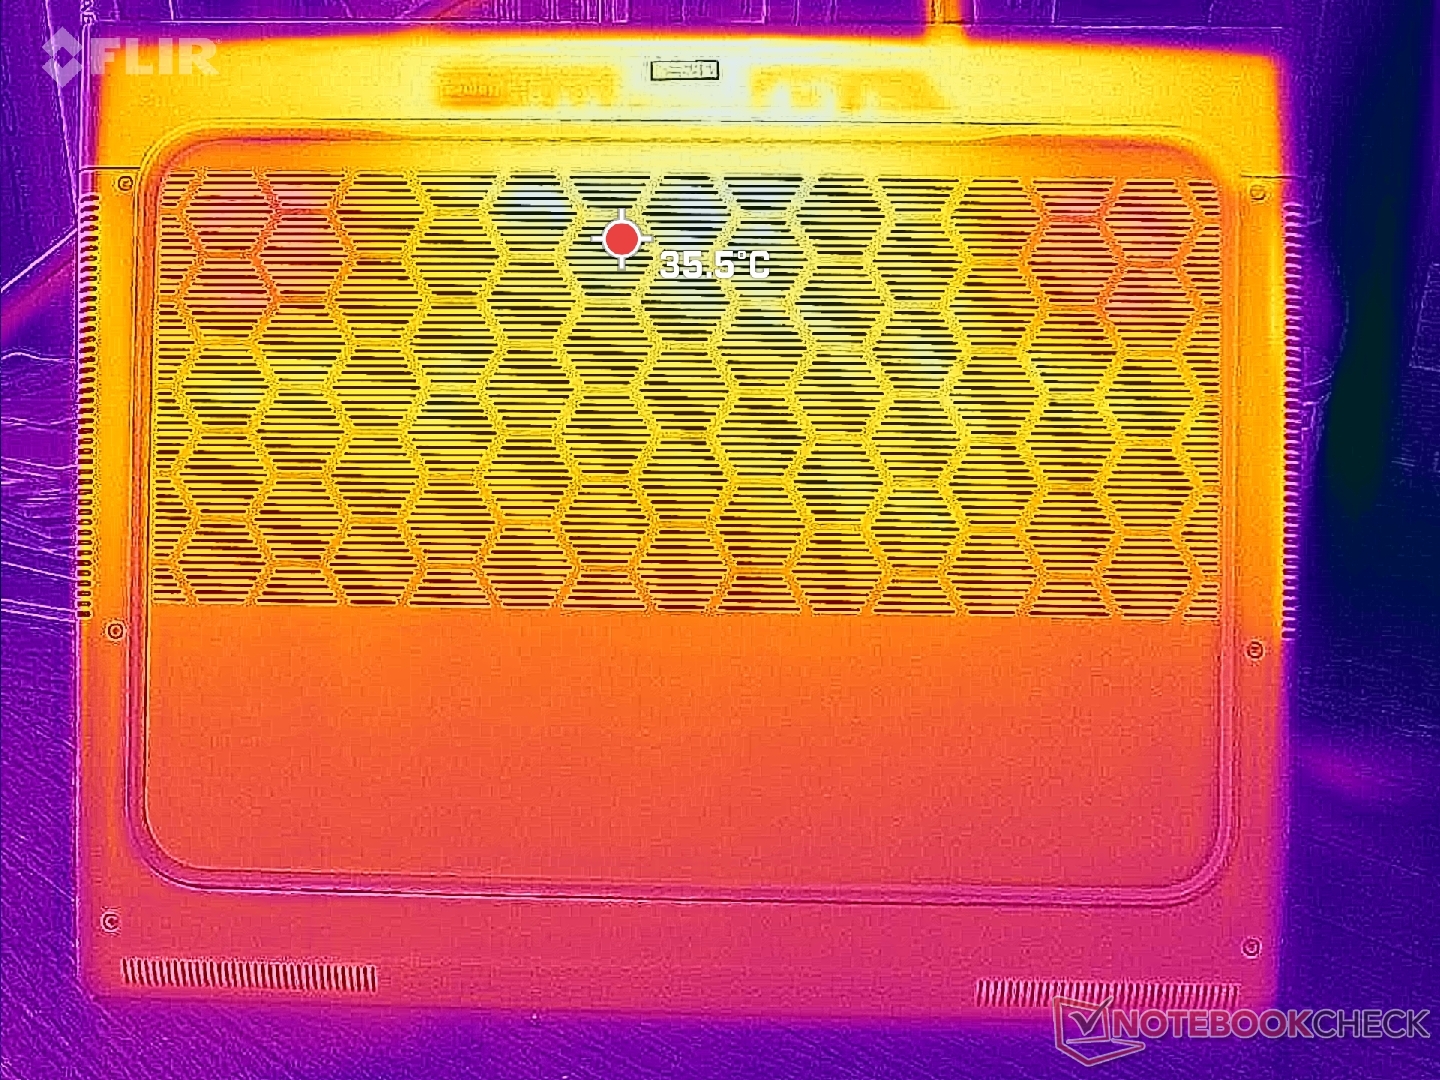
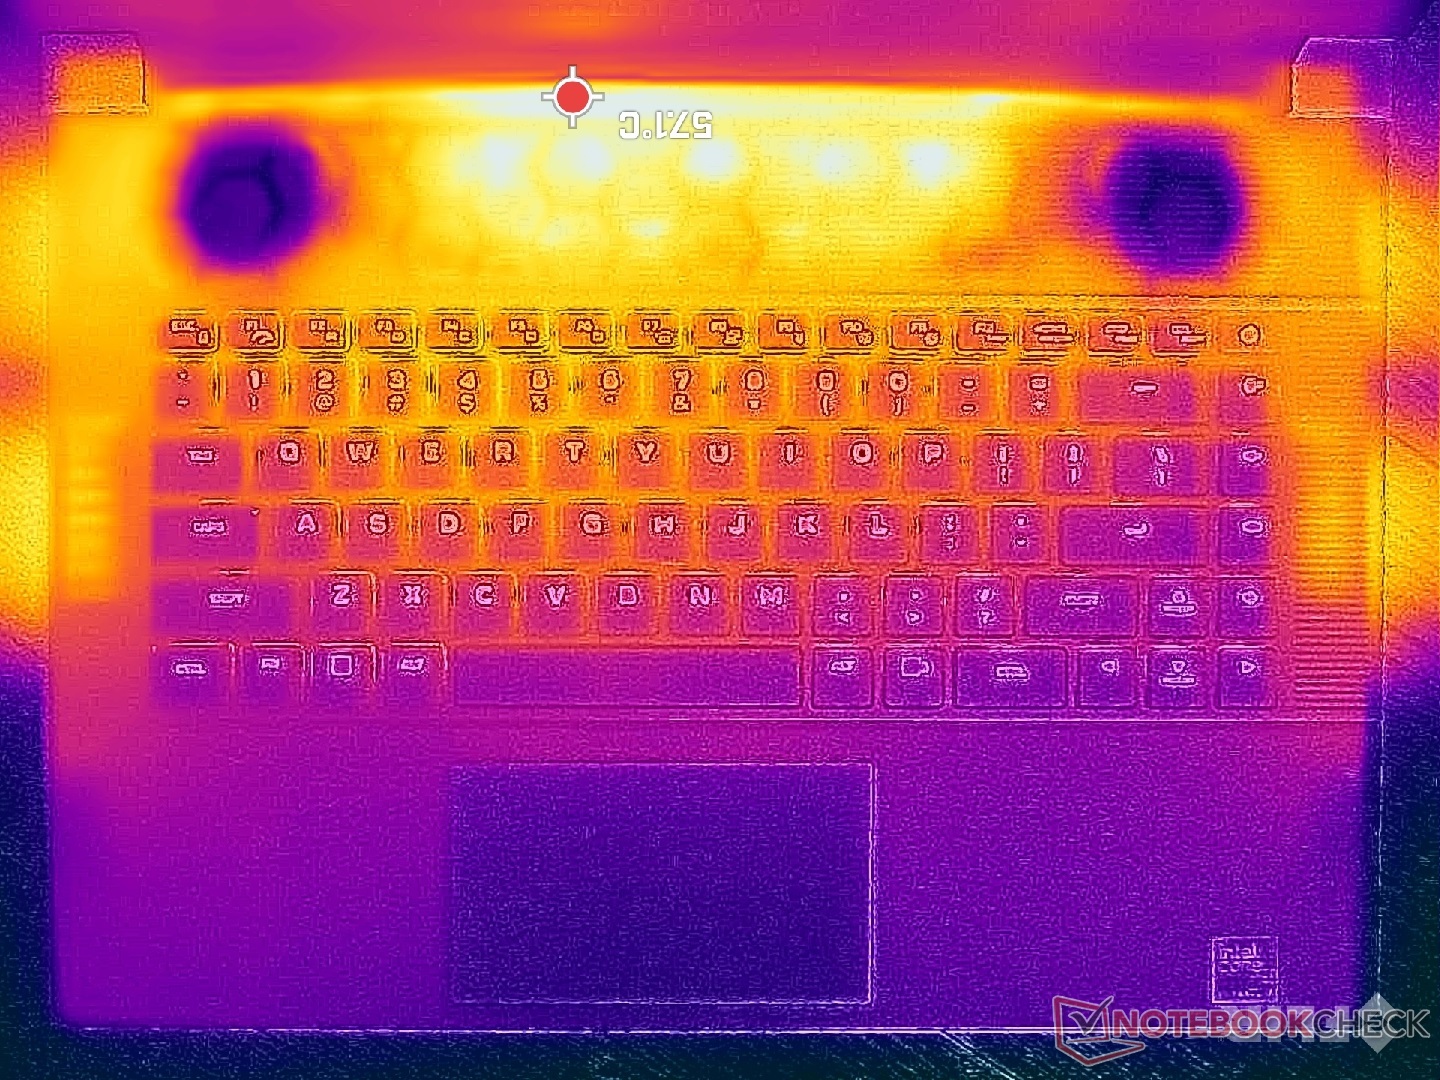
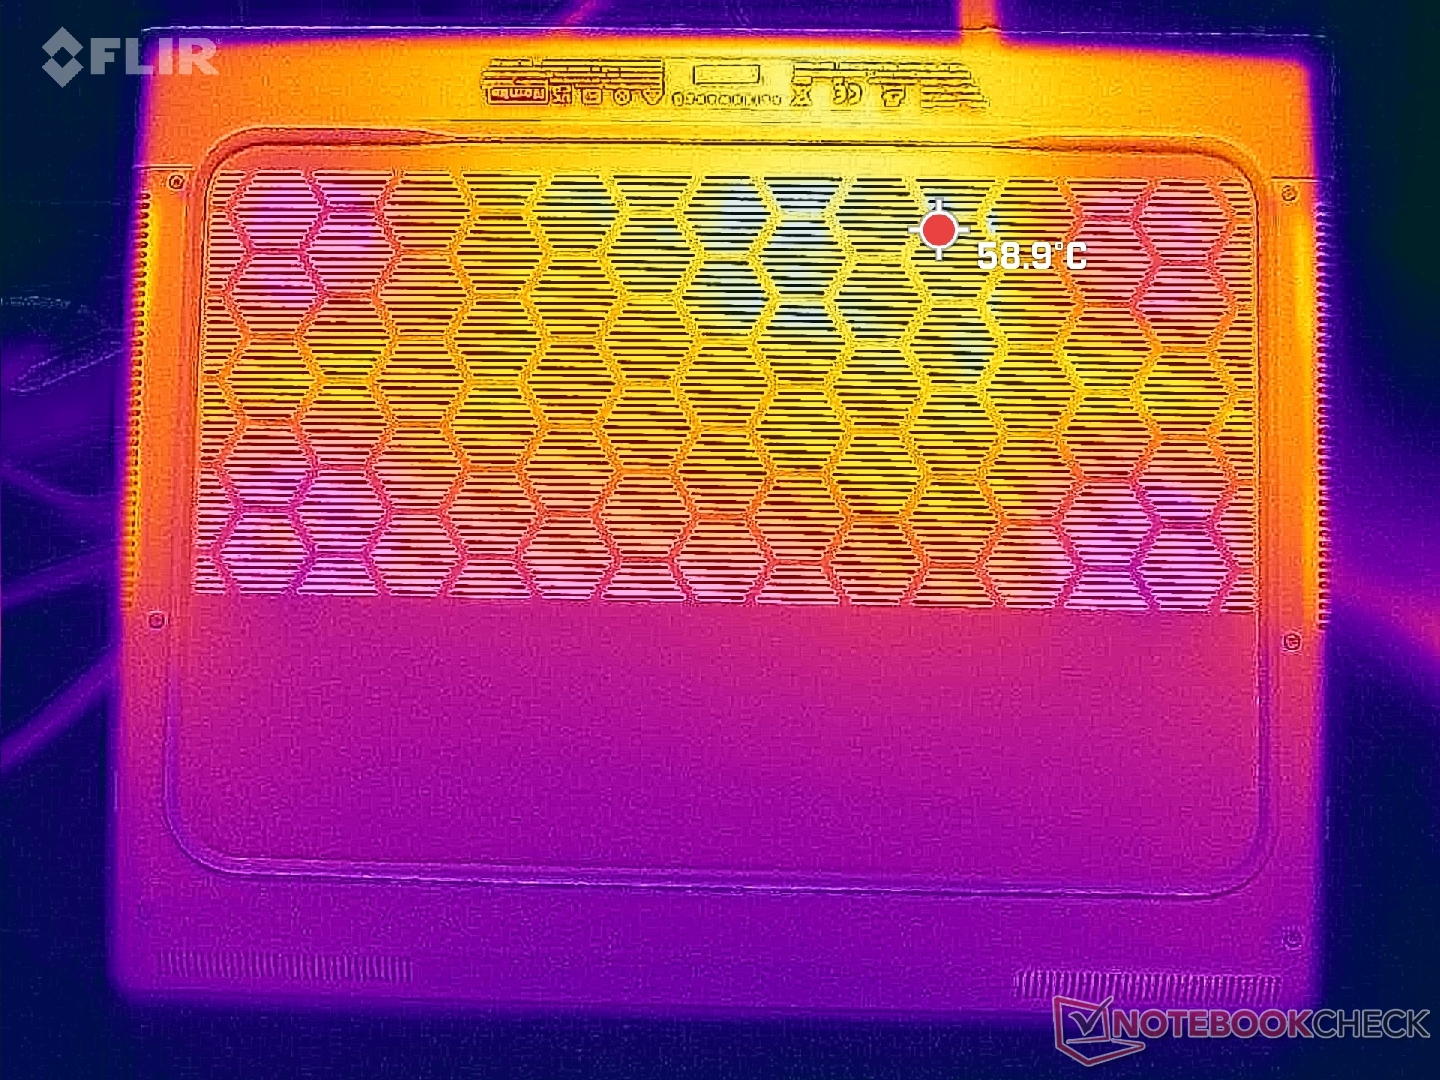
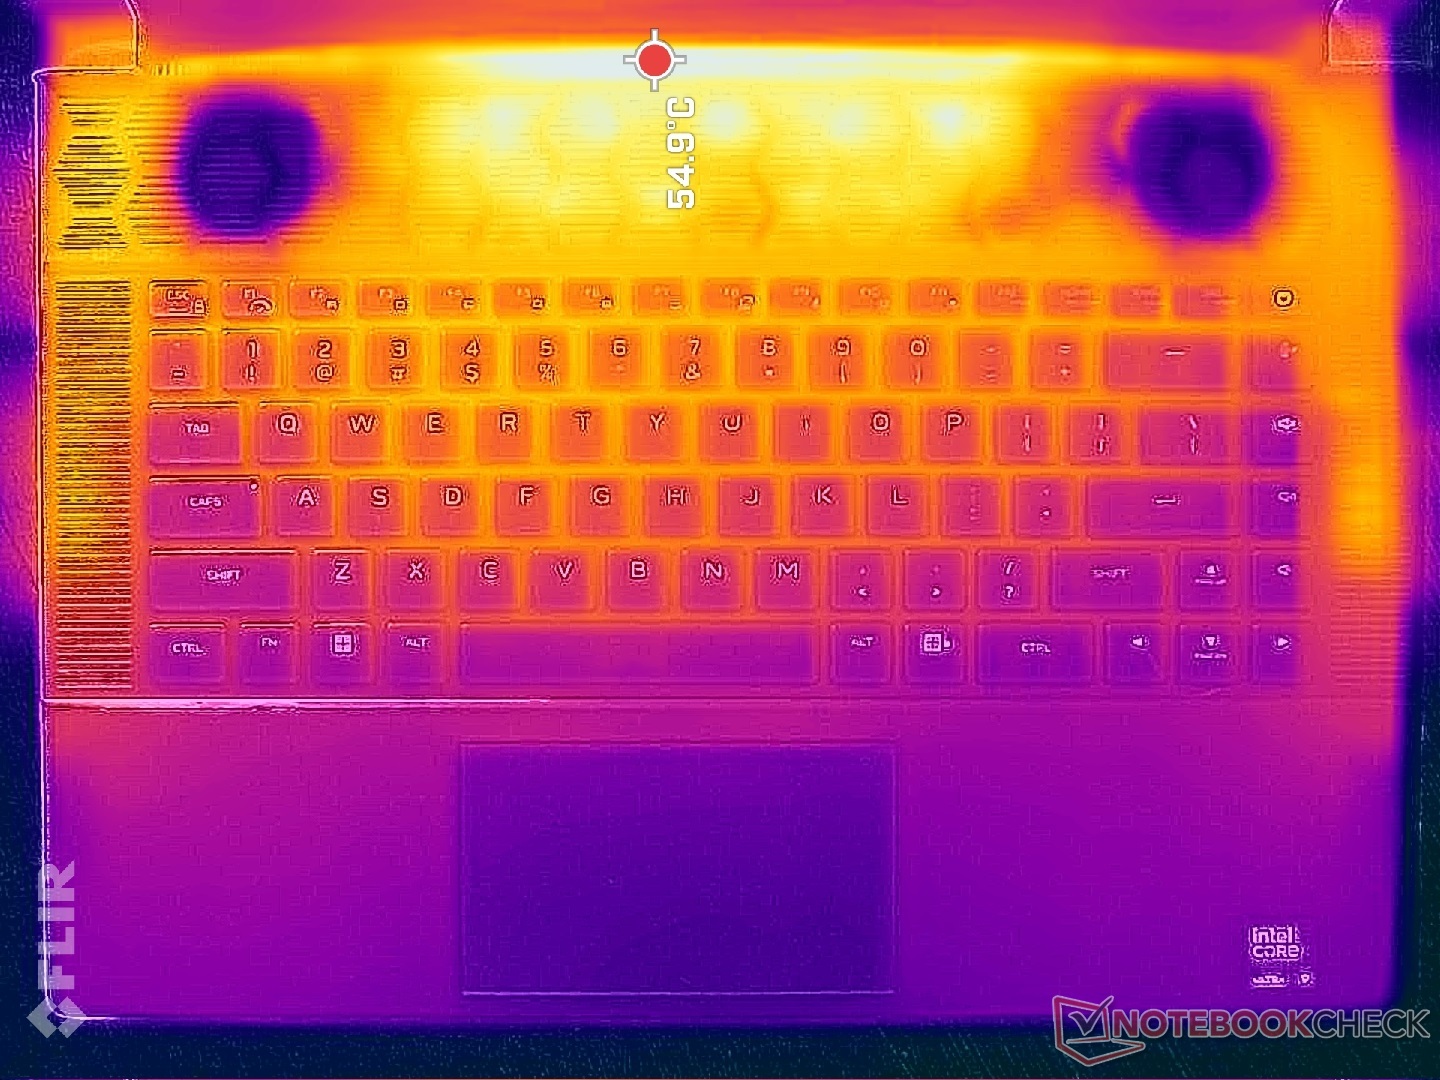
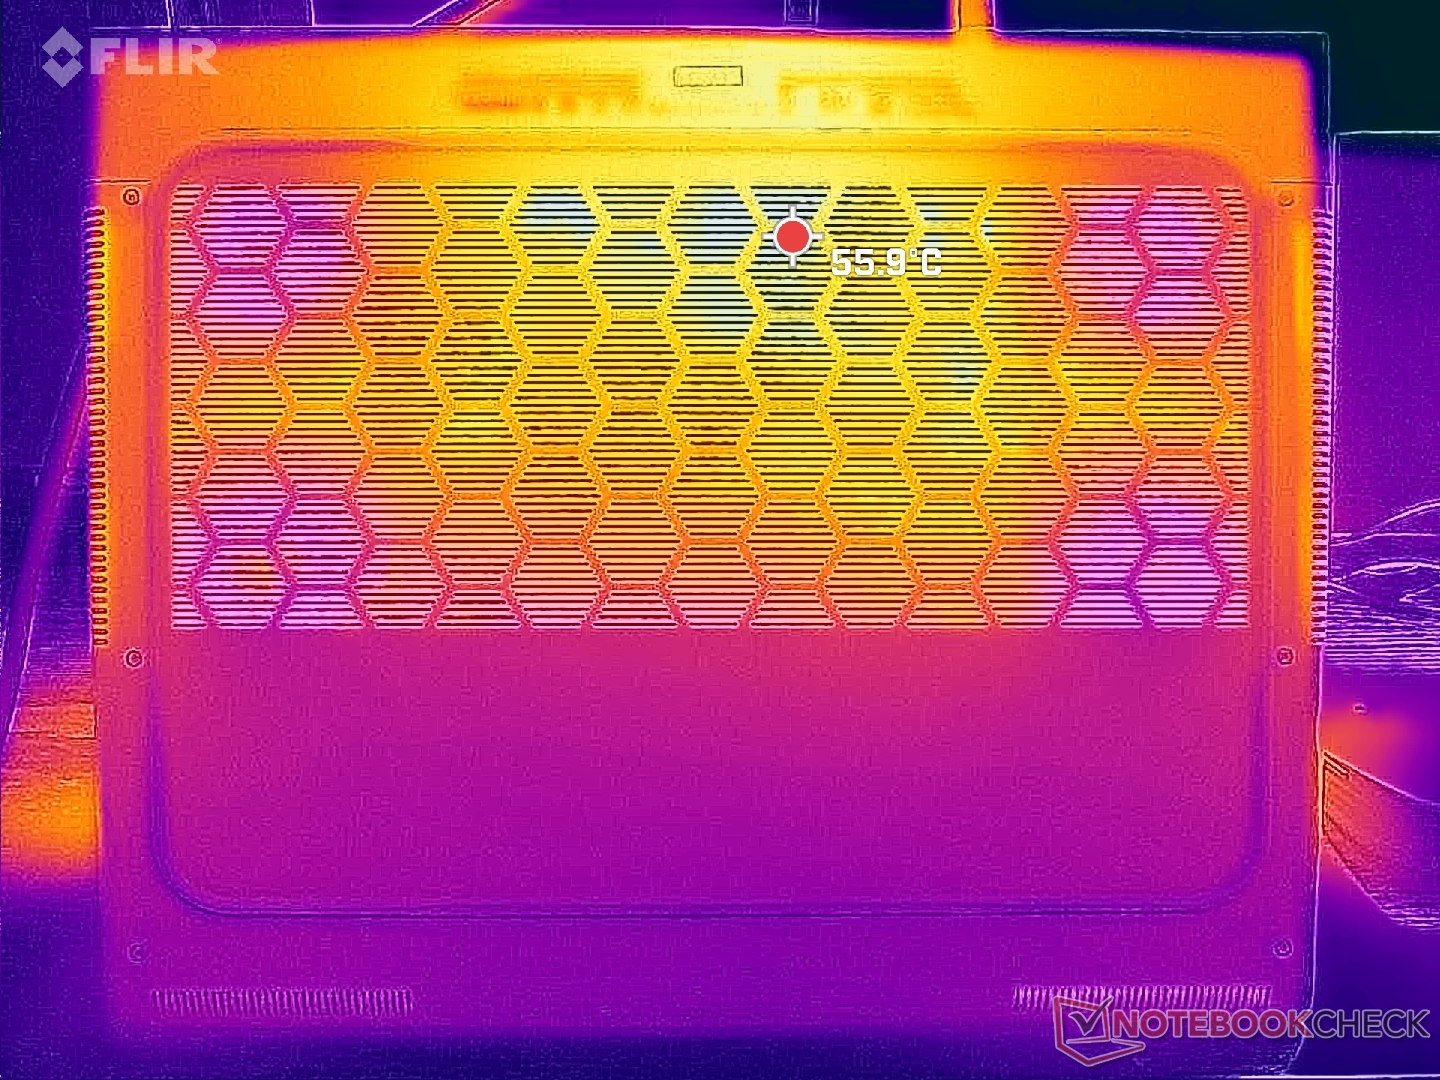
Las temperaturas superficiales son muy cálidas hacia la mitad trasera del chasis mientras que la mitad delantera es notablemente más fría para las palmas y los dedos. La serie Alienware x16 utiliza más rejillas de ventilación que la serie m16 por necesidad ya que el diseño x16 se define por su delgadez.

(-) La temperatura máxima en la parte superior es de 51 °C / 124 F, frente a la media de 40.4 °C / 105 F, que oscila entre 21.2 y 68.8 °C para la clase Gaming.
(-) El fondo se calienta hasta un máximo de 50.8 °C / 123 F, frente a la media de 43.2 °C / 110 F
(+) En reposo, la temperatura media de la parte superior es de 31.3 °C / 88# F, frente a la media del dispositivo de 33.9 °C / 93 F.
(-) Jugando a The Witcher 3, la temperatura media de la parte superior es de 42.4 °C / 108 F, frente a la media del dispositivo de 33.9 °C / 93 F.
(+) Los reposamanos y el panel táctil alcanzan como máximo la temperatura de la piel (33.2 °C / 91.8 F) y, por tanto, no están calientes.
(-) La temperatura media de la zona del reposamanos de dispositivos similares fue de 28.9 °C / 84 F (-4.3 °C / -7.8 F).
| Alienware x16 R2 P120F Intel Core Ultra 9 185H, NVIDIA GeForce RTX 4080 Laptop GPU | Alienware x16 R1 Intel Core i9-13900HK, NVIDIA GeForce RTX 4080 Laptop GPU | Alienware m16 R2 Intel Core Ultra 7 155H, NVIDIA GeForce RTX 4070 Laptop GPU | Asus ROG Strix Scar 16 G634JZR Intel Core i9-14900HX, NVIDIA GeForce RTX 4080 Laptop GPU | Lenovo Legion Pro 7 16IRX9H Intel Core i9-14900HX, NVIDIA GeForce RTX 4080 Laptop GPU | MSI Vector 16 HX A14V Intel Core i9-14900HX, NVIDIA GeForce RTX 4080 Laptop GPU | |
|---|---|---|---|---|---|---|
| Heat | 3% | -1% | 5% | 1% | 27% | |
| Maximum Upper Side * | 51 | 47.2 7% | 44.8 12% | 47.8 6% | 46 10% | 36.4 29% |
| Maximum Bottom * | 50.8 | 47.8 6% | 48 6% | 52.2 -3% | 49 4% | 35.6 30% |
| Idle Upper Side * | 36.6 | 36.8 -1% | 37.2 -2% | 32.4 11% | 38 -4% | 26.6 27% |
| Idle Bottom * | 35.2 | 35.8 -2% | 42 -19% | 33 6% | 37 -5% | 27 23% |
* ... más pequeño es mejor
Altavoces
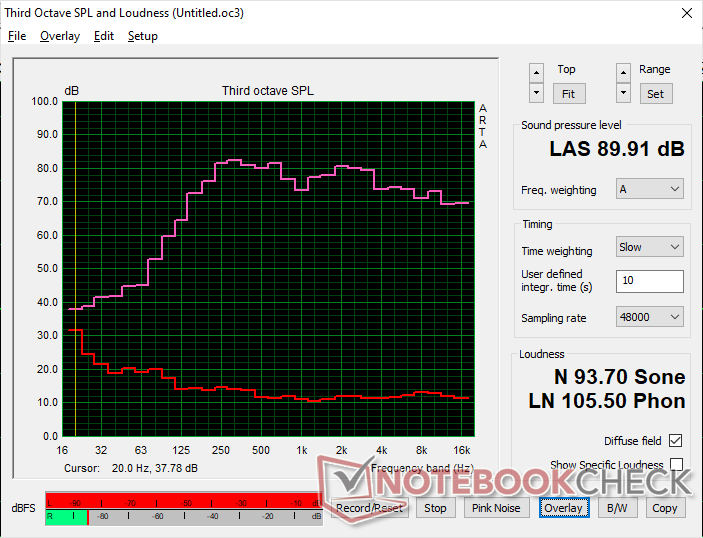
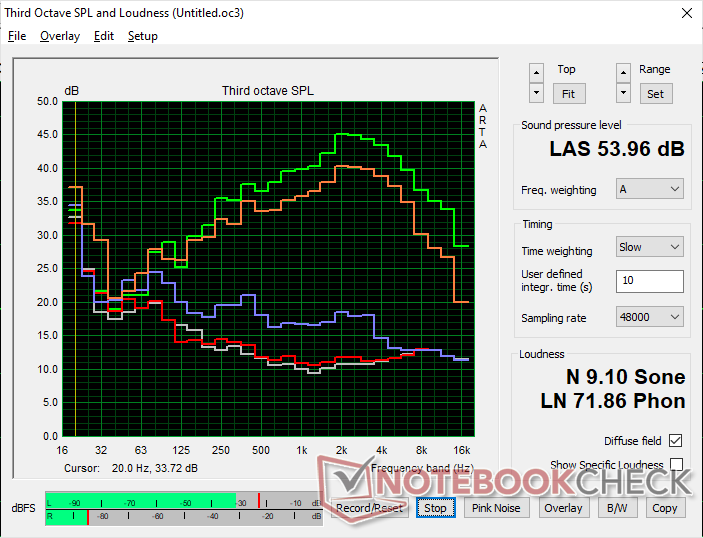
Alienware x16 R2 P120F análisis de audio
(+) | los altavoces pueden reproducir a un volumen relativamente alto (#89.9 dB)
Graves 100 - 315 Hz
(±) | lubina reducida - en promedio 7.4% inferior a la mediana
(±) | la linealidad de los graves es media (7.6% delta a frecuencia anterior)
Medios 400 - 2000 Hz
(+) | medios equilibrados - a sólo 2.6% de la mediana
(+) | los medios son lineales (3.6% delta a la frecuencia anterior)
Altos 2 - 16 kHz
(+) | máximos equilibrados - a sólo 3.4% de la mediana
(+) | los máximos son lineales (2.8% delta a la frecuencia anterior)
Total 100 - 16.000 Hz
(+) | el sonido global es lineal (8.2% de diferencia con la mediana)
En comparación con la misma clase
» 1% de todos los dispositivos probados de esta clase eran mejores, 1% similares, 98% peores
» El mejor tuvo un delta de 6%, la media fue 18%, el peor fue ###max##%
En comparación con todos los dispositivos probados
» 1% de todos los dispositivos probados eran mejores, 1% similares, 98% peores
» El mejor tuvo un delta de 4%, la media fue 24%, el peor fue ###max##%
Apple MacBook Pro 16 2021 M1 Pro análisis de audio
(+) | los altavoces pueden reproducir a un volumen relativamente alto (#84.7 dB)
Graves 100 - 315 Hz
(+) | buen bajo - sólo 3.8% lejos de la mediana
(+) | el bajo es lineal (5.2% delta a la frecuencia anterior)
Medios 400 - 2000 Hz
(+) | medios equilibrados - a sólo 1.3% de la mediana
(+) | los medios son lineales (2.1% delta a la frecuencia anterior)
Altos 2 - 16 kHz
(+) | máximos equilibrados - a sólo 1.9% de la mediana
(+) | los máximos son lineales (2.7% delta a la frecuencia anterior)
Total 100 - 16.000 Hz
(+) | el sonido global es lineal (4.6% de diferencia con la mediana)
En comparación con la misma clase
» 0% de todos los dispositivos probados de esta clase eran mejores, 0% similares, 100% peores
» El mejor tuvo un delta de 5%, la media fue 18%, el peor fue ###max##%
En comparación con todos los dispositivos probados
» 0% de todos los dispositivos probados eran mejores, 0% similares, 100% peores
» El mejor tuvo un delta de 4%, la media fue 24%, el peor fue ###max##%
Gestión de la energía
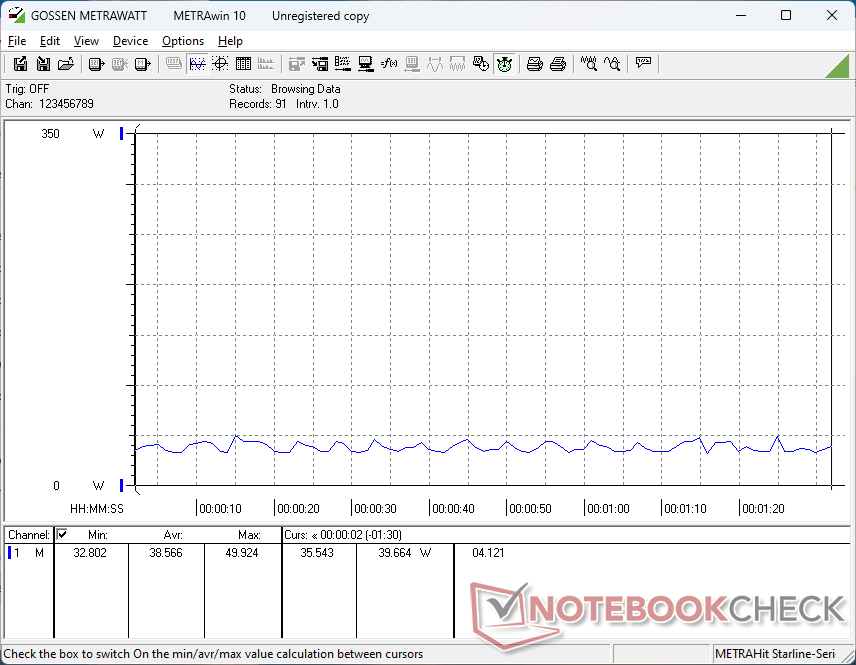
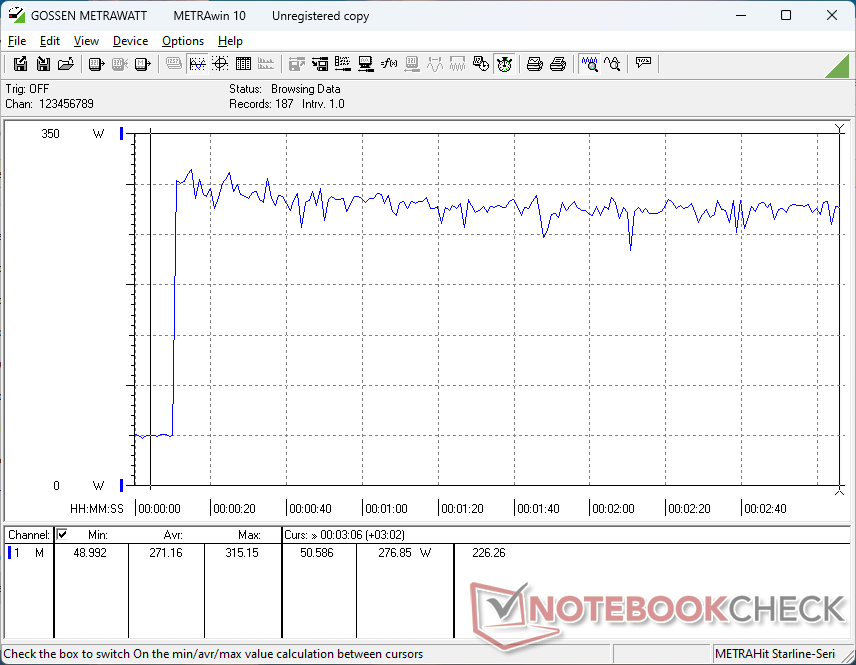
Consumo de energía
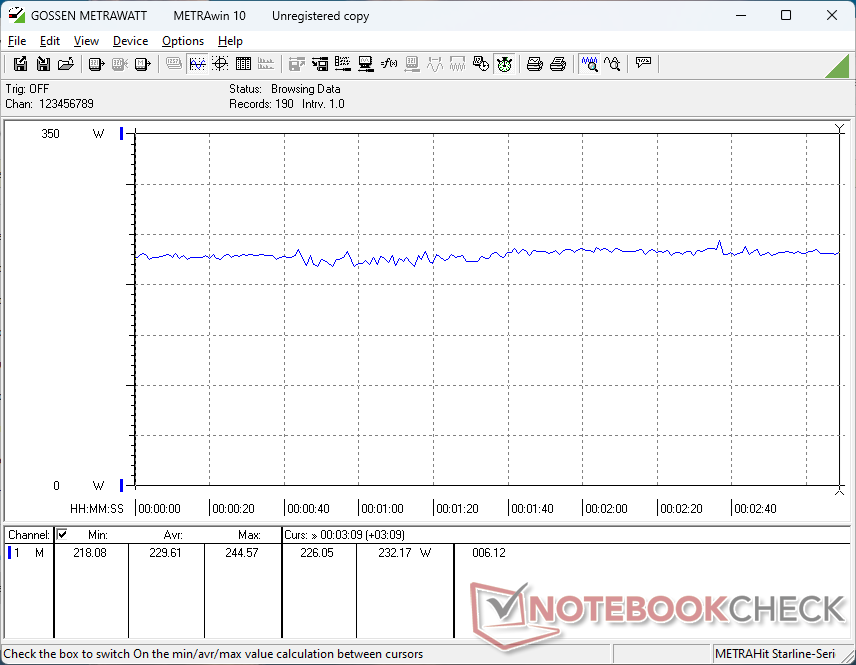
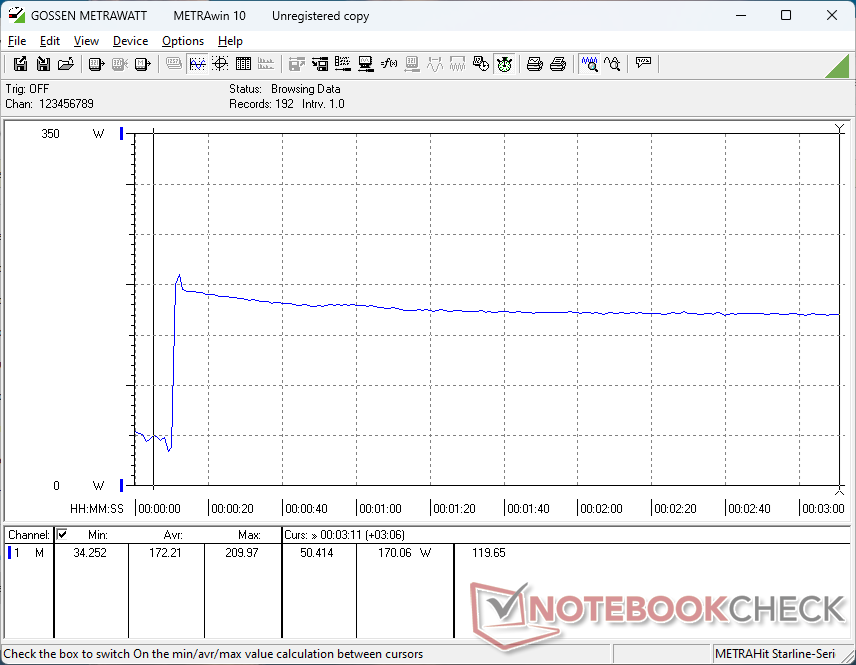
En general, el consumo global es inferior al que registramos en el x16 R1 en un 10 a 15 por ciento cuando se ejecutan cargas exigentes como juegos o el estrés de Prime95. Sin embargo, este déficit acompaña a los resultados más lentos de la CPU y la GPU señalados anteriormente. El rendimiento por vatio es, por tanto, aproximadamente el mismo año tras año a pesar del cambio de CPU.
Encontramos un error en el modo Standby. Si se configuraba en Optimus, el modo Standby funcionaba normalmente con un consumo de energía bajo <1 vatio. Sin embargo, si se configuraba en modo dGPU y Overdrive, el modo Standby demandaba hasta 39 W, lo que provocaba un calentamiento innecesario del portátil y un elevado consumo de batería.
| Off / Standby | |
| Ocioso | |
| Carga |
|
Clave:
min: | |
| Alienware x16 R2 P120F Ultra 9 185H, NVIDIA GeForce RTX 4080 Laptop GPU, WDC PC SN810 1TB, IPS, 2560x1600, 16" | Alienware x16 R1 i9-13900HK, NVIDIA GeForce RTX 4080 Laptop GPU, SK hynix PC801 HFS001TEJ9X101N, IPS, 2560x1600, 16" | Alienware m16 R2 Ultra 7 155H, NVIDIA GeForce RTX 4070 Laptop GPU, Samsung PM9A1 MZVL21T0HCLR, IPS, 2560x1600, 16" | Asus ROG Strix Scar 16 G634JZR i9-14900HX, NVIDIA GeForce RTX 4080 Laptop GPU, SK hynix PC801 HFS002TEJ9X101N, Mini LED, 2560x1600, 16" | Lenovo Legion Pro 7 16IRX9H i9-14900HX, NVIDIA GeForce RTX 4080 Laptop GPU, SK Hynix HFS001TEJ9X115N, IPS, 2560x1600, 16" | MSI Vector 16 HX A14V i9-14900HX, NVIDIA GeForce RTX 4080 Laptop GPU, WD PC SN560 SDDPNQE-1T00, IPS, 2560x1600, 16" | |
|---|---|---|---|---|---|---|
| Power Consumption | -55% | 11% | -10% | -30% | -27% | |
| Idle Minimum * | 9.9 | 25.2 -155% | 8.1 18% | 10.71 -8% | 16 -62% | 15.8 -60% |
| Idle Average * | 14.5 | 29.9 -106% | 13 10% | 14.75 -2% | 21 -45% | 23.3 -61% |
| Idle Maximum * | 33.5 | 49.8 -49% | 40.3 -20% | 30 10% | 36 -7% | 30 10% |
| Load Average * | 97.5 | 105.4 -8% | 79 19% | 135 -38% | 132 -35% | 123.9 -27% |
| Witcher 3 ultra * | 230 | 263 -14% | 188.1 18% | 286 -24% | 267 -16% | 285 -24% |
| Load Maximum * | 315.2 | 313.8 -0% | 254.9 19% | 307 3% | 360 -14% | 306 3% |
* ... más pequeño es mejor
Power Consumption Witcher 3 / Stresstest
Power Consumption external Monitor
Duración de las pilas
Los tiempos de ejecución son un poco más largos esta vez probablemente debido al menor consumo de energía general señalado anteriormente. Somos capaces de registrar un tiempo de ejecución WLAN de más de 40 minutos más que en el x16 R1, pero la mayoría de los otros portátiles para juegos siguen siendo capaces de durar mucho más tiempo incluyendo el propio Dell Alienware m16 R2.
| Alienware x16 R2 P120F Ultra 9 185H, NVIDIA GeForce RTX 4080 Laptop GPU, 90 Wh | Alienware x16 R1 i9-13900HK, NVIDIA GeForce RTX 4080 Laptop GPU, 90 Wh | Alienware m16 R2 Ultra 7 155H, NVIDIA GeForce RTX 4070 Laptop GPU, 90 Wh | Asus ROG Strix Scar 16 G634JZR i9-14900HX, NVIDIA GeForce RTX 4080 Laptop GPU, 90 Wh | Lenovo Legion Pro 7 16IRX9H i9-14900HX, NVIDIA GeForce RTX 4080 Laptop GPU, 99.9 Wh | MSI Vector 16 HX A14V i9-14900HX, NVIDIA GeForce RTX 4080 Laptop GPU, 90 Wh | |
|---|---|---|---|---|---|---|
| Duración de Batería | -23% | 150% | 125% | 93% | 72% | |
| WiFi v1.3 | 193 | 149 -23% | 483 150% | 434 125% | 373 93% | 332 72% |
| Reader / Idle | 436 | 758 | 641 | |||
| Load | 44 | 60 | 51 | 84 | ||
| H.264 | 451 | |||||
| Witcher 3 ultra | 57 |
Pro
Contra
Veredicto - El Alienware x16 R1 es más rápido para el juego puro
La gran ventaja que el Alienware x16 R2 tiene sobre el x16 R1 es su NPU integrada para acelerar las tareas de IA de Windows. Se espera que este tipo de funciones se generalicen en el próximo año más o menos a través de Microsoft Co-Pilot y otras próximas aplicaciones basadas en IA. Para los juegos, sin embargo, la NPU no aporta nada que mejore la experiencia a partir de 2024. En todo caso, podría decirse que es perjudicial, ya que el rendimiento bruto de la CPU ha disminuido en comparación con el Core i9-13900HK del x16 R1 del año pasado, ya que se ha reservado un valioso espacio en la matriz para el nuevo procesador neuronal.
El Alienware x16 R2 introduce las nuevas CPU Meteor Lake-H con una NPU integrada para la compatibilidad con las futuras funciones de IA de Windows. Desafortunadamente, el rendimiento bruto en juegos se ha resentido como resultado.
El rendimiento generalmente más lento también ha dado lugar a un menor consumo de energía y tiempos de ejecución más largos que el modelo de lanzamiento original. Sin embargo, es probable que los entusiastas de los juegos a los que va dirigida la compra de Alienware no estén muy entusiasmados con la idea de cambiar rendimiento por duración de la batería. Tal movimiento habría sido más aceptable en la gama baja de la Serie G de Dell en su lugar.
Recomendamos considerar el Alienware x16 R1 ya que el x16 R2 no ofrece nuevas opciones de GPU, opciones de pantalla, ni siquiera colores de chasis o cambios externos. La actualización de la CPU sólo es deseable para aquellos que quieran "preparar para el futuro" su espacio de trabajo con la NPU integrada.
Precio y disponibilidad
Dell ya está distribuyendo la Alienware x16 R2 a partir de 2100 dólares para la configuración Core Ultra 7, GeForce RTX 4060, teclado estándar e IPS 1600p240 o hasta 3500 dólares si se configura con la Core Ultra 9, RTX 4090 y teclado mecánico.
Alienware x16 R2 P120F
- 05/29/2024 v7 (old)
Allen Ngo
Transparencia
La selección de los dispositivos que se van a reseñar corre a cargo de nuestro equipo editorial. La muestra de prueba fue proporcionada al autor en calidad de préstamo por el fabricante o el minorista a los efectos de esta reseña. El prestamista no tuvo ninguna influencia en esta reseña, ni el fabricante recibió una copia de la misma antes de su publicación. No había ninguna obligación de publicar esta reseña. Nunca aceptamos compensaciones o pagos a cambio de nuestras reseñas. Como empresa de medios independiente, Notebookcheck no está sujeta a la autoridad de fabricantes, minoristas o editores.
Así es como prueba Notebookcheck
Cada año, Notebookcheck revisa de forma independiente cientos de portátiles y smartphones utilizando procedimientos estandarizados para asegurar que todos los resultados son comparables. Hemos desarrollado continuamente nuestros métodos de prueba durante unos 20 años y hemos establecido los estándares de la industria en el proceso. En nuestros laboratorios de pruebas, técnicos y editores experimentados utilizan equipos de medición de alta calidad. Estas pruebas implican un proceso de validación en varias fases. Nuestro complejo sistema de clasificación se basa en cientos de mediciones y puntos de referencia bien fundamentados, lo que mantiene la objetividad.Price comparison

