

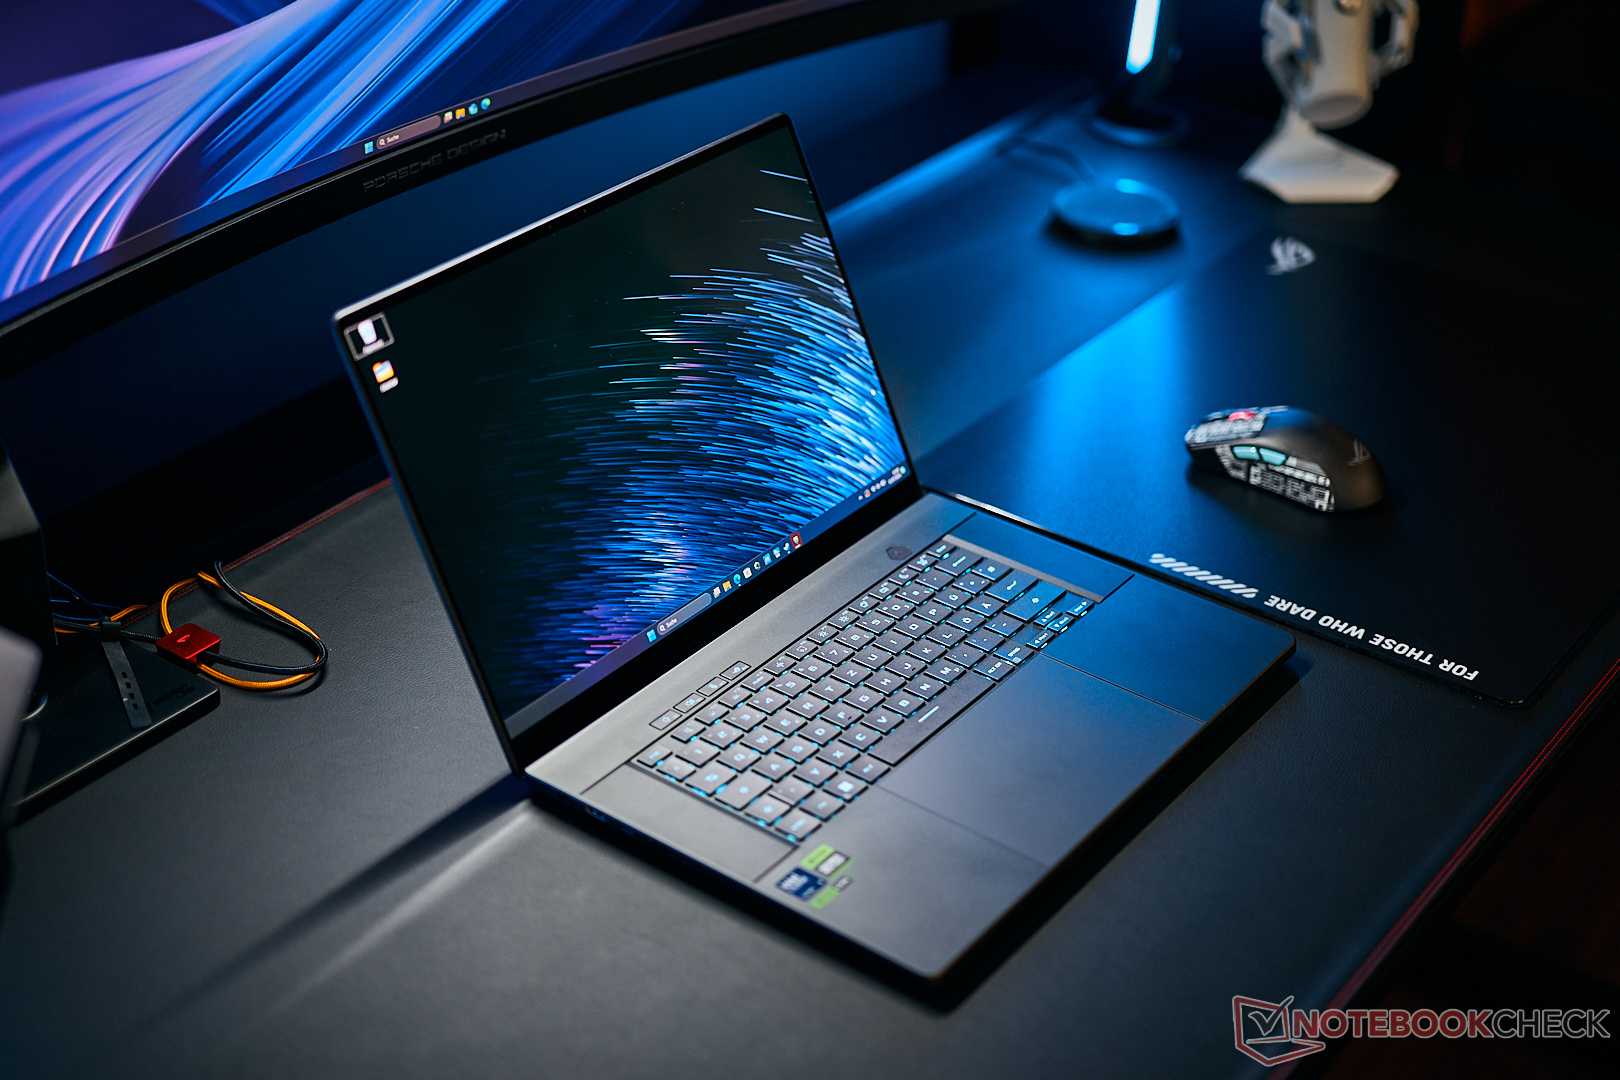
Analisis del portatil Asus ROG Zephyrus G16 - Un gamer delgado con una RTX 4090 y un potencial insatisfecho
El ROG Zephyrus G16 es actualmente la estrella fugaz en lo que a portátiles delgados para juegos de Asus se refiere. Hace unos meses, revisamos la variante con el Core Ultra 7 155H y la Nvidia GeForce RTX 4070. Ahora analizamos el modelo de gama alta con el Core Ultra 9 185H y la GeForce Portátil RTX 4090. Además de los componentes más potentes, nos encontramos con una refrigeración diferente. Aunque las configuraciones hasta el portátil RTX 4070 utilizan una unidad de refrigeración convencional formada por tres ventiladores y tubos de calor, los modelos de gama alta (portátil RTX 4080/4090) utilizan refrigeración por cámara de vapor. Por supuesto, queremos saber cómo afecta la nueva refrigeración tanto al rendimiento como a las emisiones.
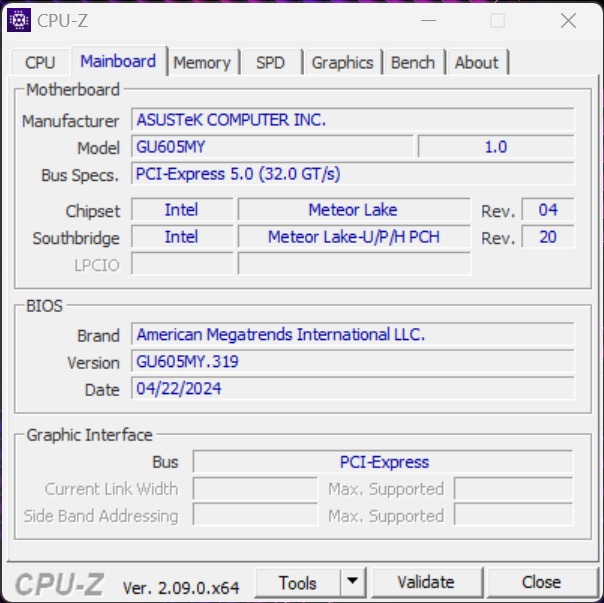
Nuestro dispositivo de revisión posee el número GU605MY, cuesta 3.649 dólares y, además del Core Ultra 9 185H y el portátil GeForce RTX 4090, también viene con 32 GB de RAM y la ya familiar pantalla OLED de 240 Hz. En este análisis, prestaremos especial atención a las diferencias entre la configuración del portátil RTX 4070 y el rendimiento, así como a las emisiones de la variante de gama alta. Toda la información adicional sobre la carcasa, los dispositivos de entrada, la pantalla y los altavoces se puede encontrar en nuestro análisis del ROG Zephyrus G16 con el portátil RTX 4070.
Asus lanzará pronto una actualización con los nuevos procesadores AMD Strix Point (Zen5), sin embargo, estos modelos sólo estarán equipados con la GeForce Portátil RTX 4070.
Posibles contendientes en la comparación
Valoración | Versión | Fecha | Modelo | Peso | Altura | Tamaño | Resolución | Precio |
|---|---|---|---|---|---|---|---|---|
| 86.1 % | v8 | 07/2024 | Asus ROG Zephyrus G16 GU605MY Ultra 9 185H, NVIDIA GeForce RTX 4090 Laptop GPU | 1.9 kg | 16.4 mm | 16.00" | 2560x1600 | |
| 85.5 % | v8 | 06/2024 | SCHENKER XMG Neo 16 (Early 24) i9-14900HX, NVIDIA GeForce RTX 4090 Laptop GPU | 2.5 kg | 26.6 mm | 16.00" | 2560x1600 | |
| 83.9 % | v8 | 06/2024 | Lenovo Legion 9 16IRX9, RTX 4090 i9-14900HX, NVIDIA GeForce RTX 4090 Laptop GPU | 2.5 kg | 22.7 mm | 16.00" | 3200x2000 | |
| 88.4 % v7 (old) | v7 (old) | 05/2024 | Alienware x16 R2 P120F Ultra 9 185H, NVIDIA GeForce RTX 4080 Laptop GPU | 2.7 kg | 18.57 mm | 16.00" | 2560x1600 | |
| 91.1 % v7 (old) | v7 (old) | 02/2024 | Razer Blade 16 2024, RTX 4090 i9-14900HX, NVIDIA GeForce RTX 4090 Laptop GPU | 2.5 kg | 22 mm | 16.00" | 2560x1600 |
Nota: Recientemente hemos actualizado nuestro sistema de clasificación y los resultados de la versión 8 no son comparables con los de la versión 7. Encontrará más información aquí .
Diferencias del G16 con el portátil RTX 4070

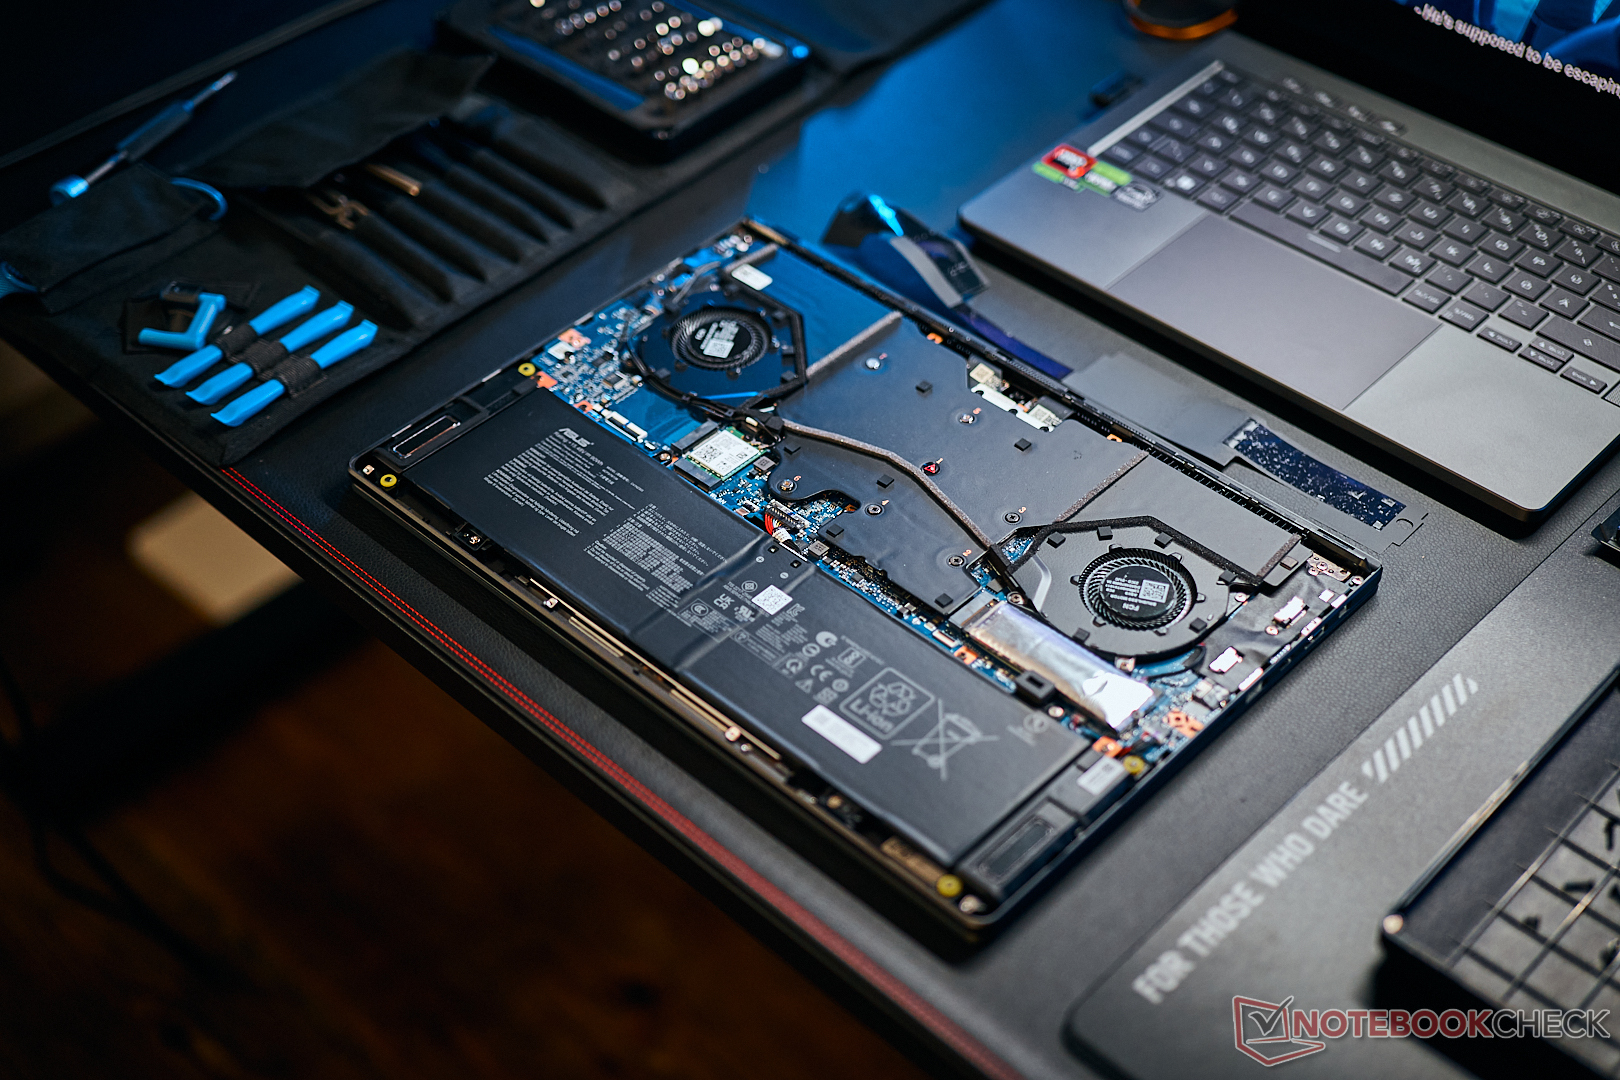

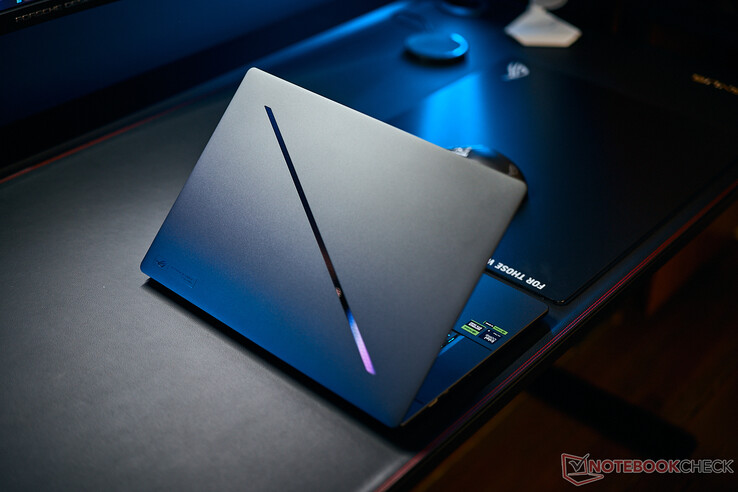
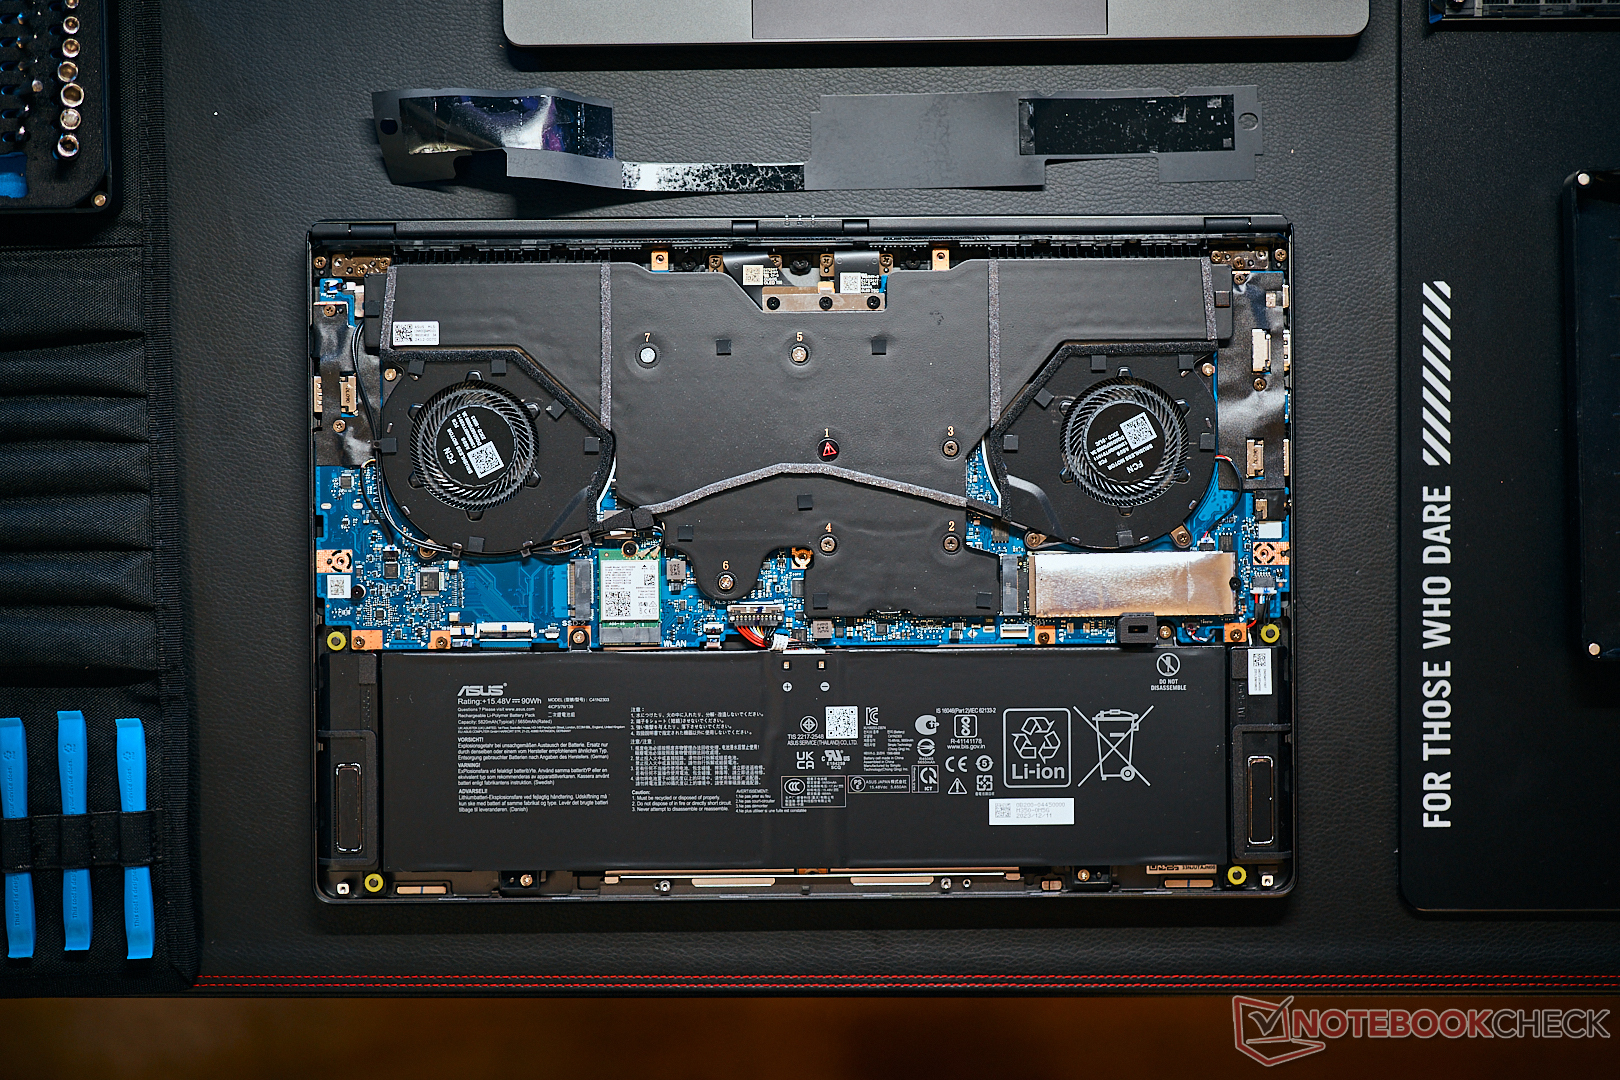
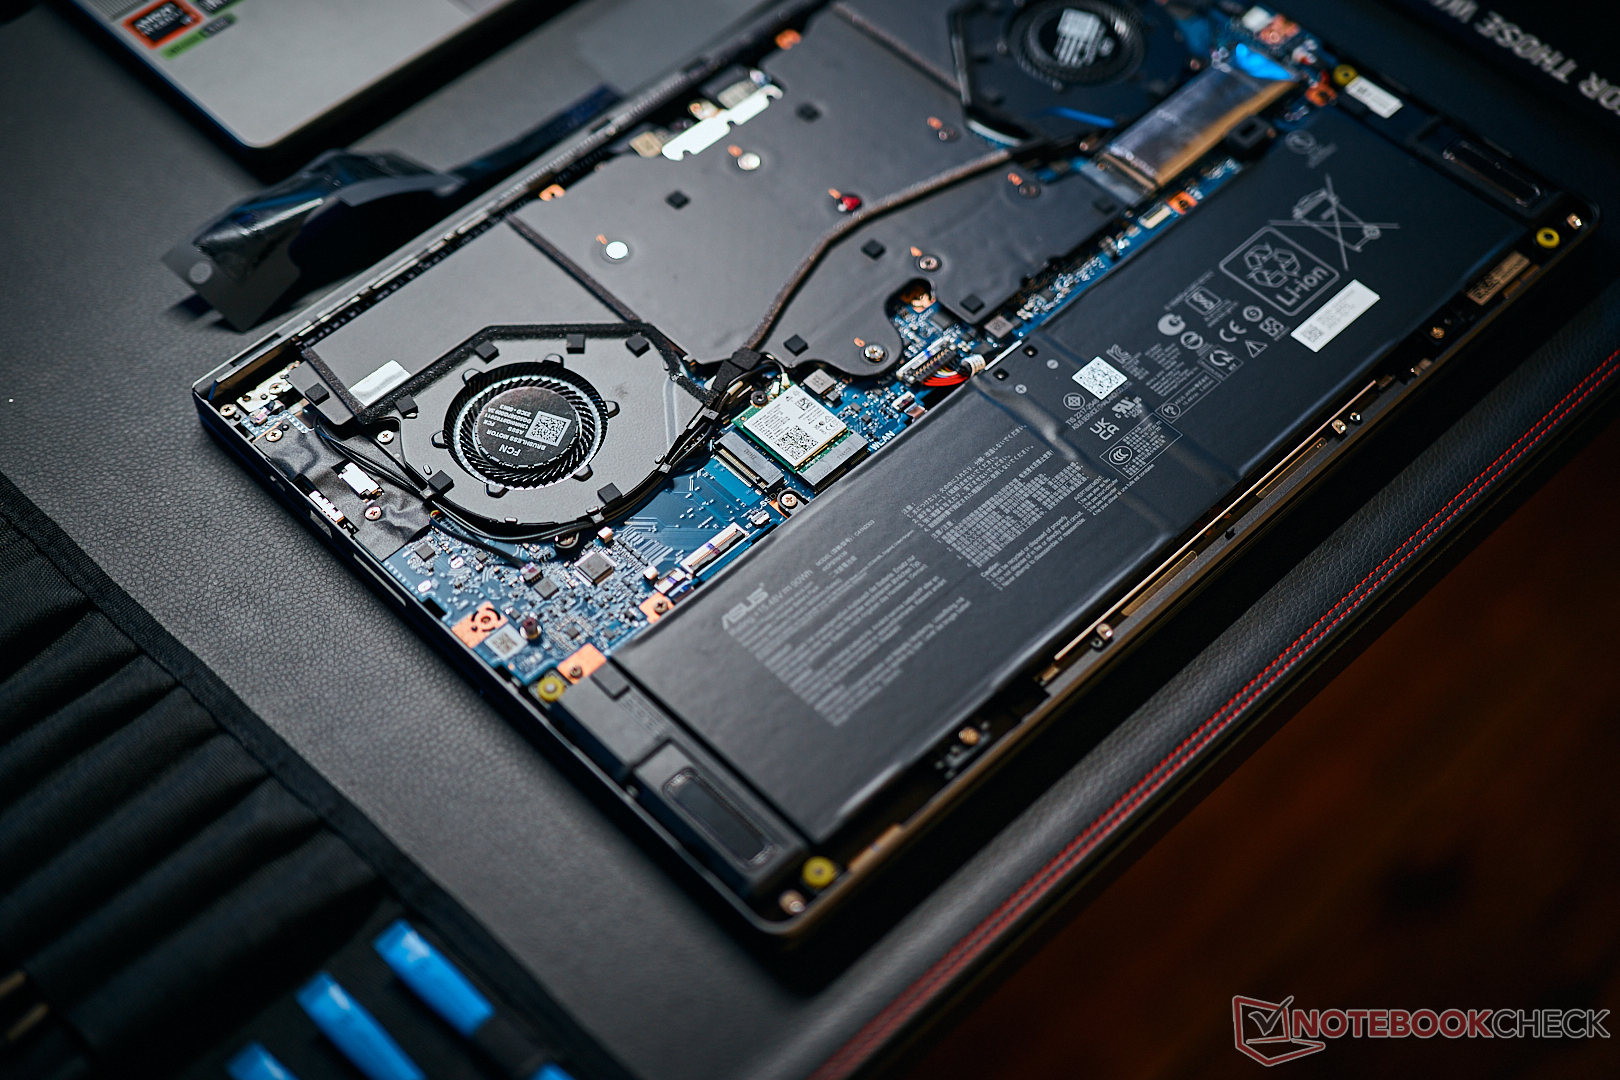
El modelo de gama alta del ROG Zephyrus G16 es visualmente indistinguible del modelo más débil equipado con el portátil RTX 4070/4060. Sin embargo, internamente las diferencias en el sistema de refrigeración se hacen evidentes. Mientras que los modelos más débiles utilizan un total de tres ventiladores y conductos de calor normales, Asus ha optado por la refrigeración por cámara de vapor con dos ventiladores para sus modelos más caros.
La refrigeración aumenta el peso de 1,817 kg a 1,908 kg, lo que sigue siendo ligero en comparación con los demás portátiles RTX 4090 del segmento de 16 pulgadas, ya que los dispositivos de comparación pesan al menos medio kilo más. Además, el Zephyrus es también simultáneamente uno de los modelos más delgados y compactos. Las configuraciones hasta el portátil RTX 4070 vienen con una fuente de alimentación de 200 vatios (583 gramos) y a partir del portátil RTX 4080 es una más potente de 240 vatios (745 gramos).

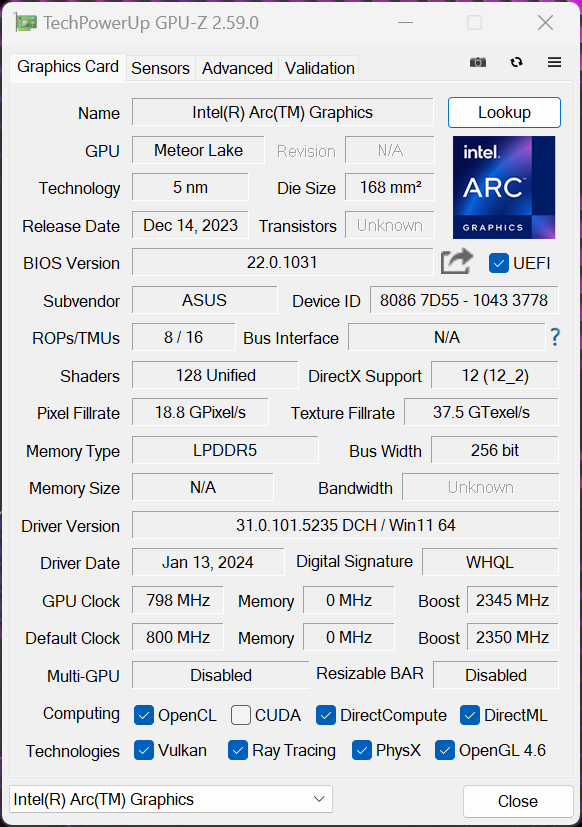
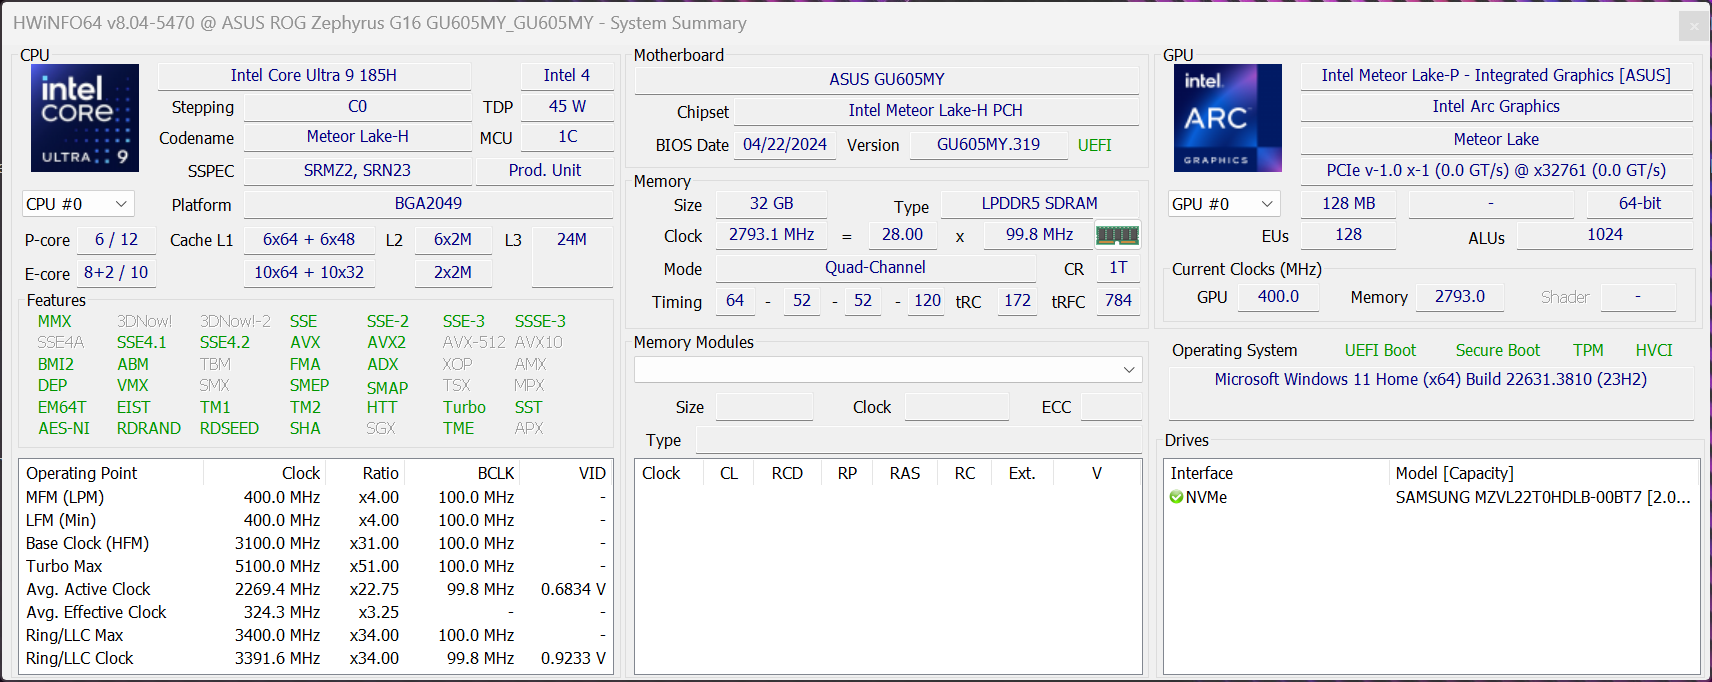
Rendimiento - Meteor Lake y RTX 4090 portátil
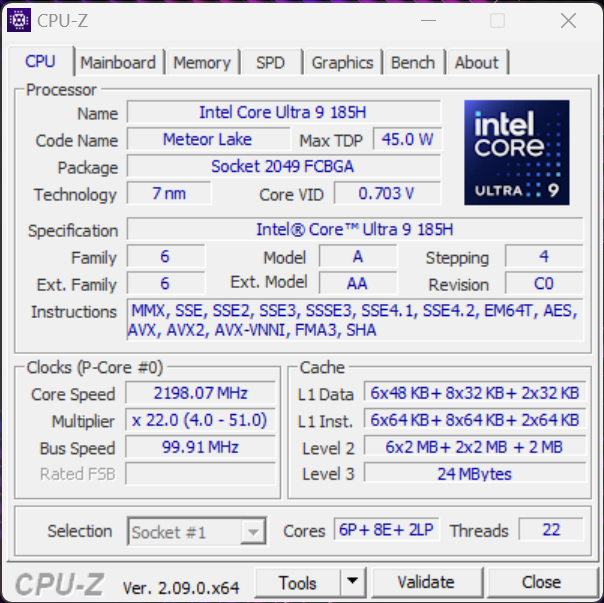
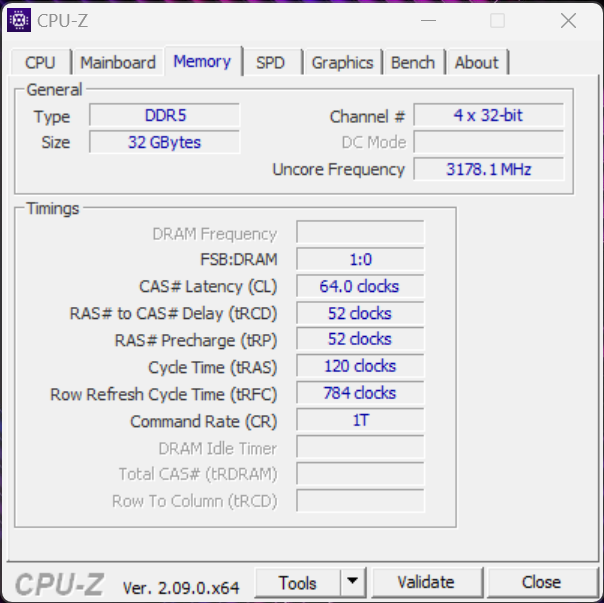
La variante de gama alta del Zephyrus está equipada actualmente con el procesador Meteor Lake más rápido, el Core Ultra 9 185H. En lo que respecta al rendimiento de la CPU, queda por detrás de las CPU HX de Intel. En la versión de 115 vatios encontrada aquí, la Nvidia GeForce RTX 4090 portátil está bastante lejos de alcanzar el máximo rendimiento. La RAM instalada es de 32 GB (LPDDR5x 7467) pero, debido al precio y a la falta de posibilidad de actualización, habríamos preferido 64 GB.
Condiciones de la prueba
Los perfiles energéticos básicos siguen siendo idénticos y el modelo más potente con el portátil RTX 4090 también ofrece los perfiles Silencioso, Rendimiento y Turbo. En la tabla siguiente, hemos enumerado sus valores TDP/TGP correspondientes, así como el efecto sobre el rendimiento. Debajo, también hemos añadido los valores del modelo RTX 4070 del Zephyrus G16 para que pueda ver una comparación directa. En principio, los modelos con la refrigeración por cámara de vapor más potente pueden consumir un poco más de energía, pero la diferencia es bastante pequeña, sobre todo cuando se trata del procesador. Tanto en el perfil Silencioso como en el de Rendimiento, la refrigeración por cámara de vapor consigue incluso ser algo más ruidosa que la más débil Variante RTX 4070. Como es habitual, llevamos a cabo los puntos de referencia y las mediciones utilizando el modo turbo que, sin embargo, sólo está disponible cuando está conectado a la red eléctrica.
| Perfil energético | Carga de la CPU | CB R23 Multi | Carga de la GPU | Time Spy Gráficos | Cyberpunk 2077 QHD Ultra | Volumen máx. del ventilador |
|---|---|---|---|---|---|---|
| Silencioso | 60 vatios | 15.750 puntos | 55 vatios | 9.731 puntos | 40,2fps | 41,4 dB(A) |
| Rendimiento | 100->70 vatios | 17.452 puntos | 90 vatios | 15.205 puntos | 60,2fps | 48,1 dB(A) |
| Turbo | 110->80 vatios | 19.109 puntos | 115 vatios | 19.109 puntos | 68,1fps | 52,3 dB(A) |
| Perfil energético | Carga de la CPU | CB R23 Multi | Carga de la GPU | Time Spy Gráficos | Cyberpunk 2077 QHD Ultra | Volumen máx. del ventilador |
|---|---|---|---|---|---|---|
| Silencioso | 60->45 vatios | 15.869 puntos | 65 vatios | 9.042 puntos | 32,6fps | 41,5 dB(A) |
| Rendimiento | 70->50 vatios | 17.133 puntos | 80 vatios | 10.989 puntos | 43,7fps | 46,4 dB(A) |
| Turbo | 95->70 vatios | 18.372 puntos | 105 vatios | 12.312 puntos | 48,7fps | 52,4 dB(A) |
Procesador - Intel Core Ultra 9 185H
El Core Ultra 9 185H es el procesador móvil más rápido de la generación Meteor Lake de Intel, sin embargo, se encuentra claramente por detrás de los procesadores HX (actualización Raptor Lake). Como acabamos de observar en la tabla comparativa, tampoco hay diferencias tangibles entre el Core Ultra 9 y el Core Ultra 7 en ambos modelos del Zephyrus G16 2024, así como en el Alienware x16 R2. Este último también cuenta con el Core Ultra 9 185H.
Sin embargo, los otros competidores de la RTX 4090 con el Core i9 14900HX ofrecen un rendimiento de CPU significativamente superior, especialmente en las pruebas multinúcleo. El rendimiento multinúcleo del ROG Zephyrus G16 no siempre se mantiene del todo estable, aunque un déficit de alrededor del 10 % bajo carga sostenida puede considerarse bastante pequeño. En modo batería, el procesador puede consumir un máximo de 75 vatios, pero esto apenas tiene efecto en el rendimiento multi-core (~8 %). Puede encontrar más pruebas de rendimiento de la CPU aquí.
Cinebench R15 Multi Continuous Test
Cinebench R23: Multi Core | Single Core
Cinebench R20: CPU (Multi Core) | CPU (Single Core)
Cinebench R15: CPU Multi 64Bit | CPU Single 64Bit
Blender: v2.79 BMW27 CPU
7-Zip 18.03: 7z b 4 | 7z b 4 -mmt1
Geekbench 6.4: Multi-Core | Single-Core
Geekbench 5.5: Multi-Core | Single-Core
HWBOT x265 Benchmark v2.2: 4k Preset
LibreOffice : 20 Documents To PDF
R Benchmark 2.5: Overall mean
| CPU Performance Rating | |
| SCHENKER XMG Neo 16 (Early 24) | |
| Razer Blade 16 2024, RTX 4090 | |
| Lenovo Legion 9 16IRX9, RTX 4090 | |
| Media de la clase Gaming | |
| Asus ROG Zephyrus G16 GU605MY | |
| Medio Intel Core Ultra 9 185H | |
| Asus ROG Zephyrus G16 2024 GU605M | |
| Alienware x16 R2 P120F | |
| Cinebench R23 / Multi Core | |
| SCHENKER XMG Neo 16 (Early 24) | |
| Lenovo Legion 9 16IRX9, RTX 4090 | |
| Razer Blade 16 2024, RTX 4090 | |
| Media de la clase Gaming (5668 - 39652, n=151, últimos 2 años) | |
| Asus ROG Zephyrus G16 GU605MY | |
| Alienware x16 R2 P120F | |
| Medio Intel Core Ultra 9 185H (12688 - 19851, n=19) | |
| Asus ROG Zephyrus G16 2024 GU605M | |
| Cinebench R23 / Single Core | |
| SCHENKER XMG Neo 16 (Early 24) | |
| Razer Blade 16 2024, RTX 4090 | |
| Media de la clase Gaming (1136 - 2252, n=151, últimos 2 años) | |
| Asus ROG Zephyrus G16 GU605MY | |
| Medio Intel Core Ultra 9 185H (1166 - 1912, n=19) | |
| Lenovo Legion 9 16IRX9, RTX 4090 | |
| Asus ROG Zephyrus G16 2024 GU605M | |
| Alienware x16 R2 P120F | |
| Cinebench R20 / CPU (Multi Core) | |
| SCHENKER XMG Neo 16 (Early 24) | |
| Lenovo Legion 9 16IRX9, RTX 4090 | |
| Razer Blade 16 2024, RTX 4090 | |
| Media de la clase Gaming (2179 - 15517, n=151, últimos 2 años) | |
| Asus ROG Zephyrus G16 GU605MY | |
| Alienware x16 R2 P120F | |
| Medio Intel Core Ultra 9 185H (4843 - 7651, n=19) | |
| Asus ROG Zephyrus G16 2024 GU605M | |
| Cinebench R20 / CPU (Single Core) | |
| SCHENKER XMG Neo 16 (Early 24) | |
| Razer Blade 16 2024, RTX 4090 | |
| Media de la clase Gaming (439 - 866, n=151, últimos 2 años) | |
| Asus ROG Zephyrus G16 GU605MY | |
| Asus ROG Zephyrus G16 2024 GU605M | |
| Medio Intel Core Ultra 9 185H (442 - 735, n=19) | |
| Lenovo Legion 9 16IRX9, RTX 4090 | |
| Alienware x16 R2 P120F | |
| Cinebench R15 / CPU Multi 64Bit | |
| SCHENKER XMG Neo 16 (Early 24) | |
| Lenovo Legion 9 16IRX9, RTX 4090 | |
| Razer Blade 16 2024, RTX 4090 | |
| Media de la clase Gaming (905 - 6074, n=154, últimos 2 años) | |
| Asus ROG Zephyrus G16 GU605MY | |
| Alienware x16 R2 P120F | |
| Medio Intel Core Ultra 9 185H (1582 - 3165, n=21) | |
| Asus ROG Zephyrus G16 2024 GU605M | |
| Cinebench R15 / CPU Single 64Bit | |
| Razer Blade 16 2024, RTX 4090 | |
| SCHENKER XMG Neo 16 (Early 24) | |
| Media de la clase Gaming (191.9 - 343, n=151, últimos 2 años) | |
| Asus ROG Zephyrus G16 GU605MY | |
| Asus ROG Zephyrus G16 2024 GU605M | |
| Medio Intel Core Ultra 9 185H (191.9 - 281, n=19) | |
| Lenovo Legion 9 16IRX9, RTX 4090 | |
| Alienware x16 R2 P120F | |
| Blender / v2.79 BMW27 CPU | |
| Asus ROG Zephyrus G16 2024 GU605M | |
| Medio Intel Core Ultra 9 185H (163 - 285, n=19) | |
| Alienware x16 R2 P120F | |
| Asus ROG Zephyrus G16 GU605MY | |
| Media de la clase Gaming (81 - 555, n=144, últimos 2 años) | |
| Razer Blade 16 2024, RTX 4090 | |
| Lenovo Legion 9 16IRX9, RTX 4090 | |
| SCHENKER XMG Neo 16 (Early 24) | |
| 7-Zip 18.03 / 7z b 4 | |
| SCHENKER XMG Neo 16 (Early 24) | |
| Lenovo Legion 9 16IRX9, RTX 4090 | |
| Razer Blade 16 2024, RTX 4090 | |
| Media de la clase Gaming (23795 - 144064, n=149, últimos 2 años) | |
| Asus ROG Zephyrus G16 GU605MY | |
| Medio Intel Core Ultra 9 185H (51738 - 76331, n=19) | |
| Asus ROG Zephyrus G16 2024 GU605M | |
| Alienware x16 R2 P120F | |
| 7-Zip 18.03 / 7z b 4 -mmt1 | |
| SCHENKER XMG Neo 16 (Early 24) | |
| Razer Blade 16 2024, RTX 4090 | |
| Media de la clase Gaming (4199 - 7573, n=149, últimos 2 años) | |
| Asus ROG Zephyrus G16 GU605MY | |
| Lenovo Legion 9 16IRX9, RTX 4090 | |
| Asus ROG Zephyrus G16 2024 GU605M | |
| Medio Intel Core Ultra 9 185H (4199 - 5781, n=19) | |
| Alienware x16 R2 P120F | |
| Geekbench 6.4 / Multi-Core | |
| SCHENKER XMG Neo 16 (Early 24) | |
| Razer Blade 16 2024, RTX 4090 | |
| Lenovo Legion 9 16IRX9, RTX 4090 | |
| Asus ROG Zephyrus G16 GU605MY | |
| Media de la clase Gaming (5340 - 21668, n=119, últimos 2 años) | |
| Medio Intel Core Ultra 9 185H (9140 - 14540, n=19) | |
| Asus ROG Zephyrus G16 2024 GU605M | |
| Alienware x16 R2 P120F | |
| Geekbench 6.4 / Single-Core | |
| SCHENKER XMG Neo 16 (Early 24) | |
| Razer Blade 16 2024, RTX 4090 | |
| Media de la clase Gaming (1490 - 3219, n=119, últimos 2 años) | |
| Asus ROG Zephyrus G16 GU605MY | |
| Medio Intel Core Ultra 9 185H (1490 - 2573, n=19) | |
| Lenovo Legion 9 16IRX9, RTX 4090 | |
| Asus ROG Zephyrus G16 2024 GU605M | |
| Alienware x16 R2 P120F | |
| Geekbench 5.5 / Multi-Core | |
| SCHENKER XMG Neo 16 (Early 24) | |
| Lenovo Legion 9 16IRX9, RTX 4090 | |
| Razer Blade 16 2024, RTX 4090 | |
| Media de la clase Gaming (4557 - 25855, n=148, últimos 2 años) | |
| Asus ROG Zephyrus G16 GU605MY | |
| Medio Intel Core Ultra 9 185H (9330 - 14230, n=19) | |
| Asus ROG Zephyrus G16 2024 GU605M | |
| Alienware x16 R2 P120F | |
| Geekbench 5.5 / Single-Core | |
| SCHENKER XMG Neo 16 (Early 24) | |
| Razer Blade 16 2024, RTX 4090 | |
| Media de la clase Gaming (986 - 2423, n=148, últimos 2 años) | |
| Asus ROG Zephyrus G16 GU605MY | |
| Medio Intel Core Ultra 9 185H (986 - 1902, n=19) | |
| Asus ROG Zephyrus G16 2024 GU605M | |
| Lenovo Legion 9 16IRX9, RTX 4090 | |
| Alienware x16 R2 P120F | |
| HWBOT x265 Benchmark v2.2 / 4k Preset | |
| SCHENKER XMG Neo 16 (Early 24) | |
| Lenovo Legion 9 16IRX9, RTX 4090 | |
| Razer Blade 16 2024, RTX 4090 | |
| Media de la clase Gaming (6.72 - 42.9, n=148, últimos 2 años) | |
| Asus ROG Zephyrus G16 GU605MY | |
| Alienware x16 R2 P120F | |
| Asus ROG Zephyrus G16 2024 GU605M | |
| Medio Intel Core Ultra 9 185H (14.1 - 22.7, n=19) | |
| LibreOffice / 20 Documents To PDF | |
| Lenovo Legion 9 16IRX9, RTX 4090 | |
| Asus ROG Zephyrus G16 2024 GU605M | |
| Media de la clase Gaming (19 - 96.6, n=147, últimos 2 años) | |
| Razer Blade 16 2024, RTX 4090 | |
| Medio Intel Core Ultra 9 185H (34.5 - 73.5, n=19) | |
| Alienware x16 R2 P120F | |
| Asus ROG Zephyrus G16 GU605MY | |
| SCHENKER XMG Neo 16 (Early 24) | |
| R Benchmark 2.5 / Overall mean | |
| Alienware x16 R2 P120F | |
| Lenovo Legion 9 16IRX9, RTX 4090 | |
| Medio Intel Core Ultra 9 185H (0.4313 - 0.759, n=20) | |
| Asus ROG Zephyrus G16 2024 GU605M | |
| Media de la clase Gaming (0.3609 - 0.759, n=150, últimos 2 años) | |
| Asus ROG Zephyrus G16 GU605MY | |
| Razer Blade 16 2024, RTX 4090 | |
| SCHENKER XMG Neo 16 (Early 24) | |
* ... más pequeño es mejor
AIDA64: FP32 Ray-Trace | FPU Julia | CPU SHA3 | CPU Queen | FPU SinJulia | FPU Mandel | CPU AES | CPU ZLib | FP64 Ray-Trace | CPU PhotoWorxx
| Performance Rating | |
| SCHENKER XMG Neo 16 (Early 24) | |
| Lenovo Legion 9 16IRX9, RTX 4090 | |
| Razer Blade 16 2024, RTX 4090 | |
| Media de la clase Gaming | |
| Alienware x16 R2 P120F | |
| Asus ROG Zephyrus G16 GU605MY | |
| Medio Intel Core Ultra 9 185H | |
| Asus ROG Zephyrus G16 2024 GU605M | |
| AIDA64 / FP32 Ray-Trace | |
| SCHENKER XMG Neo 16 (Early 24) | |
| Lenovo Legion 9 16IRX9, RTX 4090 | |
| Razer Blade 16 2024, RTX 4090 | |
| Media de la clase Gaming (4986 - 81639, n=147, últimos 2 años) | |
| Alienware x16 R2 P120F | |
| Asus ROG Zephyrus G16 GU605MY | |
| Asus ROG Zephyrus G16 2024 GU605M | |
| Medio Intel Core Ultra 9 185H (9220 - 18676, n=19) | |
| AIDA64 / FPU Julia | |
| SCHENKER XMG Neo 16 (Early 24) | |
| Lenovo Legion 9 16IRX9, RTX 4090 | |
| Razer Blade 16 2024, RTX 4090 | |
| Media de la clase Gaming (25360 - 252486, n=147, últimos 2 años) | |
| Alienware x16 R2 P120F | |
| Asus ROG Zephyrus G16 GU605MY | |
| Asus ROG Zephyrus G16 2024 GU605M | |
| Medio Intel Core Ultra 9 185H (48865 - 96463, n=19) | |
| AIDA64 / CPU SHA3 | |
| SCHENKER XMG Neo 16 (Early 24) | |
| Lenovo Legion 9 16IRX9, RTX 4090 | |
| Razer Blade 16 2024, RTX 4090 | |
| Media de la clase Gaming (1339 - 10389, n=147, últimos 2 años) | |
| Alienware x16 R2 P120F | |
| Asus ROG Zephyrus G16 GU605MY | |
| Medio Intel Core Ultra 9 185H (2394 - 4534, n=19) | |
| Asus ROG Zephyrus G16 2024 GU605M | |
| AIDA64 / CPU Queen | |
| SCHENKER XMG Neo 16 (Early 24) | |
| Razer Blade 16 2024, RTX 4090 | |
| Lenovo Legion 9 16IRX9, RTX 4090 | |
| Media de la clase Gaming (50699 - 200651, n=147, últimos 2 años) | |
| Alienware x16 R2 P120F | |
| Asus ROG Zephyrus G16 GU605MY | |
| Asus ROG Zephyrus G16 2024 GU605M | |
| Medio Intel Core Ultra 9 185H (66785 - 95241, n=19) | |
| AIDA64 / FPU SinJulia | |
| SCHENKER XMG Neo 16 (Early 24) | |
| Lenovo Legion 9 16IRX9, RTX 4090 | |
| Razer Blade 16 2024, RTX 4090 | |
| Media de la clase Gaming (4800 - 32988, n=147, últimos 2 años) | |
| Alienware x16 R2 P120F | |
| Asus ROG Zephyrus G16 GU605MY | |
| Asus ROG Zephyrus G16 2024 GU605M | |
| Medio Intel Core Ultra 9 185H (7255 - 11392, n=19) | |
| AIDA64 / FPU Mandel | |
| SCHENKER XMG Neo 16 (Early 24) | |
| Lenovo Legion 9 16IRX9, RTX 4090 | |
| Razer Blade 16 2024, RTX 4090 | |
| Media de la clase Gaming (12321 - 134044, n=147, últimos 2 años) | |
| Alienware x16 R2 P120F | |
| Asus ROG Zephyrus G16 GU605MY | |
| Asus ROG Zephyrus G16 2024 GU605M | |
| Medio Intel Core Ultra 9 185H (24004 - 48020, n=19) | |
| AIDA64 / CPU AES | |
| SCHENKER XMG Neo 16 (Early 24) | |
| Lenovo Legion 9 16IRX9, RTX 4090 | |
| Razer Blade 16 2024, RTX 4090 | |
| Media de la clase Gaming (19065 - 328679, n=147, últimos 2 años) | |
| Medio Intel Core Ultra 9 185H (53116 - 154066, n=19) | |
| Alienware x16 R2 P120F | |
| Asus ROG Zephyrus G16 GU605MY | |
| Asus ROG Zephyrus G16 2024 GU605M | |
| AIDA64 / CPU ZLib | |
| SCHENKER XMG Neo 16 (Early 24) | |
| Lenovo Legion 9 16IRX9, RTX 4090 | |
| Razer Blade 16 2024, RTX 4090 | |
| Media de la clase Gaming (373 - 2531, n=147, últimos 2 años) | |
| Alienware x16 R2 P120F | |
| Asus ROG Zephyrus G16 GU605MY | |
| Medio Intel Core Ultra 9 185H (678 - 1341, n=19) | |
| Asus ROG Zephyrus G16 2024 GU605M | |
| AIDA64 / FP64 Ray-Trace | |
| SCHENKER XMG Neo 16 (Early 24) | |
| Lenovo Legion 9 16IRX9, RTX 4090 | |
| Razer Blade 16 2024, RTX 4090 | |
| Media de la clase Gaming (2540 - 43430, n=147, últimos 2 años) | |
| Alienware x16 R2 P120F | |
| Asus ROG Zephyrus G16 GU605MY | |
| Medio Intel Core Ultra 9 185H (4428 - 10078, n=19) | |
| Asus ROG Zephyrus G16 2024 GU605M | |
| AIDA64 / CPU PhotoWorxx | |
| Lenovo Legion 9 16IRX9, RTX 4090 | |
| Alienware x16 R2 P120F | |
| Asus ROG Zephyrus G16 GU605MY | |
| Razer Blade 16 2024, RTX 4090 | |
| SCHENKER XMG Neo 16 (Early 24) | |
| Asus ROG Zephyrus G16 2024 GU605M | |
| Medio Intel Core Ultra 9 185H (44547 - 53918, n=19) | |
| Media de la clase Gaming (10805 - 60161, n=147, últimos 2 años) | |
Rendimiento del sistema
Algo menos sorprendente es que la variante de gama alta del Zephyrus G16 es un portátil muy sensible. Aunque los resultados de los benchmarks también son buenos, una vez más, la competencia equipada con el procesador HX rinde mejor. Sin embargo, esto no se nota en situaciones cotidianas. Debido a la conmutación de gráficos Advanced Optimus, hay una breve congelación ocasional al arrancar juegos cuando el sistema cambia a la dGPU, sin embargo, eso es completamente normal.
CrossMark: Overall | Productivity | Creativity | Responsiveness
WebXPRT 3: Overall
WebXPRT 4: Overall
Mozilla Kraken 1.1: Total
| PCMark 10 / Score | |
| SCHENKER XMG Neo 16 (Early 24) | |
| Razer Blade 16 2024, RTX 4090 | |
| Lenovo Legion 9 16IRX9, RTX 4090 | |
| Asus ROG Zephyrus G16 GU605MY | |
| Medio Intel Core Ultra 9 185H, NVIDIA GeForce RTX 4090 Laptop GPU (n=1) | |
| Media de la clase Gaming (5776 - 9852, n=133, últimos 2 años) | |
| Alienware x16 R2 P120F | |
| Asus ROG Zephyrus G16 2024 GU605M | |
| PCMark 10 / Essentials | |
| SCHENKER XMG Neo 16 (Early 24) | |
| Lenovo Legion 9 16IRX9, RTX 4090 | |
| Razer Blade 16 2024, RTX 4090 | |
| Asus ROG Zephyrus G16 GU605MY | |
| Medio Intel Core Ultra 9 185H, NVIDIA GeForce RTX 4090 Laptop GPU (n=1) | |
| Media de la clase Gaming (9057 - 12600, n=133, últimos 2 años) | |
| Asus ROG Zephyrus G16 2024 GU605M | |
| Alienware x16 R2 P120F | |
| PCMark 10 / Productivity | |
| SCHENKER XMG Neo 16 (Early 24) | |
| Razer Blade 16 2024, RTX 4090 | |
| Lenovo Legion 9 16IRX9, RTX 4090 | |
| Asus ROG Zephyrus G16 GU605MY | |
| Medio Intel Core Ultra 9 185H, NVIDIA GeForce RTX 4090 Laptop GPU (n=1) | |
| Media de la clase Gaming (6662 - 14612, n=133, últimos 2 años) | |
| Asus ROG Zephyrus G16 2024 GU605M | |
| Alienware x16 R2 P120F | |
| PCMark 10 / Digital Content Creation | |
| SCHENKER XMG Neo 16 (Early 24) | |
| Lenovo Legion 9 16IRX9, RTX 4090 | |
| Razer Blade 16 2024, RTX 4090 | |
| Alienware x16 R2 P120F | |
| Asus ROG Zephyrus G16 GU605MY | |
| Medio Intel Core Ultra 9 185H, NVIDIA GeForce RTX 4090 Laptop GPU (n=1) | |
| Media de la clase Gaming (6807 - 18475, n=133, últimos 2 años) | |
| Asus ROG Zephyrus G16 2024 GU605M | |
| CrossMark / Overall | |
| SCHENKER XMG Neo 16 (Early 24) | |
| Razer Blade 16 2024, RTX 4090 | |
| Lenovo Legion 9 16IRX9, RTX 4090 | |
| Media de la clase Gaming (1247 - 2344, n=114, últimos 2 años) | |
| Asus ROG Zephyrus G16 GU605MY | |
| Medio Intel Core Ultra 9 185H, NVIDIA GeForce RTX 4090 Laptop GPU (n=1) | |
| Asus ROG Zephyrus G16 2024 GU605M | |
| Alienware x16 R2 P120F | |
| CrossMark / Productivity | |
| SCHENKER XMG Neo 16 (Early 24) | |
| Razer Blade 16 2024, RTX 4090 | |
| Media de la clase Gaming (1299 - 2204, n=114, últimos 2 años) | |
| Lenovo Legion 9 16IRX9, RTX 4090 | |
| Asus ROG Zephyrus G16 GU605MY | |
| Medio Intel Core Ultra 9 185H, NVIDIA GeForce RTX 4090 Laptop GPU (n=1) | |
| Asus ROG Zephyrus G16 2024 GU605M | |
| Alienware x16 R2 P120F | |
| CrossMark / Creativity | |
| SCHENKER XMG Neo 16 (Early 24) | |
| Razer Blade 16 2024, RTX 4090 | |
| Lenovo Legion 9 16IRX9, RTX 4090 | |
| Media de la clase Gaming (1275 - 2660, n=114, últimos 2 años) | |
| Asus ROG Zephyrus G16 GU605MY | |
| Medio Intel Core Ultra 9 185H, NVIDIA GeForce RTX 4090 Laptop GPU (n=1) | |
| Asus ROG Zephyrus G16 2024 GU605M | |
| Alienware x16 R2 P120F | |
| CrossMark / Responsiveness | |
| SCHENKER XMG Neo 16 (Early 24) | |
| Razer Blade 16 2024, RTX 4090 | |
| Lenovo Legion 9 16IRX9, RTX 4090 | |
| Media de la clase Gaming (1030 - 2330, n=114, últimos 2 años) | |
| Alienware x16 R2 P120F | |
| Asus ROG Zephyrus G16 GU605MY | |
| Medio Intel Core Ultra 9 185H, NVIDIA GeForce RTX 4090 Laptop GPU (n=1) | |
| Asus ROG Zephyrus G16 2024 GU605M | |
| WebXPRT 3 / Overall | |
| SCHENKER XMG Neo 16 (Early 24) | |
| Razer Blade 16 2024, RTX 4090 | |
| Media de la clase Gaming (215 - 480, n=127, últimos 2 años) | |
| Asus ROG Zephyrus G16 2024 GU605M | |
| Asus ROG Zephyrus G16 GU605MY | |
| Medio Intel Core Ultra 9 185H, NVIDIA GeForce RTX 4090 Laptop GPU (n=1) | |
| Lenovo Legion 9 16IRX9, RTX 4090 | |
| Alienware x16 R2 P120F | |
| WebXPRT 4 / Overall | |
| SCHENKER XMG Neo 16 (Early 24) | |
| Asus ROG Zephyrus G16 GU605MY | |
| Medio Intel Core Ultra 9 185H, NVIDIA GeForce RTX 4090 Laptop GPU (n=1) | |
| Media de la clase Gaming (176.4 - 335, n=115, últimos 2 años) | |
| Asus ROG Zephyrus G16 2024 GU605M | |
| Lenovo Legion 9 16IRX9, RTX 4090 | |
| Alienware x16 R2 P120F | |
| Mozilla Kraken 1.1 / Total | |
| Alienware x16 R2 P120F | |
| Asus ROG Zephyrus G16 2024 GU605M | |
| Lenovo Legion 9 16IRX9, RTX 4090 | |
| Asus ROG Zephyrus G16 GU605MY | |
| Medio Intel Core Ultra 9 185H, NVIDIA GeForce RTX 4090 Laptop GPU (n=1) | |
| Media de la clase Gaming (409 - 674, n=139, últimos 2 años) | |
| Razer Blade 16 2024, RTX 4090 | |
| SCHENKER XMG Neo 16 (Early 24) | |
* ... más pequeño es mejor
| PCMark 10 Score | 7993 puntos | |
ayuda | ||
| AIDA64 / Memory Copy | |
| Asus ROG Zephyrus G16 GU605MY | |
| Alienware x16 R2 P120F | |
| Asus ROG Zephyrus G16 2024 GU605M | |
| Medio Intel Core Ultra 9 185H (69929 - 95718, n=19) | |
| Lenovo Legion 9 16IRX9, RTX 4090 | |
| SCHENKER XMG Neo 16 (Early 24) | |
| Razer Blade 16 2024, RTX 4090 | |
| Media de la clase Gaming (21750 - 97515, n=147, últimos 2 años) | |
| AIDA64 / Memory Read | |
| SCHENKER XMG Neo 16 (Early 24) | |
| Asus ROG Zephyrus G16 2024 GU605M | |
| Razer Blade 16 2024, RTX 4090 | |
| Asus ROG Zephyrus G16 GU605MY | |
| Alienware x16 R2 P120F | |
| Lenovo Legion 9 16IRX9, RTX 4090 | |
| Medio Intel Core Ultra 9 185H (64619 - 87768, n=19) | |
| Media de la clase Gaming (22956 - 102937, n=147, últimos 2 años) | |
| AIDA64 / Memory Write | |
| Lenovo Legion 9 16IRX9, RTX 4090 | |
| SCHENKER XMG Neo 16 (Early 24) | |
| Asus ROG Zephyrus G16 GU605MY | |
| Razer Blade 16 2024, RTX 4090 | |
| Asus ROG Zephyrus G16 2024 GU605M | |
| Alienware x16 R2 P120F | |
| Medio Intel Core Ultra 9 185H (51114 - 93871, n=19) | |
| Media de la clase Gaming (22297 - 108954, n=147, últimos 2 años) | |
| AIDA64 / Memory Latency | |
| Medio Intel Core Ultra 9 185H (121.4 - 259, n=19) | |
| Alienware x16 R2 P120F | |
| Asus ROG Zephyrus G16 2024 GU605M | |
| Asus ROG Zephyrus G16 GU605MY | |
| Media de la clase Gaming (59.5 - 259, n=147, últimos 2 años) | |
| Lenovo Legion 9 16IRX9, RTX 4090 | |
| Razer Blade 16 2024, RTX 4090 | |
| SCHENKER XMG Neo 16 (Early 24) | |
* ... más pequeño es mejor
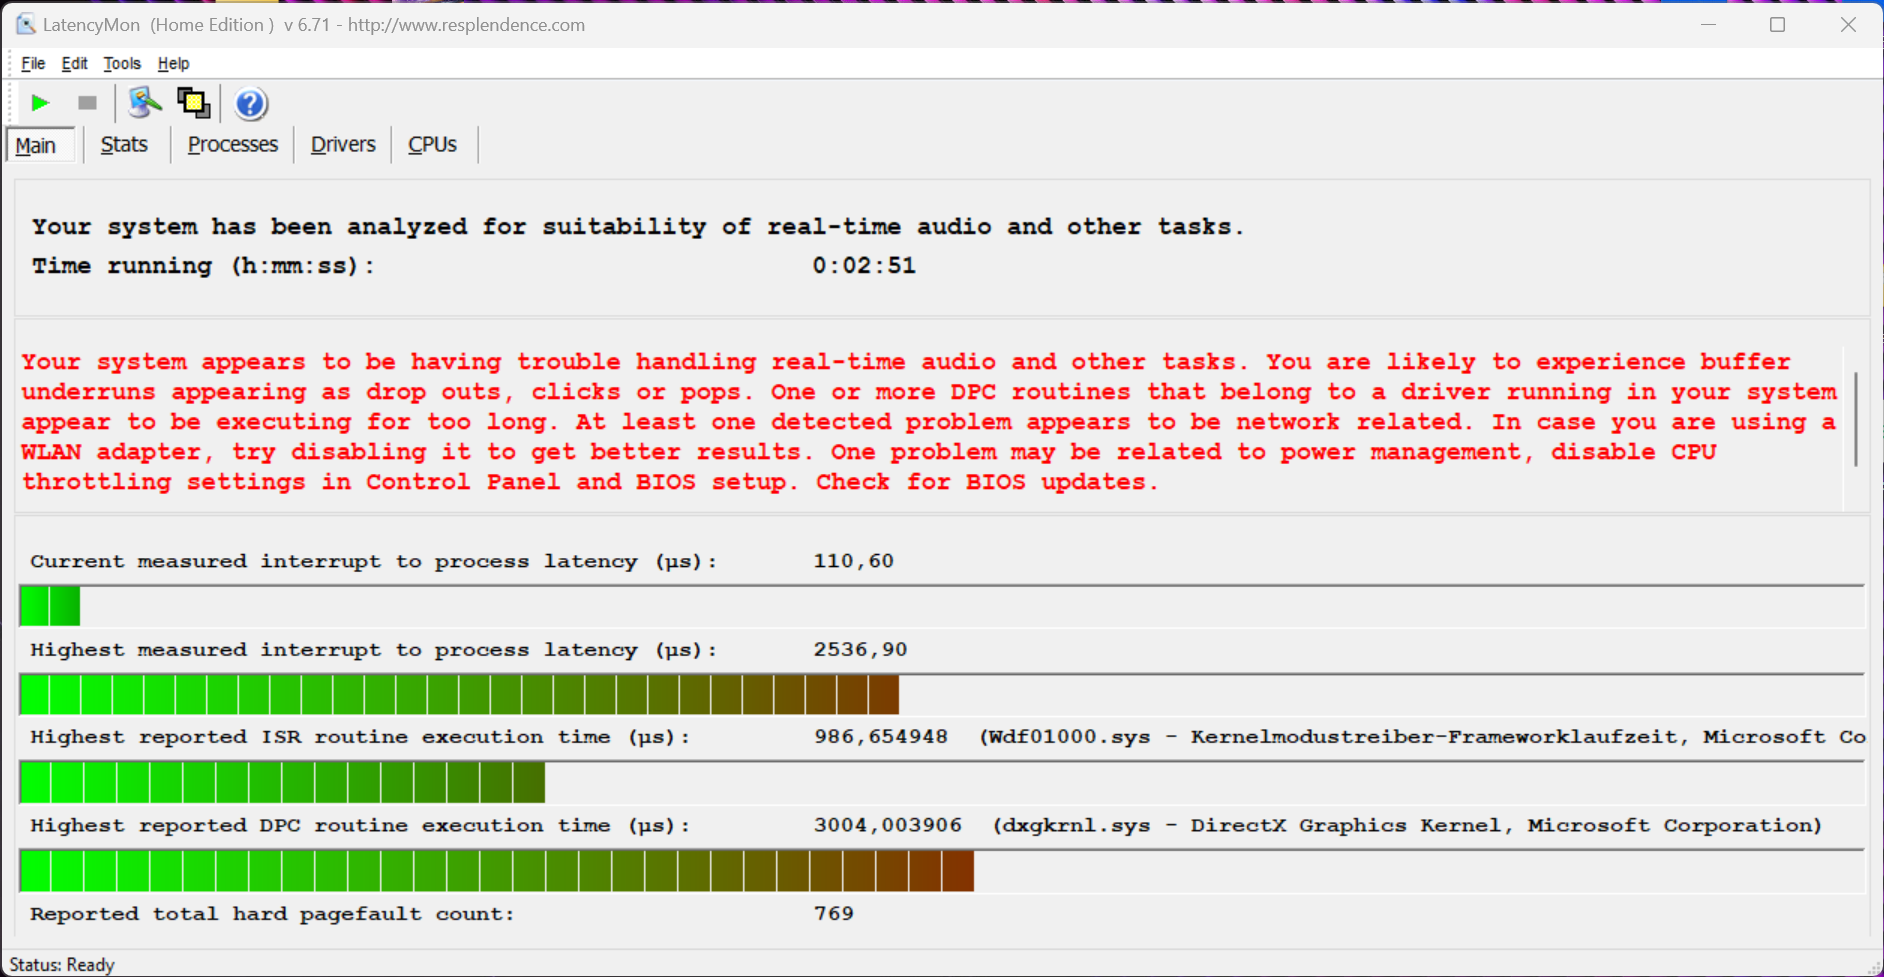
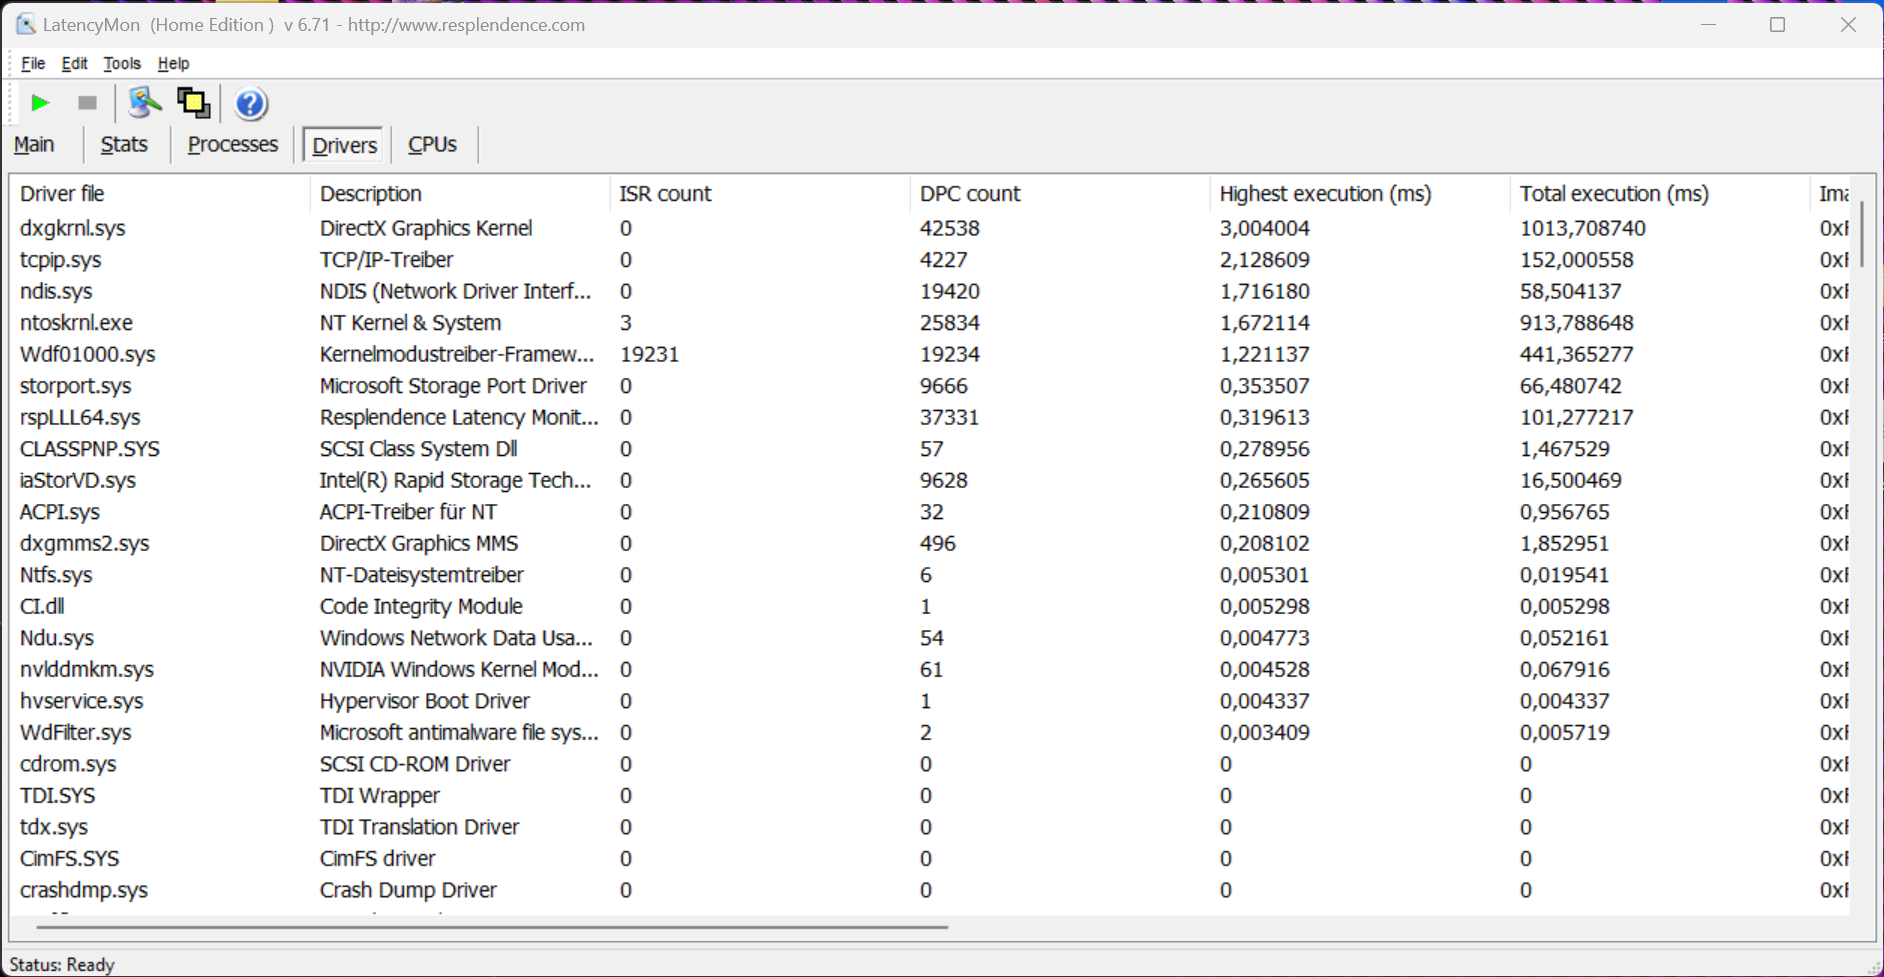
Latencias del CPD
En nuestra prueba de latencia estandarizada (navegación por Internet, reproducción 4K de YouTube, carga de la CPU), con la BIOS actual, el dispositivo de análisis mostró limitaciones a la hora de utilizar aplicaciones de audio en tiempo real. Sin embargo, ese ya era el caso con el Modelo RTX 4070.
| DPC Latencies / LatencyMon - interrupt to process latency (max), Web, Youtube, Prime95 | |
| Alienware x16 R2 P120F | |
| Asus ROG Zephyrus G16 GU605MY | |
| Asus ROG Zephyrus G16 2024 GU605M | |
| SCHENKER XMG Neo 16 (Early 24) | |
| Lenovo Legion 9 16IRX9, RTX 4090 | |
| Razer Blade 16 2024, RTX 4090 | |
* ... más pequeño es mejor
Almacenamiento masivo
El Zephyrus G16 ofrece dos rápidas ranuras PCIe 4.0 para unidades SSD M.2 2280, lo que significa que la capacidad de almacenamiento puede ampliarse de forma rápida y asequible. Nuestro dispositivo de revisión viene con una de 2 TB, Samsung PM9A1a aunque 1,76 TB están disponibles para el usuario después de la primera instalación. En las pruebas sintéticas, la unidad SSD no cumplió del todo nuestras expectativas, pero seguimos estando ante una unidad de almacenamiento muy rápida, con velocidades de transferencia que se mantienen perfectamente constantes incluso bajo carga sostenida. Puede encontrar más pruebas comparativas de la SSD aquí.

* ... más pequeño es mejor
Continuous Performance Read: DiskSpd Read Loop, Queue Depth 8
Tarjeta gráfica - GeForce RTX 4090 portátil
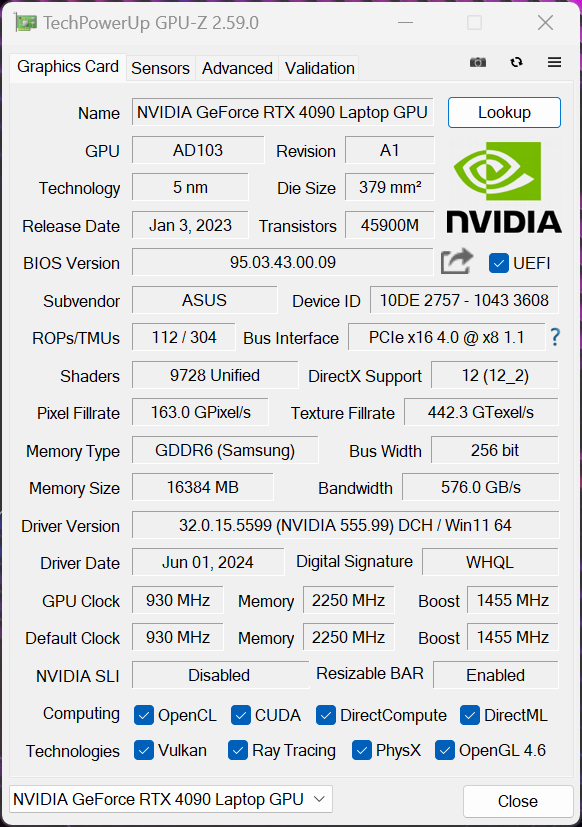
El Zephyrus G16 está disponible con toda la gama de modelos actuales de portátiles GeForce RTX (4050-4090), sin embargo, el diseño delgado se hace notar en las variantes rápidas. En el modo turbo, el GeForce Portátil RTX 4090 sólo funciona con un TGP de 95 vatios + 20 vatios de refuerzo dinámico, lo que significa que está bastante lejos de la configuración máxima de 175 vatios (150 TGP + 25 vatios de refuerzo dinámico). Esto es algo que los compradores potenciales deberían saber para evitar decepciones posteriores. En los puntos de referencia de la GPU, podemos ver claramente la desventaja en comparación con otros modelos de portátiles RTX 4090 que son entre un 15 y un 26 % más rápidos. Incluso el Portátil RTX 4080 que se encuentra en el Alienware x16 R2 (175W) es un toque más rápido que la RTX 4090 alojada en el Zephyrus G16.
La ventaja en comparación con el Zephyrus G16 con el portátil RTX 4070 se sitúa en el 50 %, lo que sigue siendo, por supuesto, enorme, sobre todo teniendo en cuenta la carcasa compacta. Básicamente, el portátil RTX 4070 (y también las versiones más débiles) pueden alcanzar mejor su potencial cuando se emparejan con el Zephyrus G16. Dependiendo del caso de uso, una mayor cantidad de memoria de vídeo (16 GB) puede ser una ventaja adicional, por ejemplo, al editar vídeos.
Bajo carga sostenida, el rendimiento de la GPU se mantiene estable, sin embargo, en modo batería, la GPU puede consumir un máximo de 55 vatios y por eso el rendimiento de la GPU cae significativamente aquí (-52 %). Puede encontrar más pruebas de rendimiento de la GPU aquí.
| 3DMark 11 Performance | 38012 puntos | |
| 3DMark Fire Strike Score | 30964 puntos | |
| 3DMark Time Spy Score | 15660 puntos | |
| 3DMark Steel Nomad Score | 3915 puntos | |
ayuda | ||
| Blender / v3.3 Classroom OPTIX/RTX | |
| Asus ROG Zephyrus G16 2024 GU605M | |
| Media de la clase Gaming (10 - 95, n=143, últimos 2 años) | |
| Alienware x16 R2 P120F | |
| Asus ROG Zephyrus G16 GU605MY | |
| Lenovo Legion 9 16IRX9, RTX 4090 | |
| SCHENKER XMG Neo 16 (Early 24) | |
| Medio NVIDIA GeForce RTX 4090 Laptop GPU (9 - 19, n=39) | |
| Razer Blade 16 2024, RTX 4090 | |
| Blender / v3.3 Classroom CUDA | |
| Media de la clase Gaming (16 - 175, n=145, últimos 2 años) | |
| Asus ROG Zephyrus G16 2024 GU605M | |
| Alienware x16 R2 P120F | |
| Asus ROG Zephyrus G16 GU605MY | |
| Medio NVIDIA GeForce RTX 4090 Laptop GPU (16 - 24, n=39) | |
| Razer Blade 16 2024, RTX 4090 | |
| Lenovo Legion 9 16IRX9, RTX 4090 | |
| SCHENKER XMG Neo 16 (Early 24) | |
| Blender / v3.3 Classroom CPU | |
| Asus ROG Zephyrus G16 2024 GU605M | |
| Asus ROG Zephyrus G16 GU605MY | |
| Alienware x16 R2 P120F | |
| Media de la clase Gaming (123 - 962, n=150, últimos 2 años) | |
| Razer Blade 16 2024, RTX 4090 | |
| Medio NVIDIA GeForce RTX 4090 Laptop GPU (144 - 305, n=39) | |
| Lenovo Legion 9 16IRX9, RTX 4090 | |
| SCHENKER XMG Neo 16 (Early 24) | |
* ... más pequeño es mejor
Rendimiento en juegos
La imagen pintada en las pruebas de GPU también continúa en los puntos de referencia de juegos, ya que el portátil RTX 4090 que se encuentra en el Zephyrus G16 combinado con el Core Ultra 185H queda notablemente por detrás de la competencia equipada tanto con las CPU HX como con el portátil RTX 4090. El Alienware x16 R2 emparejado con el Core Ultra 9 y el portátil RTX 4080 también ofrece un rendimiento de juego ligeramente mejor. Una vez más, el Zephyrus G16 con el portátil RTX 4070 resulta rotundamente superado, especialmente en las pruebas QHD.
En definitiva, el Zephyrus G16 con el portátil RTX 4090 y el rápido panel OLED se adaptan maravillosamente a los juegos. En su resolución QHD nativa, puede, sin dudarlo, jugar a todos los títulos actuales con fluidez y al máximo detalle. Sin embargo, nuestro bucle Cyberpunk 2077 muestra que el rendimiento de juego cuando se ejecutan títulos exigentes no es del todo estable y que hay pequeñas caídas de rendimiento. Puede encontrar más pruebas comparativas de juegos aquí.
| GTA V - 1920x1080 Highest Settings possible AA:4xMSAA + FX AF:16x | |
| SCHENKER XMG Neo 16 (Early 24) | |
| Razer Blade 16 2024, RTX 4090 | |
| Lenovo Legion 9 16IRX9, RTX 4090 | |
| Media de la clase Gaming (12.1 - 168.2, n=132, últimos 2 años) | |
| Asus ROG Zephyrus G16 GU605MY | |
| Asus ROG Zephyrus G16 2024 GU605M | |
| Cyberpunk 2077 2.2 Phantom Liberty - 1920x1080 Ultra Preset (FSR off) | |
| SCHENKER XMG Neo 16 (Early 24) | |
| Lenovo Legion 9 16IRX9, RTX 4090 | |
| Alienware x16 R2 P120F | |
| Razer Blade 16 2024, RTX 4090 | |
| Asus ROG Zephyrus G16 GU605MY | |
| Media de la clase Gaming (6.76 - 158, n=90, últimos 2 años) | |
| Asus ROG Zephyrus G16 2024 GU605M | |
| Horizon Forbidden West | |
| 1920x1080 Very High Preset AA:T | |
| SCHENKER XMG Neo 16 (Early 24) | |
| Medio NVIDIA GeForce RTX 4090 Laptop GPU (81 - 125.2, n=3) | |
| Asus ROG Zephyrus G16 GU605MY | |
| Media de la clase Gaming (14.7 - 125.2, n=10, últimos 2 años) | |
| 2560x1440 Very High Preset AA:T | |
| SCHENKER XMG Neo 16 (Early 24) | |
| Medio NVIDIA GeForce RTX 4090 Laptop GPU (66 - 98, n=3) | |
| Asus ROG Zephyrus G16 GU605MY | |
| Media de la clase Gaming (24.1 - 98, n=9, últimos 2 años) | |
Cyberpunk 2077 ultra FPS diagram
| bajo | medio | alto | ultra | QHD DLSS | QHD | 4K DLSS | 4K | |
|---|---|---|---|---|---|---|---|---|
| GTA V (2015) | 172.6 | 107.1 | 103.4 | 139.9 | ||||
| Dota 2 Reborn (2015) | 172.2 | 150.8 | 150.3 | 138.7 | 135.8 | |||
| Final Fantasy XV Benchmark (2018) | 183.5 | 168.4 | 138 | 113.3 | 68.9 | |||
| X-Plane 11.11 (2018) | 138.3 | 111.7 | 90 | 75.7 | ||||
| Far Cry 5 (2018) | 138 | 128 | 117 | 115 | 80 | |||
| Strange Brigade (2018) | 431 | 340 | 314 | 288 | 225 | 120 | ||
| Star Wars Jedi Survivor (2023) | 173 | 166 | 154 | 148 | 114 | 59 | ||
| F1 23 (2023) | 215 | 217 | 211 | 86.2 | 58 | 50.1 | 30.2 | |
| Baldur's Gate 3 (2023) | 144 | 126 | 123 | 118 | 99 | 57 | ||
| Cyberpunk 2077 2.2 Phantom Liberty (2023) | 119.8 | 106.6 | 109.6 | 93.1 | 68.1 | 32.9 | ||
| Call of Duty Modern Warfare 3 2023 (2023) | 204 | 189 | 155 | 148 | 113 | 73 | ||
| Horizon Forbidden West (2024) | 117 | 110 | 89 | 81 | 66 | 42.5 | ||
| F1 24 (2024) | 230 | 232 | 216 | 88 | 58.5 | 49.8 | 30.3 | |
| Black Myth: Wukong (2024) | 67 | 40 | 44 | 39 |
Emisiones - La cámara de vapor suele ser más ruidosa
Emisiones sonoras
El volumen del ventilador depende en gran medida del perfil de energía seleccionado. En reposo y con poca carga, la Zephyrus G16 se mantiene muy silenciosa, incluso en los perfiles más rápidos. Cuando se juega y se utilizan tanto el perfil Silencioso como el de Rendimiento, la refrigeración de la cámara de vapor se vuelve un poco más ruidosa que en el modelo RTX 4070 y, sin auriculares, sólo es realmente posible jugar correctamente utilizando el perfil Silencioso . En el modo turbo, éste alcanza los 52,3 dB(A), lo que representa el volumen máximo del ventilador de la variante RTX 4070. Sin embargo, la competencia llega a ser incluso ligeramente más ruidosa, con la única excepción de la Blade 16 - aunque, realmente no se puede llamar a 50 dB(A) silencioso. Nuestro dispositivo de revisión no emitía ningún otro ruido electrónico. Según Asus, el problema que encontramos con el tercer ventilador en nuestra revisión de la variante RTX 4070 debería haberse solucionado ya mediante una actualización de la BIOS.
| Perfil energético | 3DMark 06 | Cyberpunk 2077 | prueba de estrés |
|---|---|---|---|
| Silencioso | 30,9 dB(A) | 41,4 dB(A) | 41,4 dB(A) |
| Rendimiento | 36,1 dB(A) | 48,1 dB(A) | 48,1 dB(A) |
| Turbo | 49,2 dB(A) | 52,3 dB(A) | 52,3 dB(A) |
| Perfil energético | 3DMark 06 | Cyberpunk 2077 | prueba de estrés |
|---|---|---|---|
| Silencioso | 30,4 dB(A) | 41,5 dB(A) | 41,5 dB(A) |
| Rendimiento | 34,2 dB(A) | 46,4 dB(A) | 46,4 dB(A) |
| Turbo | 41,5 dB(A) | 52,4 dB(A) | 52,4 dB(A) |
Ruido
| Ocioso |
| 24.6 / 27.8 / 31.9 dB(A) |
| Carga |
| 49.2 / 52.3 dB(A) |
 | ||
30 dB silencioso 40 dB(A) audible 50 dB(A) ruidosamente alto |
||
min: | ||
| Asus ROG Zephyrus G16 GU605MY NVIDIA GeForce RTX 4090 Laptop GPU, Ultra 9 185H, Samsung PM9A1a MZVL22T0HDLB | SCHENKER XMG Neo 16 (Early 24) NVIDIA GeForce RTX 4090 Laptop GPU, i9-14900HX, Samsung 990 Pro 1 TB | Lenovo Legion 9 16IRX9, RTX 4090 NVIDIA GeForce RTX 4090 Laptop GPU, i9-14900HX, Micron 3400 2TB MTFDKBA2T0TFH | Alienware x16 R2 P120F NVIDIA GeForce RTX 4080 Laptop GPU, Ultra 9 185H, WDC PC SN810 1TB | Razer Blade 16 2024, RTX 4090 NVIDIA GeForce RTX 4090 Laptop GPU, i9-14900HX, Samsung PM9A1 MZVL22T0HBLB | Asus ROG Zephyrus G16 2024 GU605M NVIDIA GeForce RTX 4070 Laptop GPU, Ultra 7 155H, WD PC SN560 SDDPNQE-1T00 | |
|---|---|---|---|---|---|---|
| Noise | -5% | 12% | 9% | 10% | 9% | |
| apagado / medio ambiente * | 24.6 | 26 -6% | 23 7% | 23.4 5% | 23 7% | 23.9 3% |
| Idle Minimum * | 24.6 | 28 -14% | 23 7% | 23.8 3% | 23 7% | 23.9 3% |
| Idle Average * | 27.8 | 29 -4% | 23 17% | 28.5 -3% | 23 17% | 27.8 -0% |
| Idle Maximum * | 31.9 | 31 3% | 23 28% | 28.5 11% | 27.66 13% | 30.1 6% |
| Load Average * | 49.2 | 51 -4% | 39 21% | 28.8 41% | 43.76 11% | 34.2 30% |
| Cyberpunk 2077 ultra * | 52.3 | |||||
| Load Maximum * | 52.3 | 56 -7% | 55.56 -6% | 54.2 -4% | 50.37 4% | 46.4 11% |
| Witcher 3 ultra * | 54 | 55.32 | 49.5 | 46.81 | 46.4 |
* ... más pequeño es mejor
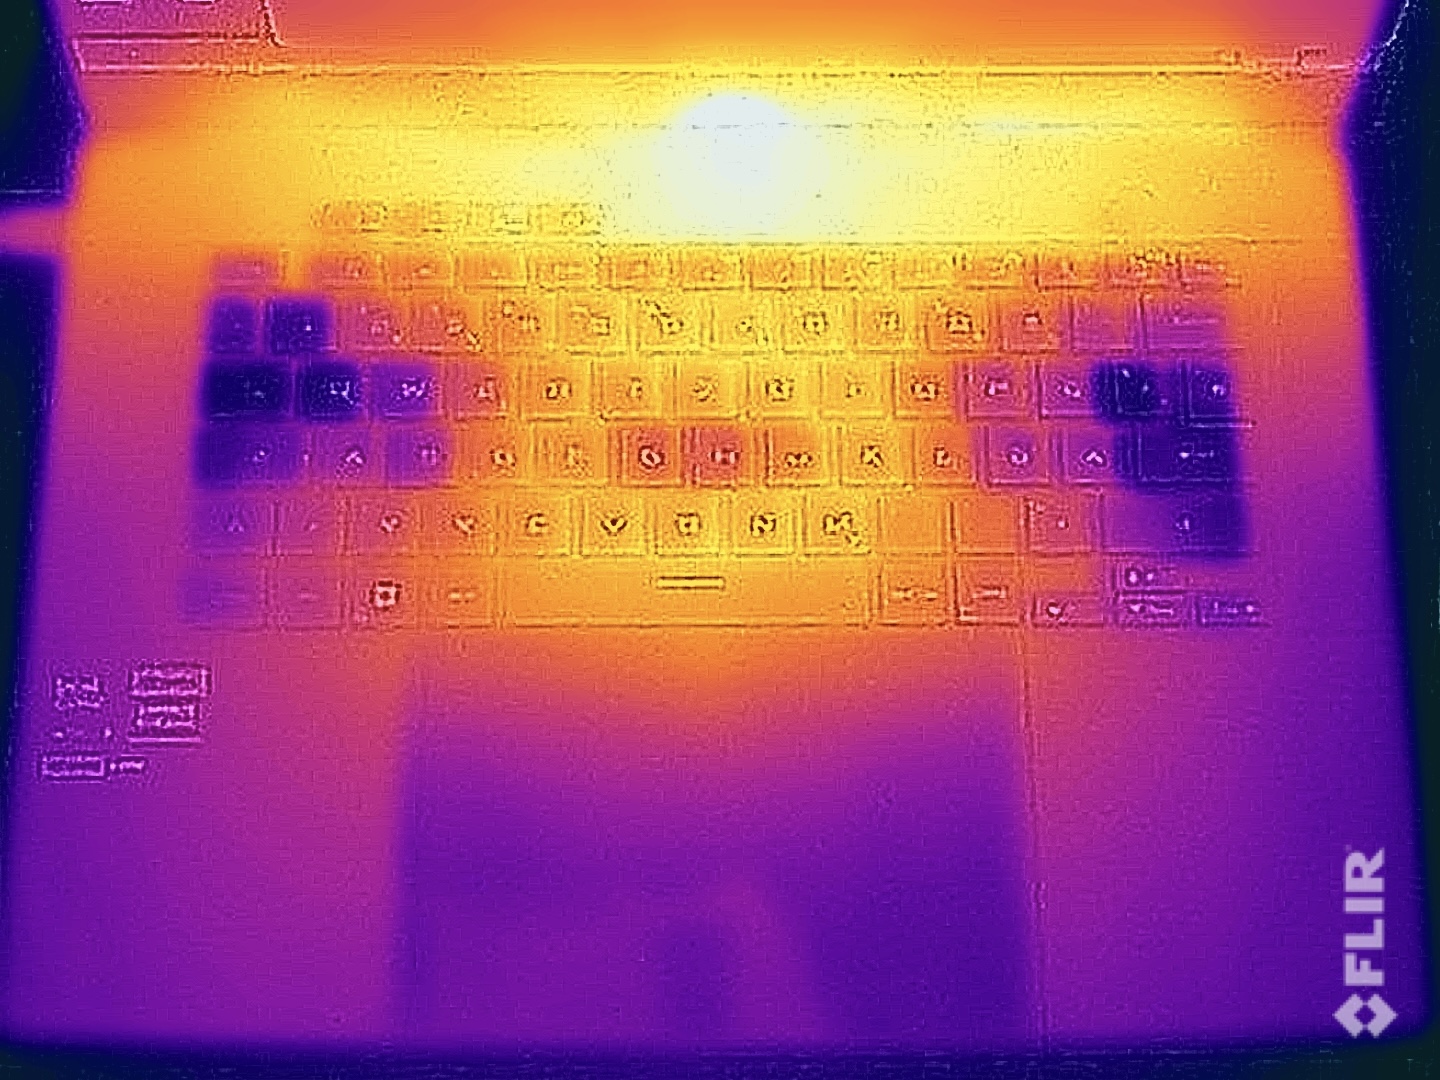
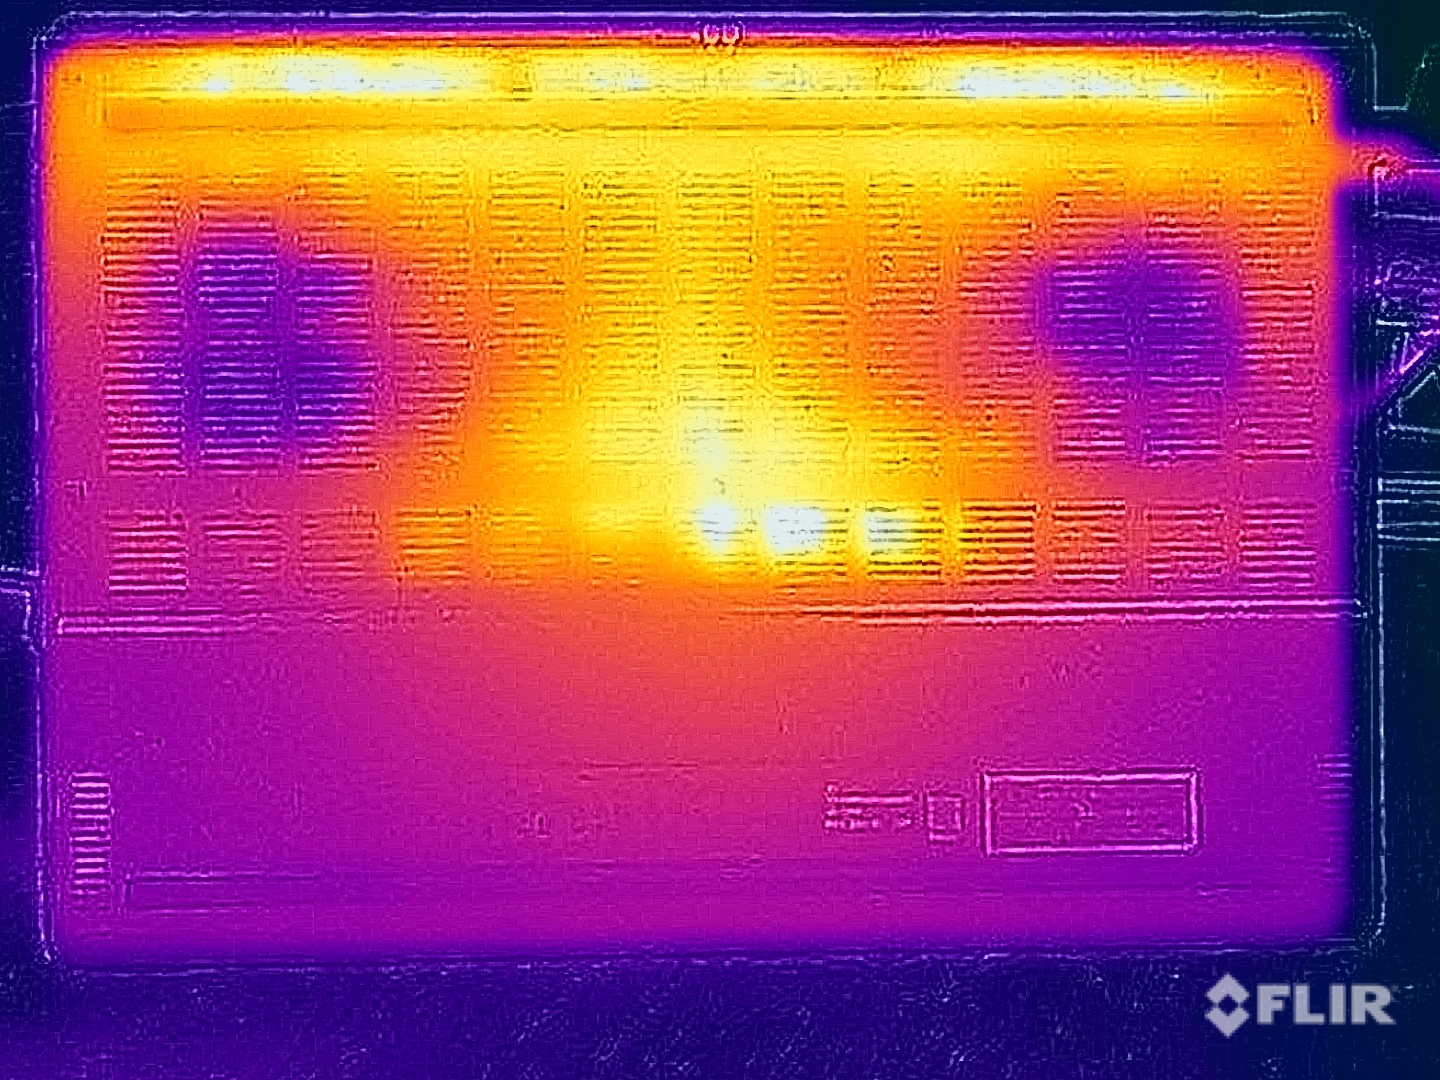
Temperatura
En uso idele y ejecutando tareas sencillas, las superficies metálicas de la carcasa permanecen muy frías y puede colocar el dispositivo sobre su regazo sin ninguna duda. Al jugar y en la prueba de estrés, medimos temperaturas de la unidad base de hasta 47 °C en el centro de la zona trasera. Esto no es motivo de preocupación, pero no debería utilizar el dispositivo sobre su regazo en tales escenarios. En la parte superior de la unidad base, la zona central por encima del teclado es propensa a calentarse, pero el teclado en sí se mantiene significativamente más fresco, con temperaturas máximas de 40 °C en el centro y de unos 36 °C a ambos lados. Esto significa que teclear va sin problemas y que jugar es también una experiencia sin restricciones.
(-) La temperatura máxima en la parte superior es de 45.9 °C / 115 F, frente a la media de 40.4 °C / 105 F, que oscila entre 21.2 y 68.8 °C para la clase Gaming.
(-) El fondo se calienta hasta un máximo de 47.5 °C / 118 F, frente a la media de 43.2 °C / 110 F
(+) En reposo, la temperatura media de la parte superior es de 25.3 °C / 78# F, frente a la media del dispositivo de 33.9 °C / 93 F.
(±) 3: The average temperature for the upper side is 36.7 °C / 98 F, compared to the average of 33.9 °C / 93 F for the class Gaming.
(+) El reposamanos y el panel táctil están a una temperatura inferior a la de la piel, con un máximo de 30.8 °C / 87.4 F y, por tanto, son fríos al tacto.
(±) La temperatura media de la zona del reposamanos de dispositivos similares fue de 28.9 °C / 84 F (-1.9 °C / -3.4 F).
| Asus ROG Zephyrus G16 GU605MY Intel Core Ultra 9 185H, NVIDIA GeForce RTX 4090 Laptop GPU | SCHENKER XMG Neo 16 (Early 24) Intel Core i9-14900HX, NVIDIA GeForce RTX 4090 Laptop GPU | Lenovo Legion 9 16IRX9, RTX 4090 Intel Core i9-14900HX, NVIDIA GeForce RTX 4090 Laptop GPU | Alienware x16 R2 P120F Intel Core Ultra 9 185H, NVIDIA GeForce RTX 4080 Laptop GPU | Razer Blade 16 2024, RTX 4090 Intel Core i9-14900HX, NVIDIA GeForce RTX 4090 Laptop GPU | Asus ROG Zephyrus G16 2024 GU605M Intel Core Ultra 7 155H, NVIDIA GeForce RTX 4070 Laptop GPU | |
|---|---|---|---|---|---|---|
| Heat | -6% | -32% | -23% | -4% | -8% | |
| Maximum Upper Side * | 45.9 | 47 -2% | 56 -22% | 51 -11% | 45 2% | 50.3 -10% |
| Maximum Bottom * | 47.5 | 56 -18% | 53 -12% | 50.8 -7% | 45 5% | 48 -1% |
| Idle Upper Side * | 26.1 | 27 -3% | 38 -46% | 36.6 -40% | 29 -11% | 28.8 -10% |
| Idle Bottom * | 26.6 | 27 -2% | 39 -47% | 35.2 -32% | 30 -13% | 29.8 -12% |
* ... más pequeño es mejor
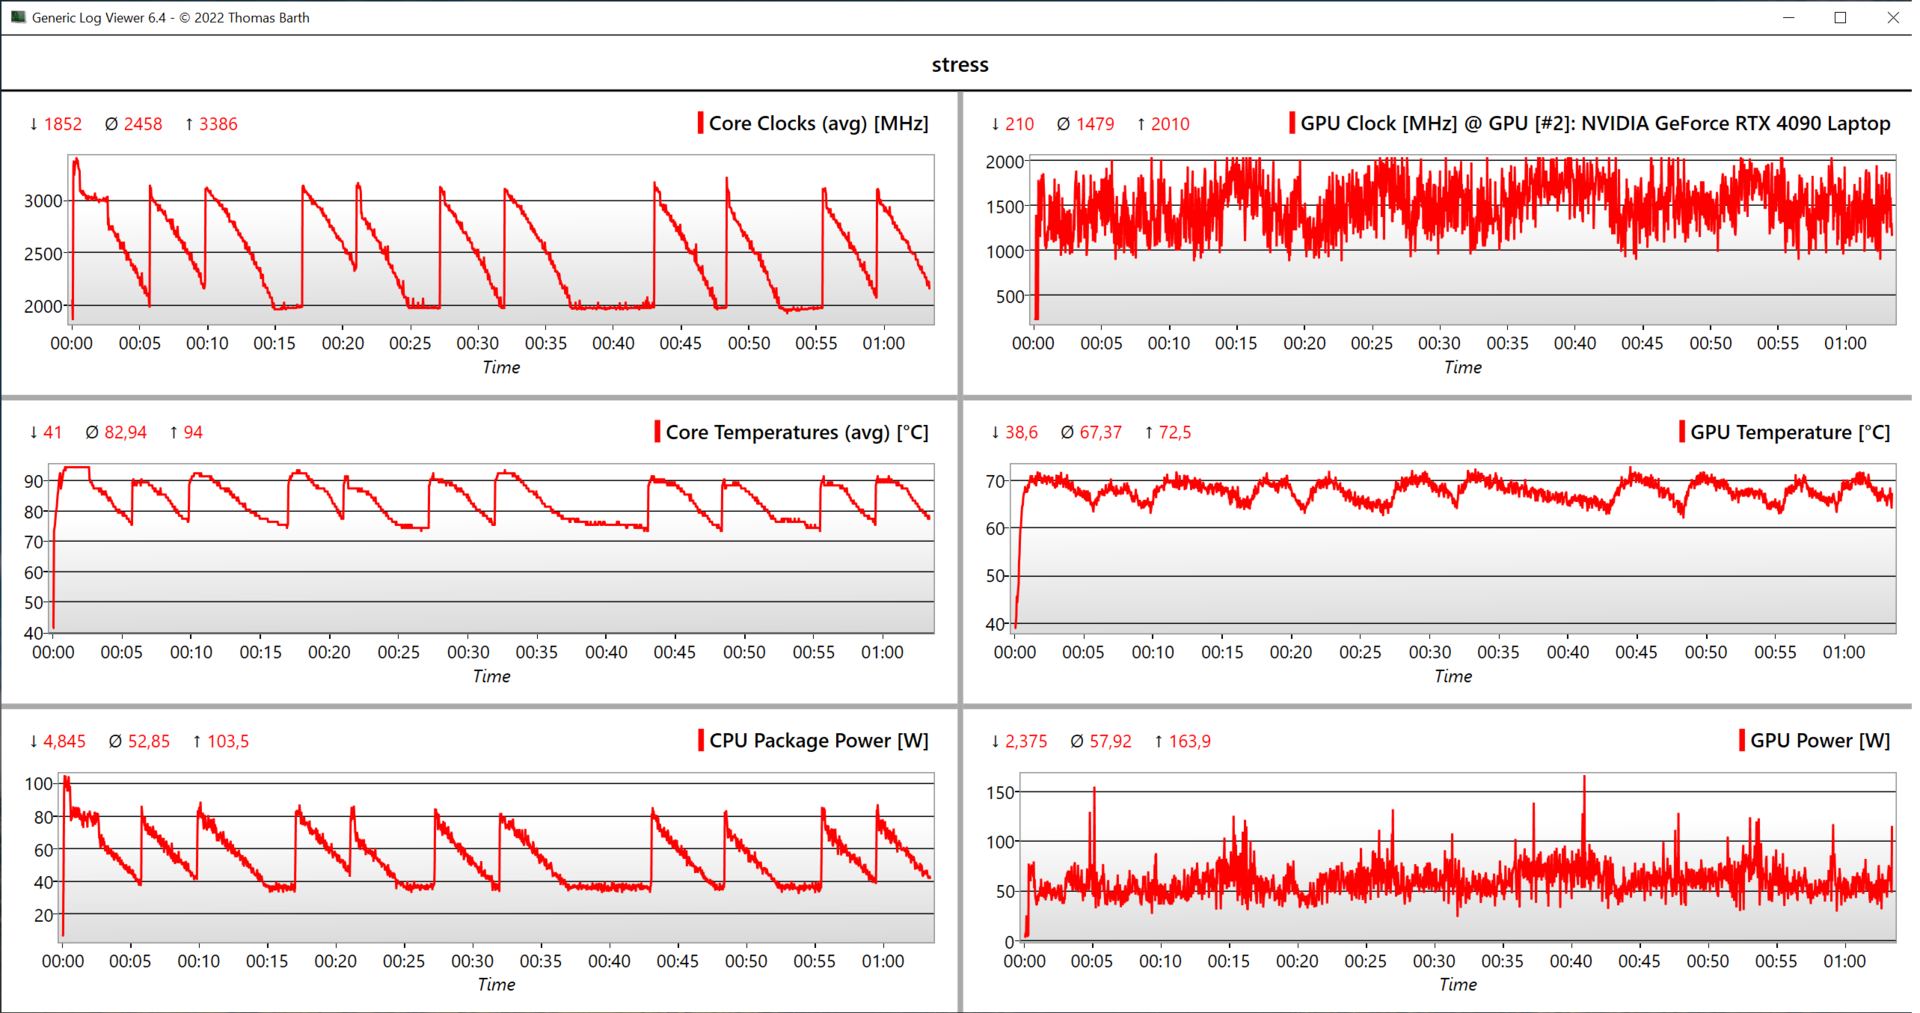
Prueba de esfuerzo
En la prueba de estrés con carga combinada de CPU/GPU, el modelo superior de Zephyrus fue incapaz de rendir de forma constante. El consumo de energía de la CPU fluctuó periódicamente entre 40-80 vatios y, al cabo de una hora, se situó en una media de 53 vatios. La tarjeta gráfica no está sujeta a fluctuaciones tan grandes, pero aún así "sólo" funciona a unos 58 vatios. Según Asus, en este escenario, estos valores deberían ser de 35 vatios para el procesador y 95 vatios para la tarjeta gráfica, sin embargo, no pudimos reproducir estos valores.
Altavoces
Asus ROG Zephyrus G16 GU605MY análisis de audio
(+) | los altavoces pueden reproducir a un volumen relativamente alto (#83 dB)
Graves 100 - 315 Hz
(+) | buen bajo - sólo 3.3% lejos de la mediana
(±) | la linealidad de los graves es media (7.6% delta a frecuencia anterior)
Medios 400 - 2000 Hz
(+) | medios equilibrados - a sólo 3.4% de la mediana
(+) | los medios son lineales (3.1% delta a la frecuencia anterior)
Altos 2 - 16 kHz
(+) | máximos equilibrados - a sólo 1.7% de la mediana
(+) | los máximos son lineales (4.6% delta a la frecuencia anterior)
Total 100 - 16.000 Hz
(+) | el sonido global es lineal (6.5% de diferencia con la mediana)
En comparación con la misma clase
» 0% de todos los dispositivos probados de esta clase eran mejores, 0% similares, 100% peores
» El mejor tuvo un delta de 6%, la media fue 18%, el peor fue ###max##%
En comparación con todos los dispositivos probados
» 1% de todos los dispositivos probados eran mejores, 0% similares, 99% peores
» El mejor tuvo un delta de 4%, la media fue 24%, el peor fue ###max##%
SCHENKER XMG Neo 16 (Early 24) análisis de audio
(+) | los altavoces pueden reproducir a un volumen relativamente alto (#86 dB)
Graves 100 - 315 Hz
(-) | casi sin bajos - de media 16.3% inferior a la mediana
(±) | la linealidad de los graves es media (8.6% delta a frecuencia anterior)
Medios 400 - 2000 Hz
(+) | medios equilibrados - a sólo 3% de la mediana
(+) | los medios son lineales (3.6% delta a la frecuencia anterior)
Altos 2 - 16 kHz
(+) | máximos equilibrados - a sólo 2.5% de la mediana
(+) | los máximos son lineales (4.9% delta a la frecuencia anterior)
Total 100 - 16.000 Hz
(+) | el sonido global es lineal (12.4% de diferencia con la mediana)
En comparación con la misma clase
» 14% de todos los dispositivos probados de esta clase eran mejores, 3% similares, 83% peores
» El mejor tuvo un delta de 6%, la media fue 18%, el peor fue ###max##%
En comparación con todos los dispositivos probados
» 9% de todos los dispositivos probados eran mejores, 2% similares, 89% peores
» El mejor tuvo un delta de 4%, la media fue 24%, el peor fue ###max##%
Lenovo Legion 9 16IRX9, RTX 4090 análisis de audio
(±) | la sonoridad del altavoz es media pero buena (78.96 dB)
Graves 100 - 315 Hz
(±) | lubina reducida - en promedio 13.2% inferior a la mediana
(±) | la linealidad de los graves es media (8.9% delta a frecuencia anterior)
Medios 400 - 2000 Hz
(+) | medios equilibrados - a sólo 3.2% de la mediana
(+) | los medios son lineales (3.4% delta a la frecuencia anterior)
Altos 2 - 16 kHz
(+) | máximos equilibrados - a sólo 1.8% de la mediana
(+) | los máximos son lineales (4% delta a la frecuencia anterior)
Total 100 - 16.000 Hz
(+) | el sonido global es lineal (11.3% de diferencia con la mediana)
En comparación con la misma clase
» 8% de todos los dispositivos probados de esta clase eran mejores, 3% similares, 89% peores
» El mejor tuvo un delta de 6%, la media fue 18%, el peor fue ###max##%
En comparación con todos los dispositivos probados
» 6% de todos los dispositivos probados eran mejores, 2% similares, 92% peores
» El mejor tuvo un delta de 4%, la media fue 24%, el peor fue ###max##%
Alienware x16 R2 P120F análisis de audio
(+) | los altavoces pueden reproducir a un volumen relativamente alto (#89.9 dB)
Graves 100 - 315 Hz
(±) | lubina reducida - en promedio 7.4% inferior a la mediana
(±) | la linealidad de los graves es media (7.6% delta a frecuencia anterior)
Medios 400 - 2000 Hz
(+) | medios equilibrados - a sólo 2.6% de la mediana
(+) | los medios son lineales (3.6% delta a la frecuencia anterior)
Altos 2 - 16 kHz
(+) | máximos equilibrados - a sólo 3.4% de la mediana
(+) | los máximos son lineales (2.8% delta a la frecuencia anterior)
Total 100 - 16.000 Hz
(+) | el sonido global es lineal (8.2% de diferencia con la mediana)
En comparación con la misma clase
» 1% de todos los dispositivos probados de esta clase eran mejores, 1% similares, 98% peores
» El mejor tuvo un delta de 6%, la media fue 18%, el peor fue ###max##%
En comparación con todos los dispositivos probados
» 1% de todos los dispositivos probados eran mejores, 1% similares, 98% peores
» El mejor tuvo un delta de 4%, la media fue 24%, el peor fue ###max##%
Razer Blade 16 2024, RTX 4090 análisis de audio
(±) | la sonoridad del altavoz es media pero buena (81.16 dB)
Graves 100 - 315 Hz
(±) | lubina reducida - en promedio 8.2% inferior a la mediana
(±) | la linealidad de los graves es media (7.4% delta a frecuencia anterior)
Medios 400 - 2000 Hz
(+) | medios equilibrados - a sólo 3.3% de la mediana
(+) | los medios son lineales (5.9% delta a la frecuencia anterior)
Altos 2 - 16 kHz
(+) | máximos equilibrados - a sólo 1.6% de la mediana
(+) | los máximos son lineales (3.1% delta a la frecuencia anterior)
Total 100 - 16.000 Hz
(+) | el sonido global es lineal (9.2% de diferencia con la mediana)
En comparación con la misma clase
» 3% de todos los dispositivos probados de esta clase eran mejores, 1% similares, 96% peores
» El mejor tuvo un delta de 6%, la media fue 18%, el peor fue ###max##%
En comparación con todos los dispositivos probados
» 3% de todos los dispositivos probados eran mejores, 1% similares, 97% peores
» El mejor tuvo un delta de 4%, la media fue 24%, el peor fue ###max##%
Gestión de la energía - Más resistencia que la competencia
Consumo de energía
Funcionando en reposo, los valores de consumo representan la variante más débil del ROG Zephyrus G16 y esto tampoco es sorprendente teniendo en cuenta que los paneles OLED son idénticos. Al jugar, con unos 170 vatios, la Zephyrus G16 es considerablemente más eficiente que la competencia RTX 4090 que consume al menos 230 vatios al jugar. En la prueba de estrés, observamos brevemente un consumo máximo de 232 vatios que luego se estabilizó rápidamente en torno a los 160 vatios. Esto significa que la fuente de alimentación de 240 vatios suministrada tiene el tamaño adecuado.
| Off / Standby | |
| Ocioso | |
| Carga |
|
Clave:
min: | |
| Asus ROG Zephyrus G16 GU605MY Ultra 9 185H, NVIDIA GeForce RTX 4090 Laptop GPU, Samsung PM9A1a MZVL22T0HDLB, OLED, 2560x1600, 16" | SCHENKER XMG Neo 16 (Early 24) i9-14900HX, NVIDIA GeForce RTX 4090 Laptop GPU, Samsung 990 Pro 1 TB, IPS, 2560x1600, 16" | Lenovo Legion 9 16IRX9, RTX 4090 i9-14900HX, NVIDIA GeForce RTX 4090 Laptop GPU, Micron 3400 2TB MTFDKBA2T0TFH, MiniLED, 3200x2000, 16" | Alienware x16 R2 P120F Ultra 9 185H, NVIDIA GeForce RTX 4080 Laptop GPU, WDC PC SN810 1TB, IPS, 2560x1600, 16" | Razer Blade 16 2024, RTX 4090 i9-14900HX, NVIDIA GeForce RTX 4090 Laptop GPU, Samsung PM9A1 MZVL22T0HBLB, OLED, 2560x1600, 16" | Asus ROG Zephyrus G16 2024 GU605M Ultra 7 155H, NVIDIA GeForce RTX 4070 Laptop GPU, WD PC SN560 SDDPNQE-1T00, OLED, 2560x1600, 16" | Medio NVIDIA GeForce RTX 4090 Laptop GPU | Media de la clase Gaming | |
|---|---|---|---|---|---|---|---|---|
| Power Consumption | -51% | -108% | -57% | -64% | 5% | -97% | -56% | |
| Idle Minimum * | 7.8 | 6 23% | 20.5 -163% | 9.9 -27% | 16.9 -117% | 8.3 -6% | 16.2 ? -108% | 13.4 ? -72% |
| Idle Average * | 10.9 | 16 -47% | 27.7 -154% | 14.5 -33% | 17.8 -63% | 12.5 -15% | 23.1 ? -112% | 18.9 ? -73% |
| Idle Maximum * | 11.6 | 28 -141% | 32.1 -177% | 33.5 -189% | 19.6 -69% | 12.8 -10% | 34.2 ? -195% | 26.3 ? -127% |
| Load Average * | 98.7 | 130 -32% | 105 -6% | 97.5 1% | 128 -30% | 71.3 28% | 130.5 ? -32% | 102.7 ? -4% |
| Cyberpunk 2077 ultra * | 157.3 | |||||||
| Cyberpunk 2077 ultra external monitor * | 165.5 | |||||||
| Load Maximum * | 232 | 361 -56% | 323 -39% | 315.2 -36% | 328 -41% | 169.1 27% | 324 ? -40% | 244 ? -5% |
| Witcher 3 ultra * | 302 | 246 | 230 | 243 | 127.5 |
* ... más pequeño es mejor
Power consumption Cyberpunk / stress test
Power consumption with an external monitor
Duración de las pilas
La batería de 90 vatios-hora es idéntica en todas las versiones del Zephyrus G16 2024 pero, en la prueba Wi-Fi, la autonomía de la batería es unos 30 minutos menor que en el caso de la variante RTX 4070. La competencia directa en juegos con el portátil RTX 4090 sigue siendo superada. En la prueba Wi-Fi a 150 cd/m² y 60 Hz, se obtienen 6,5 horas (5,5 horas a 120 Hz) y 5 horas (60 Hz) a pleno brillo (4,5 horas a 120 Hz). Con el dispositivo encendido, un ciclo de carga completo dura 104 minutos; el 80 % de la capacidad está disponible tras 47 minutos.
Pro
Contra
Veredicto - El portátil RTX 4090 no cumple su potencial
El Asus Zephyrus G16 2024 es un portátil para juegos delgado y comparativamente ligero que también es adecuado para otros grupos objetivo como los creadores de contenidos y los usuarios multimedia. Haber optado por el portátil RTX 4090 significa, por supuesto, que el rendimiento gráfico es el foco principal, pero, aquí es también exactamente donde radica un problema. En principio, es bueno que Asus ofrezca los modelos de GPU más rápidos, pero la delgada carcasa exige compromisos a pesar de la refrigeración por cámara de vapor mejorada. Con un consumo máximo de 115 vatios en el modo Turbo , el portátil RTX 4090 es simplemente incapaz de explotar su potencial, quedándose generalmente un 20-25 % por detrás de la competencia (incluso el portátil RTX 4080 que se encuentra en el Alienware x16 es ligeramente más rápido). A pesar de ello, el portátil RTX 4090 le costará el precio completo. Eso es simplemente un compromiso que tiene que aceptar por la carcasa más compacta, pero es algo que los compradores potenciales deben tener en cuenta.
La cámara de vapor aumenta el peso en comparación con la refrigeración convencional (modelos hasta el portátil RTX 4070) en unos 100 gramos y es algo más ruidosa tanto en el perfil de energía Silencioso como en el de Rendimiento. Ambas configuraciones sólo son indistinguibles entre sí en el modo Turbo. Efectivamente, esto significa que debe llevar auriculares cuando juegue.
Con el ROG Zephyrus G16, Asus ofrece un portátil muy compacto de 16 pulgadas con la GeForce RTX 4090. Sin embargo, una buena movilidad exige compromisos en términos de rendimiento y otros modelos RTX 4090 tienen ventajas cuando se trata de rendimiento en juegos.
Las demás ventajas y desventajas del Zephyrus G16 también se aplican a la configuración de gama alta, incluidos los maravillosos altavoces y el brillante panel OLED de 240 Hz. Pero, una gran desventaja es la RAM soldada y ni siquiera se obtienen 64 GB de RAM en la variante de gama alta de 3.649 dólares.
Cualquiera a la caza del máximo rendimiento gráfico en un portátil potencialmente compacto de 16 pulgadas estará bien servido por el ROG Zephyrus G16. Sin embargo, no debe esperar el mismo rendimiento que encontraría en los competidores más pesados/grandes. Si se trata de rendimiento puro para juegos, modelos como el XMG Neo 16 o el Alienware x16 R2 simplemente ofrecen más potencia.
Precio y disponibilidad
El ROG Zephyrus G16 con el Intel Core Ultra 9 185H y un portátil Nvidia GeForce RTX 4090 tiene un PVPR de 3.649 dólares y el dispositivo puede adquirirse actualmente en Amazon.
Nota: Recientemente hemos actualizado nuestro sistema de clasificación y los resultados de la versión 8 no son comparables con los de la versión 7. Encontrará más información aquí .
Asus ROG Zephyrus G16 GU605MY
- 07/12/2024 v8
Andreas Osthoff
 Total Sustainability Score:
 Transparencia
La selección de los dispositivos que se van a reseñar corre a cargo de nuestro equipo editorial. La muestra de prueba fue proporcionada al autor en calidad de préstamo por el fabricante o el minorista a los efectos de esta reseña. El prestamista no tuvo ninguna influencia en esta reseña, ni el fabricante recibió una copia de la misma antes de su publicación. No había ninguna obligación de publicar esta reseña. Nunca aceptamos compensaciones o pagos a cambio de nuestras reseñas. Como empresa de medios independiente, Notebookcheck no está sujeta a la autoridad de fabricantes, minoristas o editores.
Así es como prueba Notebookcheck
Cada año, Notebookcheck revisa de forma independiente cientos de portátiles y smartphones utilizando procedimientos estandarizados para asegurar que todos los resultados son comparables. Hemos desarrollado continuamente nuestros métodos de prueba durante unos 20 años y hemos establecido los estándares de la industria en el proceso. En nuestros laboratorios de pruebas, técnicos y editores experimentados utilizan equipos de medición de alta calidad. Estas pruebas implican un proceso de validación en varias fases. Nuestro complejo sistema de clasificación se basa en cientos de mediciones y puntos de referencia bien fundamentados, lo que mantiene la objetividad.Price comparison

