

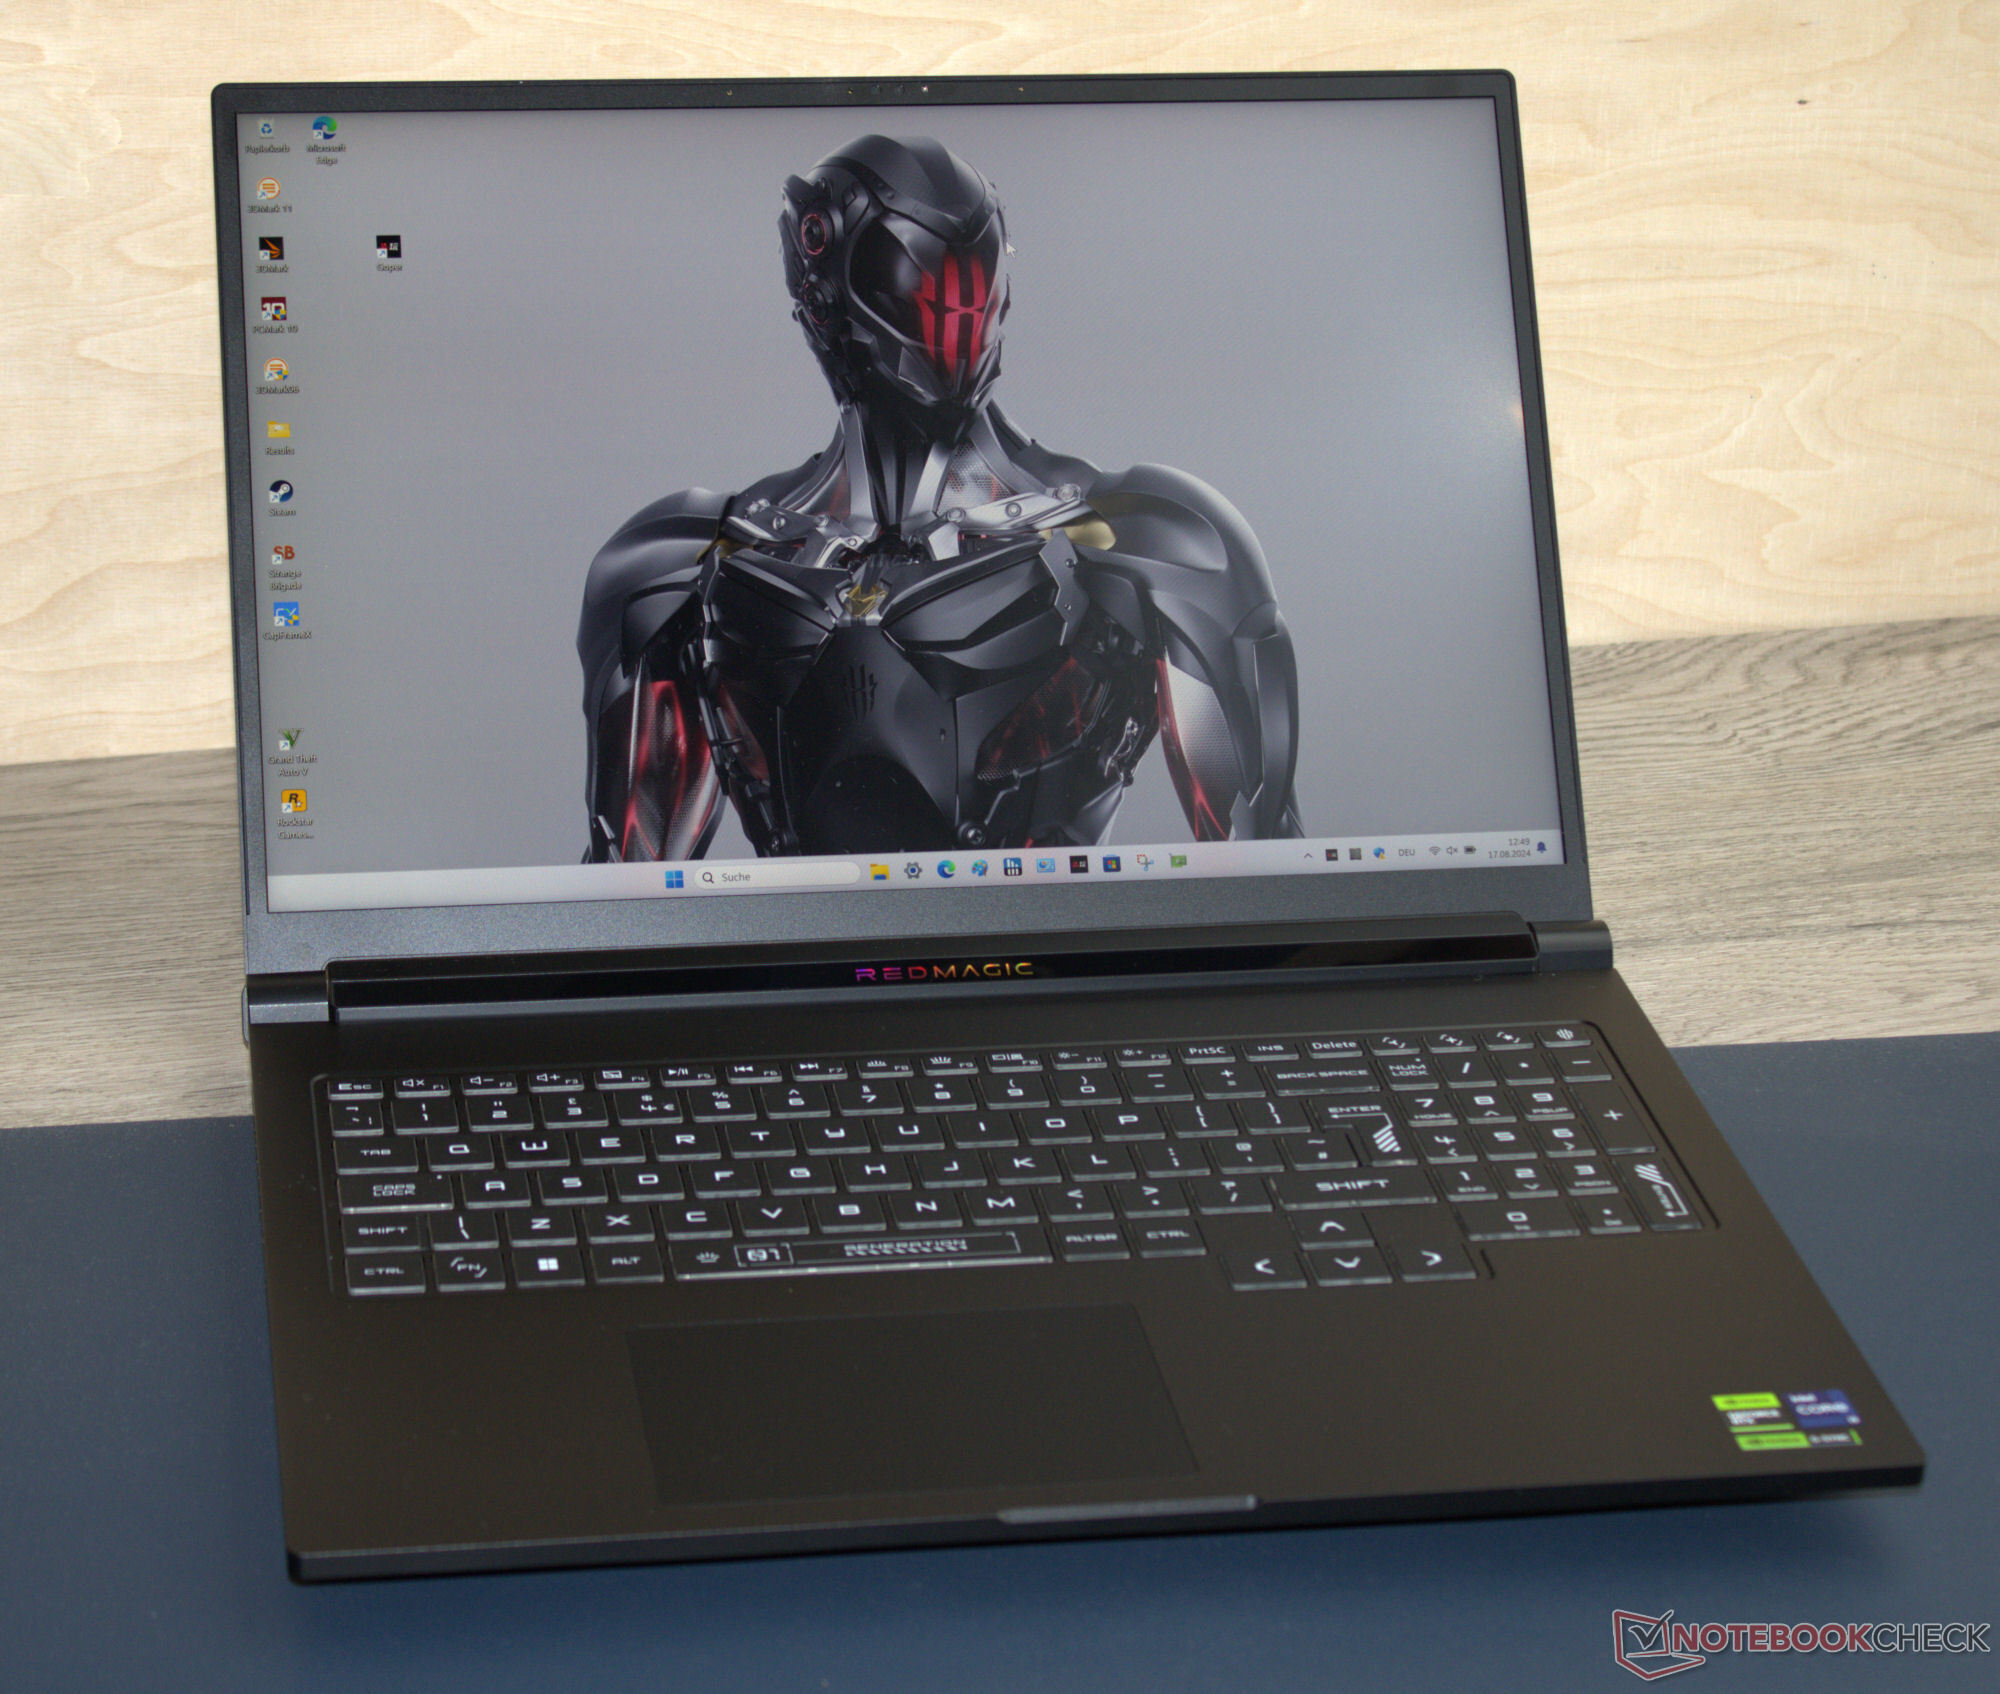
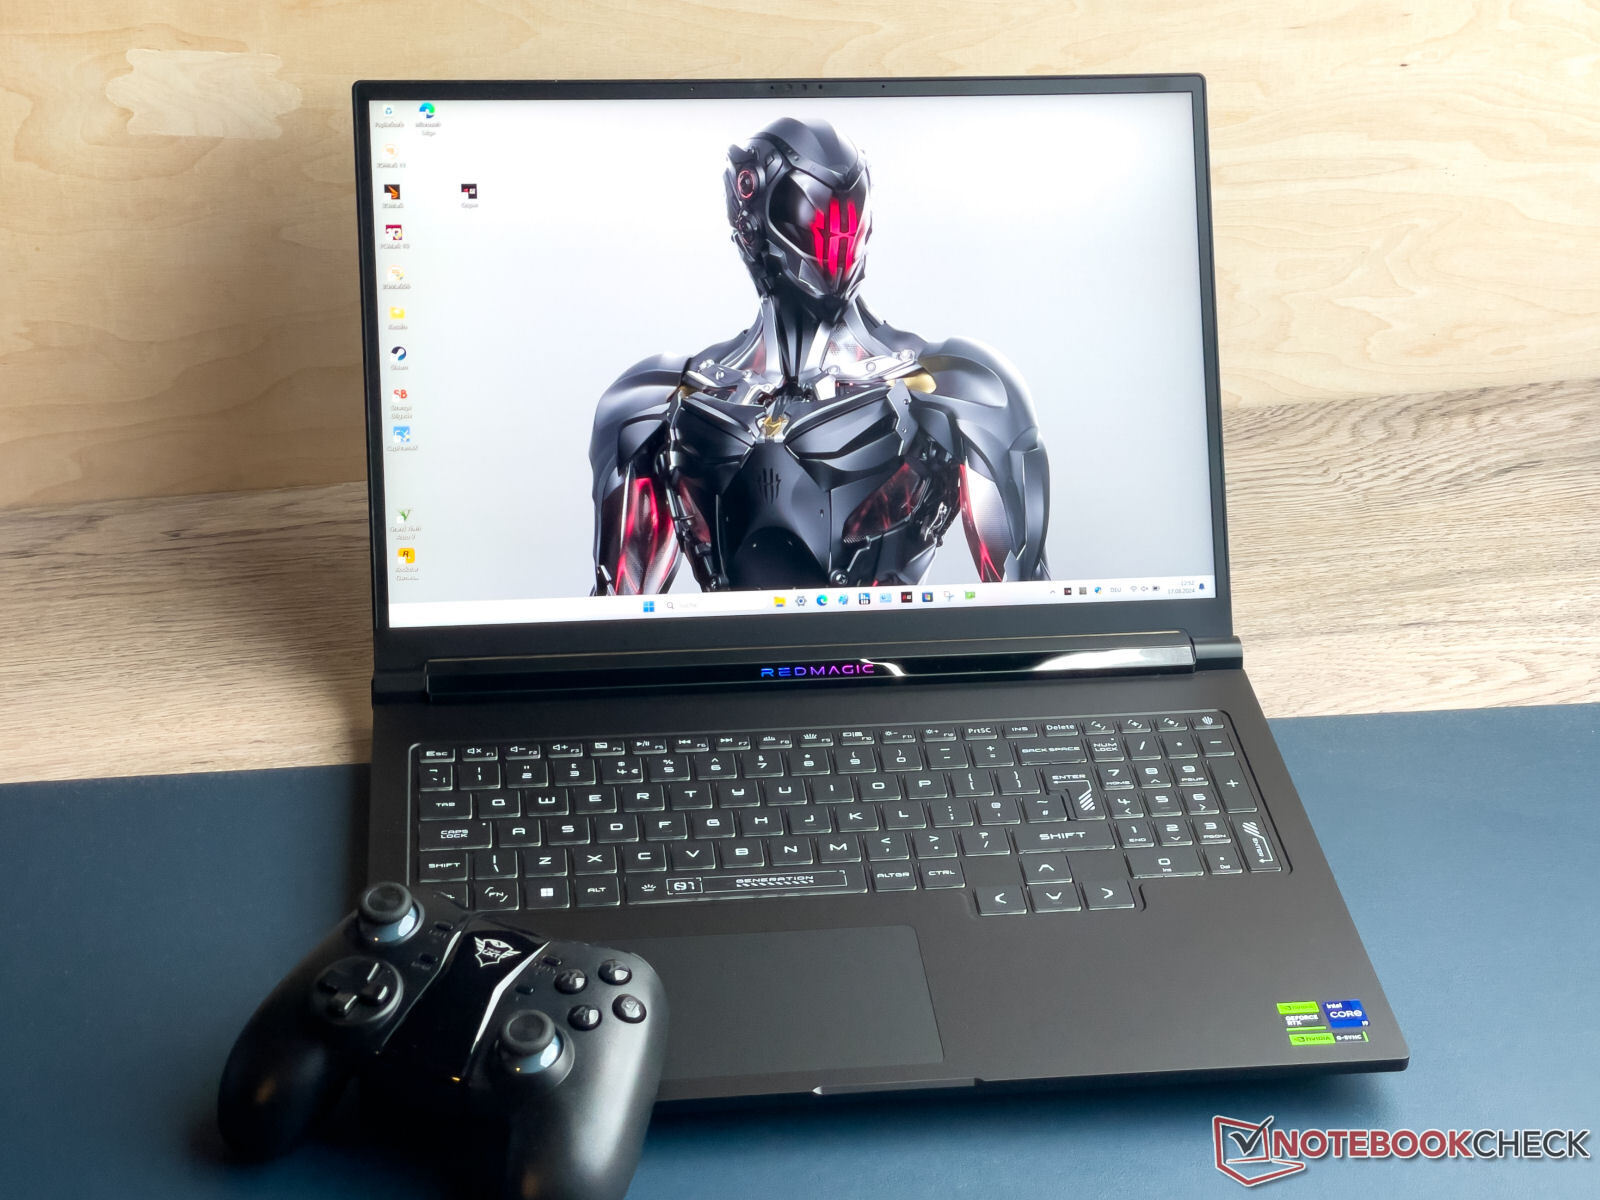
Reseña del RedMagic Titan 16 Pro: Un portátil para juegos fabricado por un fabricante de smartphones

Es posible que los visitantes habituales de este sitio web ya estén familiarizados con la marca "RedMagic" del segmento de los smartphones para juegos (por ejemplo, el Nubia RedMagic 9 Pro). El RedMagic Titan 16 Pro es la primera incursión de Nubia en el mundo de los portátiles para juegos. Su ficha técnica no depara sorpresas: A Core i9-14900HX se empareja con un GeForce RTX 4060. A esto se une una pantalla de 16 pulgadas con una relación de aspecto 16:10, Thunderbolt 4, RAM DDR5 y 2 ranuras SSD.
Queda por ver si Nubia puede hacer frente a la competencia ya bien establecida. El Titan compite contra los siguientes dispositivos El Lenovo Legion Pro 5 16IRX9, HP Victus 16 (2024), Acer Predator Helios Neo 16 (2024), XMG Pro 16 Studio (Mid 24) y el Gigabyte G6X 9KG (2024).
Posibles contendientes en la comparación
Valoración | Versión | Fecha | Modelo | Peso | Altura | Tamaño | Resolución | Precio |
|---|---|---|---|---|---|---|---|---|
| 81.2 % | v8 | 08/2024 | Nubia RedMagic Titan 16 Pro i9-14900HX, NVIDIA GeForce RTX 4060 Laptop GPU | 2.4 kg | 23.9 mm | 16.00" | 2560x1600 | |
| 82.3 % | v8 | 07/2024 | Lenovo Legion Pro 5 16IRX9 G9 i7-14700HX, NVIDIA GeForce RTX 4060 Laptop GPU | 2.5 kg | 26.55 mm | 16.00" | 2560x1600 | |
| 84.3 % v7 (old) | v7 (old) | 05/2024 | HP Victus 16 (2024) i7-14700HX, NVIDIA GeForce RTX 4060 Laptop GPU | 2.4 kg | 23.9 mm | 16.10" | 1920x1080 | |
| 86.8 % v7 (old) | v7 (old) | 05/2024 | Acer Predator Helios Neo 16 (2024) i7-14700HX, NVIDIA GeForce RTX 4070 Laptop GPU | 2.6 kg | 25.95 mm | 16.00" | 2560x1600 | |
| 81.2 % | v8 | 07/2024 | SCHENKER XMG Pro 16 Studio (Mid 24) i9-14900HX, NVIDIA GeForce RTX 4070 Laptop GPU | 2.3 kg | 19.9 mm | 16.00" | 2560x1600 | |
| 83.2 % v7 (old) | v7 (old) | 03/2024 | Gigabyte G6X 9KG (2024) i7-13650HX, NVIDIA GeForce RTX 4060 Laptop GPU | 2.6 kg | 25.1 mm | 16.00" | 1920x1200 |
Tenga en cuenta que: recientemente hemos actualizado nuestro sistema de clasificación y los resultados de la versión 8 no son comparables con los de la versión 7. Encontrará más información aquí.
Carcasa - Nubia ha optado por una carcasa de aluminio
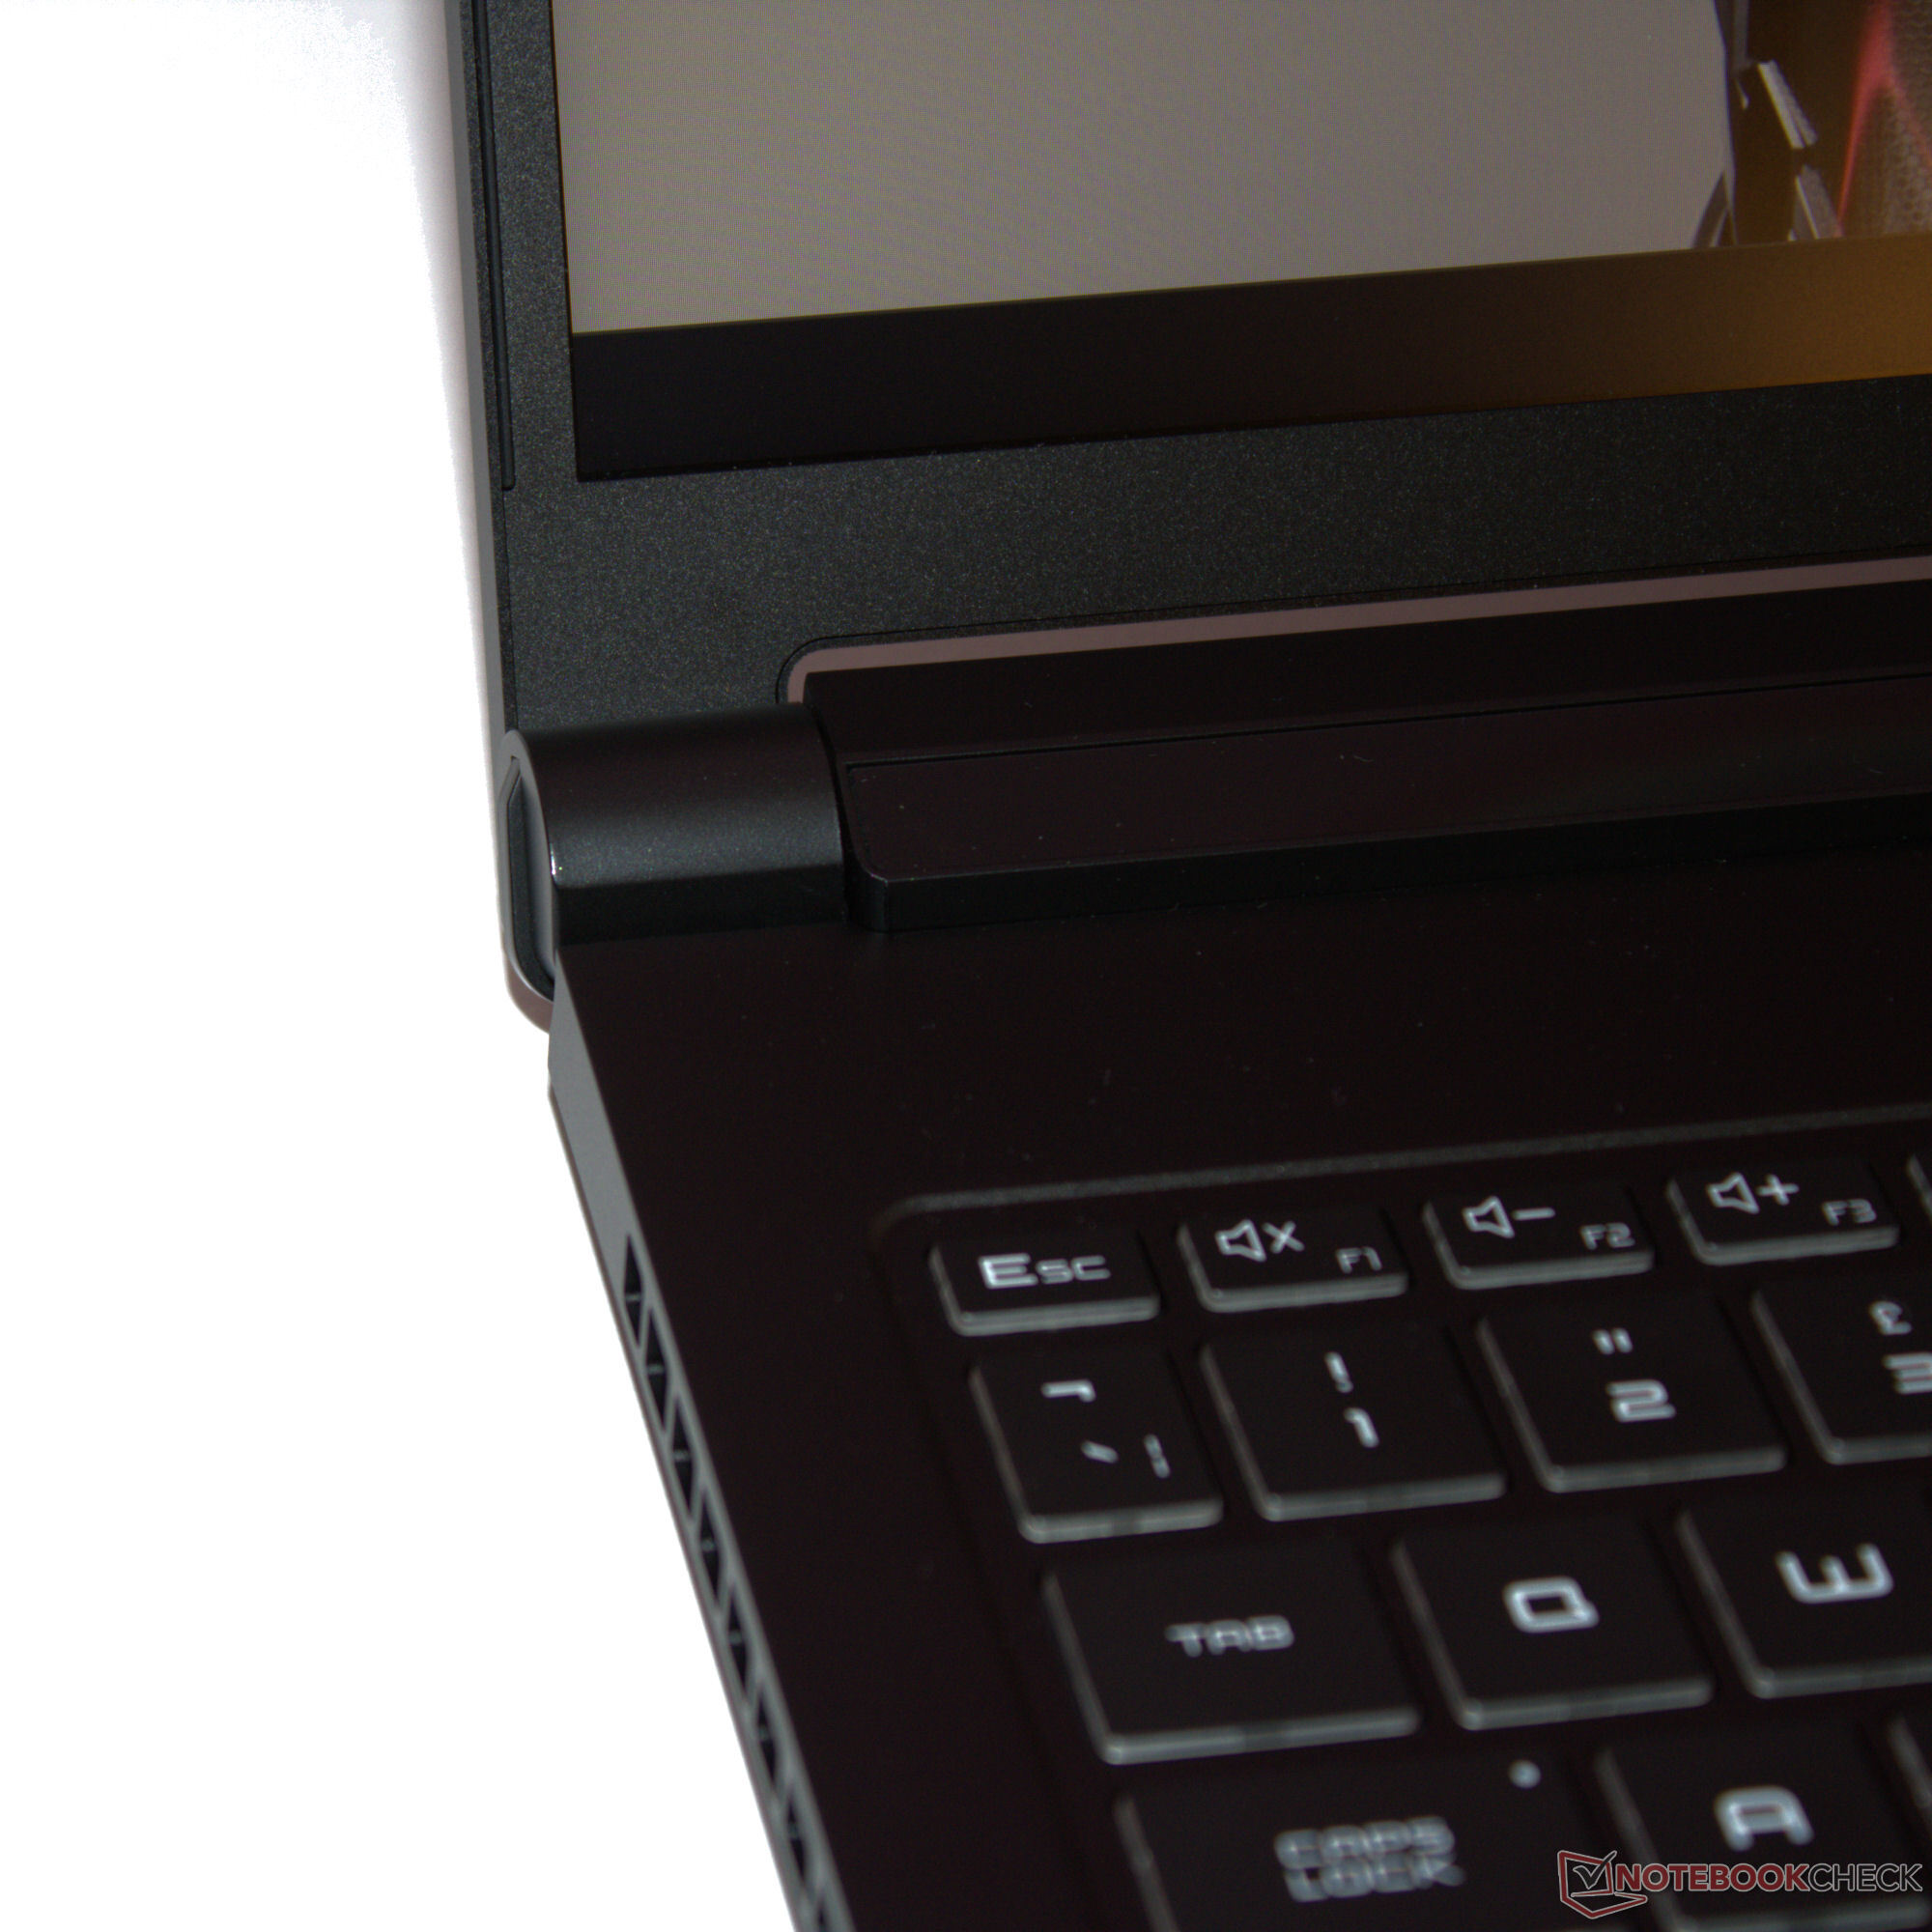
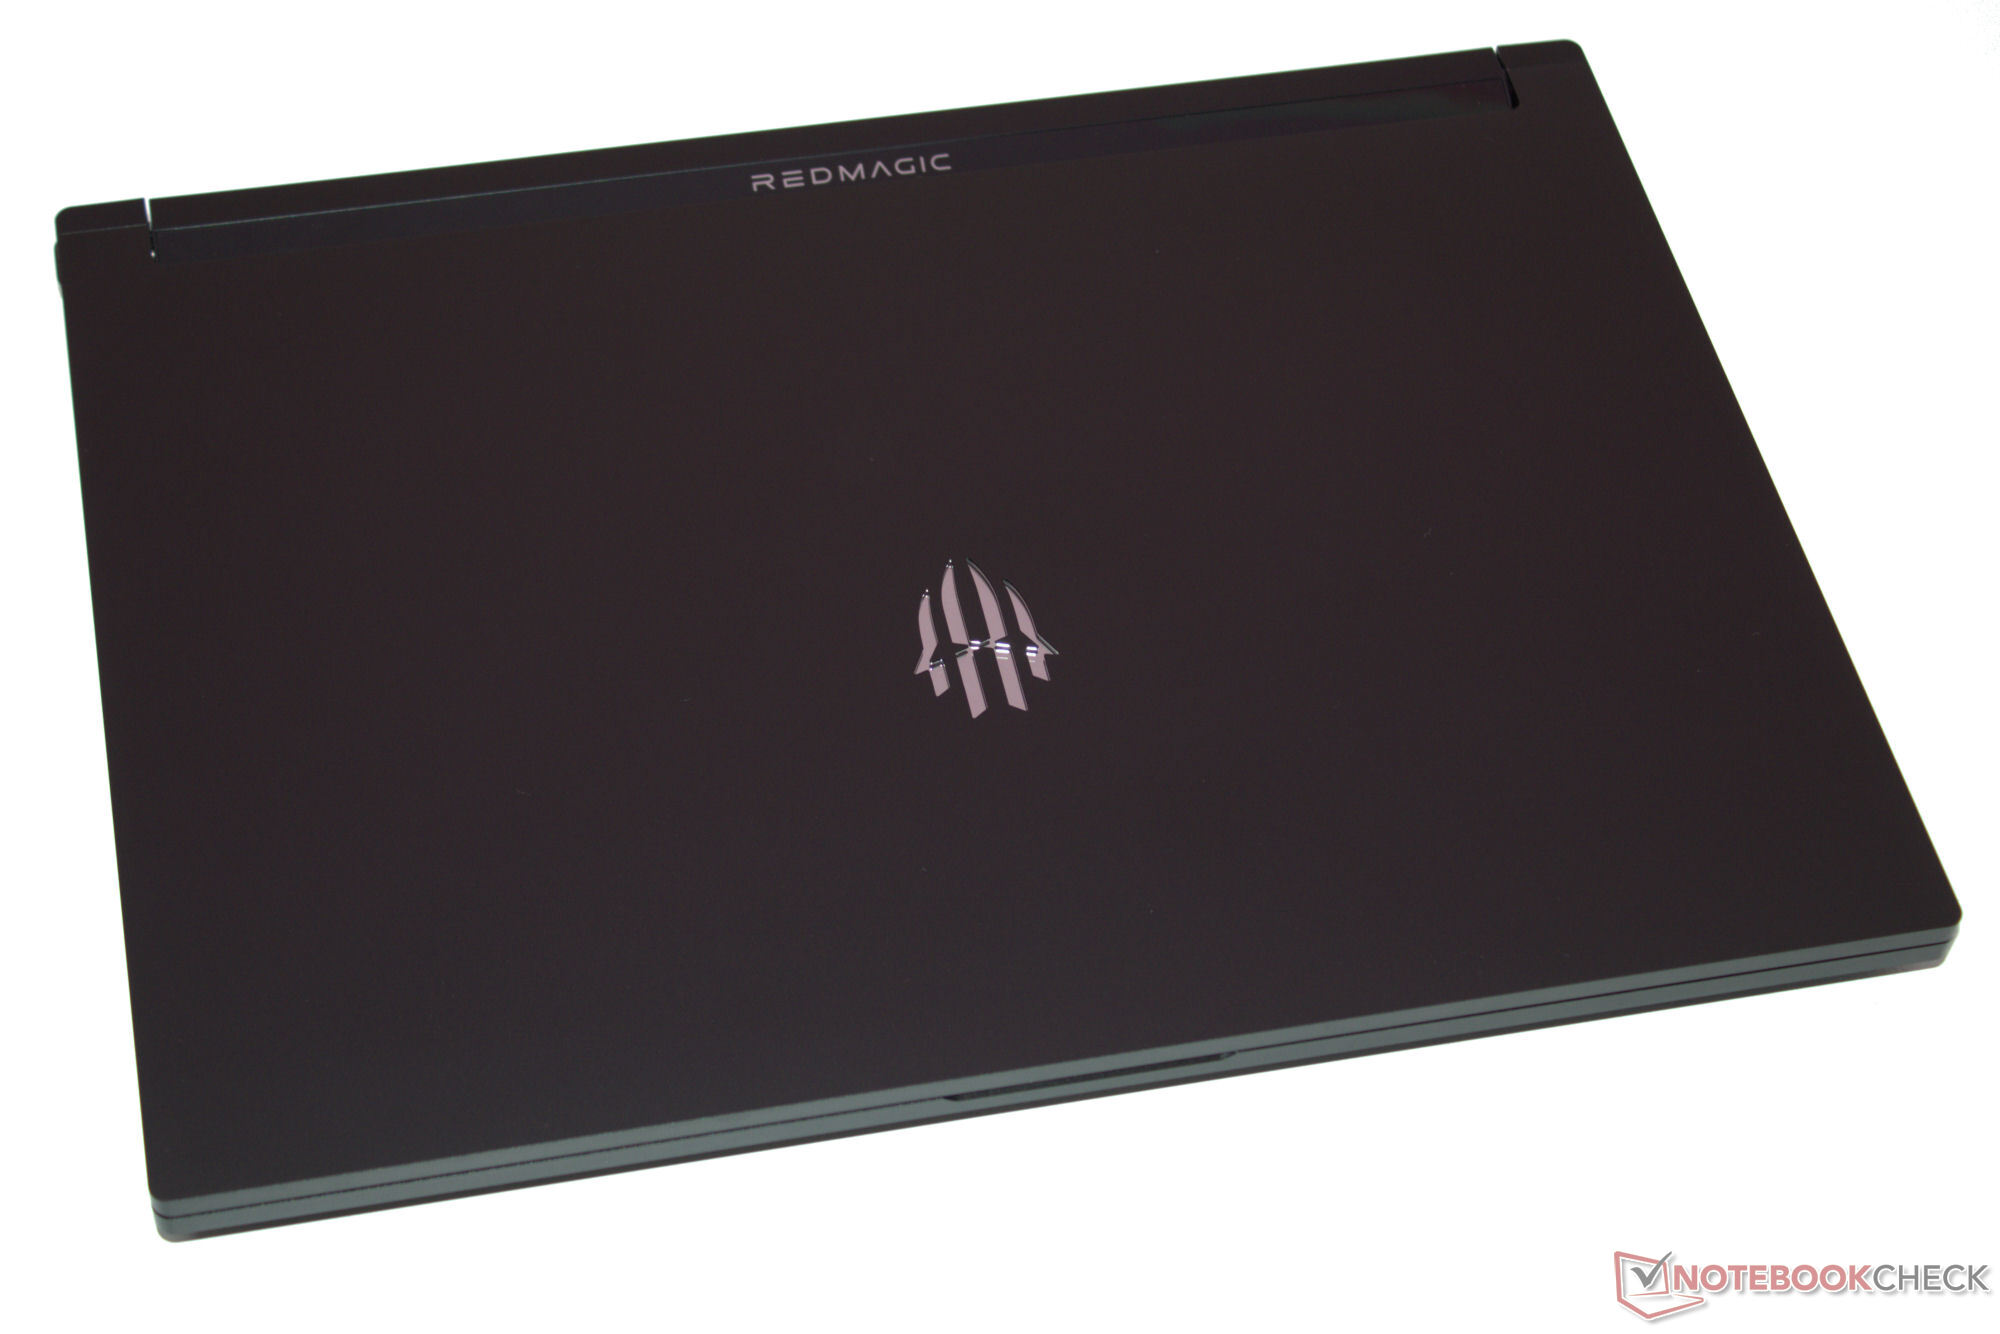
Siempre debe tener cerca un paño de limpieza: Las superficies de la carcasa negro mate son muy sensibles a acumular marcas de huellas dactilares. La unidad base y la tapa de la carcasa de aluminio sólo se pueden torcer un poco y no encontramos ningún error de construcción. Al aplicar presión en la parte posterior de la tapa no se produce ningún cambio de imagen. Las bisagras muy ajustadas mantienen la tapa firmemente en su posición y sólo se tambalea mínimamente. Su ángulo máximo de apertura es de 130 grados y se puede abrir con una sola mano.
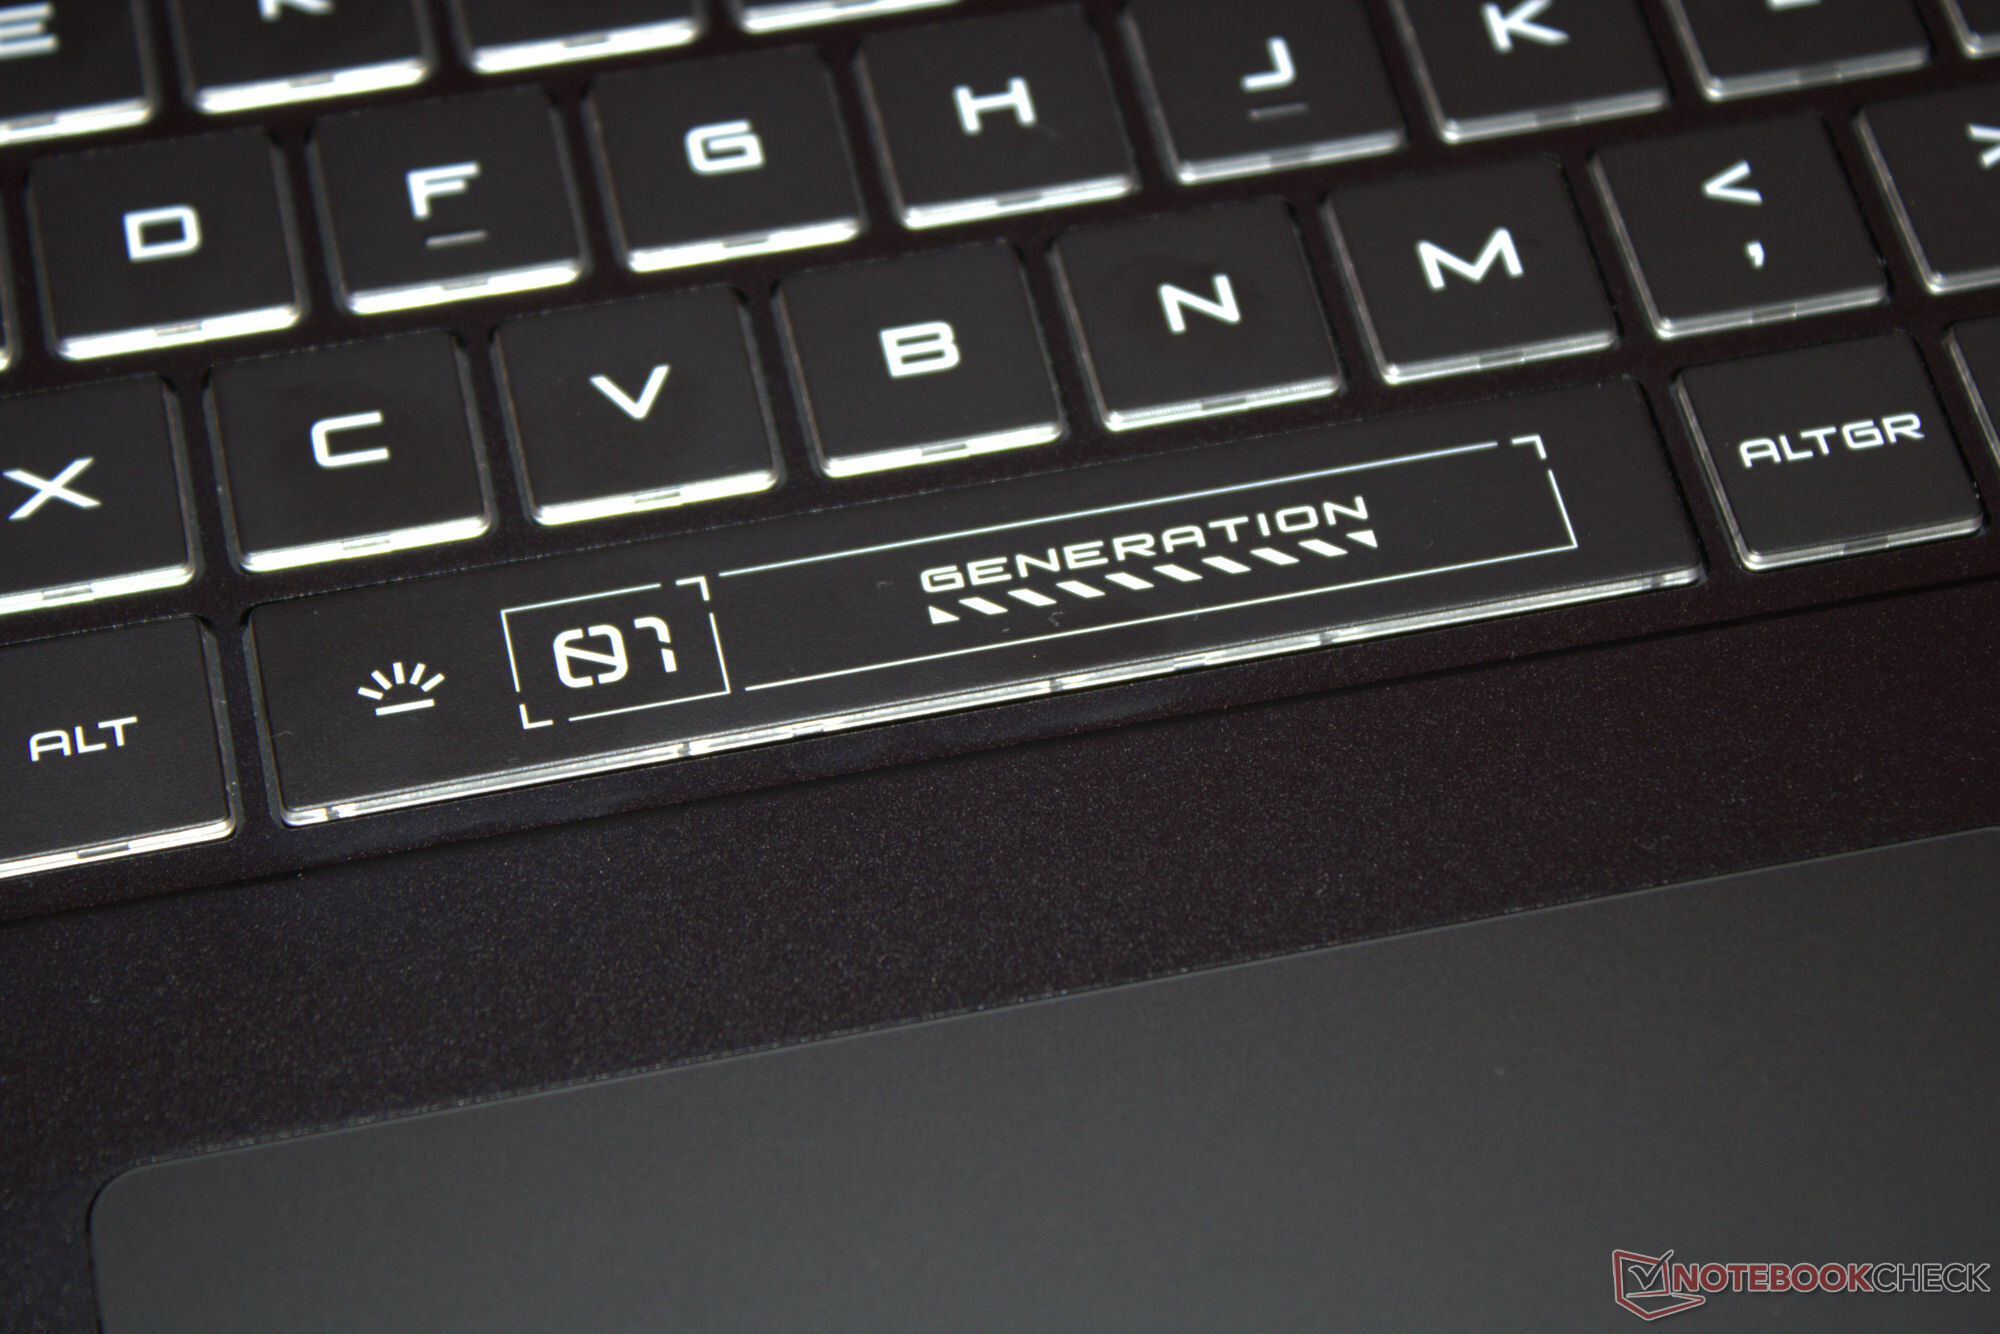
Junto con el teclado retroiluminado del portátil, dos elementos LED aportan algo de color a la mezcla: Las letras RedMagic de la cubierta de la bisagra y el logotipo de la tapa brillan en todos los colores del arco iris. Todos los elementos pueden controlarse individualmente. Las letras también sirven como indicador de batería: una luz roja parpadeante indica un nivel de carga bajo.
Dentro del campo de comparación, la Titan resulta ser uno de los dispositivos más compactos y ligeros. Aun así, las diferencias con respecto a la competencia son bastante pequeñas.
Conectividad - El Titán cuenta con Thunderbolt 4
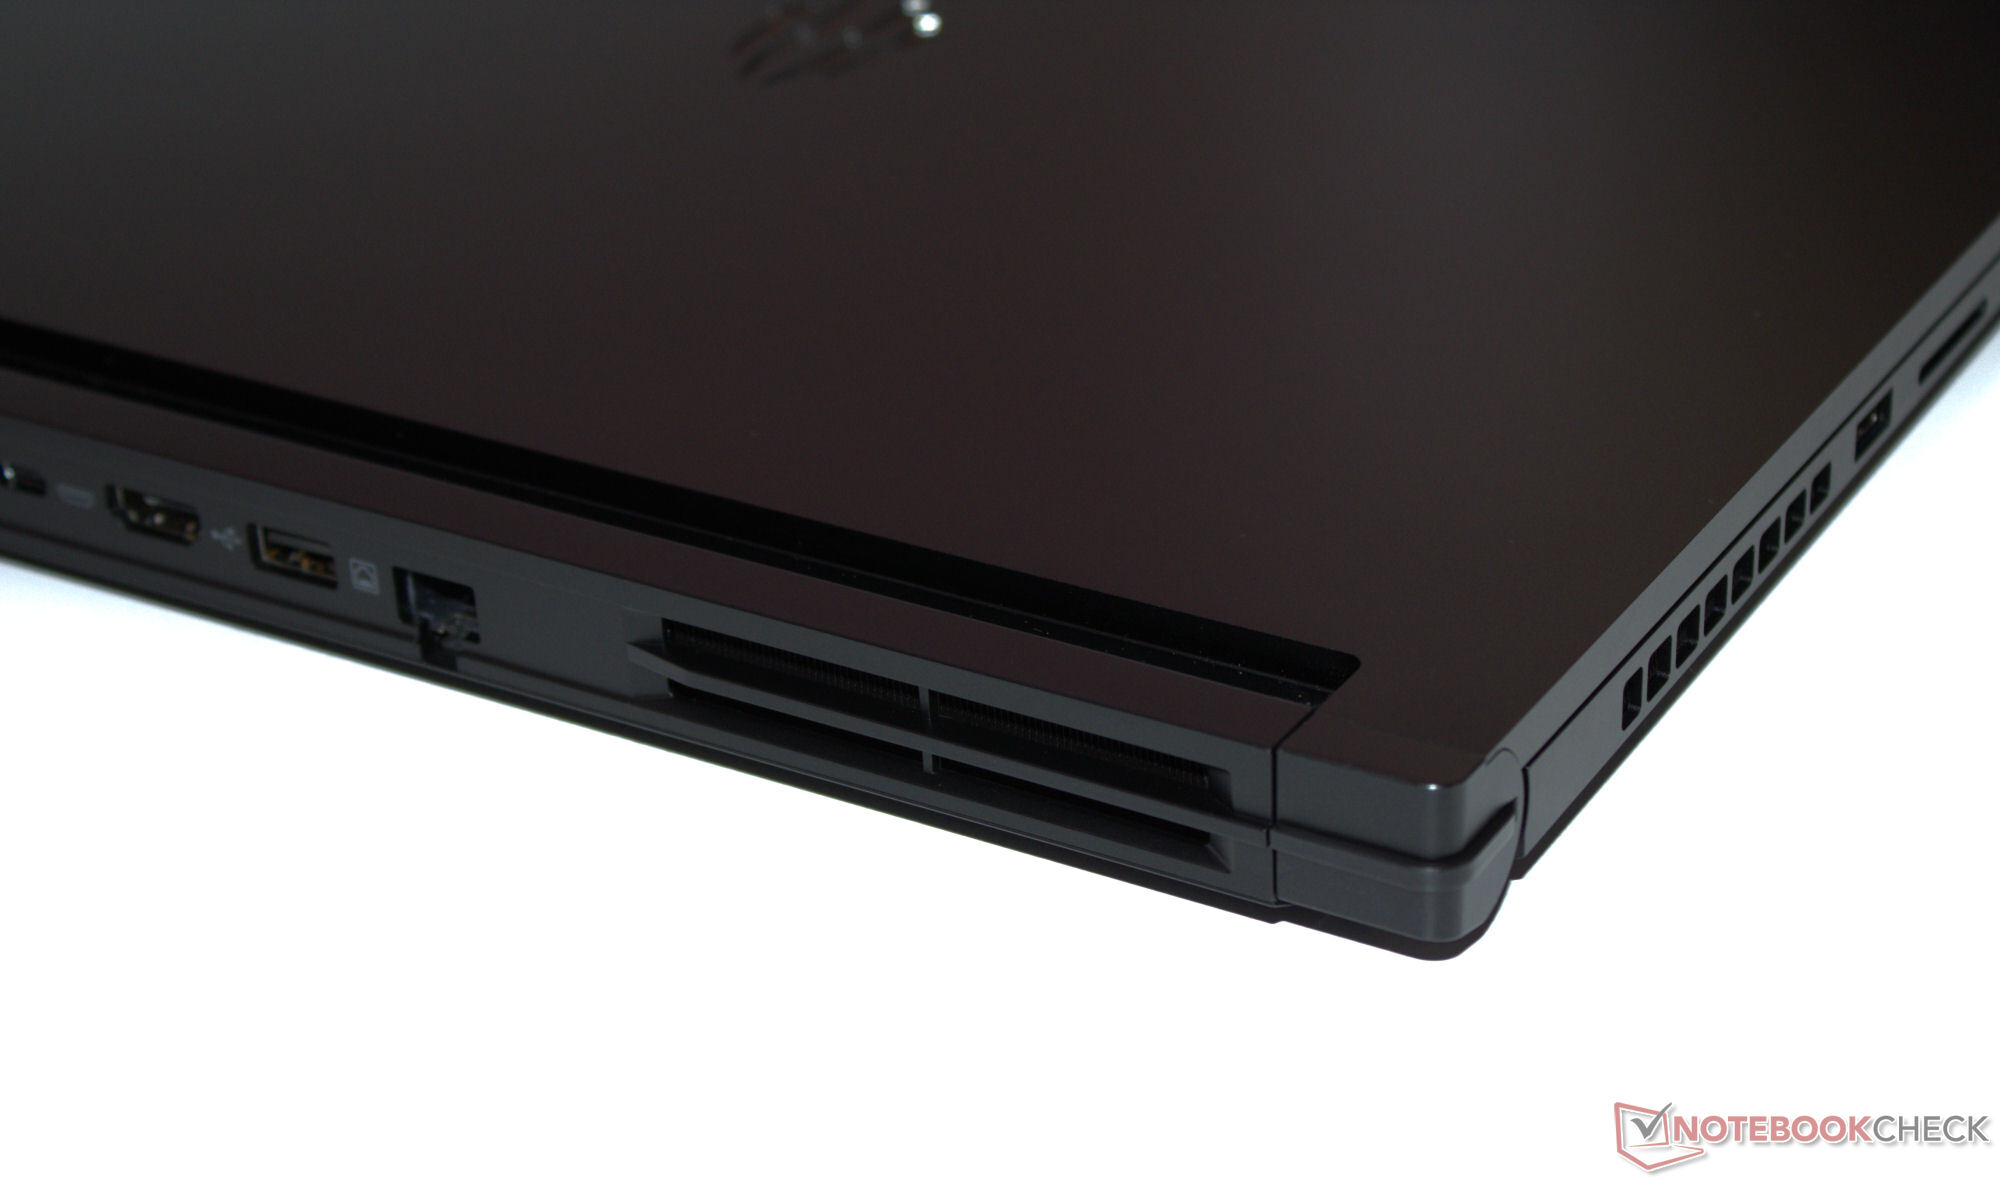
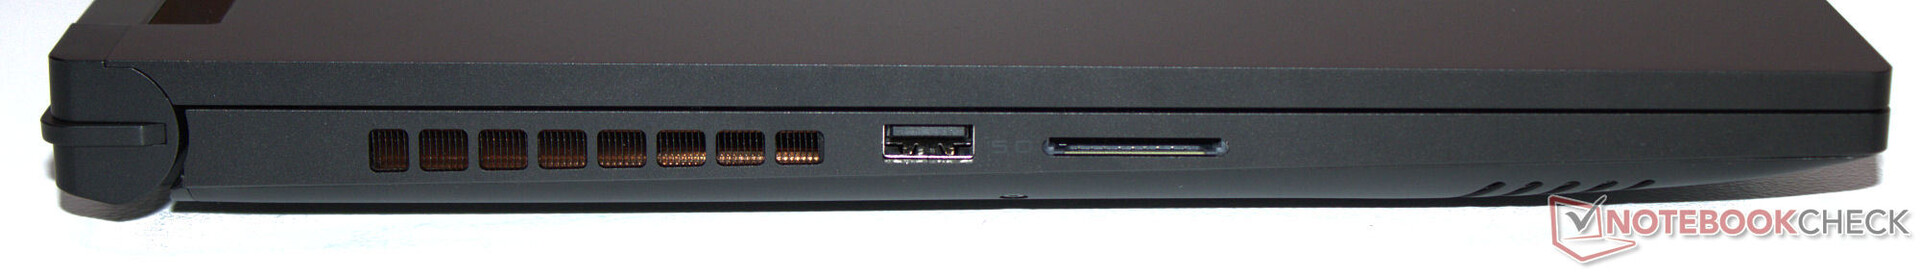
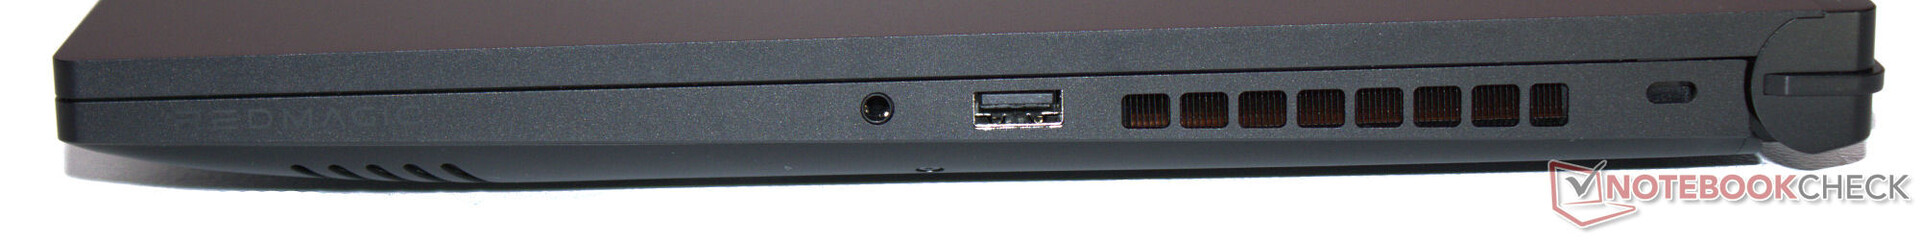
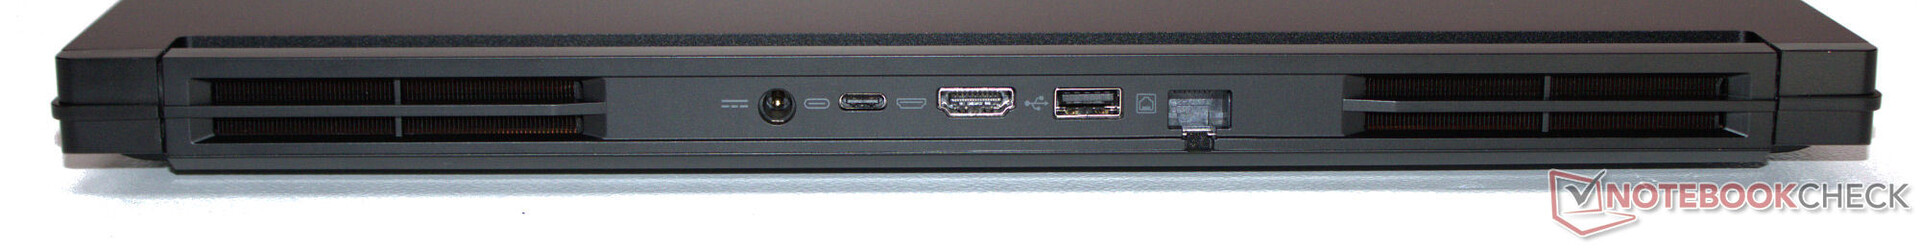
La Titan está equipada con tres puertos USB-A (2x USB 3.2 Gen 2, 1x USB 3.2 Gen 1) así como un puerto USB-C (Thunderbolt 4). Este último es compatible con Power Delivery y el modo DP Alt. Dispone de un total de dos salidas de vídeo (1x HDMI, 1x DP). Una toma de audio y un puerto ethernet (1 GBit/s) completan su paquete total.
Las salidas de vídeo, la toma de red y la conexión de alimentación están situadas en la parte trasera del aparato, por lo que los cables correspondientes no deberían estorbarle durante su uso. Un aspecto positivo es que hay un puerto USB-A en los lados izquierdo y derecho del portátil.
Lector de tarjetas SD
El lector de tarjetas SD (tarjeta de referencia: AV PRO microSD 128 GB V60) no es uno de los más rápidos de su clase, pero ofrece velocidades de datos sólidas en el rango medio-rápido. Comparando esto con los valores del Blade 16 (2024) demuestra que podrían alcanzarse tasas de transferencia significativamente superiores.
| SD Card Reader | |
| average JPG Copy Test (av. of 3 runs) | |
| Razer Blade 16 2024, RTX 4090 | |
| Media de la clase Gaming (19 - 197.3, n=68, últimos 2 años) | |
| SCHENKER XMG Pro 16 Studio (Mid 24) (AV PRO microSD 128 GB V60) | |
| Nubia RedMagic Titan 16 Pro (AV PRO microSD 128 GB V60) | |
| Acer Predator Helios Neo 16 (2024) (AV PRO microSD 128 GB V60) | |
| maximum AS SSD Seq Read Test (1GB) | |
| Razer Blade 16 2024, RTX 4090 | |
| Media de la clase Gaming (25.8 - 263, n=67, últimos 2 años) | |
| SCHENKER XMG Pro 16 Studio (Mid 24) (AV PRO microSD 128 GB V60) | |
| Nubia RedMagic Titan 16 Pro (AV PRO microSD 128 GB V60) | |
| Acer Predator Helios Neo 16 (2024) (AV PRO microSD 128 GB V60) | |
Comunicación
No hay sorpresas en lo que se refiere a sus opciones de red: De las conexiones por cable se encarga un controlador Gigabit Ethernet establecido (RTL8168/8111, 1 GBit/s) de Realtek. El chip WiFi 6E de Intel (AX211) ofrece velocidades de transmisión de datos de buenas a muy buenas en condiciones óptimas (sin dispositivos WiFi en las proximidades, distancia corta entre el portátil y el servidor).
Cámara web
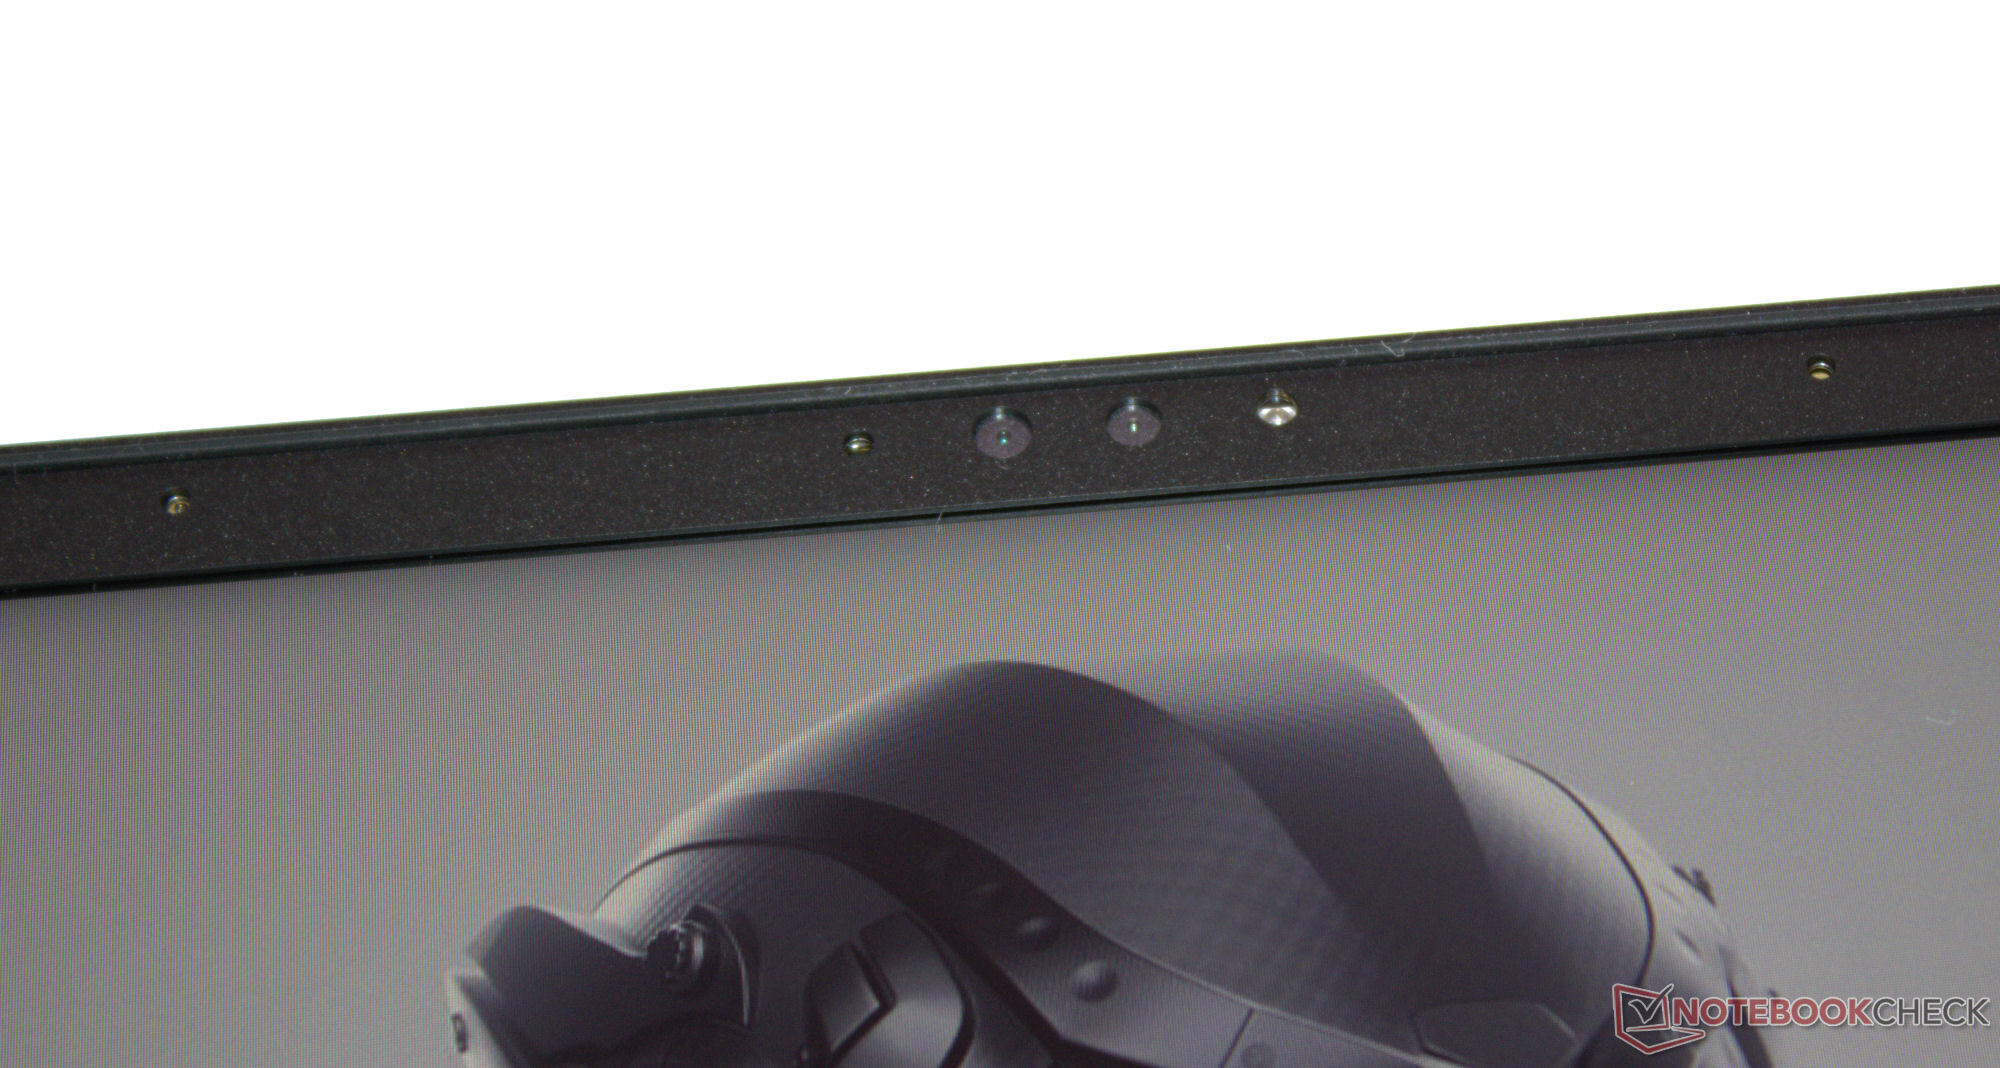
La cámara web (2,1 MP) es un asunto estándar, incluyendo soporte para Windows Hello. La cámara no tiene tapa mecánica ni interruptor físico de encendido/apagado.


Accesorios
Aparte de los documentos habituales (guía de inicio rápido e información sobre la garantía), no se incluye ningún accesorio adicional con el portátil.
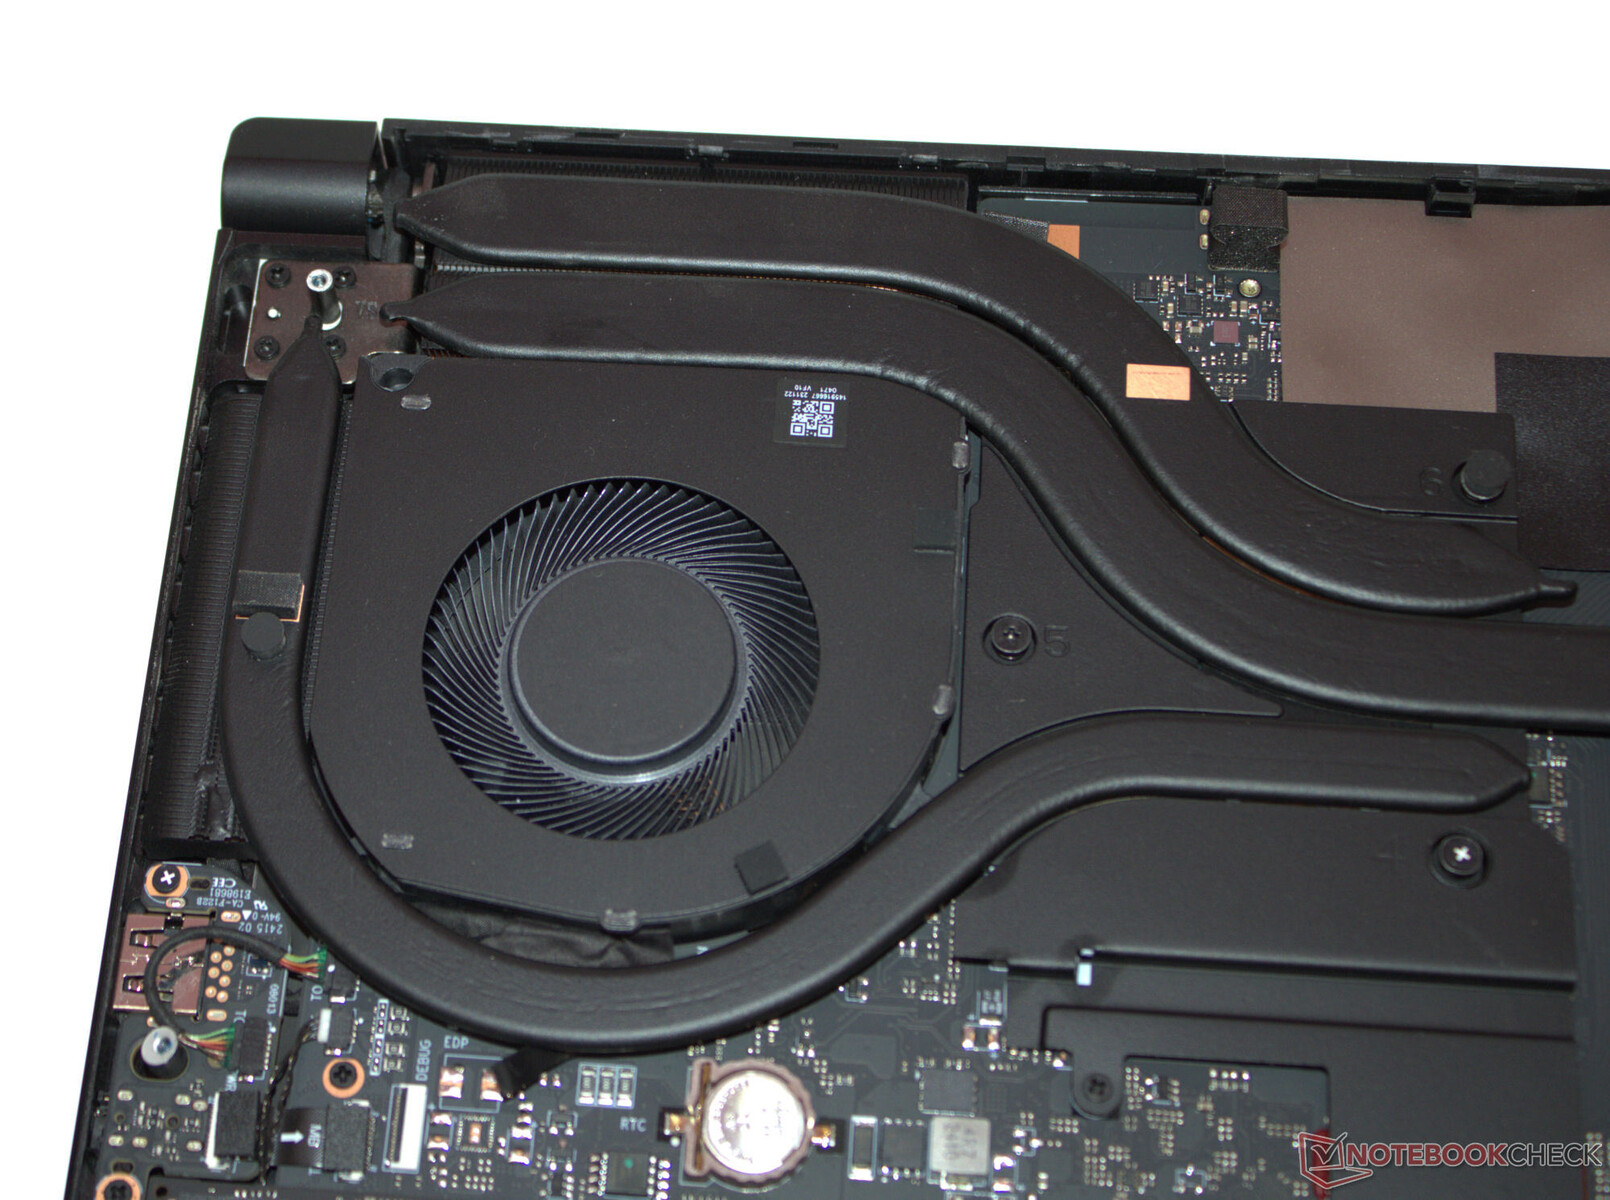
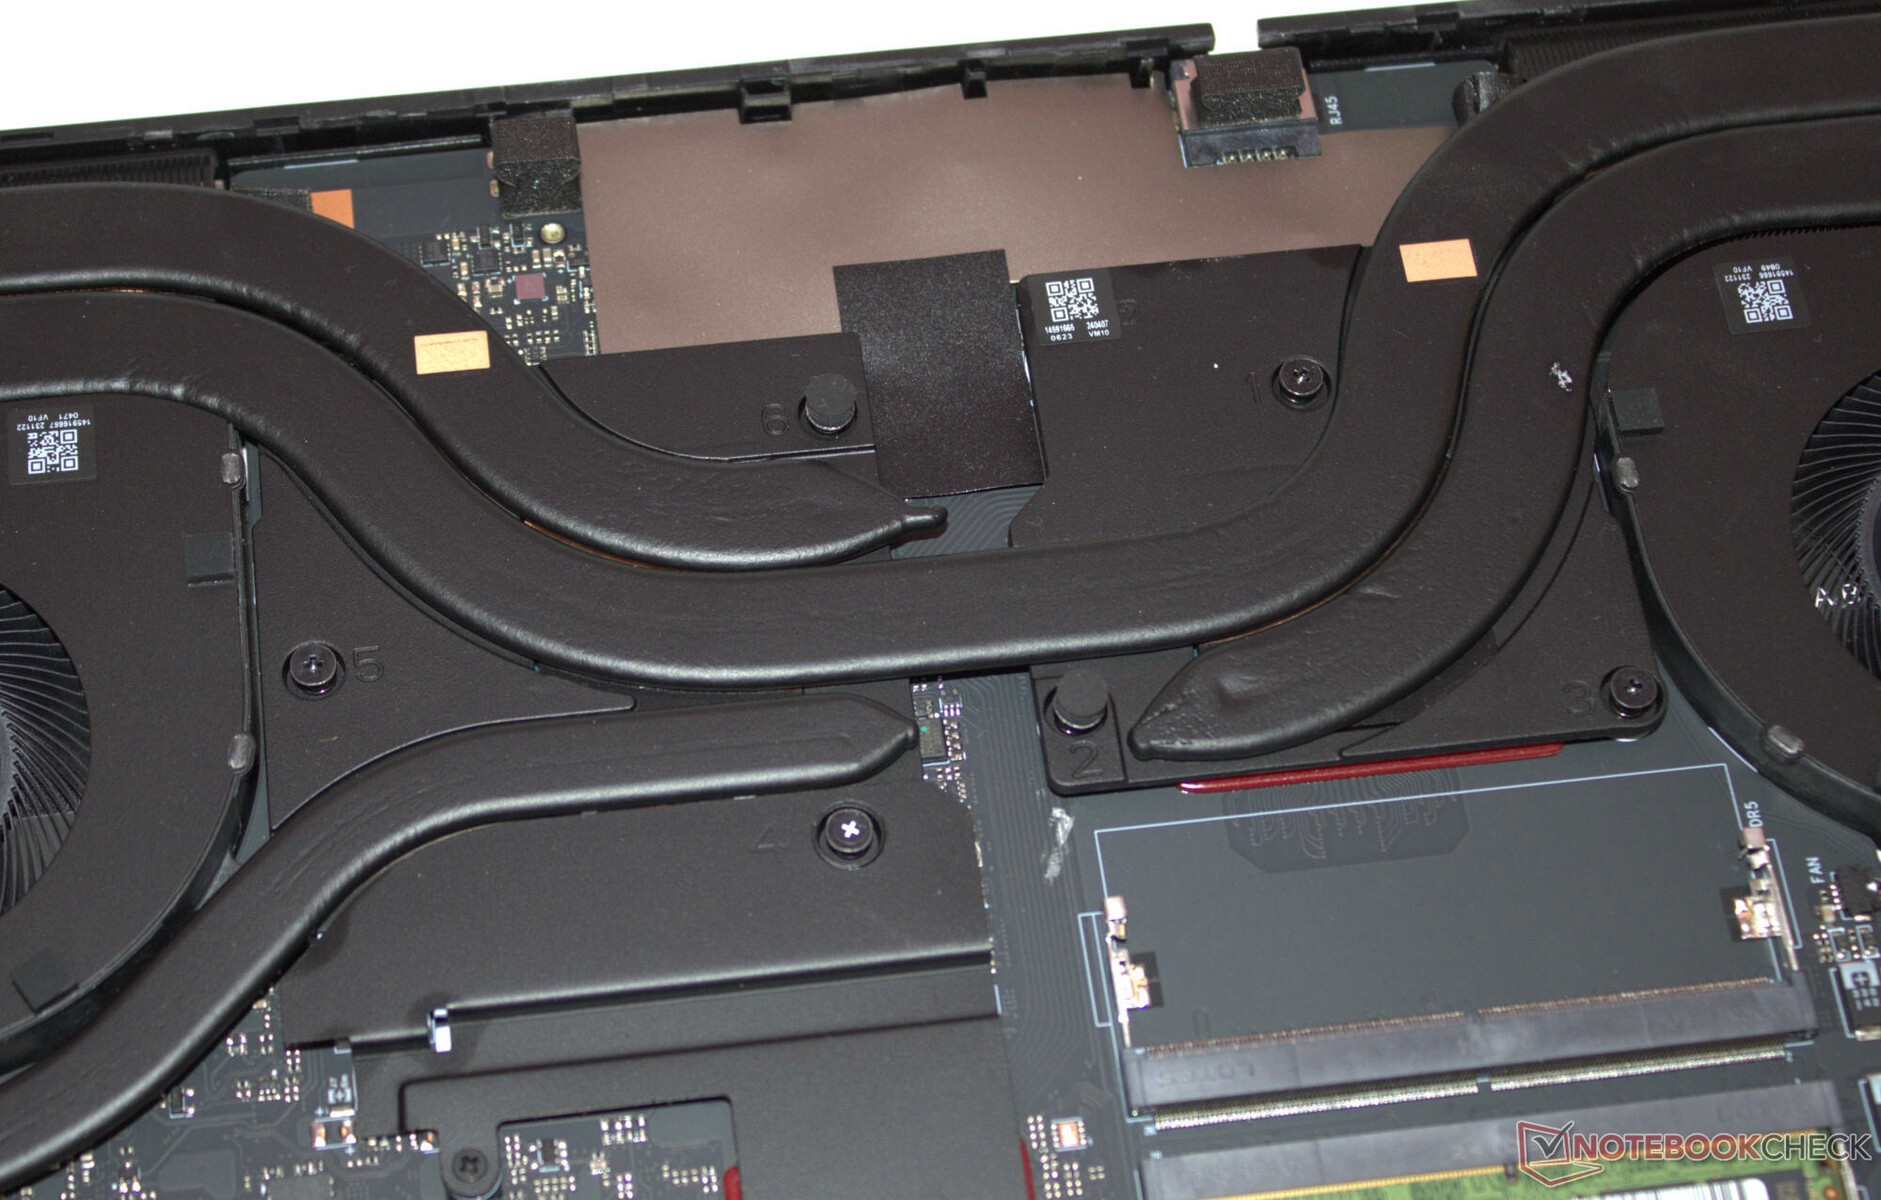
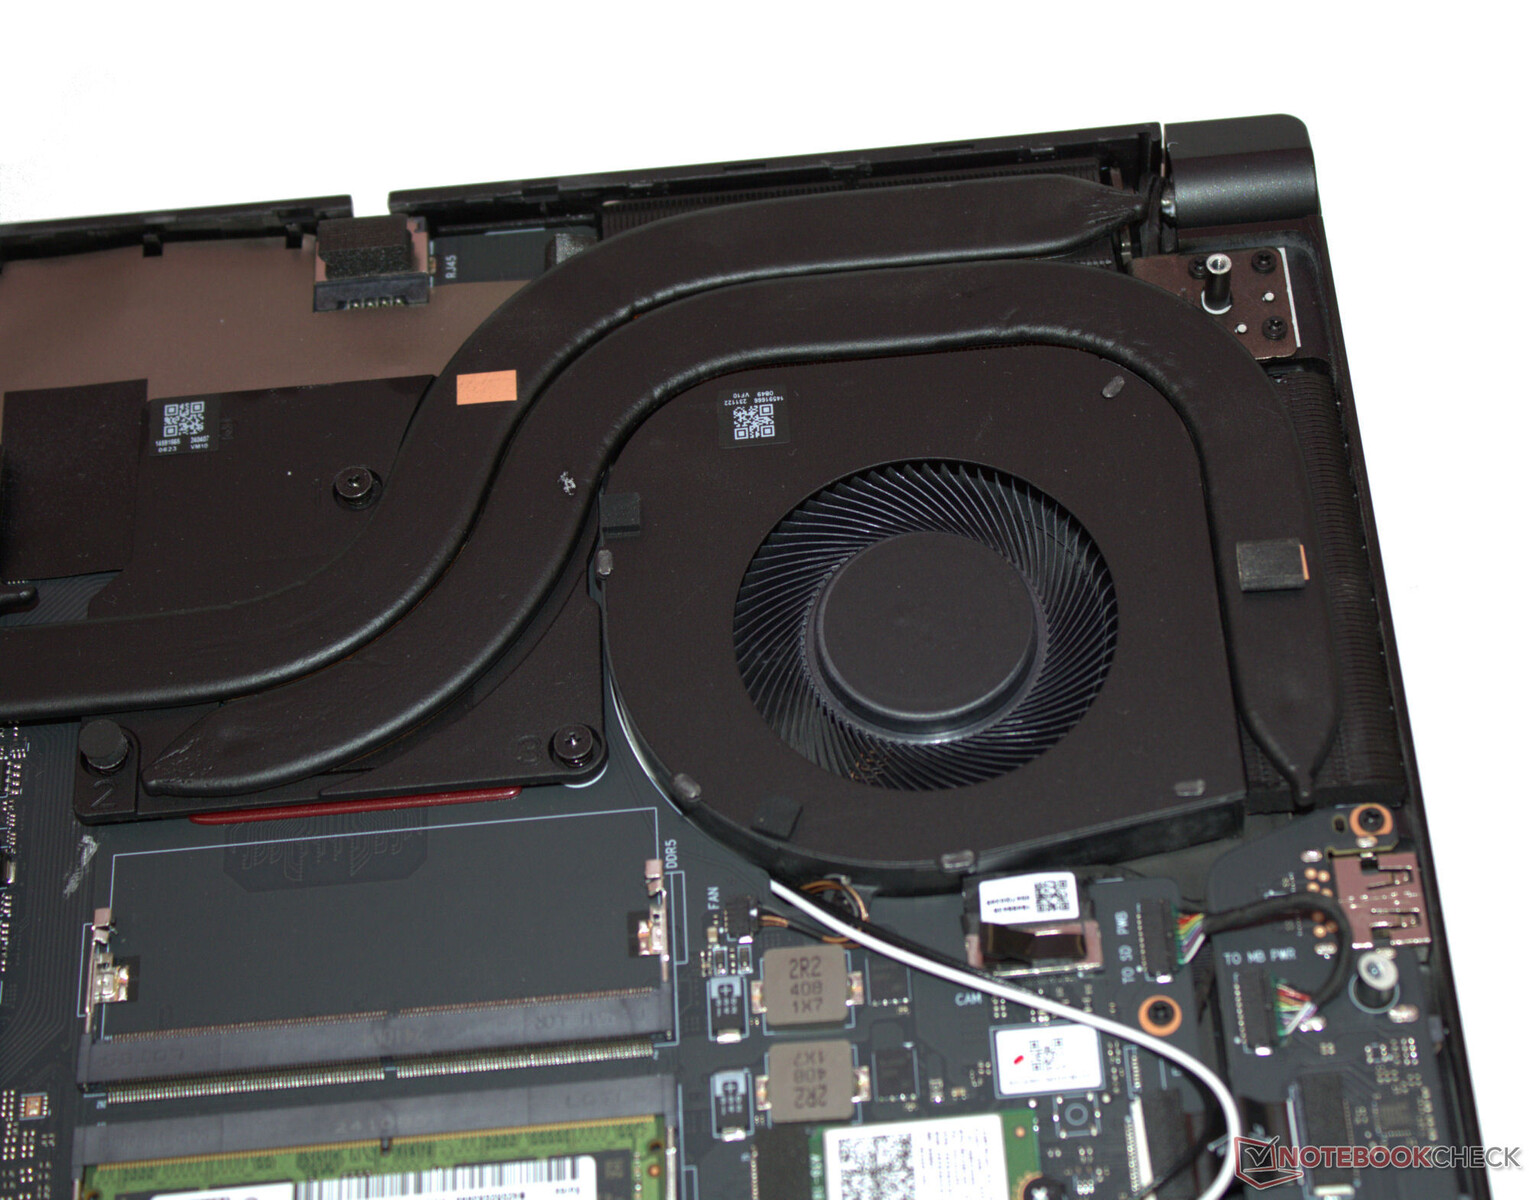
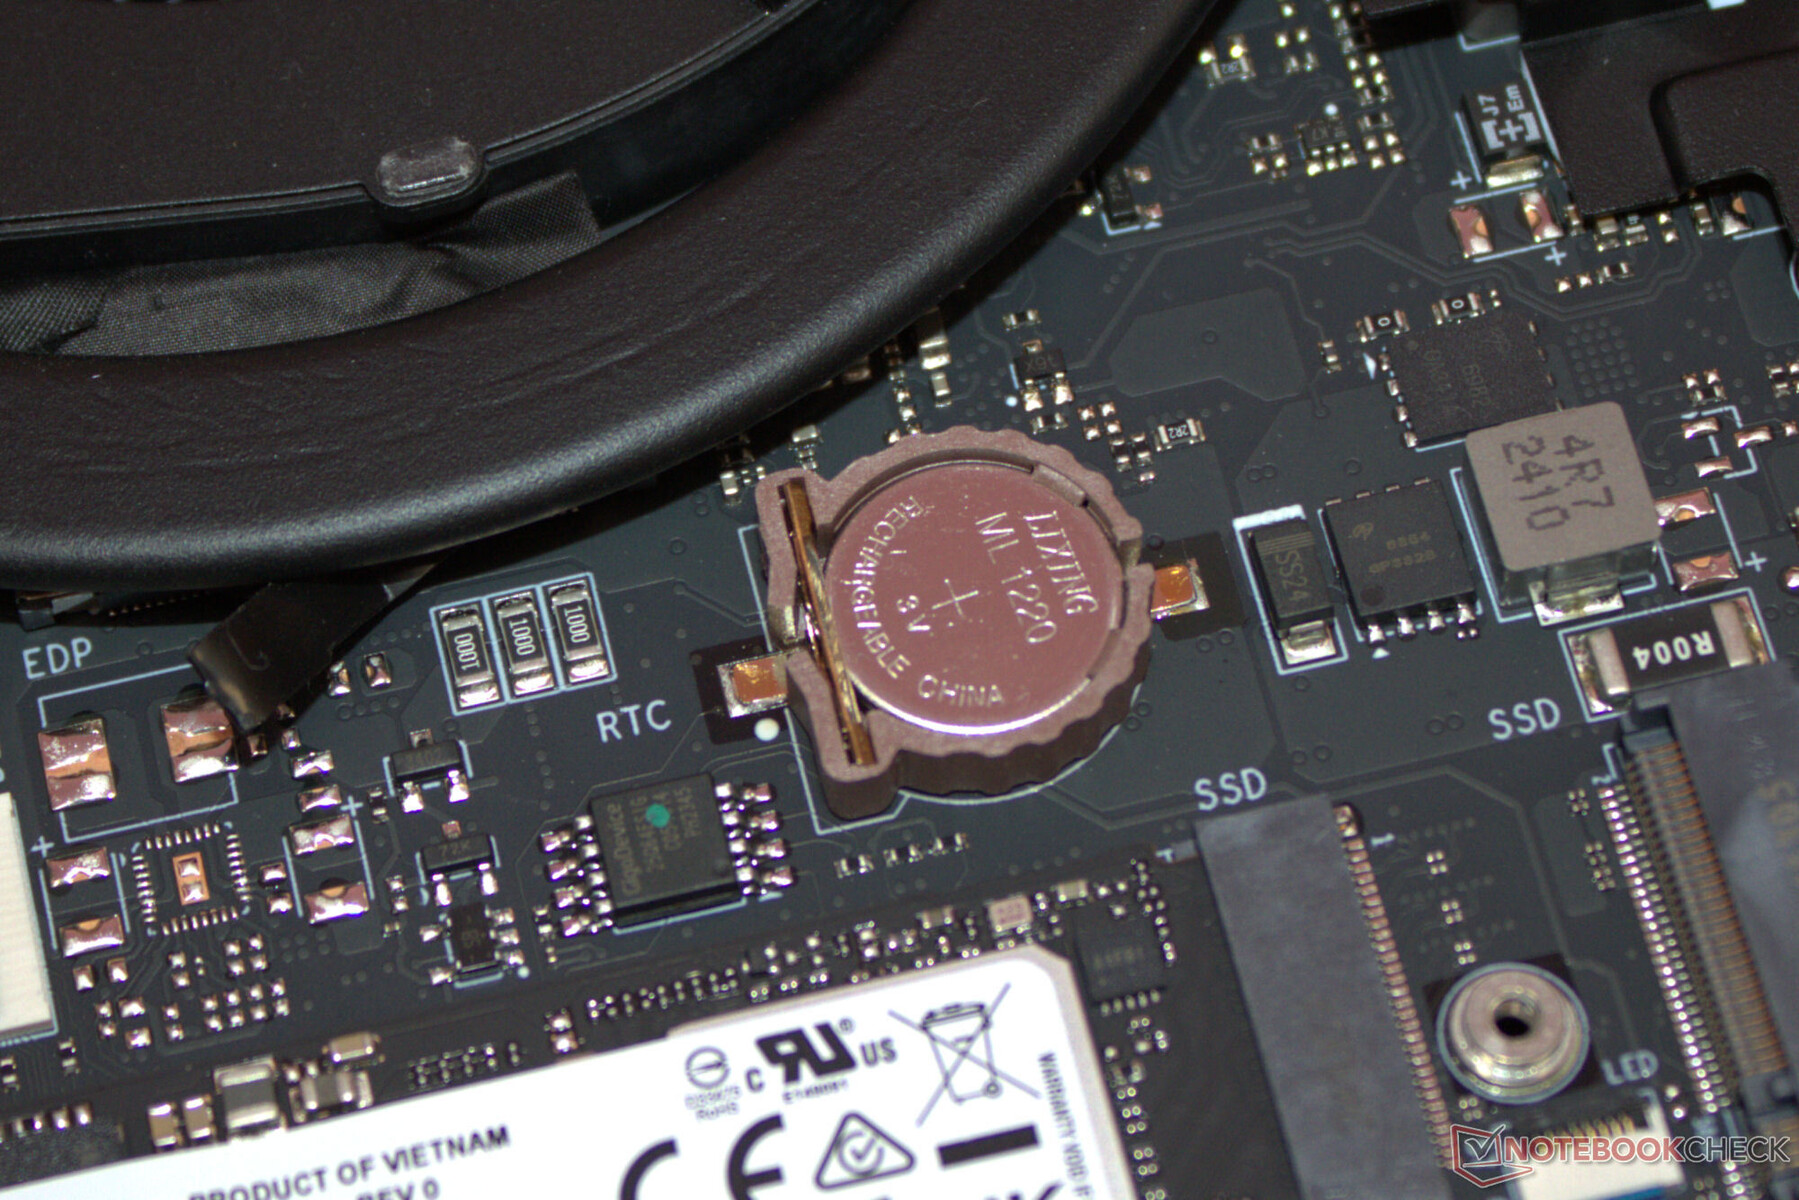
Mantenimiento
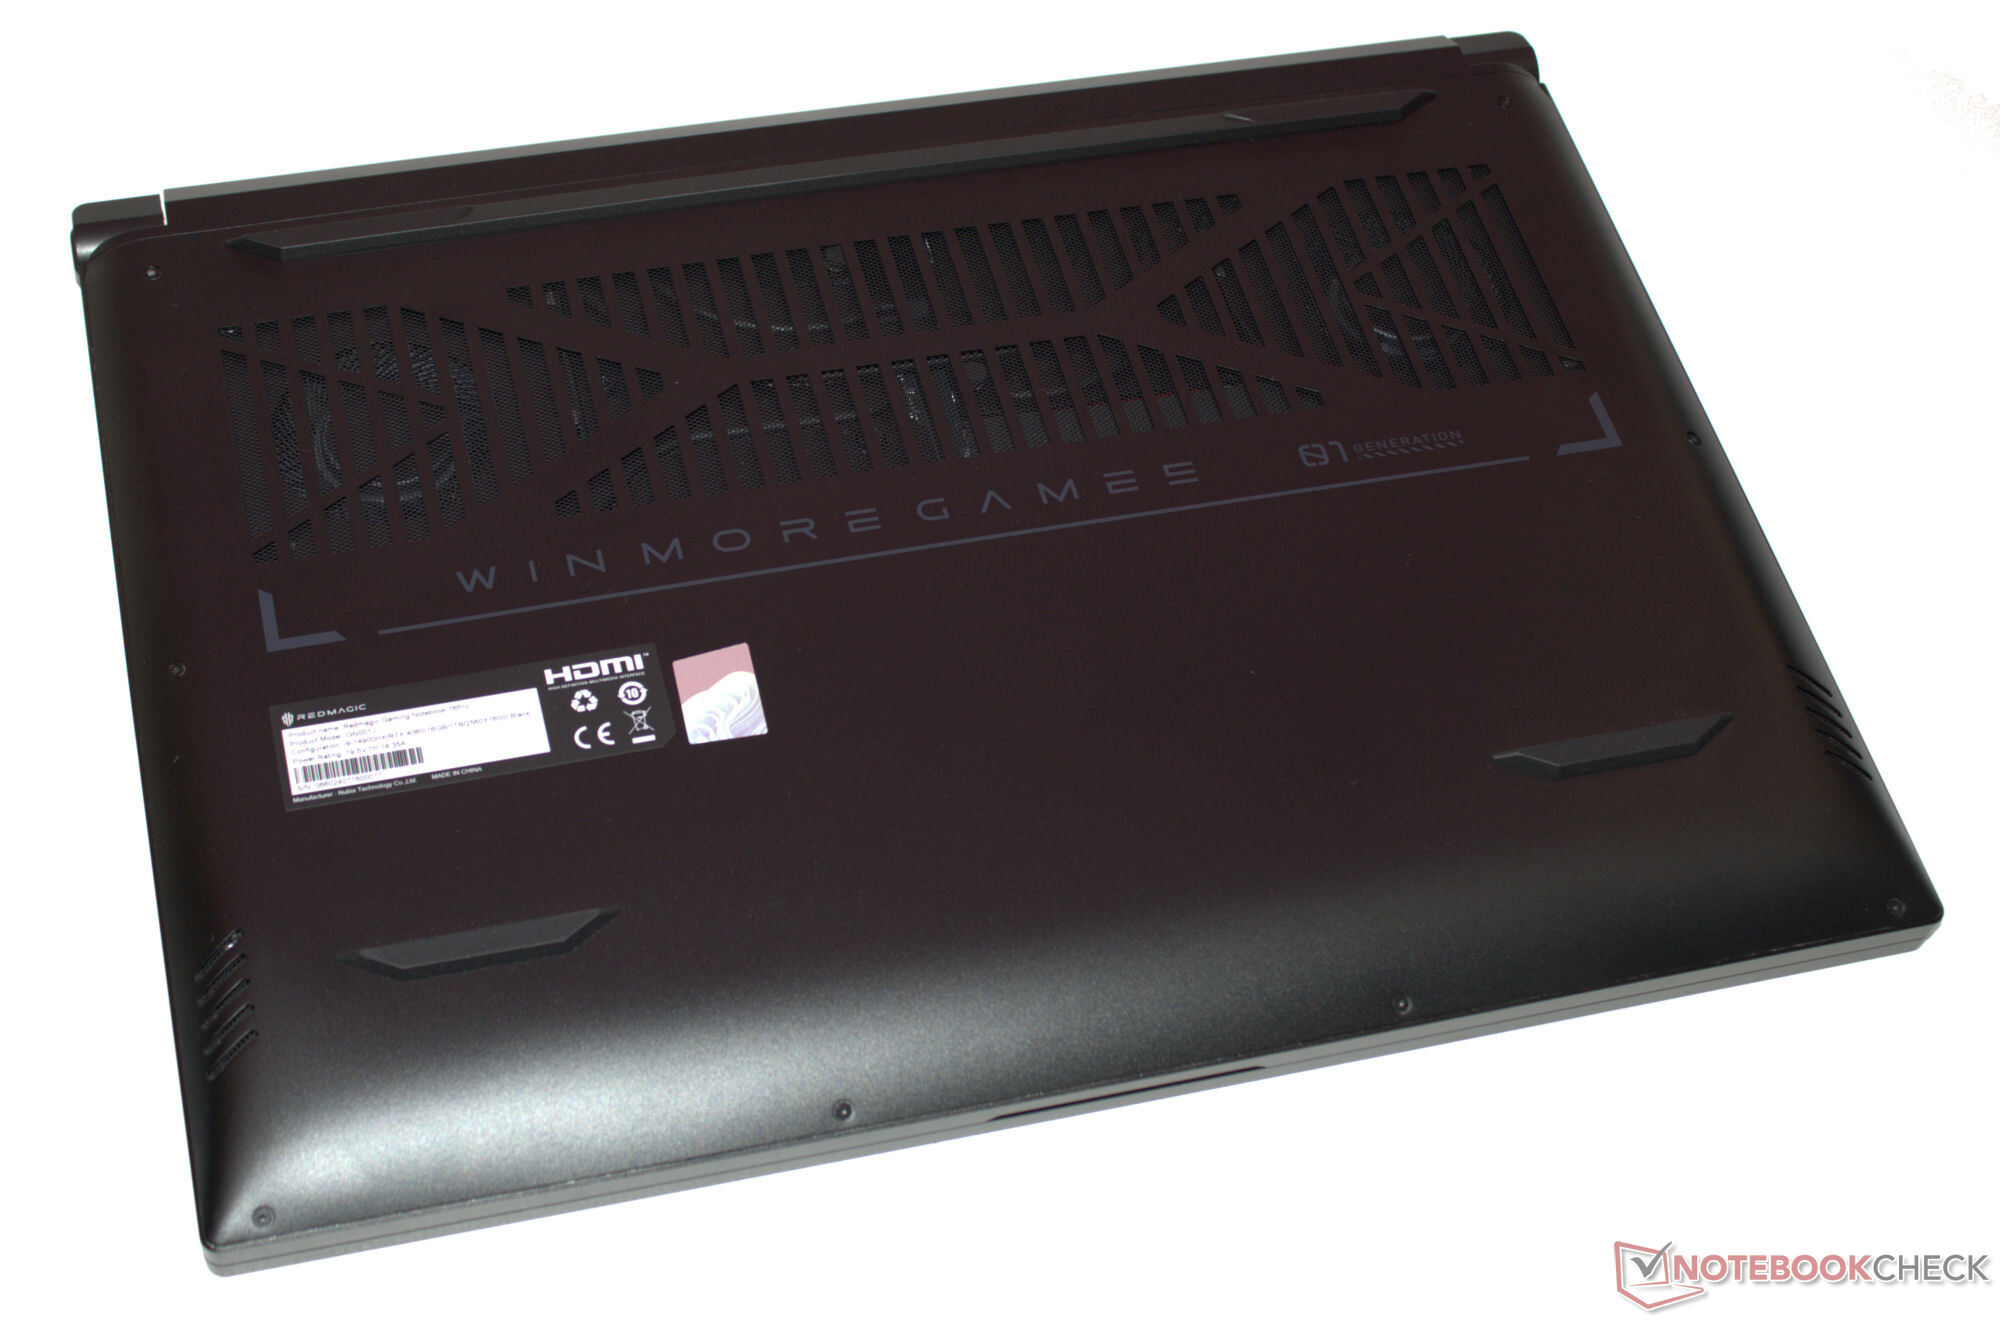
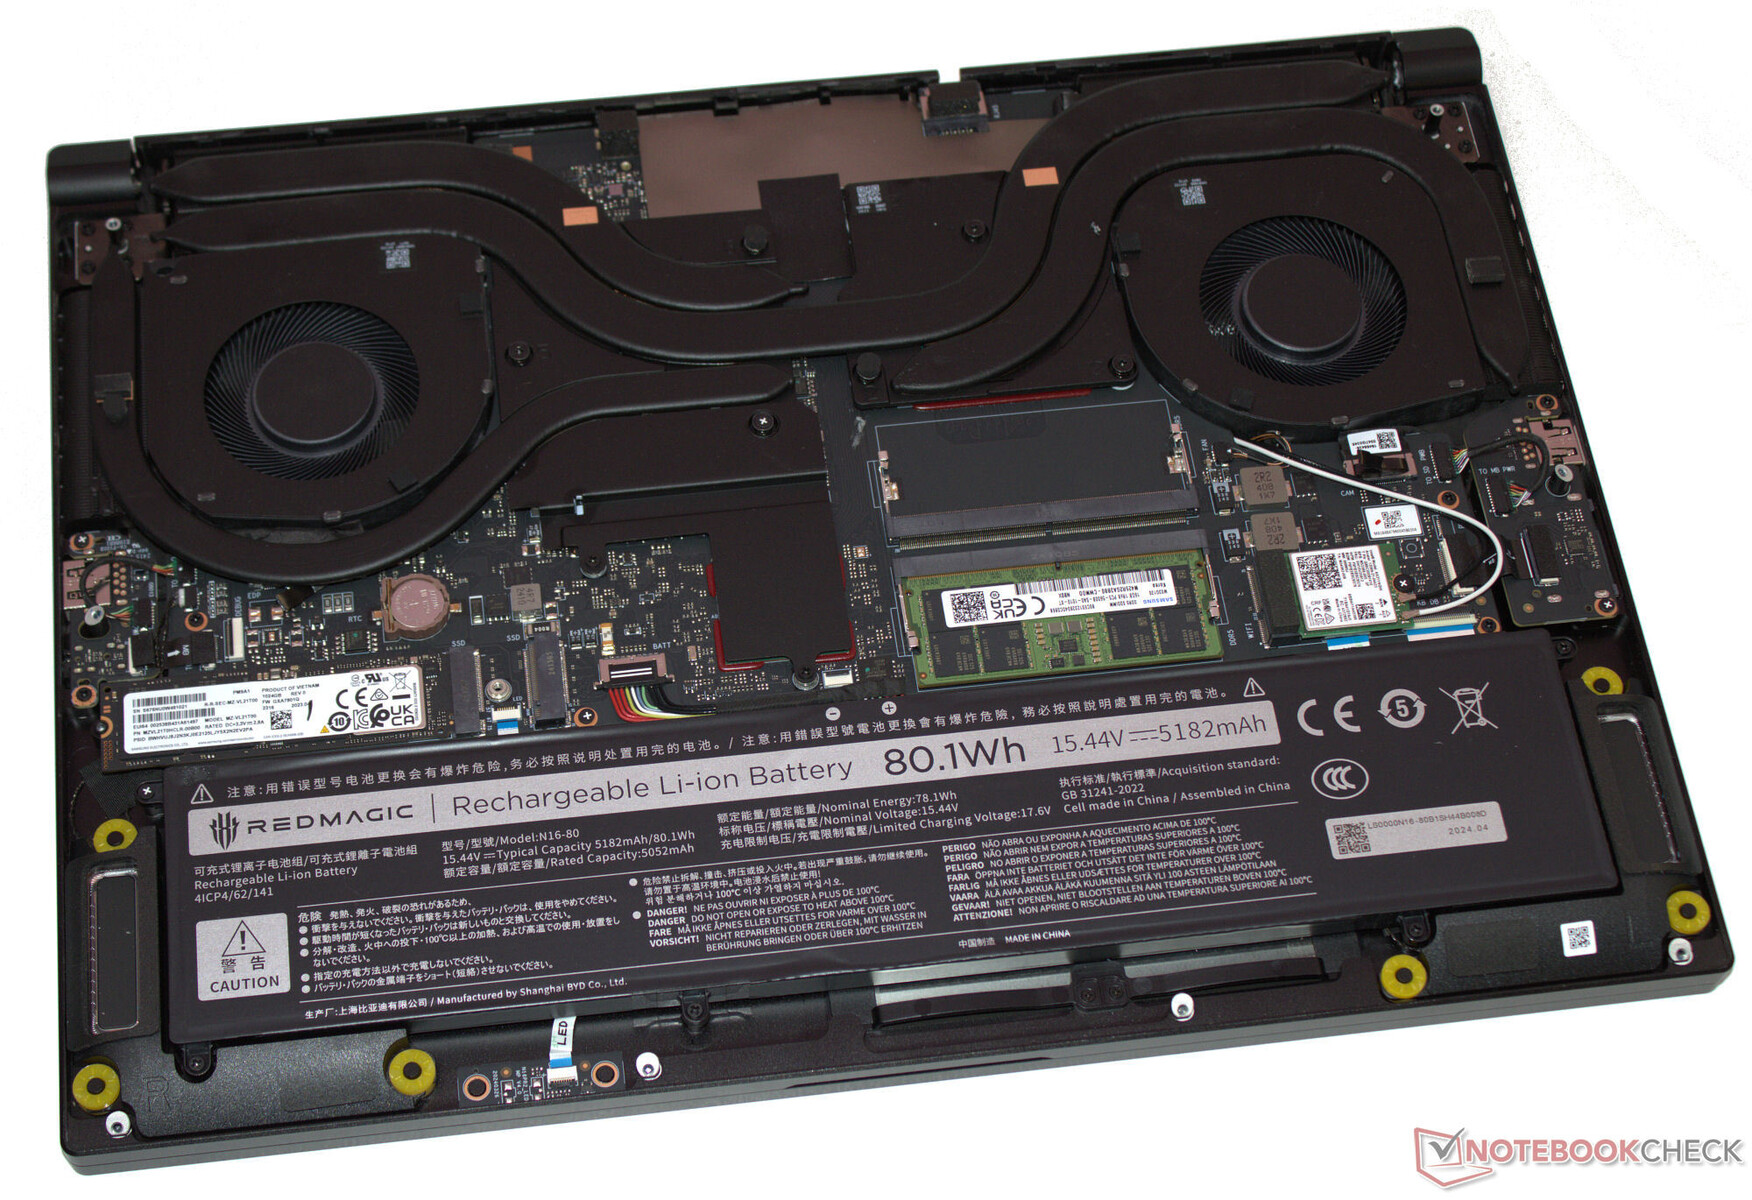
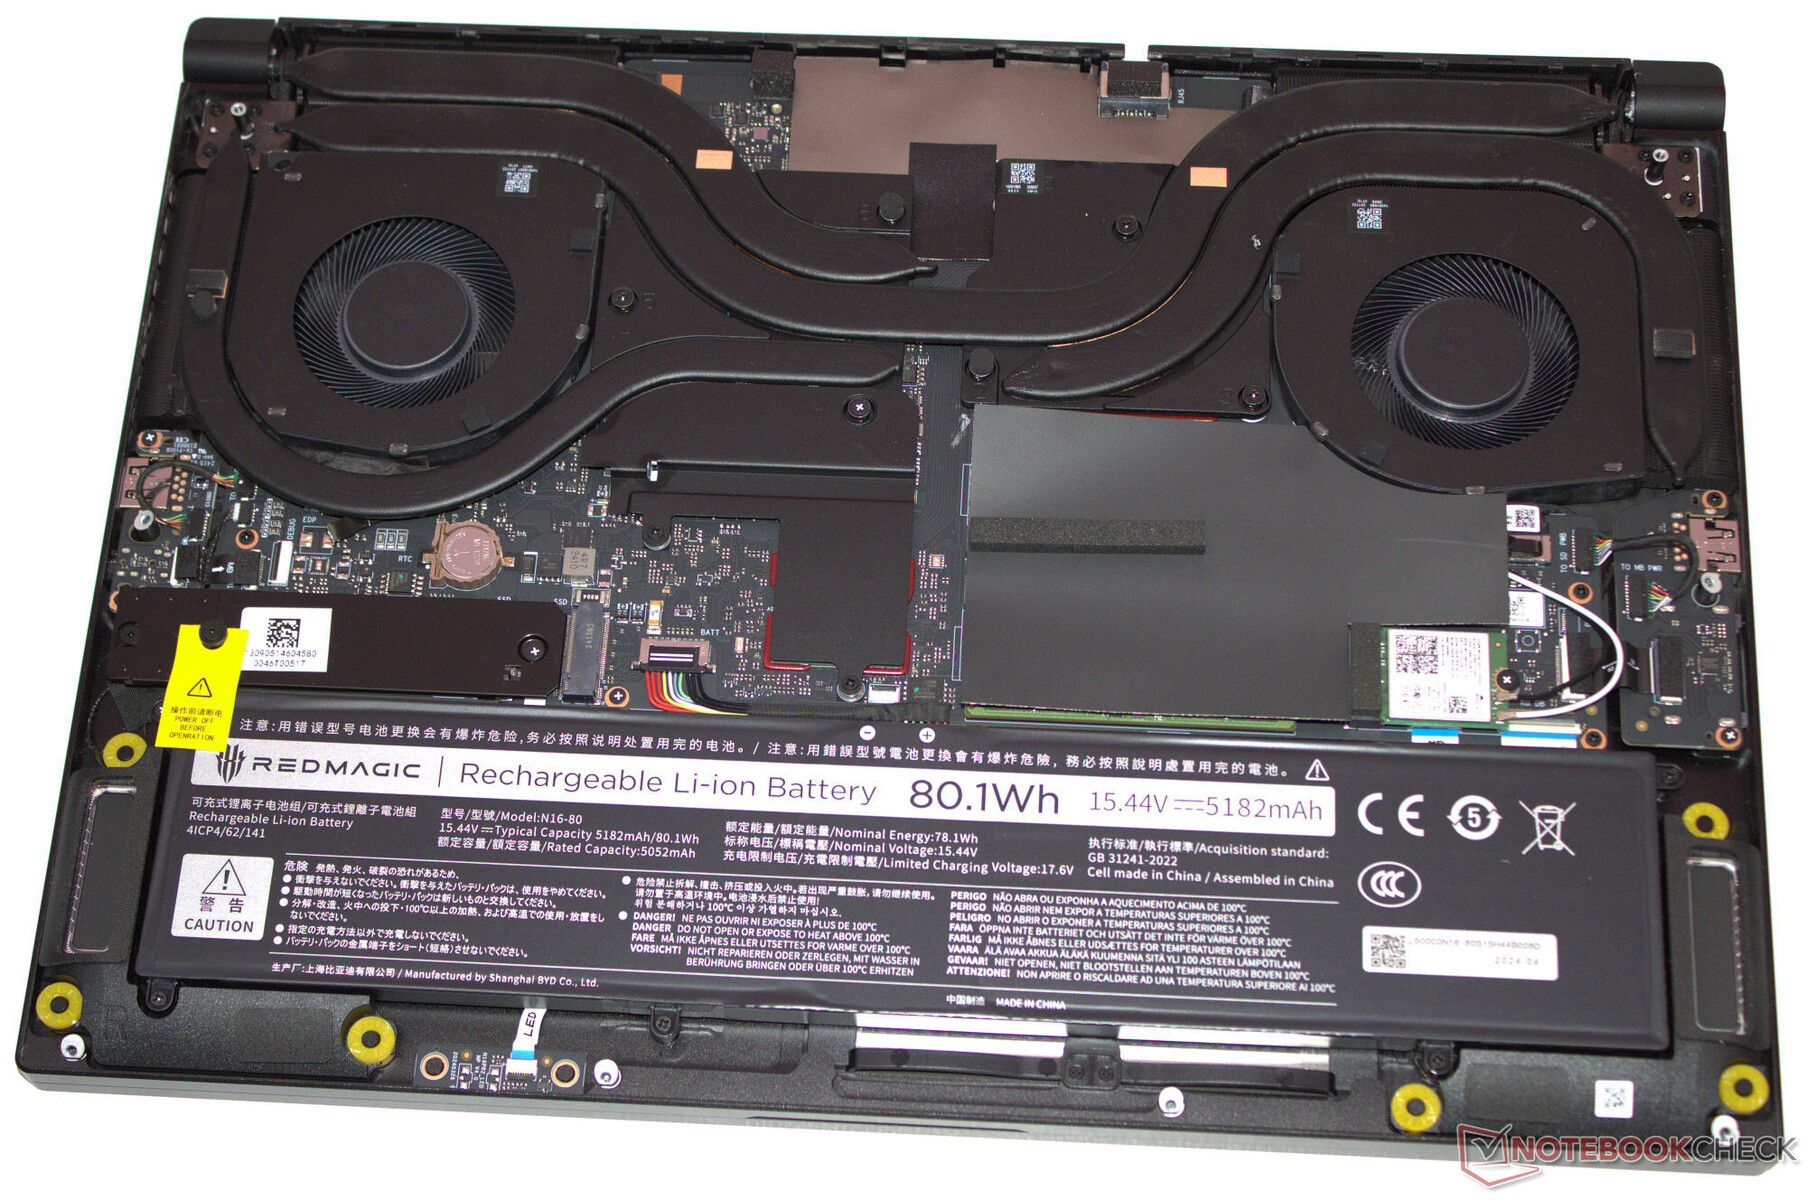
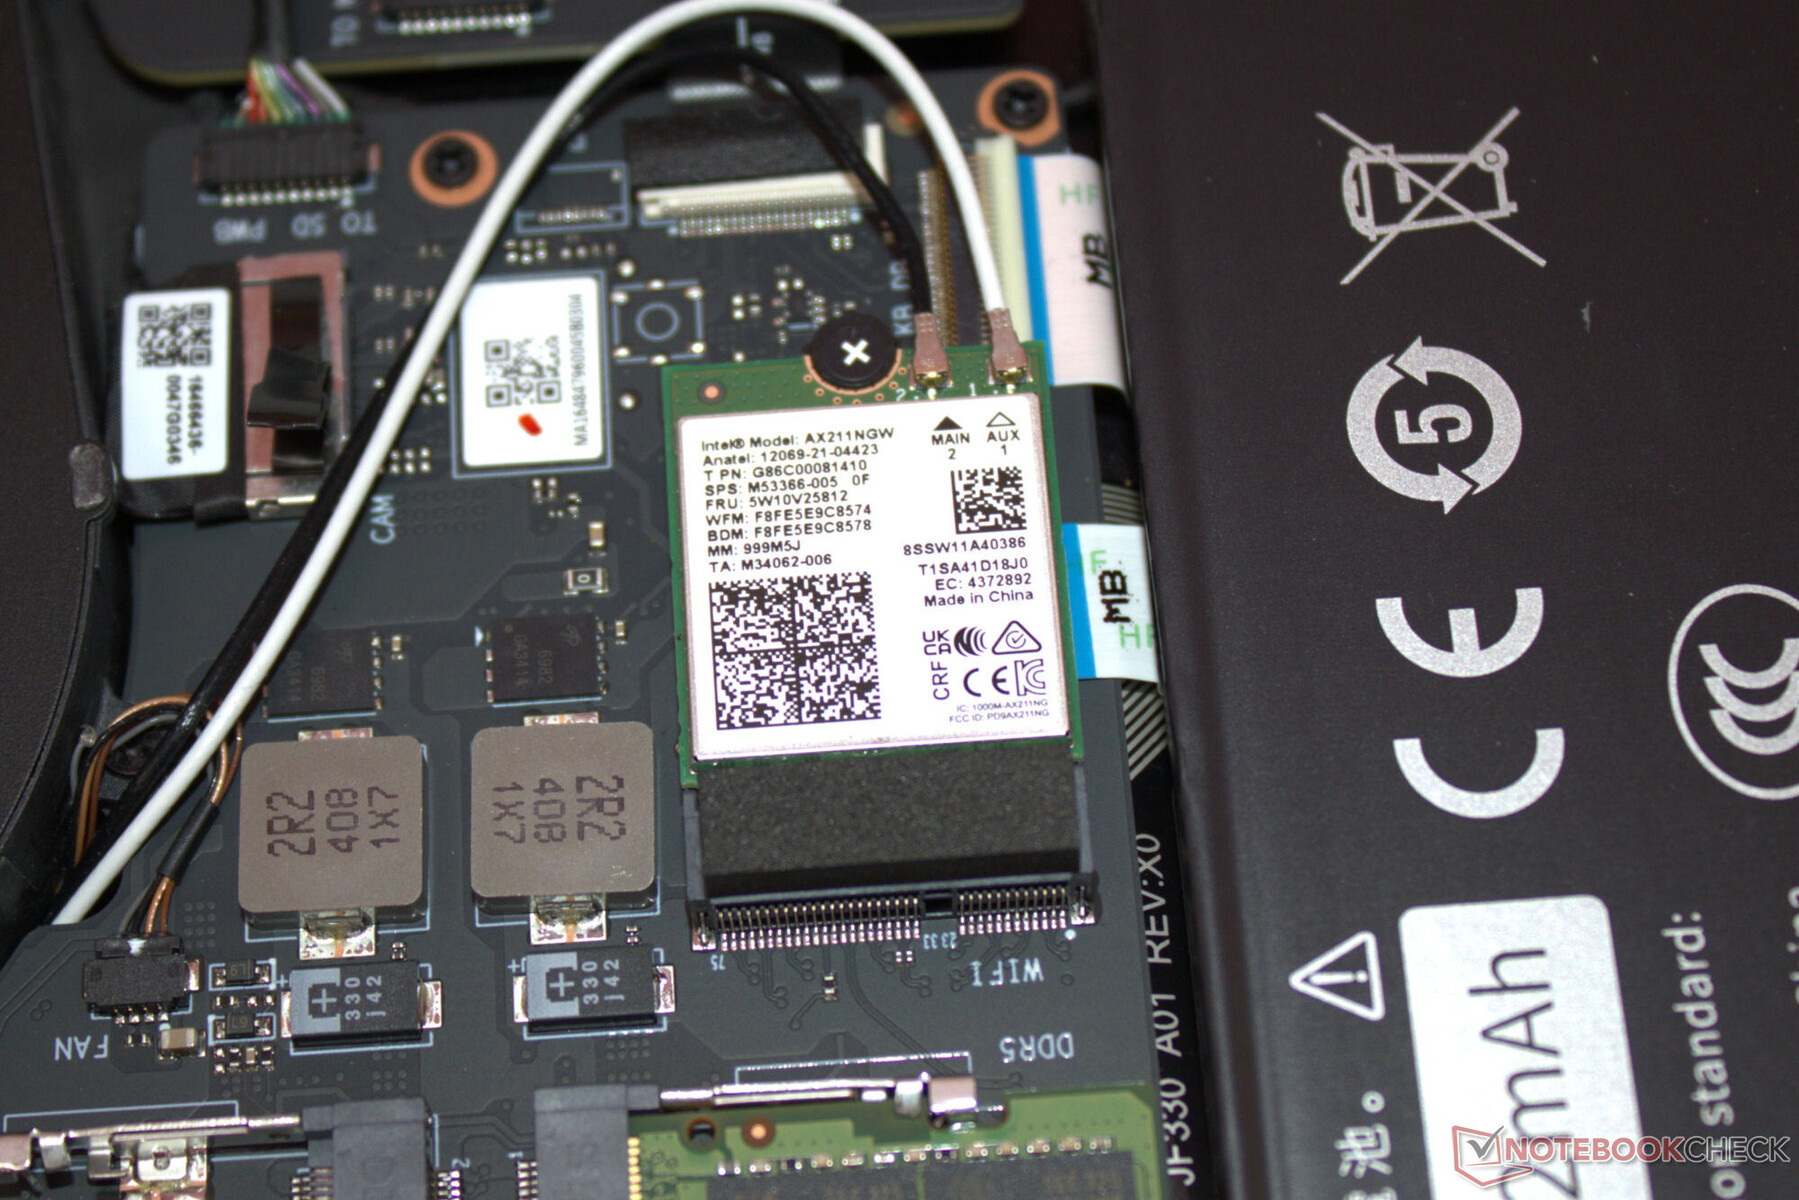
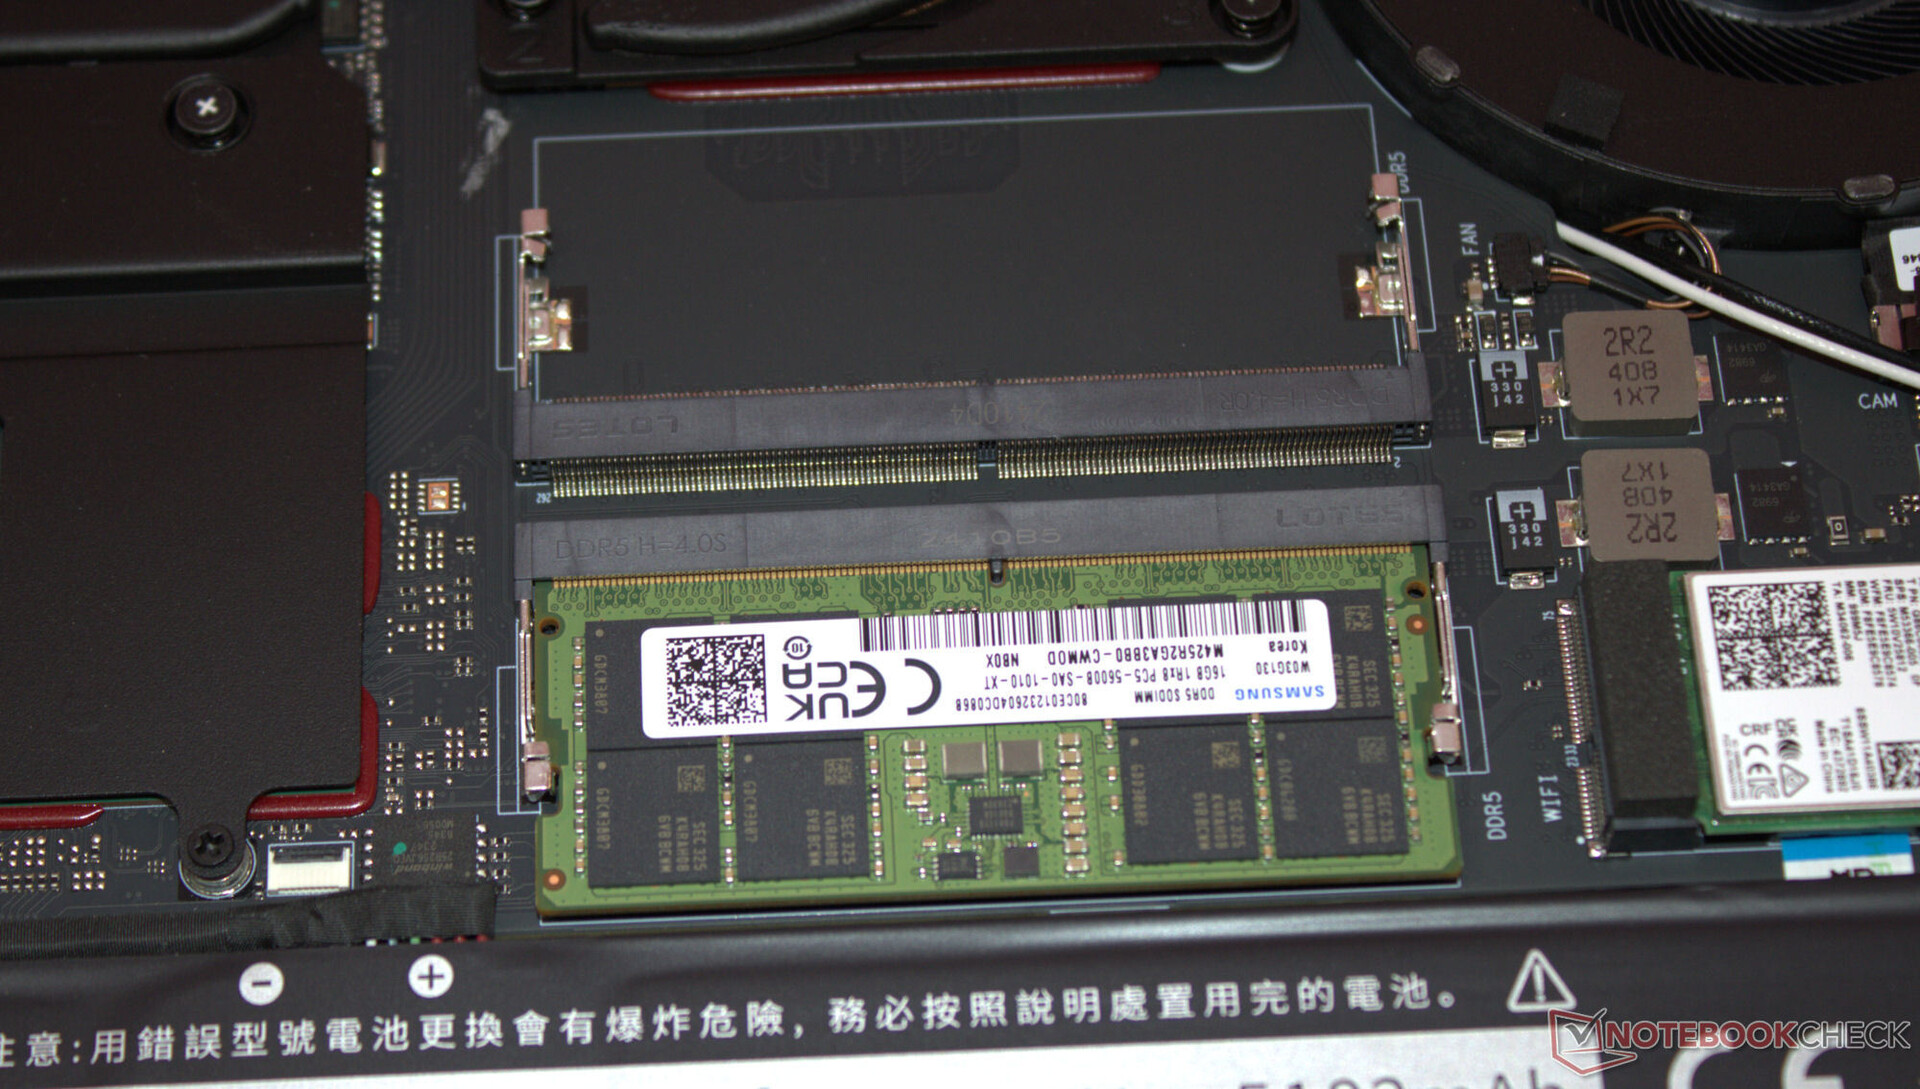
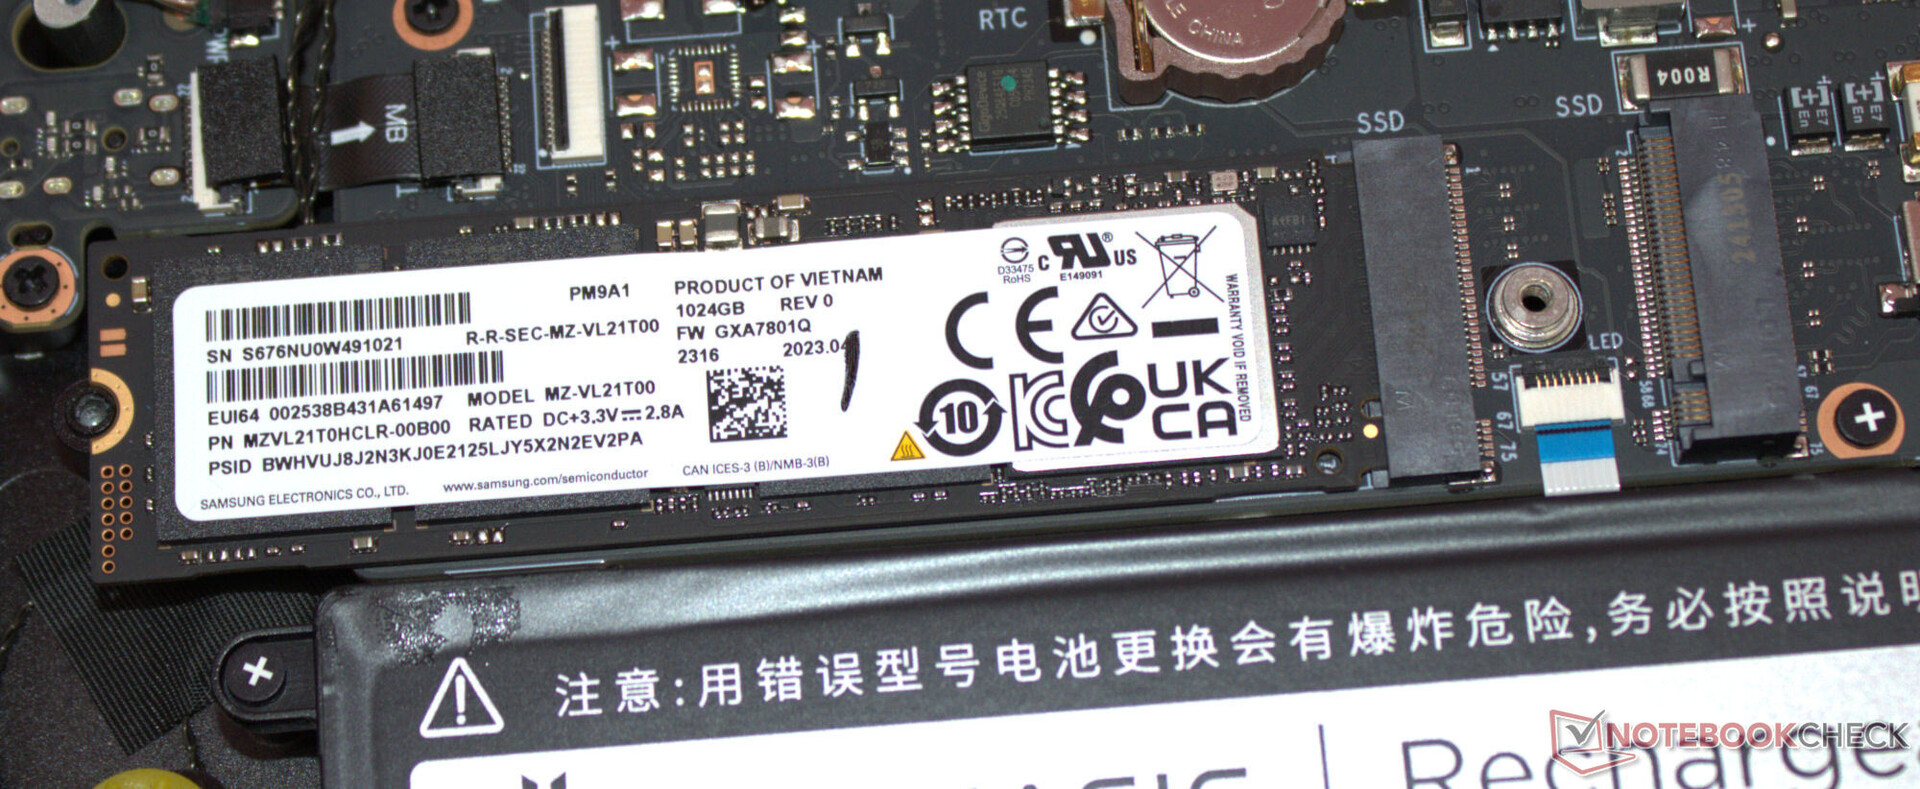
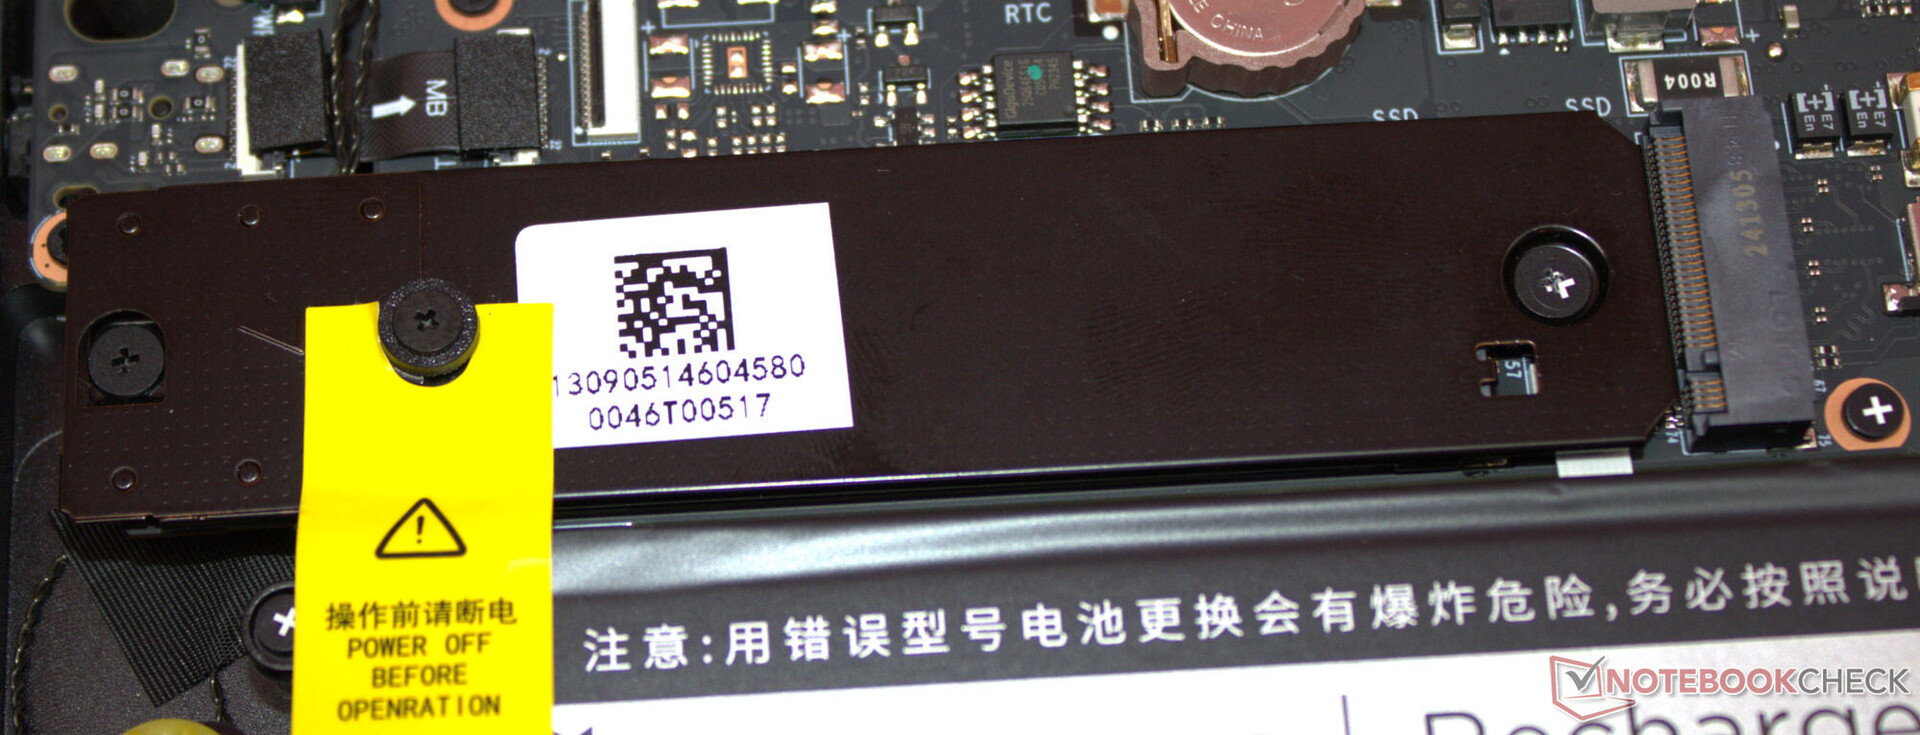
Después de retirar todos los tornillos de la parte inferior de la carcasa, se puede retirar la parte inferior de la carcasa con la ayuda de una púa o una espátula plana. Entonces podrá acceder a los bancos de memoria (de los cuales uno está ocupado), la unidad SSD (PCIe 4, M.2-2280), la segunda ranura SSD (PCIe 4, M.2-2280) el módulo WLAN, la batería de la BIOS, los ventiladores y la batería.
Sostenibilidad
Mucho cartón, poco plástico: El portátil está encerrado en una película, mientras que una fina alfombrilla de espuma protege la parte superior del aparato. La guía de inicio rápido impresa se encuentra en una bolsa de plástico. Una placa base extraíble permite realizar reparaciones en el portátil: todo el hardware es accesible. Las actualizaciones de software no deberían ser un problema durante los próximos años; después de todo, utiliza Windows 11 como sistema operativo.
Queda por ver cómo gestionará Nubia el suministro de piezas de repuesto y el soporte para su propio software. En el momento de realizar las pruebas, todavía no existe un área de descargas para el Titan en el sitio web de Nubia.
Garantía
No podemos proporcionar información sobre la garantía del portátil: es probable que sea de unos 12 meses, lo que es habitual en Estados Unidos. Consideramos poco probables las garantías ampliadas.
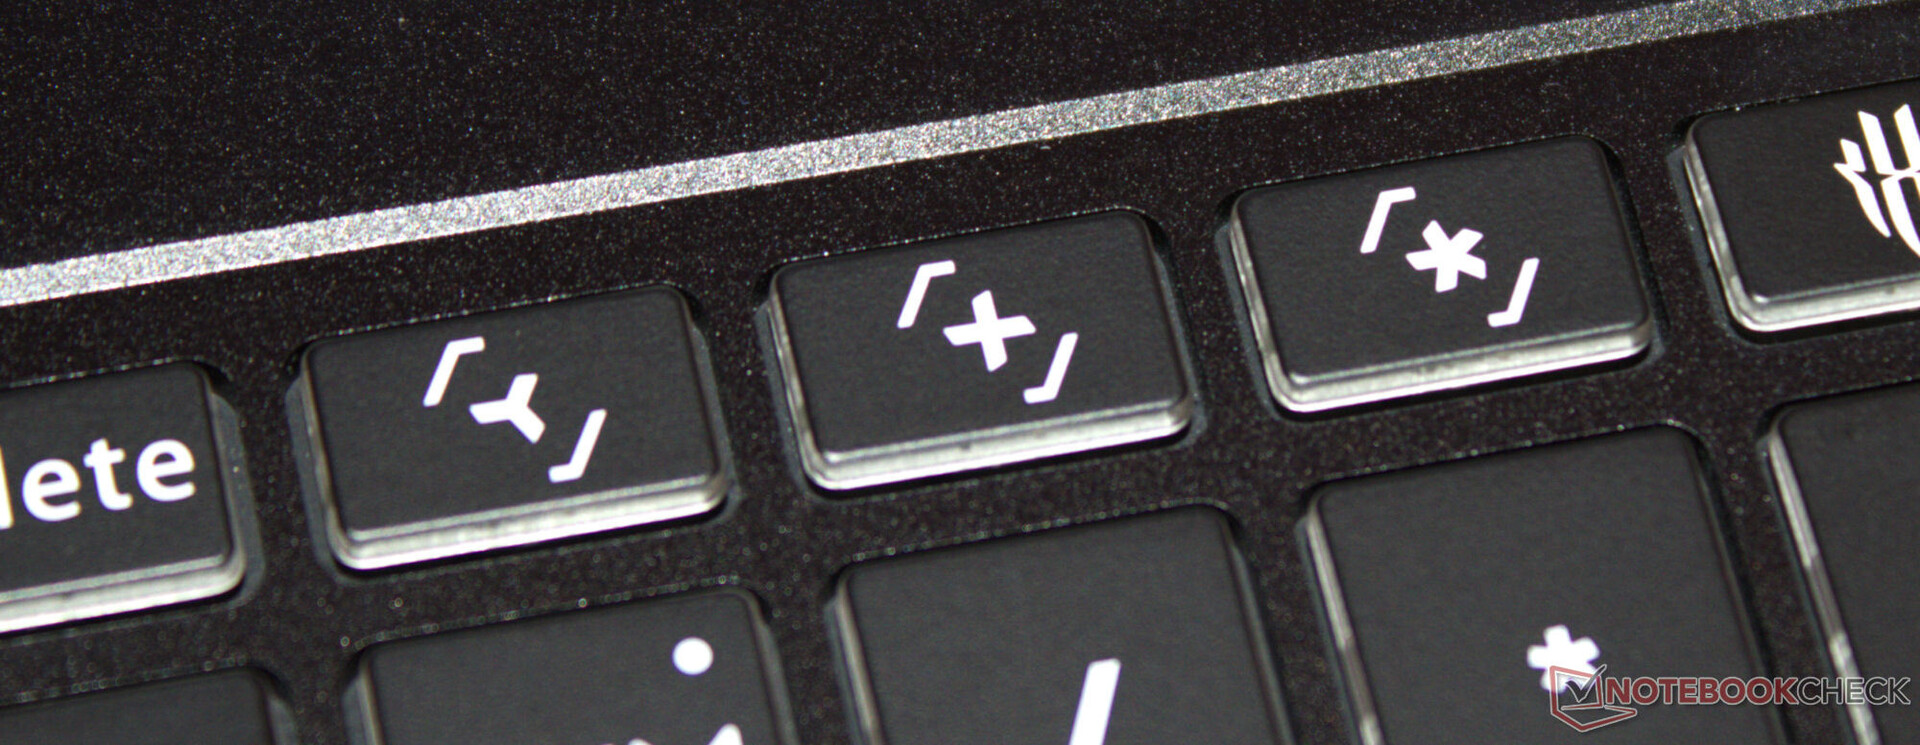
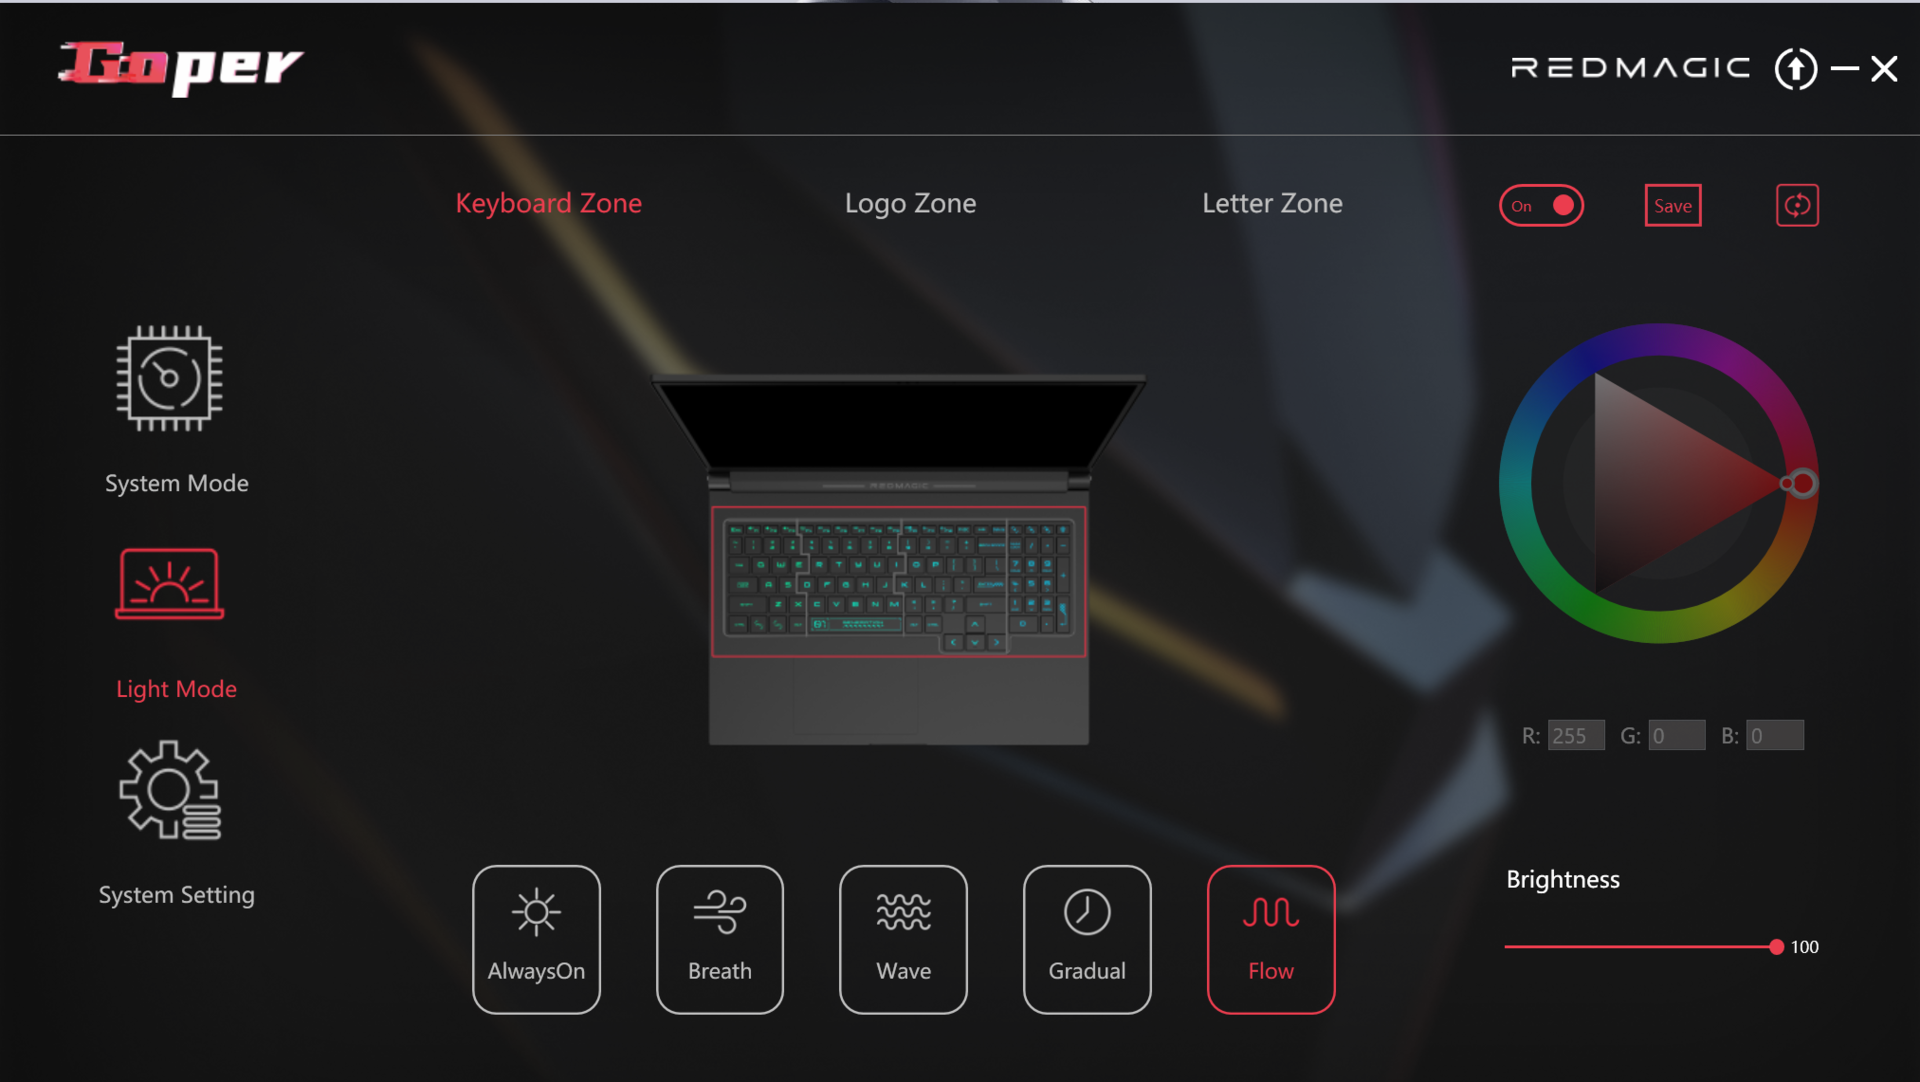
Dispositivos de entrada - El portátil RedMagic con iluminación RGB
Teclado
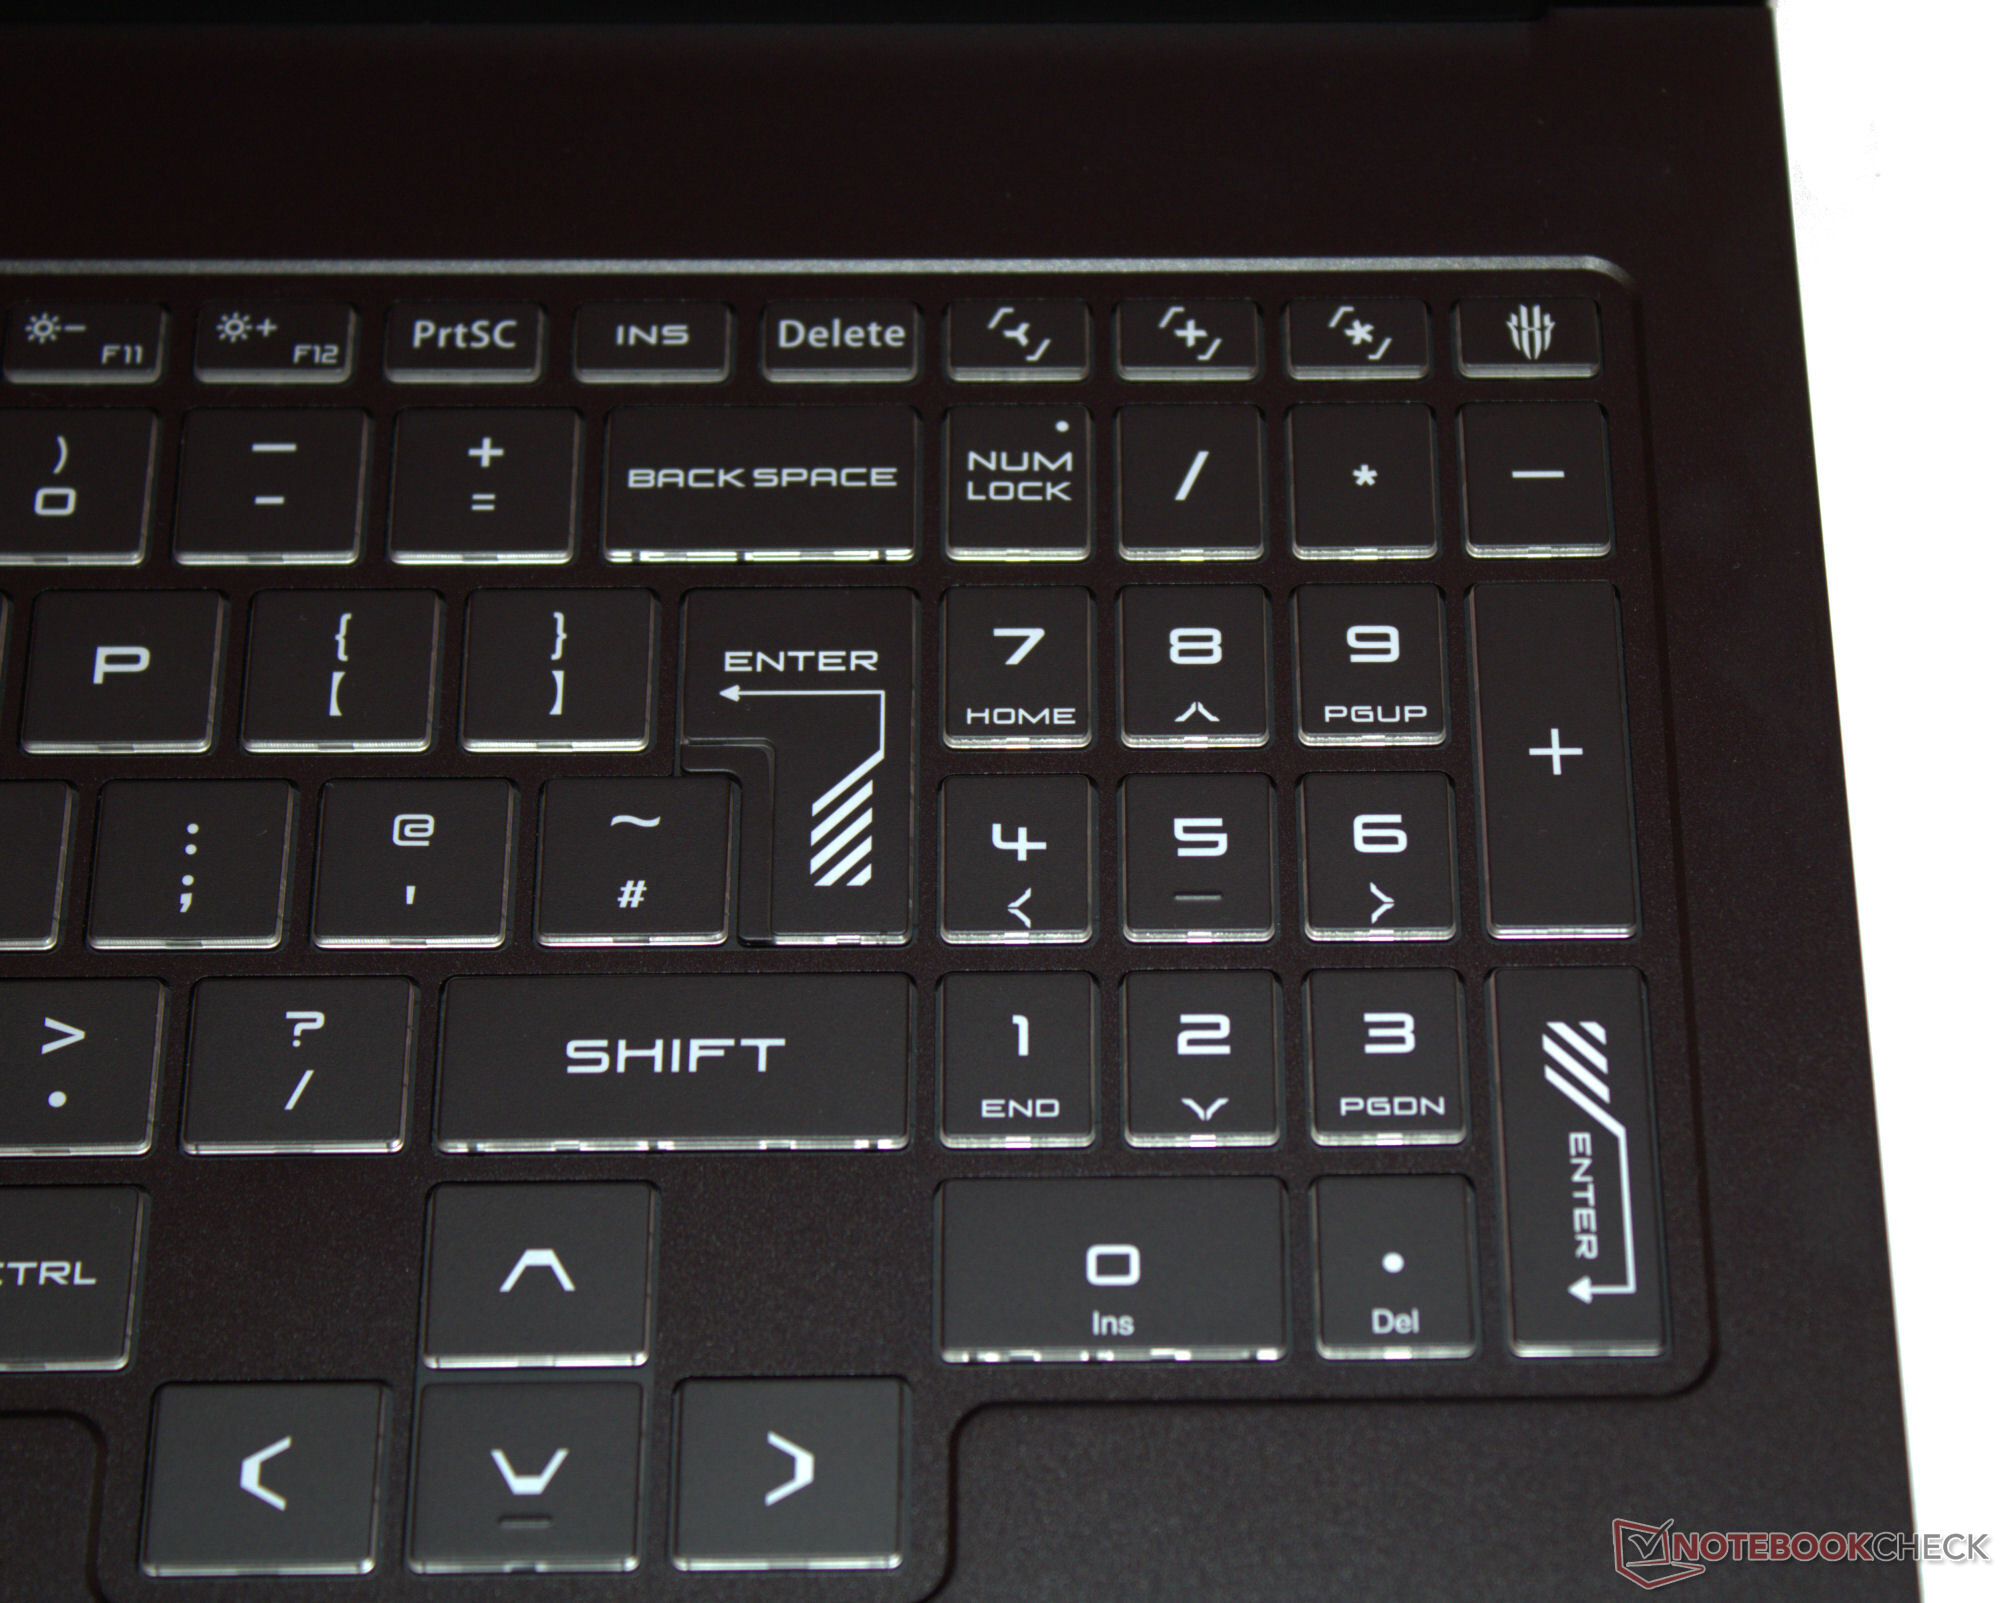
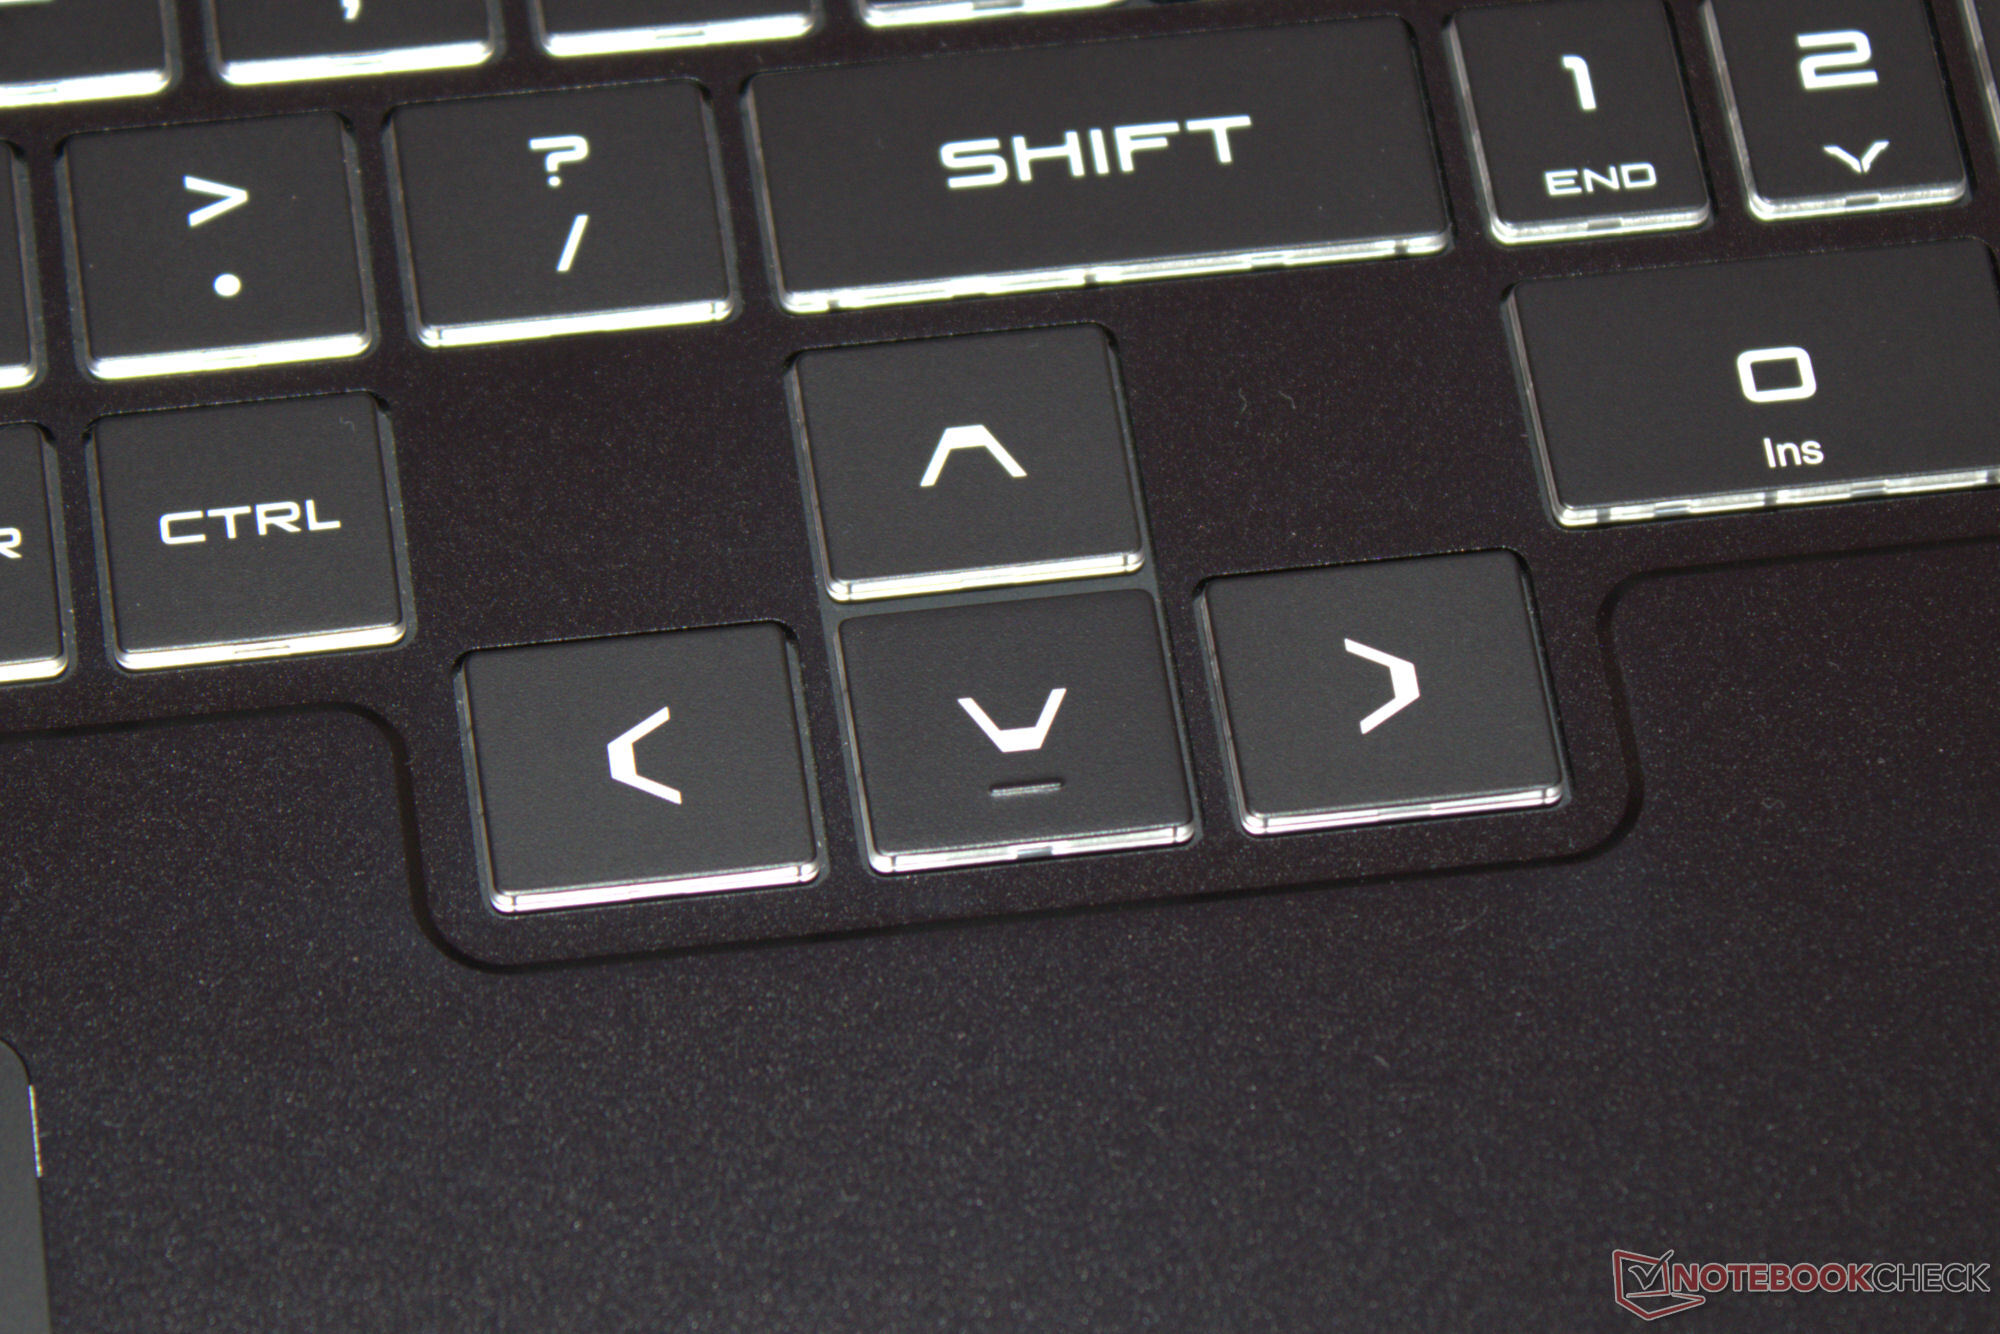
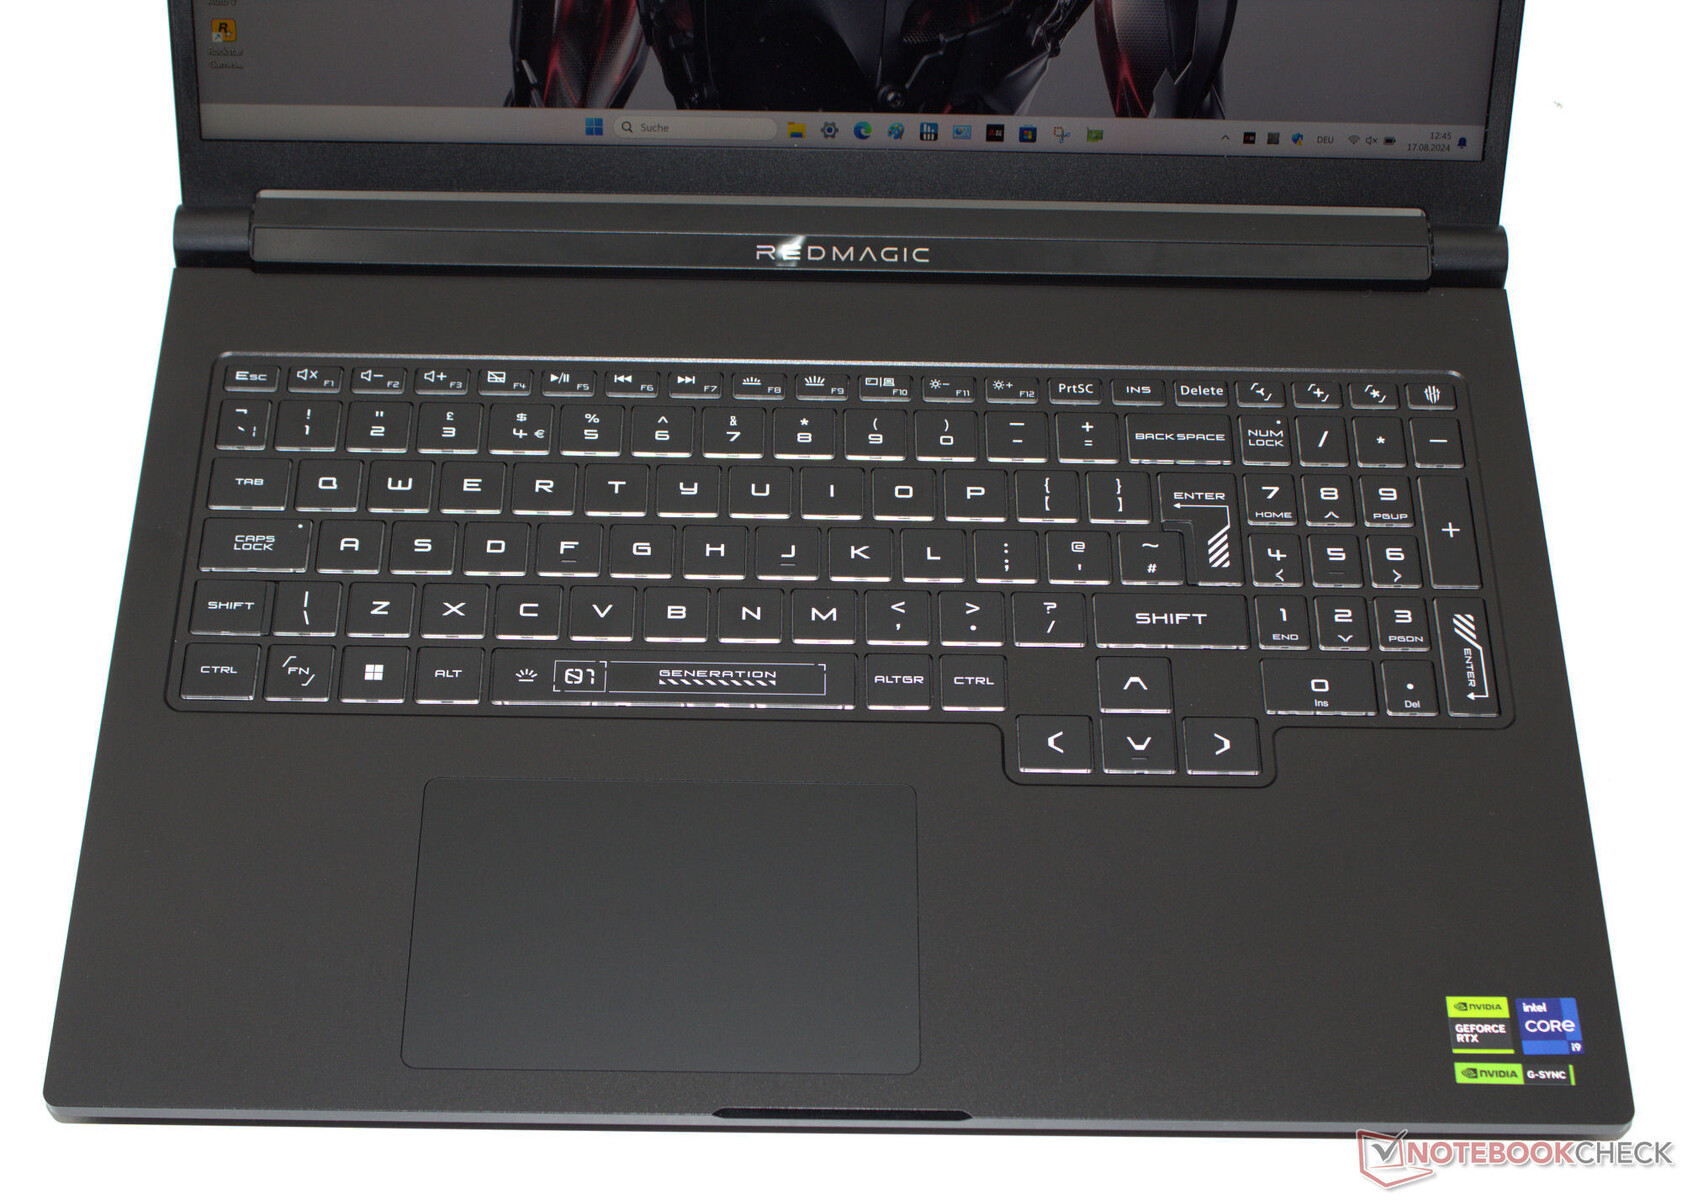
Nubia ha apostado por un teclado chiclet que incluye un teclado numérico. Las teclas, uniformemente iluminadas, tienen un recorrido corto y un punto de presión claro. El teclado no cede al escribir en él. Un punto positivo es que sus teclas de flecha desplazadas son de tamaño normal. Su retroiluminación RGB está dividida en cuatro zonas, y nuestro dispositivo de prueba tiene una distribución de teclado QWERTY. No podemos decir si el fabricante ofrece distribuciones localizadas.
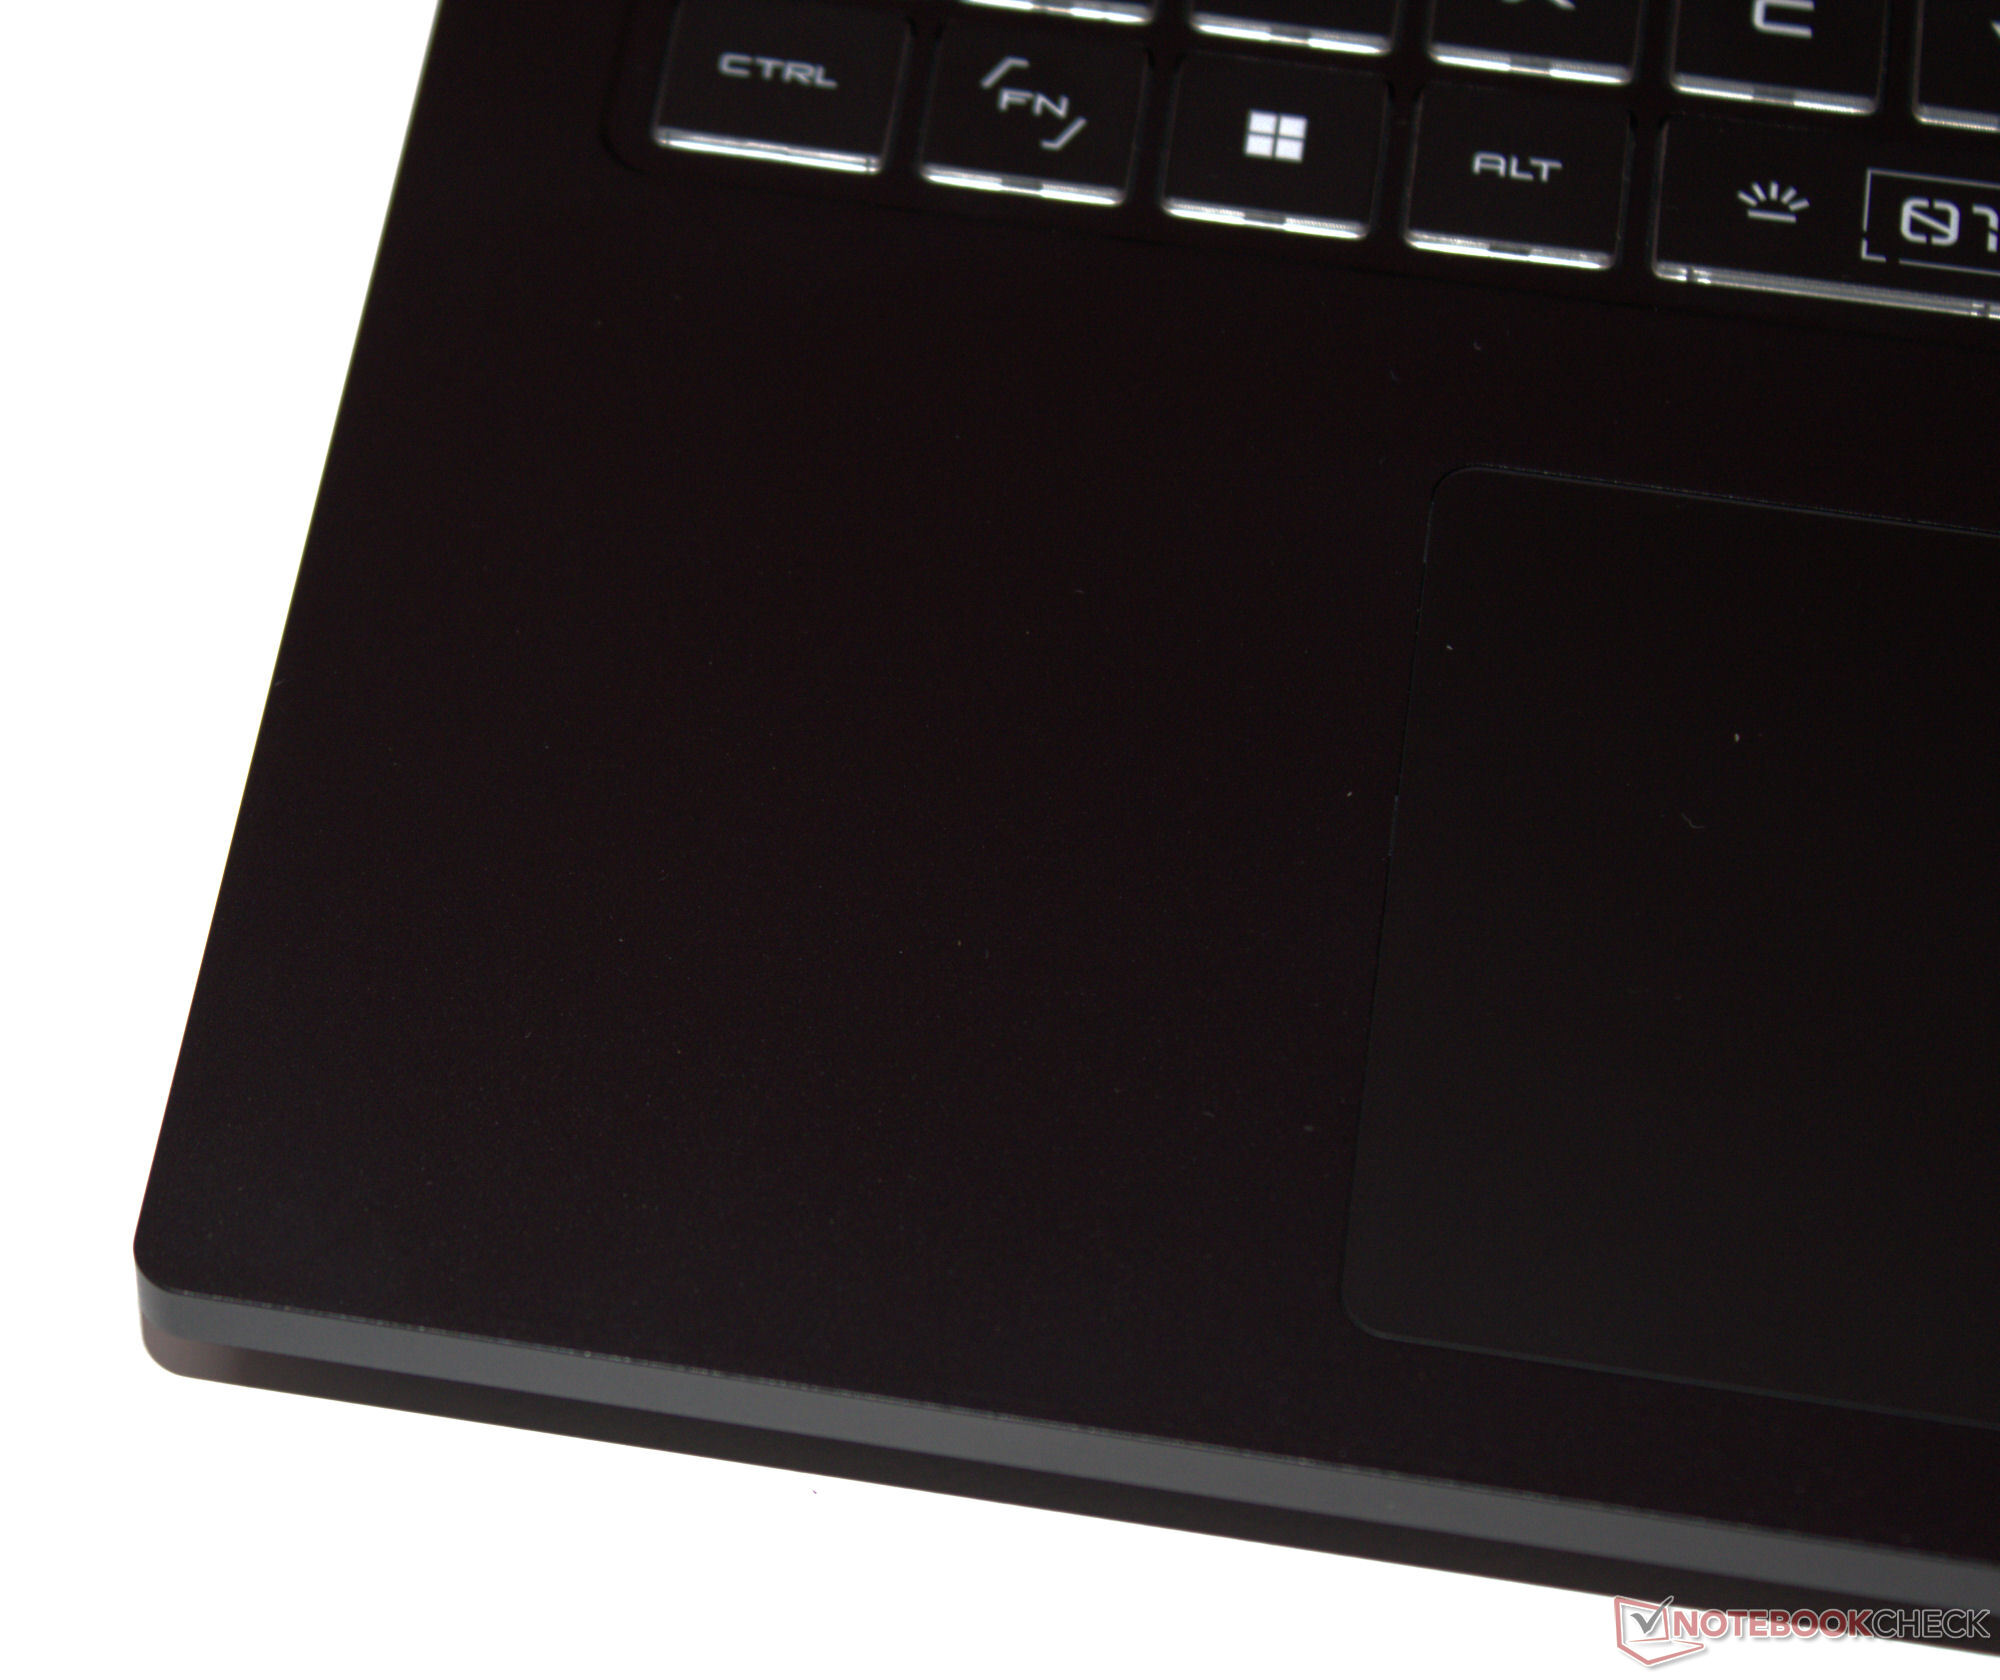
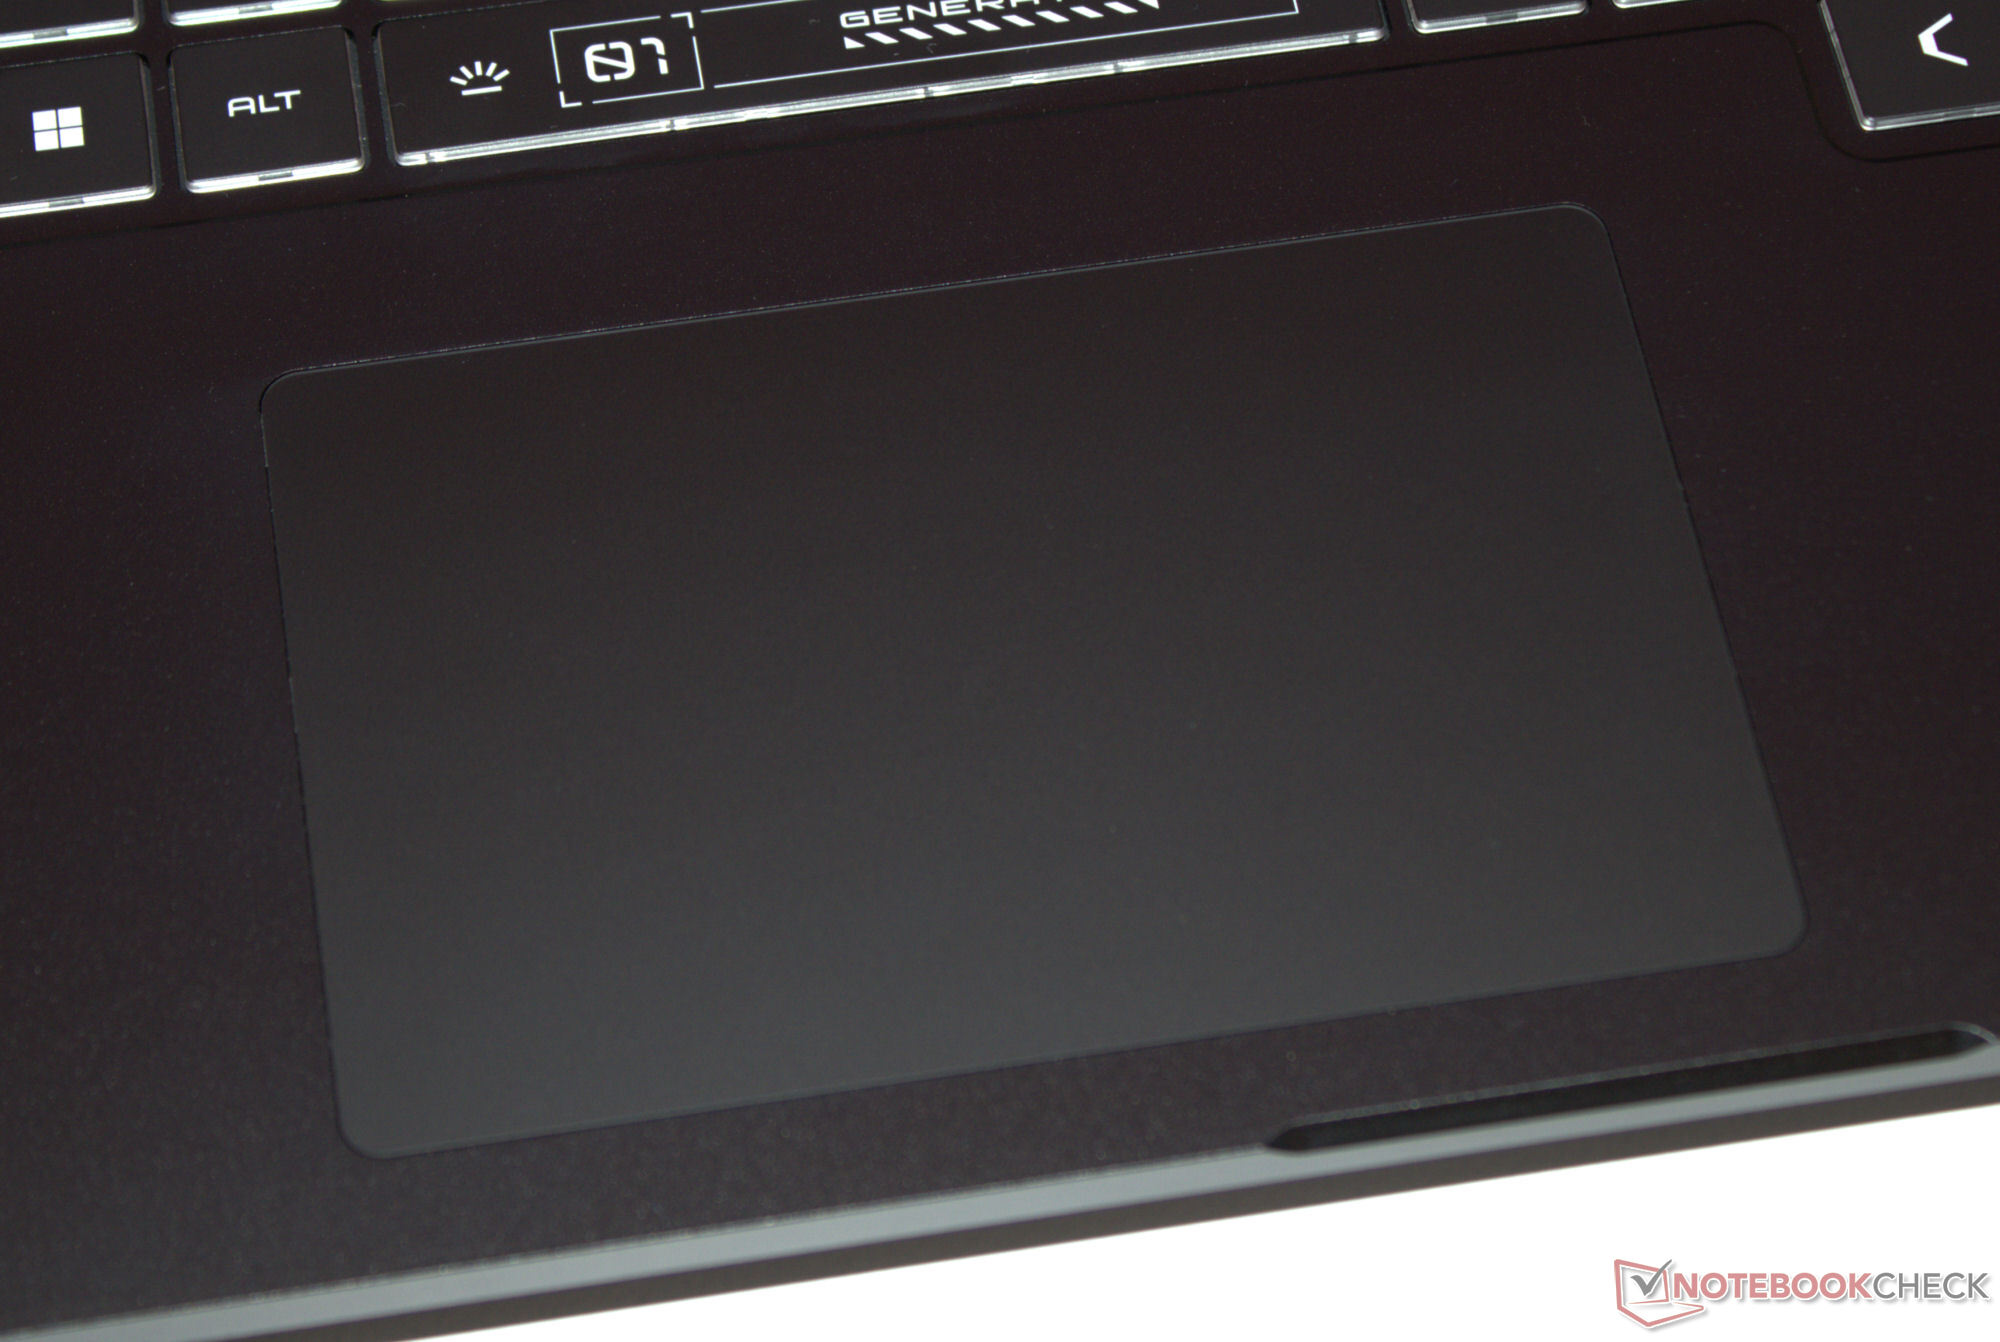
Panel táctil
Un clickpad multitáctil (aprox. 11,7 x 7,5 cm) con superficie de cristal sirve como sustituto del ratón. Tiene un recorrido corto y un punto de presión claro. La almohadilla puede desactivarse en caso necesario.
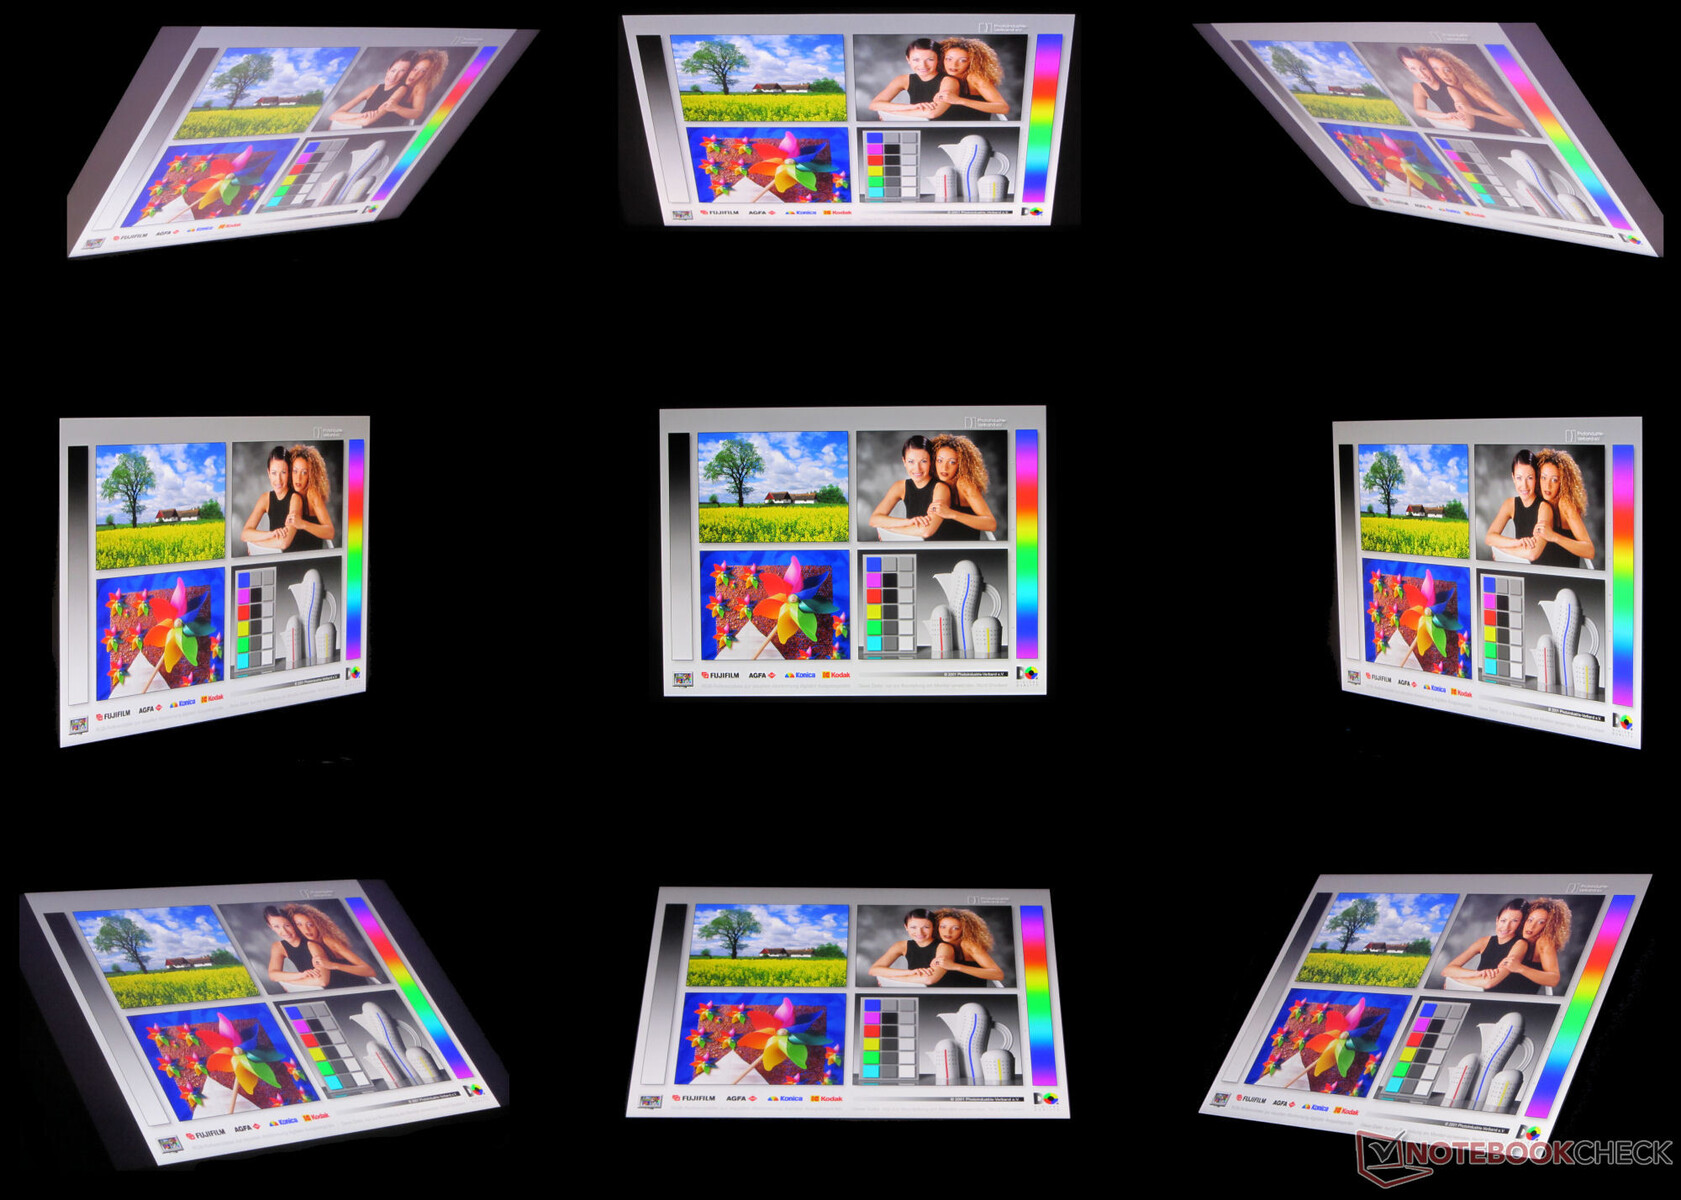
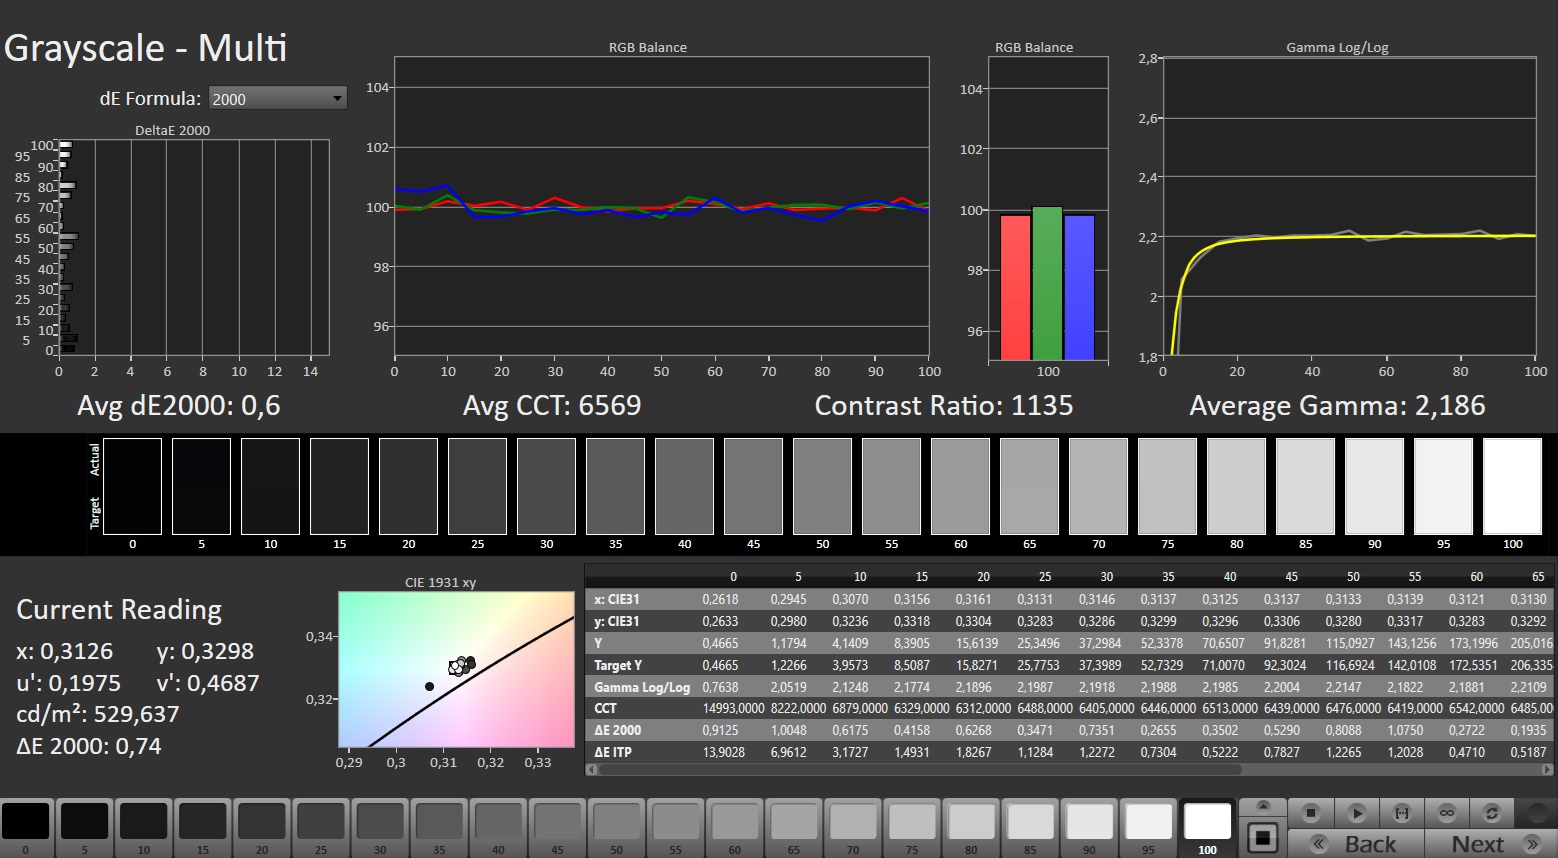
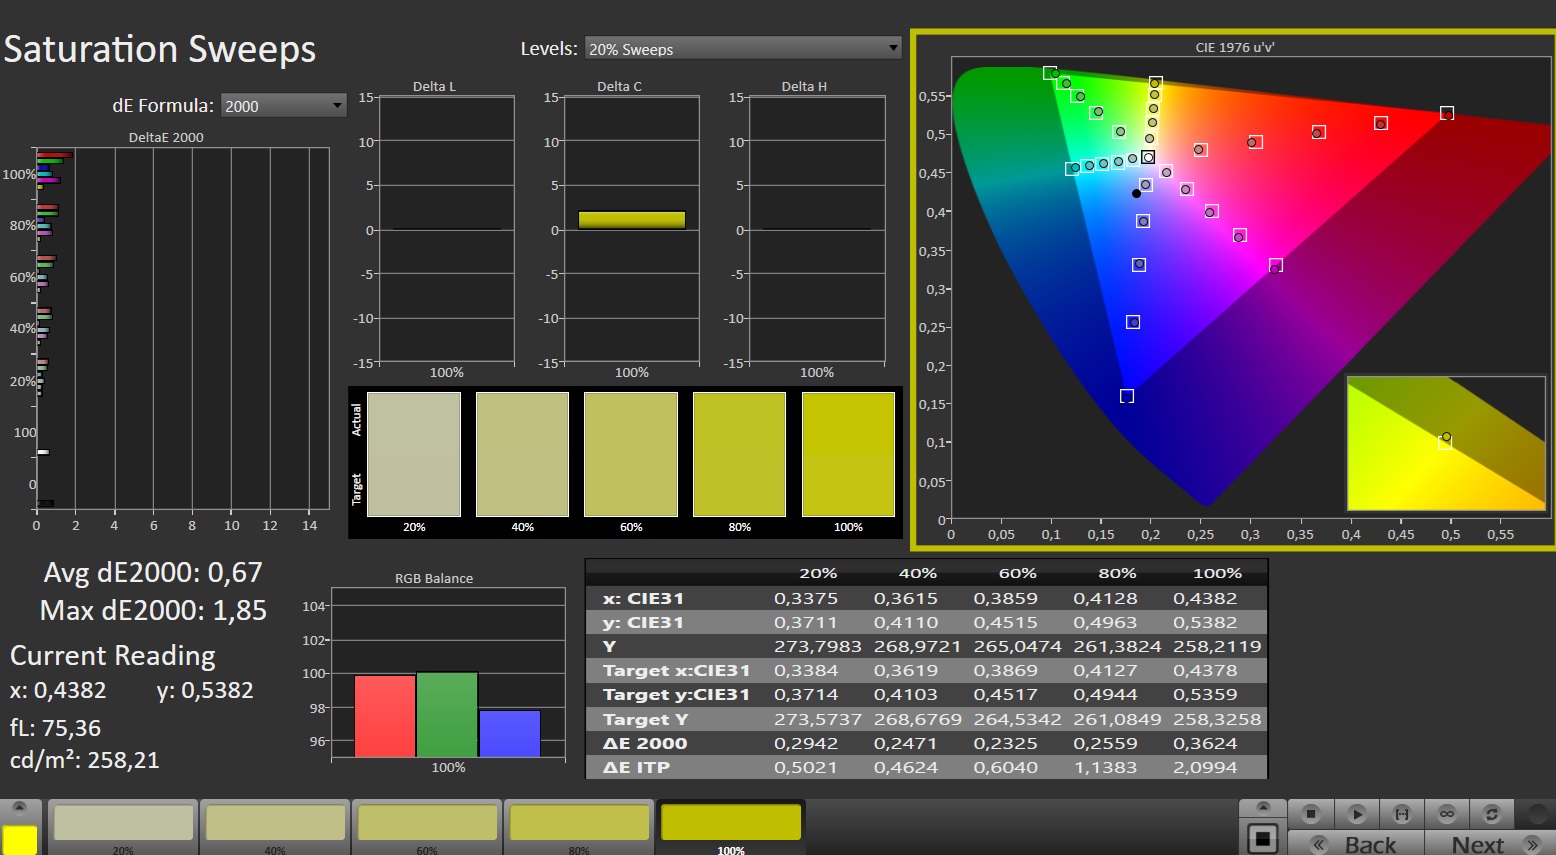
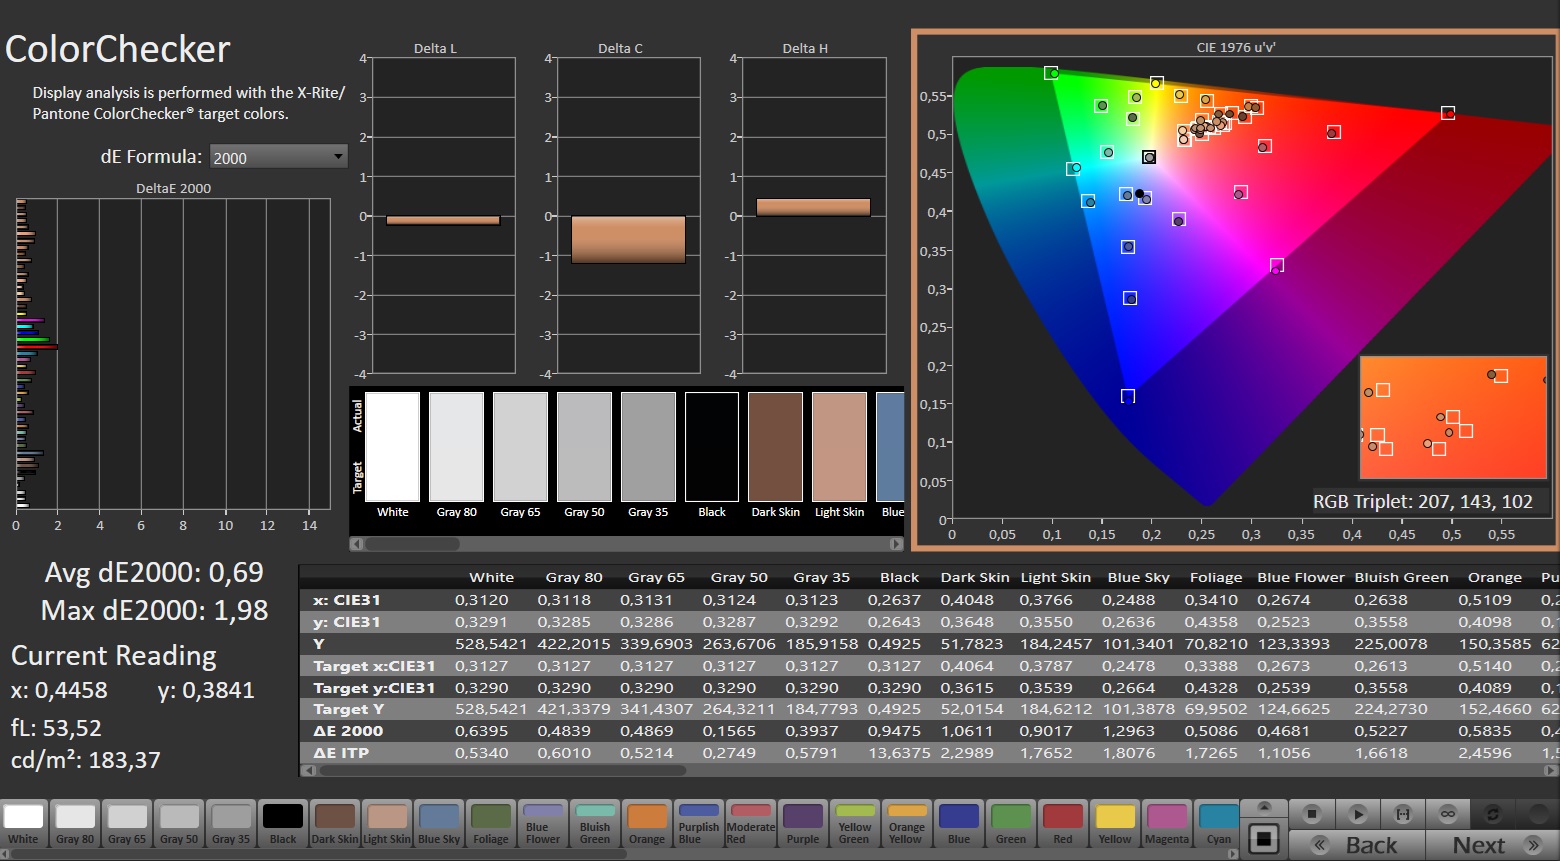
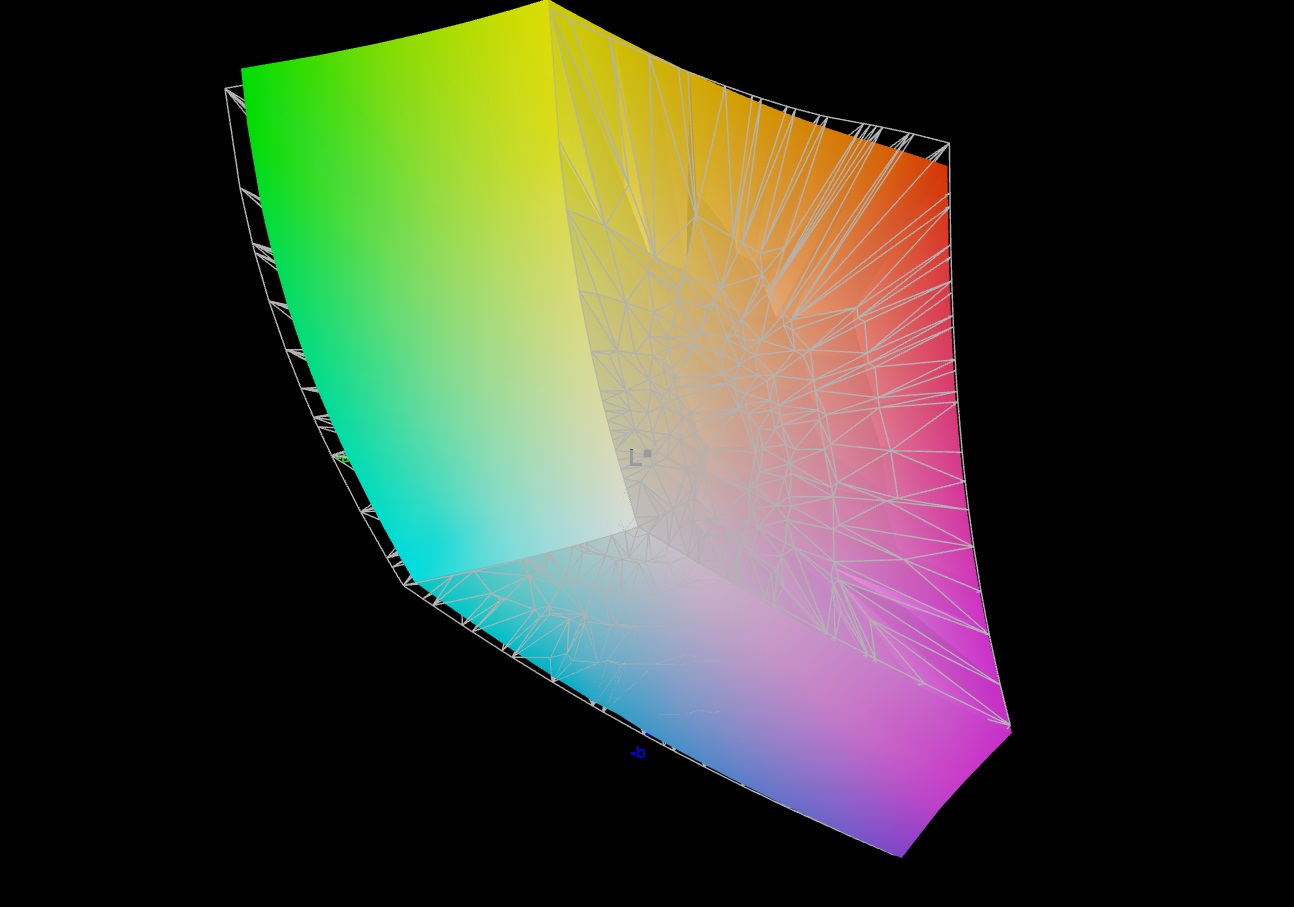
Pantalla - Un panel IPS con cobertura DCI-P3
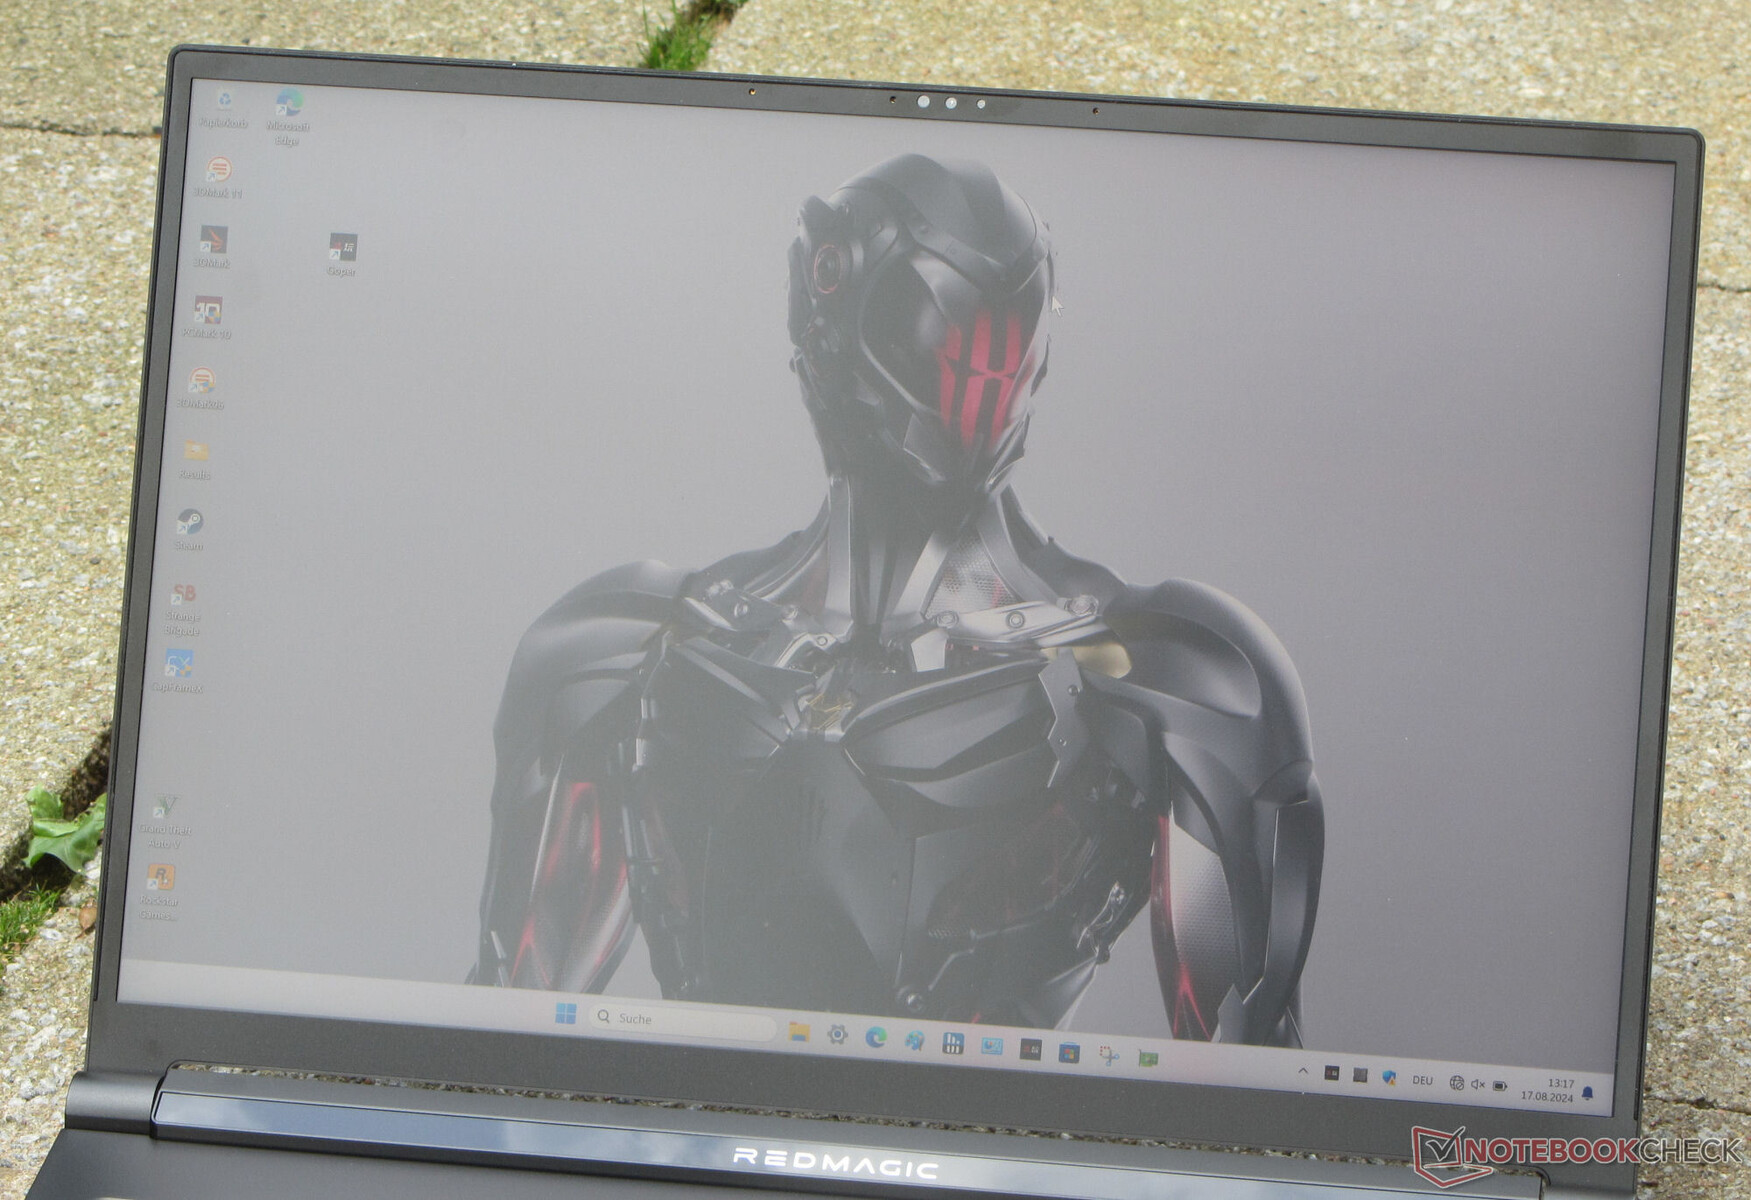
Parece que la relación de aspecto 16:10, favorable para el trabajo, se ha impuesto, ya que la mayoría de los portátiles de la comparativa tienen pantallas con esta relación de aspecto, incluido el Titan. Nubia ha equipado su portátil con una pantalla IPS mate y estable en ángulo de visión (2.560 x 1.600 píxeles) con una diagonal de 16 pulgadas. El panel es superbrillante y su contraste cumple el valor objetivo. Es perfectamente posible leer en la pantalla en exteriores. Un aspecto positivo es que el panel de 240 Hz no muestra signos de parpadeo PWM y es compatible con G-Sync. No hay pantallas alternativas disponibles.
| |||||||||||||||||||||||||
iluminación: 86 %
Brillo con batería: 543 cd/m²
Contraste: 1065:1 (Negro: 0.51 cd/m²)
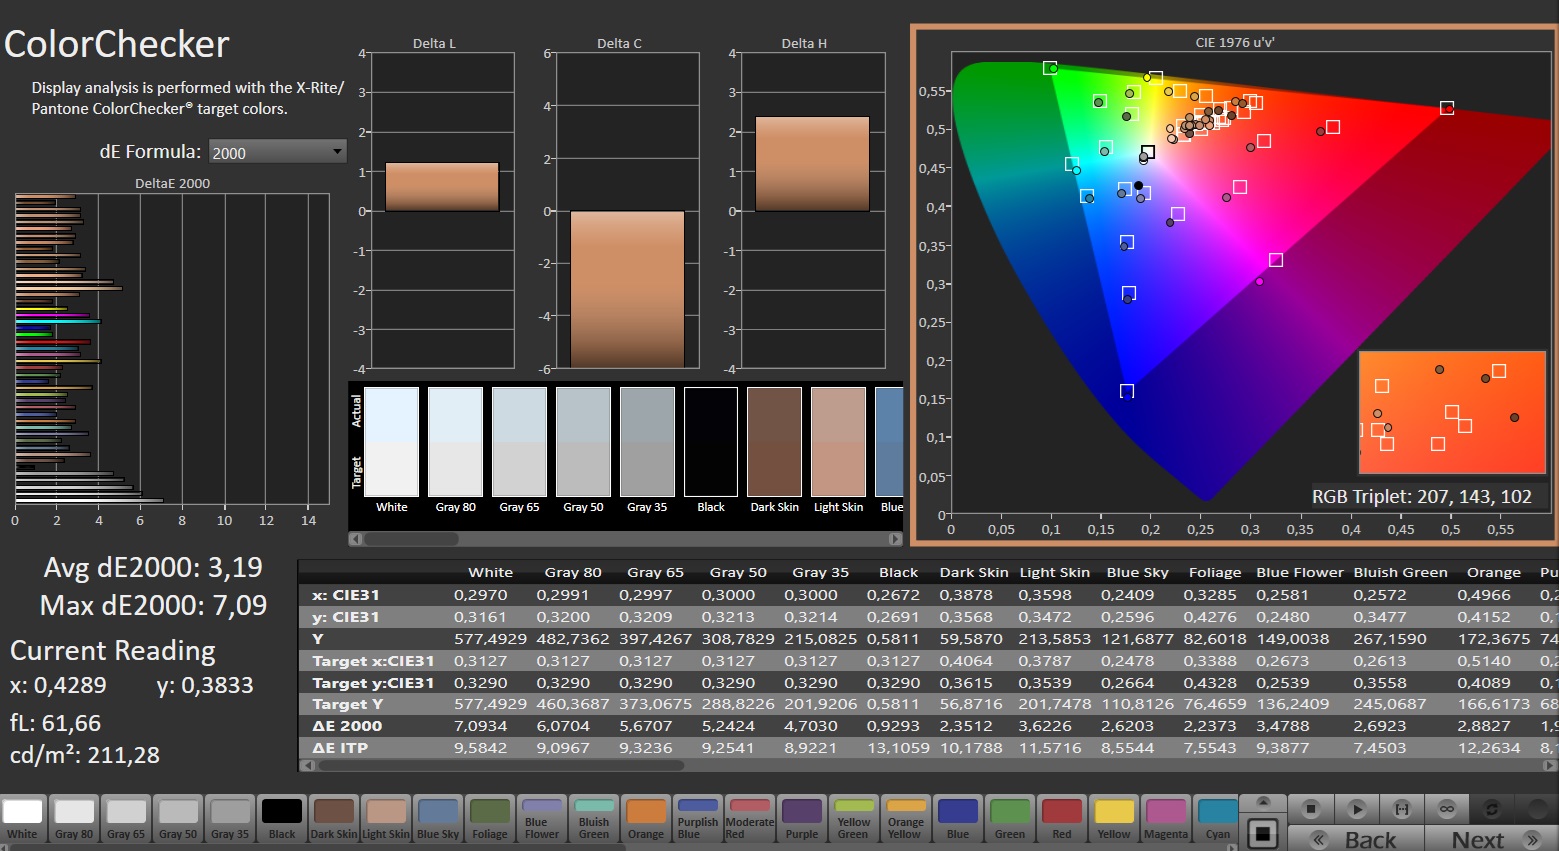
ΔE Color 3.19 | 0.5-29.43 Ø4.87, calibrated: 0.69
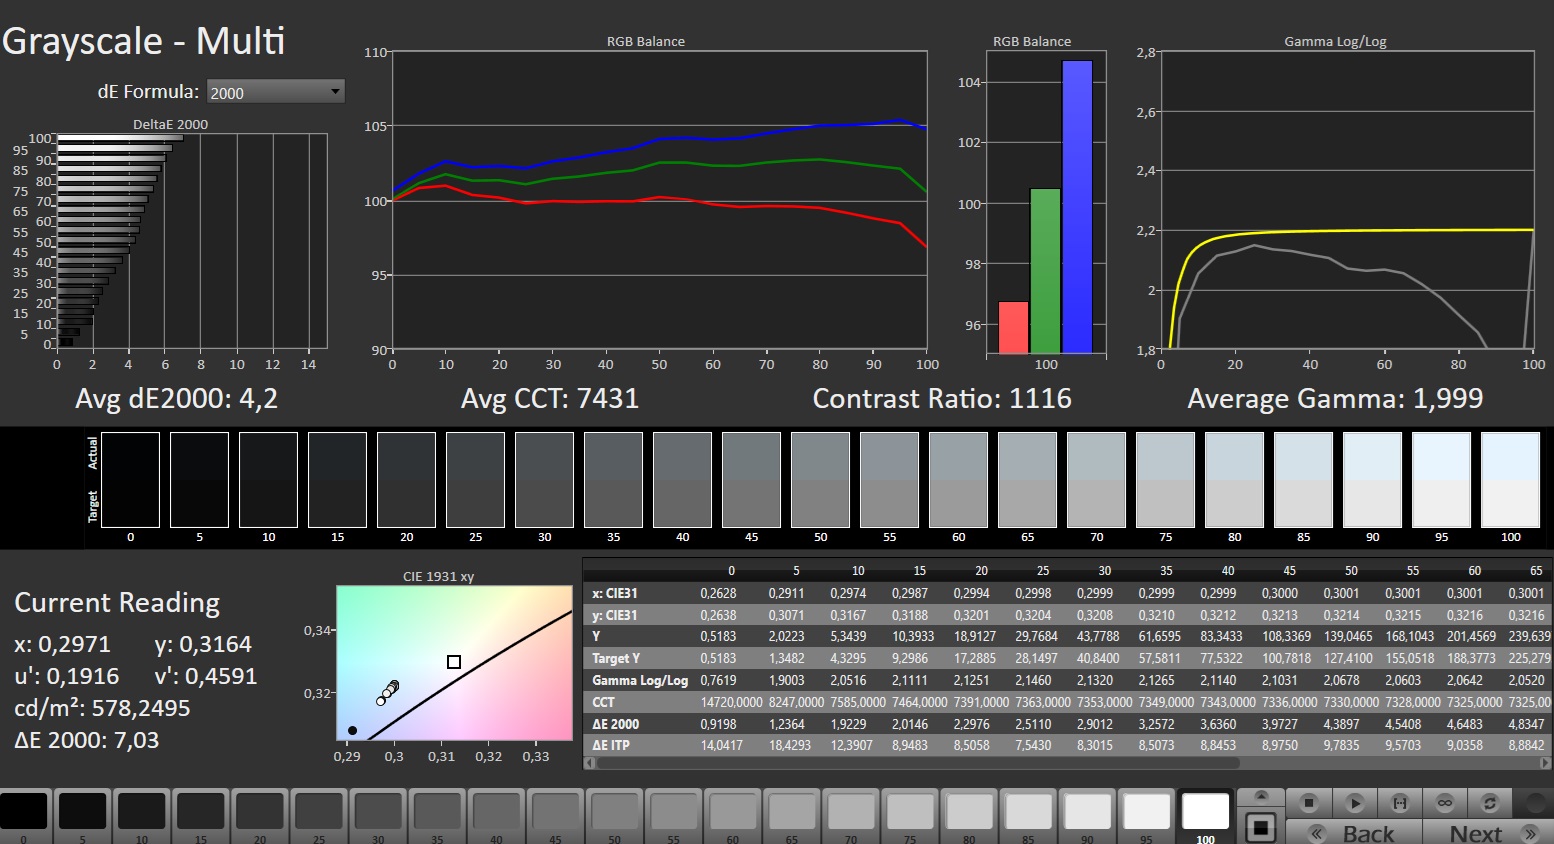
ΔE Greyscale 4.2 | 0.5-98 Ø5.1
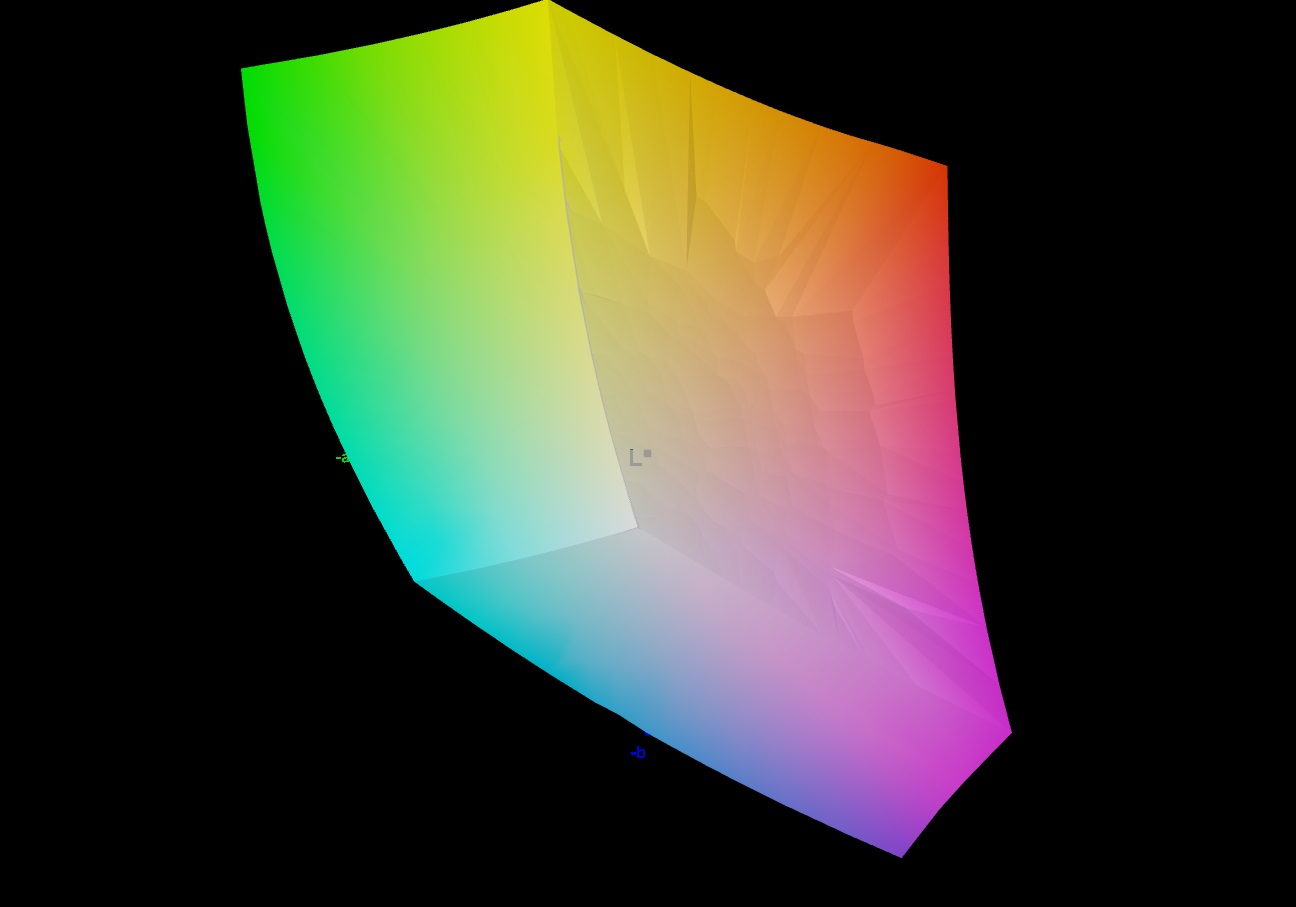
84.1% AdobeRGB 1998 (Argyll 2.2.0 3D)
100% sRGB (Argyll 2.2.0 3D)
96.3% Display P3 (Argyll 2.2.0 3D)
Gamma: 1.999
| Nubia RedMagic Titan 16 Pro BOE CQ NE160QDM-NZ2, IPS, 2560x1600, 16", 240 Hz | Lenovo Legion Pro 5 16IRX9 G9 BOE NE160QDM-NZB, IPS, 2560x1600, 16", 240 Hz | HP Victus 16 (2024) Chi Mei CMN163E, IPS, 1920x1080, 16.1", 144 Hz | Acer Predator Helios Neo 16 (2024) Chi Mei N160GME-GTB, LED, 2560x1600, 16", 240 Hz | SCHENKER XMG Pro 16 Studio (Mid 24) BOE CQ NE160QDM-NZ1, IPS, 2560x1600, 16", 240 Hz | Gigabyte G6X 9KG (2024) BOE NE160WUM-NX6, IPS, 1920x1200, 16", 165 Hz | |
|---|---|---|---|---|---|---|
| Display | 2% | -48% | 1% | -15% | -48% | |
| Display P3 Coverage | 96.3 | 99.22 3% | 41.3 -57% | 95.9 0% | 68.8 -29% | 41.8 -57% |
| sRGB Coverage | 100 | 99.93 0% | 61.7 -38% | 99.8 0% | 99.5 0% | 62.4 -38% |
| AdobeRGB 1998 Coverage | 84.1 | 87.81 4% | 42.7 -49% | 86.4 3% | 70.8 -16% | 43.3 -49% |
| Response Times | -54% | -454% | -52% | -126% | -635% | |
| Response Time Grey 50% / Grey 80% * | 3.9 ? | 4.8 ? -23% | 28.6 ? -633% | 5 ? -28% | 12.7 ? -226% | 40.5 ? -938% |
| Response Time Black / White * | 5 ? | 9.2 ? -84% | 18.7 ? -274% | 8.8 ? -76% | 6.3 ? -26% | 21.6 ? -332% |
| PWM Frequency | ||||||
| Screen | 4% | -74% | 18% | -2% | -68% | |
| Brightness middle | 543 | 518 -5% | 287 -47% | 521 -4% | 416 -23% | 353 -35% |
| Brightness | 516 | 491 -5% | 288 -44% | 506 -2% | 392 -24% | 318 -38% |
| Brightness Distribution | 86 | 90 5% | 86 0% | 85 -1% | 86 0% | 81 -6% |
| Black Level * | 0.51 | 0.36 29% | 0.19 63% | 0.44 14% | 0.38 25% | 0.21 59% |
| Contrast | 1065 | 1439 35% | 1511 42% | 1184 11% | 1095 3% | 1681 58% |
| Colorchecker dE 2000 * | 3.19 | 4.32 -35% | 5.46 -71% | 1.74 45% | 2.33 27% | 5.21 -63% |
| Colorchecker dE 2000 max. * | 7.09 | 6.37 10% | 20.36 -187% | 3.88 45% | 6.07 14% | 19.95 -181% |
| Colorchecker dE 2000 calibrated * | 0.69 | 0.75 -9% | 3.52 -410% | 0.52 25% | 1.02 -48% | 3.61 -423% |
| Greyscale dE 2000 * | 4.2 | 3.66 13% | 4.8 -14% | 3 29% | 3.7 12% | 3.6 14% |
| Gamma | 1.999 110% | 2.19 100% | 2.108 104% | 2.164 102% | 2.161 102% | 2.367 93% |
| CCT | 7431 87% | 6841 95% | 6442 101% | 6816 95% | 7102 92% | 7138 91% |
| Media total (Programa/Opciones) | -16% /
-4% | -192% /
-123% | -11% /
4% | -48% /
-22% | -250% /
-145% |
* ... más pequeño es mejor
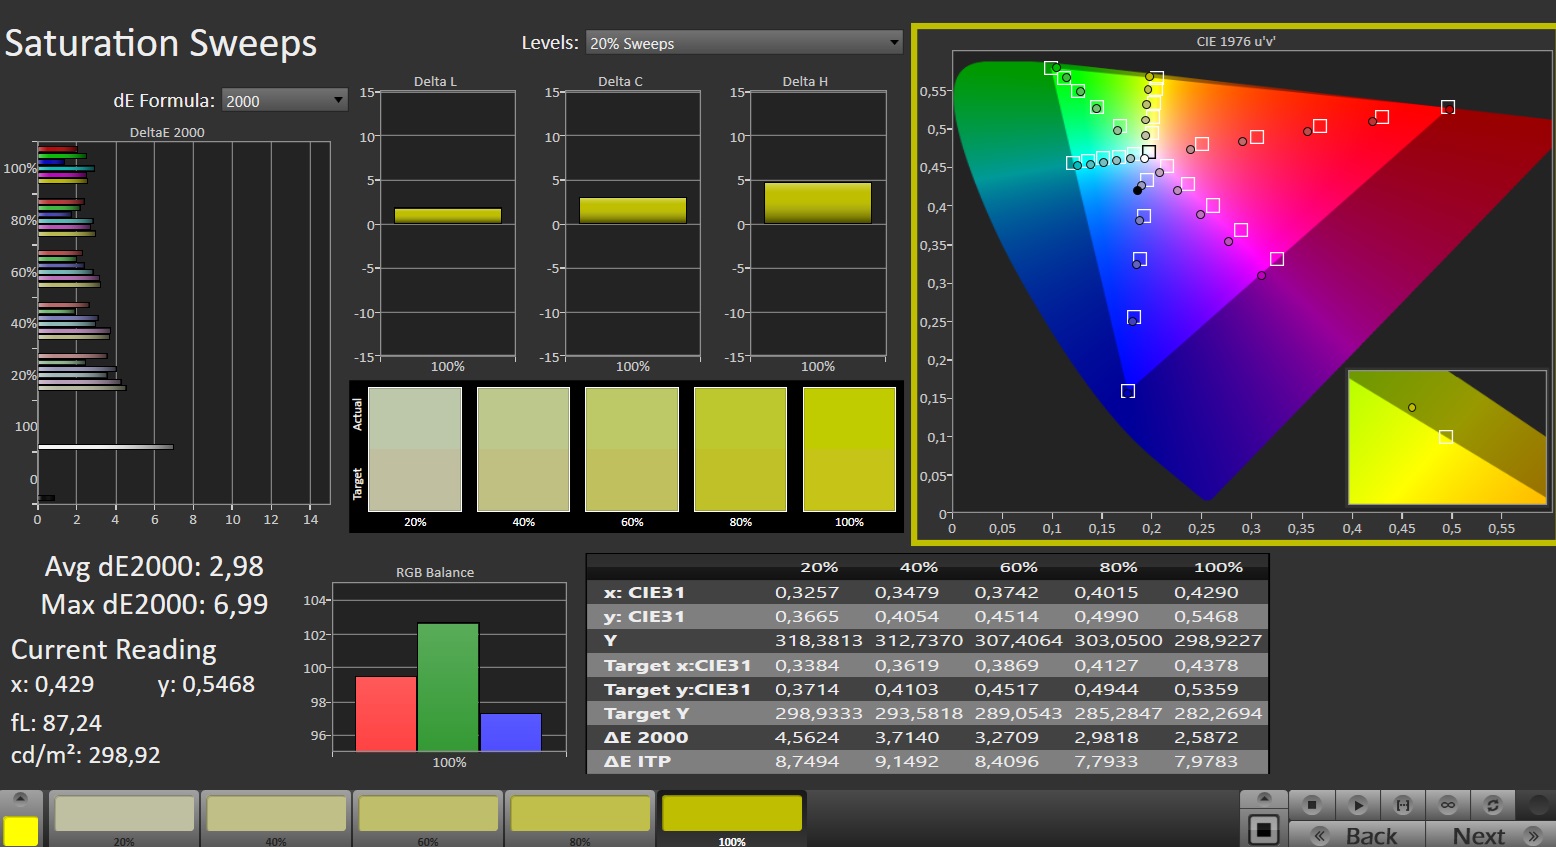
El panel cubre los espacios de color sRGB y DCI-P3 por completo o casi por completo, pero no el espacio AdobeRGB; esto es similar a las pantallas de la mayoría de los competidores. Su decente reproducción del color nada más sacarlo de la caja puede incrementarse hasta el rango de muy buena realizando una calibración: Entonces, su desviación de color baja de 3,19 a 0,69 (objetivo: DeltaE < 3). Al mismo tiempo, su representación en escala de grises parece mucho más equilibrada.
Nuestro perfil de color puede descargarse y utilizarse gratuitamente. Encontrará un enlace en el cuadro de información de la pantalla.

Tiempos de respuesta del display
| ↔ Tiempo de respuesta de Negro a Blanco | ||
|---|---|---|
| 5 ms ... subida ↗ y bajada ↘ combinada | ↗ 1.2 ms subida | 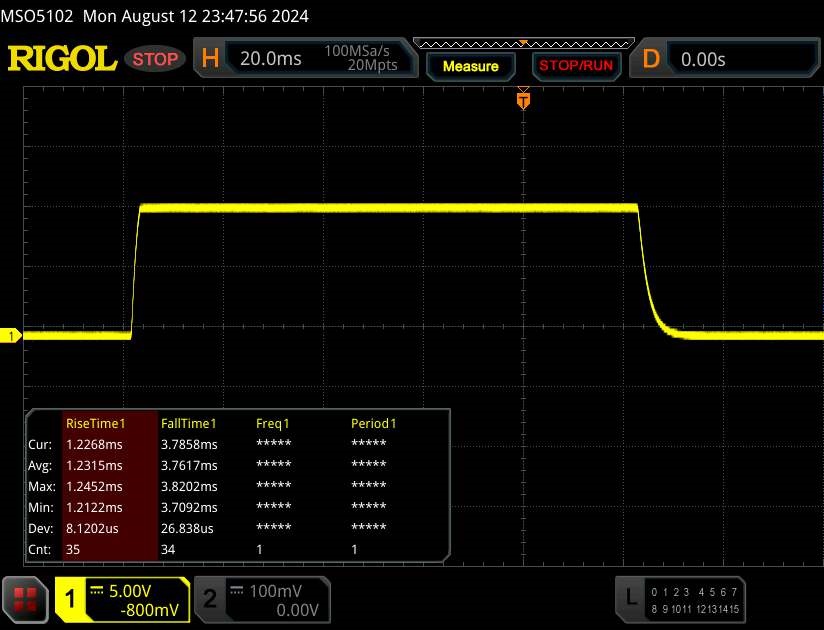 |
| ↘ 3.8 ms bajada | ||
| La pantalla mostró tiempos de respuesta muy rápidos en nuestros tests y debería ser adecuada para juegos frenéticos. En comparación, todos los dispositivos de prueba van de ##min### (mínimo) a 240 (máximo) ms. » 15 % de todos los dispositivos son mejores. Esto quiere decir que el tiempo de respuesta medido es mejor que la media (20.8 ms) de todos los dispositivos testados. | ||
| ↔ Tiempo de respuesta 50% Gris a 80% Gris | ||
| 3.9 ms ... subida ↗ y bajada ↘ combinada | ↗ 1.7 ms subida | 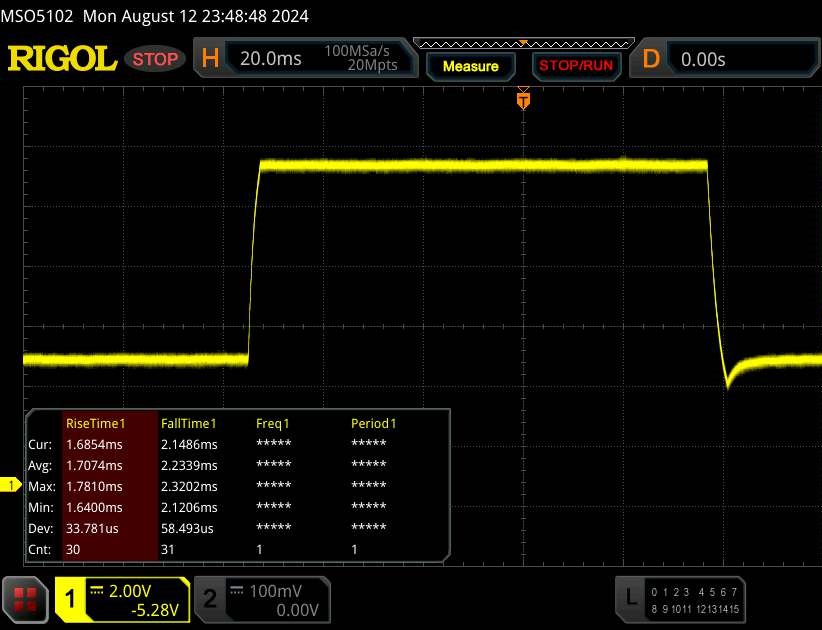 |
| ↘ 2.2 ms bajada | ||
| La pantalla mostró tiempos de respuesta muy rápidos en nuestros tests y debería ser adecuada para juegos frenéticos. En comparación, todos los dispositivos de prueba van de ##min### (mínimo) a 636 (máximo) ms. » 12 % de todos los dispositivos son mejores. Esto quiere decir que el tiempo de respuesta medido es mejor que la media (32.5 ms) de todos los dispositivos testados. | ||
Parpadeo de Pantalla / PWM (Pulse-Width Modulation)
| Parpadeo de Pantalla / PWM no detectado | 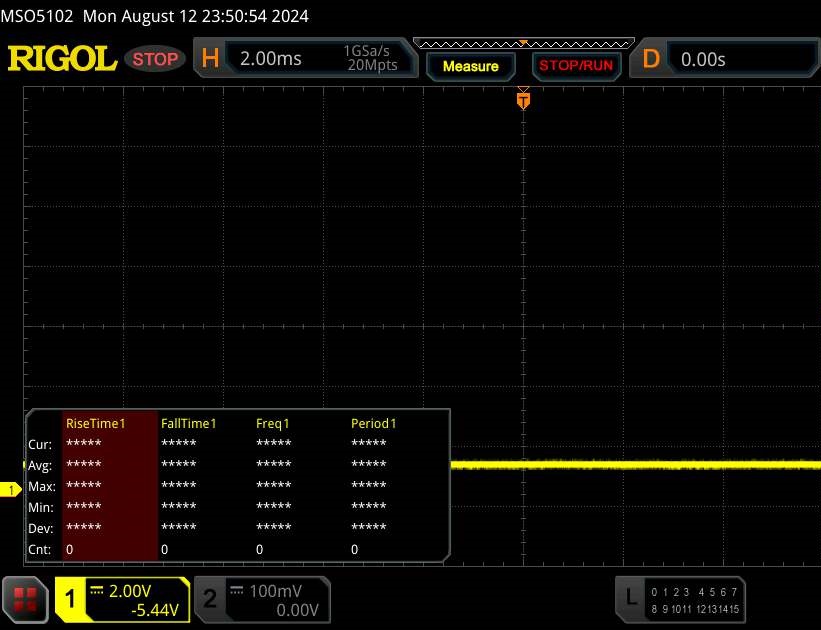 | ||
Comparación: 53 % de todos los dispositivos testados no usaron PWM para atenuar el display. Si se usó, medimos una media de 8516 (mínimo: 5 - máxmo: 343500) Hz. | |||
Rendimiento - Raptor Lake y Ada Lovelace impulsan el portátil
La Titan 16 Pro está dirigida a los jugadores y a los creadores, por lo que su enfoque probablemente se centre en los primeros. A Core i9-14900HX y una GeForce RTX 4060 impulsan el portátil. Su PVPR es de 1.699 dólares. Nubia ofrece variantes adicionales de este dispositivo, pero aún no se pueden encontrar a nivel mundial.
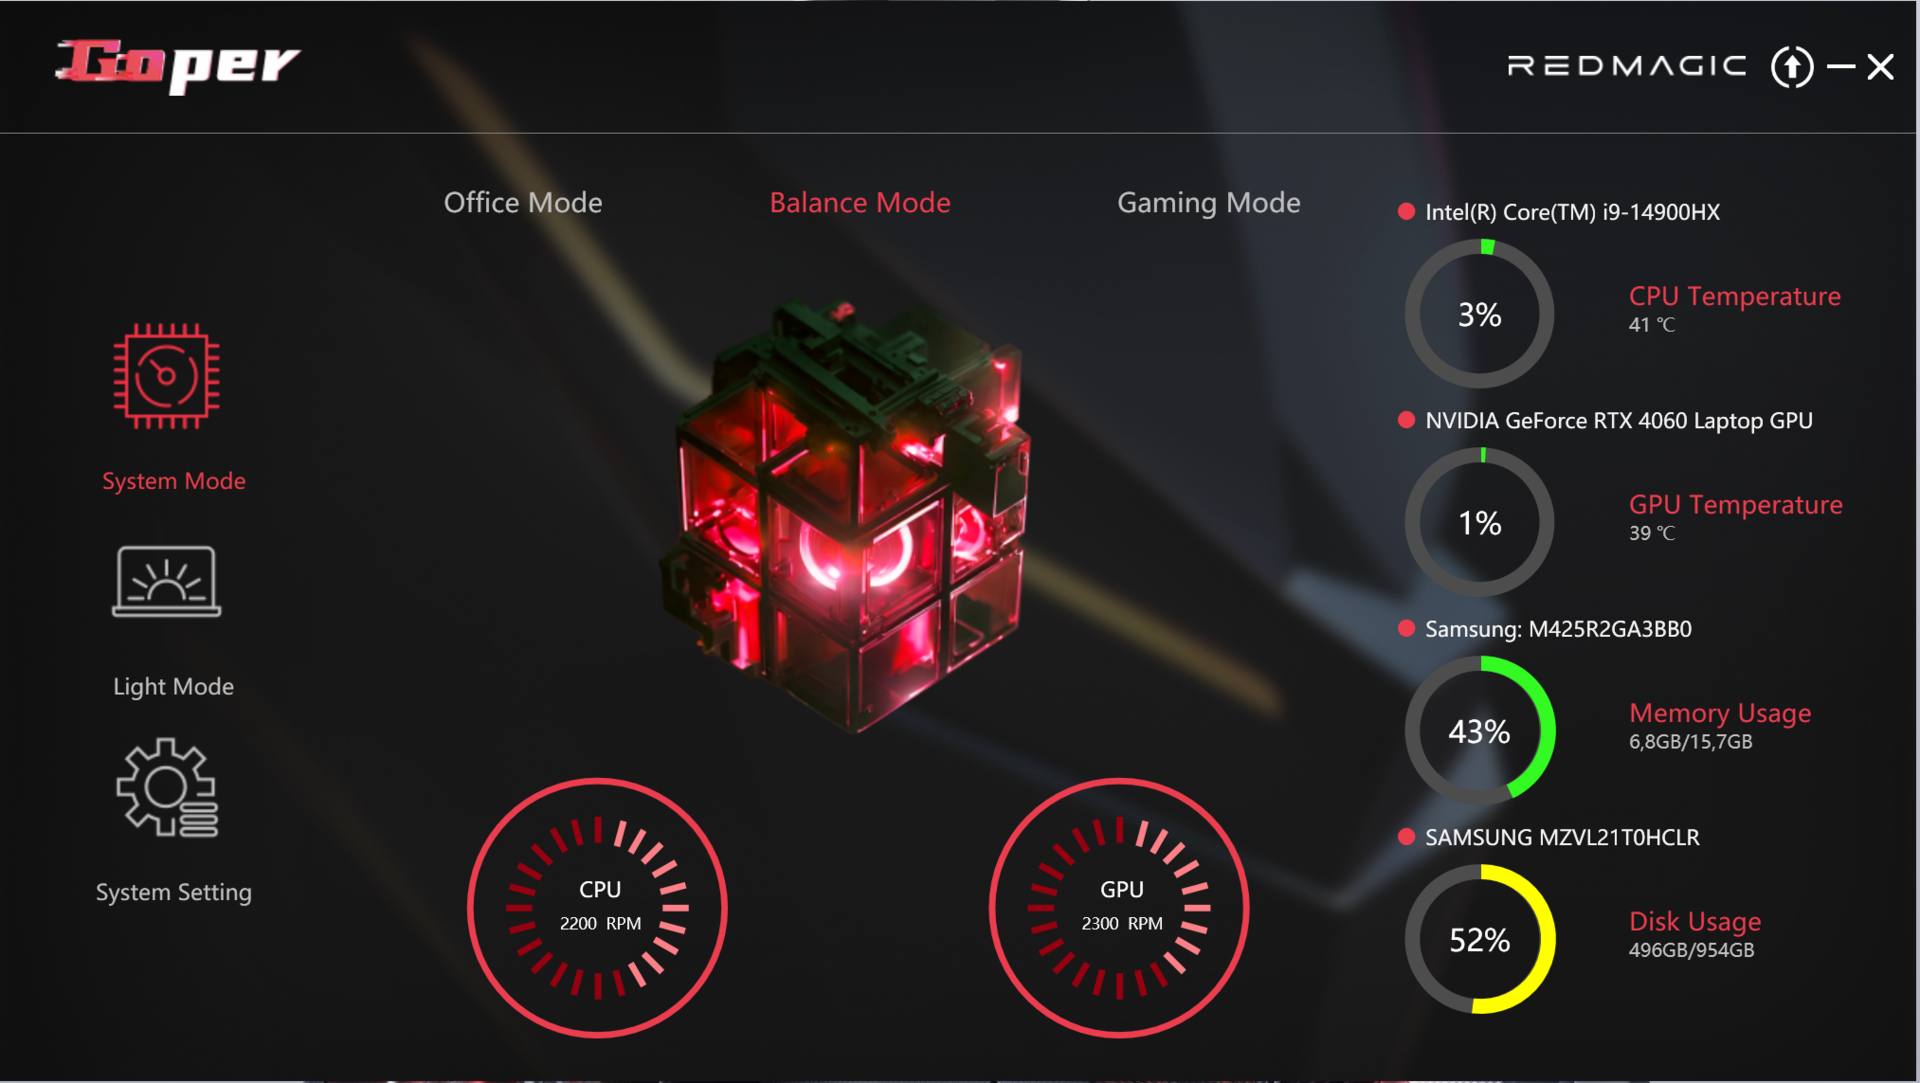
Condiciones de prueba
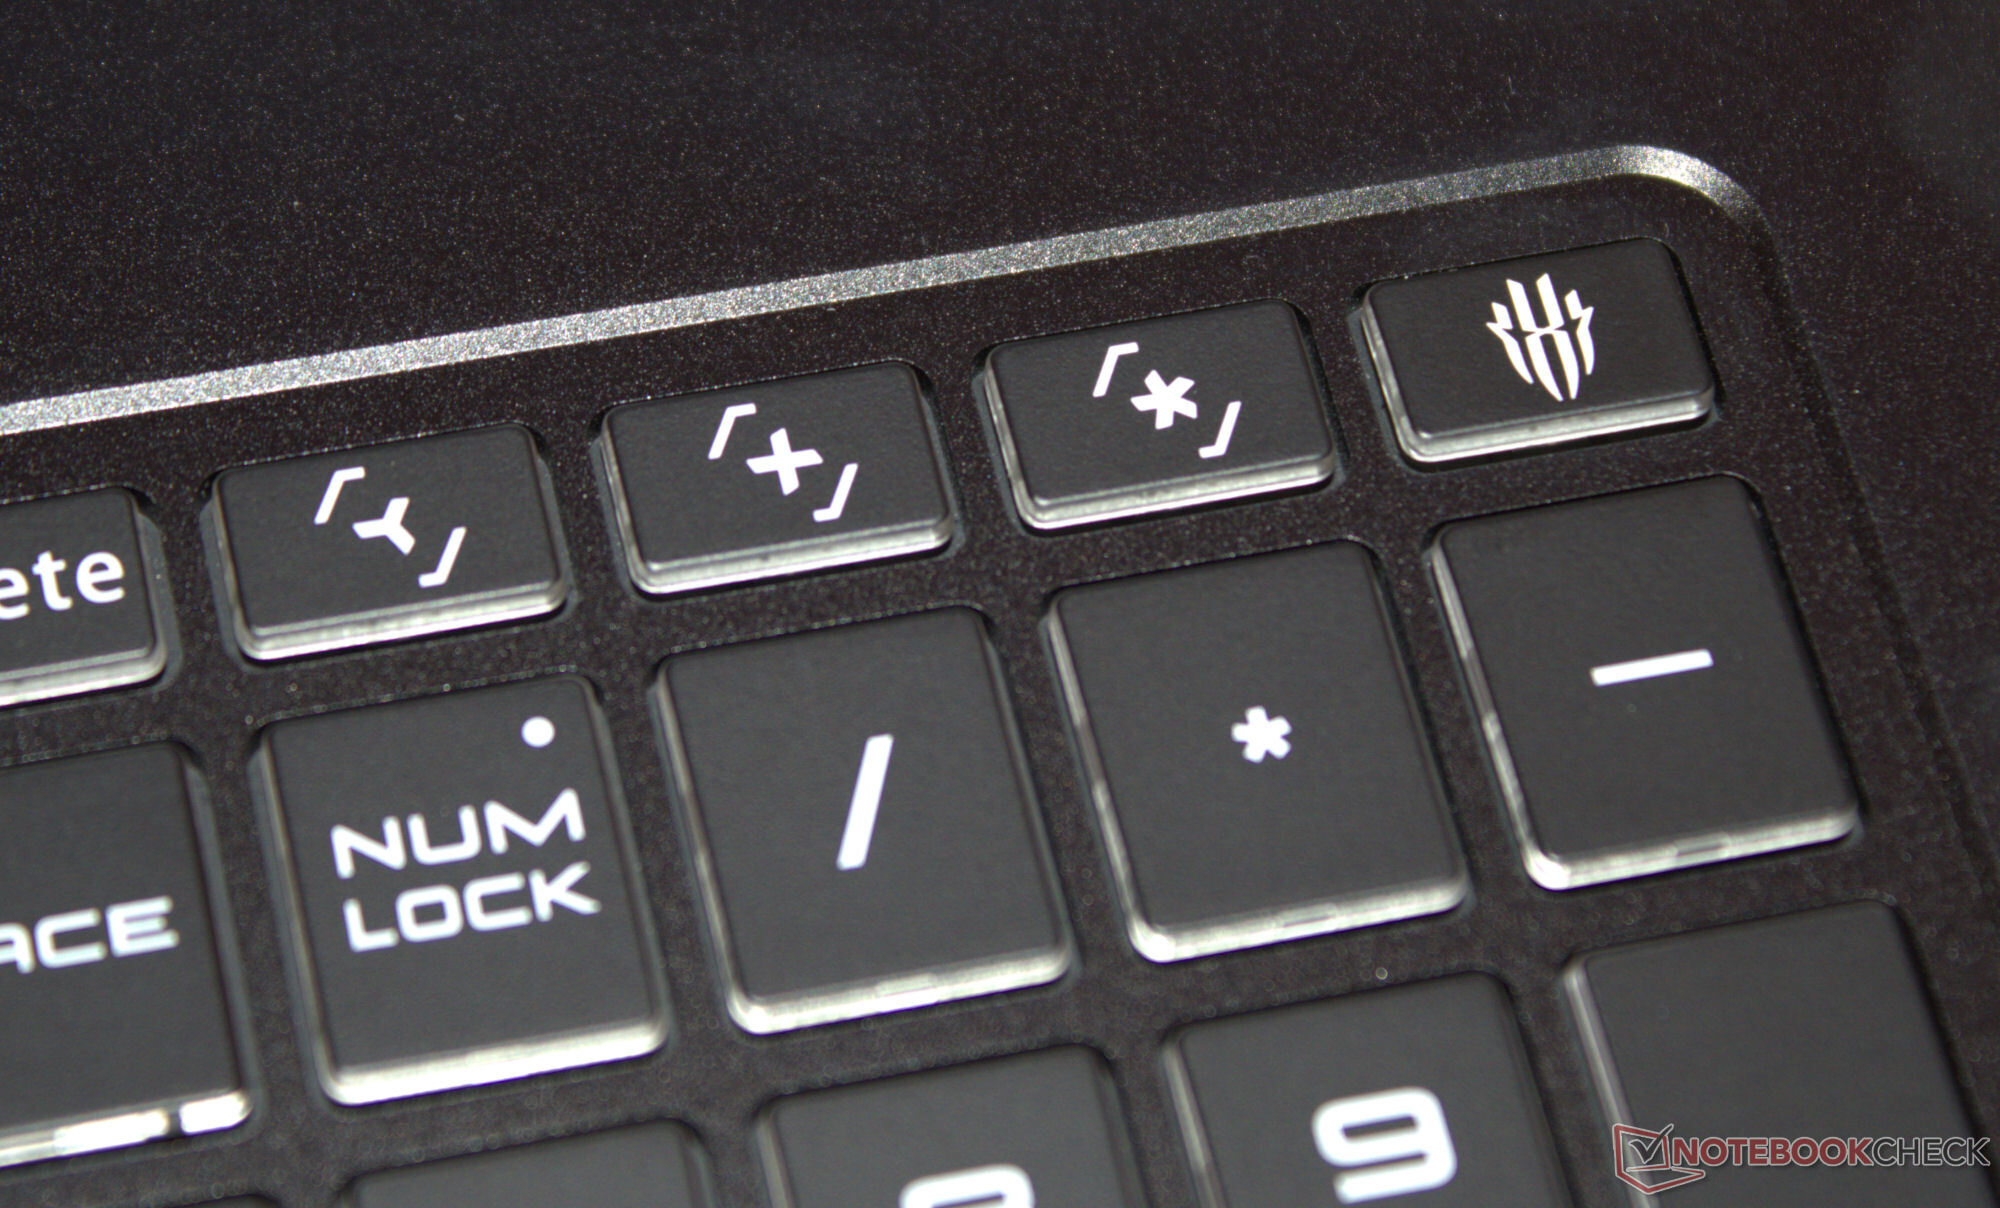
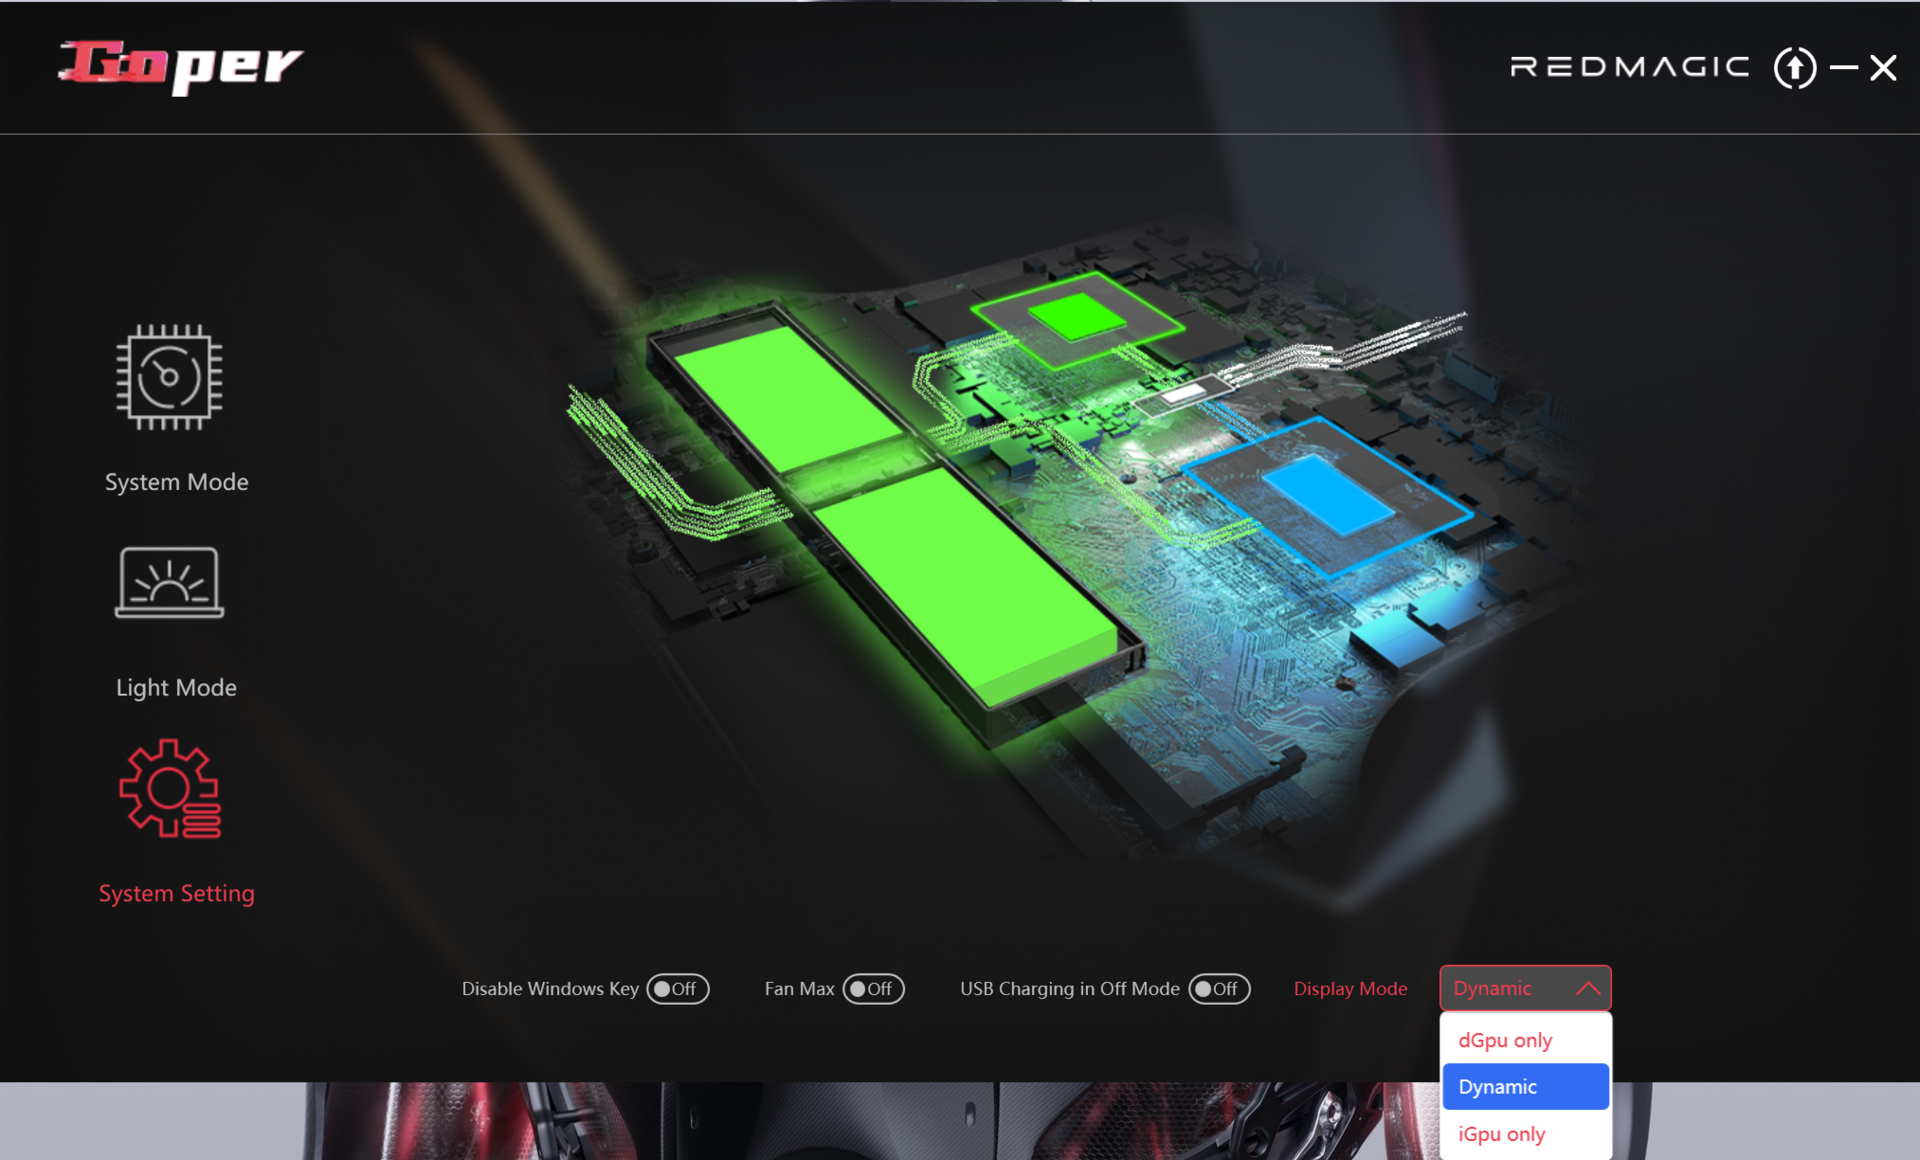
Se puede elegir entre tres perfiles de rendimiento específicos del fabricante (véase la tabla). Durante nuestra prueba se utilizaron el modo equilibrado (pruebas de rendimiento) y el modo oficina (pruebas de batería). El modo GPU se configuró como dinámico (= Optimus). Cada perfil se puede llamar directamente a través de una tecla separada en la fila superior del teclado numérico. Alternativamente, puede cambiarlos a través de la aplicación Goper (centro de control del portátil).
| Modo equilibrado | Modo juego | Modo oficina | |
|---|---|---|---|
| Límite de potencia 1 (HWInfo) | 45 vatios | 100 vatios | 35 vatios |
| Límite de potencia 2 (HWInfo) | 140 vatios | 140 vatios | 140 vatios |
| Ruido (Cyberpunk 2077) | 50 dB(A) | 53 dB(A) | 47 dB(A) |
| Rendimiento (Cyberpunk 2077) | 66 fps | 66 fps | 60 fps |
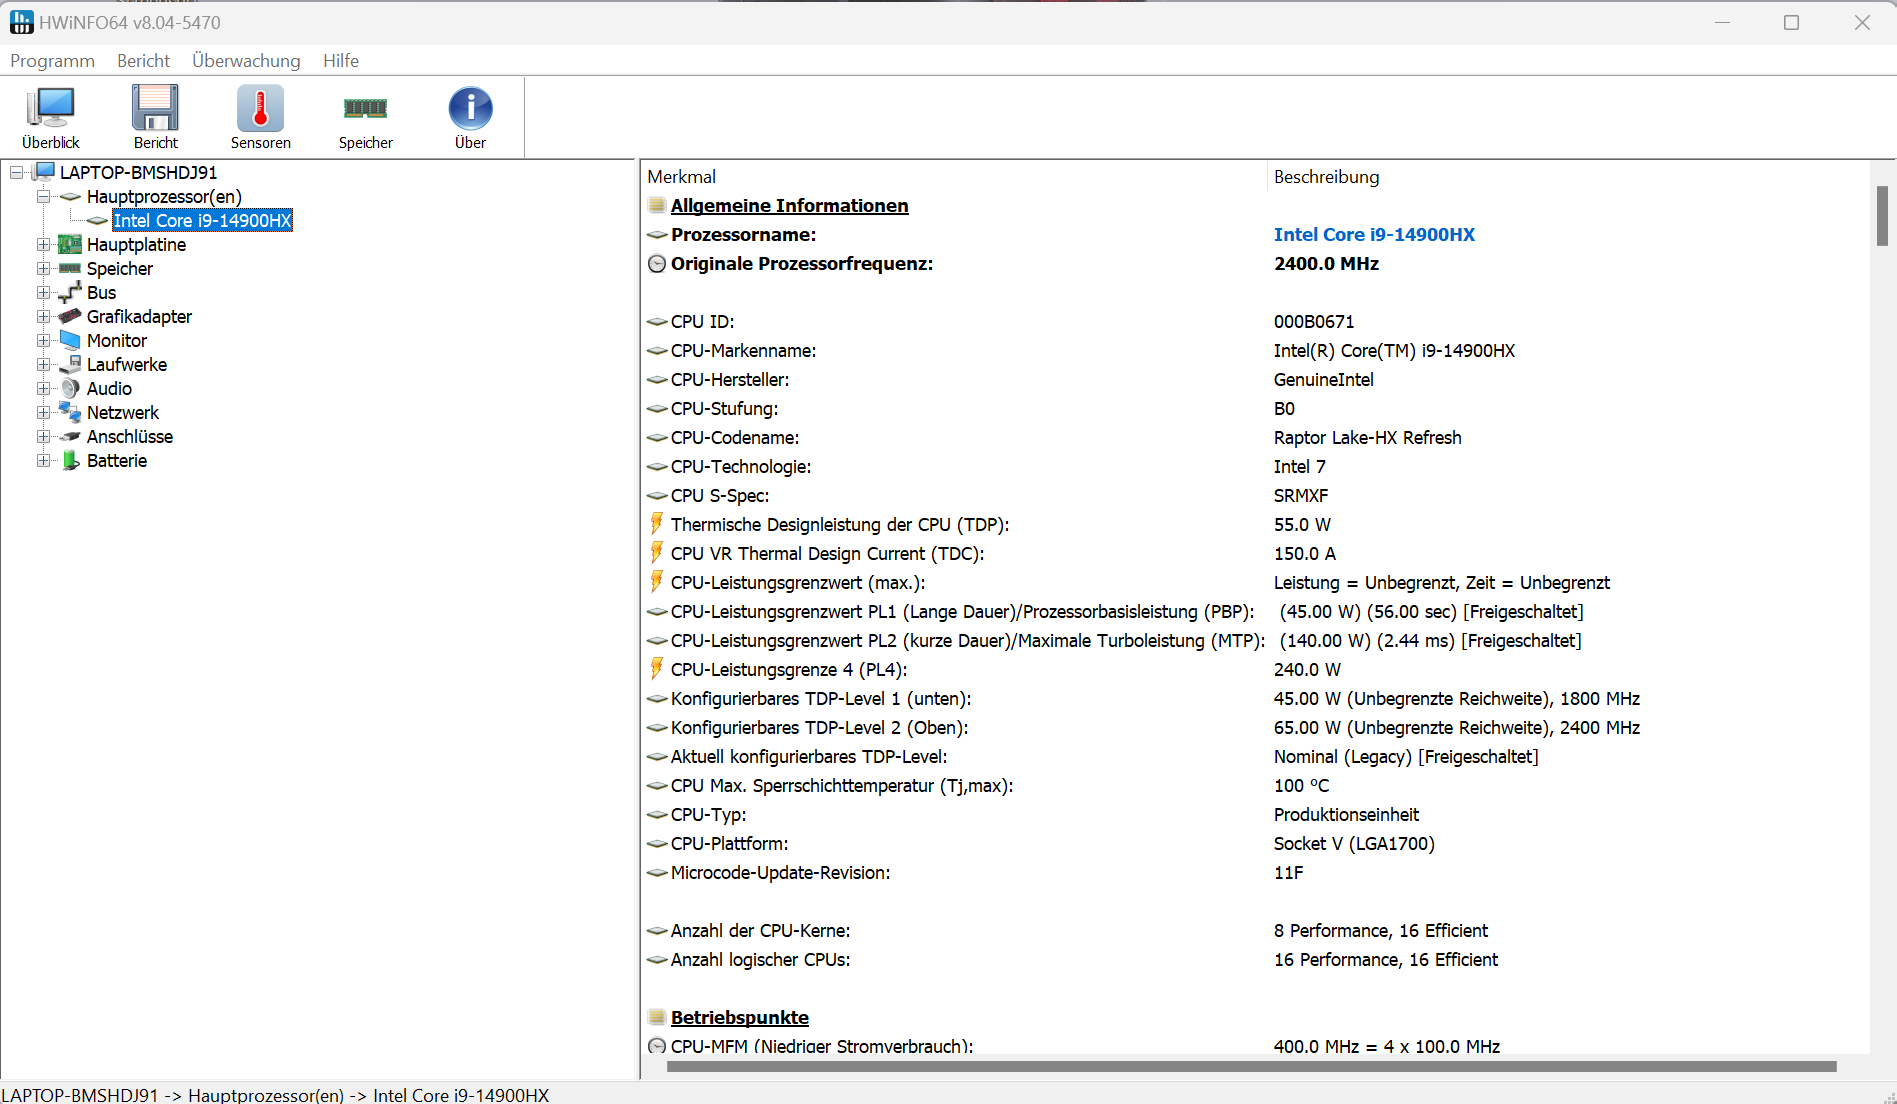
Procesador
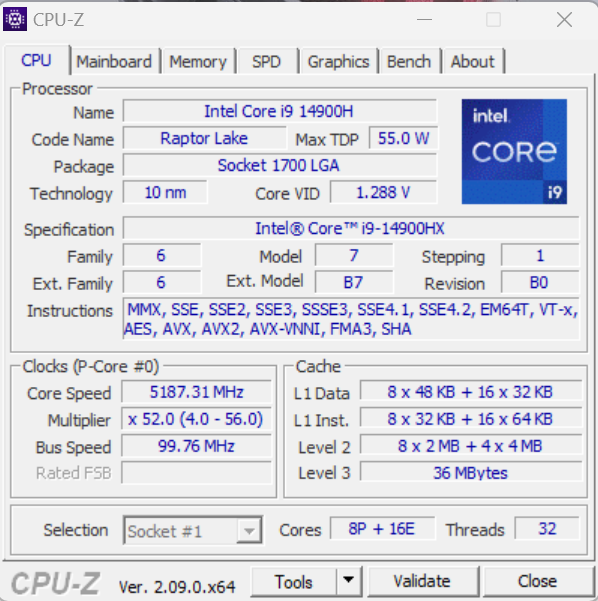
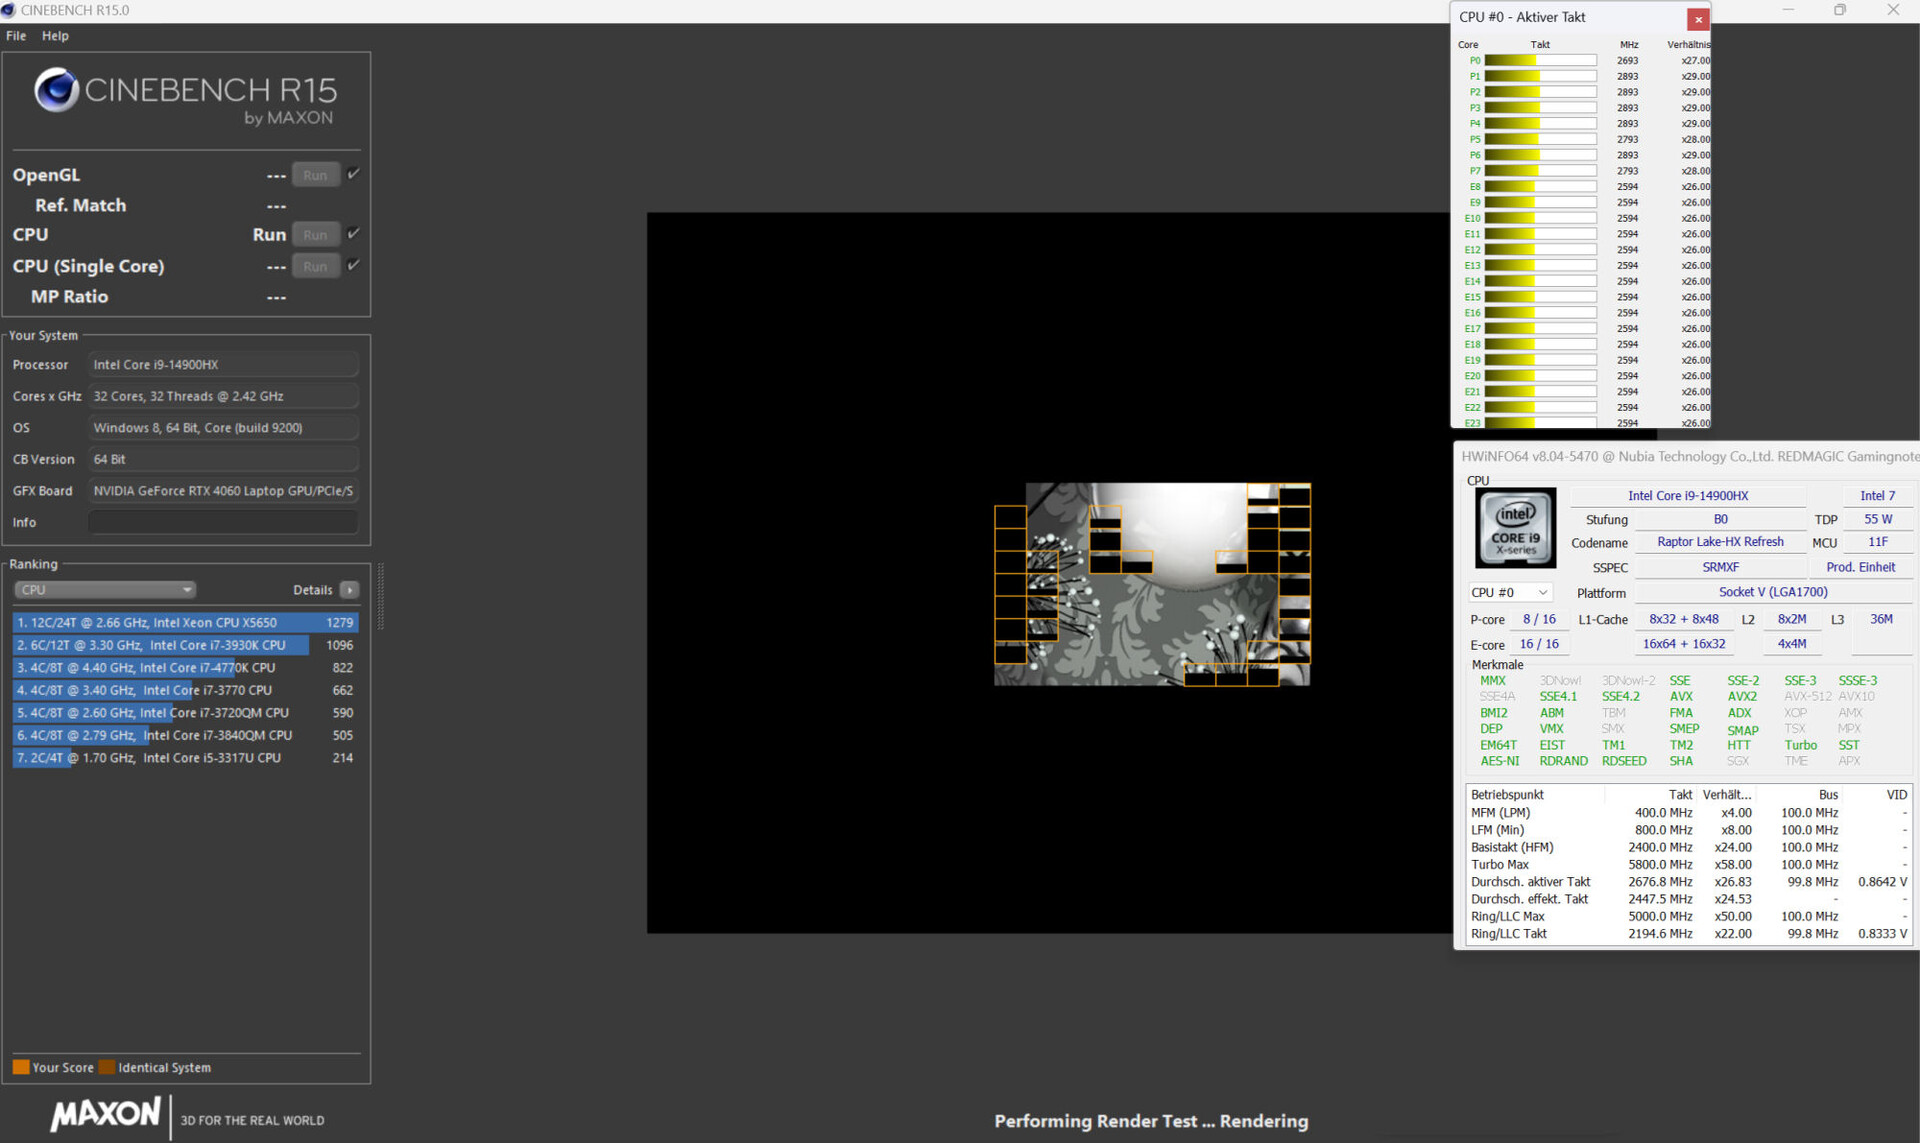
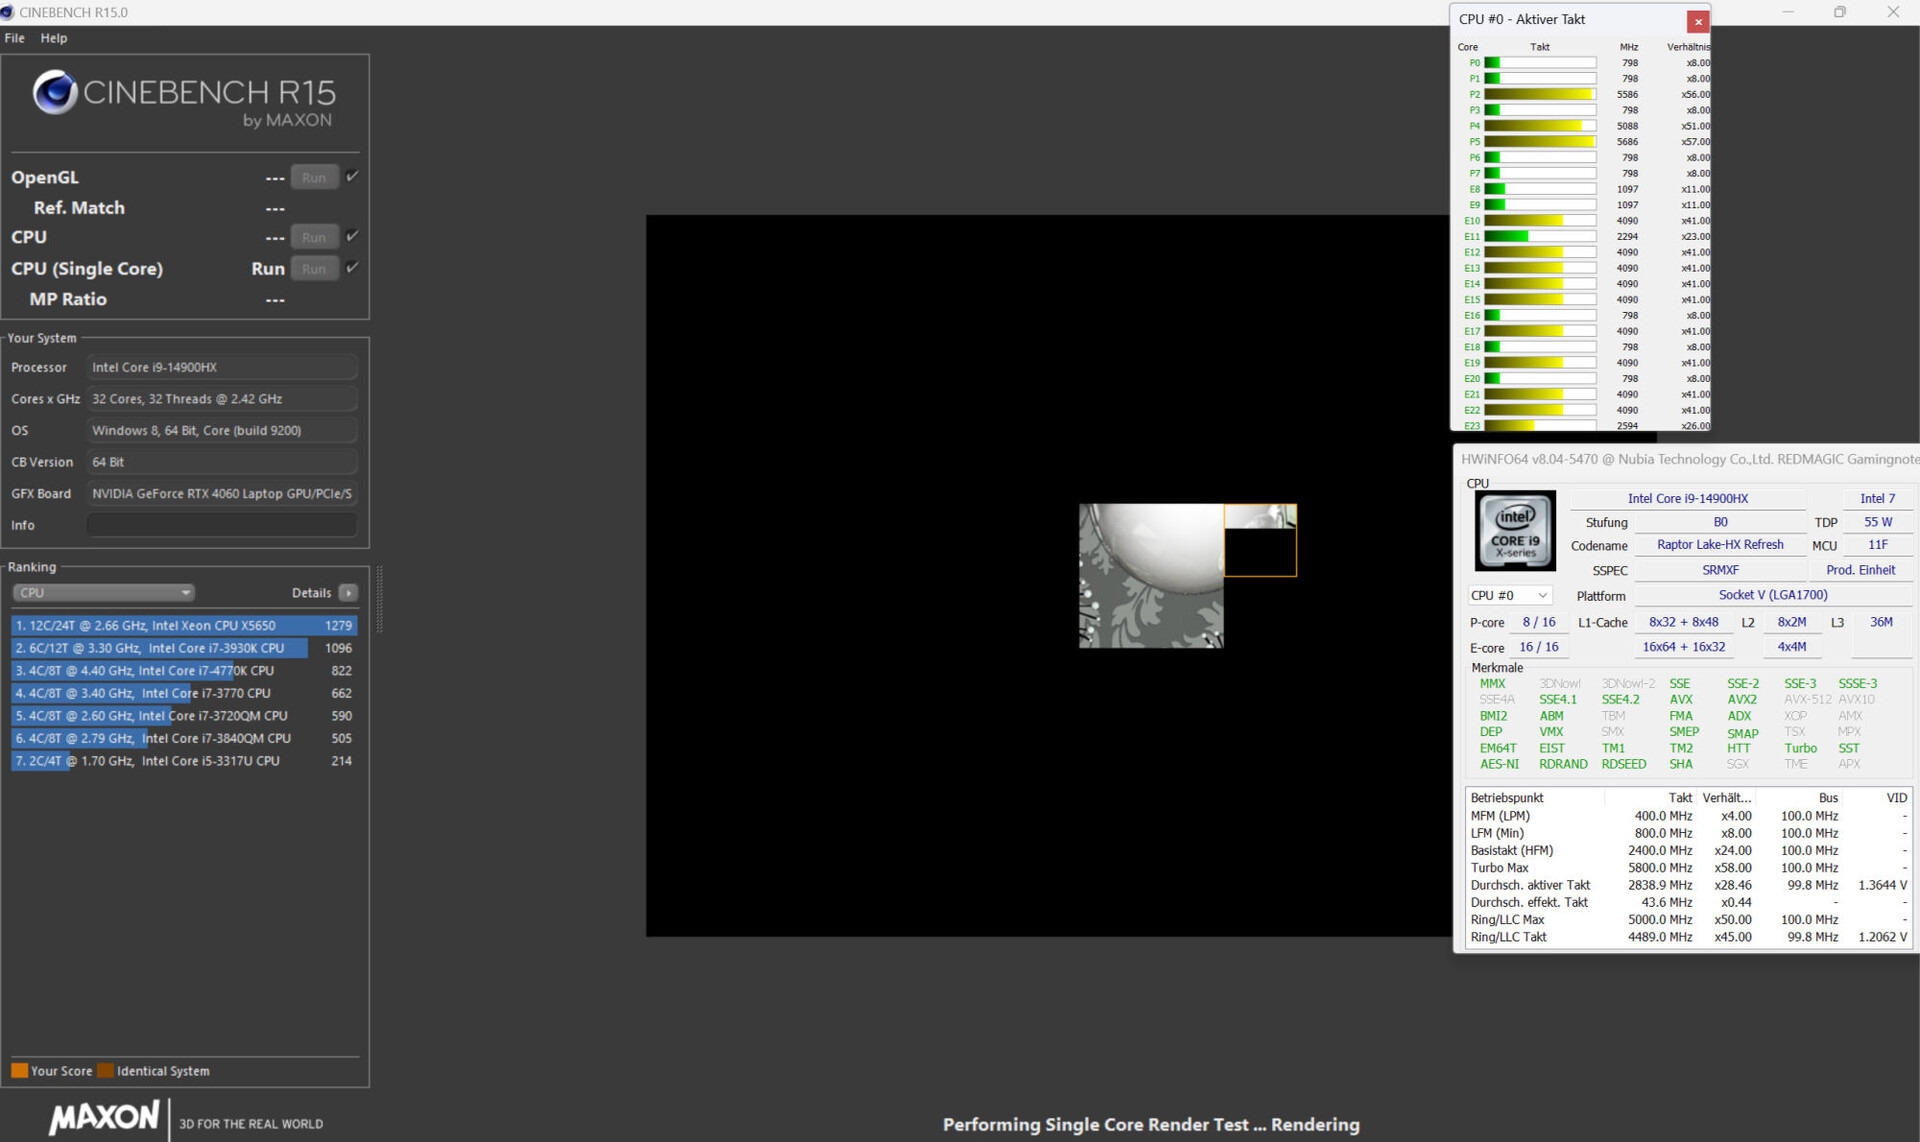
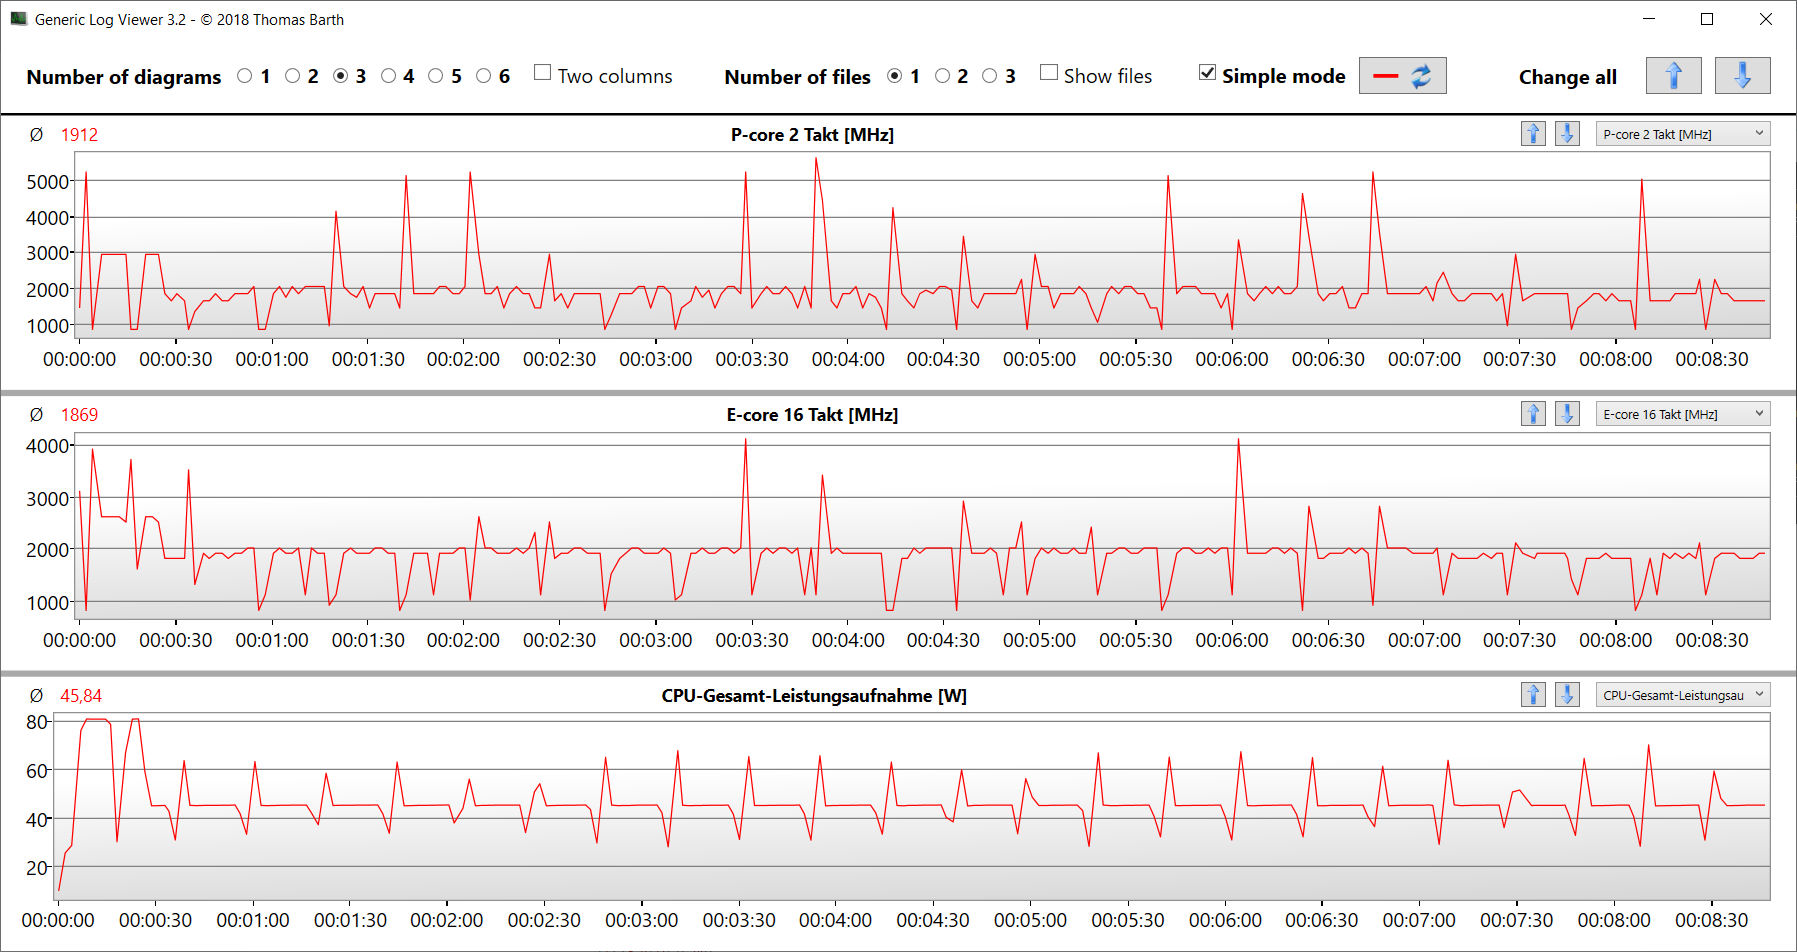
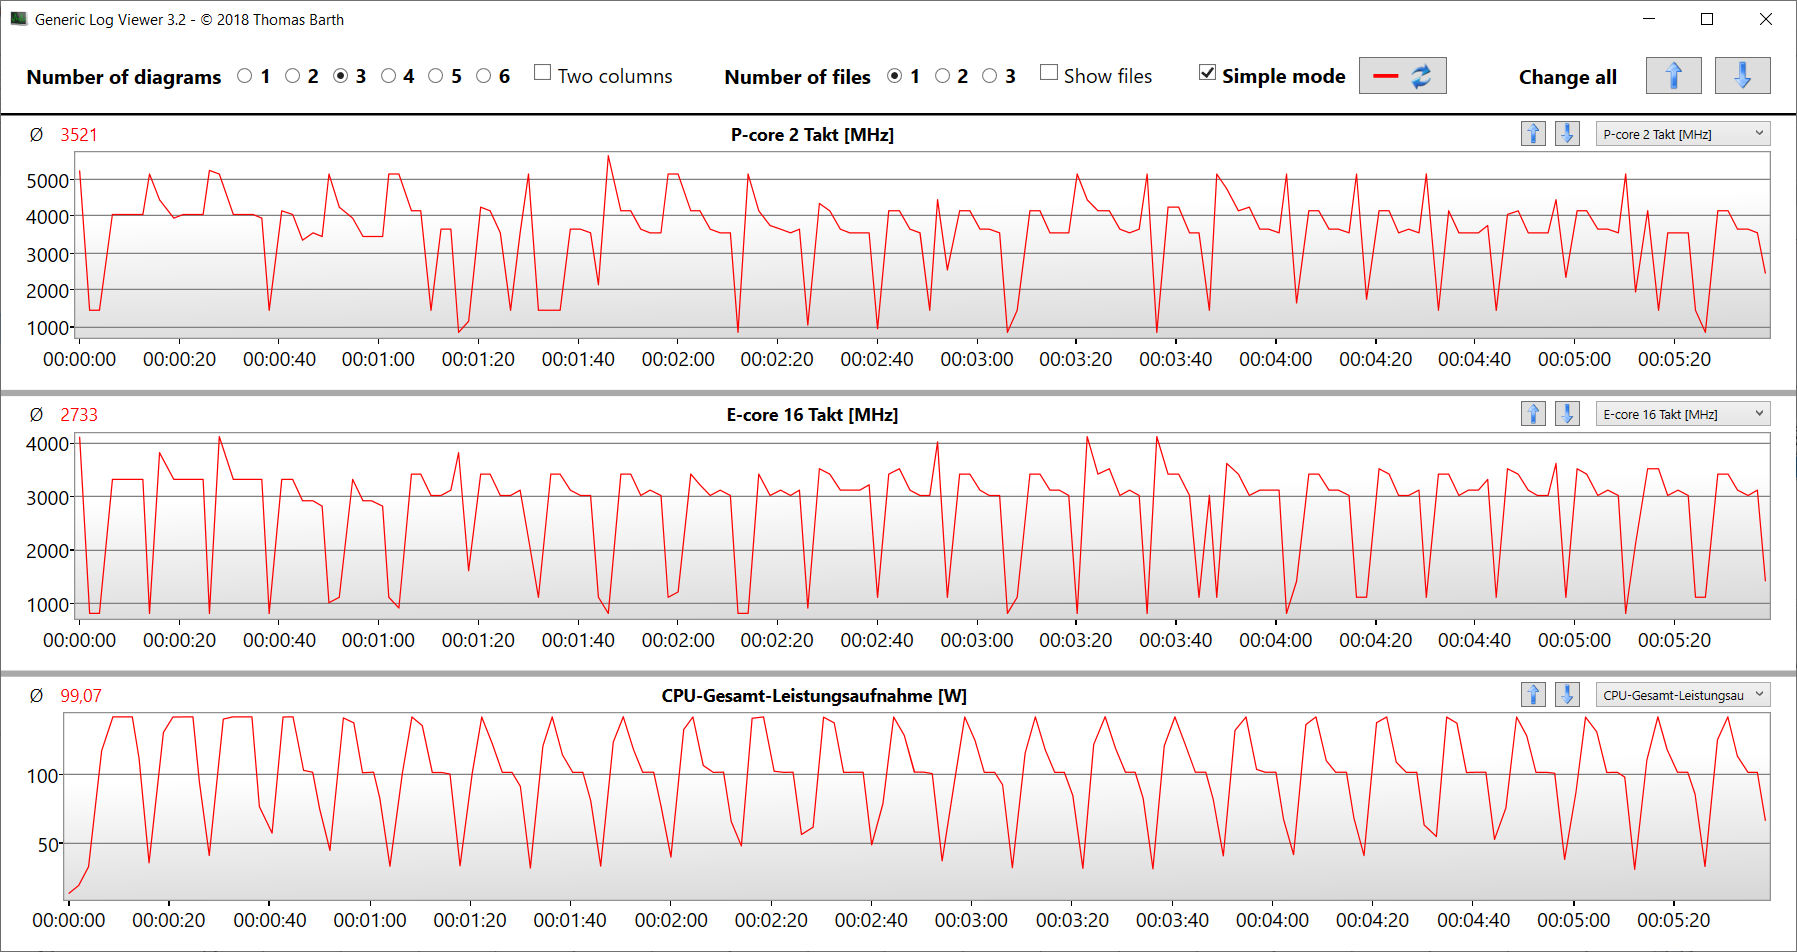
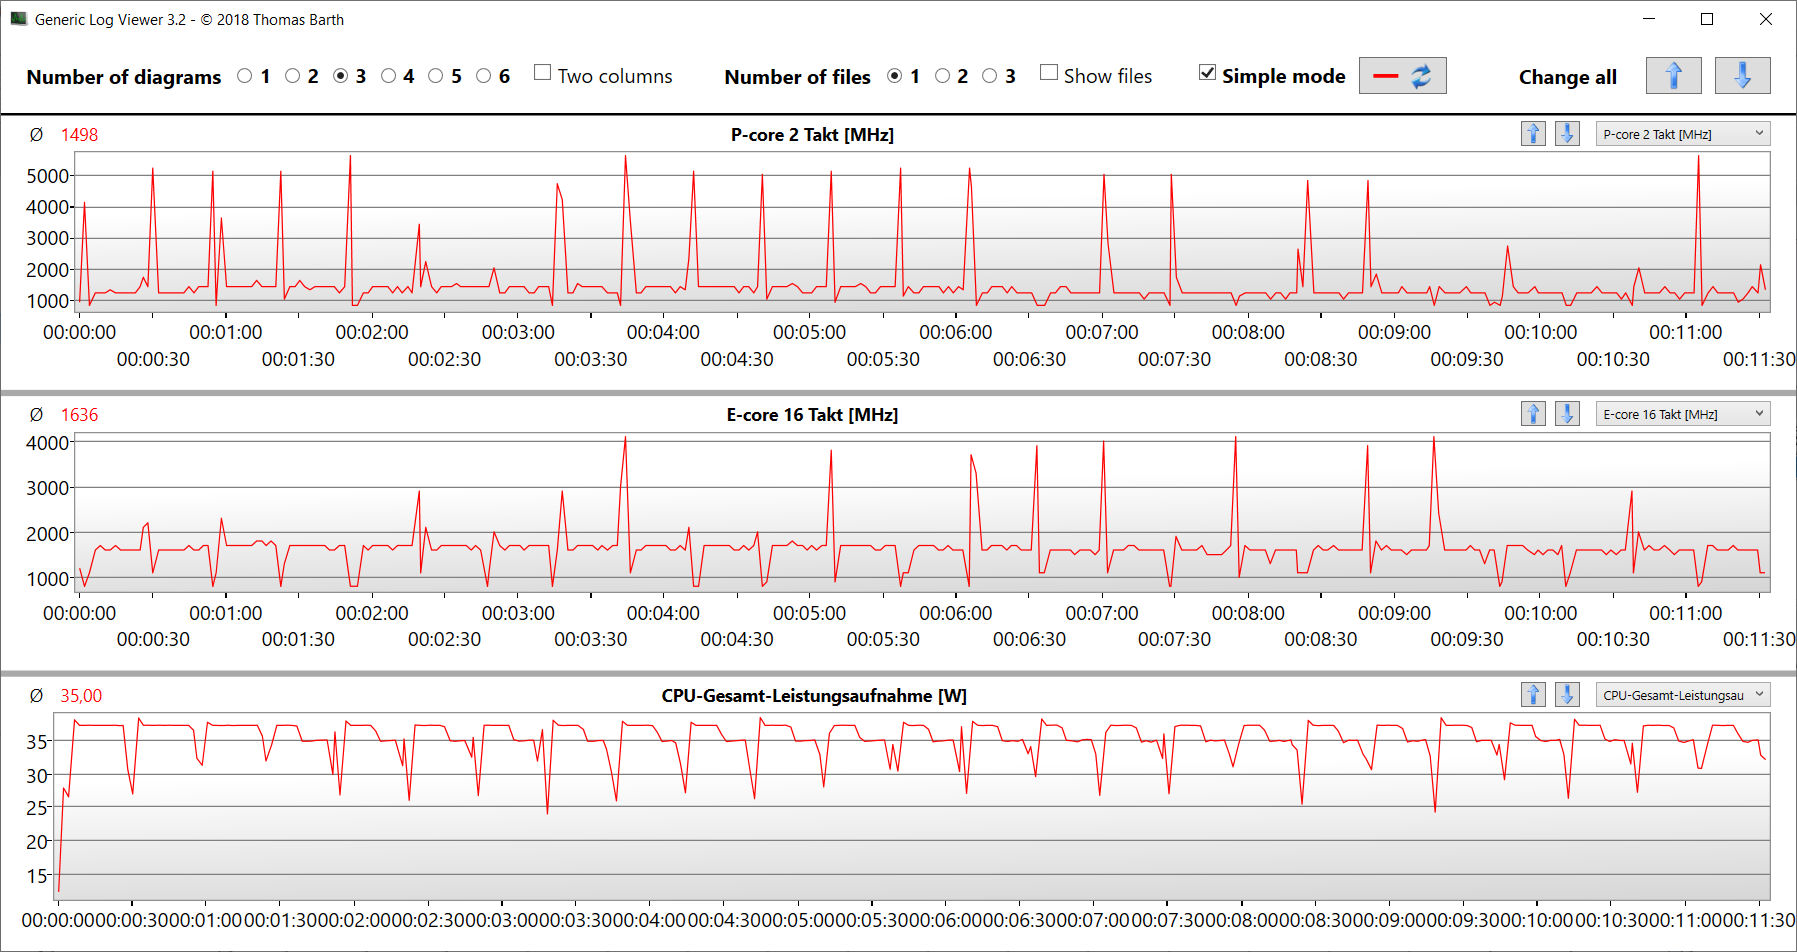
La Titan sólo tiene una opción de CPU disponible, a saber, el Core i9-14900HX (Raptor Lake). Sus 24 núcleos de CPU (8P + 16E = 32 hilos) alcanzan velocidades de reloj máximas de 5,8 GHz (P) y 4,1 GHz (E). La carga continua de varios hilos (bucle CB15) hizo que el reloj de la CPU cayera significativamente de la primera a la tercera ejecución. Después de eso, se mantuvo un nivel bastante constante. El perfil del modo de juego garantiza un nivel de rendimiento significativamente superior.
Los tres modos de alimentación ofrecen un rendimiento muy similar en un solo subproceso, aproximadamente al mismo nivel que la media de la CPU. Su rendimiento multihilo difiere en mucha mayor medida: Sólo el modo de juego arrojó valores al nivel de la media de la CPU durante nuestra prueba, mientras que los otros dos modos fueron significativamente inferiores.
Puede encontrar más información sobre el Core i9 en nuestro artículo de análisis.
Cinebench R15 Multi continuous test
| CPU Performance Rating - Percent | |
| Medio Intel Core i9-14900HX | |
| Lenovo Legion Pro 5 16IRX9 G9 | |
| Nubia RedMagic Titan 16 Pro | |
| SCHENKER XMG Pro 16 Studio (Mid 24) | |
| Acer Predator Helios Neo 16 (2024) | |
| Nubia RedMagic Titan 16 Pro | |
| Media de la clase Gaming | |
| HP Victus 16 (2024) | |
| Gigabyte G6X 9KG (2024) | |
| Cinebench R20 | |
| CPU (Multi Core) | |
| Nubia RedMagic Titan 16 Pro (Gaming Mode) | |
| Medio Intel Core i9-14900HX (6579 - 13832, n=37) | |
| Lenovo Legion Pro 5 16IRX9 G9 | |
| SCHENKER XMG Pro 16 Studio (Mid 24) | |
| HP Victus 16 (2024) | |
| Acer Predator Helios Neo 16 (2024) | |
| Media de la clase Gaming (2179 - 15517, n=151, últimos 2 años) | |
| Gigabyte G6X 9KG (2024) | |
| Nubia RedMagic Titan 16 Pro | |
| CPU (Single Core) | |
| Nubia RedMagic Titan 16 Pro | |
| Medio Intel Core i9-14900HX (657 - 859, n=37) | |
| Lenovo Legion Pro 5 16IRX9 G9 | |
| Nubia RedMagic Titan 16 Pro (Gaming Mode) | |
| Acer Predator Helios Neo 16 (2024) | |
| SCHENKER XMG Pro 16 Studio (Mid 24) | |
| Media de la clase Gaming (439 - 866, n=151, últimos 2 años) | |
| Gigabyte G6X 9KG (2024) | |
| HP Victus 16 (2024) | |
| Cinebench R15 | |
| CPU Multi 64Bit | |
| Nubia RedMagic Titan 16 Pro (Gaming Mode) | |
| Medio Intel Core i9-14900HX (3263 - 5589, n=38) | |
| SCHENKER XMG Pro 16 Studio (Mid 24) | |
| Lenovo Legion Pro 5 16IRX9 G9 | |
| HP Victus 16 (2024) | |
| Acer Predator Helios Neo 16 (2024) | |
| Nubia RedMagic Titan 16 Pro | |
| Media de la clase Gaming (905 - 6074, n=154, últimos 2 años) | |
| Gigabyte G6X 9KG (2024) | |
| CPU Single 64Bit | |
| Nubia RedMagic Titan 16 Pro | |
| Nubia RedMagic Titan 16 Pro (Gaming Mode) | |
| Medio Intel Core i9-14900HX (247 - 323, n=37) | |
| Lenovo Legion Pro 5 16IRX9 G9 | |
| Acer Predator Helios Neo 16 (2024) | |
| SCHENKER XMG Pro 16 Studio (Mid 24) | |
| Media de la clase Gaming (191.9 - 343, n=151, últimos 2 años) | |
| Gigabyte G6X 9KG (2024) | |
| HP Victus 16 (2024) | |
| Blender - v2.79 BMW27 CPU | |
| Gigabyte G6X 9KG (2024) | |
| Nubia RedMagic Titan 16 Pro | |
| Media de la clase Gaming (81 - 555, n=144, últimos 2 años) | |
| HP Victus 16 (2024) | |
| Acer Predator Helios Neo 16 (2024) | |
| SCHENKER XMG Pro 16 Studio (Mid 24) | |
| Nubia RedMagic Titan 16 Pro (Gaming Mode) | |
| Lenovo Legion Pro 5 16IRX9 G9 | |
| Medio Intel Core i9-14900HX (91 - 206, n=37) | |
| Geekbench 6.4 | |
| Multi-Core | |
| Lenovo Legion Pro 5 16IRX9 G9 (6.2.1) | |
| Medio Intel Core i9-14900HX (13158 - 19665, n=37) | |
| Acer Predator Helios Neo 16 (2024) (6.2.1) | |
| SCHENKER XMG Pro 16 Studio (Mid 24) (6.2.1) | |
| HP Victus 16 (2024) (6.2.1) | |
| Nubia RedMagic Titan 16 Pro (6.2.1, Gaming Mode) | |
| Media de la clase Gaming (5340 - 21668, n=119, últimos 2 años) | |
| Gigabyte G6X 9KG (2024) (6.2.1) | |
| Nubia RedMagic Titan 16 Pro (6.2.1) | |
| Single-Core | |
| Nubia RedMagic Titan 16 Pro (6.2.1) | |
| Nubia RedMagic Titan 16 Pro (6.2.1, Gaming Mode) | |
| Acer Predator Helios Neo 16 (2024) (6.2.1) | |
| Medio Intel Core i9-14900HX (2419 - 3129, n=37) | |
| Lenovo Legion Pro 5 16IRX9 G9 (6.2.1) | |
| SCHENKER XMG Pro 16 Studio (Mid 24) (6.2.1) | |
| Media de la clase Gaming (1490 - 3219, n=119, últimos 2 años) | |
| Gigabyte G6X 9KG (2024) (6.2.1) | |
| HP Victus 16 (2024) (6.2.1) | |
| HWBOT x265 Benchmark v2.2 - 4k Preset | |
| Nubia RedMagic Titan 16 Pro (Gaming Mode) | |
| Medio Intel Core i9-14900HX (16.8 - 38.9, n=37) | |
| Lenovo Legion Pro 5 16IRX9 G9 | |
| SCHENKER XMG Pro 16 Studio (Mid 24) | |
| Acer Predator Helios Neo 16 (2024) | |
| Media de la clase Gaming (6.72 - 42.9, n=148, últimos 2 años) | |
| HP Victus 16 (2024) | |
| Gigabyte G6X 9KG (2024) | |
| Nubia RedMagic Titan 16 Pro | |
| LibreOffice - 20 Documents To PDF | |
| HP Victus 16 (2024) (6.3.4.2) | |
| Lenovo Legion Pro 5 16IRX9 G9 (6.3.4.2) | |
| Media de la clase Gaming (19 - 96.6, n=147, últimos 2 años) | |
| SCHENKER XMG Pro 16 Studio (Mid 24) (6.3.4.2) | |
| Medio Intel Core i9-14900HX (19 - 85.1, n=37) | |
| Acer Predator Helios Neo 16 (2024) (6.3.4.2) | |
| Nubia RedMagic Titan 16 Pro (6.3.4.2, Gaming Mode) | |
| Gigabyte G6X 9KG (2024) (6.3.4.2) | |
| Nubia RedMagic Titan 16 Pro (6.3.4.2) | |
| R Benchmark 2.5 - Overall mean | |
| HP Victus 16 (2024) | |
| Media de la clase Gaming (0.3609 - 0.759, n=150, últimos 2 años) | |
| Gigabyte G6X 9KG (2024) | |
| SCHENKER XMG Pro 16 Studio (Mid 24) | |
| Lenovo Legion Pro 5 16IRX9 G9 | |
| Medio Intel Core i9-14900HX (0.3604 - 0.4859, n=37) | |
| Acer Predator Helios Neo 16 (2024) | |
| Nubia RedMagic Titan 16 Pro | |
| Nubia RedMagic Titan 16 Pro (Gaming Mode) | |
* ... más pequeño es mejor
AIDA64: FP32 Ray-Trace | FPU Julia | CPU SHA3 | CPU Queen | FPU SinJulia | FPU Mandel | CPU AES | CPU ZLib | FP64 Ray-Trace | CPU PhotoWorxx
| Performance Rating | |
| Medio Intel Core i9-14900HX | |
| Nubia RedMagic Titan 16 Pro | |
| Lenovo Legion Pro 5 16IRX9 G9 | |
| SCHENKER XMG Pro 16 Studio (Mid 24) | |
| Acer Predator Helios Neo 16 (2024) | |
| Media de la clase Gaming | |
| HP Victus 16 (2024) | |
| Nubia RedMagic Titan 16 Pro | |
| Gigabyte G6X 9KG (2024) | |
| AIDA64 / FP32 Ray-Trace | |
| Medio Intel Core i9-14900HX (13098 - 33474, n=36) | |
| Nubia RedMagic Titan 16 Pro (v6.92.6600, Gaming Mode) | |
| Lenovo Legion Pro 5 16IRX9 G9 (v6.92.6600) | |
| Media de la clase Gaming (4986 - 81639, n=147, últimos 2 años) | |
| Acer Predator Helios Neo 16 (2024) (v6.92.6600) | |
| SCHENKER XMG Pro 16 Studio (Mid 24) (v6.92.6600) | |
| HP Victus 16 (2024) (v6.92.6600) | |
| Gigabyte G6X 9KG (2024) (v6.92.6600) | |
| Nubia RedMagic Titan 16 Pro (v6.92.6600) | |
| AIDA64 / FPU Julia | |
| Medio Intel Core i9-14900HX (67573 - 166040, n=36) | |
| Nubia RedMagic Titan 16 Pro (v6.92.6600, Gaming Mode) | |
| Lenovo Legion Pro 5 16IRX9 G9 (v6.92.6600) | |
| SCHENKER XMG Pro 16 Studio (Mid 24) (v6.92.6600) | |
| Acer Predator Helios Neo 16 (2024) (v6.92.6600) | |
| Media de la clase Gaming (25360 - 252486, n=147, últimos 2 años) | |
| HP Victus 16 (2024) (v6.92.6600) | |
| Gigabyte G6X 9KG (2024) (v6.92.6600) | |
| Nubia RedMagic Titan 16 Pro (v6.92.6600) | |
| AIDA64 / CPU SHA3 | |
| Nubia RedMagic Titan 16 Pro (v6.92.6600, Gaming Mode) | |
| Medio Intel Core i9-14900HX (3589 - 7979, n=36) | |
| SCHENKER XMG Pro 16 Studio (Mid 24) (v6.92.6600) | |
| Lenovo Legion Pro 5 16IRX9 G9 (v6.92.6600) | |
| Acer Predator Helios Neo 16 (2024) (v6.92.6600) | |
| Media de la clase Gaming (1339 - 10389, n=147, últimos 2 años) | |
| HP Victus 16 (2024) (v6.92.6600) | |
| Nubia RedMagic Titan 16 Pro (v6.92.6600) | |
| Gigabyte G6X 9KG (2024) (v6.92.6600) | |
| AIDA64 / CPU Queen | |
| Lenovo Legion Pro 5 16IRX9 G9 (v6.92.6600) | |
| Acer Predator Helios Neo 16 (2024) (v6.92.6600) | |
| Nubia RedMagic Titan 16 Pro (v6.92.6600, Gaming Mode) | |
| Medio Intel Core i9-14900HX (118405 - 148966, n=36) | |
| SCHENKER XMG Pro 16 Studio (Mid 24) (v6.92.6600) | |
| HP Victus 16 (2024) (v6.92.6600) | |
| Nubia RedMagic Titan 16 Pro (v6.92.6600) | |
| Media de la clase Gaming (50699 - 200651, n=147, últimos 2 años) | |
| Gigabyte G6X 9KG (2024) (v6.92.6600) | |
| AIDA64 / FPU SinJulia | |
| Nubia RedMagic Titan 16 Pro (v6.92.6600, Gaming Mode) | |
| Medio Intel Core i9-14900HX (10475 - 18517, n=36) | |
| Lenovo Legion Pro 5 16IRX9 G9 (v6.92.6600) | |
| SCHENKER XMG Pro 16 Studio (Mid 24) (v6.92.6600) | |
| Acer Predator Helios Neo 16 (2024) (v6.92.6600) | |
| Media de la clase Gaming (4800 - 32988, n=147, últimos 2 años) | |
| HP Victus 16 (2024) (v6.92.6600) | |
| Nubia RedMagic Titan 16 Pro (v6.92.6600) | |
| Gigabyte G6X 9KG (2024) (v6.92.6600) | |
| AIDA64 / FPU Mandel | |
| Medio Intel Core i9-14900HX (32543 - 83662, n=36) | |
| Nubia RedMagic Titan 16 Pro (v6.92.6600, Gaming Mode) | |
| Lenovo Legion Pro 5 16IRX9 G9 (v6.92.6600) | |
| Acer Predator Helios Neo 16 (2024) (v6.92.6600) | |
| Media de la clase Gaming (12321 - 134044, n=147, últimos 2 años) | |
| SCHENKER XMG Pro 16 Studio (Mid 24) (v6.92.6600) | |
| HP Victus 16 (2024) (v6.92.6600) | |
| Gigabyte G6X 9KG (2024) (v6.92.6600) | |
| Nubia RedMagic Titan 16 Pro | |
| AIDA64 / CPU AES | |
| Nubia RedMagic Titan 16 Pro (v6.92.6600, Gaming Mode) | |
| Medio Intel Core i9-14900HX (86964 - 241777, n=36) | |
| Nubia RedMagic Titan 16 Pro (v6.92.6600) | |
| Lenovo Legion Pro 5 16IRX9 G9 (v6.92.6600) | |
| SCHENKER XMG Pro 16 Studio (Mid 24) (v6.92.6600) | |
| Media de la clase Gaming (19065 - 328679, n=147, últimos 2 años) | |
| Acer Predator Helios Neo 16 (2024) (v6.92.6600) | |
| HP Victus 16 (2024) (v6.92.6600) | |
| Gigabyte G6X 9KG (2024) (v6.92.6600) | |
| AIDA64 / CPU ZLib | |
| Nubia RedMagic Titan 16 Pro (v6.92.6600, Gaming Mode) | |
| Medio Intel Core i9-14900HX (1054 - 2292, n=36) | |
| Lenovo Legion Pro 5 16IRX9 G9 (v6.92.6600) | |
| SCHENKER XMG Pro 16 Studio (Mid 24) (v6.92.6600) | |
| Acer Predator Helios Neo 16 (2024) (v6.92.6600) | |
| Media de la clase Gaming (373 - 2531, n=147, últimos 2 años) | |
| HP Victus 16 (2024) (v6.92.6600) | |
| Gigabyte G6X 9KG (2024) (v6.92.6600) | |
| Nubia RedMagic Titan 16 Pro (v6.92.6600) | |
| AIDA64 / FP64 Ray-Trace | |
| Medio Intel Core i9-14900HX (6809 - 18349, n=36) | |
| Lenovo Legion Pro 5 16IRX9 G9 (v6.92.6600) | |
| Nubia RedMagic Titan 16 Pro (v6.92.6600, Gaming Mode) | |
| Media de la clase Gaming (2540 - 43430, n=147, últimos 2 años) | |
| SCHENKER XMG Pro 16 Studio (Mid 24) (v6.92.6600) | |
| Acer Predator Helios Neo 16 (2024) (v6.92.6600) | |
| HP Victus 16 (2024) (v6.92.6600) | |
| Gigabyte G6X 9KG (2024) (v6.92.6600) | |
| Nubia RedMagic Titan 16 Pro (v6.92.6600) | |
| AIDA64 / CPU PhotoWorxx | |
| Lenovo Legion Pro 5 16IRX9 G9 (v6.92.6600) | |
| SCHENKER XMG Pro 16 Studio (Mid 24) (v6.92.6600) | |
| Medio Intel Core i9-14900HX (23903 - 54702, n=36) | |
| Acer Predator Helios Neo 16 (2024) (v6.92.6600) | |
| Media de la clase Gaming (10805 - 60161, n=147, últimos 2 años) | |
| HP Victus 16 (2024) (v6.92.6600) | |
| Gigabyte G6X 9KG (2024) (v6.92.6600) | |
| Nubia RedMagic Titan 16 Pro (v6.92.6600) | |
| Nubia RedMagic Titan 16 Pro (v6.92.6600, Gaming Mode) | |
Rendimiento del sistema
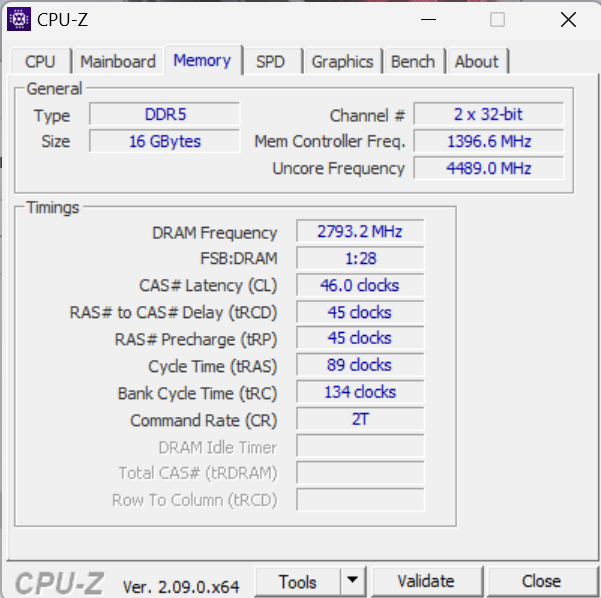
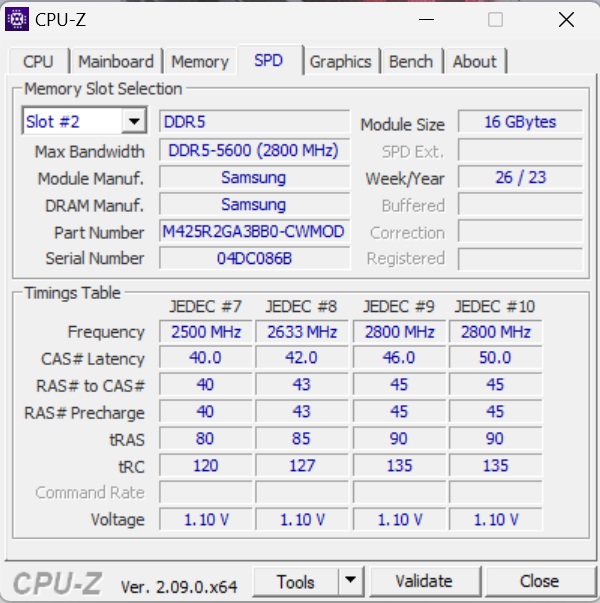
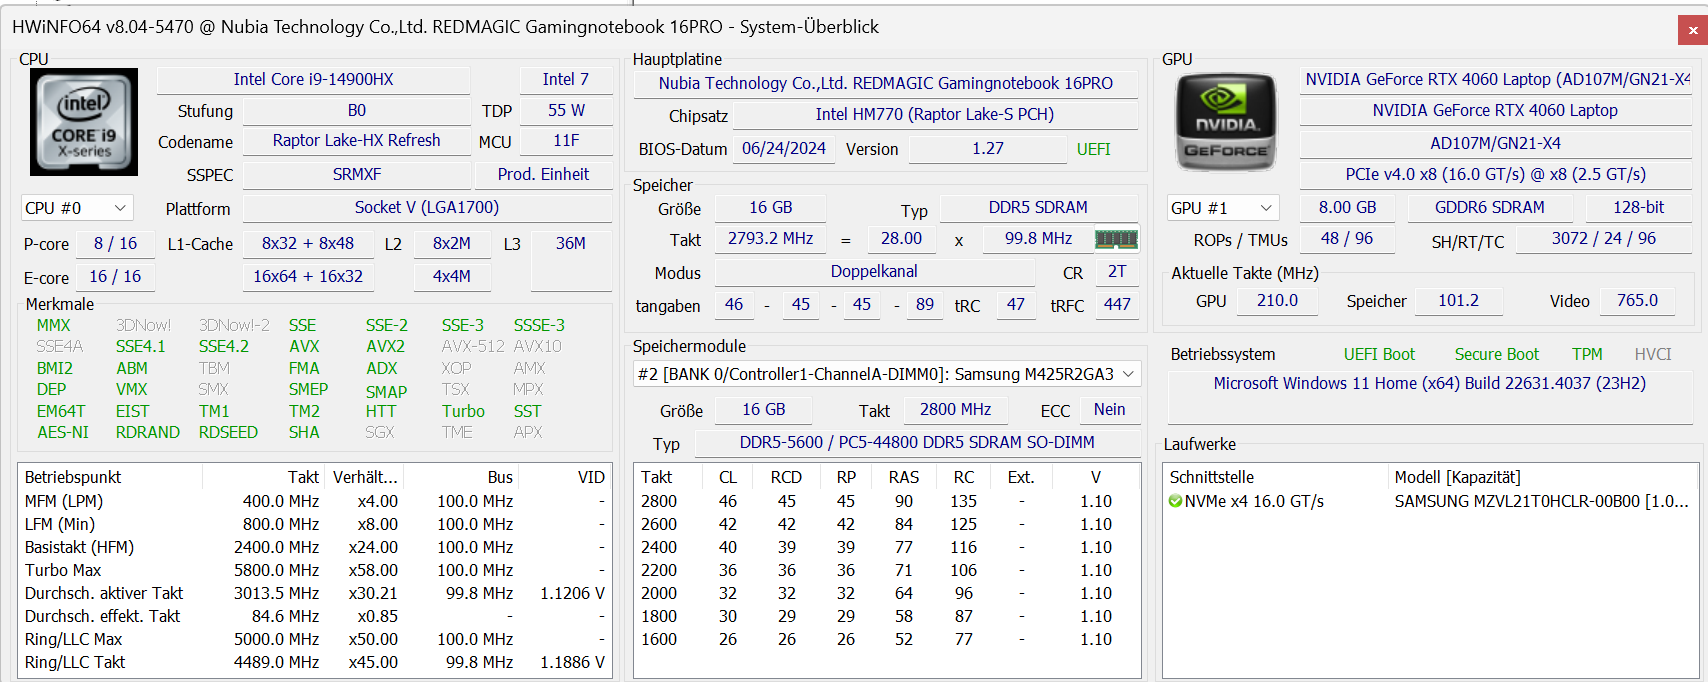
El buen funcionamiento del sistema proporciona potencia suficiente para aplicaciones exigentes como juegos, renderizado y streaming. Sin embargo, parte de su potencia de cálculo queda sin utilizar, ya que la memoria RAM (16 GB, DDR5-5600) sólo funciona en modo de canal único: las bajas velocidades de transferencia de memoria del portátil en comparación con la competencia así lo confirman. La instalación de un segundo módulo de memoria (= modo de doble canal activo) pondría remedio a esto.
CrossMark: Overall | Productivity | Creativity | Responsiveness
WebXPRT 3: Overall
WebXPRT 4: Overall
Mozilla Kraken 1.1: Total
| PCMark 10 / Score | |
| Acer Predator Helios Neo 16 (2024) | |
| Lenovo Legion Pro 5 16IRX9 G9 | |
| SCHENKER XMG Pro 16 Studio (Mid 24) | |
| Medio Intel Core i9-14900HX, NVIDIA GeForce RTX 4060 Laptop GPU (7830 - 8322, n=2) | |
| Nubia RedMagic Titan 16 Pro | |
| Media de la clase Gaming (5776 - 9852, n=133, últimos 2 años) | |
| Gigabyte G6X 9KG (2024) | |
| HP Victus 16 (2024) | |
| PCMark 10 / Essentials | |
| Acer Predator Helios Neo 16 (2024) | |
| Medio Intel Core i9-14900HX, NVIDIA GeForce RTX 4060 Laptop GPU (11022 - 11413, n=2) | |
| Lenovo Legion Pro 5 16IRX9 G9 | |
| Nubia RedMagic Titan 16 Pro | |
| HP Victus 16 (2024) | |
| Media de la clase Gaming (9057 - 12600, n=133, últimos 2 años) | |
| SCHENKER XMG Pro 16 Studio (Mid 24) | |
| Gigabyte G6X 9KG (2024) | |
| PCMark 10 / Productivity | |
| SCHENKER XMG Pro 16 Studio (Mid 24) | |
| Acer Predator Helios Neo 16 (2024) | |
| Gigabyte G6X 9KG (2024) | |
| Medio Intel Core i9-14900HX, NVIDIA GeForce RTX 4060 Laptop GPU (9776 - 10558, n=2) | |
| HP Victus 16 (2024) | |
| Media de la clase Gaming (6662 - 14612, n=133, últimos 2 años) | |
| Lenovo Legion Pro 5 16IRX9 G9 | |
| Nubia RedMagic Titan 16 Pro | |
| PCMark 10 / Digital Content Creation | |
| Lenovo Legion Pro 5 16IRX9 G9 | |
| Acer Predator Helios Neo 16 (2024) | |
| Medio Intel Core i9-14900HX, NVIDIA GeForce RTX 4060 Laptop GPU (12091 - 12979, n=2) | |
| SCHENKER XMG Pro 16 Studio (Mid 24) | |
| Media de la clase Gaming (6807 - 18475, n=133, últimos 2 años) | |
| Nubia RedMagic Titan 16 Pro | |
| Gigabyte G6X 9KG (2024) | |
| HP Victus 16 (2024) | |
| CrossMark / Overall | |
| Acer Predator Helios Neo 16 (2024) | |
| Medio Intel Core i9-14900HX, NVIDIA GeForce RTX 4060 Laptop GPU (2103 - 2184, n=2) | |
| Lenovo Legion Pro 5 16IRX9 G9 | |
| Nubia RedMagic Titan 16 Pro | |
| SCHENKER XMG Pro 16 Studio (Mid 24) | |
| Gigabyte G6X 9KG (2024) | |
| HP Victus 16 (2024) | |
| Media de la clase Gaming (1247 - 2344, n=114, últimos 2 años) | |
| CrossMark / Productivity | |
| Acer Predator Helios Neo 16 (2024) | |
| Nubia RedMagic Titan 16 Pro | |
| Medio Intel Core i9-14900HX, NVIDIA GeForce RTX 4060 Laptop GPU (2040 - 2042, n=2) | |
| Lenovo Legion Pro 5 16IRX9 G9 | |
| SCHENKER XMG Pro 16 Studio (Mid 24) | |
| Gigabyte G6X 9KG (2024) | |
| Media de la clase Gaming (1299 - 2204, n=114, últimos 2 años) | |
| HP Victus 16 (2024) | |
| CrossMark / Creativity | |
| Acer Predator Helios Neo 16 (2024) | |
| Lenovo Legion Pro 5 16IRX9 G9 | |
| SCHENKER XMG Pro 16 Studio (Mid 24) | |
| Medio Intel Core i9-14900HX, NVIDIA GeForce RTX 4060 Laptop GPU (2240 - 2472, n=2) | |
| Nubia RedMagic Titan 16 Pro | |
| HP Victus 16 (2024) | |
| Media de la clase Gaming (1275 - 2660, n=114, últimos 2 años) | |
| Gigabyte G6X 9KG (2024) | |
| CrossMark / Responsiveness | |
| Acer Predator Helios Neo 16 (2024) | |
| Gigabyte G6X 9KG (2024) | |
| Nubia RedMagic Titan 16 Pro | |
| Lenovo Legion Pro 5 16IRX9 G9 | |
| Medio Intel Core i9-14900HX, NVIDIA GeForce RTX 4060 Laptop GPU (1849 - 1899, n=2) | |
| HP Victus 16 (2024) | |
| SCHENKER XMG Pro 16 Studio (Mid 24) | |
| Media de la clase Gaming (1030 - 2330, n=114, últimos 2 años) | |
| WebXPRT 3 / Overall | |
| Medio Intel Core i9-14900HX, NVIDIA GeForce RTX 4060 Laptop GPU (329 - 339, n=2) | |
| Nubia RedMagic Titan 16 Pro | |
| Acer Predator Helios Neo 16 (2024) | |
| SCHENKER XMG Pro 16 Studio (Mid 24) | |
| Gigabyte G6X 9KG (2024) | |
| Lenovo Legion Pro 5 16IRX9 G9 | |
| Media de la clase Gaming (215 - 480, n=127, últimos 2 años) | |
| HP Victus 16 (2024) | |
| WebXPRT 4 / Overall | |
| Medio Intel Core i9-14900HX, NVIDIA GeForce RTX 4060 Laptop GPU (309 - 319, n=2) | |
| Nubia RedMagic Titan 16 Pro | |
| Acer Predator Helios Neo 16 (2024) | |
| SCHENKER XMG Pro 16 Studio (Mid 24) | |
| Lenovo Legion Pro 5 16IRX9 G9 | |
| Media de la clase Gaming (176.4 - 335, n=115, últimos 2 años) | |
| Gigabyte G6X 9KG (2024) | |
| HP Victus 16 (2024) | |
| Mozilla Kraken 1.1 / Total | |
| HP Victus 16 (2024) | |
| Gigabyte G6X 9KG (2024) | |
| Media de la clase Gaming (409 - 674, n=139, últimos 2 años) | |
| Lenovo Legion Pro 5 16IRX9 G9 | |
| SCHENKER XMG Pro 16 Studio (Mid 24) | |
| Acer Predator Helios Neo 16 (2024) | |
| Nubia RedMagic Titan 16 Pro | |
| Medio Intel Core i9-14900HX, NVIDIA GeForce RTX 4060 Laptop GPU (430 - 439, n=2) | |
* ... más pequeño es mejor
| PCMark 10 Score | 7830 puntos | |
ayuda | ||
| AIDA64 / Memory Copy | |
| SCHENKER XMG Pro 16 Studio (Mid 24) | |
| Lenovo Legion Pro 5 16IRX9 G9 | |
| Acer Predator Helios Neo 16 (2024) | |
| Medio Intel Core i9-14900HX (38028 - 83392, n=36) | |
| HP Victus 16 (2024) | |
| Media de la clase Gaming (21750 - 97515, n=147, últimos 2 años) | |
| Gigabyte G6X 9KG (2024) | |
| Nubia RedMagic Titan 16 Pro | |
| AIDA64 / Memory Read | |
| Lenovo Legion Pro 5 16IRX9 G9 | |
| SCHENKER XMG Pro 16 Studio (Mid 24) | |
| Acer Predator Helios Neo 16 (2024) | |
| Medio Intel Core i9-14900HX (43306 - 87568, n=36) | |
| HP Victus 16 (2024) | |
| Media de la clase Gaming (22956 - 102937, n=147, últimos 2 años) | |
| Gigabyte G6X 9KG (2024) | |
| Nubia RedMagic Titan 16 Pro | |
| AIDA64 / Memory Write | |
| Lenovo Legion Pro 5 16IRX9 G9 | |
| SCHENKER XMG Pro 16 Studio (Mid 24) | |
| Medio Intel Core i9-14900HX (37146 - 80589, n=36) | |
| Acer Predator Helios Neo 16 (2024) | |
| Media de la clase Gaming (22297 - 108954, n=147, últimos 2 años) | |
| HP Victus 16 (2024) | |
| Gigabyte G6X 9KG (2024) | |
| Nubia RedMagic Titan 16 Pro | |
| AIDA64 / Memory Latency | |
| HP Victus 16 (2024) | |
| Media de la clase Gaming (59.5 - 259, n=147, últimos 2 años) | |
| Acer Predator Helios Neo 16 (2024) | |
| Gigabyte G6X 9KG (2024) | |
| Medio Intel Core i9-14900HX (76.1 - 105, n=36) | |
| SCHENKER XMG Pro 16 Studio (Mid 24) | |
| Lenovo Legion Pro 5 16IRX9 G9 | |
| Nubia RedMagic Titan 16 Pro | |
* ... más pequeño es mejor
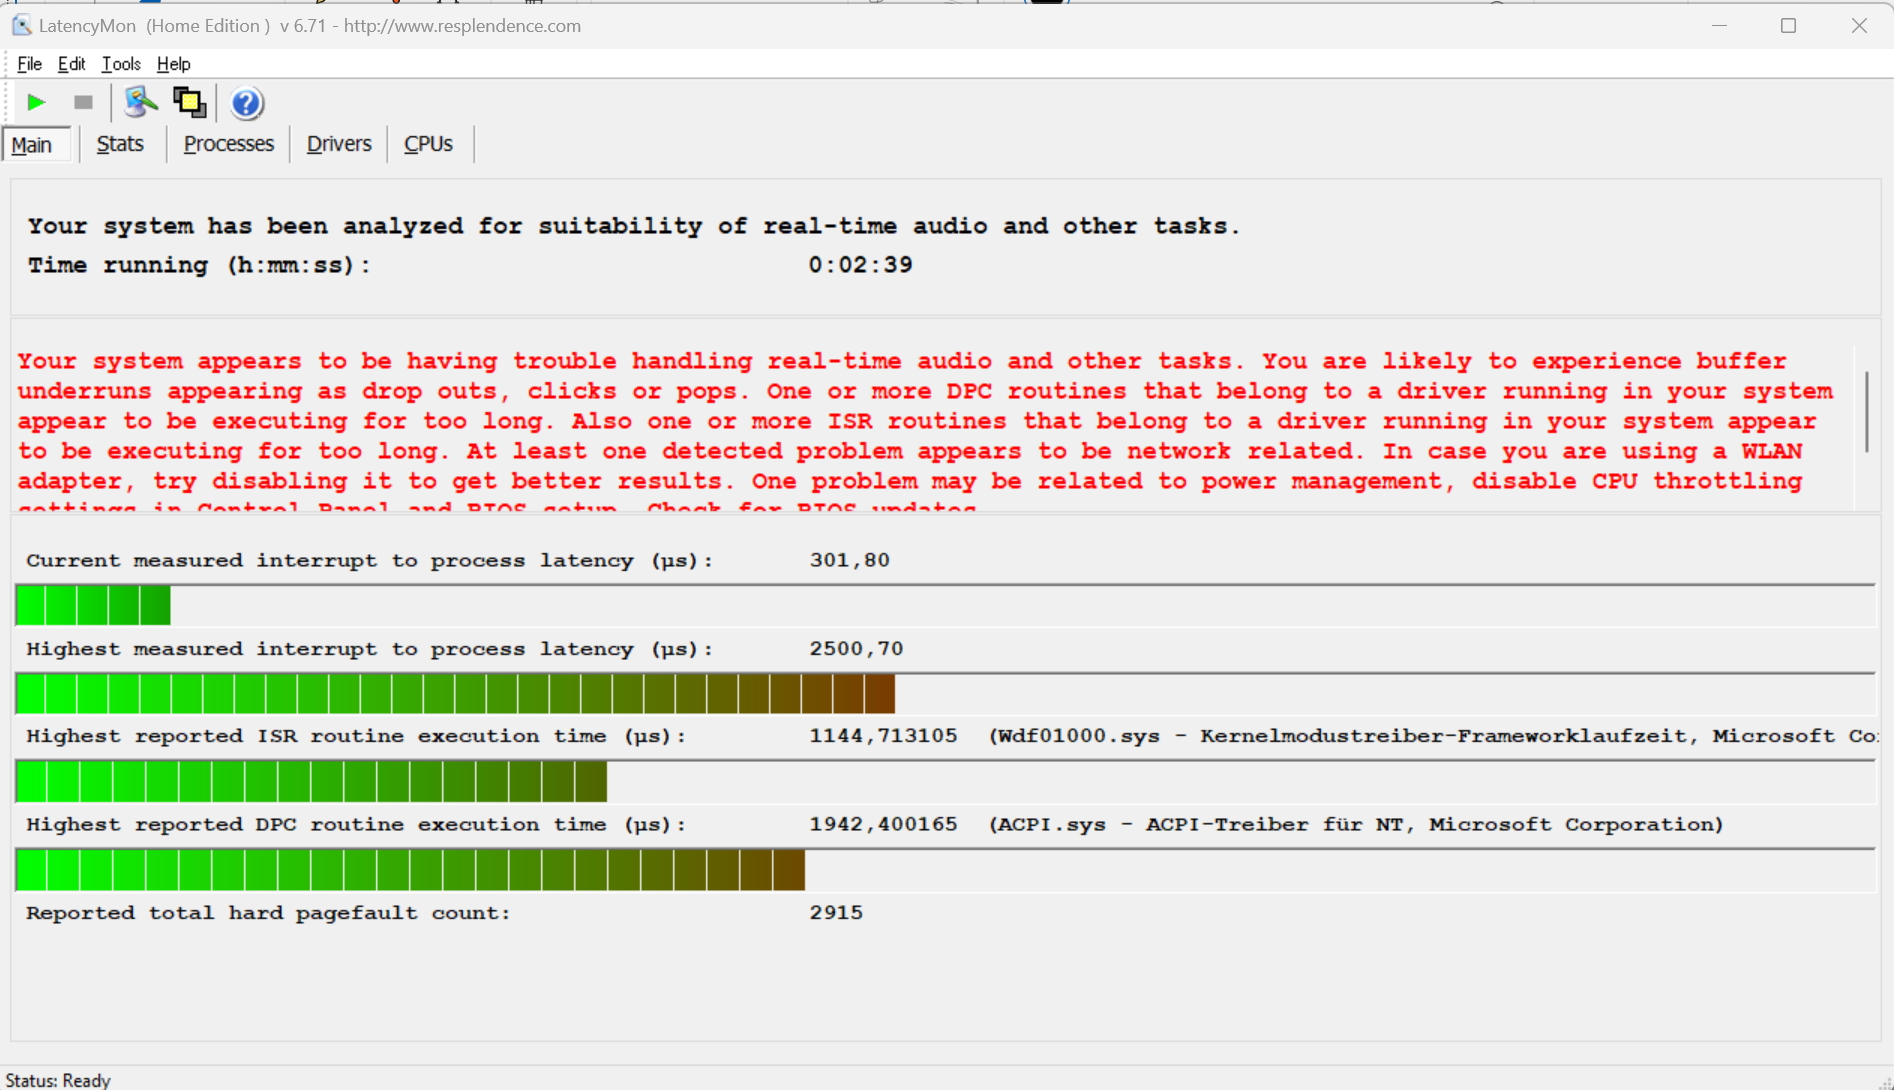
Latencias del CPD
Las altas latencias impiden la edición de vídeo y audio en tiempo real. Las futuras actualizaciones del software podrían suponer mejoras o incluso deterioros.
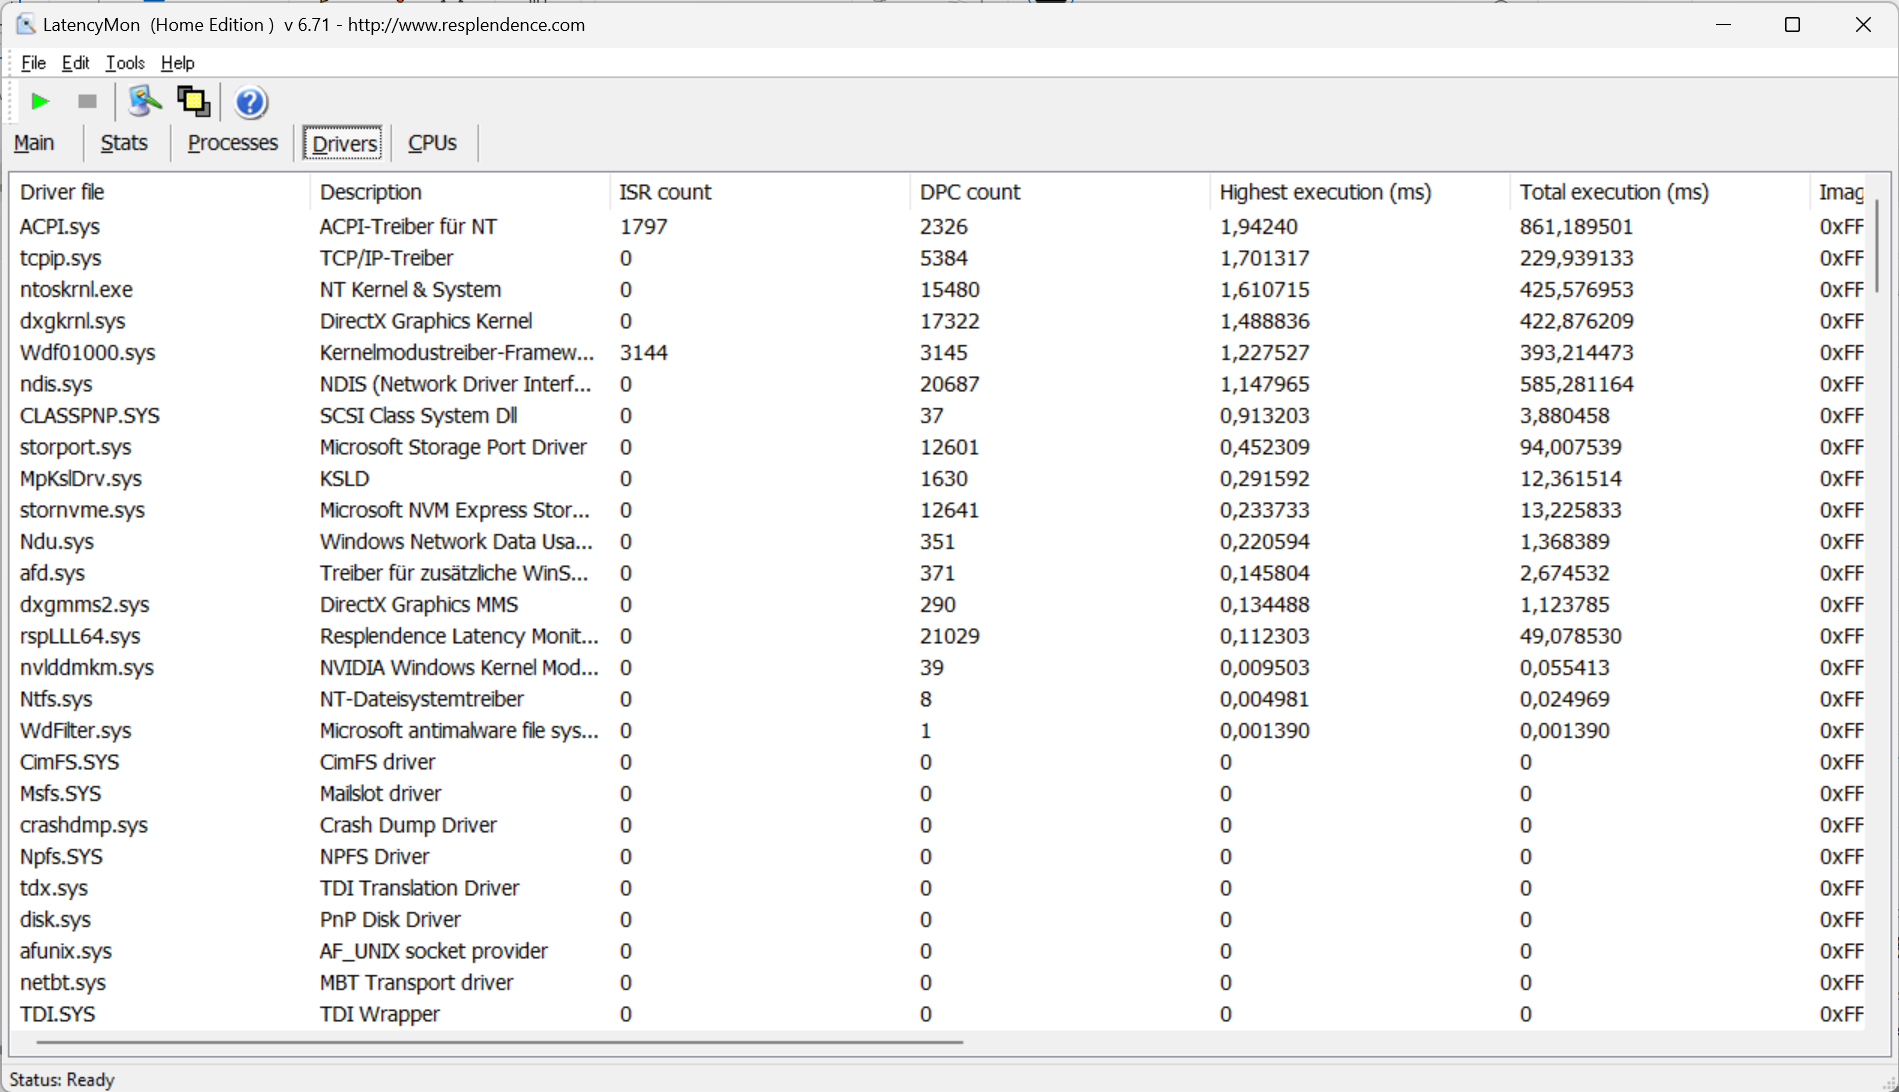
| DPC Latencies / LatencyMon - interrupt to process latency (max), Web, Youtube, Prime95 | |
| Nubia RedMagic Titan 16 Pro | |
| Gigabyte G6X 9KG (2024) | |
| SCHENKER XMG Pro 16 Studio (Mid 24) | |
| Acer Predator Helios Neo 16 (2024) | |
| Lenovo Legion Pro 5 16IRX9 G9 | |
| HP Victus 16 (2024) | |
* ... más pequeño es mejor
Dispositivos de almacenamiento
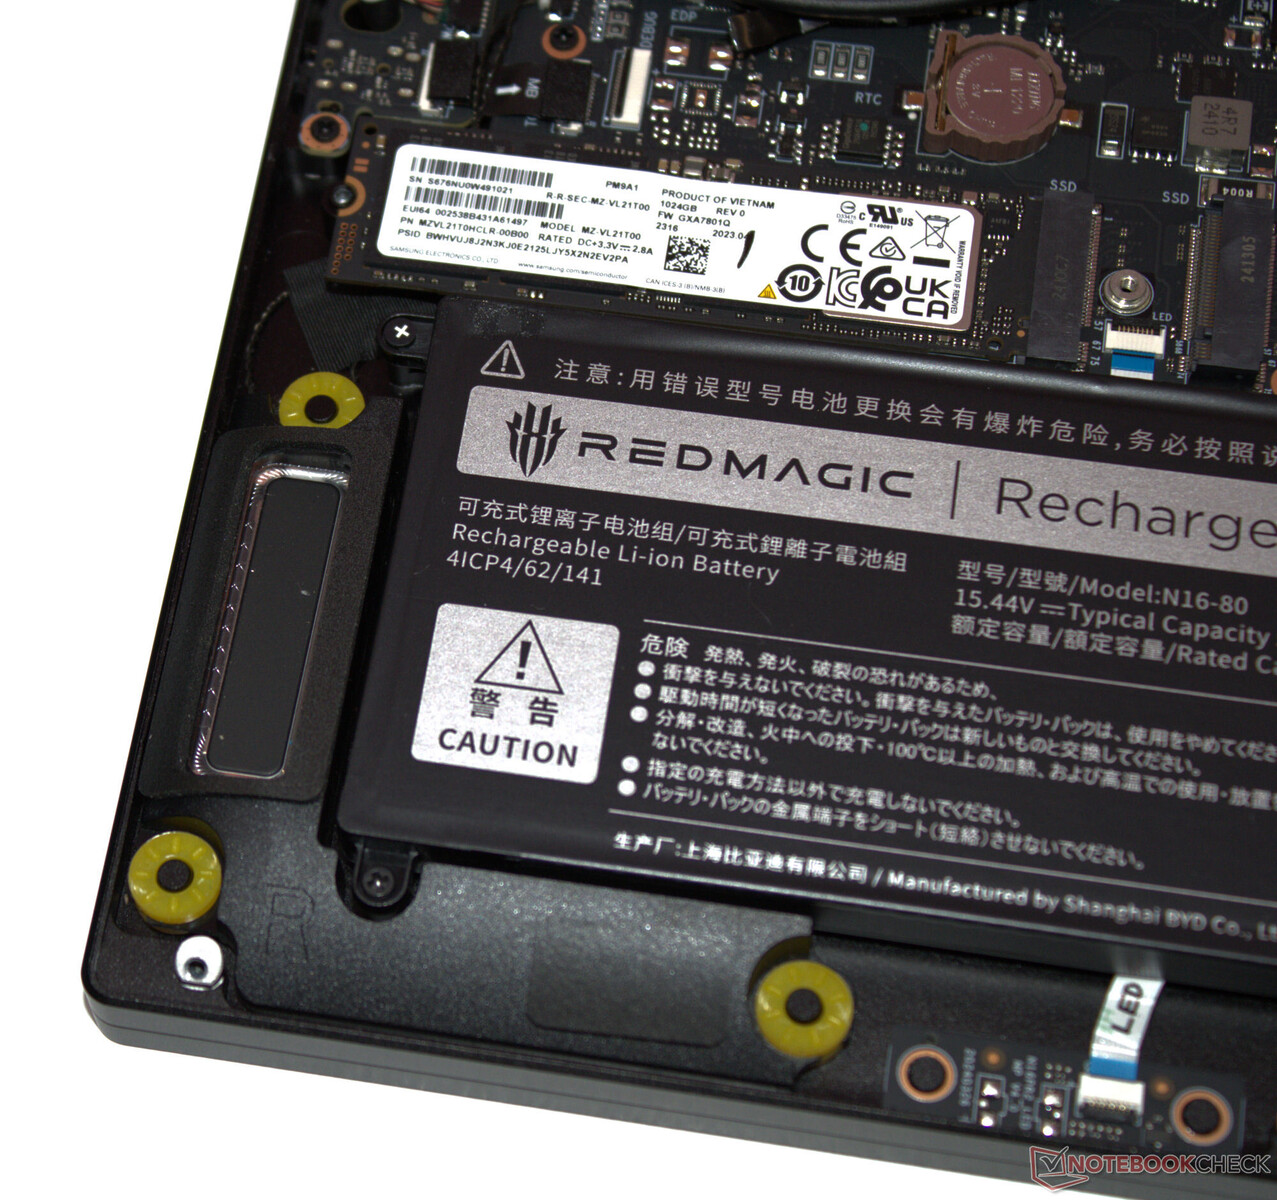
La unidad SSD PCIe 4 (M.2-2280) de Samsung ofrece una capacidad de almacenamiento de 1 TB y proporciona muy buenas velocidades de transmisión de datos. Positivo: No observamos estrangulamiento inducido térmicamente. El portátil tiene espacio para una segunda SSD PCIe 4.

* ... más pequeño es mejor
Reading continuous performance: DiskSpd Read Loop, Queue Depth 8
Tarjeta gráfica
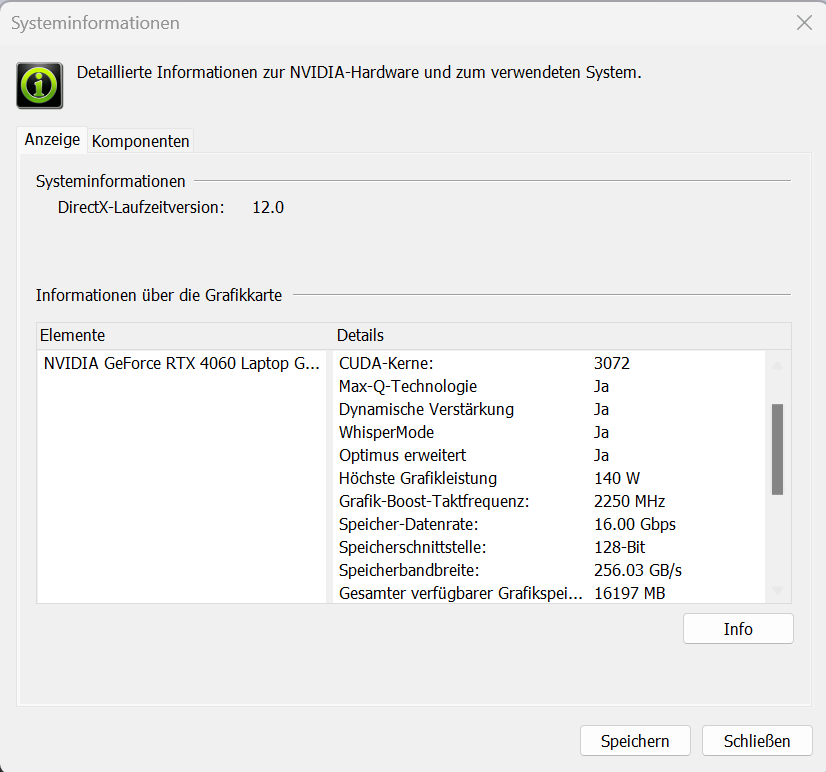
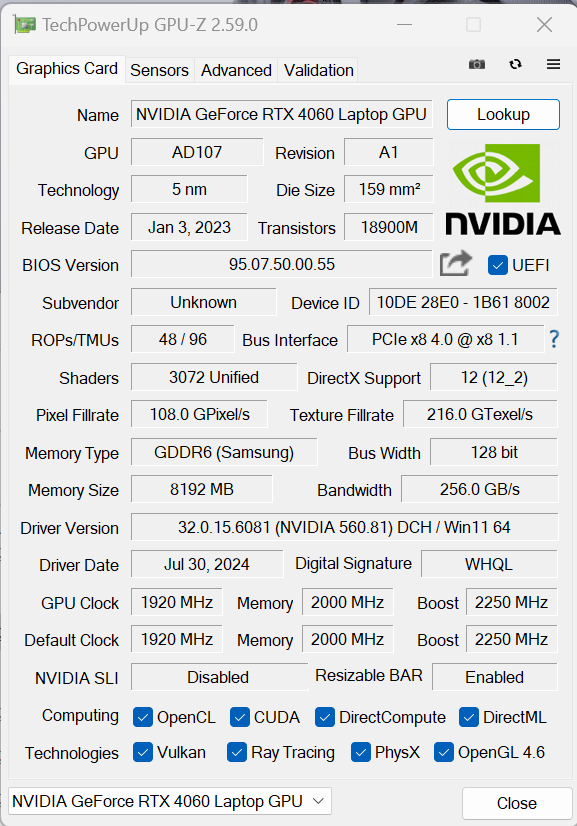
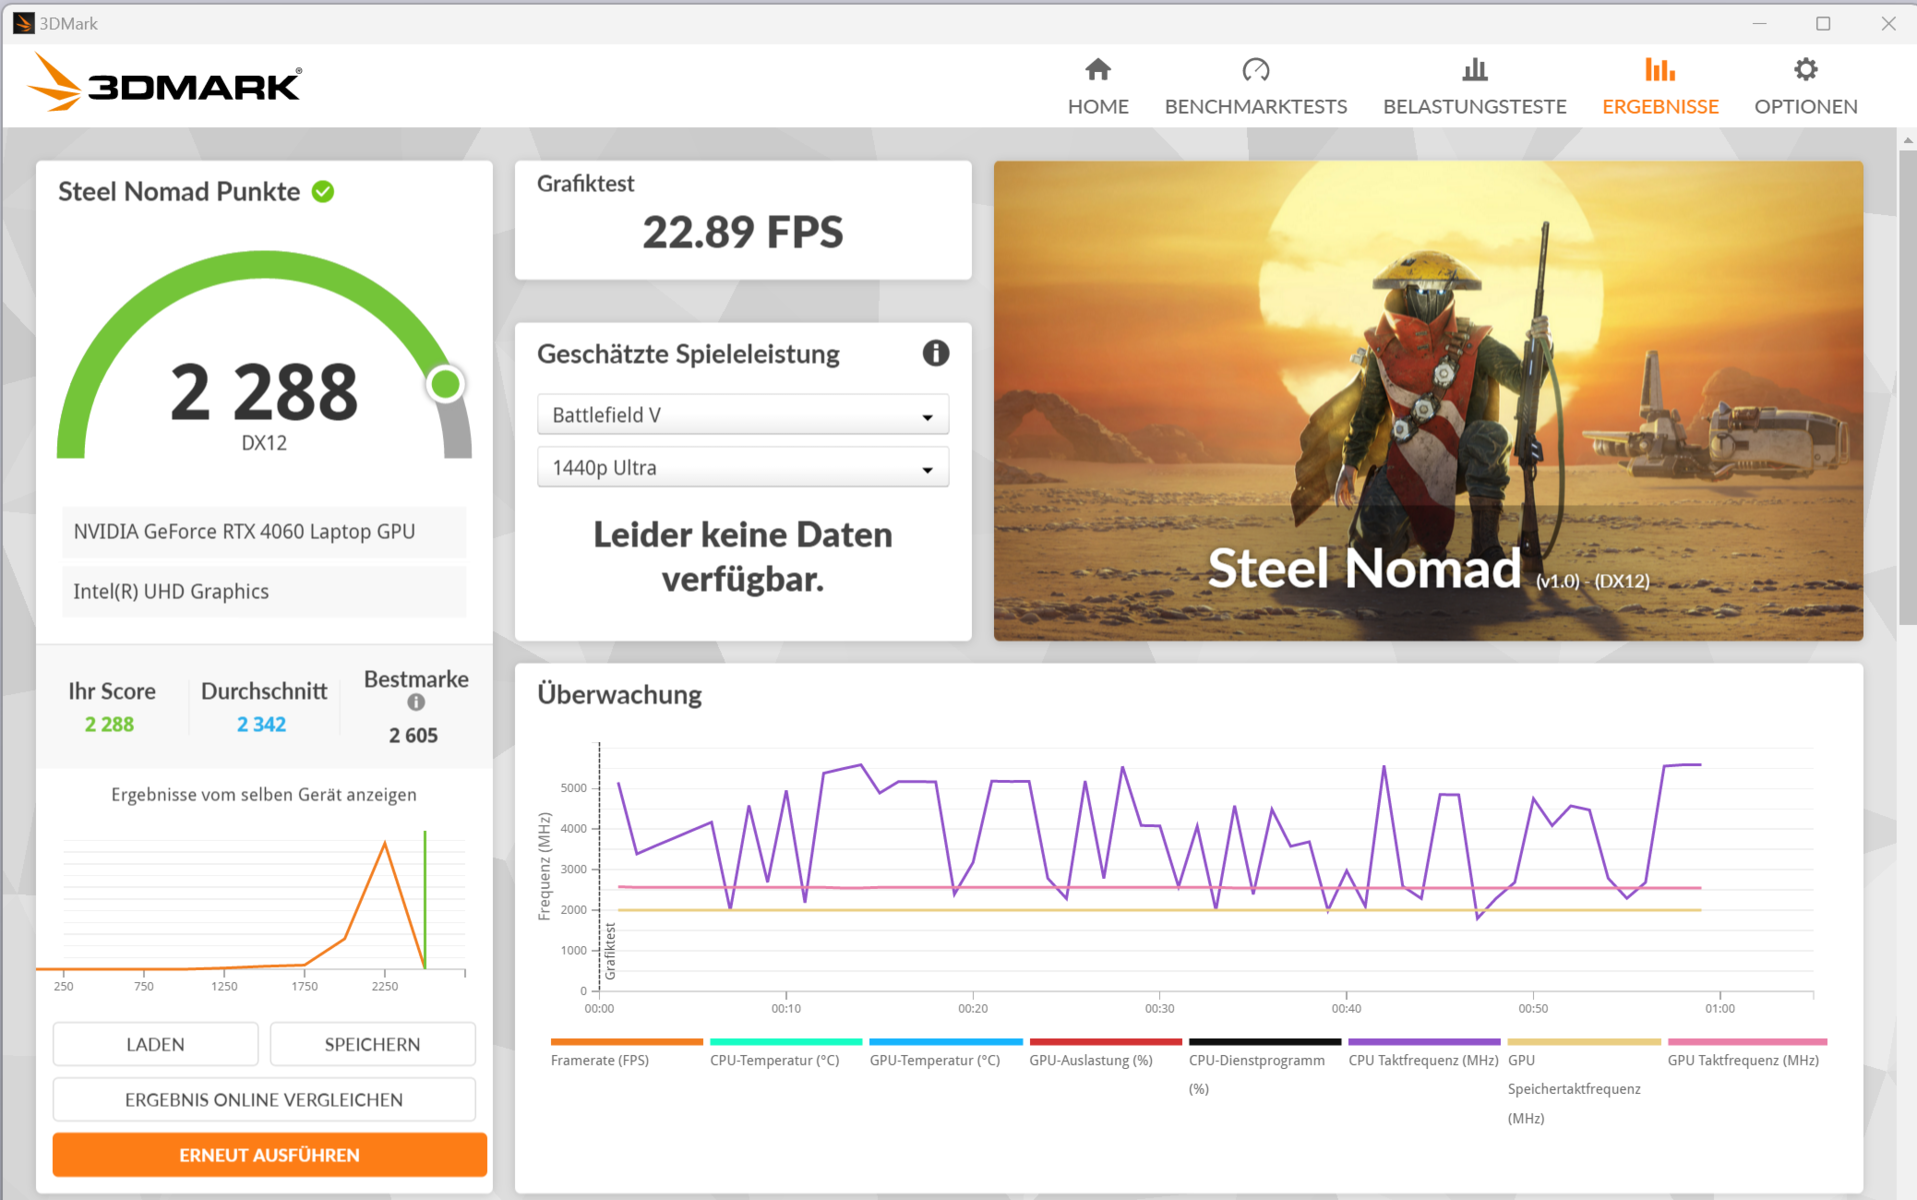
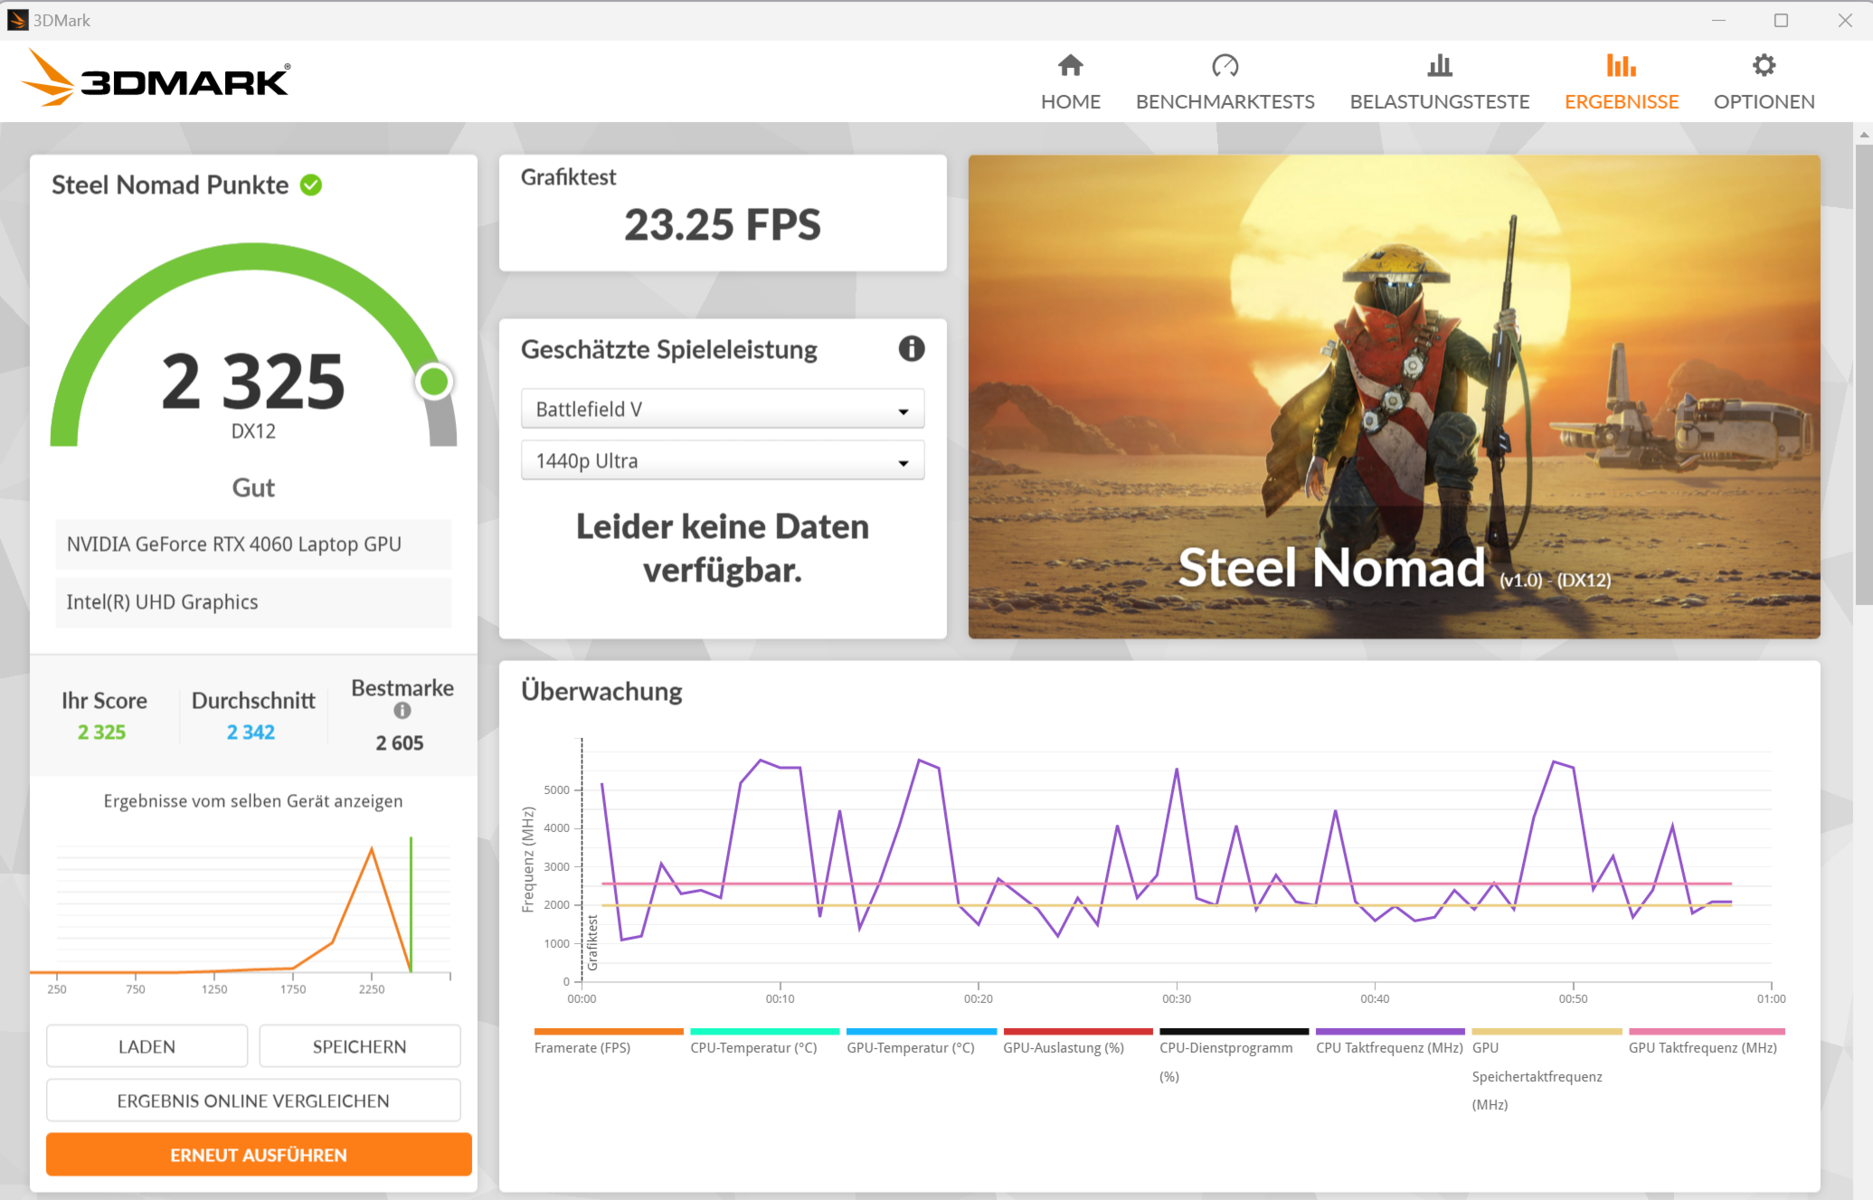
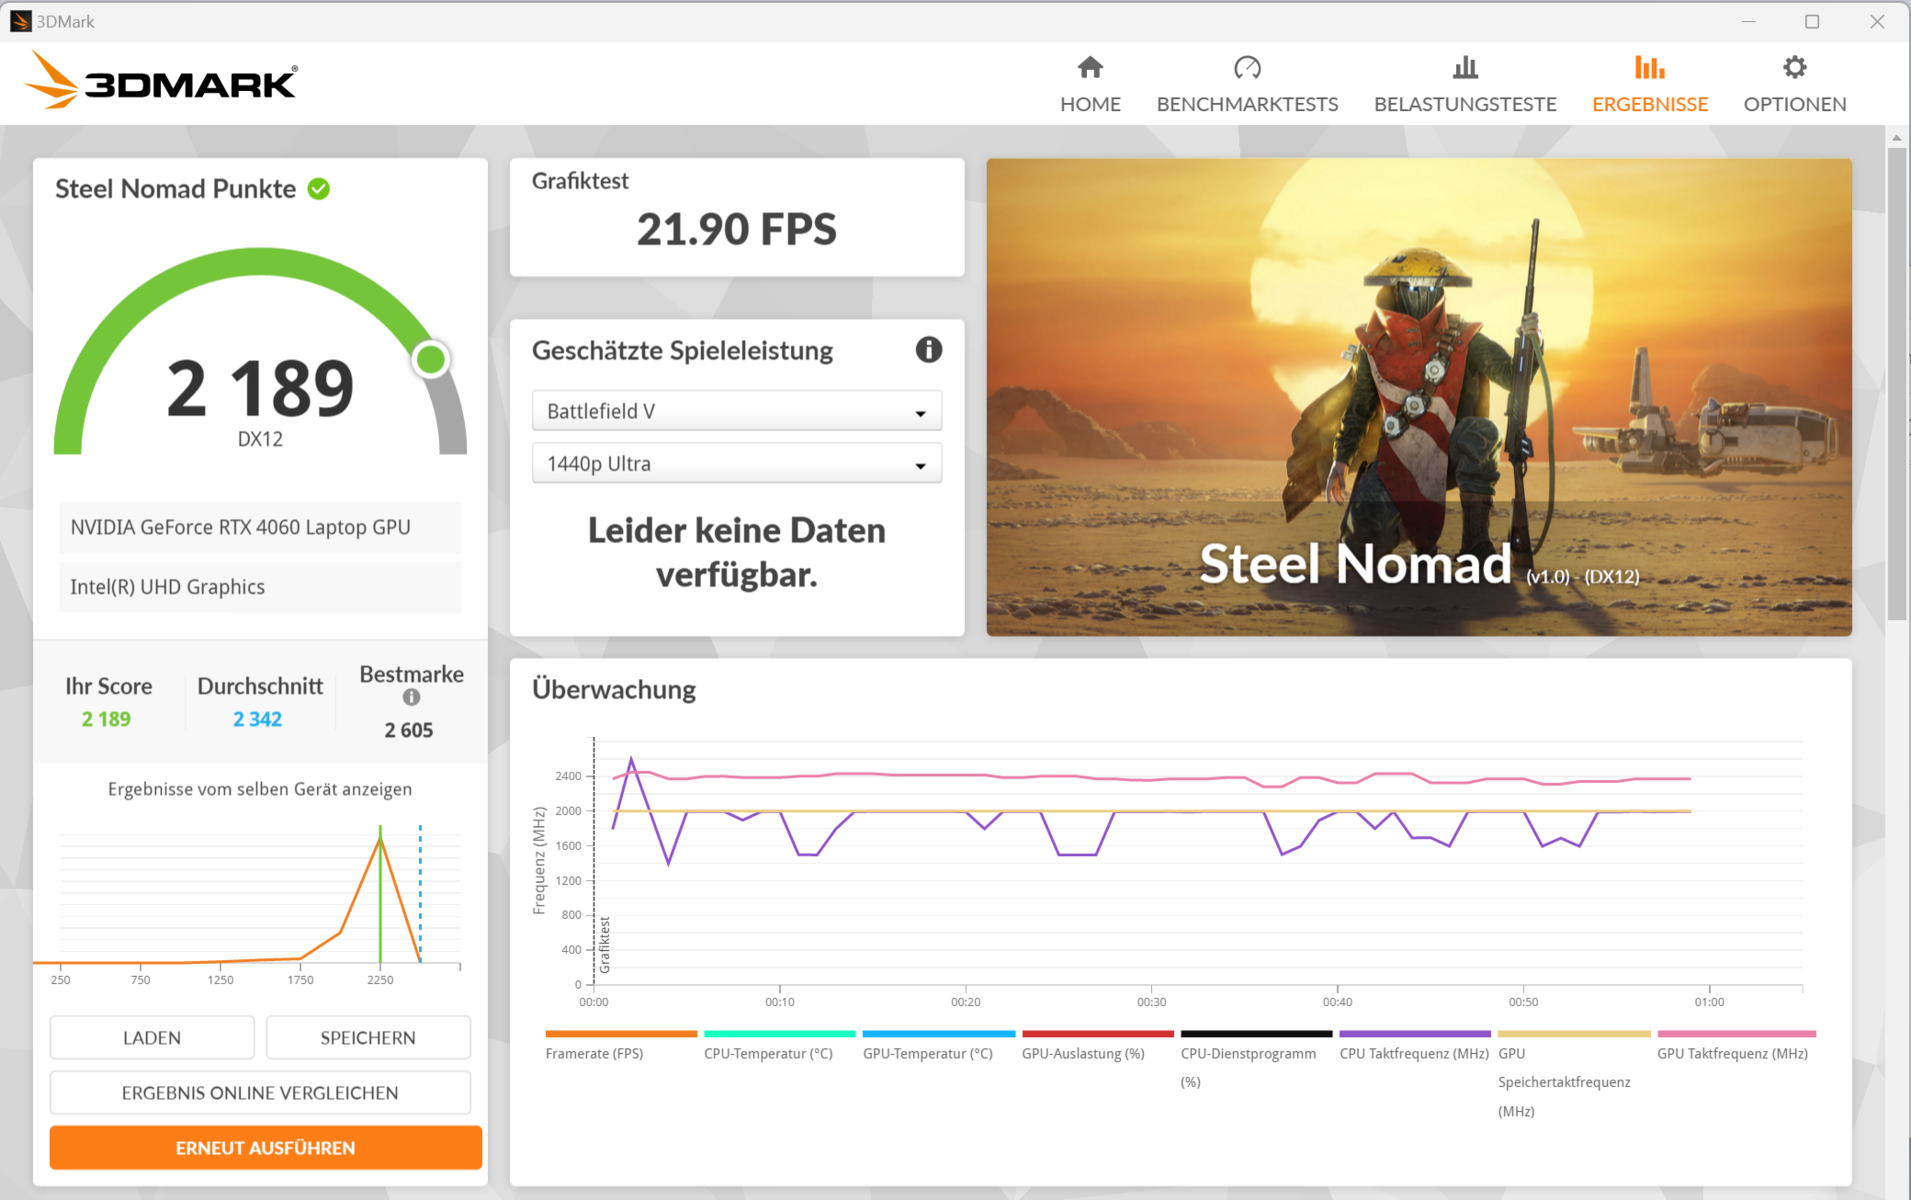
La GeForce RTX 4060 (3.072 sombreadores, bus de 128 bits, 8 GB GDDR6) es actualmente una GPU de juegos de gama (baja) media. Nubia le concede un TGP máximo de 140 vatios; más no es posible. Sus resultados en los bancos de pruebas están ligeramente por encima de la media de la RTX-4060( modoequilibrado ). El modo de juego no se traduce en un aumento. El cambio entre dGPU y Optimus no requiere un reinicio-Advanced Optimus es compatible.

| 3DMark Performance Rating - Percent | |
| Acer Predator Helios Neo 16 (2024) | |
| Media de la clase Gaming | |
| SCHENKER XMG Pro 16 Studio (Mid 24) | |
| Lenovo Legion Pro 5 16IRX9 G9 | |
| Nubia RedMagic Titan 16 Pro | |
| Nubia RedMagic Titan 16 Pro | |
| Gigabyte G6X 9KG (2024) | |
| HP Victus 16 (2024) | |
| Medio NVIDIA GeForce RTX 4060 Laptop GPU | |
| 3DMark 11 - 1280x720 Performance GPU | |
| Acer Predator Helios Neo 16 (2024) | |
| Media de la clase Gaming (10741 - 72178, n=143, últimos 2 años) | |
| SCHENKER XMG Pro 16 Studio (Mid 24) | |
| Lenovo Legion Pro 5 16IRX9 G9 | |
| Nubia RedMagic Titan 16 Pro (Gaming Mode) | |
| Nubia RedMagic Titan 16 Pro | |
| Gigabyte G6X 9KG (2024) | |
| HP Victus 16 (2024) | |
| Medio NVIDIA GeForce RTX 4060 Laptop GPU (28136 - 38912, n=57) | |
| 3DMark | |
| 1920x1080 Fire Strike Graphics | |
| Acer Predator Helios Neo 16 (2024) | |
| Media de la clase Gaming (2913 - 56116, n=155, últimos 2 años) | |
| SCHENKER XMG Pro 16 Studio (Mid 24) | |
| Lenovo Legion Pro 5 16IRX9 G9 | |
| Gigabyte G6X 9KG (2024) | |
| HP Victus 16 (2024) | |
| Nubia RedMagic Titan 16 Pro (Gaming Mode) | |
| Nubia RedMagic Titan 16 Pro | |
| Medio NVIDIA GeForce RTX 4060 Laptop GPU (20533 - 29656, n=54) | |
| 2560x1440 Time Spy Graphics | |
| Acer Predator Helios Neo 16 (2024) | |
| Media de la clase Gaming (2295 - 24599, n=151, últimos 2 años) | |
| SCHENKER XMG Pro 16 Studio (Mid 24) | |
| Lenovo Legion Pro 5 16IRX9 G9 | |
| Nubia RedMagic Titan 16 Pro (Gaming Mode) | |
| Nubia RedMagic Titan 16 Pro | |
| Medio NVIDIA GeForce RTX 4060 Laptop GPU (7484 - 11451, n=56) | |
| HP Victus 16 (2024) | |
| Gigabyte G6X 9KG (2024) | |
| 3DMark 06 Standard Score | 55770 puntos | |
| 3DMark 11 Performance | 28427 puntos | |
| 3DMark Fire Strike Score | 22307 puntos | |
| 3DMark Time Spy Score | 10789 puntos | |
| 3DMark Steel Nomad Score | 2288 puntos | |
ayuda | ||
| Geekbench 6.4 | |
| GPU OpenCL | |
| Acer Predator Helios Neo 16 (2024) (6.2.1) | |
| Media de la clase Gaming (4321 - 234213, n=118, últimos 2 años) | |
| SCHENKER XMG Pro 16 Studio (Mid 24) (6.2.1) | |
| Nubia RedMagic Titan 16 Pro (6.2.1, Gaming Mode) | |
| Nubia RedMagic Titan 16 Pro (6.2.1) | |
| Gigabyte G6X 9KG (2024) (6.2.1) | |
| HP Victus 16 (2024) (6.2.1) | |
| Medio NVIDIA GeForce RTX 4060 Laptop GPU (4321 - 100831, n=40) | |
| Lenovo Legion Pro 5 16IRX9 G9 (6.2.1) | |
| GPU Vulkan | |
| SCHENKER XMG Pro 16 Studio (Mid 24) (6.2.1) | |
| Nubia RedMagic Titan 16 Pro (6.2.1, Gaming Mode) | |
| Gigabyte G6X 9KG (2024) (6.2.1) | |
| Acer Predator Helios Neo 16 (2024) (6.2.1) | |
| HP Victus 16 (2024) (6.2.1) | |
| Media de la clase Gaming (4286 - 231659, n=110, últimos 2 años) | |
| Nubia RedMagic Titan 16 Pro (6.2.1) | |
| Lenovo Legion Pro 5 16IRX9 G9 (6.2.1) | |
| Medio NVIDIA GeForce RTX 4060 Laptop GPU (4286 - 101001, n=36) | |
| V-Ray Benchmark Next 4.10 | |
| GPU | |
| Media de la clase Gaming (54 - 1317, n=122, últimos 2 años) | |
| Lenovo Legion Pro 5 16IRX9 G9 (v4.10.07 ) | |
| Acer Predator Helios Neo 16 (2024) (v4.10.07 ) | |
| Gigabyte G6X 9KG (2024) (v4.10.07 ) | |
| Nubia RedMagic Titan 16 Pro (v4.10.07 ) | |
| Nubia RedMagic Titan 16 Pro (v4.10.07, Gaming Mode ) | |
| Medio NVIDIA GeForce RTX 4060 Laptop GPU (483 - 715, n=46) | |
| HP Victus 16 (2024) (v4.10.07 ) | |
| SCHENKER XMG Pro 16 Studio (Mid 24) (v4.10.07 ) | |
| CPU | |
| Nubia RedMagic Titan 16 Pro (v4.10.07, Gaming Mode) | |
| Lenovo Legion Pro 5 16IRX9 G9 (v4.10.07 ) | |
| SCHENKER XMG Pro 16 Studio (Mid 24) (v4.10.07 ) | |
| Acer Predator Helios Neo 16 (2024) (v4.10.07 ) | |
| HP Victus 16 (2024) (v4.10.07 ) | |
| Media de la clase Gaming (5413 - 44129, n=122, últimos 2 años) | |
| Medio NVIDIA GeForce RTX 4060 Laptop GPU (12680 - 32360, n=46) | |
| Gigabyte G6X 9KG (2024) (v4.10.07 ) | |
| Nubia RedMagic Titan 16 Pro (v4.10.07 ) | |
* ... más pequeño es mejor
Rendimiento en juegos
La Titan está diseñada para juegos QHD con ajustes de altos a máximos. El hardware instalado genera velocidades de fotogramas ligeramente superiores a la media de la RTX 4060( modoequilibrado ). El modo de juego resulta un plus cuando se ejecutan juegos que se benefician de un mayor rendimiento de la CPU, como Dota 2 Reborn y X-Plane 11. Por lo demás, su rendimiento gráfico es idéntico.
| Cyberpunk 2077 2.2 Phantom Liberty - 1920x1080 Ultra Preset (FSR off) | |
| Media de la clase Gaming (6.76 - 158, n=90, últimos 2 años) | |
| Acer Predator Helios Neo 16 (2024) (2.02) | |
| SCHENKER XMG Pro 16 Studio (Mid 24) (2.12) | |
| Lenovo Legion Pro 5 16IRX9 G9 (2.12) | |
| Nubia RedMagic Titan 16 Pro (2.12, Gaming Mode) | |
| Nubia RedMagic Titan 16 Pro (2.12) | |
| Medio NVIDIA GeForce RTX 4060 Laptop GPU (56.4 - 93.1, n=31) | |
| Gigabyte G6X 9KG (2024) (2.02) | |
| HP Victus 16 (2024) (2.02) | |
| Final Fantasy XV Benchmark - 1920x1080 High Quality | |
| Acer Predator Helios Neo 16 (2024) (1.3) | |
| SCHENKER XMG Pro 16 Studio (Mid 24) (1.3) | |
| Media de la clase Gaming (19.2 - 201, n=144, últimos 2 años) | |
| Lenovo Legion Pro 5 16IRX9 G9 (1.3) | |
| Nubia RedMagic Titan 16 Pro (1.3) | |
| Nubia RedMagic Titan 16 Pro (1.3, Gaming Mode ) | |
| Gigabyte G6X 9KG (2024) (1.3) | |
| HP Victus 16 (2024) (1.3) | |
| Medio NVIDIA GeForce RTX 4060 Laptop GPU (75.1 - 109.8, n=51) | |
| Strange Brigade - 1920x1080 ultra AA:ultra AF:16 | |
| Media de la clase Gaming (38.9 - 420, n=140, últimos 2 años) | |
| Acer Predator Helios Neo 16 (2024) (1.47.22.14 D3D12) | |
| SCHENKER XMG Pro 16 Studio (Mid 24) (1.47.22.14 D3D12) | |
| Lenovo Legion Pro 5 16IRX9 G9 (1.47.22.14 D3D12) | |
| Nubia RedMagic Titan 16 Pro (1.47.22.14 D3D12, Gaming Mode ) | |
| Nubia RedMagic Titan 16 Pro (1.47.22.14 D3D12) | |
| Gigabyte G6X 9KG (2024) (1.47.22.14 D3D12) | |
| Medio NVIDIA GeForce RTX 4060 Laptop GPU (135.3 - 210, n=50) | |
| HP Victus 16 (2024) (1.47.22.14 D3D12) | |
| Dota 2 Reborn - 1920x1080 ultra (3/3) best looking | |
| Lenovo Legion Pro 5 16IRX9 G9 | |
| Acer Predator Helios Neo 16 (2024) | |
| Nubia RedMagic Titan 16 Pro (Gaming Mode) | |
| SCHENKER XMG Pro 16 Studio (Mid 24) | |
| HP Victus 16 (2024) | |
| Media de la clase Gaming (65.1 - 220, n=148, últimos 2 años) | |
| Nubia RedMagic Titan 16 Pro | |
| Medio NVIDIA GeForce RTX 4060 Laptop GPU (115 - 183.8, n=53) | |
| Gigabyte G6X 9KG (2024) | |
| X-Plane 11.11 - 1920x1080 high (fps_test=3) | |
| Nubia RedMagic Titan 16 Pro (Gaming Mode) | |
| Lenovo Legion Pro 5 16IRX9 G9 | |
| Acer Predator Helios Neo 16 (2024) | |
| SCHENKER XMG Pro 16 Studio (Mid 24) | |
| Nubia RedMagic Titan 16 Pro | |
| Gigabyte G6X 9KG (2024) | |
| Media de la clase Gaming (32.8 - 166.2, n=151, últimos 2 años) | |
| Medio NVIDIA GeForce RTX 4060 Laptop GPU (60.7 - 141.1, n=54) | |
| HP Victus 16 (2024) | |
| Once Human | |
| 1920x1080 Very High Preset | |
| Nubia RedMagic Titan 16 Pro | |
| Medio NVIDIA GeForce RTX 4060 Laptop GPU (88.7 - 94.2, n=2) | |
| Media de la clase Gaming (14.2 - 94.2, n=2, últimos 2 años) | |
| 2560x1440 Very High Preset | |
| Nubia RedMagic Titan 16 Pro | |
| Media de la clase Gaming (n=1últimos 2 años) | |
| Medio NVIDIA GeForce RTX 4060 Laptop GPU (59.1 - 62.3, n=2) | |
| 2560x1440 Very High Preset + Quality FSR | |
| Nubia RedMagic Titan 16 Pro | |
| Medio NVIDIA GeForce RTX 4060 Laptop GPU (n=1) | |
| Media de la clase Gaming (n=1últimos 2 años) | |
| F1 24 | |
| 1920x1080 Ultra High Preset AA:T AF:16x | |
| Media de la clase Gaming (54.1 - 148, n=19, últimos 2 años) | |
| SCHENKER XMG Pro 16 Studio (Mid 24) | |
| Lenovo Legion Pro 5 16IRX9 G9 | |
| Nubia RedMagic Titan 16 Pro | |
| Medio NVIDIA GeForce RTX 4060 Laptop GPU (47.5 - 61.6, n=10) | |
| 2560x1440 Ultra High Preset AA:T AF:16x | |
| Media de la clase Gaming (36.7 - 100, n=16, últimos 2 años) | |
| SCHENKER XMG Pro 16 Studio (Mid 24) | |
| Nubia RedMagic Titan 16 Pro | |
| Medio NVIDIA GeForce RTX 4060 Laptop GPU (24.3 - 38.8, n=6) | |
| 2560x1440 Ultra High Preset + Quality DLSS AF:16x | |
| Media de la clase Gaming (59.2 - 150.4, n=12, últimos 2 años) | |
| SCHENKER XMG Pro 16 Studio (Mid 24) | |
| Nubia RedMagic Titan 16 Pro | |
| Medio NVIDIA GeForce RTX 4060 Laptop GPU (48.6 - 61, n=3) | |
| Ghost of Tsushima | |
| 1920x1080 Very High Preset AA:T | |
| SCHENKER XMG Pro 16 Studio (Mid 24) | |
| Nubia RedMagic Titan 16 Pro | |
| Medio NVIDIA GeForce RTX 4060 Laptop GPU (55.6 - 63.4, n=5) | |
| Media de la clase Gaming (28.5 - 73.7, n=7, últimos 2 años) | |
| 2560x1440 Very High Preset AA:T | |
| SCHENKER XMG Pro 16 Studio (Mid 24) | |
| Nubia RedMagic Titan 16 Pro | |
| Medio NVIDIA GeForce RTX 4060 Laptop GPU (41.1 - 47.7, n=3) | |
| Media de la clase Gaming (22.7 - 56.1, n=5, últimos 2 años) | |
| 2560x1440 Very High Preset + Quality DLSS | |
| SCHENKER XMG Pro 16 Studio (Mid 24) | |
| Media de la clase Gaming (63.6 - 74.2, n=3, últimos 2 años) | |
| Nubia RedMagic Titan 16 Pro | |
| Medio NVIDIA GeForce RTX 4060 Laptop GPU (n=1) | |
| The First Descendant | |
| 1920x1080 Ultra Preset | |
| SCHENKER XMG Pro 16 Studio (Mid 24) | |
| Nubia RedMagic Titan 16 Pro | |
| Medio NVIDIA GeForce RTX 4060 Laptop GPU (67.6 - 69.4, n=3) | |
| Media de la clase Gaming (15.4 - 80, n=5, últimos 2 años) | |
| 2560x1440 Ultra Preset | |
| SCHENKER XMG Pro 16 Studio (Mid 24) | |
| Media de la clase Gaming (43.7 - 51.2, n=3, últimos 2 años) | |
| Nubia RedMagic Titan 16 Pro | |
| Medio NVIDIA GeForce RTX 4060 Laptop GPU (43.5 - 43.7, n=2) | |
| 2560x1440 Ultra Preset + Ultra Ray Tracing + DLSS Quality | |
| SCHENKER XMG Pro 16 Studio (Mid 24) | |
| Media de la clase Gaming (43.3 - 51.8, n=2, últimos 2 años) | |
| Nubia RedMagic Titan 16 Pro | |
| Medio NVIDIA GeForce RTX 4060 Laptop GPU (n=1) | |
Cyberpunk 2077 Phantom Liberty ofreció velocidades de fotogramas ligeramente fluctuantes a un nivel bastante estable durante nuestra prueba de 30 minutos (ajustes máximos, FHD). No notamos ninguna caída notable en el rendimiento.
Cyberpunk 2077 ultra FPS diagram
| bajo | medio | alto | ultra | QHD DLSS | QHD FSR | QHD | |
|---|---|---|---|---|---|---|---|
| GTA V (2015) | 186.1 | 184 | 177.7 | 118.4 | 89.3 | ||
| Dota 2 Reborn (2015) | 206 | 170.9 | 160.2 | 146.9 | |||
| Final Fantasy XV Benchmark (2018) | 199.7 | 146 | 105.4 | 76.9 | |||
| X-Plane 11.11 (2018) | 167 | 142.8 | 117.2 | ||||
| Strange Brigade (2018) | 480 | 277 | 219 | 189.2 | 126.9 | ||
| Baldur's Gate 3 (2023) | 140.3 | 110.8 | 97.5 | 96.5 | 65.9 | ||
| Cyberpunk 2077 2.2 Phantom Liberty (2023) | 121.4 | 101.1 | 86.2 | 74.7 | 46.9 | ||
| Dragon's Dogma 2 (2024) | 71.9 | 67.7 | 52.9 | ||||
| Ghost of Tsushima (2024) | 91.3 | 86.8 | 78.2 | 63.4 | 63.6 | 47.7 | |
| F1 24 (2024) | 243 | 225 | 175.8 | 58.8 | 36.7 | ||
| The First Descendant (2024) | 159 | 100.9 | 80.6 | 69.4 | 43.7 | ||
| Once Human (2024) | 164.8 | 132.9 | 108.3 | 94.2 | 76.5 | 62.3 |
Emisiones - Demasiado ruido, demasiado calor
Emisiones sonoras
El Titan no es en absoluto un portátil de funcionamiento silencioso. Incluso en modo inactivo, los dos ventiladores se oyen constantemente. Cyberpunk hizo que el nivel subiera a unos ruidosos 50 dB(A)(modo equilibrado ) o a unos aún más ruidosos 53 dB(A)(modo de juego ). El modo oficina resultó en un valor sólo ligeramente más moderado de 47 dB(A). Los ventiladores son más silenciosos en modo batería y ocasionalmente se quedan parados.
Ruido
| Ocioso |
| 35 / 36 / 40 dB(A) |
| Carga |
| 49 / 52 dB(A) |
 | ||
30 dB silencioso 40 dB(A) audible 50 dB(A) ruidosamente alto |
||
min: | ||
| Nubia RedMagic Titan 16 Pro NVIDIA GeForce RTX 4060 Laptop GPU, i9-14900HX, Samsung PM9A1 MZVL21T0HCLR | Lenovo Legion Pro 5 16IRX9 G9 NVIDIA GeForce RTX 4060 Laptop GPU, i7-14700HX, Samsung PM9A1 MZVL21T0HCLR | HP Victus 16 (2024) NVIDIA GeForce RTX 4060 Laptop GPU, i7-14700HX, Kioxia XG8 KXG80ZNV512G | Acer Predator Helios Neo 16 (2024) NVIDIA GeForce RTX 4070 Laptop GPU, i7-14700HX, Samsung PM9A1a MZVL21T0HDLU | SCHENKER XMG Pro 16 Studio (Mid 24) NVIDIA GeForce RTX 4070 Laptop GPU, i9-14900HX, Samsung 990 Pro 1 TB | Gigabyte G6X 9KG (2024) NVIDIA GeForce RTX 4060 Laptop GPU, i7-13650HX, Gigabyte AG450E1024-SI | |
|---|---|---|---|---|---|---|
| Noise | 17% | 13% | 10% | 5% | 5% | |
| apagado / medio ambiente * | 26 | 23 12% | 25 4% | 25.2 3% | 25 4% | 26 -0% |
| Idle Minimum * | 35 | 23 34% | 28 20% | 27.8 21% | 28 20% | 30 14% |
| Idle Average * | 36 | 23 36% | 29 19% | 32 11% | 31 14% | 32 11% |
| Idle Maximum * | 40 | 25 37% | 33 17% | 29.6 26% | 35 12% | 35 12% |
| Load Average * | 49 | 45.18 8% | 45 8% | 45.2 8% | 52 -6% | 51 -4% |
| Cyberpunk 2077 ultra * | 50 | 52.69 -5% | 53 -6% | |||
| Load Maximum * | 52 | 53.13 -2% | 48 8% | 55.8 -7% | 52 -0% | 54 -4% |
| Witcher 3 ultra * | 43 | 51 |
* ... más pequeño es mejor
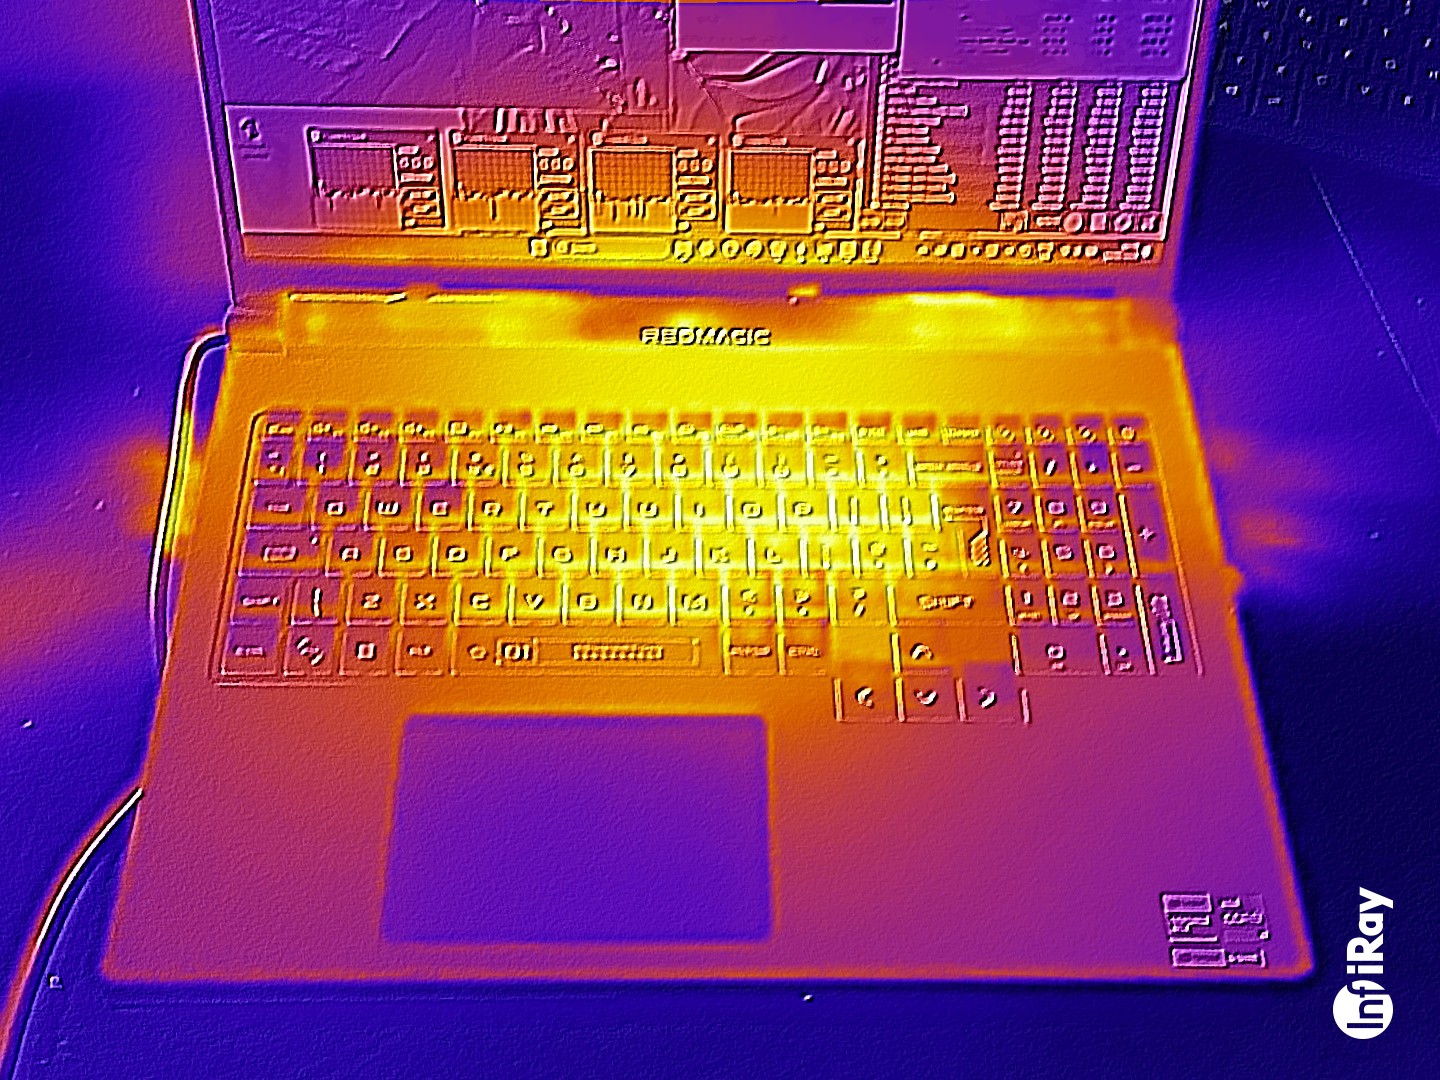
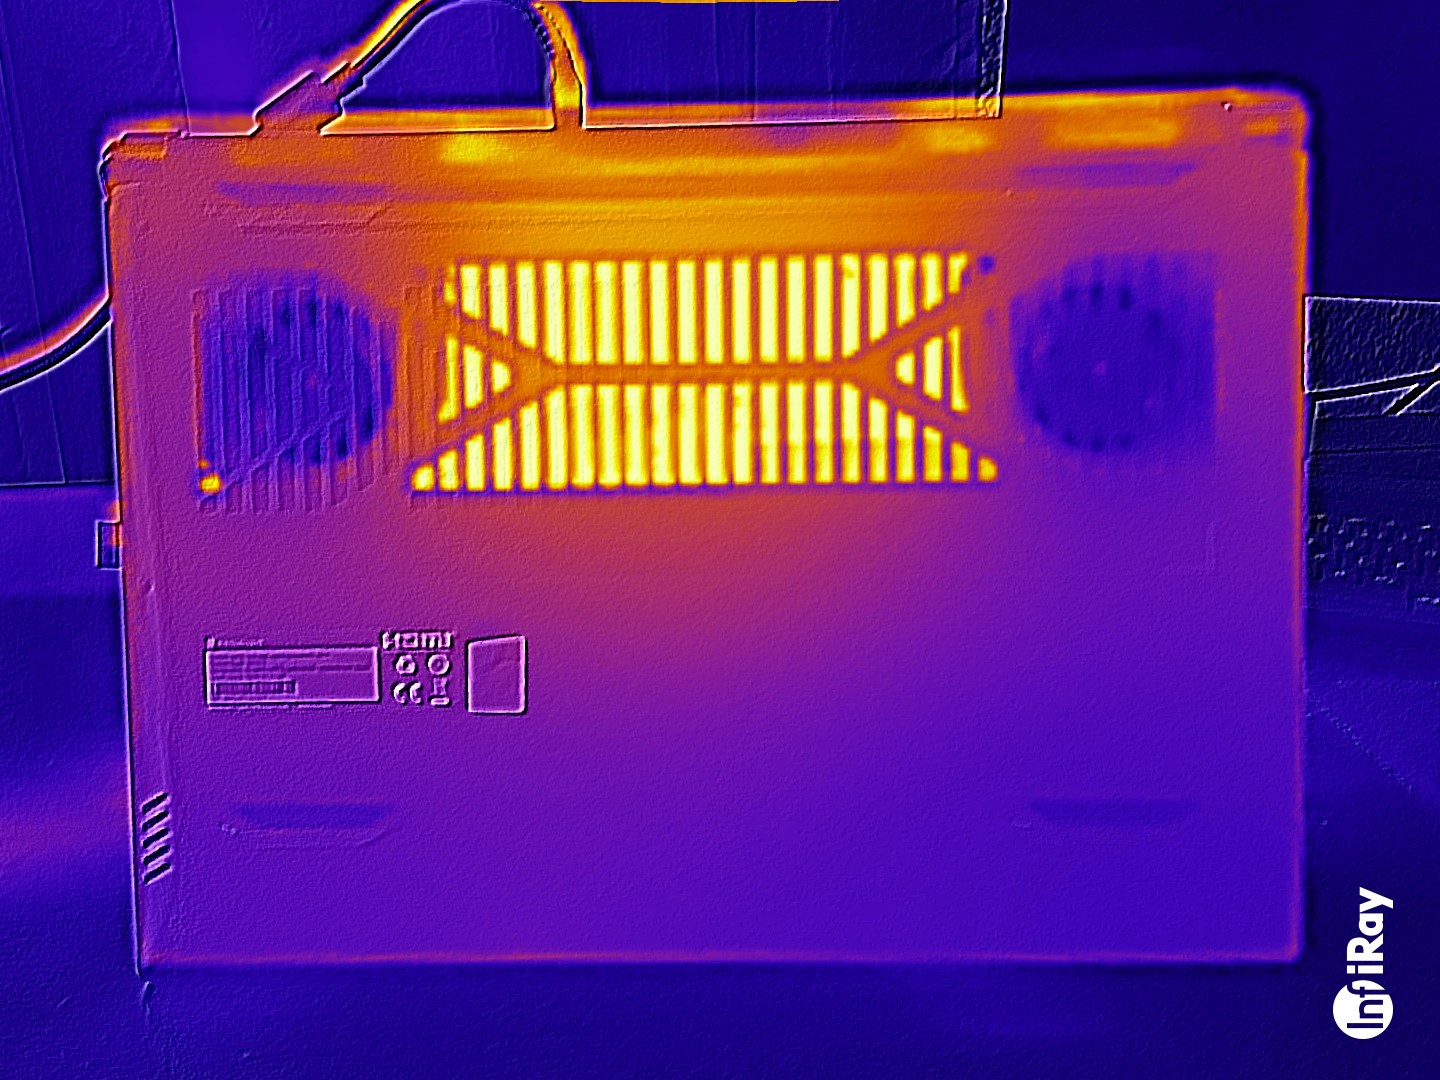
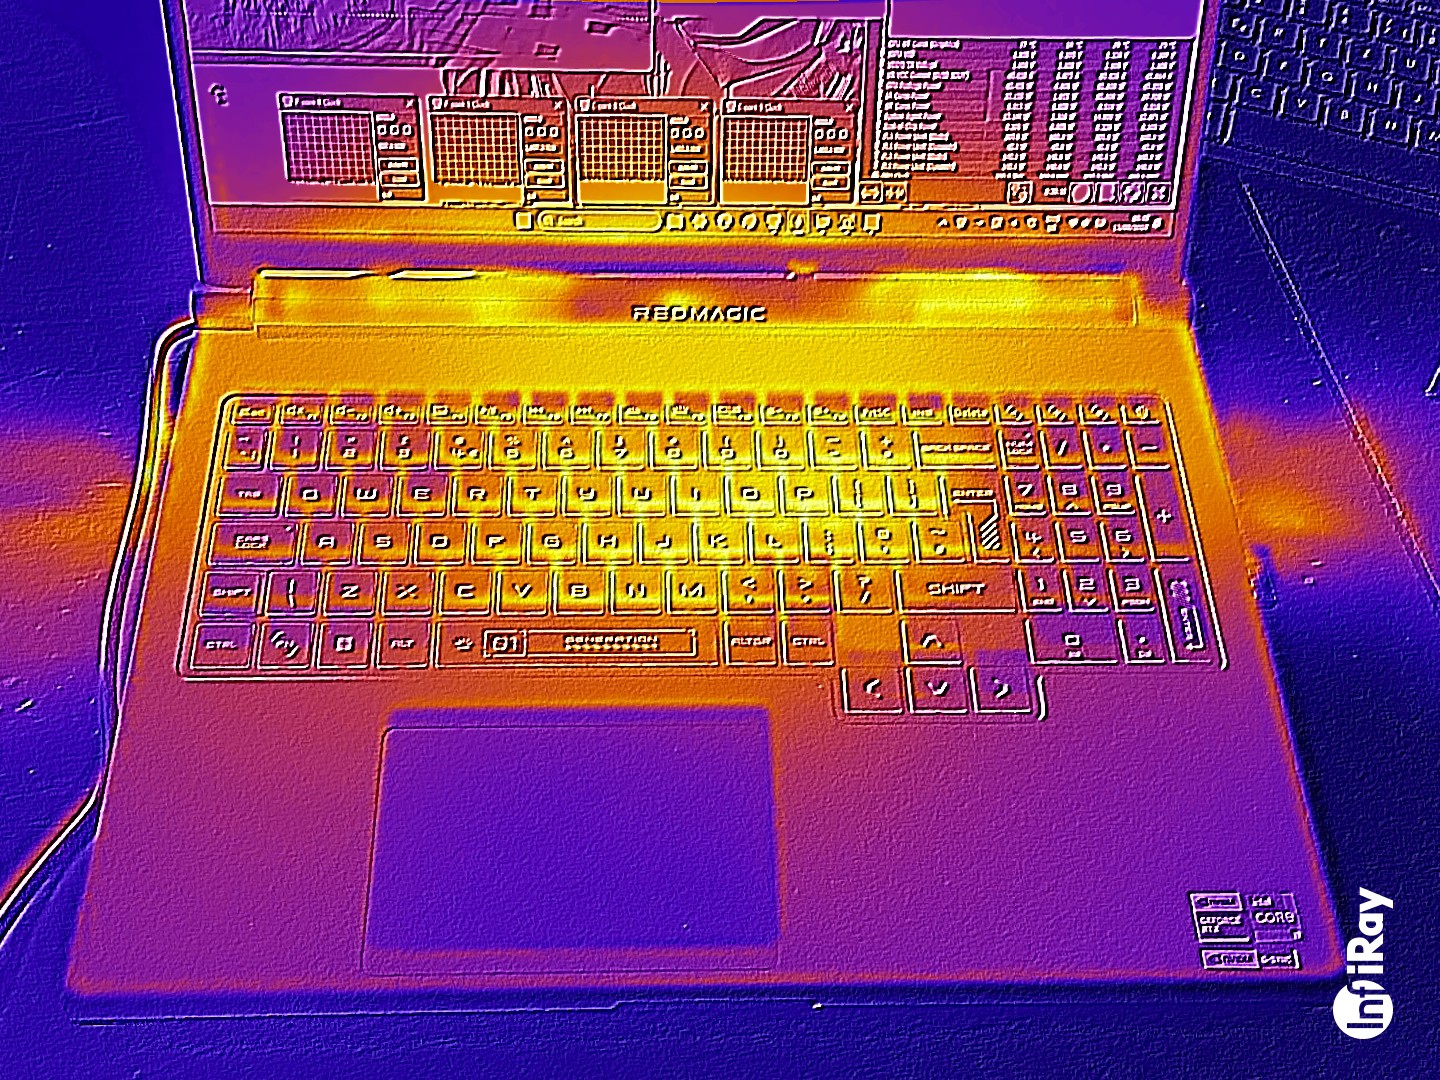
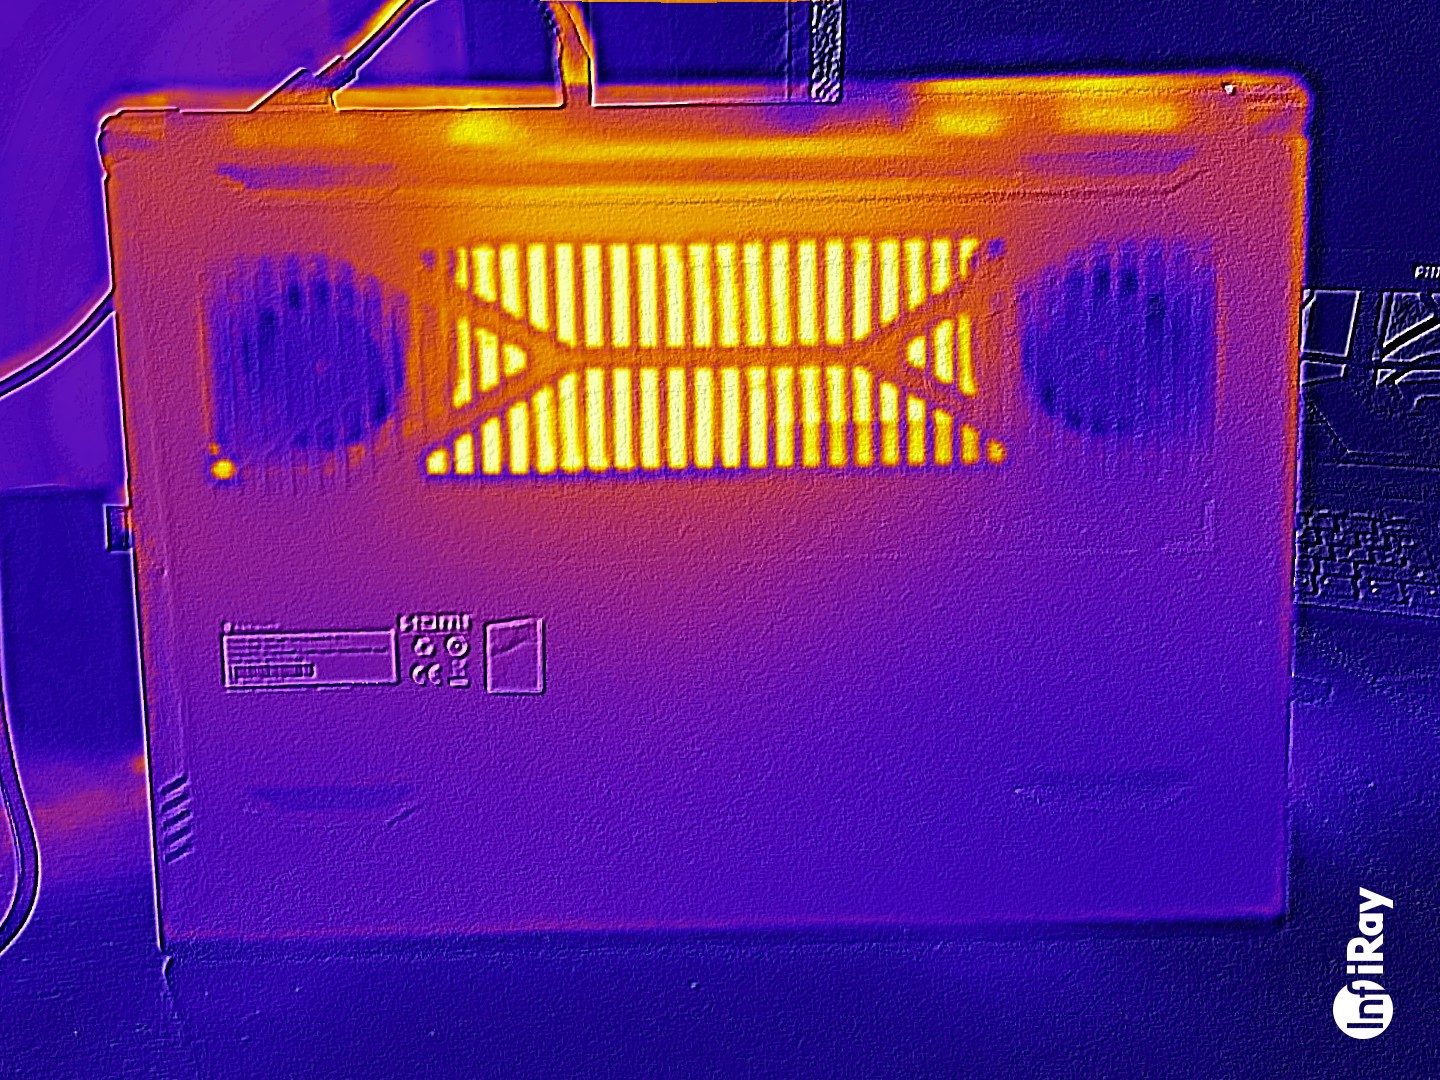
Temperatura
El portátil se calienta considerablemente bajo carga: Cyberpunk 2077 y la prueba de estrés provocaron temperaturas superiores a los 50 grados Celsius en determinados momentos. Las temperaturas del reposamanos eran a veces casi demasiado elevadas. También observamos valores superiores a la media en modo inactivo.
(-) La temperatura máxima en la parte superior es de 50 °C / 122 F, frente a la media de 40.4 °C / 105 F, que oscila entre 21.2 y 68.8 °C para la clase Gaming.
(-) El fondo se calienta hasta un máximo de 58 °C / 136 F, frente a la media de 43.2 °C / 110 F
(+) En reposo, la temperatura media de la parte superior es de 30.4 °C / 87# F, frente a la media del dispositivo de 33.9 °C / 93 F.
(-) 3: The average temperature for the upper side is 45.1 °C / 113 F, compared to the average of 33.9 °C / 93 F for the class Gaming.
(-) El reposamanos y el touchpad pueden calentarse mucho al tacto con un máximo de 40 °C / 104 F.
(-) La temperatura media de la zona del reposamanos de dispositivos similares fue de 28.9 °C / 84 F (-11.1 °C / -20 F).
| Nubia RedMagic Titan 16 Pro Intel Core i9-14900HX, NVIDIA GeForce RTX 4060 Laptop GPU | Lenovo Legion Pro 5 16IRX9 G9 Intel Core i7-14700HX, NVIDIA GeForce RTX 4060 Laptop GPU | HP Victus 16 (2024) Intel Core i7-14700HX, NVIDIA GeForce RTX 4060 Laptop GPU | Acer Predator Helios Neo 16 (2024) Intel Core i7-14700HX, NVIDIA GeForce RTX 4070 Laptop GPU | SCHENKER XMG Pro 16 Studio (Mid 24) Intel Core i9-14900HX, NVIDIA GeForce RTX 4070 Laptop GPU | Gigabyte G6X 9KG (2024) Intel Core i7-13650HX, NVIDIA GeForce RTX 4060 Laptop GPU | |
|---|---|---|---|---|---|---|
| Heat | -9% | 13% | -3% | -13% | 6% | |
| Maximum Upper Side * | 50 | 50 -0% | 50 -0% | 58 -16% | 51 -2% | 41 18% |
| Maximum Bottom * | 58 | 57 2% | 50 14% | 45.2 22% | 66 -14% | 43 26% |
| Idle Upper Side * | 31 | 36 -16% | 25 19% | 31.1 -0% | 35 -13% | 32 -3% |
| Idle Bottom * | 32 | 39 -22% | 26 19% | 37.2 -16% | 39 -22% | 37 -16% |
* ... más pequeño es mejor
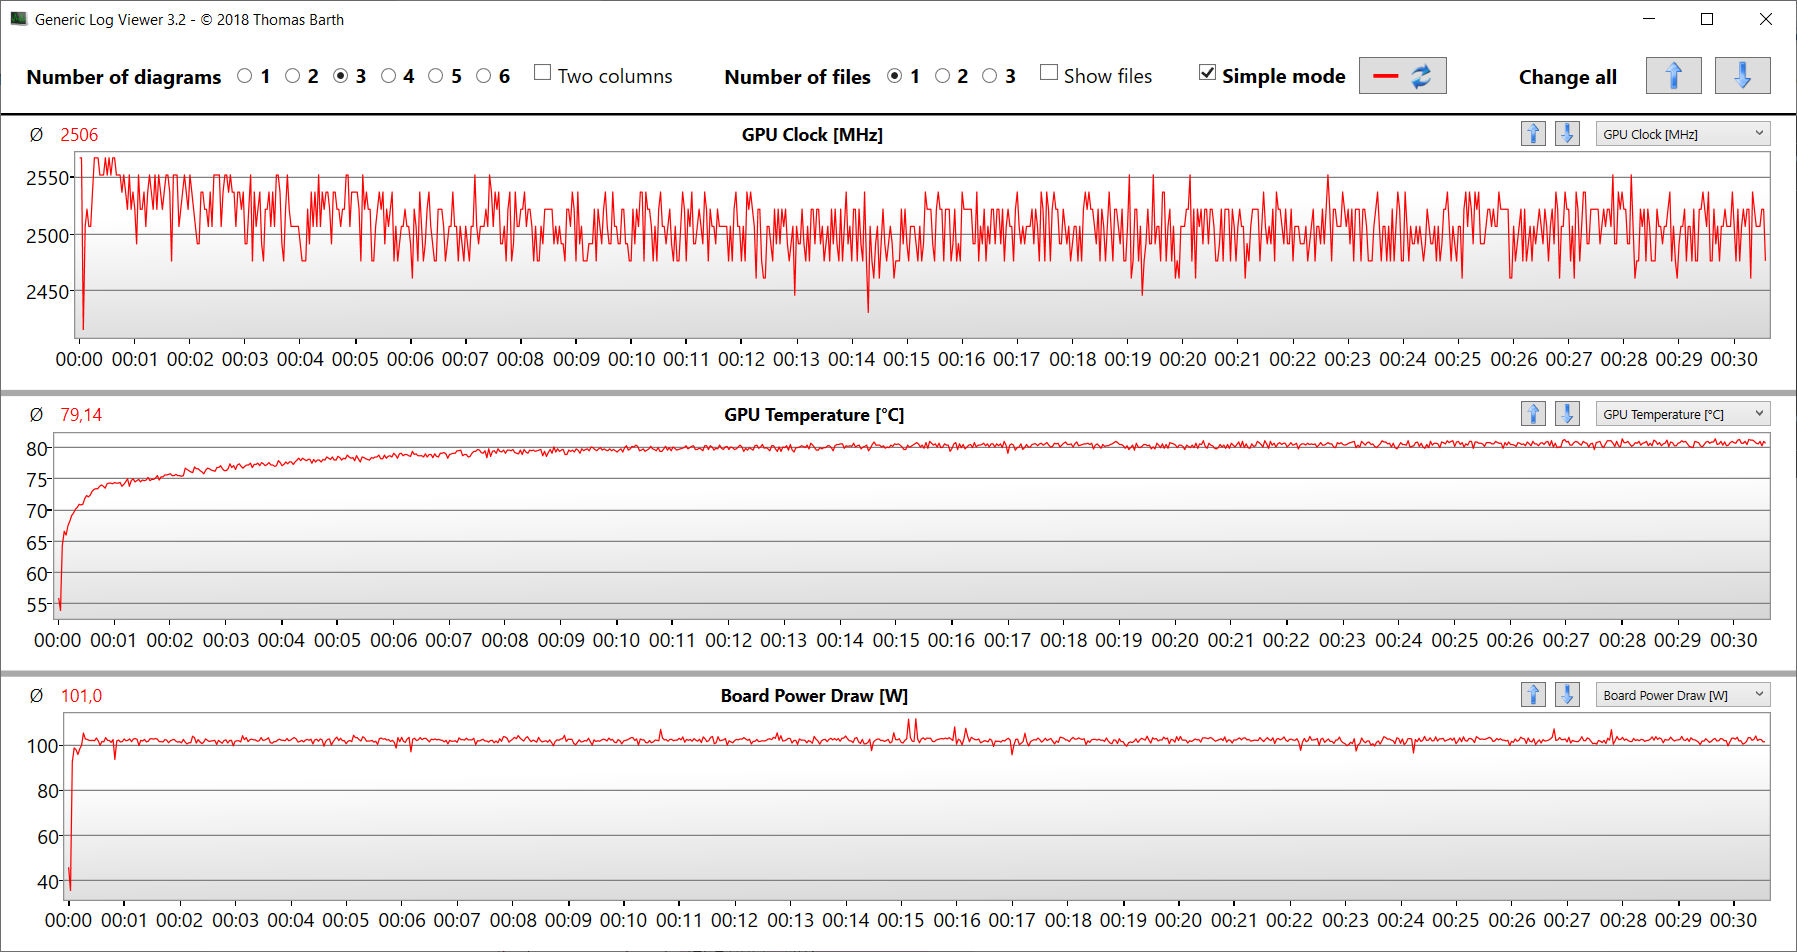
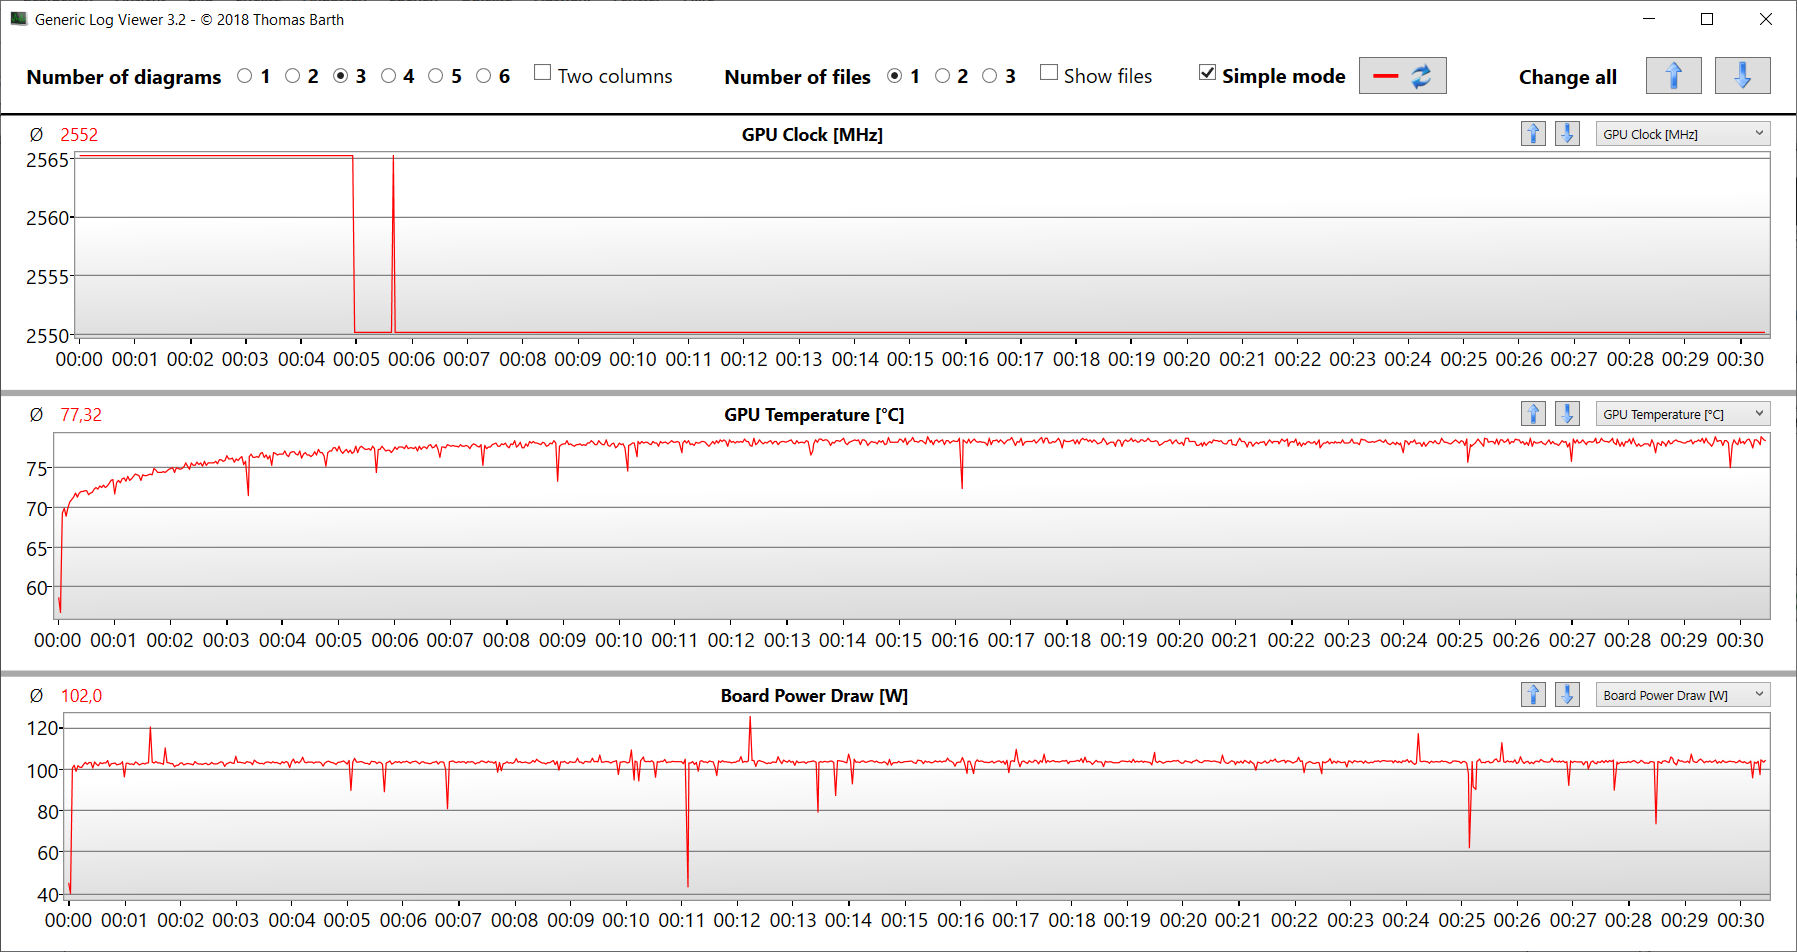
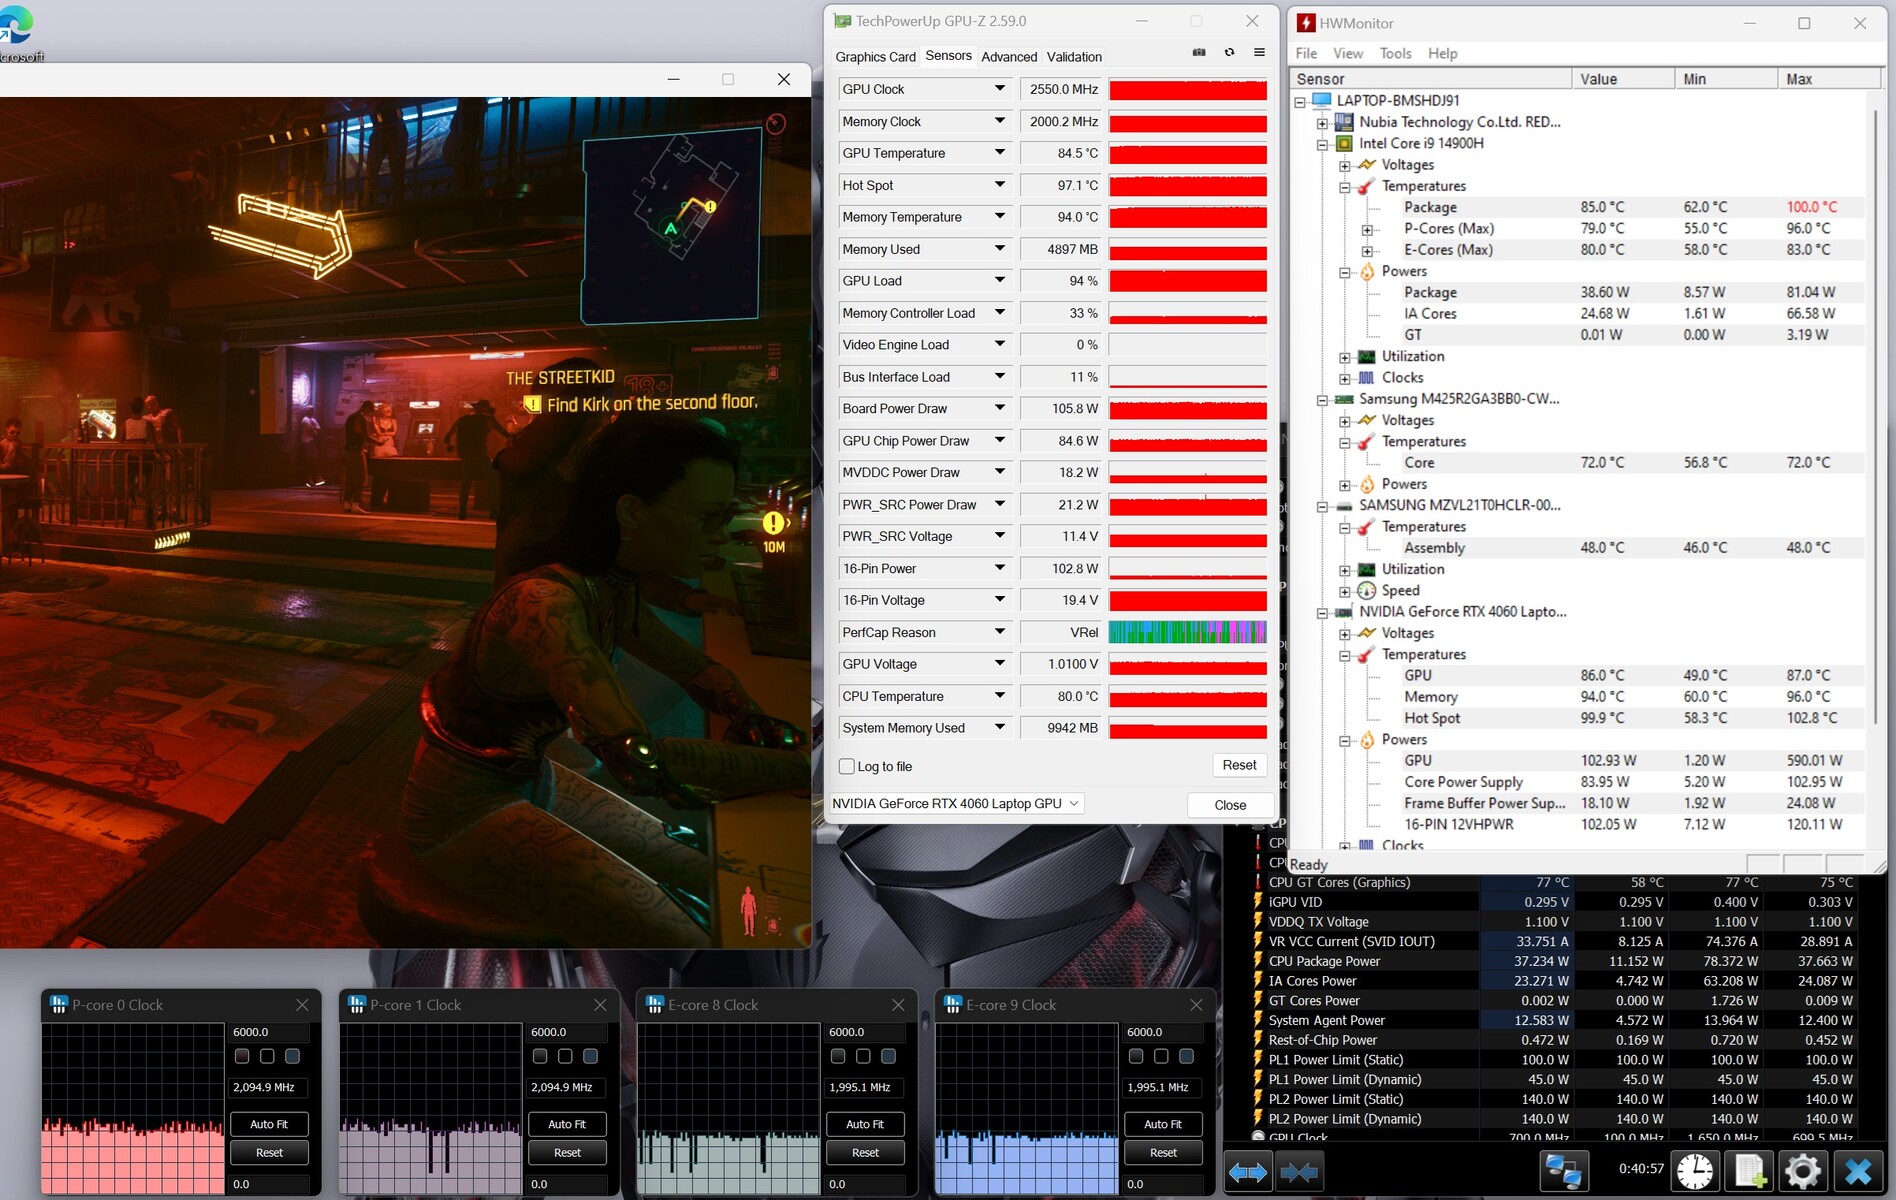
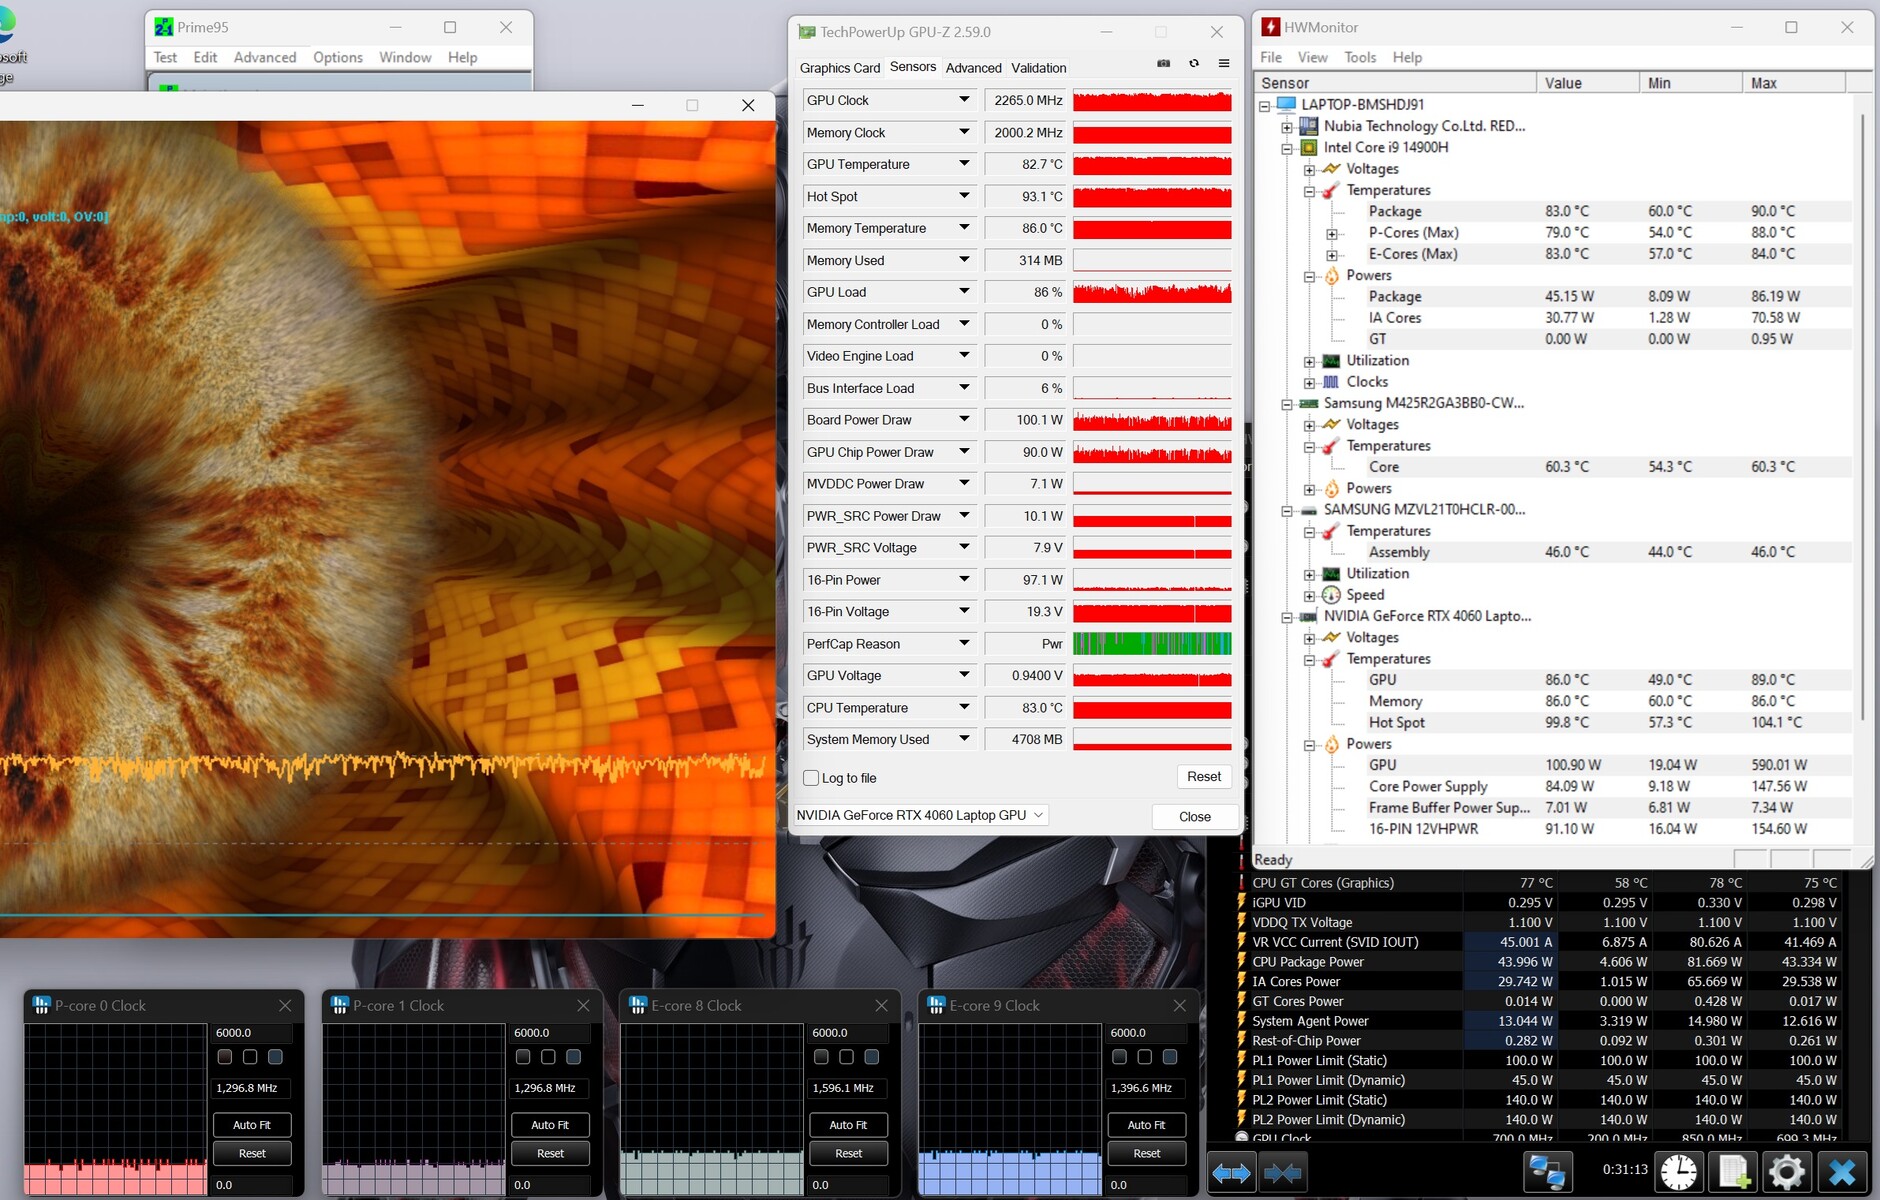
Prueba de esfuerzo
El escenario de la prueba de estrés extremo (Prime95 y Furmark en funcionamiento continuo) comprobó la estabilidad del sistema a plena carga. La CPU funcionó a frecuencias de reloj elevadas al inicio de la prueba, pero luego se estranguló a valores inferiores a 2 GHz. La GPU funcionó a plena potencia.
Altavoces
Los altavoces estéreo producen un sonido bastante decente en general. Los graves podrían ser un poco más pronunciados.
Nubia RedMagic Titan 16 Pro análisis de audio
(+) | los altavoces pueden reproducir a un volumen relativamente alto (#84 dB)
Graves 100 - 315 Hz
(±) | lubina reducida - en promedio 14.3% inferior a la mediana
(±) | la linealidad de los graves es media (11.3% delta a frecuencia anterior)
Medios 400 - 2000 Hz
(+) | medios equilibrados - a sólo 1.8% de la mediana
(+) | los medios son lineales (4.9% delta a la frecuencia anterior)
Altos 2 - 16 kHz
(+) | máximos equilibrados - a sólo 2.7% de la mediana
(+) | los máximos son lineales (5.4% delta a la frecuencia anterior)
Total 100 - 16.000 Hz
(+) | el sonido global es lineal (11.5% de diferencia con la mediana)
En comparación con la misma clase
» 9% de todos los dispositivos probados de esta clase eran mejores, 3% similares, 88% peores
» El mejor tuvo un delta de 6%, la media fue 18%, el peor fue ###max##%
En comparación con todos los dispositivos probados
» 6% de todos los dispositivos probados eran mejores, 2% similares, 92% peores
» El mejor tuvo un delta de 4%, la media fue 24%, el peor fue ###max##%
Lenovo Legion Pro 5 16IRX9 G9 análisis de audio
(±) | la sonoridad del altavoz es media pero buena (77.13 dB)
Graves 100 - 315 Hz
(-) | casi sin bajos - de media 18.3% inferior a la mediana
(±) | la linealidad de los graves es media (12% delta a frecuencia anterior)
Medios 400 - 2000 Hz
(±) | medias más altas - de media 6.9% más altas que la mediana
(+) | los medios son lineales (4.9% delta a la frecuencia anterior)
Altos 2 - 16 kHz
(+) | máximos equilibrados - a sólo 4.5% de la mediana
(±) | la linealidad de los máximos es media (9.5% delta a frecuencia anterior)
Total 100 - 16.000 Hz
(±) | la linealidad del sonido global es media (21.6% de diferencia con la mediana)
En comparación con la misma clase
» 76% de todos los dispositivos probados de esta clase eran mejores, 5% similares, 19% peores
» El mejor tuvo un delta de 6%, la media fue 18%, el peor fue ###max##%
En comparación con todos los dispositivos probados
» 58% de todos los dispositivos probados eran mejores, 7% similares, 34% peores
» El mejor tuvo un delta de 4%, la media fue 24%, el peor fue ###max##%
Gestión de la energía - La Titan 16 ofrece tiempos de ejecución mediocres
Consumo de energía
Su consumo de energía es normal para el hardware instalado. Cyberpunk 2077 y la prueba de estrés se ejecutaron con un consumo de energía constante. La fuente de alimentación (280 vatios) es suficiente en tamaño.
| Off / Standby | |
| Ocioso | |
| Carga |
|
Clave:
min: | |
| Nubia RedMagic Titan 16 Pro i9-14900HX, NVIDIA GeForce RTX 4060 Laptop GPU | Lenovo Legion Pro 5 16IRX9 G9 i7-14700HX, NVIDIA GeForce RTX 4060 Laptop GPU | HP Victus 16 (2024) i7-14700HX, NVIDIA GeForce RTX 4060 Laptop GPU | Acer Predator Helios Neo 16 (2024) i7-14700HX, NVIDIA GeForce RTX 4070 Laptop GPU | SCHENKER XMG Pro 16 Studio (Mid 24) i9-14900HX, NVIDIA GeForce RTX 4070 Laptop GPU | Gigabyte G6X 9KG (2024) i7-13650HX, NVIDIA GeForce RTX 4060 Laptop GPU | Medio NVIDIA GeForce RTX 4060 Laptop GPU | Media de la clase Gaming | |
|---|---|---|---|---|---|---|---|---|
| Power Consumption | -4% | 16% | -23% | -35% | 17% | 21% | 7% | |
| Idle Minimum * | 16 | 13.7 14% | 9 44% | 26.7 -67% | 31 -94% | 12 25% | 11.5 ? 28% | 13.4 ? 16% |
| Idle Average * | 19 | 17.7 7% | 15 21% | 24.4 -28% | 33 -74% | 13 32% | 16 ? 16% | 18.9 ? 1% |
| Idle Maximum * | 27 | 18.5 31% | 23 15% | 32.7 -21% | 41 -52% | 27 -0% | 20.3 ? 25% | 26.3 ? 3% |
| Load Average * | 123 | 124 -1% | 123 -0% | 122.1 1% | 114 7% | 105 15% | 92.9 ? 24% | 102.7 ? 17% |
| Cyberpunk 2077 ultra external monitor * | 174.2 | 224 -29% | 196.8 -13% | |||||
| Cyberpunk 2077 ultra * | 184.3 | 229 -24% | 218 -18% | |||||
| Load Maximum * | 240 | 297 -24% | 241 -0% | 241 -0% | 250 -4% | 210 12% | 210 ? 12% | 244 ? -2% |
| Witcher 3 ultra * | 143.7 | 190.6 | 167.8 |
* ... más pequeño es mejor
Power consumption Cyberpunk / stress test
Power consumption with external monitor
Tiempos de ejecución
El dispositivo de 16 pulgadas logró tiempos de ejecución de 4:40 h durante la prueba WiFi (acceso a sitios web utilizando un script) y de 5:16 h durante la prueba de vídeo (cortometraje Big Buck Bunny (codificación H.264, FHD) en bucle) -no son grandes valores. Algunos de sus competidores funcionan durante bastante más tiempo.
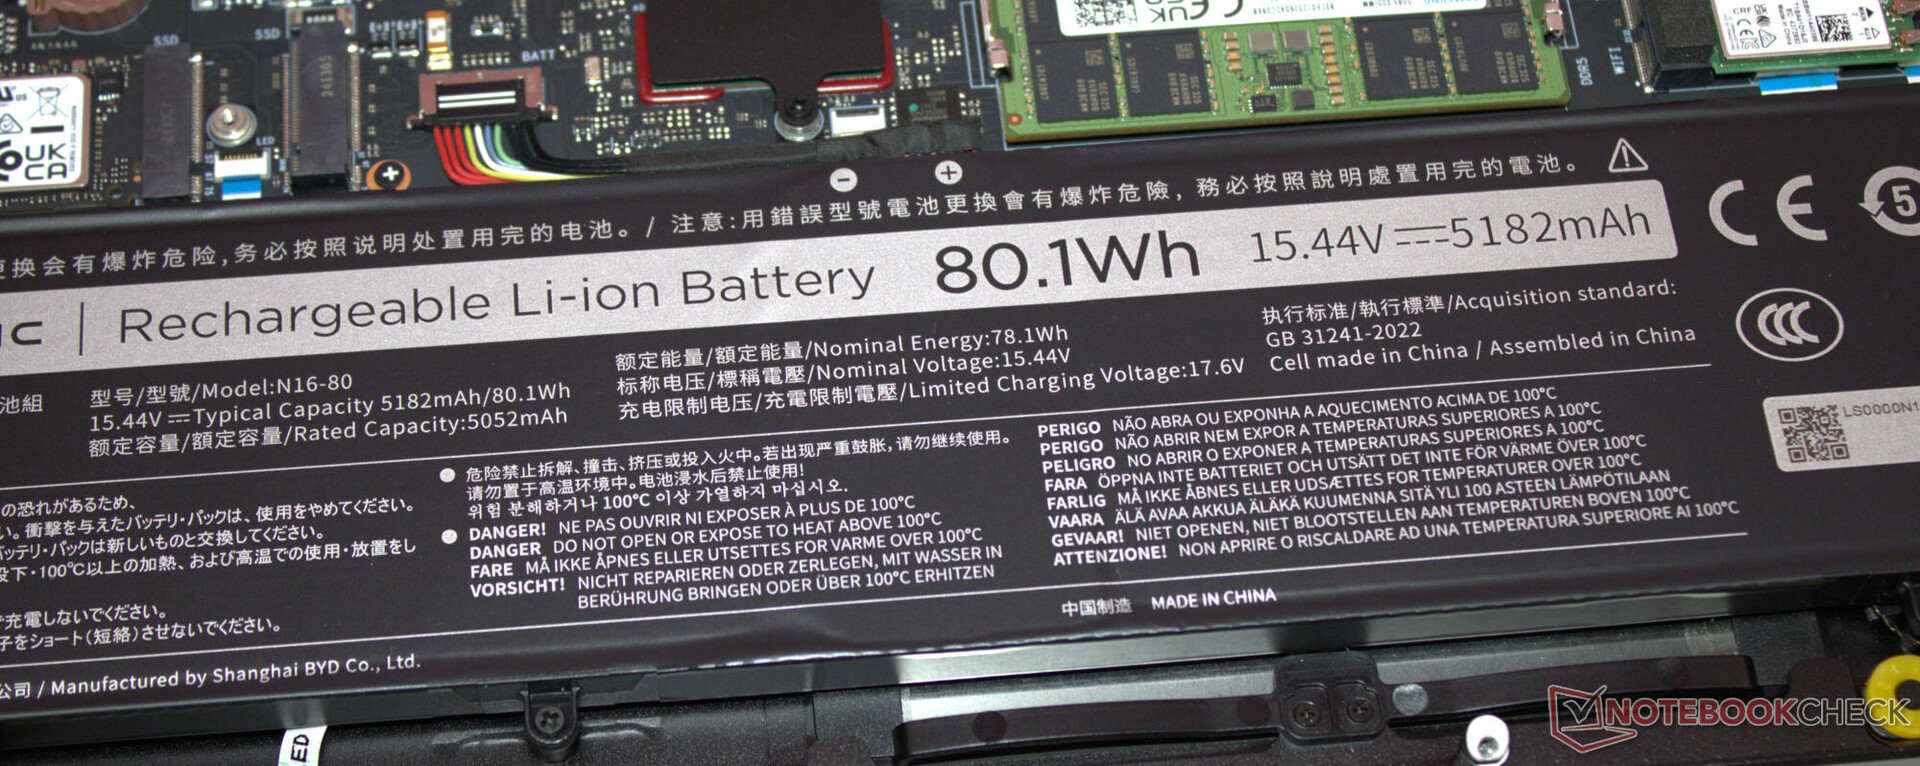
| Nubia RedMagic Titan 16 Pro i9-14900HX, NVIDIA GeForce RTX 4060 Laptop GPU, 80.1 Wh | Lenovo Legion Pro 5 16IRX9 G9 i7-14700HX, NVIDIA GeForce RTX 4060 Laptop GPU, 80 Wh | HP Victus 16 (2024) i7-14700HX, NVIDIA GeForce RTX 4060 Laptop GPU, 83 Wh | Acer Predator Helios Neo 16 (2024) i7-14700HX, NVIDIA GeForce RTX 4070 Laptop GPU, 90.61 Wh | SCHENKER XMG Pro 16 Studio (Mid 24) i9-14900HX, NVIDIA GeForce RTX 4070 Laptop GPU, 73 Wh | Gigabyte G6X 9KG (2024) i7-13650HX, NVIDIA GeForce RTX 4060 Laptop GPU, 73 Wh | Media de la clase Gaming | |
|---|---|---|---|---|---|---|---|
| Duración de Batería | 16% | 83% | -16% | 20% | 69% | 28% | |
| Reader / Idle | 481 | 356 -26% | 585 ? 22% | ||||
| H.264 | 316 | 312 -1% | 242 -23% | 447 ? 41% | |||
| WiFi v1.3 | 280 | 308 10% | 511 83% | 227 -19% | 337 20% | 474 69% | 387 ? 38% |
| Load | 76 | 105 38% | 79 4% | 84.5 ? 11% |
Pro
Contra
Veredicto - Espacio para la mejora
A Core i9-14900HX y una GeForce RTX 4060 garantizan juegos QHD con ajustes de altos a máximos. El hardware instalado no se aprovecha al máximo, ya que la RAM funciona en modo de canal único. Se recomienda instalar un segundo módulo de memoria.
El producto de debut de Nubia hace lo que está diseñado para hacer: Llevar los juegos a su pantalla sin problemas. Pero la competencia no necesita precisamente una razón para tener miedo.
Sus valores de emisión son extremadamente decepcionantes: El portátil produce (demasiado) ruido en todo el rango de carga; además, se calienta mucho. Por otro lado, su brillante pantalla IPS de color real (16 pulgadas, 2.560 x 1.600 píxeles, 240 Hz, G-Sync, DCI-P3) con una relación de aspecto 16:10 favorable para el trabajo, nos dejó una buena impresión.
La duración de la batería del portátil no dejará boquiabierto a nadie. Cabría esperar (ligeramente) más de un portátil para juegos con una batería de 80 Wh. Al menos su puerto USB-C instalado (Thunderbolt 4) soporta Power Delivery (y el modo DP Alt). Esto significa que no necesariamente tendrá que llevar siempre consigo la voluminosa fuente de alimentación propietaria.
Un hecho que debe tener en cuenta antes de comprar el dispositivo: En contraste con fabricantes establecidos como Acer, Lenovo o HP, Nubia no tiene realmente una presencia global. Como resultado, no es posible estimar cuál será la situación en cuanto al suministro de piezas de repuesto, soporte y reparaciones.
Su precio de 1.699 dólares ciertamente no habla a favor del portátil: Por ejemplo, una configuración casi idéntica del Acer Predator Helios Neo 16 (con la excepción de su RAM, que es de 32 GB en lugar de 16 GB) sólo cuesta actualmente 1.350 dólares. Otra alternativa podría ser el XMG Pro 16 Studio (mediados de 24). El precio de una versión comparable de este dispositivo es de unos 2.000 dólares (con Windows 11) o de 1.950 dólares (sin Windows como sistema operativo).
Precio y disponibilidad
El Nubia RedMagic Titan 16 Pro estará disponible a partir del 29/08/2024 y podrá adquirirse por 1.699 dólares a través de la tienda RedMagic.
Nota: Recientemente hemos actualizado nuestro sistema de clasificación y los resultados de la versión 8 no son comparables con los de la versión 7. Encontrará más información en aquí.
Nubia RedMagic Titan 16 Pro
- 08/21/2024 v8
Sascha Mölck
 Total Sustainability Score:
 Transparencia
La selección de los dispositivos que se van a reseñar corre a cargo de nuestro equipo editorial. La muestra de prueba fue proporcionada al autor en calidad de préstamo por el fabricante o el minorista a los efectos de esta reseña. El prestamista no tuvo ninguna influencia en esta reseña, ni el fabricante recibió una copia de la misma antes de su publicación. No había ninguna obligación de publicar esta reseña. Nunca aceptamos compensaciones o pagos a cambio de nuestras reseñas. Como empresa de medios independiente, Notebookcheck no está sujeta a la autoridad de fabricantes, minoristas o editores.
Así es como prueba Notebookcheck
Cada año, Notebookcheck revisa de forma independiente cientos de portátiles y smartphones utilizando procedimientos estandarizados para asegurar que todos los resultados son comparables. Hemos desarrollado continuamente nuestros métodos de prueba durante unos 20 años y hemos establecido los estándares de la industria en el proceso. En nuestros laboratorios de pruebas, técnicos y editores experimentados utilizan equipos de medición de alta calidad. Estas pruebas implican un proceso de validación en varias fases. Nuestro complejo sistema de clasificación se basa en cientos de mediciones y puntos de referencia bien fundamentados, lo que mantiene la objetividad.Price comparison

