Notebookcheck Logo
Nvidia GeForce RTX 5080 Founders Edition in review

Revisión de la Nvidia GeForce RTX 5080 Founders Edition: una tarjeta de 999 dólares que convierte en redundante a la RX 7900 XTX

Haciendo que 1.000 dólares parezcan una ganga.

Con un nuevo diseño suave que queda perfecto en una carcasa SFF, la Nvidia GeForce RTX 5080 Founders Edition por fin está aquí para desatar la ira de Blackwell entre los jugadores convencionales. La RTX 5080 FE aporta mejoras tangibles en computación, rasterización y trazado de rayos, junto con el acceso a la nueva tecnología de generación de fotogramas DLSS, por el mismo PVPR de 1.000 dólares, lo que la sitúa con una ventaja significativa sobre la Radeon RX 7900 XTX... si es que puede hacerse con una, claro.
Vaidyanathan Subramaniam, 👁 Vaidyanathan Subramaniam (traducido por DeepL / Ninh Duy) Publicado 🇺🇸 🇷🇺 ...
Nvidia Geforce GPU Gaming Desktop

Precios y disponibilidad

Best Buy ofrece actualmente la Nvidia GeForce RTX 5080 Founders Edition a su PVPR de 999 dólares, pero la tarjeta está agotada en el momento de escribir estas líneas.

En la India, la RTX 5080 Founders Edition tiene un precio oficial de ₹1.07.000. La tarjeta aún no aparece en Amazon India, pero los compradores interesados pueden realizar una consulta en RP Tech Indiael importador oficial de estas tarjetas.

Amazon Logo
$1,989.99
ASUS The SFF-Ready Prime GeForce RTX™ 5080 16GB GDDR7 Graphics Card (PCIe® 5.0, HDMI®/DP 2.1, 2.5-Slot, Axial-tech Fans, Vapor Chamber, Dual BIOS)

Las últimas GPU Blackwell RTX 50 de Nvidia han suscitado división de opiniones. La GeForce RTX 5090 Founders Edition sigue siendo la GPU a la que aspirar, y el sorprendente diseño de 2 ranuras ha sido generalmente alabado por los críticos, incluidos nosotros.

La RTX 5090 es la Big Kahuna de Blackwell que se dirige a los profesionales que también juegan y exige un MSRP igualmente bullicioso de 1.999 dólares. Pero, ¿qué pasa con los jugadores convencionales?

Introduzca la RTX 5080. La RTX 5080 viene con las mejoras arquitectónicas habituales y apuesta mucho por su destreza en IA con la esperanza de tomar el relevo de la RTX 4080 / RTX 4080 Super.

En este análisis, echamos un vistazo a la Nvidia GeForce RTX 5080 Founders Edition (FE) y vemos qué clase de mejora puede ofrecer el precio de 999 dólares que pide con respecto a la generación Ada.

Comparación de la RTX 5080 FE con otras GPU de Nvidia

Especificación RTX 5090 FE RTX 5080 FE RTX 4090 FE RTX 4080 Super FE RTX 4080 FE Asus TUF RTX 4070 Ti Super RTX 4070 Super FE KFA2RTX 4060 Ti EX RTX 3090 Ti FE RTX 3090 FE RTX 3080 Ti FE
Chip GB202 GB203 AD102 AD103 AD103 AD103 AD104 AD106 GA102 GA102 2
Proceso FinFET Personalizado 4N Personalizado 4N Personalizado 4N Personalizado 4N Personalizado 4N Personalizado 4N Personalizado 4N Personalizado 4N 8 nm 8 nm 8 nm
Núcleos CUDA 21.760 10.752 16.384 10.240 9.728 8.448 7.168 4.352 10.752 10.496 10.240
Unidades de textura 680 336 512 320 304 264 224 136 336 328 320
Núcleos Tensores 680 5ª Gen. 336 5ª Gen. 512 4ª Gen. 320 4ª Gen. 304 4ª Gen. 264 4ª Gen. 224 4ª Gen. 136 4ª Gen. 336 3ª Gen. 328 3ª Gen. 320 3ª Gen.
Núcleos RT 170 4ª Gen. 84 4ª Gen. 128 3ª Gen. 80 3ª Gen. 76 3ª Gen. 66 3ª Gen. 56 3ª Gen. 34 3ª Gen. 84 2ª Gen. 82 2ª Gen. 80 2ª Gen.
Reloj base de la GPU 2.017 MHz 2.295 MHz 2.235 MHz 2.295 MHz 2.205 MHz 2.340 MHz 1.980 MHz 2.310 MHz 1.560 MHz 1.395 MHz 1.365 MHz
Reloj Boost de la GPU 2.407 MHz 2.617 MHz 2.520 MHz 2.550 MHz 2.505 MHz 2.610 MHz 2.475 MHz 2.535 MHz 1.860 MHz 1.695 MHz 1.665 MHz
Bus de memoria 512 bits 256 bits 384 bits 256 bits 256 bits 256 bits 192 bits 128 bits 384 bits 384 bits 384 bits
Ancho de banda de memoria 1,79 TB/s 960GB/s 1.008 GB/s 736,3 GB/s 716,8 GB/s 672 GB/s 504 GB/s 288 GB/s 1.008 GB/s 936 GB/s 912 GB/s
Memoria de vídeo 32 GB GDDR7 16 GB GDDR7 24 GB GDDR6X 16 GB GDDR6X 16 GB GDDR6X 16 GB GDDR6X 12 GB GDDR6X 8 GB GDDR6 24 GB GDDR6X 24 GB GDDR6X 12 GB GDDR6X
Consumo de energía 575 W 360 W 450 W 320 W 320 W 285 W 220 W 160 W 450 W 350 W 350 W

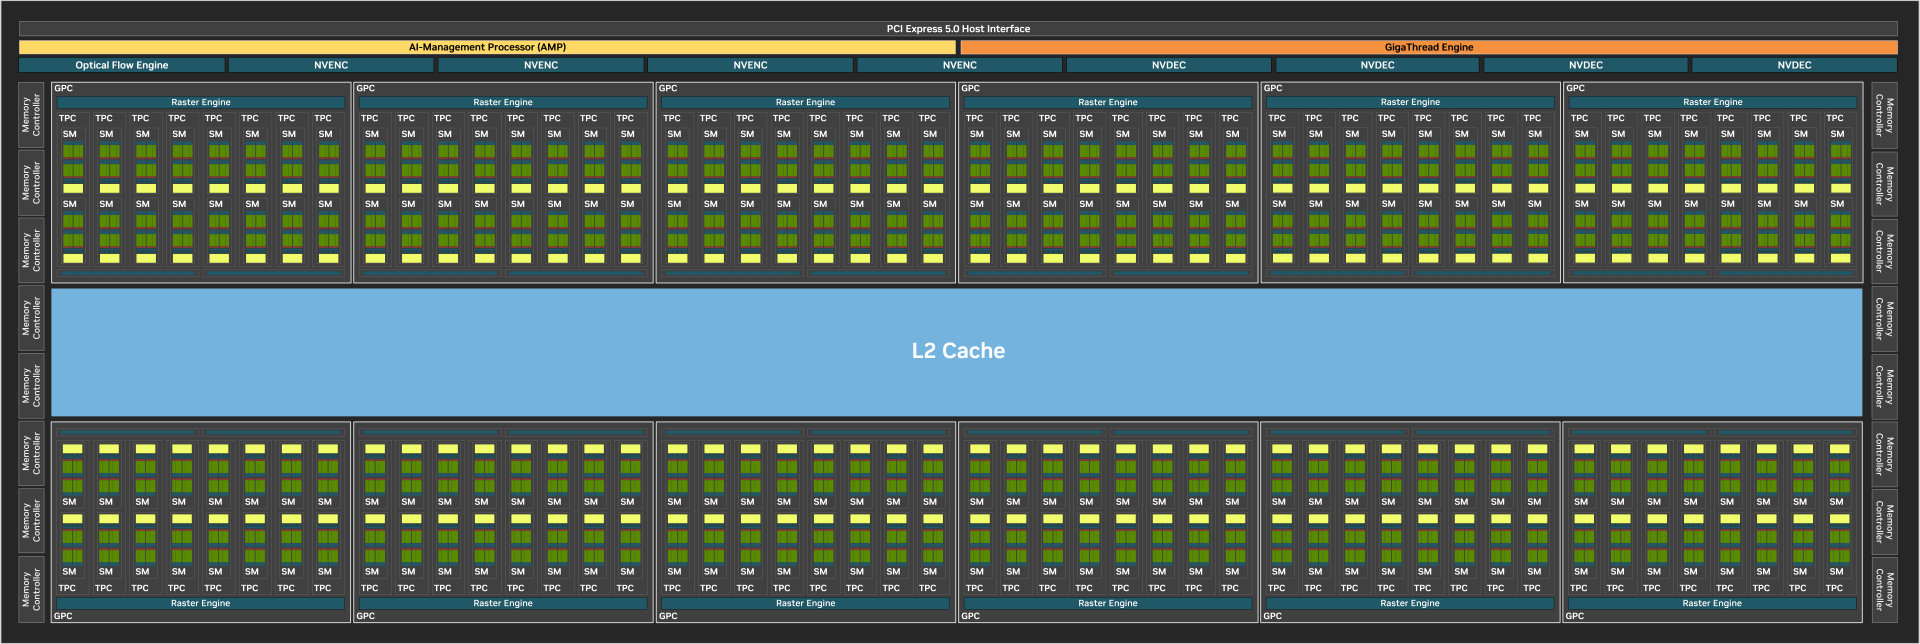
La GeForce RTX 5080 FE se basa en la GPU GB203, cuyas especificaciones recuerdan mucho a la RTX 3090 Ti. En comparación con la RTX 4080 FE, la nueva GPU Blackwell ofrece un aumento del 10,5% en núcleos CUDA, introduce nuevos núcleos Tensor de 5ª generación y de trazado de rayos (RT) de 4ª generación, y cuenta con 16 GB de rápida VRAM GDDR7 de 256 bits con un ancho de banda de 960 GB/s.

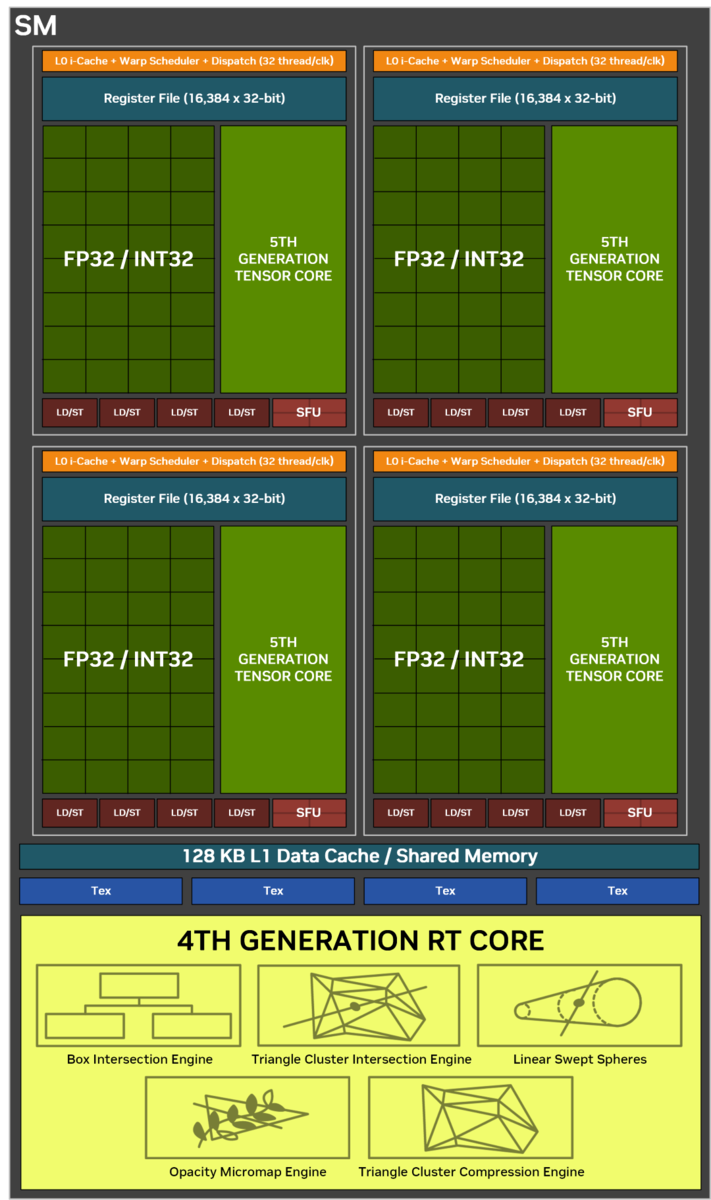
La GPU GB203 de la RTX 5080 FE incorpora 45.600 millones de transistores con 84 multiprocesadores (SM) de trazado de rayos, cada uno de los cuales contiene 128 núcleos CUDA para un total de 10.752 núcleos CUDA. Además, hay un total de 336 núcleos tensoriales, 84 núcleos RT, 336 unidades de mapeo de texturas (TMU) y 112 canalizaciones de operaciones de trama (ROP).

Diagrama de bloques completo del GB202. (Fuente de la imagen: Nvidia)
Estructura de un Blackwell SM. (Fuente de la imagen: Nvidia)

En comparación con la RTX 4080 Super FE, sin embargo, las diferencias son menos pronunciadas. Sólo obtenemos un aumento del 5% en el recuento de núcleos CUDA y un número nominalmente superior de núcleos Tensor y RT.

Si bien esto es una indicación para mantener las expectativas moderadas con respecto a las ganancias gen-gen, las mejoras en el ancho de banda de la memoria y los relojes boost con respecto tanto a la RTX 4080 FE como a la RTX 4080 Super FE pueden suponer potencialmente beneficios tangibles.

La RTX 5080 también se beneficia de la tecnología DLSS de Nvidia, que incluye Superresolución, Reconstrucción de Rayos y DLAA. Esta generación ve la introducción de DLSS 4 que utiliza un nuevo modelo de transformador.

Según Nvidia, el nuevo modelo de transformador ofrece suficiente margen para múltiples mejoras generacionales, mientras que la actual red neuronal convolucionada (CNN) ha alcanzado el límite de optimización.

Otra novedad de la generación RTX 50 Blackwell es la compatibilidad con flip metering por hardware. El flip metering desplaza la lógica del ritmo de fotogramas al motor de visualización y permite nuevas capacidades de generación de fotogramas de hasta 4x. A este proceso contribuye un coprocesador RISC-V en la GPU que descarga la programación de tareas de la CPU para reducir la latencia.

Todo esto, por supuesto, viene acompañado de un consumo de energía añadido de 40 W, ya que la RTX 5080 FE tiene un TGP de 360 W.

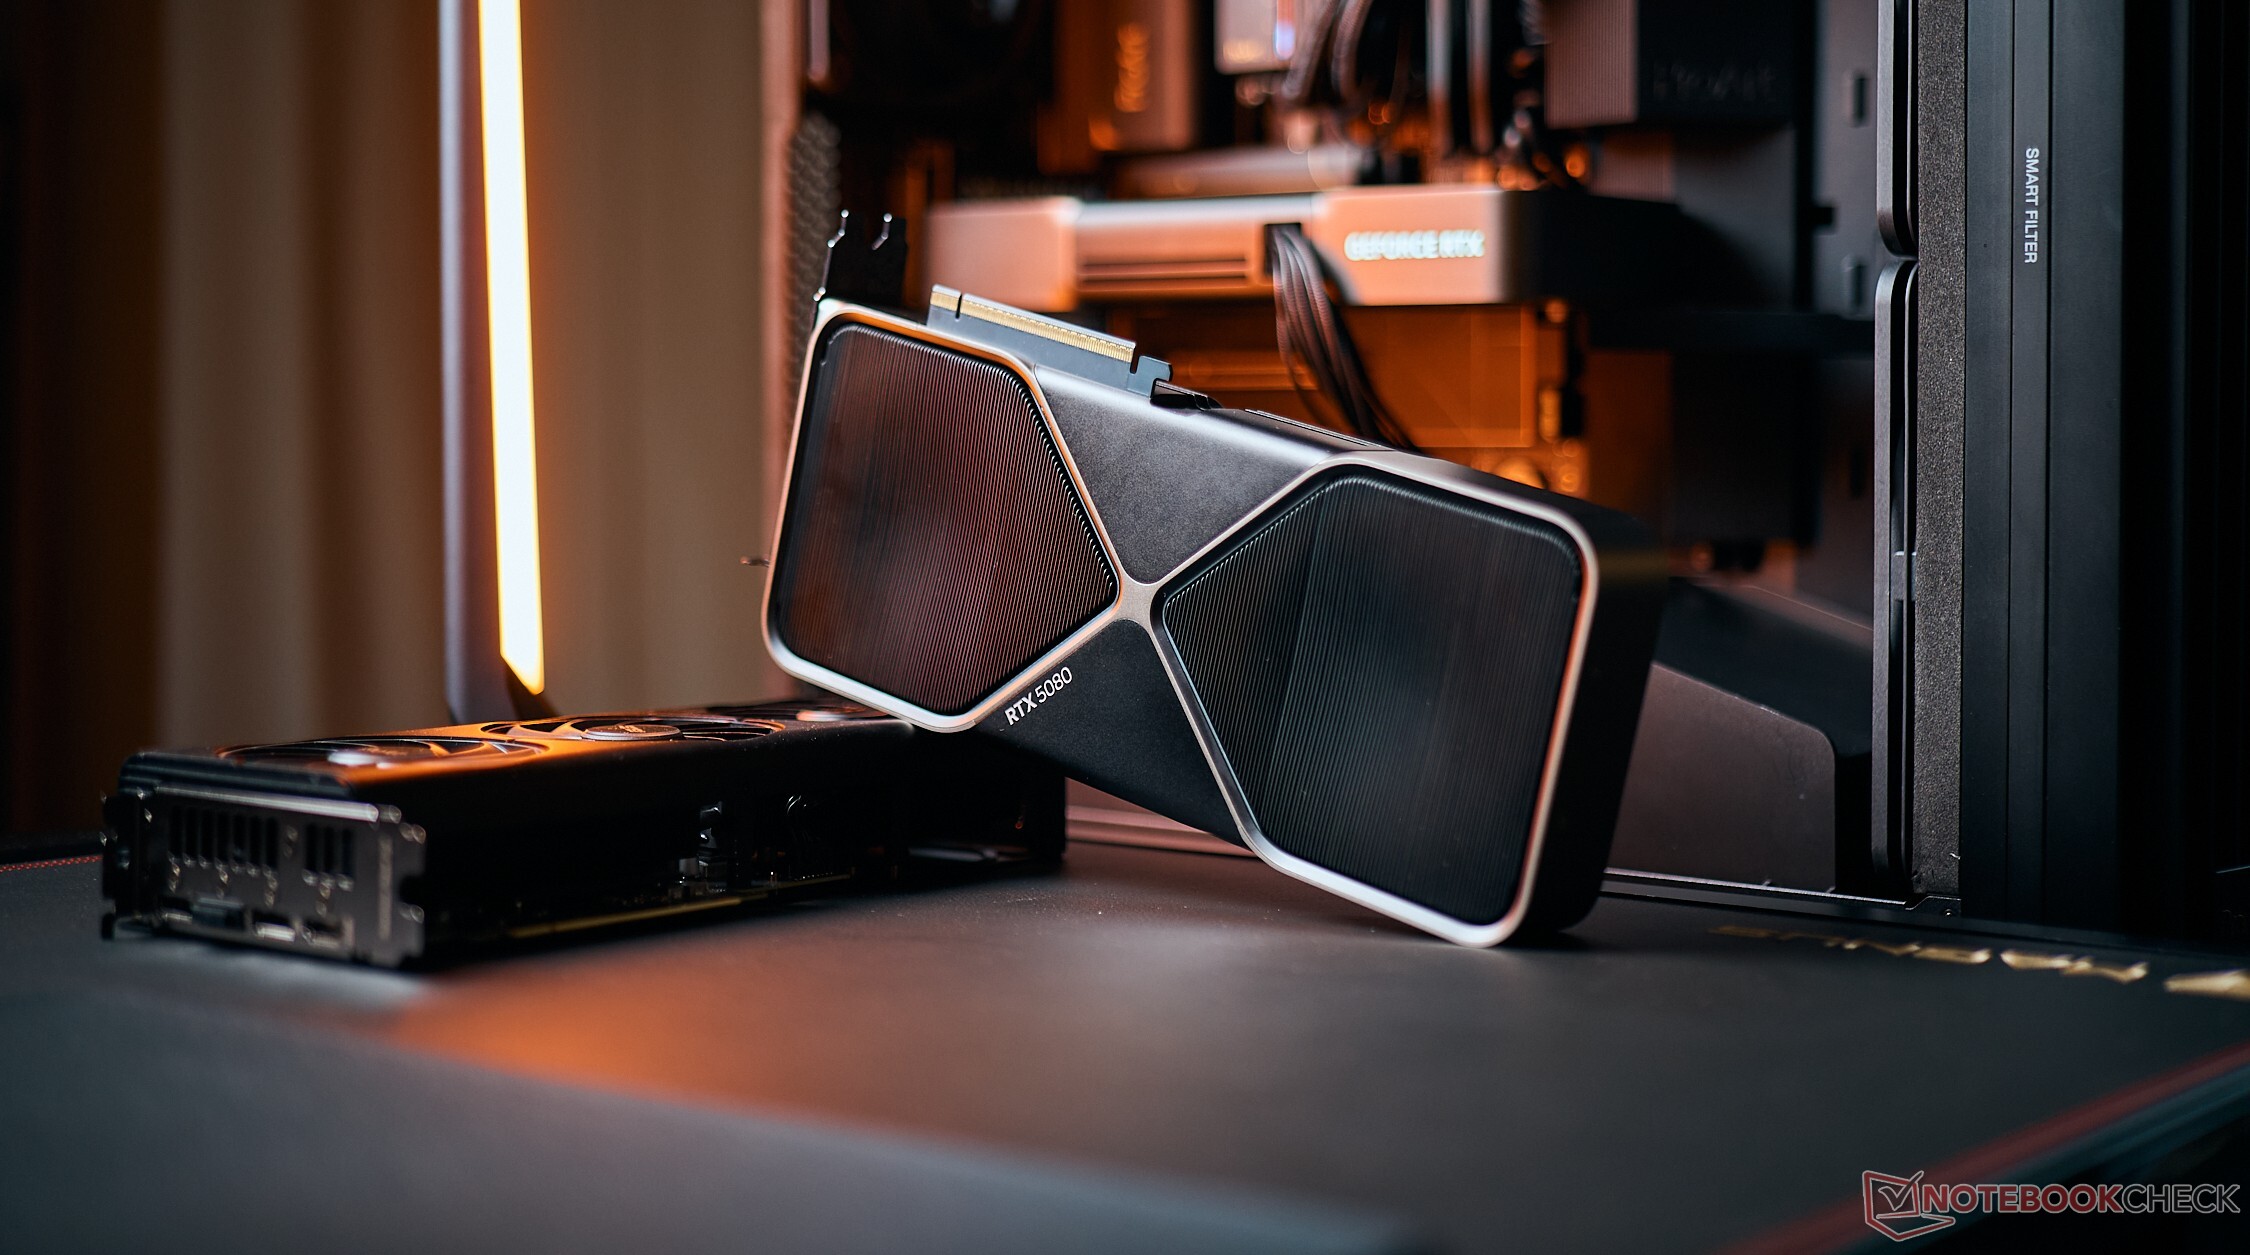
La RTX 5080 Founders Edition de cerca

Nvidia ha optado esta vez por un diseño radicalmente distinto. Tanto la tarjeta RTX 5090 como la RTX 5080 Founders Edition presentan exactamente la misma estética y casi el mismo grosor, siendo la RTX 5080 FE unos 180 g más ligera.

En comparación con la RTX 4080 FE, Nvidia ha reducido la huella de la tarjeta para ocupar sólo dos ranuras, lo que la hace ideal para construcciones de pequeño factor de forma (SFF).

A pesar de ocupar menos espacio, la RTX 5080 FE está construida con un acabado de primera calidad. En breve analizaremos cómo afecta este nuevo diseño a la térmica y a las emisiones de ruido.

Nvidia GeForce RTX 5080 Founders Edition
Nvidia GeForce RTX 5080 Founders Edition y RTX 5090 Founders Edition
Nvidia GeForce RTX 5080 Founders Edition y RTX 4080 Founders Edition

La RTX 5080 FE, al igual que toda la generación Blackwell, recibe un conjunto de puertos mejorados. Vemos tres puertos DisplayPort 2.1b compatibles con UHBR20 y una única salida HDMI 2.1b.

Nvidia confía en el nuevo estándar 12V-2x6 para alimentar la GPU. El conector 12V-2x6 presenta clavijas de detección 1,5 mm más cortas y terminales conductores 0,25 mm más largos en comparación con el estándar 12VHPWR original para mejorar la fiabilidad de la conexión.

Es útil tener en cuenta que este cambio sólo se produce en el extremo GPU del conector, por lo que los cables 12VHWPR existentes de las fuentes de alimentación ATX 3.x deberían funcionar sin problemas. Sin embargo, los conectores 12VHPWR en ángulo recto no encajarán en el hueco del conector de alimentación en ángulo de las RTX 5080 FE y RTX 5090 FE.

Nvidia proporciona un práctico adaptador de 16 pines a 3x 8 pines en la caja, si no dispone de una PSU ATX 3.x que admita cables 12VHPWR.

Puertos: 3x salida DisplayPort 2.1b, 1x salida HDMI 2.1b
Conector 12V-2x6 empotrado
cable adaptador de 12V-2x6 a 3x 8 polos

El banco de pruebas: La RTX 5080 FE combina bien con el Core i9-14900K

Muchos de nuestros análisis de GPU de sobremesa en el pasado reciente se han realizado con un Intel Core i9-13900K banco de pruebas. A partir de esta generación, estamos haciendo la transición a opciones de CPU más nuevas, incluido el Core i9-14900K y el AMD Ryzen 7 9800X3D.

Disponemos de un número limitado de GPU, pero estamos haciendo todo lo posible para volver a probar tantas GPU como sea posible en nuestra base de datos durante las próximas semanas y meses.

Los siguientes componentes conforman nuestro banco de pruebas actual:

  • Banco de pruebas abierto Cooler Master MasterFrame 700
  • Intel Core i9-14900K con el perfil Intel Extreme configurado en la BIOS
  • Placa base Gigabyte Z790 Aorus Master
  • SSD NVMe Sabrent Rocket 4 Plus Gen4 de 2 TB y 2x SSD SATA Crucial MX500 de 1 TB para el sistema operativo, pruebas de rendimiento y juegos
  • 2x 16 GB de memoria RAM Kingston Fury Renegade DDR5-6400 con tiempos 32-39-39-80 a 1,40 V
  • Monitor Alienware AW3225QF 4K 240 Hz QD-OLED
  • Thermaltake TH420 V2 Ultra EX ARGB Refrigerador AiO
  • Fuente de alimentación totalmente modular Cooler Master MVE Gold V2 1250 ATX 3.0

Se utilizó Windows 11 24H2 con los últimos parches, junto con el controlador Nvidia Game Ready versión 572.12 enviado a la prensa.

Nos gustaría dar las gracias a Cooler Master por suministrar el banco de pruebas y la PSU, a Gigabyte por la placa base, a Sabrent por la SSD, a Dell por el monitor Alienware, a Thermaltake por el refrigerador AiO y a Kingston por la memoria.

Benchmarks sintéticos: La RX 7900 XTX roe los talones a la RTX 5080

En los puntos de referencia sintéticos acumulativos compuestos por las pruebas 3DMark y Unigine, la RTX 5080 Founders Edition logra sólo una ligera ventaja sobre la XFX Radeon RX 7900 XTX.

Mientras que la tarjeta Blackwell ofrece evidentes ganancias sobre las Radeon en pruebas que implican cierta cantidad de trazado de rayos como 3DMark Port Royal y Speed Way, la RX 7900 XTX está a la par con la RTX 5080 en trazado de rayos.

Performance Rating - Percent
NVIDIA GeForce RTX 5090 Founders Edition
Intel Core i9-14900K, NVIDIA GeForce RTX 5090
98.9 pt
NVIDIA GeForce RTX 4090
Intel Core i9-14900K, NVIDIA GeForce RTX 4090
78.4 pt
NVIDIA GeForce RTX 5080 Founders Edition
Intel Core i9-14900K, NVIDIA GeForce RTX 5080
70.4 pt
XFX Radeon RX 7900 XTX Merc 310 Black Edition
Intel Core i9-14900K, AMD Radeon RX 7900 XTX
66.6 pt
Sapphire Pulse AMD Radeon RX 7900 XTX
Intel Core i9-14900K, AMD Radeon RX 7900 XTX
65.4 pt
Zotac RTX 4080 Super Trinity Black Edition -1!
Intel Core i9-14900K, NVIDIA GeForce RTX 4080 Super
65.1 pt
KFA2 GeForce RTX 4080 Super SG -1!
Intel Core i9-14900K, NVIDIA GeForce RTX 4080 Super
64.2 pt
NVIDIA GeForce RTX 4080 Founders Edition
Intel Core i9-14900K, NVIDIA GeForce RTX 4080
59.2 pt
Sapphire Pulse AMD Radeon RX 7900 XT
Intel Core i9-14900K, AMD Radeon RX 7900 XT
57.1 pt
ASUS TUF Gaming Radeon RX 7800 XT
Intel Core i9-14900K, AMD Radeon RX 7800 XT
43.4 pt
3DMark
1920x1080 Fire Strike Graphics
NVIDIA GeForce RTX 5090 Founders Edition
Intel Core i9-14900K, NVIDIA GeForce RTX 5090
70445 Points +14%
NVIDIA GeForce RTX 4090
Intel Core i9-14900K, NVIDIA GeForce RTX 4090
68682 Points +11%
Sapphire Pulse AMD Radeon RX 7900 XTX
Intel Core i9-14900K, AMD Radeon RX 7900 XTX
66518 Points +8%
Sapphire Pulse AMD Radeon RX 7900 XT
Intel Core i9-14900K, AMD Radeon RX 7900 XT
63086 Points +2%
XFX Radeon RX 7900 XTX Merc 310 Black Edition
Intel Core i9-14900K, AMD Radeon RX 7900 XTX
62392 Points +1%
NVIDIA GeForce RTX 5080 Founders Edition
Intel Core i9-14900K, NVIDIA GeForce RTX 5080
61690 Points
Zotac RTX 4080 Super Trinity Black Edition
Intel Core i9-14900K, NVIDIA GeForce RTX 4080 Super
59674 Points -3%
NVIDIA GeForce RTX 4080 Founders Edition
Intel Core i9-14900K, NVIDIA GeForce RTX 4080
59489 Points -4%
KFA2 GeForce RTX 4080 Super SG
Intel Core i9-14900K, NVIDIA GeForce RTX 4080 Super
59075 Points -4%
ASUS TUF Gaming Radeon RX 7800 XT
Intel Core i9-14900K, AMD Radeon RX 7800 XT
49232 Points -20%
Fire Strike Extreme Graphics
NVIDIA GeForce RTX 5090 Founders Edition
Intel Core i9-14900K, NVIDIA GeForce RTX 5090
53439 Points +33%
NVIDIA GeForce RTX 4090
Intel Core i9-14900K, NVIDIA GeForce RTX 4090
43471 Points +8%
XFX Radeon RX 7900 XTX Merc 310 Black Edition
Intel Core i9-14900K, AMD Radeon RX 7900 XTX
40464 Points +1%
NVIDIA GeForce RTX 5080 Founders Edition
Intel Core i9-14900K, NVIDIA GeForce RTX 5080
40159 Points
Sapphire Pulse AMD Radeon RX 7900 XTX
Intel Core i9-14900K, AMD Radeon RX 7900 XTX
39479 Points -2%
Zotac RTX 4080 Super Trinity Black Edition
Intel Core i9-14900K, NVIDIA GeForce RTX 4080 Super
34430 Points -14%
KFA2 GeForce RTX 4080 Super SG
Intel Core i9-14900K, NVIDIA GeForce RTX 4080 Super
33634 Points -16%
Sapphire Pulse AMD Radeon RX 7900 XT
Intel Core i9-14900K, AMD Radeon RX 7900 XT
33632 Points -16%
NVIDIA GeForce RTX 4080 Founders Edition
Intel Core i9-14900K, NVIDIA GeForce RTX 4080
32344 Points -19%
ASUS TUF Gaming Radeon RX 7800 XT
Intel Core i9-14900K, AMD Radeon RX 7800 XT
25690 Points -36%
3840x2160 Fire Strike Ultra Graphics
NVIDIA GeForce RTX 5090 Founders Edition
Intel Core i9-14900K, NVIDIA GeForce RTX 5090
32495 Points +56%
NVIDIA GeForce RTX 4090
Intel Core i9-14900K, NVIDIA GeForce RTX 4090
23886 Points +15%
XFX Radeon RX 7900 XTX Merc 310 Black Edition
Intel Core i9-14900K, AMD Radeon RX 7900 XTX
20998 Points +1%
NVIDIA GeForce RTX 5080 Founders Edition
Intel Core i9-14900K, NVIDIA GeForce RTX 5080
20843 Points
Sapphire Pulse AMD Radeon RX 7900 XTX
Intel Core i9-14900K, AMD Radeon RX 7900 XTX
20515 Points -2%
Zotac RTX 4080 Super Trinity Black Edition
Intel Core i9-14900K, NVIDIA GeForce RTX 4080 Super
17579 Points -16%
Sapphire Pulse AMD Radeon RX 7900 XT
Intel Core i9-14900K, AMD Radeon RX 7900 XT
17293 Points -17%
KFA2 GeForce RTX 4080 Super SG
Intel Core i9-14900K, NVIDIA GeForce RTX 4080 Super
17236 Points -17%
NVIDIA GeForce RTX 4080 Founders Edition
Intel Core i9-14900K, NVIDIA GeForce RTX 4080
16760 Points -20%
ASUS TUF Gaming Radeon RX 7800 XT
Intel Core i9-14900K, AMD Radeon RX 7800 XT
12845 Points -38%
2560x1440 Port Royal Graphics
NVIDIA GeForce RTX 5090 Founders Edition
Intel Core i9-14900K, NVIDIA GeForce RTX 5090
33897 Points +59%
NVIDIA GeForce RTX 4090
Intel Core i9-14900K, NVIDIA GeForce RTX 4090
25364 Points +19%
NVIDIA GeForce RTX 5080 Founders Edition
Intel Core i9-14900K, NVIDIA GeForce RTX 5080
21363 Points
Zotac RTX 4080 Super Trinity Black Edition
Intel Core i9-14900K, NVIDIA GeForce RTX 4080 Super
18187 Points -15%
KFA2 GeForce RTX 4080 Super SG
Intel Core i9-14900K, NVIDIA GeForce RTX 4080 Super
17893 Points -16%
XFX Radeon RX 7900 XTX Merc 310 Black Edition
Intel Core i9-14900K, AMD Radeon RX 7900 XTX
17193 Points -20%
NVIDIA GeForce RTX 4080 Founders Edition
Intel Core i9-14900K, NVIDIA GeForce RTX 4080
16547 Points -23%
Sapphire Pulse AMD Radeon RX 7900 XTX
Intel Core i9-14900K, AMD Radeon RX 7900 XTX
16463 Points -23%
Sapphire Pulse AMD Radeon RX 7900 XT
Intel Core i9-14900K, AMD Radeon RX 7900 XT
13984 Points -35%
ASUS TUF Gaming Radeon RX 7800 XT
Intel Core i9-14900K, AMD Radeon RX 7800 XT
10816 Points -49%
2560x1440 Speed Way Score
NVIDIA GeForce RTX 5090 Founders Edition
Intel Core i9-14900K, NVIDIA GeForce RTX 5090
14384 Points +62%
NVIDIA GeForce RTX 4090
Intel Core i9-14900K, NVIDIA GeForce RTX 4090
10007 Points +13%
NVIDIA GeForce RTX 5080 Founders Edition
Intel Core i9-14900K, NVIDIA GeForce RTX 5080
8861 Points
Zotac RTX 4080 Super Trinity Black Edition
Intel Core i9-14900K, NVIDIA GeForce RTX 4080 Super
7378 Points -17%
KFA2 GeForce RTX 4080 Super SG
Intel Core i9-14900K, NVIDIA GeForce RTX 4080 Super
7277 Points -18%
NVIDIA GeForce RTX 4080 Founders Edition
Intel Core i9-14900K, NVIDIA GeForce RTX 4080
6861 Points -23%
XFX Radeon RX 7900 XTX Merc 310 Black Edition
Intel Core i9-14900K, AMD Radeon RX 7900 XTX
6551 Points -26%
Sapphire Pulse AMD Radeon RX 7900 XTX
Intel Core i9-14900K, AMD Radeon RX 7900 XTX
6122 Points -31%
Sapphire Pulse AMD Radeon RX 7900 XT
Intel Core i9-14900K, AMD Radeon RX 7900 XT
5048 Points -43%
ASUS TUF Gaming Radeon RX 7800 XT
Intel Core i9-14900K, AMD Radeon RX 7800 XT
4007 Points -55%
Steel Nomad Score
NVIDIA GeForce RTX 5090 Founders Edition
Intel Core i9-14900K, NVIDIA GeForce RTX 5090
13807 Points +69%
NVIDIA GeForce RTX 4090
Intel Core i9-14900K, NVIDIA GeForce RTX 4090
8985 Points +10%
NVIDIA GeForce RTX 5080 Founders Edition
Intel Core i9-14900K, NVIDIA GeForce RTX 5080
8159 Points
XFX Radeon RX 7900 XTX Merc 310 Black Edition
Intel Core i9-14900K, AMD Radeon RX 7900 XTX
6975 Points -15%
Sapphire Pulse AMD Radeon RX 7900 XTX
Intel Core i9-14900K, AMD Radeon RX 7900 XTX
6618 Points -19%
NVIDIA GeForce RTX 4080 Founders Edition
Intel Core i9-14900K, NVIDIA GeForce RTX 4080
6427 Points -21%
Sapphire Pulse AMD Radeon RX 7900 XT
Intel Core i9-14900K, AMD Radeon RX 7900 XT
5443 Points -33%
ASUS TUF Gaming Radeon RX 7800 XT
Intel Core i9-14900K, AMD Radeon RX 7800 XT
4253 Points -48%
2560x1440 Time Spy Graphics
NVIDIA GeForce RTX 5090 Founders Edition
Intel Core i9-14900K, NVIDIA GeForce RTX 5090
42108 Points +32%
NVIDIA GeForce RTX 4090
Intel Core i9-14900K, NVIDIA GeForce RTX 4090
35551 Points +12%
XFX Radeon RX 7900 XTX Merc 310 Black Edition
Intel Core i9-14900K, AMD Radeon RX 7900 XTX
32205 Points +1%
NVIDIA GeForce RTX 5080 Founders Edition
Intel Core i9-14900K, NVIDIA GeForce RTX 5080
31803 Points
Sapphire Pulse AMD Radeon RX 7900 XTX
Intel Core i9-14900K, AMD Radeon RX 7900 XTX
31227 Points -2%
Zotac RTX 4080 Super Trinity Black Edition
Intel Core i9-14900K, NVIDIA GeForce RTX 4080 Super
28605 Points -10%
KFA2 GeForce RTX 4080 Super SG
Intel Core i9-14900K, NVIDIA GeForce RTX 4080 Super
28378 Points -11%
Sapphire Pulse AMD Radeon RX 7900 XT
Intel Core i9-14900K, AMD Radeon RX 7900 XT
26878 Points -15%
NVIDIA GeForce RTX 4080 Founders Edition
Intel Core i9-14900K, NVIDIA GeForce RTX 4080
26550 Points -17%
ASUS TUF Gaming Radeon RX 7800 XT
Intel Core i9-14900K, AMD Radeon RX 7800 XT
20147 Points -37%
Unigine Heaven 4.0 - Extreme Preset DX11
NVIDIA GeForce RTX 5090 Founders Edition
Intel Core i9-14900K, NVIDIA GeForce RTX 5090
511.2 (55.3min - 899.7max) fps +21%
NVIDIA GeForce RTX 4090
Intel Core i9-14900K, NVIDIA GeForce RTX 4090
439.7 (54.3min - 978.6max) fps +4%
NVIDIA GeForce RTX 5080 Founders Edition
Intel Core i9-14900K, NVIDIA GeForce RTX 5080
421.5 (56.3min - 870.3max) fps
Zotac RTX 4080 Super Trinity Black Edition
Intel Core i9-14900K, NVIDIA GeForce RTX 4080 Super
394.4 fps -6%
XFX Radeon RX 7900 XTX Merc 310 Black Edition
Intel Core i9-14900K, AMD Radeon RX 7900 XTX
390.2 fps -7%
KFA2 GeForce RTX 4080 Super SG
Intel Core i9-14900K, NVIDIA GeForce RTX 4080 Super
386.2 fps -8%
Sapphire Pulse AMD Radeon RX 7900 XTX
Intel Core i9-14900K, AMD Radeon RX 7900 XTX
376.1 (56.3min - 807.1max) fps -11%
NVIDIA GeForce RTX 4080 Founders Edition
Intel Core i9-14900K, NVIDIA GeForce RTX 4080
343 (55.4min - 668.3max) fps -19%
Sapphire Pulse AMD Radeon RX 7900 XT
Intel Core i9-14900K, AMD Radeon RX 7900 XT
336.5 (55.2min - 676.4max) fps -20%
ASUS TUF Gaming Radeon RX 7800 XT
Intel Core i9-14900K, AMD Radeon RX 7800 XT
251 fps -40%
Unigine Valley 1.0 - 1920x1080 Extreme HD DirectX AA:x8
XFX Radeon RX 7900 XTX Merc 310 Black Edition
Intel Core i9-14900K, AMD Radeon RX 7900 XTX
293.3 fps +16%
Sapphire Pulse AMD Radeon RX 7900 XTX
Intel Core i9-14900K, AMD Radeon RX 7900 XTX
288.1 (81.4min - 495.4max) fps +14%
Zotac RTX 4080 Super Trinity Black Edition
Intel Core i9-14900K, NVIDIA GeForce RTX 4080 Super
282.3 fps +12%
KFA2 GeForce RTX 4080 Super SG
Intel Core i9-14900K, NVIDIA GeForce RTX 4080 Super
277.1 fps +10%
Sapphire Pulse AMD Radeon RX 7900 XT
Intel Core i9-14900K, AMD Radeon RX 7900 XT
274.8 (84.5min - 515.1max) fps +9%
NVIDIA GeForce RTX 4090
Intel Core i9-14900K, NVIDIA GeForce RTX 4090
259.4 (79.6min - 541.8max) fps +3%
NVIDIA GeForce RTX 5090 Founders Edition
Intel Core i9-14900K, NVIDIA GeForce RTX 5090
256.4 (56.1min - 464max) fps +2%
NVIDIA GeForce RTX 4080 Founders Edition
Intel Core i9-14900K, NVIDIA GeForce RTX 4080
253.1 (70min - 521.5max) fps 0%
NVIDIA GeForce RTX 5080 Founders Edition
Intel Core i9-14900K, NVIDIA GeForce RTX 5080
252.2 (78.8min - 499.6max) fps
ASUS TUF Gaming Radeon RX 7800 XT
Intel Core i9-14900K, AMD Radeon RX 7800 XT
202.8 fps -20%
Unigine Superposition
3840x2160 4k Optimized
NVIDIA GeForce RTX 5090 Founders Edition
Intel Core i9-14900K, NVIDIA GeForce RTX 5090
43145 Points +62%
NVIDIA GeForce RTX 4090
Intel Core i9-14900K, NVIDIA GeForce RTX 4090
31971 Points +20%
NVIDIA GeForce RTX 5080 Founders Edition
Intel Core i9-14900K, NVIDIA GeForce RTX 5080
26580 Points
XFX Radeon RX 7900 XTX Merc 310 Black Edition
Intel Core i9-14900K, AMD Radeon RX 7900 XTX
23972 Points -10%
Sapphire Pulse AMD Radeon RX 7900 XTX
Intel Core i9-14900K, AMD Radeon RX 7900 XTX
23558 Points -11%
Zotac RTX 4080 Super Trinity Black Edition
Intel Core i9-14900K, NVIDIA GeForce RTX 4080 Super
23135 Points -13%
KFA2 GeForce RTX 4080 Super SG
Intel Core i9-14900K, NVIDIA GeForce RTX 4080 Super
23130 Points -13%
NVIDIA GeForce RTX 4080 Founders Edition
Intel Core i9-14900K, NVIDIA GeForce RTX 4080
21717 Points -18%
Sapphire Pulse AMD Radeon RX 7900 XT
Intel Core i9-14900K, AMD Radeon RX 7900 XT
19101 Points -28%
ASUS TUF Gaming Radeon RX 7800 XT
Intel Core i9-14900K, AMD Radeon RX 7800 XT
14327 Points -46%
7680x4320 8k Optimized
NVIDIA GeForce RTX 5090 Founders Edition
Intel Core i9-14900K, NVIDIA GeForce RTX 5090
18256 Points +72%
NVIDIA GeForce RTX 4090
Intel Core i9-14900K, NVIDIA GeForce RTX 4090
12421 Points +17%
NVIDIA GeForce RTX 5080 Founders Edition
Intel Core i9-14900K, NVIDIA GeForce RTX 5080
10625 Points
XFX Radeon RX 7900 XTX Merc 310 Black Edition
Intel Core i9-14900K, AMD Radeon RX 7900 XTX
8931 Points -16%
Sapphire Pulse AMD Radeon RX 7900 XTX
Intel Core i9-14900K, AMD Radeon RX 7900 XTX
8864 Points -17%
Zotac RTX 4080 Super Trinity Black Edition
Intel Core i9-14900K, NVIDIA GeForce RTX 4080 Super
8767 Points -17%
KFA2 GeForce RTX 4080 Super SG
Intel Core i9-14900K, NVIDIA GeForce RTX 4080 Super
8729 Points -18%
NVIDIA GeForce RTX 4080 Founders Edition
Intel Core i9-14900K, NVIDIA GeForce RTX 4080
8239 Points -22%
Sapphire Pulse AMD Radeon RX 7900 XT
Intel Core i9-14900K, AMD Radeon RX 7900 XT
7120 Points -33%
ASUS TUF Gaming Radeon RX 7800 XT
Intel Core i9-14900K, AMD Radeon RX 7800 XT
5454 Points -49%
3DMark Fire Strike Score
45908 puntos
3DMark Fire Strike Extreme Score
35517 puntos
3DMark Time Spy Score
29987 puntos
3DMark Steel Nomad Score
8159 puntos
ayuda

IA y rendimiento informático: Ganancias significativas sobre RTX 4080 FE y RDNA 3

En MLPerf, la RTX 5080 FE logra una tasa de generación de tokens un 19% superior a la de la RTX 4080 FE, aunque queda por detrás de la RTX 4090 en un 10%. Ni que decir tiene que la RTX 5090 FE es casi un 60% más rápida que la RTX 5080 FE en la generación de tokens gracias a un recuento de núcleos un 102% superior.

La RTX 4090 también resulta ser un 29% más rápida que la RTX 5080 FE en Blender 3.3 CUDA. Aunque es comprensible que las GPU AMD estén en desventaja en las pruebas CUDA, la RX 7900 XTX se queda por detrás de la RTX 5080 FE por sólo un 9% en las puntuaciones acumuladas de ComputeMark.

MLPerf Client 0.5 - overall generation rate
NVIDIA GeForce RTX 5090 Founders Edition
Intel Core i9-14900K, NVIDIA GeForce RTX 5090
248 tokens/s +59%
NVIDIA GeForce RTX 4090
Intel Core i9-14900K, NVIDIA GeForce RTX 4090
173.9 tokens/s +12%
NVIDIA GeForce RTX 5080 Founders Edition
Intel Core i9-14900K, NVIDIA GeForce RTX 5080
155.8 tokens/s
Sapphire Pulse AMD Radeon RX 7900 XTX
Intel Core i9-14900K, AMD Radeon RX 7900 XTX
131.7 tokens/s -15%
NVIDIA GeForce RTX 4080 Founders Edition
Intel Core i9-14900K, NVIDIA GeForce RTX 4080
130.9 tokens/s -16%
Sapphire Pulse AMD Radeon RX 7900 XT
Intel Core i9-14900K, AMD Radeon RX 7900 XT
116.9 tokens/s -25%
Blender
v3.3 Classroom CUDA
KFA2 GeForce RTX 4080 Super SG
Intel Core i9-14900K, NVIDIA GeForce RTX 4080 Super
99 Seconds * -607%
Zotac RTX 4080 Super Trinity Black Edition
Intel Core i9-14900K, NVIDIA GeForce RTX 4080 Super
97 Seconds * -593%
NVIDIA GeForce RTX 4080 Founders Edition
Intel Core i9-14900K, NVIDIA GeForce RTX 4080
15 Seconds * -7%
NVIDIA GeForce RTX 5080 Founders Edition
Intel Core i9-14900K, NVIDIA GeForce RTX 5080
14 Seconds *
NVIDIA GeForce RTX 4090
Intel Core i9-14900K, NVIDIA GeForce RTX 4090
10 Seconds * +29%
NVIDIA GeForce RTX 5090 Founders Edition
Intel Core i9-14900K, NVIDIA GeForce RTX 5090
8 Seconds * +43%
v3.3 Classroom OPTIX/RTX
Zotac RTX 4080 Super Trinity Black Edition
Intel Core i9-14900K, NVIDIA GeForce RTX 4080 Super
9 Seconds * -13%
KFA2 GeForce RTX 4080 Super SG
Intel Core i9-14900K, NVIDIA GeForce RTX 4080 Super
9 Seconds * -13%
NVIDIA GeForce RTX 4080 Founders Edition
Intel Core i9-14900K, NVIDIA GeForce RTX 4080
9 Seconds * -13%
NVIDIA GeForce RTX 5080 Founders Edition
Intel Core i9-14900K, NVIDIA GeForce RTX 5080
8 Seconds *
NVIDIA GeForce RTX 4090
Intel Core i9-14900K, NVIDIA GeForce RTX 4090
7 Seconds * +12%
NVIDIA GeForce RTX 5090 Founders Edition
Intel Core i9-14900K, NVIDIA GeForce RTX 5090
5 Seconds * +37%
V-Ray Benchmark Next 4.10 - GPU
NVIDIA GeForce RTX 5090 Founders Edition
Intel Core i9-14900K, NVIDIA GeForce RTX 5090
2381 mpaths +58%
NVIDIA GeForce RTX 4090
Intel Core i9-14900K, NVIDIA GeForce RTX 4090
1858 mpaths +24%
NVIDIA GeForce RTX 5080 Founders Edition
Intel Core i9-14900K, NVIDIA GeForce RTX 5080
1504 mpaths
KFA2 GeForce RTX 4080 Super SG
Intel Core i9-14900K, NVIDIA GeForce RTX 4080 Super
1492 mpaths -1%
NVIDIA GeForce RTX 4080 Founders Edition
Intel Core i9-14900K, NVIDIA GeForce RTX 4080
1445 mpaths -4%
ASUS TUF Gaming Radeon RX 7800 XT
Intel Core i9-14900K, AMD Radeon RX 7800 XT
236 mpaths -84%
XFX Radeon RX 7900 XTX Merc 310 Black Edition
Intel Core i9-14900K, AMD Radeon RX 7900 XTX
224 mpaths -85%
Sapphire Pulse AMD Radeon RX 7900 XTX
Intel Core i9-14900K, AMD Radeon RX 7900 XTX
219 mpaths -85%
Sapphire Pulse AMD Radeon RX 7900 XT
Intel Core i9-14900K, AMD Radeon RX 7900 XT
217 mpaths -86%
V-Ray 5 Benchmark
GPU CUDA
NVIDIA GeForce RTX 5090 Founders Edition
Intel Core i9-14900K, NVIDIA GeForce RTX 5090
5780 mpaths +57%
NVIDIA GeForce RTX 4090
Intel Core i9-14900K, NVIDIA GeForce RTX 4090
4344 mpaths +18%
NVIDIA GeForce RTX 5080 Founders Edition
Intel Core i9-14900K, NVIDIA GeForce RTX 5080
3683 mpaths
KFA2 GeForce RTX 4080 Super SG
Intel Core i9-14900K, NVIDIA GeForce RTX 4080 Super
3072 mpaths -17%
NVIDIA GeForce RTX 4080 Founders Edition
Intel Core i9-14900K, NVIDIA GeForce RTX 4080
3063 mpaths -17%
ASUS TUF Gaming Radeon RX 7800 XT
Intel Core i9-14900K, AMD Radeon RX 7800 XT
738 mpaths -80%
XFX Radeon RX 7900 XTX Merc 310 Black Edition
Intel Core i9-14900K, AMD Radeon RX 7900 XTX
698 mpaths -81%
Sapphire Pulse AMD Radeon RX 7900 XTX
Intel Core i9-14900K, AMD Radeon RX 7900 XTX
685 mpaths -81%
Sapphire Pulse AMD Radeon RX 7900 XT
Intel Core i9-14900K, AMD Radeon RX 7900 XT
674 mpaths -82%
GPU RTX
NVIDIA GeForce RTX 5090 Founders Edition
Intel Core i9-14900K, NVIDIA GeForce RTX 5090
7311 mpaths +63%
NVIDIA GeForce RTX 4090
Intel Core i9-14900K, NVIDIA GeForce RTX 4090
5622 mpaths +26%
NVIDIA GeForce RTX 5080 Founders Edition
Intel Core i9-14900K, NVIDIA GeForce RTX 5080
4477 mpaths
KFA2 GeForce RTX 4080 Super SG
Intel Core i9-14900K, NVIDIA GeForce RTX 4080 Super
4220 mpaths -6%
XFX Radeon RX 7900 XTX Merc 310 Black Edition
Intel Core i9-14900K, AMD Radeon RX 7900 XTX
4220 mpaths -6%
NVIDIA GeForce RTX 4080 Founders Edition
Intel Core i9-14900K, NVIDIA GeForce RTX 4080
4036 mpaths -10%
ComputeMark v2.1
1024x600 Normal, Score
NVIDIA GeForce RTX 5090 Founders Edition
Intel Core i9-14900K, NVIDIA GeForce RTX 5090
115468 Points +64%
NVIDIA GeForce RTX 4090
Intel Core i9-14900K, NVIDIA GeForce RTX 4090
80195 Points +14%
NVIDIA GeForce RTX 5080 Founders Edition
Intel Core i9-14900K, NVIDIA GeForce RTX 5080
70574 Points
Sapphire Pulse AMD Radeon RX 7900 XTX
Intel Core i9-14900K, AMD Radeon RX 7900 XTX
67993 Points -4%
Zotac RTX 4080 Super Trinity Black Edition
Intel Core i9-14900K, NVIDIA GeForce RTX 4080 Super
67215 Points -5%
KFA2 GeForce RTX 4080 Super SG
Intel Core i9-14900K, NVIDIA GeForce RTX 4080 Super
65378 Points -7%
XFX Radeon RX 7900 XTX Merc 310 Black Edition
Intel Core i9-14900K, AMD Radeon RX 7900 XTX
64304 Points -9%
Sapphire Pulse AMD Radeon RX 7900 XT
Intel Core i9-14900K, AMD Radeon RX 7900 XT
60102 Points -15%
NVIDIA GeForce RTX 4080 Founders Edition
Intel Core i9-14900K, NVIDIA GeForce RTX 4080
59738 Points -15%
ASUS TUF Gaming Radeon RX 7800 XT
Intel Core i9-14900K, AMD Radeon RX 7800 XT
41893 Points -41%
1024x600 Normal, Fluid 3DTex
NVIDIA GeForce RTX 5090 Founders Edition
Intel Core i9-14900K, NVIDIA GeForce RTX 5090
17834 Points +77%
NVIDIA GeForce RTX 5080 Founders Edition
Intel Core i9-14900K, NVIDIA GeForce RTX 5080
10101 Points
NVIDIA GeForce RTX 4090
Intel Core i9-14900K, NVIDIA GeForce RTX 4090
9728 Points -4%
XFX Radeon RX 7900 XTX Merc 310 Black Edition
Intel Core i9-14900K, AMD Radeon RX 7900 XTX
9123 Points -10%
Sapphire Pulse AMD Radeon RX 7900 XTX
Intel Core i9-14900K, AMD Radeon RX 7900 XTX
8680 Points -14%
Sapphire Pulse AMD Radeon RX 7900 XT
Intel Core i9-14900K, AMD Radeon RX 7900 XT
6985 Points -31%
KFA2 GeForce RTX 4080 Super SG
Intel Core i9-14900K, NVIDIA GeForce RTX 4080 Super
6807 Points -33%
Zotac RTX 4080 Super Trinity Black Edition
Intel Core i9-14900K, NVIDIA GeForce RTX 4080 Super
6780 Points -33%
NVIDIA GeForce RTX 4080 Founders Edition
Intel Core i9-14900K, NVIDIA GeForce RTX 4080
6232 Points -38%
ASUS TUF Gaming Radeon RX 7800 XT
Intel Core i9-14900K, AMD Radeon RX 7800 XT
4542 Points -55%
1024x600 Normal, Fluid 2DTexArr
NVIDIA GeForce RTX 5090 Founders Edition
Intel Core i9-14900K, NVIDIA GeForce RTX 5090
8368 Points +31%
XFX Radeon RX 7900 XTX Merc 310 Black Edition
Intel Core i9-14900K, AMD Radeon RX 7900 XTX
7993 Points +25%
Sapphire Pulse AMD Radeon RX 7900 XTX
Intel Core i9-14900K, AMD Radeon RX 7900 XTX
7726 Points +21%
Sapphire Pulse AMD Radeon RX 7900 XT
Intel Core i9-14900K, AMD Radeon RX 7900 XT
6684 Points +5%
NVIDIA GeForce RTX 5080 Founders Edition
Intel Core i9-14900K, NVIDIA GeForce RTX 5080
6388 Points
NVIDIA GeForce RTX 4090
Intel Core i9-14900K, NVIDIA GeForce RTX 4090
6226 Points -3%
Zotac RTX 4080 Super Trinity Black Edition
Intel Core i9-14900K, NVIDIA GeForce RTX 4080 Super
5674 Points -11%
KFA2 GeForce RTX 4080 Super SG
Intel Core i9-14900K, NVIDIA GeForce RTX 4080 Super
5651 Points -12%
NVIDIA GeForce RTX 4080 Founders Edition
Intel Core i9-14900K, NVIDIA GeForce RTX 4080
5334 Points -16%
ASUS TUF Gaming Radeon RX 7800 XT
Intel Core i9-14900K, AMD Radeon RX 7800 XT
4453 Points -30%
1024x600 Normal, Mandel Vector
NVIDIA GeForce RTX 5090 Founders Edition
Intel Core i9-14900K, NVIDIA GeForce RTX 5090
23732 Points +71%
Sapphire Pulse AMD Radeon RX 7900 XTX
Intel Core i9-14900K, AMD Radeon RX 7900 XTX
15307 Points +10%
NVIDIA GeForce RTX 4090
Intel Core i9-14900K, NVIDIA GeForce RTX 4090
14965 Points +8%
NVIDIA GeForce RTX 5080 Founders Edition
Intel Core i9-14900K, NVIDIA GeForce RTX 5080
13854 Points
Sapphire Pulse AMD Radeon RX 7900 XT
Intel Core i9-14900K, AMD Radeon RX 7900 XT
13767 Points -1%
Zotac RTX 4080 Super Trinity Black Edition
Intel Core i9-14900K, NVIDIA GeForce RTX 4080 Super
12779 Points -8%
XFX Radeon RX 7900 XTX Merc 310 Black Edition
Intel Core i9-14900K, AMD Radeon RX 7900 XTX
12625 Points -9%
KFA2 GeForce RTX 4080 Super SG
Intel Core i9-14900K, NVIDIA GeForce RTX 4080 Super
11618 Points -16%
NVIDIA GeForce RTX 4080 Founders Edition
Intel Core i9-14900K, NVIDIA GeForce RTX 4080
11246 Points -19%
ASUS TUF Gaming Radeon RX 7800 XT
Intel Core i9-14900K, AMD Radeon RX 7800 XT
9379 Points -32%
1024x600 Normal, Mandel Scalar
NVIDIA GeForce RTX 5090 Founders Edition
Intel Core i9-14900K, NVIDIA GeForce RTX 5090
27258 Points +78%
NVIDIA GeForce RTX 4090
Intel Core i9-14900K, NVIDIA GeForce RTX 4090
19769 Points +29%
Sapphire Pulse AMD Radeon RX 7900 XTX
Intel Core i9-14900K, AMD Radeon RX 7900 XTX
16776 Points +9%
Zotac RTX 4080 Super Trinity Black Edition
Intel Core i9-14900K, NVIDIA GeForce RTX 4080 Super
15806 Points +3%
KFA2 GeForce RTX 4080 Super SG
Intel Core i9-14900K, NVIDIA GeForce RTX 4080 Super
15609 Points +2%
XFX Radeon RX 7900 XTX Merc 310 Black Edition
Intel Core i9-14900K, AMD Radeon RX 7900 XTX
15422 Points +1%
NVIDIA GeForce RTX 5080 Founders Edition
Intel Core i9-14900K, NVIDIA GeForce RTX 5080
15326 Points
Sapphire Pulse AMD Radeon RX 7900 XT
Intel Core i9-14900K, AMD Radeon RX 7900 XT
14608 Points -5%
NVIDIA GeForce RTX 4080 Founders Edition
Intel Core i9-14900K, NVIDIA GeForce RTX 4080
14001 Points -9%
ASUS TUF Gaming Radeon RX 7800 XT
Intel Core i9-14900K, AMD Radeon RX 7800 XT
10759 Points -30%
1024x600 Normal, QJuliaRayTrace
NVIDIA GeForce RTX 5090 Founders Edition
Intel Core i9-14900K, NVIDIA GeForce RTX 5090
38276 Points +54%
NVIDIA GeForce RTX 4090
Intel Core i9-14900K, NVIDIA GeForce RTX 4090
29507 Points +18%
Zotac RTX 4080 Super Trinity Black Edition
Intel Core i9-14900K, NVIDIA GeForce RTX 4080 Super
26177 Points +5%
KFA2 GeForce RTX 4080 Super SG
Intel Core i9-14900K, NVIDIA GeForce RTX 4080 Super
25693 Points +3%
NVIDIA GeForce RTX 5080 Founders Edition
Intel Core i9-14900K, NVIDIA GeForce RTX 5080
24906 Points
NVIDIA GeForce RTX 4080 Founders Edition
Intel Core i9-14900K, NVIDIA GeForce RTX 4080
22926 Points -8%
Sapphire Pulse AMD Radeon RX 7900 XTX
Intel Core i9-14900K, AMD Radeon RX 7900 XTX
19505 Points -22%
XFX Radeon RX 7900 XTX Merc 310 Black Edition
Intel Core i9-14900K, AMD Radeon RX 7900 XTX
19141 Points -23%
Sapphire Pulse AMD Radeon RX 7900 XT
Intel Core i9-14900K, AMD Radeon RX 7900 XT
18058 Points -27%
ASUS TUF Gaming Radeon RX 7800 XT
Intel Core i9-14900K, AMD Radeon RX 7800 XT
12761 Points -49%
LuxMark v2.0 64Bit
Room GPUs-only
NVIDIA GeForce RTX 5090 Founders Edition
Intel Core i9-14900K, NVIDIA GeForce RTX 5090
14722 Samples/s +27%
NVIDIA GeForce RTX 4090
Intel Core i9-14900K, NVIDIA GeForce RTX 4090
12513 Samples/s +8%
NVIDIA GeForce RTX 5080 Founders Edition
Intel Core i9-14900K, NVIDIA GeForce RTX 5080
11576 Samples/s
NVIDIA GeForce RTX 4080 Founders Edition
Intel Core i9-14900K, NVIDIA GeForce RTX 4080
10203 Samples/s -12%
Zotac RTX 4080 Super Trinity Black Edition
Intel Core i9-14900K, NVIDIA GeForce RTX 4080 Super
10136 Samples/s -12%
KFA2 GeForce RTX 4080 Super SG
Intel Core i9-14900K, NVIDIA GeForce RTX 4080 Super
10075 Samples/s -13%
Sapphire Pulse AMD Radeon RX 7900 XTX
Intel Core i9-14900K, AMD Radeon RX 7900 XTX
6226 Samples/s -46%
Sapphire Pulse AMD Radeon RX 7900 XT
Intel Core i9-14900K, AMD Radeon RX 7900 XT
5924 Samples/s -49%
XFX Radeon RX 7900 XTX Merc 310 Black Edition
Intel Core i9-14900K, AMD Radeon RX 7900 XTX
4534 Samples/s -61%
ASUS TUF Gaming Radeon RX 7800 XT
Intel Core i9-14900K, AMD Radeon RX 7800 XT
3737 Samples/s -68%
Sala GPUs-only
NVIDIA GeForce RTX 5090 Founders Edition
Intel Core i9-14900K, NVIDIA GeForce RTX 5090
33461 Samples/s +32%
NVIDIA GeForce RTX 4090
Intel Core i9-14900K, NVIDIA GeForce RTX 4090
26702 Samples/s +6%
NVIDIA GeForce RTX 5080 Founders Edition
Intel Core i9-14900K, NVIDIA GeForce RTX 5080
25255 Samples/s
NVIDIA GeForce RTX 4080 Founders Edition
Intel Core i9-14900K, NVIDIA GeForce RTX 4080
24215 Samples/s -4%
Zotac RTX 4080 Super Trinity Black Edition
Intel Core i9-14900K, NVIDIA GeForce RTX 4080 Super
23374 Samples/s -7%
KFA2 GeForce RTX 4080 Super SG
Intel Core i9-14900K, NVIDIA GeForce RTX 4080 Super
22634 Samples/s -10%
Sapphire Pulse AMD Radeon RX 7900 XTX
Intel Core i9-14900K, AMD Radeon RX 7900 XTX
17547 Samples/s -31%
Sapphire Pulse AMD Radeon RX 7900 XT
Intel Core i9-14900K, AMD Radeon RX 7900 XT
15531 Samples/s -39%
XFX Radeon RX 7900 XTX Merc 310 Black Edition
Intel Core i9-14900K, AMD Radeon RX 7900 XTX
13953 Samples/s -45%
ASUS TUF Gaming Radeon RX 7800 XT
Intel Core i9-14900K, AMD Radeon RX 7800 XT
10441 Samples/s -59%

* ... más pequeño es mejor

Rendimiento en juegos: Buena ventaja sobre la RX 7900 XTX en trama 4K

La RTX 5080 FE demuestra una ventaja de hasta el 17% sobre la RX 7900 XTX en las pruebas acumulativas de juegos de trama pura a 4K Ultra. Esto se reduce hasta un 9% en los ajustes 1080p y 2K Ultra, mientras que queda por detrás de la RTX 4090 por un margen similar. Espere un aumento medio del 22% a 4K y del 29% a 1080p y 2K combinados si está actualizando desde una RTX 4080 FE.

Aunque a la RTX 5080 FE le cuesta acercarse a la codiciada marca de los 60 fps en títulos con muchas texturas como Avatar: Frontiers of Pandora y Black Myth: Wukong, un buen número de juegos AAA modernos deberían poder jugarse a resolución 4K nativa sin ayuda de reescalado, siempre que no haya trazado de rayos de por medio.

Como se ha visto con la serie RTX 40, necesitará una CPU rápida para mantener la RTX 5080 FE alimentada sin contratiempos. El Core i9-14900K no es una mala opción si juega principalmente a resoluciones 2K o superiores, pero las configuraciones 1080p e inferiores se beneficiarán enormemente de un Ryzen 7 9800X3D.

Performance Rating - Percent
NVIDIA GeForce RTX 5090 Founders Edition
Intel Core i9-14900K, NVIDIA GeForce RTX 5090
100 pt
NVIDIA GeForce RTX 4090
Intel Core i9-14900K, NVIDIA GeForce RTX 4090
78.9 pt
NVIDIA GeForce RTX 5080 Founders Edition
Intel Core i9-14900K, NVIDIA GeForce RTX 5080
69.7 pt
XFX Radeon RX 7900 XTX Merc 310 Black Edition
Intel Core i9-14900K, AMD Radeon RX 7900 XTX
60.9 pt
Sapphire Pulse AMD Radeon RX 7900 XTX
Intel Core i9-14900K, AMD Radeon RX 7900 XTX
59.6 pt
NVIDIA GeForce RTX 4080 Founders Edition
Intel Core i9-14900K, NVIDIA GeForce RTX 4080
57.2 pt
Sapphire Pulse AMD Radeon RX 7900 XT
Intel Core i9-14900K, AMD Radeon RX 7900 XT
49.6 pt
Indiana Jones and the Great Circle - 3840x2160 Very Ultra Preset
NVIDIA GeForce RTX 5090 Founders Edition
Intel Core i9-14900K, NVIDIA GeForce RTX 5090
123.9 (4.96min, 65.9P0.1, 103.3P1 - 184.7max) fps +38%
NVIDIA GeForce RTX 4090
Intel Core i9-14900K, NVIDIA GeForce RTX 4090
103.4 (9.64min, 58.6P0.1, 93.5P1 - 203max) fps +15%
NVIDIA GeForce RTX 5080 Founders Edition
Intel Core i9-14900K, NVIDIA GeForce RTX 5080
89.9 (7.74min, 55.4P0.1, 76.1P1 - 131.6max) fps
XFX Radeon RX 7900 XTX Merc 310 Black Edition
Intel Core i9-14900K, AMD Radeon RX 7900 XTX
76.7 (66.2min, 68.9P0.1, 70.9P1 - 89.1max) fps -15%
Sapphire Pulse AMD Radeon RX 7900 XTX
Intel Core i9-14900K, AMD Radeon RX 7900 XTX
72.1 (4.67min, 32.5P0.1, 65.8P1 - 81.5max) fps -20%
NVIDIA GeForce RTX 4080 Founders Edition
Intel Core i9-14900K, NVIDIA GeForce RTX 4080
64.6 (5.96min, 25.3P0.1, 51.2P1 - 219max) fps -28%
Sapphire Pulse AMD Radeon RX 7900 XT
Intel Core i9-14900K, AMD Radeon RX 7900 XT
61.2 (7.29min, 23.4P0.1, 56.4P1 - 69.1max) fps -32%
Black Myth: Wukong - 3840x2160 cinematic TSR 100
NVIDIA GeForce RTX 5090 Founders Edition
Intel Core i9-14900K, NVIDIA GeForce RTX 5090
58 (48min - 65max) fps +53%
NVIDIA GeForce RTX 4090
Intel Core i9-14900K, NVIDIA GeForce RTX 4090
43 (33min - 48max) fps +13%
NVIDIA GeForce RTX 5080 Founders Edition
Intel Core i9-14900K, NVIDIA GeForce RTX 5080
38 (30min - 43max) fps
XFX Radeon RX 7900 XTX Merc 310 Black Edition
Intel Core i9-14900K, AMD Radeon RX 7900 XTX
32 (26min - 37max) fps -16%
NVIDIA GeForce RTX 4080 Founders Edition
Intel Core i9-14900K, NVIDIA GeForce RTX 4080
31 (25min - 35max) fps -18%
Sapphire Pulse AMD Radeon RX 7900 XTX
Intel Core i9-14900K, AMD Radeon RX 7900 XTX
31 (16min - 36max) fps -18%
Sapphire Pulse AMD Radeon RX 7900 XT
Intel Core i9-14900K, AMD Radeon RX 7900 XT
26 (21min - 31max) fps -32%
Alan Wake 2 - 3840x2160 High Preset
NVIDIA GeForce RTX 5090 Founders Edition
Intel Core i9-14900K, NVIDIA GeForce RTX 5090
88.7 (46.5min, 63.4P0.1, 77.1P1 - 97.8max) fps +59%
NVIDIA GeForce RTX 4090
Intel Core i9-14900K, NVIDIA GeForce RTX 4090
67 (36.9min, 44.9P0.1, 57.2P1 - 80.5max) fps +20%
Sapphire Pulse AMD Radeon RX 7900 XTX
Intel Core i9-14900K, AMD Radeon RX 7900 XTX
63.7 (34min, 42.3P0.1, 55.1P1 - 68.5max) fps +14%
XFX Radeon RX 7900 XTX Merc 310 Black Edition
Intel Core i9-14900K, AMD Radeon RX 7900 XTX
62.2 (29.3min, 29.5P0.1, 38.8P1 - 160max) fps +12%
NVIDIA GeForce RTX 5080 Founders Edition
Intel Core i9-14900K, NVIDIA GeForce RTX 5080
55.7 (34min, 43P0.1, 49P1 - 60.3max) fps
Sapphire Pulse AMD Radeon RX 7900 XT
Intel Core i9-14900K, AMD Radeon RX 7900 XT
48.5 (30.1min, 37.4P0.1, 42.8P1 - 52.3max) fps -13%
NVIDIA GeForce RTX 4080 Founders Edition
Intel Core i9-14900K, NVIDIA GeForce RTX 4080
44.1 (23.7min, 24.2P0.1, 31P1 - 51.5max) fps -21%
F1 24 - 3840x2160 Ultra High Preset AA:T AF:16x
NVIDIA GeForce RTX 5090 Founders Edition
Intel Core i9-14900K, NVIDIA GeForce RTX 5090
120.9 (95min, 97P1 - 145max) fps +66%
NVIDIA GeForce RTX 4090
Intel Core i9-14900K, NVIDIA GeForce RTX 4090
89.9 (75min, 73P1 - 107max) fps +23%
NVIDIA GeForce RTX 5080 Founders Edition
Intel Core i9-14900K, NVIDIA GeForce RTX 5080
72.8 (60min, 60P1 - 88max) fps
NVIDIA GeForce RTX 4080 Founders Edition
Intel Core i9-14900K, NVIDIA GeForce RTX 4080
62.1 (53min, 52P1 - 75max) fps -15%
Sapphire Pulse AMD Radeon RX 7900 XTX
Intel Core i9-14900K, AMD Radeon RX 7900 XTX
49.9 (39min, 37P1 - 61max) fps -31%
XFX Radeon RX 7900 XTX Merc 310 Black Edition
Intel Core i9-14900K, AMD Radeon RX 7900 XTX
46.6 (32min, 32P1 - 57max) fps -36%
Sapphire Pulse AMD Radeon RX 7900 XT
Intel Core i9-14900K, AMD Radeon RX 7900 XT
42.4 (33min, 32P1 - 51max) fps -42%
Assassin's Creed Mirage - 3840x2160 Ultra High Preset (Adaptive Quality Off)
NVIDIA GeForce RTX 5090 Founders Edition
Intel Core i9-14900K, NVIDIA GeForce RTX 5090
148 (76min - 201max) fps +36%
NVIDIA GeForce RTX 4090
Intel Core i9-14900K, NVIDIA GeForce RTX 4090
123 (68min - 180max) fps +13%
NVIDIA GeForce RTX 5080 Founders Edition
Intel Core i9-14900K, NVIDIA GeForce RTX 5080
109 (56min - 155max) fps
XFX Radeon RX 7900 XTX Merc 310 Black Edition
Intel Core i9-14900K, AMD Radeon RX 7900 XTX
102 (49min, 54P0.1, 66P1 - 205max) fps -6%
Sapphire Pulse AMD Radeon RX 7900 XTX
Intel Core i9-14900K, AMD Radeon RX 7900 XTX
100 (44min - 142max) fps -8%
NVIDIA GeForce RTX 4080 Founders Edition
Intel Core i9-14900K, NVIDIA GeForce RTX 4080
93 (28min - 177max) fps -15%
Sapphire Pulse AMD Radeon RX 7900 XT
Intel Core i9-14900K, AMD Radeon RX 7900 XT
81 (42min - 204max) fps -26%
Avatar Frontiers of Pandora - 3840x2160 Ultra Preset AA:T
NVIDIA GeForce RTX 5090 Founders Edition
Intel Core i9-14900K, NVIDIA GeForce RTX 5090
83.3 (70min - 106max) fps +60%
NVIDIA GeForce RTX 4090
Intel Core i9-14900K, NVIDIA GeForce RTX 4090
64.5 (54min - 80max) fps +24%
NVIDIA GeForce RTX 5080 Founders Edition
Intel Core i9-14900K, NVIDIA GeForce RTX 5080
52.1 (45min - 65max) fps
XFX Radeon RX 7900 XTX Merc 310 Black Edition
Intel Core i9-14900K, AMD Radeon RX 7900 XTX
46 (38min - 58max) fps -12%
Sapphire Pulse AMD Radeon RX 7900 XTX
Intel Core i9-14900K, AMD Radeon RX 7900 XTX
44.8 (39min - 57max) fps -14%
NVIDIA GeForce RTX 4080 Founders Edition
Intel Core i9-14900K, NVIDIA GeForce RTX 4080
43.8 (35min - 55max) fps -16%
Sapphire Pulse AMD Radeon RX 7900 XT
Intel Core i9-14900K, AMD Radeon RX 7900 XT
35.4 (31min - 45max) fps -32%
Cyberpunk 2077 2.2 Phantom Liberty - 3840x2160 Ultra Preset (FSR off)
NVIDIA GeForce RTX 5090 Founders Edition
Intel Core i9-14900K, NVIDIA GeForce RTX 5090
111.7 (87.8min - 140.2max) fps +56%
NVIDIA GeForce RTX 4090
Intel Core i9-14900K, NVIDIA GeForce RTX 4090
73.3 (57.5min - 92.4max) fps +3%
NVIDIA GeForce RTX 5080 Founders Edition
Intel Core i9-14900K, NVIDIA GeForce RTX 5080
71.4 (58.6min - 90.8max) fps
XFX Radeon RX 7900 XTX Merc 310 Black Edition
Intel Core i9-14900K, AMD Radeon RX 7900 XTX
67.9 (57.2min - 85.2max) fps -5%
Sapphire Pulse AMD Radeon RX 7900 XTX
Intel Core i9-14900K, AMD Radeon RX 7900 XTX
65 (54.8min - 81.6max) fps -9%
NVIDIA GeForce RTX 4080 Founders Edition
Intel Core i9-14900K, NVIDIA GeForce RTX 4080
54.9 (44.9min - 69.5max) fps -23%
Sapphire Pulse AMD Radeon RX 7900 XT
Intel Core i9-14900K, AMD Radeon RX 7900 XT
53.3 (45.2min - 67.1max) fps -25%
X-Plane 11.11 - 3840x2160 high (fps_test=3)
NVIDIA GeForce RTX 5090 Founders Edition
Intel Core i9-14900K, NVIDIA GeForce RTX 5090
132.2 fps +4%
NVIDIA GeForce RTX 4090
Intel Core i9-14900K, NVIDIA GeForce RTX 4090
128.9 fps +1%
NVIDIA GeForce RTX 5080 Founders Edition
Intel Core i9-14900K, NVIDIA GeForce RTX 5080
127.7 fps
NVIDIA GeForce RTX 4080 Founders Edition
Intel Core i9-14900K, NVIDIA GeForce RTX 4080
113.8 fps -11%
XFX Radeon RX 7900 XTX Merc 310 Black Edition
Intel Core i9-14900K, AMD Radeon RX 7900 XTX
101.2 fps -21%
Sapphire Pulse AMD Radeon RX 7900 XTX
Intel Core i9-14900K, AMD Radeon RX 7900 XTX
95.5 fps -25%
Sapphire Pulse AMD Radeon RX 7900 XT
Intel Core i9-14900K, AMD Radeon RX 7900 XT
89.5 fps -30%
1080p and 2K Performance Rating - Percent
NVIDIA GeForce RTX 5090 Founders Edition
Intel Core i9-14900K, NVIDIA GeForce RTX 5090
99.4 pt
NVIDIA GeForce RTX 4090
Intel Core i9-14900K, NVIDIA GeForce RTX 4090
85.6 pt
NVIDIA GeForce RTX 5080 Founders Edition
Intel Core i9-14900K, NVIDIA GeForce RTX 5080
79.7 pt
XFX Radeon RX 7900 XTX Merc 310 Black Edition
Intel Core i9-14900K, AMD Radeon RX 7900 XTX
74.4 pt
Sapphire Pulse AMD Radeon RX 7900 XTX
Intel Core i9-14900K, AMD Radeon RX 7900 XTX
72.9 pt
Sapphire Pulse AMD Radeon RX 7900 XT -1!
Intel Core i9-14900K, AMD Radeon RX 7900 XT
62.6 pt
NVIDIA GeForce RTX 4080 Founders Edition
Intel Core i9-14900K, NVIDIA GeForce RTX 4080
61.8 pt
Indiana Jones and the Great Circle
2560x1440 Very Ultra Preset
NVIDIA GeForce RTX 5090 Founders Edition
Intel Core i9-14900K, NVIDIA GeForce RTX 5090
176.5 (8.79min, 89.2P0.1, 128P1 - 333max) fps +33%
NVIDIA GeForce RTX 4090
Intel Core i9-14900K, NVIDIA GeForce RTX 4090
148.7 (19.3min, 89.8P0.1, 124.9P1 - 360max) fps +12%
NVIDIA GeForce RTX 5080 Founders Edition
Intel Core i9-14900K, NVIDIA GeForce RTX 5080
132.3 (9.96min, 73.6P0.1, 102.1P1 - 193.6max) fps
XFX Radeon RX 7900 XTX Merc 310 Black Edition
Intel Core i9-14900K, AMD Radeon RX 7900 XTX
127.1 (103min, 108.9P0.1, 113P1 - 146.5max) fps -4%
Sapphire Pulse AMD Radeon RX 7900 XTX
Intel Core i9-14900K, AMD Radeon RX 7900 XTX
122.9 (13.6min, 88.2P0.1, 110.8P1 - 145max) fps -7%
Sapphire Pulse AMD Radeon RX 7900 XT
Intel Core i9-14900K, AMD Radeon RX 7900 XT
105.1 (11.2min, 62.3P0.1, 92.4P1 - 126max) fps -21%
NVIDIA GeForce RTX 4080 Founders Edition
Intel Core i9-14900K, NVIDIA GeForce RTX 4080
86.9 (15.2min, 48.8P0.1, 64.1P1 - 205max) fps -34%
1920x1080 Very Ultra Preset
NVIDIA GeForce RTX 5090 Founders Edition
Intel Core i9-14900K, NVIDIA GeForce RTX 5090
199.4 (15min, 121.6P0.1, 140.5P1 - 645max) fps +24%
NVIDIA GeForce RTX 4090
Intel Core i9-14900K, NVIDIA GeForce RTX 4090
179.3 (31.7min, 136.2P0.1, 142.8P1 - 503max) fps +11%
NVIDIA GeForce RTX 5080 Founders Edition
Intel Core i9-14900K, NVIDIA GeForce RTX 5080
161.2 (17.1min, 89.6P0.1, 128.1P1 - 267max) fps
XFX Radeon RX 7900 XTX Merc 310 Black Edition
Intel Core i9-14900K, AMD Radeon RX 7900 XTX
160.5 (128.2min, 133.4P0.1, 139.9P1 - 195.5max) fps 0%
Sapphire Pulse AMD Radeon RX 7900 XTX
Intel Core i9-14900K, AMD Radeon RX 7900 XTX
153.2 (20.4min, 106.1P0.1, 133.3P1 - 179max) fps -5%
Sapphire Pulse AMD Radeon RX 7900 XT
Intel Core i9-14900K, AMD Radeon RX 7900 XT
134 (21min, 105.8P0.1, 116.8P1 - 157.9max) fps -17%
NVIDIA GeForce RTX 4080 Founders Edition
Intel Core i9-14900K, NVIDIA GeForce RTX 4080
95.8 (16.5min, 52.1P0.1, 67.2P1 - 267max) fps -41%
Black Myth: Wukong
2560x1440 cinematic TSR 100
NVIDIA GeForce RTX 5090 Founders Edition
Intel Core i9-14900K, NVIDIA GeForce RTX 5090
87 (74min - 98max) fps +45%
NVIDIA GeForce RTX 4090
Intel Core i9-14900K, NVIDIA GeForce RTX 4090
68 (18min - 76max) fps +13%
NVIDIA GeForce RTX 5080 Founders Edition
Intel Core i9-14900K, NVIDIA GeForce RTX 5080
60 (53min - 68max) fps
XFX Radeon RX 7900 XTX Merc 310 Black Edition
Intel Core i9-14900K, AMD Radeon RX 7900 XTX
53 (43min - 60max) fps -12%
Sapphire Pulse AMD Radeon RX 7900 XTX
Intel Core i9-14900K, AMD Radeon RX 7900 XTX
51 (39min - 58max) fps -15%
NVIDIA GeForce RTX 4080 Founders Edition
Intel Core i9-14900K, NVIDIA GeForce RTX 4080
50 (44min - 56max) fps -17%
Sapphire Pulse AMD Radeon RX 7900 XT
Intel Core i9-14900K, AMD Radeon RX 7900 XT
44 (34min - 51max) fps -27%
1920x1080 cinematic TSR 100
NVIDIA GeForce RTX 5090 Founders Edition
Intel Core i9-14900K, NVIDIA GeForce RTX 5090
104 (19min - 124max) fps +33%
NVIDIA GeForce RTX 4090
Intel Core i9-14900K, NVIDIA GeForce RTX 4090
85 (73min - 98max) fps +9%
NVIDIA GeForce RTX 5080 Founders Edition
Intel Core i9-14900K, NVIDIA GeForce RTX 5080
78 (69min - 92max) fps
XFX Radeon RX 7900 XTX Merc 310 Black Edition
Intel Core i9-14900K, AMD Radeon RX 7900 XTX
68 (55min - 80max) fps -13%
NVIDIA GeForce RTX 4080 Founders Edition
Intel Core i9-14900K, NVIDIA GeForce RTX 4080
64 (18min - 72max) fps -18%
Sapphire Pulse AMD Radeon RX 7900 XTX
Intel Core i9-14900K, AMD Radeon RX 7900 XTX
62 (52min - 76max) fps -21%
Sapphire Pulse AMD Radeon RX 7900 XT
Intel Core i9-14900K, AMD Radeon RX 7900 XT
57 (20min - 66max) fps -27%
Alan Wake 2
2560x1440 High Preset
NVIDIA GeForce RTX 5090 Founders Edition
Intel Core i9-14900K, NVIDIA GeForce RTX 5090
150 (85.2min, 98.3P0.1, 126.1P1 - 165.4max) fps +47%
Sapphire Pulse AMD Radeon RX 7900 XTX
Intel Core i9-14900K, AMD Radeon RX 7900 XTX
121.6 (42.6min, 59.5P0.1, 104.8P1 - 138.9max) fps +19%
XFX Radeon RX 7900 XTX Merc 310 Black Edition
Intel Core i9-14900K, AMD Radeon RX 7900 XTX
120.4 (51.3min, 61.1P0.1, 93.5P1 - 167.6max) fps +18%
NVIDIA GeForce RTX 4090
Intel Core i9-14900K, NVIDIA GeForce RTX 4090
120.1 (78.4min, 87P0.1, 105.4P1 - 141.6max) fps +18%
NVIDIA GeForce RTX 5080 Founders Edition
Intel Core i9-14900K, NVIDIA GeForce RTX 5080
101.9 (52.6min, 73.1P0.1, 90.5P1 - 112.2max) fps
Sapphire Pulse AMD Radeon RX 7900 XT
Intel Core i9-14900K, AMD Radeon RX 7900 XT
95.9 (65.2min, 71.9P0.1, 85.1P1 - 151.5max) fps -6%
NVIDIA GeForce RTX 4080 Founders Edition
Intel Core i9-14900K, NVIDIA GeForce RTX 4080
75.1 (30min, 33.4P0.1, 52.9P1 - 87.3max) fps -26%
1920x1080 High Preset
NVIDIA GeForce RTX 5090 Founders Edition
Intel Core i9-14900K, NVIDIA GeForce RTX 5090
174 (76.8min, 88.2P0.1, 119.3P1 - 214max) fps +21%
NVIDIA GeForce RTX 4090
Intel Core i9-14900K, NVIDIA GeForce RTX 4090
163.7 (84.5min, 102.7P0.1, 129.9P1 - 199max) fps +14%
Sapphire Pulse AMD Radeon RX 7900 XTX
Intel Core i9-14900K, AMD Radeon RX 7900 XTX
155.8 (52.5min, 73.9P0.1, 98P1 - 194.4max) fps +8%
XFX Radeon RX 7900 XTX Merc 310 Black Edition
Intel Core i9-14900K, AMD Radeon RX 7900 XTX
155.4 (66.4min, 85P0.1, 120.3P1 - 177.8max) fps +8%
NVIDIA GeForce RTX 5080 Founders Edition
Intel Core i9-14900K, NVIDIA GeForce RTX 5080
144.1 (69.4min, 88P0.1, 113.1P1 - 163.4max) fps
Sapphire Pulse AMD Radeon RX 7900 XT
Intel Core i9-14900K, AMD Radeon RX 7900 XT
143.4 (49min, 76.3P0.1, 107.6P1 - 159.7max) fps 0%
NVIDIA GeForce RTX 4080 Founders Edition
Intel Core i9-14900K, NVIDIA GeForce RTX 4080
94.9 (29.8min, 38.9P0.1, 60.9P1 - 127.7max) fps -34%
F1 24
2560x1440 Ultra High Preset AA:T AF:16x
NVIDIA GeForce RTX 5090 Founders Edition
Intel Core i9-14900K, NVIDIA GeForce RTX 5090
211 (99min, 122P1 - 241max) fps +51%
NVIDIA GeForce RTX 4090
Intel Core i9-14900K, NVIDIA GeForce RTX 4090
169 (103min, 117P1 - 200max) fps +21%
NVIDIA GeForce RTX 5080 Founders Edition
Intel Core i9-14900K, NVIDIA GeForce RTX 5080
139.5 (101min, 107P1 - 168max) fps
NVIDIA GeForce RTX 4080 Founders Edition
Intel Core i9-14900K, NVIDIA GeForce RTX 4080
117.9 (83min, 88P1 - 136max) fps -15%
Sapphire Pulse AMD Radeon RX 7900 XTX
Intel Core i9-14900K, AMD Radeon RX 7900 XTX
98.4 (72min, 75P1 - 120max) fps -29%
XFX Radeon RX 7900 XTX Merc 310 Black Edition
Intel Core i9-14900K, AMD Radeon RX 7900 XTX
91.2 (66min, 63P1 - 112max) fps -35%
Sapphire Pulse AMD Radeon RX 7900 XT
Intel Core i9-14900K, AMD Radeon RX 7900 XT
85 (68min, 66P1 - 103max) fps -39%
1920x1080 Ultra High Preset AA:T AF:16x
NVIDIA GeForce RTX 5090 Founders Edition
Intel Core i9-14900K, NVIDIA GeForce RTX 5090
214 (120min, 123P1 - 242max) fps +7%
NVIDIA GeForce RTX 4090
Intel Core i9-14900K, NVIDIA GeForce RTX 4090
213 (103min, 120P1 - 238max) fps +7%
NVIDIA GeForce RTX 5080 Founders Edition
Intel Core i9-14900K, NVIDIA GeForce RTX 5080
199.7 (97min, 121P1 - 229max) fps
NVIDIA GeForce RTX 4080 Founders Edition
Intel Core i9-14900K, NVIDIA GeForce RTX 4080
147 (79min, 86P1 - 167max) fps -26%
Sapphire Pulse AMD Radeon RX 7900 XTX
Intel Core i9-14900K, AMD Radeon RX 7900 XTX
144.3 (76min, 94P1 - 169max) fps -28%
XFX Radeon RX 7900 XTX Merc 310 Black Edition
Intel Core i9-14900K, AMD Radeon RX 7900 XTX
134.9 (101min, 94P1 - 161max) fps -32%
Sapphire Pulse AMD Radeon RX 7900 XT
Intel Core i9-14900K, AMD Radeon RX 7900 XT
126.9 (78min, 89P1 - 151max) fps -36%
Assassin's Creed Mirage
2560x1440 Ultra High Preset (Adaptive Quality Off)
NVIDIA GeForce RTX 5090 Founders Edition
Intel Core i9-14900K, NVIDIA GeForce RTX 5090
195 (94min - 245max) fps +22%
XFX Radeon RX 7900 XTX Merc 310 Black Edition
Intel Core i9-14900K, AMD Radeon RX 7900 XTX
160 (63min, 77P0.1, 101P1 - 173max) fps 0%
NVIDIA GeForce RTX 5080 Founders Edition
Intel Core i9-14900K, NVIDIA GeForce RTX 5080
160 (84min - 206max) fps
Sapphire Pulse AMD Radeon RX 7900 XTX
Intel Core i9-14900K, AMD Radeon RX 7900 XTX
160 (59min - 200max) fps 0%
Sapphire Pulse AMD Radeon RX 7900 XT
Intel Core i9-14900K, AMD Radeon RX 7900 XT
138 (53min - 235max) fps -14%
NVIDIA GeForce RTX 4080 Founders Edition
Intel Core i9-14900K, NVIDIA GeForce RTX 4080
133 (24min - 191max) fps -17%
NVIDIA GeForce RTX 4090
Intel Core i9-14900K, NVIDIA GeForce RTX 4090
123 (68min - 180max) fps -23%
1920x1080 Ultra High Preset (Adaptive Quality Off)
NVIDIA GeForce RTX 4090
Intel Core i9-14900K, NVIDIA GeForce RTX 4090
199 (104min - 255max) fps +2%
NVIDIA GeForce RTX 5090 Founders Edition
Intel Core i9-14900K, NVIDIA GeForce RTX 5090
198 (81min - 243max) fps +2%
NVIDIA GeForce RTX 5080 Founders Edition
Intel Core i9-14900K, NVIDIA GeForce RTX 5080
195 (102min - 247max) fps
XFX Radeon RX 7900 XTX Merc 310 Black Edition
Intel Core i9-14900K, AMD Radeon RX 7900 XTX
192 (60min, 83P0.1, 123P1 - 251max) fps -2%
Sapphire Pulse AMD Radeon RX 7900 XTX
Intel Core i9-14900K, AMD Radeon RX 7900 XTX
187 (67min - 231max) fps -4%
Sapphire Pulse AMD Radeon RX 7900 XT
Intel Core i9-14900K, AMD Radeon RX 7900 XT
169 (61min - 255max) fps -13%
NVIDIA GeForce RTX 4080 Founders Edition
Intel Core i9-14900K, NVIDIA GeForce RTX 4080
155 (43min - 198max) fps -21%
Avatar Frontiers of Pandora
2560x1440 Ultra Preset AA:T
NVIDIA GeForce RTX 5090 Founders Edition
Intel Core i9-14900K, NVIDIA GeForce RTX 5090
144.6 (120min - 181max) fps +50%
NVIDIA GeForce RTX 4090
Intel Core i9-14900K, NVIDIA GeForce RTX 4090
116 (92min - 142max) fps +20%
NVIDIA GeForce RTX 5080 Founders Edition
Intel Core i9-14900K, NVIDIA GeForce RTX 5080
96.4 (78min - 122max) fps
XFX Radeon RX 7900 XTX Merc 310 Black Edition
Intel Core i9-14900K, AMD Radeon RX 7900 XTX
86 (66min - 108max) fps -11%
Sapphire Pulse AMD Radeon RX 7900 XTX
Intel Core i9-14900K, AMD Radeon RX 7900 XTX
84.6 (70min - 104max) fps -12%
NVIDIA GeForce RTX 4080 Founders Edition
Intel Core i9-14900K, NVIDIA GeForce RTX 4080
77.8 (57min - 99max) fps -19%
Sapphire Pulse AMD Radeon RX 7900 XT
Intel Core i9-14900K, AMD Radeon RX 7900 XT
68.3 (58min - 83max) fps -29%
1920x1080 Ultra Preset AA:T
NVIDIA GeForce RTX 5090 Founders Edition
Intel Core i9-14900K, NVIDIA GeForce RTX 5090
190.2 (152min - 228max) fps +42%
NVIDIA GeForce RTX 4090
Intel Core i9-14900K, NVIDIA GeForce RTX 4090
157.1 (126min - 196max) fps +17%
NVIDIA GeForce RTX 5080 Founders Edition
Intel Core i9-14900K, NVIDIA GeForce RTX 5080
134.4 (106min - 163max) fps
XFX Radeon RX 7900 XTX Merc 310 Black Edition
Intel Core i9-14900K, AMD Radeon RX 7900 XTX
120 (86min - 149max) fps -11%
Sapphire Pulse AMD Radeon RX 7900 XTX
Intel Core i9-14900K, AMD Radeon RX 7900 XTX
117.6 (92min - 144max) fps -12%
NVIDIA GeForce RTX 4080 Founders Edition
Intel Core i9-14900K, NVIDIA GeForce RTX 4080
103.4 (73min - 127max) fps -23%
Sapphire Pulse AMD Radeon RX 7900 XT
Intel Core i9-14900K, AMD Radeon RX 7900 XT
97.2 (77min - 121max) fps -28%
Cyberpunk 2077 2.2 Phantom Liberty
2560x1440 Ultra Preset (FSR off)
NVIDIA GeForce RTX 5090 Founders Edition
Intel Core i9-14900K, NVIDIA GeForce RTX 5090
181.7 (136.1min - 220max) fps +21%
NVIDIA GeForce RTX 5080 Founders Edition
Intel Core i9-14900K, NVIDIA GeForce RTX 5080
150 (125.8min - 189.9max) fps
NVIDIA GeForce RTX 4090
Intel Core i9-14900K, NVIDIA GeForce RTX 4090
149.1 (121.1min - 185.4max) fps -1%
XFX Radeon RX 7900 XTX Merc 310 Black Edition
Intel Core i9-14900K, AMD Radeon RX 7900 XTX
144.8 (122.7min - 179.5max) fps -3%
Sapphire Pulse AMD Radeon RX 7900 XTX
Intel Core i9-14900K, AMD Radeon RX 7900 XTX
142.7 (120.3min - 176max) fps -5%
Sapphire Pulse AMD Radeon RX 7900 XT
Intel Core i9-14900K, AMD Radeon RX 7900 XT
122.7 (103.7min - 153.1max) fps -18%
NVIDIA GeForce RTX 4080 Founders Edition
Intel Core i9-14900K, NVIDIA GeForce RTX 4080
113.1 (91min - 144.5max) fps -25%
1920x1080 Ultra Preset (FSR off)
XFX Radeon RX 7900 XTX Merc 310 Black Edition
Intel Core i9-14900K, AMD Radeon RX 7900 XTX
201 (152.5min - 253max) fps +15%
NVIDIA GeForce RTX 5090 Founders Edition
Intel Core i9-14900K, NVIDIA GeForce RTX 5090
184.6 (140.7min - 220max) fps +6%
Sapphire Pulse AMD Radeon RX 7900 XTX
Intel Core i9-14900K, AMD Radeon RX 7900 XTX
181.6 (138min - 223max) fps +4%
NVIDIA GeForce RTX 4090
Intel Core i9-14900K, NVIDIA GeForce RTX 4090
180.4 (135.7min - 218max) fps +3%
NVIDIA GeForce RTX 5080 Founders Edition
Intel Core i9-14900K, NVIDIA GeForce RTX 5080
174.9 (132.5min - 209max) fps
NVIDIA GeForce RTX 4080 Founders Edition
Intel Core i9-14900K, NVIDIA GeForce RTX 4080
152.9 (101.6min - 193.8max) fps -13%
X-Plane 11.11 - 1920x1080 high (fps_test=3)
NVIDIA GeForce RTX 5090 Founders Edition
Intel Core i9-14900K, NVIDIA GeForce RTX 5090
159.3 fps +1%
NVIDIA GeForce RTX 5080 Founders Edition
Intel Core i9-14900K, NVIDIA GeForce RTX 5080
157.3 fps
NVIDIA GeForce RTX 4090
Intel Core i9-14900K, NVIDIA GeForce RTX 4090
155.8 fps -1%
NVIDIA GeForce RTX 4080 Founders Edition
Intel Core i9-14900K, NVIDIA GeForce RTX 4080
140.6 fps -11%
XFX Radeon RX 7900 XTX Merc 310 Black Edition
Intel Core i9-14900K, AMD Radeon RX 7900 XTX
128.4 fps -18%
Sapphire Pulse AMD Radeon RX 7900 XTX
Intel Core i9-14900K, AMD Radeon RX 7900 XTX
124.9 fps -21%
Sapphire Pulse AMD Radeon RX 7900 XT
Intel Core i9-14900K, AMD Radeon RX 7900 XT
121.5 fps -23%

Rendimiento del trazado de rayos

Con la ayuda de la superresolución DLSS y la generación de fotogramas, la RTX 5080 FE también ofrece un buen rendimiento en el trazado de rayos. La RTX 5080 FE logra un aumento del 33% en el rendimiento de trazado de rayos sobre la RTX 4080 FE en Indiana Jones y el Gran Círculo pero se queda por detrás de la RTX 5090 FE en la misma proporción.

La RX 7900 XTX simplemente no puede igualar las capacidades de trazado de rayos de la RTX 5080 FE, con esta última registrando ventajas de hasta un enorme 71% en Alan Wake 2 4K High Ray Tracing preset.

Dicho esto, la RTX 5080 FE no puede soportar la carga por sí sola sin la ayuda de upscalers. Con los juegos modernos tomando cada vez más la ruta de trazado de rayos, invariablemente tendrá que habilitar la generación de fotogramas para obtener velocidades de fotogramas jugables.

Indiana Jones and the Great Circle - 2560x1440 Very Ultra Preset + Full Path Tracing + Quality DLSS + Frame Generation
NVIDIA GeForce RTX 5090 Founders Edition
Intel Core i9-14900K, NVIDIA GeForce RTX 5090
143.5 (13.3min, 101.6P0.1, 113.3P1 - 279max) fps +49%
NVIDIA GeForce RTX 4090
Intel Core i9-14900K, NVIDIA GeForce RTX 4090
111.3 (45.7min, 80.3P0.1, 89.8P1 - 182.7max) fps +15%
NVIDIA GeForce RTX 5080 Founders Edition
Intel Core i9-14900K, NVIDIA GeForce RTX 5080
96.5 (25.3min, 52.7P0.1, 78.1P1 - 144.2max) fps
NVIDIA GeForce RTX 4080 Founders Edition
Intel Core i9-14900K, NVIDIA GeForce RTX 4080
72.7 (31.1min, 33.3P0.1, 42.3P1 - 393max) fps -25%
Black Myth: Wukong
3840x2160 cinematic RT: Very High DLSS 68 FG
NVIDIA GeForce RTX 4090
Intel Core i9-14900K, NVIDIA GeForce RTX 4090
103 (93min - 115max) fps +69%
NVIDIA GeForce RTX 5090 Founders Edition
Intel Core i9-14900K, NVIDIA GeForce RTX 5090
99 (42min - 115max) fps +62%
NVIDIA GeForce RTX 5080 Founders Edition
Intel Core i9-14900K, NVIDIA GeForce RTX 5080
61 (53min - 71max) fps
NVIDIA GeForce RTX 4080 Founders Edition
Intel Core i9-14900K, NVIDIA GeForce RTX 4080
50 (42min - 59max) fps -18%
2560x1440 cinematic RT: Very High DLSS 68 FG
NVIDIA GeForce RTX 5090 Founders Edition
Intel Core i9-14900K, NVIDIA GeForce RTX 5090
152 (129min - 177max) fps +48%
NVIDIA GeForce RTX 4090
Intel Core i9-14900K, NVIDIA GeForce RTX 4090
135 (116min - 154max) fps +31%
NVIDIA GeForce RTX 5080 Founders Edition
Intel Core i9-14900K, NVIDIA GeForce RTX 5080
103 (87min - 120max) fps
NVIDIA GeForce RTX 4080 Founders Edition
Intel Core i9-14900K, NVIDIA GeForce RTX 4080
83 (70min - 98max) fps -19%
Star Wars Outlaws
3840x2160 cinem. ultra, RT ultra, DLSS, FG RR
NVIDIA GeForce RTX 5090 Founders Edition
Intel Core i9-14900K, NVIDIA GeForce RTX 5090
111.4 (64.8min, 78.5P0.1, 89.7P1 - 176.2max) fps +61%
NVIDIA GeForce RTX 4090
Intel Core i9-14900K, NVIDIA GeForce RTX 4090
89.9 (43.1min, 68.5P0.1, 75.7P1 - 120.4max) fps +30%
NVIDIA GeForce RTX 5080 Founders Edition
Intel Core i9-14900K, NVIDIA GeForce RTX 5080
69.2 (43.9min, 45.8P0.1, 58.1P1 - 98.1max) fps
2560x1440 cinem. ultra, RT ultra, DLSS, FG RR
NVIDIA GeForce RTX 5090 Founders Edition
Intel Core i9-14900K, NVIDIA GeForce RTX 5090
160.5 (107.4min, 115.8P0.1, 127.5P1 - 278max) fps +44%
NVIDIA GeForce RTX 4090
Intel Core i9-14900K, NVIDIA GeForce RTX 4090
131.3 (55.5min, 77.1P0.1, 102.9P1 - 253max) fps +18%
NVIDIA GeForce RTX 5080 Founders Edition
Intel Core i9-14900K, NVIDIA GeForce RTX 5080
111.3 (75.5min, 83P0.1, 88.6P1 - 164.2max) fps
Alan Wake 2
3840x2160 High Preset + High Ray Tracing + Quality DLSS + FG
NVIDIA GeForce RTX 5090 Founders Edition
Intel Core i9-14900K, NVIDIA GeForce RTX 5090
146.4 (57min, 88.5P0.1, 109.6P1 - 1324max) fps +60%
NVIDIA GeForce RTX 4090
Intel Core i9-14900K, NVIDIA GeForce RTX 4090
108.2 (46.8min, 65.2P0.1, 82.2P1 - 495max) fps +18%
NVIDIA GeForce RTX 5080 Founders Edition
Intel Core i9-14900K, NVIDIA GeForce RTX 5080
91.7 (47min, 60.3P0.1, 70.4P1 - 212max) fps
NVIDIA GeForce RTX 4080 Founders Edition
Intel Core i9-14900K, NVIDIA GeForce RTX 4080
70.8 (32.4min, 34.3P0.1, 43P1 - 156.6max) fps -23%
3840x2160 High Preset + High Ray Tracing
NVIDIA GeForce RTX 5090 Founders Edition
Intel Core i9-14900K, NVIDIA GeForce RTX 5090
47.3 (29.7min, 32.7P0.1, 35.9P1 - 53.3max) fps +65%
NVIDIA GeForce RTX 4090
Intel Core i9-14900K, NVIDIA GeForce RTX 4090
34.2 (24min, 24.5P0.1, 26.6P1 - 38.8max) fps +19%
NVIDIA GeForce RTX 5080 Founders Edition
Intel Core i9-14900K, NVIDIA GeForce RTX 5080
28.7 (19.4min, 20.3P0.1, 23.1P1 - 32.2max) fps
NVIDIA GeForce RTX 4080 Founders Edition
Intel Core i9-14900K, NVIDIA GeForce RTX 4080
22.9 (16.5min, 16.9P0.1, 18.3P1 - 26.8max) fps -20%
XFX Radeon RX 7900 XTX Merc 310 Black Edition
Intel Core i9-14900K, AMD Radeon RX 7900 XTX
16.8 (6.89min, 6.9P0.1, 7.41P1 - 141.1max) fps -41%
Sapphire Pulse AMD Radeon RX 7900 XTX
Intel Core i9-14900K, AMD Radeon RX 7900 XTX
15.6 (11.8min, 11.8P0.1, 12.1P1 - 17.8max) fps -46%
Sapphire Pulse AMD Radeon RX 7900 XT
Intel Core i9-14900K, AMD Radeon RX 7900 XT
13.5 (9.06min, 9.08P0.1, 9.81P1 - 15.2max) fps -53%
1920x1080 High Preset + High Ray Tracing
NVIDIA GeForce RTX 5090 Founders Edition
Intel Core i9-14900K, NVIDIA GeForce RTX 5090
126.5 (51.8min, 79P0.1, 97.4P1 - 153.5max) fps +52%
NVIDIA GeForce RTX 4090
Intel Core i9-14900K, NVIDIA GeForce RTX 4090
97.4 (71.9min, 73P0.1, 79.4P1 - 116.4max) fps +17%
NVIDIA GeForce RTX 5080 Founders Edition
Intel Core i9-14900K, NVIDIA GeForce RTX 5080
83.3 (54min, 58.6P0.1, 64.2P1 - 97.4max) fps
NVIDIA GeForce RTX 4080 Founders Edition
Intel Core i9-14900K, NVIDIA GeForce RTX 4080
62.5 (34.6min, 35.9P0.1, 44.7P1 - 82.6max) fps -25%
XFX Radeon RX 7900 XTX Merc 310 Black Edition
Intel Core i9-14900K, AMD Radeon RX 7900 XTX
53.2 (21.9min, 34.4P0.1, 40.3P1 - 101.5max) fps -36%
Sapphire Pulse AMD Radeon RX 7900 XTX
Intel Core i9-14900K, AMD Radeon RX 7900 XTX
49.9 (30.5min, 33.2P0.1, 37.6P1 - 58.3max) fps -40%
Sapphire Pulse AMD Radeon RX 7900 XT
Intel Core i9-14900K, AMD Radeon RX 7900 XT
44.7 (30.3min, 30.4P0.1, 32.5P1 - 50.7max) fps -46%
Cyberpunk 2077 2.2 Phantom Liberty
3840x2160 Ray Tracing Ultra Preset (DLSS off, no Path Tracing)
NVIDIA GeForce RTX 5090 Founders Edition
Intel Core i9-14900K, NVIDIA GeForce RTX 5090
58.2 (52.6min - 68.1max) fps +65%
NVIDIA GeForce RTX 4090
Intel Core i9-14900K, NVIDIA GeForce RTX 4090
41.9 (37.3min - 50.4max) fps +19%
NVIDIA GeForce RTX 5080 Founders Edition
Intel Core i9-14900K, NVIDIA GeForce RTX 5080
35.3 (31.5min - 42.9max) fps
NVIDIA GeForce RTX 4080 Founders Edition
Intel Core i9-14900K, NVIDIA GeForce RTX 4080
28.7 (25.7min - 34.6max) fps -19%
XFX Radeon RX 7900 XTX Merc 310 Black Edition
Intel Core i9-14900K, AMD Radeon RX 7900 XTX
22.4 (19.5min - 28.8max) fps -37%
Sapphire Pulse AMD Radeon RX 7900 XTX
Intel Core i9-14900K, AMD Radeon RX 7900 XTX
21.9 (19.2min - 27.6max) fps -38%
Sapphire Pulse AMD Radeon RX 7900 XT
Intel Core i9-14900K, AMD Radeon RX 7900 XT
18.5 (16.1min - 23.4max) fps -48%
1920x1080 Ray Tracing Ultra Preset (DLSS off)
NVIDIA GeForce RTX 5090 Founders Edition
Intel Core i9-14900K, NVIDIA GeForce RTX 5090
139.4 (117.5min - 162.6max) fps +28%
NVIDIA GeForce RTX 4090
Intel Core i9-14900K, NVIDIA GeForce RTX 4090
118.9 (105.3min - 138.4max) fps +9%
NVIDIA GeForce RTX 5080 Founders Edition
Intel Core i9-14900K, NVIDIA GeForce RTX 5080
108.8 (96.1min - 127.8max) fps
NVIDIA GeForce RTX 4080 Founders Edition
Intel Core i9-14900K, NVIDIA GeForce RTX 4080
82.3 (72.6min - 91.6max) fps -24%
XFX Radeon RX 7900 XTX Merc 310 Black Edition
Intel Core i9-14900K, AMD Radeon RX 7900 XTX
70.3 (61.5min - 84max) fps -35%
Sapphire Pulse AMD Radeon RX 7900 XTX
Intel Core i9-14900K, AMD Radeon RX 7900 XTX
69.1 (60.2min - 83.3max) fps -36%
Sapphire Pulse AMD Radeon RX 7900 XT
Intel Core i9-14900K, AMD Radeon RX 7900 XT
60.7 (52.6min - 73.6max) fps -44%
Alan Wake 2
3840x2160 High Preset + Ultra Ray Tracing + Quality DLSS + FG 4x
NVIDIA GeForce RTX 5090 Founders Edition
Intel Core i9-14900K, NVIDIA GeForce RTX 5090
242 (76min, 105.4P0.1, 162.5P1) fps +57%
NVIDIA GeForce RTX 5080 Founders Edition
Intel Core i9-14900K, NVIDIA GeForce RTX 5080
154.2 (54.6min, 81P0.1, 106.2P1) fps
3840x2160 High Preset + Ultra Ray Tracing + Quality DLSS + FG 2x
NVIDIA GeForce RTX 5090 Founders Edition
Intel Core i9-14900K, NVIDIA GeForce RTX 5090
133.6 (50.3min, 72.1P0.1, 94.7P1) fps +57%
NVIDIA GeForce RTX 5080 Founders Edition
Intel Core i9-14900K, NVIDIA GeForce RTX 5080
84.9 (40.1min, 45.5P0.1, 61.9P1) fps
Cyberpunk 2077 2.2 Phantom Liberty
3840x2160 Ray Tracing Overdrive Preset + DLSS 4 Transformer Quality + Frame Generation MFG 4x
NVIDIA GeForce RTX 5090 Founders Edition
Intel Core i9-14900K, NVIDIA GeForce RTX 5090
216 (198.8min) fps +68%
NVIDIA GeForce RTX 5080 Founders Edition
Intel Core i9-14900K, NVIDIA GeForce RTX 5080
128.4 (116min) fps
3840x2160 Ray Tracing Overdrive Preset + DLSS 4 Transformer Quality + Frame Generation (M)FG 2x
NVIDIA GeForce RTX 5090 Founders Edition
Intel Core i9-14900K, NVIDIA GeForce RTX 5090
116.7 (106.8min) fps +14%
NVIDIA GeForce RTX 5080 Founders Edition
Intel Core i9-14900K, NVIDIA GeForce RTX 5080
102.2 (93.3min) fps
2560x1440 Ultra Preset DLSS4 quality no FG
NVIDIA GeForce RTX 5090 Founders Edition
Intel Core i9-14900K, NVIDIA GeForce RTX 5090
182.5 (140.4min) fps
Star Wars Outlaws - 3840x2160 cinem. ultra, RT ultra, DLSS, FG 4x, RR
NVIDIA GeForce RTX 5090 Founders Edition
Intel Core i9-14900K, NVIDIA GeForce RTX 5090
203 (56min, 126.4P0.1, 159.2P1) fps +60%
NVIDIA GeForce RTX 5080 Founders Edition
Intel Core i9-14900K, NVIDIA GeForce RTX 5080
126.5 (47.5min, 64.5P0.1, 93.2P1) fps
bajomedioaltoultraQHD DLSSQHD4K DLSS4K
The Witcher 3 (2015) 279 223 232
X-Plane 11.11 (2018) 157.3 127.7
Metro Exodus (2019) 195.5 172.8
Control (2019)
F1 22 (2022) 189.5 135.4 69.9
Cyberpunk 2077 2.2 Phantom Liberty (2023) 174.9 150 104 71.4
Assassin's Creed Mirage (2023) 195 160 140 109
Alan Wake 2 (2023) 144.1 101.9 91.7 55.7
Avatar Frontiers of Pandora (2023) 134.4 96.4 88.1 52.1
F1 24 (2024) 199.7 139.5 120 72.8
Black Myth: Wukong (2024) 78 85 60 63 38
Star Wars Outlaws (2024) 97.2 97 74.8 66.4 46.6
Stalker 2 (2024) 103.1 164.3 82.9 110.5 53.6
Indiana Jones and the Great Circle (2024) 161.2 132.3 89.9

Cyberpunk 2077 1080p Ultra FPS chart

0102030405060708090100110120130140150160170180Tooltip
NVIDIA GeForce RTX 5080 Founders Edition i9-14900K, GeForce RTX 5080; 3840x2160 Ultra Preset (FSR off): Ø84 (81.6-84.8)
NVIDIA GeForce RTX 5080 Founders Edition i9-14900K, GeForce RTX 5080; 1920x1080 30min Start Ultra Preset (FSR off): Ø180.9 (175.1-183.9)

Power consumption: External monitor

0306090120150180210240270300330360390420450480510Tooltip
NVIDIA GeForce RTX 5080 Founders Edition; 1280x720 FurMark 1.19 GPU Stress Test (external Monitor); Idle: 70 W: Ø476 (464-496)
NVIDIA GeForce RTX 5080 Founders Edition; Idle 1min (external Monitor): Ø69.8 (68.8-73.7)
NVIDIA GeForce RTX 5080 Founders Edition; Cyberpunk 2077 FHD ultra no FSR (external Monitor); Idle: 70 W: Ø520 (510-533)
Power Consumption / FurMark 1.19 GPU Stress Test (external Monitor)
NVIDIA GeForce RTX 5090 Founders Edition
Intel Core i9-14900K, NVIDIA GeForce RTX 5090 (Idle: 90 W)
708 (700min, 700P1 - 718max) Watt * -49%
NVIDIA GeForce RTX 4090
Intel Core i9-14900K, NVIDIA GeForce RTX 4090 (Idle: 82 W)
579 (558min, 561P1 - 595max) Watt * -22%
Sapphire Pulse AMD Radeon RX 7900 XTX
Intel Core i9-14900K, AMD Radeon RX 7900 XTX (Idle: 74 W)
549 (540min, 541P1 - 638max) Watt * -15%
NVIDIA GeForce RTX 5080 Founders Edition
Intel Core i9-14900K, NVIDIA GeForce RTX 5080 (Idle: 70 W)
476 (464min, 466P1 - 496max) Watt *
Sapphire Pulse AMD Radeon RX 7900 XT
Intel Core i9-14900K, AMD Radeon RX 7900 XT (Idle: 94 W)
474 (467min, 468P1 - 523max) Watt * -0%
NVIDIA GeForce RTX 4080 Founders Edition
Intel Core i9-14900K, NVIDIA GeForce RTX 4080 (Idle: 72 W)
420 (402min, 403P1 - 461max) Watt * +12%
Power Consumption / Cyberpunk 2077 FHD ultra no FSR (external Monitor)
Sapphire Pulse AMD Radeon RX 7900 XTX
Intel Core i9-14900K, AMD Radeon RX 7900 XTX (Idle: 74 W)
716 (697min, 701P1 - 730max) Watt * -38%
Sapphire Pulse AMD Radeon RX 7900 XT
Intel Core i9-14900K, AMD Radeon RX 7900 XT (Idle: 94 W)
652 (636min, 638P1 - 665max) Watt * -25%
NVIDIA GeForce RTX 5090 Founders Edition
Intel Core i9-14900K, NVIDIA GeForce RTX 5090 (Idle: 90 )
629 (615min, 618P1 - 646max) Watt * -21%
NVIDIA GeForce RTX 4090
Intel Core i9-14900K, NVIDIA GeForce RTX 4090 (Idle: 82 W)
588 (580min, 581P1 - 596max) Watt * -13%
NVIDIA GeForce RTX 5080 Founders Edition
Intel Core i9-14900K, NVIDIA GeForce RTX 5080 (Idle: 70 W)
520 (510min, 512P1 - 533max) Watt *
NVIDIA GeForce RTX 4080 Founders Edition
Intel Core i9-14900K, NVIDIA GeForce RTX 4080 (Idle: 72 W)
488 (479min, 480P1 - 503max) Watt * +6%
Power Consumption / Cyberpunk 2077 ultra Efficiency
NVIDIA GeForce RTX 5080 Founders Edition
Intel Core i9-14900K, NVIDIA GeForce RTX 5080
0.3479 fps per Watt
NVIDIA GeForce RTX 4090
Intel Core i9-14900K, NVIDIA GeForce RTX 4090
0.2991 fps per Watt -14%
NVIDIA GeForce RTX 4080 Founders Edition
Intel Core i9-14900K, NVIDIA GeForce RTX 4080
0.2988 fps per Watt -14%
NVIDIA GeForce RTX 5090 Founders Edition
Intel Core i9-14900K, NVIDIA GeForce RTX 5090
0.2928 fps per Watt -16%
Sapphire Pulse AMD Radeon RX 7900 XT
Intel Core i9-14900K, AMD Radeon RX 7900 XT
0.2874 fps per Watt -17%
Sapphire Pulse AMD Radeon RX 7900 XTX
Intel Core i9-14900K, AMD Radeon RX 7900 XTX
0.2654 fps per Watt -24%
Power Consumption / The Witcher 3 ultra (external Monitor)
NVIDIA GeForce RTX 5090 Founders Edition
Intel Core i9-14900K, NVIDIA GeForce RTX 5090 (Idle: 90 W)
692 (662min, 663P1 - 719max) Watt * -54%
Sapphire Pulse AMD Radeon RX 7900 XTX
Intel Core i9-14900K, AMD Radeon RX 7900 XTX (Idle: 74 W)
609 (598min, 600P1 - 622max) Watt * -35%
NVIDIA GeForce RTX 4090
Intel Core i9-14900K, NVIDIA GeForce RTX 4090 (Idle: 82 W)
538 (515min, 526P1 - 588max) Watt * -20%
Sapphire Pulse AMD Radeon RX 7900 XT
Intel Core i9-14900K, AMD Radeon RX 7900 XT (Idle: 94 W)
527 (522min, 523P1 - 540max) Watt * -17%
NVIDIA GeForce RTX 5080 Founders Edition
Intel Core i9-14900K, NVIDIA GeForce RTX 5080 (Idle: 70 W)
450 (440min, 441P1 - 483max) Watt *
NVIDIA GeForce RTX 4080 Founders Edition
Intel Core i9-14900K, NVIDIA GeForce RTX 4080 (Idle: 72 W)
367 (361min, 361P1 - 386max) Watt * +18%
Power Consumption / Witcher 3 ultra Efficiency (external Monitor)
NVIDIA GeForce RTX 5080 Founders Edition
Intel Core i9-14900K, NVIDIA GeForce RTX 5080
0.62 fps per Watt
NVIDIA GeForce RTX 4080 Founders Edition
Intel Core i9-14900K, NVIDIA GeForce RTX 4080
0.574 fps per Watt -7%
NVIDIA GeForce RTX 4090
Intel Core i9-14900K, NVIDIA GeForce RTX 4090
0.557 fps per Watt -10%
NVIDIA GeForce RTX 5090 Founders Edition
Intel Core i9-14900K, NVIDIA GeForce RTX 5090
0.4942 fps per Watt -20%
Sapphire Pulse AMD Radeon RX 7900 XT
Intel Core i9-14900K, AMD Radeon RX 7900 XT
0.463 fps per Watt -25%
Sapphire Pulse AMD Radeon RX 7900 XTX
Intel Core i9-14900K, AMD Radeon RX 7900 XTX
0.4548 fps per Watt -27%
1280x720 FurMark 1.19 GPU Stress Test (external Monitor)
350.77
1920x1080 The Witcher 3 ultra (external Monitor)
357.59

* ... más pequeño es mejor

Transparencia

La selección de los dispositivos que se van a reseñar corre a cargo de nuestro equipo editorial. La muestra de prueba fue proporcionada al autor en calidad de préstamo por el fabricante o el minorista a los efectos de esta reseña. El prestamista no tuvo ninguna influencia en esta reseña, ni el fabricante recibió una copia de la misma antes de su publicación. No había ninguna obligación de publicar esta reseña. Nunca aceptamos compensaciones o pagos a cambio de nuestras reseñas. Como empresa de medios independiente, Notebookcheck no está sujeta a la autoridad de fabricantes, minoristas o editores.

Así es como prueba Notebookcheck

Cada año, Notebookcheck revisa de forma independiente cientos de portátiles y smartphones utilizando procedimientos estandarizados para asegurar que todos los resultados son comparables. Hemos desarrollado continuamente nuestros métodos de prueba durante unos 20 años y hemos establecido los estándares de la industria en el proceso. En nuestros laboratorios de pruebas, técnicos y editores experimentados utilizan equipos de medición de alta calidad. Estas pruebas implican un proceso de validación en varias fases. Nuestro complejo sistema de clasificación se basa en cientos de mediciones y puntos de referencia bien fundamentados, lo que mantiene la objetividad.
Please share our article, every link counts!
Mail Logo
> Análisis y pruebas de ordenadores portátiles y móviles teléfonos > Análisis > Revisión de la Nvidia GeForce RTX 5080 Founders Edition: una tarjeta de 999 dólares que convierte en redundante a la RX 7900 XTX
Vaidyanathan Subramaniam, 2025-03- 6 (Update: 2025-03- 6)