

Análisis del HP Omen 17 (2024): RTX 4070 y Ryzen 7 muestran su tamaño en el portátil para juegos
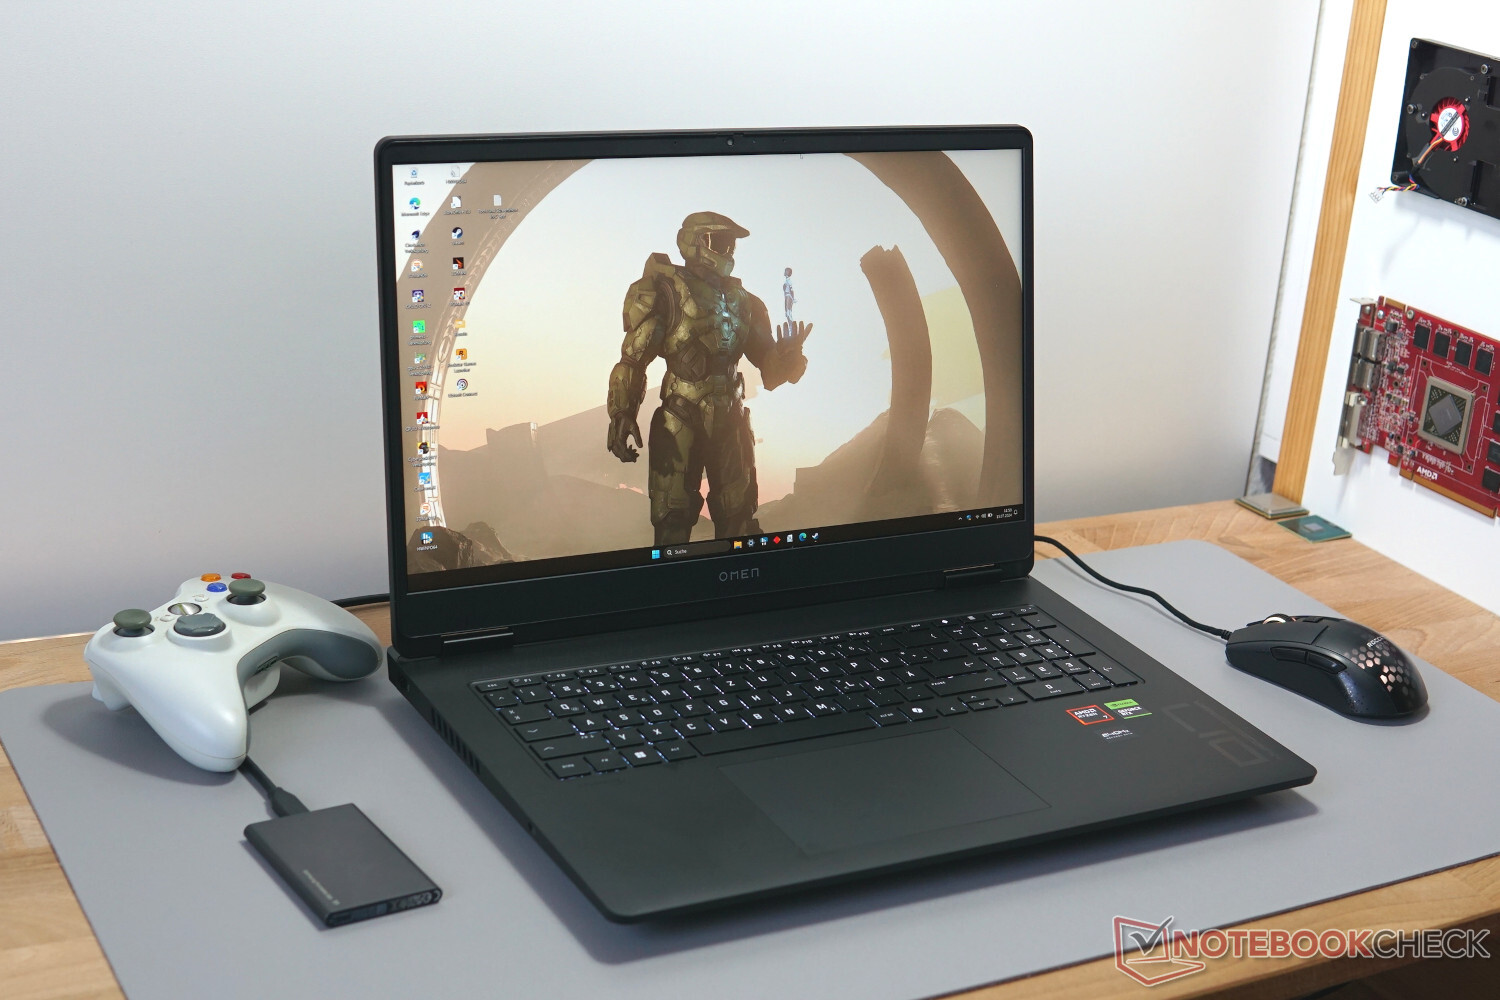
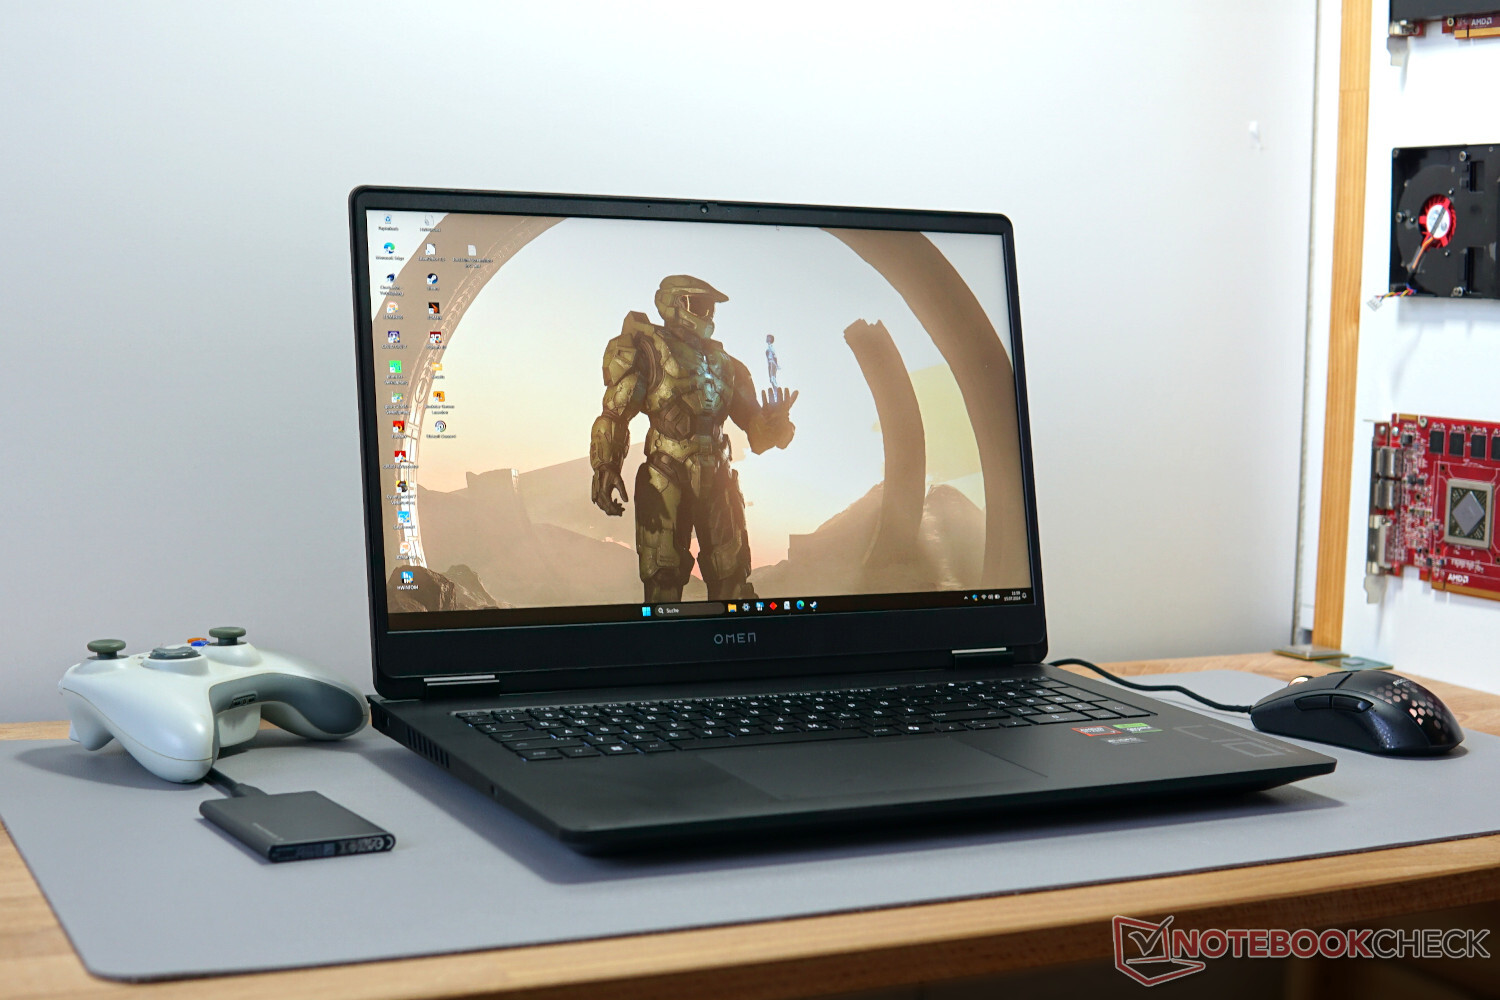
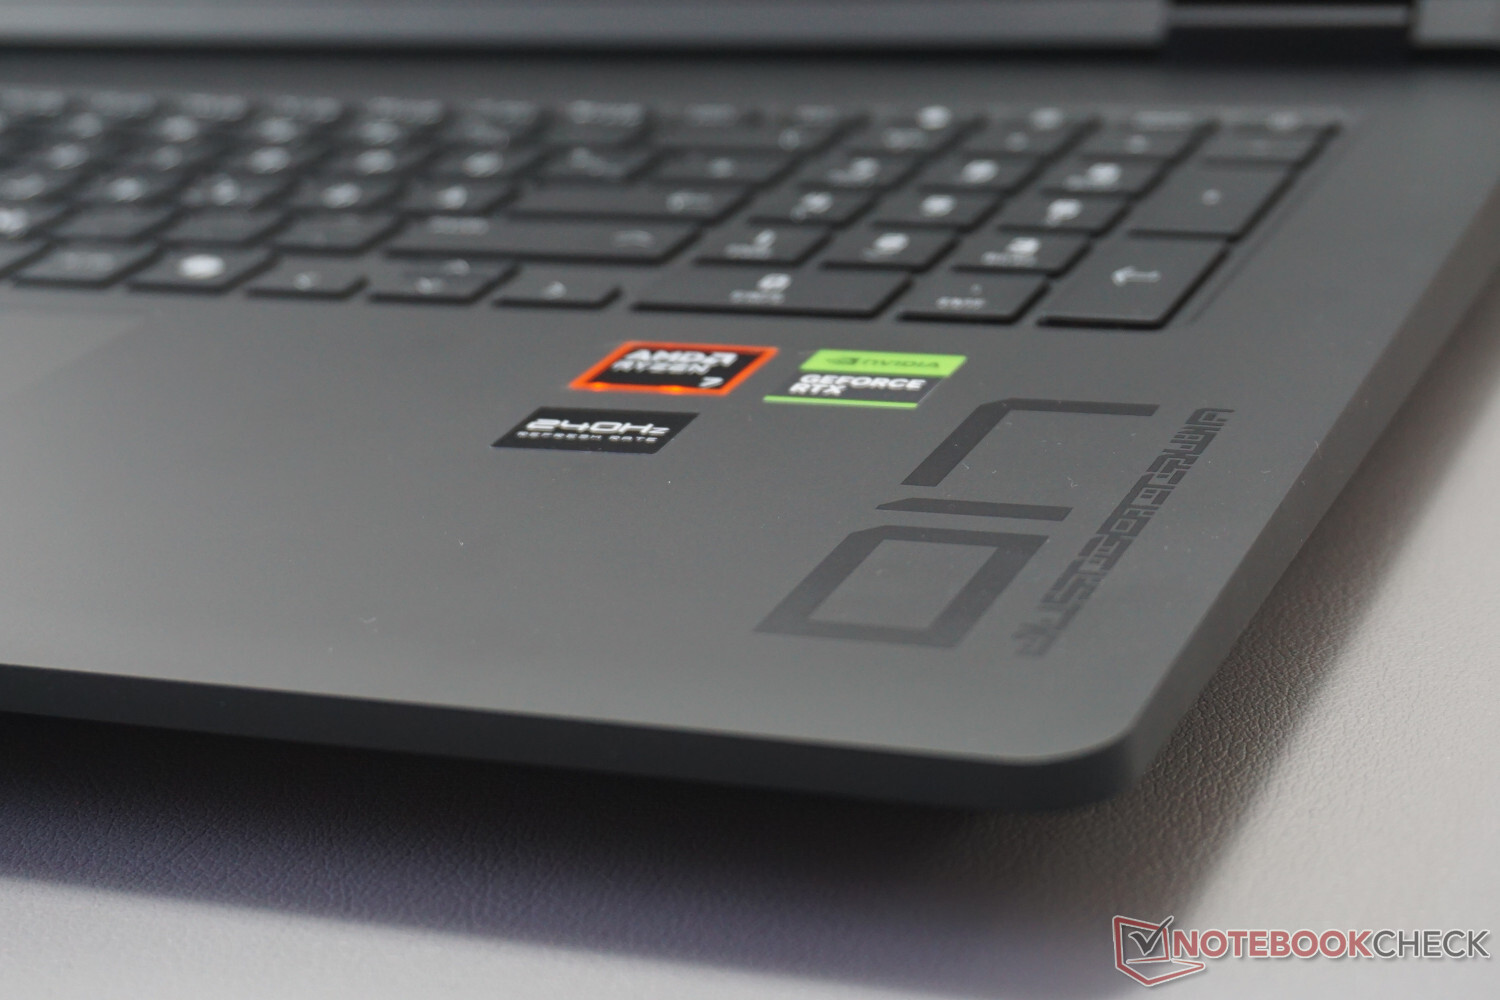
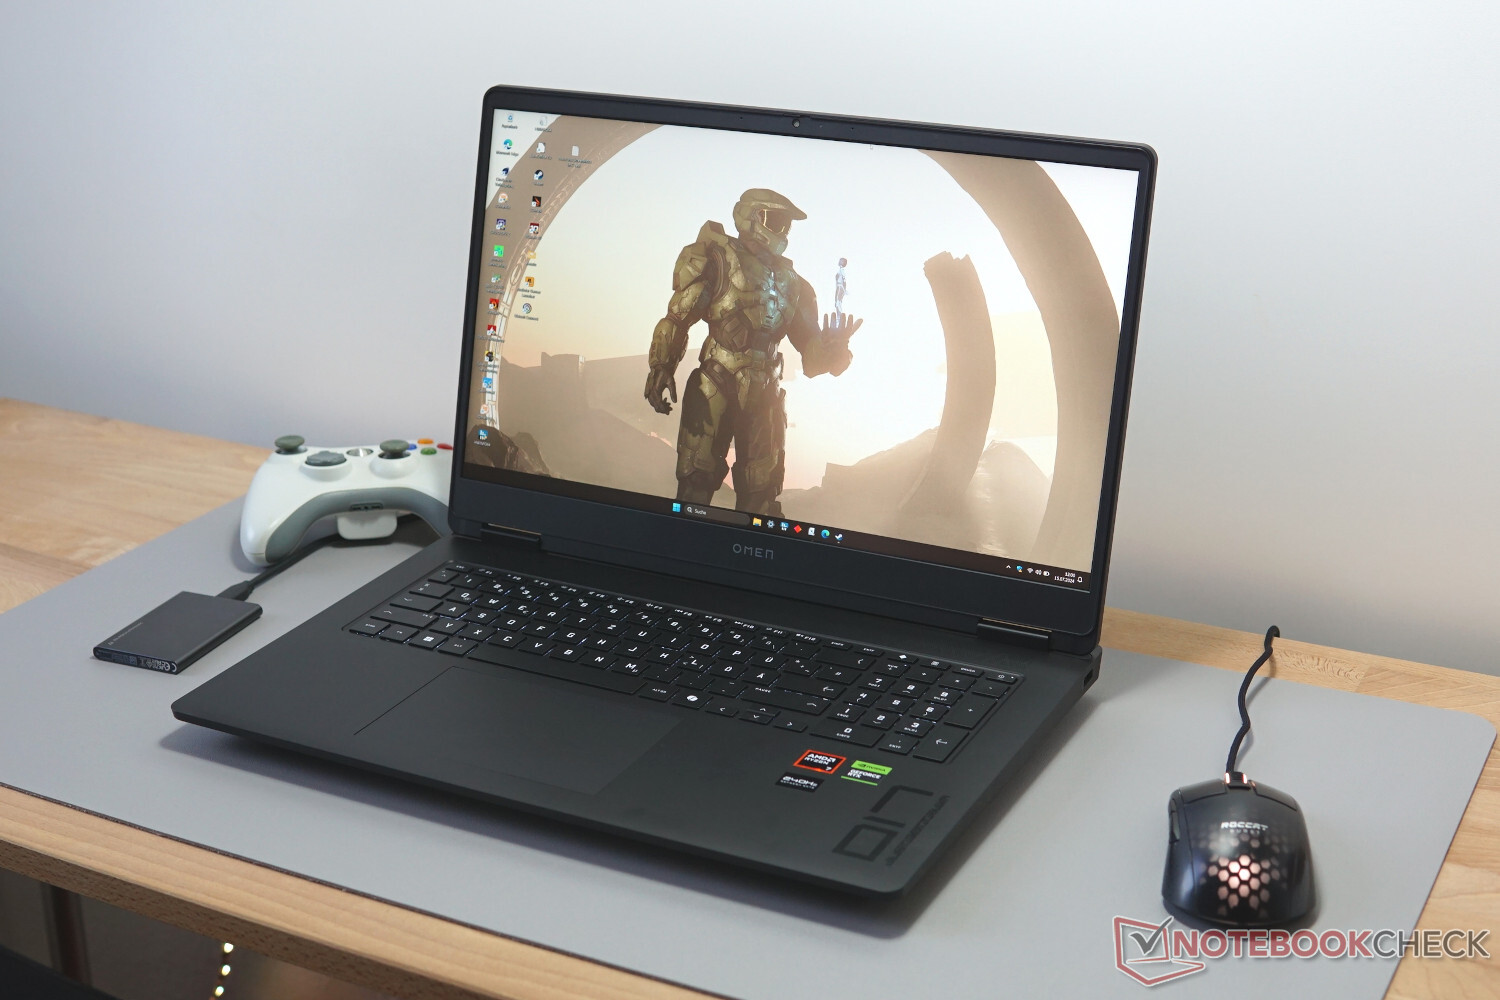
Bien equipado para todos los juegos actuales de alto nivel con una RTX 4070 y un AMD Ryzen 7 8845HS, el HP Omen 17 (2024) se sitúa en el punto de partida hacia la gama media elevada. Además, cuenta con una pantalla QHD con una resolución adecuada que también ofrece una frecuencia de actualización de 240 hercios. Con esto, todos los aspectos básicos para un buen portátil de juegos están cubiertos
Con tanto espacio, sobre todo en el interior, también podemos esperar unos valores de rendimiento estables que deberían resultar mejores en comparación con los de portátiles más pequeños. Esto lo evaluamos en numerosos puntos de referencia y pruebas de juegos.
El hecho de que nuestra unidad de pruebas se mantenga por debajo de los 2.000 euros (~2.172 dólares) de precio a pesar de su elevado nivel de equipamiento ya no es un hecho a estas alturas. Para conseguirlo, también hay que aceptar varios compromisos, algunos de ellos innecesarios. Nuestra prueba demostrará si sigue siendo suficiente para mantenerse por delante de competidores como el Acer Predator Helios Neo 16 con procesador Intel o el Asus TUF Gaming A17 con la generación anterior del AMD Ryzen 9.
Posibles contendientes en la comparación
Valoración | Versión | Fecha | Modelo | Peso | Altura | Tamaño | Resolución | Precio |
|---|---|---|---|---|---|---|---|---|
| 80.4 % | v8 | 07/2024 | HP Omen 17-db0079ng R7 8845HS, NVIDIA GeForce RTX 4070 Laptop GPU | 2.8 kg | 30.1 mm | 17.30" | 2560x1440 | |
| 80.3 % | v8 | 07/2024 | Asus TUF Gaming A15 FA507UV R9 8945H, NVIDIA GeForce RTX 4060 Laptop GPU | 2.1 kg | 22.4 mm | 15.60" | 1920x1080 | |
| 90.2 % v7 (old) | v7 (old) | 03/2024 | Alienware m16 R2 Ultra 7 155H, NVIDIA GeForce RTX 4070 Laptop GPU | 2.5 kg | 23.5 mm | 16.00" | 2560x1600 | |
| 87.6 % v7 (old) | v7 (old) | 04/2024 | Asus ROG Strix Scar 16 G634JZR i9-14900HX, NVIDIA GeForce RTX 4080 Laptop GPU | 2.7 kg | 30.4 mm | 16.00" | 2560x1600 | |
| 86.8 % v7 (old) | v7 (old) | 05/2024 | Acer Predator Helios Neo 16 (2024) i7-14700HX, NVIDIA GeForce RTX 4070 Laptop GPU | 2.6 kg | 25.95 mm | 16.00" | 2560x1600 | |
| 85.6 % v7 (old) | v7 (old) | 01/2024 | Asus TUF Gaming A17 FA707XI-NS94 R9 7940HS, NVIDIA GeForce RTX 4070 Laptop GPU | 2.5 kg | 25.4 mm | 17.30" | 1920x1080 |
Tenga en cuenta que recientemente hemos actualizado nuestro sistema de clasificación y que los resultados de la versión 8 ya no son comparables con los de la versión 7. Puede encontrar información adicional al respecto aquí.
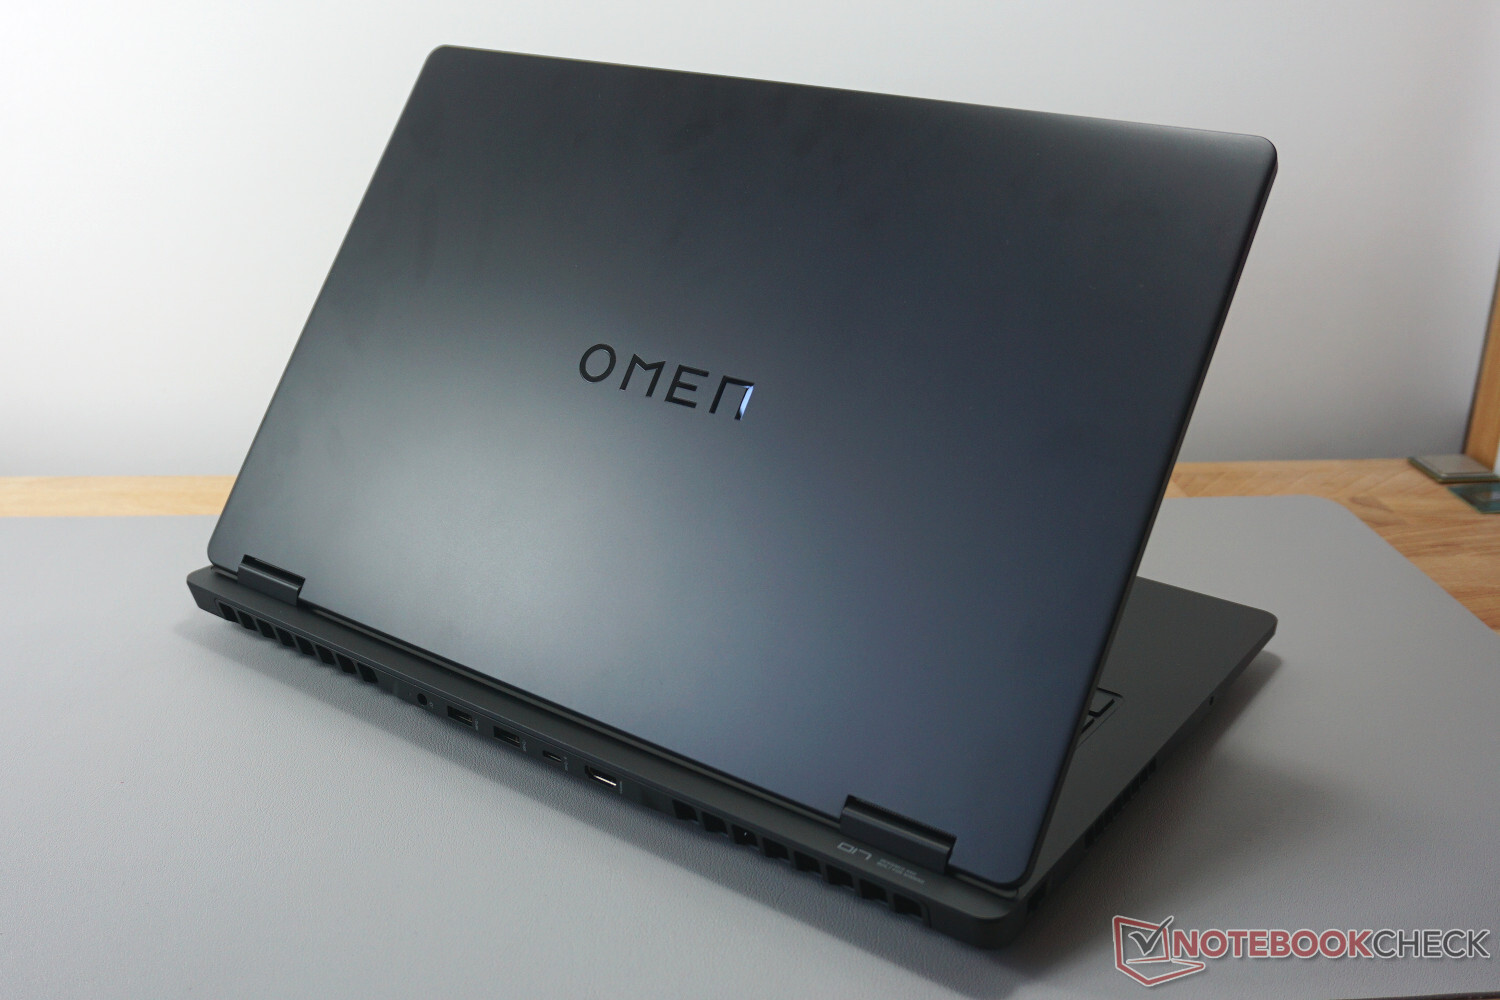
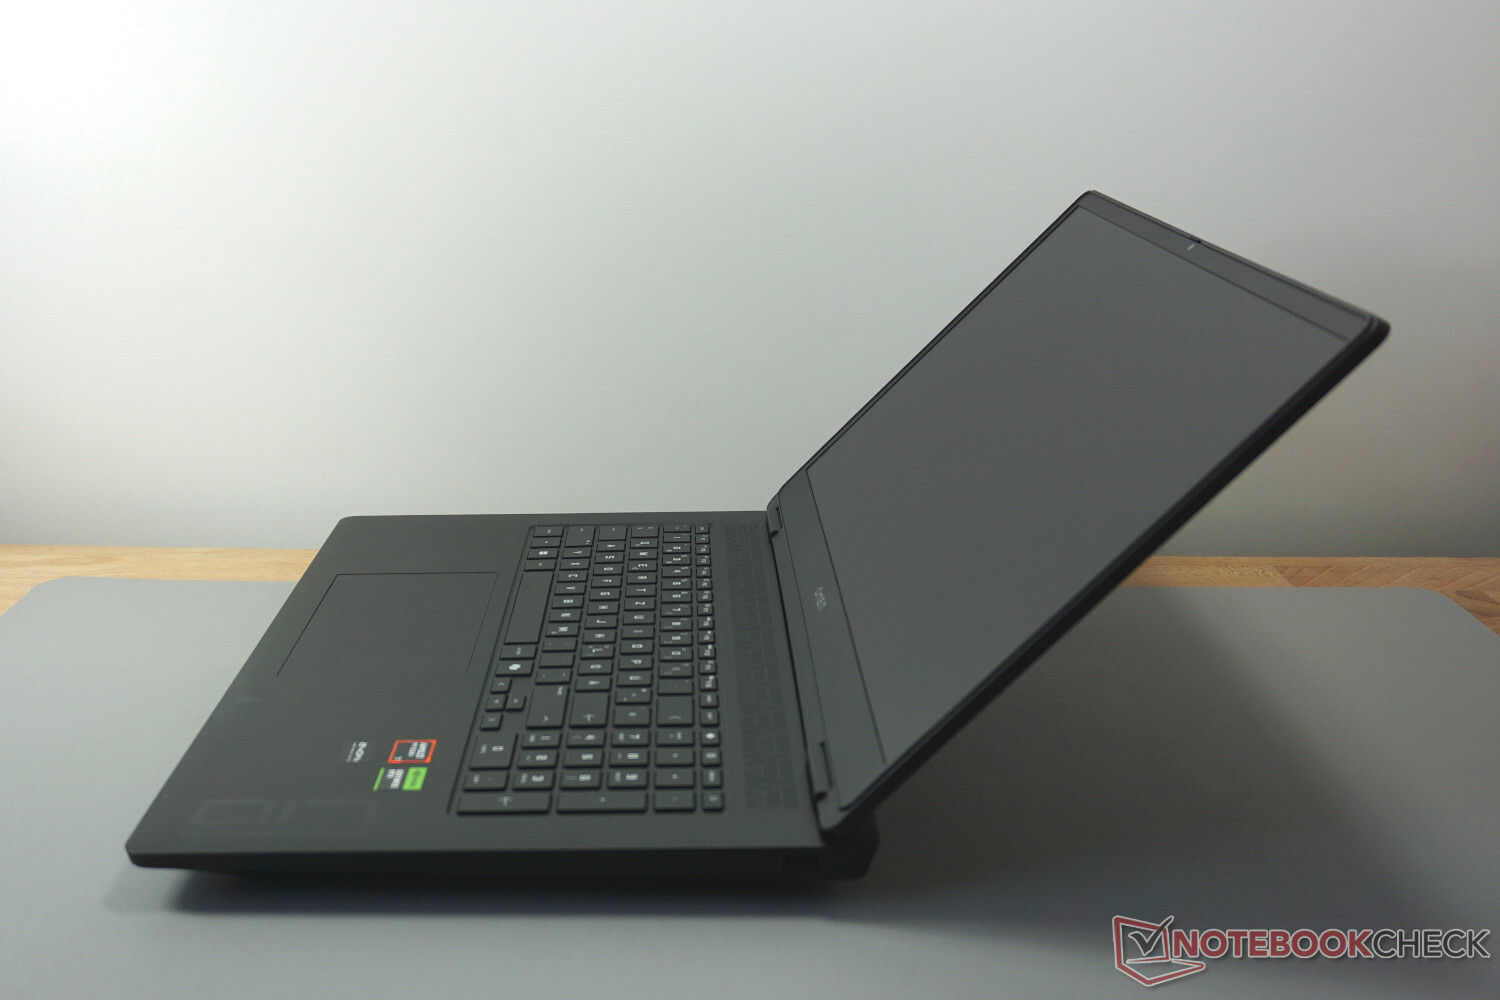
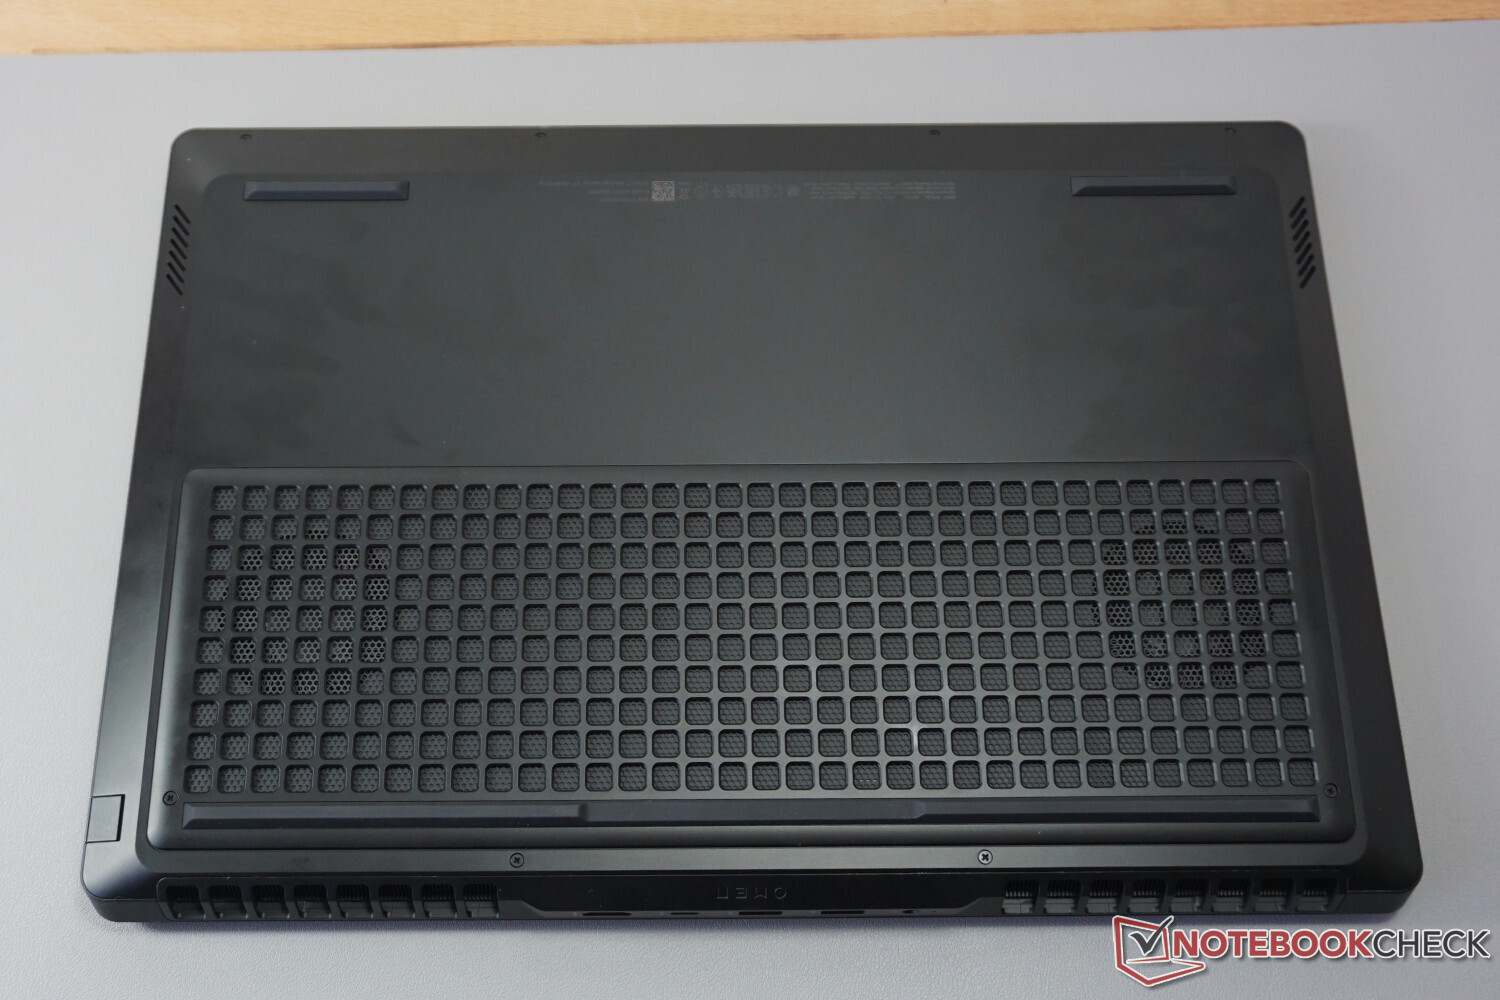
Maletín - Un jugador grande y pesado
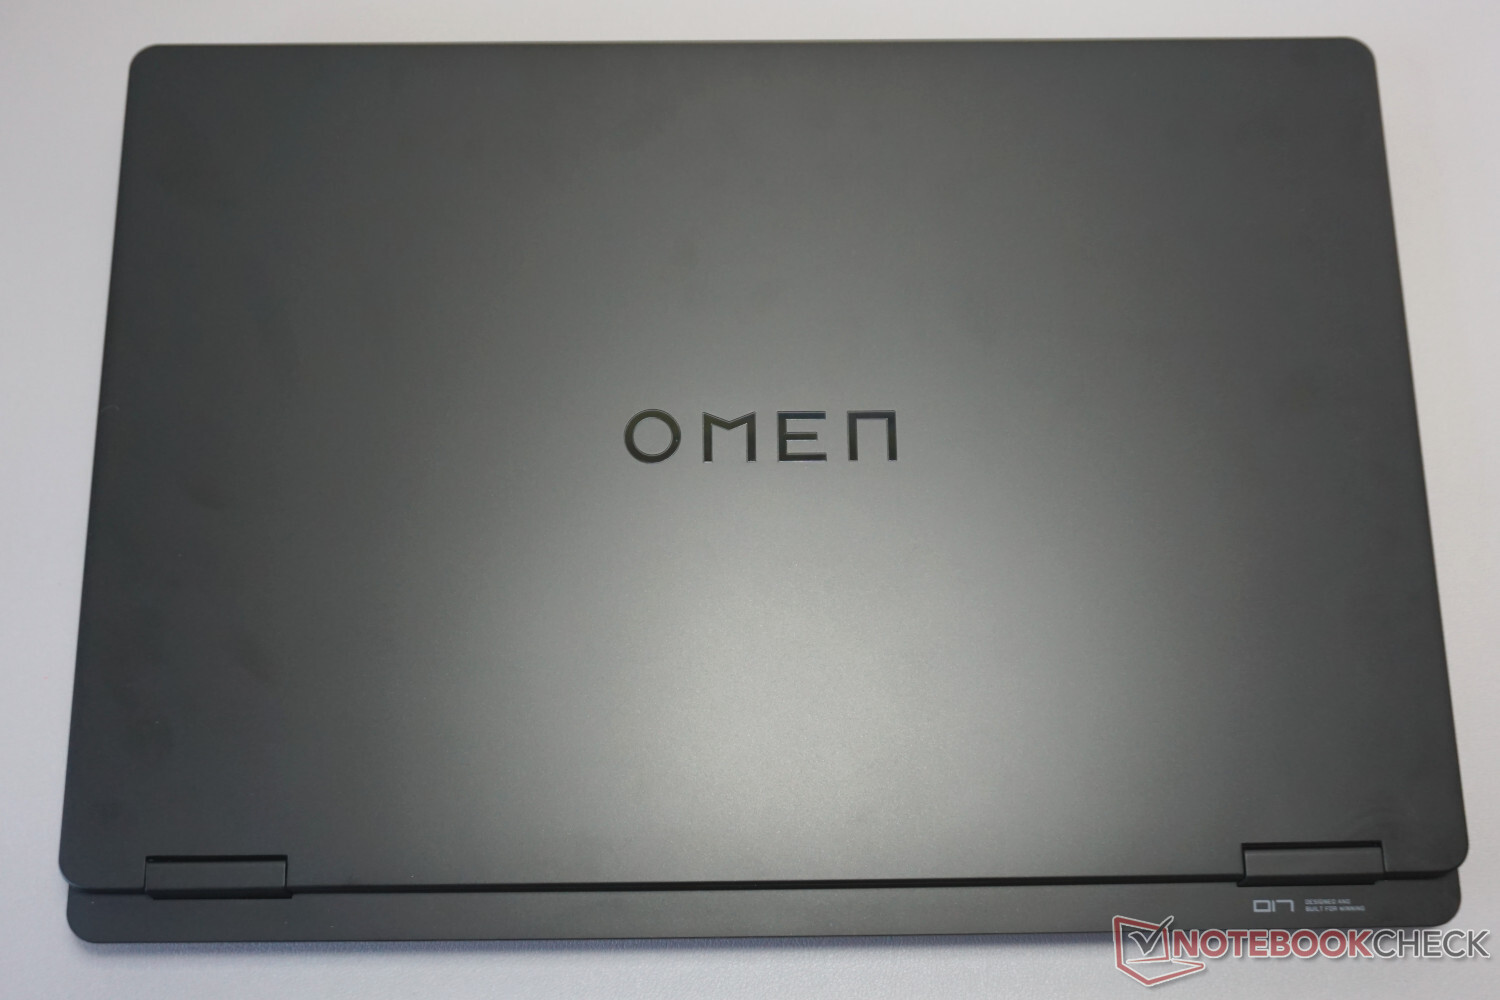
La carcasa tiene un aspecto casi anodino. El plástico negro, que también se siente así, domina todo alrededor. No hay resaltes visuales, pequeños detalles o incluso efectos de luz que admirar.
Pero una vez que intenta levantar el portátil -o cuando lo saca directamente de la caja en nuestro caso- queda claro que HP definitivamente no ahorró en utilizar componentes masivos en su interior. El peso no está lejos de la marca de los 3 kg (~6,6 lb), aunque la base no se ve afectada si lo levanta por una sola esquina delantera. Todo permanece rígido y apretado.
Las bisagras de la pantalla ofrecen una impresión similar, pero la tapa de la pantalla podría haber utilizado un poco más de estabilidad, permaneciendo bastante flexible sin ningún marco metálico adicional.
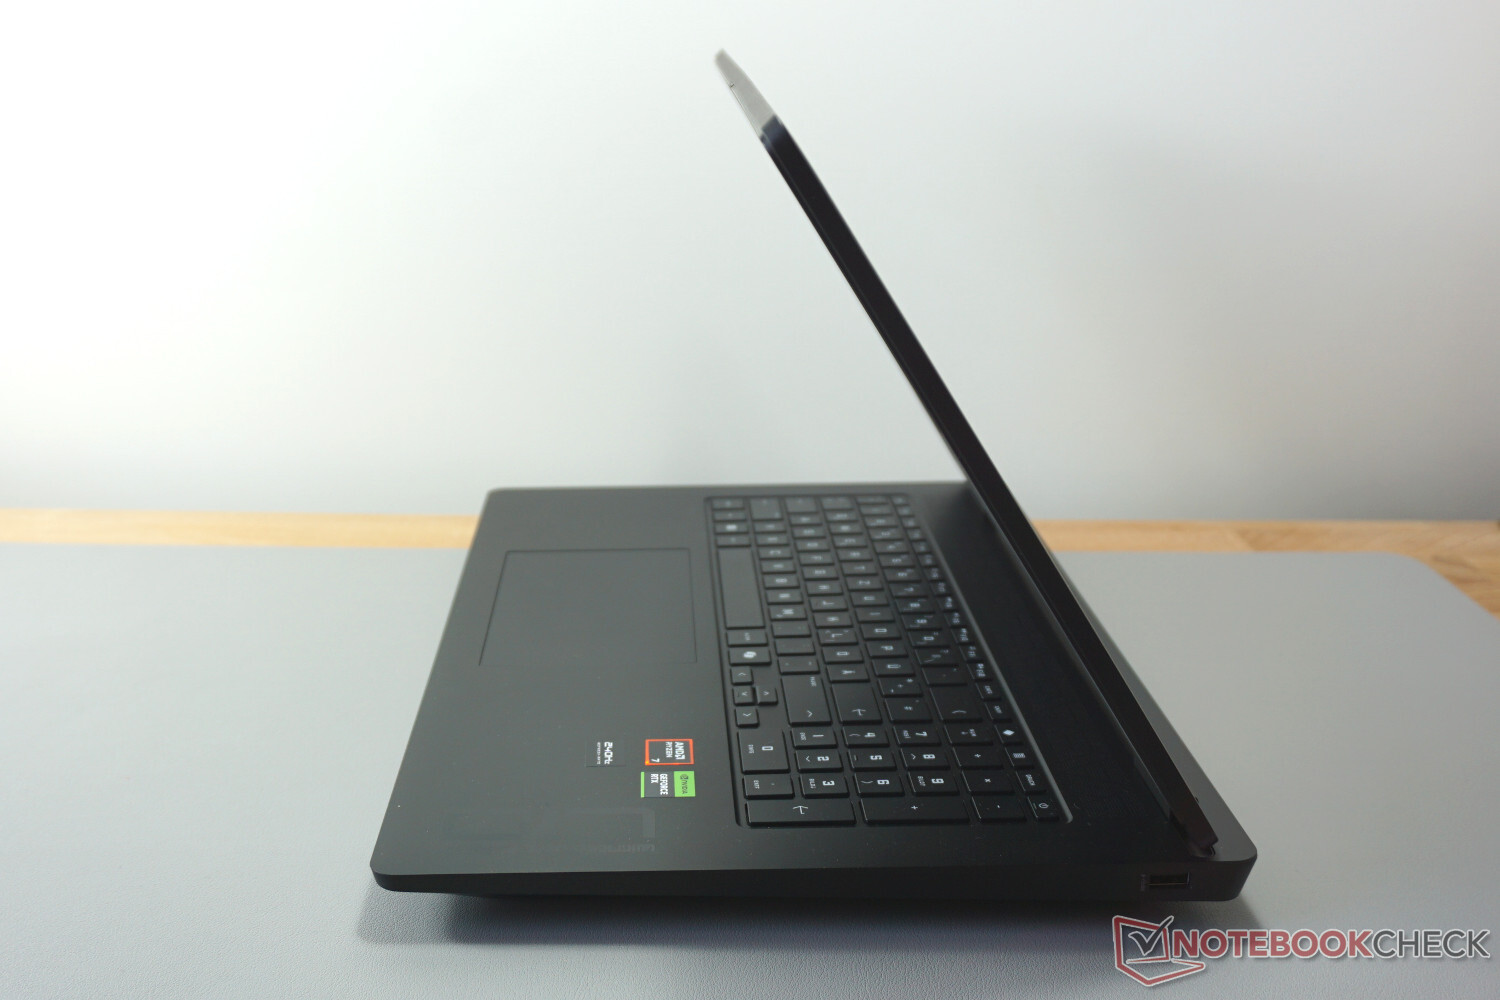
En términos de tamaño total, sólo hay unos pocos modelos que sean aún más grandes. Una anchura de 40 cm y una altura de 3 cm, incluso sin los pies, no parecen mucha movilidad. Por otro lado, esto garantiza mucho espacio para el hardware y la refrigeración, aunque podría resultar demasiado grande para algunas bolsas o mochilas para portátiles.
Equipo de conexión - Omen 17 con pocas áreas para brillar
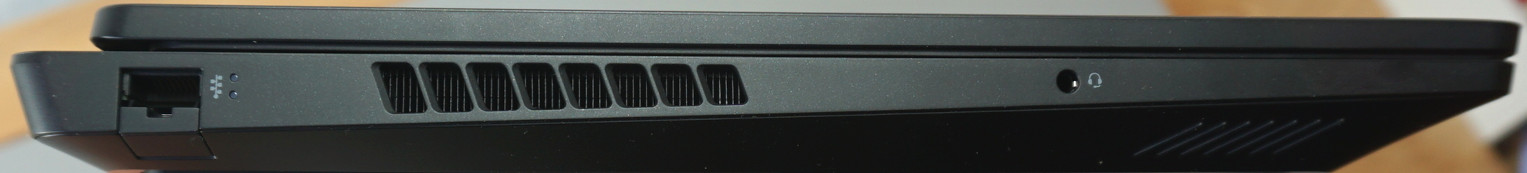
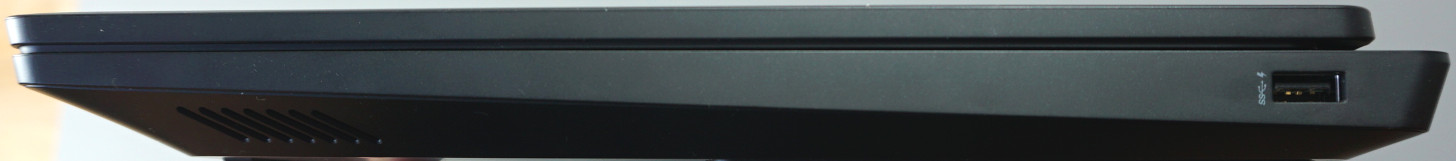
Aunque hubiera espacio de sobra, los puertos de conexión son limitados. Y no sólo eso, sino que además son las versiones más lentas. Todas las conexiones USB de la parte trasera sólo alcanzan 10 Gbit/s y la del lateral incluso sólo 5 Gbit/s. USB4 o TB4 habrían sido cuatro u ocho veces más rápidos. Pero al menos los puertos de la parte trasera deberían seguir permitiéndole jugar a muchos juegos desde un SSD externo.
Del mismo modo, el puerto LAN también sólo alcanza 1 Gbit/s, mientras que los competidores mejor equipados como el Acer Predator Helios Neo van más con los tiempos ofreciendo 2,5 Gbit/s. La posición del puerto en el lado izquierdo tampoco es óptima y hubiera sido mejor en la parte trasera. Además, no hay ni un tercer puerto de vídeo ni un lector de tarjetas.
Al menos, las salidas de vídeo HDMI y USB-C admiten la visualización 4K@120Hz, lo que permitirá hacer un buen uso de ella a quienes dispongan de un televisor adecuado.

Comunicación
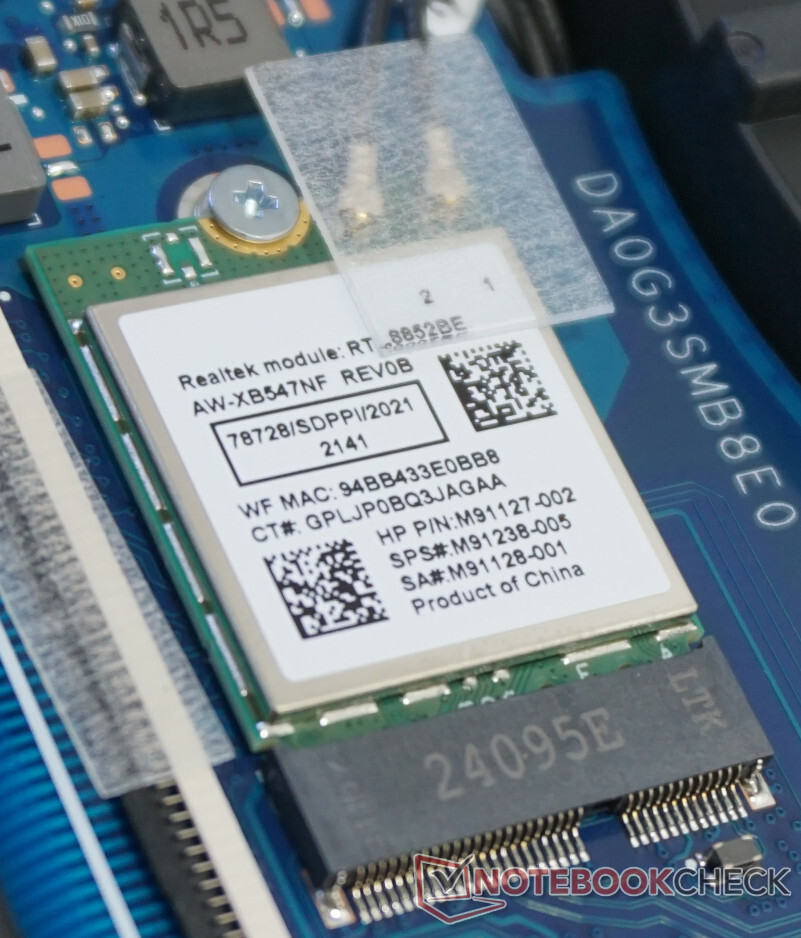
El módulo WLAN funciona bien en la medida de sus posibilidades. Con casi 1 Gbit/s en condiciones ideales, es casi tan buena como una conexión por cable. No se produjeron caídas dignas de mención durante nuestra prueba.
Aunque el módulo Wi-Fi 6 garantiza una conexión estable y fiable, apenas es adecuado para la transferencia de grandes cantidades de datos.
Cámara web
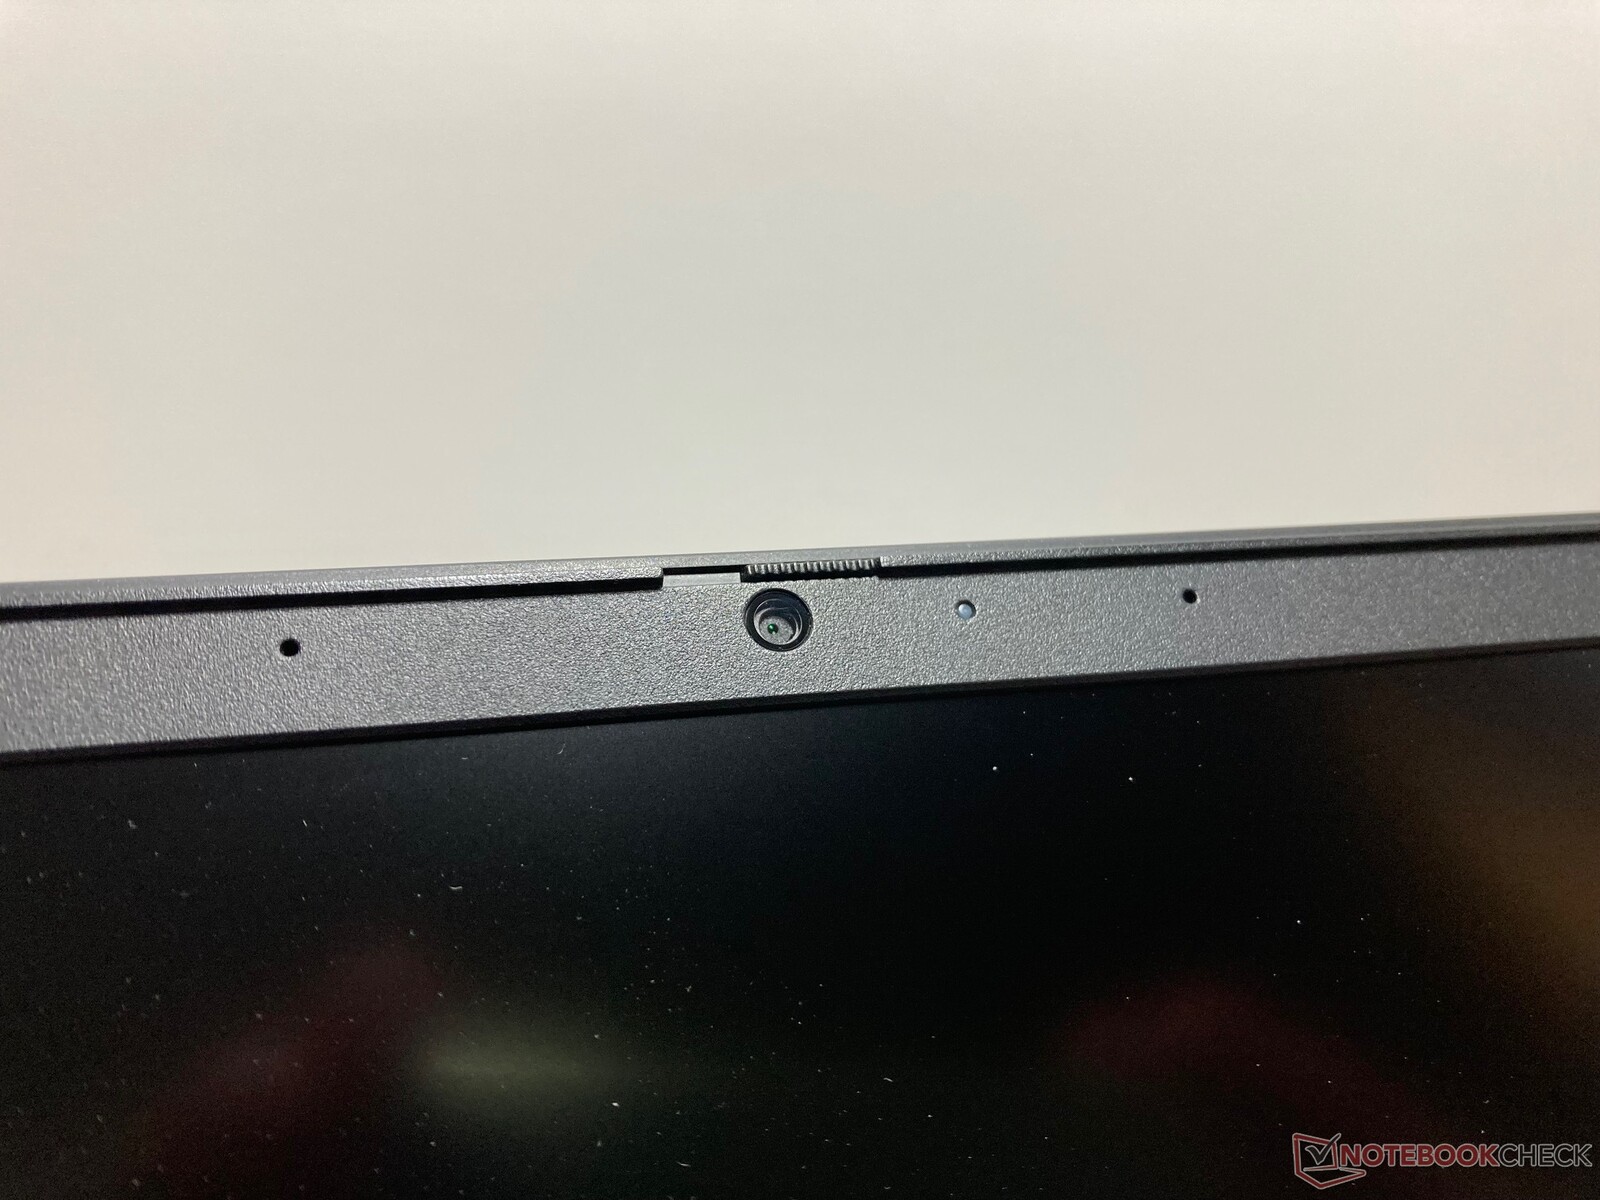
Una resolución Full-HD decente da como resultado imágenes detalladas. Pero esto sólo es válido para una luz suficientemente brillante en la habitación. Incluso una luz de techo que no sea muy brillante resulta en una caída de la calidad de la imagen. La cámara apenas es capaz de manejar condiciones de luz débil. Los detalles se pierden y la reproducción del color se resiente considerablemente. La precisión del color sólo es convincente para una cámara alojada en el marco de la pantalla si la luz circundante es brillante. Así que no podemos recomendar el uso de la cámara para más que unas pocas videollamadas.
Es una lástima, porque el micrófono tiene cierto potencial. Aunque sus grabaciones suenan ligeramente metálico, siempre se graban al mismo volumen y suenan muy claras. Incluso puede oír fácilmente las voces de fuera de la habitación.


Mantenimiento
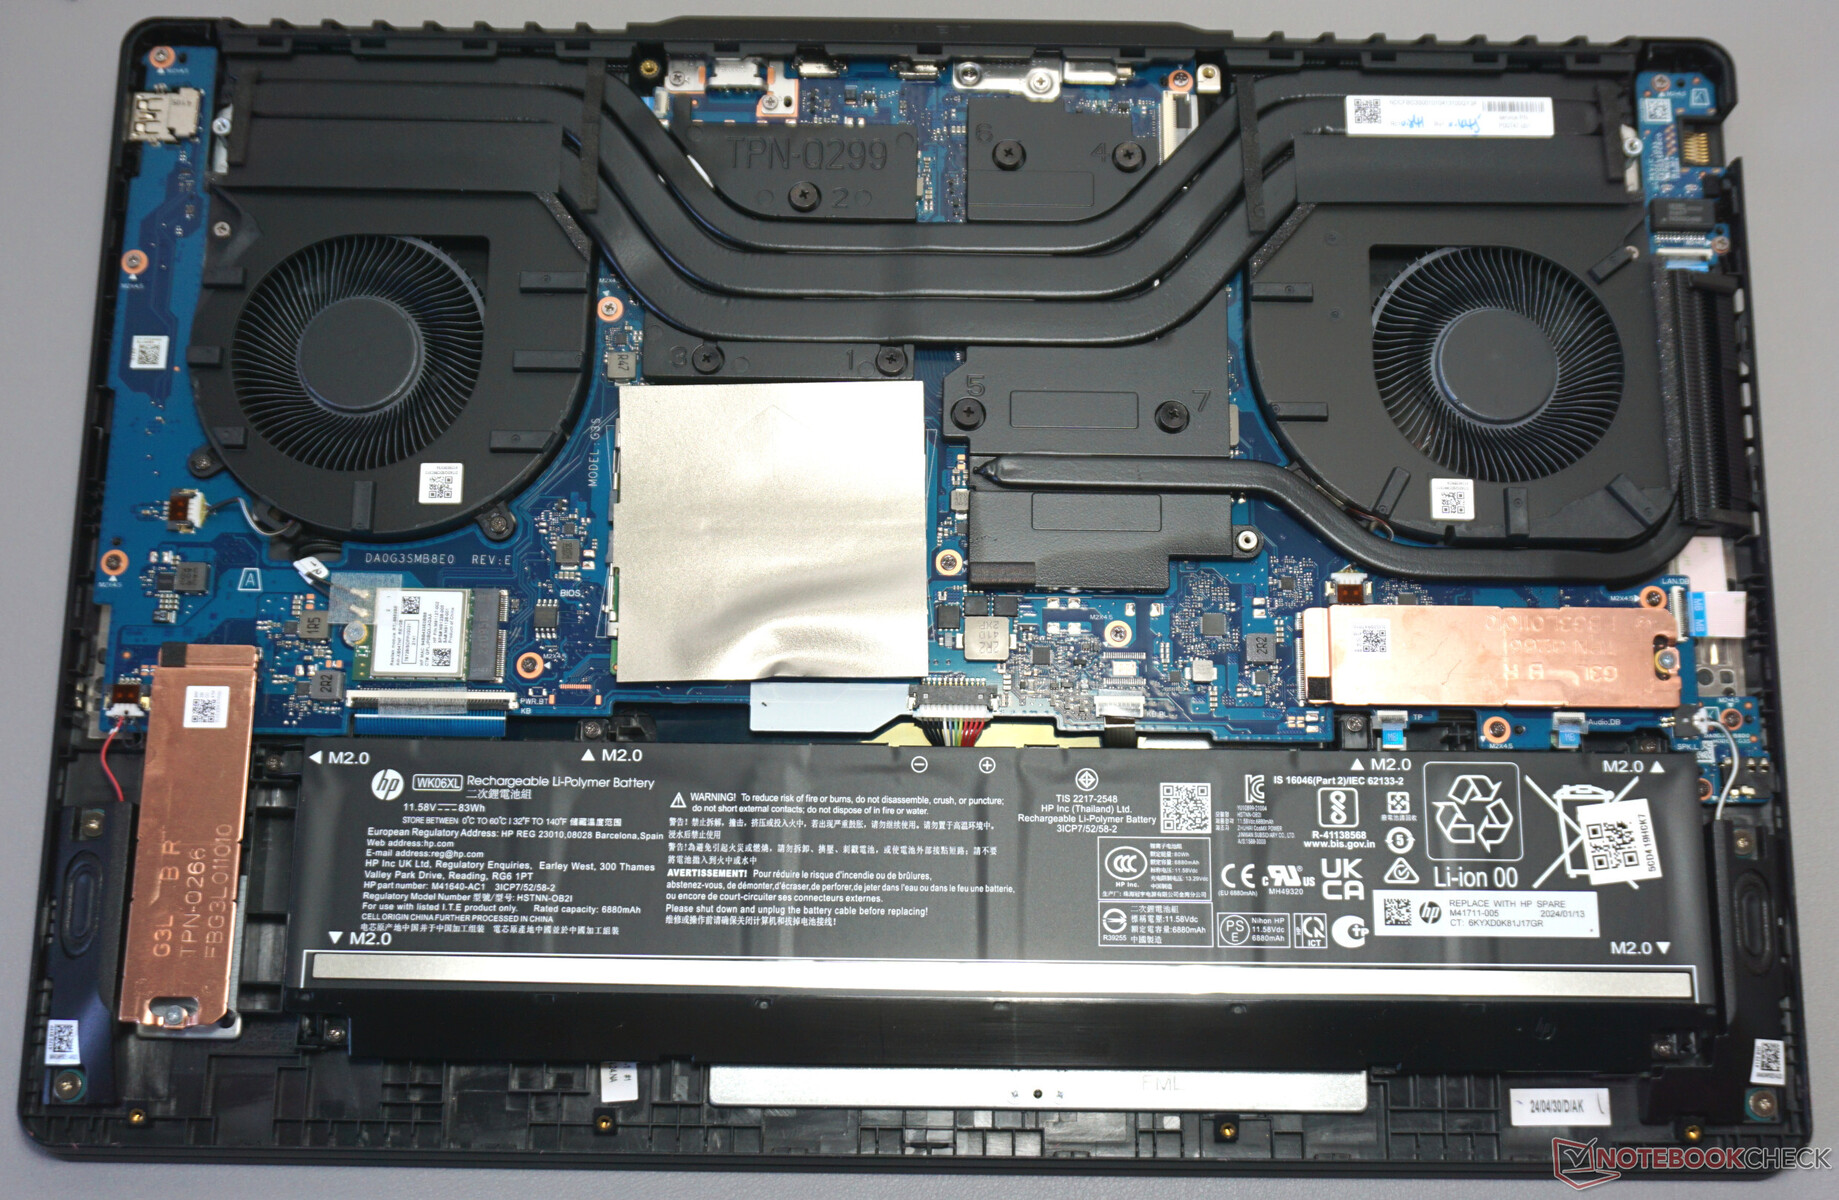
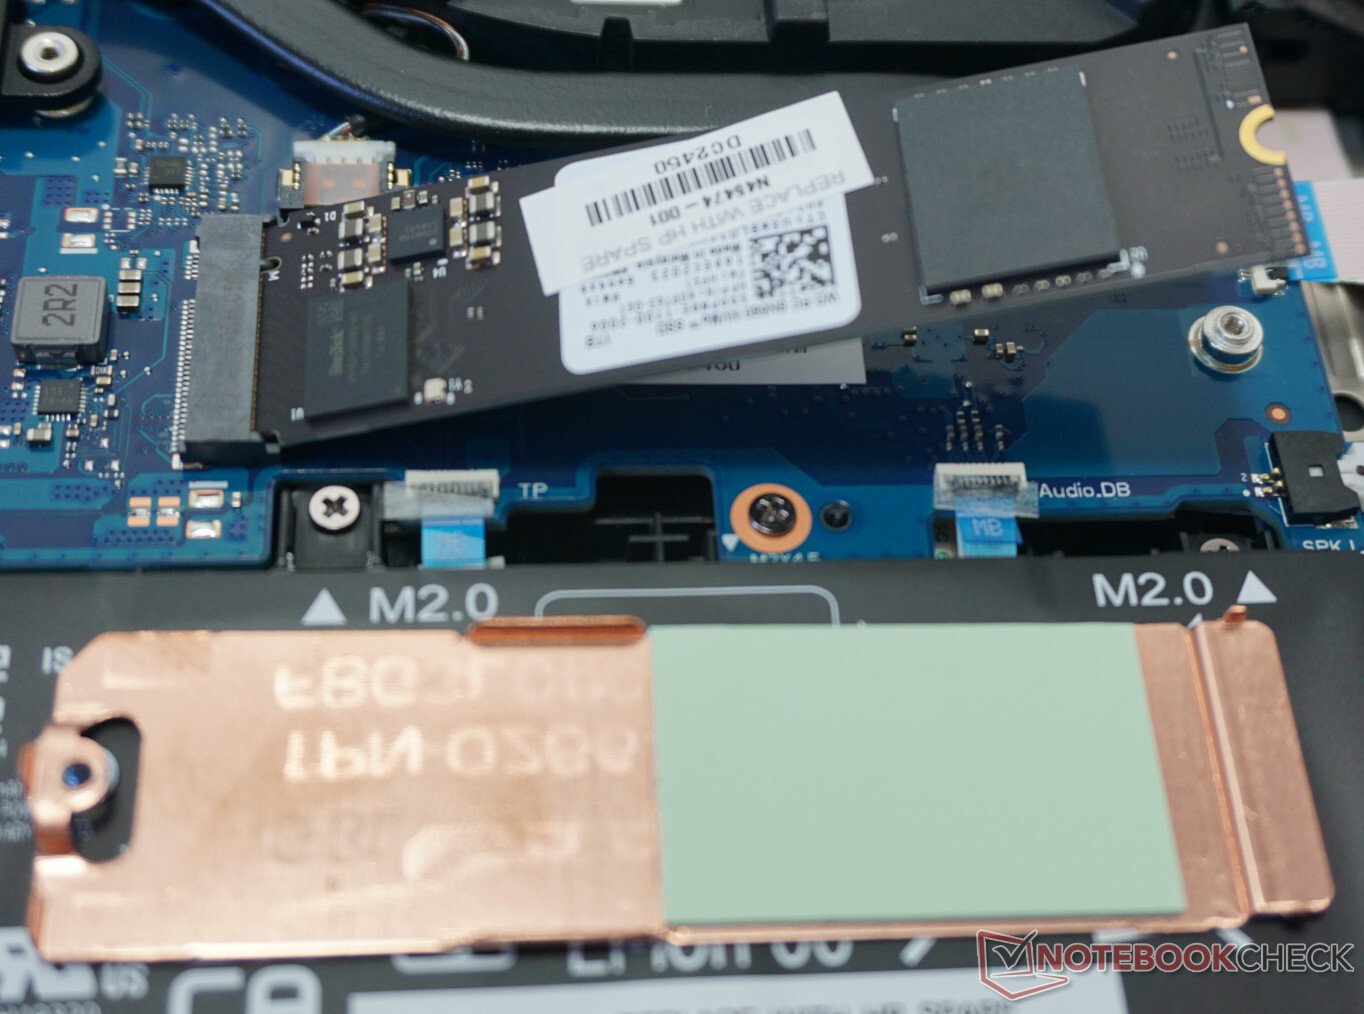
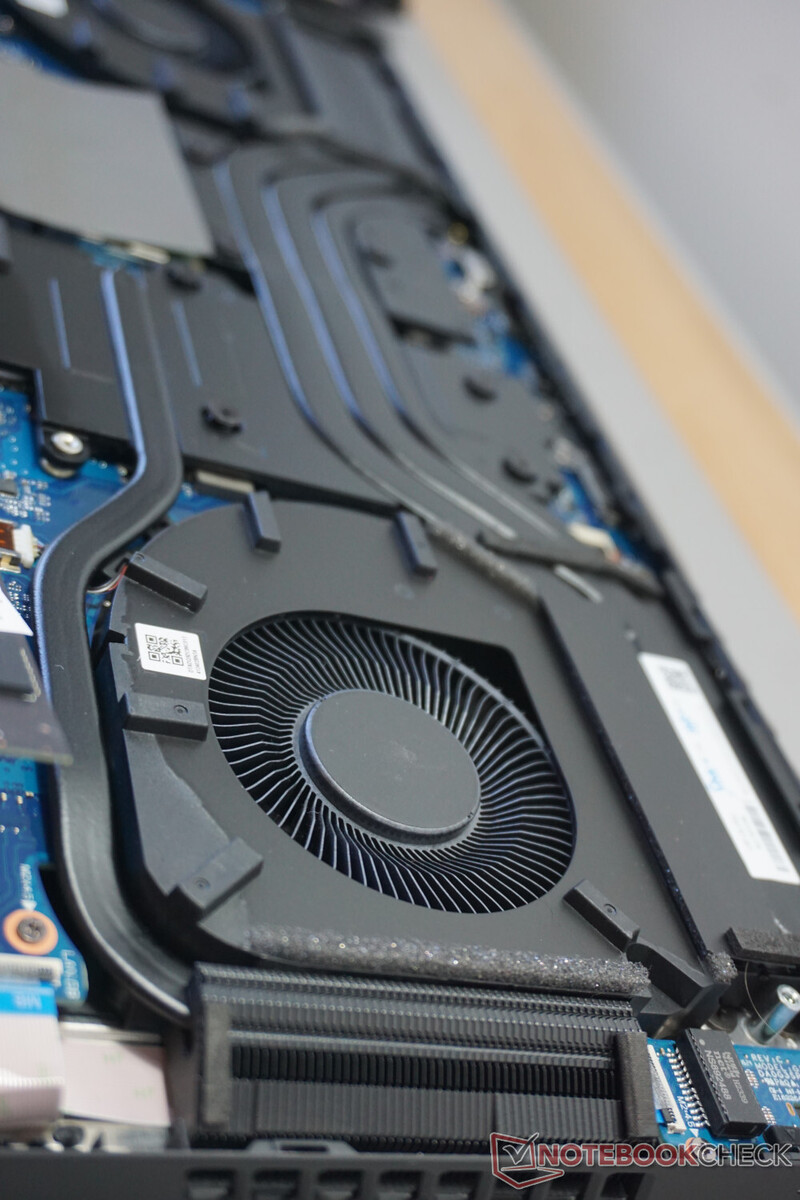
El HP Omen 17 recoge algunos puntos positivos con su facilidad para abrir el fondo de la carcasa. Una vez que haya retirado los ocho tornillos Philips normales, la tapa de la carcasa no ofrece ninguna resistencia y puede retirarse fácilmente sin necesidad de hacer fuerza.
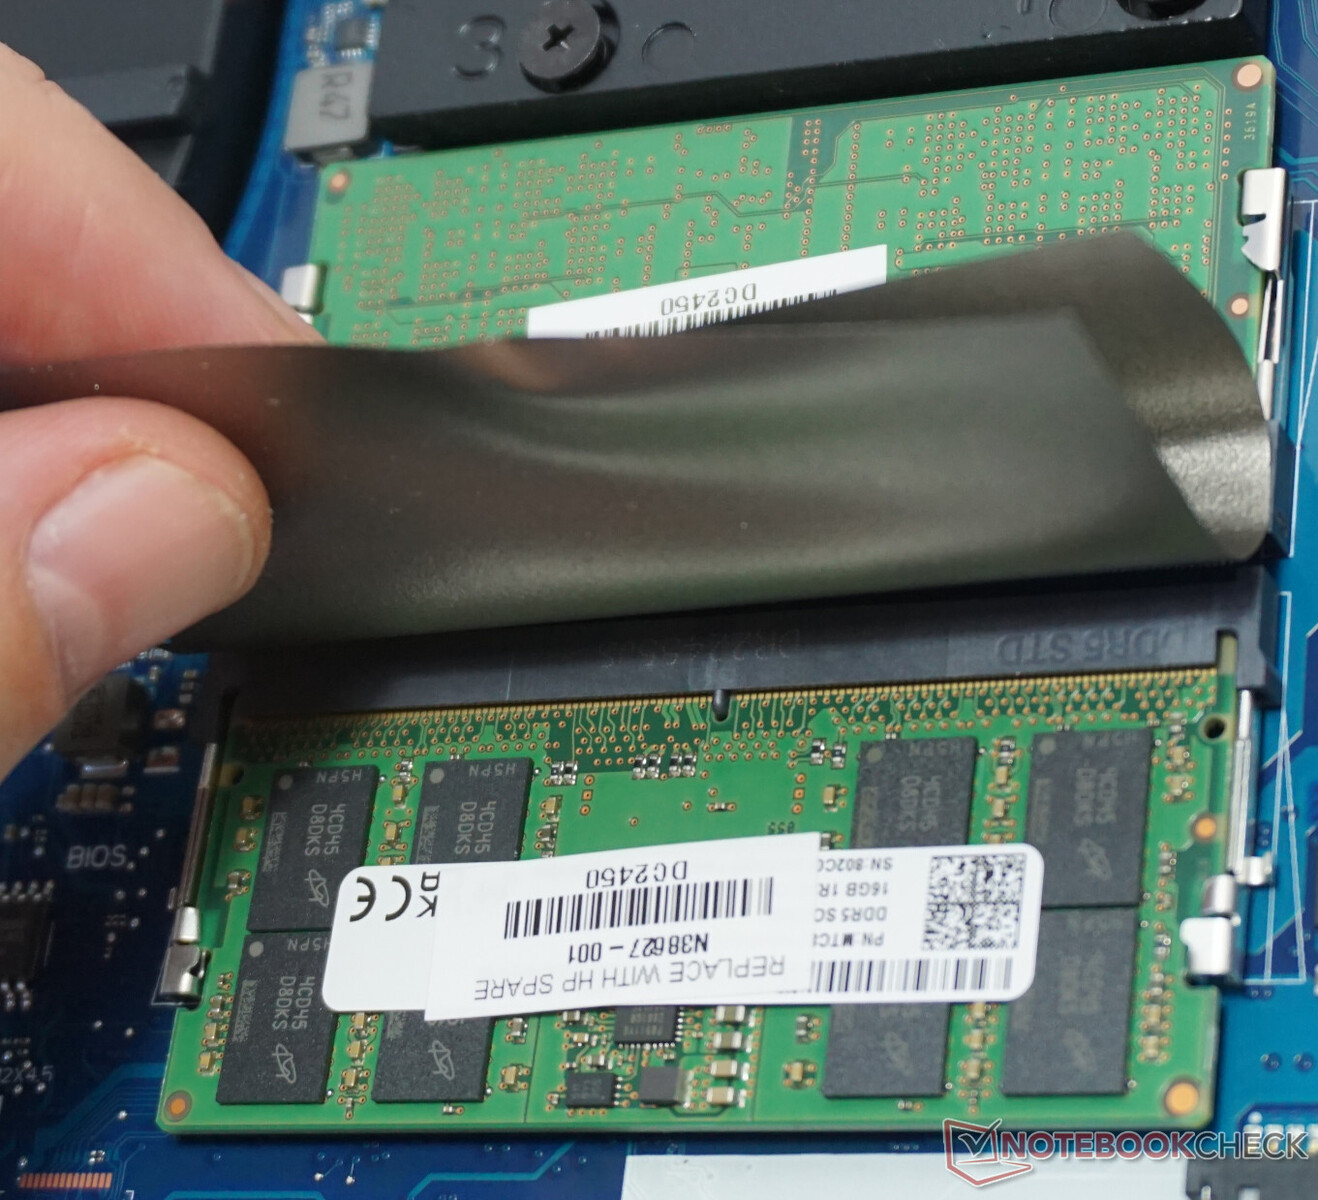
Esto le da acceso para limpiar los ventiladores y sustituir todos los componentes importantes. Dos ranuras para RAM, un módulo WLAN con conectores de antena de fácil acceso, dos ranuras para SSD y una batería que se puede extraer fácilmente no son cosas que muchos de los portátiles más compactos puedan ofrecer, al menos no en esta combinación tan completa.
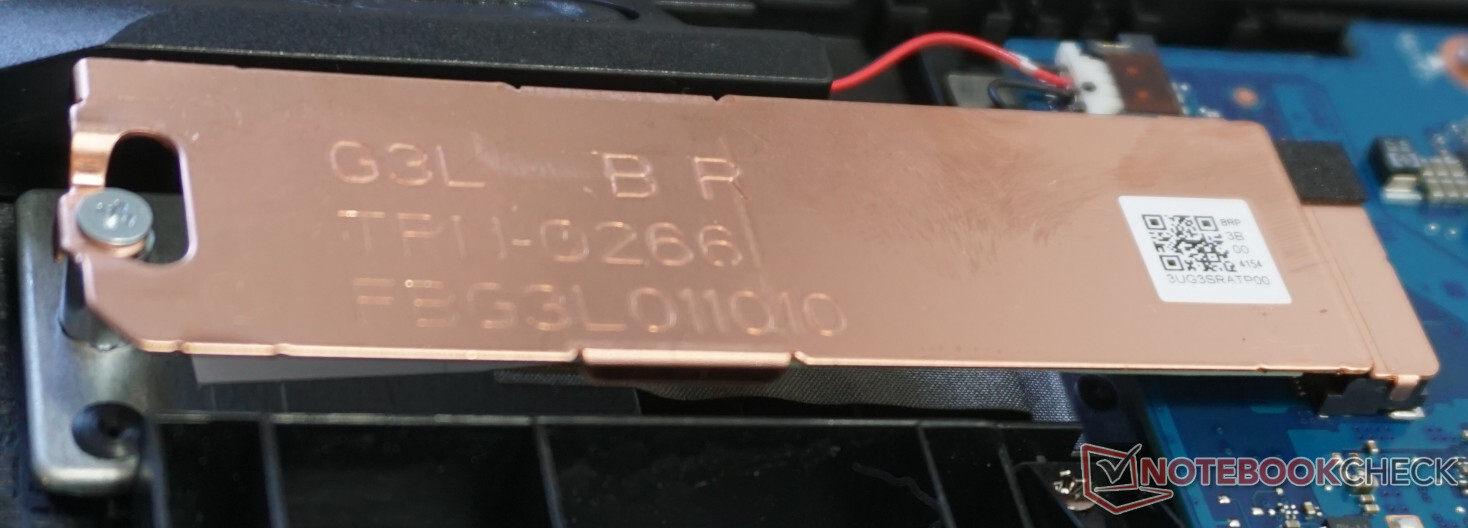
Además, hay cubiertas de cobre para las ranuras M.2 SSD que aparentemente también tienen un efecto, como descubriremos más adelante en la prueba. Una de las ranuras sigue estando disponible, lo que hace que una adición posterior de espacio de almacenamiento sea fácilmente realizable.
Sostenibilidad
El embalaje está compuesto principalmente de cartón y papel. Incluso la cubierta protectora del portátil y el teclado son de papel. Sólo el cargador está envuelto en una lámina protectora de plástico. A esto hay que añadir el fácil mantenimiento del portátil, que seguramente beneficiará a la longevidad del Omen 17. Desde la memoria de trabajo hasta la batería, todo puede sustituirse.
Luego está el moderado consumo de energía con las tareas cotidianas, que en la mayoría de los casos se sitúa por debajo de los 10 vatios. Un PC de sobremesa típico está claramente en desventaja aquí.
Y por último, HP publica un informe anual de sostenibilidad que muestra las iniciativas del fabricante, que empiezan por la generación de energía a partir de fuentes renovables y llegan hasta el objetivo de la igualdad de trato de todos los empleados en todos los niveles de la estructura de la empresa. Puede conocer los detalles aquí.
Garantía
Aunque HP concede una garantía de dos años, no ofrece ningún extra como la reparación in situ. Dependiendo del proveedor, es posible que pueda reservar allí alguna opción de garantía adicional.
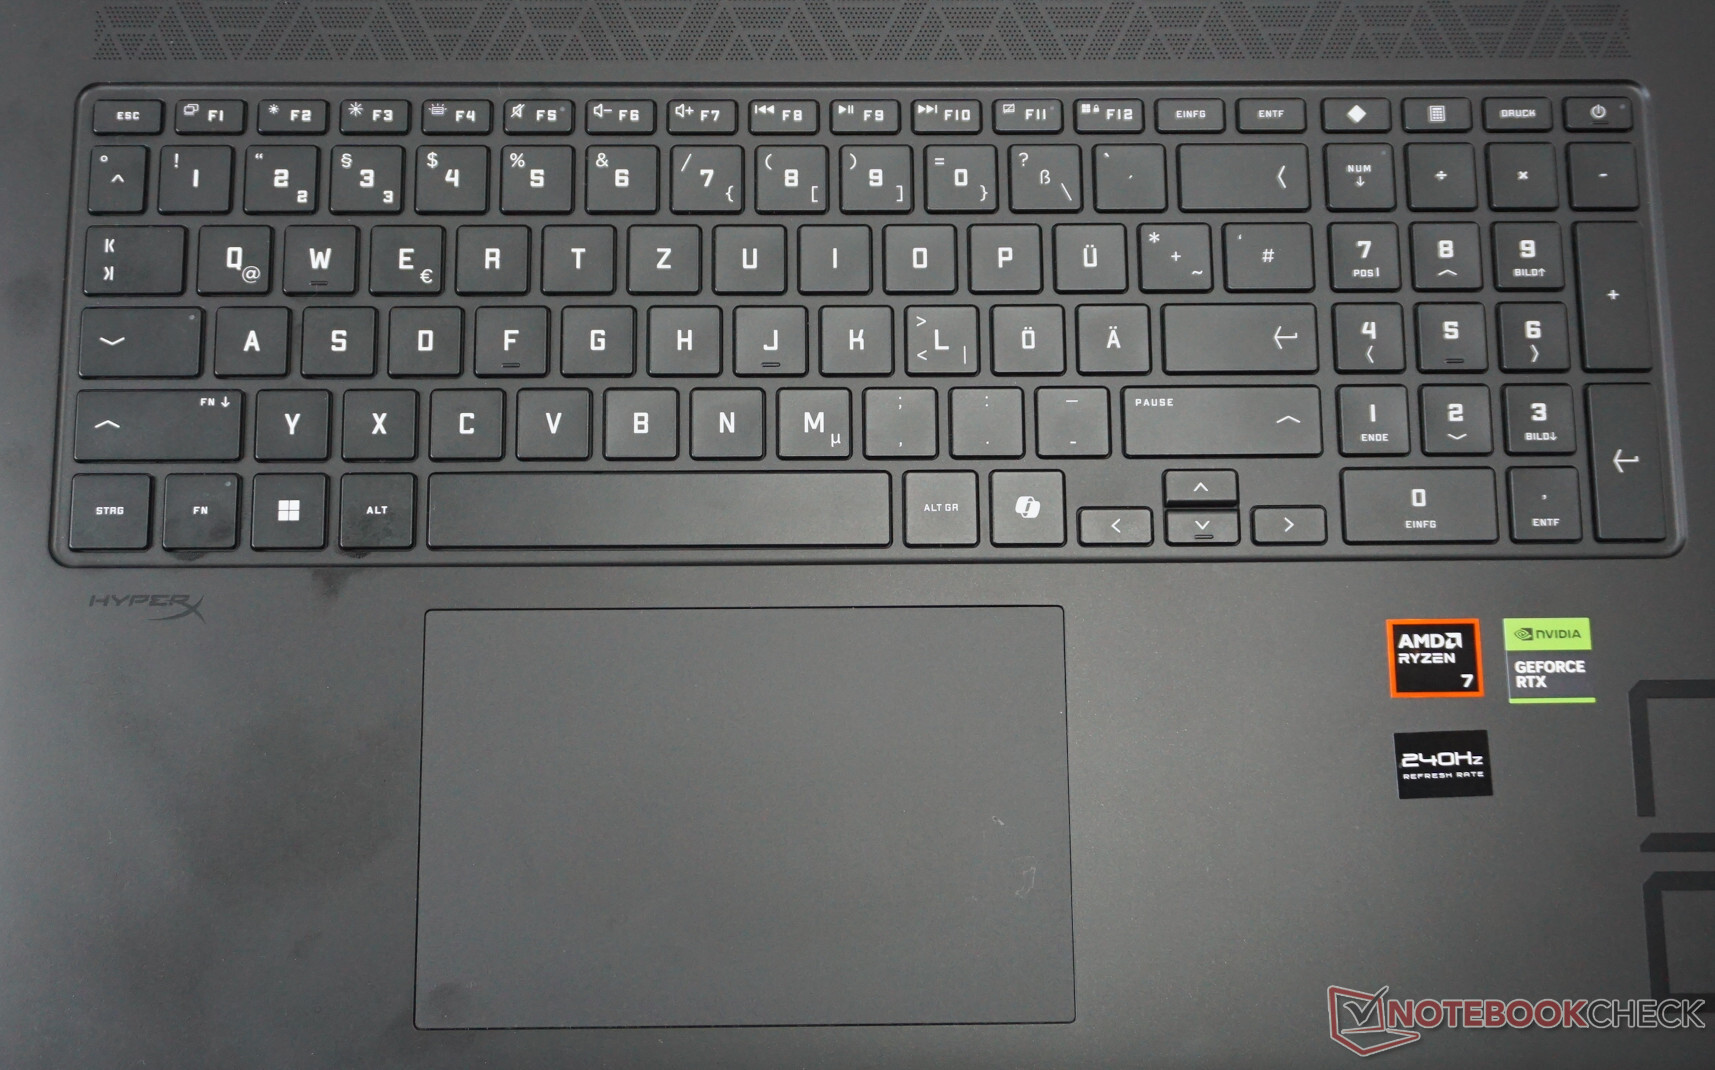
Dispositivos de entrada - HP Omen 17 sólo ofrece la tarifa estándar
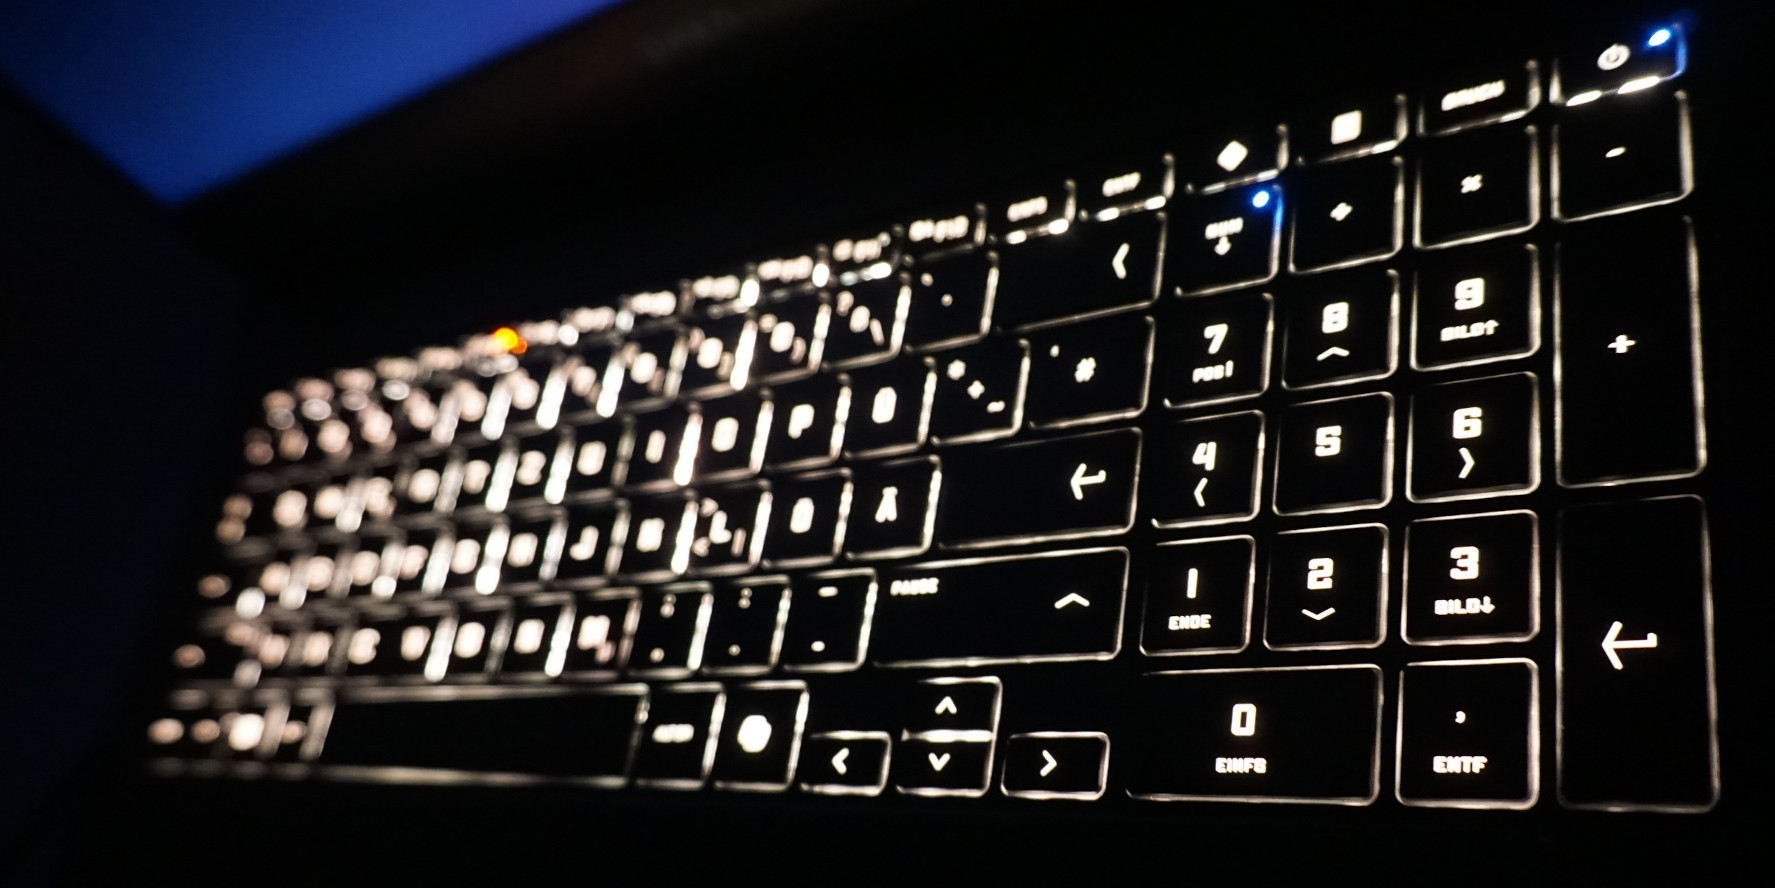
El teclado no parece muy adecuado para un portátil de juegos. El recorrido de las teclas es corto y la resistencia de las teclas apenas se nota. Además, el teclado carece de la iluminación ajustable individualmente. Aunque puede seleccionar casi cualquier color con ajustes finos del brillo, todas las teclas se iluminan entonces en el mismo color. Al menos, las teclas de flecha deberían haber sido de tamaño normal.
El panel táctil muestra una imagen similar. Aunque con un tamaño de 13 x 8 cm (5,1 x 3,15 pulg.), tiene un tamaño cómodo y también responde con mucha precisión, la pulsación de las teclas parece menos ajustada. Una presión más potente da lugar a cierto repiqueteo perceptible. Aunque en general es suficiente para las tareas cotidianas -el teclado también ofrece un marco ajustado y una buena experiencia de escritura-, quienes quieran adentrarse en juegos más intensos se verán casi obligados a utilizar dispositivos de entrada adicionales.
Pantalla - Bien ajustada al rendimiento de juego ofrecido
Si piensa en lo que tiene que ser capaz de hacer una buena pantalla para juegos en un portátil, obtendrá con bastante exactitud la pantalla QHD del HP Omen 17. Combinada con una diagonal de 17 pulgadas, la resolución garantiza una imagen nítida y detallada.
Además de para juegos, el formato 16:9 también es muy adecuado para streaming. Los colores del panel IPS tienen un aspecto bastante natural, y la superficie mate también evita los molestos reflejos.
La frecuencia de actualización de 240 hercios y un espacio de color suficientemente amplio garantizan que los distintos géneros de juego se muestren como se desea. Los tiempos de respuesta en nuestras mediciones también son capaces de mantenerse a la altura de los mejores modelos, alcanzando un nivel considerablemente superior a los del Asus TUF Gaming 17por ejemplo.
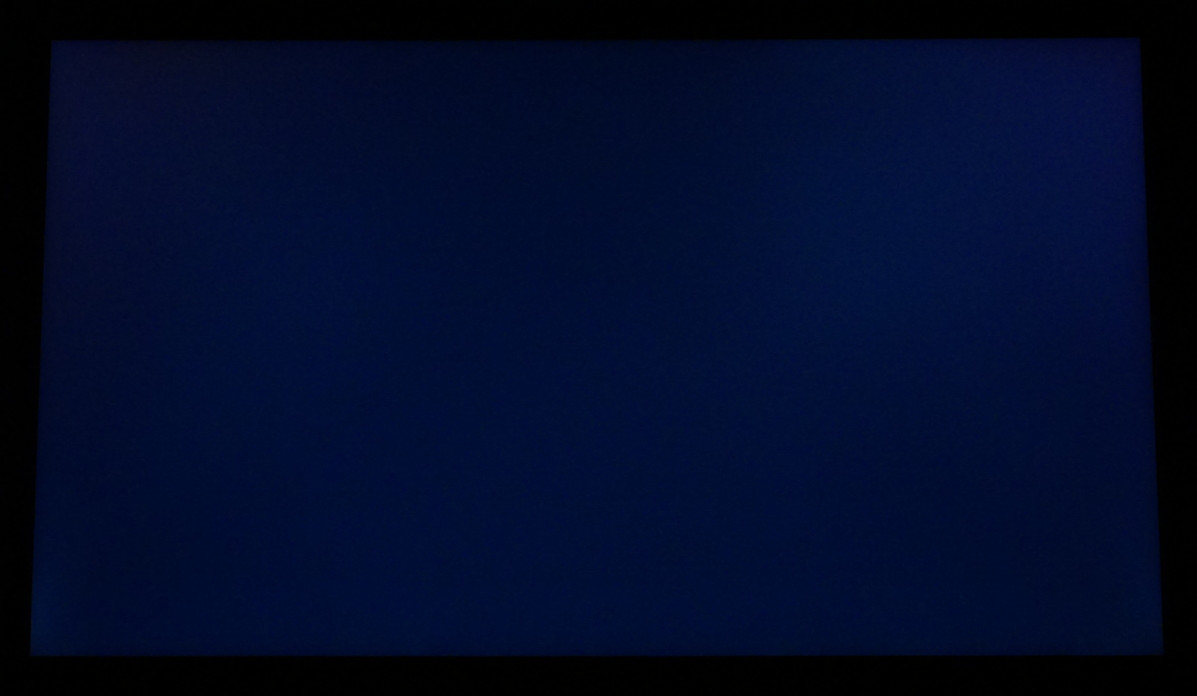
Lo que es menos impresionante es el contraste y el valor de negro. Incluso para un panel IPS, del que de todos modos no esperamos un negro perfecto, la imagen parece demasiado brillante con una oscuridad absoluta. Por otro lado, no somos capaces de detectar en absoluto ningún sangrado de pantalla con nuestros propios ojos, o sólo muy poco con una exposición prolongada. Tampoco observamos ningún parpadeo por modulación de anchura de impulsos en nuestra prueba.
Además, HP también ofrece una versión Full-HD con 144 hercios, que podría ser una opción sensata en combinación con una RTX 4060.
| |||||||||||||||||||||||||
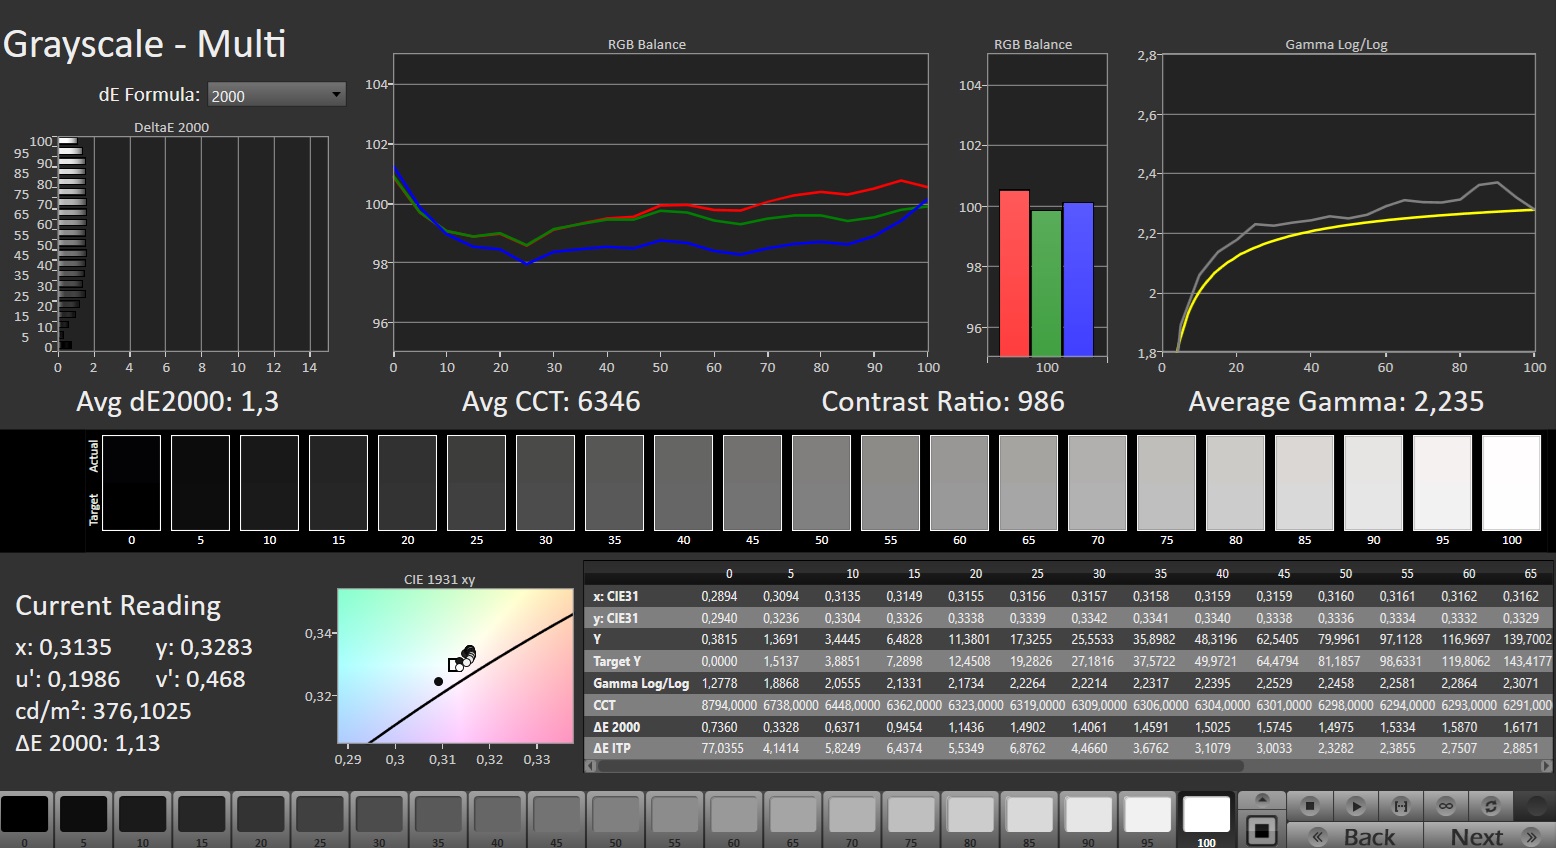
iluminación: 84 %
Brillo con batería: 363 cd/m²
Contraste: 955:1 (Negro: 0.38 cd/m²)
ΔE Color 1.74 | 0.5-29.43 Ø4.87, calibrated: 1.43
ΔE Greyscale 1.3 | 0.5-98 Ø5.1
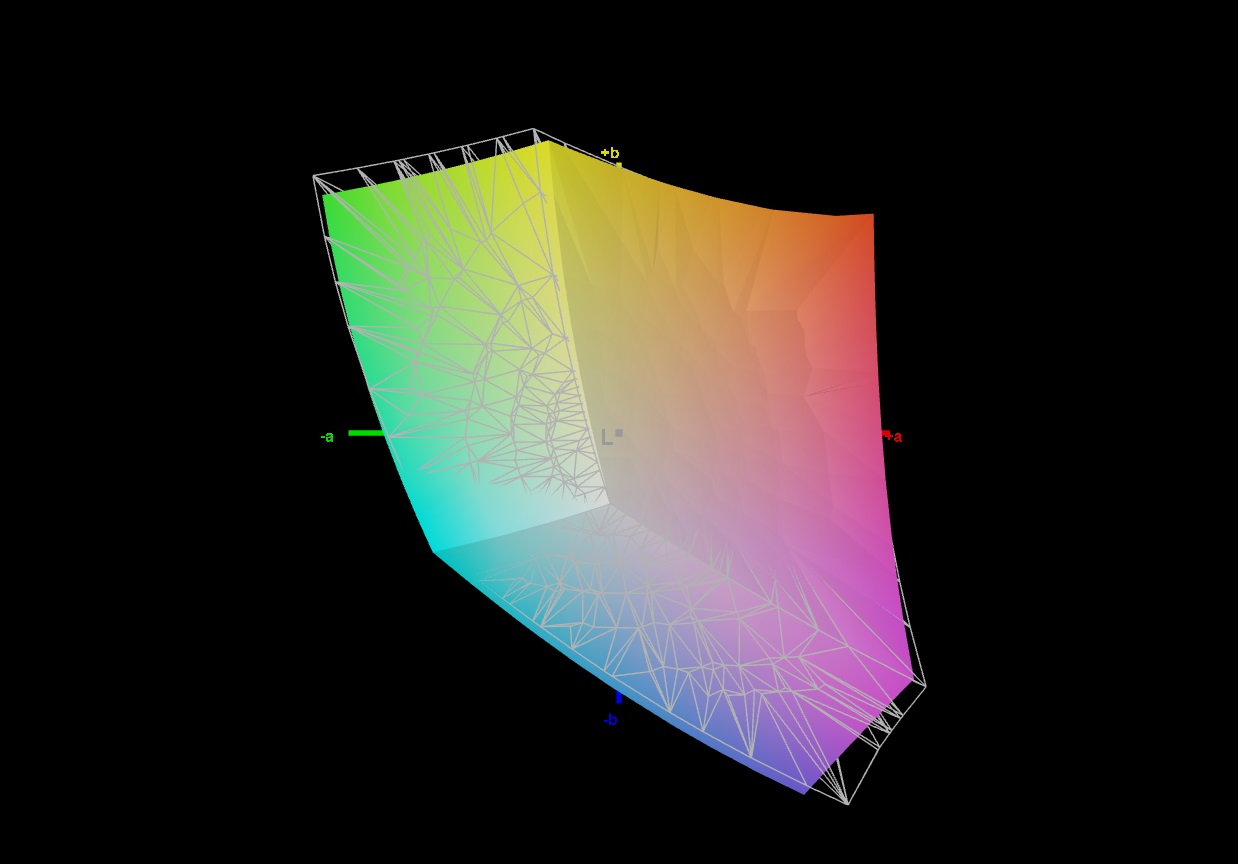
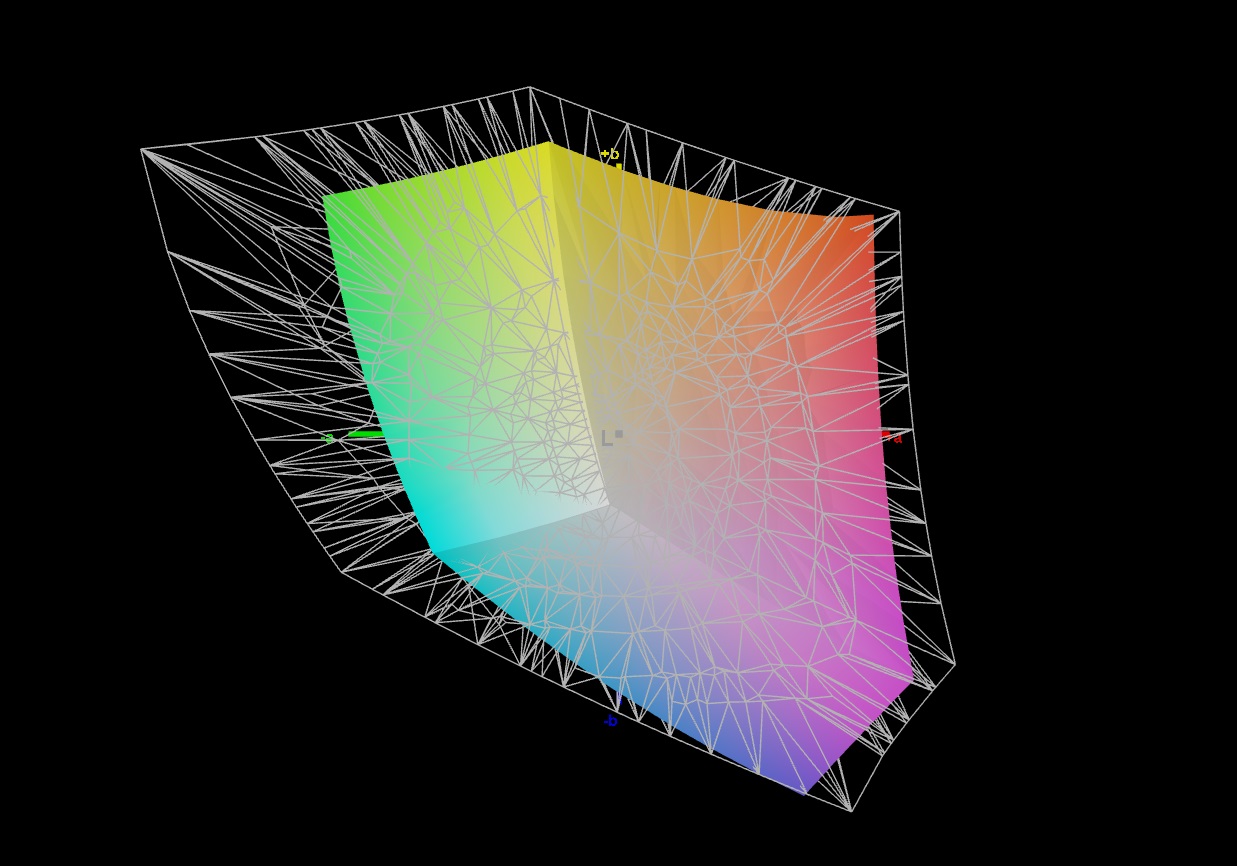
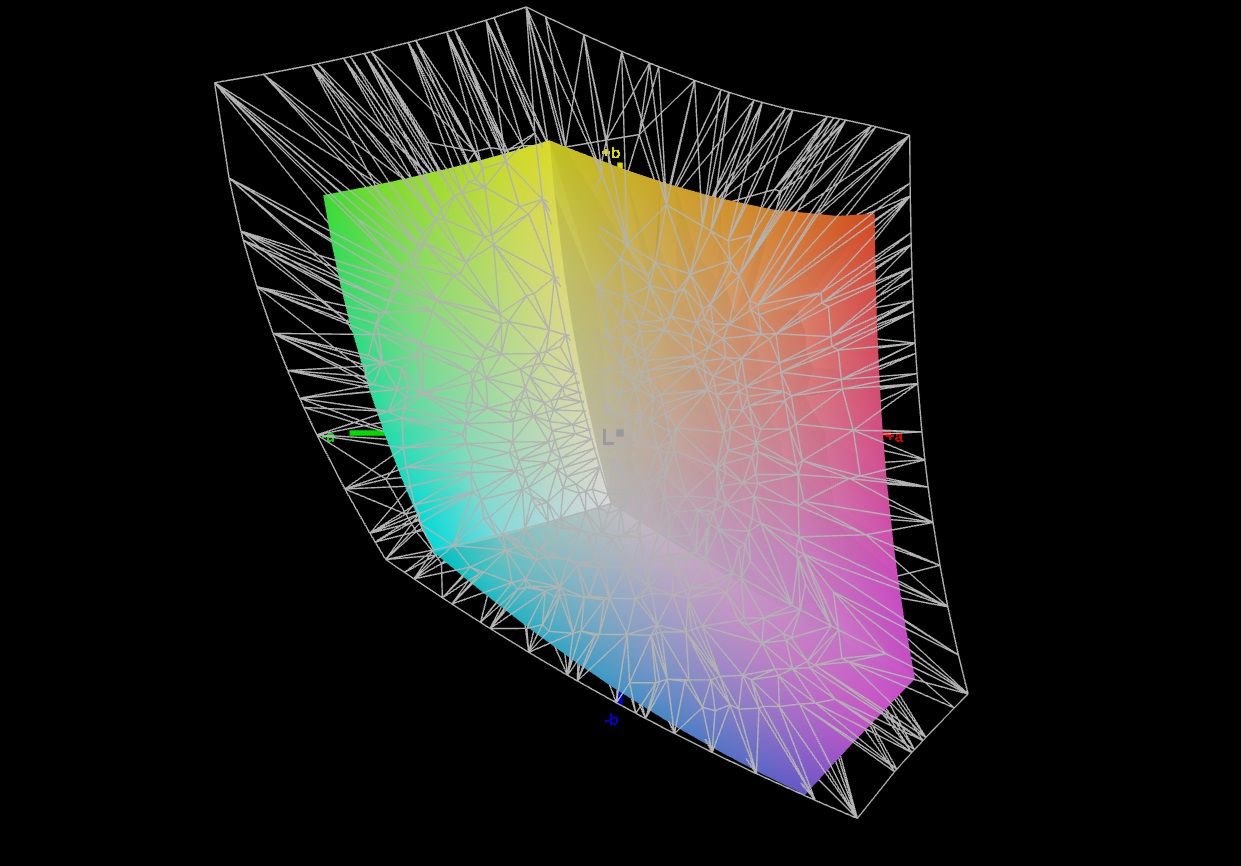
68.1% AdobeRGB 1998 (Argyll 2.2.0 3D)
95.5% sRGB (Argyll 2.2.0 3D)
66.2% Display P3 (Argyll 2.2.0 3D)
Gamma: 2.235
| HP Omen 17-db0079ng BOE0B67, IPS, 2560x1440, 17.3" | Alienware m16 R2 BOE NE16NYH, IPS, 2560x1600, 16" | Asus ROG Strix Scar 16 G634JZR BOE NE160QDM-NM7, Mini LED, 2560x1600, 16" | Acer Predator Helios Neo 16 (2024) Chi Mei N160GME-GTB, LED, 2560x1600, 16" | Asus TUF Gaming A17 FA707XI-NS94 AU Optronics B173HAN04.9, IPS, 1920x1080, 17.3" | Asus TUF Gaming A15 FA507UV AU Optronics B156HAN15.H, IPS, 1920x1080, 15.6" | |
|---|---|---|---|---|---|---|
| Display | 6% | 30% | 26% | -39% | 5% | |
| Display P3 Coverage | 66.2 | 71 7% | 99.8 51% | 95.9 45% | 39.7 -40% | 70.5 6% |
| sRGB Coverage | 95.5 | 100 5% | 100 5% | 99.8 5% | 59.1 -38% | 98.5 3% |
| AdobeRGB 1998 Coverage | 68.1 | 71.4 5% | 90.8 33% | 86.4 27% | 41 -40% | 72.7 7% |
| Response Times | 28% | 20% | 30% | -198% | -148% | |
| Response Time Grey 50% / Grey 80% * | 14.4 ? | 5.7 ? 60% | 5 ? 65% | 5 ? 65% | 39 ? -171% | 31.7 ? -120% |
| Response Time Black / White * | 8.3 ? | 8.7 ? -5% | 10.4 ? -25% | 8.8 ? -6% | 26.9 ? -224% | 22.9 ? -176% |
| PWM Frequency | 2040 ? | |||||
| Screen | 6% | 29% | 7% | -66% | -22% | |
| Brightness middle | 363 | 345.8 -5% | 490 35% | 521 44% | 255.9 -30% | 315 -13% |
| Brightness | 341 | 337 -1% | 487 43% | 506 48% | 248 -27% | 303 -11% |
| Brightness Distribution | 84 | 87 4% | 94 12% | 85 1% | 91 8% | 90 7% |
| Black Level * | 0.38 | 0.3 21% | 0.4 -5% | 0.44 -16% | 0.21 45% | 0.25 34% |
| Contrast | 955 | 1153 21% | 1225 28% | 1184 24% | 1219 28% | 1260 32% |
| Colorchecker dE 2000 * | 1.74 | 1.99 -14% | 1.08 38% | 1.74 -0% | 4.51 -159% | 2.26 -30% |
| Colorchecker dE 2000 max. * | 5.39 | 3.52 35% | 2.38 56% | 3.88 28% | 20.77 -285% | 7.37 -37% |
| Colorchecker dE 2000 calibrated * | 1.43 | 0.62 57% | 0.9 37% | 0.52 64% | 1.82 -27% | 1.03 28% |
| Greyscale dE 2000 * | 1.3 | 2.1 -62% | 1.1 15% | 3 -131% | 3.2 -146% | 4 -208% |
| Gamma | 2.235 98% | 2.32 95% | 2.13 103% | 2.164 102% | 2.08 106% | 2.116 104% |
| CCT | 6346 102% | 6369 102% | 6724 97% | 6816 95% | 6054 107% | 7570 86% |
| Media total (Programa/Opciones) | 13% /
9% | 26% /
28% | 21% /
14% | -101% /
-79% | -55% /
-34% |
* ... más pequeño es mejor
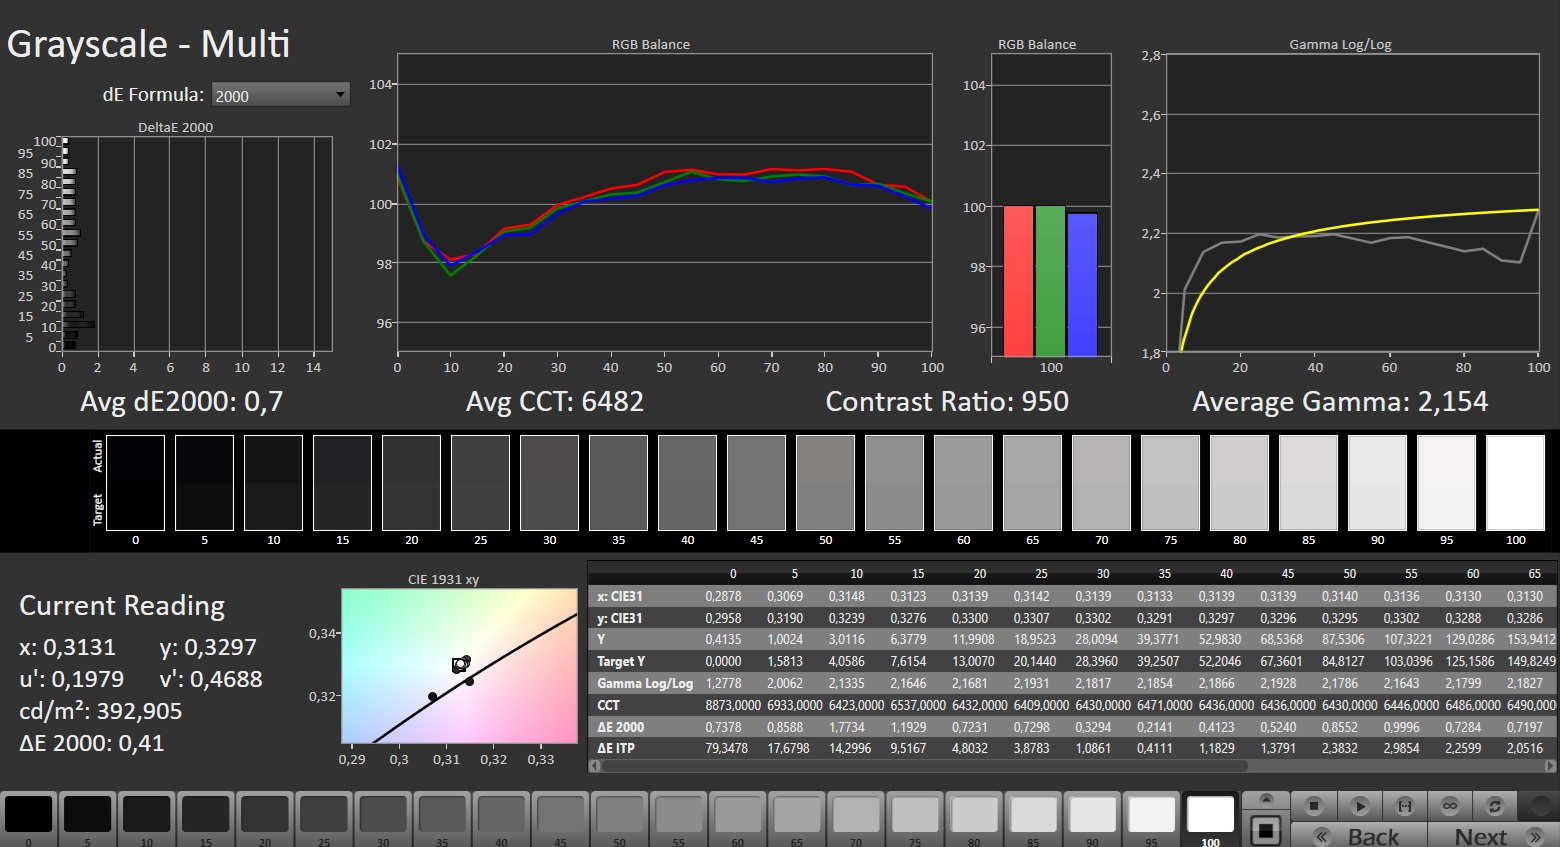
La reproducción del color es correcta incluso sin una calibración adicional. Sólo medimos una desviación mayor con el color azul que también podría apreciarse a simple vista. En las demás áreas de color, incluida la escala de grises, la reproducción del color es casi perfecta en el estado de entrega.
Tras el calibrado, ya no hay valores atípicos y la precisión del color está a un alto nivel en todas las zonas.
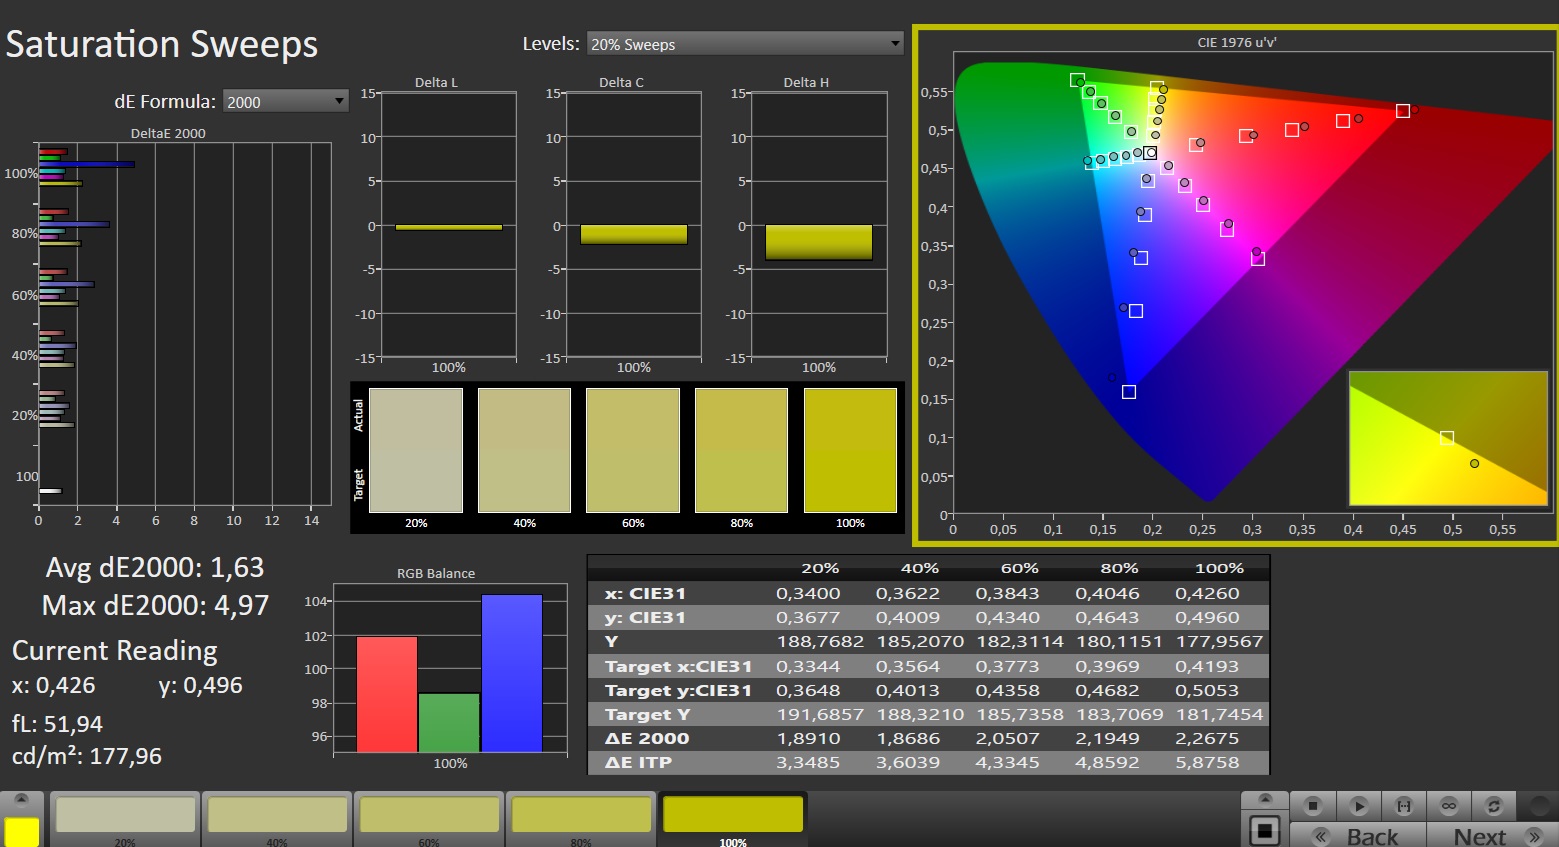
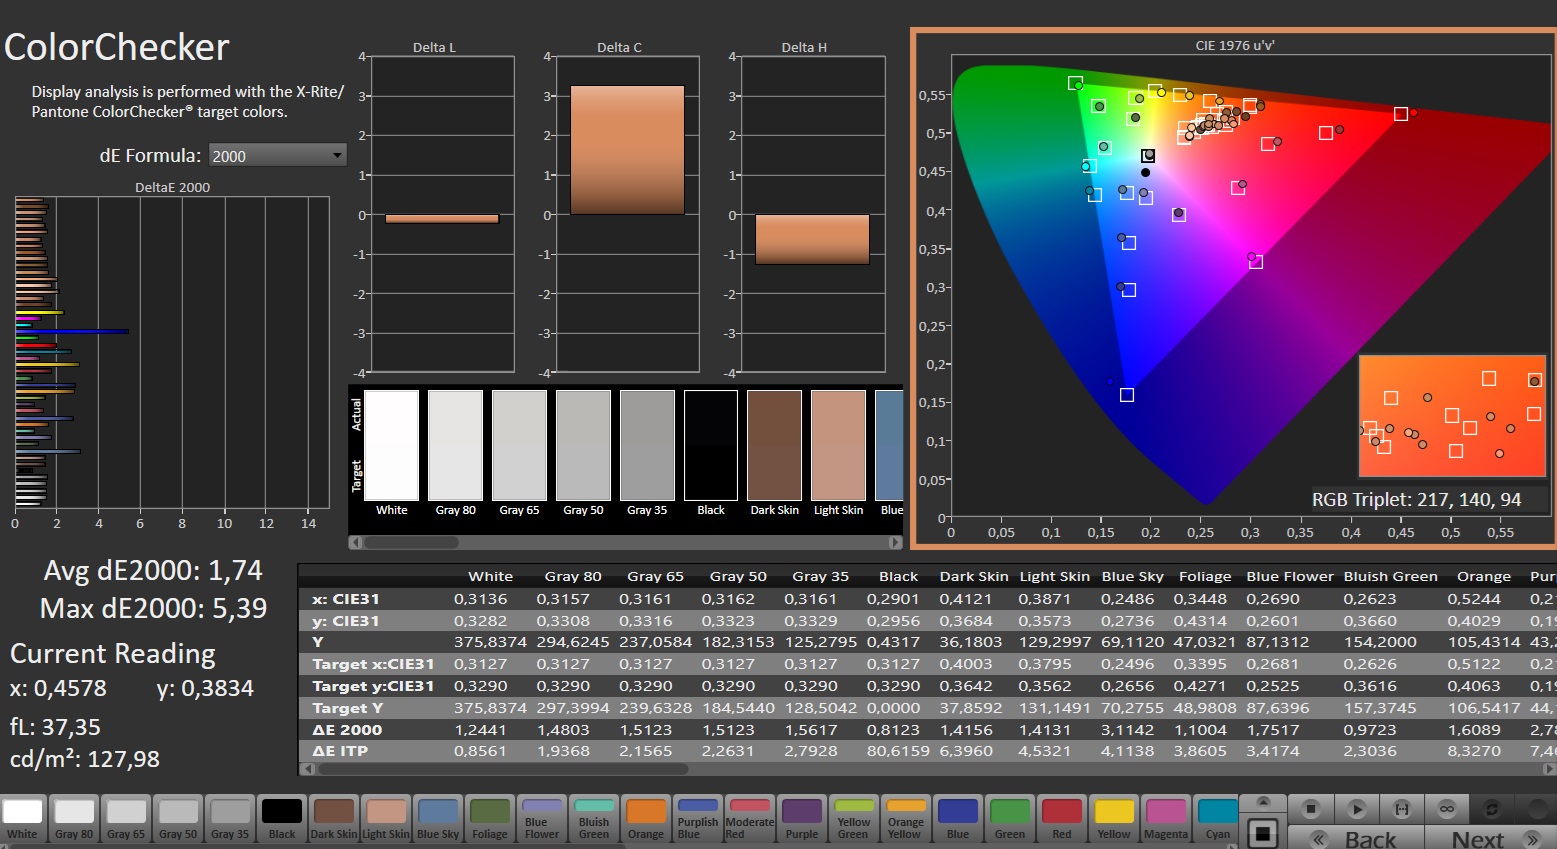
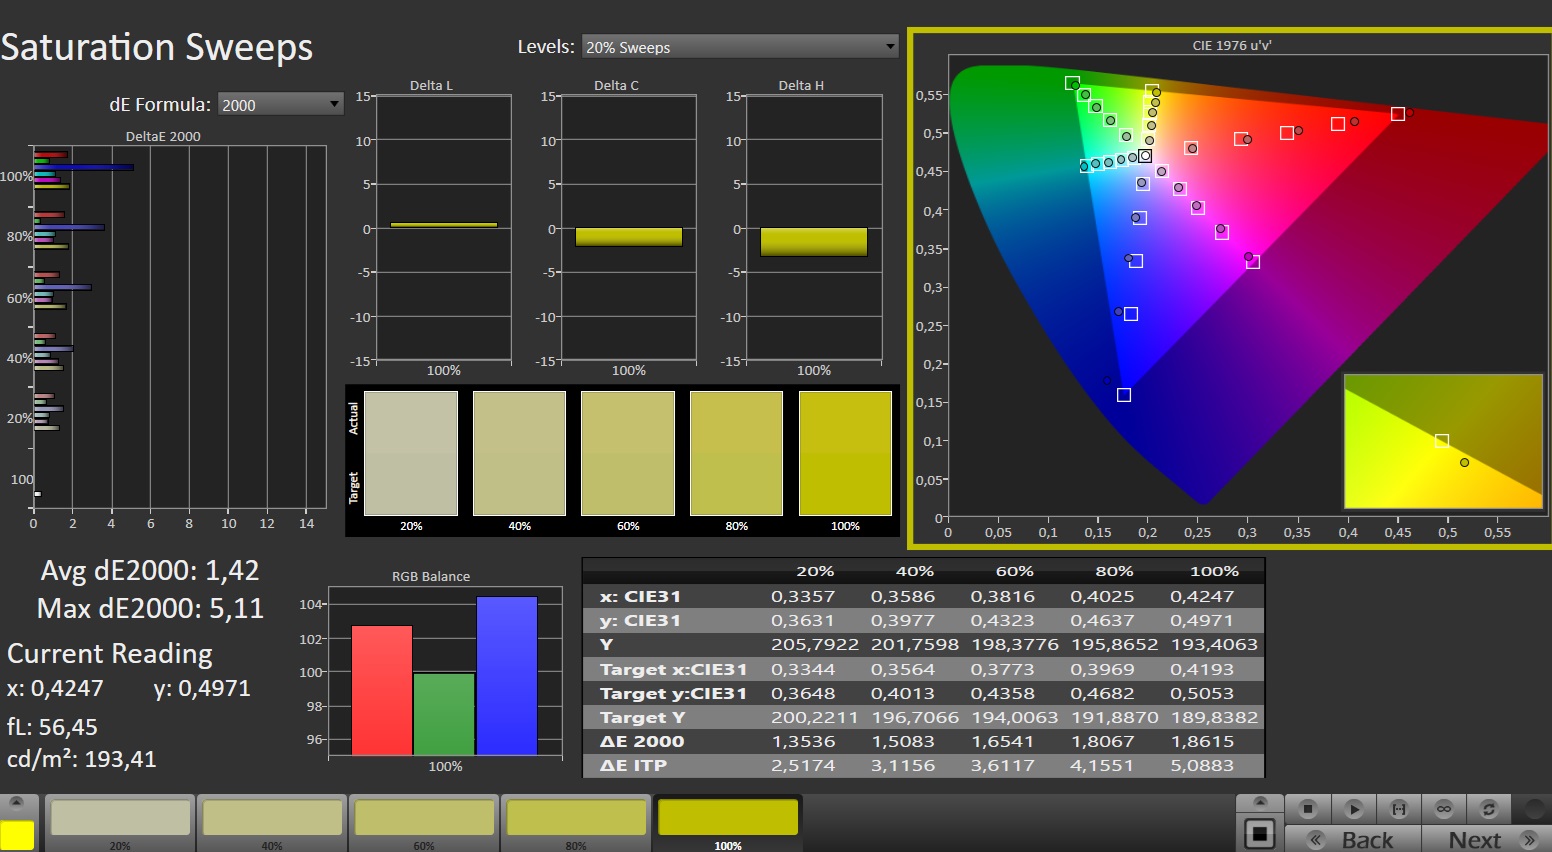
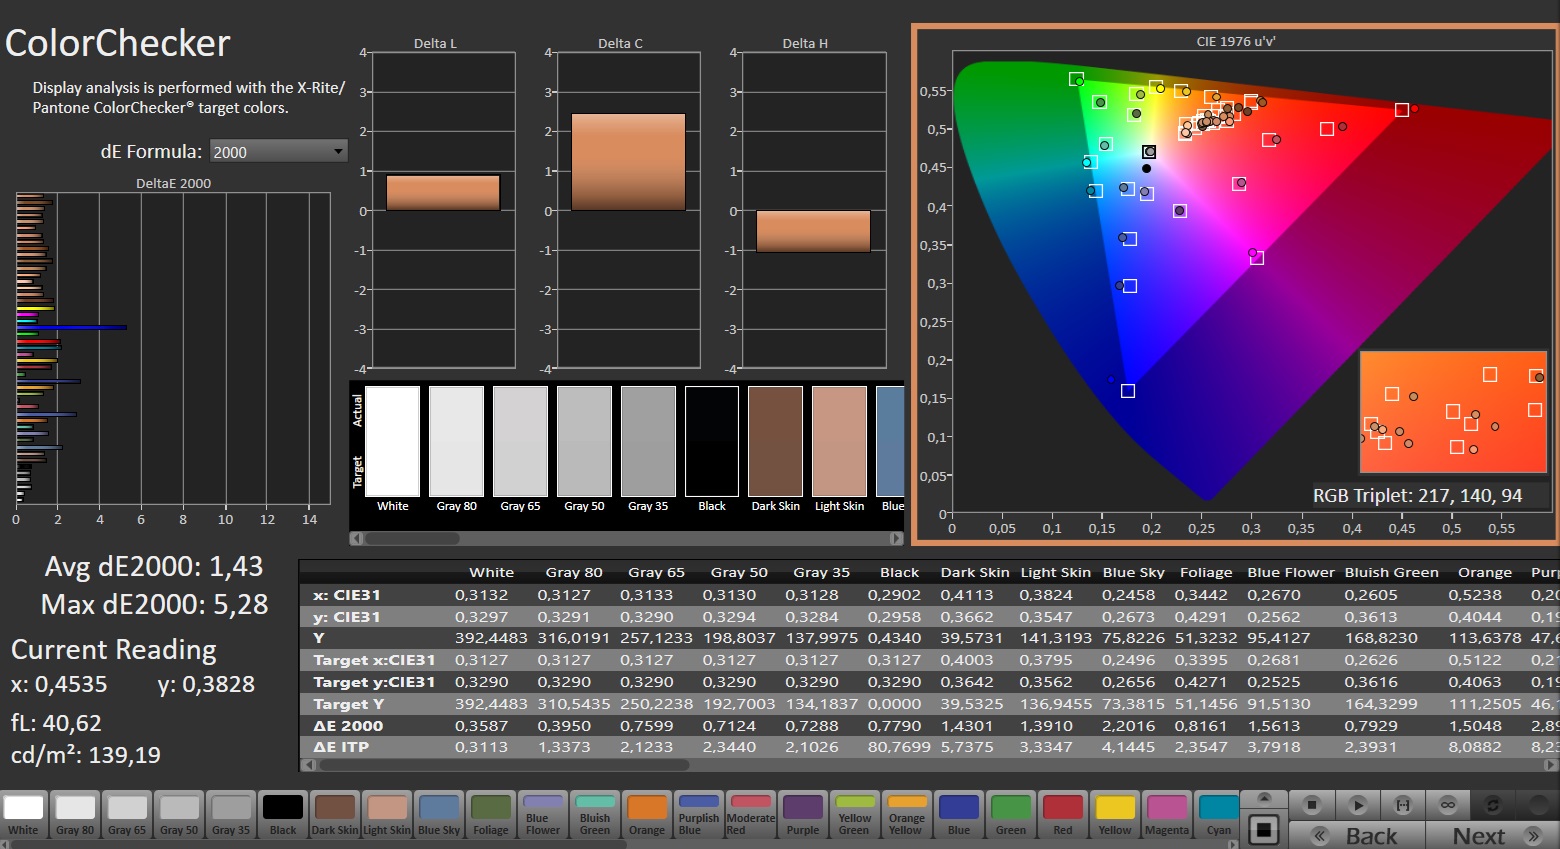
El espacio de color sRGB, recomendado para los juegos, no está cubierto por completo. Pero eso apenas debería notarse en la práctica, y las pantallas más sencillas muestran un tercio menos de colores. Sin embargo, algunos competidores como el Alienware m16 R2 son capaces de alcanzar un 100% completo con la misma tecnología de panel. Si desea realizar procesamiento de imagen y vídeo aparte, una pantalla de este tipo sería la mejor opción.
Tiempos de respuesta del display
| ↔ Tiempo de respuesta de Negro a Blanco | ||
|---|---|---|
| 8.3 ms ... subida ↗ y bajada ↘ combinada | ↗ 3.5 ms subida | 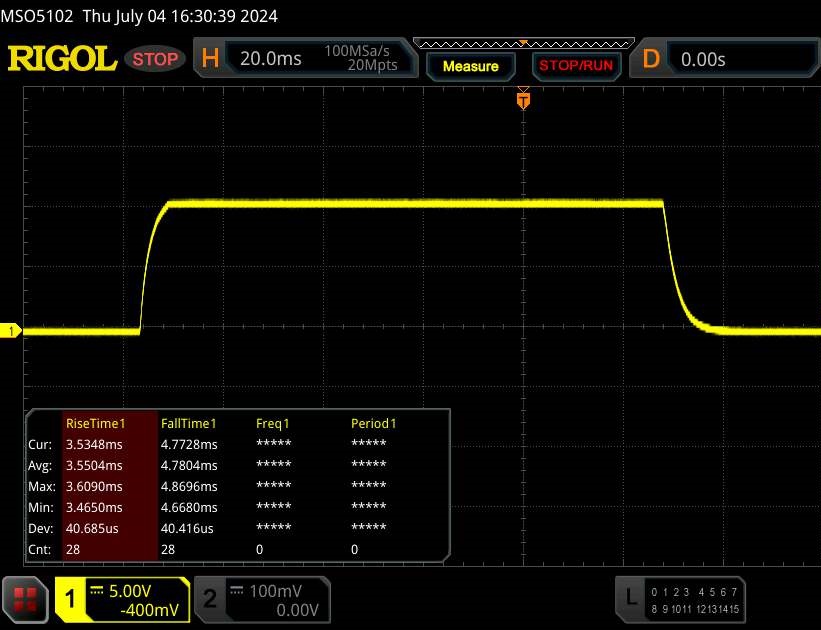 |
| ↘ 4.8 ms bajada | ||
| La pantalla mostró tiempos de respuesta rápidos en nuestros tests y debería ser adecuada para juegos. En comparación, todos los dispositivos de prueba van de ##min### (mínimo) a 240 (máximo) ms. » 21 % de todos los dispositivos son mejores. Esto quiere decir que el tiempo de respuesta medido es mejor que la media (20.7 ms) de todos los dispositivos testados. | ||
| ↔ Tiempo de respuesta 50% Gris a 80% Gris | ||
| 14.4 ms ... subida ↗ y bajada ↘ combinada | ↗ 6.8 ms subida | 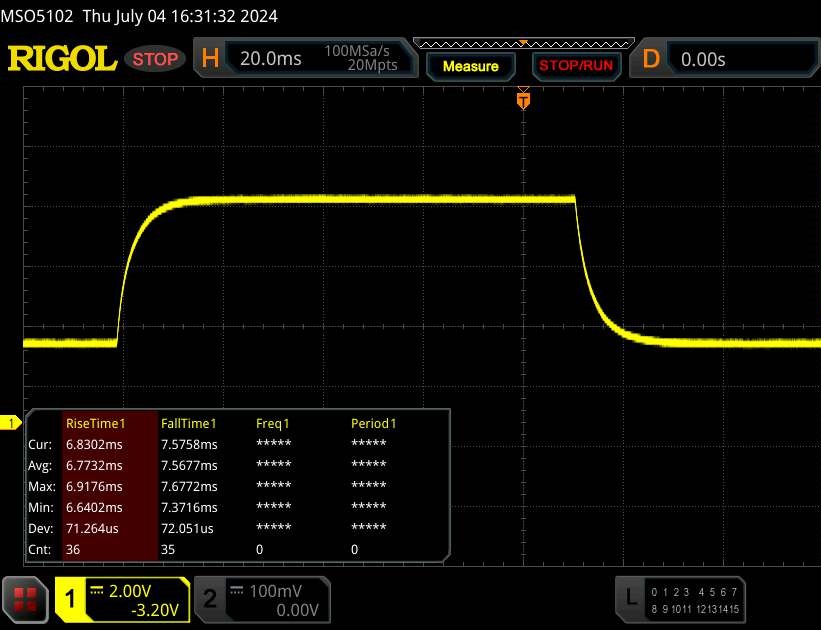 |
| ↘ 7.6 ms bajada | ||
| La pantalla mostró buenos tiempos de respuesta en nuestros tests pero podría ser demasiado lenta para los jugones competitivos. En comparación, todos los dispositivos de prueba van de ##min### (mínimo) a 636 (máximo) ms. » 26 % de todos los dispositivos son mejores. Esto quiere decir que el tiempo de respuesta medido es mejor que la media (32.5 ms) de todos los dispositivos testados. | ||
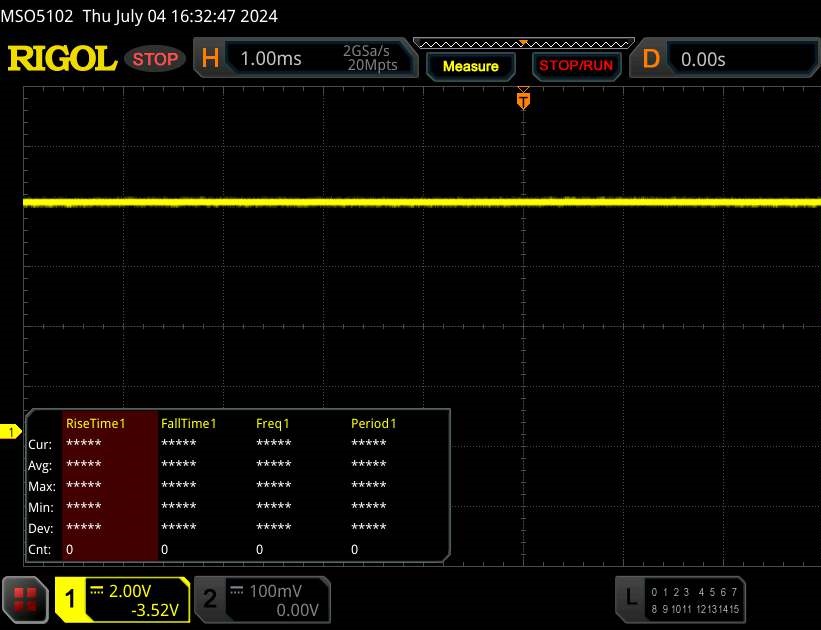
Parpadeo de Pantalla / PWM (Pulse-Width Modulation)
| Parpadeo de Pantalla / PWM no detectado | 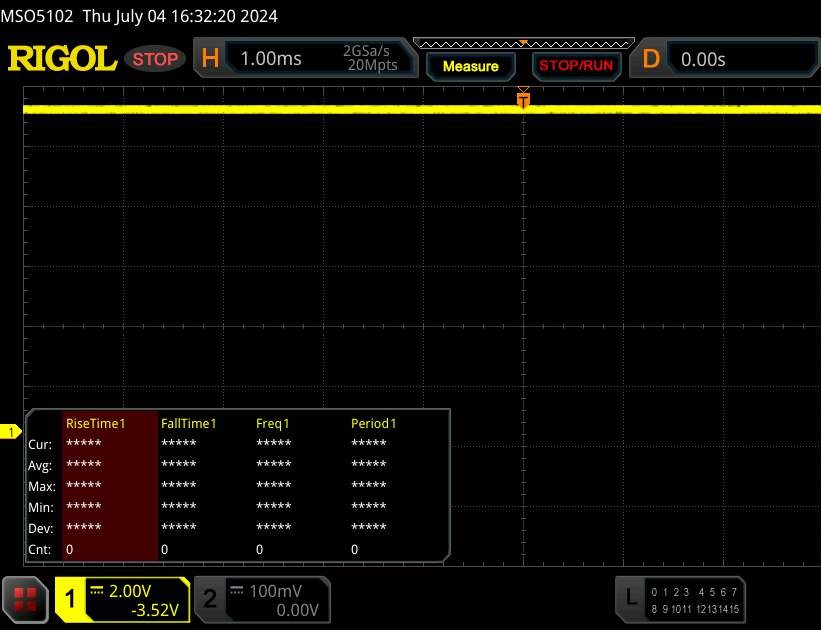 | ||
Comparación: 53 % de todos los dispositivos testados no usaron PWM para atenuar el display. Si se usó, medimos una media de 8492 (mínimo: 5 - máxmo: 343500) Hz. | |||
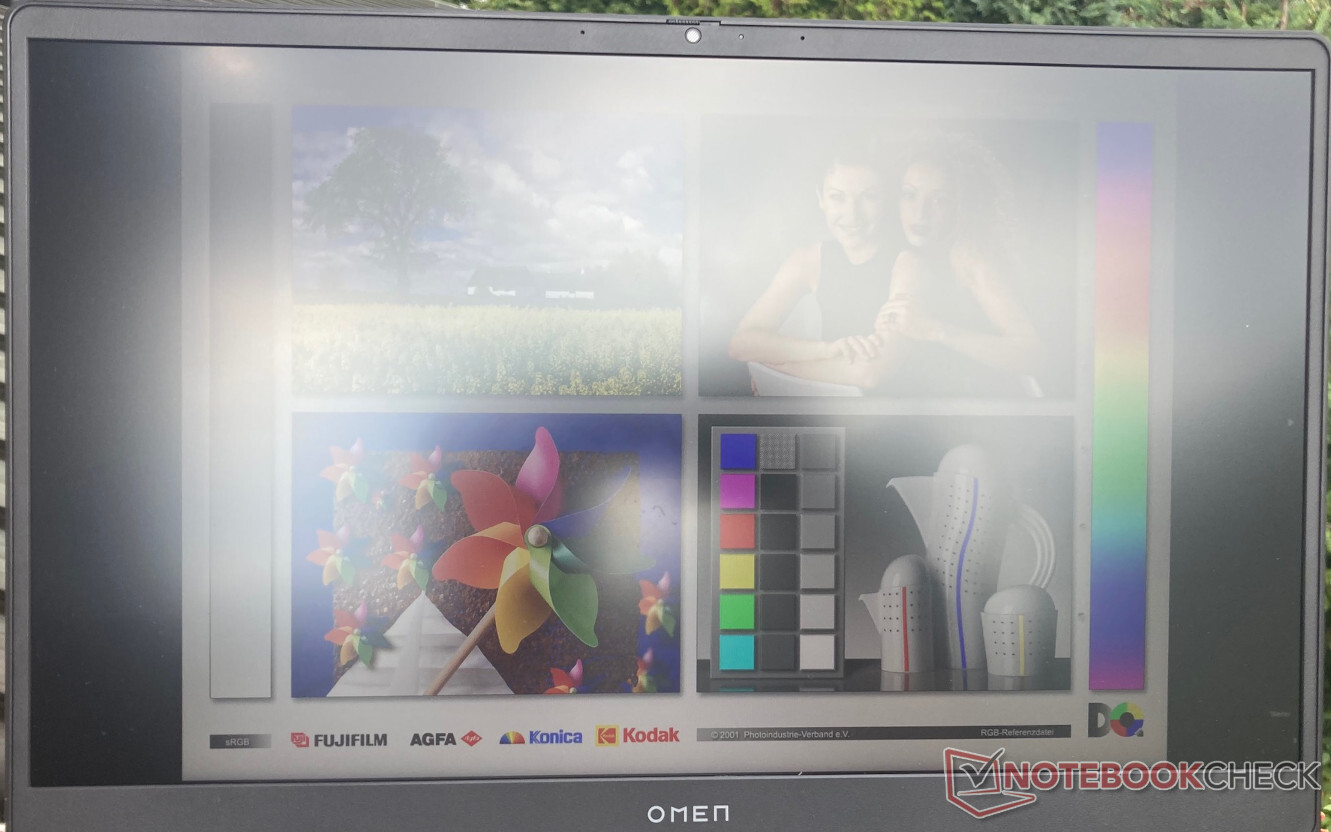
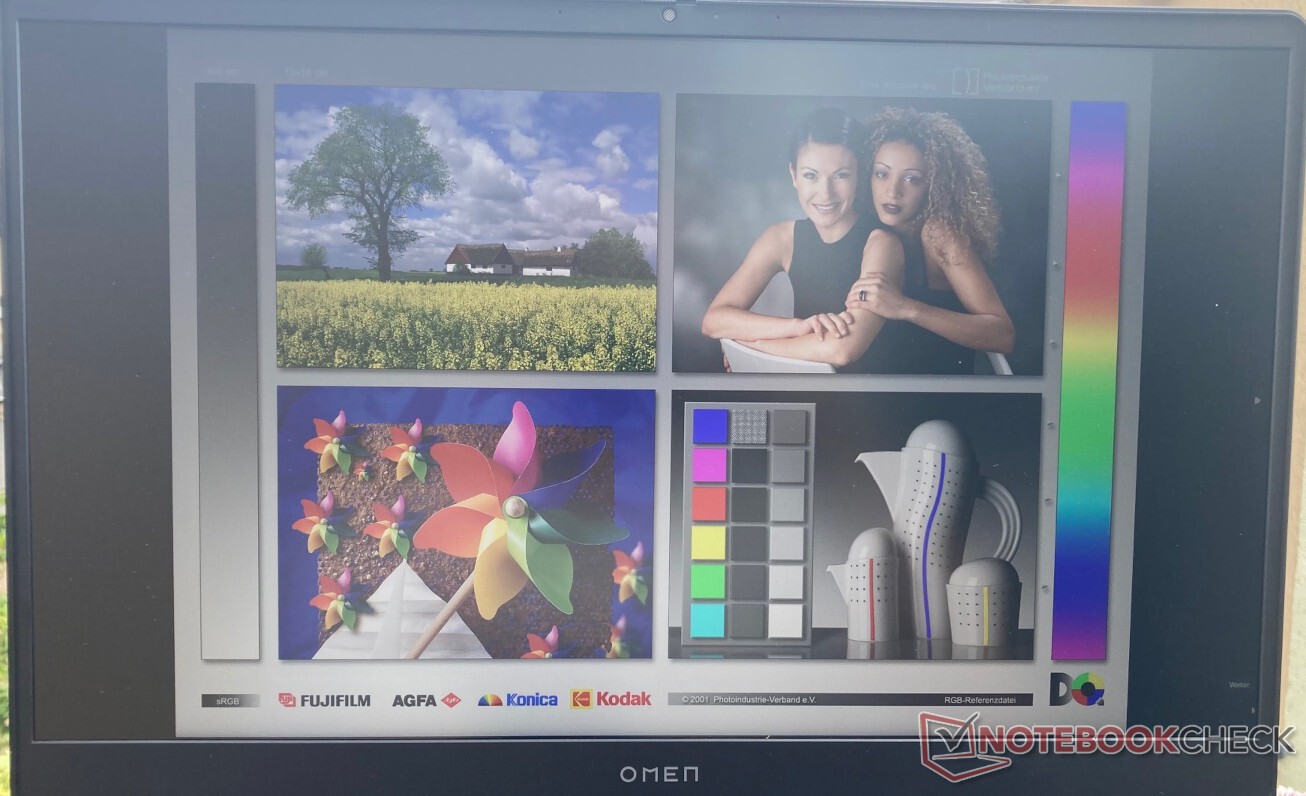
En exteriores, definitivamente deberá sentarse a la sombra si aún quiere reconocer algo en la pantalla. El brillo limitado del Omen 17 significa que incluso la luminosidad de un cielo ligeramente nublado puede limitar su capacidad de ver algo en la pantalla.
Pero la imagen se ve pálida incluso así. Los colores no tienen viveza en exteriores y están cubiertos por un velo gris. Si quiere disfrutar del juego en un esplendor colorista, tendrá que jugar en interiores.
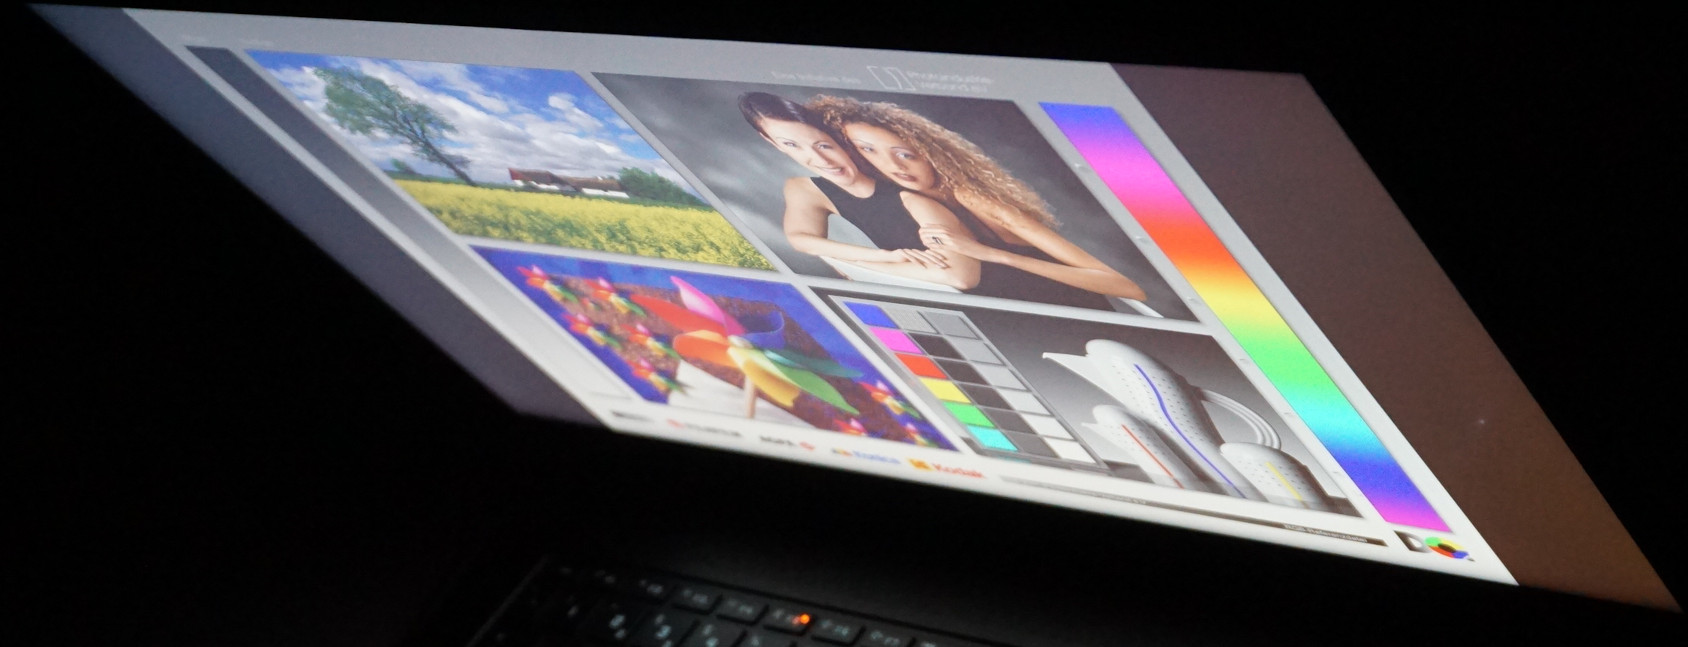
En contraste con lo que solemos ver en un panel IPS, el HP Omen con resolución QHD muestra algunos cambios de color claramente perceptibles a partir de ángulos de visión de unos 45 grados. Hasta entonces, la imagen sigue siendo fácilmente reconocible, y tampoco notamos ninguna disminución del brillo antes de ese punto. Más allá de los 45 grados todos los colores muestran un ligero tinte amarillo.


Rendimiento - El Omen 17 es un portátil para juegos equilibrado
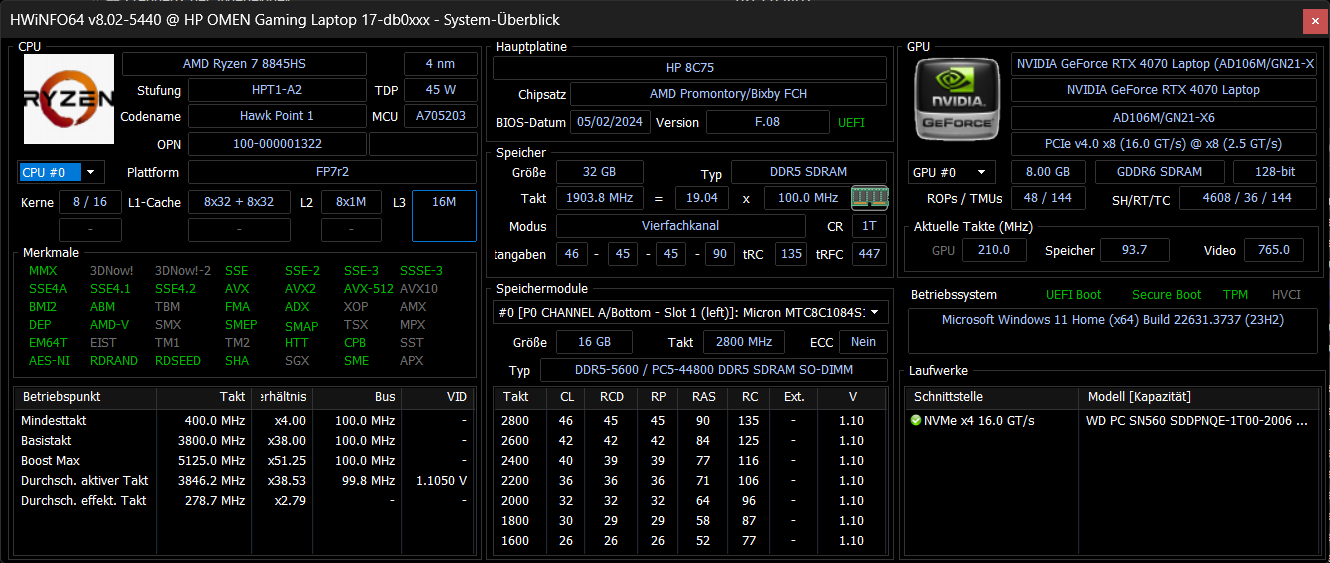
En términos de capacidad de rendimiento, nuestra unidad de prueba con el AMD Ryzen 7 8845HS y Nvidia GeForce RTX 4070 se sitúa en el medio del campo de nuestros dispositivos de comparación. Sin embargo, tanto la CPU como la GPU rinden ligeramente por debajo de su máximo potencial.
El Ryzen 7 funciona constantemente a 65 vatios en lugar de 70 o incluso 80 vatios como en el Schenker XMG Core 15por ejemplo. La GPU también está ligeramente estrangulada y sólo es capaz de utilizar 120 en lugar del máximo posible de 140 vatios. Portátiles para juegos comparables como el Asus TUF Gaming A17 FA707 son capaces de obtener un rendimiento ligeramente superior de la tarjeta gráfica, aunque eso no sólo tiene ventajas y no conduce necesariamente a framerates notablemente superiores.
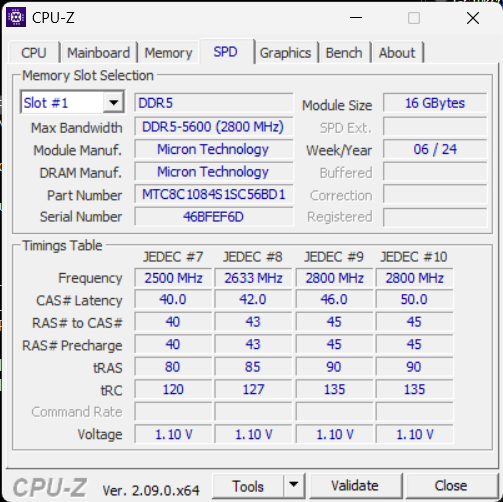
Con 32 Gigabytes de DDR5-5600, el equipo RAM también es sólido. Dado que la memoria se puede sustituir fácilmente, también es posible ampliarla más adelante. A este nivel, no esperamos un efecto limitador del hecho de que sólo sea de 5.600 MHz.
También está disponible una versión más pequeña del HP Omen 17 con la RTX 4060.
Condiciones de la prueba
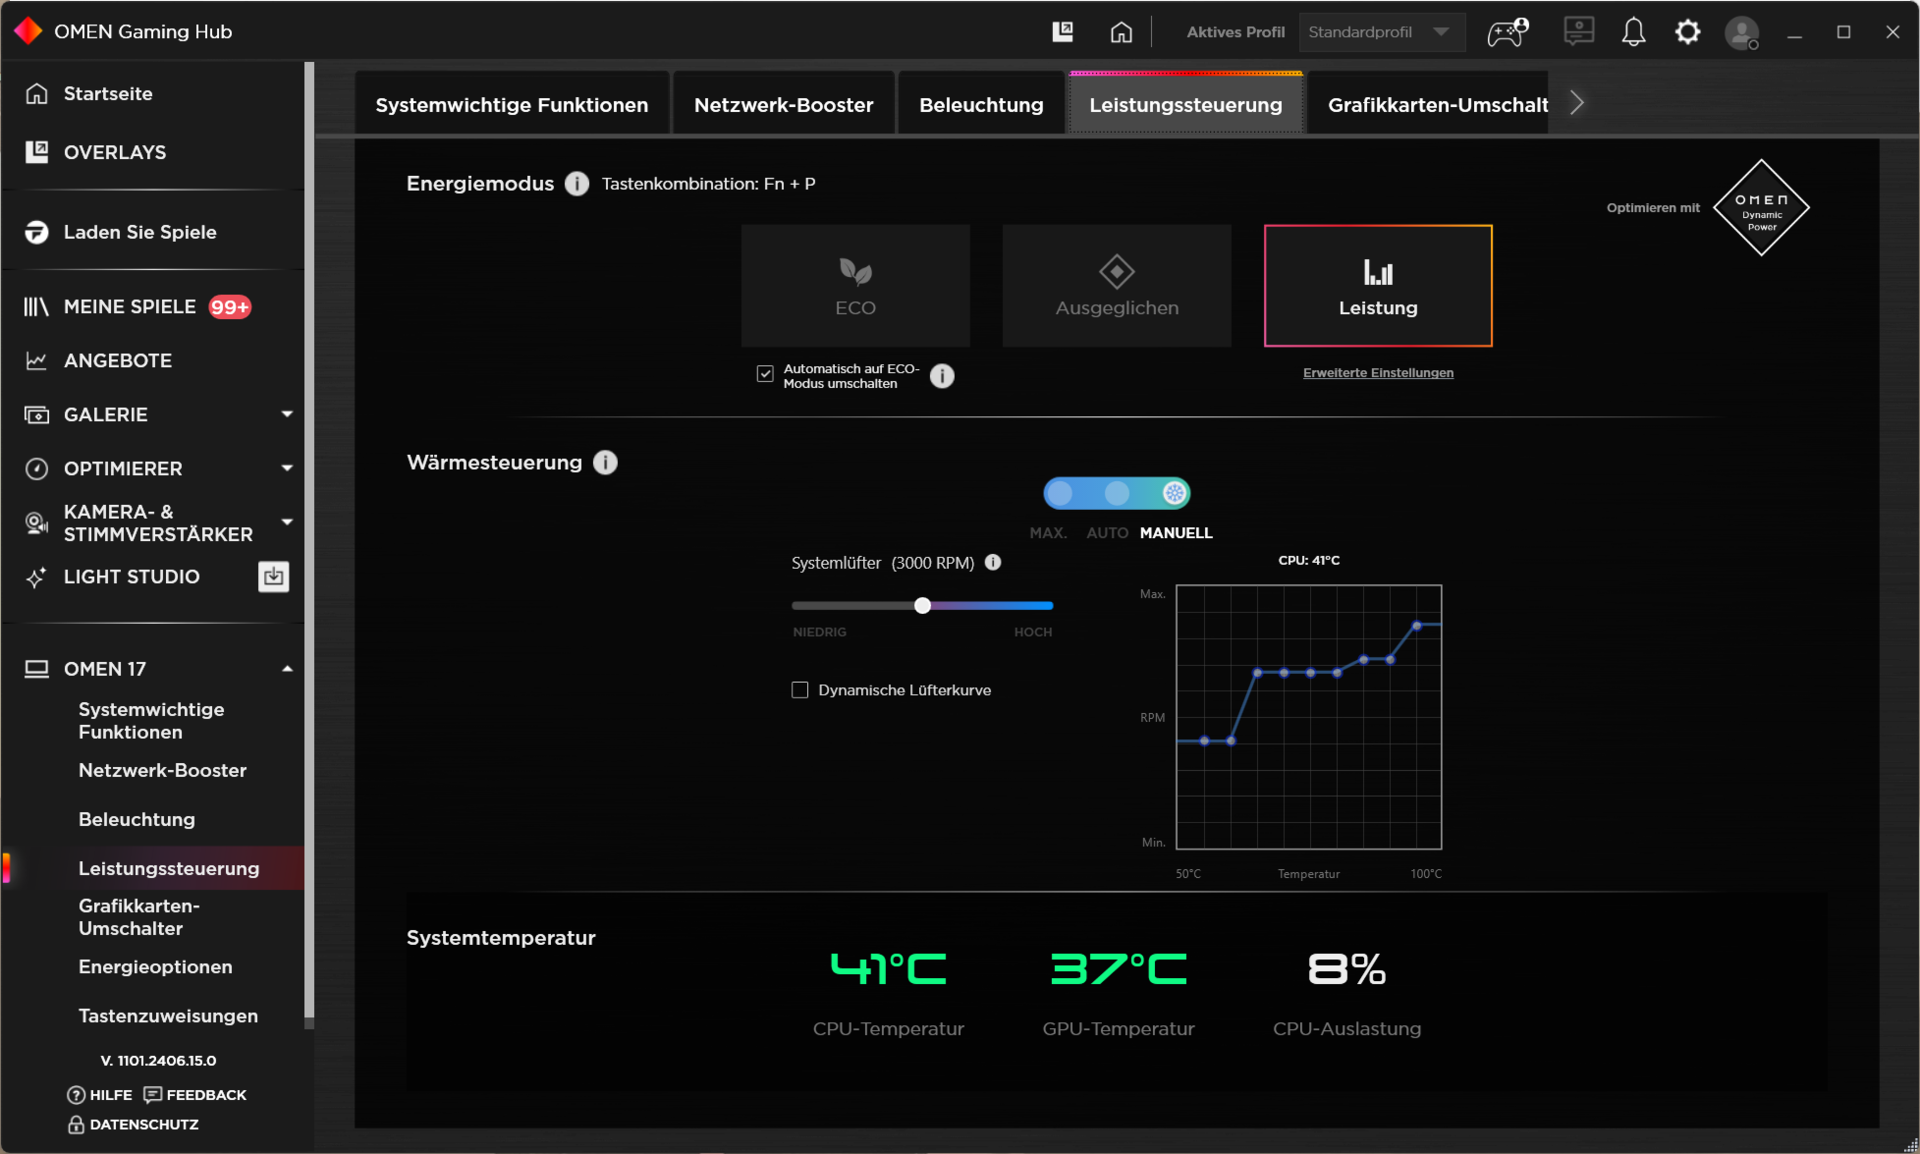
Tres perfiles de potencia le permiten ajustar el Omen 17 a la mayoría de los escenarios típicos. Puede averiguar el efecto exacto sobre el consumo de energía, el comportamiento del ventilador y el rendimiento en juegos en la siguiente tabla.
Utilizamos el perfil "Rendimiento" para nuestros puntos de referencia. Además, puede realizar numerosos ajustes que tienen una gran influencia en el comportamiento del ventilador. Por ejemplo, los niveles del ventilador pueden ajustarse para que sean más potentes, o podrían reducirse significativamente incluso en el nivel de rendimiento más alto, lo que tendría un efecto sobre el rendimiento máximo.
| Perfil de potencia | Carga de la CPU | Carga de la GPU (incluido el refuerzo de 15 vatios) | Steel Nomad | Cyberpunk 2077 QHD Ultra | Ruido máximo del ventilador |
|---|---|---|---|---|---|
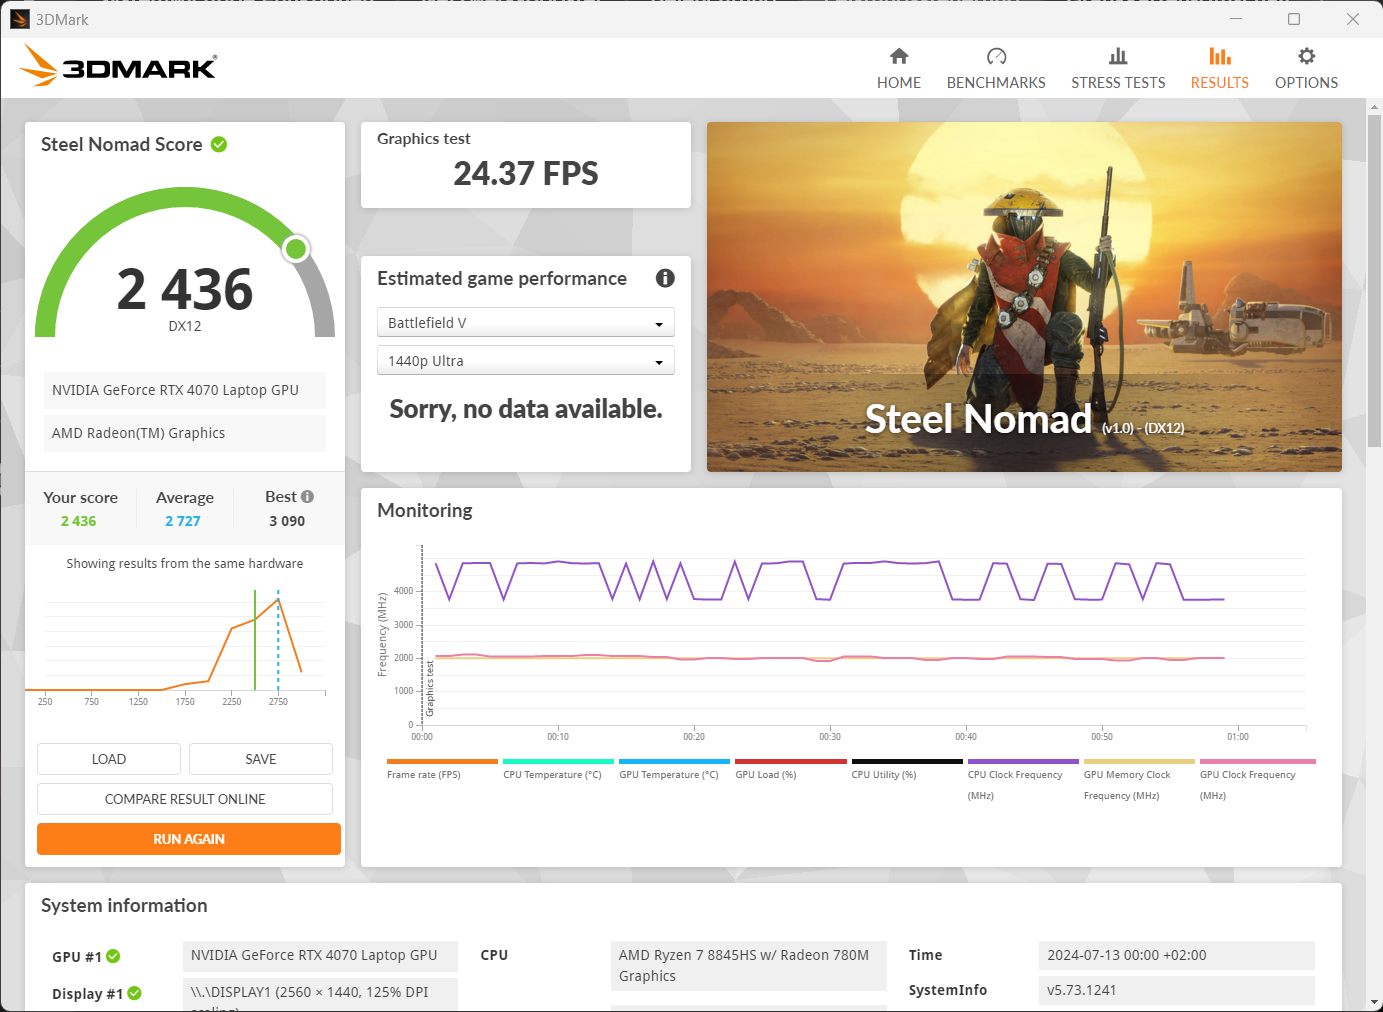
| Eco | 65->35 vatios | 40 vatios | 24,37 FPS | 60 FPS (bloqueo) | 41 dB(A) |
| Equilibrado | 65->35 vatios | 90 vatios | 25,23 FPS | 75 FPS | 43 dB(A) |
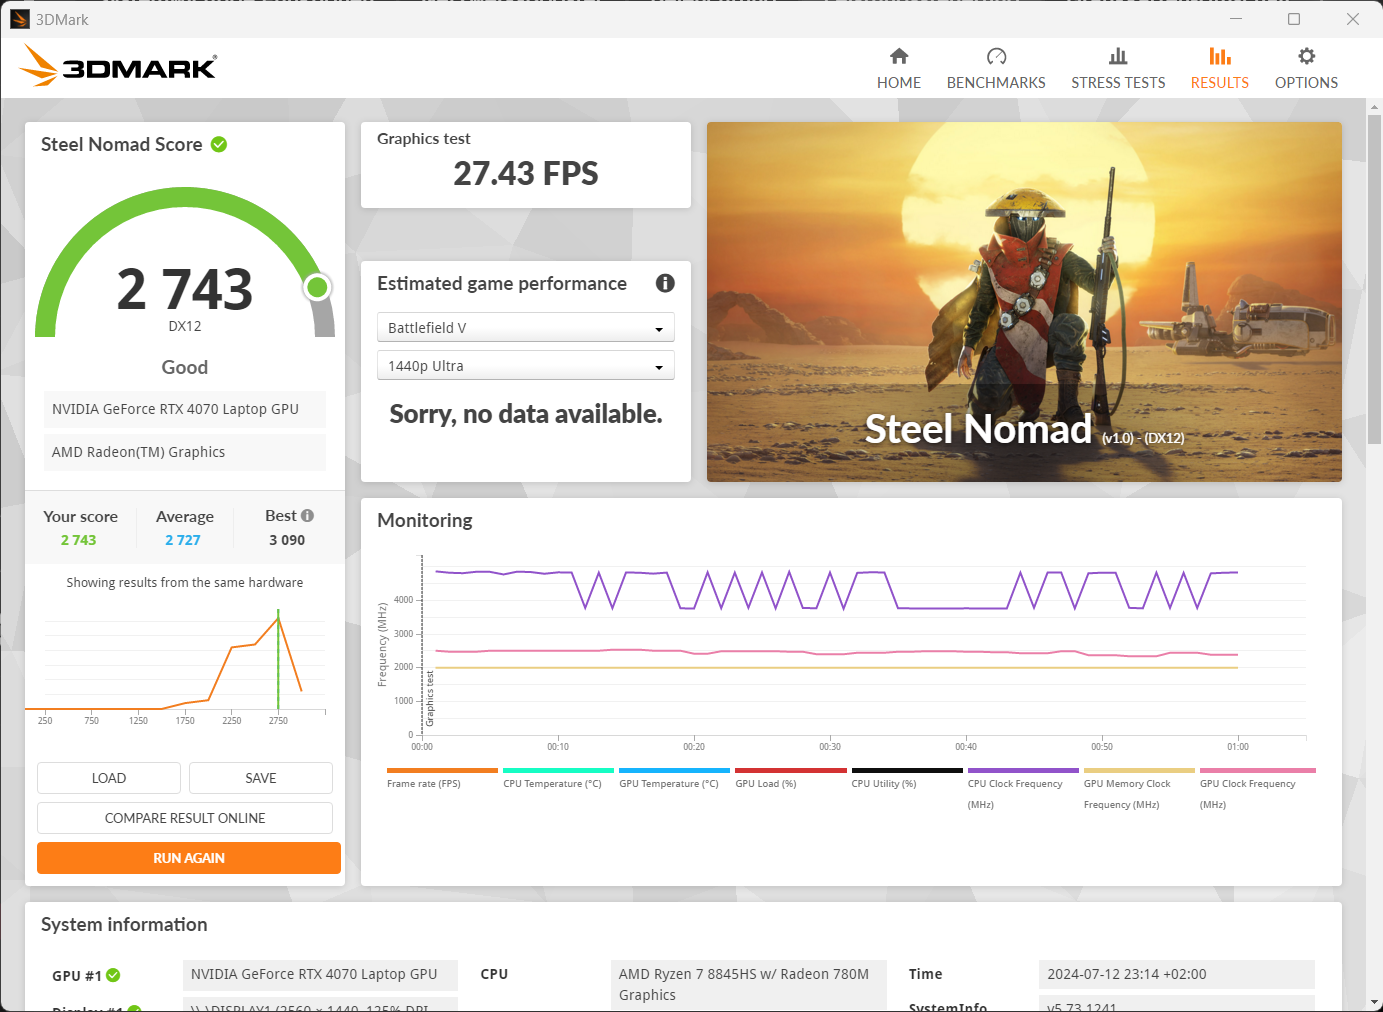
| Rendimiento | 100->65 vatios | 120 vatios | 27,43 FPS | 80 FPS | 48 dB(A) |
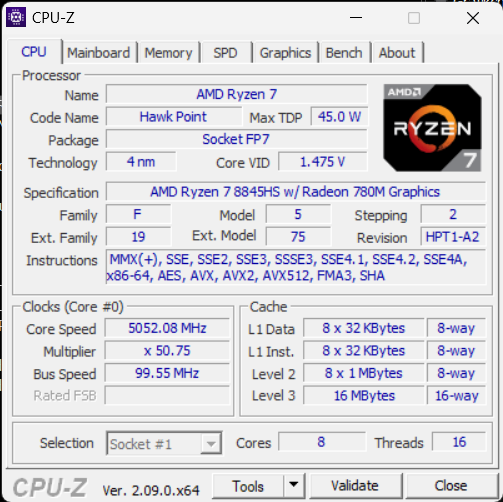
Procesador
El AMD Ryzen 7 8845HS es un procesador rápido de la serie Hawk Point que utiliza la arquitectura Zen 4 y casi alcanza el rendimiento del AMD Ryzen 9 7940HS de la generación anterior. También rinde casi a la altura del Intel Core i7-13700H.
Sin embargo, los ocho núcleos idénticos del Ryzen 7 son capaces en repetidas ocasiones de obtener una pequeña ventaja frente a los seis núcleos de rendimiento del i7-13700H, especialmente durante los juegos.
Mientras que casi siempre podemos observar una ligera caída en el rendimiento constante con los competidores, la CPU es capaz de rendir constantemente a un buen nivel aquí.
Puede encontrar mediciones adicionales y resultados de pruebas de varios procesadores en nuestra Lista de pruebas de CPU.
Cinebench R15 Multi Constant Load Test
Cinebench R23: Multi Core | Single Core
Cinebench R20: CPU (Multi Core) | CPU (Single Core)
Cinebench R15: CPU Multi 64Bit | CPU Single 64Bit
Blender: v2.79 BMW27 CPU
7-Zip 18.03: 7z b 4 | 7z b 4 -mmt1
Geekbench 6.4: Multi-Core | Single-Core
Geekbench 5.5: Multi-Core | Single-Core
HWBOT x265 Benchmark v2.2: 4k Preset
LibreOffice : 20 Documents To PDF
R Benchmark 2.5: Overall mean
| CPU Performance Rating | |
| Asus ROG Strix Scar 16 G634JZR | |
| Acer Predator Helios Neo 16 (2024) | |
| Media de la clase Gaming | |
| Asus TUF Gaming A17 FA707XI-NS94 | |
| Asus TUF Gaming A15 FA507UV | |
| Alienware m16 R2 -1! | |
| Medio AMD Ryzen 7 8845HS | |
| Tulpar T7 V20.6 | |
| HP Omen 17-db0079ng | |
| Cinebench R23 / Multi Core | |
| Asus ROG Strix Scar 16 G634JZR | |
| Acer Predator Helios Neo 16 (2024) | |
| Media de la clase Gaming (5668 - 39652, n=154, últimos 2 años) | |
| Alienware m16 R2 | |
| Tulpar T7 V20.6 | |
| Asus TUF Gaming A17 FA707XI-NS94 | |
| Asus TUF Gaming A15 FA507UV | |
| HP Omen 17-db0079ng | |
| Medio AMD Ryzen 7 8845HS (14895 - 18037, n=13) | |
| Cinebench R23 / Single Core | |
| Asus ROG Strix Scar 16 G634JZR | |
| Acer Predator Helios Neo 16 (2024) | |
| Tulpar T7 V20.6 | |
| Media de la clase Gaming (1136 - 2252, n=154, últimos 2 años) | |
| Asus TUF Gaming A17 FA707XI-NS94 | |
| Asus TUF Gaming A15 FA507UV | |
| Medio AMD Ryzen 7 8845HS (1623 - 1783, n=13) | |
| Alienware m16 R2 | |
| HP Omen 17-db0079ng | |
| Cinebench R20 / CPU (Multi Core) | |
| Asus ROG Strix Scar 16 G634JZR | |
| Acer Predator Helios Neo 16 (2024) | |
| Media de la clase Gaming (2179 - 15517, n=154, últimos 2 años) | |
| Alienware m16 R2 | |
| Tulpar T7 V20.6 | |
| Asus TUF Gaming A17 FA707XI-NS94 | |
| Asus TUF Gaming A15 FA507UV | |
| HP Omen 17-db0079ng | |
| Medio AMD Ryzen 7 8845HS (5808 - 7026, n=13) | |
| Cinebench R20 / CPU (Single Core) | |
| Asus ROG Strix Scar 16 G634JZR | |
| Acer Predator Helios Neo 16 (2024) | |
| Tulpar T7 V20.6 | |
| Media de la clase Gaming (439 - 866, n=154, últimos 2 años) | |
| Asus TUF Gaming A17 FA707XI-NS94 | |
| Medio AMD Ryzen 7 8845HS (673 - 698, n=13) | |
| HP Omen 17-db0079ng | |
| Alienware m16 R2 | |
| Asus TUF Gaming A15 FA507UV | |
| Cinebench R15 / CPU Multi 64Bit | |
| Asus ROG Strix Scar 16 G634JZR | |
| Acer Predator Helios Neo 16 (2024) | |
| Media de la clase Gaming (905 - 6074, n=157, últimos 2 años) | |
| Alienware m16 R2 | |
| Asus TUF Gaming A17 FA707XI-NS94 | |
| Asus TUF Gaming A15 FA507UV | |
| Tulpar T7 V20.6 | |
| HP Omen 17-db0079ng | |
| Medio AMD Ryzen 7 8845HS (2342 - 2908, n=13) | |
| Cinebench R15 / CPU Single 64Bit | |
| Asus ROG Strix Scar 16 G634JZR | |
| Acer Predator Helios Neo 16 (2024) | |
| Asus TUF Gaming A17 FA707XI-NS94 | |
| Asus TUF Gaming A15 FA507UV | |
| Media de la clase Gaming (191.9 - 343, n=154, últimos 2 años) | |
| Tulpar T7 V20.6 | |
| Medio AMD Ryzen 7 8845HS (269 - 283, n=13) | |
| HP Omen 17-db0079ng | |
| Alienware m16 R2 | |
| Blender / v2.79 BMW27 CPU | |
| Medio AMD Ryzen 7 8845HS (179 - 216, n=13) | |
| HP Omen 17-db0079ng | |
| Asus TUF Gaming A17 FA707XI-NS94 | |
| Asus TUF Gaming A15 FA507UV | |
| Media de la clase Gaming (81 - 555, n=147, últimos 2 años) | |
| Tulpar T7 V20.6 | |
| Acer Predator Helios Neo 16 (2024) | |
| Asus ROG Strix Scar 16 G634JZR | |
| 7-Zip 18.03 / 7z b 4 | |
| Asus ROG Strix Scar 16 G634JZR | |
| Acer Predator Helios Neo 16 (2024) | |
| Media de la clase Gaming (23795 - 144064, n=152, últimos 2 años) | |
| Asus TUF Gaming A15 FA507UV | |
| Asus TUF Gaming A17 FA707XI-NS94 | |
| Medio AMD Ryzen 7 8845HS (62669 - 74664, n=13) | |
| Alienware m16 R2 | |
| HP Omen 17-db0079ng | |
| Tulpar T7 V20.6 | |
| 7-Zip 18.03 / 7z b 4 -mmt1 | |
| Asus ROG Strix Scar 16 G634JZR | |
| Acer Predator Helios Neo 16 (2024) | |
| Asus TUF Gaming A17 FA707XI-NS94 | |
| Asus TUF Gaming A15 FA507UV | |
| Medio AMD Ryzen 7 8845HS (5197 - 6714, n=13) | |
| Media de la clase Gaming (4199 - 7573, n=152, últimos 2 años) | |
| Tulpar T7 V20.6 | |
| HP Omen 17-db0079ng | |
| Alienware m16 R2 | |
| Geekbench 6.4 / Multi-Core | |
| Asus ROG Strix Scar 16 G634JZR | |
| Acer Predator Helios Neo 16 (2024) | |
| Media de la clase Gaming (5340 - 21668, n=123, últimos 2 años) | |
| Medio AMD Ryzen 7 8845HS (11073 - 14014, n=18) | |
| HP Omen 17-db0079ng | |
| Alienware m16 R2 | |
| Asus TUF Gaming A15 FA507UV | |
| Asus TUF Gaming A17 FA707XI-NS94 | |
| Tulpar T7 V20.6 | |
| Geekbench 6.4 / Single-Core | |
| Asus ROG Strix Scar 16 G634JZR | |
| Acer Predator Helios Neo 16 (2024) | |
| Asus TUF Gaming A17 FA707XI-NS94 | |
| Asus TUF Gaming A15 FA507UV | |
| Media de la clase Gaming (1490 - 3219, n=123, últimos 2 años) | |
| Medio AMD Ryzen 7 8845HS (2510 - 2698, n=16) | |
| Tulpar T7 V20.6 | |
| HP Omen 17-db0079ng | |
| Alienware m16 R2 | |
| Geekbench 5.5 / Multi-Core | |
| Asus ROG Strix Scar 16 G634JZR | |
| Acer Predator Helios Neo 16 (2024) | |
| Media de la clase Gaming (4557 - 25855, n=151, últimos 2 años) | |
| Alienware m16 R2 | |
| Asus TUF Gaming A15 FA507UV | |
| Medio AMD Ryzen 7 8845HS (11256 - 12726, n=15) | |
| HP Omen 17-db0079ng | |
| Asus TUF Gaming A17 FA707XI-NS94 | |
| Tulpar T7 V20.6 | |
| Geekbench 5.5 / Single-Core | |
| Asus ROG Strix Scar 16 G634JZR | |
| Acer Predator Helios Neo 16 (2024) | |
| Asus TUF Gaming A17 FA707XI-NS94 | |
| Asus TUF Gaming A15 FA507UV | |
| Medio AMD Ryzen 7 8845HS (1765 - 2004, n=15) | |
| Media de la clase Gaming (986 - 2423, n=151, últimos 2 años) | |
| Tulpar T7 V20.6 | |
| HP Omen 17-db0079ng | |
| Alienware m16 R2 | |
| HWBOT x265 Benchmark v2.2 / 4k Preset | |
| Asus ROG Strix Scar 16 G634JZR | |
| Acer Predator Helios Neo 16 (2024) | |
| Media de la clase Gaming (6.72 - 42.9, n=151, últimos 2 años) | |
| Asus TUF Gaming A15 FA507UV | |
| Asus TUF Gaming A17 FA707XI-NS94 | |
| Alienware m16 R2 | |
| Medio AMD Ryzen 7 8845HS (18.6 - 22.7, n=13) | |
| HP Omen 17-db0079ng | |
| Tulpar T7 V20.6 | |
| LibreOffice / 20 Documents To PDF | |
| HP Omen 17-db0079ng | |
| Tulpar T7 V20.6 | |
| Medio AMD Ryzen 7 8845HS (44.4 - 77, n=13) | |
| Alienware m16 R2 | |
| Asus TUF Gaming A17 FA707XI-NS94 | |
| Asus ROG Strix Scar 16 G634JZR | |
| Media de la clase Gaming (19 - 96.6, n=150, últimos 2 años) | |
| Asus TUF Gaming A15 FA507UV | |
| Acer Predator Helios Neo 16 (2024) | |
| R Benchmark 2.5 / Overall mean | |
| HP Omen 17-db0079ng | |
| Alienware m16 R2 | |
| Medio AMD Ryzen 7 8845HS (0.4304 - 0.4935, n=13) | |
| Tulpar T7 V20.6 | |
| Media de la clase Gaming (0.3609 - 0.759, n=153, últimos 2 años) | |
| Asus TUF Gaming A15 FA507UV | |
| Asus TUF Gaming A17 FA707XI-NS94 | |
| Acer Predator Helios Neo 16 (2024) | |
| Asus ROG Strix Scar 16 G634JZR | |
* ... más pequeño es mejor
AIDA64: FP32 Ray-Trace | FPU Julia | CPU SHA3 | CPU Queen | FPU SinJulia | FPU Mandel | CPU AES | CPU ZLib | FP64 Ray-Trace | CPU PhotoWorxx
| Performance Rating | |
| Asus ROG Strix Scar 16 G634JZR | |
| Asus TUF Gaming A15 FA507UV | |
| Asus TUF Gaming A17 FA707XI-NS94 | |
| Acer Predator Helios Neo 16 (2024) | |
| HP Omen 17-db0079ng | |
| Medio AMD Ryzen 7 8845HS | |
| Media de la clase Gaming | |
| Alienware m16 R2 | |
| Tulpar T7 V20.6 | |
| AIDA64 / FP32 Ray-Trace | |
| Asus TUF Gaming A17 FA707XI-NS94 | |
| Asus TUF Gaming A15 FA507UV | |
| HP Omen 17-db0079ng | |
| Asus ROG Strix Scar 16 G634JZR | |
| Medio AMD Ryzen 7 8845HS (23708 - 29544, n=13) | |
| Media de la clase Gaming (4986 - 81639, n=150, últimos 2 años) | |
| Acer Predator Helios Neo 16 (2024) | |
| Alienware m16 R2 | |
| Tulpar T7 V20.6 | |
| AIDA64 / FPU Julia | |
| Asus ROG Strix Scar 16 G634JZR | |
| Asus TUF Gaming A17 FA707XI-NS94 | |
| Asus TUF Gaming A15 FA507UV | |
| HP Omen 17-db0079ng | |
| Medio AMD Ryzen 7 8845HS (99659 - 125873, n=13) | |
| Media de la clase Gaming (25360 - 252486, n=150, últimos 2 años) | |
| Acer Predator Helios Neo 16 (2024) | |
| Alienware m16 R2 | |
| Tulpar T7 V20.6 | |
| AIDA64 / CPU SHA3 | |
| Asus ROG Strix Scar 16 G634JZR | |
| Asus TUF Gaming A17 FA707XI-NS94 | |
| Asus TUF Gaming A15 FA507UV | |
| Acer Predator Helios Neo 16 (2024) | |
| Media de la clase Gaming (1339 - 10389, n=150, últimos 2 años) | |
| HP Omen 17-db0079ng | |
| Medio AMD Ryzen 7 8845HS (4332 - 5180, n=13) | |
| Alienware m16 R2 | |
| Tulpar T7 V20.6 | |
| AIDA64 / CPU Queen | |
| Acer Predator Helios Neo 16 (2024) | |
| Asus ROG Strix Scar 16 G634JZR | |
| Asus TUF Gaming A15 FA507UV | |
| Asus TUF Gaming A17 FA707XI-NS94 | |
| Medio AMD Ryzen 7 8845HS (109458 - 124695, n=13) | |
| HP Omen 17-db0079ng | |
| Media de la clase Gaming (50699 - 200651, n=150, últimos 2 años) | |
| Tulpar T7 V20.6 | |
| Alienware m16 R2 | |
| AIDA64 / FPU SinJulia | |
| Asus ROG Strix Scar 16 G634JZR | |
| Asus TUF Gaming A15 FA507UV | |
| Asus TUF Gaming A17 FA707XI-NS94 | |
| HP Omen 17-db0079ng | |
| Medio AMD Ryzen 7 8845HS (14062 - 15519, n=13) | |
| Acer Predator Helios Neo 16 (2024) | |
| Media de la clase Gaming (4800 - 32988, n=150, últimos 2 años) | |
| Tulpar T7 V20.6 | |
| Alienware m16 R2 | |
| AIDA64 / FPU Mandel | |
| Asus TUF Gaming A17 FA707XI-NS94 | |
| Asus TUF Gaming A15 FA507UV | |
| Asus ROG Strix Scar 16 G634JZR | |
| HP Omen 17-db0079ng | |
| Medio AMD Ryzen 7 8845HS (53436 - 67367, n=13) | |
| Media de la clase Gaming (12321 - 134044, n=150, últimos 2 años) | |
| Acer Predator Helios Neo 16 (2024) | |
| Alienware m16 R2 | |
| Tulpar T7 V20.6 | |
| AIDA64 / CPU AES | |
| Asus ROG Strix Scar 16 G634JZR | |
| Media de la clase Gaming (19065 - 328679, n=150, últimos 2 años) | |
| Acer Predator Helios Neo 16 (2024) | |
| Medio AMD Ryzen 7 8845HS (64515 - 172642, n=13) | |
| Asus TUF Gaming A17 FA707XI-NS94 | |
| Asus TUF Gaming A15 FA507UV | |
| HP Omen 17-db0079ng | |
| Alienware m16 R2 | |
| Tulpar T7 V20.6 | |
| AIDA64 / CPU ZLib | |
| Asus ROG Strix Scar 16 G634JZR | |
| Acer Predator Helios Neo 16 (2024) | |
| Media de la clase Gaming (373 - 2531, n=150, últimos 2 años) | |
| Alienware m16 R2 | |
| Tulpar T7 V20.6 | |
| Asus TUF Gaming A17 FA707XI-NS94 | |
| Asus TUF Gaming A15 FA507UV | |
| HP Omen 17-db0079ng | |
| Medio AMD Ryzen 7 8845HS (627 - 1080, n=13) | |
| AIDA64 / FP64 Ray-Trace | |
| Asus TUF Gaming A17 FA707XI-NS94 | |
| Asus TUF Gaming A15 FA507UV | |
| HP Omen 17-db0079ng | |
| Asus ROG Strix Scar 16 G634JZR | |
| Medio AMD Ryzen 7 8845HS (12361 - 15911, n=13) | |
| Media de la clase Gaming (2540 - 43430, n=150, últimos 2 años) | |
| Acer Predator Helios Neo 16 (2024) | |
| Alienware m16 R2 | |
| Tulpar T7 V20.6 | |
| AIDA64 / CPU PhotoWorxx | |
| Asus ROG Strix Scar 16 G634JZR | |
| Acer Predator Helios Neo 16 (2024) | |
| HP Omen 17-db0079ng | |
| Media de la clase Gaming (10805 - 60161, n=150, últimos 2 años) | |
| Alienware m16 R2 | |
| Medio AMD Ryzen 7 8845HS (33192 - 41668, n=13) | |
| Asus TUF Gaming A15 FA507UV | |
| Asus TUF Gaming A17 FA707XI-NS94 | |
| Tulpar T7 V20.6 | |
Rendimiento del sistema
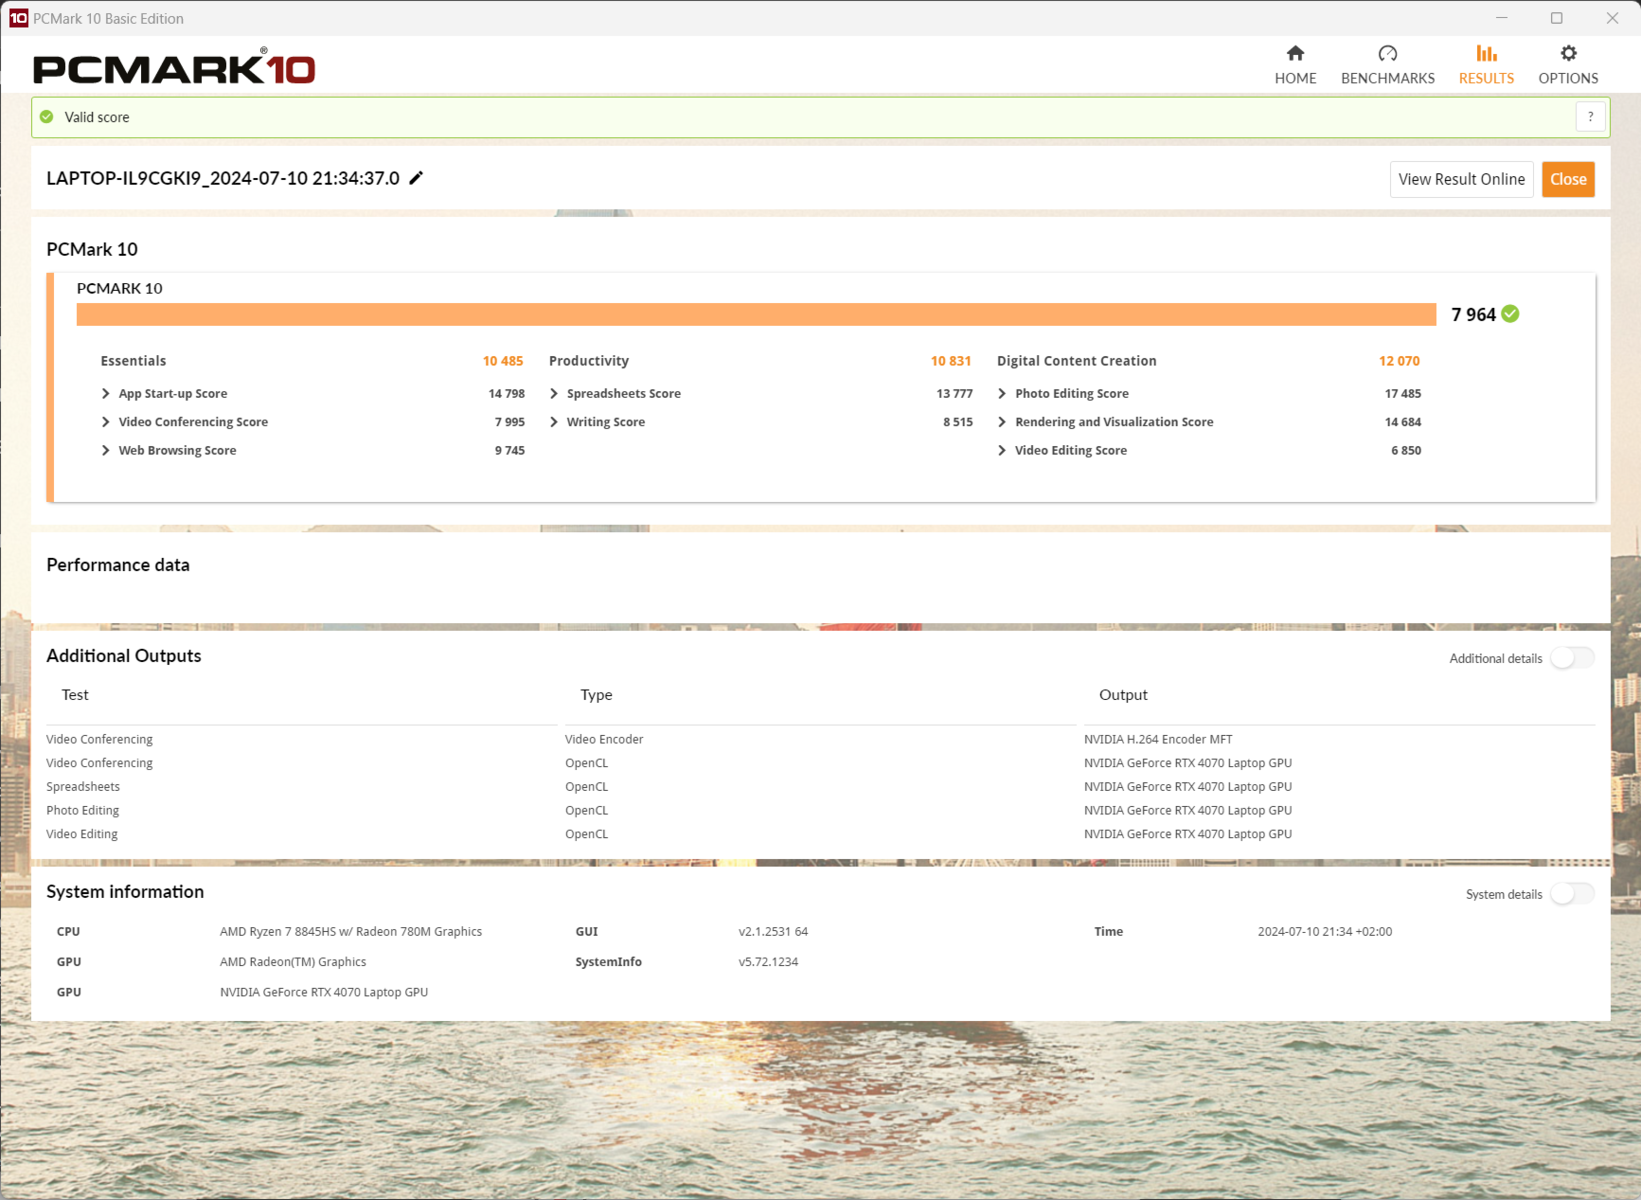
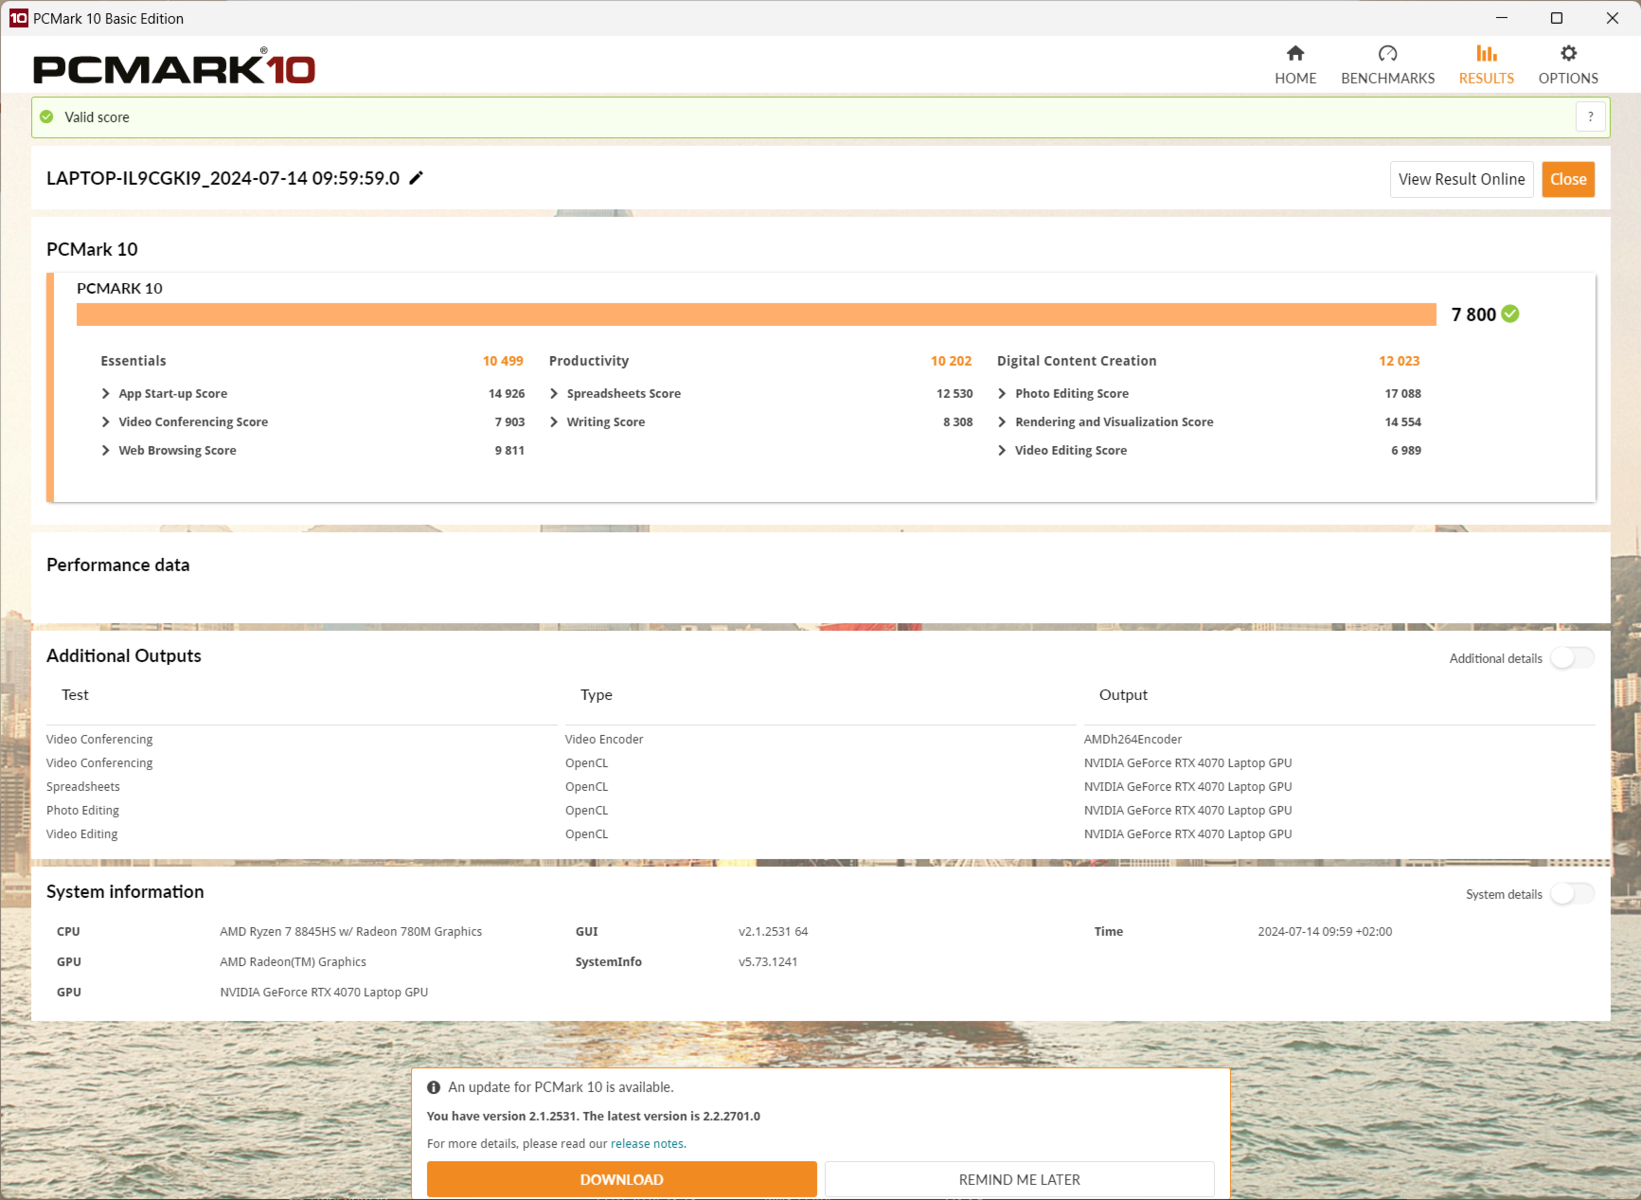
Durante las tareas cotidianas que evaluamos con PCMark 10 y algunos otros benchmarks similares, básicamente no hay diferencias notables con sistemas comparables. Los valores están al nivel de un Ryzen 7 8845HS de configuración más potente y en medio del campo de los competidores, aunque apenas hay un 10% de diferencia entre el valor más alto y el más bajo de la tabla.
El portátil responde en todo momento y no muestra tiempos de espera durante los procesos de instalación o cuando hay numerosos programas abiertos simultáneamente. Incluso mientras se juega a un juego exigente, sigue siendo posible cambiar a otra aplicación, aunque esto rara vez es recomendable.

CrossMark: Overall | Productivity | Creativity | Responsiveness
WebXPRT 3: Overall
WebXPRT 4: Overall
Mozilla Kraken 1.1: Total
| PCMark 10 / Score | |
| Acer Predator Helios Neo 16 (2024) | |
| Asus TUF Gaming A17 FA707XI-NS94 | |
| Asus TUF Gaming A15 FA507UV | |
| Medio AMD Ryzen 7 8845HS, NVIDIA GeForce RTX 4070 Laptop GPU (7800 - 8070, n=2) | |
| Media de la clase Gaming (5776 - 9852, n=134, últimos 2 años) | |
| HP Omen 17-db0079ng | |
| Alienware m16 R2 | |
| Asus ROG Strix Scar 16 G634JZR | |
| Tulpar T7 V20.6 | |
| PCMark 10 / Essentials | |
| Acer Predator Helios Neo 16 (2024) | |
| Asus ROG Strix Scar 16 G634JZR | |
| Tulpar T7 V20.6 | |
| Asus TUF Gaming A17 FA707XI-NS94 | |
| Asus TUF Gaming A15 FA507UV | |
| Media de la clase Gaming (9057 - 12600, n=134, últimos 2 años) | |
| Medio AMD Ryzen 7 8845HS, NVIDIA GeForce RTX 4070 Laptop GPU (10499 - 10664, n=2) | |
| HP Omen 17-db0079ng | |
| Alienware m16 R2 | |
| PCMark 10 / Productivity | |
| Acer Predator Helios Neo 16 (2024) | |
| Asus TUF Gaming A15 FA507UV | |
| HP Omen 17-db0079ng | |
| Medio AMD Ryzen 7 8845HS, NVIDIA GeForce RTX 4070 Laptop GPU (9887 - 10202, n=2) | |
| Media de la clase Gaming (6662 - 14612, n=134, últimos 2 años) | |
| Tulpar T7 V20.6 | |
| Asus TUF Gaming A17 FA707XI-NS94 | |
| Alienware m16 R2 | |
| Asus ROG Strix Scar 16 G634JZR | |
| PCMark 10 / Digital Content Creation | |
| Asus ROG Strix Scar 16 G634JZR | |
| Asus TUF Gaming A17 FA707XI-NS94 | |
| Alienware m16 R2 | |
| Acer Predator Helios Neo 16 (2024) | |
| Medio AMD Ryzen 7 8845HS, NVIDIA GeForce RTX 4070 Laptop GPU (12023 - 13528, n=2) | |
| Media de la clase Gaming (6807 - 19351, n=134, últimos 2 años) | |
| Asus TUF Gaming A15 FA507UV | |
| HP Omen 17-db0079ng | |
| Tulpar T7 V20.6 | |
| CrossMark / Overall | |
| Acer Predator Helios Neo 16 (2024) | |
| Asus ROG Strix Scar 16 G634JZR | |
| Media de la clase Gaming (1247 - 2344, n=114, últimos 2 años) | |
| Asus TUF Gaming A15 FA507UV | |
| Asus TUF Gaming A17 FA707XI-NS94 | |
| Alienware m16 R2 | |
| Tulpar T7 V20.6 | |
| Medio AMD Ryzen 7 8845HS, NVIDIA GeForce RTX 4070 Laptop GPU (1531 - 1790, n=2) | |
| HP Omen 17-db0079ng | |
| CrossMark / Productivity | |
| Acer Predator Helios Neo 16 (2024) | |
| Asus ROG Strix Scar 16 G634JZR | |
| Media de la clase Gaming (1299 - 2204, n=114, últimos 2 años) | |
| Asus TUF Gaming A15 FA507UV | |
| Asus TUF Gaming A17 FA707XI-NS94 | |
| Tulpar T7 V20.6 | |
| Alienware m16 R2 | |
| Medio AMD Ryzen 7 8845HS, NVIDIA GeForce RTX 4070 Laptop GPU (1488 - 1720, n=2) | |
| HP Omen 17-db0079ng | |
| CrossMark / Creativity | |
| Acer Predator Helios Neo 16 (2024) | |
| Asus ROG Strix Scar 16 G634JZR | |
| Media de la clase Gaming (1275 - 2660, n=114, últimos 2 años) | |
| Asus TUF Gaming A17 FA707XI-NS94 | |
| Asus TUF Gaming A15 FA507UV | |
| Alienware m16 R2 | |
| Tulpar T7 V20.6 | |
| Medio AMD Ryzen 7 8845HS, NVIDIA GeForce RTX 4070 Laptop GPU (1683 - 1932, n=2) | |
| HP Omen 17-db0079ng | |
| CrossMark / Responsiveness | |
| Acer Predator Helios Neo 16 (2024) | |
| Asus ROG Strix Scar 16 G634JZR | |
| Media de la clase Gaming (1030 - 2330, n=114, últimos 2 años) | |
| Asus TUF Gaming A15 FA507UV | |
| Alienware m16 R2 | |
| Tulpar T7 V20.6 | |
| Asus TUF Gaming A17 FA707XI-NS94 | |
| Medio AMD Ryzen 7 8845HS, NVIDIA GeForce RTX 4070 Laptop GPU (1255 - 1603, n=2) | |
| HP Omen 17-db0079ng | |
| WebXPRT 3 / Overall | |
| Acer Predator Helios Neo 16 (2024) | |
| Asus TUF Gaming A17 FA707XI-NS94 | |
| Asus ROG Strix Scar 16 G634JZR | |
| Asus TUF Gaming A15 FA507UV | |
| Media de la clase Gaming (215 - 480, n=130, últimos 2 años) | |
| Alienware m16 R2 | |
| Tulpar T7 V20.6 | |
| Medio AMD Ryzen 7 8845HS, NVIDIA GeForce RTX 4070 Laptop GPU (275 - 312, n=2) | |
| HP Omen 17-db0079ng | |
| WebXPRT 4 / Overall | |
| Asus ROG Strix Scar 16 G634JZR | |
| Acer Predator Helios Neo 16 (2024) | |
| Tulpar T7 V20.6 | |
| Asus TUF Gaming A17 FA707XI-NS94 | |
| Medio AMD Ryzen 7 8845HS, NVIDIA GeForce RTX 4070 Laptop GPU (n=1) | |
| Media de la clase Gaming (176.4 - 335, n=116, últimos 2 años) | |
| Asus TUF Gaming A15 FA507UV | |
| Alienware m16 R2 | |
| Mozilla Kraken 1.1 / Total | |
| HP Omen 17-db0079ng | |
| Alienware m16 R2 | |
| Medio AMD Ryzen 7 8845HS, NVIDIA GeForce RTX 4070 Laptop GPU (500 - 564, n=2) | |
| Asus TUF Gaming A15 FA507UV | |
| Media de la clase Gaming (408 - 674, n=143, últimos 2 años) | |
| Tulpar T7 V20.6 | |
| Asus TUF Gaming A17 FA707XI-NS94 | |
| Acer Predator Helios Neo 16 (2024) | |
| Asus ROG Strix Scar 16 G634JZR | |
* ... más pequeño es mejor
| PCMark 10 Score | 7800 puntos | |
ayuda | ||
| AIDA64 / Memory Copy | |
| Asus ROG Strix Scar 16 G634JZR | |
| Acer Predator Helios Neo 16 (2024) | |
| HP Omen 17-db0079ng | |
| Medio AMD Ryzen 7 8845HS (61459 - 71873, n=13) | |
| Media de la clase Gaming (21750 - 97515, n=150, últimos 2 años) | |
| Alienware m16 R2 | |
| Asus TUF Gaming A15 FA507UV | |
| Asus TUF Gaming A17 FA707XI-NS94 | |
| Tulpar T7 V20.6 | |
| AIDA64 / Memory Read | |
| Asus ROG Strix Scar 16 G634JZR | |
| Acer Predator Helios Neo 16 (2024) | |
| Alienware m16 R2 | |
| Media de la clase Gaming (22956 - 102937, n=150, últimos 2 años) | |
| Asus TUF Gaming A15 FA507UV | |
| Asus TUF Gaming A17 FA707XI-NS94 | |
| HP Omen 17-db0079ng | |
| Medio AMD Ryzen 7 8845HS (49866 - 61976, n=13) | |
| Tulpar T7 V20.6 | |
| AIDA64 / Memory Write | |
| HP Omen 17-db0079ng | |
| Medio AMD Ryzen 7 8845HS (68425 - 93239, n=13) | |
| Asus TUF Gaming A15 FA507UV | |
| Asus ROG Strix Scar 16 G634JZR | |
| Asus TUF Gaming A17 FA707XI-NS94 | |
| Acer Predator Helios Neo 16 (2024) | |
| Media de la clase Gaming (22297 - 108954, n=150, últimos 2 años) | |
| Alienware m16 R2 | |
| Tulpar T7 V20.6 | |
| AIDA64 / Memory Latency | |
| Alienware m16 R2 | |
| HP Omen 17-db0079ng | |
| Media de la clase Gaming (59.5 - 259, n=150, últimos 2 años) | |
| Medio AMD Ryzen 7 8845HS (82.5 - 117, n=13) | |
| Asus TUF Gaming A15 FA507UV | |
| Asus TUF Gaming A17 FA707XI-NS94 | |
| Acer Predator Helios Neo 16 (2024) | |
| Tulpar T7 V20.6 | |
| Asus ROG Strix Scar 16 G634JZR | |
* ... más pequeño es mejor
Latencias del CPD
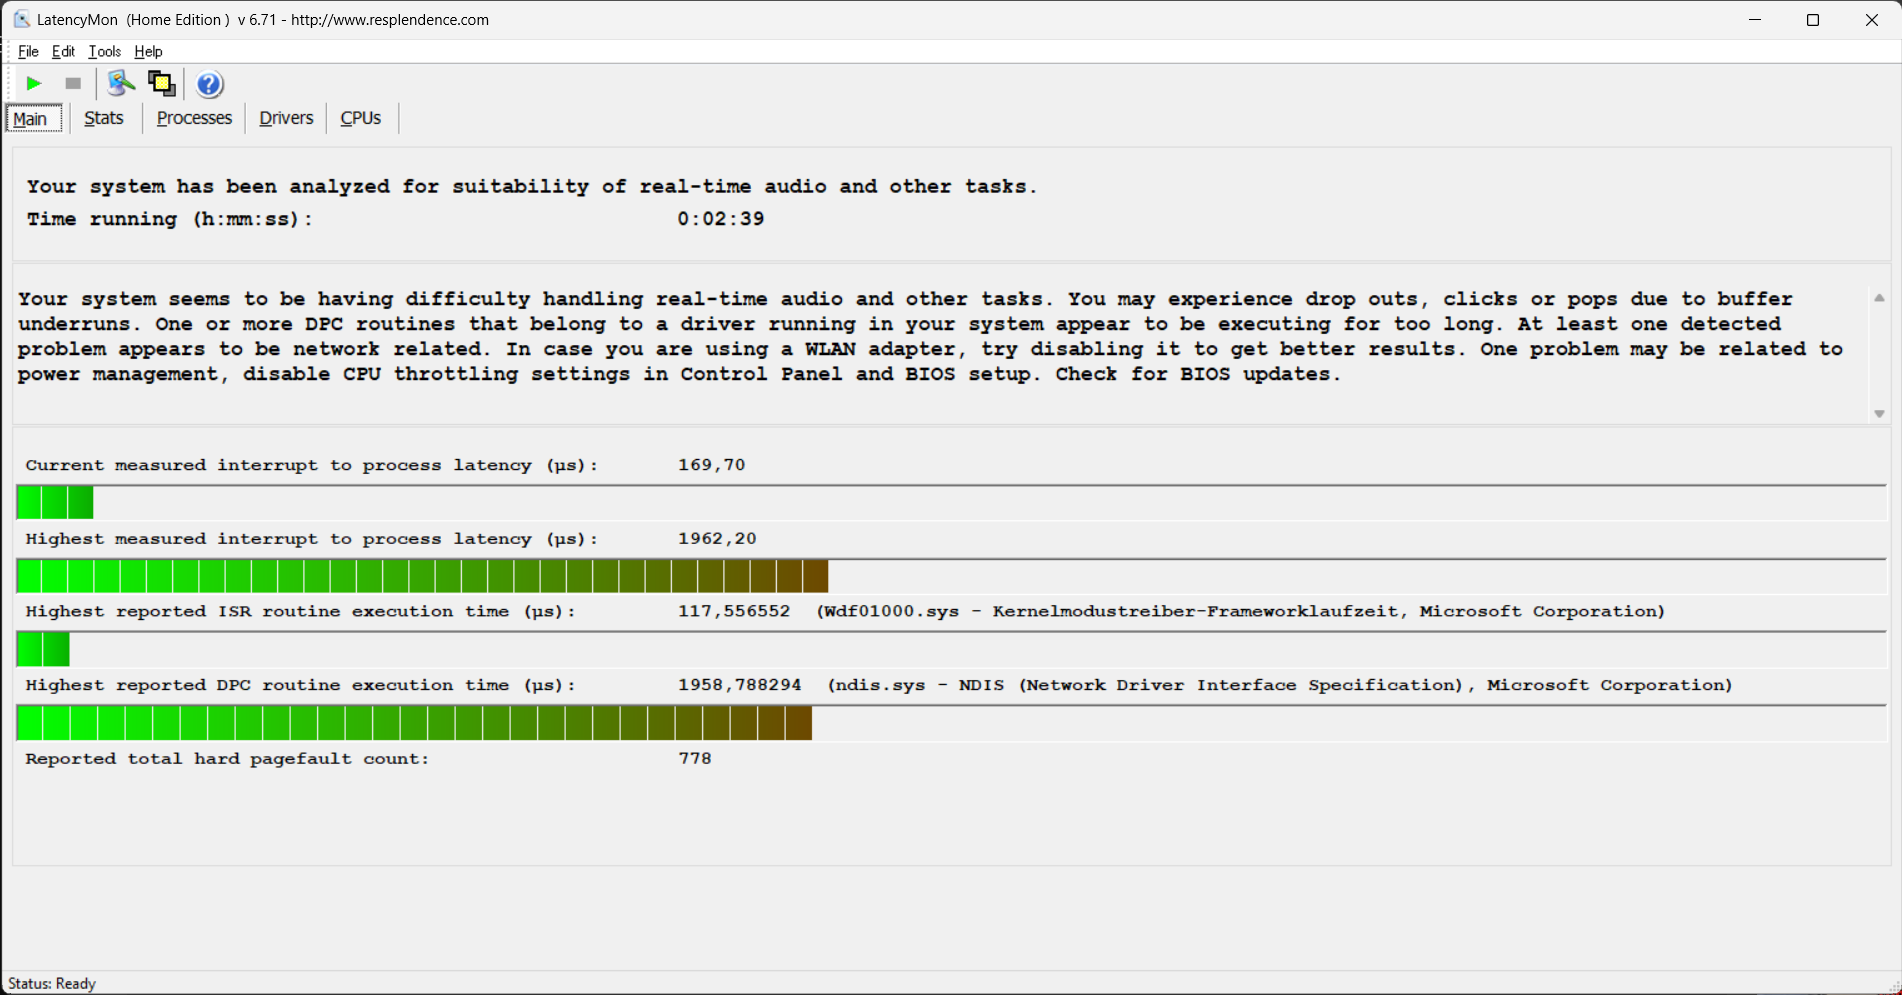
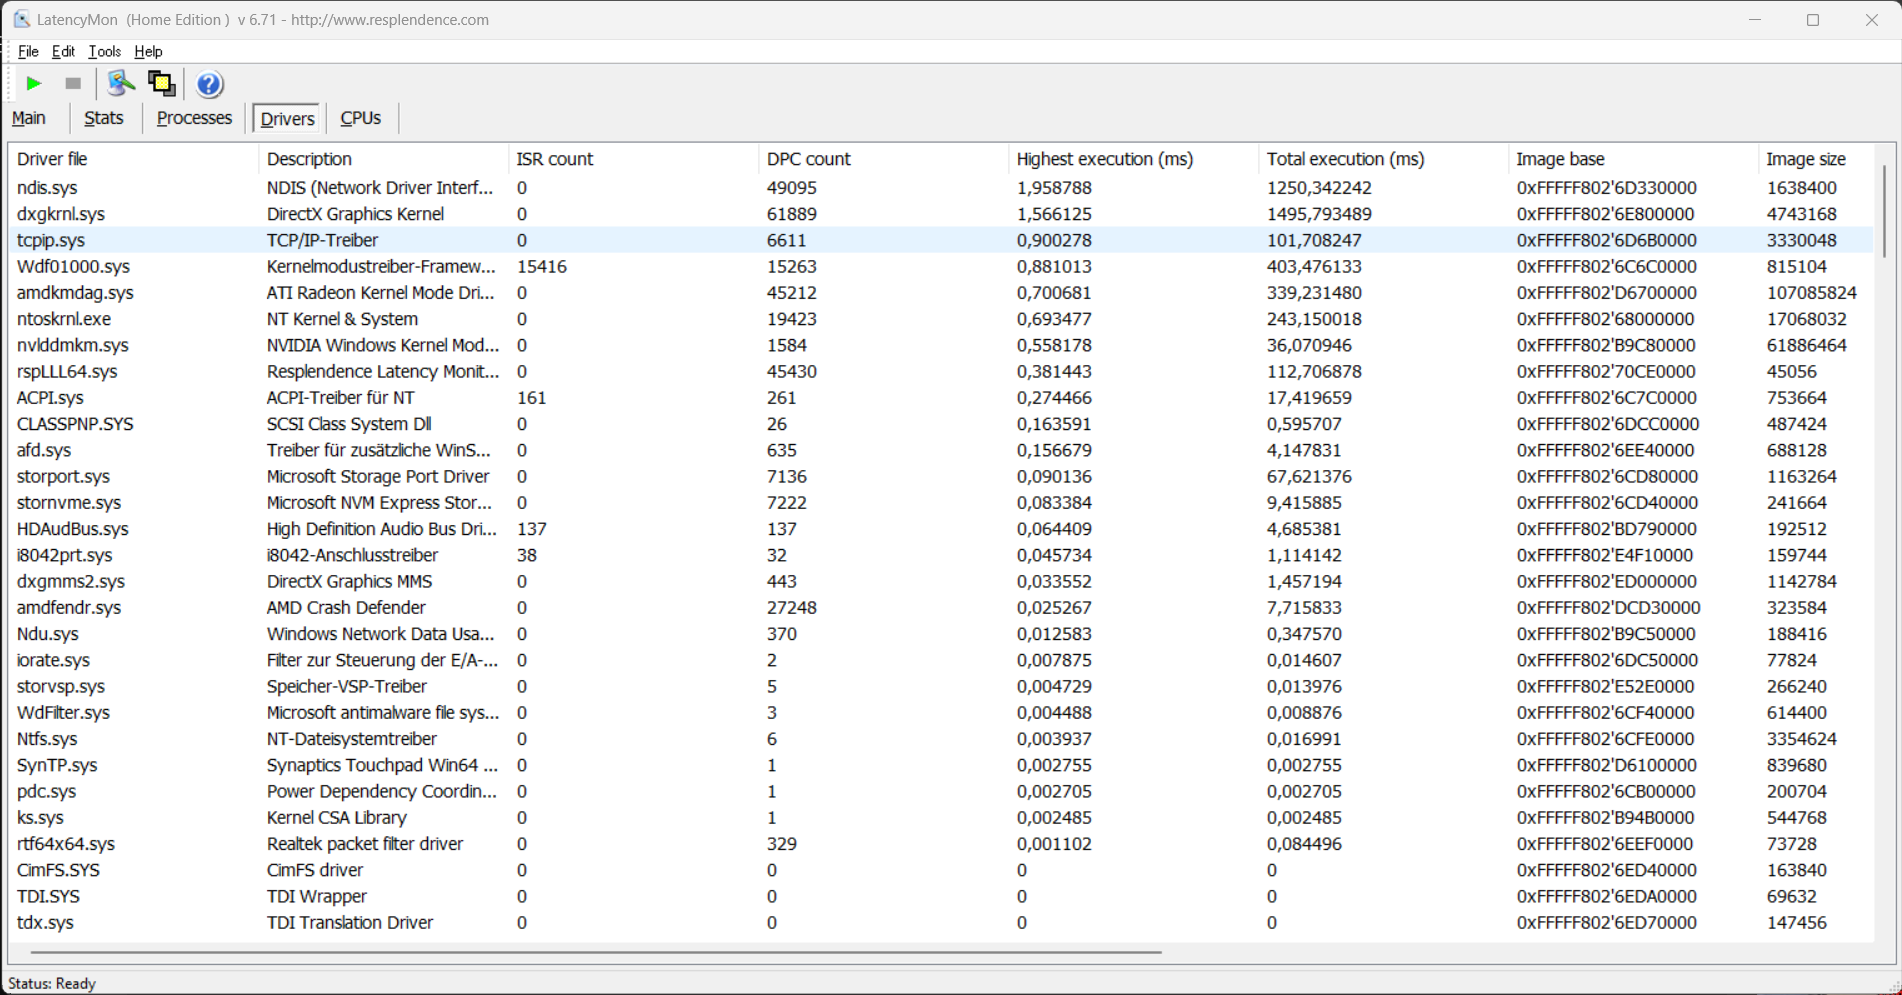
Nuestra unidad de pruebas en su configuración actual no es necesariamente adecuada para el procesamiento de audio y vídeo en tiempo real, ya que hay que esperar algunos pequeños tartamudeos. Los controladores de red y el núcleo gráfico DirectX impiden un mejor resultado. Con algunos controladores modificados o una actualización posterior del software, esta situación podría mejorar o incluso empeorar.
Lo que destaca es la alta utilización de la iGPU mientras se reproduce un vídeo 4K. Aunque una utilización del 60% sigue siendo defendible, es casi el doble que la de la solución gráfica integrada de Intel. Y 13 fotogramas caídos en un lapso de tiempo de un minuto tampoco son un resultado óptimo.
| DPC Latencies / LatencyMon - interrupt to process latency (max), Web, Youtube, Prime95 | |
| Asus ROG Strix Scar 16 G634JZR | |
| Alienware m16 R2 | |
| HP Omen 17-db0079ng | |
| Asus TUF Gaming A17 FA707XI-NS94 | |
| Acer Predator Helios Neo 16 (2024) | |
| Asus TUF Gaming A15 FA507UV | |
* ... más pequeño es mejor
Solución de almacenamiento
La SSD utilizada aquí definitivamente no alcanza velocidades máximas absolutas. Por ejemplo, la solución de almacenamiento en el Asus ROG Strix Scar 16 es capaz de rendir un 30% más en términos de acceso secuencial. Pero esto sólo en raras ocasiones contribuye a un aumento de las velocidades de fotogramas mientras se juega. Sólo podríamos observar una mejora mínima, si acaso, durante la multitarea intensa con muchas tareas de acceso paralelo.
Por otro lado, el Omen 17 muestra cómo debería ser una buena refrigeración de la SSD. En contraste con muchos competidores de construcción similar, incluido el ROG Strix Scar, el rendimiento constante se mantiene permanentemente a un nivel bueno, aunque no sobresaliente.
La segunda ranura para una SSD M.2-NVMe también dispone de un refrigerador ya preinstalado. Así que si lo desea, puede añadir aquí una unidad más rápida o al menos más grande.

* ... más pequeño es mejor
Disk Throttling: DiskSpd Read Loop, Queue Depth 8
Tarjeta gráfica
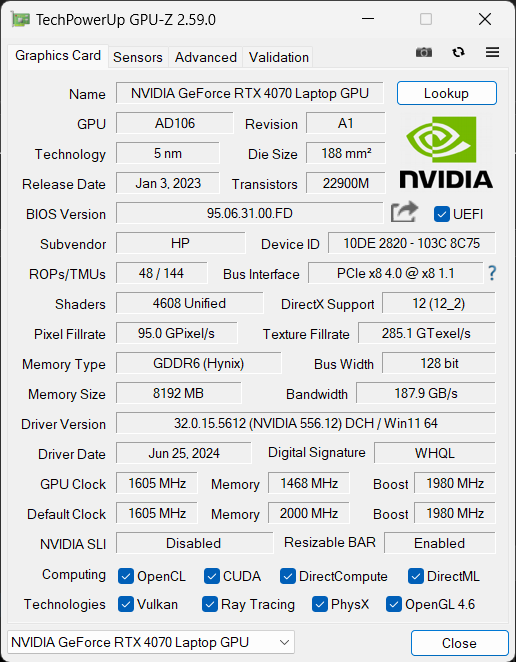
La HP Omen 17 utiliza la Nvidia GeForce RTX 4070 tarjeta gráfica. Como alternativa, también puede adquirir una versión más pequeña con la tarjeta gráfica RTX 4060. La mayor de las dos se adapta bien a la pantalla QHD. Sólo tuvimos que renunciar a los ajustes de máximo detalle con los juegos más recientes si aún queríamos obtener más de 60 FPS.
La RTX 4070 es capaz de consumir aquí un máximo de 120 vatios, lo que está por debajo de su valor máximo permitido de 140 vatios. Pero esto no es muy perceptible, sobre todo en los benchmarks sintéticos de 3DMark, y a veces incluso observamos lo contrario. Por ejemplo, el Asus TUF Gaming A17que está mejor equipada sobre el papel con una RTX 4070 de 140 vatios, se queda por detrás del 9% en general. Sin embargo, la distancia es menor en el rendimiento en juegos. Probablemente vemos el efecto de que el HP Omen 17 no necesita acelerar aquí.
Los valores de potencia se reducen aún más en los otros modos de potencia. En el modo "Equilibrado", sigue siendo de 90 vatios, lo que reduce el rendimiento en un 10% como máximo. La caída de potencia se hace más pronunciada en el modo "Eco" y durante el funcionamiento con batería, donde la tarjeta gráfica sólo puede consumir 40 vatios. Aunque los juegos que no son tan complejos siguen siendo jugables, hay que contar con una velocidad de fotogramas que se reduce en un tercio.
Puede encontrar más pruebas comparativas y de juegos en nuestra Lista de pruebas de GPU.
| 3DMark 11 Performance | 35016 puntos | |
| 3DMark Cloud Gate Standard Score | 65355 puntos | |
| 3DMark Fire Strike Score | 27594 puntos | |
| 3DMark Time Spy Score | 12346 puntos | |
| 3DMark Steel Nomad Score | 2743 puntos | |
ayuda | ||
* ... más pequeño es mejor
Rendimiento en juegos
Con unos ajustes de detalle meramente altos en lugar de máximos, el HP Omen 17 es capaz de superar con fiabilidad la marca de los 100 FPS en resolución Full-HD. Esto también vale para los juegos actuales. Con varios juegos, las diferencias con otros portátiles para juegos con la RTX 4070 son sólo de unos pocos puntos porcentuales. La ventaja para el Asus TUF Gaming A15 con una CPU más rápida pero solo una RTX 4060 es de apenas un 4%. Pero los juegos gráficamente exigentes como Cyberpunk 2077 2. 1 son mucho más jugables con el Omen 17. Sin embargo, la GPU más pequeña sigue siendo capaz de dominar juegos más antiguos a la altura de los ojos.
La diferencia entre el modo "Equilibrado", más silencioso, y el rendimiento máximo sigue siendo pequeña. A menudo se alcanzan los 100 FPS incluso entonces. Así que podemos decir en general, que la decisión por una TGP más baja no trajo ninguna desventaja seria digna de mención en los juegos. Dado que el rendimiento informático disponible se mantiene estable, el Omen 17 tiene incluso una ventaja a veces bajo carga constante.


| GTA V - 1920x1080 Highest Settings possible AA:4xMSAA + FX AF:16x | |
| Asus ROG Strix Scar 16 G634JZR | |
| Acer Predator Helios Neo 16 (2024) | |
| Media de la clase Gaming (12.1 - 168.2, n=132, últimos 2 años) | |
| HP Omen 16 (2024) | |
| Asus ROG Zephyrus M16 GU603Z | |
| Asus TUF Gaming A15 FA507UV | |
| HP Omen 17-db0079ng | |
| HP Omen 16-b0085ng | |
| Cyberpunk 2077 2.2 Phantom Liberty - 1920x1080 Ultra Preset (FSR off) | |
| Asus ROG Strix Scar 16 G634JZR | |
| Media de la clase Gaming (6.76 - 158, n=92, últimos 2 años) | |
| HP Omen 17-db0079ng | |
| Asus TUF Gaming A17 FA707XI-NS94 | |
| HP Omen 16 (2024) | |
| Acer Predator Helios Neo 16 (2024) | |
| Alienware m16 R2 | |
| Asus TUF Gaming A15 FA507UV | |
| F1 23 | |
| 1920x1080 Ultra High Preset AA:T AF:16x | |
| Asus ROG Strix Scar 16 G634JZR | |
| Media de la clase Gaming (12.9 - 149.2, n=39, últimos 2 años) | |
| Medio NVIDIA GeForce RTX 4070 Laptop GPU (49.5 - 100, n=14) | |
| 2560x1440 Ultra High Preset AA:T AF:16x | |
| Asus ROG Strix Scar 16 G634JZR | |
| Media de la clase Gaming (17 - 144.6, n=30, últimos 2 años) | |
| Medio NVIDIA GeForce RTX 4070 Laptop GPU (35.2 - 49, n=13) | |
| F1 24 | |
| 1920x1080 Ultra High Preset AA:T AF:16x | |
| Media de la clase Gaming (54.1 - 148, n=20, últimos 2 años) | |
| HP Omen 17-db0079ng | |
| Medio NVIDIA GeForce RTX 4070 Laptop GPU (58.4 - 78.1, n=9) | |
| Asus TUF Gaming A15 FA507UV | |
| 2560x1440 Ultra High Preset AA:T AF:16x | |
| Media de la clase Gaming (36.7 - 100, n=17, últimos 2 años) | |
| HP Omen 17-db0079ng | |
| Medio NVIDIA GeForce RTX 4070 Laptop GPU (36.8 - 50.9, n=9) | |
La prueba de carga constante con Cyberpunk 2077 2.1 también muestra la estabilidad del rendimiento del portátil, resultando en una línea casi perfectamente recta de principio a fin. Con el reducido consumo de energía, el Omen 17 no necesita acelerar en ningún momento.
Cyberpunk 2077 Ultra FPS Chart
| bajo | medio | alto | ultra | QHD | |
|---|---|---|---|---|---|
| GTA V (2015) | 178.9 | 175.5 | 163.1 | 103.9 | 90.2 |
| Dota 2 Reborn (2015) | 152.5 | 138.8 | 137.3 | 126.3 | |
| Final Fantasy XV Benchmark (2018) | 201 | 155.7 | 117.2 | 88.2 | |
| X-Plane 11.11 (2018) | 128.8 | 115.7 | 89.5 | ||
| Far Cry 5 (2018) | 137 | 123 | 115 | 110 | 108 |
| Strange Brigade (2018) | 318 | 276 | 240 | 213 | 138.3 |
| God of War (2022) | 149 | 129 | 105 | 74 | 60 |
| Hogwarts Legacy (2023) | 103 | 92 | 87 | 76 | 52 |
| Cyberpunk 2077 2.2 Phantom Liberty (2023) | 135.3 | 122 | 102.6 | 88.9 | 54.5 |
| F1 24 (2024) | 205 | 210 | 196.6 | 74.1 | 48.4 |
Emisiones - No es un avión a reacción
Niveles de ruido
El control del ventilador bajo carga muestra una acertada implementación de la refrigeración. Incluso en los momentos de mayor rendimiento, el ruido nunca llega a ser molesto, aunque entonces es claramente audible. En contraste con competidores como el Alienware m16 R2los auriculares no serán absolutamente necesarios en esos momentos, aunque seguirían siendo recomendables.
El Omen 17 lo hace aún mejor en el modo "Equilibrado", que sólo aporta algunas pequeñas limitaciones en el rendimiento. Mientras el juego sea medianamente interesante, apenas debería notar ya el ruido del ventilador. Además, el software incluido le permitirá realizar fácilmente más ajustes en la velocidad del ventilador para reducir un poco más el nivel de ruido.
Sin embargo, por desgracia, el portátil para juegos nunca llega a ser absolutamente silencioso. Incluso sin ninguna carga, los ventiladores se aceleran de vez en cuando, y aunque no llegan a los niveles máximos de velocidad, sigue siendo muy audible. El Omen 17 permanece lejos de alcanzar temperaturas críticas.
Ruido
| Ocioso |
| 25 / 29 / 33 dB(A) |
| Carga |
| 45 / 52 dB(A) |
 | ||
30 dB silencioso 40 dB(A) audible 50 dB(A) ruidosamente alto |
||
min: | ||
| HP Omen 17-db0079ng NVIDIA GeForce RTX 4070 Laptop GPU, R7 8845HS, WD PC SN560 SDDPNQE-1T00 | Alienware m16 R2 NVIDIA GeForce RTX 4070 Laptop GPU, Ultra 7 155H, Samsung PM9A1 MZVL21T0HCLR | Asus ROG Strix Scar 16 G634JZR NVIDIA GeForce RTX 4080 Laptop GPU, i9-14900HX, SK hynix PC801 HFS002TEJ9X101N | Acer Predator Helios Neo 16 (2024) NVIDIA GeForce RTX 4070 Laptop GPU, i7-14700HX, Samsung PM9A1a MZVL21T0HDLU | Asus TUF Gaming A17 FA707XI-NS94 NVIDIA GeForce RTX 4070 Laptop GPU, R9 7940HS, WD PC SN560 SDDPNQE-1T00 | Asus TUF Gaming A15 FA507UV NVIDIA GeForce RTX 4060 Laptop GPU, R9 8945H, WD PC SN560 SDDPNQE-1T00 | |
|---|---|---|---|---|---|---|
| Noise | 8% | -5% | -3% | -1% | 5% | |
| apagado / medio ambiente * | 25 | 24.7 1% | 21.07 16% | 25.2 -1% | 27.9 -12% | 25 -0% |
| Idle Minimum * | 25 | 25.3 -1% | 29.75 -19% | 27.8 -11% | 28.5 -14% | 25 -0% |
| Idle Average * | 29 | 25.3 13% | 29.75 -3% | 32 -10% | 29.8 -3% | 27 7% |
| Idle Maximum * | 33 | 25.3 23% | 29.75 10% | 29.6 10% | 29.8 10% | 33 -0% |
| Load Average * | 45 | 31.7 30% | 54.85 -22% | 45.2 -0% | 34.8 23% | 40 11% |
| Cyberpunk 2077 ultra * | 48 | 45 6% | ||||
| Load Maximum * | 52 | 62 -19% | 58 -12% | 55.8 -7% | 57.3 -10% | 46 12% |
| Witcher 3 ultra * | 53.8 | 57.8 | 57.1 |
* ... más pequeño es mejor
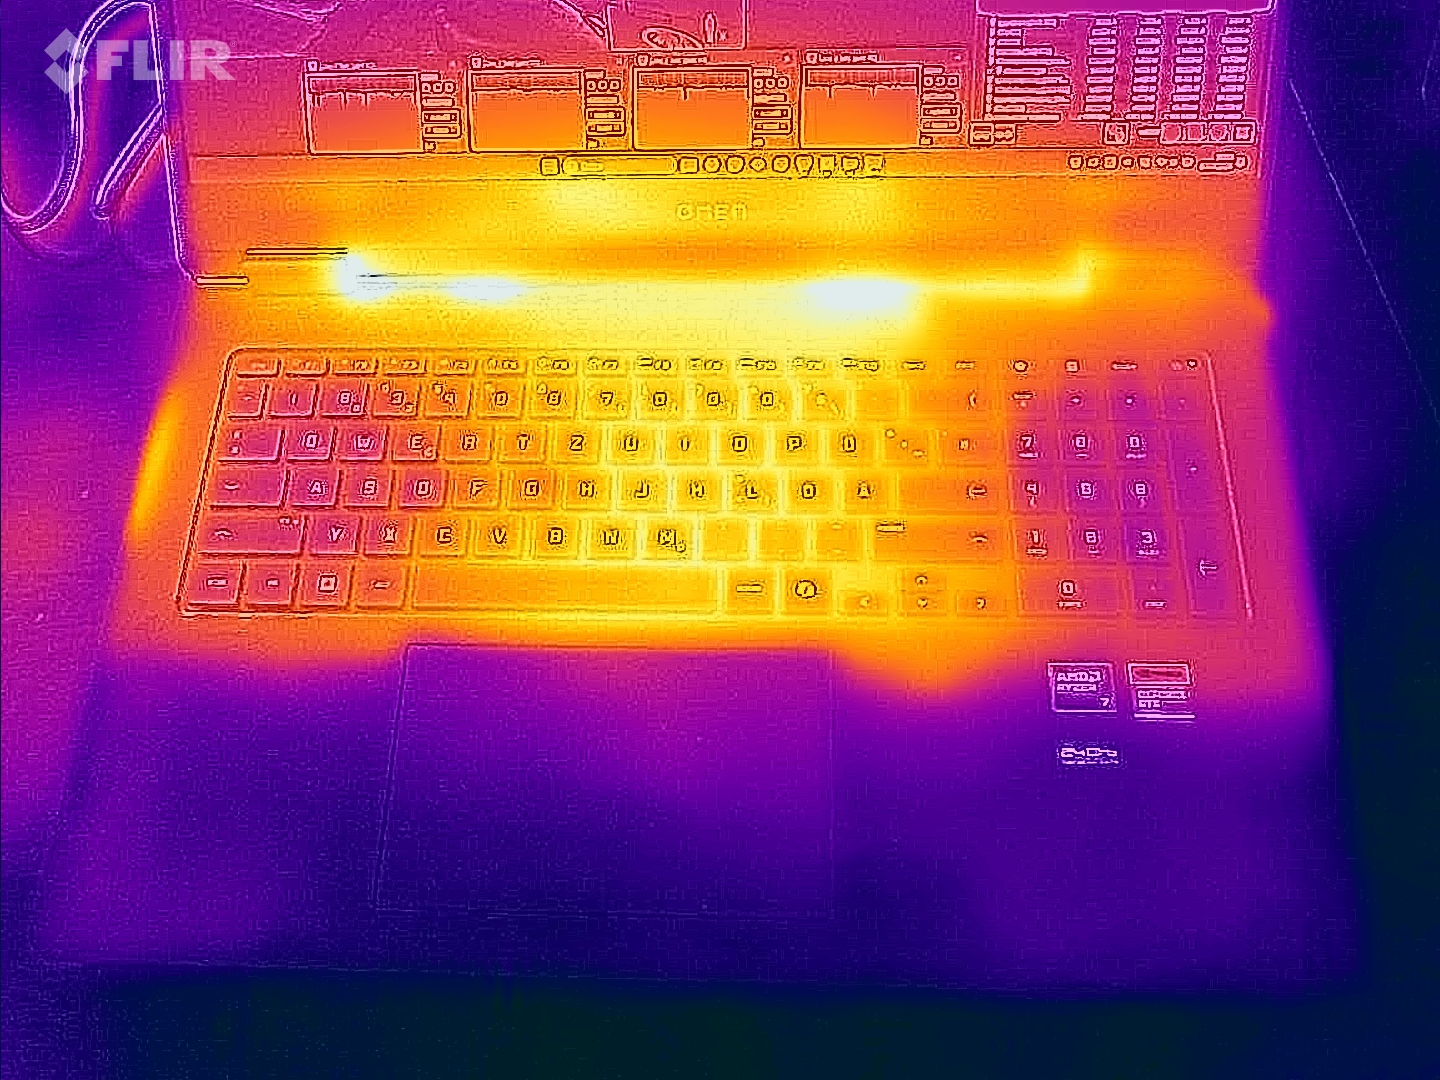
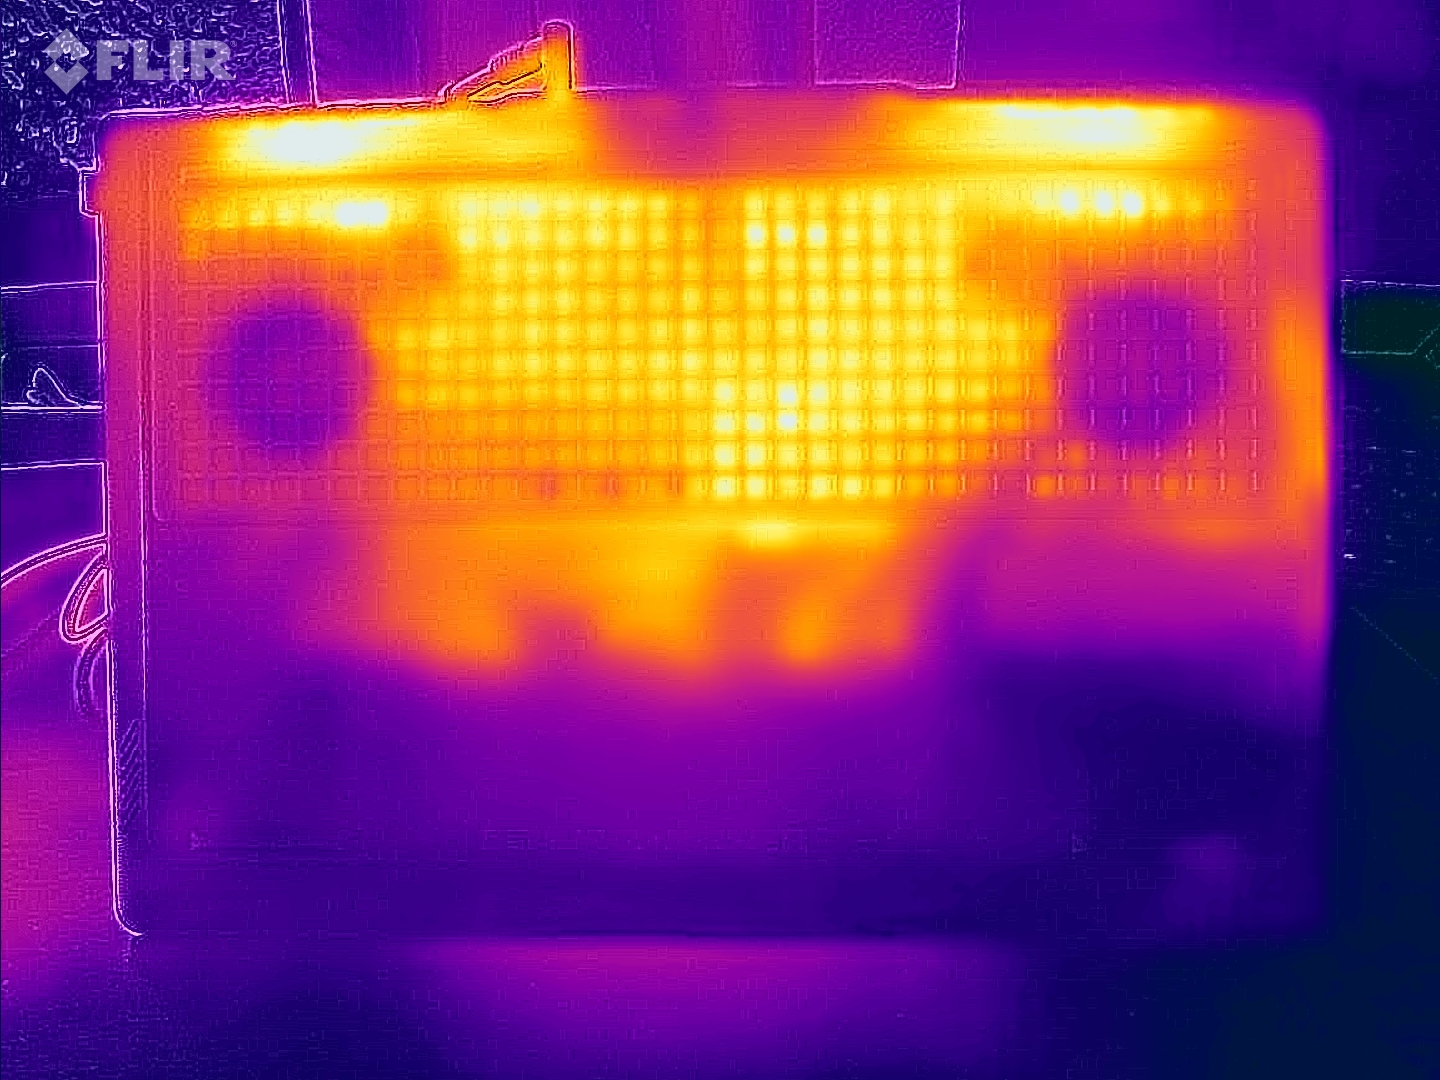
Temperaturas
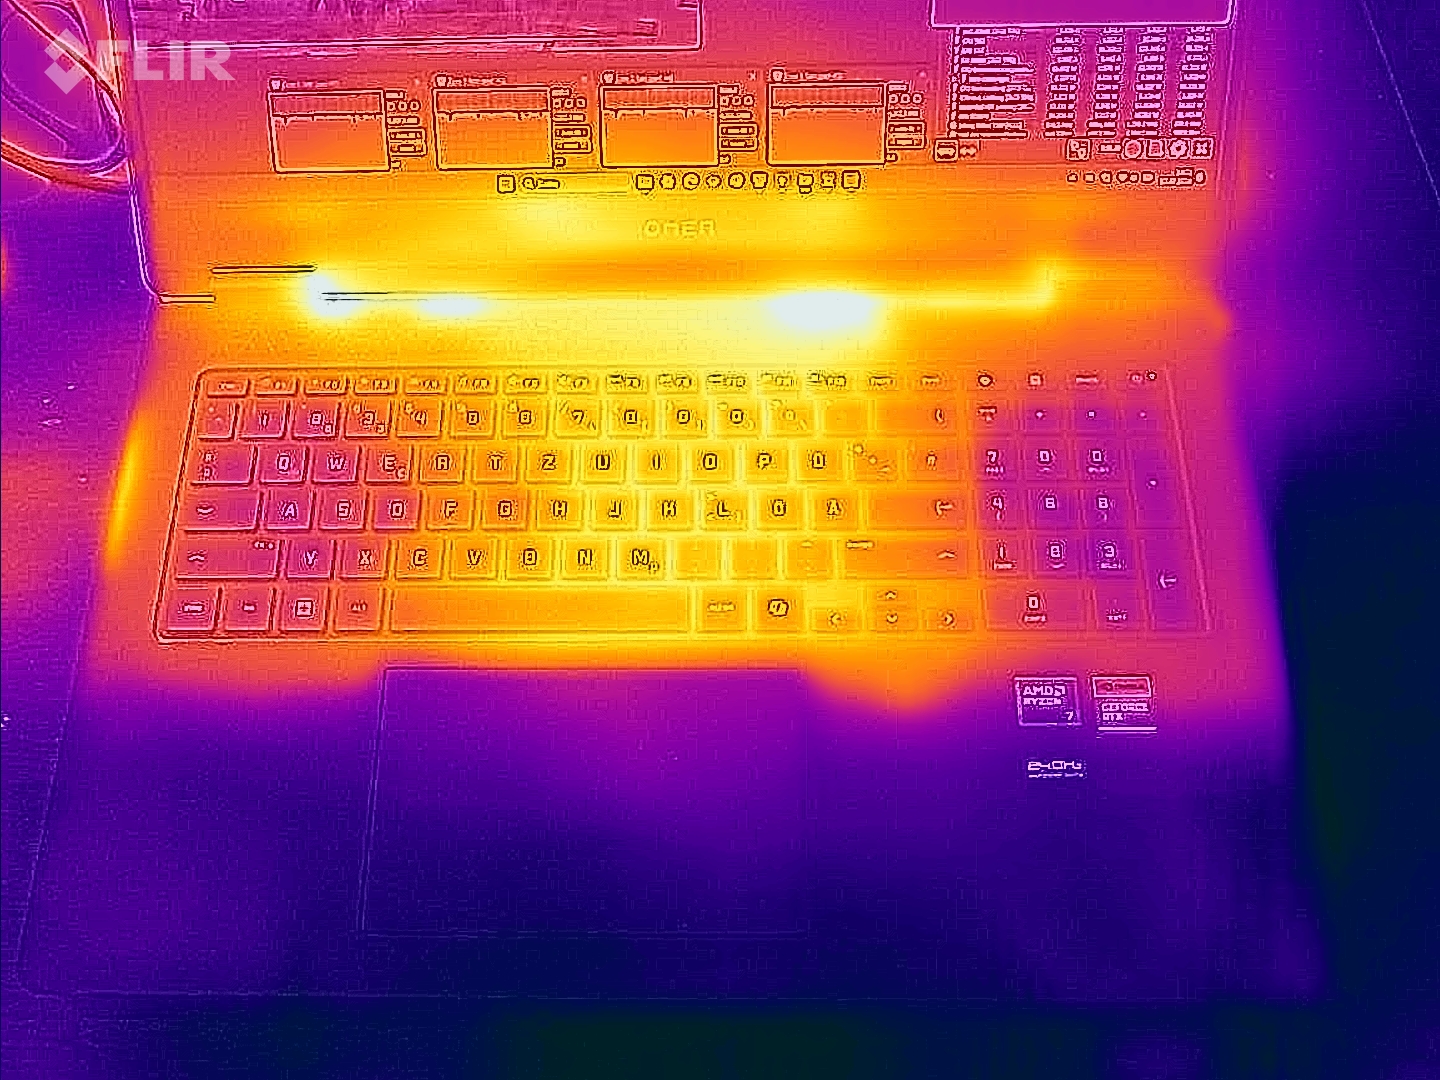
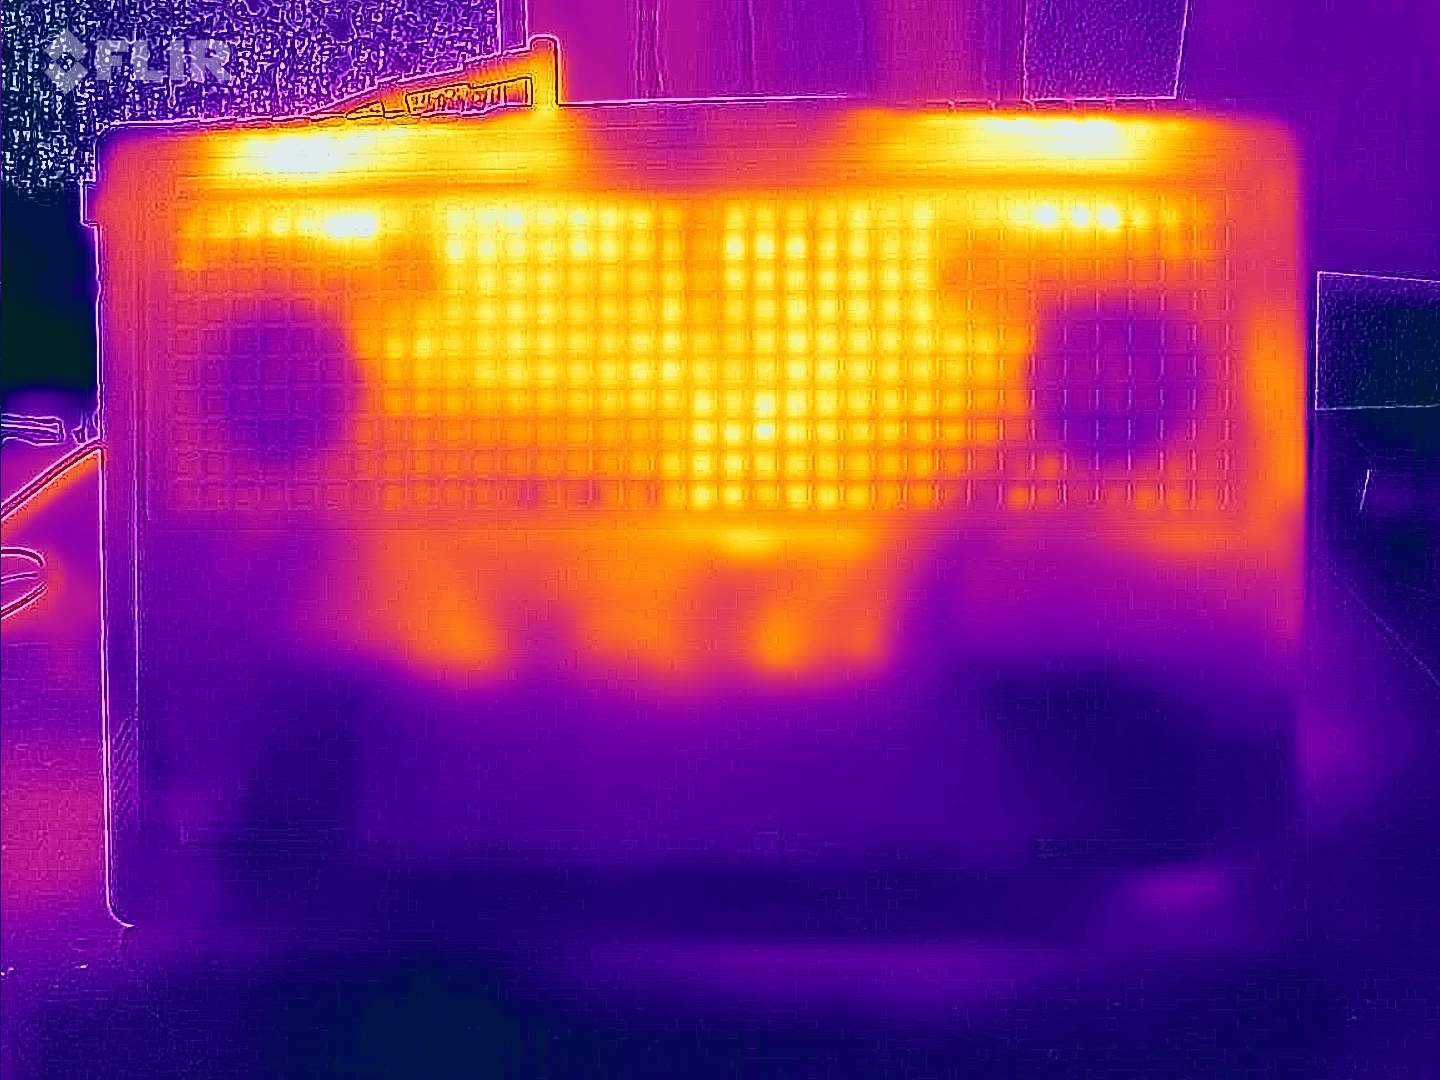
Tanto en funcionamiento en vacío como bajo carga elevada, la Omen 17 se mantiene más fresca que muchos de sus competidores. En particular, los reposamanos apenas se calientan. En la zona del teclado, en cambio, el aumento de temperatura es claramente perceptible durante los juegos. Aquí se recomienda una solución externa, sobre todo porque el teclado integrado no es muy impresionante de todos modos. Durante tareas sencillas como navegar por Internet o trabajar en tareas de oficina, todo el dispositivo permanece fresco y cómodo de manejar. También puede utilizarlo cómodamente sobre el regazo.
(±) La temperatura máxima en la parte superior es de 44 °C / 111 F, frente a la media de 40.4 °C / 105 F, que oscila entre 21.2 y 68.8 °C para la clase Gaming.
(±) El fondo se calienta hasta un máximo de 45 °C / 113 F, frente a la media de 43.2 °C / 110 F
(+) En reposo, la temperatura media de la parte superior es de 25.7 °C / 78# F, frente a la media del dispositivo de 33.9 °C / 93 F.
(±) 3: The average temperature for the upper side is 36.1 °C / 97 F, compared to the average of 33.9 °C / 93 F for the class Gaming.
(+) El reposamanos y el panel táctil están a una temperatura inferior a la de la piel, con un máximo de 28 °C / 82.4 F y, por tanto, son fríos al tacto.
(±) La temperatura media de la zona del reposamanos de dispositivos similares fue de 28.9 °C / 84 F (+0.9 °C / 1.6 F).
| HP Omen 17-db0079ng AMD Ryzen 7 8845HS, NVIDIA GeForce RTX 4070 Laptop GPU | Alienware m16 R2 Intel Core Ultra 7 155H, NVIDIA GeForce RTX 4070 Laptop GPU | Asus ROG Strix Scar 16 G634JZR Intel Core i9-14900HX, NVIDIA GeForce RTX 4080 Laptop GPU | Acer Predator Helios Neo 16 (2024) Intel Core i7-14700HX, NVIDIA GeForce RTX 4070 Laptop GPU | Asus TUF Gaming A17 FA707XI-NS94 AMD Ryzen 9 7940HS, NVIDIA GeForce RTX 4070 Laptop GPU | Asus TUF Gaming A15 FA507UV AMD Ryzen 9 8945H, NVIDIA GeForce RTX 4060 Laptop GPU | |
|---|---|---|---|---|---|---|
| Heat | -27% | -18% | -23% | 11% | -18% | |
| Maximum Upper Side * | 44 | 44.8 -2% | 47.8 -9% | 58 -32% | 40 9% | 53 -20% |
| Maximum Bottom * | 45 | 48 -7% | 52.2 -16% | 45.2 -0% | 33.6 25% | 46 -2% |
| Idle Upper Side * | 26 | 37.2 -43% | 32.4 -25% | 31.1 -20% | 26.6 -2% | 32 -23% |
| Idle Bottom * | 27 | 42 -56% | 33 -22% | 37.2 -38% | 24.4 10% | 34 -26% |
* ... más pequeño es mejor
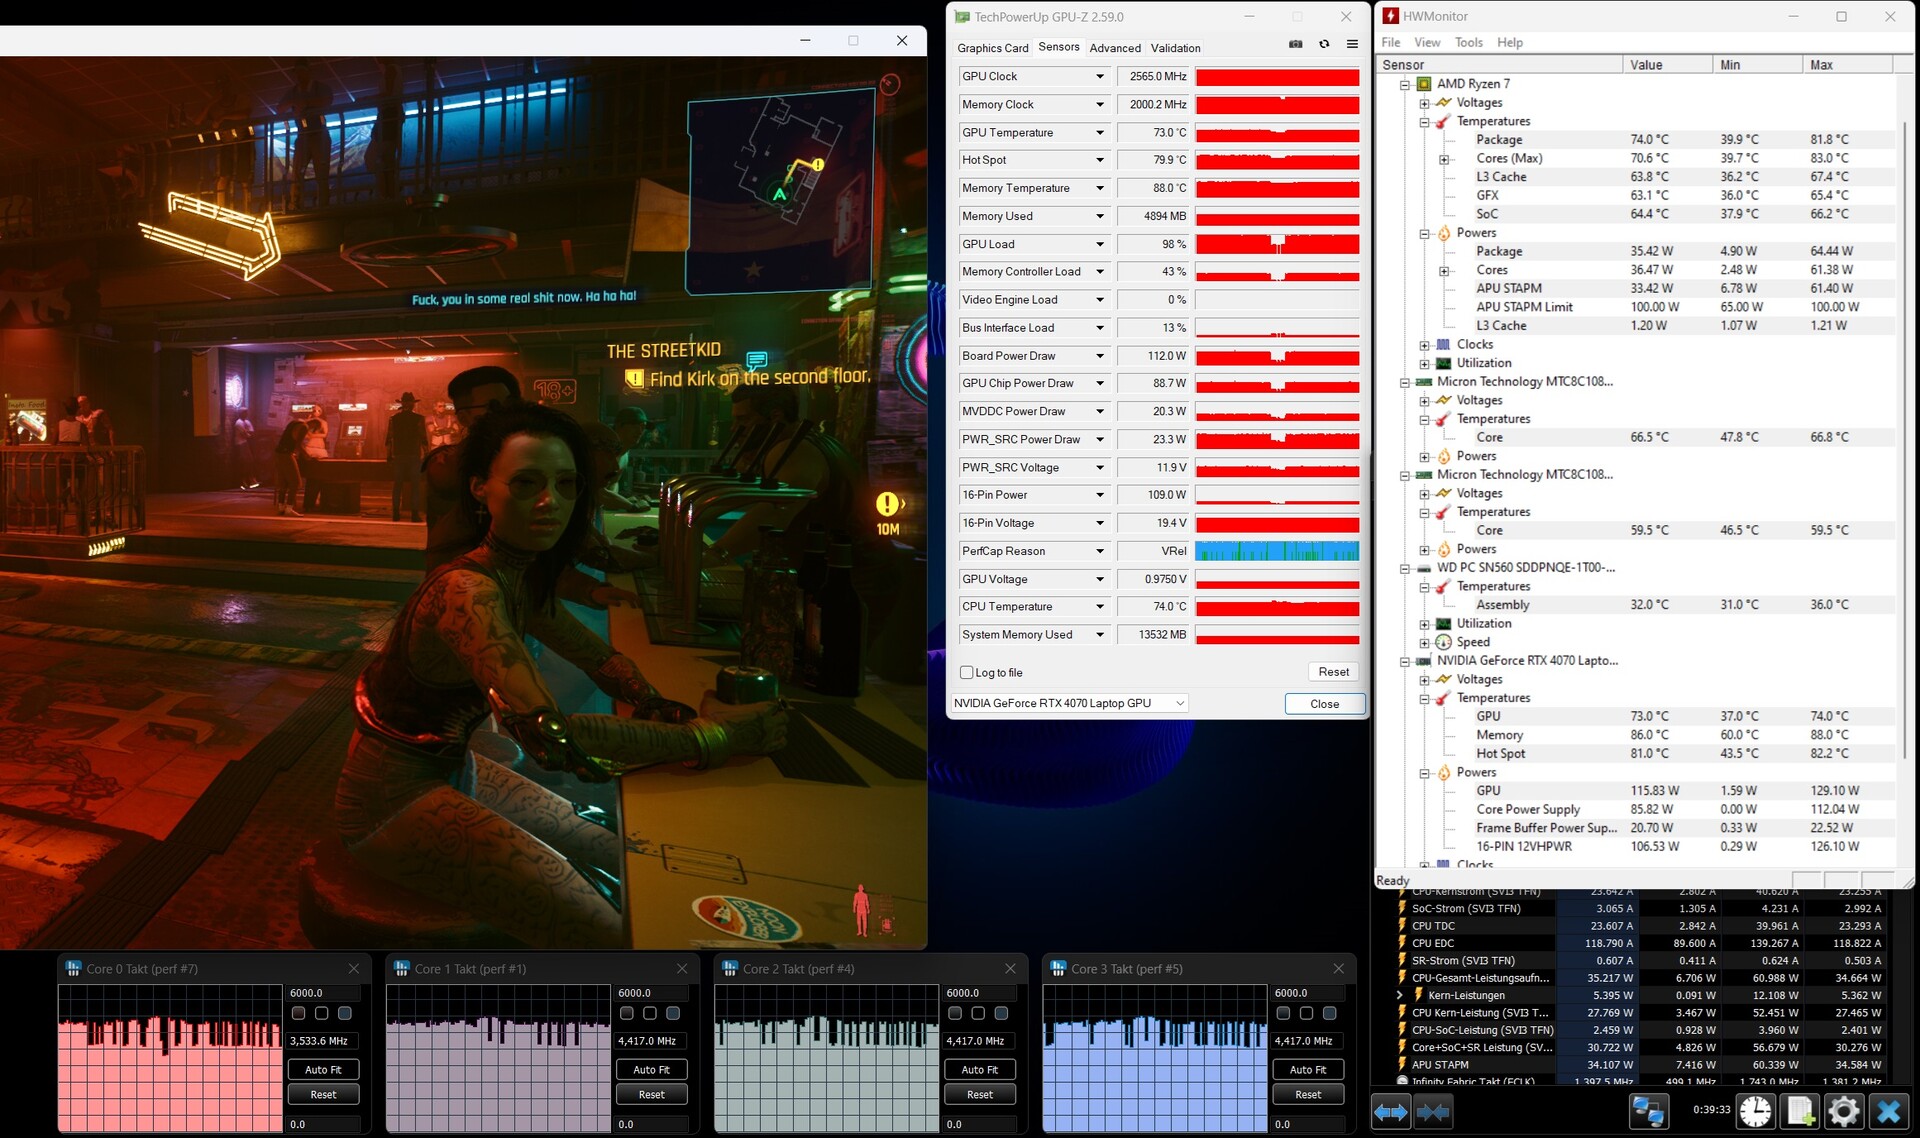
Prueba de estrés
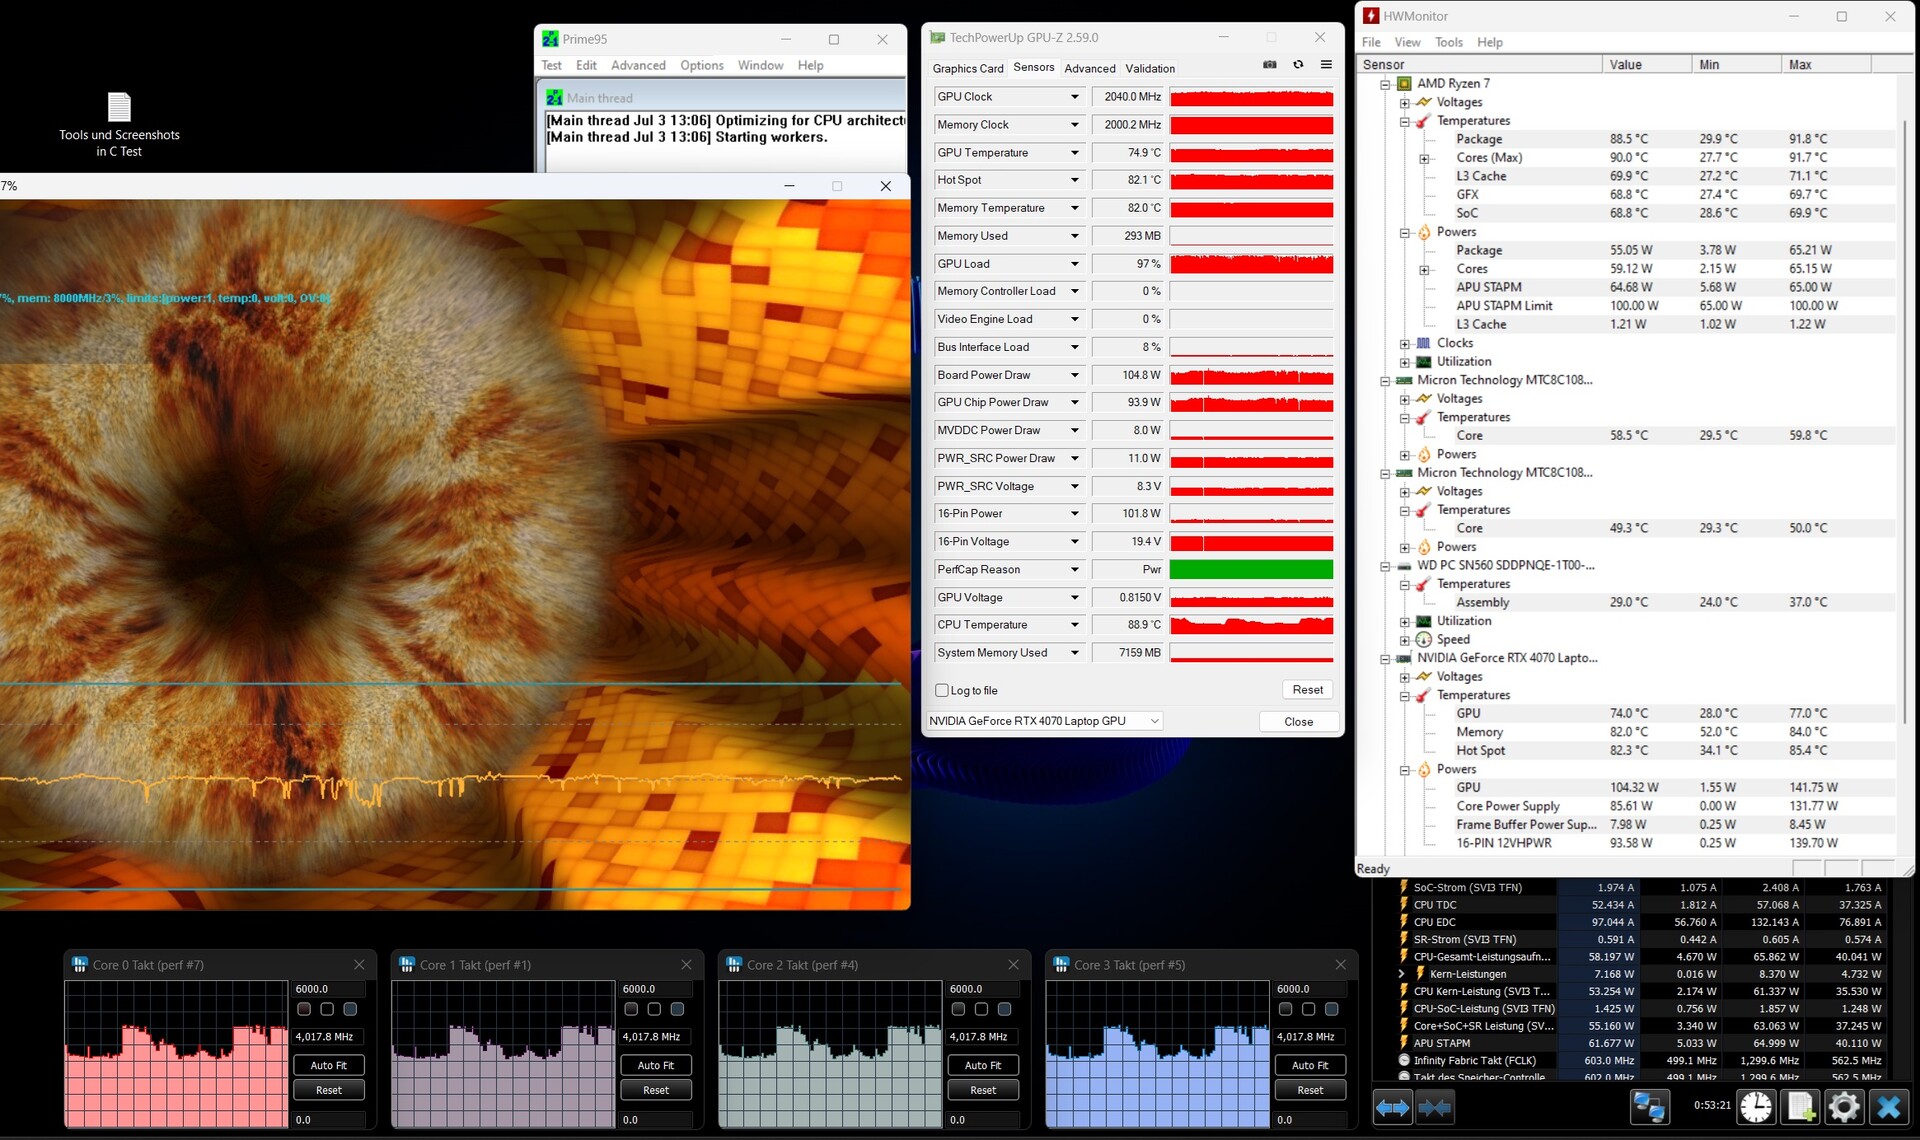
Cuando la CPU se pone a plena carga con Prime95, consume constantemente los 65 vatios permitidos. Aunque se trata de un valor menor que el de algunos competidores con la misma CPU, se mantiene constante durante periodos de tiempo más largos. La temperatura del núcleo se mantiene en unos aceptables 80 °C o menos.
Sólo bajo carga adicional de la tarjeta gráfica, el HP Omen 17 alcanza sus límites. Cuando ambos componentes funcionan a pleno rendimiento, el consumo de energía se mantiene en sus valores máximos de 50 vatios para la CPU (menos el refuerzo dinámico para la GPU) y 120 vatios para la tarjeta gráfica. Las temperaturas aumentarán entonces hasta casi 90 °C (194 °F) para la CPU y 75 °C (167 °F) para la GPU.
Durante la prueba de estrés, la velocidad de reloj de la CPU se mantiene en torno a los 4.500 MHz, bajando a unos 4.000 MHz cuando se añade el chip gráfico.
Altavoces
Los altavoces dejan una impresión muy variada. Los graves medios, que se utilizan sobre todo en los juegos de acción, suenan sorprendentemente bien y potentes. Las voces también suenan naturales e incluyen cierta profundidad en los detalles.
Los graves profundos no están presentes en absoluto, y los medios bajos, la gama de las guitarras o la batería, resultan débiles. También se nota que las voces pueden perderse fácilmente en el fondo detrás de otros ruidos. Los altavoces están bien para los juegos, pero ni la transmisión de vídeo ni escuchar música deberían incluirse en los escenarios de uso recomendados para unos altavoces en general sólo mediocres.
HP Omen 17-db0079ng análisis de audio
(±) | la sonoridad del altavoz es media pero buena (80 dB)
Graves 100 - 315 Hz
(-) | casi sin bajos - de media 19.1% inferior a la mediana
(±) | la linealidad de los graves es media (10.3% delta a frecuencia anterior)
Medios 400 - 2000 Hz
(+) | medios equilibrados - a sólo 1.9% de la mediana
(+) | los medios son lineales (4.4% delta a la frecuencia anterior)
Altos 2 - 16 kHz
(+) | máximos equilibrados - a sólo 3.8% de la mediana
(±) | la linealidad de los máximos es media (7.8% delta a frecuencia anterior)
Total 100 - 16.000 Hz
(+) | el sonido global es lineal (14.3% de diferencia con la mediana)
En comparación con la misma clase
» 25% de todos los dispositivos probados de esta clase eran mejores, 7% similares, 69% peores
» El mejor tuvo un delta de 6%, la media fue 18%, el peor fue ###max##%
En comparación con todos los dispositivos probados
» 16% de todos los dispositivos probados eran mejores, 4% similares, 80% peores
» El mejor tuvo un delta de 4%, la media fue 24%, el peor fue ###max##%
Apple MacBook Pro 16 2021 M1 Pro análisis de audio
(+) | los altavoces pueden reproducir a un volumen relativamente alto (#84.7 dB)
Graves 100 - 315 Hz
(+) | buen bajo - sólo 3.8% lejos de la mediana
(+) | el bajo es lineal (5.2% delta a la frecuencia anterior)
Medios 400 - 2000 Hz
(+) | medios equilibrados - a sólo 1.3% de la mediana
(+) | los medios son lineales (2.1% delta a la frecuencia anterior)
Altos 2 - 16 kHz
(+) | máximos equilibrados - a sólo 1.9% de la mediana
(+) | los máximos son lineales (2.7% delta a la frecuencia anterior)
Total 100 - 16.000 Hz
(+) | el sonido global es lineal (4.6% de diferencia con la mediana)
En comparación con la misma clase
» 0% de todos los dispositivos probados de esta clase eran mejores, 0% similares, 100% peores
» El mejor tuvo un delta de 5%, la media fue 18%, el peor fue ###max##%
En comparación con todos los dispositivos probados
» 0% de todos los dispositivos probados eran mejores, 0% similares, 100% peores
» El mejor tuvo un delta de 4%, la media fue 24%, el peor fue ###max##%
Gestión de la energía - Eficiente para un portátil de juegos
Consumo de energía
El limitado consumo máximo de energía no es muy sorprendente, ya que tanto la CPU como la GPU están ligeramente estranguladas. Medimos un valor máximo de 230 vatios, lo que supone casi un 10% menos que el consumo de otros modelos con esta tarjeta gráfica.
Por otro lado, lo realmente destacable son nuestras mediciones de consumo cuando no hay ninguna carga digna de mención. En ocasiones, el Omen 17 sólo consume el 50% de lo que utilizan sus competidores. Esto explica también la falta de calentamiento, que apenas se registra, y la buena duración de la batería.
| Off / Standby | |
| Ocioso | |
| Carga |
|
Clave:
min: | |
| HP Omen 17-db0079ng R7 8845HS, NVIDIA GeForce RTX 4070 Laptop GPU | Alienware m16 R2 Ultra 7 155H, NVIDIA GeForce RTX 4070 Laptop GPU | Asus ROG Strix Scar 16 G634JZR i9-14900HX, NVIDIA GeForce RTX 4080 Laptop GPU | Acer Predator Helios Neo 16 (2024) i7-14700HX, NVIDIA GeForce RTX 4070 Laptop GPU | Asus TUF Gaming A17 FA707XI-NS94 R9 7940HS, NVIDIA GeForce RTX 4070 Laptop GPU | Asus TUF Gaming A15 FA507UV R9 8945H, NVIDIA GeForce RTX 4060 Laptop GPU | Medio NVIDIA GeForce RTX 4070 Laptop GPU | Media de la clase Gaming | |
|---|---|---|---|---|---|---|---|---|
| Power Consumption | -38% | -59% | -122% | -20% | 6% | -46% | -57% | |
| Idle Minimum * | 6 | 8.1 -35% | 10.71 -79% | 26.7 -345% | 6.2 -3% | 7 -17% | 12.8 ? -113% | 13.6 ? -127% |
| Idle Average * | 12 | 13 -8% | 14.75 -23% | 24.4 -103% | 21.8 -82% | 12 -0% | 17.8 ? -48% | 19 ? -58% |
| Idle Maximum * | 18 | 40.3 -124% | 30 -67% | 32.7 -82% | 22 -22% | 18 -0% | 24.3 ? -35% | 26.4 ? -47% |
| Load Average * | 71 | 79 -11% | 135 -90% | 122.1 -72% | 59.2 17% | 70 1% | 96.9 ? -36% | 103.2 ? -45% |
| Cyberpunk 2077 ultra * | 197 | 146.8 25% | ||||||
| Cyberpunk 2077 ultra external monitor * | 191.8 | 146.2 24% | ||||||
| Load Maximum * | 228 | 254.9 -12% | 307 -35% | 241 -6% | 247.8 -9% | 206 10% | 221 ? 3% | 247 ? -8% |
| Witcher 3 ultra * | 188.1 | 286 | 190.6 | 189.7 |
* ... más pequeño es mejor
Power Consumption Cyberpunk / Stress Test
Power Consumption With External Monitor
Duración de las pilas
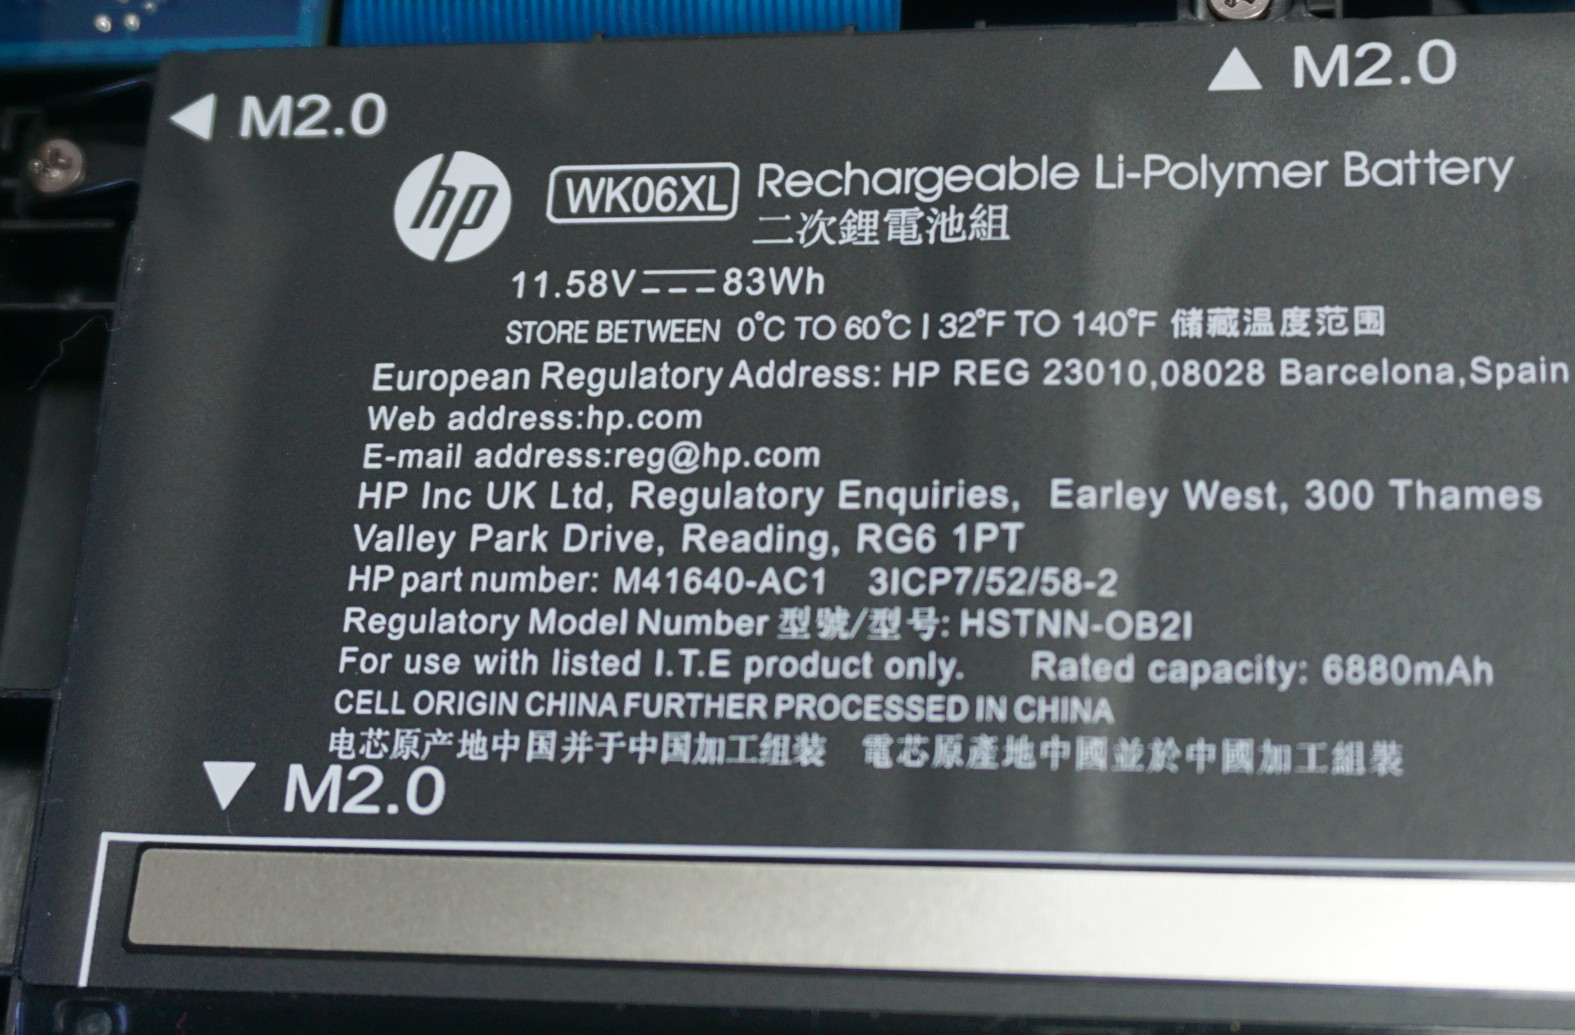
Como esperábamos a la luz del moderado consumo de energía, la duración de la batería está a un alto nivel teniendo en cuenta el rendimiento informático. Aunque con una capacidad de 83 Wh, la batería es más pequeña que las de otros portátiles para juegos de gama media, la autonomía en nuestra prueba de navegación web es ligeramente superior a 9 horas. Durante esta prueba, el brillo de la pantalla se reduce a 150 cd/m², lo que también debería ser suficiente para el trabajo de escritorio y, en general, durante las horas de la noche.
Con el brillo máximo, el Omen 17 no es tan eficiente. La gran pantalla exige lo suyo, lo que hace que la duración de la batería se reduzca casi a la mitad, a apenas 5 horas. La reproducción de vídeos también es menos eficiente. Como también se hace evidente durante la reproducción de vídeos, los gráficos integrados se utilizan al máximo. Pero al menos la duración de la batería alcanza entonces casi la marca de las 8 horas.
Aunque la duración de la batería no sea sobresaliente en general, está a un buen nivel para un portátil de juegos.
| HP Omen 17-db0079ng R7 8845HS, NVIDIA GeForce RTX 4070 Laptop GPU, 83 Wh | Alienware m16 R2 Ultra 7 155H, NVIDIA GeForce RTX 4070 Laptop GPU, 90 Wh | Asus ROG Strix Scar 16 G634JZR i9-14900HX, NVIDIA GeForce RTX 4080 Laptop GPU, 90 Wh | Acer Predator Helios Neo 16 (2024) i7-14700HX, NVIDIA GeForce RTX 4070 Laptop GPU, 90.61 Wh | Asus TUF Gaming A17 FA707XI-NS94 R9 7940HS, NVIDIA GeForce RTX 4070 Laptop GPU, 90 Wh | Asus TUF Gaming A15 FA507UV R9 8945H, NVIDIA GeForce RTX 4060 Laptop GPU, 90 Wh | Media de la clase Gaming | |
|---|---|---|---|---|---|---|---|
| Duración de Batería | -11% | -11% | -53% | 1% | 29% | -16% | |
| H.264 | 462 | 451 -2% | 242 -48% | 452 ? -2% | |||
| WiFi v1.3 | 544 | 483 -11% | 434 -20% | 227 -58% | 548 1% | 702 29% | 387 ? -29% |
| Cyberpunk 2077 ultra 150cd | 59 | ||||||
| Witcher 3 ultra | 57 | 74.7 ? |
Pro
Contra
Veredicto - El enfoque en el juego requiere algunos compromisos
El HP Omen 17 (2024) es un portátil para juegos puro que no ofrece en ningún sitio más que el equipamiento necesario. El resultado es una combinación de rendimiento informático elevado para juegos exigentes y un precio aceptable.
La RTX 4070 y el AMD Ryzen 7 de octava generación combinan bien con la pantalla QHD, aunque su frecuencia de refresco de 240 hercios sea casi imposible de alcanzar con los juegos actuales. Por desgracia, el resto de características de la pantalla son insuficientes para poder manejar también tareas como el procesamiento de imágenes a un alto nivel.
Juegos rápidos con un ruido de ventilador atenuado, pero el Omen 17 no ofrece mucho más que eso.
Lo que también es un acierto es la implementación del sistema de refrigeración. HP configura la CPU y la GPU para que funcionen por debajo de sus capacidades máximas y hace un buen uso del espacio dentro de un portátil de 17 pulgadas. Incluso bajo la carga más alta, el ruido del ventilador sigue siendo soportable. En modo "equilibrado", incluso desaparece en un segundo plano.
En el resto de áreas, hay algunos compromisos importantes. Las conexiones son limitadas y las que están disponibles son relativamente lentas. La cámara web y los altavoces sólo cumplen las exigencias más bajas en el mejor de los casos. Y, por último, los dispositivos de entrada sólo son adecuados para jugar hasta cierto punto, por lo que no sólo deberá añadir el habitual ratón para juegos, sino también un teclado adecuado.
Aunque los competidores con un rendimiento de juego comparable suelen ofrecer el mejor paquete global, también son más caros. Una alternativa que apenas está mejor equipada e incluso tiene una pantalla más débil mientras que al menos ofrece un teclado sólido es el Asus TUF Gaming A17 F707. Y con dos conexiones Thunderbolt 4 y una pantalla excelente, el Acer Predator Helios Neo 16 es claramente un portátil mejor. Pero si sólo tenemos en cuenta el rendimiento puro en juegos, ninguno de esos dos portátiles es significativamente más rápido, sino sólo mucho más ruidoso.
Precio y disponibilidad
El HP Omen 17 (2024) está disponible directamente en HP a partir de 999 dólares. Puede configurar los componentes y nuestra configuración probada con una RTX 4070 y pantalla QHD cuesta ~$1660. Amazon ofrece un modelo con el mismo procesador pero la RTX 4050 por ~$1500.
Tenga en cuenta que recientemente hemos actualizado nuestro sistema de clasificación y que los resultados de la versión 8 ya no son comparables con los de la versión 7. Puede encontrar información adicional al respecto aquí.
HP Omen 17-db0079ng
- 07/22/2024 v8
Mario Petzold
 Total Sustainability Score:
 Transparencia
La selección de los dispositivos que se van a reseñar corre a cargo de nuestro equipo editorial. La muestra de prueba fue proporcionada al autor en calidad de préstamo por el fabricante o el minorista a los efectos de esta reseña. El prestamista no tuvo ninguna influencia en esta reseña, ni el fabricante recibió una copia de la misma antes de su publicación. No había ninguna obligación de publicar esta reseña. Nunca aceptamos compensaciones o pagos a cambio de nuestras reseñas. Como empresa de medios independiente, Notebookcheck no está sujeta a la autoridad de fabricantes, minoristas o editores.
Así es como prueba Notebookcheck
Cada año, Notebookcheck revisa de forma independiente cientos de portátiles y smartphones utilizando procedimientos estandarizados para asegurar que todos los resultados son comparables. Hemos desarrollado continuamente nuestros métodos de prueba durante unos 20 años y hemos establecido los estándares de la industria en el proceso. En nuestros laboratorios de pruebas, técnicos y editores experimentados utilizan equipos de medición de alta calidad. Estas pruebas implican un proceso de validación en varias fases. Nuestro complejo sistema de clasificación se basa en cientos de mediciones y puntos de referencia bien fundamentados, lo que mantiene la objetividad.Price comparison

