

Análisis del portátil Asus V16 V3607V: GeForce Gráficos RTX sin arruinarse
Debut en el rendimiento del Core 7 240H.
Siempre que sepa dónde están los recortes, el Asus V16 puede ser una sólida solución polivalente que rinde lo suficientemente bien para la mayoría de los escenarios domésticos, de oficina o de aula.Allen Ngo, 👁 Allen Ngo (traducido por DeepL / Ninh Duy) Publicado 🇺🇸 🇫🇷 ...
Veredicto - Bien equipada y barata
A medida que la serie Vivobook sube de precio, la V16 se introdujo como la nueva opción de gama baja para los usuarios con presupuestos más ajustados. El V16 satisface este espacio de ~$1000 bastante bien al equilibrar una CPU nueva y decentemente rápida con una GPU RTX discreta en un diseño que es bastante delgado y portátil para ser competitivo frente al HP Pavilion Plus 16 o el más pesado Dell Inspiron 16 Plus 7640.
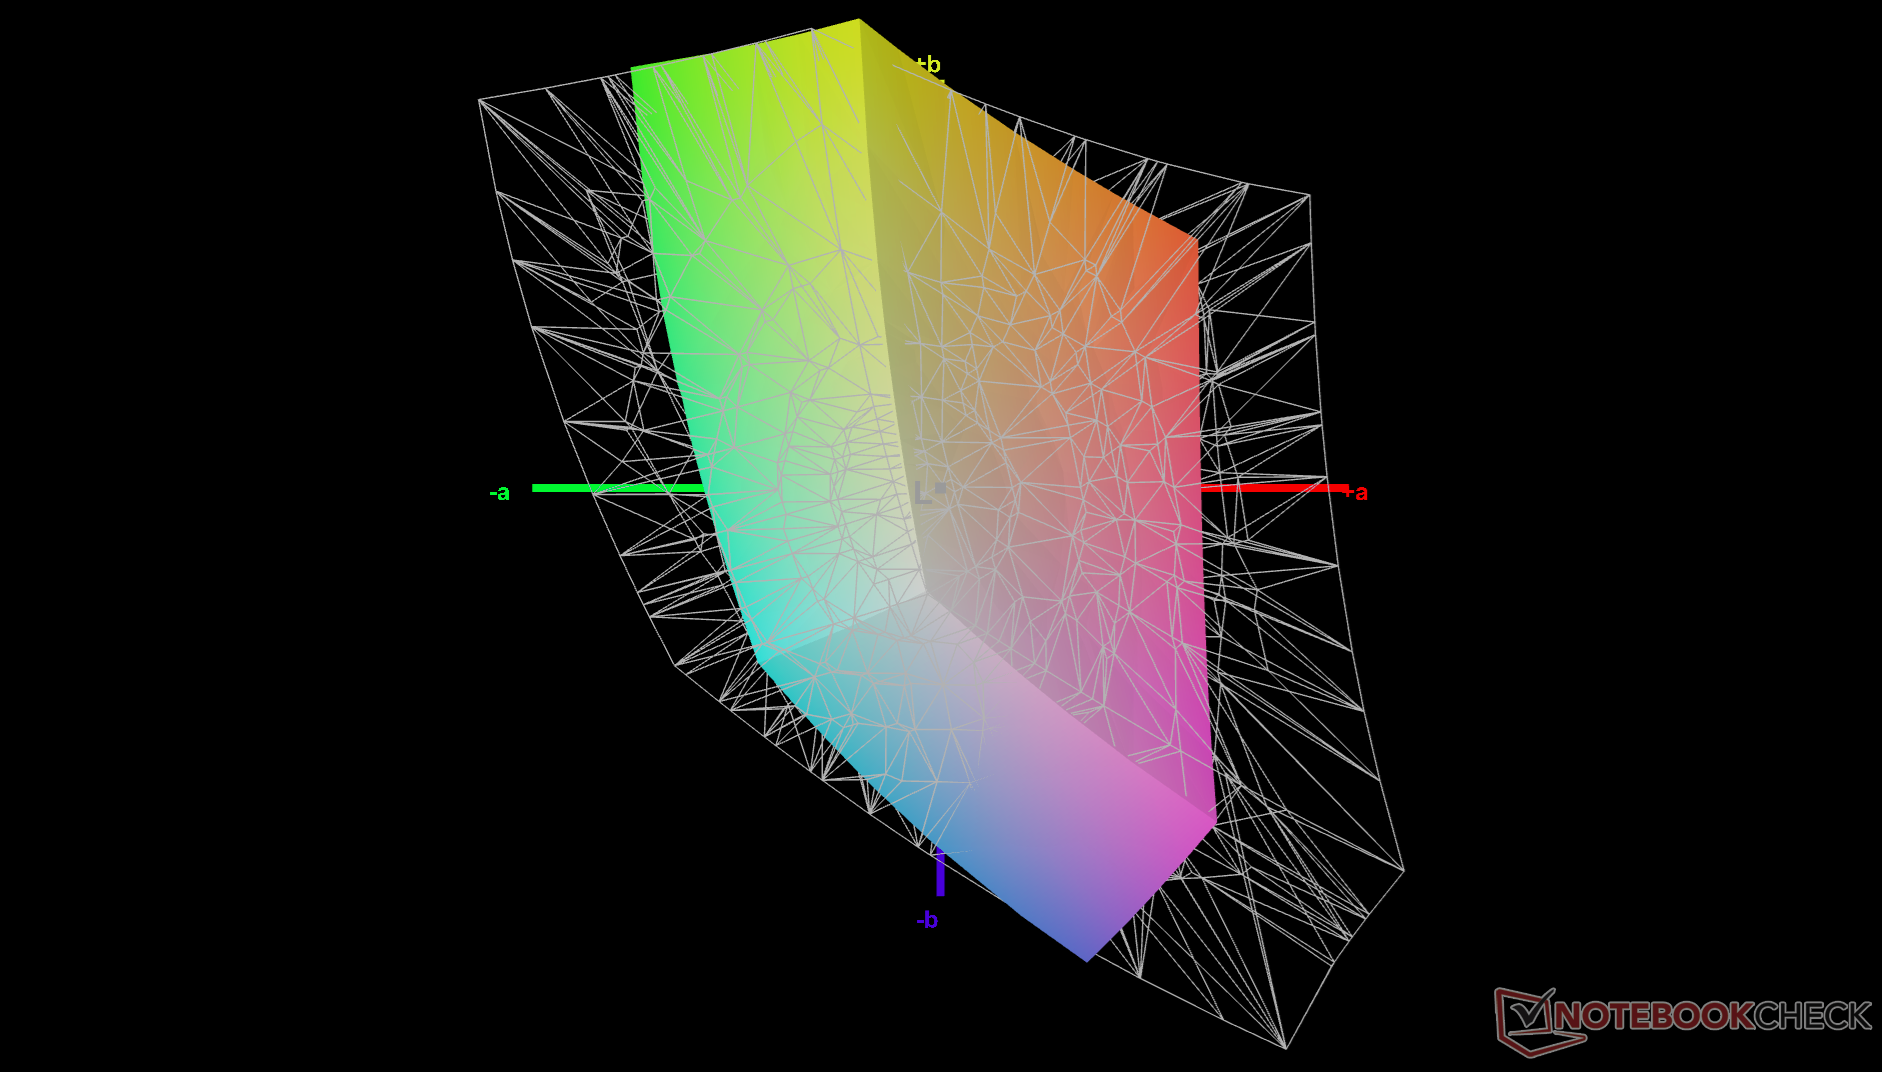
No obstante, los recortes son perceptibles. La pantalla, por ejemplo, ofrece una cobertura de color estrecha mientras que el chasis de plástico puede parecer bastante barato. El HP antes mencionado se siente más fuerte e incluso ofrece >99 por ciento de colores sRGB aunque a precios más altos que nuestro Asus.
En el momento de escribir estas líneas, la configuración RTX 4050 se vende por 100 dólares más que la RTX 3050. Es posible que los compradores potenciales quieran considerar la opción RTX 4050, ya que ofrece un rendimiento gráfico más de un 50 por ciento más rápido que la RTX 3050.
Pro
Contra
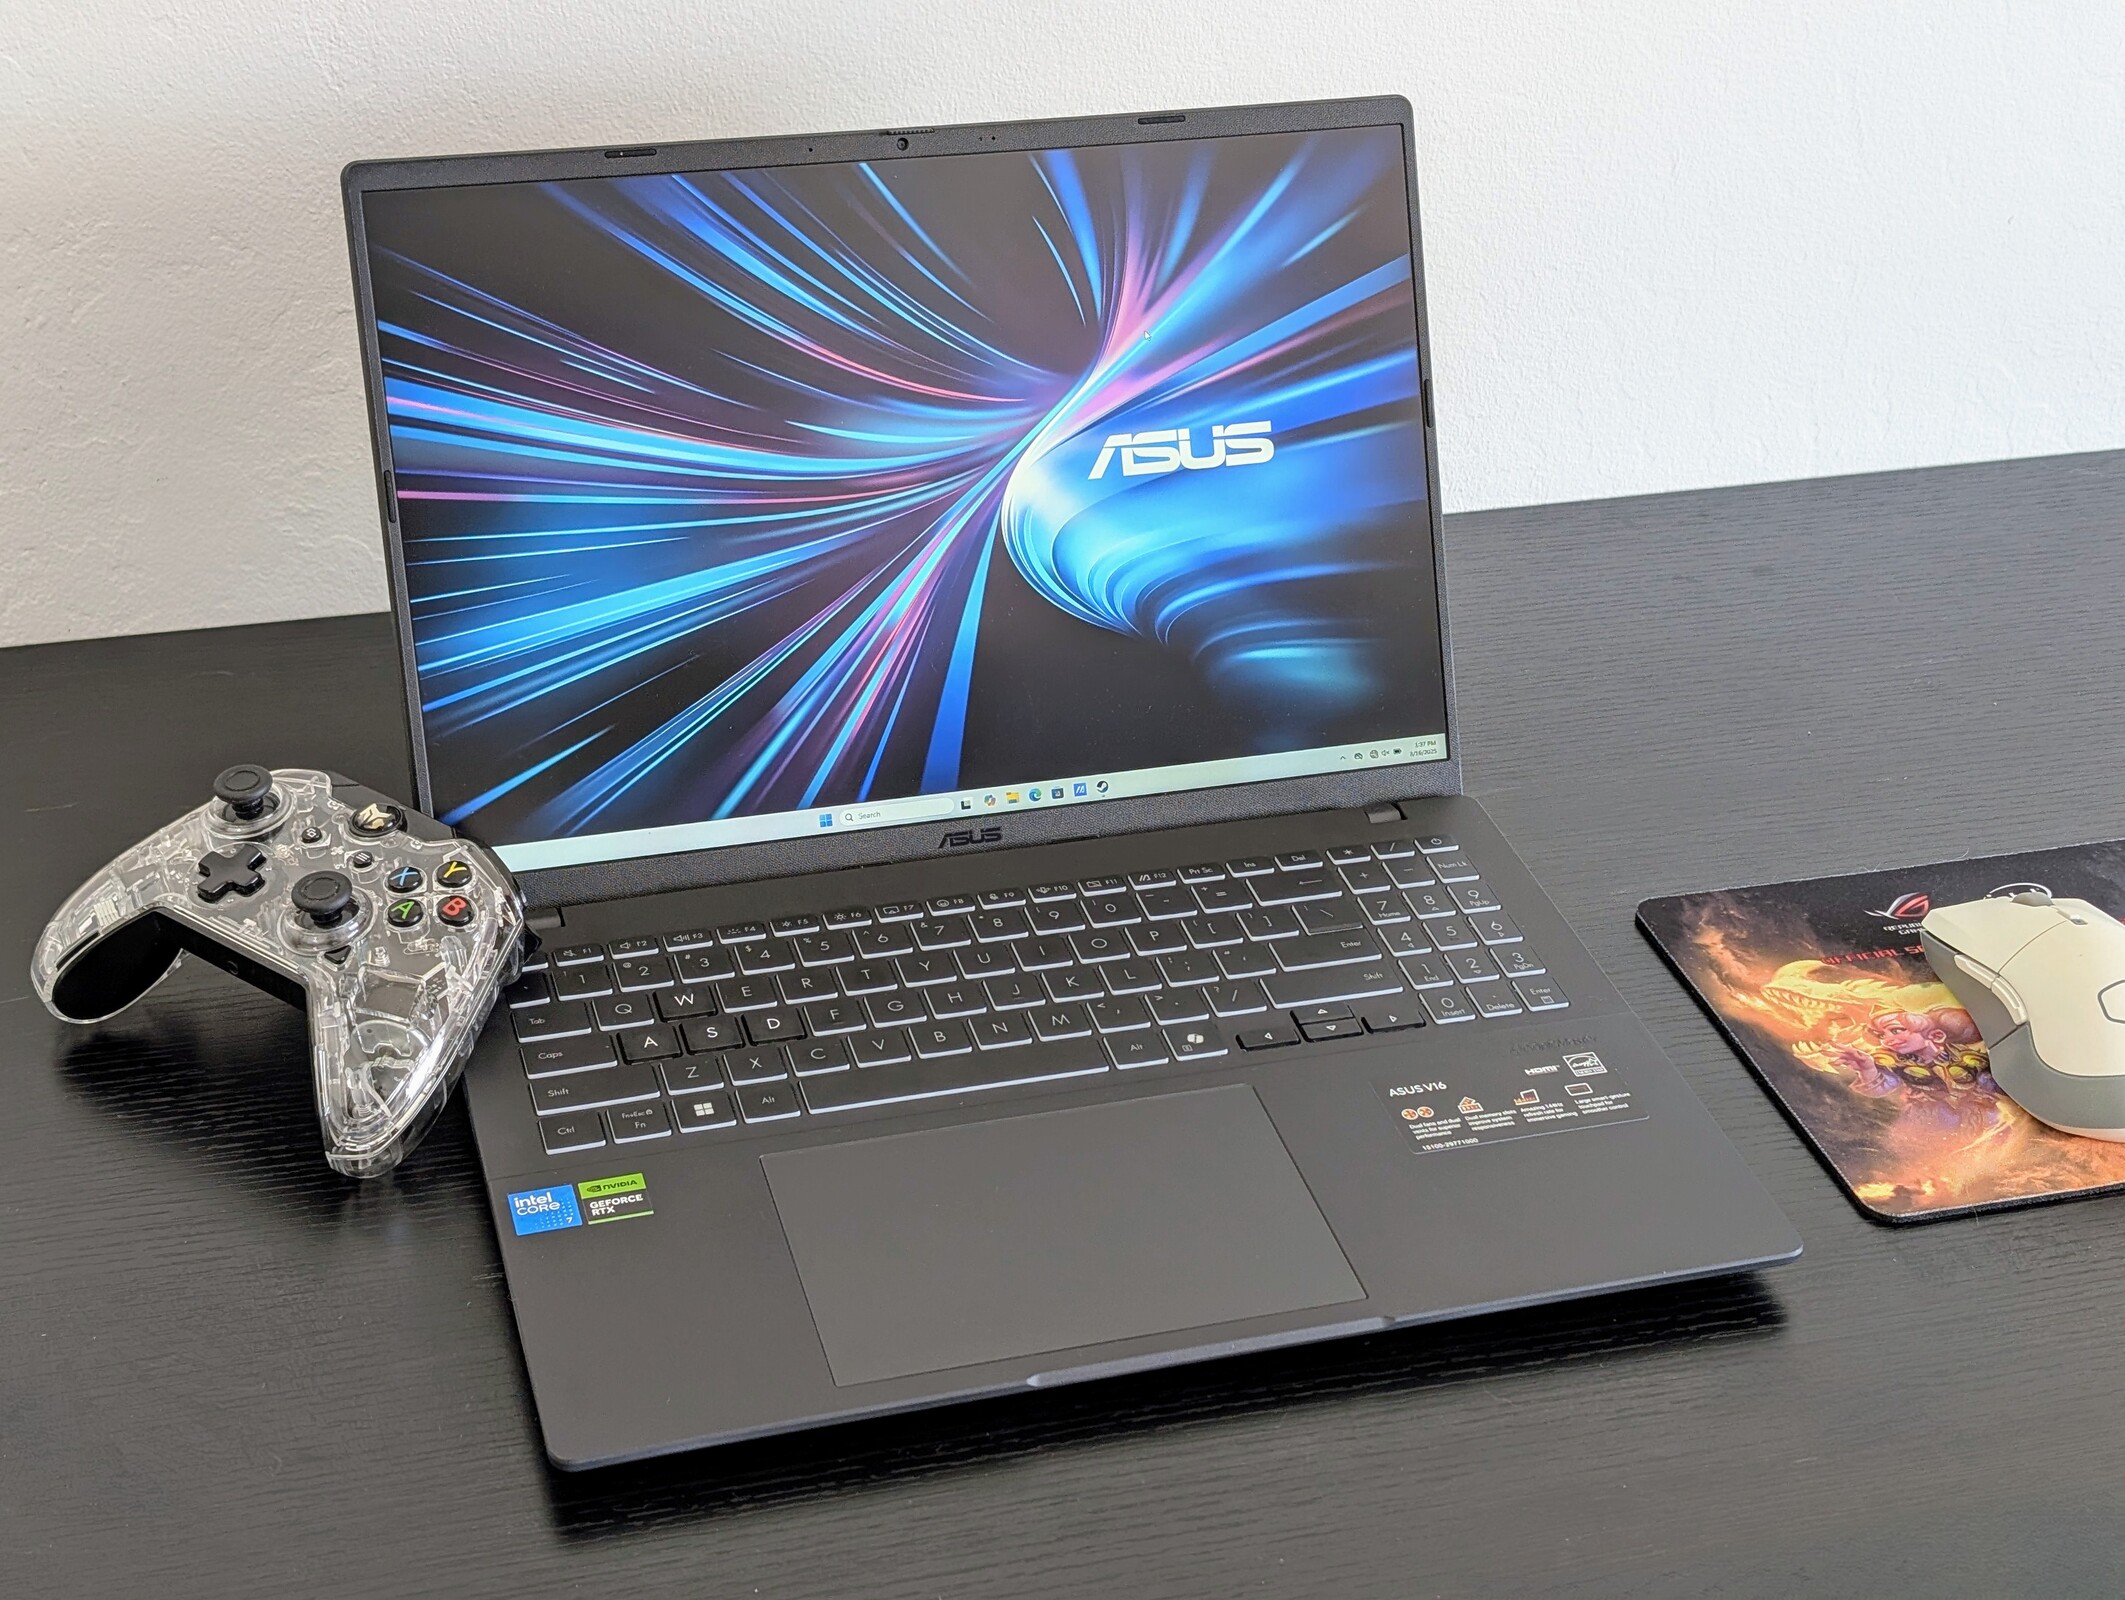
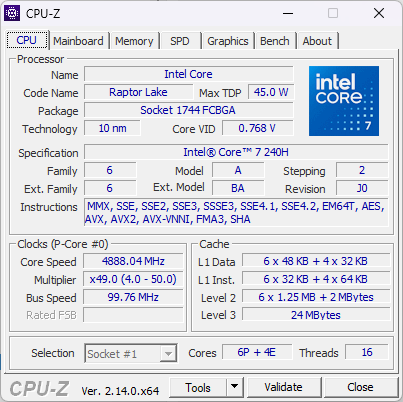
No debe confundirse con el VivoBook 16, el V16 es el modelo multimedia económico de Asus con precios de partida incluso inferiores a los de la serie VivoBook. Carece de ciertas características de lujo que se encuentran en el VivoBook como OLED y atractivos diseños metálicos. El 2025 V16 se entrega con el nuevo Core 7 240H de gama media alta.
Nuestra unidad de prueba viene con la mencionada CPU, pantalla IPS 1200p 144 Hz, y la antigua GeForce RTX 3050 de 6 GB para mantener los precios por debajo de los 1000 dólares. Otras SKU pueden enviarse con la RTX 4050 en su lugar.
Las alternativas al V16 incluyen otros portátiles multimedia económicos con GPU discretas como el HP Pavilion Plus 16, Dell Inspiron 16 Plus, o el Lenovo IdeaPad Pro 5 16.
Más opiniones sobre Asus:
Especificaciones
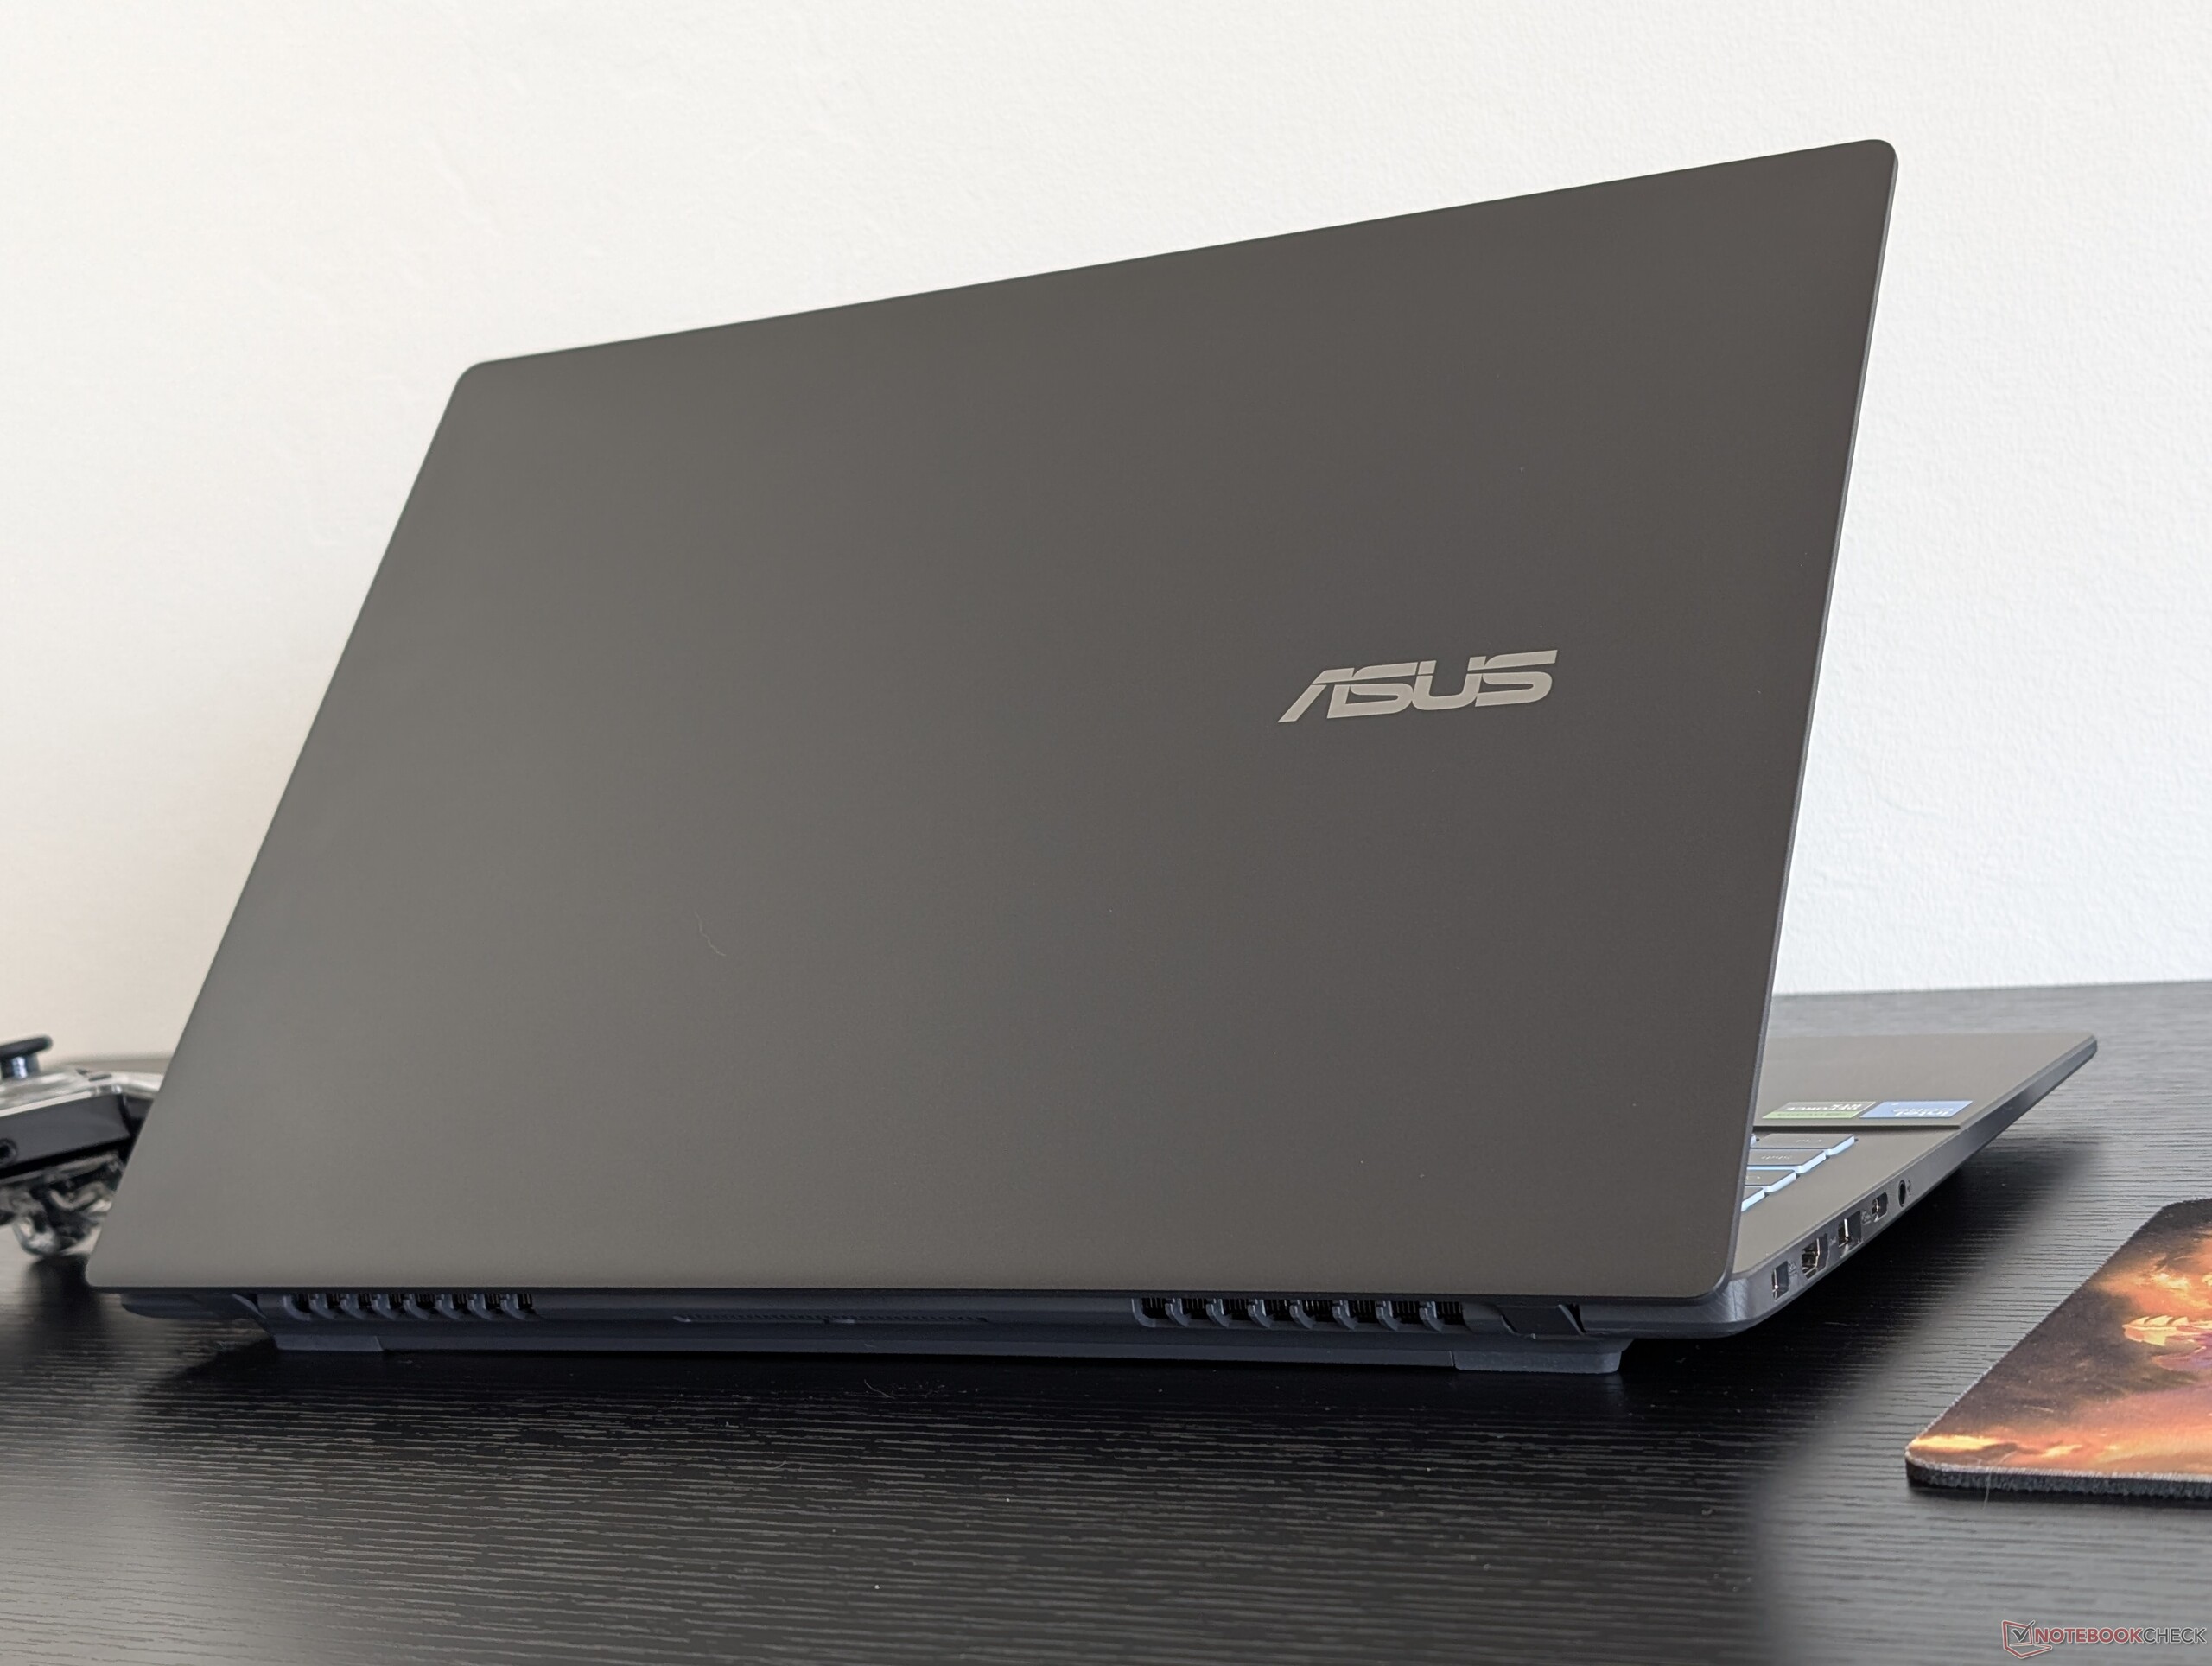
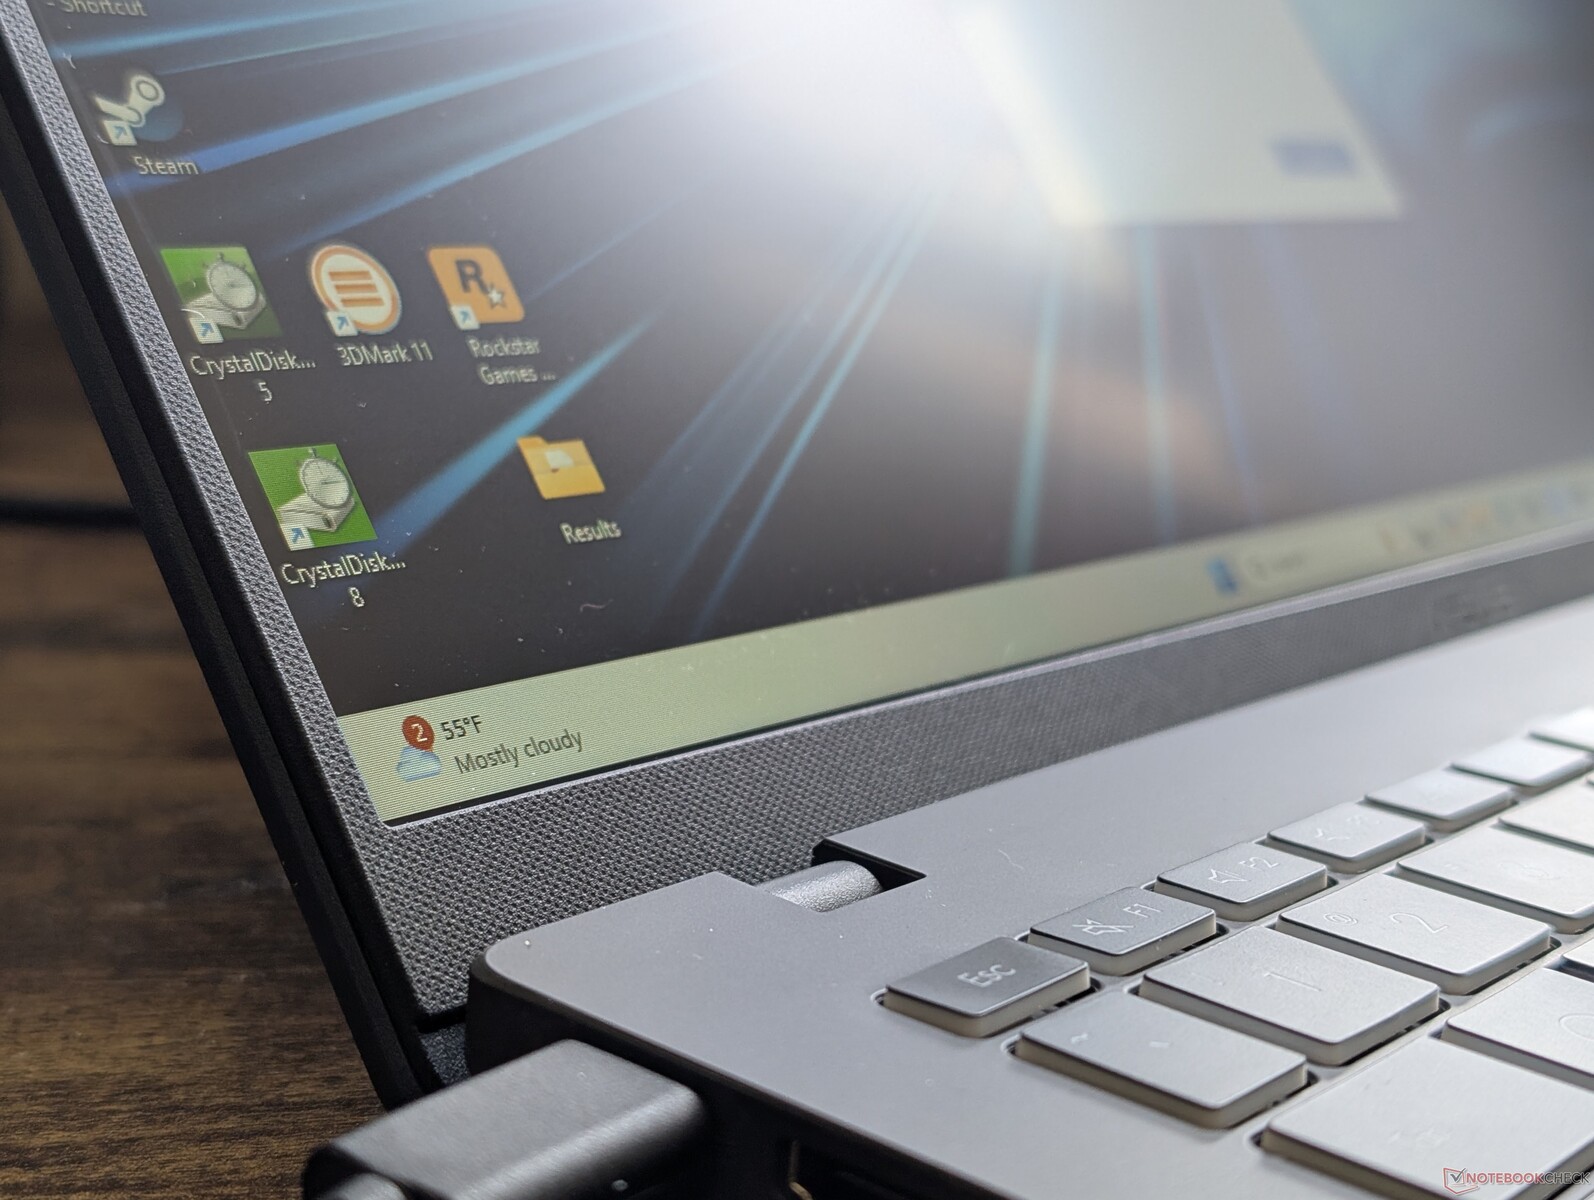
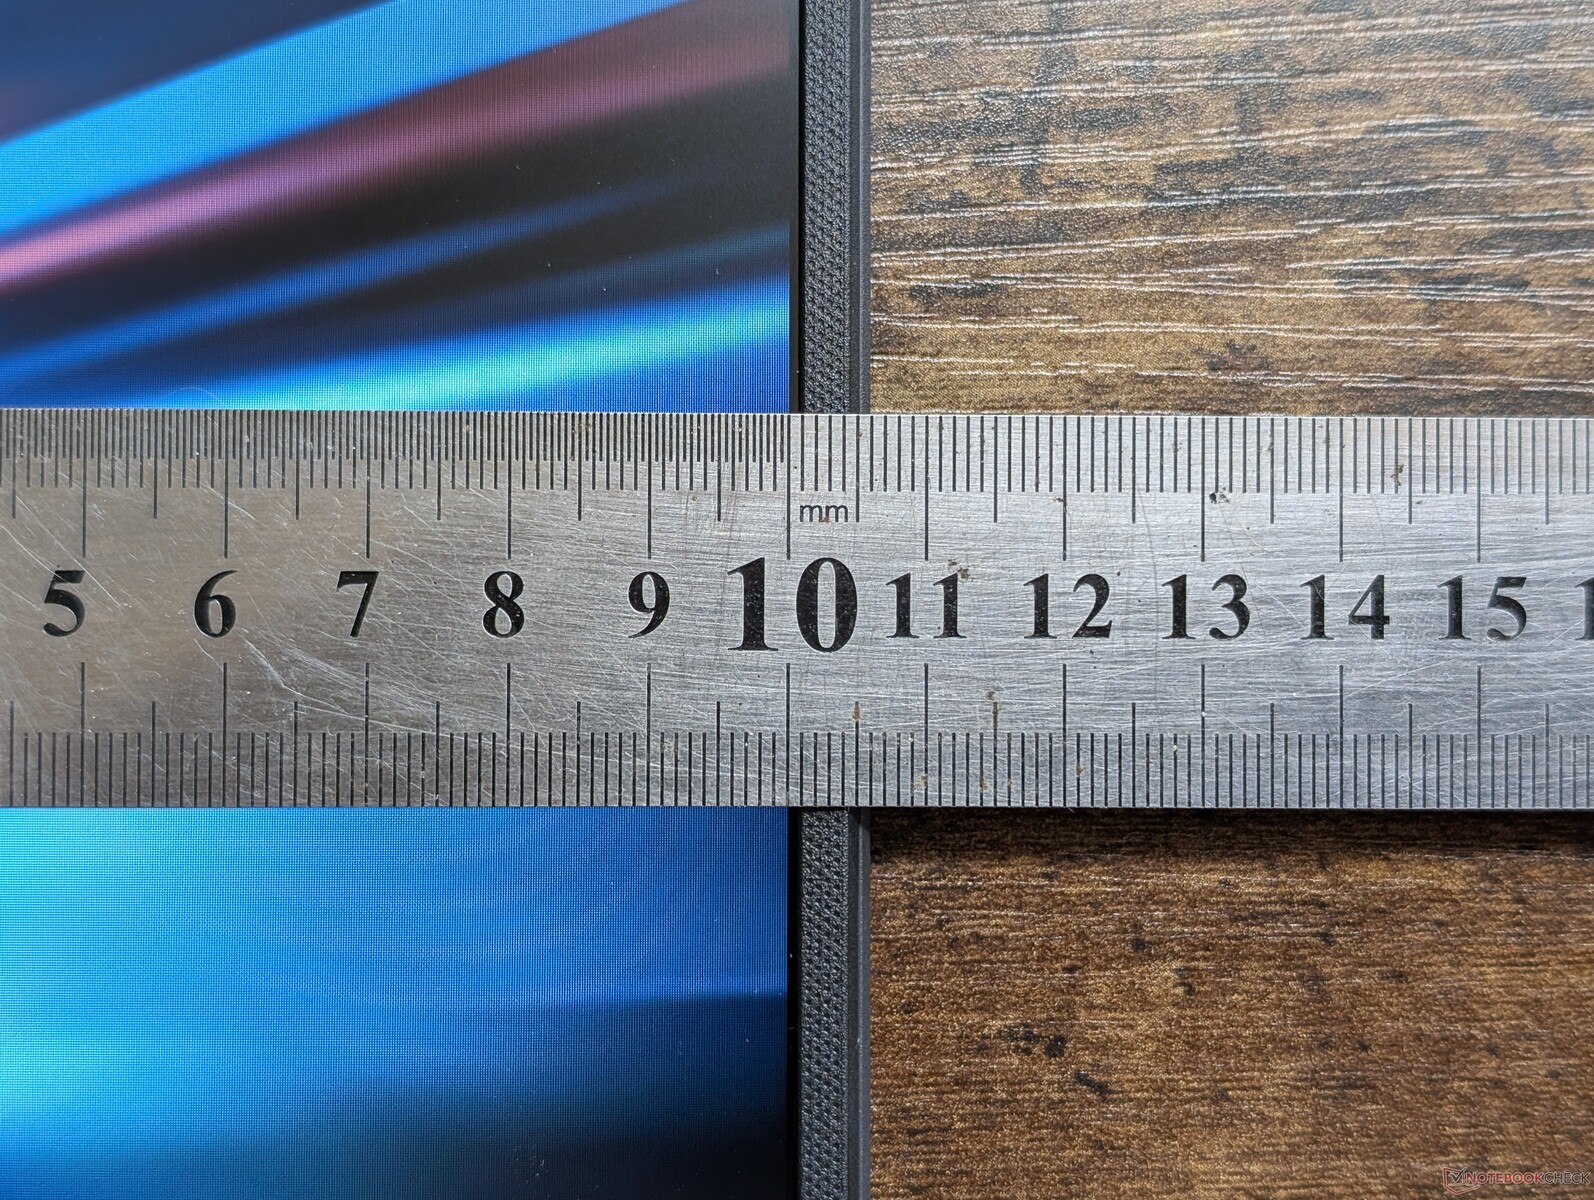
Caja - Plástico negro monótono
El chasis es inequívocamente de plástico, incluso la cubierta exterior, donde los fabricantes suelen utilizar metal para dar una mejor primera impresión. La base y la tapa son propensas a torcerse y son extremadamente susceptibles a las antiestéticas huellas dactilares.
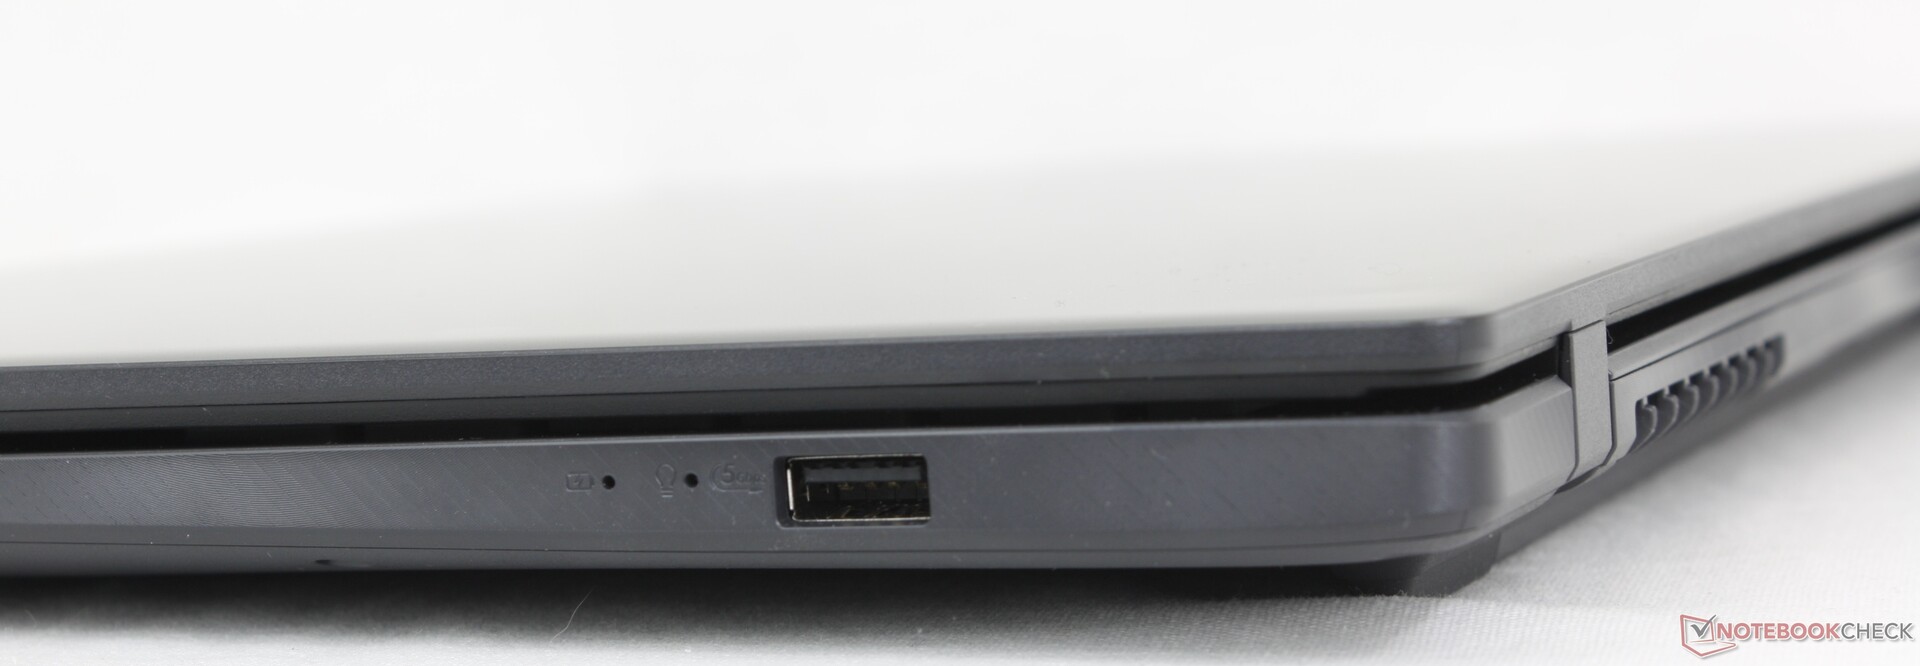
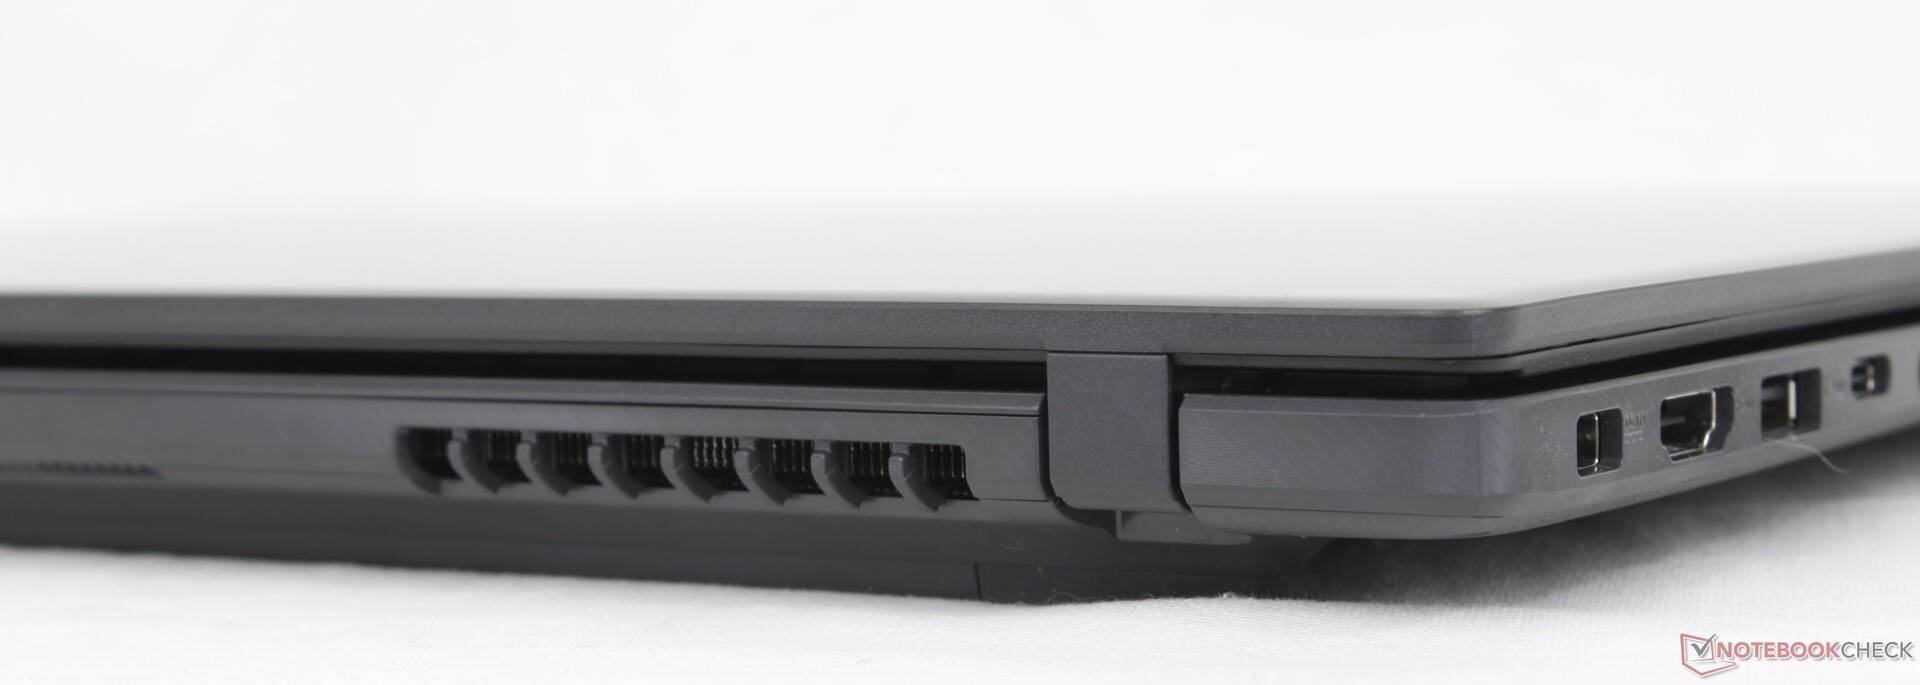
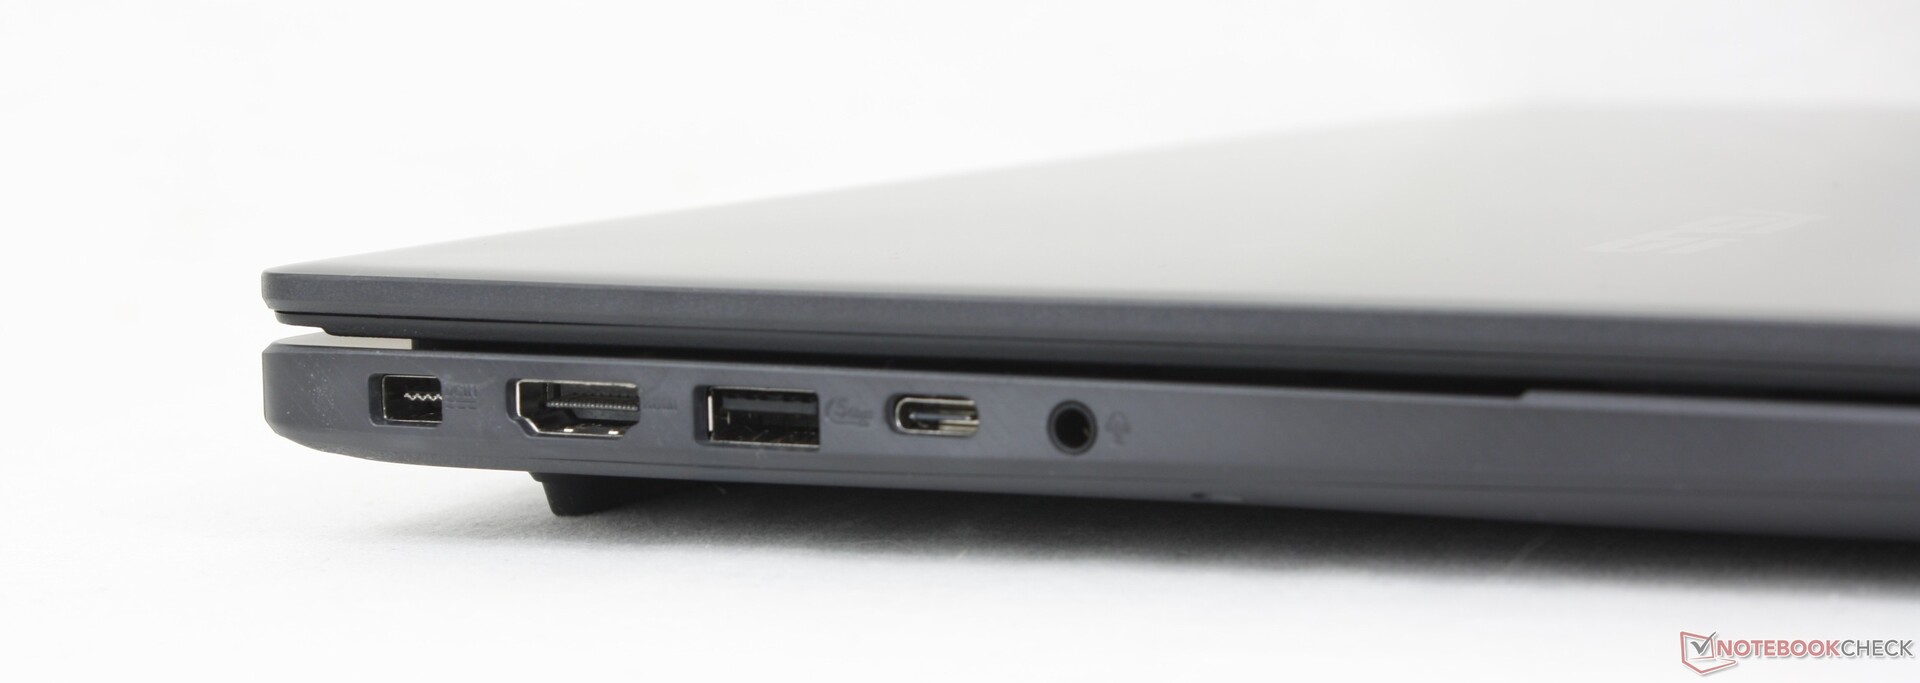
Conectividad
El puerto USB-C no es compatible con Thunderbolt, a diferencia del más caro VivoBook Pro 16 que integra una mayor variedad de puertos. Lamentablemente, el V16 también utiliza un cable adaptador de CA diferente al de la serie VivoBook.
Comunicación
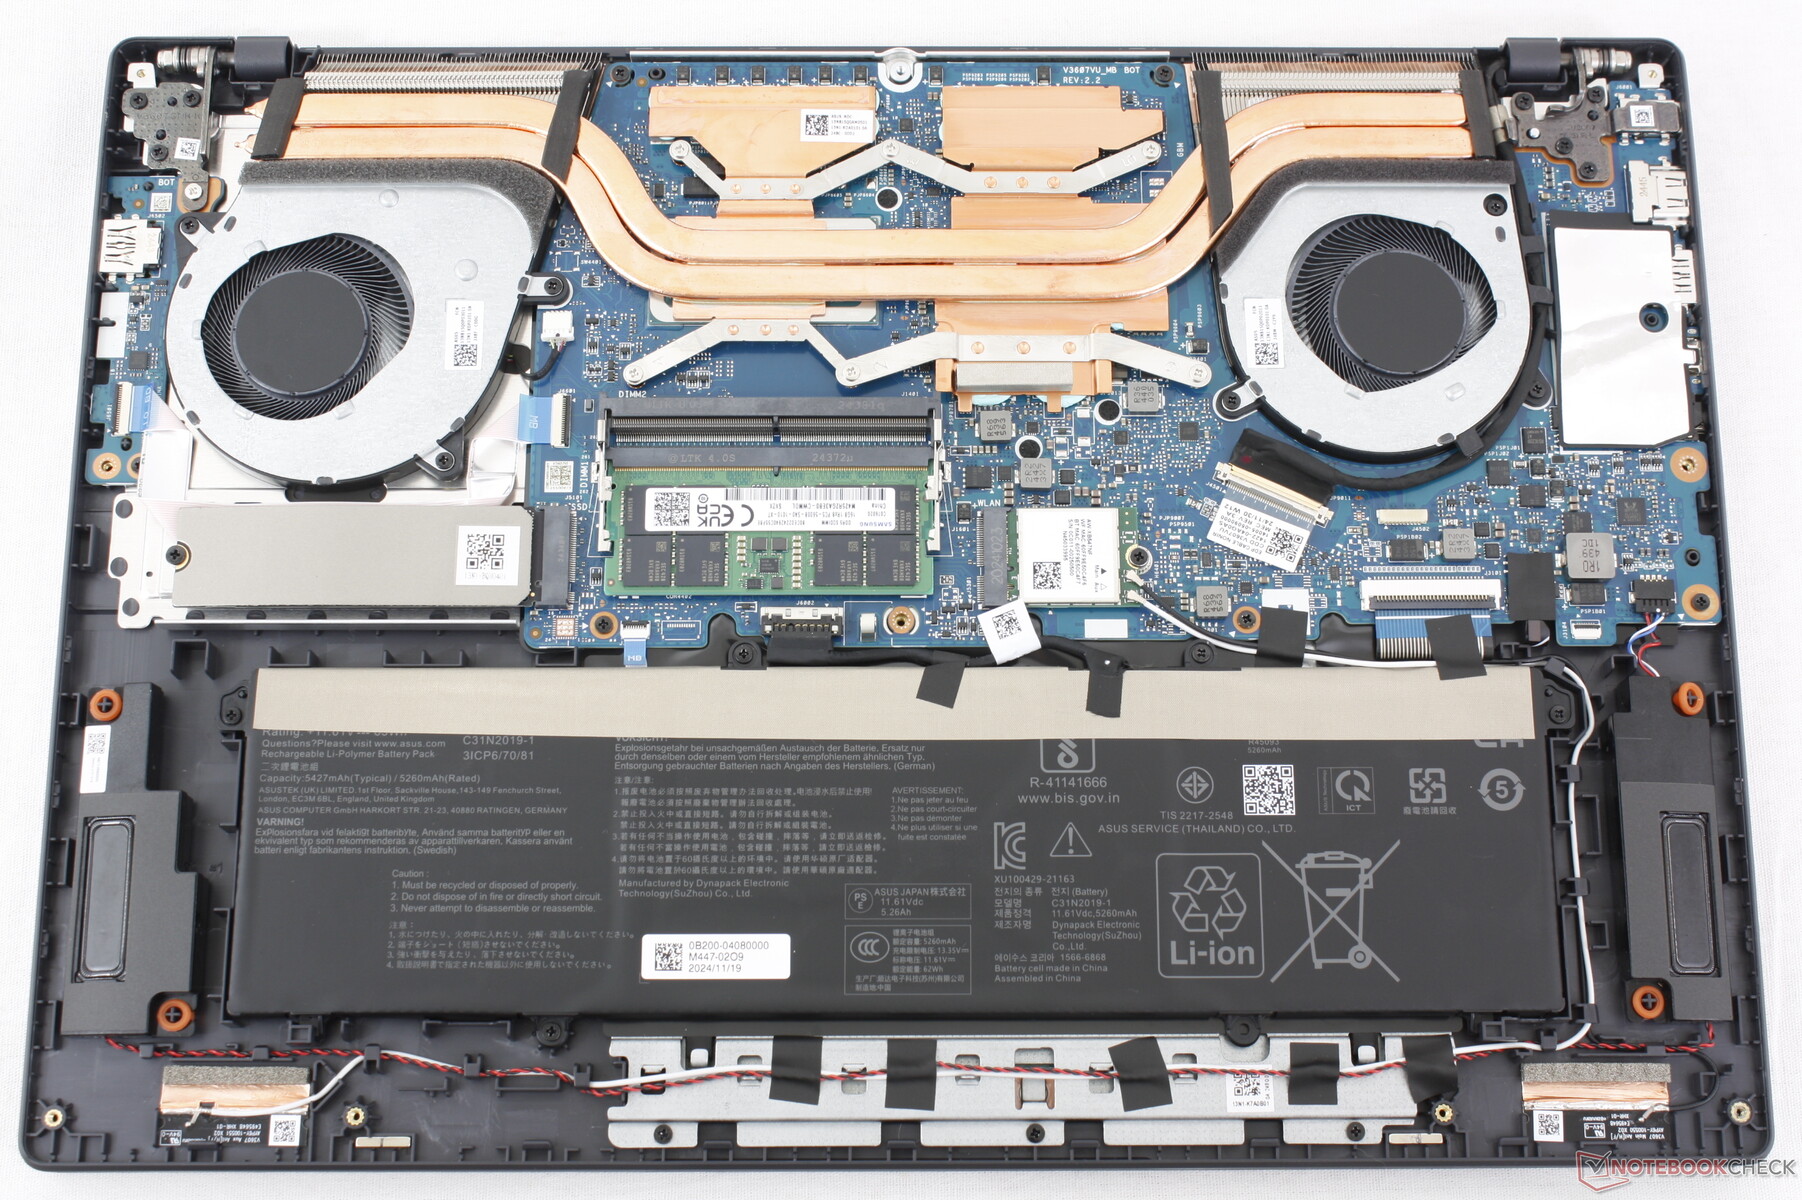
El Realtek RTL8852BE extraíble viene de serie con conectividad Wi-Fi 6 y Bluetooth 5.3. No hay soporte para Wi-Fi 6E o Wi-Fi 7.
Cámara web
Una cámara web de 2 MP con obturador físico viene de serie. No hay cámara IR para ahorrar costes.


Mantenimiento
El panel inferior se extrae con relativa facilidad con un destornillador Phillips para facilitar el mantenimiento. No admite una unidad SSD secundaria.
Sostenibilidad
Asus pretende ser neutra en emisiones de carbono, pero por lo demás no se proporcionan datos específicos sobre el proceso de fabricación del V16. El embalaje de venta al público es en su mayor parte de papel y cartón con muy poco envoltorio de plástico.
Accesorios y garantía
No hay más extras en la caja que el adaptador de CA y la documentación. Se aplica una garantía del fabricante de un año si se adquiere en EE.UU.
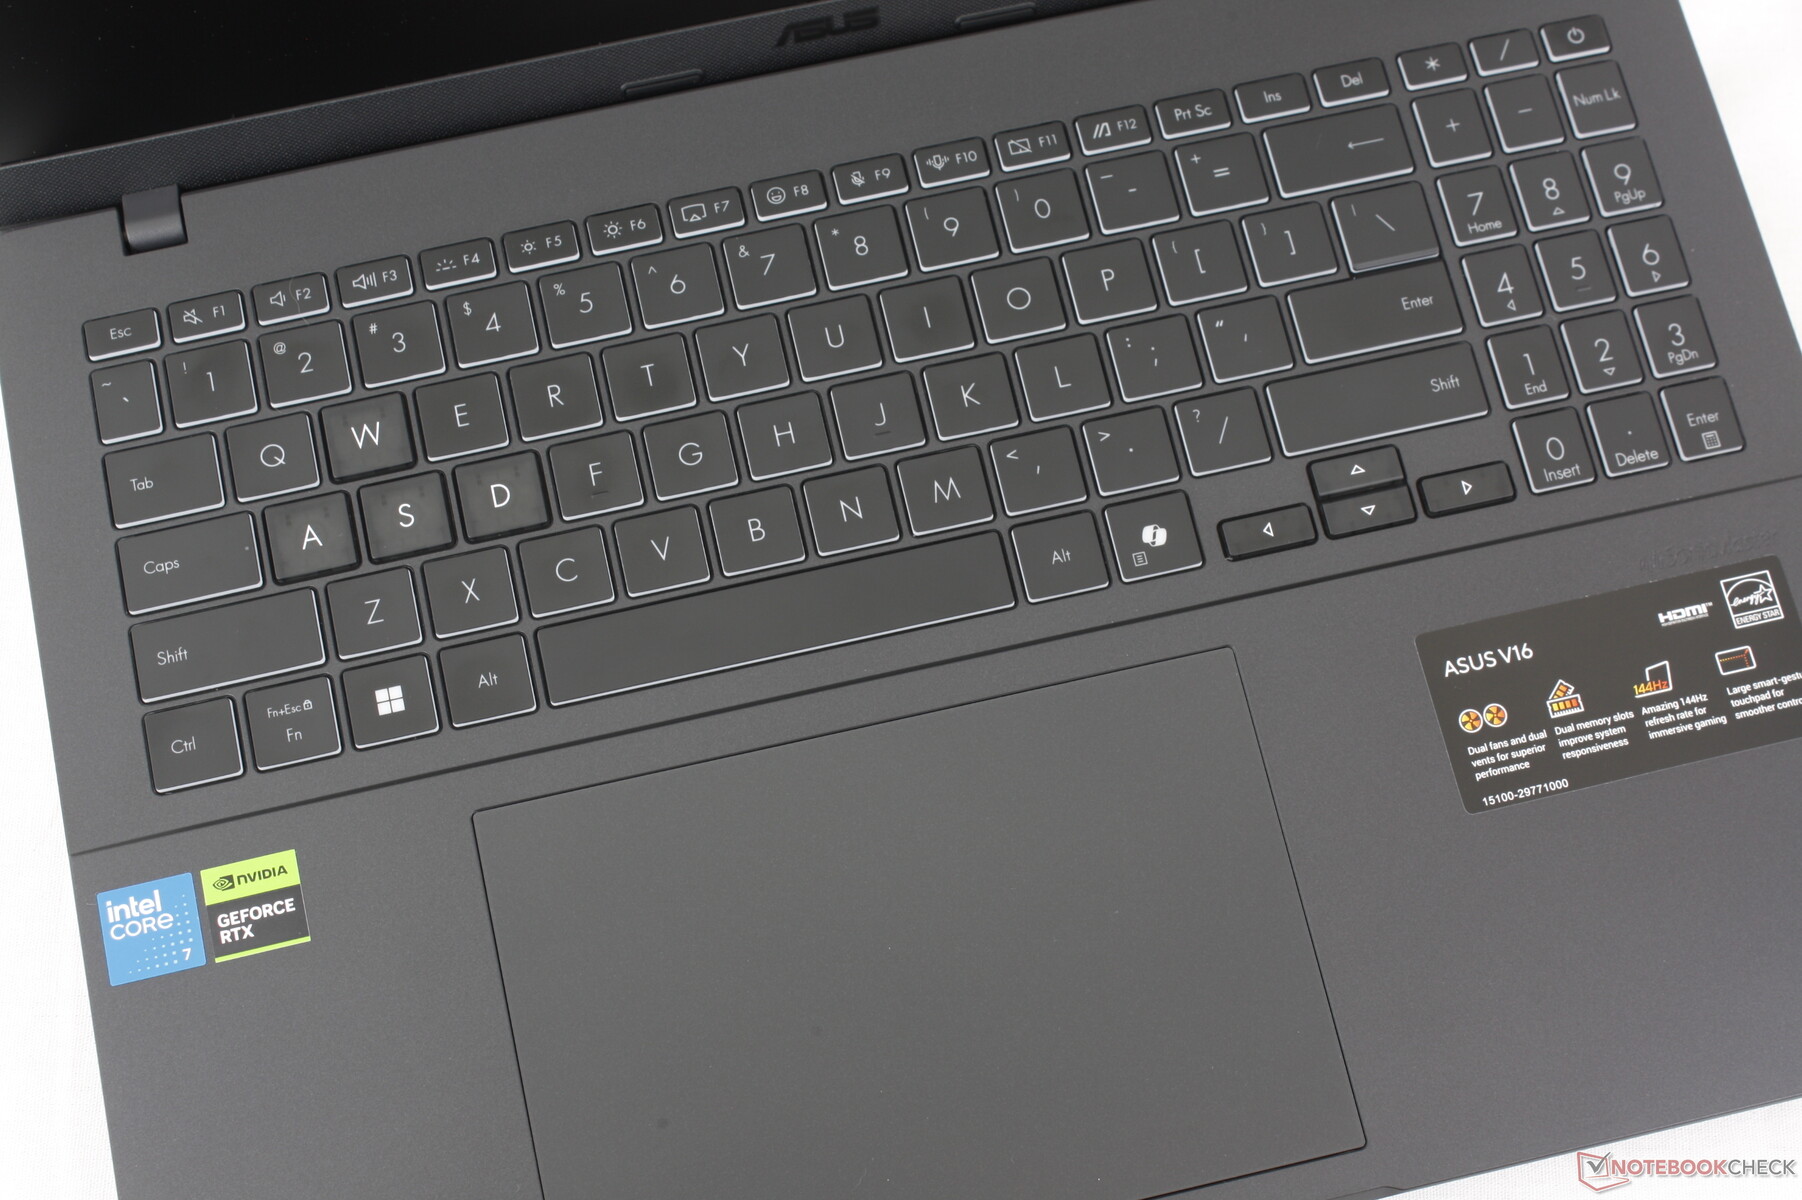
Dispositivos de entrada - VivoBook Vibes
Teclado
El V16 adopta el teclado de la serie VivoBook 16 para bien o para mal. El desplazamiento y la retroalimentación podrían haber sido más profundos y fuertes, respectivamente, pero funciona con suficiente fiabilidad sin necesidad de gastar más en alternativas con mejores teclados como un ThinkPad serie T o EliteBook.
Panel táctil
El clickpad es grande, de 15 x 10 cm, frente a los escasos 11,5 x 8 cm del Dell Inspiron 16 Plus 7640. Por desgracia, la respuesta es muy suave y silenciosa. Presionar hacia abajo también requiere más fuerza que en la mayoría de otros portátiles, lo que puede resultar incómodo al cabo de poco tiempo.
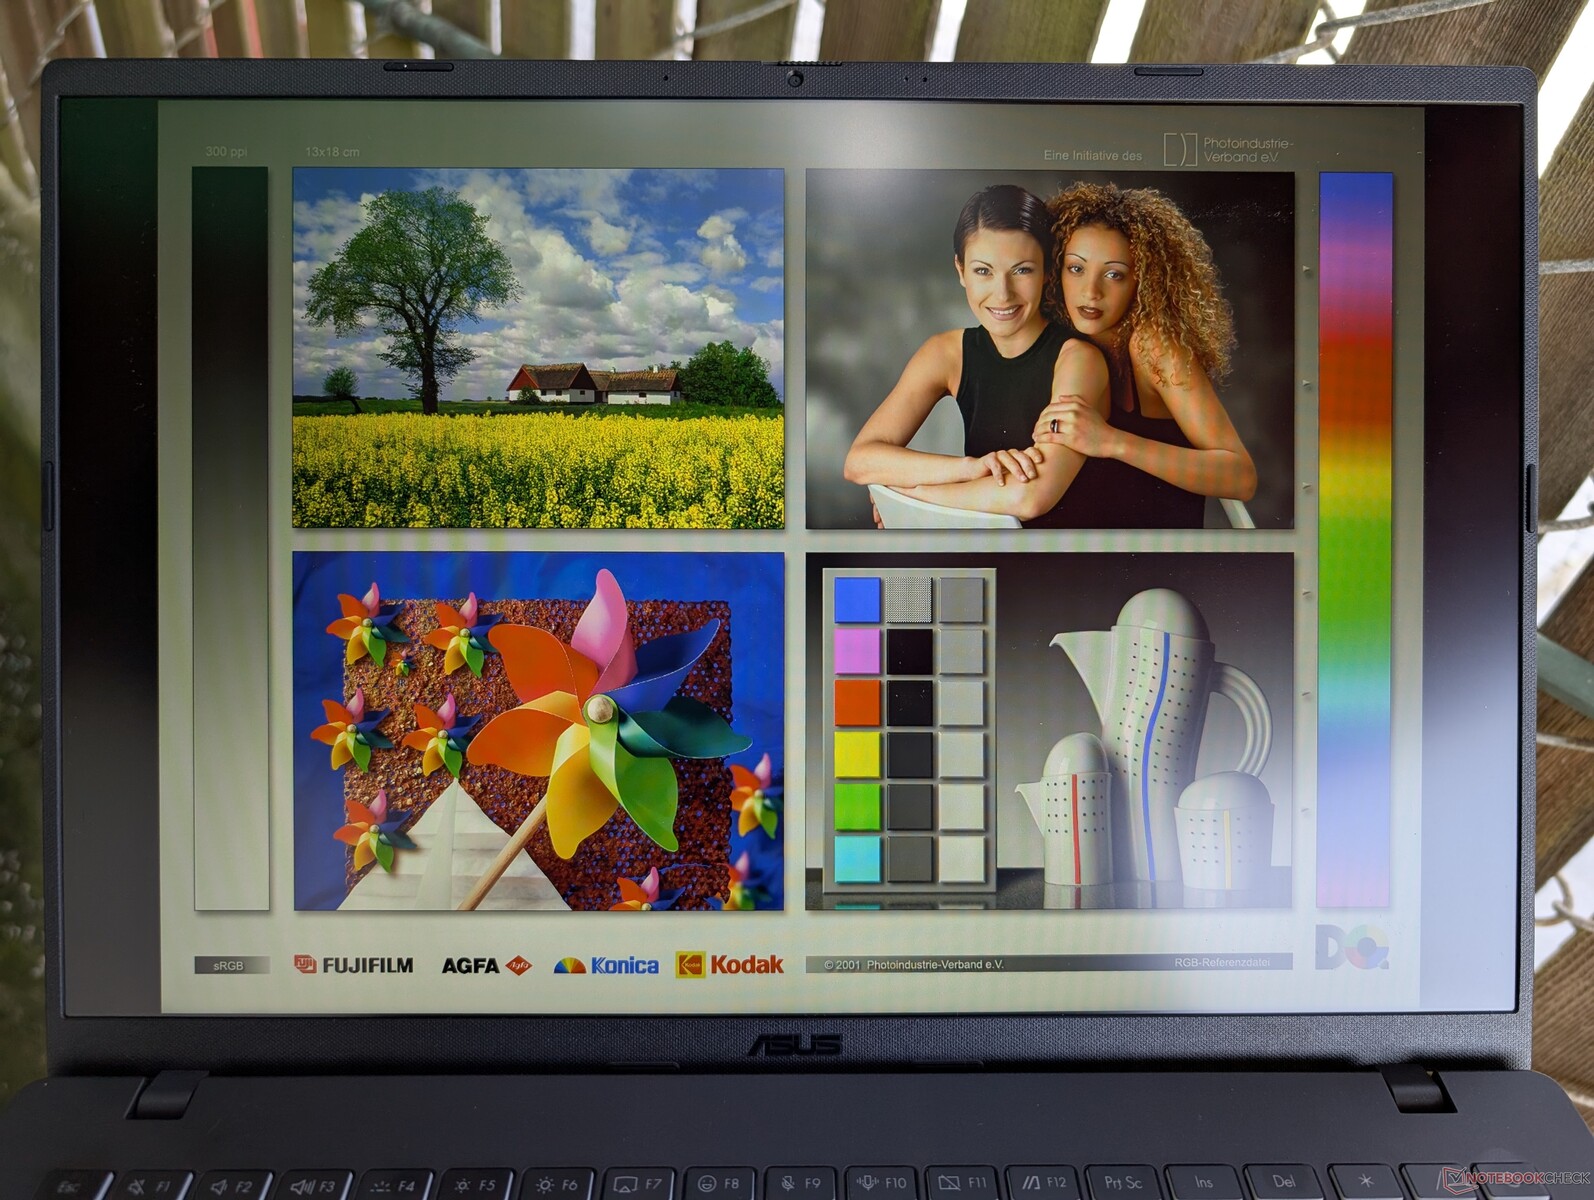
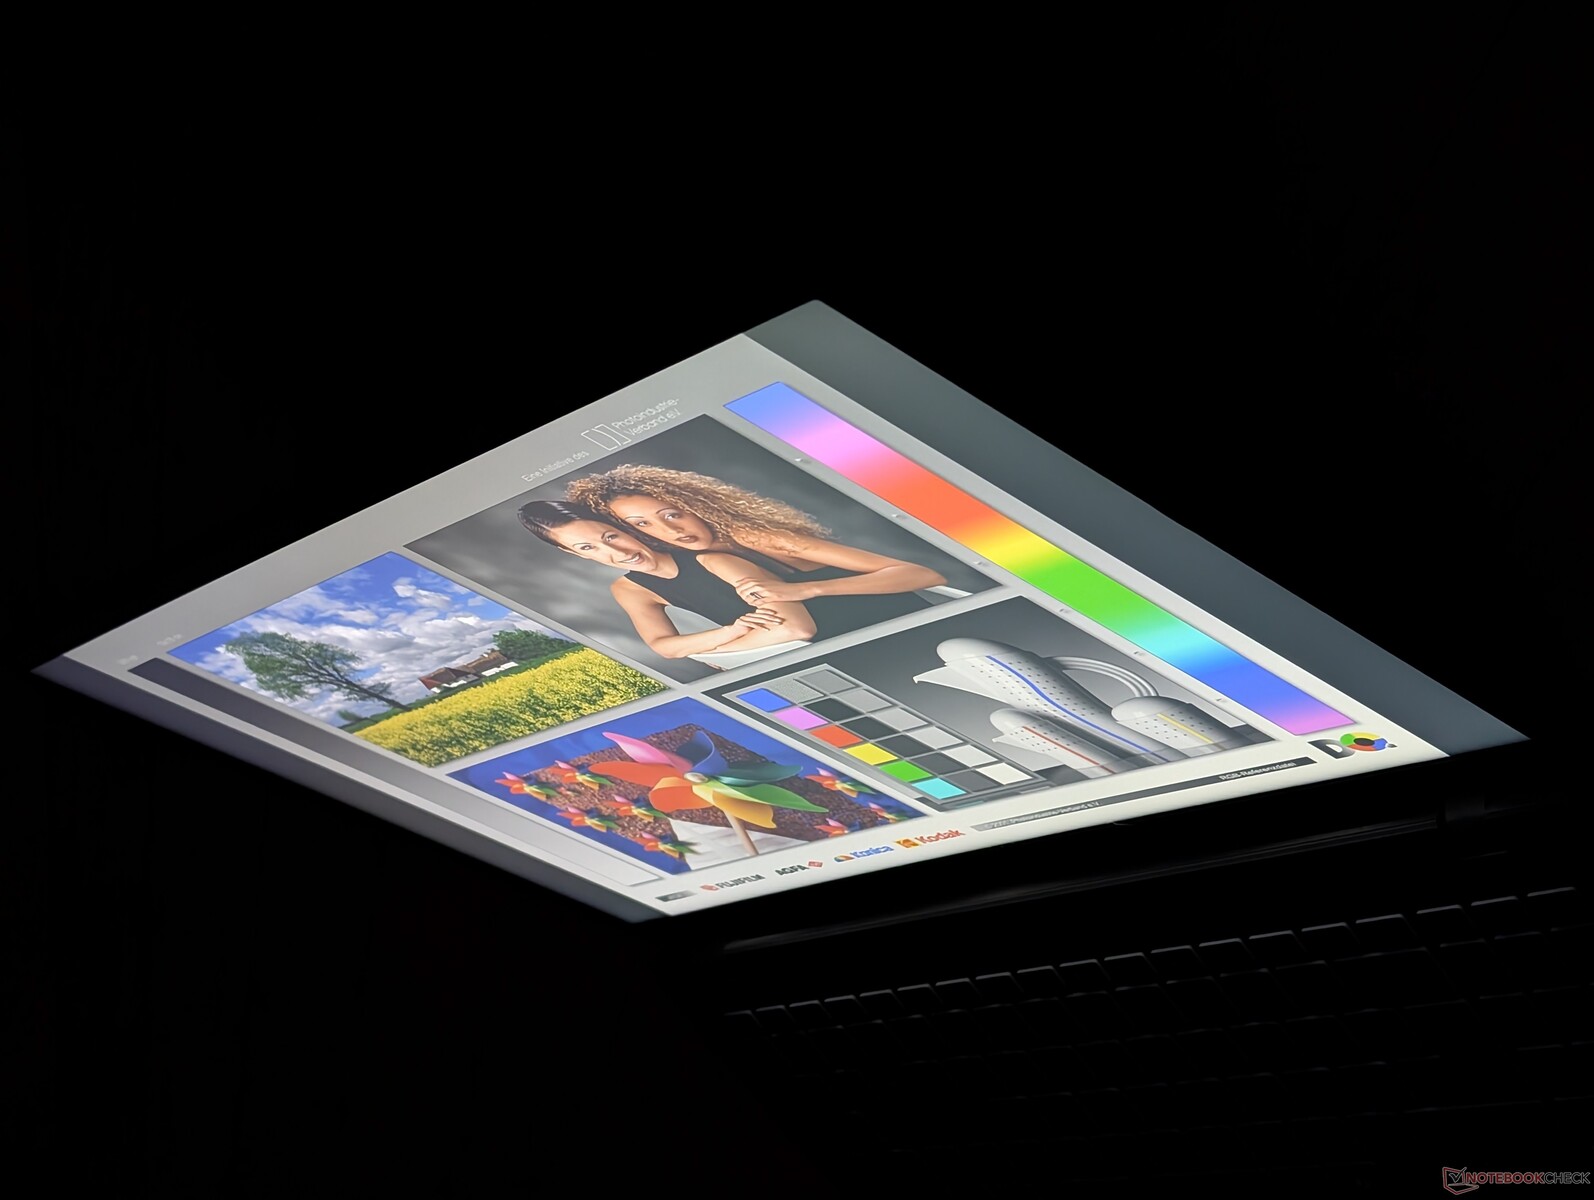
Pantalla - 144 Hz viene de serie
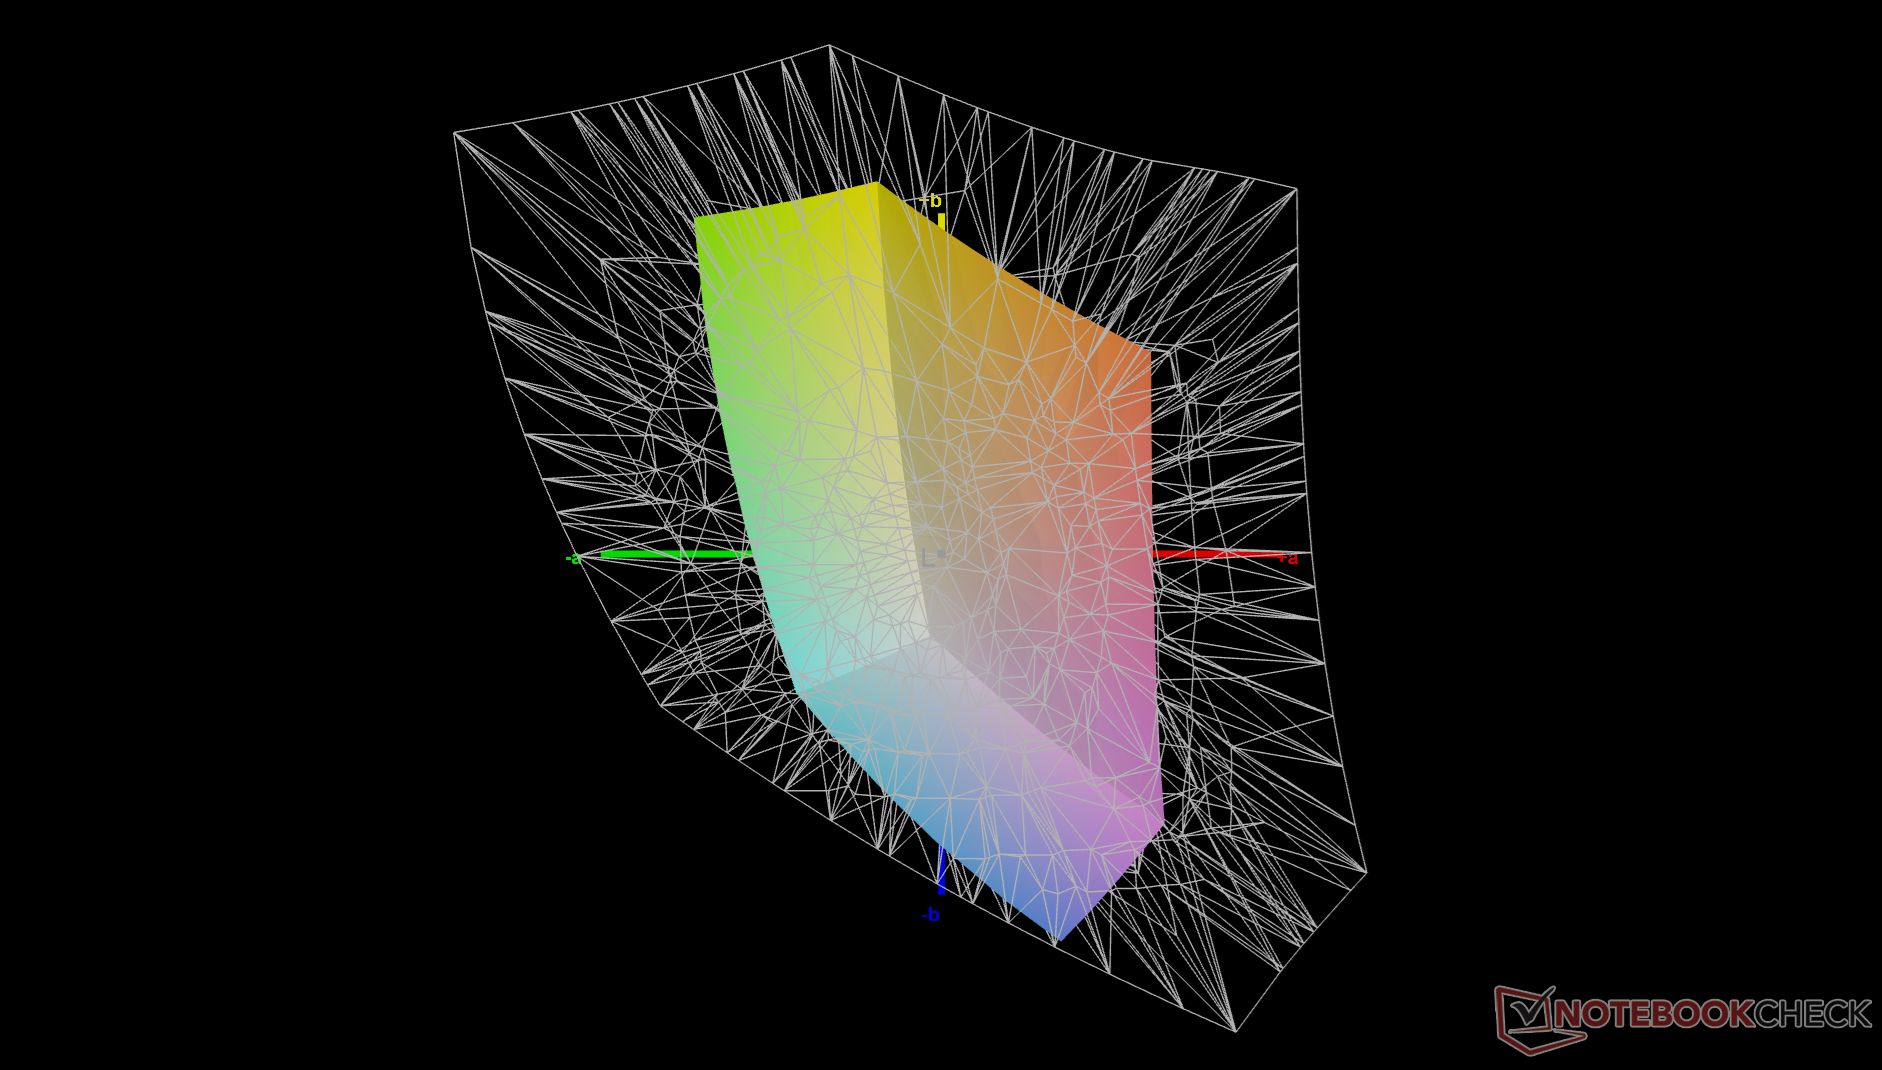
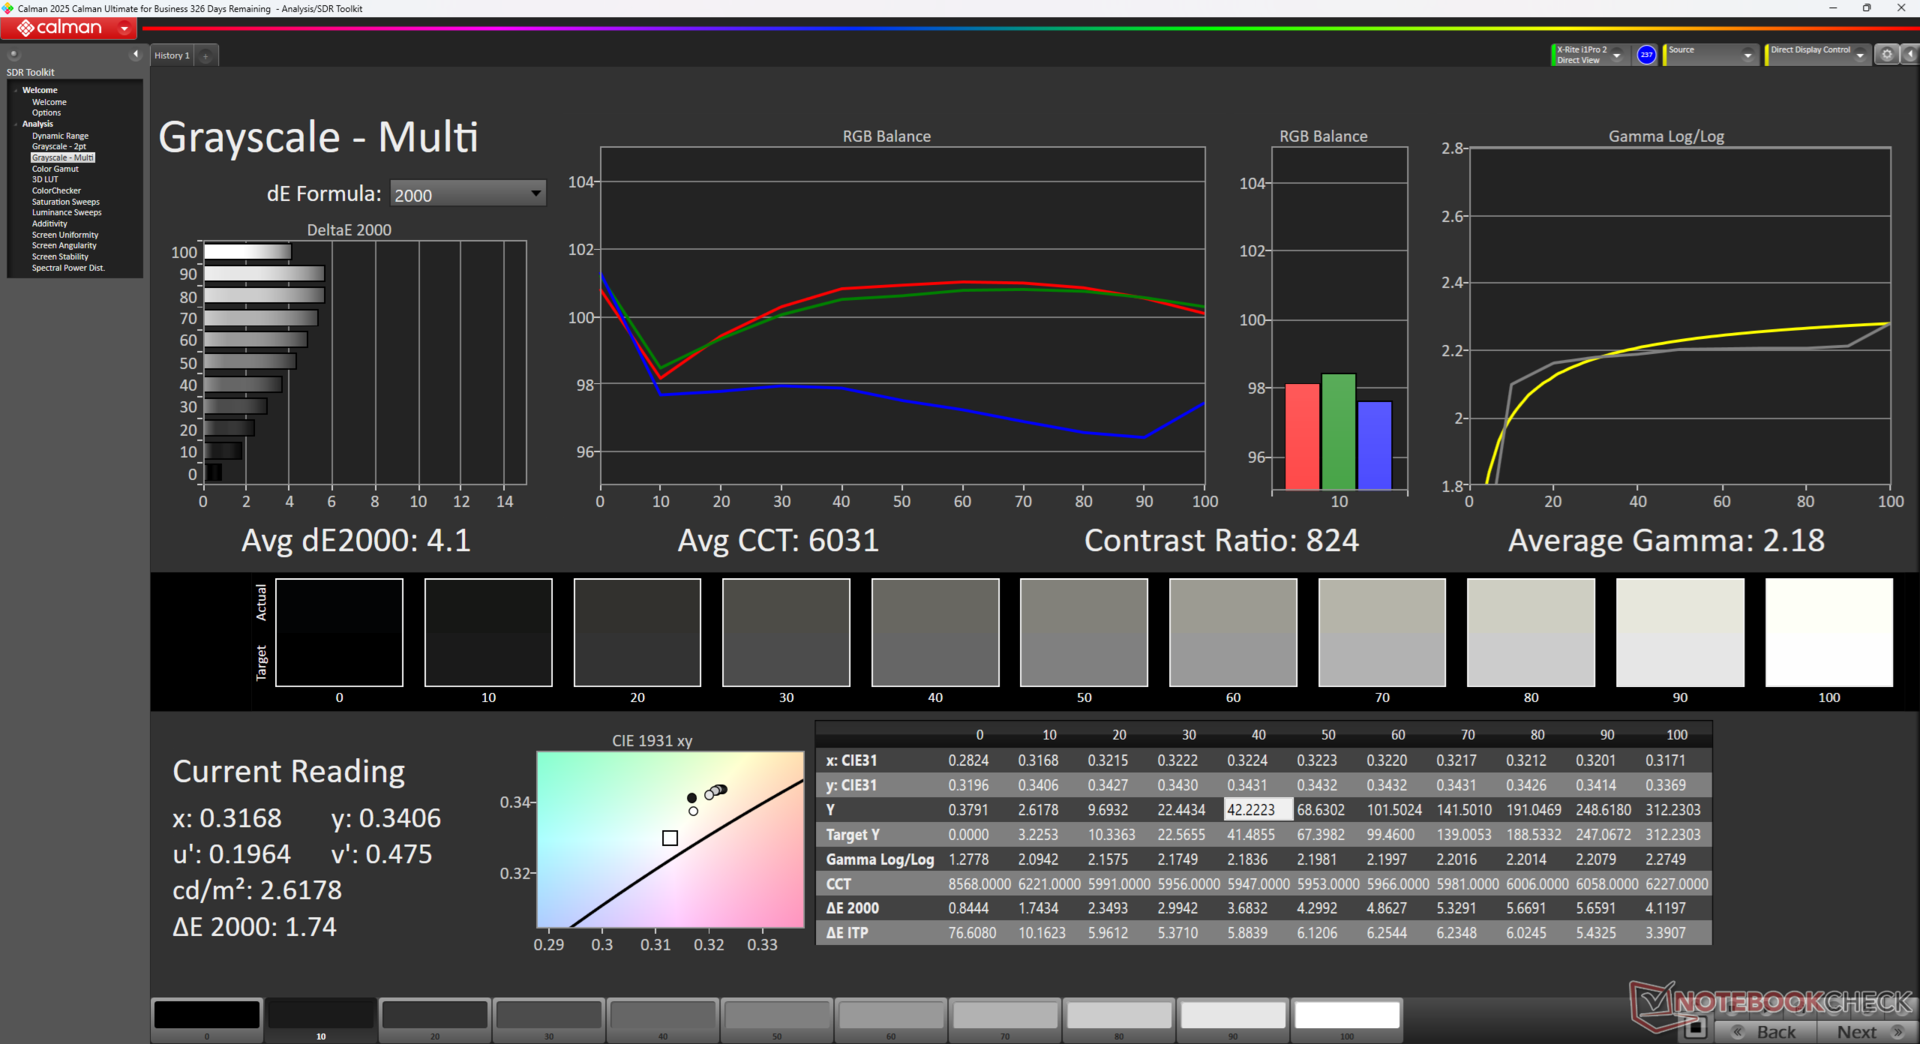
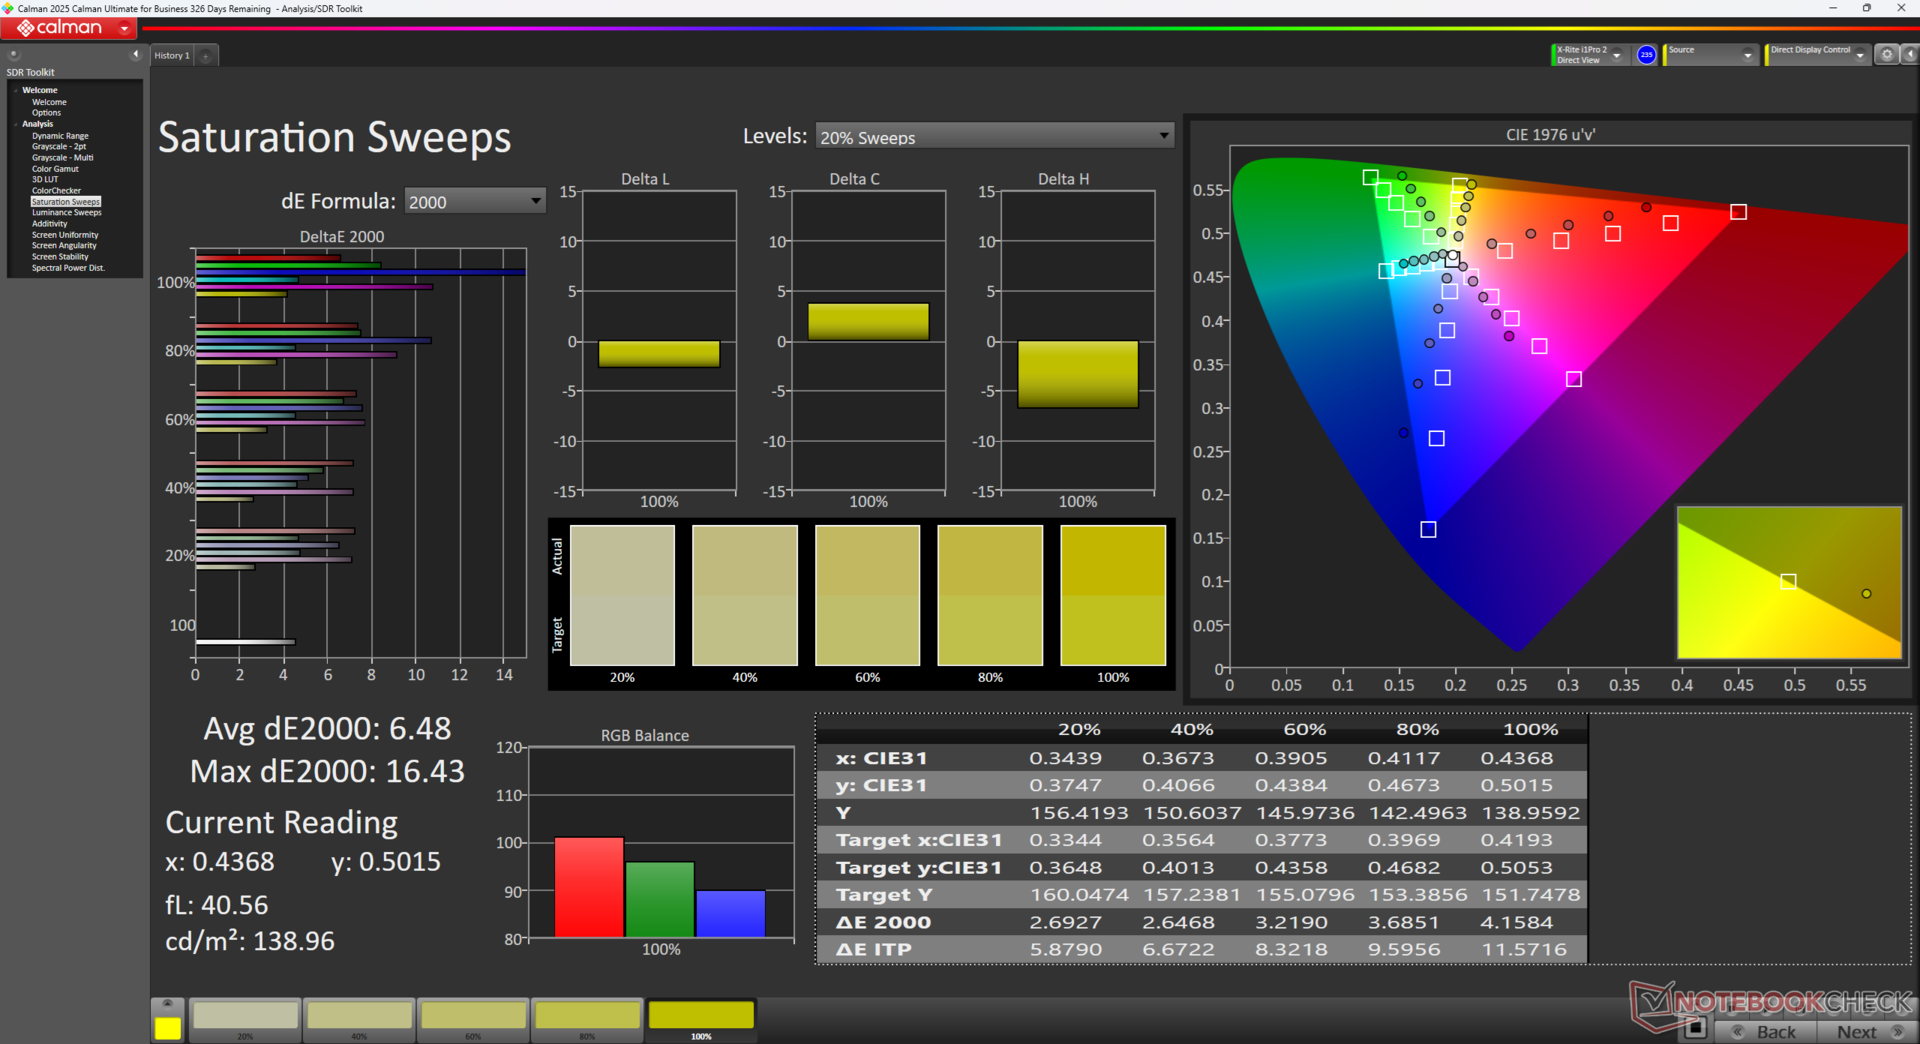
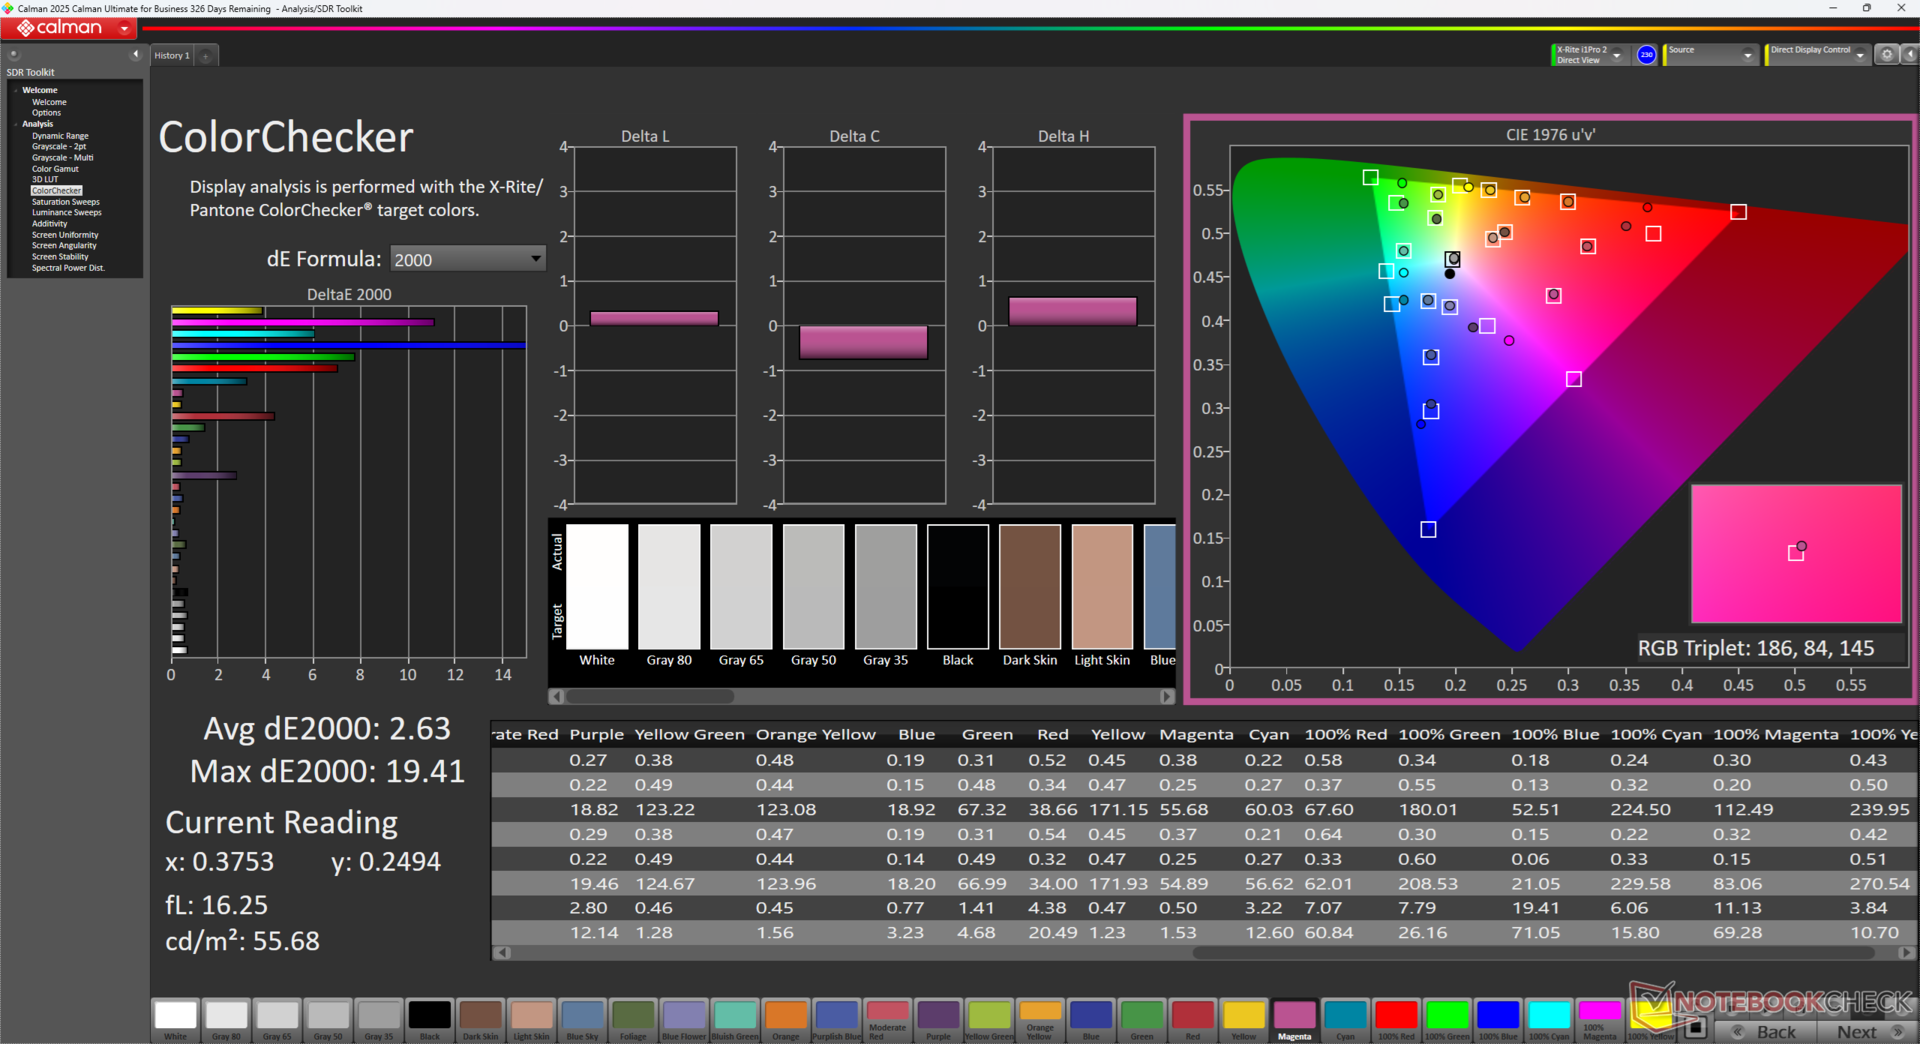
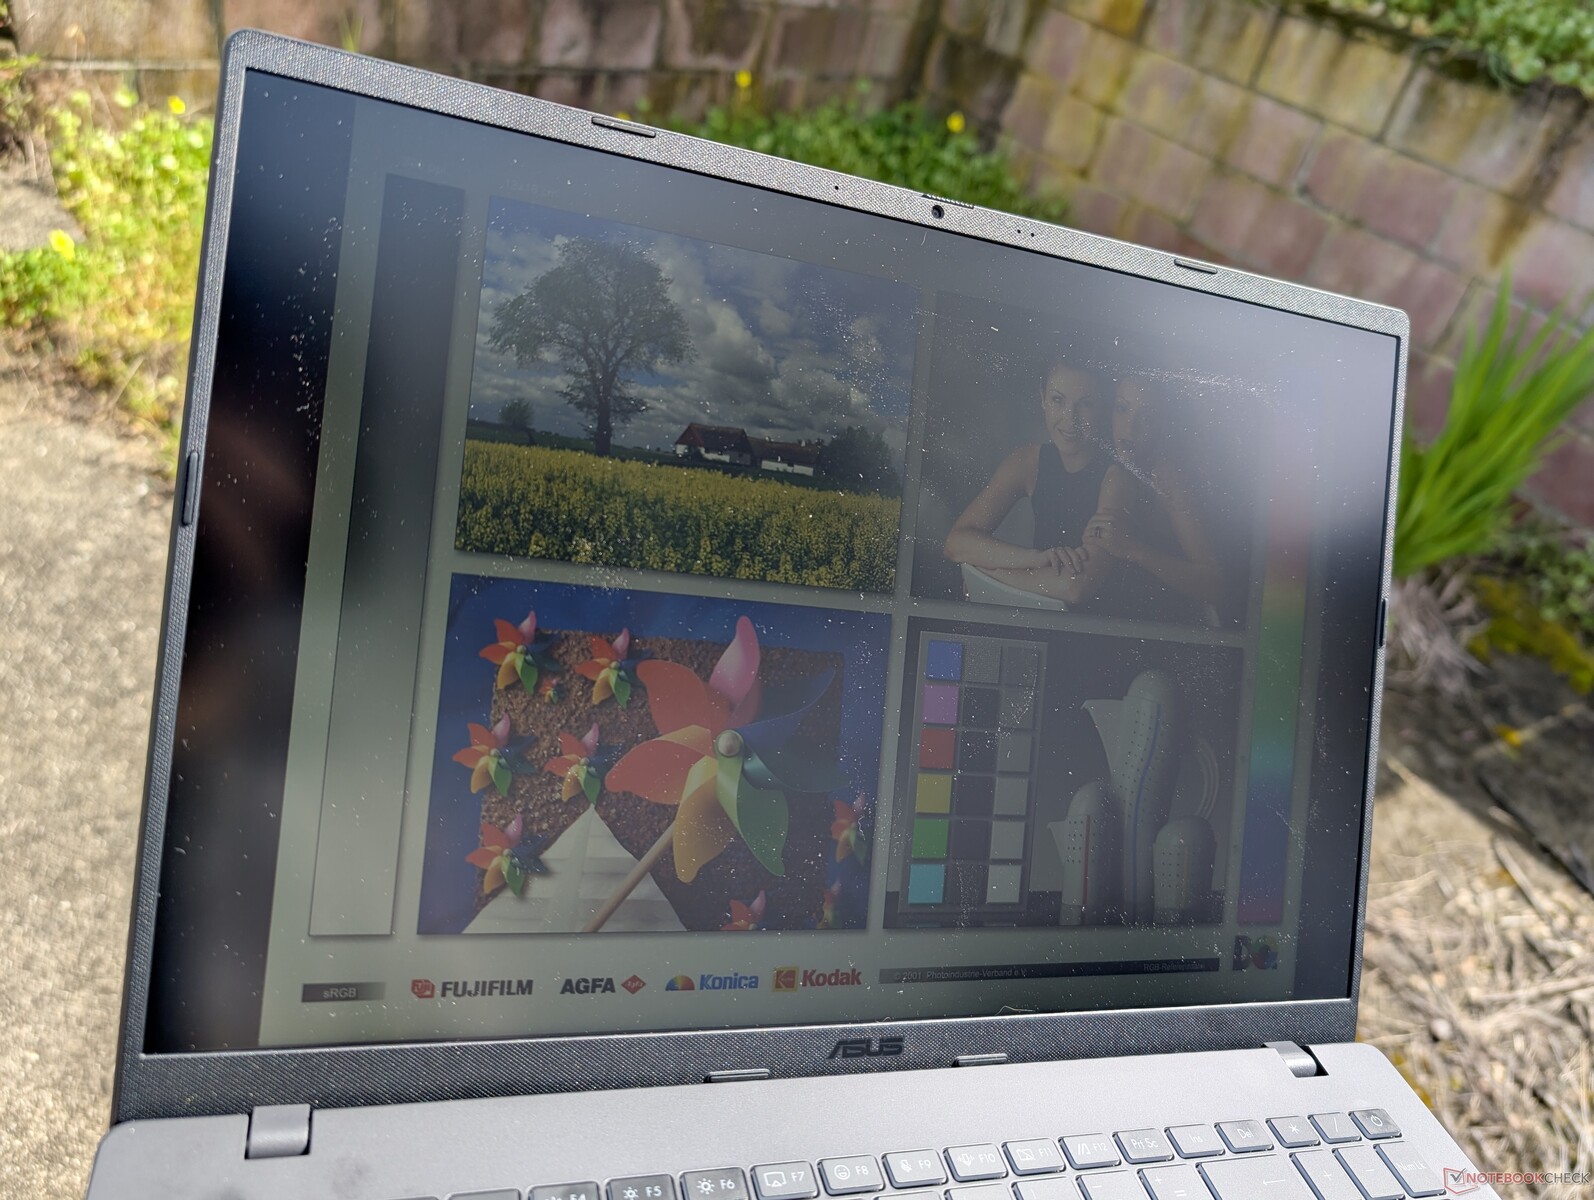
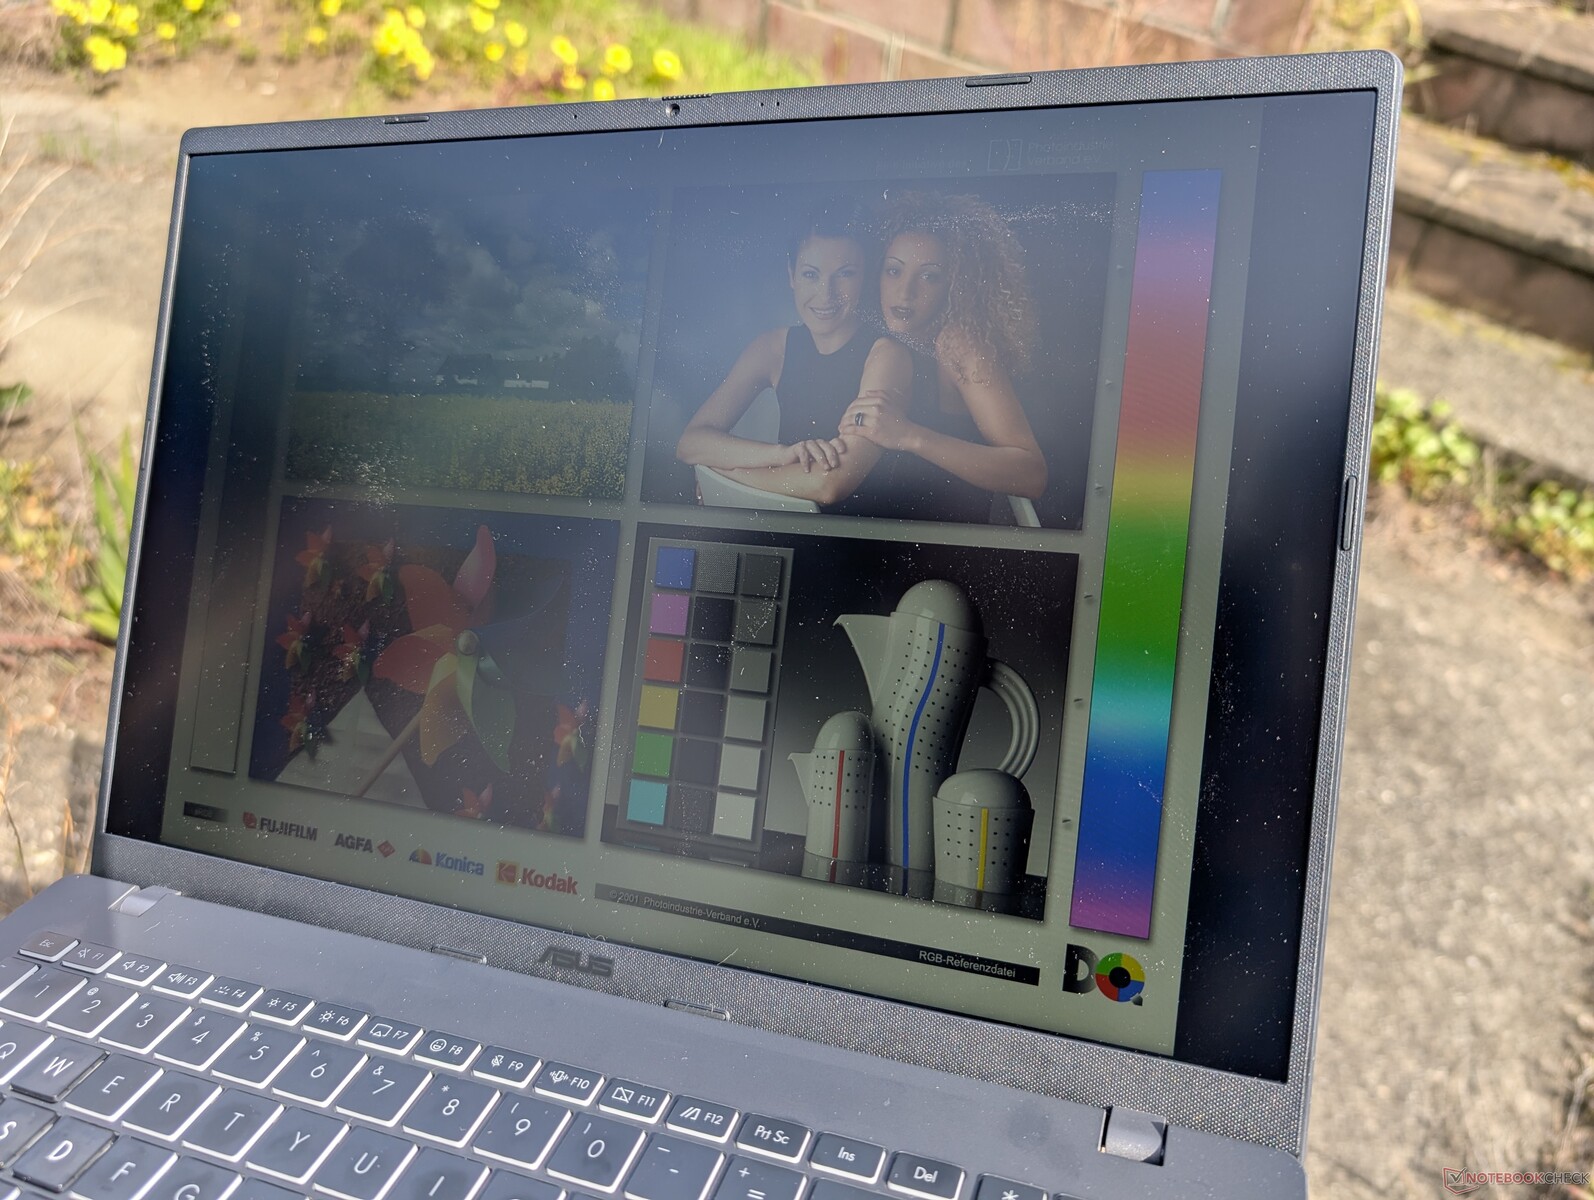
La característica más destacable de la pantalla es su frecuencia de actualización nativa de 144 Hz para un control del cursor y una capacidad de respuesta suaves como la mantequilla. Por lo demás, es un panel económico con sus colores estrechos, baja relación de contraste y brillo máximo medio.

| |||||||||||||||||||||||||
iluminación: 88 %
Brillo con batería: 313.3 cd/m²
Contraste: 627:1 (Negro: 0.5 cd/m²)
ΔE Color 6.09 | 0.5-29.43 Ø4.87, calibrated: 2.63
ΔE Greyscale 4.1 | 0.5-98 Ø5.1
42.2% AdobeRGB 1998 (Argyll 2.2.0 3D)
59.7% sRGB (Argyll 2.2.0 3D)
40.9% Display P3 (Argyll 2.2.0 3D)
Gamma: 2.18
| Asus V16 V3607V MNG007QX2-2, IPS, 1920x1200, 16", 144 Hz | Asus VivoBook Pro 16 K6602VU Samsung ATNA60BX01-1, OLED, 3200x2000, 16", 120 Hz | Dell Inspiron 16 Plus 7640 AU Optronics B160QAN, IPS, 2560x1600, 16", 120 Hz | Lenovo ThinkBook 16 G7 IML LEN160WUXGA, IPS, 1920x1200, 16", 60 Hz | HP Pavilion Plus 16-ab0456tx AU Optronics AUOFDA4, IPS, 2560x1600, 16", 120 Hz | Acer Swift Edge 16 SFE16-44-R0XV Samsung ATNA60BX03-0, OLED, 3200x2000, 16", 120 Hz | |
|---|---|---|---|---|---|---|
| Display | 112% | 78% | 2% | 76% | 115% | |
| Display P3 Coverage | 40.9 | 98.7 141% | 76 86% | 41.6 2% | 74.6 82% | 99.9 144% |
| sRGB Coverage | 59.7 | 99.7 67% | 99.8 67% | 61.2 3% | 99 66% | 100 68% |
| AdobeRGB 1998 Coverage | 42.2 | 96.5 129% | 76.7 82% | 43 2% | 76.5 81% | 98 132% |
| Response Times | 58% | -11% | 9% | 59% | 97% | |
| Response Time Grey 50% / Grey 80% * | 22.9 ? | 0.68 ? 97% | 25.6 ? -12% | 18.4 ? 20% | 9.06 ? 60% | 0.4 ? 98% |
| Response Time Black / White * | 16.1 ? | 13.2 ? 18% | 17.6 ? -9% | 16.5 ? -2% | 6.7 ? 58% | 0.6 ? 96% |
| PWM Frequency | 240 ? | 120 ? | ||||
| Screen | 26% | 45% | -7% | 36% | 7243% | |
| Brightness middle | 313.3 | 353 13% | 314.7 0% | 321.2 3% | 403 29% | 407 30% |
| Brightness | 298 | 354 19% | 291 -2% | 319 7% | 394 32% | 405 36% |
| Brightness Distribution | 88 | 98 11% | 89 1% | 92 5% | 90 2% | 98 11% |
| Black Level * | 0.5 | 0.28 44% | 0.37 26% | 0.34 32% | 0.001 100% | |
| Contrast | 627 | 1124 79% | 868 38% | 1185 89% | 407000 64812% | |
| Colorchecker dE 2000 * | 6.09 | 4.23 31% | 1.62 73% | 8.7 -43% | 3.13 49% | 2.27 63% |
| Colorchecker dE 2000 max. * | 19.31 | 7.13 63% | 2.94 85% | 19.85 -3% | 6.14 68% | 4.46 77% |
| Colorchecker dE 2000 calibrated * | 2.63 | 2.42 8% | 1.08 59% | 1.82 31% | 1.65 37% | 2.17 17% |
| Greyscale dE 2000 * | 4.1 | 2.5 39% | 1.3 68% | 9.2 -124% | 4.5 -10% | 2.3 44% |
| Gamma | 2.18 101% | 2.4 92% | 2.26 97% | 2.83 78% | 2.18 101% | 2.231 99% |
| CCT | 6031 108% | 6642 98% | 6385 102% | 6200 105% | 6261 104% | 6443 101% |
| Media total (Programa/Opciones) | 65% /
53% | 37% /
44% | 1% /
-3% | 57% /
48% | 2485% /
4695% |
* ... más pequeño es mejor
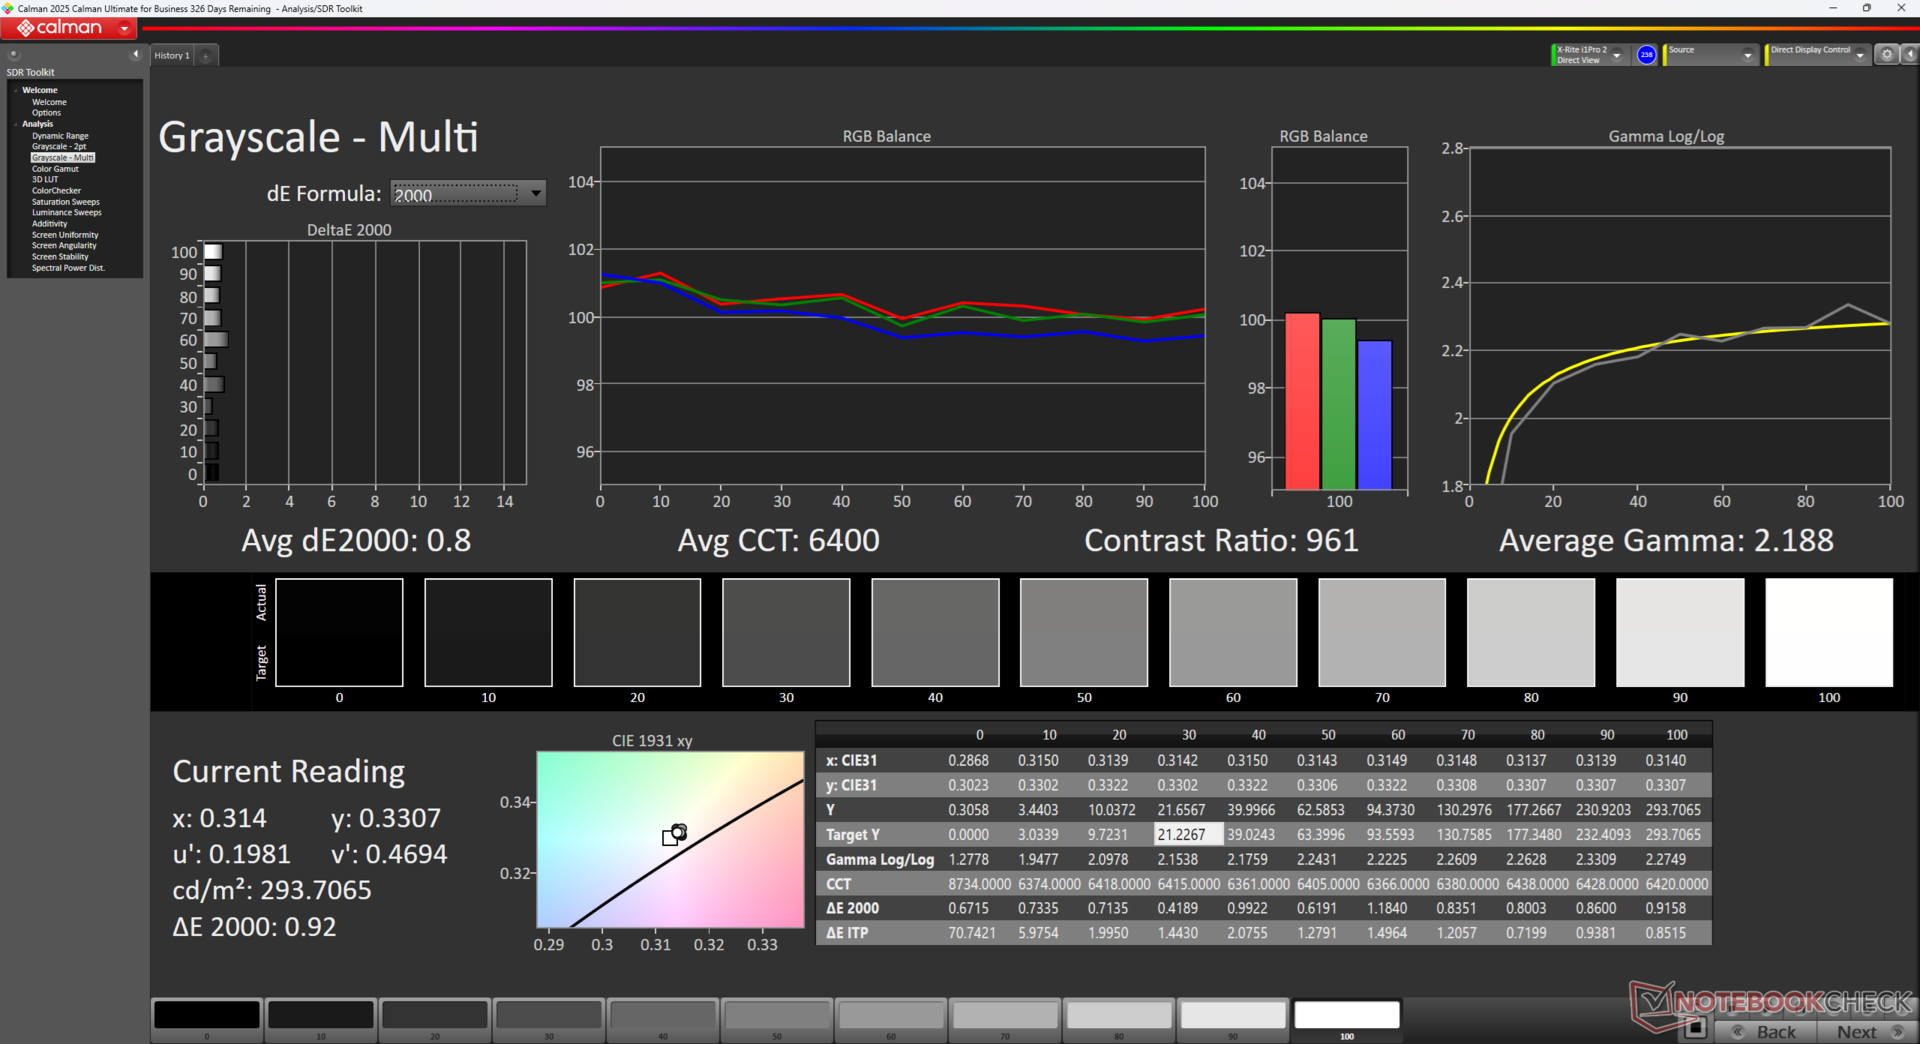
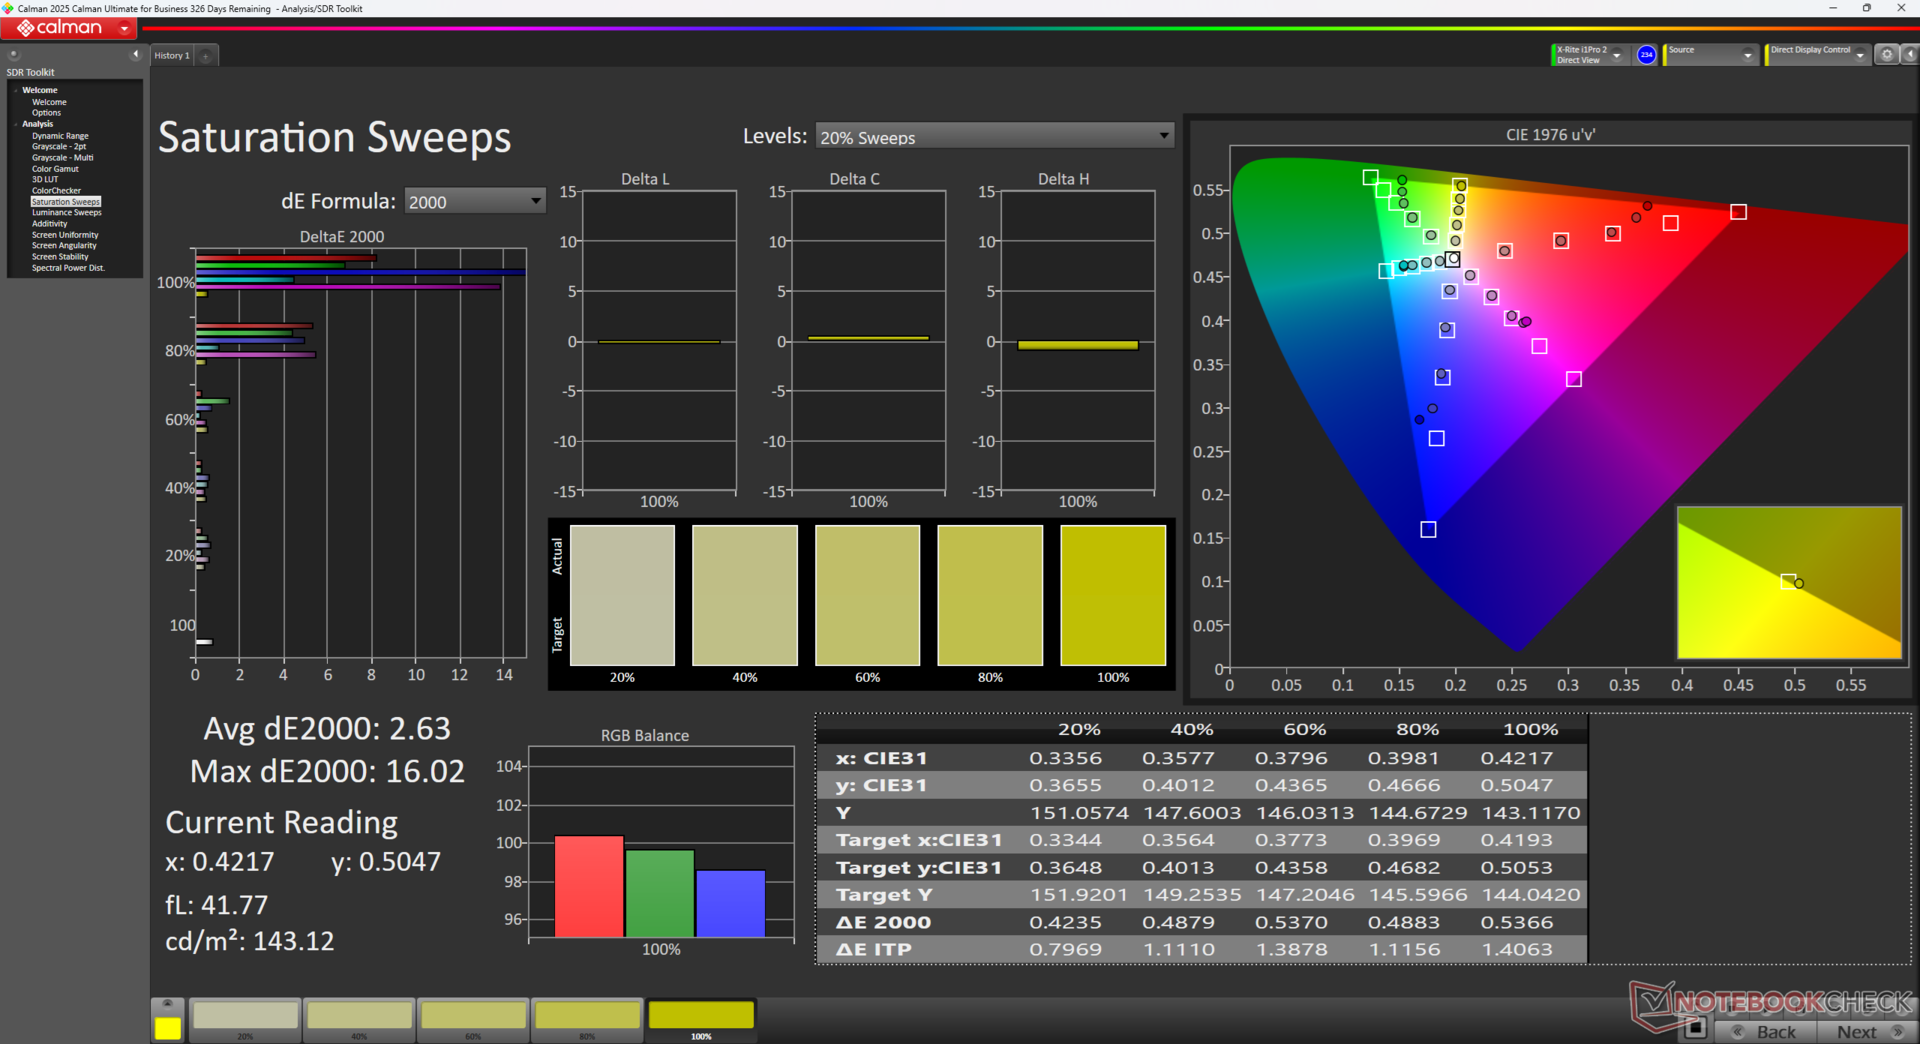
Los valores medios deltaE en escala de grises y color son decentes nada más sacarla de la caja, con 4,1 y 6,09, respectivamente. Nuestros propios esfuerzos de calibración con un colorímetro X-Rite mejorarían estos valores a sólo 0,8 y 2,63.

Tiempos de respuesta del display
| ↔ Tiempo de respuesta de Negro a Blanco | ||
|---|---|---|
| 16.1 ms ... subida ↗ y bajada ↘ combinada | ↗ 8.2 ms subida | 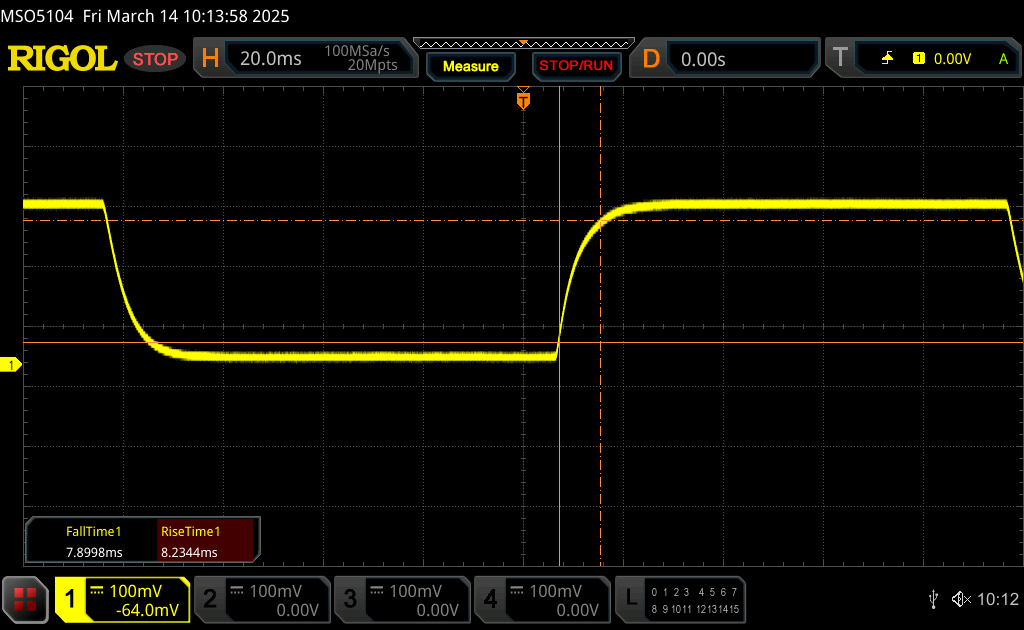 |
| ↘ 7.9 ms bajada | ||
| La pantalla mostró buenos tiempos de respuesta en nuestros tests pero podría ser demasiado lenta para los jugones competitivos. En comparación, todos los dispositivos de prueba van de ##min### (mínimo) a 240 (máximo) ms. » 35 % de todos los dispositivos son mejores. Esto quiere decir que el tiempo de respuesta medido es mejor que la media (20.8 ms) de todos los dispositivos testados. | ||
| ↔ Tiempo de respuesta 50% Gris a 80% Gris | ||
| 22.9 ms ... subida ↗ y bajada ↘ combinada | ↗ 11.2 ms subida | 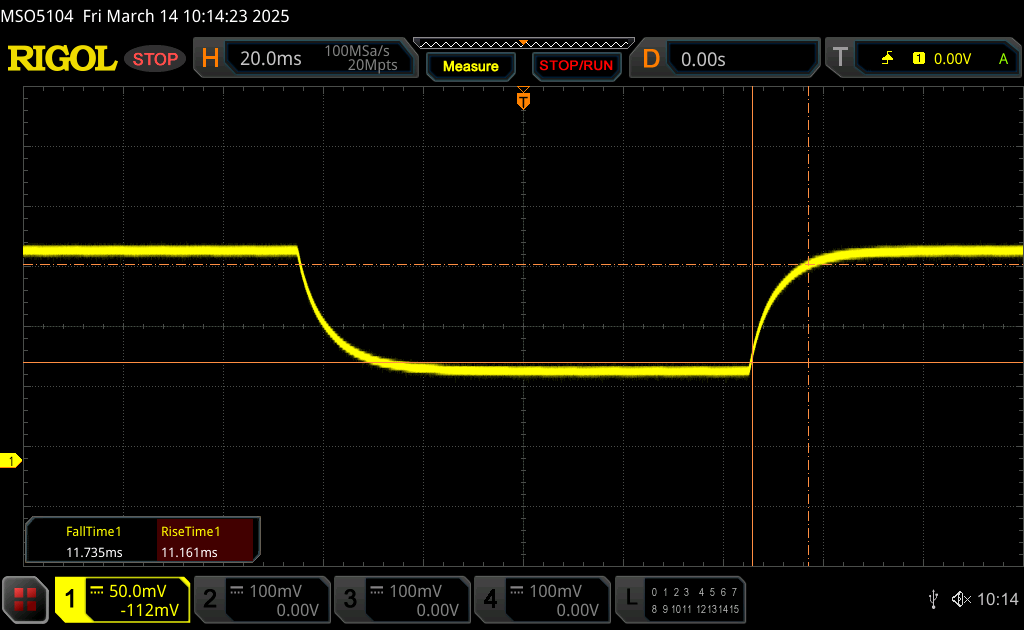 |
| ↘ 11.7 ms bajada | ||
| La pantalla mostró buenos tiempos de respuesta en nuestros tests pero podría ser demasiado lenta para los jugones competitivos. En comparación, todos los dispositivos de prueba van de ##min### (mínimo) a 636 (máximo) ms. » 31 % de todos los dispositivos son mejores. Esto quiere decir que el tiempo de respuesta medido es mejor que la media (32.5 ms) de todos los dispositivos testados. | ||
Parpadeo de Pantalla / PWM (Pulse-Width Modulation)
| Parpadeo de Pantalla / PWM no detectado |  | ||
Comparación: 53 % de todos los dispositivos testados no usaron PWM para atenuar el display. Si se usó, medimos una media de 8516 (mínimo: 5 - máxmo: 343500) Hz. | |||
Rendimiento - Sin mejoras destacables
Condiciones de prueba
Pusimos Windows en modo Rendimiento y MyAsus en modo Rendimiento y Optimizado antes de ejecutar los puntos de referencia que se indican a continuación. La GPU discreta puede desactivarse por completo sin necesidad de reiniciar.
Procesador
El Core 7 240H tiene un rendimiento similar al Core Ultra 155H aunque sin la NPU integrada para ahorrar costes. Es poco probable que el público al que va dirigido, jugadores o editores con un presupuesto ajustado, necesite o utilice la NPU.
Cinebench R15 Multi Loop
Cinebench R23: Multi Core | Single Core
Cinebench R20: CPU (Multi Core) | CPU (Single Core)
Cinebench R15: CPU Multi 64Bit | CPU Single 64Bit
Blender: v2.79 BMW27 CPU
7-Zip 18.03: 7z b 4 | 7z b 4 -mmt1
Geekbench 6.4: Multi-Core | Single-Core
Geekbench 5.5: Multi-Core | Single-Core
HWBOT x265 Benchmark v2.2: 4k Preset
LibreOffice : 20 Documents To PDF
R Benchmark 2.5: Overall mean
| CPU Performance Rating | |
| Lenovo ThinkBook 16p G5 IRX 21N50011GE | |
| Asus TUF Gaming A16 FA608WV | |
| MSI Prestige 16 AI Evo B2HMG | |
| Lenovo ThinkPad Z16 Gen 2 | |
| Medio Intel Core 7 240H | |
| Asus V16 V3607V | |
| HP Spectre x360 16 RTX 4050 -1! | |
| Acer Aspire 16 A16-51GM-77G2 | |
| Cinebench R23 / Multi Core | |
| Lenovo ThinkBook 16p G5 IRX 21N50011GE | |
| Asus TUF Gaming A16 FA608WV | |
| MSI Prestige 16 AI Evo B2HMG | |
| Lenovo ThinkPad Z16 Gen 2 | |
| HP Spectre x360 16 RTX 4050 | |
| Asus V16 V3607V | |
| Medio Intel Core 7 240H (n=1) | |
| Acer Aspire 16 A16-51GM-77G2 | |
| Cinebench R23 / Single Core | |
| Lenovo ThinkBook 16p G5 IRX 21N50011GE | |
| MSI Prestige 16 AI Evo B2HMG | |
| Asus TUF Gaming A16 FA608WV | |
| Acer Aspire 16 A16-51GM-77G2 | |
| Asus V16 V3607V | |
| Medio Intel Core 7 240H (n=1) | |
| Lenovo ThinkPad Z16 Gen 2 | |
| HP Spectre x360 16 RTX 4050 | |
| Cinebench R20 / CPU (Multi Core) | |
| Lenovo ThinkBook 16p G5 IRX 21N50011GE | |
| Asus TUF Gaming A16 FA608WV | |
| MSI Prestige 16 AI Evo B2HMG | |
| Lenovo ThinkPad Z16 Gen 2 | |
| Asus V16 V3607V | |
| Medio Intel Core 7 240H (n=1) | |
| HP Spectre x360 16 RTX 4050 | |
| Acer Aspire 16 A16-51GM-77G2 | |
| Cinebench R20 / CPU (Single Core) | |
| Lenovo ThinkBook 16p G5 IRX 21N50011GE | |
| MSI Prestige 16 AI Evo B2HMG | |
| Asus TUF Gaming A16 FA608WV | |
| Acer Aspire 16 A16-51GM-77G2 | |
| Asus V16 V3607V | |
| Medio Intel Core 7 240H (n=1) | |
| Lenovo ThinkPad Z16 Gen 2 | |
| HP Spectre x360 16 RTX 4050 | |
| Cinebench R15 / CPU Multi 64Bit | |
| Lenovo ThinkBook 16p G5 IRX 21N50011GE | |
| Asus TUF Gaming A16 FA608WV | |
| MSI Prestige 16 AI Evo B2HMG | |
| Lenovo ThinkPad Z16 Gen 2 | |
| Asus V16 V3607V | |
| Medio Intel Core 7 240H (n=1) | |
| HP Spectre x360 16 RTX 4050 | |
| Acer Aspire 16 A16-51GM-77G2 | |
| Cinebench R15 / CPU Single 64Bit | |
| Lenovo ThinkBook 16p G5 IRX 21N50011GE | |
| MSI Prestige 16 AI Evo B2HMG | |
| Asus TUF Gaming A16 FA608WV | |
| Acer Aspire 16 A16-51GM-77G2 | |
| Lenovo ThinkPad Z16 Gen 2 | |
| Asus V16 V3607V | |
| Medio Intel Core 7 240H (n=1) | |
| HP Spectre x360 16 RTX 4050 | |
| Blender / v2.79 BMW27 CPU | |
| Acer Aspire 16 A16-51GM-77G2 | |
| Asus V16 V3607V | |
| Medio Intel Core 7 240H (n=1) | |
| MSI Prestige 16 AI Evo B2HMG | |
| Lenovo ThinkPad Z16 Gen 2 | |
| Asus TUF Gaming A16 FA608WV | |
| Lenovo ThinkBook 16p G5 IRX 21N50011GE | |
| 7-Zip 18.03 / 7z b 4 -mmt1 | |
| Lenovo ThinkBook 16p G5 IRX 21N50011GE | |
| Acer Aspire 16 A16-51GM-77G2 | |
| Lenovo ThinkPad Z16 Gen 2 | |
| Asus V16 V3607V | |
| Medio Intel Core 7 240H (n=1) | |
| Asus TUF Gaming A16 FA608WV | |
| MSI Prestige 16 AI Evo B2HMG | |
| HP Spectre x360 16 RTX 4050 | |
| Geekbench 6.4 / Multi-Core | |
| Lenovo ThinkBook 16p G5 IRX 21N50011GE | |
| MSI Prestige 16 AI Evo B2HMG | |
| Asus TUF Gaming A16 FA608WV | |
| Lenovo ThinkPad Z16 Gen 2 | |
| Medio Intel Core 7 240H (11285 - 12846, n=2) | |
| HP Spectre x360 16 RTX 4050 | |
| Asus V16 V3607V | |
| Acer Aspire 16 A16-51GM-77G2 | |
| Geekbench 6.4 / Single-Core | |
| Lenovo ThinkBook 16p G5 IRX 21N50011GE | |
| MSI Prestige 16 AI Evo B2HMG | |
| Asus TUF Gaming A16 FA608WV | |
| Acer Aspire 16 A16-51GM-77G2 | |
| Medio Intel Core 7 240H (2646 - 2648, n=2) | |
| Asus V16 V3607V | |
| Lenovo ThinkPad Z16 Gen 2 | |
| HP Spectre x360 16 RTX 4050 | |
| Geekbench 5.5 / Multi-Core | |
| Lenovo ThinkBook 16p G5 IRX 21N50011GE | |
| MSI Prestige 16 AI Evo B2HMG | |
| Asus TUF Gaming A16 FA608WV | |
| HP Spectre x360 16 RTX 4050 | |
| Lenovo ThinkPad Z16 Gen 2 | |
| Asus V16 V3607V | |
| Medio Intel Core 7 240H (n=1) | |
| Acer Aspire 16 A16-51GM-77G2 | |
| Geekbench 5.5 / Single-Core | |
| Lenovo ThinkBook 16p G5 IRX 21N50011GE | |
| Asus TUF Gaming A16 FA608WV | |
| MSI Prestige 16 AI Evo B2HMG | |
| Acer Aspire 16 A16-51GM-77G2 | |
| Lenovo ThinkPad Z16 Gen 2 | |
| Asus V16 V3607V | |
| Medio Intel Core 7 240H (n=1) | |
| HP Spectre x360 16 RTX 4050 | |
| HWBOT x265 Benchmark v2.2 / 4k Preset | |
| Lenovo ThinkBook 16p G5 IRX 21N50011GE | |
| Asus TUF Gaming A16 FA608WV | |
| MSI Prestige 16 AI Evo B2HMG | |
| Lenovo ThinkPad Z16 Gen 2 | |
| Asus V16 V3607V | |
| Medio Intel Core 7 240H (n=1) | |
| HP Spectre x360 16 RTX 4050 | |
| Acer Aspire 16 A16-51GM-77G2 | |
| LibreOffice / 20 Documents To PDF | |
| Asus V16 V3607V | |
| Medio Intel Core 7 240H (n=1) | |
| Asus TUF Gaming A16 FA608WV | |
| Lenovo ThinkPad Z16 Gen 2 | |
| Lenovo ThinkBook 16p G5 IRX 21N50011GE | |
| HP Spectre x360 16 RTX 4050 | |
| MSI Prestige 16 AI Evo B2HMG | |
| Acer Aspire 16 A16-51GM-77G2 | |
| R Benchmark 2.5 / Overall mean | |
| HP Spectre x360 16 RTX 4050 | |
| Lenovo ThinkPad Z16 Gen 2 | |
| Acer Aspire 16 A16-51GM-77G2 | |
| MSI Prestige 16 AI Evo B2HMG | |
| Asus V16 V3607V | |
| Medio Intel Core 7 240H (n=1) | |
| Asus TUF Gaming A16 FA608WV | |
| Lenovo ThinkBook 16p G5 IRX 21N50011GE | |
* ... más pequeño es mejor
AIDA64: FP32 Ray-Trace | FPU Julia | CPU SHA3 | CPU Queen | FPU SinJulia | FPU Mandel | CPU AES | CPU ZLib | FP64 Ray-Trace | CPU PhotoWorxx
| Performance Rating | |
| Asus VivoBook Pro 16 K6602VU | |
| HP Pavilion Plus 16-ab0456tx | |
| Dell Inspiron 16 Plus 7640 | |
| Acer Swift Edge 16 SFE16-44-R0XV | |
| Asus V16 V3607V | |
| Medio Intel Core 7 240H | |
| Lenovo ThinkBook 16 G7 IML | |
| AIDA64 / FP32 Ray-Trace | |
| Acer Swift Edge 16 SFE16-44-R0XV | |
| HP Pavilion Plus 16-ab0456tx | |
| Dell Inspiron 16 Plus 7640 | |
| Asus V16 V3607V | |
| Medio Intel Core 7 240H (n=1) | |
| Asus VivoBook Pro 16 K6602VU | |
| Lenovo ThinkBook 16 G7 IML | |
| AIDA64 / FPU Julia | |
| HP Pavilion Plus 16-ab0456tx | |
| Asus VivoBook Pro 16 K6602VU | |
| Dell Inspiron 16 Plus 7640 | |
| Acer Swift Edge 16 SFE16-44-R0XV | |
| Asus V16 V3607V | |
| Medio Intel Core 7 240H (n=1) | |
| Lenovo ThinkBook 16 G7 IML | |
| AIDA64 / CPU SHA3 | |
| HP Pavilion Plus 16-ab0456tx | |
| Dell Inspiron 16 Plus 7640 | |
| Asus VivoBook Pro 16 K6602VU | |
| Acer Swift Edge 16 SFE16-44-R0XV | |
| Asus V16 V3607V | |
| Medio Intel Core 7 240H (n=1) | |
| Lenovo ThinkBook 16 G7 IML | |
| AIDA64 / CPU Queen | |
| HP Pavilion Plus 16-ab0456tx | |
| Asus VivoBook Pro 16 K6602VU | |
| Dell Inspiron 16 Plus 7640 | |
| Acer Swift Edge 16 SFE16-44-R0XV | |
| Asus V16 V3607V | |
| Medio Intel Core 7 240H (n=1) | |
| Lenovo ThinkBook 16 G7 IML | |
| AIDA64 / FPU SinJulia | |
| Acer Swift Edge 16 SFE16-44-R0XV | |
| Dell Inspiron 16 Plus 7640 | |
| HP Pavilion Plus 16-ab0456tx | |
| Asus VivoBook Pro 16 K6602VU | |
| Asus V16 V3607V | |
| Medio Intel Core 7 240H (n=1) | |
| Lenovo ThinkBook 16 G7 IML | |
| AIDA64 / FPU Mandel | |
| Acer Swift Edge 16 SFE16-44-R0XV | |
| HP Pavilion Plus 16-ab0456tx | |
| Dell Inspiron 16 Plus 7640 | |
| Asus VivoBook Pro 16 K6602VU | |
| Asus V16 V3607V | |
| Medio Intel Core 7 240H (n=1) | |
| Lenovo ThinkBook 16 G7 IML | |
| AIDA64 / CPU AES | |
| Asus VivoBook Pro 16 K6602VU | |
| Dell Inspiron 16 Plus 7640 | |
| HP Pavilion Plus 16-ab0456tx | |
| Acer Swift Edge 16 SFE16-44-R0XV | |
| Asus V16 V3607V | |
| Medio Intel Core 7 240H (n=1) | |
| Lenovo ThinkBook 16 G7 IML | |
| AIDA64 / CPU ZLib | |
| Dell Inspiron 16 Plus 7640 | |
| HP Pavilion Plus 16-ab0456tx | |
| Asus VivoBook Pro 16 K6602VU | |
| Asus V16 V3607V | |
| Medio Intel Core 7 240H (n=1) | |
| Lenovo ThinkBook 16 G7 IML | |
| Acer Swift Edge 16 SFE16-44-R0XV | |
| AIDA64 / FP64 Ray-Trace | |
| Acer Swift Edge 16 SFE16-44-R0XV | |
| HP Pavilion Plus 16-ab0456tx | |
| Asus VivoBook Pro 16 K6602VU | |
| Dell Inspiron 16 Plus 7640 | |
| Asus V16 V3607V | |
| Medio Intel Core 7 240H (n=1) | |
| Lenovo ThinkBook 16 G7 IML | |
| AIDA64 / CPU PhotoWorxx | |
| HP Pavilion Plus 16-ab0456tx | |
| Dell Inspiron 16 Plus 7640 | |
| Asus VivoBook Pro 16 K6602VU | |
| Acer Swift Edge 16 SFE16-44-R0XV | |
| Lenovo ThinkBook 16 G7 IML | |
| Asus V16 V3607V | |
| Medio Intel Core 7 240H (n=1) | |
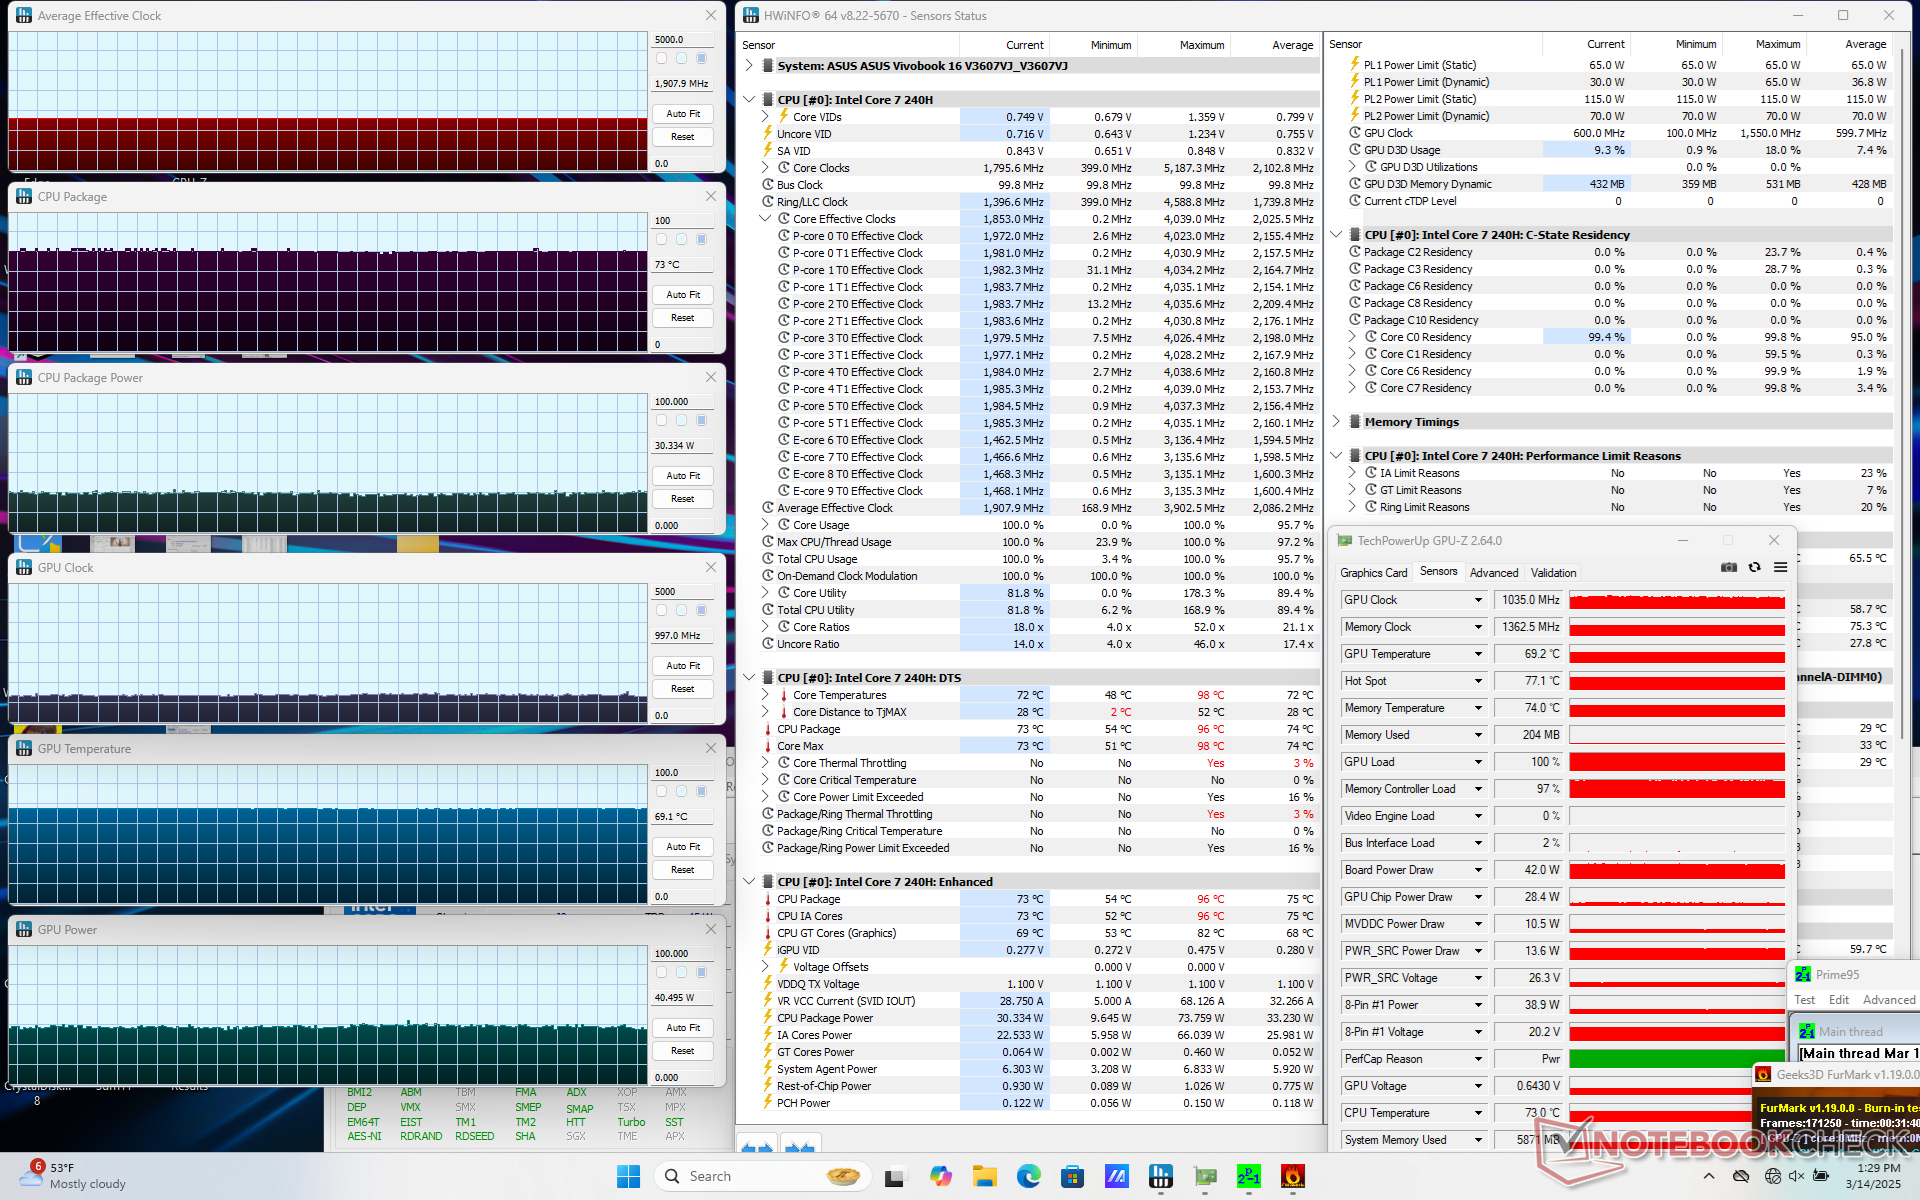
Prueba de estrés
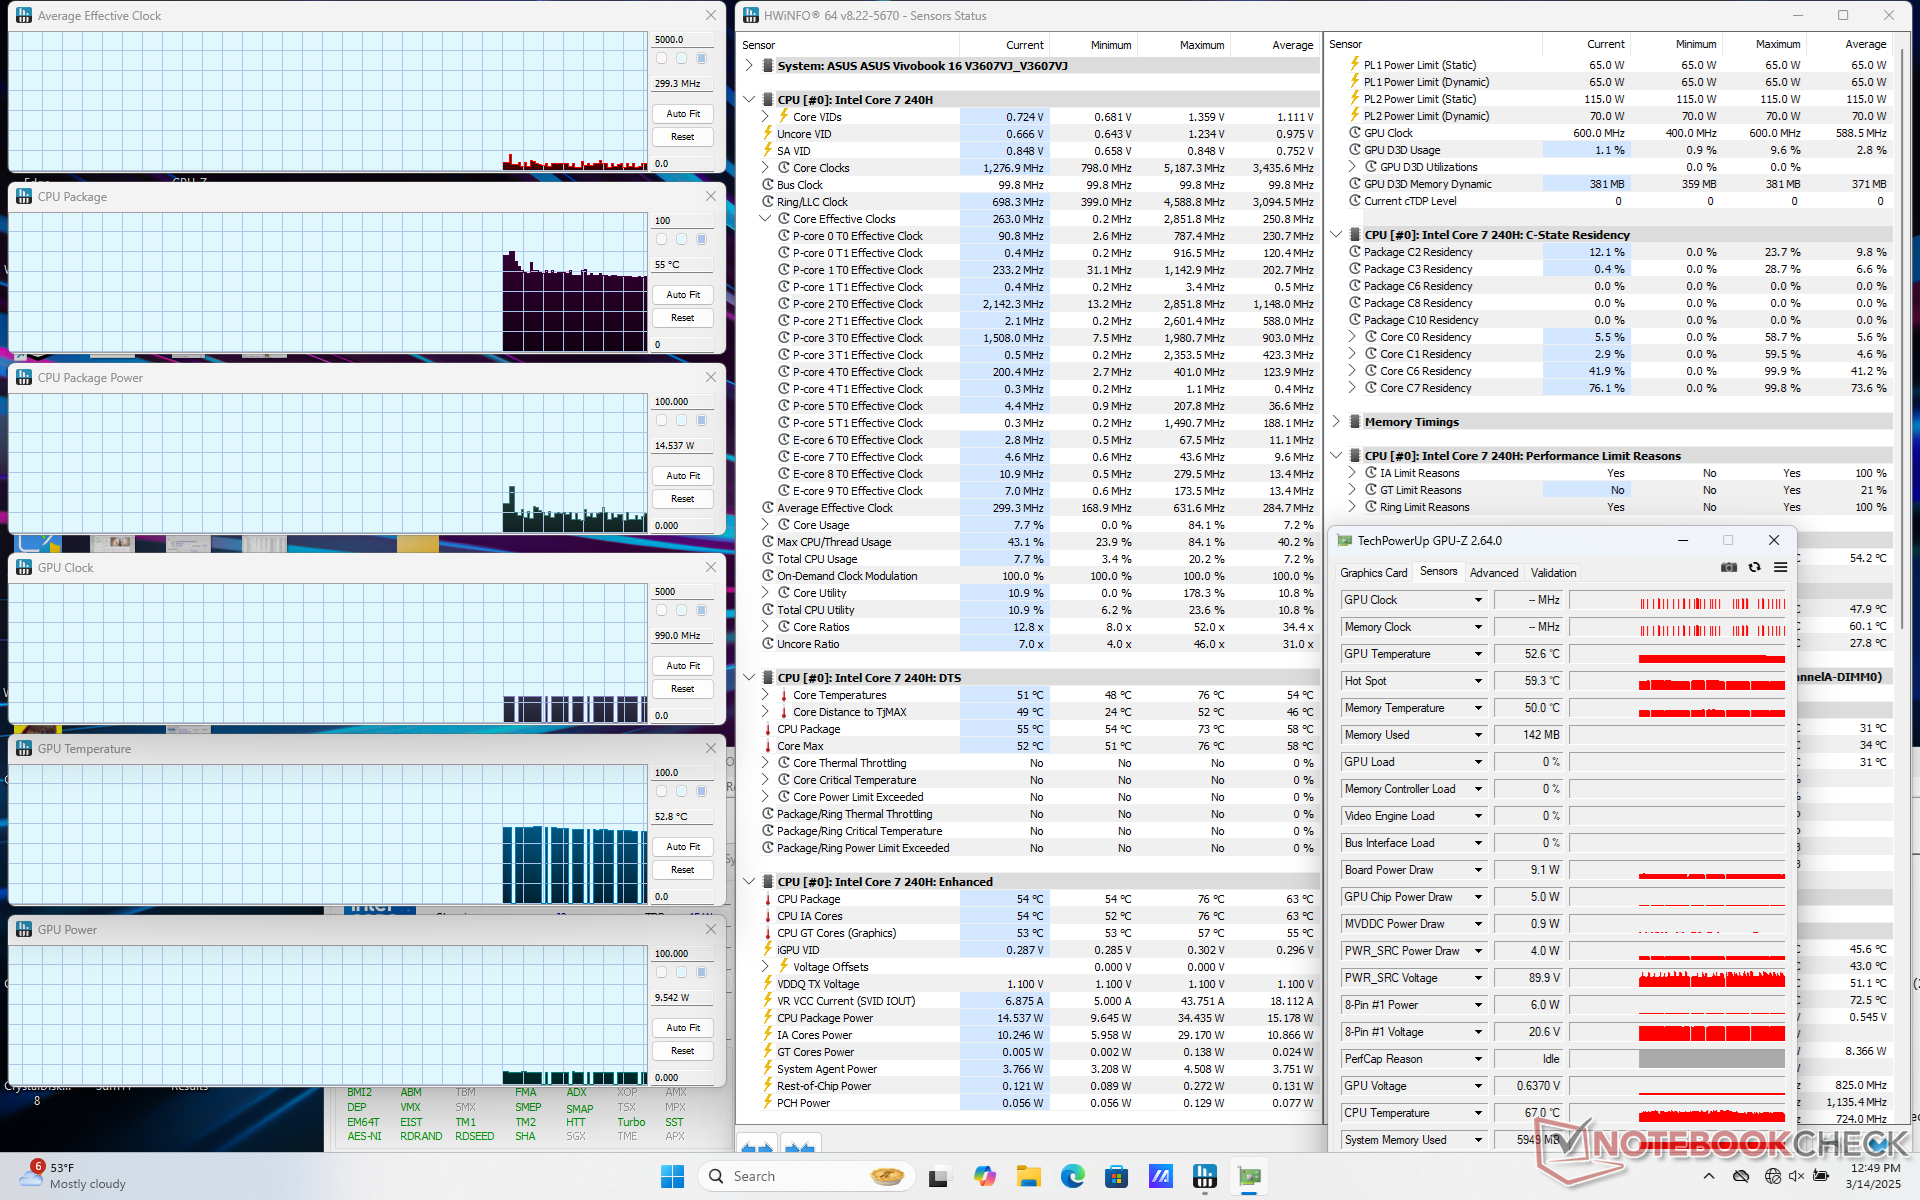
La CPU se dispararía a 3,9 GHz y 71 W durando sólo un minuto más o menos hasta alcanzar una temperatura del núcleo de 94 C. A continuación, se estrangularía hasta un mínimo de 2,4 GHz y 33 W antes de rebotar de nuevo a ~3,1 GHz y 50 W.
El rendimiento en juegos también caería ligeramente si se ejecuta en modo Equilibrado/Estándar en lugar de en modo Rendimiento. MyAsus también dispone de un modo "A toda velocidad", pero en nuestras pruebas no ofrece ninguna ventaja de rendimiento sobre el modo Rendimiento.
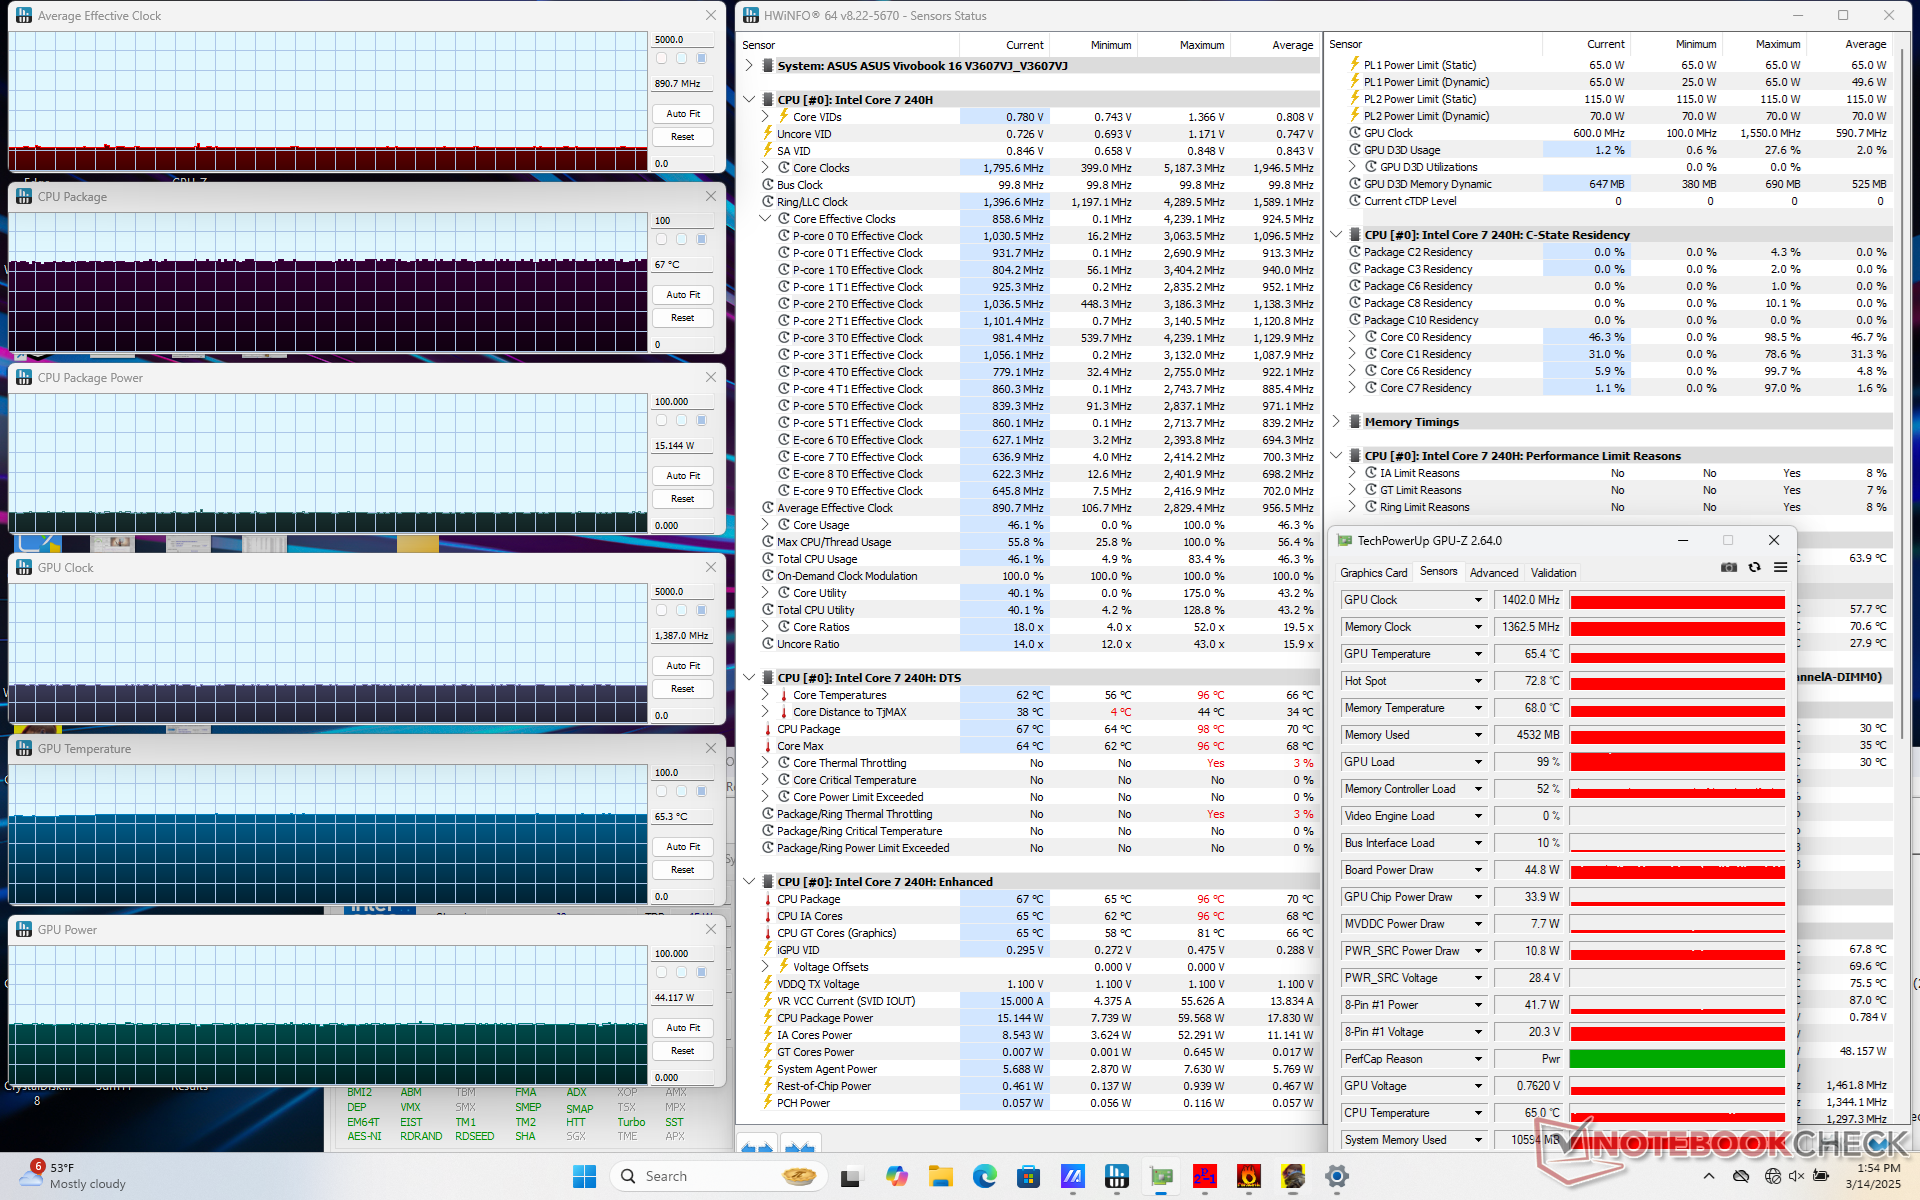
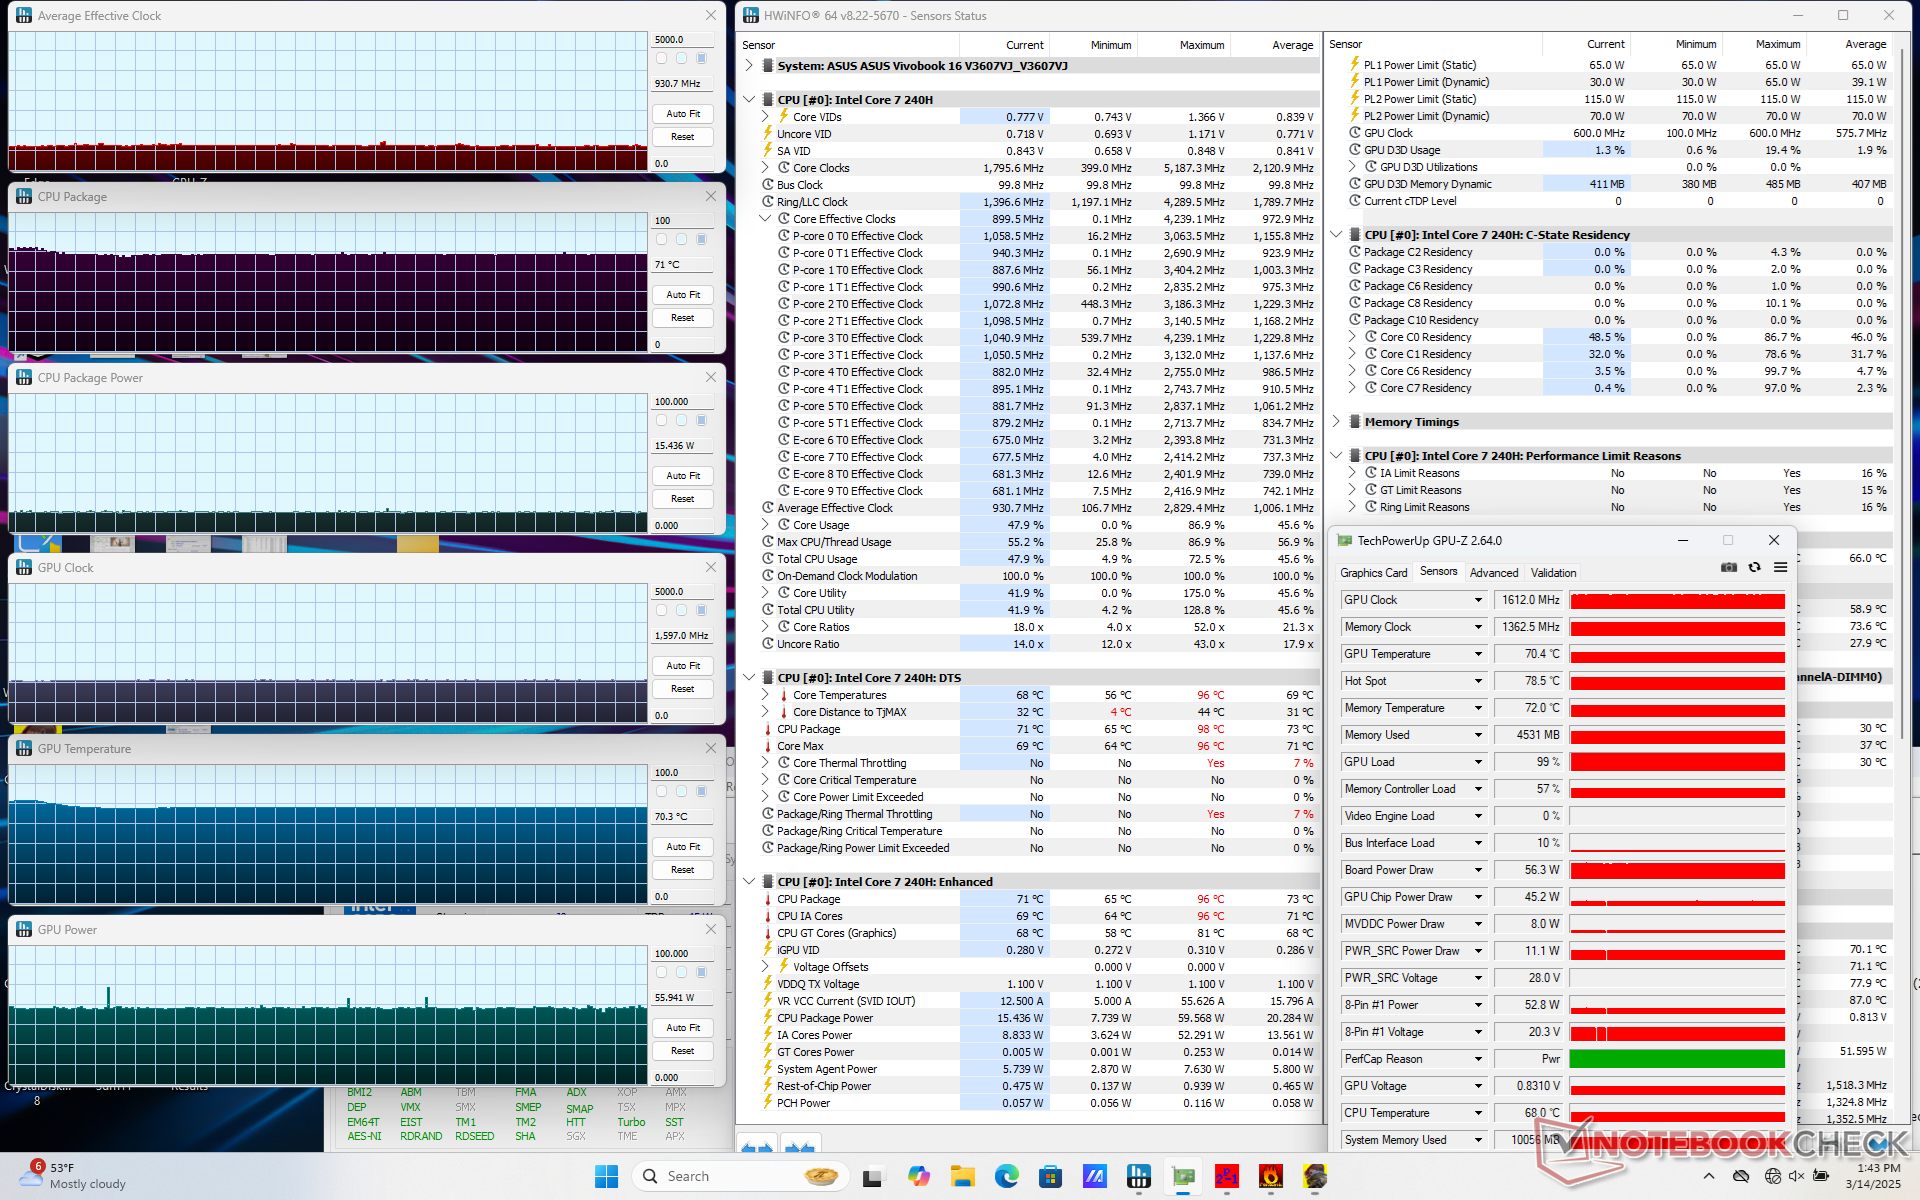

| Reloj medio de la CPU (GHz) | Reloj medio de la GPU (MHz) | Temperatura media dela CPU (°C) | Temperatura media de la GPU (°C) | |
| Sistema en reposo | -- | -- | 55 | 53 |
| Prime95 Stress | 3.1 | -- | 78 | 63 |
| Estrés Prime95 + FurMark | 1,9 | 1035 | 73 | 69 |
| Estrés de Cyberpunk 2077 (modo Rendimiento) | 0,9 | 1612 | 71 | 70 |
| Cyberpunk 2077 Estrés (modo Equilibrado) | 0.9 | 1402 | 67 | 65 |
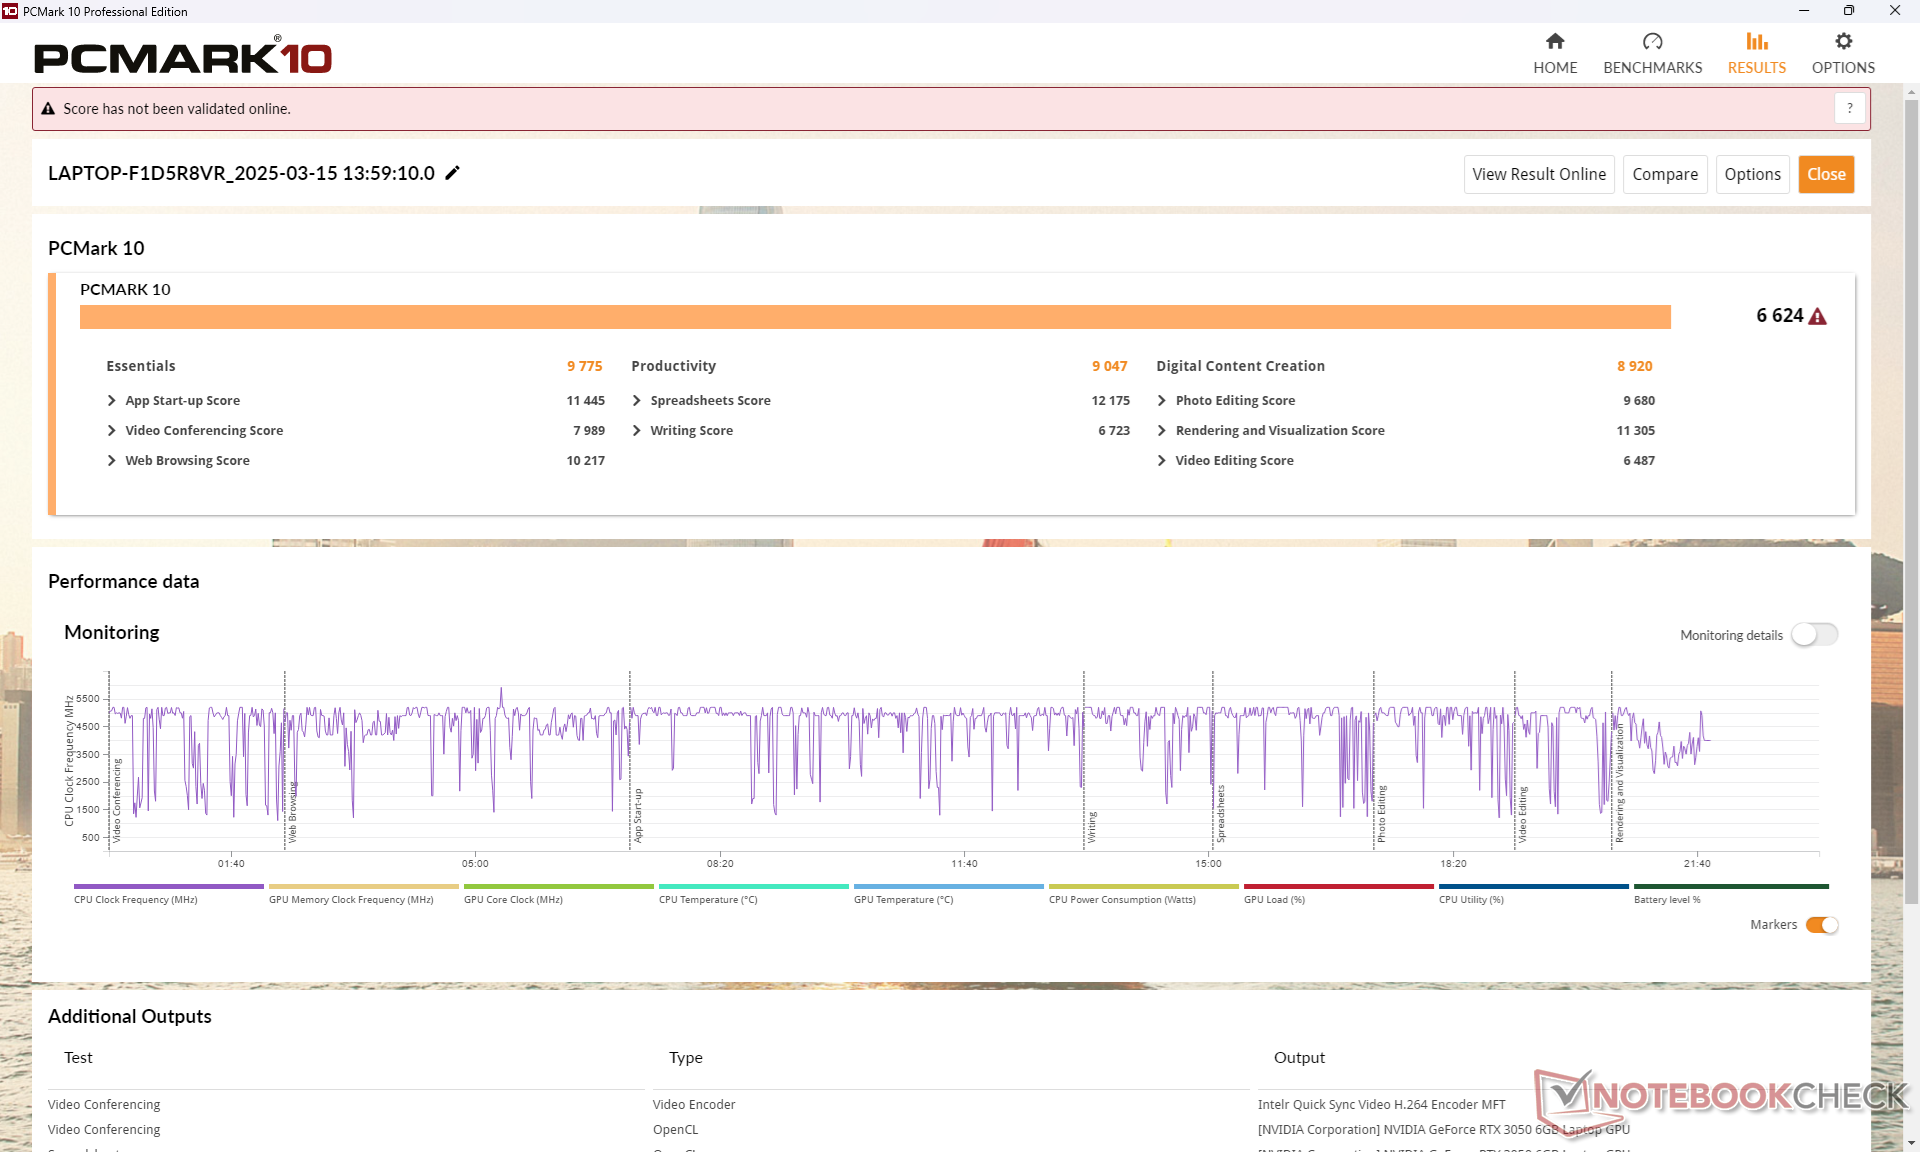
Rendimiento del sistema
CrossMark: Overall | Productivity | Creativity | Responsiveness
WebXPRT 3: Overall
WebXPRT 4: Overall
Mozilla Kraken 1.1: Total
| PCMark 10 / Score | |
| Asus VivoBook Pro 16 K6602VU | |
| Dell Inspiron 16 Plus 7640 | |
| Asus V16 V3607V | |
| Medio Intel Core 7 240H, NVIDIA GeForce RTX 3050 6GB Laptop GPU (n=1) | |
| HP Pavilion Plus 16-ab0456tx | |
| Acer Swift Edge 16 SFE16-44-R0XV | |
| Lenovo ThinkBook 16 G7 IML | |
| PCMark 10 / Essentials | |
| Dell Inspiron 16 Plus 7640 | |
| Asus VivoBook Pro 16 K6602VU | |
| Acer Swift Edge 16 SFE16-44-R0XV | |
| HP Pavilion Plus 16-ab0456tx | |
| Lenovo ThinkBook 16 G7 IML | |
| Asus V16 V3607V | |
| Medio Intel Core 7 240H, NVIDIA GeForce RTX 3050 6GB Laptop GPU (n=1) | |
| PCMark 10 / Productivity | |
| Acer Swift Edge 16 SFE16-44-R0XV | |
| Asus V16 V3607V | |
| Medio Intel Core 7 240H, NVIDIA GeForce RTX 3050 6GB Laptop GPU (n=1) | |
| HP Pavilion Plus 16-ab0456tx | |
| Asus VivoBook Pro 16 K6602VU | |
| Dell Inspiron 16 Plus 7640 | |
| Lenovo ThinkBook 16 G7 IML | |
| PCMark 10 / Digital Content Creation | |
| Dell Inspiron 16 Plus 7640 | |
| Asus VivoBook Pro 16 K6602VU | |
| Asus V16 V3607V | |
| Medio Intel Core 7 240H, NVIDIA GeForce RTX 3050 6GB Laptop GPU (n=1) | |
| HP Pavilion Plus 16-ab0456tx | |
| Acer Swift Edge 16 SFE16-44-R0XV | |
| Lenovo ThinkBook 16 G7 IML | |
| CrossMark / Overall | |
| Asus V16 V3607V | |
| Medio Intel Core 7 240H, NVIDIA GeForce RTX 3050 6GB Laptop GPU (n=1) | |
| HP Pavilion Plus 16-ab0456tx | |
| Asus VivoBook Pro 16 K6602VU | |
| Dell Inspiron 16 Plus 7640 | |
| Lenovo ThinkBook 16 G7 IML | |
| CrossMark / Productivity | |
| Asus V16 V3607V | |
| Medio Intel Core 7 240H, NVIDIA GeForce RTX 3050 6GB Laptop GPU (n=1) | |
| Asus VivoBook Pro 16 K6602VU | |
| HP Pavilion Plus 16-ab0456tx | |
| Dell Inspiron 16 Plus 7640 | |
| Lenovo ThinkBook 16 G7 IML | |
| CrossMark / Creativity | |
| HP Pavilion Plus 16-ab0456tx | |
| Asus V16 V3607V | |
| Medio Intel Core 7 240H, NVIDIA GeForce RTX 3050 6GB Laptop GPU (n=1) | |
| Dell Inspiron 16 Plus 7640 | |
| Asus VivoBook Pro 16 K6602VU | |
| Lenovo ThinkBook 16 G7 IML | |
| CrossMark / Responsiveness | |
| Asus V16 V3607V | |
| Medio Intel Core 7 240H, NVIDIA GeForce RTX 3050 6GB Laptop GPU (n=1) | |
| Asus VivoBook Pro 16 K6602VU | |
| HP Pavilion Plus 16-ab0456tx | |
| Dell Inspiron 16 Plus 7640 | |
| Lenovo ThinkBook 16 G7 IML | |
| WebXPRT 3 / Overall | |
| Dell Inspiron 16 Plus 7640 | |
| HP Pavilion Plus 16-ab0456tx | |
| Acer Swift Edge 16 SFE16-44-R0XV | |
| Acer Swift Edge 16 SFE16-44-R0XV | |
| Lenovo ThinkBook 16 G7 IML | |
| WebXPRT 4 / Overall | |
| Asus V16 V3607V | |
| Medio Intel Core 7 240H, NVIDIA GeForce RTX 3050 6GB Laptop GPU (n=1) | |
| HP Pavilion Plus 16-ab0456tx | |
| Dell Inspiron 16 Plus 7640 | |
| Acer Swift Edge 16 SFE16-44-R0XV | |
| Asus VivoBook Pro 16 K6602VU | |
| Lenovo ThinkBook 16 G7 IML | |
| Mozilla Kraken 1.1 / Total | |
| Lenovo ThinkBook 16 G7 IML | |
| Acer Swift Edge 16 SFE16-44-R0XV | |
| Acer Swift Edge 16 SFE16-44-R0XV | |
| Asus VivoBook Pro 16 K6602VU | |
| Dell Inspiron 16 Plus 7640 | |
| Asus V16 V3607V | |
| Medio Intel Core 7 240H, NVIDIA GeForce RTX 3050 6GB Laptop GPU (n=1) | |
| HP Pavilion Plus 16-ab0456tx | |
* ... más pequeño es mejor
| PCMark 10 Score | 6624 puntos | |
ayuda | ||
| AIDA64 / Memory Copy | |
| Acer Swift Edge 16 SFE16-44-R0XV | |
| HP Pavilion Plus 16-ab0456tx | |
| Dell Inspiron 16 Plus 7640 | |
| Asus VivoBook Pro 16 K6602VU | |
| Lenovo ThinkBook 16 G7 IML | |
| Asus V16 V3607V | |
| Medio Intel Core 7 240H (n=1) | |
| AIDA64 / Memory Read | |
| Dell Inspiron 16 Plus 7640 | |
| Asus VivoBook Pro 16 K6602VU | |
| HP Pavilion Plus 16-ab0456tx | |
| Acer Swift Edge 16 SFE16-44-R0XV | |
| Asus V16 V3607V | |
| Medio Intel Core 7 240H (n=1) | |
| Lenovo ThinkBook 16 G7 IML | |
| AIDA64 / Memory Write | |
| Acer Swift Edge 16 SFE16-44-R0XV | |
| HP Pavilion Plus 16-ab0456tx | |
| Dell Inspiron 16 Plus 7640 | |
| Asus VivoBook Pro 16 K6602VU | |
| Lenovo ThinkBook 16 G7 IML | |
| Asus V16 V3607V | |
| Medio Intel Core 7 240H (n=1) | |
| AIDA64 / Memory Latency | |
| Lenovo ThinkBook 16 G7 IML | |
| Dell Inspiron 16 Plus 7640 | |
| Acer Swift Edge 16 SFE16-44-R0XV | |
| Asus V16 V3607V | |
| Medio Intel Core 7 240H (n=1) | |
| Asus VivoBook Pro 16 K6602VU | |
| HP Pavilion Plus 16-ab0456tx | |
* ... más pequeño es mejor
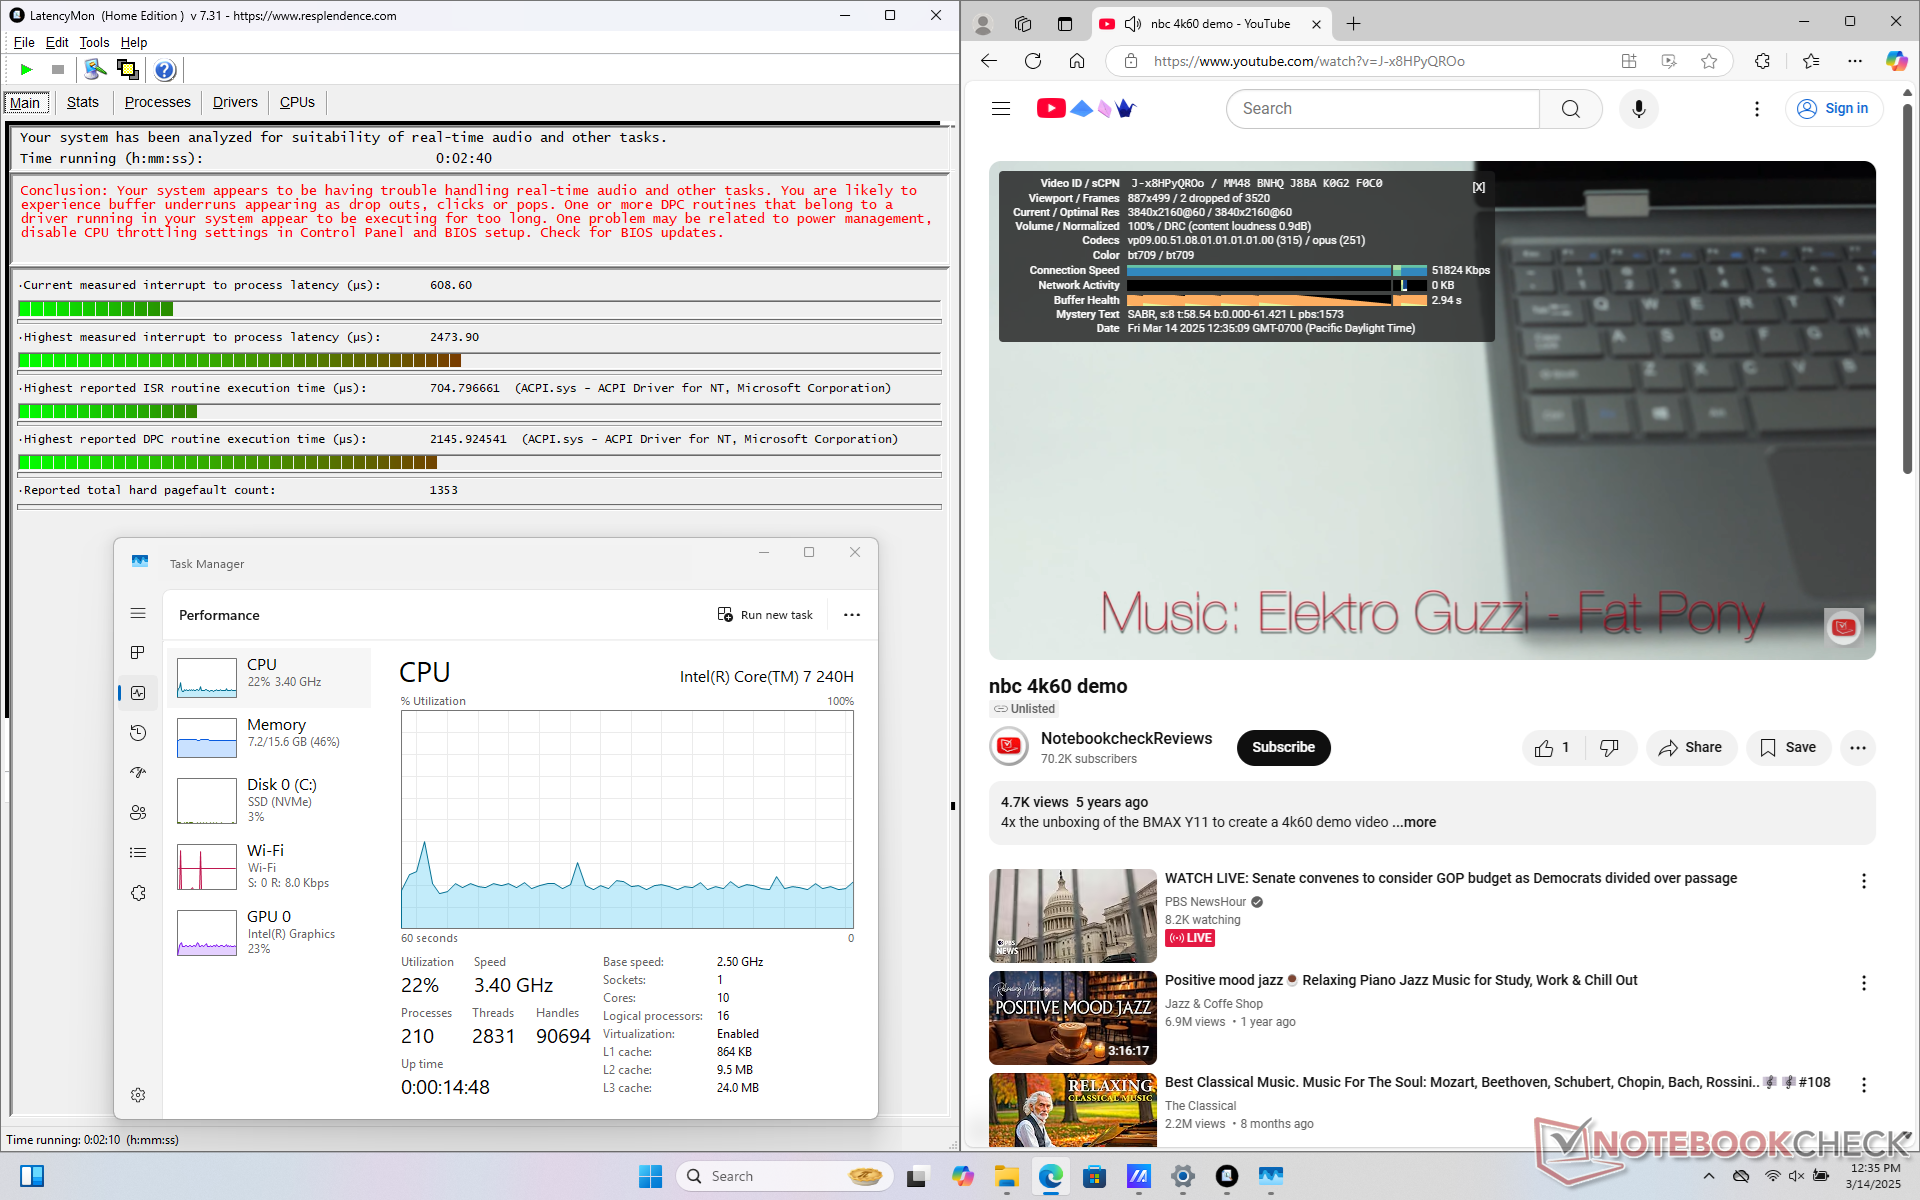
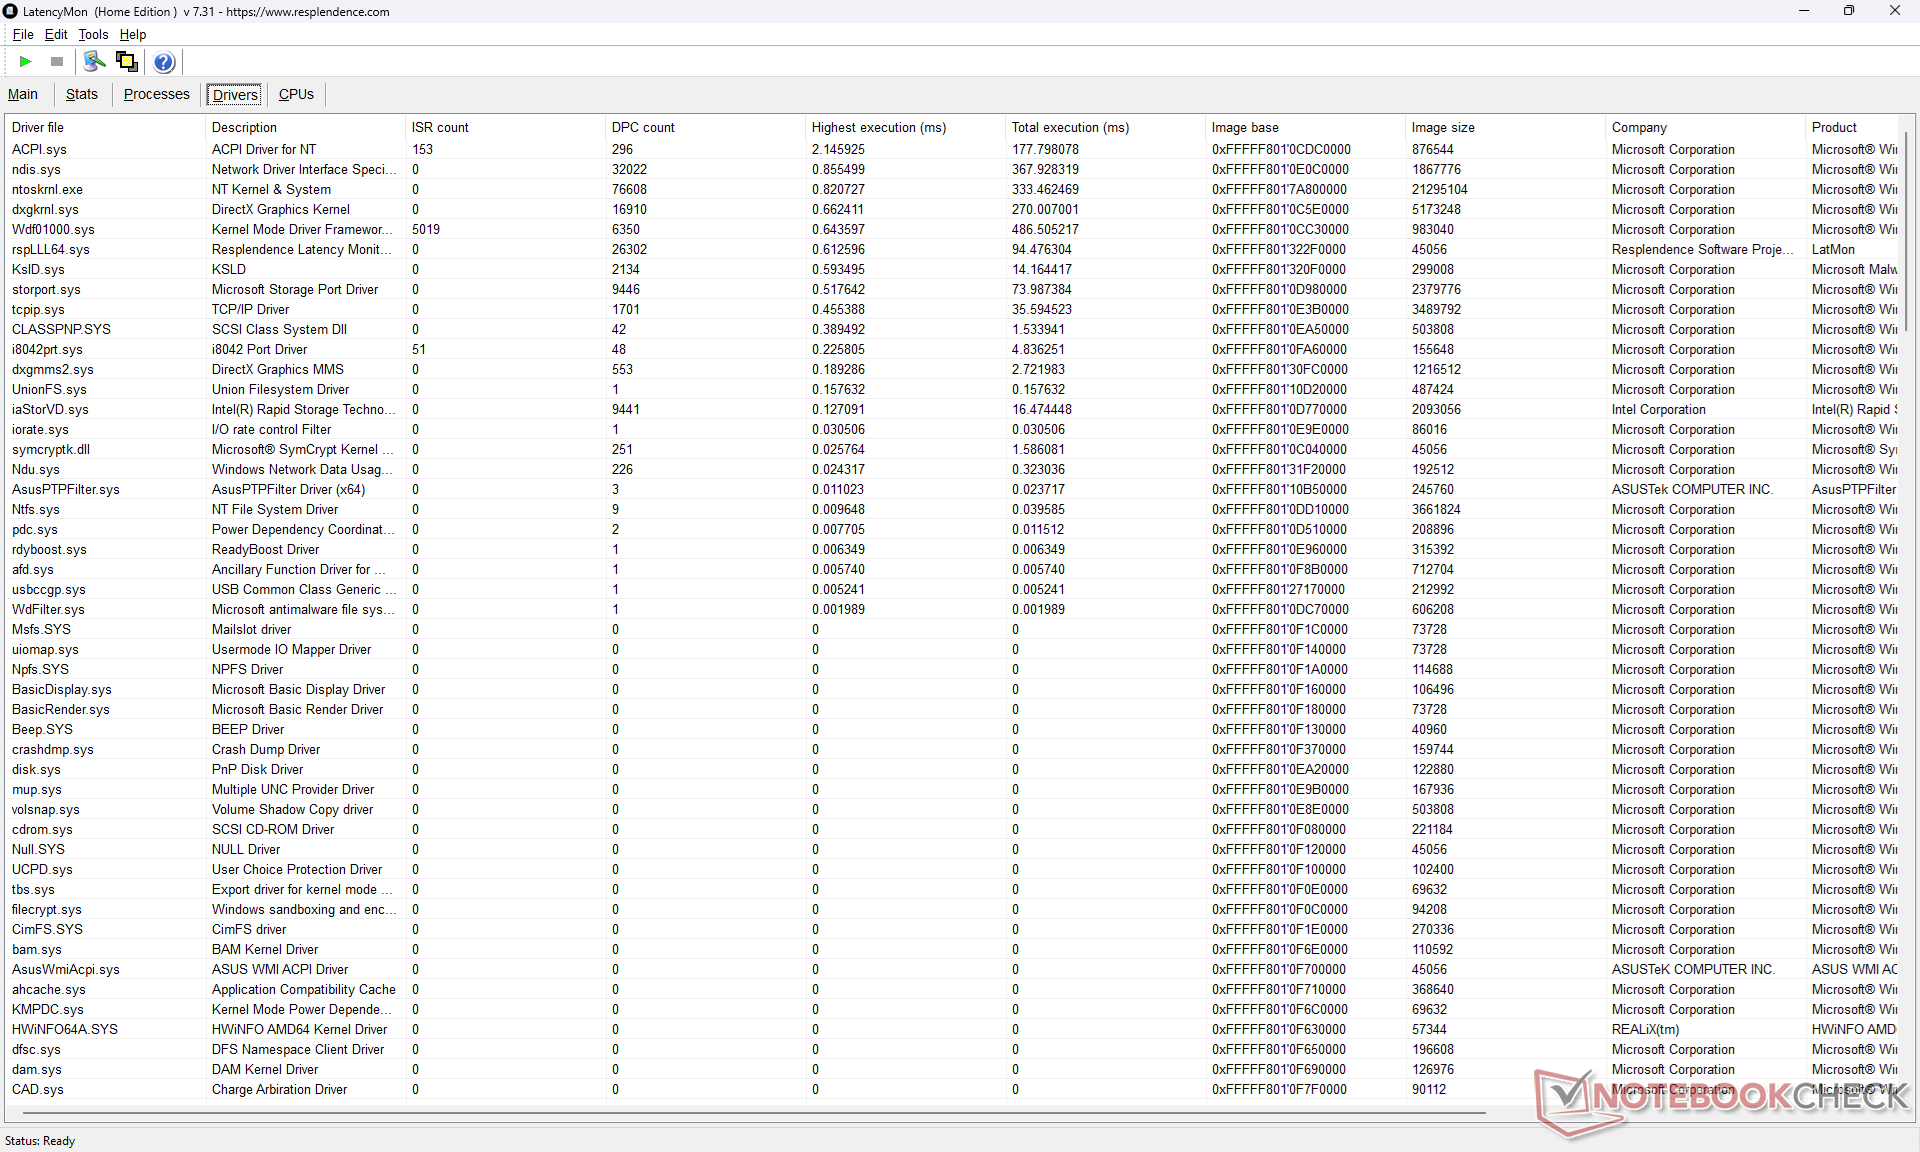
Latencia del CPD
LatencyMon muestra problemas de DPC al abrir varias pestañas de nuestra página de inicio y sólo un par de caídas de fotogramas durante nuestra prueba de reproducción de vídeo 4K60.
| DPC Latencies / LatencyMon - interrupt to process latency (max), Web, Youtube, Prime95 | |
| Acer Swift Edge 16 SFE16-44-R0XV | |
| HP Pavilion Plus 16-ab0456tx | |
| Asus V16 V3607V | |
| Asus VivoBook Pro 16 K6602VU | |
| Lenovo ThinkBook 16 G7 IML | |
| Dell Inspiron 16 Plus 7640 | |
* ... más pequeño es mejor
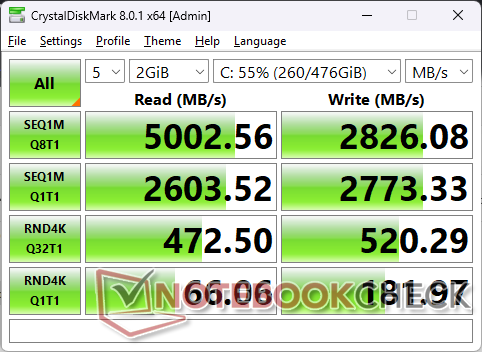
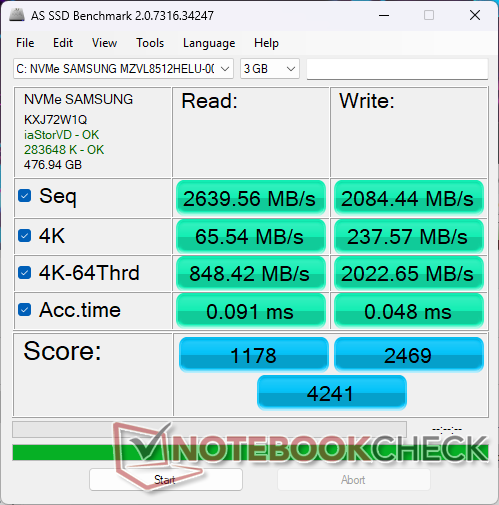
Dispositivos de almacenamiento
La unidad SSD Samsung MZVL8512HELU PCIe4 de 512 GB alcanza un máximo de poco menos de 5000 MB/s. Sin embargo, el rendimiento se estrangularía tras unos minutos de uso, como muestra nuestro gráfico siguiente.

| Drive Performance Rating - Percent | |
| Acer Swift Edge 16 SFE16-44-R0XV | |
| HP Pavilion Plus 16-ab0456tx | |
| Asus V16 V3607V | |
| Asus VivoBook Pro 16 K6602VU | |
| Dell Inspiron 16 Plus 7640 | |
| Lenovo ThinkBook 16 G7 IML | |
* ... más pequeño es mejor
Disk Throttling: DiskSpd Read Loop, Queue Depth 8
Rendimiento de la GPU
La GeForce RTX 3050 es entre un 20 y un 25 por ciento más rápida que la RTX 2050 o entre un 30 y un 35 por ciento más lenta que la RTX 4050. Tenga en cuenta que el Asus se envía con la mejor versión de 6 GB de la RTX 3050 en lugar de la versión de 4 GB.
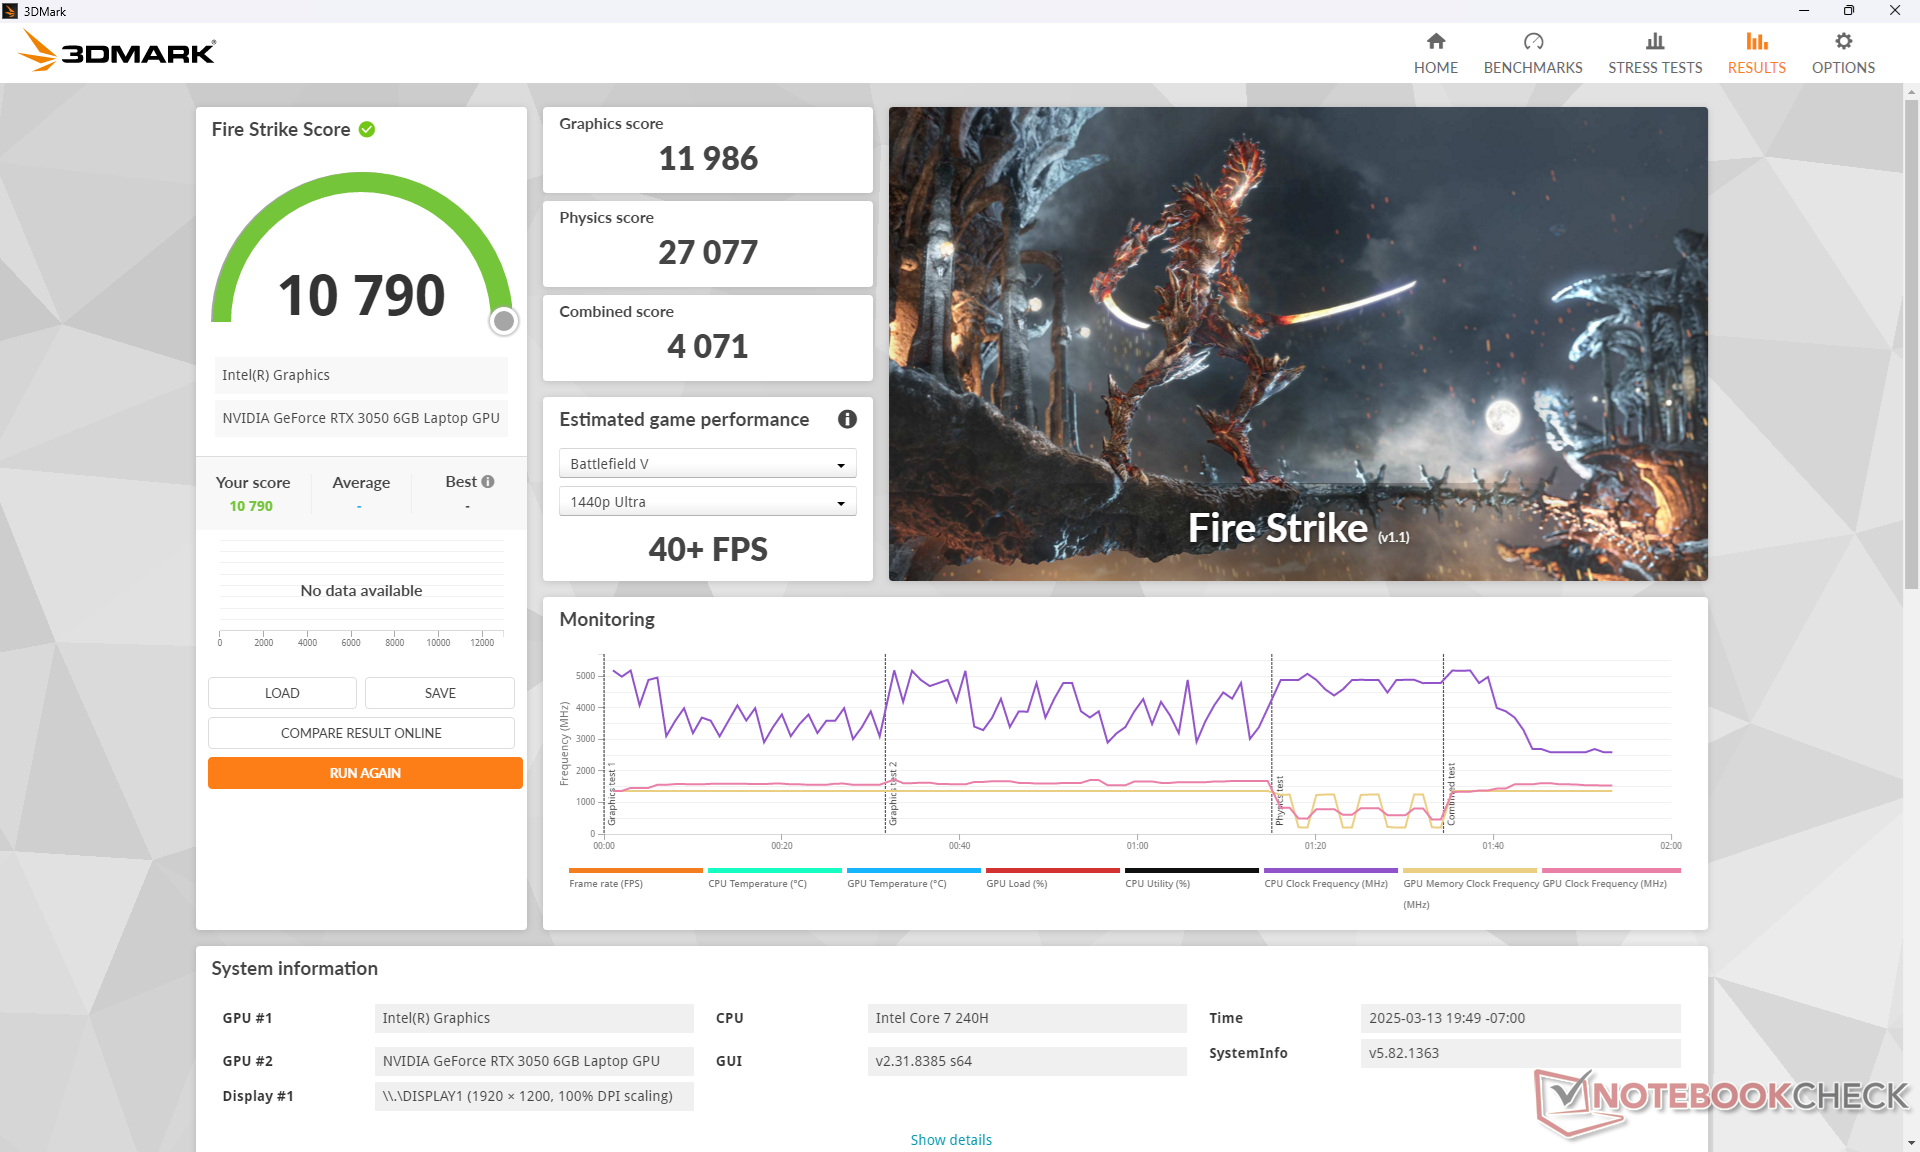
| Perfil de potencia | Puntuación gráfica | Puntuación física | Puntuación combinada |
| Modo de rendimiento | 11986 | 27077 | 4071 |
| Modo equilibrado | 11317 (-6%) | 28246 (-0%) | 3842 (-6%) |
| Batería | 9900 (-17%) | 20557 (-24%) | 3573 (-12%) |
El funcionamiento en modo equilibrado afecta ligeramente al rendimiento gráfico, mientras que el modo batería reduciría aún más el rendimiento, como muestra nuestra tabla de resultados Fire Strike anterior.
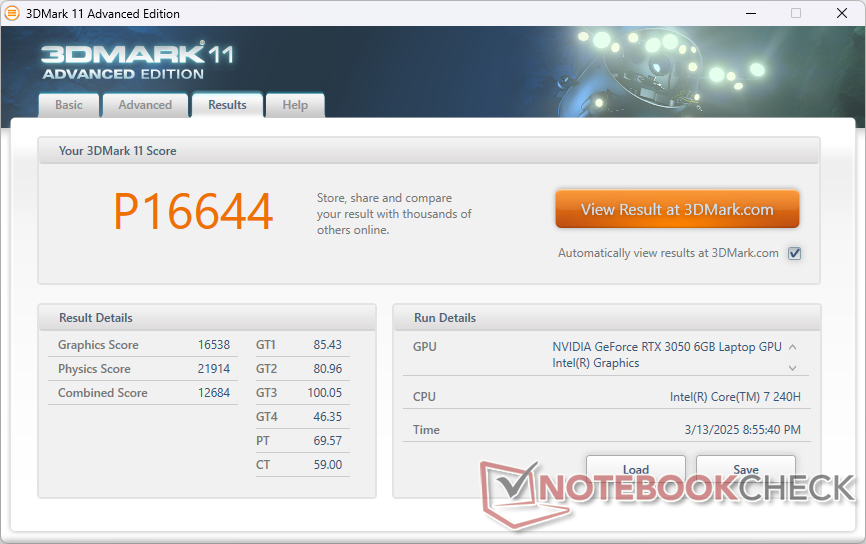

| 3DMark 11 Performance | 16644 puntos | |
| 3DMark Fire Strike Score | 10790 puntos | |
| 3DMark Time Spy Score | 5033 puntos | |
ayuda | ||
* ... más pequeño es mejor
Rendimiento en juegos
Puede que la RTX 3050 se esté haciendo larga, pero sigue siendo lo suficientemente potente como para ejecutar títulos exigentes como Cyberpunk 2077 a la resolución nativa de 1080p o 1200p con la mayoría de los ajustes en Alto.
| F1 22 | |
| 1280x720 Ultra Low Preset AA:T AF:16x | |
| Lenovo ThinkPad Z16 Gen 2 | |
| Asus V16 V3607V | |
| Medio NVIDIA GeForce RTX 3050 6GB Laptop GPU (198 - 236, n=3) | |
| HP Spectre x360 16 RTX 4050 | |
| 1920x1080 Low Preset AA:T AF:16x | |
| HP Spectre x360 16 RTX 4050 | |
| Asus V16 V3607V | |
| Medio NVIDIA GeForce RTX 3050 6GB Laptop GPU (110.9 - 163.5, n=4) | |
| Lenovo ThinkPad Z16 Gen 2 | |
| 1920x1080 Medium Preset AA:T AF:16x | |
| HP Spectre x360 16 RTX 4050 | |
| Asus V16 V3607V | |
| Medio NVIDIA GeForce RTX 3050 6GB Laptop GPU (106.1 - 151.5, n=4) | |
| Lenovo ThinkPad Z16 Gen 2 | |
| 1920x1080 High Preset AA:T AF:16x | |
| HP Spectre x360 16 RTX 4050 | |
| Asus V16 V3607V | |
| Medio NVIDIA GeForce RTX 3050 6GB Laptop GPU (85.5 - 109.7, n=4) | |
| Lenovo ThinkPad Z16 Gen 2 | |
| 1920x1080 Ultra High Preset AA:T AF:16x | |
| HP Spectre x360 16 RTX 4050 | |
| Medio NVIDIA GeForce RTX 3050 6GB Laptop GPU (30.7 - 34, n=4) | |
| Asus V16 V3607V | |
| Lenovo ThinkPad Z16 Gen 2 | |
| Tiny Tina's Wonderlands | |
| 1280x720 Lowest Preset (DX12) | |
| Lenovo ThinkPad Z16 Gen 2 | |
| Asus V16 V3607V | |
| Medio NVIDIA GeForce RTX 3050 6GB Laptop GPU (n=1) | |
| 1920x1080 Low Preset (DX12) | |
| HP Spectre x360 16 RTX 4050 | |
| Lenovo ThinkPad Z16 Gen 2 | |
| Medio NVIDIA GeForce RTX 3050 6GB Laptop GPU (105.6 - 113.3, n=2) | |
| Asus V16 V3607V | |
| 1920x1080 Medium Preset (DX12) | |
| HP Spectre x360 16 RTX 4050 | |
| Lenovo ThinkPad Z16 Gen 2 | |
| Medio NVIDIA GeForce RTX 3050 6GB Laptop GPU (84.7 - 89.7, n=2) | |
| Asus V16 V3607V | |
| 1920x1080 High Preset (DX12) | |
| HP Spectre x360 16 RTX 4050 | |
| Lenovo ThinkPad Z16 Gen 2 | |
| Medio NVIDIA GeForce RTX 3050 6GB Laptop GPU (55.9 - 59.2, n=2) | |
| Asus V16 V3607V | |
| 1920x1080 Badass Preset (DX12) | |
| HP Spectre x360 16 RTX 4050 | |
| Medio NVIDIA GeForce RTX 3050 6GB Laptop GPU (44.3 - 46.4, n=2) | |
| Asus V16 V3607V | |
| Lenovo ThinkPad Z16 Gen 2 | |
Cyberpunk 2077 ultra FPS Chart
| bajo | medio | alto | ultra | |
|---|---|---|---|---|
| GTA V (2015) | 184.2 | 178.4 | 127.3 | 63.2 |
| Dota 2 Reborn (2015) | 181.4 | 161.2 | 146.8 | 135.1 |
| Final Fantasy XV Benchmark (2018) | 126.5 | 67.6 | 49.1 | |
| X-Plane 11.11 (2018) | 96.3 | 89.3 | 78.6 | |
| Far Cry 5 (2018) | 149 | 85 | 78 | 74 |
| Strange Brigade (2018) | 246 | 106.9 | 88.4 | 77 |
| Tiny Tina's Wonderlands (2022) | 105.6 | 84.7 | 55.9 | 44.3 |
| F1 22 (2022) | 149.9 | 138.9 | 102 | 31.6 |
| Baldur's Gate 3 (2023) | 59.7 | 50.3 | 45.4 | 44.3 |
| Cyberpunk 2077 2.2 Phantom Liberty (2023) | 66.7 | 51.4 | 42.7 | 36.1 |
Emisiones
Ruido del sistema
El ruido del ventilador es generalmente silencioso bajo cargas bajas, pero desgraciadamente aumenta con bastante rapidez cuando se introducen cargas más exigentes, como al iniciar aplicaciones. Los juegos en modo Equilibrado son ligeramente más silenciosos que en modo Rendimiento (38,3 dB(A) frente a 40,5 dB(A)) a costa de un rendimiento gráfico ligeramente más lento, como ya se ha mencionado.

Ruido
| Ocioso |
| 23.5 / 23.7 / 23.7 dB(A) |
| Carga |
| 48 / 51 dB(A) |
 | ||
30 dB silencioso 40 dB(A) audible 50 dB(A) ruidosamente alto |
||
min: | ||
| Asus V16 V3607V GeForce RTX 3050 6GB Laptop GPU, Core 7 240H | Asus VivoBook Pro 16 K6602VU NVIDIA GeForce RTX 4050 Laptop GPU, i9-13900H, Micron 2400 MTFDKBA1T0QFM | Dell Inspiron 16 Plus 7640 NVIDIA GeForce RTX 4060 Laptop GPU, Ultra 7 155H, SK hynix BC901 HFS001TEJ4X164N | Lenovo ThinkBook 16 G7 IML Graphics 4-Core, Ultra 5 125U, SK hynix HFS512GEJ4X112N | HP Pavilion Plus 16-ab0456tx GeForce RTX 3050 6GB Laptop GPU, i7-13700H, WDC PC SN810 1TB | Acer Swift Edge 16 SFE16-44-R0XV Radeon 760M, R5 8640U, Micron 3400 MTFDKBA512TFH 512GB | |
|---|---|---|---|---|---|---|
| Noise | -4% | 5% | 18% | 9% | -13% | |
| apagado / medio ambiente * | 23.3 | 20.96 10% | 23.8 -2% | 23.1 1% | 22.22 5% | 25 -7% |
| Idle Minimum * | 23.5 | 25.28 -8% | 24.2 -3% | 23.1 2% | 22.22 5% | 26 -11% |
| Idle Average * | 23.7 | 25.28 -7% | 24.2 -2% | 23.1 3% | 22.22 6% | 29 -22% |
| Idle Maximum * | 23.7 | 25.28 -7% | 24.2 -2% | 23.1 3% | 22.22 6% | 39 -65% |
| Load Average * | 48 | 51.88 -8% | 28.9 40% | 23.2 52% | 42.03 12% | 45 6% |
| Cyberpunk 2077 ultra * | 40.5 | 29.2 28% | 43 -6% | |||
| Load Maximum * | 51 | 51.8 -2% | 51 -0% | 32.6 36% | 42.1 17% | 45 12% |
| Witcher 3 ultra * | 49 | 51 | 42.1 |
* ... más pequeño es mejor
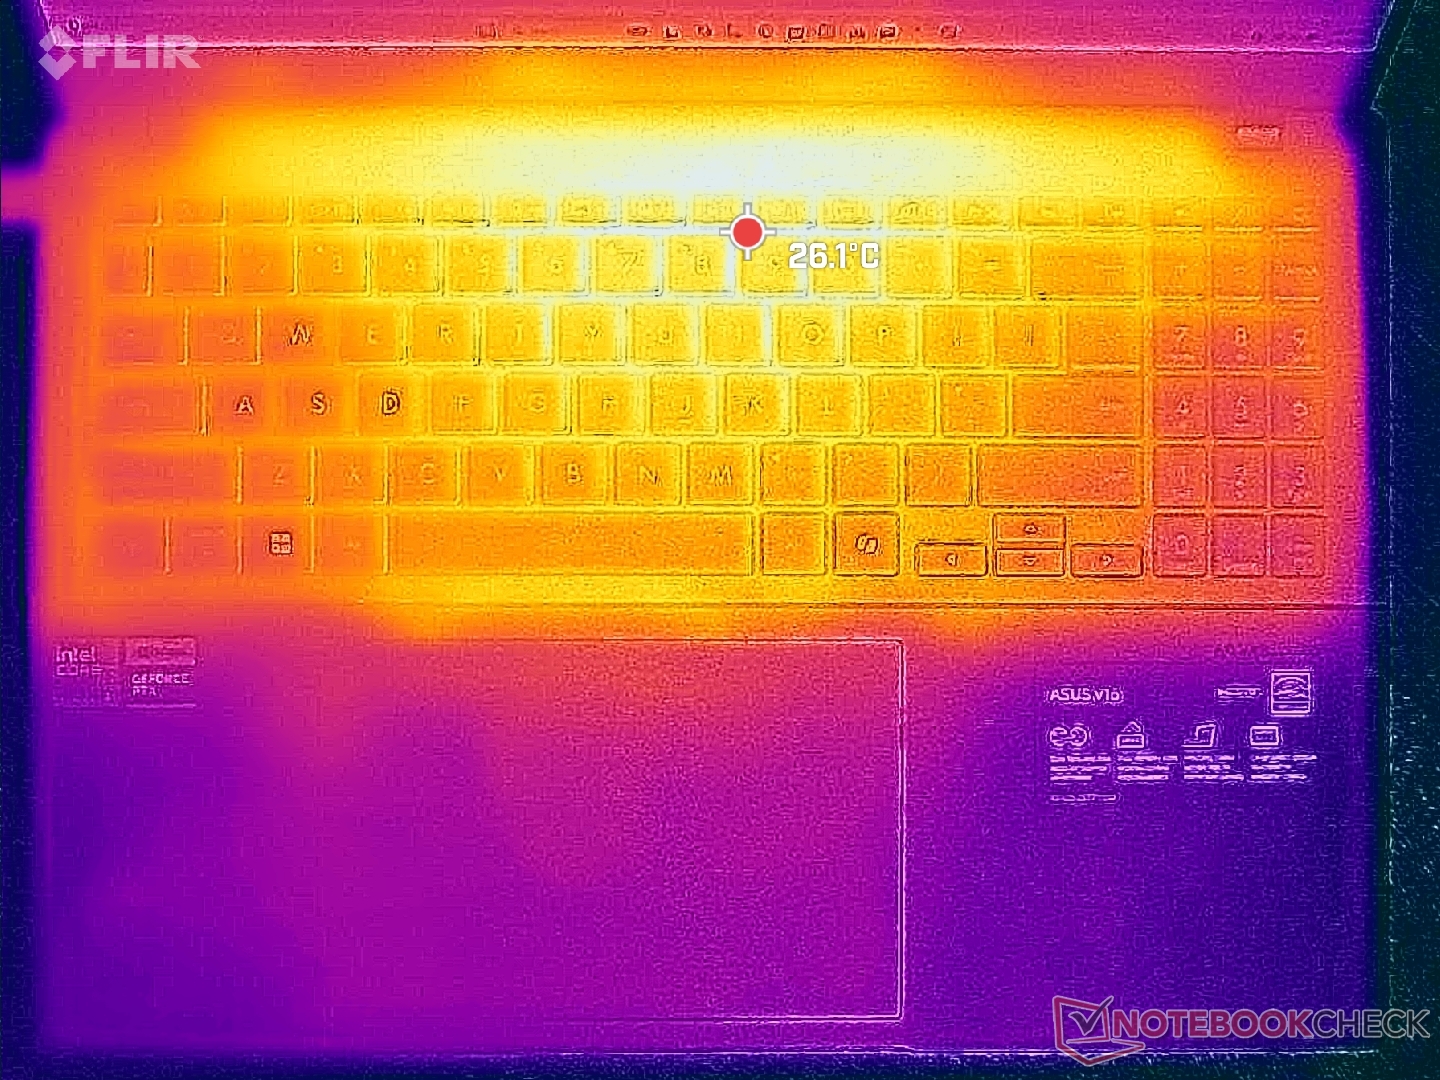
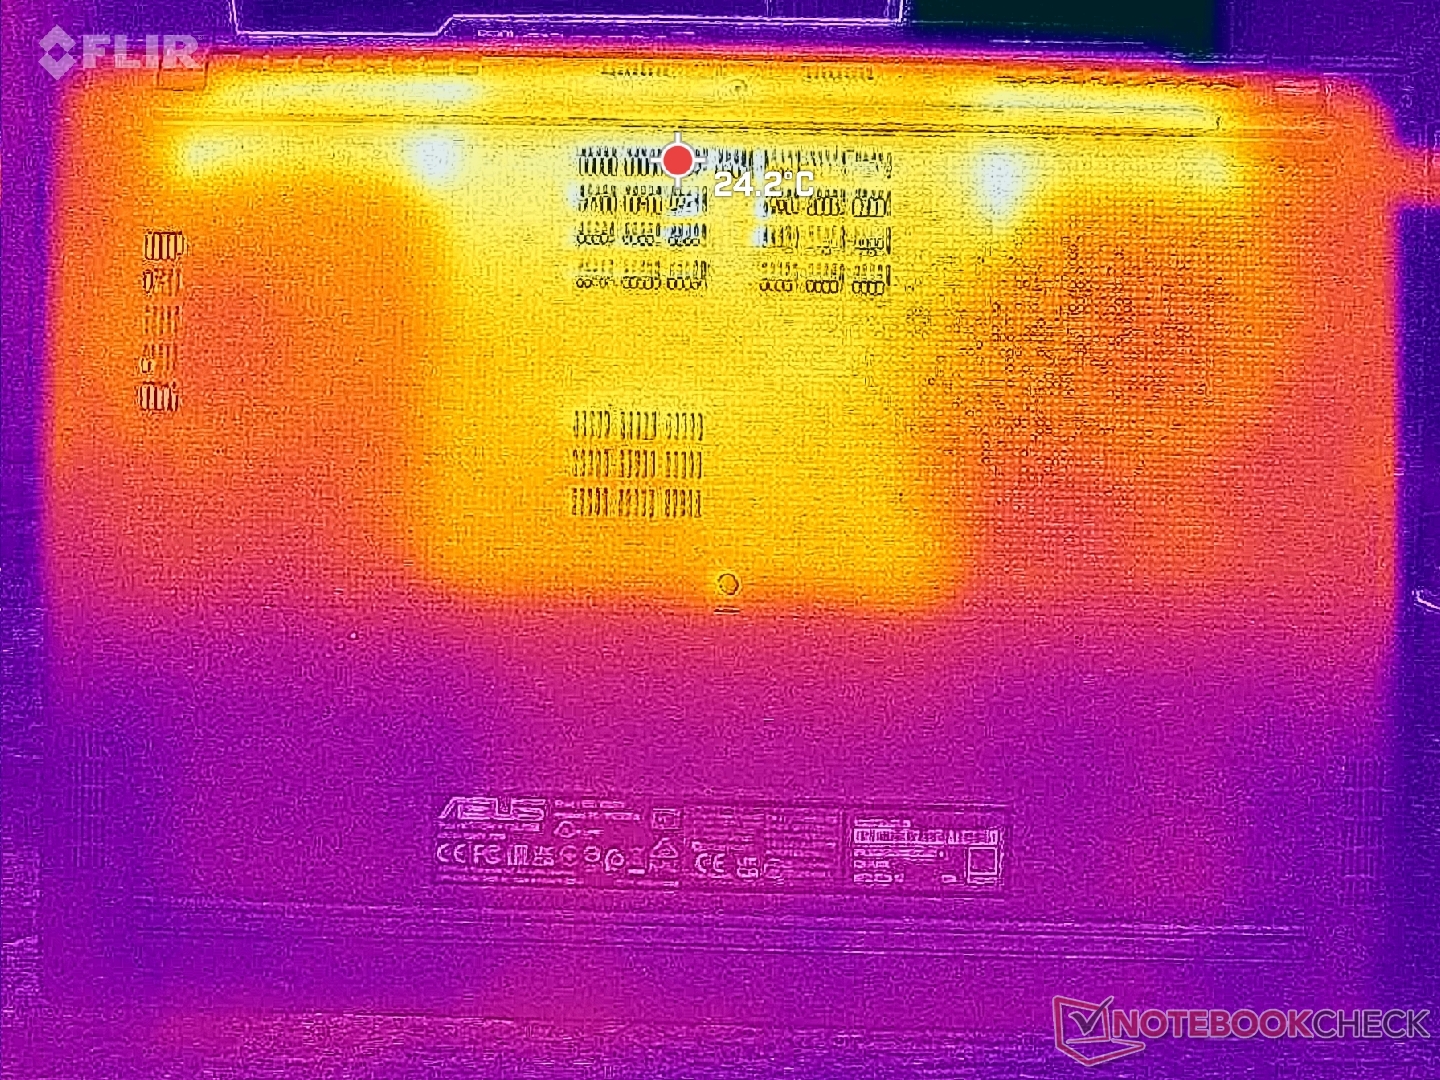
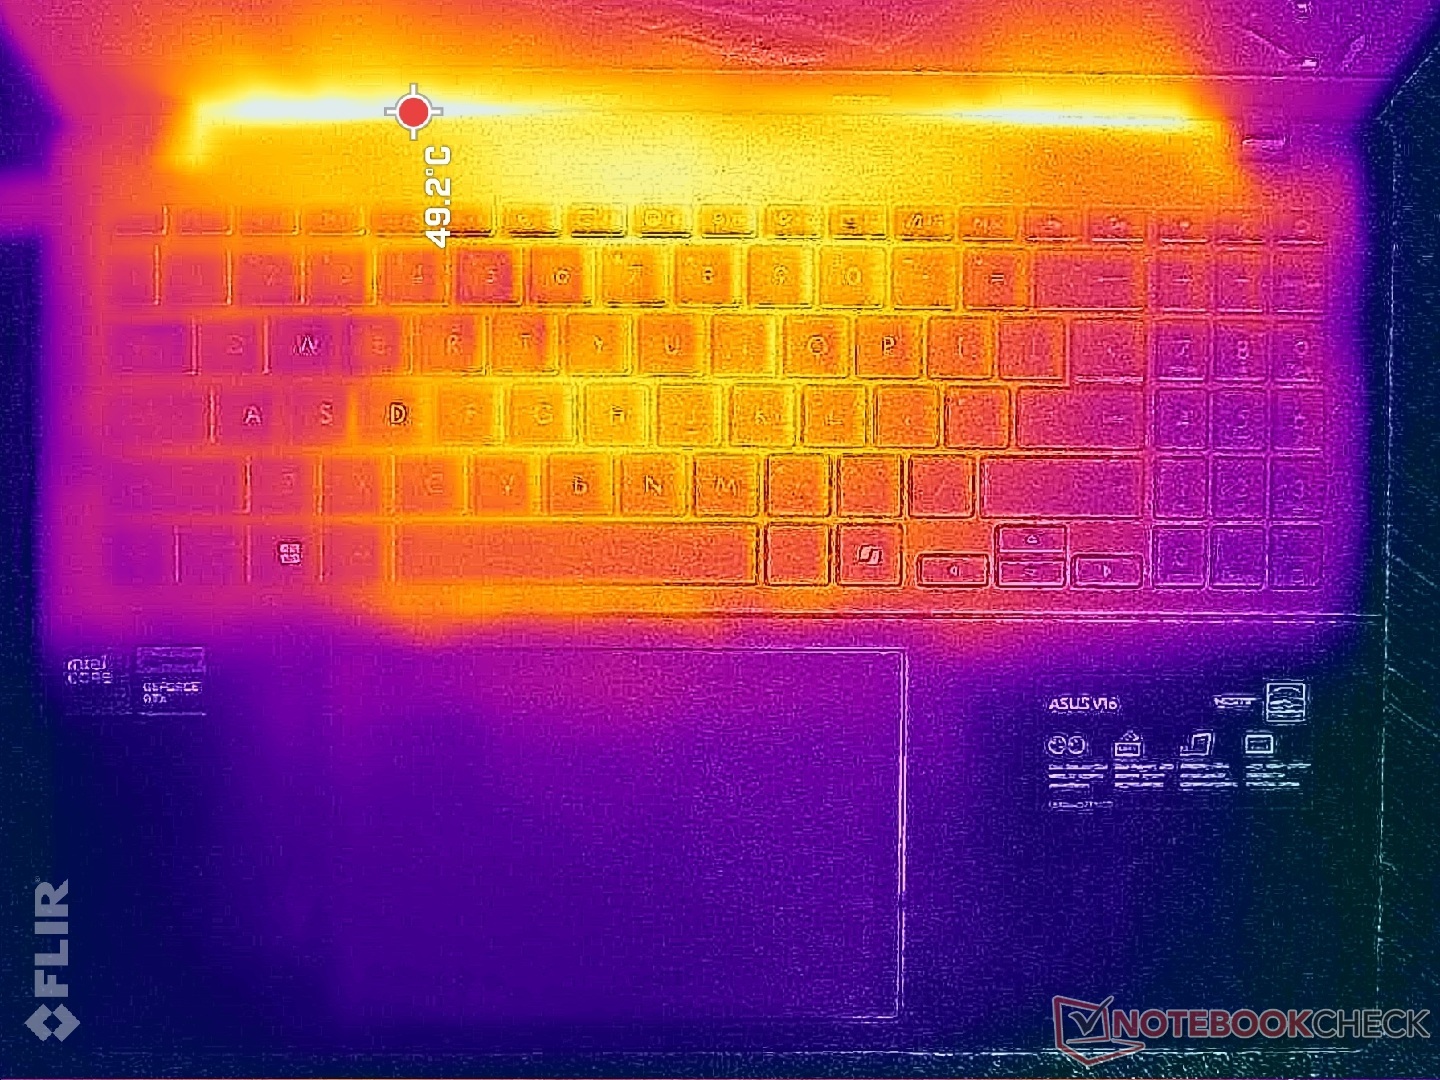
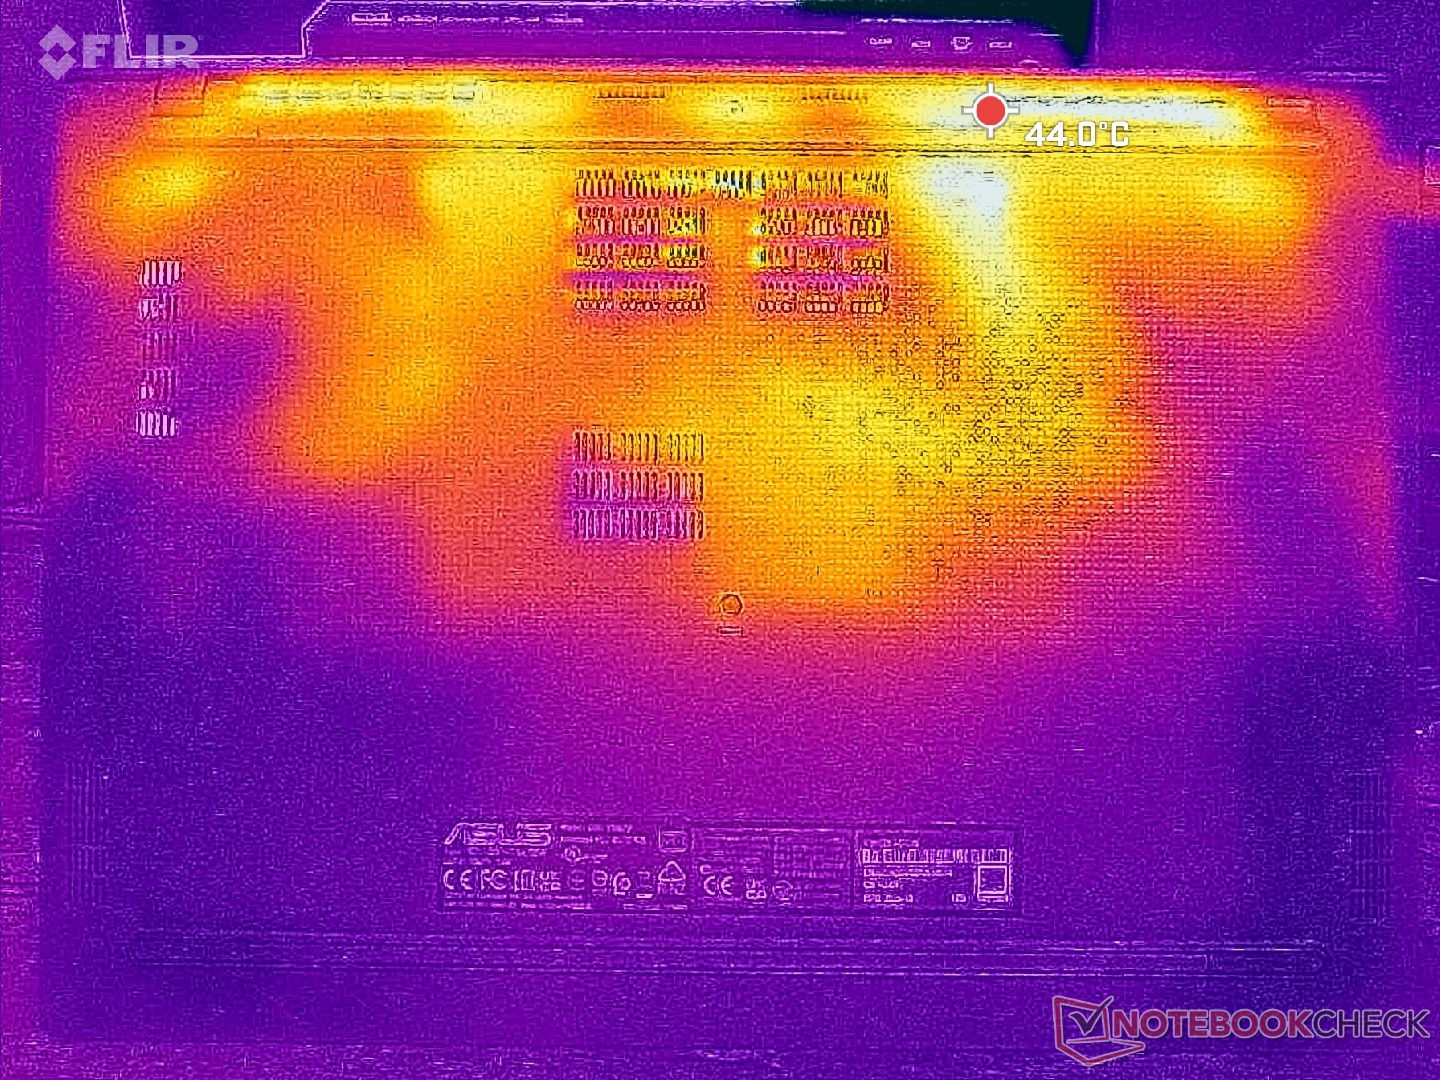
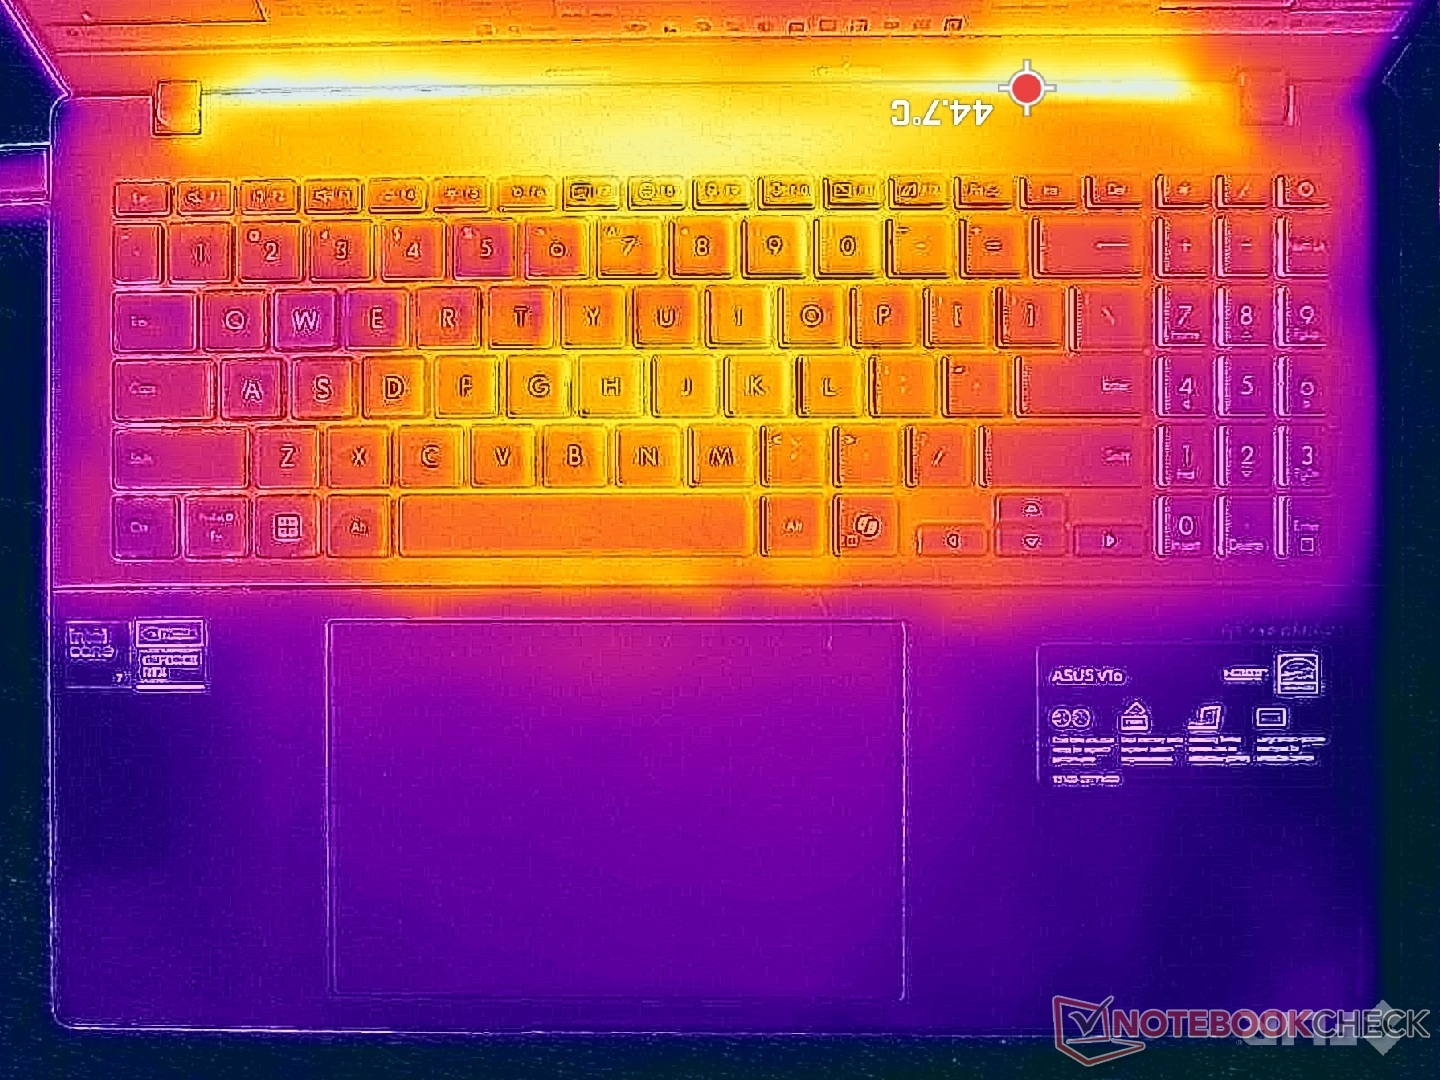
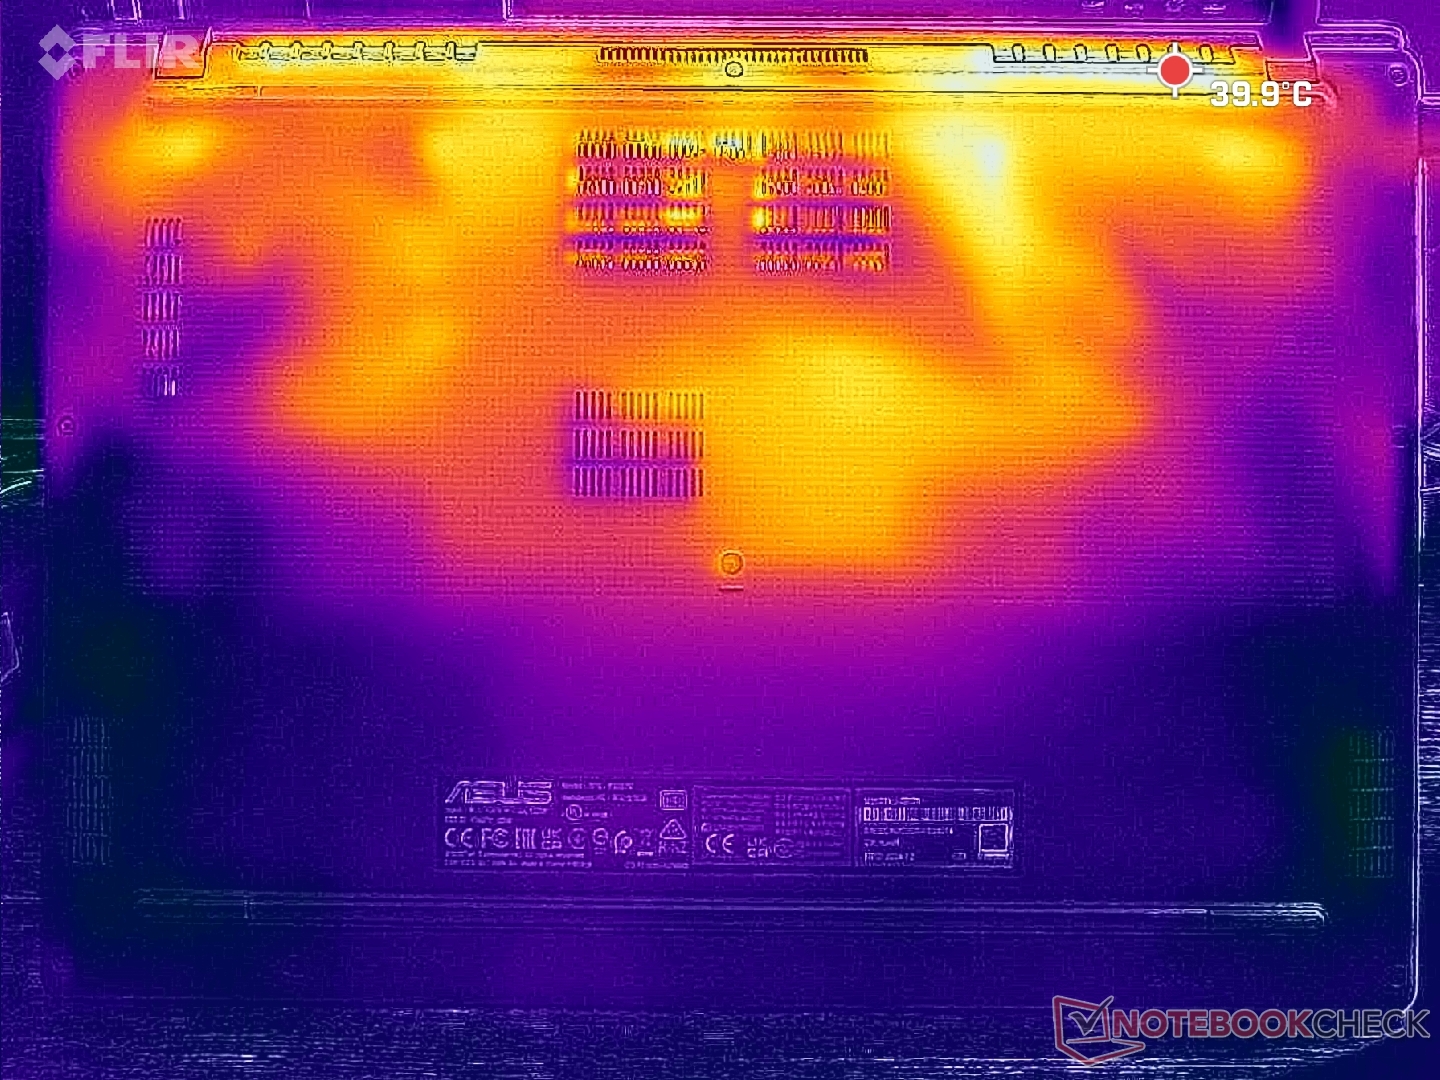
Temperatura
Los puntos calientes están hacia la parte trasera, donde pueden alcanzar más de 40 C, como muestran los mapas de temperatura de abajo. Los reposamuñecas, el teclado numérico y las teclas WASD permanecerían más fríos para escribir o jugar.
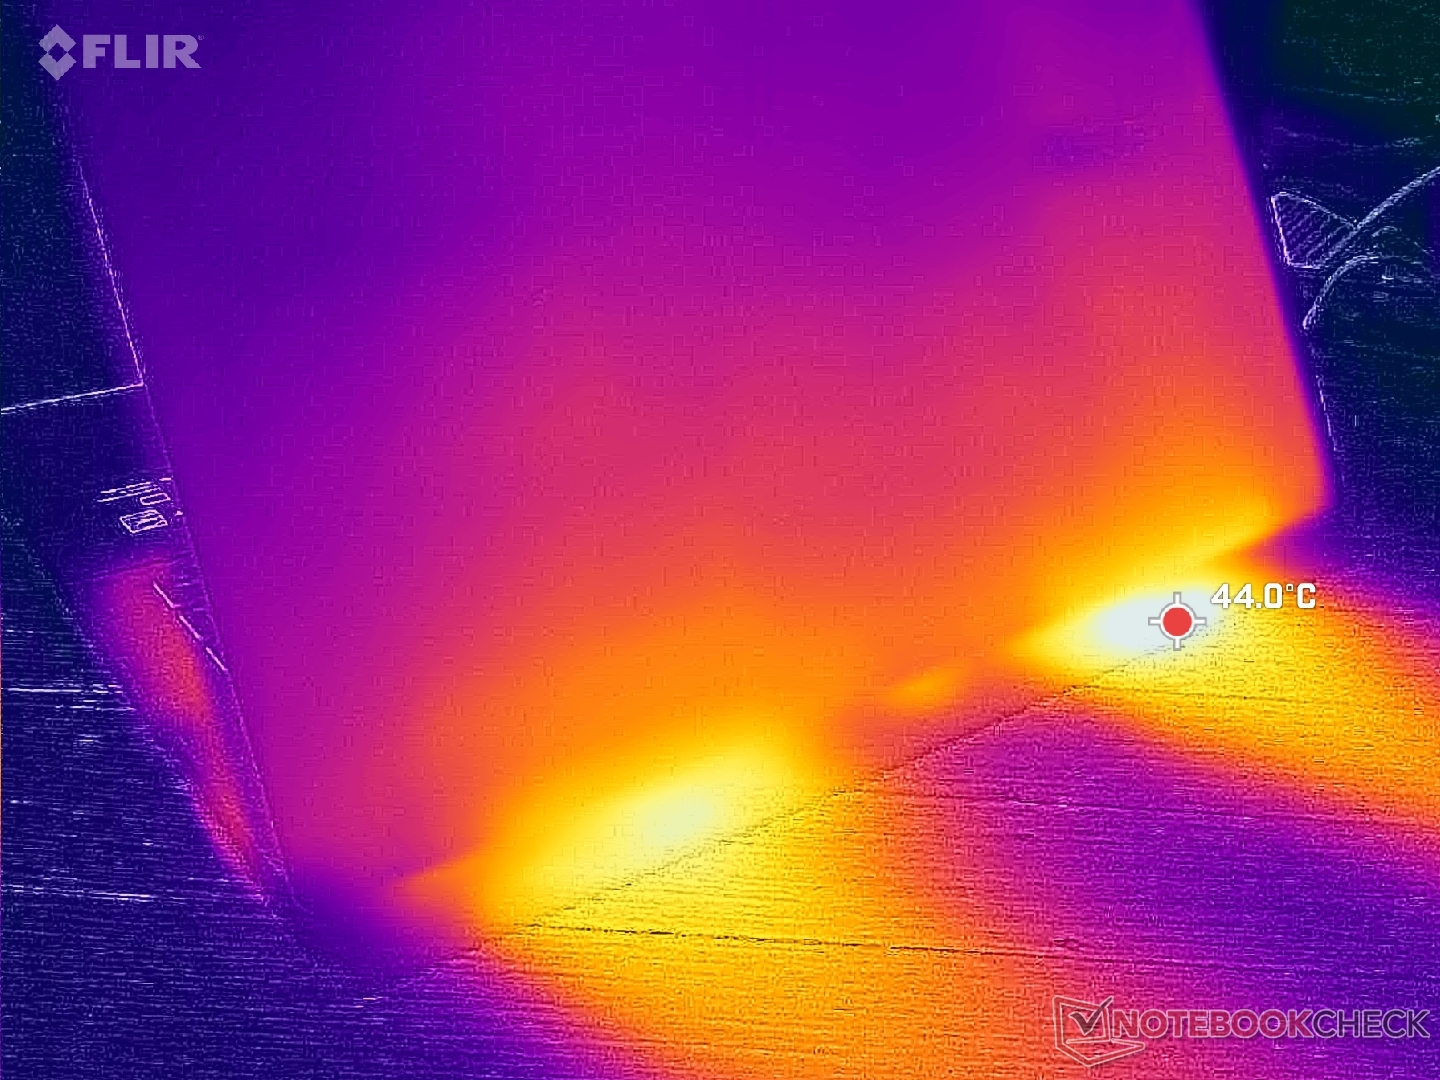
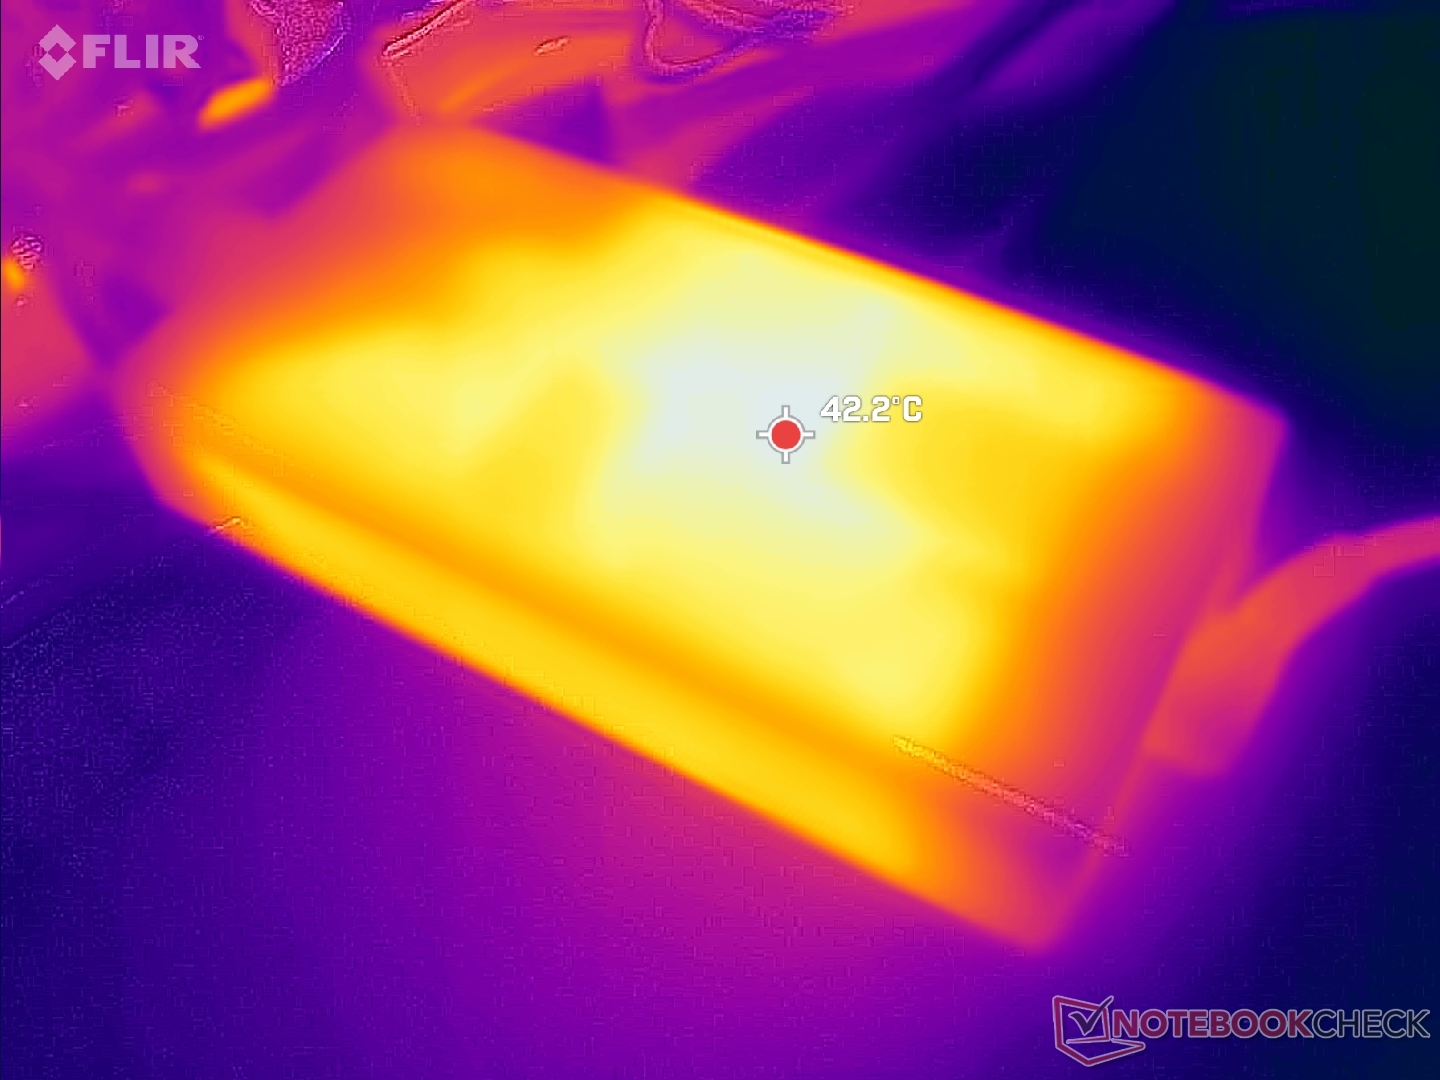
(±) La temperatura máxima en la parte superior es de 41.2 °C / 106 F, frente a la media de 36.9 °C / 98 F, que oscila entre 21.1 y 71 °C para la clase Multimedia.
(+) El fondo se calienta hasta un máximo de 34.4 °C / 94 F, frente a la media de 39.2 °C / 103 F
(+) En reposo, la temperatura media de la parte superior es de 24.6 °C / 76# F, frente a la media del dispositivo de 31.3 °C / 88 F.
(+) 3: The average temperature for the upper side is 31.2 °C / 88 F, compared to the average of 31.3 °C / 88 F for the class Multimedia.
(+) El reposamanos y el panel táctil están a una temperatura inferior a la de la piel, con un máximo de 21.8 °C / 71.2 F y, por tanto, son fríos al tacto.
(+) La temperatura media de la zona del reposamanos de dispositivos similares fue de 28.8 °C / 83.8 F (+7 °C / 12.6 F).
| Asus V16 V3607V Intel Core 7 240H, NVIDIA GeForce RTX 3050 6GB Laptop GPU | Asus VivoBook Pro 16 K6602VU Intel Core i9-13900H, NVIDIA GeForce RTX 4050 Laptop GPU | Dell Inspiron 16 Plus 7640 Intel Core Ultra 7 155H, NVIDIA GeForce RTX 4060 Laptop GPU | Lenovo ThinkBook 16 G7 IML Intel Core Ultra 5 125U, Intel Graphics 4-Core iGPU (Arc) | HP Pavilion Plus 16-ab0456tx Intel Core i7-13700H, NVIDIA GeForce RTX 3050 6GB Laptop GPU | Acer Swift Edge 16 SFE16-44-R0XV AMD Ryzen 5 8640U, AMD Radeon 760M | |
|---|---|---|---|---|---|---|
| Heat | -30% | -13% | 7% | -28% | -24% | |
| Maximum Upper Side * | 41.2 | 42.6 -3% | 43.4 -5% | 33.2 19% | 49.6 -20% | 48 -17% |
| Maximum Bottom * | 34.4 | 48.4 -41% | 41.6 -21% | 41.2 -20% | 45.8 -33% | 60 -74% |
| Idle Upper Side * | 28.8 | 39.4 -37% | 32.8 -14% | 23.4 19% | 39.2 -36% | 28 3% |
| Idle Bottom * | 29 | 39.8 -37% | 32.4 -12% | 26.6 8% | 35.4 -22% | 31 -7% |
* ... más pequeño es mejor
Altavoces
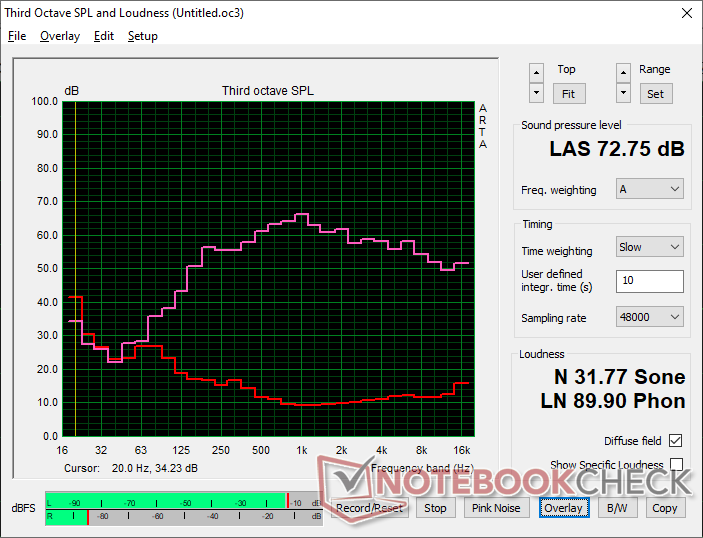
Asus V16 V3607V análisis de audio
(±) | la sonoridad del altavoz es media pero buena (72.8 dB)
Graves 100 - 315 Hz
(±) | lubina reducida - en promedio 7.7% inferior a la mediana
(±) | la linealidad de los graves es media (7.8% delta a frecuencia anterior)
Medios 400 - 2000 Hz
(+) | medios equilibrados - a sólo 4.7% de la mediana
(+) | los medios son lineales (4.8% delta a la frecuencia anterior)
Altos 2 - 16 kHz
(+) | máximos equilibrados - a sólo 1.9% de la mediana
(+) | los máximos son lineales (5.3% delta a la frecuencia anterior)
Total 100 - 16.000 Hz
(+) | el sonido global es lineal (13.2% de diferencia con la mediana)
En comparación con la misma clase
» 23% de todos los dispositivos probados de esta clase eran mejores, 5% similares, 72% peores
» El mejor tuvo un delta de 5%, la media fue 18%, el peor fue ###max##%
En comparación con todos los dispositivos probados
» 12% de todos los dispositivos probados eran mejores, 3% similares, 86% peores
» El mejor tuvo un delta de 4%, la media fue 24%, el peor fue ###max##%
Apple MacBook Pro 16 2021 M1 Pro análisis de audio
(+) | los altavoces pueden reproducir a un volumen relativamente alto (#84.7 dB)
Graves 100 - 315 Hz
(+) | buen bajo - sólo 3.8% lejos de la mediana
(+) | el bajo es lineal (5.2% delta a la frecuencia anterior)
Medios 400 - 2000 Hz
(+) | medios equilibrados - a sólo 1.3% de la mediana
(+) | los medios son lineales (2.1% delta a la frecuencia anterior)
Altos 2 - 16 kHz
(+) | máximos equilibrados - a sólo 1.9% de la mediana
(+) | los máximos son lineales (2.7% delta a la frecuencia anterior)
Total 100 - 16.000 Hz
(+) | el sonido global es lineal (4.6% de diferencia con la mediana)
En comparación con la misma clase
» 0% de todos los dispositivos probados de esta clase eran mejores, 0% similares, 100% peores
» El mejor tuvo un delta de 5%, la media fue 18%, el peor fue ###max##%
En comparación con todos los dispositivos probados
» 0% de todos los dispositivos probados eran mejores, 0% similares, 100% peores
» El mejor tuvo un delta de 4%, la media fue 24%, el peor fue ###max##%
Gestión de la energía
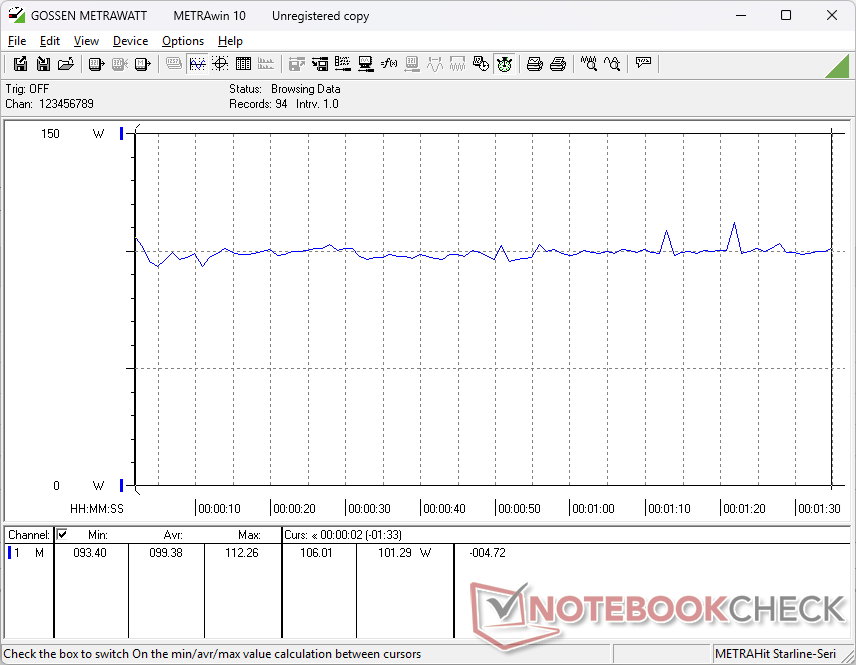
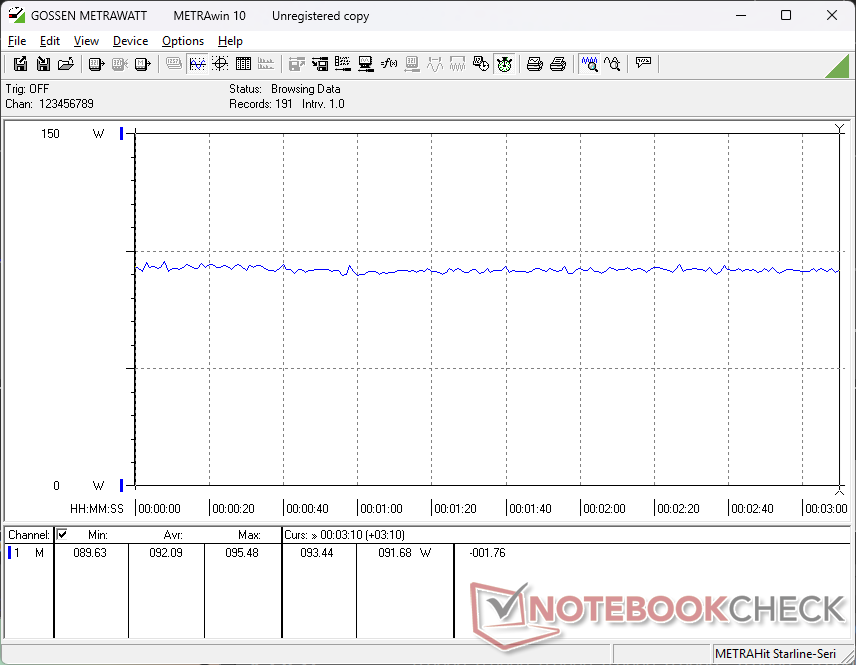
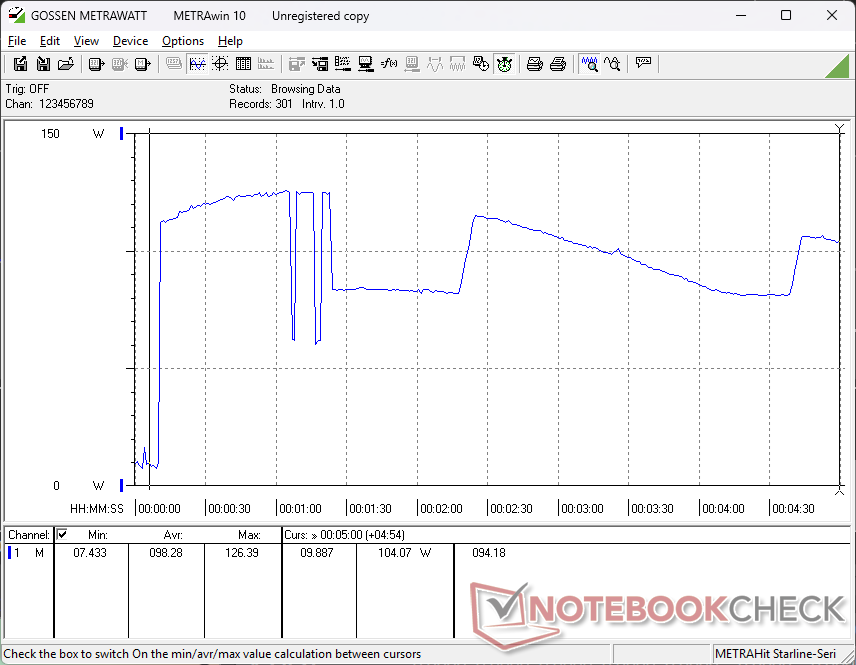
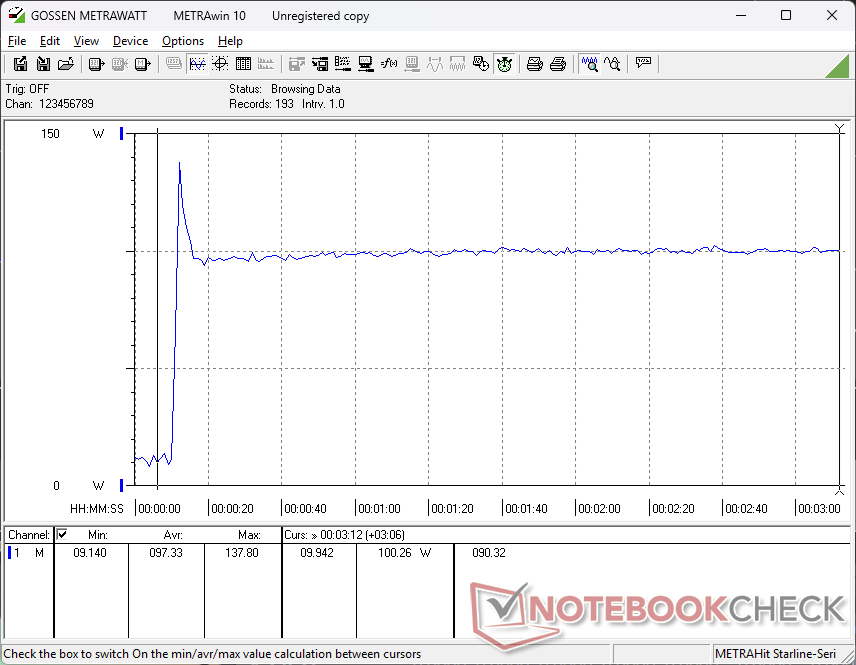
Consumo de energía
El ralentí puede oscilar entre sólo 2 W con la dGPU desactivada o hasta 11 W con la dGPU activada y en el ajuste de brillo máximo. El consumo fluctuaría salvajemente al ejecutar Prime95 bajo estrés debido al comportamiento de estrangulamiento del rendimiento mencionado anteriormente.
| Off / Standby | |
| Ocioso | |
| Carga |
|
Clave:
min: | |
| Asus V16 V3607V Core 7 240H, GeForce RTX 3050 6GB Laptop GPU, , IPS, 1920x1200, 16" | Asus VivoBook Pro 16 K6602VU i9-13900H, NVIDIA GeForce RTX 4050 Laptop GPU, Micron 2400 MTFDKBA1T0QFM, OLED, 3200x2000, 16" | Dell Inspiron 16 Plus 7640 Ultra 7 155H, NVIDIA GeForce RTX 4060 Laptop GPU, SK hynix BC901 HFS001TEJ4X164N, IPS, 2560x1600, 16" | Lenovo ThinkBook 16 G7 IML Ultra 5 125U, Graphics 4-Core, SK hynix HFS512GEJ4X112N, IPS, 1920x1200, 16" | HP Pavilion Plus 16-ab0456tx i7-13700H, GeForce RTX 3050 6GB Laptop GPU, WDC PC SN810 1TB, IPS, 2560x1600, 16" | Acer Swift Edge 16 SFE16-44-R0XV R5 8640U, Radeon 760M, Micron 3400 MTFDKBA512TFH 512GB, OLED, 3200x2000, 16" | |
|---|---|---|---|---|---|---|
| Power Consumption | -247% | -22% | 18% | -13% | -19% | |
| Idle Minimum * | 2.1 | 21.06 -903% | 4.2 -100% | 4.3 -105% | 3.3 -57% | 8 -281% |
| Idle Average * | 7.2 | 24.27 -237% | 6.9 4% | 8.9 -24% | 7.3 -1% | 10 -39% |
| Idle Maximum * | 10.7 | 25.12 -135% | 15.2 -42% | 9.1 15% | 14.24 -33% | 15 -40% |
| Load Average * | 99.4 | 52.4 47% | 70.4 29% | 31.7 68% | 91.7 8% | 42 58% |
| Cyberpunk 2077 ultra external monitor * | 88.7 | 35.2 60% | 42.8 52% | |||
| Cyberpunk 2077 ultra * | 92.1 | 39.4 57% | 44.4 52% | |||
| Load Maximum * | 137.8 | 146 -6% | 137.4 -0% | 66.7 52% | 115.8 16% | 49 64% |
| Witcher 3 ultra * | 110.2 | 115.9 | 96.2 |
* ... más pequeño es mejor
Power Consumption Cyberpunk / Stress Test
Power Consumption external Monitor
Duración de las pilas
La autonomía WLAN es respetable con casi 9 horas de navegación real a pesar de la batería de tamaño medio de 63 Wh. La prueba se realizó con la dGPU inactiva y en modo Eco/Equilibrado.
| Asus V16 V3607V Core 7 240H, GeForce RTX 3050 6GB Laptop GPU, 63 Wh | Asus VivoBook Pro 16 K6602VU i9-13900H, NVIDIA GeForce RTX 4050 Laptop GPU, 96 Wh | Dell Inspiron 16 Plus 7640 Ultra 7 155H, NVIDIA GeForce RTX 4060 Laptop GPU, 90 Wh | Lenovo ThinkBook 16 G7 IML Ultra 5 125U, Graphics 4-Core, 45 Wh | HP Pavilion Plus 16-ab0456tx i7-13700H, GeForce RTX 3050 6GB Laptop GPU, 68 Wh | Acer Swift Edge 16 SFE16-44-R0XV R5 8640U, Radeon 760M, 54 Wh | |
|---|---|---|---|---|---|---|
| Duración de Batería | 12% | 48% | -2% | 16% | -46% | |
| WiFi v1.3 | 539 | 606 12% | 799 48% | 528 -2% | 624 16% | 290 -46% |
| H.264 | 585 | 720 | ||||
| Reader / Idle | 1150 | |||||
| Load | 79 |
Valoración de Notebookcheck
Asus V16 V3607V
- 03/19/2025 v8
Allen Ngo
 Total Sustainability Score:
 Potential Competitors in Comparison
Imagen | Modelo | Precio | Peso | Altura | Pantalla |
|---|---|---|---|---|---|
1. 78.5%  | Asus V16 V3607V Intel Core 7 240H ⎘ NVIDIA GeForce RTX 3050 6GB Laptop GPU ⎘ 16 GB Memoría | Precio de catálogo: 900 USD | 2 kg | 22 mm | 16.00" 1920x1200 142 PPI IPS |
2. 87.6% v7 (old)  | Asus VivoBook Pro 16 K6602VU Intel Core i9-13900H ⎘ NVIDIA GeForce RTX 4050 Laptop GPU ⎘ 16 GB Memoría, 1024 GB SSD | Amazon: 1. $1,649.00 ASUS Vivobook Pro K6602V 202... 2. $1,999.99 ASUS Vivobook Pro 16X OLED L... 3. $1,396.38 ASUS VivoBook Pro 16X OLED S... Precio de catálogo: 2199 EUR | 1.9 kg | 19 mm | 16.00" 3200x2000 236 PPI OLED |
3. 83.4%  | Dell Inspiron 16 Plus 7640 Intel Core Ultra 7 155H ⎘ NVIDIA GeForce RTX 4060 Laptop GPU ⎘ 16 GB Memoría, 1024 GB SSD | Amazon: $1,299.99 Precio de catálogo: 1300 USD | 2.2 kg | 19.9 mm | 16.00" 2560x1600 189 PPI IPS |
4. 83%  | Lenovo ThinkBook 16 G7 IML Intel Core Ultra 5 125U ⎘ Intel Graphics 4-Core iGPU (Arc) ⎘ 16 GB Memoría, 512 GB SSD | Amazon: $833.82 Precio de catálogo: 750 USD | 1.8 kg | 17.5 mm | 16.00" 1920x1200 142 PPI IPS |
5. 88.7% v7 (old)  | HP Pavilion Plus 16-ab0456tx Intel Core i7-13700H ⎘ NVIDIA GeForce RTX 3050 6GB Laptop GPU ⎘ 16 GB Memoría, 1024 GB SSD | Amazon: 1. $1,120.18 HP Pavilion Plus 16 inch Lap... 2. $34.99 200W 150W 135W AC Charger Fo... 3. $55.00 Laptop LCD Bezel for HP Pavi... Precio de catálogo: 1350 USD | 1.9 kg | 19.9 mm | 16.00" 2560x1600 189 PPI IPS |
6. 81.3%  | Acer Swift Edge 16 SFE16-44-R0XV AMD Ryzen 5 8640U ⎘ AMD Radeon 760M ⎘ 16 GB Memoría, 512 GB SSD | Precio de catálogo: 1000 EUR | 1.2 kg | 13 mm | 16.00" 3200x2000 236 PPI OLED |
Transparencia
La selección de los dispositivos que se van a reseñar corre a cargo de nuestro equipo editorial. La muestra de prueba fue proporcionada al autor en calidad de préstamo por el fabricante o el minorista a los efectos de esta reseña. El prestamista no tuvo ninguna influencia en esta reseña, ni el fabricante recibió una copia de la misma antes de su publicación. No había ninguna obligación de publicar esta reseña. Nunca aceptamos compensaciones o pagos a cambio de nuestras reseñas. Como empresa de medios independiente, Notebookcheck no está sujeta a la autoridad de fabricantes, minoristas o editores.
Así es como prueba Notebookcheck
Cada año, Notebookcheck revisa de forma independiente cientos de portátiles y smartphones utilizando procedimientos estandarizados para asegurar que todos los resultados son comparables. Hemos desarrollado continuamente nuestros métodos de prueba durante unos 20 años y hemos establecido los estándares de la industria en el proceso. En nuestros laboratorios de pruebas, técnicos y editores experimentados utilizan equipos de medición de alta calidad. Estas pruebas implican un proceso de validación en varias fases. Nuestro complejo sistema de clasificación se basa en cientos de mediciones y puntos de referencia bien fundamentados, lo que mantiene la objetividad.
