

Análisis del Lenovo IdeaPad Pro 5 16IMH G9: 90 W GeForce RTX 4050 casi tan buena como la RTX 4060

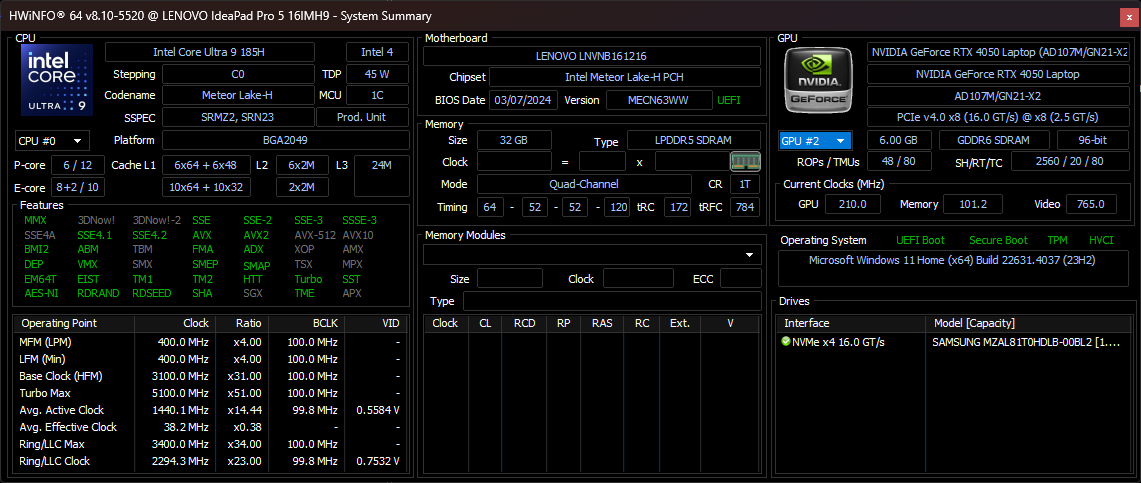
Después de haber revisado recientemente el más barato IdeaPad Pro 5 16IMH iGPU y configuración IPS, ahora estamos listos para comprobar la configuración más costosa dGPU y OLED. Nuestra unidad de prueba específica viene ataviada con opciones de gama alta, incluido el Meteor Lake Core Ultra 9 185H por 1.500 dólares al por menor. También resulta ser uno de los pocos portátiles multimedia ultrafinos con una GeForce RTX 4050 de 90 W, ya que la mayoría de los demás de la categoría suelen apuntar a techos de TGP más bajos.
El IdeaPad Pro 5 16 G9 es distinto del buque insignia Yoga Pro 9i 16 G9. Este último, por ejemplo, ofrece opciones mini-LED y RTX 4070 que no están disponibles en el IdeaPad.
Las alternativas al IdeaPad Pro 5 16IMH incluyen otros portátiles multimedia de 16 pulgadas de gama media a alta como el Dell Inspiron 16 7640 2 en 1, Asus Zenbook S16, Samsung Galaxy Book4 Ultra, o la Serie HP Envy. Le recomendamos que consulte nuestro análisis existente sobre el iGPU IdeaPad Pro 5 16IMH G9 para obtener más información sobre las características físicas del modelo. Una versión más pequeña de 14 pulgadas de este modelo también está disponible llamado el IdeaPad Pro 5 14 G9.
Más opiniones de Lenovo:
Posibles contendientes en la comparación
Valoración | Versión | Fecha | Modelo | Peso | Altura | Tamaño | Resolución | Precio |
|---|---|---|---|---|---|---|---|---|
| 84.7 % | v8 | 09/2024 | Lenovo IdeaPad Pro 5 16IMH G9 RTX 4050 Ultra 9 185H, NVIDIA GeForce RTX 4050 Laptop GPU | 2 kg | 18.95 mm | 16.00" | 2048x1280 | |
| 87.9 % v7 (old) | v7 (old) | 05/2024 | Lenovo IdeaPad Pro 5 16IMH G9 Ultra 7 155H, Arc 8-Core | 1.9 kg | 17.5 mm | 16.00" | 2560x1600 | |
| 82.1 % | v8 | 07/2024 | Dell Inspiron 16 7640 2-in-1 Ultra 7 155H, Arc 8-Core | 2.1 kg | 18.99 mm | 16.00" | 2560x1600 | |
| 84.7 % | v8 | 07/2024 | Asus Zenbook S 16 UM5606-RK333W Ryzen AI 9 HX 370, Radeon 890M | 1.5 kg | 12.9 mm | 16.00" | 2880x1800 | |
| 87.2 % v7 (old) | v7 (old) | 05/2024 | HP Envy x360 2-in-1 16-ad0097nr R7 8840HS, Radeon 780M | 1.8 kg | 18.3 mm | 16.00" | 2880x1800 | |
| 90.4 % v7 (old) | v7 (old) | 03/2024 | Samsung Galaxy Book4 Ultra Ultra 7 155H, NVIDIA GeForce RTX 4050 Laptop GPU | 1.8 kg | 17 mm | 16.00" | 2880x1800 |
Nota: Recientemente hemos actualizado nuestro sistema de clasificación y los resultados de la versión 8 no son comparables con los de la versión 7. Encontrará más información aquí .
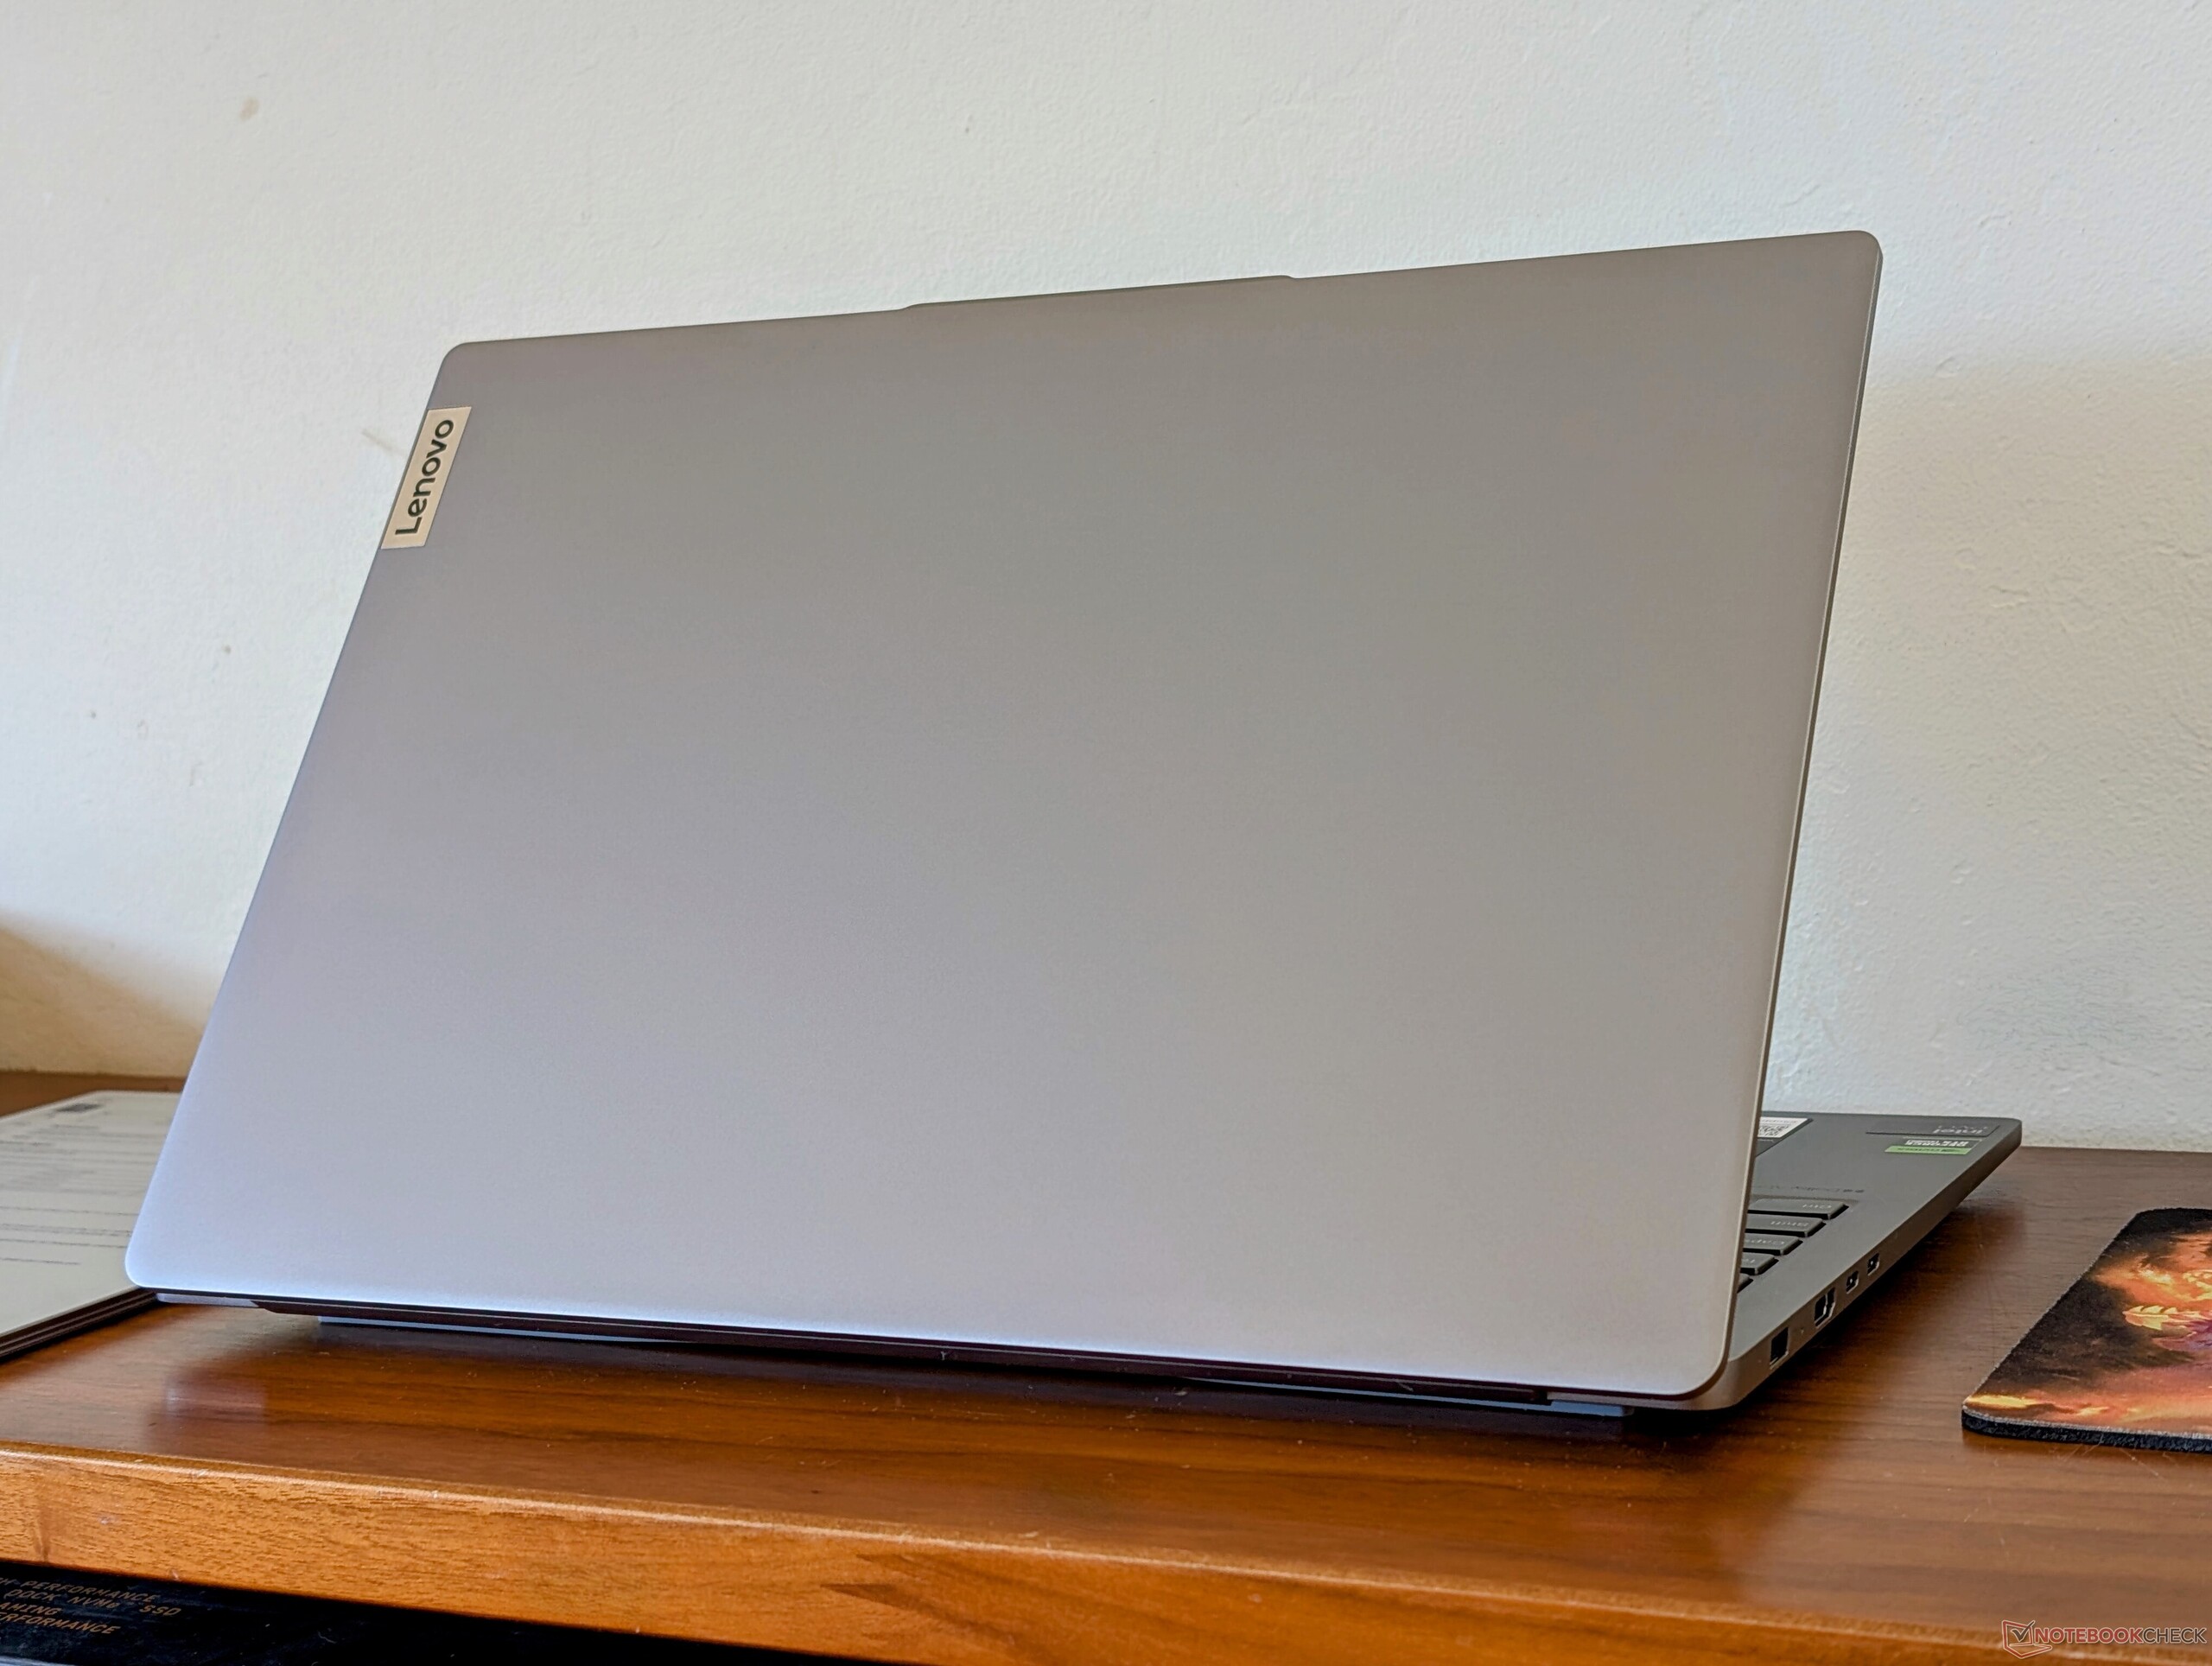
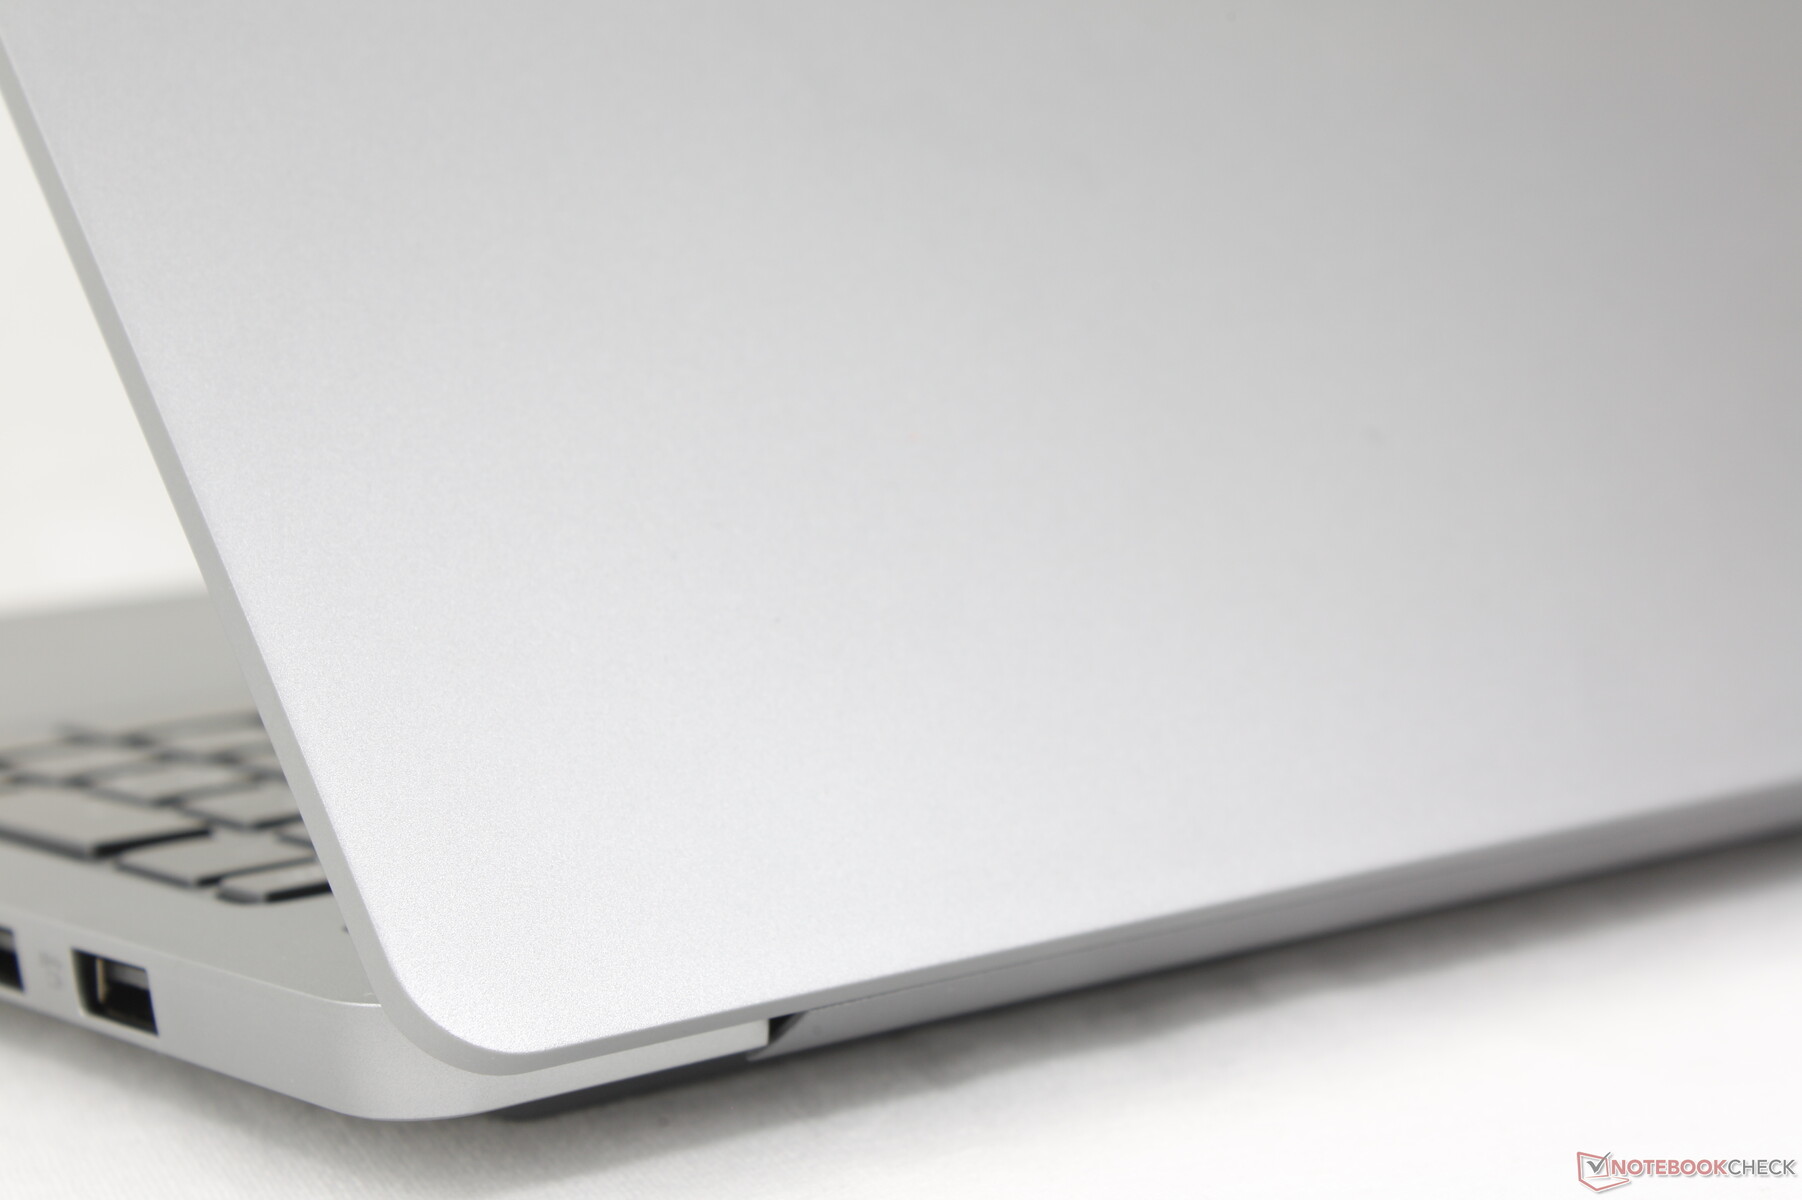
Caso
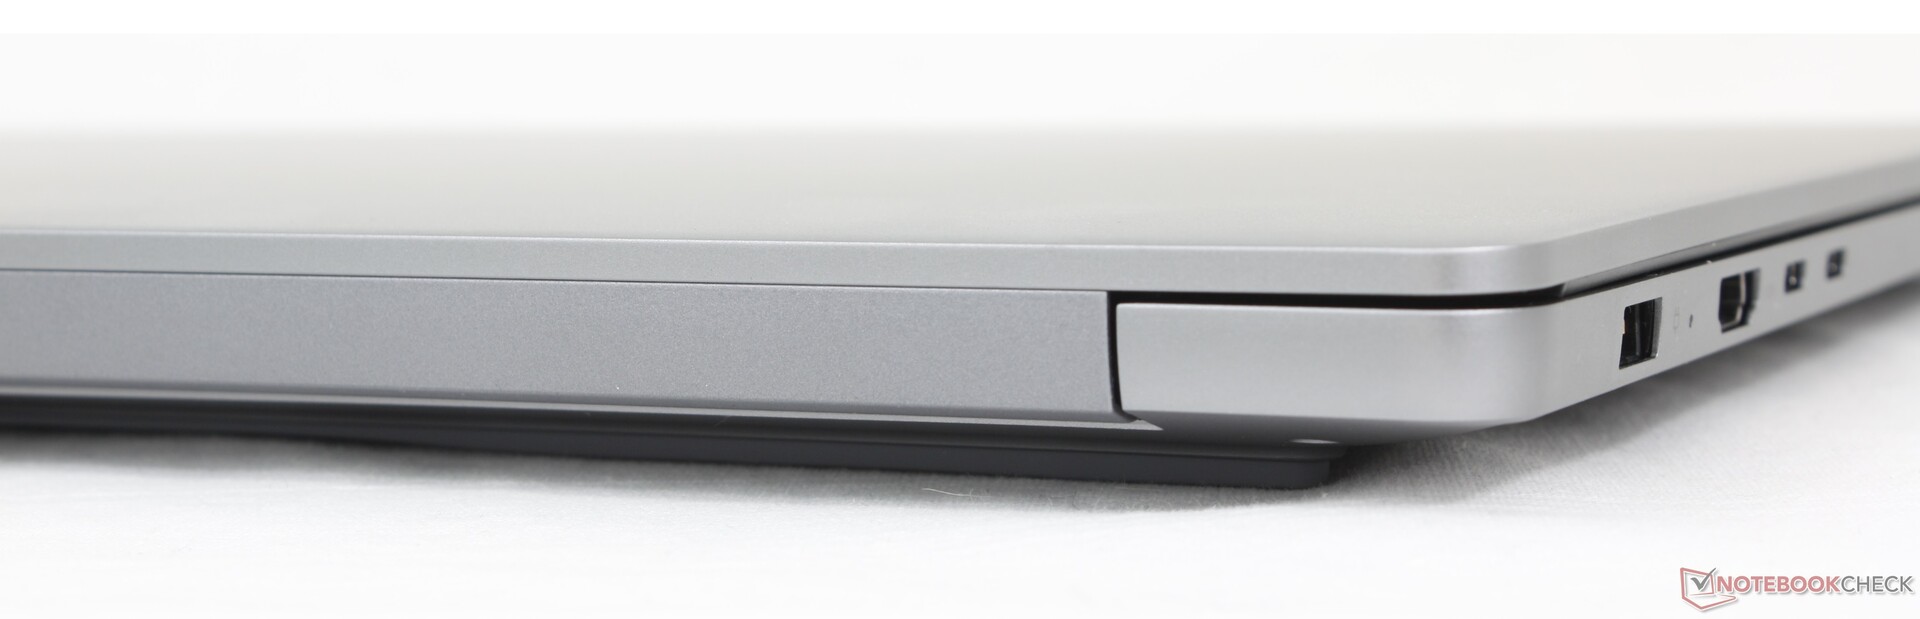
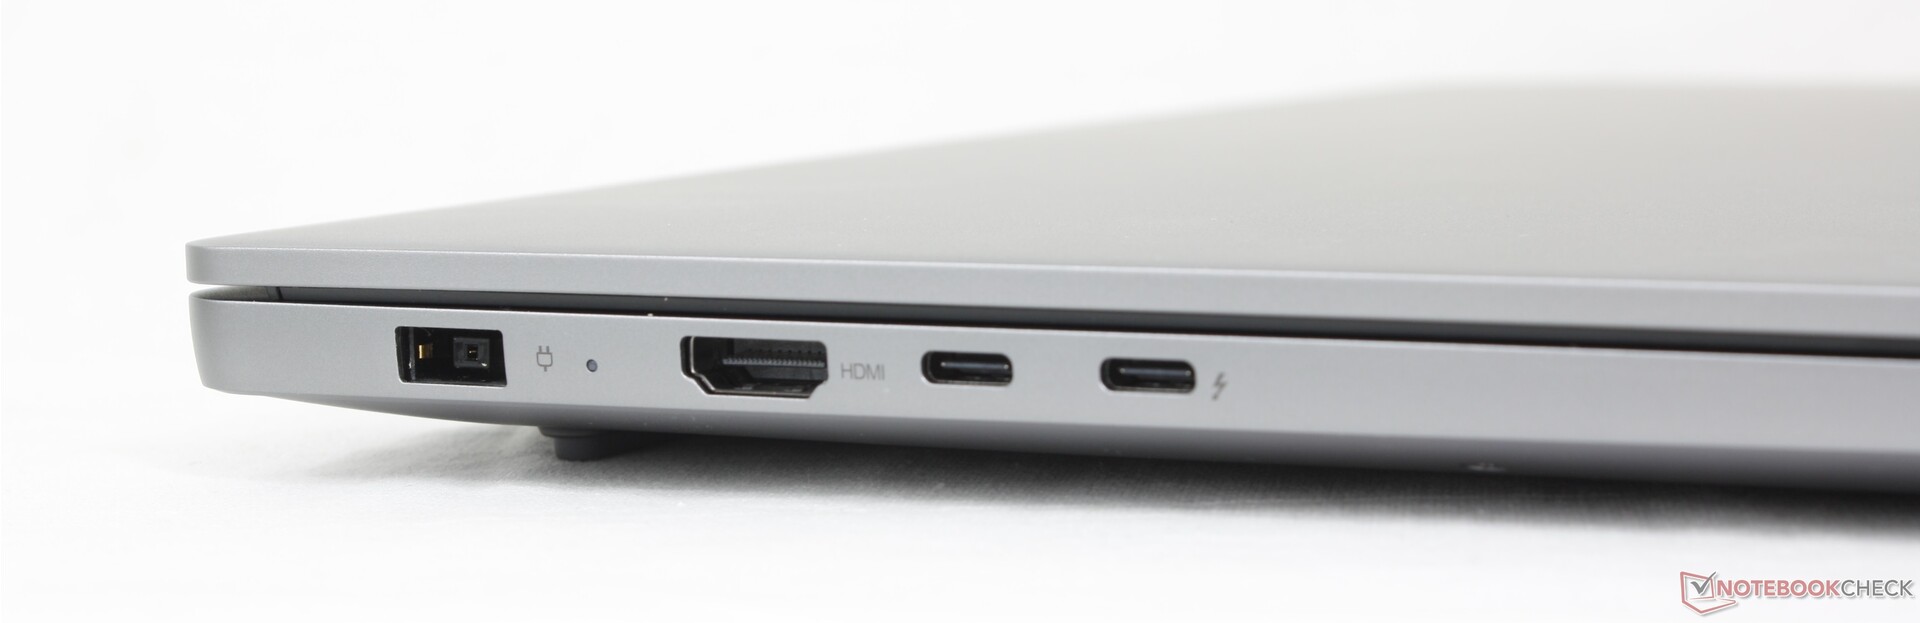
El chasis incorpora un puerto dedicado para el adaptador de CA a lo largo del borde izquierdo que sirve también para distinguir visualmente entre las configuraciones iGPU y dGPU. La GPU y el panel OLED añaden unos 100 g al peso total, por lo que nuestra unidad no es mucho más pesada que la opción iGPU básica. Por lo demás, las dimensiones, el diseño y los materiales permanecen inalterados.

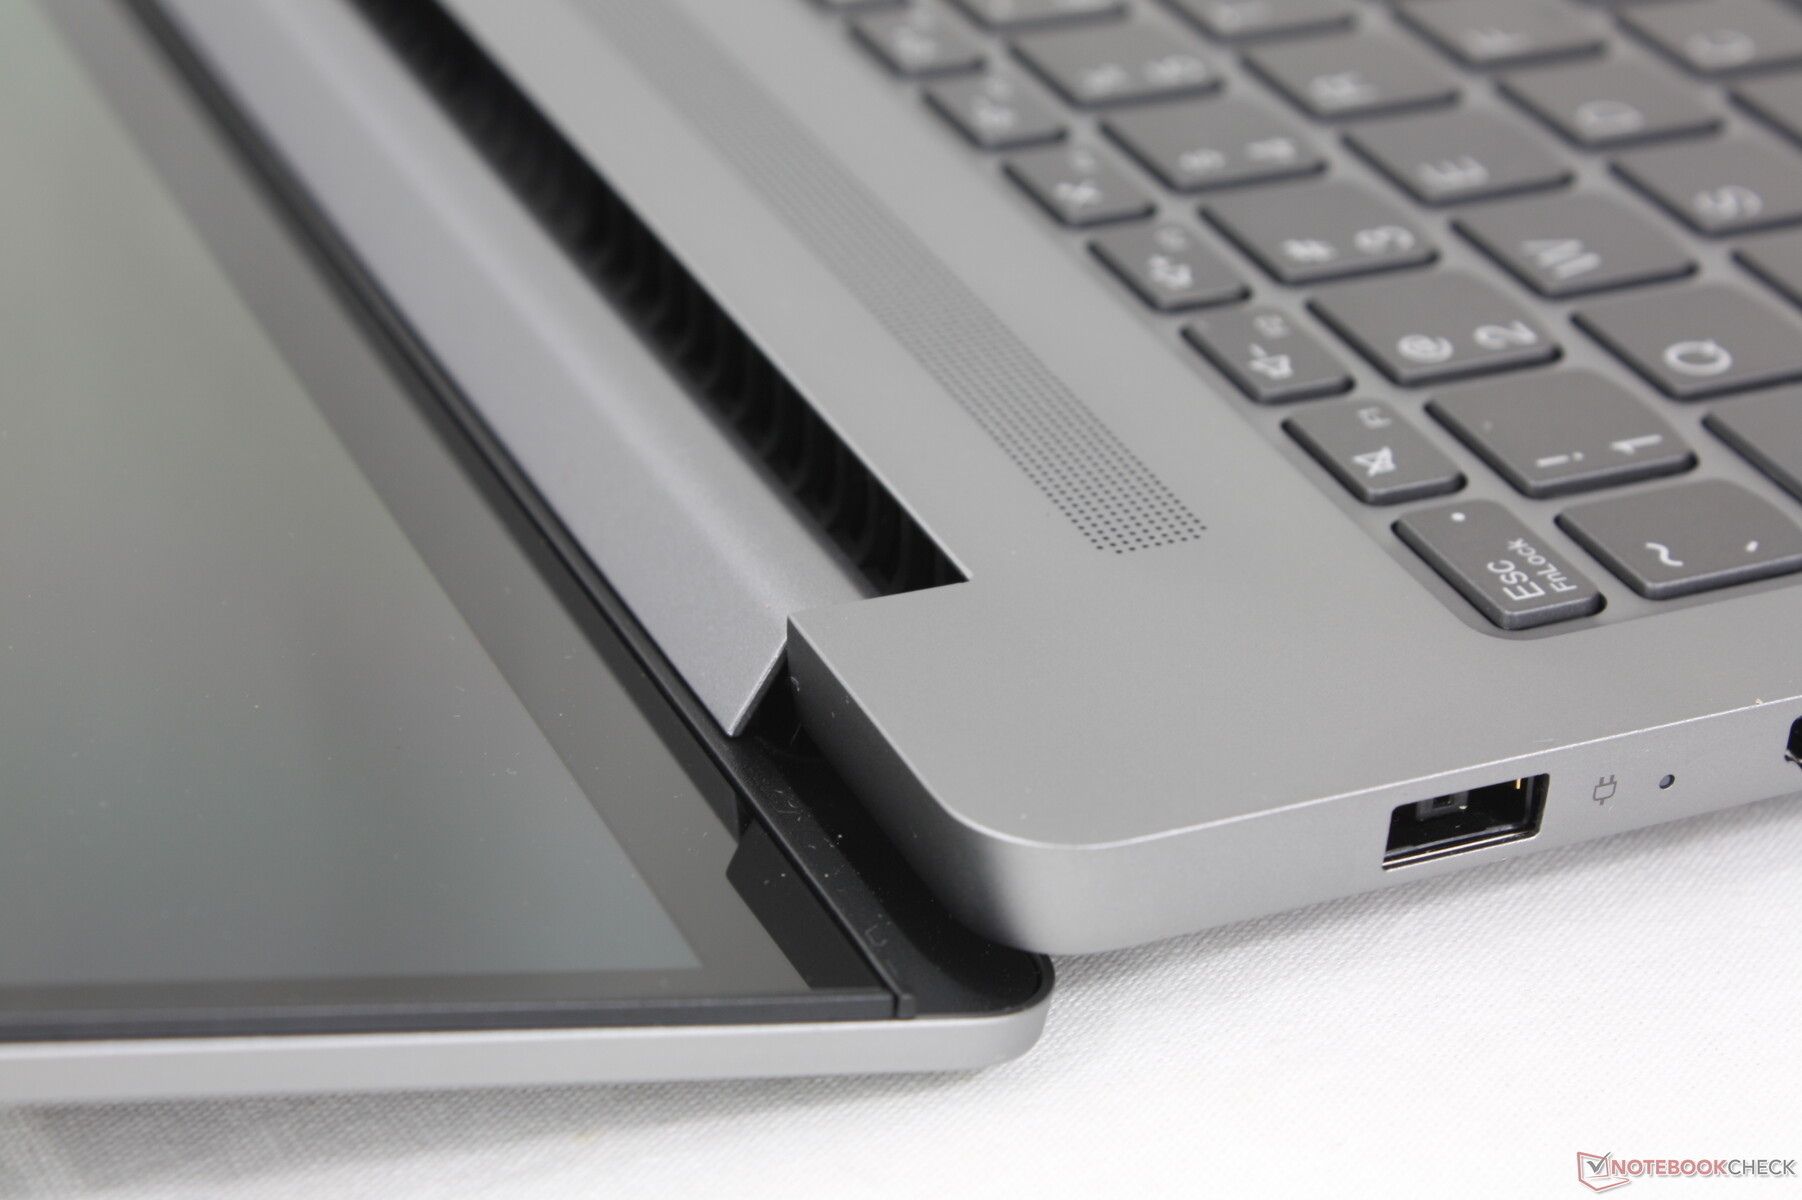
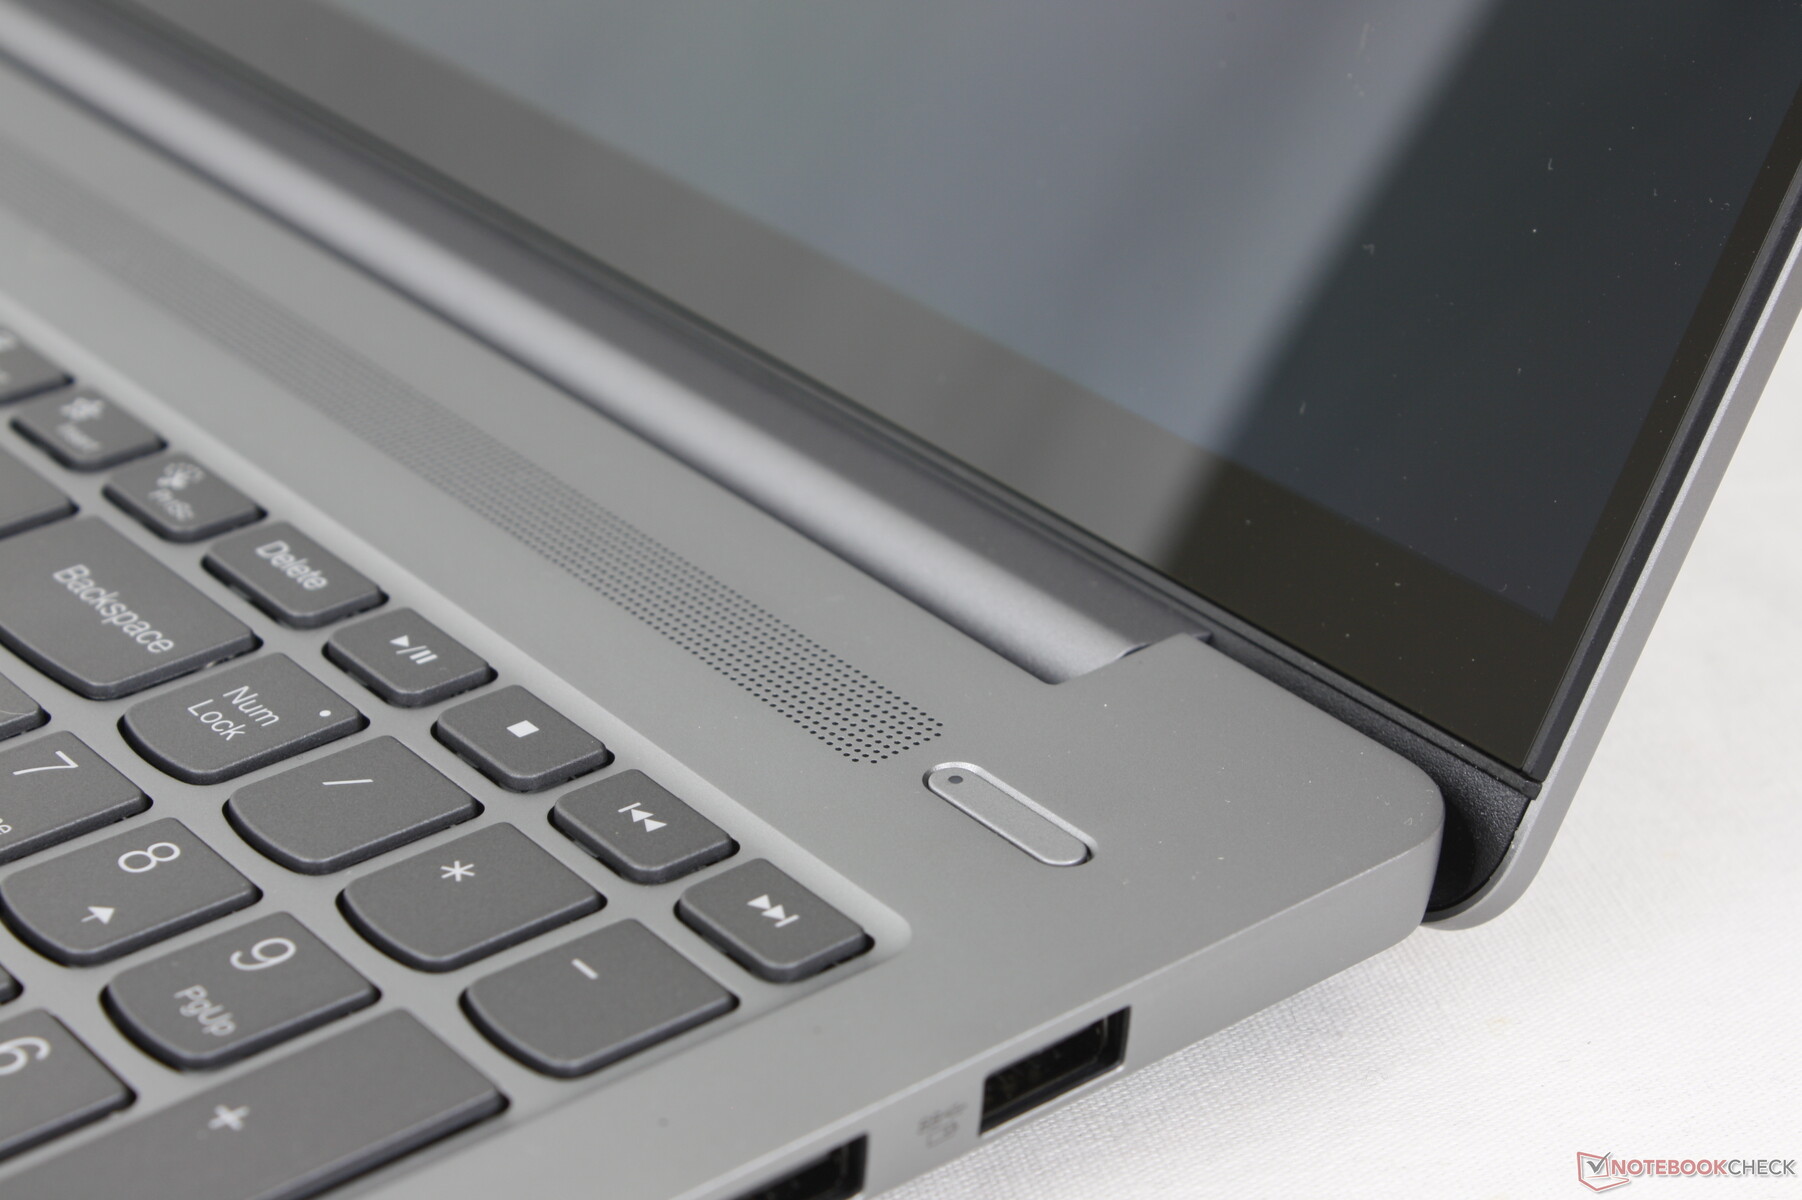
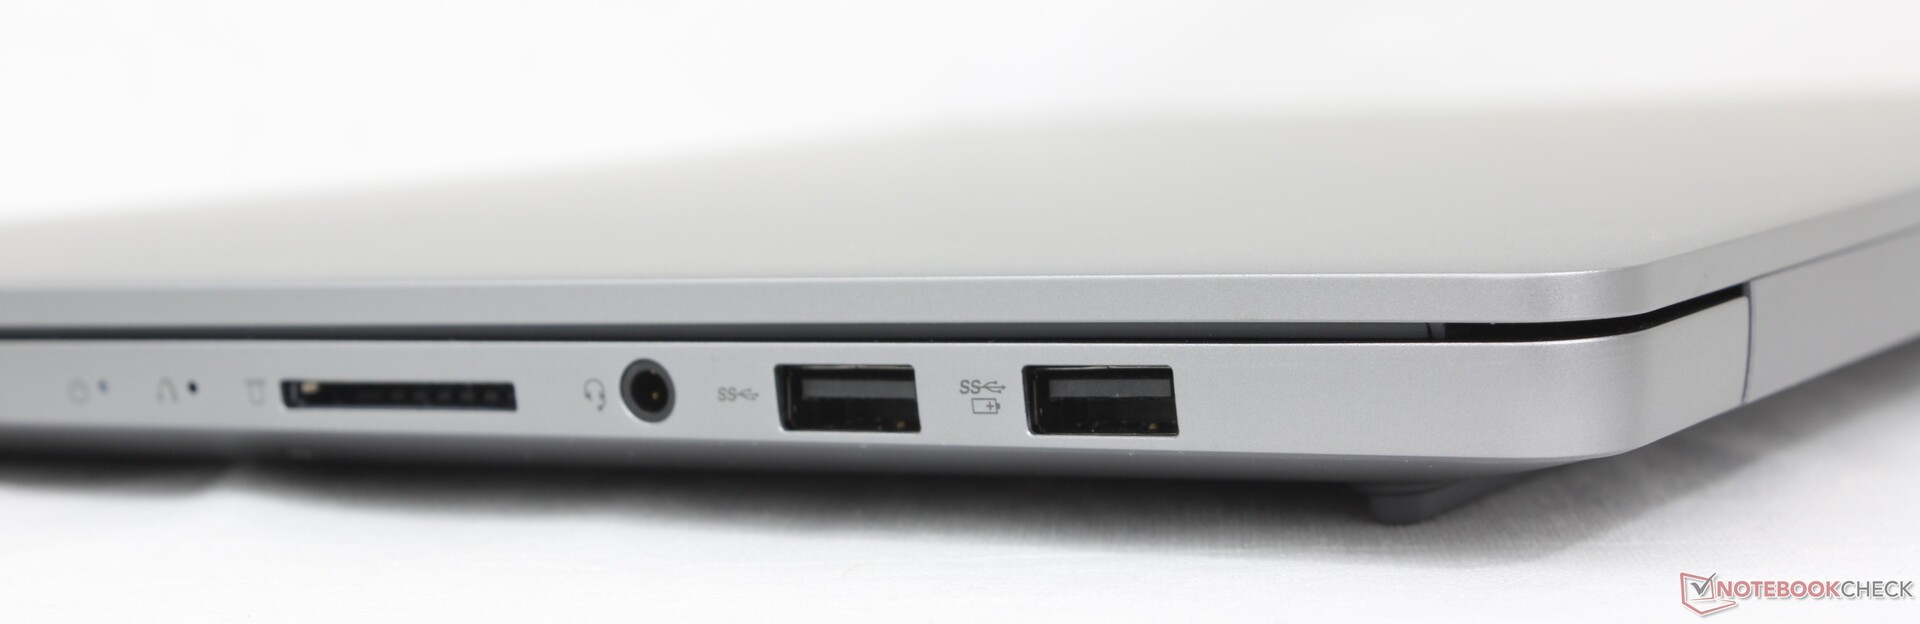
Conectividad
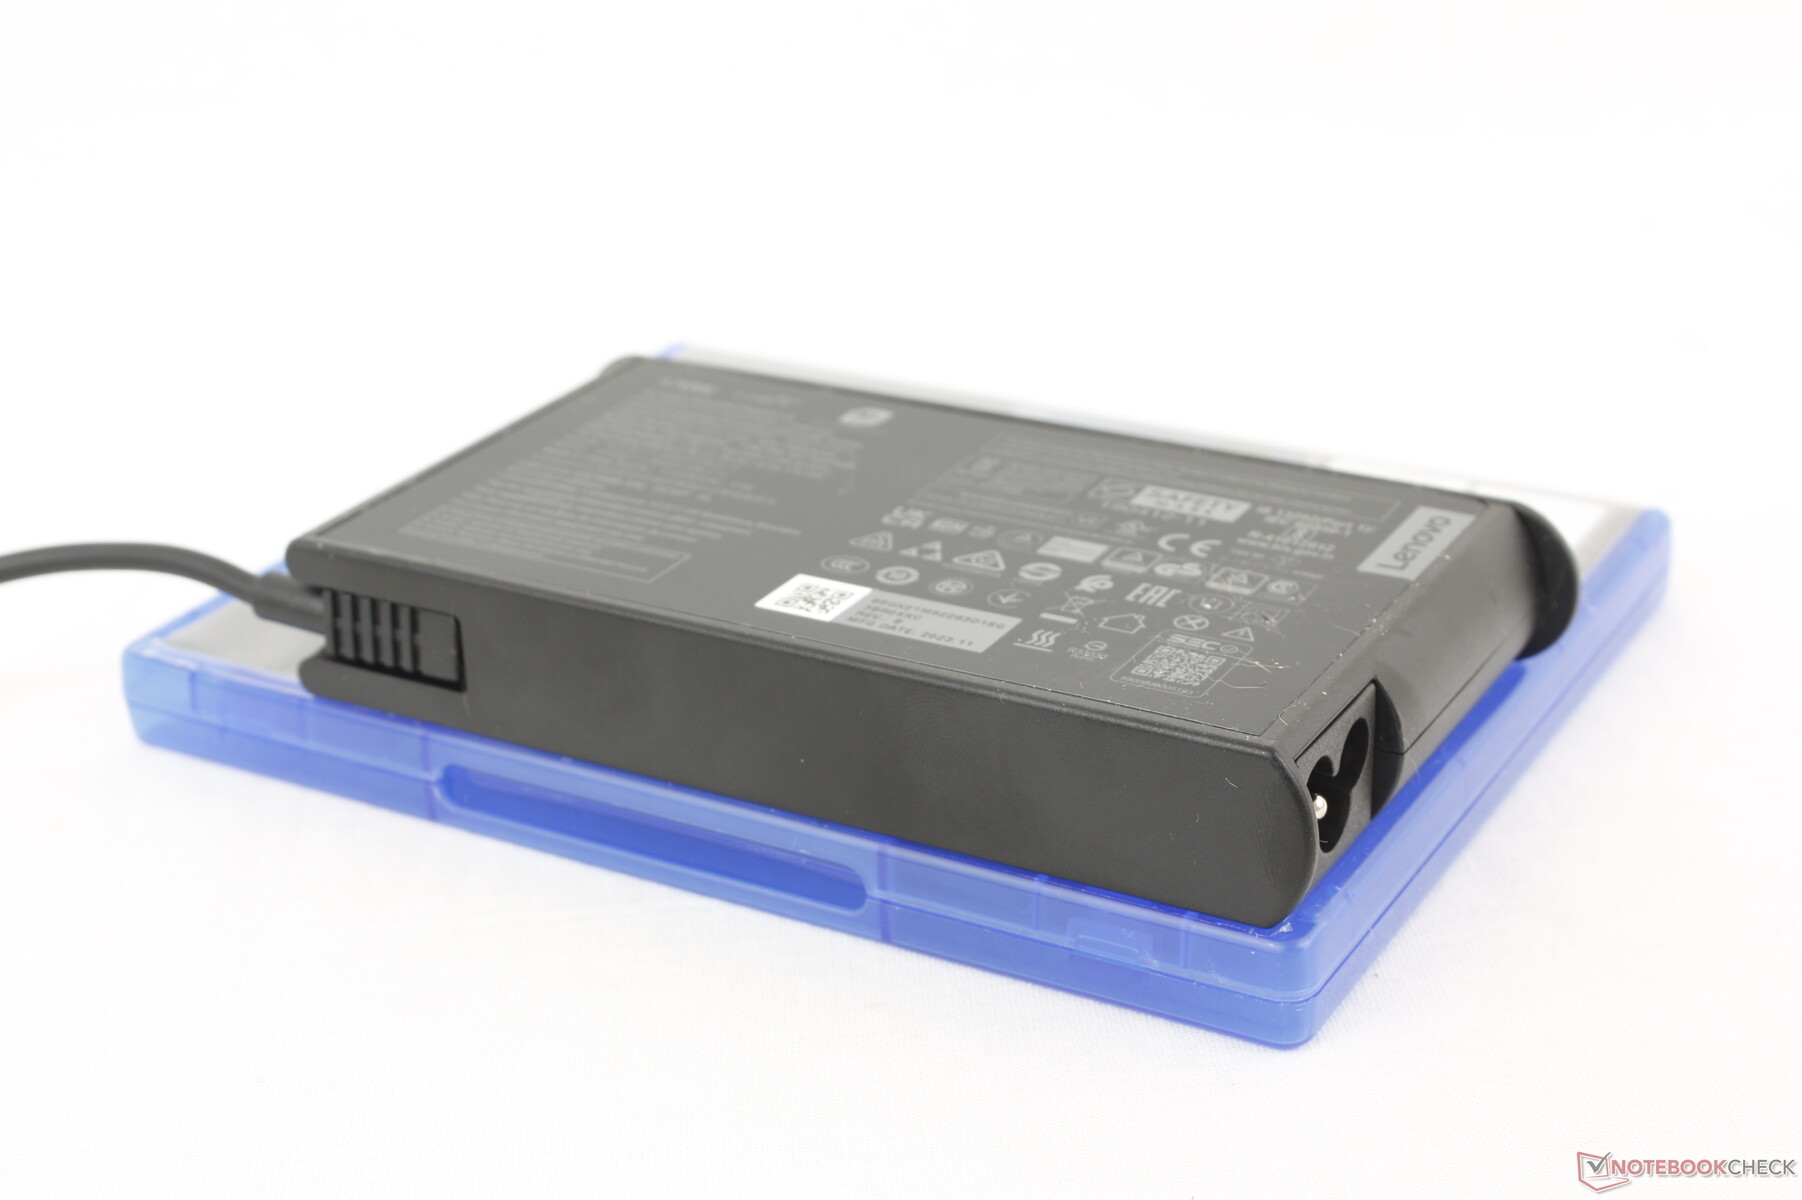
Nuestra configuración dGPU admite tanto la carga universal USB-C como la carga con adaptador de CA propietario, a diferencia de la configuración iGPU que solo admite la primera. El adaptador de CA de barril es necesario para alimentar la CPU Core Ultra H y los gráficos discretos Nvidia de 90 W sin recurrir a un techo TGP inferior de 50 W que es el enfoque que Samsung está adoptando con su Galaxy Book4 Ultra.
Por lo demás, las opciones de puertos son idénticas a las del Inspiron 16 7640 2 en 1 aunque ofrece más que el Samsung.
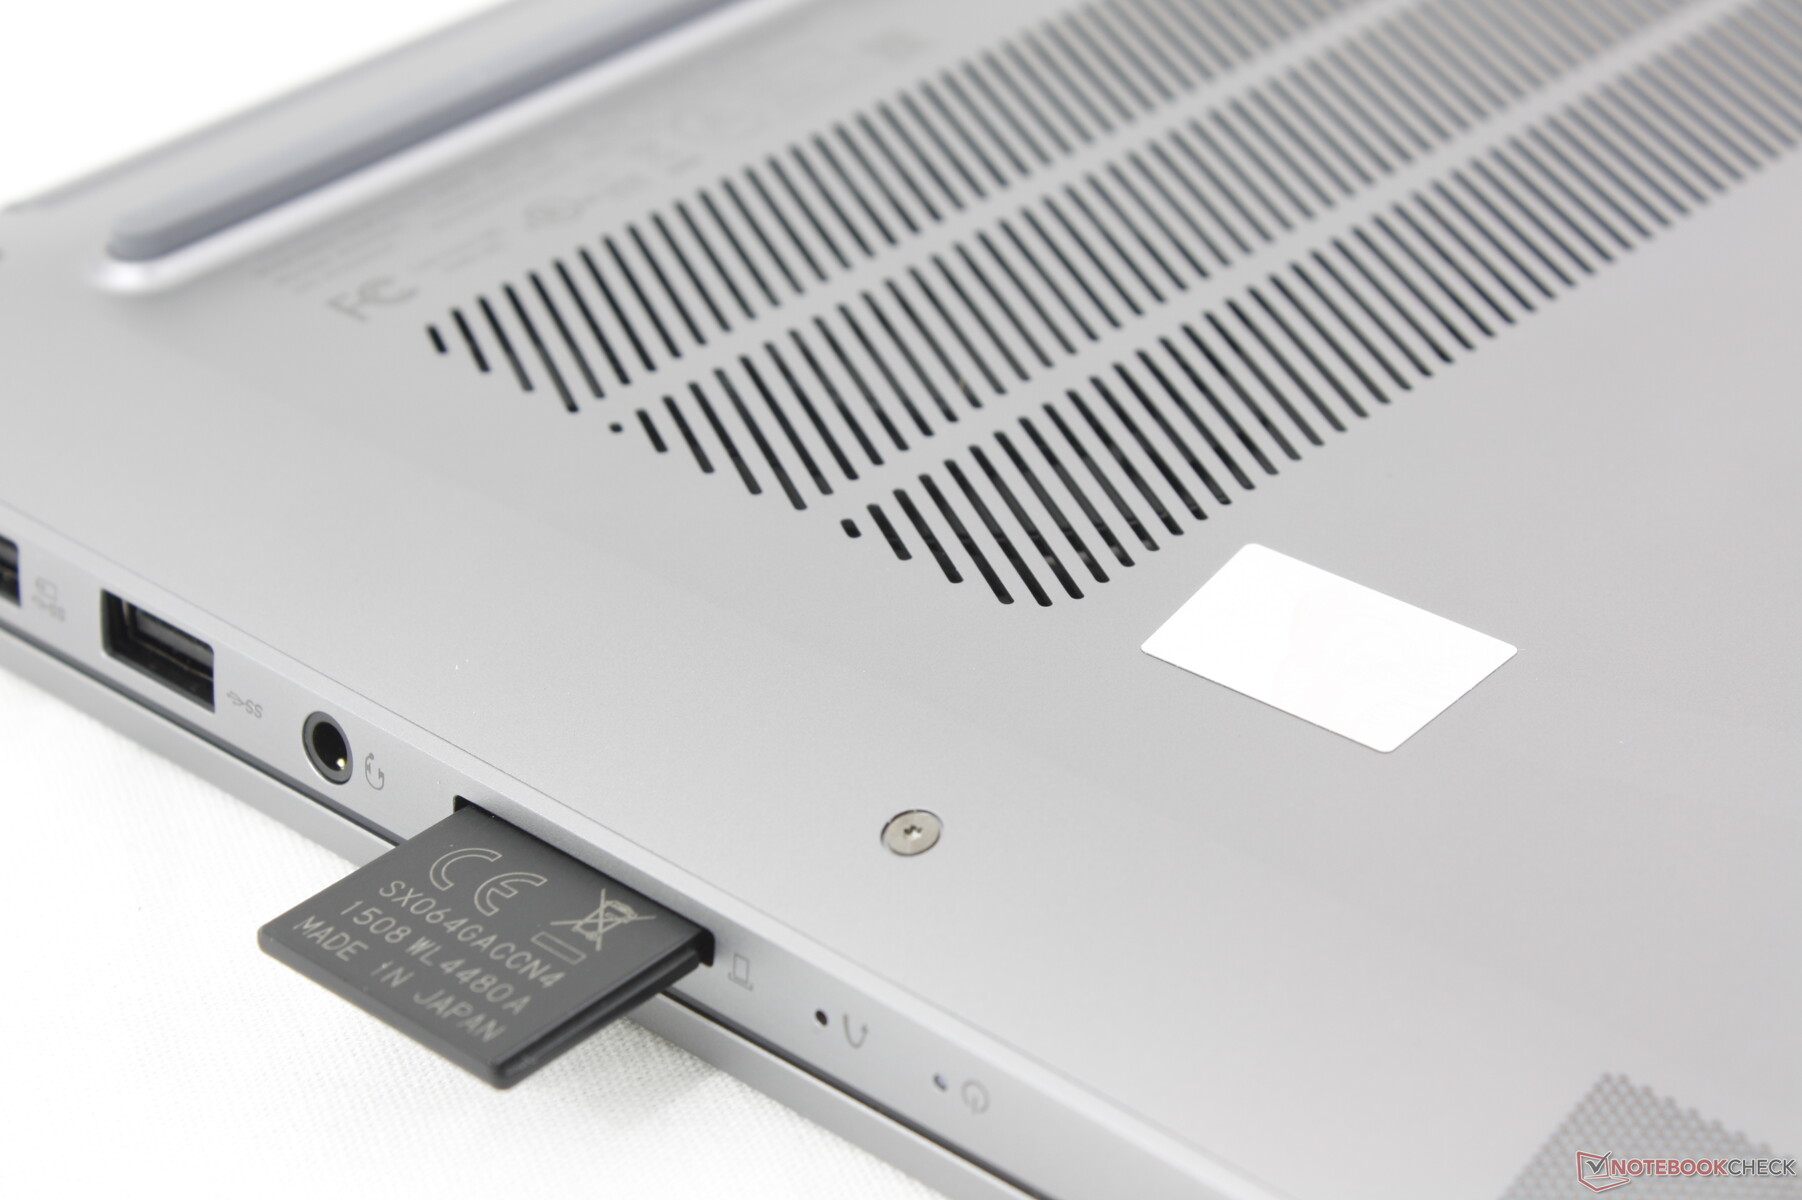
Lector de tarjetas SD
| SD Card Reader | |
| average JPG Copy Test (av. of 3 runs) | |
| Asus Zenbook S 16 UM5606-RK333W (Angelbird AV Pro V60) | |
| Samsung Galaxy Book4 Ultra (Angelbird AV Pro V60) | |
| Lenovo IdeaPad Pro 5 16IMH G9 RTX 4050 (Toshiba Exceria Pro SDXC 64 GB UHS-II) | |
| Lenovo IdeaPad Pro 5 16IMH G9 (Angelbird AV Pro V60) | |
| Dell Inspiron 16 7640 2-in-1 (Toshiba Exceria Pro SDXC 64 GB UHS-II) | |
| maximum AS SSD Seq Read Test (1GB) | |
| Asus Zenbook S 16 UM5606-RK333W (Angelbird AV Pro V60) | |
| Lenovo IdeaPad Pro 5 16IMH G9 (Angelbird AV Pro V60) | |
| Samsung Galaxy Book4 Ultra (Angelbird AV Pro V60) | |
| Lenovo IdeaPad Pro 5 16IMH G9 RTX 4050 (Toshiba Exceria Pro SDXC 64 GB UHS-II) | |
| Dell Inspiron 16 7640 2-in-1 (Toshiba Exceria Pro SDXC 64 GB UHS-II) | |
Comunicación
El Intel AX211 viene de serie con Wi-Fi 6E y compatibilidad con Bluetooth 5.3. Las velocidades de transferencia son estables por encima de 1 Gbps cuando se empareja con nuestro router de prueba AXE11000.
Cámara web
La cámara web de 2 MP viene de serie con IR y un obturador físico para mayor privacidad.


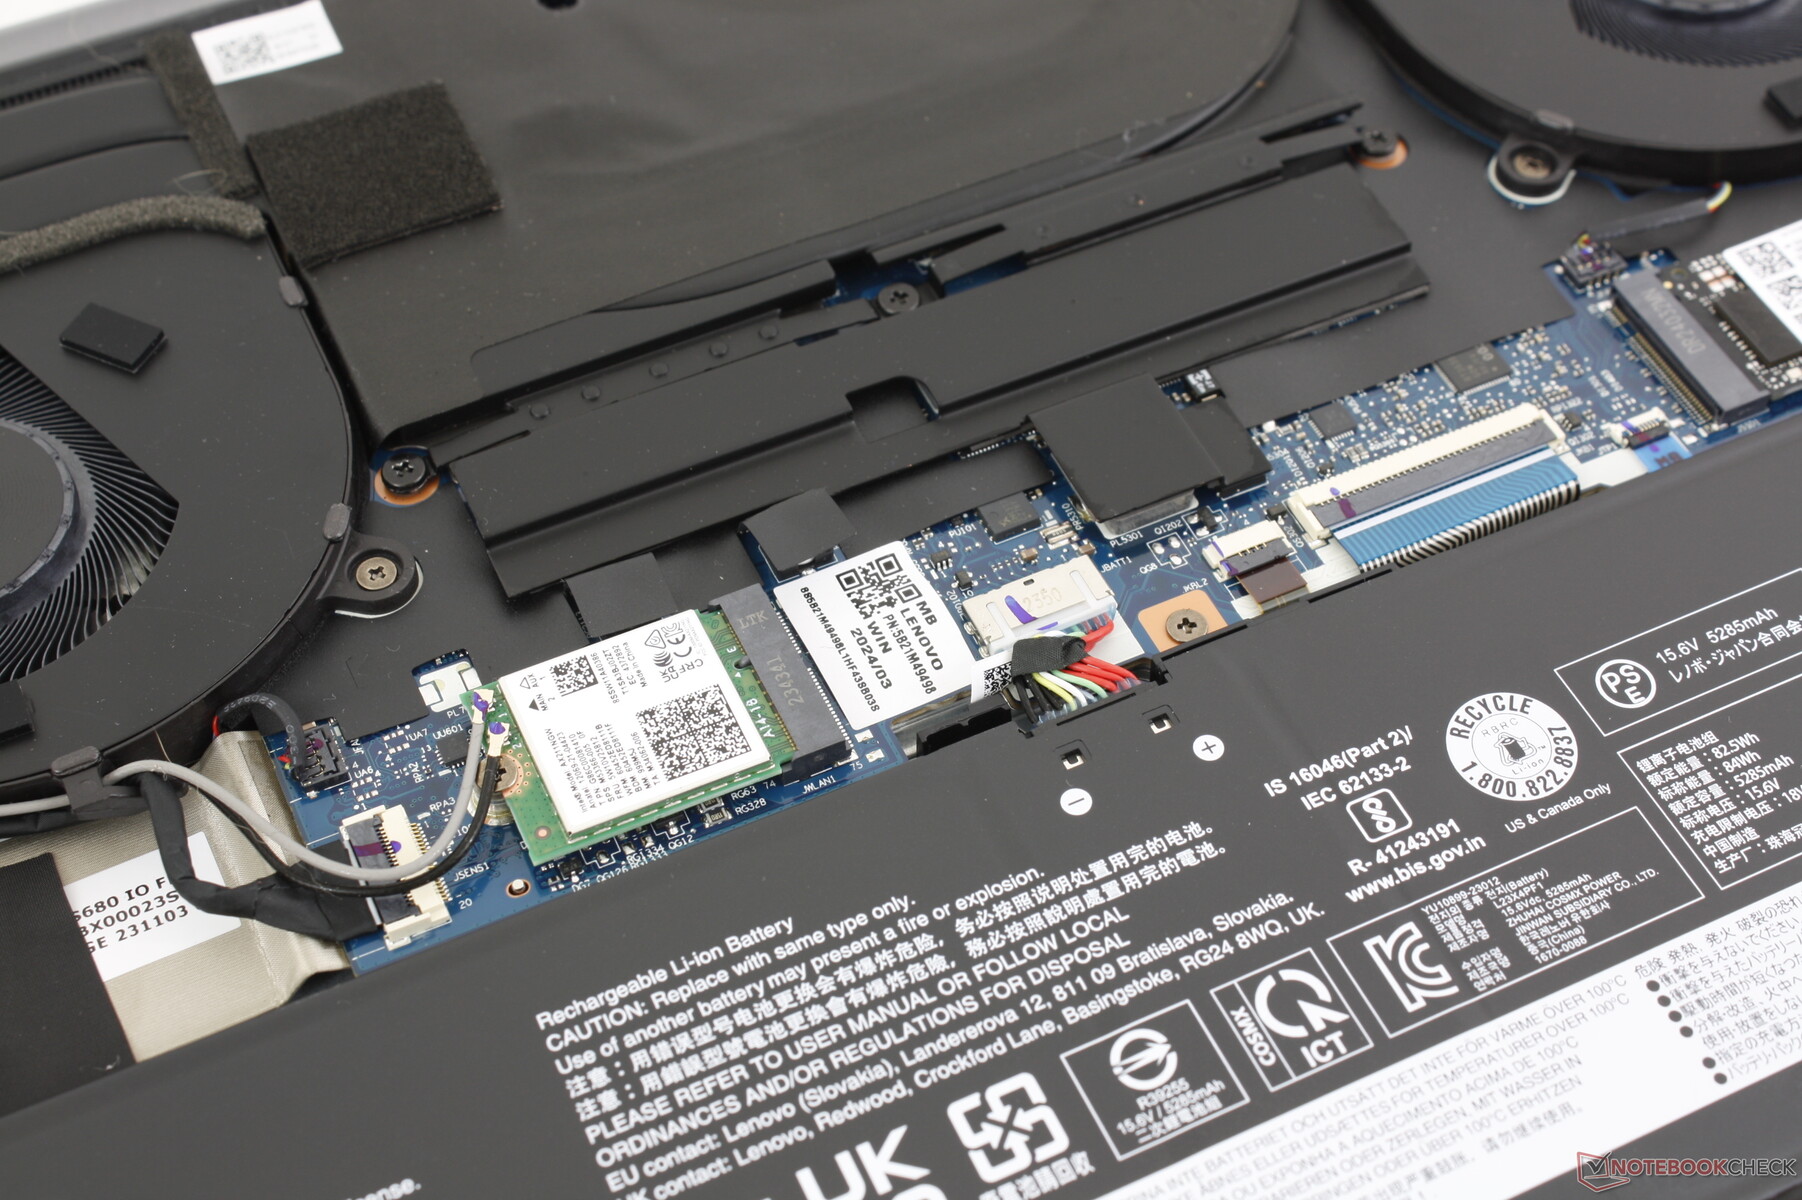
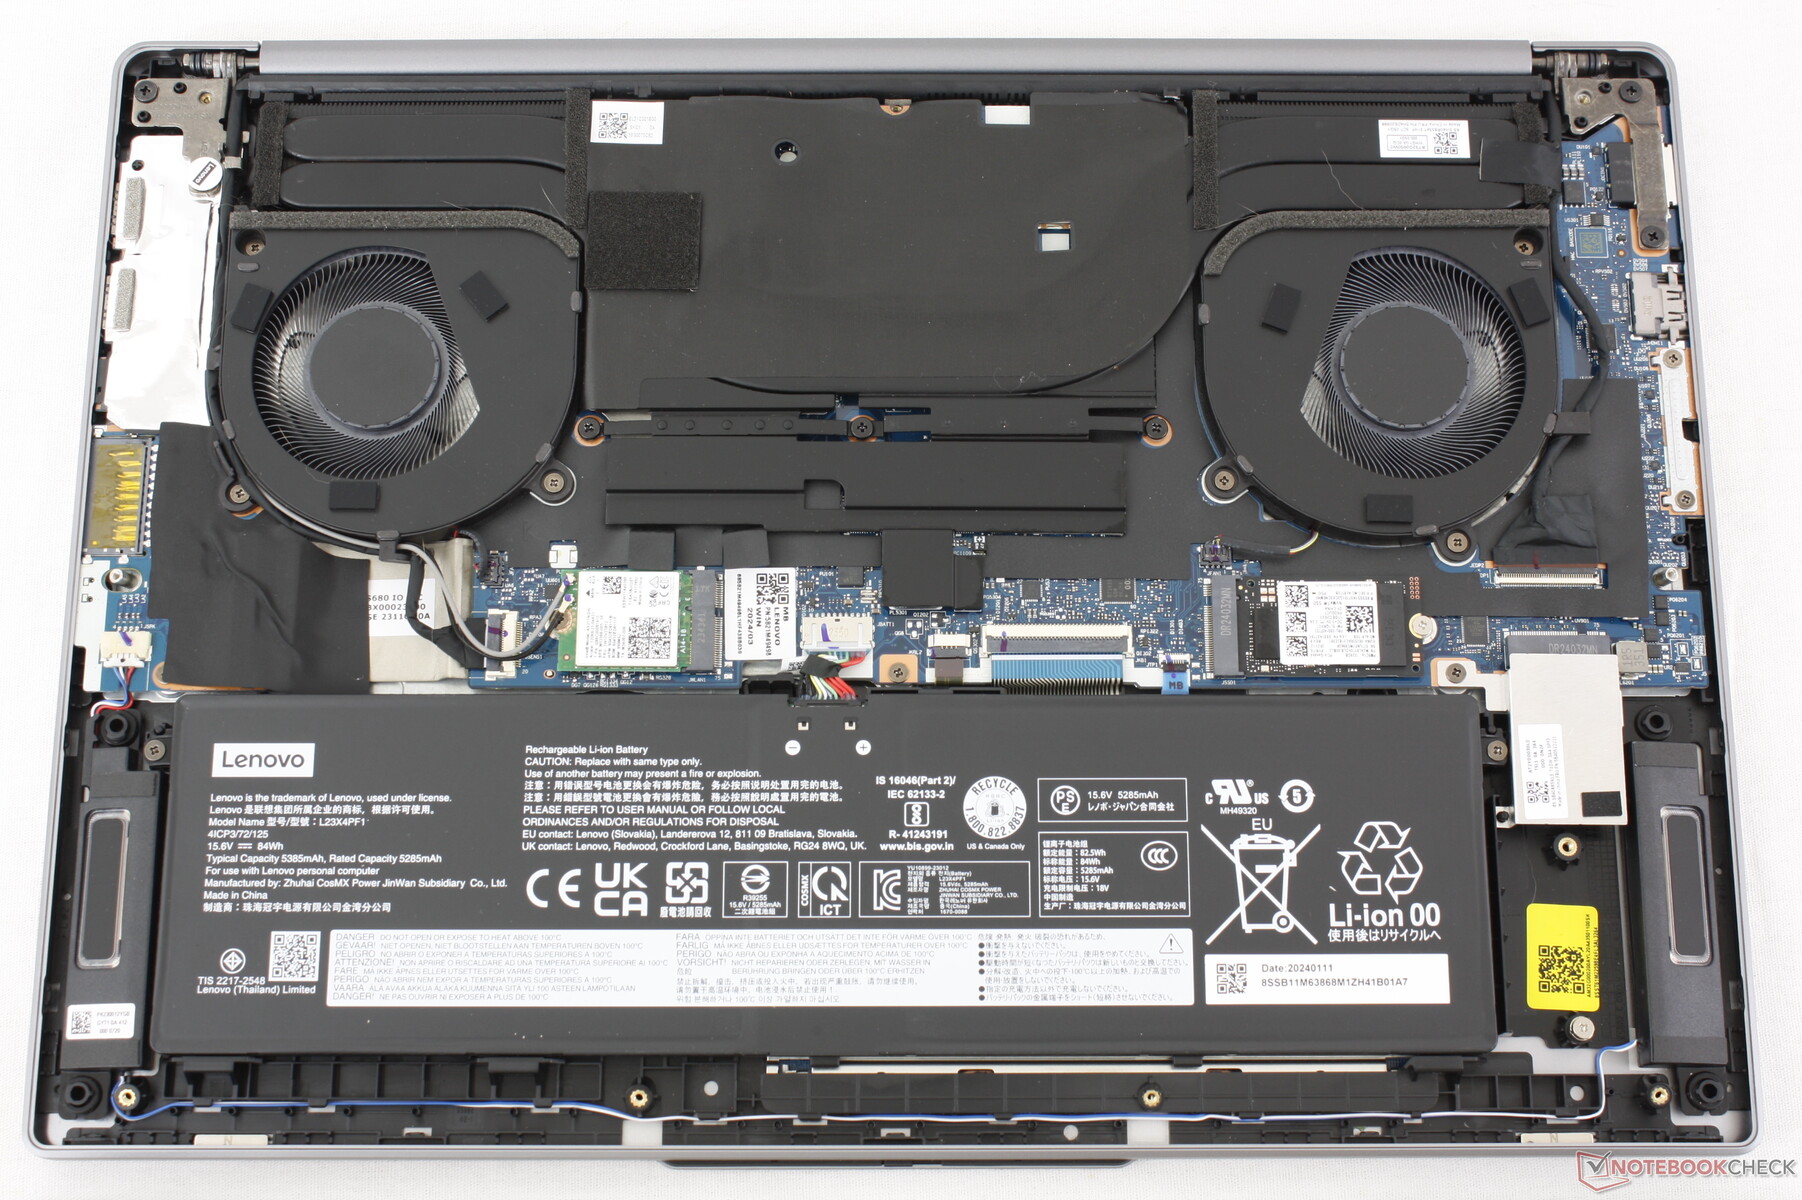
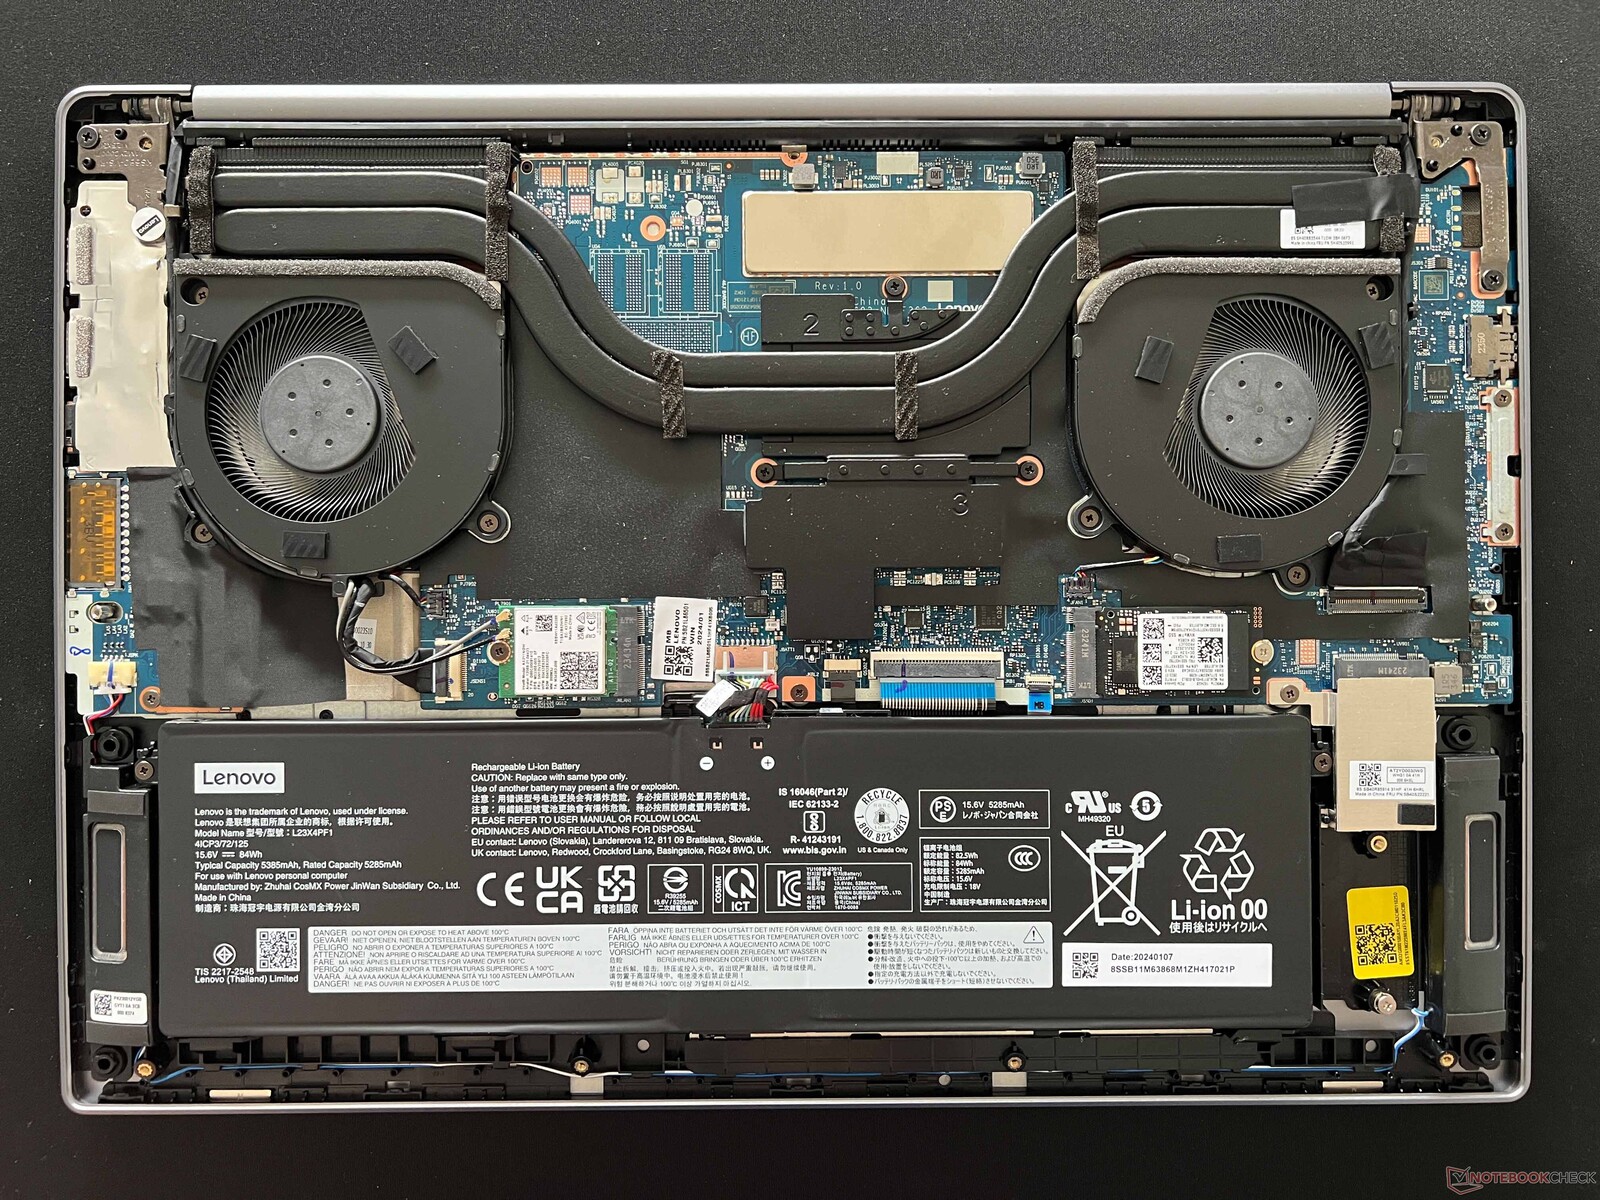
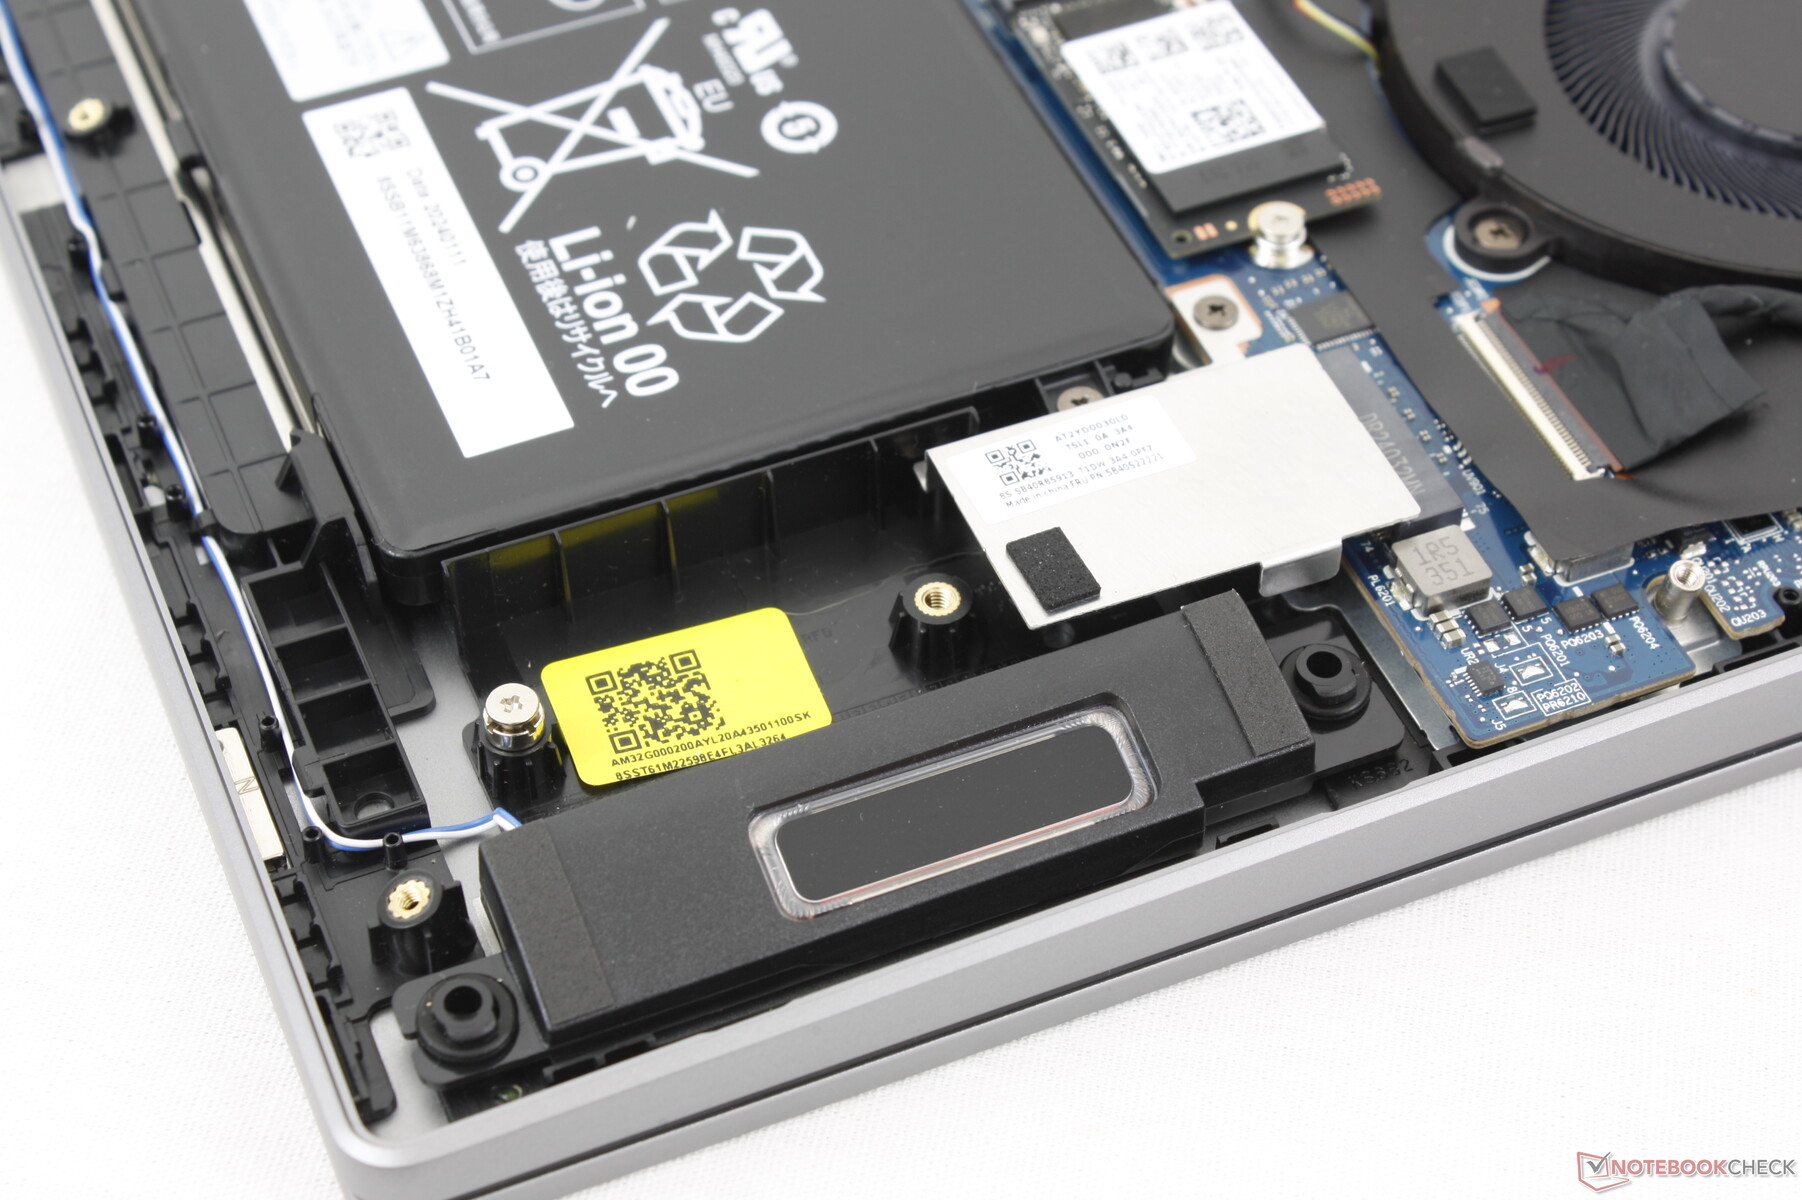
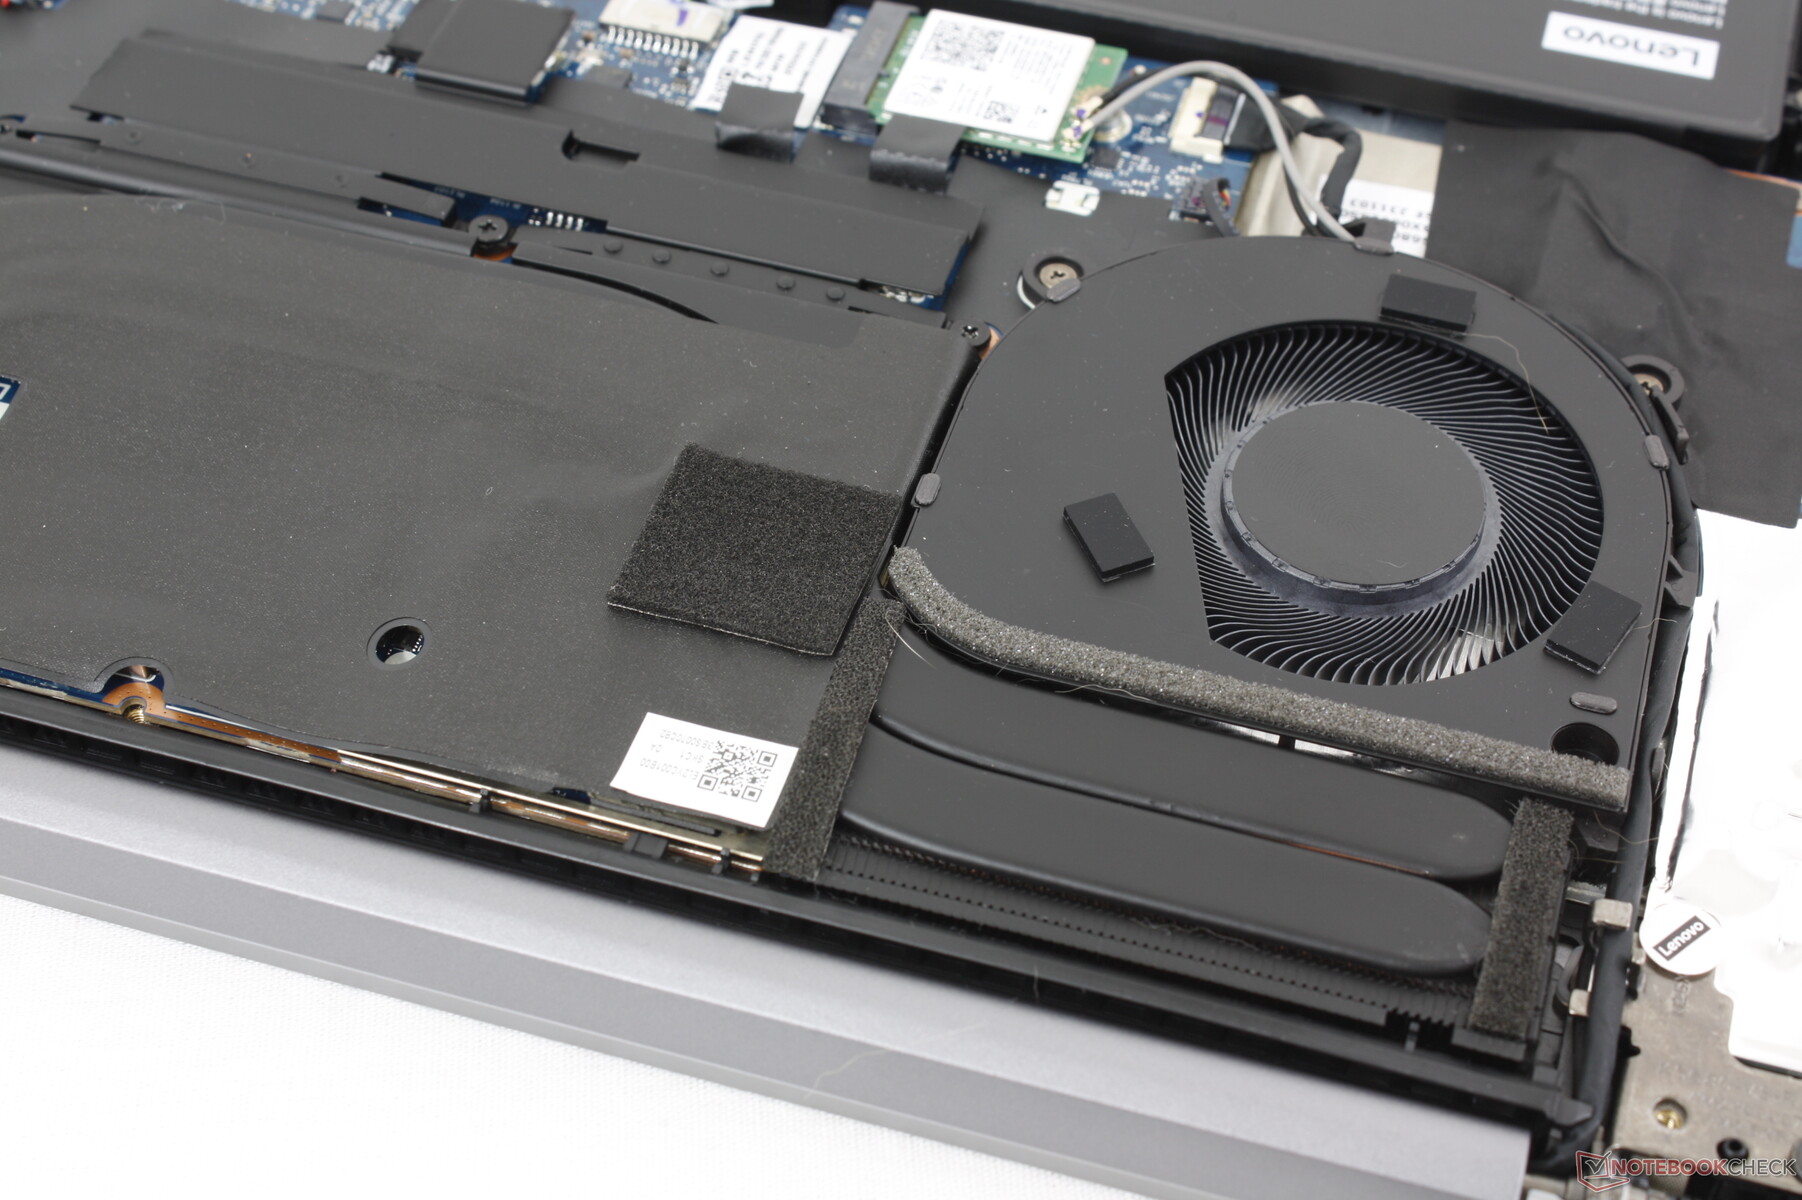
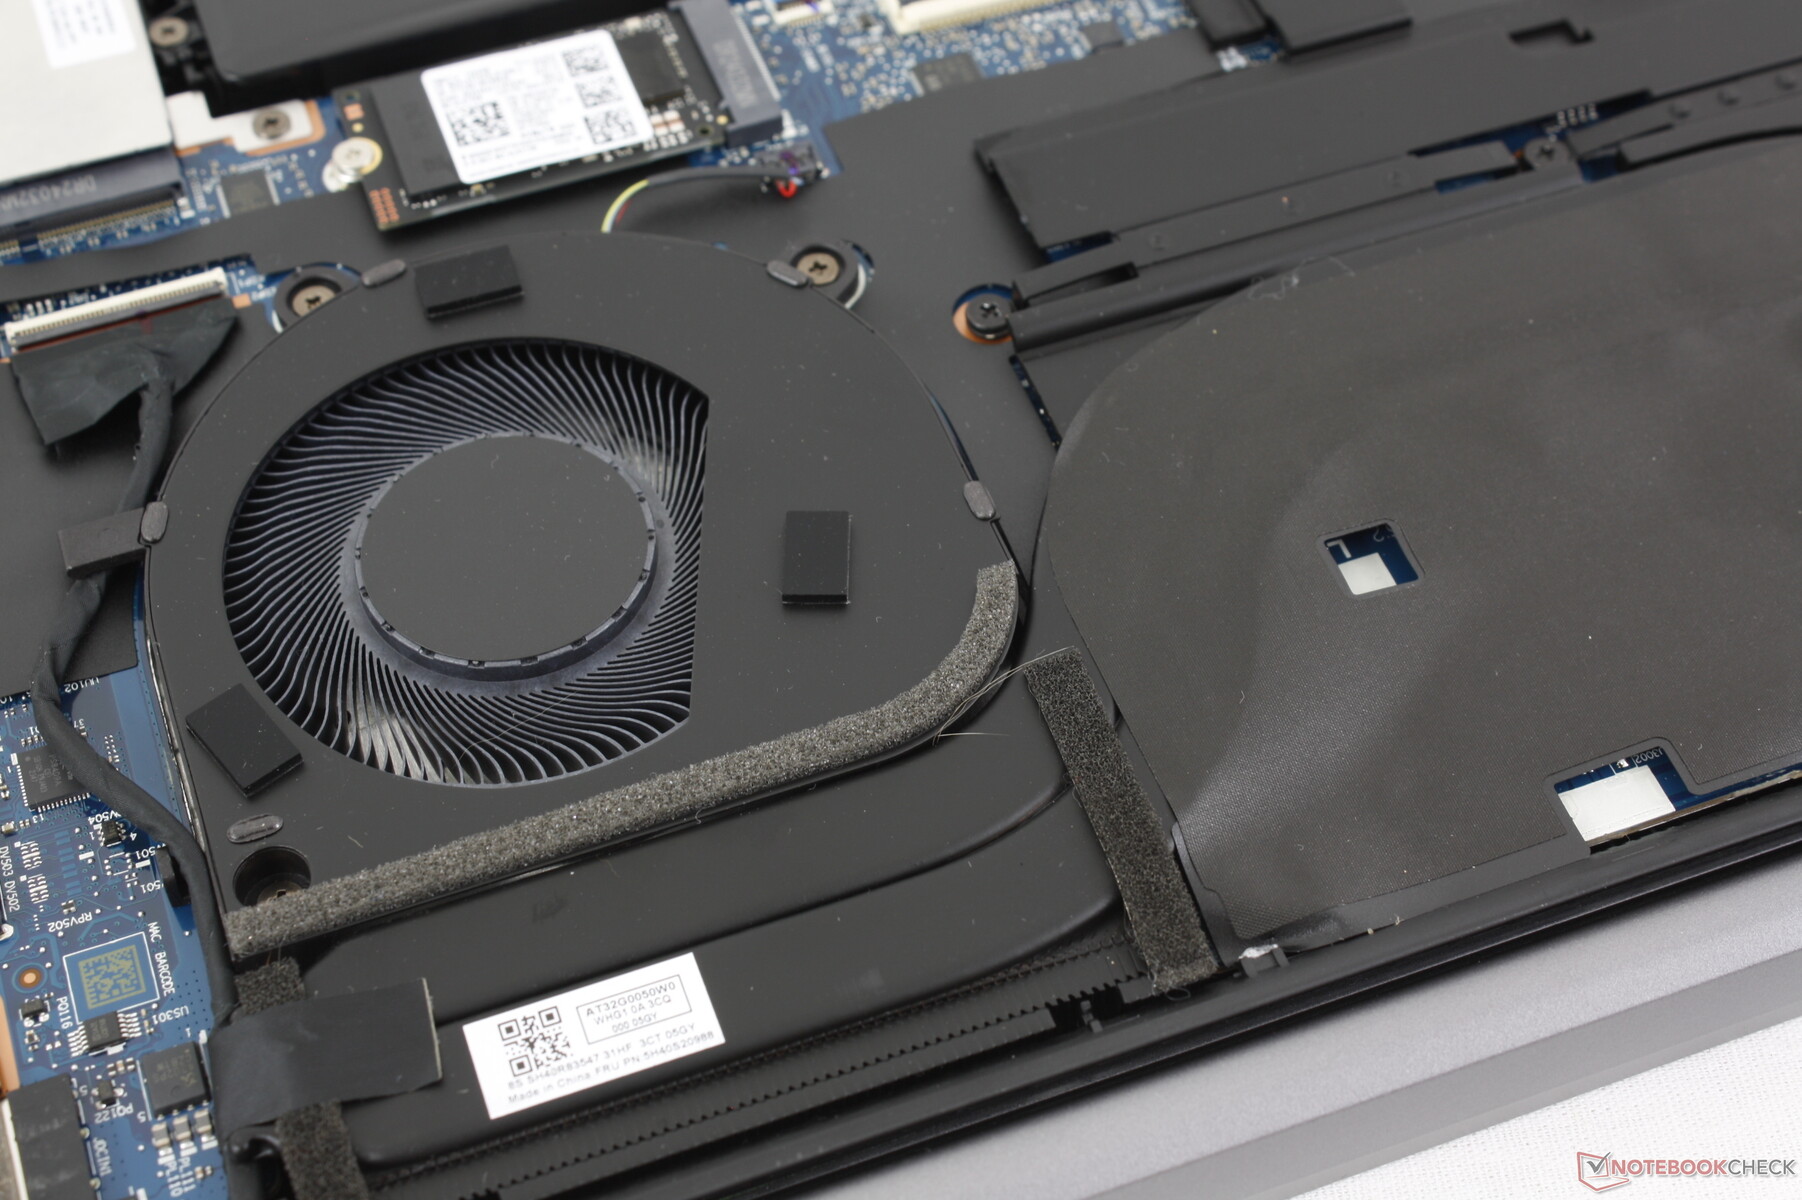
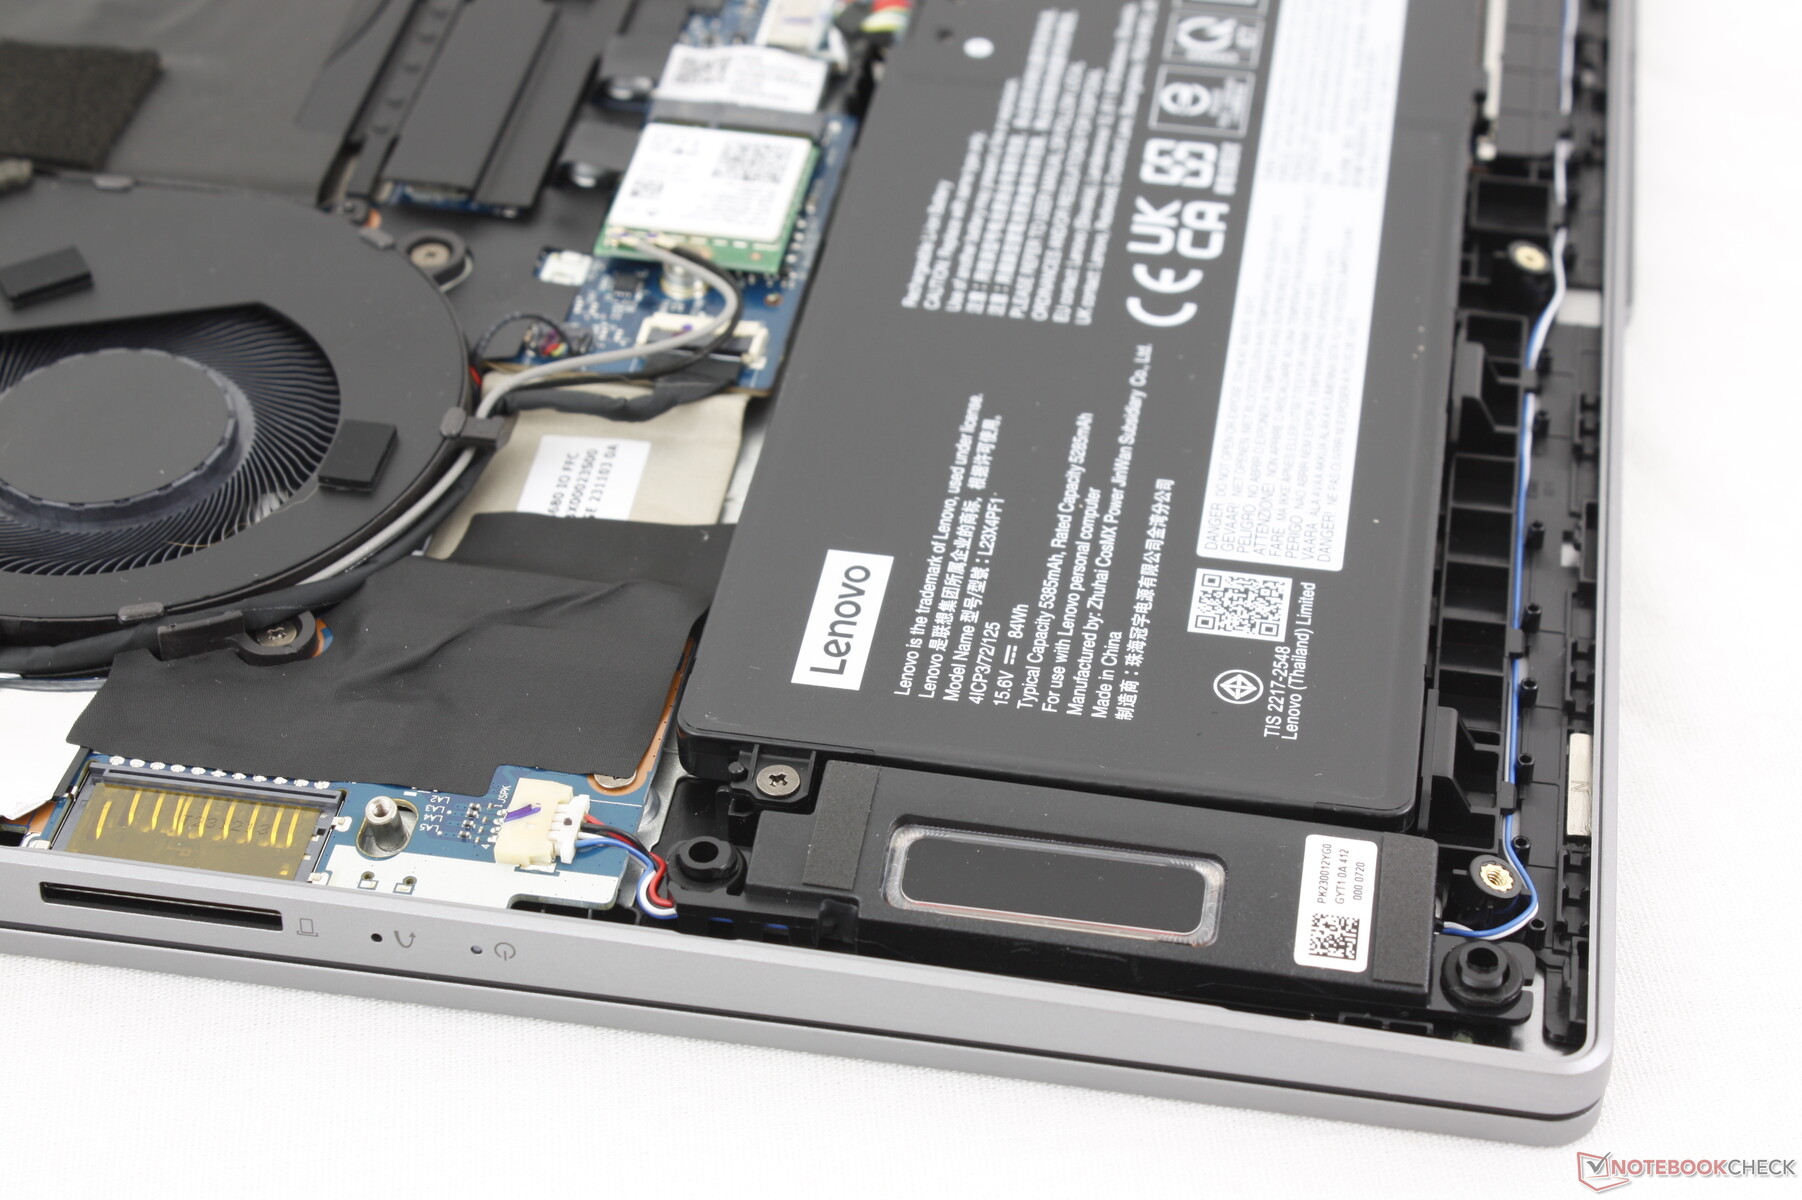
Mantenimiento
El panel inferior está asegurado por nueve tornillos Torx para un mantenimiento relativamente sencillo. La solución de refrigeración se mantiene sin cambios con respecto a la versión iGPU a pesar del hardware más exigente, lo que significa que podemos esperar tanto un ruido más fuerte como temperaturas más altas de media.
Sostenibilidad
La cubierta inferior está compuesta en un 50 por ciento de aluminio reciclado, mientras que los plásticos del embalaje proceden en un 90 por ciento de fuentes oceánicas. También apreciamos que las guías de reparación oficiales de https://pcsupport.lenovo.com/us/en/products/laptops-and-netbooks/5-series/ideapad-pro-5-16imh9/83d4/83d4001hus/document-userguide para el modelo estén disponibles directamente en Lenovo como descargas gratuitas.
Accesorios y garantía
No hay más extras en la caja de venta al público que el adaptador de CA y la documentación. Se aplica la garantía limitada habitual de un año si se adquiere en EE.UU.
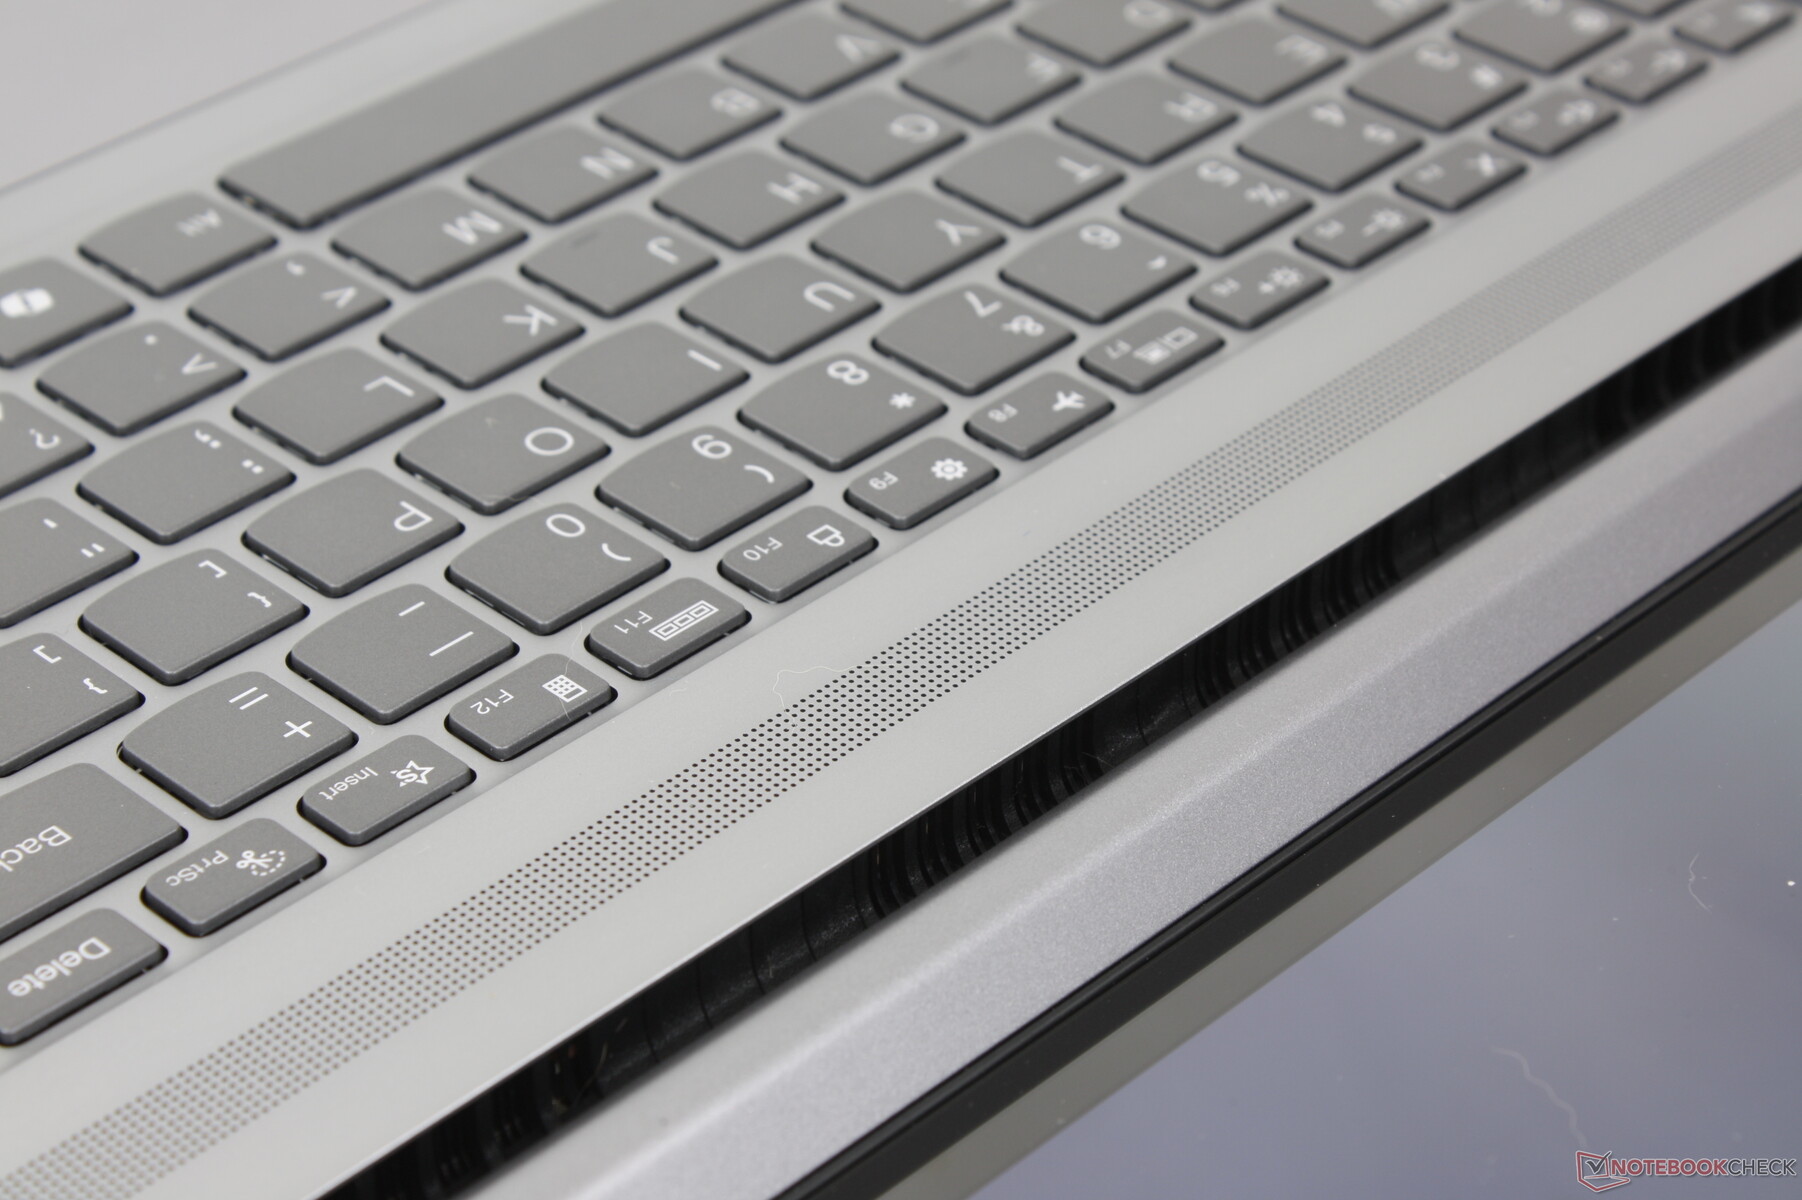
Dispositivos de entrada
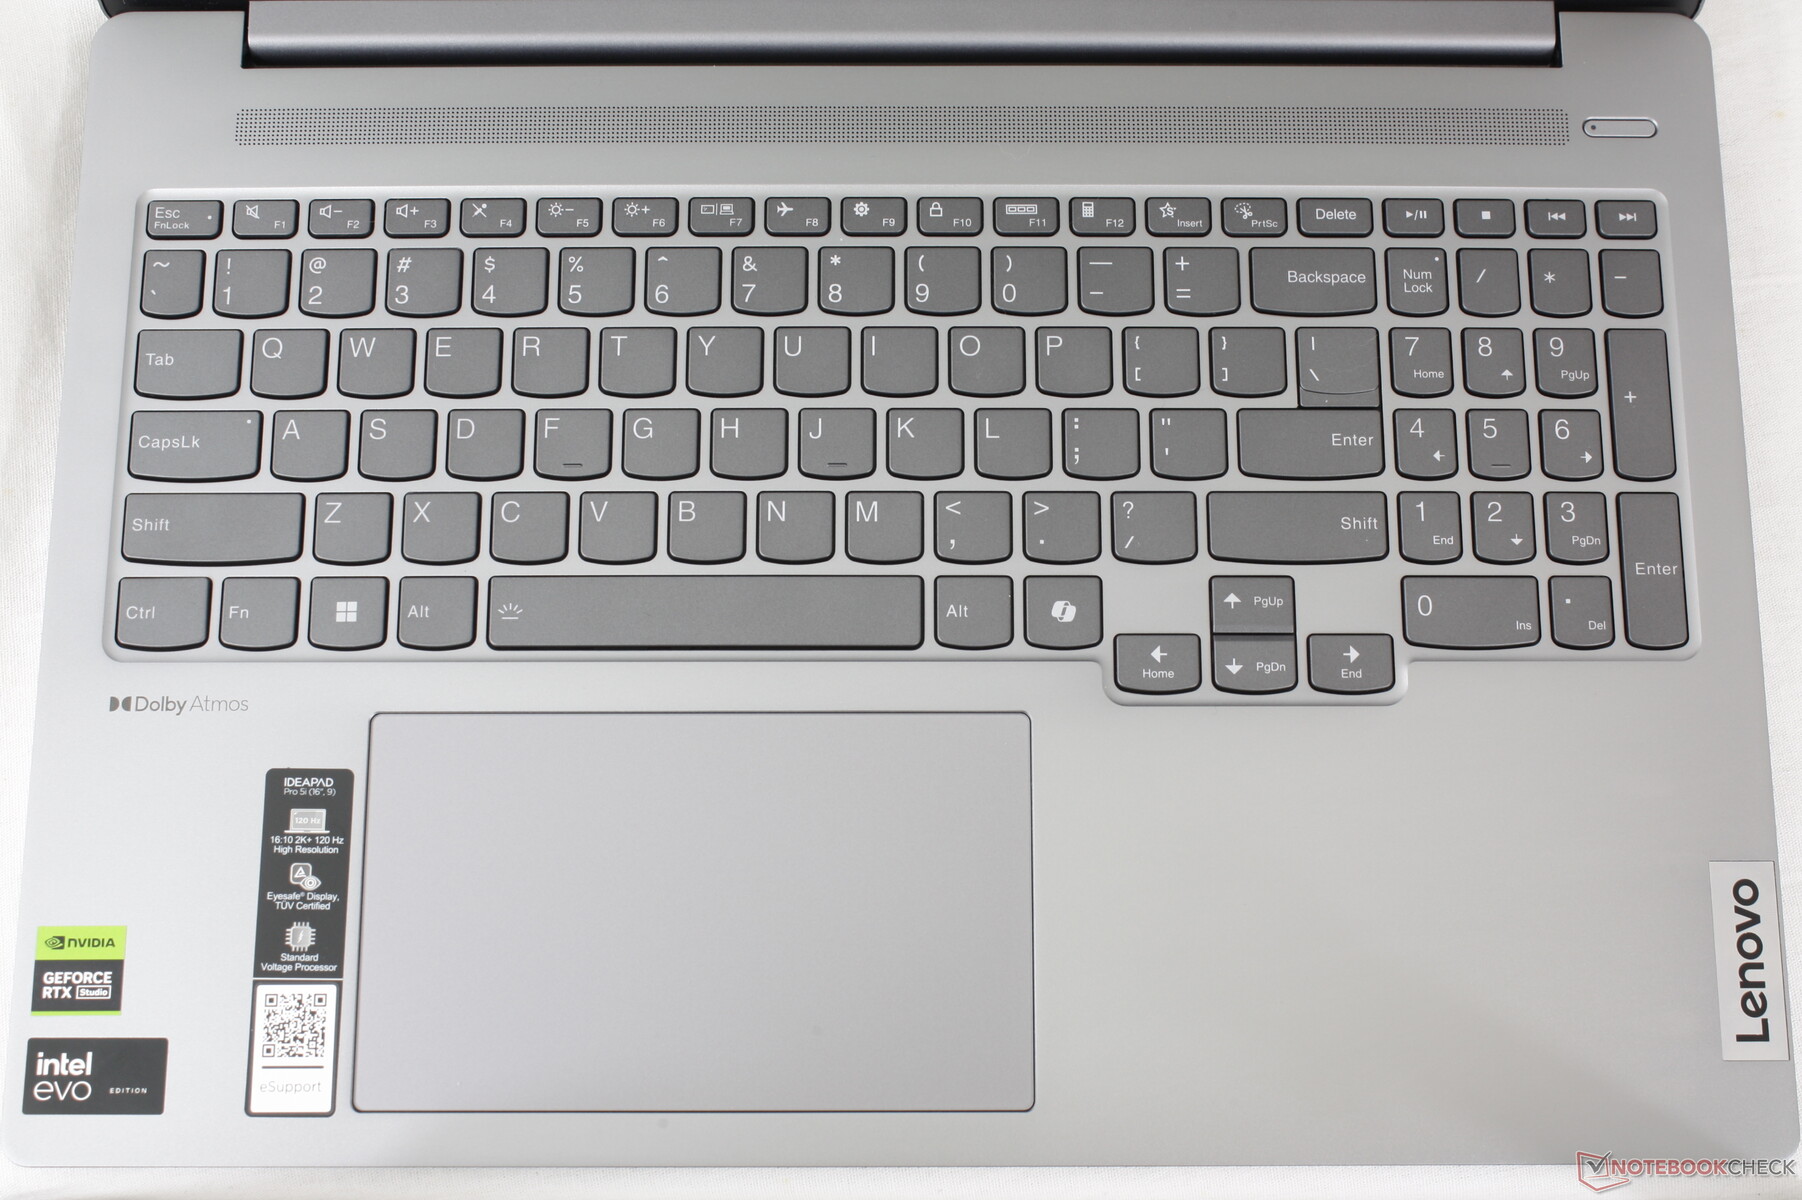
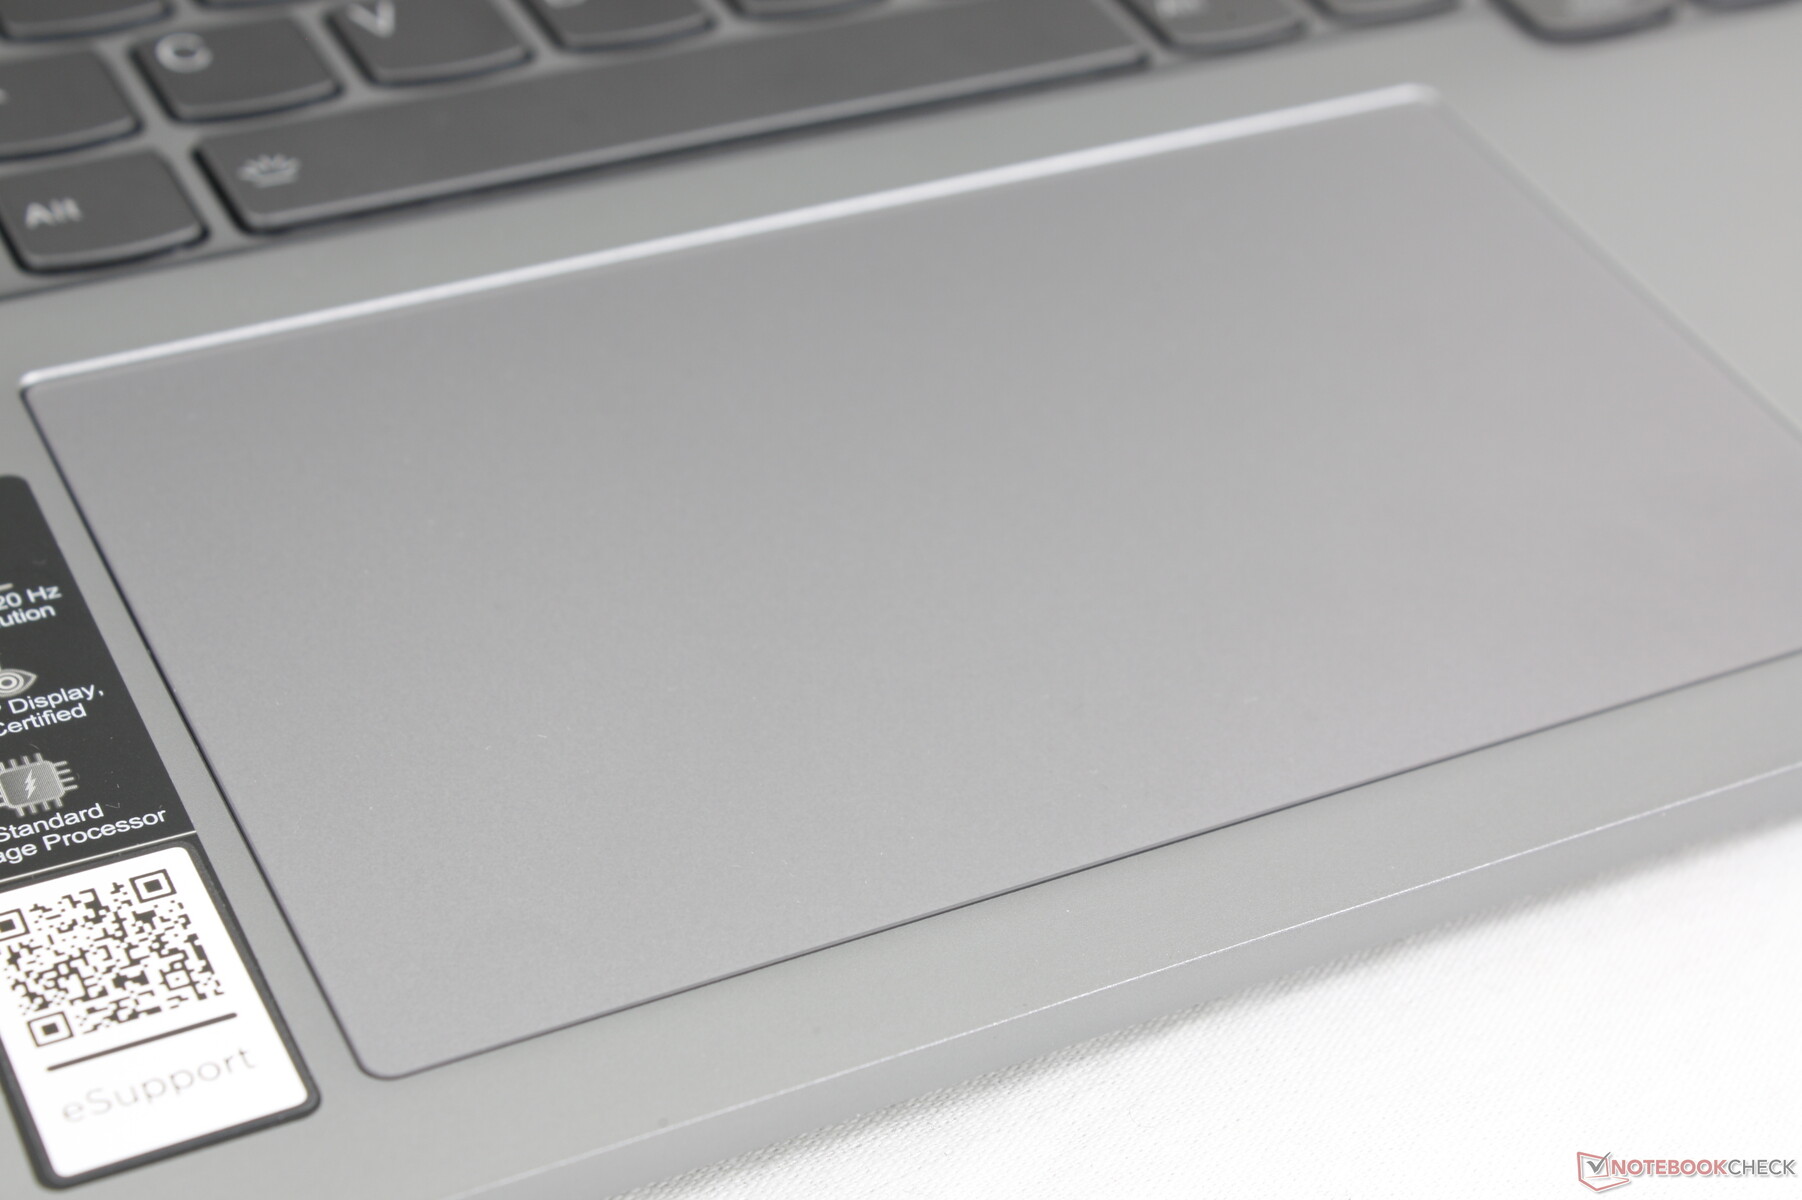
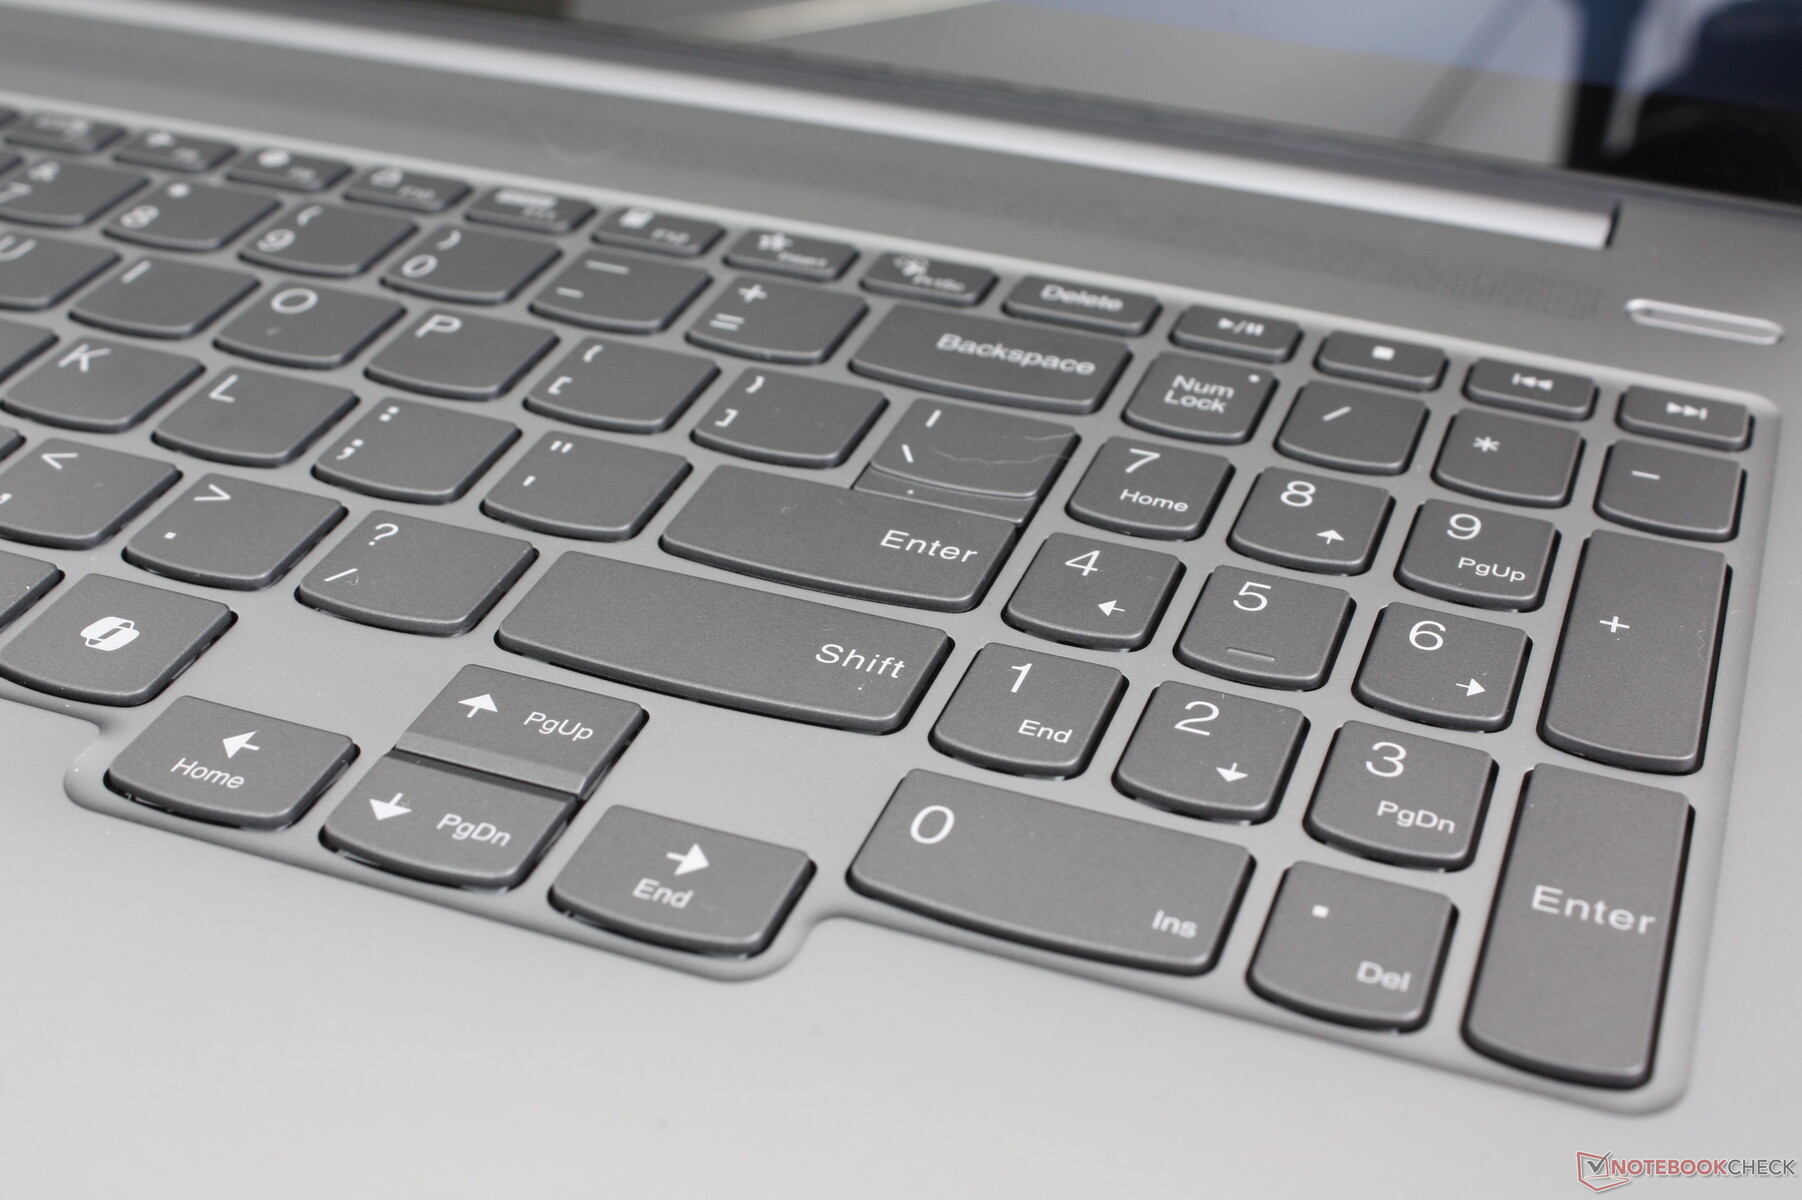
Teclado y panel táctil
Los teclados de los modelos IdeaPad son menos profundos y con una respuesta más débil que los teclados de los modelos ThinkPad. Aunque servicial, la experiencia de tecleo es sin duda un paso por debajo de lo mejor de Lenovo para estar más cerca de los sistemas más baratos, incluso en la configuración de gama alta de 1500 dólares.

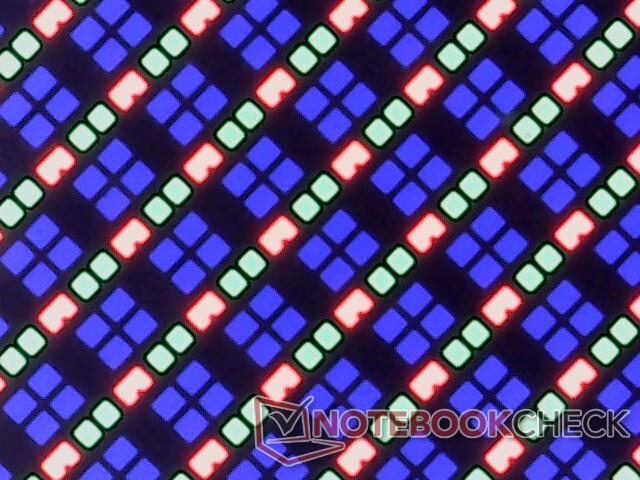
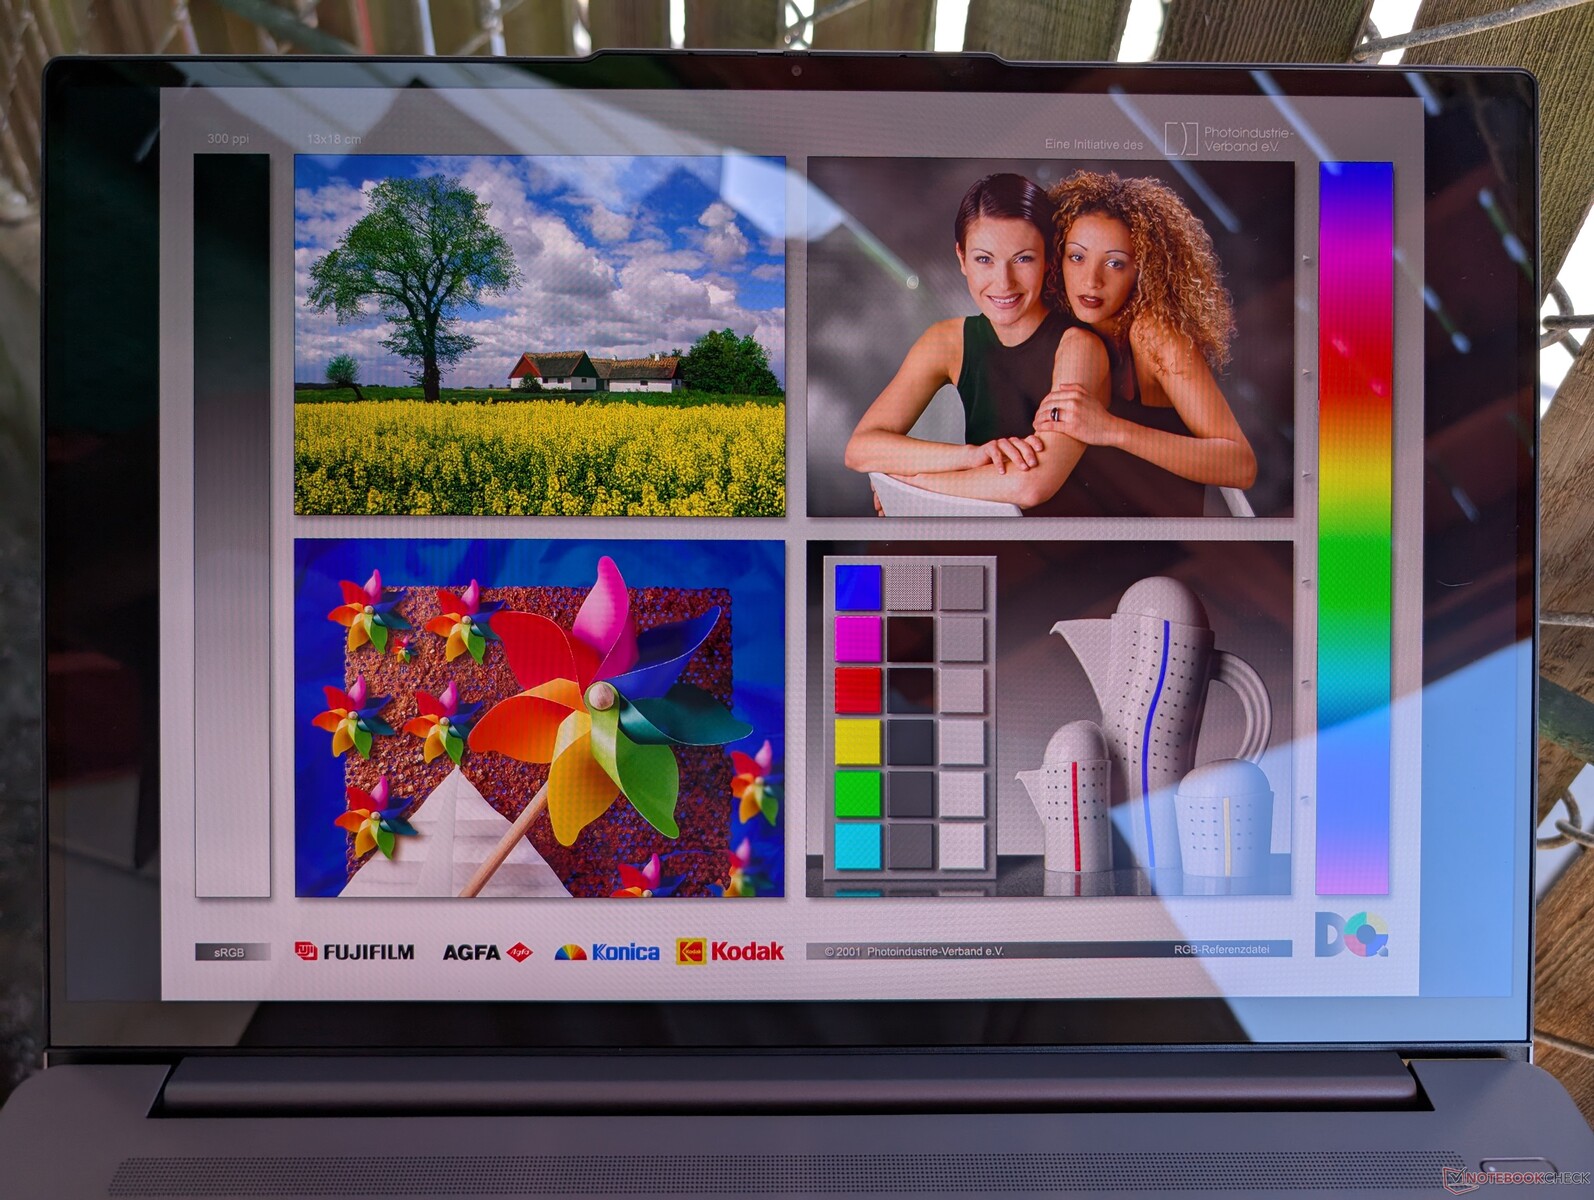
Pantalla - De IPS a OLED
Existen dos opciones de visualización
- 2560 x 1600, IPS, 120 Hz, no táctil
- 2048 x 1280, OLED, 120 Hz, táctil
A diferencia de la mayoría de portátiles, la opción OLED no es necesariamente mejor que la opción IPS, ya que cambia una resolución nativa más alta por colores más profundos y una mejor compatibilidad con HDR. Si sus cargas de trabajo consisten principalmente en hojas de cálculo o multitarea de ventanas, entonces el panel IPS de mayor resolución puede ser más productivo. Para tareas como la reproducción o edición de vídeo, los colores más profundos y el contraste más oscuro de OLED pueden mejorar la experiencia.
La resolución de 1280p es, no obstante, inferior a la de otros portátiles de 16 pulgadas como el Asus Zenbook S 16, Envy x360 2-en-1 16, o Galaxy Book4 Ultra todos los cuales vienen con paneles OLED de 1800p. Esto es probablemente intencional como una forma de animar a los compradores a considerar la gama más alta Serie Yoga Pro 9 16 G9 en su lugar, pero todavía hace que el IdeaPad Pro 5 16 G9 sea un poco menos atractivo en comparación con sus competidores inmediatos.

| |||||||||||||||||||||||||
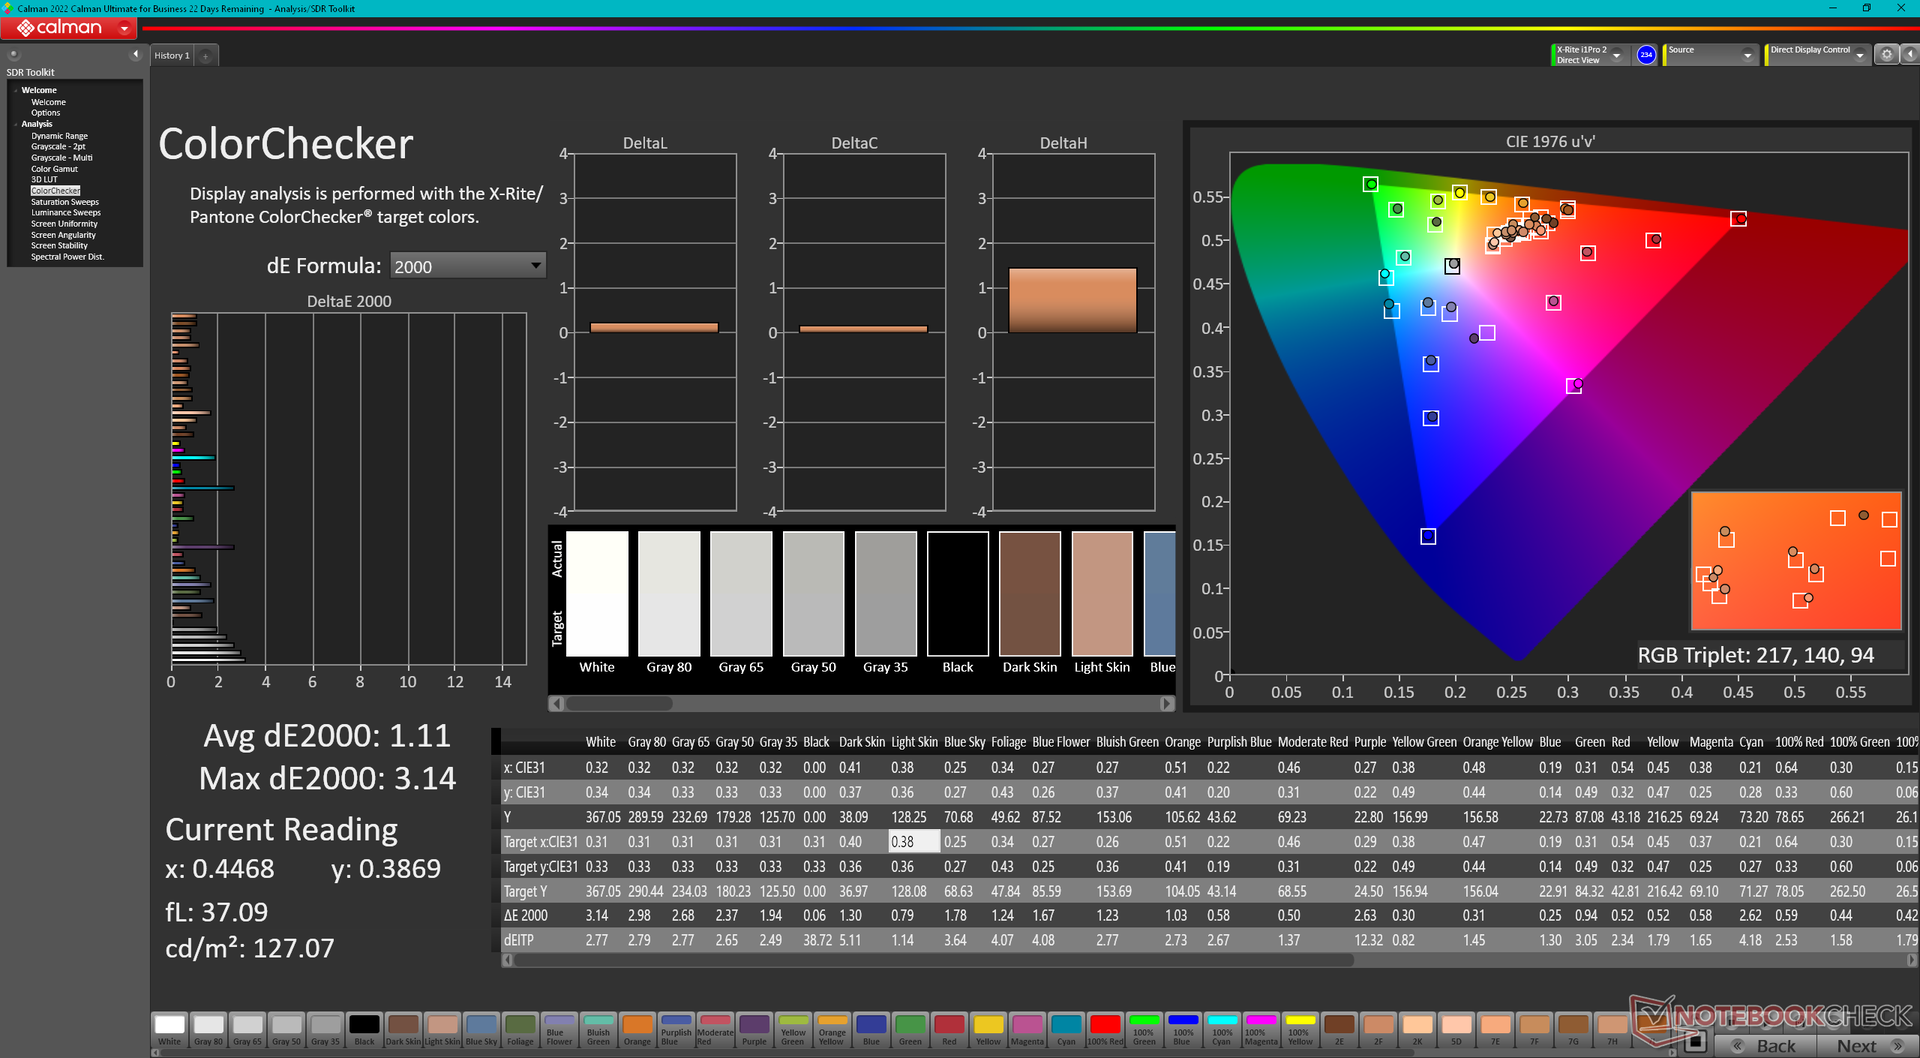
iluminación: 98 %
Brillo con batería: 367.6 cd/m²
Contraste: ∞:1 (Negro: 0 cd/m²)
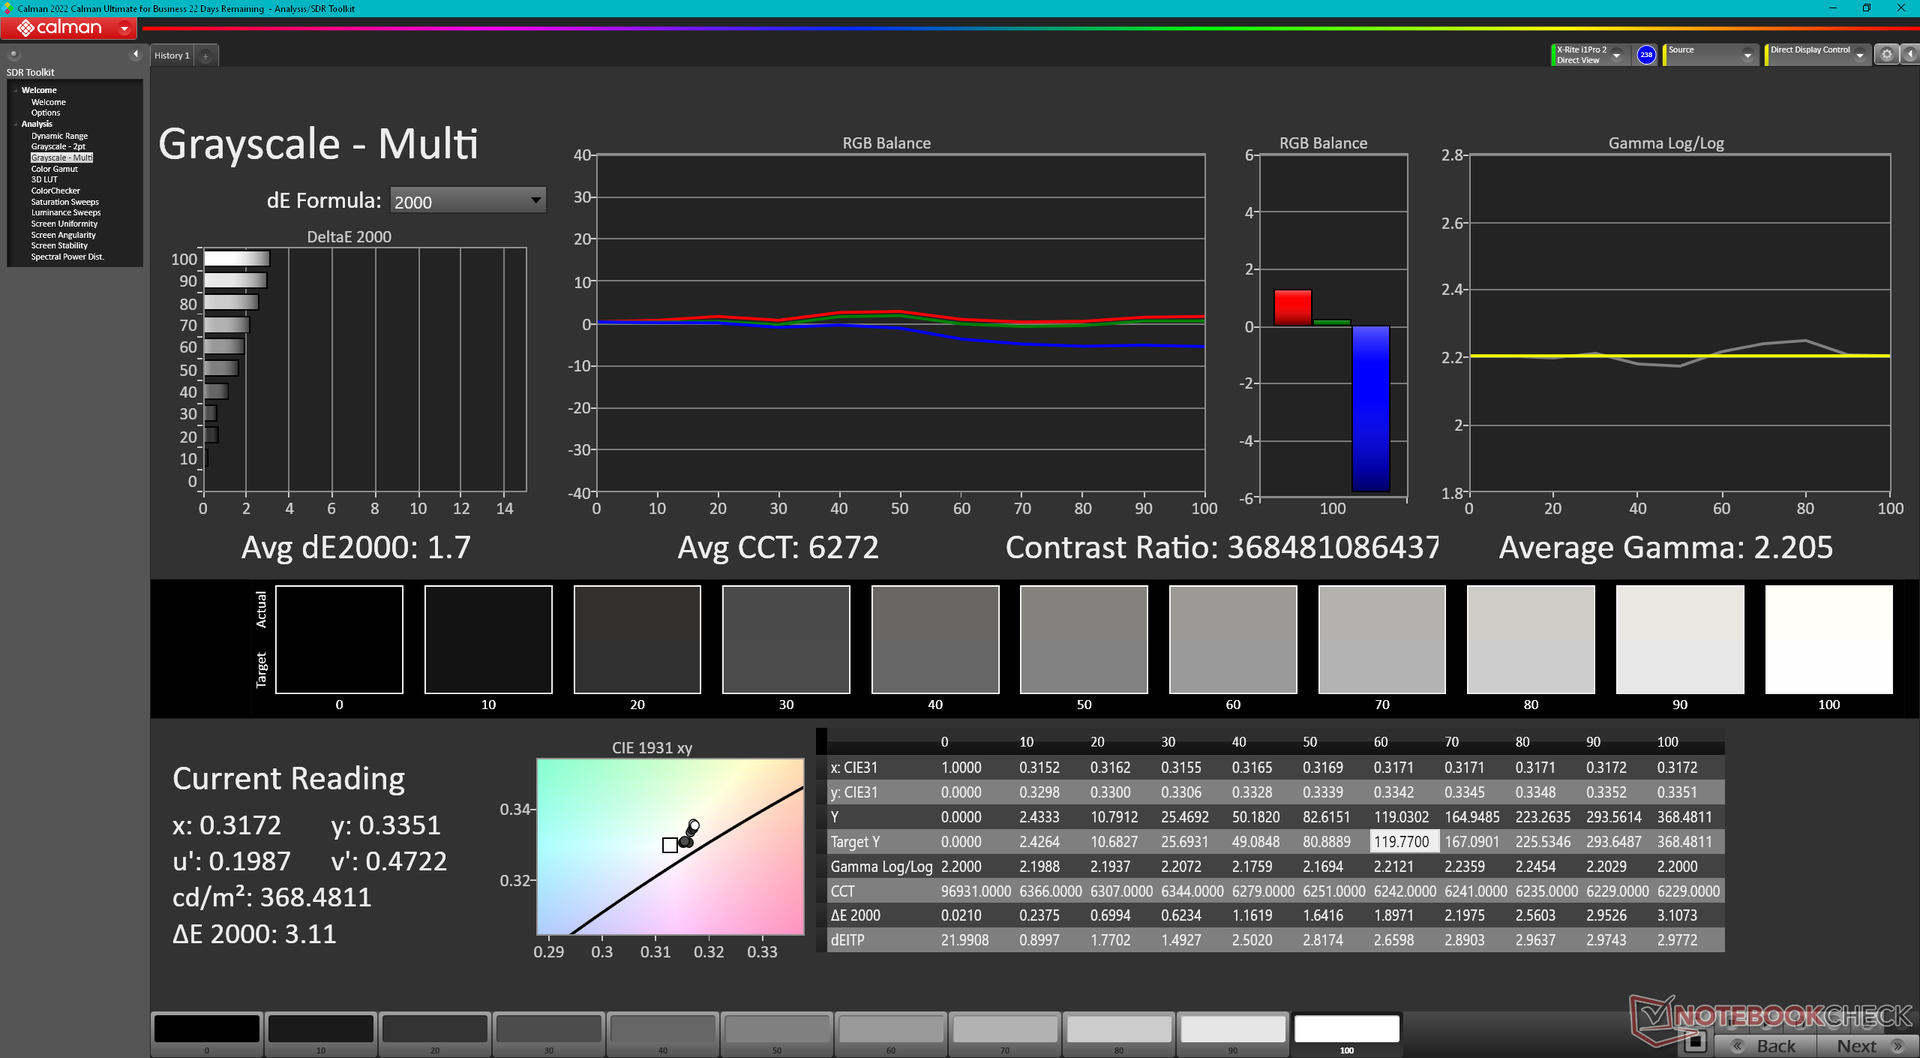
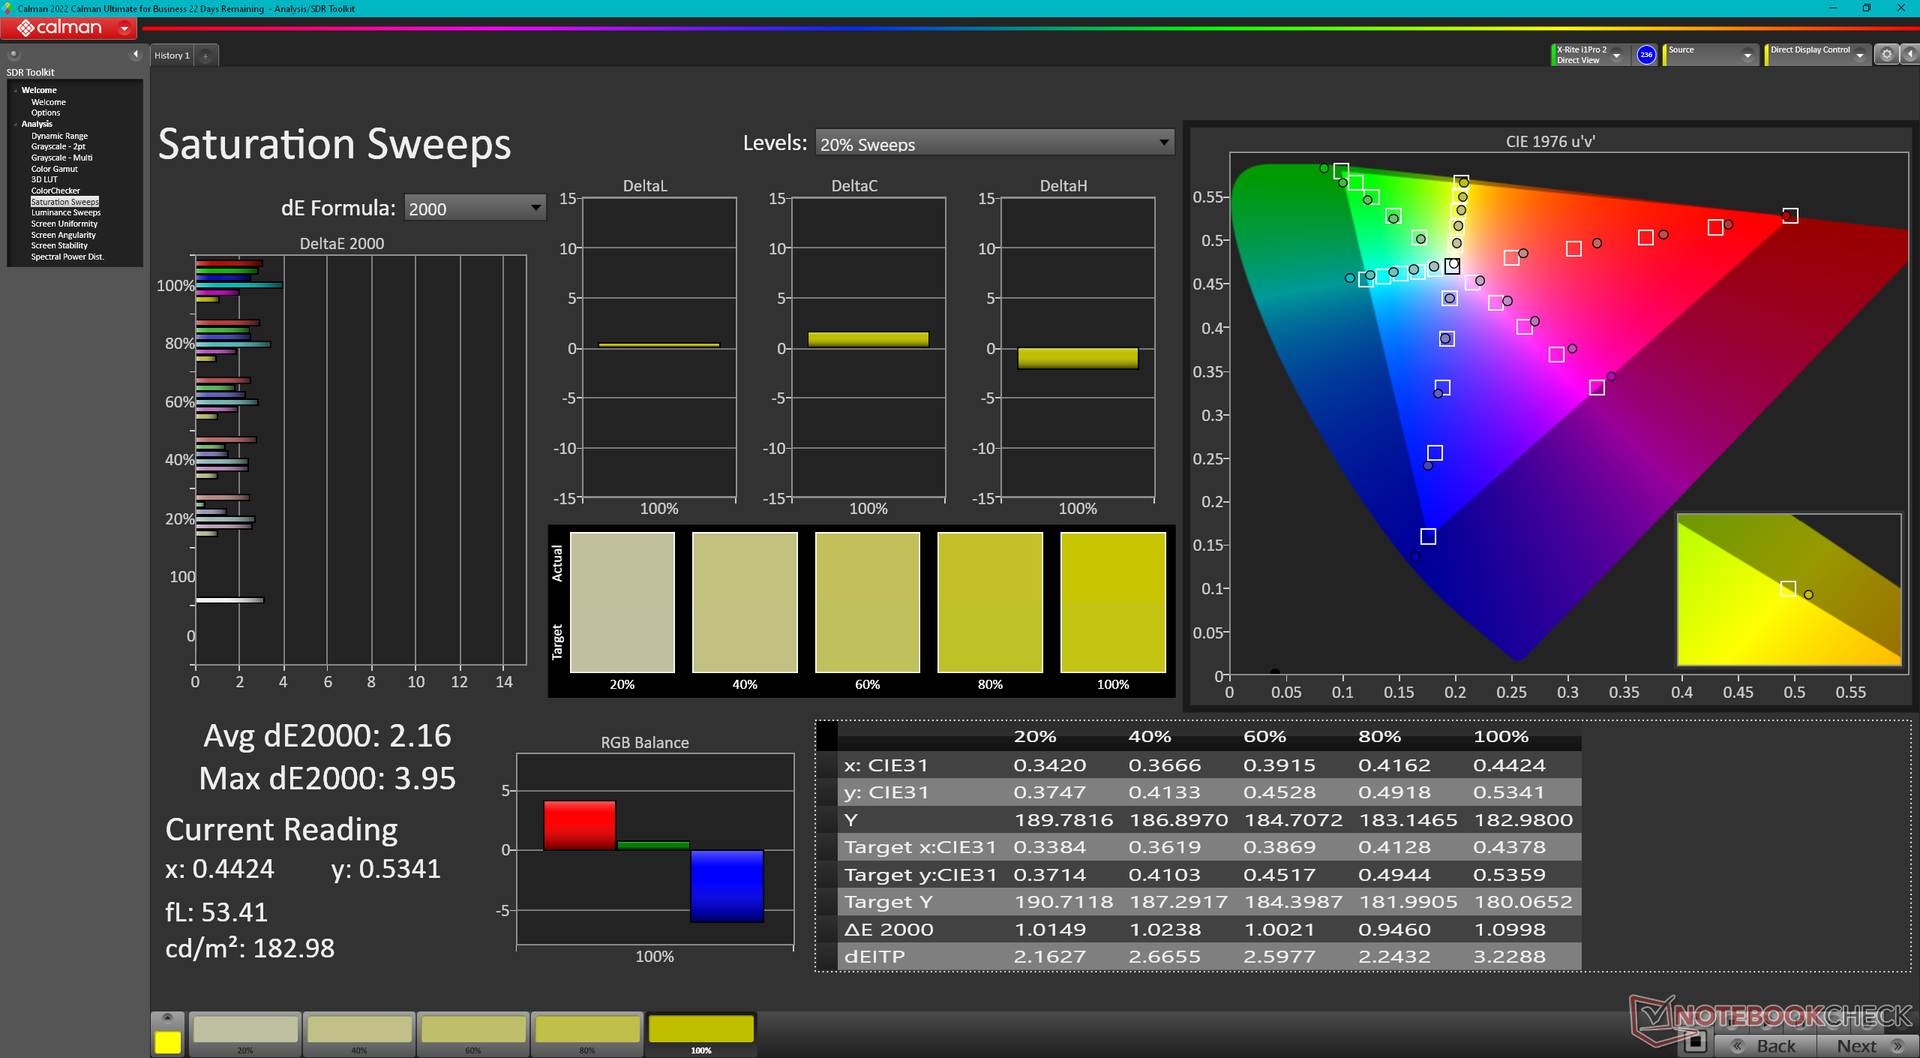
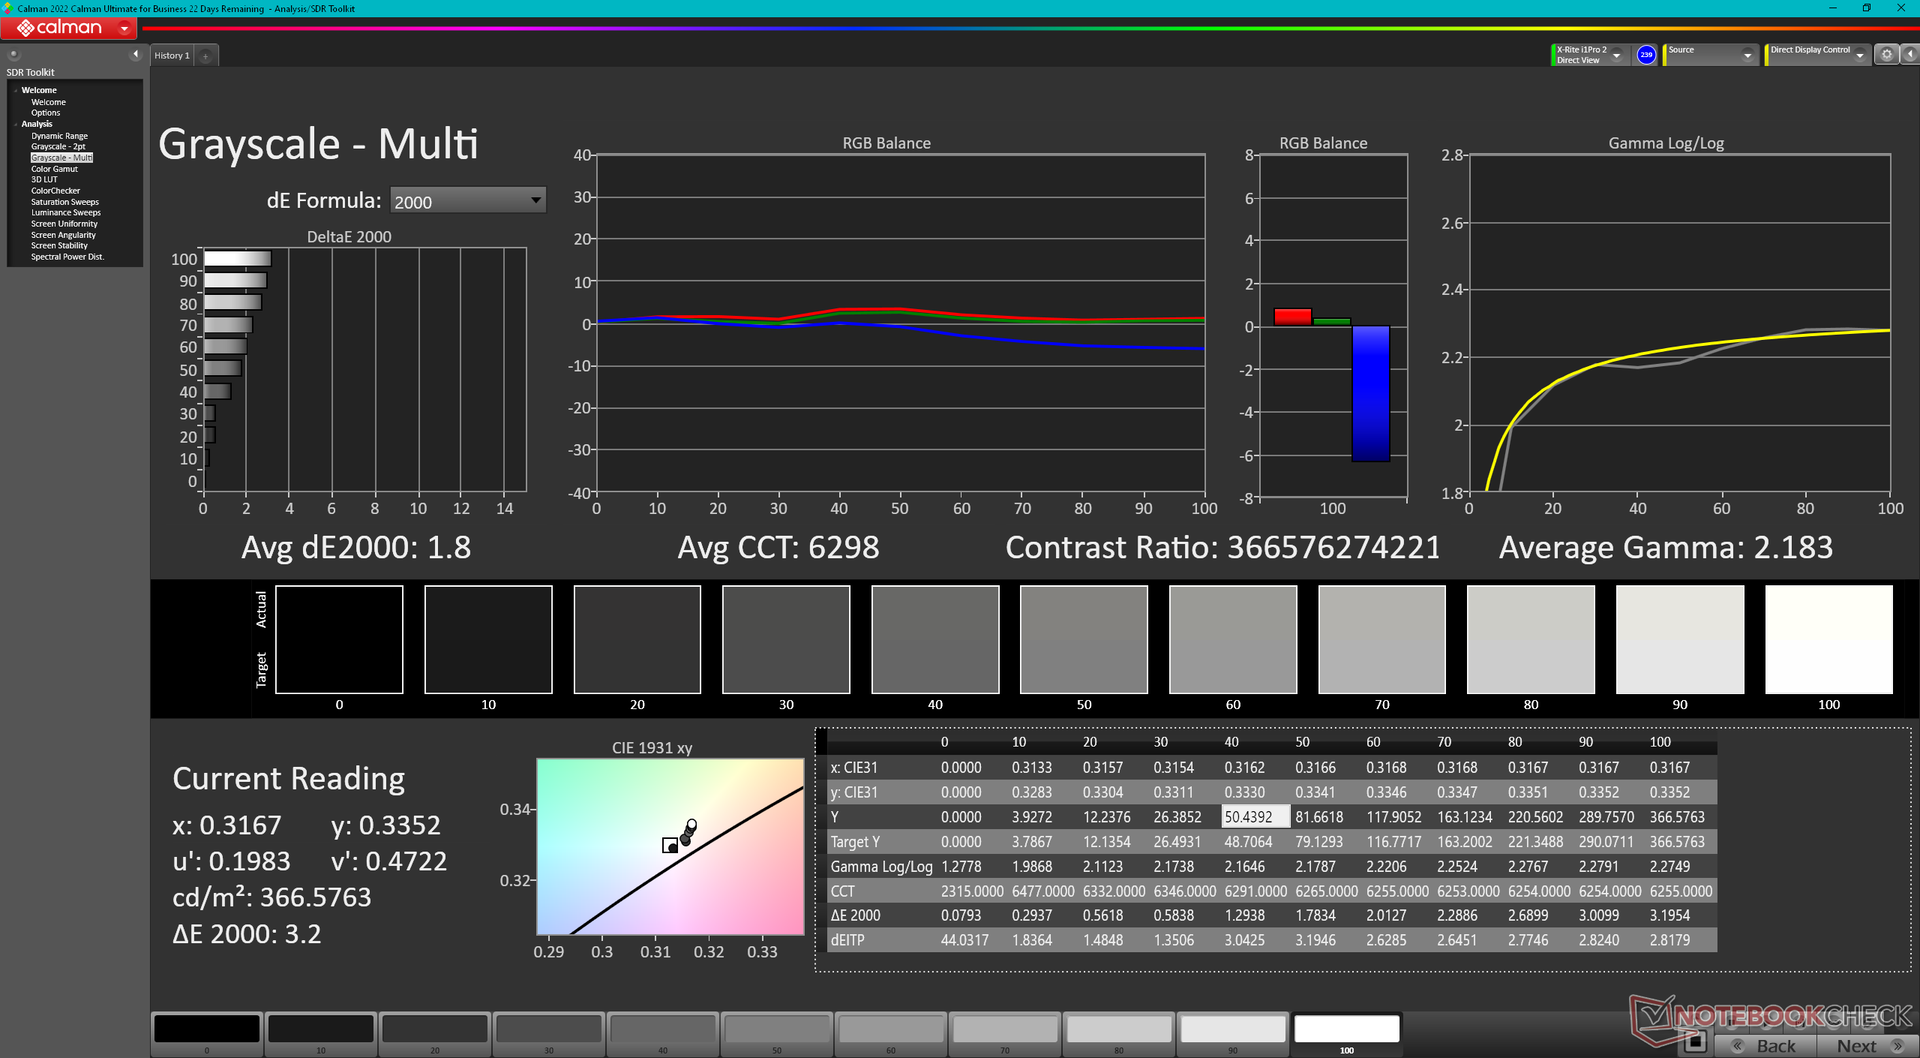
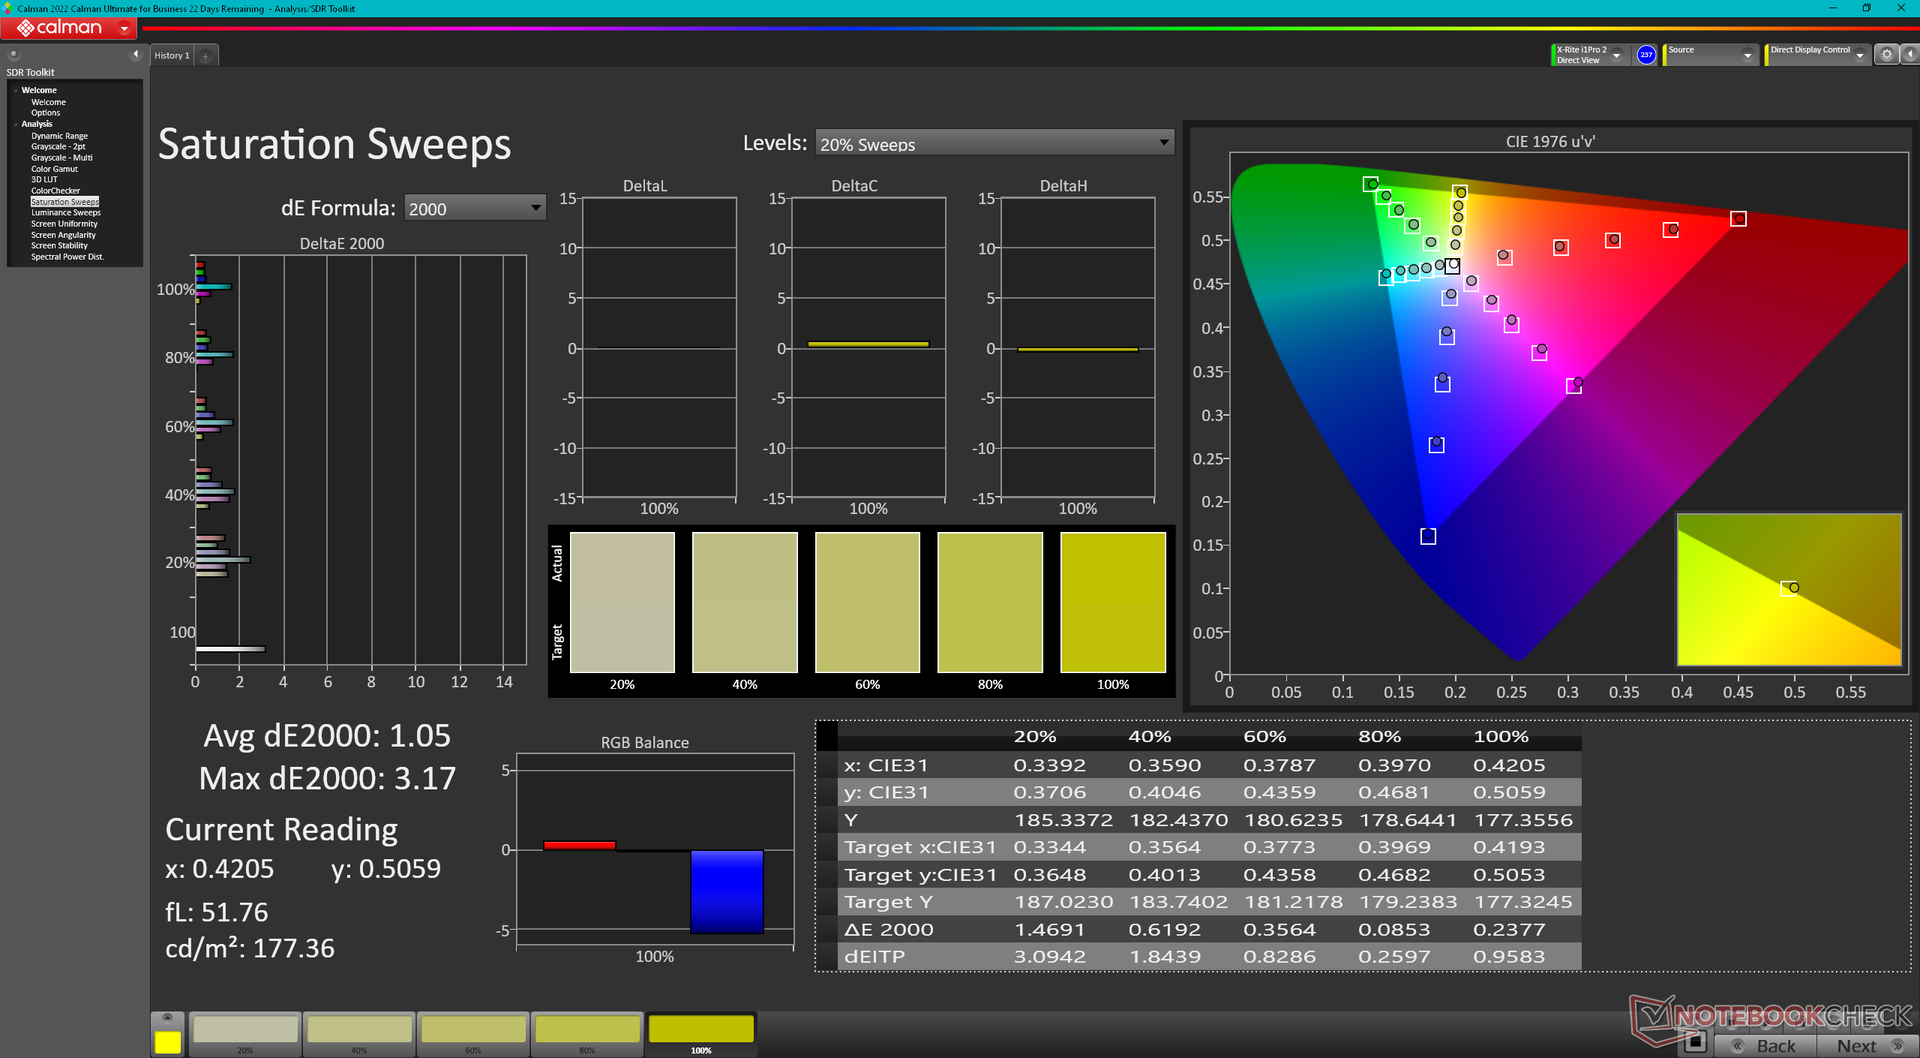
ΔE Color 4.31 | 0.5-29.43 Ø4.87, calibrated: 1.11
ΔE Greyscale 1.7 | 0.5-98 Ø5.1
97.8% AdobeRGB 1998 (Argyll 2.2.0 3D)
100% sRGB (Argyll 2.2.0 3D)
99.7% Display P3 (Argyll 2.2.0 3D)
Gamma: 2.2
| Lenovo IdeaPad Pro 5 16IMH G9 RTX 4050 LEN1602K, OLED, 2048x1280, 16", 120 Hz | Lenovo IdeaPad Pro 5 16IMH G9 NE160QDM-NY2, IPS, 2560x1600, 16", 120 Hz | Dell Inspiron 16 7640 2-in-1 AU Optronics B160QAT, Mini-LED, 2560x1600, 16", 90 Hz | Asus Zenbook S 16 UM5606-RK333W ATNA60CL10-0, OLED, 2880x1800, 16", 120 Hz | HP Envy x360 2-in-1 16-ad0097nr Samsung SDC41A6, OLED, 2880x1800, 16", 120 Hz | Samsung Galaxy Book4 Ultra ATNA60CL07-0, OLED, 2880x1800, 16", 120 Hz | |
|---|---|---|---|---|---|---|
| Display | -25% | -2% | -1% | -0% | -4% | |
| Display P3 Coverage | 99.7 | 63.3 -37% | 99.4 0% | 99.9 0% | 99.6 0% | 98.6 -1% |
| sRGB Coverage | 100 | 95.2 -5% | 100 0% | 100 0% | 100 0% | 99.9 0% |
| AdobeRGB 1998 Coverage | 97.8 | 65.3 -33% | 92.5 -5% | 95.6 -2% | 96.5 -1% | 88.5 -10% |
| Response Times | -1708% | -2489% | 46% | 26% | 13% | |
| Response Time Grey 50% / Grey 80% * | 0.58 ? | 15 ? -2486% | 15.4 ? -2555% | 0.56 ? 3% | 0.8 ? -38% | 0.54 ? 7% |
| Response Time Black / White * | 1 ? | 10.3 ? -930% | 60.6 ? -5960% | 0.65 ? 35% | 0.89 ? 11% | 0.69 ? 31% |
| PWM Frequency | 240 ? | 2753.7 ? 1047% | 480 100% | 491.8 ? 105% | 240 ? 0% | |
| Screen | -14% | -21% | 43% | 10% | 20% | |
| Brightness middle | 367.6 | 368 0% | 413 12% | 407 11% | 399.4 9% | 390 6% |
| Brightness | 371 | 368 -1% | 409 10% | 405 9% | 405 9% | 393 6% |
| Brightness Distribution | 98 | 91 -7% | 97 -1% | 97 -1% | 98 0% | 98 0% |
| Black Level * | 0.31 | 0.14 | 0.02 | |||
| Colorchecker dE 2000 * | 4.31 | 2.4 44% | 3.48 19% | 0.6 86% | 4.05 6% | 1.4 68% |
| Colorchecker dE 2000 max. * | 6.85 | 6.5 5% | 6.97 -2% | 1.2 82% | 6.69 2% | 2.7 61% |
| Colorchecker dE 2000 calibrated * | 1.11 | 0.8 28% | 1.02 8% | |||
| Greyscale dE 2000 * | 1.7 | 4.5 -165% | 4.5 -165% | 0.5 71% | 1.1 35% | 2.1 -24% |
| Gamma | 2.2 100% | 2.21 100% | 2.15 102% | 2.2 100% | 2.27 97% | 2.27 97% |
| CCT | 6272 104% | 6324 103% | 6446 101% | 6453 101% | 6419 101% | 6431 101% |
| Contrast | 1187 | 2950 | 20350 | |||
| Media total (Programa/Opciones) | -582% /
-299% | -837% /
-633% | 29% /
33% | 12% /
11% | 10% /
12% |
* ... más pequeño es mejor
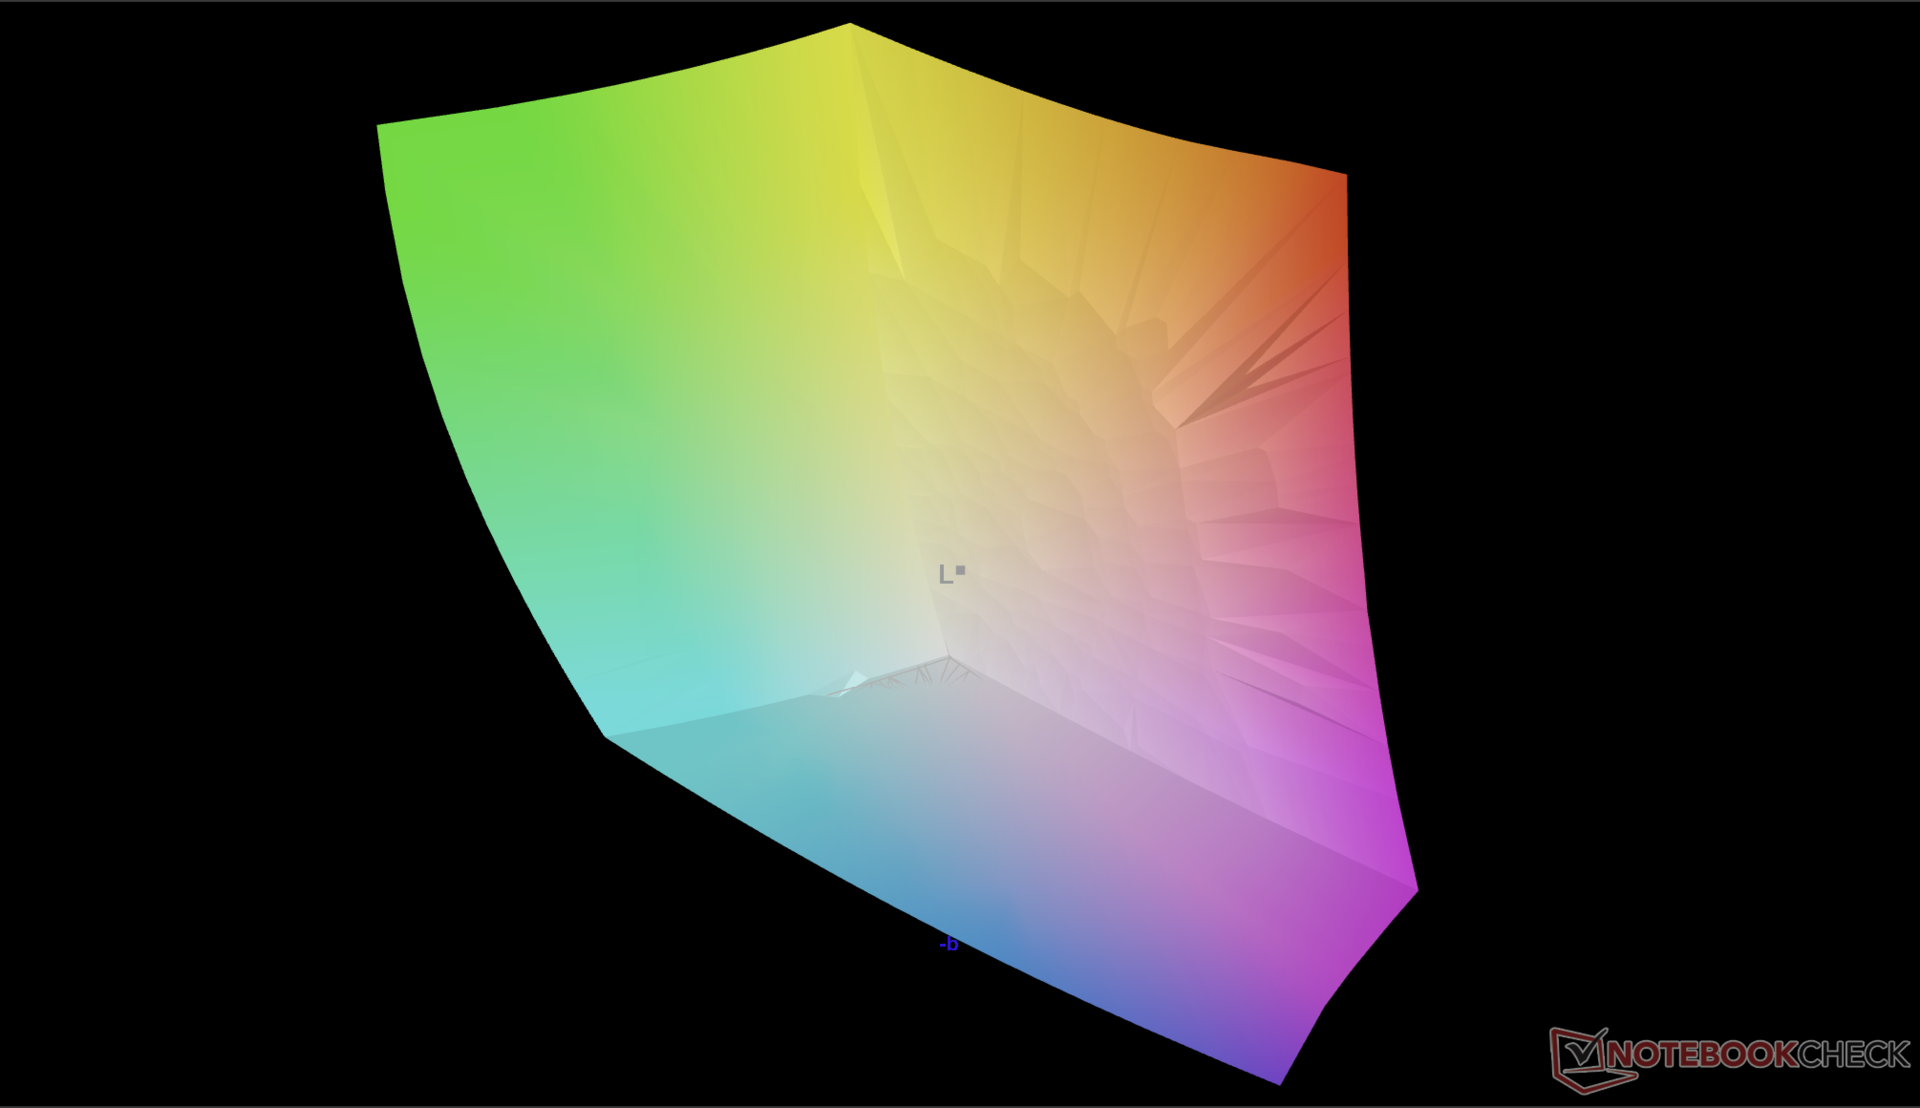

Aunque no viene calibrada de fábrica, la pantalla es decentemente precisa respecto a la norma P3, con unos valores medios deltaE en escala de grises y color de 1,7 y 4,31, respectivamente.

Tiempos de respuesta del display
| ↔ Tiempo de respuesta de Negro a Blanco | ||
|---|---|---|
| 1 ms ... subida ↗ y bajada ↘ combinada | ↗ 0.56 ms subida | 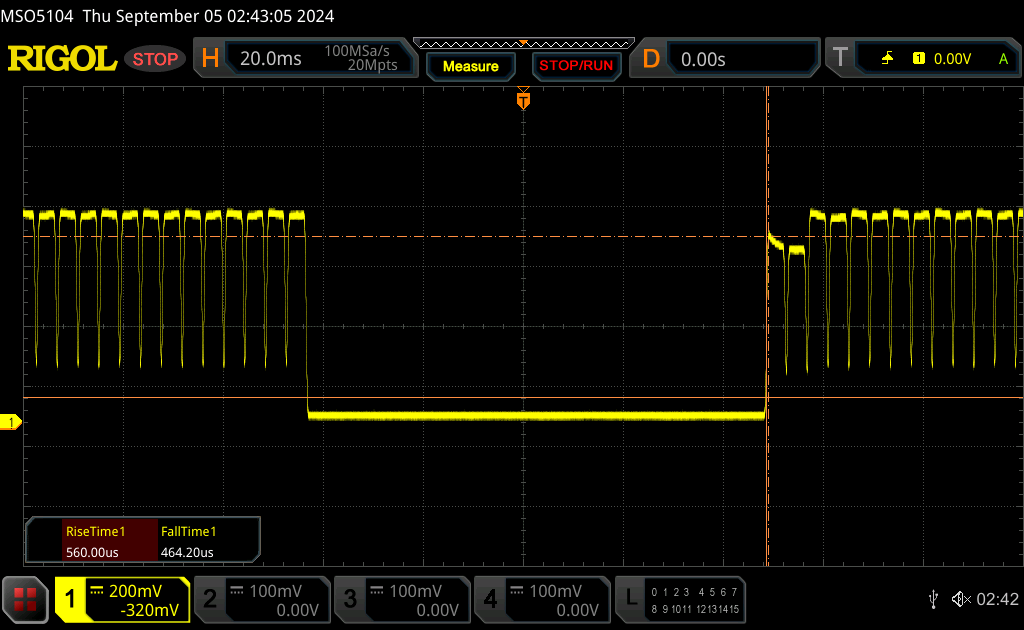 |
| ↘ 0.44 ms bajada | ||
| La pantalla mostró tiempos de respuesta muy rápidos en nuestros tests y debería ser adecuada para juegos frenéticos. En comparación, todos los dispositivos de prueba van de ##min### (mínimo) a 240 (máximo) ms. » 2 % de todos los dispositivos son mejores. Esto quiere decir que el tiempo de respuesta medido es mejor que la media (20.8 ms) de todos los dispositivos testados. | ||
| ↔ Tiempo de respuesta 50% Gris a 80% Gris | ||
| 0.58 ms ... subida ↗ y bajada ↘ combinada | ↗ 0.28 ms subida | 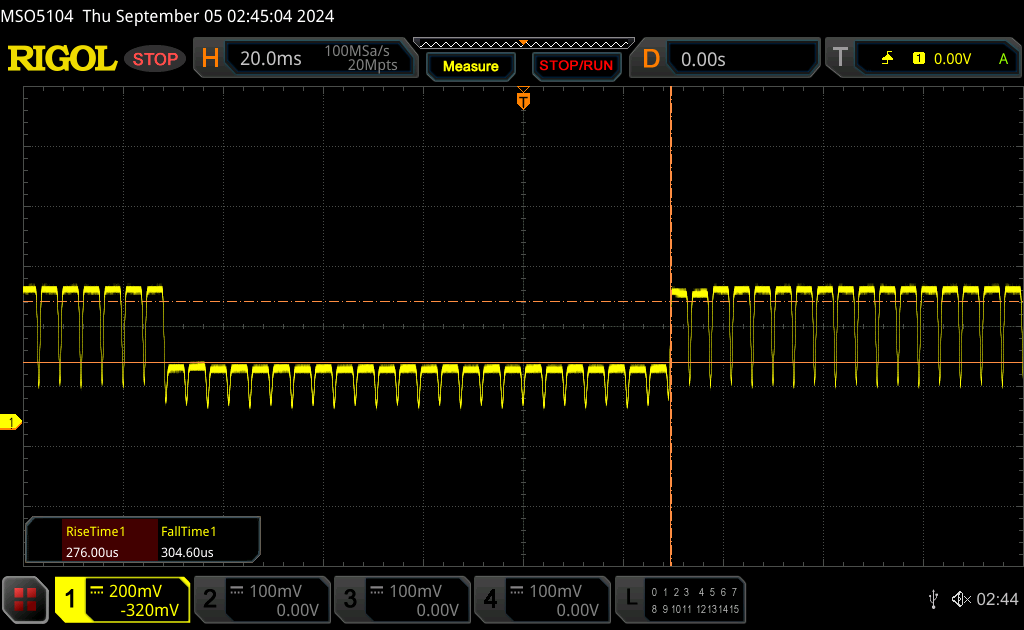 |
| ↘ 0.3 ms bajada | ||
| La pantalla mostró tiempos de respuesta muy rápidos en nuestros tests y debería ser adecuada para juegos frenéticos. En comparación, todos los dispositivos de prueba van de ##min### (mínimo) a 636 (máximo) ms. » 1 % de todos los dispositivos son mejores. Esto quiere decir que el tiempo de respuesta medido es mejor que la media (32.5 ms) de todos los dispositivos testados. | ||
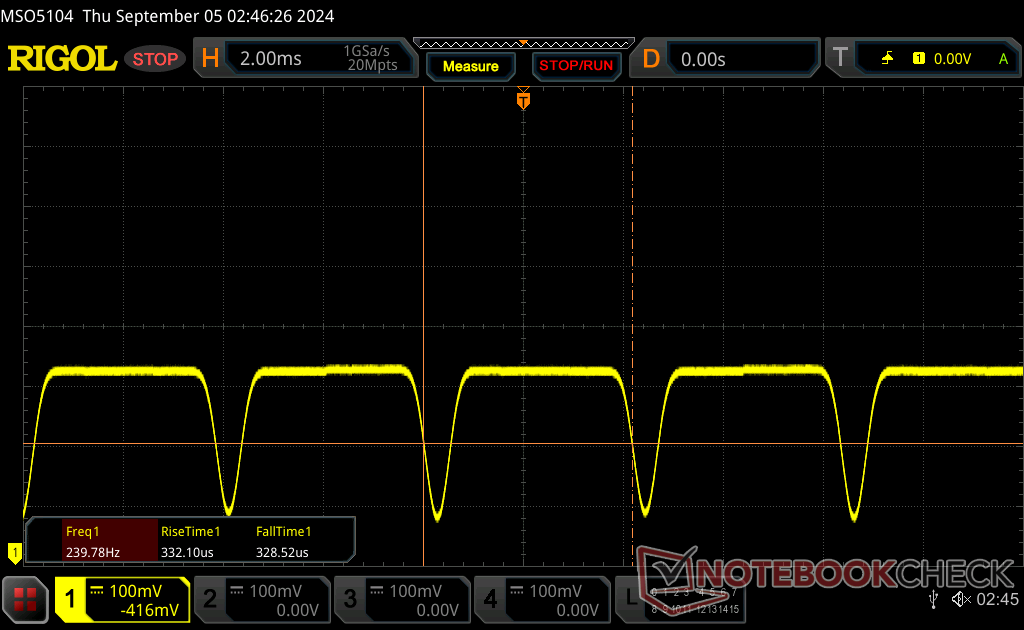
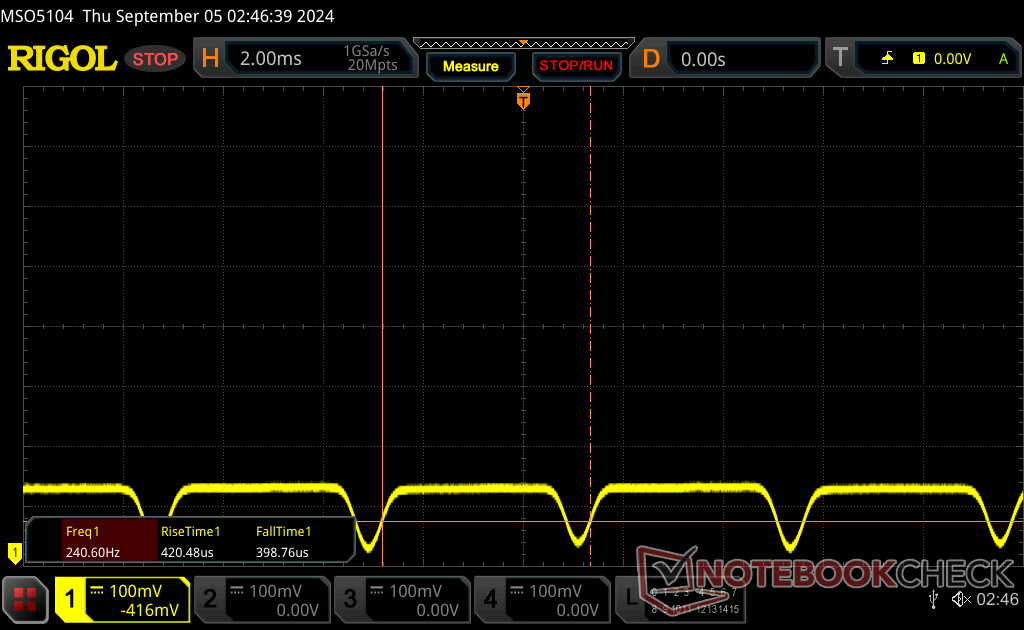
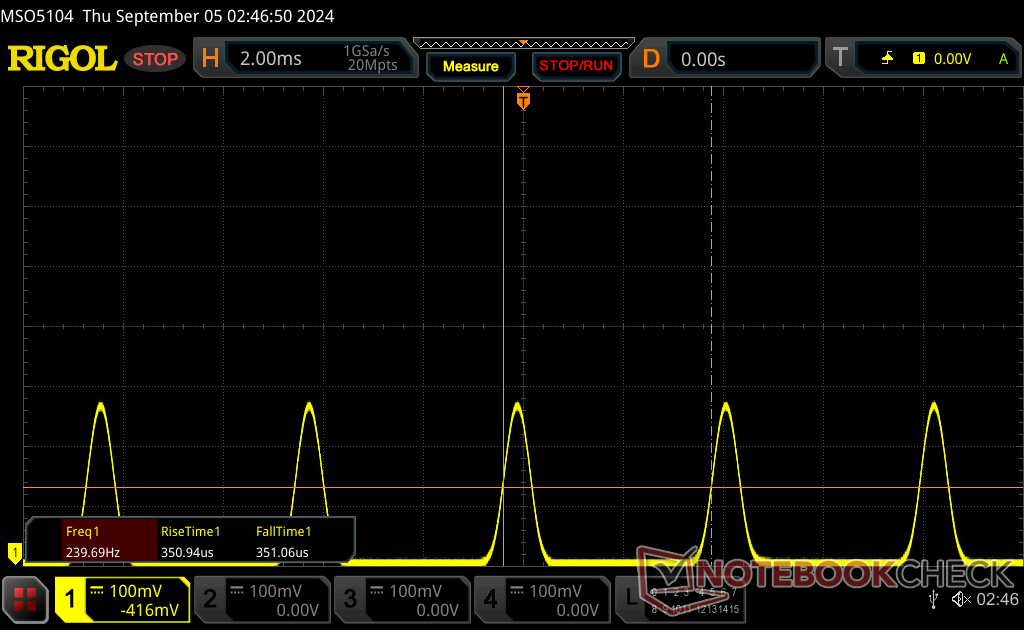
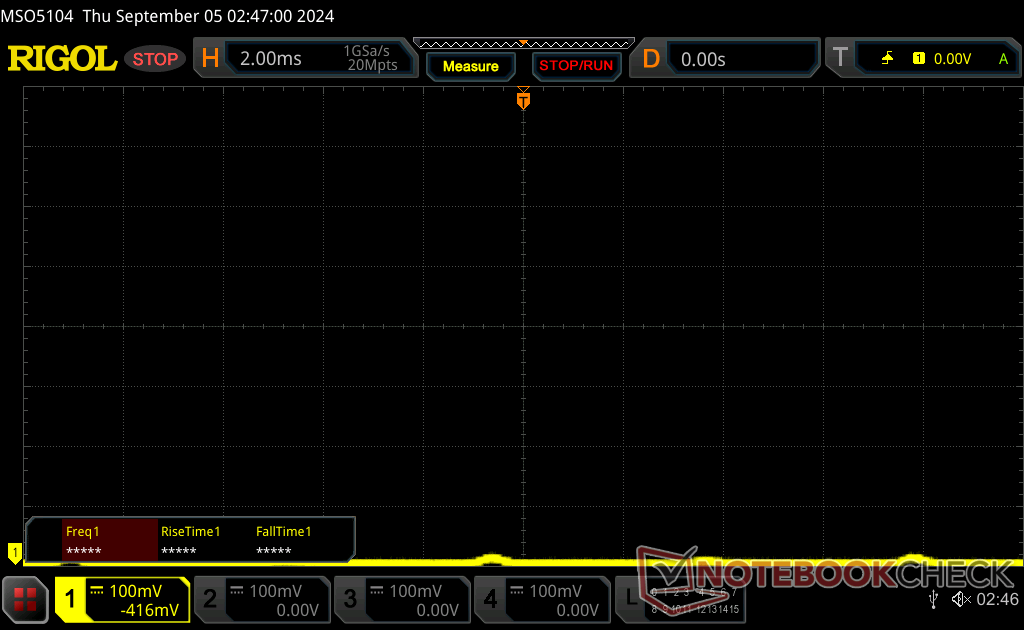
Parpadeo de Pantalla / PWM (Pulse-Width Modulation)
| Parpadeo de Pantalla / PWM detectado | 240 Hz Amplitude: 38 % | ≤ 100 % de brillo | 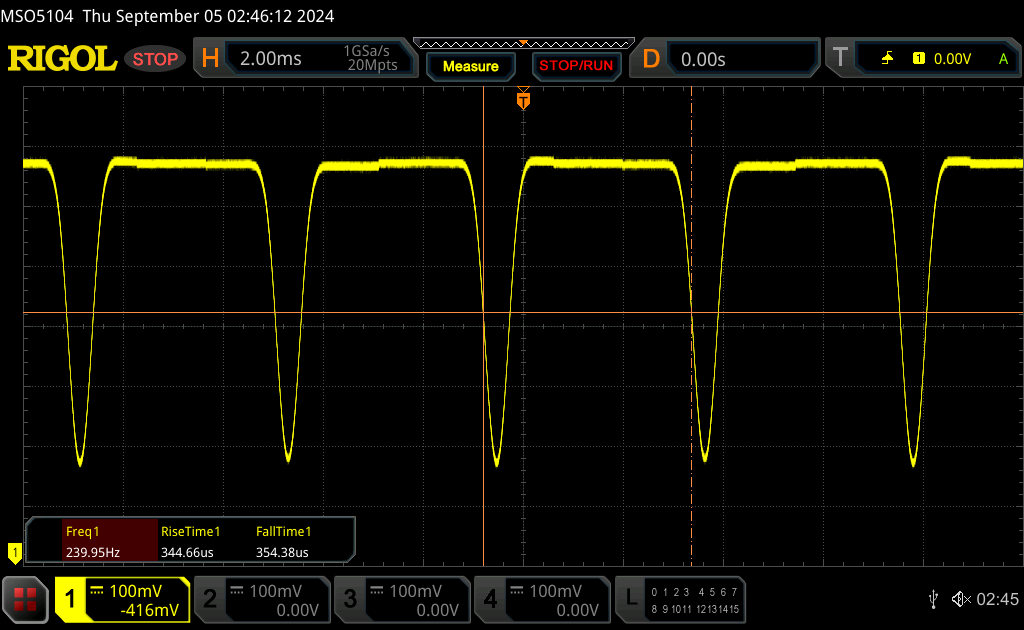 |
La retroiluminación del display parpadea a 240 Hz (seguramente usa PWM - Pulse-Width Modulation) a un brillo del 100 % e inferior. Sobre este nivel de brillo no debería darse parpadeo / PWM. La frecuencia de 240 Hz es relativamente baja, por lo que la gente sensible debería ver parpadeos y padecer fatiga visual por la pantalla (usado al brillo indicado a continuación). Comparación: 53 % de todos los dispositivos testados no usaron PWM para atenuar el display. Si se usó, medimos una media de 8516 (mínimo: 5 - máxmo: 343500) Hz. | |||
Una frecuencia de modulación por ancho de pulso de 240 Hz es detectable y constante en todos los niveles de luminosidad.
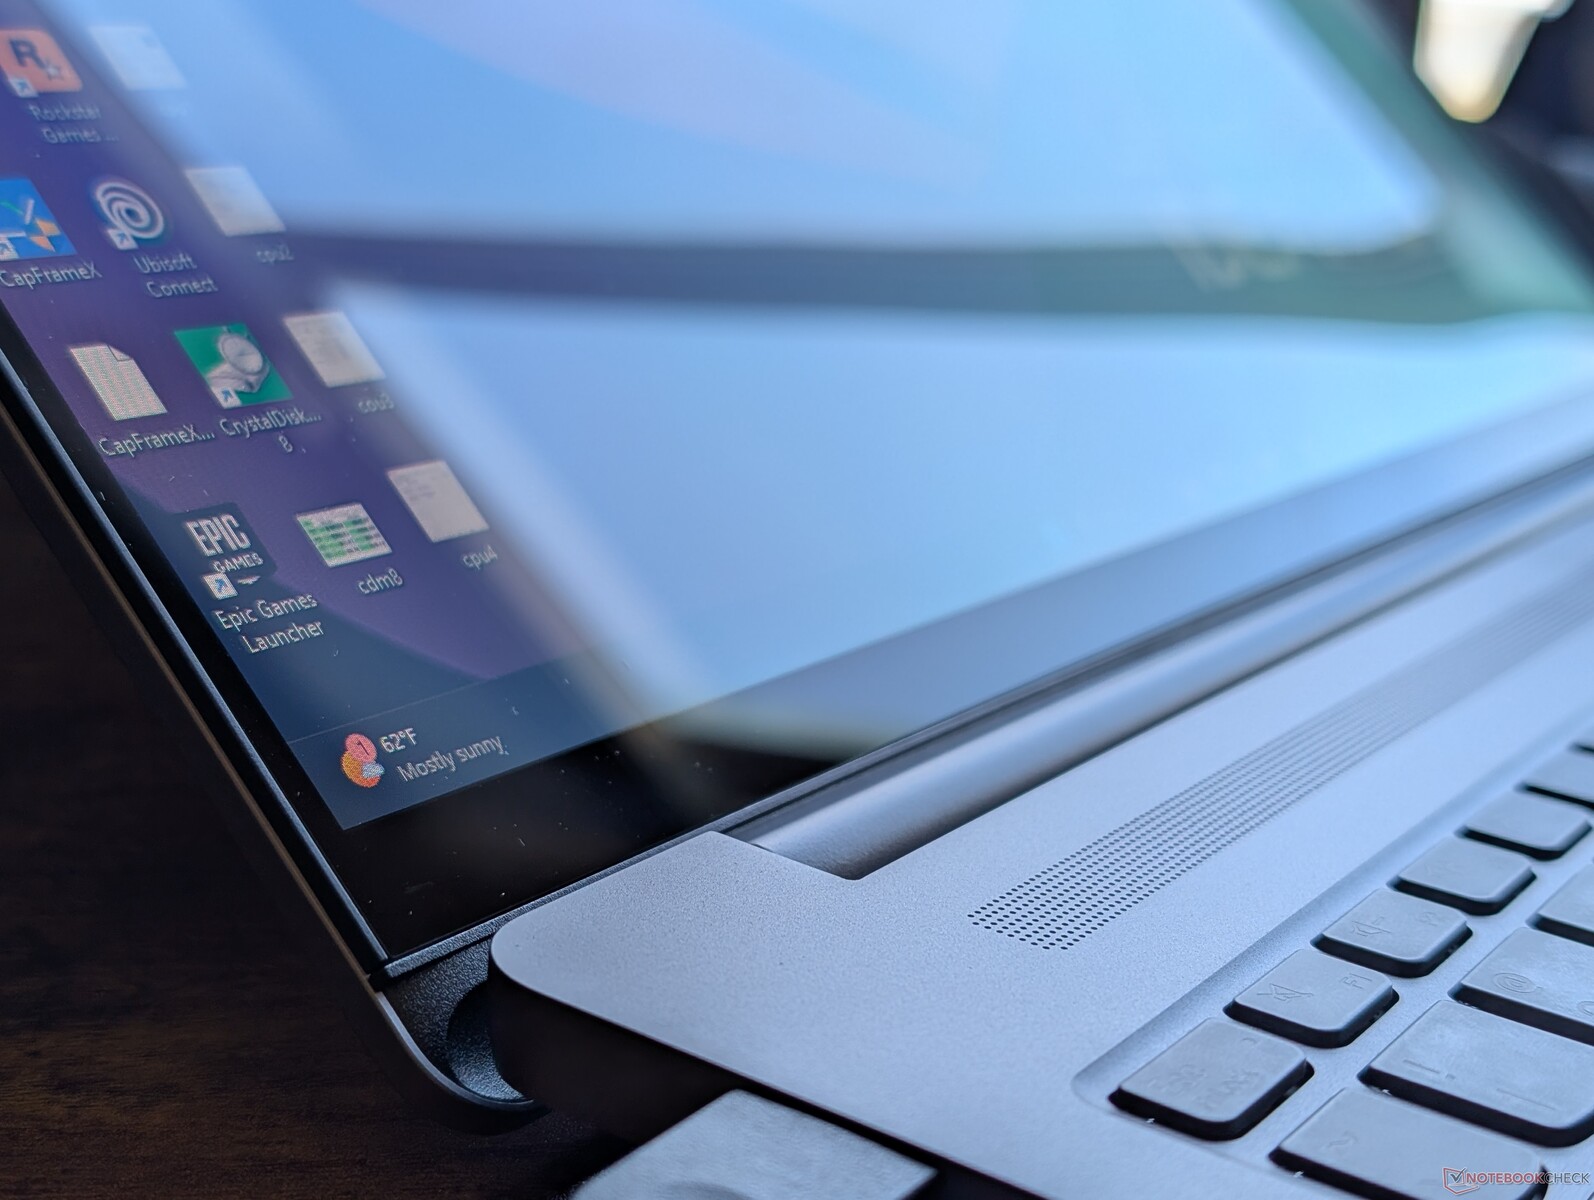
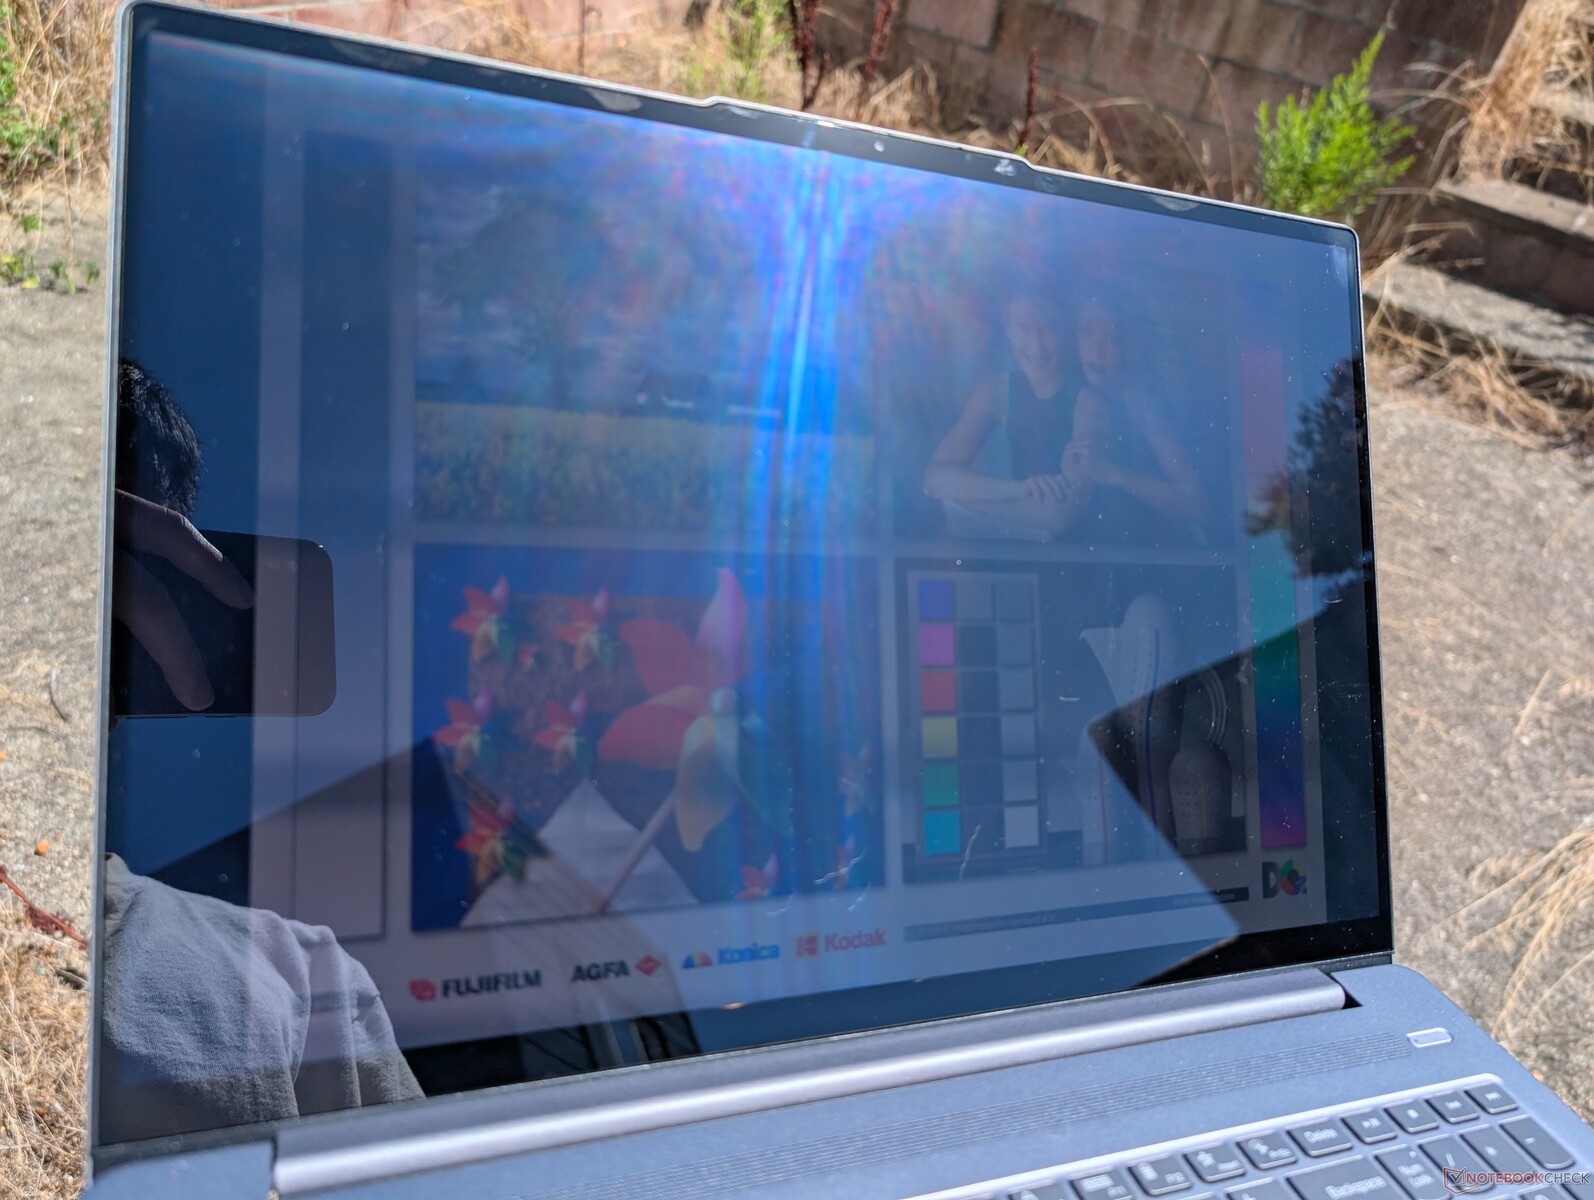
La opción OLED no es necesariamente mejor para ver en exteriores que la opción IPS, ya que sus niveles máximos de brillo son prácticamente los mismos. En todo caso, la configuración OLED es peor debido a su superposición brillante mientras que la configuración IPS es mate para reducir los reflejos.

Rendimiento - Core Ultra 9 es una potencia
Condiciones de prueba
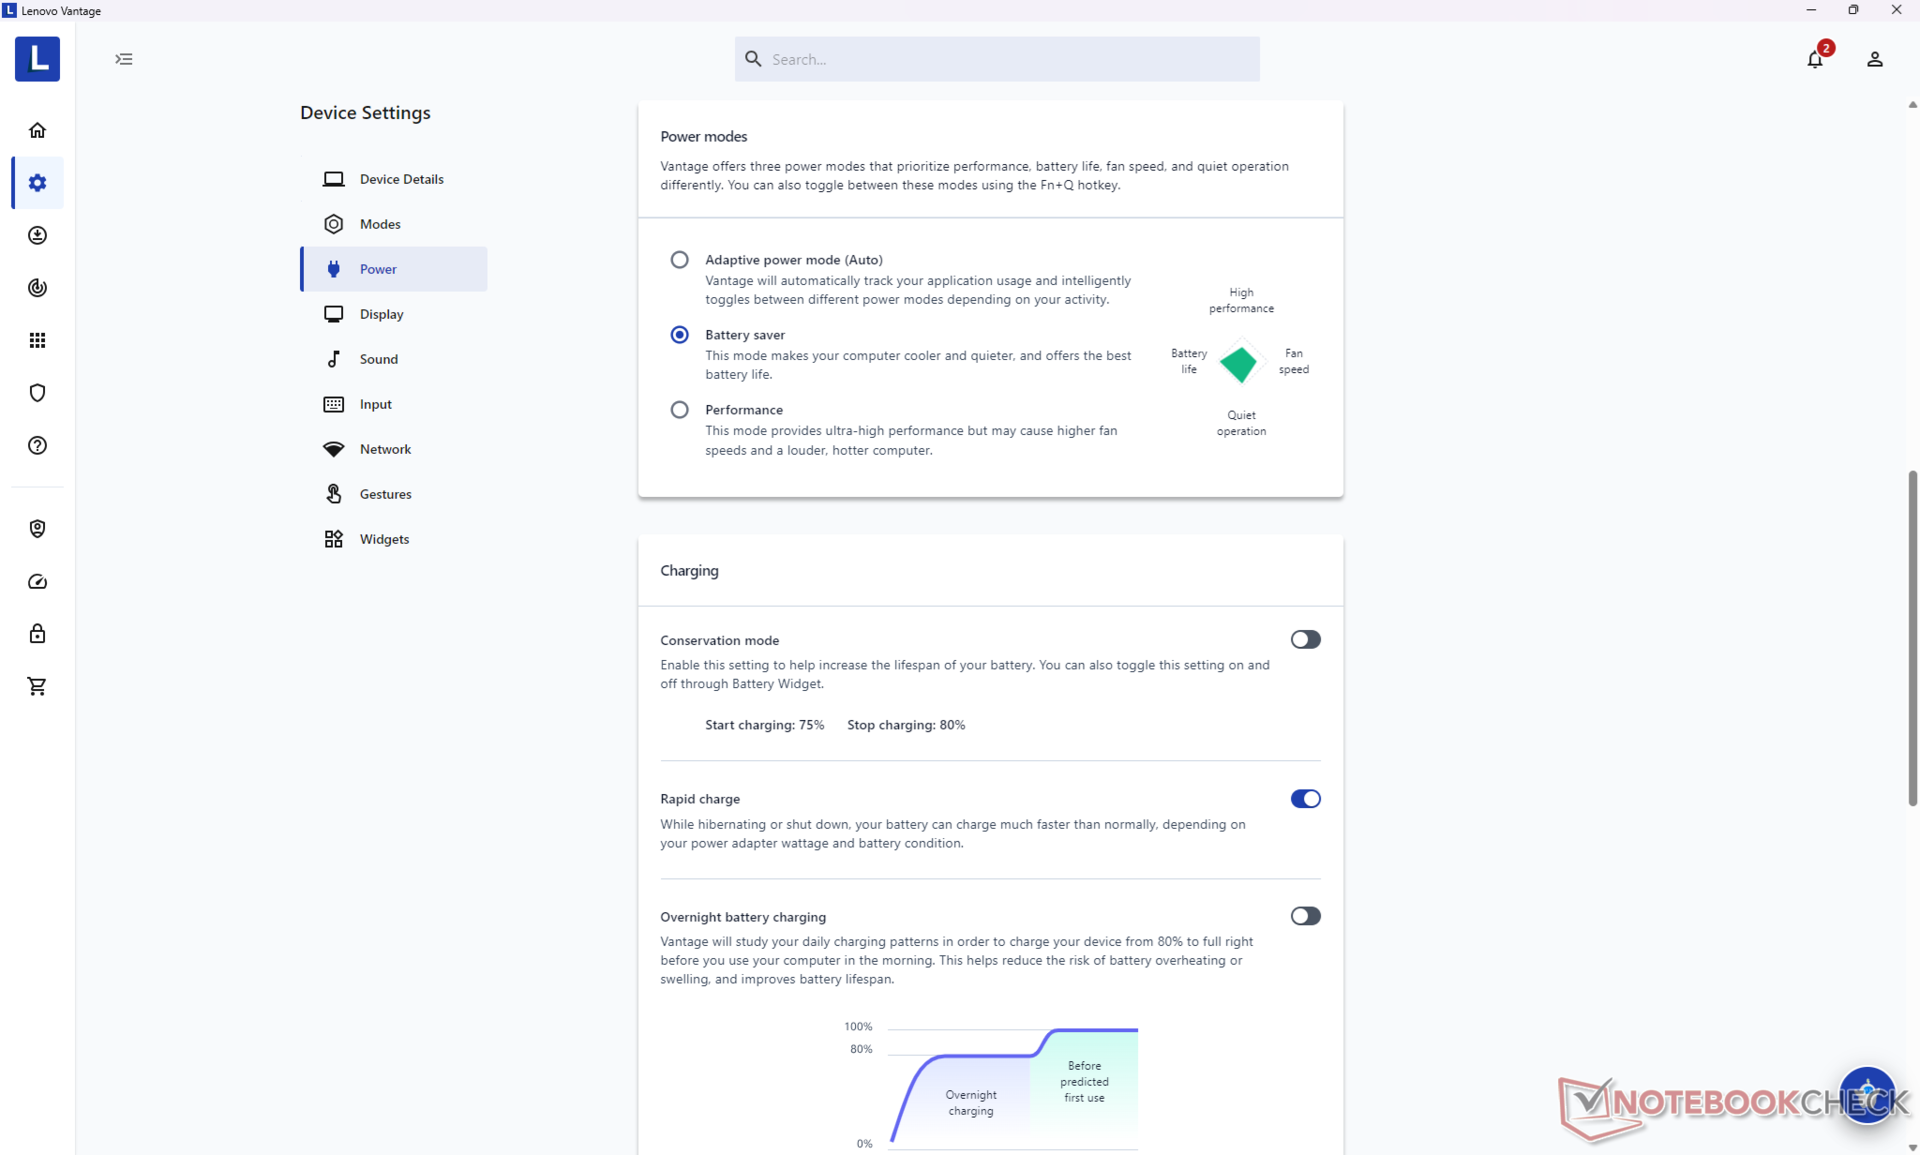
Pusimos tanto Windows como Lenovo Vantage en modo Rendimiento antes de ejecutar los benchmarks que se muestran a continuación. Sólo se admite Optimus 1.0 sin las opciones G-Sync, MUX o Windows VRR.

Procesador
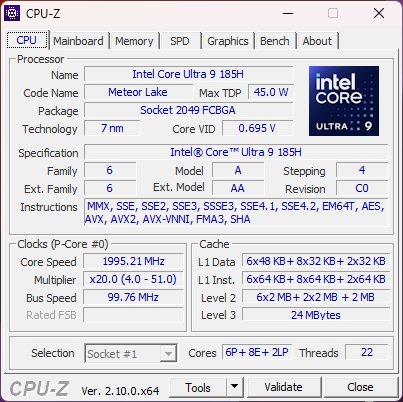
Hay tres opciones de CPU Meteor Lake disponibles: Core Ultra 5 125H, Core Ultra 7 155Hy Core Ultra 9 185H. El salto del Core Ultra 5 al Core Ultra 7 proporciona un aumento significativo del 80 por ciento en el rendimiento mientras que el salto del Core Ultra 7 al Core Ultra 9 sólo añade otro 5 a 10 por ciento que es prácticamente imperceptible en la mayoría de los escenarios de uso. Por lo tanto, a menos que quiera lo mejor de lo mejor a toda costa, la opción Core Ultra 7 será suficiente para la gran mayoría de los usuarios, especialmente porque sigue siendo más rápida que la mayoría de las demás opciones de esta categoría de tamaño.
El rendimiento en bruto se sitúa por delante de las CPU AMD de la competencia, incluido el Ryzen 7 8840HS y el último Ryzen AI 9 HX 370. La serie Raptor Lake Core i7 HX puede ser aún más rápida, pero esas CPU carecen de una NPU integrada para acelerar las tareas de IA compatibles. Tenga en cuenta que Co-Pilot Plus lamentablemente no es compatible con los procesadores Meteor Lake.
Cinebench R15 Multi Loop
Cinebench R23: Multi Core | Single Core
Cinebench R20: CPU (Multi Core) | CPU (Single Core)
Cinebench R15: CPU Multi 64Bit | CPU Single 64Bit
Blender: v2.79 BMW27 CPU
7-Zip 18.03: 7z b 4 | 7z b 4 -mmt1
Geekbench 6.4: Multi-Core | Single-Core
Geekbench 5.5: Multi-Core | Single-Core
HWBOT x265 Benchmark v2.2: 4k Preset
LibreOffice : 20 Documents To PDF
R Benchmark 2.5: Overall mean
* ... más pequeño es mejor
AIDA64: FP32 Ray-Trace | FPU Julia | CPU SHA3 | CPU Queen | FPU SinJulia | FPU Mandel | CPU AES | CPU ZLib | FP64 Ray-Trace | CPU PhotoWorxx
| Performance Rating | |
| Asus Zenbook S 16 UM5606-RK333W | |
| Lenovo IdeaPad Pro 5 16IMH G9 RTX 4050 | |
| Lenovo IdeaPad Pro 5 16IMH G9 | |
| Medio Intel Core Ultra 9 185H | |
| HP Envy x360 2-in-1 16-ad0097nr | |
| Dell Inspiron 16 7640 2-in-1 | |
| Samsung Galaxy Book4 Ultra | |
| AIDA64 / FP32 Ray-Trace | |
| Asus Zenbook S 16 UM5606-RK333W | |
| HP Envy x360 2-in-1 16-ad0097nr | |
| Lenovo IdeaPad Pro 5 16IMH G9 RTX 4050 | |
| Lenovo IdeaPad Pro 5 16IMH G9 | |
| Medio Intel Core Ultra 9 185H (9220 - 18676, n=19) | |
| Dell Inspiron 16 7640 2-in-1 | |
| Samsung Galaxy Book4 Ultra | |
| AIDA64 / FPU Julia | |
| Asus Zenbook S 16 UM5606-RK333W | |
| Lenovo IdeaPad Pro 5 16IMH G9 RTX 4050 | |
| Lenovo IdeaPad Pro 5 16IMH G9 | |
| Medio Intel Core Ultra 9 185H (48865 - 96463, n=19) | |
| HP Envy x360 2-in-1 16-ad0097nr | |
| Dell Inspiron 16 7640 2-in-1 | |
| Samsung Galaxy Book4 Ultra | |
| AIDA64 / CPU SHA3 | |
| Asus Zenbook S 16 UM5606-RK333W | |
| Lenovo IdeaPad Pro 5 16IMH G9 RTX 4050 | |
| Medio Intel Core Ultra 9 185H (2394 - 4534, n=19) | |
| Lenovo IdeaPad Pro 5 16IMH G9 | |
| HP Envy x360 2-in-1 16-ad0097nr | |
| Dell Inspiron 16 7640 2-in-1 | |
| Samsung Galaxy Book4 Ultra | |
| AIDA64 / CPU Queen | |
| HP Envy x360 2-in-1 16-ad0097nr | |
| Lenovo IdeaPad Pro 5 16IMH G9 RTX 4050 | |
| Medio Intel Core Ultra 9 185H (66785 - 95241, n=19) | |
| Dell Inspiron 16 7640 2-in-1 | |
| Lenovo IdeaPad Pro 5 16IMH G9 | |
| Asus Zenbook S 16 UM5606-RK333W | |
| Samsung Galaxy Book4 Ultra | |
| AIDA64 / FPU SinJulia | |
| Asus Zenbook S 16 UM5606-RK333W | |
| HP Envy x360 2-in-1 16-ad0097nr | |
| Lenovo IdeaPad Pro 5 16IMH G9 RTX 4050 | |
| Lenovo IdeaPad Pro 5 16IMH G9 | |
| Medio Intel Core Ultra 9 185H (7255 - 11392, n=19) | |
| Dell Inspiron 16 7640 2-in-1 | |
| Samsung Galaxy Book4 Ultra | |
| AIDA64 / FPU Mandel | |
| Asus Zenbook S 16 UM5606-RK333W | |
| Lenovo IdeaPad Pro 5 16IMH G9 RTX 4050 | |
| HP Envy x360 2-in-1 16-ad0097nr | |
| Lenovo IdeaPad Pro 5 16IMH G9 | |
| Medio Intel Core Ultra 9 185H (24004 - 48020, n=19) | |
| Dell Inspiron 16 7640 2-in-1 | |
| Samsung Galaxy Book4 Ultra | |
| AIDA64 / CPU ZLib | |
| Lenovo IdeaPad Pro 5 16IMH G9 RTX 4050 | |
| Medio Intel Core Ultra 9 185H (678 - 1341, n=19) | |
| Lenovo IdeaPad Pro 5 16IMH G9 | |
| Asus Zenbook S 16 UM5606-RK333W | |
| Dell Inspiron 16 7640 2-in-1 | |
| Samsung Galaxy Book4 Ultra | |
| HP Envy x360 2-in-1 16-ad0097nr | |
| AIDA64 / FP64 Ray-Trace | |
| Asus Zenbook S 16 UM5606-RK333W | |
| HP Envy x360 2-in-1 16-ad0097nr | |
| Lenovo IdeaPad Pro 5 16IMH G9 RTX 4050 | |
| Lenovo IdeaPad Pro 5 16IMH G9 | |
| Medio Intel Core Ultra 9 185H (4428 - 10078, n=19) | |
| Dell Inspiron 16 7640 2-in-1 | |
| Samsung Galaxy Book4 Ultra | |
| AIDA64 / CPU PhotoWorxx | |
| Lenovo IdeaPad Pro 5 16IMH G9 | |
| Lenovo IdeaPad Pro 5 16IMH G9 RTX 4050 | |
| Samsung Galaxy Book4 Ultra | |
| Asus Zenbook S 16 UM5606-RK333W | |
| Medio Intel Core Ultra 9 185H (44547 - 53918, n=19) | |
| Dell Inspiron 16 7640 2-in-1 | |
| HP Envy x360 2-in-1 16-ad0097nr | |
Prueba de estrés
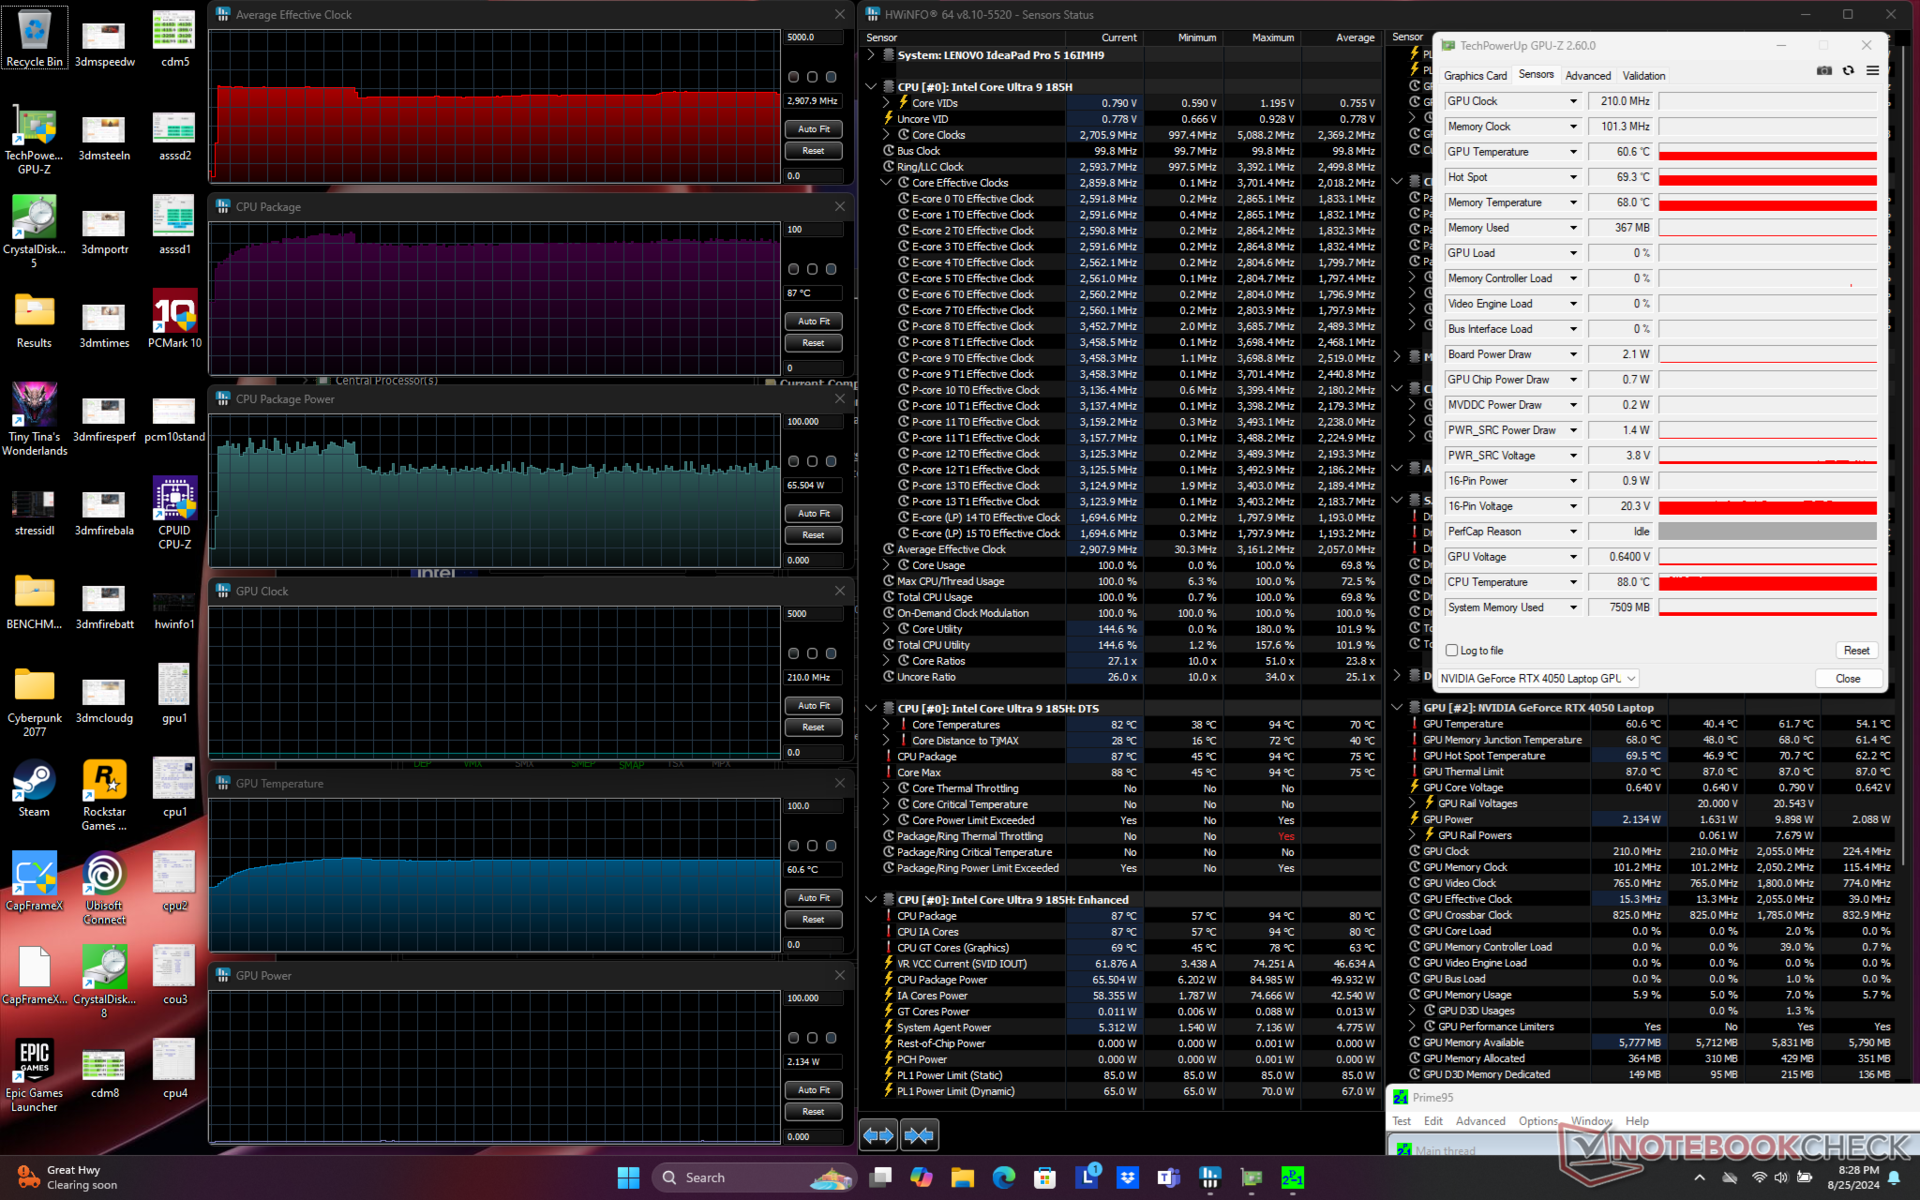
La CPU aumentaría a 3,2 GHz, 81 W y 94 C al iniciar el estrés Prime95. Después de un minuto más o menos, esto caería a 2,8 GHz y 65 W con el fin de mantener una temperatura del núcleo ligeramente más fría de 87 C. El alto rango de 80 C sigue siendo muy caliente para sugerir que el rendimiento de la CPU probablemente habría sido más rápido si el chasis hubiera sido ligeramente más grande y con una solución de refrigeración más capaz.
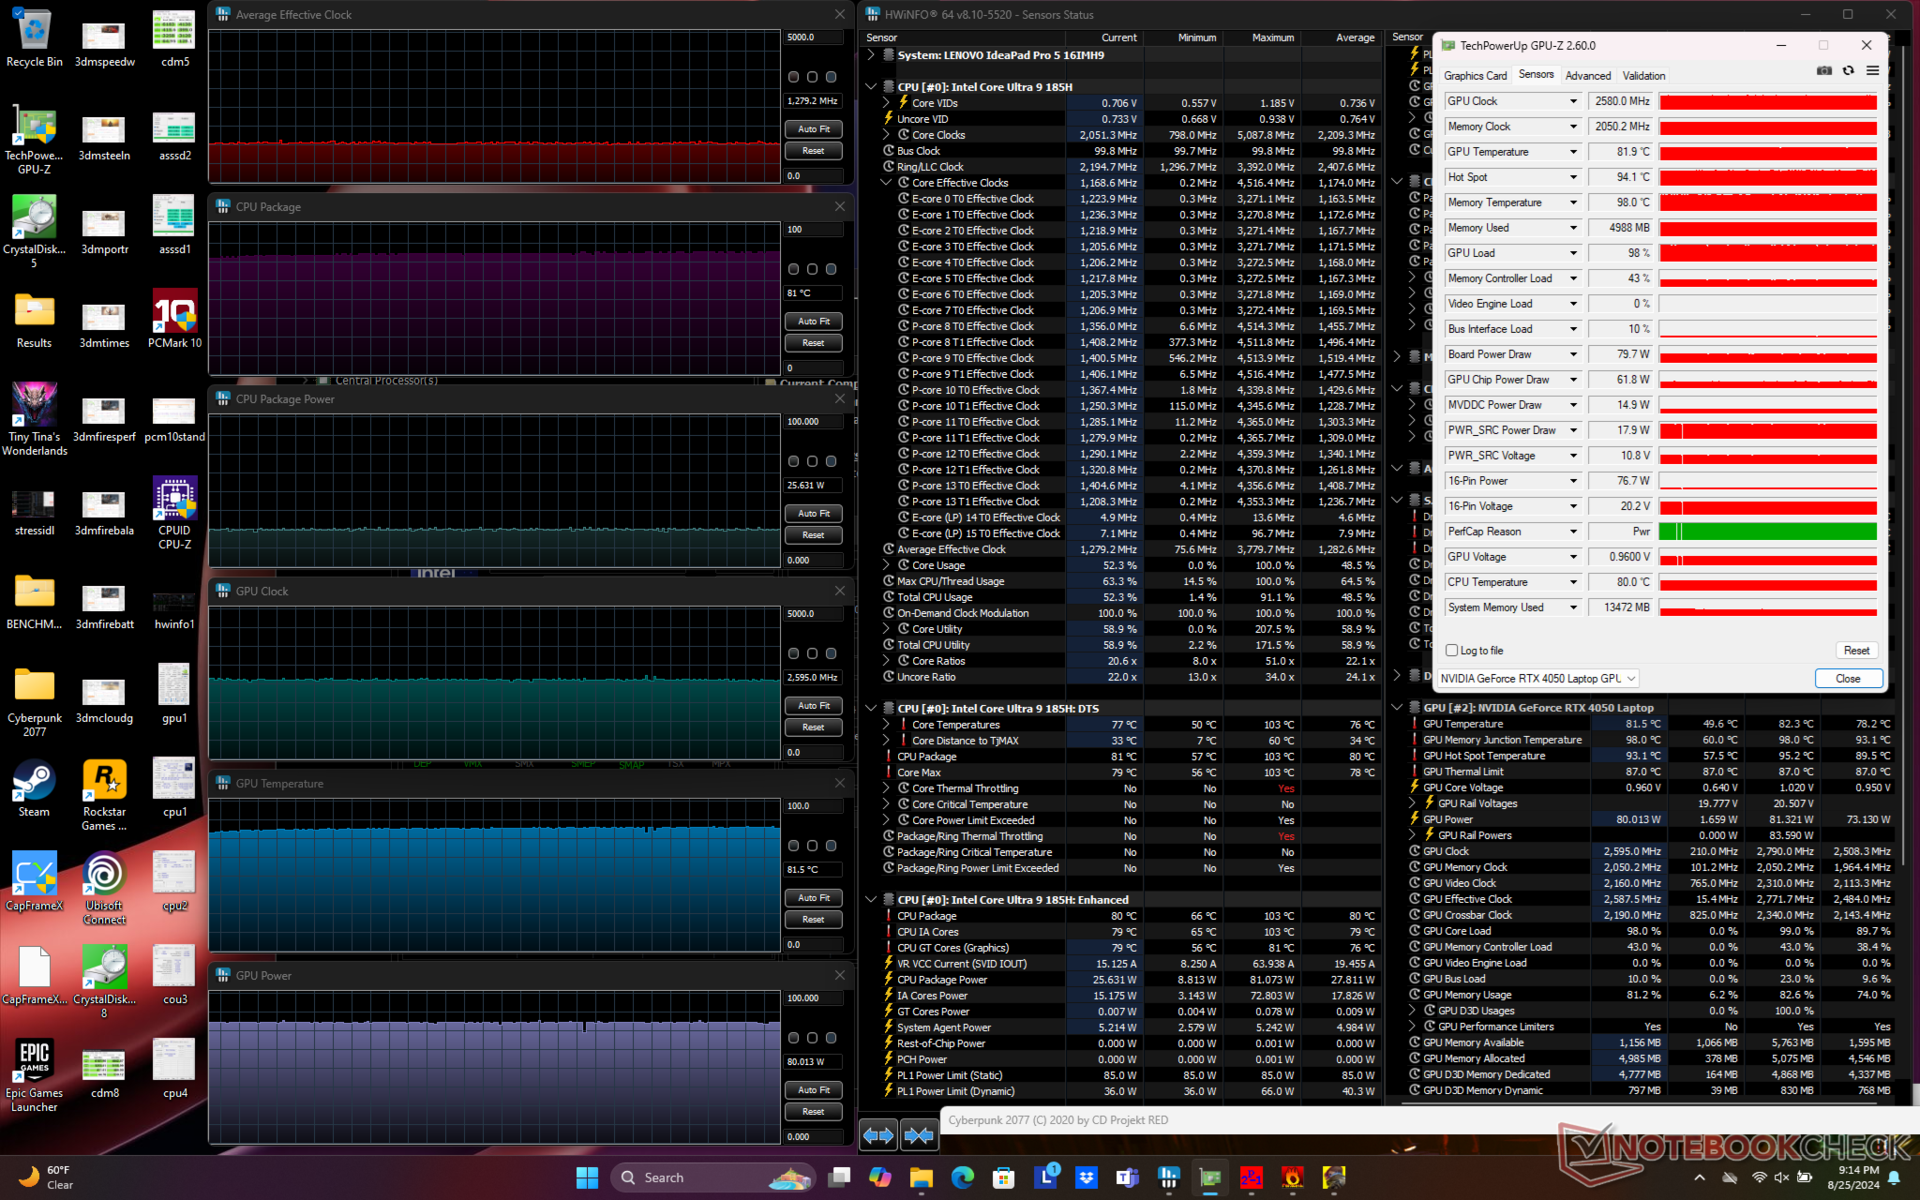
La GPU se estabilizaría en 2595 MHz, 82 C y 80 W cuando se ejecuta Cyberpunk 2077 para representar las cargas típicas de juego en comparación con sólo 71 C y 75 C en la Spectre x360 16 o Lenovo LOQ 15respectivamente, cada una con la misma GPU RTX 4050. Las temperaturas de funcionamiento generalmente más cálidas no son sorprendentes dado el diseño delgado del chasis, la CPU Core Ultra serie H y el objetivo TGP relativamente alto de 90 W.
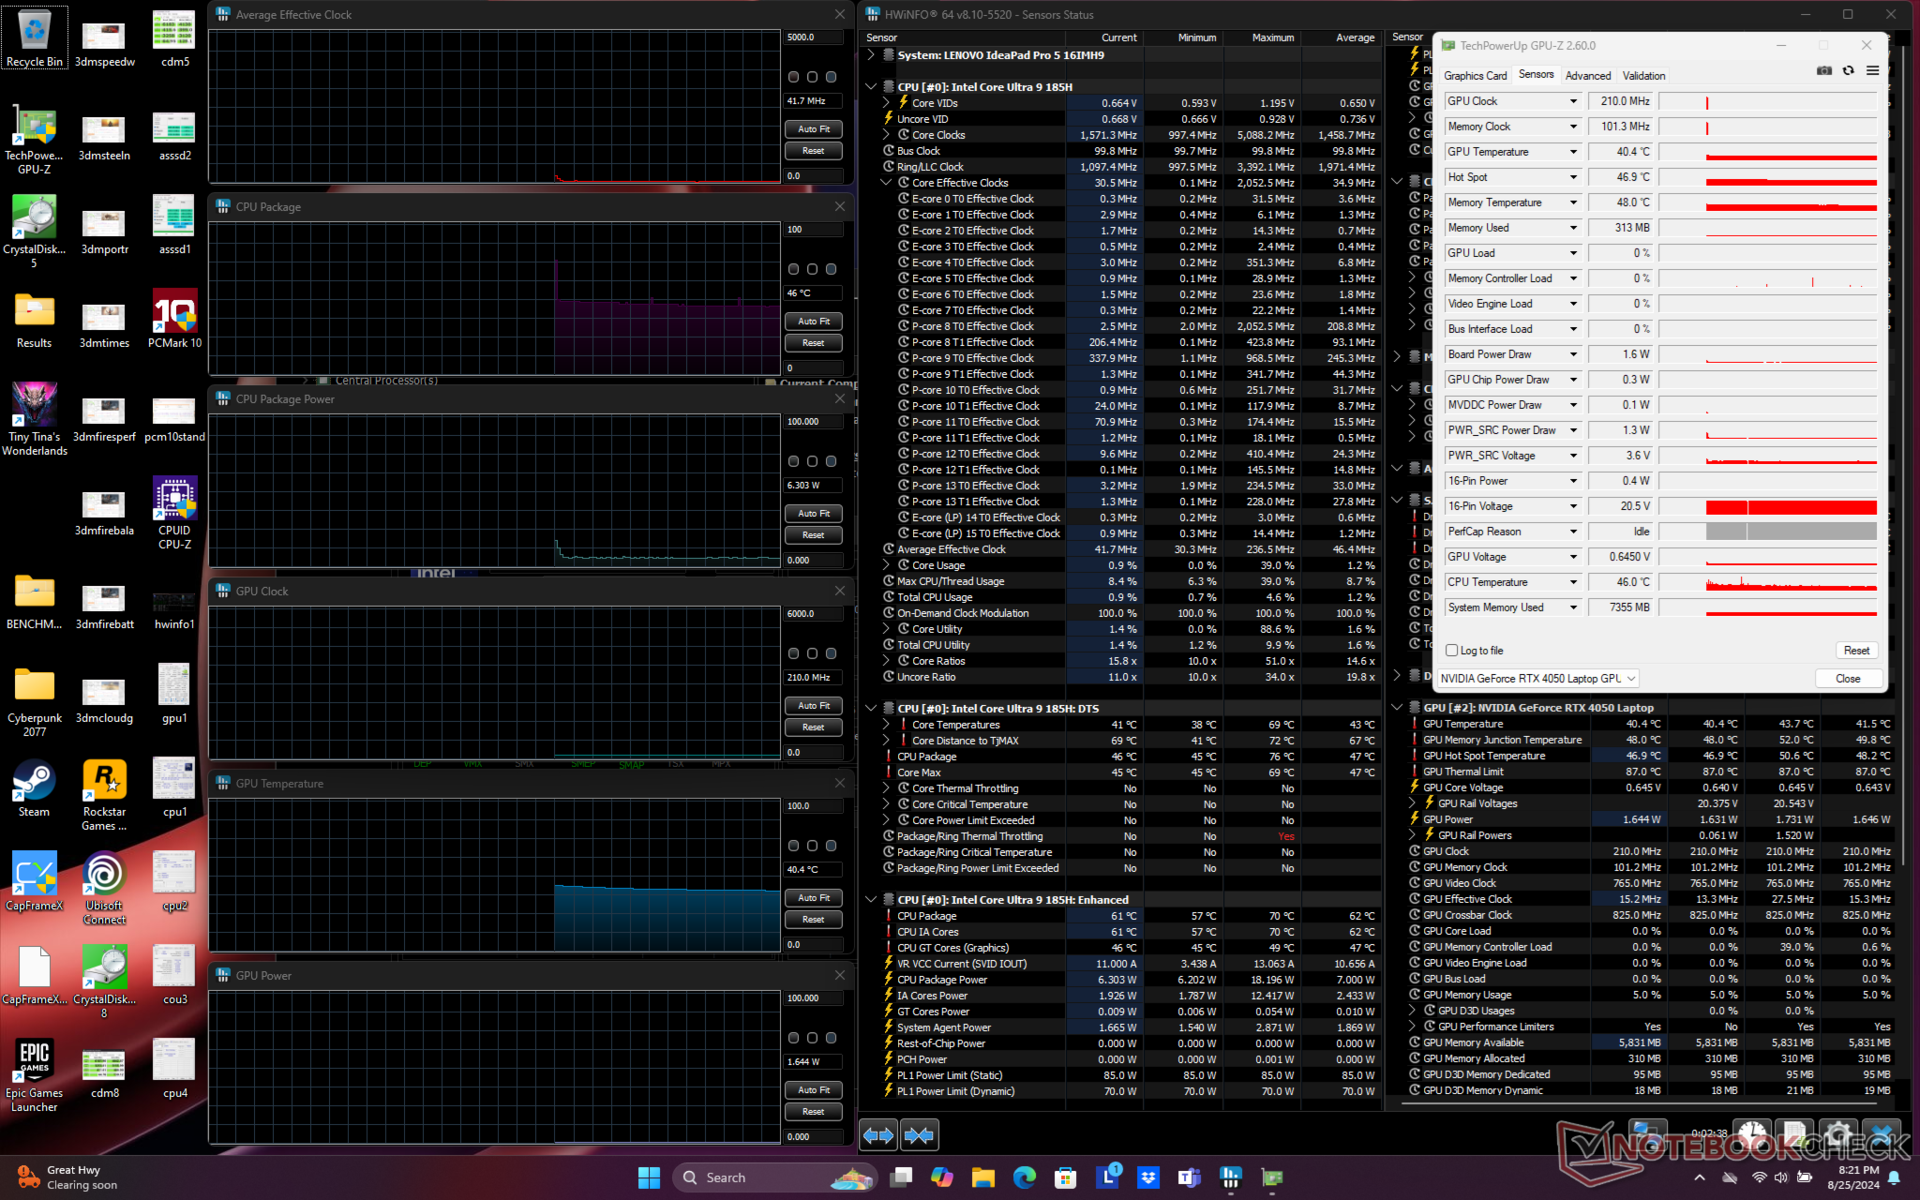
| Reloj medio de la CPU (GHz) | Reloj medio de la GPU (MHz) | Temperatura media dela CPU (°C) | Temperatura media de la GPU (°C) | |
| Sistema en reposo | -- | -- | 46 | 40 |
| Prime95 Stress | 2.9 | -- | 87 | 61 |
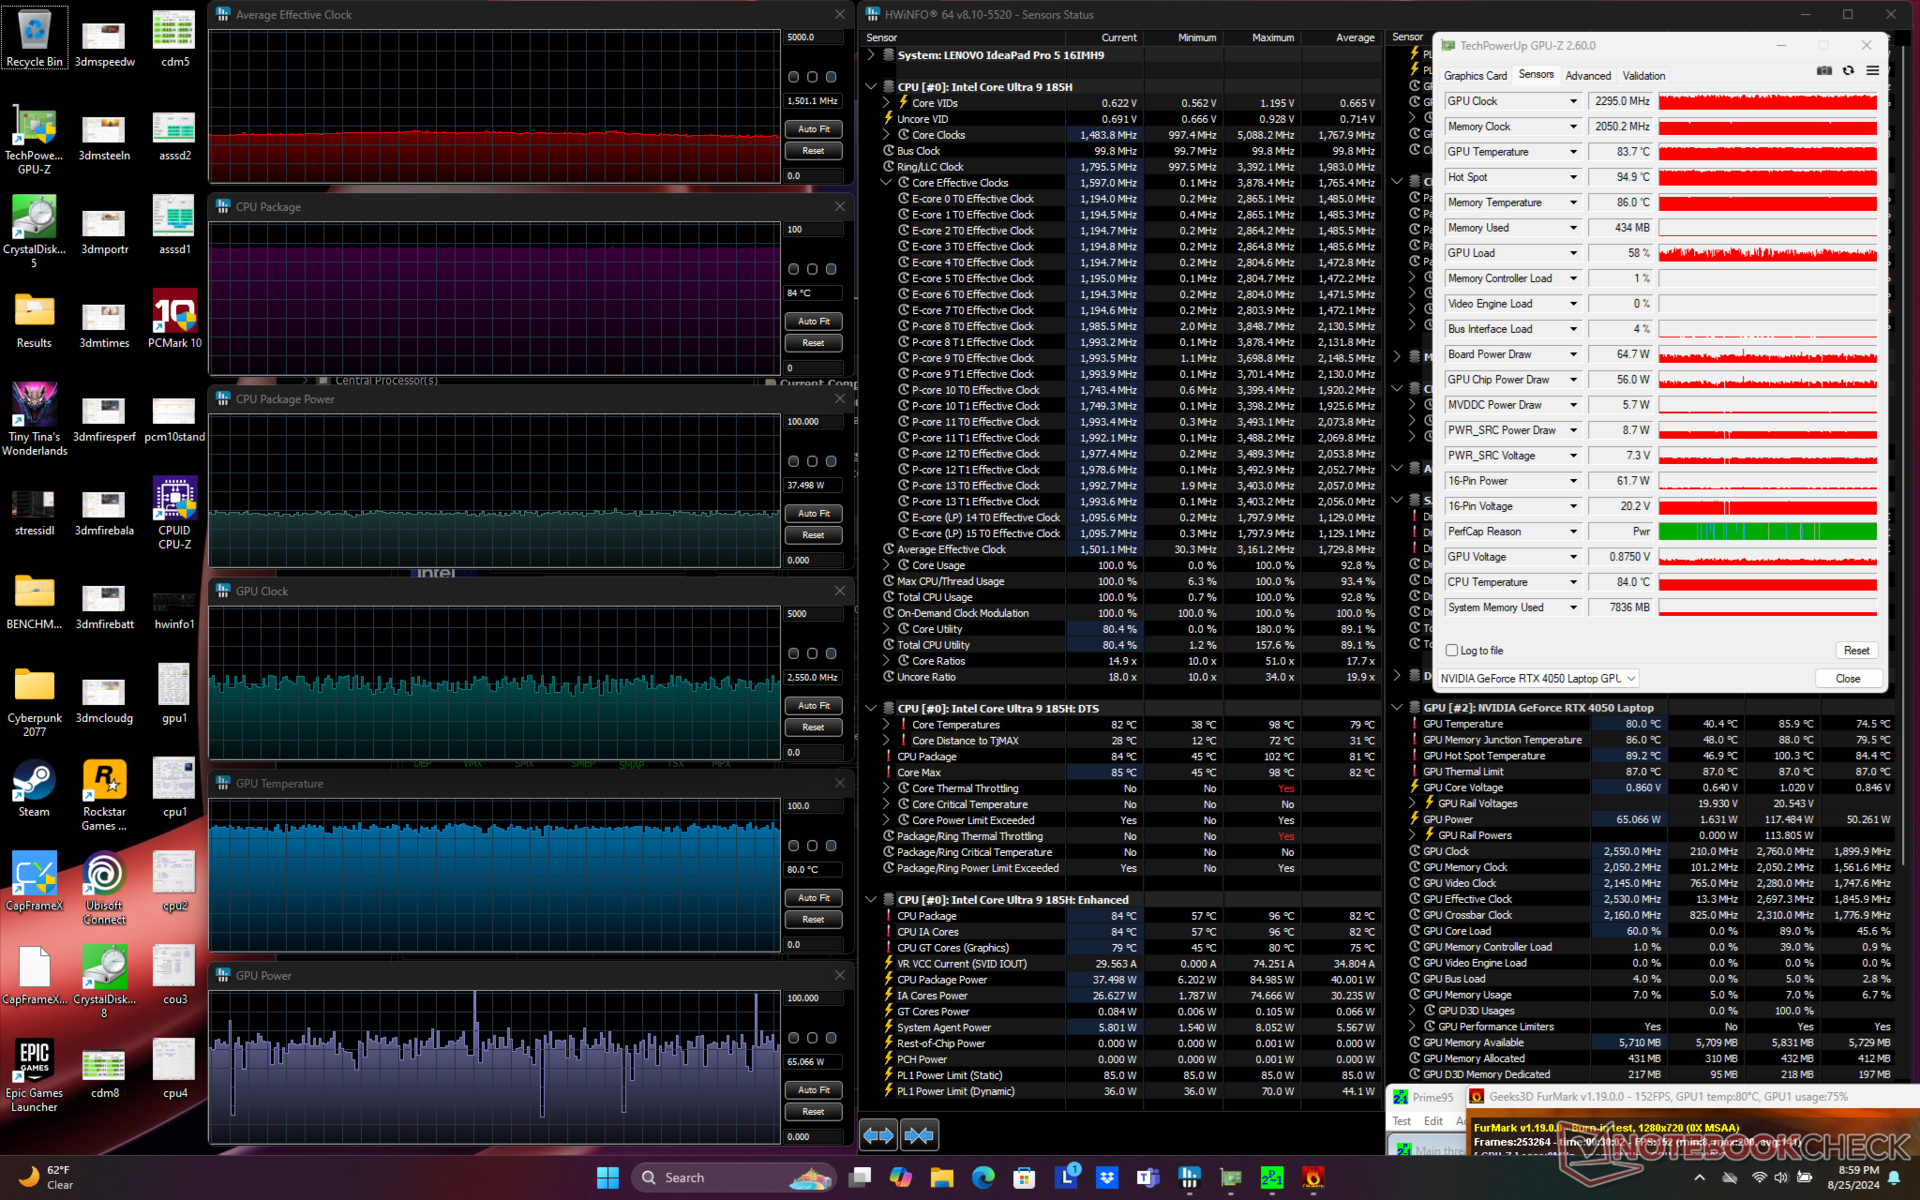
| Prime95 + FurMark Estrés | 1,5 | 2295 - 2550 | 84 | 80 |
| Cyberpunk 2077 Estrés | 1,3 | 2580 | 81 | 82 |
Rendimiento del sistema
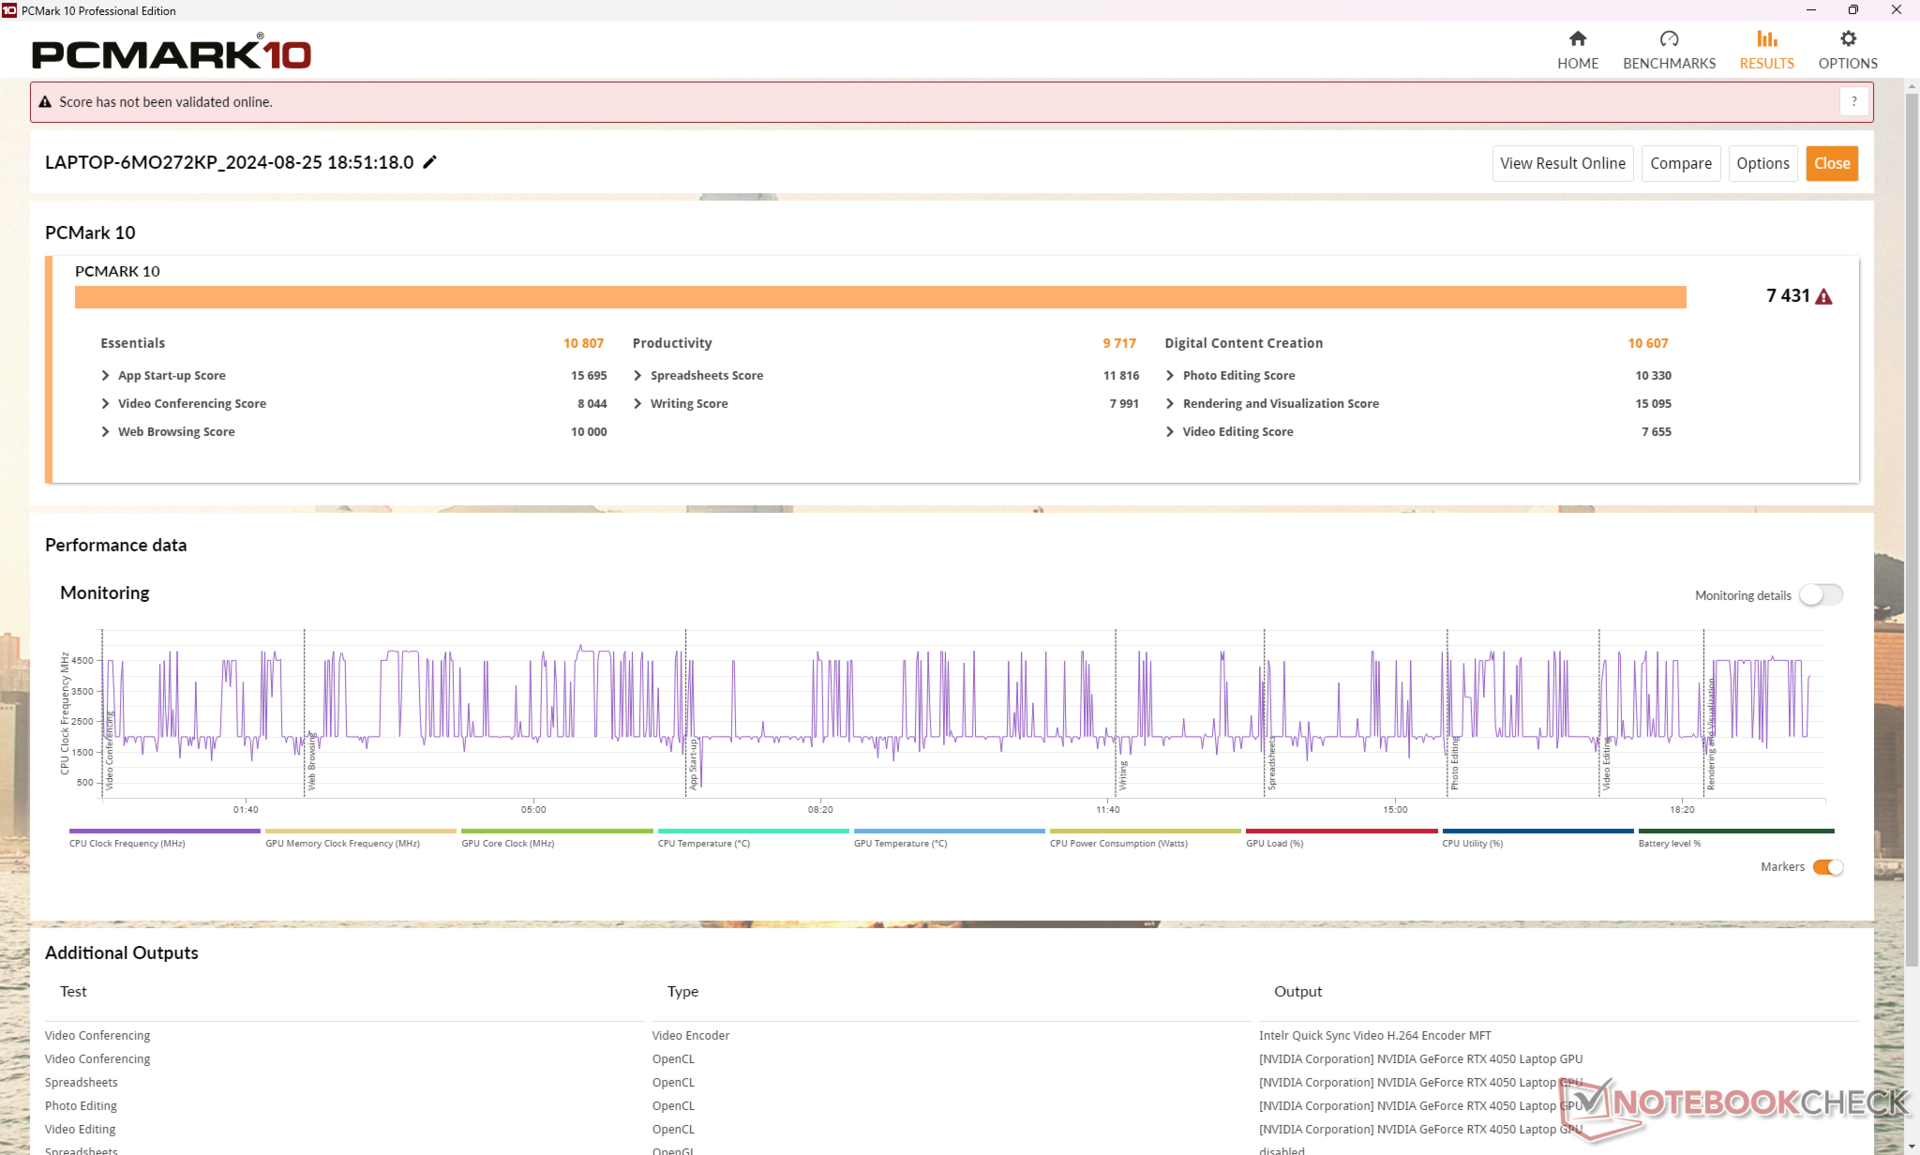
Los resultados de PCMark están en línea con otros portátiles multimedia de 16 pulgadas con gráficos integrados más lentos. El benchmark PCMark 10 generalmente hace un mal trabajo a la hora de distinguir entre portátiles con dGPU e iGPU, especialmente si no se admite MUX.
CrossMark: Overall | Productivity | Creativity | Responsiveness
WebXPRT 3: Overall
WebXPRT 4: Overall
Mozilla Kraken 1.1: Total
| PCMark 10 / Score | |
| Medio Intel Core Ultra 9 185H, NVIDIA GeForce RTX 4050 Laptop GPU (7431 - 7846, n=2) | |
| Asus Zenbook S 16 UM5606-RK333W | |
| Lenovo IdeaPad Pro 5 16IMH G9 RTX 4050 | |
| Lenovo IdeaPad Pro 5 16IMH G9 | |
| Dell Inspiron 16 7640 2-in-1 | |
| Samsung Galaxy Book4 Ultra | |
| HP Envy x360 2-in-1 16-ad0097nr | |
| PCMark 10 / Essentials | |
| Lenovo IdeaPad Pro 5 16IMH G9 | |
| Dell Inspiron 16 7640 2-in-1 | |
| Asus Zenbook S 16 UM5606-RK333W | |
| Lenovo IdeaPad Pro 5 16IMH G9 RTX 4050 | |
| Medio Intel Core Ultra 9 185H, NVIDIA GeForce RTX 4050 Laptop GPU (10672 - 10807, n=2) | |
| HP Envy x360 2-in-1 16-ad0097nr | |
| Samsung Galaxy Book4 Ultra | |
| PCMark 10 / Productivity | |
| Asus Zenbook S 16 UM5606-RK333W | |
| HP Envy x360 2-in-1 16-ad0097nr | |
| Medio Intel Core Ultra 9 185H, NVIDIA GeForce RTX 4050 Laptop GPU (9717 - 9986, n=2) | |
| Lenovo IdeaPad Pro 5 16IMH G9 RTX 4050 | |
| Samsung Galaxy Book4 Ultra | |
| Lenovo IdeaPad Pro 5 16IMH G9 | |
| Dell Inspiron 16 7640 2-in-1 | |
| PCMark 10 / Digital Content Creation | |
| Medio Intel Core Ultra 9 185H, NVIDIA GeForce RTX 4050 Laptop GPU (10607 - 12301, n=2) | |
| Lenovo IdeaPad Pro 5 16IMH G9 RTX 4050 | |
| Lenovo IdeaPad Pro 5 16IMH G9 | |
| Asus Zenbook S 16 UM5606-RK333W | |
| Dell Inspiron 16 7640 2-in-1 | |
| Samsung Galaxy Book4 Ultra | |
| HP Envy x360 2-in-1 16-ad0097nr | |
| CrossMark / Overall | |
| Medio Intel Core Ultra 9 185H, NVIDIA GeForce RTX 4050 Laptop GPU (1790 - 1811, n=2) | |
| Lenovo IdeaPad Pro 5 16IMH G9 RTX 4050 | |
| Asus Zenbook S 16 UM5606-RK333W | |
| Samsung Galaxy Book4 Ultra | |
| Dell Inspiron 16 7640 2-in-1 | |
| HP Envy x360 2-in-1 16-ad0097nr | |
| Lenovo IdeaPad Pro 5 16IMH G9 | |
| CrossMark / Productivity | |
| Medio Intel Core Ultra 9 185H, NVIDIA GeForce RTX 4050 Laptop GPU (1700 - 1717, n=2) | |
| Lenovo IdeaPad Pro 5 16IMH G9 RTX 4050 | |
| Samsung Galaxy Book4 Ultra | |
| Dell Inspiron 16 7640 2-in-1 | |
| Asus Zenbook S 16 UM5606-RK333W | |
| HP Envy x360 2-in-1 16-ad0097nr | |
| Lenovo IdeaPad Pro 5 16IMH G9 | |
| CrossMark / Creativity | |
| Lenovo IdeaPad Pro 5 16IMH G9 RTX 4050 | |
| Medio Intel Core Ultra 9 185H, NVIDIA GeForce RTX 4050 Laptop GPU (2037 - 2038, n=2) | |
| Asus Zenbook S 16 UM5606-RK333W | |
| Samsung Galaxy Book4 Ultra | |
| Dell Inspiron 16 7640 2-in-1 | |
| Lenovo IdeaPad Pro 5 16IMH G9 | |
| HP Envy x360 2-in-1 16-ad0097nr | |
| CrossMark / Responsiveness | |
| Samsung Galaxy Book4 Ultra | |
| Medio Intel Core Ultra 9 185H, NVIDIA GeForce RTX 4050 Laptop GPU (1419 - 1493, n=2) | |
| Lenovo IdeaPad Pro 5 16IMH G9 RTX 4050 | |
| Asus Zenbook S 16 UM5606-RK333W | |
| Dell Inspiron 16 7640 2-in-1 | |
| HP Envy x360 2-in-1 16-ad0097nr | |
| Lenovo IdeaPad Pro 5 16IMH G9 | |
| WebXPRT 3 / Overall | |
| Asus Zenbook S 16 UM5606-RK333W | |
| Lenovo IdeaPad Pro 5 16IMH G9 RTX 4050 | |
| HP Envy x360 2-in-1 16-ad0097nr | |
| Medio Intel Core Ultra 9 185H, NVIDIA GeForce RTX 4050 Laptop GPU (293 - 301, n=2) | |
| Lenovo IdeaPad Pro 5 16IMH G9 | |
| Dell Inspiron 16 7640 2-in-1 | |
| Samsung Galaxy Book4 Ultra | |
| WebXPRT 4 / Overall | |
| Lenovo IdeaPad Pro 5 16IMH G9 RTX 4050 | |
| Medio Intel Core Ultra 9 185H, NVIDIA GeForce RTX 4050 Laptop GPU (268 - 271, n=2) | |
| Asus Zenbook S 16 UM5606-RK333W | |
| Lenovo IdeaPad Pro 5 16IMH G9 | |
| Samsung Galaxy Book4 Ultra | |
| Dell Inspiron 16 7640 2-in-1 | |
| HP Envy x360 2-in-1 16-ad0097nr | |
| Mozilla Kraken 1.1 / Total | |
| HP Envy x360 2-in-1 16-ad0097nr | |
| Dell Inspiron 16 7640 2-in-1 | |
| Lenovo IdeaPad Pro 5 16IMH G9 | |
| Medio Intel Core Ultra 9 185H, NVIDIA GeForce RTX 4050 Laptop GPU (498 - 512, n=2) | |
| Lenovo IdeaPad Pro 5 16IMH G9 RTX 4050 | |
| Asus Zenbook S 16 UM5606-RK333W | |
| Samsung Galaxy Book4 Ultra | |
* ... más pequeño es mejor
| PCMark 10 Score | 7431 puntos | |
ayuda | ||
| AIDA64 / Memory Copy | |
| Lenovo IdeaPad Pro 5 16IMH G9 RTX 4050 | |
| Lenovo IdeaPad Pro 5 16IMH G9 | |
| Samsung Galaxy Book4 Ultra | |
| Asus Zenbook S 16 UM5606-RK333W | |
| Medio Intel Core Ultra 9 185H (69929 - 95718, n=19) | |
| Dell Inspiron 16 7640 2-in-1 | |
| HP Envy x360 2-in-1 16-ad0097nr | |
| AIDA64 / Memory Read | |
| Asus Zenbook S 16 UM5606-RK333W | |
| Samsung Galaxy Book4 Ultra | |
| Lenovo IdeaPad Pro 5 16IMH G9 RTX 4050 | |
| Lenovo IdeaPad Pro 5 16IMH G9 | |
| Medio Intel Core Ultra 9 185H (64619 - 87768, n=19) | |
| Dell Inspiron 16 7640 2-in-1 | |
| HP Envy x360 2-in-1 16-ad0097nr | |
| AIDA64 / Memory Write | |
| Asus Zenbook S 16 UM5606-RK333W | |
| HP Envy x360 2-in-1 16-ad0097nr | |
| Dell Inspiron 16 7640 2-in-1 | |
| Lenovo IdeaPad Pro 5 16IMH G9 | |
| Samsung Galaxy Book4 Ultra | |
| Lenovo IdeaPad Pro 5 16IMH G9 RTX 4050 | |
| Medio Intel Core Ultra 9 185H (51114 - 93871, n=19) | |
| AIDA64 / Memory Latency | |
| Medio Intel Core Ultra 9 185H (121.4 - 259, n=19) | |
| Dell Inspiron 16 7640 2-in-1 | |
| Samsung Galaxy Book4 Ultra | |
| Lenovo IdeaPad Pro 5 16IMH G9 | |
| Lenovo IdeaPad Pro 5 16IMH G9 RTX 4050 | |
| HP Envy x360 2-in-1 16-ad0097nr | |
| Asus Zenbook S 16 UM5606-RK333W | |
* ... más pequeño es mejor
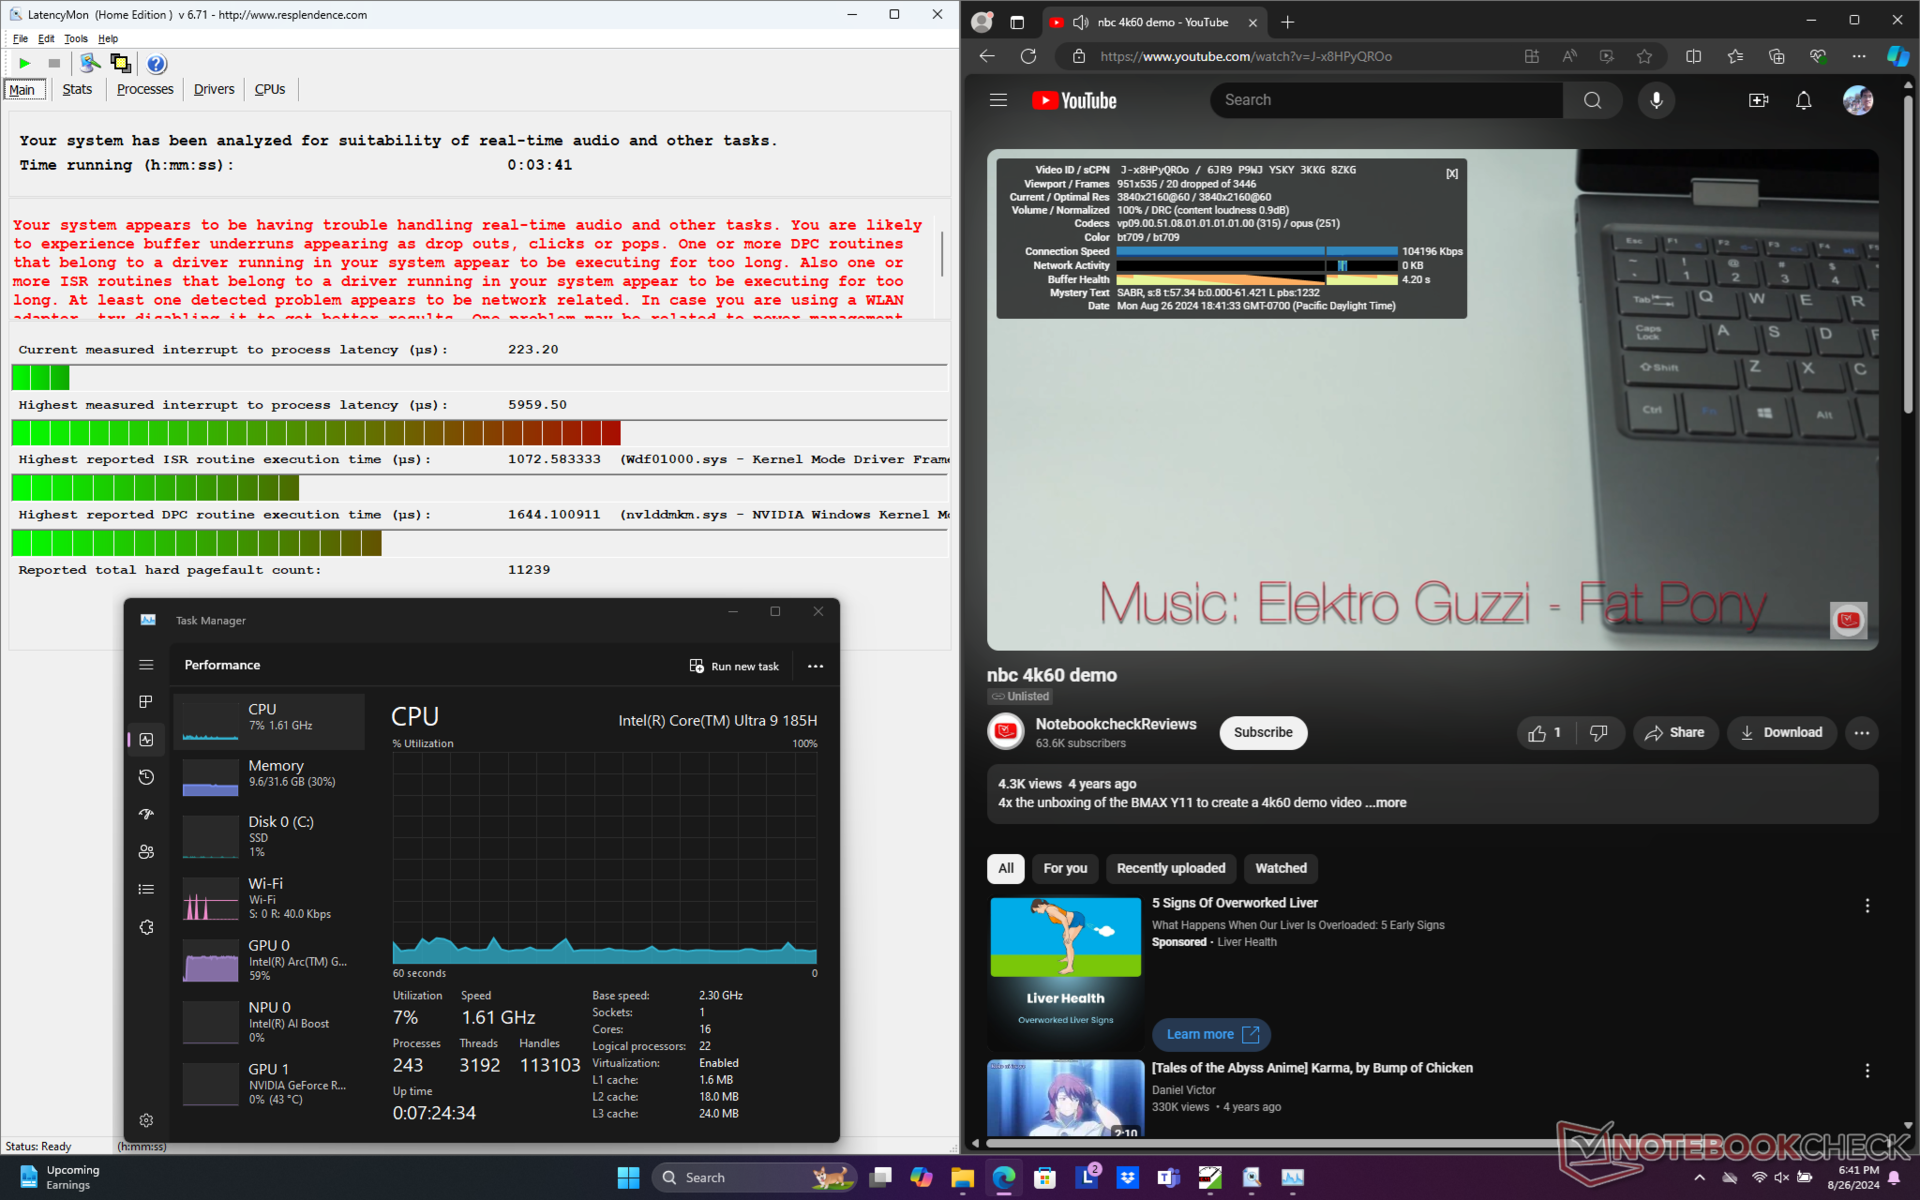
Latencia del CPD
LatencyMon revela tanto problemas de DPC como una reproducción imperfecta de vídeo 4K a 60 FPS. Hemos podido registrar 20 fotogramas caídos en un lapso de tiempo de un minuto que se manifiestan como fotogramas caídos al transmitir vídeo. Esto es decepcionante de ver ya que nuestra configuración iGPU no mostraría fotogramas caídos en comparación.

| DPC Latencies / LatencyMon - interrupt to process latency (max), Web, Youtube, Prime95 | |
| Lenovo IdeaPad Pro 5 16IMH G9 RTX 4050 | |
| HP Envy x360 2-in-1 16-ad0097nr | |
| Dell Inspiron 16 7640 2-in-1 | |
| Lenovo IdeaPad Pro 5 16IMH G9 | |
| Samsung Galaxy Book4 Ultra | |
* ... más pequeño es mejor
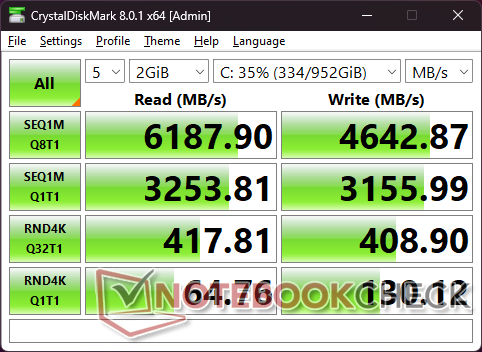
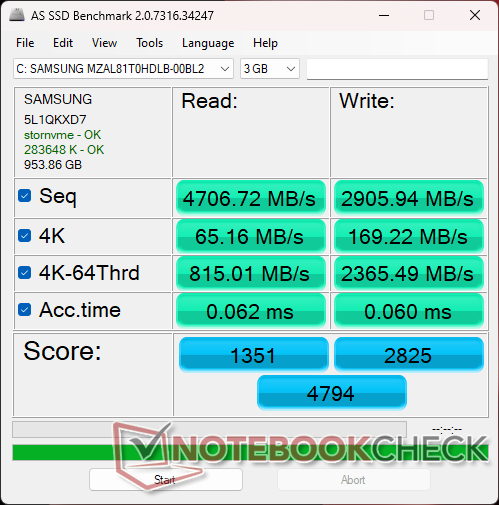
Dispositivos de almacenamiento
El sistema se entrega con el mismo Samsung PM9C1a MZAL81T0HDLB que en la versión iGPU. Curiosamente, también presenta las mismas peculiaridades de velocidad de transferencia, donde el rendimiento saltaba de 5100 MB/s a 6100 MB/s tras unos minutos en nuestra prueba en bucle DiskSpd. La mayoría de las otras unidades, como la Samsung PM9A1 del Galaxy Book4 Ultrase mantendrían estables de principio a fin.
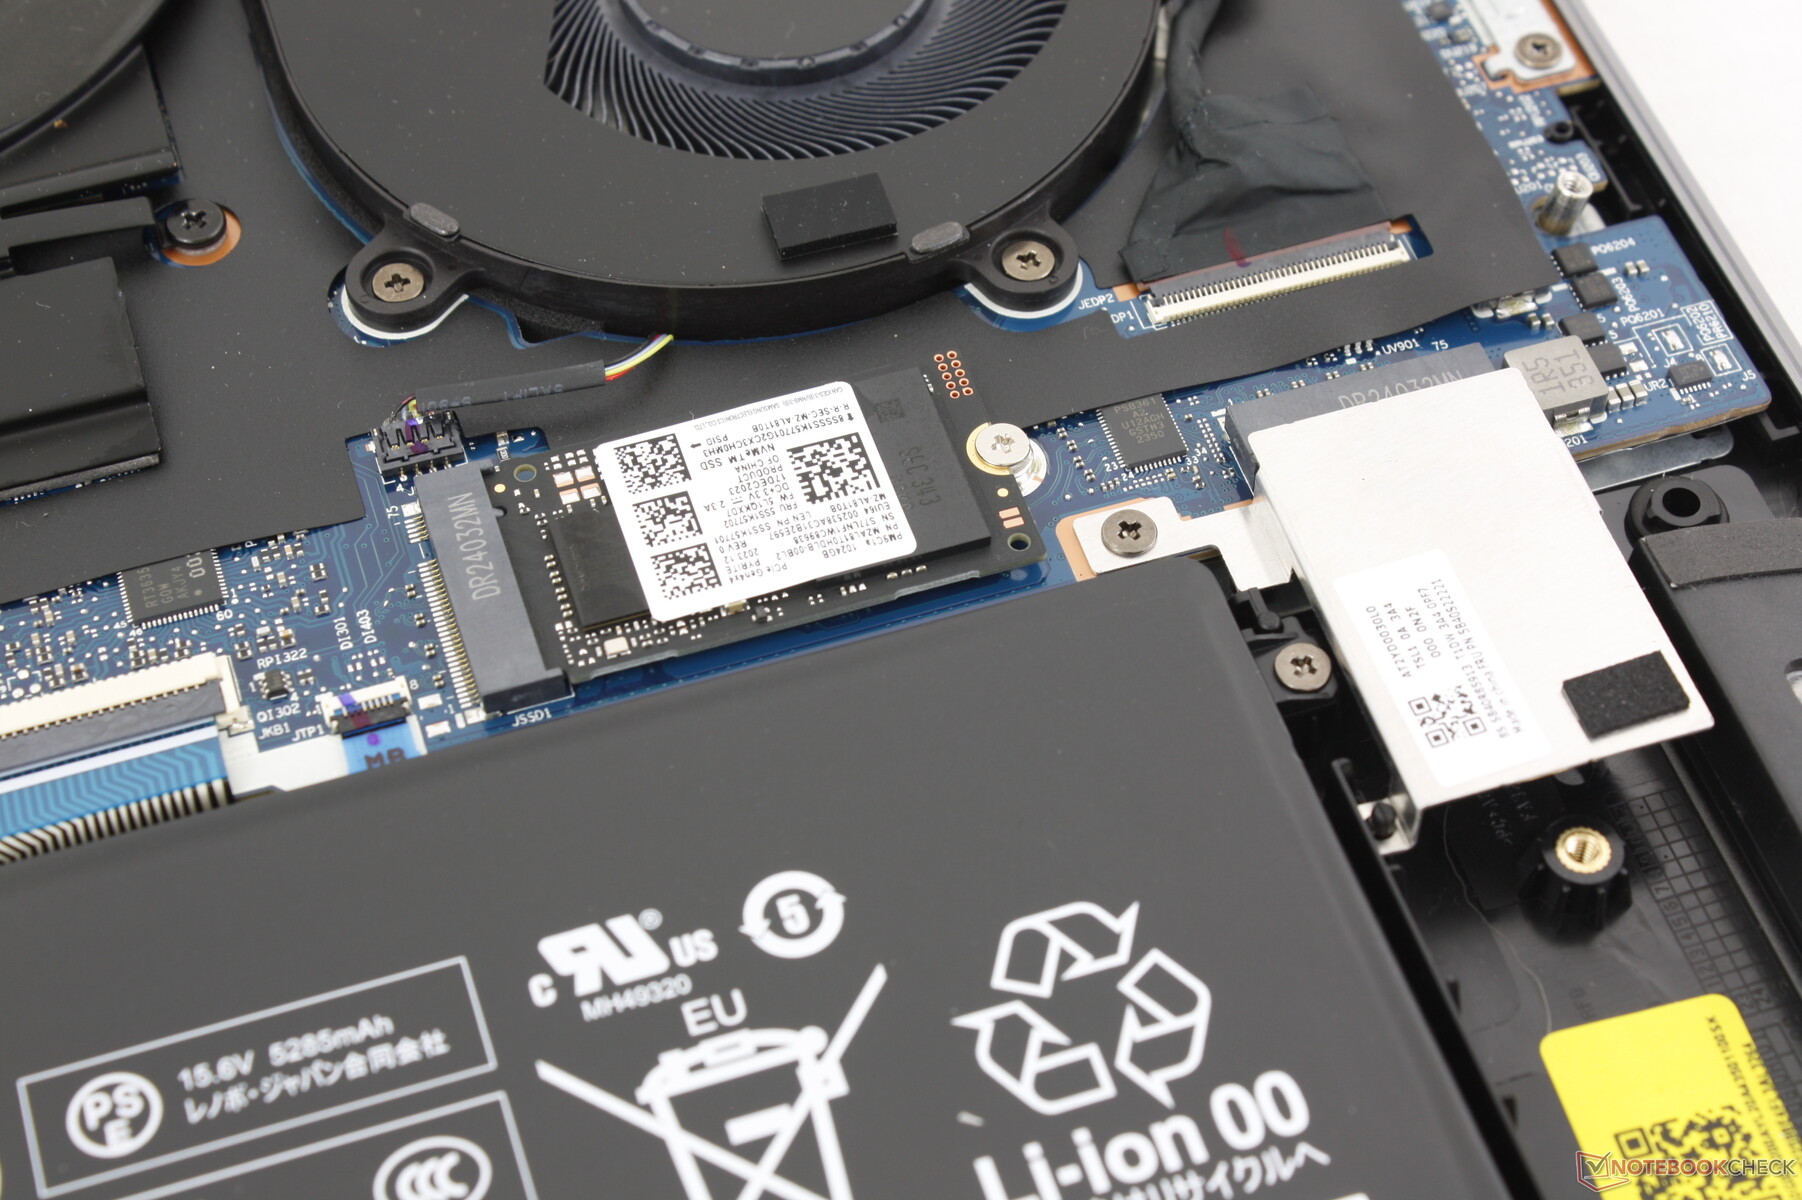
Se incluye una almohadilla térmica para la SSD primaria para ayudar a disipar el calor en la cubierta metálica que hay debajo.

* ... más pequeño es mejor
Disk Throttling: DiskSpd Read Loop, Queue Depth 8
Rendimiento de la GPU: la diferencia de 90 W
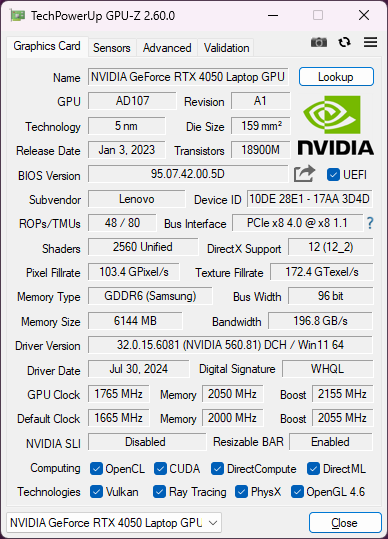
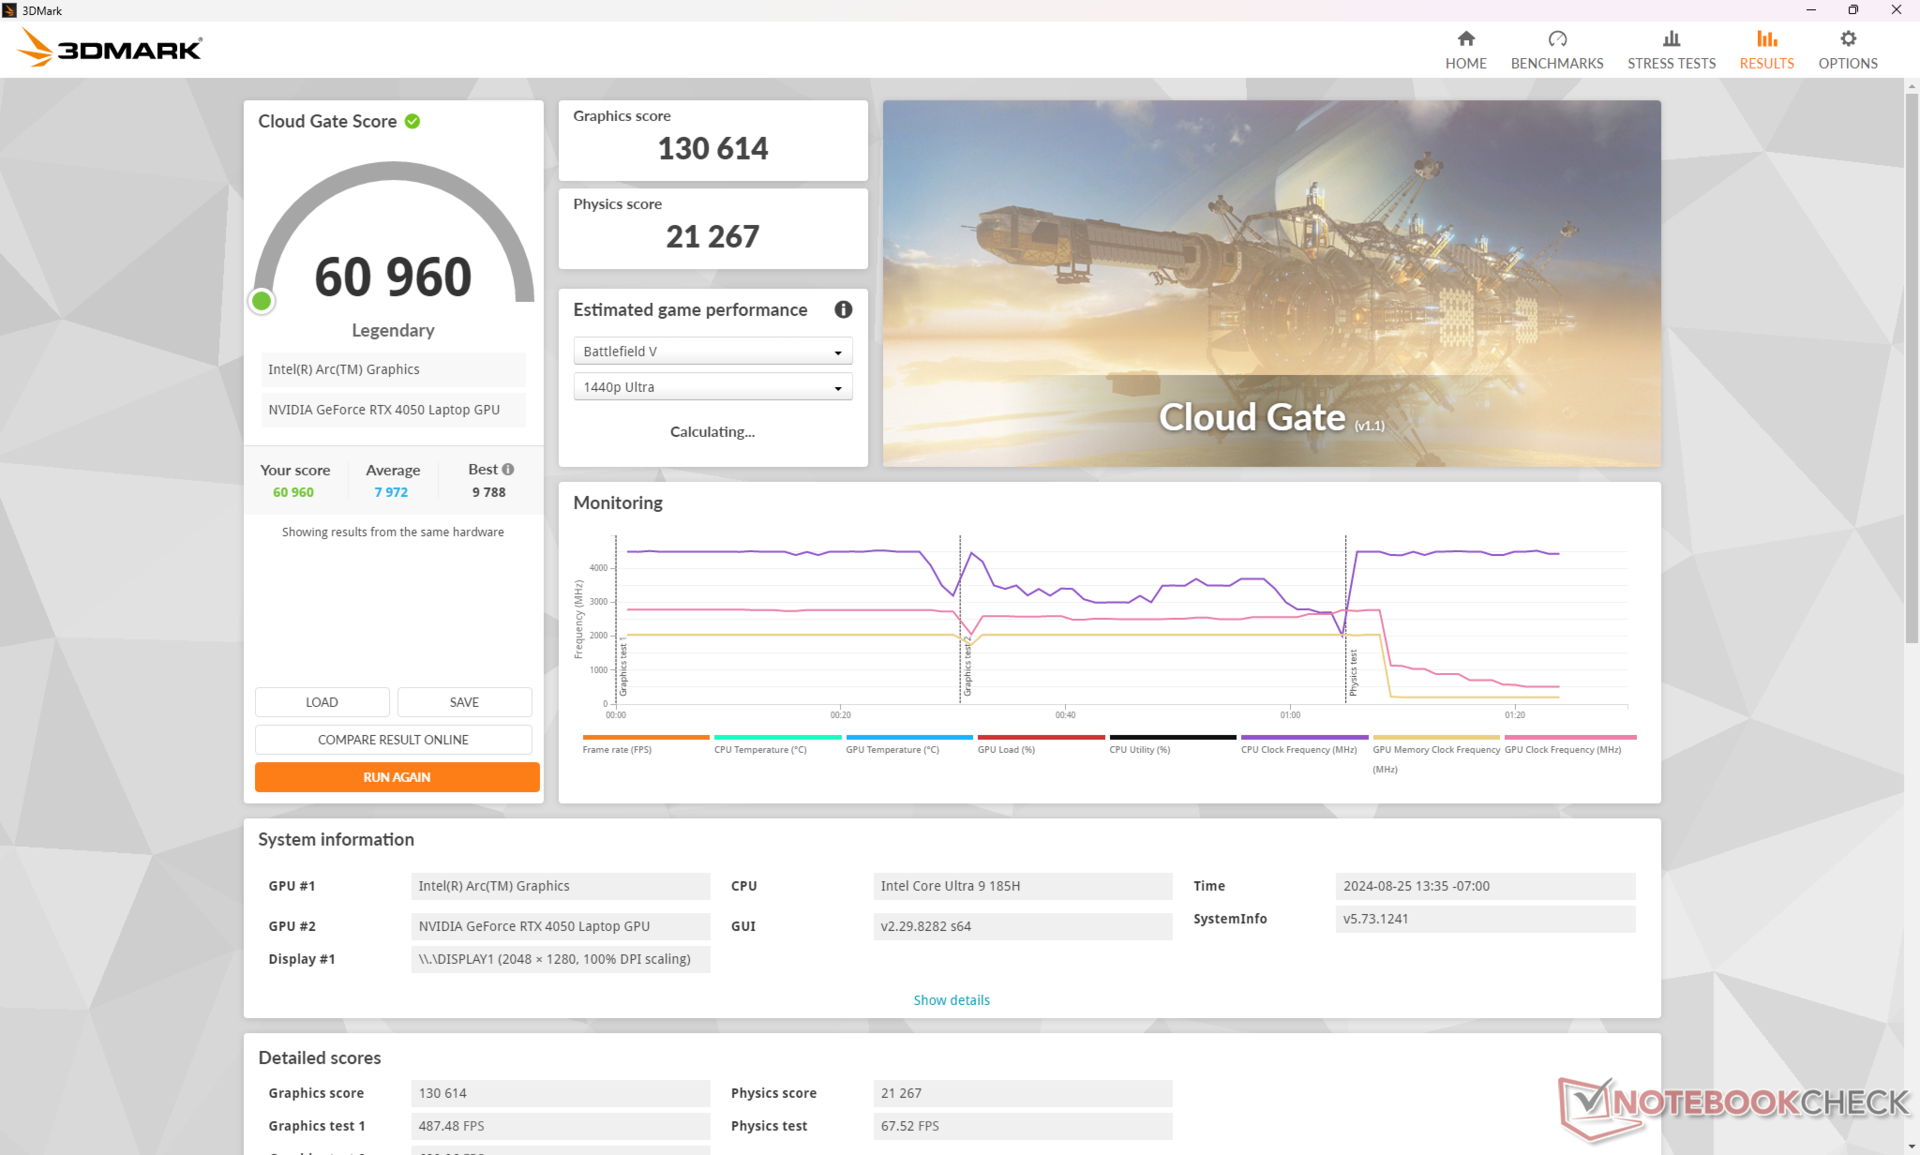
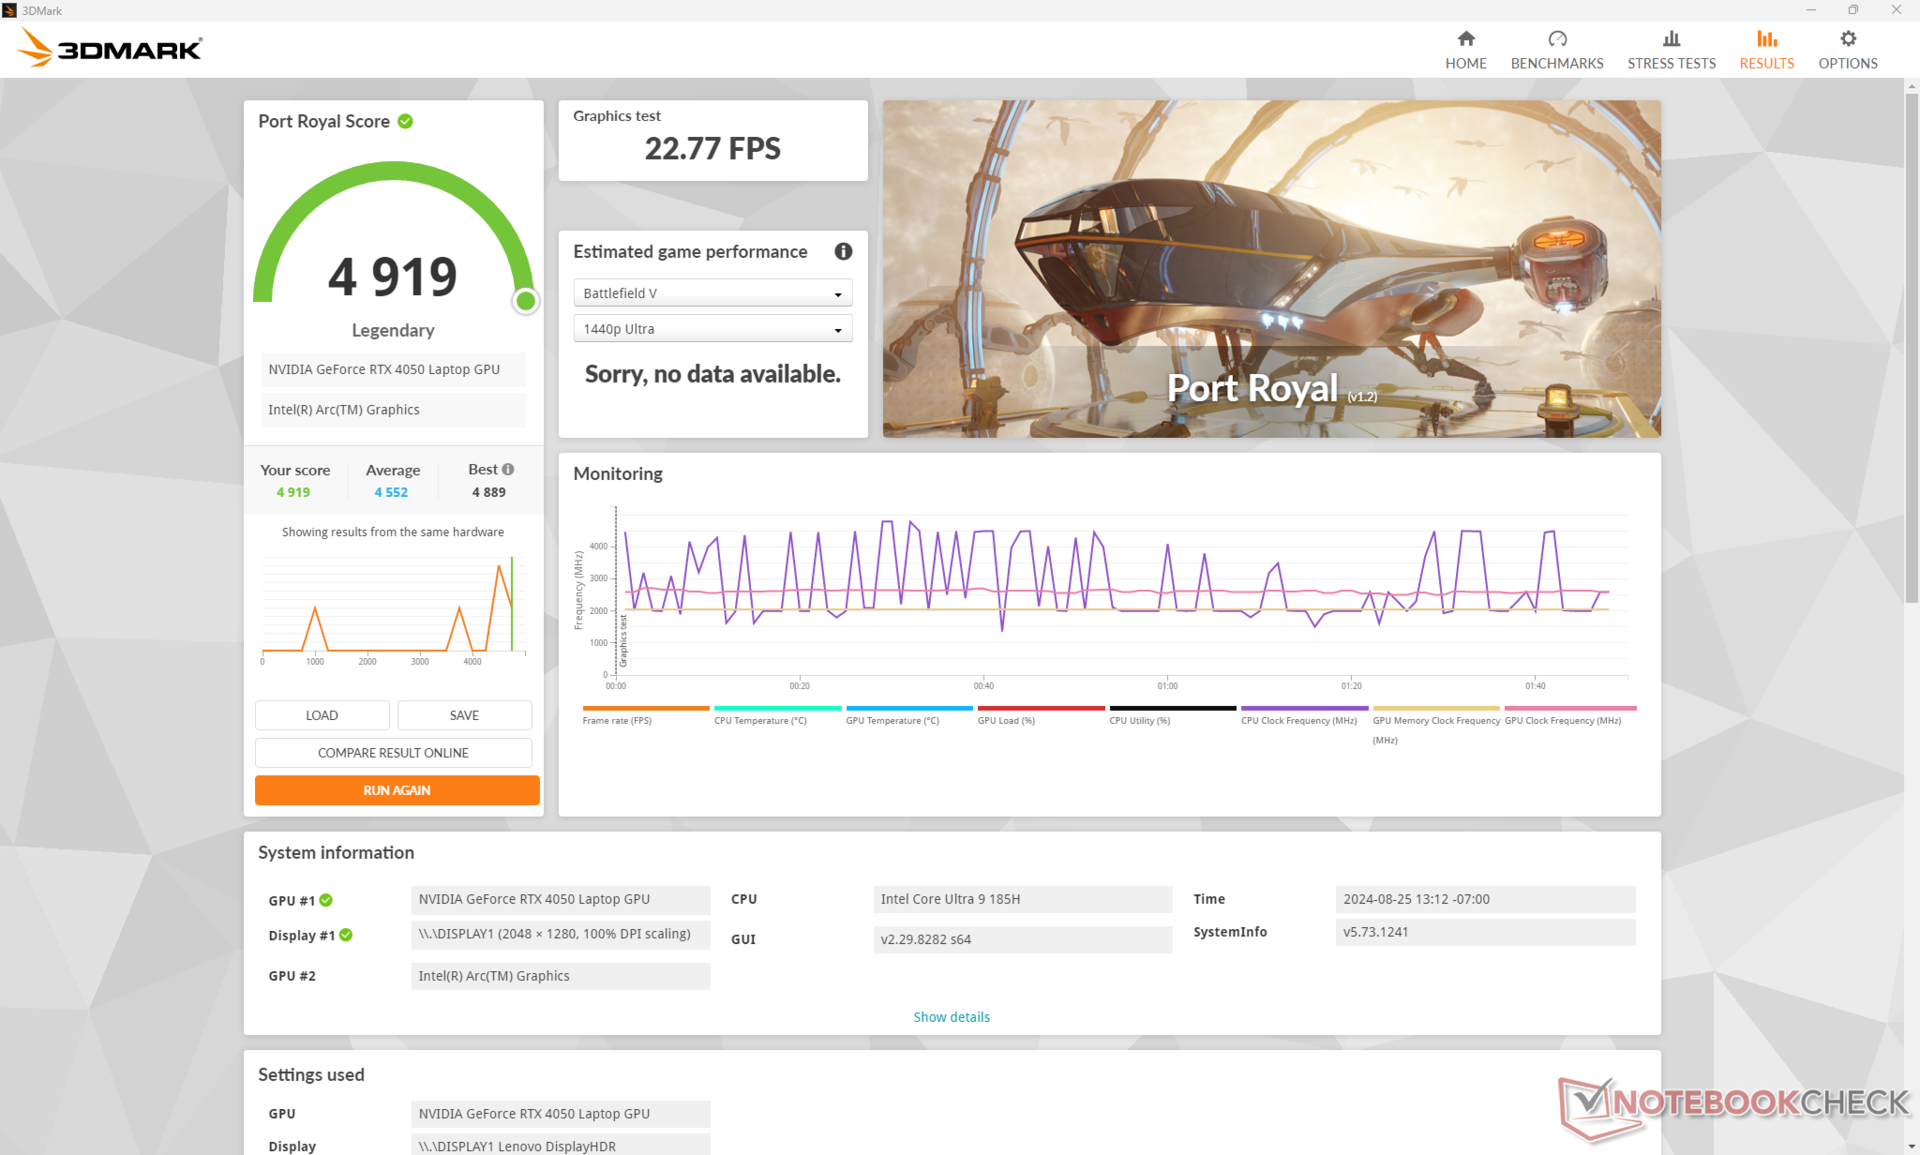
Los 90 W GeForce RTX 4050 Apunta a un techo TGP más alto que en muchos otros portátiles no destinados a juegos con la misma opción de GPU. La RTX 4050 en el Spectre x360 16 y el Samsung Galaxy Book3 Ultra 16por ejemplo, tienen valores de TGP inferiores, de solo 55 W y 60 W, respectivamente. Como resultado, la GPU de nuestro IdeaPad Pro 5 16 G9 puede ser hasta un 10% más rápida que la media de portátiles de nuestra base de datos con la misma GPU RTX 4050. Esta diferencia es suficiente para superar sistemáticamente incluso a la RTX 4060 de 70 W del competidor Inspiron 16 Plus 7640 según las pruebas de rendimiento 3DMark.
Los usuarios que actualicen desde la antigua GeForce RTX 3050, que estaba en la última generación IdeaPad Pro 5 16 G7 o G8, pueden esperar un aumento significativo del 70 al 80 por ciento en el rendimiento con la RTX 4050. Los beneficios son mayores en 2x a 2,5x cuando se actualiza desde el integrado Arc 8 integrada.
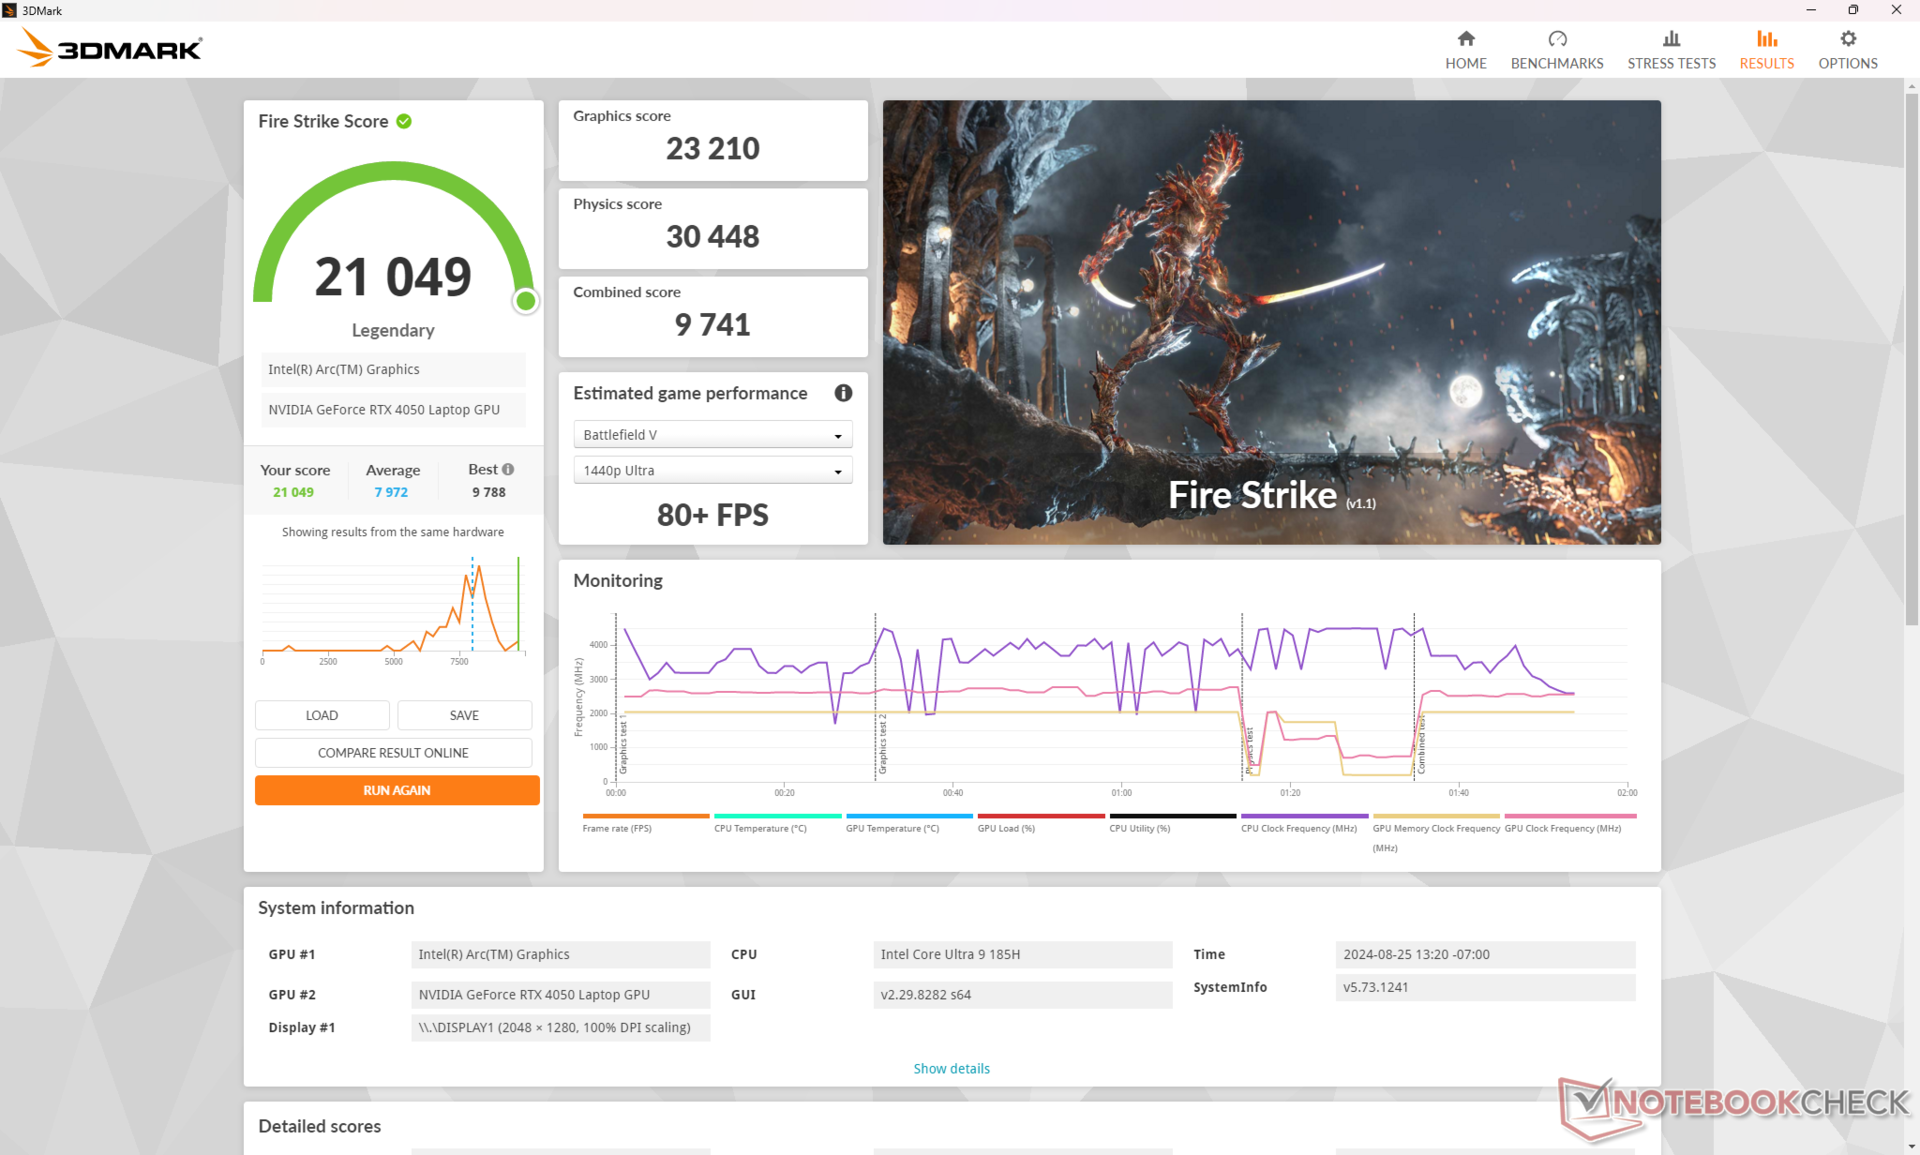
| Perfil de potencia | Puntuación de gráficos | Puntuación de física | Puntuación combinada |
| Modo de rendimiento | 23210 | 30448 | 9741 |
| Modo equilibrado | 21032 (-9%) | 30008 (-1%) | 8158 (-16%) |
| Batería | 19718 (-15%) | 30484 (-0%) | 8216 (-16%) |
Ejecutar en modo Equilibrado en lugar de en modo Rendimiento repercute en el rendimiento de los gráficos hasta en un 10%, mientras que el rendimiento de la CPU se mantiene relativamente igual según nuestra tabla de resultados Fire Strike anterior. Ejecutar en batería no impacta en el rendimiento del procesador tanto como esperábamos inicialmente.

| 3DMark 11 Performance | 27986 puntos | |
| 3DMark Cloud Gate Standard Score | 60960 puntos | |
| 3DMark Fire Strike Score | 21049 puntos | |
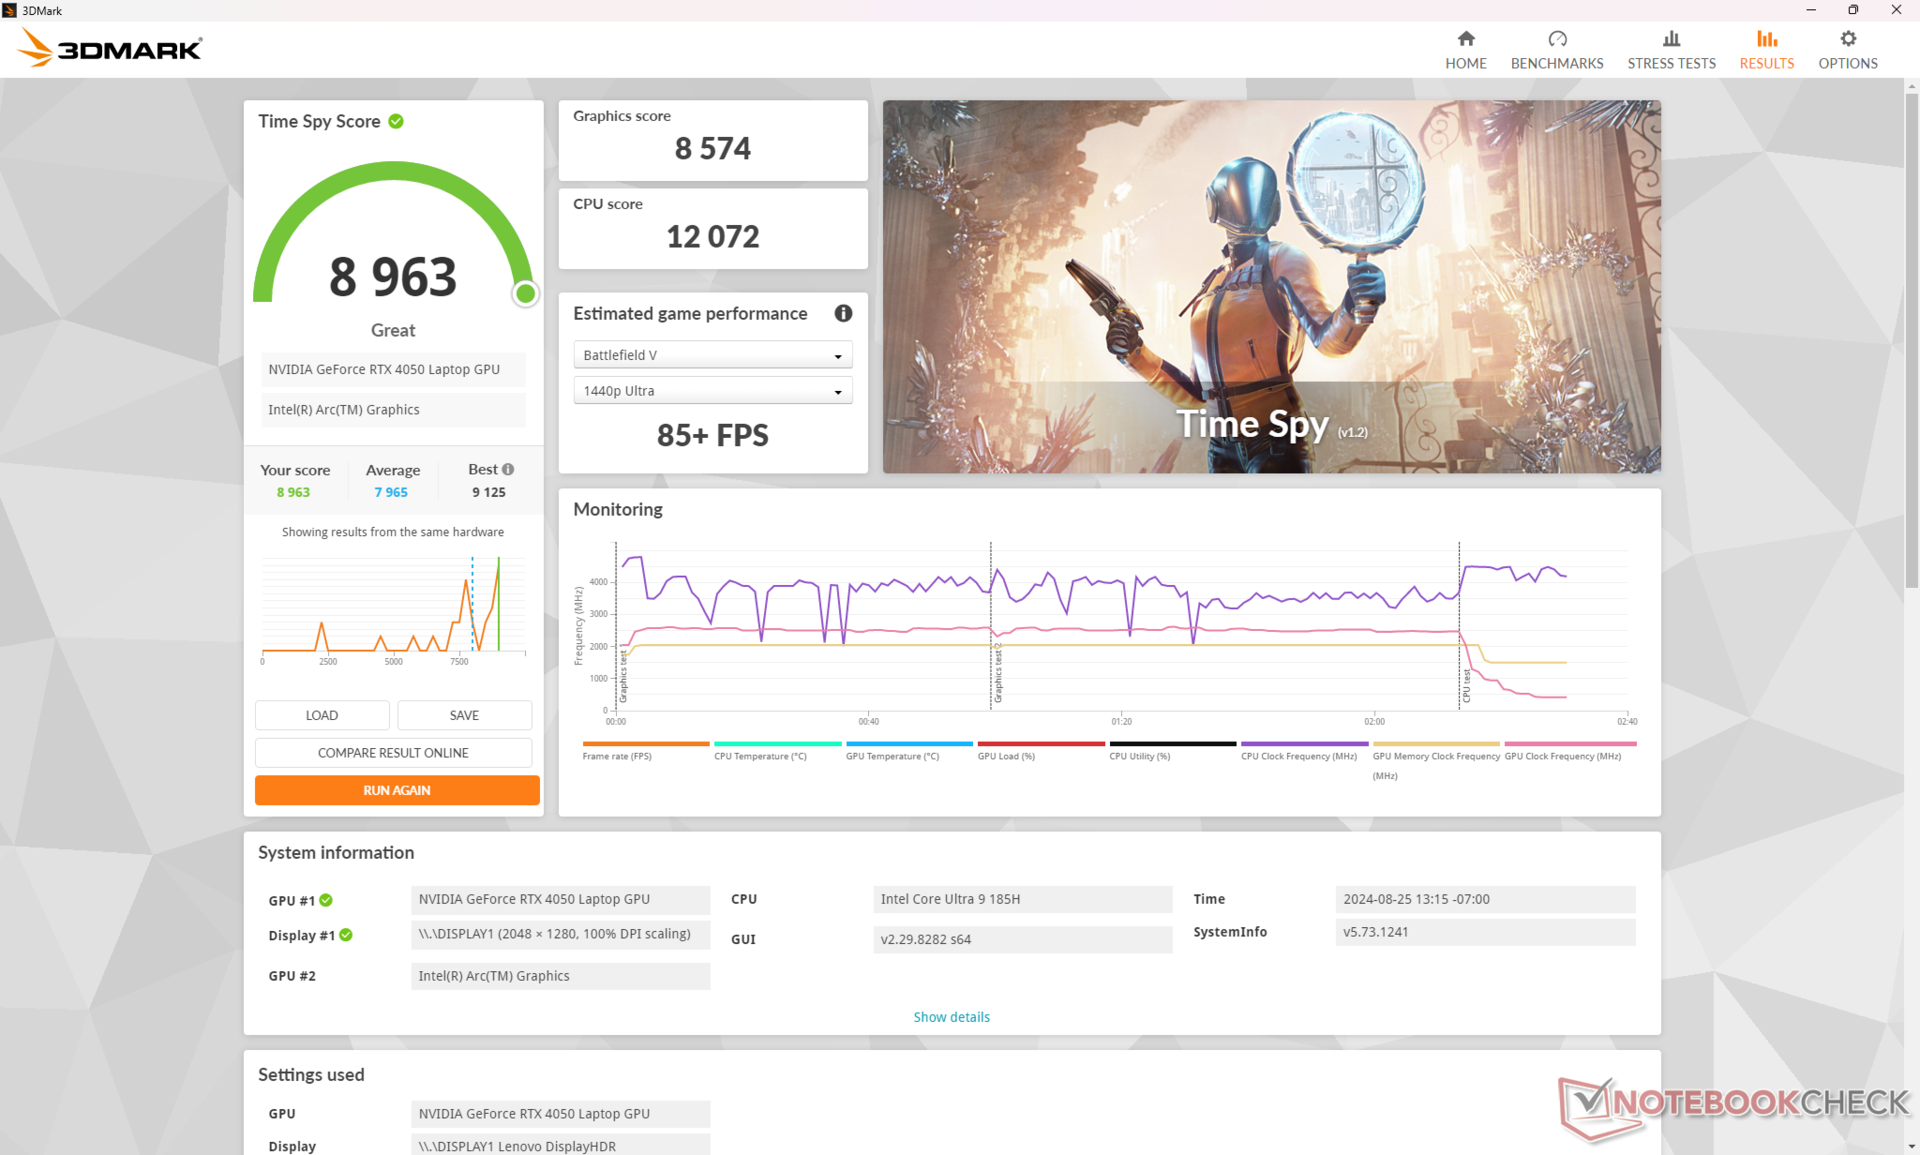
| 3DMark Time Spy Score | 8963 puntos | |
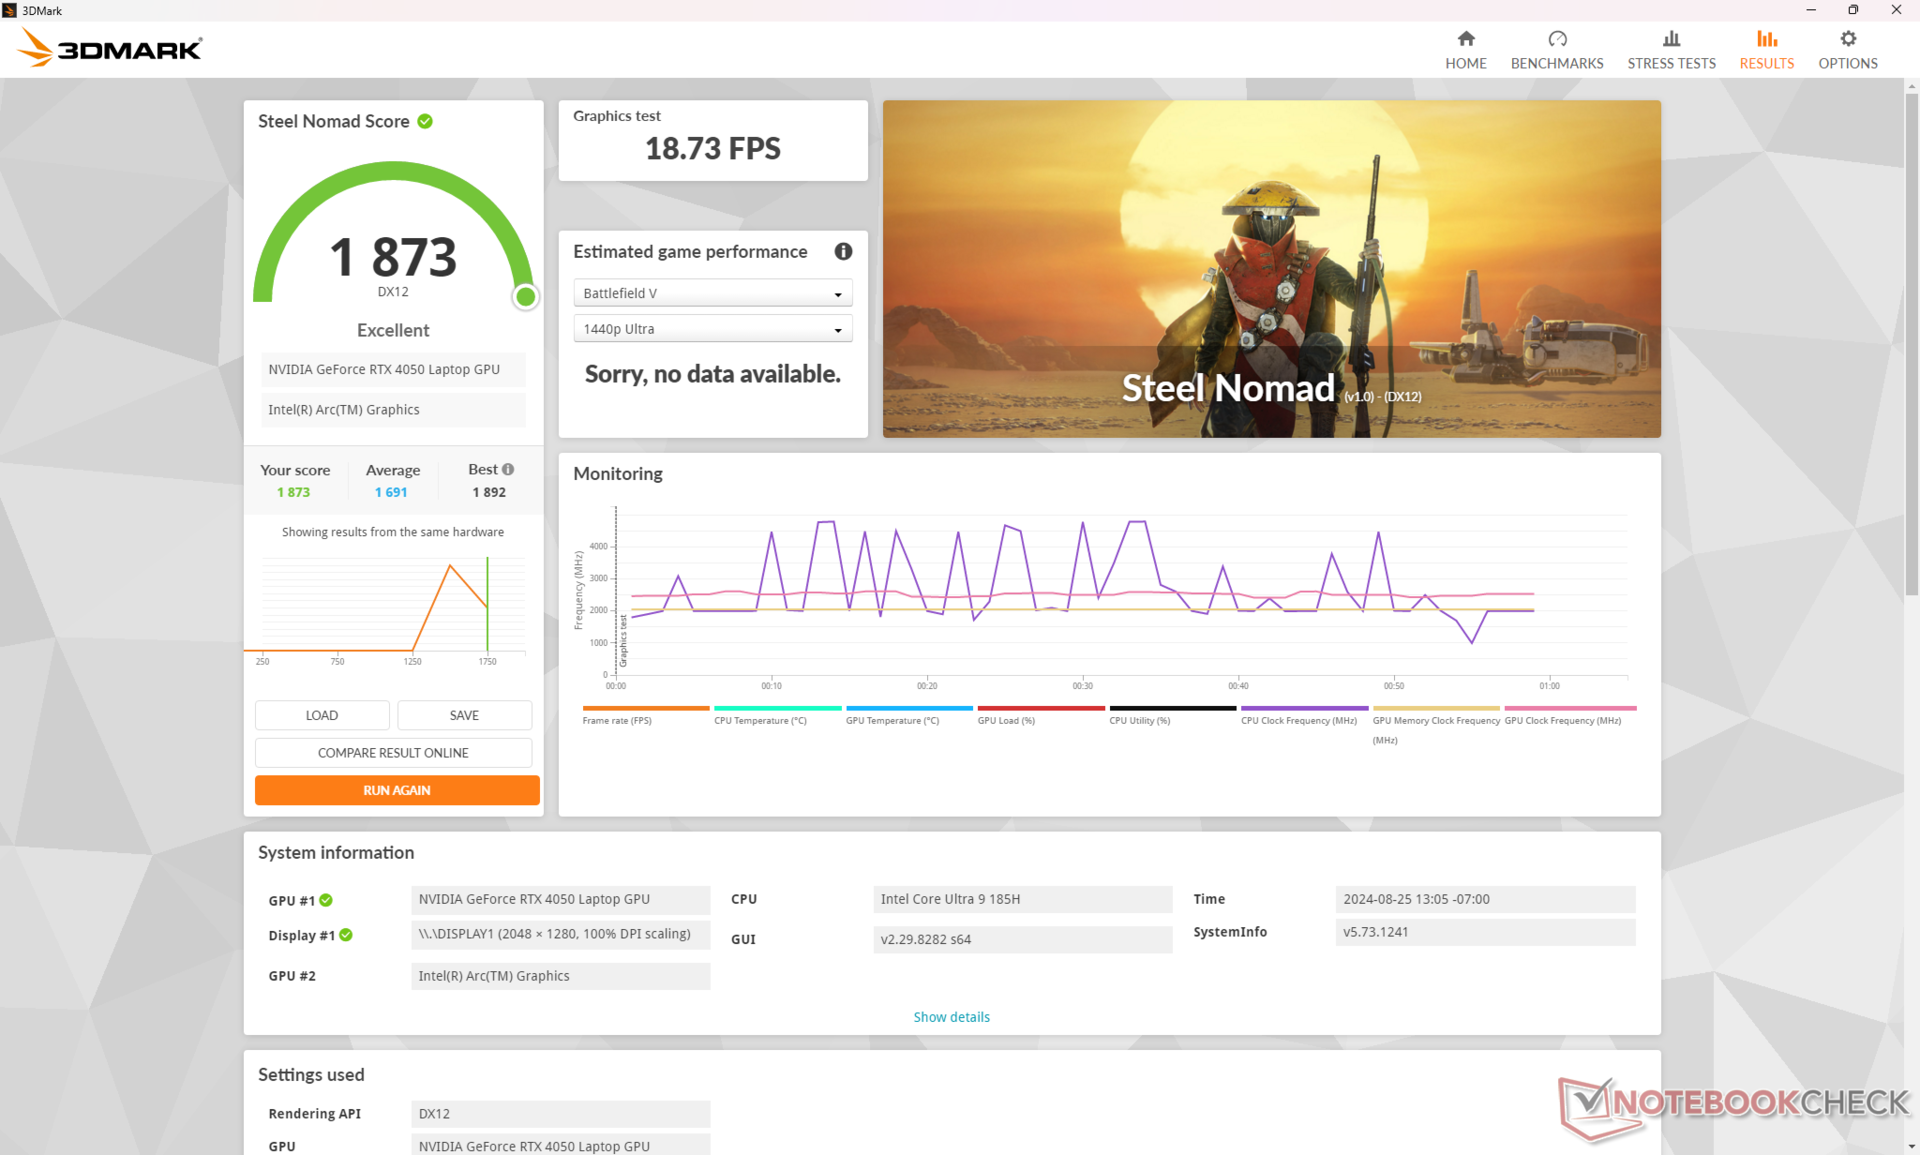
| 3DMark Steel Nomad Score | 1873 puntos | |
ayuda | ||
* ... más pequeño es mejor
Rendimiento en juegos
Aunque no es explícitamente un portátil para juegos, la RTX 4050 de 90 W permite al Lenovo ejecutar juegos mejor de lo esperado. De hecho, títulos como Final Fantasy XV, Cyberpunk 2077, Tiny Tina's Wonderlands y otros se ejecutan entre un 25% y un 30% más rápido que en el HP Spectre x360 16 con la misma GPU RTX 4050. Nuestro sistema también supera al Inspiron 16 Plus 7640 y su GPU RTX 4060 de 70 W, como predecían las puntuaciones 3DMark anteriores. En este escenario, la menor resolución nativa del panel OLED resulta beneficiosa para una experiencia de juego más fluida que la del panel IPS de 1600p.
| GTA V - 1920x1080 Highest Settings possible AA:4xMSAA + FX AF:16x | |
| Lenovo IdeaPad Pro 5 16IMH G9 RTX 4050 | |
| Samsung Galaxy Book4 Ultra | |
| Asus Zenbook S 16 UM5606-RK333W | |
| Lenovo IdeaPad Pro 5 16IMH G9 | |
| Final Fantasy XV Benchmark - 1920x1080 High Quality | |
| Lenovo IdeaPad Pro 5 16IMH G9 RTX 4050 | |
| Samsung Galaxy Book4 Ultra | |
| Lenovo IdeaPad Pro 5 16IMH G9 | |
| Asus Zenbook S 16 UM5606-RK333W | |
| Dell Inspiron 16 7640 2-in-1 | |
| HP Envy x360 2-in-1 16-ad0097nr | |
| Strange Brigade - 1920x1080 ultra AA:ultra AF:16 | |
| Lenovo IdeaPad Pro 5 16IMH G9 RTX 4050 | |
| Samsung Galaxy Book4 Ultra | |
| Lenovo IdeaPad Pro 5 16IMH G9 | |
| Asus Zenbook S 16 UM5606-RK333W | |
| Dell Inspiron 16 7640 2-in-1 | |
| HP Envy x360 2-in-1 16-ad0097nr | |
| Dota 2 Reborn - 1920x1080 ultra (3/3) best looking | |
| Lenovo IdeaPad Pro 5 16IMH G9 RTX 4050 | |
| Samsung Galaxy Book4 Ultra | |
| Lenovo IdeaPad Pro 5 16IMH G9 | |
| Dell Inspiron 16 7640 2-in-1 | |
| HP Envy x360 2-in-1 16-ad0097nr | |
| Asus Zenbook S 16 UM5606-RK333W | |
Cyberpunk 2077 ultra FPS Chart
| bajo | medio | alto | ultra | |
|---|---|---|---|---|
| GTA V (2015) | 183 | 178.4 | 166.9 | 98.7 |
| Dota 2 Reborn (2015) | 167.2 | 151.9 | 145.9 | 137.4 |
| Final Fantasy XV Benchmark (2018) | 171.3 | 123.3 | 87.8 | |
| X-Plane 11.11 (2018) | 127.7 | 114.1 | 89 | |
| Far Cry 5 (2018) | 155 | 129 | 120 | 113 |
| Strange Brigade (2018) | 411 | 204 | 172.9 | 149.4 |
| Tiny Tina's Wonderlands (2022) | 181.6 | 149.2 | 96 | 74 |
| F1 22 (2022) | 211 | 204 | 156.6 | 54.1 |
| Baldur's Gate 3 (2023) | 110.1 | 91.4 | 81.3 | 78.6 |
| Cyberpunk 2077 2.2 Phantom Liberty (2023) | 103.1 | 82.2 | 69.4 | 59.8 |
Emisiones - Ruidosas y calientes bajo carga
Ruido del sistema
El ruido del ventilador permanece silencioso cuando se ejecutan cargas poco exigentes como navegadores o Word sin molestos comportamientos de pulsaciones o picos. Al ejecutar cargas más pesadas como 3DMark 06, el ruido del ventilador se mantendría estable en torno a los 26 dB(A) durante la mayor parte de la primera escena del benchmark antes de elevarse finalmente a casi 46 dB(A), que se aproxima a lo que registramos en la configuración de la iGPU.
Durante los juegos, el ruido del ventilador alcanzó un máximo de 48 dB(A), unos decibelios más que en la configuración iGPU. Esto también resulta ser más ruidoso que los portátiles de 16 pulgadas de la competencia por márgenes decentes incluyendo el Inspiron 16 7640 2 en 1 o el Samsung Galaxy Book4 Ultra. Así pues, la opción dGPU no es necesariamente más ruidosa que la opción iGPU hasta que se empiezan a introducir cargas mucho más exigentes.
Ruido
| Ocioso |
| 23 / 23.3 / 23.3 dB(A) |
| Carga |
| 45.7 / 48.4 dB(A) |
 | ||
30 dB silencioso 40 dB(A) audible 50 dB(A) ruidosamente alto |
||
min: | ||
| Lenovo IdeaPad Pro 5 16IMH G9 RTX 4050 NVIDIA GeForce RTX 4050 Laptop GPU, Ultra 9 185H, Samsung PM9C1a MZAL81T0HDLB | Lenovo IdeaPad Pro 5 16IMH G9 Arc 8-Core, Ultra 7 155H, Samsung PM9C1a MZAL81T0HDLB | Dell Inspiron 16 7640 2-in-1 Arc 8-Core, Ultra 7 155H, Micron 2550 1TB | Asus Zenbook S 16 UM5606-RK333W Radeon 890M, Ryzen AI 9 HX 370, Micron 2400 MTFDKBA1T0QFM | HP Envy x360 2-in-1 16-ad0097nr Radeon 780M, R7 8840HS, KIOXIA BG5 KBG50ZNV1T02 | Samsung Galaxy Book4 Ultra NVIDIA GeForce RTX 4050 Laptop GPU, Ultra 7 155H, Samsung PM9A1 MZVL2512HCJQ | |
|---|---|---|---|---|---|---|
| Noise | -4% | 1% | 5% | 10% | 2% | |
| apagado / medio ambiente * | 23 | 24.1 -5% | 22.9 -0% | 24.7 -7% | 22.9 -0% | 24.2 -5% |
| Idle Minimum * | 23 | 24.1 -5% | 22.9 -0% | 24.7 -7% | 23 -0% | 24.2 -5% |
| Idle Average * | 23.3 | 24.1 -3% | 22.9 2% | 24.7 -6% | 23 1% | 24.2 -4% |
| Idle Maximum * | 23.3 | 28.2 -21% | 25 -7% | 26.4 -13% | 23 1% | 24.2 -4% |
| Load Average * | 45.7 | 44.4 3% | 45.1 1% | 35.7 22% | 23.8 48% | 37.9 17% |
| Cyberpunk 2077 ultra * | 48.4 | 44.9 7% | 36.8 24% | |||
| Load Maximum * | 48.4 | 44.4 8% | 44.9 7% | 36.8 24% | 43.8 10% | 41.7 14% |
| Witcher 3 ultra * | 36.5 | 43.8 | 41.7 |
* ... más pequeño es mejor
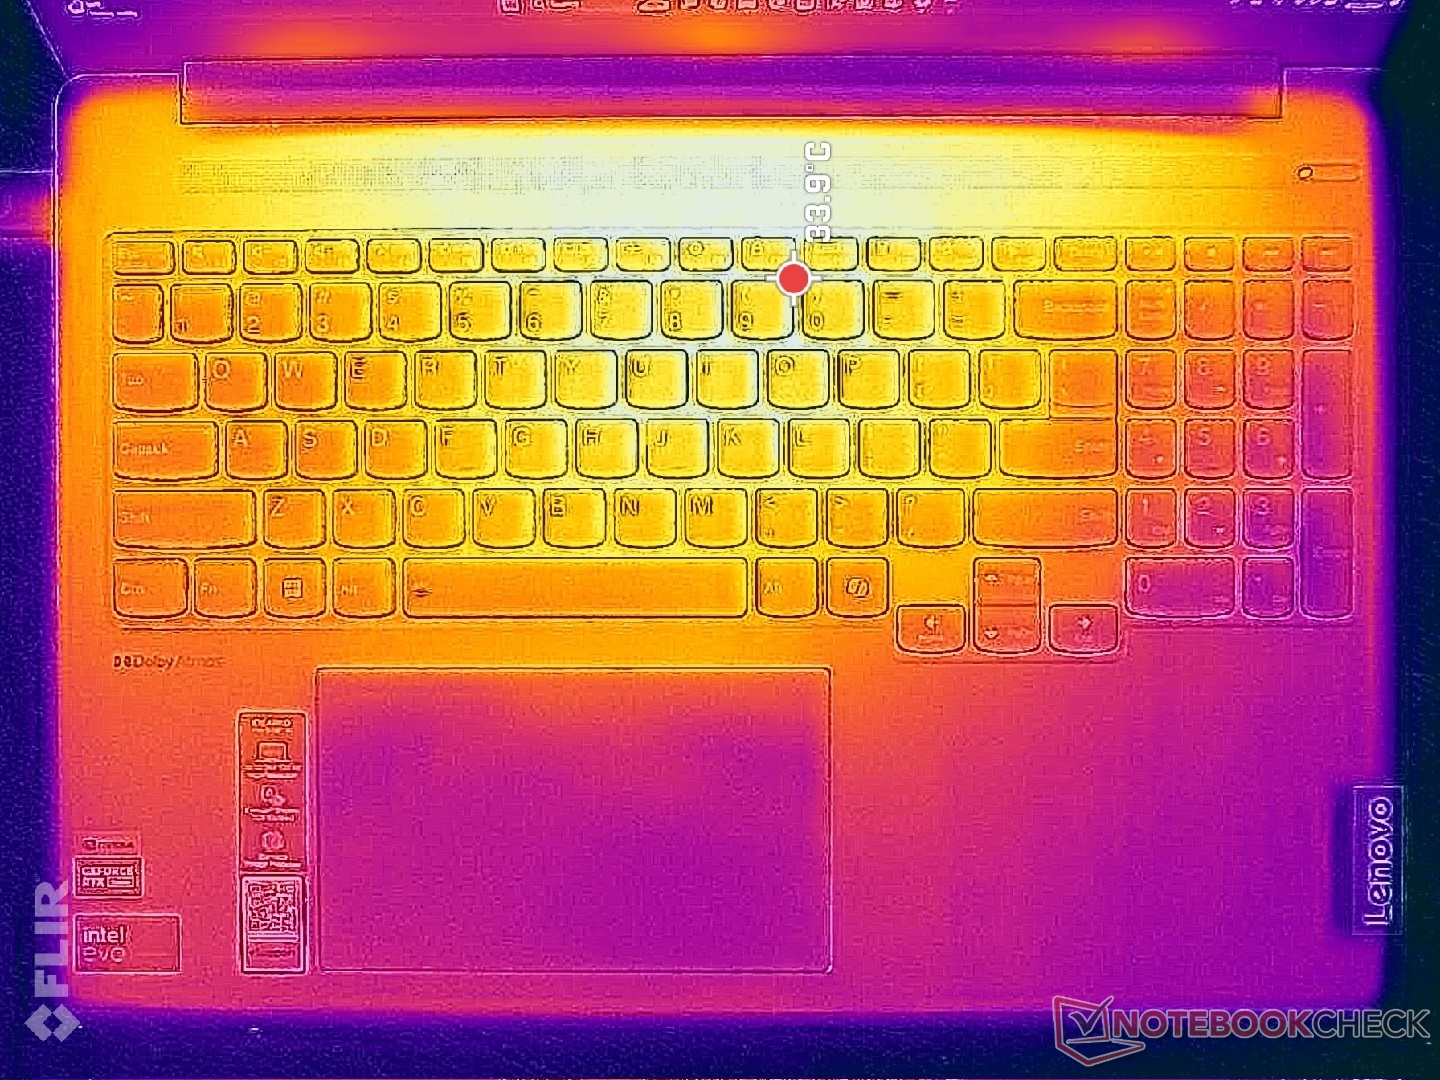
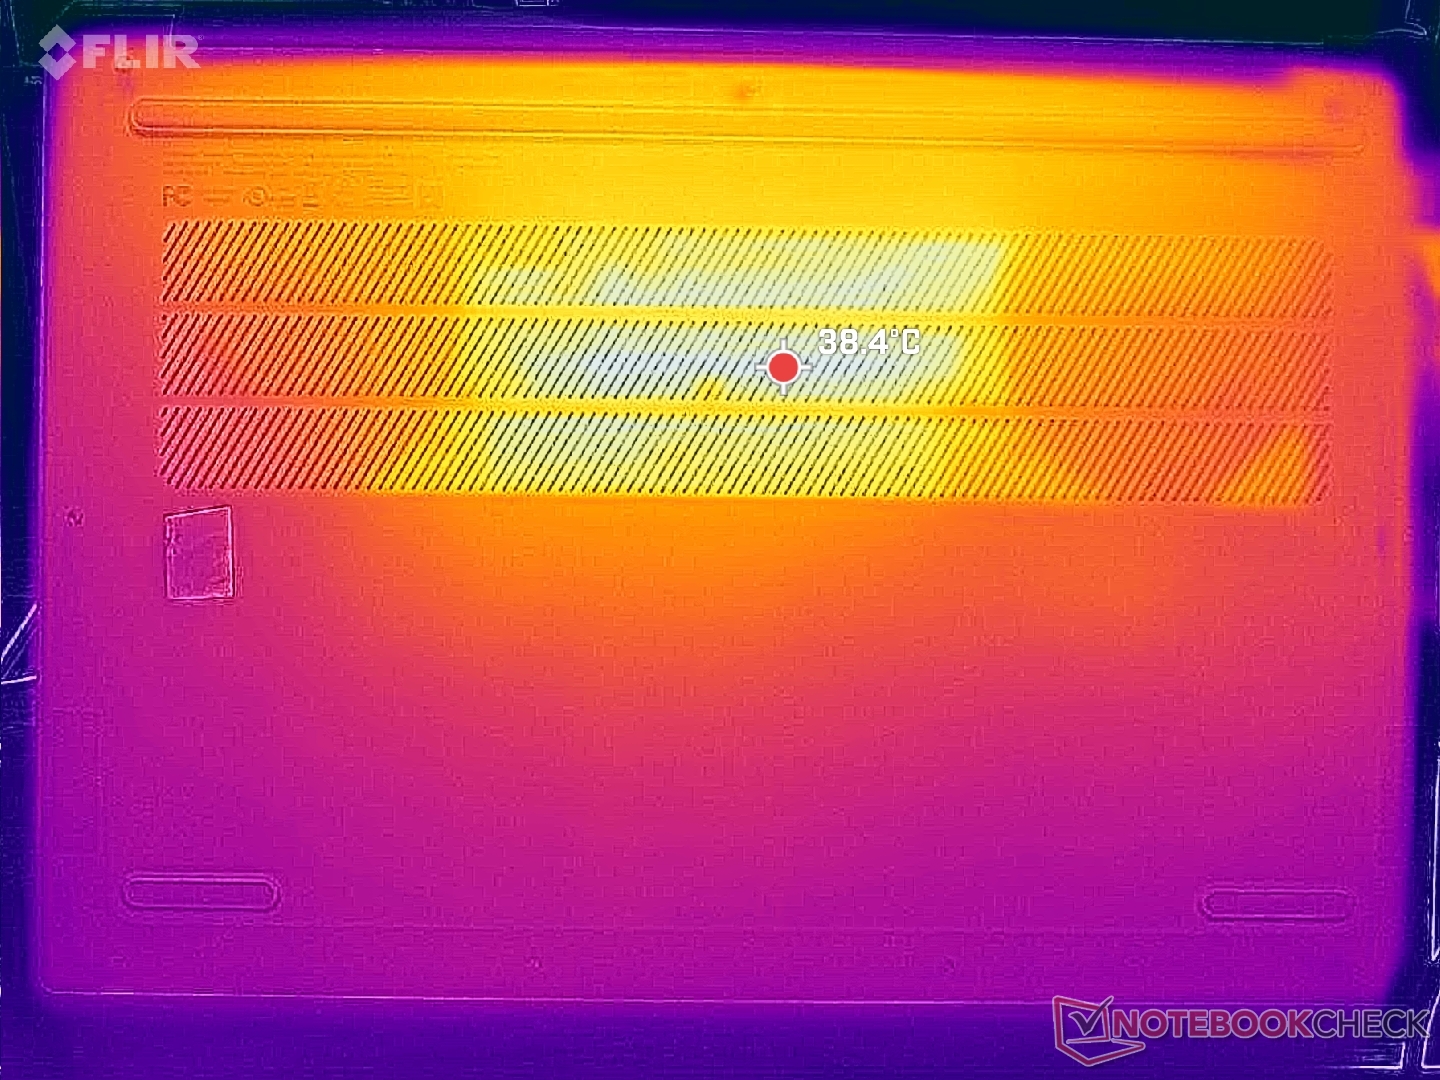
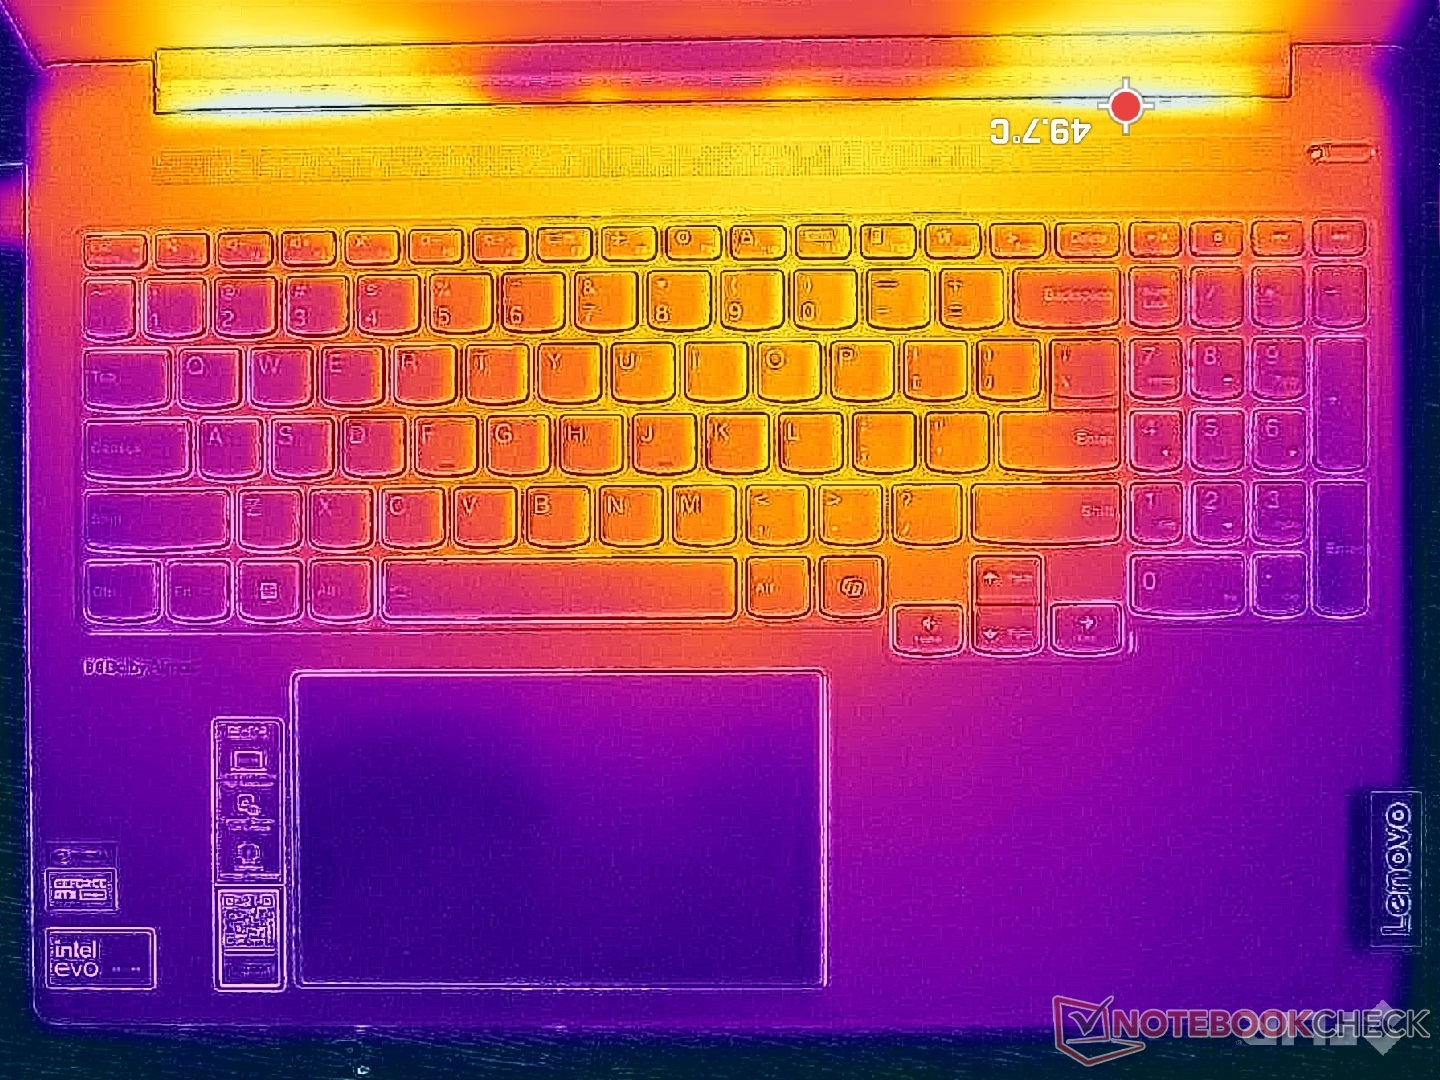
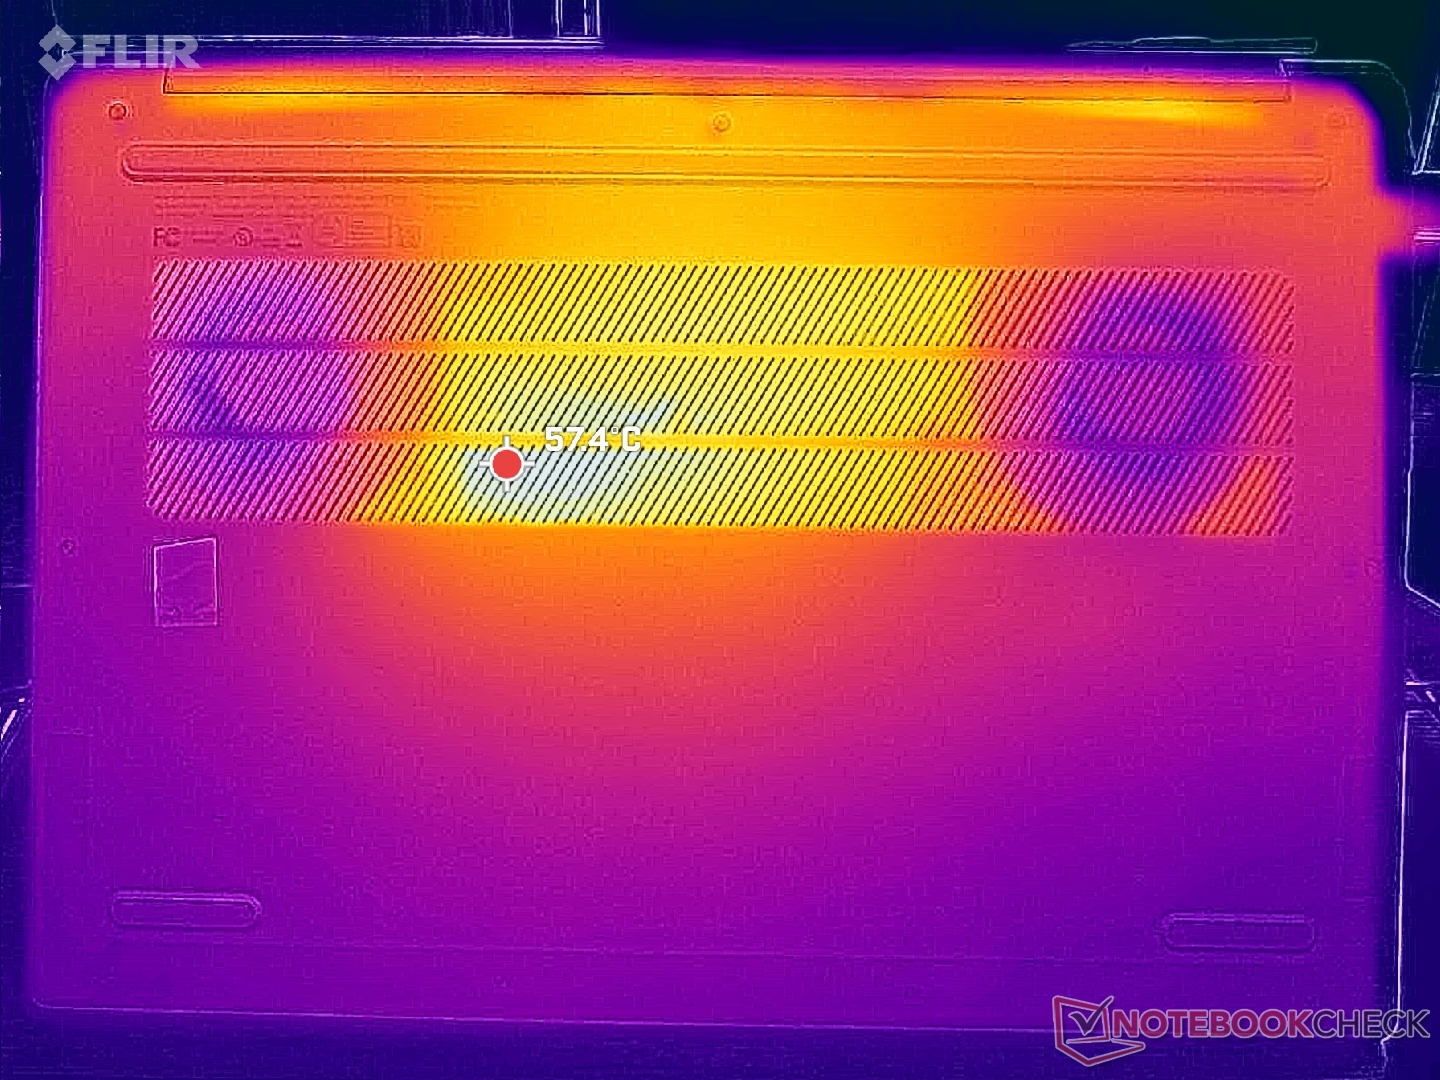
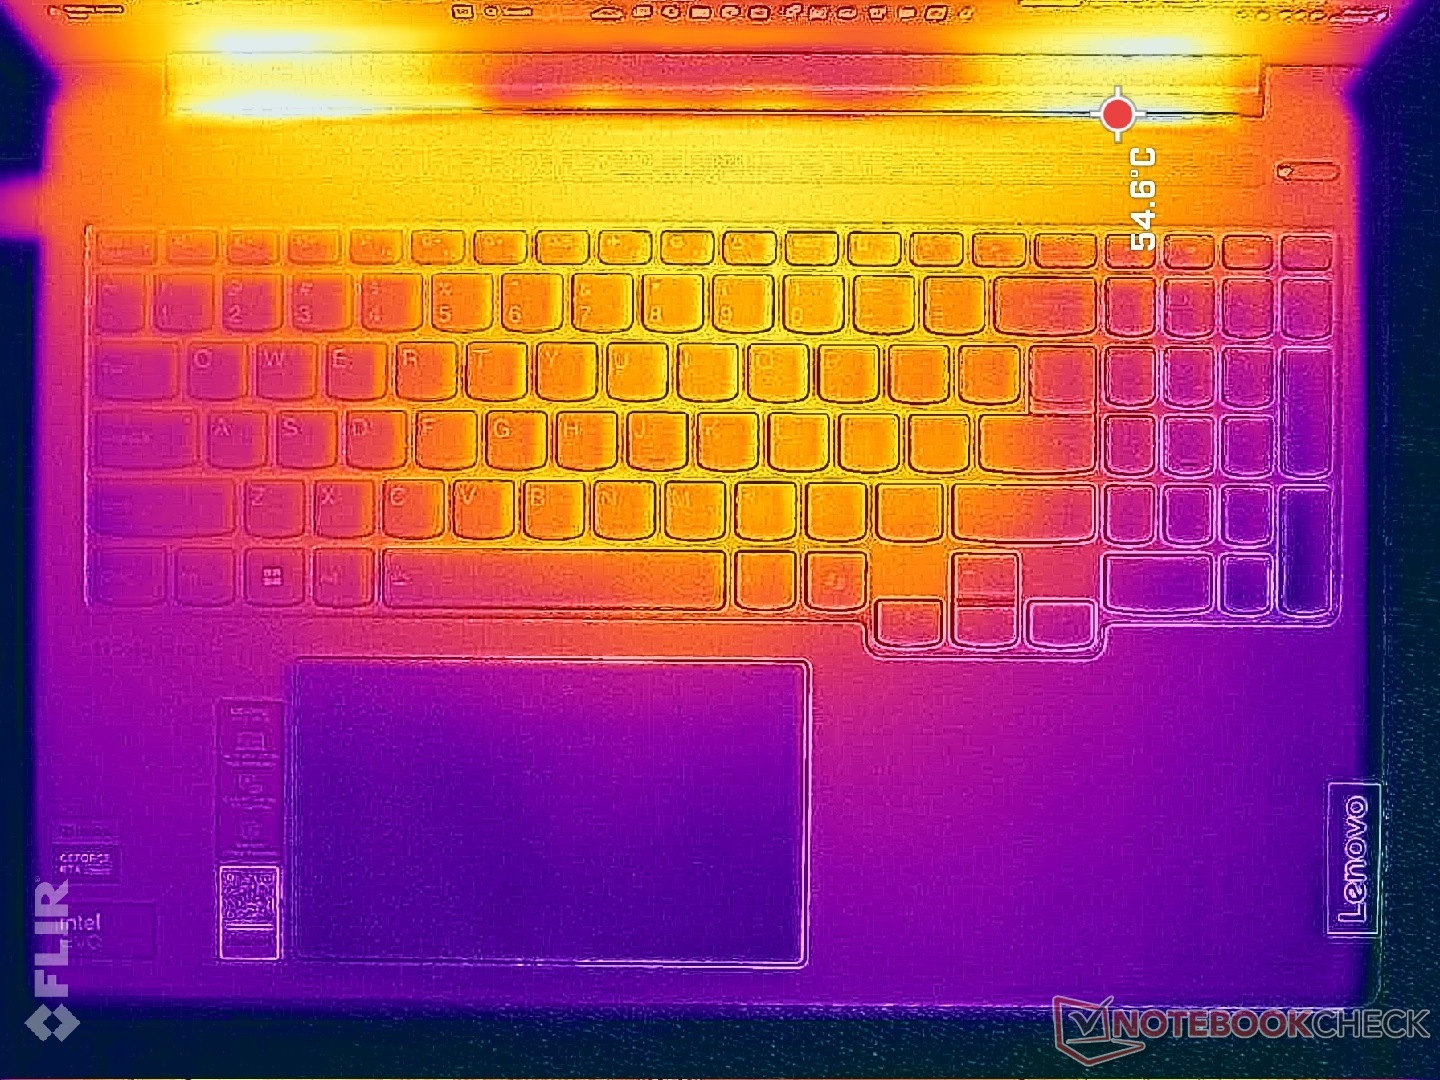
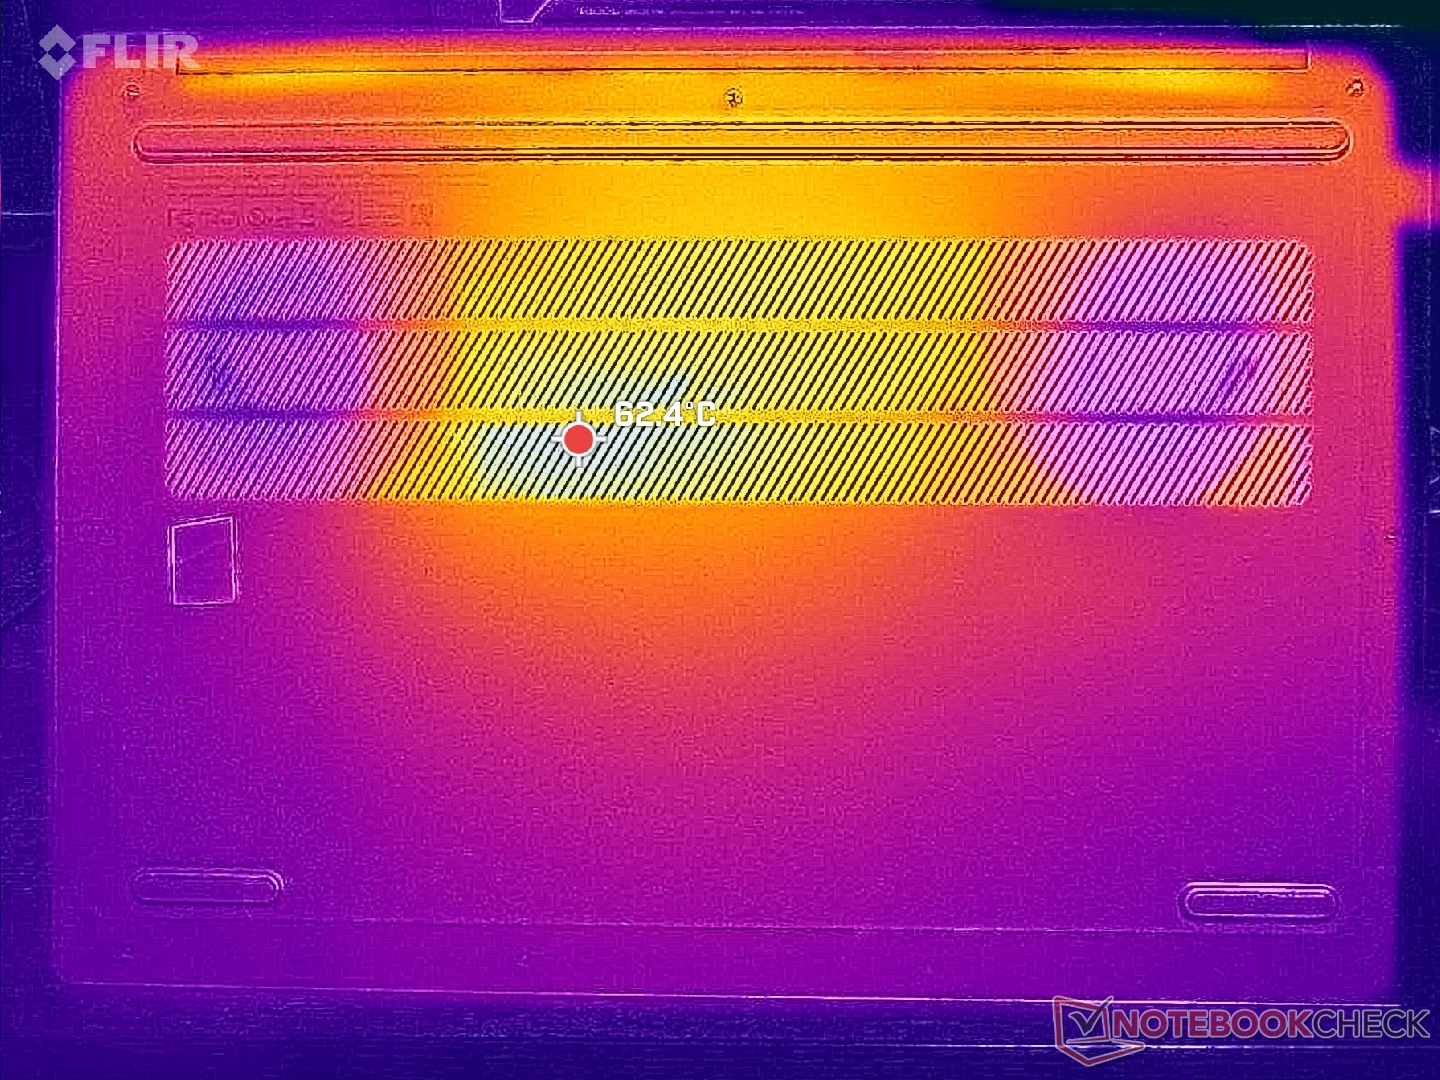
Temperatura
Las temperaturas de la superficie son notablemente más cálidas que en la configuración iGPU en más de varios grados, incluso en reposo. Los puntos calientes cuando se juega pueden alcanzar los 42 C y 52 C en la cubierta del teclado y la superficie inferior, respectivamente, en comparación con sólo 32 C y 38 C en la versión iGPU. Los puntos calientes están afortunadamente hacia el centro del teclado, pero definitivamente querrá ejecutar cargas exigentes en un escritorio plano siempre que sea posible para un flujo de aire óptimo.
El sistema se ejecuta más caliente que el Galaxy Book4 Ultra a pesar de que ambos modelos vienen con CPUs Core Ultra H similares y opciones RTX GeForce.
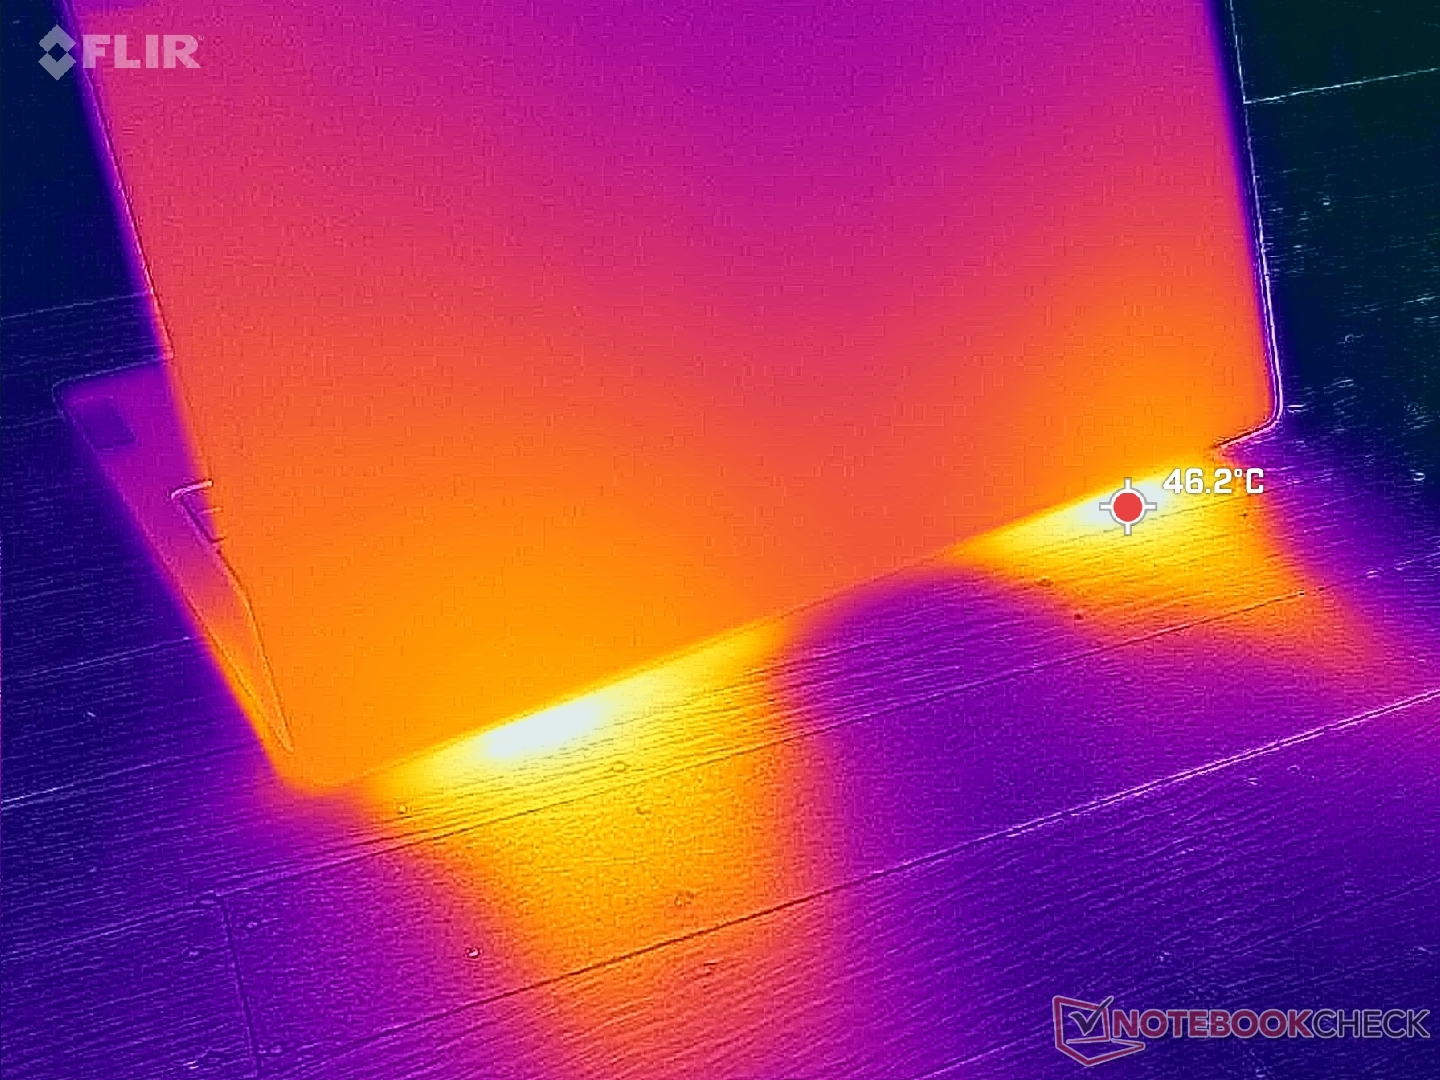
(-) La temperatura máxima en la parte superior es de 48.2 °C / 119 F, frente a la media de 36.9 °C / 98 F, que oscila entre 21.1 y 71 °C para la clase Multimedia.
(-) El fondo se calienta hasta un máximo de 59.4 °C / 139 F, frente a la media de 39.2 °C / 103 F
(+) En reposo, la temperatura media de la parte superior es de 31.2 °C / 88# F, frente a la media del dispositivo de 31.3 °C / 88 F.
(±) 3: The average temperature for the upper side is 35.7 °C / 96 F, compared to the average of 31.3 °C / 88 F for the class Multimedia.
(+) Los reposamanos y el panel táctil alcanzan como máximo la temperatura de la piel (34.4 °C / 93.9 F) y, por tanto, no están calientes.
(-) La temperatura media de la zona del reposamanos de dispositivos similares fue de 28.8 °C / 83.8 F (-5.6 °C / -10.1 F).
| Lenovo IdeaPad Pro 5 16IMH G9 RTX 4050 Intel Core Ultra 9 185H, NVIDIA GeForce RTX 4050 Laptop GPU | Lenovo IdeaPad Pro 5 16IMH G9 Intel Core Ultra 7 155H, Intel Arc 8-Core iGPU | Dell Inspiron 16 7640 2-in-1 Intel Core Ultra 7 155H, Intel Arc 8-Core iGPU | Asus Zenbook S 16 UM5606-RK333W AMD Ryzen AI 9 HX 370, AMD Radeon 890M | HP Envy x360 2-in-1 16-ad0097nr AMD Ryzen 7 8840HS, AMD Radeon 780M | Samsung Galaxy Book4 Ultra Intel Core Ultra 7 155H, NVIDIA GeForce RTX 4050 Laptop GPU | |
|---|---|---|---|---|---|---|
| Heat | 28% | 11% | 10% | 18% | 28% | |
| Maximum Upper Side * | 48.2 | 36.3 25% | 46.8 3% | 46.9 3% | 42.6 12% | 38.5 20% |
| Maximum Bottom * | 59.4 | 39.1 34% | 45.6 23% | 53.5 10% | 47.8 20% | 41.2 31% |
| Idle Upper Side * | 34.2 | 24.9 27% | 32.2 6% | 29.5 14% | 27.4 20% | 23.5 31% |
| Idle Bottom * | 34.8 | 26.1 25% | 31.4 10% | 30.2 13% | 27.8 20% | 24.1 31% |
* ... más pequeño es mejor
Altavoces
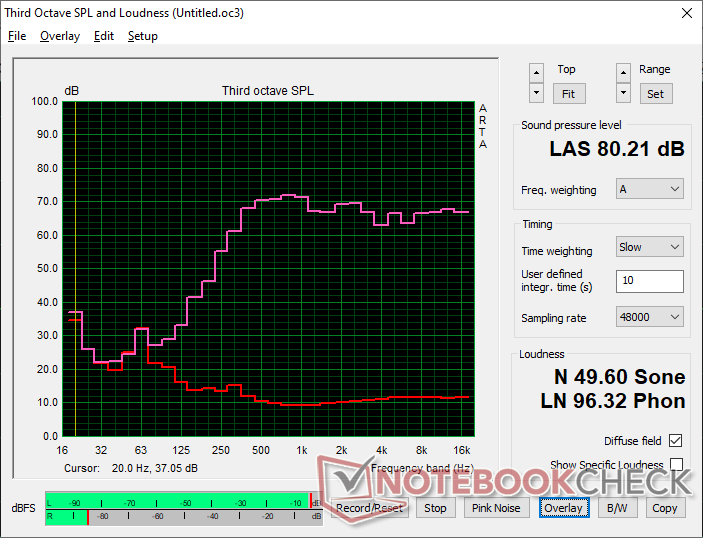
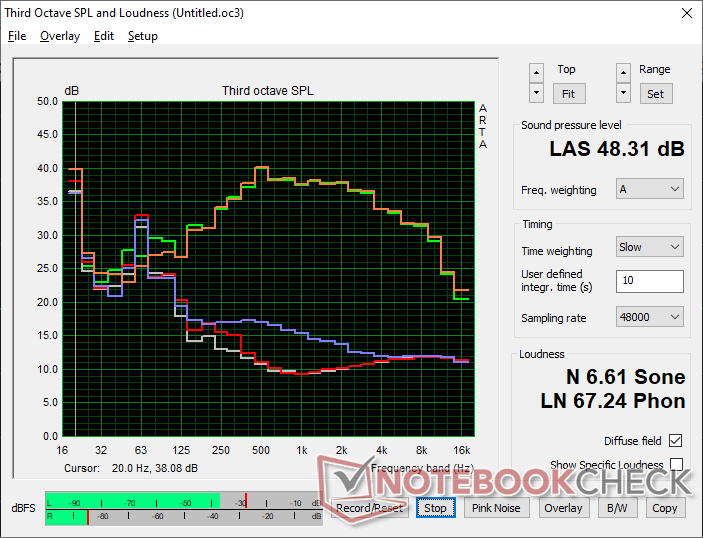
Lenovo IdeaPad Pro 5 16IMH G9 RTX 4050 análisis de audio
(±) | la sonoridad del altavoz es media pero buena (80.2 dB)
Graves 100 - 315 Hz
(-) | casi sin bajos - de media 22.4% inferior a la mediana
(±) | la linealidad de los graves es media (10.3% delta a frecuencia anterior)
Medios 400 - 2000 Hz
(+) | medios equilibrados - a sólo 2.7% de la mediana
(+) | los medios son lineales (4% delta a la frecuencia anterior)
Altos 2 - 16 kHz
(+) | máximos equilibrados - a sólo 1.5% de la mediana
(+) | los máximos son lineales (4.1% delta a la frecuencia anterior)
Total 100 - 16.000 Hz
(+) | el sonido global es lineal (14.3% de diferencia con la mediana)
En comparación con la misma clase
» 28% de todos los dispositivos probados de esta clase eran mejores, 5% similares, 67% peores
» El mejor tuvo un delta de 5%, la media fue 18%, el peor fue ###max##%
En comparación con todos los dispositivos probados
» 16% de todos los dispositivos probados eran mejores, 4% similares, 80% peores
» El mejor tuvo un delta de 4%, la media fue 24%, el peor fue ###max##%
Apple MacBook Pro 16 2021 M1 Pro análisis de audio
(+) | los altavoces pueden reproducir a un volumen relativamente alto (#84.7 dB)
Graves 100 - 315 Hz
(+) | buen bajo - sólo 3.8% lejos de la mediana
(+) | el bajo es lineal (5.2% delta a la frecuencia anterior)
Medios 400 - 2000 Hz
(+) | medios equilibrados - a sólo 1.3% de la mediana
(+) | los medios son lineales (2.1% delta a la frecuencia anterior)
Altos 2 - 16 kHz
(+) | máximos equilibrados - a sólo 1.9% de la mediana
(+) | los máximos son lineales (2.7% delta a la frecuencia anterior)
Total 100 - 16.000 Hz
(+) | el sonido global es lineal (4.6% de diferencia con la mediana)
En comparación con la misma clase
» 0% de todos los dispositivos probados de esta clase eran mejores, 0% similares, 100% peores
» El mejor tuvo un delta de 5%, la media fue 18%, el peor fue ###max##%
En comparación con todos los dispositivos probados
» 0% de todos los dispositivos probados eran mejores, 0% similares, 100% peores
» El mejor tuvo un delta de 4%, la media fue 24%, el peor fue ###max##%
Gestión de la energía
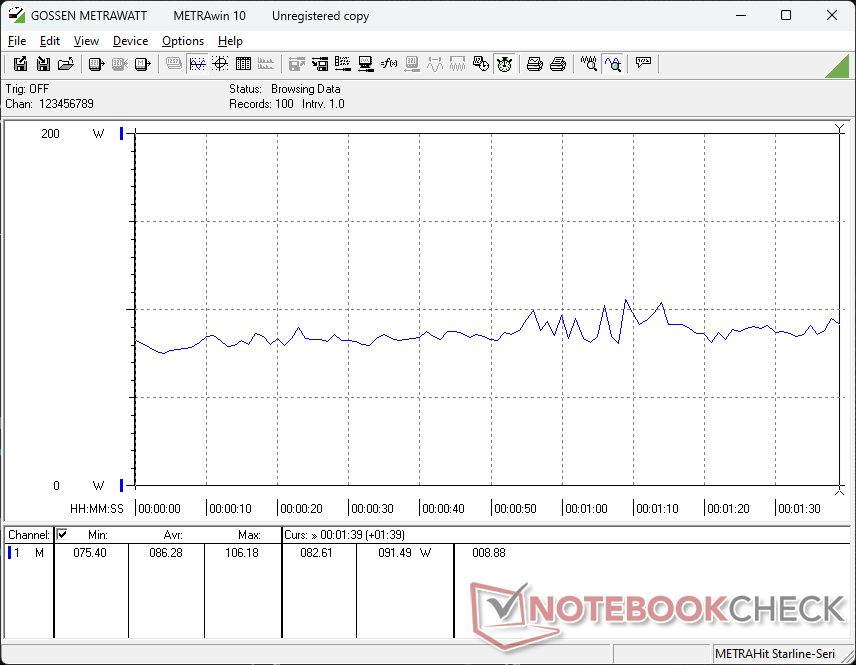
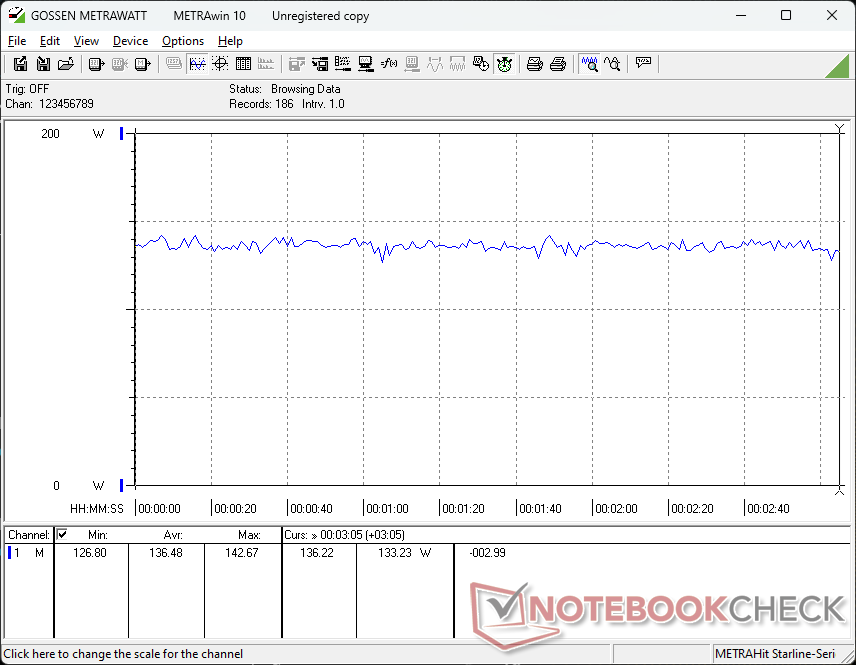
Consumo de energía
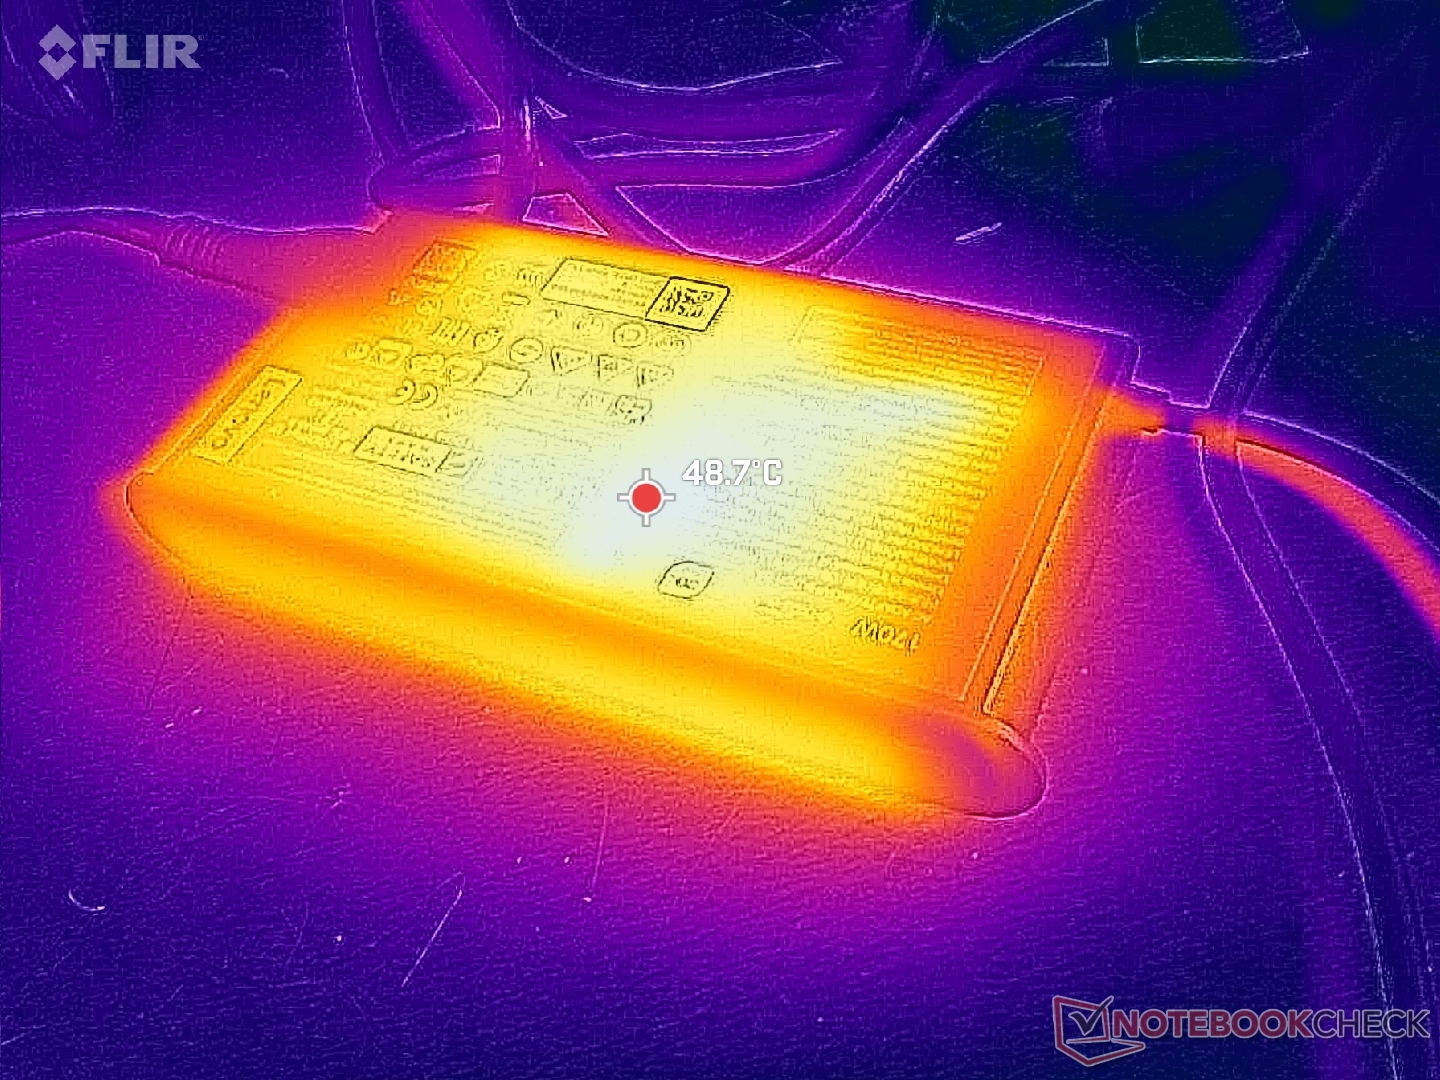
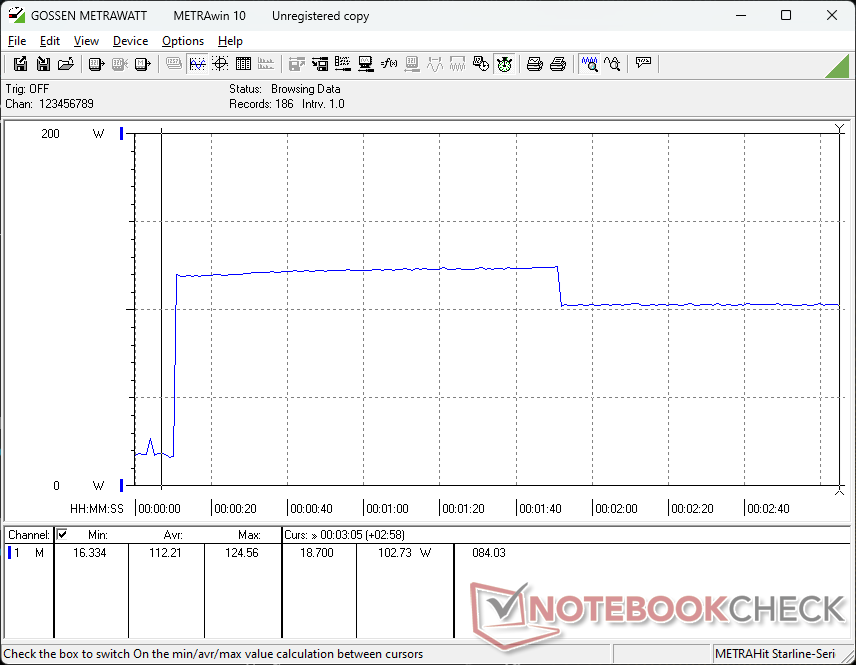
El ralentí en el sobremesa exige hasta 15 W frente a sólo 10 W en la configuración iGPU debido en gran parte al panel OLED. El delta crece mucho más, de 70 W a 80 W, cuando se ejecutan cargas exigentes como juegos. Vale la pena señalar que nuestra GPU RTX 4050 alcanza ligeramente más de 80 W cuando se juega en comparación con sólo ~ 50 W en el Galaxy Book4 Ultra por lo que el consumo general de energía es notablemente superior en nuestro Lenovo hasta ser casi como un portátil de juegos de nivel de entrada.
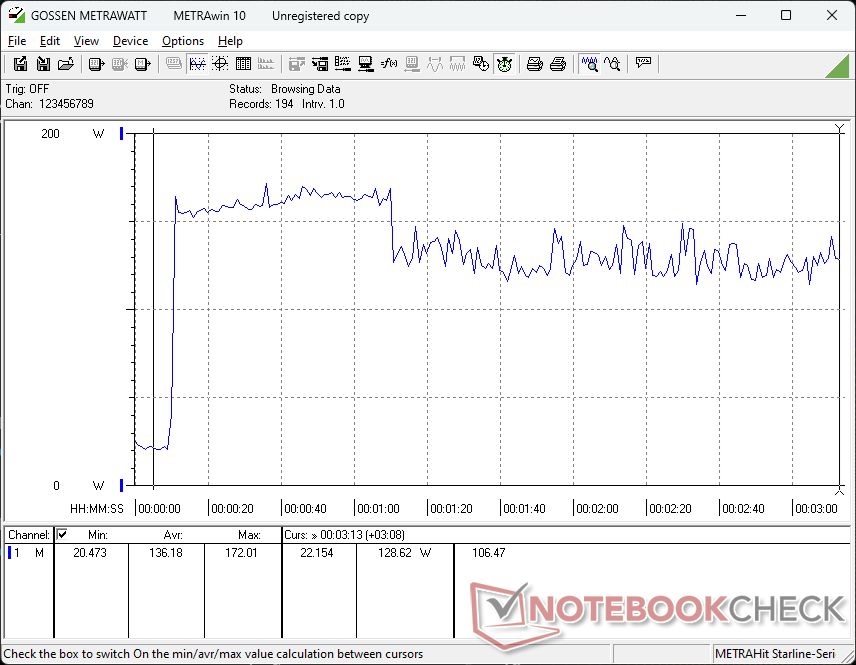
Somos capaces de registrar un consumo máximo temporal de 172 W desde el adaptador de CA de 170 W de tamaño medio (~15 x 7,8 x 2,2 cm) cuando la CPU y la GPU están al 100% de utilización. El consumo rondaría justo por debajo de los 140 W cuando se está jugando, por lo que el sistema aún puede cargarse simultáneamente a un ritmo decente si es necesario. Nos alegra ver que el sistema de Lenovo admite carga de CA tipo barril en lugar de únicamente USB-C, ya que la menor potencia de este último habría afectado gravemente al rendimiento. El Galaxy Book4 Ultra, por ejemplo, sólo admite carga USB-C y, sin embargo, nuestro Lenovo superaría sistemáticamente al Samsung debido a nuestros mayores techos de potencia.
| Off / Standby | |
| Ocioso | |
| Carga |
|
Clave:
min: | |
| Lenovo IdeaPad Pro 5 16IMH G9 RTX 4050 Ultra 9 185H, NVIDIA GeForce RTX 4050 Laptop GPU, Samsung PM9C1a MZAL81T0HDLB, OLED, 2048x1280, 16" | Lenovo IdeaPad Pro 5 16IMH G9 Ultra 7 155H, Arc 8-Core, Samsung PM9C1a MZAL81T0HDLB, IPS, 2560x1600, 16" | Dell Inspiron 16 7640 2-in-1 Ultra 7 155H, Arc 8-Core, Micron 2550 1TB, Mini-LED, 2560x1600, 16" | Asus Zenbook S 16 UM5606-RK333W Ryzen AI 9 HX 370, Radeon 890M, Micron 2400 MTFDKBA1T0QFM, OLED, 2880x1800, 16" | HP Envy x360 2-in-1 16-ad0097nr R7 8840HS, Radeon 780M, KIOXIA BG5 KBG50ZNV1T02, OLED, 2880x1800, 16" | Samsung Galaxy Book4 Ultra Ultra 7 155H, NVIDIA GeForce RTX 4050 Laptop GPU, Samsung PM9A1 MZVL2512HCJQ, OLED, 2880x1800, 16" | |
|---|---|---|---|---|---|---|
| Power Consumption | 21% | 11% | 32% | 26% | 18% | |
| Idle Minimum * | 5.6 | 3.5 37% | 6.1 -9% | 5.4 4% | 5 11% | 4.8 14% |
| Idle Average * | 7.3 | 9.6 -32% | 13.5 -85% | 10.5 -44% | 6.2 15% | 7.5 -3% |
| Idle Maximum * | 14.6 | 9.9 32% | 13.8 5% | 10.9 25% | 14.7 -1% | 7.9 46% |
| Load Average * | 86.3 | 62.7 27% | 63.6 26% | 47.8 45% | 49.9 42% | 79.3 8% |
| Cyberpunk 2077 ultra external monitor * | 135.8 | 64.6 52% | 46.7 66% | |||
| Cyberpunk 2077 ultra * | 136.4 | 67 51% | 49.2 64% | |||
| Load Maximum * | 172 | 101.2 41% | 109.7 36% | 58.6 66% | 65 62% | 125 27% |
| Witcher 3 ultra * | 55.8 | 54.5 | 79.2 |
* ... más pequeño es mejor
Power Consumption Cyberpunk / Stress Test
Power Consumption external Monitor
Duración de las pilas
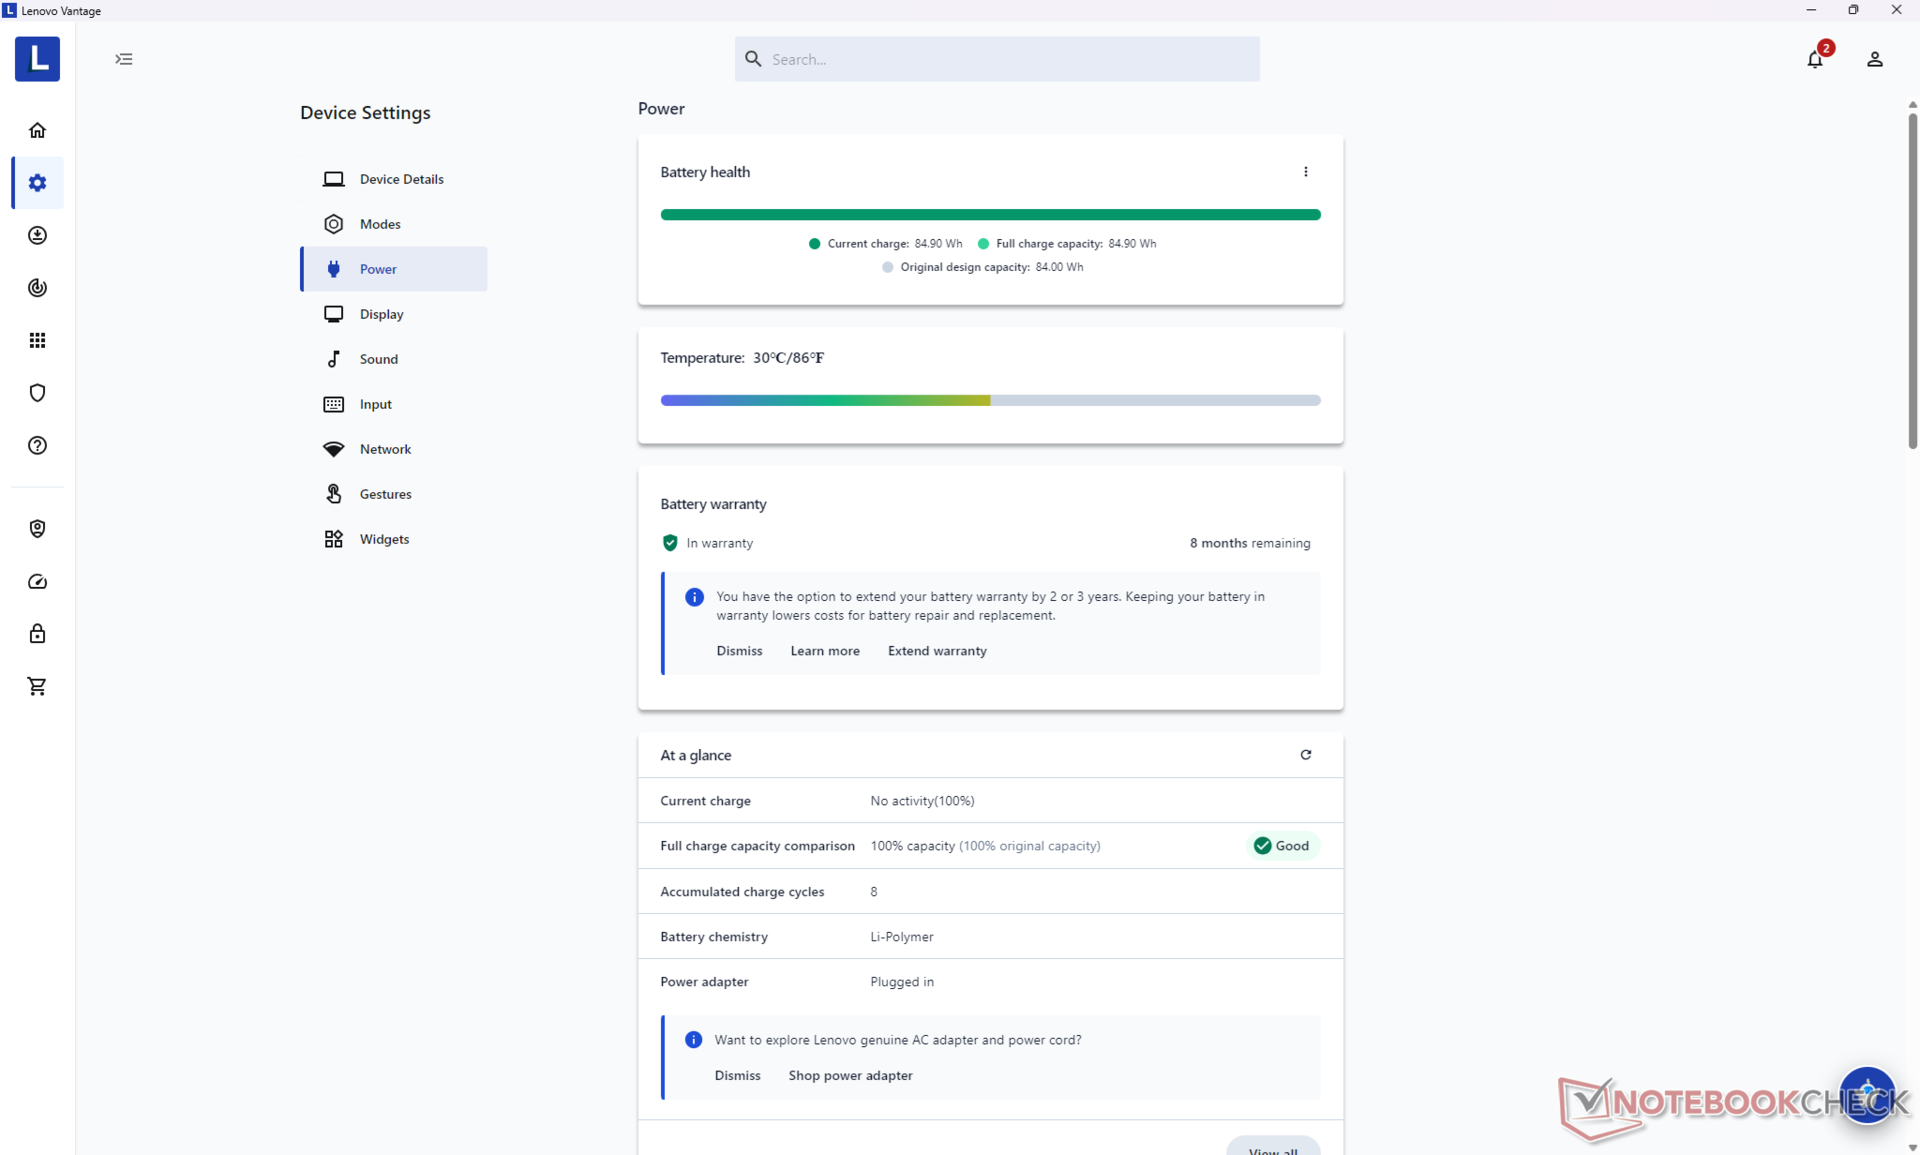
Los tiempos de ejecución son previsiblemente más cortos que en la configuración IPS iGPU debido a las razones mencionadas en la sección anterior. Aun así, 10,5 horas de navegación WLAN en el mundo real sigue siendo bastante larga y comparable a la del Inspiron 16 7640 2 en 1 o el Zenbook S 16.
La carga desde vacío a plena capacidad es muy rápida con unos 60 minutos en comparación con los 90 minutos de la mayoría de los otros Ultrabooks. La carga con adaptadores de CA USB-C será más lenta.
| Lenovo IdeaPad Pro 5 16IMH G9 RTX 4050 Ultra 9 185H, NVIDIA GeForce RTX 4050 Laptop GPU, 84 Wh | Lenovo IdeaPad Pro 5 16IMH G9 Ultra 7 155H, Arc 8-Core, 84 Wh | Dell Inspiron 16 7640 2-in-1 Ultra 7 155H, Arc 8-Core, 90 Wh | Asus Zenbook S 16 UM5606-RK333W Ryzen AI 9 HX 370, Radeon 890M, 78 Wh | HP Envy x360 2-in-1 16-ad0097nr R7 8840HS, Radeon 780M, 68 Wh | Samsung Galaxy Book4 Ultra Ultra 7 155H, NVIDIA GeForce RTX 4050 Laptop GPU, 76 Wh | |
|---|---|---|---|---|---|---|
| Duración de Batería | 27% | 30% | 57% | 25% | 30% | |
| Reader / Idle | 1338 | 1310 -2% | 935 -30% | |||
| WiFi v1.3 | 639 | 756 18% | 686 7% | 640 0% | 459 -28% | 656 3% |
| Load | 50 | 68 36% | 93 86% | 107 114% | 116 132% | 78 56% |
| H.264 | 957 | 1204 | 1076 |
Pro
Contra
Veredicto - Bien equilibrado por $1500
Mientras que la configuración iGPU de gama baja es una máquina multimedia respetable, la configuración dGPU de gama alta es una máquina de juegos al límite. Su gráfica GeForce RTX 4050 de 90 W es más rápida que en la mayoría de portátiles multimedia como el Samsung Galaxy Book4 Ultra e incluso rivaliza con muchos portátiles para juegos de gama básica equipados con gráficos RTX 4060 como el Legion LOQ. El sistema tiene bastante potencia teniendo en cuenta su perfil delgado y su diseño aburrido de oficina.
El IdeaPad Pro 5 16 G9 es más rápido de lo que parece cuando está totalmente configurado gracias a su fornida GPU GeForce RTX 4050 de 90 W.
Todo ese rendimiento en un paquete tan delgado viene a costa de una menor duración de la batería, ventiladores más ruidosos y temperaturas más cálidas que la opción iGPU de gama más baja y la mayoría de los competidores en el espacio de 16 pulgadas. Lenovo podría haber mitigado estos inconvenientes yendo con una GPU más lenta de 50 W en su lugar, pero en realidad nos gusta que hayan ido con un techo más alto de 90 W para distinguir mejor el IdeaPad Pro 5 16 G9 de la competencia. No destaca especialmente en el trabajo de oficina de la misma forma que un ThinkPad T16 o en juegos de la misma forma que un Legion Pro 5 16pero es mejor que la media en ambos para ser una buena solución polivalente.
Precio y disponibilidad
Costco está enviando ahora el Lenovo IdeaPad Pro 5i 16 con el Core Ultra 9 185H y RTX 4050 como configurado por $ 1500 o $ 1350 durante la venta de tiempo limitado.
Nota: Recientemente hemos actualizado nuestro sistema de clasificación y los resultados de la versión 8 no son comparables con los de la versión 7. Encontrará más información aquí .
Lenovo IdeaPad Pro 5 16IMH G9 RTX 4050
- 09/08/2024 v8
Allen Ngo
 Total Sustainability Score:
 Transparencia
La selección de los dispositivos que se van a reseñar corre a cargo de nuestro equipo editorial. La muestra de prueba fue proporcionada al autor en calidad de préstamo por el fabricante o el minorista a los efectos de esta reseña. El prestamista no tuvo ninguna influencia en esta reseña, ni el fabricante recibió una copia de la misma antes de su publicación. No había ninguna obligación de publicar esta reseña. Nunca aceptamos compensaciones o pagos a cambio de nuestras reseñas. Como empresa de medios independiente, Notebookcheck no está sujeta a la autoridad de fabricantes, minoristas o editores.
Así es como prueba Notebookcheck
Cada año, Notebookcheck revisa de forma independiente cientos de portátiles y smartphones utilizando procedimientos estandarizados para asegurar que todos los resultados son comparables. Hemos desarrollado continuamente nuestros métodos de prueba durante unos 20 años y hemos establecido los estándares de la industria en el proceso. En nuestros laboratorios de pruebas, técnicos y editores experimentados utilizan equipos de medición de alta calidad. Estas pruebas implican un proceso de validación en varias fases. Nuestro complejo sistema de clasificación se basa en cientos de mediciones y puntos de referencia bien fundamentados, lo que mantiene la objetividad.Price comparison

