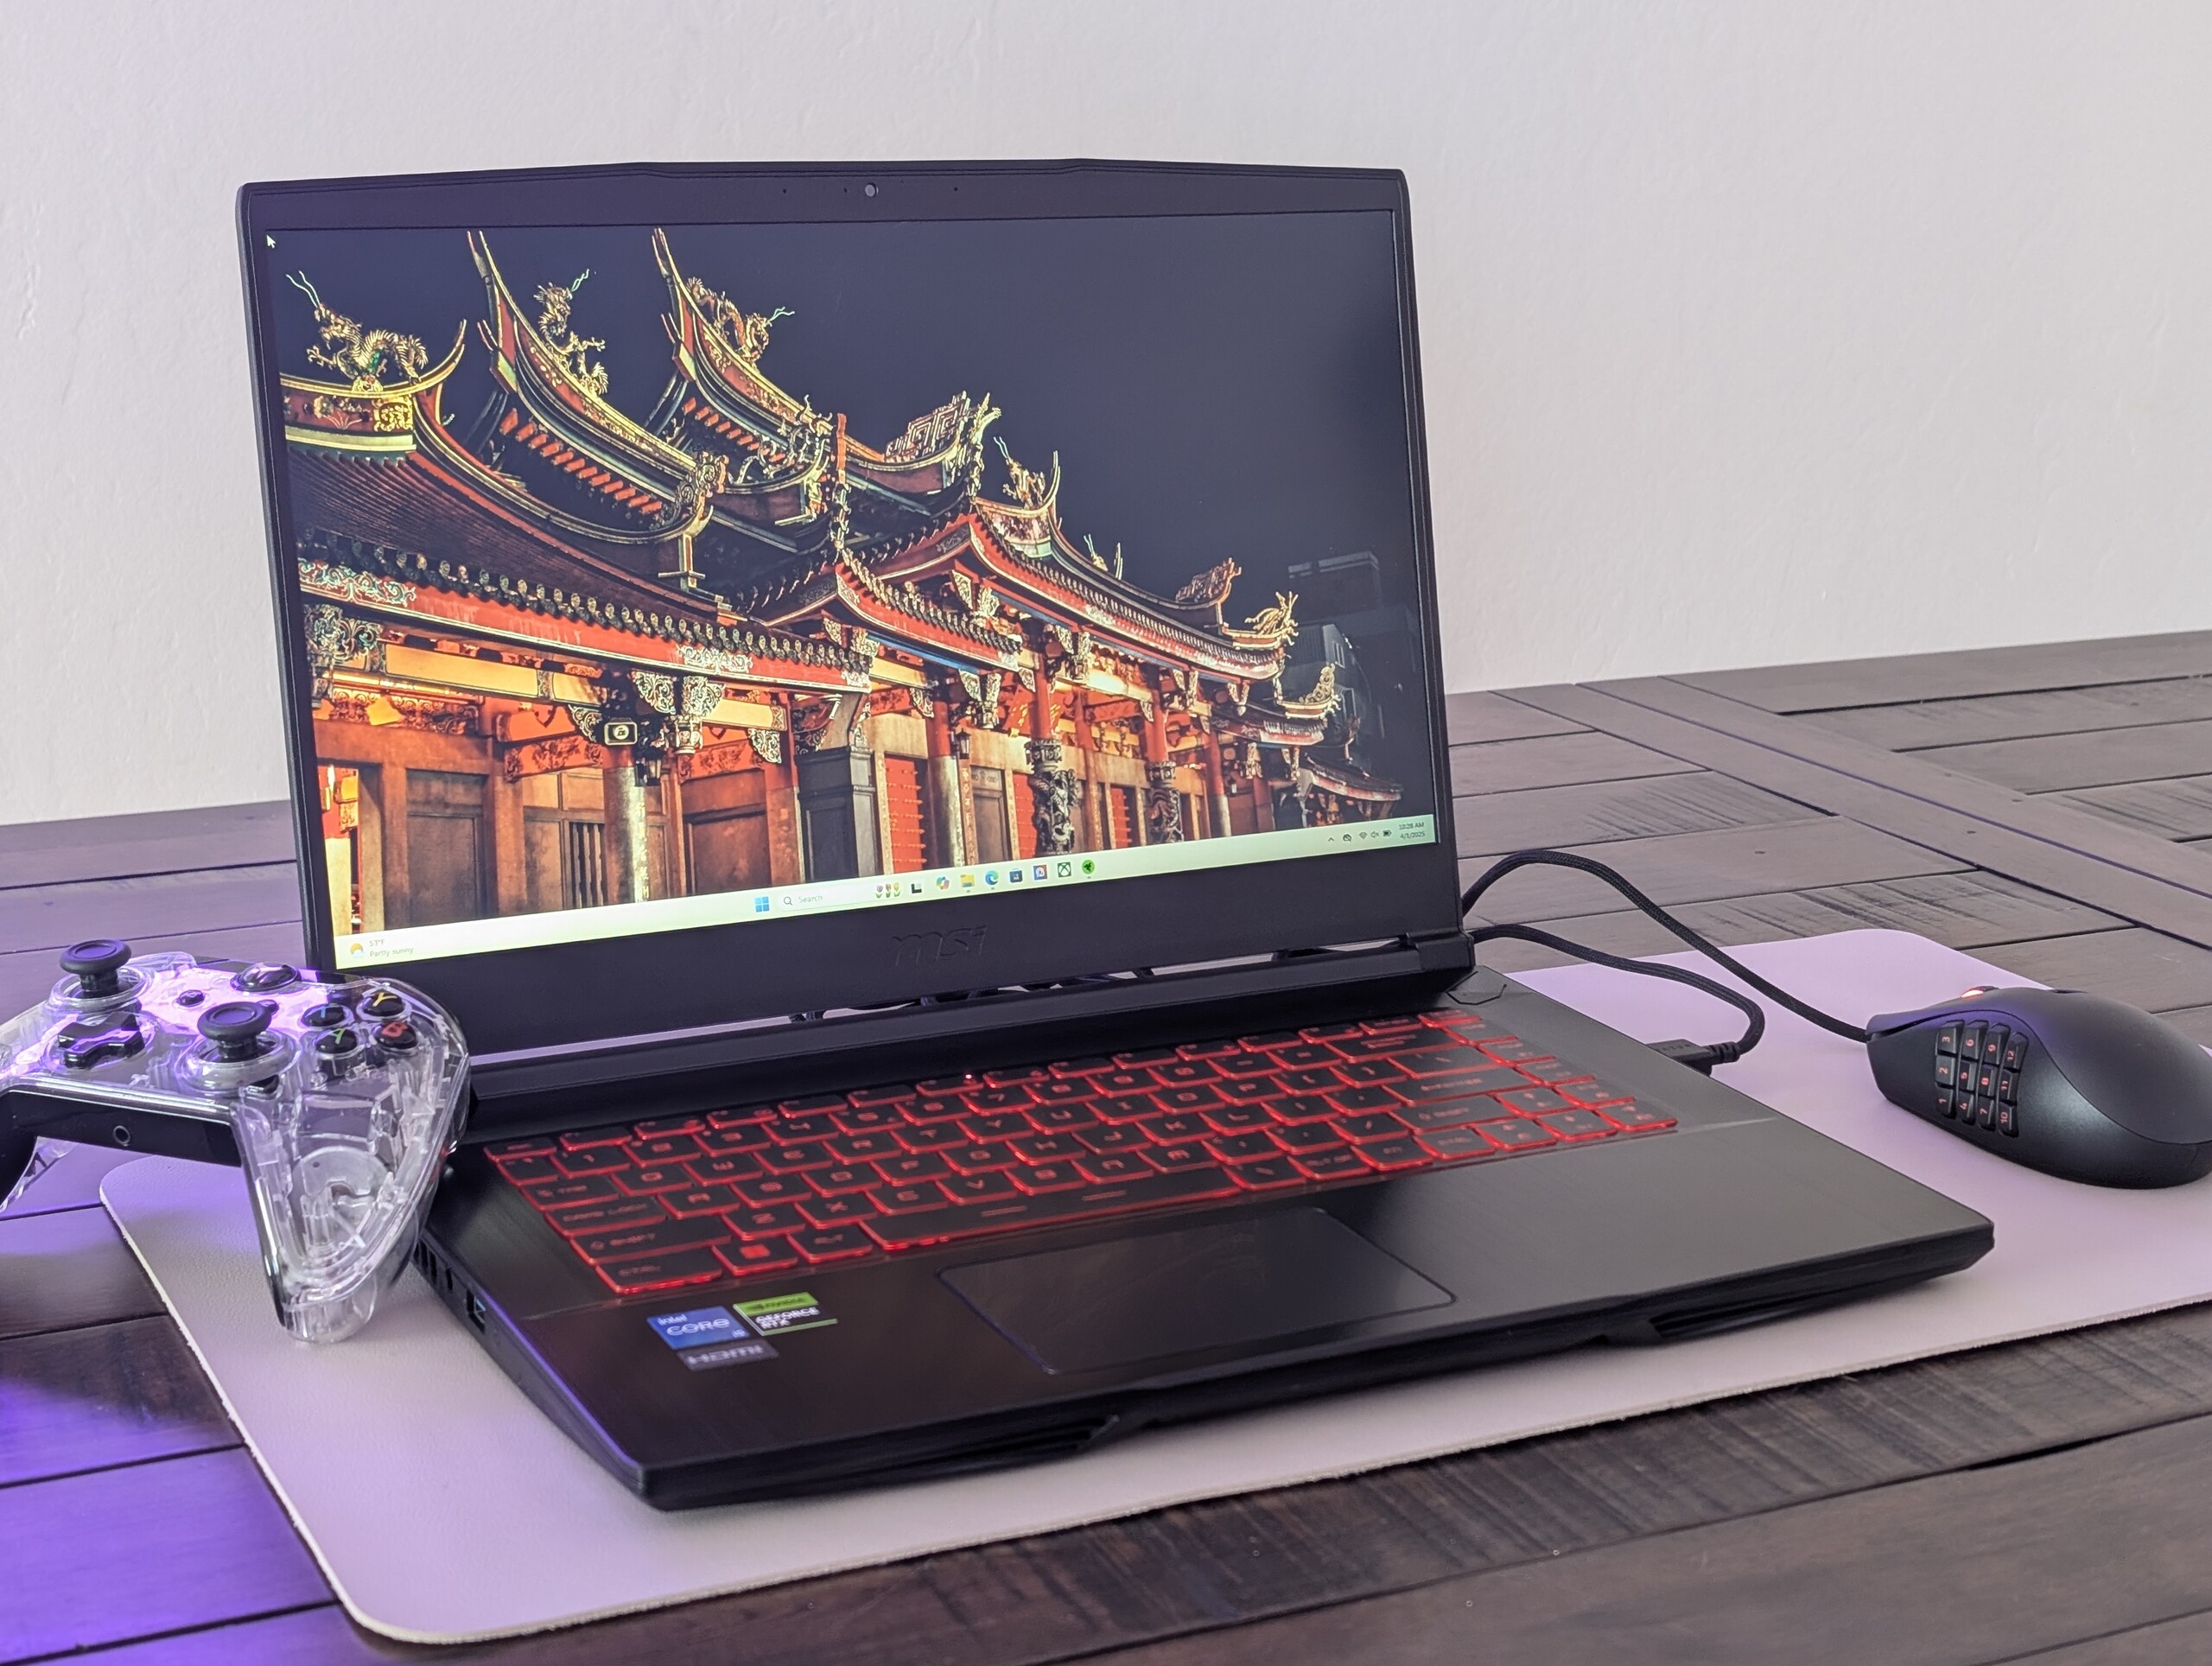
Análisis del portátil MSI Thin GF63 12VE: GeForce RTX 4050 para juegos con 8 GB de RAM
Cortar demasiadas esquinas.
El portátil para juegos de 15,6 pulgadas menos caro de MSI cuenta con características modernas como una pantalla IPS de 144 Hz, gráficos GeForce RTX 4050 y un procesador de la serie Core-H. Sin embargo, querrá evitar ciertas SKUs especialmente aquellas con solo 8 GB de RAM.Allen Ngo, 👁 Allen Ngo (traducido por DeepL / Ninh Duy) Publicado 🇺🇸 🇫🇷 ...
Veredicto - Consiga la configuración de 16 GB
El precio de <900 dólares es suficiente para que cualquier jugador económico se interese por el MSI GF63. Sus especificaciones marcan muchas casillas, incluida la rápida frecuencia de actualización de 144 Hz, la GPU GeForce RTX 4050, la relativamente nueva CPU Core i5 o i7 de serie H de 12ª generación y 512 GB de almacenamiento. Esta no es una máquina lenta en su núcleo y sólo va a ser más barata ahora que los portátiles GeForce RTX 50 están llegando al mercado. El sistema de MSI también es más ligero que muchas alternativas, incluyendo el Acer Nitro V 15 o el Lenovo LOQ 15.
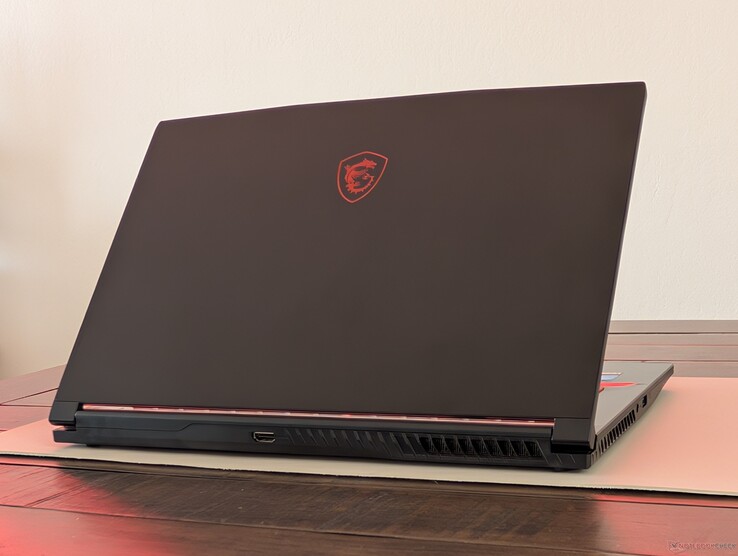
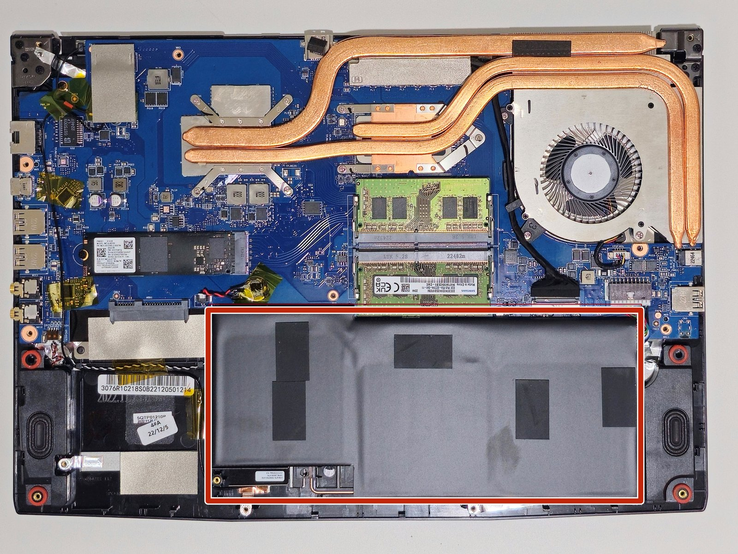
Lamentablemente, la experiencia del usuario no ha cambiado con respecto al modelo 2020 lo que significa que el chasis sigue pareciendo barato y que cualquier reparación por parte del usuario final requiere romper una pegatina de fábrica antimanipulación. Por tanto, deberían evitarse las SKU con 8 GB de RAM, ya que la memoria limitada repercute en el rendimiento general, mientras que la pegatina de fábrica disuade de cualquier tipo de actualización.
Pro
Contra
Precio y disponibilidad
La versión Core i7 el MSI Thin GF63 ya está disponible en Amazon por 860 dólares.
El GF63 es la línea menos costosa de MSI de portátiles para juegos diseñados para jugadores conscientes del presupuesto que quieren gráficos RTX GeForce sin todas las campanas y silbatos. Han pasado 5 años desde que revisamos el último GF63, por lo que este último modelo viene con opciones de GPU Intel Alder Lake y Ada Lovelace mucho más recientes.
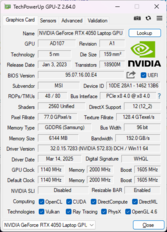
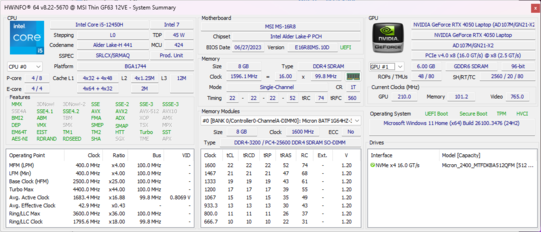
Nuestra unidad de prueba es una configuración de gama baja ampliamente disponible en minoristas como Target y Amazon. Se vende con el Core i5-12450H, 6 GB de RTX 4050, 8 GB de RAM y pantalla IPS 1080p de 144 Hz por aproximadamente entre 850 y 900 dólares. También hay disponibles SKU con el Core i7-12650H, RTX 4060 y el doble de RAM.
Entre sus competidores se incluyen otros portátiles para juegos de gama básica como el Lenovo LOQ 15, el Asus TUF A15 o el Acer Nitro V 15.
Más análisis de MSI:
Especificaciones
Top 10 Análisis
» Top 10 Portátiles Multimedia
» Top 10 Portátiles de Juego
» Top 10 Portátiles de Juego ligeros
» Top 10 Portátiles Asequibles de Oficina/Empresa
» Top 10 Portátiles de Juego Ligeros
» Top 10 Portátiles de Oficina/Empresa Premium
» Top 10 Estaciones de Trabajo
» Top 10 Subportátiles
» Top 10 Ultrabooks
» Top 10 Convertibles
» Top 10 Tablets
» Top 10 Tablets Windows
» Top 10 Tablets de menos de 250 Euros
» Top 10 Phablets (>5.5")
» Top 10 Smartphones
» Top 10 Smartphones (≤5")
» Top 10 Smartphones de menos de 300 Euros
» Top 10 Smartphones de menos de 120 Euros
» Top 10 Portátiles de menos de 1000 Euros
» Top 10 Portátiles de menos de 500 Euros
» Top 10 Portátiles de menos de 300 Euros
» Los Mejores Displays de Portátiles Analizados por Notebookcheck
Caso
Conectividad
Comunicación
| Networking | |
| iperf3 transmit AX12 | |
| MSI GF63 Thin 9SC | |
| iperf3 receive AX12 | |
| MSI GF63 Thin 9SC | |
| iperf3 transmit AXE11000 | |
| Asus TUF A15 FA507 | |
| MSI Thin GF63 12VE | |
| Lenovo LOQ 15IRX9 | |
| Acer Nitro V 15 ANV15-51-582S | |
| HP Victus 15-fa1057ng | |
| iperf3 receive AXE11000 | |
| Lenovo LOQ 15IRX9 | |
| Acer Nitro V 15 ANV15-51-582S | |
| Asus TUF A15 FA507 | |
| MSI Thin GF63 12VE | |
| HP Victus 15-fa1057ng | |
Cámara web
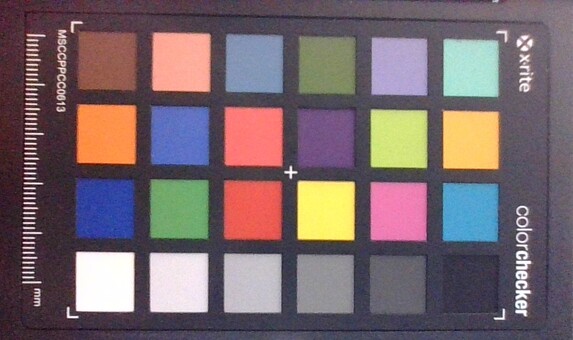
No hay sensor de infrarrojos ni control deslizante físico de la cámara. En su lugar, la cámara puede apagarse electrónicamente mediante una tecla de acceso directo.
Mantenimiento
Sostenibilidad
MSI no anuncia ninguna medida de sostenibilidad para la serie GF63. El embalaje, sin embargo, es mayoritariamente de papel y cartón.
Accesorios y garantía
No hay extras en la caja. Se aplica la garantía limitada estándar del fabricante de un año.
Dispositivos de entrada
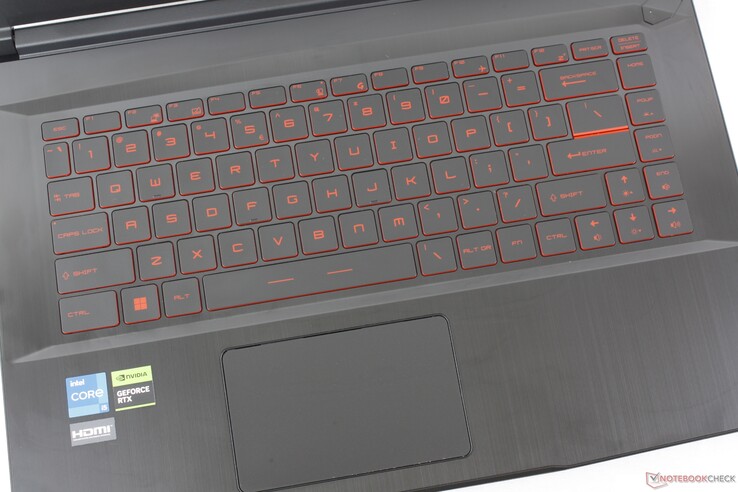
Teclado y panel táctil
Mostrar
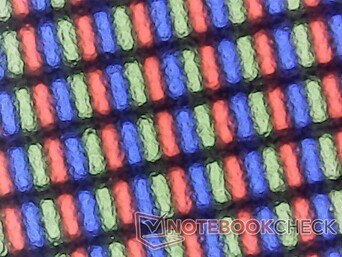
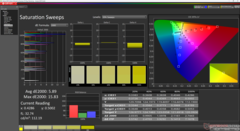
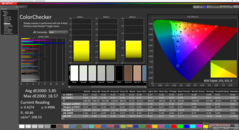
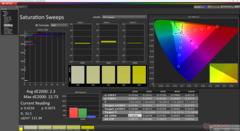
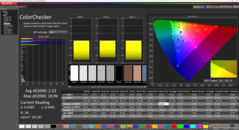
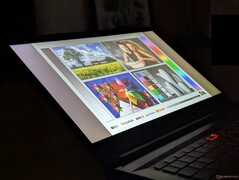
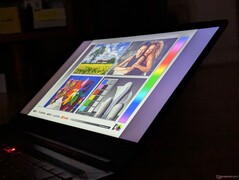
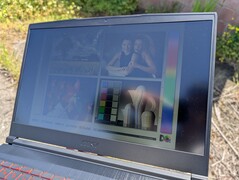
Nuestro panel IPS AU Optronics B156HAN08.4 es una mejora respecto al AU Optronics B156HAN02.1 del GF63 2020 en términos de frecuencia de actualización nativa y tiempos de respuesta. Sin embargo, la cobertura sRGB y el brillo siguen siendo débiles.
| |||||||||||||||||||||||||
iluminación: 96 %
Brillo con batería: 248.6 cd/m²
Contraste: 1381:1 (Negro: 0.18 cd/m²)
ΔE Color 5.85 | 0.5-29.43 Ø4.87, calibrated: 2.52
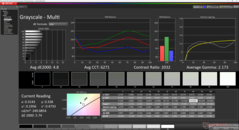
ΔE Greyscale 4.8 | 0.5-98 Ø5.1
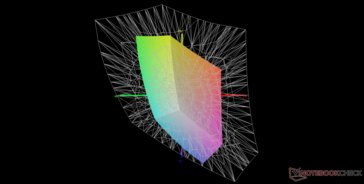
40.5% AdobeRGB 1998 (Argyll 2.2.0 3D)
58.4% sRGB (Argyll 2.2.0 3D)
39.2% Display P3 (Argyll 2.2.0 3D)
Gamma: 2.17
| MSI Thin GF63 12VE AU Optronics B156HAN08.4, IPS, 1920x1080, 15.6", 144 Hz | MSI GF63 Thin 9SC AU Optronics B156HAN02.1 (AUO21ED), IPS, 1920x1080, 15.6", Hz | Lenovo LOQ 15IRX9 BOE NJ NE156FHM-NX9, IPS, 1920x1080, 15.6", 144 Hz | HP Victus 15-fa1057ng BOE094D, IPS, 1920x1080, 15.6", 144 Hz | Acer Nitro V 15 ANV15-51-582S LG LP156WFJ-SPB4 (LGD0742), IPS, 1920x1080, 15.6", 144 Hz | Asus TUF A15 FA507 N156HMA-GA1, IPS, 1920x1080, 15.6", 144 Hz | |
|---|---|---|---|---|---|---|
| Display | -4% | 79% | -0% | 2% | 65% | |
| Display P3 Coverage | 39.2 | 37.76 -4% | 73.7 88% | 39.2 0% | 40 2% | 64.9 66% |
| sRGB Coverage | 58.4 | 56.5 -3% | 99.1 70% | 57.9 -1% | 60 3% | 96.5 65% |
| AdobeRGB 1998 Coverage | 40.5 | 39.01 -4% | 72.6 79% | 40.5 0% | 41.4 2% | 66.6 64% |
| Response Times | -60% | -35% | 16% | -26% | -7% | |
| Response Time Grey 50% / Grey 80% * | 25.6 ? | 44.8 ? -75% | 42.2 ? -65% | 23.8 ? 7% | 34.2 ? -34% | 30.4 ? -19% |
| Response Time Black / White * | 21.8 ? | 31.6 ? -45% | 22.6 ? -4% | 16.3 ? 25% | 25.8 ? -18% | 20.8 ? 5% |
| PWM Frequency | ||||||
| Screen | 4% | 27% | -12% | -14% | 34% | |
| Brightness middle | 248.6 | 260 5% | 306 23% | 273 10% | 292 17% | 288 16% |
| Brightness | 257 | 249 -3% | 287 12% | 249 -3% | 263 2% | 271 5% |
| Brightness Distribution | 96 | 92 -4% | 88 -8% | 84 -12% | 80 -17% | 91 -5% |
| Black Level * | 0.18 | 0.23 -28% | 0.21 -17% | 0.28 -56% | 0.25 -39% | 0.17 6% |
| Contrast | 1381 | 1130 -18% | 1457 6% | 975 -29% | 1168 -15% | 1694 23% |
| Colorchecker dE 2000 * | 5.85 | 4.1 30% | 2.25 62% | 5.19 11% | 7.15 -22% | 1.9 68% |
| Colorchecker dE 2000 max. * | 18.57 | 7.93 57% | 4.84 74% | 21.16 -14% | 15.51 16% | 3.3 82% |
| Colorchecker dE 2000 calibrated * | 2.52 | 3.56 -41% | 1.45 42% | 4.54 -80% | 4.13 -64% | 0.9 64% |
| Greyscale dE 2000 * | 4.8 | 2.83 41% | 2.4 50% | 1.7 65% | 4.9 -2% | 2.7 44% |
| Gamma | 2.17 101% | 2.53 87% | 2.259 97% | 2.148 102% | 2.014 109% | 2.32 95% |
| CCT | 6271 104% | 6158 106% | 6790 96% | 6819 95% | 7178 91% | 6535 99% |
| Color Space (Percent of AdobeRGB 1998) | 36 | |||||
| Color Space (Percent of sRGB) | 56 | |||||
| Media total (Programa/Opciones) | -20% /
-7% | 24% /
29% | 1% /
-6% | -13% /
-12% | 31% /
35% |
* ... más pequeño es mejor
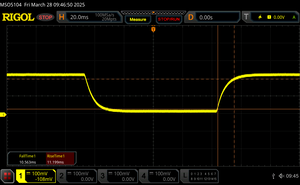
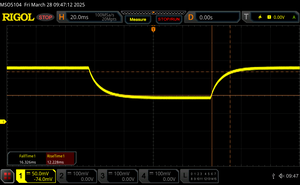
Tiempos de respuesta del display
| ↔ Tiempo de respuesta de Negro a Blanco | ||
|---|---|---|
| 21.8 ms ... subida ↗ y bajada ↘ combinada | ↗ 11.2 ms subida | |
| ↘ 10.6 ms bajada | ||
| La pantalla mostró buenos tiempos de respuesta en nuestros tests pero podría ser demasiado lenta para los jugones competitivos. En comparación, todos los dispositivos de prueba van de ##min### (mínimo) a 240 (máximo) ms. » 45 % de todos los dispositivos son mejores. Eso quiere decir que el tiempo de respuesta es similar al dispositivo testado medio (20.7 ms). | ||
| ↔ Tiempo de respuesta 50% Gris a 80% Gris | ||
| 25.6 ms ... subida ↗ y bajada ↘ combinada | ↗ 12.2 ms subida | |
| ↘ 13.4 ms bajada | ||
| La pantalla mostró tiempos de respuesta relativamente lentos en nuestros tests pero podría ser demasiado lenta para los jugones. En comparación, todos los dispositivos de prueba van de ##min### (mínimo) a 636 (máximo) ms. » 33 % de todos los dispositivos son mejores. Esto quiere decir que el tiempo de respuesta medido es mejor que la media (32.5 ms) de todos los dispositivos testados. | ||
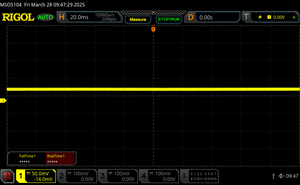
Parpadeo de Pantalla / PWM (Pulse-Width Modulation)
| Parpadeo de Pantalla / PWM no detectado | |||
Comparación: 53 % de todos los dispositivos testados no usaron PWM para atenuar el display. Si se usó, medimos una media de 8496 (mínimo: 5 - máxmo: 343500) Hz. | |||
Rendimiento
Condiciones de prueba
Pusimos el Centro MSI en el modo de Rendimiento Extremo antes de ejecutar los benchmarks que se muestran a continuación.
Procesador
Cinebench R15 Multi Loop
Cinebench R23: Multi Core | Single Core
Cinebench R20: CPU (Multi Core) | CPU (Single Core)
Cinebench R15: CPU Multi 64Bit | CPU Single 64Bit
Blender: v2.79 BMW27 CPU
7-Zip 18.03: 7z b 4 | 7z b 4 -mmt1
Geekbench 6.4: Multi-Core | Single-Core
Geekbench 5.5: Multi-Core | Single-Core
HWBOT x265 Benchmark v2.2: 4k Preset
LibreOffice : 20 Documents To PDF
R Benchmark 2.5: Overall mean
| CPU Performance Rating | |
| Asus TUF Gaming A15 FA507UV | |
| Gigabyte G5 KF5 2024 | |
| Lenovo LOQ 15IRH8 Core i7 | |
| Lenovo LOQ 15IRX9 | |
| HP Victus 15 fa0020nr -2! | |
| Gigabyte G5 KE -2! | |
| HP Victus 15-fa1057ng -4! | |
| Acer Nitro V 15 ANV15-51-582S | |
| Medio Intel Core i5-12450H | |
| MSI Thin GF63 12VE | |
| Lenovo IdeaPad Gaming 3 15ARH7 -2! | |
| Cinebench R20 / CPU (Multi Core) | |
| Asus TUF Gaming A15 FA507UV | |
| Lenovo LOQ 15IRX9 | |
| HP Victus 15 fa0020nr | |
| Lenovo LOQ 15IRH8 Core i7 | |
| Gigabyte G5 KF5 2024 | |
| HP Victus 15-fa1057ng | |
| Gigabyte G5 KE | |
| Acer Nitro V 15 ANV15-51-582S | |
| MSI Thin GF63 12VE | |
| Lenovo IdeaPad Gaming 3 15ARH7 | |
| Medio Intel Core i5-12450H (2952 - 4105, n=6) | |
| Cinebench R20 / CPU (Single Core) | |
| Lenovo LOQ 15IRH8 Core i7 | |
| Gigabyte G5 KF5 2024 | |
| HP Victus 15 fa0020nr | |
| Asus TUF Gaming A15 FA507UV | |
| HP Victus 15-fa1057ng | |
| Acer Nitro V 15 ANV15-51-582S | |
| Lenovo LOQ 15IRX9 | |
| Medio Intel Core i5-12450H (622 - 646, n=6) | |
| Gigabyte G5 KE | |
| MSI Thin GF63 12VE | |
| Lenovo IdeaPad Gaming 3 15ARH7 | |
| Cinebench R15 / CPU Multi 64Bit | |
| Asus TUF Gaming A15 FA507UV | |
| HP Victus 15 fa0020nr | |
| Lenovo LOQ 15IRX9 | |
| Gigabyte G5 KF5 2024 | |
| Lenovo LOQ 15IRH8 Core i7 | |
| HP Victus 15-fa1057ng | |
| Gigabyte G5 KE | |
| Acer Nitro V 15 ANV15-51-582S | |
| Lenovo IdeaPad Gaming 3 15ARH7 | |
| MSI Thin GF63 12VE | |
| Medio Intel Core i5-12450H (1150 - 1591, n=6) | |
| Cinebench R15 / CPU Single 64Bit | |
| Asus TUF Gaming A15 FA507UV | |
| Gigabyte G5 KF5 2024 | |
| Lenovo LOQ 15IRH8 Core i7 | |
| HP Victus 15 fa0020nr | |
| Gigabyte G5 KE | |
| HP Victus 15-fa1057ng | |
| Acer Nitro V 15 ANV15-51-582S | |
| Lenovo LOQ 15IRX9 | |
| Medio Intel Core i5-12450H (225 - 239, n=6) | |
| Lenovo IdeaPad Gaming 3 15ARH7 | |
| MSI Thin GF63 12VE | |
| Geekbench 6.4 / Multi-Core | |
| Gigabyte G5 KF5 2024 | |
| Lenovo LOQ 15IRX9 | |
| Asus TUF Gaming A15 FA507UV | |
| Lenovo LOQ 15IRH8 Core i7 | |
| Acer Nitro V 15 ANV15-51-582S | |
| Medio Intel Core i5-12450H (7081 - 9109, n=7) | |
| MSI Thin GF63 12VE | |
| Geekbench 6.4 / Single-Core | |
| Asus TUF Gaming A15 FA507UV | |
| Lenovo LOQ 15IRH8 Core i7 | |
| Gigabyte G5 KF5 2024 | |
| Lenovo LOQ 15IRX9 | |
| Acer Nitro V 15 ANV15-51-582S | |
| Medio Intel Core i5-12450H (2155 - 2293, n=7) | |
| MSI Thin GF63 12VE | |
| Geekbench 5.5 / Multi-Core | |
| Lenovo LOQ 15IRX9 | |
| Asus TUF Gaming A15 FA507UV | |
| Gigabyte G5 KF5 2024 | |
| Lenovo LOQ 15IRH8 Core i7 | |
| HP Victus 15 fa0020nr | |
| Gigabyte G5 KE | |
| Acer Nitro V 15 ANV15-51-582S | |
| Medio Intel Core i5-12450H (6777 - 8330, n=7) | |
| MSI Thin GF63 12VE | |
| Lenovo IdeaPad Gaming 3 15ARH7 | |
| Geekbench 5.5 / Single-Core | |
| Asus TUF Gaming A15 FA507UV | |
| Lenovo LOQ 15IRH8 Core i7 | |
| Gigabyte G5 KF5 2024 | |
| HP Victus 15 fa0020nr | |
| Lenovo LOQ 15IRX9 | |
| Acer Nitro V 15 ANV15-51-582S | |
| Gigabyte G5 KE | |
| Medio Intel Core i5-12450H (1527 - 1665, n=7) | |
| MSI Thin GF63 12VE | |
| Lenovo IdeaPad Gaming 3 15ARH7 | |
| HWBOT x265 Benchmark v2.2 / 4k Preset | |
| Asus TUF Gaming A15 FA507UV | |
| Gigabyte G5 KF5 2024 | |
| Lenovo LOQ 15IRX9 | |
| Gigabyte G5 KE | |
| Lenovo LOQ 15IRH8 Core i7 | |
| HP Victus 15 fa0020nr | |
| HP Victus 15-fa1057ng | |
| Acer Nitro V 15 ANV15-51-582S | |
| Lenovo IdeaPad Gaming 3 15ARH7 | |
| MSI Thin GF63 12VE | |
| Medio Intel Core i5-12450H (8.78 - 12.3, n=6) | |
| LibreOffice / 20 Documents To PDF | |
| HP Victus 15-fa1057ng | |
| MSI Thin GF63 12VE | |
| Acer Nitro V 15 ANV15-51-582S | |
| Lenovo LOQ 15IRX9 | |
| Lenovo IdeaPad Gaming 3 15ARH7 | |
| Gigabyte G5 KE | |
| Gigabyte G5 KF5 2024 | |
| HP Victus 15 fa0020nr | |
| Medio Intel Core i5-12450H (41.1 - 60.3, n=7) | |
| Asus TUF Gaming A15 FA507UV | |
| Lenovo LOQ 15IRH8 Core i7 | |
| R Benchmark 2.5 / Overall mean | |
| MSI Thin GF63 12VE | |
| Lenovo IdeaPad Gaming 3 15ARH7 | |
| Medio Intel Core i5-12450H (0.4949 - 0.54, n=7) | |
| Acer Nitro V 15 ANV15-51-582S | |
| HP Victus 15-fa1057ng | |
| Gigabyte G5 KE | |
| Lenovo LOQ 15IRX9 | |
| HP Victus 15 fa0020nr | |
| Lenovo LOQ 15IRH8 Core i7 | |
| Gigabyte G5 KF5 2024 | |
| Asus TUF Gaming A15 FA507UV | |
* ... más pequeño es mejor
AIDA64: FP32 Ray-Trace | FPU Julia | CPU SHA3 | CPU Queen | FPU SinJulia | FPU Mandel | CPU AES | CPU ZLib | FP64 Ray-Trace | CPU PhotoWorxx
| Performance Rating | |
| Asus TUF A15 FA507 | |
| Lenovo LOQ 15IRX9 | |
| HP Victus 15-fa1057ng | |
| Acer Nitro V 15 ANV15-51-582S | |
| MSI Thin GF63 12VE | |
| Medio Intel Core i5-12450H | |
| AIDA64 / FP32 Ray-Trace | |
| Asus TUF A15 FA507 | |
| Lenovo LOQ 15IRX9 | |
| HP Victus 15-fa1057ng | |
| Acer Nitro V 15 ANV15-51-582S | |
| MSI Thin GF63 12VE | |
| Medio Intel Core i5-12450H (7229 - 10474, n=6) | |
| AIDA64 / FPU Julia | |
| Asus TUF A15 FA507 | |
| Lenovo LOQ 15IRX9 | |
| Acer Nitro V 15 ANV15-51-582S | |
| HP Victus 15-fa1057ng | |
| MSI Thin GF63 12VE | |
| Medio Intel Core i5-12450H (37583 - 51636, n=6) | |
| AIDA64 / CPU SHA3 | |
| Lenovo LOQ 15IRX9 | |
| Asus TUF A15 FA507 | |
| Acer Nitro V 15 ANV15-51-582S | |
| HP Victus 15-fa1057ng | |
| MSI Thin GF63 12VE | |
| Medio Intel Core i5-12450H (1724 - 2359, n=6) | |
| AIDA64 / CPU Queen | |
| Asus TUF A15 FA507 | |
| Lenovo LOQ 15IRX9 | |
| HP Victus 15-fa1057ng | |
| Acer Nitro V 15 ANV15-51-582S | |
| MSI Thin GF63 12VE | |
| Medio Intel Core i5-12450H (59539 - 68897, n=6) | |
| AIDA64 / FPU SinJulia | |
| Asus TUF A15 FA507 | |
| Lenovo LOQ 15IRX9 | |
| HP Victus 15-fa1057ng | |
| Acer Nitro V 15 ANV15-51-582S | |
| MSI Thin GF63 12VE | |
| Medio Intel Core i5-12450H (5007 - 6147, n=6) | |
| AIDA64 / FPU Mandel | |
| Asus TUF A15 FA507 | |
| Lenovo LOQ 15IRX9 | |
| HP Victus 15-fa1057ng | |
| Acer Nitro V 15 ANV15-51-582S | |
| MSI Thin GF63 12VE | |
| Medio Intel Core i5-12450H (18516 - 25115, n=6) | |
| AIDA64 / CPU AES | |
| Acer Nitro V 15 ANV15-51-582S | |
| Lenovo LOQ 15IRX9 | |
| Asus TUF A15 FA507 | |
| Medio Intel Core i5-12450H (46835 - 78537, n=6) | |
| HP Victus 15-fa1057ng | |
| MSI Thin GF63 12VE | |
| AIDA64 / CPU ZLib | |
| Lenovo LOQ 15IRX9 | |
| HP Victus 15-fa1057ng | |
| Acer Nitro V 15 ANV15-51-582S | |
| MSI Thin GF63 12VE | |
| Asus TUF A15 FA507 | |
| Medio Intel Core i5-12450H (490 - 708, n=6) | |
| AIDA64 / FP64 Ray-Trace | |
| Asus TUF A15 FA507 | |
| Lenovo LOQ 15IRX9 | |
| HP Victus 15-fa1057ng | |
| Acer Nitro V 15 ANV15-51-582S | |
| MSI Thin GF63 12VE | |
| Medio Intel Core i5-12450H (4025 - 5614, n=6) | |
| AIDA64 / CPU PhotoWorxx | |
| Lenovo LOQ 15IRX9 | |
| Asus TUF A15 FA507 | |
| HP Victus 15-fa1057ng | |
| Medio Intel Core i5-12450H (12271 - 28682, n=6) | |
| Acer Nitro V 15 ANV15-51-582S | |
| MSI Thin GF63 12VE | |
Rendimiento del sistema
CrossMark: Overall | Productivity | Creativity | Responsiveness
WebXPRT 3: Overall
WebXPRT 4: Overall
Mozilla Kraken 1.1: Total
| PCMark 10 / Score | |
| Asus TUF A15 FA507 | |
| Lenovo LOQ 15IRX9 | |
| HP Victus 15-fa1057ng | |
| Acer Nitro V 15 ANV15-51-582S | |
| MSI Thin GF63 12VE | |
| Medio Intel Core i5-12450H, NVIDIA GeForce RTX 4050 Laptop GPU (n=1) | |
| MSI GF63 Thin 9SC | |
| PCMark 10 / Essentials | |
| Asus TUF A15 FA507 | |
| HP Victus 15-fa1057ng | |
| Acer Nitro V 15 ANV15-51-582S | |
| Lenovo LOQ 15IRX9 | |
| MSI Thin GF63 12VE | |
| Medio Intel Core i5-12450H, NVIDIA GeForce RTX 4050 Laptop GPU (n=1) | |
| MSI GF63 Thin 9SC | |
| PCMark 10 / Productivity | |
| Asus TUF A15 FA507 | |
| HP Victus 15-fa1057ng | |
| Lenovo LOQ 15IRX9 | |
| Acer Nitro V 15 ANV15-51-582S | |
| MSI Thin GF63 12VE | |
| Medio Intel Core i5-12450H, NVIDIA GeForce RTX 4050 Laptop GPU (n=1) | |
| MSI GF63 Thin 9SC | |
| PCMark 10 / Digital Content Creation | |
| Lenovo LOQ 15IRX9 | |
| Asus TUF A15 FA507 | |
| HP Victus 15-fa1057ng | |
| Acer Nitro V 15 ANV15-51-582S | |
| MSI Thin GF63 12VE | |
| Medio Intel Core i5-12450H, NVIDIA GeForce RTX 4050 Laptop GPU (n=1) | |
| MSI GF63 Thin 9SC | |
| CrossMark / Overall | |
| Lenovo LOQ 15IRX9 | |
| Asus TUF A15 FA507 | |
| MSI Thin GF63 12VE | |
| Medio Intel Core i5-12450H, NVIDIA GeForce RTX 4050 Laptop GPU (n=1) | |
| CrossMark / Productivity | |
| Lenovo LOQ 15IRX9 | |
| MSI Thin GF63 12VE | |
| Medio Intel Core i5-12450H, NVIDIA GeForce RTX 4050 Laptop GPU (n=1) | |
| Asus TUF A15 FA507 | |
| CrossMark / Creativity | |
| Lenovo LOQ 15IRX9 | |
| Asus TUF A15 FA507 | |
| MSI Thin GF63 12VE | |
| Medio Intel Core i5-12450H, NVIDIA GeForce RTX 4050 Laptop GPU (n=1) | |
| CrossMark / Responsiveness | |
| Lenovo LOQ 15IRX9 | |
| MSI Thin GF63 12VE | |
| Medio Intel Core i5-12450H, NVIDIA GeForce RTX 4050 Laptop GPU (n=1) | |
| Asus TUF A15 FA507 | |
| WebXPRT 3 / Overall | |
| Asus TUF A15 FA507 | |
| HP Victus 15-fa1057ng | |
| Acer Nitro V 15 ANV15-51-582S | |
| Lenovo LOQ 15IRX9 | |
| MSI Thin GF63 12VE | |
| Medio Intel Core i5-12450H, NVIDIA GeForce RTX 4050 Laptop GPU (n=1) | |
| WebXPRT 4 / Overall | |
| Lenovo LOQ 15IRX9 | |
| Acer Nitro V 15 ANV15-51-582S | |
| MSI Thin GF63 12VE | |
| Medio Intel Core i5-12450H, NVIDIA GeForce RTX 4050 Laptop GPU (n=1) | |
| Asus TUF A15 FA507 | |
| Mozilla Kraken 1.1 / Total | |
| Asus TUF A15 FA507 | |
| MSI Thin GF63 12VE | |
| Medio Intel Core i5-12450H, NVIDIA GeForce RTX 4050 Laptop GPU (n=1) | |
| Acer Nitro V 15 ANV15-51-582S | |
| Lenovo LOQ 15IRX9 | |
| HP Victus 15-fa1057ng | |
* ... más pequeño es mejor
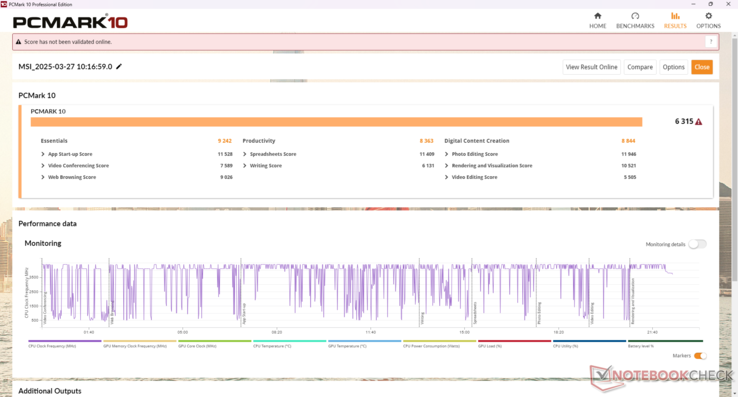
| PCMark 10 Score | 6315 puntos | |
ayuda | ||
| AIDA64 / Memory Copy | |
| Lenovo LOQ 15IRX9 | |
| Asus TUF A15 FA507 | |
| HP Victus 15-fa1057ng | |
| Medio Intel Core i5-12450H (21750 - 43918, n=6) | |
| Acer Nitro V 15 ANV15-51-582S | |
| MSI Thin GF63 12VE | |
| AIDA64 / Memory Read | |
| Lenovo LOQ 15IRX9 | |
| Asus TUF A15 FA507 | |
| HP Victus 15-fa1057ng | |
| Medio Intel Core i5-12450H (22956 - 47555, n=6) | |
| Acer Nitro V 15 ANV15-51-582S | |
| MSI Thin GF63 12VE | |
| AIDA64 / Memory Write | |
| Lenovo LOQ 15IRX9 | |
| Asus TUF A15 FA507 | |
| HP Victus 15-fa1057ng | |
| Medio Intel Core i5-12450H (22297 - 46963, n=6) | |
| Acer Nitro V 15 ANV15-51-582S | |
| MSI Thin GF63 12VE | |
| AIDA64 / Memory Latency | |
| MSI Thin GF63 12VE | |
| Lenovo LOQ 15IRX9 | |
| Acer Nitro V 15 ANV15-51-582S | |
| HP Victus 15-fa1057ng | |
| Medio Intel Core i5-12450H (76.5 - 100.9, n=6) | |
| Asus TUF A15 FA507 | |
* ... más pequeño es mejor
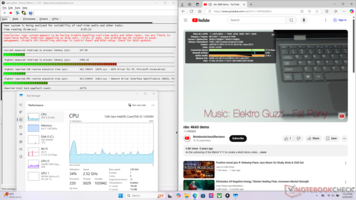
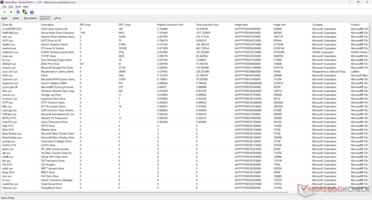
| DPC Latencies / LatencyMon - interrupt to process latency (max), Web, Youtube, Prime95 | |
| MSI Thin GF63 12VE | |
| HP Victus 15-fa1057ng | |
| Lenovo LOQ 15IRX9 | |
| Acer Nitro V 15 ANV15-51-582S | |
* ... más pequeño es mejor
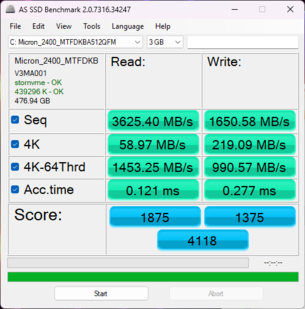
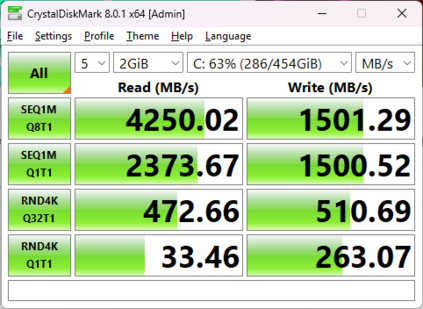
| Drive Performance Rating - Percent | |
| Acer Nitro V 15 ANV15-51-582S | |
| Lenovo LOQ 15IRX9 | |
| HP Victus 15-fa1057ng | |
| MSI Thin GF63 12VE | |
| Asus TUF A15 FA507 | |
| MSI GF63 Thin 9SC -8! | |
* ... más pequeño es mejor
Disk Throttling: DiskSpd Read Loop, Queue Depth 8
Rendimiento de la GPU
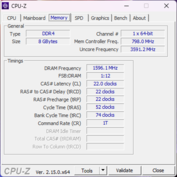
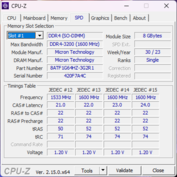
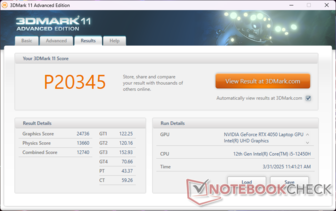
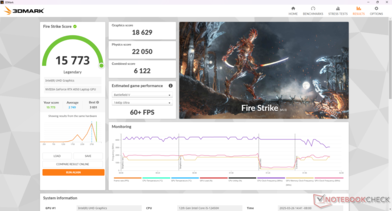
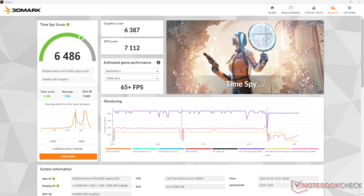
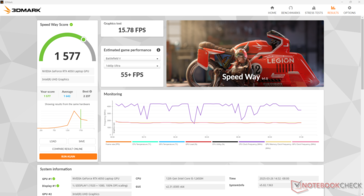
El rendimiento gráfico está por debajo de la media en comparación con otros portátiles con la misma GPU RTX 4050 debido en gran parte a nuestros limitados 8 GB de RAM del sistema.
| 3DMark Performance Rating - Percent | |
| Asus TUF Gaming A15 FA507UV -1! | |
| Lenovo LOQ 15IRX9 -1! | |
| Gigabyte G5 KF5 2024 -1! | |
| Gigabyte G5 KE | |
| Lenovo LOQ 15IRH8 Core i7 | |
| Medio NVIDIA GeForce RTX 4050 Laptop GPU | |
| HP Victus 15-fa1057ng -1! | |
| Acer Nitro V 15 ANV15-51-582S -1! | |
| MSI Thin GF63 12VE | |
| Lenovo IdeaPad Gaming 3 15ARH7 -1! | |
| HP Victus 15 fa0020nr | |
| 3DMark 11 Performance | 20345 puntos | |
| 3DMark Fire Strike Score | 15773 puntos | |
| 3DMark Time Spy Score | 6486 puntos | |
ayuda | ||
* ... más pequeño es mejor
| Tiny Tina's Wonderlands | |
| 1280x720 Lowest Preset (DX12) | |
| Medio NVIDIA GeForce RTX 4050 Laptop GPU (109.3 - 250, n=4) | |
| MSI Thin GF63 12VE | |
| 1920x1080 Low Preset (DX12) | |
| Medio NVIDIA GeForce RTX 4050 Laptop GPU (104.5 - 183.3, n=7) | |
| MSI Thin GF63 12VE | |
| 1920x1080 Medium Preset (DX12) | |
| Medio NVIDIA GeForce RTX 4050 Laptop GPU (93.4 - 149.2, n=7) | |
| MSI Thin GF63 12VE | |
| 1920x1080 High Preset (DX12) | |
| Medio NVIDIA GeForce RTX 4050 Laptop GPU (63.3 - 99.5, n=7) | |
| MSI Thin GF63 12VE | |
| 1920x1080 Badass Preset (DX12) | |
| Medio NVIDIA GeForce RTX 4050 Laptop GPU (49.8 - 77.3, n=7) | |
| MSI Thin GF63 12VE | |
| F1 22 | |
| 1280x720 Ultra Low Preset AA:T AF:16x | |
| Lenovo LOQ 15IRH8 Core i7 | |
| Medio NVIDIA GeForce RTX 4050 Laptop GPU (175.1 - 364, n=16) | |
| Gigabyte G5 KE | |
| MSI Thin GF63 12VE | |
| 1920x1080 Low Preset AA:T AF:16x | |
| Lenovo LOQ 15IRH8 Core i7 | |
| Gigabyte G5 KE | |
| Medio NVIDIA GeForce RTX 4050 Laptop GPU (100.9 - 244, n=22) | |
| MSI Thin GF63 12VE | |
| 1920x1080 Medium Preset AA:T AF:16x | |
| Lenovo LOQ 15IRH8 Core i7 | |
| Gigabyte G5 KE | |
| Medio NVIDIA GeForce RTX 4050 Laptop GPU (101.8 - 234, n=21) | |
| MSI Thin GF63 12VE | |
| 1920x1080 High Preset AA:T AF:16x | |
| Lenovo LOQ 15IRH8 Core i7 | |
| Gigabyte G5 KE | |
| Medio NVIDIA GeForce RTX 4050 Laptop GPU (94.4 - 174.7, n=22) | |
| MSI Thin GF63 12VE | |
| 1920x1080 Ultra High Preset AA:T AF:16x | |
| Gigabyte G5 KE | |
| Lenovo LOQ 15IRH8 Core i7 | |
| Medio NVIDIA GeForce RTX 4050 Laptop GPU (10.9 - 56.4, n=24) | |
| MSI Thin GF63 12VE | |
| Cyberpunk 2077 2.2 Phantom Liberty | |
| 1280x720 Low Preset (FSR off) | |
| Lenovo LOQ 15IRX9 | |
| Asus TUF Gaming A15 FA507UV | |
| Gigabyte G5 KF5 2024 | |
| Medio NVIDIA GeForce RTX 4050 Laptop GPU (83.1 - 122, n=5) | |
| MSI Thin GF63 12VE | |
| 1920x1080 Low Preset (FSR off) | |
| Asus TUF Gaming A15 FA507UV | |
| Lenovo LOQ 15IRX9 | |
| Gigabyte G5 KF5 2024 | |
| Medio NVIDIA GeForce RTX 4050 Laptop GPU (67.2 - 103.1, n=8) | |
| MSI Thin GF63 12VE | |
| 1920x1080 Medium Preset (FSR off) | |
| Asus TUF Gaming A15 FA507UV | |
| Lenovo LOQ 15IRX9 | |
| Gigabyte G5 KF5 2024 | |
| Medio NVIDIA GeForce RTX 4050 Laptop GPU (50.1 - 88.6, n=9) | |
| MSI Thin GF63 12VE | |
| 1920x1080 High Preset (FSR off) | |
| Asus TUF Gaming A15 FA507UV | |
| Lenovo LOQ 15IRX9 | |
| Gigabyte G5 KF5 2024 | |
| Medio NVIDIA GeForce RTX 4050 Laptop GPU (42.4 - 75, n=9) | |
| MSI Thin GF63 12VE | |
| 1920x1080 Ultra Preset (FSR off) | |
| Asus TUF Gaming A15 FA507UV | |
| Lenovo LOQ 15IRX9 | |
| Gigabyte G5 KF5 2024 | |
| Medio NVIDIA GeForce RTX 4050 Laptop GPU (35.8 - 67.3, n=9) | |
| MSI Thin GF63 12VE | |
Cyberpunk 2077 ultra FPS Chart
| bajo | medio | alto | ultra | |
|---|---|---|---|---|
| GTA V (2015) | 150.9 | 142.2 | 110.7 | 67.1 |
| Dota 2 Reborn (2015) | 122.7 | 108.6 | 95.9 | 90.5 |
| Final Fantasy XV Benchmark (2018) | 123.2 | 85.7 | 64.2 | |
| X-Plane 11.11 (2018) | 70.1 | 63.8 | 55.5 | |
| Far Cry 5 (2018) | 97 | 84 | 82 | 70 |
| Strange Brigade (2018) | 299 | 160.9 | 129.5 | 113.6 |
| Tiny Tina's Wonderlands (2022) | 113 | 95.6 | 72.1 | 55 |
| F1 22 (2022) | 129.2 | 126.3 | 99.3 | 40.1 |
| Baldur's Gate 3 (2023) | 82.1 | 71.3 | 64 | 63.8 |
| Cyberpunk 2077 2.2 Phantom Liberty (2023) | 76.4 | 65.1 | 55.7 | 47.3 |
Emisiones
Ruido del sistema
Tenga en cuenta que el ruido del ventilador cuando se juega en modo Equilibrado es el mismo que cuando se juega en modo Rendimiento (47,7 dB(A)). Por tanto, se recomienda jugar en modo Rendimiento, ya que no se produce un aumento significativo del ruido del ventilador.
Ruido
| Ocioso |
| 24.3 / 24.3 / 24.3 dB(A) |
| Carga |
| 36.2 / 59.3 dB(A) |
 | ||
30 dB silencioso 40 dB(A) audible 50 dB(A) ruidosamente alto |
||
min: | ||
| MSI Thin GF63 12VE NVIDIA GeForce RTX 4050 Laptop GPU, i5-12450H, Micron 2400 MTFDKBA512QFM | MSI GF63 Thin 9SC GeForce GTX 1650 Max-Q, i5-9300H, Toshiba KBG30ZMV512G | Lenovo LOQ 15IRX9 NVIDIA GeForce RTX 4060 Laptop GPU, i5-13450HX, Micron 2400 MTFDKCD1T0QFM | HP Victus 15-fa1057ng NVIDIA GeForce RTX 4050 Laptop GPU, i5-13500H, Kioxia XG8 KXG80ZNV512G | Acer Nitro V 15 ANV15-51-582S NVIDIA GeForce RTX 4050 Laptop GPU, i5-13420H, SK hynix PC801 HFS512GEJ9X115N | Asus TUF A15 FA507 NVIDIA GeForce RTX 4050 Laptop GPU, R7 7735HS, Micron 2400 MTFDKBA512QFM | |
|---|---|---|---|---|---|---|
| Noise | -27% | -17% | -11% | -12% | 10% | |
| apagado / medio ambiente * | 24.3 | 30 -23% | 25 -3% | 25 -3% | 25 -3% | 23.3 4% |
| Idle Minimum * | 24.3 | 35 -44% | 26 -7% | 29 -19% | 25 -3% | 23.3 4% |
| Idle Average * | 24.3 | 36 -48% | 34 -40% | 30 -23% | 29 -19% | 23.3 4% |
| Idle Maximum * | 24.3 | 37 -52% | 36 -48% | 31 -28% | 30 -23% | 23.3 4% |
| Load Average * | 36.2 | 44 -22% | 48 -33% | 40 -10% | 49 -35% | 29.6 18% |
| Cyberpunk 2077 ultra * | 47.7 | 48 -1% | ||||
| Load Maximum * | 59.3 | 43 27% | 50 16% | 48 19% | 51 14% | 43 27% |
| Witcher 3 ultra * | 41 | 42 | 49 | 43 |
* ... más pequeño es mejor
Temperatura
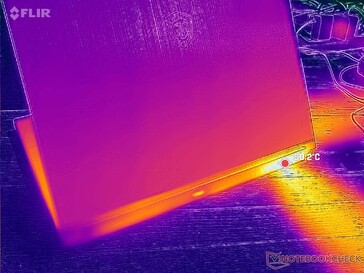
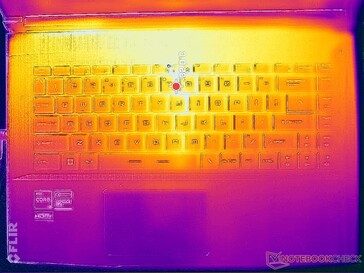
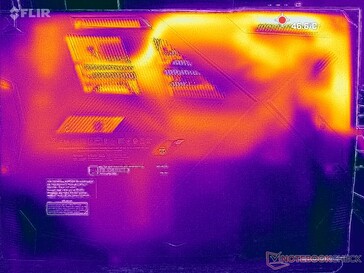
(+) La temperatura máxima en la parte superior es de 39.8 °C / 104 F, frente a la media de 40.4 °C / 105 F, que oscila entre 21.2 y 68.8 °C para la clase Gaming.
(+) El fondo se calienta hasta un máximo de 37.6 °C / 100 F, frente a la media de 43.2 °C / 110 F
(+) En reposo, la temperatura media de la parte superior es de 28.5 °C / 83# F, frente a la media del dispositivo de 33.9 °C / 93 F.
(+) El reposamanos y el panel táctil están a una temperatura inferior a la de la piel, con un máximo de 24.6 °C / 76.3 F y, por tanto, son fríos al tacto.
(+) La temperatura media de la zona del reposamanos de dispositivos similares fue de 28.9 °C / 84 F (+4.3 °C / 7.7 F).
| MSI Thin GF63 12VE Intel Core i5-12450H, NVIDIA GeForce RTX 4050 Laptop GPU | MSI GF63 Thin 9SC Intel Core i5-9300H, NVIDIA GeForce GTX 1650 Max-Q | Lenovo LOQ 15IRX9 Intel Core i5-13450HX, NVIDIA GeForce RTX 4060 Laptop GPU | HP Victus 15-fa1057ng Intel Core i5-13500H, NVIDIA GeForce RTX 4050 Laptop GPU | Acer Nitro V 15 ANV15-51-582S Intel Core i5-13420H, NVIDIA GeForce RTX 4050 Laptop GPU | Asus TUF A15 FA507 AMD Ryzen 7 7735HS, NVIDIA GeForce RTX 4050 Laptop GPU | |
|---|---|---|---|---|---|---|
| Heat | 2% | -17% | 11% | 0% | 1% | |
| Maximum Upper Side * | 39.8 | 47 -18% | 47 -18% | 42 -6% | 46 -16% | 48.9 -23% |
| Maximum Bottom * | 37.6 | 47 -25% | 58 -54% | 42 -12% | 48 -28% | 44.6 -19% |
| Idle Upper Side * | 32.8 | 26 21% | 32 2% | 24 27% | 27 18% | 27.1 17% |
| Idle Bottom * | 37.6 | 26 31% | 36 4% | 24 36% | 28 26% | 27.5 27% |
* ... más pequeño es mejor
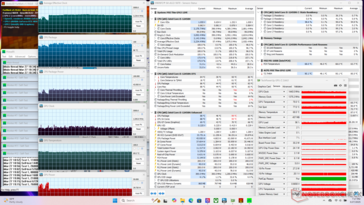
Prueba de estrés
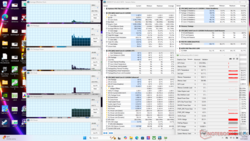
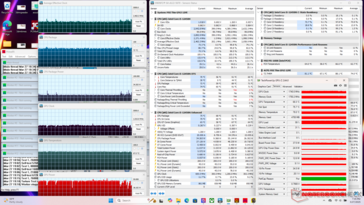
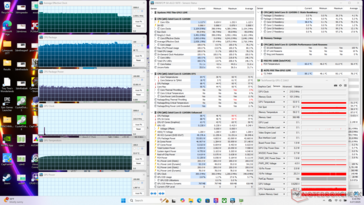
| Reloj medio de la CPU (GHz) | Reloj medio de la GPU (MHz) | Temperatura media dela CPU (°C) | Temperatura media de la GPU (°C) | |
| Sistema en reposo | -- | -- | 46 | 45 |
| Prime95 Stress | 2.9 | -- | 88 | 54 |
| Estrés de Prime95 + FurMark | 3,2 | 1440 | 86 | 70 |
| Estrésde Cyberpunk 2077 (modo equilibrado) | 2.4 | 1740 | 72 | 68 |
| Cyberpunk 2077 Estrés (modo Rendimiento) | 2.4 | 1755 | 79 | 64 |
Altavoces
MSI Thin GF63 12VE análisis de audio
(±) | la sonoridad del altavoz es media pero buena (81.5 dB)
Graves 100 - 315 Hz
(-) | casi sin bajos - de media 18.4% inferior a la mediana
(±) | la linealidad de los graves es media (14.2% delta a frecuencia anterior)
Medios 400 - 2000 Hz
(+) | medios equilibrados - a sólo 2.9% de la mediana
(+) | los medios son lineales (4.3% delta a la frecuencia anterior)
Altos 2 - 16 kHz
(+) | máximos equilibrados - a sólo 2.9% de la mediana
(+) | los máximos son lineales (4% delta a la frecuencia anterior)
Total 100 - 16.000 Hz
(+) | el sonido global es lineal (13.8% de diferencia con la mediana)
En comparación con la misma clase
» 20% de todos los dispositivos probados de esta clase eran mejores, 6% similares, 73% peores
» El mejor tuvo un delta de 6%, la media fue 18%, el peor fue ###max##%
En comparación con todos los dispositivos probados
» 14% de todos los dispositivos probados eran mejores, 4% similares, 83% peores
» El mejor tuvo un delta de 4%, la media fue 24%, el peor fue ###max##%
Apple MacBook Pro 16 2021 M1 Pro análisis de audio
(+) | los altavoces pueden reproducir a un volumen relativamente alto (#84.7 dB)
Graves 100 - 315 Hz
(+) | buen bajo - sólo 3.8% lejos de la mediana
(+) | el bajo es lineal (5.2% delta a la frecuencia anterior)
Medios 400 - 2000 Hz
(+) | medios equilibrados - a sólo 1.3% de la mediana
(+) | los medios son lineales (2.1% delta a la frecuencia anterior)
Altos 2 - 16 kHz
(+) | máximos equilibrados - a sólo 1.9% de la mediana
(+) | los máximos son lineales (2.7% delta a la frecuencia anterior)
Total 100 - 16.000 Hz
(+) | el sonido global es lineal (4.6% de diferencia con la mediana)
En comparación con la misma clase
» 0% de todos los dispositivos probados de esta clase eran mejores, 0% similares, 100% peores
» El mejor tuvo un delta de 5%, la media fue 18%, el peor fue ###max##%
En comparación con todos los dispositivos probados
» 0% de todos los dispositivos probados eran mejores, 0% similares, 100% peores
» El mejor tuvo un delta de 4%, la media fue 24%, el peor fue ###max##%
Gestión de la energía
Consumo de energía
| Off / Standby | |
| Ocioso | |
| Carga |
|
Clave:
min: | |
| MSI Thin GF63 12VE i5-12450H, NVIDIA GeForce RTX 4050 Laptop GPU, Micron 2400 MTFDKBA512QFM, IPS, 1920x1080, 15.6" | MSI GF63 Thin 9SC i5-9300H, GeForce GTX 1650 Max-Q, Toshiba KBG30ZMV512G, IPS, 1920x1080, 15.6" | Lenovo LOQ 15IRX9 i5-13450HX, NVIDIA GeForce RTX 4060 Laptop GPU, Micron 2400 MTFDKCD1T0QFM, IPS, 1920x1080, 15.6" | HP Victus 15-fa1057ng i5-13500H, NVIDIA GeForce RTX 4050 Laptop GPU, Kioxia XG8 KXG80ZNV512G, IPS, 1920x1080, 15.6" | Acer Nitro V 15 ANV15-51-582S i5-13420H, NVIDIA GeForce RTX 4050 Laptop GPU, SK hynix PC801 HFS512GEJ9X115N, IPS, 1920x1080, 15.6" | Asus TUF A15 FA507 R7 7735HS, NVIDIA GeForce RTX 4050 Laptop GPU, Micron 2400 MTFDKBA512QFM, IPS, 1920x1080, 15.6" | |
|---|---|---|---|---|---|---|
| Power Consumption | -18% | -83% | -20% | -8% | -32% | |
| Idle Minimum * | 4.3 | 7 -63% | 13 -202% | 5 -16% | 7 -63% | 8 -86% |
| Idle Average * | 9.2 | 9 2% | 18 -96% | 9 2% | 8 13% | 12.1 -32% |
| Idle Maximum * | 16.4 | 13 21% | 24 -46% | 22 -34% | 11 33% | 12.5 24% |
| Load Average * | 67 | 79 -18% | 85 -27% | 72 -7% | 76 -13% | 74.9 -12% |
| Cyberpunk 2077 ultra external monitor * | 94.2 | 150.9 -60% | ||||
| Cyberpunk 2077 ultra * | 98.2 | 155.7 -59% | ||||
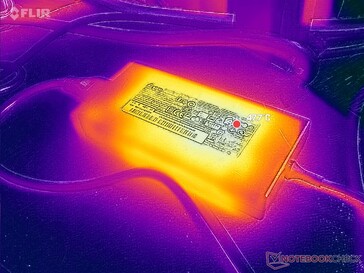
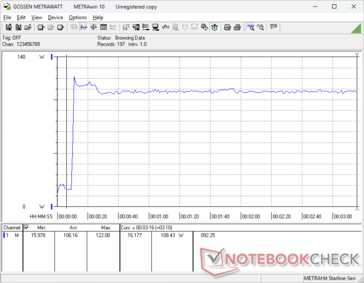
| Load Maximum * | 122 | 164 -34% | 232 -90% | 176 -44% | 136 -11% | 185 -52% |
| Witcher 3 ultra * | 73 | 113 | 98.2 | 136.6 |
* ... más pequeño es mejor
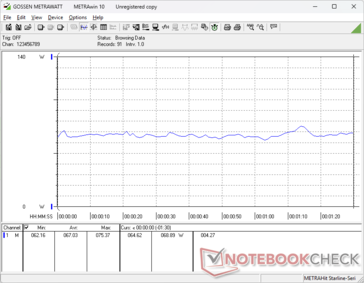
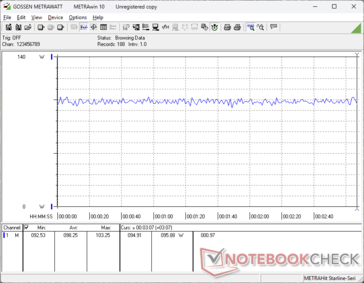
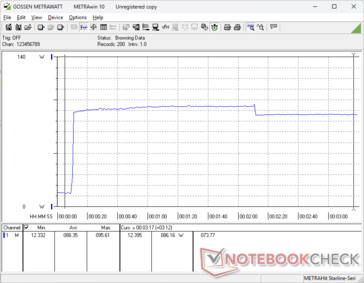
Power Consumption Cyberpunk / Stress Test
Power Consumption external Monitor
Duración de las pilas
| MSI Thin GF63 12VE i5-12450H, NVIDIA GeForce RTX 4050 Laptop GPU, 52.4 Wh | MSI GF63 Thin 9SC i5-9300H, GeForce GTX 1650 Max-Q, 51 Wh | Lenovo LOQ 15IRX9 i5-13450HX, NVIDIA GeForce RTX 4060 Laptop GPU, 60 Wh | HP Victus 15-fa1057ng i5-13500H, NVIDIA GeForce RTX 4050 Laptop GPU, 70 Wh | Acer Nitro V 15 ANV15-51-582S i5-13420H, NVIDIA GeForce RTX 4050 Laptop GPU, 57 Wh | Asus TUF A15 FA507 R7 7735HS, NVIDIA GeForce RTX 4050 Laptop GPU, 90 Wh | |
|---|---|---|---|---|---|---|
| Duración de Batería | 23% | 50% | 110% | 163% | 229% | |
| WiFi v1.3 | 213 | 262 23% | 320 50% | 448 110% | 561 163% | 701 229% |
| Reader / Idle | 507 | 1290 | ||||
| Load | 72 | 100 | 59 | |||
| H.264 | 747 |
Valoración de Notebookcheck
MSI Thin GF63 12VE
- 04/03/2025 v8
Allen Ngo
Potential Competitors in Comparison
Imagen | Modelo | Precio | Peso | Altura | Pantalla |
|---|---|---|---|---|---|
| MSI Thin GF63 12VE Intel Core i5-12450H ⎘ NVIDIA GeForce RTX 4050 Laptop GPU ⎘ 8 GB Memoría, 512 GB SSD | Amazon: $899.00 Precio de catálogo: 900 USD | 1.8 kg | 21.7 mm | 15.60" 1920x1080 141 PPI IPS | |
| MSI GF63 Thin 9SC Intel Core i5-9300H ⎘ NVIDIA GeForce GTX 1650 Max-Q ⎘ 8 GB Memoría, 512 GB SSD | Amazon: 1. $587.00 MSI GF63 Thin 9SC-068 15.6" ... 2. $896.99 MSI GF63 Thin 9SC-066 15.6" ... 3. $28.19 TREE.NB BTY-M6K Laptop Batte... Precio de catálogo: 975 EUR | 1.8 kg | 22 mm | 15.60" 1920x1080 141 PPI IPS | |
| Lenovo LOQ 15IRX9 Intel Core i5-13450HX ⎘ NVIDIA GeForce RTX 4060 Laptop GPU ⎘ 16 GB Memoría, 1024 GB SSD | Amazon: $1,269.00 Precio de catálogo: 1149 Euro | 2.4 kg | 23.9 mm | 15.60" 1920x1080 141 PPI IPS | |
| HP Victus 15-fa1057ng Intel Core i5-13500H ⎘ NVIDIA GeForce RTX 4050 Laptop GPU ⎘ 16 GB Memoría, 512 GB SSD | Amazon: 1. $12.00 RAKSTORE Laptop CPU Cooling ... 2. $125.00 15.6" for HP Victus 15-fa105... 3. $123.00 15.6" FHD 1920(RGB)*1080 for... Precio de catálogo: 1000 EUR | 2.3 kg | 24 mm | 15.60" 1920x1080 141 PPI IPS | |
| Acer Nitro V 15 ANV15-51-582S Intel Core i5-13420H ⎘ NVIDIA GeForce RTX 4050 Laptop GPU ⎘ 16 GB Memoría, 512 GB SSD | Amazon: 1. $22.99 Deal4GO CPU & GPU Graphics C... Precio de catálogo: 900 EUR | 2.1 kg | 23.5 mm | 15.60" 1920x1080 141 PPI IPS | |
| Asus TUF A15 FA507 AMD Ryzen 7 7735HS ⎘ NVIDIA GeForce RTX 4050 Laptop GPU ⎘ 16 GB Memoría, 512 GB SSD | Amazon: 1. $934.00 ASUS TUF Gaming A15 Gaming L... 2. $28.99 Replacement Backlit Keyboard... 3. $14.99 HSSDTECH Lower Bottom Base C... Precio de catálogo: 1199€ | 2.2 kg | 24.9 mm | 15.60" 1920x1080 141 PPI IPS |
Transparencia
Nuestro equipo editorial se encarga de seleccionar los dispositivos que se someten a revisión. La muestra de prueba fue adquirida libremente por el autor a sus expensas. El prestamista no influyó en esta reseña, ni el fabricante recibió una copia de la misma antes de su publicación. No había ninguna obligación de publicar esta reseña. Nunca aceptamos compensaciones o pagos a cambio de nuestras reseñas. Como empresa de medios independiente, Notebookcheck no está sujeta a la autoridad de fabricantes, minoristas o editores.
Así es como prueba Notebookcheck
Cada año, Notebookcheck revisa de forma independiente cientos de portátiles y smartphones utilizando procedimientos estandarizados para asegurar que todos los resultados son comparables. Hemos desarrollado continuamente nuestros métodos de prueba durante unos 20 años y hemos establecido los estándares de la industria en el proceso. En nuestros laboratorios de pruebas, técnicos y editores experimentados utilizan equipos de medición de alta calidad. Estas pruebas implican un proceso de validación en varias fases. Nuestro complejo sistema de clasificación se basa en cientos de mediciones y puntos de referencia bien fundamentados, lo que mantiene la objetividad.
















 Total Sustainability Score:


