Debut del rendimiento de la Nvidia RTX 3500 Ada: Análisis de la estación de trabajo HP ZBook Fury 16 G11
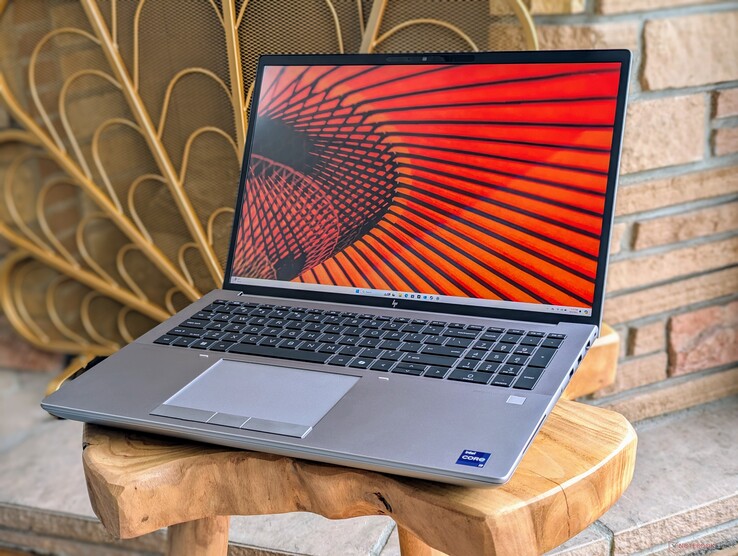
El 2024 ZBook Fury 16 G11 sucede al 2023 Fury 16 G10 al cambiar las CPU Raptor Lake-HX por las nuevas opciones Raptor Lake-HX Refresh. Por lo demás, el chasis sigue siendo idéntico al del Fury 16 G10 o Fury 16 G9, al igual que muchas de las opciones configurables. Recomendamos consultar nuestro análisis de la Fury 16 G9 para saber más sobre las características físicas del modelo.
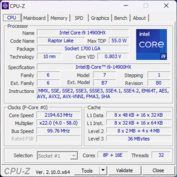
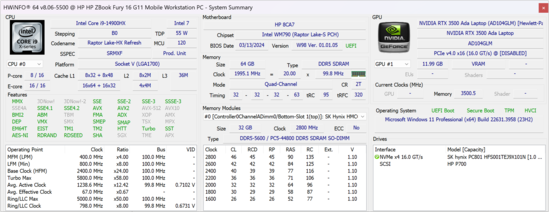
Nuestra unidad de prueba es una configuración de gama media-alta con la CPU Core i9-14900HX, GPU RTX 3500 Ada y pantalla IPS 3840 x 2400 a 120 Hz por aproximadamente 3300 $. Otras SKU empiezan con la Core i5-13600HX hasta la RTX 5000 Ada y la pantalla táctil OLED de 2400p. No hay opciones de CPU Meteor Lake.
Los competidores del ZBook Fury 16 G11 incluyen otras estaciones de trabajo de 16 pulgadas como el Dell Precision 5690, Lenovo ThinkPad P16 G2o el Asus ProArt Studiobook 16.
Más reseñas de HP:
Posibles contendientes en la comparación
Valoración | Versión | Fecha | Modelo | Peso | Altura | Tamaño | Resolución | Precio |
|---|---|---|---|---|---|---|---|---|
| 85.9 % | v8 | 08/2024 | HP ZBook Fury 16 G11 i9-14900HX, NVIDIA RTX 3500 Ada Generation Laptop GPU | 2.6 kg | 28.5 mm | 16.00" | 3840x2400 | |
| 92.3 % v7 (old) | v7 (old) | 09/2023 | HP ZBook Fury 16 G10 i9-13950HX, NVIDIA RTX 5000 Ada Generation Laptop GPU | 2.6 kg | 28.5 mm | 16.00" | 3840x2400 | |
| 91 % v7 (old) | v7 (old) | 06/2023 | HP ZBook Fury 16 G9 i9-12950HX, RTX A5500 Laptop GPU | 2.6 kg | 28.5 mm | 16.00" | 3840x2400 | |
| 88.3 % v7 (old) | v7 (old) | 05/2024 | Dell Precision 5690 Ultra 9 185H, NVIDIA RTX 5000 Ada Generation Laptop GPU | 2.3 kg | 22.17 mm | 16.00" | 3840x2400 | |
| 90.2 % v7 (old) | v7 (old) | 03/2024 | Lenovo ThinkPad P16 G2 21FA000FGE i7-13700HX, NVIDIA RTX 2000 Ada Generation Laptop GPU | 3 kg | 30.23 mm | 16.00" | 2560x1600 | |
| 90.1 % v7 (old) | v7 (old) | 12/2023 | Lenovo ThinkPad P1 G6 21FV001KUS i7-13800H, NVIDIA GeForce RTX 4080 Laptop GPU | 1.9 kg | 17.5 mm | 16.00" | 3480x2400 | |
| 86.1 % v7 (old) | v7 (old) | 06/2023 | Asus ProArt Studiobook 16 OLED H7604 i9-13980HX, NVIDIA GeForce RTX 4070 Laptop GPU | 2.4 kg | 23.9 mm | 16.00" | 3200x2000 |
Nota: Hemos actualizado nuestro sistema de evaluación y los resultados de la versión 8 no se pueden comparar con los de la versión 7. Más información aquí verfügbar.
Nota: Recientemente hemos actualizado nuestro sistema de clasificación y los resultados de la versión 8 no son comparables con los de la versión 7. Encontrará más información aquí .
Top 10 Análisis
» Top 10 Portátiles Multimedia
» Top 10 Portátiles de Juego
» Top 10 Portátiles de Juego ligeros
» Top 10 Portátiles Asequibles de Oficina/Empresa
» Top 10 Portátiles de Juego Ligeros
» Top 10 Portátiles de Oficina/Empresa Premium
» Top 10 Estaciones de Trabajo
» Top 10 Subportátiles
» Top 10 Ultrabooks
» Top 10 Convertibles
» Top 10 Tablets
» Top 10 Tablets Windows
» Top 10 Tablets de menos de 250 Euros
» Top 10 Phablets (>5.5")
» Top 10 Smartphones
» Top 10 Smartphones (≤5")
» Top 10 Smartphones de menos de 300 Euros
» Top 10 Smartphones de menos de 120 Euros
» Top 10 Portátiles de menos de 1000 Euros
» Top 10 Portátiles de menos de 500 Euros
» Top 10 Portátiles de menos de 300 Euros
» Los Mejores Displays de Portátiles Analizados por Notebookcheck
Caso
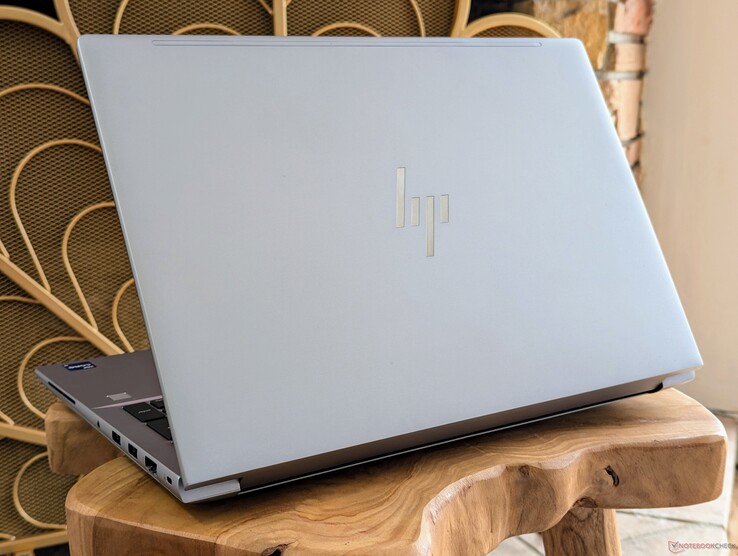
Una forma fácil de distinguir el ZBook Fury 16 G11 de las iteraciones anteriores es buscar la tecla Co-Pilot en el teclado. Por lo demás, el diseño del chasis sigue siendo el mismo que antes.
Conectividad
Lector de tarjetas SD
| SD Card Reader | |
| average JPG Copy Test (av. of 3 runs) | |
| Lenovo ThinkPad P1 G6 21FV001KUS (Toshiba Exceria Pro SDXC 64 GB UHS-II) | |
| HP ZBook Fury 16 G11 (Toshiba Exceria Pro SDXC 64 GB UHS-II) | |
| HP ZBook Fury 16 G10 (Toshiba Exceria Pro SDXC 64 GB UHS-II) | |
| HP ZBook Fury 16 G9 (PNY EliteX-PRO60) | |
| Asus ProArt Studiobook 16 OLED H7604 (Angelibird AV Pro V60) | |
| Lenovo ThinkPad P16 G2 21FA000FGE | |
| maximum AS SSD Seq Read Test (1GB) | |
| HP ZBook Fury 16 G11 (Toshiba Exceria Pro SDXC 64 GB UHS-II) | |
| Lenovo ThinkPad P1 G6 21FV001KUS (Toshiba Exceria Pro SDXC 64 GB UHS-II) | |
| HP ZBook Fury 16 G10 (Toshiba Exceria Pro SDXC 64 GB UHS-II) | |
| HP ZBook Fury 16 G9 (PNY EliteX-PRO60) | |
| Lenovo ThinkPad P16 G2 21FA000FGE | |
| Asus ProArt Studiobook 16 OLED H7604 (Angelibird AV Pro V60) | |
Comunicación
La WLAN se ha actualizado del Intel AX211 al BE200 para que sea compatible con Wi-Fi 7. En la práctica, sin embargo, la mayoría de los usuarios seguirán conectándose a puntos de acceso Wi-Fi 6 o 6E.
Cámara web
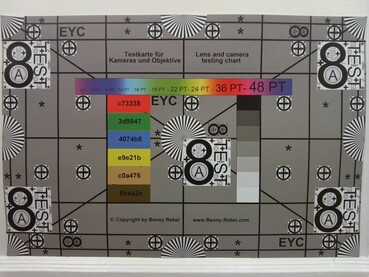
Mantenimiento
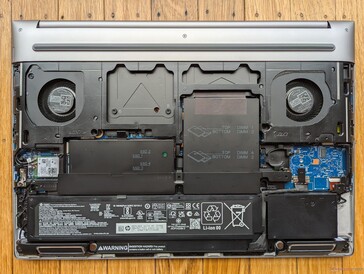
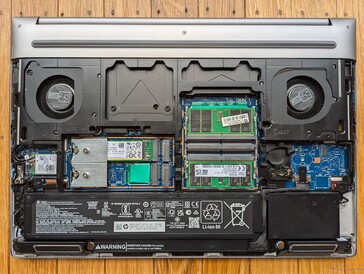
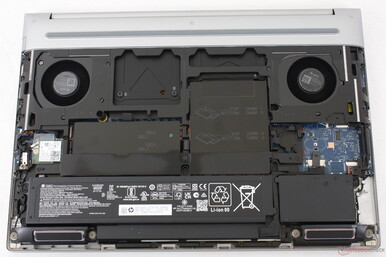
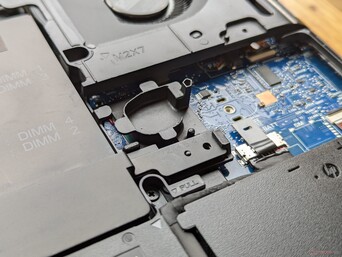
HP lleva presumiendo de un mantenimiento sin herramientas para su serie Fury 16 desde el modelo G9 a principios del año pasado. Mientras que el panel inferior se deslizaba fácilmente sin necesidad de herramientas, los módulos RAM y SODIMM seguían protegidos por una cubierta de aluminio que requería un destornillador para retirarlos. Esta cubierta de aluminio ha sido rediseñada con pestillos en lugar de tornillos en el modelo G11, lo que significa que ahora los usuarios pueden instalar los módulos RAM sin necesidad de herramientas.
Las unidades SSD, sin embargo, siguen estando fijadas a la placa base con tornillos, por lo que sigue siendo necesario un destornillador a la hora de cambiar las unidades. El sistema admite hasta cuatro unidades SSD y cuatro módulos RAM.
Sostenibilidad
El embalaje es totalmente reciclable y está compuesto en su mayor parte por papel. El adaptador de CA es el único artículo que viene envuelto en plástico.
Accesorios y garantía
La caja de venta al público no incluye más extras que el adaptador de CA y la documentación. La garantía del fabricante de tres años viene de serie si se adquiere en EE.UU.
Mostrar
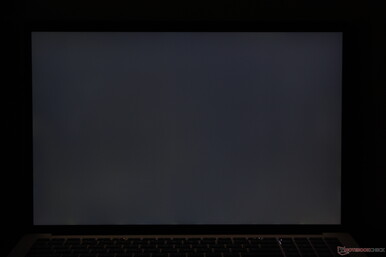
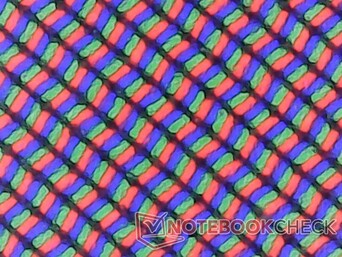
Hay cinco opciones de pantalla disponibles. Nuestra unidad de pruebas específica viene con el panel en negrita.
- 3840 x 2400, OLED, pantalla táctil, brillante, 400 nits, 100% DCI-P3, 60 Hz
- 3840 x 2400, IPS, no táctil, mate, 500 nits, 100% DCI-P3, 120 Hz
- 1920 x 1200, IPS, no táctil, mate, 400 nits, 100% sRGB, 60 Hz
- 1920 x 1200, IPS, no táctil, mate, 1000 nits, 100% sRGB, 60 Hz, Sure View Integrated
- 1920 x 1200, IPS, táctil, brillante, 400 nits, 100% sRGB, 60 Hz
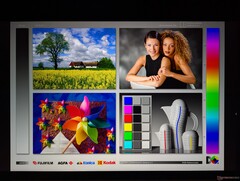
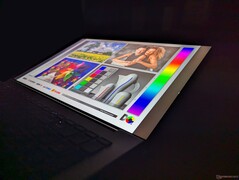
Este panel en particular resulta ser el mismo que se envió con nuestro ZBook Fury 16 G10, por lo que la experiencia visual sigue siendo idéntica. Los compradores que tengan la intención de utilizar el portátil en exteriores pueden querer considerar la opción de 1000 nits, pero este panel está desafortunadamente ligado a Sure View que limita significativamente los ángulos de visión haciendo que la pantalla sea más difícil de compartir con otros. Mientras tanto, la opción OLED ofrecerá unos niveles de negro muy superiores para satisfacer a los artistas digitales y las aplicaciones de edición multimedia, pero su superposición brillante y su escasa frecuencia de actualización de 60 Hz pueden ser un inconveniente.
La frecuencia de actualización dinámica de Windows sólo es compatible hasta 60 Hz en nuestro panel configurado.
| |||||||||||||||||||||||||
iluminación: 83 %
Brillo con batería: 457.6 cd/m²
Contraste: 1064:1 (Negro: 0.43 cd/m²)
ΔE Color 2.78 | 0.5-29.43 Ø4.87, calibrated: 1.37
ΔE Greyscale 2 | 0.5-98 Ø5.1
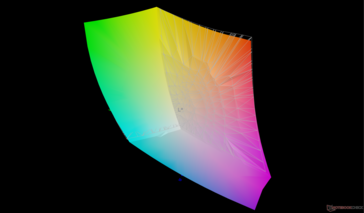
86% AdobeRGB 1998 (Argyll 2.2.0 3D)
99.9% sRGB (Argyll 2.2.0 3D)
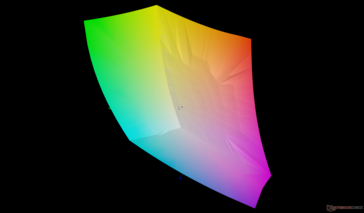
98.4% Display P3 (Argyll 2.2.0 3D)
Gamma: 2.28
| HP ZBook Fury 16 G11 AUO87A8, IPS, 3840x2400, 16", 120 Hz | HP ZBook Fury 16 G10 AUO87A8, IPS, 3840x2400, 16", 120 Hz | HP ZBook Fury 16 G9 BOE0A52, IPS, 3840x2400, 16", 60 Hz | Dell Precision 5690 Samsung 160YV03, OLED, 3840x2400, 16", 60 Hz | Lenovo ThinkPad P16 G2 21FA000FGE MNG007DA1-9, IPS LED, 2560x1600, 16", 165 Hz | Lenovo ThinkPad P1 G6 21FV001KUS Samsung ATNA60YV04-0, OLED, 3480x2400, 16", 60 Hz | Asus ProArt Studiobook 16 OLED H7604 ATNA60BX01-1, OLED, 3200x2000, 16", 120 Hz | |
|---|---|---|---|---|---|---|---|
| Display | 0% | -0% | 4% | -15% | 5% | 2% | |
| Display P3 Coverage | 98.4 | 98 0% | 97.4 -1% | 99.8 1% | 71 -28% | 99.8 1% | 99.6 1% |
| sRGB Coverage | 99.9 | 99.9 0% | 99.9 0% | 100 0% | 99.2 -1% | 100 0% | 100 0% |
| AdobeRGB 1998 Coverage | 86 | 86.2 0% | 86.3 0% | 96.6 12% | 73.2 -15% | 97.9 14% | 89.4 4% |
| Response Times | -9% | -11% | 83% | -16% | 82% | 93% | |
| Response Time Grey 50% / Grey 80% * | 11.4 ? | 11.9 ? -4% | 13.7 ? -20% | 1.7 ? 85% | 12.8 ? -12% | 1.69 ? 85% | 0.59 ? 95% |
| Response Time Black / White * | 8.4 ? | 9.6 ? -14% | 8.6 ? -2% | 1.7 ? 80% | 10.1 ? -20% | 1.73 ? 79% | 0.79 ? 91% |
| PWM Frequency | 60 ? | 60 ? | 240 ? | ||||
| Screen | 19% | -25% | -8% | -7% | 19% | 179% | |
| Brightness middle | 457.6 | 514.6 12% | 530.5 16% | 348.1 -24% | 510 11% | 375.1 -18% | 349 -24% |
| Brightness | 466 | 495 6% | 476 2% | 351 -25% | 517 11% | 379 -19% | 350 -25% |
| Brightness Distribution | 83 | 90 8% | 83 0% | 97 17% | 89 7% | 98 18% | 95 14% |
| Black Level * | 0.43 | 0.46 -7% | 0.57 -33% | 0.37 14% | 0.02 95% | ||
| Contrast | 1064 | 1119 5% | 931 -12% | 1378 30% | 17450 1540% | ||
| Colorchecker dE 2000 * | 2.78 | 2.4 14% | 2.26 19% | 4.18 -50% | 2.6 6% | 1.16 58% | 2.1 24% |
| Colorchecker dE 2000 max. * | 5.53 | 4.86 12% | 6.68 -21% | 5.2 6% | 2.94 47% | 5.5 1% | |
| Colorchecker dE 2000 calibrated * | 1.37 | 0.4 71% | 4.73 -245% | 0.97 29% | 2.3 -68% | 2.1 -53% | |
| Greyscale dE 2000 * | 2 | 1 50% | 1 50% | 1.7 15% | 3.6 -80% | 1.4 30% | 1.2 40% |
| Gamma | 2.28 96% | 2.3 96% | 2.28 96% | 2.2 100% | 2.26 97% | 2.2 100% | 2.19 100% |
| CCT | 6806 96% | 6553 99% | 6543 99% | 6198 105% | 5969 109% | 6325 103% | 6545 99% |
| Media total (Programa/Opciones) | 3% /
11% | -12% /
-17% | 26% /
10% | -13% /
-10% | 35% /
27% | 91% /
129% |
* ... más pequeño es mejor
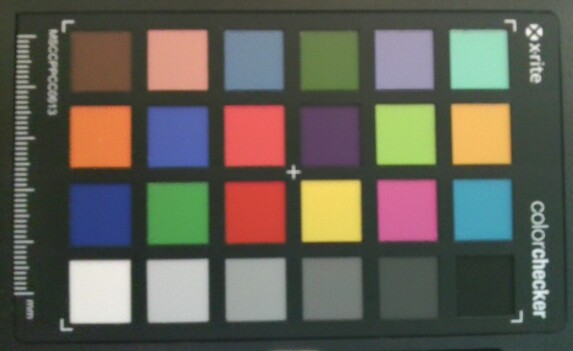
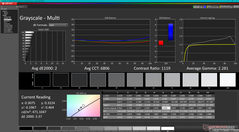
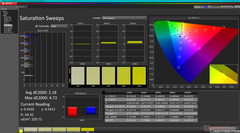
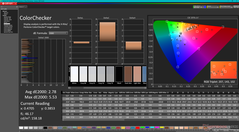
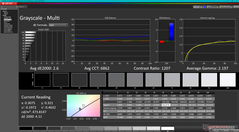
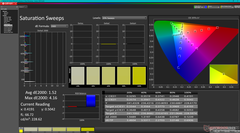
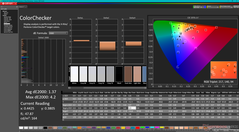
La pantalla está bien calibrada con respecto a la norma P3, con unos valores medios deltaE en escala de grises y color de sólo 2 y 2,18, respectivamente. Calibrar el panel aún más con nuestro colorímetro X-Rite mejoraría la precisión sólo ligeramente para ser sobre todo innecesario para la mayoría de los usuarios.
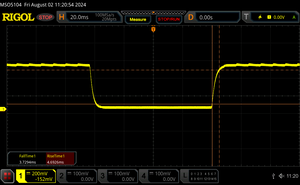
Tiempos de respuesta del display
| ↔ Tiempo de respuesta de Negro a Blanco | ||
|---|---|---|
| 8.4 ms ... subida ↗ y bajada ↘ combinada | ↗ 4.7 ms subida | |
| ↘ 3.7 ms bajada | ||
| La pantalla mostró tiempos de respuesta rápidos en nuestros tests y debería ser adecuada para juegos. En comparación, todos los dispositivos de prueba van de ##min### (mínimo) a 240 (máximo) ms. » 21 % de todos los dispositivos son mejores. Esto quiere decir que el tiempo de respuesta medido es mejor que la media (20.8 ms) de todos los dispositivos testados. | ||
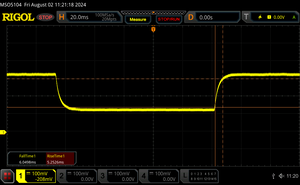
| ↔ Tiempo de respuesta 50% Gris a 80% Gris | ||
| 11.4 ms ... subida ↗ y bajada ↘ combinada | ↗ 5.3 ms subida | |
| ↘ 6.1 ms bajada | ||
| La pantalla mostró buenos tiempos de respuesta en nuestros tests pero podría ser demasiado lenta para los jugones competitivos. En comparación, todos los dispositivos de prueba van de ##min### (mínimo) a 636 (máximo) ms. » 22 % de todos los dispositivos son mejores. Esto quiere decir que el tiempo de respuesta medido es mejor que la media (32.5 ms) de todos los dispositivos testados. | ||
Parpadeo de Pantalla / PWM (Pulse-Width Modulation)
| Parpadeo de Pantalla / PWM no detectado | |||
Comparación: 53 % de todos los dispositivos testados no usaron PWM para atenuar el display. Si se usó, medimos una media de 8516 (mínimo: 5 - máxmo: 343500) Hz. | |||
Rendimiento - Mayor potencial de turbo
Condiciones de prueba
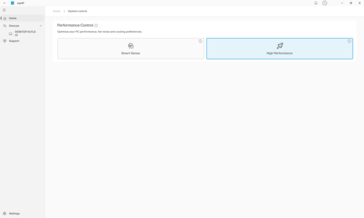
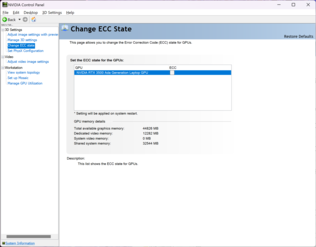
Pusimos tanto Windows como MyHP en modo Rendimiento antes de ejecutar los benchmarks que se muestran a continuación. También desactivamos el modo ECC de la GPU a través del Panel de control de Nvidia.
Procesador
Saltando del Core i9-12950HX en el ZBook Fury 16 G9 al Core i9-13950HX en la ZBook Fury 16 G10 supuso un aumento significativo del rendimiento. Desafortunadamente, no se puede decir lo mismo al saltar del Core i9-13950HX en la Fury 16 G10 al Core i9-14900HX en nuestra configuración Fury 16 G11. Las ganancias son mucho menores en alrededor de 10 a 15 por ciento antes de contabilizar cualquier estrangulamiento. Una vez que se tiene en cuenta la ralentización, el rendimiento general del procesador sería esencialmente idéntico al del Core i9-13950HX, como muestran nuestros resultados de la prueba de bucle CineBench R15 xT que se muestran a continuación. El Core i9-14900HX utiliza la misma arquitectura subyacente que el Core i9-13950HX, por lo que puede considerarse un rebranding de las opciones del año pasado. Así, el mayor techo de Turbo Boost es su principal ventaja sobre el procesador saliente, incluso si esas mayores velocidades de Turbo Boost son efímeras.
El Lenovo Legion 9 16IRX9, que viene con el mismo Core i9-14900HX que nuestro HP, funcionaría hasta un 20 por ciento más rápido probablemente debido a su solución de refrigeración más capaz de sostener velocidades de reloj Turbo Boost más altas.
Cinebench R15 Multi Loop
Cinebench R23: Multi Core | Single Core
Cinebench R20: CPU (Multi Core) | CPU (Single Core)
Cinebench R15: CPU Multi 64Bit | CPU Single 64Bit
Blender: v2.79 BMW27 CPU
7-Zip 18.03: 7z b 4 | 7z b 4 -mmt1
Geekbench 6.4: Multi-Core | Single-Core
Geekbench 5.5: Multi-Core | Single-Core
HWBOT x265 Benchmark v2.2: 4k Preset
LibreOffice : 20 Documents To PDF
R Benchmark 2.5: Overall mean
| Geekbench 6.4 / Multi-Core | |
| Medio Intel Core i9-14900HX (13158 - 19665, n=37) | |
| HP ZBook Fury 16 G10 | |
| HP ZBook Fury 16 G11 | |
| Dell Precision 5000 5680 | |
| Dell Precision 5690 | |
| Lenovo ThinkPad P1 G6 21FV001KUS | |
| Lenovo ThinkPad P1 G6-21FV000DGE | |
| Lenovo ThinkPad P16v G1 AMD | |
| Geekbench 6.4 / Single-Core | |
| Medio Intel Core i9-14900HX (2419 - 3129, n=37) | |
| HP ZBook Fury 16 G10 | |
| HP ZBook Fury 16 G11 | |
| Lenovo ThinkPad P1 G6 21FV001KUS | |
| Lenovo ThinkPad P1 G6-21FV000DGE | |
| Dell Precision 5000 5680 | |
| Lenovo ThinkPad P16v G1 AMD | |
| Dell Precision 5690 | |
Cinebench R23: Multi Core | Single Core
Cinebench R20: CPU (Multi Core) | CPU (Single Core)
Cinebench R15: CPU Multi 64Bit | CPU Single 64Bit
Blender: v2.79 BMW27 CPU
7-Zip 18.03: 7z b 4 | 7z b 4 -mmt1
Geekbench 6.4: Multi-Core | Single-Core
Geekbench 5.5: Multi-Core | Single-Core
HWBOT x265 Benchmark v2.2: 4k Preset
LibreOffice : 20 Documents To PDF
R Benchmark 2.5: Overall mean
* ... más pequeño es mejor
AIDA64: FP32 Ray-Trace | FPU Julia | CPU SHA3 | CPU Queen | FPU SinJulia | FPU Mandel | CPU AES | CPU ZLib | FP64 Ray-Trace | CPU PhotoWorxx
| Performance Rating | |
| Asus ProArt Studiobook 16 OLED H7604 | |
| Medio Intel Core i9-14900HX | |
| HP ZBook Fury 16 G10 | |
| HP ZBook Fury 16 G11 | |
| Dell Precision 5690 | |
| Lenovo ThinkPad P16 G2 21FA000FGE | |
| HP ZBook Fury 16 G9 | |
| Lenovo ThinkPad P1 G6 21FV001KUS | |
| AIDA64 / FP32 Ray-Trace | |
| Asus ProArt Studiobook 16 OLED H7604 | |
| Medio Intel Core i9-14900HX (13098 - 33474, n=36) | |
| HP ZBook Fury 16 G10 | |
| HP ZBook Fury 16 G11 | |
| Dell Precision 5690 | |
| Lenovo ThinkPad P16 G2 21FA000FGE | |
| HP ZBook Fury 16 G9 | |
| Lenovo ThinkPad P1 G6 21FV001KUS | |
| AIDA64 / FPU SinJulia | |
| Asus ProArt Studiobook 16 OLED H7604 | |
| Medio Intel Core i9-14900HX (10475 - 18517, n=36) | |
| HP ZBook Fury 16 G11 | |
| HP ZBook Fury 16 G10 | |
| Lenovo ThinkPad P16 G2 21FA000FGE | |
| HP ZBook Fury 16 G9 | |
| Dell Precision 5690 | |
| Lenovo ThinkPad P1 G6 21FV001KUS | |
| AIDA64 / FPU Mandel | |
| Asus ProArt Studiobook 16 OLED H7604 | |
| Medio Intel Core i9-14900HX (32543 - 83662, n=36) | |
| HP ZBook Fury 16 G10 | |
| HP ZBook Fury 16 G11 | |
| Dell Precision 5690 | |
| HP ZBook Fury 16 G9 | |
| Lenovo ThinkPad P16 G2 21FA000FGE | |
| Lenovo ThinkPad P1 G6 21FV001KUS | |
| AIDA64 / FP64 Ray-Trace | |
| Asus ProArt Studiobook 16 OLED H7604 | |
| Medio Intel Core i9-14900HX (6809 - 18349, n=36) | |
| HP ZBook Fury 16 G10 | |
| HP ZBook Fury 16 G11 | |
| Lenovo ThinkPad P16 G2 21FA000FGE | |
| Dell Precision 5690 | |
| Lenovo ThinkPad P1 G6 21FV001KUS | |
| HP ZBook Fury 16 G9 | |
| AIDA64 / CPU PhotoWorxx | |
| Dell Precision 5690 | |
| Asus ProArt Studiobook 16 OLED H7604 | |
| Medio Intel Core i9-14900HX (23903 - 54702, n=36) | |
| HP ZBook Fury 16 G10 | |
| HP ZBook Fury 16 G9 | |
| HP ZBook Fury 16 G11 | |
| Lenovo ThinkPad P16 G2 21FA000FGE | |
| Lenovo ThinkPad P1 G6 21FV001KUS | |
Prueba de estrés
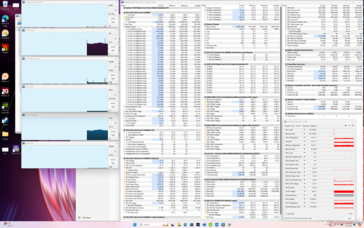
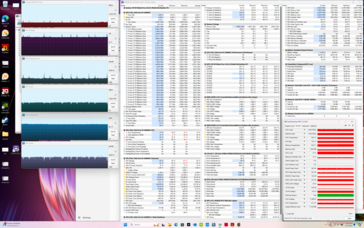
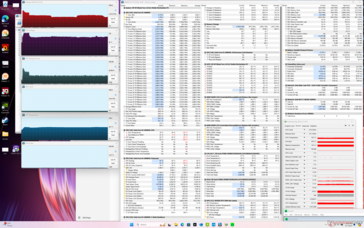
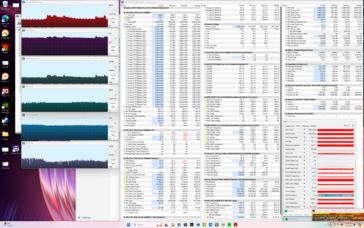
Al ejecutar Prime95 para estresar la CPU, las velocidades de reloj del núcleo y el consumo de energía del paquete se dispararían a 3,7 GHz y 139 W, respectivamente, durando sólo un minuto como máximo con la temperatura del núcleo también disparándose a 99 C. La CPU finalmente se establecería en 2,3 GHz y 69 W con el fin de mantener una temperatura del núcleo más manejable de 82 C. La caída relativamente pronunciada en el rendimiento con el tiempo conduce a las puntuaciones de bucle CineBench R15 xT progresivamente más bajas mencionadas anteriormente.
Las temperaturas de la CPU y la GPU al ejecutar cargas más altas como juegos se estabilizarían en casi las mismas lecturas que las que registramos en el ZBook Fury 16 G10 del año pasado a pesar de sus diferencias de rendimiento.
| Reloj medio de la CPU (GHz) | Reloj medio de la GPU (MHz) | Temperatura media dela CPU (°C) | Temperatura media de la GPU (°C) | |
| Sistema en reposo | -- | -- | 51 | 42 |
| Prime95 Stress | 2.2 - 2.6 | -- | 82 | 57 |
| Prime95 + FurMark Estrés | 1.8 | 1995 | 81 | 65 |
| Cyberpunk 2077 Estrés | 1.1 | 1845 | 81 | 69 |
Rendimiento del sistema
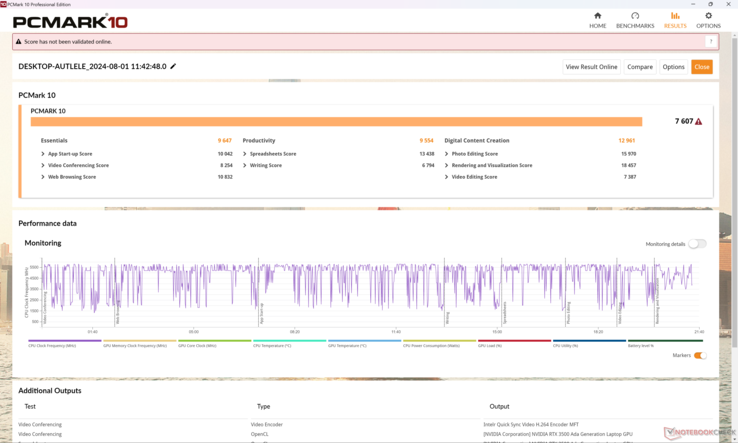
Los resultados de PCMark son similares a los que registramos en el ZBook Fury 16 G10 del año pasado, lo que sugiere que el ZBook Fury 16 G11 no ejecutará la mayoría de las tareas cotidianas más rápido que su predecesor.
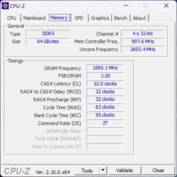
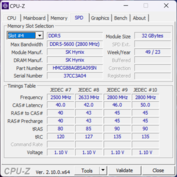
Hay que tener en cuenta que la velocidad máxima de la RAM está limitada a sólo 4000 MT/s si se configura con 128 GB de memoria debido a las limitaciones del estándar SODIMM. El modelo admite tanto memoria RAM ECC como RAM no ECC.
CrossMark: Overall | Productivity | Creativity | Responsiveness
WebXPRT 3: Overall
WebXPRT 4: Overall
Mozilla Kraken 1.1: Total
| PCMark 10 / Score | |
| HP ZBook Fury 16 G10 | |
| Dell Precision 5690 | |
| Lenovo ThinkPad P1 G6 21FV001KUS | |
| HP ZBook Fury 16 G11 | |
| Medio Intel Core i9-14900HX, NVIDIA RTX 3500 Ada Generation Laptop GPU (n=1) | |
| Asus ProArt Studiobook 16 OLED H7604 | |
| Lenovo ThinkPad P16 G2 21FA000FGE | |
| HP ZBook Fury 16 G9 | |
| PCMark 10 / Essentials | |
| Lenovo ThinkPad P1 G6 21FV001KUS | |
| HP ZBook Fury 16 G10 | |
| Dell Precision 5690 | |
| Lenovo ThinkPad P16 G2 21FA000FGE | |
| HP ZBook Fury 16 G9 | |
| Asus ProArt Studiobook 16 OLED H7604 | |
| HP ZBook Fury 16 G11 | |
| Medio Intel Core i9-14900HX, NVIDIA RTX 3500 Ada Generation Laptop GPU (n=1) | |
| PCMark 10 / Productivity | |
| Dell Precision 5690 | |
| Lenovo ThinkPad P1 G6 21FV001KUS | |
| Asus ProArt Studiobook 16 OLED H7604 | |
| HP ZBook Fury 16 G11 | |
| Medio Intel Core i9-14900HX, NVIDIA RTX 3500 Ada Generation Laptop GPU (n=1) | |
| Lenovo ThinkPad P16 G2 21FA000FGE | |
| HP ZBook Fury 16 G10 | |
| HP ZBook Fury 16 G9 | |
| PCMark 10 / Digital Content Creation | |
| HP ZBook Fury 16 G10 | |
| HP ZBook Fury 16 G11 | |
| Medio Intel Core i9-14900HX, NVIDIA RTX 3500 Ada Generation Laptop GPU (n=1) | |
| Lenovo ThinkPad P1 G6 21FV001KUS | |
| Dell Precision 5690 | |
| Asus ProArt Studiobook 16 OLED H7604 | |
| Lenovo ThinkPad P16 G2 21FA000FGE | |
| HP ZBook Fury 16 G9 | |
| CrossMark / Overall | |
| Asus ProArt Studiobook 16 OLED H7604 | |
| HP ZBook Fury 16 G11 | |
| Medio Intel Core i9-14900HX, NVIDIA RTX 3500 Ada Generation Laptop GPU (n=1) | |
| HP ZBook Fury 16 G10 | |
| HP ZBook Fury 16 G9 | |
| Lenovo ThinkPad P16 G2 21FA000FGE | |
| Lenovo ThinkPad P1 G6 21FV001KUS | |
| Dell Precision 5690 | |
| CrossMark / Productivity | |
| Asus ProArt Studiobook 16 OLED H7604 | |
| HP ZBook Fury 16 G11 | |
| Medio Intel Core i9-14900HX, NVIDIA RTX 3500 Ada Generation Laptop GPU (n=1) | |
| HP ZBook Fury 16 G10 | |
| HP ZBook Fury 16 G9 | |
| Dell Precision 5690 | |
| Lenovo ThinkPad P1 G6 21FV001KUS | |
| Lenovo ThinkPad P16 G2 21FA000FGE | |
| CrossMark / Creativity | |
| Asus ProArt Studiobook 16 OLED H7604 | |
| HP ZBook Fury 16 G11 | |
| Medio Intel Core i9-14900HX, NVIDIA RTX 3500 Ada Generation Laptop GPU (n=1) | |
| Lenovo ThinkPad P16 G2 21FA000FGE | |
| HP ZBook Fury 16 G9 | |
| HP ZBook Fury 16 G10 | |
| Lenovo ThinkPad P1 G6 21FV001KUS | |
| Dell Precision 5690 | |
| CrossMark / Responsiveness | |
| Asus ProArt Studiobook 16 OLED H7604 | |
| HP ZBook Fury 16 G11 | |
| Medio Intel Core i9-14900HX, NVIDIA RTX 3500 Ada Generation Laptop GPU (n=1) | |
| HP ZBook Fury 16 G10 | |
| HP ZBook Fury 16 G9 | |
| Dell Precision 5690 | |
| Lenovo ThinkPad P1 G6 21FV001KUS | |
| Lenovo ThinkPad P16 G2 21FA000FGE | |
| WebXPRT 3 / Overall | |
| HP ZBook Fury 16 G10 | |
| Asus ProArt Studiobook 16 OLED H7604 | |
| Lenovo ThinkPad P16 G2 21FA000FGE | |
| HP ZBook Fury 16 G11 | |
| Medio Intel Core i9-14900HX, NVIDIA RTX 3500 Ada Generation Laptop GPU (n=1) | |
| Lenovo ThinkPad P1 G6 21FV001KUS | |
| HP ZBook Fury 16 G9 | |
| Dell Precision 5690 | |
| WebXPRT 4 / Overall | |
| HP ZBook Fury 16 G11 | |
| Medio Intel Core i9-14900HX, NVIDIA RTX 3500 Ada Generation Laptop GPU (n=1) | |
| HP ZBook Fury 16 G10 | |
| Asus ProArt Studiobook 16 OLED H7604 | |
| Lenovo ThinkPad P1 G6 21FV001KUS | |
| HP ZBook Fury 16 G9 | |
| Dell Precision 5690 | |
| Mozilla Kraken 1.1 / Total | |
| Dell Precision 5690 | |
| HP ZBook Fury 16 G9 | |
| Lenovo ThinkPad P16 G2 21FA000FGE | |
| Lenovo ThinkPad P1 G6 21FV001KUS | |
| HP ZBook Fury 16 G10 | |
| HP ZBook Fury 16 G11 | |
| Medio Intel Core i9-14900HX, NVIDIA RTX 3500 Ada Generation Laptop GPU (n=1) | |
| Asus ProArt Studiobook 16 OLED H7604 | |
* ... más pequeño es mejor
| PCMark 10 Score | 7607 puntos | |
ayuda | ||
| AIDA64 / Memory Copy | |
| Dell Precision 5690 | |
| Medio Intel Core i9-14900HX (38028 - 83392, n=36) | |
| Asus ProArt Studiobook 16 OLED H7604 | |
| HP ZBook Fury 16 G10 | |
| HP ZBook Fury 16 G9 | |
| HP ZBook Fury 16 G11 | |
| Lenovo ThinkPad P16 G2 21FA000FGE | |
| Lenovo ThinkPad P1 G6 21FV001KUS | |
| AIDA64 / Memory Read | |
| Dell Precision 5690 | |
| Medio Intel Core i9-14900HX (43306 - 87568, n=36) | |
| Asus ProArt Studiobook 16 OLED H7604 | |
| HP ZBook Fury 16 G10 | |
| HP ZBook Fury 16 G11 | |
| HP ZBook Fury 16 G9 | |
| Lenovo ThinkPad P16 G2 21FA000FGE | |
| Lenovo ThinkPad P1 G6 21FV001KUS | |
| AIDA64 / Memory Write | |
| Dell Precision 5690 | |
| Medio Intel Core i9-14900HX (37146 - 80589, n=36) | |
| Asus ProArt Studiobook 16 OLED H7604 | |
| HP ZBook Fury 16 G10 | |
| HP ZBook Fury 16 G9 | |
| Lenovo ThinkPad P16 G2 21FA000FGE | |
| HP ZBook Fury 16 G11 | |
| Lenovo ThinkPad P1 G6 21FV001KUS | |
| AIDA64 / Memory Latency | |
| Dell Precision 5690 | |
| HP ZBook Fury 16 G10 | |
| Lenovo ThinkPad P16 G2 21FA000FGE | |
| HP ZBook Fury 16 G11 | |
| HP ZBook Fury 16 G9 | |
| Asus ProArt Studiobook 16 OLED H7604 | |
| Lenovo ThinkPad P1 G6 21FV001KUS | |
| Medio Intel Core i9-14900HX (76.1 - 105, n=36) | |
* ... más pequeño es mejor
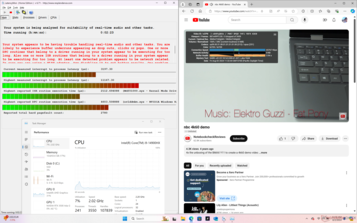
Latencia del CPD
| DPC Latencies / LatencyMon - interrupt to process latency (max), Web, Youtube, Prime95 | |
| HP ZBook Fury 16 G11 | |
| HP ZBook Fury 16 G10 | |
| HP ZBook Fury 16 G9 | |
| Asus ProArt Studiobook 16 OLED H7604 | |
| Lenovo ThinkPad P1 G6 21FV001KUS | |
| Lenovo ThinkPad P16 G2 21FA000FGE | |
| Dell Precision 5690 | |
* ... más pequeño es mejor
Dispositivos de almacenamiento
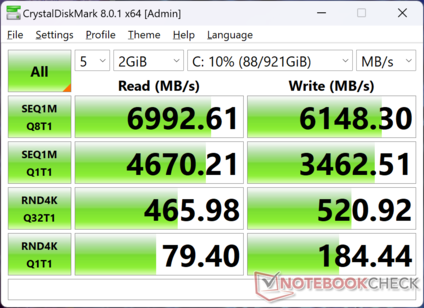
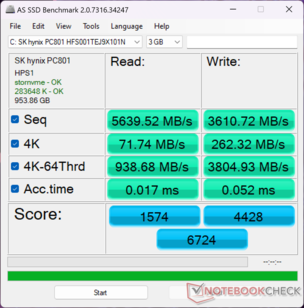
Nuestra unidad de prueba se entrega con el mismo disco duro de 1 TB SK Hynix PC801 HFS001TEJ9X101N PCIe4 M.2 SSD que se encuentra en el ZBook Fury 16 G10 del año pasado. Por desgracia, la unidad también sufre los mismos problemas de estrangulamiento del rendimiento. Al ejecutar DiskSpd en un bucle, las tasas de transferencia comenzarían muy altas a casi 7000 MB/s antes de caer a tan sólo 3400 MB/s unos minutos más tarde, como se muestra en el gráfico siguiente. Esto puede atribuirse a una refrigeración insuficiente de las unidades, pero quizá sea el precio a pagar por soportar más unidades individuales que la mayoría de los demás portátiles.
* ... más pequeño es mejor
Disk Throttling: DiskSpd Read Loop, Queue Depth 8
Rendimiento de la GPU
Los usuarios pueden esperar la RTX 3500 Ada sea entre un 20 y un 30 por ciento más lenta que la RTX 5000 Ada. Dado que Nvidia aún no ha introducido una nueva generación de GPU móviles, el ZBook Fury 16 G11 se entrega con las mismas opciones de GPU que en el modelo del año pasado sin mejoras de rendimiento dignas de mención. La RTA 5000 Ada sigue siendo la GPU más rápida disponible para estaciones de trabajo móviles.
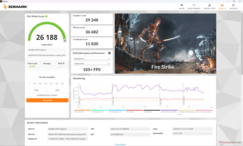
| Perfil de potencia | Puntuación gráfica | Puntuación física | Puntuación combinada |
| Modo de rendimiento | 29248 | 36682 | 11830 |
| Modo equilibrado | 28214 (-4%) | 33094 (-10%) | 10246 (-13%) |
| Batería | 16618 (-43%) | 25118 (-32%) | 4101 (-65%) |
Ejecutar en modo Equilibrado en lugar de en modo Rendimiento tendría un impacto en el rendimiento de hasta un 10 a 15 por ciento, como muestra nuestra tabla Fire Strike anterior. El déficit de rendimiento crece aún más si se ejecuta con batería, lo que es de esperar en la mayoría de los portátiles de alto rendimiento.
| 3DMark Performance Rating - Percent | |
| HP ZBook Fury 16 G10 -2! | |
| Dell Precision 5690 -2! | |
| Dell Precision 5000 5680 -2! | |
| HP ZBook Fury 16 G11 | |
| Medio NVIDIA RTX 3500 Ada Generation Laptop GPU | |
| Lenovo ThinkPad P1 G6 21FV001KUS -2! | |
| Lenovo ThinkPad P1 G6-21FV000DGE -17! | |
| HP ZBook Fury 16 G9 -2! | |
| Lenovo ThinkPad P16 G2 21FA000FGE -17! | |
| MSI CreatorPro Z16P B12UKST -17! | |
| Asus ProArt Studiobook 16 OLED H7604 -17! | |
| Asus ExpertBook B6 Flip B6602FC2 -17! | |
| Lenovo ThinkPad P1 G4-20Y4S0KS00 -10! | |
| Lenovo ThinkPad P16v G1 AMD -17! | |
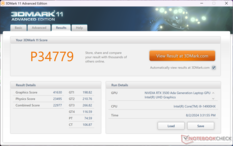
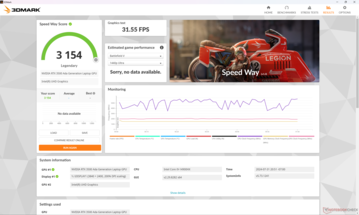
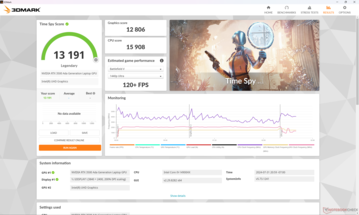
| 3DMark 11 Performance | 34779 puntos | |
| 3DMark Fire Strike Score | 26188 puntos | |
| 3DMark Time Spy Score | 13191 puntos | |
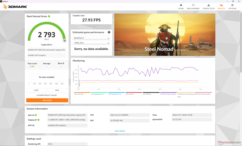
| 3DMark Steel Nomad Score | 2793 puntos | |
ayuda | ||
* ... más pequeño es mejor
Rendimiento en juegos
Aunque no está diseñada para juegos, la RTX 3500 Ada rinde ligeramente por encima de la GeForce RTX 4070 móvil pero por debajo de la RTX 4080 para móviles, especialmente si se tiene en cuenta el número de pipelines unificados, los núcleos tensoriales y el ancho de banda de la memoria. No obstante, el rendimiento puede disminuir gradualmente con el tiempo cuando se somete a estrés, ya que las velocidades de aumento de la GPU no son indefinidas. Por ejemplo, al ejecutar Cyberpunk 2077 en ralentí con ajustes Ultra a 1080p, el rendimiento comenzaría con algo más de 70 FPS antes de descender gradualmente hasta el rango bajo de los 60 FPS después de sólo 30 minutos, como muestra el gráfico siguiente.
| Performance Rating - Percent | |
| HP ZBook Fury 16 G10 -2! | |
| Lenovo ThinkPad P1 G6 21FV001KUS -1! | |
| HP ZBook Fury 16 G11 | |
| Asus ProArt Studiobook 16 OLED H7604 -1! | |
| Dell Precision 5690 -1! | |
| HP ZBook Fury 16 G9 -1! | |
| Lenovo ThinkPad P16 G2 21FA000FGE -1! | |
| GTA V - 1920x1080 Highest Settings possible AA:4xMSAA + FX AF:16x | |
| Asus ProArt Studiobook 16 OLED H7604 | |
| Lenovo ThinkPad P1 G6 21FV001KUS | |
| HP ZBook Fury 16 G9 | |
| HP ZBook Fury 16 G11 | |
| Lenovo ThinkPad P16 G2 21FA000FGE | |
| Final Fantasy XV Benchmark - 1920x1080 High Quality | |
| HP ZBook Fury 16 G10 | |
| Lenovo ThinkPad P1 G6 21FV001KUS | |
| Dell Precision 5690 | |
| HP ZBook Fury 16 G11 | |
| Asus ProArt Studiobook 16 OLED H7604 | |
| HP ZBook Fury 16 G9 | |
| Lenovo ThinkPad P16 G2 21FA000FGE | |
| Strange Brigade - 1920x1080 ultra AA:ultra AF:16 | |
| HP ZBook Fury 16 G10 | |
| Dell Precision 5690 | |
| HP ZBook Fury 16 G11 | |
| HP ZBook Fury 16 G9 | |
| Lenovo ThinkPad P16 G2 21FA000FGE | |
| Asus ProArt Studiobook 16 OLED H7604 | |
| Dota 2 Reborn - 1920x1080 ultra (3/3) best looking | |
| Asus ProArt Studiobook 16 OLED H7604 | |
| HP ZBook Fury 16 G10 | |
| HP ZBook Fury 16 G11 | |
| HP ZBook Fury 16 G9 | |
| Lenovo ThinkPad P16 G2 21FA000FGE | |
| Lenovo ThinkPad P1 G6 21FV001KUS | |
| Dell Precision 5690 | |
| Cyberpunk 2077 2.2 Phantom Liberty - 1920x1080 Ultra Preset (FSR off) | |
| Dell Precision 5690 | |
| Lenovo ThinkPad P1 G6 21FV001KUS | |
| HP ZBook Fury 16 G11 | |
| Baldur's Gate 3 | |
| 1920x1080 Ultra Preset | |
| Dell Precision 5690 | |
| Lenovo ThinkPad P1 G6 21FV001KUS | |
| HP ZBook Fury 16 G11 | |
| Medio NVIDIA RTX 3500 Ada Generation Laptop GPU (n=1) | |
| 2560x1440 Ultra Preset | |
| Dell Precision 5690 | |
| Lenovo ThinkPad P1 G6 21FV001KUS | |
| HP ZBook Fury 16 G11 | |
| Medio NVIDIA RTX 3500 Ada Generation Laptop GPU (n=1) | |
| 3840x2160 Ultra Preset | |
| Dell Precision 5690 | |
| Lenovo ThinkPad P1 G6 21FV001KUS | |
| HP ZBook Fury 16 G11 | |
| Medio NVIDIA RTX 3500 Ada Generation Laptop GPU (n=1) | |
Cyberpunk 2077 ultra FPS Chart
| bajo | medio | alto | ultra | QHD | 4K | |
|---|---|---|---|---|---|---|
| GTA V (2015) | 184.3 | 181 | 170.1 | 115.5 | 97.5 | 59.6 |
| Dota 2 Reborn (2015) | 201 | 177.7 | 162.1 | 153.9 | 134.4 | |
| Final Fantasy XV Benchmark (2018) | 200 | 167.6 | 128.9 | 97.5 | 54.2 | |
| X-Plane 11.11 (2018) | 144.6 | 137.8 | 110.9 | 92.7 | ||
| Far Cry 5 (2018) | 133 | 135 | 127 | 109 | 62 | |
| Strange Brigade (2018) | 411 | 296 | 235 | 223 | 159.2 | 78.6 |
| Tiny Tina's Wonderlands (2022) | 232.5 | 195.4 | 137.9 | 109.3 | 74.4 | 41.6 |
| F1 22 (2022) | 228 | 223 | 182.8 | 72.9 | 48.3 | 24 |
| Baldur's Gate 3 (2023) | 164.8 | 136.2 | 118.6 | 117.3 | 80.2 | 41.2 |
| Cyberpunk 2077 2.2 Phantom Liberty (2023) | 121.2 | 113.1 | 101.8 | 90.3 | 60.2 | 21.3 |
Emisiones
Ruido del sistema
El ruido y el comportamiento de los ventiladores son aproximadamente los mismos que los que registramos en el modelo del año pasado, si no ligeramente más ruidosos cuando se ejecutan cargas más altas. Los ventiladores aún pulsarían ocasionalmente cuando están en ralentí en el escritorio, incluso cuando están configurados en modo equilibrado sin aplicaciones en ejecución. Peor aún, nuestra unidad específica sufre de un notable zumbido de la bobina que persistiría durante todo el período de pruebas.
Ruido
| Ocioso |
| 23.2 / 23.2 / 29.5 dB(A) |
| Carga |
| 43 / 48.2 dB(A) |
 | ||
30 dB silencioso 40 dB(A) audible 50 dB(A) ruidosamente alto |
||
min: | ||
| HP ZBook Fury 16 G11 NVIDIA RTX 3500 Ada Generation Laptop GPU, i9-14900HX, SK hynix PC801 HFS001TEJ9X101N | HP ZBook Fury 16 G10 NVIDIA RTX 5000 Ada Generation Laptop GPU, i9-13950HX, SK hynix PC801 HFS001TEJ9X101N | HP ZBook Fury 16 G9 RTX A5500 Laptop GPU, i9-12950HX, Micron 3400 1TB MTFDKBA1T0TFH | Dell Precision 5690 NVIDIA RTX 5000 Ada Generation Laptop GPU, Ultra 9 185H, 2x Samsung PM9A1 1TB (RAID 0) | Lenovo ThinkPad P16 G2 21FA000FGE NVIDIA RTX 2000 Ada Generation Laptop GPU, i7-13700HX, SK hynix PC801 HFS001TEJ9X162N | Lenovo ThinkPad P1 G6 21FV001KUS NVIDIA GeForce RTX 4080 Laptop GPU, i7-13800H, Kioxia XG8 KXG8AZNV1T02 | Asus ProArt Studiobook 16 OLED H7604 NVIDIA GeForce RTX 4070 Laptop GPU, i9-13980HX, Phison EM2804TBMTCB47 | |
|---|---|---|---|---|---|---|---|
| Noise | 3% | 4% | -3% | -4% | 9% | -5% | |
| apagado / medio ambiente * | 23.2 | 22.9 1% | 22.6 3% | 23.4 -1% | 23.5 -1% | 22.5 3% | 24.5 -6% |
| Idle Minimum * | 23.2 | 22.9 1% | 22.7 2% | 23.6 -2% | 23.5 -1% | 22.5 3% | 24.5 -6% |
| Idle Average * | 23.2 | 22.9 1% | 22.7 2% | 24.9 -7% | 29.2 -26% | 22.5 3% | 24.5 -6% |
| Idle Maximum * | 29.5 | 28.5 3% | 28.8 2% | 30.9 -5% | 29.5 -0% | 22.5 24% | 24.5 17% |
| Load Average * | 43 | 40.6 6% | 36.2 16% | 40.4 6% | 32.7 24% | 28.7 33% | 47.6 -11% |
| Cyberpunk 2077 ultra * | 48.2 | ||||||
| Load Maximum * | 48.2 | 45.8 5% | 49.3 -2% | 51.9 -8% | 56.6 -17% | 54.4 -13% | 56.7 -18% |
| Witcher 3 ultra * | 44.1 | 49.5 | 48.3 | 50.6 | 47.5 | 55.9 |
* ... más pequeño es mejor
Temperatura
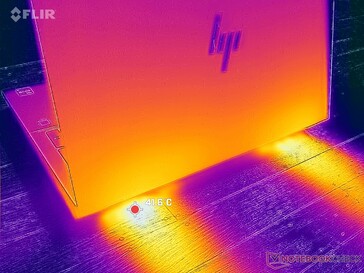
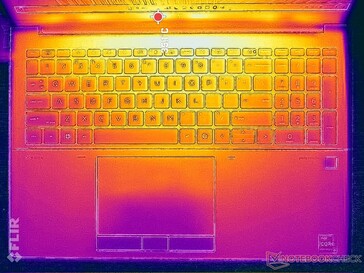
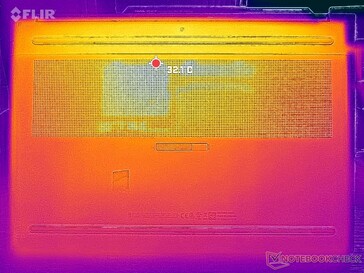
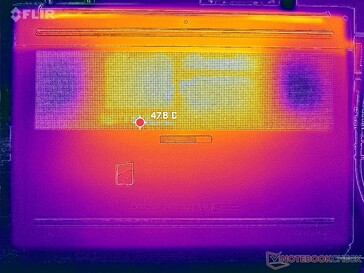
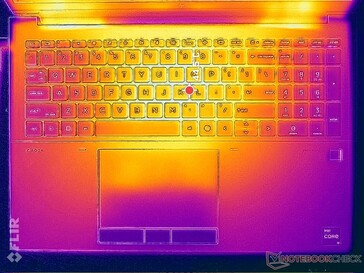
(±) La temperatura máxima en la parte superior es de 42.2 °C / 108 F, frente a la media de 38.2 °C / 101 F, que oscila entre 22.2 y 69.8 °C para la clase Workstation.
(-) El fondo se calienta hasta un máximo de 48 °C / 118 F, frente a la media de 41.2 °C / 106 F
(±) En reposo, la temperatura media de la parte superior es de 33.8 °C / 93# F, frente a la media del dispositivo de 32 °C / 90 F.
(-) 3: The average temperature for the upper side is 38.5 °C / 101 F, compared to the average of 32 °C / 90 F for the class Workstation.
(±) El reposamanos y el touchpad pueden calentarse mucho al tacto con un máximo de 37.6 °C / 99.7 F.
(-) La temperatura media de la zona del reposamanos de dispositivos similares fue de 27.8 °C / 82 F (-9.8 °C / -17.7 F).
| HP ZBook Fury 16 G11 Intel Core i9-14900HX, NVIDIA RTX 3500 Ada Generation Laptop GPU | HP ZBook Fury 16 G10 Intel Core i9-13950HX, Nvidia RTX 5000 Ada Generation Laptop GPU | HP ZBook Fury 16 G9 Intel Core i9-12950HX, NVIDIA RTX A5500 Laptop GPU | Dell Precision 5690 Intel Core Ultra 9 185H, Nvidia RTX 5000 Ada Generation Laptop GPU | Lenovo ThinkPad P16 G2 21FA000FGE Intel Core i7-13700HX, NVIDIA RTX 2000 Ada Generation Laptop GPU | Lenovo ThinkPad P1 G6 21FV001KUS Intel Core i7-13800H, NVIDIA GeForce RTX 4080 Laptop GPU | Asus ProArt Studiobook 16 OLED H7604 Intel Core i9-13980HX, NVIDIA GeForce RTX 4070 Laptop GPU | |
|---|---|---|---|---|---|---|---|
| Heat | 3% | 10% | 13% | 15% | 4% | 3% | |
| Maximum Upper Side * | 42.2 | 44.8 -6% | 43.2 -2% | 46.6 -10% | 47.2 -12% | 42 -0% | 44.1 -5% |
| Maximum Bottom * | 48 | 50 -4% | 50.4 -5% | 33 31% | 39.5 18% | 45.2 6% | 48 -0% |
| Idle Upper Side * | 37 | 34.4 7% | 28.6 23% | 32.4 12% | 28.1 24% | 33 11% | 32.7 12% |
| Idle Bottom * | 36.8 | 31.8 14% | 28.2 23% | 29.4 20% | 25.3 31% | 37 -1% | 34.9 5% |
* ... más pequeño es mejor
Altavoces
HP ZBook Fury 16 G11 análisis de audio
(+) | los altavoces pueden reproducir a un volumen relativamente alto (#88.9 dB)
Graves 100 - 315 Hz
(±) | lubina reducida - en promedio 13.3% inferior a la mediana
(±) | la linealidad de los graves es media (11.2% delta a frecuencia anterior)
Medios 400 - 2000 Hz
(+) | medios equilibrados - a sólo 2.2% de la mediana
(+) | los medios son lineales (3.2% delta a la frecuencia anterior)
Altos 2 - 16 kHz
(+) | máximos equilibrados - a sólo 3.7% de la mediana
(+) | los máximos son lineales (4.6% delta a la frecuencia anterior)
Total 100 - 16.000 Hz
(+) | el sonido global es lineal (12.9% de diferencia con la mediana)
En comparación con la misma clase
» 17% de todos los dispositivos probados de esta clase eran mejores, 6% similares, 76% peores
» El mejor tuvo un delta de 7%, la media fue 18%, el peor fue ###max##%
En comparación con todos los dispositivos probados
» 11% de todos los dispositivos probados eran mejores, 3% similares, 87% peores
» El mejor tuvo un delta de 4%, la media fue 24%, el peor fue ###max##%
Apple MacBook Pro 16 2021 M1 Pro análisis de audio
(+) | los altavoces pueden reproducir a un volumen relativamente alto (#84.7 dB)
Graves 100 - 315 Hz
(+) | buen bajo - sólo 3.8% lejos de la mediana
(+) | el bajo es lineal (5.2% delta a la frecuencia anterior)
Medios 400 - 2000 Hz
(+) | medios equilibrados - a sólo 1.3% de la mediana
(+) | los medios son lineales (2.1% delta a la frecuencia anterior)
Altos 2 - 16 kHz
(+) | máximos equilibrados - a sólo 1.9% de la mediana
(+) | los máximos son lineales (2.7% delta a la frecuencia anterior)
Total 100 - 16.000 Hz
(+) | el sonido global es lineal (4.6% de diferencia con la mediana)
En comparación con la misma clase
» 0% de todos los dispositivos probados de esta clase eran mejores, 0% similares, 100% peores
» El mejor tuvo un delta de 5%, la media fue 18%, el peor fue ###max##%
En comparación con todos los dispositivos probados
» 0% de todos los dispositivos probados eran mejores, 0% similares, 100% peores
» El mejor tuvo un delta de 4%, la media fue 24%, el peor fue ###max##%
Gestión de la energía
Consumo de energía
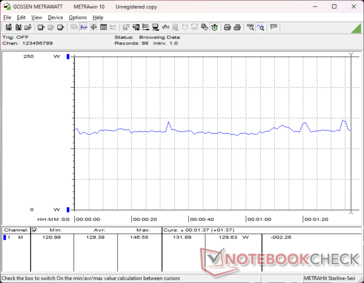
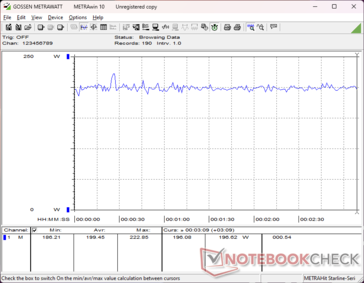
El sistema es más eficiente cuando está en ralentí en el escritorio en comparación con nuestro ZBook Fury 16 G10 configuración. Por lo demás, el consumo es casi el mismo cuando se ejecutan cargas más exigentes, como juegos, a pesar de que las GPU configuradas son diferentes entre nuestros dos ejemplos. Por tanto, el rendimiento por vatio aumenta al seleccionar configuraciones de GPU de gama alta frente a nuestra RTX 3500 Ada de gama media.
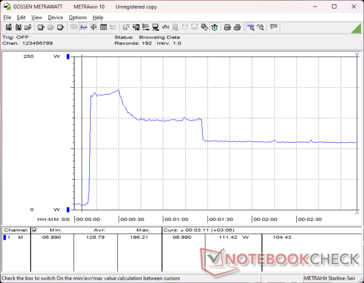
El consumo al ejecutar Prime95 o CineBench R15 xT sería notablemente superior en nuestra unidad en comparación con el modelo del año pasado debido al mayor potencial Turbo Boost de nuestro procesador Core i9-14900HX. Después de un minuto más o menos, sin embargo, el consumo caería para estar casi en línea con lo que medimos en el modelo del año pasado como se muestra en el gráfico de comparación a continuación que se alinea con nuestras observaciones del bucle CineBench R15 xT de arriba. Por lo tanto, nuestro mayor potencial inicial de Turbo Boost es la ventaja clave entre el nuevo Core i9-14900HX y el Core i9-13950HX más antiguo.
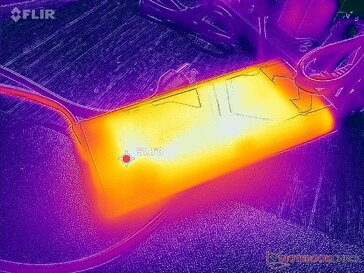
Somos capaces de registrar un consumo máximo de 236 W del gran adaptador de CA de 230 W (~18 x 8,8 x 2,5 cm) cuando la CPU y la GPU están cada una al 100 por ciento de utilización.
| Off / Standby | |
| Ocioso | |
| Carga |
|
Clave:
min: | |
| HP ZBook Fury 16 G11 i9-14900HX, NVIDIA RTX 3500 Ada Generation Laptop GPU, SK hynix PC801 HFS001TEJ9X101N, IPS, 3840x2400, 16" | HP ZBook Fury 16 G10 i9-13950HX, NVIDIA RTX 5000 Ada Generation Laptop GPU, SK hynix PC801 HFS001TEJ9X101N, IPS, 3840x2400, 16" | HP ZBook Fury 16 G9 i9-12950HX, RTX A5500 Laptop GPU, Micron 3400 1TB MTFDKBA1T0TFH, IPS, 3840x2400, 16" | Dell Precision 5690 Ultra 9 185H, NVIDIA RTX 5000 Ada Generation Laptop GPU, 2x Samsung PM9A1 1TB (RAID 0), OLED, 3840x2400, 16" | Lenovo ThinkPad P16 G2 21FA000FGE i7-13700HX, NVIDIA RTX 2000 Ada Generation Laptop GPU, SK hynix PC801 HFS001TEJ9X162N, IPS LED, 2560x1600, 16" | Lenovo ThinkPad P1 G6 21FV001KUS i7-13800H, NVIDIA GeForce RTX 4080 Laptop GPU, Kioxia XG8 KXG8AZNV1T02, OLED, 3480x2400, 16" | Asus ProArt Studiobook 16 OLED H7604 i9-13980HX, NVIDIA GeForce RTX 4070 Laptop GPU, Phison EM2804TBMTCB47, OLED, 3200x2000, 16" | |
|---|---|---|---|---|---|---|---|
| Power Consumption | -34% | -77% | -1% | 4% | 7% | -24% | |
| Idle Minimum * | 8.6 | 15.3 -78% | 19.5 -127% | 7.9 8% | 9.3 -8% | 8 7% | 12.8 -49% |
| Idle Average * | 14.8 | 18.2 -23% | 29 -96% | 12 19% | 14.1 5% | 9.5 36% | 19.9 -34% |
| Idle Maximum * | 15.7 | 28 -78% | 40.7 -159% | 28.6 -82% | 15.5 1% | 23.7 -51% | 20.3 -29% |
| Load Average * | 129.4 | 137.9 -7% | 142.1 -10% | 98.8 24% | 133.6 -3% | 97.2 25% | 131.4 -2% |
| Cyberpunk 2077 ultra external monitor * | 192.6 | ||||||
| Cyberpunk 2077 ultra * | 199.4 | ||||||
| Load Maximum * | 236.1 | 202 14% | 224.4 5% | 174.8 26% | 179.6 24% | 197.2 16% | 246.8 -5% |
| Witcher 3 ultra * | 189.4 | 188.6 | 144.5 | 144.9 | 144 | 196.5 |
* ... más pequeño es mejor
Power Consumption Cyberpunk / Stress Test
Power Consumption external Monitor
Duración de las pilas
Los tiempos de ejecución son muy similares a los del ZBook Fury 16 G11 del año pasado, si no ligeramente más cortos, probablemente debido al mayor techo de Turbo Boost para la CPU Raptor Lake-HX Refresh. Los modelos de la competencia como el Precision 5690 o el ThinkPad P16 G2 pueden durar cada uno al menos una hora más en comparación.
La carga desde vacío a plena capacidad con el adaptador de CA de barril incluido es relativamente rápida con poco más de 60 minutos.
| HP ZBook Fury 16 G11 i9-14900HX, NVIDIA RTX 3500 Ada Generation Laptop GPU, 95 Wh | HP ZBook Fury 16 G10 i9-13950HX, NVIDIA RTX 5000 Ada Generation Laptop GPU, 95 Wh | HP ZBook Fury 16 G9 i9-12950HX, RTX A5500 Laptop GPU, 95 Wh | Dell Precision 5690 Ultra 9 185H, NVIDIA RTX 5000 Ada Generation Laptop GPU, 98 Wh | Lenovo ThinkPad P16 G2 21FA000FGE i7-13700HX, NVIDIA RTX 2000 Ada Generation Laptop GPU, 94 Wh | Lenovo ThinkPad P1 G6 21FV001KUS i7-13800H, NVIDIA GeForce RTX 4080 Laptop GPU, 90 Wh | Asus ProArt Studiobook 16 OLED H7604 i9-13980HX, NVIDIA GeForce RTX 4070 Laptop GPU, 90 Wh | |
|---|---|---|---|---|---|---|---|
| Duración de Batería | 8% | -10% | 37% | 28% | -37% | -17% | |
| WiFi v1.3 | 402 | 435 8% | 360 -10% | 549 37% | 515 28% | 252 -37% | 334 -17% |
| Reader / Idle | 319 | ||||||
| Load | 71 | 65 | |||||
| H.264 | 358 |
Pro
Contra
Veredicto - Un diseño sólido lastrado por un turboalimentador limitado
Nos encanta el diseño del ZBook Fury 16 G11. Aunque sigue siendo el mismo que el Fury 16 G9, su facilidad de mantenimiento, las amplias opciones configurables, la compatibilidad con RAM ECC y el cómodo teclado y touchpad marcan todas las casillas correctas para los usuarios de estaciones de trabajo.
En cambio, los principales problemas del ZBook Fury 16 G11 residen en su rendimiento. Cuando otro portátil como el Lenovo Legion 9 16IRX9 puede ejecutar exactamente la misma CPU Core i9-14900HX hasta un 20 por ciento más rápido que nuestro ZBook, entonces la solución de refrigeración en el HP definitivamente podría utilizar una actualización para soportar mayores velocidades Turbo Boost durante más tiempo. Del mismo modo, las unidades SSD M.2 podrían beneficiarse de disipadores de calor por la misma razón, ya que también se estrangularían cuando se estresan. Estas limitaciones empañan los beneficios de la CPU Core i9 y la SSD PCIe4 ya que potencialmente pueden rendir más rápido en máquinas de la competencia de Dell o Lenovo.
El ZBook Fury 16 G11 es sólo una actualización menor sobre el ZBook Fury G10 del año pasado. Aunque todavía se ve y se siente muy bien, el rendimiento tiende a estrangularse para escenarios de uso más pesado.
Por último, es un poco desafortunado que el modelo no ofrezca opciones Meteor Lake para no acelerar la IA local. Concedido, tal característica probablemente sólo atrae a un pequeño subconjunto de usuarios de estaciones de trabajo, pero habría ayudado a distinguir aún más la Fury 16 G11 de la Fury 16 G10. Puede obtener esencialmente el mismo rendimiento y características de la Fury 16 G10 que en la última Fury 16 G11.
Precio y disponibilidad
La ZBook Fury 16 G11 se comercializa actualmente por unos 3400 $ configurada con el Core i9-14900HX y la RTX 3500 Ada hasta más de 5500 $ si está totalmente configurada con la RTX 5000 Ada.
Nota: Hemos actualizado nuestro sistema de evaluación y los resultados de la versión 8 no se pueden comparar con los de la versión 7. Más información aquí verfügbar.
Nota: Recientemente hemos actualizado nuestro sistema de clasificación y los resultados de la versión 8 no son comparables con los de la versión 7. Encontrará más información aquí .
HP ZBook Fury 16 G11
- 08/12/2024 v8
Allen Ngo
Transparencia
La selección de los dispositivos que se van a reseñar corre a cargo de nuestro equipo editorial. La muestra de prueba fue proporcionada al autor en calidad de préstamo por el fabricante o el minorista a los efectos de esta reseña. El prestamista no tuvo ninguna influencia en esta reseña, ni el fabricante recibió una copia de la misma antes de su publicación. No había ninguna obligación de publicar esta reseña. Nunca aceptamos compensaciones o pagos a cambio de nuestras reseñas. Como empresa de medios independiente, Notebookcheck no está sujeta a la autoridad de fabricantes, minoristas o editores.
Así es como prueba Notebookcheck
Cada año, Notebookcheck revisa de forma independiente cientos de portátiles y smartphones utilizando procedimientos estandarizados para asegurar que todos los resultados son comparables. Hemos desarrollado continuamente nuestros métodos de prueba durante unos 20 años y hemos establecido los estándares de la industria en el proceso. En nuestros laboratorios de pruebas, técnicos y editores experimentados utilizan equipos de medición de alta calidad. Estas pruebas implican un proceso de validación en varias fases. Nuestro complejo sistema de clasificación se basa en cientos de mediciones y puntos de referencia bien fundamentados, lo que mantiene la objetividad.














 Total Sustainability Score:


