

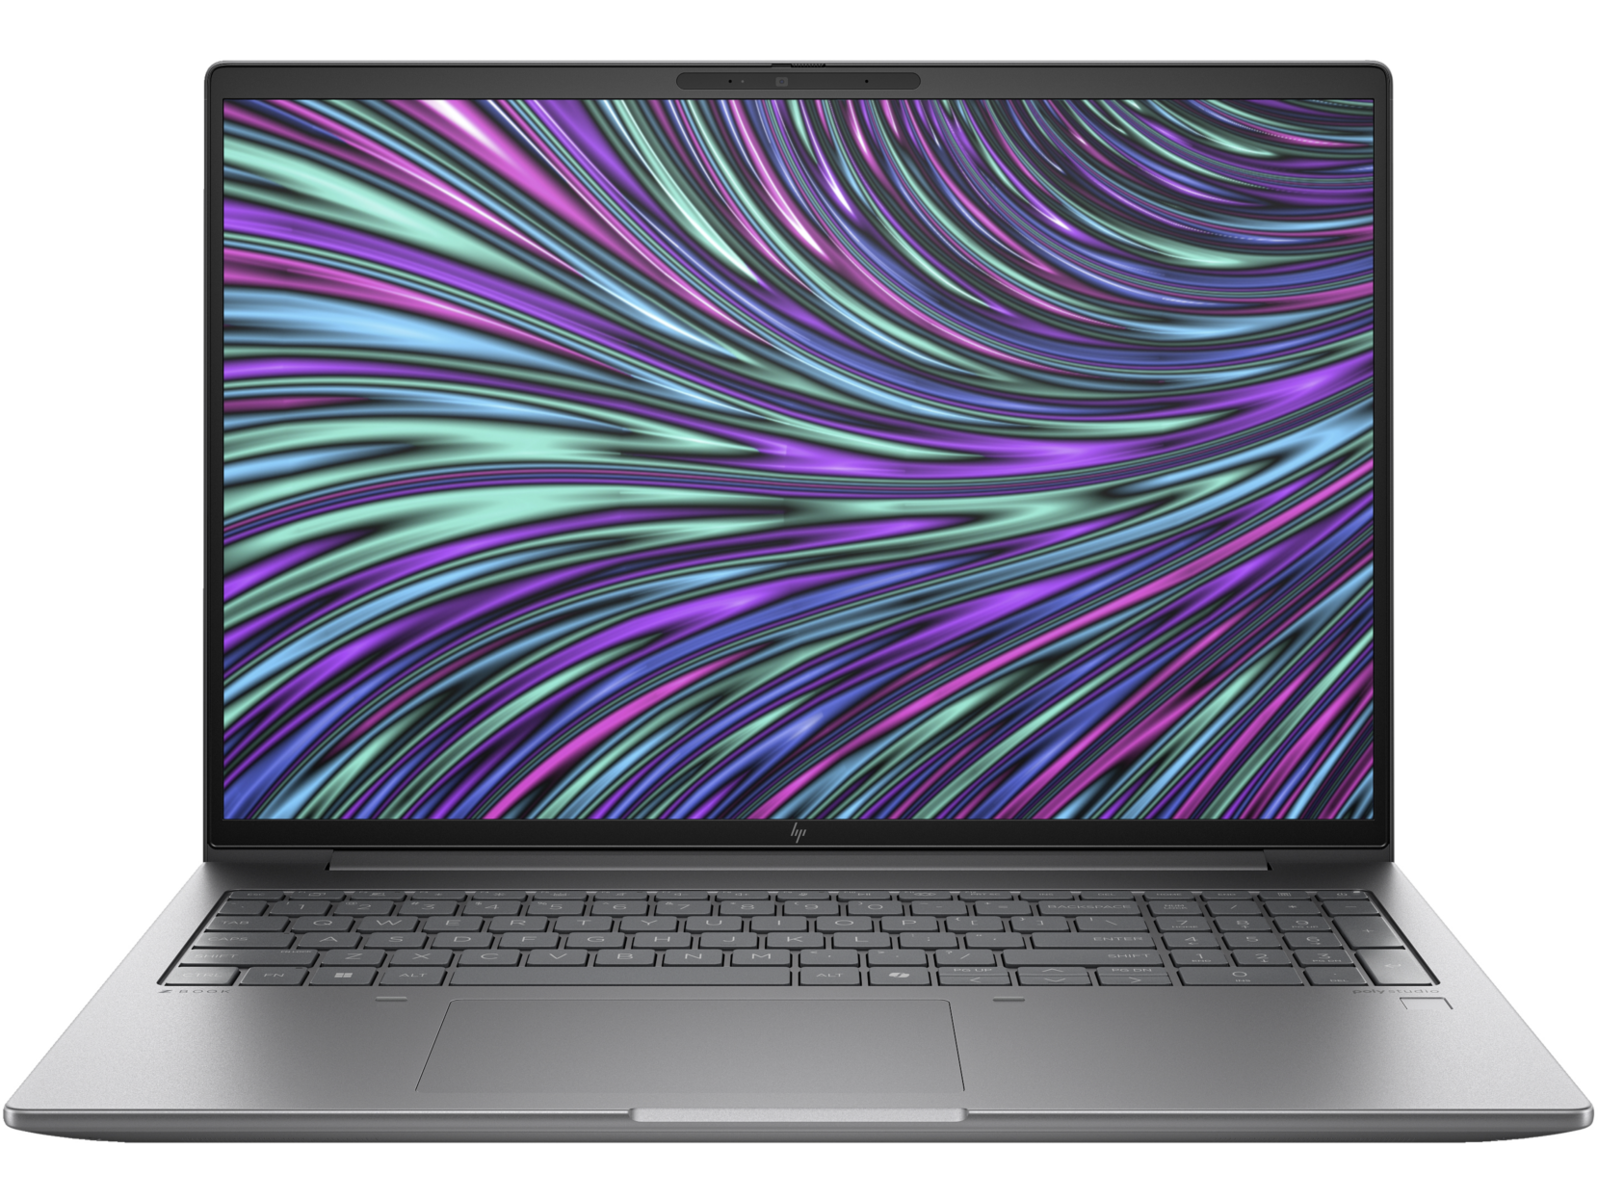
Reseña de la HP ZBook Power 16 G11 A: Potente estación de trabajo con AMD Zen 4

El ZBook Power 16 G11 sucede al antiguo ZBook Power 15 G10 tanto con nuevos procesadores internos como con nuevos cambios externos. Como su nombre indica, el ZBook Power 16 G11 moderniza la serie abandonando el antiguo factor de forma de 15,6 pulgadas por un diseño de 16 pulgadas. Se sitúa entre el ZBook Firefly de gama baja y el ZBook Fury de gama alta en lo que a rendimiento se refiere. Los usuarios pueden configurarlo con CPU Meteor Lake Intel Core Ultra o CPU AMD Ryzen Zen 4 y gráficos Nvidia RTX.
Nuestra unidad en revisión es una configuración AMD de gama alta (ZBook Power 16 G11 A) con la CPU Ryzen 7 8845HS, GPU RTX 2000 Ada y pantalla IPS de 120Hz 2560 x 1600p por aproximadamente 2100 dólares. Las opciones son muy amplias y van desde el Ryzen 5 8645HS hasta el Ryzen 9 8945HS con pantalla 1200p y gráficos RTX 1000, RTX 2000 o RTX 3000. Los usuarios también pueden optar por ningún tipo de gráficos discretos.
Los competidores en este espacio incluyen otras estaciones de trabajo de 16 pulgadas como la Dell Precision 5690, MSI CreatorPro Z16Po el Lenovo ThinkPad P16s G2.
Más opiniones sobre HP:
Posibles contendientes en la comparación
Valoración | Versión | Fecha | Modelo | Peso | Altura | Tamaño | Resolución | Precio |
|---|---|---|---|---|---|---|---|---|
| 85.4 % | v8 | 10/2024 | HP ZBook Power 16 G11 A R7 8845HS, NVIDIA RTX 2000 Ada Generation Laptop GPU | 2.2 kg | 22.9 mm | 16.00" | 2560x1600 | |
| 88.9 % v7 (old) | v7 (old) | 12/2023 | HP ZBook Power 15 G10 R7 PRO 7840HS, NVIDIA RTX 2000 Ada Generation Laptop GPU | 2 kg | 22.9 mm | 15.60" | 2560x1440 | |
| 85.9 % | v8 | 08/2024 | HP ZBook Fury 16 G11 i9-14900HX, NVIDIA RTX 3500 Ada Generation Laptop GPU | 2.6 kg | 28.5 mm | 16.00" | 3840x2400 | |
| 83.5 % | v8 | 10/2024 | Lenovo ThinkPad P1 Gen 7 21KV001SGE Ultra 7 155H, NVIDIA GeForce RTX 4060 Laptop GPU | 2 kg | 20.5 mm | 16.00" | 2560x1600 | |
| 88.6 % v7 (old) | v7 (old) | 01/2024 | Lenovo ThinkPad P16s G2 21K9000CGE R7 PRO 7840U, Radeon 780M | 1.8 kg | 24.4 mm | 16.00" | 3840x2400 | |
| 88.3 % v7 (old) | v7 (old) | 05/2024 | Dell Precision 5690 Ultra 9 185H, NVIDIA RTX 5000 Ada Generation Laptop GPU | 2.3 kg | 22.17 mm | 16.00" | 3840x2400 |
Nota: Recientemente hemos actualizado nuestro sistema de clasificación y los resultados de la versión 8 no son comparables con los de la versión 7. Encontrará más información aquí .
Estuche - Certificado MIL-STD 810
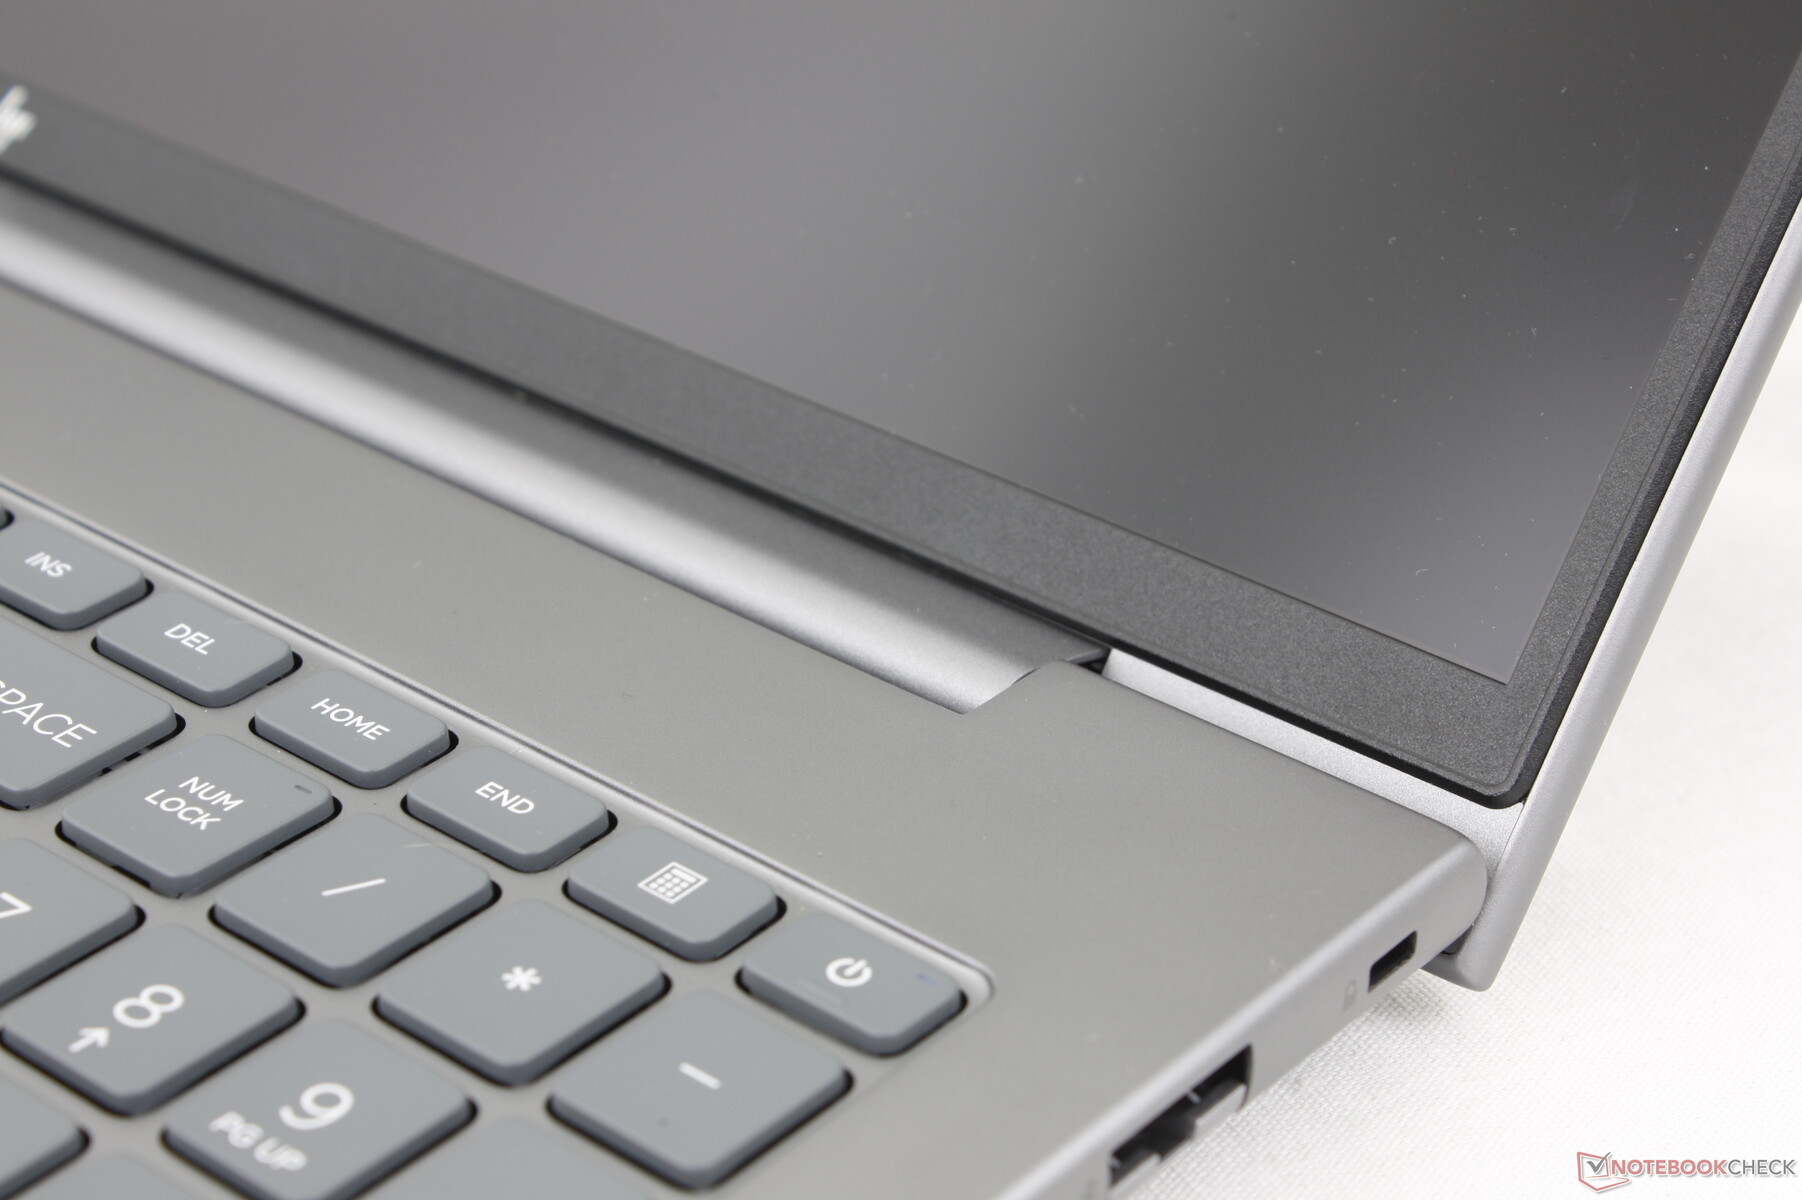
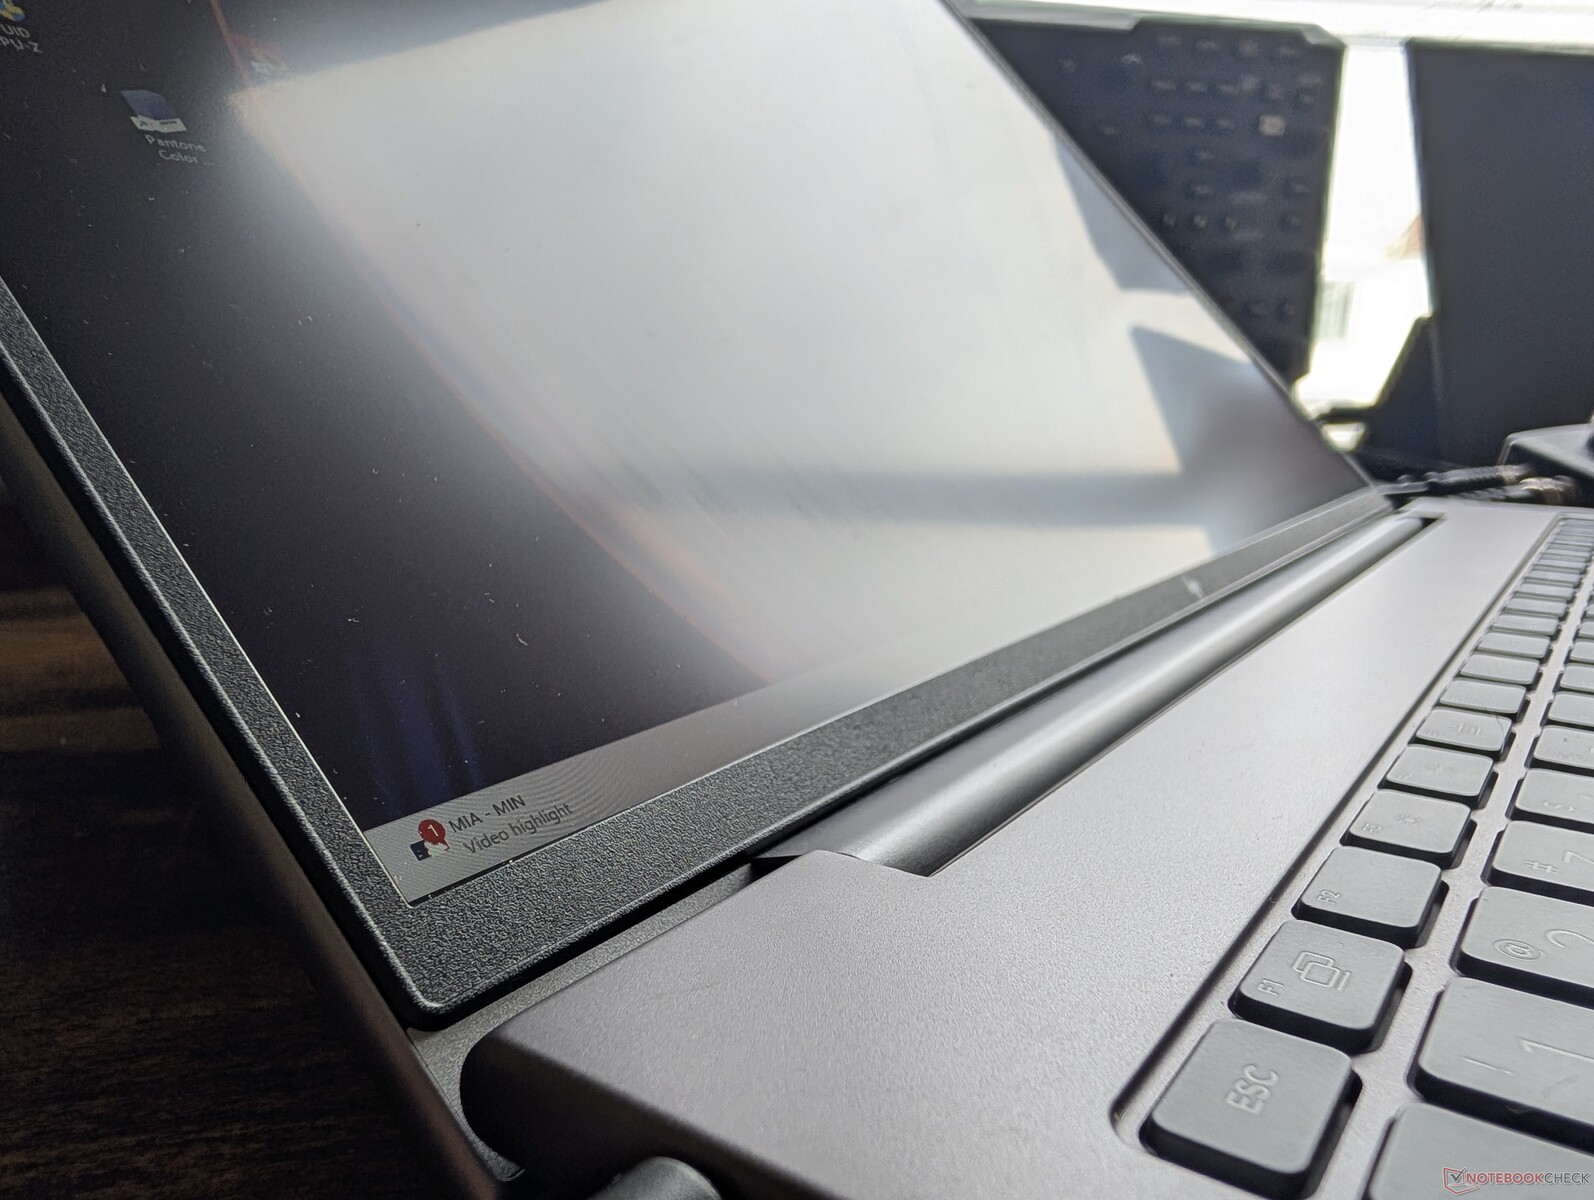
HP utiliza materiales de aleación de aluminio gris similares en casi todos sus modelos ZBook para dar una sensación de coherencia a toda la familia. En este caso, el ZBook Power 16 G11 luce la misma textura lisa de metal mate que el ZBook Power 15 G10 pero con cambios superficiales en los bordes del teclado, el embellecedor exterior de la tapa y el panel inferior.
La rigidez del chasis es excelente, con mínimas flexiones y depresiones al intentar girar la base. Sin embargo, las bisagras y la tapa podrían haber sido más rígidas especialmente porque la tapa puede abrirse casi los 180 grados completos a diferencia del Precision 5690.
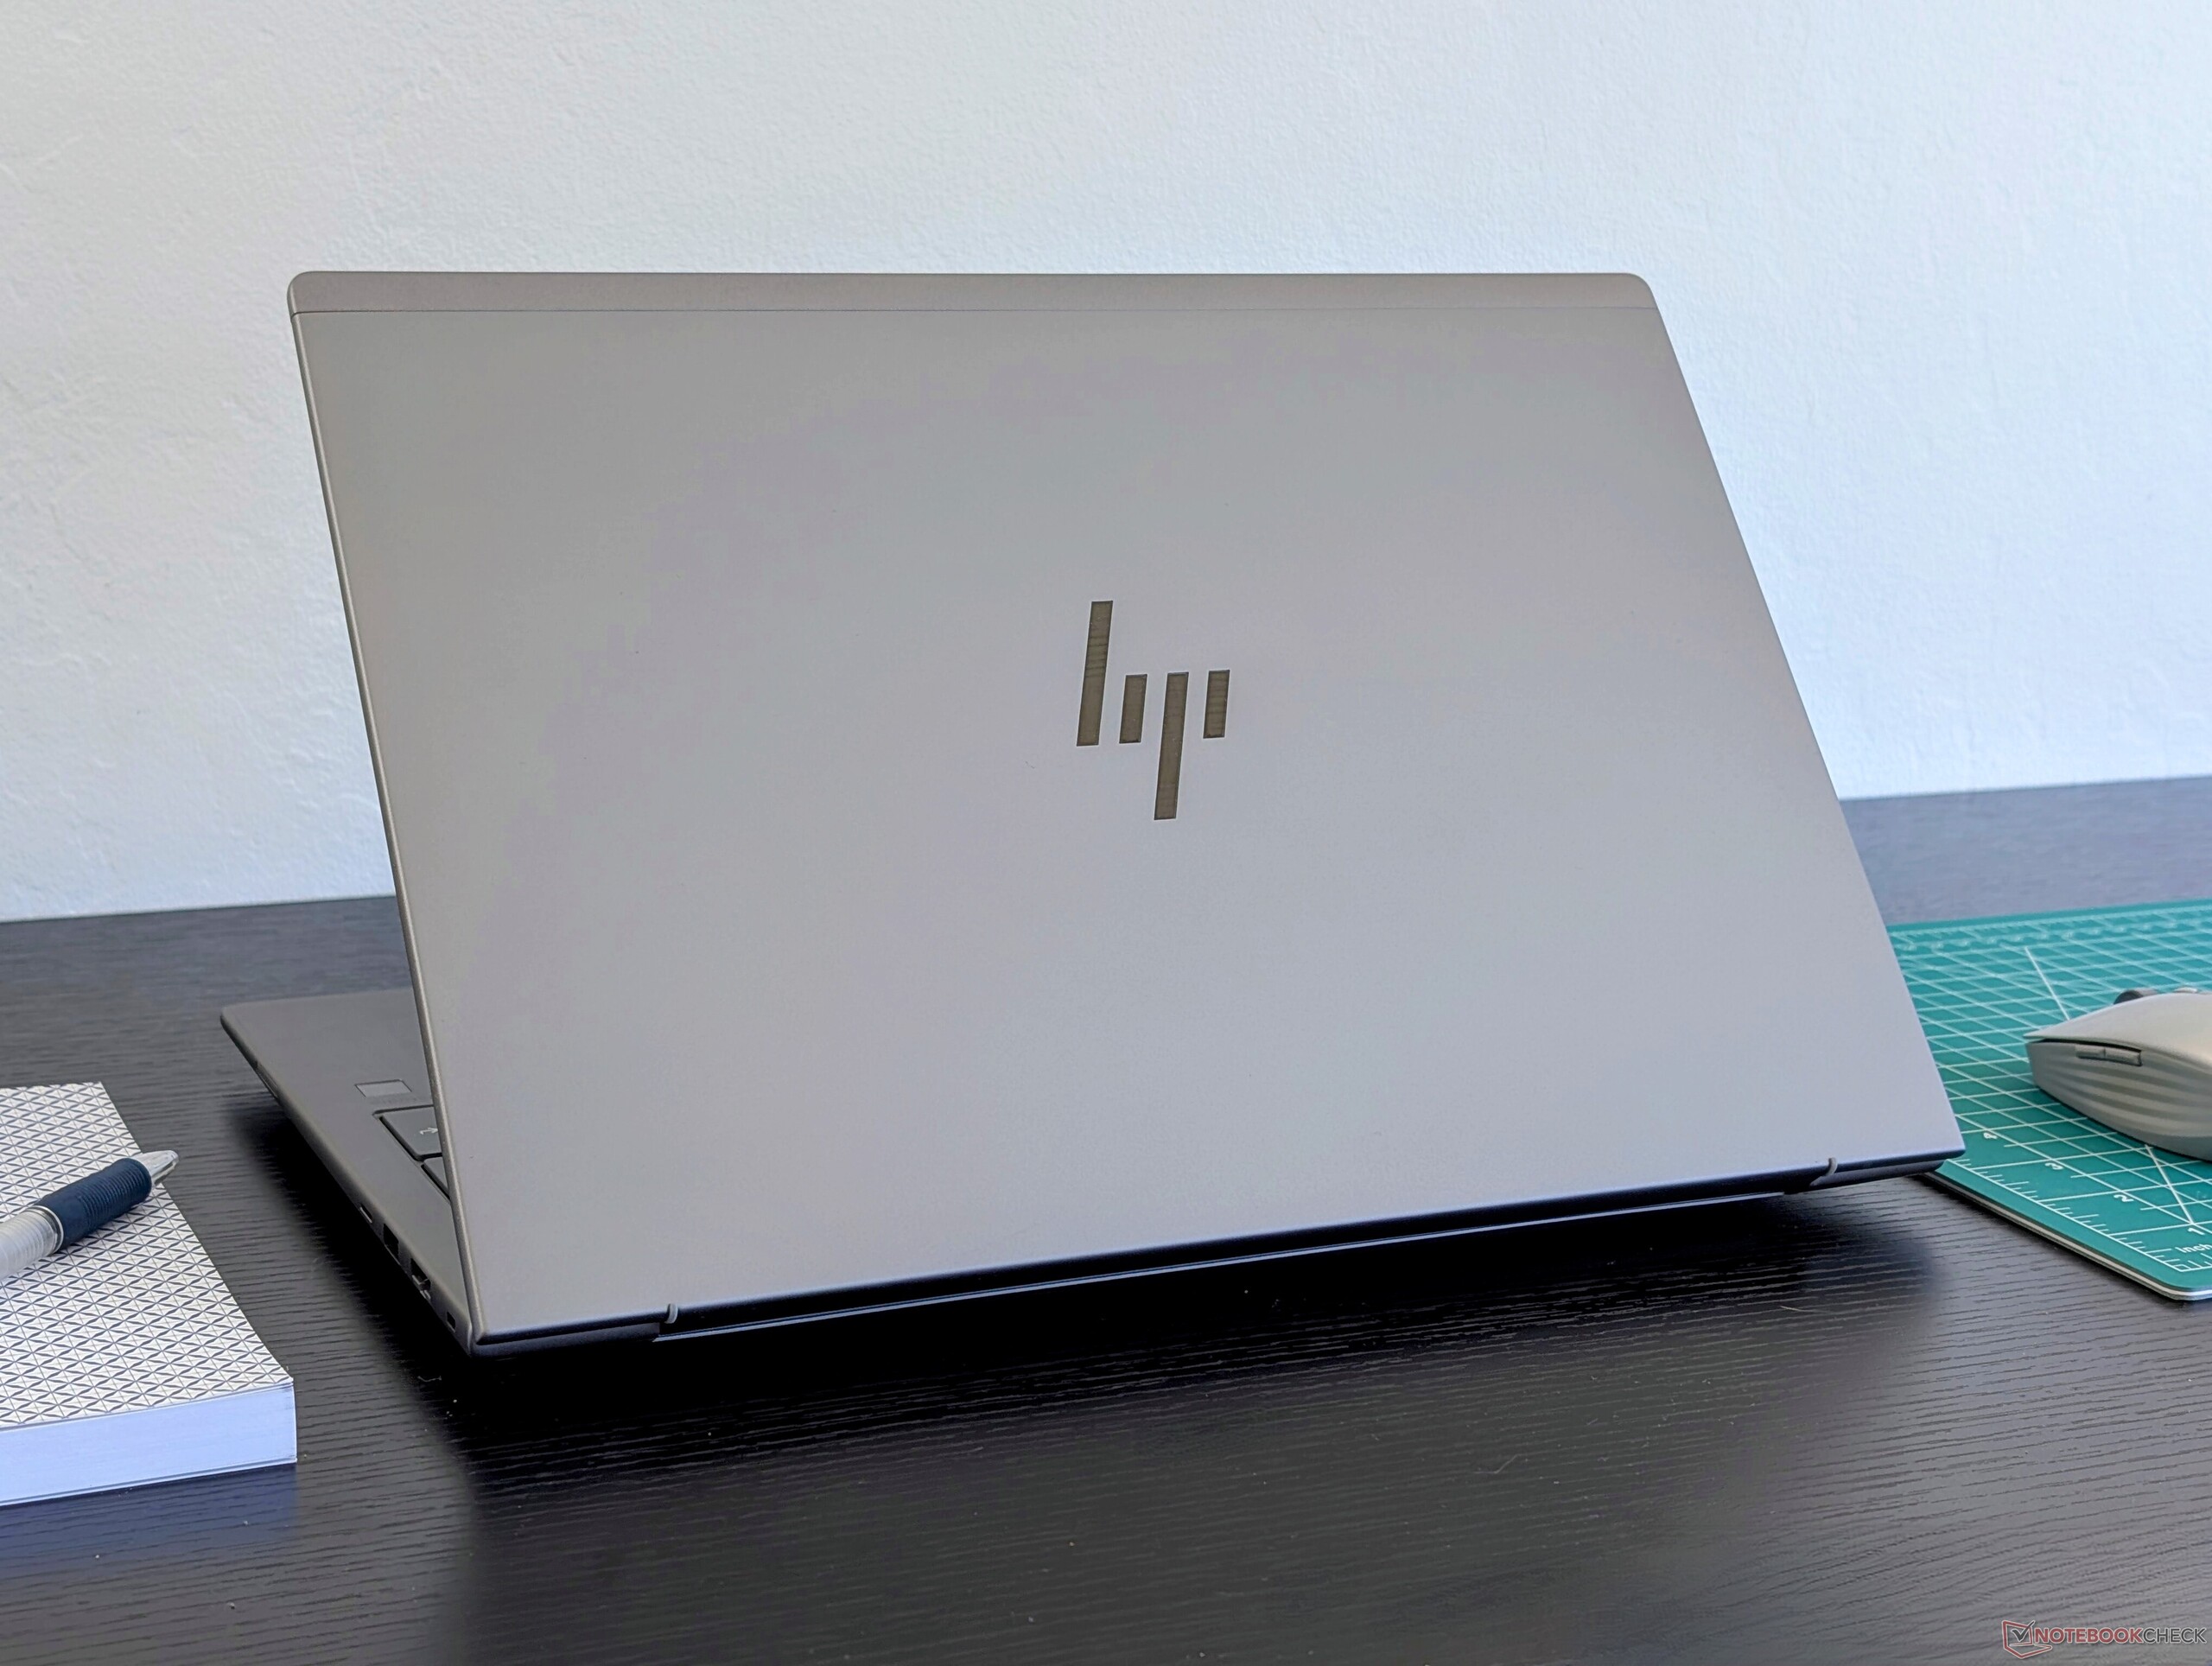
El nuevo diseño de 16 pulgadas es un 10 por ciento más pesado y un 7 por ciento más grande que el modelo saliente de 15 pulgadas. No es notablemente más delgado, lo que es un fastidio ya que ya es más grueso que algunos competidores como el ThinkPad P1 Gen 7. El ZBook Fury 16 G11 es aún más pesado y grueso pero con opciones de CPU y GPU más rápidas para compensar. HP ofrece el más delgado ZBook Firefly 16 si los usuarios desean una opción más portátil.
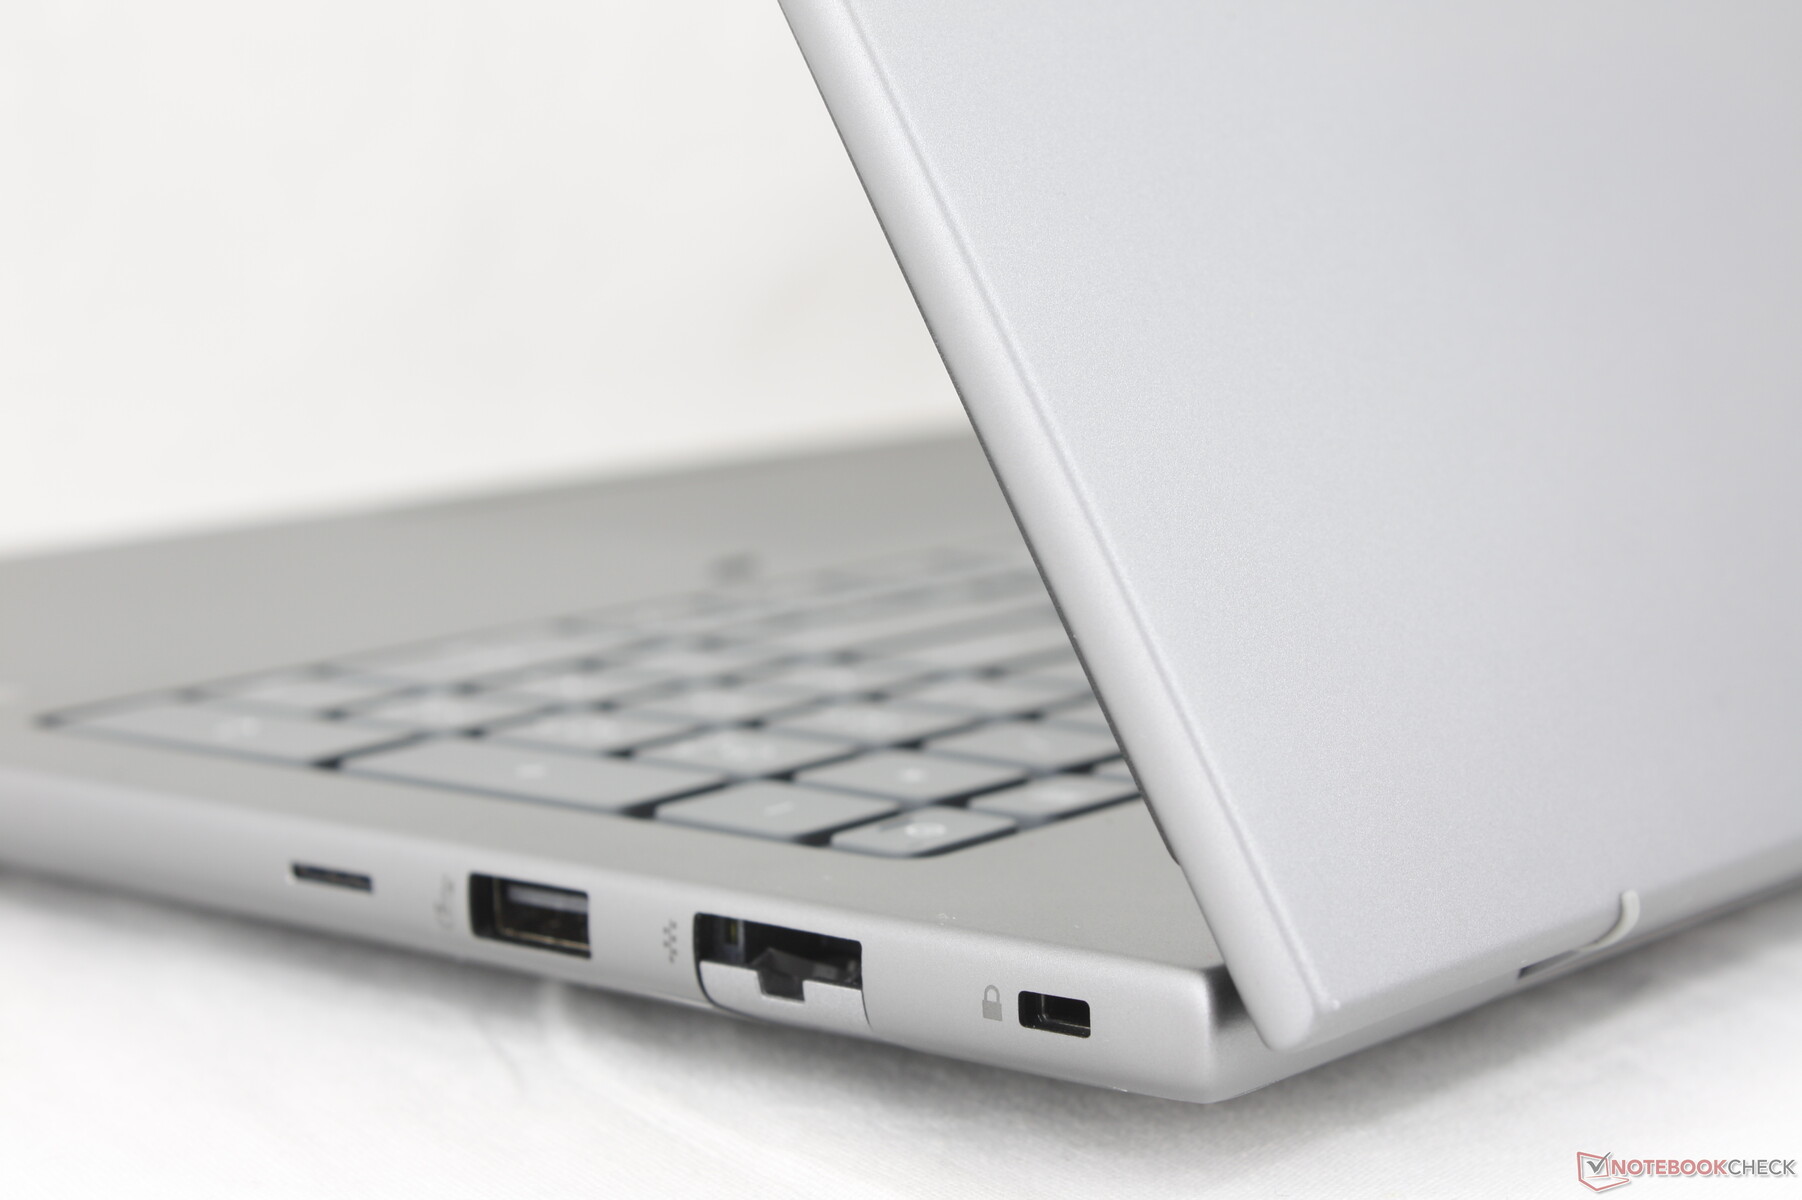
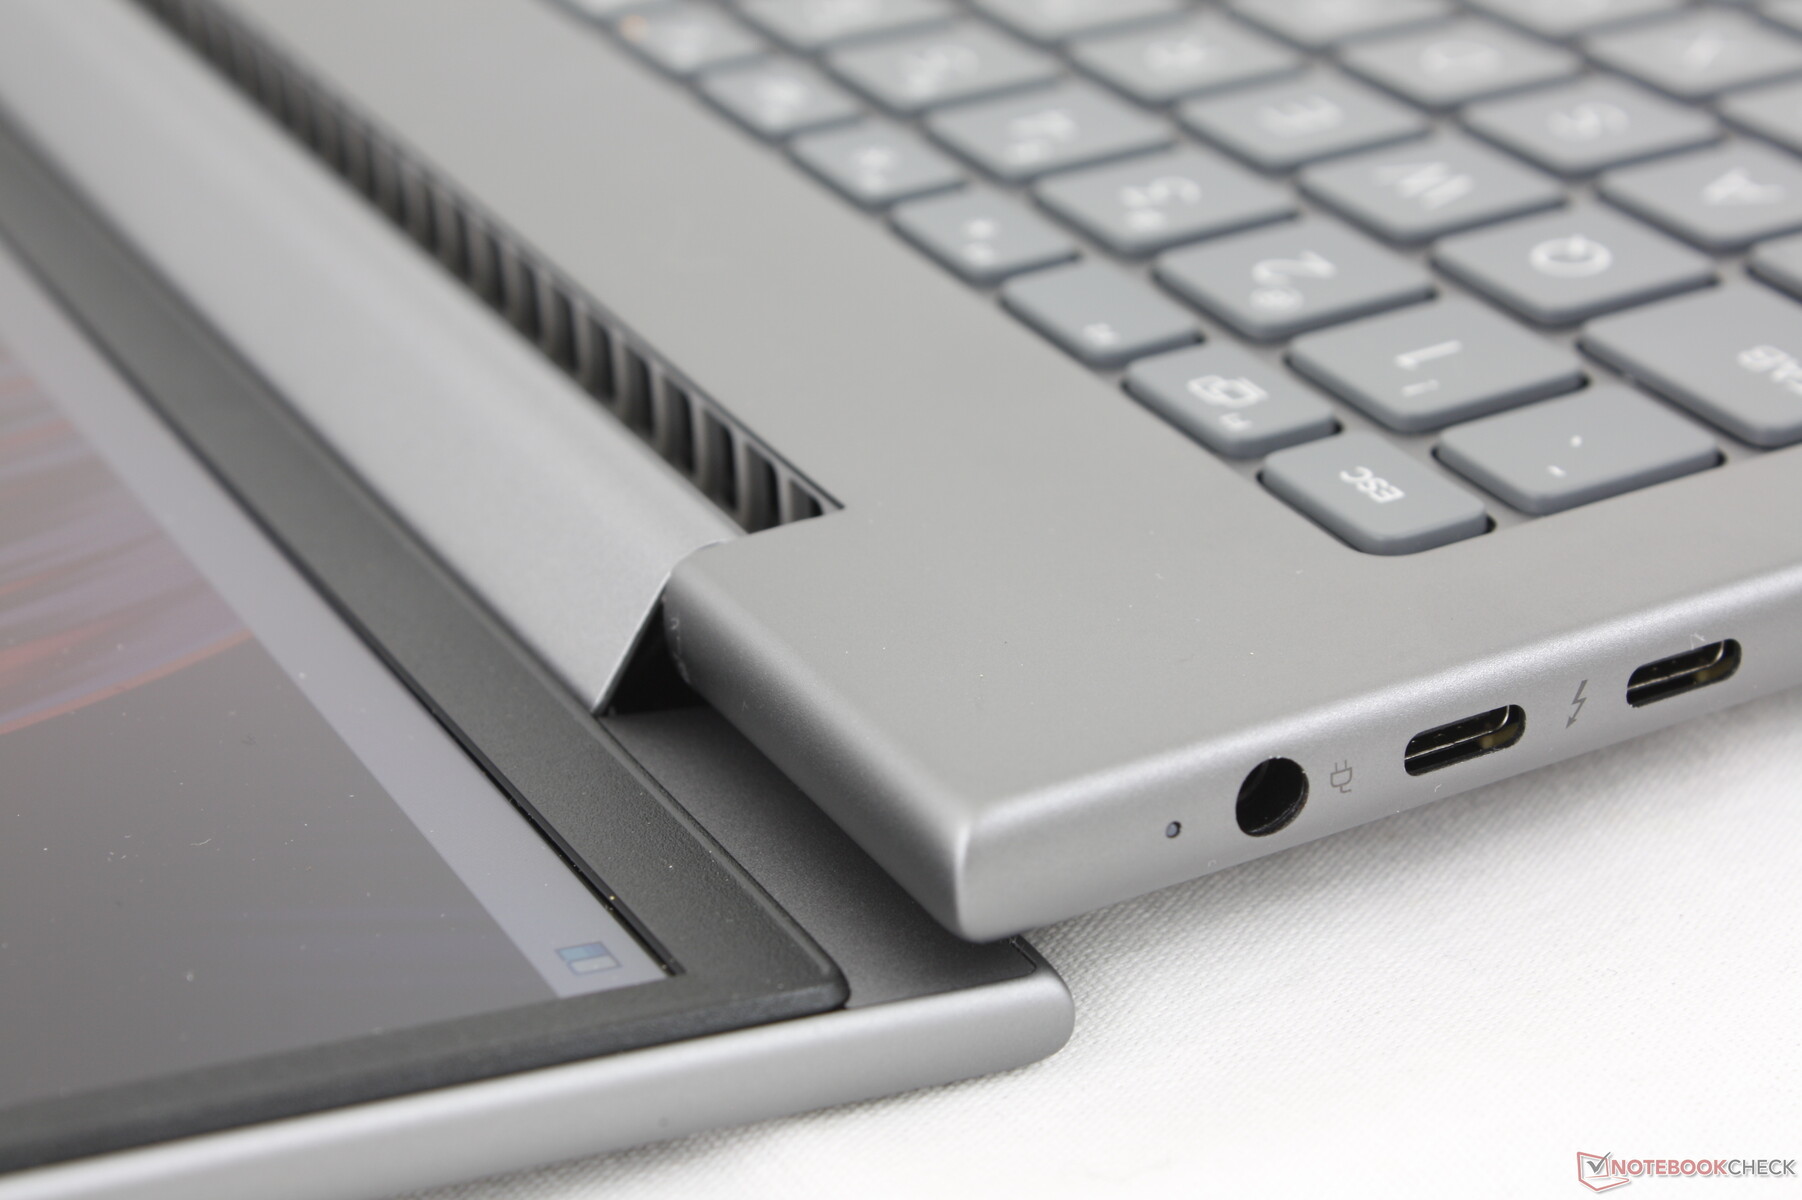
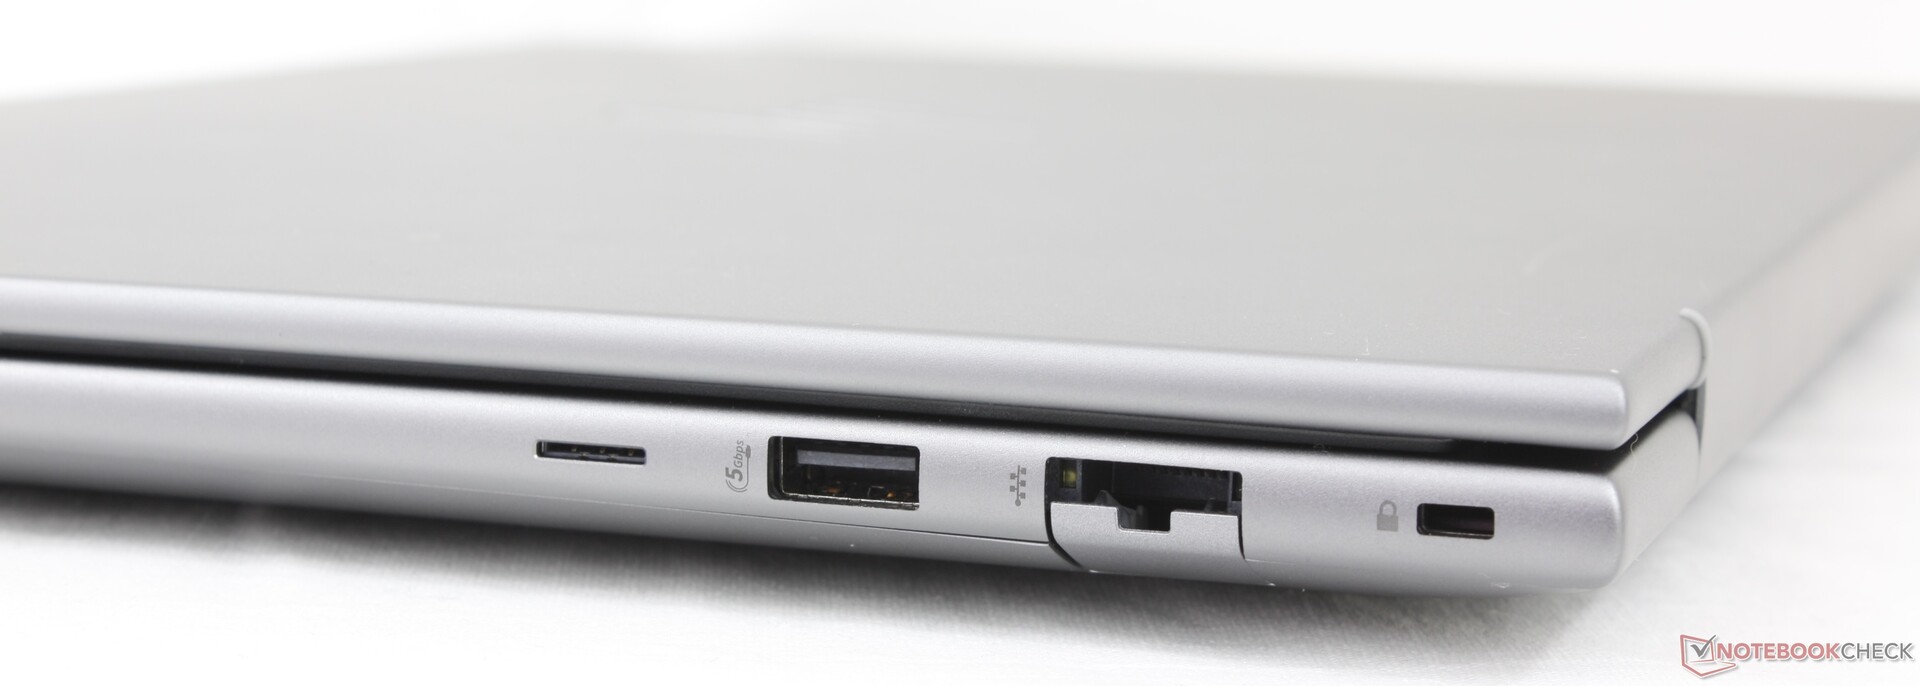
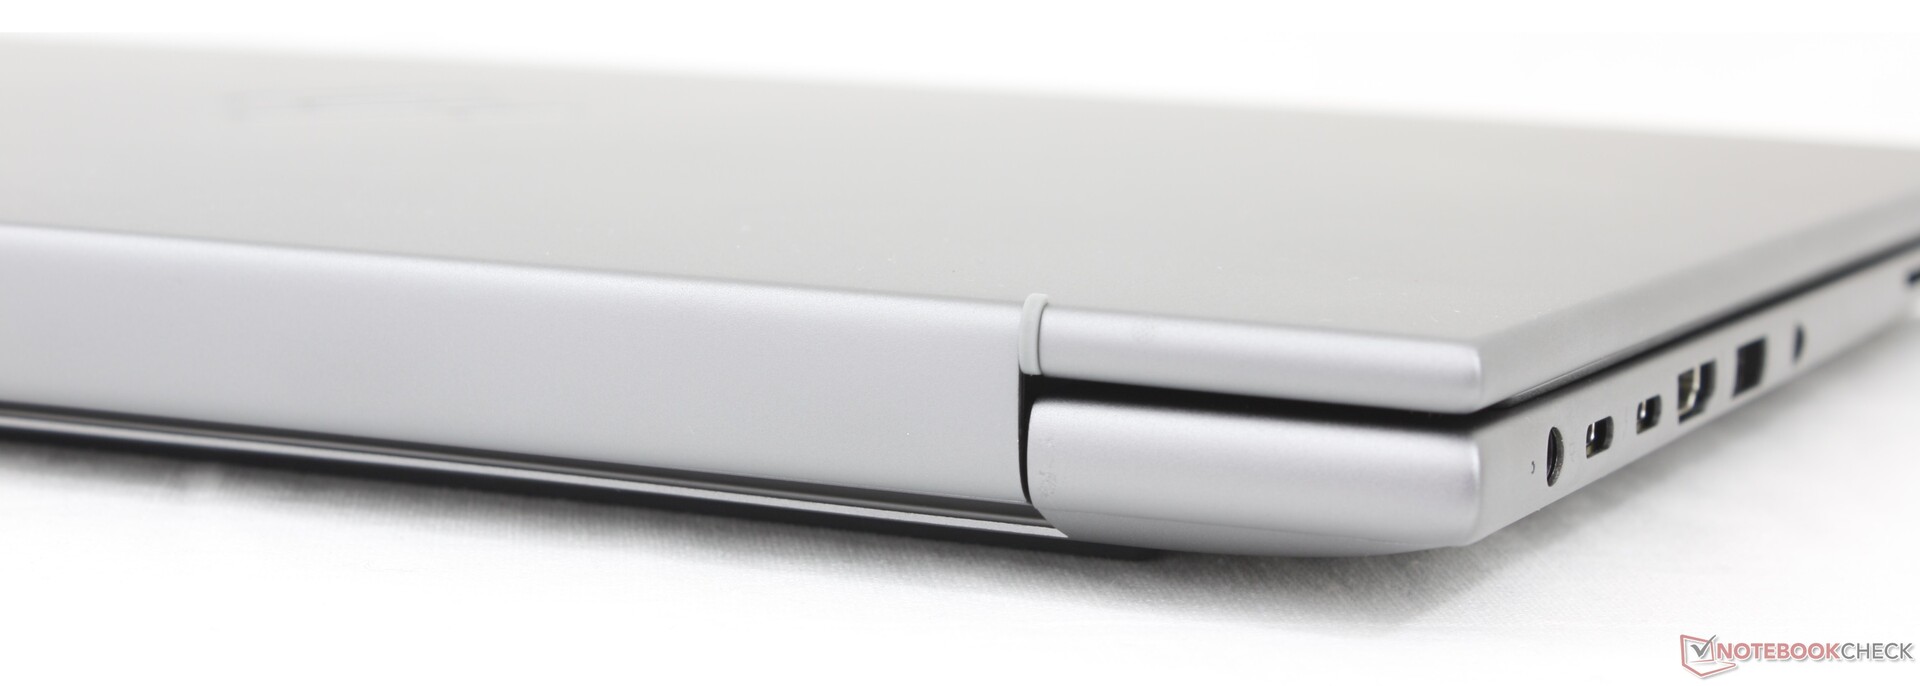
Conectividad - Puertos Thunderbolt 4
El modelo incluye menos puertos USB-A que en el ZBook Power 15 G10 del año pasado. Todo lo demás ha vuelto, incluido el lector de tarjetas inteligentes y los puertos duales USB-C Thunderbolt 4, aunque reordenados. Los puertos a lo largo del borde izquierdo en particular están demasiado apiñados y podrían haberse repartido un poco más.
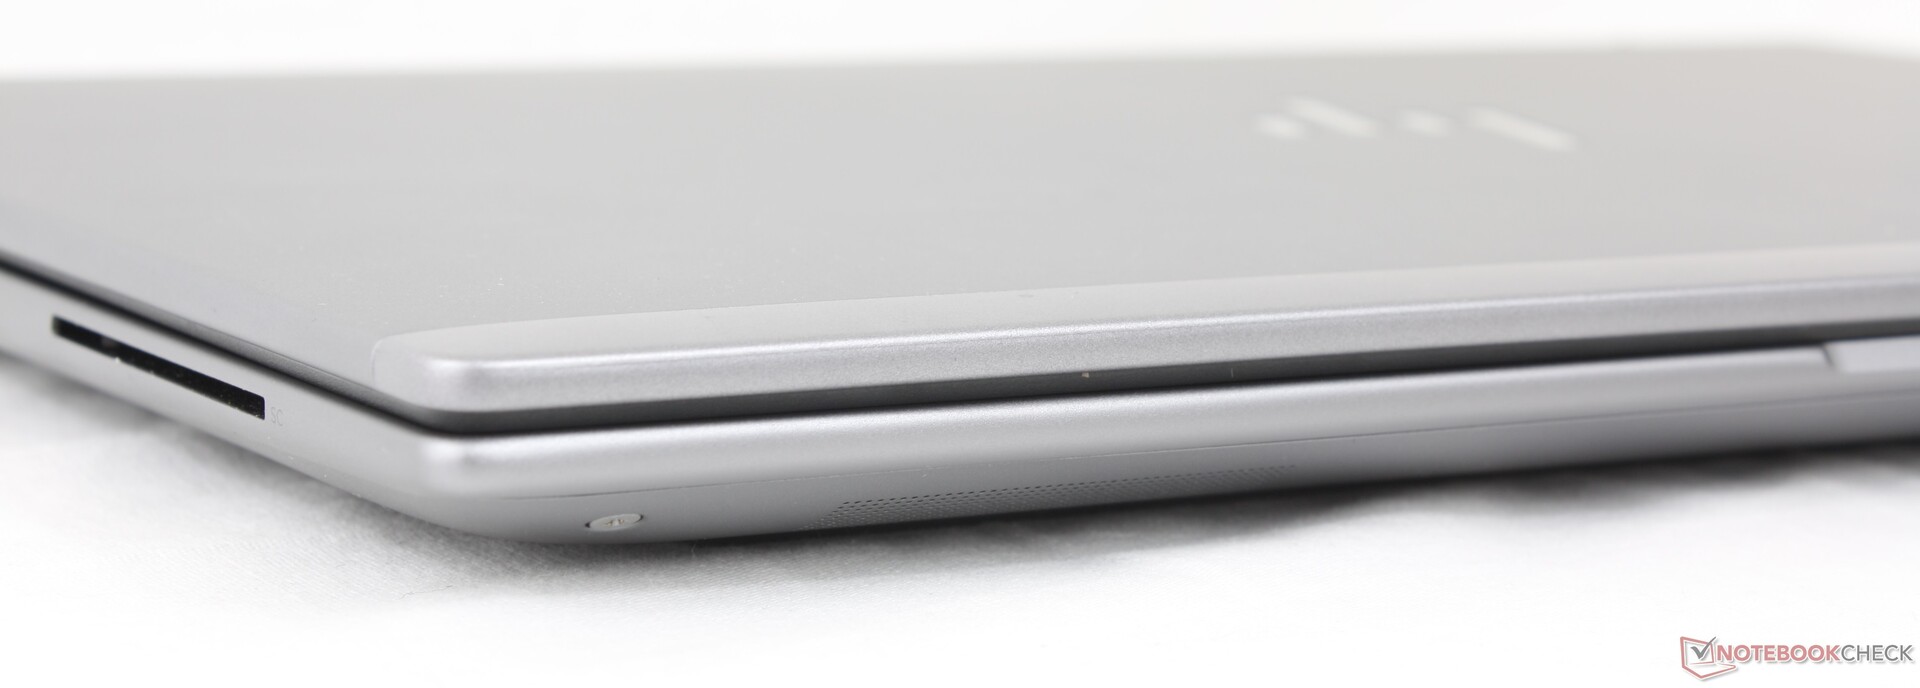

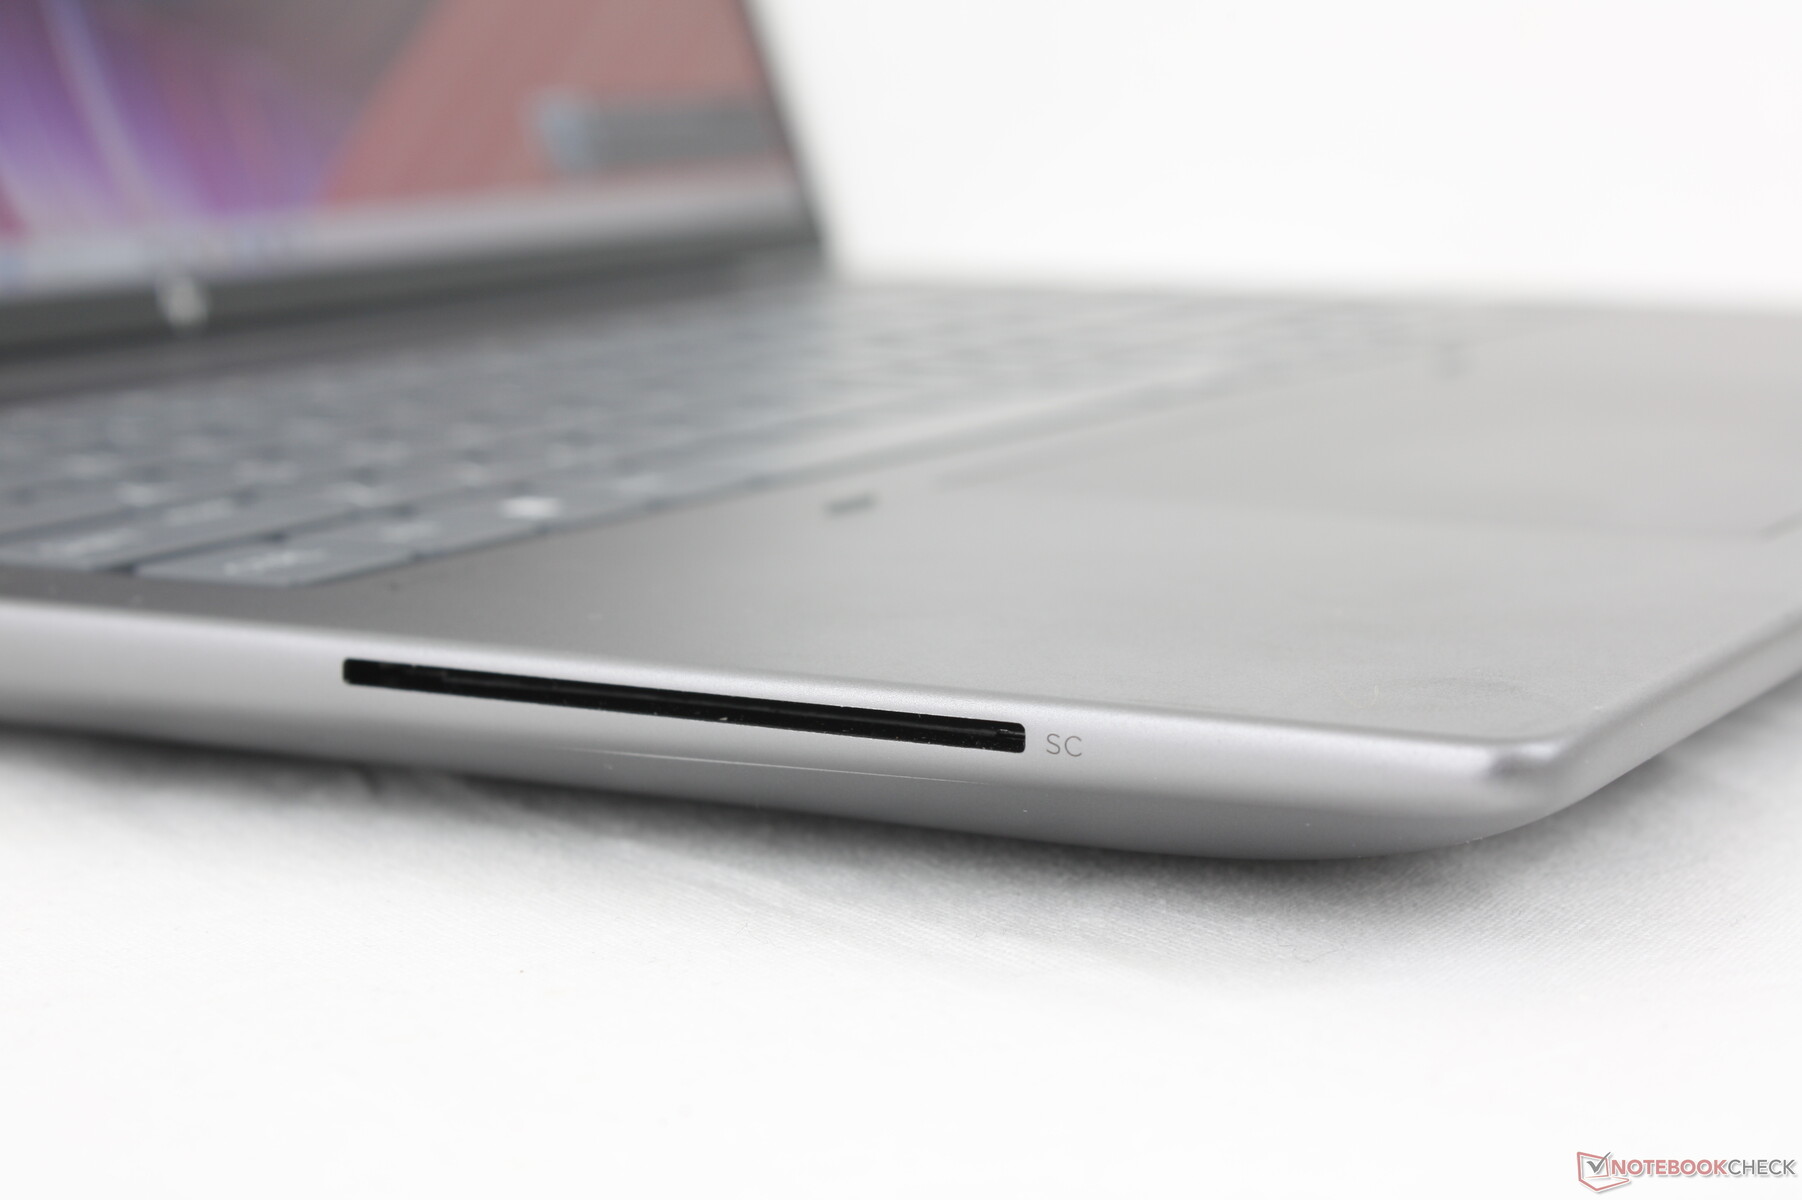
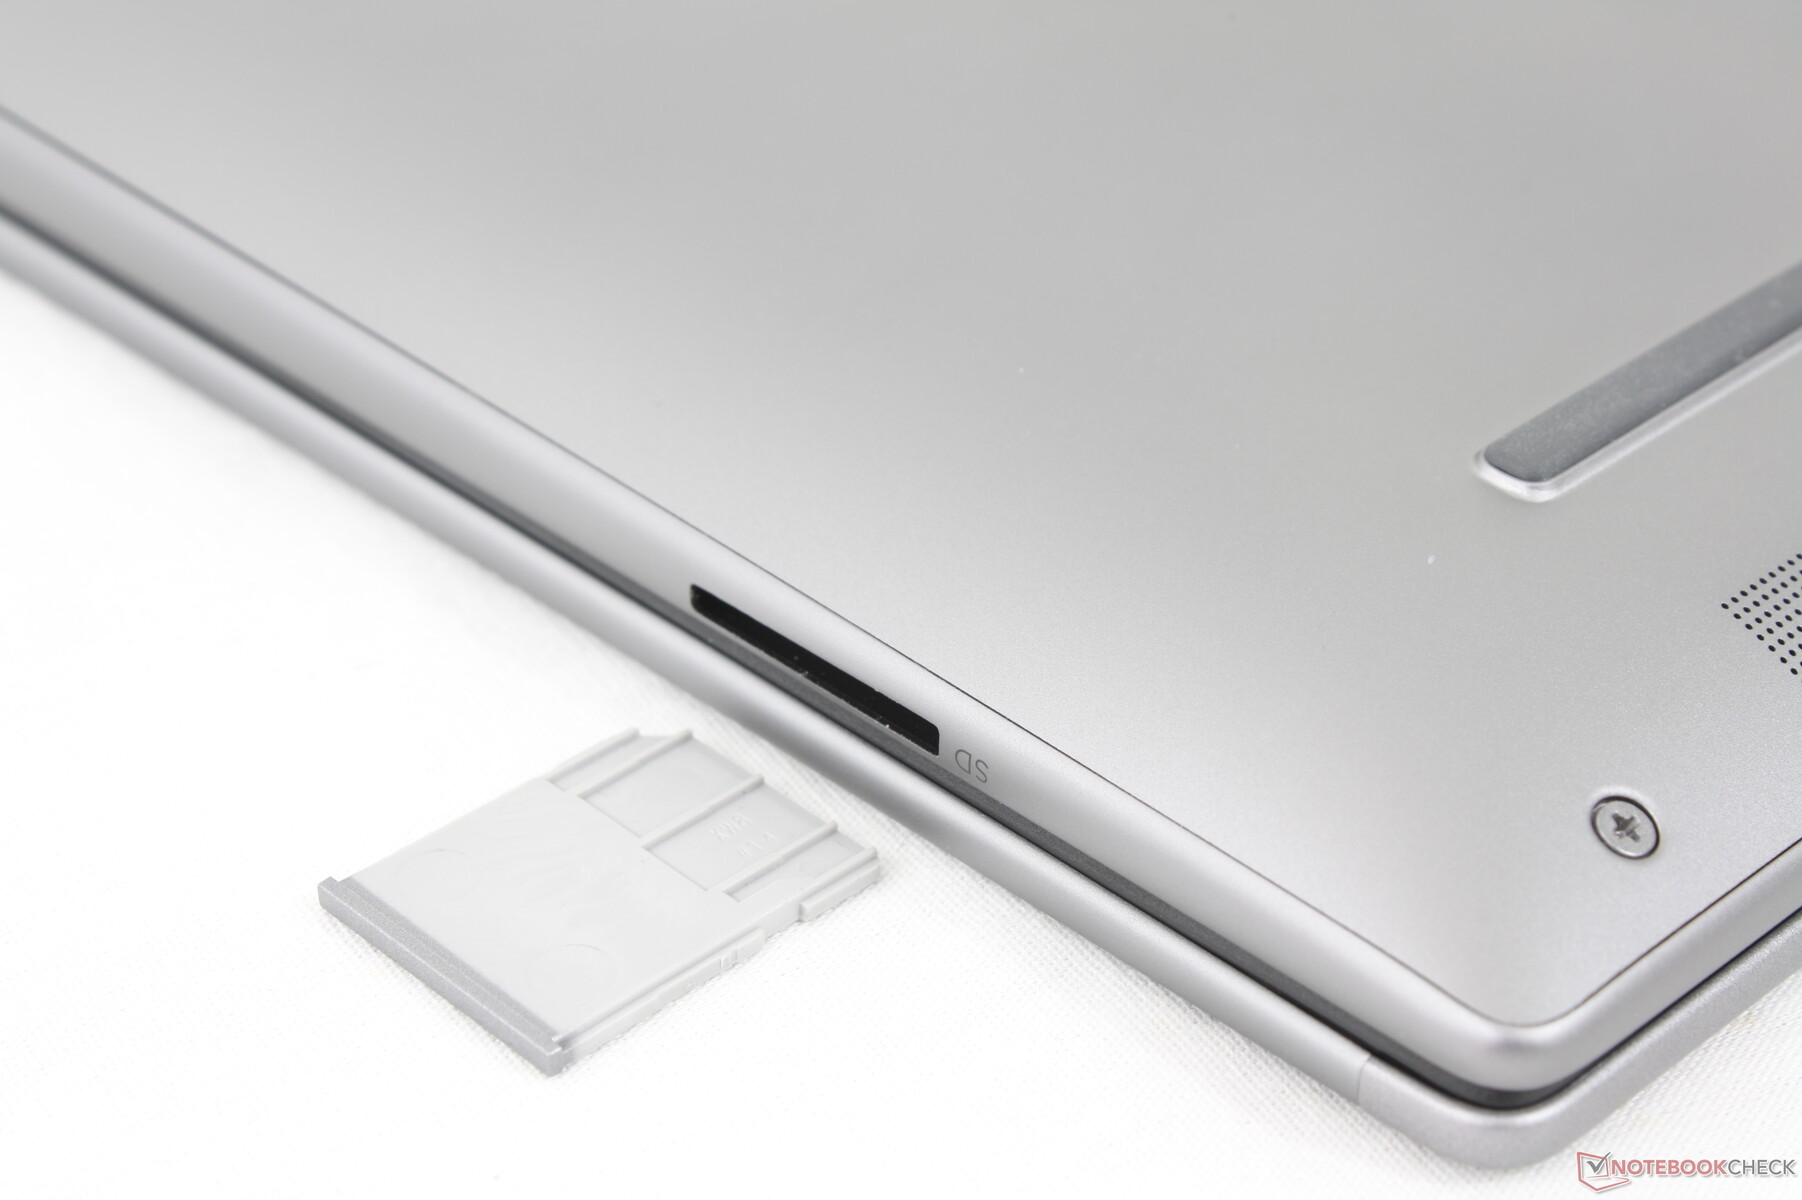
Lector de tarjetas SD
El modelo integra un lector de tarjetas MicroSD mientras que la característica faltaba en el ZBook Power 15 G10. Las velocidades de transferencia son muy rápidas; mover 1 GB de imágenes desde nuestra tarjeta de prueba UHS-II lleva menos de 6 segundos en comparación con los 12 segundos del ZBook Fury 16 G11 o el ThinkPad P1 Gen 7.
| SD Card Reader | |
| average JPG Copy Test (av. of 3 runs) | |
| HP ZBook Power 16 G11 A (Toshiba Exceria Pro SDXC 64 GB UHS-II) | |
| HP ZBook Fury 16 G11 (Toshiba Exceria Pro SDXC 64 GB UHS-II) | |
| Lenovo ThinkPad P1 Gen 7 21KV001SGE (AV Pro V60) | |
| maximum AS SSD Seq Read Test (1GB) | |
| HP ZBook Power 16 G11 A (Toshiba Exceria Pro SDXC 64 GB UHS-II) | |
| HP ZBook Fury 16 G11 (Toshiba Exceria Pro SDXC 64 GB UHS-II) | |
| Lenovo ThinkPad P1 Gen 7 21KV001SGE (AV Pro V60) | |
Comunicación
El MediaTek MT7922 viene de serie para la conectividad Wi-Fi 6E y Bluetooth 5.2. También hay disponibles opciones Realtek, así como HP 4000 o Qualcomm 9205 para la conectividad WAN.
Cámara web
Una webcam de 5 MP viene de serie junto con IR y un obturador físico deslizante similar al del ThinkPad P16s G2. El Precision 5690 viene con una webcam de 2 MP de resolución mucho menor.


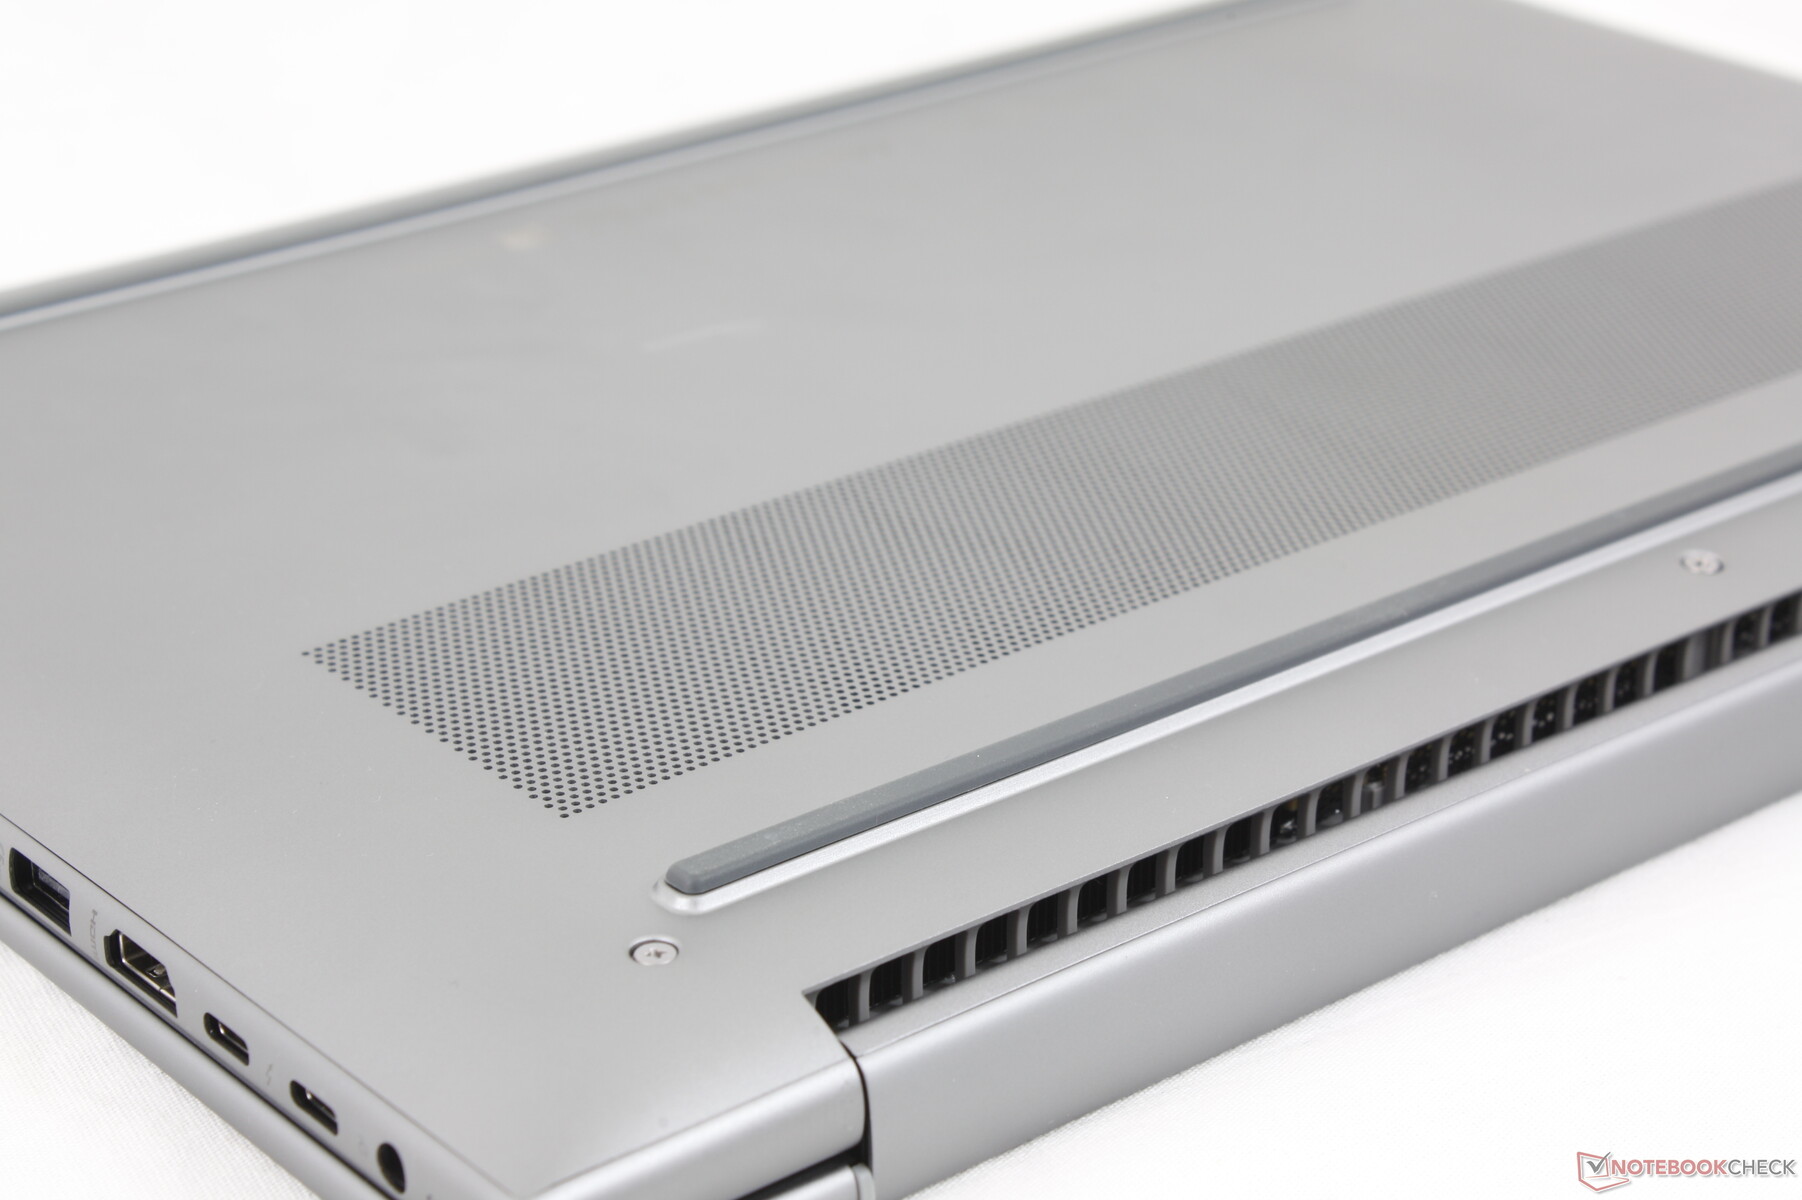
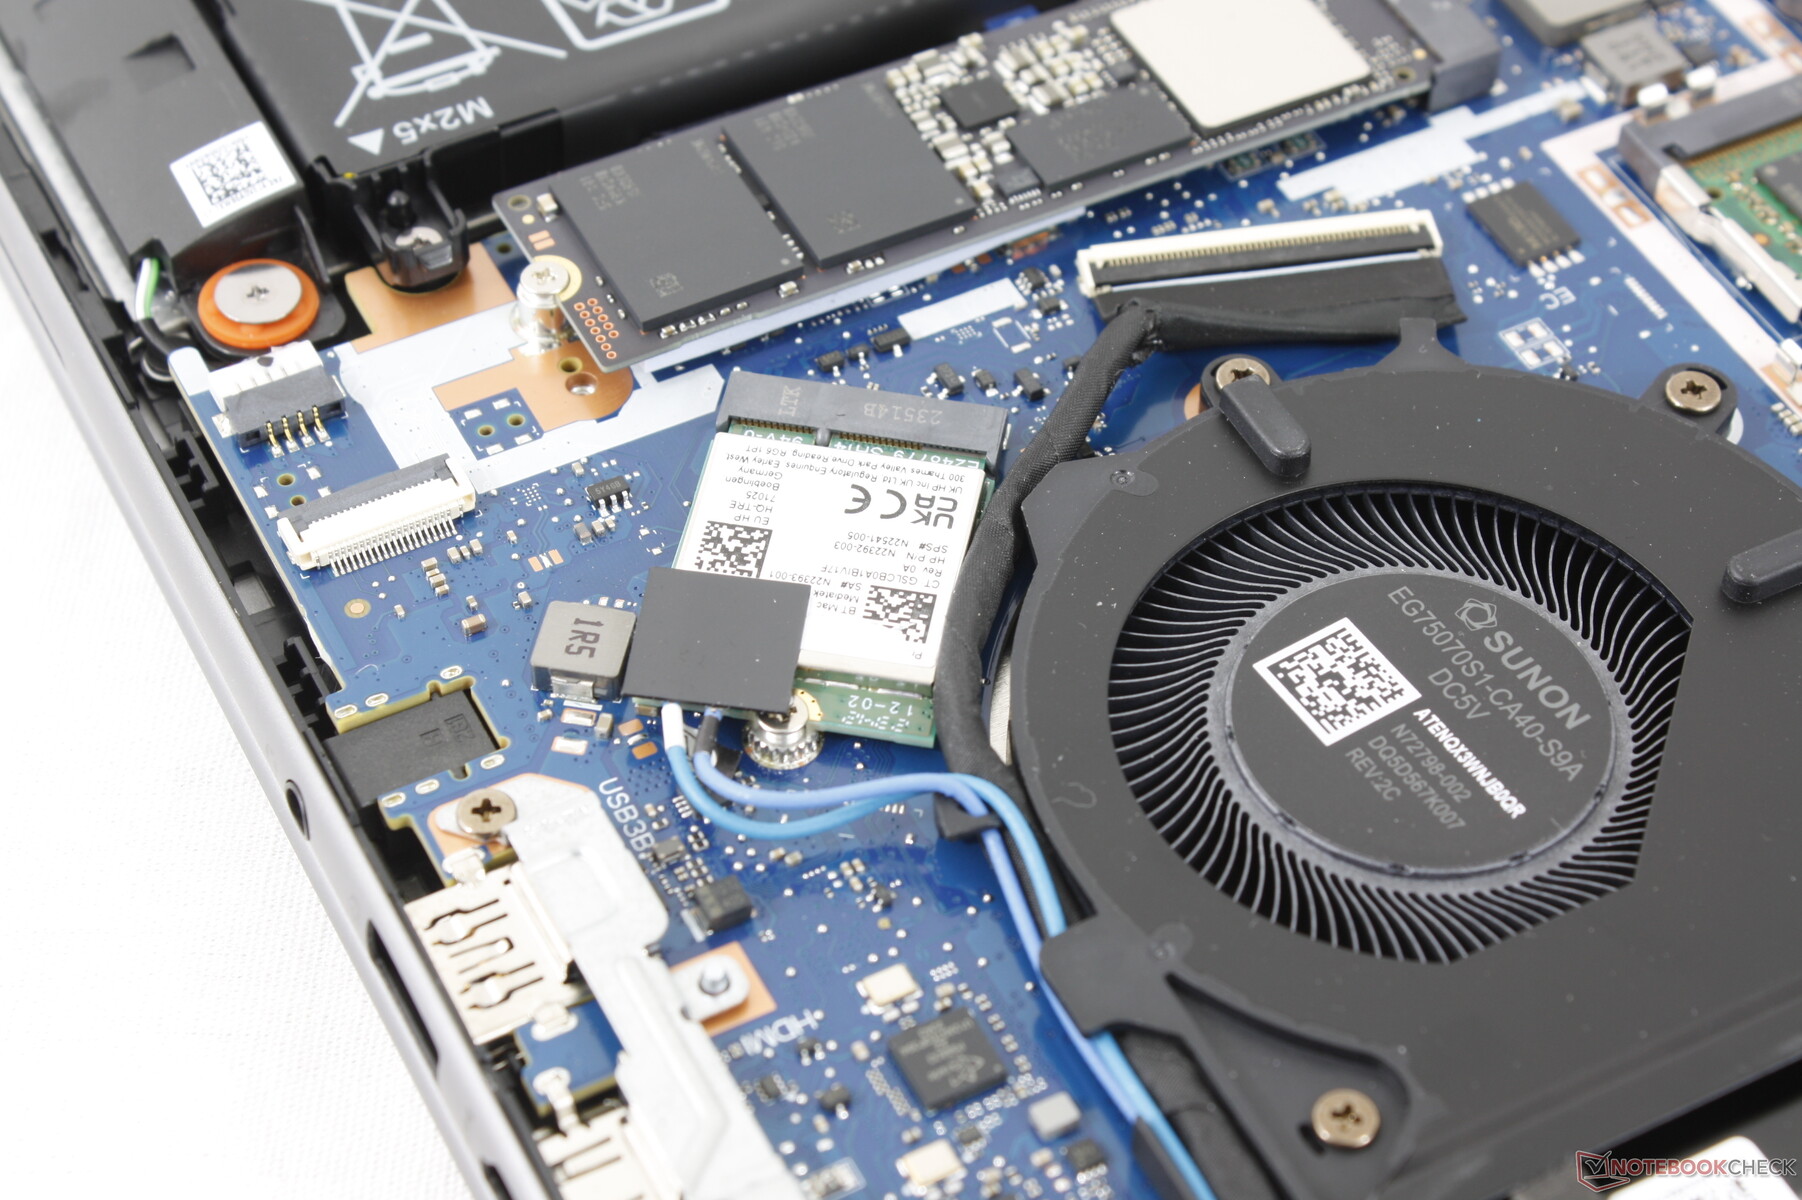
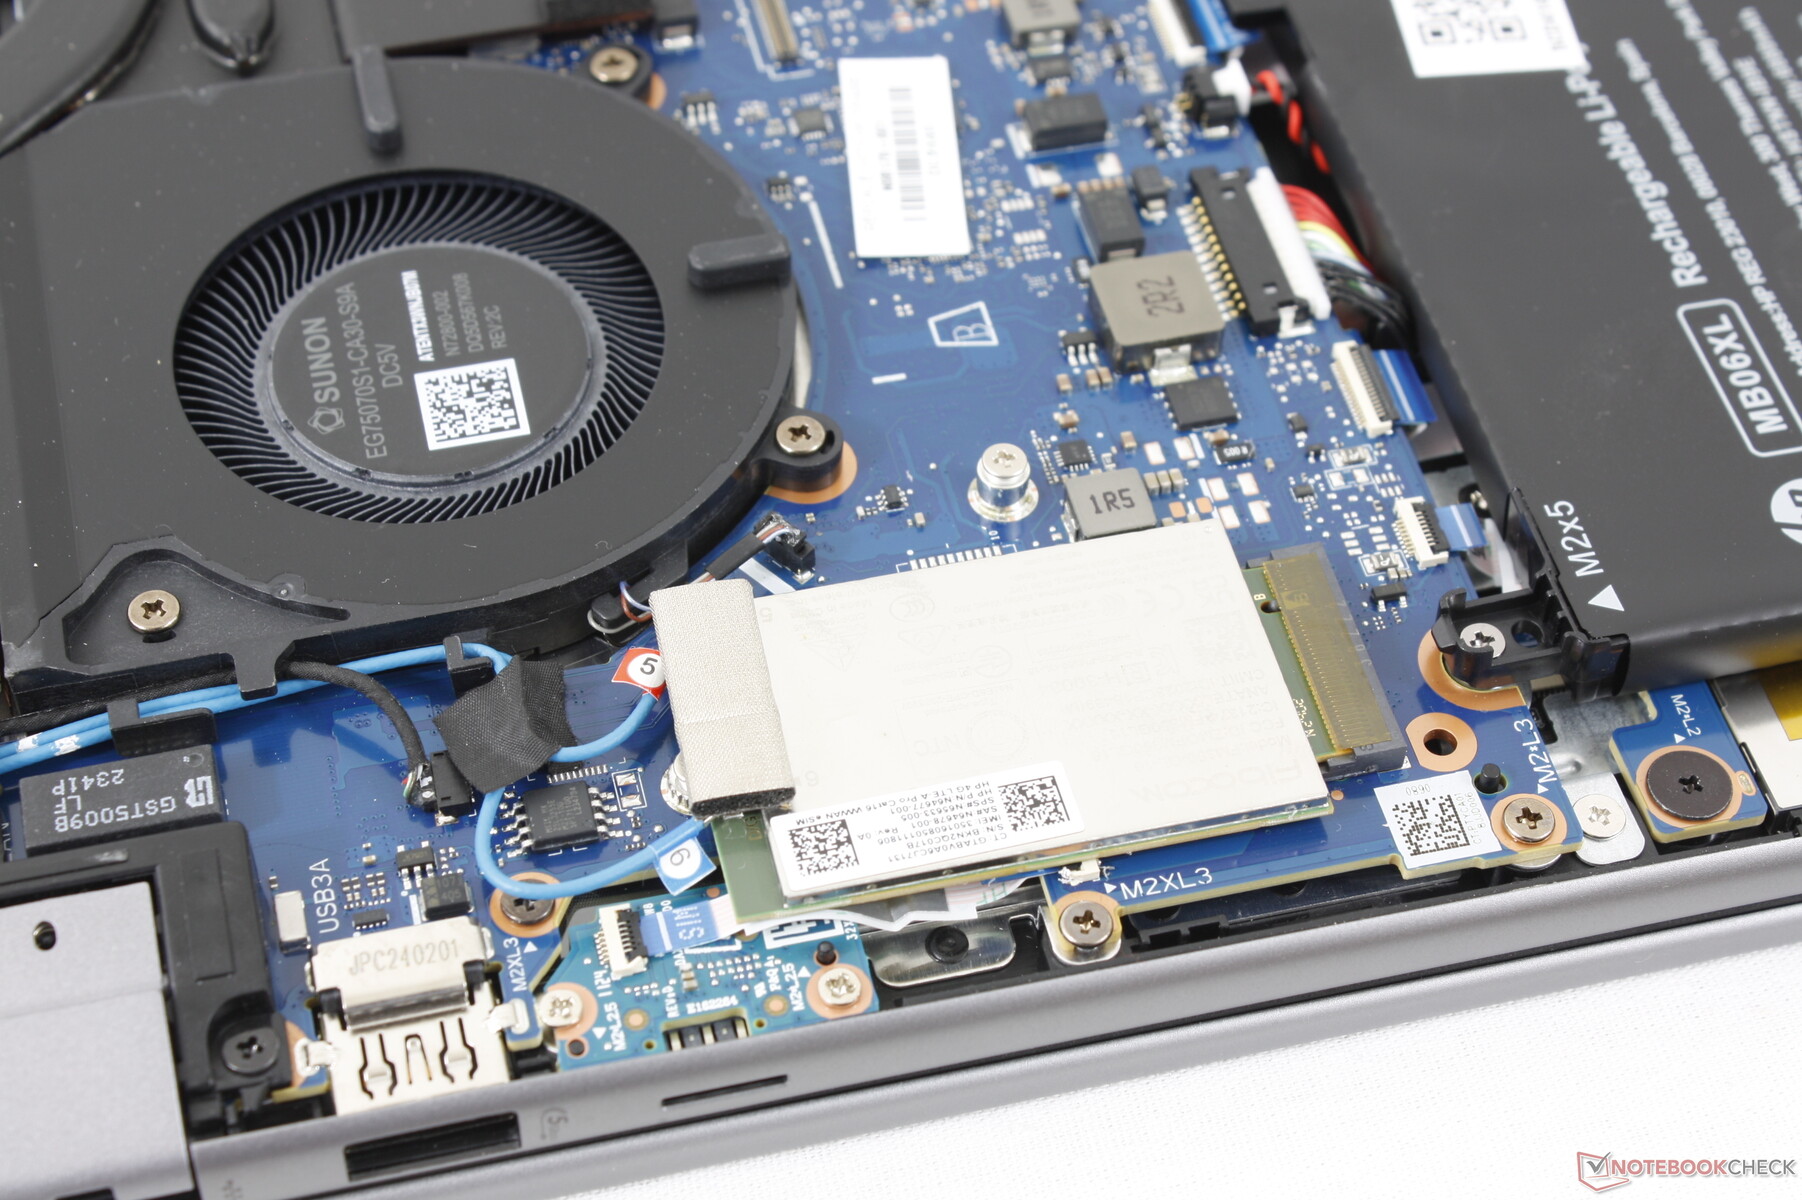
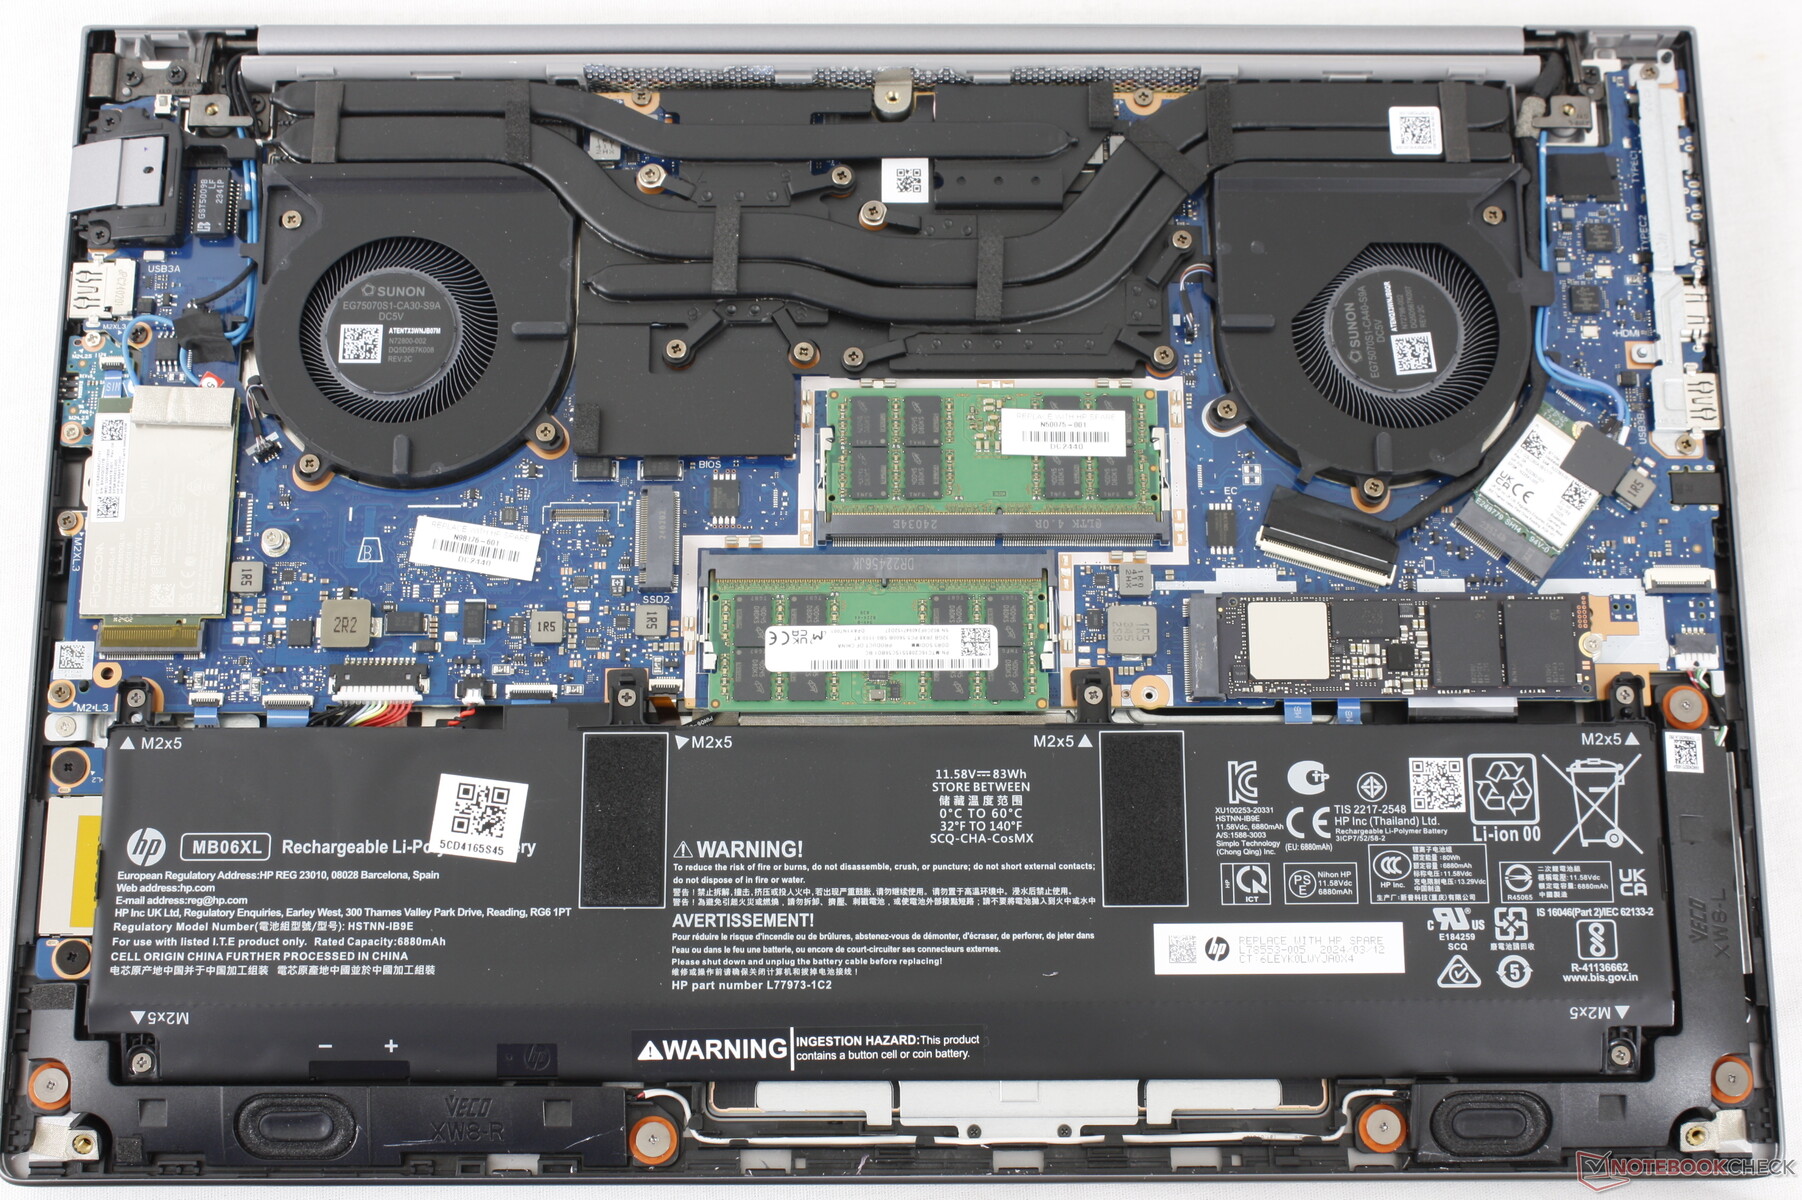
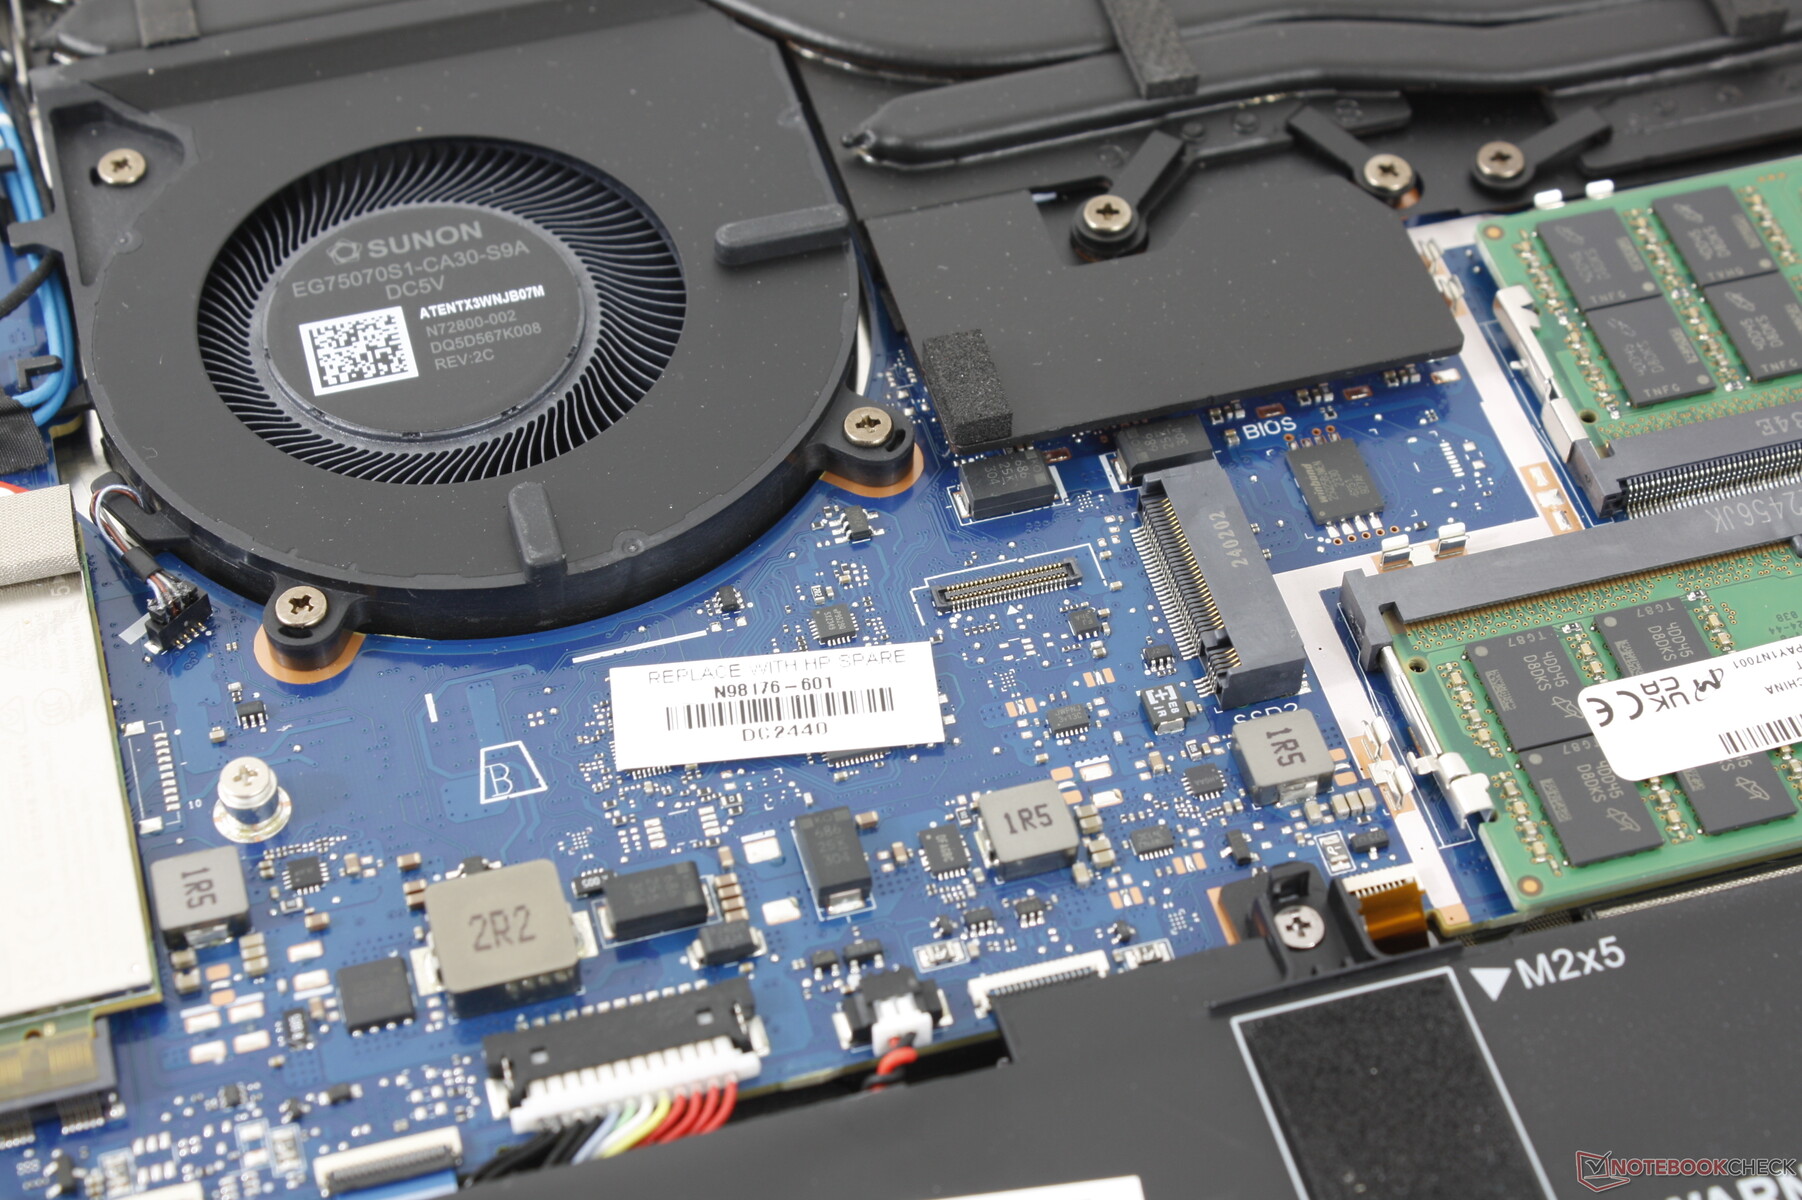
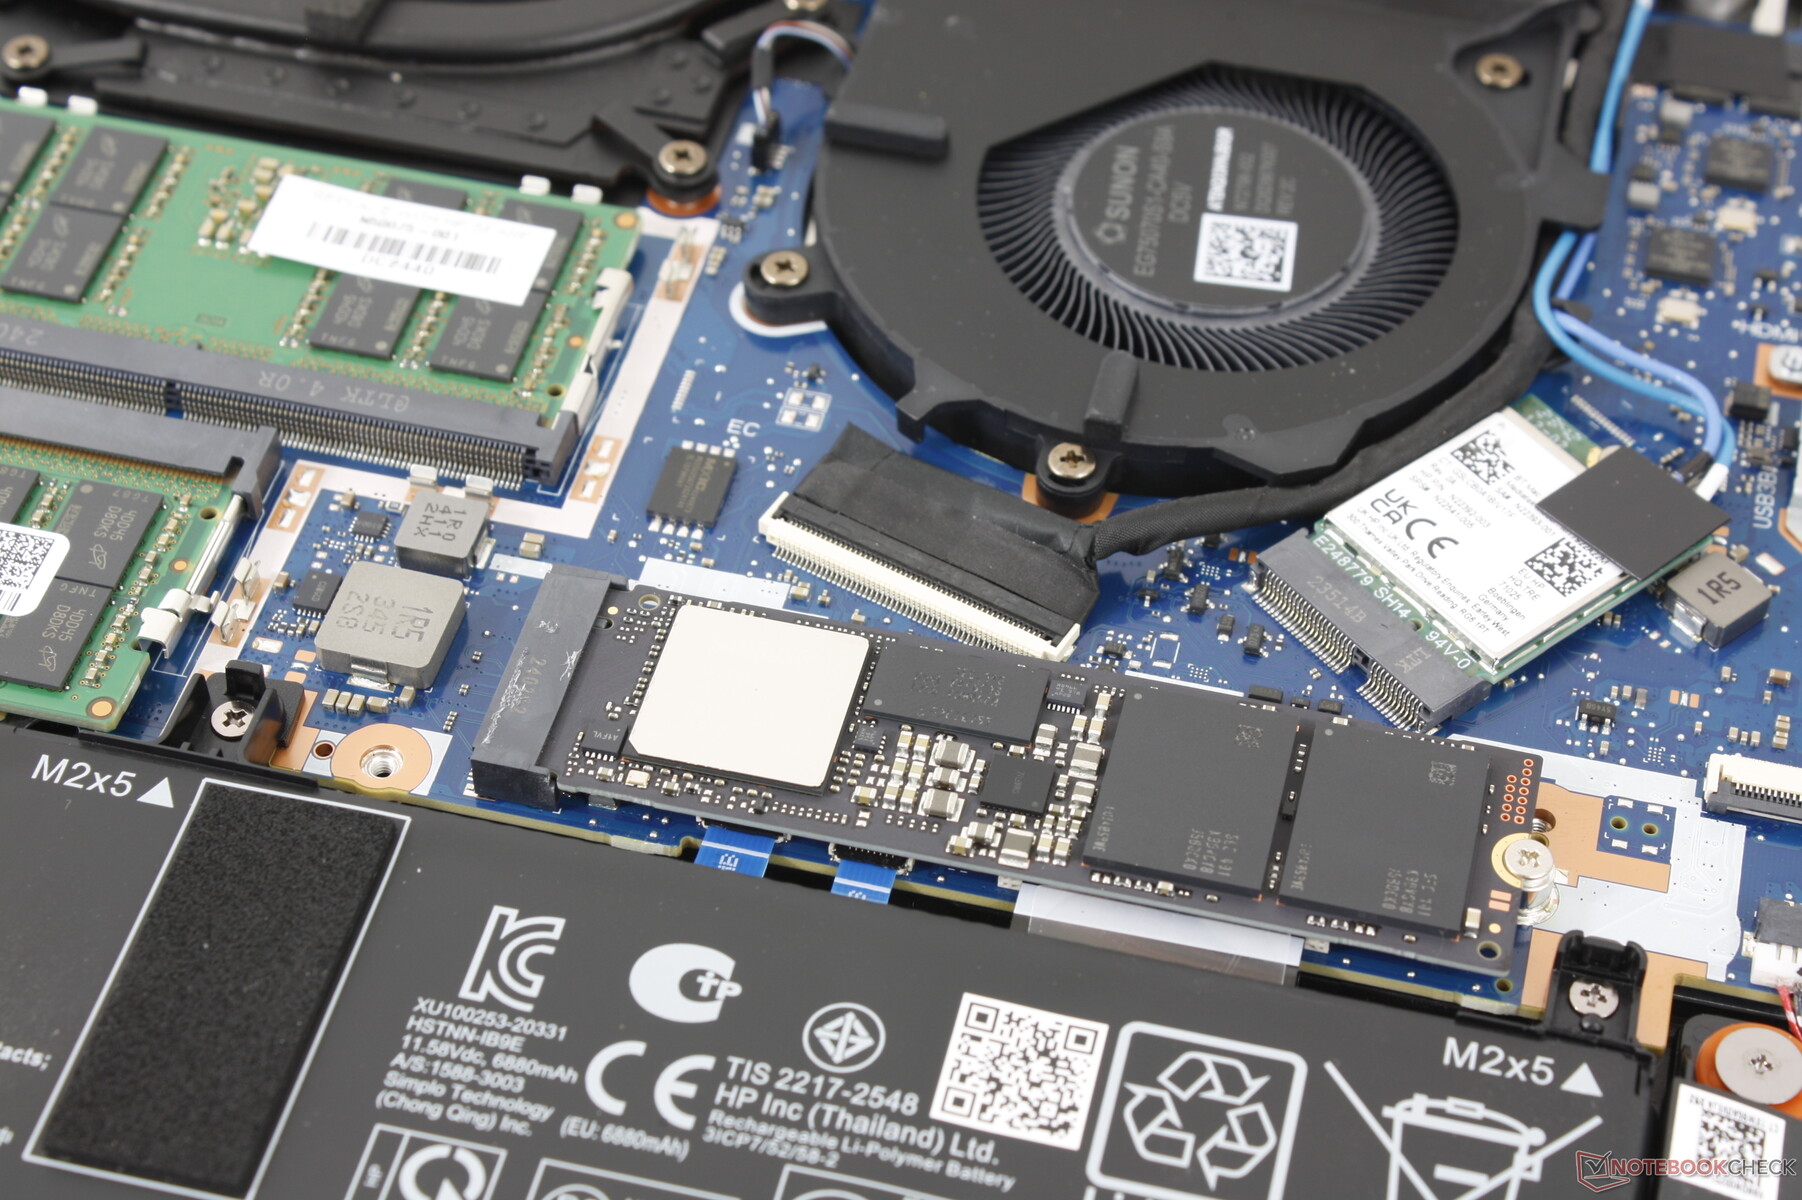
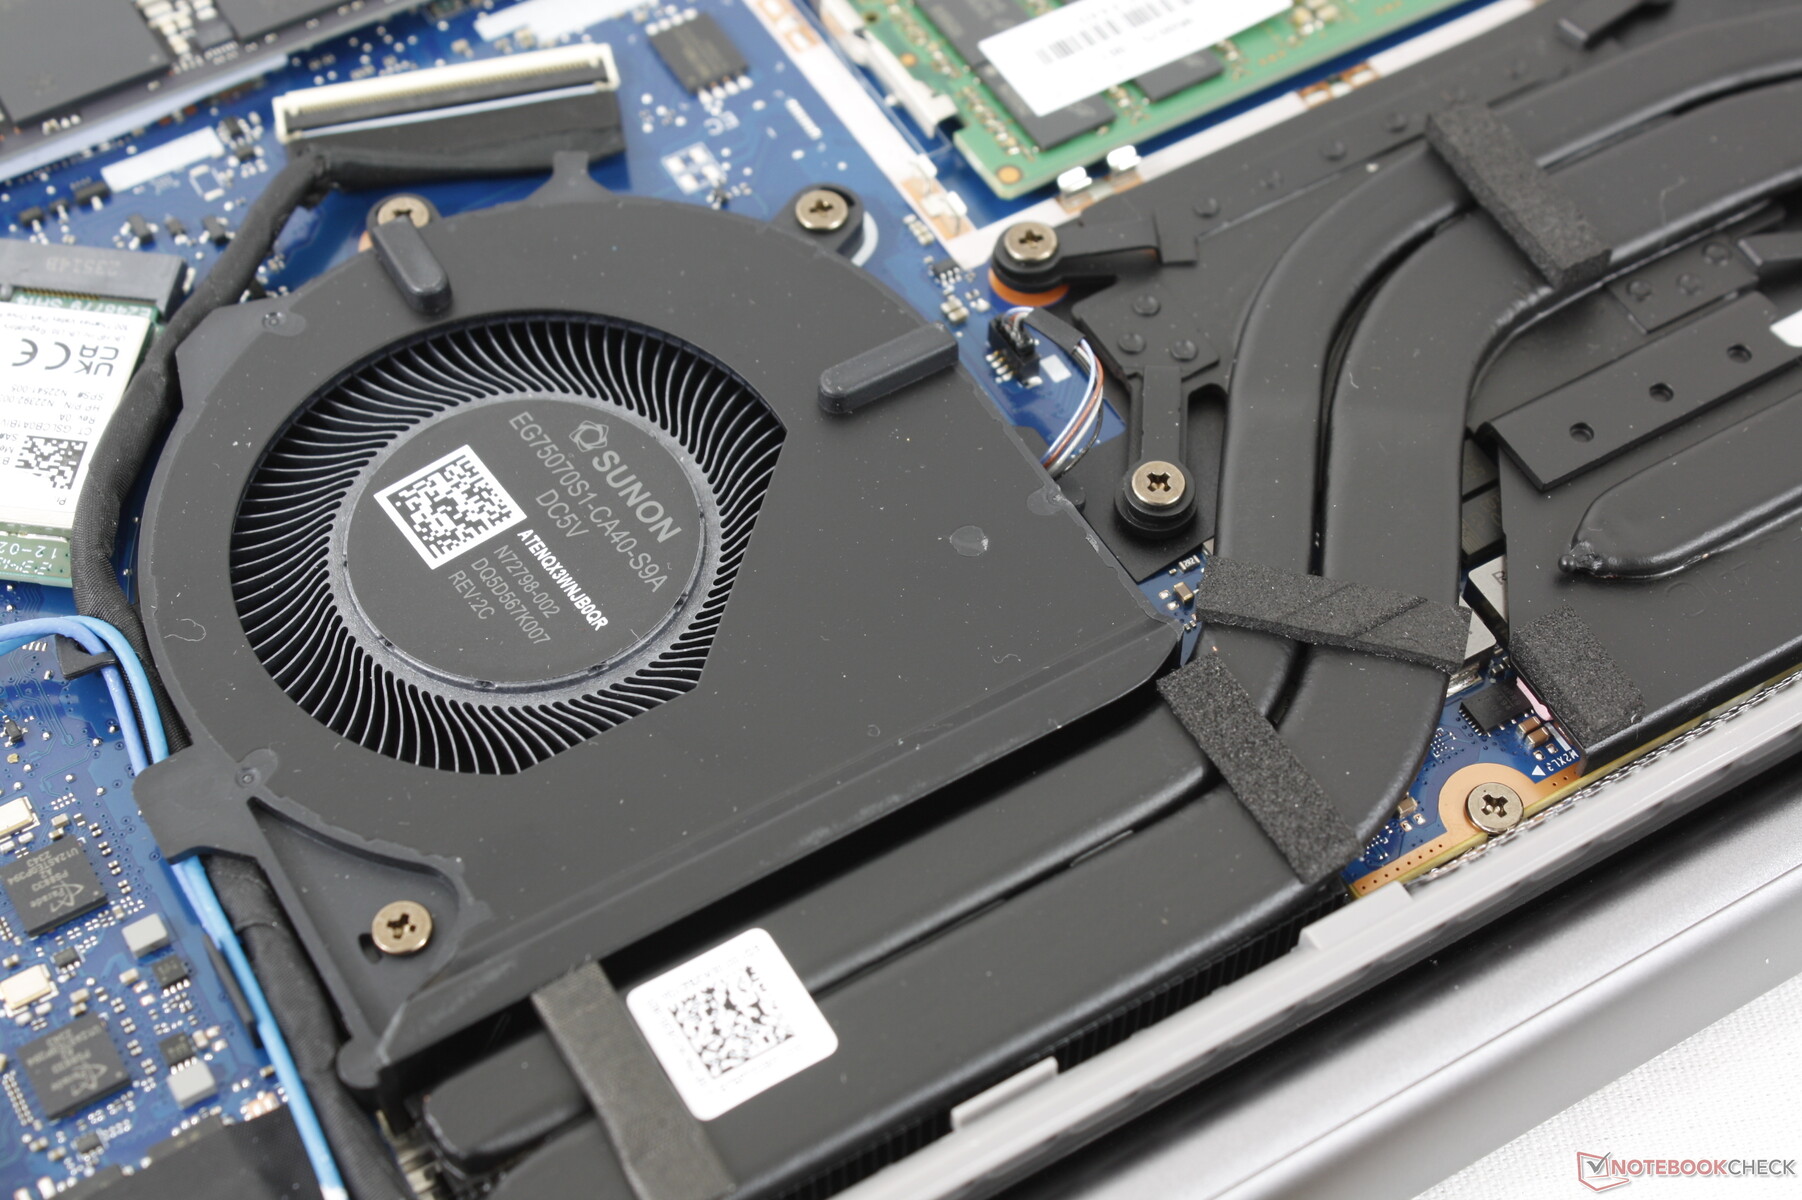
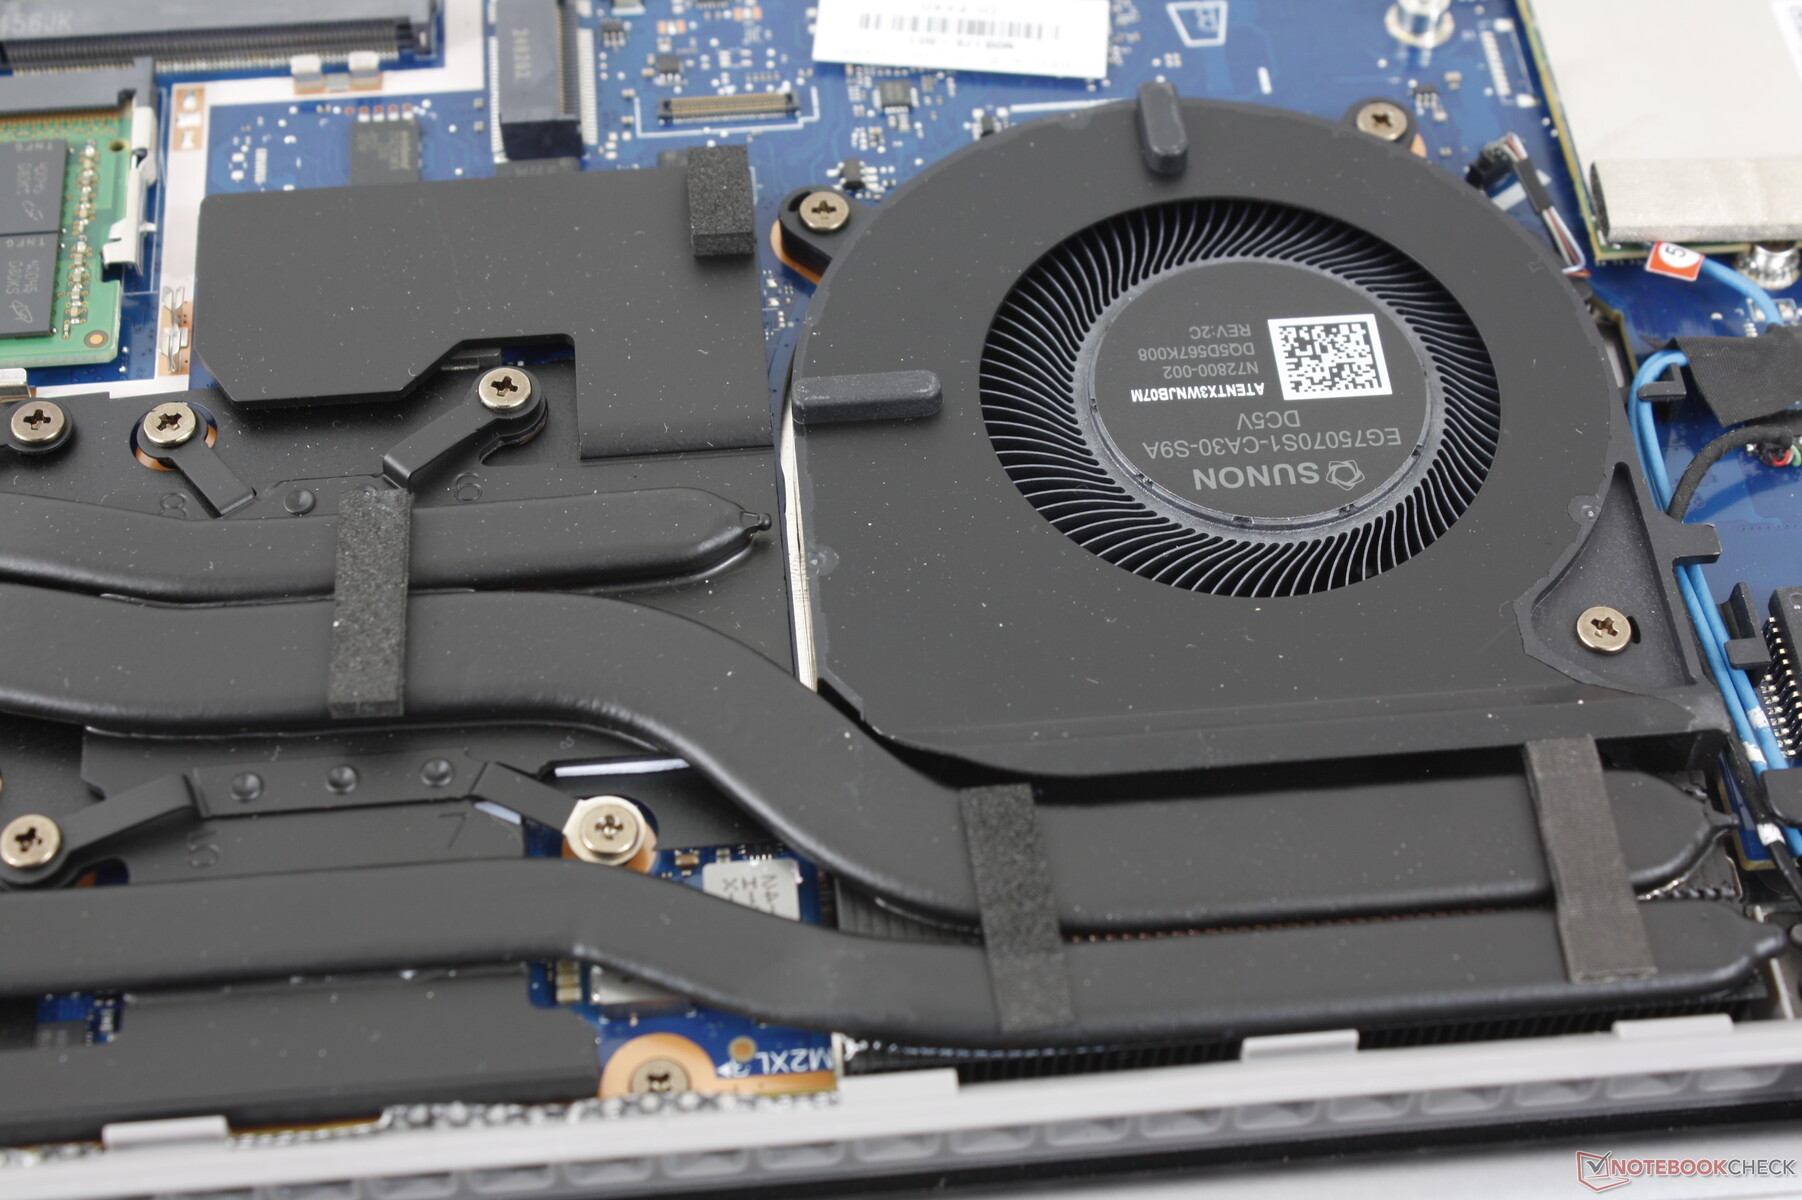
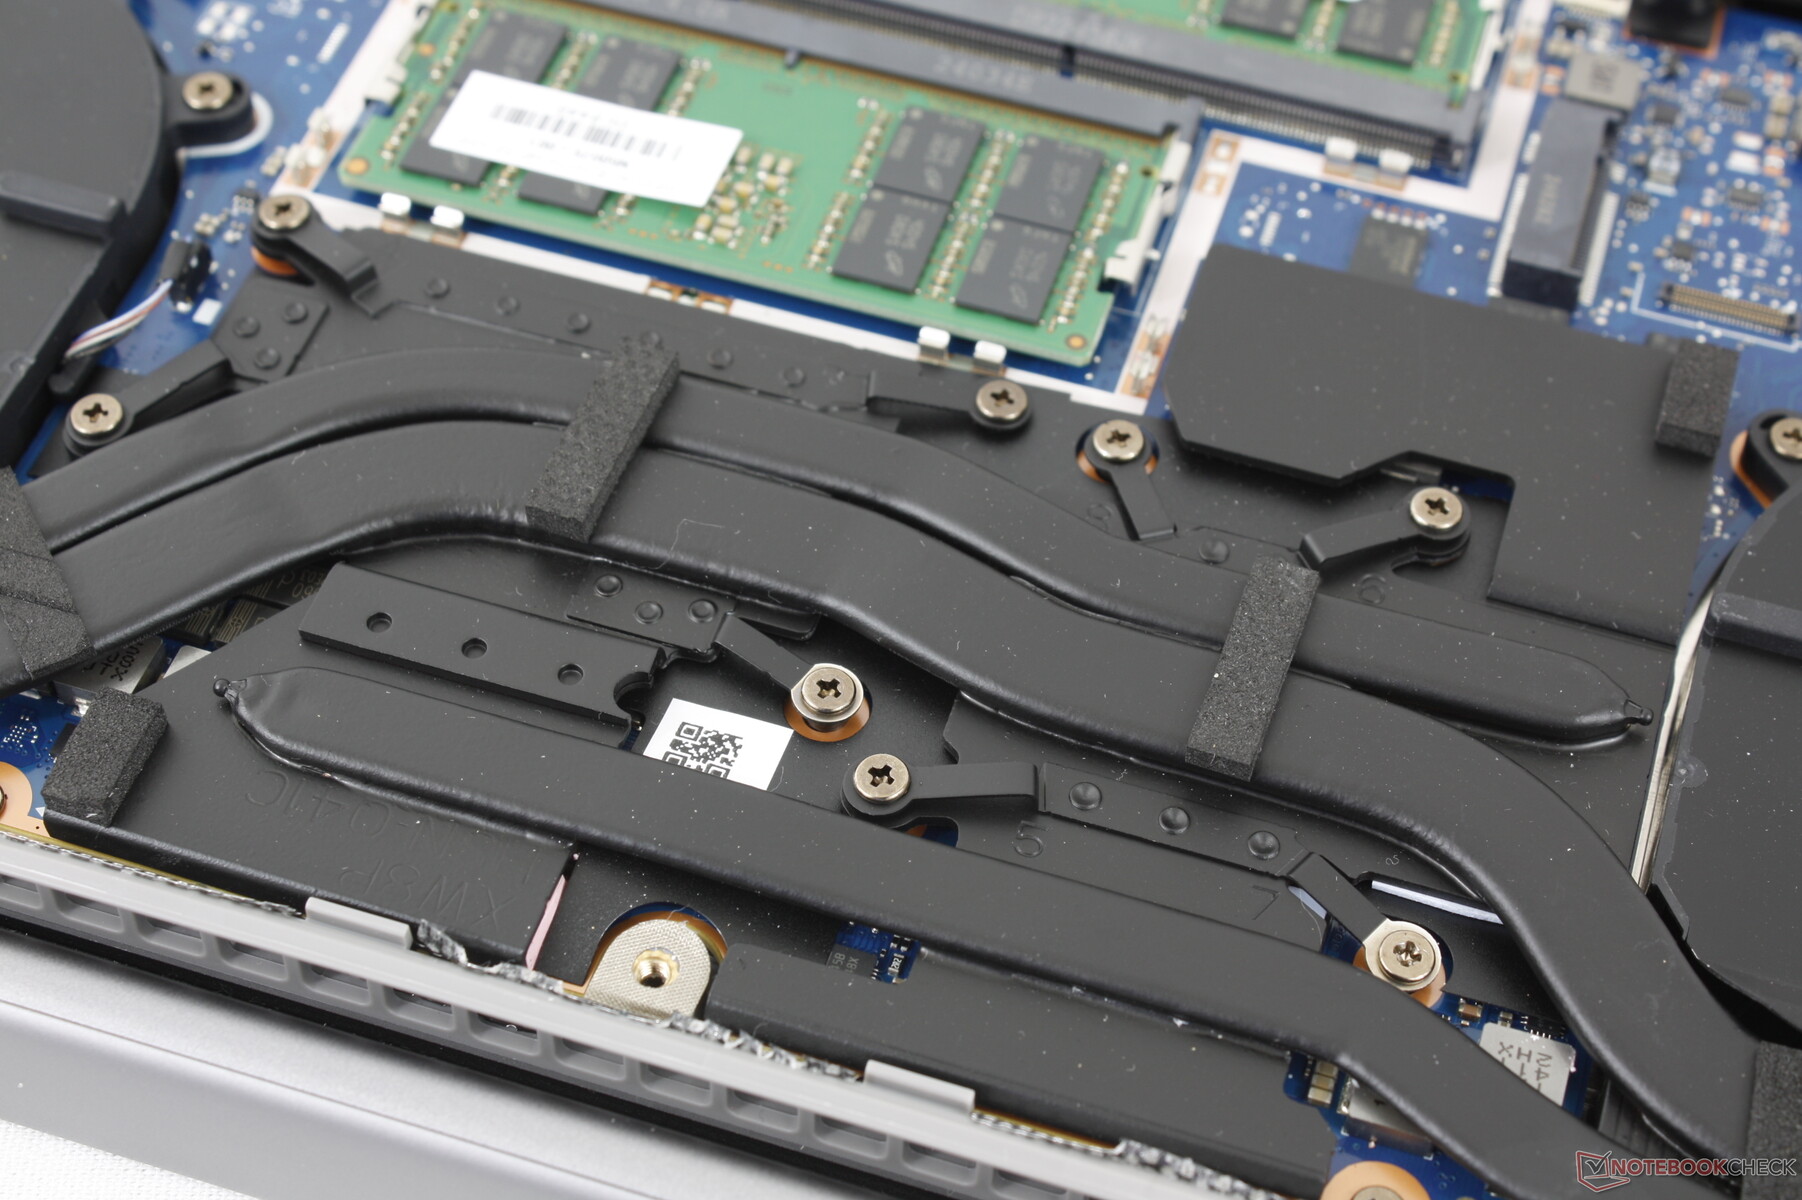
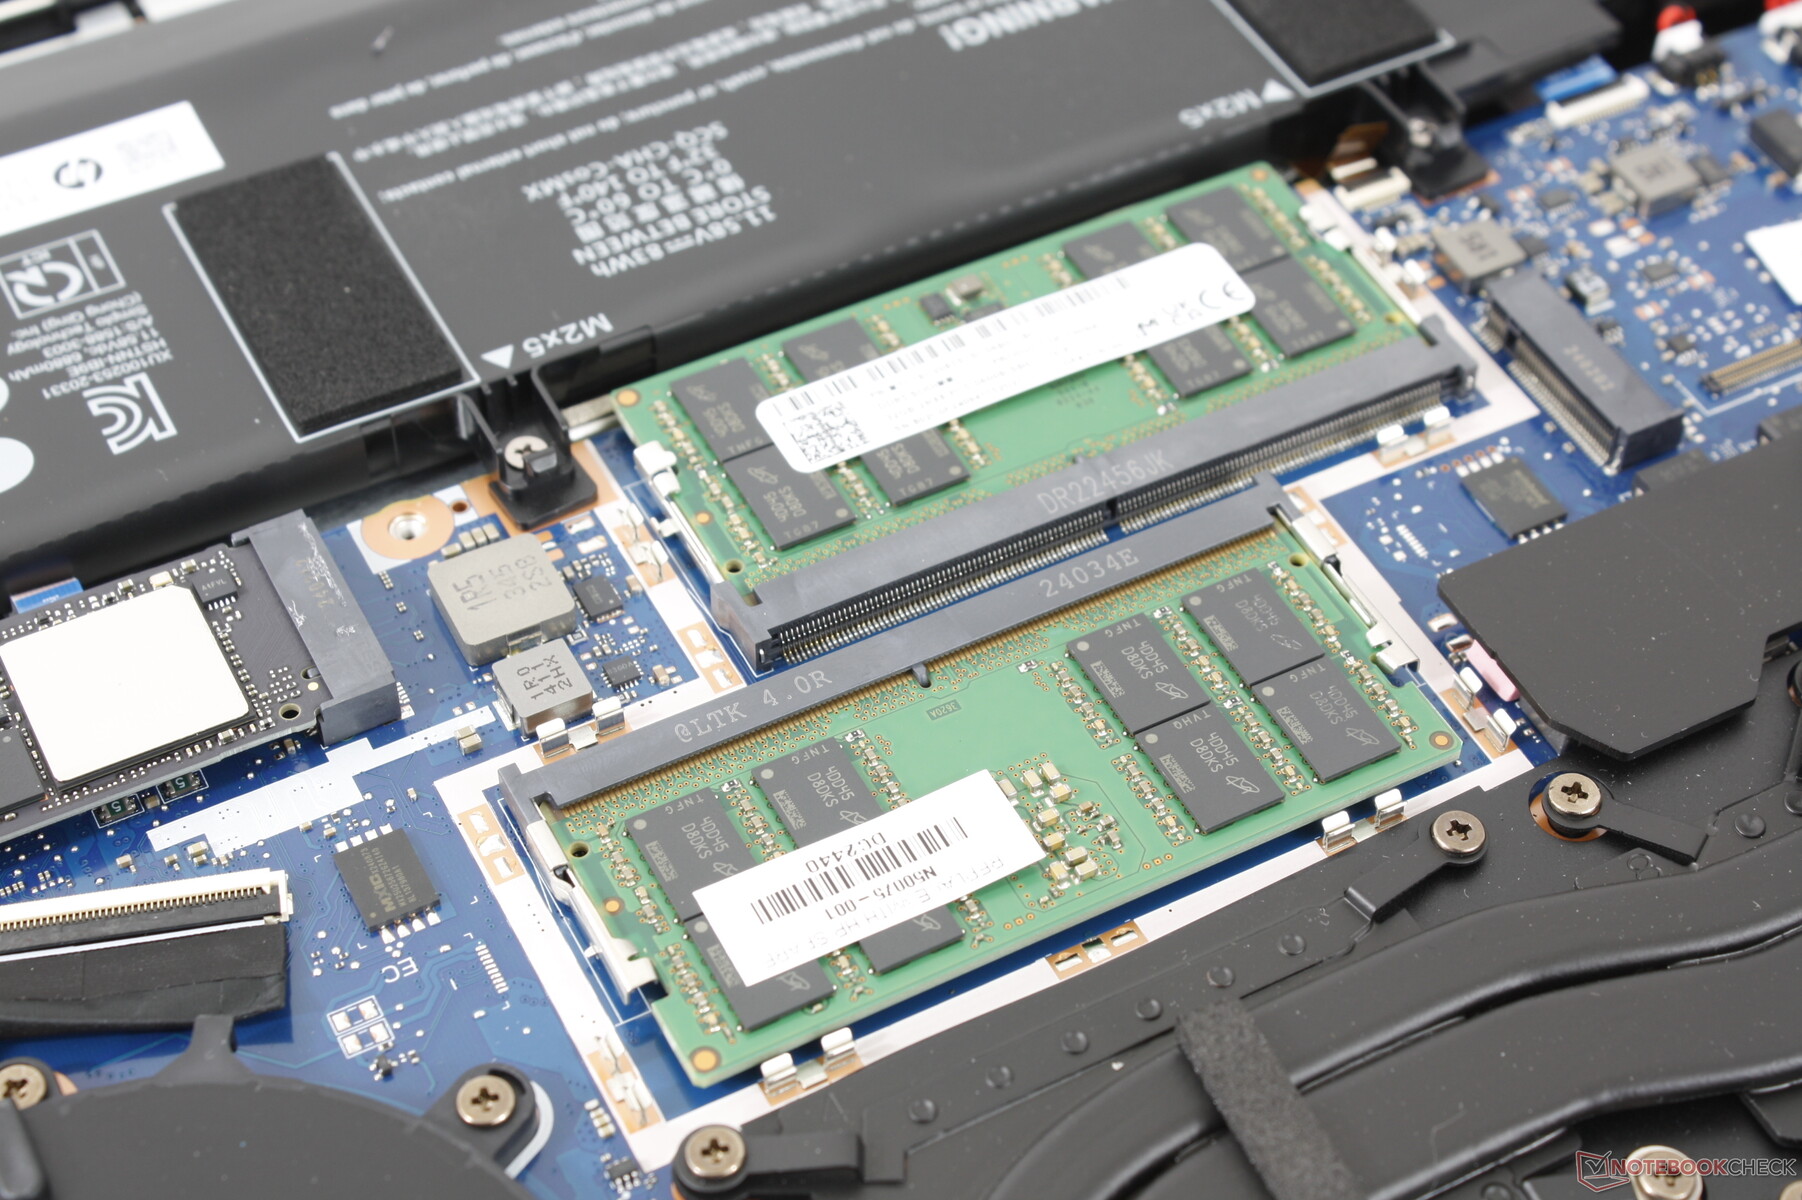
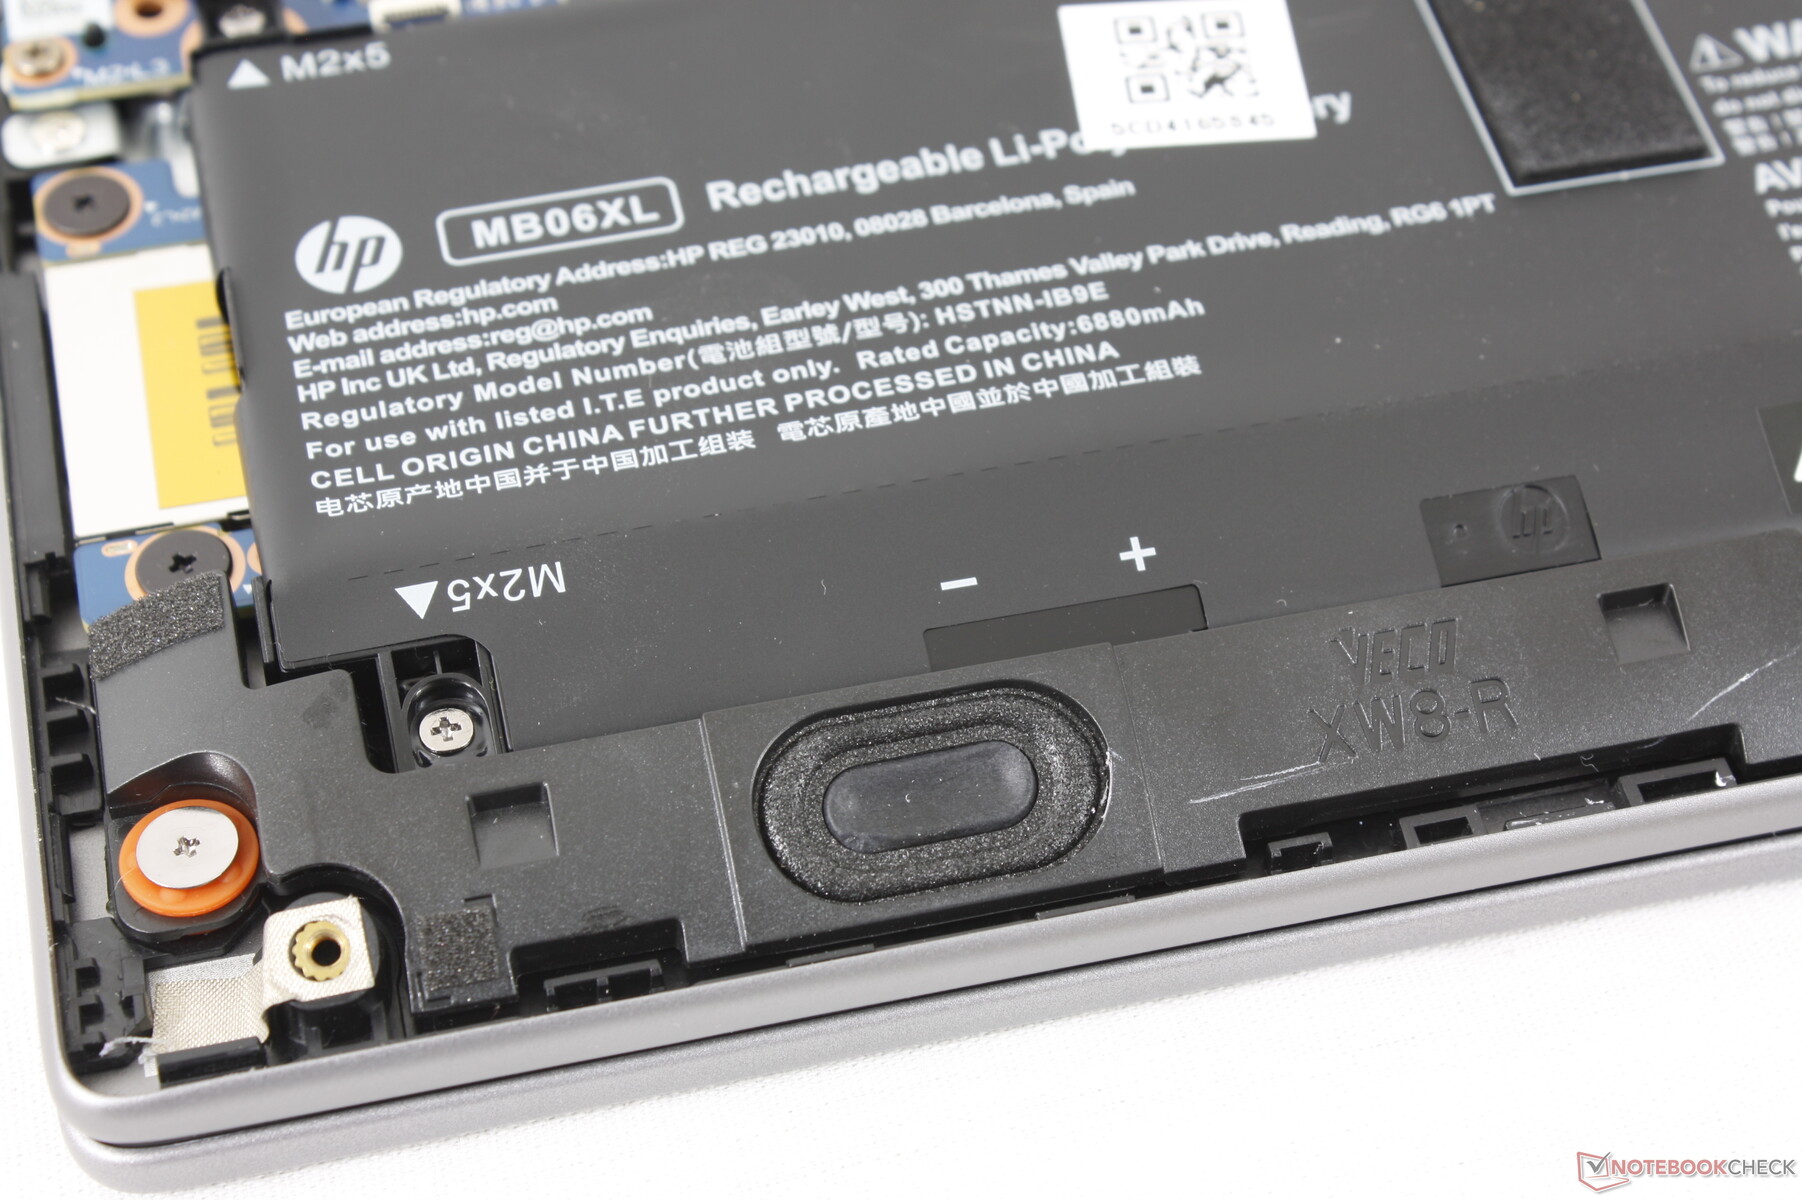
Mantenimiento
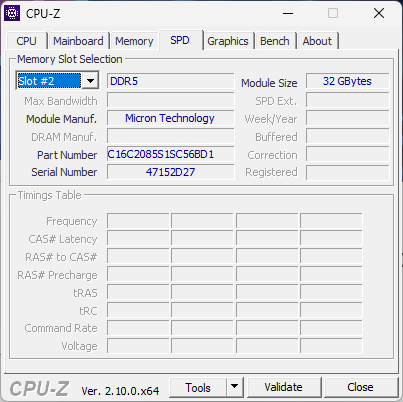
El panel inferior se desprende con relativa facilidad con sólo un destornillador Phillips y un borde afilado. Los componentes internos se han rediseñado por completo en comparación con el ZBook Power 15 G10, pero conservando las mismas opciones actualizables, como las 2 ranuras SODIMM, las 2 ranuras SSD PCIe4 x4 NVMe y el módulo WLAN extraíble. La WAN es una opción añadida en esta ocasión.
Sostenibilidad
La fabricación utiliza un bajo contenido en halógenos, mientras que el envase se compone de pulpa de papel moldeada y plásticos reciclados procedentes en un 100% de fuentes sostenibles y en un 60% de fuentes postconsumo, respectivamente.
Accesorios y garantía
No hay extras en la caja que acompañen al adaptador de CA y el papeleo. Decepcionantemente, la garantía limitada estándar es sólo de un año si se compra en EE.UU. mientras que el ZBook Fury viene con tres años de serie.
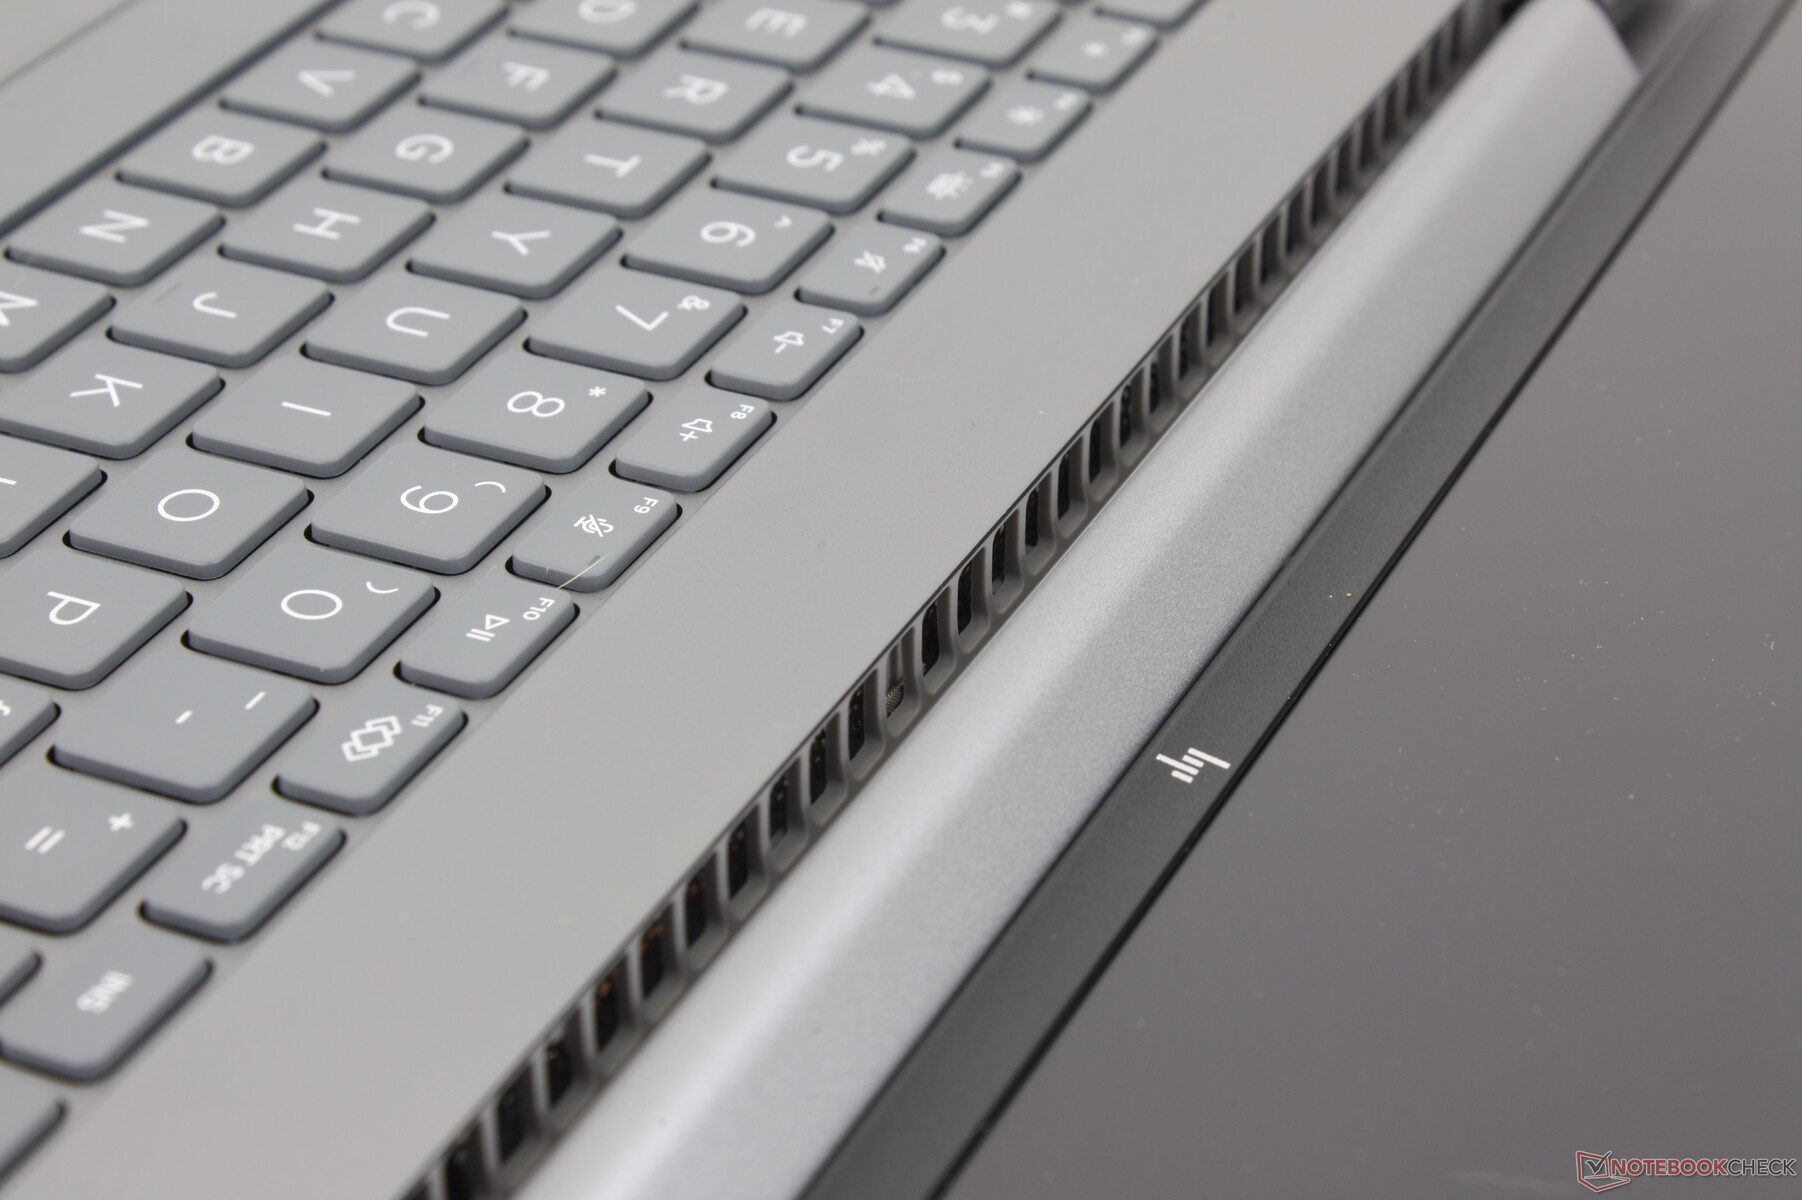
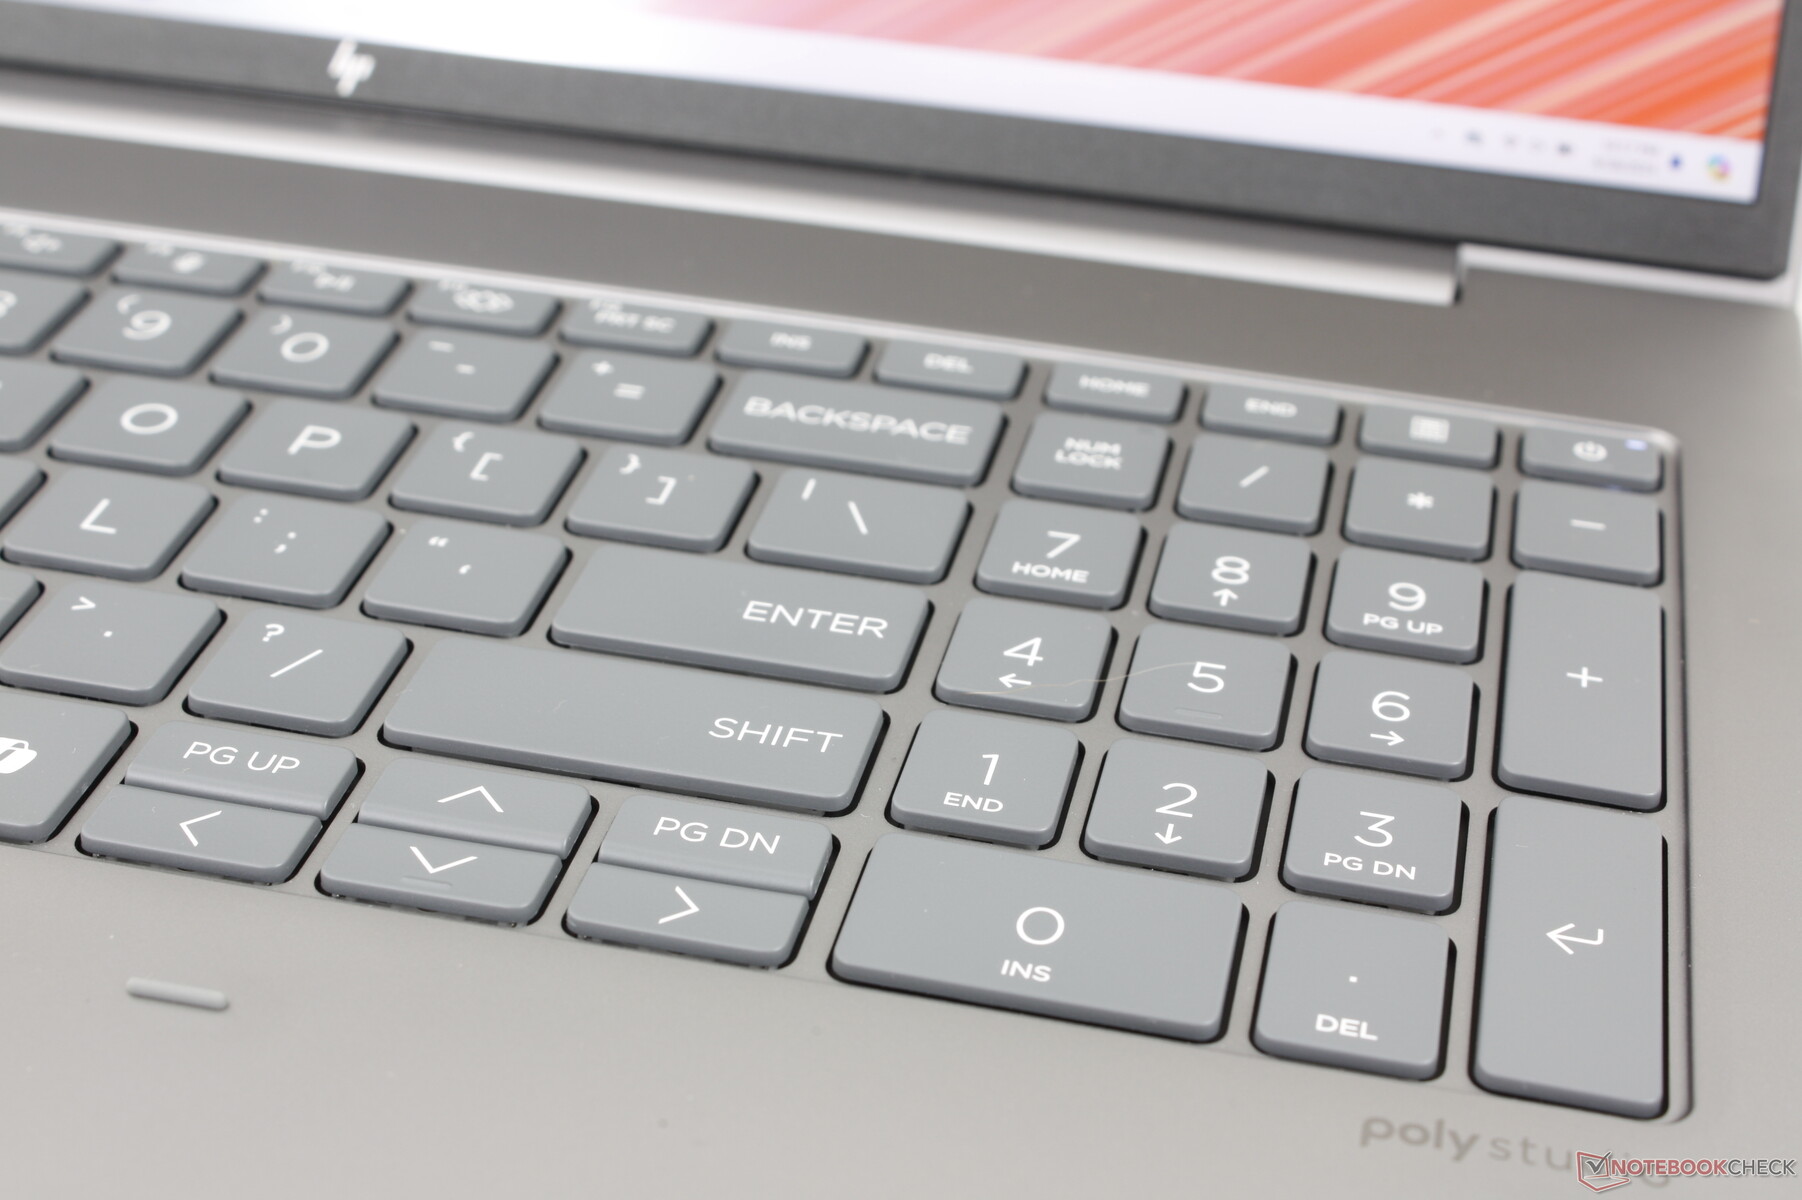
Dispositivos de entrada - Teclas espaciosas
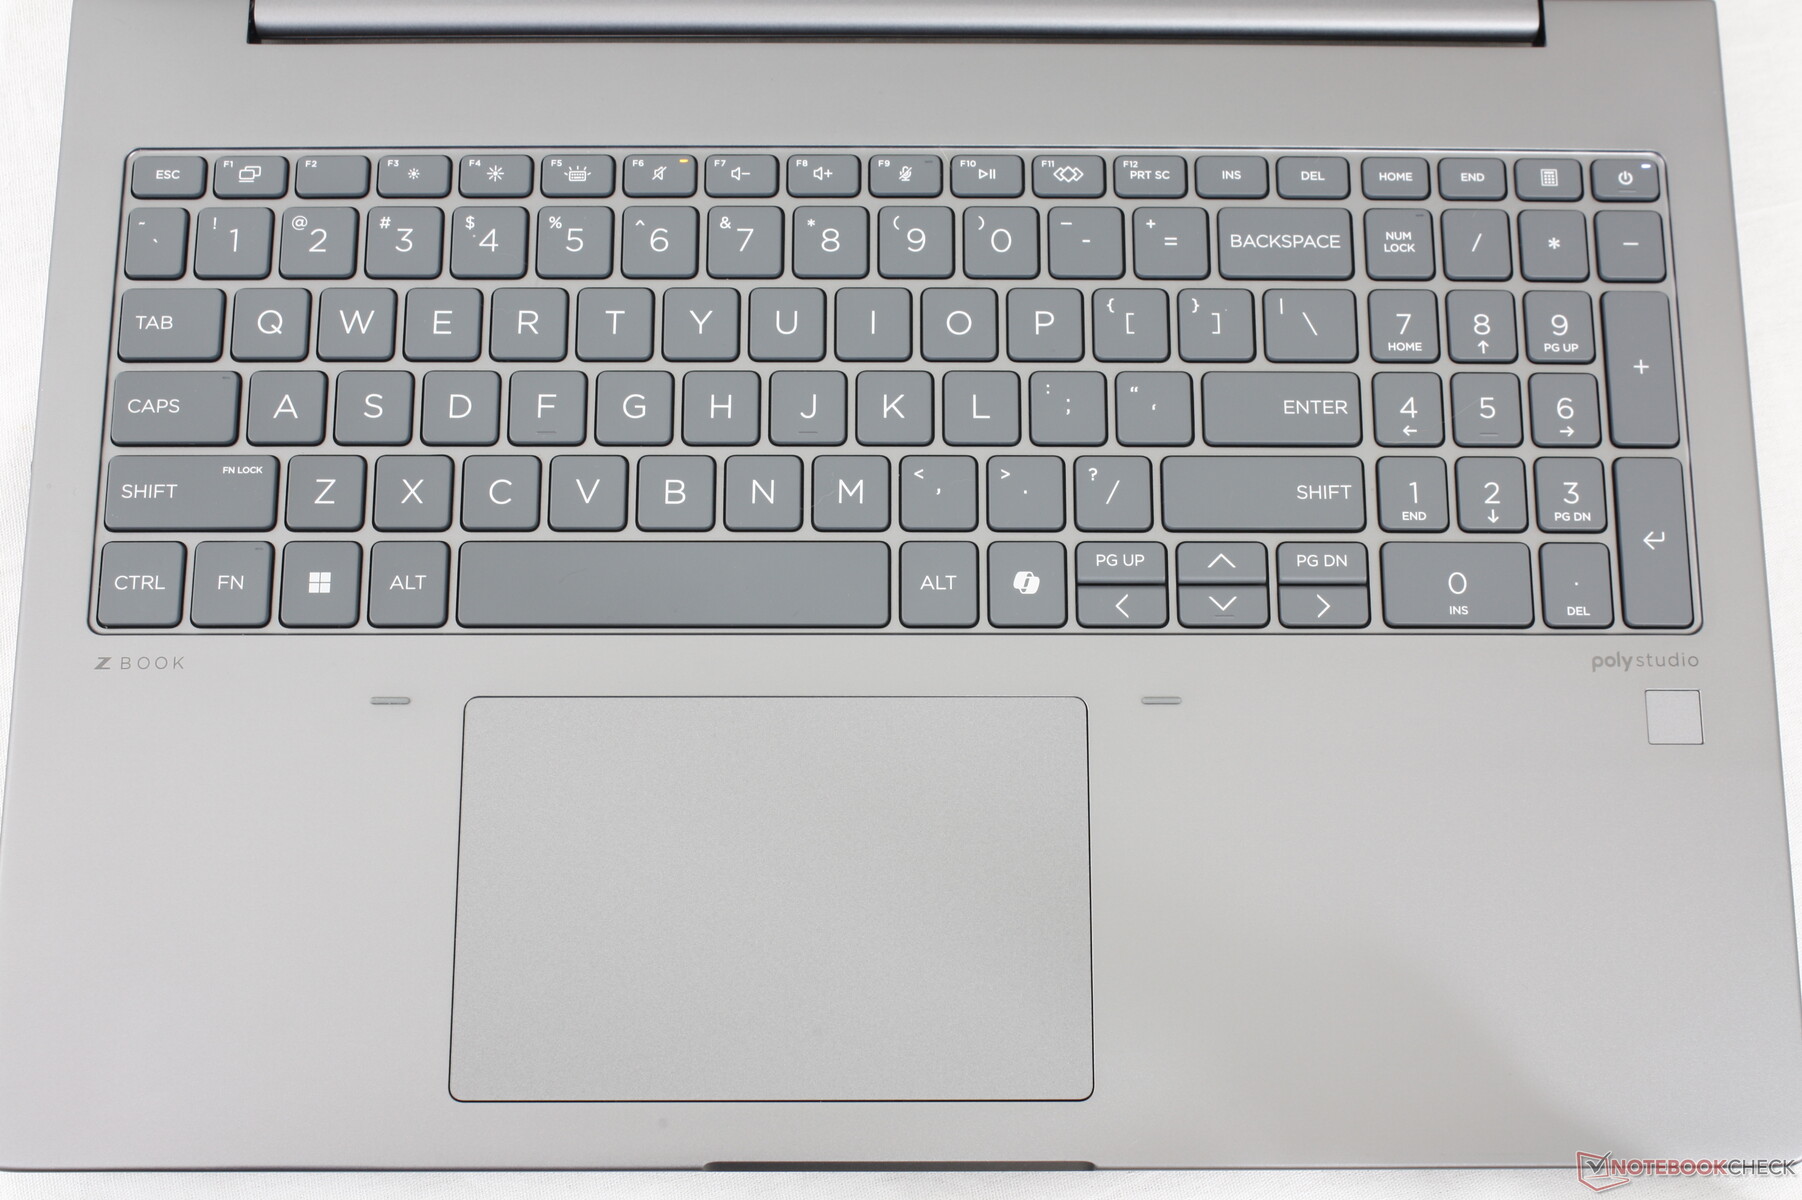
Teclado
La experiencia de escritura es similar a la de un Spectre x360 16 en que las teclas son firmes con una retroalimentación relativamente nítida para ser cómodas para escribir. El recorrido de las teclas en particular se siente más profundo que en la mayoría de los Ultrabooks para evitar la típica retroalimentación superficial o esponjosa.
El teclado numérico ha vuelto mientras que falta en el competidor Precision 5690. Sin embargo, sus teclas son ligeramente más estrechas que las teclas QWERTY principales, por lo que la respuesta es notablemente más suave al pulsarlas.
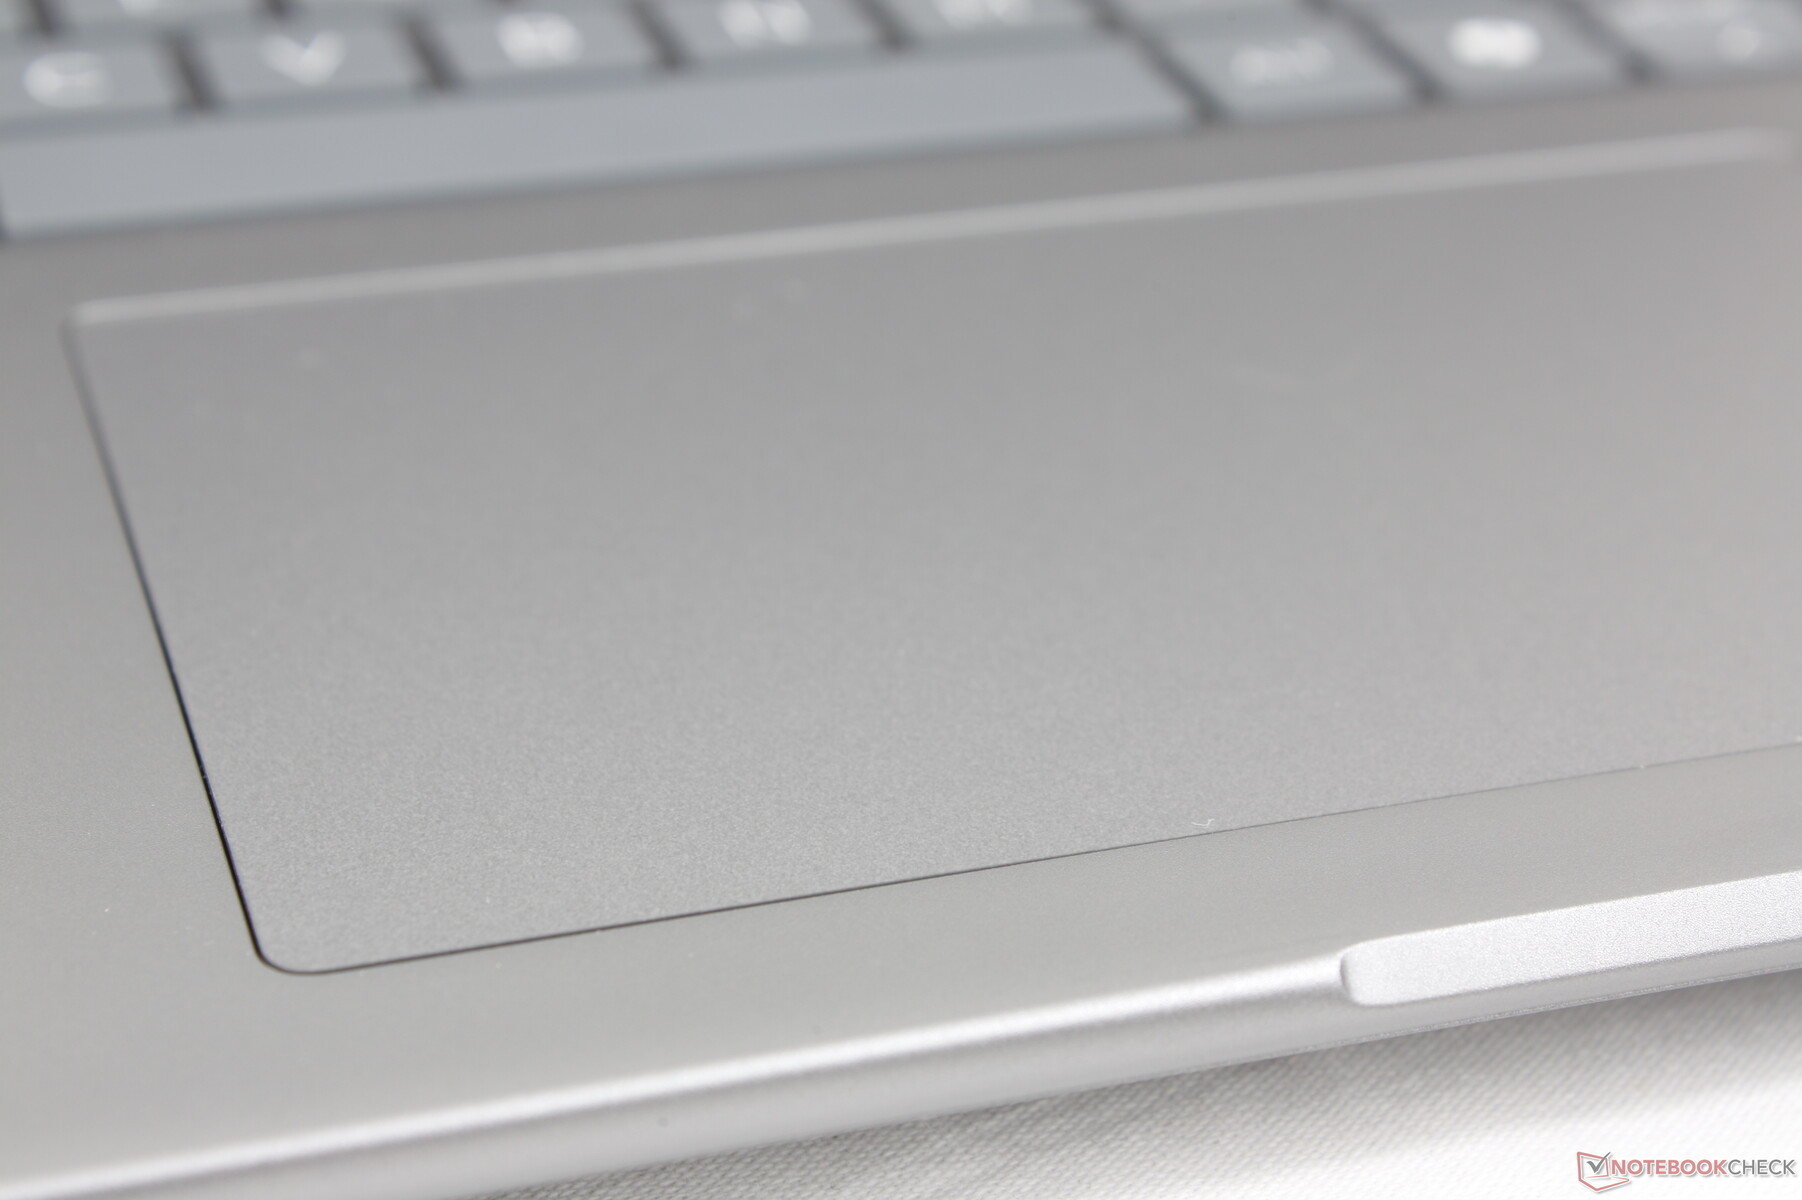
Panel táctil
El clickpad es más grande que antes (12,5 x 8 cm frente a 11,5 × 7 cm) para aprovechar el mayor factor de forma de 16 pulgadas. Siguen faltando teclas dedicadas, disponibles en cambio en la serie ZBook Fury, más cara. La tracción y la respuesta son, no obstante, suaves y cliqueantes, respectivamente, para ser más fiables que los clickpads normalmente más esponjosos de la mayoría de los portátiles de consumo.

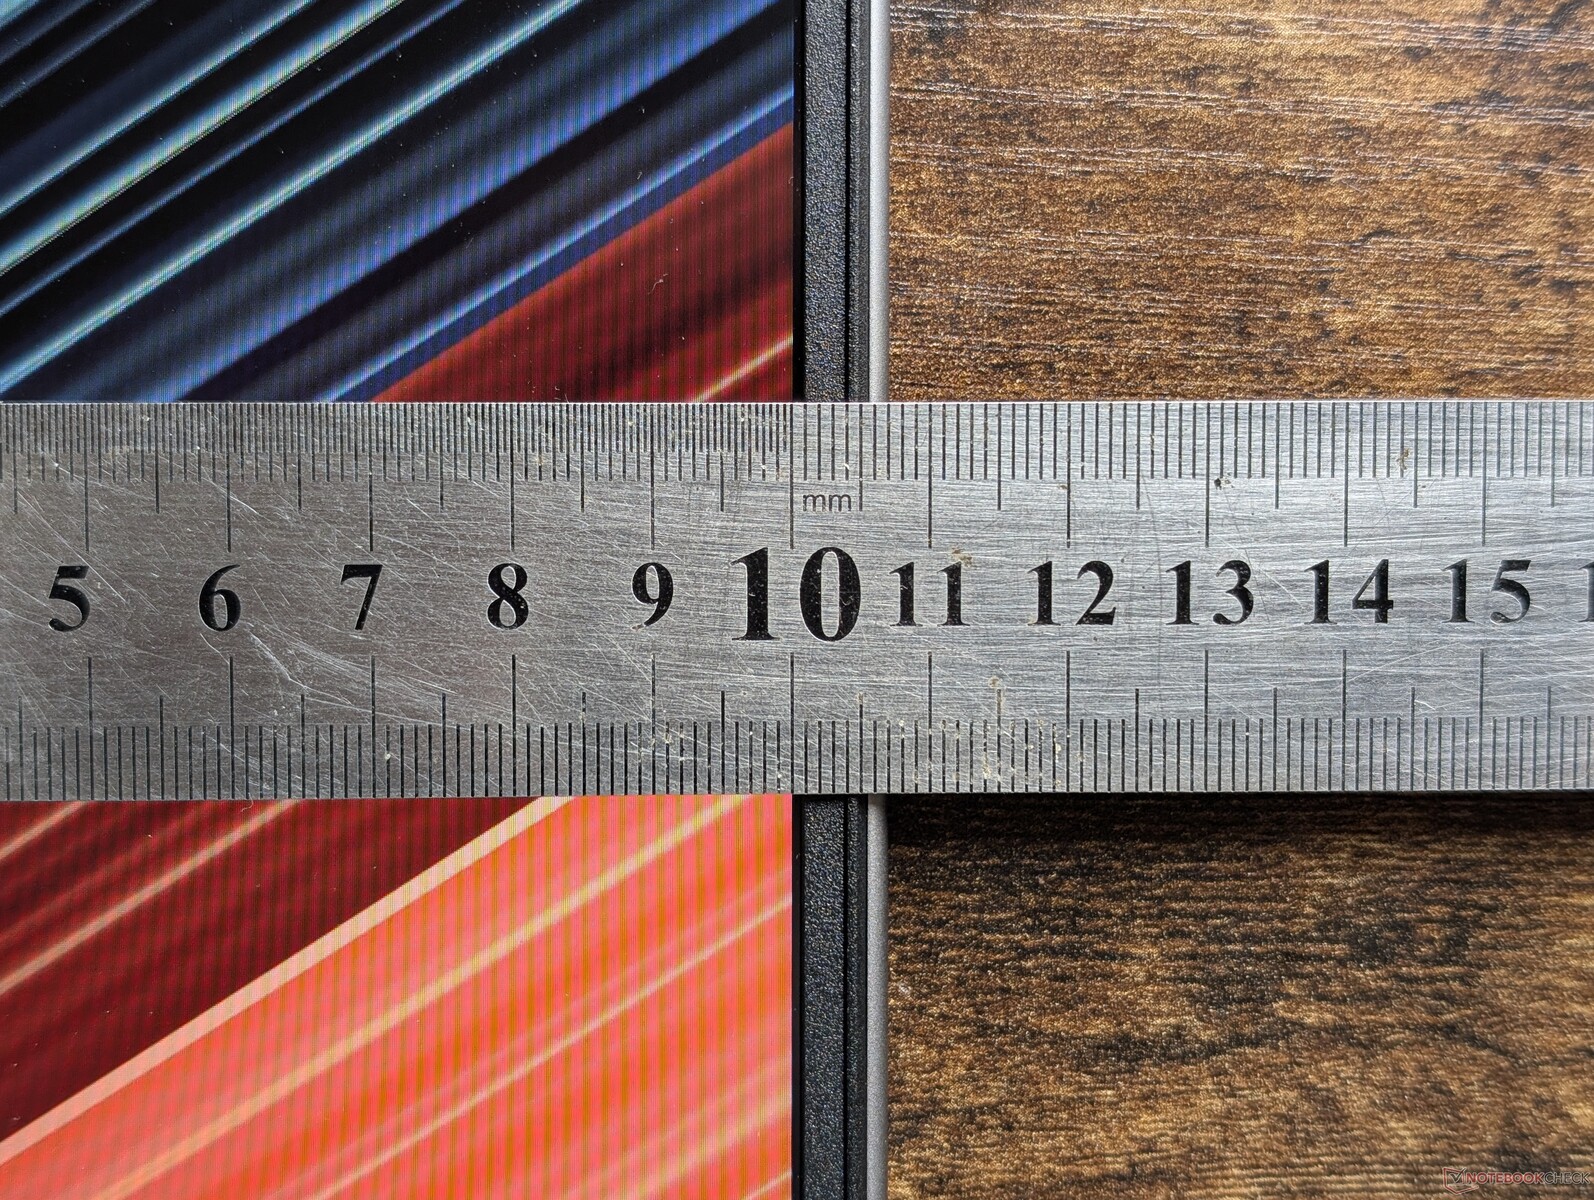
Pantalla - IPS en toda la gama
Hay disponibles un total de cinco opciones de pantalla, todas ellas sólo IPS. Nuestra configuración se entrega con la opción en negrita.
- 1920 x 1200, no táctil, mate, 250 nits, 45 por ciento NTSC, 60 Hz
- 1920 x 1200, táctil, mate, 250 nits, 45 por ciento NTSC, 60 Hz
- 1920 x 1200, no táctil, mate, 400 nits, 100 por ciento sRGB, 60 Hz
- 1920 x 1200, no táctil, mate, 1000 nits, 100 por ciento sRGB, HP Sure View, 60 Hz
- 2560 x 1600, no táctil, mate, 400 nits, 100 por ciento sRGB, 120 Hz
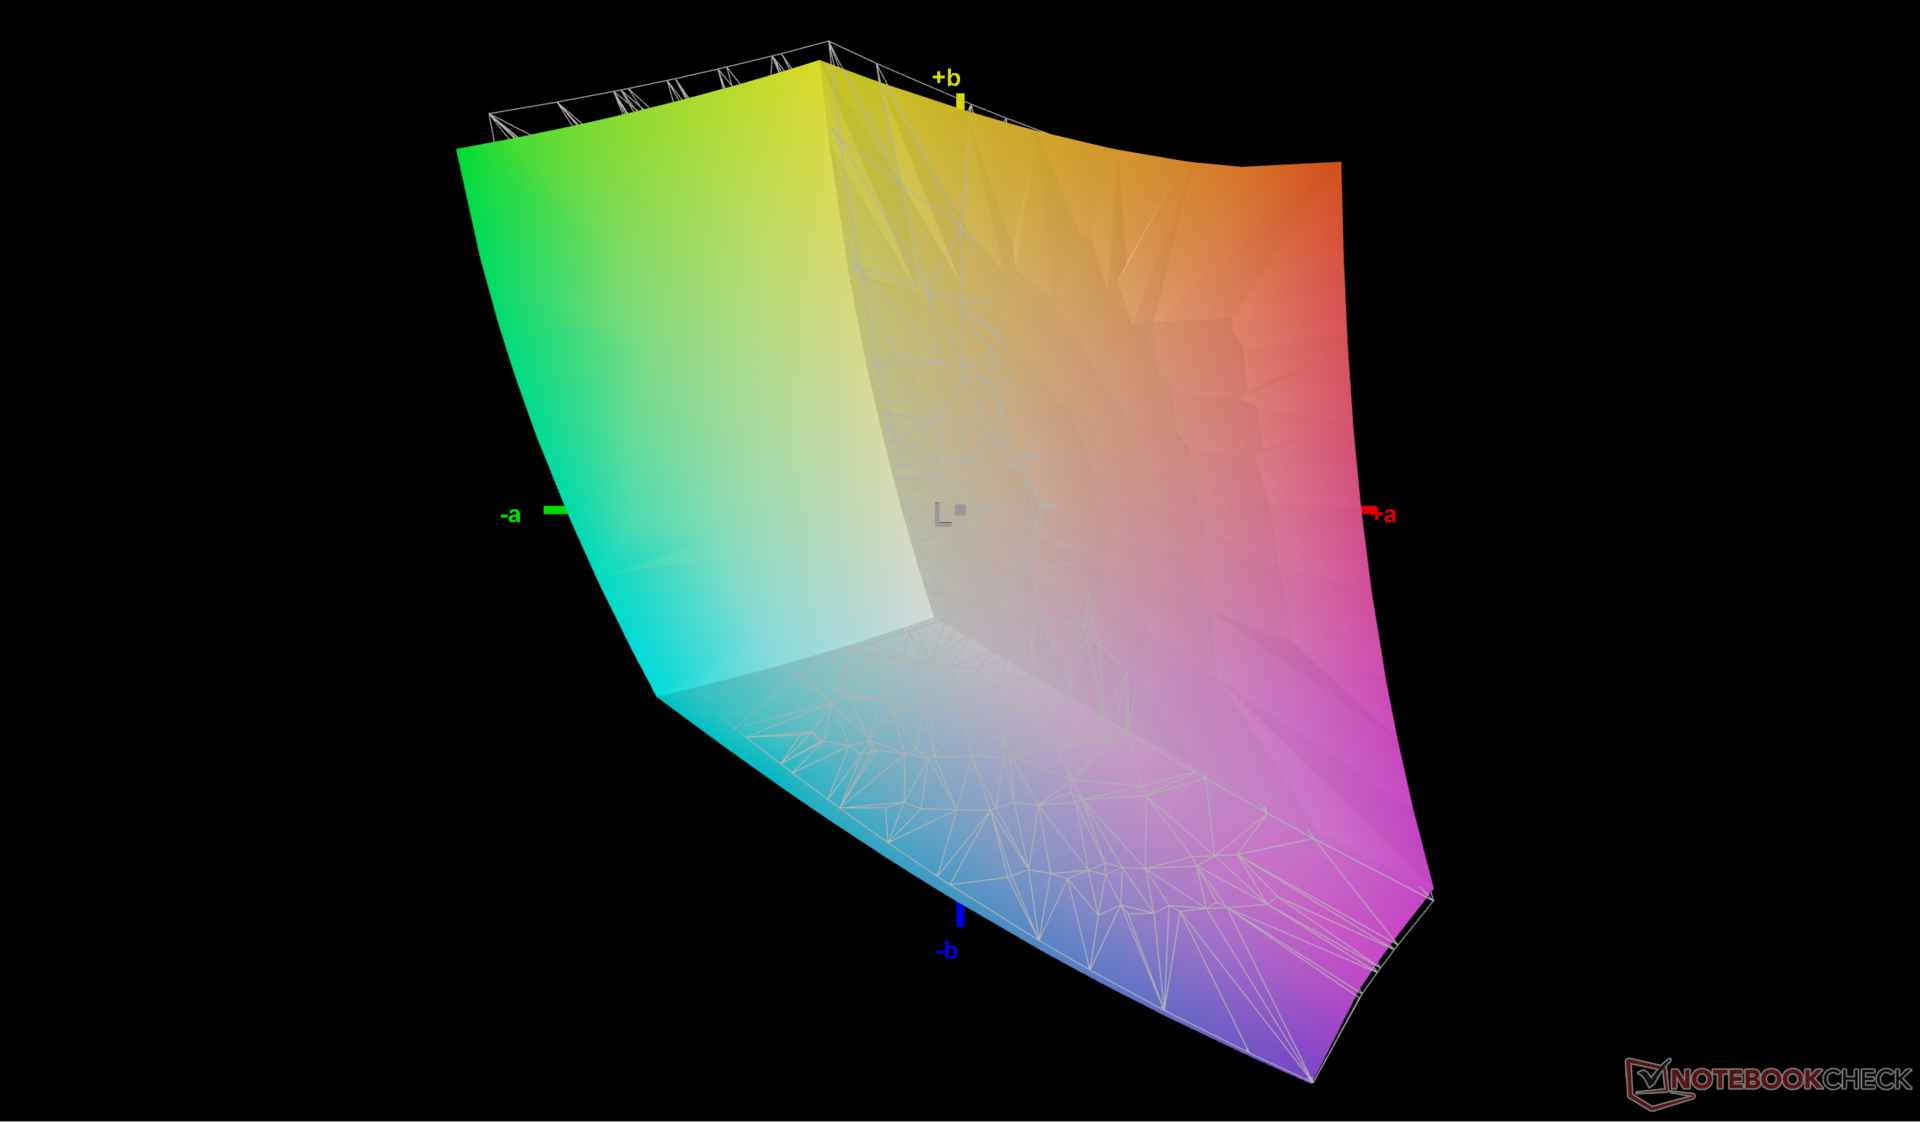
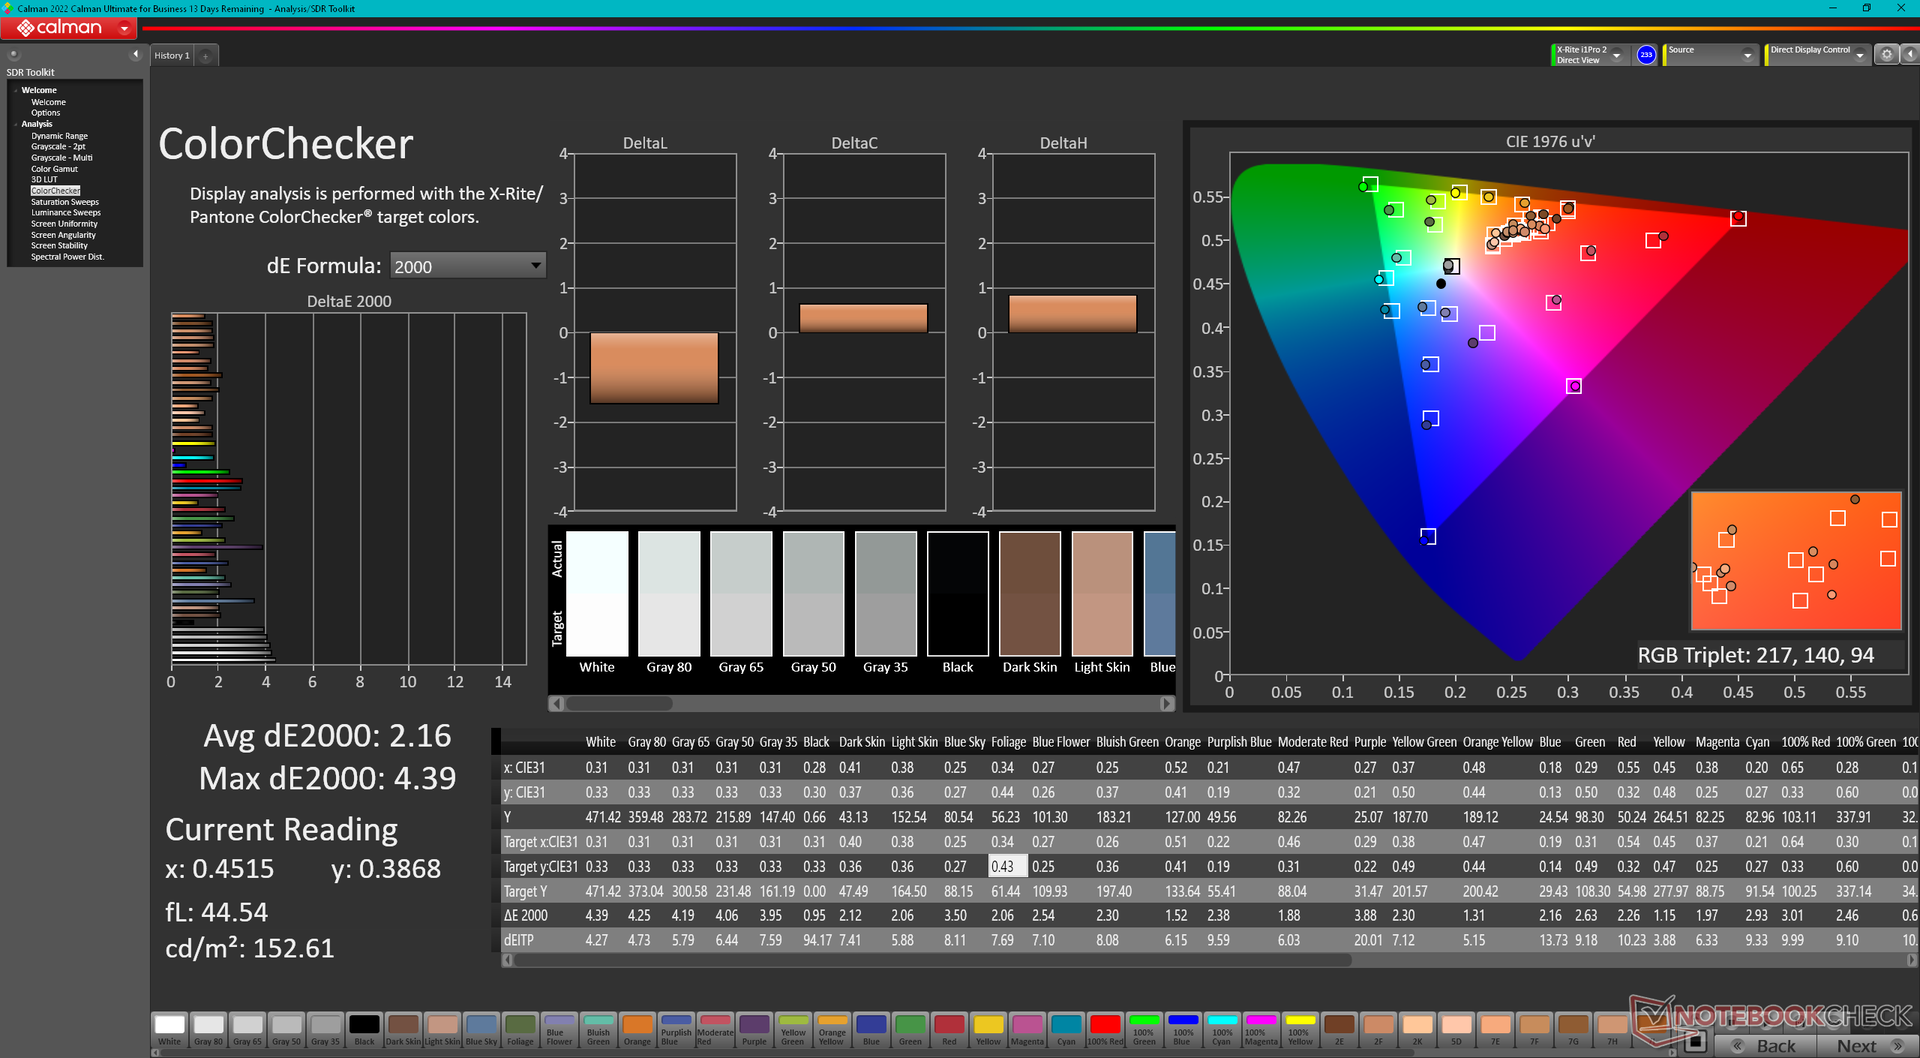
Si la calidad de imagen es una preocupación, los usuarios deberían omitir las dos primeras opciones de gama baja, ya que la cobertura de color sólo sería de aproximadamente el 60 por ciento de sRGB. El panel superbrillante de 1000 nits es digno de mención, ya que muchas otras estaciones de trabajo no ofrecen esta característica, pero la opción está desafortunadamente ligada a Sure View, que limita severamente los ángulos de visión para aumentar la privacidad. No hay opciones OLED, HDR o P3 de las que hablar, lo que resulta algo decepcionante para una estación de trabajo de alto rendimiento. Los usuarios tendrían que actualizarse al HP ZBook Fury 16 G11 o considerar el ThinkPad P16s G2 para tales características.

| |||||||||||||||||||||||||
iluminación: 88 %
Brillo con batería: 470.7 cd/m²
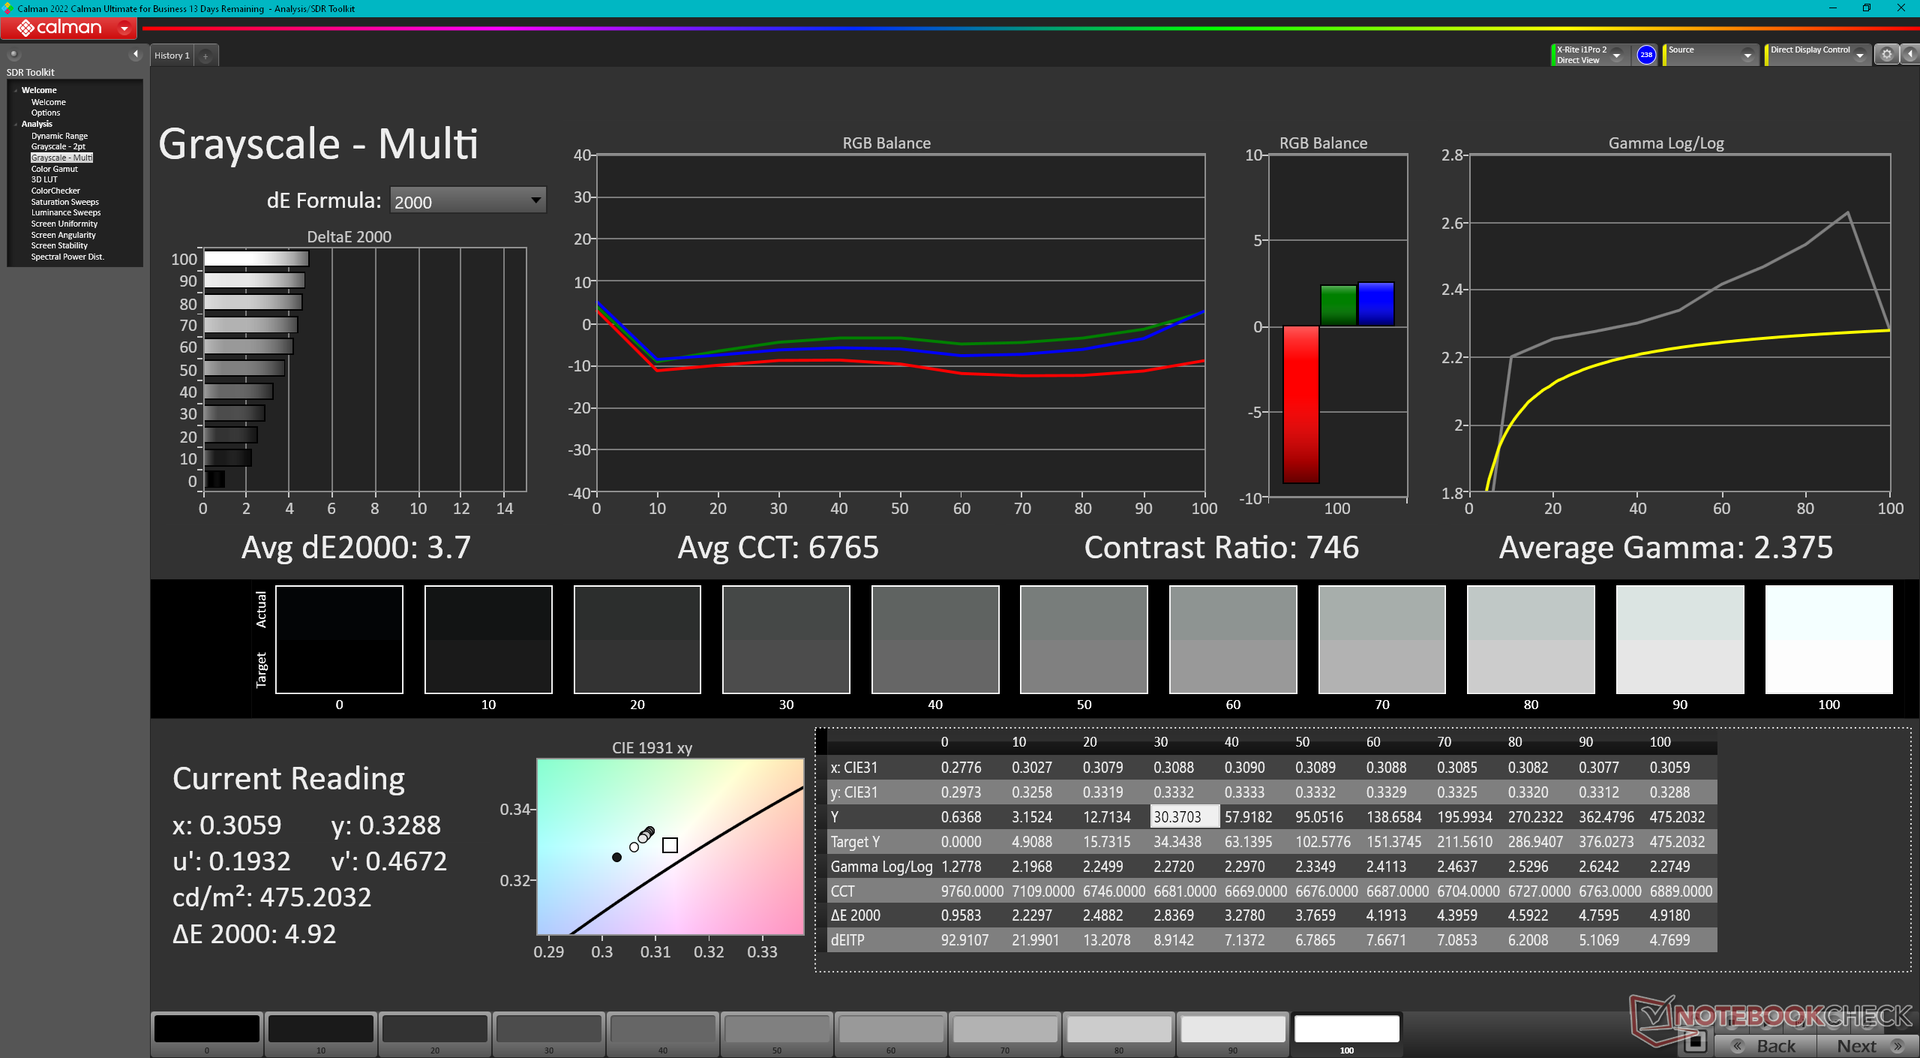
Contraste: 826:1 (Negro: 0.57 cd/m²)
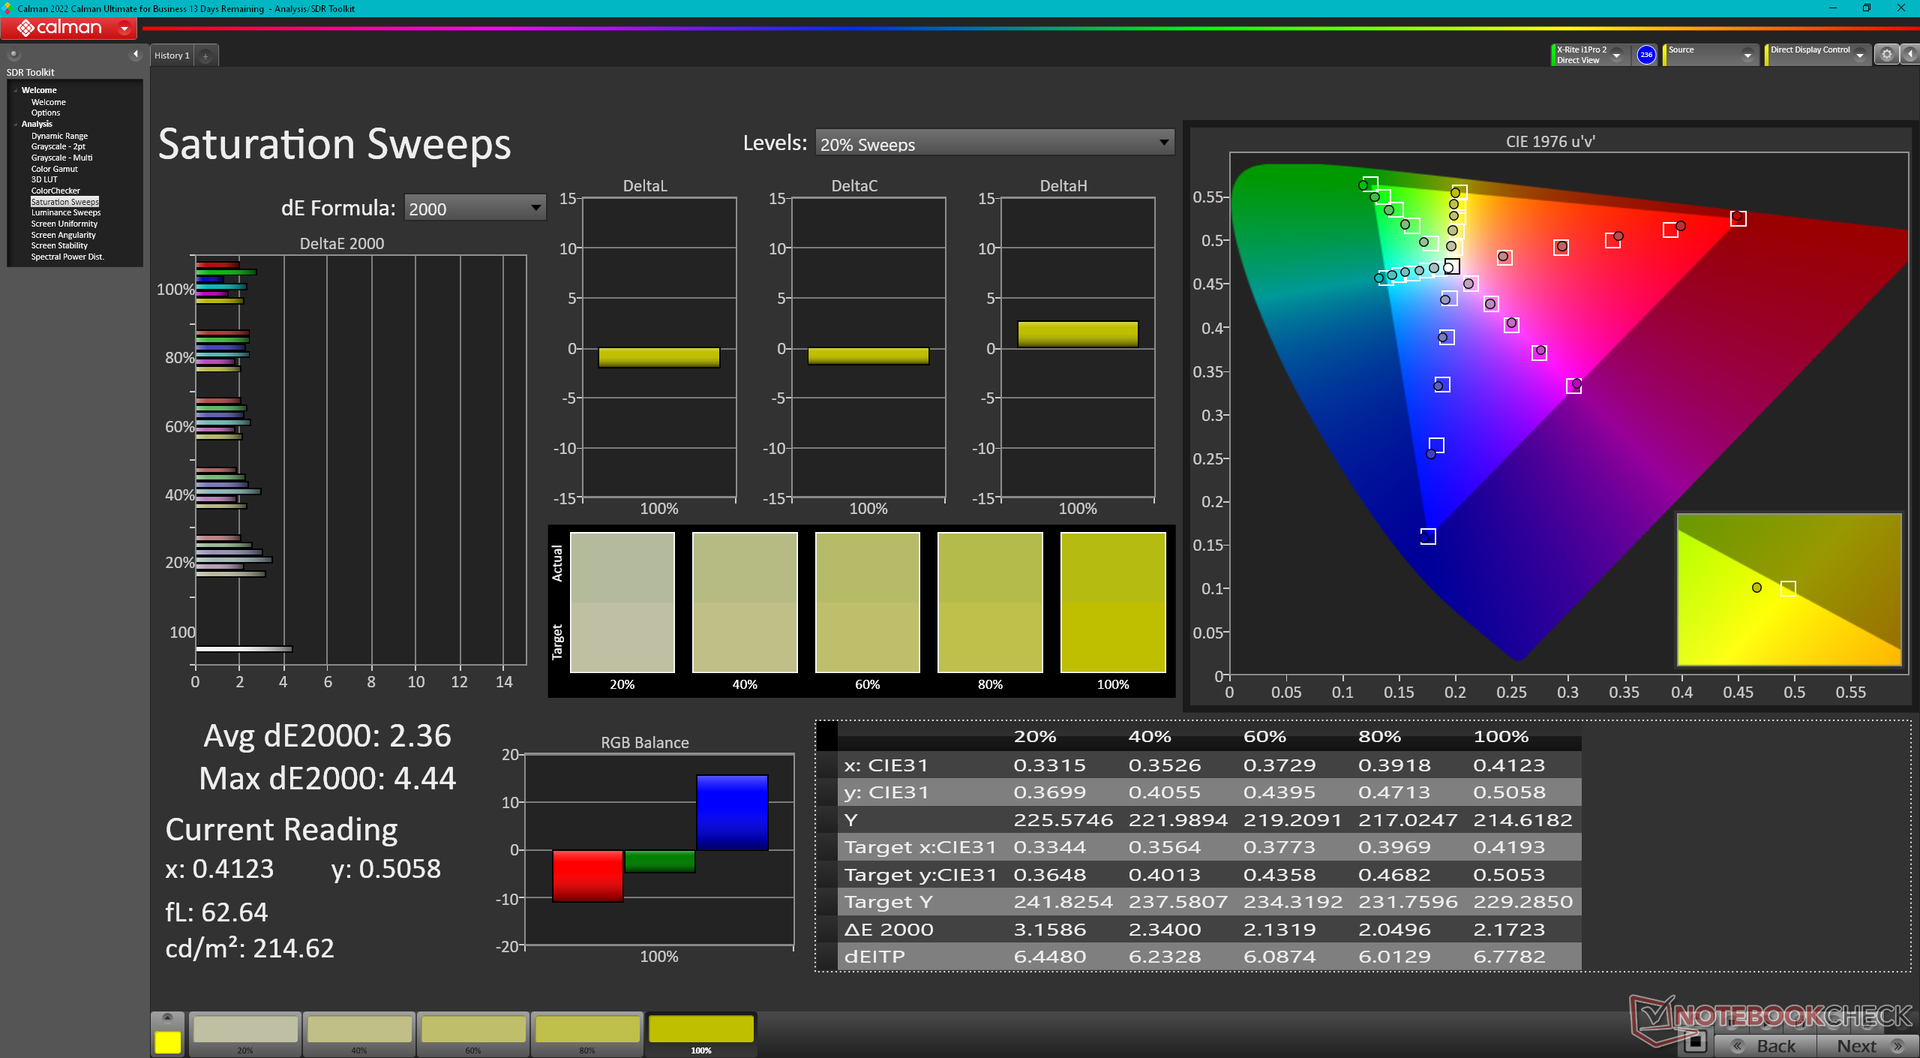
ΔE Color 2.16 | 0.5-29.43 Ø4.86, calibrated: 1.37
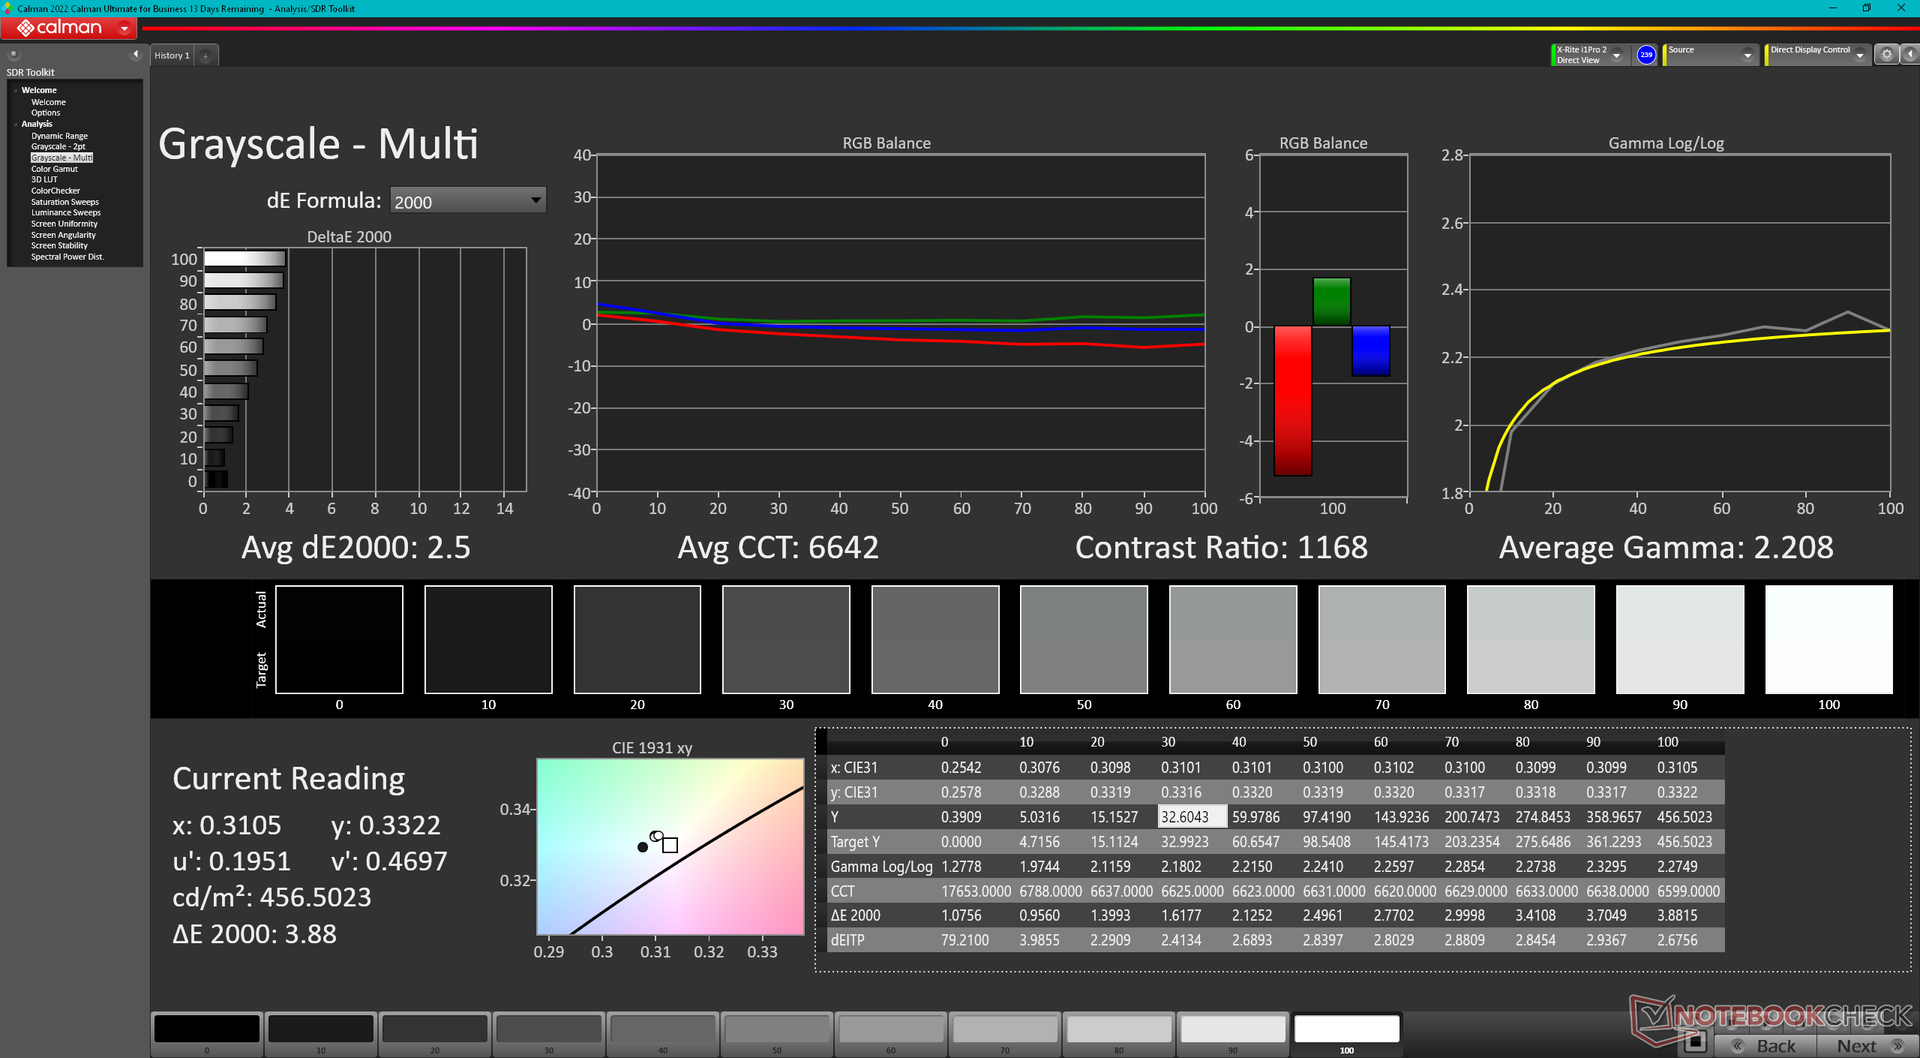
ΔE Greyscale 3.7 | 0.5-98 Ø5.1
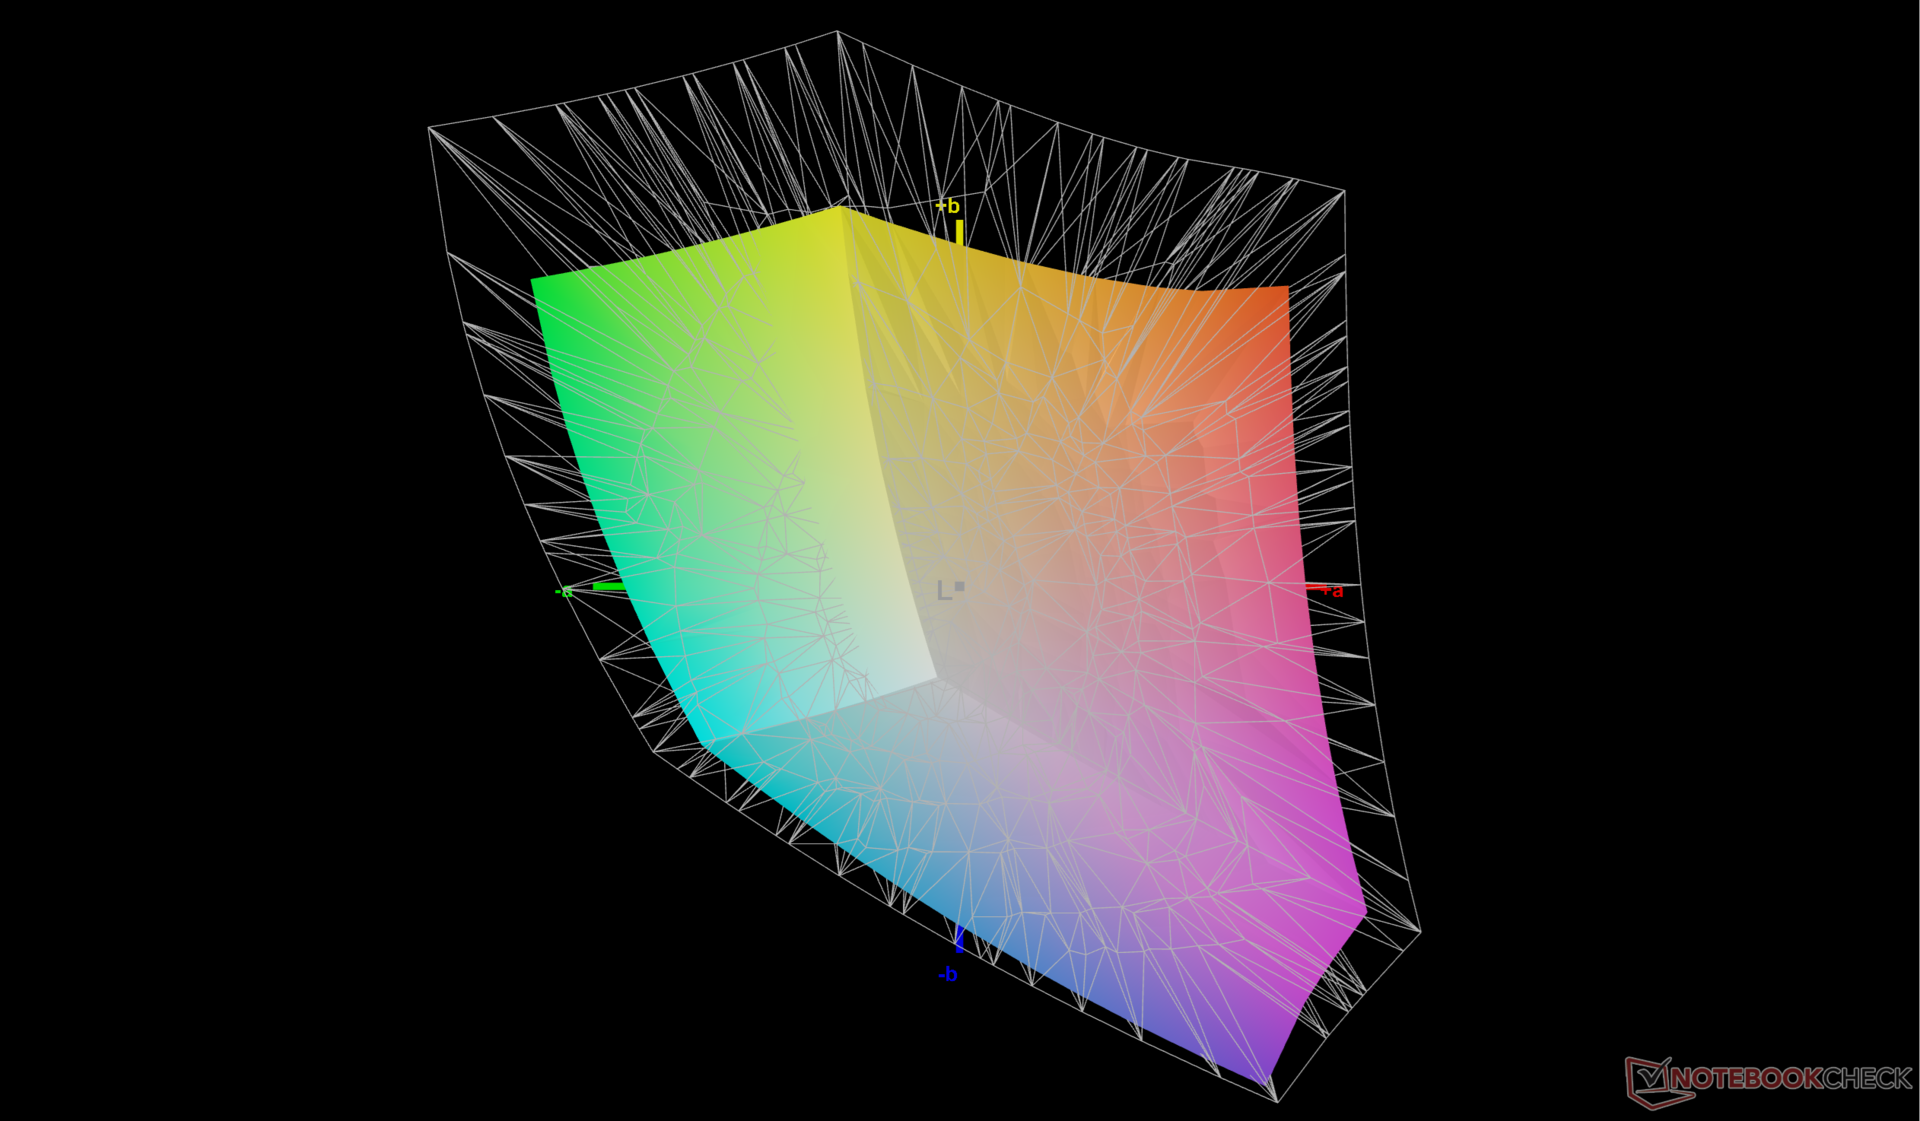
71% AdobeRGB 1998 (Argyll 2.2.0 3D)
97.7% sRGB (Argyll 2.2.0 3D)
69.1% Display P3 (Argyll 2.2.0 3D)
Gamma: 2.38
| HP ZBook Power 16 G11 A AUOA0A9, IPS, 2560x1600, 16", 120 Hz | HP ZBook Power 15 G10 BOE0B6A, IPS, 2560x1440, 15.6", 120 Hz | HP ZBook Fury 16 G11 AUO87A8, IPS, 3840x2400, 16", 120 Hz | Lenovo ThinkPad P1 Gen 7 21KV001SGE MNG007DA1-9 , IPS LED, 2560x1600, 16", 165 Hz | Lenovo ThinkPad P16s G2 21K9000CGE ATNA60YV04-0, OLED, 3840x2400, 16", 60 Hz | Dell Precision 5690 Samsung 160YV03, OLED, 3840x2400, 16", 60 Hz | |
|---|---|---|---|---|---|---|
| Display | -1% | 22% | 0% | 28% | 27% | |
| Display P3 Coverage | 69.1 | 68.2 -1% | 98.4 42% | 69.4 0% | 99.9 45% | 99.8 44% |
| sRGB Coverage | 97.7 | 95.6 -2% | 99.9 2% | 97.6 0% | 100 2% | 100 2% |
| AdobeRGB 1998 Coverage | 71 | 70.5 -1% | 86 21% | 71.8 1% | 96.9 36% | 96.6 36% |
| Response Times | -10% | 8% | -4% | 87% | 84% | |
| Response Time Grey 50% / Grey 80% * | 13.6 ? | 13 ? 4% | 11.4 ? 16% | 11.2 ? 18% | 1.5 ? 89% | 1.7 ? 87% |
| Response Time Black / White * | 8.4 ? | 10.4 ? -24% | 8.4 ? -0% | 10.6 ? -26% | 1.3 ? 85% | 1.7 ? 80% |
| PWM Frequency | 60 | 60 ? | ||||
| Screen | -13% | 5% | -10% | 2% | -14% | |
| Brightness middle | 470.7 | 313.8 -33% | 457.6 -3% | 516 10% | 416 -12% | 348.1 -26% |
| Brightness | 431 | 302 -30% | 466 8% | 505 17% | 421 -2% | 351 -19% |
| Brightness Distribution | 88 | 83 -6% | 83 -6% | 89 1% | 98 11% | 97 10% |
| Black Level * | 0.57 | 0.29 49% | 0.43 25% | 0.41 28% | ||
| Contrast | 826 | 1082 31% | 1064 29% | 1259 52% | ||
| Colorchecker dE 2000 * | 2.16 | 3.27 -51% | 2.78 -29% | 3.5 -62% | 1.3 40% | 4.18 -94% |
| Colorchecker dE 2000 max. * | 4.39 | 7.81 -78% | 5.53 -26% | 8.8 -100% | 2.8 36% | 6.68 -52% |
| Colorchecker dE 2000 calibrated * | 1.37 | 0.56 59% | 1.37 -0% | 1.2 12% | 2.9 -112% | 0.97 29% |
| Greyscale dE 2000 * | 3.7 | 5.9 -59% | 2 46% | 5.6 -51% | 1.8 51% | 1.7 54% |
| Gamma | 2.38 92% | 2.18 101% | 2.28 96% | 2.27 97% | 2.25 98% | 2.2 100% |
| CCT | 6765 96% | 6323 103% | 6806 96% | 6071 107% | 6574 99% | 6198 105% |
| Media total (Programa/Opciones) | -8% /
-10% | 12% /
9% | -5% /
-7% | 39% /
22% | 32% /
13% |
* ... más pequeño es mejor
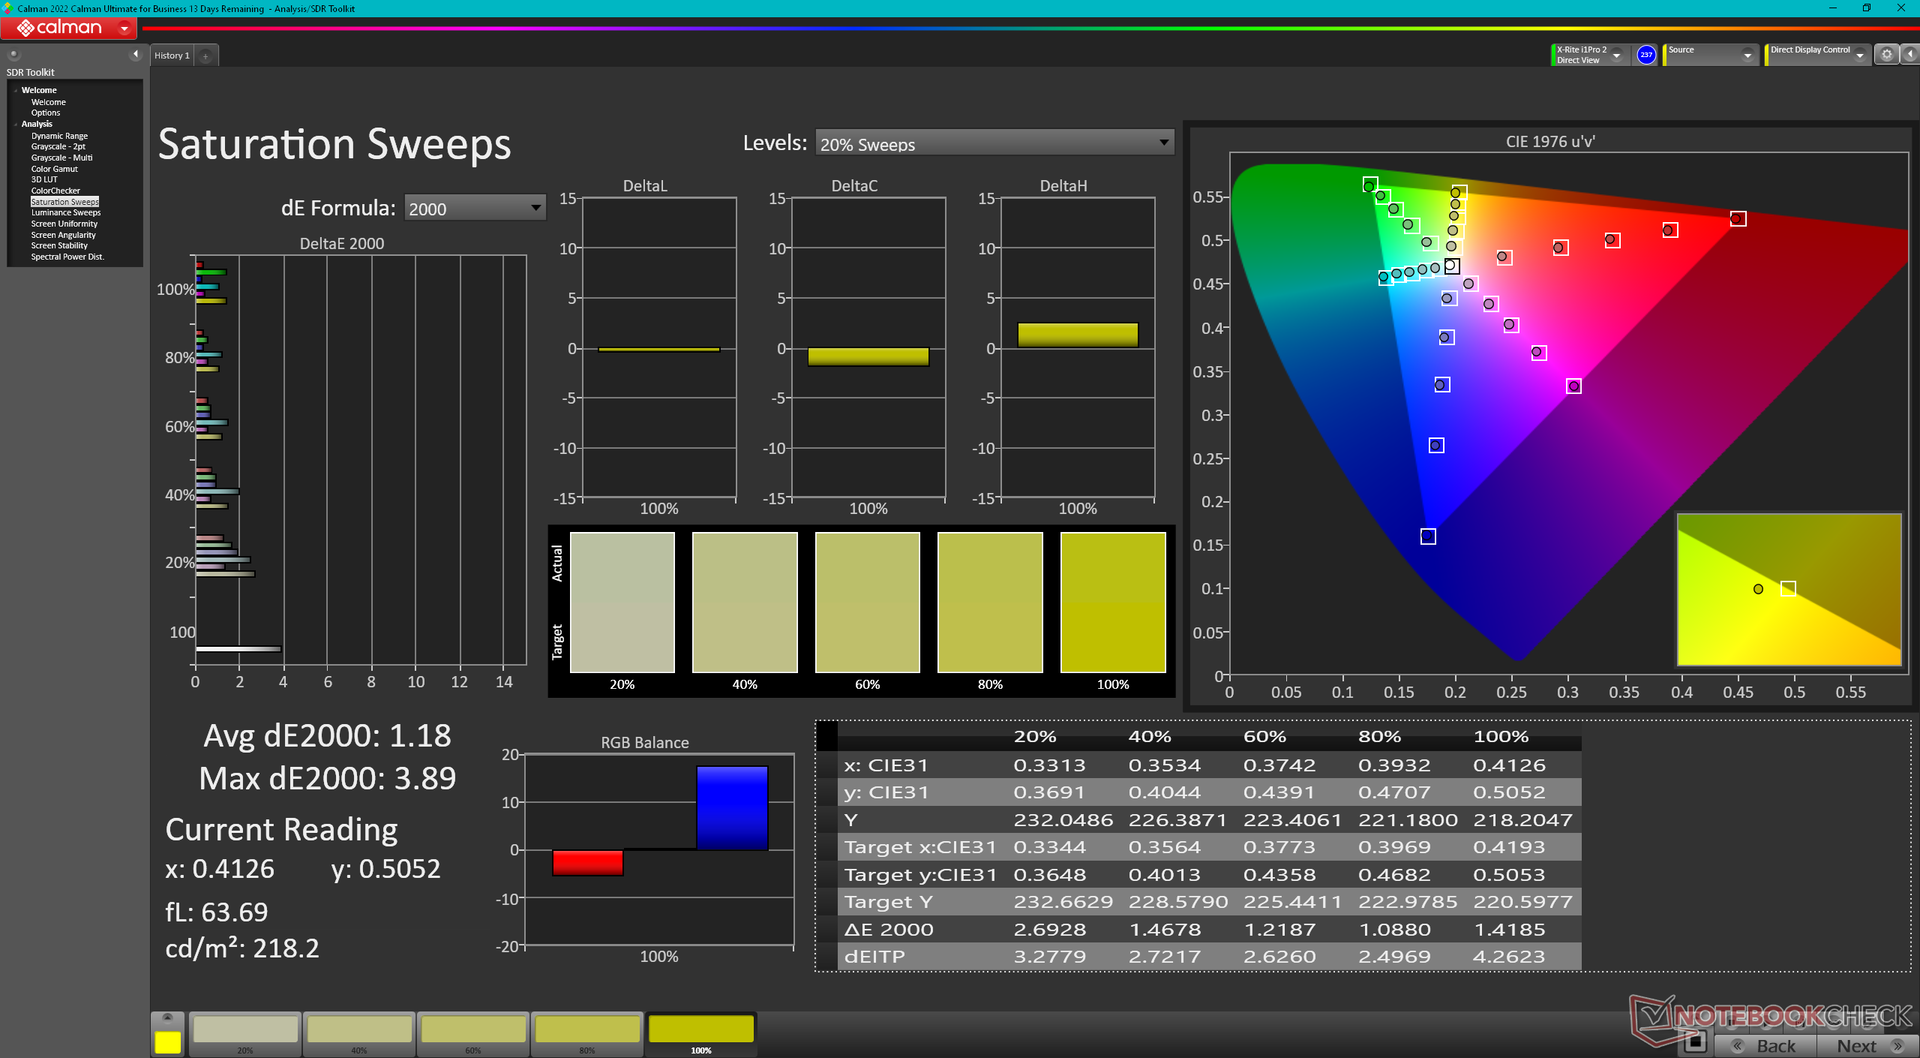
La pantalla está decentemente calibrada fuera de la caja contra el estándar sRGB. Calibrar el panel con nuestro colorímetro X-Rite mejoraría aún más los valores medios de escala de grises y deltaE de color de 3,7 y 2,16 a sólo 2,5 y 1,37, respectivamente. Nuestro perfil ICM calibrado está disponible para su descarga gratuita más arriba.

Tiempos de respuesta del display
| ↔ Tiempo de respuesta de Negro a Blanco | ||
|---|---|---|
| 8.4 ms ... subida ↗ y bajada ↘ combinada | ↗ 4.5 ms subida | 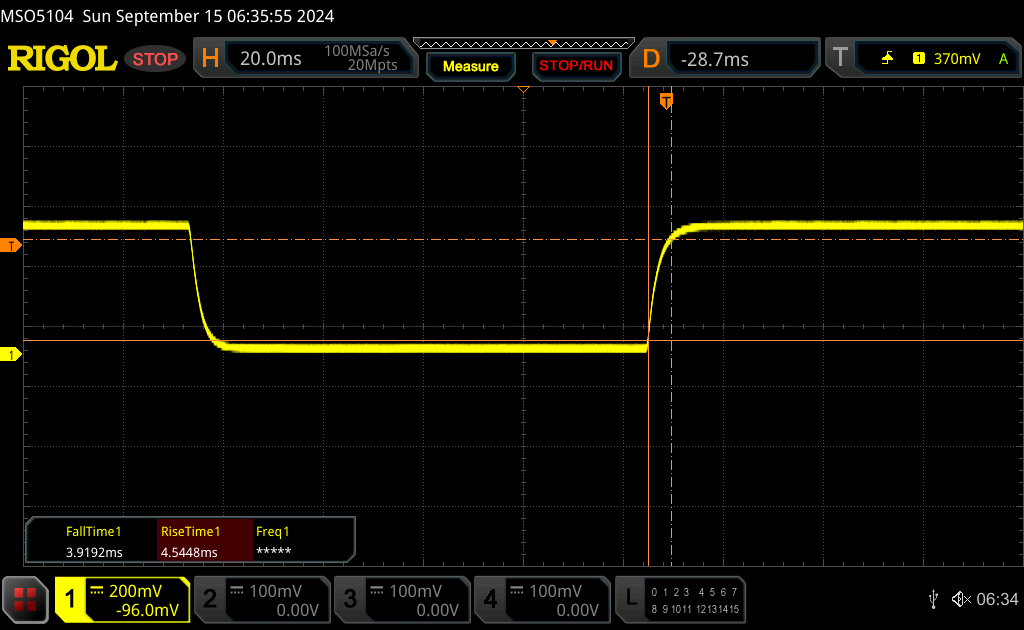 |
| ↘ 3.9 ms bajada | ||
| La pantalla mostró tiempos de respuesta rápidos en nuestros tests y debería ser adecuada para juegos. En comparación, todos los dispositivos de prueba van de ##min### (mínimo) a 240 (máximo) ms. » 21 % de todos los dispositivos son mejores. Esto quiere decir que el tiempo de respuesta medido es mejor que la media (20.7 ms) de todos los dispositivos testados. | ||
| ↔ Tiempo de respuesta 50% Gris a 80% Gris | ||
| 13.6 ms ... subida ↗ y bajada ↘ combinada | ↗ 7.2 ms subida | 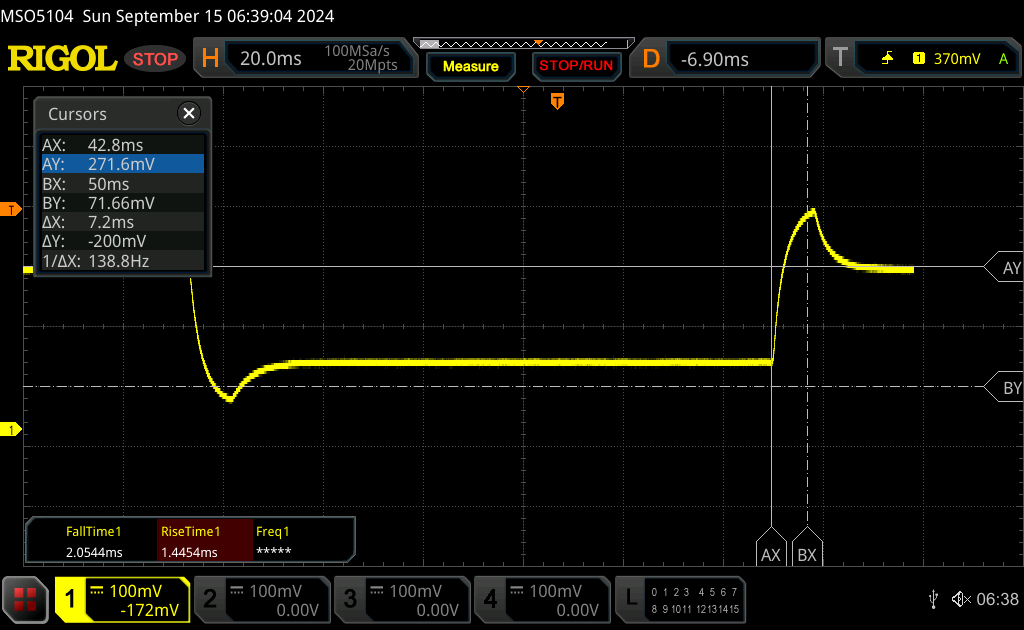 |
| ↘ 6.4 ms bajada | ||
| La pantalla mostró buenos tiempos de respuesta en nuestros tests pero podría ser demasiado lenta para los jugones competitivos. En comparación, todos los dispositivos de prueba van de ##min### (mínimo) a 636 (máximo) ms. » 24 % de todos los dispositivos son mejores. Esto quiere decir que el tiempo de respuesta medido es mejor que la media (32.5 ms) de todos los dispositivos testados. | ||
Parpadeo de Pantalla / PWM (Pulse-Width Modulation)
| Parpadeo de Pantalla / PWM no detectado | 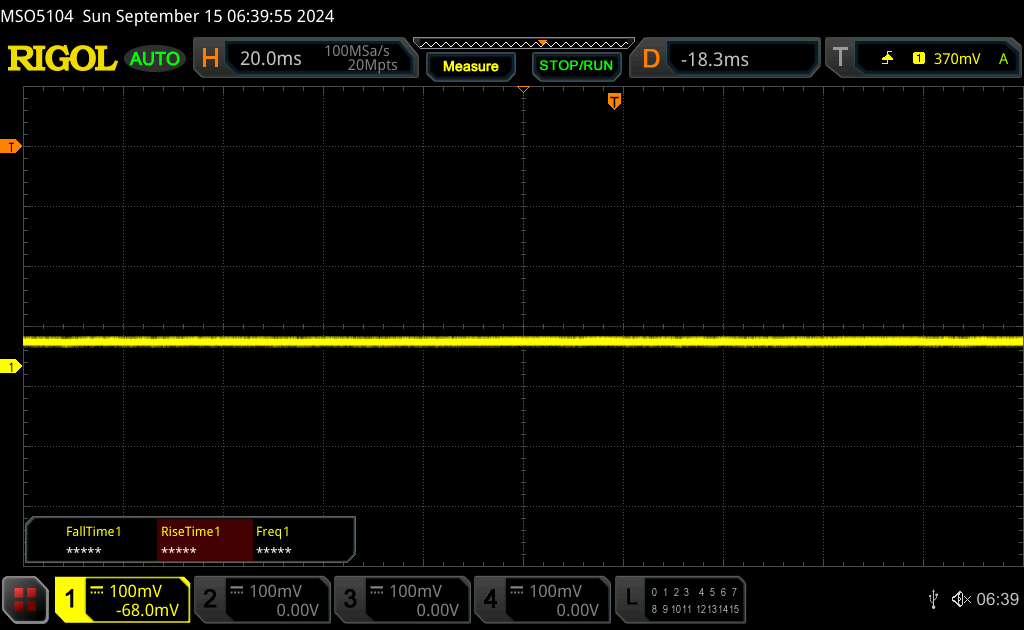 | ||
Comparación: 53 % de todos los dispositivos testados no usaron PWM para atenuar el display. Si se usó, medimos una media de 8485 (mínimo: 5 - máxmo: 343500) Hz. | |||
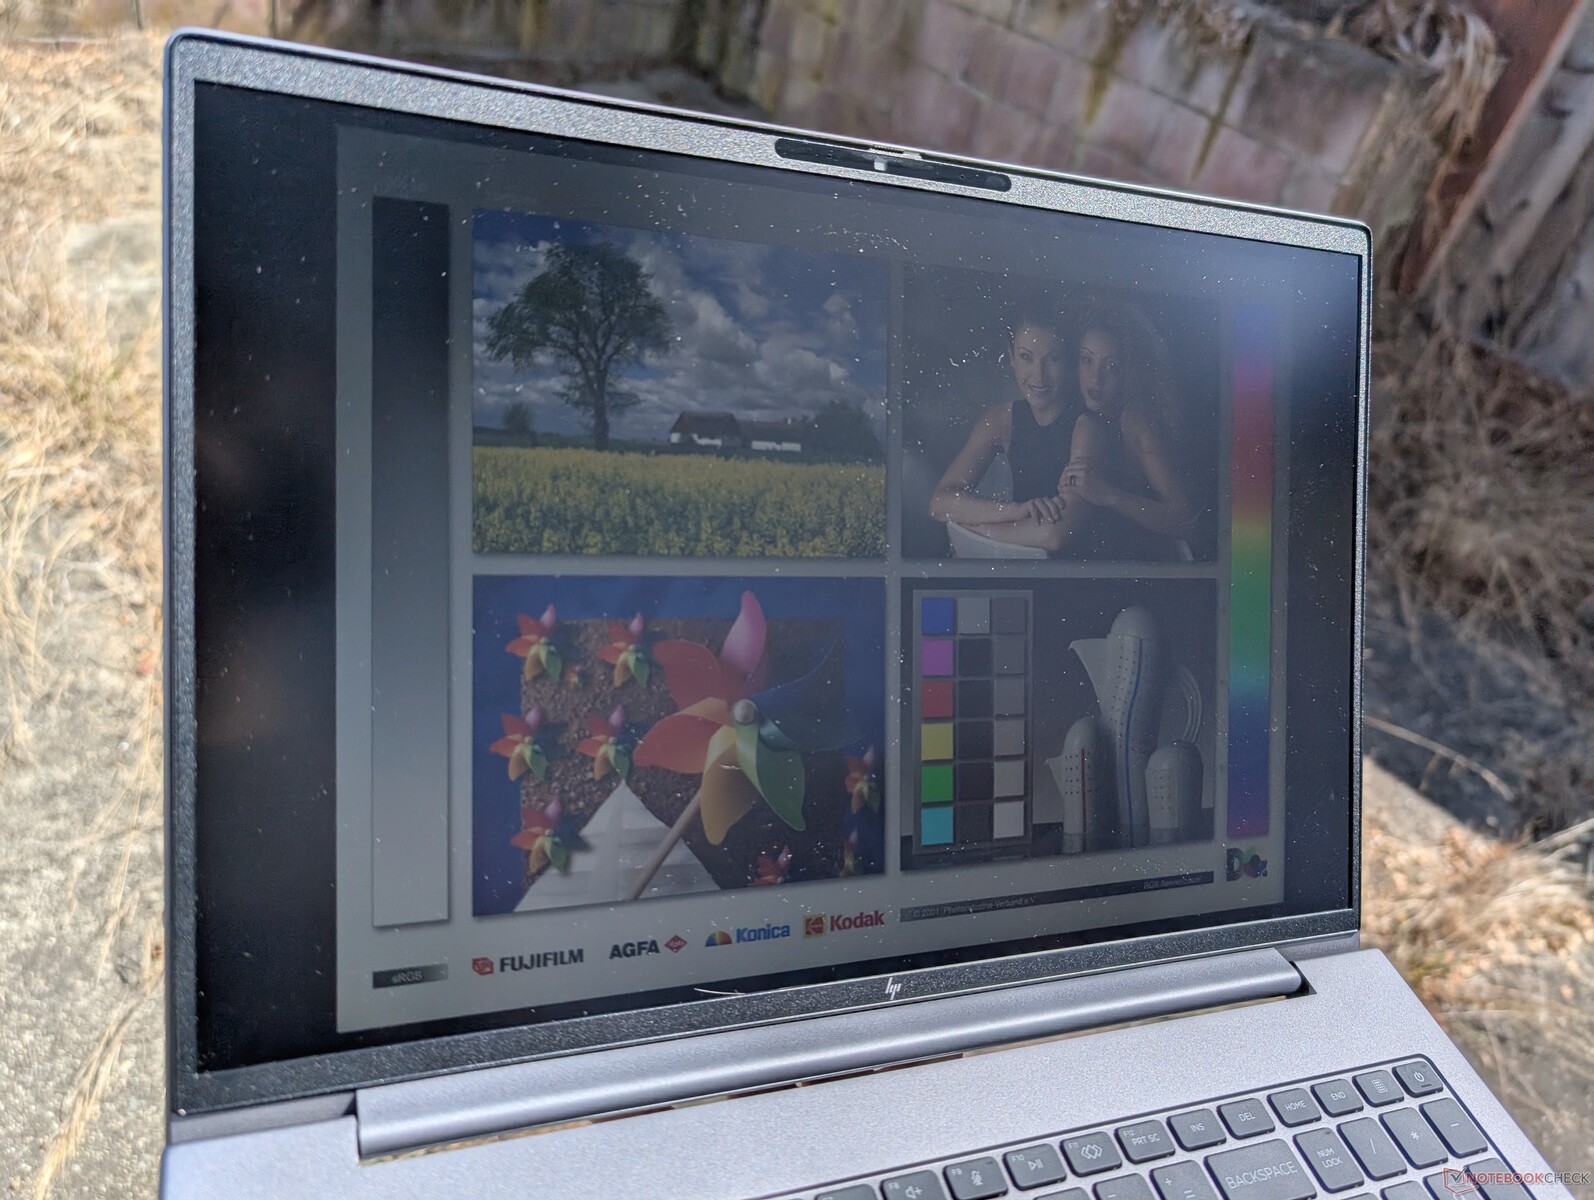
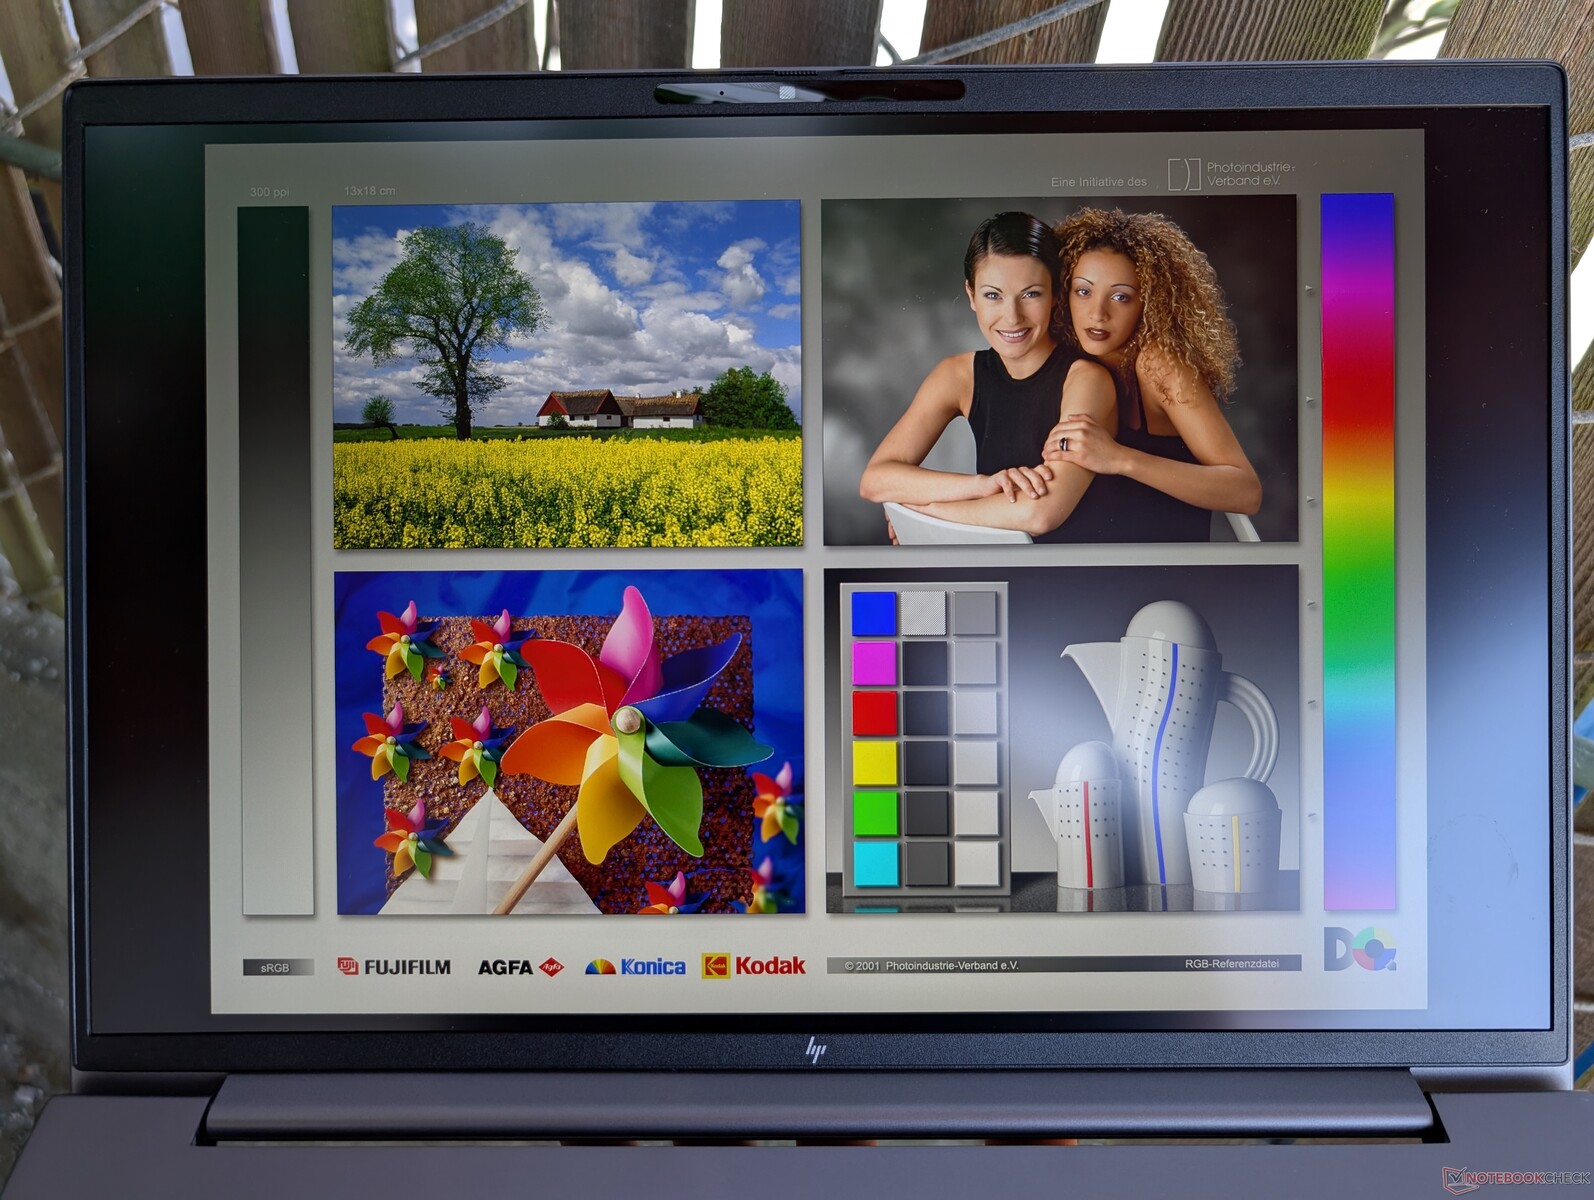
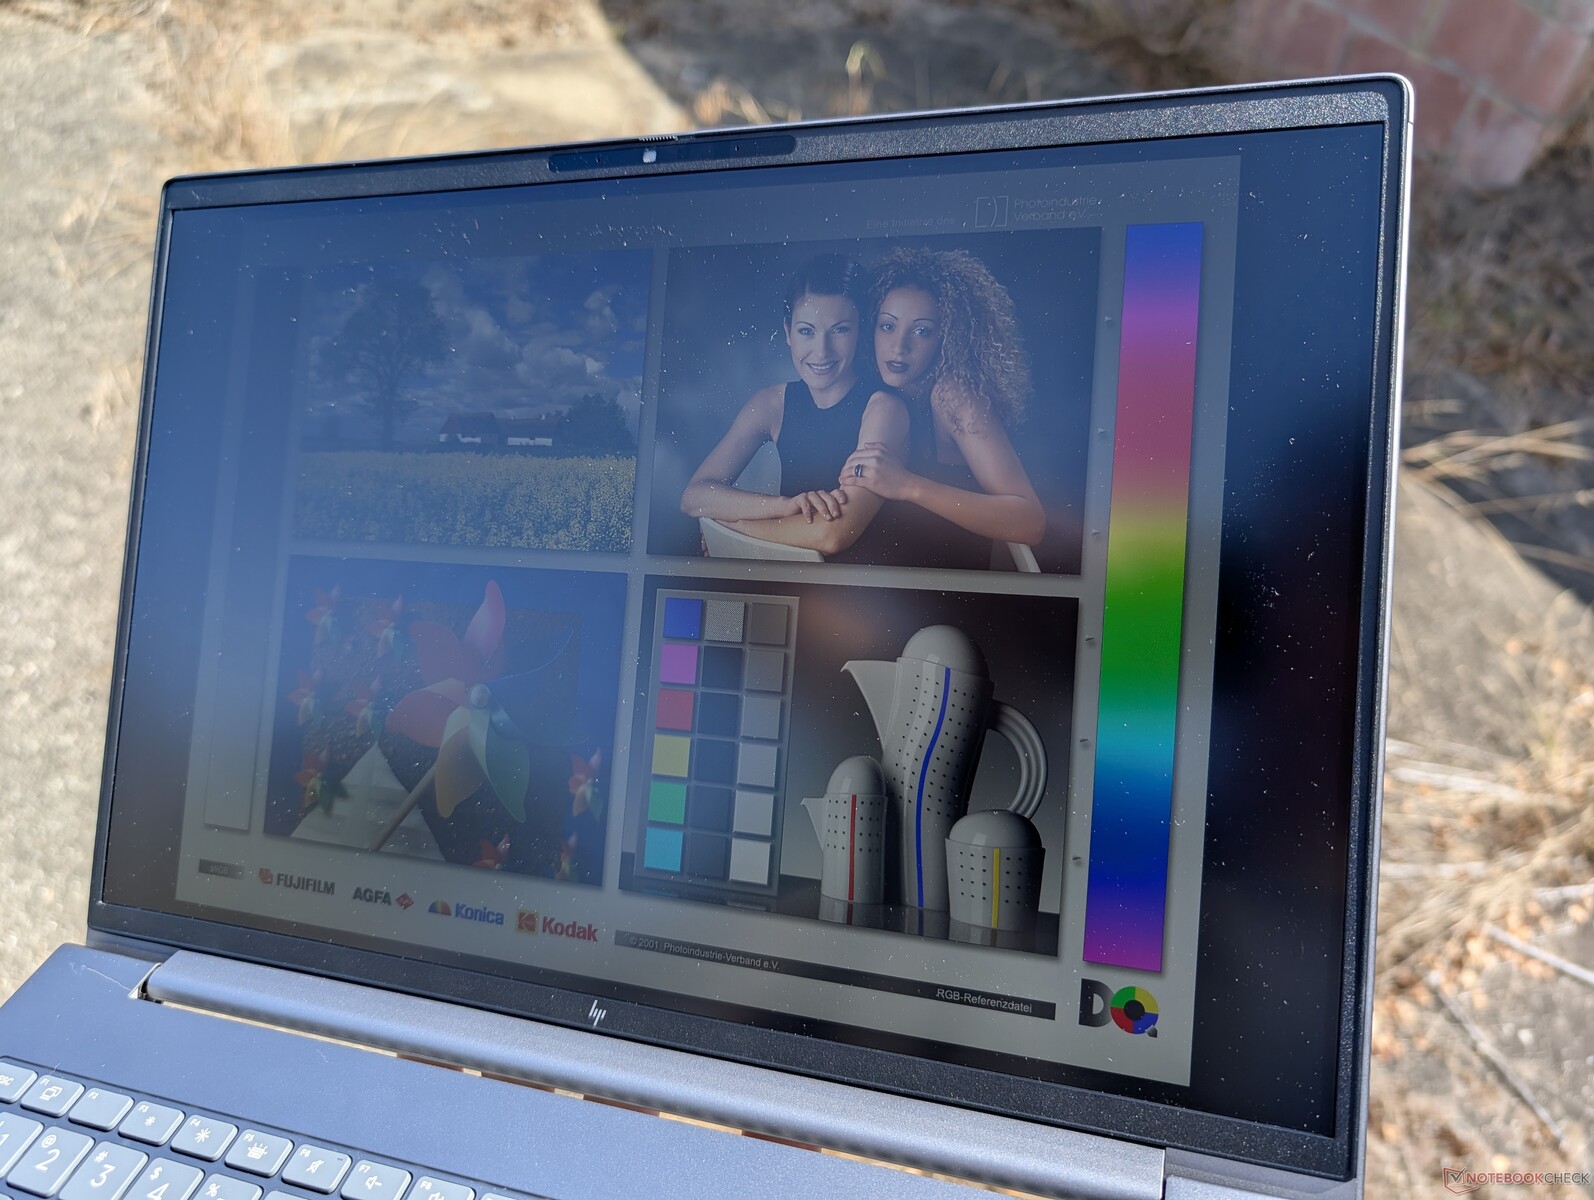
La visibilidad en exteriores es decente cuando está a la sombra con nuestro panel de 1600p, pero las opciones de gama inferior serán más tenues y más propensas a los reflejos. La opción de 1000 nits debería considerarse si se utiliza con frecuencia en exteriores.
Rendimiento - Nuevo Zen 4, mismo rendimiento Zen 4
Condiciones de la prueba
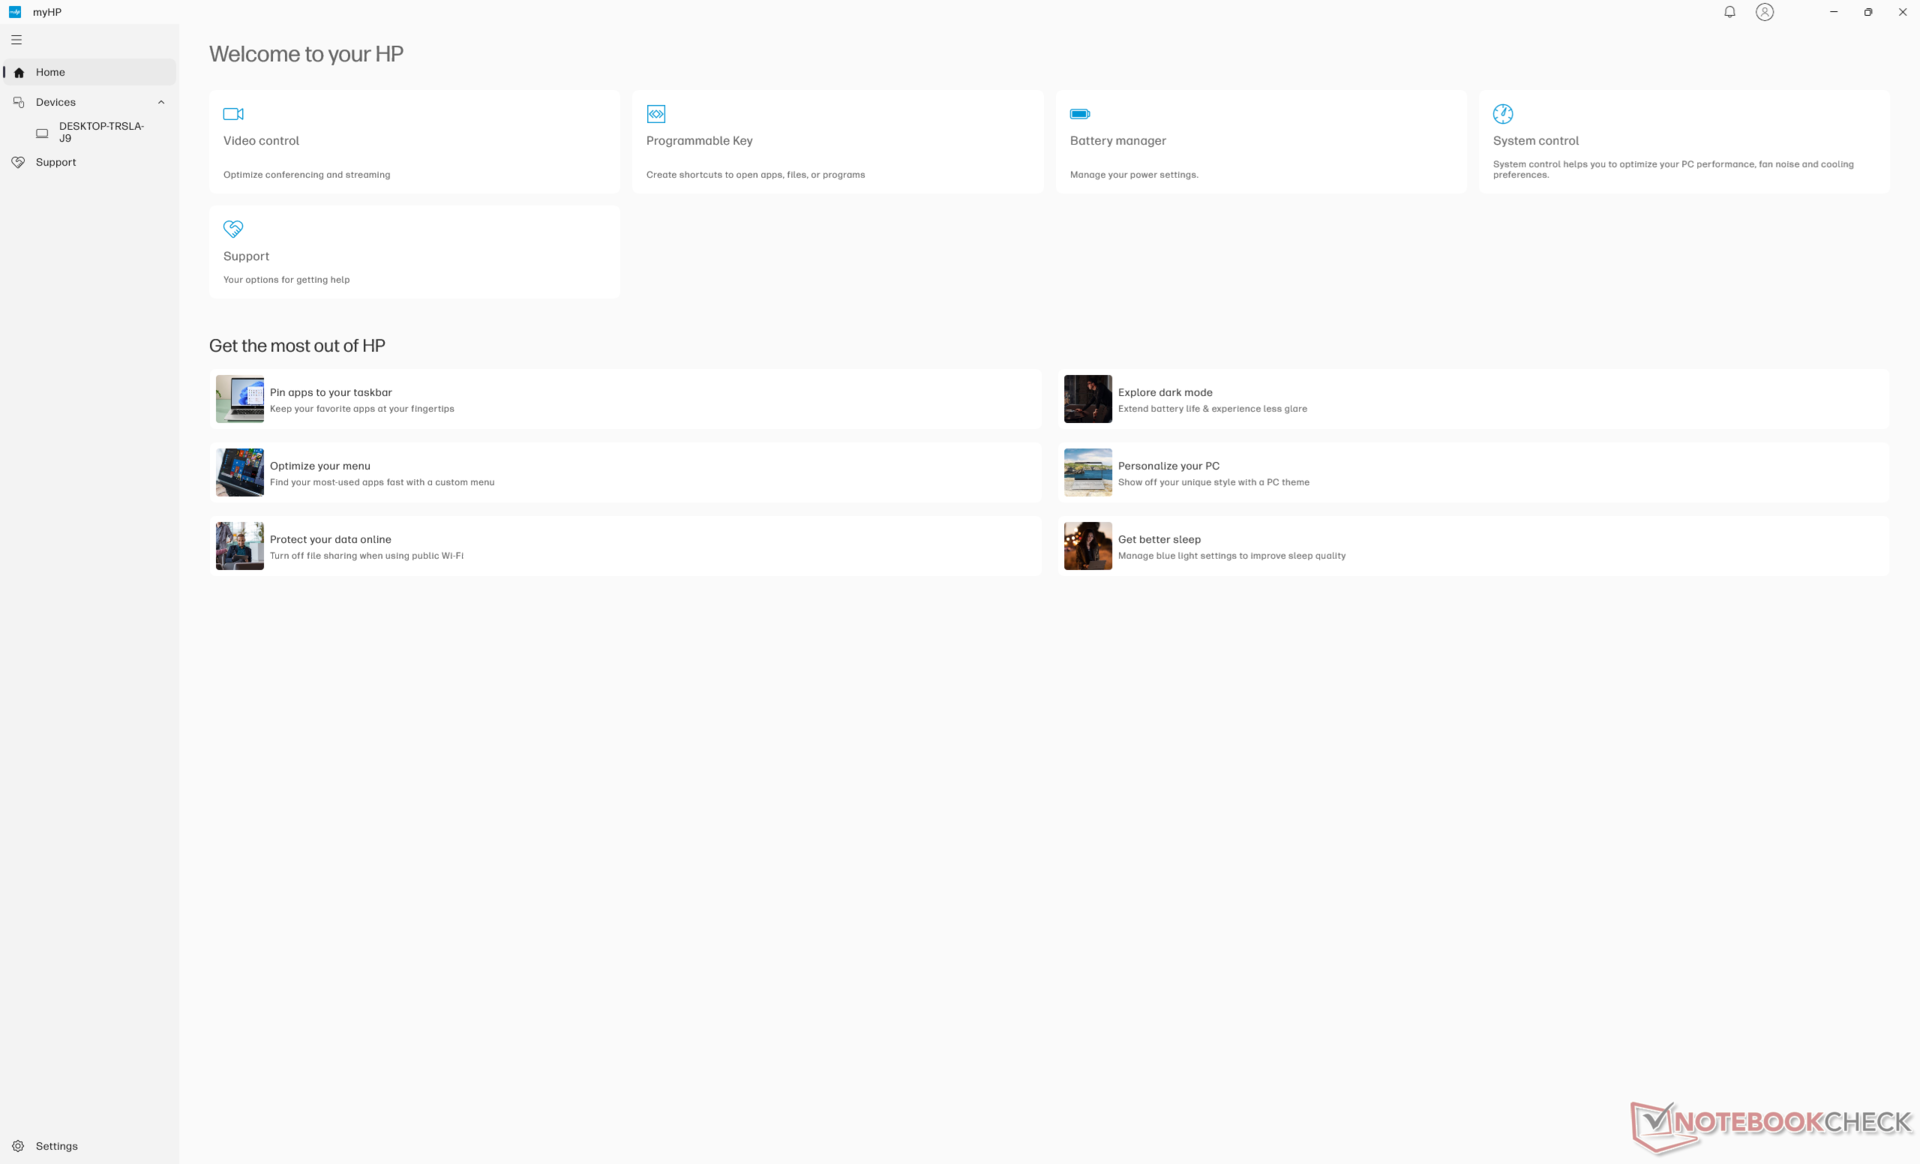
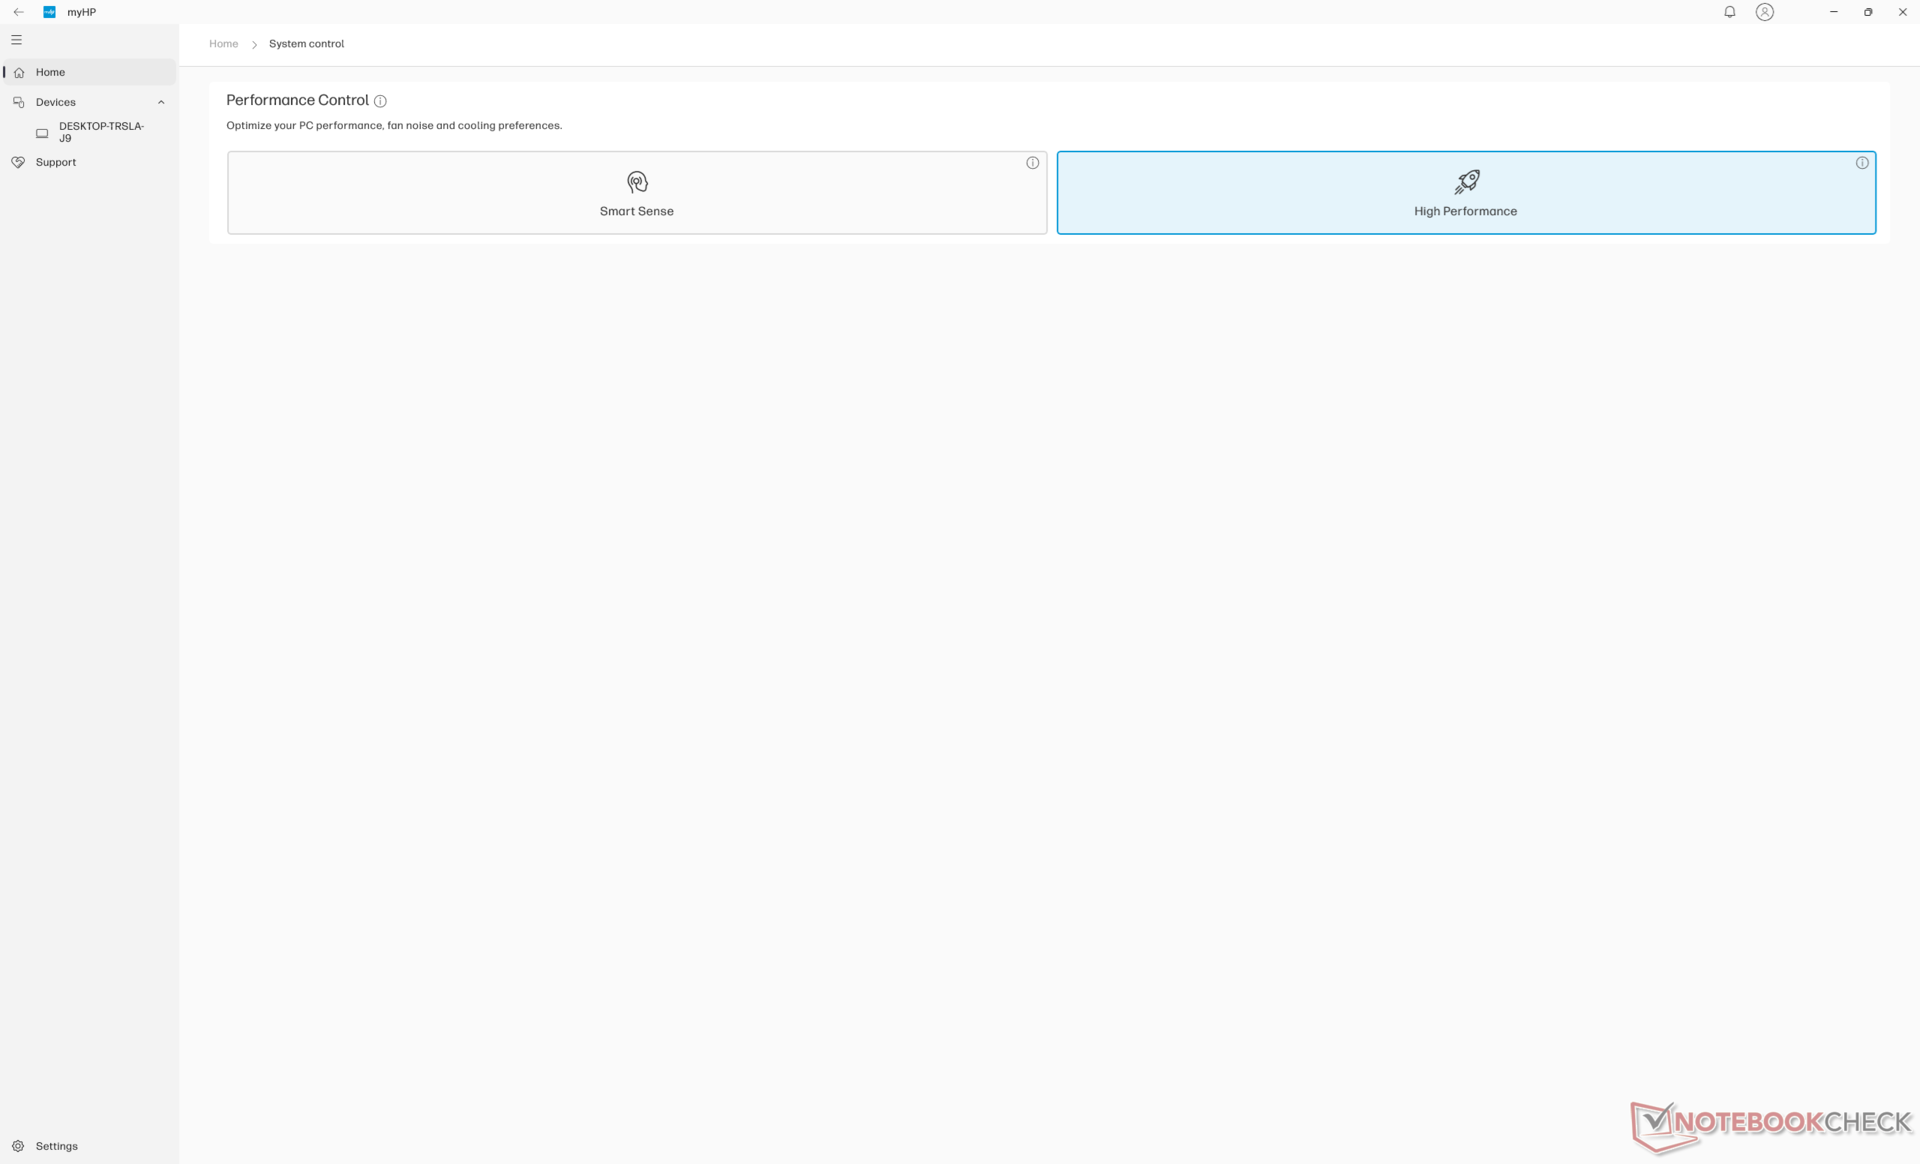
Pusimos tanto Windows como MyHP en modo Rendimiento antes de ejecutar los puntos de referencia que se muestran a continuación. Optimus 1.0 es compatible.
Procesador
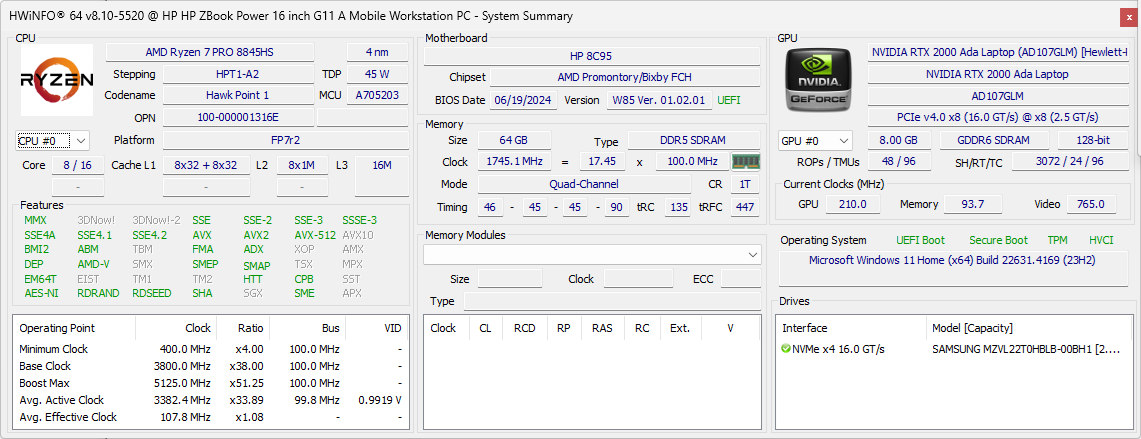
El Ryzen 7 8845HS no ofrece mucho más que el Ryzen 7 7840HS que sustituye en el ZBook Power 15 G10. De hecho, los puntos de referencia sitúan a ambos procesadores codo con codo por sólo unos pocos puntos porcentuales para ser esencialmente idénticos. Esto puede resultar decepcionante para los usuarios avanzados que esperaban mejoras de rendimiento más significativas en la transición de 15 a 16 pulgadas. Las opciones Raptor Lake-HX más rápidas sólo están disponibles en la serie ZBook Fury de HP, más gruesa.
La principal ventaja del Ryzen 7 8845HS sobre el Ryzen 7 7840HS es la aceleración de IA gracias a su NPU integrada. Sin embargo, Co-Pilot+ es incompatible con las CPU Hawk Point, por lo que la practicidad de la NPU es muy limitada en esta máquina.
Bajando de categoría al Ryzen 5 8645HS se espera que reduzca el rendimiento entre un 25 y un 30 por ciento, mientras que la actualización al Ryzen 9 8945HS se espera que mejore el rendimiento en sólo un 5 por ciento.
Cinebench R15 Multi Loop
Cinebench R23: Multi Core | Single Core
Cinebench R20: CPU (Multi Core) | CPU (Single Core)
Cinebench R15: CPU Multi 64Bit | CPU Single 64Bit
Blender: v2.79 BMW27 CPU
7-Zip 18.03: 7z b 4 | 7z b 4 -mmt1
Geekbench 6.4: Multi-Core | Single-Core
Geekbench 5.5: Multi-Core | Single-Core
HWBOT x265 Benchmark v2.2: 4k Preset
LibreOffice : 20 Documents To PDF
R Benchmark 2.5: Overall mean
| CPU Performance Rating | |
| HP ZBook Fury 16 G11 | |
| Asus ExpertBook B6 Flip B6602FC2 -2! | |
| Dell Precision 5690 | |
| HP ZBook Fury 16 G9 -2! | |
| HP ZBook Power 15 G10 | |
| Medio AMD Ryzen 7 8845HS | |
| HP ZBook Power 16 G11 A | |
| Dell Precision 5000 5490 | |
| MSI CreatorPro Z16P B12UKST -2! | |
| Lenovo ThinkPad P16v G1 AMD | |
| Lenovo ThinkPad P16s G2 21K9000CGE | |
| Lenovo ThinkPad P1 G4-20Y4Z9DVUS -2! | |
| HP ZBook Firefly 16 G9-6B897EA -2! | |
| Cinebench R23 / Multi Core | |
| HP ZBook Fury 16 G11 | |
| Asus ExpertBook B6 Flip B6602FC2 | |
| Dell Precision 5690 | |
| HP ZBook Fury 16 G9 | |
| MSI CreatorPro Z16P B12UKST | |
| Dell Precision 5000 5490 | |
| Medio AMD Ryzen 7 8845HS (14895 - 18037, n=13) | |
| HP ZBook Power 16 G11 A | |
| HP ZBook Power 15 G10 | |
| Lenovo ThinkPad P16s G2 21K9000CGE | |
| Lenovo ThinkPad P16v G1 AMD | |
| Lenovo ThinkPad P1 G4-20Y4Z9DVUS | |
| HP ZBook Firefly 16 G9-6B897EA | |
| Cinebench R23 / Single Core | |
| HP ZBook Fury 16 G11 | |
| HP ZBook Fury 16 G9 | |
| Asus ExpertBook B6 Flip B6602FC2 | |
| Dell Precision 5690 | |
| HP ZBook Power 15 G10 | |
| Dell Precision 5000 5490 | |
| HP ZBook Power 16 G11 A | |
| Medio AMD Ryzen 7 8845HS (1623 - 1783, n=13) | |
| MSI CreatorPro Z16P B12UKST | |
| Lenovo ThinkPad P16s G2 21K9000CGE | |
| Lenovo ThinkPad P16v G1 AMD | |
| Lenovo ThinkPad P1 G4-20Y4Z9DVUS | |
| HP ZBook Firefly 16 G9-6B897EA | |
| Cinebench R20 / CPU (Multi Core) | |
| HP ZBook Fury 16 G11 | |
| Asus ExpertBook B6 Flip B6602FC2 | |
| Dell Precision 5690 | |
| HP ZBook Fury 16 G9 | |
| MSI CreatorPro Z16P B12UKST | |
| Dell Precision 5000 5490 | |
| HP ZBook Power 16 G11 A | |
| Medio AMD Ryzen 7 8845HS (5808 - 7026, n=13) | |
| HP ZBook Power 15 G10 | |
| Lenovo ThinkPad P16s G2 21K9000CGE | |
| Lenovo ThinkPad P16v G1 AMD | |
| Lenovo ThinkPad P1 G4-20Y4Z9DVUS | |
| HP ZBook Firefly 16 G9-6B897EA | |
| Cinebench R20 / CPU (Single Core) | |
| HP ZBook Fury 16 G11 | |
| HP ZBook Fury 16 G9 | |
| Asus ExpertBook B6 Flip B6602FC2 | |
| Dell Precision 5690 | |
| HP ZBook Power 15 G10 | |
| Medio AMD Ryzen 7 8845HS (673 - 698, n=13) | |
| HP ZBook Power 16 G11 A | |
| Dell Precision 5000 5490 | |
| MSI CreatorPro Z16P B12UKST | |
| Lenovo ThinkPad P16s G2 21K9000CGE | |
| Lenovo ThinkPad P16v G1 AMD | |
| Lenovo ThinkPad P1 G4-20Y4Z9DVUS | |
| HP ZBook Firefly 16 G9-6B897EA | |
| Cinebench R15 / CPU Multi 64Bit | |
| HP ZBook Fury 16 G11 | |
| Asus ExpertBook B6 Flip B6602FC2 | |
| Dell Precision 5690 | |
| Dell Precision 5000 5490 | |
| HP ZBook Power 16 G11 A | |
| Medio AMD Ryzen 7 8845HS (2342 - 2908, n=13) | |
| HP ZBook Power 15 G10 | |
| HP ZBook Fury 16 G9 | |
| Lenovo ThinkPad P16s G2 21K9000CGE | |
| Lenovo ThinkPad P16v G1 AMD | |
| MSI CreatorPro Z16P B12UKST | |
| Lenovo ThinkPad P1 G4-20Y4Z9DVUS | |
| HP ZBook Firefly 16 G9-6B897EA | |
| Cinebench R15 / CPU Single 64Bit | |
| HP ZBook Fury 16 G11 | |
| HP ZBook Power 15 G10 | |
| Medio AMD Ryzen 7 8845HS (269 - 283, n=13) | |
| HP ZBook Power 16 G11 A | |
| Asus ExpertBook B6 Flip B6602FC2 | |
| Dell Precision 5690 | |
| Lenovo ThinkPad P16s G2 21K9000CGE | |
| Lenovo ThinkPad P16v G1 AMD | |
| Dell Precision 5000 5490 | |
| MSI CreatorPro Z16P B12UKST | |
| Lenovo ThinkPad P1 G4-20Y4Z9DVUS | |
| HP ZBook Firefly 16 G9-6B897EA | |
| HP ZBook Fury 16 G9 | |
| Blender / v2.79 BMW27 CPU | |
| HP ZBook Firefly 16 G9-6B897EA | |
| Lenovo ThinkPad P1 G4-20Y4Z9DVUS | |
| Lenovo ThinkPad P16s G2 21K9000CGE | |
| Dell Precision 5690 | |
| HP ZBook Power 16 G11 A | |
| Lenovo ThinkPad P16v G1 AMD | |
| Dell Precision 5000 5490 | |
| MSI CreatorPro Z16P B12UKST | |
| HP ZBook Power 15 G10 | |
| Medio AMD Ryzen 7 8845HS (179 - 216, n=13) | |
| Asus ExpertBook B6 Flip B6602FC2 | |
| HP ZBook Fury 16 G9 | |
| HP ZBook Fury 16 G11 | |
| 7-Zip 18.03 / 7z b 4 | |
| HP ZBook Fury 16 G11 | |
| HP ZBook Fury 16 G9 | |
| Dell Precision 5690 | |
| Asus ExpertBook B6 Flip B6602FC2 | |
| HP ZBook Power 15 G10 | |
| Medio AMD Ryzen 7 8845HS (62669 - 74664, n=13) | |
| Dell Precision 5000 5490 | |
| HP ZBook Power 16 G11 A | |
| MSI CreatorPro Z16P B12UKST | |
| Lenovo ThinkPad P16v G1 AMD | |
| Lenovo ThinkPad P16s G2 21K9000CGE | |
| Lenovo ThinkPad P1 G4-20Y4Z9DVUS | |
| HP ZBook Firefly 16 G9-6B897EA | |
| 7-Zip 18.03 / 7z b 4 -mmt1 | |
| HP ZBook Fury 16 G11 | |
| Lenovo ThinkPad P16v G1 AMD | |
| HP ZBook Power 15 G10 | |
| Medio AMD Ryzen 7 8845HS (5197 - 6714, n=13) | |
| HP ZBook Power 16 G11 A | |
| Asus ExpertBook B6 Flip B6602FC2 | |
| HP ZBook Fury 16 G9 | |
| Lenovo ThinkPad P16s G2 21K9000CGE | |
| MSI CreatorPro Z16P B12UKST | |
| Lenovo ThinkPad P1 G4-20Y4Z9DVUS | |
| Dell Precision 5000 5490 | |
| Dell Precision 5690 | |
| HP ZBook Firefly 16 G9-6B897EA | |
| Geekbench 6.4 / Multi-Core | |
| HP ZBook Fury 16 G11 | |
| Dell Precision 5690 | |
| Dell Precision 5000 5490 | |
| HP ZBook Power 15 G10 | |
| Medio AMD Ryzen 7 8845HS (11073 - 14014, n=18) | |
| HP ZBook Power 16 G11 A | |
| Lenovo ThinkPad P16s G2 21K9000CGE | |
| Lenovo ThinkPad P16v G1 AMD | |
| Geekbench 6.4 / Single-Core | |
| HP ZBook Fury 16 G11 | |
| HP ZBook Power 15 G10 | |
| Medio AMD Ryzen 7 8845HS (2510 - 2698, n=16) | |
| HP ZBook Power 16 G11 A | |
| Lenovo ThinkPad P16v G1 AMD | |
| Dell Precision 5690 | |
| Lenovo ThinkPad P16s G2 21K9000CGE | |
| Dell Precision 5000 5490 | |
| Geekbench 5.5 / Multi-Core | |
| HP ZBook Fury 16 G11 | |
| Asus ExpertBook B6 Flip B6602FC2 | |
| Dell Precision 5690 | |
| HP ZBook Fury 16 G9 | |
| Dell Precision 5000 5490 | |
| MSI CreatorPro Z16P B12UKST | |
| HP ZBook Power 15 G10 | |
| Medio AMD Ryzen 7 8845HS (11256 - 12726, n=15) | |
| HP ZBook Power 16 G11 A | |
| Lenovo ThinkPad P16s G2 21K9000CGE | |
| Lenovo ThinkPad P16v G1 AMD | |
| Lenovo ThinkPad P1 G4-20Y4Z9DVUS | |
| HP ZBook Firefly 16 G9-6B897EA | |
| Geekbench 5.5 / Single-Core | |
| HP ZBook Fury 16 G11 | |
| HP ZBook Power 15 G10 | |
| HP ZBook Fury 16 G9 | |
| Medio AMD Ryzen 7 8845HS (1765 - 2004, n=15) | |
| HP ZBook Power 16 G11 A | |
| Asus ExpertBook B6 Flip B6602FC2 | |
| Dell Precision 5690 | |
| Lenovo ThinkPad P16v G1 AMD | |
| HP ZBook Firefly 16 G9-6B897EA | |
| MSI CreatorPro Z16P B12UKST | |
| Dell Precision 5000 5490 | |
| Lenovo ThinkPad P16s G2 21K9000CGE | |
| Lenovo ThinkPad P1 G4-20Y4Z9DVUS | |
| HWBOT x265 Benchmark v2.2 / 4k Preset | |
| HP ZBook Fury 16 G11 | |
| Dell Precision 5690 | |
| Asus ExpertBook B6 Flip B6602FC2 | |
| Medio AMD Ryzen 7 8845HS (18.6 - 22.7, n=13) | |
| HP ZBook Power 15 G10 | |
| HP ZBook Fury 16 G9 | |
| HP ZBook Power 16 G11 A | |
| MSI CreatorPro Z16P B12UKST | |
| Lenovo ThinkPad P16v G1 AMD | |
| Lenovo ThinkPad P16s G2 21K9000CGE | |
| Dell Precision 5000 5490 | |
| Lenovo ThinkPad P1 G4-20Y4Z9DVUS | |
| HP ZBook Firefly 16 G9-6B897EA | |
| LibreOffice / 20 Documents To PDF | |
| HP ZBook Power 15 G10 | |
| HP ZBook Firefly 16 G9-6B897EA | |
| Lenovo ThinkPad P16s G2 21K9000CGE | |
| HP ZBook Power 16 G11 A | |
| Medio AMD Ryzen 7 8845HS (44.4 - 77, n=13) | |
| Lenovo ThinkPad P1 G4-20Y4Z9DVUS | |
| HP ZBook Fury 16 G11 | |
| Lenovo ThinkPad P16v G1 AMD | |
| Dell Precision 5000 5490 | |
| Asus ExpertBook B6 Flip B6602FC2 | |
| Dell Precision 5690 | |
| MSI CreatorPro Z16P B12UKST | |
| HP ZBook Fury 16 G9 | |
| R Benchmark 2.5 / Overall mean | |
| Lenovo ThinkPad P1 G4-20Y4Z9DVUS | |
| HP ZBook Firefly 16 G9-6B897EA | |
| Dell Precision 5000 5490 | |
| Lenovo ThinkPad P16s G2 21K9000CGE | |
| Dell Precision 5690 | |
| MSI CreatorPro Z16P B12UKST | |
| Asus ExpertBook B6 Flip B6602FC2 | |
| Medio AMD Ryzen 7 8845HS (0.4304 - 0.4935, n=13) | |
| HP ZBook Power 15 G10 | |
| HP ZBook Power 16 G11 A | |
| Lenovo ThinkPad P16v G1 AMD | |
| HP ZBook Fury 16 G9 | |
| HP ZBook Fury 16 G11 | |
Cinebench R23: Multi Core | Single Core
Cinebench R20: CPU (Multi Core) | CPU (Single Core)
Cinebench R15: CPU Multi 64Bit | CPU Single 64Bit
Blender: v2.79 BMW27 CPU
7-Zip 18.03: 7z b 4 | 7z b 4 -mmt1
Geekbench 6.4: Multi-Core | Single-Core
Geekbench 5.5: Multi-Core | Single-Core
HWBOT x265 Benchmark v2.2: 4k Preset
LibreOffice : 20 Documents To PDF
R Benchmark 2.5: Overall mean
* ... más pequeño es mejor
AIDA64: FP32 Ray-Trace | FPU Julia | CPU SHA3 | CPU Queen | FPU SinJulia | FPU Mandel | CPU AES | CPU ZLib | FP64 Ray-Trace | CPU PhotoWorxx
| Performance Rating | |
| Medio AMD Ryzen 7 8845HS | |
| HP ZBook Power 15 G10 | |
| HP ZBook Power 16 G11 A | |
| HP ZBook Fury 16 G11 | |
| Lenovo ThinkPad P16s G2 21K9000CGE | |
| Dell Precision 5690 | |
| Lenovo ThinkPad P1 Gen 7 21KV001SGE | |
| AIDA64 / FP32 Ray-Trace | |
| Medio AMD Ryzen 7 8845HS (23708 - 29544, n=13) | |
| HP ZBook Power 15 G10 | |
| HP ZBook Power 16 G11 A | |
| Lenovo ThinkPad P16s G2 21K9000CGE | |
| HP ZBook Fury 16 G11 | |
| Dell Precision 5690 | |
| Lenovo ThinkPad P1 Gen 7 21KV001SGE | |
| AIDA64 / FPU Julia | |
| HP ZBook Power 16 G11 A | |
| Medio AMD Ryzen 7 8845HS (99659 - 125873, n=13) | |
| HP ZBook Power 15 G10 | |
| HP ZBook Fury 16 G11 | |
| Lenovo ThinkPad P16s G2 21K9000CGE | |
| Dell Precision 5690 | |
| Lenovo ThinkPad P1 Gen 7 21KV001SGE | |
| AIDA64 / CPU SHA3 | |
| HP ZBook Fury 16 G11 | |
| HP ZBook Power 16 G11 A | |
| Medio AMD Ryzen 7 8845HS (4332 - 5180, n=13) | |
| HP ZBook Power 15 G10 | |
| Lenovo ThinkPad P16s G2 21K9000CGE | |
| Dell Precision 5690 | |
| Lenovo ThinkPad P1 Gen 7 21KV001SGE | |
| AIDA64 / CPU Queen | |
| HP ZBook Fury 16 G11 | |
| HP ZBook Power 16 G11 A | |
| Medio AMD Ryzen 7 8845HS (109458 - 124695, n=13) | |
| HP ZBook Power 15 G10 | |
| Lenovo ThinkPad P16s G2 21K9000CGE | |
| Dell Precision 5690 | |
| Lenovo ThinkPad P1 Gen 7 21KV001SGE | |
| AIDA64 / FPU SinJulia | |
| Medio AMD Ryzen 7 8845HS (14062 - 15519, n=13) | |
| HP ZBook Power 15 G10 | |
| HP ZBook Power 16 G11 A | |
| Lenovo ThinkPad P16s G2 21K9000CGE | |
| HP ZBook Fury 16 G11 | |
| Dell Precision 5690 | |
| Lenovo ThinkPad P1 Gen 7 21KV001SGE | |
| AIDA64 / FPU Mandel | |
| Medio AMD Ryzen 7 8845HS (53436 - 67367, n=13) | |
| HP ZBook Power 15 G10 | |
| HP ZBook Power 16 G11 A | |
| Lenovo ThinkPad P16s G2 21K9000CGE | |
| HP ZBook Fury 16 G11 | |
| Dell Precision 5690 | |
| Lenovo ThinkPad P1 Gen 7 21KV001SGE | |
| AIDA64 / CPU AES | |
| HP ZBook Fury 16 G11 | |
| Medio AMD Ryzen 7 8845HS (64515 - 172642, n=13) | |
| Dell Precision 5690 | |
| HP ZBook Power 15 G10 | |
| Lenovo ThinkPad P1 Gen 7 21KV001SGE | |
| HP ZBook Power 16 G11 A | |
| Lenovo ThinkPad P16s G2 21K9000CGE | |
| AIDA64 / CPU ZLib | |
| HP ZBook Fury 16 G11 | |
| Dell Precision 5690 | |
| Lenovo ThinkPad P1 Gen 7 21KV001SGE | |
| HP ZBook Power 16 G11 A | |
| HP ZBook Power 15 G10 | |
| Lenovo ThinkPad P16s G2 21K9000CGE | |
| Medio AMD Ryzen 7 8845HS (627 - 1080, n=13) | |
| AIDA64 / FP64 Ray-Trace | |
| HP ZBook Power 15 G10 | |
| Medio AMD Ryzen 7 8845HS (12361 - 15911, n=13) | |
| HP ZBook Power 16 G11 A | |
| Lenovo ThinkPad P16s G2 21K9000CGE | |
| HP ZBook Fury 16 G11 | |
| Dell Precision 5690 | |
| Lenovo ThinkPad P1 Gen 7 21KV001SGE | |
| AIDA64 / CPU PhotoWorxx | |
| Dell Precision 5690 | |
| HP ZBook Power 15 G10 | |
| Lenovo ThinkPad P1 Gen 7 21KV001SGE | |
| HP ZBook Power 16 G11 A | |
| Medio AMD Ryzen 7 8845HS (33192 - 41668, n=13) | |
| Lenovo ThinkPad P16s G2 21K9000CGE | |
| HP ZBook Fury 16 G11 | |
Prueba de estrés
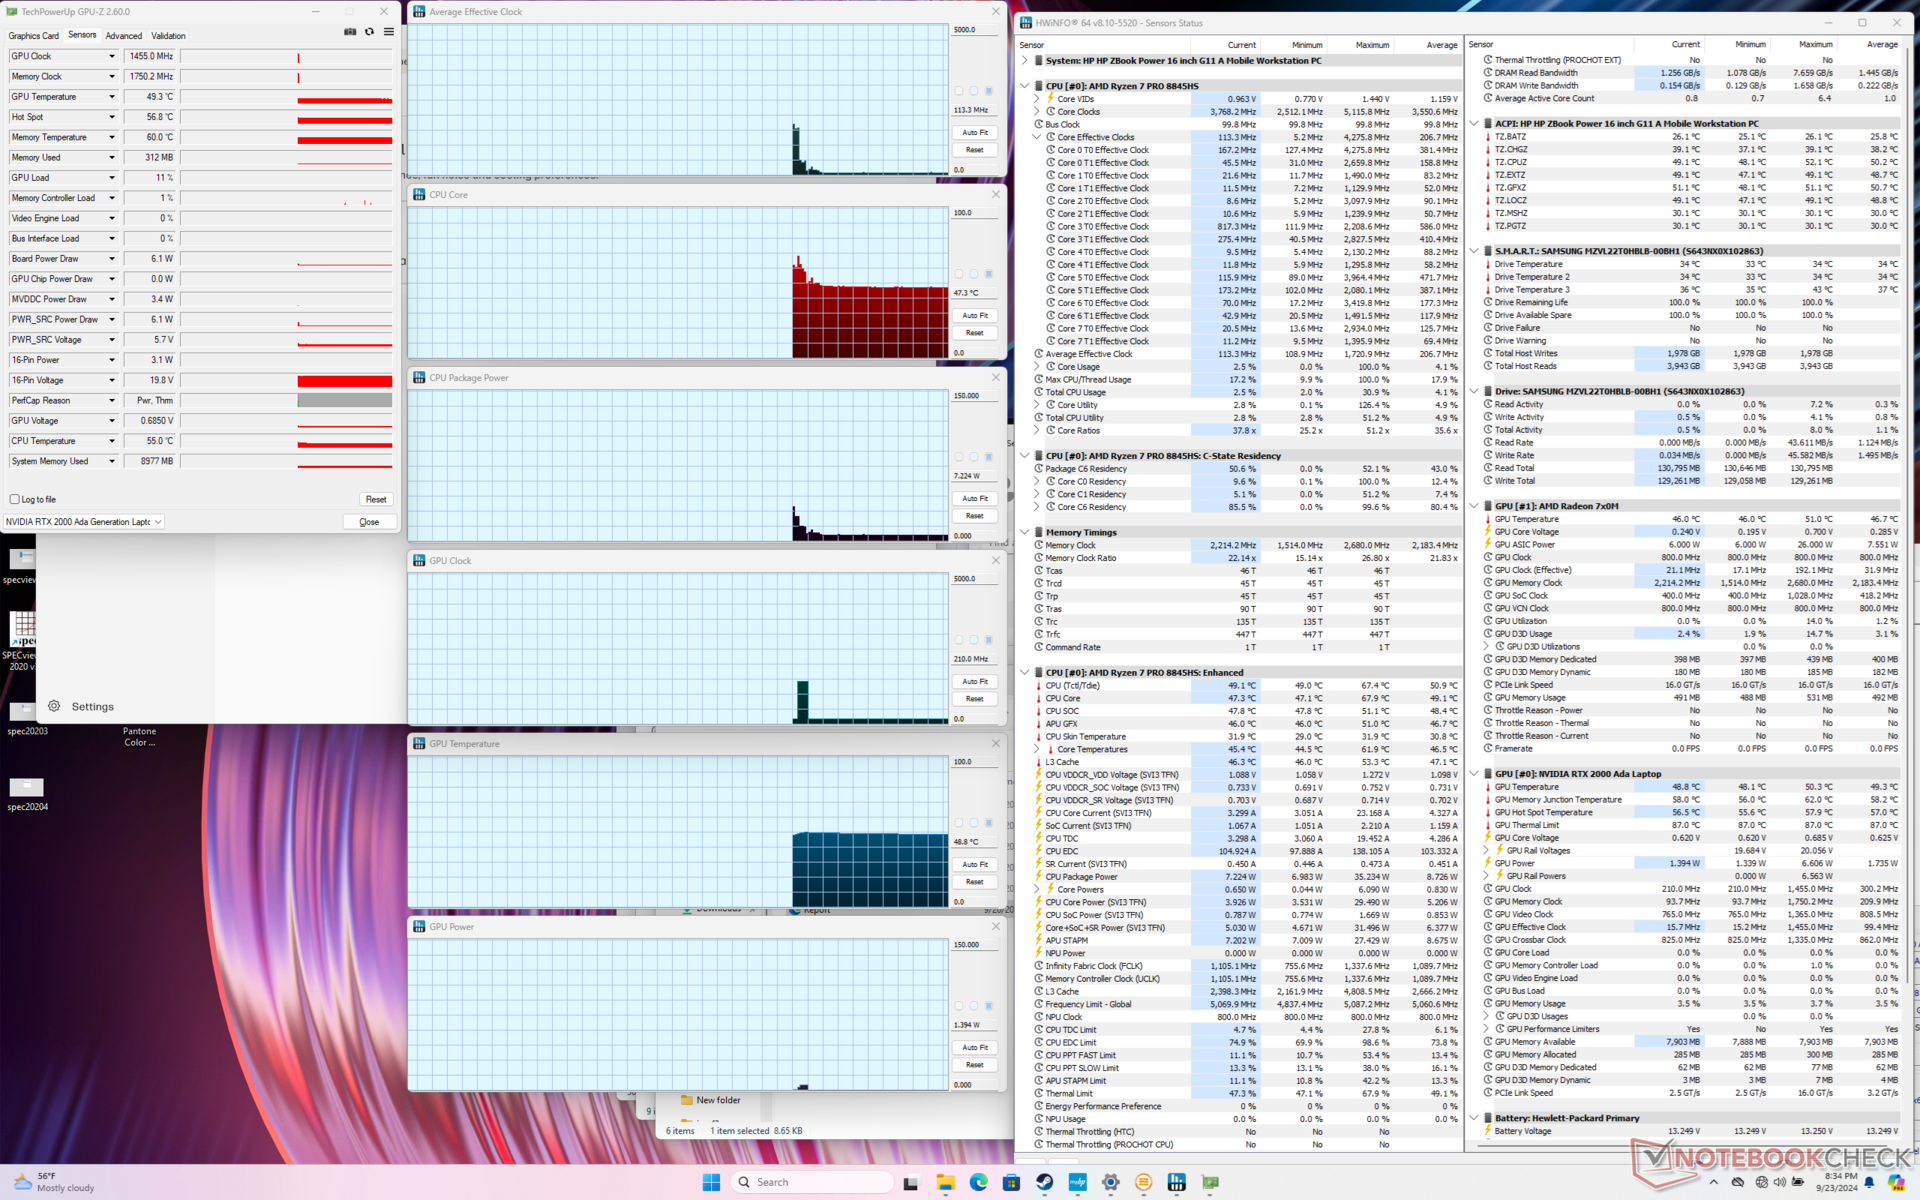
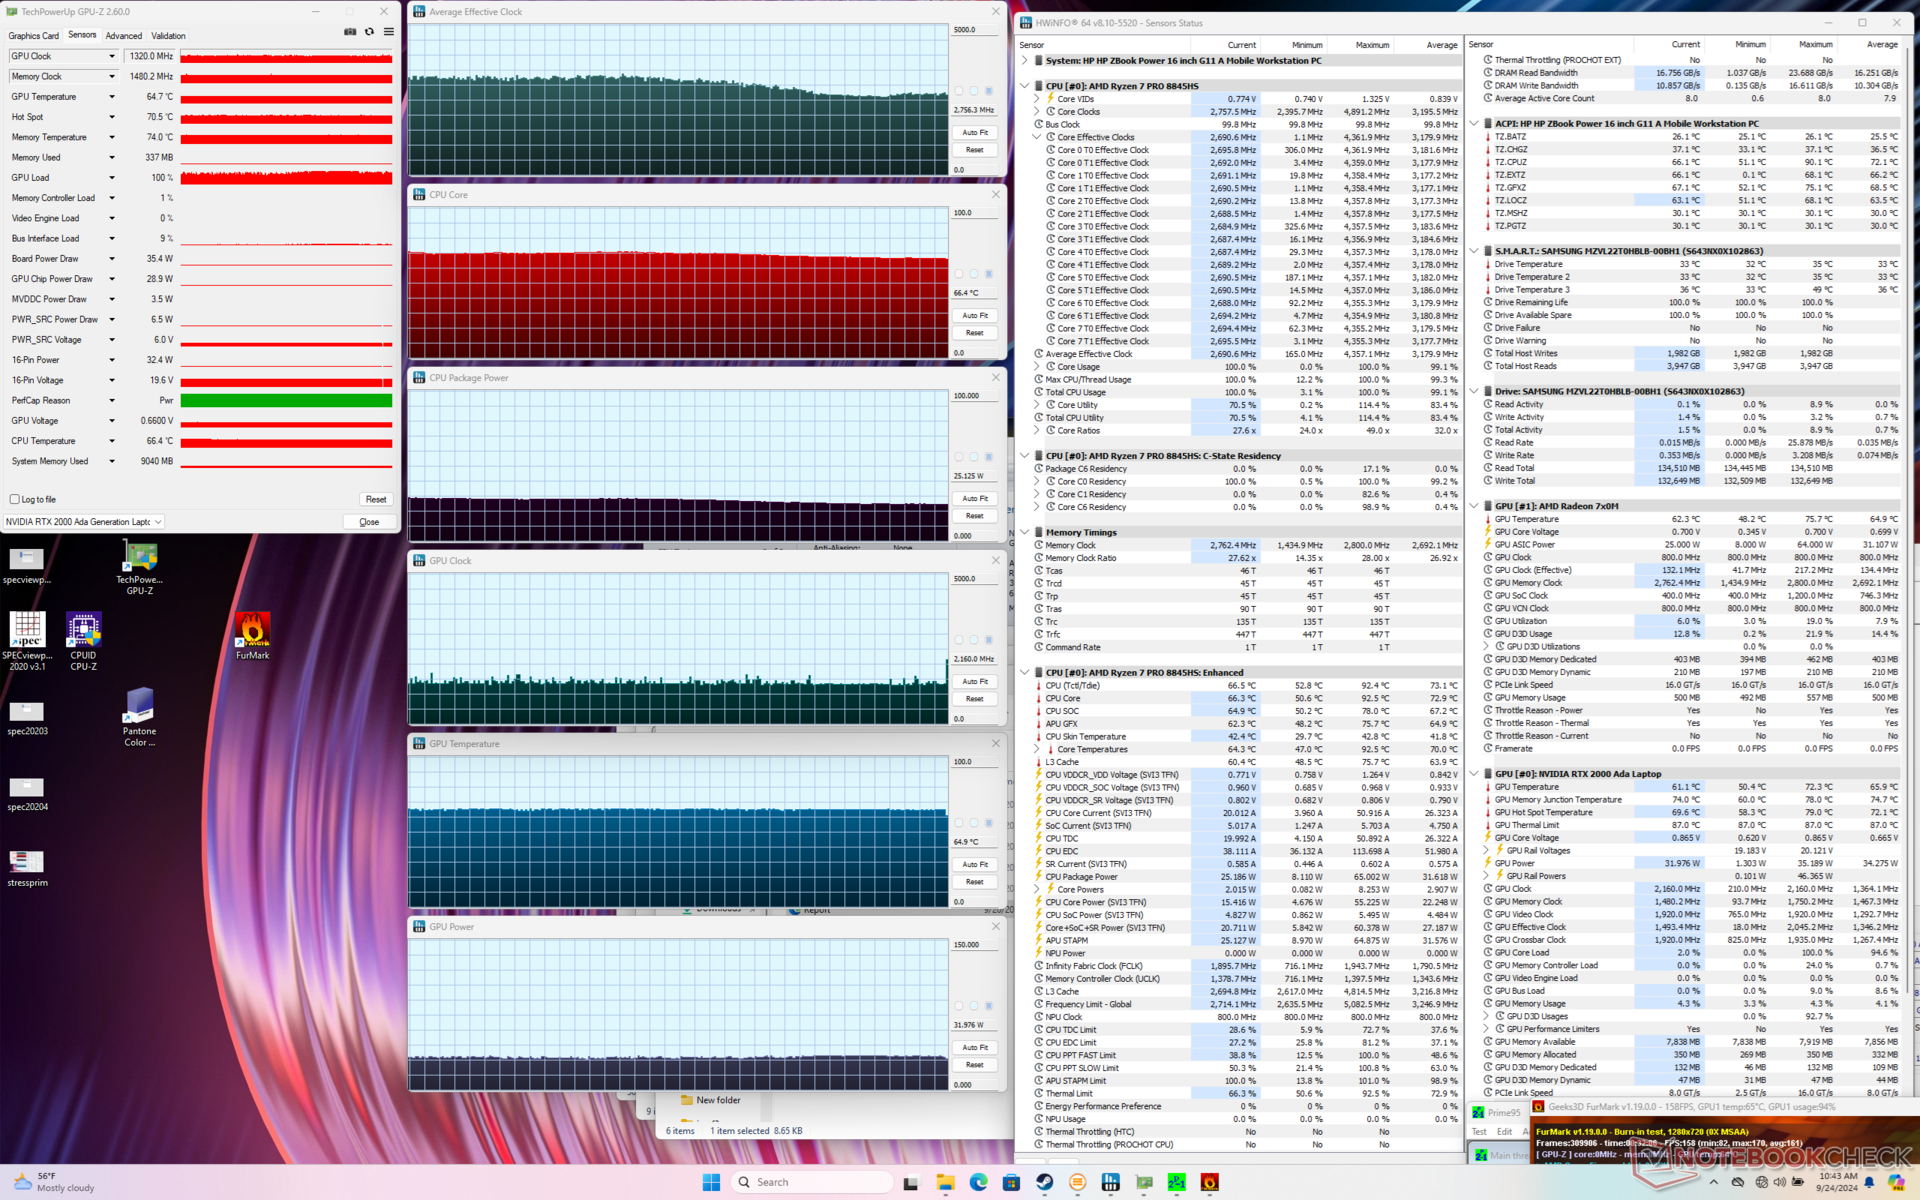
La CPU aumentaba a 4,3 GHz, 65 W y 90 C al iniciar el estrés Prime95 antes de caer rápidamente y estabilizarse en 3,8 GHz y 50 W para evitar temperaturas más altas del núcleo. Los resultados son parecidos a los que observamos en el ZBook Power 15 G10, si no ligeramente más calientes por unos pocos grados.
Curiosamente, la CPU se estrangula más fuertemente a sólo 2,8 GHz cuando se ejecutan simultáneamente Prime95 y FurMark en lugar de 3,8 GHz como en el modelo del año pasado. Es probable que este cambio haya servido para mejorar las temperaturas del núcleo; ahora la CPU se estabiliza en unos más cómodos 66 C en lugar de los 99 C del ZBook Power 15 G10.
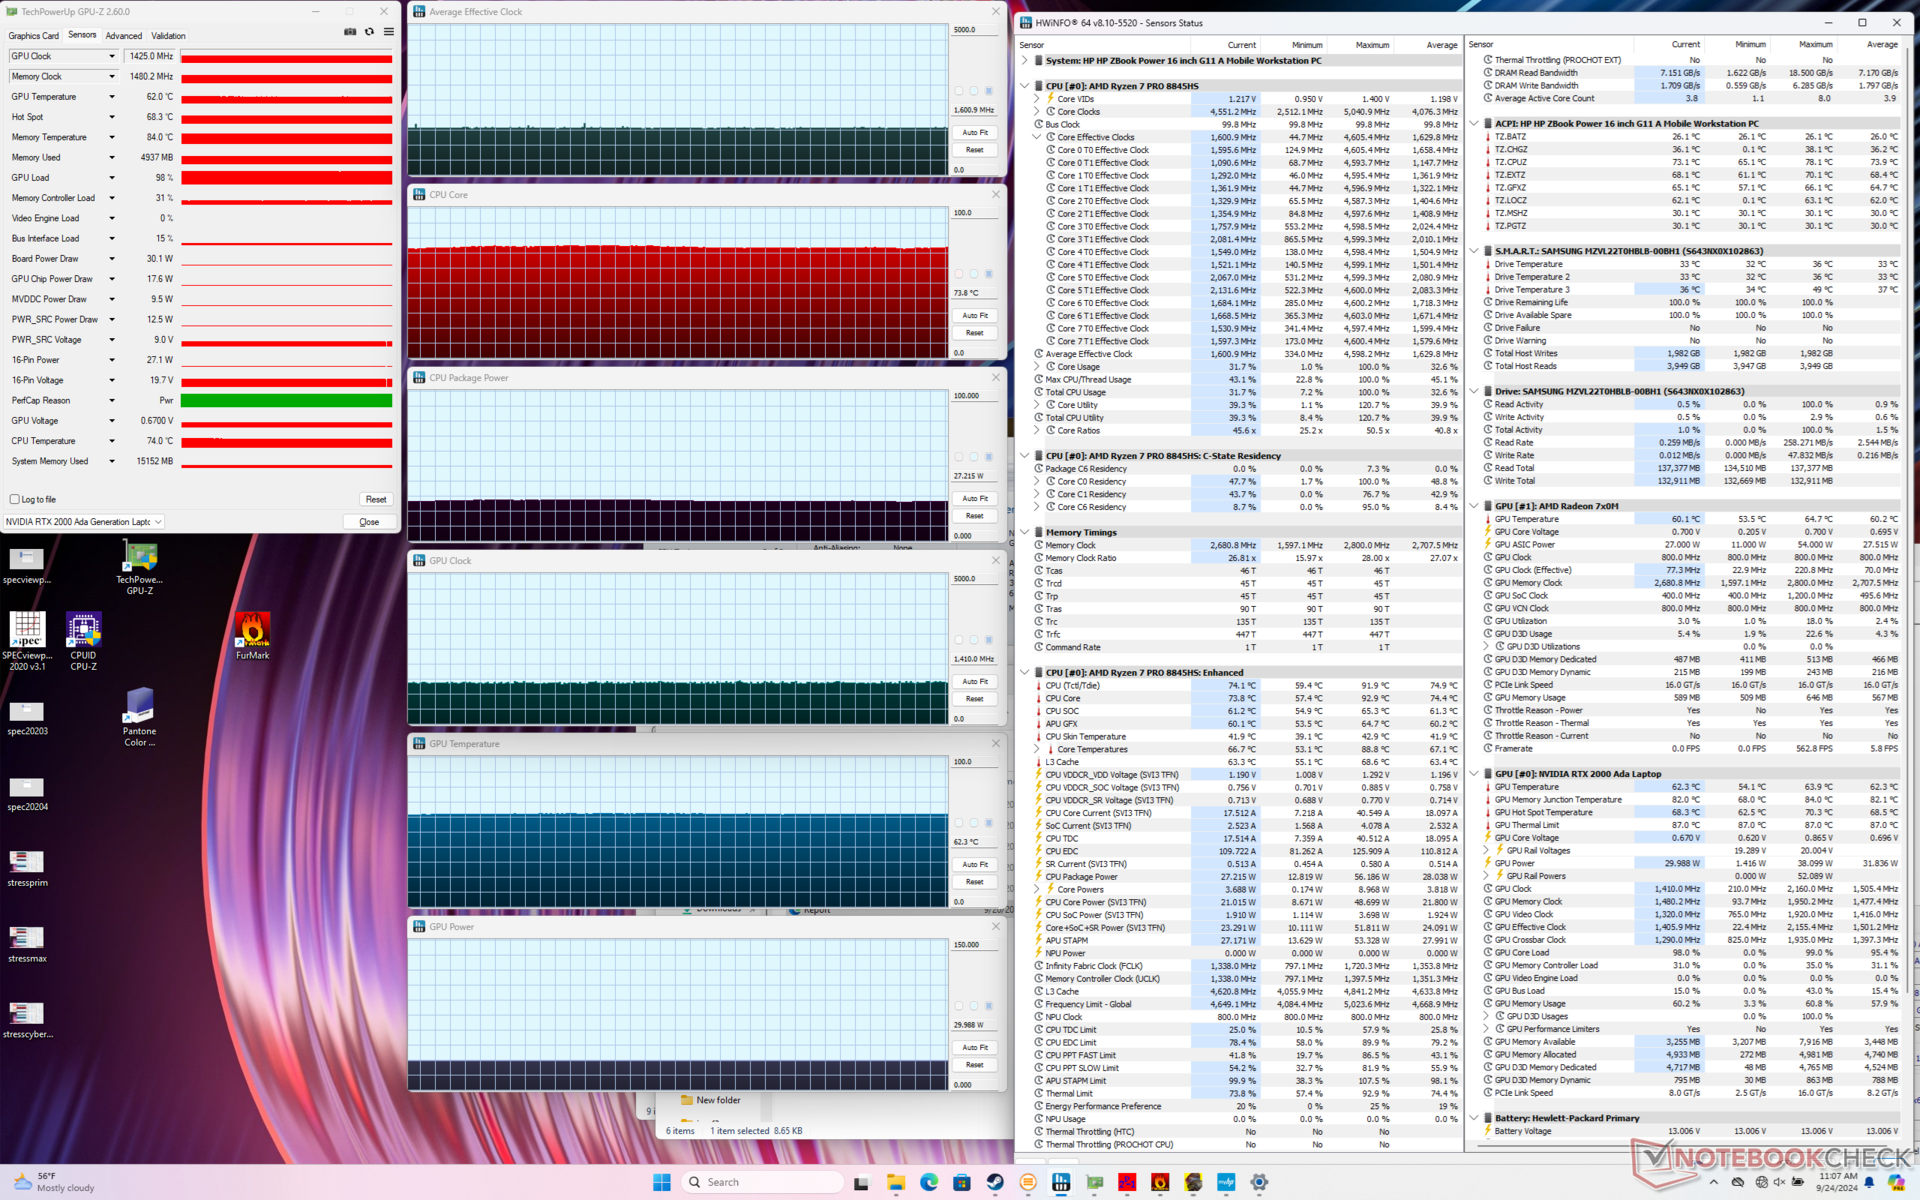
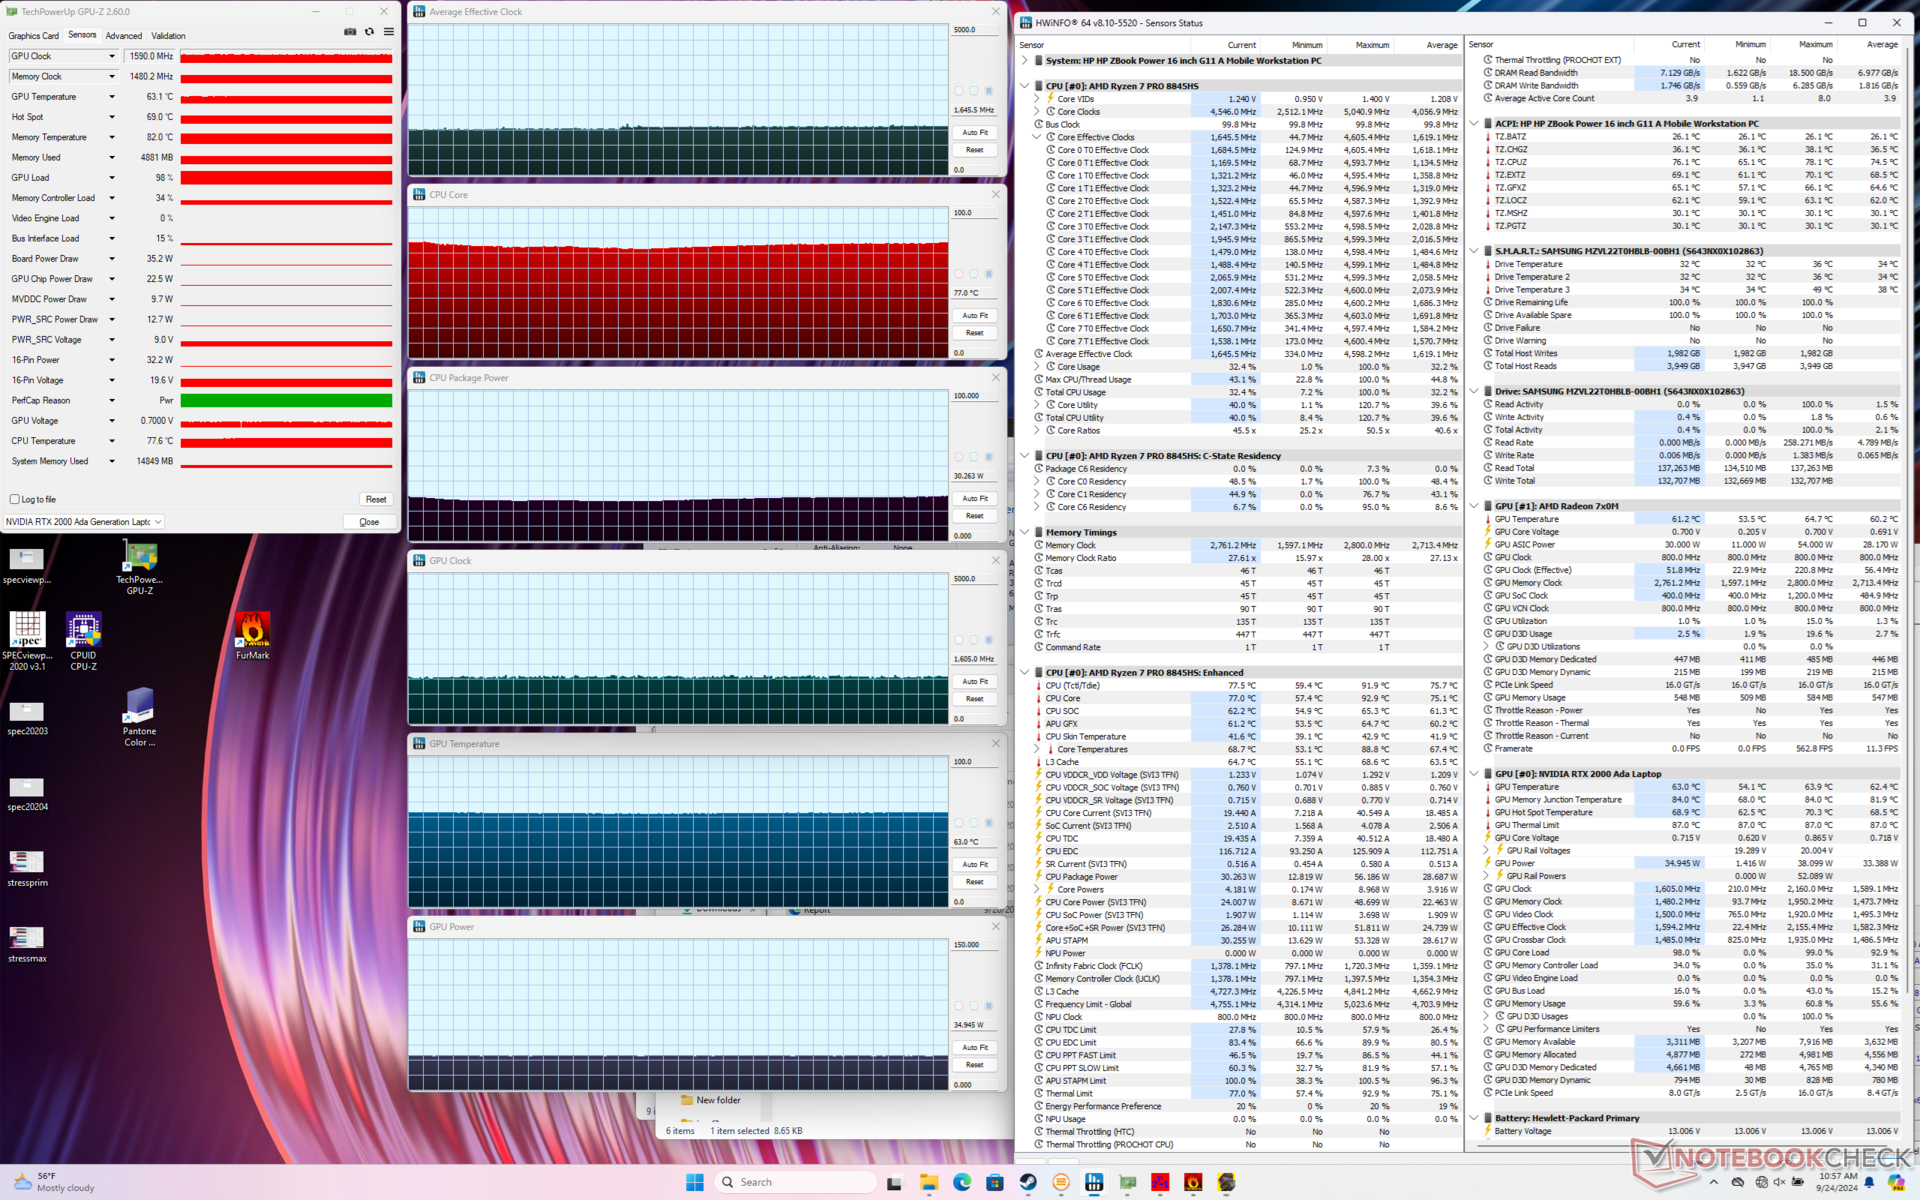
Ejecutar Cyberpunk 2077 en modo Equilibrado en lugar de en modo Rendimiento resulta tanto en temperaturas de núcleo ligeramente más frías como en velocidades de reloj medias ligeramente más lentas, como se muestra a continuación. El consumo de energía de la placa GPU también caería de 35 W a 30 W frente al máximo anunciado de 50 W.
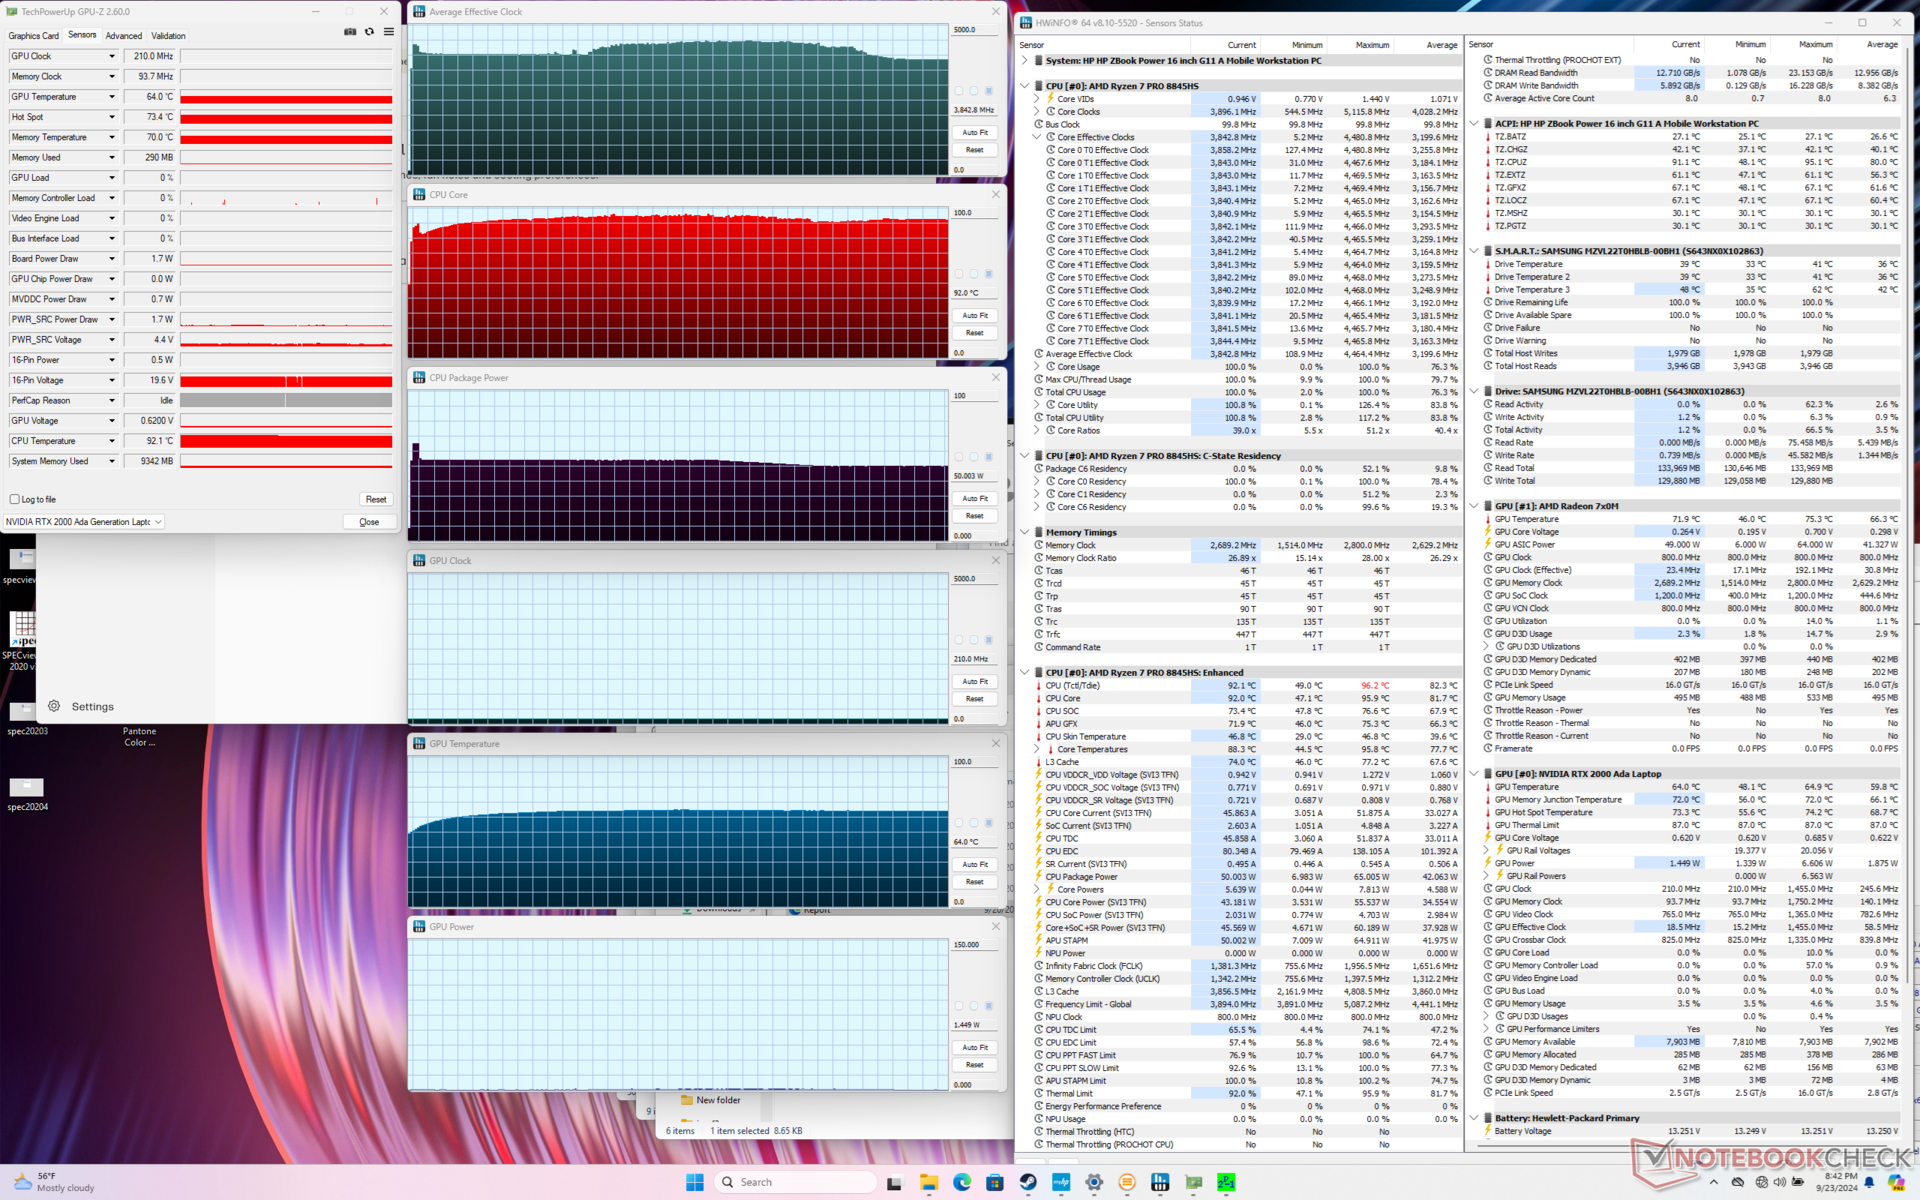
| Reloj medio de la CPU (GHz) | Reloj medio de la GPU (MHz) | Temperatura mediadelaCPU (°C) | Temperatura media de la GPU (°C) | |
| Sistema en reposo | -- | -- | 47 | 49 |
| EstrésdePrime95 | 3,9 | -- | 92 | 64 |
| Estrés de Prime95 + FurMark | 2,8 | 1320 | 66 | 65 |
| Estrés de Cyberpunk 2077 (modo equilibrado) | 1,6 | 1425 | 74 | 62 |
| Estrés deCyberpunk2077 (modo Rendimiento) | 1,7 | 1590 | 77 | 63 |
Rendimiento del sistema
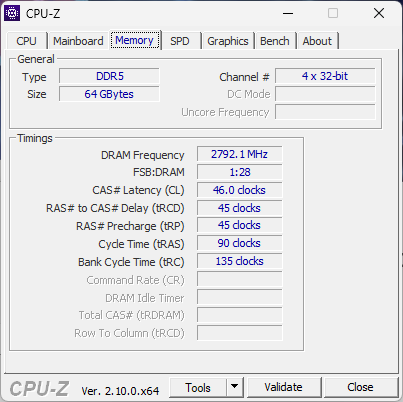
Los resultados de PCMark son casi idénticos a los que registramos en el ZBook Power 15 G10 del año pasado. Esto significa que las cargas tradicionales del día a día, como navegar o editar, no son notablemente más rápidas en nuestro modelo más reciente. El rendimiento de la RAM tampoco ha mejorado.
Experimentamos un problema de despertar del sueño donde se requería un apagado duro para volver a Windows. No pudimos reproducir el problema de forma fiable, pero el hecho de que ocurriera en una estación de trabajo móvil es digno de mención.

CrossMark: Overall | Productivity | Creativity | Responsiveness
WebXPRT 3: Overall
WebXPRT 4: Overall
Mozilla Kraken 1.1: Total
| PCMark 10 / Score | |
| Dell Precision 5690 | |
| HP ZBook Fury 16 G11 | |
| HP ZBook Power 15 G10 | |
| HP ZBook Power 16 G11 A | |
| Medio AMD Ryzen 7 8845HS, NVIDIA RTX 2000 Ada Generation Laptop GPU (n=1) | |
| Lenovo ThinkPad P1 Gen 7 21KV001SGE | |
| Lenovo ThinkPad P16s G2 21K9000CGE | |
| PCMark 10 / Essentials | |
| Dell Precision 5690 | |
| HP ZBook Power 15 G10 | |
| HP ZBook Power 16 G11 A | |
| Medio AMD Ryzen 7 8845HS, NVIDIA RTX 2000 Ada Generation Laptop GPU (n=1) | |
| Lenovo ThinkPad P1 Gen 7 21KV001SGE | |
| Lenovo ThinkPad P16s G2 21K9000CGE | |
| HP ZBook Fury 16 G11 | |
| PCMark 10 / Productivity | |
| Dell Precision 5690 | |
| HP ZBook Power 15 G10 | |
| HP ZBook Power 16 G11 A | |
| Medio AMD Ryzen 7 8845HS, NVIDIA RTX 2000 Ada Generation Laptop GPU (n=1) | |
| HP ZBook Fury 16 G11 | |
| Lenovo ThinkPad P1 Gen 7 21KV001SGE | |
| Lenovo ThinkPad P16s G2 21K9000CGE | |
| PCMark 10 / Digital Content Creation | |
| HP ZBook Fury 16 G11 | |
| Dell Precision 5690 | |
| Lenovo ThinkPad P1 Gen 7 21KV001SGE | |
| HP ZBook Power 15 G10 | |
| HP ZBook Power 16 G11 A | |
| Medio AMD Ryzen 7 8845HS, NVIDIA RTX 2000 Ada Generation Laptop GPU (n=1) | |
| Lenovo ThinkPad P16s G2 21K9000CGE | |
| CrossMark / Overall | |
| HP ZBook Fury 16 G11 | |
| Dell Precision 5690 | |
| HP ZBook Power 16 G11 A | |
| Medio AMD Ryzen 7 8845HS, NVIDIA RTX 2000 Ada Generation Laptop GPU (n=1) | |
| Lenovo ThinkPad P1 Gen 7 21KV001SGE | |
| HP ZBook Power 15 G10 | |
| Lenovo ThinkPad P16s G2 21K9000CGE | |
| CrossMark / Productivity | |
| HP ZBook Fury 16 G11 | |
| Dell Precision 5690 | |
| HP ZBook Power 16 G11 A | |
| Medio AMD Ryzen 7 8845HS, NVIDIA RTX 2000 Ada Generation Laptop GPU (n=1) | |
| Lenovo ThinkPad P1 Gen 7 21KV001SGE | |
| HP ZBook Power 15 G10 | |
| Lenovo ThinkPad P16s G2 21K9000CGE | |
| CrossMark / Creativity | |
| HP ZBook Fury 16 G11 | |
| HP ZBook Power 16 G11 A | |
| Medio AMD Ryzen 7 8845HS, NVIDIA RTX 2000 Ada Generation Laptop GPU (n=1) | |
| Dell Precision 5690 | |
| Lenovo ThinkPad P1 Gen 7 21KV001SGE | |
| HP ZBook Power 15 G10 | |
| Lenovo ThinkPad P16s G2 21K9000CGE | |
| CrossMark / Responsiveness | |
| HP ZBook Fury 16 G11 | |
| Dell Precision 5690 | |
| HP ZBook Power 16 G11 A | |
| Medio AMD Ryzen 7 8845HS, NVIDIA RTX 2000 Ada Generation Laptop GPU (n=1) | |
| Lenovo ThinkPad P1 Gen 7 21KV001SGE | |
| Lenovo ThinkPad P16s G2 21K9000CGE | |
| HP ZBook Power 15 G10 | |
| WebXPRT 3 / Overall | |
| HP ZBook Fury 16 G11 | |
| HP ZBook Power 15 G10 | |
| HP ZBook Power 16 G11 A | |
| Medio AMD Ryzen 7 8845HS, NVIDIA RTX 2000 Ada Generation Laptop GPU (n=1) | |
| Dell Precision 5690 | |
| Lenovo ThinkPad P1 Gen 7 21KV001SGE | |
| Lenovo ThinkPad P16s G2 21K9000CGE | |
| WebXPRT 4 / Overall | |
| HP ZBook Fury 16 G11 | |
| Dell Precision 5690 | |
| Lenovo ThinkPad P1 Gen 7 21KV001SGE | |
| HP ZBook Power 16 G11 A | |
| Medio AMD Ryzen 7 8845HS, NVIDIA RTX 2000 Ada Generation Laptop GPU (n=1) | |
| HP ZBook Power 15 G10 | |
| Mozilla Kraken 1.1 / Total | |
| Lenovo ThinkPad P16s G2 21K9000CGE | |
| HP ZBook Power 15 G10 | |
| HP ZBook Power 16 G11 A | |
| Medio AMD Ryzen 7 8845HS, NVIDIA RTX 2000 Ada Generation Laptop GPU (n=1) | |
| Lenovo ThinkPad P1 Gen 7 21KV001SGE | |
| Dell Precision 5690 | |
| HP ZBook Fury 16 G11 | |
* ... más pequeño es mejor
| PCMark 10 Score | 7376 puntos | |
ayuda | ||
| AIDA64 / Memory Copy | |
| Dell Precision 5690 | |
| HP ZBook Power 15 G10 | |
| Medio AMD Ryzen 7 8845HS (61459 - 71873, n=13) | |
| Lenovo ThinkPad P16s G2 21K9000CGE | |
| Lenovo ThinkPad P1 Gen 7 21KV001SGE | |
| HP ZBook Power 16 G11 A | |
| HP ZBook Fury 16 G11 | |
| AIDA64 / Memory Read | |
| Dell Precision 5690 | |
| Lenovo ThinkPad P1 Gen 7 21KV001SGE | |
| HP ZBook Power 15 G10 | |
| HP ZBook Power 16 G11 A | |
| HP ZBook Fury 16 G11 | |
| Medio AMD Ryzen 7 8845HS (49866 - 61976, n=13) | |
| Lenovo ThinkPad P16s G2 21K9000CGE | |
| AIDA64 / Memory Write | |
| Lenovo ThinkPad P16s G2 21K9000CGE | |
| Medio AMD Ryzen 7 8845HS (68425 - 93239, n=13) | |
| HP ZBook Power 15 G10 | |
| HP ZBook Power 16 G11 A | |
| Dell Precision 5690 | |
| Lenovo ThinkPad P1 Gen 7 21KV001SGE | |
| HP ZBook Fury 16 G11 | |
| AIDA64 / Memory Latency | |
| Dell Precision 5690 | |
| Lenovo ThinkPad P1 Gen 7 21KV001SGE | |
| Lenovo ThinkPad P16s G2 21K9000CGE | |
| HP ZBook Power 15 G10 | |
| HP ZBook Power 16 G11 A | |
| Medio AMD Ryzen 7 8845HS (82.5 - 117, n=13) | |
| HP ZBook Fury 16 G11 | |
* ... más pequeño es mejor
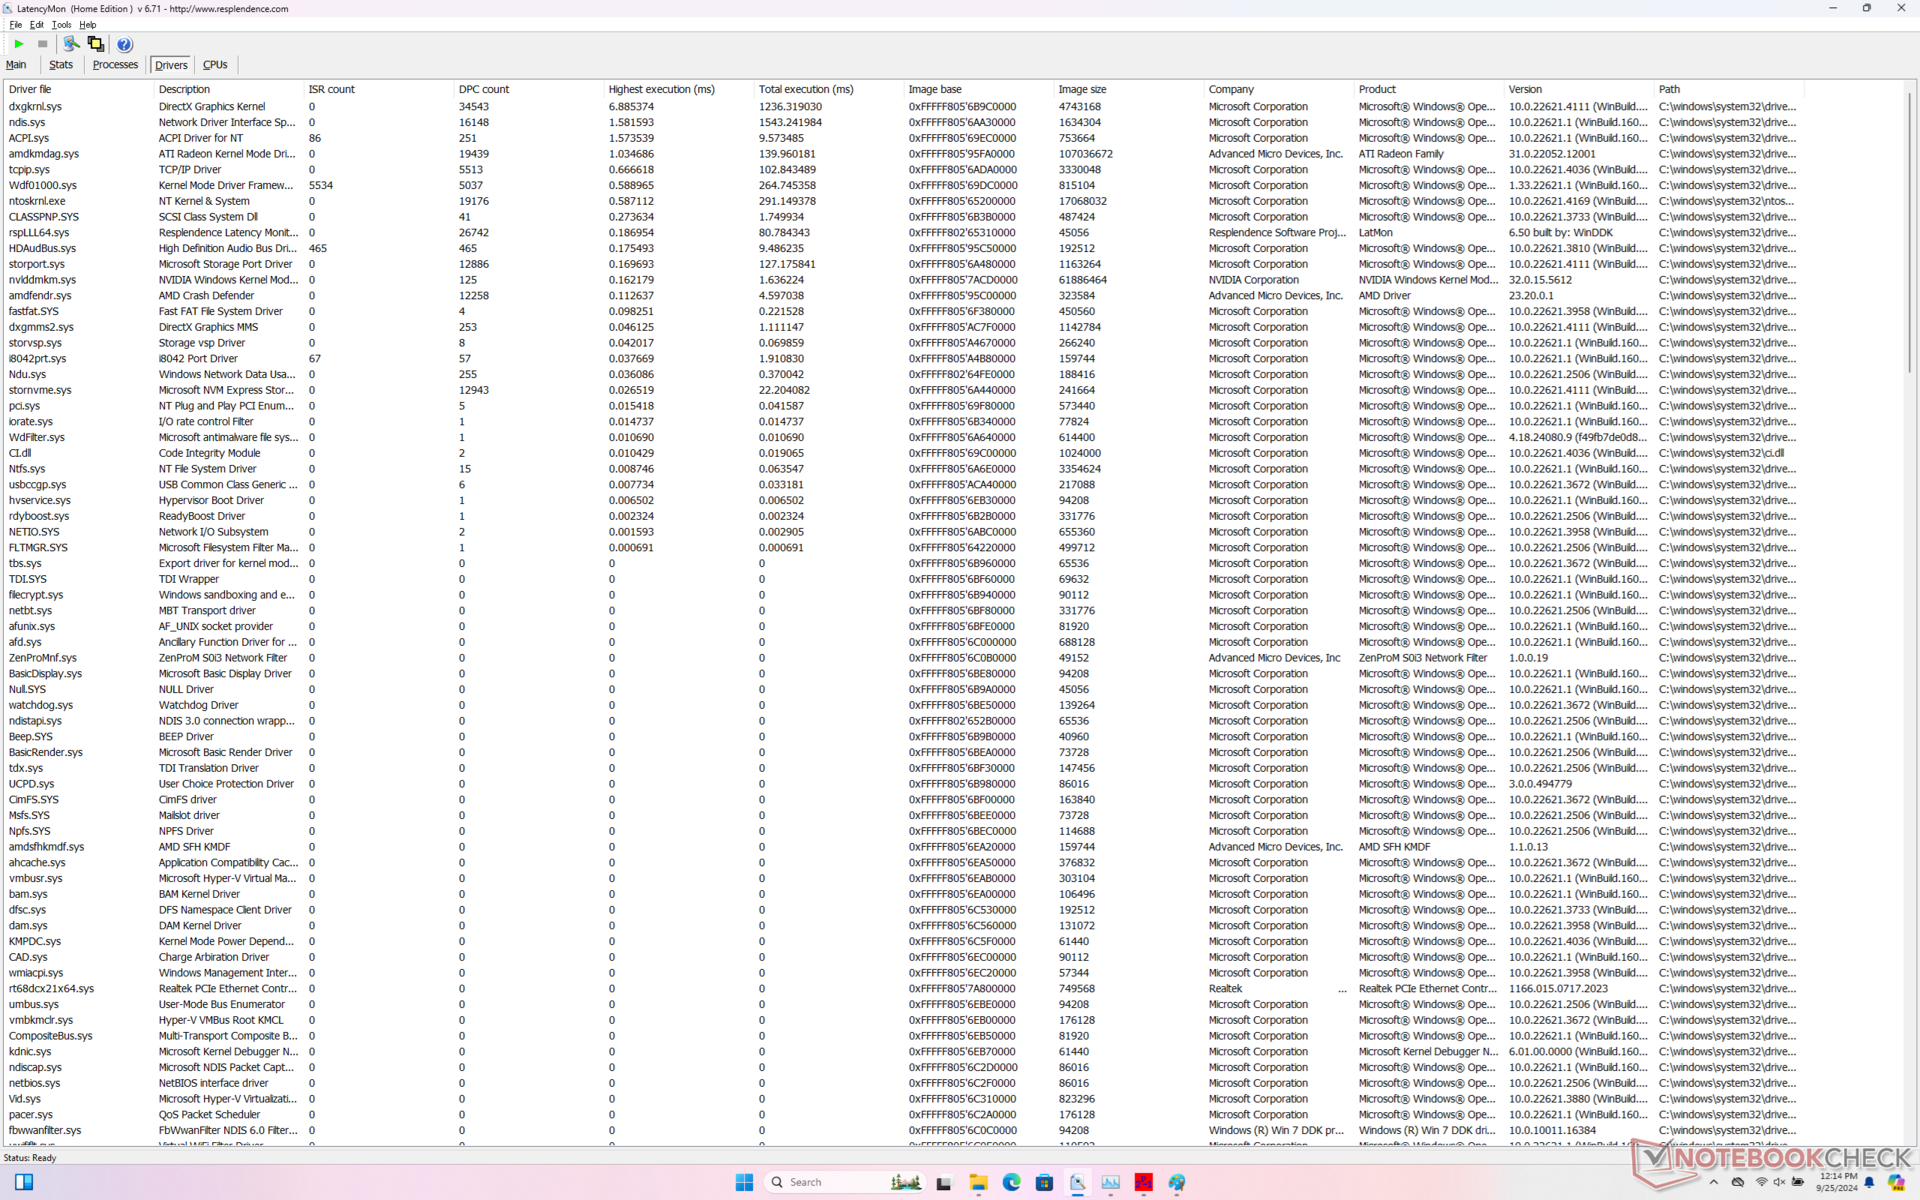
Latencia del CPD
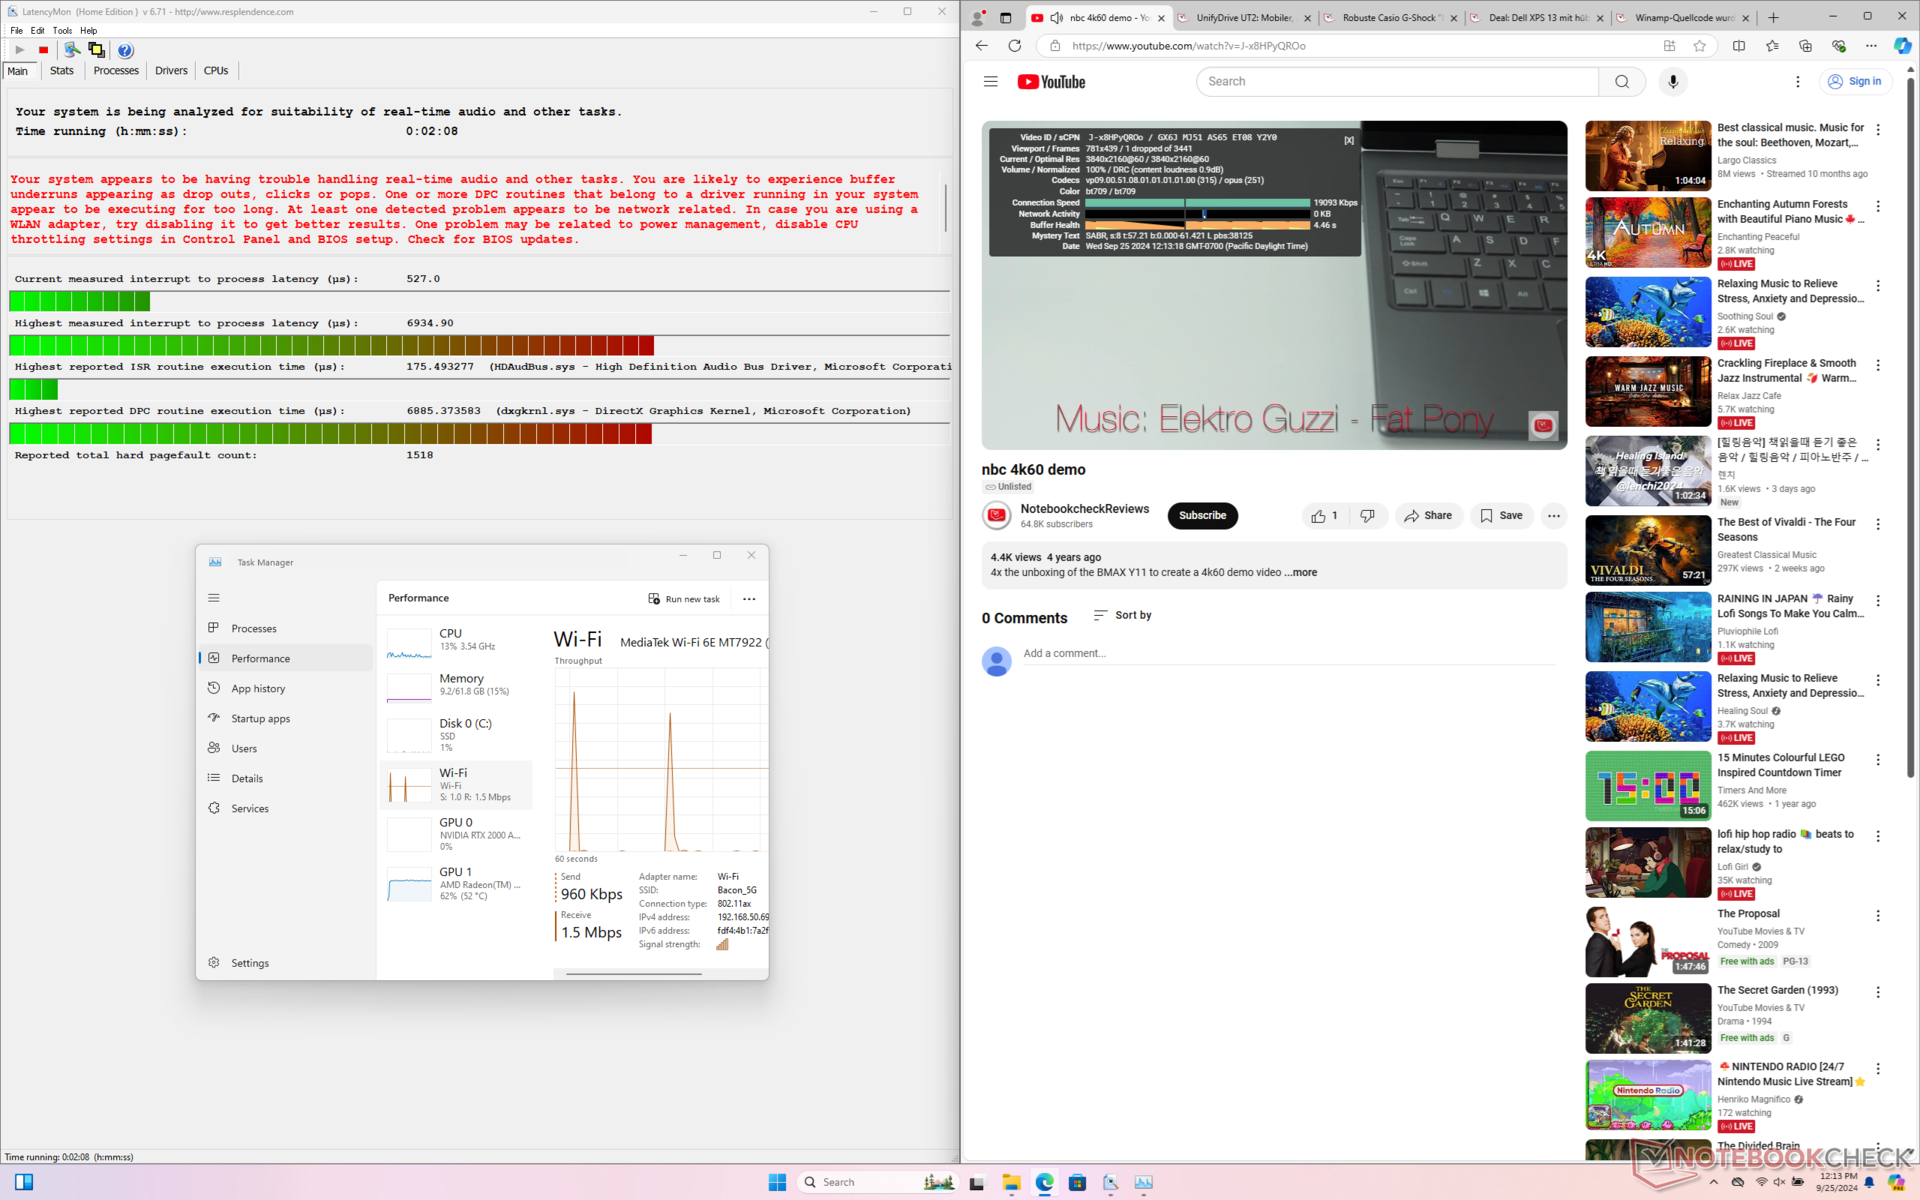
LatencyMon revela problemas de DPC relacionados con HDAudBus.sys incluso después de múltiples repeticiones de la prueba. por lo demás, la reproducción de vídeo 4K a 60 FPS es excelente, con un solo fotograma caído registrado durante una ventana de 60 segundos.
| DPC Latencies / LatencyMon - interrupt to process latency (max), Web, Youtube, Prime95 | |
| HP ZBook Fury 16 G11 | |
| HP ZBook Power 16 G11 A | |
| HP ZBook Power 15 G10 | |
| Lenovo ThinkPad P1 Gen 7 21KV001SGE | |
| Lenovo ThinkPad P16s G2 21K9000CGE | |
| Dell Precision 5690 | |
* ... más pequeño es mejor
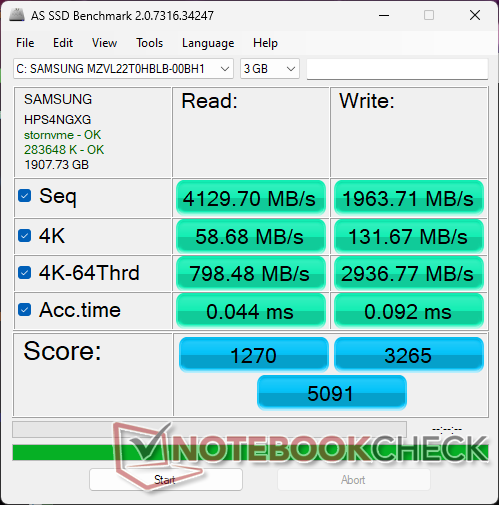
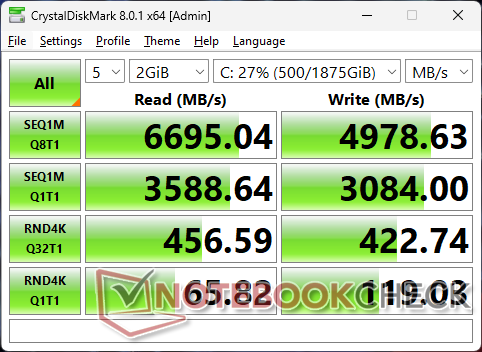
Dispositivos de almacenamiento
Nuestra unidad de prueba se entrega con un Samsung PM9A1 PCIe4 x4 NVMe SSD para velocidades de lectura secuencial tan altas como 6700 MB/s. Desafortunadamente, la unidad se ralentizaba rápidamente hasta el rango por debajo de los 2000 MB/s tras unos pocos minutos de estrés, como muestran los resultados de nuestra prueba en bucle DiskSpd que se muestran a continuación. Repetimos la prueba y los resultados no mejoraron. Esto es decepcionante, ya que la unidad WD en el antiguo ZBook Power 15 G10 no presentaba ningún problema de estrangulamiento. Un disipador de calor probablemente habría mejorado el rendimiento.

| Drive Performance Rating - Percent | |
| HP ZBook Fury 16 G11 | |
| Dell Precision 5690 | |
| Lenovo ThinkPad P16s G2 21K9000CGE | |
| HP ZBook Power 15 G10 | |
| HP ZBook Power 16 G11 A | |
| Lenovo ThinkPad P1 Gen 7 21KV001SGE | |
* ... más pequeño es mejor
Disk Throttling: DiskSpd Read Loop, Queue Depth 8
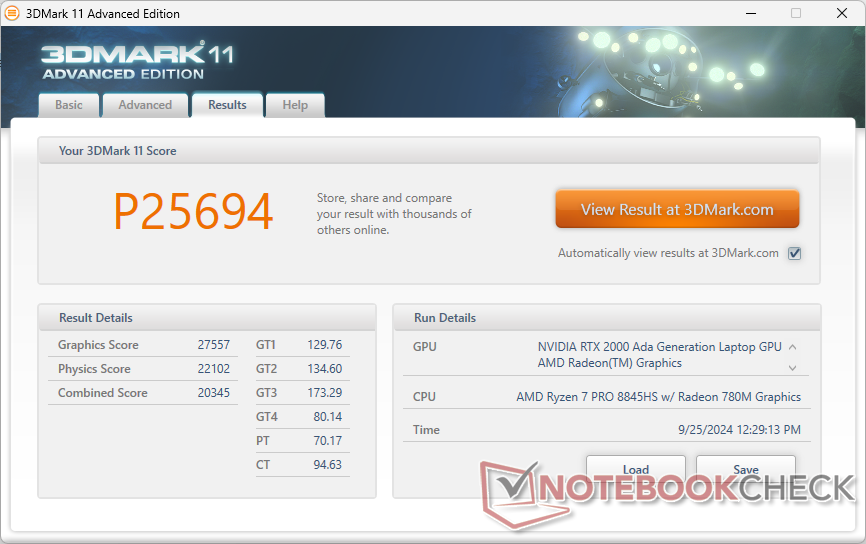
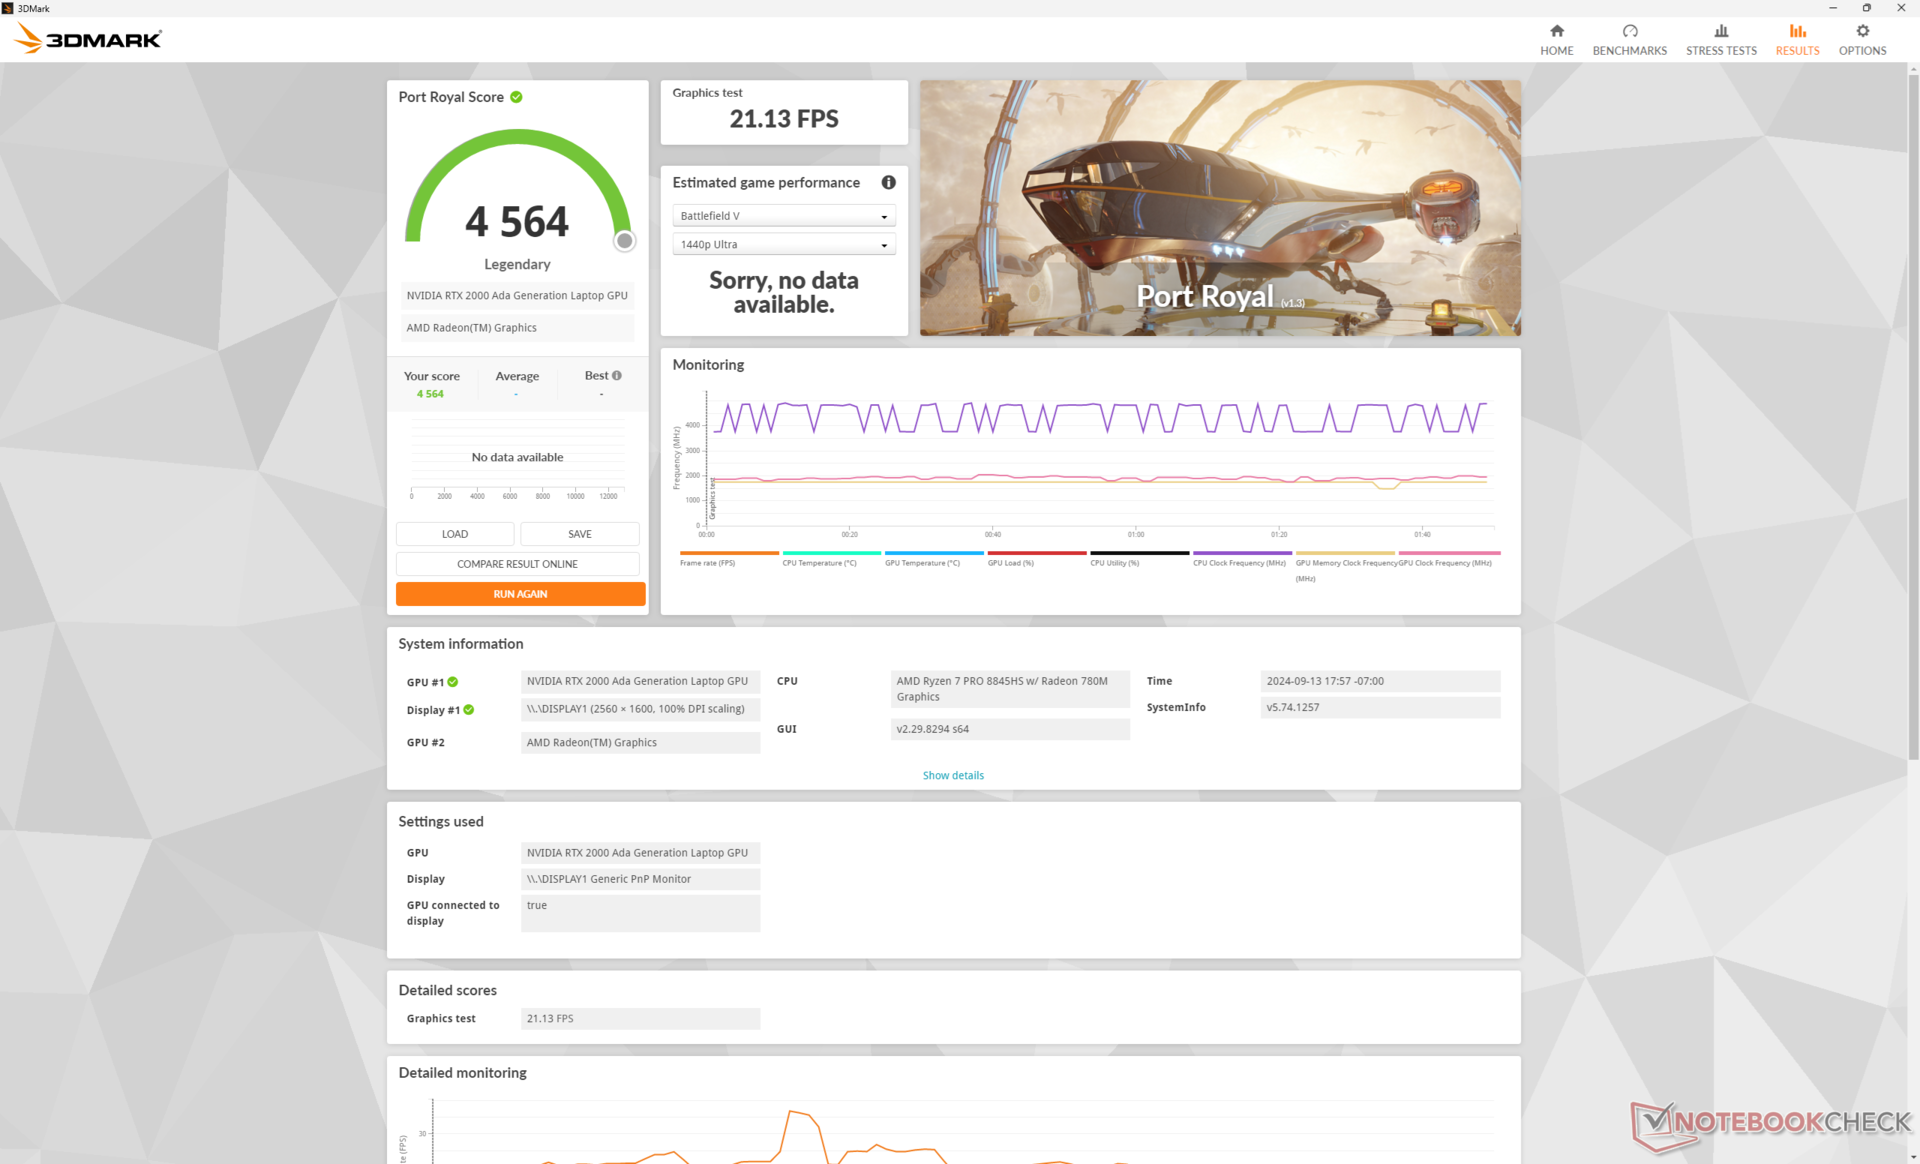
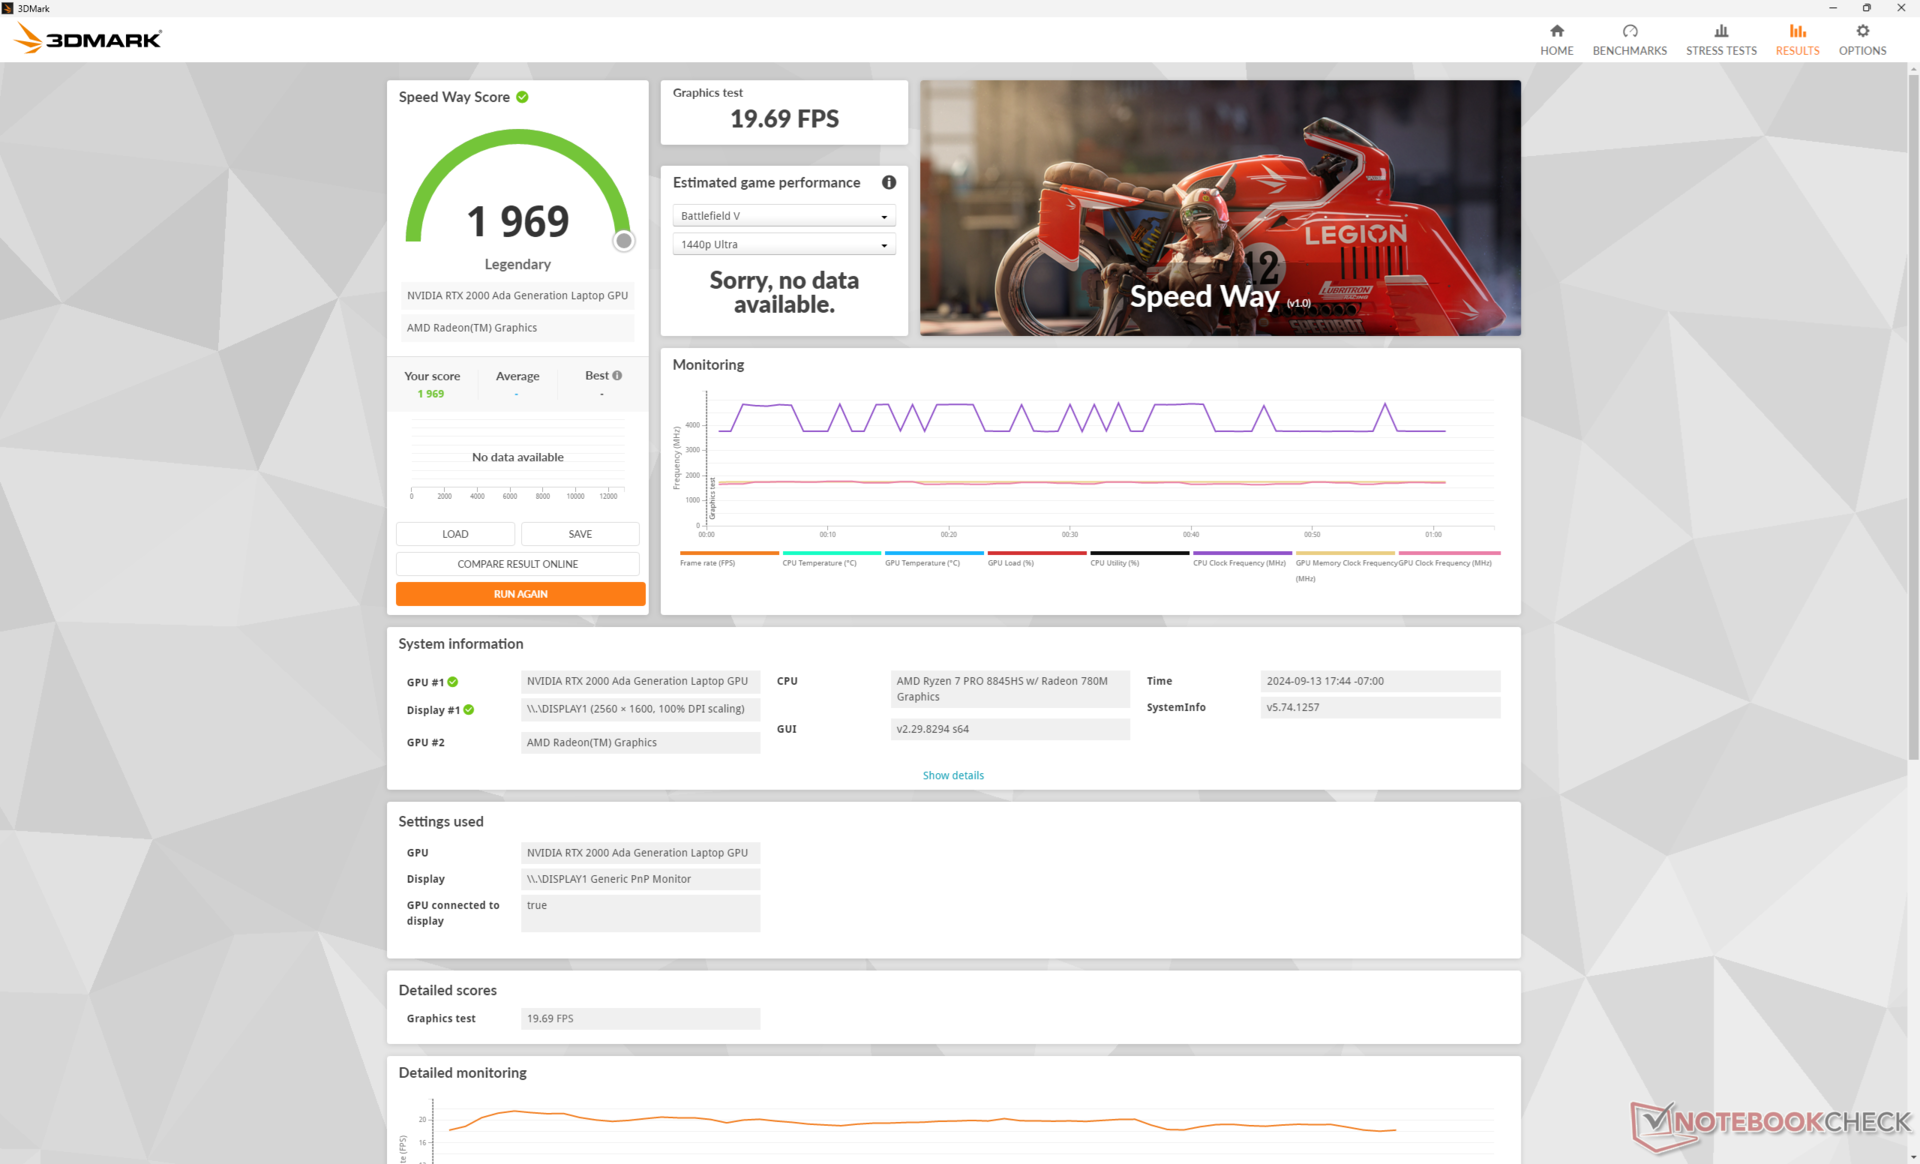
Rendimiento de la GPU
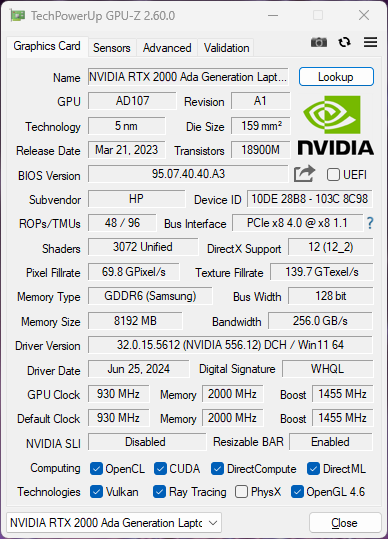
Las opciones de GPU discreta siguen siendo idénticas a las del ZBook Power 15 G10 de 15 pulgadas, ya que Nvidia aún no ha lanzado un sucesor para la serie móvil Ada Lovelace. Además, la solución de refrigeración no ha mejorado mucho durante el cambio a un factor de forma de 16 pulgadas, lo que significa que el ZBook Power 16 G11 sigue limitado al mismo techo de 50 W TGP y RTX 1000 Ada, RTX 2000 Aday RTX 3000 Ada como antes. Los usuarios tendrán que considerar la serie ZBook Fury 16 más gruesa para las opciones RTX Ada de gama más alta.
La actualización a la RTX 3000 Ada trae aumentos de rendimiento marginales en el mejor de los casos sobre la base de nuestra experiencia con el Dell Precision 5490.
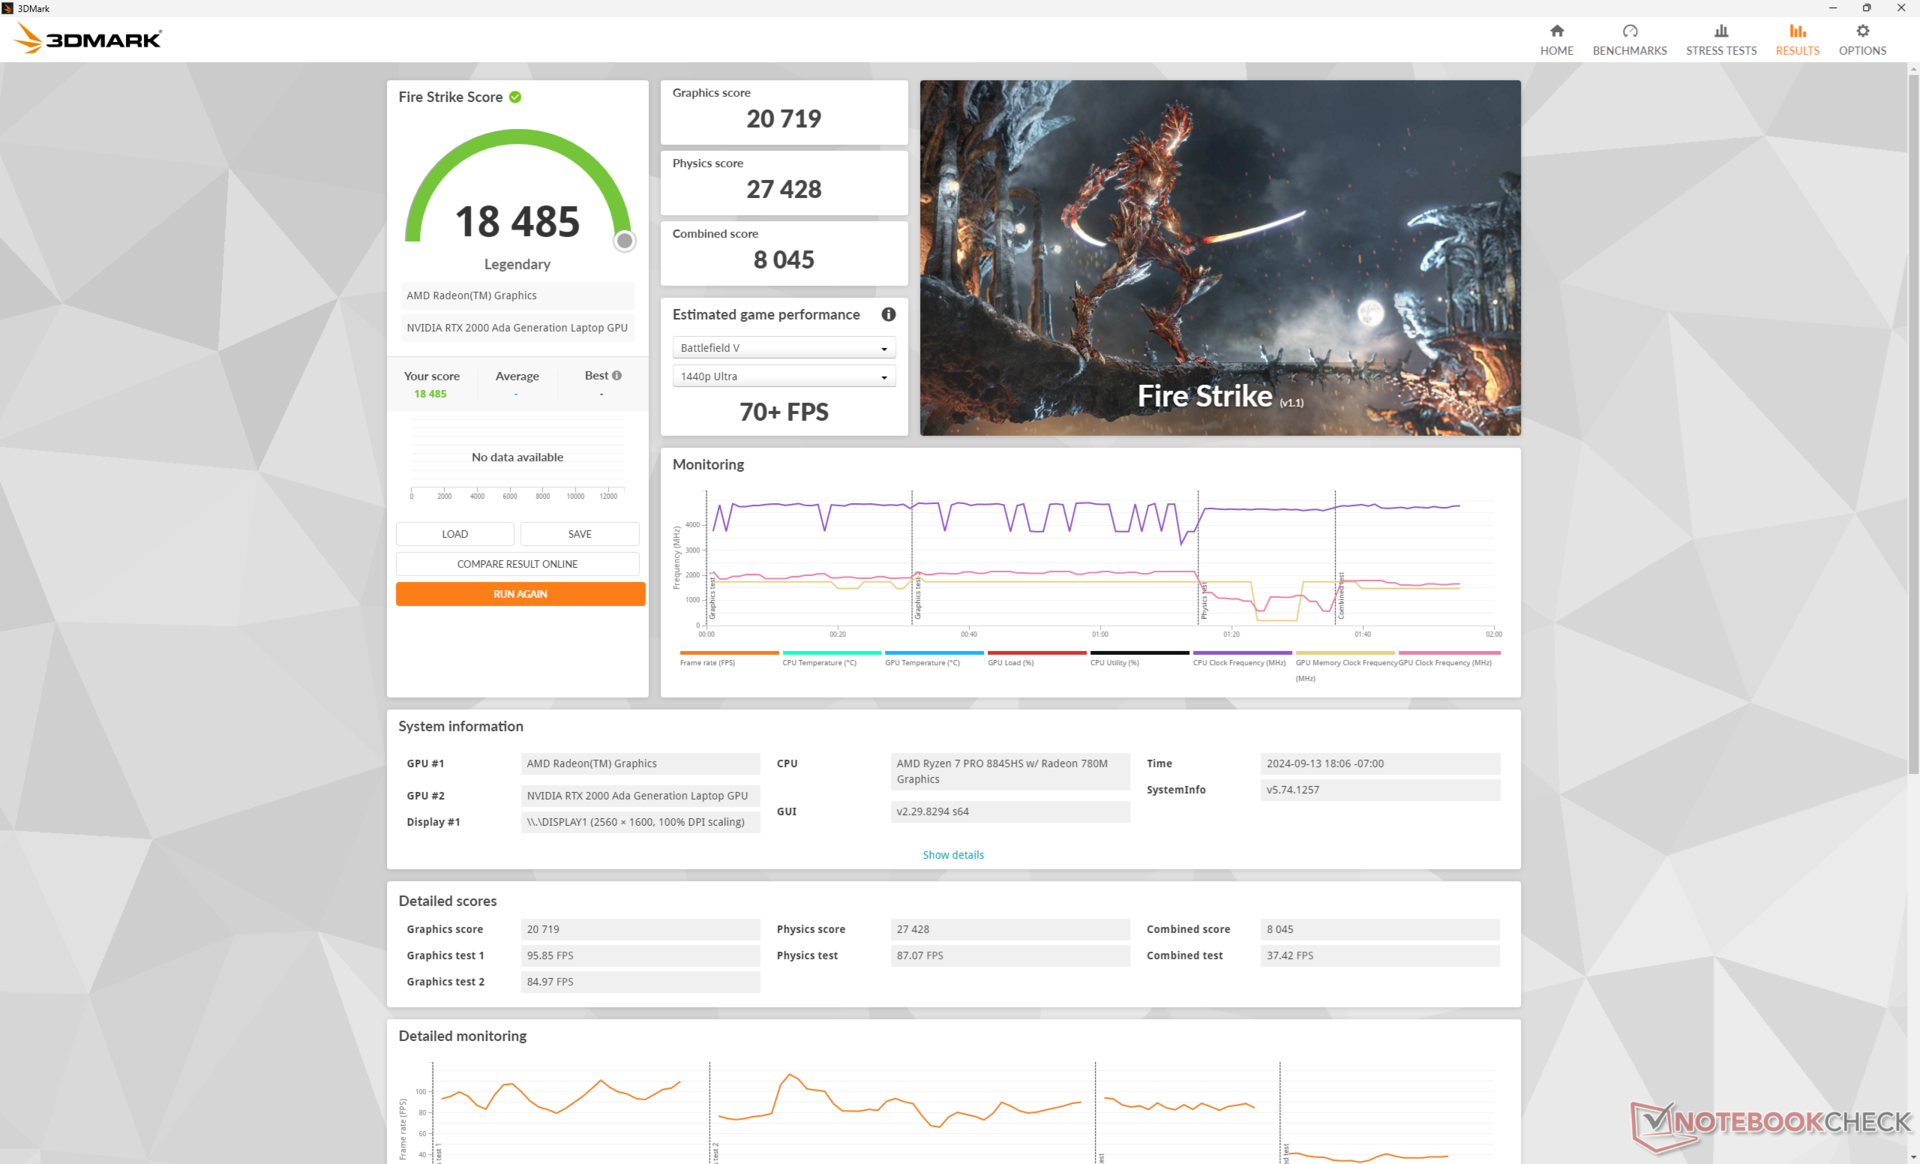
| Perfil de potencia | Puntuación de gráficos | Puntuación física | Puntuación combinada |
| Modo de rendimiento | 20719 | 27428 | 8045 |
| Modo equilibrado | 19961 (-4%) | 26363 (-4%) | 7633 (-5%) |
| Batería | 8108 (-61%) | 6149 (-78%) | 1727 (-79%) |
Ejecutar en modo Equilibrado en lugar de en modo Rendimiento repercute ligeramente en el rendimiento, como muestra nuestra tabla de resultados Fire Strike anterior. Sin embargo, tanto el rendimiento de la CPU como el de la GPU se reducen significativamente si se ejecutan en pilas.
| 3DMark Performance Rating - Percent | |
| Dell Precision 5690 -3! | |
| HP ZBook Fury 16 G11 | |
| HP ZBook Fury 16 G9 -3! | |
| HP ZBook Power 16 G11 A | |
| Medio NVIDIA RTX 2000 Ada Generation Laptop GPU | |
| Dell Precision 5000 5490 -3! | |
| MSI CreatorPro Z16P B12UKST -19! | |
| HP ZBook Power 15 G10 -11! | |
| Asus ExpertBook B6 Flip B6602FC2 -19! | |
| Lenovo ThinkPad P16v G1 AMD -18! | |
| Lenovo ThinkPad P1 G4-20Y4Z9DVUS -19! | |
| Lenovo ThinkPad P16s G2 21K9000CGE -19! | |
| HP ZBook Firefly 16 G9-6B897EA -19! | |
| 3DMark 11 Performance | 25694 puntos | |
| 3DMark Cloud Gate Standard Score | 51846 puntos | |
| 3DMark Fire Strike Score | 18485 puntos | |
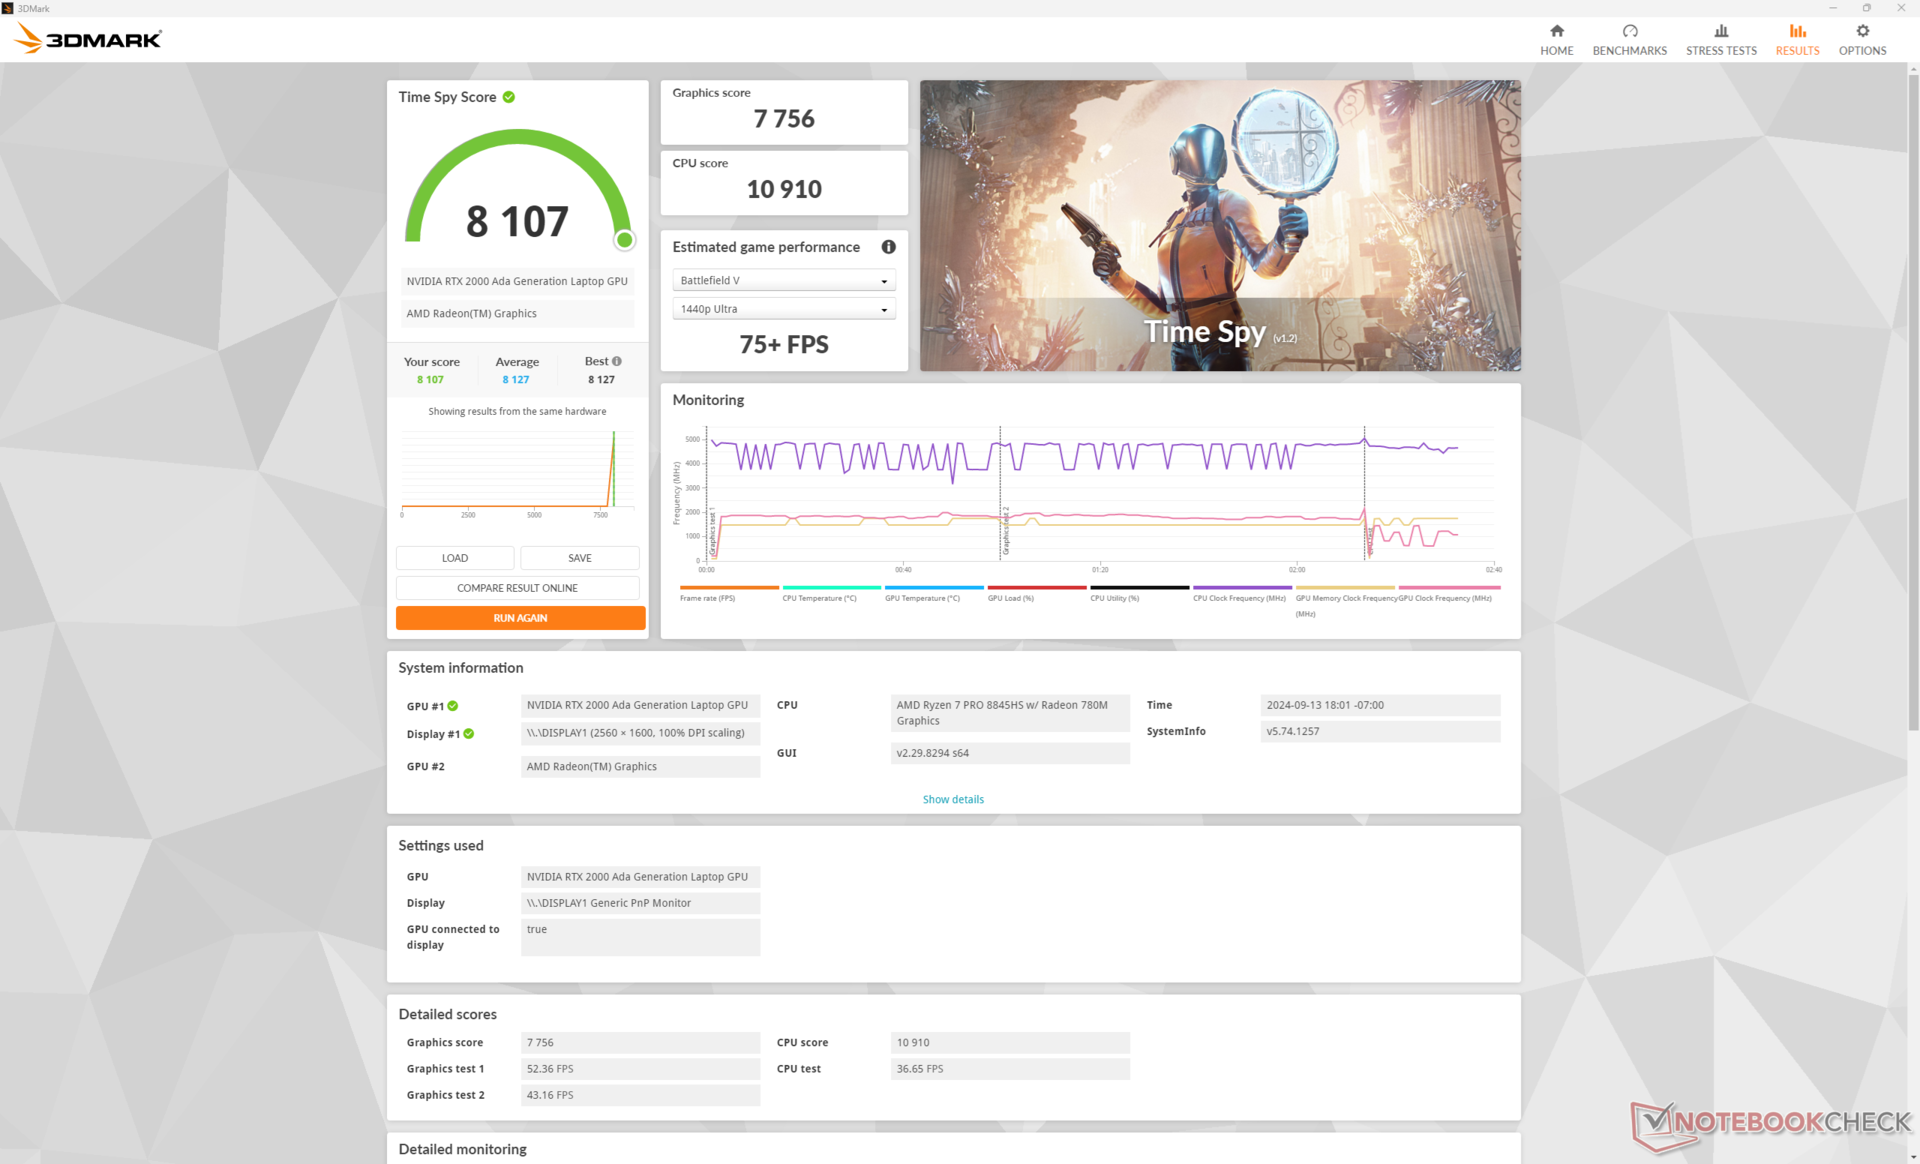
| 3DMark Time Spy Score | 8107 puntos | |
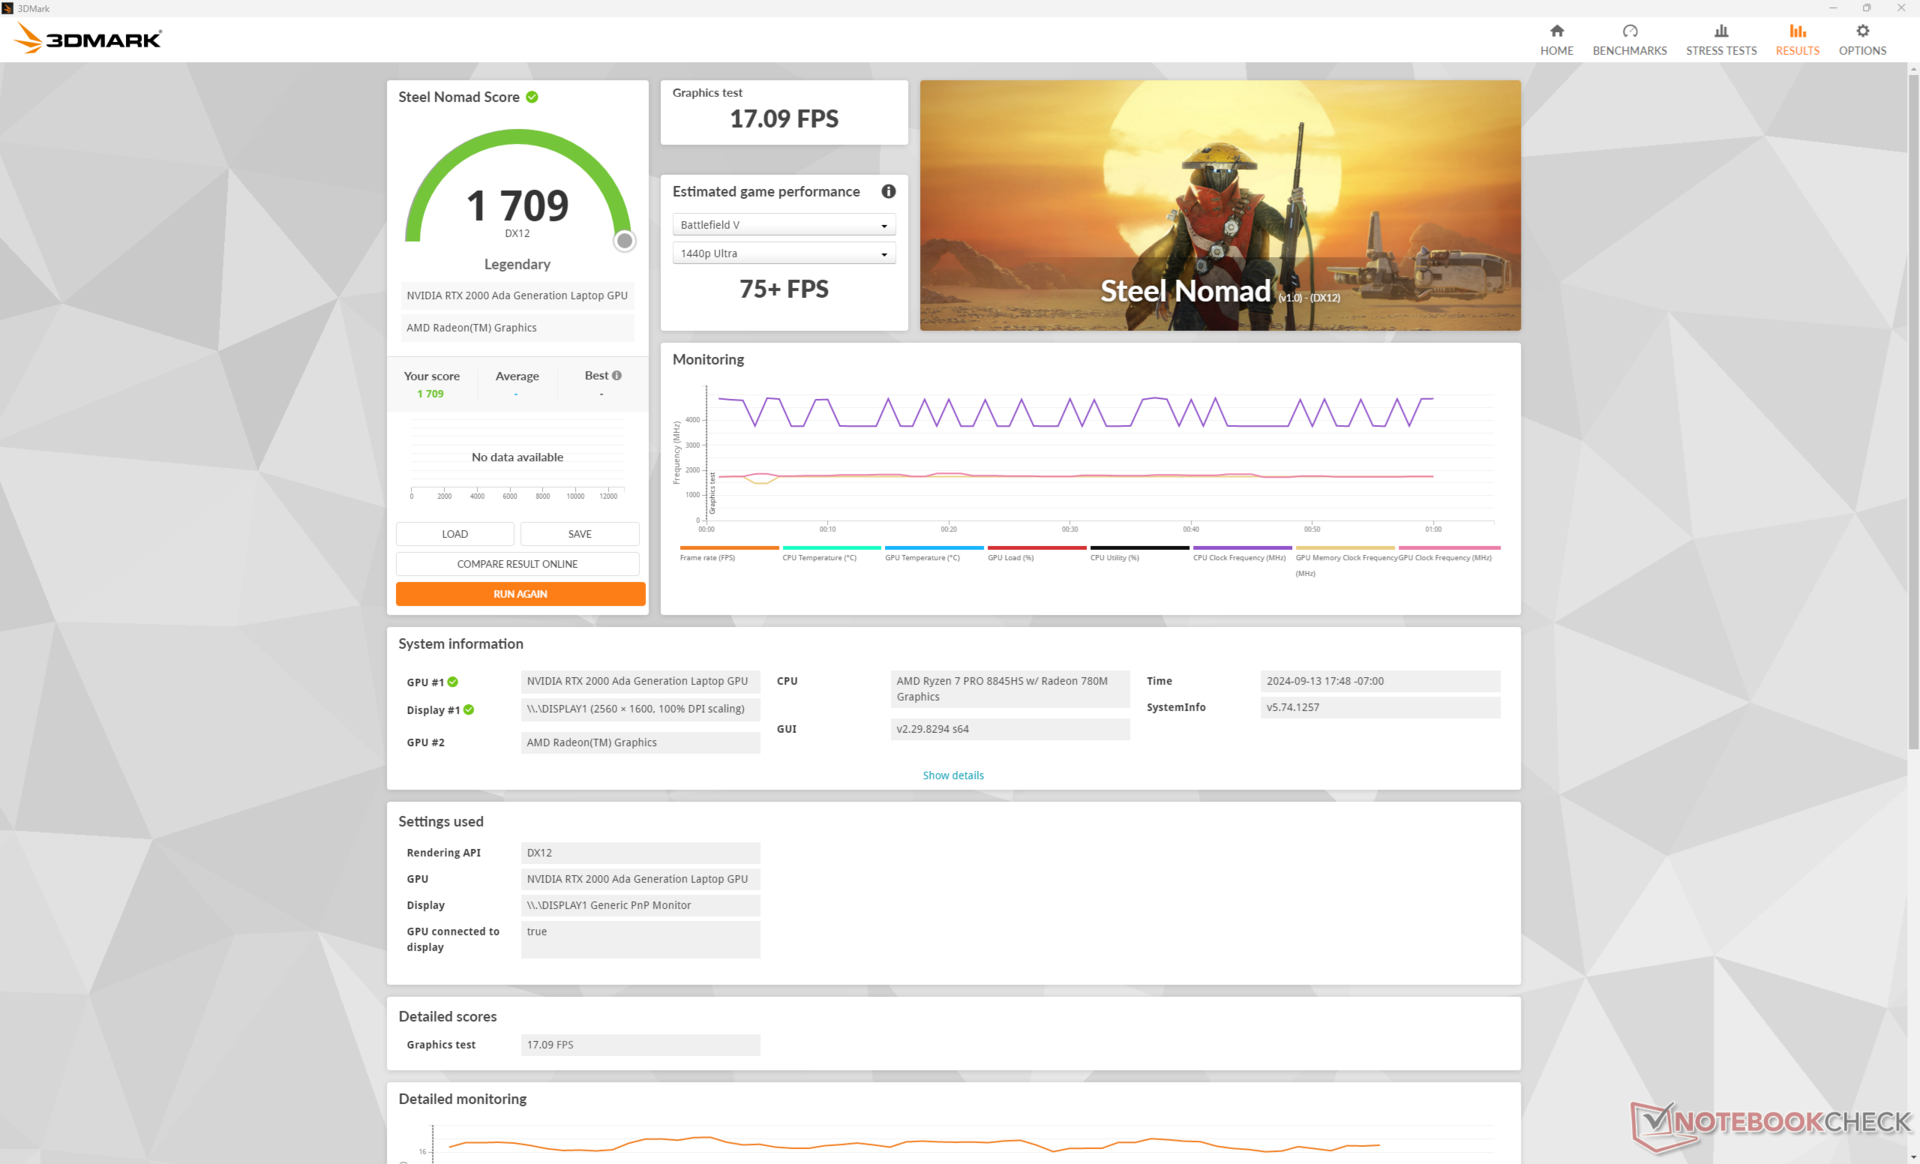
| 3DMark Steel Nomad Score | 1709 puntos | |
ayuda | ||
* ... más pequeño es mejor
Rendimiento en juegos
Aunque no está optimizada para juegos, la RTX 2000 Ada es más parecida a los portátiles que funcionan con la GeForce RTX 3060 o RTX 4060.
| Performance Rating - Percent | |
| HP ZBook Fury 16 G11 | |
| Dell Precision 5690 -1! | |
| HP ZBook Fury 16 G9 -1! | |
| MSI CreatorPro Z16P B12UKST | |
| Asus ExpertBook B6 Flip B6602FC2 | |
| Dell Precision 5000 5490 -1! | |
| HP ZBook Power 16 G11 A | |
| HP ZBook Power 15 G10 | |
| Lenovo ThinkPad P1 G4-20Y4Z9DVUS -3! | |
| Lenovo ThinkPad P16v G1 AMD | |
| HP ZBook Firefly 16 G9-6B897EA | |
| Lenovo ThinkPad P16s G2 21K9000CGE | |
| GTA V - 1920x1080 Highest Settings possible AA:4xMSAA + FX AF:16x | |
| HP ZBook Fury 16 G9 | |
| HP ZBook Fury 16 G11 | |
| MSI CreatorPro Z16P B12UKST | |
| HP ZBook Power 16 G11 A | |
| HP ZBook Power 15 G10 | |
| Asus ExpertBook B6 Flip B6602FC2 | |
| Lenovo ThinkPad P16v G1 AMD | |
| HP ZBook Firefly 16 G9-6B897EA | |
| Lenovo ThinkPad P16s G2 21K9000CGE | |
| Final Fantasy XV Benchmark - 1920x1080 High Quality | |
| Dell Precision 5690 | |
| HP ZBook Fury 16 G11 | |
| HP ZBook Fury 16 G9 | |
| Dell Precision 5000 5490 | |
| HP ZBook Power 15 G10 | |
| HP ZBook Power 16 G11 A | |
| MSI CreatorPro Z16P B12UKST | |
| Asus ExpertBook B6 Flip B6602FC2 | |
| Lenovo ThinkPad P16v G1 AMD | |
| Lenovo ThinkPad P1 G4-20Y4Z9DVUS | |
| Lenovo ThinkPad P16s G2 21K9000CGE | |
| HP ZBook Firefly 16 G9-6B897EA | |
| Dota 2 Reborn - 1920x1080 ultra (3/3) best looking | |
| HP ZBook Fury 16 G11 | |
| HP ZBook Fury 16 G9 | |
| MSI CreatorPro Z16P B12UKST | |
| Asus ExpertBook B6 Flip B6602FC2 | |
| Dell Precision 5690 | |
| HP ZBook Power 15 G10 | |
| Dell Precision 5000 5490 | |
| HP ZBook Power 16 G11 A | |
| Lenovo ThinkPad P16v G1 AMD | |
| Lenovo ThinkPad P1 G4-20Y4Z9DVUS | |
| HP ZBook Firefly 16 G9-6B897EA | |
| Lenovo ThinkPad P16s G2 21K9000CGE | |
Cyberpunk 2077 ultra FPS Chart
| bajo | medio | alto | ultra | QHD | |
|---|---|---|---|---|---|
| GTA V (2015) | 180.6 | 162.7 | 90.3 | 63.4 | |
| Dota 2 Reborn (2015) | 145.2 | 142 | 126.1 | 119.9 | |
| Final Fantasy XV Benchmark (2018) | 166.1 | 89.3 | 66.3 | 49.4 | |
| X-Plane 11.11 (2018) | 83.2 | 72.1 | 60.6 | ||
| Far Cry 5 (2018) | 138 | 111 | 104 | 98 | 67 |
| Strange Brigade (2018) | 329 | 187.8 | 158.1 | 138.5 | 99.5 |
| Tiny Tina's Wonderlands (2022) | 139.1 | 115.1 | 80 | 64.4 | 46.3 |
| F1 22 (2022) | 186.6 | 171.1 | 129.1 | 46.2 | 29.8 |
| Baldur's Gate 3 (2023) | 87.1 | 75.7 | 67.6 | 66.1 | 45.6 |
| Cyberpunk 2077 2.2 Phantom Liberty (2023) | 81.1 | 61.4 | 51.7 | 44.8 | 29.7 |
Emisiones
Ruido del sistema
Los niveles de ruido del ventilador y su comportamiento son similares a los que observamos en el modelo del año pasado. El sistema se mantiene silencioso con sólo 25,4 dB(A) incluso después de ejecutar la primera escena de pruebas comparativas de 3DMark 06, que es mucho más silencioso que los modelos de la competencia como el ThinkPad P16s G2 o Precision 5690 en condiciones similares.
Tenga en cuenta que el ruido del ventilador es notablemente más silencioso en modo Equilibrado; ejecutar Cyberpunk 2077 en modo Rendimiento puede ser tan ruidoso como 43 dB(A) en comparación con sólo 37,5 dB(A) si está en modo Equilibrado.
Ruido
| Ocioso |
| 23.8 / 24.2 / 24.2 dB(A) |
| Carga |
| 25.4 / 45 dB(A) |
 | ||
30 dB silencioso 40 dB(A) audible 50 dB(A) ruidosamente alto |
||
min: | ||
| HP ZBook Power 16 G11 A NVIDIA RTX 2000 Ada Generation Laptop GPU, R7 8845HS, Samsung PM9A1 MZVL22T0HBLB | HP ZBook Power 15 G10 NVIDIA RTX 2000 Ada Generation Laptop GPU, R7 PRO 7840HS, WDC PC SN810 2TB | HP ZBook Fury 16 G11 NVIDIA RTX 3500 Ada Generation Laptop GPU, i9-14900HX, SK hynix PC801 HFS001TEJ9X101N | Lenovo ThinkPad P1 Gen 7 21KV001SGE NVIDIA GeForce RTX 4060 Laptop GPU, Ultra 7 155H, Kioxia XG8 KXG8AZNV1T02 | Lenovo ThinkPad P16s G2 21K9000CGE Radeon 780M, R7 PRO 7840U, SK hynix PC801 HFS001TEJ9X162N | Dell Precision 5690 NVIDIA RTX 5000 Ada Generation Laptop GPU, Ultra 9 185H, 2x Samsung PM9A1 1TB (RAID 0) | |
|---|---|---|---|---|---|---|
| Noise | -3% | -15% | -18% | -3% | -17% | |
| apagado / medio ambiente * | 23.5 | 24.2 -3% | 23.2 1% | 24.7 -5% | 22.6 4% | 23.4 -0% |
| Idle Minimum * | 23.8 | 24.4 -3% | 23.2 3% | 24.7 -4% | 22.6 5% | 23.6 1% |
| Idle Average * | 24.2 | 24.4 -1% | 23.2 4% | 24.7 -2% | 22.6 7% | 24.9 -3% |
| Idle Maximum * | 24.2 | 24.4 -1% | 29.5 -22% | 24.7 -2% | 22.6 7% | 30.9 -28% |
| Load Average * | 25.4 | 27.4 -8% | 43 -69% | 43.7 -72% | 37.8 -49% | 40.4 -59% |
| Cyberpunk 2077 ultra * | 43 | 48.2 -12% | 53.2 -24% | |||
| Load Maximum * | 45 | 46.8 -4% | 48.2 -7% | 53.3 -18% | 40.5 10% | 51.9 -15% |
| Witcher 3 ultra * | 43.3 | 40.3 | 48.3 |
* ... más pequeño es mejor
Temperatura
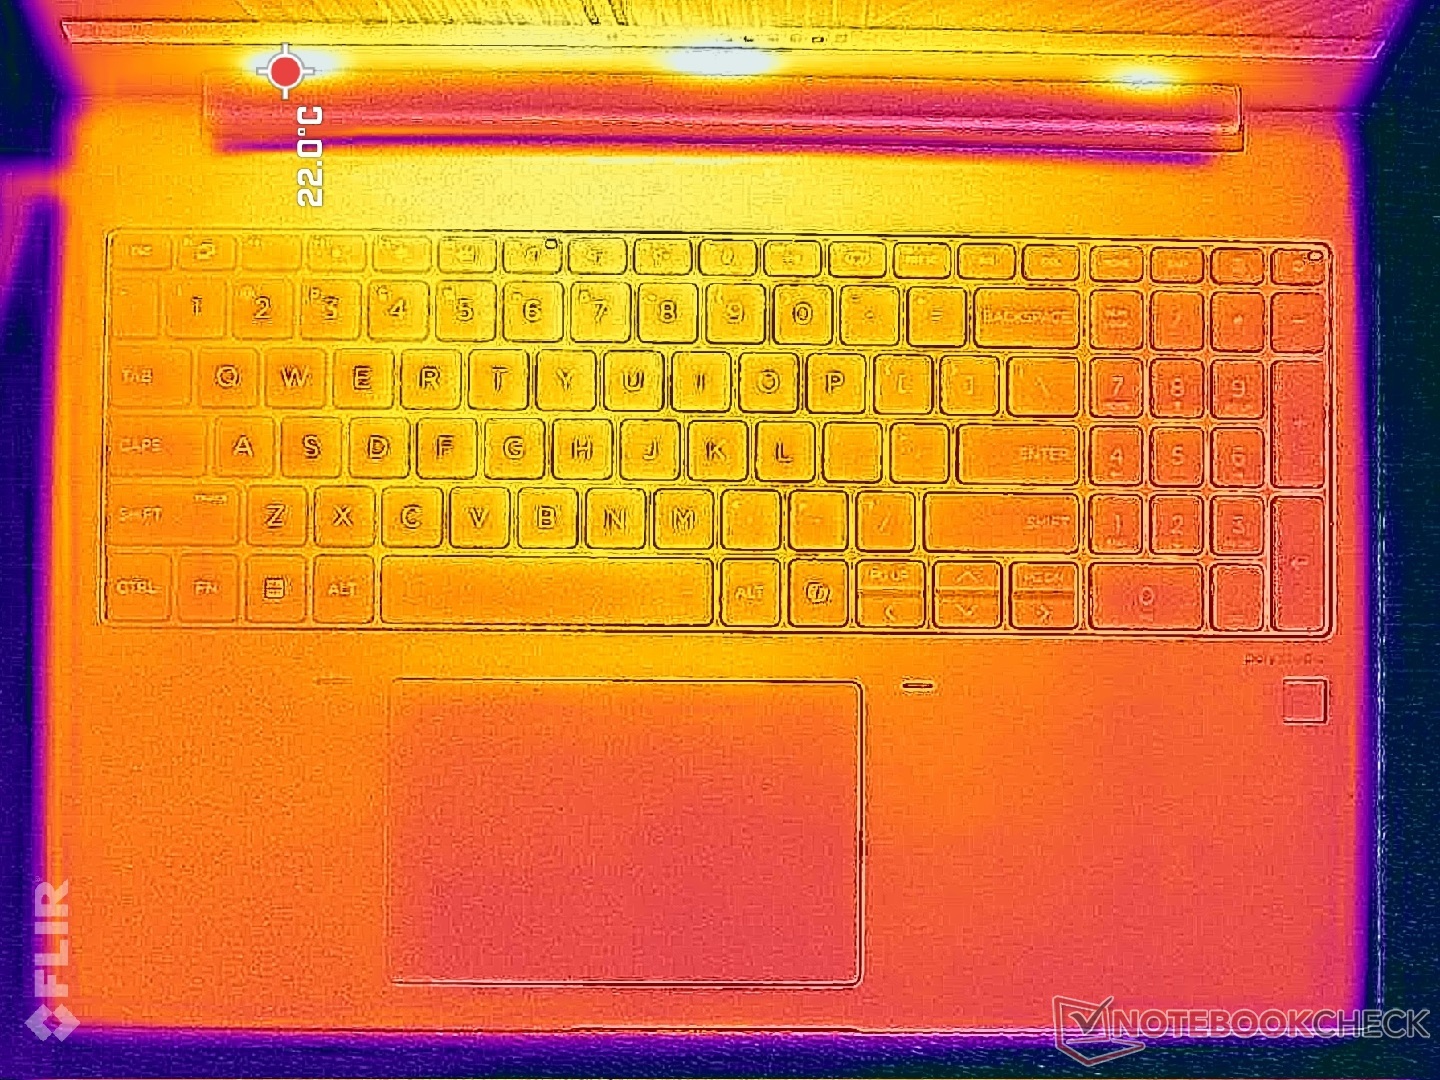
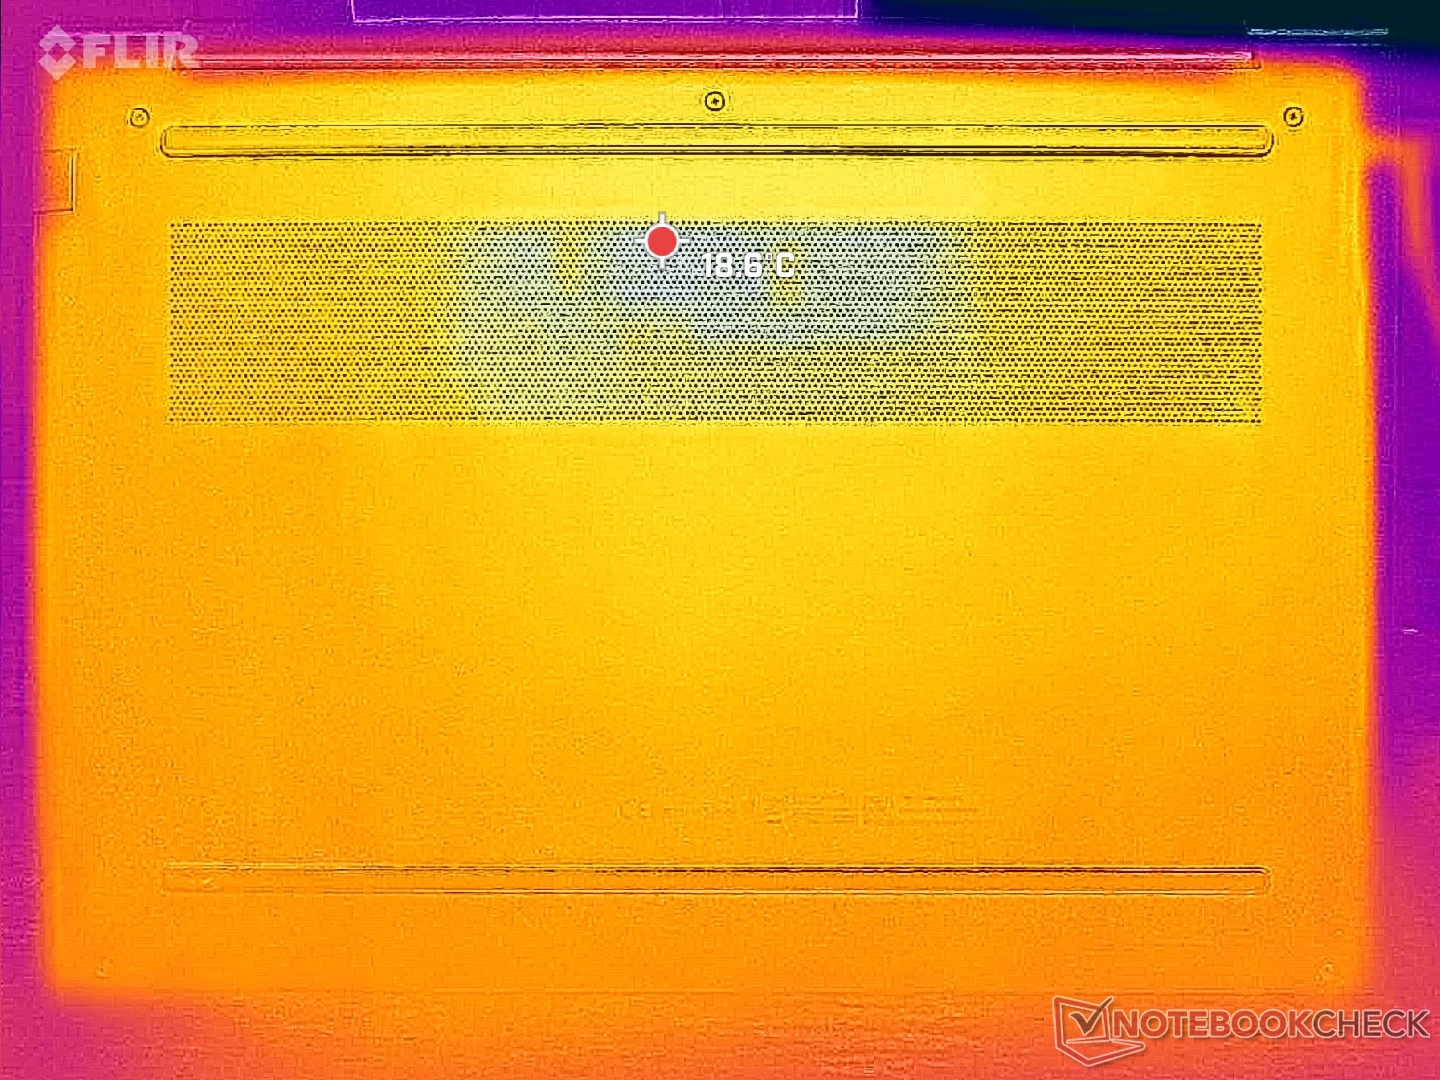
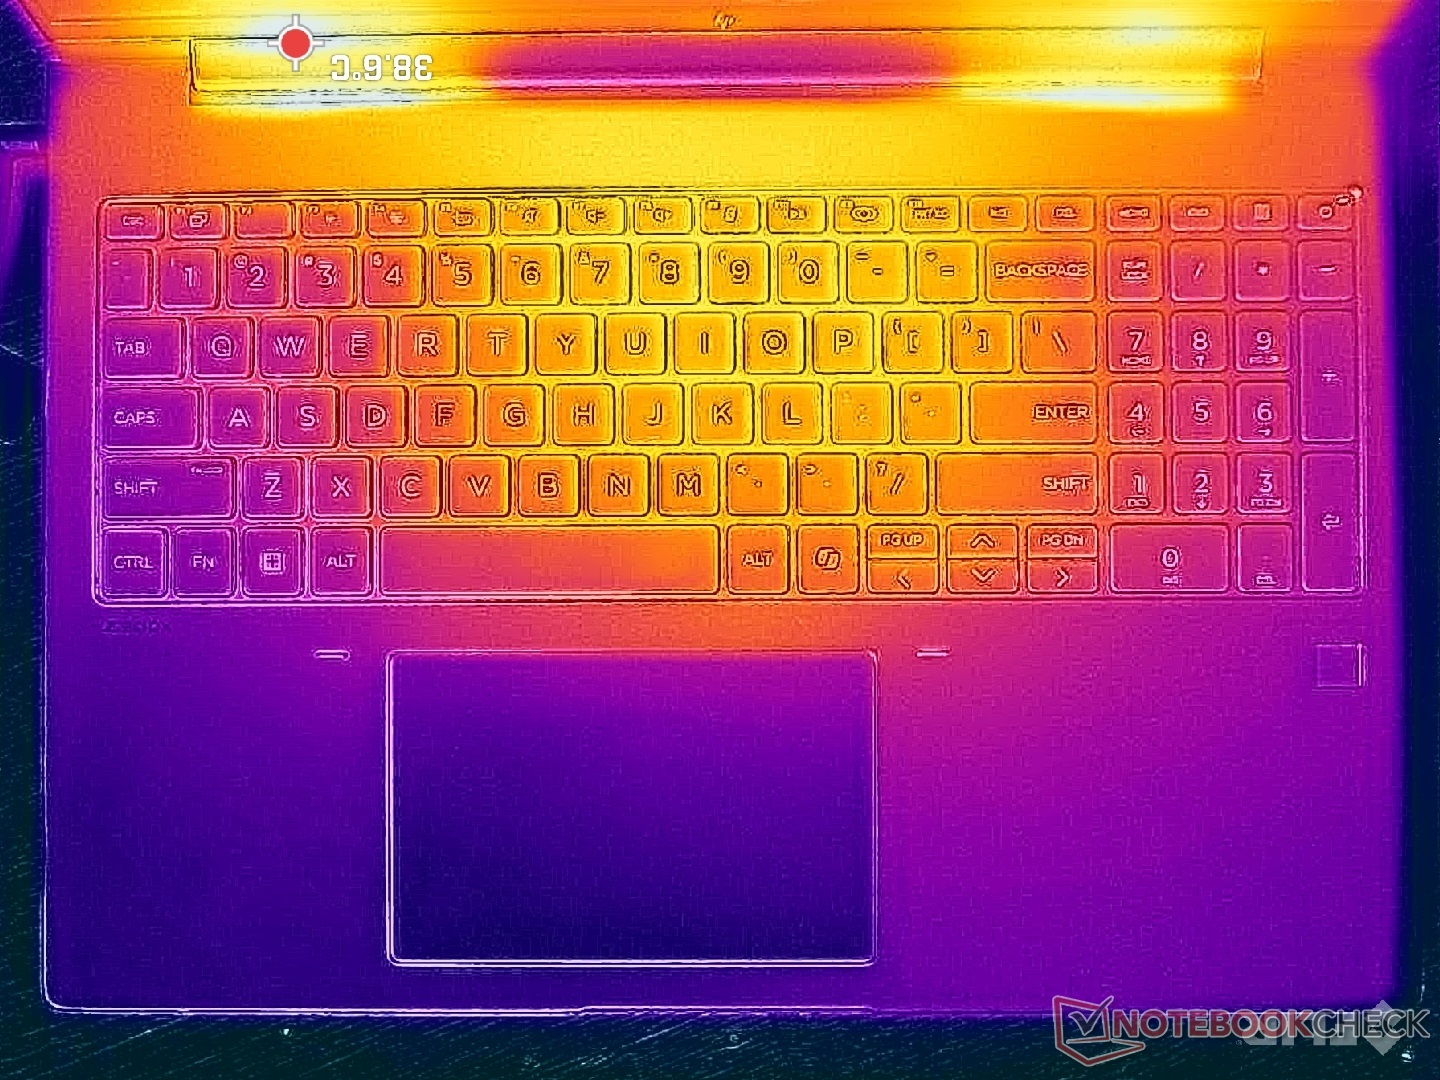
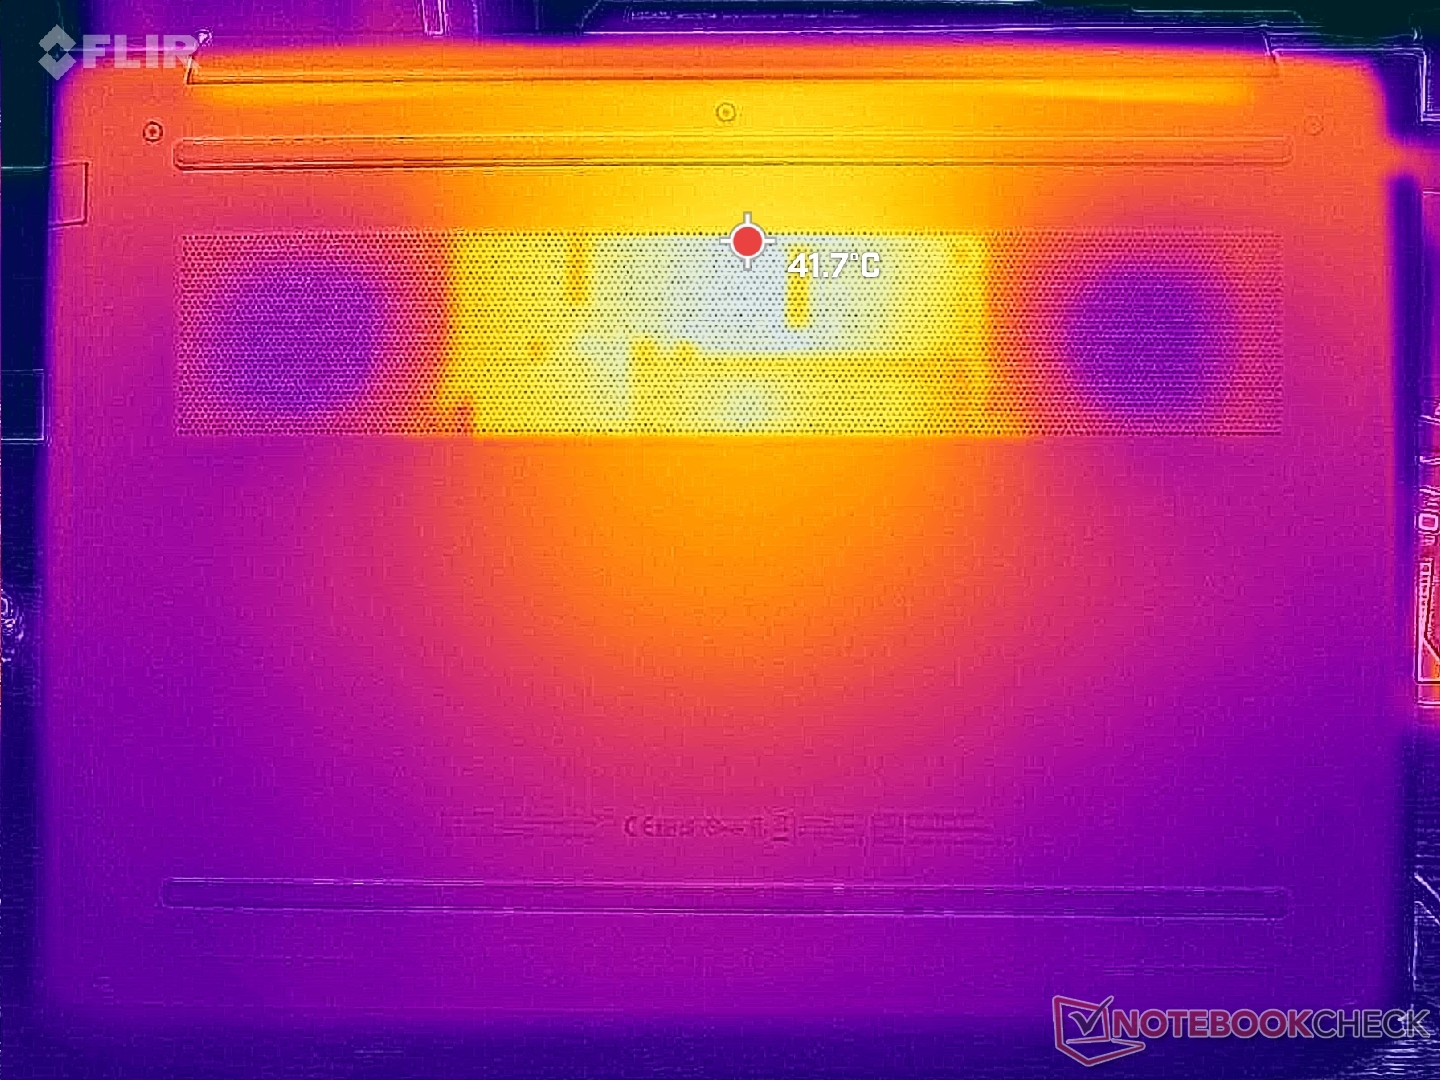
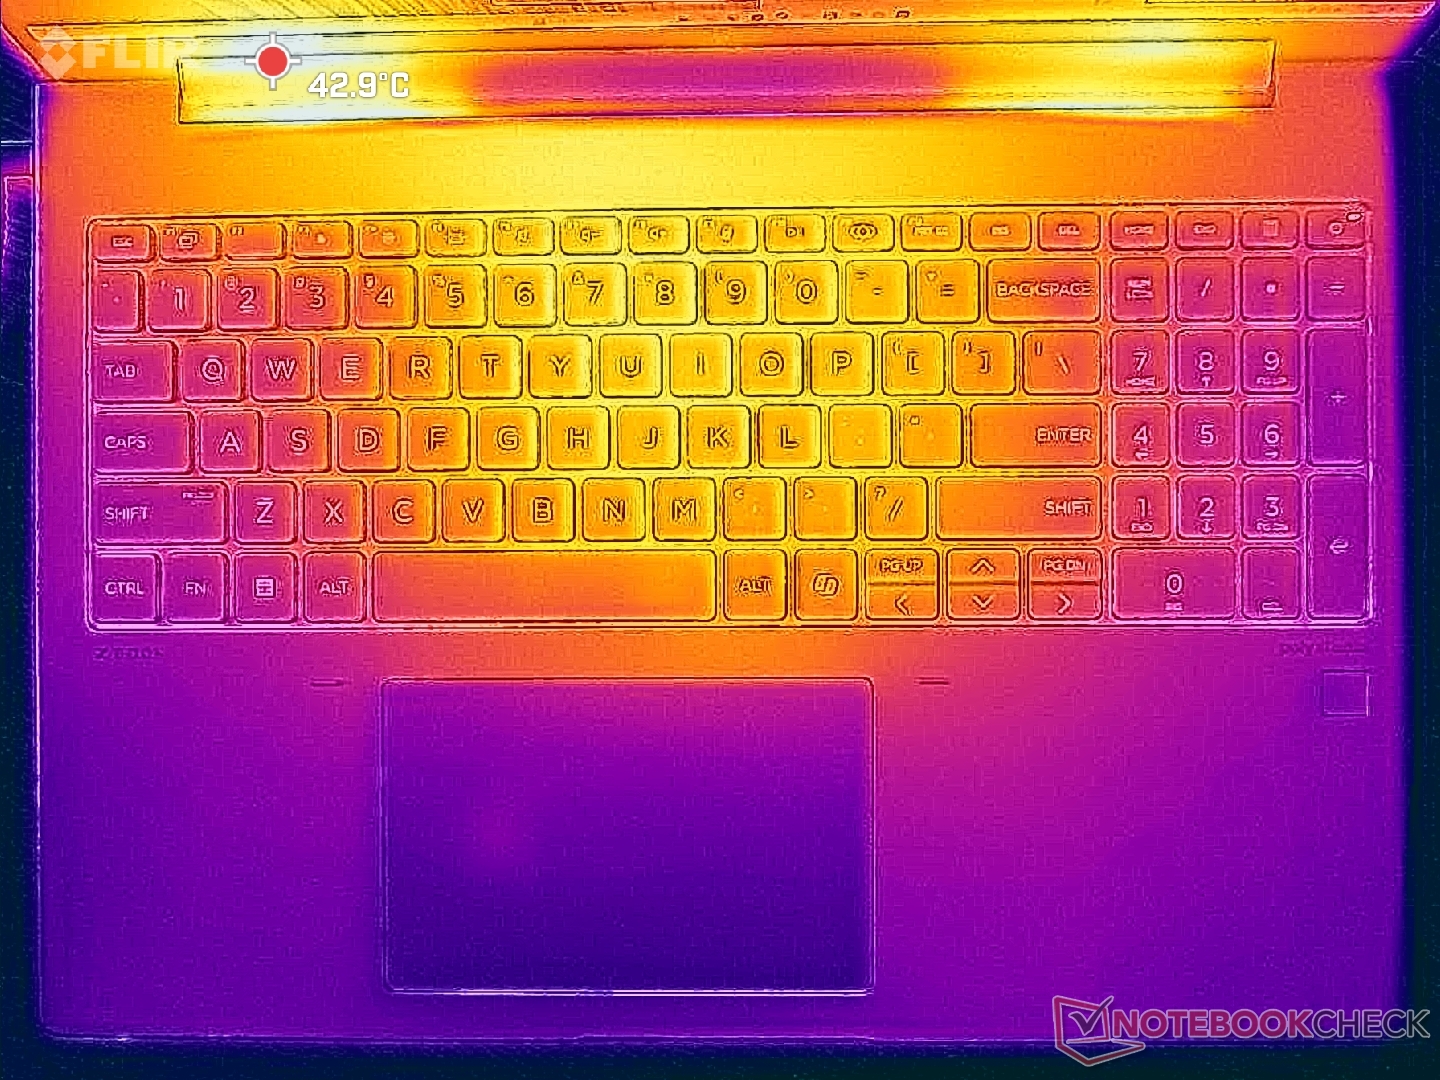
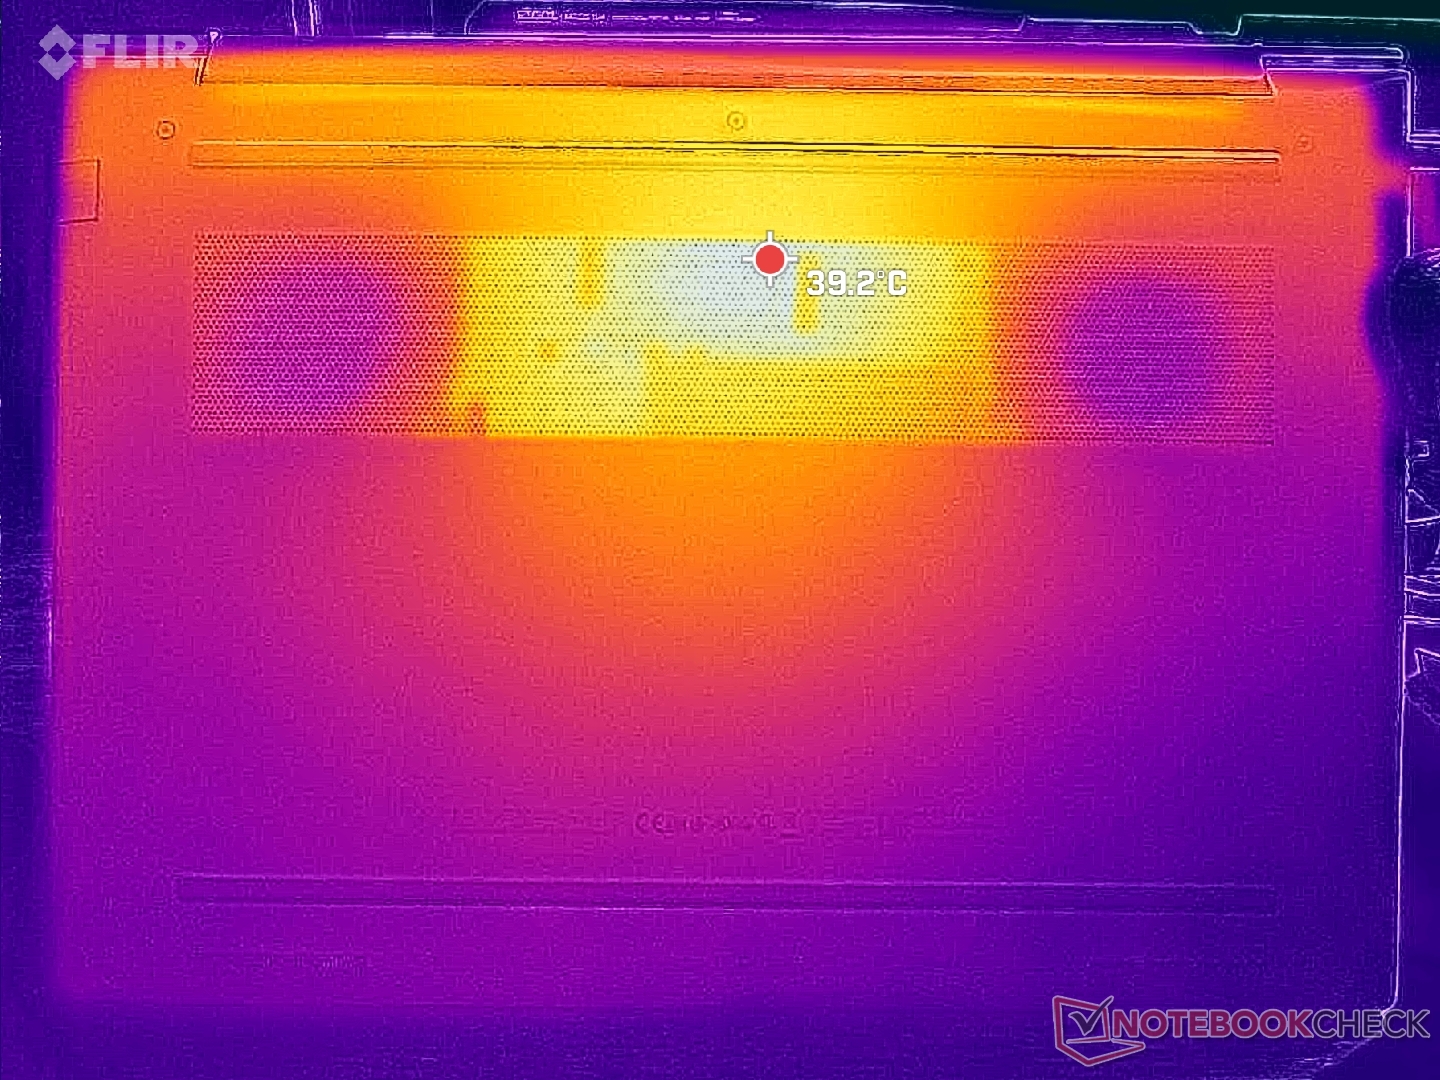
Las temperaturas superficiales son generalmente más frías en nuestro nuevo factor de forma de 16 pulgadas, especialmente en lo que respecta a la cubierta inferior. Los puntos calientes en la parte inferior alcanzan sólo 41 C cuando se ejecutan cargas exigentes en comparación con los 48 C del antiguo ZBook Power 15 G10. El punto caliente en el centro del teclado también alcanza los 41 C mientras que los reposamanos y los laterales permanecen más frescos y cómodos para las palmas y los dedos.
Cuando se compara con el más potente Precision 5690la unidad Dell es aún más caliente en el teclado mientras que es más fría en la superficie inferior.
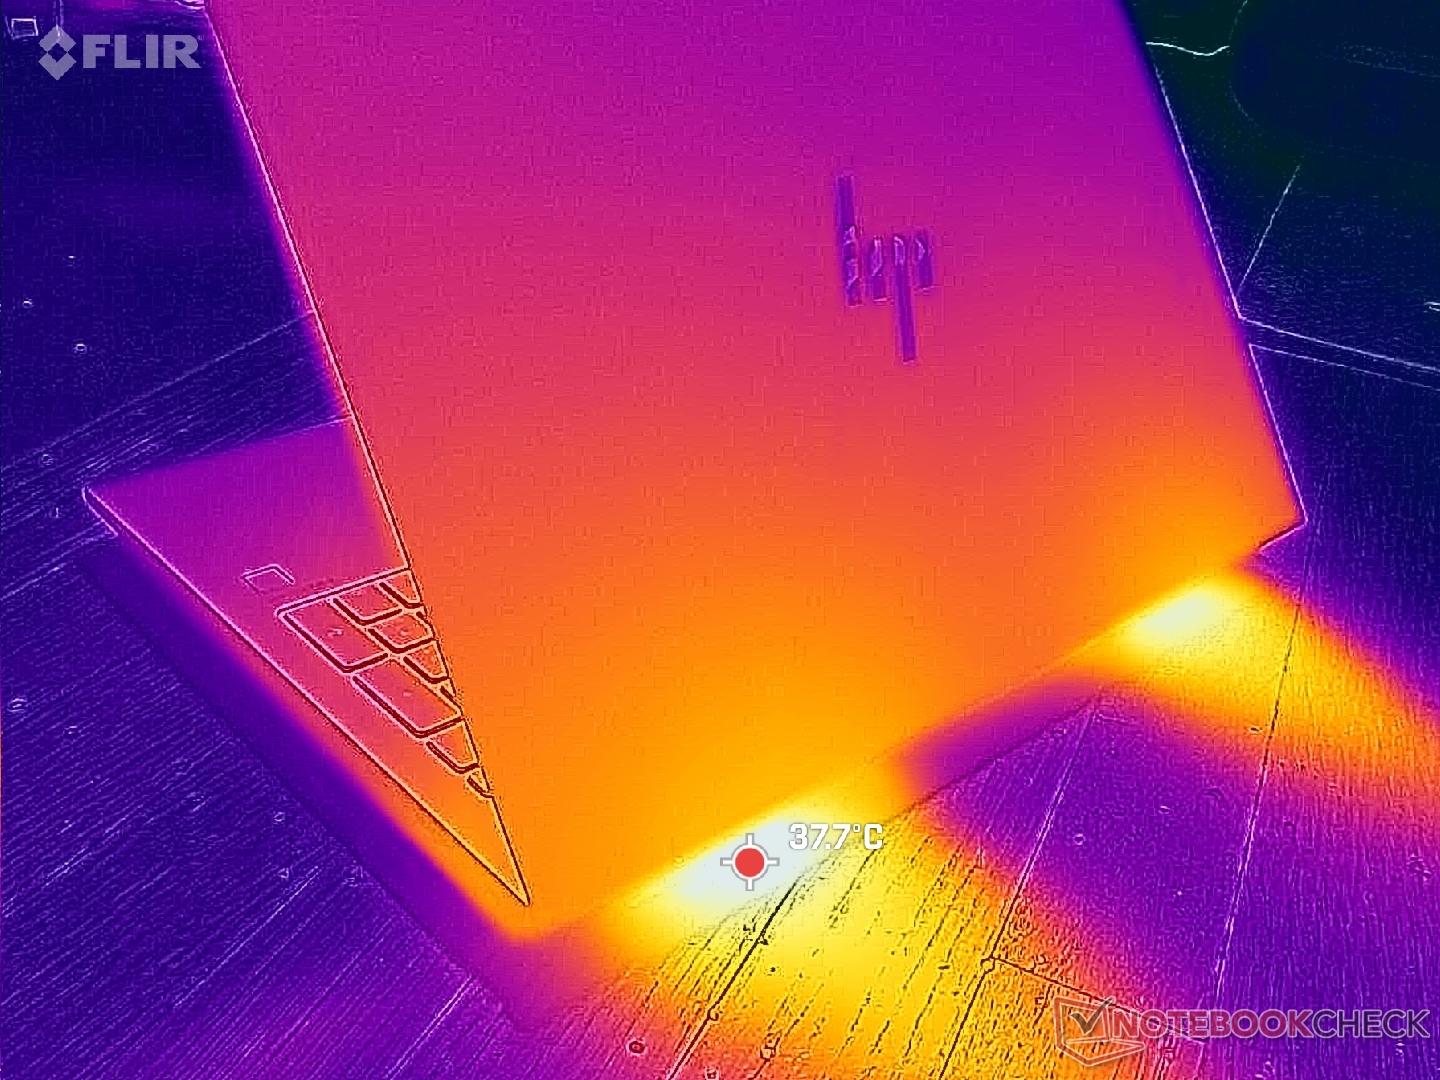
(±) La temperatura máxima en la parte superior es de 40.6 °C / 105 F, frente a la media de 38.2 °C / 101 F, que oscila entre 22.2 y 69.8 °C para la clase Workstation.
(±) El fondo se calienta hasta un máximo de 40.6 °C / 105 F, frente a la media de 41.2 °C / 106 F
(+) En reposo, la temperatura media de la parte superior es de 24.6 °C / 76# F, frente a la media del dispositivo de 32 °C / 90 F.
(+) 3: The average temperature for the upper side is 30.1 °C / 86 F, compared to the average of 32 °C / 90 F for the class Workstation.
(+) El reposamanos y el panel táctil están a una temperatura inferior a la de la piel, con un máximo de 27.2 °C / 81 F y, por tanto, son fríos al tacto.
(±) La temperatura media de la zona del reposamanos de dispositivos similares fue de 27.8 °C / 82 F (+0.6 °C / 1 F).
| HP ZBook Power 16 G11 A AMD Ryzen 7 8845HS, NVIDIA RTX 2000 Ada Generation Laptop GPU | HP ZBook Power 15 G10 AMD Ryzen 7 PRO 7840HS, NVIDIA RTX 2000 Ada Generation Laptop GPU | HP ZBook Fury 16 G11 Intel Core i9-14900HX, NVIDIA RTX 3500 Ada Generation Laptop GPU | Lenovo ThinkPad P1 Gen 7 21KV001SGE Intel Core Ultra 7 155H, NVIDIA GeForce RTX 4060 Laptop GPU | Lenovo ThinkPad P16s G2 21K9000CGE AMD Ryzen 7 PRO 7840U, AMD Radeon 780M | Dell Precision 5690 Intel Core Ultra 9 185H, Nvidia RTX 5000 Ada Generation Laptop GPU | |
|---|---|---|---|---|---|---|
| Heat | -7% | -26% | -8% | -9% | -8% | |
| Maximum Upper Side * | 40.6 | 42.4 -4% | 42.2 -4% | 50.3 -24% | 42.7 -5% | 46.6 -15% |
| Maximum Bottom * | 40.6 | 47.8 -18% | 48 -18% | 38 6% | 47.2 -16% | 33 19% |
| Idle Upper Side * | 26 | 26.8 -3% | 37 -42% | 28.3 -9% | 27.8 -7% | 32.4 -25% |
| Idle Bottom * | 26.6 | 27.2 -2% | 36.8 -38% | 27.3 -3% | 28.4 -7% | 29.4 -11% |
* ... más pequeño es mejor
Altavoces
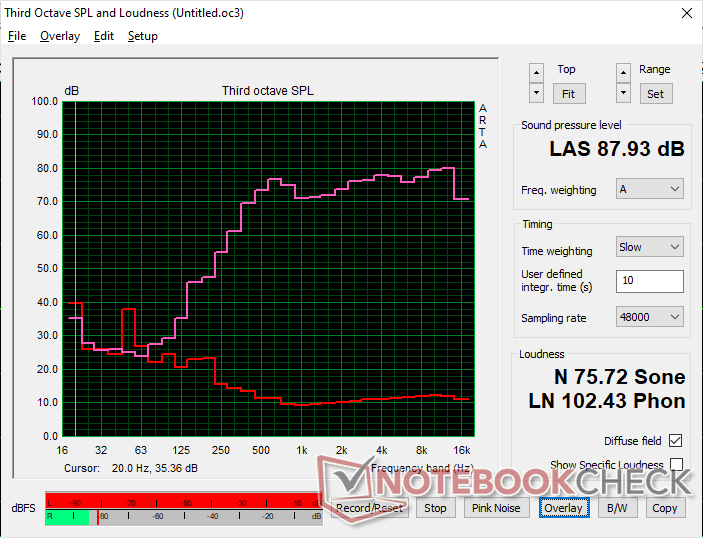
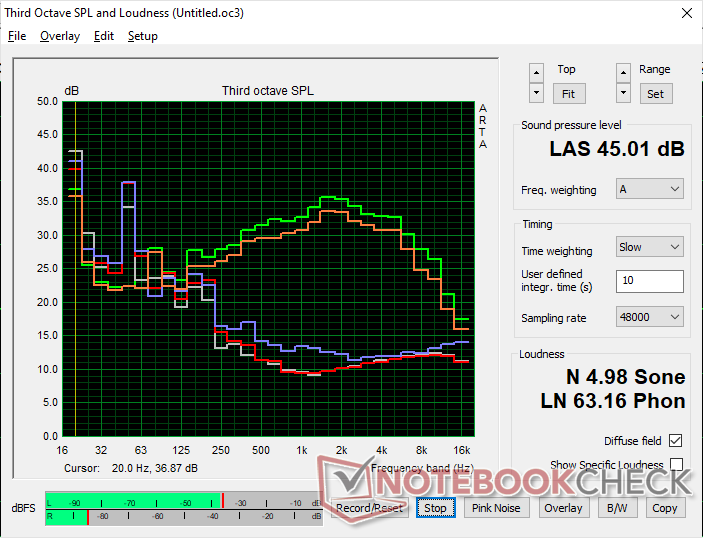
HP ZBook Power 16 G11 A análisis de audio
(+) | los altavoces pueden reproducir a un volumen relativamente alto (#87.9 dB)
Graves 100 - 315 Hz
(-) | casi sin bajos - de media 28.1% inferior a la mediana
(±) | la linealidad de los graves es media (9% delta a frecuencia anterior)
Medios 400 - 2000 Hz
(+) | medios equilibrados - a sólo 1.9% de la mediana
(+) | los medios son lineales (4.8% delta a la frecuencia anterior)
Altos 2 - 16 kHz
(+) | máximos equilibrados - a sólo 3.6% de la mediana
(+) | los máximos son lineales (2.4% delta a la frecuencia anterior)
Total 100 - 16.000 Hz
(±) | la linealidad del sonido global es media (15.1% de diferencia con la mediana)
En comparación con la misma clase
» 29% de todos los dispositivos probados de esta clase eran mejores, 7% similares, 63% peores
» El mejor tuvo un delta de 7%, la media fue 18%, el peor fue ###max##%
En comparación con todos los dispositivos probados
» 19% de todos los dispositivos probados eran mejores, 4% similares, 77% peores
» El mejor tuvo un delta de 4%, la media fue 24%, el peor fue ###max##%
Apple MacBook Pro 16 2021 M1 Pro análisis de audio
(+) | los altavoces pueden reproducir a un volumen relativamente alto (#84.7 dB)
Graves 100 - 315 Hz
(+) | buen bajo - sólo 3.8% lejos de la mediana
(+) | el bajo es lineal (5.2% delta a la frecuencia anterior)
Medios 400 - 2000 Hz
(+) | medios equilibrados - a sólo 1.3% de la mediana
(+) | los medios son lineales (2.1% delta a la frecuencia anterior)
Altos 2 - 16 kHz
(+) | máximos equilibrados - a sólo 1.9% de la mediana
(+) | los máximos son lineales (2.7% delta a la frecuencia anterior)
Total 100 - 16.000 Hz
(+) | el sonido global es lineal (4.6% de diferencia con la mediana)
En comparación con la misma clase
» 0% de todos los dispositivos probados de esta clase eran mejores, 0% similares, 100% peores
» El mejor tuvo un delta de 5%, la media fue 18%, el peor fue ###max##%
En comparación con todos los dispositivos probados
» 0% de todos los dispositivos probados eran mejores, 0% similares, 100% peores
» El mejor tuvo un delta de 4%, la media fue 24%, el peor fue ###max##%
Gestión de la energía
Consumo de energía
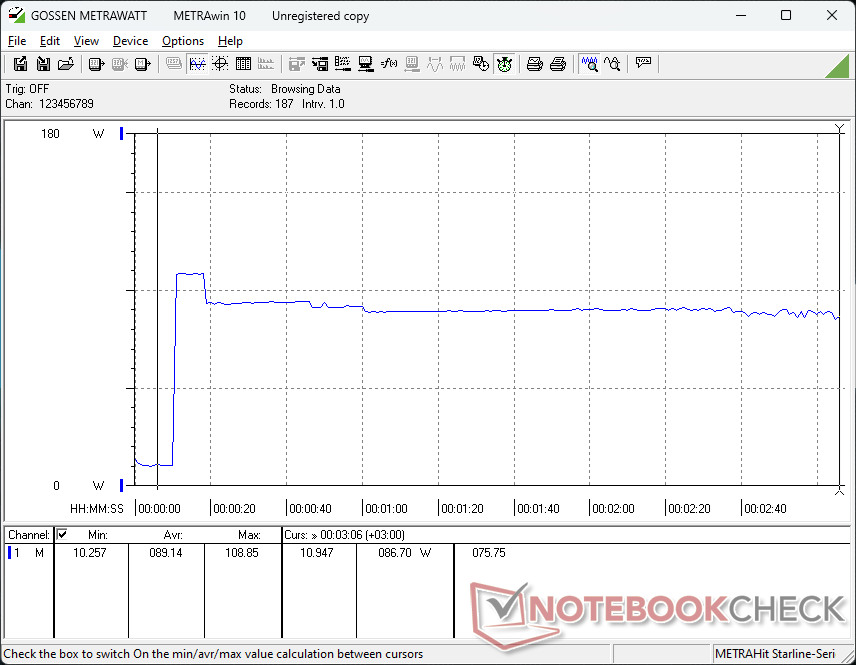
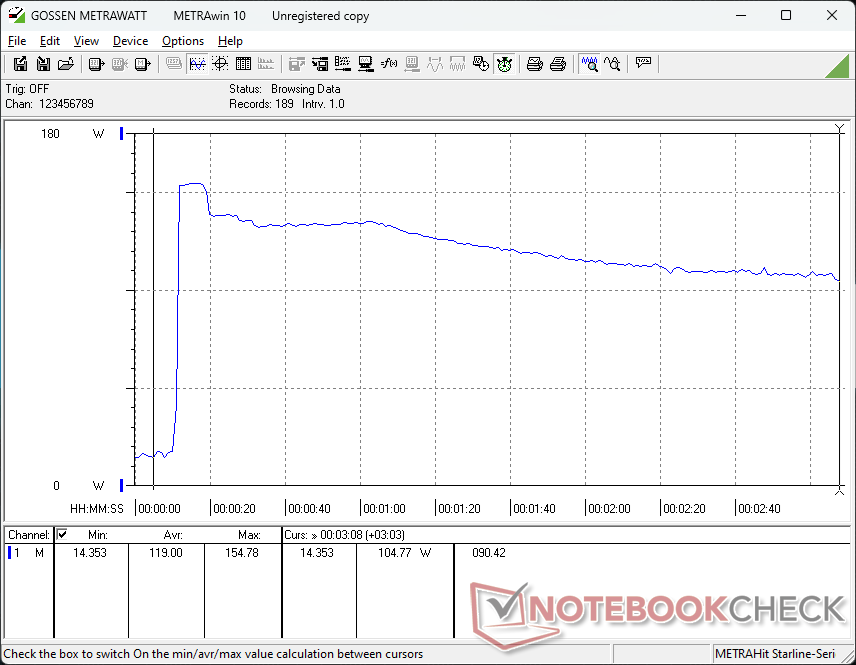
Los niveles de consumo y el comportamiento son similares a los que observamos en el ZBook Power 15 G10, lo que no es sorprendente dado que la envolvente de potencia sigue siendo la misma entre ambos. Quizás la diferencia más notable se refiere al menor consumo de unos 25 W al ejecutar Prime95 y FurMark simultáneamente. Esto puede atribuirse al mayor estrangulamiento para enfriar las temperaturas del núcleo cuando se ejecutan tales cargas, como se mencionó anteriormente en la sección de Pruebas de Estrés.
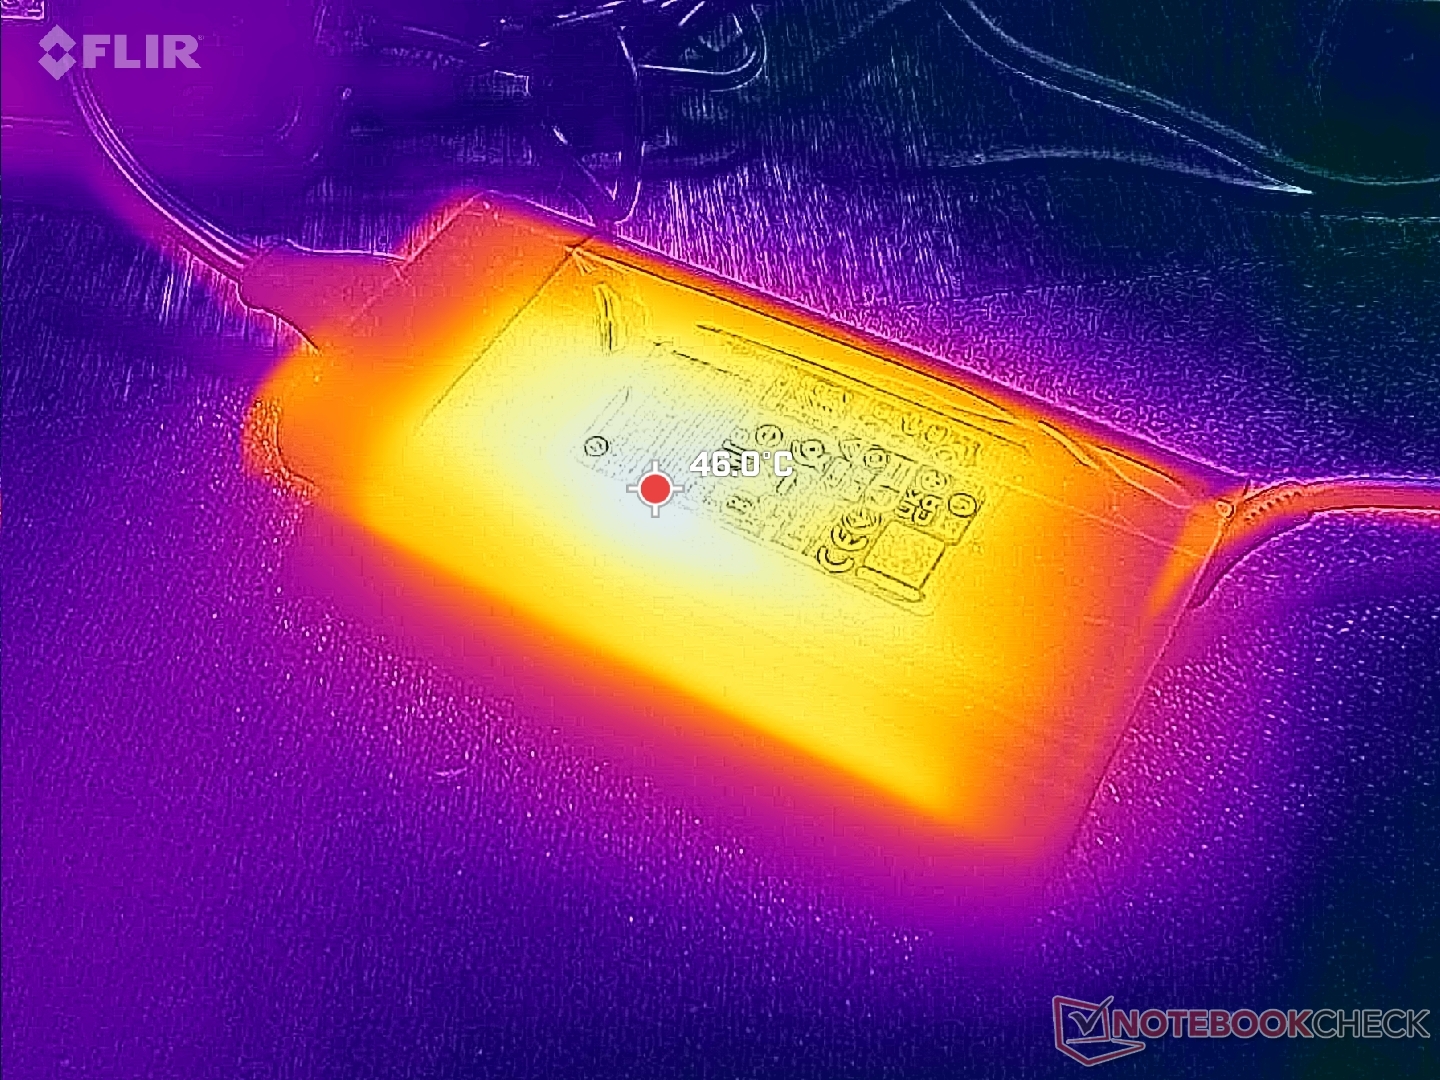
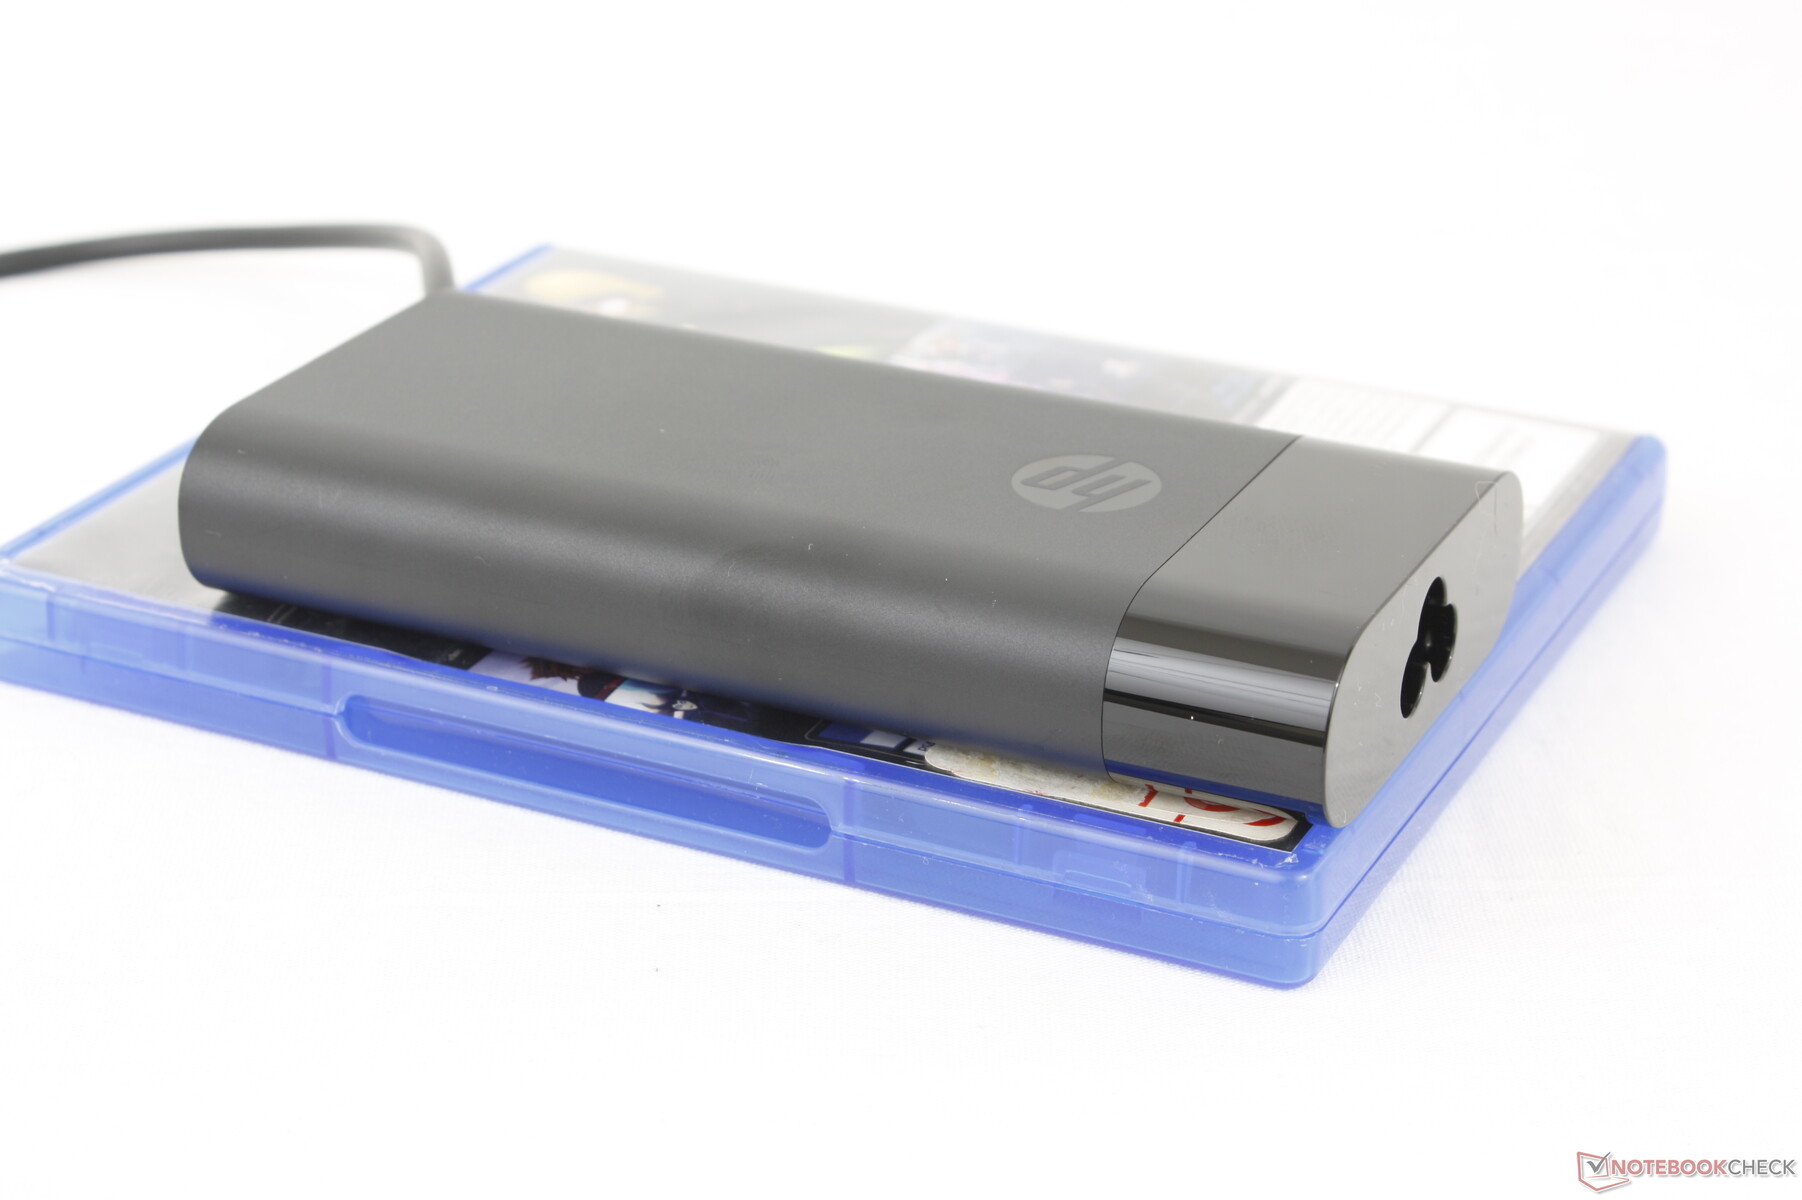
Somos capaces de registrar un consumo temporal máximo de 155 W desde el adaptador de CA de 150 W de tamaño medio (~13,8 x 6,5 x 2,2 cm).
| Off / Standby | |
| Ocioso | |
| Carga |
|
Clave:
min: | |
| HP ZBook Power 16 G11 A R7 8845HS, NVIDIA RTX 2000 Ada Generation Laptop GPU, Samsung PM9A1 MZVL22T0HBLB, IPS, 2560x1600, 16" | HP ZBook Power 15 G10 R7 PRO 7840HS, NVIDIA RTX 2000 Ada Generation Laptop GPU, WDC PC SN810 2TB, IPS, 2560x1440, 15.6" | HP ZBook Fury 16 G11 i9-14900HX, NVIDIA RTX 3500 Ada Generation Laptop GPU, SK hynix PC801 HFS001TEJ9X101N, IPS, 3840x2400, 16" | Lenovo ThinkPad P1 Gen 7 21KV001SGE Ultra 7 155H, NVIDIA GeForce RTX 4060 Laptop GPU, Kioxia XG8 KXG8AZNV1T02, IPS LED, 2560x1600, 16" | Lenovo ThinkPad P16s G2 21K9000CGE R7 PRO 7840U, Radeon 780M, SK hynix PC801 HFS001TEJ9X162N, OLED, 3840x2400, 16" | Dell Precision 5690 Ultra 9 185H, NVIDIA RTX 5000 Ada Generation Laptop GPU, 2x Samsung PM9A1 1TB (RAID 0), OLED, 3840x2400, 16" | |
|---|---|---|---|---|---|---|
| Power Consumption | -13% | -80% | -35% | 20% | -67% | |
| Idle Minimum * | 4.6 | 5.3 -15% | 8.6 -87% | 7.3 -59% | 6.1 -33% | 7.9 -72% |
| Idle Average * | 10 | 9.9 1% | 14.8 -48% | 12.3 -23% | 6.5 35% | 12 -20% |
| Idle Maximum * | 10.6 | 16.7 -58% | 15.7 -48% | 17.9 -69% | 7 34% | 28.6 -170% |
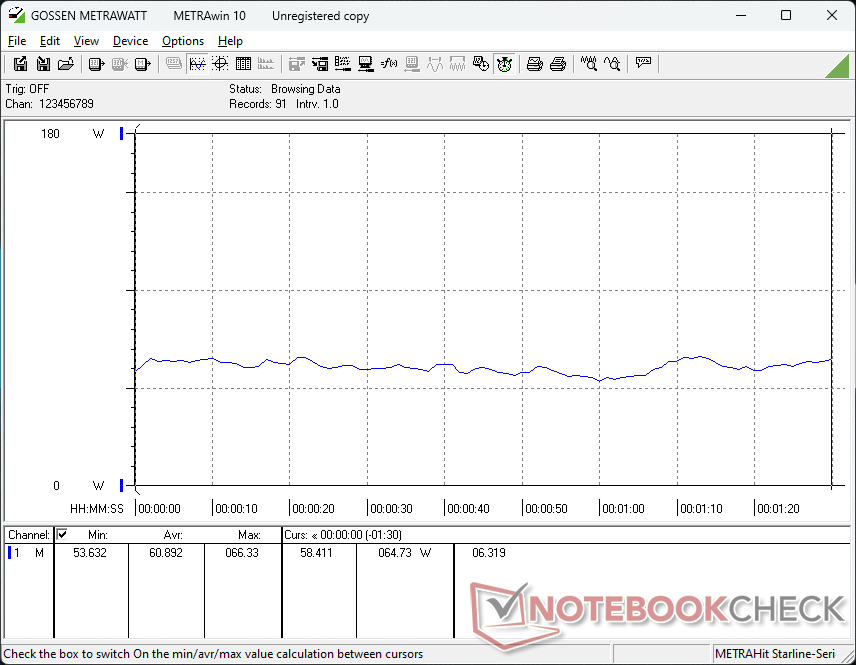
| Load Average * | 60.9 | 61.3 -1% | 129.4 -112% | 78.2 -28% | 56.6 7% | 98.8 -62% |
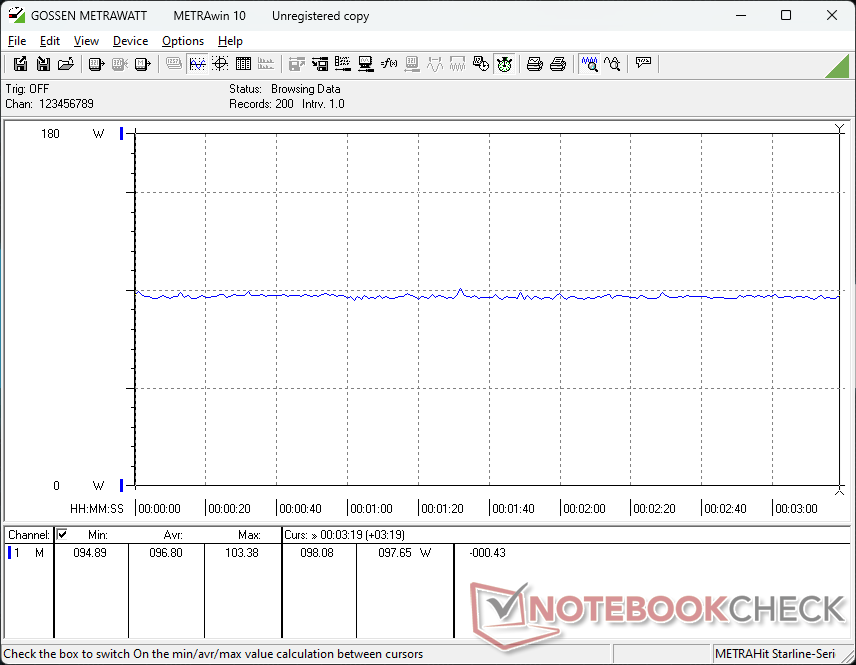
| Cyberpunk 2077 ultra external monitor * | 92.8 | 192.6 -108% | 117.7 -27% | |||
| Cyberpunk 2077 ultra * | 96.8 | 199.4 -106% | 123.5 -28% | |||
| Load Maximum * | 154.8 | 145.3 6% | 236.1 -53% | 167.5 -8% | 68.3 56% | 174.8 -13% |
| Witcher 3 ultra * | 87.9 | 61.2 | 144.5 |
* ... más pequeño es mejor
Power Consumption Cyberpunk / Stress Test
Power Consumption external Monitor
Duración de las pilas
La capacidad de la batería no ha cambiado con respecto al ZBook Power 15 G10 del año pasado a pesar de las actualizaciones del factor de forma. Tal vez por coincidencia, los tiempos de ejecución siguen siendo casi los mismos en poco más de 9,5 horas de navegación WLAN en el mundo real antes del apagado automático.
La carga desde vacío a plena capacidad es relativamente rápida con menos de 70 minutos. La carga a través de USB-C es compatible aunque a velocidades más lentas.
| HP ZBook Power 16 G11 A R7 8845HS, NVIDIA RTX 2000 Ada Generation Laptop GPU, 83 Wh | HP ZBook Power 15 G10 R7 PRO 7840HS, NVIDIA RTX 2000 Ada Generation Laptop GPU, 83 Wh | HP ZBook Fury 16 G11 i9-14900HX, NVIDIA RTX 3500 Ada Generation Laptop GPU, 95 Wh | Lenovo ThinkPad P1 Gen 7 21KV001SGE Ultra 7 155H, NVIDIA GeForce RTX 4060 Laptop GPU, 90 Wh | Lenovo ThinkPad P16s G2 21K9000CGE R7 PRO 7840U, Radeon 780M, 84 Wh | Dell Precision 5690 Ultra 9 185H, NVIDIA RTX 5000 Ada Generation Laptop GPU, 98 Wh | |
|---|---|---|---|---|---|---|
| Duración de Batería | 3% | -31% | 7% | -1% | -6% | |
| Reader / Idle | 1566 | |||||
| WiFi v1.3 | 582 | 601 3% | 402 -31% | 595 2% | 635 9% | 549 -6% |
| Load | 103 | 114 11% | 92 -11% | |||
| H.264 | 797 |
Pro
Contra
Veredicto - Pantalla más grande pero mismo rendimiento
El ZBook Power 16 G11 sustituye a la serie ZBook Power 15 con un diseño más grande y pesado de 16 pulgadas. Uno podría suponer que el factor de forma más grande conduce a un rendimiento más rápido, pero lamentablemente no es el caso. Las nuevas CPU Hawk Point no ofrecen mucho respecto a las opciones Phoenix del año pasado, mientras que las opciones de GPU son exactamente las mismas hasta sus techos TGP. El rediseño del chasis era la oportunidad de HP para mejorar la solución de refrigeración y exprimir más rendimiento de los procesadores, pero suponemos que el fabricante no quería invadir demasiado el territorio del ZBook Fury de gama alta.
Las opciones de pantalla también son un poco decepcionantes para una estación de trabajo. Aparte de la única opción de 1000 nits, no hay características dignas de mención como OLED, colores P3 o resolución 4K. Tales paneles habrían hecho que el mayor tamaño de pantalla fuera mucho más atractivo que la versión saliente de 15,6 pulgadas. En su lugar, los usuarios están limitados a 2K e IPS.
El ZBook Power 16 G11 no ofrece mucho más sobre su predecesor aparte del mayor tamaño de pantalla de 16 pulgadas. El rendimiento y las características son prácticamente iguales entre los dos modelos.
El HP sigue siendo una sólida estación de trabajo de gama media a pesar de la falta de mejoras de rendimiento y nuevas características. El rendimiento de la CPU sigue siendo notablemente más rápido que el ThinkPad P16s G2 que está limitado a las CPU de la serie Ryzen-U, al tiempo que es menos caro que el popular Dell Precision 5690 cuando se configura con la misma GPU. Sin embargo, si ya posee un ZBook Power 15 G10, la versión más pesada de 16 pulgadas puede parecerle un paso atrás.
Precio y disponibilidad
HP ya está distribuyendo el ZBook Power 16 G11 A a partir de 1140 dólares en la configuración base Ryzen 5 e iGPU. Nuestra configuración de revisión con la CPU Ryzen 7, la GPU RTX 2000 Ada y la pantalla 1600p se vende por unos 2000 $.
Nota: Recientemente hemos actualizado nuestro sistema de clasificación y los resultados de la versión 8 no son comparables con los de la versión 7. Encontrará más información aquí .
HP ZBook Power 16 G11 A
- 09/30/2024 v8
Allen Ngo
 Total Sustainability Score:
 Transparencia
La selección de los dispositivos que se van a reseñar corre a cargo de nuestro equipo editorial. La muestra de prueba fue proporcionada al autor en calidad de préstamo por el fabricante o el minorista a los efectos de esta reseña. El prestamista no tuvo ninguna influencia en esta reseña, ni el fabricante recibió una copia de la misma antes de su publicación. No había ninguna obligación de publicar esta reseña. Nunca aceptamos compensaciones o pagos a cambio de nuestras reseñas. Como empresa de medios independiente, Notebookcheck no está sujeta a la autoridad de fabricantes, minoristas o editores.
Así es como prueba Notebookcheck
Cada año, Notebookcheck revisa de forma independiente cientos de portátiles y smartphones utilizando procedimientos estandarizados para asegurar que todos los resultados son comparables. Hemos desarrollado continuamente nuestros métodos de prueba durante unos 20 años y hemos establecido los estándares de la industria en el proceso. En nuestros laboratorios de pruebas, técnicos y editores experimentados utilizan equipos de medición de alta calidad. Estas pruebas implican un proceso de validación en varias fases. Nuestro complejo sistema de clasificación se basa en cientos de mediciones y puntos de referencia bien fundamentados, lo que mantiene la objetividad.Price comparison

