

Análisis del MSI Raider 18 HX A14V: Rendimiento Titán sin el precio Titán
")
Los portátiles para juegos de 18 pulgadas más grandes están haciendo una especie de reaparición a medida que la línea continúa ampliándose de forma constante. MSI ya ofrece la experiencia de juego "definitiva" de 18 pulgadas con el Titan 18 HX, pero este último modelo Raider 18 HX está un escalón por debajo en cuanto a características para reducir la barrera de entrada.
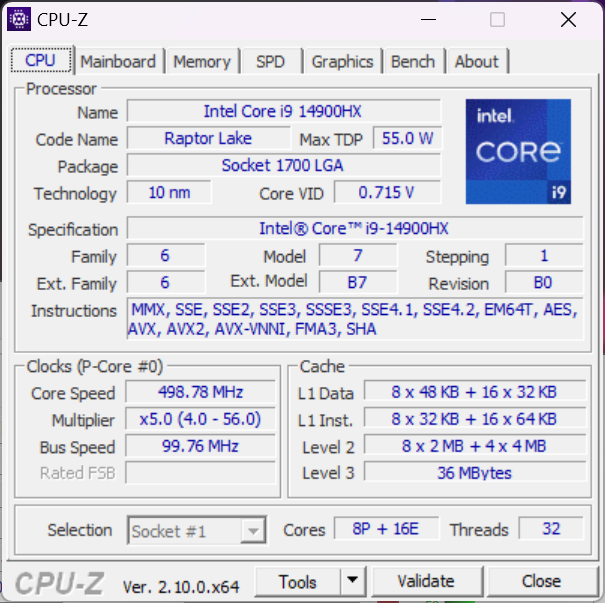
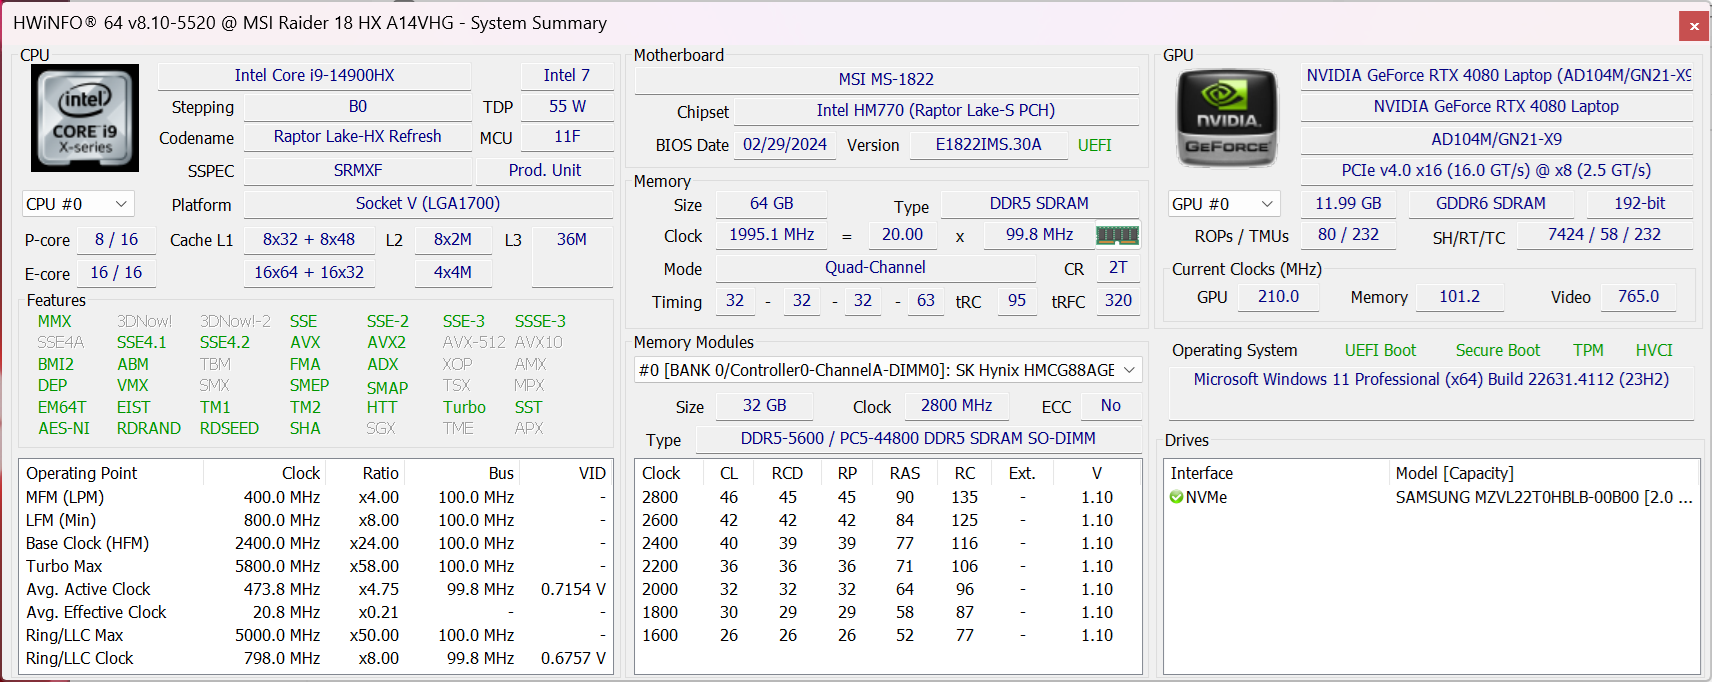
Nuestra unidad de prueba es una configuración intermedia con la CPU Raptor Lake-R Core i9-14900HX, GPU GeForce RTX 4080 de 175 W y pantalla Mini-LED de 3840 x 2400 120 Hz por aproximadamente 3200 $ al por menor. Otras SKU incluyen en su lugar la Zen 4 Ryzen 9 7945HX, RTX 4070, RTX 4090, o pantalla IPS QHD+ 2560 x 1600 240 Hz.
Entre los competidores del Raider 18 HX se incluyen otros portátiles para juegos de 18 pulgadas como el Razer Blade 18, Alienware m18 R2o el Asus ROG Strix G18.
Más reseñas de MSI:
Posibles contendientes en la comparación
Valoración | Versión | Fecha | Modelo | Peso | Altura | Tamaño | Resolución | Precio |
|---|---|---|---|---|---|---|---|---|
| 84.7 % | v8 | 09/2024 | MSI Raider 18 HX A14V i9-14900HX, NVIDIA GeForce RTX 4080 Laptop GPU | 3.6 kg | 32 mm | 18.00" | 3840x2400 | |
| 90.5 % v7 (old) | v7 (old) | 05/2024 | Razer Blade 18 2024 RZ09-0509 i9-14900HX, NVIDIA GeForce RTX 4090 Laptop GPU | 3.1 kg | 21.9 mm | 18.00" | 2560x1600 | |
| 89.5 % v7 (old) | v7 (old) | 03/2024 | Alienware m18 R2 i9-14900HX, NVIDIA GeForce RTX 4090 Laptop GPU | 4 kg | 26.7 mm | 18.00" | 2560x1600 | |
| 88.8 % v7 (old) | v7 (old) | 01/2024 | MSI Titan 18 HX A14VIG i9-14900HX, NVIDIA GeForce RTX 4090 Laptop GPU | 3.6 kg | 32.1 mm | 18.00" | 3840x2400 | |
| 87.4 % v7 (old) | v7 (old) | 03/2023 | Asus ROG Strix G18 G814JI i7-13650HX, NVIDIA GeForce RTX 4070 Laptop GPU | 3 kg | 31 mm | 18.00" | 2560x1600 | |
| 87.1 % v7 (old) | v7 (old) | 03/2024 | Acer Predator Helios 18 PH18-72-98MW i9-14900HX, NVIDIA GeForce RTX 4090 Laptop GPU | 3.3 kg | 29.5 mm | 18.00" | 2560x1600 |
Nota: Recientemente hemos actualizado nuestro sistema de clasificación y los resultados de la versión 8 no son comparables con los de la versión 7. Encontrará más información aquí .
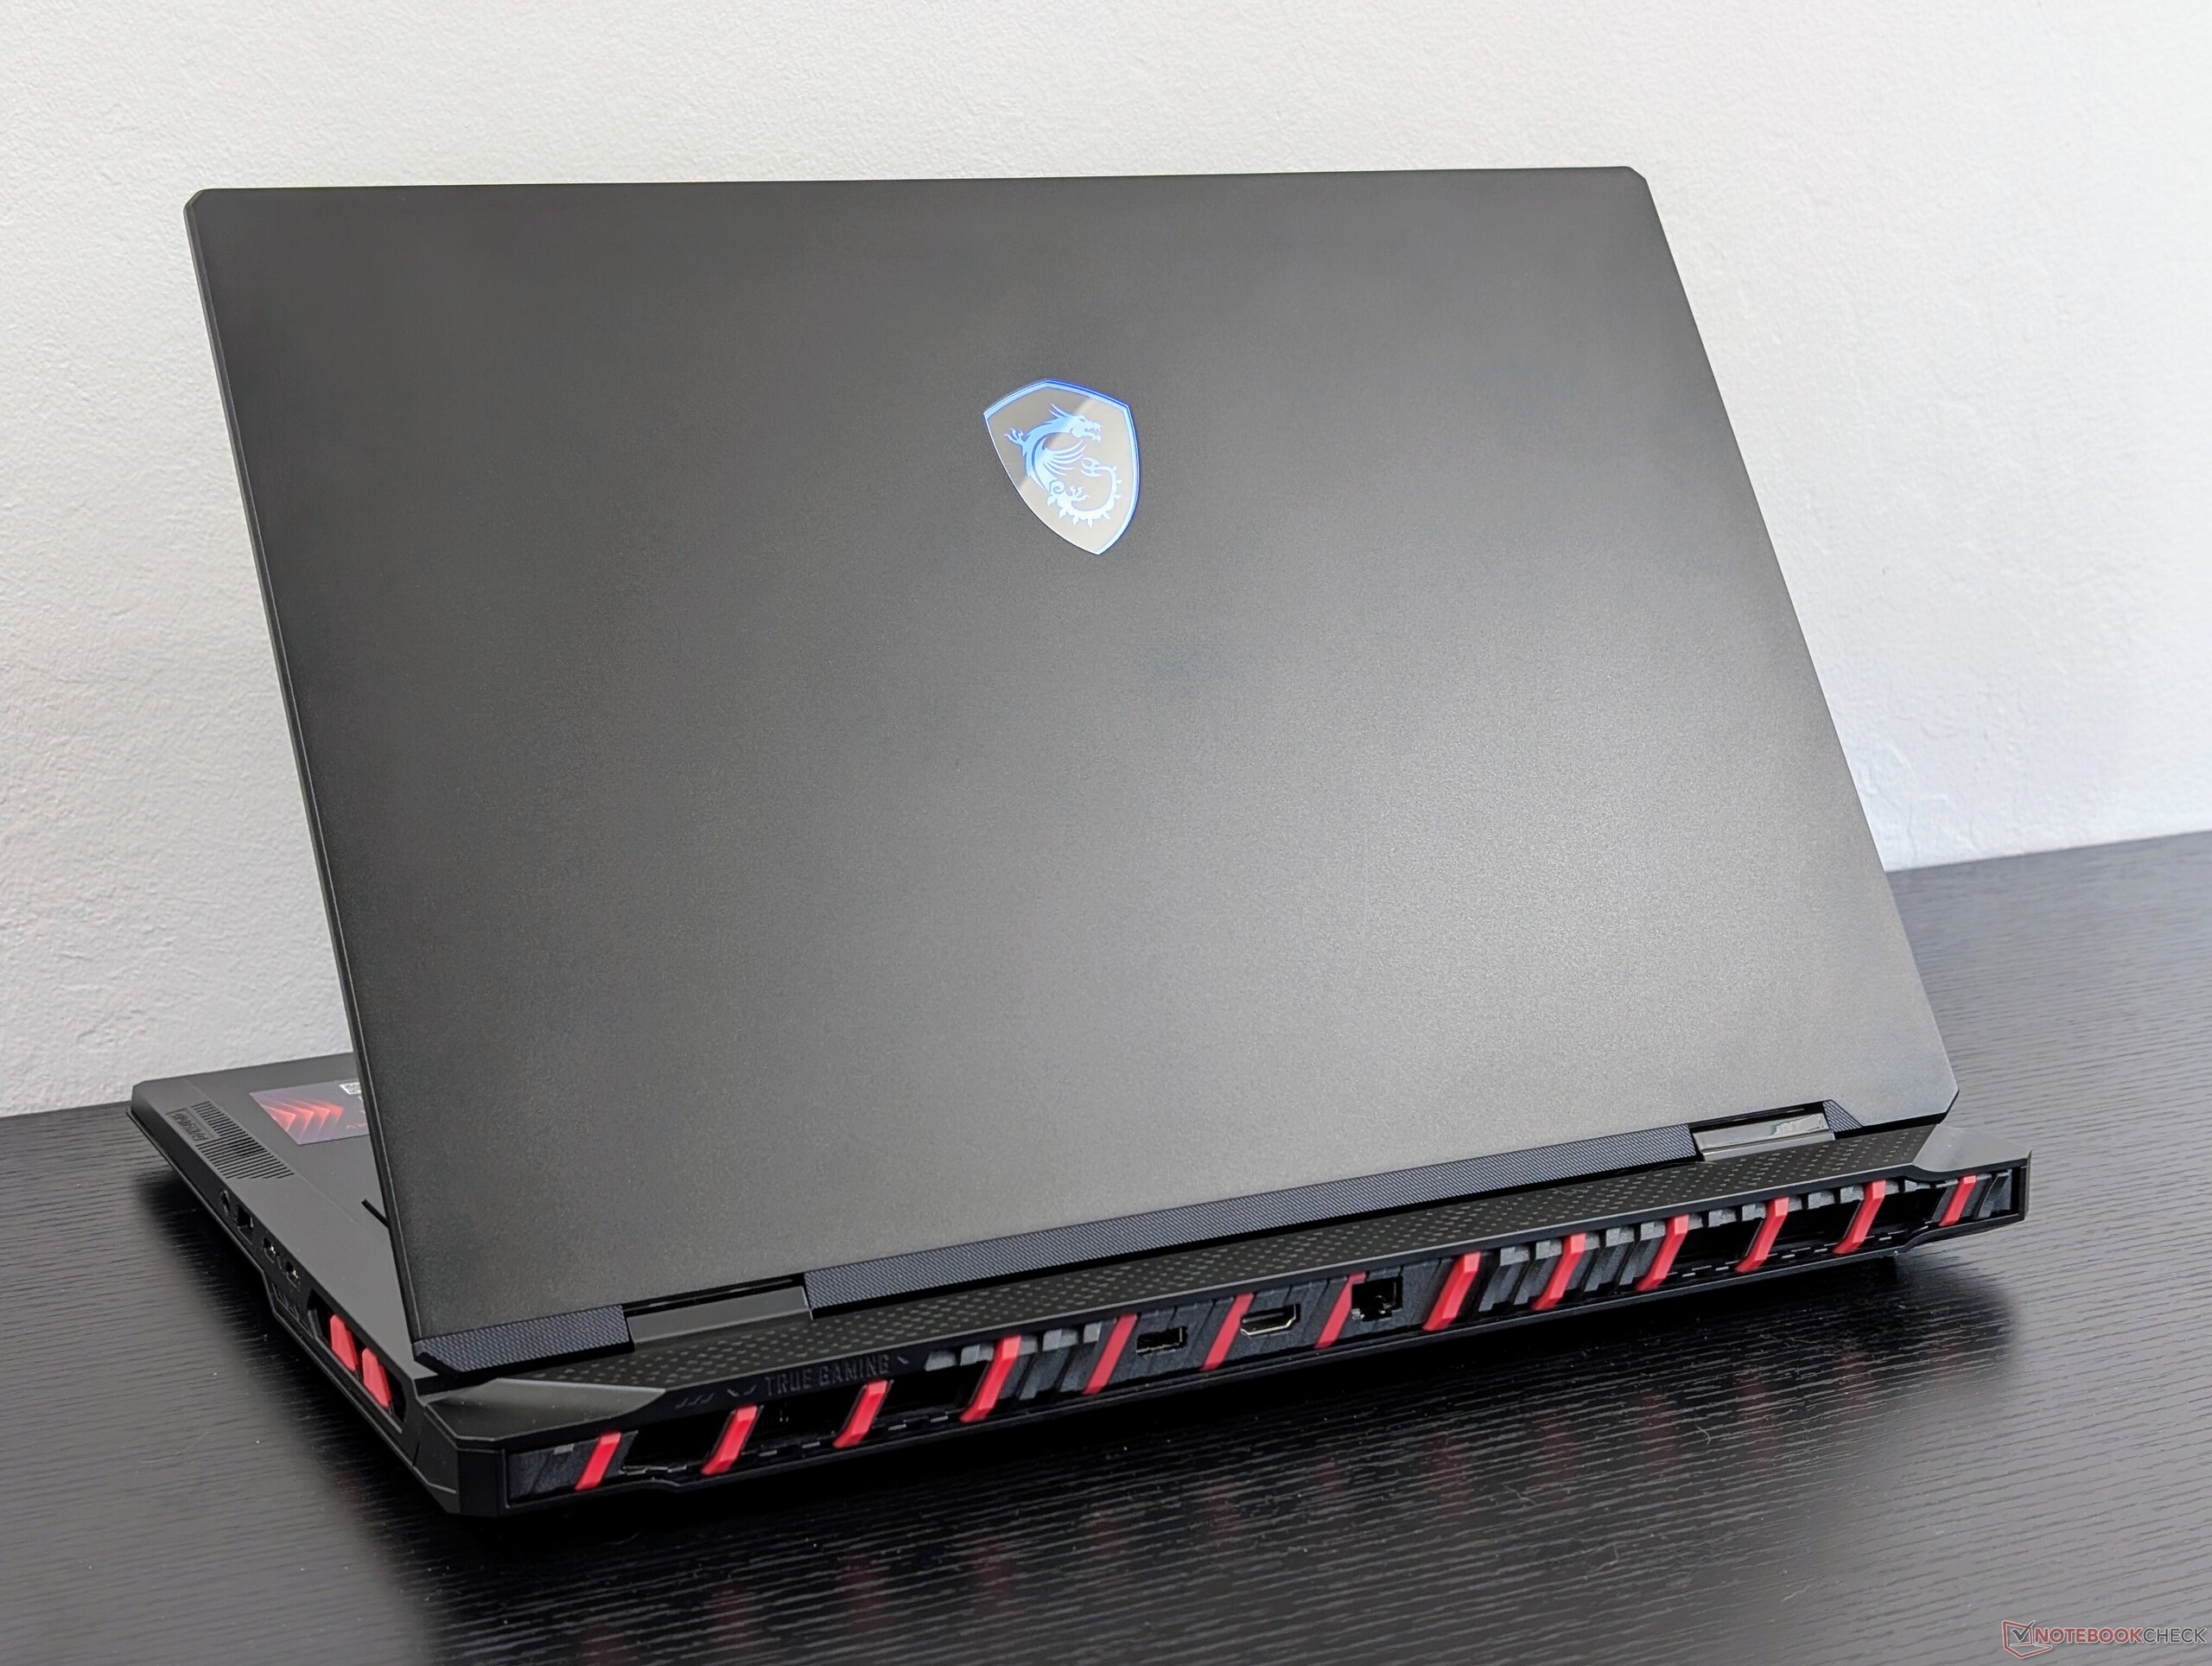
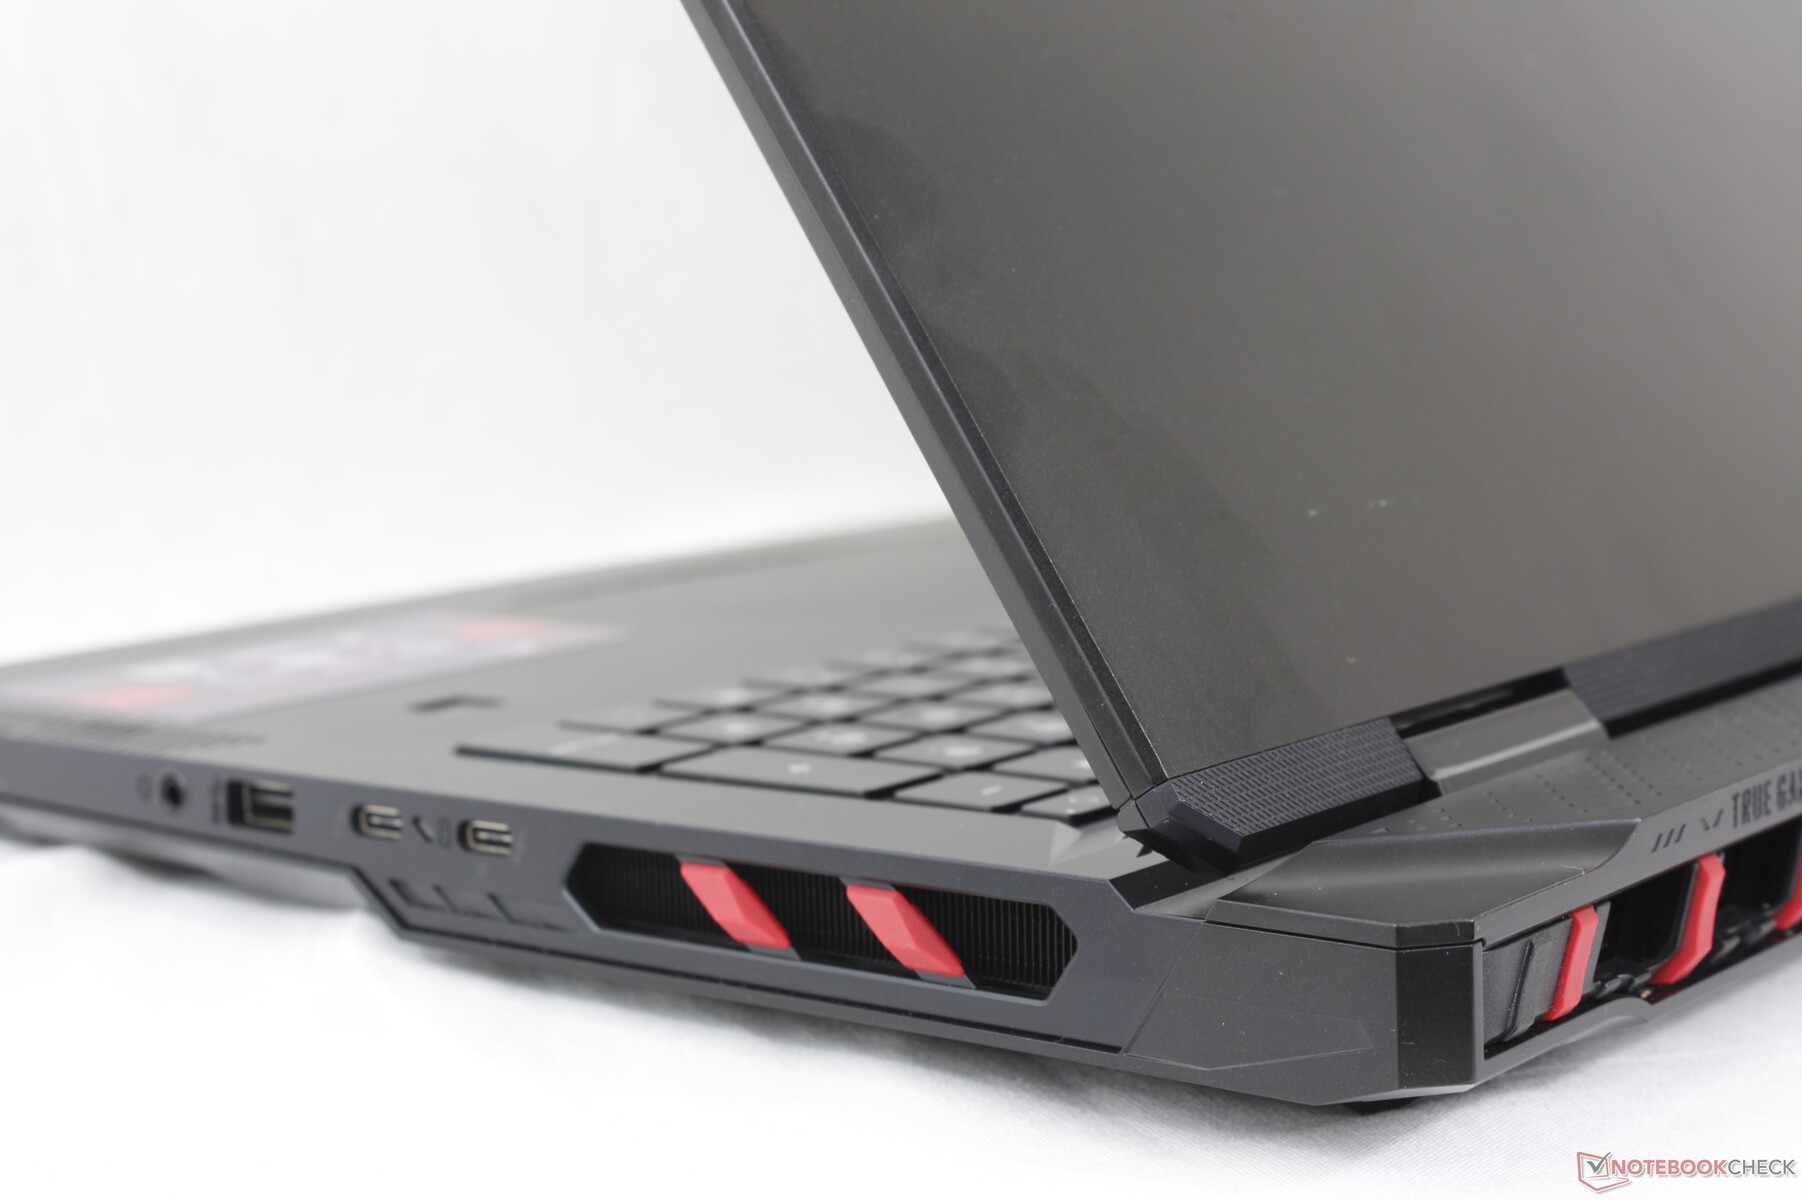
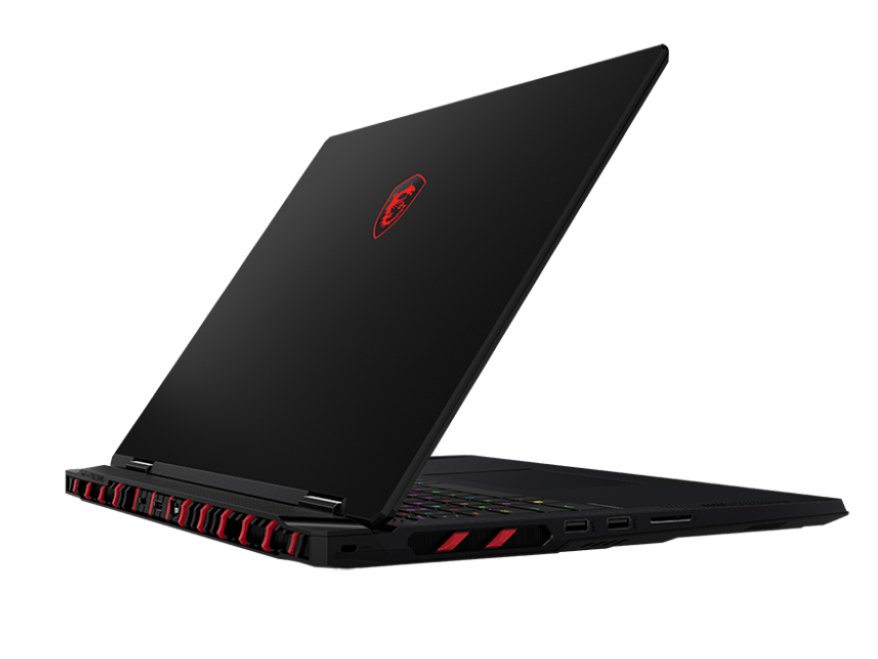
Caso - Del dragón azul al rojo
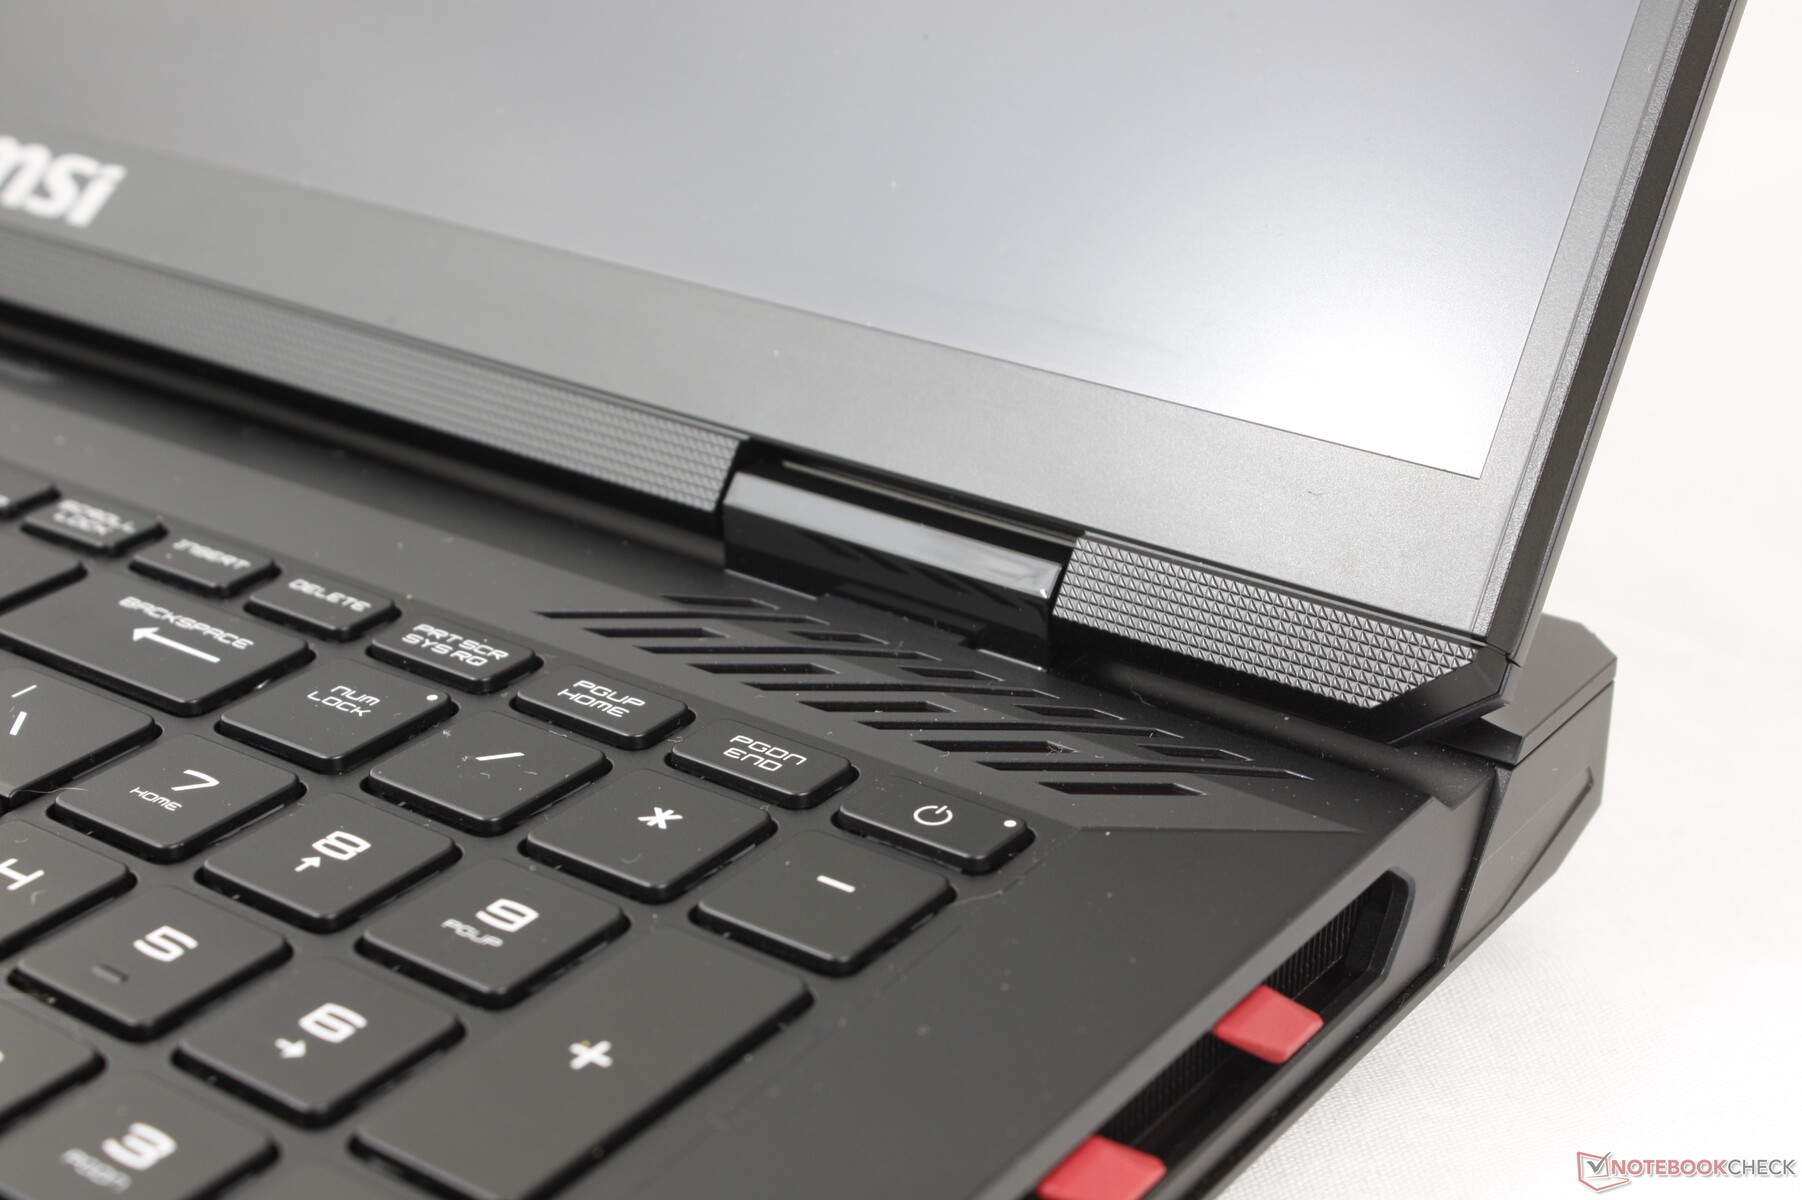
El chasis es un derivado de la Titan 18 HX. Los acentos rojos de la Titan son en cambio azules en la nueva Raider y la mayoría de las superficies son de color negro azabache en lugar de gris o plata para un aspecto general más oscuro. MSI también ha añadido una barra de LED a lo largo del borde frontal del sistema mientras que esto faltaba en la Titan. Los cambios son en gran medida estéticos, por lo que el Raider sigue pareciendo tan robusto como su hermano más caro, ya que los materiales subyacentes y el esqueleto son los mismos.
Quizá la diferencia visual más notable entre el Raider 18 HX y el Titan 18 HX sea la cubierta del teclado rediseñada. Mientras que el Titan 18 HX tiene una cubierta más plana con un elegante panel de cristal que se extiende por los reposamuñecas y el clickpad, el Raider adopta un enfoque más tradicional sin cristal y con sólo un clickpad básico.
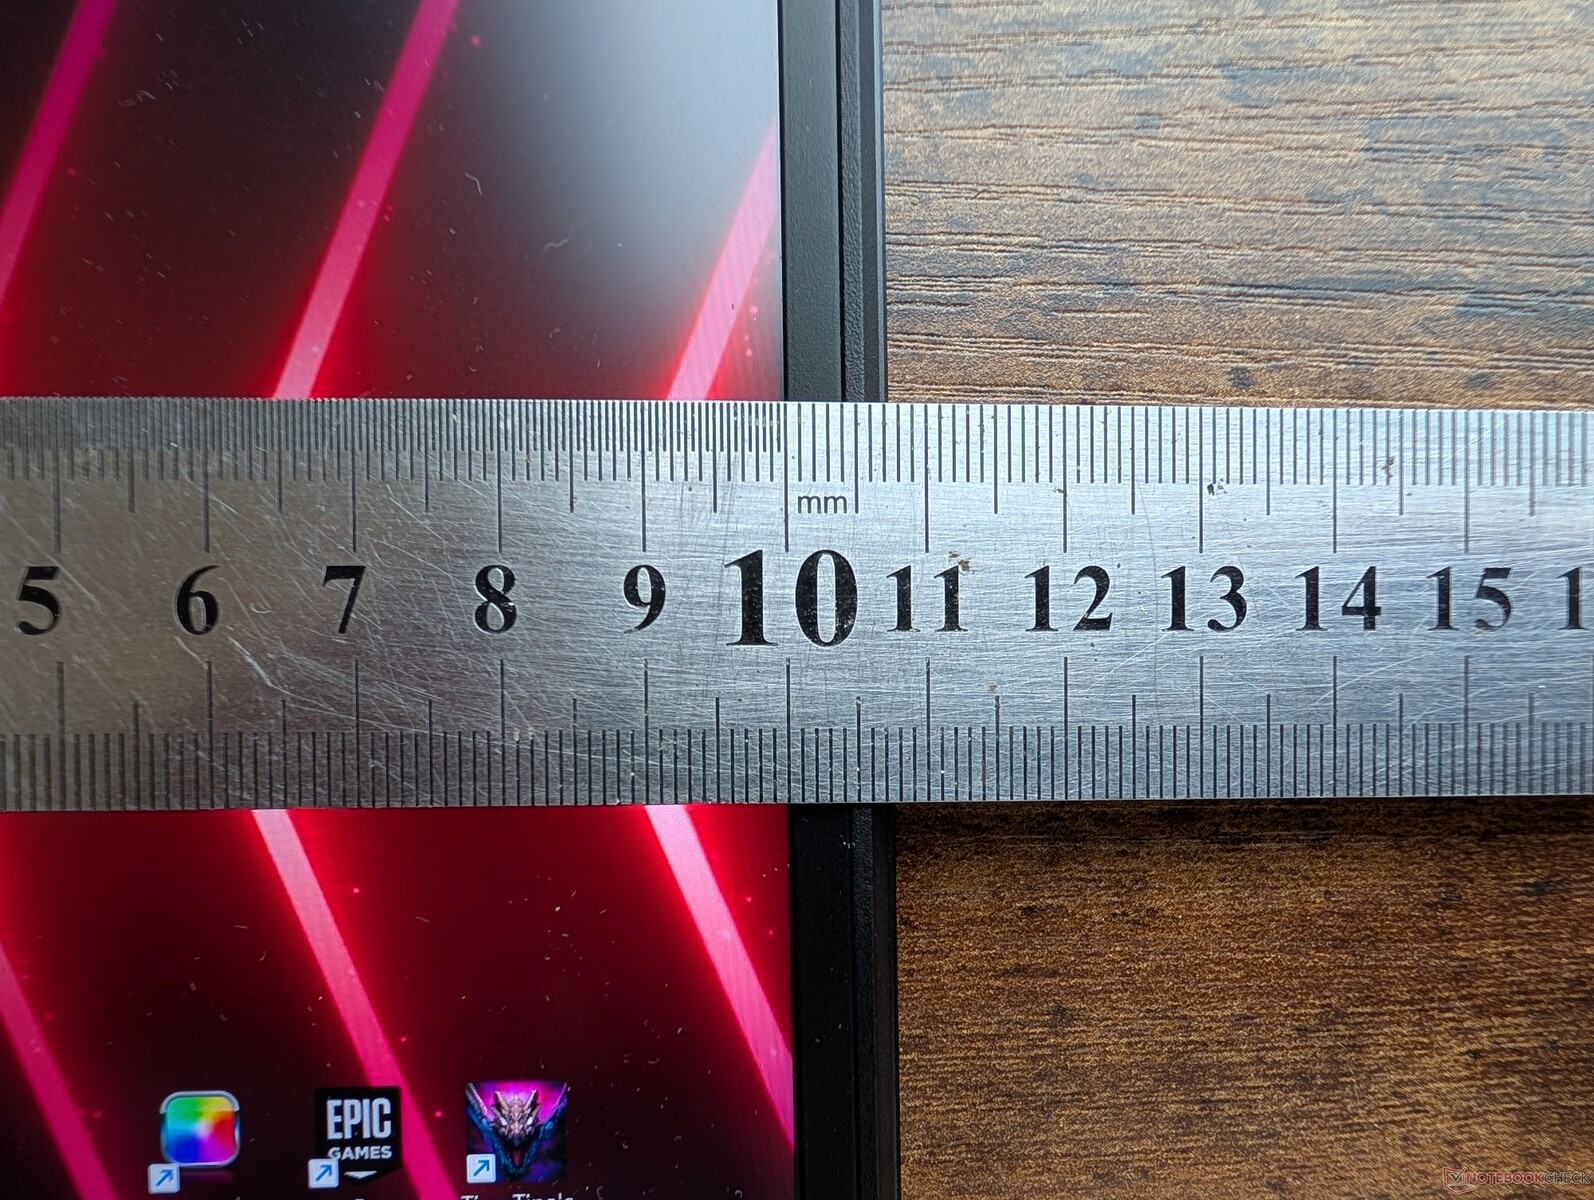
Las dimensiones y el peso son esencialmente idénticos a los de la Titan 18 HX a pesar de todas las diferencias externas entre ellos. Por lo tanto, este modelo se encuentra en el medio del pelotón en cuanto a portabilidad, ya que alternativas como el Alienware m18 R2 son más pesados y grandes, mientras que el ROG Strix G18 o el Blade 18 son mucho más ligeros.
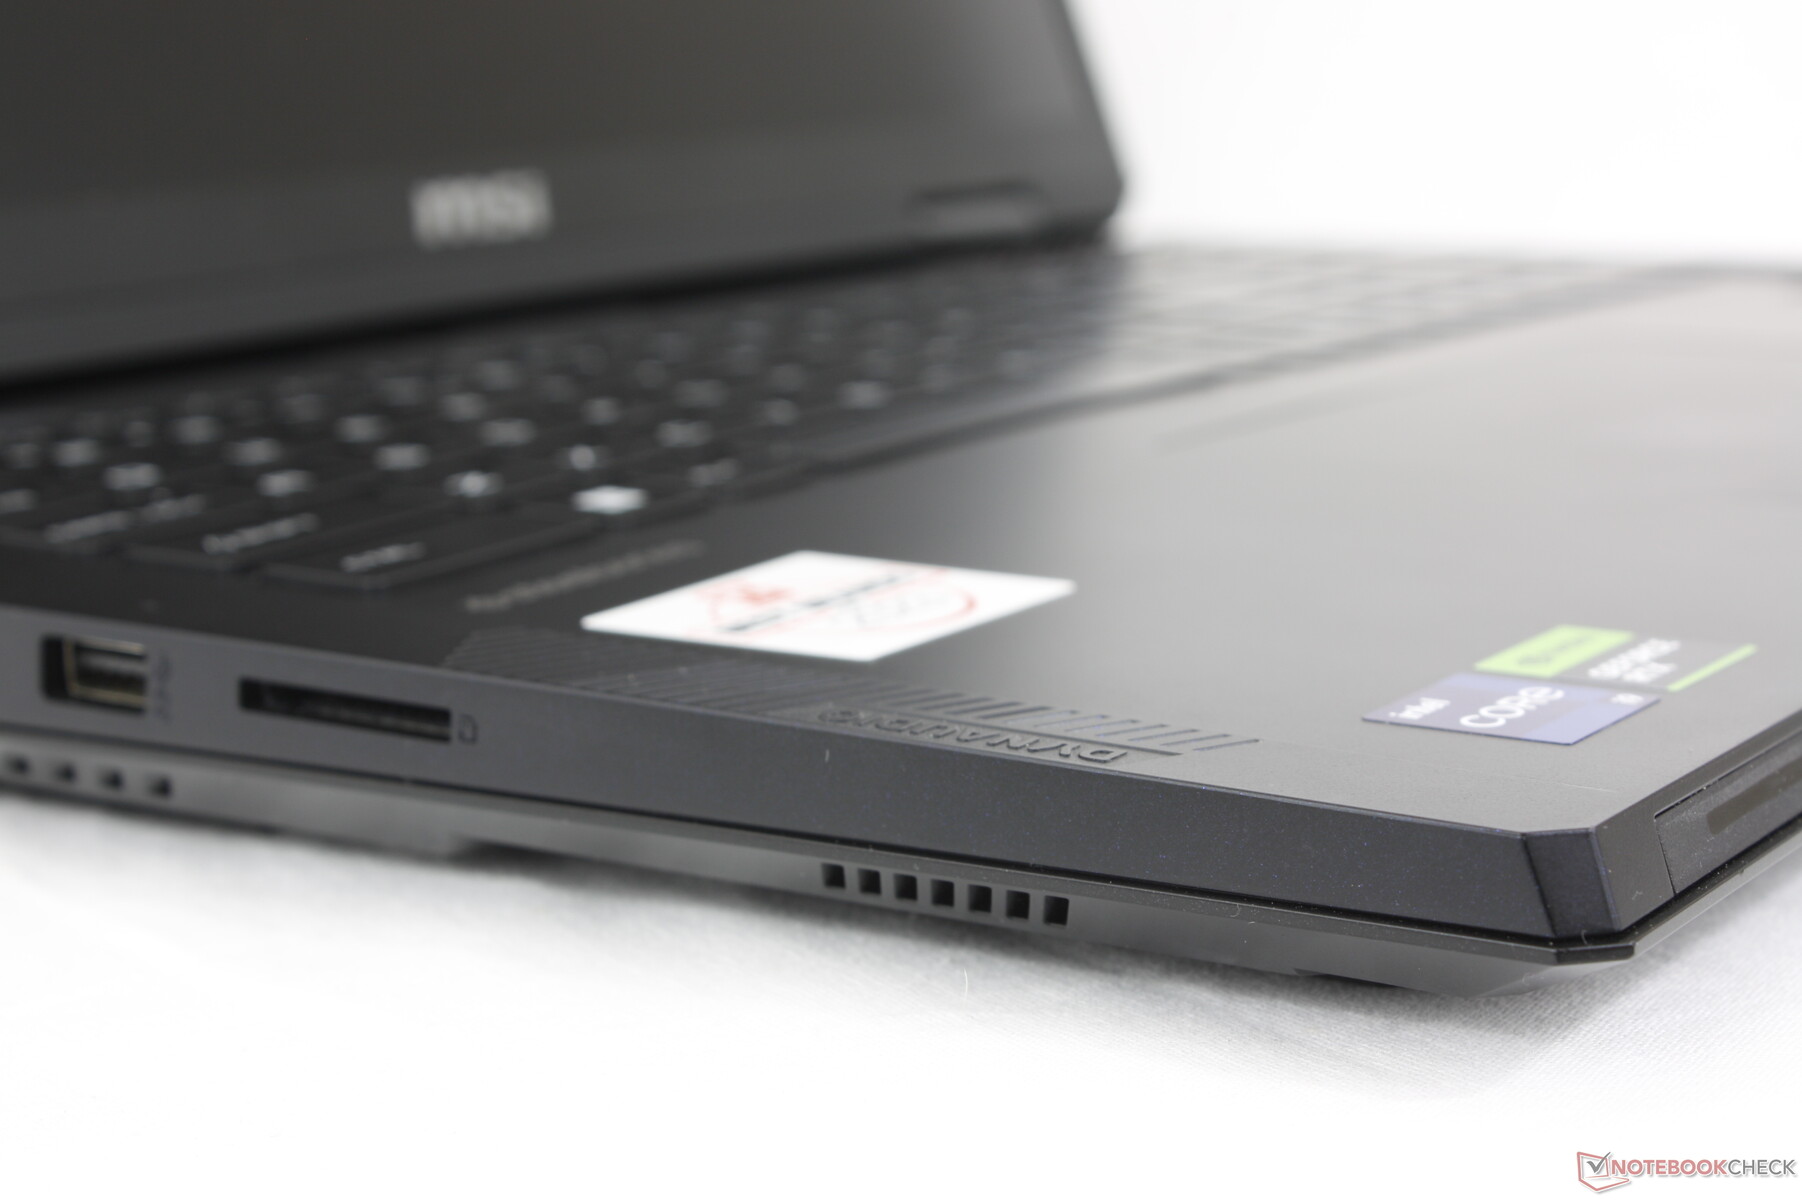
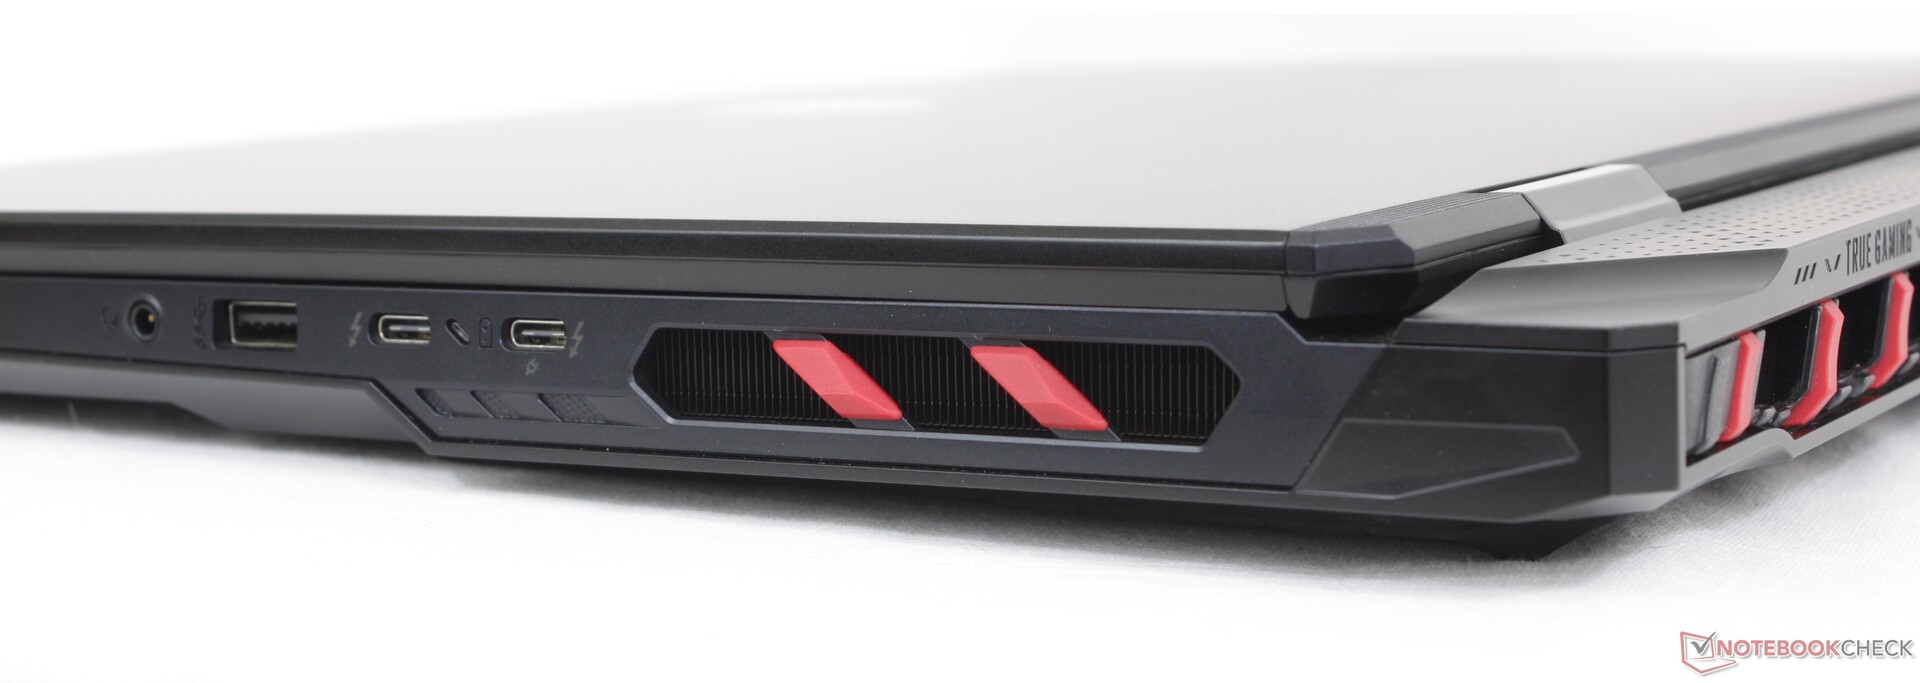
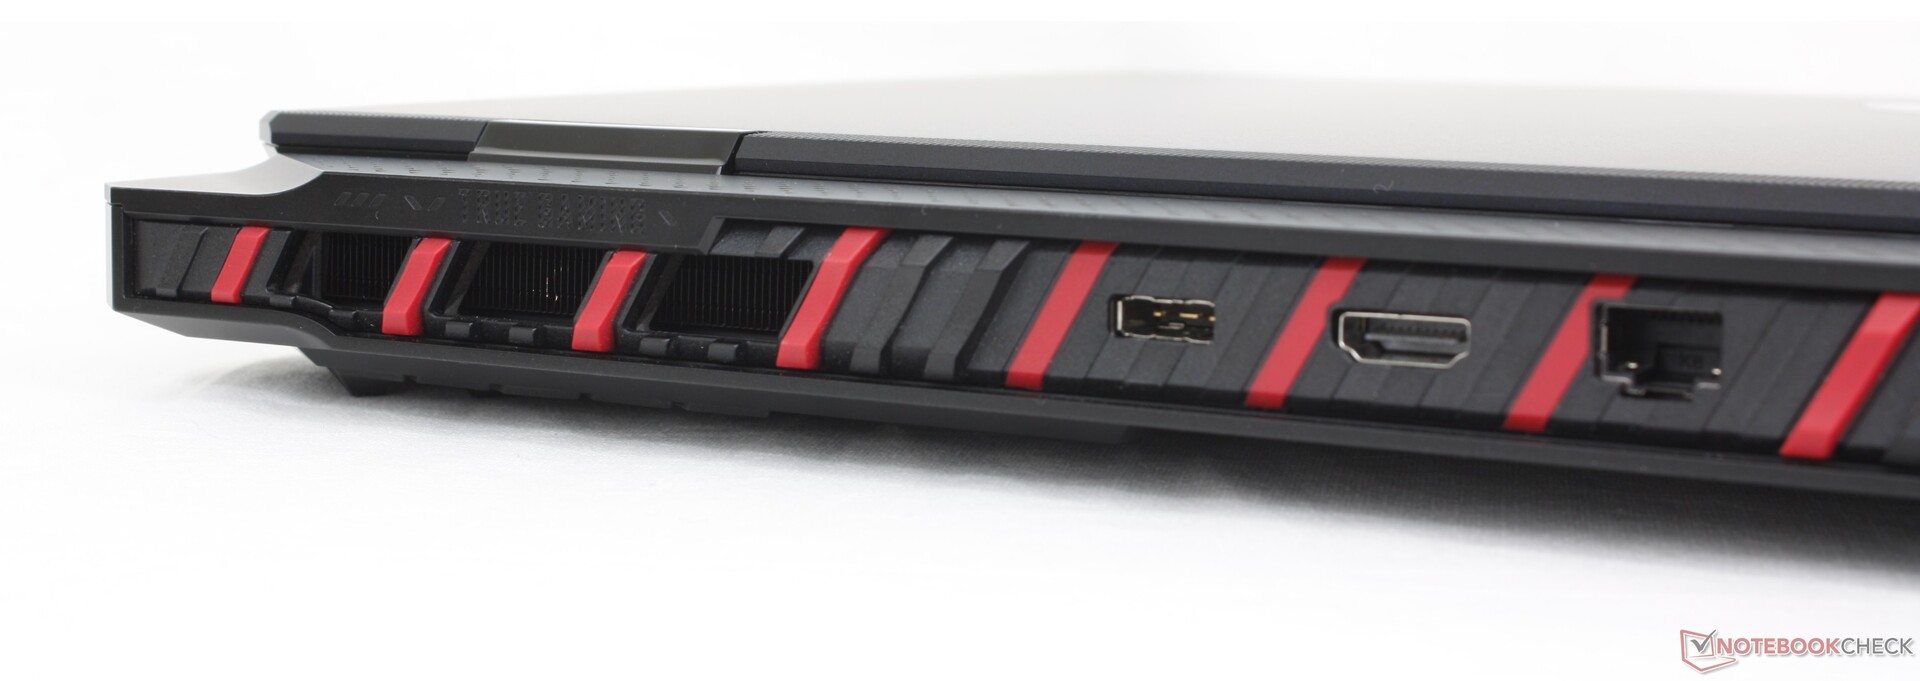
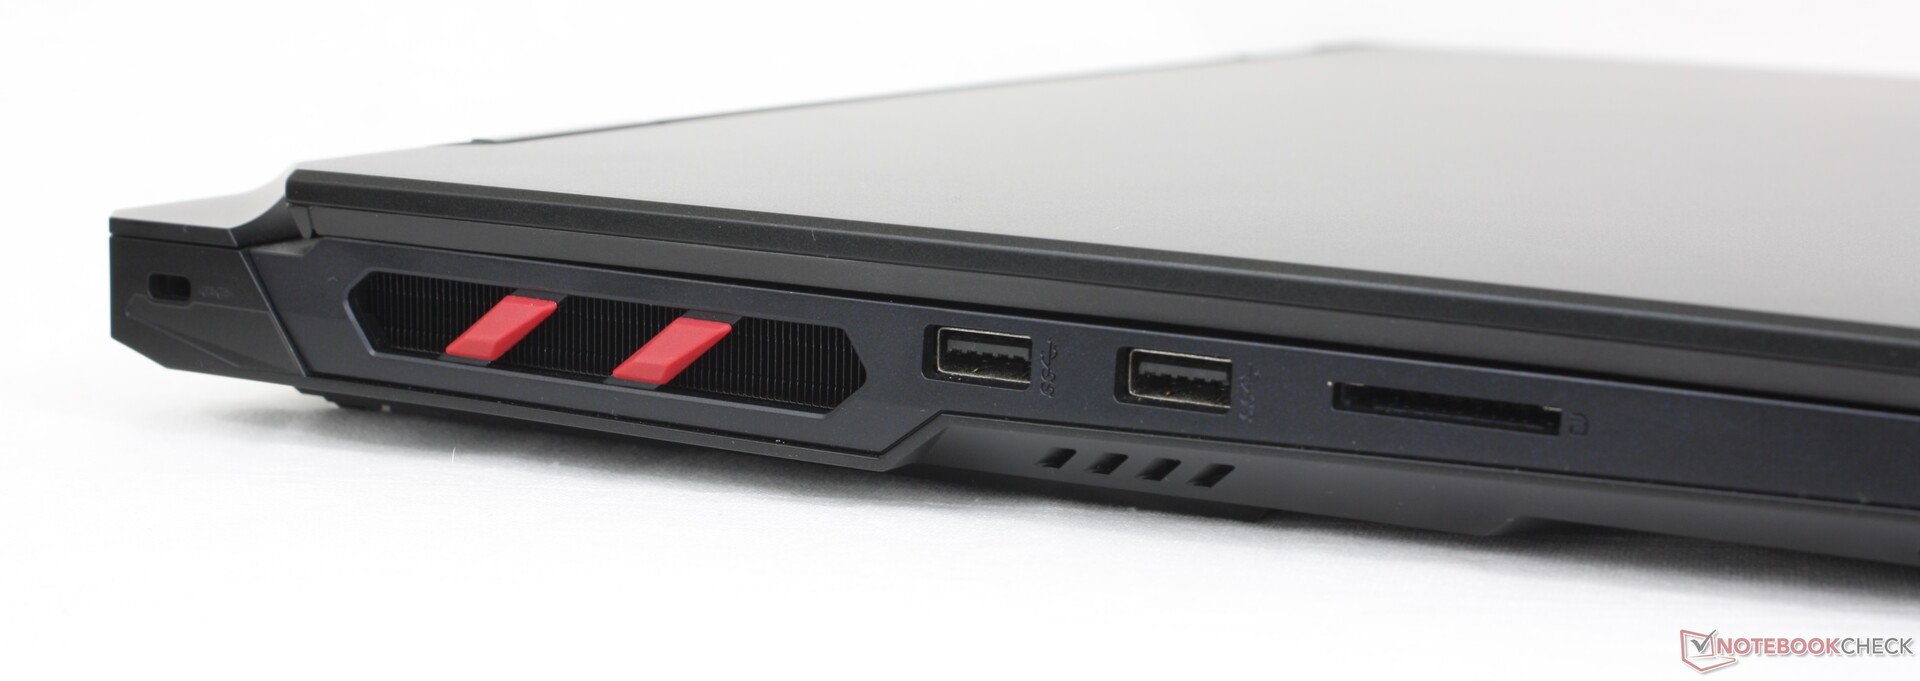
Conectividad
Los puertos y la colocación son idénticos a los de la Titan 18 HX, lo que es una gran pista sobre lo que cabe esperar debajo del capó. Las opciones integradas son comparables a las que encontrará en la Blade 18 o el ROG Strix G18 aunque en disposiciones muy diferentes.
Tenga en cuenta que solo uno de los dos puertos USB-C es compatible con Power Delivery. Por lo demás, ambos son compatibles con DisplayPort.

Lector de tarjetas SD
A unos 90 MB/s, el lector SD integrado es decente pero, por lo demás, lento en relación con el elevado precio del Raider 18 HX. Los lectores de tarjetas SD del Razer Blade 18 o del Alienware m18 R2por ejemplo, son más de dos veces más rápidos en comparación.
| SD Card Reader | |
| average JPG Copy Test (av. of 3 runs) | |
| Alienware m18 R2 (Toshiba Exceria Pro SDXC 64 GB UHS-II) | |
| Razer Blade 18 2024 RZ09-0509 (Toshiba Exceria Pro SDXC 64 GB UHS-II) | |
| Acer Predator Helios 18 PH18-72-98MW (AV PRO microSD 128 GB V60) | |
| MSI Raider 18 HX A14V (Toshiba Exceria Pro SDXC 64 GB UHS-II) | |
| MSI Titan 18 HX A14VIG (Toshiba Exceria Pro SDXC 64 GB UHS-II) | |
| maximum AS SSD Seq Read Test (1GB) | |
| Razer Blade 18 2024 RZ09-0509 (Toshiba Exceria Pro SDXC 64 GB UHS-II) | |
| Alienware m18 R2 (Toshiba Exceria Pro SDXC 64 GB UHS-II) | |
| MSI Titan 18 HX A14VIG (Toshiba Exceria Pro SDXC 64 GB UHS-II) | |
| MSI Raider 18 HX A14V (Toshiba Exceria Pro SDXC 64 GB UHS-II) | |
| Acer Predator Helios 18 PH18-72-98MW (AV PRO microSD 128 GB V60) | |
Comunicación
El Killer BE1750x viene de serie con conectividad Wi-Fi 7 y Bluetooth 5.4. Las velocidades de transferencia son constantes y fiables cuando se empareja con nuestro router de prueba Wi-Fi 6E.
Cámara web
Una webcam de 2 MP con IR y obturador físico vienen de serie al igual que en la Titan 18 HX. Curiosamente, la cámara también presentaría problemas de brillo similares.


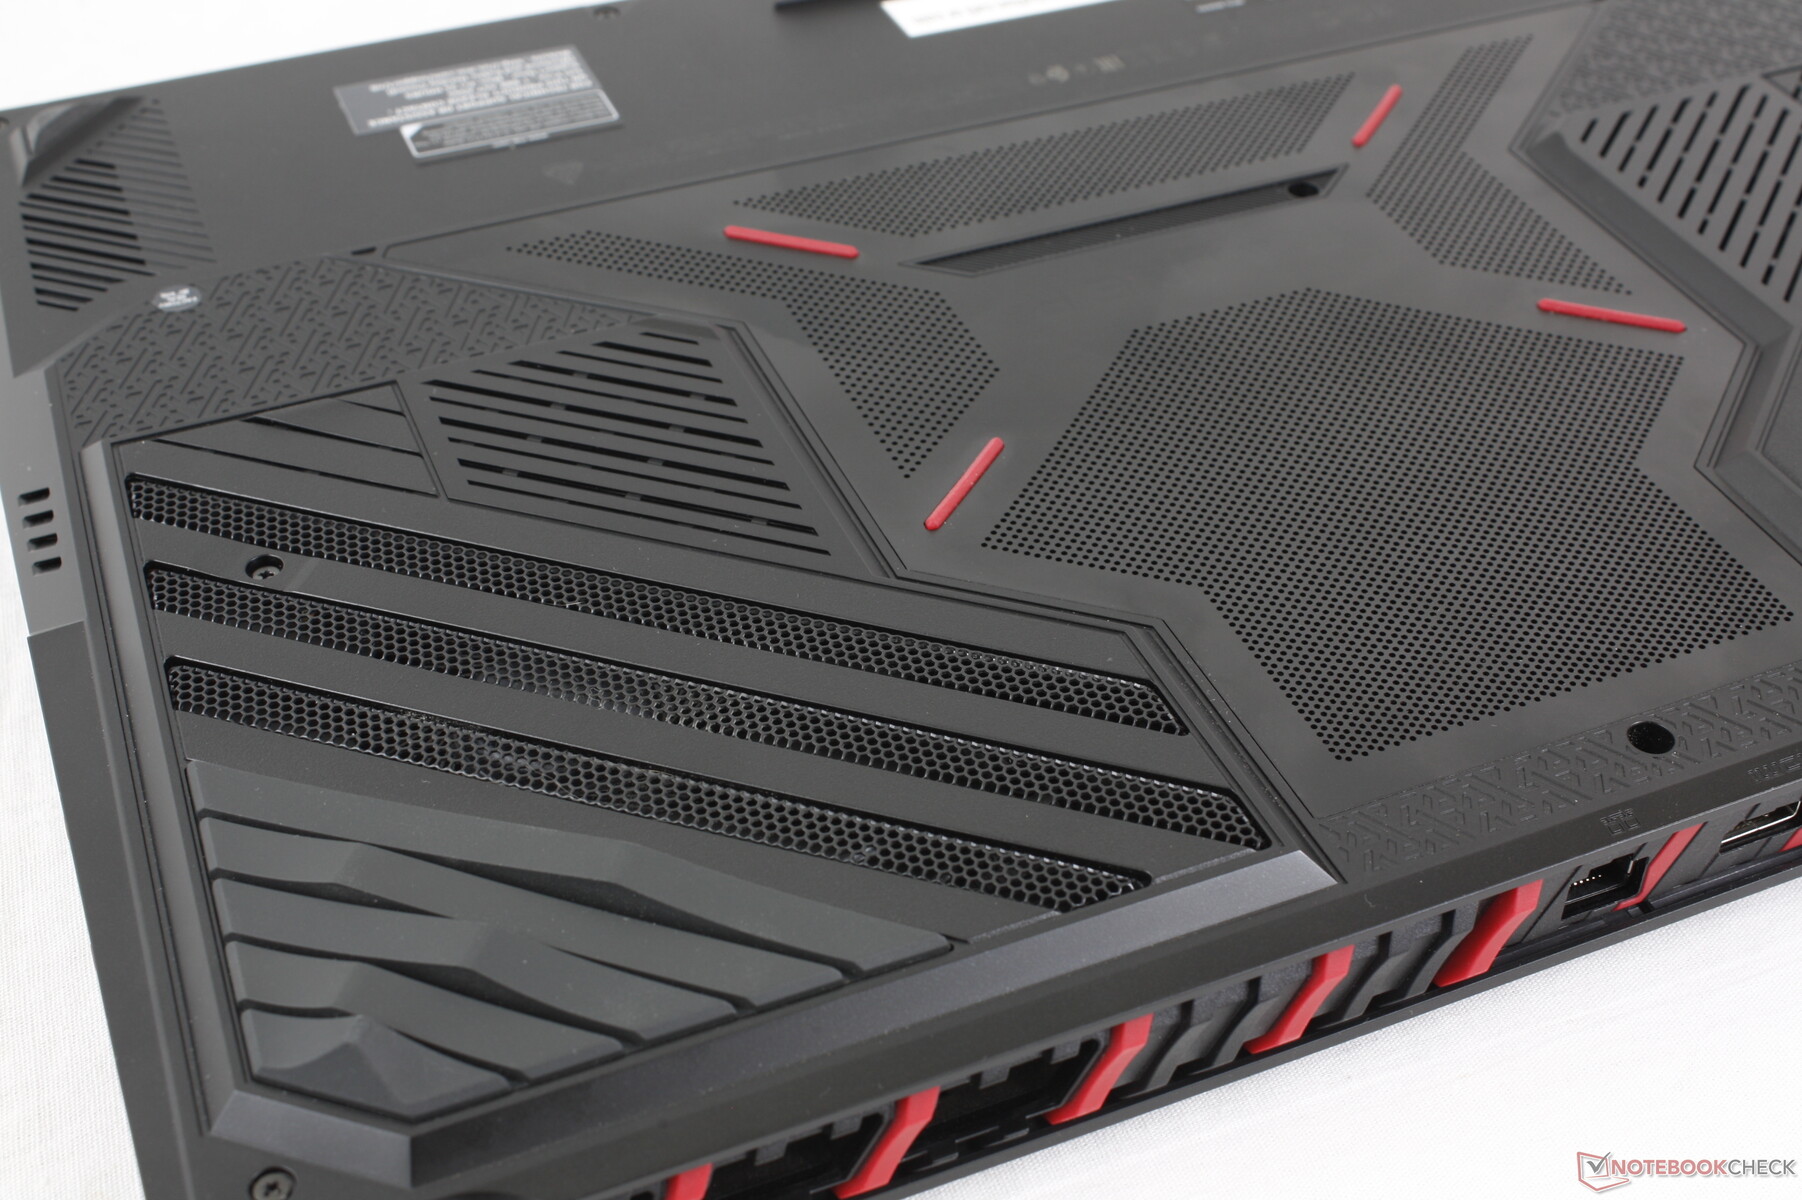
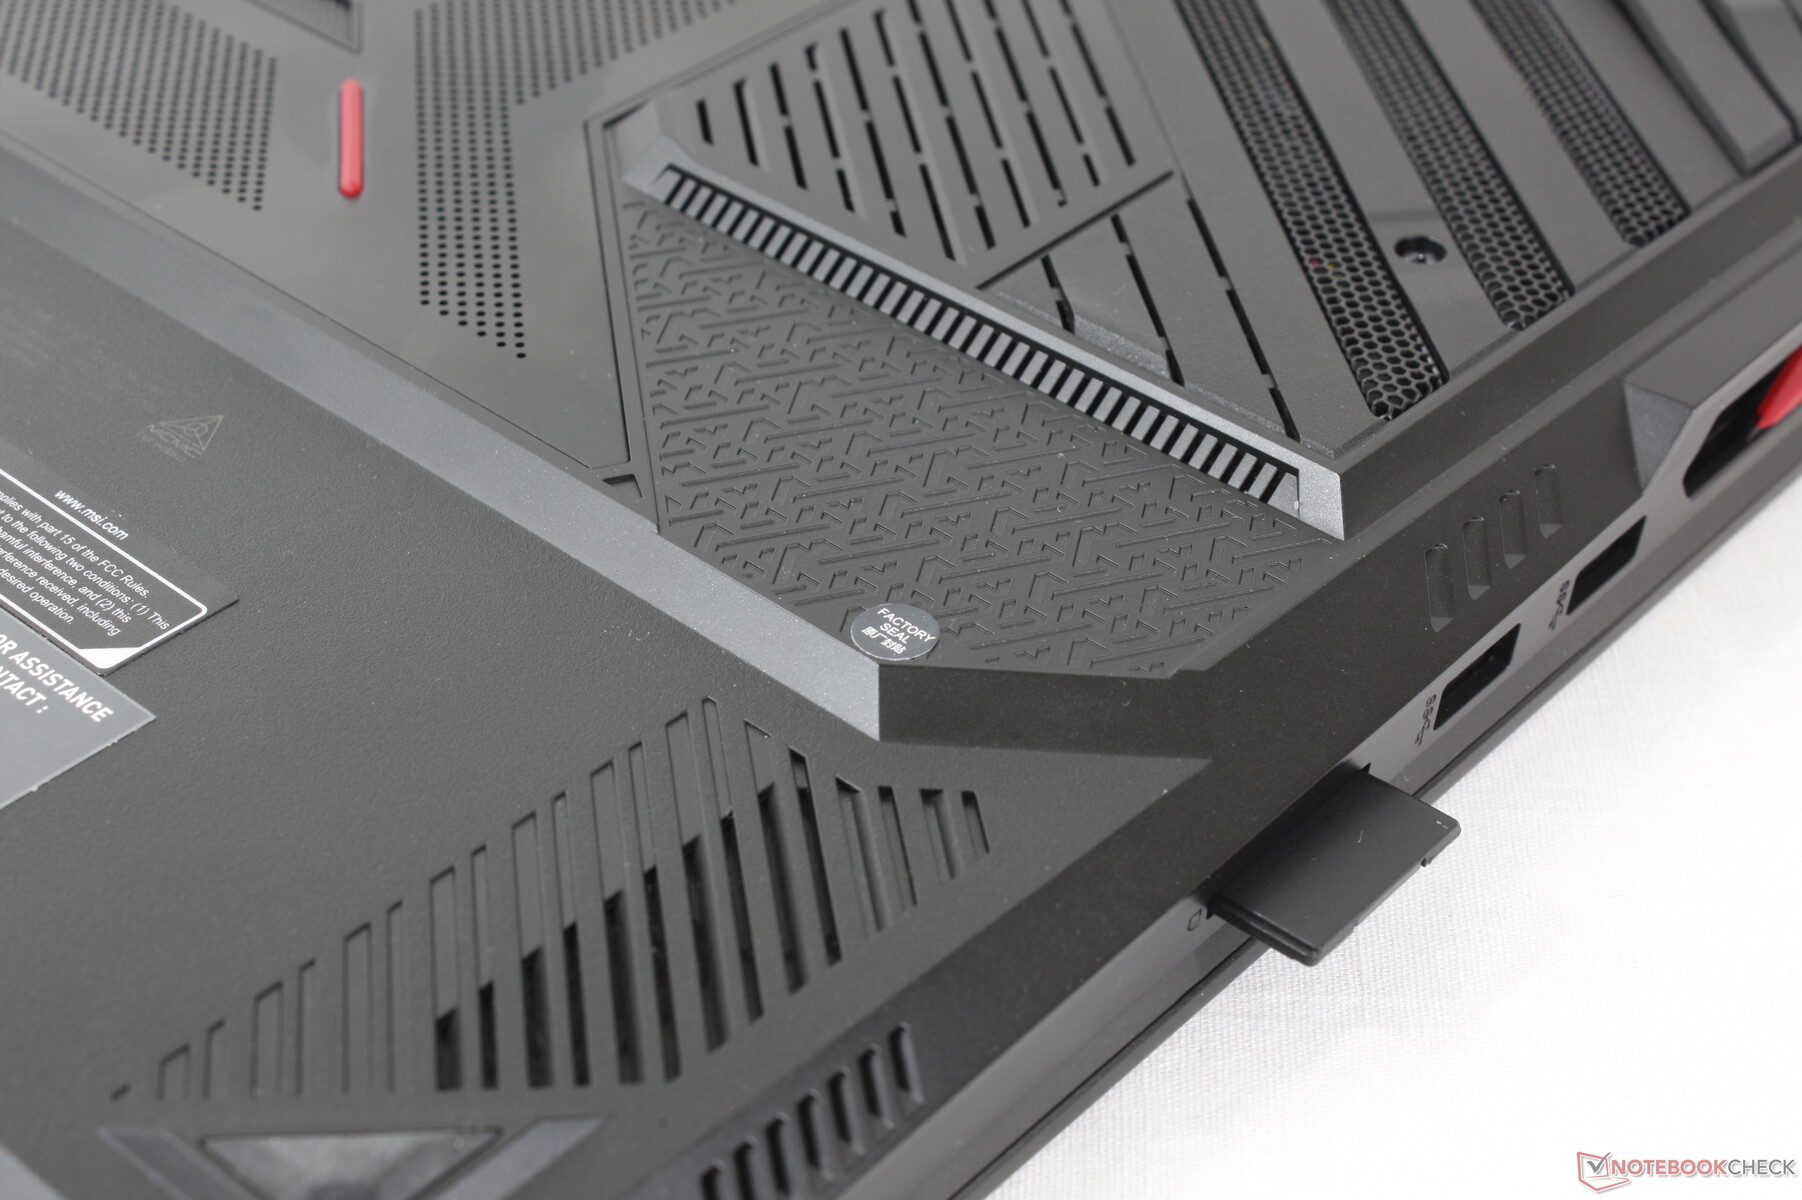
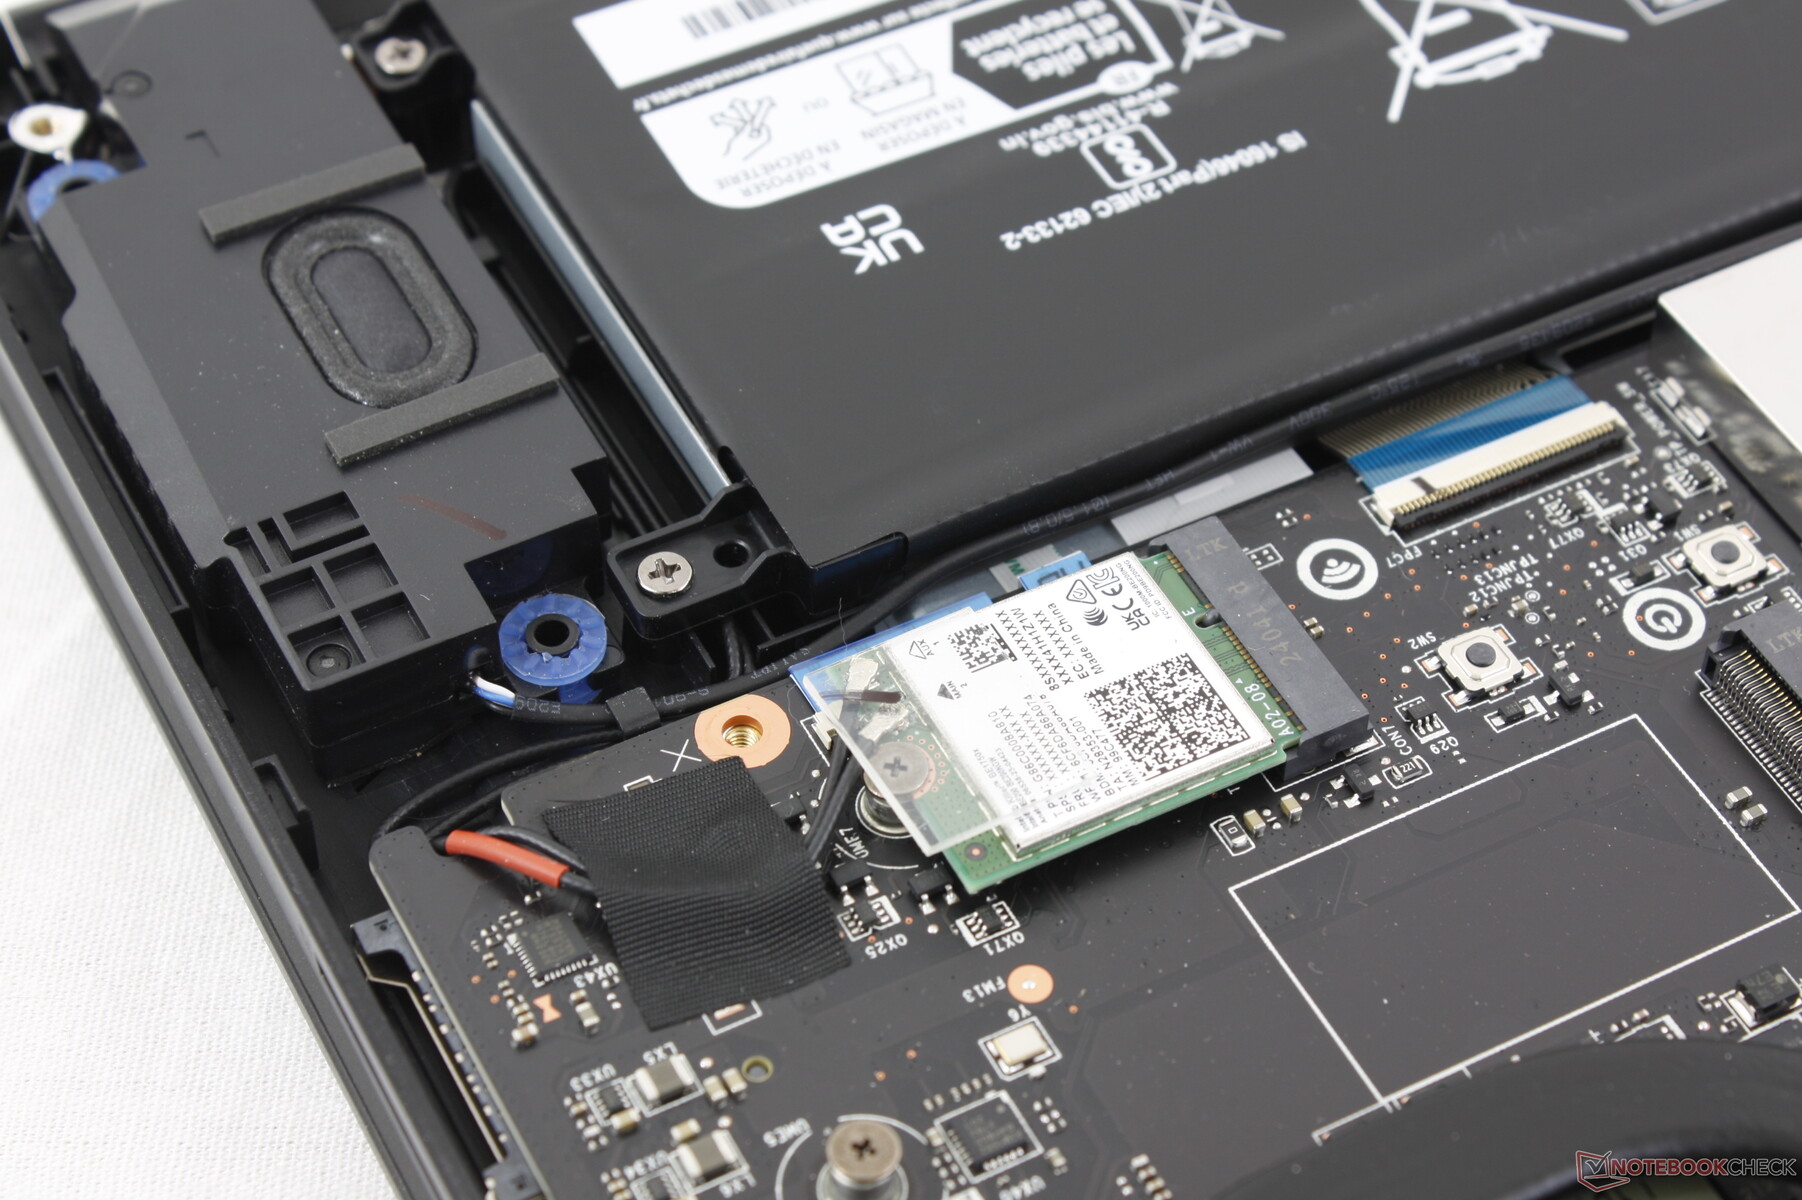
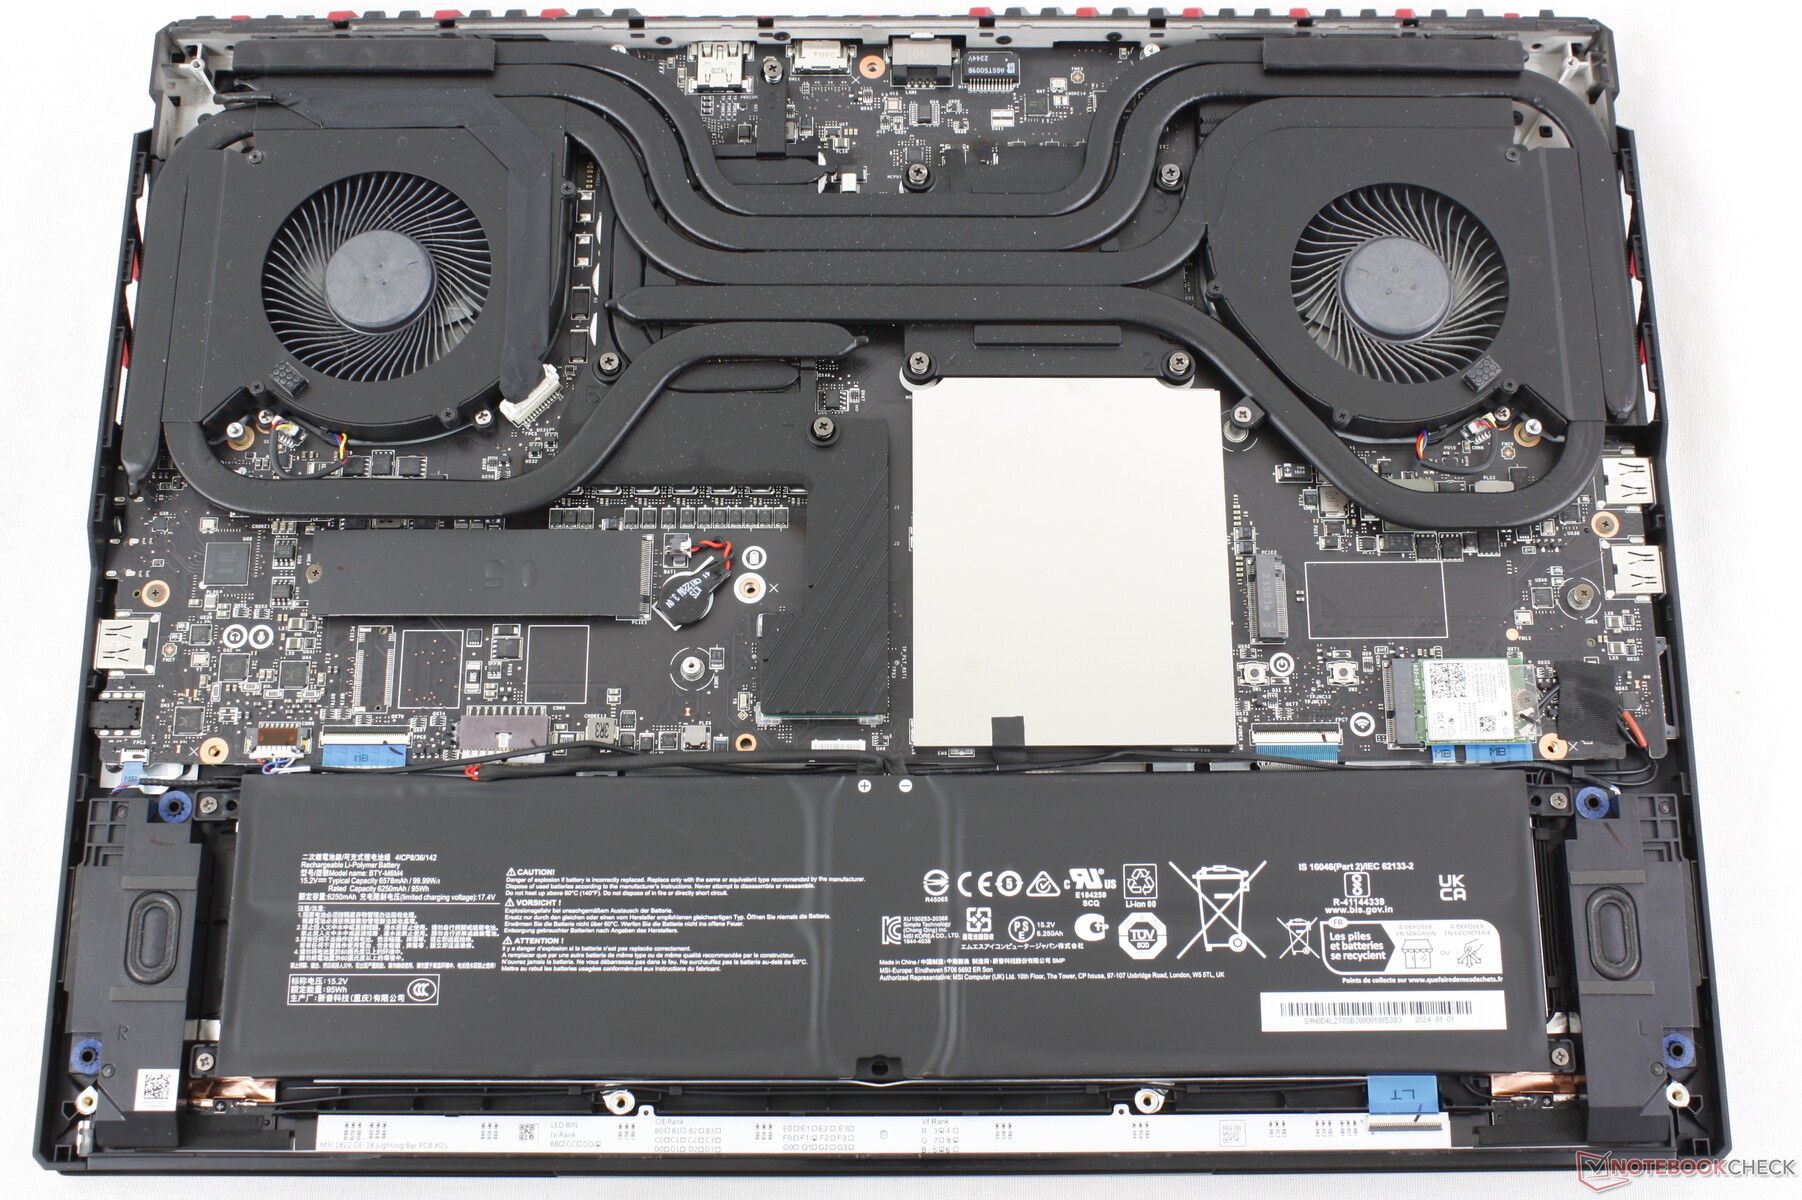
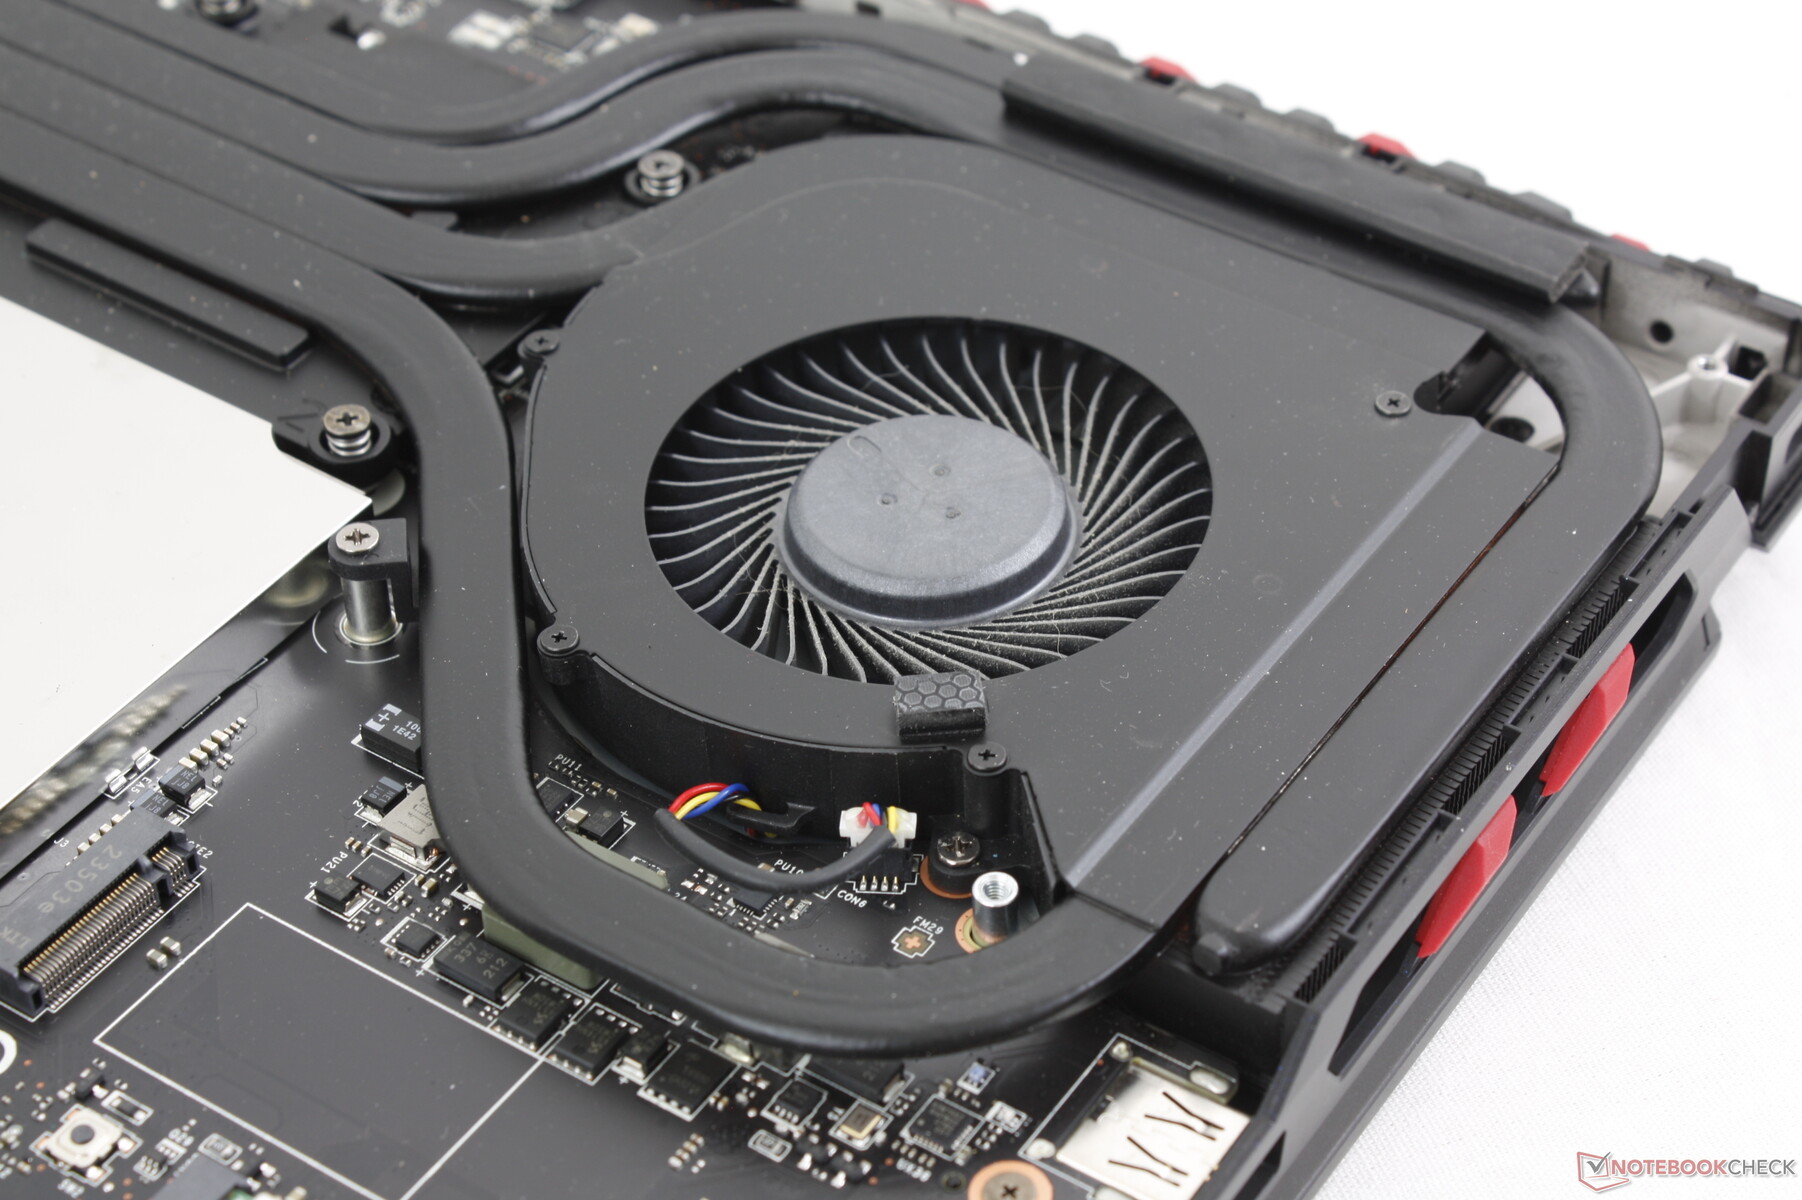
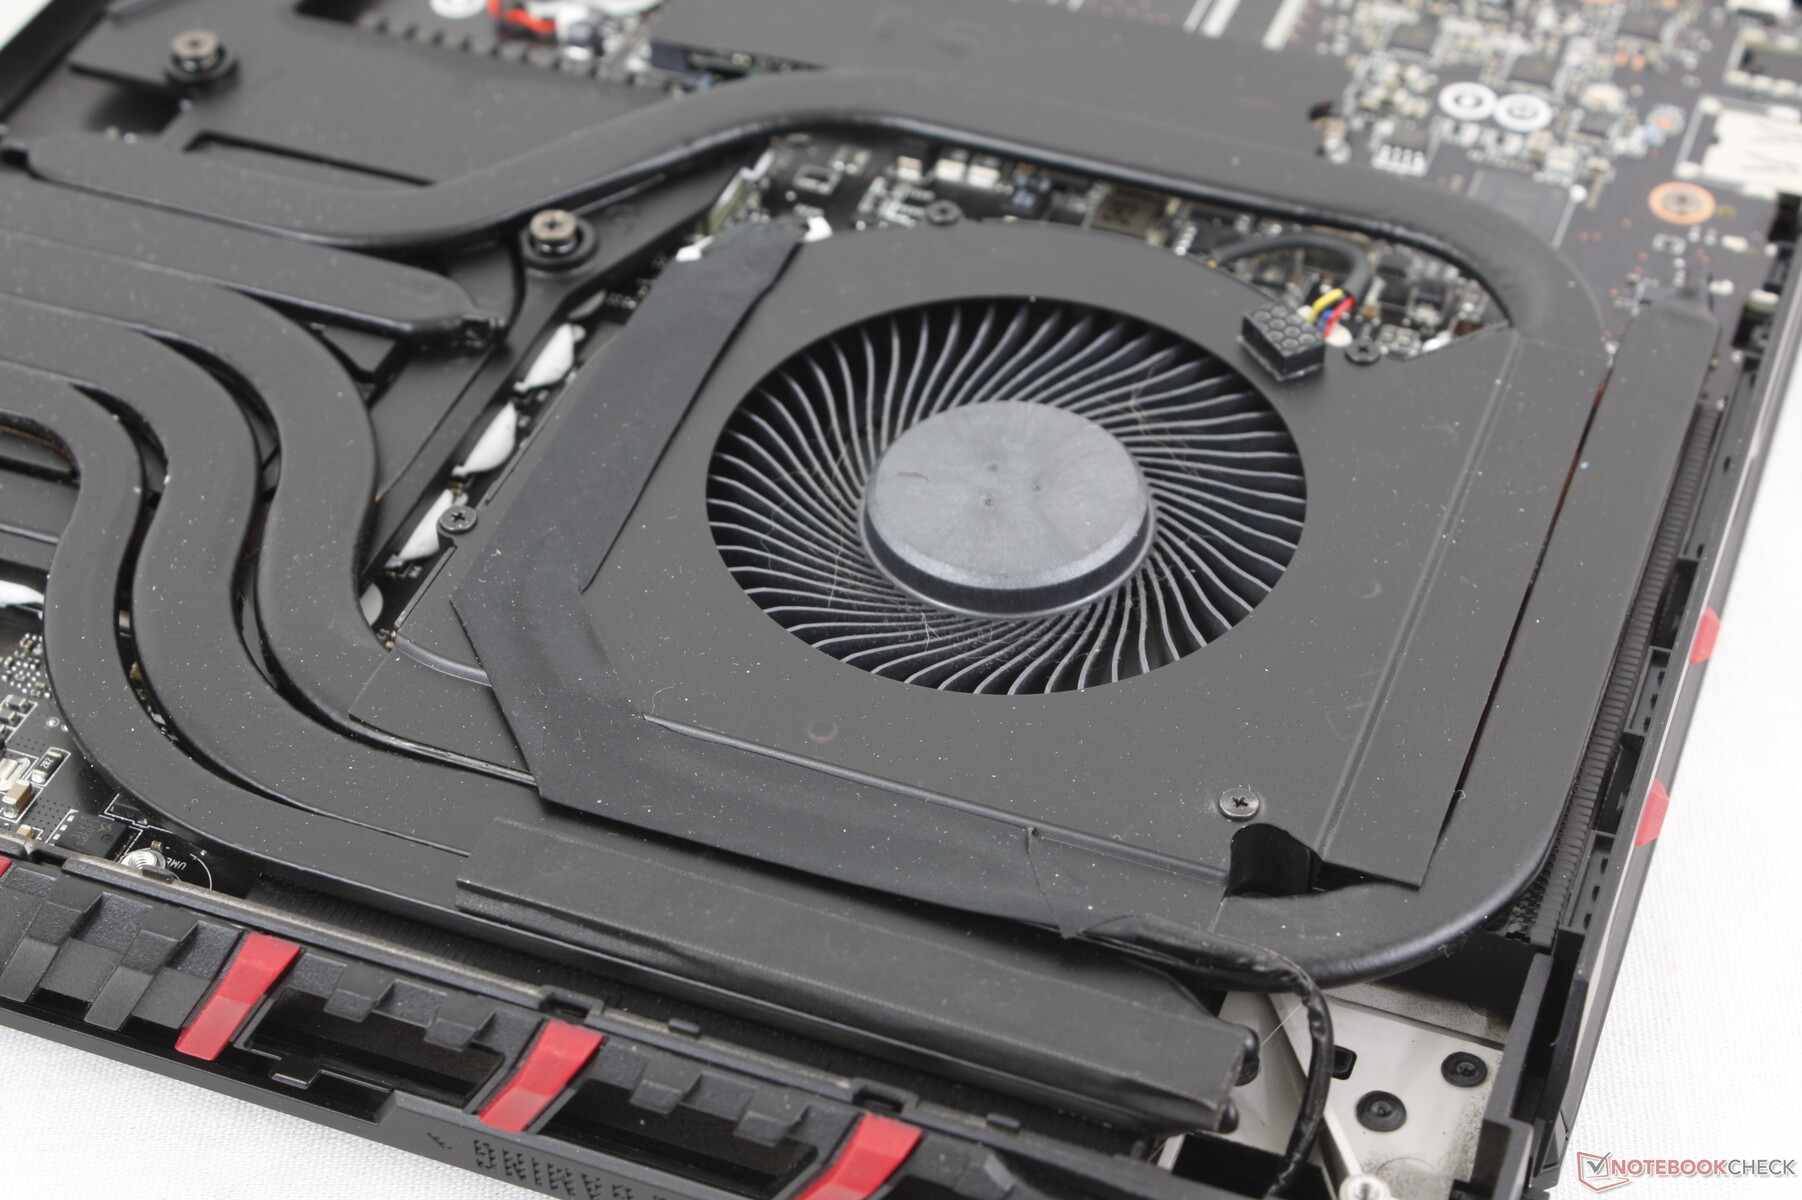
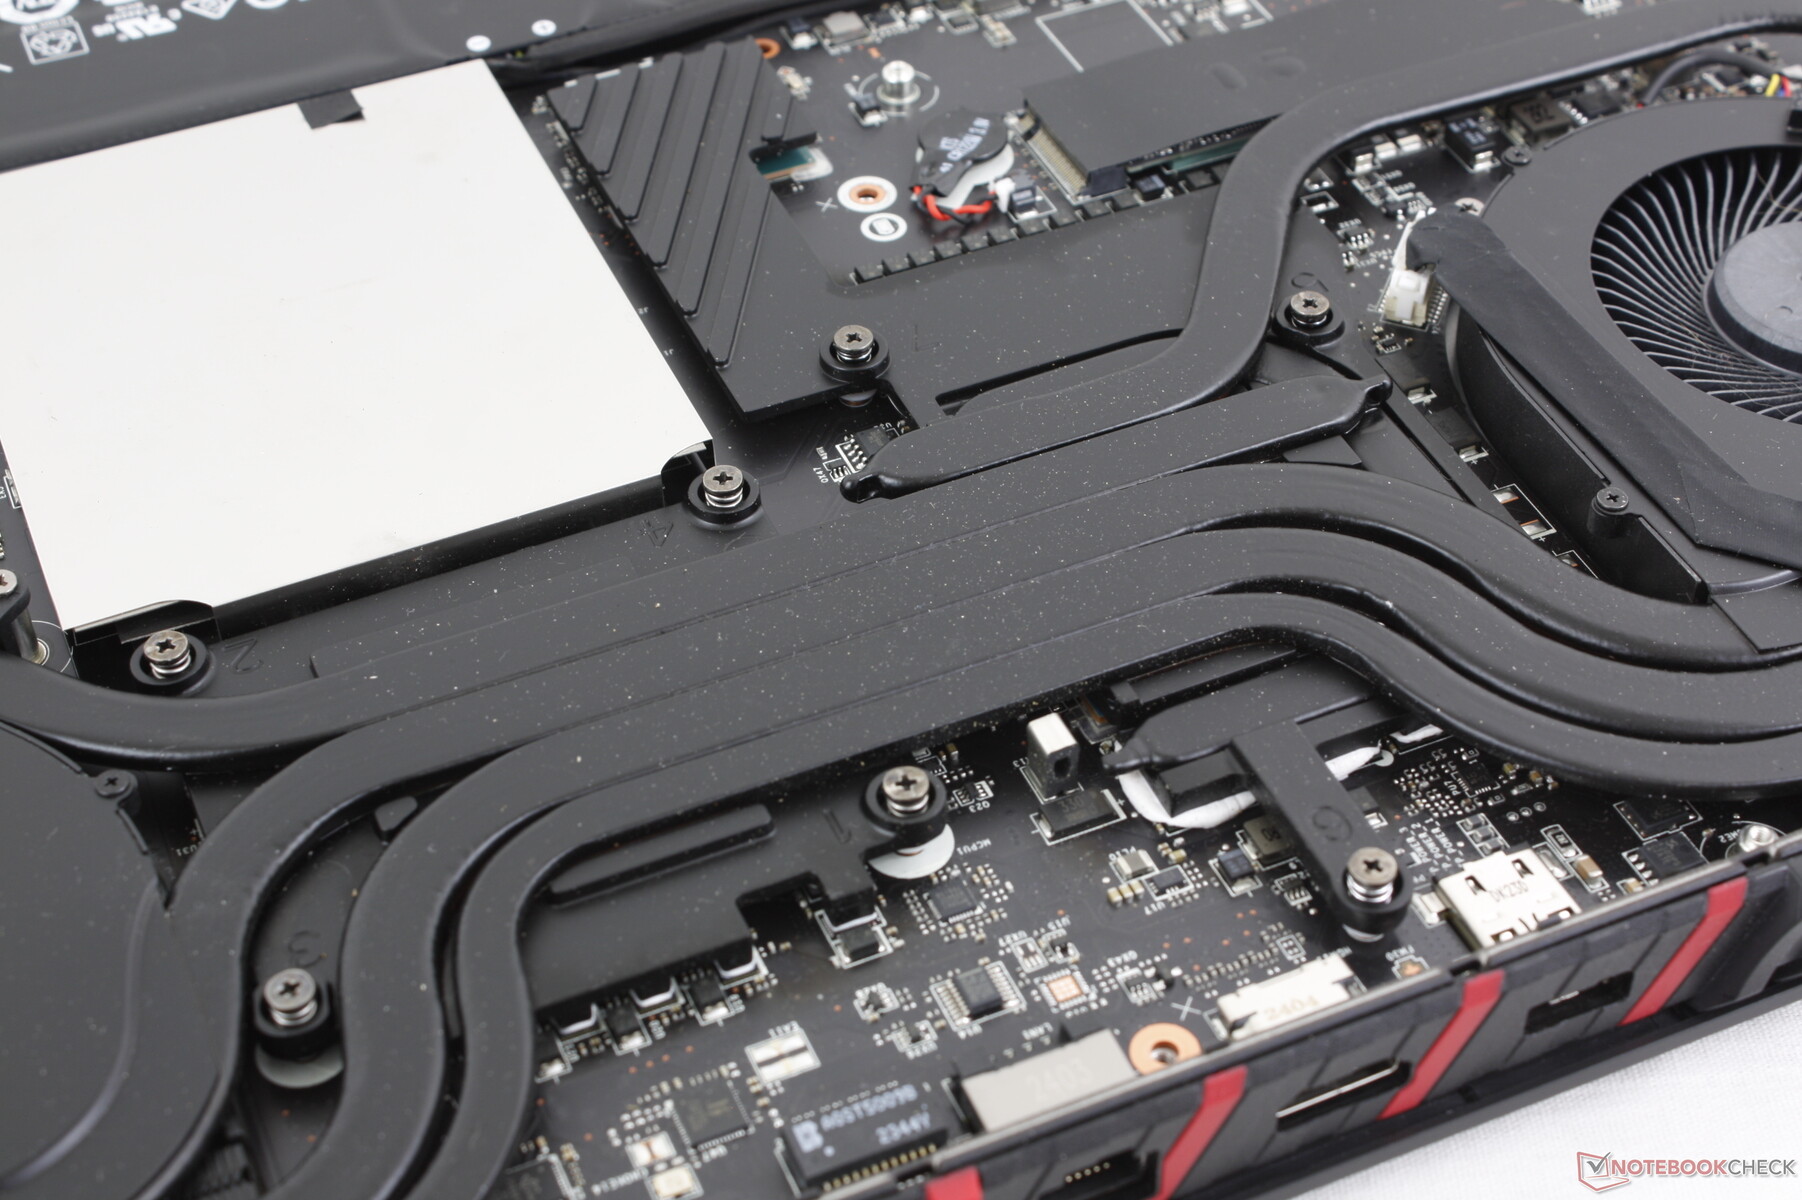
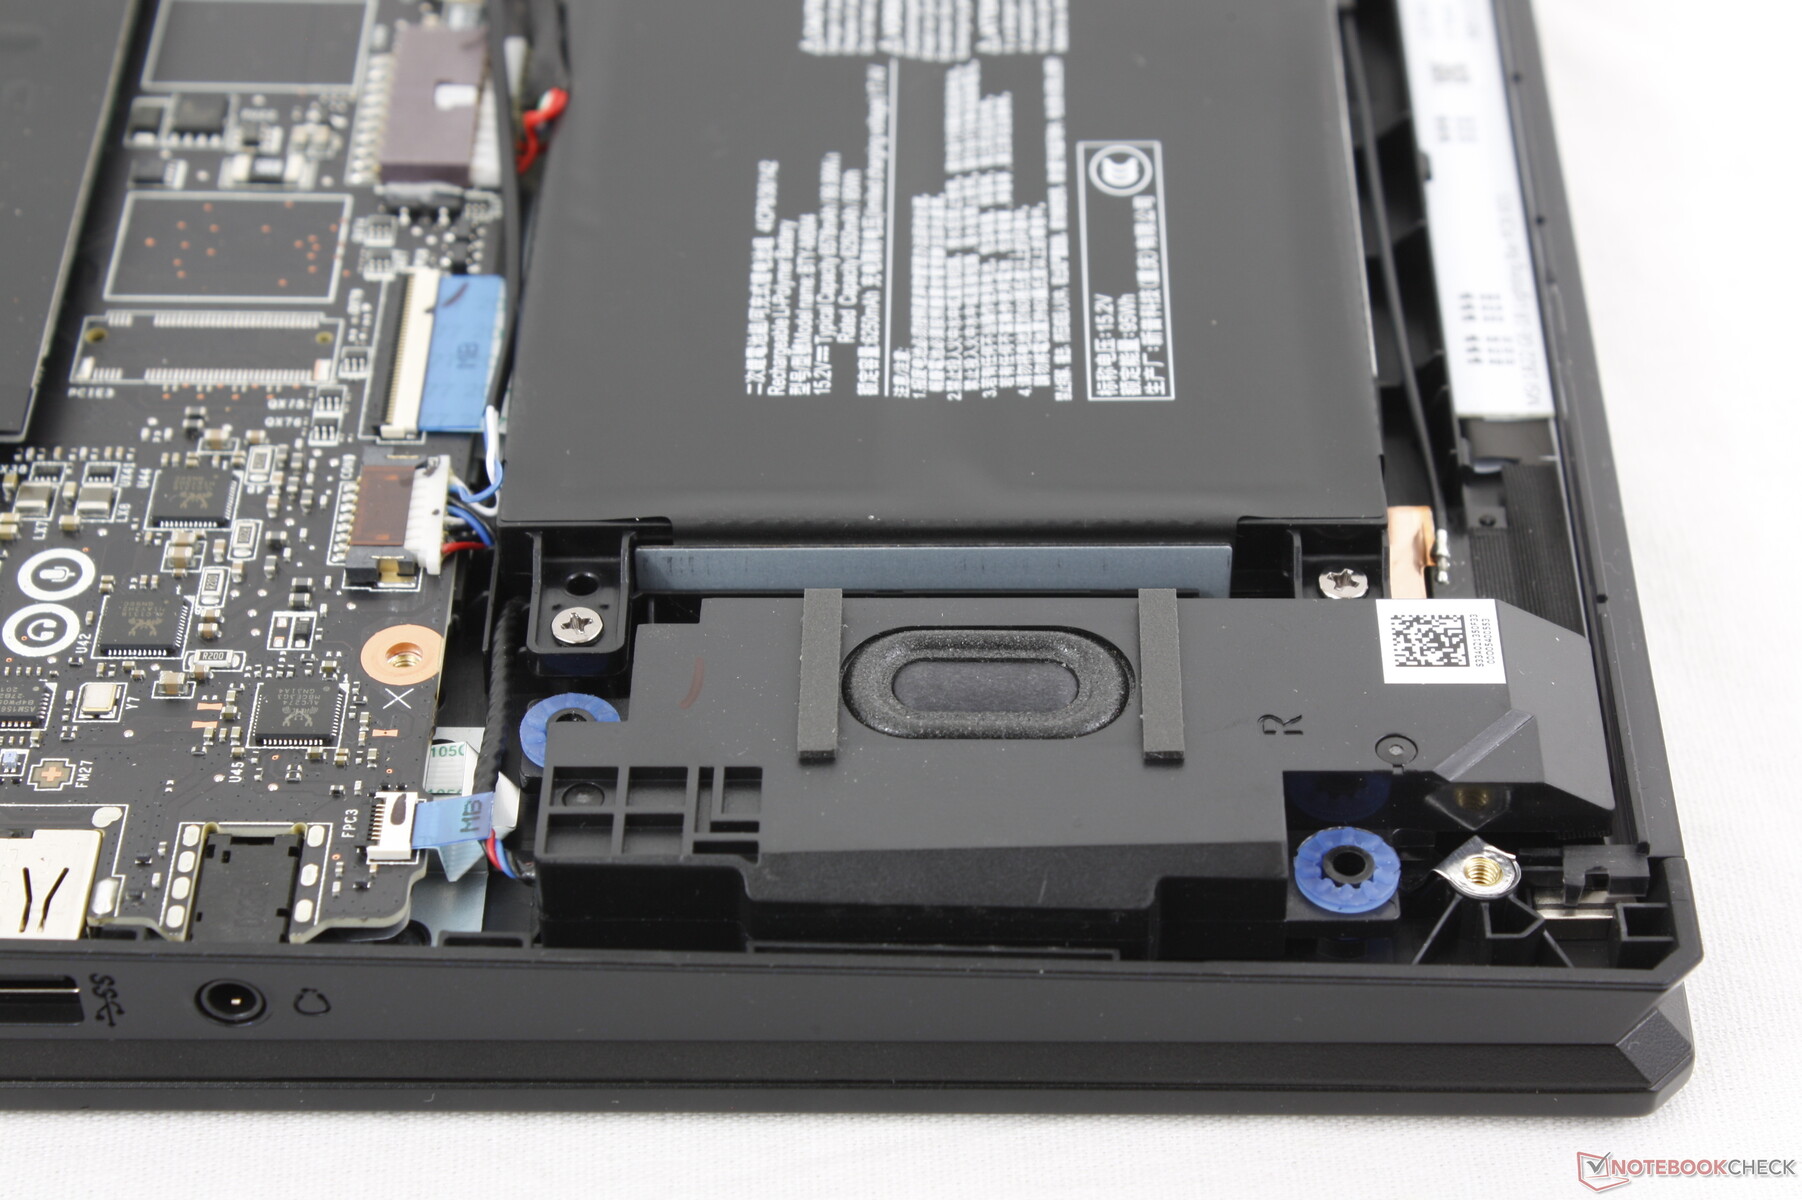
Mantenimiento
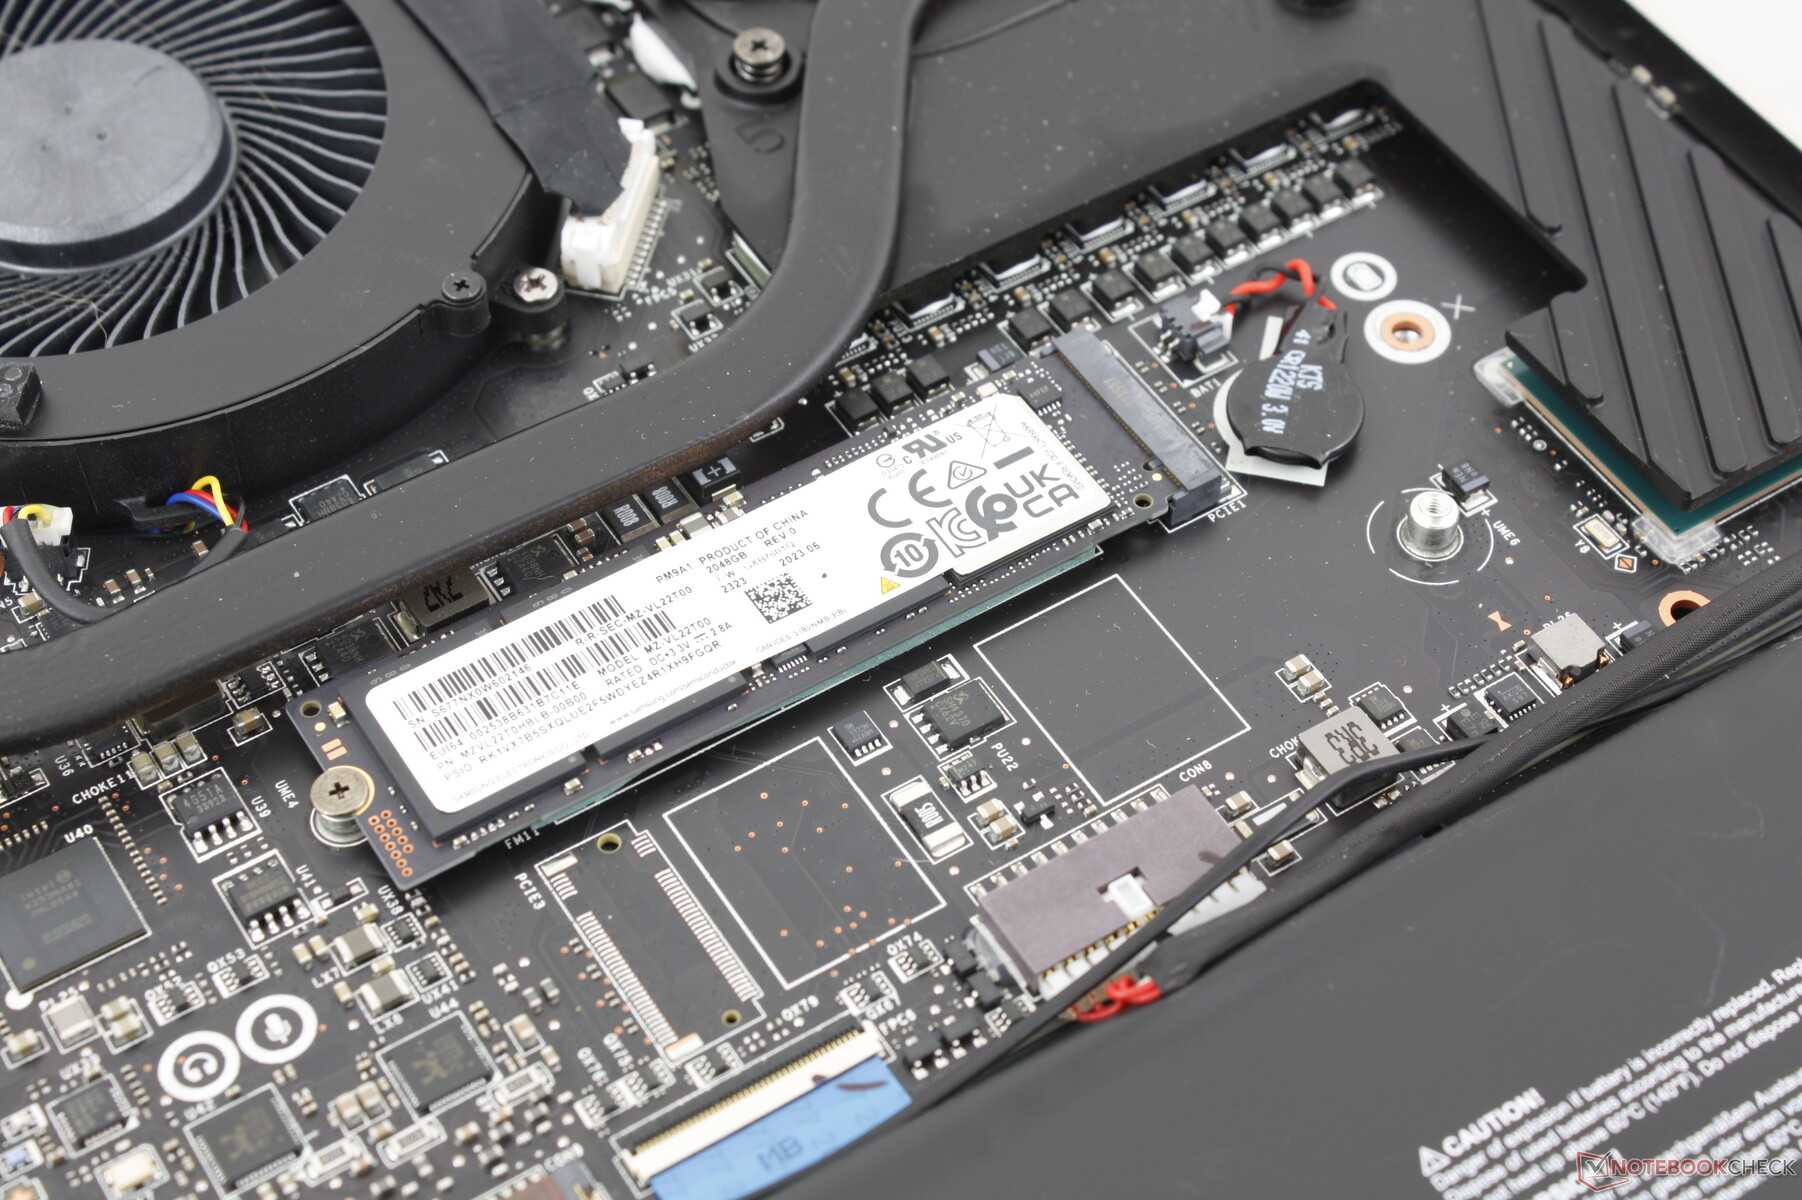
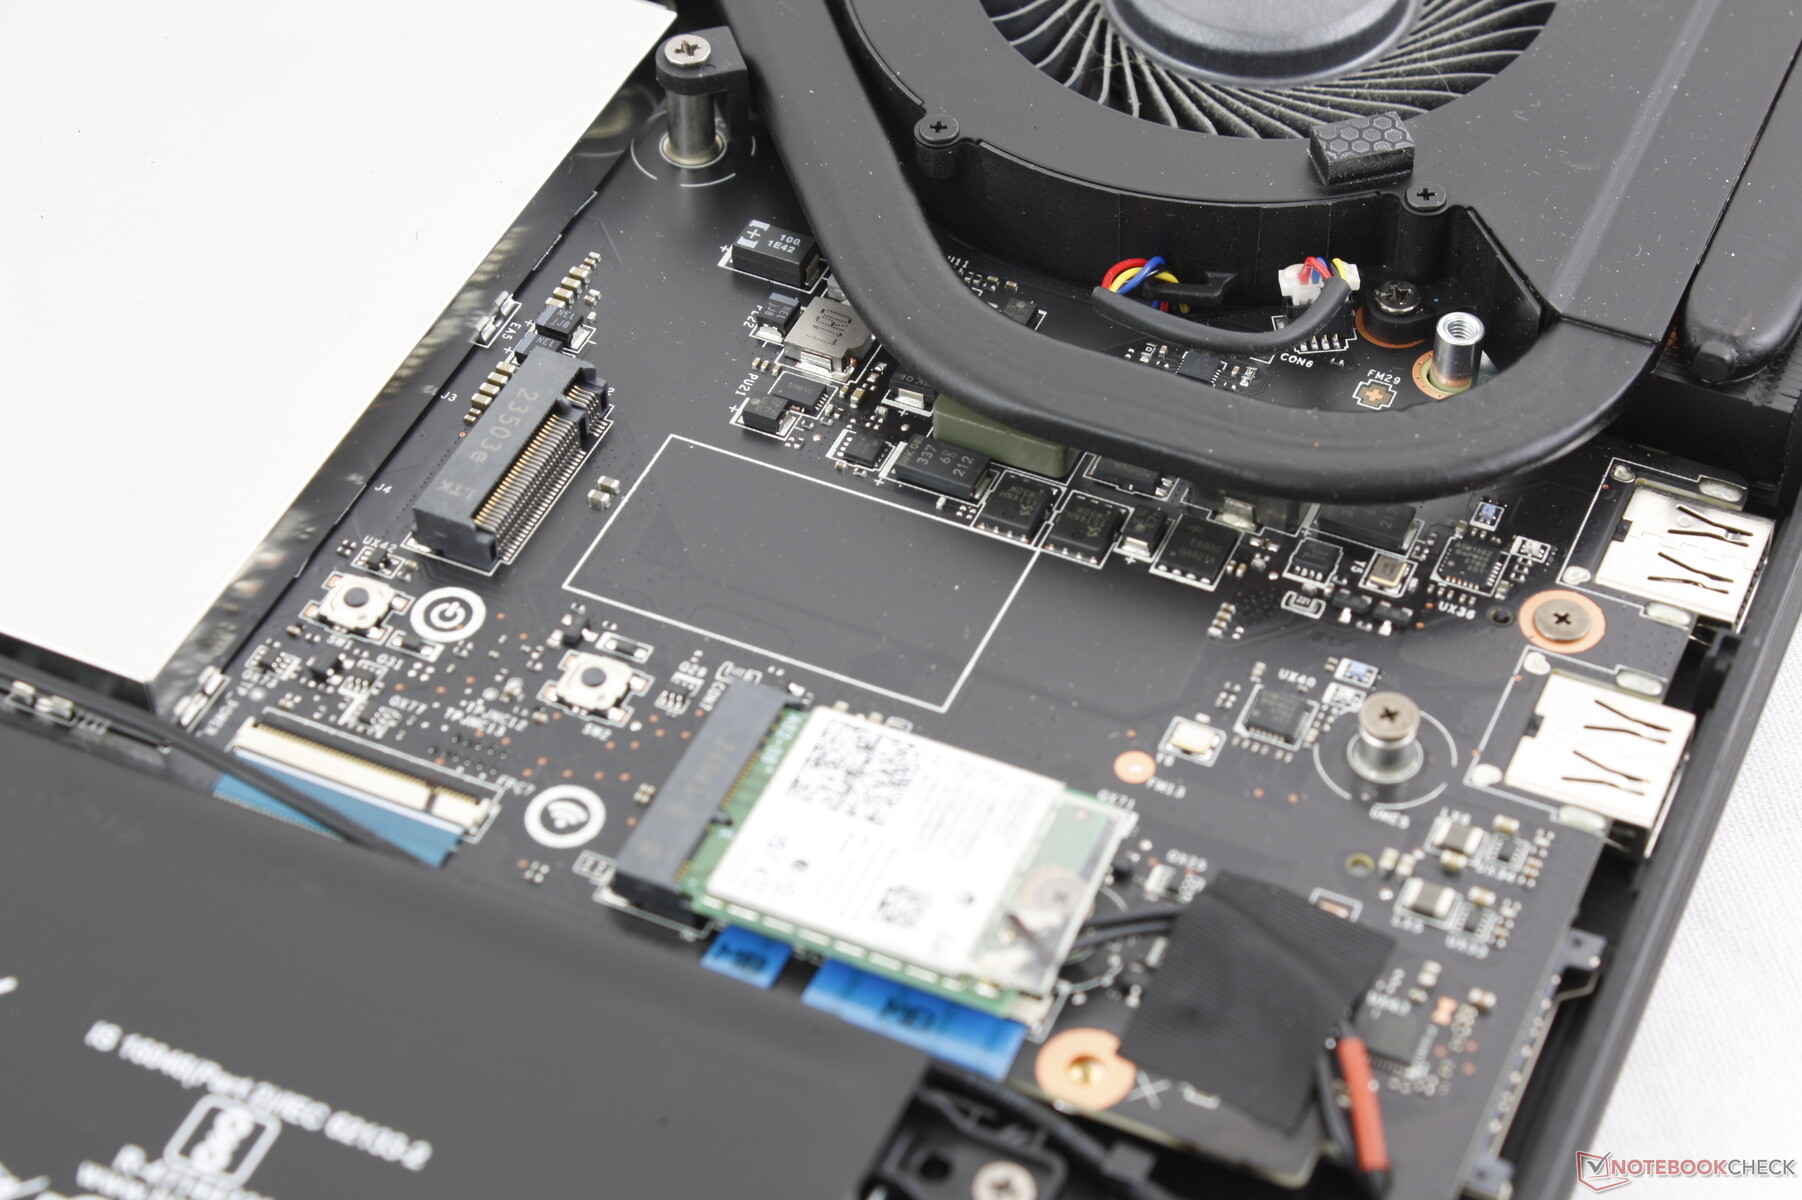
El panel inferior está asegurado por 12 tornillos Phillips para un desmontaje relativamente fácil. Sin embargo, MSI sigue siendo uno de los pocos fabricantes con una pegatina antimanipulación que cubre uno de los tornillos y que debe romperse incluso para realizar actualizaciones sencillas como la RAM o el almacenamiento.
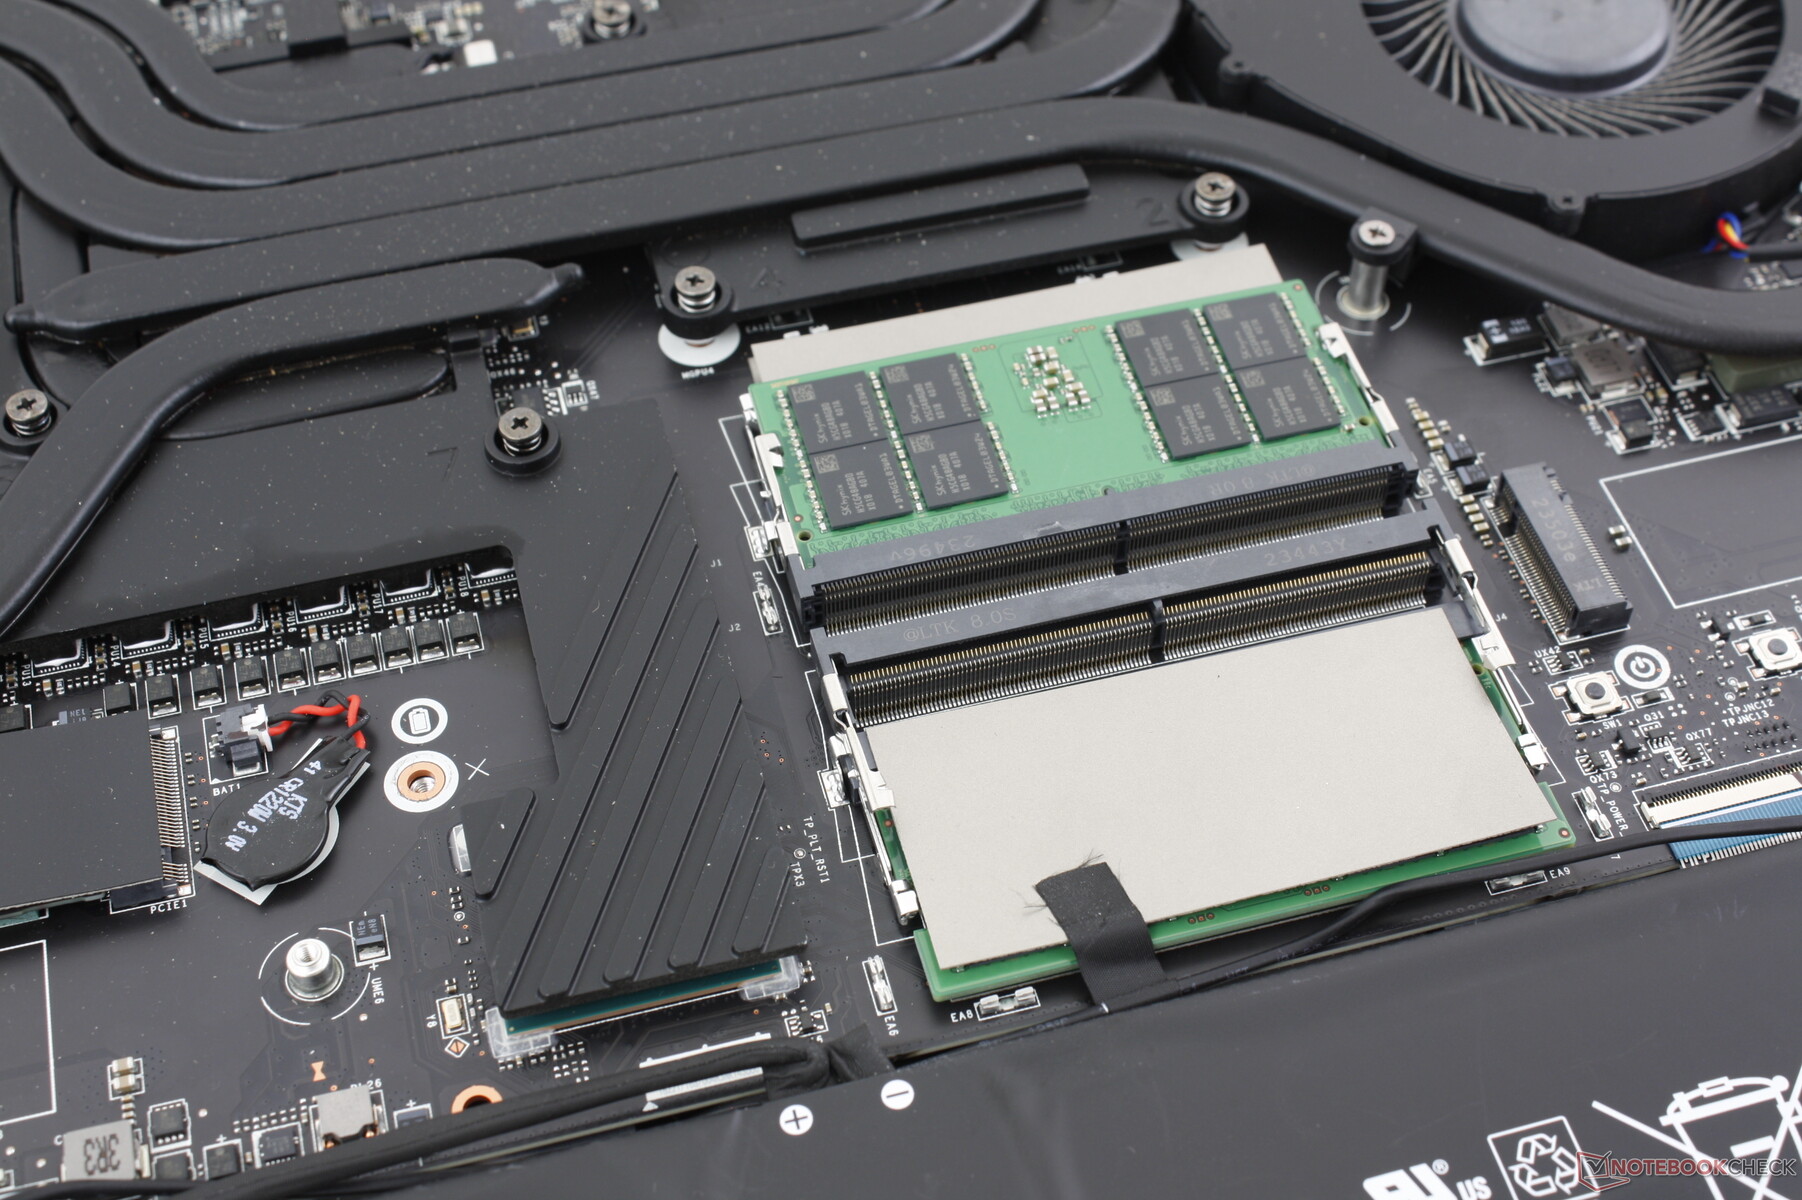
El Raider 18 HX comparte muchos de los mismos componentes internos que el Titan 18 HX. Los usuarios tienen acceso a dos ranuras SSD M.2 2280 y cuatro ranuras SODIMM DDR5. Tenga en cuenta que la tercera ranura para SSD M.2 se ha eliminado de este modelo; los usuarios deben actualizarse a la Titan 18 HX para disponer de dicha característica.

Sostenibilidad
El embalaje es totalmente reciclable y casi todo de cartón, con sólo un poco de envoltorio de plástico para el manual del usuario. Sin embargo, no hay información sobre los materiales reciclados utilizados durante la fabricación del sistema.
Accesorios y garantía
No hay más extras en la caja que el adaptador de CA y el papeleo. Los modelos Raider más antiguos se enviaban con un paño de limpieza de terciopelo, pero parece que esto ya no es así.
Se aplica la habitual garantía limitada de un año del fabricante si se adquiere en EE.UU.
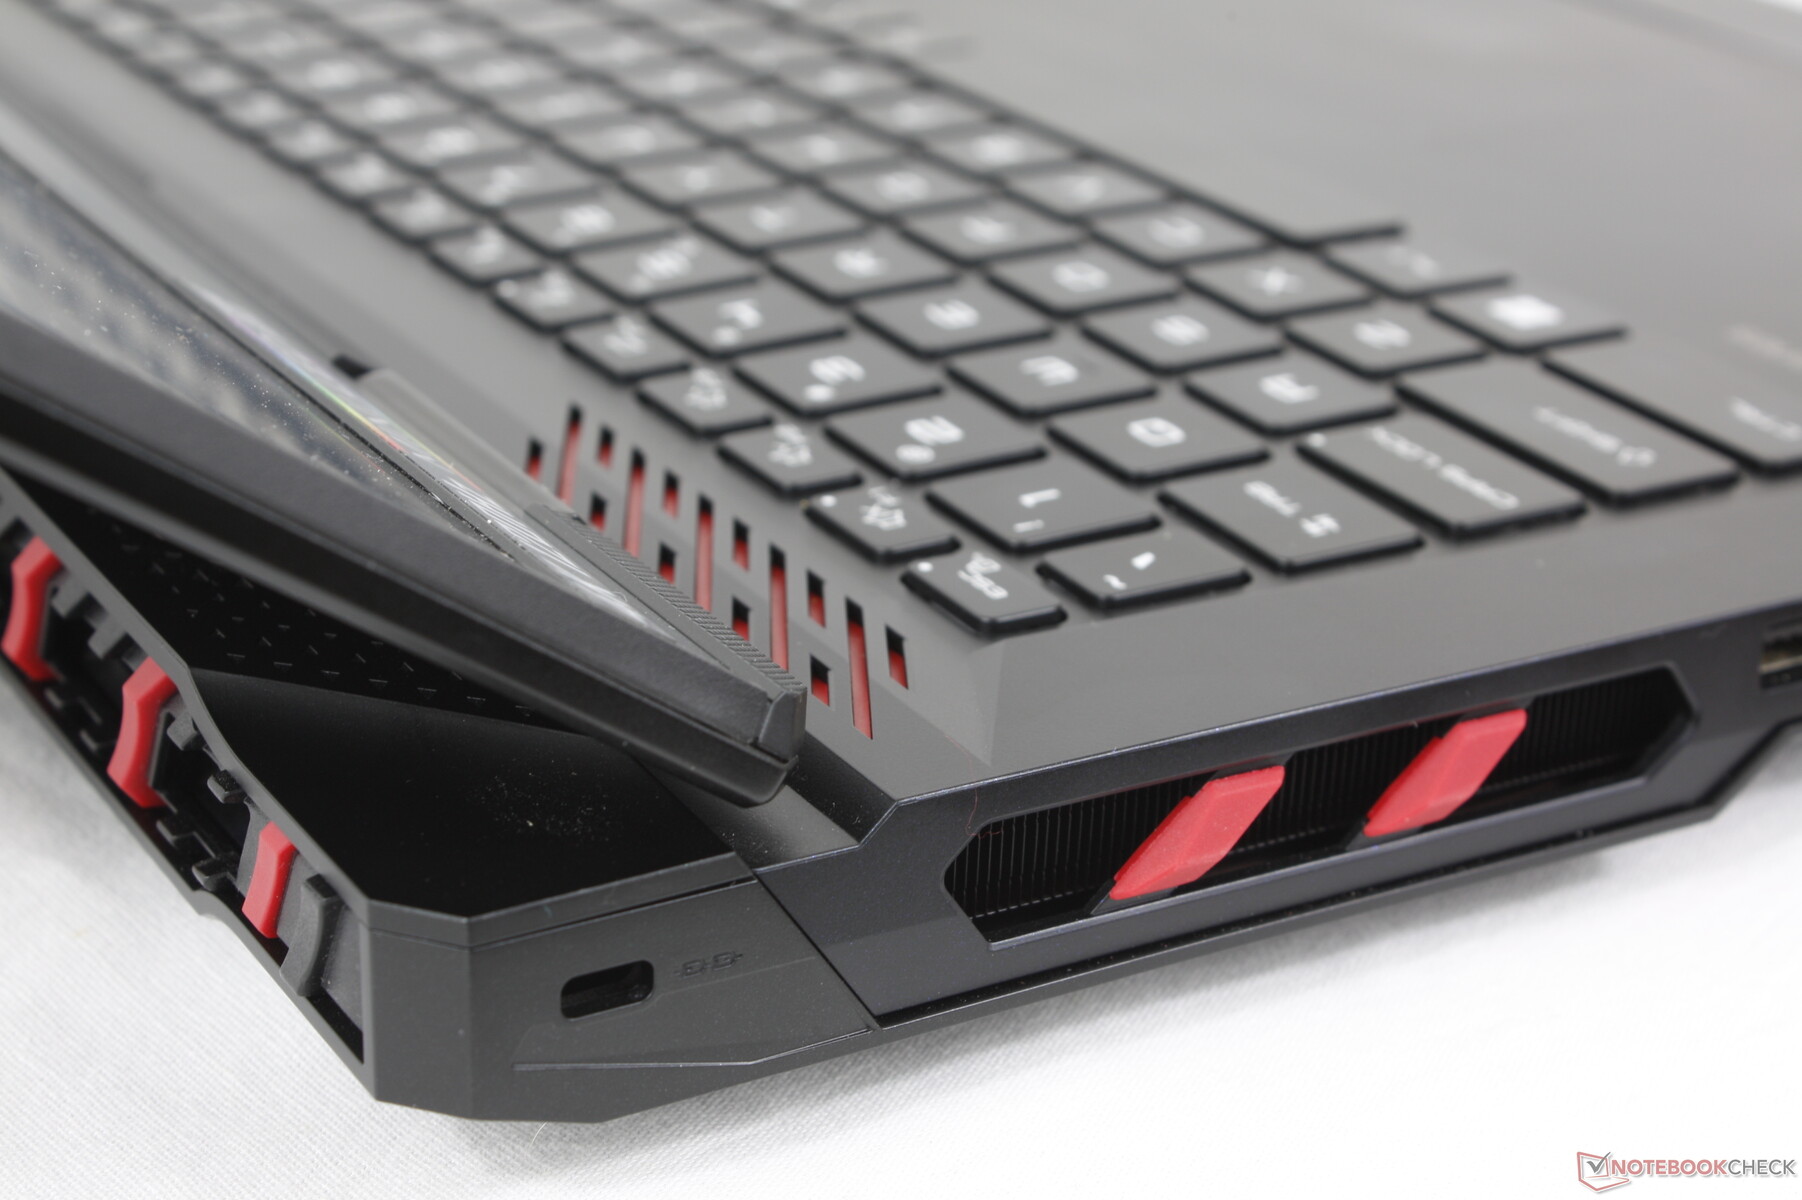
Dispositivos de entrada: lo familiar por encima de lo extravagante
Teclado
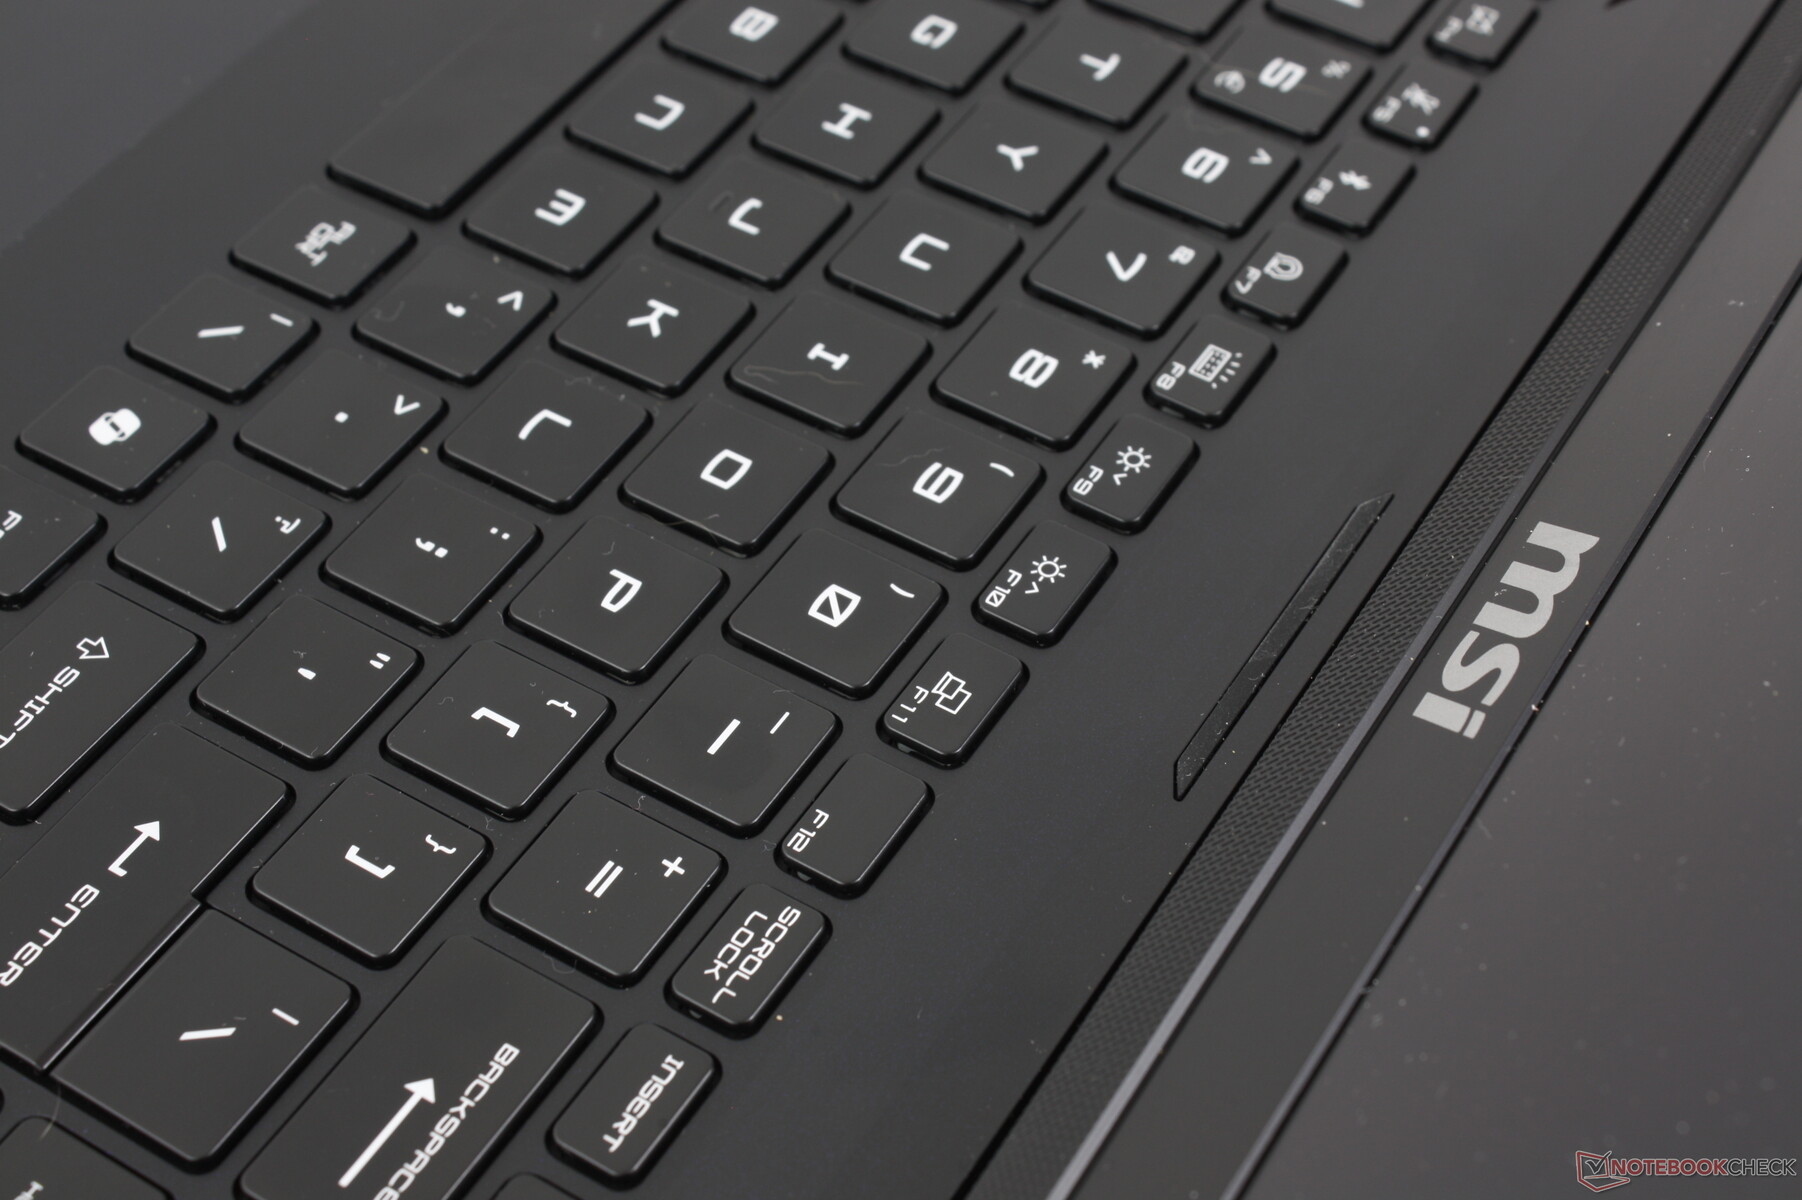
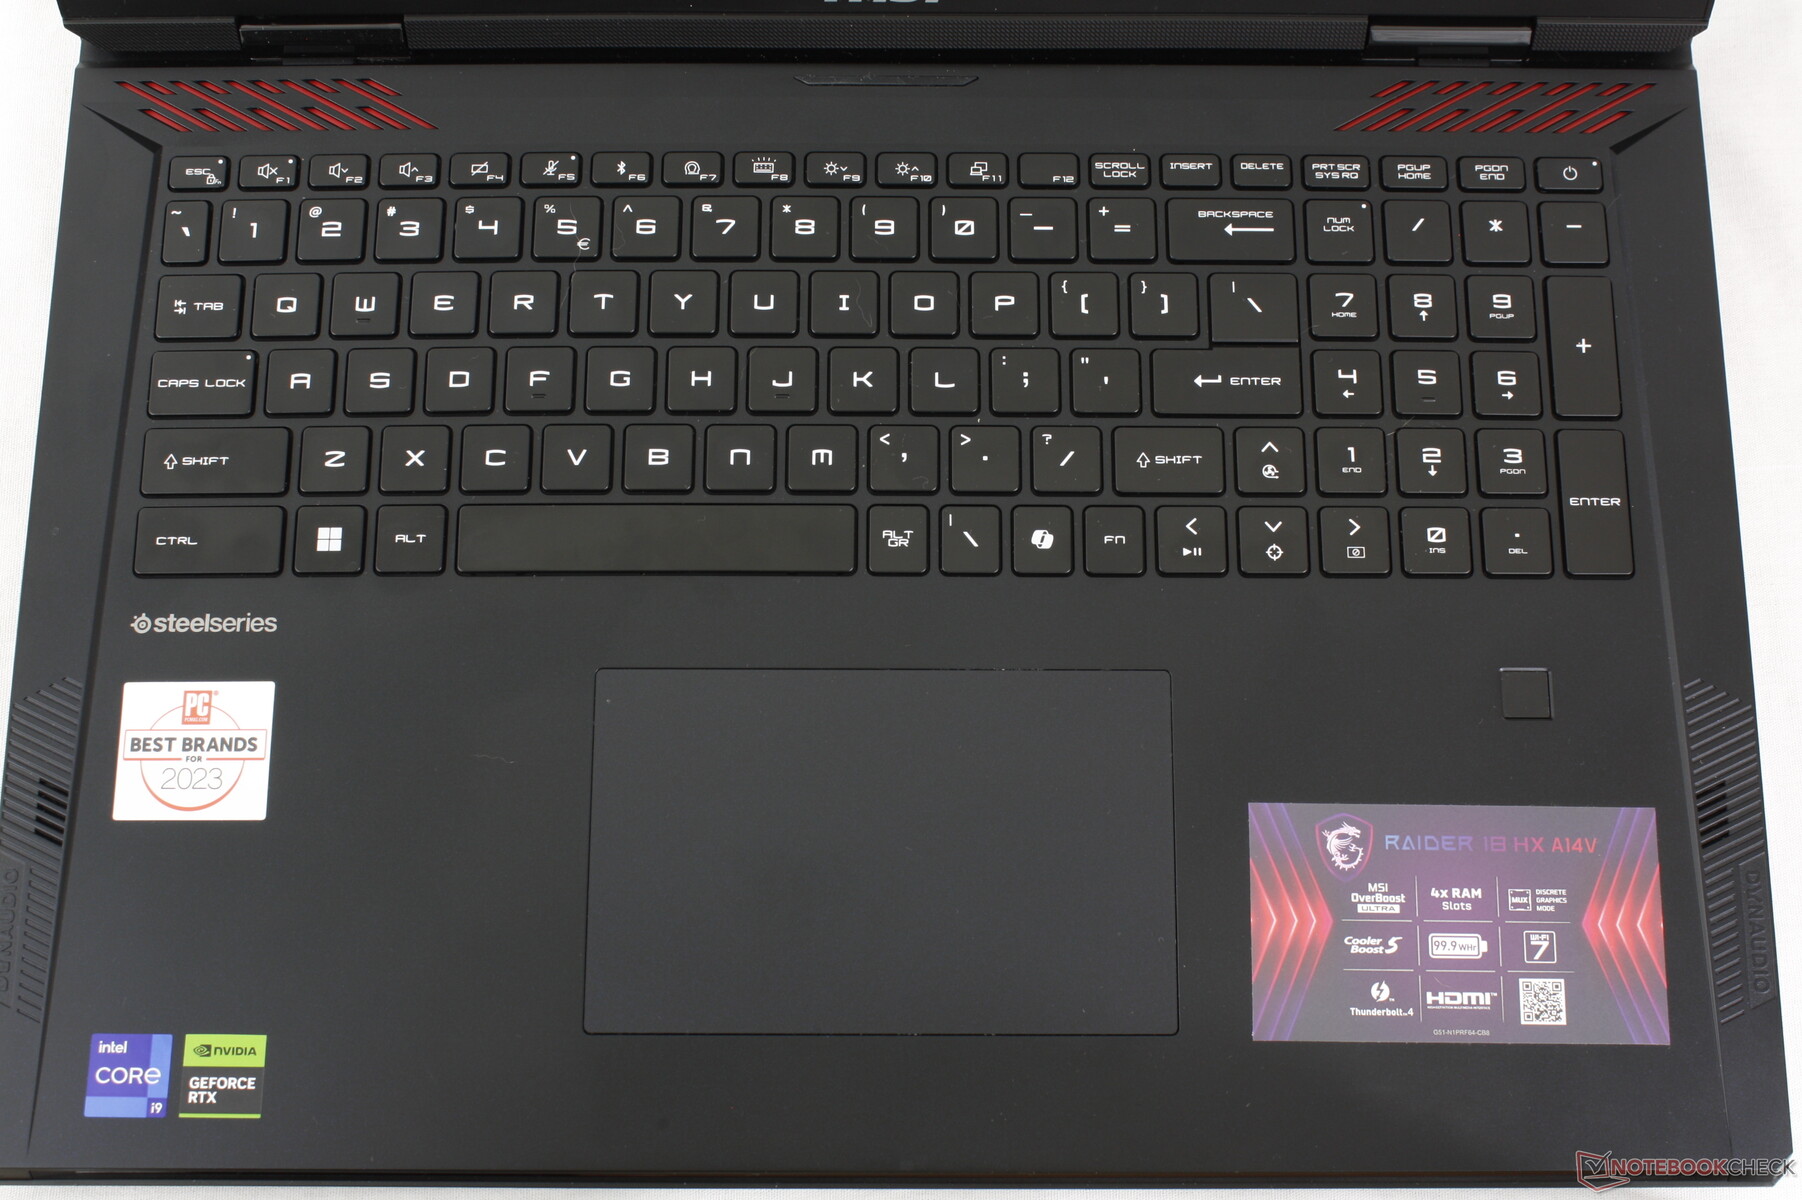
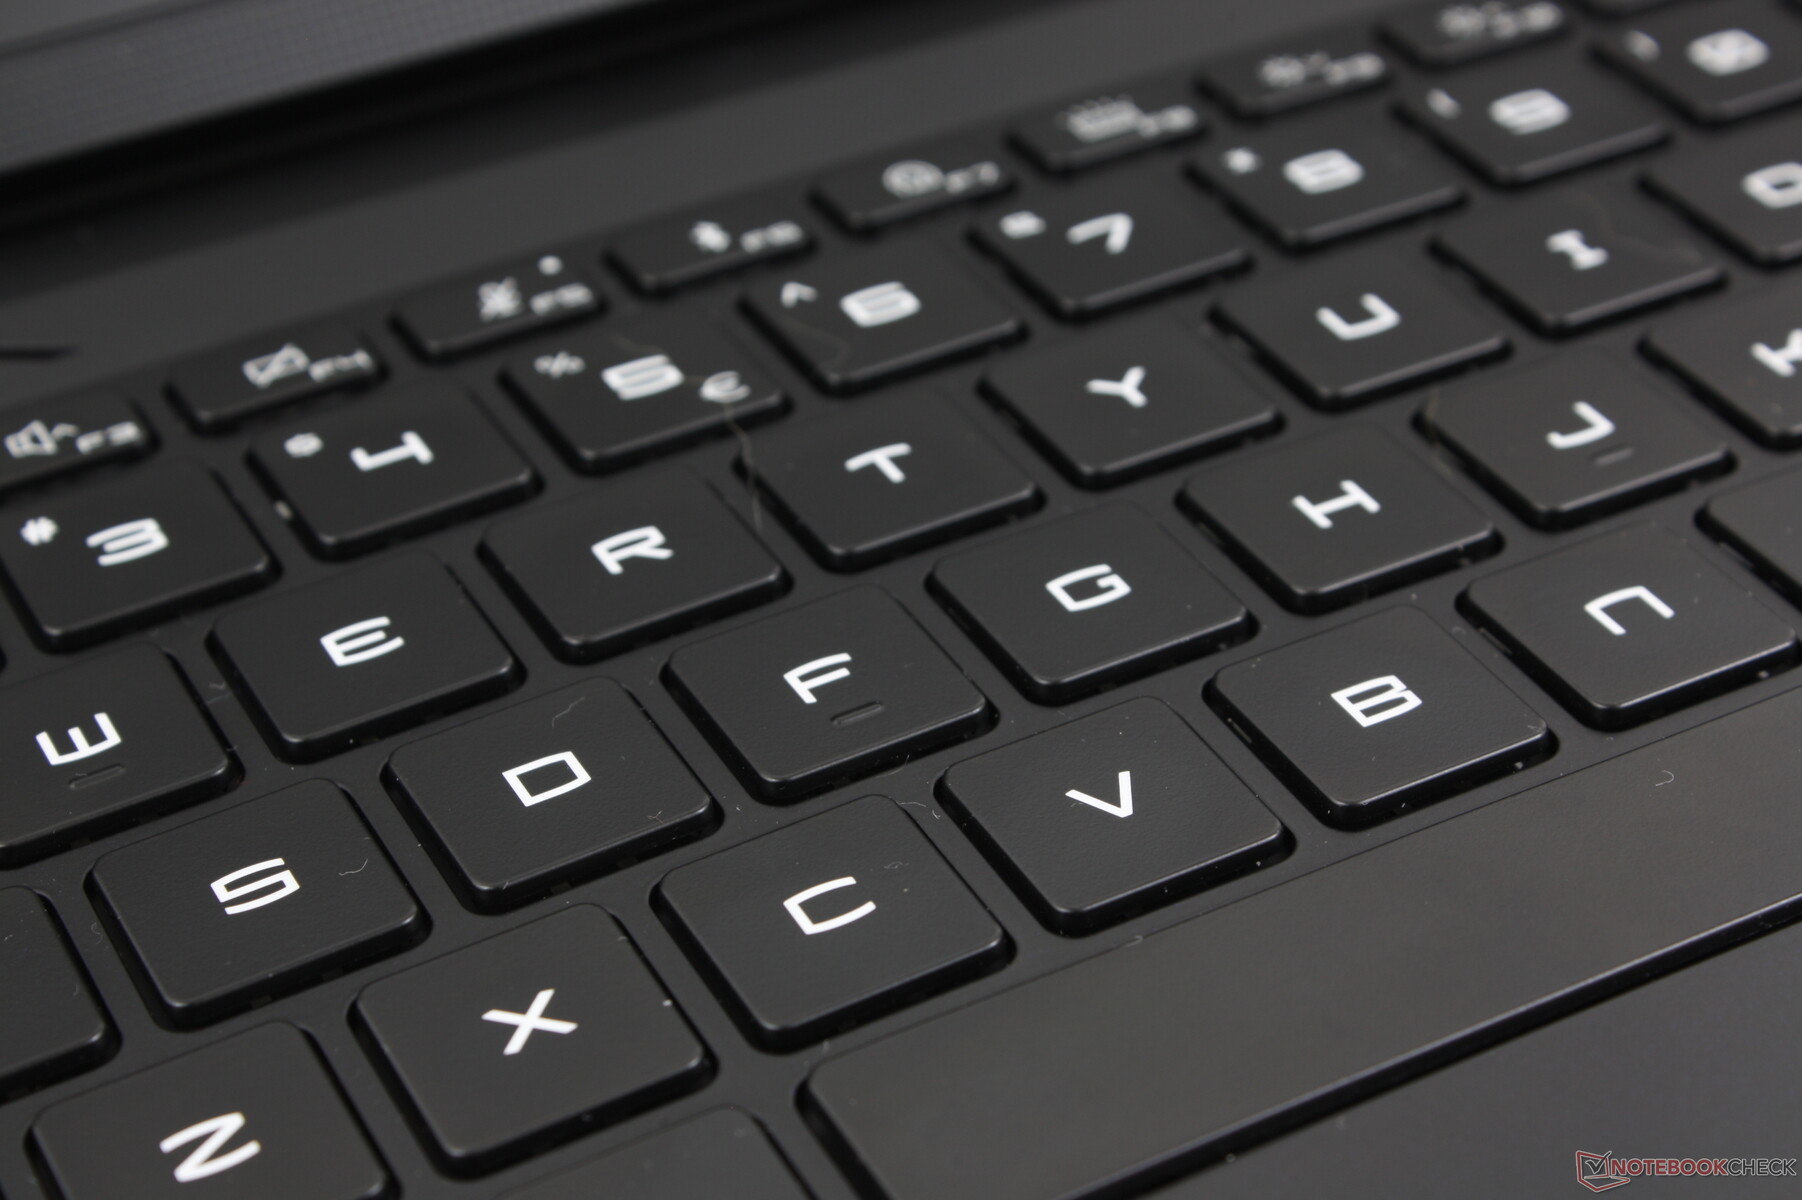
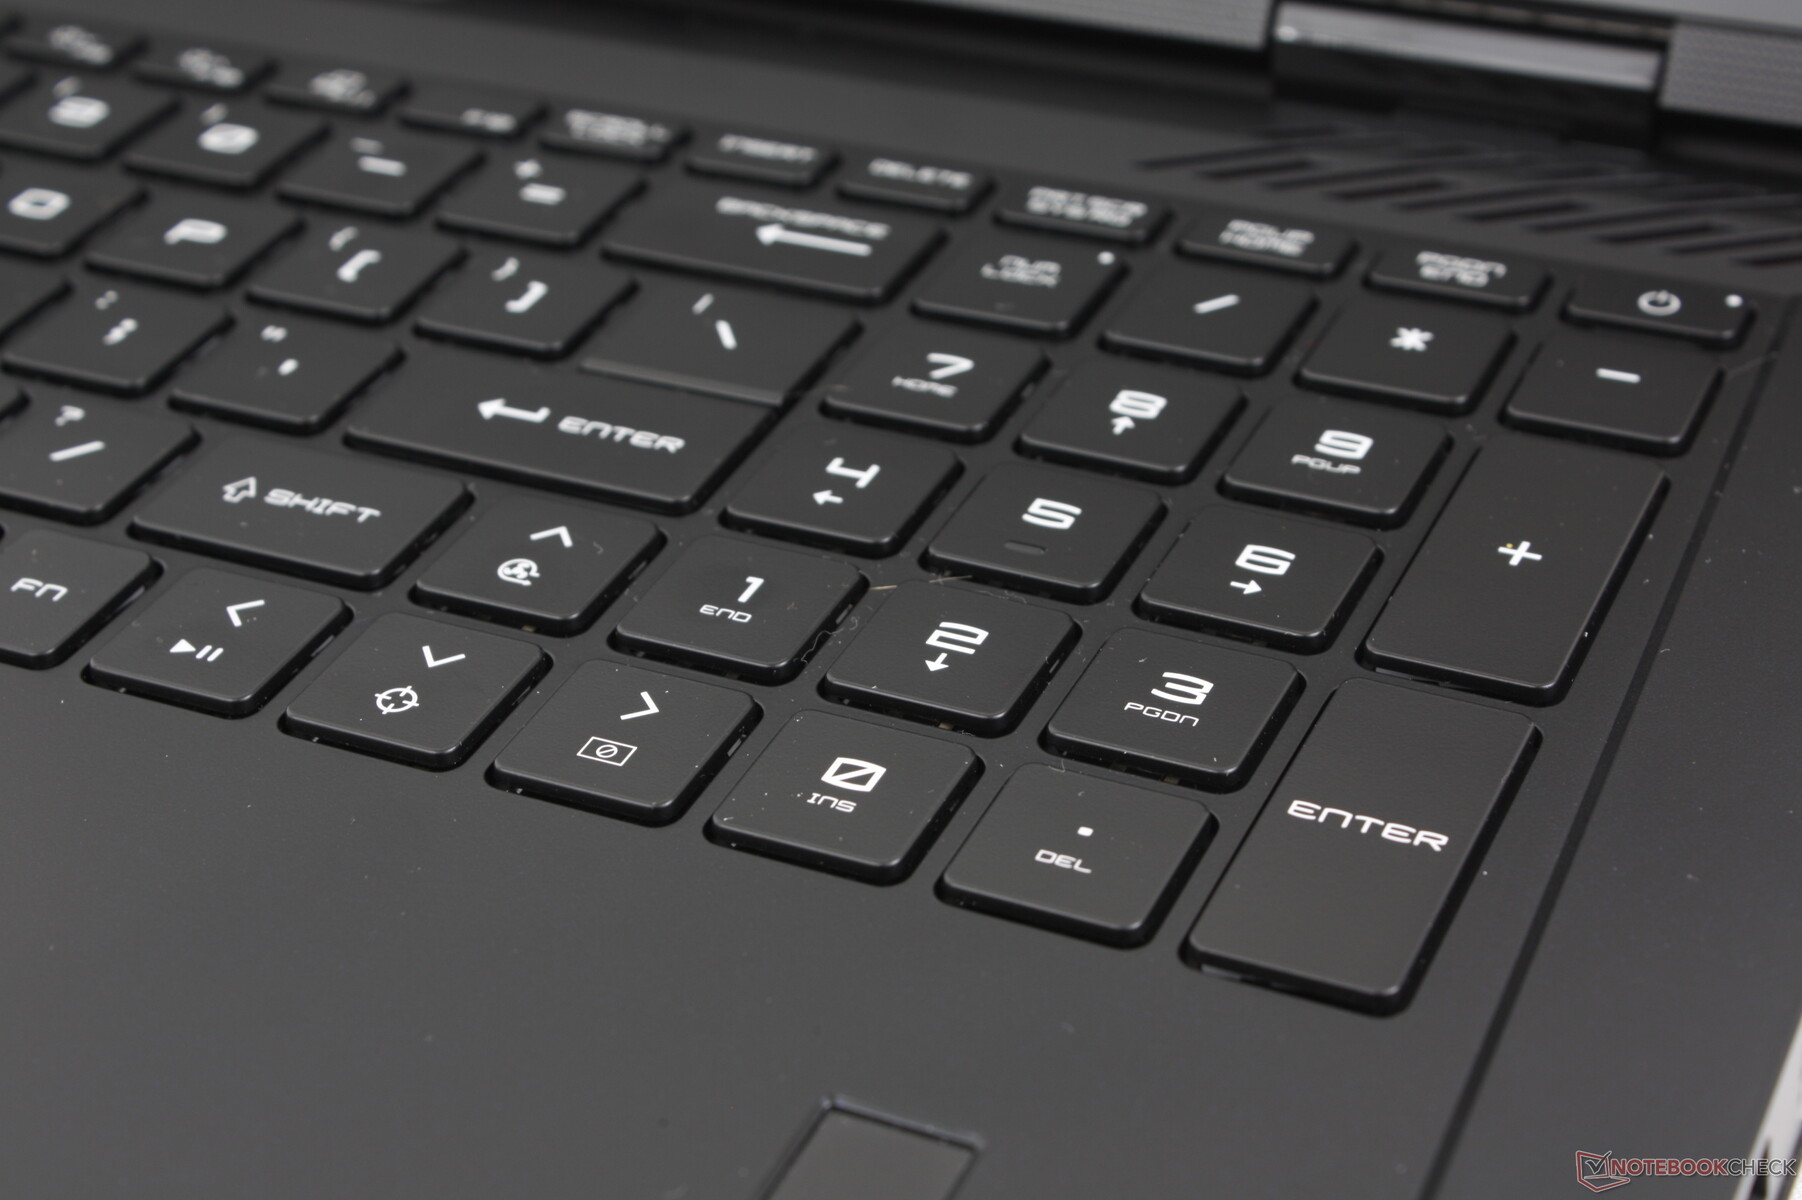
El teclado es visualmente idéntico al de la Titan 18 HX pero con una diferencia muy importante: La ausencia de opciones mecánicas CherryMX. Por lo tanto, escribir en el Raider 18 HX es más parecido a hacerlo en teclados de portátiles más tradicionales como en el MSI Stealth 16 o los modelos Raider de generaciones anteriores. La respuesta no es ni de lejos tan chasqueante o firme, pero el traqueteo más suave puede ser preferible para entornos como salas de conferencias, aulas, bibliotecas o dormitorios.
Apreciamos especialmente el teclado numérico de tamaño completo y las teclas de flecha, ya que suelen ser más estrechas y pequeñas que las teclas QWERTY principales de la mayoría de los demás portátiles. Por tanto, el trabajo con hojas de cálculo resulta más cómodo en el Raider 18 HX que en el Blade 18 o el ROG Strix G18.
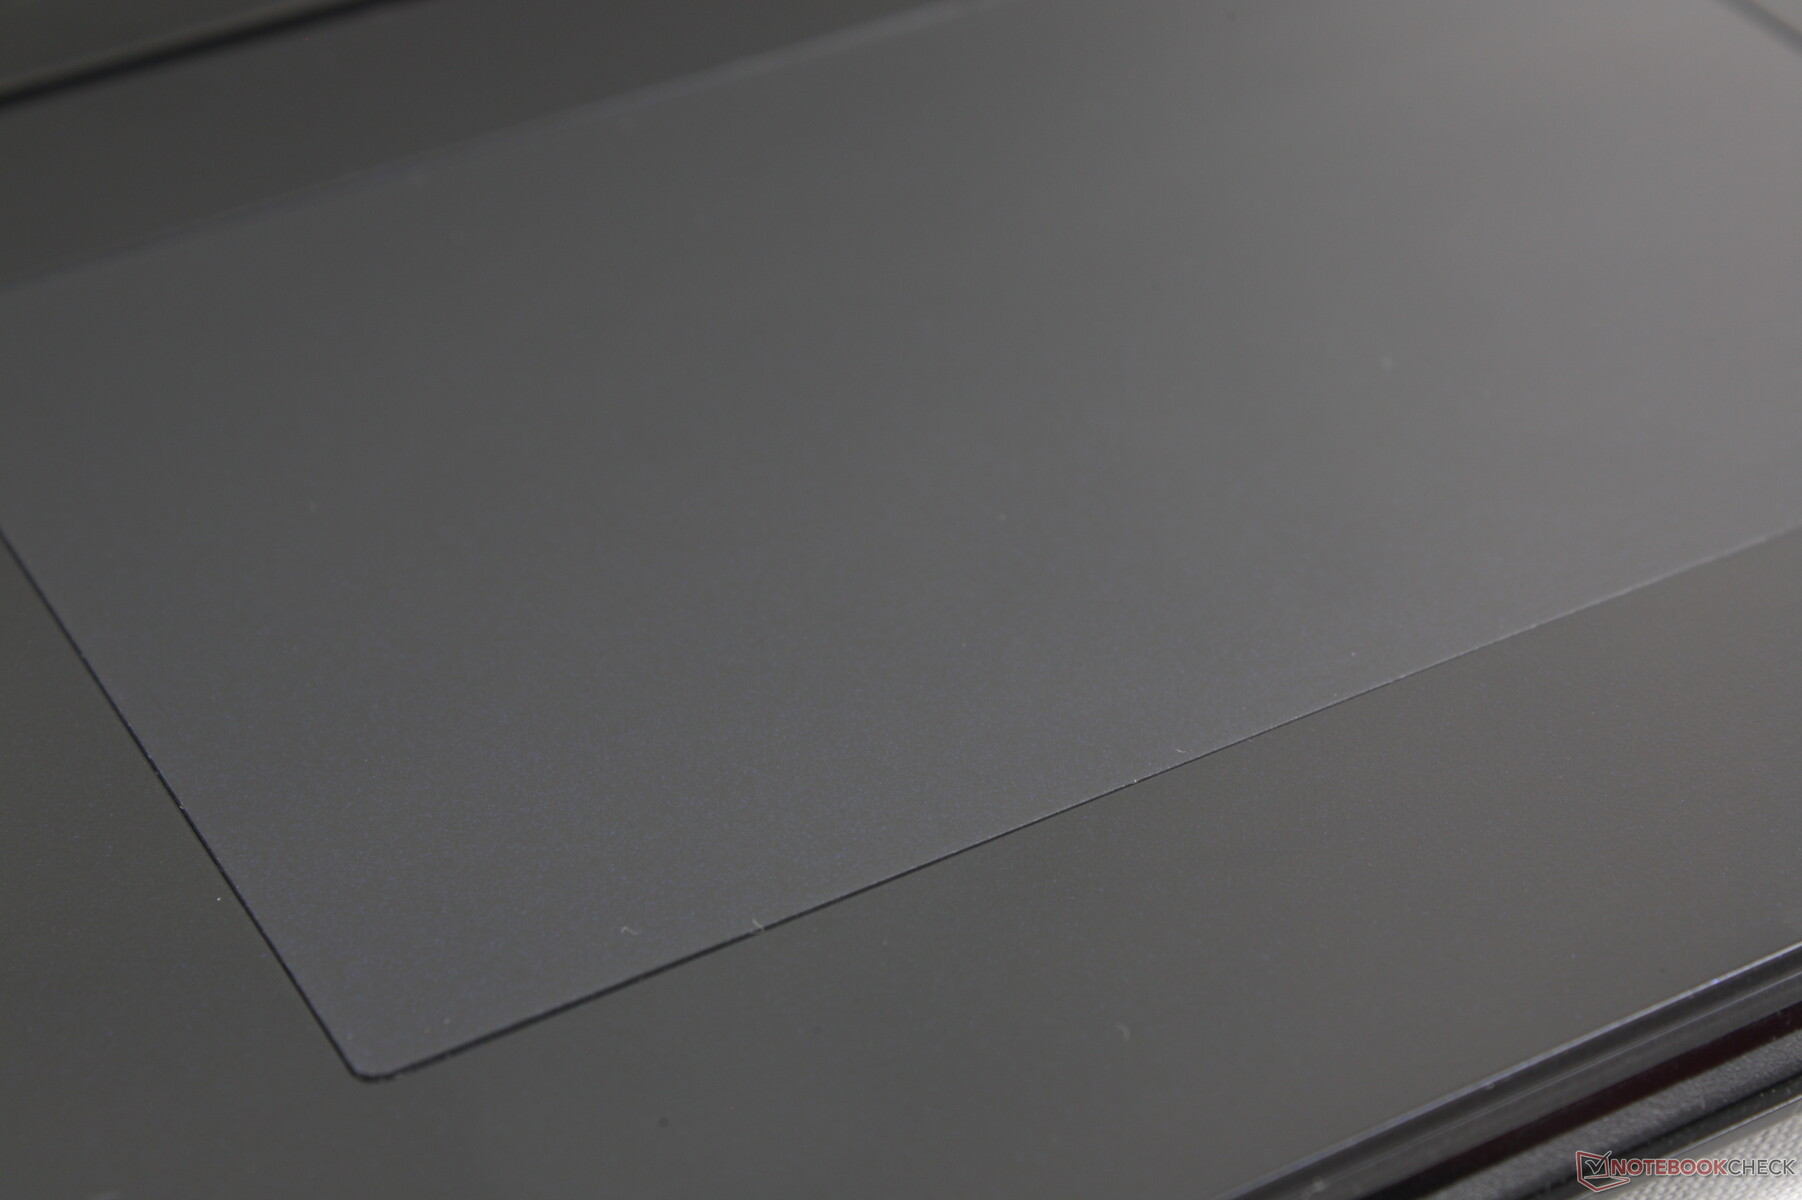
Panel táctil
A diferencia del elegante clickpad sin bordes iluminado por LED de la Titan 18 HX, la Raider 18 HX utiliza un clickpad tradicional para una sensación más familiar. El tamaño sigue siendo exactamente el mismo (13 x 8,2 cm) y podría decirse que es más cómodo de usar, ya que no intenta ser nada nuevo ni solucionar un problema que no existía en primer lugar. La tracción es ultrasuave con sólo un poco de adherencia a velocidades más lentas para mayor precisión.
Presionar hacia abajo para introducir un clic sigue siendo, por desgracia, superficial y suave, con una respuesta insatisfactoria. Hubiera sido preferible un clic más fuerte y firme o incluso el regreso de las teclas dedicadas al ratón, ya que la cubierta del teclado es bastante espaciosa.
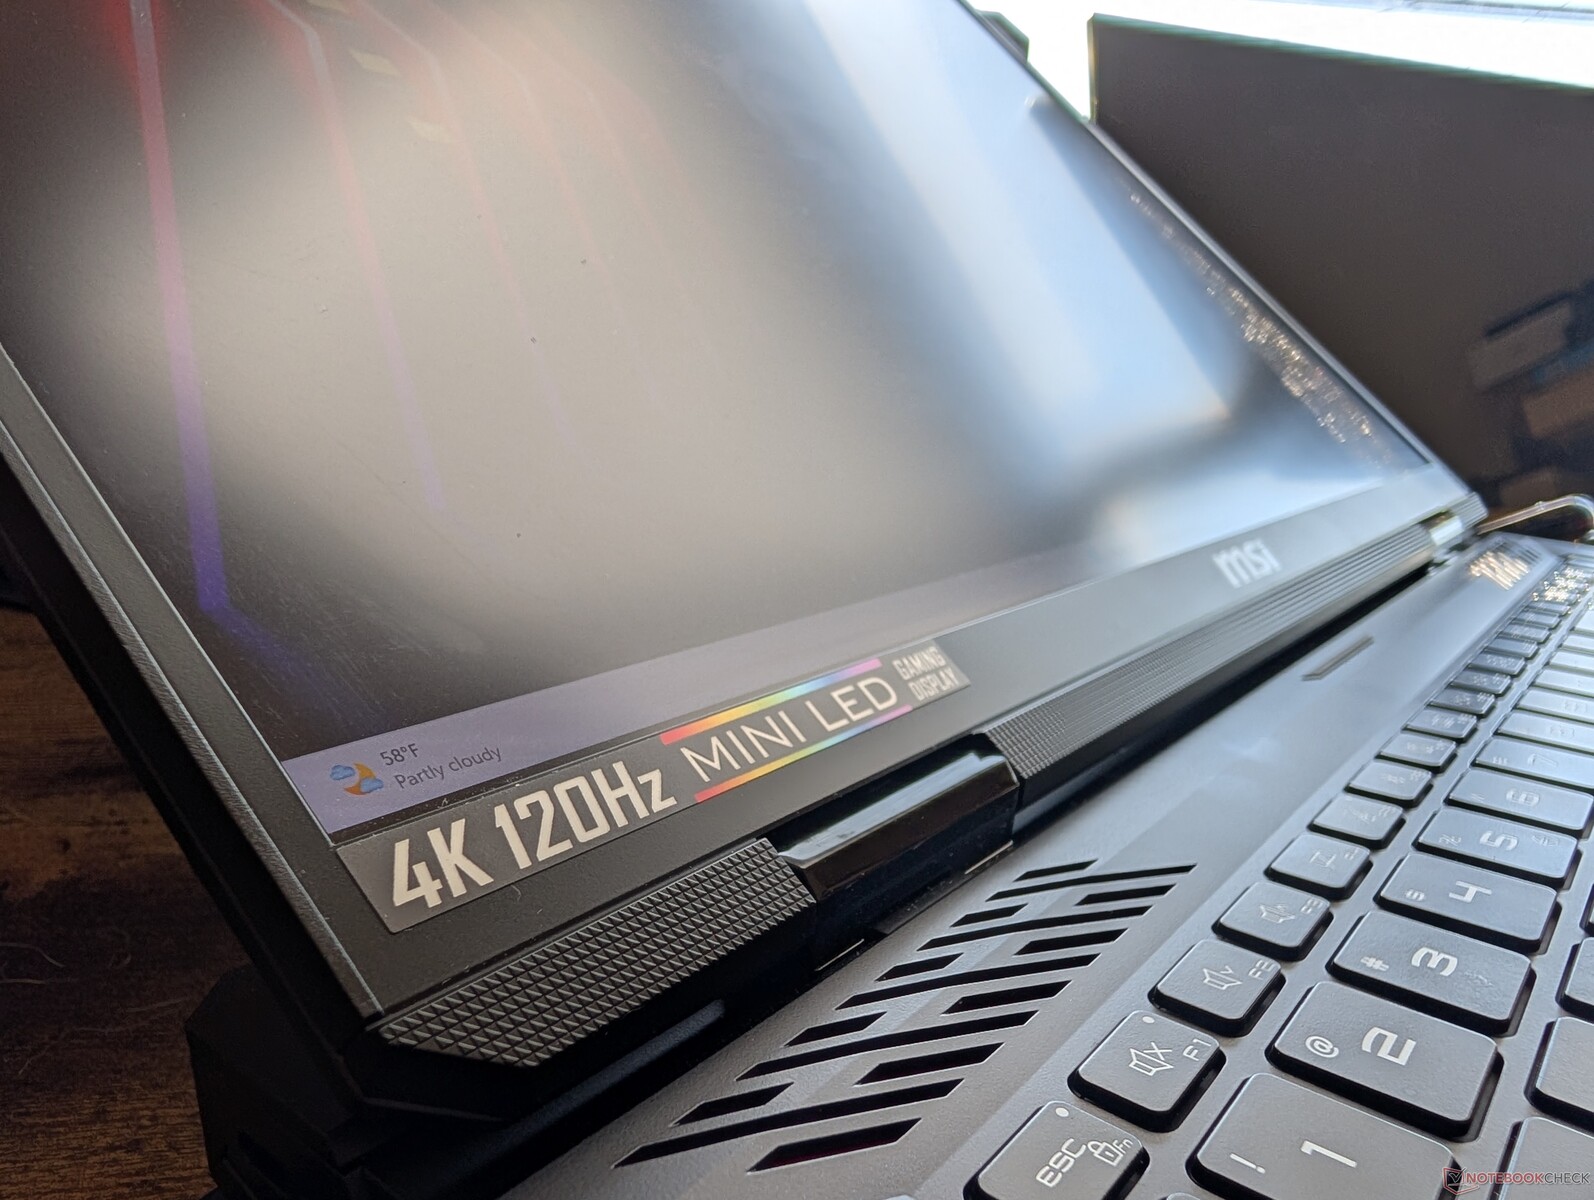
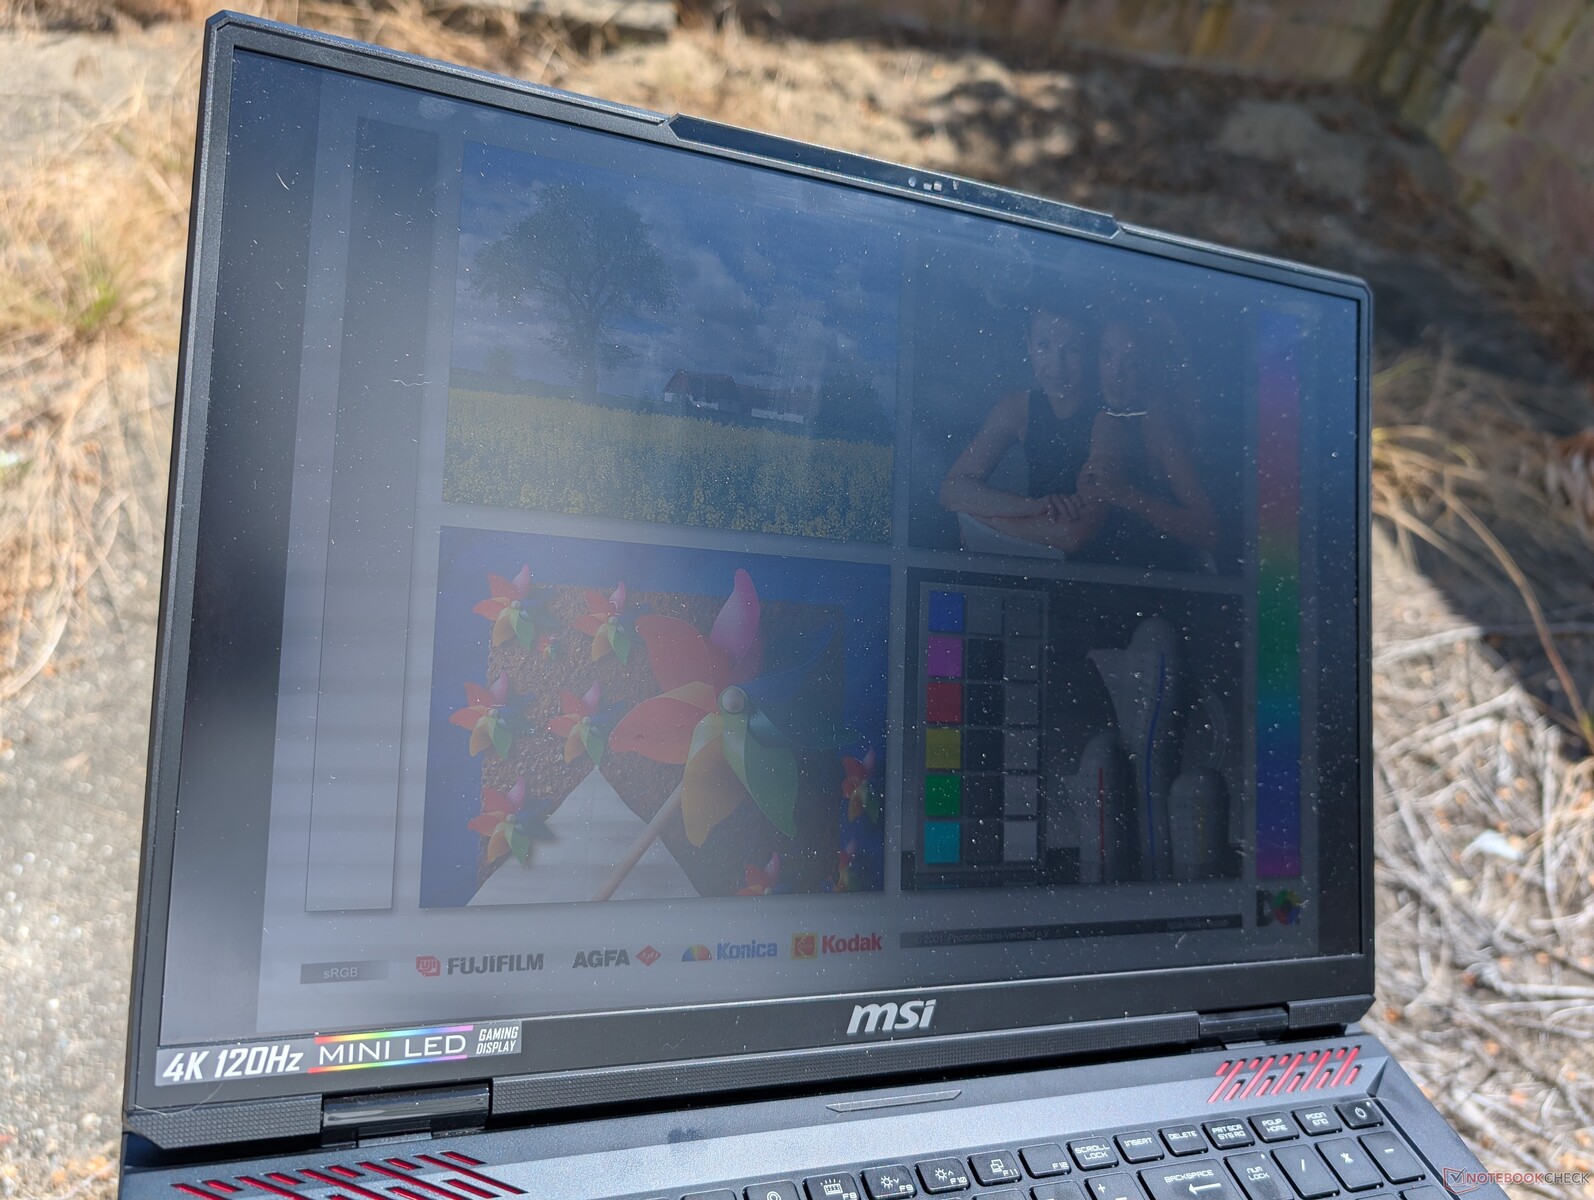
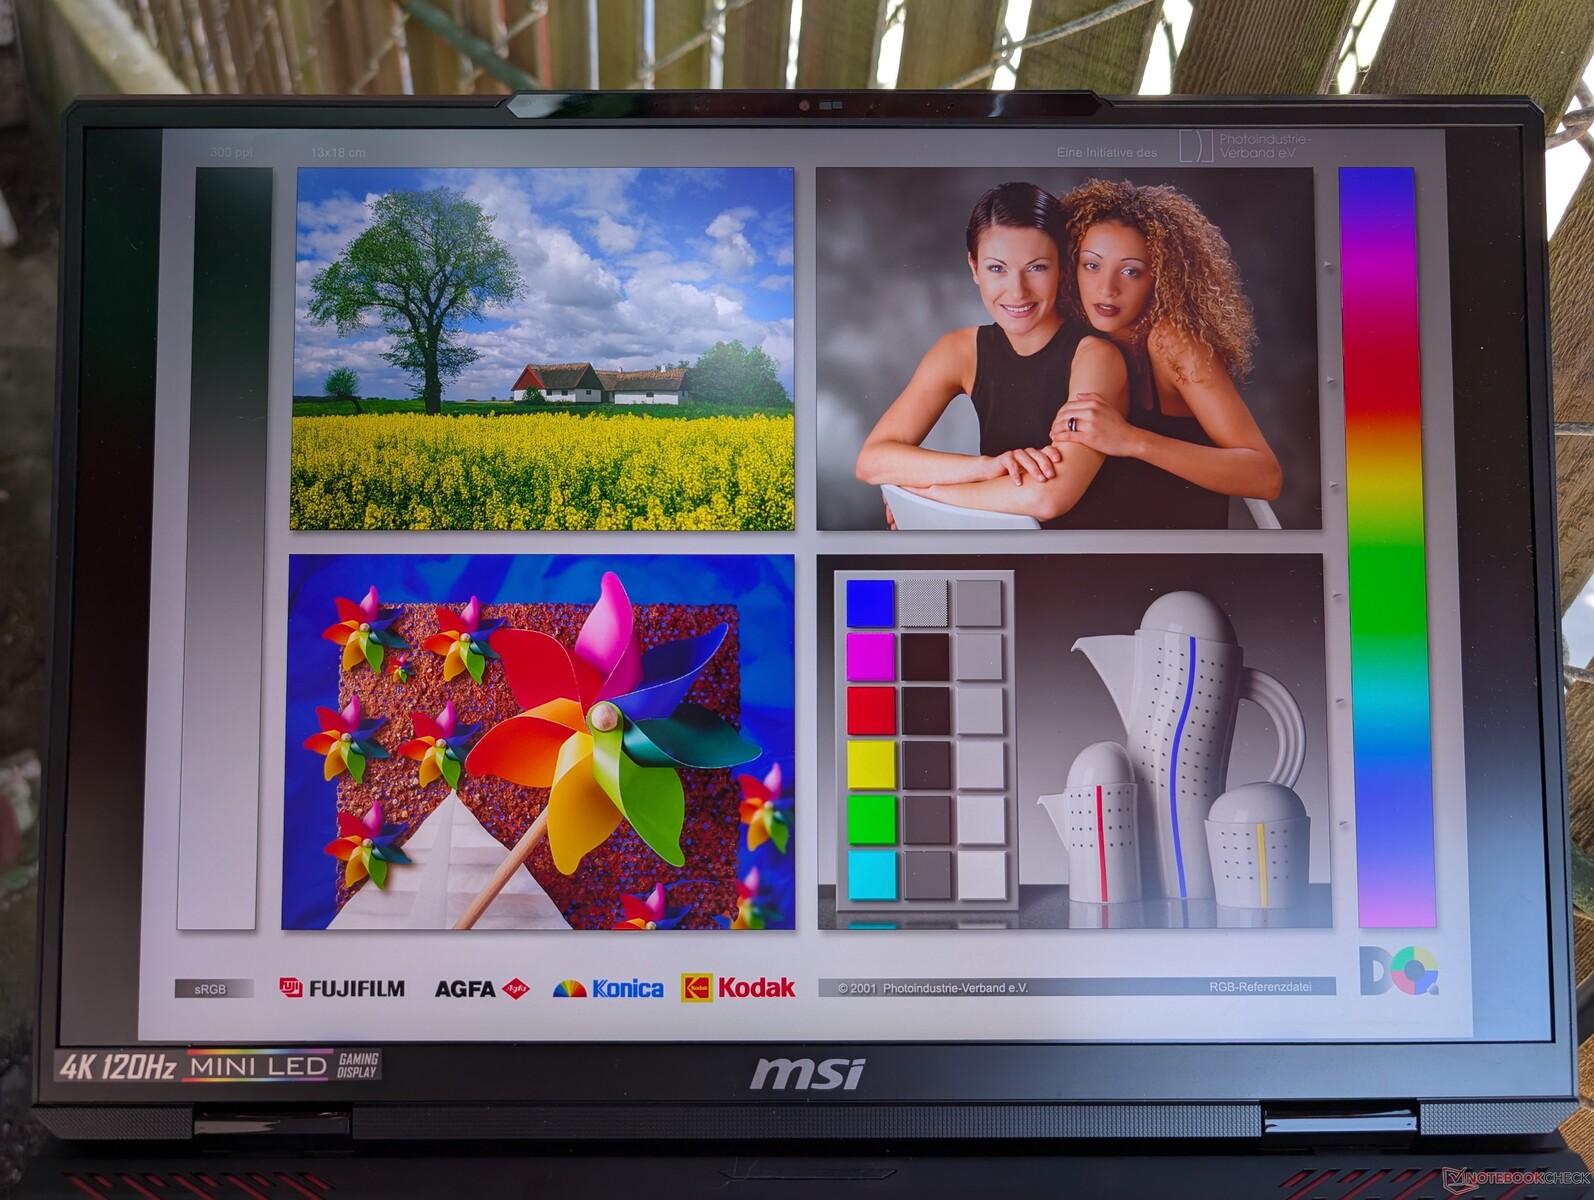
Pantalla - Titan 18 HX Experiencia por menos
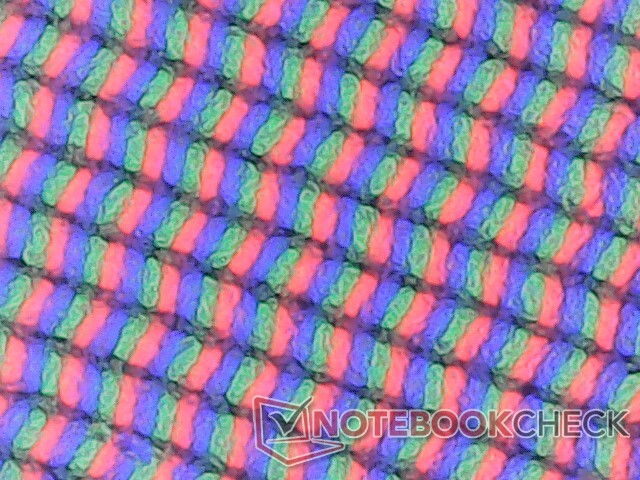
El Raider 18 HX se suministra con exactamente el mismo panel mini-LED AU Optronics B180ZAN01.0 de 120 Hz que se encuentra en el Titan 18 HX para una experiencia de visualización prácticamente idéntica. El brillo máximo alcanza casi 600 nits cuando el HDR está desactivado o 935 nits cuando está activado. Cuando se compara con IPS u OLED, el mini-LED proporciona una mejor experiencia de visualización HDR ya que es capaz de alcanzar niveles de brillo más altos que cualquiera de los dos a costa de un mayor consumo de energía. Los portátiles IPS u OLED suelen soportar HDR600 como mucho, mientras que los paneles mini-LED suelen prometer HDR1000.
| |||||||||||||||||||||||||
iluminación: 94 %
Brillo con batería: 392.2 cd/m²
Contraste: ∞:1 (Negro: 0 cd/m²)
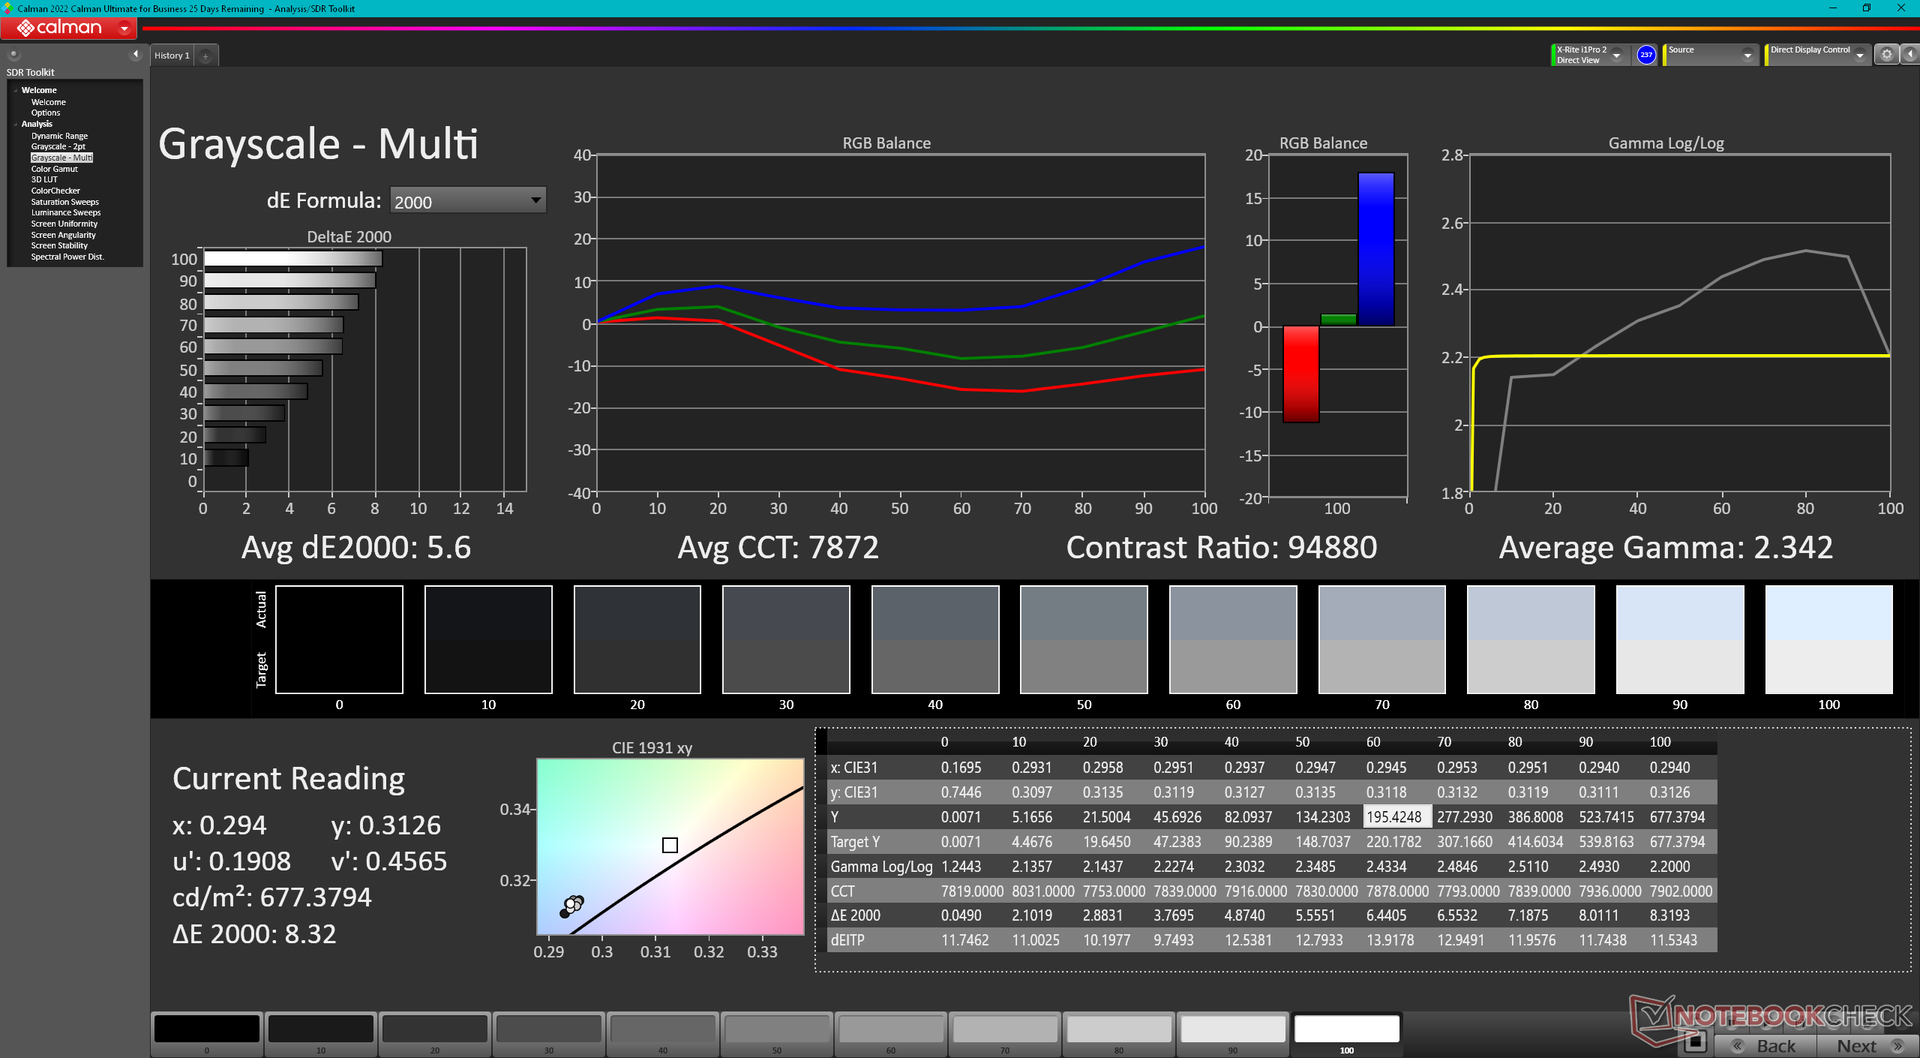
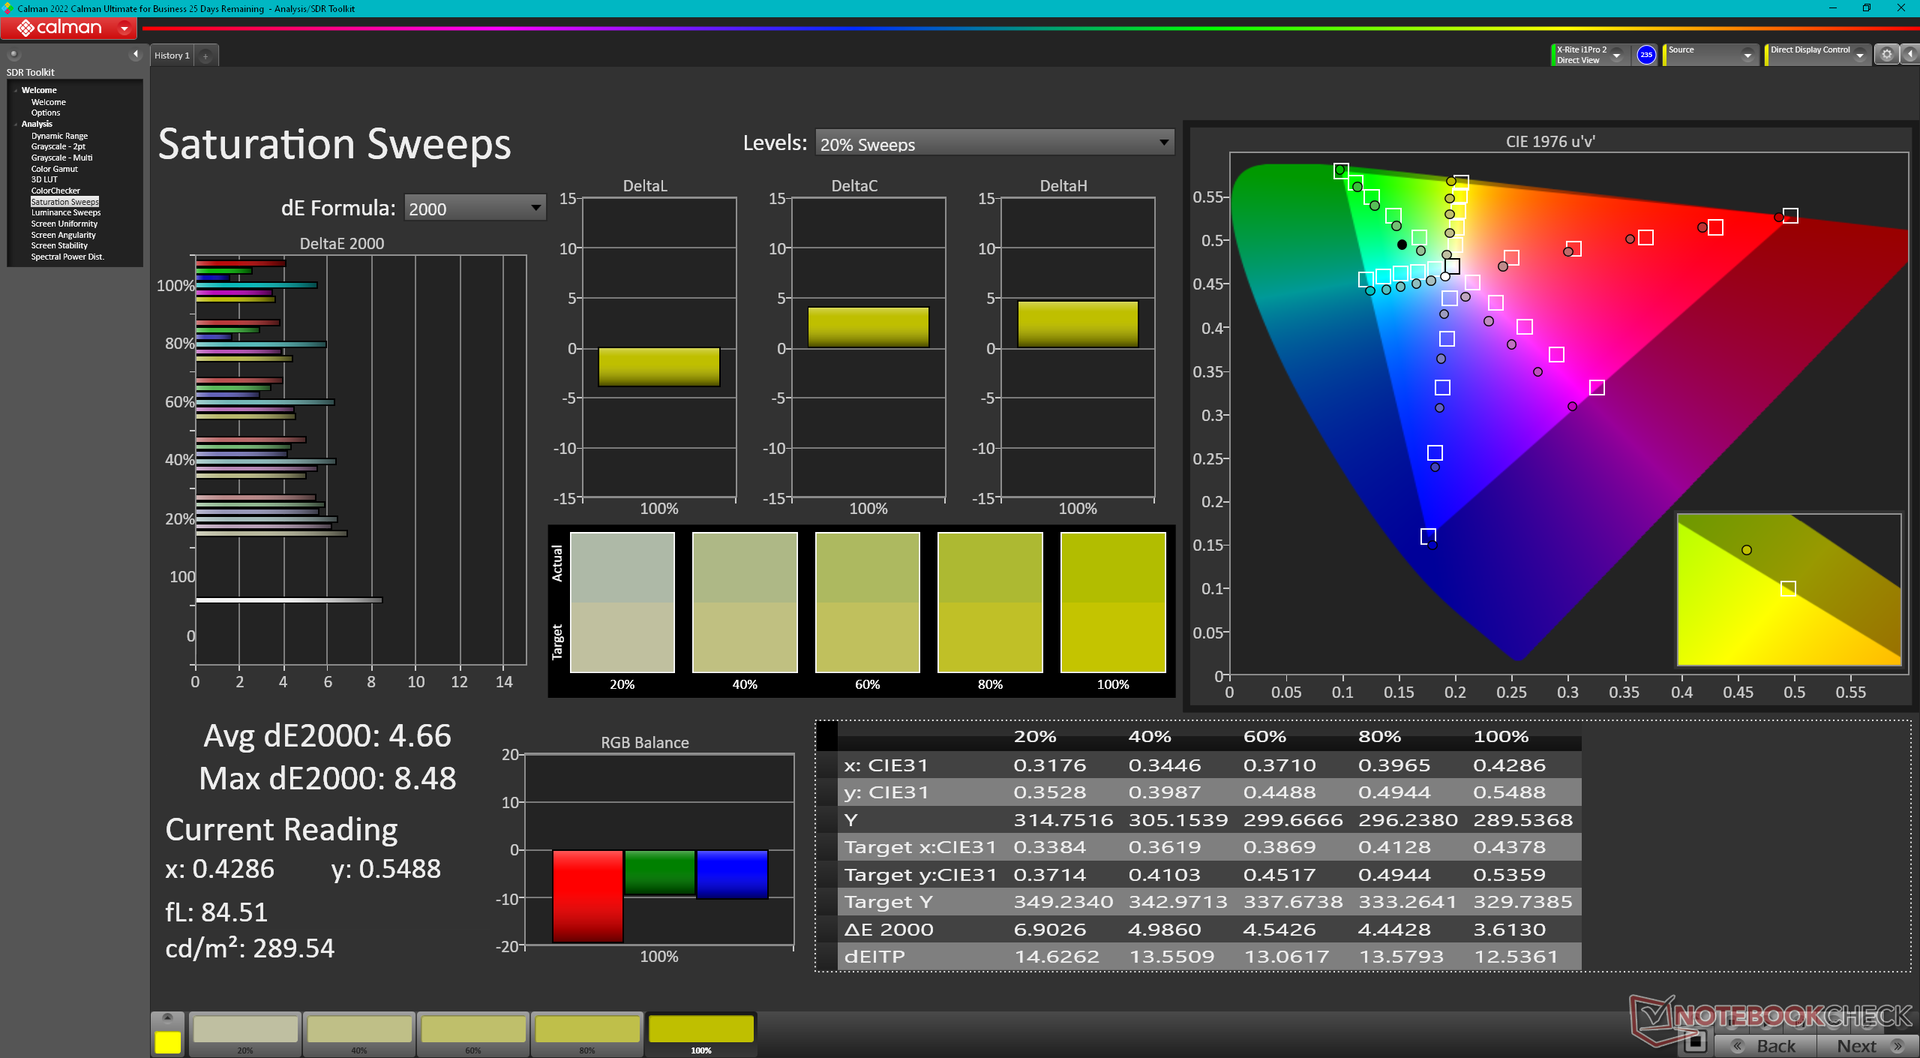
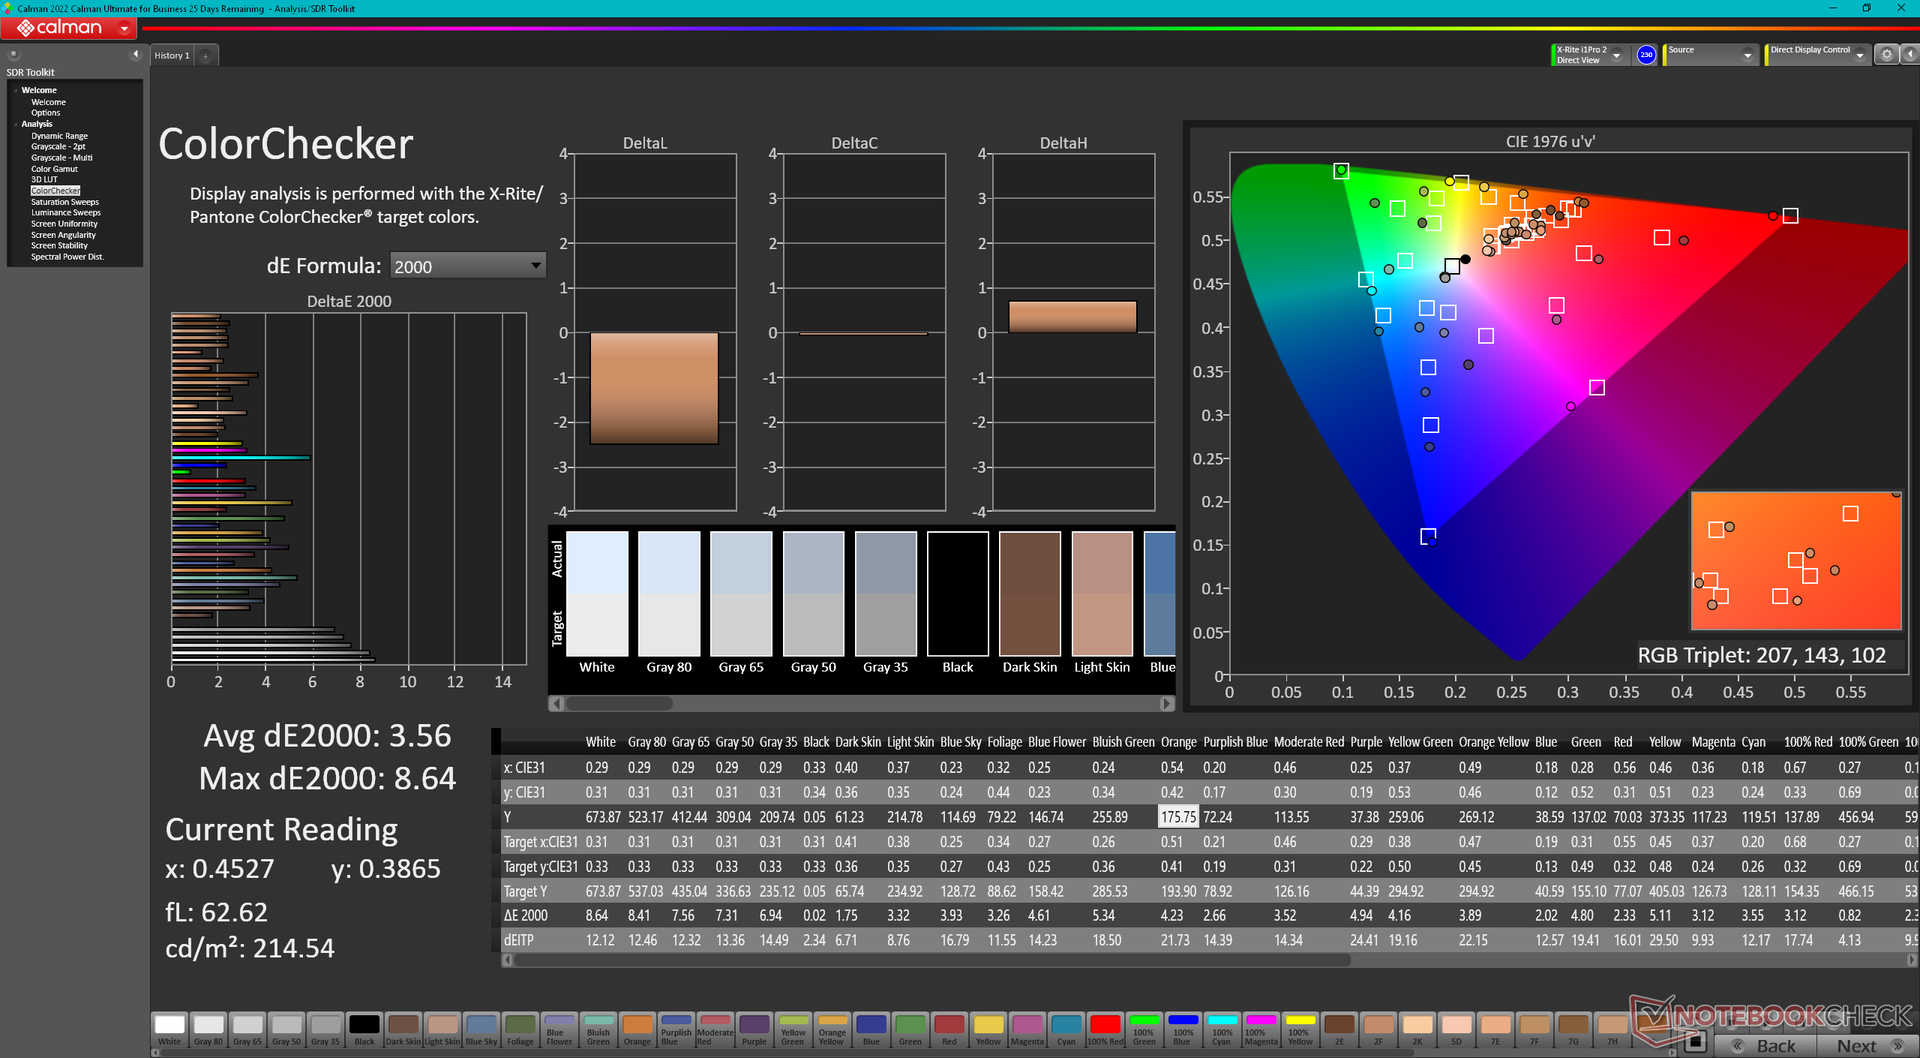
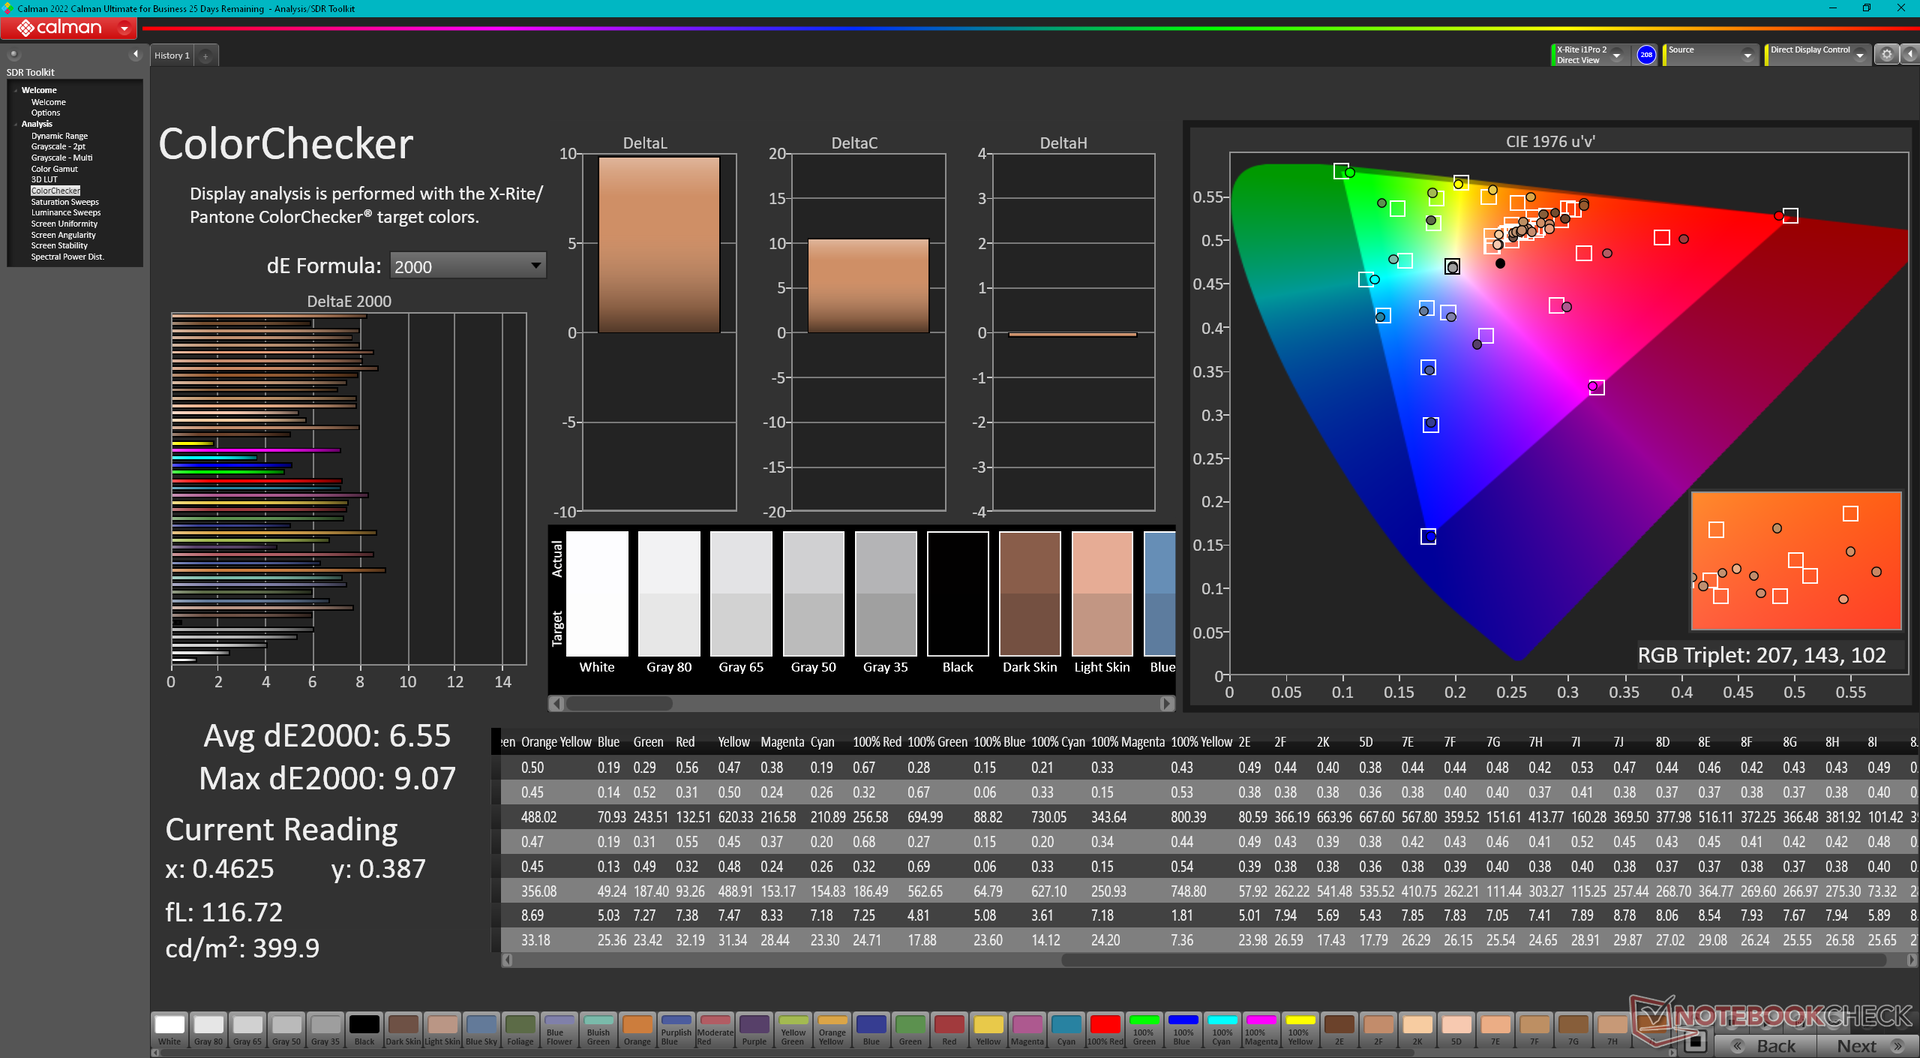
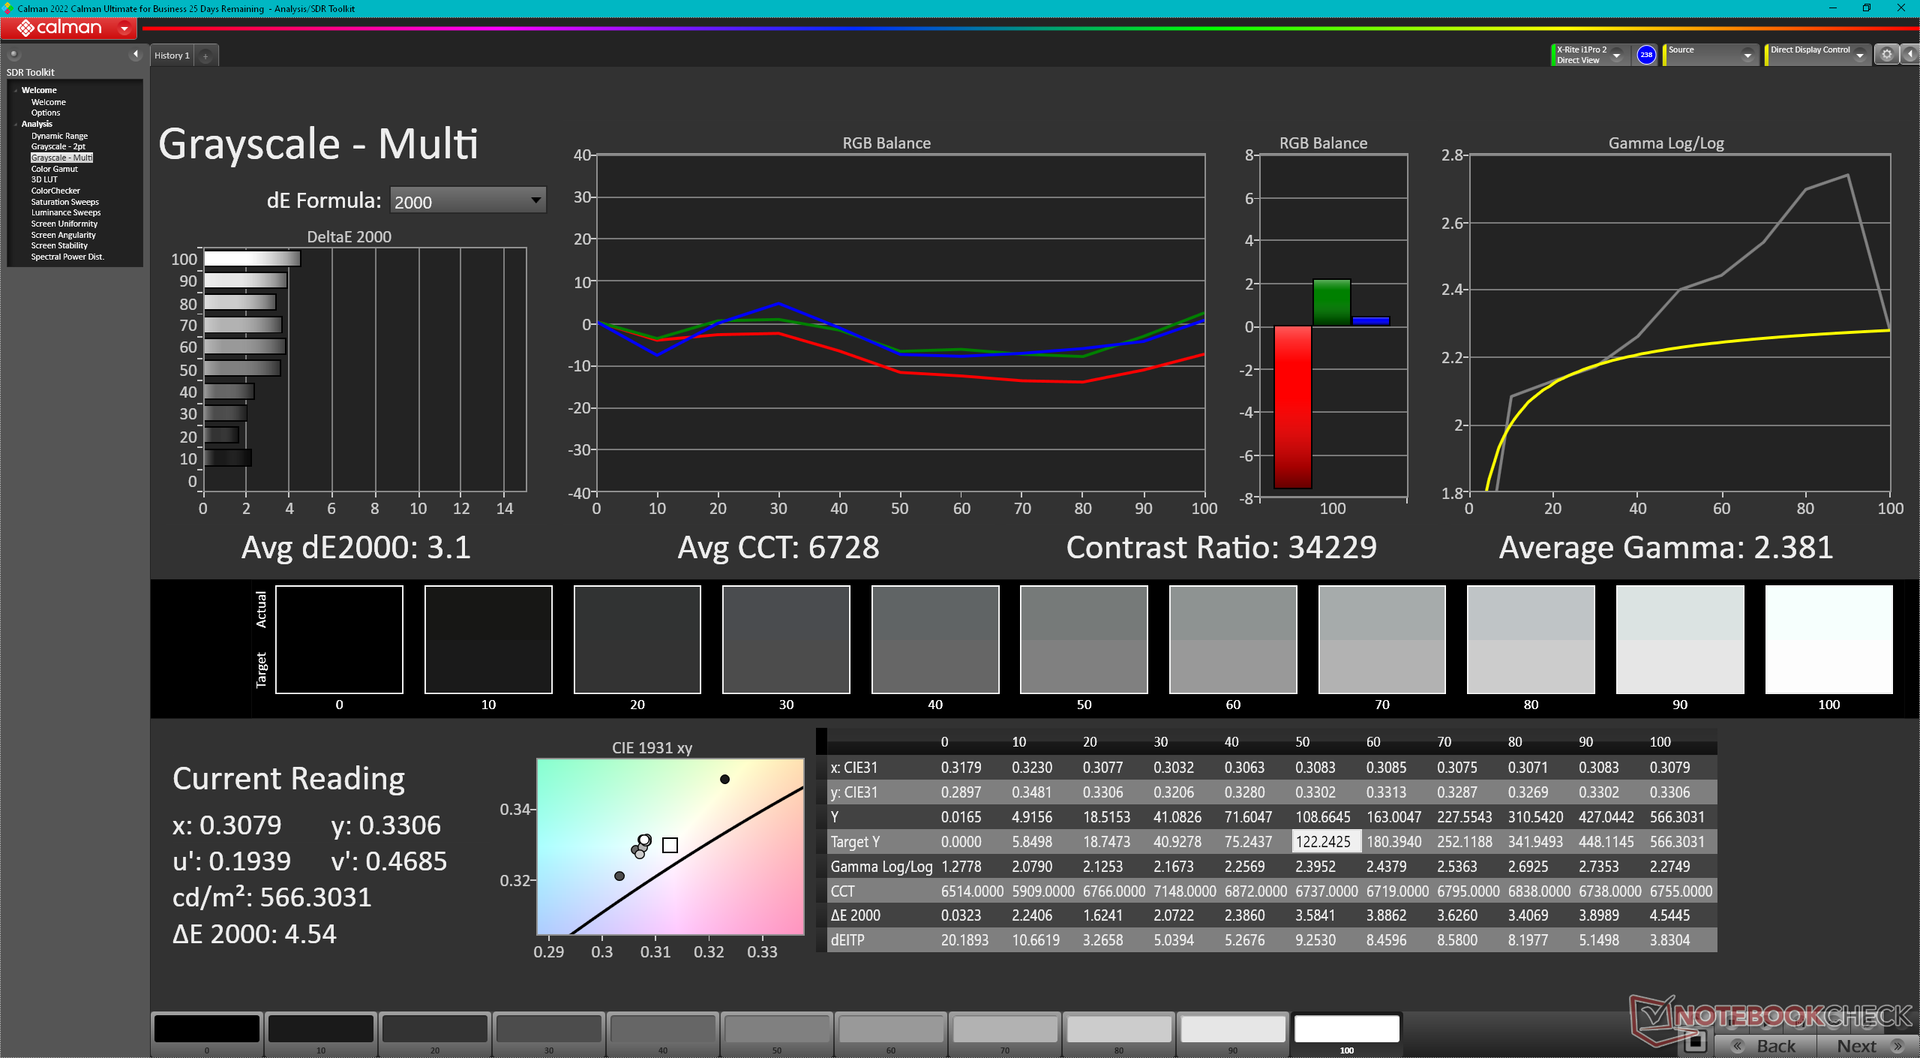
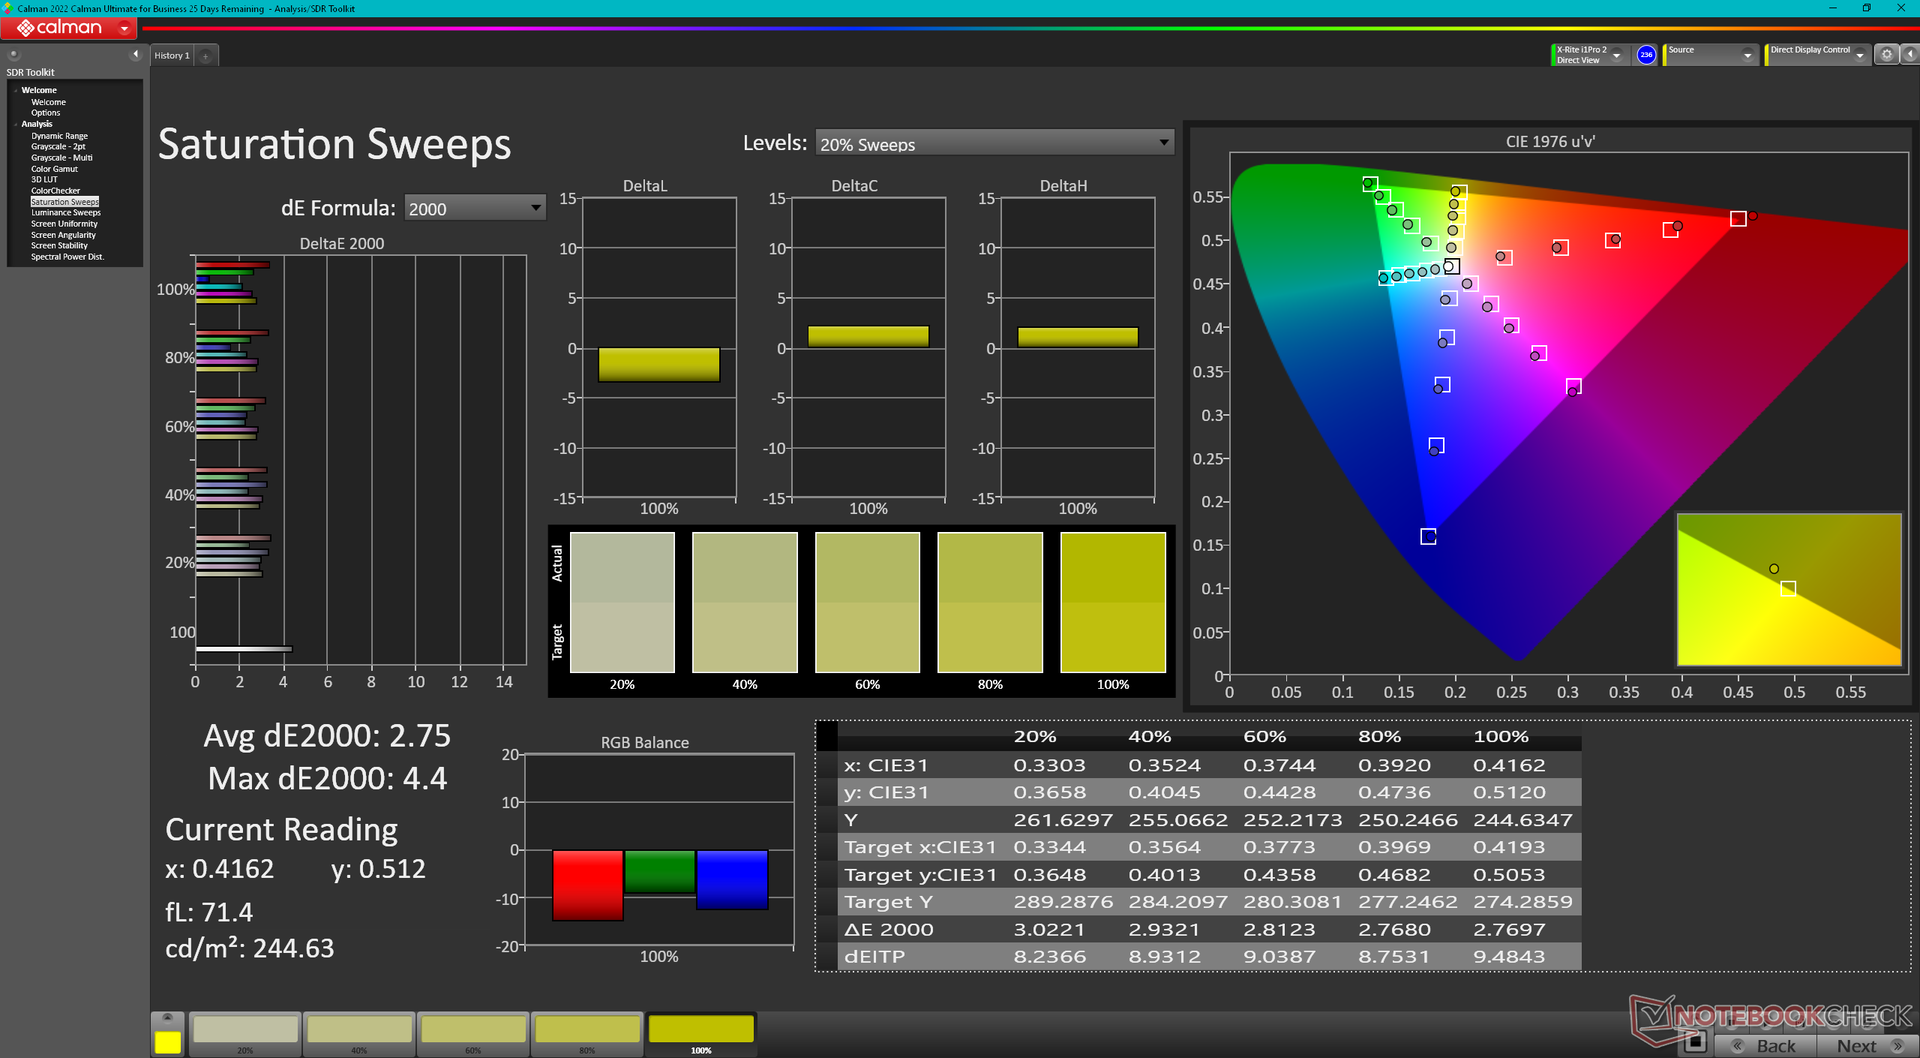
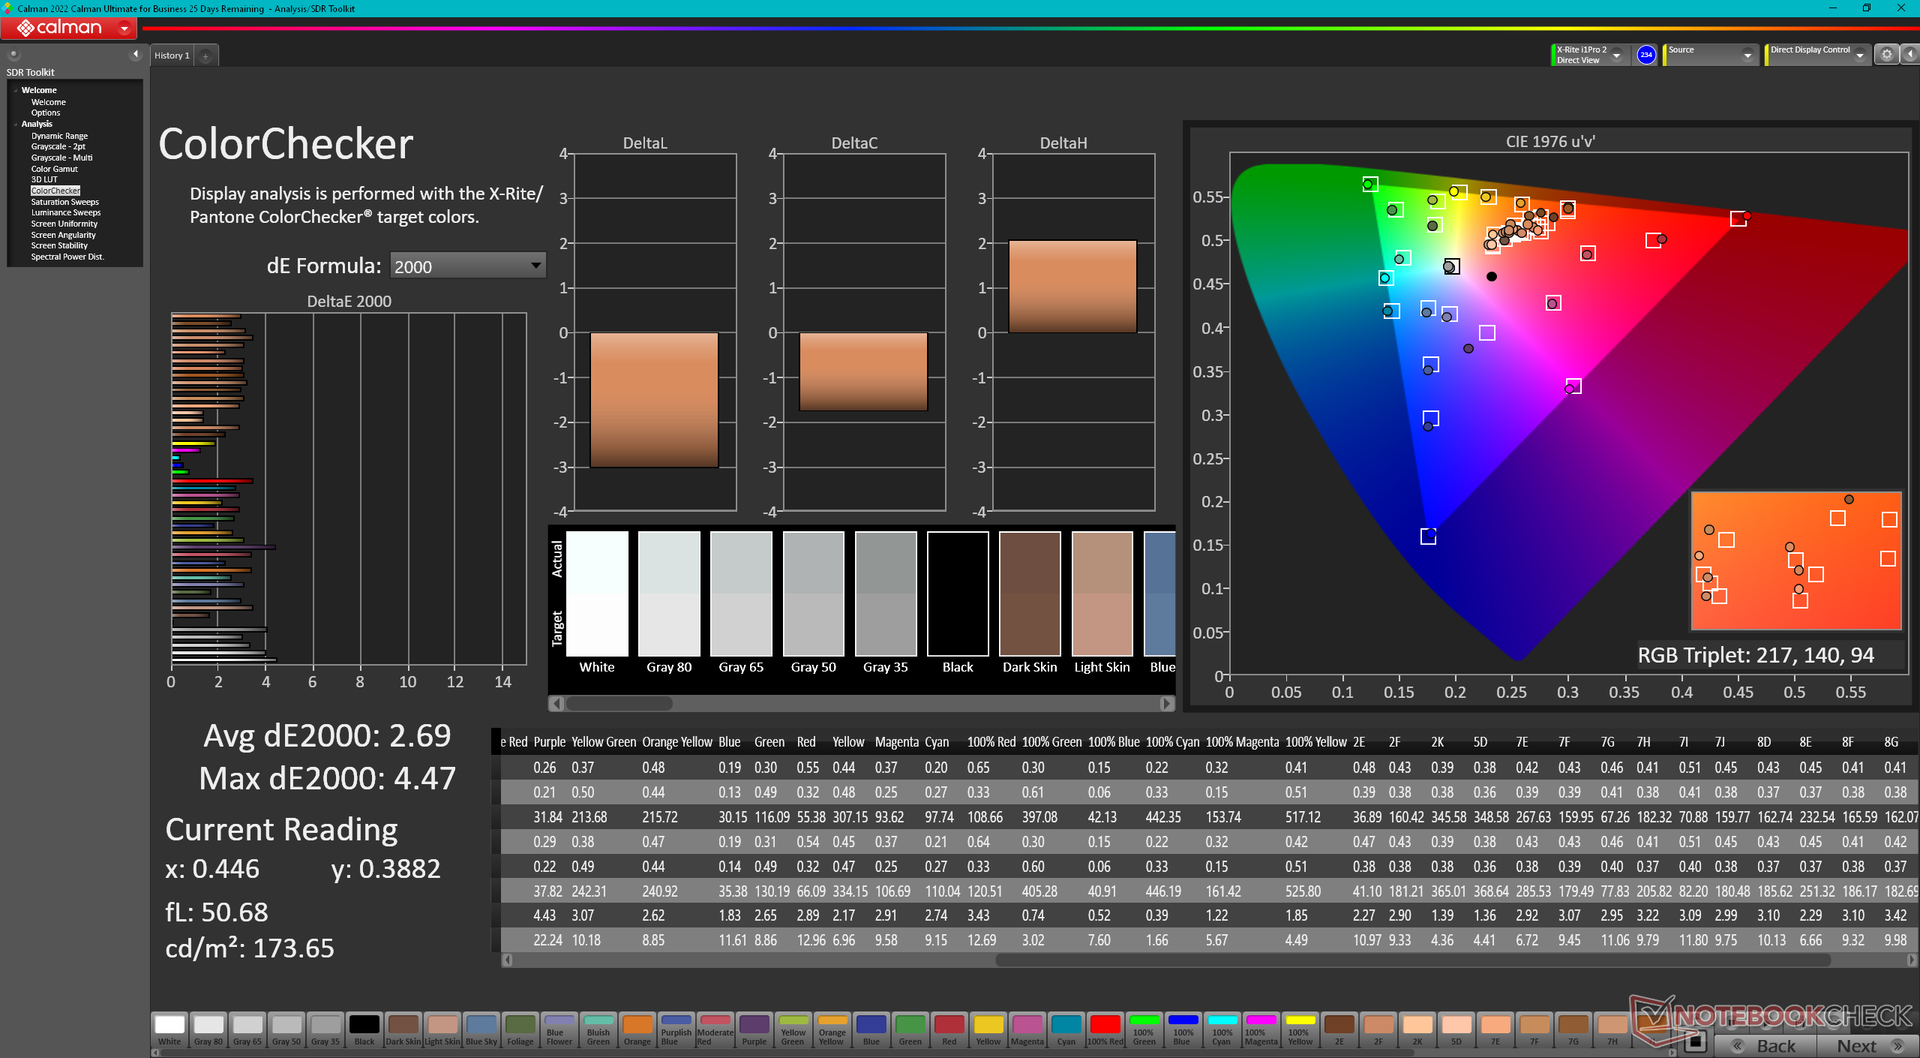
ΔE Color 3.56 | 0.5-29.43 Ø4.87, calibrated: 2.69
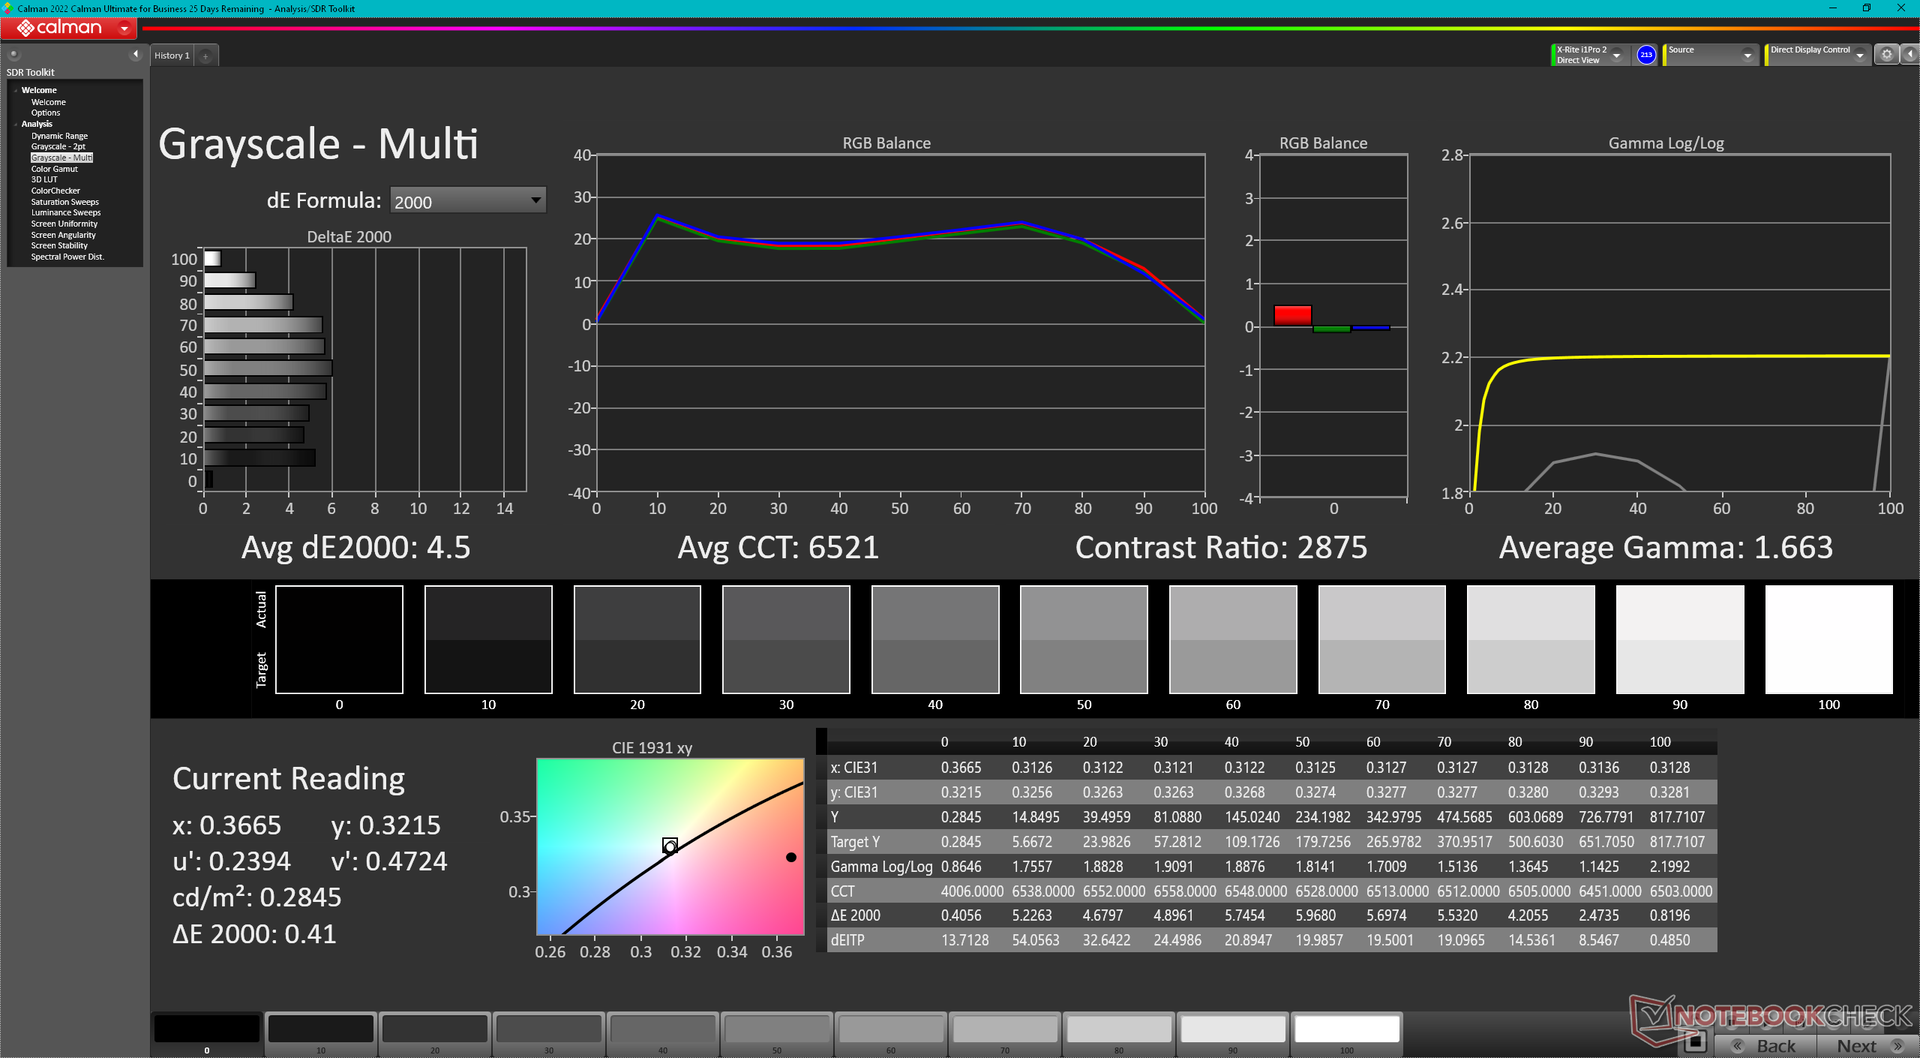
ΔE Greyscale 5.6 | 0.5-98 Ø5.1
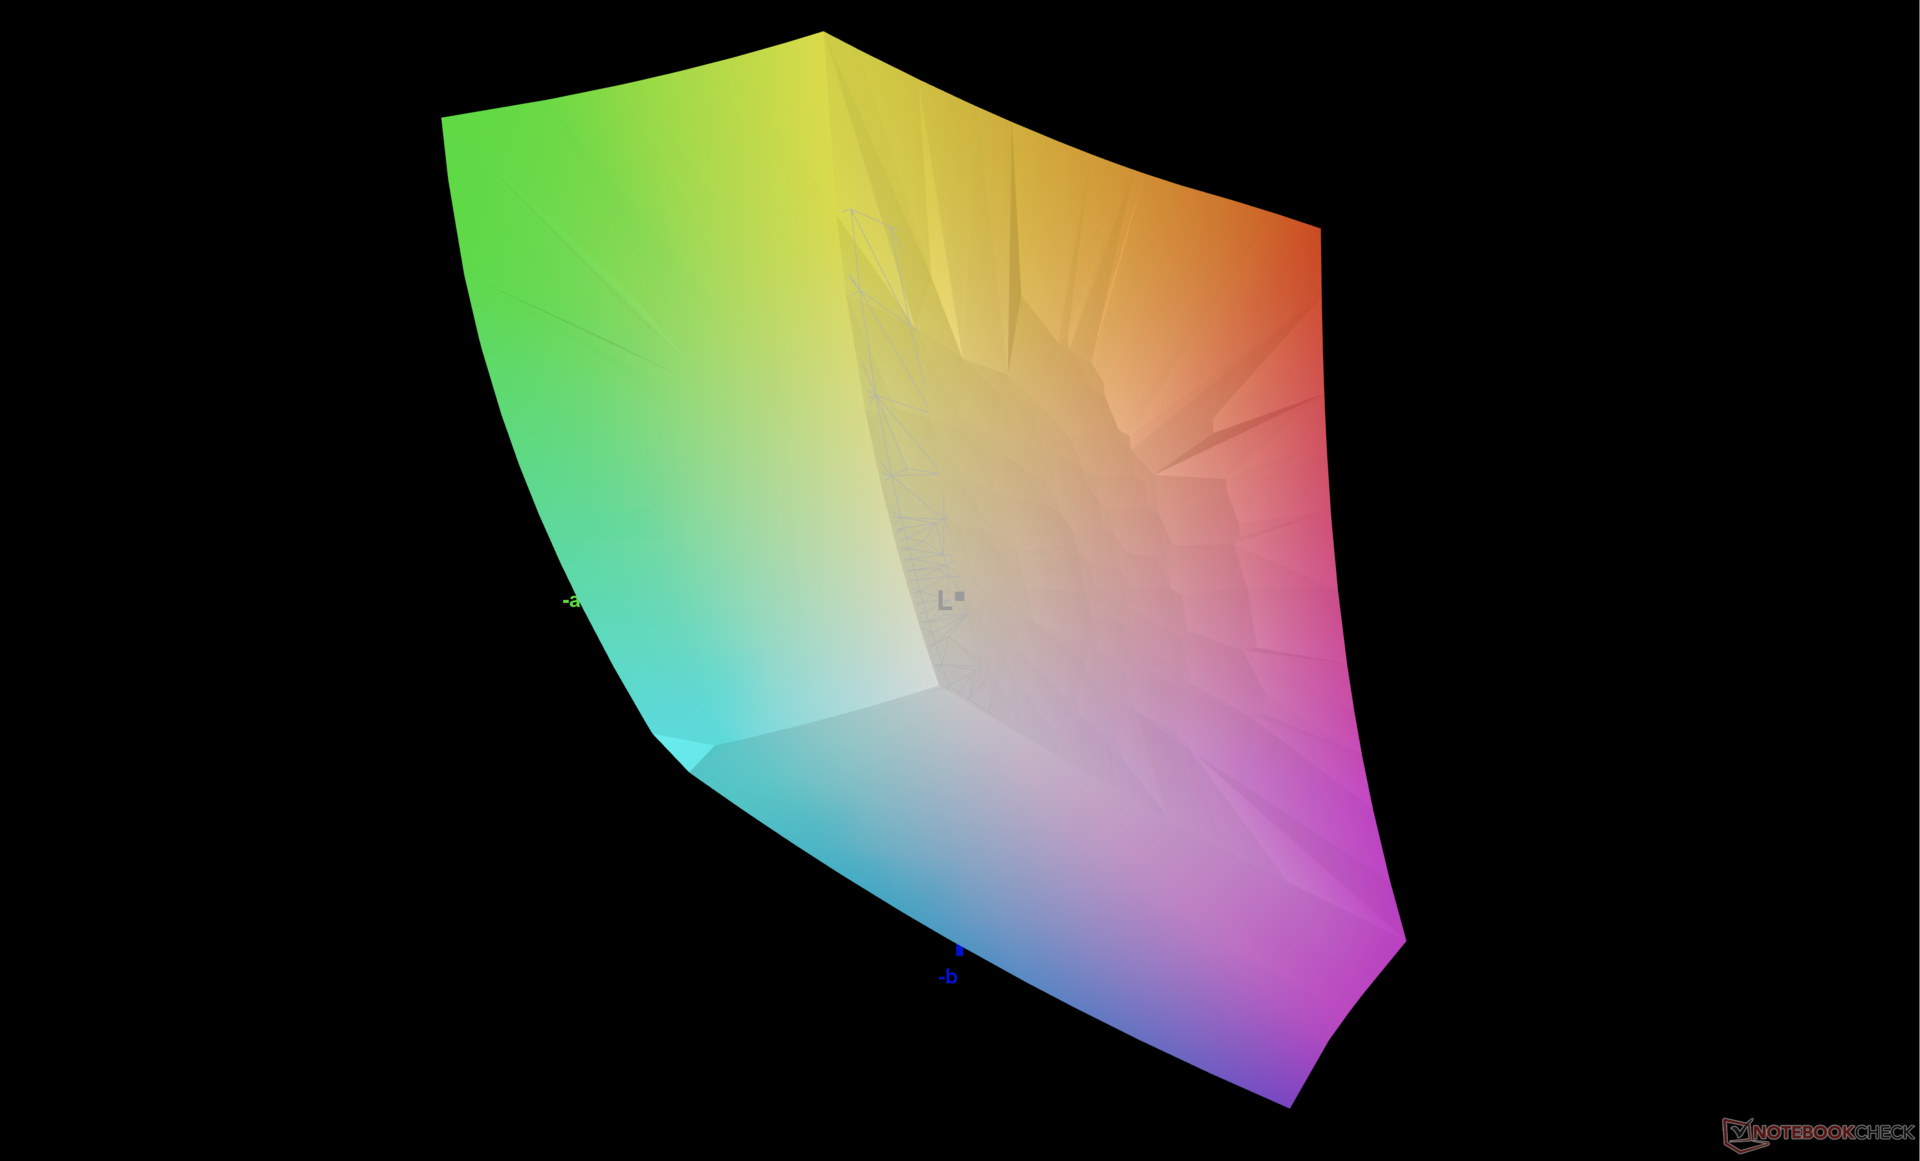
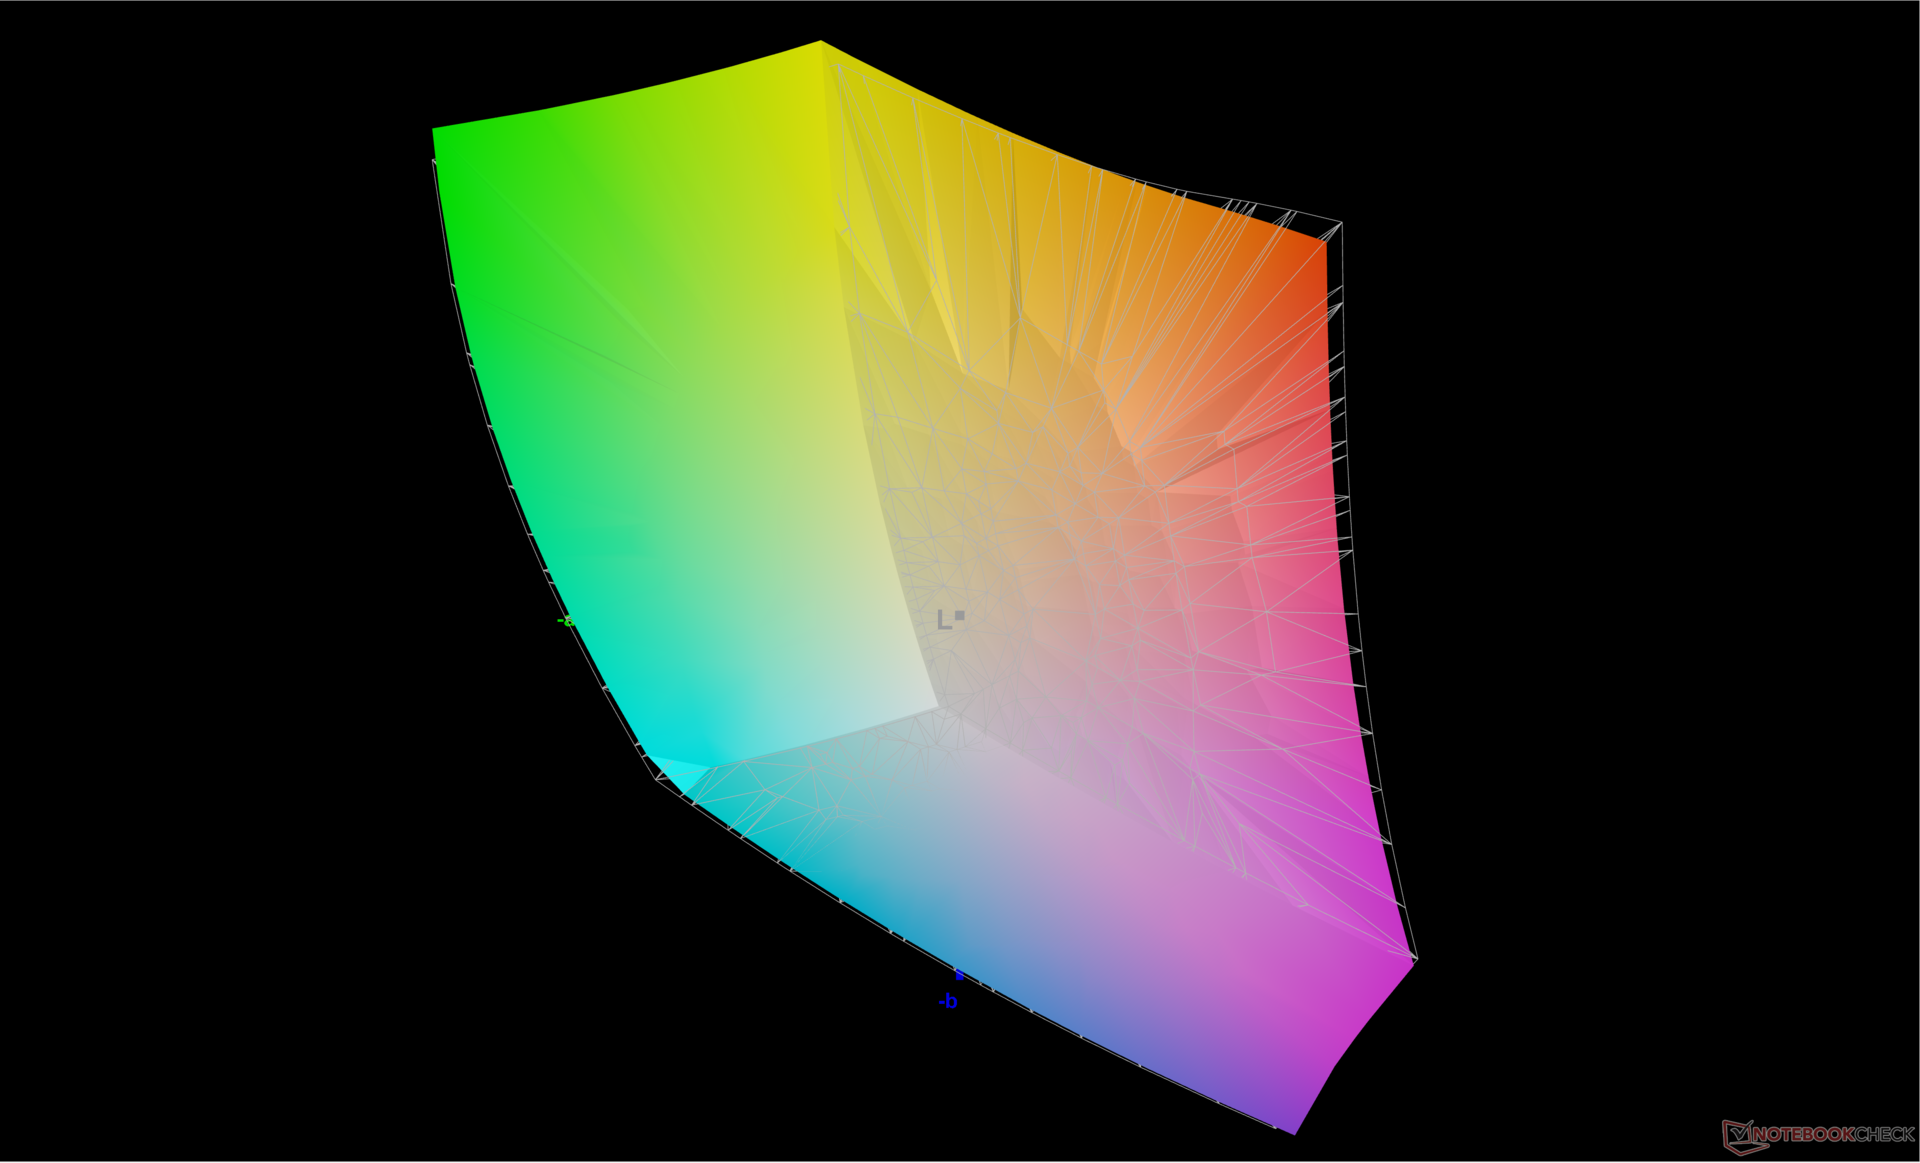
84.8% AdobeRGB 1998 (Argyll 2.2.0 3D)
99.9% sRGB (Argyll 2.2.0 3D)
96.6% Display P3 (Argyll 2.2.0 3D)
Gamma: 2.34
| MSI Raider 18 HX A14V AU Optronics B180ZAN1.0, Mini-LED, 3840x2400, 18", 120 Hz | Razer Blade 18 2024 RZ09-0509 BOE NE180QDM-NM1, Mini-LED, 2560x1600, 18", 300 Hz | Alienware m18 R2 BOE NE18NZ1, IPS, 2560x1600, 18", 165 Hz | MSI Titan 18 HX A14VIG AU Optronics B180ZAN01.0, Mini-LED, 3840x2400, 18", 120 Hz | Asus ROG Strix G18 G814JI NE180QDM-NZ2 (BOE0B35), IPS, 2560x1600, 18", 240 Hz | Acer Predator Helios 18 PH18-72-98MW B180QAN01.2 (AUO45A8), Mini-LED, 2560x1600, 18", 250 Hz | |
|---|---|---|---|---|---|---|
| Display | 1% | 2% | 1% | 1% | 4% | |
| Display P3 Coverage | 96.6 | 99 2% | 97.8 1% | 98.1 2% | 98.1 2% | 99.7 3% |
| sRGB Coverage | 99.9 | 100 0% | 99.5 0% | 99.8 0% | 99.9 0% | 100 0% |
| AdobeRGB 1998 Coverage | 84.8 | 86.9 2% | 88.9 5% | 86.2 2% | 85.6 1% | 91.6 8% |
| Response Times | 341% | 68% | 3% | 67% | 62% | |
| Response Time Grey 50% / Grey 80% * | 10.4 ? | 7.6 ? 27% | 5.3 ? 49% | 8.6 ? 17% | 5.6 ? 46% | 8 ? 23% |
| Response Time Black / White * | 75.8 ? | 14 ? 82% | 10.4 ? 86% | 81.8 ? -8% | 9 ? 88% | 17.6 ? 77% |
| PWM Frequency | 2606.2 ? | 26444 ? 915% | 2592 ? -1% | 4832 ? 85% | ||
| Screen | 29% | 8% | 2% | 23% | 24% | |
| Brightness middle | 575.7 | 605.4 5% | 271.8 -53% | 467.5 -19% | 471 -18% | 722 25% |
| Brightness | 574 | 600 5% | 275 -52% | 459 -20% | 422 -26% | 724 26% |
| Brightness Distribution | 94 | 97 3% | 78 -17% | 90 -4% | 83 -12% | 93 -1% |
| Black Level * | 0.62 | 0.27 | 0.47 | 0.04 | ||
| Colorchecker dE 2000 * | 3.56 | 1.53 57% | 2.48 30% | 3.77 -6% | 2.05 42% | 3.4 4% |
| Colorchecker dE 2000 max. * | 8.64 | 4.15 52% | 5.59 35% | 6.12 29% | 4.15 52% | 5.32 38% |
| Colorchecker dE 2000 calibrated * | 2.69 | 0.56 79% | 2.94 -9% | 0.8 70% | 1.6 41% | |
| Greyscale dE 2000 * | 5.6 | 2.6 54% | 3.7 34% | 3.2 43% | 2.8 50% | 3.8 32% |
| Gamma | 2.34 94% | 2.22 99% | 2.2 100% | 2.43 91% | 2.204 100% | 2.383 92% |
| CCT | 7872 83% | 6843 95% | 6355 102% | 6478 100% | 7122 91% | 7051 92% |
| Contrast | 976 | 1007 | 1002 | 18050 | ||
| Media total (Programa/Opciones) | 124% /
100% | 26% /
16% | 2% /
2% | 30% /
25% | 30% /
28% |
* ... más pequeño es mejor
La temperatura de color cuando se ajusta a Display P3 y HDR desactivado es bastante fría a 7872. Al activar HDR se desactiva automáticamente cualquier ajuste TrueColor de MSI, pero la temperatura del color también se vuelve automáticamente más cálida a 6521 para obtener colores más precisos. MSI no anuncia calibración de fábrica para este modelo Raider.
Tiempos de respuesta del display
| ↔ Tiempo de respuesta de Negro a Blanco | ||
|---|---|---|
| 75.8 ms ... subida ↗ y bajada ↘ combinada | ↗ 71 ms subida | 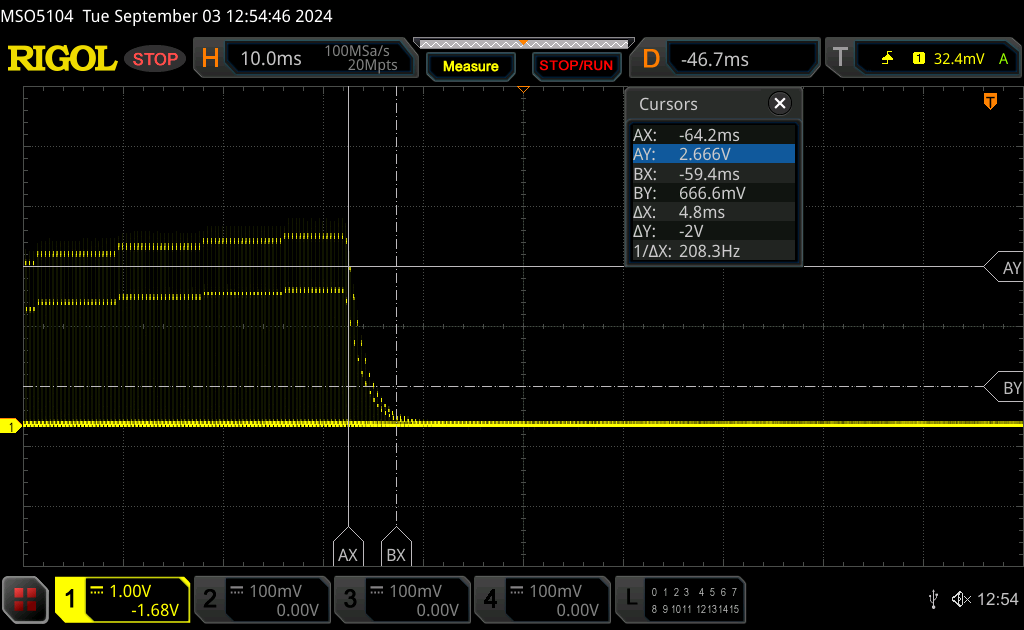 |
| ↘ 4.8 ms bajada | ||
| La pantalla mostró tiempos de respuesta lentos en nuestros tests y podría ser demasiado lenta para los jugones. En comparación, todos los dispositivos de prueba van de ##min### (mínimo) a 240 (máximo) ms. » 100 % de todos los dispositivos son mejores. Eso quiere decir que el tiempo de respuesta es peor que la media (20.8 ms) de todos los dispositivos testados. | ||
| ↔ Tiempo de respuesta 50% Gris a 80% Gris | ||
| 10.4 ms ... subida ↗ y bajada ↘ combinada | ↗ 4.8 ms subida | 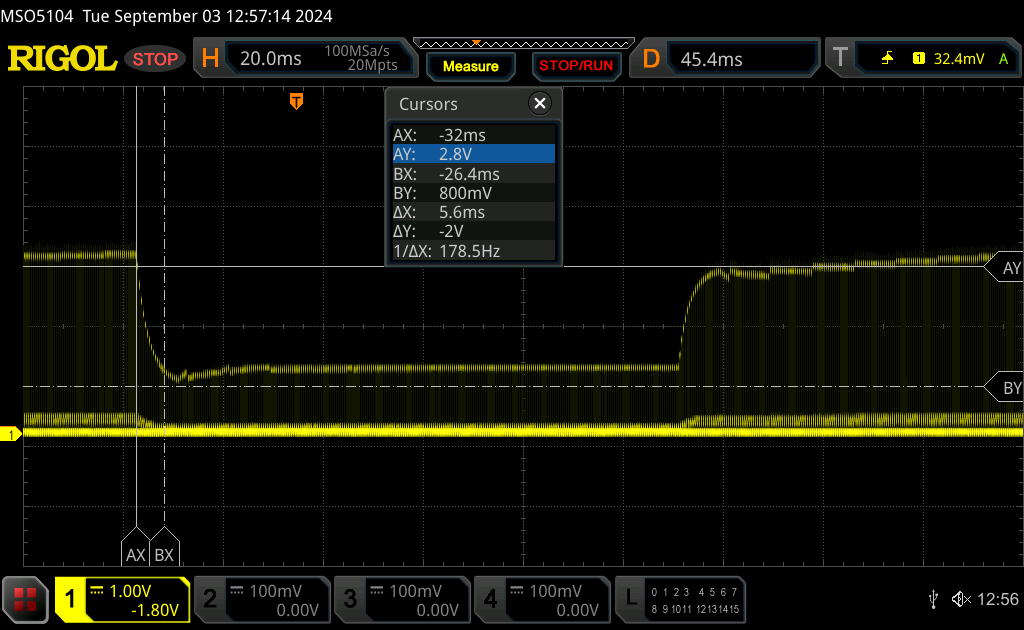 |
| ↘ 5.6 ms bajada | ||
| La pantalla mostró buenos tiempos de respuesta en nuestros tests pero podría ser demasiado lenta para los jugones competitivos. En comparación, todos los dispositivos de prueba van de ##min### (mínimo) a 636 (máximo) ms. » 21 % de todos los dispositivos son mejores. Esto quiere decir que el tiempo de respuesta medido es mejor que la media (32.5 ms) de todos los dispositivos testados. | ||
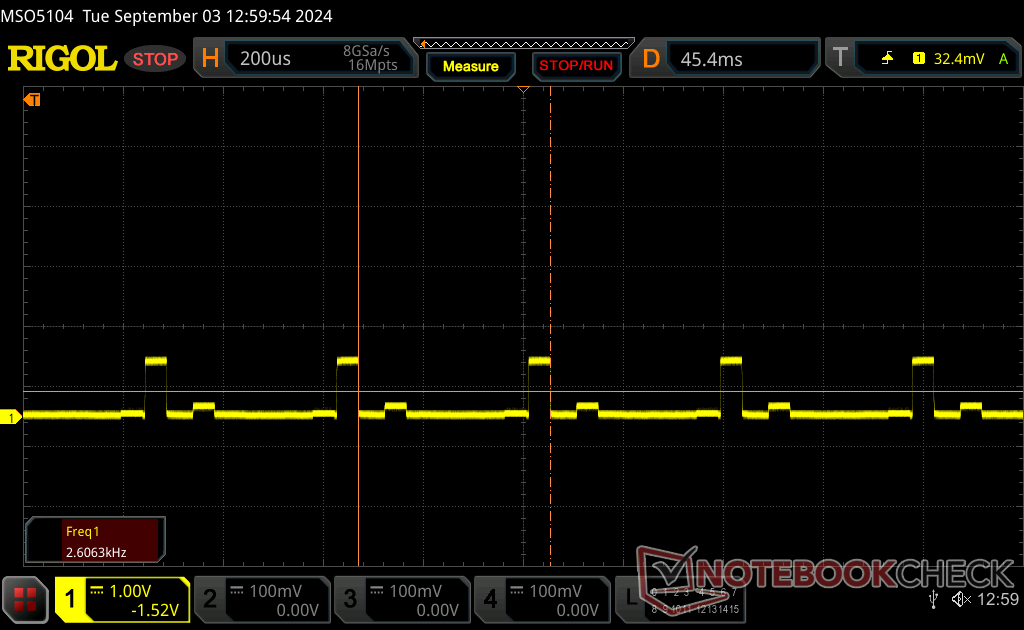
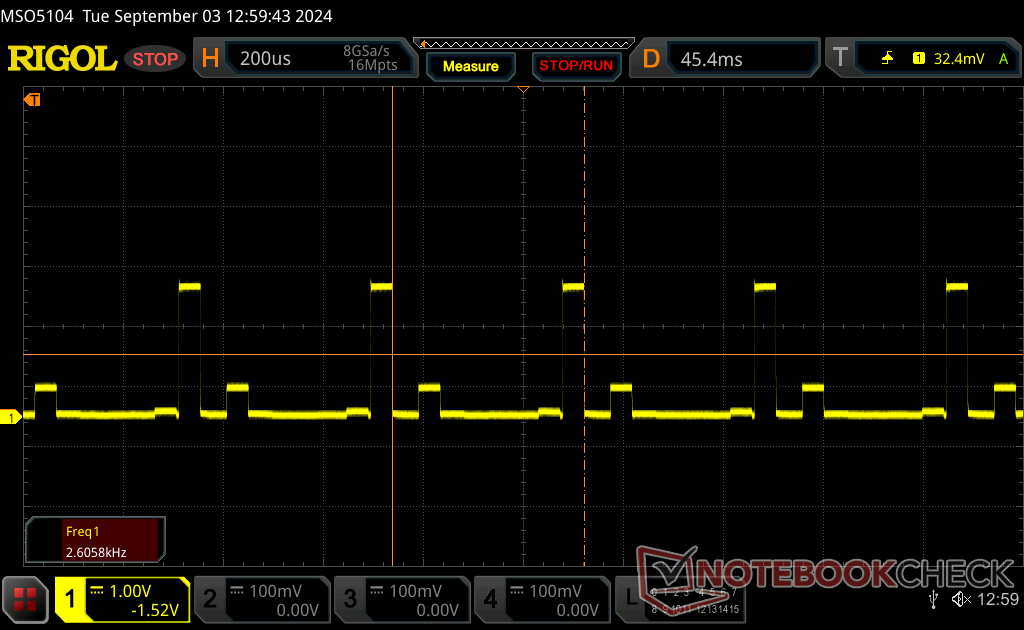
Parpadeo de Pantalla / PWM (Pulse-Width Modulation)
| Parpadeo de Pantalla / PWM detectado | 2606.2 Hz Amplitude: 90 % | ≤ 100 % de brillo | 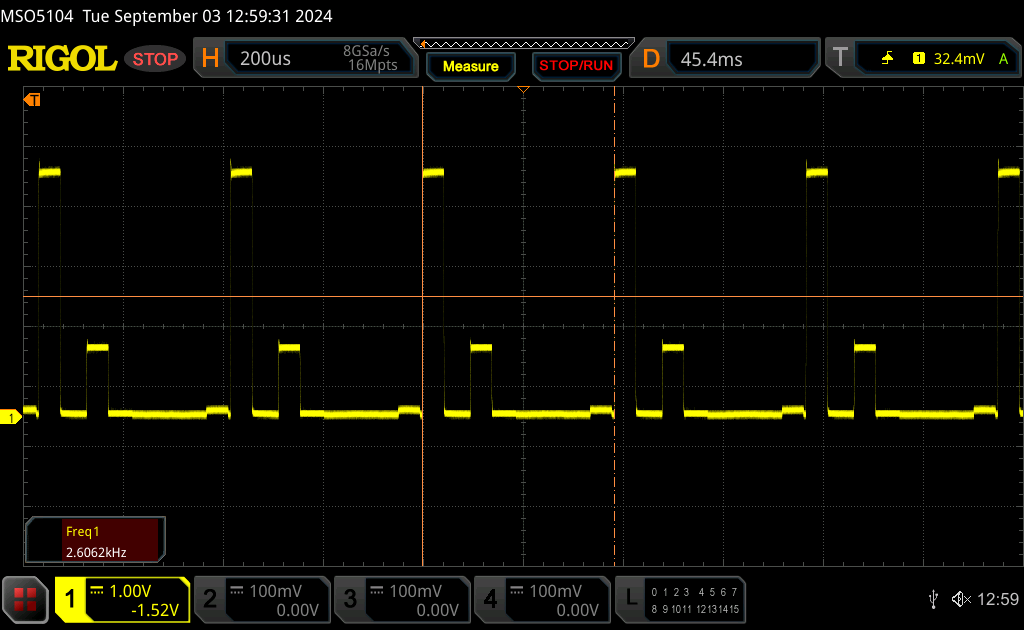 |
La retroiluminación del display parpadea a 2606.2 Hz (seguramente usa PWM - Pulse-Width Modulation) a un brillo del 100 % e inferior. Sobre este nivel de brillo no debería darse parpadeo / PWM. La frecuencia de 2606.2 Hz es bastante alta, por lo que la mayoría de gente sensible al parpadeo no debería ver parpadeo o tener fatiga visual. Comparación: 53 % de todos los dispositivos testados no usaron PWM para atenuar el display. Si se usó, medimos una media de 8516 (mínimo: 5 - máxmo: 343500) Hz. | |||


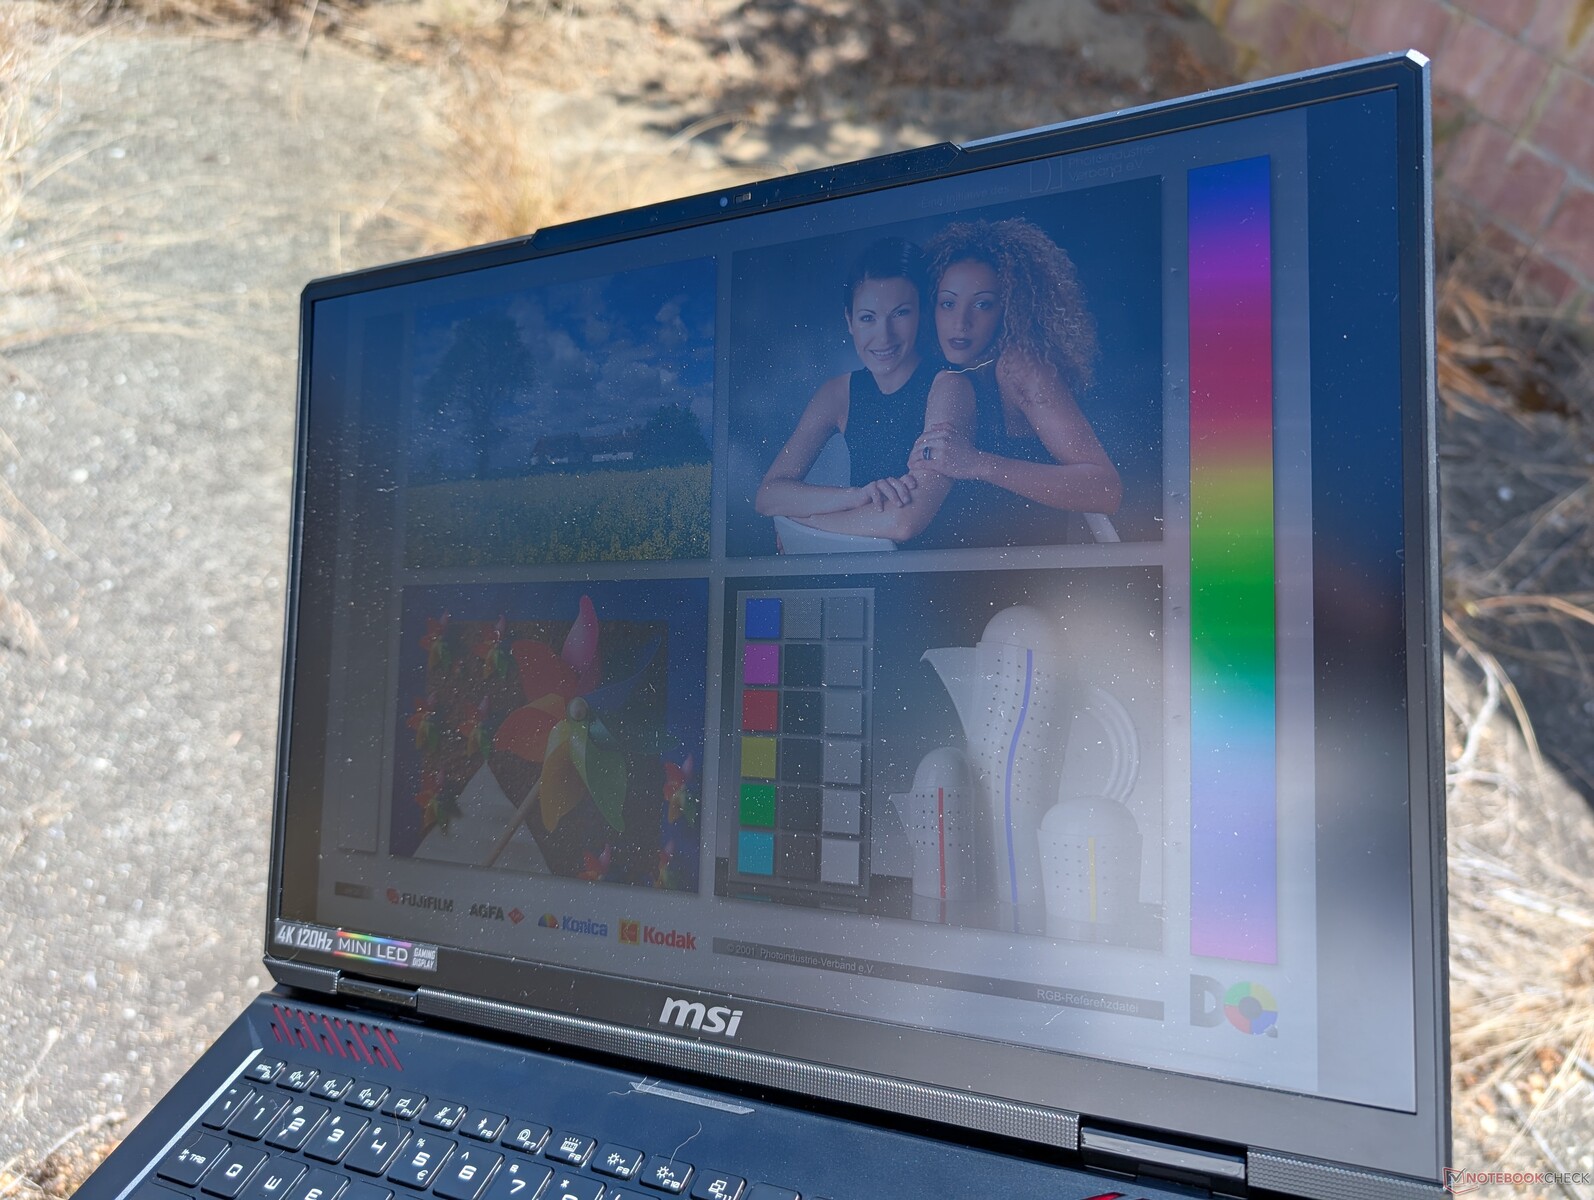
La visibilidad en exteriores es sólo decente a la sombra y no tan buena bajo la luz del sol. Funcionar con batería reduce el brillo máximo a sólo 392 nits y el HDR de Windows se desactiva automáticamente.
Rendimiento - Nuevo nombre de CPU, mismo rendimiento de CPU
Condiciones de prueba
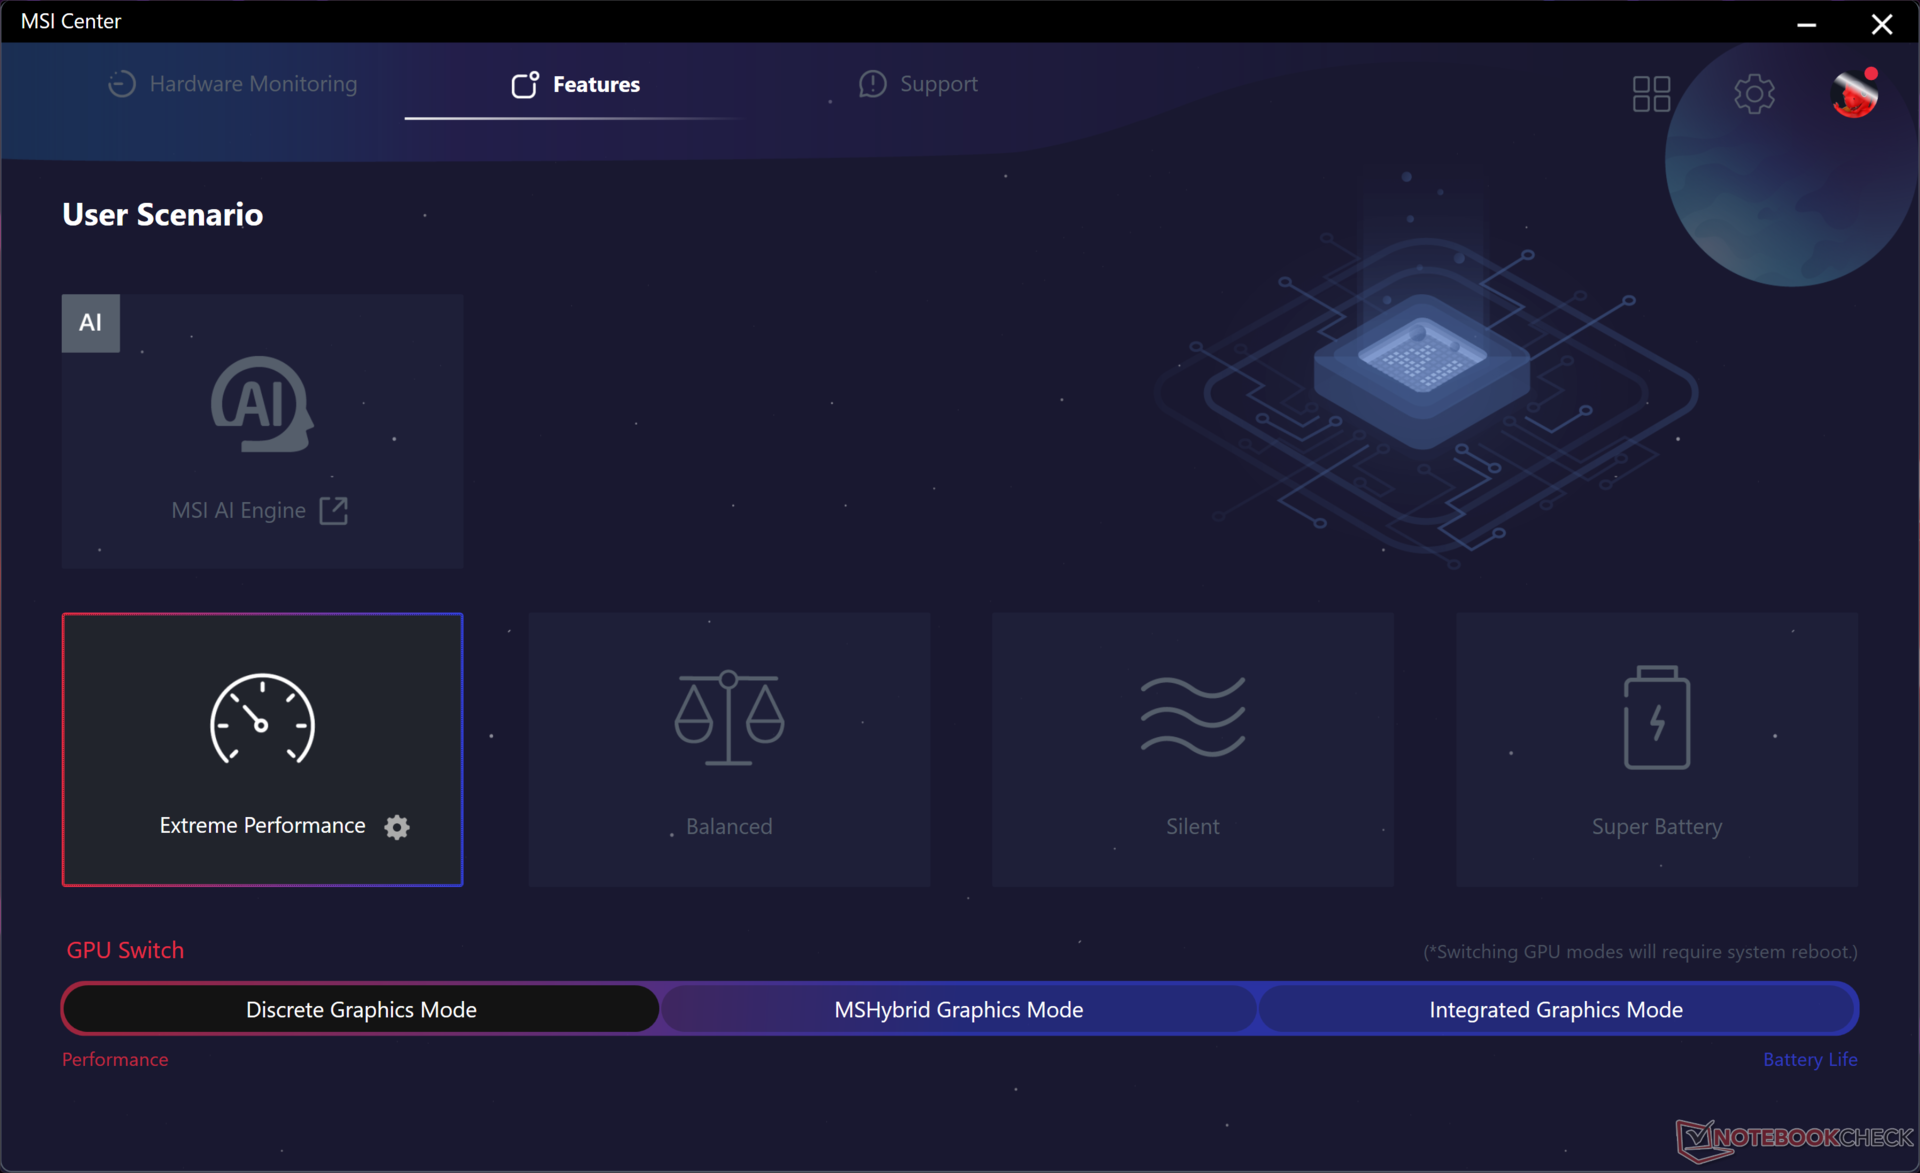
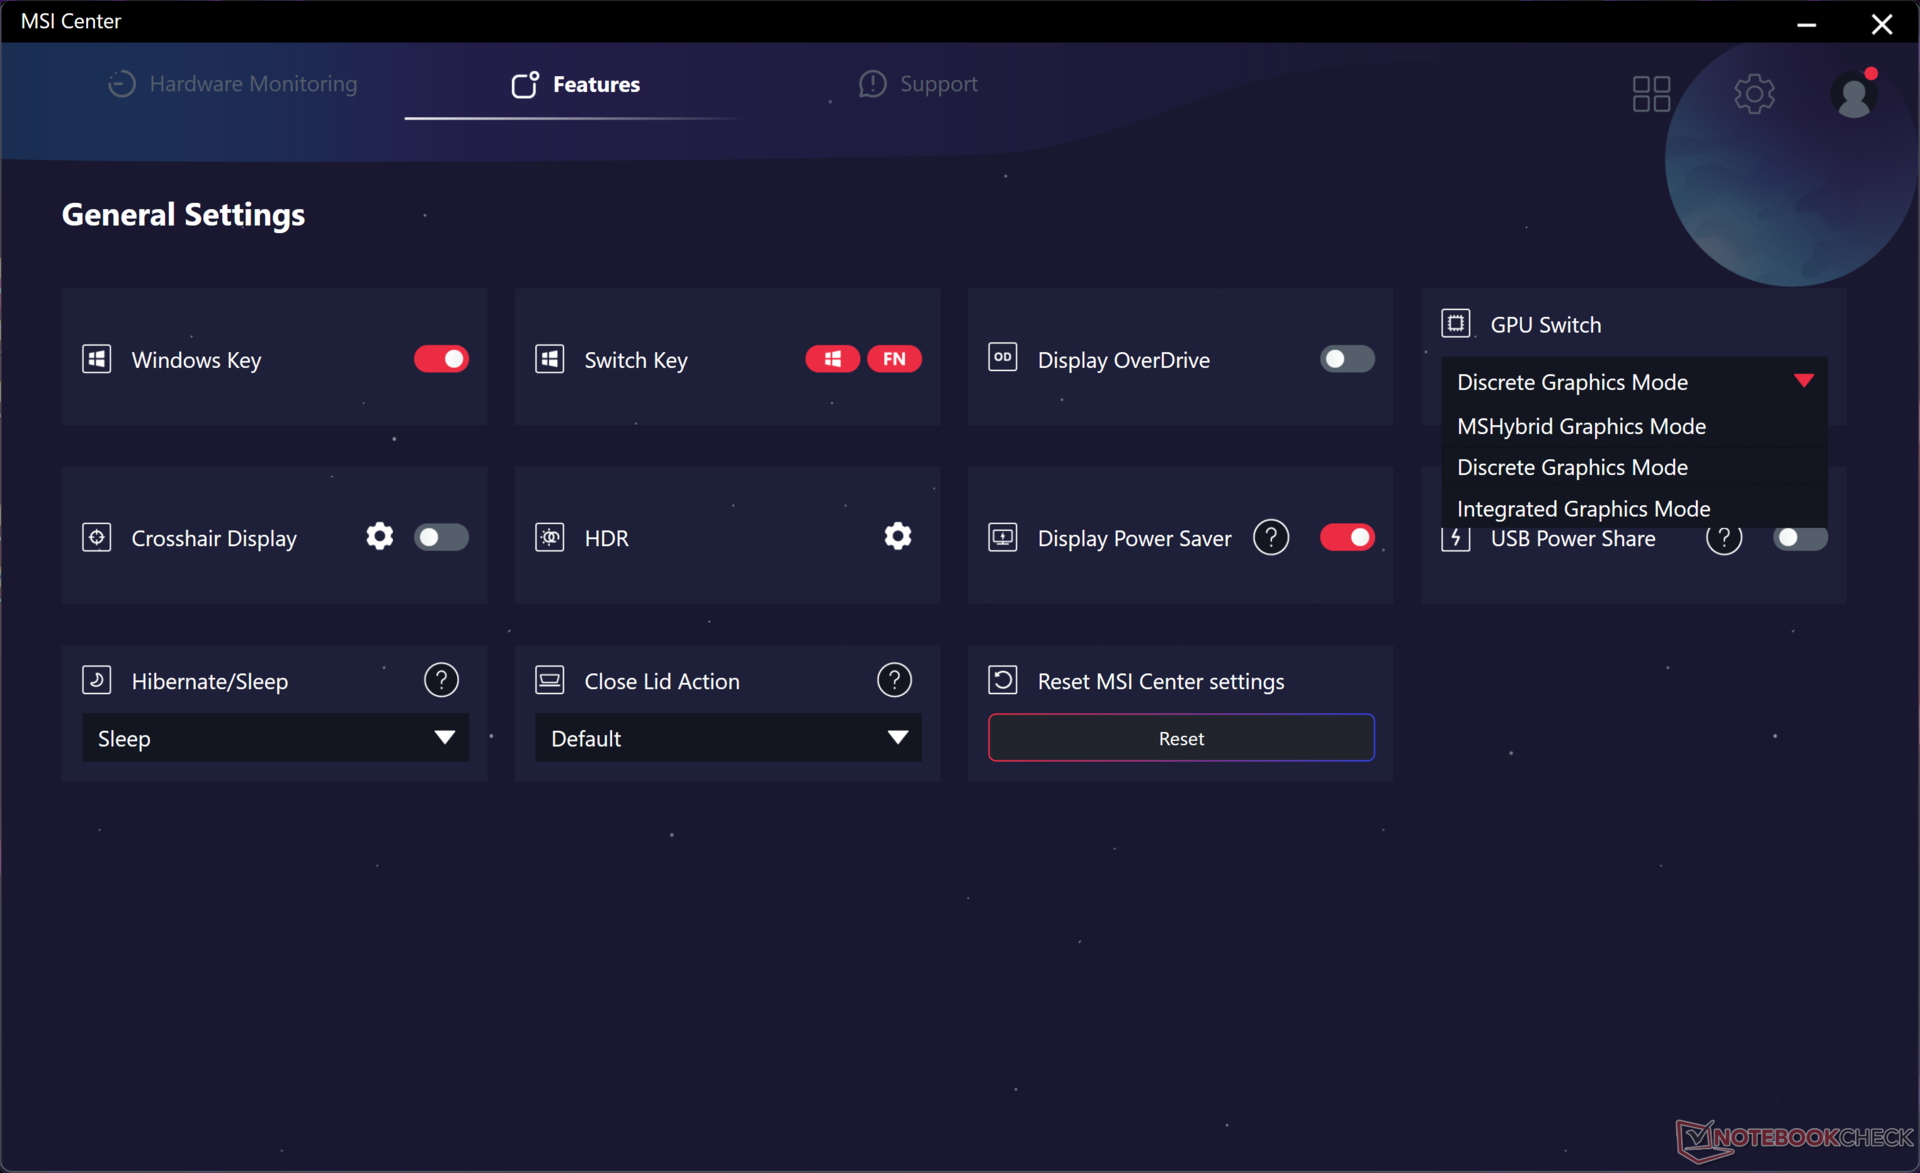
Configuramos la GPU en el modo de gráficos discretos, Windows en el modo Rendimiento y el Centro MSI en el modo Rendimiento extremo antes de ejecutar las pruebas comparativas que se indican a continuación. El modo Cooler Boost (es decir, el modo de ventilador máximo) es otro ajuste dentro del modo Rendimiento extremo, pero esta opción no suele ser necesaria para obtener el máximo rendimiento, como mostrarán nuestros resultados. Esto coincide con nuestra experiencia en otros portátiles MSI que incorporan la misma función Cooler Boost.
MUX es compatible para cambiar entre los modos dGPU, iGPU y MSHybrid, pero Advanced Optimus no lo es como en la Titan 18 HX. De hecho, un inconveniente clave del panel mini-LED 4K es su falta de compatibilidad con G-Sync.
Procesador
El Core i9-14900HX no es más que un Core i9-13900HX por lo que, en el mejor de los casos, sólo aporta ventajas marginales. Aun así, sigue siendo una de las CPU más rápidas disponibles en portátiles cuando se trata de métricas de rendimiento tradicionales como CineBench o renderizado Blender. La CPU complementa al Meteor Lake Core Ultra 9 185H que cambia algo de rendimiento bruto por una NPU integrada para acelerar las tareas de IA.
La sostenibilidad del rendimiento es excelente sin grandes caídas en las velocidades de reloj cuando se estresa a diferencia de lo que observamos en el Acer Predator Helios 18 equipado con la misma CPU Core i9-14900HX.
Cambiando al basado en AMD Ryzen 9 7945HX se espera que aumente el rendimiento multihilo entre un 10 y un 15 por ciento, mientras que el rendimiento monohilo se verá afectado entre un 10 y un 15 por ciento.
Cinebench R15 Multi Loop
Cinebench R23: Multi Core | Single Core
Cinebench R20: CPU (Multi Core) | CPU (Single Core)
Cinebench R15: CPU Multi 64Bit | CPU Single 64Bit
Blender: v2.79 BMW27 CPU
7-Zip 18.03: 7z b 4 | 7z b 4 -mmt1
Geekbench 6.4: Multi-Core | Single-Core
Geekbench 5.5: Multi-Core | Single-Core
HWBOT x265 Benchmark v2.2: 4k Preset
LibreOffice : 20 Documents To PDF
R Benchmark 2.5: Overall mean
* ... más pequeño es mejor
AIDA64: FP32 Ray-Trace | FPU Julia | CPU SHA3 | CPU Queen | FPU SinJulia | FPU Mandel | CPU AES | CPU ZLib | FP64 Ray-Trace | CPU PhotoWorxx
| Performance Rating | |
| Alienware m18 R2 | |
| MSI Titan 18 HX A14VIG | |
| MSI Raider 18 HX A14V | |
| Medio Intel Core i9-14900HX | |
| Razer Blade 18 2024 RZ09-0509 | |
| Acer Predator Helios 18 PH18-72-98MW | |
| Asus ROG Strix G18 G814JI | |
| AIDA64 / FP32 Ray-Trace | |
| MSI Titan 18 HX A14VIG | |
| Alienware m18 R2 | |
| MSI Raider 18 HX A14V | |
| Razer Blade 18 2024 RZ09-0509 | |
| Medio Intel Core i9-14900HX (13098 - 33474, n=36) | |
| Acer Predator Helios 18 PH18-72-98MW | |
| Asus ROG Strix G18 G814JI | |
| AIDA64 / FPU Julia | |
| MSI Titan 18 HX A14VIG | |
| Alienware m18 R2 | |
| MSI Raider 18 HX A14V | |
| Razer Blade 18 2024 RZ09-0509 | |
| Medio Intel Core i9-14900HX (67573 - 166040, n=36) | |
| Acer Predator Helios 18 PH18-72-98MW | |
| Asus ROG Strix G18 G814JI | |
| AIDA64 / CPU SHA3 | |
| MSI Titan 18 HX A14VIG | |
| Alienware m18 R2 | |
| MSI Raider 18 HX A14V | |
| Razer Blade 18 2024 RZ09-0509 | |
| Medio Intel Core i9-14900HX (3589 - 7979, n=36) | |
| Acer Predator Helios 18 PH18-72-98MW | |
| Asus ROG Strix G18 G814JI | |
| AIDA64 / CPU Queen | |
| MSI Titan 18 HX A14VIG | |
| MSI Raider 18 HX A14V | |
| Alienware m18 R2 | |
| Acer Predator Helios 18 PH18-72-98MW | |
| Medio Intel Core i9-14900HX (118405 - 148966, n=36) | |
| Razer Blade 18 2024 RZ09-0509 | |
| Asus ROG Strix G18 G814JI | |
| AIDA64 / FPU SinJulia | |
| MSI Titan 18 HX A14VIG | |
| MSI Raider 18 HX A14V | |
| Alienware m18 R2 | |
| Razer Blade 18 2024 RZ09-0509 | |
| Medio Intel Core i9-14900HX (10475 - 18517, n=36) | |
| Acer Predator Helios 18 PH18-72-98MW | |
| Asus ROG Strix G18 G814JI | |
| AIDA64 / FPU Mandel | |
| Alienware m18 R2 | |
| MSI Titan 18 HX A14VIG | |
| MSI Raider 18 HX A14V | |
| Razer Blade 18 2024 RZ09-0509 | |
| Medio Intel Core i9-14900HX (32543 - 83662, n=36) | |
| Acer Predator Helios 18 PH18-72-98MW | |
| Asus ROG Strix G18 G814JI | |
| AIDA64 / CPU AES | |
| Medio Intel Core i9-14900HX (86964 - 241777, n=36) | |
| MSI Titan 18 HX A14VIG | |
| Alienware m18 R2 | |
| MSI Raider 18 HX A14V | |
| Razer Blade 18 2024 RZ09-0509 | |
| Acer Predator Helios 18 PH18-72-98MW | |
| Asus ROG Strix G18 G814JI | |
| AIDA64 / CPU ZLib | |
| MSI Titan 18 HX A14VIG | |
| Alienware m18 R2 | |
| MSI Raider 18 HX A14V | |
| Razer Blade 18 2024 RZ09-0509 | |
| Medio Intel Core i9-14900HX (1054 - 2292, n=36) | |
| Acer Predator Helios 18 PH18-72-98MW | |
| Asus ROG Strix G18 G814JI | |
| AIDA64 / FP64 Ray-Trace | |
| Alienware m18 R2 | |
| MSI Titan 18 HX A14VIG | |
| MSI Raider 18 HX A14V | |
| Razer Blade 18 2024 RZ09-0509 | |
| Medio Intel Core i9-14900HX (6809 - 18349, n=36) | |
| Acer Predator Helios 18 PH18-72-98MW | |
| Asus ROG Strix G18 G814JI | |
| AIDA64 / CPU PhotoWorxx | |
| Alienware m18 R2 | |
| Razer Blade 18 2024 RZ09-0509 | |
| Acer Predator Helios 18 PH18-72-98MW | |
| Medio Intel Core i9-14900HX (23903 - 54702, n=36) | |
| Asus ROG Strix G18 G814JI | |
| MSI Raider 18 HX A14V | |
| MSI Titan 18 HX A14VIG | |
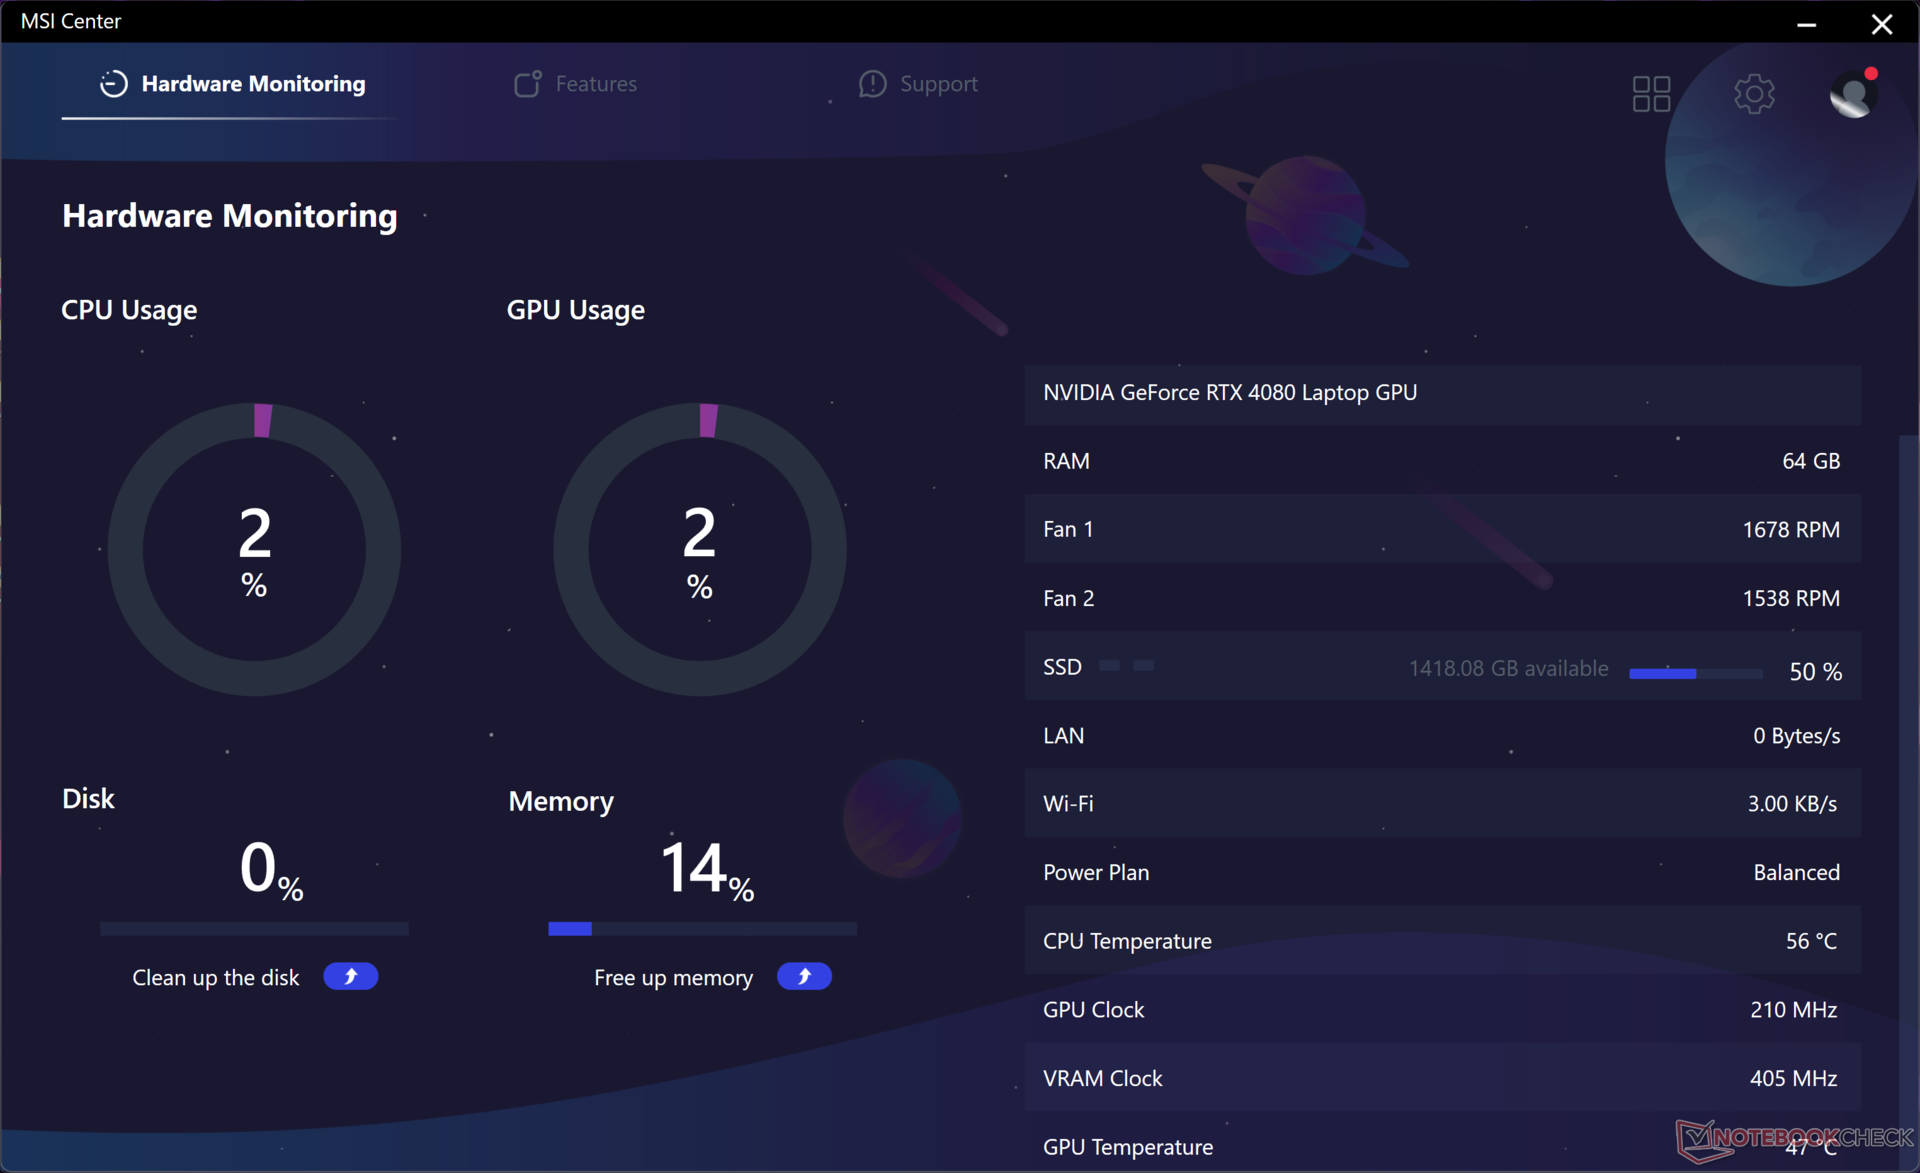
Prueba de estrés
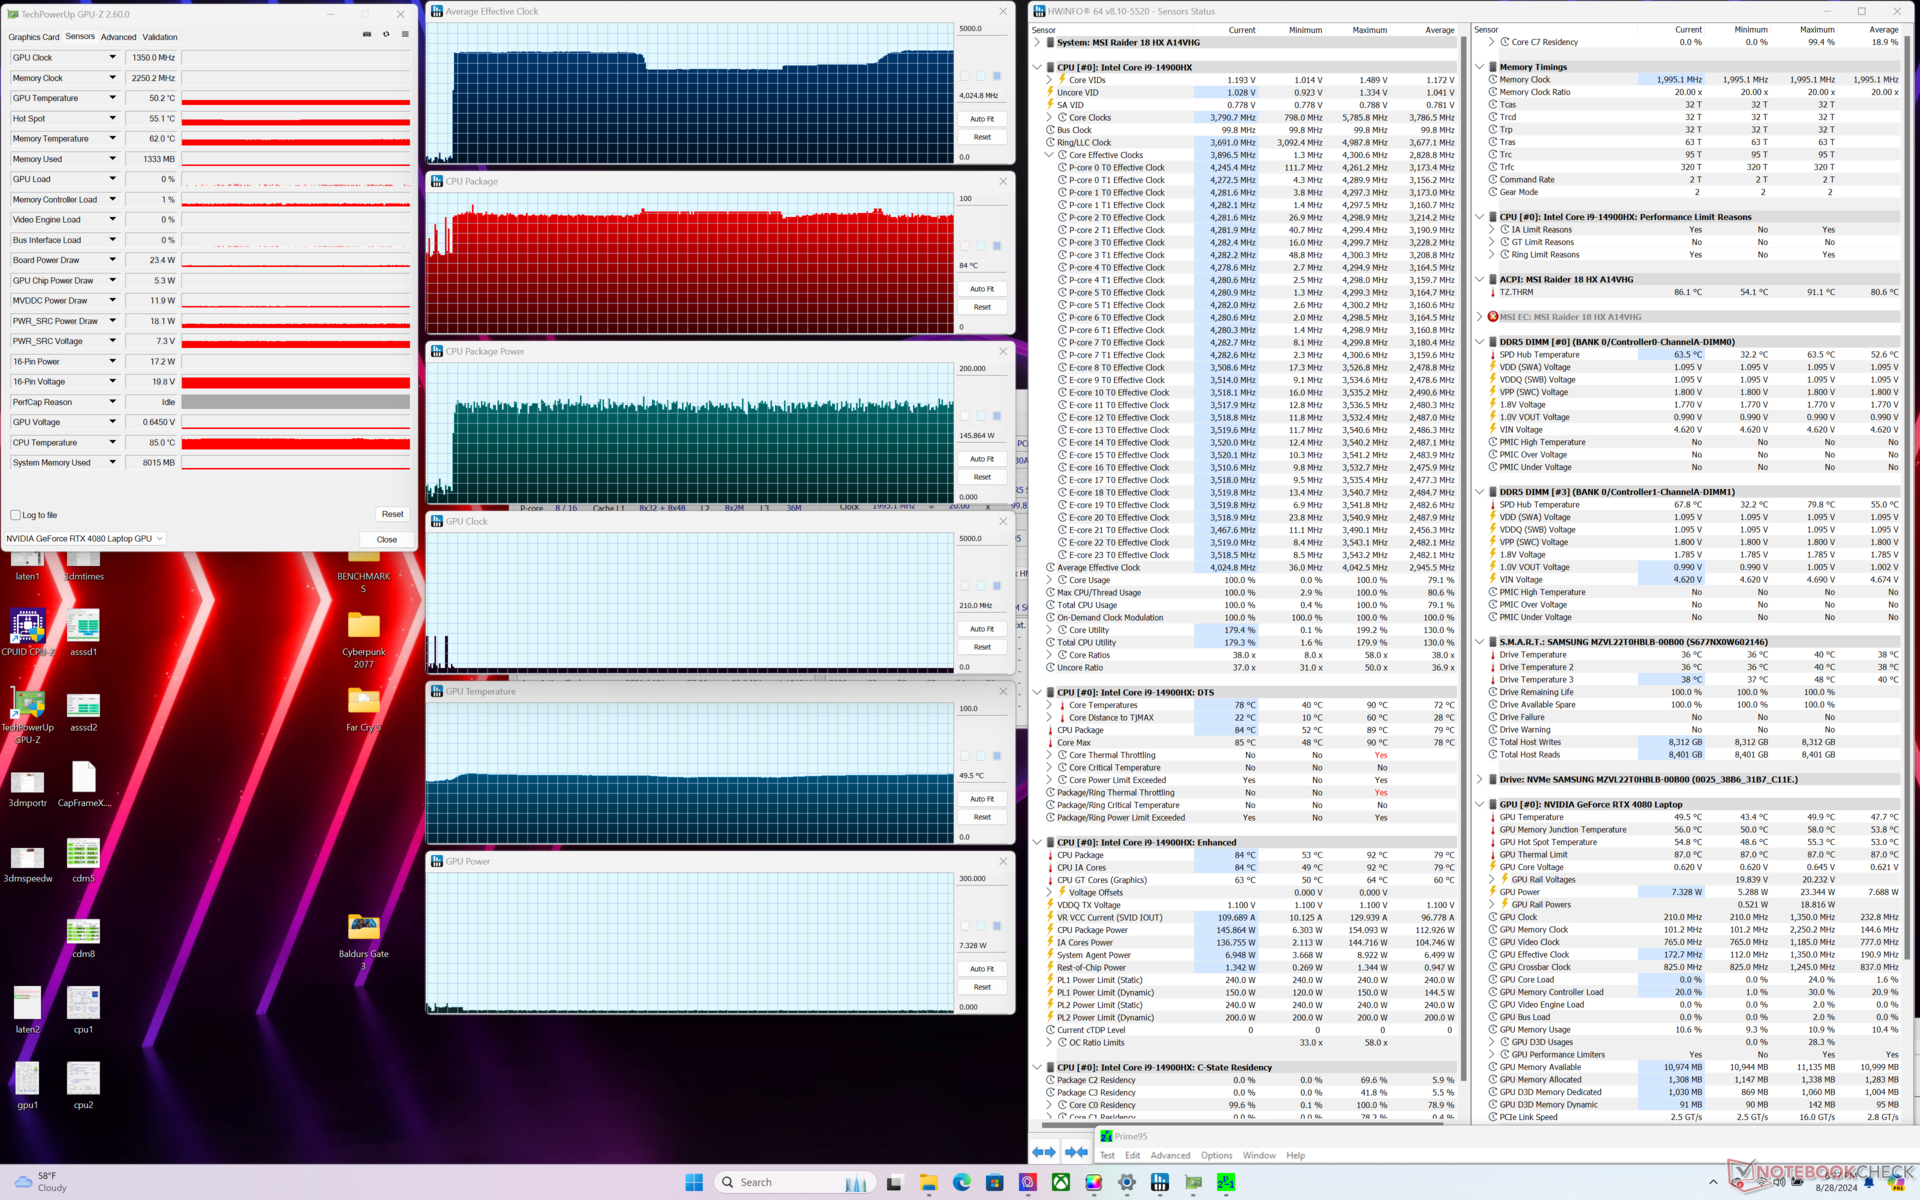
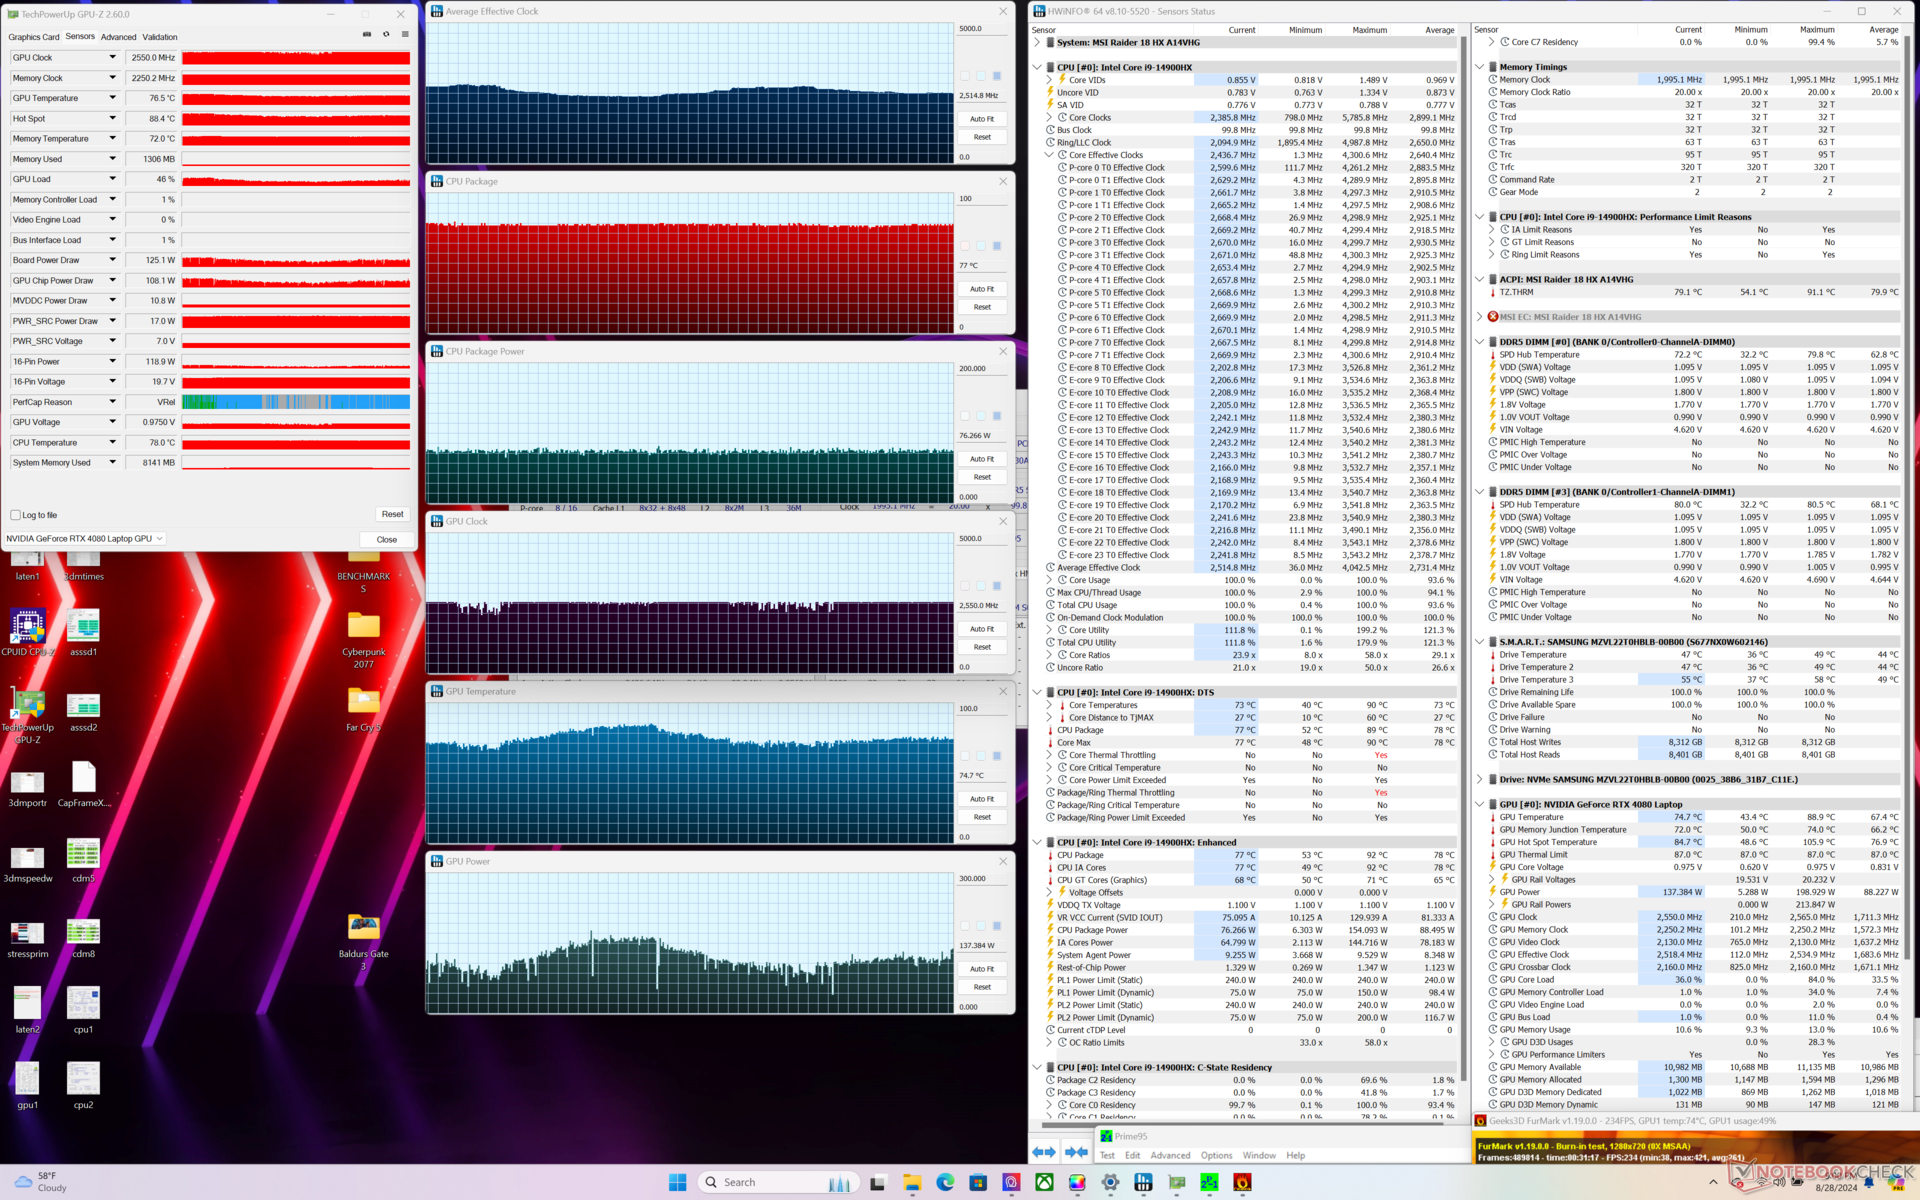
La CPU aumentaría a 4 GHz, 86 C y 145 W al iniciar el estrés Prime95 sin grandes caídas en las velocidades de reloj o el rendimiento con el tiempo. El gran chasis y la solución de refrigeración pueden extraer más rendimiento del Core i9-14900HX en comparación con sistemas más pequeños con el mismo procesador como el RedMagic Titan 16 Pro que se ralentiza bastante.
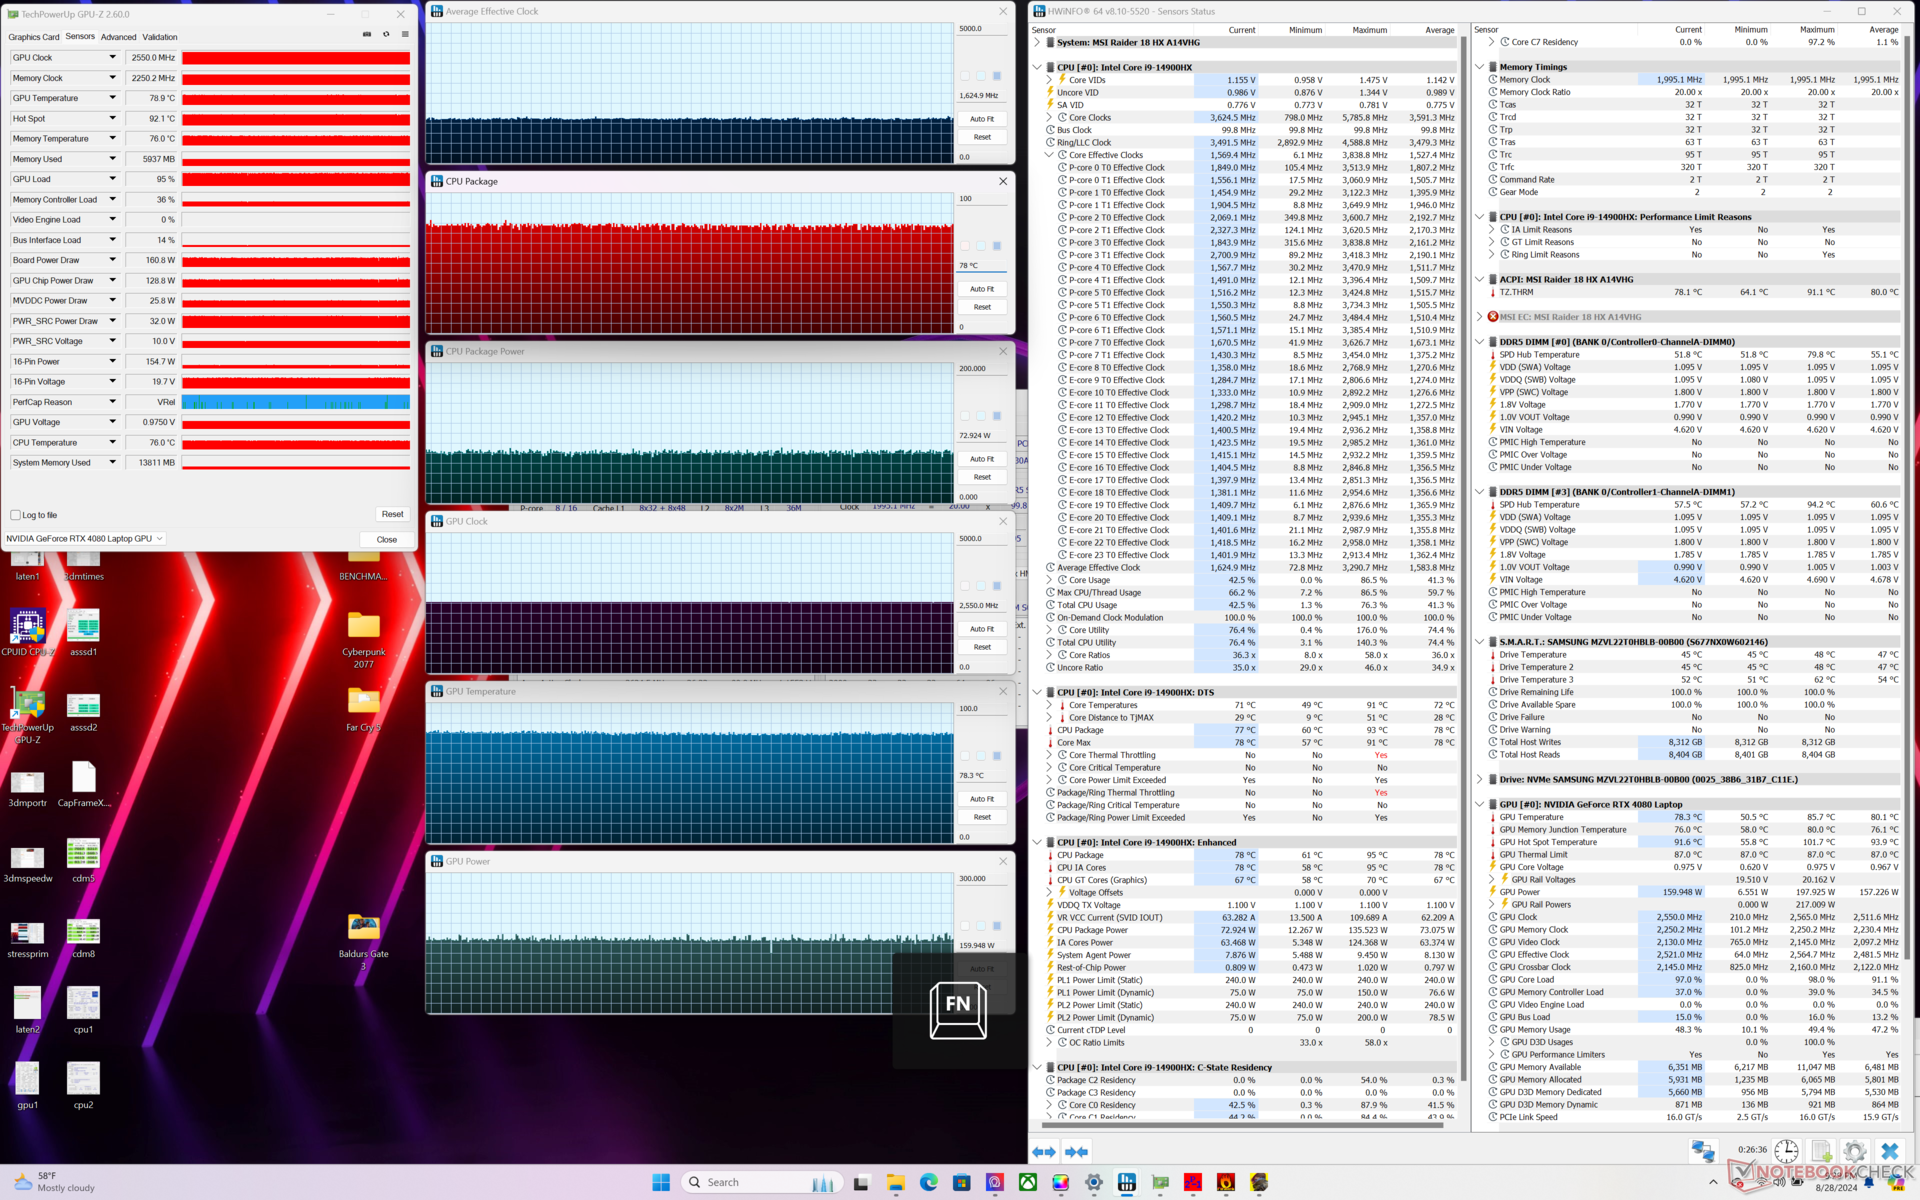
Ejecutar en modo de rendimiento extremo con Cooler Boost activado no proporciona beneficios tangibles de rendimiento en comparación con Cooler Boost desactivado cuando se juega. La velocidad de reloj de la GPU, la velocidad de reloj de la memoria y el consumo de energía de la placa al ejecutar Cyberpunk 2077 se estabilizarían en 2550 MHz, 2250 MHz y 159 W, respectivamente, entre las dos configuraciones. Las temperaturas del núcleo son ligeramente más frías en unos pocos grados C con Cooler Boost activado ya que el ruido del ventilador es más fuerte, pero esa es la única ventaja notable.
Bajar al modo Equilibrado reduce la velocidad de reloj de la GPU y el consumo de energía de la placa a 2295 MHz y 150 W, respectivamente, que son sólo marginalmente más lentos que el modo Rendimiento Extremo. Por tanto, los deltas de rendimiento entre los modos Equilibrado y Rendimiento extremo son menores de lo que cabría esperar.
Las temperaturas de la GPU son más cálidas que en el Razer Blade 18 en hasta 9 C al jugar, a pesar de que nuestro MSI es el sistema más grueso y pesado.
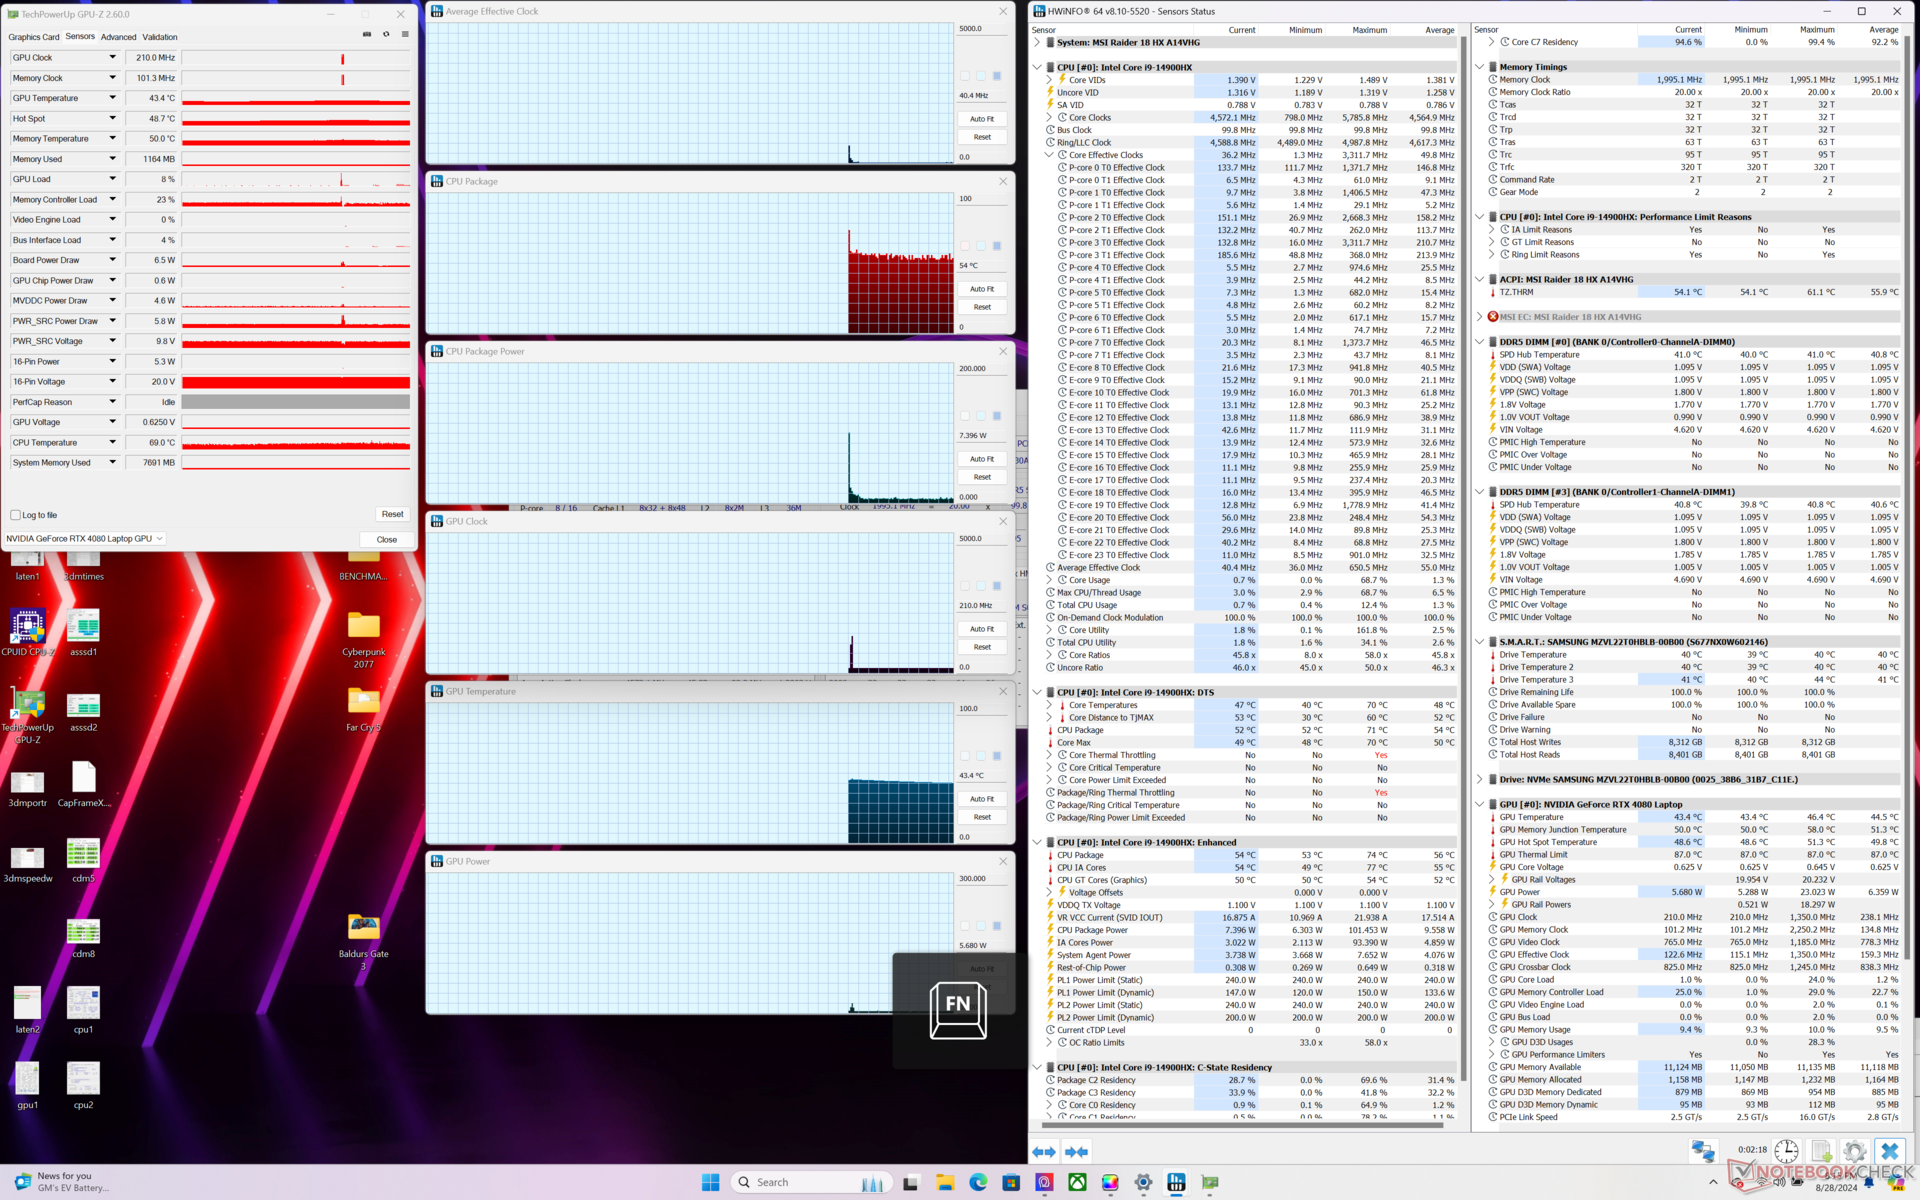

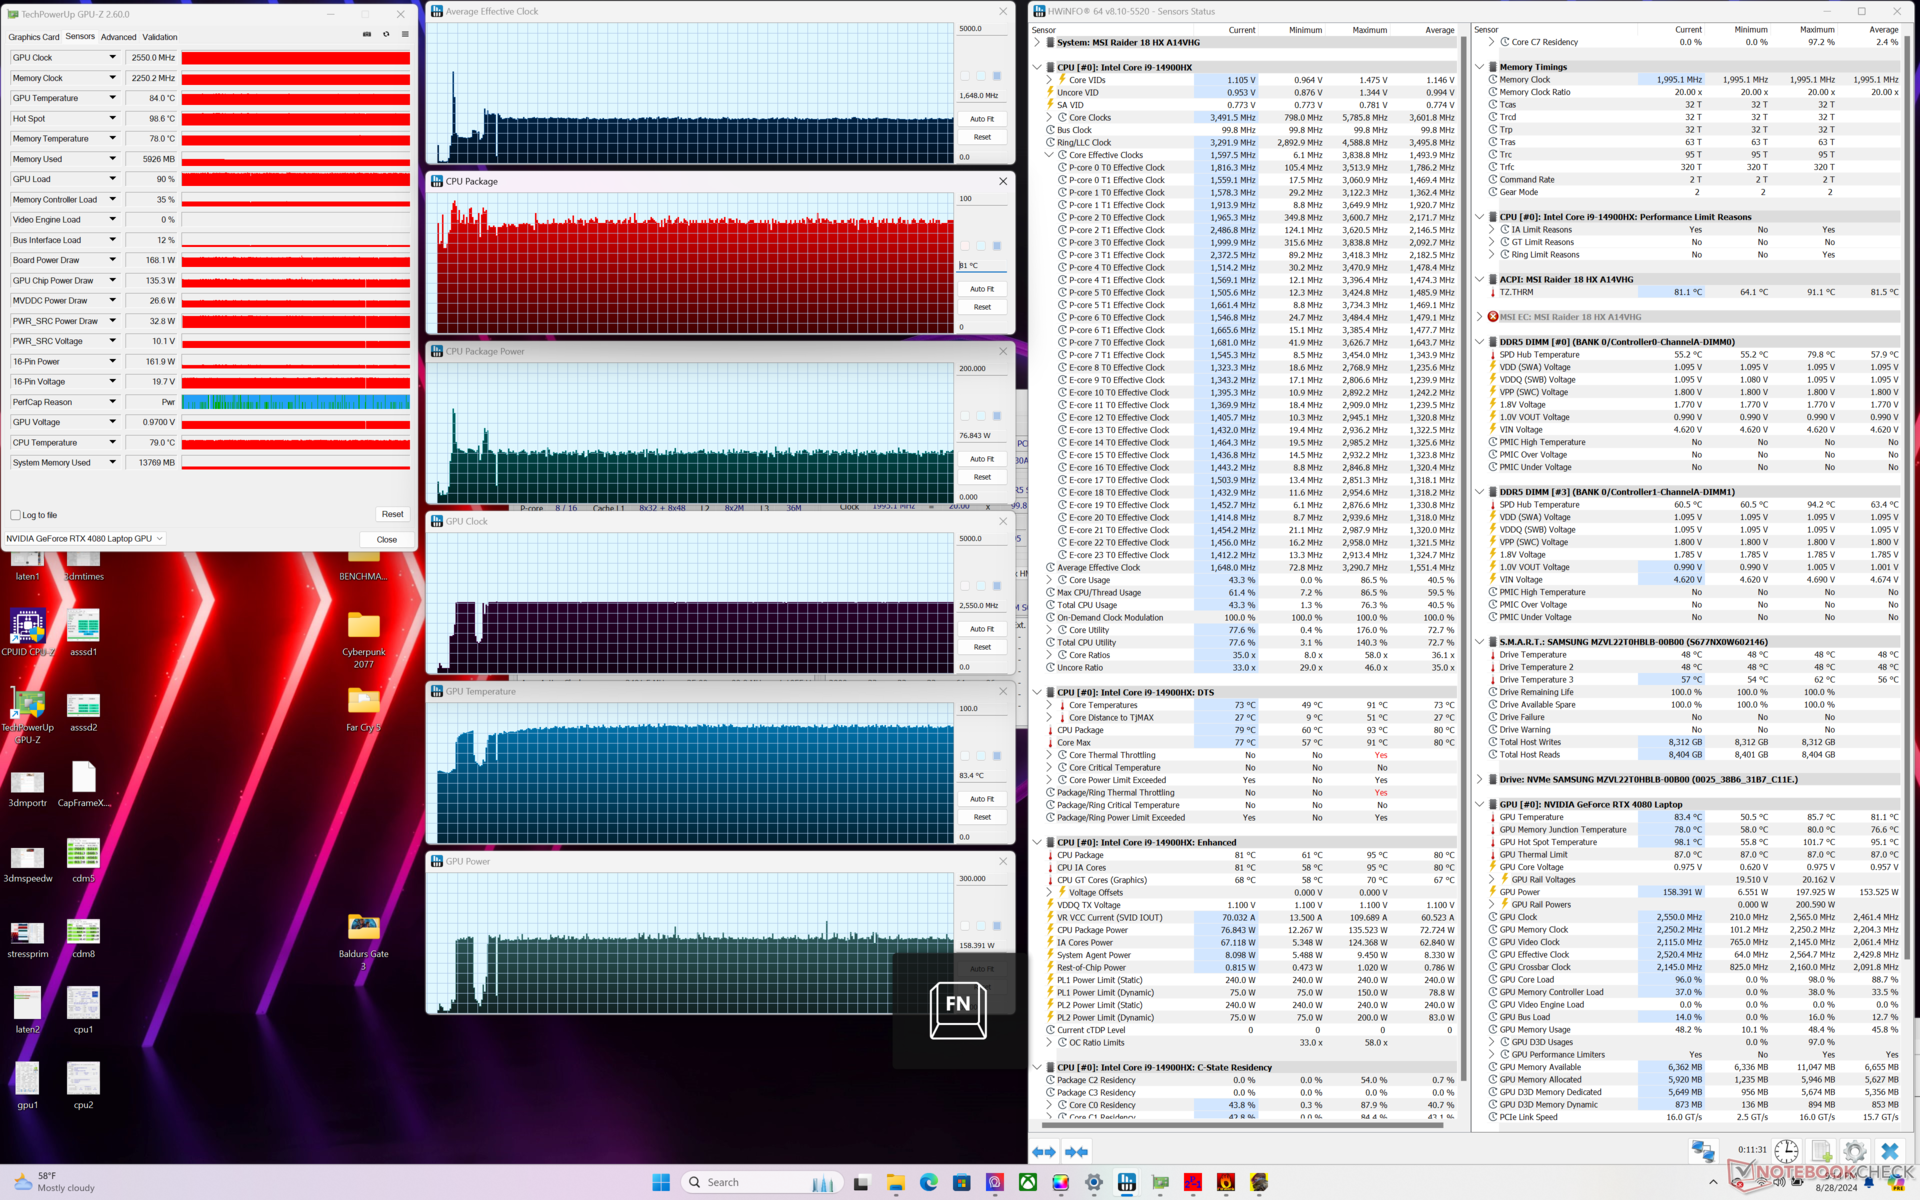
| Reloj medio de la CPU (GHz) | Reloj medio de la GPU (MHz) | Temperatura media dela CPU (°C) | Temperatura media de la GPU (°C) | |
| Sistema en reposo | -- | -- | 54 | 43 |
| Prime95 Stress | 4.0 | -- | 84 | 50 |
| Estrés de Prime95 + FurMark | 2.5 | 2550 | 77 | 75 |
| Cyberpunk 2077 Estrés (modo equilibrado) | 1.5 | 2295 | 78 | 85 |
| Cyberpunk 2077 Stress (Rendimiento extremo con Cooler Boost desactivado) | 1.7 | 2550 | 81 | 83 |
| Cyberpunk 2077 Stress (Rendimiento extremo con Cooler Boost activado) | 1.6 | 2550 | 78 | 78 |
Rendimiento del sistema
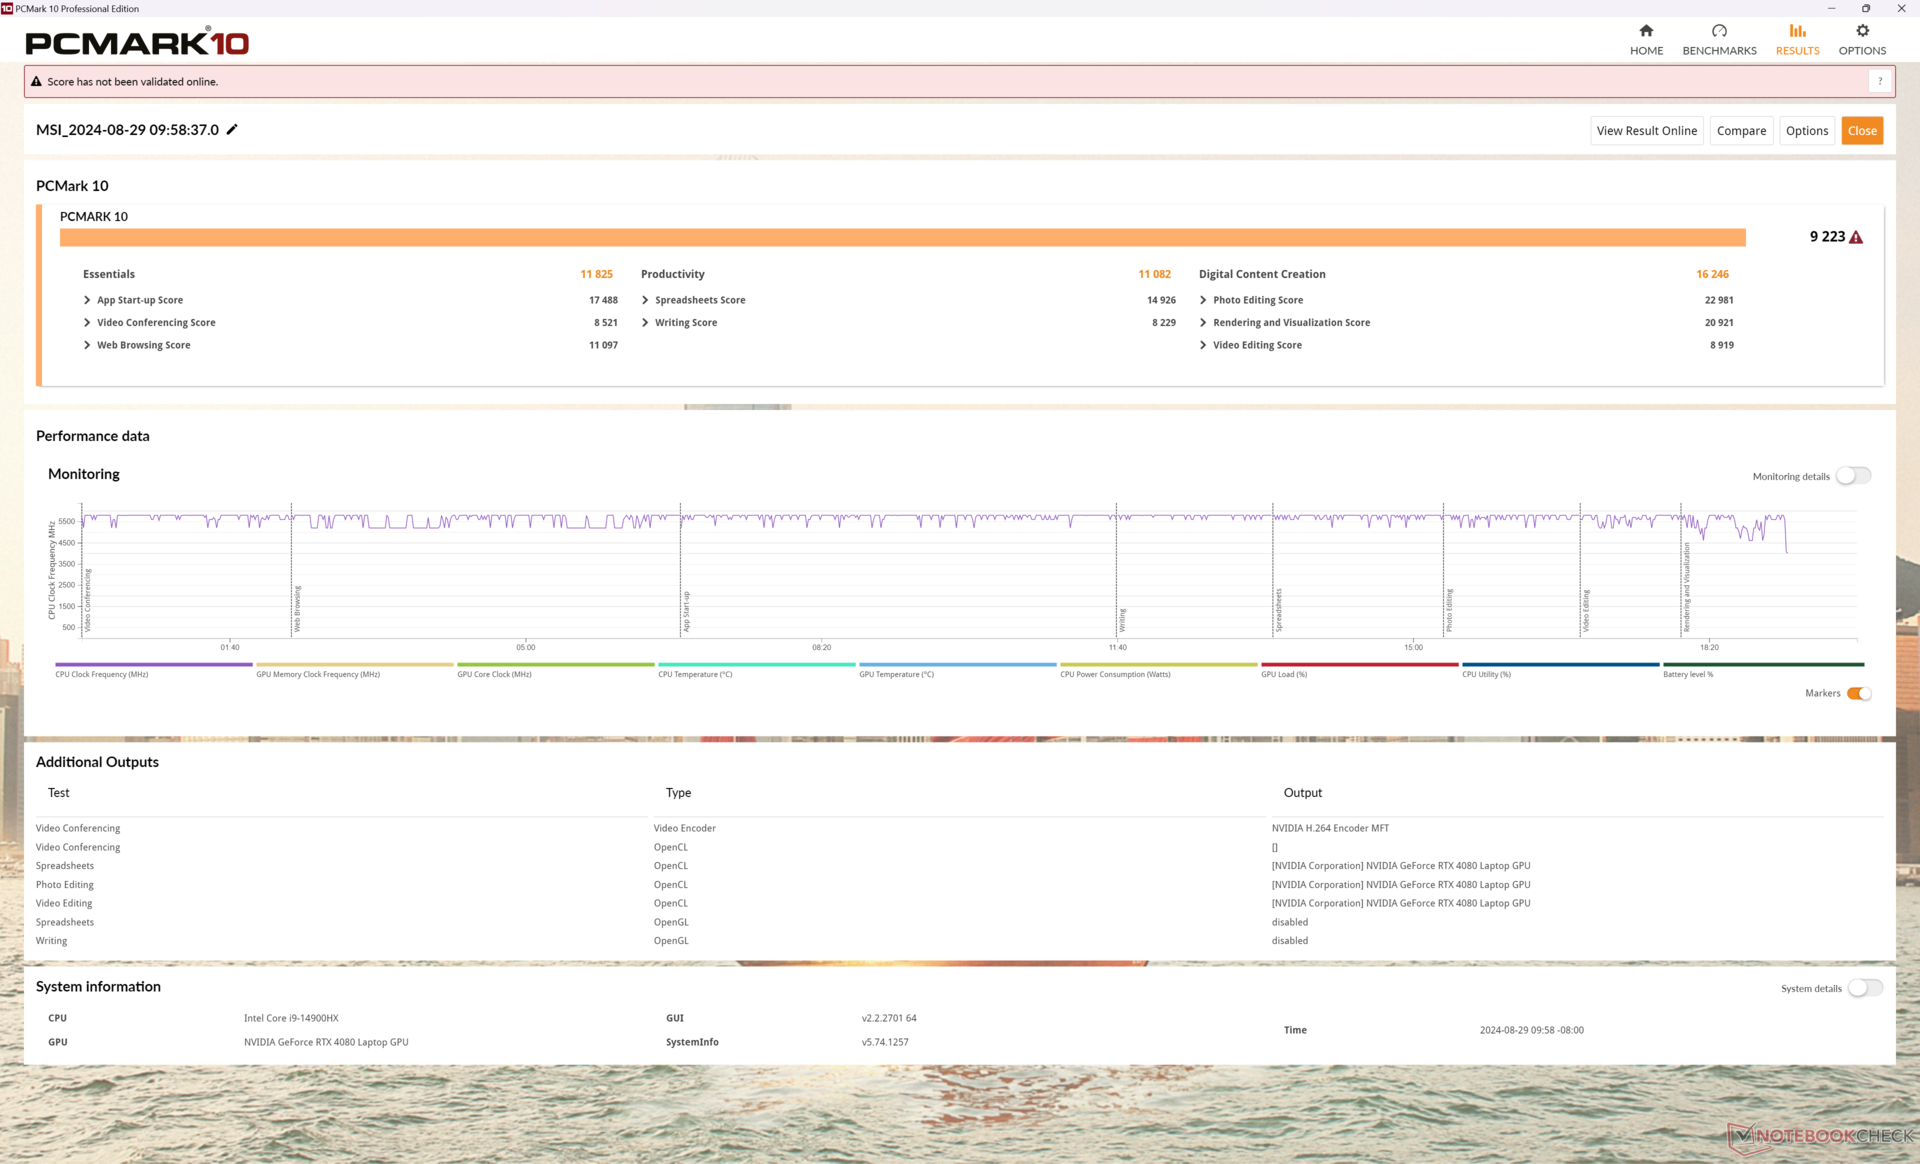
Las puntuaciones de PCMark 10 son comparables a las de la MSI Titan 18 HX para demostrar que las tareas cotidianas no son realmente más lentas en la Raider 18 HX a pesar de que es esencialmente una Titan rebajada de tono.
Experimentamos extraños problemas de inicio de sesión con nuestra unidad de pruebas al cambiar entre los modos dGPU e iGPU que nos obligaban a reiniciar el PIN cada vez.
CrossMark: Overall | Productivity | Creativity | Responsiveness
WebXPRT 3: Overall
WebXPRT 4: Overall
Mozilla Kraken 1.1: Total
| PCMark 10 / Score | |
| Alienware m18 R2 | |
| MSI Raider 18 HX A14V | |
| MSI Titan 18 HX A14VIG | |
| Razer Blade 18 2024 RZ09-0509 | |
| Medio Intel Core i9-14900HX, NVIDIA GeForce RTX 4080 Laptop GPU (7703 - 9223, n=7) | |
| Acer Predator Helios 18 PH18-72-98MW | |
| Asus ROG Strix G18 G814JI | |
| PCMark 10 / Essentials | |
| MSI Raider 18 HX A14V | |
| Medio Intel Core i9-14900HX, NVIDIA GeForce RTX 4080 Laptop GPU (11255 - 12600, n=7) | |
| MSI Titan 18 HX A14VIG | |
| Alienware m18 R2 | |
| Razer Blade 18 2024 RZ09-0509 | |
| Acer Predator Helios 18 PH18-72-98MW | |
| Asus ROG Strix G18 G814JI | |
| PCMark 10 / Productivity | |
| Alienware m18 R2 | |
| MSI Raider 18 HX A14V | |
| Medio Intel Core i9-14900HX, NVIDIA GeForce RTX 4080 Laptop GPU (6662 - 11410, n=7) | |
| MSI Titan 18 HX A14VIG | |
| Razer Blade 18 2024 RZ09-0509 | |
| Acer Predator Helios 18 PH18-72-98MW | |
| Asus ROG Strix G18 G814JI | |
| PCMark 10 / Digital Content Creation | |
| MSI Titan 18 HX A14VIG | |
| Alienware m18 R2 | |
| MSI Raider 18 HX A14V | |
| Razer Blade 18 2024 RZ09-0509 | |
| Medio Intel Core i9-14900HX, NVIDIA GeForce RTX 4080 Laptop GPU (14211 - 16246, n=7) | |
| Acer Predator Helios 18 PH18-72-98MW | |
| Asus ROG Strix G18 G814JI | |
| CrossMark / Overall | |
| Medio Intel Core i9-14900HX, NVIDIA GeForce RTX 4080 Laptop GPU (1992 - 2334, n=7) | |
| MSI Raider 18 HX A14V | |
| Alienware m18 R2 | |
| Razer Blade 18 2024 RZ09-0509 | |
| MSI Titan 18 HX A14VIG | |
| CrossMark / Productivity | |
| Medio Intel Core i9-14900HX, NVIDIA GeForce RTX 4080 Laptop GPU (1812 - 2204, n=7) | |
| MSI Raider 18 HX A14V | |
| Razer Blade 18 2024 RZ09-0509 | |
| Alienware m18 R2 | |
| MSI Titan 18 HX A14VIG | |
| CrossMark / Creativity | |
| Medio Intel Core i9-14900HX, NVIDIA GeForce RTX 4080 Laptop GPU (2327 - 2500, n=7) | |
| Alienware m18 R2 | |
| MSI Raider 18 HX A14V | |
| Razer Blade 18 2024 RZ09-0509 | |
| MSI Titan 18 HX A14VIG | |
| CrossMark / Responsiveness | |
| Medio Intel Core i9-14900HX, NVIDIA GeForce RTX 4080 Laptop GPU (1520 - 2254, n=7) | |
| MSI Raider 18 HX A14V | |
| Alienware m18 R2 | |
| Razer Blade 18 2024 RZ09-0509 | |
| MSI Titan 18 HX A14VIG | |
| WebXPRT 3 / Overall | |
| Razer Blade 18 2024 RZ09-0509 | |
| MSI Raider 18 HX A14V | |
| Medio Intel Core i9-14900HX, NVIDIA GeForce RTX 4080 Laptop GPU (310 - 345, n=7) | |
| MSI Titan 18 HX A14VIG | |
| Alienware m18 R2 | |
| Asus ROG Strix G18 G814JI | |
| Asus ROG Strix G18 G814JI | |
| WebXPRT 4 / Overall | |
| MSI Raider 18 HX A14V | |
| Medio Intel Core i9-14900HX, NVIDIA GeForce RTX 4080 Laptop GPU (300 - 321, n=7) | |
| Alienware m18 R2 | |
| MSI Titan 18 HX A14VIG | |
| Asus ROG Strix G18 G814JI | |
| Asus ROG Strix G18 G814JI | |
| Mozilla Kraken 1.1 / Total | |
| Asus ROG Strix G18 G814JI | |
| Asus ROG Strix G18 G814JI | |
| MSI Titan 18 HX A14VIG | |
| Razer Blade 18 2024 RZ09-0509 | |
| MSI Raider 18 HX A14V | |
| Acer Predator Helios 18 PH18-72-98MW | |
| Medio Intel Core i9-14900HX, NVIDIA GeForce RTX 4080 Laptop GPU (437 - 446, n=7) | |
| Alienware m18 R2 | |
* ... más pequeño es mejor
| PCMark 10 Score | 9223 puntos | |
ayuda | ||
| AIDA64 / Memory Copy | |
| Alienware m18 R2 | |
| Acer Predator Helios 18 PH18-72-98MW | |
| Razer Blade 18 2024 RZ09-0509 | |
| Medio Intel Core i9-14900HX (38028 - 83392, n=36) | |
| MSI Raider 18 HX A14V | |
| Asus ROG Strix G18 G814JI | |
| MSI Titan 18 HX A14VIG | |
| AIDA64 / Memory Read | |
| Alienware m18 R2 | |
| Acer Predator Helios 18 PH18-72-98MW | |
| Razer Blade 18 2024 RZ09-0509 | |
| Medio Intel Core i9-14900HX (43306 - 87568, n=36) | |
| Asus ROG Strix G18 G814JI | |
| MSI Raider 18 HX A14V | |
| MSI Titan 18 HX A14VIG | |
| AIDA64 / Memory Write | |
| Alienware m18 R2 | |
| Medio Intel Core i9-14900HX (37146 - 80589, n=36) | |
| Acer Predator Helios 18 PH18-72-98MW | |
| Razer Blade 18 2024 RZ09-0509 | |
| MSI Raider 18 HX A14V | |
| Asus ROG Strix G18 G814JI | |
| MSI Titan 18 HX A14VIG | |
| AIDA64 / Memory Latency | |
| MSI Titan 18 HX A14VIG | |
| MSI Raider 18 HX A14V | |
| Razer Blade 18 2024 RZ09-0509 | |
| Alienware m18 R2 | |
| Medio Intel Core i9-14900HX (76.1 - 105, n=36) | |
| Asus ROG Strix G18 G814JI | |
| Acer Predator Helios 18 PH18-72-98MW | |
* ... más pequeño es mejor
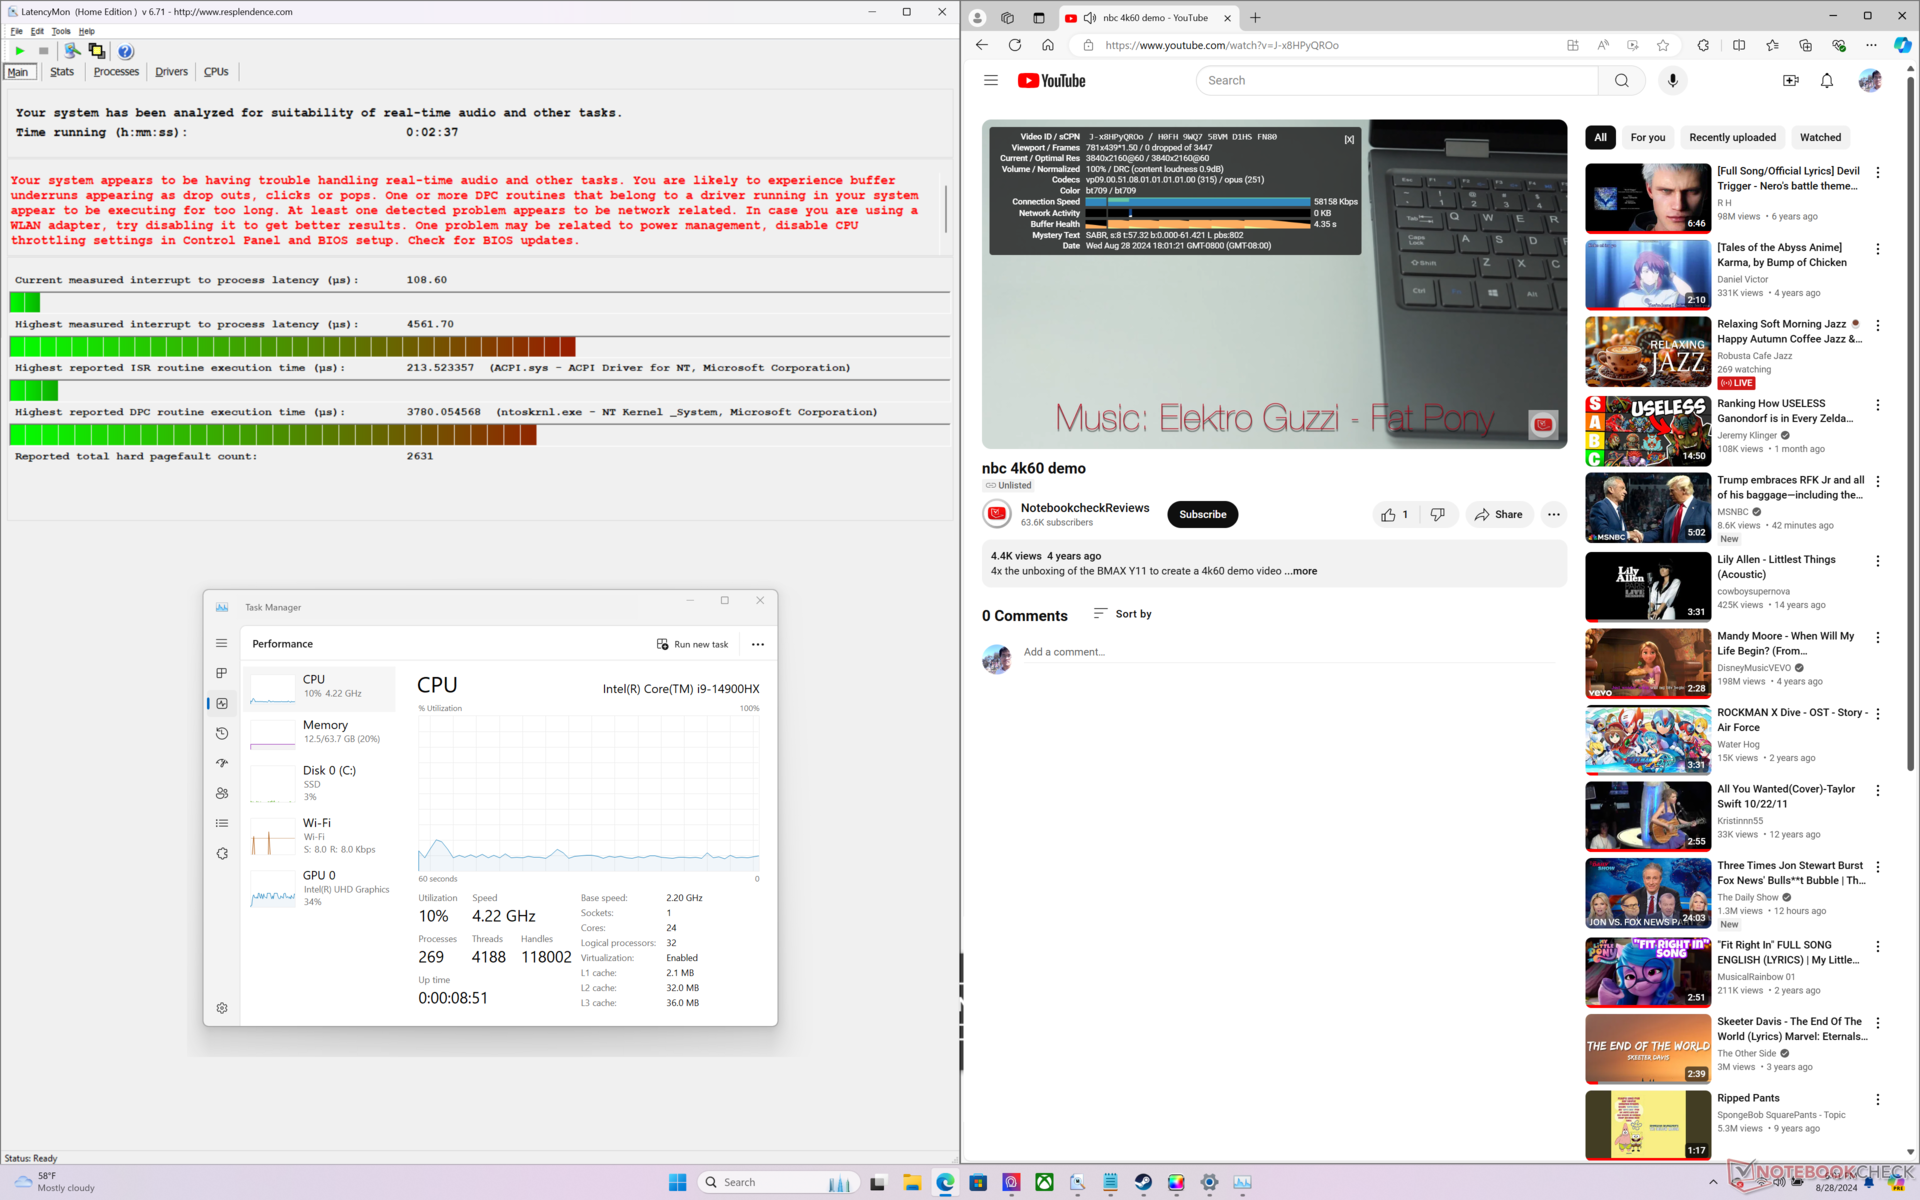
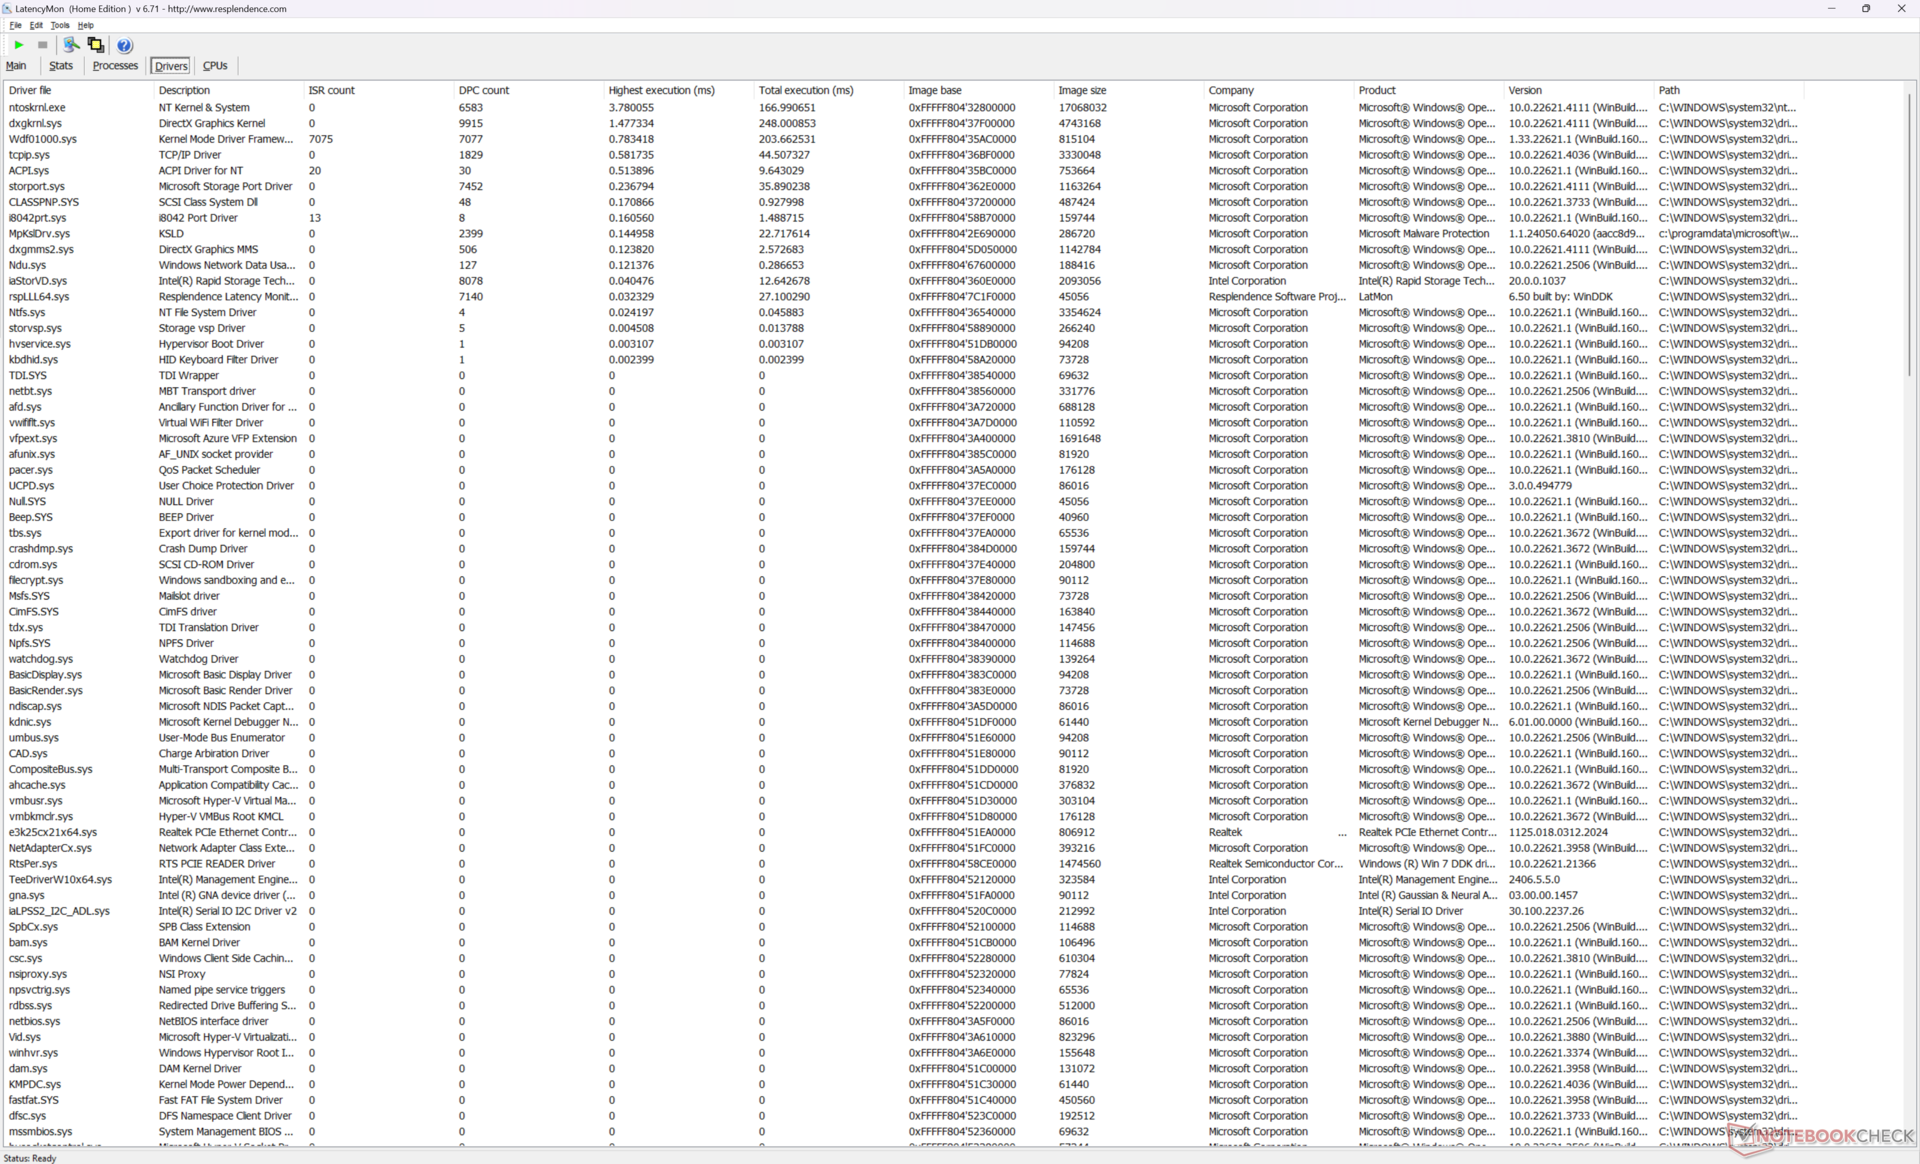
Latencia del CPD
LatencyMon revela problemas de DPC al abrir varias pestañas de nuestra página de inicio, incluso cuando está configurado en modo iGPU. por lo demás, la reproducción de vídeo 4K a 60 FPS es perfecta sin que se registre ninguna caída de fotogramas.
| DPC Latencies / LatencyMon - interrupt to process latency (max), Web, Youtube, Prime95 | |
| MSI Raider 18 HX A14V | |
| Acer Predator Helios 18 PH18-72-98MW | |
| Alienware m18 R2 | |
| MSI Titan 18 HX A14VIG | |
| Razer Blade 18 2024 RZ09-0509 | |
| Asus ROG Strix G18 G814JI | |
* ... más pequeño es mejor
Dispositivos de almacenamiento
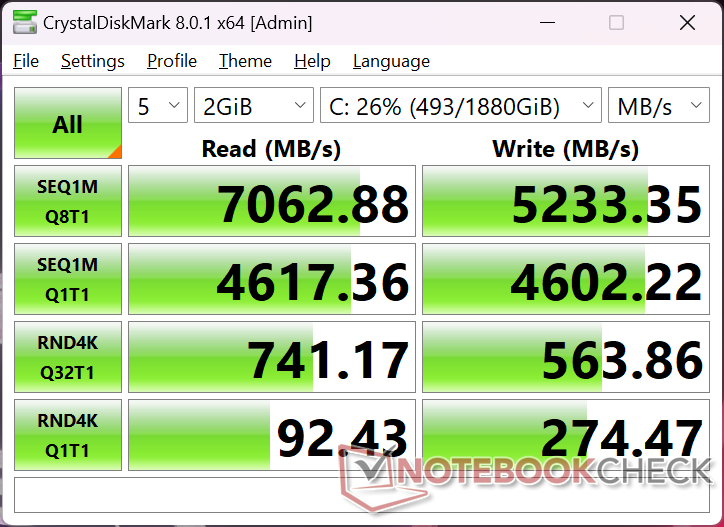
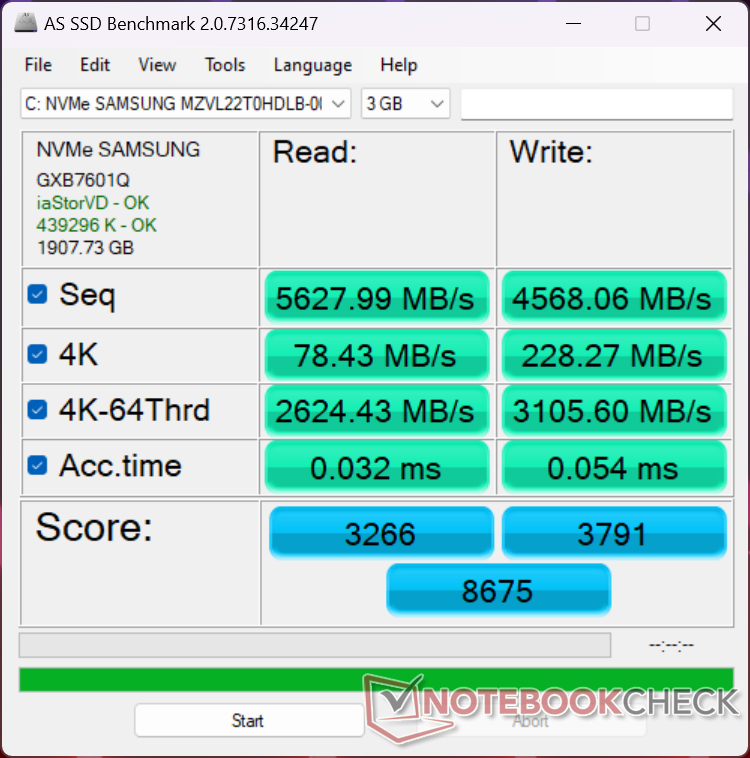
Nuestra unidad se envía con el Samsung PM9A1a MZVL22T0HDLB SSD PCIe4 que suele encontrarse en los portátiles de gama alta. Las velocidades de transferencia son estables en ~7000 MB/s incluso bajo tensión y pueden ser aún más rápidas si se configuran con una unidad PCIe5. Sin embargo, la falta de un disipador de calor incluido puede significar que las unidades PCIe5 son más propensas al estrangulamiento.

| Drive Performance Rating - Percent | |
| Alienware m18 R2 | |
| MSI Raider 18 HX A14V | |
| Acer Predator Helios 18 PH18-72-98MW | |
| MSI Titan 18 HX A14VIG | |
| Razer Blade 18 2024 RZ09-0509 | |
| Asus ROG Strix G18 G814JI | |
* ... más pequeño es mejor
Disk Throttling: DiskSpd Read Loop, Queue Depth 8
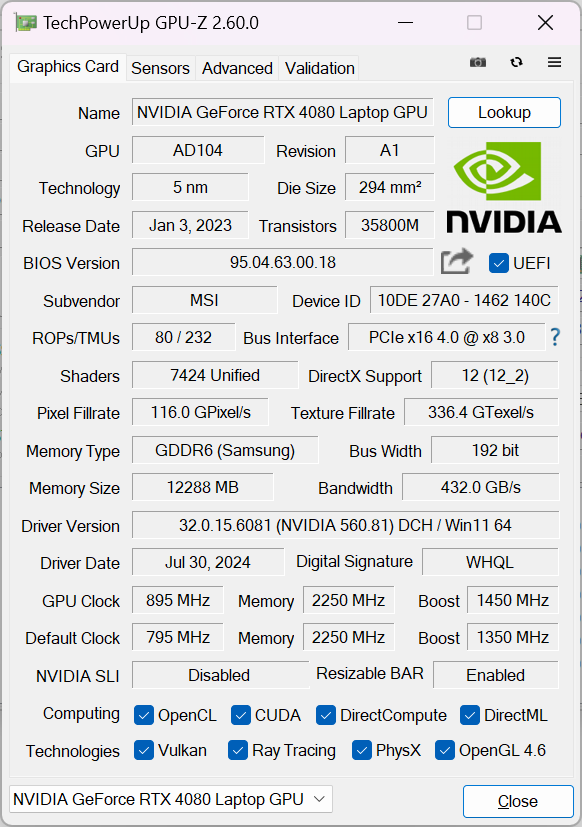
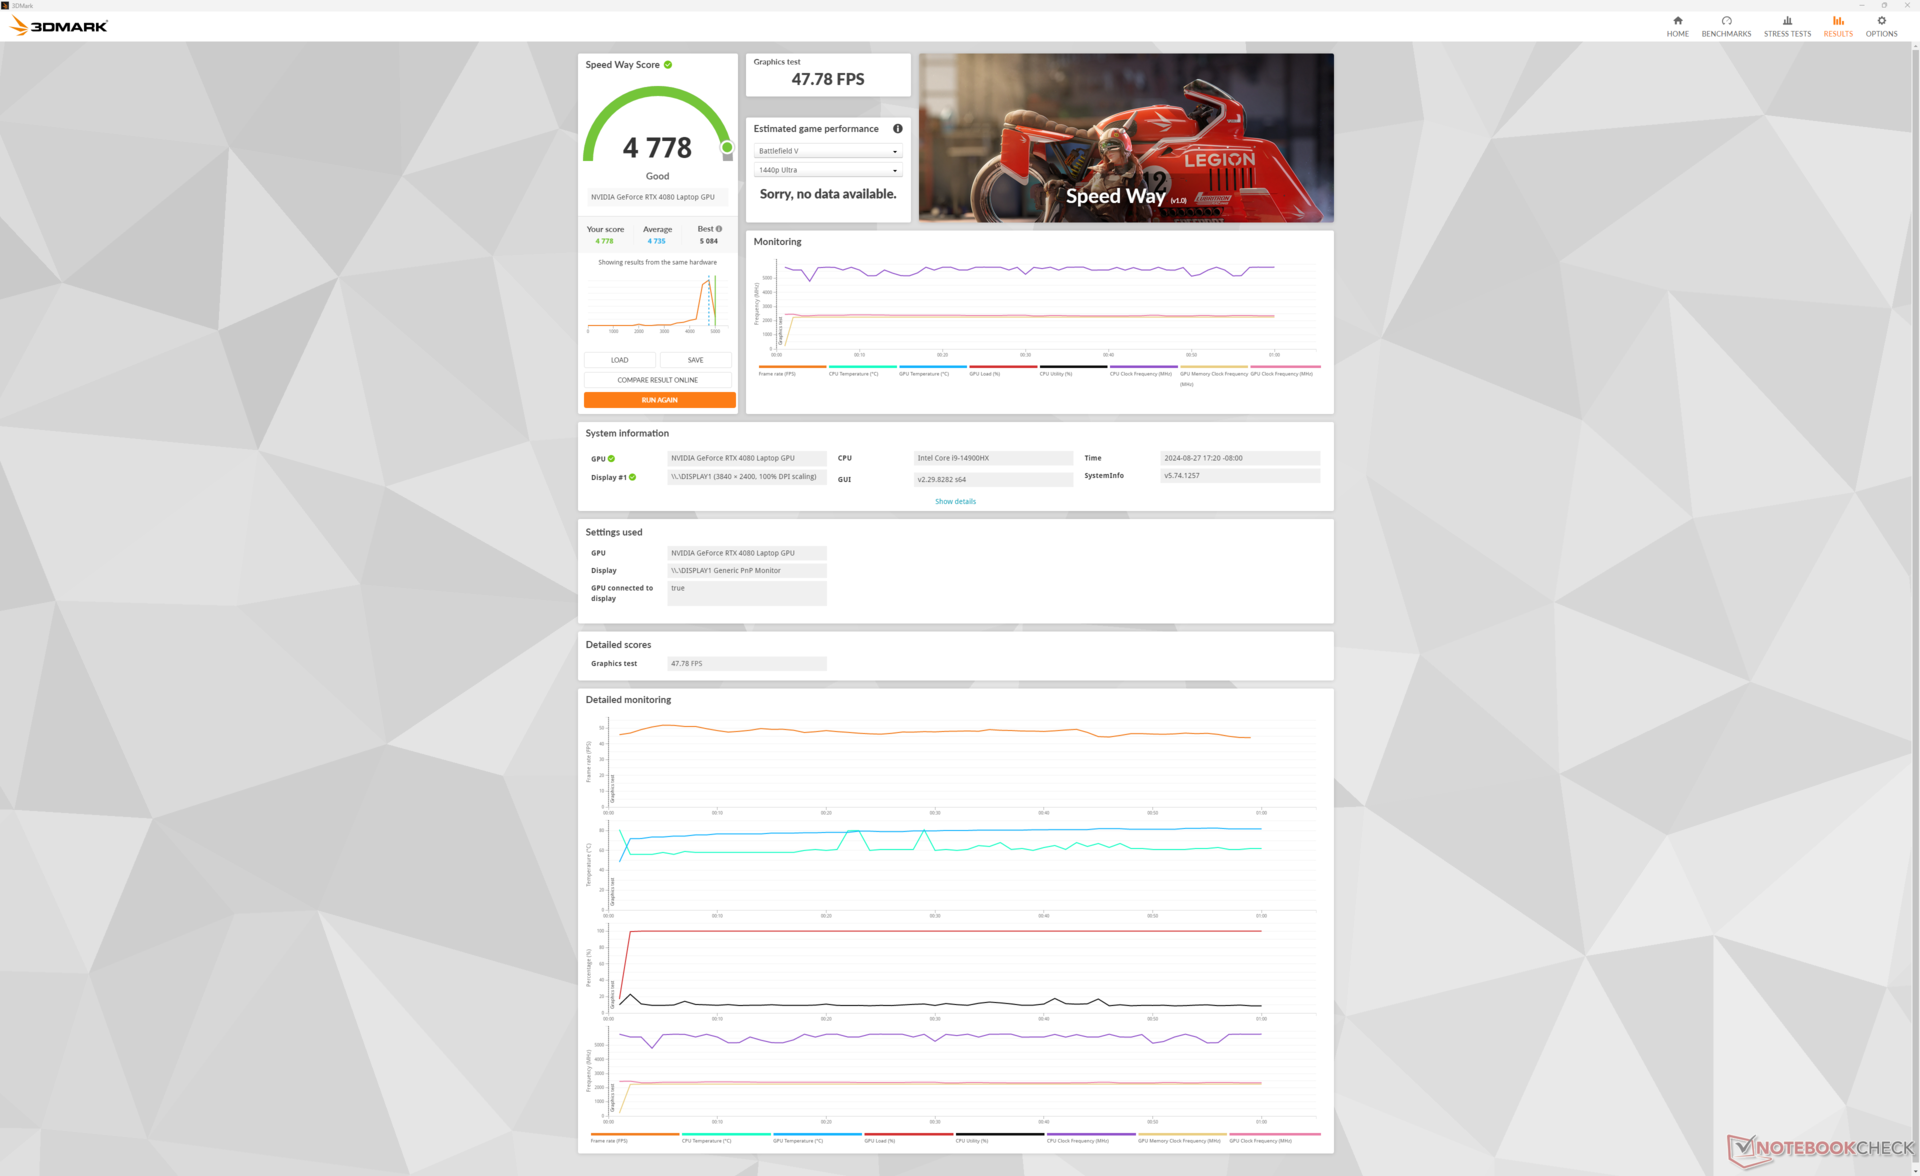
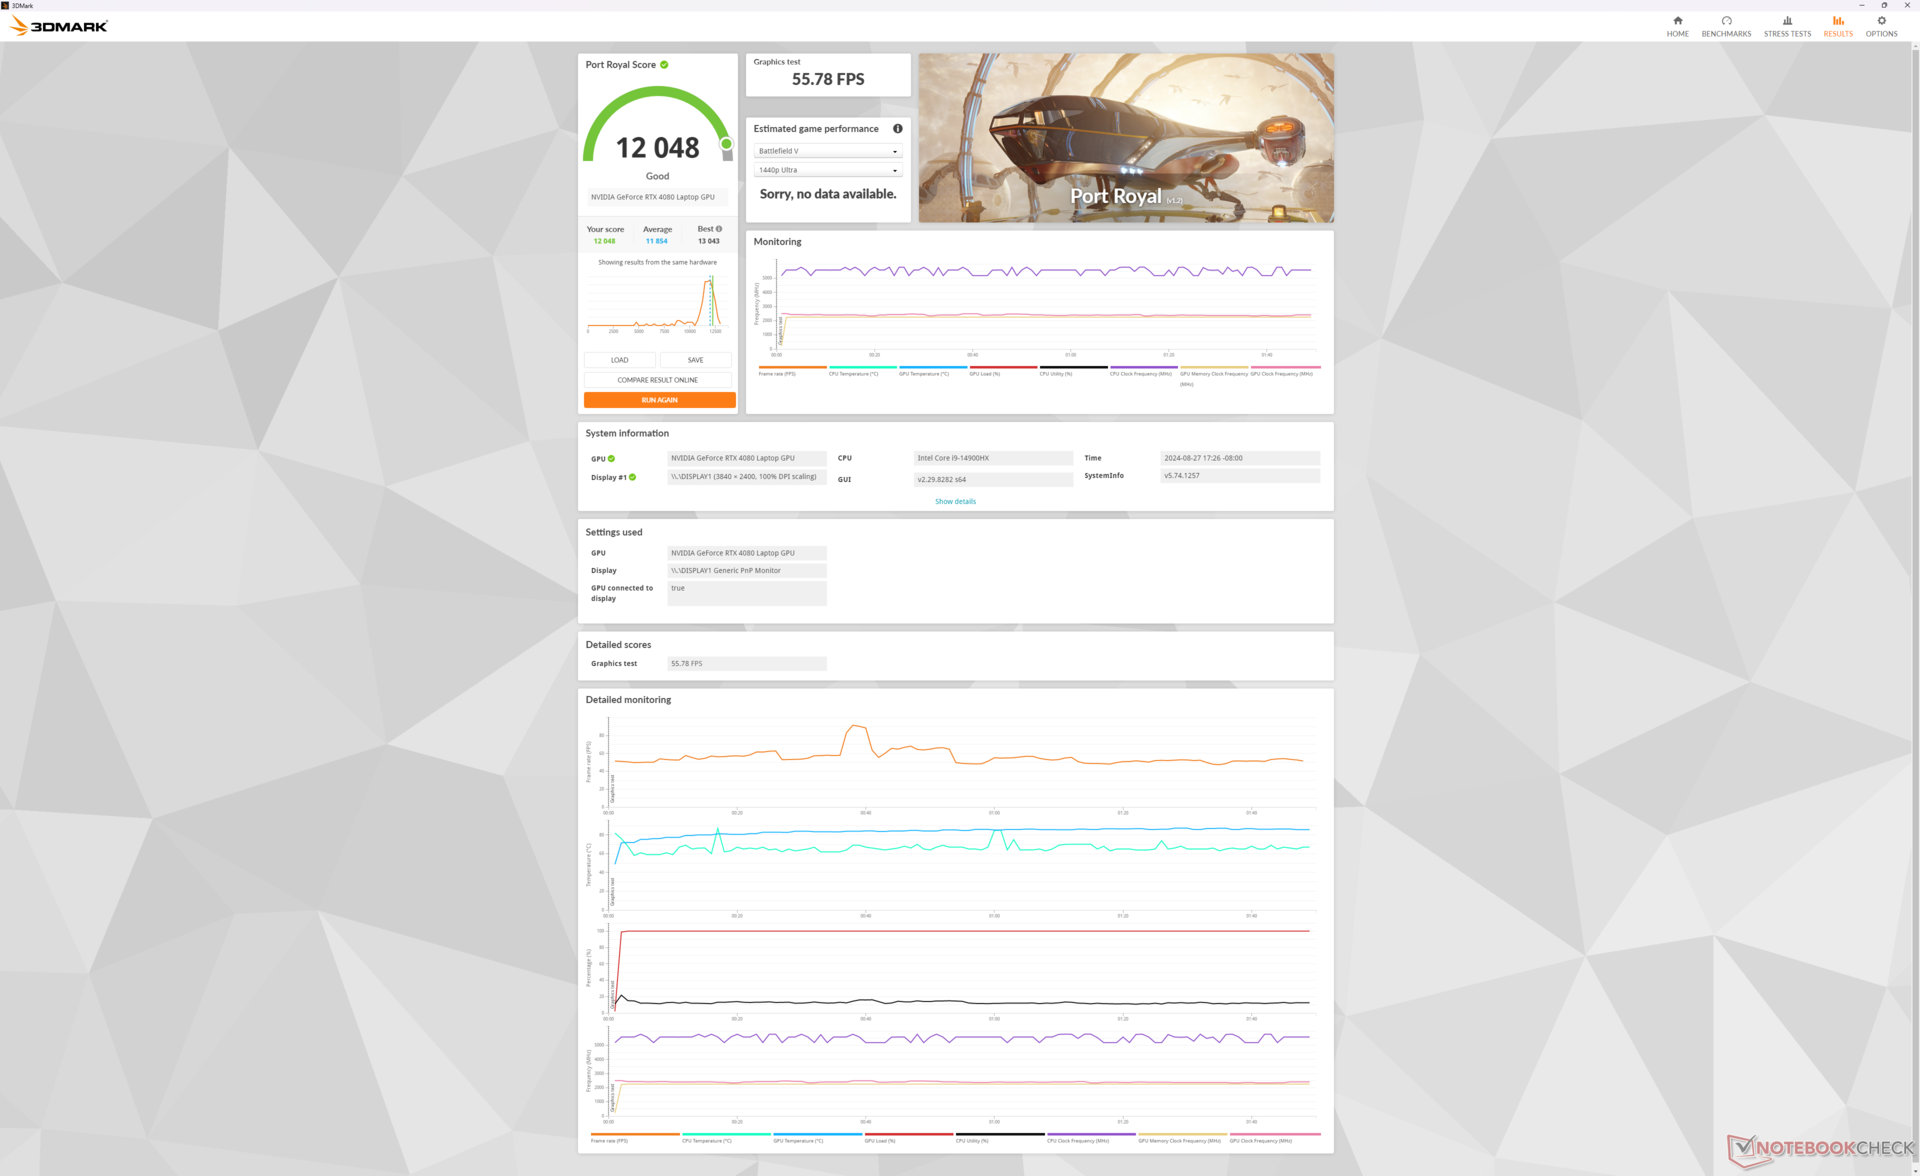
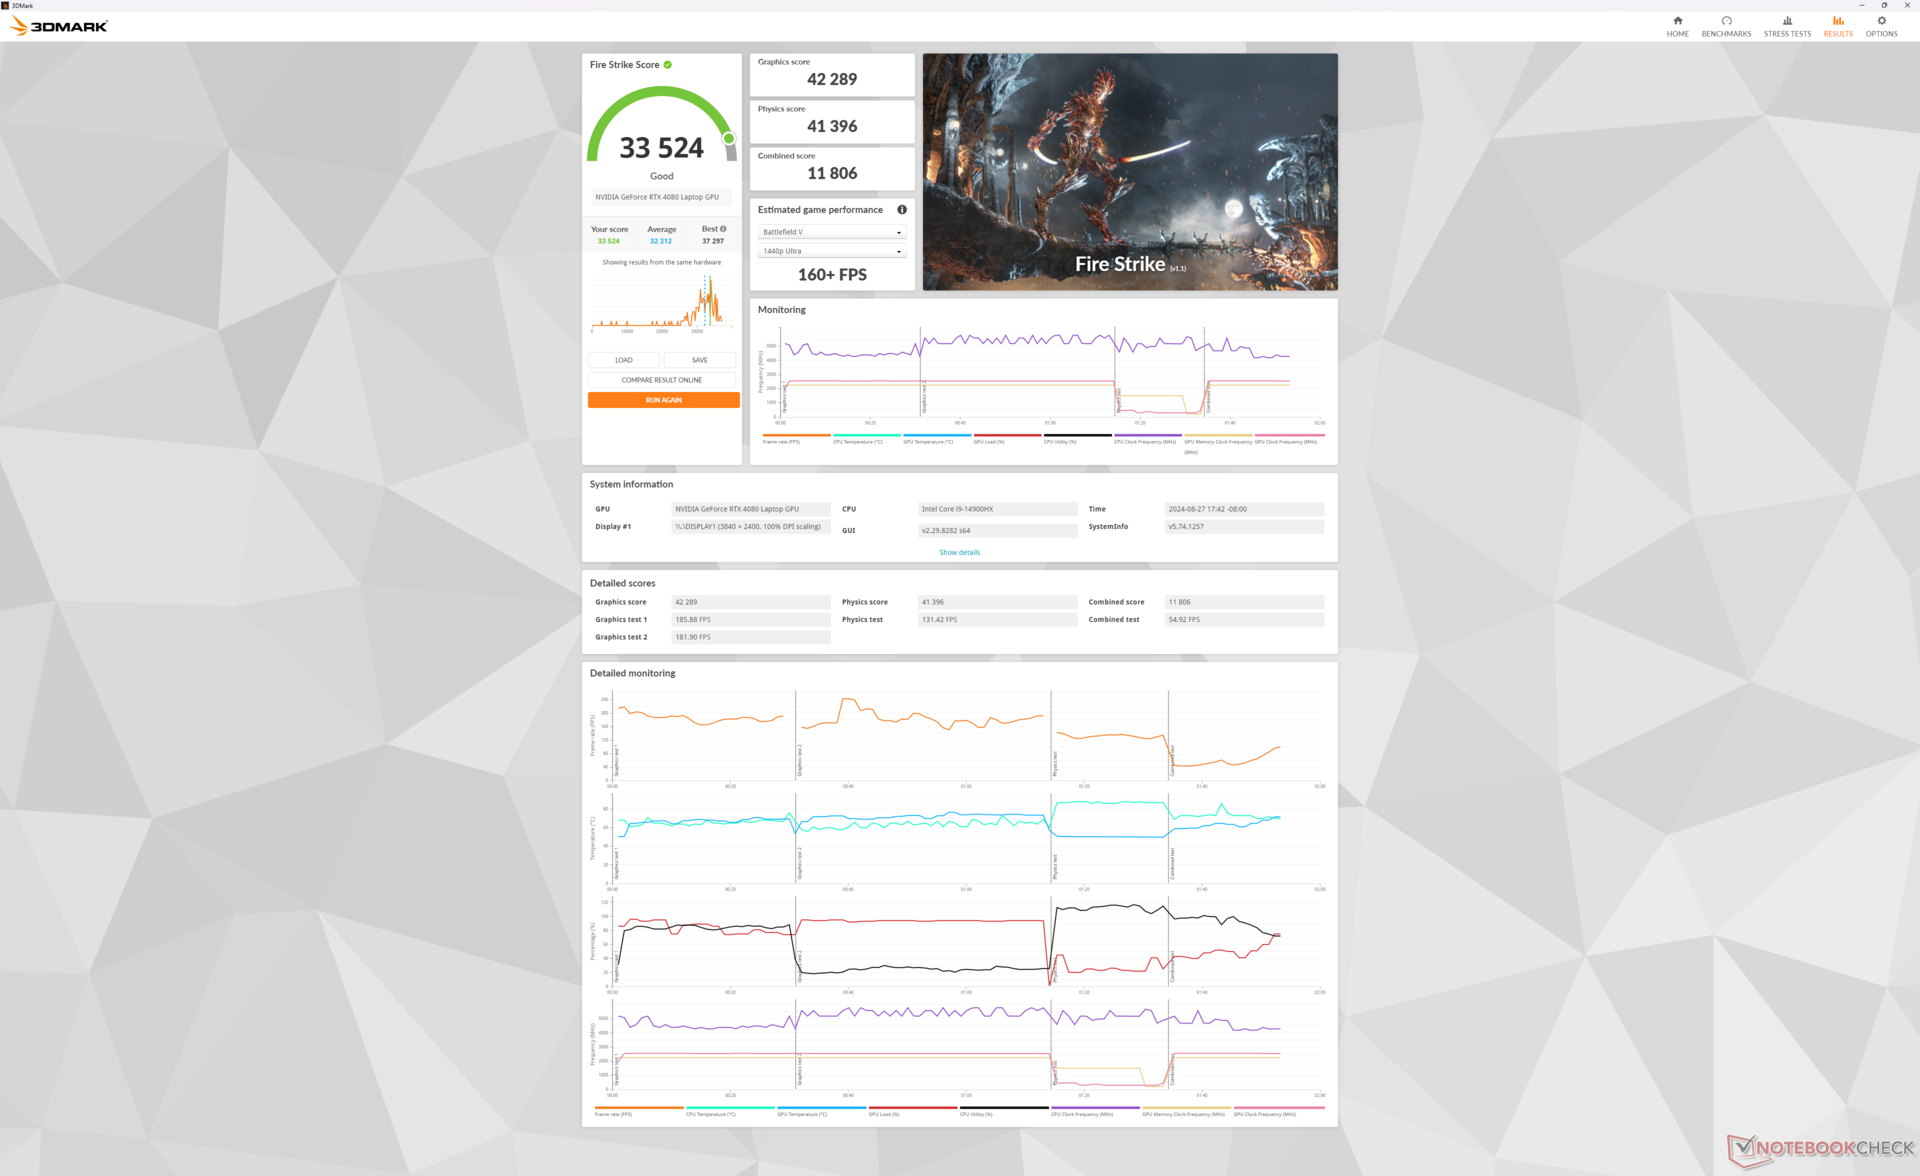
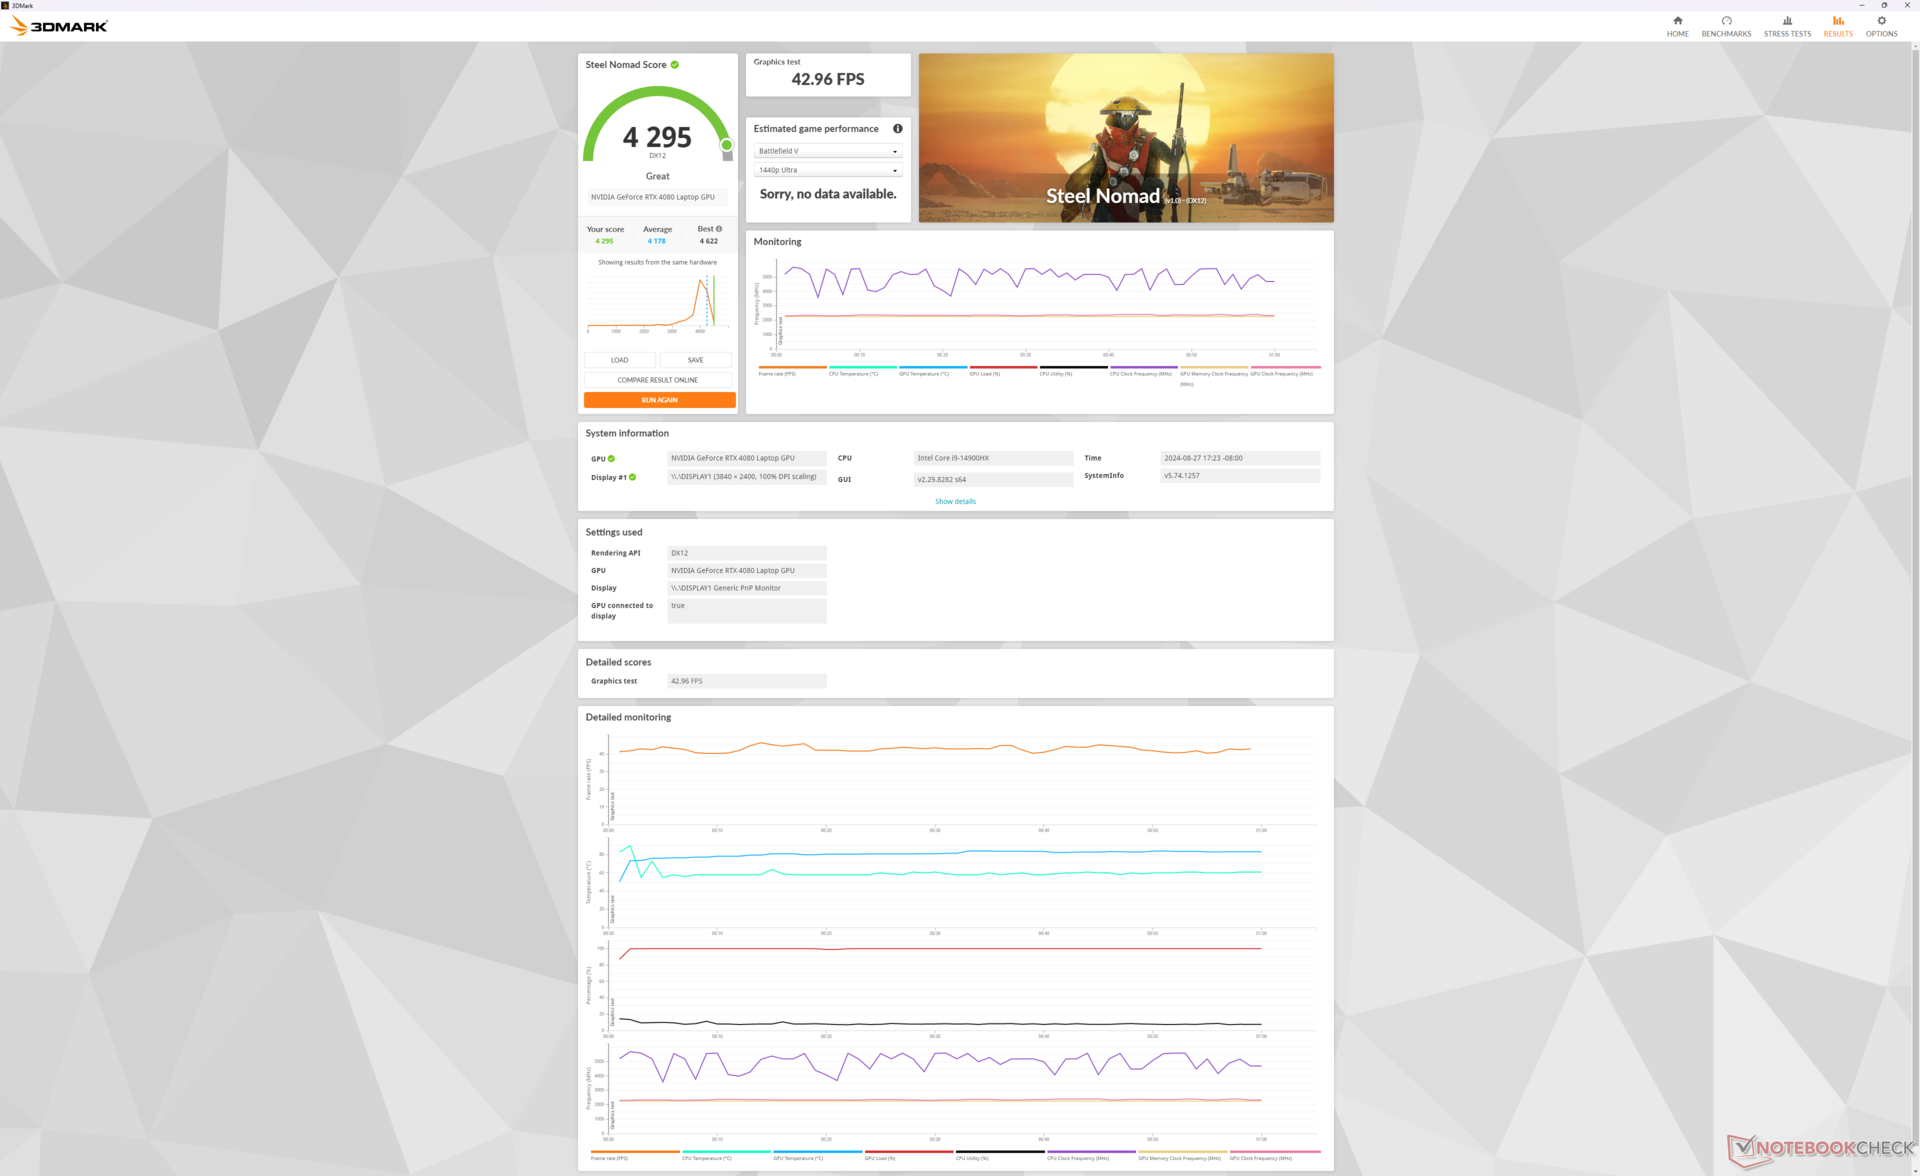
Rendimiento de la GPU - Gráficos TGP de 175 W
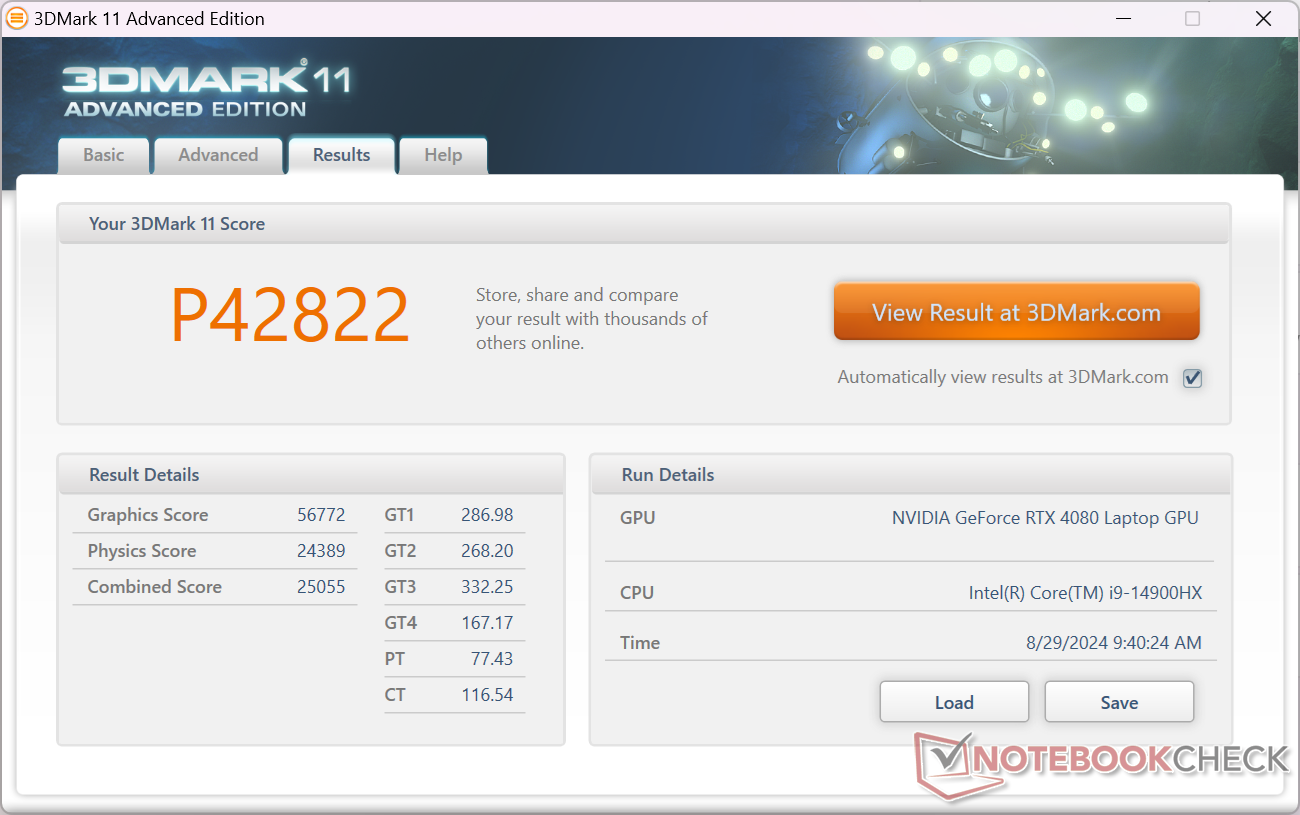
A diferencia de los portátiles más delgados que pueden venir con gráficos más débiles de 80 W GeForce RTX 4080, el Raider 18 HX de mayor tamaño se entrega con una versión más potente de 175 W (150 W + 25 W de refuerzo dinámico). El rendimiento es aproximadamente un 5 por ciento más rápido que el del portátil medio de nuestra base de datos con la misma GPU mientras que la actualización a la RTX 4090 aumentará el rendimiento en otro 10 por ciento.
Tenga en cuenta que el rendimiento general sigue siendo entre un 30 y un 35 por ciento más lento que la versión de sobremesa de la GeForce RTX 4080 a pesar de que la versión móvil comparte el mismo nombre. Por lo tanto, nuestra RTX 4080 móvil está más cerca en rendimiento de la rTX 4070 de sobremesa.
| Perfil de potencia | Puntuación gráfica | Puntuación de Física | Puntuación combinada |
| Rendimiento extremo (Cooler Boost activado) | 42289 | 41396 | 11806 |
| Rendimiento extremo (Cooler Boost desactivado) | 41778 (-1%) | 40723 (-2%) | 11968 (-1%) |
| Modo equilibrado | 41673 (-2%) | 41013 (-1%) | 10404 (-12%) |
| Batería | 21731 (-49%) | 17988 (-57%) | 5809 (-51%) |
Pasar del modo de Rendimiento Extremo al modo Equilibrado impacta en el rendimiento sólo ligeramente lo que se alinea con nuestras observaciones de la Prueba de Estrés anteriores. Habilitar Cooler Boost también hace poca diferencia excepto por reducir las temperaturas del núcleo aumentando significativamente el ruido del ventilador.

| 3DMark Performance Rating - Percent | |
| NVIDIA GeForce RTX 4080 Founders Edition -1! | |
| Alienware m18 R2 -1! | |
| Razer Blade 18 2024 RZ09-0509 -1! | |
| MSI Raider 18 HX A14V | |
| Alienware m18 R1 AMD -2! | |
| Medio NVIDIA GeForce RTX 4080 Laptop GPU | |
| Zotac Gaming GeForce RTX 4070 AMP Airo -1! | |
| Asus ROG Strix Scar 17 SE G733CX-LL014W -1! | |
| Alienware x17 RTX 3080 P48E -2! | |
| Asus ROG Strix G18 G814JI -2! | |
| SCHENKER XMG Ultra 17 Comet Lake -2! | |
| MSI Pulse GL76 12UGK -1! | |
| 3DMark 11 Performance | 42822 puntos | |
| 3DMark Fire Strike Score | 33524 puntos | |
| 3DMark Time Spy Score | 18608 puntos | |
| 3DMark Steel Nomad Score | 4295 puntos | |
ayuda | ||
* ... más pequeño es mejor
Rendimiento en juegos
Los títulos modernos se ejecutan decentemente bien a la resolución nativa 4K UHD+. Se recomienda DLSS cuando se ejecutan títulos más exigentes como Cyberpunk 2077 para aumentar la velocidad de fotogramas más cerca de 60 FPS.
Extrañamente, Baldur's Gate 3 no se iniciaba en nuestra unidad incluso después de múltiples reinicios del sistema en los modos DX11 o DX12.
| Performance Rating - Percent | |
| Alienware m18 R2 | |
| MSI Titan 18 HX A14VIG | |
| MSI Raider 18 HX A14V | |
| Razer Blade 18 2024 RZ09-0509 -1! | |
| Acer Predator Helios 18 PH18-72-98MW | |
| Asus ROG Strix G18 G814JI | |
| GTA V - 1920x1080 Highest Settings possible AA:4xMSAA + FX AF:16x | |
| MSI Raider 18 HX A14V | |
| MSI Titan 18 HX A14VIG | |
| Alienware m18 R2 | |
| Acer Predator Helios 18 PH18-72-98MW | |
| Razer Blade 18 2024 RZ09-0509 | |
| Asus ROG Strix G18 G814JI | |
| Final Fantasy XV Benchmark - 1920x1080 High Quality | |
| Alienware m18 R2 | |
| MSI Titan 18 HX A14VIG | |
| MSI Raider 18 HX A14V | |
| Acer Predator Helios 18 PH18-72-98MW | |
| Razer Blade 18 2024 RZ09-0509 | |
| Asus ROG Strix G18 G814JI | |
| Strange Brigade - 1920x1080 ultra AA:ultra AF:16 | |
| MSI Titan 18 HX A14VIG | |
| Alienware m18 R2 | |
| MSI Raider 18 HX A14V | |
| Razer Blade 18 2024 RZ09-0509 | |
| Acer Predator Helios 18 PH18-72-98MW | |
| Asus ROG Strix G18 G814JI | |
| Dota 2 Reborn - 1920x1080 ultra (3/3) best looking | |
| Acer Predator Helios 18 PH18-72-98MW | |
| MSI Titan 18 HX A14VIG | |
| MSI Raider 18 HX A14V | |
| Alienware m18 R2 | |
| Razer Blade 18 2024 RZ09-0509 | |
| Asus ROG Strix G18 G814JI | |
| X-Plane 11.11 - 1920x1080 high (fps_test=3) | |
| MSI Raider 18 HX A14V | |
| Alienware m18 R2 | |
| Razer Blade 18 2024 RZ09-0509 | |
| MSI Titan 18 HX A14VIG | |
| Acer Predator Helios 18 PH18-72-98MW | |
| Asus ROG Strix G18 G814JI | |
| Far Cry 5 - 1920x1080 Ultra Preset AA:T | |
| Alienware m18 R2 | |
| MSI Titan 18 HX A14VIG | |
| MSI Raider 18 HX A14V | |
| Asus ROG Strix G18 G814JI | |
| Acer Predator Helios 18 PH18-72-98MW | |
| Tiny Tina's Wonderlands | |
| 1920x1080 High Preset (DX12) | |
| Alienware m18 R2 | |
| MSI Raider 18 HX A14V | |
| Medio NVIDIA GeForce RTX 4080 Laptop GPU (166.7 - 213, n=6) | |
| 1920x1080 Badass Preset (DX12) | |
| Alienware m18 R2 | |
| MSI Raider 18 HX A14V | |
| Alienware m18 R1 AMD | |
| Medio NVIDIA GeForce RTX 4080 Laptop GPU (112.9 - 167.1, n=9) | |
| 2560x1440 Badass Preset (DX12) | |
| Alienware m18 R2 | |
| MSI Raider 18 HX A14V | |
| Alienware m18 R1 AMD | |
| Medio NVIDIA GeForce RTX 4080 Laptop GPU (85 - 114.8, n=9) | |
| 3840x2160 Badass Preset (DX12) | |
| Alienware m18 R2 | |
| MSI Raider 18 HX A14V | |
| Alienware m18 R1 AMD | |
| Medio NVIDIA GeForce RTX 4080 Laptop GPU (46.4 - 60.9, n=9) | |
Cyberpunk 2077 ultra FPS Chart
| bajo | medio | alto | ultra | QHD | 4K | |
|---|---|---|---|---|---|---|
| GTA V (2015) | 185.1 | 183.8 | 181.6 | 143.4 | 134.6 | 158.3 |
| Dota 2 Reborn (2015) | 218 | 193.1 | 184.6 | 172.5 | 166.4 | |
| Final Fantasy XV Benchmark (2018) | 223 | 212 | 177 | 141.8 | 78.6 | |
| X-Plane 11.11 (2018) | 199 | 178.5 | 143.5 | 119.3 | ||
| Far Cry 5 (2018) | 173 | 163 | 151 | 149 | 96 | |
| Strange Brigade (2018) | 504 | 408 | 378 | 349 | 246 | 122.6 |
| Tiny Tina's Wonderlands (2022) | 352.5 | 292.6 | 203.3 | 159.4 | 111.2 | 60.9 |
| F1 22 (2022) | 305 | 299 | 271 | 121.2 | 77.8 | 39.8 |
| Cyberpunk 2077 2.2 Phantom Liberty (2023) | 150.6 | 150 | 140.7 | 125.5 | 82.5 | 35.1 |
Emisiones - Silenciosas al ralentí, ruidosas al jugar
Ruido del sistema
El ruido y el comportamiento del ventilador son similares a los del Titan 18 HX a pesar de sus diferencias en la solución de refrigeración. Los ventiladores son propensos a pulsar incluso cuando se navega por Internet en modo equilibrado o modo silencioso al igual que en la Titan, pero el aumento de ruido afortunadamente no es lo suficientemente agudo como para distraer.
MSI Center afecta directamente a la experiencia de juego ya que el ruido de los ventiladores está estrechamente ligado al perfil de potencia seleccionado. Ejecutando Cyberpunk 2077 en modo Equilibrado, modo Rendimiento Extremo con Cooler Boost desactivado y modo Rendimiento Extremo con Cooler Boost activado se obtendría un ruido de ventilador estable de 52,8 dB(A), 59,4 dB(A) y 62,7 dB(A), respectivamente. La diferencia de ruido entre los modos Equilibrado y Rendimiento extremo es significativa a pesar de que el déficit de rendimiento entre ellos es pequeño, lo que significa que el modo Equilibrado se recomienda para la mayoría de los escenarios de juego. Por lo tanto, Cooler Boost es útil sobre todo para el overclocking manual ya que, por lo demás, no aporta grandes ventajas para el juego cuando se utiliza la configuración de fábrica.
El rango bajo a medio de 50 dB(A) cuando se juega es más similar al del Blade 18 o el Alienware m18 R2. Se recomienda el uso de auriculares, especialmente si se juega en el modo de rendimiento extremo.
Ruido
| Ocioso |
| 28.6 / 28.6 / 31.3 dB(A) |
| Carga |
| 44.1 / 62.7 dB(A) |
 | ||
30 dB silencioso 40 dB(A) audible 50 dB(A) ruidosamente alto |
||
min: | ||
| MSI Raider 18 HX A14V NVIDIA GeForce RTX 4080 Laptop GPU, i9-14900HX, Samsung PM9A1 MZVL22T0HBLB | Razer Blade 18 2024 RZ09-0509 NVIDIA GeForce RTX 4090 Laptop GPU, i9-14900HX | Alienware m18 R2 NVIDIA GeForce RTX 4090 Laptop GPU, i9-14900HX, SK Hynix PC811 HFS002TEM9X152N | MSI Titan 18 HX A14VIG NVIDIA GeForce RTX 4090 Laptop GPU, i9-14900HX, 2x Samsung PM9A1a MZVL22T0HDLB (RAID 0) | Asus ROG Strix G18 G814JI NVIDIA GeForce RTX 4070 Laptop GPU, i7-13650HX, Micron 2400 MTFDKBA1T0QFM | Acer Predator Helios 18 PH18-72-98MW NVIDIA GeForce RTX 4090 Laptop GPU, i9-14900HX, 2x SK Hynix HFS001TEJ9X115N (RAID 0) | |
|---|---|---|---|---|---|---|
| Noise | 7% | 11% | 10% | 8% | -12% | |
| apagado / medio ambiente * | 23.3 | 23.4 -0% | 23.6 -1% | 22.8 2% | 25 -7% | 25 -7% |
| Idle Minimum * | 28.6 | 23.9 16% | 23.8 17% | 23.8 17% | 26 9% | 30 -5% |
| Idle Average * | 28.6 | 28.2 1% | 26.1 9% | 23.8 17% | 28 2% | 36 -26% |
| Idle Maximum * | 31.3 | 29 7% | 31.5 -1% | 28 11% | 29 7% | 44 -41% |
| Load Average * | 44.1 | 36.8 17% | 31.5 29% | 38 14% | 41 7% | 48 -9% |
| Cyberpunk 2077 ultra * | 59.4 | |||||
| Load Maximum * | 62.7 | 61.1 3% | 56.6 10% | 62.8 -0% | 46 27% | 51 19% |
| Witcher 3 ultra * | 54.1 | 52.1 | 57.3 | 44 | 49 |
* ... más pequeño es mejor
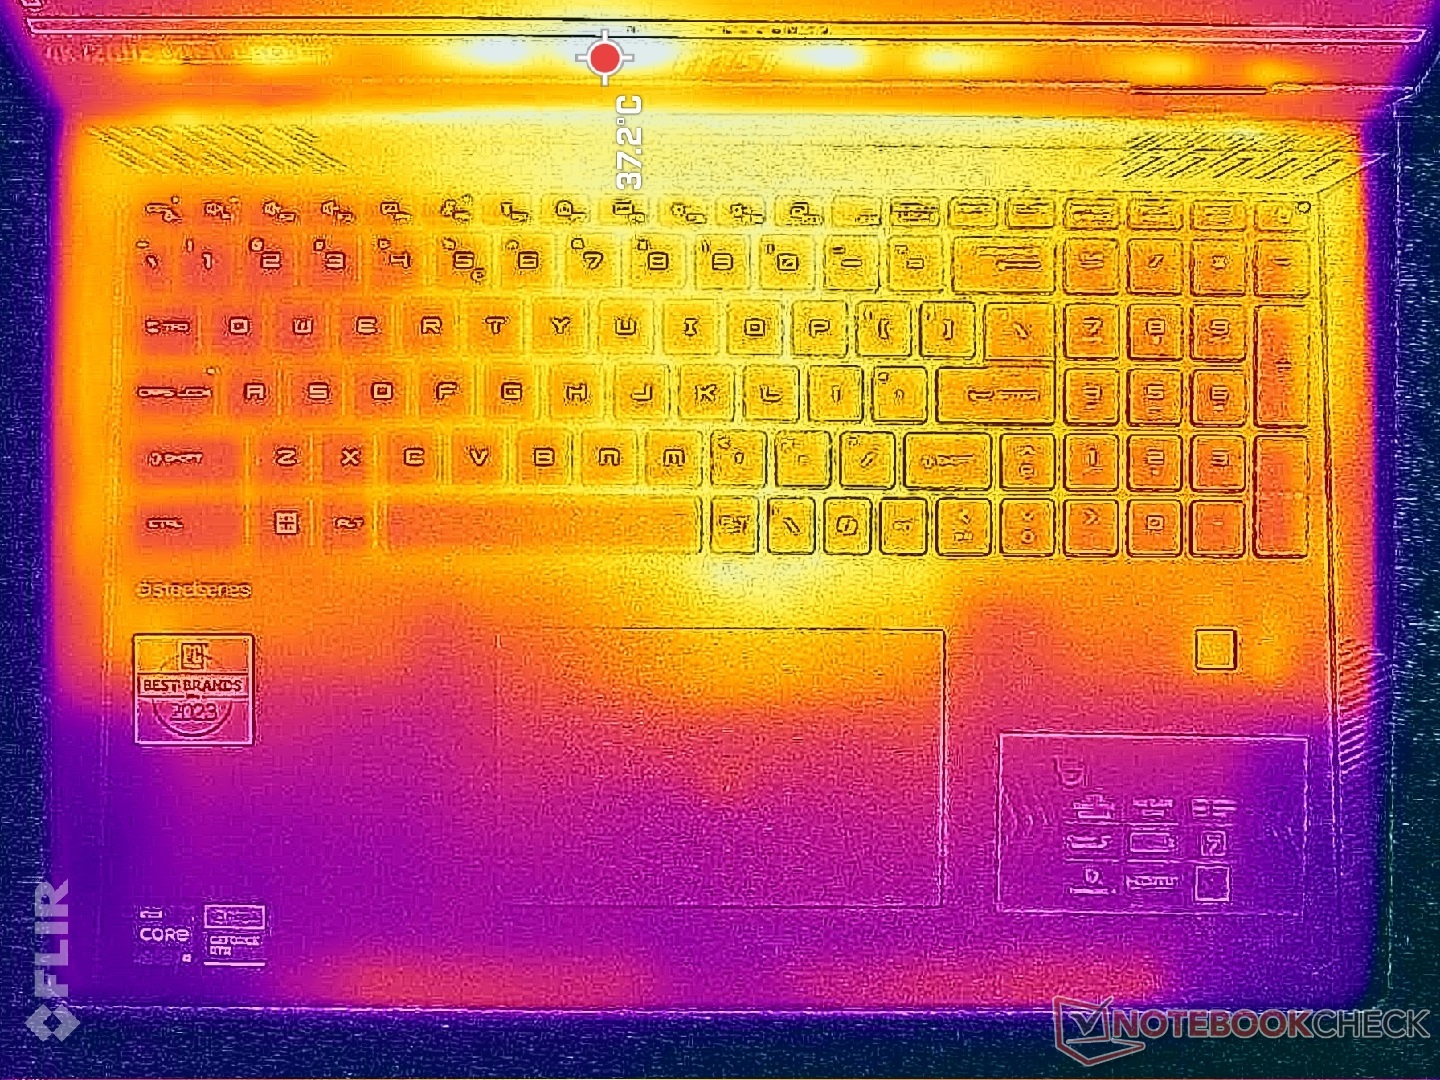
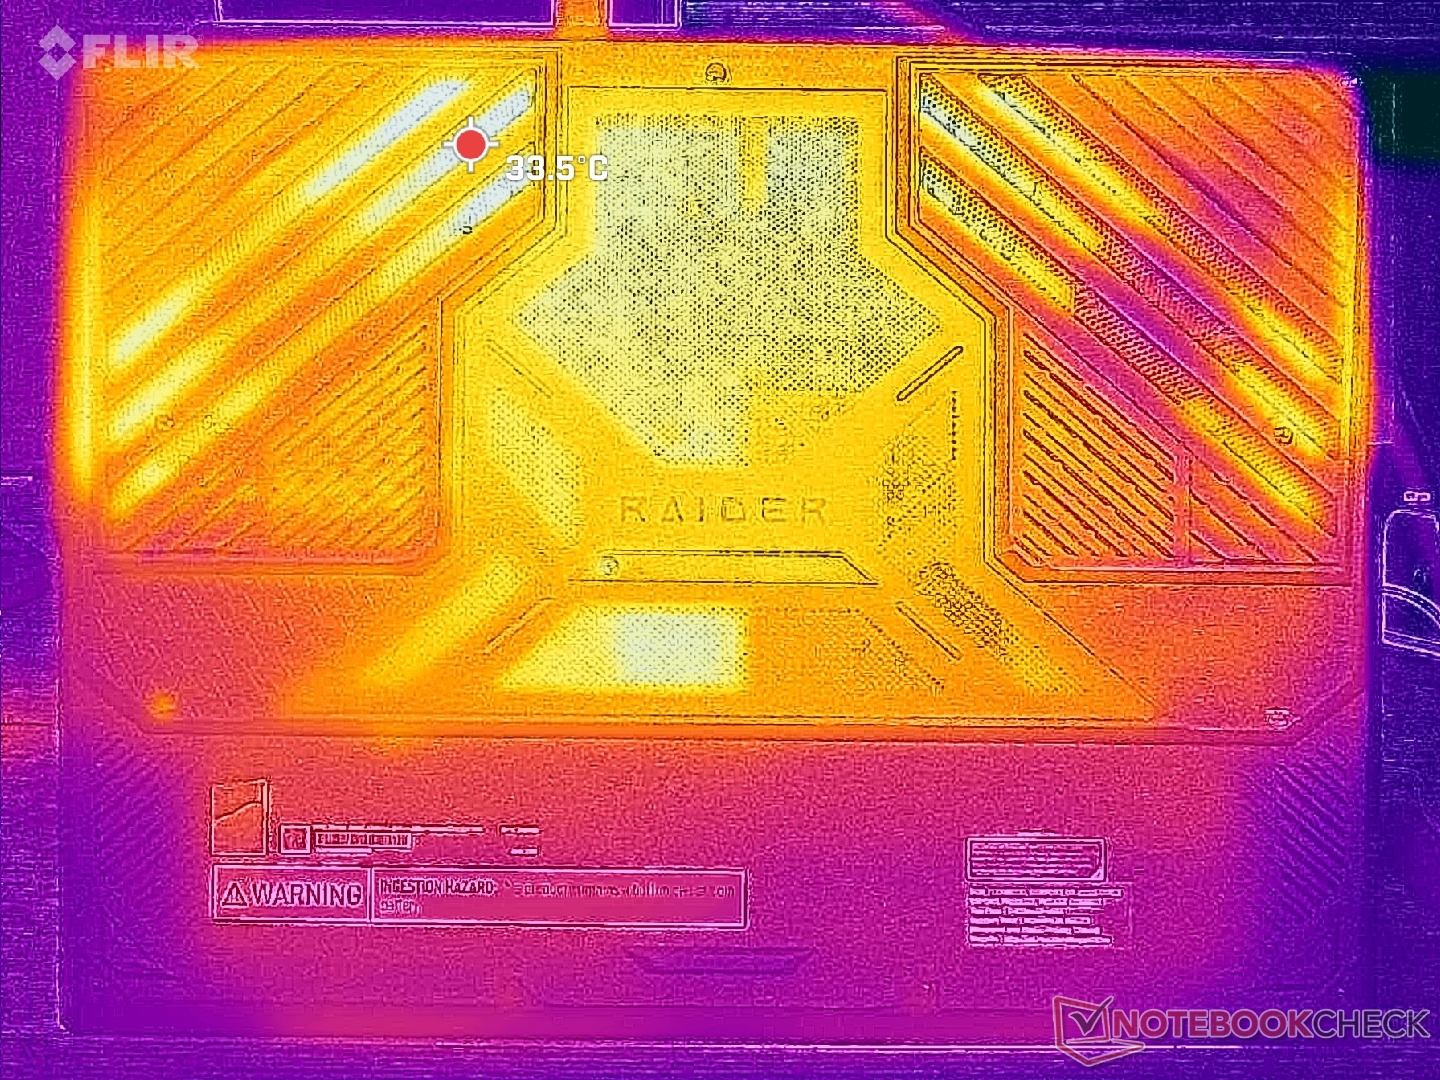
Temperatura
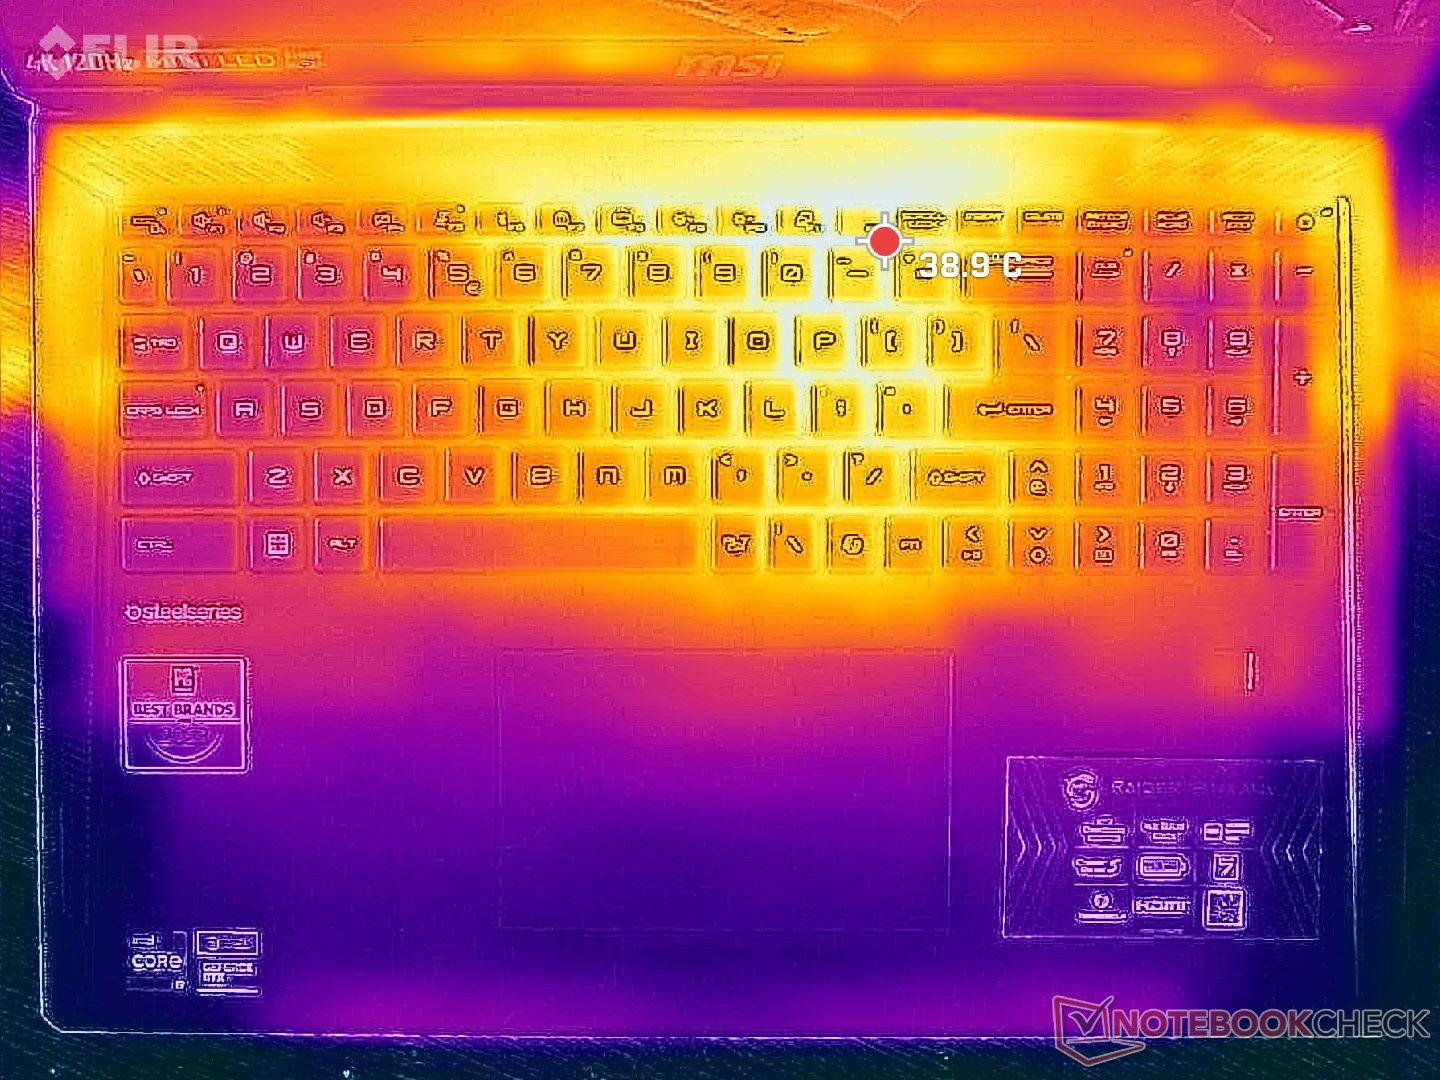
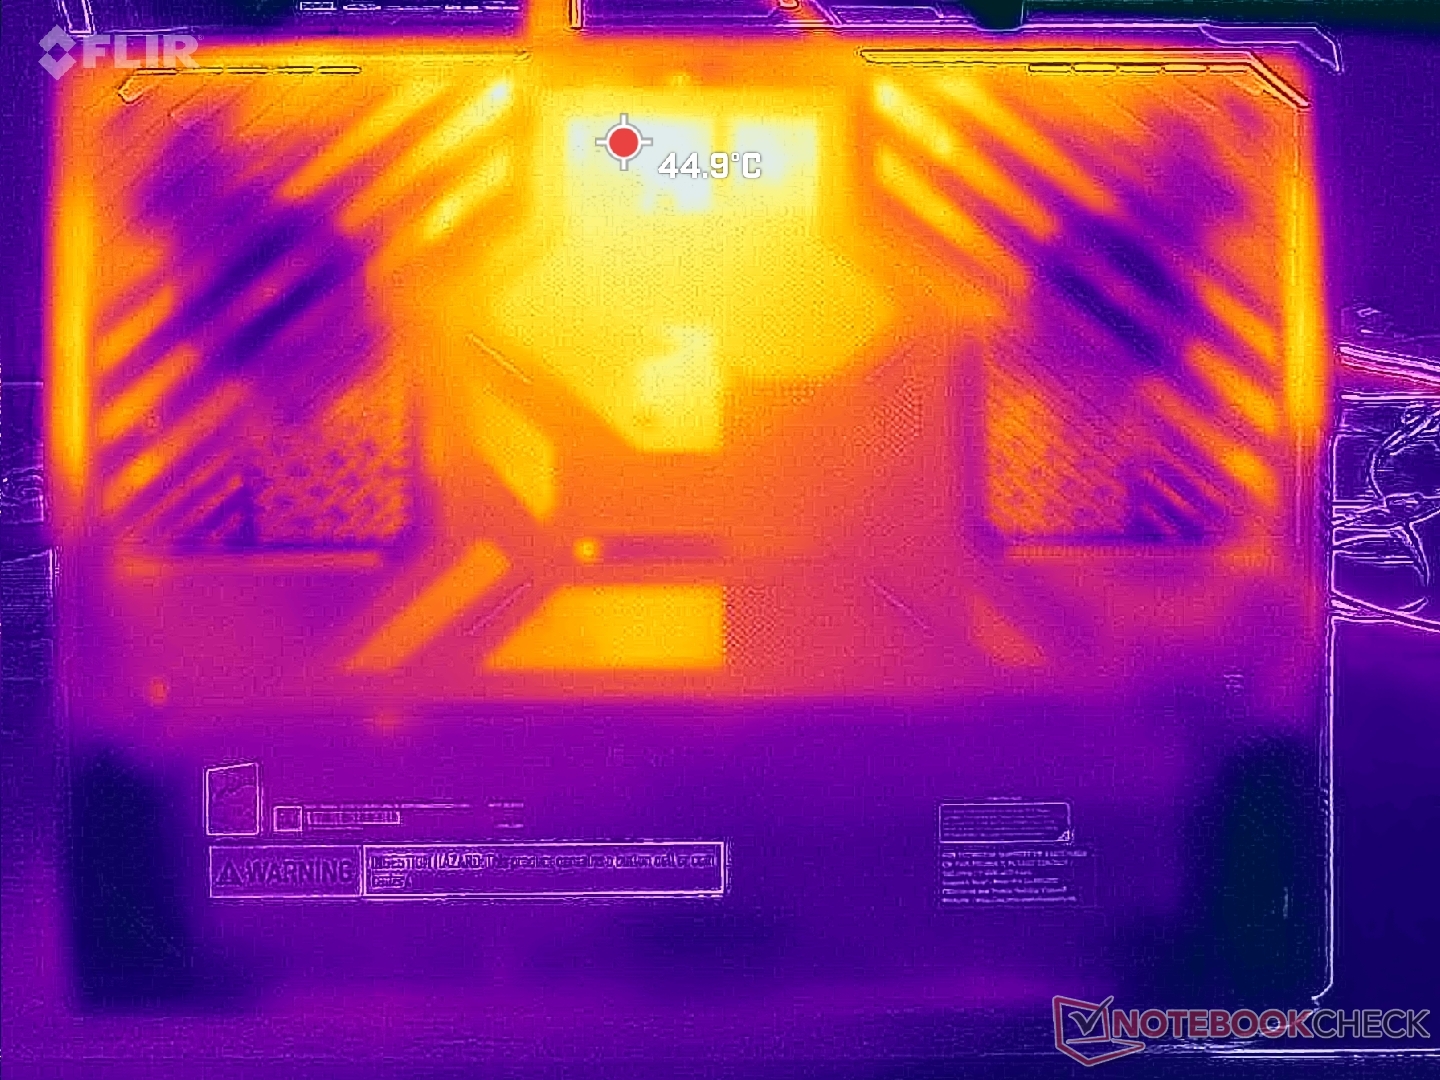
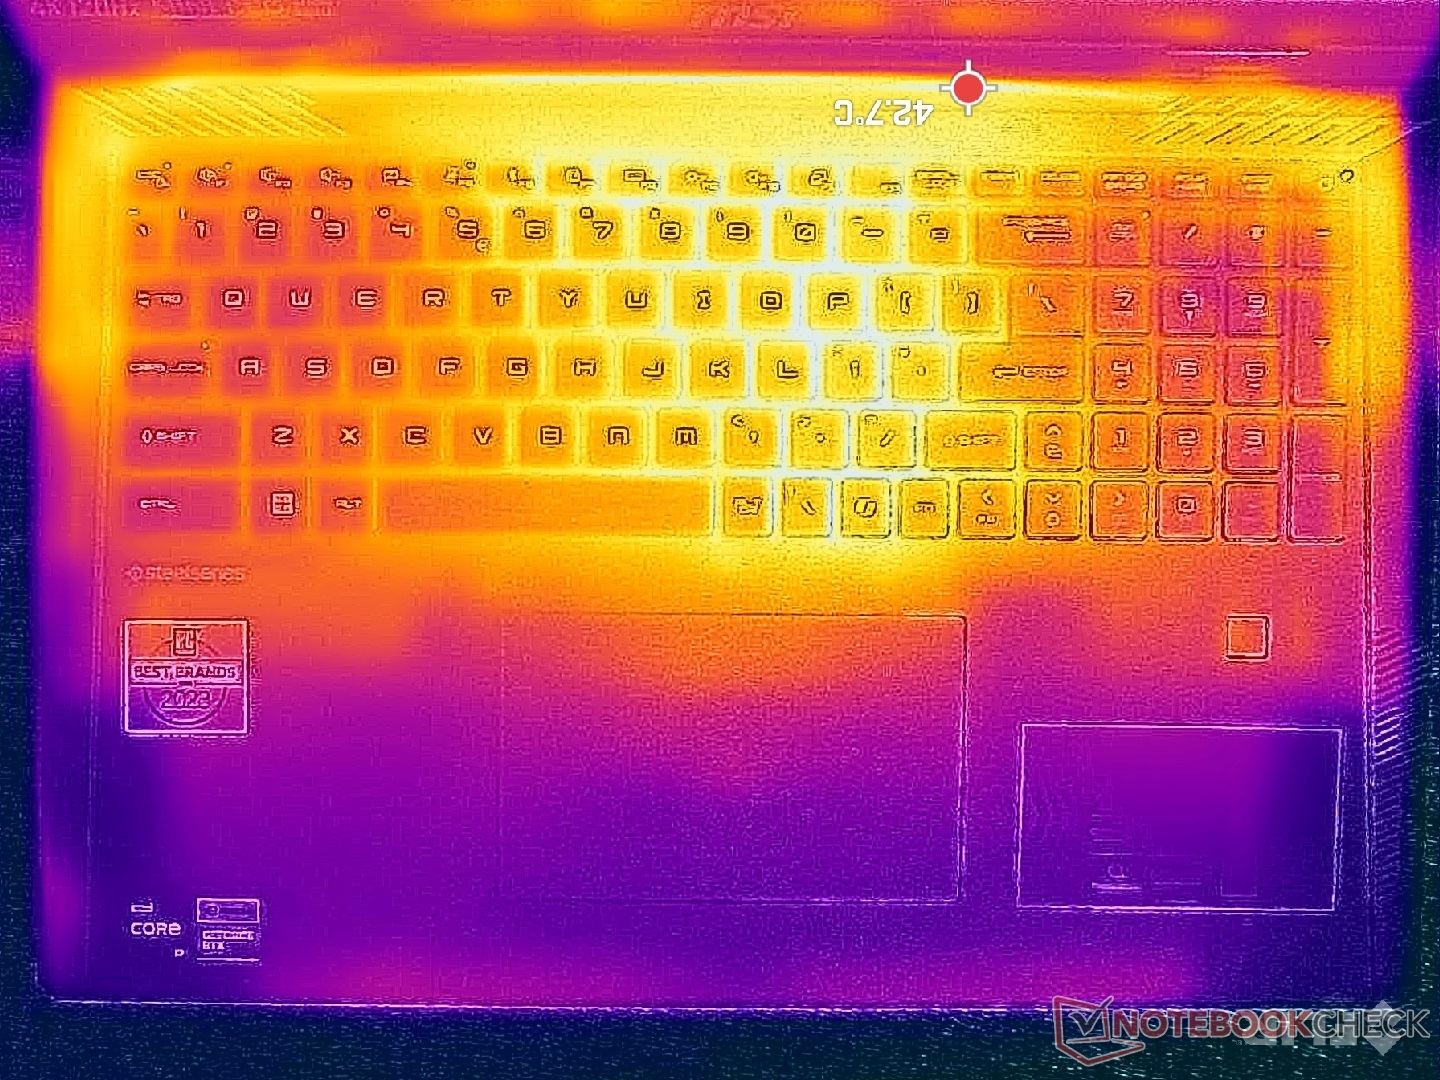
Las zonas calientes pueden alcanzar algo más de 40 C cuando se juega, al igual que en la Titan 18 HX. Las zonas más calientes están hacia el centro del teclado, por lo que las teclas WASD, el teclado numérico y los reposamanos permanecerían mucho más fríos y cómodos para la piel.
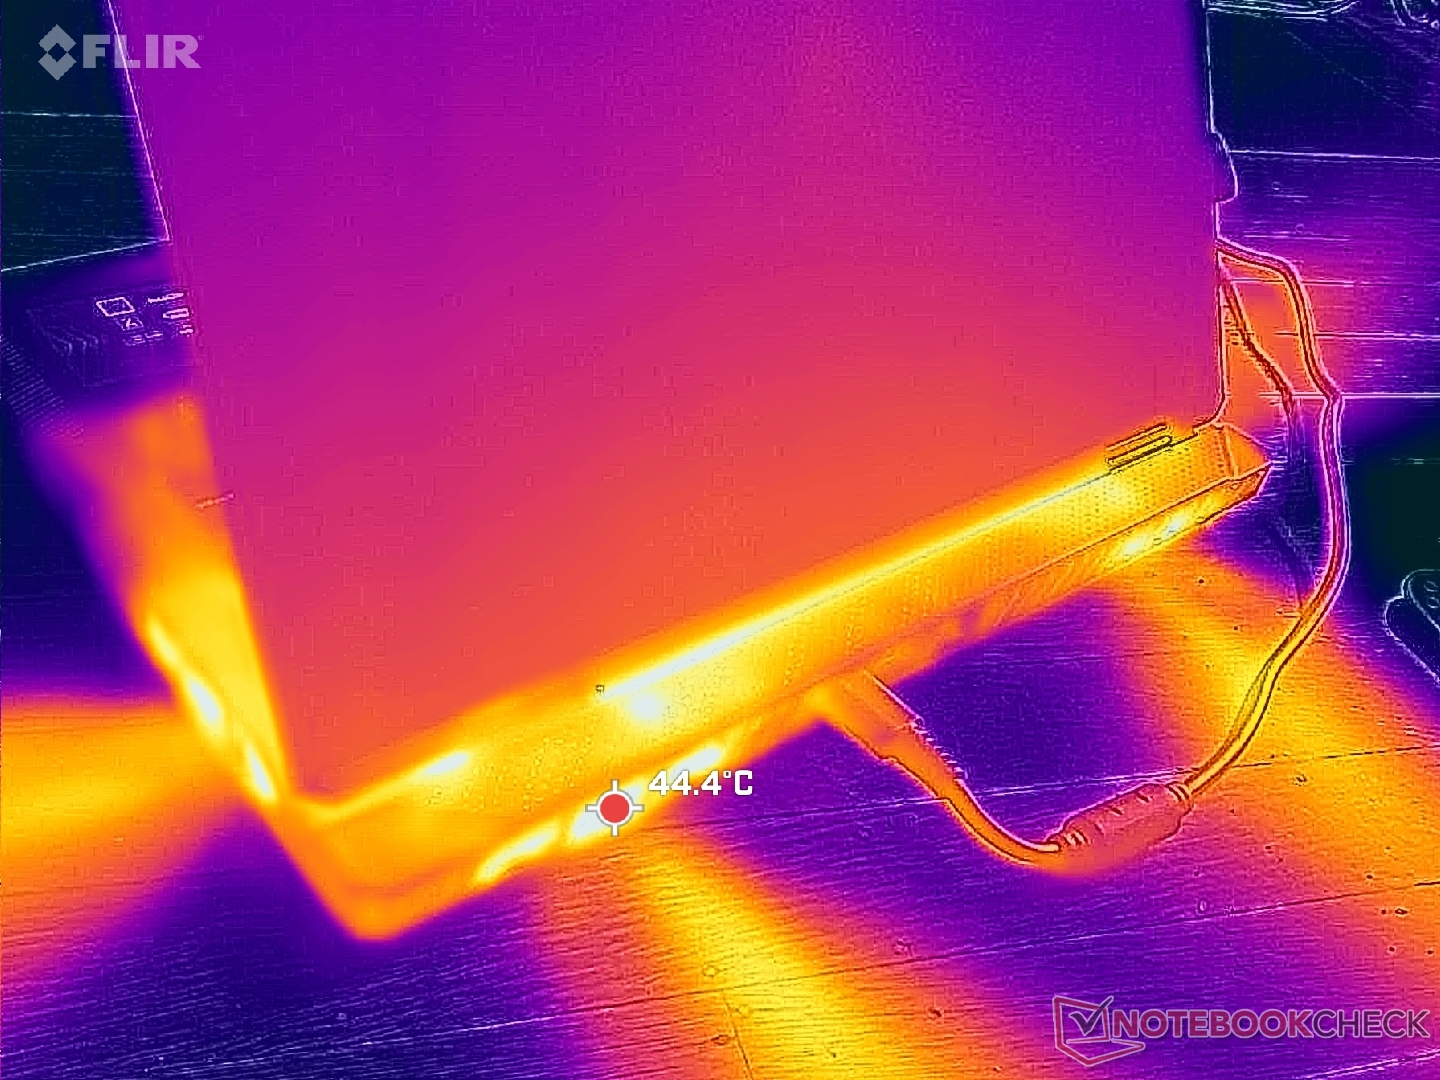
(±) La temperatura máxima en la parte superior es de 40.8 °C / 105 F, frente a la media de 40.4 °C / 105 F, que oscila entre 21.2 y 68.8 °C para la clase Gaming.
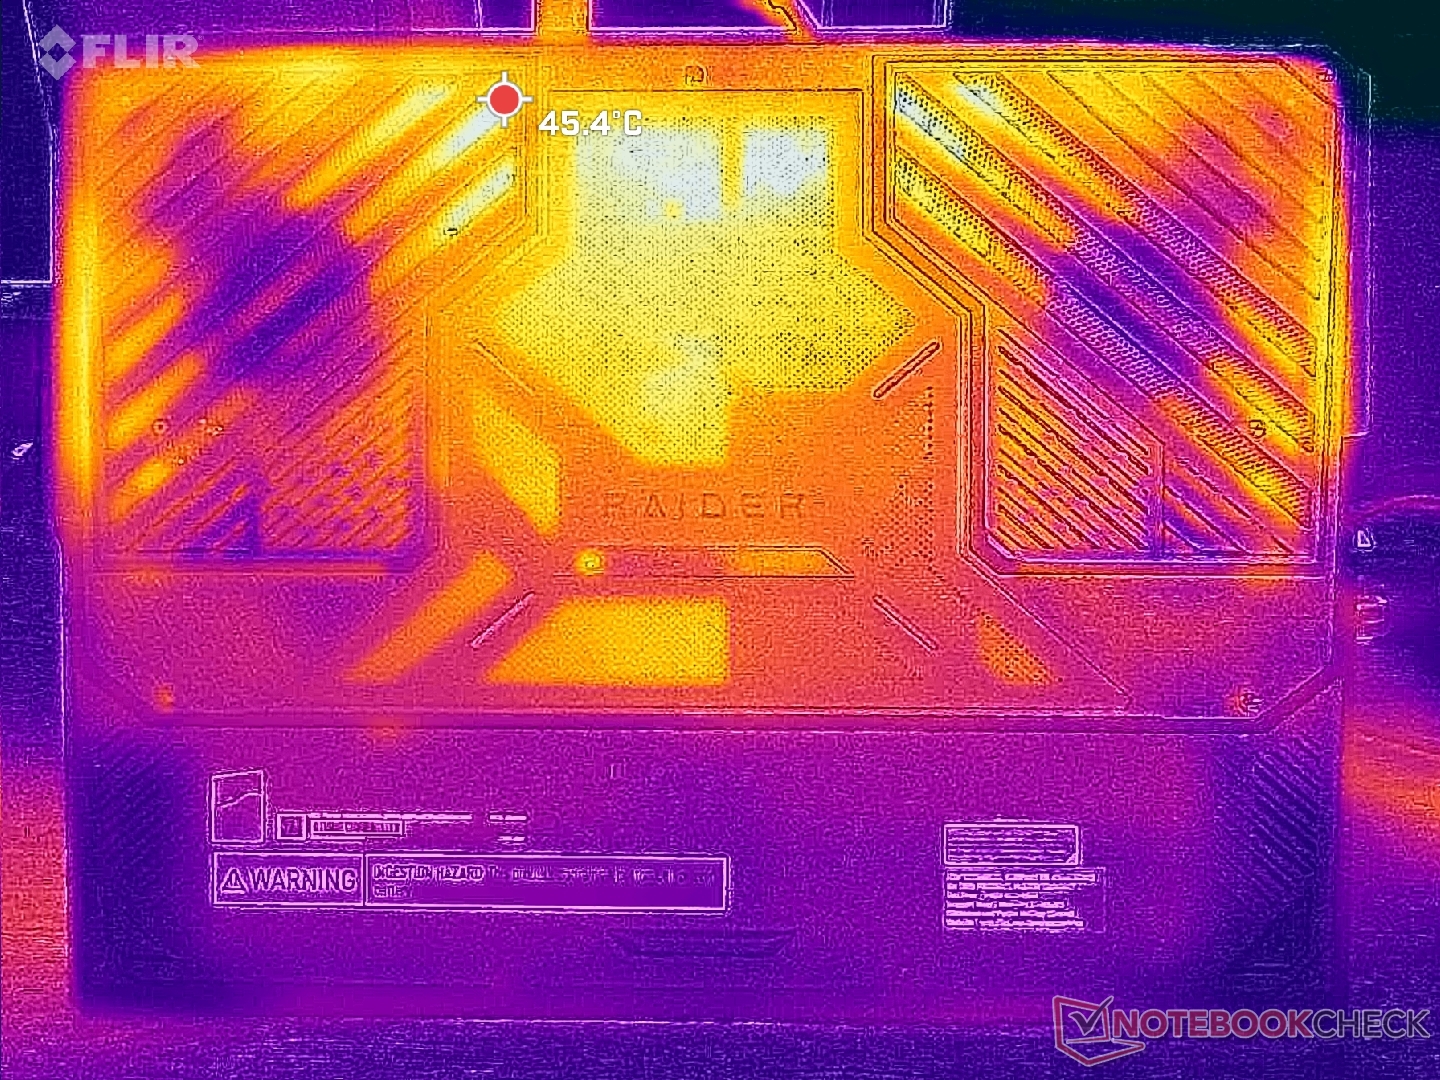
(±) El fondo se calienta hasta un máximo de 43.4 °C / 110 F, frente a la media de 43.2 °C / 110 F
(±) En reposo, la temperatura media de la parte superior es de 33.7 °C / 93# F, frente a la media del dispositivo de 33.9 °C / 93 F.
(±) 3: The average temperature for the upper side is 34.4 °C / 94 F, compared to the average of 33.9 °C / 93 F for the class Gaming.
(+) Los reposamanos y el panel táctil alcanzan como máximo la temperatura de la piel (32.6 °C / 90.7 F) y, por tanto, no están calientes.
(-) La temperatura media de la zona del reposamanos de dispositivos similares fue de 28.9 °C / 84 F (-3.7 °C / -6.7 F).
| MSI Raider 18 HX A14V Intel Core i9-14900HX, NVIDIA GeForce RTX 4080 Laptop GPU | Razer Blade 18 2024 RZ09-0509 Intel Core i9-14900HX, NVIDIA GeForce RTX 4090 Laptop GPU | Alienware m18 R2 Intel Core i9-14900HX, NVIDIA GeForce RTX 4090 Laptop GPU | MSI Titan 18 HX A14VIG Intel Core i9-14900HX, NVIDIA GeForce RTX 4090 Laptop GPU | Asus ROG Strix G18 G814JI Intel Core i7-13650HX, NVIDIA GeForce RTX 4070 Laptop GPU | Acer Predator Helios 18 PH18-72-98MW Intel Core i9-14900HX, NVIDIA GeForce RTX 4090 Laptop GPU | |
|---|---|---|---|---|---|---|
| Heat | -1% | -5% | 6% | 5% | -6% | |
| Maximum Upper Side * | 40.8 | 43.2 -6% | 41.2 -1% | 37.8 7% | 45 -10% | 43 -5% |
| Maximum Bottom * | 43.4 | 42.6 2% | 34.6 20% | 37.6 13% | 47 -8% | 59 -36% |
| Idle Upper Side * | 36.4 | 36 1% | 42.8 -18% | 34.8 4% | 28 23% | 32 12% |
| Idle Bottom * | 36.4 | 36.4 -0% | 43.6 -20% | 36 1% | 31 15% | 34 7% |
* ... más pequeño es mejor
Altavoces
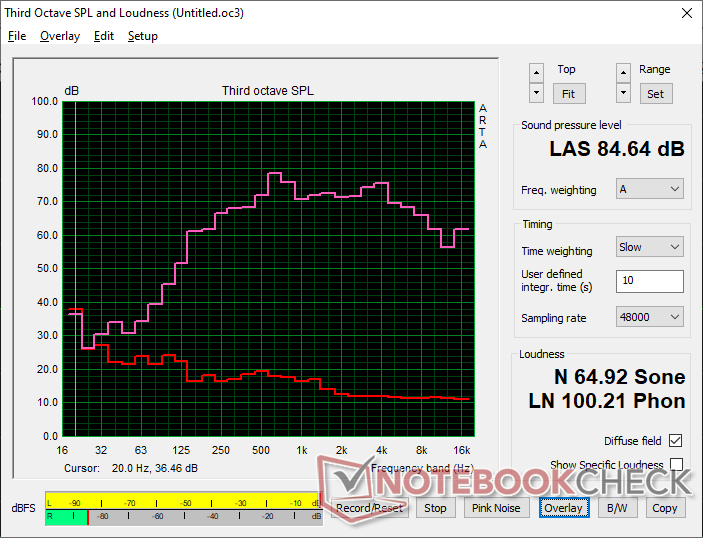
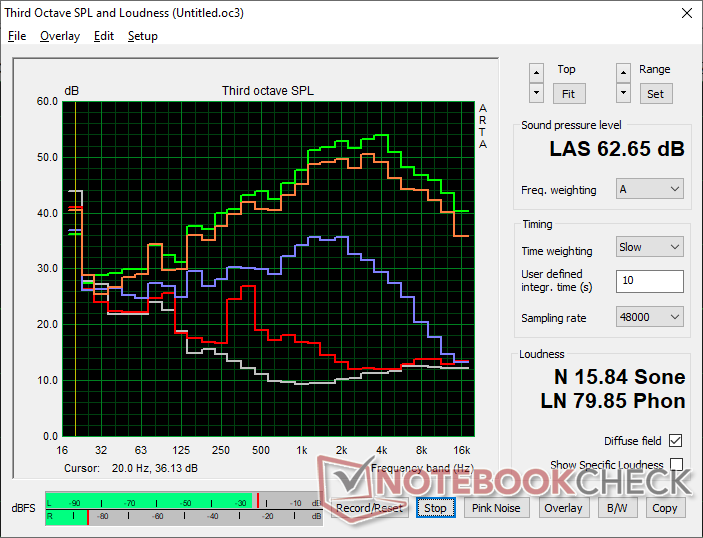
MSI Raider 18 HX A14V análisis de audio
(+) | los altavoces pueden reproducir a un volumen relativamente alto (#84.6 dB)
Graves 100 - 315 Hz
(±) | lubina reducida - en promedio 9.2% inferior a la mediana
(±) | la linealidad de los graves es media (9.2% delta a frecuencia anterior)
Medios 400 - 2000 Hz
(+) | medios equilibrados - a sólo 4.3% de la mediana
(+) | los medios son lineales (5.1% delta a la frecuencia anterior)
Altos 2 - 16 kHz
(+) | máximos equilibrados - a sólo 3.8% de la mediana
(+) | los máximos son lineales (4.9% delta a la frecuencia anterior)
Total 100 - 16.000 Hz
(+) | el sonido global es lineal (11.9% de diferencia con la mediana)
En comparación con la misma clase
» 11% de todos los dispositivos probados de esta clase eran mejores, 4% similares, 85% peores
» El mejor tuvo un delta de 6%, la media fue 18%, el peor fue ###max##%
En comparación con todos los dispositivos probados
» 8% de todos los dispositivos probados eran mejores, 2% similares, 90% peores
» El mejor tuvo un delta de 4%, la media fue 24%, el peor fue ###max##%
Apple MacBook Pro 16 2021 M1 Pro análisis de audio
(+) | los altavoces pueden reproducir a un volumen relativamente alto (#84.7 dB)
Graves 100 - 315 Hz
(+) | buen bajo - sólo 3.8% lejos de la mediana
(+) | el bajo es lineal (5.2% delta a la frecuencia anterior)
Medios 400 - 2000 Hz
(+) | medios equilibrados - a sólo 1.3% de la mediana
(+) | los medios son lineales (2.1% delta a la frecuencia anterior)
Altos 2 - 16 kHz
(+) | máximos equilibrados - a sólo 1.9% de la mediana
(+) | los máximos son lineales (2.7% delta a la frecuencia anterior)
Total 100 - 16.000 Hz
(+) | el sonido global es lineal (4.6% de diferencia con la mediana)
En comparación con la misma clase
» 0% de todos los dispositivos probados de esta clase eran mejores, 0% similares, 100% peores
» El mejor tuvo un delta de 5%, la media fue 18%, el peor fue ###max##%
En comparación con todos los dispositivos probados
» 0% de todos los dispositivos probados eran mejores, 0% similares, 100% peores
» El mejor tuvo un delta de 4%, la media fue 24%, el peor fue ###max##%
Gestión de la energía
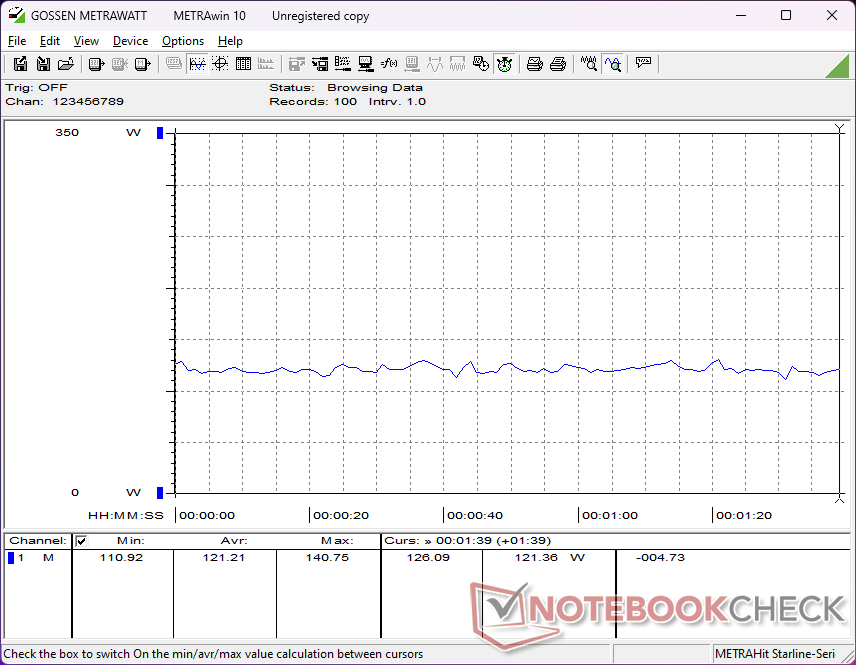
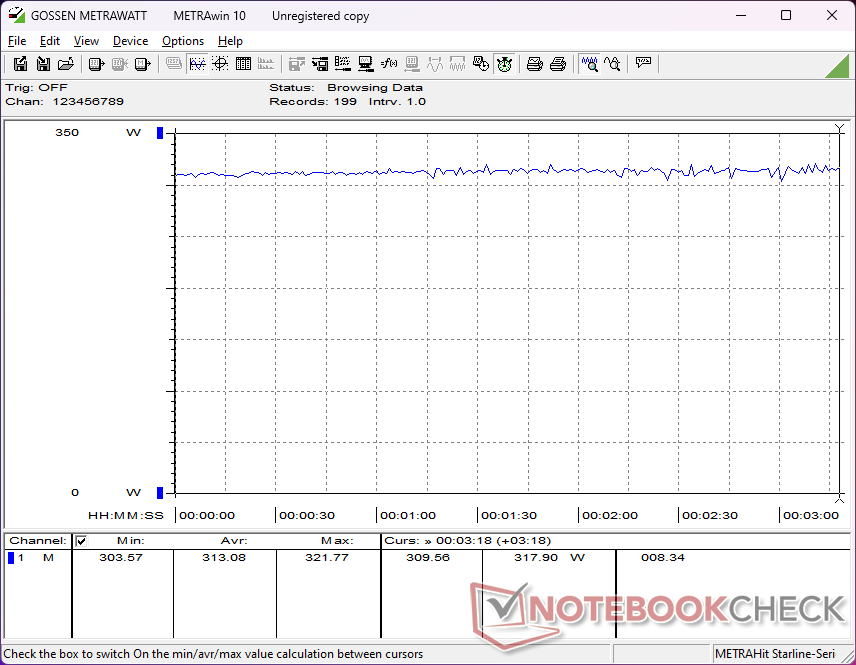
Consumo de energía
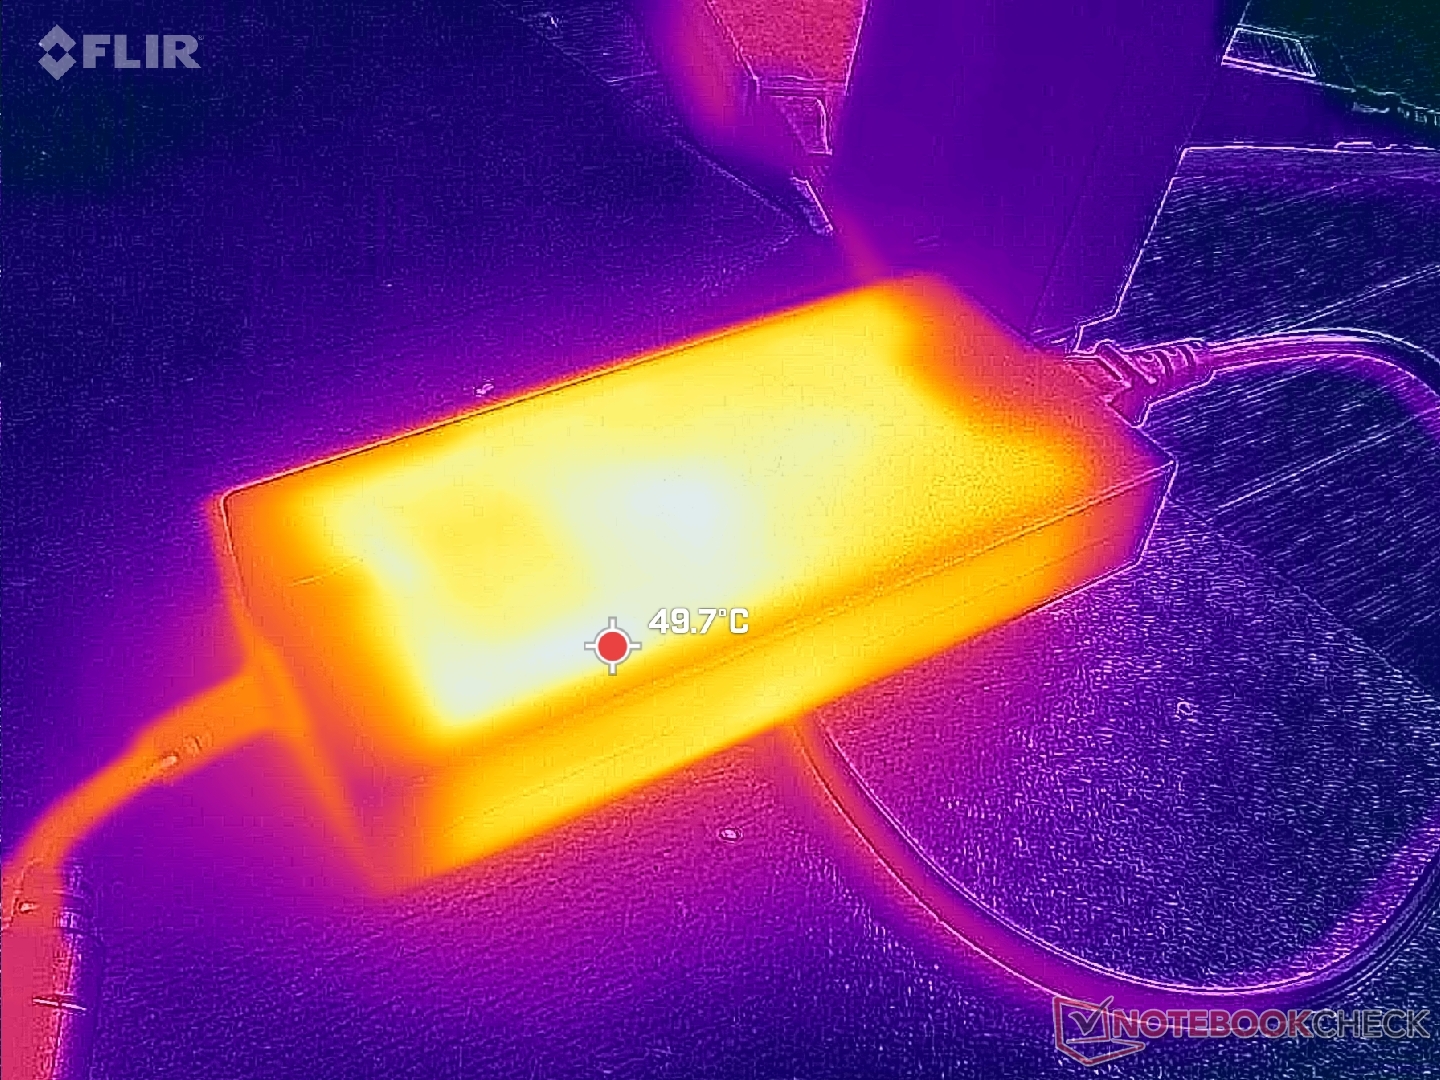
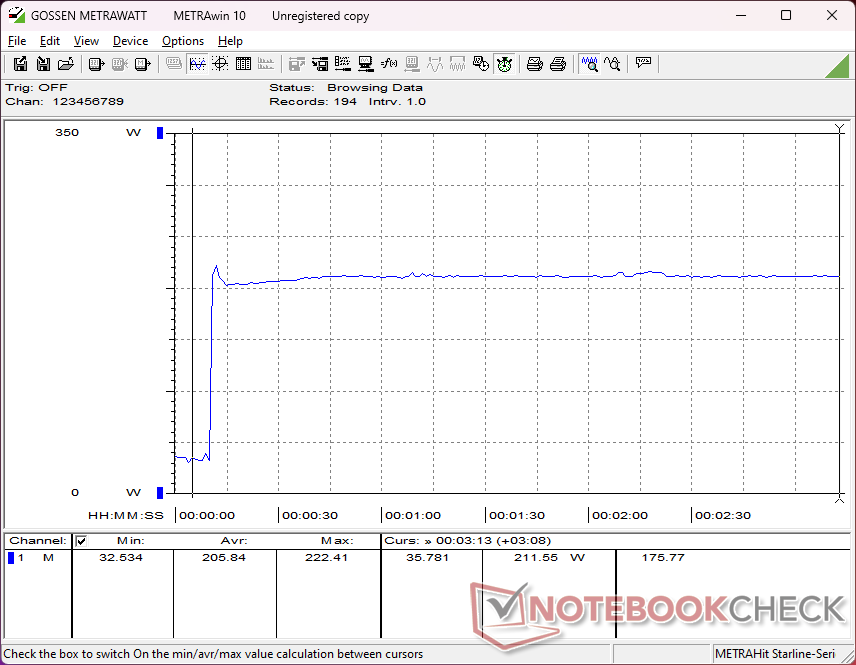
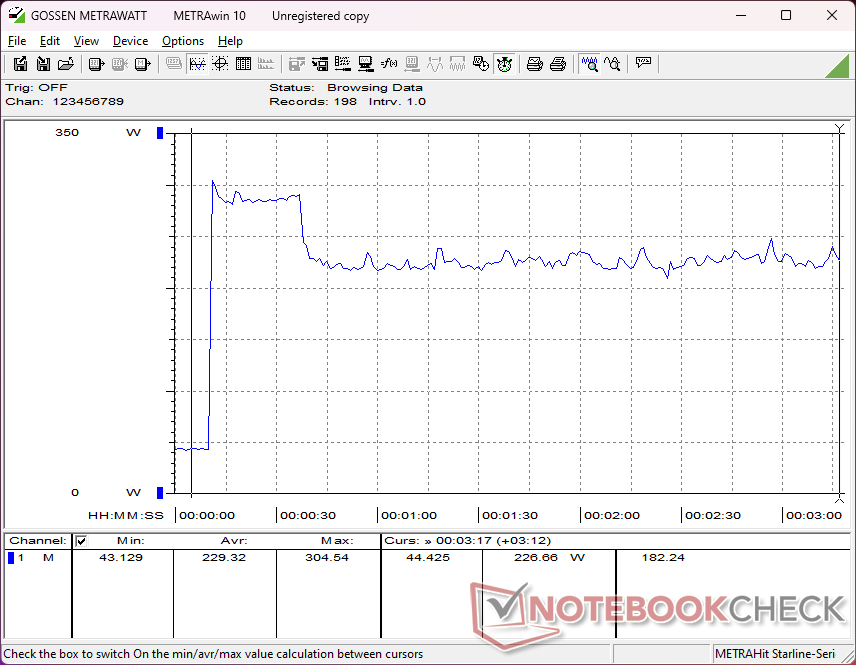
El consumo total es muy elevado, como cabe esperar de un DTR de 18 pulgadas equipado con un exigente panel 4K mini-LED. En ralentí sobre el escritorio consume entre 27 W y 48 W en función del ajuste de brillo, la configuración de la GPU y el ajuste del perfil de energía. Los juegos exigirían algo más de 300 W frente a los sólo 220 W del Acer Predator Helios 18.
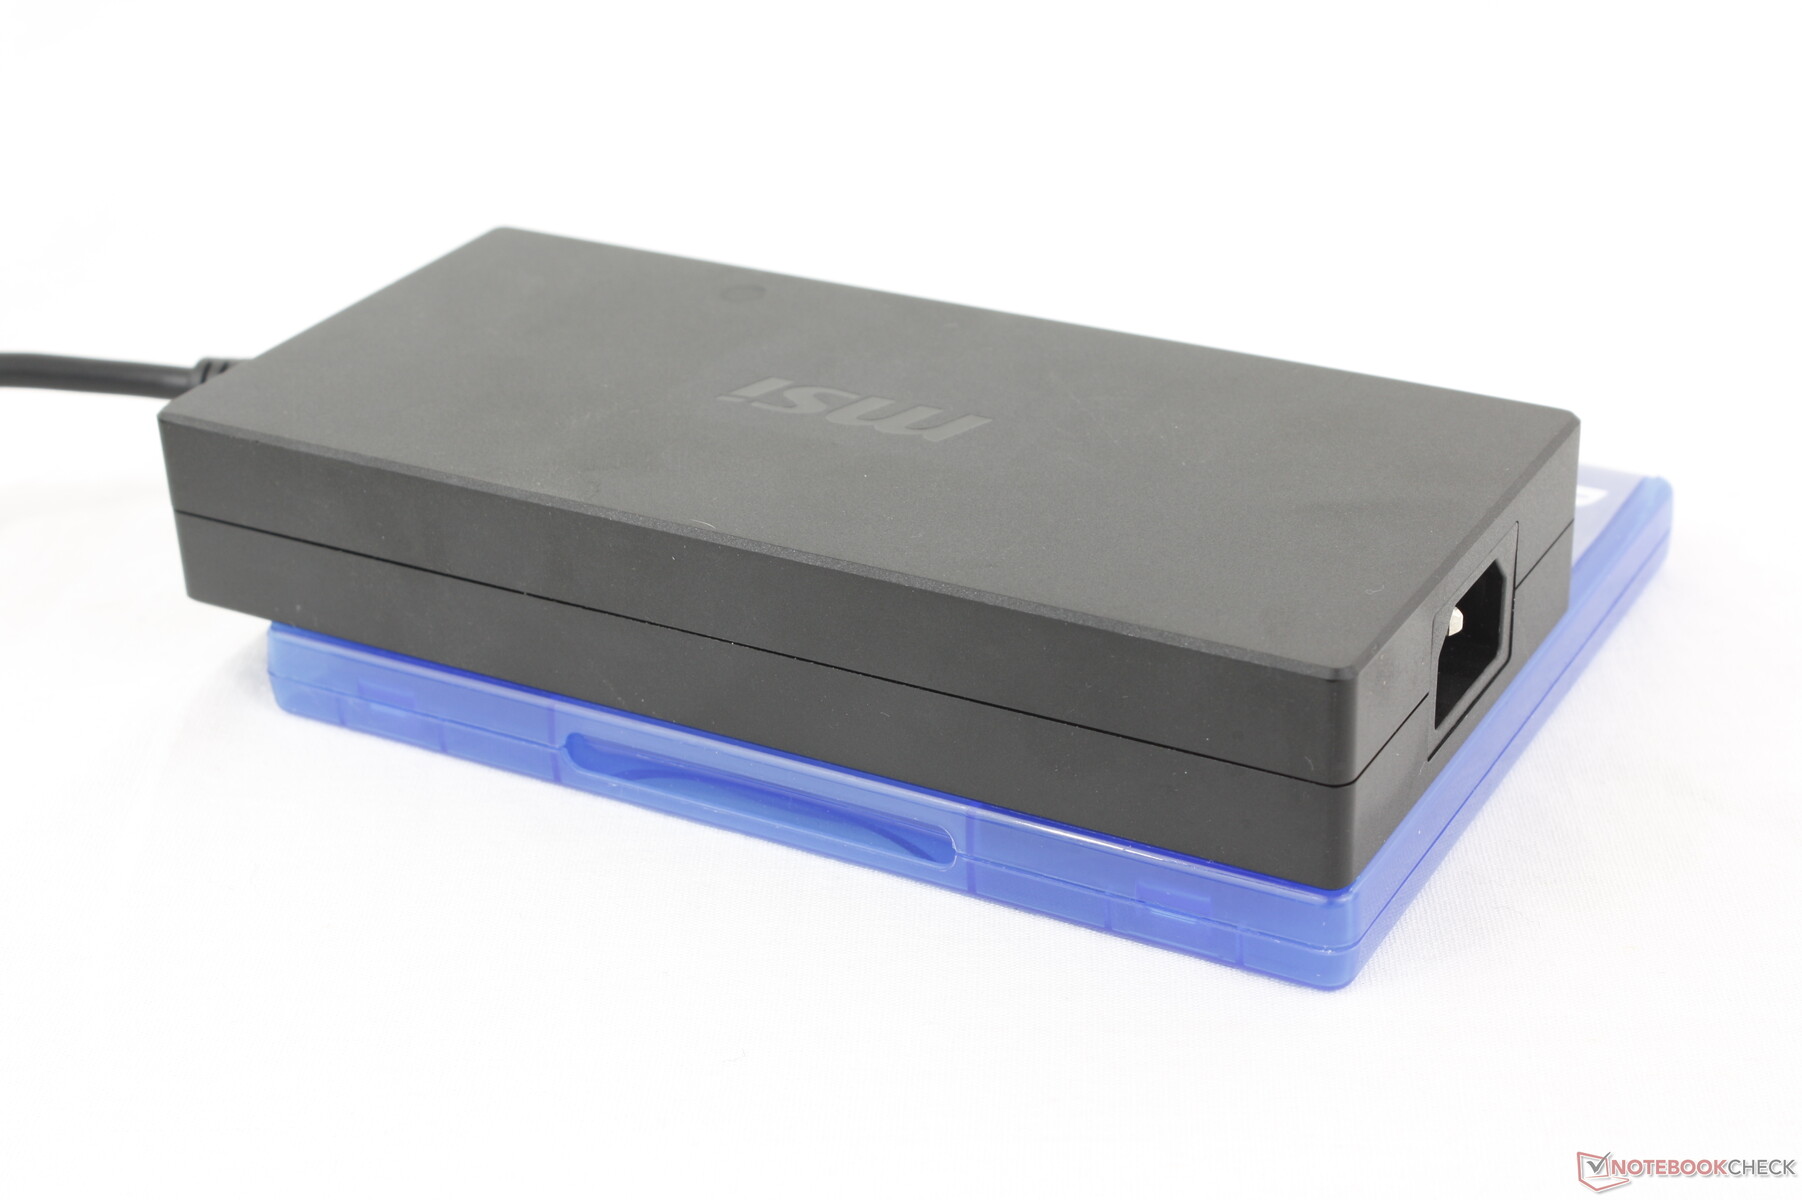
Hemos podido registrar un consumo de hasta 322 W con el gran adaptador de CA de 330 W. Si lo comparamos con el adaptador de CA de 400 W del Titan 18 HX, el de 330 W es ligeramente más pequeño (~18,4 x 8,4 x 3,1 cm frente a ~18,8 x 8,8 x 3,2 cm). El consumo al ejecutar tareas intensivas de la CPU es generalmente menor en la Raider 18 HX a pesar de que se suministra con la misma CPU que la Titan 18 HX, lo que concuerda con el rendimiento ligeramente inferior de la CPU registrado en nuestra sección CineBench anterior.
| Off / Standby | |
| Ocioso | |
| Carga |
|
Clave:
min: | |
| MSI Raider 18 HX A14V i9-14900HX, NVIDIA GeForce RTX 4080 Laptop GPU, Samsung PM9A1 MZVL22T0HBLB, Mini-LED, 3840x2400, 18" | Razer Blade 18 2024 RZ09-0509 i9-14900HX, NVIDIA GeForce RTX 4090 Laptop GPU, , Mini-LED, 2560x1600, 18" | Alienware m18 R2 i9-14900HX, NVIDIA GeForce RTX 4090 Laptop GPU, SK Hynix PC811 HFS002TEM9X152N, IPS, 2560x1600, 18" | MSI Titan 18 HX A14VIG i9-14900HX, NVIDIA GeForce RTX 4090 Laptop GPU, 2x Samsung PM9A1a MZVL22T0HDLB (RAID 0), Mini-LED, 3840x2400, 18" | Asus ROG Strix G18 G814JI i7-13650HX, NVIDIA GeForce RTX 4070 Laptop GPU, Micron 2400 MTFDKBA1T0QFM, IPS, 2560x1600, 18" | Acer Predator Helios 18 PH18-72-98MW i9-14900HX, NVIDIA GeForce RTX 4090 Laptop GPU, 2x SK Hynix HFS001TEJ9X115N (RAID 0), Mini-LED, 2560x1600, 18" | |
|---|---|---|---|---|---|---|
| Power Consumption | -2% | 8% | 5% | 42% | -2% | |
| Idle Minimum * | 27.7 | 25.4 8% | 10.6 62% | 13.2 52% | 8 71% | 31 -12% |
| Idle Average * | 38.3 | 37.7 2% | 20.9 45% | 25.4 34% | 15 61% | 35 9% |
| Idle Maximum * | 47.1 | 57.9 -23% | 40 15% | 53.5 -14% | 26 45% | 43 9% |
| Load Average * | 121.2 | 128.4 -6% | 201.1 -66% | 151.4 -25% | 102 16% | 144 -19% |
| Cyberpunk 2077 ultra * | 313 | |||||
| Cyberpunk 2077 ultra external monitor * | 306 | |||||
| Load Maximum * | 321.8 | 297.9 7% | 378.9 -18% | 395.2 -23% | 267 17% | 318 1% |
| Witcher 3 ultra * | 273.1 | 358 | 336 | 178.6 | 228 |
* ... más pequeño es mejor
Power Consumption Cyberpunk / Stress Test
Power Consumption external Monitor
Duración de las pilas
Los tiempos de ejecución son cortos debido al exigente hardware. Somos capaces de registrar poco más de 3 horas de uso real de la red WLAN incluso cuando se establece en el modo de ahorro de batería y el modo iGPU mientras que el ROG Strix G18 puede durar más del doble con su pantalla IPS. La capacidad de la batería ya está en su máximo legal de 99,9 Wh.
La carga desde vacío a plena capacidad tarda casi 2,5 horas, que es un poco más que en la mayoría de otros portátiles. La carga con adaptadores de CA USB-C de terceros será aún más lenta.
| MSI Raider 18 HX A14V i9-14900HX, NVIDIA GeForce RTX 4080 Laptop GPU, 99.9 Wh | Razer Blade 18 2024 RZ09-0509 i9-14900HX, NVIDIA GeForce RTX 4090 Laptop GPU, 91.7 Wh | Alienware m18 R2 i9-14900HX, NVIDIA GeForce RTX 4090 Laptop GPU, 97 Wh | MSI Titan 18 HX A14VIG i9-14900HX, NVIDIA GeForce RTX 4090 Laptop GPU, 99.9 Wh | Asus ROG Strix G18 G814JI i7-13650HX, NVIDIA GeForce RTX 4070 Laptop GPU, 90 Wh | Acer Predator Helios 18 PH18-72-98MW i9-14900HX, NVIDIA GeForce RTX 4090 Laptop GPU, 90 Wh | |
|---|---|---|---|---|---|---|
| Duración de Batería | 20% | 46% | 19% | 101% | -10% | |
| Reader / Idle | 264 | 395 50% | 353 34% | 702 166% | ||
| WiFi v1.3 | 198 | 263 33% | 290 46% | 252 27% | 484 144% | 192 -3% |
| Load | 76 | 58 -24% | 72 -5% | 71 -7% | 64 -16% |
Pro
Contra
Veredicto - Un titán de corazón
Cuando revisamos la Titan 18 HX a principios de este año, elogiamos su rendimiento pero nos quedamos sorprendidos al conocer su precio de venta de más de 5.000 dólares. El hecho de que la CPU y la GPU no fueran en realidad nada nuevo sólo hizo que el modelo resultara mucho menos atractivo. La Raider 18 HX aborda el precio exorbitantemente alto de la Titan 18 HX recortando la grasa y manteniendo las mismas opciones de CPU, GPU y pantalla. Los propietarios del Raider pierden el clickpad retroiluminado, la refrigeración por cámara de vapor, las teclas mecánicas y la compatibilidad con SSD M.2 terciarias, pero es fácil desprenderse de esas características de lujo cuando la experiencia de juego entre el Raider y el Titan es, por lo demás, exactamente la misma. De hecho, se puede argumentar que el Raider es más cómodo de usar, ya que su clickpad tradicional y su teclado basado en membranas resultan más familiares que el enfoque atípico del Titan.
El Raider 18 HX exprime cada gramo de rendimiento que puede de la CPU Core i9 y la GPU de 175 W aunque tenga que ser más grande, más pesado y a menudo más ruidoso que muchos de sus competidores.
Si lo comparamos con otros portátiles para juegos de 18 pulgadas, el Raider 18 HX ofrece una experiencia de escritura más espaciosa y cuatro ranuras SODIMM, mientras que alternativas como el Blade 18 o el ROG Strix G18 carecen por completo de teclado numérico o sólo admiten dos módulos SODIMM. Sin embargo, el sistema de MSI sigue siendo notablemente más grande y pesado que la mayoría de la competencia y no necesariamente funciona de forma más silenciosa para compensarlo. El rendimiento de la CPU y la GPU puede ser ligeramente más rápido, pero muchos usuarios pueden no notarlo en la práctica. En este caso, tendrá que valorar la mayor facilidad de mantenimiento y las opciones 4K mini-LED del Raider para justificar su peso.
Precio y disponibilidad
El MSI Raider 18 HX configurado en nuestro análisis ya está disponible en Amazon por 3190 dólares. Alternativamente, la versión IPS también está disponible por 3290 $.
Nota: Recientemente hemos actualizado nuestro sistema de clasificación y los resultados de la versión 8 no son comparables con los de la versión 7. Encontrará más información aquí .
MSI Raider 18 HX A14V
- 09/03/2024 v8
Allen Ngo
 Total Sustainability Score:
 Transparencia
La selección de los dispositivos que se van a reseñar corre a cargo de nuestro equipo editorial. La muestra de prueba fue proporcionada al autor en calidad de préstamo por el fabricante o el minorista a los efectos de esta reseña. El prestamista no tuvo ninguna influencia en esta reseña, ni el fabricante recibió una copia de la misma antes de su publicación. No había ninguna obligación de publicar esta reseña. Nunca aceptamos compensaciones o pagos a cambio de nuestras reseñas. Como empresa de medios independiente, Notebookcheck no está sujeta a la autoridad de fabricantes, minoristas o editores.
Así es como prueba Notebookcheck
Cada año, Notebookcheck revisa de forma independiente cientos de portátiles y smartphones utilizando procedimientos estandarizados para asegurar que todos los resultados son comparables. Hemos desarrollado continuamente nuestros métodos de prueba durante unos 20 años y hemos establecido los estándares de la industria en el proceso. En nuestros laboratorios de pruebas, técnicos y editores experimentados utilizan equipos de medición de alta calidad. Estas pruebas implican un proceso de validación en varias fases. Nuestro complejo sistema de clasificación se basa en cientos de mediciones y puntos de referencia bien fundamentados, lo que mantiene la objetividad.Price comparison

