Análisis del portátil Asus ProArt P16 - El Zen 5 de AMD se une al portátil RTX 4070 y a la OLED 4K
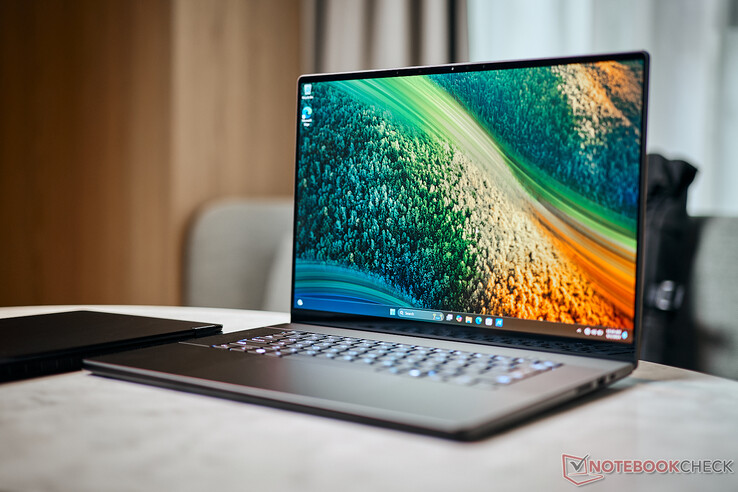
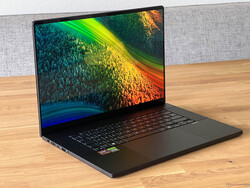
Además del ProArt PX13 de 13,3 pulgadas, 2 en 1 (reseñado ampliamente aquí), Asus también lanza un portátil más grande de 16 pulgadas para creadores de contenidos en forma del ProArt 16. Combina un moderno procesador AMD Zen 5 con GPU Nvidia dedicadas, así como una pantalla táctil OLED 4K de alta resolución. Sin embargo, a diferencia del pequeño PX13, el nuevo P16 se enfrenta a varios dispositivos de la competencia que vienen con especificaciones similares. ¿Ofrece el nuevo ProArt P16 un número suficiente de características para destacar entre los demás potentes portátiles multimedia?
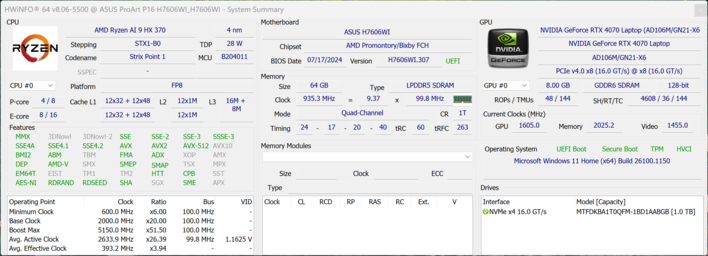
Nuestro dispositivo de análisis es la variante de gama alta con el procesador AMD Ryzen AI 9 HX 37064 GB de RAM, Nvidia GeForce RTX 4070 portátil, una SSD de 1 TB (variante de venta al público con SSD de 2 TB) y una OLED 4K por un PVPR de 2.699 dólares. La actualización de 32 GB de RAM (PVPR: 2.299 $) a 64 GB de RAM asciende a la friolera de 400 $. El precio de entrada para la versión con Ryzen AI 9 36524 GB de RAM, una unidad SSD de 1 TB y el procesador GeForce Portátil RTX 4050 se sitúa en 1.899 dólares.
Posibles contendientes en la comparación
Valoración | Versión | Fecha | Modelo | Peso | Altura | Tamaño | Resolución | Precio |
|---|---|---|---|---|---|---|---|---|
| 87.8 % | v8 | 08/2024 | Asus ProArt P16 H7606WI Ryzen AI 9 HX 370, NVIDIA GeForce RTX 4070 Laptop GPU | 1.8 kg | 17.3 mm | 16.00" | 3840x2400 | |
| 81.2 % | v8 | 07/2024 | SCHENKER XMG Pro 16 Studio (Mid 24) i9-14900HX, NVIDIA GeForce RTX 4070 Laptop GPU | 2.3 kg | 19.9 mm | 16.00" | 2560x1600 | |
| 88.7 % v7 (old) | v7 (old) | 04/2024 | Lenovo Yoga Pro 9 16IMH9 Ultra 9 185H, NVIDIA GeForce RTX 4070 Laptop GPU | 2.1 kg | 18.3 mm | 16.00" | 3200x2000 | |
| 88.6 % v7 (old) | v7 (old) | 04/2024 | Dell XPS 16 9640 Ultra 7 155H, NVIDIA GeForce RTX 4070 Laptop GPU | 2.3 kg | 18.7 mm | 16.30" | 3840x2400 | |
| 92.3 % v7 (old) | v7 (old) | 02/2024 | Asus ROG Zephyrus G16 2024 GU605M Ultra 7 155H, NVIDIA GeForce RTX 4070 Laptop GPU | 1.8 kg | 16.4 mm | 16.00" | 2560x1600 | |
| 93.2 % v7 (old) | v7 (old) | 11/2023 | Apple MacBook Pro 16 2023 M3 Max Apple M3 Max 16-Core, M3 Max 40-Core GPU | 2.1 kg | 16.9 mm | 16.00" | 3456x2234 | |
| 90.5 % v7 (old) | v7 (old) | 11/2023 | Asus Zenbook Pro 16X UX7602BZ-MY005W i9-13905H, NVIDIA GeForce RTX 4080 Laptop GPU | 2.4 kg | 17.8 mm | 16.00" | 3200x2000 |
Nota: Recientemente hemos actualizado nuestro sistema de clasificación y los resultados de la versión 8 no son comparables con los de la versión 7. Encontrará más información aquí.
Top 10 Análisis
» Top 10 Portátiles Multimedia
» Top 10 Portátiles de Juego
» Top 10 Portátiles de Juego ligeros
» Top 10 Portátiles Asequibles de Oficina/Empresa
» Top 10 Portátiles de Juego Ligeros
» Top 10 Portátiles de Oficina/Empresa Premium
» Top 10 Estaciones de Trabajo
» Top 10 Subportátiles
» Top 10 Ultrabooks
» Top 10 Convertibles
» Top 10 Tablets
» Top 10 Tablets Windows
» Top 10 Tablets de menos de 250 Euros
» Top 10 Phablets (>5.5")
» Top 10 Smartphones
» Top 10 Smartphones (≤5")
» Top 10 Smartphones de menos de 300 Euros
» Top 10 Smartphones de menos de 120 Euros
» Top 10 Portátiles de menos de 1000 Euros
» Top 10 Portátiles de menos de 500 Euros
» Top 10 Portátiles de menos de 300 Euros
» Los Mejores Displays de Portátiles Analizados por Notebookcheck
Estuche - Unibody de aluminio al igual que el ROG Zephyrus G16
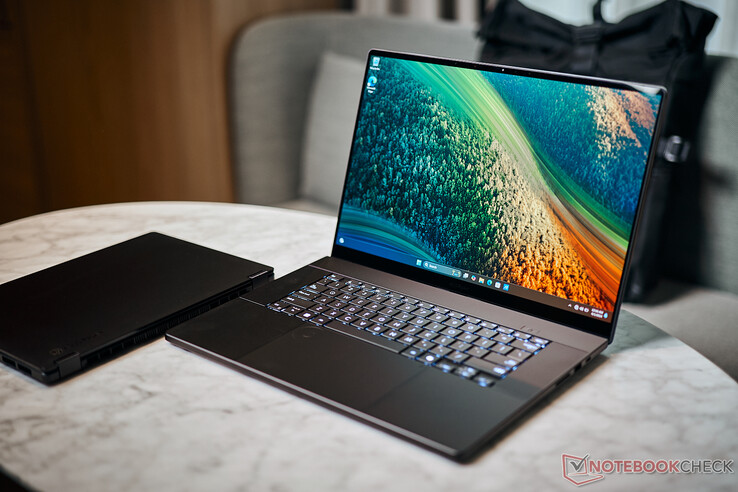
La carcasa unibody de aluminio negro tiene mucho en común con el ROG Zephyrus G16sin embargo, el ProArt prescinde de la iluminación LED de la carcasa. En cuanto se abre la tapa de la pantalla se nota que no hay muchos cambios en cuanto a la disposición del teclado (faltan las teclas especiales adicionales y el botón de encendido tiene una forma diferente) pero, aparte de eso, se trata casi exclusivamente de similitudes que incluyen las tapas de los altavoces y sus 4.110 orificios. El ProArt P16 sólo viene en la variante de color Nano Black, que es propensa a atraer rápidamente las huellas dactilares.
En cuanto a la calidad, el P16 tampoco es tan diferente del Zephyrus G16, tanto por razones positivas como negativas. Los aspectos positivos son tanto la excelente estabilidad como la calidad de construcción, pero las bisagras ligeramente sueltas y el notable bamboleo de la tapa resultante siguen siendo características negativas.
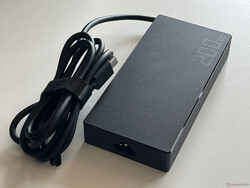
En términos de huella, el ProArt P16 se sitúa en medio del pelotón. Una comparación con el Zenbook Pro 16X también es interesante, ya que este dispositivo es sólo un toque más grueso pero, con 2,4 kg, es considerablemente más pesado que el nuevo P16 y sus 1,8 kg. Esto también convierte al nuevo P16 en el dispositivo más ligero de nuestra tabla comparativa, y por bastante distancia (junto con el Zephyrus G16 de idéntica construcción). La fuente de alimentación de 200 vatios aporta otros 588 gramos a la balanza.
Características - USB 4 y Wi-Fi 7
La ubicación de los puertos también es la misma que la del ROG Zephyrus, pero el ProArt P16 alimentado por procesador AMD prescinde de la compatibilidad con Thunderbolt 4 para sus puertos USB 4.0. Sin embargo, todos los conectores importantes están a bordo lo que significa que no debería haber ningún problema cuando se trata de uso diario.
Lector de tarjetas SD
El lector de tarjetas SD situado en el lado derecho no admite totalmente tarjetas de memoria pero, en comparación con la Zephyrus, la velocidad es mejor. Emparejado con nuestra tarjeta de referencia (Angelbird AV Pro V60), las velocidades de transferencia son ahora significativamente superiores, de hasta 254 MB/s y también de 127 MB/s al copiar datos.
| SD Card Reader | |
| average JPG Copy Test (av. of 3 runs) | |
| Apple MacBook Pro 16 2023 M3 Max (Angelbird AV Pro V60) | |
| Dell XPS 16 9640 (Angelbird AV Pro V60) | |
| Asus ProArt P16 H7606WI (Angelbird AV Pro V60) | |
| Media de la clase Multimedia (18.4 - 201, n=56, últimos 2 años) | |
| Asus Zenbook Pro 16X UX7602BZ-MY005W | |
| SCHENKER XMG Pro 16 Studio (Mid 24) (AV PRO microSD 128 GB V60) | |
| Asus ROG Zephyrus G16 2024 GU605M | |
| Lenovo Yoga Pro 9 16IMH9 (Angelbird AV Pro V60) | |
| maximum AS SSD Seq Read Test (1GB) | |
| Asus ProArt P16 H7606WI (Angelbird AV Pro V60) | |
| Apple MacBook Pro 16 2023 M3 Max (Angelbird AV Pro V60) | |
| Dell XPS 16 9640 (Angelbird AV Pro V60) | |
| Media de la clase Multimedia (25.8 - 266, n=56, últimos 2 años) | |
| Asus ROG Zephyrus G16 2024 GU605M | |
| Lenovo Yoga Pro 9 16IMH9 (Angelbird AV Pro V60) | |
| SCHENKER XMG Pro 16 Studio (Mid 24) (AV PRO microSD 128 GB V60) | |
| Asus Zenbook Pro 16X UX7602BZ-MY005W | |
Comunicación
Asus ha equipado el ProArt P16 con un moderno módulo MediaTek (MT7925) Wi-Fi 7 que también es compatible con Bluetooth 5.4. Junto con nuestro router de referencia Asus, registramos velocidades de transferencia muy altas que se encuentran entre las mejores que se pueden encontrar en los portátiles actuales. Durante nuestras pruebas, tampoco encontramos problemas de ningún tipo con la conexión de red inalámbrica.
| Networking | |
| Asus ProArt P16 H7606WI | |
| iperf3 transmit AXE11000 | |
| iperf3 receive AXE11000 | |
| SCHENKER XMG Pro 16 Studio (Mid 24) | |
| iperf3 transmit AXE11000 | |
| iperf3 receive AXE11000 | |
| Lenovo Yoga Pro 9 16IMH9 | |
| iperf3 transmit AXE11000 | |
| iperf3 receive AXE11000 | |
| Dell XPS 16 9640 | |
| iperf3 transmit AXE11000 | |
| iperf3 receive AXE11000 | |
| Asus ROG Zephyrus G16 2024 GU605M | |
| iperf3 transmit AXE11000 | |
| iperf3 receive AXE11000 | |
| Apple MacBook Pro 16 2023 M3 Max | |
| iperf3 transmit AXE11000 | |
| iperf3 receive AXE11000 | |
| Asus Zenbook Pro 16X UX7602BZ-MY005W | |
| iperf3 transmit AXE11000 | |
| iperf3 receive AXE11000 | |
| iperf3 transmit AXE11000 6GHz | |
| iperf3 receive AXE11000 6GHz | |
Cámara web
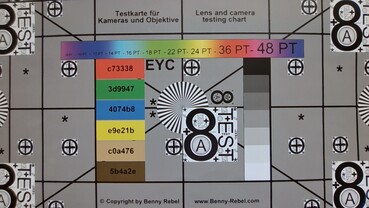
La cámara web de 1080p es compatible con los efectos actuales de Windows Studio, pero la calidad de imagen no es especialmente buena. Además, se ha instalado un módulo IR que permite el reconocimiento facial a través de Windows Hello.
Mantenimiento
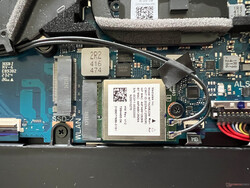
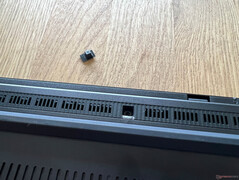
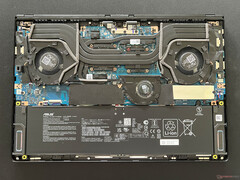
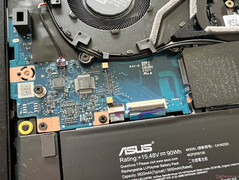
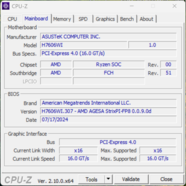
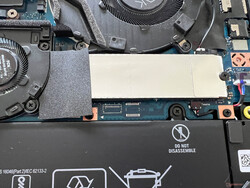
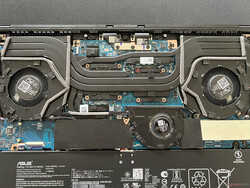
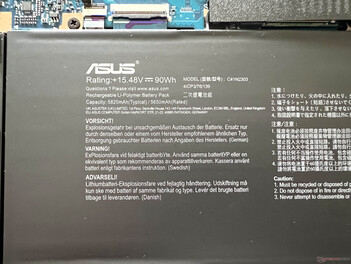
El acceso a los componentes se ve agravado por dos tornillos ocultos que se encuentran bajo cubiertas de goma pegadas. Al igual que en los modelos Zephyrus G16 más débiles (hasta el portátil RTX 4070), el dispositivo cuenta con un sistema de refrigeración convencional con un tercer ventilador pequeño adicional. La RAM está soldada, pero hay dos ranuras para SSD M.2 2280, así como un módulo Wi-Fi, ambos intercambiables. La batería está atornillada y también es sustituible en caso necesario.
Dispositivos de entrada: recorrido de las teclas de 1,7 mm y DialPad
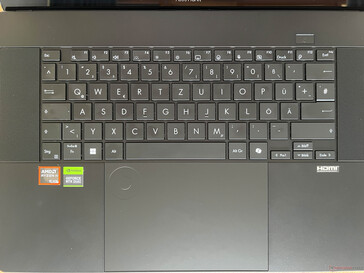
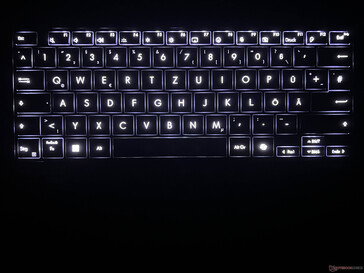
Aparte de la ausencia de teclas de función adicionales, el teclado no difiere del Zephyrus G16 y gracias al recorrido de tecla de 1,7 mm, obtendrá uno de los teclados más cómodos del segmento de portátiles. También se echa en falta la iluminación RGB, pero la iluminación blanca se puede ajustar automáticamente mediante un sensor. La disposición no es perfecta, ya que la tecla Intro de una sola línea y las pequeñas teclas de flecha no son ideales.
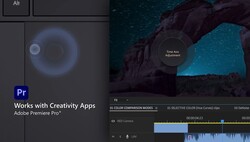
Con unas dimensiones de 15 x 9,8 cm, el clickpad es muy grande y la navegación del cursor funciona de maravilla. Además, los clics mecánicos están agradablemente silenciados y confieren al dispositivo una sensación de primera calidad. El DialPad está integrado en la parte superior izquierda del panel táctil y también funciona muy bien. Su utilidad depende en gran medida de lo hábil que sea usted en el uso del dial. Debido al gran tamaño del pad, el DialPad no nos molestó tanto como el más pequeño ProArt PX13en situaciones reales.
Por supuesto, el ProArt también tiene una pantalla táctil capacitiva para las entradas y esto también funcionó sin problemas. El lápiz óptico Asus Pen 2.0 suministrado funcionó sin problemas, pero no hay lugar para fijar el lápiz óptico a la carcasa.
Pantalla - 4K OLED a 60 Hz
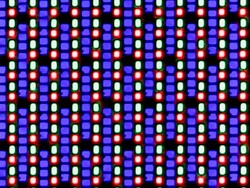
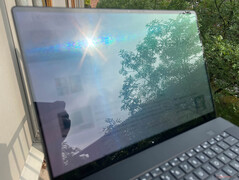
Asus ha equipado al ProArt P16 con una pantalla táctil OLED con una resolución de 3.840 x 2.400 píxeles y una relación de aspecto 16:10. Junto con el XPS 16, esta es la resolución más alta en el campo de comparación y todo el contenido aparece muy nítido. Sin embargo, las zonas brillantes aparecen un poco granuladas (da la impresión de que la pantalla está húmeda) pero el problema es bastante menos pronunciado que, por ejemplo, el Dell XPS 16. El gran problema es la frecuencia, que sólo se sitúa en 60 Hz. Esto se nota en movimiento y, a pesar de la resolución ligeramente superior, es un paso atrás en comparación con el antiguo Zenbook Pro 16X que venía con un OLED de 120 Hz (3.200 x 2.000 píxeles).
En modo SDR, el panel tiene un brillo medio de 360 cd/m² y, junto con el bajo nivel de negro, esto da como resultado una relación de contraste maravillosa. En modo HDR (que aún debe activarse manualmente en Windows y cuyos perfiles de color ya no funcionan), medimos un máximo de 605 cd/m² en una pequeña zona de la pantalla y sólo 420 cd/m² con una imagen casi totalmente blanca, una cifra bastante baja.
| |||||||||||||||||||||||||
iluminación: 98 %
Brillo con batería: 355 cd/m²
Contraste: ∞:1 (Negro: 0 cd/m²)
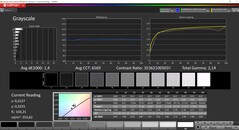
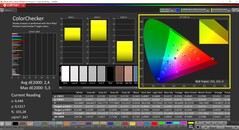
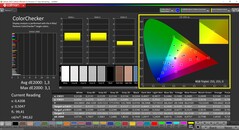
ΔE Color 1.2 | 0.5-29.43 Ø4.87
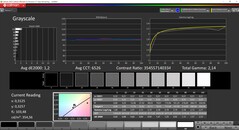
ΔE Greyscale 1.2 | 0.5-98 Ø5.1
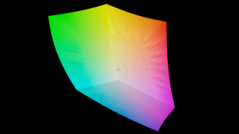
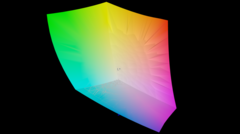
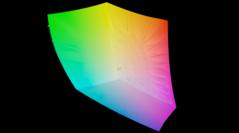
99.1% AdobeRGB 1998 (Argyll 2.2.0 3D)
100% sRGB (Argyll 2.2.0 3D)
99.9% Display P3 (Argyll 2.2.0 3D)
Gamma: 2.14
| Asus ProArt P16 H7606WI ATNA60YV02-0, OLED, 3840x2400, 16", 60 Hz | SCHENKER XMG Pro 16 Studio (Mid 24) BOE CQ NE160QDM-NZ1, IPS, 2560x1600, 16", 240 Hz | Lenovo Yoga Pro 9 16IMH9 LEN160-3.2K, Mini-LED, 3200x2000, 16", 165 Hz | Dell XPS 16 9640 SDC4196, OLED, 3840x2400, 16.3", 90 Hz | Asus ROG Zephyrus G16 2024 GU605M ATNA60DL01-0, OLED, 2560x1600, 16", 240 Hz | Apple MacBook Pro 16 2023 M3 Max Mini-LED, 3456x2234, 16", 120 Hz | Asus Zenbook Pro 16X UX7602BZ-MY005W ATNA60BX01-1, OLED, 3200x2000, 16", 120 Hz | |
|---|---|---|---|---|---|---|---|
| Display | -20% | -5% | -4% | -1% | -1% | -1% | |
| Display P3 Coverage | 99.9 | 68.8 -31% | 97 -3% | 98.3 -2% | 99.9 0% | 99.2 -1% | 99.93 0% |
| sRGB Coverage | 100 | 99.5 0% | 99.9 0% | 100 0% | 100 0% | 100 0% | |
| AdobeRGB 1998 Coverage | 99.1 | 70.8 -29% | 86.6 -13% | 87.8 -11% | 96.9 -2% | 97.48 -2% | |
| Response Times | -554% | -216% | 43% | 155% | -474% | -15% | |
| Response Time Grey 50% / Grey 80% * | 1.58 ? | 12.7 ? -704% | 22.2 ? -1305% | 0.82 ? 48% | 0.22 ? 86% | 66.9 ? -4134% | 1.4 ? 11% |
| Response Time Black / White * | 1.25 ? | 6.3 ? -404% | 17 ? -1260% | 0.85 ? 32% | 0.25 ? 80% | 43.6 ? -3388% | 2 ? -60% |
| PWM Frequency | 240 ? | 4840 ? 1917% | 360 ? 50% | 960 ? 300% | 14877 6099% | 250 ? 4% | |
| Screen | -70% | -18% | -21% | -18% | 13% | -61% | |
| Brightness middle | 355 | 416 17% | 651 83% | 366 3% | 416 17% | 630 77% | 331.8 -7% |
| Brightness | 360 | 392 9% | 673 87% | 367 2% | 418 16% | 604 68% | 334 -7% |
| Brightness Distribution | 98 | 86 -12% | 93 -5% | 96 -2% | 96 -2% | 94 -4% | 98 0% |
| Black Level * | 0.38 | 0.22 | 0.07 | ||||
| Colorchecker dE 2000 * | 1.2 | 2.33 -94% | 1.9 -58% | 1.3 -8% | 1.6 -33% | 1.2 -0% | 1.58 -32% |
| Colorchecker dE 2000 max. * | 2.6 | 6.07 -133% | 4.2 -62% | 3.6 -38% | 2.1 19% | 2.8 -8% | 4.23 -63% |
| Greyscale dE 2000 * | 1.2 | 3.7 -208% | 3 -150% | 2.2 -83% | 2.7 -125% | 1.9 -58% | 4.25 -254% |
| Gamma | 2.14 103% | 2.161 102% | 2.18 101% | 2.14 103% | 2.16 102% | 2.29 96% | 2.206 100% |
| CCT | 6526 100% | 7102 92% | 6738 96% | 6680 97% | 6331 103% | 6812 95% | 6249 104% |
| Contrast | 1095 | 2959 | 4740 | ||||
| Colorchecker dE 2000 calibrated * | 1.02 | 0.6 | 1 | 6.66 | |||
| Media total (Programa/Opciones) | -215% /
-144% | -80% /
-64% | 6% /
-1% | 45% /
30% | -154% /
-135% | -26% /
-34% |
* ... más pequeño es mejor
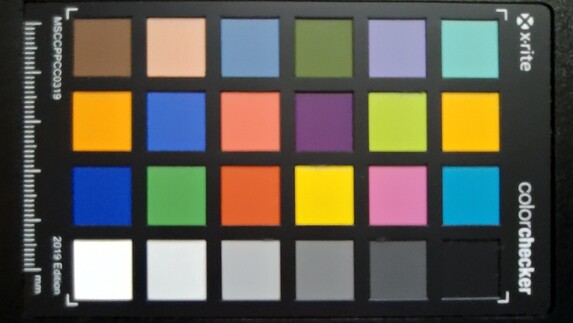
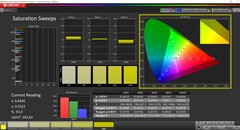
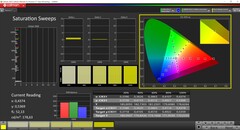
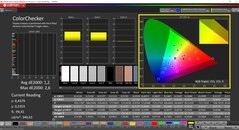
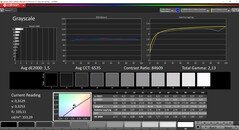
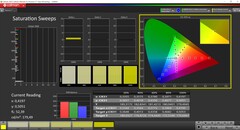
Analizamos el panel utilizando el software profesional CalMAN (X-Rite i1 Pro 2) y, como es normal, Asus proporciona varios perfiles de color. El modo preinstalado ofrece una buena imagen para las tareas cotidianas, pero los colores están un poco saturados. Las cosas son significativamente más precisas en el modo de pantalla P3, tanto las escalas de grises como las desviaciones de color se sitúan por debajo de la importante marca de 3. Del mismo modo, el modo sRGB ofrece resultados precisos y, gracias a la cobertura completa de los espacios de color sRGB y P3, la ProArt P16 es perfectamente adecuada para editar imágenes y vídeos. Con nuestra propia calibración, pudimos mejorar la reproducción de la escala de grises pero las desviaciones de color aumentaron y por eso no proporcionamos un perfil descargable.
Tiempos de respuesta del display
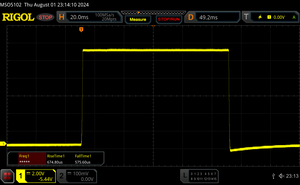
| ↔ Tiempo de respuesta de Negro a Blanco | ||
|---|---|---|
| 1.25 ms ... subida ↗ y bajada ↘ combinada | ↗ 0.67 ms subida | |
| ↘ 0.58 ms bajada | ||
| La pantalla mostró tiempos de respuesta muy rápidos en nuestros tests y debería ser adecuada para juegos frenéticos. En comparación, todos los dispositivos de prueba van de ##min### (mínimo) a 240 (máximo) ms. » 5 % de todos los dispositivos son mejores. Esto quiere decir que el tiempo de respuesta medido es mejor que la media (20.8 ms) de todos los dispositivos testados. | ||
| ↔ Tiempo de respuesta 50% Gris a 80% Gris | ||
| 1.58 ms ... subida ↗ y bajada ↘ combinada | ↗ 0.84 ms subida | |
| ↘ 0.74 ms bajada | ||
| La pantalla mostró tiempos de respuesta muy rápidos en nuestros tests y debería ser adecuada para juegos frenéticos. En comparación, todos los dispositivos de prueba van de ##min### (mínimo) a 636 (máximo) ms. » 5 % de todos los dispositivos son mejores. Esto quiere decir que el tiempo de respuesta medido es mejor que la media (32.5 ms) de todos los dispositivos testados. | ||
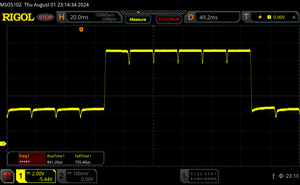
Parpadeo de Pantalla / PWM (Pulse-Width Modulation)
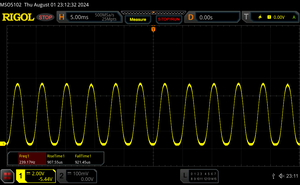
| Parpadeo de Pantalla / PWM detectado | 240 Hz Amplitude: 36 % | ≤ 52 % de brillo | |
| ≤ 93 cd/m² brillo | |||
La retroiluminación del display parpadea a 240 Hz (seguramente usa PWM - Pulse-Width Modulation) a un brillo del 52 % (93 cd/m²) e inferior. Sobre este nivel de brillo no debería darse parpadeo / PWM. La frecuencia de 240 Hz es relativamente baja, por lo que la gente sensible debería ver parpadeos y padecer fatiga visual por la pantalla (usado al brillo indicado a continuación). El parpadeo se da a un brillo relativamente bajo, por lo que el uso prolongado en interiores con este nivel de brillo puede ser fatigoso. Comparación: 53 % de todos los dispositivos testados no usaron PWM para atenuar el display. Si se usó, medimos una media de 8516 (mínimo: 5 - máxmo: 343500) Hz. | |||
La atenuación DC a una frecuencia de 60 Hz entra en vigor con un brillo de hasta el 53 %, por debajo del cual se produce un parpadeo a 240 Hz. Para evitar entrar en esta zona perjudicial, Asus ofrece la llamada atenuación OLED sin parpadeo en la app MyAsus.
Rendimiento - Zen 5 con una GPU GeForce y 64 GB de RAM
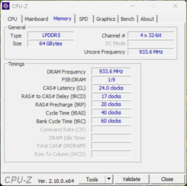
Asus ofrece el nuevo ProArt P16 con los dos nuevos Procesadores móviles Ryzen AI 300 que se combinan cada uno con memoria RAM LPDDR5x 7500 soldada (24, 32 o 64 GB). Además, tenemos las actuales GPU Ada Lovelace de Nvidia (RTX 4050/4060/4070 portátil).
Condiciones de la prueba
Como es habitual, Asus ofrece tres perfiles de energía diferentes: Susurro, Estándar y Rendimiento. En la siguiente tabla, hemos recopilado un resumen de sus respectivos valores de TDP/TGP y rendimiento. Como es habitual, realizamos las siguientes pruebas y mediciones utilizando el modo Rendimiento, que sólo está disponible cuando está conectado a la red eléctrica.
| Perfil energético | TDP | CB R23 Multi | TGP | Time Spy Gráficos | CP 2077 QHD/Ultra | Prueba de estrés | velocidad máxima del ventilador |
|---|---|---|---|---|---|---|---|
| Whisper | 60/55W | 21.046 puntos | 60W | 8.749 puntos | 34 FPS | CPU: 30W GPU: 42W |
42,2 dB(A) |
| Estándar | 70/65W | 22.651 puntos | 80W | 10.526 puntos | 44,2 FPS | CPU: 30W GPU: 65W |
47,1 dB(A) |
| Rendimiento | 80W | 23.795 puntos | 105W | 11.941 puntos | 49,4 FPS | CPU: 37W GPU: 85W |
53,2 dB(A) |
Procesador - Ryzen AI 9 HX 370
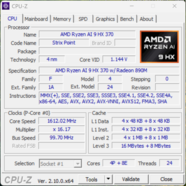
El nuevo AMD Ryzen AI 9 HX 370 ofrece 12 núcleos Zen 5 (24 hilos) que pueden alcanzar una velocidad máxima de 5,1 GHz. Para más análisis técnicos, consulte nuestro análisis de CPU. El procesador del ProArt P16 permite un consumo constante de 80 vatios que se refleja en un rendimiento muy elevado y especialmente estable. Sólo los competidores con el Core i9 14900HX y el Apple M3 Max ofrecen aún más rendimiento con los chips Meteor Lake y el Zenbook Pro 16X con su Core i9 13905H se queda atrás. En modo batería, el procesador puede consumir un máximo de 70/65 vatios y esto solo provoca una pequeña caída del rendimiento (-7 %). Puede encontrar más pruebas de rendimiento de la CPU aquí.
Cinebench R15 Multi Continuous Test
Cinebench R23: Multi Core | Single Core
Cinebench R20: CPU (Multi Core) | CPU (Single Core)
Cinebench R15: CPU Multi 64Bit | CPU Single 64Bit
Blender: v2.79 BMW27 CPU
7-Zip 18.03: 7z b 4 | 7z b 4 -mmt1
Geekbench 6.4: Multi-Core | Single-Core
Geekbench 5.5: Multi-Core | Single-Core
HWBOT x265 Benchmark v2.2: 4k Preset
LibreOffice : 20 Documents To PDF
R Benchmark 2.5: Overall mean
| Cinebench 2024 / CPU Multi Core | |
| Apple MacBook Pro 16 2023 M3 Max | |
| SCHENKER XMG Pro 16 Studio (Mid 24) | |
| Asus ProArt P16 H7606WI | |
| Medio AMD Ryzen AI 9 HX 370 (621 - 1284, n=24) | |
| Dell XPS 16 9640 | |
| Media de la clase Multimedia (327 - 2069, n=57, últimos 2 años) | |
| Asus ROG Zephyrus G16 2024 GU605M | |
| Cinebench 2024 / CPU Single Core | |
| Apple MacBook Pro 16 2023 M3 Max | |
| Media de la clase Multimedia (72.5 - 178, n=38, últimos 2 años) | |
| SCHENKER XMG Pro 16 Studio (Mid 24) | |
| Medio AMD Ryzen AI 9 HX 370 (113.6 - 121, n=14) | |
| Asus ProArt P16 H7606WI | |
| Dell XPS 16 9640 | |
| Asus ROG Zephyrus G16 2024 GU605M | |
| Cinebench R23 / Multi Core | |
| SCHENKER XMG Pro 16 Studio (Mid 24) | |
| Apple MacBook Pro 16 2023 M3 Max | |
| Asus ProArt P16 H7606WI | |
| Asus Zenbook Pro 16X UX7602BZ-MY005W | |
| Medio AMD Ryzen AI 9 HX 370 (10435 - 23805, n=24) | |
| Lenovo Yoga Pro 9 16IMH9 | |
| Dell XPS 16 9640 | |
| Asus ROG Zephyrus G16 2024 GU605M | |
| Media de la clase Multimedia (4861 - 30789, n=96, últimos 2 años) | |
| Cinebench R23 / Single Core | |
| SCHENKER XMG Pro 16 Studio (Mid 24) | |
| Asus ProArt P16 H7606WI | |
| Asus Zenbook Pro 16X UX7602BZ-MY005W | |
| Medio AMD Ryzen AI 9 HX 370 (1921 - 2049, n=17) | |
| Apple MacBook Pro 16 2023 M3 Max | |
| Lenovo Yoga Pro 9 16IMH9 | |
| Media de la clase Multimedia (878 - 2290, n=87, últimos 2 años) | |
| Dell XPS 16 9640 | |
| Asus ROG Zephyrus G16 2024 GU605M | |
| Cinebench R20 / CPU (Multi Core) | |
| SCHENKER XMG Pro 16 Studio (Mid 24) | |
| Asus ProArt P16 H7606WI | |
| Medio AMD Ryzen AI 9 HX 370 (6449 - 9250, n=16) | |
| Lenovo Yoga Pro 9 16IMH9 | |
| Asus Zenbook Pro 16X UX7602BZ-MY005W | |
| Dell XPS 16 9640 | |
| Asus ROG Zephyrus G16 2024 GU605M | |
| Apple MacBook Pro 16 2023 M3 Max | |
| Media de la clase Multimedia (1887 - 11924, n=80, últimos 2 años) | |
| Cinebench R20 / CPU (Single Core) | |
| Asus ProArt P16 H7606WI | |
| SCHENKER XMG Pro 16 Studio (Mid 24) | |
| Medio AMD Ryzen AI 9 HX 370 (753 - 804, n=16) | |
| Lenovo Yoga Pro 9 16IMH9 | |
| Asus ROG Zephyrus G16 2024 GU605M | |
| Media de la clase Multimedia (341 - 853, n=80, últimos 2 años) | |
| Dell XPS 16 9640 | |
| Asus Zenbook Pro 16X UX7602BZ-MY005W | |
| Apple MacBook Pro 16 2023 M3 Max | |
| Cinebench R15 / CPU Multi 64Bit | |
| SCHENKER XMG Pro 16 Studio (Mid 24) | |
| Asus ProArt P16 H7606WI | |
| Apple MacBook Pro 16 2023 M3 Max | |
| Medio AMD Ryzen AI 9 HX 370 (2498 - 3505, n=16) | |
| Lenovo Yoga Pro 9 16IMH9 | |
| Asus Zenbook Pro 16X UX7602BZ-MY005W | |
| Dell XPS 16 9640 | |
| Asus ROG Zephyrus G16 2024 GU605M | |
| Media de la clase Multimedia (856 - 5224, n=87, últimos 2 años) | |
| Cinebench R15 / CPU Single 64Bit | |
| Asus ProArt P16 H7606WI | |
| Medio AMD Ryzen AI 9 HX 370 (293 - 315, n=16) | |
| SCHENKER XMG Pro 16 Studio (Mid 24) | |
| Lenovo Yoga Pro 9 16IMH9 | |
| Apple MacBook Pro 16 2023 M3 Max | |
| Asus ROG Zephyrus G16 2024 GU605M | |
| Media de la clase Multimedia (99.6 - 323, n=82, últimos 2 años) | |
| Dell XPS 16 9640 | |
| Asus Zenbook Pro 16X UX7602BZ-MY005W | |
| Blender / v2.79 BMW27 CPU | |
| Media de la clase Multimedia (100 - 557, n=80, últimos 2 años) | |
| Apple MacBook Pro 16 2023 M3 Max | |
| Asus ROG Zephyrus G16 2024 GU605M | |
| Dell XPS 16 9640 | |
| Asus Zenbook Pro 16X UX7602BZ-MY005W | |
| Lenovo Yoga Pro 9 16IMH9 | |
| Medio AMD Ryzen AI 9 HX 370 (140 - 192, n=16) | |
| Asus ProArt P16 H7606WI | |
| SCHENKER XMG Pro 16 Studio (Mid 24) | |
| 7-Zip 18.03 / 7z b 4 | |
| SCHENKER XMG Pro 16 Studio (Mid 24) | |
| Asus ProArt P16 H7606WI | |
| Medio AMD Ryzen AI 9 HX 370 (66154 - 83714, n=16) | |
| Lenovo Yoga Pro 9 16IMH9 | |
| Dell XPS 16 9640 | |
| Asus Zenbook Pro 16X UX7602BZ-MY005W | |
| Asus ROG Zephyrus G16 2024 GU605M | |
| Media de la clase Multimedia (29095 - 130368, n=75, últimos 2 años) | |
| 7-Zip 18.03 / 7z b 4 -mmt1 | |
| SCHENKER XMG Pro 16 Studio (Mid 24) | |
| Asus ProArt P16 H7606WI | |
| Medio AMD Ryzen AI 9 HX 370 (5859 - 6497, n=16) | |
| Media de la clase Multimedia (3398 - 7545, n=75, últimos 2 años) | |
| Lenovo Yoga Pro 9 16IMH9 | |
| Asus Zenbook Pro 16X UX7602BZ-MY005W | |
| Dell XPS 16 9640 | |
| Asus ROG Zephyrus G16 2024 GU605M | |
| Geekbench 6.4 / Multi-Core | |
| Apple MacBook Pro 16 2023 M3 Max | |
| SCHENKER XMG Pro 16 Studio (Mid 24) | |
| Asus ProArt P16 H7606WI | |
| Medio AMD Ryzen AI 9 HX 370 (11973 - 15671, n=18) | |
| Asus Zenbook Pro 16X UX7602BZ-MY005W | |
| Lenovo Yoga Pro 9 16IMH9 | |
| Dell XPS 16 9640 | |
| Media de la clase Multimedia (4983 - 25760, n=77, últimos 2 años) | |
| Asus ROG Zephyrus G16 2024 GU605M | |
| Geekbench 6.4 / Single-Core | |
| Apple MacBook Pro 16 2023 M3 Max | |
| Asus ProArt P16 H7606WI | |
| Medio AMD Ryzen AI 9 HX 370 (2780 - 2965, n=18) | |
| SCHENKER XMG Pro 16 Studio (Mid 24) | |
| Media de la clase Multimedia (1534 - 3927, n=73, últimos 2 años) | |
| Lenovo Yoga Pro 9 16IMH9 | |
| Dell XPS 16 9640 | |
| Asus ROG Zephyrus G16 2024 GU605M | |
| Asus Zenbook Pro 16X UX7602BZ-MY005W | |
| Geekbench 5.5 / Multi-Core | |
| Apple MacBook Pro 16 2023 M3 Max | |
| SCHENKER XMG Pro 16 Studio (Mid 24) | |
| Asus ProArt P16 H7606WI | |
| Lenovo Yoga Pro 9 16IMH9 | |
| Medio AMD Ryzen AI 9 HX 370 (11394 - 15407, n=17) | |
| Asus Zenbook Pro 16X UX7602BZ-MY005W | |
| Dell XPS 16 9640 | |
| Asus ROG Zephyrus G16 2024 GU605M | |
| Media de la clase Multimedia (4652 - 23059, n=79, últimos 2 años) | |
| Geekbench 5.5 / Single-Core | |
| Apple MacBook Pro 16 2023 M3 Max | |
| Medio AMD Ryzen AI 9 HX 370 (1957 - 2136, n=17) | |
| Asus ProArt P16 H7606WI | |
| SCHENKER XMG Pro 16 Studio (Mid 24) | |
| Lenovo Yoga Pro 9 16IMH9 | |
| Media de la clase Multimedia (891 - 2555, n=79, últimos 2 años) | |
| Dell XPS 16 9640 | |
| Asus ROG Zephyrus G16 2024 GU605M | |
| Asus Zenbook Pro 16X UX7602BZ-MY005W | |
| HWBOT x265 Benchmark v2.2 / 4k Preset | |
| SCHENKER XMG Pro 16 Studio (Mid 24) | |
| Medio AMD Ryzen AI 9 HX 370 (20.3 - 28.7, n=16) | |
| Asus ProArt P16 H7606WI | |
| Lenovo Yoga Pro 9 16IMH9 | |
| Asus Zenbook Pro 16X UX7602BZ-MY005W | |
| Dell XPS 16 9640 | |
| Asus ROG Zephyrus G16 2024 GU605M | |
| Media de la clase Multimedia (5.26 - 34.3, n=74, últimos 2 años) | |
| LibreOffice / 20 Documents To PDF | |
| Asus ProArt P16 H7606WI | |
| Medio AMD Ryzen AI 9 HX 370 (46.8 - 66.6, n=16) | |
| Media de la clase Multimedia (23.9 - 146.7, n=76, últimos 2 años) | |
| Asus ROG Zephyrus G16 2024 GU605M | |
| Asus Zenbook Pro 16X UX7602BZ-MY005W | |
| SCHENKER XMG Pro 16 Studio (Mid 24) | |
| Dell XPS 16 9640 | |
| Lenovo Yoga Pro 9 16IMH9 | |
| R Benchmark 2.5 / Overall mean | |
| Dell XPS 16 9640 | |
| Asus Zenbook Pro 16X UX7602BZ-MY005W | |
| Media de la clase Multimedia (0.3604 - 0.947, n=74, últimos 2 años) | |
| Asus ROG Zephyrus G16 2024 GU605M | |
| Lenovo Yoga Pro 9 16IMH9 | |
| Medio AMD Ryzen AI 9 HX 370 (0.3892 - 0.529, n=16) | |
| SCHENKER XMG Pro 16 Studio (Mid 24) | |
| Asus ProArt P16 H7606WI | |
* ... más pequeño es mejor
AIDA64: FP32 Ray-Trace | FPU Julia | CPU SHA3 | CPU Queen | FPU SinJulia | FPU Mandel | CPU AES | CPU ZLib | FP64 Ray-Trace | CPU PhotoWorxx
| Performance Rating | |
| Asus ProArt P16 H7606WI -2! | |
| Medio AMD Ryzen AI 9 HX 370 | |
| SCHENKER XMG Pro 16 Studio (Mid 24) | |
| Lenovo Yoga Pro 9 16IMH9 | |
| Asus Zenbook Pro 16X UX7602BZ-MY005W | |
| Dell XPS 16 9640 | |
| Asus ROG Zephyrus G16 2024 GU605M | |
| Media de la clase Multimedia | |
| AIDA64 / FP32 Ray-Trace | |
| Medio AMD Ryzen AI 9 HX 370 (24673 - 37654, n=15) | |
| SCHENKER XMG Pro 16 Studio (Mid 24) | |
| Asus Zenbook Pro 16X UX7602BZ-MY005W | |
| Lenovo Yoga Pro 9 16IMH9 | |
| Dell XPS 16 9640 | |
| Asus ROG Zephyrus G16 2024 GU605M | |
| Media de la clase Multimedia (5121 - 50388, n=73, últimos 2 años) | |
| AIDA64 / FPU Julia | |
| Asus ProArt P16 H7606WI | |
| Medio AMD Ryzen AI 9 HX 370 (95655 - 147937, n=16) | |
| SCHENKER XMG Pro 16 Studio (Mid 24) | |
| Lenovo Yoga Pro 9 16IMH9 | |
| Asus Zenbook Pro 16X UX7602BZ-MY005W | |
| Dell XPS 16 9640 | |
| Asus ROG Zephyrus G16 2024 GU605M | |
| Media de la clase Multimedia (14528 - 201874, n=74, últimos 2 años) | |
| AIDA64 / CPU SHA3 | |
| Asus ProArt P16 H7606WI | |
| SCHENKER XMG Pro 16 Studio (Mid 24) | |
| Medio AMD Ryzen AI 9 HX 370 (4421 - 5843, n=16) | |
| Lenovo Yoga Pro 9 16IMH9 | |
| Asus Zenbook Pro 16X UX7602BZ-MY005W | |
| Dell XPS 16 9640 | |
| Asus ROG Zephyrus G16 2024 GU605M | |
| Media de la clase Multimedia (1188 - 8623, n=74, últimos 2 años) | |
| AIDA64 / CPU Queen | |
| SCHENKER XMG Pro 16 Studio (Mid 24) | |
| Asus ProArt P16 H7606WI | |
| Asus Zenbook Pro 16X UX7602BZ-MY005W | |
| Lenovo Yoga Pro 9 16IMH9 | |
| Asus ROG Zephyrus G16 2024 GU605M | |
| Dell XPS 16 9640 | |
| Media de la clase Multimedia (21547 - 181505, n=74, últimos 2 años) | |
| Medio AMD Ryzen AI 9 HX 370 (41744 - 99088, n=16) | |
| AIDA64 / FPU SinJulia | |
| Asus ProArt P16 H7606WI | |
| Medio AMD Ryzen AI 9 HX 370 (16445 - 19115, n=16) | |
| SCHENKER XMG Pro 16 Studio (Mid 24) | |
| Lenovo Yoga Pro 9 16IMH9 | |
| Asus ROG Zephyrus G16 2024 GU605M | |
| Dell XPS 16 9640 | |
| Asus Zenbook Pro 16X UX7602BZ-MY005W | |
| Media de la clase Multimedia (1240 - 28794, n=74, últimos 2 años) | |
| AIDA64 / FPU Mandel | |
| Medio AMD Ryzen AI 9 HX 370 (50357 - 79251, n=15) | |
| SCHENKER XMG Pro 16 Studio (Mid 24) | |
| Asus Zenbook Pro 16X UX7602BZ-MY005W | |
| Lenovo Yoga Pro 9 16IMH9 | |
| Dell XPS 16 9640 | |
| Asus ROG Zephyrus G16 2024 GU605M | |
| Media de la clase Multimedia (9903 - 105740, n=73, últimos 2 años) | |
| AIDA64 / CPU AES | |
| SCHENKER XMG Pro 16 Studio (Mid 24) | |
| Lenovo Yoga Pro 9 16IMH9 | |
| Dell XPS 16 9640 | |
| Asus ProArt P16 H7606WI | |
| Asus Zenbook Pro 16X UX7602BZ-MY005W | |
| Asus ROG Zephyrus G16 2024 GU605M | |
| Medio AMD Ryzen AI 9 HX 370 (67015 - 96781, n=16) | |
| Media de la clase Multimedia (26066 - 169946, n=74, últimos 2 años) | |
| AIDA64 / CPU ZLib | |
| SCHENKER XMG Pro 16 Studio (Mid 24) | |
| Asus ProArt P16 H7606WI | |
| Medio AMD Ryzen AI 9 HX 370 (1077 - 1530, n=16) | |
| Lenovo Yoga Pro 9 16IMH9 | |
| Dell XPS 16 9640 | |
| Asus Zenbook Pro 16X UX7602BZ-MY005W | |
| Asus ROG Zephyrus G16 2024 GU605M | |
| Media de la clase Multimedia (440 - 2022, n=74, últimos 2 años) | |
| AIDA64 / FP64 Ray-Trace | |
| Asus ProArt P16 H7606WI | |
| Medio AMD Ryzen AI 9 HX 370 (13665 - 20608, n=16) | |
| SCHENKER XMG Pro 16 Studio (Mid 24) | |
| Asus Zenbook Pro 16X UX7602BZ-MY005W | |
| Lenovo Yoga Pro 9 16IMH9 | |
| Dell XPS 16 9640 | |
| Asus ROG Zephyrus G16 2024 GU605M | |
| Media de la clase Multimedia (2759 - 26875, n=74, últimos 2 años) | |
| AIDA64 / CPU PhotoWorxx | |
| Asus Zenbook Pro 16X UX7602BZ-MY005W | |
| Lenovo Yoga Pro 9 16IMH9 | |
| Dell XPS 16 9640 | |
| Asus ROG Zephyrus G16 2024 GU605M | |
| SCHENKER XMG Pro 16 Studio (Mid 24) | |
| Asus ProArt P16 H7606WI | |
| Medio AMD Ryzen AI 9 HX 370 (36752 - 51727, n=16) | |
| Media de la clase Multimedia (12860 - 58844, n=74, últimos 2 años) | |
Rendimiento del sistema
Tanto en situaciones cotidianas como en pruebas comparativas sintéticas, el ProArt P16 es un sistema muy rápido y sensible, que ofrece reservas suficientes para tareas exigentes. A diferencia del pequeño PX13, dispone opcionalmente de 64 GB de RAM. Durante las pruebas, no pudimos iniciar LatencyMon y en F1 24 se produjeron pantallas azules reproducibles. Sin embargo, suponemos que se trata de un problema de controladores y ya estamos en contacto con AMD.
CrossMark: Overall | Productivity | Creativity | Responsiveness
WebXPRT 3: Overall
WebXPRT 4: Overall
Mozilla Kraken 1.1: Total
| PCMark 10 / Score | |
| SCHENKER XMG Pro 16 Studio (Mid 24) | |
| Asus Zenbook Pro 16X UX7602BZ-MY005W | |
| Asus ProArt P16 H7606WI | |
| Medio AMD Ryzen AI 9 HX 370, NVIDIA GeForce RTX 4070 Laptop GPU (7696 - 7752, n=3) | |
| Lenovo Yoga Pro 9 16IMH9 | |
| Asus ROG Zephyrus G16 2024 GU605M | |
| Dell XPS 16 9640 | |
| Media de la clase Multimedia (4325 - 8670, n=70, últimos 2 años) | |
| PCMark 10 / Essentials | |
| Asus Zenbook Pro 16X UX7602BZ-MY005W | |
| Lenovo Yoga Pro 9 16IMH9 | |
| SCHENKER XMG Pro 16 Studio (Mid 24) | |
| Media de la clase Multimedia (8025 - 12420, n=70, últimos 2 años) | |
| Dell XPS 16 9640 | |
| Asus ROG Zephyrus G16 2024 GU605M | |
| Asus ProArt P16 H7606WI | |
| Medio AMD Ryzen AI 9 HX 370, NVIDIA GeForce RTX 4070 Laptop GPU (9856 - 10144, n=3) | |
| PCMark 10 / Productivity | |
| SCHENKER XMG Pro 16 Studio (Mid 24) | |
| Asus Zenbook Pro 16X UX7602BZ-MY005W | |
| Asus ProArt P16 H7606WI | |
| Medio AMD Ryzen AI 9 HX 370, NVIDIA GeForce RTX 4070 Laptop GPU (9713 - 10027, n=3) | |
| Asus ROG Zephyrus G16 2024 GU605M | |
| Dell XPS 16 9640 | |
| Lenovo Yoga Pro 9 16IMH9 | |
| Media de la clase Multimedia (6089 - 10615, n=70, últimos 2 años) | |
| PCMark 10 / Digital Content Creation | |
| Asus ProArt P16 H7606WI | |
| Medio AMD Ryzen AI 9 HX 370, NVIDIA GeForce RTX 4070 Laptop GPU (12165 - 13205, n=3) | |
| SCHENKER XMG Pro 16 Studio (Mid 24) | |
| Asus Zenbook Pro 16X UX7602BZ-MY005W | |
| Lenovo Yoga Pro 9 16IMH9 | |
| Asus ROG Zephyrus G16 2024 GU605M | |
| Dell XPS 16 9640 | |
| Media de la clase Multimedia (3651 - 13548, n=70, últimos 2 años) | |
| CrossMark / Overall | |
| SCHENKER XMG Pro 16 Studio (Mid 24) | |
| Apple MacBook Pro 16 2023 M3 Max | |
| Asus Zenbook Pro 16X UX7602BZ-MY005W | |
| Dell XPS 16 9640 | |
| Asus ProArt P16 H7606WI | |
| Medio AMD Ryzen AI 9 HX 370, NVIDIA GeForce RTX 4070 Laptop GPU (1785 - 1794, n=2) | |
| Media de la clase Multimedia (866 - 2255, n=81, últimos 2 años) | |
| Asus ROG Zephyrus G16 2024 GU605M | |
| Lenovo Yoga Pro 9 16IMH9 | |
| CrossMark / Productivity | |
| SCHENKER XMG Pro 16 Studio (Mid 24) | |
| Asus Zenbook Pro 16X UX7602BZ-MY005W | |
| Apple MacBook Pro 16 2023 M3 Max | |
| Dell XPS 16 9640 | |
| Media de la clase Multimedia (913 - 2050, n=81, últimos 2 años) | |
| Asus ROG Zephyrus G16 2024 GU605M | |
| Lenovo Yoga Pro 9 16IMH9 | |
| Asus ProArt P16 H7606WI | |
| Medio AMD Ryzen AI 9 HX 370, NVIDIA GeForce RTX 4070 Laptop GPU (1611 - 1611, n=2) | |
| CrossMark / Creativity | |
| Apple MacBook Pro 16 2023 M3 Max | |
| SCHENKER XMG Pro 16 Studio (Mid 24) | |
| Asus Zenbook Pro 16X UX7602BZ-MY005W | |
| Asus ProArt P16 H7606WI | |
| Medio AMD Ryzen AI 9 HX 370, NVIDIA GeForce RTX 4070 Laptop GPU (2212 - 2270, n=2) | |
| Dell XPS 16 9640 | |
| Lenovo Yoga Pro 9 16IMH9 | |
| Media de la clase Multimedia (907 - 2795, n=81, últimos 2 años) | |
| Asus ROG Zephyrus G16 2024 GU605M | |
| CrossMark / Responsiveness | |
| SCHENKER XMG Pro 16 Studio (Mid 24) | |
| Dell XPS 16 9640 | |
| Asus Zenbook Pro 16X UX7602BZ-MY005W | |
| Apple MacBook Pro 16 2023 M3 Max | |
| Media de la clase Multimedia (605 - 2094, n=81, últimos 2 años) | |
| Asus ROG Zephyrus G16 2024 GU605M | |
| Lenovo Yoga Pro 9 16IMH9 | |
| Medio AMD Ryzen AI 9 HX 370, NVIDIA GeForce RTX 4070 Laptop GPU (1225 - 1274, n=2) | |
| Asus ProArt P16 H7606WI | |
| WebXPRT 3 / Overall | |
| Apple MacBook Pro 16 2023 M3 Max | |
| Media de la clase Multimedia (136.4 - 545, n=81, últimos 2 años) | |
| SCHENKER XMG Pro 16 Studio (Mid 24) | |
| Asus ProArt P16 H7606WI | |
| Lenovo Yoga Pro 9 16IMH9 | |
| Medio AMD Ryzen AI 9 HX 370, NVIDIA GeForce RTX 4070 Laptop GPU (282 - 298, n=2) | |
| Asus ROG Zephyrus G16 2024 GU605M | |
| Dell XPS 16 9640 | |
| WebXPRT 4 / Overall | |
| SCHENKER XMG Pro 16 Studio (Mid 24) | |
| Media de la clase Multimedia (133.2 - 353, n=75, últimos 2 años) | |
| Lenovo Yoga Pro 9 16IMH9 | |
| Asus ROG Zephyrus G16 2024 GU605M | |
| Dell XPS 16 9640 | |
| Medio AMD Ryzen AI 9 HX 370, NVIDIA GeForce RTX 4070 Laptop GPU (244 - 247, n=2) | |
| Asus ProArt P16 H7606WI | |
| Asus Zenbook Pro 16X UX7602BZ-MY005W | |
| Mozilla Kraken 1.1 / Total | |
| Asus ROG Zephyrus G16 2024 GU605M | |
| Asus Zenbook Pro 16X UX7602BZ-MY005W | |
| Lenovo Yoga Pro 9 16IMH9 | |
| Media de la clase Multimedia (254 - 1016, n=86, últimos 2 años) | |
| SCHENKER XMG Pro 16 Studio (Mid 24) | |
| Medio AMD Ryzen AI 9 HX 370, NVIDIA GeForce RTX 4070 Laptop GPU (439 - 460, n=2) | |
| Asus ProArt P16 H7606WI | |
| Apple MacBook Pro 16 2023 M3 Max | |
* ... más pequeño es mejor
| PCMark 10 Score | 7752 puntos | |
ayuda | ||
| AIDA64 / Memory Copy | |
| Lenovo Yoga Pro 9 16IMH9 | |
| Dell XPS 16 9640 | |
| Asus ProArt P16 H7606WI | |
| Asus ROG Zephyrus G16 2024 GU605M | |
| Asus Zenbook Pro 16X UX7602BZ-MY005W | |
| Medio AMD Ryzen AI 9 HX 370 (72702 - 93640, n=16) | |
| SCHENKER XMG Pro 16 Studio (Mid 24) | |
| Media de la clase Multimedia (21158 - 104459, n=74, últimos 2 años) | |
| AIDA64 / Memory Read | |
| Asus ProArt P16 H7606WI | |
| Medio AMD Ryzen AI 9 HX 370 (84635 - 102937, n=16) | |
| Lenovo Yoga Pro 9 16IMH9 | |
| Asus ROG Zephyrus G16 2024 GU605M | |
| SCHENKER XMG Pro 16 Studio (Mid 24) | |
| Dell XPS 16 9640 | |
| Asus Zenbook Pro 16X UX7602BZ-MY005W | |
| Media de la clase Multimedia (24312 - 125604, n=74, últimos 2 años) | |
| AIDA64 / Memory Write | |
| Asus Zenbook Pro 16X UX7602BZ-MY005W | |
| Asus ProArt P16 H7606WI | |
| Medio AMD Ryzen AI 9 HX 370 (83907 - 108954, n=16) | |
| Lenovo Yoga Pro 9 16IMH9 | |
| Dell XPS 16 9640 | |
| Asus ROG Zephyrus G16 2024 GU605M | |
| SCHENKER XMG Pro 16 Studio (Mid 24) | |
| Media de la clase Multimedia (23679 - 117933, n=74, últimos 2 años) | |
| AIDA64 / Memory Latency | |
| Asus ROG Zephyrus G16 2024 GU605M | |
| Dell XPS 16 9640 | |
| Lenovo Yoga Pro 9 16IMH9 | |
| Asus ProArt P16 H7606WI | |
| Media de la clase Multimedia (7 - 346, n=74, últimos 2 años) | |
| Medio AMD Ryzen AI 9 HX 370 (87.2 - 119.4, n=16) | |
| Asus Zenbook Pro 16X UX7602BZ-MY005W | |
| SCHENKER XMG Pro 16 Studio (Mid 24) | |
* ... más pequeño es mejor
Latencias del CPD
Como ya hemos mencionado, no pudimos poner en marcha LatencyMon con nuestro dispositivo de revisión. Sin embargo, al menos no hubo problemas con la reproducción de vídeo 4K (YouTube) en términos de fotogramas caídos.
Almacenamiento masivo
Nuestro dispositivo de análisis está equipado con una variante Micron 2400 de 1 TB, sin embargo, el usuario dispone de 879 GB tras la primera instalación. La unidad SSD M.2 2280 principal está conectada a través de una rápida interfaz PCIe 4.0 x4 pero, en comparación con la competencia, el rendimiento de la unidad SSD no es especialmente bueno. No obstante, el rendimiento se mantiene estable durante largos periodos de carga. El ProArt P16 también ofrece una segunda ranura M.2 2280, lo que significa que el almacenamiento puede actualizarse fácilmente. Sin embargo, la segunda ranura sólo está conectada a través de Pcie 4.0 x2 que está limitado a una velocidad máxima de 4 GB/s. Puede encontrar más pruebas comparativas de SSD aquí.
* ... más pequeño es mejor
Continuous Performance Read: DiskSpd Read Loop, Queue Depth 8
Tarjeta gráfica - GeForce RTX 4070 portátil
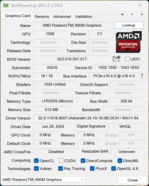
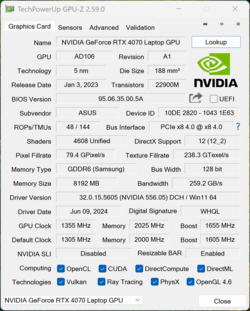
Nuestro modelo superior del ProArt P16 está equipado con una GeForce Portátil RTX 4070. El consumo máximo de energía se sitúa en 105 vatios (85 vatios TGP + 20 vatios Dynamic Boost) y la conmutación de gráficos se realiza mediante la tecnología Optimus estándar. Con tareas menos exigentes, de los cálculos gráficos se encarga la integrada Radeon 890M.
En las pruebas comparativas de la GPU, el rendimiento está al mismo nivel que el de otros competidores de la RTX 4070, pero la Portátil RTX 4080 que se encuentra en el Zenbook Pro 16X (máx. 140 vatios) es comprensiblemente (y notablemente) más rápido. Apple's GPU M3 Max también es considerablemente más rápida y tiene la ventaja de tener acceso a toda la RAM, mientras que los 8 GB de VRAM del portátil RTX 4070 pueden convertirse rápidamente en el cuello de botella, especialmente al editar vídeos.
Bajo carga continua, la GPU se mantiene totalmente estable. En modo batería, la RTX 4070 puede consumir un máximo de 42 vatios, por lo que el rendimiento de la GPU es significativamente inferior en este caso (-35 %). Puede encontrar más pruebas comparativas de gráficos aquí.
| GFXBench | |
| 3840x2160 4K Aztec Ruins High Tier Offscreen | |
| Apple MacBook Pro 16 2023 M3 Max | |
| Medio NVIDIA GeForce RTX 4070 Laptop GPU (123.9 - 127.6, n=2) | |
| Asus ProArt P16 H7606WI | |
| Media de la clase Multimedia (36.4 - 232, n=16, últimos 2 años) | |
| 2560x1440 Aztec Ruins High Tier Offscreen | |
| Apple MacBook Pro 16 2023 M3 Max | |
| Medio NVIDIA GeForce RTX 4070 Laptop GPU (282 - 289, n=2) | |
| Asus ProArt P16 H7606WI | |
| Media de la clase Multimedia (73.3 - 516, n=16, últimos 2 años) | |
| 1920x1080 Aztec Ruins Normal Tier Offscreen | |
| Apple MacBook Pro 16 2023 M3 Max | |
| Medio NVIDIA GeForce RTX 4070 Laptop GPU (696 - 736, n=2) | |
| Asus ProArt P16 H7606WI | |
| Media de la clase Multimedia (178.3 - 1302, n=15, últimos 2 años) | |
| 3DMark 11 Performance | 33231 puntos | |
| 3DMark Fire Strike Score | 26198 puntos | |
| 3DMark Time Spy Score | 11790 puntos | |
| 3DMark Steel Nomad Score | 2637 puntos | |
| 3DMark Steel Nomad Light Score | 12189 puntos | |
ayuda | ||
| Blender / v3.3 Classroom OPTIX/RTX | |
| Media de la clase Multimedia (19 - 105, n=39, últimos 2 años) | |
| SCHENKER XMG Pro 16 Studio (Mid 24) | |
| Asus ROG Zephyrus G16 2024 GU605M | |
| Asus ProArt P16 H7606WI | |
| Medio NVIDIA GeForce RTX 4070 Laptop GPU (18 - 30, n=67) | |
| Dell XPS 16 9640 | |
| Lenovo Yoga Pro 9 16IMH9 | |
| Asus Zenbook Pro 16X UX7602BZ-MY005W | |
| Blender / v3.3 Classroom CUDA | |
| Media de la clase Multimedia (32 - 164, n=39, últimos 2 años) | |
| Dell XPS 16 9640 | |
| Medio NVIDIA GeForce RTX 4070 Laptop GPU (32 - 50, n=66) | |
| Asus ROG Zephyrus G16 2024 GU605M | |
| SCHENKER XMG Pro 16 Studio (Mid 24) | |
| Asus ProArt P16 H7606WI | |
| Lenovo Yoga Pro 9 16IMH9 | |
| Asus Zenbook Pro 16X UX7602BZ-MY005W | |
| Blender / v3.3 Classroom CPU | |
| Media de la clase Multimedia (160 - 1042, n=80, últimos 2 años) | |
| Asus ROG Zephyrus G16 2024 GU605M | |
| Dell XPS 16 9640 | |
| Medio NVIDIA GeForce RTX 4070 Laptop GPU (158 - 440, n=66) | |
| Lenovo Yoga Pro 9 16IMH9 | |
| Asus Zenbook Pro 16X UX7602BZ-MY005W | |
| SCHENKER XMG Pro 16 Studio (Mid 24) | |
| Asus ProArt P16 H7606WI | |
| Apple MacBook Pro 16 2023 M3 Max | |
| Blender / v3.3 Classroom METAL | |
| Media de la clase Multimedia (17.8 - 121, n=7, últimos 2 años) | |
| Apple MacBook Pro 16 2023 M3 Max | |
* ... más pequeño es mejor
Rendimiento en juegos
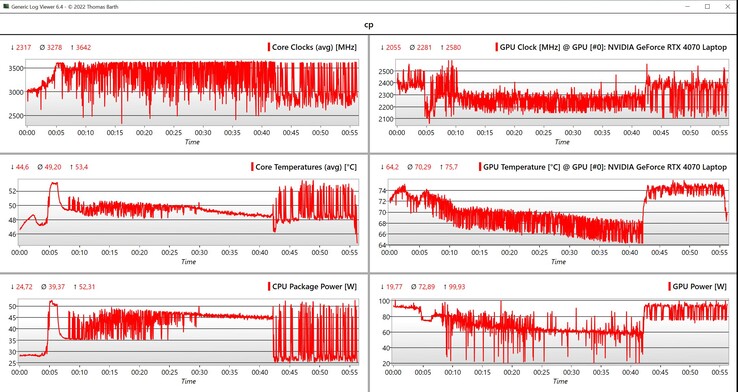
En general, el rendimiento en juegos del ProArt P16 es muy bueno y los resultados están al nivel que cabría esperar de un portátil RTX 4070. Incluso los juegos actuales se ejecutan sin esfuerzo en resolución QHD. Por el contrario, para una resolución 4K nativa, hay que recurrir a upsampling como la tecnología DLSS de Nvidia para títulos exigentes. En nuestro bucle Cyberpunk, nos encontramos con un problema interesante y reproducible. Aunque el rendimiento gráfico y el rendimiento general en la prueba de estrés (véase la sección de temperatura) se mantuvieron completamente estables, en los primeros 42 minutos, el rendimiento de juego en Cyberpunk bajó algo continuamente. Esto puede verse claramente al evaluar los datos de la CPU/GPU, sin embargo, después de 42 minutos, el rendimiento volvió a su nivel inicial y también se mantuvo estable en este nivel. Actualmente no podemos explicar este comportamiento y, en nuestras pruebas, esto sólo ocurrió con Cyberpunk.
| The Witcher 3 - 1920x1080 Ultra Graphics & Postprocessing (HBAO+) | |
| Asus Zenbook Pro 16X UX7602BZ-MY005W | |
| Asus ProArt P16 H7606WI | |
| Lenovo Yoga Pro 9 16IMH9 | |
| Asus ROG Zephyrus G16 2024 GU605M | |
| Dell XPS 16 9640 | |
| Media de la clase Multimedia (11 - 143.2, n=62, últimos 2 años) | |
| GTA V - 1920x1080 Highest Settings possible AA:4xMSAA + FX AF:16x | |
| Asus Zenbook Pro 16X UX7602BZ-MY005W | |
| SCHENKER XMG Pro 16 Studio (Mid 24) | |
| Asus ProArt P16 H7606WI | |
| Lenovo Yoga Pro 9 16IMH9 | |
| Dell XPS 16 9640 | |
| Asus ROG Zephyrus G16 2024 GU605M | |
| Media de la clase Multimedia (9.38 - 141.6, n=77, últimos 2 años) | |
| Call of Duty Modern Warfare 3 2023 | |
| 1920x1080 Extreme Preset | |
| Asus ProArt P16 H7606WI | |
| Medio NVIDIA GeForce RTX 4070 Laptop GPU (92 - 120, n=7) | |
| Asus ROG Zephyrus G16 2024 GU605M | |
| Media de la clase Multimedia (27 - 120, n=6, últimos 2 años) | |
| 2560x1440 Extreme Preset | |
| Asus ProArt P16 H7606WI | |
| Medio NVIDIA GeForce RTX 4070 Laptop GPU (64 - 83, n=6) | |
| Asus ROG Zephyrus G16 2024 GU605M | |
| Media de la clase Multimedia (29 - 83, n=3, últimos 2 años) | |
| Horizon Forbidden West | |
| 1920x1080 Very High Preset AA:T | |
| Lenovo Yoga Pro 9 16IMH9 | |
| Asus ProArt P16 H7606WI | |
| Medio NVIDIA GeForce RTX 4070 Laptop GPU (53.2 - 76.7, n=10) | |
| Dell XPS 16 9640 | |
| Media de la clase Multimedia (12.4 - 65.4, n=5, últimos 2 años) | |
| 2560x1440 Very High Preset AA:T | |
| Lenovo Yoga Pro 9 16IMH9 | |
| Medio NVIDIA GeForce RTX 4070 Laptop GPU (40.3 - 59.1, n=9) | |
| Asus ProArt P16 H7606WI | |
| Media de la clase Multimedia (40.3 - 56.1, n=3, últimos 2 años) | |
| Dell XPS 16 9640 | |
Cyberpunk 2077 ultra FPS diagram
| bajo | medio | alto | ultra | QHD | 4K | |
|---|---|---|---|---|---|---|
| GTA V (2015) | 168 | 111.2 | 86.6 | 83.7 | ||
| The Witcher 3 (2015) | 224 | 121 | 88 | 71 | ||
| Dota 2 Reborn (2015) | 165.7 | 151.4 | 148.1 | 141.6 | 129.9 | |
| Final Fantasy XV Benchmark (2018) | 189.3 | 152.9 | 115.3 | 85.3 | 47.2 | |
| X-Plane 11.11 (2018) | 95.2 | 88.7 | 72.3 | 63.4 | ||
| Far Cry 5 (2018) | 147 | 130 | 124 | 115 | 102 | 59 |
| Strange Brigade (2018) | 333 | 270 | 164.5 | 206 | 130 | 68.4 |
| F1 23 (2023) | 192.9 | 197.3 | 188.8 | 70.3 | 41 | 19.6 |
| Baldur's Gate 3 (2023) | 150 | 125.6 | 82.8 | 82.5 | 59.9 | 33.4 |
| Cyberpunk 2077 2.2 Phantom Liberty (2023) | 119.4 | 110 | 94.1 | 80.7 | 49.4 | 20.2 |
| Call of Duty Modern Warfare 3 2023 (2023) | 182 | 164 | 127 | 120 | 83 | 49 |
| Horizon Forbidden West (2024) | 100.2 | 91.5 | 71.8 | 64.4 | 49.9 | 30.4 |
Emisiones - Excelentes altavoces
Emisiones sonoras
El sistema de refrigeración consta de tres ventiladores y, aunque tuvimos problemas para controlar el tercer ventilador en nuestras pruebas con el ROG Zephyrus G16, estos se han resuelto desde entonces. En el modo de rendimiento, hay un ruido silencioso casi omnipresente, sin embargo, en los otros dos modos, los ventiladores suelen estar inactivos tanto en reposo como realizando tareas exigentes. Bajo carga, los tres perfiles difieren notablemente aunque tanto el Estándar como el Rendimiento llegan a ser bastante ruidosos.
| Perfil energético | 3DMark 06 | Cyberpunk 2077Prueba de estrés |
|---|---|---|
| Susurro | 34 dB(A) | 42,2 dB(A) |
| Estándar | 42,2 dB(A) | 47,1 dB(A) |
| Rendimiento | 51,3 dB(A) | 53,2 dB(A) |
Ruido
| Ocioso |
| 24.4 / 27.7 / 32.3 dB(A) |
| Carga |
| 42.2 / 53.2 dB(A) |
 | ||
30 dB silencioso 40 dB(A) audible 50 dB(A) ruidosamente alto |
||
min: | ||
| Asus ProArt P16 H7606WI NVIDIA GeForce RTX 4070 Laptop GPU, Ryzen AI 9 HX 370, Micron 2400 MTFDKBA1T0QFM | SCHENKER XMG Pro 16 Studio (Mid 24) NVIDIA GeForce RTX 4070 Laptop GPU, i9-14900HX, Samsung 990 Pro 1 TB | Lenovo Yoga Pro 9 16IMH9 NVIDIA GeForce RTX 4070 Laptop GPU, Ultra 9 185H, SK Hynix HFS001TEJ9X115N | Dell XPS 16 9640 NVIDIA GeForce RTX 4070 Laptop GPU, Ultra 7 155H, Kioxia XG8 KXG80ZNV1T02 | Asus ROG Zephyrus G16 2024 GU605M NVIDIA GeForce RTX 4070 Laptop GPU, Ultra 7 155H, WD PC SN560 SDDPNQE-1T00 | Apple MacBook Pro 16 2023 M3 Max M3 Max 40-Core GPU, Apple M3 Max 16-Core, Apple SSD AP8192Z | Asus Zenbook Pro 16X UX7602BZ-MY005W NVIDIA GeForce RTX 4080 Laptop GPU, i9-13905H, Samsung PM9A1 MZVL22T0HBLB | |
|---|---|---|---|---|---|---|---|
| Noise | -8% | 3% | 7% | 7% | 12% | 7% | |
| apagado / medio ambiente * | 24.4 | 25 -2% | 24.3 -0% | 24.5 -0% | 23.9 2% | 23.7 3% | 24.9 -2% |
| Idle Minimum * | 24.4 | 28 -15% | 24.3 -0% | 24.5 -0% | 23.9 2% | 23.7 3% | 24.9 -2% |
| Idle Average * | 27.7 | 31 -12% | 24.3 12% | 24.5 12% | 27.8 -0% | 23.7 14% | 24.9 10% |
| Idle Maximum * | 32.3 | 35 -8% | 25.8 20% | 27.5 15% | 30.1 7% | 23.7 27% | 24.9 23% |
| Load Average * | 42.2 | 52 -23% | 48.1 -14% | 39.6 6% | 34.2 19% | 40.8 3% | 38 10% |
| Cyberpunk 2077 ultra * | 53.2 | 53 -0% | |||||
| Load Maximum * | 53.2 | 52 2% | 53.9 -1% | 49.7 7% | 46.4 13% | 42.8 20% | 51 4% |
| Witcher 3 ultra * | 49.7 | 49.7 | 46.4 | 42.8 |
* ... más pequeño es mejor
Temperatura
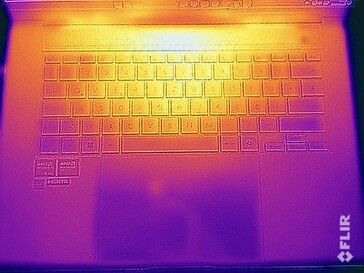
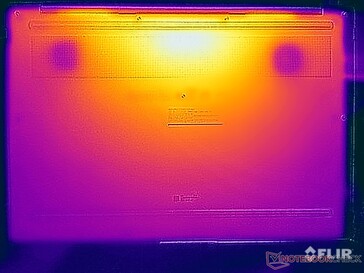
En su configuración más rápida, el ProArt P16 es esencialmente un portátil relativamente cálido y, en uso inactivo, medimos casi 30 °C en la mayoría de los lugares. Pero eso no es un problema y no hay que temer ninguna limitación en situaciones cotidianas. Bajo carga, hay un punto caliente en la zona central trasera, tanto en la parte superior como en la inferior de la unidad base. En este escenario, debe evitar colocar el dispositivo sobre el regazo, pero el uso normal del teclado no presentará ningún problema.
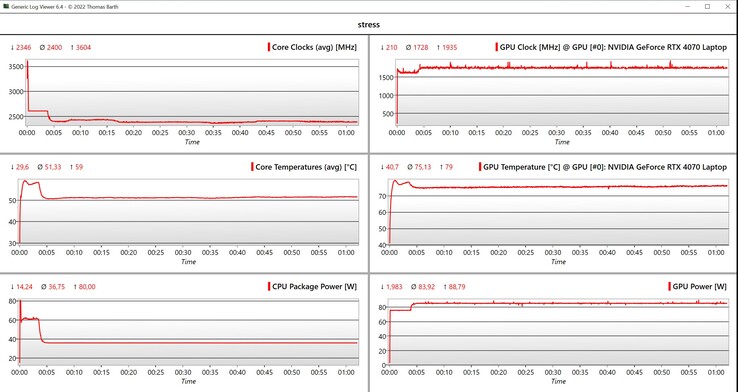
En la prueba de estrés con carga combinada de CPU y GPU, el procesador funciona a 60 vatios durante el primer minuto y la GPU a 75 vatios. Tras unos 4 minutos, el procesador se estabiliza en 37 vatios y la tarjeta gráfica en 85 vatios. En general, un buen resultado y al mismo nivel que el Zenbook Pro 16X (45/80 vatios).
(-) La temperatura máxima en la parte superior es de 46.9 °C / 116 F, frente a la media de 36.9 °C / 98 F, que oscila entre 21.1 y 71 °C para la clase Multimedia.
(-) El fondo se calienta hasta un máximo de 50.9 °C / 124 F, frente a la media de 39.2 °C / 103 F
(+) En reposo, la temperatura media de la parte superior es de 27.5 °C / 82# F, frente a la media del dispositivo de 31.3 °C / 88 F.
(±) 3: The average temperature for the upper side is 37 °C / 99 F, compared to the average of 31.3 °C / 88 F for the class Multimedia.
(+) Los reposamanos y el panel táctil alcanzan como máximo la temperatura de la piel (34 °C / 93.2 F) y, por tanto, no están calientes.
(-) La temperatura media de la zona del reposamanos de dispositivos similares fue de 28.8 °C / 83.8 F (-5.2 °C / -9.4 F).
| Asus ProArt P16 H7606WI AMD Ryzen AI 9 HX 370, NVIDIA GeForce RTX 4070 Laptop GPU | SCHENKER XMG Pro 16 Studio (Mid 24) Intel Core i9-14900HX, NVIDIA GeForce RTX 4070 Laptop GPU | Lenovo Yoga Pro 9 16IMH9 Intel Core Ultra 9 185H, NVIDIA GeForce RTX 4070 Laptop GPU | Dell XPS 16 9640 Intel Core Ultra 7 155H, NVIDIA GeForce RTX 4070 Laptop GPU | Asus ROG Zephyrus G16 2024 GU605M Intel Core Ultra 7 155H, NVIDIA GeForce RTX 4070 Laptop GPU | Apple MacBook Pro 16 2023 M3 Max Apple M3 Max 16-Core, Apple M3 Max 40-Core GPU | Asus Zenbook Pro 16X UX7602BZ-MY005W Intel Core i9-13905H, NVIDIA GeForce RTX 4080 Laptop GPU | |
|---|---|---|---|---|---|---|---|
| Heat | -23% | 10% | 14% | 0% | 18% | 22% | |
| Maximum Upper Side * | 46.9 | 51 -9% | 41.7 11% | 39.4 16% | 50.3 -7% | 42.3 10% | 28.2 40% |
| Maximum Bottom * | 50.9 | 66 -30% | 46.3 9% | 36.9 28% | 48 6% | 42 17% | 35.1 31% |
| Idle Upper Side * | 28.9 | 35 -21% | 26.2 9% | 28.2 2% | 28.8 -0% | 22.5 22% | 24.6 15% |
| Idle Bottom * | 30 | 39 -30% | 27.2 9% | 27.4 9% | 29.8 1% | 22.9 24% | 29.4 2% |
* ... más pequeño es mejor
Altavoces
El sistema de sonido consta de 6 módulos (4 woofers, 2 vatios cada uno + 2x tweeters, 2 vatios cada uno). El sistema ya era maravilloso en el ROG Zephyrus G16 y no ha cambiado mucho desde entonces. Según nuestras mediciones, sólo el volumen máximo es ligeramente inferior. En este sentido, el ProArt P16 es uno de los mejores portátiles del mercado.
Asus ProArt P16 H7606WI análisis de audio
(±) | la sonoridad del altavoz es media pero buena (81.4 dB)
Graves 100 - 315 Hz
(+) | buen bajo - sólo 3% lejos de la mediana
(±) | la linealidad de los graves es media (8.3% delta a frecuencia anterior)
Medios 400 - 2000 Hz
(+) | medios equilibrados - a sólo 3.5% de la mediana
(+) | los medios son lineales (2.5% delta a la frecuencia anterior)
Altos 2 - 16 kHz
(+) | máximos equilibrados - a sólo 3% de la mediana
(+) | los máximos son lineales (3.6% delta a la frecuencia anterior)
Total 100 - 16.000 Hz
(+) | el sonido global es lineal (8.5% de diferencia con la mediana)
En comparación con la misma clase
» 6% de todos los dispositivos probados de esta clase eran mejores, 2% similares, 92% peores
» El mejor tuvo un delta de 5%, la media fue 18%, el peor fue ###max##%
En comparación con todos los dispositivos probados
» 2% de todos los dispositivos probados eran mejores, 1% similares, 98% peores
» El mejor tuvo un delta de 4%, la media fue 24%, el peor fue ###max##%
SCHENKER XMG Pro 16 Studio (Mid 24) análisis de audio
(±) | la sonoridad del altavoz es media pero buena (79 dB)
Graves 100 - 315 Hz
(-) | casi sin bajos - de media 15.1% inferior a la mediana
(±) | la linealidad de los graves es media (13.6% delta a frecuencia anterior)
Medios 400 - 2000 Hz
(±) | medias más altas - de media 5.3% más altas que la mediana
(+) | los medios son lineales (4.4% delta a la frecuencia anterior)
Altos 2 - 16 kHz
(+) | máximos equilibrados - a sólo 4.4% de la mediana
(+) | los máximos son lineales (4.9% delta a la frecuencia anterior)
Total 100 - 16.000 Hz
(±) | la linealidad del sonido global es media (17.7% de diferencia con la mediana)
En comparación con la misma clase
» 50% de todos los dispositivos probados de esta clase eran mejores, 10% similares, 40% peores
» El mejor tuvo un delta de 6%, la media fue 18%, el peor fue ###max##%
En comparación con todos los dispositivos probados
» 33% de todos los dispositivos probados eran mejores, 8% similares, 59% peores
» El mejor tuvo un delta de 4%, la media fue 24%, el peor fue ###max##%
Lenovo Yoga Pro 9 16IMH9 análisis de audio
(+) | los altavoces pueden reproducir a un volumen relativamente alto (#84.5 dB)
Graves 100 - 315 Hz
(±) | lubina reducida - en promedio 7% inferior a la mediana
(±) | la linealidad de los graves es media (7.2% delta a frecuencia anterior)
Medios 400 - 2000 Hz
(+) | medios equilibrados - a sólo 3.9% de la mediana
(+) | los medios son lineales (4.5% delta a la frecuencia anterior)
Altos 2 - 16 kHz
(+) | máximos equilibrados - a sólo 2.8% de la mediana
(+) | los máximos son lineales (3.2% delta a la frecuencia anterior)
Total 100 - 16.000 Hz
(+) | el sonido global es lineal (8.8% de diferencia con la mediana)
En comparación con la misma clase
» 8% de todos los dispositivos probados de esta clase eran mejores, 2% similares, 91% peores
» El mejor tuvo un delta de 5%, la media fue 18%, el peor fue ###max##%
En comparación con todos los dispositivos probados
» 2% de todos los dispositivos probados eran mejores, 1% similares, 97% peores
» El mejor tuvo un delta de 4%, la media fue 24%, el peor fue ###max##%
Dell XPS 16 9640 análisis de audio
(+) | los altavoces pueden reproducir a un volumen relativamente alto (#83.4 dB)
Graves 100 - 315 Hz
(±) | lubina reducida - en promedio 11.2% inferior a la mediana
(±) | la linealidad de los graves es media (8.9% delta a frecuencia anterior)
Medios 400 - 2000 Hz
(+) | medios equilibrados - a sólo 4.5% de la mediana
(+) | los medios son lineales (3% delta a la frecuencia anterior)
Altos 2 - 16 kHz
(+) | máximos equilibrados - a sólo 1.4% de la mediana
(+) | los máximos son lineales (2% delta a la frecuencia anterior)
Total 100 - 16.000 Hz
(+) | el sonido global es lineal (10% de diferencia con la mediana)
En comparación con la misma clase
» 10% de todos los dispositivos probados de esta clase eran mejores, 1% similares, 89% peores
» El mejor tuvo un delta de 5%, la media fue 18%, el peor fue ###max##%
En comparación con todos los dispositivos probados
» 4% de todos los dispositivos probados eran mejores, 1% similares, 95% peores
» El mejor tuvo un delta de 4%, la media fue 24%, el peor fue ###max##%
Asus ROG Zephyrus G16 2024 GU605M análisis de audio
(+) | los altavoces pueden reproducir a un volumen relativamente alto (#83.3 dB)
Graves 100 - 315 Hz
(+) | buen bajo - sólo 3.8% lejos de la mediana
(±) | la linealidad de los graves es media (8.1% delta a frecuencia anterior)
Medios 400 - 2000 Hz
(+) | medios equilibrados - a sólo 3.5% de la mediana
(+) | los medios son lineales (2.4% delta a la frecuencia anterior)
Altos 2 - 16 kHz
(+) | máximos equilibrados - a sólo 2.2% de la mediana
(+) | los máximos son lineales (3.7% delta a la frecuencia anterior)
Total 100 - 16.000 Hz
(+) | el sonido global es lineal (7.3% de diferencia con la mediana)
En comparación con la misma clase
» 1% de todos los dispositivos probados de esta clase eran mejores, 0% similares, 99% peores
» El mejor tuvo un delta de 6%, la media fue 18%, el peor fue ###max##%
En comparación con todos los dispositivos probados
» 1% de todos los dispositivos probados eran mejores, 0% similares, 99% peores
» El mejor tuvo un delta de 4%, la media fue 24%, el peor fue ###max##%
Apple MacBook Pro 16 2023 M3 Max análisis de audio
(+) | los altavoces pueden reproducir a un volumen relativamente alto (#84.3 dB)
Graves 100 - 315 Hz
(±) | lubina reducida - en promedio 5% inferior a la mediana
(+) | el bajo es lineal (5.6% delta a la frecuencia anterior)
Medios 400 - 2000 Hz
(+) | medios equilibrados - a sólo 1.2% de la mediana
(+) | los medios son lineales (3.1% delta a la frecuencia anterior)
Altos 2 - 16 kHz
(+) | máximos equilibrados - a sólo 2.4% de la mediana
(+) | los máximos son lineales (2.4% delta a la frecuencia anterior)
Total 100 - 16.000 Hz
(+) | el sonido global es lineal (5.3% de diferencia con la mediana)
En comparación con la misma clase
» 1% de todos los dispositivos probados de esta clase eran mejores, 1% similares, 98% peores
» El mejor tuvo un delta de 5%, la media fue 18%, el peor fue ###max##%
En comparación con todos los dispositivos probados
» 0% de todos los dispositivos probados eran mejores, 0% similares, 100% peores
» El mejor tuvo un delta de 4%, la media fue 24%, el peor fue ###max##%
Asus Zenbook Pro 16X UX7602BZ-MY005W análisis de audio
(+) | los altavoces pueden reproducir a un volumen relativamente alto (#88.5 dB)
Graves 100 - 315 Hz
(±) | lubina reducida - en promedio 9.8% inferior a la mediana
(±) | la linealidad de los graves es media (7.7% delta a frecuencia anterior)
Medios 400 - 2000 Hz
(+) | medios equilibrados - a sólo 1.6% de la mediana
(+) | los medios son lineales (4.5% delta a la frecuencia anterior)
Altos 2 - 16 kHz
(+) | máximos equilibrados - a sólo 2.1% de la mediana
(+) | los máximos son lineales (3.3% delta a la frecuencia anterior)
Total 100 - 16.000 Hz
(+) | el sonido global es lineal (8.1% de diferencia con la mediana)
En comparación con la misma clase
» 1% de todos los dispositivos probados de esta clase eran mejores, 1% similares, 98% peores
» El mejor tuvo un delta de 6%, la media fue 18%, el peor fue ###max##%
En comparación con todos los dispositivos probados
» 1% de todos los dispositivos probados eran mejores, 1% similares, 98% peores
» El mejor tuvo un delta de 4%, la media fue 24%, el peor fue ###max##%
Gestión de la energía - Más resistencia que el ROG Zephyrus G16
Consumo de energía
A pesar de su panel OLED, la ProArt P16 es bastante eficiente. Funcionando en reposo y al máximo brillo SDR, sólo registramos un máximo de 11,6 vatios, a pesar del fondo de pantalla relativamente brillante. Al jugar, este entonces alrededor de 160 vatios y en la prueba de estrés, durante un breve tiempo, 212,6 vatios. Sin embargo, después de unos minutos, esto baja rápidamente y se asienta en 160 vatios. Esto significa que la fuente de alimentación de 200 vatios suministrada tiene el tamaño adecuado.
| Off / Standby | |
| Ocioso | |
| Carga |
|
Clave:
min: | |
| Asus ProArt P16 H7606WI Ryzen AI 9 HX 370, NVIDIA GeForce RTX 4070 Laptop GPU, Micron 2400 MTFDKBA1T0QFM, OLED, 3840x2400, 16" | SCHENKER XMG Pro 16 Studio (Mid 24) i9-14900HX, NVIDIA GeForce RTX 4070 Laptop GPU, Samsung 990 Pro 1 TB, IPS, 2560x1600, 16" | Lenovo Yoga Pro 9 16IMH9 Ultra 9 185H, NVIDIA GeForce RTX 4070 Laptop GPU, SK Hynix HFS001TEJ9X115N, Mini-LED, 3200x2000, 16" | Dell XPS 16 9640 Ultra 7 155H, NVIDIA GeForce RTX 4070 Laptop GPU, Kioxia XG8 KXG80ZNV1T02, OLED, 3840x2400, 16.3" | Asus ROG Zephyrus G16 2024 GU605M Ultra 7 155H, NVIDIA GeForce RTX 4070 Laptop GPU, WD PC SN560 SDDPNQE-1T00, OLED, 2560x1600, 16" | Apple MacBook Pro 16 2023 M3 Max Apple M3 Max 16-Core, M3 Max 40-Core GPU, Apple SSD AP8192Z, Mini-LED, 3456x2234, 16" | Asus Zenbook Pro 16X UX7602BZ-MY005W i9-13905H, NVIDIA GeForce RTX 4080 Laptop GPU, Samsung PM9A1 MZVL22T0HBLB, OLED, 3200x2000, 16" | Medio NVIDIA GeForce RTX 4070 Laptop GPU | Media de la clase Multimedia | |
|---|---|---|---|---|---|---|---|---|---|
| Power Consumption | -129% | -50% | 9% | -3% | -14% | -32% | -56% | 7% | |
| Idle Minimum * | 8 | 31 -288% | 10.3 -29% | 7.7 4% | 8.3 -4% | 5.2 35% | 9 -13% | 12.8 ? -60% | 6.86 ? 14% |
| Idle Average * | 9.9 | 33 -233% | 21.9 -121% | 10.3 -4% | 12.5 -26% | 16.9 -71% | 11.9 -20% | 17.8 ? -80% | 11.5 ? -16% |
| Idle Maximum * | 11.6 | 41 -253% | 22.4 -93% | 10.6 9% | 12.8 -10% | 17.2 -48% | 20.5 -77% | 24.3 ? -109% | 13.5 ? -16% |
| Load Average * | 76.9 | 114 -48% | 96.9 -26% | 76.5 1% | 71.3 7% | 90.5 -18% | 93.5 -22% | 96.9 ? -26% | 71.4 ? 7% |
| Cyberpunk 2077 ultra * | 157.7 | 218 -38% | |||||||
| Cyberpunk 2077 ultra external monitor * | 156.6 | 196.8 -26% | |||||||
| Load Maximum * | 212.6 | 250 -18% | 173.8 18% | 138.5 35% | 169.1 20% | 145.2 32% | 267 -26% | 221 ? -4% | 116.6 ? 45% |
| Witcher 3 ultra * | 159.6 | 126.4 | 127.5 | 109 | 195.7 |
* ... más pequeño es mejor
Power consumption Cyberpunk / stress test
Power consumption with an external monitor
Duración de las pilas
En nuestras pruebas Wi-Fi, la batería de 90 Wh fue responsable de una autonomía media ligeramente mejor que la del Zephyrus G16 de construcción similar. En la prueba Wi-Fi a 150 cd/m² (lo que representa el 70 % del brillo máximo SDR), registramos 8 horas y 18 minutos y, a pleno brillo, unas 2 horas menos (6 horas y 23 minutos). Por el contrario, en la prueba de vídeo, nos quedamos muy sorprendidos porque, a 150 cd/m², la autonomía fue de unas enormes 21 horas, lo que supone un rendimiento tremendo teniendo en cuenta el gran panel de 16 pulgadas del portátil. A pleno brillo, un vídeo HDR puede durar 5 horas.
Con el aparato encendido, un ciclo de carga completo dura sólo 108 minutos y el 80 % de la capacidad está disponible tras 48 minutos.
| Asus ProArt P16 H7606WI Ryzen AI 9 HX 370, NVIDIA GeForce RTX 4070 Laptop GPU, 90 Wh | SCHENKER XMG Pro 16 Studio (Mid 24) i9-14900HX, NVIDIA GeForce RTX 4070 Laptop GPU, 73 Wh | Lenovo Yoga Pro 9 16IMH9 Ultra 9 185H, NVIDIA GeForce RTX 4070 Laptop GPU, 84 Wh | Dell XPS 16 9640 Ultra 7 155H, NVIDIA GeForce RTX 4070 Laptop GPU, 99.5 Wh | Asus ROG Zephyrus G16 2024 GU605M Ultra 7 155H, NVIDIA GeForce RTX 4070 Laptop GPU, 90 Wh | Apple MacBook Pro 16 2023 M3 Max Apple M3 Max 16-Core, M3 Max 40-Core GPU, 99.6 Wh | Asus Zenbook Pro 16X UX7602BZ-MY005W i9-13905H, NVIDIA GeForce RTX 4080 Laptop GPU, 96 Wh | Media de la clase Multimedia | |
|---|---|---|---|---|---|---|---|---|
| Duración de Batería | -32% | -26% | -7% | -33% | 19% | 10% | -6% | |
| H.264 | 1260 | 692 -45% | 988 -22% | 671 -47% | 1221 -3% | 864 ? -31% | ||
| WiFi v1.3 | 499 | 337 -32% | 526 5% | 629 26% | 435 -13% | 999 100% | 472.8 -5% | 645 ? 29% |
| Load | 116 | 73 -37% | 87 -25% | 71 -39% | 71 -39% | 144 24% | 99 ? -15% |
Pro
Contra
Veredicto - La ProArt P16 es una potencia compacta con compromisos
El nuevo Asus ProArt P16 está basado en el conocido portátil para juegos/multimedia, el ROG Zephyrus G16 y también ofrece toneladas de rendimiento gracias a los nuevos procesadores móviles AMD Zen 5 - y todo ello en un paquete compacto y particularmente ligero, que inclina la balanza a 1,8 kg. El Ryzen AI 9 HX 370 ofrece un rendimiento de CPU significativamente mayor que el procesador Meteor Lake que se encuentra en el Zephyrus G16, pero, como portátil para usuarios creativos, el P16 es más un sustituto del Zenbook Pro 16X cuyo Core i9 13905H no es mucho más lento pero tiene un RTX 4080 portátil que es simplemente mucho más rápido que el Portátil RTX 4070 del ProArt. Esto significa que en lo que respecta al rendimiento de la GPU, tendrá que aceptar un paso atrás si opta por el más ligero de los dos portátiles.
En cuanto a la pantalla, también es discutible si la nueva pantalla táctil OLED de 60 Hz y 4K es una mejora en comparación con el panel OLED de 120 Hz y 3,2K del Zenbook Pro 16X. La mayor resolución es una ventaja y la precisión del color también es muy buena, pero una frecuencia de solo 60 Hz ya no puede considerarse actualizada cuando se trata de un dispositivo tan caro en 2024.
Con el ProArt P16, Asus ofrece una potencia comparativamente ligera y compacta para los usuarios creativos que necesitan una pantalla táctil y están dispuestos a prescindir de una frecuencia más alta. En concreto, la versión superior de 64 GB es extremadamente cara.
Sin embargo, si puede vivir con el compromiso del rendimiento, seguirá obteniendo un portátil de 16 pulgadas comparativamente ligero y de gran rendimiento con suficientes puertos, una carcasa de primera calidad, muy buenos dispositivos de entrada, así como un excelente sistema de sonido. No obstante, esto también lo obtiene con el ROG Zephyrus G16 y aquí es donde tendrá que decidir si prefiere una pantalla táctil en lugar de una OLED de mayor frecuencia. Se pueden instalar dos SSD M.2 2280 en el ProArt pero la RAM está soldada. Hay una opción de 64 GB pero el salto de precio desde los 32 GB es de unos enormes 400 dólares. El ProArt P16 tiene un grupo objetivo relativamente pequeño y si esta es la combinación que busca, realmente no puede equivocarse aquí.
Precio y disponibilidad
El nuevo ProArt P16 puede solicitarse directamente a Asus en https://shop.asus.com/us/90nb1421-m00a80-proart-p16-h7606.html.
Nota: Recientemente hemos actualizado nuestro sistema de clasificación y los resultados de la versión 8 no son comparables con los de la versión 7. Encontrará más información aquí.
Asus ProArt P16 H7606WI
- 08/04/2024 v8
Andreas Osthoff
Transparencia
La selección de los dispositivos que se van a reseñar corre a cargo de nuestro equipo editorial. La muestra de prueba fue proporcionada al autor en calidad de préstamo por el fabricante o el minorista a los efectos de esta reseña. El prestamista no tuvo ninguna influencia en esta reseña, ni el fabricante recibió una copia de la misma antes de su publicación. No había ninguna obligación de publicar esta reseña. Nunca aceptamos compensaciones o pagos a cambio de nuestras reseñas. Como empresa de medios independiente, Notebookcheck no está sujeta a la autoridad de fabricantes, minoristas o editores.
Así es como prueba Notebookcheck
Cada año, Notebookcheck revisa de forma independiente cientos de portátiles y smartphones utilizando procedimientos estandarizados para asegurar que todos los resultados son comparables. Hemos desarrollado continuamente nuestros métodos de prueba durante unos 20 años y hemos establecido los estándares de la industria en el proceso. En nuestros laboratorios de pruebas, técnicos y editores experimentados utilizan equipos de medición de alta calidad. Estas pruebas implican un proceso de validación en varias fases. Nuestro complejo sistema de clasificación se basa en cientos de mediciones y puntos de referencia bien fundamentados, lo que mantiene la objetividad.











 Total Sustainability Score:


