

Framework Laptop 13.5 Ryzen AI 9 review: Sáltese la versión Intel para un mejor rendimiento
Cada vez es más rápido.
Framework está exprimiendo todo lo que puede de su anticuado diseño, todo en nombre de la sostenibilidad. Está funcionando mejor de lo esperado en su mayor parte en términos de rendimiento bruto, pero todavía hay algunas características clave que nos gustaría ver.Allen Ngo (traducido por DeepL / Ninh Duy) Publicado 🇺🇸 🇫🇷 ...
Veredicto - Familiar pero más rápido
El nuevo Ryzen AI 9 HX 370 es una mejora considerable sobre el 2024 Core Ultra 7 o Zen 4 Ryzen U configuraciones. El rendimiento ha mejorado sin necesidad de aumentar la potencia o ampliar la solución de refrigeración para mantener la compatibilidad de las piezas con las antiguas configuraciones del portátil 13.5.
Si no necesita todo ese rendimiento, las configuraciones más antiguas del portátil 13,5 pueden seguir ofreciendo esencialmente la misma experiencia de usuario por menos. Las configuraciones Marco de gama alta se están volviendo notablemente más caras, con nuestra unidad de prueba en particular rozando el techo de los 2.000 dólares. Las configuraciones Core Ultra, más lentas y baratas, ofrecen una mayor duración de la batería junto con cuatro puertos USB-C 4.0 idénticos para ser una buena compensación si el rendimiento bruto no es una prioridad.
Algunos aspectos del diseño del Marco de cinco años están empezando a mostrar su edad. La webcam de 2 MP, la falta de opciones de color OLED o P3 y unos altavoces relativamente débiles se están quedando atrás respecto a los últimos modelos de la competencia de Lenovo, HPo Dell. Framework aún no ha ofrecido este tipo de actualizaciones a pesar de la filosofía de diseño flexible de la serie Laptop 13.5.
Pro
Contra
Precio y disponibilidad
Marco es ahora el envío de el portátil 13.5 con opciones de la serie Ryzen AI 300 a partir de $1330 USD. Nuestra unidad como revisado se vende al por menor por $ 2100.
- $1,094.16ASUS Vivobook S 14 OLED Slim Laptop, AMD Ryzen AI 9, 24GB, 512GB SSD, Customizable RGB Keyboard, Neutral Black, M5406WA-DS76
- $1,449.00HP OmniBook Ultra 14 2024 Laptop, 12-Core AMD Ryzen AI 9 HX 375 APU, 14" 2.2K IPS Touchscreen Display, AMD Radeon Graphics, 32GB LPDDR5 2TB SSD, Backlit Keyboard, Fingerprint, Copilot+, Win11 Home
Framework ha actualizado este año su portátil 13.5 con procesadores AMD Zen 5 de la serie HX para suplantar a las opciones Core Ultra 7 Zen 4 de la serie U del año pasado. Por lo demás, el chasis es idéntico, por lo que recomendamos consultar nuestro análisis sobre el modelo original para saber más sobre las características físicas del sistema.
Nuestra unidad de prueba es la configuración de gama más alta con la CPU Ryzen AI 9 HX 370 y pantalla IPS de 2880 x 1920 120 Hz por más de 2100 USD. Las configuraciones inferiores empiezan con la Ryzen AI 5 340 o una pantalla de 2256 x 1504 60 Hz en su lugar.
Entre los competidores del Laptop 13.5 se incluyen populares subportátiles insignia para prosumidores o empresas como el Lenovo ThinkPad T14s, Dell Pro 13o la Serie HP EliteBook.
Más revisiones de Framework:
Especificaciones
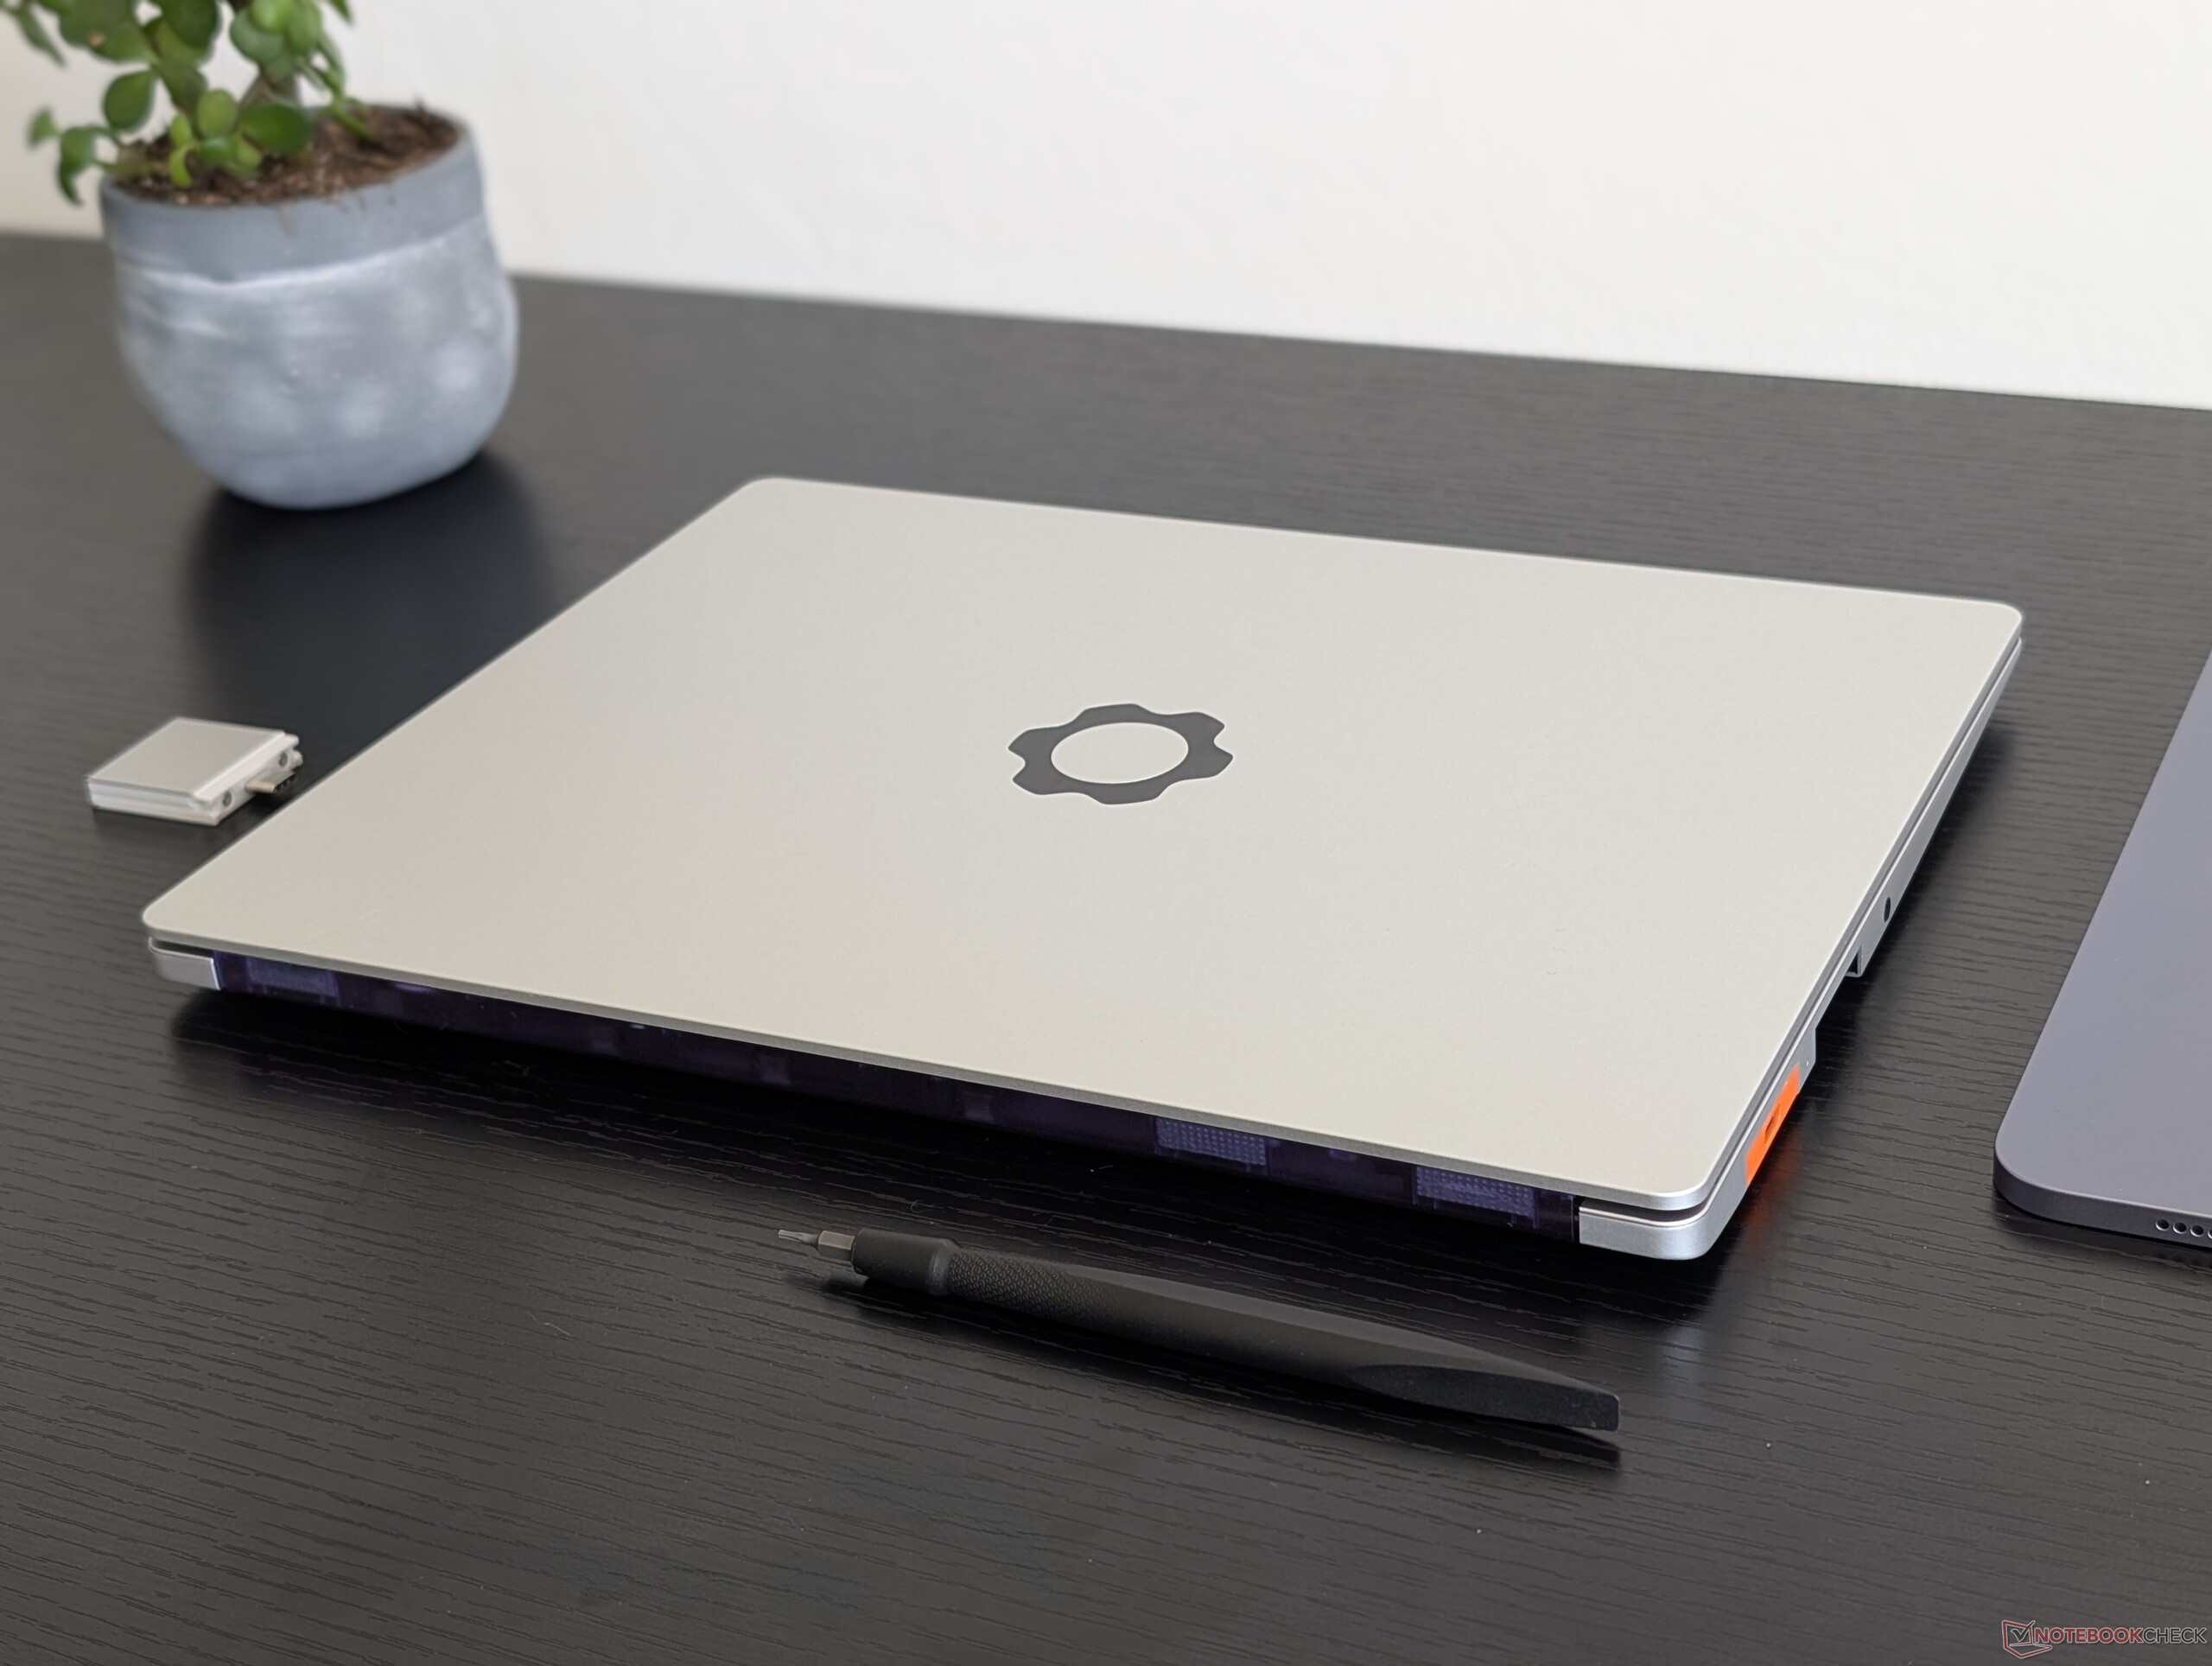
Caso
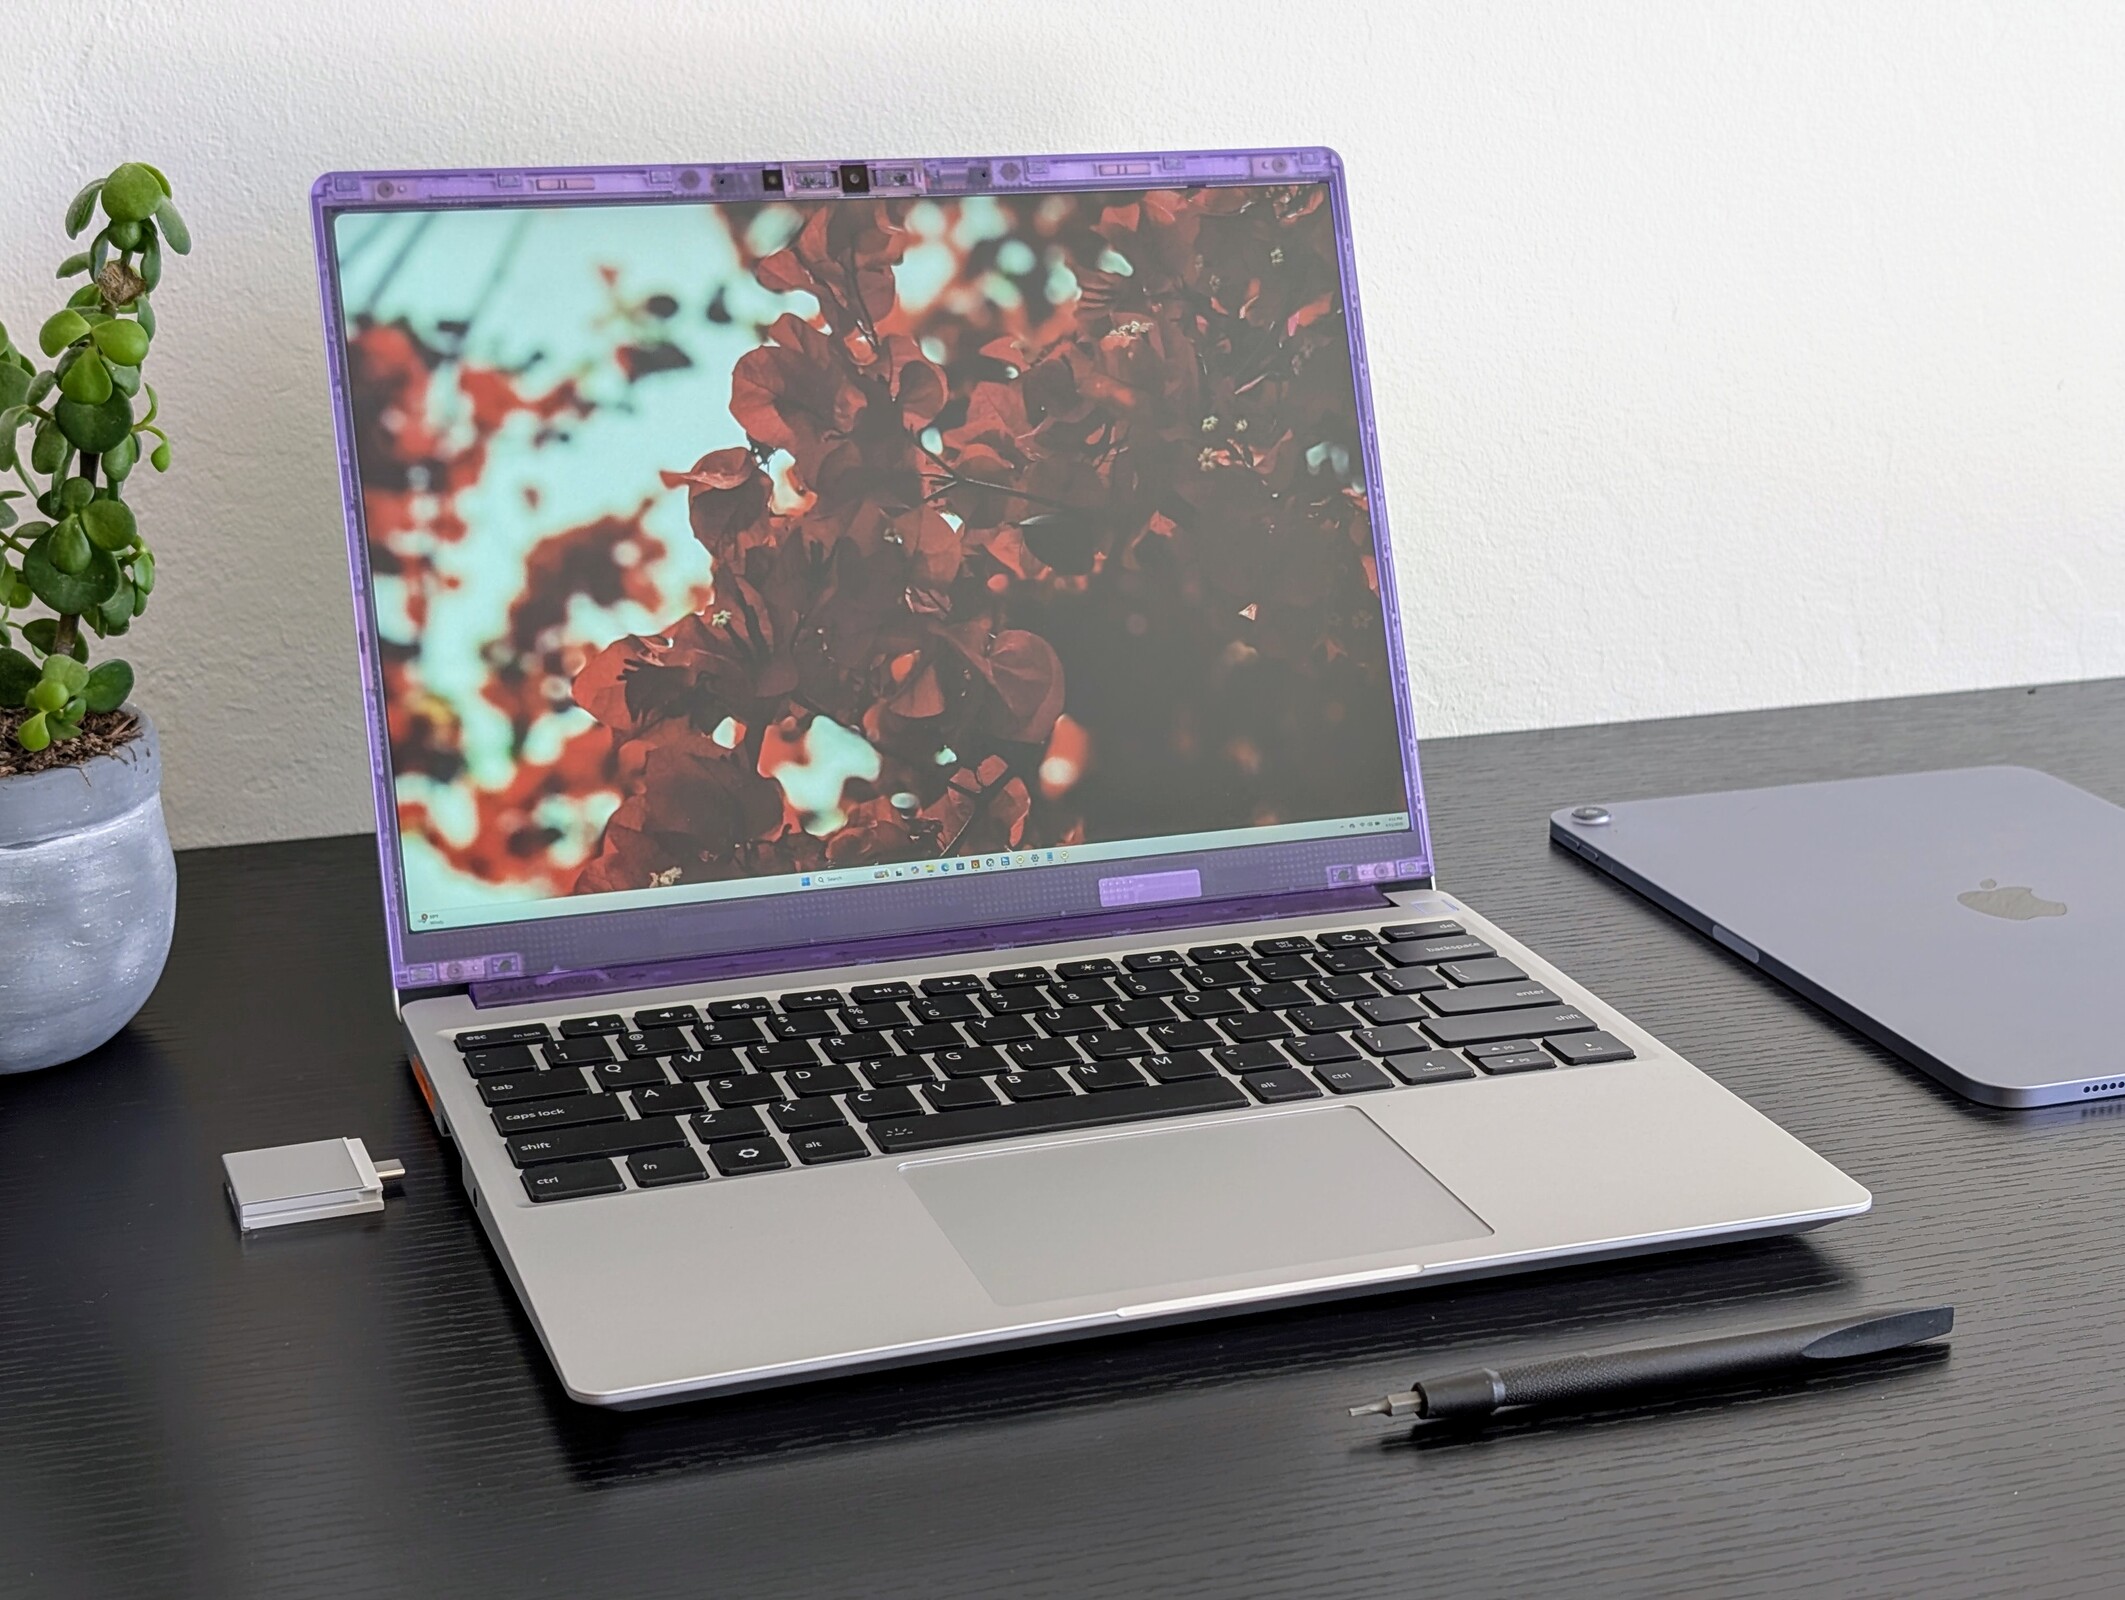
No hay cambios en el diseño del chasis para seguir siendo compatible con las piezas de repuesto y los accesorios existentes.
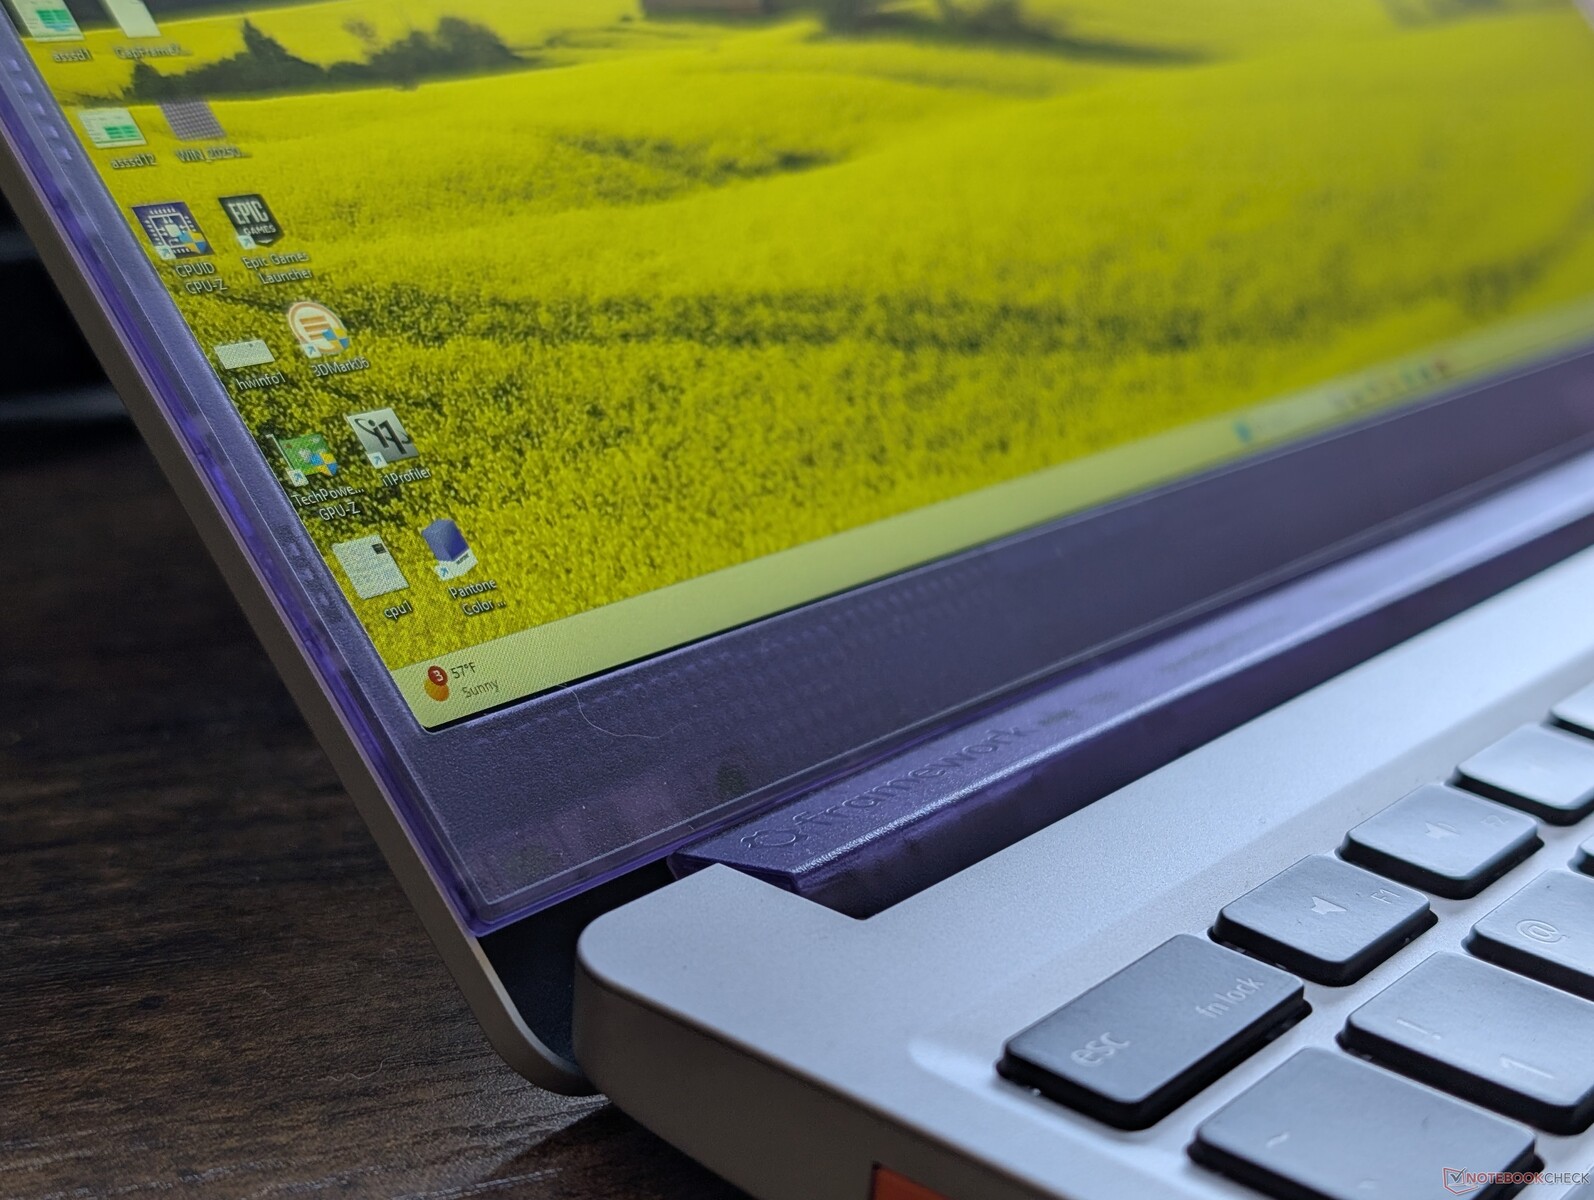
Las nuevas opciones de este año incluyen los biseles de plástico de color translúcido para los aficionados al bricolaje que quieran añadir un poco de color a sus sistemas y un teclado de segunda generación que reduce el repiqueteo de las teclas y la vibración de los altavoces integrados. Aun así, las diferencias son discutiblemente menores y en gran medida estéticas.
Conectividad
Aunque los cuatro puertos USB-C han regresado, tenga en cuenta que no son todos idénticos a diferencia de la versión Intel de este portátil debido a las diferencias arquitectónicas subyacentes del procesador AMD. En concreto, aquí solo los dos puertos USB-C traseros son compatibles con velocidades USB4, mientras que los dos puertos USB-C delanteros son USB 3.2.
Lector de tarjetas SD
| SD Card Reader | |
| average JPG Copy Test (av. of 3 runs) | |
| Framework Laptop 13.5 Core Ultra 7 155H (Toshiba Exceria Pro SDXC 64 GB UHS-II) | |
| Framework Laptop 13.5 Ryzen AI 9 HX 370 (AV PRO microSD 128 GB V60) | |
| maximum AS SSD Seq Read Test (1GB) | |
| Framework Laptop 13.5 Core Ultra 7 155H (Toshiba Exceria Pro SDXC 64 GB UHS-II) | |
| Framework Laptop 13.5 Ryzen AI 9 HX 370 (AV PRO microSD 128 GB V60) | |
Comunicación
Cámara web
La cámara web de 2 MP vuelve sin opciones de mayor resolución.


Mantenimiento
La facilidad de mantenimiento permanece inalterada e indiscutible en comparación con otros subportátiles de los principales fabricantes. Vea nuestro vídeo a continuación para obtener una guía más detallada sobre las características de mantenimiento.
Sostenibilidad
Framework utiliza un 75% de aluminio reciclado para la cubierta superior y los altavoces, un 50% de aluminio reciclado para la cubierta inferior y el teclado, un 50% de plástico reciclado para las teclas y hasta un 30% de plástico reciclado para las tarjetas de expansión. El embalaje es todo de papel y cartón para que sea totalmente reciclable.
El fabricante también ofrece piezas de repuesto, módulos de actualización y guías de mantenimiento detalladas que incluso los fabricantes más grandes aún no han igualado.
Accesorios y garantía
Las novedades de este año para las tarjetas de expansión son los colores de plástico translúcido y las opciones HDMI 2.0b actualizadas. Los colores translúcidos no suponen un coste adicional en comparación con los colores existentes de aluminio gris o plástico sólido.
Se aplica la garantía limitada estándar del fabricante de un año.
Mostrar
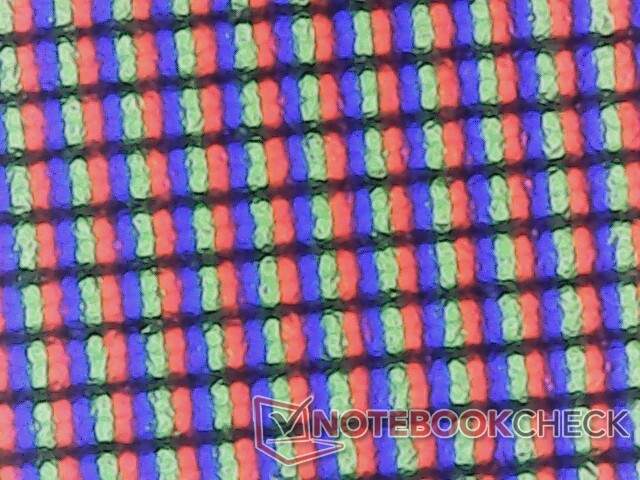
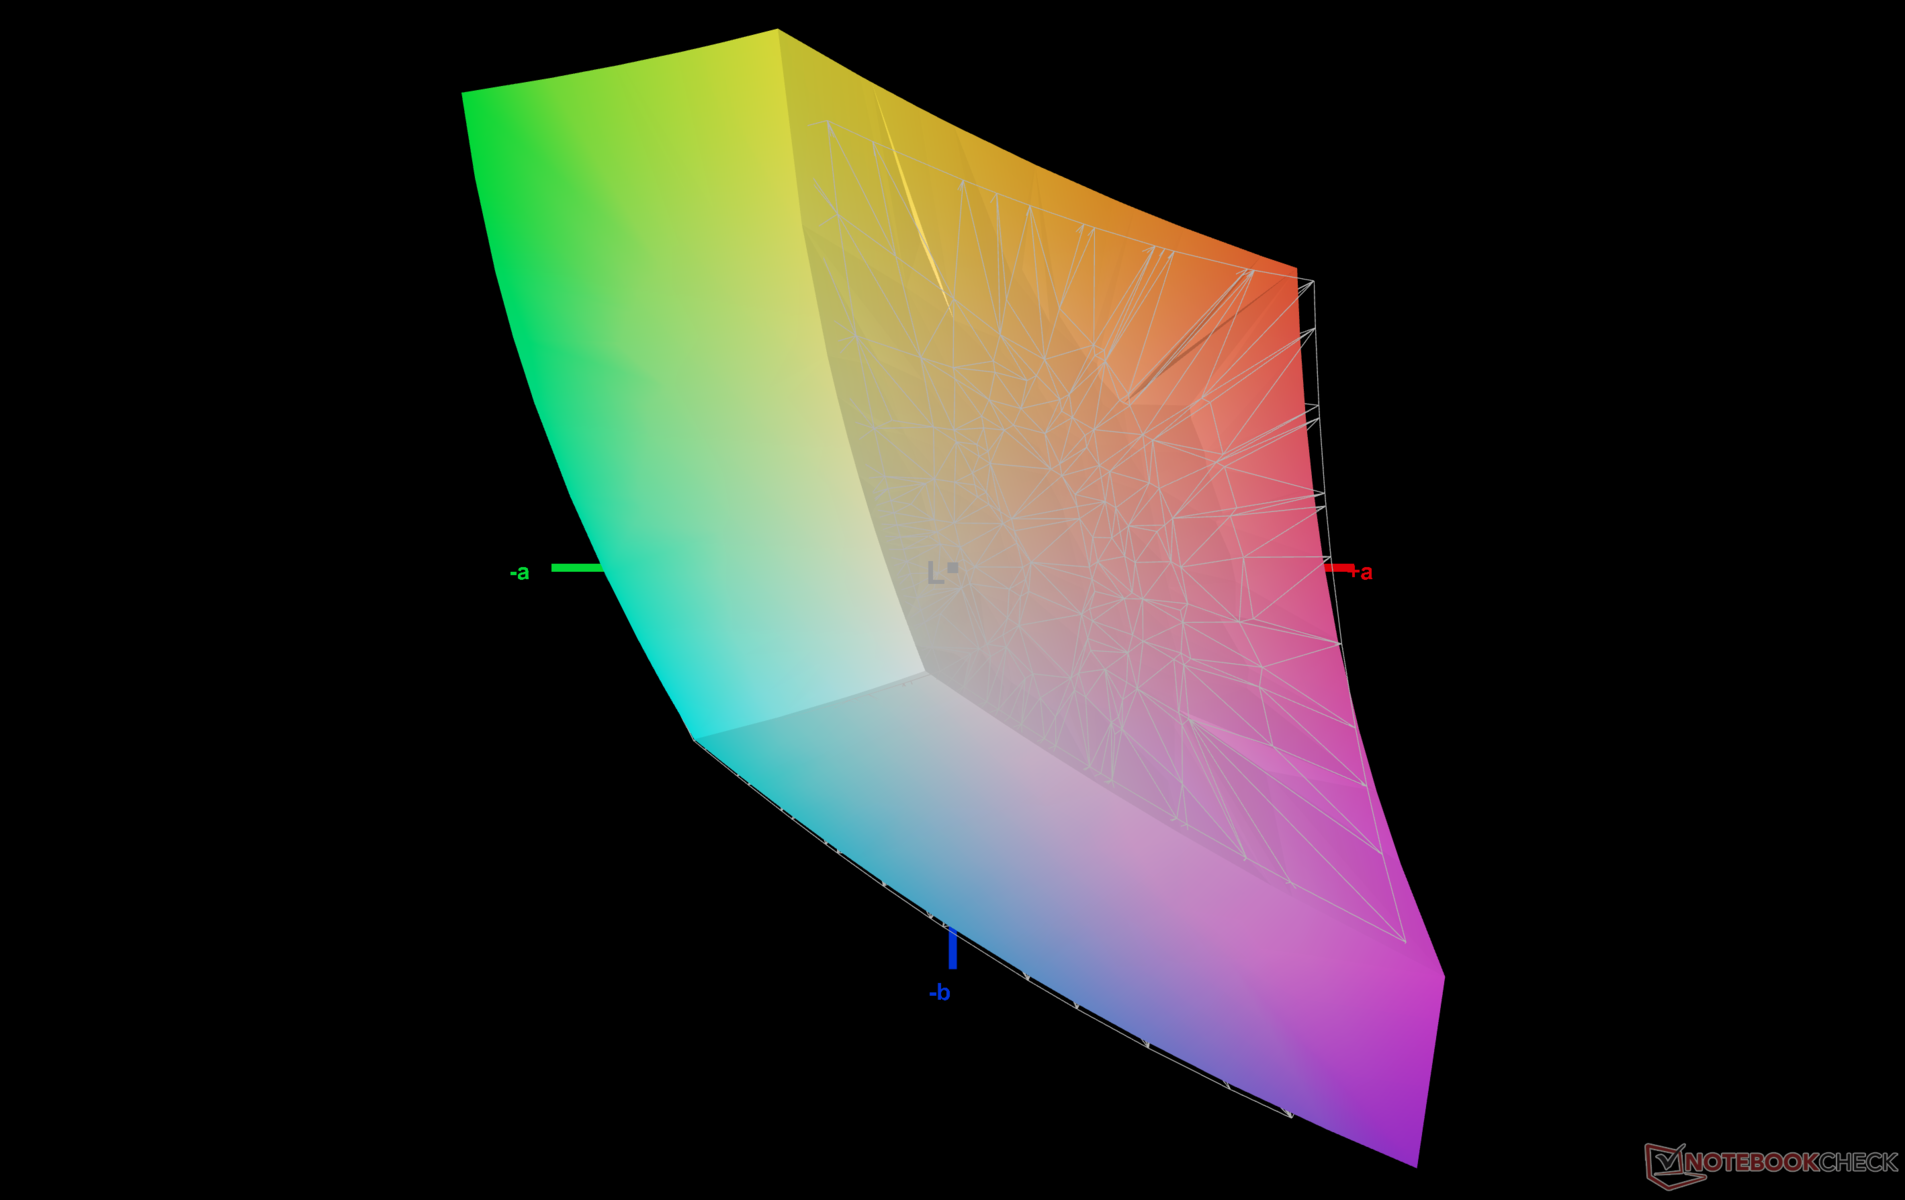
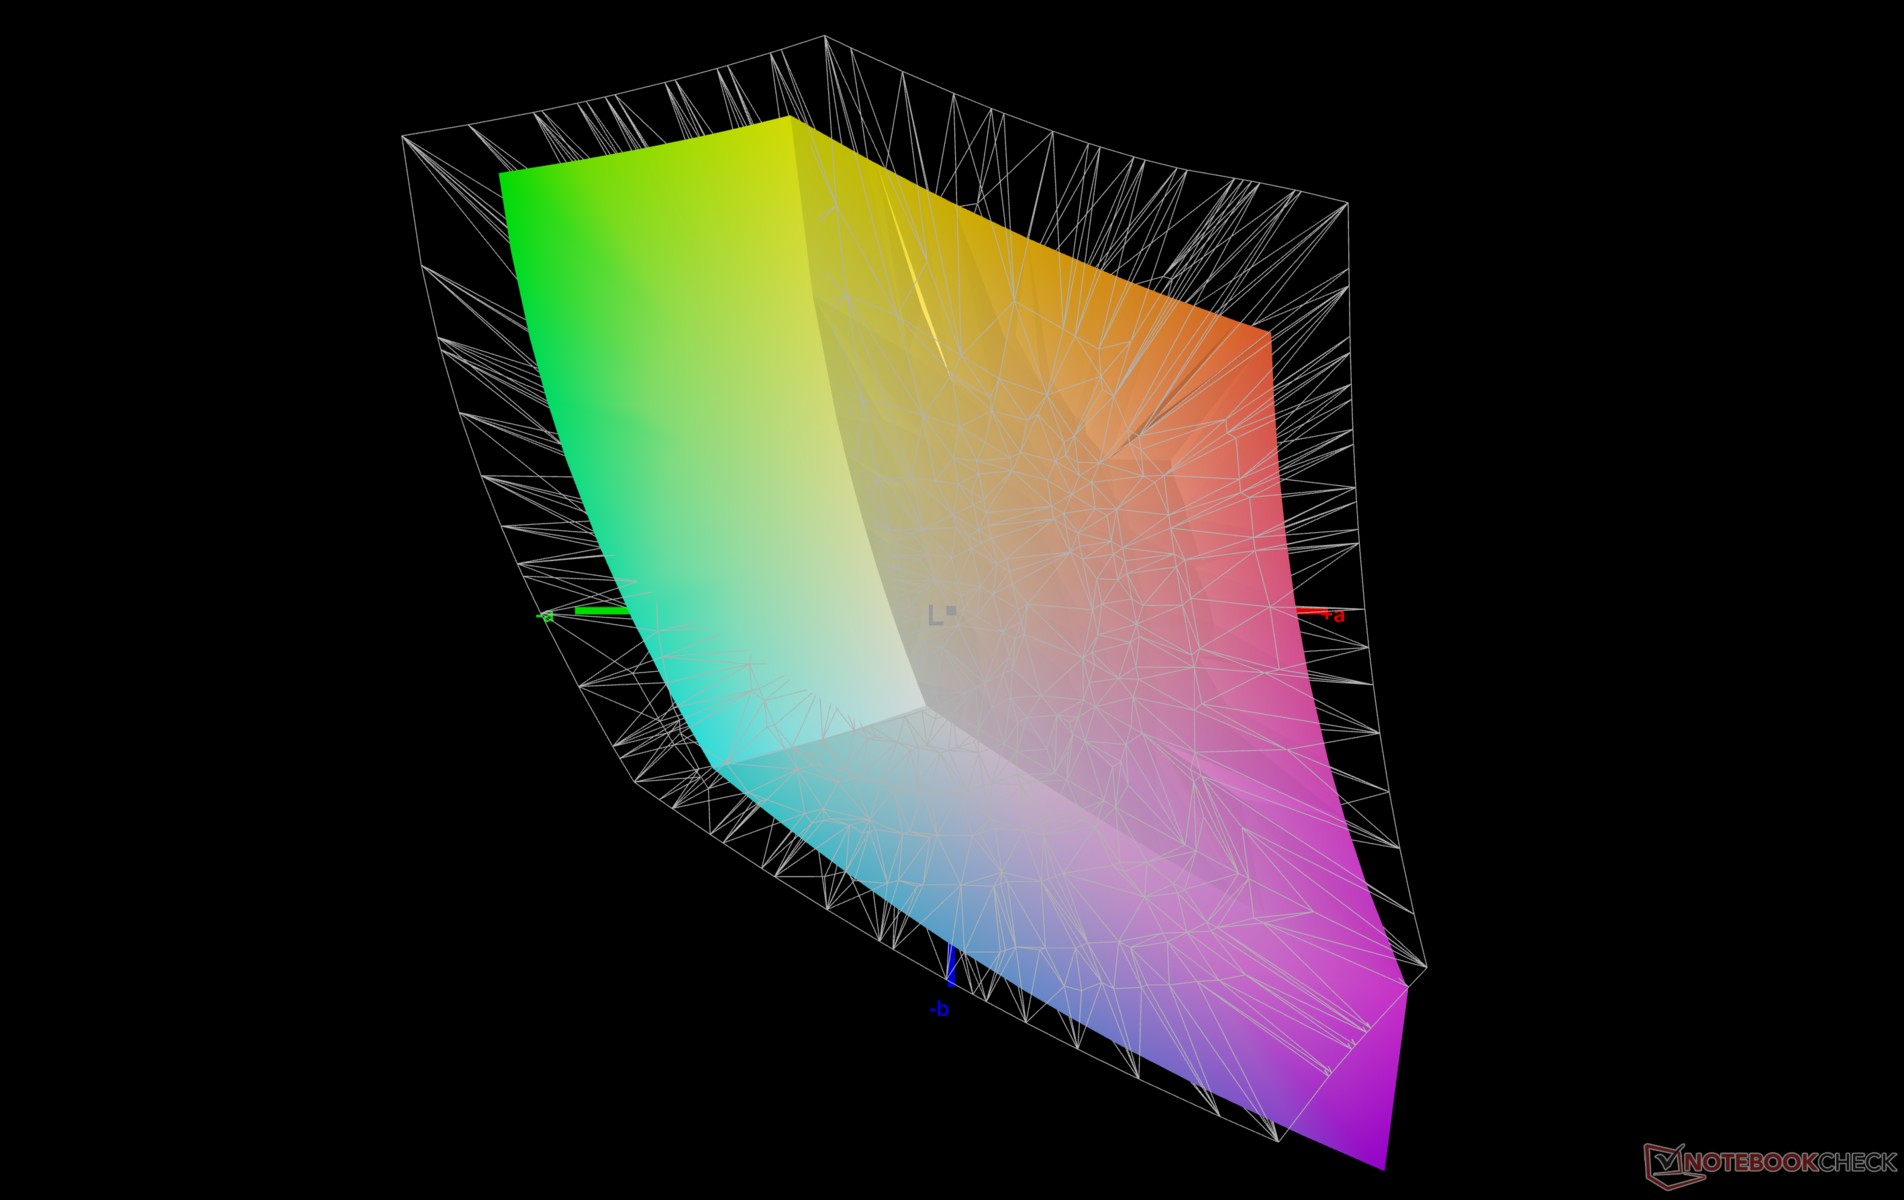
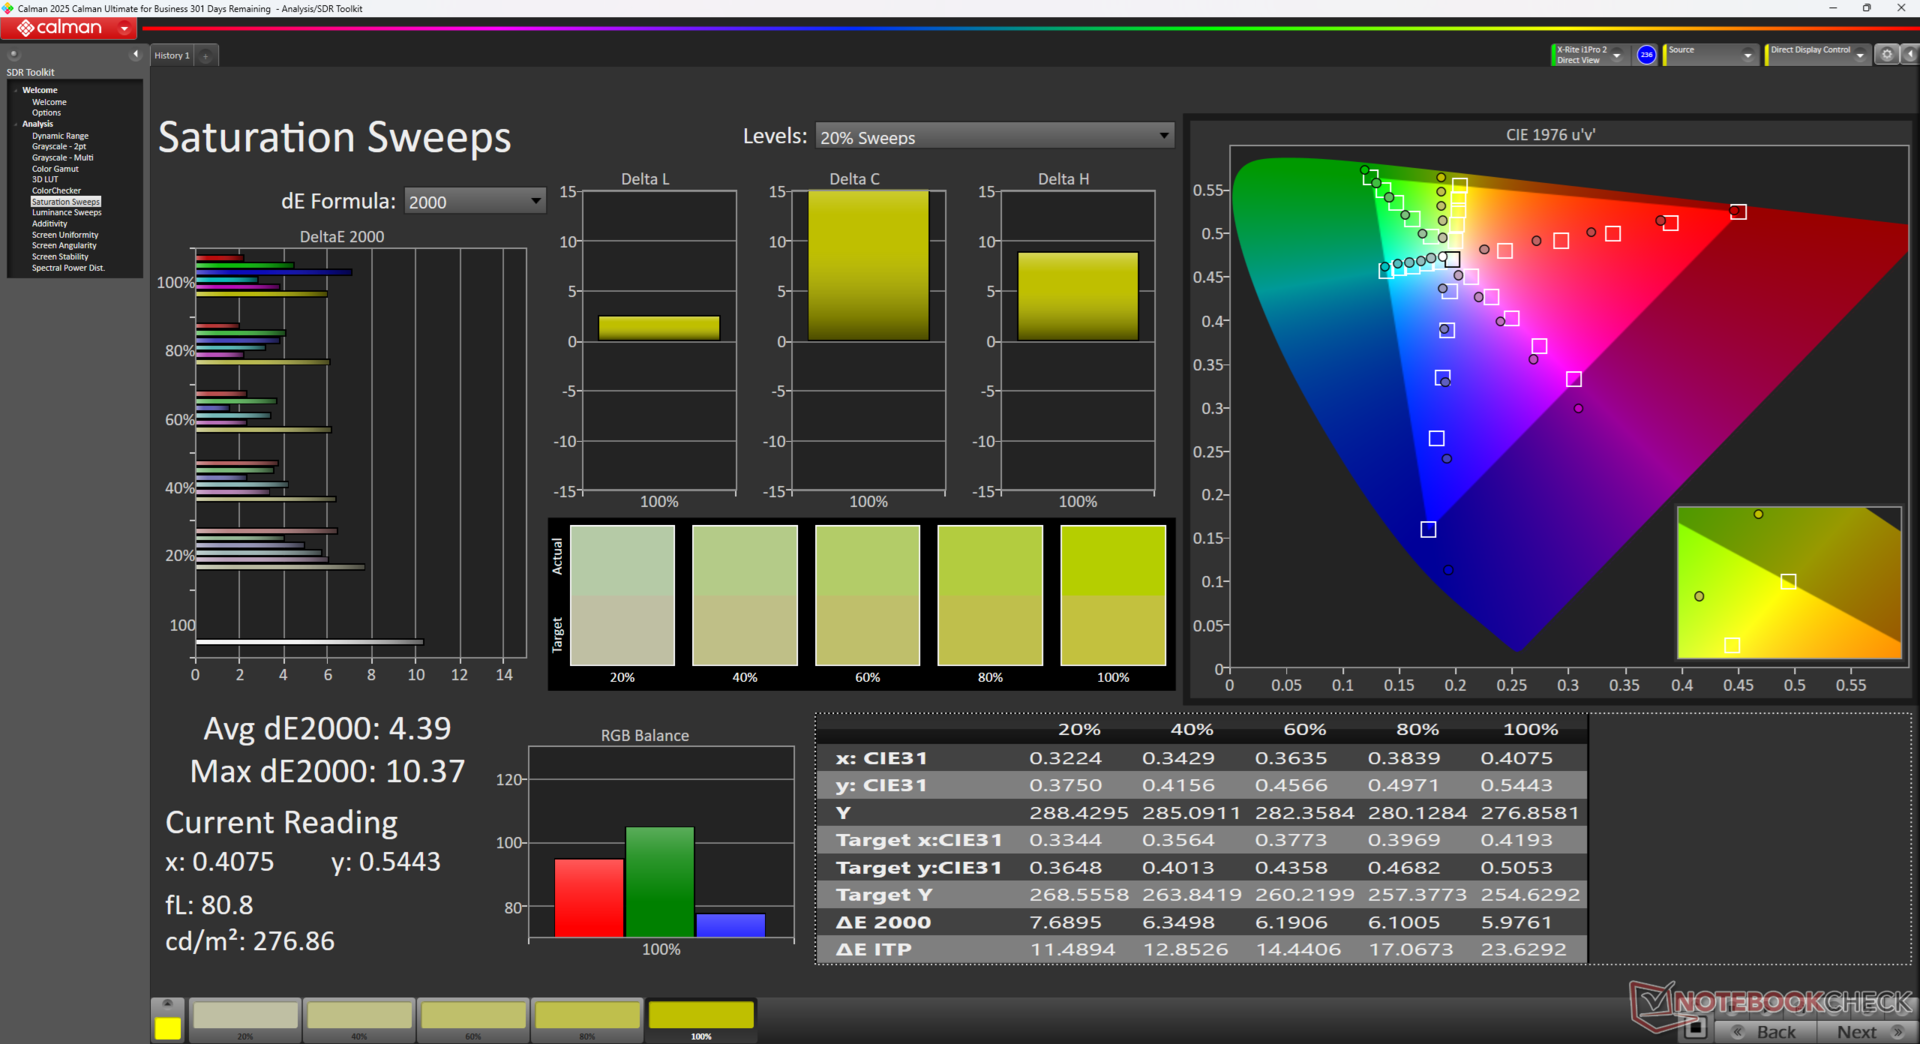
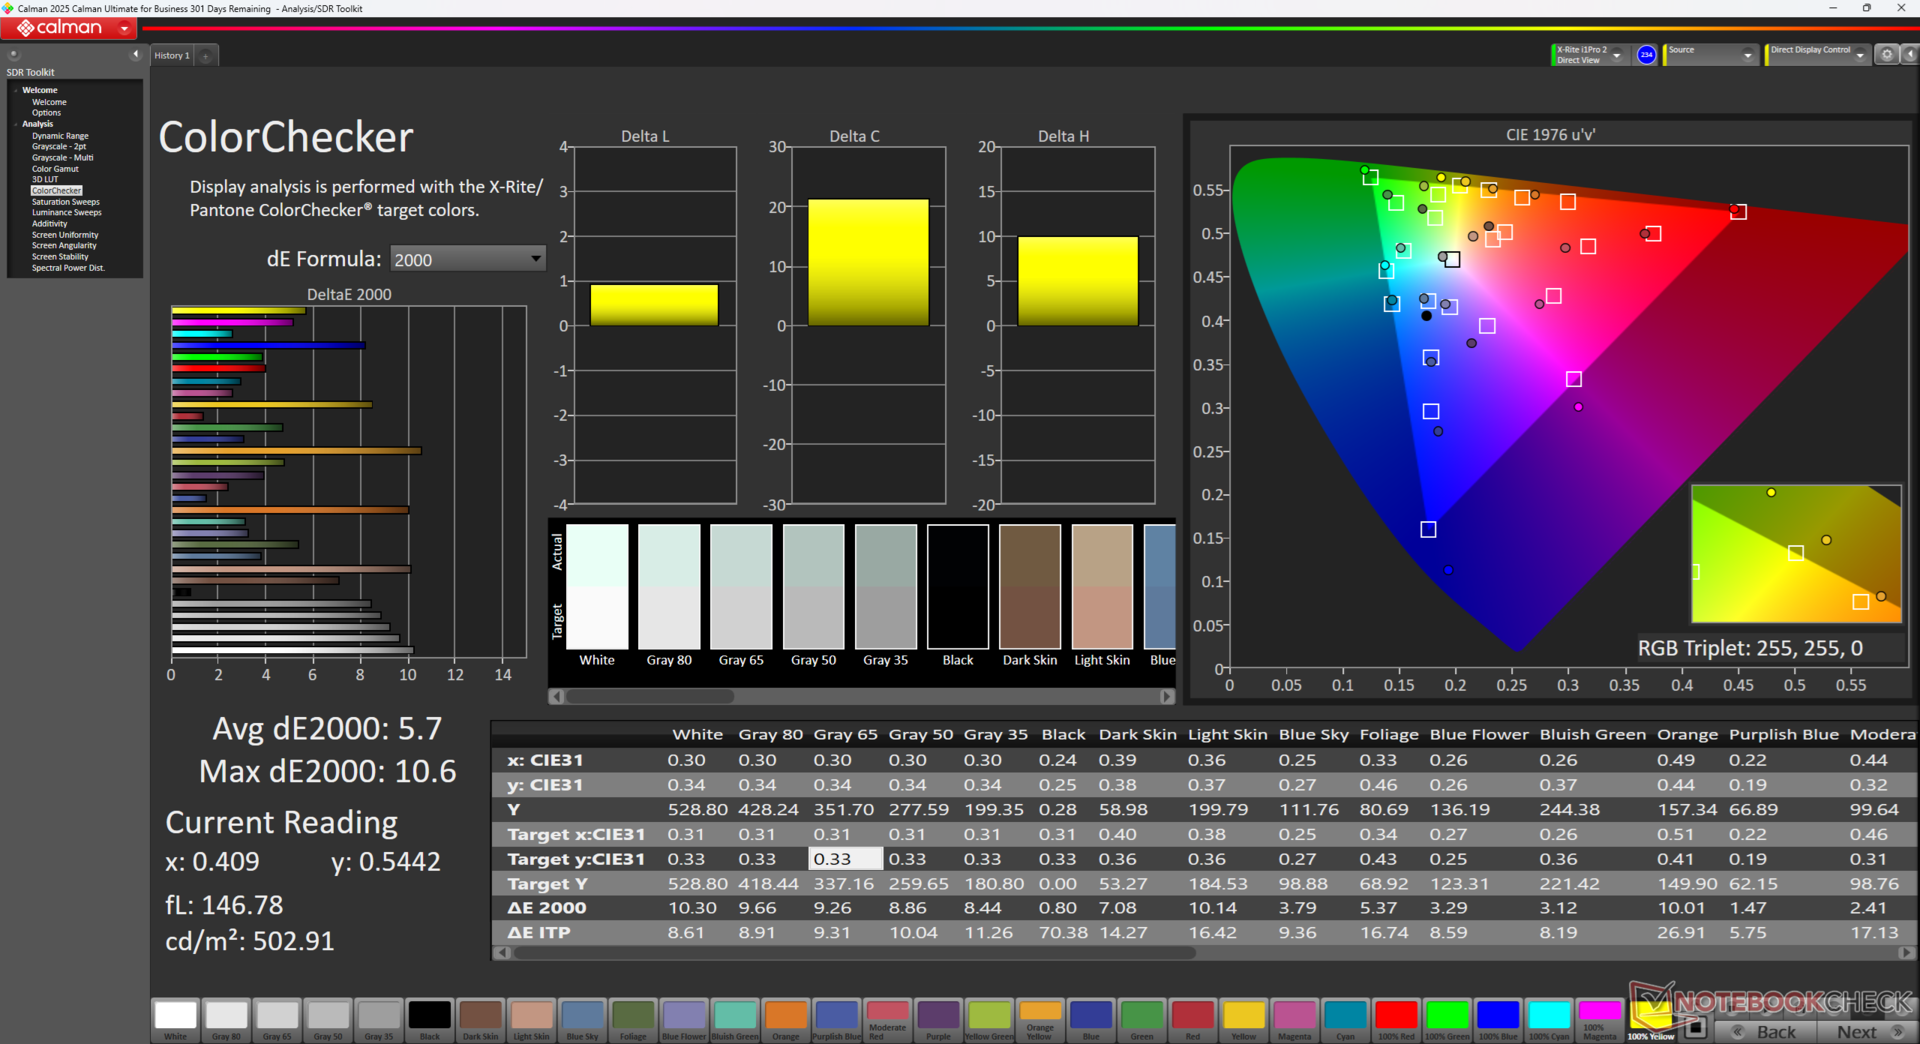
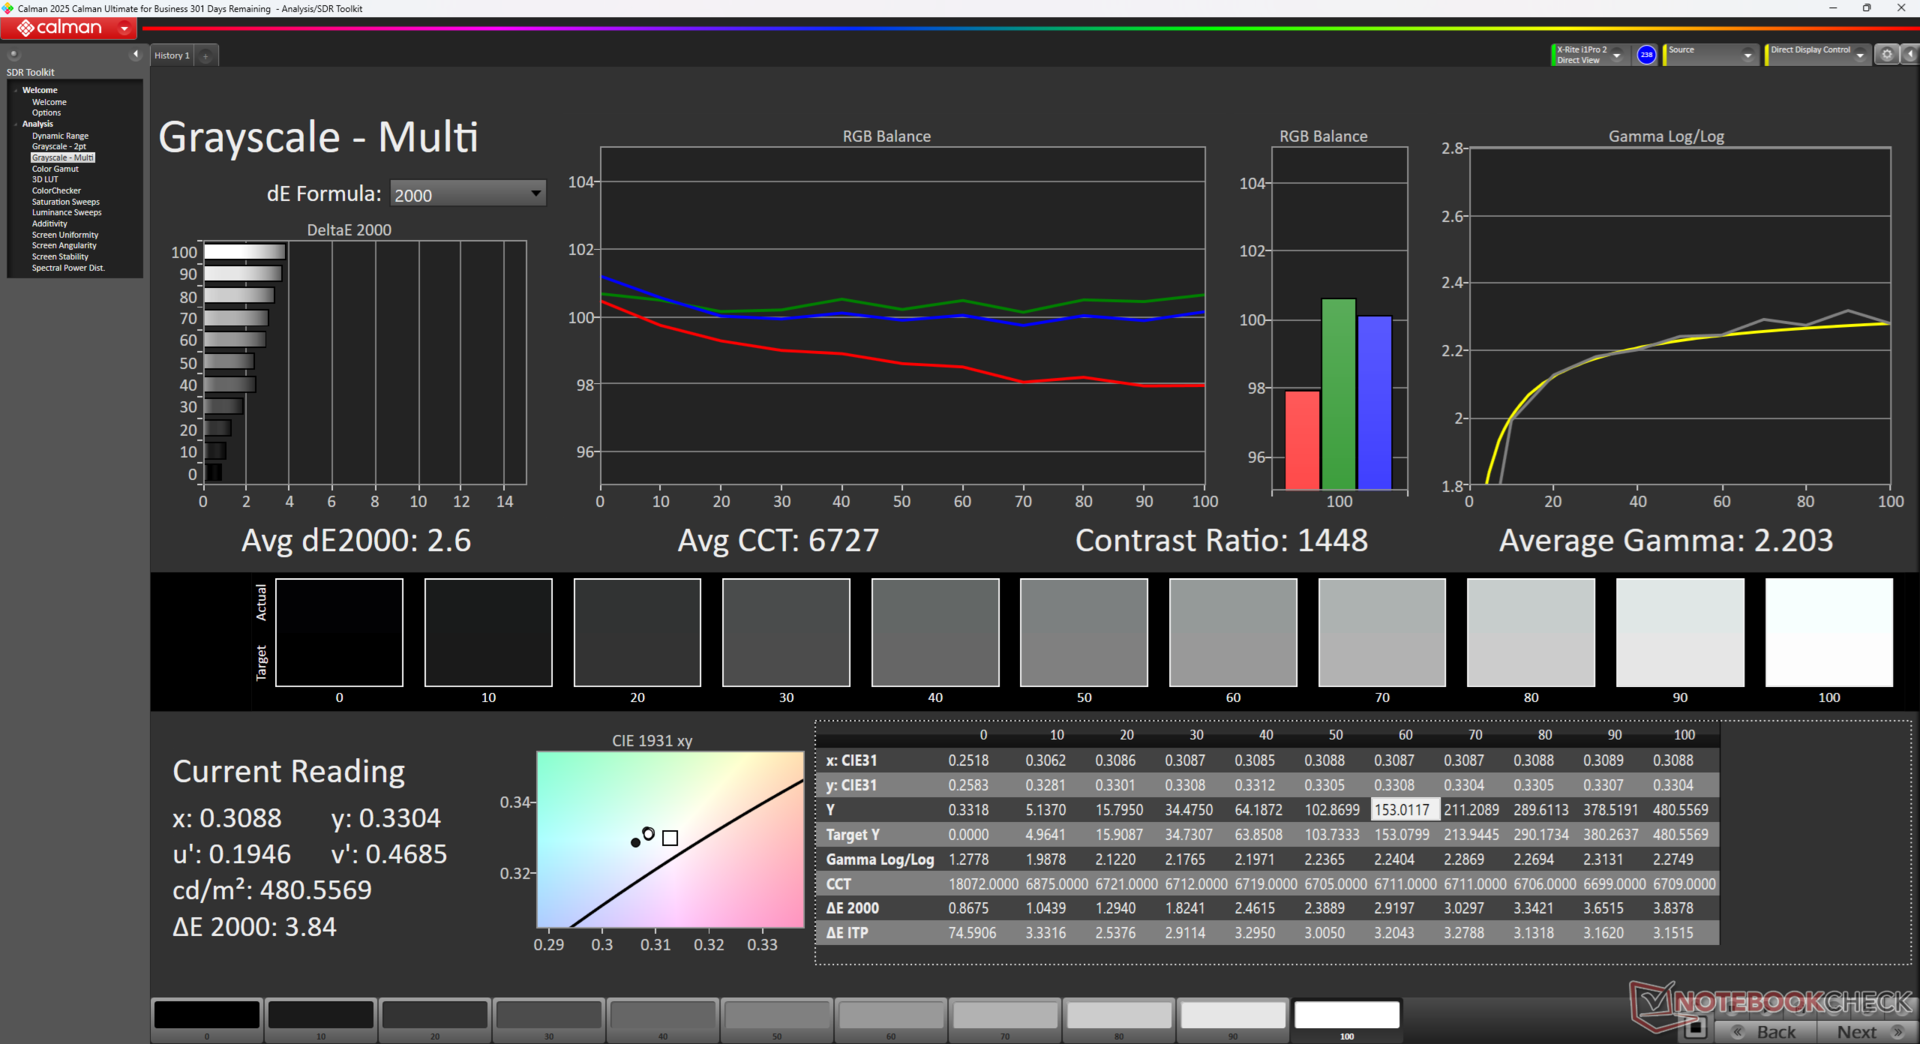
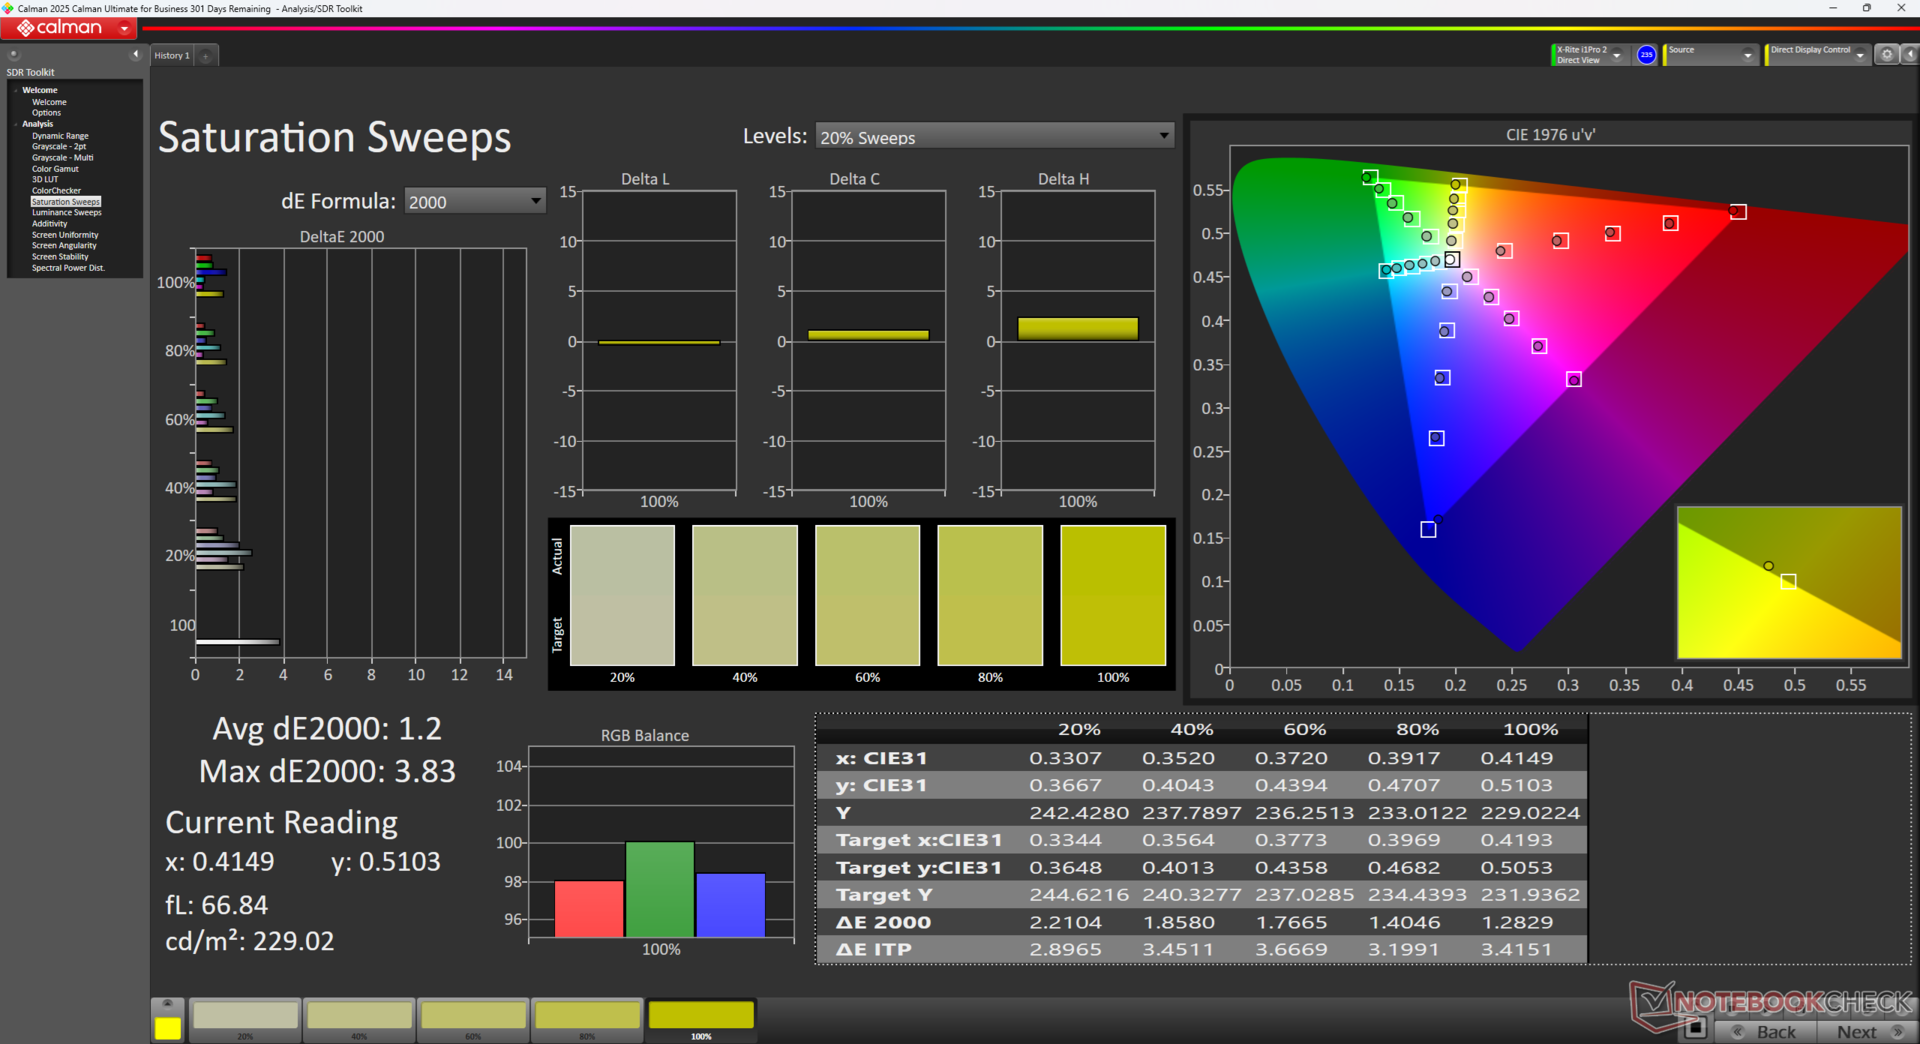
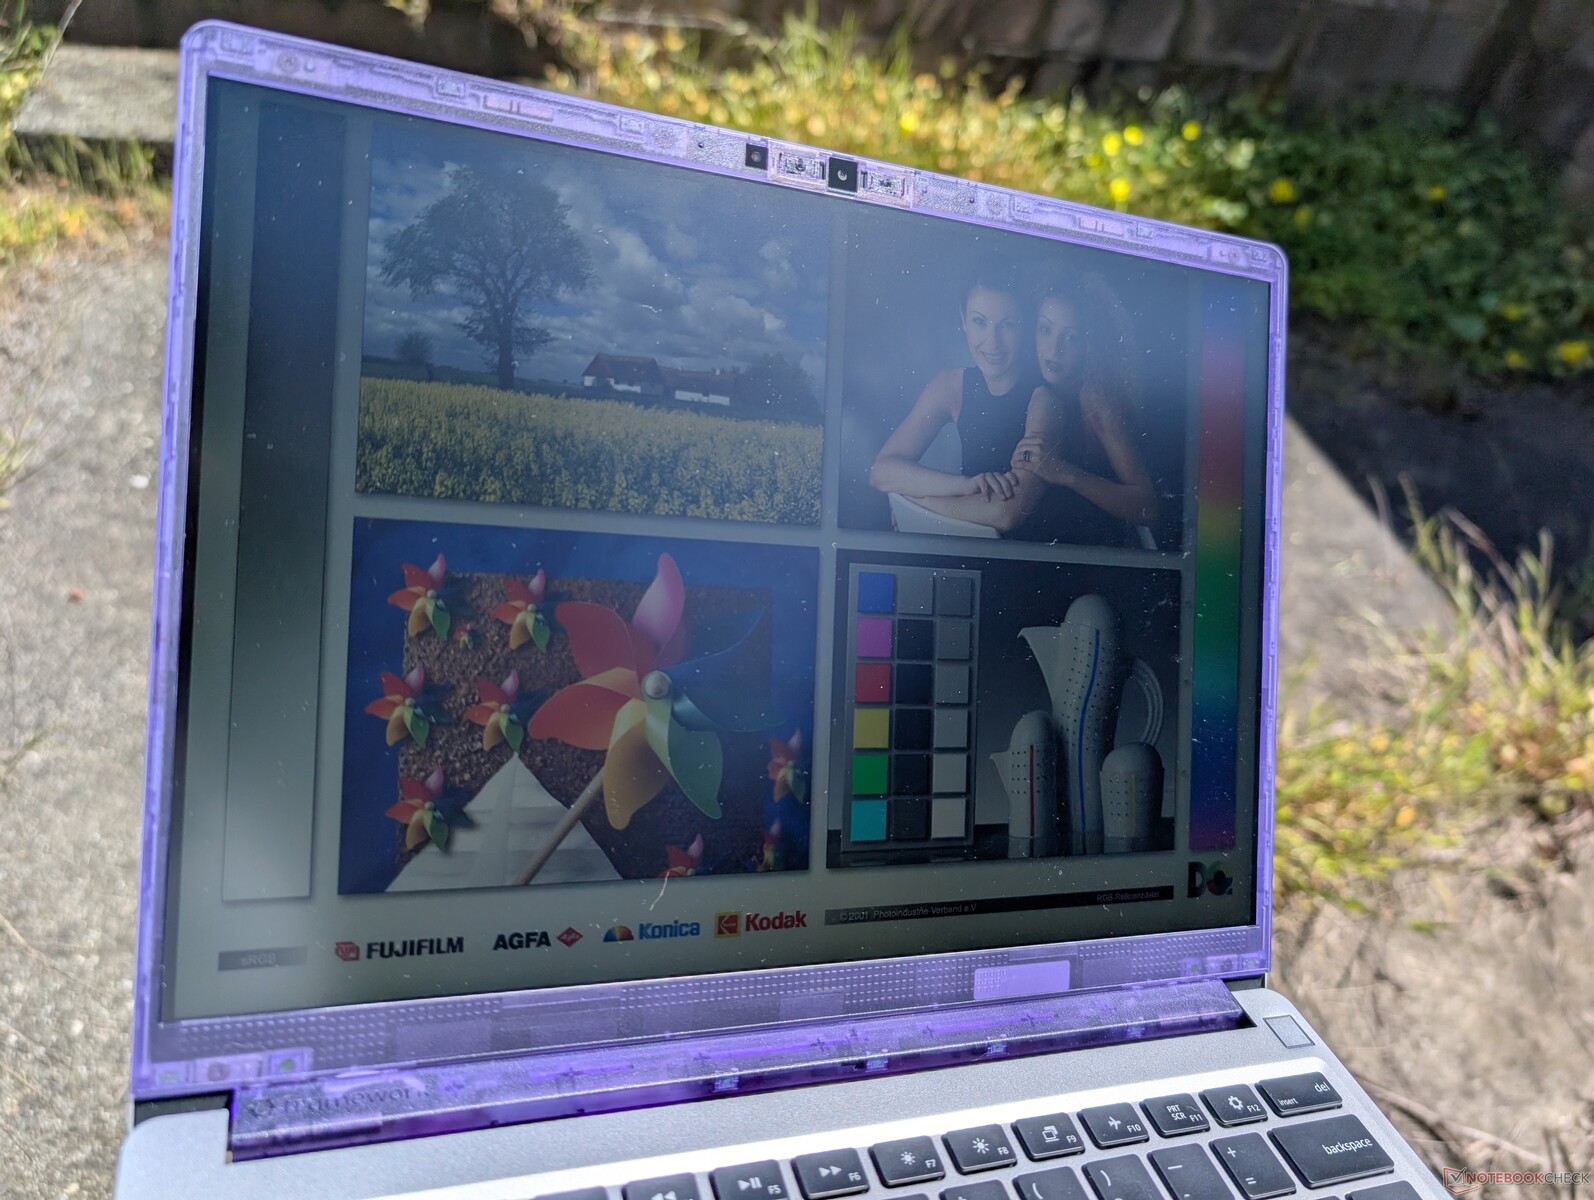
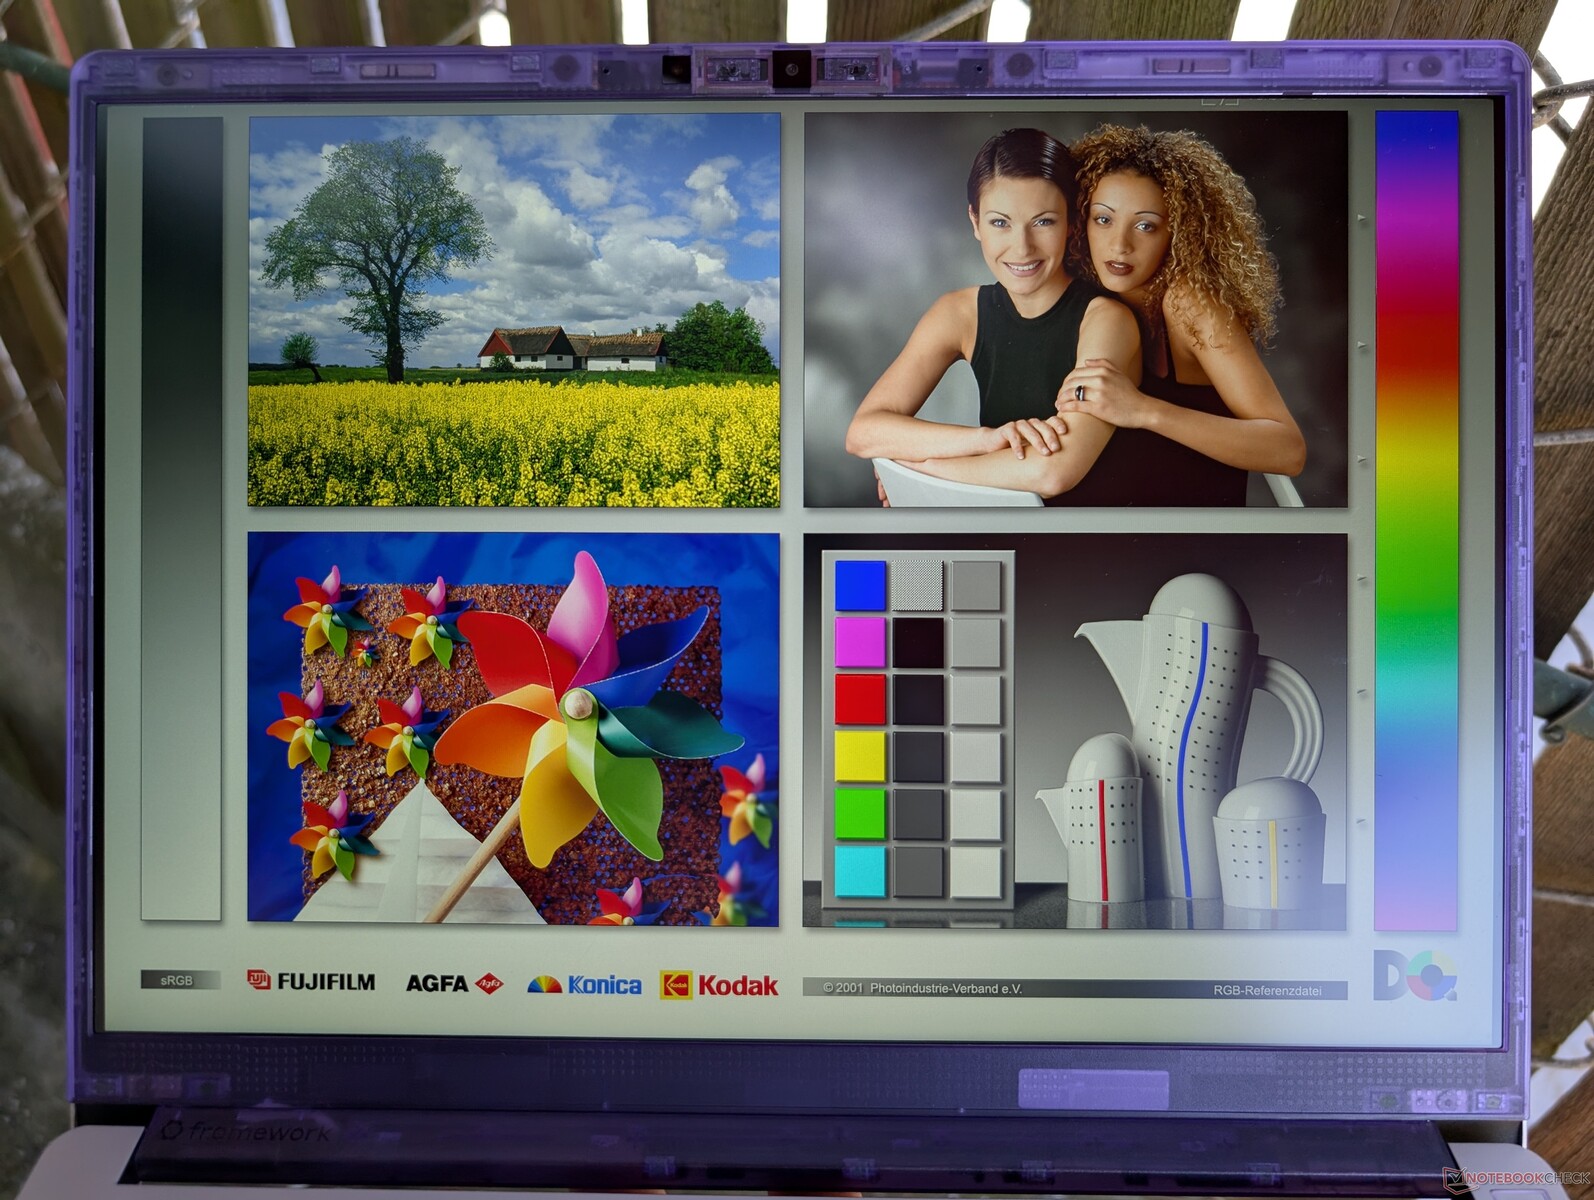
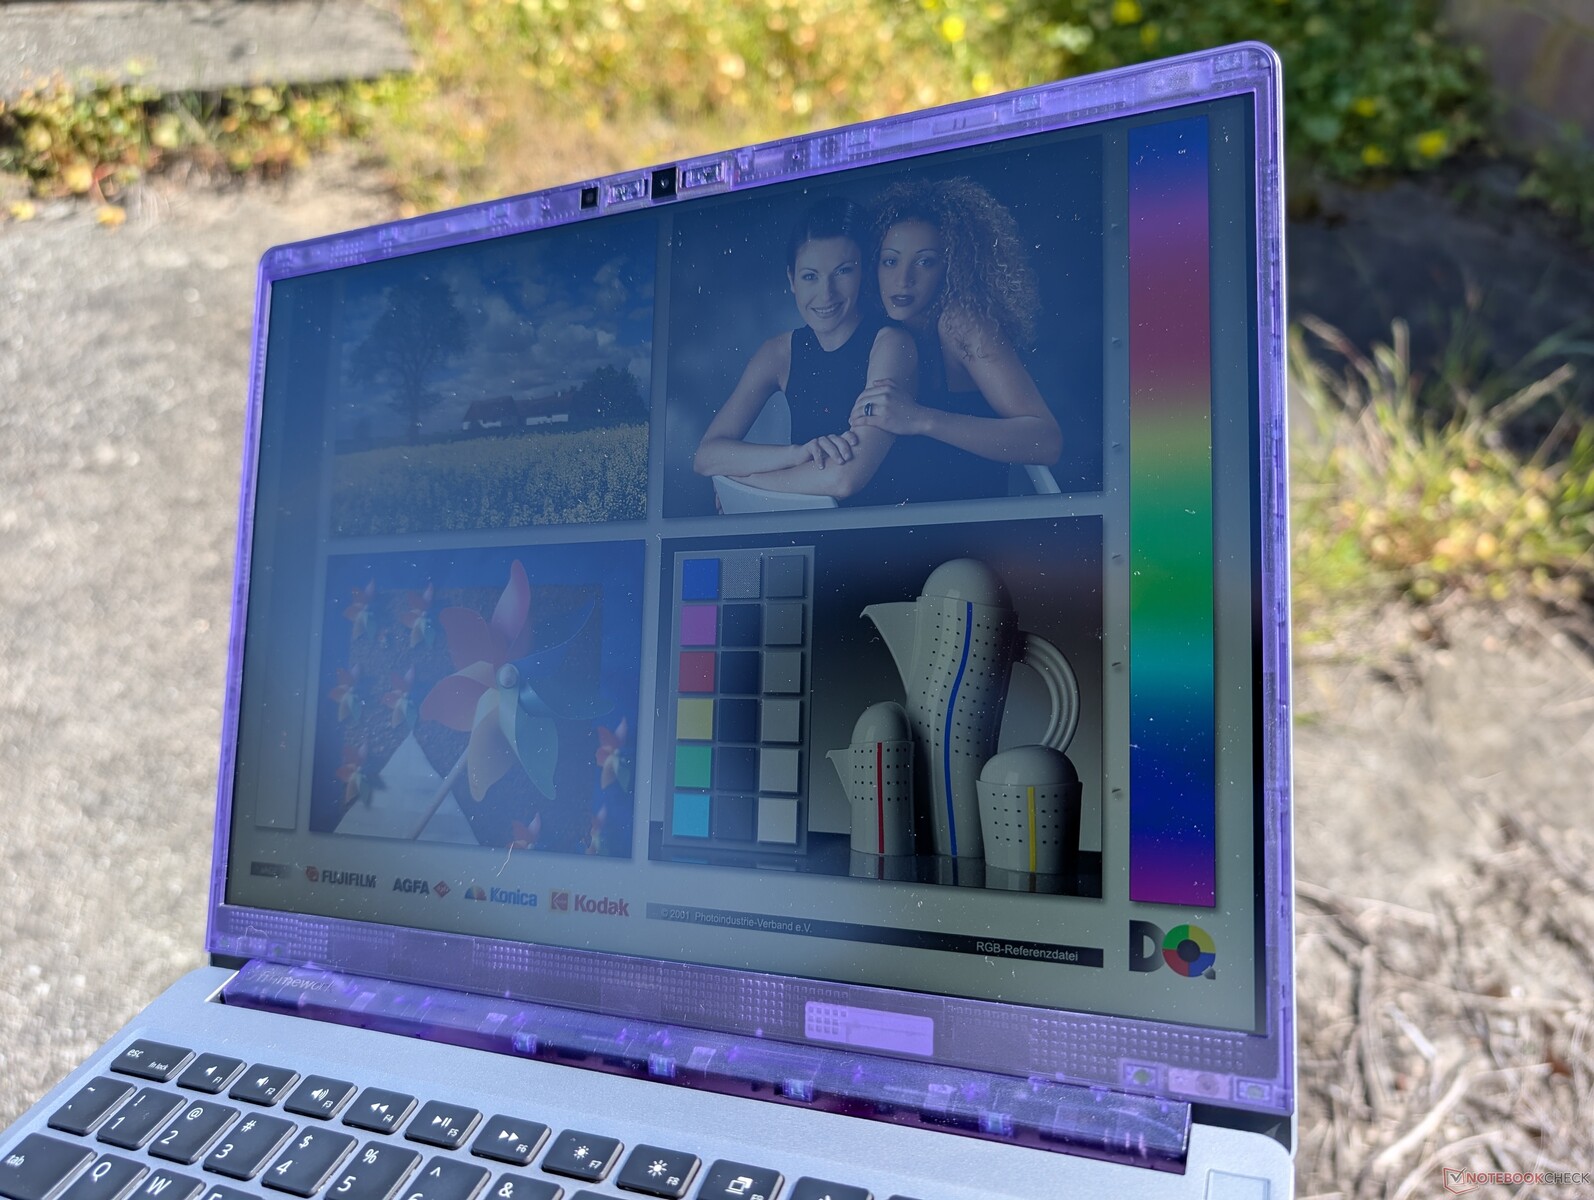
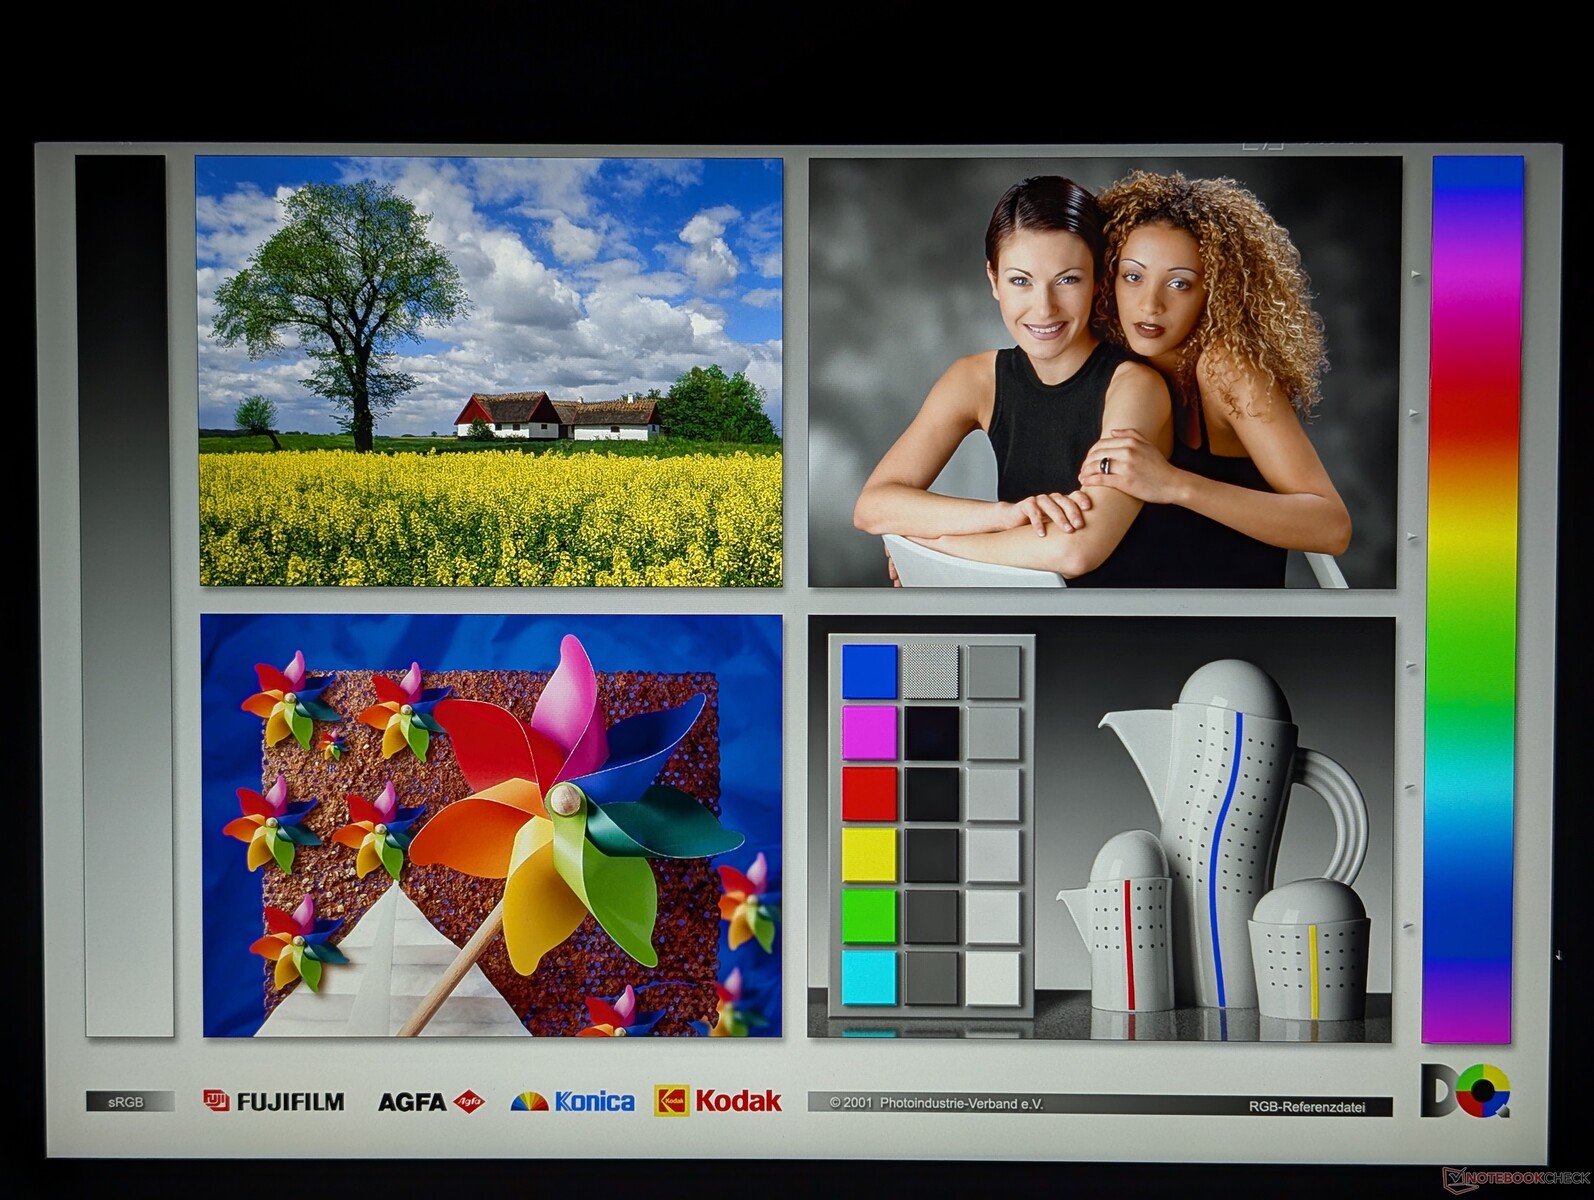
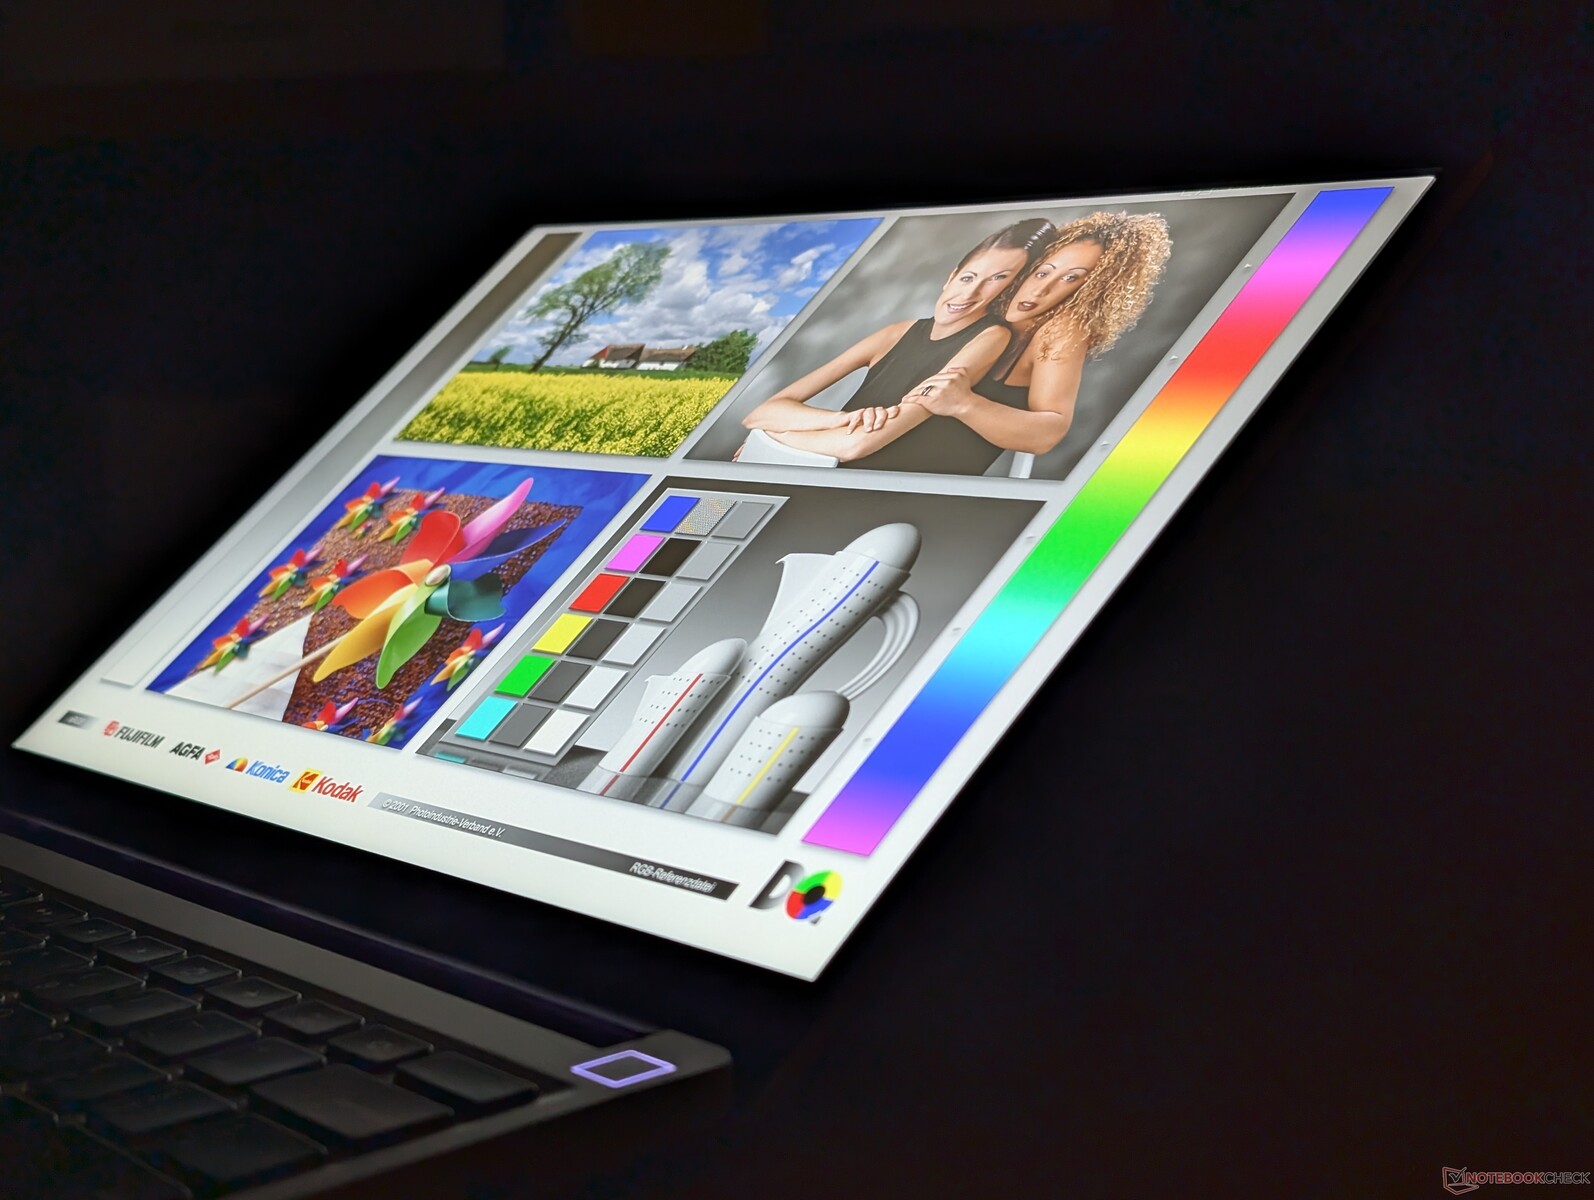
Framework está utilizando el mismo panel IPS BOE NE135A1M-NY1 que se encuentra en el modelo Intel del año pasado para la actualización AMD de este año. Aunque sigue siendo un panel excelente, habría estado bien ver opciones OLED o colores P3 para quienes los demanden.
| |||||||||||||||||||||||||
iluminación: 94 %
Brillo con batería: 529.9 cd/m²
Contraste: 1766:1 (Negro: 0.3 cd/m²)
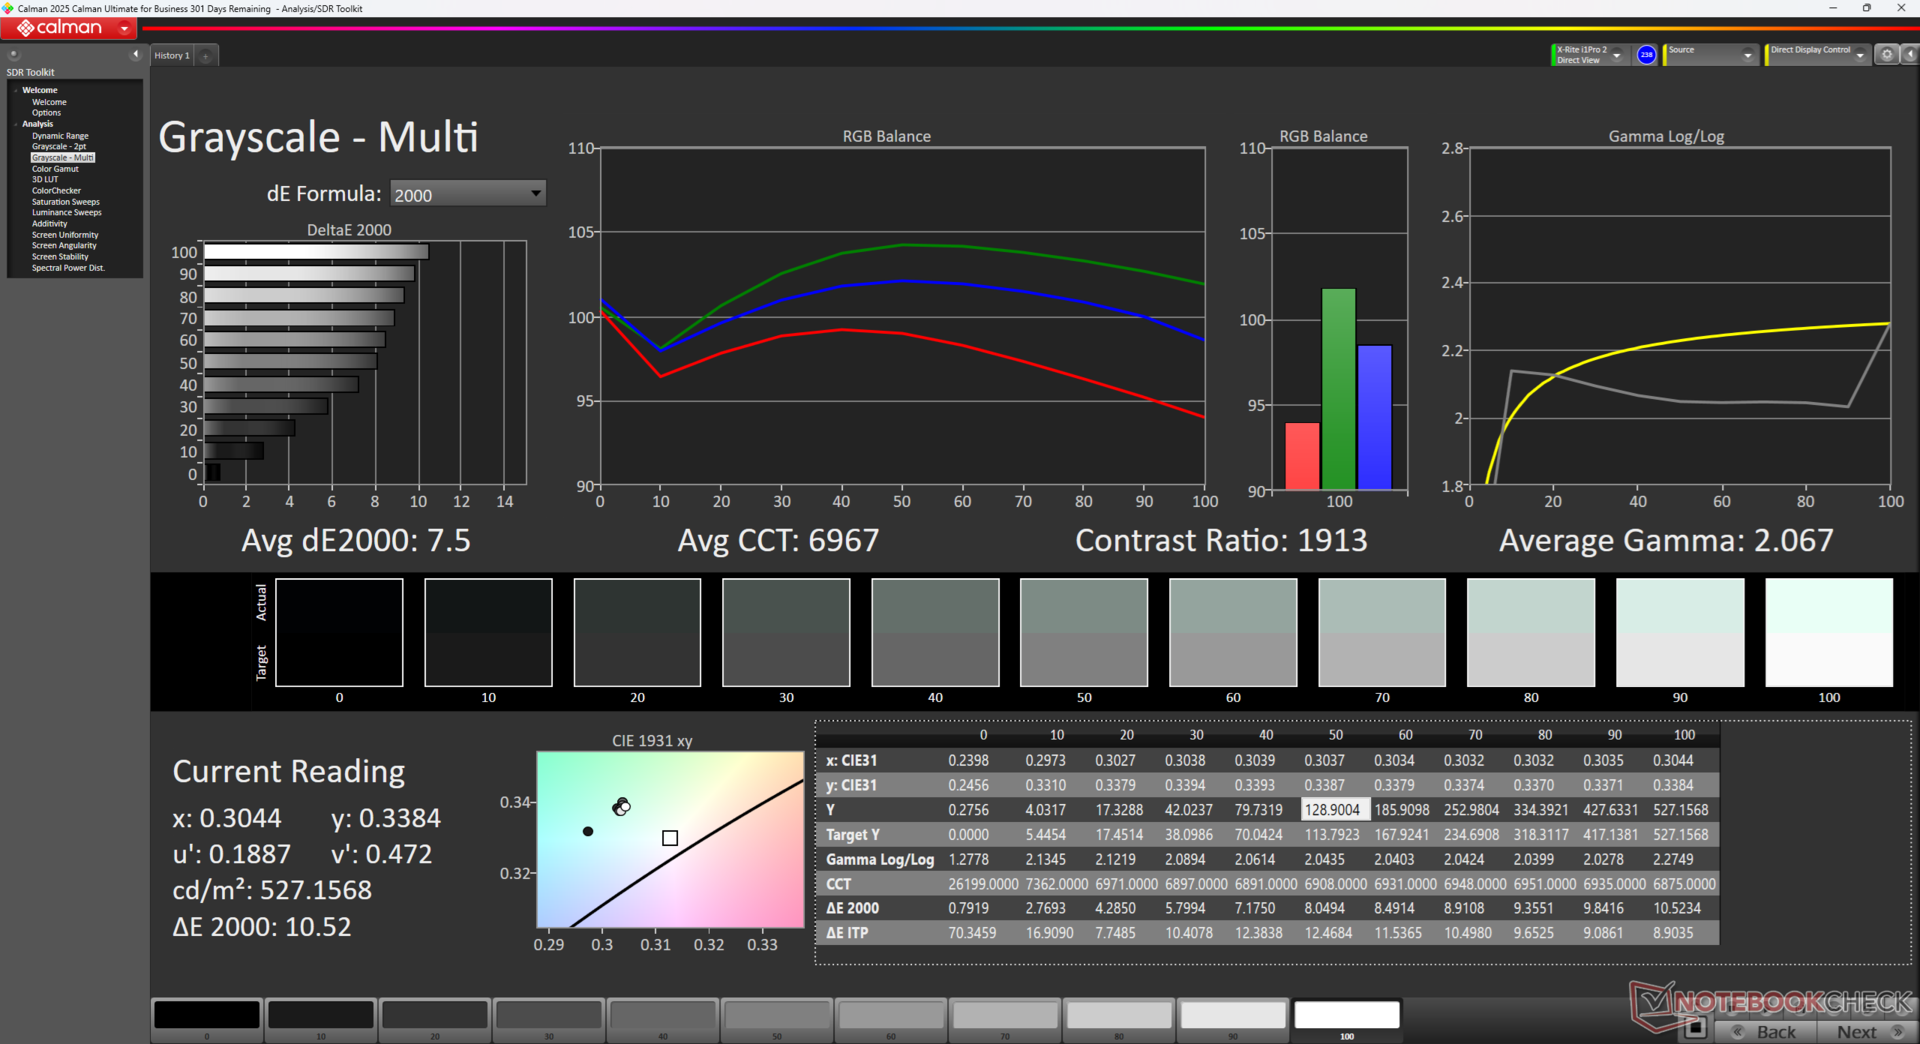
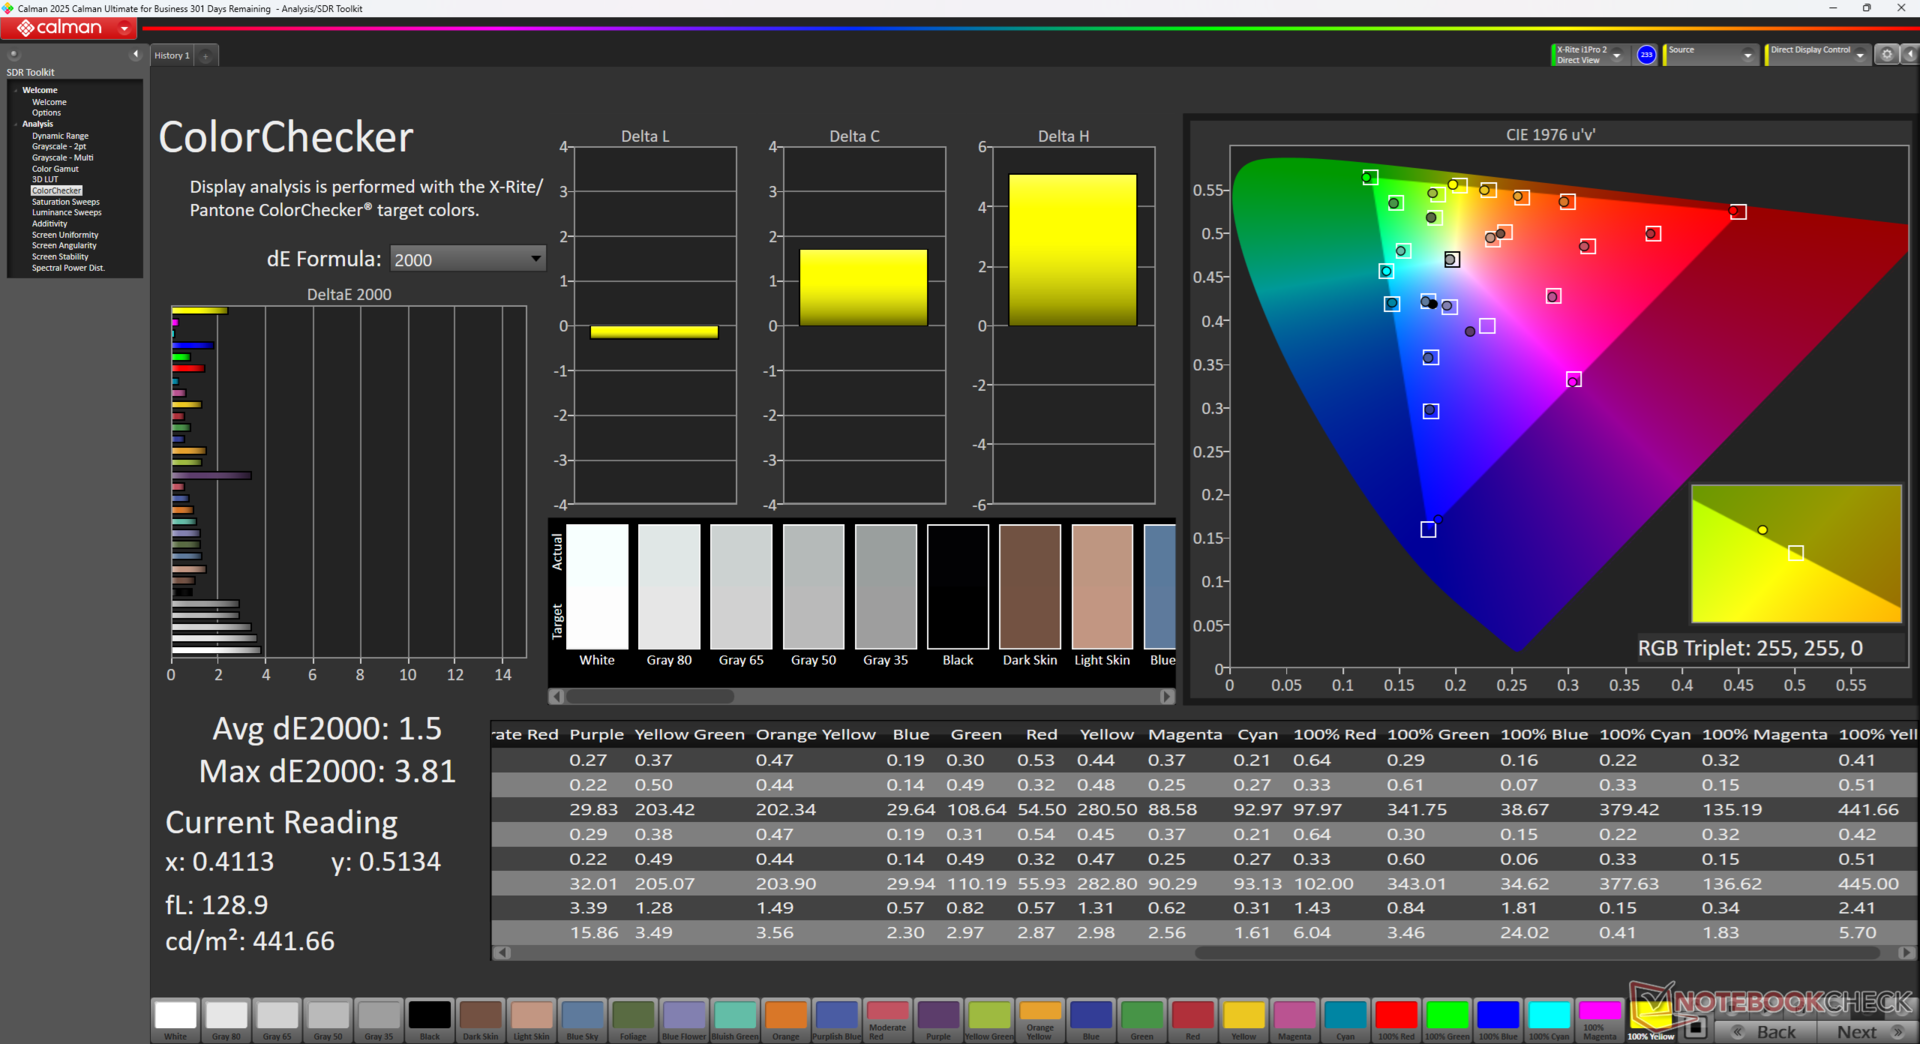
ΔE Color 5.7 | 0.5-29.43 Ø4.87, calibrated: 1.5
ΔE Greyscale 7.5 | 0.5-98 Ø5.1
70.8% AdobeRGB 1998 (Argyll 2.2.0 3D)
95.9% sRGB (Argyll 2.2.0 3D)
71.9% Display P3 (Argyll 2.2.0 3D)
Gamma: 2.07
| Framework Laptop 13.5 Ryzen AI 9 HX 370 BOE NE135A1M-NY1, IPS, 2880x1920, 13.5", 120 Hz | Framework Laptop 13.5 Core Ultra 7 155H BOE NE135A1M-NY1, IPS, 2880x1920, 13.5", 120 Hz | Dell Pro 13 Premium PA13250 B133UAN (AUOBEB0), IPS, 1920x1200, 13.3", 60 Hz | MSI Summit E13 AI Evo A1MTG CMN13C6, IPS, 1920x1200, 13.3", 60 Hz | HP EliteBook x360 830 G10 7L7U1ET LGD06E5, IPS LED, 1920x1200, 13.3", Hz | Lenovo ThinkPad Z13 Gen 2 ATNA33AA02-0, OLED, 2880x1800, 13.3", 60 Hz | |
|---|---|---|---|---|---|---|
| Display | 2% | 4% | 2% | -8% | 27% | |
| Display P3 Coverage | 71.9 | 72.8 1% | 74.3 3% | 71.6 0% | 63.2 -12% | 99.7 39% |
| sRGB Coverage | 95.9 | 98.6 3% | 99.1 3% | 98.6 3% | 92.7 -3% | 100 4% |
| AdobeRGB 1998 Coverage | 70.8 | 72.9 3% | 75.9 7% | 73.1 3% | 65.1 -8% | 97.3 37% |
| Response Times | -6% | -25% | -54% | -10% | 93% | |
| Response Time Grey 50% / Grey 80% * | 40 ? | 41.9 ? -5% | 52.8 ? -32% | 60 ? -50% | 39.8 ? -0% | 2.1 ? 95% |
| Response Time Black / White * | 22.3 ? | 23.7 ? -6% | 26.4 ? -18% | 35.1 ? -57% | 26.8 ? -20% | 2.2 ? 90% |
| PWM Frequency | 60.1 ? | |||||
| Screen | 5% | 13% | 18% | 9% | 31% | |
| Brightness middle | 529.9 | 498.5 -6% | 456 -14% | 405.2 -24% | 394 -26% | 372 -30% |
| Brightness | 506 | 464 -8% | 460 -9% | 372 -26% | 372 -26% | 375 -26% |
| Brightness Distribution | 94 | 86 -9% | 89 -5% | 88 -6% | 84 -11% | 99 5% |
| Black Level * | 0.3 | 0.36 -20% | 0.23 23% | 0.34 -13% | 0.17 43% | |
| Contrast | 1766 | 1385 -22% | 1983 12% | 1192 -33% | 2318 31% | |
| Colorchecker dE 2000 * | 5.7 | 4.27 25% | 3.3 42% | 2.4 58% | 4.1 28% | 0.88 85% |
| Colorchecker dE 2000 max. * | 10.6 | 7.08 33% | 6.47 39% | 3.56 66% | 8.3 22% | 3.22 70% |
| Colorchecker dE 2000 calibrated * | 1.5 | 1.26 16% | 1.7 -13% | 0.54 64% | ||
| Greyscale dE 2000 * | 7.5 | 4.7 37% | 4.35 42% | 1.9 75% | 6.6 12% | 1.2 84% |
| Gamma | 2.07 106% | 2.09 105% | 2.51 88% | 2 110% | 2.17 101% | 2.18 101% |
| CCT | 6967 93% | 7417 88% | 6215 105% | 6503 100% | 6019 108% | 6326 103% |
| Media total (Programa/Opciones) | 0% /
3% | -3% /
6% | -11% /
4% | -3% /
2% | 50% /
41% |
* ... más pequeño es mejor
La pantalla no viene precalibrada. Recomendamos aplicar nuestro perfil ICM calibrado más arriba para obtener colores sRGB más precisos.
Tiempos de respuesta del display
| ↔ Tiempo de respuesta de Negro a Blanco | ||
|---|---|---|
| 22.3 ms ... subida ↗ y bajada ↘ combinada | ↗ 11.1 ms subida | 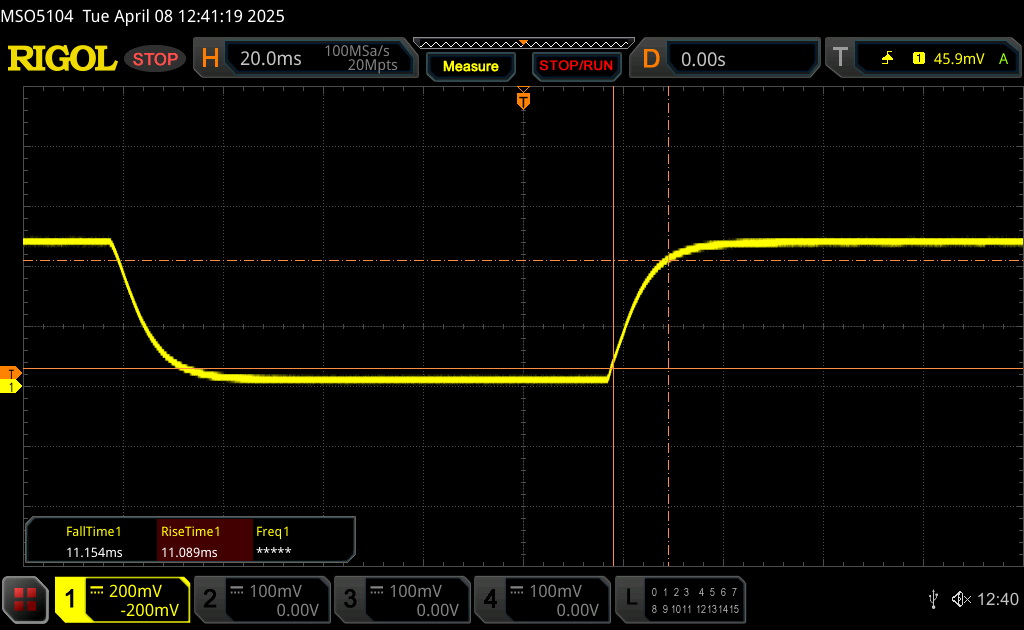 |
| ↘ 11.2 ms bajada | ||
| La pantalla mostró buenos tiempos de respuesta en nuestros tests pero podría ser demasiado lenta para los jugones competitivos. En comparación, todos los dispositivos de prueba van de ##min### (mínimo) a 240 (máximo) ms. » 47 % de todos los dispositivos son mejores. Eso quiere decir que el tiempo de respuesta es similar al dispositivo testado medio (20.8 ms). | ||
| ↔ Tiempo de respuesta 50% Gris a 80% Gris | ||
| 40 ms ... subida ↗ y bajada ↘ combinada | ↗ 18.2 ms subida | 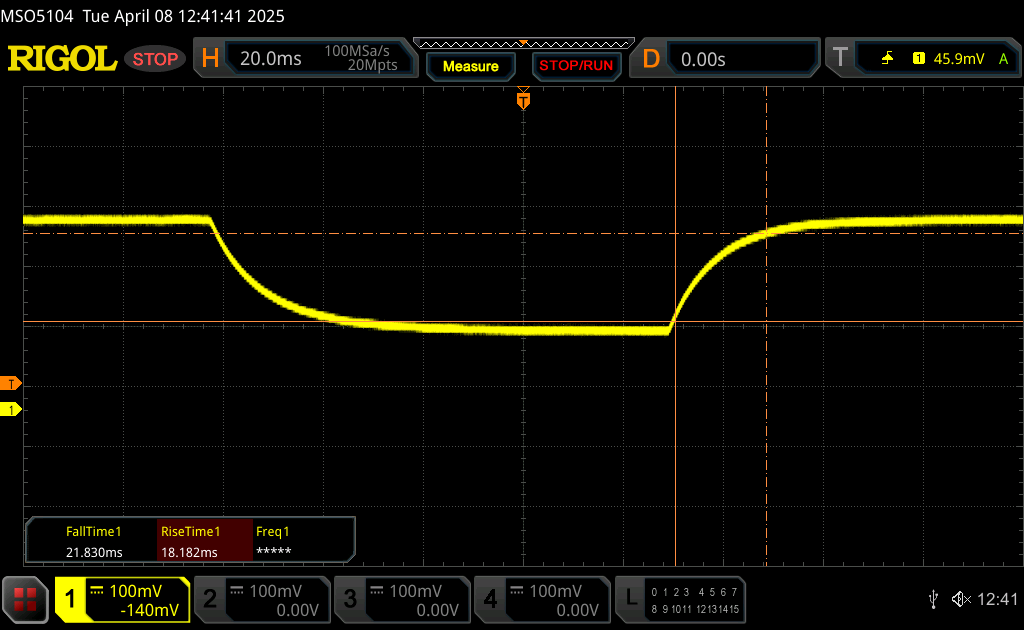 |
| ↘ 21.8 ms bajada | ||
| La pantalla mostró tiempos de respuesta lentos en nuestros tests y podría ser demasiado lenta para los jugones. En comparación, todos los dispositivos de prueba van de ##min### (mínimo) a 636 (máximo) ms. » 58 % de todos los dispositivos son mejores. Eso quiere decir que el tiempo de respuesta es peor que la media (32.5 ms) de todos los dispositivos testados. | ||
Parpadeo de Pantalla / PWM (Pulse-Width Modulation)
| Parpadeo de Pantalla / PWM no detectado | 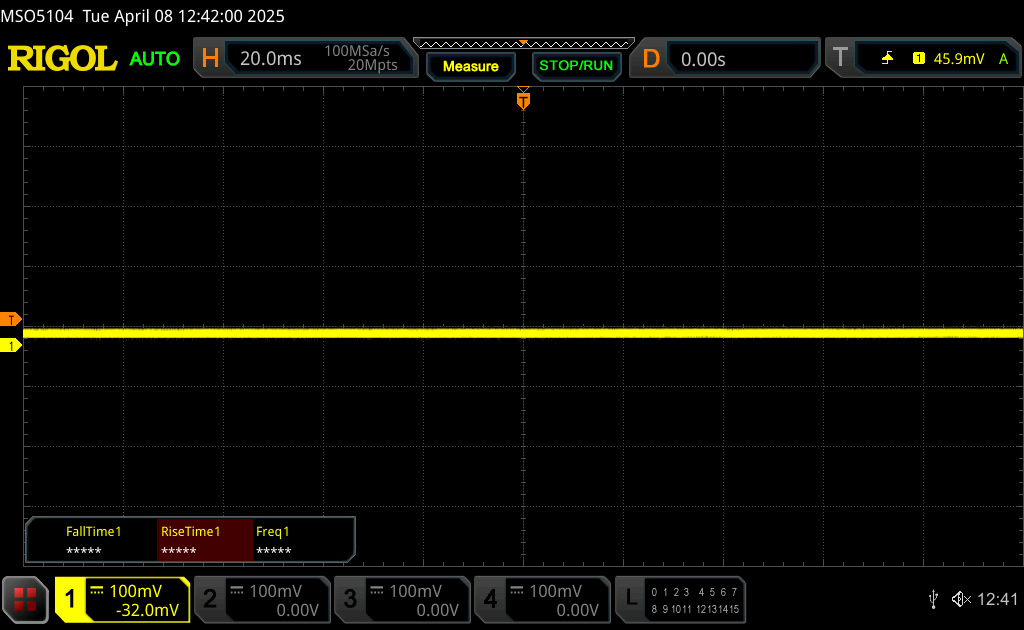 | ||
Comparación: 53 % de todos los dispositivos testados no usaron PWM para atenuar el display. Si se usó, medimos una media de 8516 (mínimo: 5 - máxmo: 343500) Hz. | |||

Rendimiento
Condiciones de prueba
Pusimos Windows en modo Rendimiento antes de ejecutar las pruebas comparativas que se indican a continuación.
Procesador
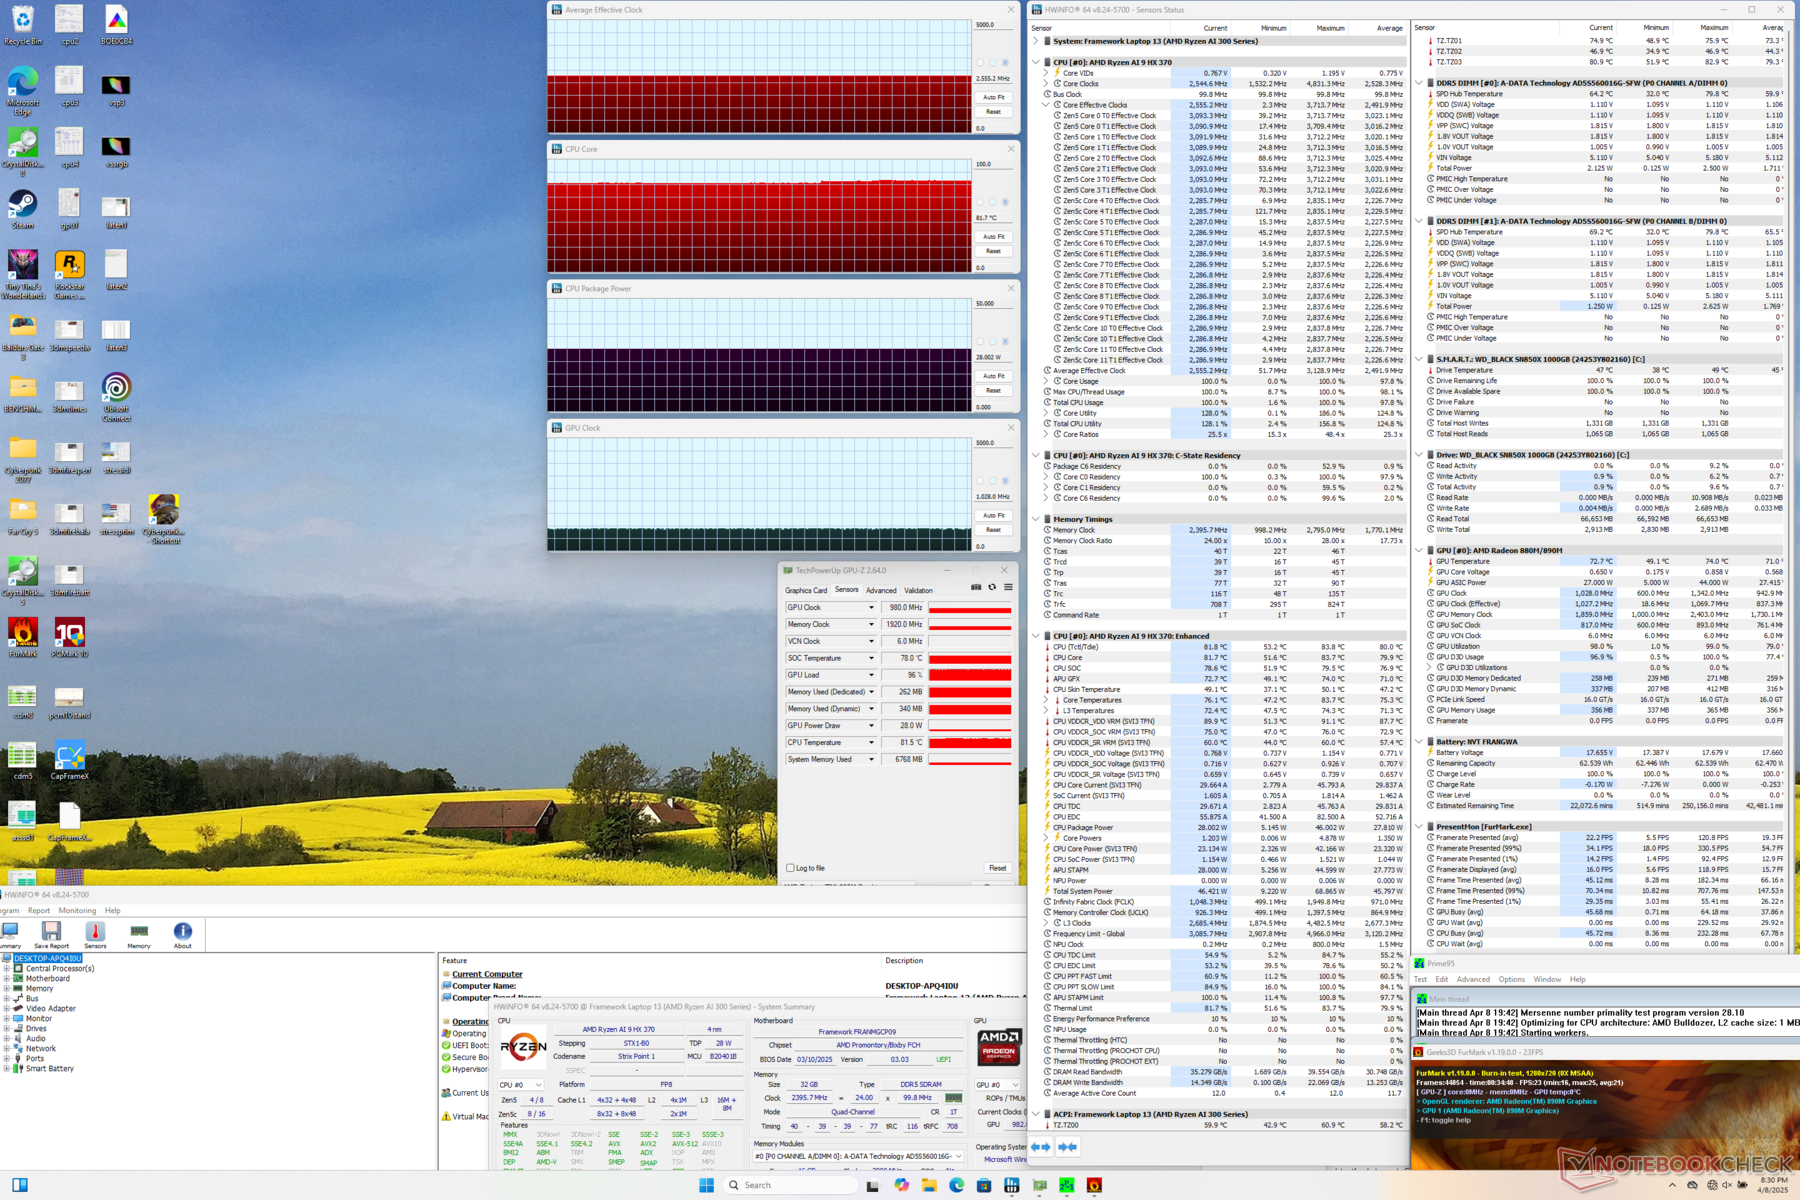
El Ryzen AI 9 HX 370 es fácilmente entre un 30 y un 35 por ciento más rápido que el Intel Core Ultra 7 155H del año pasado cuando se trata de cargas de trabajo multihilo. Sin embargo, la sostenibilidad del rendimiento podría ser mejor, ya que las puntuaciones caen lentamente hasta un 15 por ciento con el tiempo al ejecutar nuestra prueba de bucle CineBench R15 xT, como se muestra en el gráfico siguiente. No obstante, sigue siendo más rápido que las configuraciones anteriores del portátil 13.5 incluso después de tener en cuenta la ligera ralentización.
Cinebench R15 Multi Loop
Cinebench R23: Multi Core | Single Core
Cinebench R20: CPU (Multi Core) | CPU (Single Core)
Cinebench R15: CPU Multi 64Bit | CPU Single 64Bit
Blender: v2.79 BMW27 CPU
7-Zip 18.03: 7z b 4 | 7z b 4 -mmt1
Geekbench 6.4: Multi-Core | Single-Core
Geekbench 5.5: Multi-Core | Single-Core
HWBOT x265 Benchmark v2.2: 4k Preset
LibreOffice : 20 Documents To PDF
R Benchmark 2.5: Overall mean
| Geekbench 6.4 / Multi-Core | |
| Framework Laptop 13.5 Ryzen AI 9 HX 370 | |
| Medio AMD Ryzen AI 9 HX 370 (11973 - 15671, n=18) | |
| Framework Laptop 13.5 Core Ultra 7 155H | |
| Framework Laptop 13.5 Ryzen 7 7840U | |
| MSI Summit E13 AI Evo A1MTG | |
| Dell Pro 13 Premium PA13250 | |
| Dell Latitude 13 7350 | |
| Geekbench 6.4 / Single-Core | |
| Medio AMD Ryzen AI 9 HX 370 (2780 - 2965, n=18) | |
| Framework Laptop 13.5 Ryzen AI 9 HX 370 | |
| Dell Pro 13 Premium PA13250 | |
| Framework Laptop 13.5 Ryzen 7 7840U | |
| Framework Laptop 13.5 Core Ultra 7 155H | |
| MSI Summit E13 AI Evo A1MTG | |
| Dell Latitude 13 7350 | |
* ... más pequeño es mejor
AIDA64: FP32 Ray-Trace | FPU Julia | CPU SHA3 | CPU Queen | FPU SinJulia | FPU Mandel | CPU AES | CPU ZLib | FP64 Ray-Trace | CPU PhotoWorxx
| AIDA64 / FP32 Ray-Trace | |
| Medio AMD Ryzen AI 9 HX 370 (24673 - 37654, n=15) | |
| Framework Laptop 13.5 Ryzen AI 9 HX 370 | |
| Lenovo ThinkPad Z13 Gen 2 | |
| Framework Laptop 13.5 Core Ultra 7 155H | |
| Dell Pro 13 Premium PA13250 | |
| MSI Summit E13 AI Evo A1MTG | |
| HP EliteBook x360 830 G10 7L7U1ET | |
| AIDA64 / FP64 Ray-Trace | |
| Medio AMD Ryzen AI 9 HX 370 (13665 - 20608, n=16) | |
| Framework Laptop 13.5 Ryzen AI 9 HX 370 | |
| Lenovo ThinkPad Z13 Gen 2 | |
| Framework Laptop 13.5 Core Ultra 7 155H | |
| Dell Pro 13 Premium PA13250 | |
| MSI Summit E13 AI Evo A1MTG | |
| HP EliteBook x360 830 G10 7L7U1ET | |
| AIDA64 / CPU PhotoWorxx | |
| Medio AMD Ryzen AI 9 HX 370 (36752 - 51727, n=16) | |
| Framework Laptop 13.5 Ryzen AI 9 HX 370 | |
| Dell Pro 13 Premium PA13250 | |
| Framework Laptop 13.5 Core Ultra 7 155H | |
| MSI Summit E13 AI Evo A1MTG | |
| Lenovo ThinkPad Z13 Gen 2 | |
| HP EliteBook x360 830 G10 7L7U1ET | |
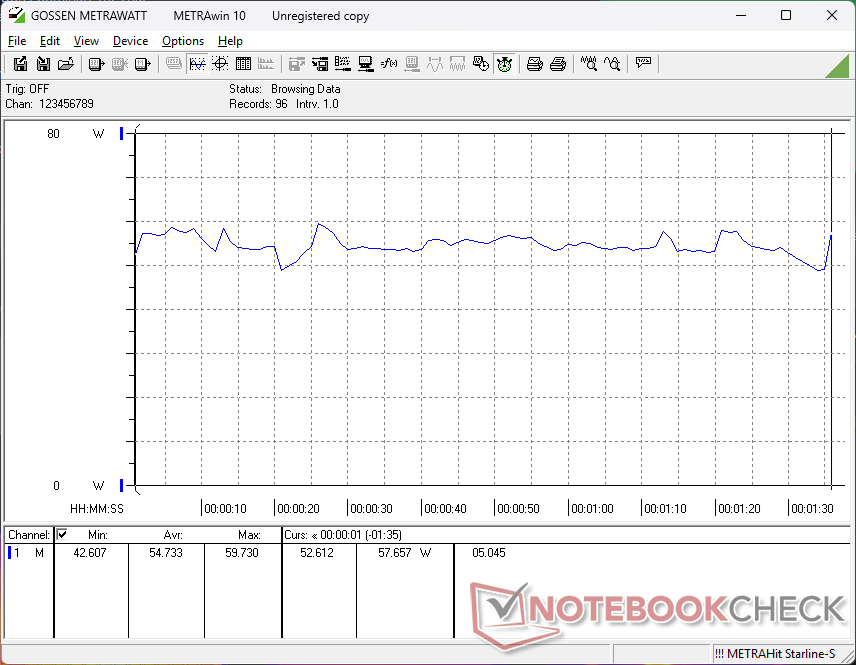
Prueba de estrés
La CPU aumentaría a 3,2 GHz y 46 W al iniciar el estrés Prime95 antes de caer a 2,6 GHz y 33 W al cabo de un minuto de la prueba para representar el Turbo Boost máximo limitado. Por lo demás, las temperaturas del núcleo son similares a las de la configuración Intel, si no ligeramente más frías al jugar.
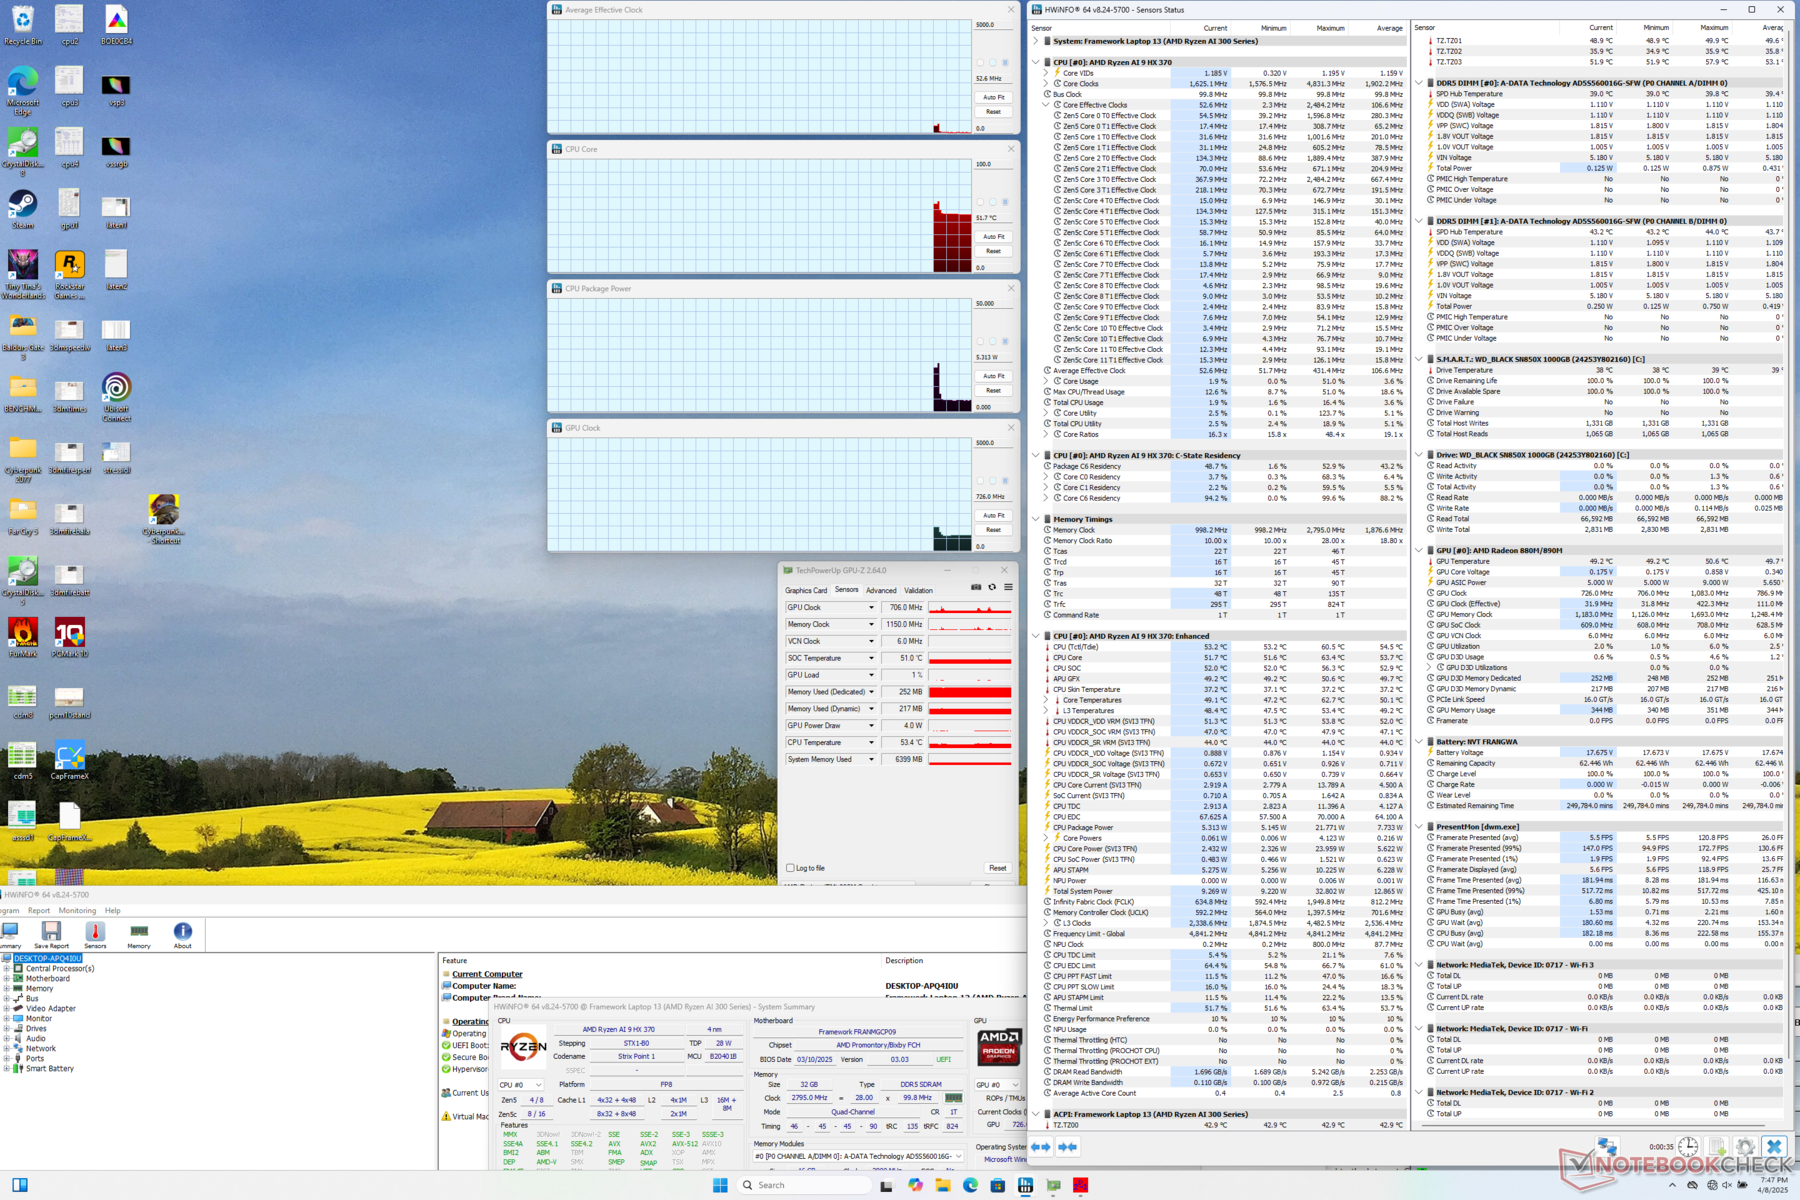
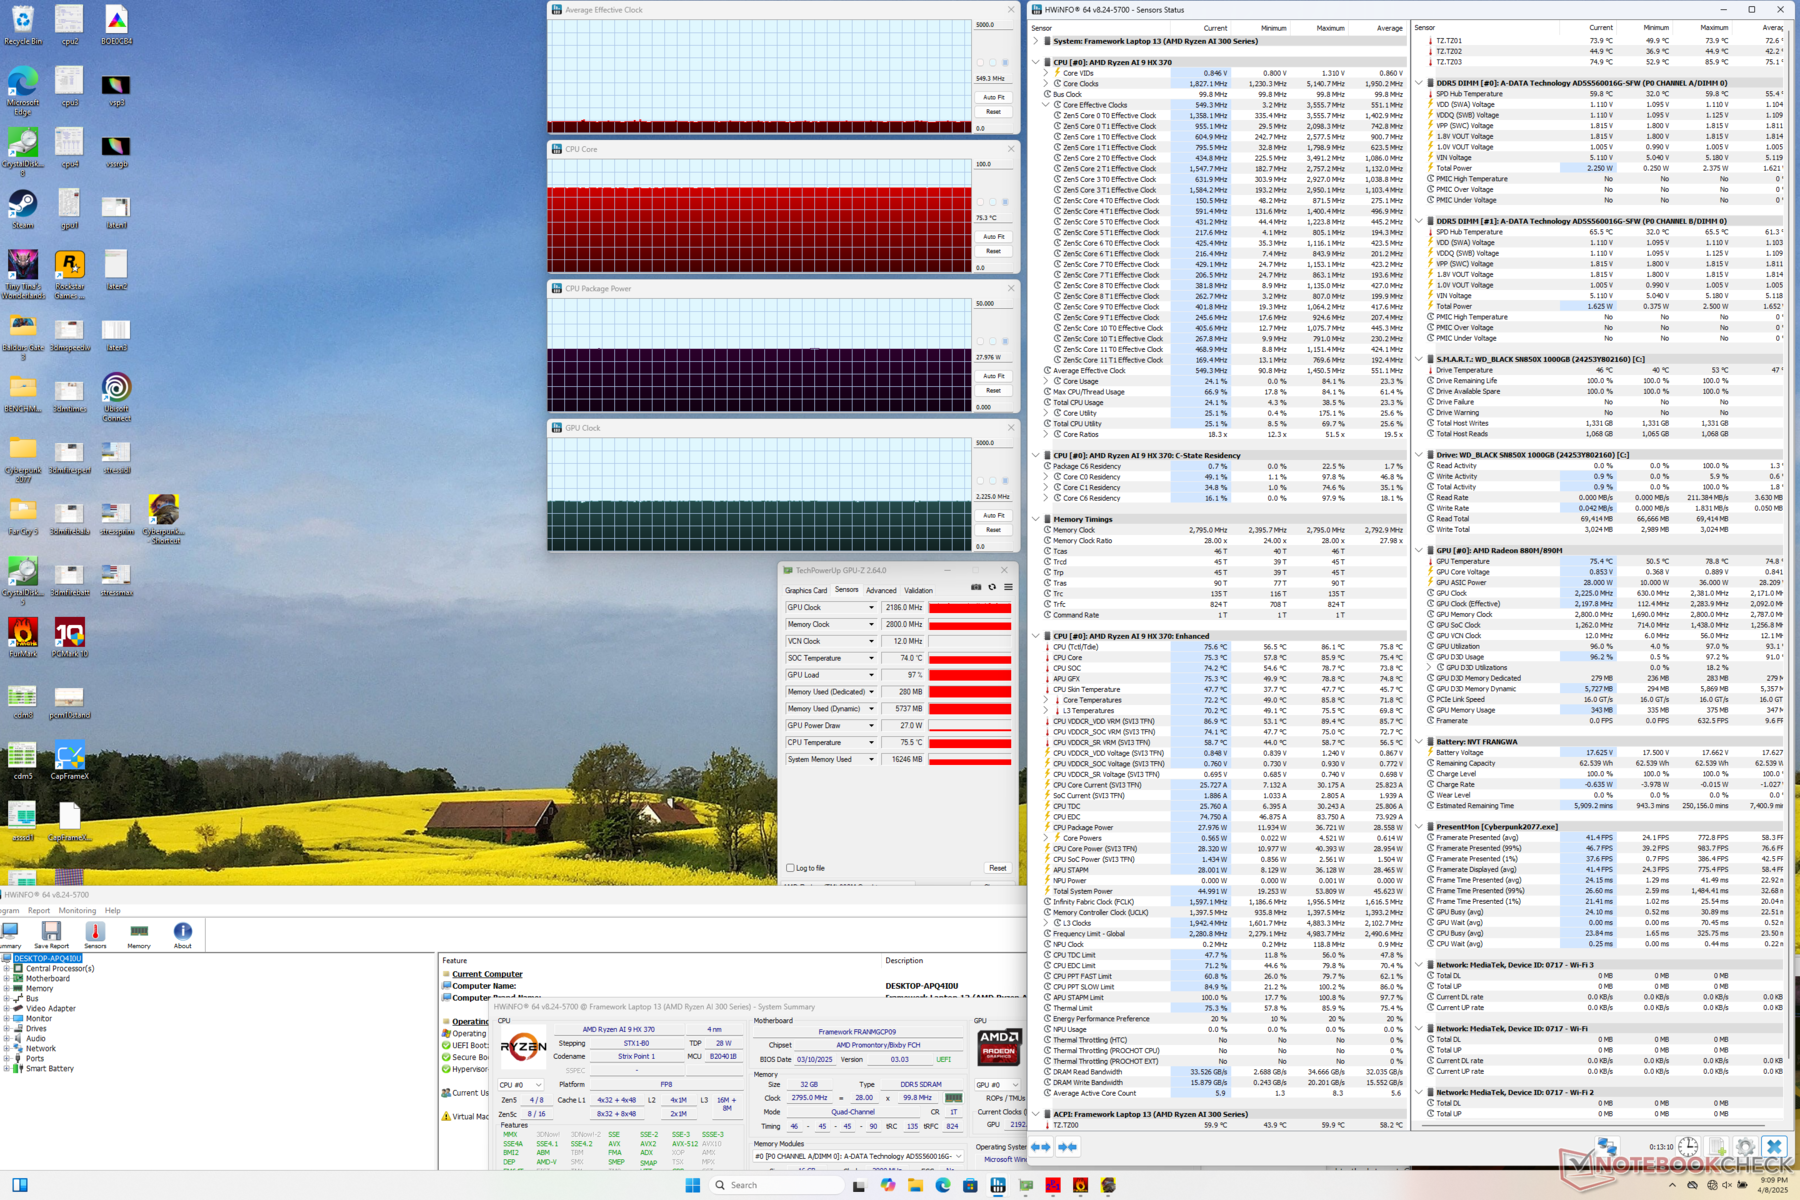
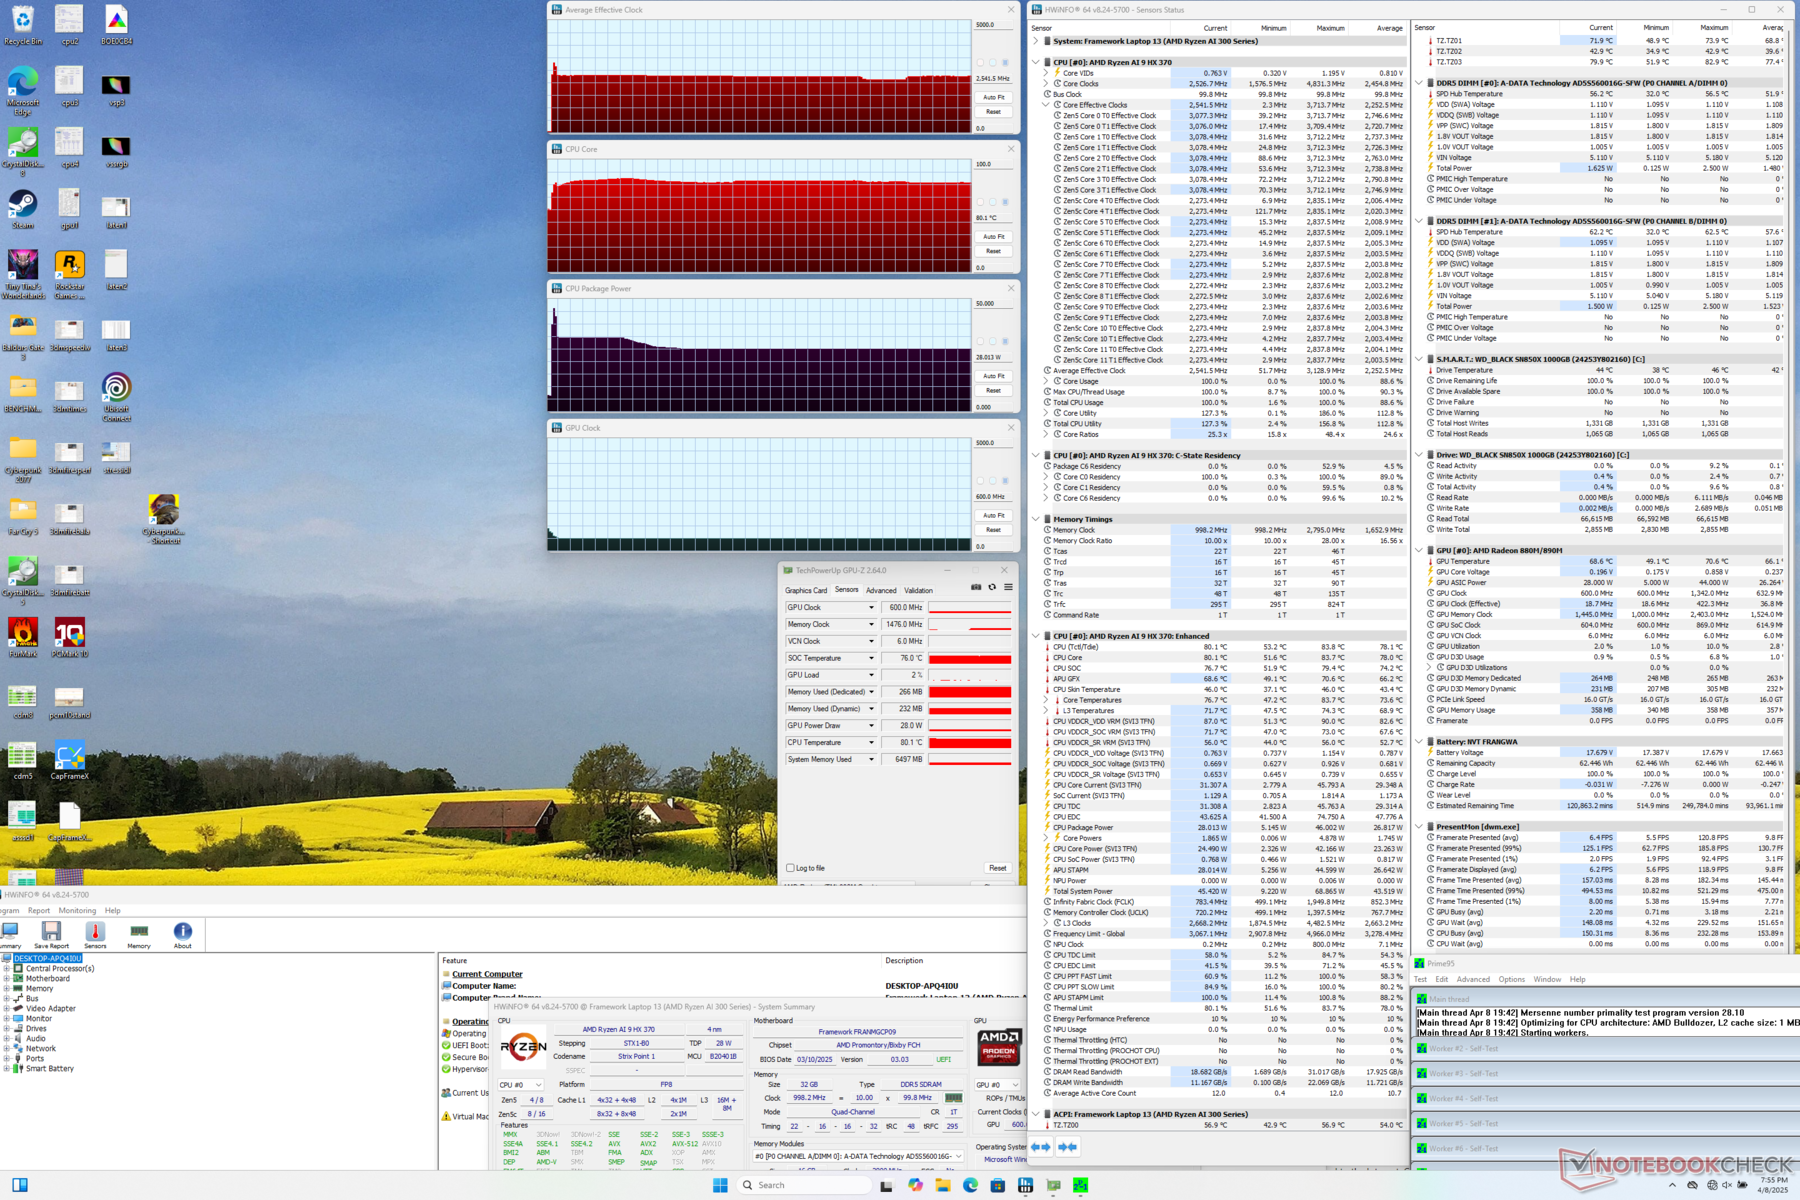
| Reloj medio de la CPU (GHz) | Reloj de la GPU (MHz) | Temperatura media de la CPU (°C) | |
| Sistema en reposo | -- | -- | 52 |
| Prime95 Stress | 2.5 | -- | 80 |
| Prime95 + FurMark Stress | 2.6 | 980 | 82 |
| Cyberpunk 2077 Estrés | 0,6 | 2186 | 75 |
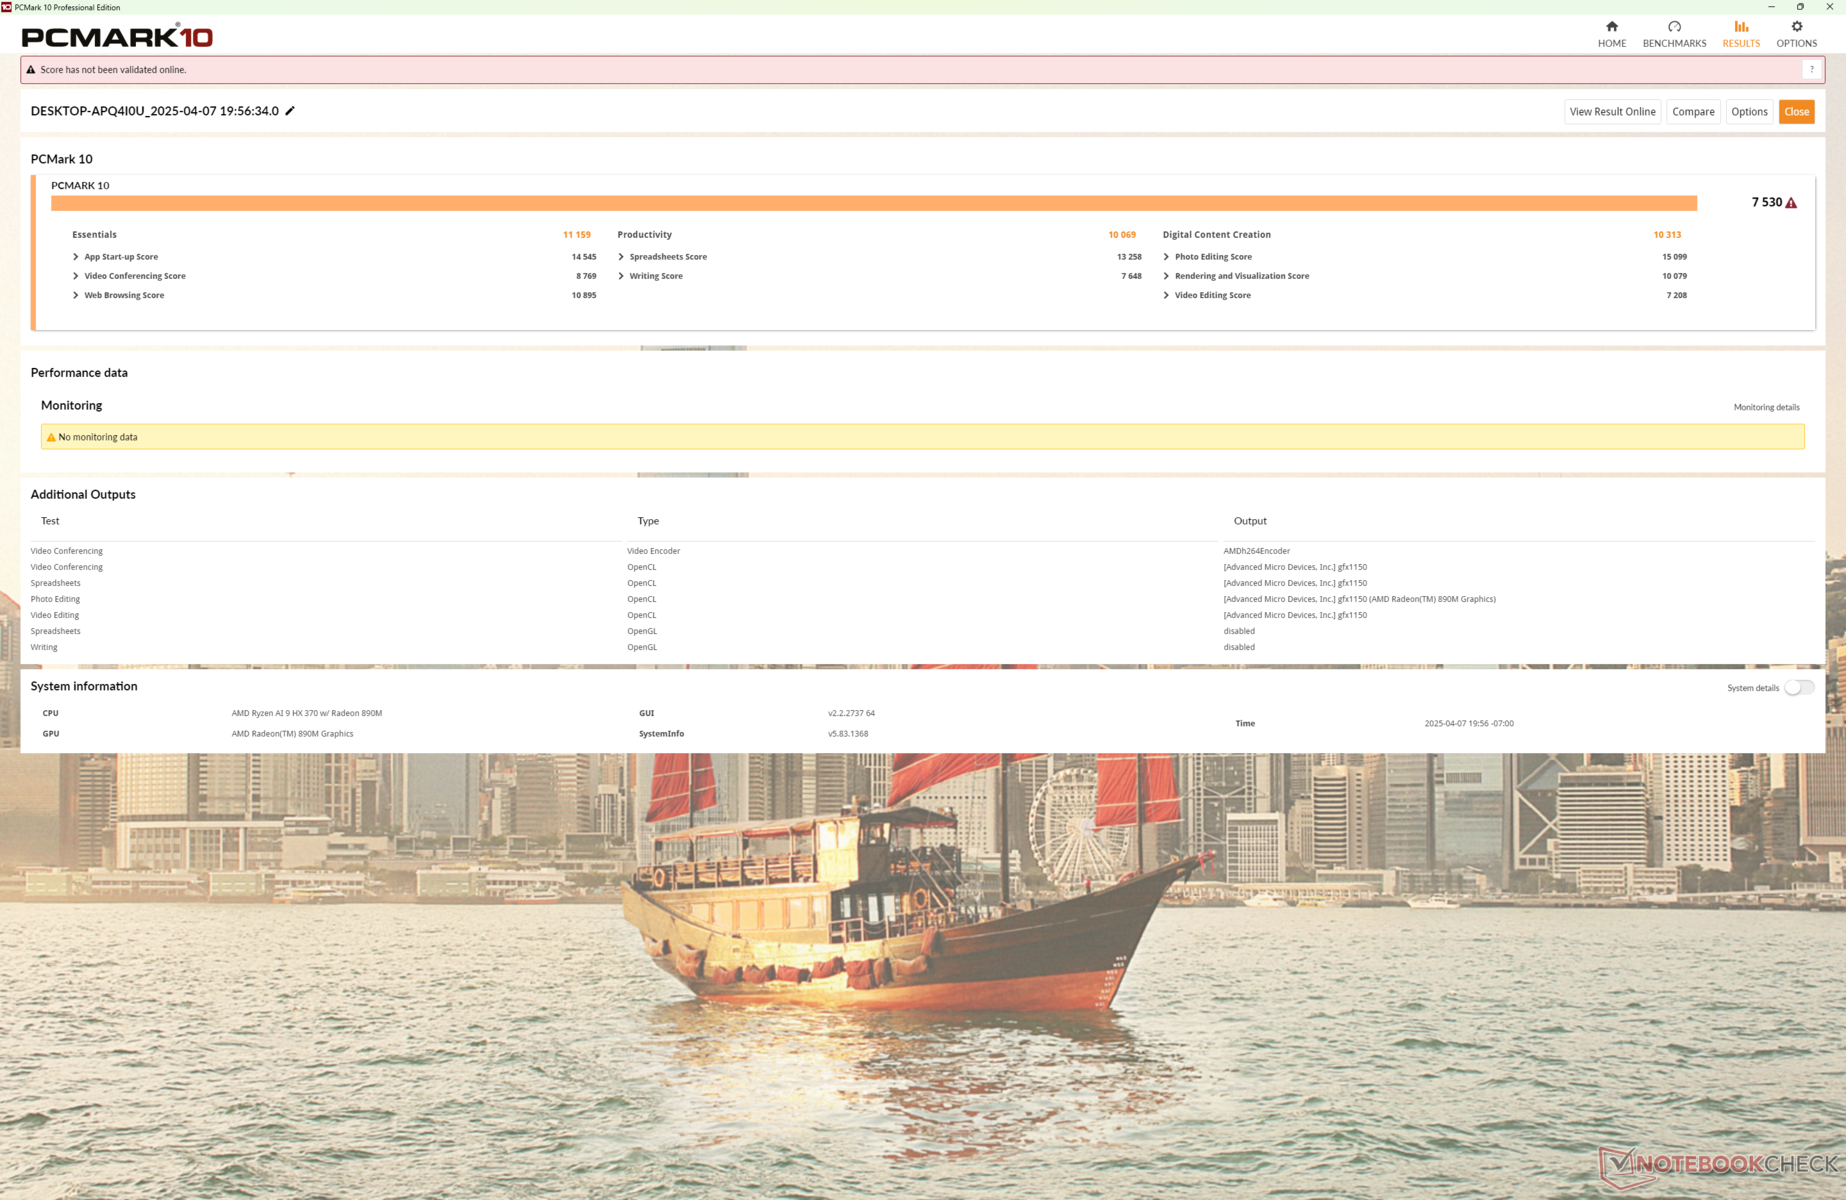
Rendimiento del sistema
CrossMark: Overall | Productivity | Creativity | Responsiveness
WebXPRT 3: Overall
WebXPRT 4: Overall
Mozilla Kraken 1.1: Total
| PCMark 10 / Score | |
| Framework Laptop 13.5 Ryzen AI 9 HX 370 | |
| Medio AMD Ryzen AI 9 HX 370, AMD Radeon 890M (6577 - 7646, n=10) | |
| Lenovo ThinkPad Z13 Gen 2 | |
| Framework Laptop 13.5 Core Ultra 7 155H | |
| Dell Pro 13 Premium PA13250 | |
| HP EliteBook x360 830 G10 7L7U1ET | |
| MSI Summit E13 AI Evo A1MTG | |
| PCMark 10 / Essentials | |
| Framework Laptop 13.5 Ryzen AI 9 HX 370 | |
| Lenovo ThinkPad Z13 Gen 2 | |
| Framework Laptop 13.5 Core Ultra 7 155H | |
| Medio AMD Ryzen AI 9 HX 370, AMD Radeon 890M (9277 - 11262, n=10) | |
| HP EliteBook x360 830 G10 7L7U1ET | |
| Dell Pro 13 Premium PA13250 | |
| MSI Summit E13 AI Evo A1MTG | |
| PCMark 10 / Productivity | |
| Framework Laptop 13.5 Ryzen AI 9 HX 370 | |
| Medio AMD Ryzen AI 9 HX 370, AMD Radeon 890M (8497 - 10615, n=10) | |
| Lenovo ThinkPad Z13 Gen 2 | |
| Dell Pro 13 Premium PA13250 | |
| Framework Laptop 13.5 Core Ultra 7 155H | |
| HP EliteBook x360 830 G10 7L7U1ET | |
| MSI Summit E13 AI Evo A1MTG | |
| PCMark 10 / Digital Content Creation | |
| Medio AMD Ryzen AI 9 HX 370, AMD Radeon 890M (9334 - 11422, n=10) | |
| Framework Laptop 13.5 Ryzen AI 9 HX 370 | |
| Framework Laptop 13.5 Core Ultra 7 155H | |
| Dell Pro 13 Premium PA13250 | |
| Lenovo ThinkPad Z13 Gen 2 | |
| MSI Summit E13 AI Evo A1MTG | |
| HP EliteBook x360 830 G10 7L7U1ET | |
| CrossMark / Overall | |
| Framework Laptop 13.5 Ryzen AI 9 HX 370 | |
| Medio AMD Ryzen AI 9 HX 370, AMD Radeon 890M (1686 - 1847, n=8) | |
| Framework Laptop 13.5 Core Ultra 7 155H | |
| Dell Pro 13 Premium PA13250 | |
| MSI Summit E13 AI Evo A1MTG | |
| Lenovo ThinkPad Z13 Gen 2 | |
| HP EliteBook x360 830 G10 7L7U1ET | |
| CrossMark / Productivity | |
| Framework Laptop 13.5 Ryzen AI 9 HX 370 | |
| Medio AMD Ryzen AI 9 HX 370, AMD Radeon 890M (1588 - 1719, n=8) | |
| Framework Laptop 13.5 Core Ultra 7 155H | |
| Dell Pro 13 Premium PA13250 | |
| MSI Summit E13 AI Evo A1MTG | |
| Lenovo ThinkPad Z13 Gen 2 | |
| HP EliteBook x360 830 G10 7L7U1ET | |
| CrossMark / Creativity | |
| Framework Laptop 13.5 Ryzen AI 9 HX 370 | |
| Medio AMD Ryzen AI 9 HX 370, AMD Radeon 890M (1817 - 2211, n=8) | |
| Framework Laptop 13.5 Core Ultra 7 155H | |
| Dell Pro 13 Premium PA13250 | |
| Lenovo ThinkPad Z13 Gen 2 | |
| MSI Summit E13 AI Evo A1MTG | |
| HP EliteBook x360 830 G10 7L7U1ET | |
| CrossMark / Responsiveness | |
| Medio AMD Ryzen AI 9 HX 370, AMD Radeon 890M (1222 - 1610, n=8) | |
| Framework Laptop 13.5 Ryzen AI 9 HX 370 | |
| MSI Summit E13 AI Evo A1MTG | |
| Framework Laptop 13.5 Core Ultra 7 155H | |
| Dell Pro 13 Premium PA13250 | |
| Lenovo ThinkPad Z13 Gen 2 | |
| HP EliteBook x360 830 G10 7L7U1ET | |
| WebXPRT 3 / Overall | |
| Framework Laptop 13.5 Ryzen AI 9 HX 370 | |
| Medio AMD Ryzen AI 9 HX 370, AMD Radeon 890M (252 - 342, n=9) | |
| Lenovo ThinkPad Z13 Gen 2 | |
| Framework Laptop 13.5 Core Ultra 7 155H | |
| MSI Summit E13 AI Evo A1MTG | |
| HP EliteBook x360 830 G10 7L7U1ET | |
| Dell Pro 13 Premium PA13250 | |
| WebXPRT 4 / Overall | |
| Framework Laptop 13.5 Ryzen AI 9 HX 370 | |
| Framework Laptop 13.5 Core Ultra 7 155H | |
| Medio AMD Ryzen AI 9 HX 370, AMD Radeon 890M (210 - 277, n=10) | |
| Dell Pro 13 Premium PA13250 | |
| Lenovo ThinkPad Z13 Gen 2 | |
| MSI Summit E13 AI Evo A1MTG | |
| Mozilla Kraken 1.1 / Total | |
| Lenovo ThinkPad Z13 Gen 2 | |
| HP EliteBook x360 830 G10 7L7U1ET | |
| MSI Summit E13 AI Evo A1MTG | |
| Framework Laptop 13.5 Core Ultra 7 155H | |
| Dell Pro 13 Premium PA13250 | |
| Framework Laptop 13.5 Ryzen AI 9 HX 370 | |
| Medio AMD Ryzen AI 9 HX 370, AMD Radeon 890M (419 - 503, n=11) | |
* ... más pequeño es mejor
| PCMark 10 Score | 7530 puntos | |
ayuda | ||
* ... más pequeño es mejor
Latencia del CPD
La configuración AMD experimenta una latencia y caídas de fotogramas ligeramente superiores a la configuración Intel al reproducir vídeo 4K60.
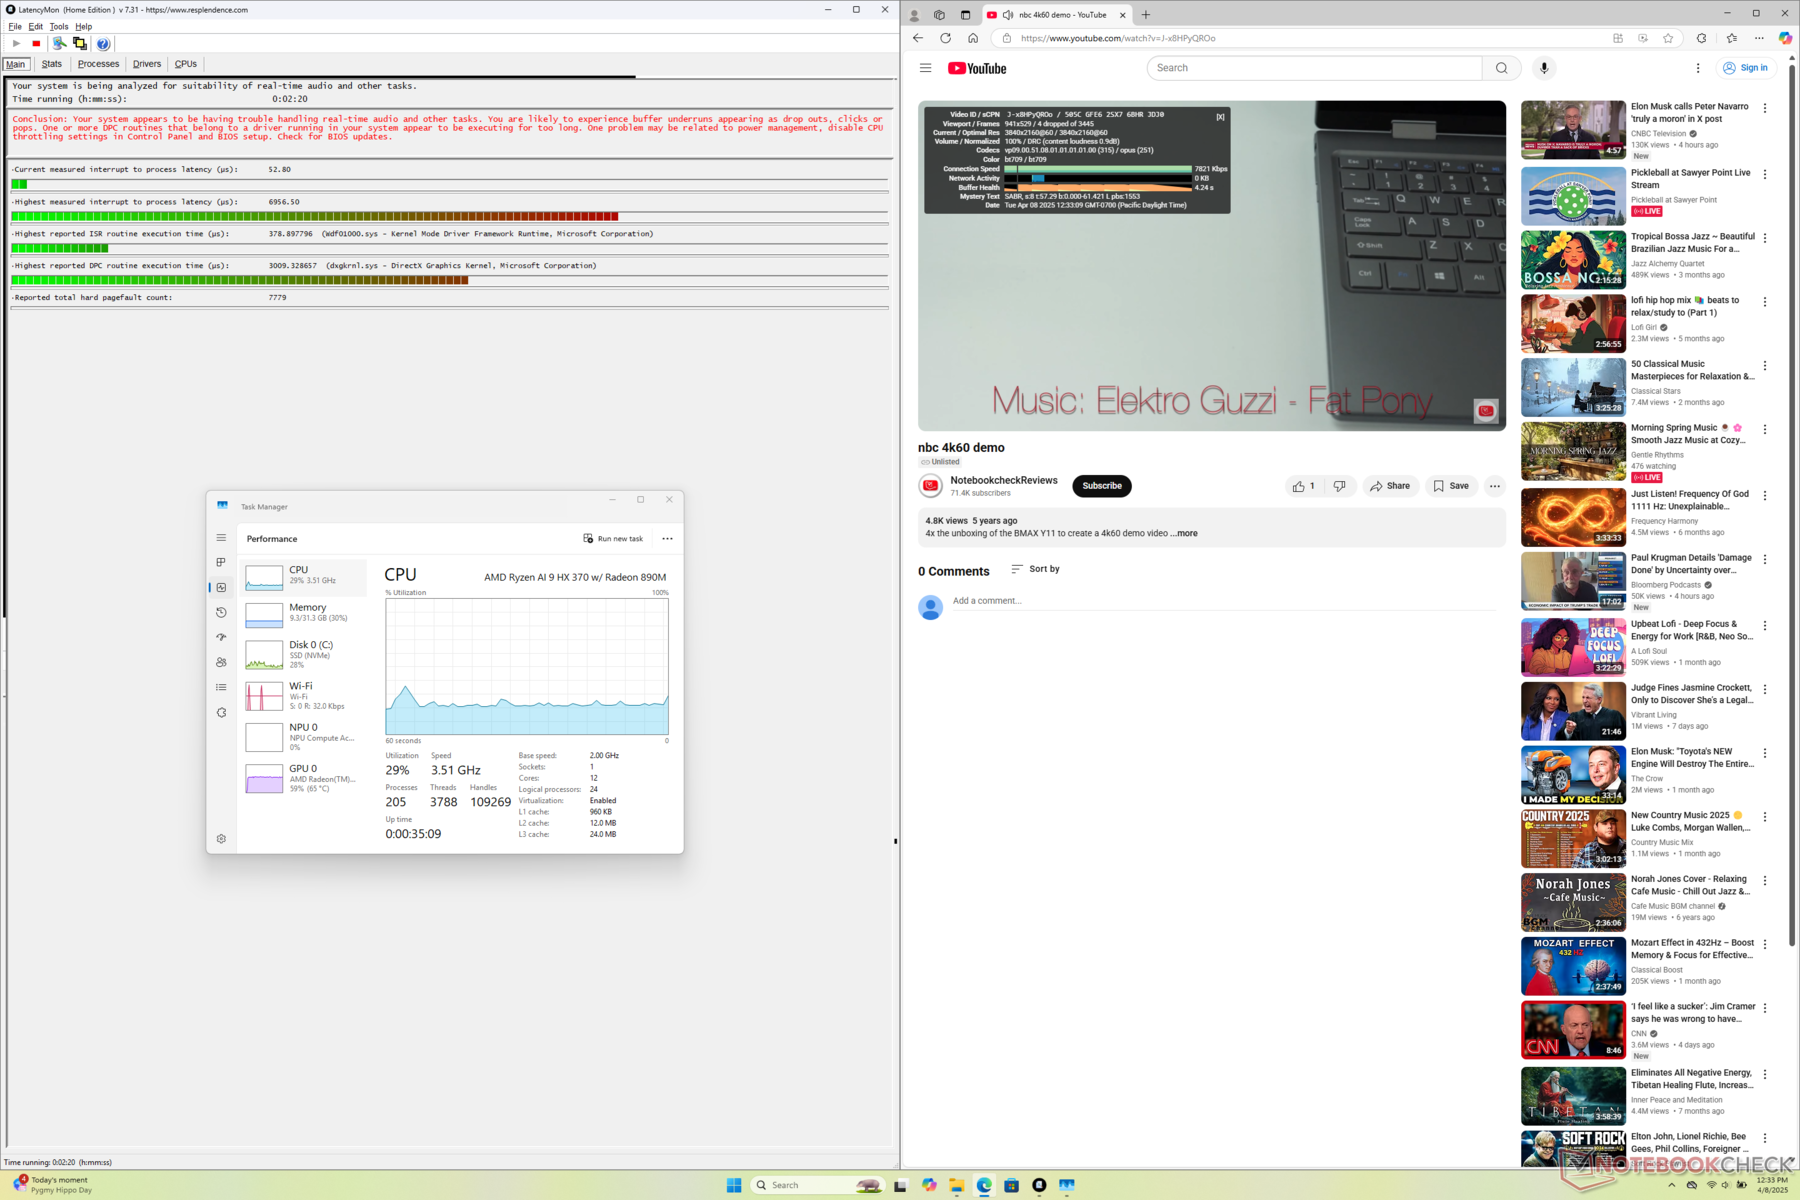
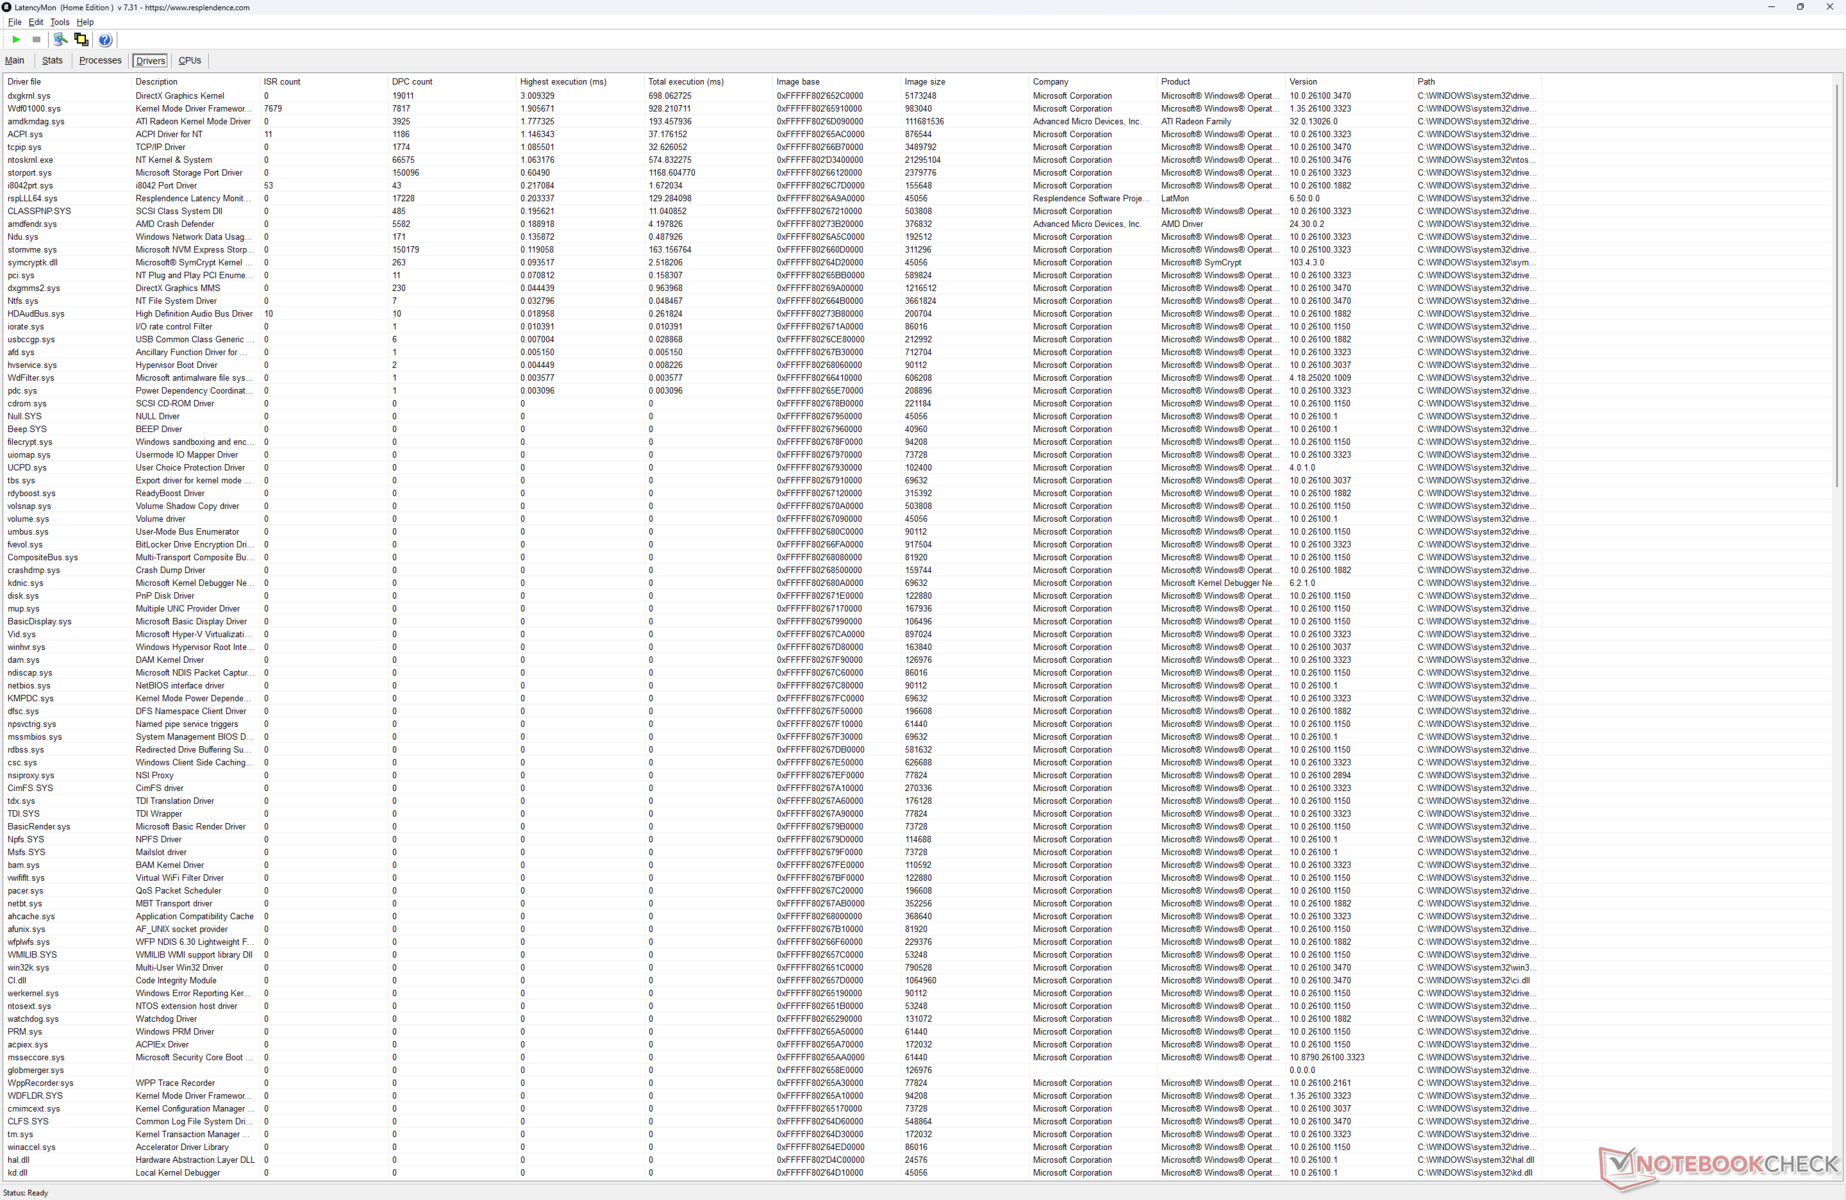
| DPC Latencies / LatencyMon - interrupt to process latency (max), Web, Youtube, Prime95 | |
| Framework Laptop 13.5 Ryzen AI 9 HX 370 | |
| MSI Summit E13 AI Evo A1MTG | |
| HP EliteBook x360 830 G10 7L7U1ET | |
| Lenovo ThinkPad Z13 Gen 2 | |
| Dell Pro 13 Premium PA13250 | |
| Framework Laptop 13.5 Core Ultra 7 155H | |
* ... más pequeño es mejor
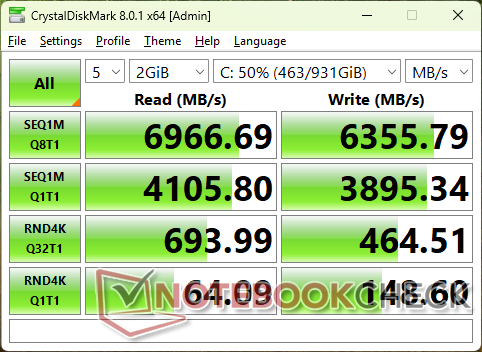
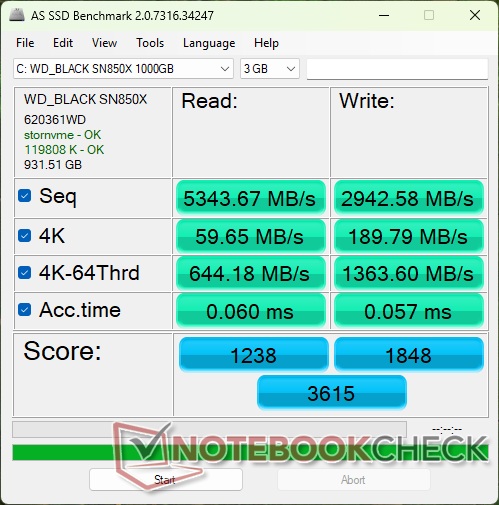
Dispositivos de almacenamiento
Framework ofrece el mismo WD Black SN850X SSD PCIe4 NVMe que en el modelo del año pasado.

* ... más pequeño es mejor
Disk Throttling: DiskSpd Read Loop, Queue Depth 8
Rendimiento de la GPU
los resultados de 3DMark son inferiores a lo esperado hasta en un 15 por ciento en comparación con el portátil medio de nuestra base de datos con la misma GPU Radeon RX 890M. Sin embargo, al ejecutar juegos reales, nuestra unidad seguía superando sistemáticamente a los antiguos Core Ultra 7 155H y Arco 8 por márgenes cómodos.
| 3DMark 11 Performance | 12491 puntos | |
| 3DMark Fire Strike Score | 7387 puntos | |
| 3DMark Time Spy Score | 3287 puntos | |
ayuda | ||
* ... más pequeño es mejor
Cyberpunk 2077 ultra FPS Chart
| bajo | medio | alto | ultra | |
|---|---|---|---|---|
| GTA V (2015) | 172.7 | 159.9 | 71.2 | 29.7 |
| Dota 2 Reborn (2015) | 171.3 | 138.8 | 47.7 | 45.1 |
| Final Fantasy XV Benchmark (2018) | 73 | 39.1 | 27.8 | |
| X-Plane 11.11 (2018) | 71.6 | 55 | 45.4 | |
| Far Cry 5 (2018) | 80 | 45 | 42 | 40 |
| Strange Brigade (2018) | 174.4 | 70.8 | 58.7 | 48.5 |
| Tiny Tina's Wonderlands (2022) | 68.1 | 52.2 | 36.1 | 29.4 |
| F1 22 (2022) | 99.2 | 90.6 | 67.8 | 20.1 |
| Baldur's Gate 3 (2023) | 44.6 | 36.9 | 30.8 | 30 |
| Cyberpunk 2077 2.2 Phantom Liberty (2023) | 44.5 | 34.7 | 27.4 | 24.4 |
| Monster Hunter Wilds (2025) | 25 | 19.5 | 14 |
Emisiones
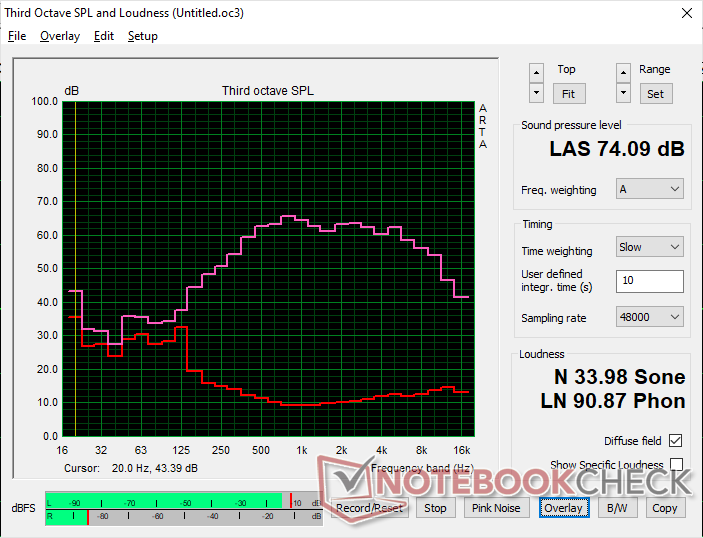
Ruido del sistema
El perfil de ruido del ventilador sigue siendo prácticamente el mismo, con un suelo y un techo similares a los de la configuración Intel. Las RPM del ventilador, sin embargo, tienden a aumentar ligeramente antes con la configuración AMD.
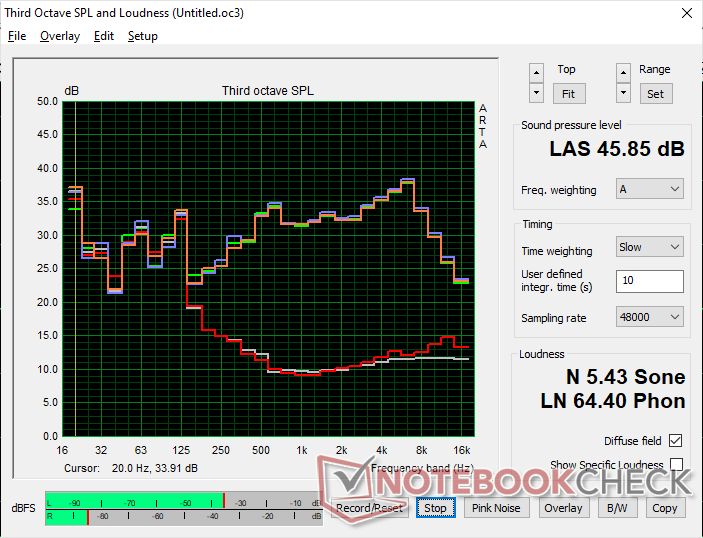
Ruido
| Ocioso |
| 24.4 / 24.4 / 28 dB(A) |
| Carga |
| 46.2 / 45.9 dB(A) |
 | ||
30 dB silencioso 40 dB(A) audible 50 dB(A) ruidosamente alto |
||
min: | ||
| Framework Laptop 13.5 Ryzen AI 9 HX 370 Radeon 890M, Ryzen AI 9 HX 370 | Framework Laptop 13.5 Core Ultra 7 155H Arc 8-Core, Ultra 7 155H | Dell Pro 13 Premium PA13250 Arc 140V, Core Ultra 7 268V, Micron 2550 1TB | MSI Summit E13 AI Evo A1MTG Arc 8-Core, Ultra 7 155H, Micron 2400 MTFDKBA1T0QFM | HP EliteBook x360 830 G10 7L7U1ET Iris Xe G7 80EUs, i5-1335U, Samsung PM991 MZVLQ512HBLU | Lenovo ThinkPad Z13 Gen 2 Radeon 780M, R7 PRO 7840U, SK hynix BC901 HFS001TEJ4X164N | |
|---|---|---|---|---|---|---|
| Noise | 4% | 10% | 2% | 12% | 4% | |
| apagado / medio ambiente * | 24.2 | 24 1% | 23 5% | 24 1% | 23.2 4% | 25.1 -4% |
| Idle Minimum * | 24.4 | 24.1 1% | 23 6% | 24.1 1% | 23.2 5% | 25.8 -6% |
| Idle Average * | 24.4 | 25.1 -3% | 23 6% | 24.8 -2% | 23.2 5% | 25.8 -6% |
| Idle Maximum * | 28 | 27 4% | 23 18% | 26.5 5% | 23.2 17% | 28.3 -1% |
| Load Average * | 46.2 | 38.4 17% | 37 20% | 39.3 15% | 29.4 36% | 28.3 39% |
| Cyberpunk 2077 ultra * | 45.8 | 43.7 5% | 42.74 7% | 45 2% | ||
| Load Maximum * | 45.9 | 45.8 -0% | 42.74 7% | 49.1 -7% | 42.5 7% | 44.8 2% |
| Witcher 3 ultra * | 42.3 | 44.8 |
* ... más pequeño es mejor
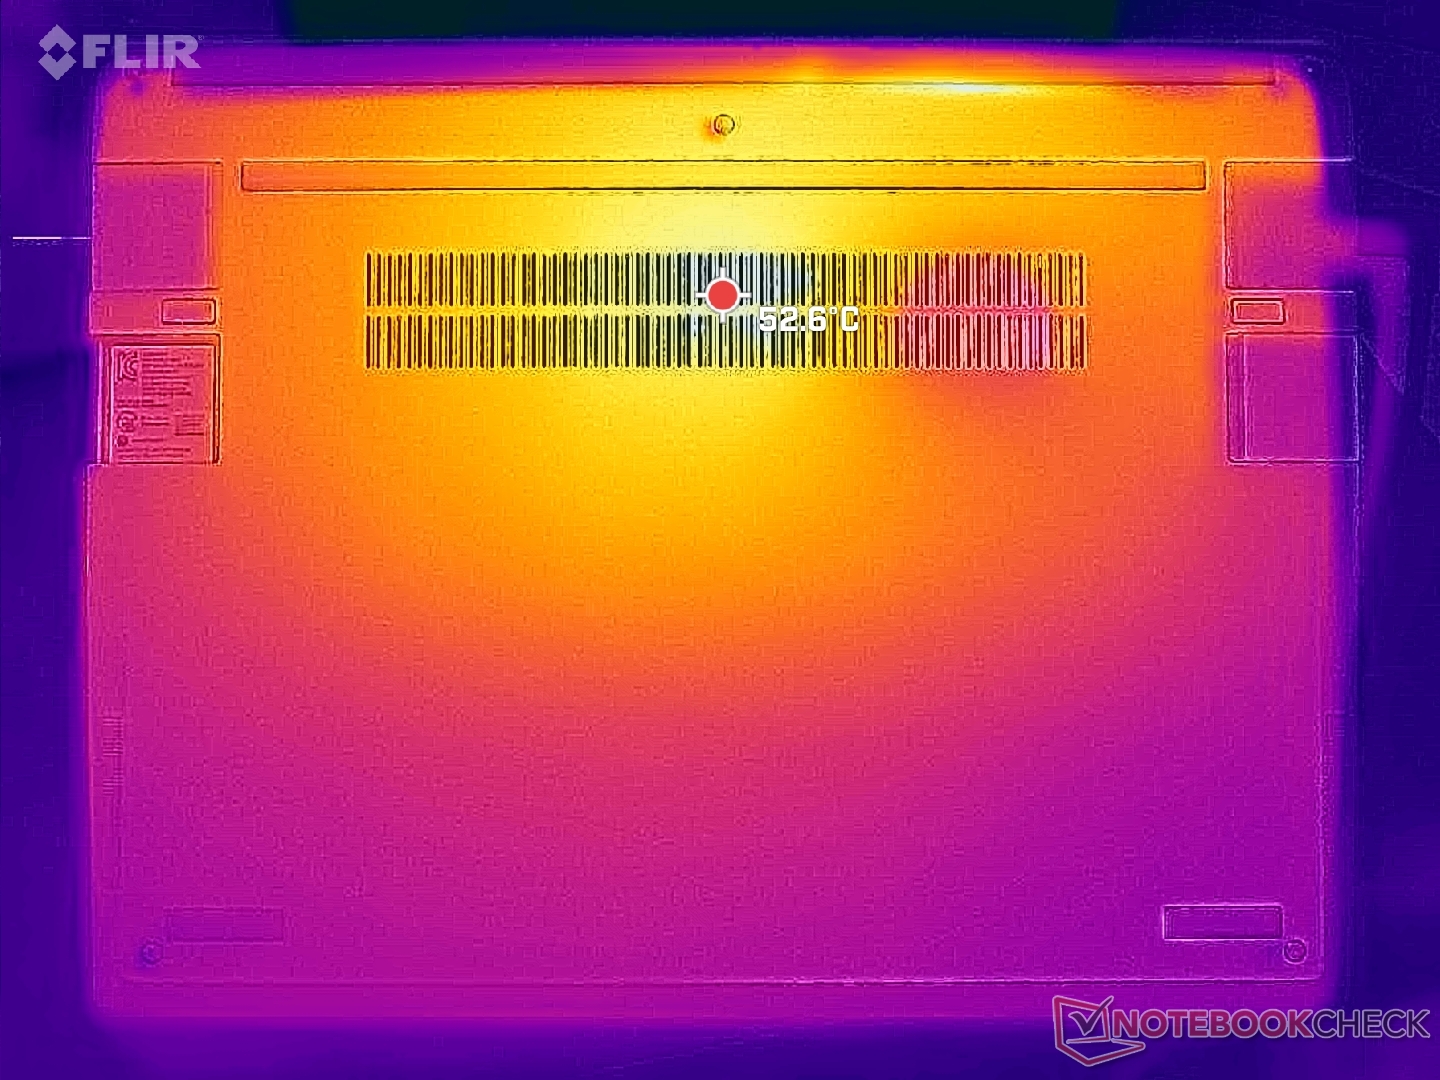
Temperatura
La evolución de la temperatura de la superficie sigue siendo en gran medida la misma que antes, ya que la envoltura térmica y la solución de refrigeración no han cambiado.
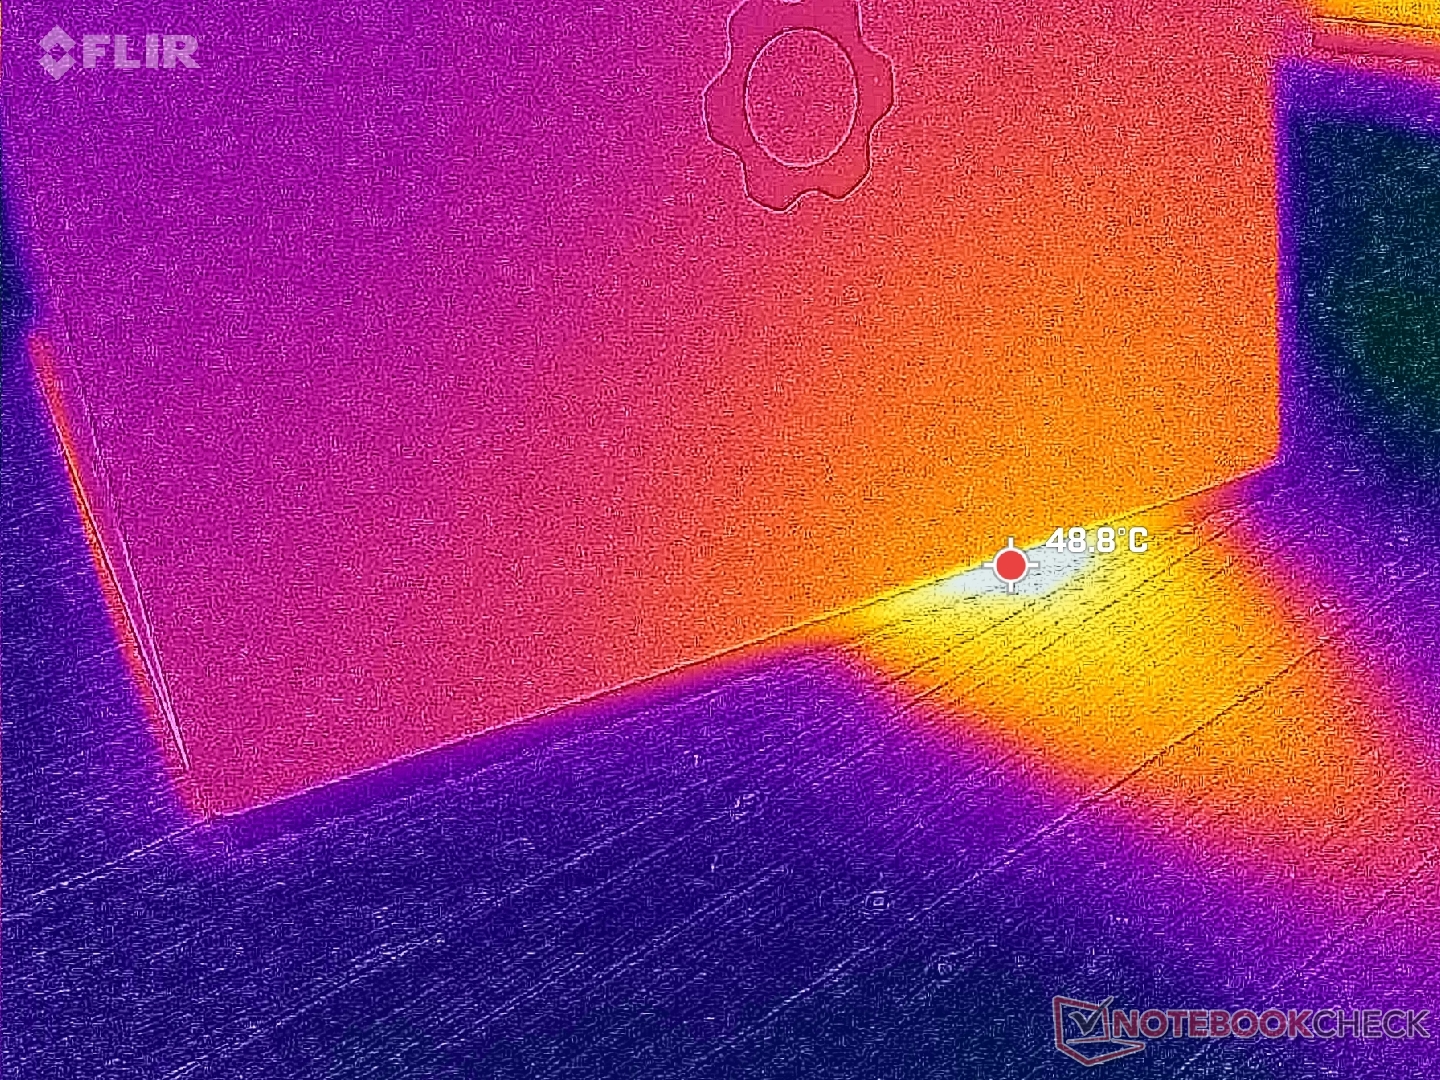
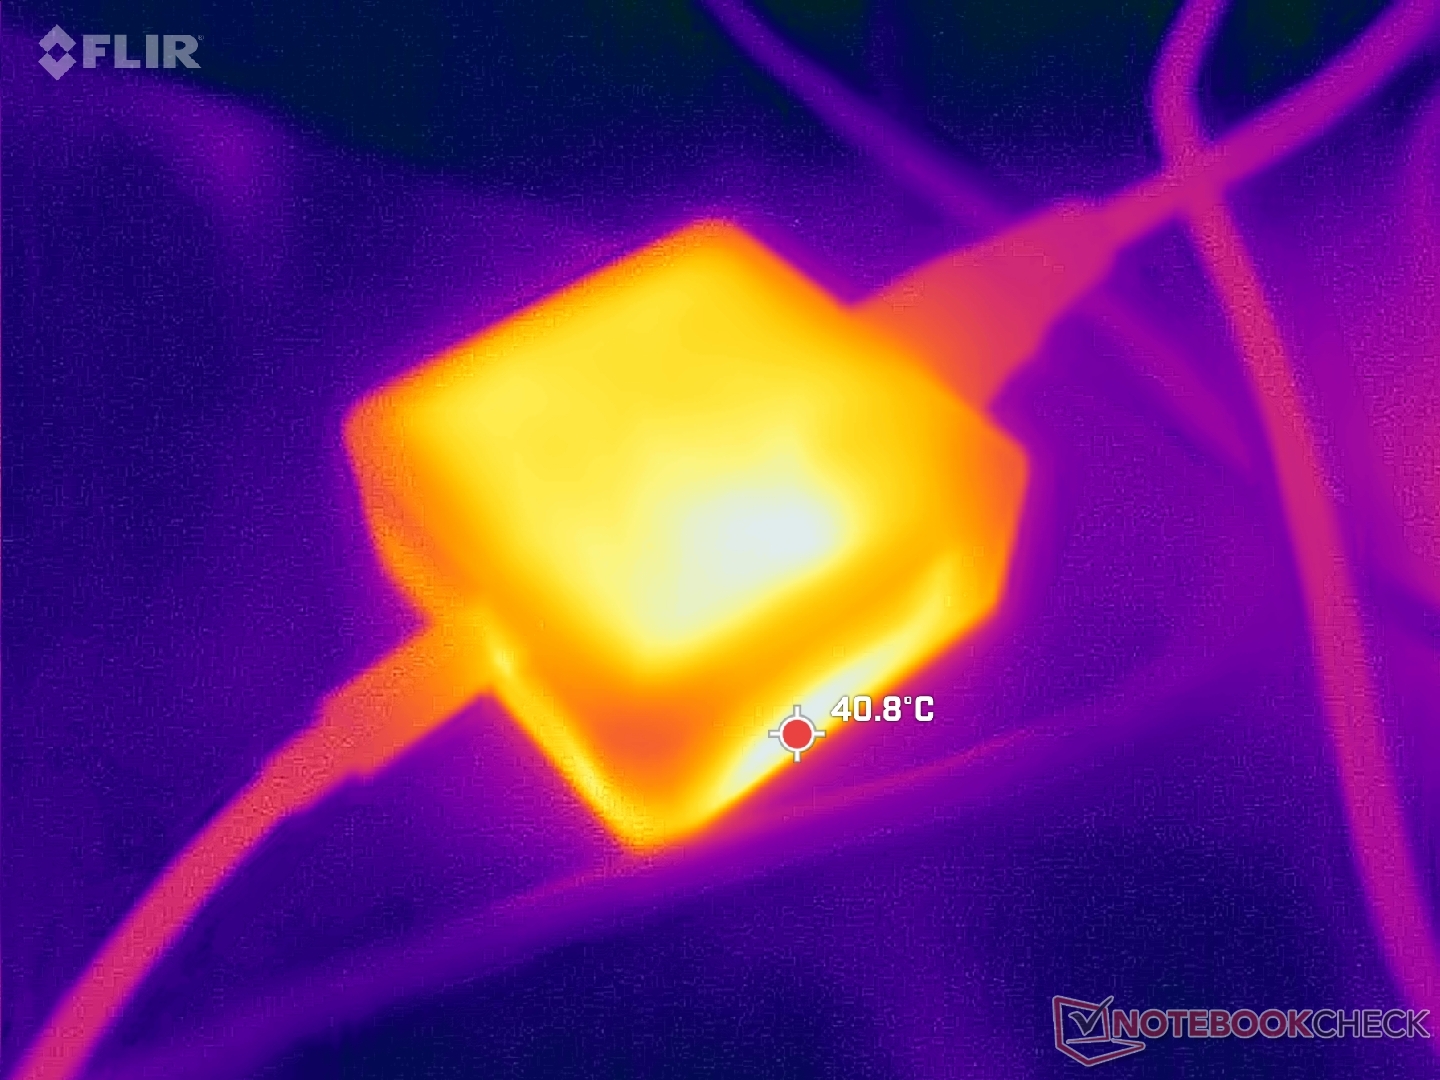
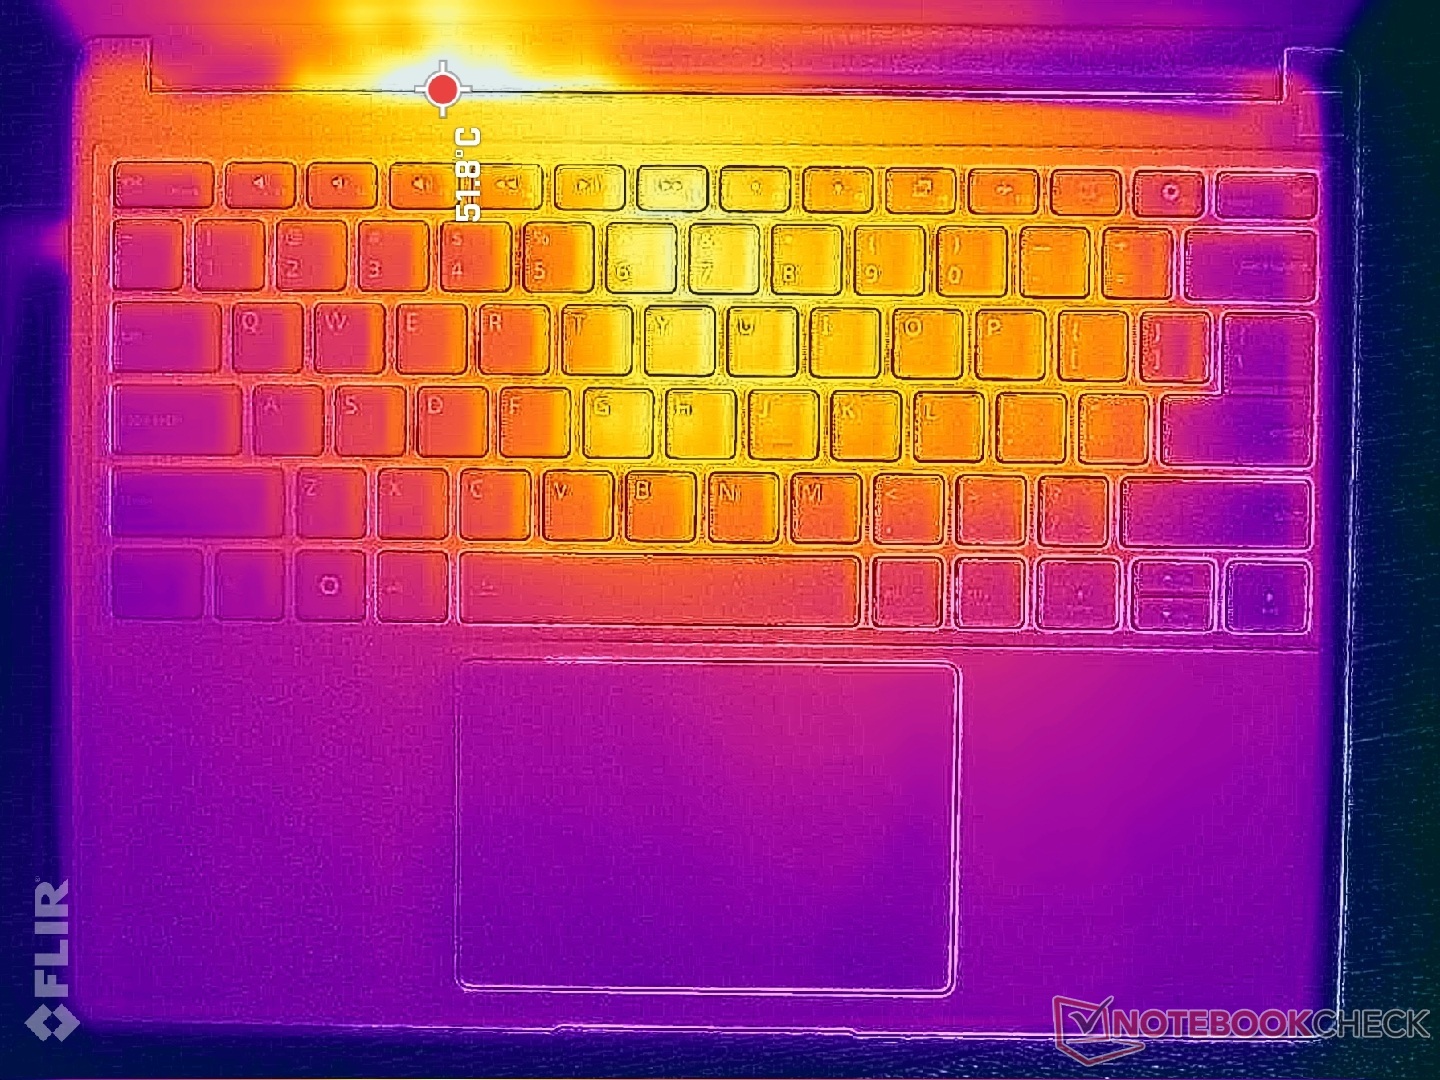
(±) La temperatura máxima en la parte superior es de 42.2 °C / 108 F, frente a la media de 34.3 °C / 94 F, que oscila entre 21.2 y 62.5 °C para la clase Office.
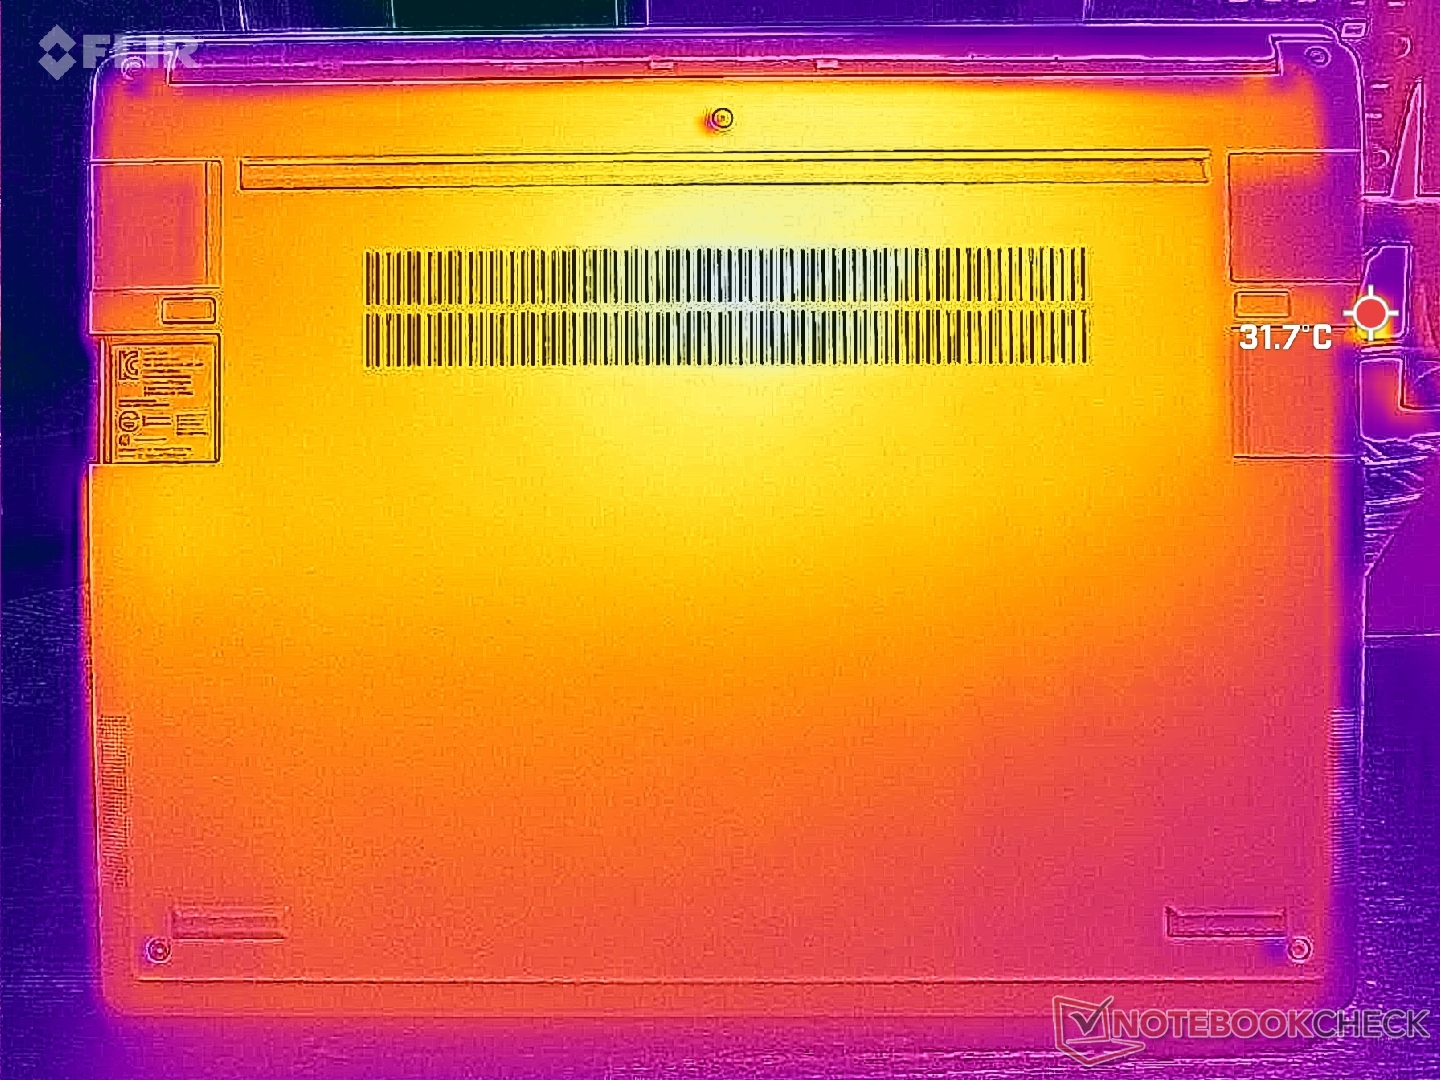
(-) El fondo se calienta hasta un máximo de 46.8 °C / 116 F, frente a la media de 36.8 °C / 98 F
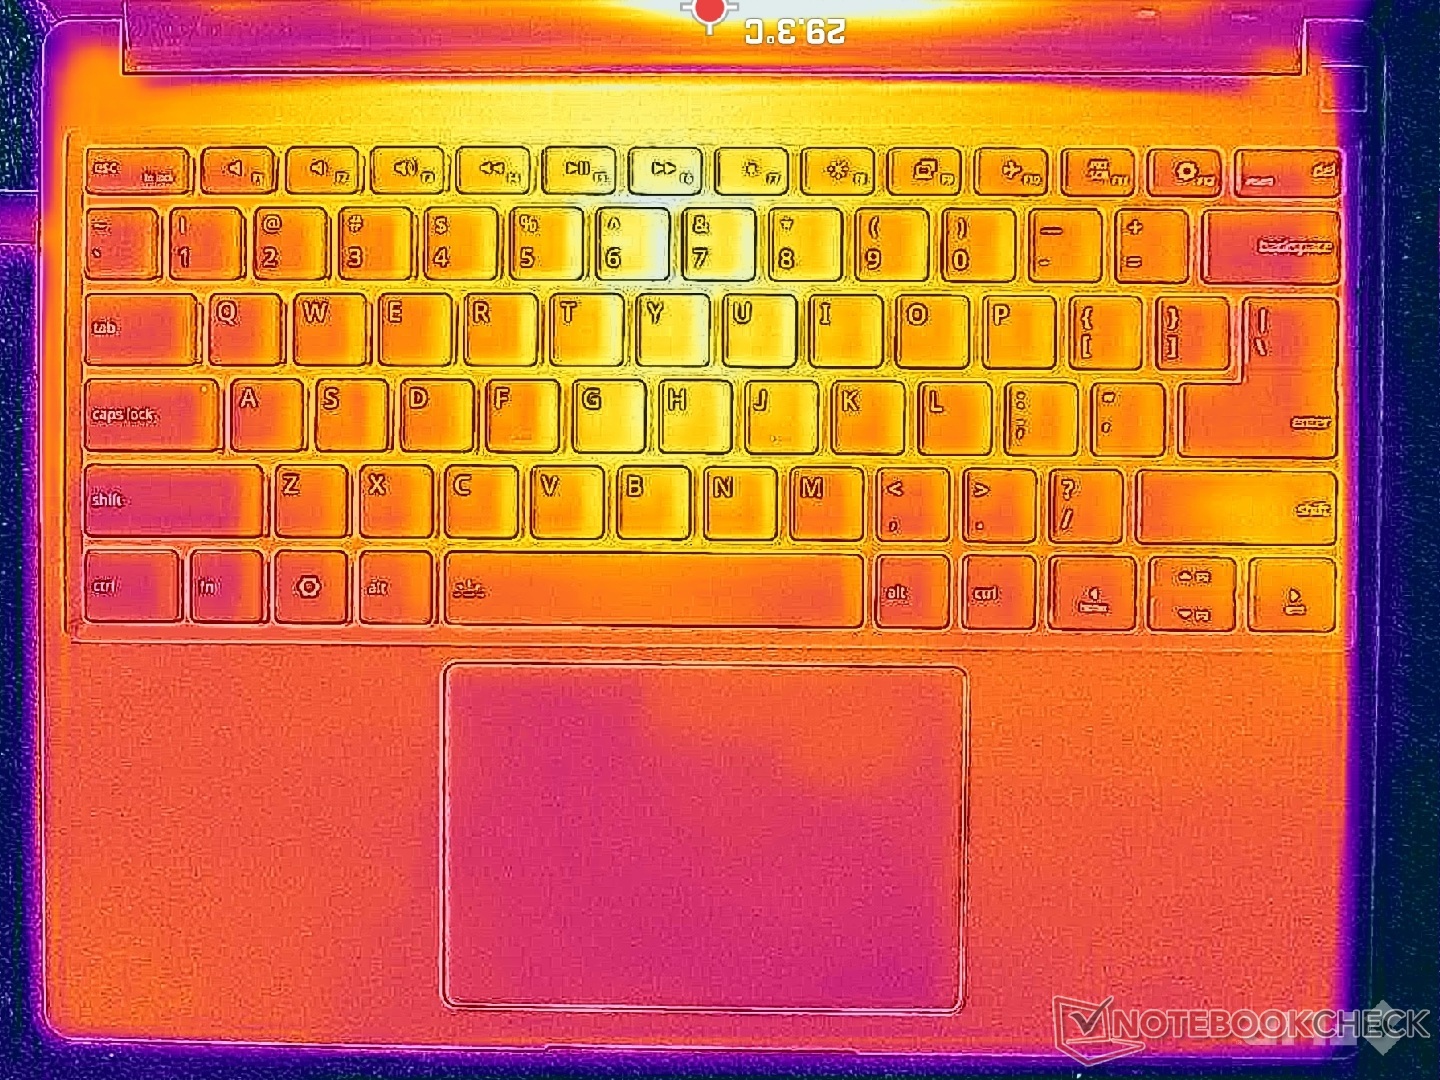
(+) En reposo, la temperatura media de la parte superior es de 29.2 °C / 85# F, frente a la media del dispositivo de 29.5 °C / 85 F.
(+) El reposamanos y el panel táctil están a una temperatura inferior a la de la piel, con un máximo de 29 °C / 84.2 F y, por tanto, son fríos al tacto.
(±) La temperatura media de la zona del reposamanos de dispositivos similares fue de 27.6 °C / 81.7 F (-1.4 °C / -2.5 F).
| Framework Laptop 13.5 Ryzen AI 9 HX 370 AMD Ryzen AI 9 HX 370, AMD Radeon 890M | Framework Laptop 13.5 Core Ultra 7 155H Intel Core Ultra 7 155H, Intel Arc 8-Core iGPU | Dell Pro 13 Premium PA13250 Intel Core Ultra 7 268V, Intel Arc Graphics 140V | MSI Summit E13 AI Evo A1MTG Intel Core Ultra 7 155H, Intel Arc 8-Core iGPU | HP EliteBook x360 830 G10 7L7U1ET Intel Core i5-1335U, Intel Iris Xe Graphics G7 80EUs | Lenovo ThinkPad Z13 Gen 2 AMD Ryzen 7 PRO 7840U, AMD Radeon 780M | |
|---|---|---|---|---|---|---|
| Heat | 6% | 27% | -7% | 5% | 11% | |
| Maximum Upper Side * | 42.2 | 42.8 -1% | 31 27% | 45.2 -7% | 40.2 5% | 46.2 -9% |
| Maximum Bottom * | 46.8 | 45.2 3% | 31 34% | 44.8 4% | 42.4 9% | 48.4 -3% |
| Idle Upper Side * | 31 | 27.2 12% | 24 23% | 34.8 -12% | 30 3% | 23.2 25% |
| Idle Bottom * | 32.2 | 28.6 11% | 24 25% | 35.8 -11% | 31.8 1% | 23 29% |
* ... más pequeño es mejor
Altavoces
Framework Laptop 13.5 Ryzen AI 9 HX 370 análisis de audio
(±) | la sonoridad del altavoz es media pero buena (74.1 dB)
Graves 100 - 315 Hz
(±) | lubina reducida - en promedio 14.3% inferior a la mediana
(±) | la linealidad de los graves es media (7.3% delta a frecuencia anterior)
Medios 400 - 2000 Hz
(+) | medios equilibrados - a sólo 3.5% de la mediana
(+) | los medios son lineales (4.7% delta a la frecuencia anterior)
Altos 2 - 16 kHz
(+) | máximos equilibrados - a sólo 2.9% de la mediana
(+) | los máximos son lineales (4.3% delta a la frecuencia anterior)
Total 100 - 16.000 Hz
(±) | la linealidad del sonido global es media (17.4% de diferencia con la mediana)
En comparación con la misma clase
» 23% de todos los dispositivos probados de esta clase eran mejores, 7% similares, 69% peores
» El mejor tuvo un delta de 7%, la media fue 21%, el peor fue ###max##%
En comparación con todos los dispositivos probados
» 30% de todos los dispositivos probados eran mejores, 8% similares, 61% peores
» El mejor tuvo un delta de 4%, la media fue 24%, el peor fue ###max##%
Apple MacBook Pro 16 2021 M1 Pro análisis de audio
(+) | los altavoces pueden reproducir a un volumen relativamente alto (#84.7 dB)
Graves 100 - 315 Hz
(+) | buen bajo - sólo 3.8% lejos de la mediana
(+) | el bajo es lineal (5.2% delta a la frecuencia anterior)
Medios 400 - 2000 Hz
(+) | medios equilibrados - a sólo 1.3% de la mediana
(+) | los medios son lineales (2.1% delta a la frecuencia anterior)
Altos 2 - 16 kHz
(+) | máximos equilibrados - a sólo 1.9% de la mediana
(+) | los máximos son lineales (2.7% delta a la frecuencia anterior)
Total 100 - 16.000 Hz
(+) | el sonido global es lineal (4.6% de diferencia con la mediana)
En comparación con la misma clase
» 0% de todos los dispositivos probados de esta clase eran mejores, 0% similares, 100% peores
» El mejor tuvo un delta de 5%, la media fue 18%, el peor fue ###max##%
En comparación con todos los dispositivos probados
» 0% de todos los dispositivos probados eran mejores, 0% similares, 100% peores
» El mejor tuvo un delta de 4%, la media fue 24%, el peor fue ###max##%
Gestión de la energía
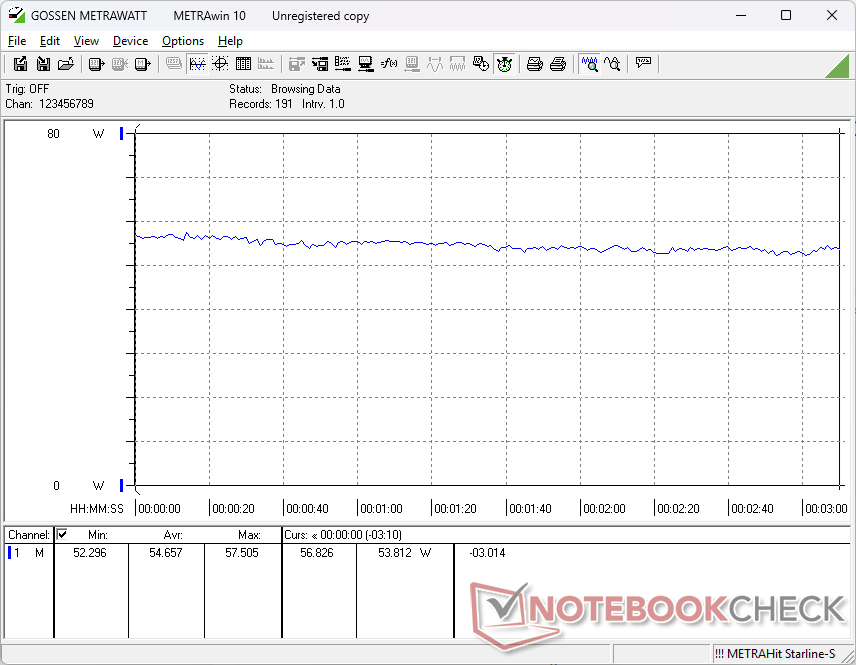
Consumo de energía
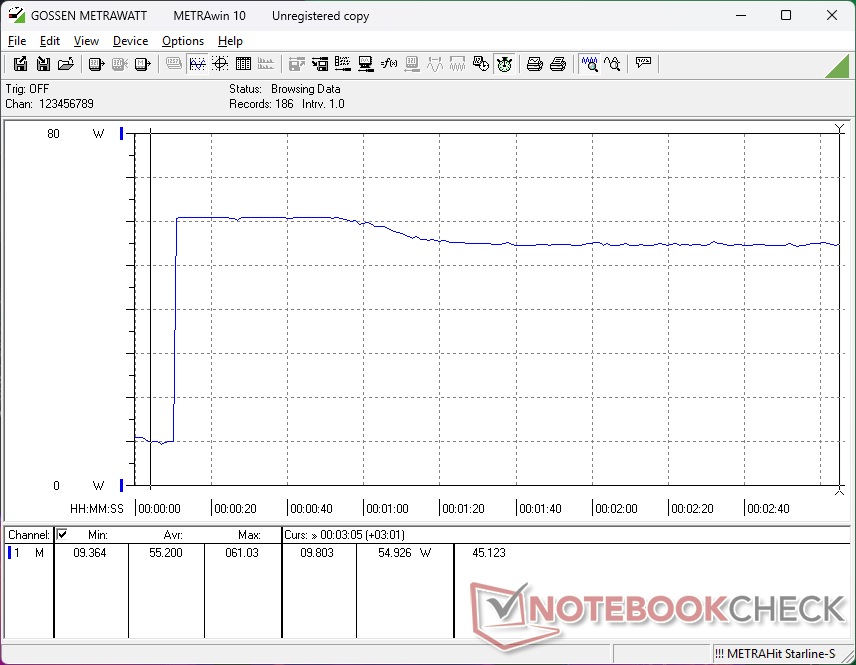
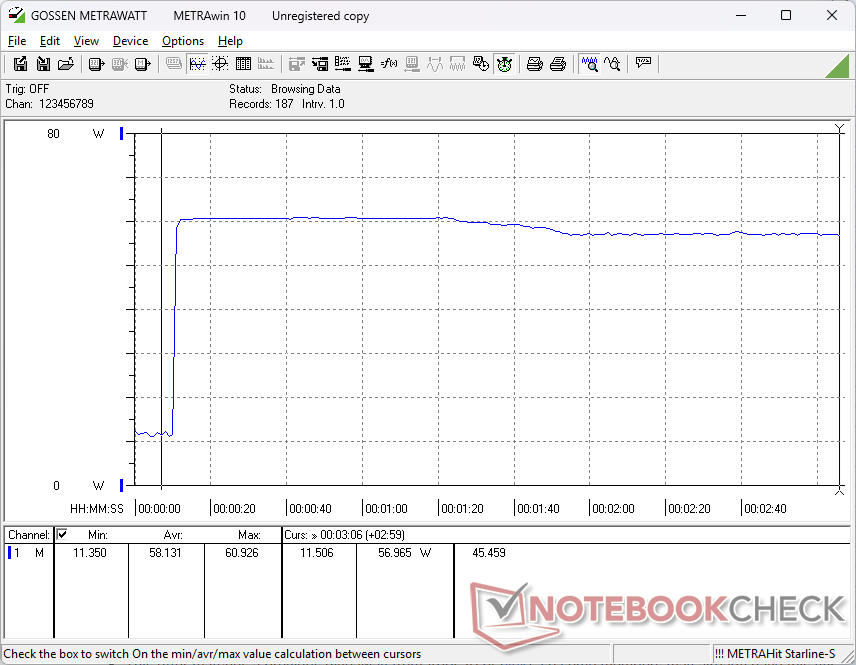
Los niveles de consumo se acercan a los que registramos en la opción Core Ultra 7 155H del año pasado, al tiempo que proporciona un rendimiento más rápido de la CPU y la GPU para un rendimiento por vatio superior con nuestra configuración AMD. Aun así, el sistema AMD es ligeramente más exigente cuando está en reposo en el escritorio, lo que repercute en la duración de la batería.
| Off / Standby | |
| Ocioso | |
| Carga |
|
Clave:
min: | |
| Framework Laptop 13.5 Ryzen AI 9 HX 370 Ryzen AI 9 HX 370, Radeon 890M, , IPS, 2880x1920, 13.5" | Framework Laptop 13.5 Core Ultra 7 155H Ultra 7 155H, Arc 8-Core, , IPS, 2880x1920, 13.5" | Framework Laptop 13.5 Ryzen 7 7840U R7 7840U, Radeon 780M, WD PC SN740 512GB SDDPNQD-512G, IPS, 2256x1504, 13.5" | Framework Laptop 13.5 13th Gen Intel i7-1370P, Iris Xe G7 96EUs, WD PC SN740 SDDPNQD-1T00, IPS, 2256x1504, 13.5" | Framework Laptop 13.5 12th Gen Intel i7-1260P, Iris Xe G7 96EUs, WDC PC SN730 SDBPNTY-512G, IPS, 2256x1504, 13.5" | Framework Laptop 13.5 i7-1165G7, Iris Xe G7 96EUs, Western Digital WD_BLACK SN850 WDS100T1X0E, IPS, 2256x1504, 13.5" | |
|---|---|---|---|---|---|---|
| Power Consumption | 26% | 30% | 23% | 11% | 23% | |
| Idle Minimum * | 7.6 | 2.5 67% | 4 47% | 2.9 62% | 5.3 30% | 4.3 43% |
| Idle Average * | 11.3 | 5.2 54% | 6.5 42% | 6.3 44% | 8.4 26% | 8.2 27% |
| Idle Maximum * | 11.5 | 5.8 50% | 6.8 41% | 9.9 14% | 11.2 3% | 8.7 24% |
| Load Average * | 54.7 | 47.5 13% | 48 12% | 56.2 -3% | 57.4 -5% | 43.5 20% |
| Cyberpunk 2077 ultra external monitor * | 51.3 | 52.4 -2% | ||||
| Cyberpunk 2077 ultra * | 54.6 | 54.5 -0% | ||||
| Load Maximum * | 60.9 | 61.5 -1% | 55.2 9% | 60.8 -0% | 61.2 -0% | 61.8 -1% |
| Witcher 3 ultra * | 52.3 | 56.6 | 46.7 | 43.5 |
* ... más pequeño es mejor
Power Consumption Cyberpunk / Stress Test
Power Consumption external Monitor
Duración de las pilas
Los tiempos de ejecución son buenos pero notablemente más cortos que con las opciones de procesador más antiguas.
| Framework Laptop 13.5 Ryzen AI 9 HX 370 Ryzen AI 9 HX 370, Radeon 890M, 61 Wh | Framework Laptop 13.5 Core Ultra 7 155H Ultra 7 155H, Arc 8-Core, 61 Wh | Framework Laptop 13.5 Ryzen 7 7840U R7 7840U, Radeon 780M, 61 Wh | Framework Laptop 13.5 13th Gen Intel i7-1370P, Iris Xe G7 96EUs, 61 Wh | Framework Laptop 13.5 12th Gen Intel i7-1260P, Iris Xe G7 96EUs, 55 Wh | Framework Laptop 13.5 i7-1165G7, Iris Xe G7 96EUs, 55 Wh | |
|---|---|---|---|---|---|---|
| Duración de Batería | 31% | 51% | 10% | -7% | 0% | |
| WiFi v1.3 | 480 | 630 31% | 726 51% | 527 10% | 447 -7% | 478 0% |
| Reader / Idle | 2296 | |||||
| Load | 90 |
Valoración de Notebookcheck
Framework Laptop 13.5 Ryzen AI 9 HX 370
- 04/14/2025 v8
Allen Ngo
 Total Sustainability Score:
 Potential Competitors in Comparison
Imagen | Modelo | Precio | Peso | Altura | Pantalla |
|---|---|---|---|---|---|
1. 83.8%  | Framework Laptop 13.5 Ryzen AI 9 HX 370 AMD Ryzen AI 9 HX 370 ⎘ AMD Radeon 890M ⎘ 32 GB Memoría | Amazon: 1. $1,449.00 HP 2024 OmniBook Ultra 14”... 2. $1,094.16 ASUS Vivobook S 14 OLED Slim... 3. $1,449.00 HP OmniBook Ultra 14 2024 La... Precio de catálogo: 2100 USD | 1.3 kg | 15.85 mm | 13.50" 2880x1920 256 PPI IPS |
2. 84%  | Framework Laptop 13.5 Core Ultra 7 155H Intel Core Ultra 7 155H ⎘ Intel Arc 8-Core iGPU ⎘ 32 GB Memoría | Precio de catálogo: 1500 USD | 1.4 kg | 15.85 mm | 13.50" 2880x1920 256 PPI IPS |
3. 89.9%  | Dell Pro 13 Premium PA13250 Intel Core Ultra 7 268V ⎘ Intel Arc Graphics 140V ⎘ 32 GB Memoría, 1024 GB SSD | Amazon: 1. $39.99 Smatree Hard Shell Laptop Ca... 2. $29.99 Smatree Hard EVA Protective ... 3. $49.99 Smatree 13 inch Laptop Sleev... Precio de catálogo: 2700 Euro | 1.1 kg | 17.2 mm | 13.30" 1920x1200 170 PPI IPS |
4. 78.6%  | MSI Summit E13 AI Evo A1MTG Intel Core Ultra 7 155H ⎘ Intel Arc 8-Core iGPU ⎘ 16 GB Memoría, 1024 GB SSD | Amazon: $1,099.00 Precio de catálogo: 1100 USD | 1.3 kg | 16.2 mm | 13.30" 1920x1200 170 PPI IPS |
5. 89.4% v7 (old)  | HP EliteBook x360 830 G10 7L7U1ET Intel Core i5-1335U ⎘ Intel Iris Xe Graphics G7 80EUs ⎘ 16 GB Memoría, 512 GB SSD | Amazon: $699.99 Precio de catálogo: 1300 Euro | 1.3 kg | 19.2 mm | 13.30" 1920x1200 170 PPI IPS LED |
6. 89.5% v7 (old)  | Lenovo ThinkPad Z13 Gen 2 AMD Ryzen 7 PRO 7840U ⎘ AMD Radeon 780M ⎘ 32 GB Memoría, 1024 GB SSD | Amazon: 1. $1,279.00 Lenovo 2024 ThinkPad Z13 Gen... 2. $1,339.99 Lenovo ThinkPad X13 2-in-1 G... 3. $959.99 Lenovo ThinkPad E16 Gen 2 AI... Precio de catálogo: 1800 USD | 1.2 kg | 13.99 mm | 13.30" 2880x1800 255 PPI OLED |
Transparencia
La selección de los dispositivos que se van a reseñar corre a cargo de nuestro equipo editorial. La muestra de prueba fue proporcionada al autor en calidad de préstamo por el fabricante o el minorista a los efectos de esta reseña. El prestamista no tuvo ninguna influencia en esta reseña, ni el fabricante recibió una copia de la misma antes de su publicación. No había ninguna obligación de publicar esta reseña. Nunca aceptamos compensaciones o pagos a cambio de nuestras reseñas. Como empresa de medios independiente, Notebookcheck no está sujeta a la autoridad de fabricantes, minoristas o editores.
Así es como prueba Notebookcheck
Cada año, Notebookcheck revisa de forma independiente cientos de portátiles y smartphones utilizando procedimientos estandarizados para asegurar que todos los resultados son comparables. Hemos desarrollado continuamente nuestros métodos de prueba durante unos 20 años y hemos establecido los estándares de la industria en el proceso. En nuestros laboratorios de pruebas, técnicos y editores experimentados utilizan equipos de medición de alta calidad. Estas pruebas implican un proceso de validación en varias fases. Nuestro complejo sistema de clasificación se basa en cientos de mediciones y puntos de referencia bien fundamentados, lo que mantiene la objetividad.
